Assessing pricing for a new product concept: PDA+electronic health records+real-time monitoring
24
UNCORRECTED PROOF 1 © 2009 PALGRAVE MACMILLAN 1746-0166 VOL.X NO.Y PP 1–24. Journal of Direct, Data and Digital Marketing Practice www.palgrave-journals.com/dddmp/ Journal: DDDMP Disk used Despatch Date: Ed: Article:200910 Article Type: Pages: Col Figs: Op: Sudha Assessing pricing for a new product concept: PDA + Electronic Health Records + Real Time Monitoring Gillie Gabay, Hala Badreddine, Samuel Rabino, David Moskowitz and Howard R. Moskowitz Received: • • • Abstract of the broad stream of research dealing with the diffusion of innovation. In this study, we focus on pricing-related issues associated with the introduction of a ‘new-to-the-world’ product. We examine pricing as a pivotal component in the horizontal framework of the business model. After working with the group that developed a new-to-the-world product in the category of Personal Digital Assistants (PDA), we empirically tested a segmentation pricing model with 493 respondents. Results showed that different prices can be used for the same new-to-the-world product for different consumer segments. Potential customers were willing to pay an additional amount for each feature that adds utility. An actual US dollar amount was identified for each feature, based on the consumer’s rating of its monetary worth. Although the project study focused on new-to-the-world PDAs, the approach is appropriate for similar high-tech consumer products with unique health features. Journal of Direct, Data and Digital Marketing Practice (2009) 0, 000–000. doi:10.1057/dddmp.2009.10 Introduction The relation between innovation in products or processes and above-average returns is becoming increasingly interesting for a growing number of industries. 1 Innovation is most closely associated with the development of new products 2 and drives competitiveness, both in saturated as well as in developing global markets. Innovation attempts to improve strategic competitiveness and financial performance. 3 Therefore, in many cases innovation is used to reverse trends in declining markets. Innovation as a strategy affects corporate activities in many high-tech consumer products, such as electronic and medical devices. 4,5 The ability to develop and manage innovation is critical in corporate efforts to implement their strategies. 2 Innovation links together the Q1 Gillie Gabay is a systems science expert. Dr. Gabay focuses on linkages among multiple disciplines in a company, translating business strategies into marketing strategies and other pivotal organisational processes. She teaches business strategies at the College of Management Academic Studies in Israel. As the representative of Moskowitz Jacobs, Inc. in Israel, she provides insights regarding good concepts of innovative products and strategies to Israeli- based companies that operate globally. Dr. Gabay researches strategy implementation processes that provide companies with competitive advantage. Hala Badreddine is the author of papers, presentations and books, including Health Mutual Funds in Lebanon; Transparency, Accountability and Good Governance, and other books and reports on the public sector. Her PhD thesis from the University of Bath broke new ground in understanding the adoption dynamics of electronic healthcare records in the Middle East. Her research focuses on public policy, public opinion and the analysis of customers in the Middle East. Samuel Rabino is Professor of Marketing and Faculty Coordinator of the High Technology MBA programme at Northeastern University and Lecturer and Researcher in the Masters Programme in Industrial Management at Universita Degli Studi Di Siena, Italy, as well as at Harvard University and executive MBA programmes. Professor Rabino holds an MBA and PhD degrees from New York University. He has been a consultant to the US Department of Commerce; Nestle Corporation; Durkee Foods; Gillette Corporation; First National Bank of Boston; Elscint, Inc.; and Times Mirror Cable T.V.; Digital Equipment; IBM; Samsung; Blue Cross Blue Shield of Massachusetts; Albany International; Piaggio and Nokia,
Transcript of Assessing pricing for a new product concept: PDA+electronic health records+real-time monitoring

UNCORRECTED PROOF
1© 2009 PALGRAVE MACMILLAN 1746-0166 VOL.X NO.Y PP 1–24. Journal of Direct, Data and Digital Marketing Practice
www.palgrave-journals.com/dddmp/
Jour
nal:
DD
DM
P
Dis
k us
ed
D
espa
tch
Dat
e:
Ed:
A
rtic
le:2
0091
0
Art
icle
Typ
e:
Pa
ges:
Col
Fig
s:
Op:
Sud
ha
Assessing pricing for a new product concept: PDA + Electronic Health Records + Real Time Monitoring Gillie Gabay , Hala Badreddine , Samuel Rabino , David Moskowitz and Howard R. Moskowitz Received: • • •
Abstract of the broad stream of research dealing with the diffusion of innovation. In this study, we focus on pricing-related issues associated with the introduction of a ‘ new-to-the-world ’ product. We examine pricing as a pivotal component in the horizontal framework of the business model. After working with the group that developed a new-to-the-world product in the category of Personal Digital Assistants (PDA), we empirically tested a segmentation pricing model with 493 respondents. Results showed that different prices can be used for the same new-to-the-world product for different consumer segments. Potential customers were willing to pay an additional amount for each feature that adds utility. An actual US dollar amount was identifi ed for each feature, based on the consumer ’ s rating of its monetary worth. Although the project study focused on new-to-the-world PDAs, the approach is appropriate for similar high-tech consumer products with unique health features. Journal of Direct, Data and Digital Marketing Practice (2009) 0, 000 – 000. doi: 10.1057/dddmp.2009.10
Introduction The relation between innovation in products or processes and above-average returns is becoming increasingly interesting for a growing number of industries. 1 Innovation is most closely associated with the development of new products 2 and drives competitiveness, both in saturated as well as in developing global markets. Innovation attempts to improve strategic competitiveness and fi nancial performance. 3 Therefore, in many cases innovation is used to reverse trends in declining markets. Innovation as a strategy affects corporate activities in many high-tech consumer products, such as electronic and medical devices. 4,5
The ability to develop and manage innovation is critical in corporate efforts to implement their strategies. 2 Innovation links together the
Q1Q1
Gillie Gabay is a systems science expert. Dr. Gabay focuses on linkages among multiple disciplines in a company, translating business strategies into marketing strategies and other pivotal organisational processes. She teaches business strategies at the College of Management Academic Studies in Israel. As the representative of Moskowitz Jacobs, Inc. in Israel, she provides insights regarding good concepts of innovative products and strategies to Israeli-based companies that operate globally. Dr. Gabay researches strategy implementation processes that provide companies with competitive advantage.
Hala Badreddine is the author of papers, presentations and books, including Health Mutual Funds in Lebanon; Transparency, Accountability and Good Governance , and other books and reports on the public sector. Her PhD thesis from the University of Bath broke new ground in understanding the adoption dynamics of electronic healthcare records in the Middle East. Her research focuses on public policy, public opinion and the analysis of customers in the Middle East.
Samuel Rabino is Professor of Marketing and Faculty Coordinator of the High Technology MBA programme at Northeastern University and Lecturer and Researcher in the Masters Programme in Industrial Management at Universita Degli Studi Di Siena, Italy, as well as at Harvard University and executive MBA programmes. Professor Rabino holds an MBA and PhD degrees from New York University. He has been a consultant to the US Department of Commerce; Nestle Corporation; Durkee Foods; Gillette Corporation; First National Bank of Boston; Elscint, Inc.; and Times Mirror Cable T.V.; Digital Equipment; IBM; Samsung; Blue Cross Blue Shield of Massachusetts; Albany International; Piaggio and Nokia,

UNCORRECTED PROOF
Rabino et al.
2 © 2009 PALGRAVE MACMILLAN 1746-0166 VOL.X NO.Y PP 1–24. Journal of Direct, Data and Digital Marketing Practice
diverse, multi-silo activities in corporations. Innovation links strategic and tactical levels of actions that the organisation takes. 6 – 9 Large innovative companies have immense market power, as they have greater resources to invest in R & D. The more a company invests in R & D, the higher its performance has been reported. 10 However, no matter the size of the company, or the speed and rate of innovation, the quality of the product will still affect the dynamic of competitiveness in the industry. Strategic implementation is unfeasible if the product quality is poor. 11,12
This study is a subset of the broad stream of research dealing with the diffusion of innovation. 13 – 27 It also intersects with the body of work coming out of the organisational strategy fi eld, especially in industries related to information and communications. In such industries, it is argued that the number of competitive forces that the fi rm faces has expounded, and that technological innovations have accelerated the rate of change. 28 This study focuses specifi cally on consumer-driven pricing issues that are associated to the introduction of a ‘ new-to-the-world ’ product, a Personal Digital Assistant (PDA) that can also be used as an electronic dietician, using a procedure that can be adapted to similar classes of problems worldwide.
This paper applies conjoint analysis or experimental analysis of ideas, to evaluate both interest and pricing of a new-to-the-world product. We also used the data to segment consumers into ‘ mindsets ’ for differential marketing, using a segmentation-based pricing strategy for the product. In the fi rst phase of the study, we selected ideas from three different domains — medical equipment, information technology and electronic features of a PDA — to create the product concept: the ‘ electronic dietician ’ . Respondents evaluated combinations of product features that came from the different domains, creating an innovative nutrition device that comprises what consumers want and then goes beyond it. Conjoint analysis here provides the mechanism for identifying ‘ what works ’ in the product. At the same time, we identifi ed the part-worth ‘ dollar value ’ of each particular element in this new electronic dietician. Managers have been reported to trust these conjoint part-worths more than subjective ratings of or intuitions about attribute part-worths because the conjoint task has been shown to predict actual market behaviour. 29
Creating value innovation Product quality means satisfying customer expectations or exceeding them. 30,31 The quest for quality fl ows from top management downward. The particular form in which quality is described and manifested creates values of quality across an organisation. 32 These values are structured into strategies that refl ect the company ’ s long-term commitment to its customers and shareholders. 30 In order to create value in the eyes of customers, companies must identify product features for which the customer is willing to pay. The greater the value provided to customers, the more customers will be willing
among others. Professor Rabino ’ s research on industrial marketing, international marketing, export incentive programmes, product planning, and brand strategies and development have been published in various journals He is currently conducting research in the area of Internet privacy, credibility of Internet advertising, transfer of research methodology platform in international settings and the development of international product segmentation methodologies.
David Moskowitz B.S. is the Ideamap.net account manager and IS Coordinator for Moskowitz Jacobs, Inc. He graduated Cum Laude from the Sy Syms School of Business with a B.S. in Management Information Systems in June 2000. Mr. Moskowitz has been instrumental in applying scientifi c analyses to the law fi eld, as well as other industries. He helped develop MJI ’ s ChoiceMap ™ platform, applying scientifi c analyses to choice-based conjoint studies.
Howard R. Moskowitz is President of Moskowitz Jacobs, Inc., a strategic marketing research company headquartered in White Plains, New York, USA, which specialises in the screening and optimisation of products, concepts and package designs at the early stages of innovation and development. He is the co-author of Selling Blue Elephants: How to Make Great Products That People Want Even Before They Know They Want Them (Wharton School Publishing). In less than 10 months, the book had brisk sales on six continents, was on international bestseller lists, had been endorsed by top universities and corporations, and enjoyed wide media coverage. It has been republished and translated in many countries. The author of 18 other books, three others in progress and several hundred papers, Dr. Moskowitz is a frequent contributor to business and scientifi c journals on topics of
UNCORRECTED PROOF
Assessing pricing for a new product concept
3© 2009 PALGRAVE MACMILLAN 1746-0166 VOL.X NO.Y PP 1–24. Journal of Direct, Data and Digital Marketing Practice
to pay and the stronger the relationship will be between R & D and above-average returns. 1
Kim and Mauborgne 32 discuss coupling innovation with value, arguing that value innovation makes competition irrelevant by presenting superior value that is new in existing markets, and creates new markets where competition cannot yet exist. By creating value innovation, a company may commercialise any invention so that features of the new product will exceed customer expectations. In this effort, value, speed and quality, and most of all applied knowledge embedded in innovations, become pivotal.
This study, which evaluates a ‘ new-to-the-world ’ World Product, presents a case study linking innovation and value. New-to-the-world innovation represents leapfrogging advancements in product design, often creating signifi cant gains in consumer utility. Such new products are critical, not only because of their ability to become means for market share gain and revenue growth, but also because they change the competitive landscape of the markets in which they are launched. New-to-the-world products have become critical to maintaining revenue levels and market share in increasingly competitive markets. Examples of new-to-the-world products include the Xerox photocopier introduced in 1952 and the Sony Walkman introduced in 1979. Ultimately, the value-innovation strategy is defi ned as a strategy where companies that aim at a profi table growth spend less energy on building advantages over their competitors, and direct their efforts to providing buyers with a quantum leap in value. 32
The general class of PDAs is a major area for state-of-the-art mobile information technology. The PDA is often used for ‘ individual organisation tasks, ’ such as managing calendars and taking notes in the fi eld. The typical PDA device is a fl at, wirelessly connected computer that is portable, interactive and easy to use. It connects to a network either via a cable to a computer, or wirelessly via a mobile phone or router in a building or nearby area. Currently, connecting a PDA to a network is quite cumbersome. Therefore, most people use them for tasks that do not require constant network access. Many users process personal information on the PDA, for example manage their address books and calendars. Shared information is most often updated asynchronously. For this study, we worked with a new-to-the-world type of PDA — an electronic health recorder that may be also used as an electronic dietician. When going back and forth from one doctor ’ s visit to another, the client can connect his / her PDA to a mobile phone and transfer information to the doctor ’ s offi ce, as well as control and process all nutrition data. In the next sections we describe the PDA ’ s development.
Relevant literature and research propositions Recently studies indicate that marketing and engineering design goals are driven by consumer preferences and engineering capabilities, 33 and that business strategy and product design strategy interaction impact market performance of new products. 34 Similarly, Ulrich and Pearson 35
messaging, product optimisation and the emerging area of psychophysics and the law.
Keywords: value innovation , pricing , segmentation , new-to-the-world product , business model , experimental design

UNCORRECTED PROOF
Rabino et al.
4 © 2009 PALGRAVE MACMILLAN 1746-0166 VOL.X NO.Y PP 1–24. Journal of Direct, Data and Digital Marketing Practice
argue that a superior product design is one that contributes competitively — compared to other designs — to the profi tability of a new product. More recently, it has been shown that consumers follow through less often on positive purchase intentions to buy really new products than on intentions to buy incrementally new products. 36
It has been demonstrated that systematic experimentation with alternative designs can lead to increased product success. 37 When a company explores different options for a product development, either at the design stages or at the actual prototype stage, the chances are higher of coming up with a winning product, simply because there are many more products or product combinations from which to select the fi nal entry. This array increases the probability of success in creating value innovation. Furthermore, when the products or product ideas are systematically varied into different combinations by statistical design, one can quickly identify the specifi c feature that drives success (consumer acceptance) or its, dual, failure. 38
Experimental design of ideas — a conjoint analysis — empowers this systematic approach to innovation. Experimental design presents respondents with different test combinations of product features, benefi ts or both. When respondents see combinations of ideas for a new product, they simply respond to the specifi c combination. Testing in this manner, with elements taken from different sources and perspectives, allows rapid innovation to occur, as the ideas from one domain are conjoined with the ideas from a different one, in order to form a new combination or new-to-the-world product.
Appropriate pricing becomes a fundamental problem in developing new-to-the-world products after substantiating their unique attribute mix or their combination of technological features to bring customer value. Correct pricing on market introduction is a fundamental decision that may affect and even drive the success of a new-to-the-world product. As a novelty product, a new-to-the-world product, by defi nition, has no clear substitute on the market at the time of its introduction. One of the biggest marketing challenges is, therefore, the determination of an effective launch price.
Seventy per cent of managers indicated that their tendency is to either underestimate or overestimate the value of their products and services delivered to customers. 39 This lack of understanding about how to price properly can signifi cantly affect the course of the business. Hogan and Lucke 39 argue that there is less than a 50 per cent chance that new-to-the-world products will hit their volume and profi ts goals. Thus, understanding the value that a product brings to different customer segments is an essential ingredient in determining the price of new-to-the-world products. Haws and Bearden 40 stress the importance of customer-perceived ‘ fairness ’ as affecting product success. Whereas prices that are too low decrease profi t margins, prices that are perceived to be too high create a perception of unfairness among customers, decreasing the demand for the product.
Bergstein and Estelami 41 identifi ed four ways in which prices for new-to-the-world products have been set: intuition, direct questioning,

UNCORRECTED PROOF
Assessing pricing for a new product concept
5© 2009 PALGRAVE MACMILLAN 1746-0166 VOL.X NO.Y PP 1–24. Journal of Direct, Data and Digital Marketing Practice
conjoint analysis and market-testing. In setting prices by intuition, while keeping in mind production costs, management simultaneously conducts internal discussions and determines price by the general consensus about the product price. Some methods use qualitative approaches, such as focus groups or depth interviews. Other methods use more quantitative procedures. Conjoint analysis was and still is often used to determine shifts in consumer preferences at various proposed price points. 42 The analysis allows managers to determine the optimal range for launching the new product. One very popular method uses the four questions that create the price sensitivity metre, as shown in Table 1 . 43 – 45 The distribution of consumer responses is believed to refl ect market demand and consumer inference of product quality.
Online researchers are by now accustomed to testing reactions to price, and have done so for almost a decade. 46 The speed of feedback allows companies to modify their pricing strategy based on timely reactions of consumers. However, it may exclude opportunities to initially set prices at higher price points. Online test marketing is most commonly carried out through company websites. 47 These sites can be stocked with actual new-to-the-world products, and can ask consumers for their suggestions.
Online conjoint analysis is one of the newest, and most complex, areas of market research, with great potential for determining the price of new products. Consumers are presented with a series of product features, combined into test products and instructed to rate each screen, a test product, in terms of acceptance. Traditionally, price was one of these features. Until quite recently, the use of conjoint analysis provided information as to what feature respondents perceived as worth the additional costs. 48 This study presents price in a different way. Here price is the dependent variable. The goal is to identify, through conjoint analysis (experimental design), the part-worth price of each element in the new PDA product. Thus, the pricing is consumer-driven, but the objective is to ferret out what the consumer is willing to pay for each PDA feature.
The importance of pricing — A key factor in business models When it comes to the formulation of effective strategies, emphasis is shifting from complete business models to the deconstruction of business models into their constituents, which are referred to as the pillars of the business model. 49,50 Components of such a model include the value offered by the fi rm to its customers, its market approach, segmentation within markets and how it organises its capabilities to deliver this value to customers. 49 As described below, pricing is a key part of the business strategy.
A framework that synthesises the standard components of a business model comprises two dimensions. The fi rst comprises primary components such as strategic objectives, target markets, the value proposition, capabilities, organisational practices, revenue streams,

UNCORRECTED PROOF
Rabino et al.
6 © 2009 PALGRAVE MACMILLAN 1746-0166 VOL.X NO.Y PP 1–24. Journal of Direct, Data and Digital Marketing Practice
pricing, alliances and partnerships. The second comprises underlying environmental components drawn from the wider business and social environment of business such as market trends, technology and regulations. Pricing new products is contained in this dimension. Market trends and technology enable the innovative features of the electronic dietician PDA discussed earlier. These environmental forces enable new value propositions that capture new users, generate new revenue streams and allow the achievement of strategic goals. 51
Hence, we advance the following propositions:
1. Proposition A: Different prices can be used for the same product for different consumer segments.
2. Proposition B: Customers will be willing to pay an additional amount for each feature that adds utility. Actual dollar amount can be identifi ed in relation to every feature based on the consumer ’ s rating of the feature ’ s monetary worth.
These propositions were explored in a case study of a specially designed electronic dietician PDA. Specifi cally, a single product category (electronic health recorder) was evaluated for the purpose of understanding a larger class of similar categories representing new-to-the-world products. 52
Table 1 : Coeffi cients for the interest and price model
Interest Price
(US $ )
Additive constant 20 153 A3 Organises and displays your complete medical history
… right at your fi ngertips to share with your doctor 9 20
A2 Monitors your heart rate and blood pressure 7 12 A1 Monitors your cholesterol and glucose levels 6 12 A4 Works with the new electronic health record (EHR)
dashboard … helps you understand your health situation, based on what it monitors and your records
6 17
B1 Automatically notifi es your doctor in case of an emergency
4 16
B4 Works all over the world so you always have your records with you
3 12
B3 Linked to your hospital, so your EHRs can be easily accessed while maintaining privacy
3 17
E1 Has all of the functions of a typical PDA 3 13 D1 Light weight, compact design … take it anywhere you go 3 6 D4 A medical monitor in your pocket 3 6 E2 Comes with a 1-year parts and labour warranty with
Customer Care 2 11
E3 24-hour customer service 2 9 C1 Includes a privacy locking device 2 5 D3 Battery recharges in less than 2 hours 2 5 E4 Live help to assist with device setup 2 10 C3 Information presented in easy to read language 2 5 C2 Automatic web access to favourite medical sites like
WebMD 1 5
C4 Backs up your information automatically via Microsoft ActivSync
1 9
D2 Comes in a titanium case 1 6 B2 Automatically linked to insurance claims for doctor visits − 1 10

UNCORRECTED PROOF
Assessing pricing for a new product concept
7© 2009 PALGRAVE MACMILLAN 1746-0166 VOL.X NO.Y PP 1–24. Journal of Direct, Data and Digital Marketing Practice
The contribution of this study This study demonstrates the use of experimental design, as part of a novel approach to pricing. This study goes well beyond the measurement of estimated shifts in consumer preferences at various proposed price points. It also contributes to the expansion of the conjoint analysis application, in that in this study we create a price strategy for each segment (as opposed to determining only a price threshold or a range), designed to optimise profi tability by connecting value of the offering, its price and the customer-perceived fairness.
Research method
Respondents ’ ideas, and the experimental design The study assessed the impact of 20 different elements (ideas / messages), divided into fi ve separate silos, each of which comprised four separate elements. Table 1 presents the ideas. The fi ve silos are as follows:
Silo A — What the PDA does with respect to health monitoring and health information.
Silo B — How the PDA works with respect to electronic health records (EHRs).
Silo C — How the PDA interacts with the user to present the information.
Silo D — Physical features. Silo E — Service features.
The division of elements into silos is a bookkeeping device set up so that any test concept contains, at most, one element from a silo, but often, no elements from the silo. In this way, a silo can contain elements that are mutually contradictory or do not make sense together, and that, therefore, should not appear together in a test concept. By designing test concepts using silos, researchers guarantee that these elements never appear together. In the subsequent statistical analysis, however, the silos disappear and all the elements are treated separately, as individual ‘ free agents ’ in the modelling.
The experimental design is a main effects design, in that each concept element appears three times against different backgrounds provided by the other elements. Each respondent evaluated a unique permutation of the basic experimental design, comprising 25 combinations. Each combination or test concept, in turn, comprised 2 – 5 elements. The elements were arranged so that they were systematically independent, allowing for dummy variable modelling using ordinary least squares. 22
Each respondent evaluated a relatively unique set of combinations, created by permuting the basic experimental design so that the design structure remained but the specifi c elements were permuted. In this way, all the respondents evaluated the same elements but in different combinations, thus ensuring that no particular combination could

UNCORRECTED PROOF
Rabino et al.
8 © 2009 PALGRAVE MACMILLAN 1746-0166 VOL.X NO.Y PP 1–24. Journal of Direct, Data and Digital Marketing Practice
unduly affect the results. 53 This strategy of permutation differs dramatically from the more conventional approaches to experimental design, which create a limited set of combinations and then have many people test the limited set. The key benefi t of the permuted design is that it allows the respondents to evaluate many more combinations across the entire spectrum of study participants, rather than relying, as traditional conjoint methods do, on a limited set of 25 combinations to represent all of the possible combinations.
Finally, the approach used here allows for the estimation of a utility model either for each respondent or for all respondents at the aggregate level. The individual-level model permits segmentation based upon the pattern of utility values shown by each respondent.
Field implementation The e-mail invitation was sent to the i-Novation panel, a panel of individuals who had agreed previously to participate. These respondents did not consider the invitation spam. Respondents were motivated to participate by the chance to win a fi rst prize of US $ 100 and two second prizes of US $ 50 each. Beyond the sweepstakes, however, the topic of the survey was introduced in a manner that tried to make the survey interesting, without giving away too much of the topic and contents.
The orientation page and concept screens Respondents who clicked on the link were then led to the orientation page for the new product. The orientation page presents the product in general terms while introducing the focus on nutrition. The page explains what the respondent will see, fi nishing with a discussion of how to answer the rating question (see Appendix A ). At the next phase, respondents were introduced to concept screens.
Each respondent evaluated 25 screens, comprising test concepts of 2 – 5 elements each. An example of a test concept appears in Tables 2 and 3 ( Appendices B, C ), with the top screen showing the concept and the rating question for interest. The bottom screen shows the concept, but with the rating question for ‘ price ’ in US $ . The rating question always appeared before the price question. When the respondent fi nished rating the concept on each question, the computer program automatically advanced, either to the next rating scale (price after interest) or to the next test concept.
The study invitation was mailed to 10,000 respondents. Altogether, 644 respondents logged in to participate, whereas 493 respondents completed the study. The response percentage (about 6.4 per cent) is approximately what has been observed in other studies when the study was run (late 2007). The completion rate, 76 per cent, is also what has been observed in other studies with other food-related topics, and higher than what has been observed with fi nancial topics, such as credit cards.
The panel comprised more women than men, as women tend to participate in these studies more frequently. All respondents had opted to participate in these studies, with the majority of the respondents being female. As this was an exploratory study, no effort was made
UNCORRECTED PROOF
Assessing pricing for a new product concept
9© 2009 PALGRAVE MACMILLAN 1746-0166 VOL.X NO.Y PP 1–24. Journal of Direct, Data and Digital Marketing Practice
to balance the sample. Rather, the effort was to get as many interested respondents as possible. The classifi cation portion of the questionnaire allowed the respondent to profi le himself, and thus permits us to aggregate respondents by different criteria. These aggregated data will be presented in the paper for key subgroups.
The primary objective of the study was to identify how individual elements of the test concepts drive interest both in the new product and in price. To this end, a dummy regression variable was generated to create the following model:
Rating = + +k k A k A k E0 1 1 2 2 20 4( ) ( ) ( )…
In this model, the rating of elements (as defi ned below) is a weighted combination of the 20 elements, and an additive constant, k 0 . Therefore, knowing the values of the 20 different elements A 1 … E 4 , along with the additive constant and the weight, allows us to estimate the rating.
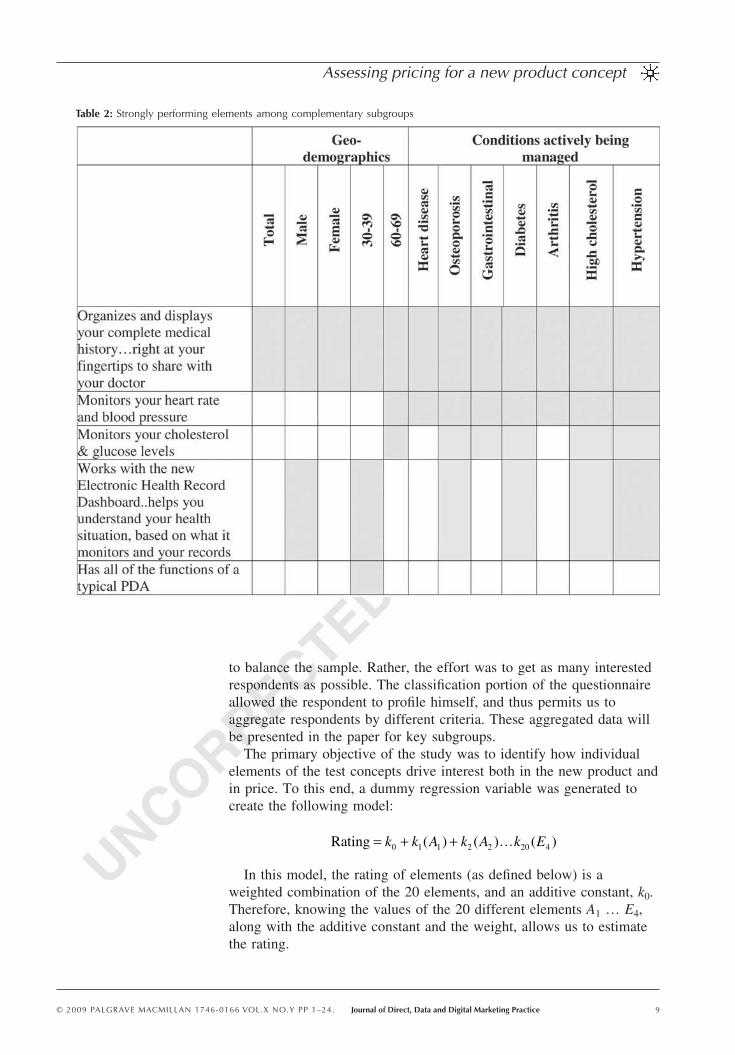
Table 2 : Strongly performing elements among complementary subgroups

UNCORRECTED PROOF
Rabino et al.
10 © 2009 PALGRAVE MACMILLAN 1746-0166 VOL.X NO.Y PP 1–24. Journal of Direct, Data and Digital Marketing Practice
Three models that use the presence / absence of the 20 elements as the independent variable, but which have different dependent variables, were created:
1. Persuasion model — the 9-point rating scale is used as the dependent variable. This persuasion model generates coeffi cients or utility values that will be used for the segmentation.
2. Interest model — The ratings of interest, originally on a 1 – 9 scale, were transformed into a binary scale, with ratings of 1 – 6 transformed to 0, and ratings of 7 – 9 transformed to 100. This transformation is carried out in the spirit of market research investigations, which trace their intellectual heritage to sociology. The focus of the market research study is on the proportion of individuals in the population who exhibit a certain behaviour. In this case, we look at the proportion of individuals in the population who accept each concept element. The binary transformation changes the focus from metric information about
Table 3 : Price contribution of different features for three groups, monitoring nothing, monitoring high cholesterol, monitoring diabetes
Not monitoring
anything Cholesterol Diabetes
Additive constant (base price without price contributed by features)
160 142 150
Not monitoring anything Organises and displays your complete
medical history … right at your fi ngertips to share with your doctor
16 21 30
Linked to your hospital, so your EHRs can be easily accessed while maintaining privacy
15 22 12
Monitoring cholesterol Linked to your hospital, so your EHRs can be
easily accessed while maintaining privacy 15 22 12
Organises and displays your complete medical history … right at your fi ngertips to share with your doctor
16 21 30
Works with the new EHR dashboard helps you understand your health situation, based on what it monitors and your records
13 21 26
Automatically notifi es your doctor in case of an emergency
12 21 13
Monitors your cholesterol and glucose levels 8 17 21 Has all of the functions of a typical PDA 12 15 10 Monitors your heart rate and blood pressure 7 15 17 Monitoring diabetes Organises and displays your complete
medical history … right at your fi ngertips to share with your doctor
16 21 30
Works with the new EHR dashboard helps you understand your health situation, based on what it monitors and your records
13 21 26
Monitors your cholesterol and glucose levels 8 17 21 Monitors your heart rate and blood pressure 7 15 17
These results support Proposition B and indicate that indeed respondents are willing to pay an additional amount for each feature that is perceived to add utility.
Q3Q3

UNCORRECTED PROOF
Assessing pricing for a new product concept
11© 2009 PALGRAVE MACMILLAN 1746-0166 VOL.X NO.Y PP 1–24. Journal of Direct, Data and Digital Marketing Practice
interest (ie how strong is the feeling about the concept) to classifi cation of the response (would the person be interested in the product described, no or yes). After the transformation, we related the presence / absence of the 20 elements to the binary response (0,100) for each individual respondent. The individual-level model is appropriate because the experimental design was developed at the individual level, so each person ’ s data can be separately analysed 54,55 . Ordinary least-squares regression was used for the dummy variable model, making the outcome (additive constant and coeffi cients) easy to interpret, as discussed below.
3. Price model — The respondents chose the appropriate price that they thought the manufacturer should charge. The ratings were recoded to the actual US dollars, rather than the original 1 – 9 rating. Again, ordinary least-squares regression was used to create the dummy variable model relating the presence / absence of the elements to the dollar value estimated as the proper price. The modelling was carried out at the level of individual respondents. 56
Results The coeffi cients for the interest and price models appear in Table 1 in descending order of interest. We present some of the observations from the total panel below:
1. The additive constant for interest measures the estimate level of interest in the base product, without the presence of elements. The additive constant is an inferred or estimated parameter. The value is 20, meaning that 20 per cent of the respondents would be interested, defi ned as rating the PDA as 7 – 9, if no additional information were presented. This level is low, about the same as that seen for credit cards. We conclude that the notion of a nutrition PDA by itself does not provide a topic of interest. It is the set of messages about the product that must drive interest.
2. Most of the coeffi cients are low, around 0. There are a few strong performers, all in the fi rst silo, about how the product works. The most important feature is A3: Organises and displays your complete medical history … right at your fi ngertips to share with your doctor . The utility value is 9, meaning that we can become up to 29 per cent interested just by using this element.
3. Many of the elements hover around 0. There is only negative element, and even that element hovers near 0 (utility of − 1: Automatically linked to insurance claims for doctor visits ).
4. With respect to price that a company should charge, the additive constant suggests a base price of US $ 153, if no features are described.
5. The features that deal with health add the greatest amount of money to the expected price. Just because a feature is not highly

UNCORRECTED PROOF
Rabino et al.
12 © 2009 PALGRAVE MACMILLAN 1746-0166 VOL.X NO.Y PP 1–24. Journal of Direct, Data and Digital Marketing Practice
desired does not mean its value is down-rated. For example, the feature Linked to your hospital, so your EHRs can be easily accessed while maintaining privacy constitutes only a modest driver of interest to the general panel (utility = + 3 for the interest model). Yet, the respondents recognise that this feature should drive up the cost, and think that a feature of this type should command an extra US $ 17. We further fi nd this differentiation between interest in the feature and expected price of the feature for the element Automatically linked to insurance claims for doctor visits. This element is virtually irrelevant (interest utility = − 1), but yet is expected to drive up the price by US $ 10.
6. Thus, we see that respondents differentiate between their interest in the product and what they think the features should cost. Interest and price questions, asked in this fashion, do not necessarily correlate. Price, therefore, is not a redundant attribute.
Interest in features among contrasting subgroups (gender, age, health condition) The database of 493 respondents allows us to look at the interest in the various features among different subgroups. The results from the total panel suggest that only a few elements score well, and that only two elements show utility values above 8. The utility value 8 is an arbitrary cut-off point used by the authors to identify elements that are fairly certain to be ‘ meaningful ’ in other studies. The utility value 8 corresponds to a t -value greater than 5 ( Table 1 ).
The results from some key subgroups appear in Table 2 . The list of elements has been truncated to the higher-performing elements. Elements not in the table never scored 8 or higher in their utility values. We show the elements that perform well, but in the interest of readability we simply show when these elements do very well by shading in the appropriate ‘ box ’ in the table.
1. Genders show little difference. Men are slightly more receptive to the notion of a dashboard for EHRs than are women (utility of 8 versus utility of 5, respectively).
2. Younger and older respondents (ages 30 – 39 versus ages 60 – 69) show higher additive constants than do respondents in the middle age ranges (not shown). However, the two opposing age groups then diverge. Older respondents are interested in the product as a monitoring device. Younger respondents are interested in the product as an information device, and are strongly positive to the notion of EHRs (utility of + 11).
3. Condition being actively monitored makes a difference. Keep in mind that the product was positioned as a nutrition-oriented product (personal dietician). We see the highest basic interest from the respondents among those who are actively monitoring heart disease (additive constant = 41), and the least among those who are actively monitoring hypertension (additive constant = 28). These are

UNCORRECTED PROOF
Assessing pricing for a new product concept
13© 2009 PALGRAVE MACMILLAN 1746-0166 VOL.X NO.Y PP 1–24. Journal of Direct, Data and Digital Marketing Practice
both substantially higher than the undifferentiated total panel (additive constant = 20).
4. All respondents who actively monitor a condition respond strongly to the monitoring capabilities for heart rate and blood pressure, and to a lesser extent cholesterol and glucose.
5. As might be expected, respondents with diabetes, followed by respondents with high cholesterol, are most strongly responsive to the ability to monitor cholesterol and glucose level.
6. Responses to EHRs are mixed, albeit all positive. The strongest responses come from those actively monitoring diabetes, perhaps because they are aware of their conditions every day, and have to take steps in order to actively maintain their health.
One of the key foci of this paper was estimating the price an interested respondent would pay for this new technology, and whether a respondent who could actually use the product, for medical conditions currently being monitored, would be willing to pay more. We saw that each of the features commands a certain amount of willingness to pay, even if the respondent did not necessarily fi nd that feature to be of particular interest. As such, Proposition A, asserting willingness to pay different prices by different segments for the same product, was confi rmed.
A closer examination of the subgroups suggests that we can explore three different groups that might be intuitively expected to have radically different demands for the electronic dietician. One group comprises those individuals who are not monitoring anything. The other groups are those who are monitoring diabetes and high cholesterol, respectively.
These three groups show different patterns of attaching a dollar value for the features. We selected only those features for which the respondents would be willing to pay US $ 15 or more , based upon their response to the second question, which asked the respondent to select the appropriate price. We see that those not managing any medical condition would be willing to pay $ 160, and are really paying only for the ability to organise the health records in an electronic form. Table 3 presents the price contribution of different features for three groups.
Those actively monitoring a condition clearly linked with nutritional state (high cholesterol and diabetes) show a more complex pattern. Both groups want physiological monitoring of cholesterol, glucose, heart rate and blood pressure. However, the really important property for both groups is information. For those who monitor cholesterol, where the effect of overly high cholesterol may not be immediately obvious, it is important to link this product to the hospital and to the doctor. There appears to be a latent need here for the product ’ s connectivity to medical help. In contrast, among those who are actively monitoring diabetes, the key is information and monitoring, but not necessarily connection with the doctor or hospital, perhaps because the respondent is already actively involved in controlling diabetes on a daily basis.

UNCORRECTED PROOF
Rabino et al.
14 © 2009 PALGRAVE MACMILLAN 1746-0166 VOL.X NO.Y PP 1–24. Journal of Direct, Data and Digital Marketing Practice
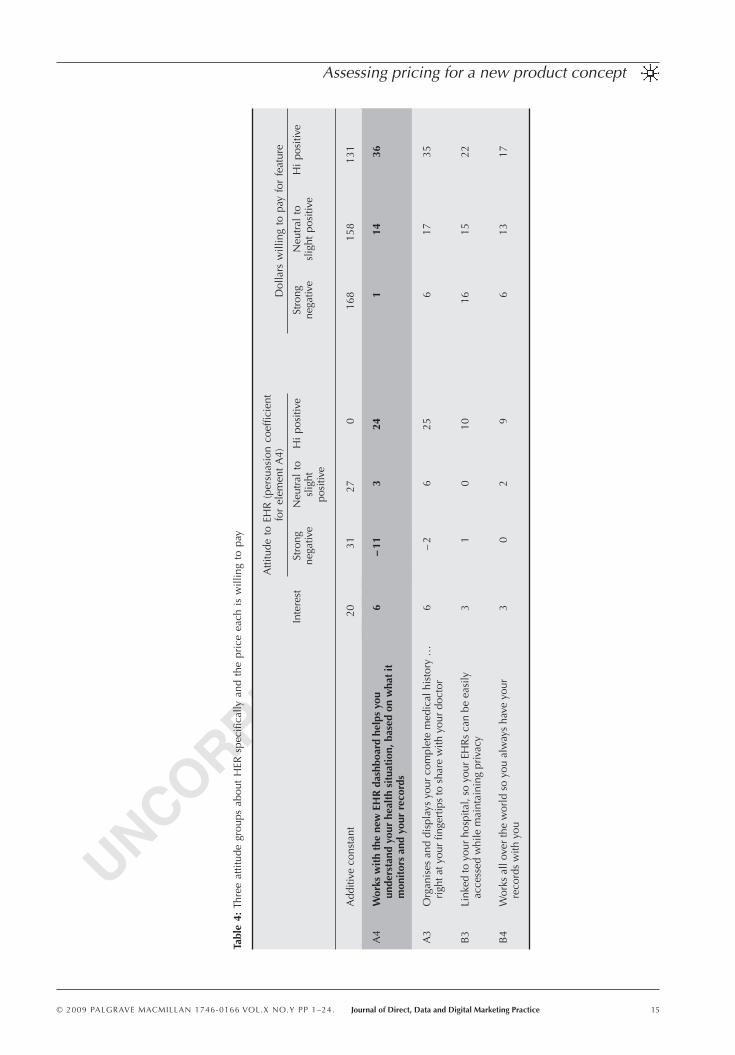
EHR as a driver of price The current trends in medical informatics are leaning towards the creation of EHRs that can be accessed easily by any doctor or hospital, as well as by the patient herself. One of the objectives of this study was to determine how individuals differ in their interest in EHRs (negative to strongly positive), and whether pricing would be affected.
To better understand user attitudes, the 493 respondents were disaggregated into three groups, based upon the coeffi cient for the EHR statement (A4). We created three separate groups — strong negatives, neutral to slight positive and high positive. These refl ect three separate groups, with different feelings towards the EHR dashboard. Table 4 presents the coeffi cients for EHR for each attitude group, for the elements that deal with EHR.
These three groups differed dramatically on their interest coeffi cient for EHR (A4), which makes sense, as it was the persuasion value for A4 that was used as the dividing criteria. In essence, we ‘ typed ’ the respondent by their response to A4. The important fi nding is that, among those respondents who are high positive (strongly interested), the EHR dashboard can command US $ 36, whereas among those who are not interested it commands a mere US $ 1.
Discussion A recurring theme in these results is that individual differences exist. Some of these differences make intuitive sense. Older consumers are more interested in the monitoring function of the product than younger consumers. Individuals who are selected on the basis of their response to EHRs are willing to pay more for this type of information feature.
On a more basic level, however, remains the question as to whether there exist in the respondent population different mindsets of individuals, based upon the pattern of their responses to the entire set of elements, and perhaps transcending the geo-demographic and psychographic differences that we are able to capture in the classifi cation questionnaire.
The notion of such underlying, latent segments, based upon responses to the concept elements, is not new. Other researchers have recognised the importance of such segments for product design. 57 It has been shown to be useful both for conventional packaged goods and for fast moving electronics, where innovation is key. 37
Procedures for segmenting responses typically use cluster analysis. 58 These analyses divide the respondents by the pattern of their responses, according to a well-defi ned statistical algorithm. The individuals in a cluster are ‘ similar ’ to each other, whereas the individuals in different clusters are different from each other. In these data, the respondents were clustered by k-means clustering, based upon the utilities of the 20 elements in the persuasion model. 59 The criterion for segmentation was the interpretability of the different segments. That is, the statistical assumptions of clustering were valid numerically, but a cluster had to make intuitive sense.
UNCORRECTED PROOF
Assessing pricing for a new product concept
15© 2009 PALGRAVE MACMILLAN 1746-0166 VOL.X NO.Y PP 1–24. Journal of Direct, Data and Digital Marketing Practice
Tabl
e 4 :
Thr
ee a
ttitu
de g
roup
s ab
out
HER
spe
cifi c
ally
and
the
pri
ce e
ach
is w
illin
g to
pay
A
ttitu
de t
o EH
R (
pers
uasi
on c
oeffi
cien
t fo
r el
emen
t A
4)
D
olla
rs w
illin
g to
pay
for
fea
ture
Inte
rest
St
rong
ne
gativ
e N
eutr
al t
o sl
ight
po
sitiv
e
Hi
posi
tive
St
rong
ne
gativ
e N
eutr
al t
o sl
ight
pos
itive
H
i po
sitiv
e
A
dditi
ve c
onst
ant
20
31
27
0
168
158
131
A4
Wor
ks w
ith
the
new
EH
R d
ashb
oard
hel
ps y
ou
unde
rsta
nd y
our
heal
th s
itua
tion
, bas
ed o
n w
hat
it
mon
itor
s an
d yo
ur r
ecor
ds
6 −
11
3 24
1 14
36
A3
Org
anis
es a
nd d
ispl
ays
your
com
plet
e m
edic
al h
isto
ry …
ri
ght a
t you
r fi n
gert
ips
to s
hare
with
you
r do
ctor
6
− 2
6
25
6
17
35
B3
Link
ed to
you
r ho
spita
l, so
you
r EH
Rs
can
be e
asily
ac
cess
ed w
hile
mai
ntai
ning
priv
acy
3 1
0 10
16
15
22
B4
Wor
ks a
ll ov
er th
e w
orld
so
you
alw
ays
have
you
r re
cord
s w
ith y
ou
3 0
2 9
6
13
17

UNCORRECTED PROOF
Rabino et al.
16 © 2009 PALGRAVE MACMILLAN 1746-0166 VOL.X NO.Y PP 1–24. Journal of Direct, Data and Digital Marketing Practice
With 493 respondents, it is possible to create a number of different cluster solutions. We created 2, 3, 4 and 5 cluster solutions for the same respondents. For each cluster solution, for example, putting the respondents into two groups to create a 2-cluster solution, we looked at the elements that performed well, to see whether the solution differentiated the groups in a way that made intuitive sense. That is, were the strong performers in a cluster all qualitatively similar, or was there a seeming mix of two or more types of strong elements?
The outcome of this intuitive analysis of the segments indicates that a minimum of three clusters or segments is required to produce an intuitive ‘ story ’ that could be easily conveyed in a vignette (see Table 5) . Higher numbers of segments in a solution were even more focused, but failed the test of being parsimonious, as there were more clusters than needed. Winning elements for interest for the three clusters, price of these elements and defi nition of the clusters appear in Table 9. The following fi ndings emerge:
1. The three segments are ordinary health maintenance (basic monitoring and information), medical connection (being connected to doctors and hospitals is important) and want information and PDA functions (but not monitoring).
2. All groups are fairly low on their basic interest in this product. It is the elements that must do the work to convince the respondents.
3. The segments feel that the basic price is about US $ 150 – 165, but the features may command substantial additional premiums.
4. The segments differ in what features drive acceptance, as well as in the prices for features.
a. The top feature price for Segments 1 and 3 is about US $ 20. b. Those in Segment 1, who want ordinary health maintenance,
are willing to pay an additional US $ 20 for monitoring glucose level.
c. Those in Segment 3, who want the informational features, are also willing to pay an additional US $ 20 for glucose level.
d. Neither segment pay very much for blood pressure monitoring. e. Respondents in Segment 2, who are connection-oriented, are
willing to pay an additional US $ 29 just to have the device connect them automatically to the hospital. The connection is worth a lot more money.
EHR, per se , appear directly as the ‘ hot buttons ’ for Segment 1 (ordinary health) and Segment 2 (connection), and somewhat indirectly for Segment 3 (additional features for information processing). Segment 3 wants their medical information linked to the insurance company for doctor visits. Understanding these segments can help in product-positioning based on perceived value and benefi ts as related to price.
Understanding these segments can contribute to the articulation of a sharper value proposition linking perceived value and benefi ts to a product price.
Q2Q2

UNCORRECTED PROOF
Assessing pricing for a new product concept
17© 2009 PALGRAVE MACMILLAN 1746-0166 VOL.X NO.Y PP 1–24. Journal of Direct, Data and Digital Marketing Practice
Discussion Effective value innovation creates greater value compared to the creation of gradual additional changes to existing products. Such innovative processes produce organisational learning that serves as a basis for the development of new competencies. One such competency involves the pricing processes of products. Historically, maximising profi ts has been an optimisation goal for companies. At present, in a shopping reality where customers regularly turn to the web to gather intelligence on a product, its price and the accompanying services before actively considering a purchase, pricing can become a survival issue.
A great deal has been written about pricing under various competitive conditions. 60 – 62 Such expositions often assume perfect information, which companies rarely possess. 60 When fi rms develop new-to-the-world products, they lack information regarding the pricing environment. To avoid cost-based pricing, which may result in loss of potential
Table 5 : Winning elements for interest for the three segments and the feature price
Feature interest Feature price
S1 S2 S3 S1 S2 S3
Additive constant 17 28 19 152 149 164
Segment 1 — Ordinary health maintenance A2 Monitors your heart rate and
blood pressure 12 − 2 6 15 7 8
A3 Organises and displays your complete medical history … right at your fi ngertips to share with your doctor
11 − 8 7 16 3 10
A1 Monitors your cholesterol and glucose levels
11 7 8 20 19 20
A4 Works with the new EHR dashboard helps you understand your health situation, based on what it monitors and your records
9 0 2 18 17 15
Segment 2 — Wants to be ‘ medically connected ’ B1 Automatically notifi es your doctor
in case of an emergency 1 11 6 11 29 14
B3 Linked to your hospital, so your EHRs can be easily accessed while maintaining privacy
0 11 3 12 27 21
E1 Has all of the functions of a typical PDA
2 8 2 9 19 16
Segment 3 — Wants the PDA to be an ‘ information processor ’ C2 Automatic web access to favourite
medical sites like WebMD 1 2 12 13 9 19
C4 Backs up your information automatically via Microsoft ActivSync
1 1 10 10 8 15
A1 Monitors your cholesterol and glucose levels
11 7 8 20 19 20
B2 Automatically linked to insurance claims for doctor visits
1 − 1 8 11 5 10
D2 Comes in a titanium case 1 0 8 9 6 12

UNCORRECTED PROOF
Rabino et al.
18 © 2009 PALGRAVE MACMILLAN 1746-0166 VOL.X NO.Y PP 1–24. Journal of Direct, Data and Digital Marketing Practice
profi ts, 63 companies should incorporate cost information with information concerning customer wants.
In this study, we incorporated these types of information, creating a new-to-the-world product that was shaped by features that customers chose as enhancing their utility. The results of this study suggest that the nutritional device, that is, the PDA dietician, has promise. Customers generated the perceived value of each feature in the PDA dietician, providing a basis for value-pricing. Ingenbleek 64 found that value-pricing is the most effective pricing method when the product has a signifi cant advantage over competing products. However, when companies fail to create real value, it leads to disappointing pricing, resulting in a smaller market share and profi ts.
We demonstrated how using different prices for the same product for different consumer segments can optimise profi tability. We measured the dollar value of every feature, and identifi ed the actual US dollar amount by which a price should be increased or decreased per feature. We showed how conjoint analysis is used to determine the additional expenditure customers are willing to make for each feature providing differentiated utility for each segment.
Results of our study show that even features that were not highly desired drove up the cost and commanded an extra US $ amount. The perceived value of features varied among age groups, that is, young people desired the electronic dietician as an information device, whereas older people were interested in the electronic dietician as a health-monitoring device.
Results showed that, surprisingly, respondents differentiated between their interest in the product and what they thought the feature should additionally cost. Contrary to expectation, interest and price did not necessarily correlate. Depending on the value attributed to a certain identifi ed feature, customers were willing to pay US $ 36 more than the price that was determined as the base price for the product.
Thus, discrimination pricing, by segment perceived as the most valuable feature of the product, extracted the best pricing strategy. A focus on customer perspective on value is an effi cient way to achieve profi table pricing. It leads to the enhancement of profi ts and market demand, while enabling customers ’ value innovation, at what they perceive to be fair prices.
Direction for future studies The results of this study showed that only a few elements did very well for the total panel. The answer to successful sales, therefore, must lie in appealing to the different mindsets. What attracts one group may not attract another group. To sell a ‘ new-to-the-world product ’ that has features with different appeals to at least three different groups, the marketer may use several approaches that have yet to be studied. One approach to selling the new product may involve the direct engagement of the prospective customer in an interaction, such as a web-based interaction in order to ‘ type ’ the customer. The interactive-typing approach was implemented in the website of ‘ Success Built to Last ’ ,

UNCORRECTED PROOF
Assessing pricing for a new product concept
19© 2009 PALGRAVE MACMILLAN 1746-0166 VOL.X NO.Y PP 1–24. Journal of Direct, Data and Digital Marketing Practice
with good results. 65 In two other client studies, one on customer experience and one on jury selection, the typing approach was used. The results are waiting for in-market validation for the customer experience, and literally trial-by-jury validation for the jury selection.
In a competitive marketplace, where customer segments are defi ned by constantly changing customer needs and expectations, understanding and monitoring these expectations is critical to the sustenance of profi ts and competitive edge. The approach presented in this paper opens up the opportunity for a new look at the way features of products drive the perception of the ‘ right price ’ .
References 1 . Zahra , S . A . , Nielson , A . P . and Bogner , W . C . ( 1999 ) ‘ Corporate entrepreneurship,
knowledge and competence development ’ , Entrepreneurship: Theory and Practice , Vol. 23 , No. 3 , pp. 169 – 189 .
2 . Hitt , M . A . , Ireland , R . D . and Hoskisson , R . A . ( 2001 ) Strategic Management: Competitiveness and Globalization , 4th ed., ITP Southwestern Publishing Co., Cincinnati .
3 . Mone , M . A . , Mc Kinley , W . and Barger , V . L . III. ( 1998 ) ‘ Organizational decline and innovation: A contingency framework ’ , Academy of Management Review , Vol. 23 , pp. 115 – 132 .
4 . Wind , J . ( 1997 ) ‘ Pre-emptive strategies ’ , in Day, G. S. and Reibstein, D.J. (eds) Wharton on Dynamic Competitive Strategy , John Wiley and Sons, New York .
5 . Krider , R . E . and Weinberg , C . B . ( 1998 ) ‘ Competitive dynamics and the introduction of new products: The motion picture timing game ’ , Journal of Marketing Research , Vol. 35 , pp. 1 – 15 .
6 . Baum , J . A . C . and Korn , H . J . ( 1999 ) ‘ Dynamics of dyadic competitive interaction ’ , Strategic Management Journal , Vol. 20 , pp. 251 – 278 .
7 . Day , G . S . ( 1997 ) ‘ Assessing competitive arenas: Who are your competitors ’ , in Day, G.S. and Reibsten, D.J. (eds) Wharton on Competitive Strategy , John Wiley and Sons, New York .
8 . Grimm , C . M . and Smith , K . G . ( 1997 ) Strategy as Action: Industry Rivalry and Coordination , ITP Southwestern College Publishing Co, Cincinnati (OH) .
9 . Krishnamurthi , L . and Shankar , V . ( 1998 ) ‘ What are the options for later entrants ’ , Financial Times , 19 October, p. 4, Mastering Marketing .
10 . Franco , L . G . ( 1989 ) ‘ Corporate global competition: Who’s winning, who’s losing and the R & D factor as one reason why ’ , Strategic Management Journal , Vol. 10 , pp. 449 – 474 .
11 . Dean , J . W . and Bowen , D . E . ( 1994 ) ‘ Management theory and total quality; improving research and practice through theory development ’ , Academy of Management Review , Vol. 9 , pp. 392 – 419 .
12 . Aley , J . ( 1994 ) ‘ Manufacturers grade themselves ’ , Fortune , March , pp. 21 – 26 .
13 . Alexander , M . ( 2008 ) ‘ Cultural infl uences on adoption of SMS advertising: A study of American and Taiwanese consumers ’ , Journal of Targeting, Measurement and Analysis for Marketing , Vol. 16 , No. 1 , pp. 39 – 47 .
14 . Au , A . K . M . and Yeung , M . ( 2007 ) ‘ Modeling Chinese manufacturers ’ technology adoption behavior ’ , Organizational Transformation and Social Change , Vol. 4 , No. 2 , pp. 131 – 147 .
15 . Burns , D . J . ( 2007 ) ‘ Toward an explanatory model of innovative behavior ’ , Journal of Business and Psychology , Vol. 21 , No. 4 , pp. 461 – 488 .
16 . De Marez , L . , Vyncke , P . , Berte , K . , Schuurman , D . and De Moor , K . ( 2008 ) ‘ Adopter segments, adoption determinants and mobile marketing ’ , Journal of Targeting, Measurement and Analysis for Marketing , Vol. 16 , No. 1 , pp. 78 – 95 .
17 . Eriksson , K . , Kerem , K . and Nilsson , D . ( 2008 ) ‘ The adoption of commercial innovations in the former central and Eastern European markets: The case of internet banking in Estonia ’ , International Journal of Bank Marketing , Vol. 26 , No. 3 , pp. 154 – 169 .
18 . Kaplan , A . M . , Schoder , D . and Haenlein , M . ( 2007 ) ‘ Factors infl uencing the adoption of mass customization: The impact of base category consumption frequency and need satisfaction ’ , Journal of Product Innovation Management , Vol. 24 , No. 2 , pp. 101 – 116 .

UNCORRECTED PROOF
Rabino et al.
20 © 2009 PALGRAVE MACMILLAN 1746-0166 VOL.X NO.Y PP 1–24. Journal of Direct, Data and Digital Marketing Practice
19 . Kozinets , R . B . ( 2008 ) ‘ Technology/ideology: How ideological fi elds infl uence consumers ’ technology narratives ’ , Journal of Consumer Research , Vol. 34 , No. 6 , pp. 865 – 881 .
20 . Pass , L . J . , Jeroen , K . P . , Tammo , V . H . and Bijmolt , A . ( 2007 ) ‘ Discrete time, discrete state latent Markov modeling for assessing and predicting household acquisitions of fi nancial products ’ , Journal of the Royal Statistical Society: Series A (Statistics in Society) , Vol. 170 , No. 4 , pp. 955 – 974 .
21 . Moschis , G . P . ( 2007 ) ‘ Life course perspectives on consumer behavior ’ , Journal of the Academy of Marketing Science , Vol. 35 , No. 2 , pp. 295 – 307 .
22 . Moskowitz , H . R . , Porretta , S . and Silcher , M . ( 2005 ) Concept Research in Food Product Design and Development , Blackwell Publishing, Ames, IA .
23 . McDonald , H . and Alpert , F . ( 2007 ) ‘ Who are “ Innovators ” and do they matter?: A critical review of the evidence supporting the targeting of “ Innovative ” consumers ’ , Marketing Intelligence & Planning , Vol. 25 , No. 5 , pp. 421 – 435 .
24 . Ruvio , A . and Shoham , A . ( 2007 ) ‘ Innovativeness, exploratory behavior, market mavenship, and opinion leadership: An empirical examination in the Asian context ’ , Psychology and Marketing , Vol. 24 , No. 8 , pp. 703 – 722 .
25 . Schreier , M . , Oberhauser , S . and Pr ü gl , R . ( 2007 ) ‘ Lead users and the adoption and diffusion of new products: Insights from two extreme sports communities ’ , Marketing Letters , Vol. 18 , No. 1 – 2 , pp. 15 – 30 .
26 . Timmor , Y . and Katz-Navon , T . ( 2008 ) ‘ Being the same and different: A model explaining new product adoption ’ , Journal of Consumer Behavior , Vol. 7 , No. 3 , pp. 249 – 262 .
27 . Wang , G . , Dou , W . and Zhou , N . ( 2008 ) ‘ Consumption attitudes and adoption of new consumer products: A contingency approach ’ , European Journal of Marketing , Vol. 42 , No. 1/2 , pp. 238 – 254 .
28 . Chakvavarthy , B . ( 1997 ) ‘ A new strategy framework or coping with turbulence ’ , Sloan Management Review , ( Winter ), pp. 69 – 82 .
29 . Wittink , D . R . and Bergestuen , T . ( 2001 ) Principles of Forecasting with Conjoint Analysis: A Handbook for Researchers and Practitioners , Kluwer Academic Publishers, Norwell, MA .
30 . Hiezer , J . and Render , B . ( 1999 ) Operations Management , 5th ed., Prentice Hall, Upper Saddle River, NJ .
31 . Ben-Rechav Gabay , G . ( 2000 ) Relationship Selling: Antecedents and Outcomes , Portland State University, Portland, OR (Dissertation) .
32 . Chatterjee , S . and Yilmaz , M . ( 1993 ) ‘ Quality confusion: Too many gurus not enough disciplines ’ , Business Horizons , Vol. 36 , No. 3 , pp. 15 – 18 .
33 . Kim , C . W . and Mauborgne , R . ( 2005 ) Blue Ocean Strategy , Harvard Business School Press, Boston, MA .
34 . Lin , M . J . J . , Chen , C . H . and Huang , Z . C . ( 2007 ) ‘ Effects of business and design strategy integration on new product development performance ’ , International Journal of Business and Systems Research , Vol. 1 , No. 4 , pp. 438 – 457 .
35 . Ulrich , K . T . and Pearson , S . ( 1998 ) ‘ Assessing the importance of design thought product archaeology ’ , Management Science , Vol. 44 , No. 3 , pp. 352 – 369 .
36 . Alexander , D . L . , Lynch , J . G . Jr. and Want , Q . ( 2008 ) ‘ As time goes by: Do cold feet follow warm intentions for really new versus incrementally new products? ’ Journal of Marketing Research , Vol. XLV (June) , pp. 307 – 219 .
37 . Moskowitz , H . and Gofman , A . ( 2007 ) Selling Blue Elephants: How to Make Great Products Before Your Customers Even Know They Want Them , Wharton School Publishing, Upper Saddle River, NJ .
38 . Gofman , A . ( 2006 ) ‘ Emergent scenarios, synergies and suppressions uncovered within conjoint analysis ’ , Journal of Sensory Studies , Vol. 21 , pp. 373 – 414 .
39 . Hogan , J . and Lucke , T . ( 2006 ) ‘ Driving growth with new products: Common pricing traps to avoid ’ , The Journal of Business Strategy , Vol. 27 , No. 1 , pp. 54 – 58 .
40 . Haws , K . and Bearden , W . O . ( 2006 ) ‘ Dynamic pricing and consumer fairness perceptions ’ , Journal of Consumer Research , Vol. 33 (December) , pp. 304 – 311 .
Q4Q4
Q5Q5

UNCORRECTED PROOF
Assessing pricing for a new product concept
21© 2009 PALGRAVE MACMILLAN 1746-0166 VOL.X NO.Y PP 1–24. Journal of Direct, Data and Digital Marketing Practice
41 . Bergstein , H . and Estelami , H . ( 2002 ) ‘ A survey of emerging technologies for pricing new-to-the-world products ’ , Journal of Product and Brand Management , Vol. 11 , No. 4/5 , pp. 303 – 318 .
42 . Green , P . E . and Wind , Y . ( 1975 ) ‘ New way to measure consumer judgments ’ , Harvard Business Review , Vol. 3 (July – August) , pp. 107 – 117 .
43 . Monroe , K . B . ( 1971 ) ‘ Measuring price thresholds by psychophysics and latitudes of acceptance ’ , Journal of Marketing Research , Vol. 8 , pp. 460 – 464 .
44 . Monroe , K . B . ( 1990 ) Pricing: Making Profi table Decisions , McGraw-Hill, New York .
45 . Van Westendrop , P . E . ( 1976 ) ‘ NSS price sensitivity meter – A new approach to study consumer perceptions of price ’ , in, ESOMAR Congress Proceedings, Venice, Italy .
46 . Whiting , R . ( 2001 ) ‘ Virtual focus group ’ , Information Week , Vol. 848 (July) , pp. 53 – 58 .
47 . Cross , R . and Neal , M . ( 2000 ) ‘ Real time and on-line research is paying off ’ , Direct Marketing , Vol. 63 , No. 1 , pp. 58 – 62 .
48 . Aaker , D . , Day , G . and Kumar , V . ( 2001 ) Marketing Research , 7th ed., John Wiley & Sons, New York .
49 . Afuah , A . and Tucci , C . ( 2001 ) Internet Business Models and Strategies , McGraw-Hill, New York .
50 . Hamel , G . ( 2000 ) Leading the Revolution , Harvard Business School Press, Boston .
51 . Linder , J . C . and Cantrell , S . ( 2000 ) ‘ Changing business models: Surveying the landscape ’ , Working Paper, The Accenture Institute for Strategic Change, Palo Alto, CA .
52 . Gerring , J . ( 2004 ) ‘ What is a case study and what is it good for ’ , American Political Science Review , Vol. 98 , No. 2 , pp. 341 – 354 .
53 . Moskowitz , H . R . , Gofman , A . , Beckley , J . and Ashman , H . ( 2006 ) ‘ Founding a new science: Mind genomics ’ , Journal of Sensory Studies , No. 2006 , pp. 266 – 307 .
54 . Box , G . E . P . , Hunter , J . and Hunter , S . ( 1978 ) Statistics for Experimenters , John Wiley, New York .
55 . Systat Corporation . ( 1997 ) The System for Statistics (User Manual) , Systat Corporation, Division of SPSS, Evanston, IL .
56 . The analysis focuses on the values of the coeffi cients, rather than on the statistical signifi cance of each coeffi cient. Table 4 shows the relation between the coeffi cient value and the t-value for the interest model. Any coeffi cient exceeding 2.0 is deemed to be statistically signifi cant from ‘ 0 ’ . However, from these studies coeffi cients above +5 are meaningful in the marketplace, because they co-vary with successful products, and coeffi cients above +10 constitute a ‘ should-have ’ or ‘ should-do ’ because they strongly break through the respondent’s indifference .
57 . Green , P . E . and Krieger , A . M . ( 1991 ) ‘ Segmenting markets with conjoint analysis ’ , Journal of Marketing , Vol. 55 , pp. 20 – 31 .
58 . Green , P . E . and Srinivasan , V . ( 1980 ) ‘ A general approach to product design optimization via conjoint measurement ’ , Journal of Marketing , Vol. 45 , pp. 17 – 37 .
59 . Green , P . E . and Srinivasan , V . ( 1982 ) Health Care Management: Strategy, Structure, and Process , Jones & Bartlett, Sudbury, MA .
60 . Christen , M . ( 2000 ) Pricing Under Uncertainty: Does it Explain Cost Based Pricing? , INSEAD, Paris, France .
61 . Dolan , R . J . and Simon , H . ( 1996 ) Power Pricing , Free Press, New York .
62 . Tellis , G . J . ( 1986 ) ‘ Beyond the many faces of price: An integration of pricing strategies ’ , Journal of Marketing , Vol. 50 , No. 10 , pp. 146 – 160 .
63 . Harmon , R . , Raffo , D . and Faulk , S . ( 2004 ) ‘ Value based pricing for new products: Strategy insights for developers ’ , in Innovation Management in the Technology-Driven World, Portland International Conference on the Management of Engineering and Technology, Portland, OR .
64 . Ingenbleek , P . ( 2007 ) ‘ Value informed pricing in its organization context ’ , Journal of Product & Brand Management , Vol. 16 , No. 7 , pp. 441 – 458 .
65 . Moskowitz , H . R . and Gofman , A . ( 2005 ) ‘ System and method for performing conjoint analysis ’ US Patent Pending, US2005/0177398 A1, August .
Q6Q6
Q7Q7
Q8Q8

UNCORRECTED PROOF
Rabino et al.
22 © 2009 PALGRAVE MACMILLAN 1746-0166 VOL.X NO.Y PP 1–24. Journal of Direct, Data and Digital Marketing Practice
Appendix A
The Orientation Page Presenting the Products and Pricing in US $

UNCORRECTED PROOF
Assessing pricing for a new product concept
23© 2009 PALGRAVE MACMILLAN 1746-0166 VOL.X NO.Y PP 1–24. Journal of Direct, Data and Digital Marketing Practice
Appendix B
Example of a Product Concept and the Rating Scale for Interest

UNCORRECTED PROOF
Rabino et al.
24 © 2009 PALGRAVE MACMILLAN 1746-0166 VOL.X NO.Y PP 1–24. Journal of Direct, Data and Digital Marketing Practice
Appendix C
Pricing Questions for the Same Concept