Rapid on-chip postcolumn labeling and high-resolution separations of DNA
14
Vincent J. Sieben Christopher J. Backhouse Department of Electrical and Computer Engineering, University of Alberta, Edmonton, Alberta, Canada Rapid on-chip postcolumn labeling and high- resolution separations of DNA When performing genetic analysis on microfluidic systems, labeling the sample DNA for detection is a critical preparation step. Labeling procedures often involve fluores- cently tagged primers and PCRs, which lengthen experimental run times and introduce higher levels of complexity, increasing the overall cost per analysis. Alternatively, on- chip labeling techniques based on intercalating dyes permit rapid labeling of DNA fragments. However, as noted in the literature, the stochastic nature of dye-DNA complex formation hinders the native electrophoretic migration of DNA fragments, degrading the separation resolution. In this study, we present a novel method of con- trollably labeling DNA fragments at the end of the electrophoretic separation channel in a glass microfluidic chip. Permitting the DNA to separate and labeling just before detection, achieves the rapid labeling associated with intercalators while maintaining the high resolution of native DNA separations. Our analyses are completed in minutes, rather than the hours typical of sample prelabeling. We demonstrate an electrophoretic microchip-based intercalator labeling technique that achieves higher resolution per- formance than reported in the literature to date. Keywords: Capillary electrophoresis / DNA sequencing / Intercalator / Label / Microfluidics DOI 10.1002/elps.200500459 1 Introduction 1.1 General aspects Since Manz et al. [1–9] introduced the concept of micro- total analysis systems (mTAS) in the early 1990s, micro- fluidic devices have demonstrated that they are potentially a superior platform for biological assays when compared with many conventional analytical tools. The integration inherent in mTAS leads to a significant reduction in total analysis time with other advantages such as smaller volumes of sample and reagent usage, portability, and high density parallel processing [11]. Subsequently, microchip CE has been applied successfully for genetic analysis; in particular, mutation detection [12], high- throughput genotyping [13], and rapid DNA sequencing [14]. Although an extremely effective analysis technique, microchip CE often requires a labor and time-intensive sample labeling procedure that is difficult to integrate onto microfluidic chips. In addition, alternative methods of sample labeling can significantly degrade performance. The very small volumes (pL) of sample utilized in microchip CE requires sensitive detection techniques. To date, LIF detection remains one of the most sensitive and common detection techniques for chip-based analysis, and subse- quently the DNA samples that are to be analyzed must be “tagged” with a fluorescent dye for detection [15]. DNA labeling procedures often rely primarily on a time-intensive sample preparation step involving PCRs and primers cova- lently labeled with fluorophores. A conventional benchtop PCR procedure that amplifies and labels DNA can take hours, while the microchip CE injection and separation por- tions of the genetic analysis can be completed in minutes. One approach to minimize this processing time is to inte- grate PCR on the microchip, thus reducing the labeling time by a factor of 2–10 [10]. However, microchip PCR imple- mentations still require a considerable degree of complexity; including microvalving, micropumping, thin-film heaters, and on-chip temperature sensors [10, 16]. For the purpose of on-chip labeling, the level of complexity involved with microchip PCR may not be appropriate. As an alternative, many laboratories have employed intercalator dyes for on- chip DNA labeling [11, 16, 17]. The term “intercalator” was first used by Lerman to describe a molecule containing a planar aromatic struc- ture that inserts itself between two adjacent base pairs of a DNA double helix [18]. As the intercalator wedges itself Correspondence: Professor Christopher J. Backhouse, Depart- ment of Electrical and Computer Engineering, University of Alberta, 2nd Floor, ECERF (9107–116 St.), Edmonton, Canada T6G 2V4 E-mail: [email protected] Fax: 11-780-492-1811 Abbreviations: PROD, postcolumn reactor for on-chip derivati- zation; TO, Thiazol Orange Electrophoresis 2005, 26, 4729–4742 4729 Supplementary material for this article is available on the WWW under www.electrophoresis-journal.de. 2005 WILEY-VCH Verlag GmbH & Co. KGaA, Weinheim Miniaturization
-
Upload
independent -
Category
Documents
-
view
1 -
download
0
Transcript of Rapid on-chip postcolumn labeling and high-resolution separations of DNA
Vincent J. SiebenChristopher J. Backhouse
Department of Electrical andComputer Engineering,University of Alberta, Edmonton,Alberta, Canada
Rapid on-chip postcolumn labeling and high-resolution separations of DNA
When performing genetic analysis on microfluidic systems, labeling the sample DNAfor detection is a critical preparation step. Labeling procedures often involve fluores-cently tagged primers and PCRs, which lengthen experimental run times and introducehigher levels of complexity, increasing the overall cost per analysis. Alternatively, on-chip labeling techniques based on intercalating dyes permit rapid labeling of DNAfragments. However, as noted in the literature, the stochastic nature of dye-DNAcomplex formation hinders the native electrophoretic migration of DNA fragments,degrading the separation resolution. In this study, we present a novel method of con-trollably labeling DNA fragments at the end of the electrophoretic separation channel ina glass microfluidic chip. Permitting the DNA to separate and labeling just beforedetection, achieves the rapid labeling associated with intercalators while maintainingthe high resolution of native DNA separations. Our analyses are completed in minutes,rather than the hours typical of sample prelabeling. We demonstrate an electrophoreticmicrochip-based intercalator labeling technique that achieves higher resolution per-formance than reported in the literature to date.
Keywords: Capillary electrophoresis / DNA sequencing / Intercalator / Label / MicrofluidicsDOI 10.1002/elps.200500459
1 Introduction
1.1 General aspects
Since Manz et al. [1–9] introduced the concept of micro-total analysis systems (mTAS) in the early 1990s, micro-fluidic devices have demonstrated that they are potentiallya superior platform for biological assays when comparedwith many conventional analytical tools. The integrationinherent in mTAS leads to a significant reduction in totalanalysis time with other advantages such as smallervolumes of sample and reagent usage, portability, andhigh density parallel processing [11]. Subsequently,microchip CE has been applied successfully for geneticanalysis; in particular, mutation detection [12], high-throughput genotyping [13], and rapid DNA sequencing[14]. Although an extremely effective analysis technique,microchip CE often requires a labor and time-intensivesample labeling procedure that is difficult to integrate ontomicrofluidic chips. In addition, alternative methods ofsample labeling can significantly degrade performance.
The very small volumes (pL) of sample utilized in microchipCE requires sensitive detection techniques. To date, LIFdetection remains one of the most sensitive and commondetection techniques for chip-based analysis, and subse-quently the DNA samples that are to be analyzed must be“tagged” with a fluorescent dye for detection [15]. DNAlabeling procedures often rely primarily on a time-intensivesample preparation step involving PCRs and primers cova-lently labeled with fluorophores. A conventional benchtopPCR procedure that amplifies and labels DNA can takehours, while the microchip CE injection and separation por-tions of the genetic analysis can be completed in minutes.One approach to minimize this processing time is to inte-grate PCR on the microchip, thus reducing the labeling timeby a factor of 2–10 [10]. However, microchip PCR imple-mentations still require a considerable degree of complexity;including microvalving, micropumping, thin-film heaters,and on-chip temperature sensors [10, 16]. For the purposeof on-chip labeling, the level of complexity involved withmicrochip PCR may not be appropriate. As an alternative,many laboratories have employed intercalator dyes for on-chip DNA labeling [11, 16, 17].
The term “intercalator” was first used by Lerman todescribe a molecule containing a planar aromatic struc-ture that inserts itself between two adjacent base pairs ofa DNA double helix [18]. As the intercalator wedges itself
Correspondence: Professor Christopher J. Backhouse, Depart-ment of Electrical and Computer Engineering, University ofAlberta, 2nd Floor, ECERF (9107–116 St.), Edmonton, CanadaT6G 2V4E-mail: [email protected]: 11-780-492-1811
Abbreviations: PROD, postcolumn reactor for on-chip derivati-zation; TO, Thiazol Orange
Electrophoresis 2005, 26, 4729–4742 4729
Supplementary material for this article is available on the WWWunder www.electrophoresis-journal.de.
2005 WILEY-VCH Verlag GmbH & Co. KGaA, Weinheim
Min
iatu
riza
tio
n
4730 V. J. Sieben and C. J. Backhouse Electrophoresis 2005, 26, 4729–4742
into the center of the DNA double helix, the two adjacentbase pairs physically separate to accommodate theintercalating compound, deforming the DNA double helix.Upon the formation of this DNA-dye complex, the inter-calating molecules can become strongly fluorescent,usually a 20–1000-fold increase in fluorescence, yieldingexcellent S/N ratios [19]. Since basic labeling of DNA withintercalators can be accomplished by mixing the dye withDNA, the complexity of intercalator labeling initiallyappears to be minimal. This is not the case. It is well-known that the dye to DNA concentration ratios [20], theorder and duration of mixing [19], the type of intercalatordye utilized [21], and when the intercalator is added dur-ing analysis [22], are all important variables for intercala-tion labeling that impact the results of a CE separation.Zhu et al. discovered that high degrees of labeling withintercalator dyes resulted in a loss of resolution [20]. Theyattributed the peak broadening seen with high dye to DNAratios to the heterogeneity in the number of dye moleculesbound per DNA fragment. The random nature of the dye-DNA complex formation, of positive intercalator dyemolecules to negatively charged DNA, results in a dis-tribution of mobilities. Therefore, a penalty in resolution isnoted if the labeling is done before electrophoresis.Additionally, Rye et al. [19] discovered that when per-forming intercalator-based labeling, adding DNA to dyeinstead of dye to DNA resulted in better resolution. Theirmixing order was determined to impact the distribution ofdye molecules on DNA fragments. Carlsson et al. [23]verified this by heating the prelabeled DNA/dye mixturefor 2 h resulting in sharper peaks and enhanced resolutiondue to a more homogeneous distribution of dye mole-cules on DNA fragments.
Furthermore, Kim et al. [21] noted that the use of dimericintercalator dyes lead to poorer resolution than monomericintercalator dyes. From these studies, it is clear that theintercalator labeling dynamics hinder the electrophoreticseparation of DNA fragments. Although intercalator dyesallow rapid labeling of DNA, the intercalators adverselyaffect the migration of DNA during the separation phase ofCE, resulting in degraded resolution performance whencompared with end-labeled DNA. Nevertheless, the degra-dation of resolution associated with the stochastic nature ofDNA-dye formation can be circumvented if the labeling iscontrolled and completed just before detection. If labeling isperformed after the separation, it may be possible to extractthe benefit of rapid labeling while maintaining the high reso-lution of native DNA separations.
Typically, the derivatization of DNA with intercalators can beperformed either preseparation (precolumn), duringseparation (on-column), or postseparation (postcolumn).Precolumn labeling mixes the dye with DNA prior to theseparation phase of CE. Homogeneous prelabeling is often
completed off chip and requires on the order of hours ofincubation time, negating the rapid labeling advantage pos-sible with intercalators. On-column labeling incorporatesintercalator in the sieving medium and running buffer. As theDNA migrates during separation, it becomes labeled bygradually accumulating dye molecules. When precolumn oron-column labeling are employed for CE analysis, the dyemolecules come to an equilibrium between the various DNAfragments, the capillary walls, and the sieving medium, andthis leads to dynamic changes of the DNA mobility [20, 24].These changing mobilities result in a degradation of resolu-tion performance. However, postcolumn labeling circum-vents these interactions, permitting DNA to migrate withoutany intercalators present. In postcolumn labeling, the dye isadded at the end of the separation, after the DNA fragmentshave already been separated, thereby providing the optimalresolution. Early work on capillary systems implementedpostcolumn reactors using sheath flow setups [25–29];however, these postcolumn reactor implementationsexperienced peak-broadening from the extra connectionsrequired to deliver the dyes at the end of the capillary [15].Although usingaminoacids, Jacobsonet al. [6] fabricated anon-chip postcolumn reactor and also noted that significantband-broadening was caused by the extra postcolumnconnections required. In terms of labeling DNA, Gibson et al.performed postcolumn labeling on a capillary-based systemwith the intercalating dye PO-PRO-3 and found that thereaction rate was not fast enough to label the DNA in apostcolumn mode [22]. On the other hand, Ren et al. [30]successfully performed a variant of postcolumn labeling(called inverse flow derivatization) on a capillary-based sys-tem with the intercalator Thiazol Orange (TO).
Inverse flow derivatization is similar to postcolumn labelingin that the intercalating dye is placed in the separationbuffer waste well (held at positive polarity during separa-tion) causing the dye to migrate into the separation chan-nel, forming DNA-dye complexes toward the end of theseparation. However, there is no way to limit or control theamount of dye that is injected into the separation column,and eventually inverse flow derivatization will become anon-column type of labeling. To compensate for this, Ren etal. replaced the sieving medium in the capillary with freshmedium between each run by a pressure rinse system, butthis can be time and labor intensive. We present a micro-fluidic platform on which the intercalators can be con-trollablydelivered to the sample DNA after their separation,yielding an effective postcolumn reactor that achieves highresolution, high intensity, and high speed labeling.
In order to assess the effectiveness of microchip post-column labeling of nucleic acids, we also compare withprecolumn and on-column derivatization methods. Thebp resolution and reproducibility were compared betweenthe three methods of labeling, both within our results and
2005 WILEY-VCH Verlag GmbH & Co. KGaA, Weinheim
Electrophoresis 2005, 26, 4729–4742 Rapid on-chip postcolumn labeling 4731
with those presented in the literature. Of the three meth-ods, postcolumn derivatization yielded the highest reso-lution performance. Although postseparation labeling hasbeen demonstrated on microchips for proteins [31, 32]and amino acids [6, 33], to our knowledge it has not beenpreviously demonstrated for nucleic acids. As theseparation and sizing of nucleic acids is one of the leadingapplications of microchip-based analysis tools [34], theaddition of a postseparation labeling technique that couldrapidly label DNA while maintaining high-resolutionseparations would be advantageous. We demonstrate arapid on-chip postcolumn labeling technique that attainshigher resolution than reported in the literature to date.
1.2 Principle of postchannel labeling
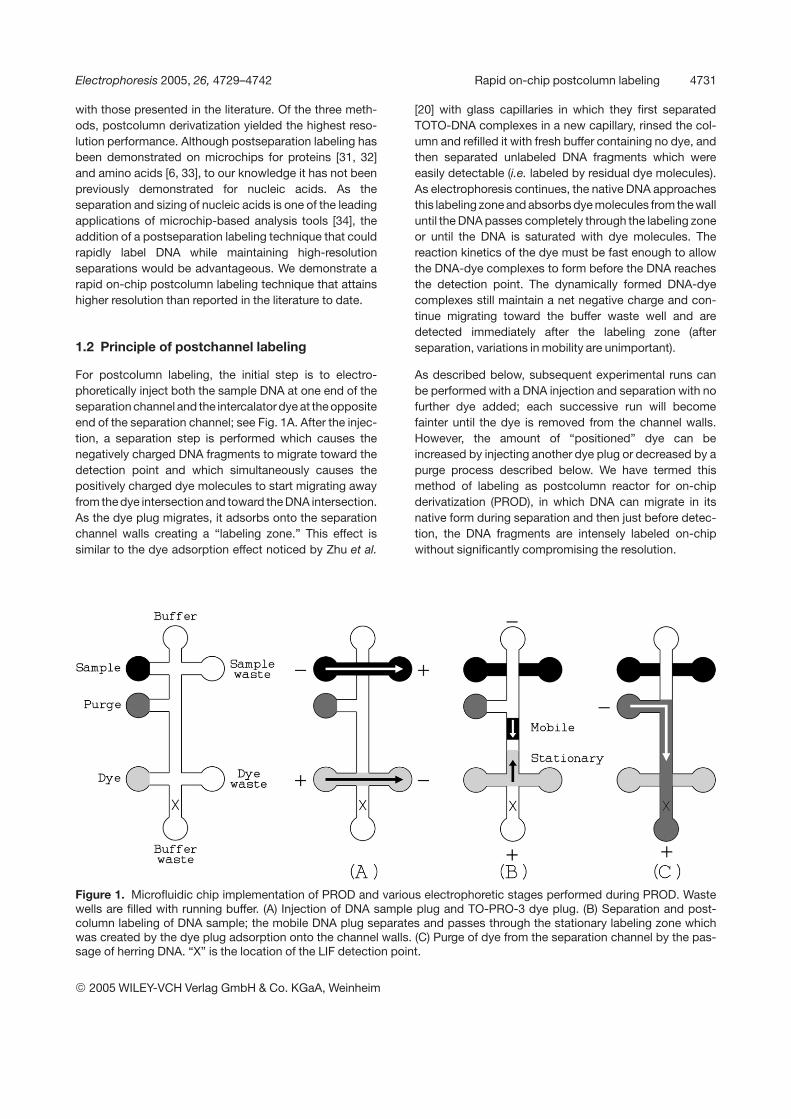
For postcolumn labeling, the initial step is to electro-phoretically inject both the sample DNA at one end of theseparation channel and the intercalatordye at the oppositeend of the separation channel; see Fig. 1A. After the injec-tion, a separation step is performed which causes thenegatively charged DNA fragments to migrate toward thedetection point and which simultaneously causes thepositively charged dye molecules to start migrating awayfrom the dye intersection and toward the DNA intersection.As the dye plug migrates, it adsorbs onto the separationchannel walls creating a “labeling zone.” This effect issimilar to the dye adsorption effect noticed by Zhu et al.
[20] with glass capillaries in which they first separatedTOTO-DNA complexes in a new capillary, rinsed the col-umn and refilled it with fresh buffer containing no dye, andthen separated unlabeled DNA fragments which wereeasily detectable (i.e. labeled by residual dye molecules).As electrophoresis continues, the native DNA approachesthis labeling zone and absorbs dye molecules from the walluntil the DNA passes completely through the labeling zoneor until the DNA is saturated with dye molecules. Thereaction kinetics of the dye must be fast enough to allowthe DNA-dye complexes to form before the DNA reachesthe detection point. The dynamically formed DNA-dyecomplexes still maintain a net negative charge and con-tinue migrating toward the buffer waste well and aredetected immediately after the labeling zone (afterseparation, variations in mobility are unimportant).
As described below, subsequent experimental runs canbe performed with a DNA injection and separation with nofurther dye added; each successive run will becomefainter until the dye is removed from the channel walls.However, the amount of “positioned” dye can beincreased by injecting another dye plug or decreased by apurge process described below. We have termed thismethod of labeling as postcolumn reactor for on-chipderivatization (PROD), in which DNA can migrate in itsnative form during separation and then just before detec-tion, the DNA fragments are intensely labeled on-chipwithout significantly compromising the resolution.
Figure 1. Microfluidic chip implementation of PROD and various electrophoretic stages performed during PROD. Wastewells are filled with running buffer. (A) Injection of DNA sample plug and TO-PRO-3 dye plug. (B) Separation and post-column labeling of DNA sample; the mobile DNA plug separates and passes through the stationary labeling zone whichwas created by the dye plug adsorption onto the channel walls. (C) Purge of dye from the separation channel by the pas-sage of herring DNA. “X” is the location of the LIF detection point.
2005 WILEY-VCH Verlag GmbH & Co. KGaA, Weinheim
4732 V. J. Sieben and C. J. Backhouse Electrophoresis 2005, 26, 4729–4742
2 Materials and methods
2.1 Reagents and solutions
GeneScan polymer (7%, P/N: 401885) and the GeneS-can r-500 size ladder were obtained from PE AppliedBiosystems (Foster City, CA, USA). Glycerol wasobtained from Sigma-Aldrich (St. Louis, MO, USA). Tris(crystallized free base) and boric acid were obtainedfrom Fisher Scientific (Fair Lawn, NJ, USA). EDTA wasobtained from Merck (KGaA, Darmstadt, Germany).Sodium hydroxide, 5 M, was obtained from Fisher Sci-entific (Nepean, Ontario, Canada). Concentrated sulfuricacid (H2SO4, ca. 96%) was obtained from Anachemia(Montreal, QC, CA). TO-PRO-3 as 1 mM stock solutionin DMSO was obtained from Molecular Probes (Eugene,OR, USA). The PhiX174-HaeIII digest fragment ladder,0.5 mg/mL, was obtained from Invitrogen (Carlsbad, CA,USA). Herring sperm DNA was purchased from Sigma-Aldrich.
All dilutions were performed with autoclaved Milli-Qwater unless otherwise noted. The 5 M sodium hydrox-ide was diluted to 1 M concentrations. The TO-PRO-3stock solution was divided into aliquots to avoid exces-sive thawing and refreezing as working solutions wereprepared daily from stock solutions. A Tris-borate-EDTAbuffer (TBE) was made with Tris, boric acid, and EDTA.The sieving medium and running buffer formulationswere based on the protocol published in the “GeneScan Reference Guide—Chemistry Reference for theABI310, Applied Biosystems, 2000” [35]. The runningbuffer is referred to as 1TBE10G (10% w/w glycerol,pH 8.5) and the sieving medium is referred to as 5GS10G(5% w/w GeneScan polymer and 10% w/w glycerol).The DNA used for the purge process (a sustained elec-trophoretic injection of concentrated DNA to remove dyemolecules from the channel walls) was formed by mixing0.01 g of herring sperm DNA to 1 mL of Milli-Q water(10 mg/mL). Precolumn: For the precolumn experiments,the preformed DNA-dye complexes were created byadding 10 mL of 0.5 mg/mL PhiX174-HaeIII digest frag-ments to 10 mL of 0.25 mM TO-PRO-3, yielding an inter-calation ratio of 3:1 (bp:dye molecules). The order ofmixing is important, as noted by Rye et al. [19]; it is bestto add DNA to the dye solution. This solution is thenvortexed for 30 s and left to incubate in the dark at roomtemperature for 1 h. On-column: As with typical on-col-umn experiments, a final concentration of 1 mM TO-PRO-3 was added to the sieving medium 5GS10G andto the running buffer 1TBE10G and vortexed for 30 s justprior to the experiment. It should be noted that the pre-column and on-column resolution varies with the degreeof labeling (i.e., the value of dye:DNA ratios) [20]; there-fore, it is necessary to establish approximately equal
peak amplitudes for precolumn, on-column, and post-column labeling. The dye concentrations selected hereresult in similar peak amplitudes for each of the meth-ods. Ensuring a constant labeling ratio permits a moreaccurate assessment of the change of resolution due tothe method of labeling employed.
2.2 Microfluidic chip and equipment
The postcolumn labeling is accomplished on a customdesigned Protolyne microchip fabricated by Micralyne(Edmonton, AB, Canada). The microfluidic network thatimplements the PROD method is illustrated in Fig. 1.The microchip used here consists of seven wells (eachcontaining ca. 3 mL) in 2.2 mm thick borofloat glass.These wells are linked by four microchannels that arenominally 50 mm wide and 20 mm deep; one of whichprovides a separation channel approximately 80 mm inlength and three that provide injection channels ap-proximately 8 mm in length. This microchip was alsoused to perform precolumn and on-column derivatiza-tion. The Microfluidic Tool Kit, referred to as the mTK,was purchased from Micralyne and provided electro-phoretic control of reagents and DNA samples. The mTKis composed of eight high voltages power supplies,each capable of potentials up to 6 kV, and an LIF sys-tem with an excitation wavelength of 635 nm and adetection wavelength of 670 nm. The programmableapplication of high voltages to the microchip is fullycontrolled by the mTK via a compiled LabVIEW interfacesupplied by Micralyne. The LabVIEW control program isrun on a PC and is connected to the mTK by a seriallink. The mTK acquired the LIF signal at 200 Hz and thedata were recorded in the PC. The fluorescence signalis recorded in volts and is graphed as relative fluores-cence units (RFU) versus time. Subsequent analysis ofthe fluorescence data was performed by a C11 pro-gram developed in our laboratory. Further details can befound in previous work [36].
Fluorescence microscopy was performed on a Carl ZeissAG Axiovert 200M inverted microscope (Oberkochen,Germany). A Chroma 41008 filter set (Rockingham, VT,USA) was used for TO-PRO-3 fluorescence imaging. Theimages and videos were captured with a HamamatsuC9100 EM-CCD (Hamamatsu City, Japan) employing thesoftware program AxioVision (Release 4.2—service pack1), both supplied by Carl Zeiss AG. A custom plexi-glassenclosure was built that mounted onto the microscopestage in order to provide real-time images and videoswhile high voltages were being applied to the microchip.The high voltages were supplied from the mTK powersupply and software mentioned above.
2005 WILEY-VCH Verlag GmbH & Co. KGaA, Weinheim
Electrophoresis 2005, 26, 4729–4742 Rapid on-chip postcolumn labeling 4733
2.3 Chip preparation and loading
We define an experimental “load” as the complete load-ing of new reagents such as the sieving medium, buffer,sample, and dye onto the microfluidic chip. The sievingmedium was loaded into the microchannels through thebuffer waste well by a syringe applying positive pressure;further details can be found in Footz et al. [36]. From eachload, several analysis “runs” can be completed thatinvolve sample injection, separation, and labeling. Be-tween each load, the electrodes on the mTK were brushedwith a Q-tip soaked in 70% ethanol to prevent load to loadcontamination. Furthermore, to demonstrate a reproduc-ible starting point between each experimental load, thechip was run through a rejuvenation protocol developedin our laboratory that completely removed residual dyemolecules adsorbed onto the channel walls [37]. As willbe described below we also demonstrate that this labor-intensive step is not required as the same effect can beobtained from running an automated purge cycle (180 s).Nevertheless, the PROD method yielded high-resolutionperformance without employing the cleaning process.After removing the sieving medium from the chip, therejuvenation process involved filling the channels withconcentrated sulfuric acid and then heating the chip toapproximately 4007C for 10 min. Next, the chip wasallowed to cool to room temperature for 5 min and wasfilled with 1 M sodium hydroxide and left to sit at roomtemperature for 5 min. The sodium hydroxide was flushedout with nitrogen and the microchannels and wells wereflushed three times with Milli-Q water. The cleaning pro-cess was finalized by flushing the channels with runningbuffer and then drying with nitrogen. The chip was thenprepared for either precolumn, on-column, or postcolumnderivatization. To ensure complete removal of residualdye molecules and verify that the rejuvenation protocolwas successful, the first run of a PROD load was a controlrun that injected and separated an unlabeled DNA samplewithout adding dye. No fluorescence signal was detectedthen, indicating the complete removal of dye molecules.
2.3.1 Precolumn loading
In all loading procedures, the unused wells were filled withrunning buffer. For precolumn derivatization, the channelswere filled with the sieving matrix 5GS10G. The samplereservoir well of the postcolumn microchip was loadedwith 0.3 mL of running buffer 1TBE10G, 0.6 mL of the pre-labeled PhiX174-TO-PRO-3 complexes (resulting in afinal concentration of 50 ng/mL), and 2.1 mL of Milli-Qwater. The remaining three wells used in precolumn deri-vatization: the sample waste well, the buffer reservoirwell, and the buffer waste well, were filled with 3 mL of the
running buffer 1TBE10G. An intercalation ratio of 3:1bp:dye, just under full intercalation for monointercalators,was chosen from optimal values noted in the literature toprovide maximum fluorescence. For instance, Zhu et al.[20] indicates that the fluorescence intensity continuallyincreased for monointercalators up to full intercalation(2:1 bp:dye), while Molecular Probes and Kim et al. [21]state that the optimal ratio is 5:1 bp:dye for dimeric inter-calators. These ratio values are in accordance with theneighbor exclusion principle that state every second sitealong the double helix remains unoccupied [38]. There-fore, the precolumn protocol described above will permitus to evaluate the optimal resolution attainable with themaximum fluorescence intensity possible.
2.3.2 On-column loading
For on-column derivatization, the channels were filledwith the sieving matrix 5GS10G which was mixed with a1 mM final molarity of TO-PRO-3. The sample reservoirwell of the postcolumn microchip was loaded with 0.3 mLof running buffer 1TBE10G, 0.3 mL of 0.5 mg/mL PhiX174-HaeIII digest (resulting in a final concentration of 50 ng/mL), and 2.4 mL of Milli-Q water. The sample waste wellwas filled with 3 mL of the running buffer 1TBE10G. Thebuffer reservoir well and the buffer waste well were filledwith 3 mL of the running buffer 1TBE10G mixed with a1 mM final molarity of TO-PRO-3. Similar to the prelabeledmethod, the 1 mM TO-PRO-3 concentration for on-col-umn labeling was chosen based on the optimal con-centration noted in the literature. Rampal et al. [39] char-acterized TO-PRO-3 with a capillary-based on-columnlabeling method and found that 0.1 mM TO-PRO-3 in therunning buffer and sieving medium resolved each peak ofthe HaeIII digest of PhiX174. However, Rampal et al. [39]also noted that with 1.0 mM TO-PRO-3 concentration inthe running buffer and sieving medium, the relative fluo-rescence was four to five times brighter than with 0.1 mMat higher concentrations of dsDNA (1–10 ng/mL). On amicrochip platform, Fu et al. [11] utilized on-columnlabeling with 1.0 mM TO-PRO-3 to resolve a 100 bpdsDNA ladder. By incorporating 1.0 mM TO-PRO-3 intothe running buffer and sieving medium for our protocol,we establish a way to compare the resolution resultingfrom on-column labeling with the other methods of deri-vatization.
2.3.3 Postcolumn loading
For the postcolumn derivatization, the microchip utilizesseven reagent wells as shown in Fig. 1; one for the sampleto be analyzed, one containing the intercalating dye usedfor derivatization, another well holds sacrificial DNA for
2005 WILEY-VCH Verlag GmbH & Co. KGaA, Weinheim

4734 V. J. Sieben and C. J. Backhouse Electrophoresis 2005, 26, 4729–4742
the purge process, and the remaining four wells are filledwith running buffer. The channels were filled with thesieving matrix 5GS10G.
The sample reservoir well of the postcolumn microchipwas loaded with 0.3 mL of running buffer 1TBE10G, 0.3 mLof 0.5 mg/mL PhiX174-HaeIII digest (resulting in a finalconcentration of 50 ng/mL), and 2.4 mL of Milli-Q water.The dye reservoir well was loaded with 0.3 mL of1TBE10G running buffer and 2.7 mL of 0.1 mM TO-PRO-3.The purge reservoir well was loaded with 0.3 mL of1TBE10G running buffer and 2.7 mL of 10 mg/mL herringsperm DNA. The sample waste well, dye waste well, buf-fer reservoir well, and buffer waste well were filled with3 mL of the running buffer 1TBE10G. The optimal con-centration of dye to use in the dye well with postcolumnlabeling was experimentally determined to be 100 mMTO-PRO-3 in order to yield peak intensities similar tothose observed in precolumn and on-column experi-ments, thereby permitting an assessment of the resolu-tion with a constant degree of labeling.
2.4 Microchip electrophoresis
2.4.1 Precolumn and on-columnelectrophoresis
The electrophoresis injection and separation proceduresfor precolumn and on-column derivatization were iden-tical. First, the DNA-dye (precolumn) or DNA (on-column)sample was electrophoretically injected from the samplewell into the chip’s injection microchannel; performed byapplying a potential of 1 kV (1250 V/cm) for 60 s at thesample waste well and 0 V at the sample reservoir well(refer to Fig. 1). The next electrophoresis step is theseparation; performed by applying a potential of 2.5 kV(300 V/cm) for 550 s at the buffer waste well and 0 V at thebuffer reservoir well. The separation will cause the DNA inthe intersection of the two channels, called the plug, tostart migrating toward the detection point, and in the pro-cess, separating into the various DNA fragment sizes.Detection was performed at 80 mm from the DNA injectionintersection. After the first run, the injection time is loweredto 30 s and separation parameters remain the same.
2.4.2 Postcolumn electrophoresis
For the postcolumn derivatization, the initial step is toelectrophoretically inject a plug of sample DNA at one endof the separation channel, and of intercalator dye at theopposite end of the separation channel, for a duration of60 s; see Fig. 1. For the injections, a potential of 1 kV(1250 V/cm) is applied to both the dye reservoir well and
the sample waste well with 0 V applied to the dye wastewell and the sample reservoir well as shown in Fig. 1A.After the injection, a separation step (Fig. 1B) is performedwith a potential of 2.5 kV (300 V/cm) for 500 s; this causesthe negatively charged DNA fragments to migrate towardthe detection point X (80 mm) and which simultaneouslycauses the positively charged dye molecules to startmigrating away from the dye intersection and toward theDNA intersection. However, the dye molecules quicklystick to the channel walls creating the labeling zone; Fig. 5illustrates the rapid adsorption of the dye plug within 1 mmof the dye intersection. Detection was performed at 80 mmfrom the DNA injection intersection or 4 mm down from thedye intersection. Subsequent experimental runs can beperformed with a 30 s DNA injection and a 500 s separationuntil the dye is removed from the channel walls.
2.4.3 Purge process
In other reported work, labor-intensive procedures aretypically employed in an attempt to clean the intercalatormolecules off the channel walls; e.g., 10 min rinses priorto each run. In this work, we present an automated on-chip electrophoretic purge process which can be used toremove dye molecules from the channel walls; seeFig. 1C. First, in a “purge step,” a continuous flow injec-tion of concentrated herring DNA is performed to con-tinuously adsorb the dye from the wall; executed byapplying a potential of 6 kV (750 V/cm) at the buffer wastewell and 0 V at the purge reservoir well for 180 s (Fig. 1C).Next, a delay or pause step can be performed for 180 s toincrease the transfer of dye molecules from the channelwalls to the sacrificial DNA. Finally, a separation is com-pleted to remove the now labeled sacrificial DNA from theseparation column; a potential of 6 kV (750 V/cm) appliedat the buffer waste well and 0 V applied at the bufferreservoir well for 180 s.
3 Results
3.1 Resolution
Resolution in bp provides a useful quantitative assess-ment of the performance for a particular labeling tech-nique, with a smaller number indicative of a higher resolu-tion. Similar to Heller et al. [40], we define resolution interms of bp calculated as shown in Eq. (1)
bp:Res ¼ ðw1 þ w2Þ2
DMDt
(1)
where w1 is the full width at half the maximum (FWHM)value of the preceding peak, w2 is the FWHM of the peakunder investigation, Dt is the separation time difference
2005 WILEY-VCH Verlag GmbH & Co. KGaA, Weinheim
Electrophoresis 2005, 26, 4729–4742 Rapid on-chip postcolumn labeling 4735
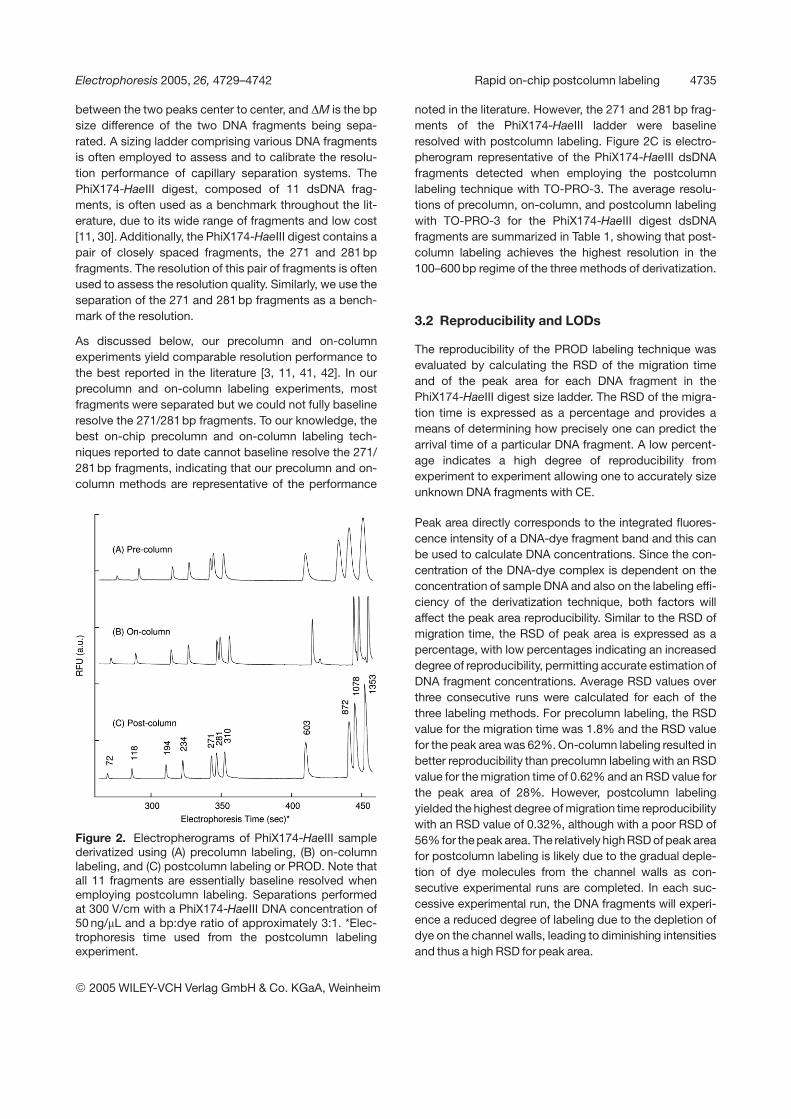
between the two peaks center to center, and DM is the bpsize difference of the two DNA fragments being sepa-rated. A sizing ladder comprising various DNA fragmentsis often employed to assess and to calibrate the resolu-tion performance of capillary separation systems. ThePhiX174-HaeIII digest, composed of 11 dsDNA frag-ments, is often used as a benchmark throughout the lit-erature, due to its wide range of fragments and low cost[11, 30]. Additionally, the PhiX174-HaeIII digest contains apair of closely spaced fragments, the 271 and 281 bpfragments. The resolution of this pair of fragments is oftenused to assess the resolution quality. Similarly, we use theseparation of the 271 and 281 bp fragments as a bench-mark of the resolution.
As discussed below, our precolumn and on-columnexperiments yield comparable resolution performance tothe best reported in the literature [3, 11, 41, 42]. In ourprecolumn and on-column labeling experiments, mostfragments were separated but we could not fully baselineresolve the 271/281 bp fragments. To our knowledge, thebest on-chip precolumn and on-column labeling tech-niques reported to date cannot baseline resolve the 271/281 bp fragments, indicating that our precolumn and on-column methods are representative of the performance
Figure 2. Electropherograms of PhiX174-HaeIII samplederivatized using (A) precolumn labeling, (B) on-columnlabeling, and (C) postcolumn labeling or PROD. Note thatall 11 fragments are essentially baseline resolved whenemploying postcolumn labeling. Separations performedat 300 V/cm with a PhiX174-HaeIII DNA concentration of50 ng/mL and a bp:dye ratio of approximately 3:1. *Elec-trophoresis time used from the postcolumn labelingexperiment.
noted in the literature. However, the 271 and 281 bp frag-ments of the PhiX174-HaeIII ladder were baselineresolved with postcolumn labeling. Figure 2C is electro-pherogram representative of the PhiX174-HaeIII dsDNAfragments detected when employing the postcolumnlabeling technique with TO-PRO-3. The average resolu-tions of precolumn, on-column, and postcolumn labelingwith TO-PRO-3 for the PhiX174-HaeIII digest dsDNAfragments are summarized in Table 1, showing that post-column labeling achieves the highest resolution in the100–600 bp regime of the three methods of derivatization.
3.2 Reproducibility and LODs
The reproducibility of the PROD labeling technique wasevaluated by calculating the RSD of the migration timeand of the peak area for each DNA fragment in thePhiX174-HaeIII digest size ladder. The RSD of the migra-tion time is expressed as a percentage and provides ameans of determining how precisely one can predict thearrival time of a particular DNA fragment. A low percent-age indicates a high degree of reproducibility fromexperiment to experiment allowing one to accurately sizeunknown DNA fragments with CE.
Peak area directly corresponds to the integrated fluores-cence intensity of a DNA-dye fragment band and this canbe used to calculate DNA concentrations. Since the con-centration of the DNA-dye complex is dependent on theconcentration of sample DNA and also on the labeling effi-ciency of the derivatization technique, both factors willaffect the peak area reproducibility. Similar to the RSD ofmigration time, the RSD of peak area is expressed as apercentage, with low percentages indicating an increaseddegree of reproducibility, permitting accurate estimation ofDNA fragment concentrations. Average RSD values overthree consecutive runs were calculated for each of thethree labeling methods. For precolumn labeling, the RSDvalue for the migration time was 1.8% and the RSD valuefor the peak area was 62%. On-column labeling resulted inbetter reproducibility than precolumn labeling with an RSDvalue for the migration time of 0.62% and an RSD value forthe peak area of 28%. However, postcolumn labelingyielded the highest degree of migration time reproducibilitywith an RSD value of 0.32%, although with a poor RSD of56% for the peak area. The relatively high RSD of peak areafor postcolumn labeling is likely due to the gradual deple-tion of dye molecules from the channel walls as con-secutive experimental runs are completed. In each suc-cessive experimental run, the DNA fragments will experi-ence a reduced degree of labeling due to the depletion ofdye on the channel walls, leading to diminishing intensitiesand thus a high RSD for peak area.
2005 WILEY-VCH Verlag GmbH & Co. KGaA, Weinheim
4736 V. J. Sieben and C. J. Backhouse Electrophoresis 2005, 26, 4729–4742
Table 1. Resolution results of precolumn, on-column, and postcolumn labeling techniques using TO-PRO-3 (n = 3)
PhiX174 dsDNA Resolution (bp) GS-500 ladder Res. (bp)
Fragment (bp) Precolumn On-column Postcolumn Fragment (bp) End-labeled
72 23–100118 3.2 2.6 2.6 139 2.4194 4.0 3.4 3.0 150 3.0234 5.1 3.8 3.4 160 1.9271 3.8 2.8 2.1 200 2.9281 9.7 9.6 5.2 250 4.3310 8.6 7.9 7.3 300 2.9603 15.5 7.9 8.5 340 2.7872 47.7 18.7 18.4 350 1.5
1078 144 105 111 400 2.61353 158 239 101 450a) 15.2
490 7.0500 2.0
Average resolution as a percentage of fragment size for 100–600 bp rangePrecolumn On-column Postcolumn End-labeled
2.5% 2.0% 1.6% 1.4%
Resolution in bp attained for size fragments of the PhiX174-HaeIII digest (50 ng/mL) when derivatizedprecolumn, on-column, and postcolumn with TO-PRO-3. First fragment resolution not listed due touse of Eq. (1) (see text). Additionally, the resolution achieved for the end-labeled GS-500 ladderseparation is presented. Data presented are the average of three consecutive experimental runs permethod (n = 3).a) The 450 bp fragment appears to run anomalously, see text.
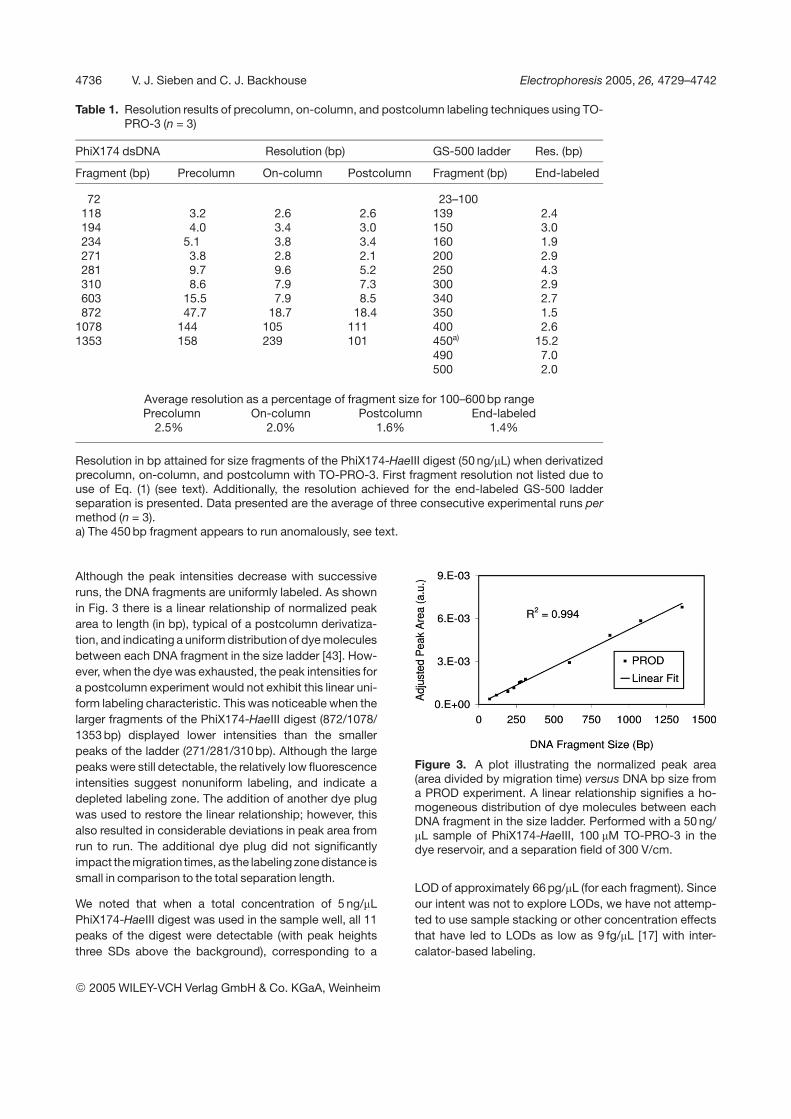
Although the peak intensities decrease with successiveruns, the DNA fragments are uniformly labeled. As shownin Fig. 3 there is a linear relationship of normalized peakarea to length (in bp), typical of a postcolumn derivatiza-tion, and indicating a uniform distribution of dye moleculesbetween each DNA fragment in the size ladder [43]. How-ever, when the dye was exhausted, the peak intensities fora postcolumn experiment would not exhibit this linear uni-form labeling characteristic. This was noticeable when thelarger fragments of the PhiX174-HaeIII digest (872/1078/1353 bp) displayed lower intensities than the smallerpeaks of the ladder (271/281/310bp). Although the largepeaks were still detectable, the relatively low fluorescenceintensities suggest nonuniform labeling, and indicate adepleted labeling zone. The addition of another dye plugwas used to restore the linear relationship; however, thisalso resulted in considerable deviations in peak area fromrun to run. The additional dye plug did not significantlyimpact the migration times, as the labeling zone distance issmall in comparison to the total separation length.
We noted that when a total concentration of 5 ng/mLPhiX174-HaeIII digest was used in the sample well, all 11peaks of the digest were detectable (with peak heightsthree SDs above the background), corresponding to a
Figure 3. A plot illustrating the normalized peak area(area divided by migration time) versus DNA bp size froma PROD experiment. A linear relationship signifies a ho-mogeneous distribution of dye molecules between eachDNA fragment in the size ladder. Performed with a 50 ng/mL sample of PhiX174-HaeIII, 100 mM TO-PRO-3 in thedye reservoir, and a separation field of 300 V/cm.
LOD of approximately 66 pg/mL (for each fragment). Sinceour intent was not to explore LODs, we have not attemp-ted to use sample stacking or other concentration effectsthat have led to LODs as low as 9 fg/mL [17] with inter-calator-based labeling.
2005 WILEY-VCH Verlag GmbH & Co. KGaA, Weinheim
Electrophoresis 2005, 26, 4729–4742 Rapid on-chip postcolumn labeling 4737
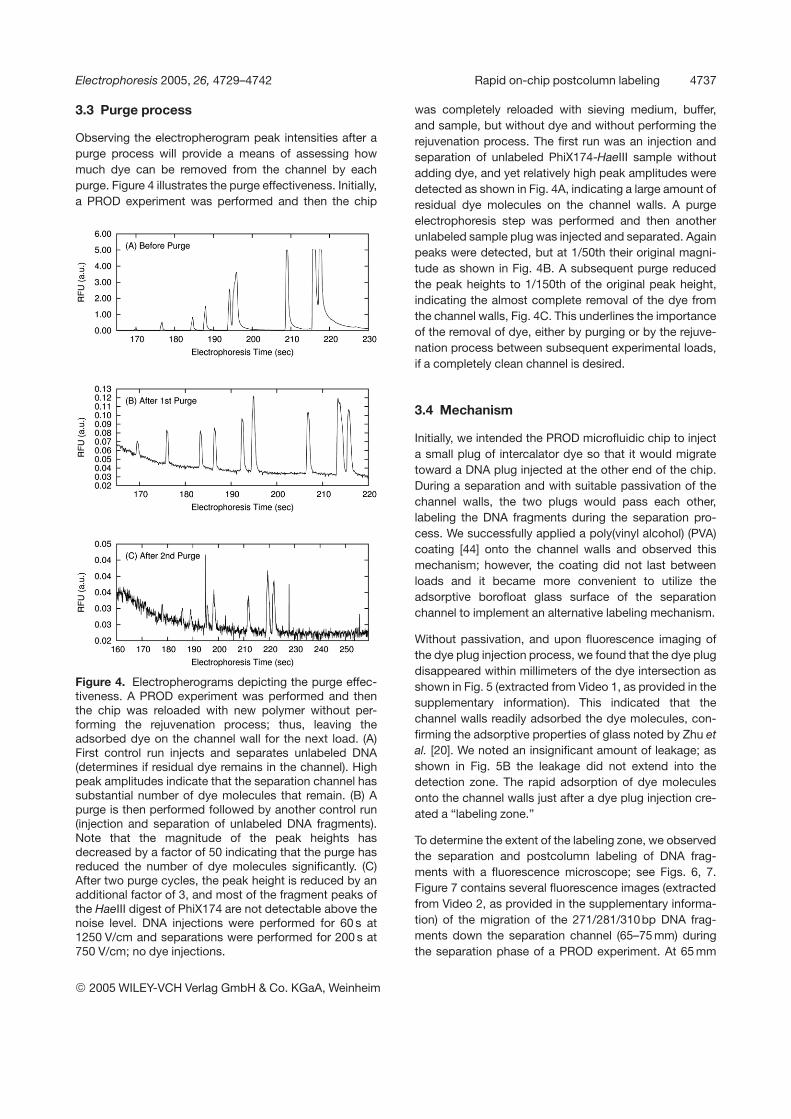
3.3 Purge process
Observing the electropherogram peak intensities after apurge process will provide a means of assessing howmuch dye can be removed from the channel by eachpurge. Figure 4 illustrates the purge effectiveness. Initially,a PROD experiment was performed and then the chip
Figure 4. Electropherograms depicting the purge effec-tiveness. A PROD experiment was performed and thenthe chip was reloaded with new polymer without per-forming the rejuvenation process; thus, leaving theadsorbed dye on the channel wall for the next load. (A)First control run injects and separates unlabeled DNA(determines if residual dye remains in the channel). Highpeak amplitudes indicate that the separation channel hassubstantial number of dye molecules that remain. (B) Apurge is then performed followed by another control run(injection and separation of unlabeled DNA fragments).Note that the magnitude of the peak heights hasdecreased by a factor of 50 indicating that the purge hasreduced the number of dye molecules significantly. (C)After two purge cycles, the peak height is reduced by anadditional factor of 3, and most of the fragment peaks ofthe HaeIII digest of PhiX174 are not detectable above thenoise level. DNA injections were performed for 60 s at1250 V/cm and separations were performed for 200 s at750 V/cm; no dye injections.
was completely reloaded with sieving medium, buffer,and sample, but without dye and without performing therejuvenation process. The first run was an injection andseparation of unlabeled PhiX174-HaeIII sample withoutadding dye, and yet relatively high peak amplitudes weredetected as shown in Fig. 4A, indicating a large amount ofresidual dye molecules on the channel walls. A purgeelectrophoresis step was performed and then anotherunlabeled sample plug was injected and separated. Againpeaks were detected, but at 1/50th their original magni-tude as shown in Fig. 4B. A subsequent purge reducedthe peak heights to 1/150th of the original peak height,indicating the almost complete removal of the dye fromthe channel walls, Fig. 4C. This underlines the importanceof the removal of dye, either by purging or by the rejuve-nation process between subsequent experimental loads,if a completely clean channel is desired.
3.4 Mechanism
Initially, we intended the PROD microfluidic chip to injecta small plug of intercalator dye so that it would migratetoward a DNA plug injected at the other end of the chip.During a separation and with suitable passivation of thechannel walls, the two plugs would pass each other,labeling the DNA fragments during the separation pro-cess. We successfully applied a poly(vinyl alcohol) (PVA)coating [44] onto the channel walls and observed thismechanism; however, the coating did not last betweenloads and it became more convenient to utilize theadsorptive borofloat glass surface of the separationchannel to implement an alternative labeling mechanism.
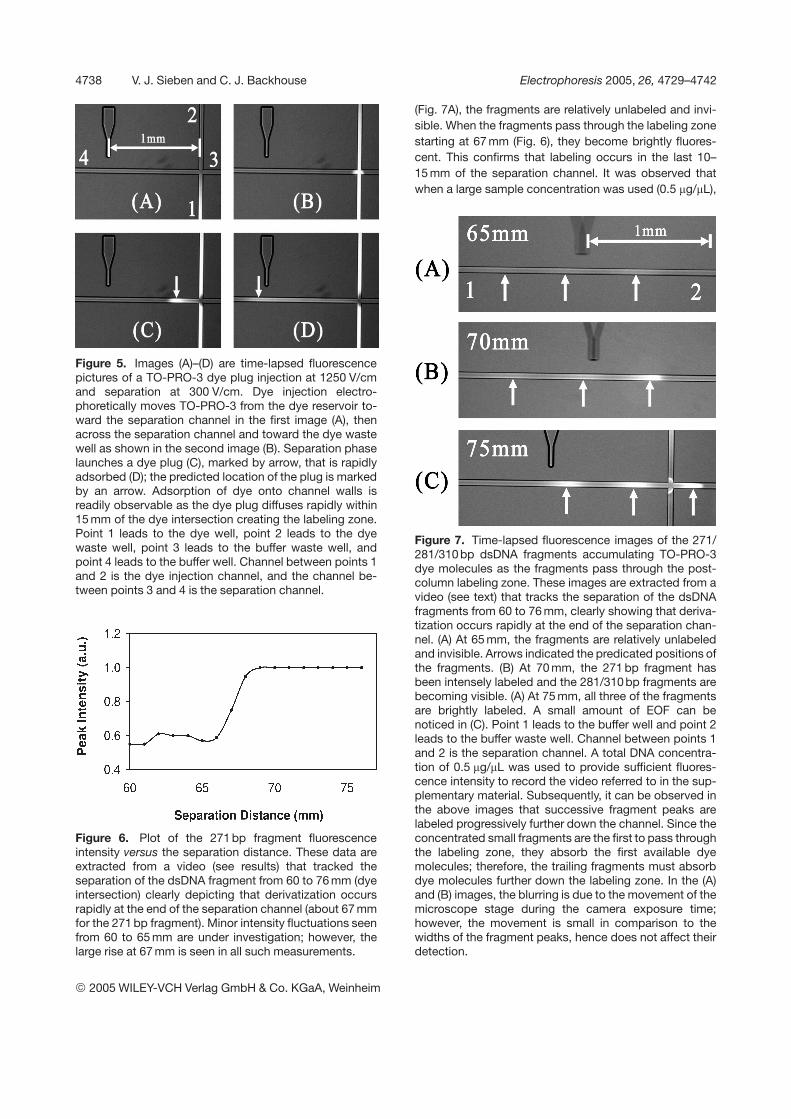
Without passivation, and upon fluorescence imaging ofthe dye plug injection process, we found that the dye plugdisappeared within millimeters of the dye intersection asshown in Fig. 5 (extracted from Video 1, as provided in thesupplementary information). This indicated that thechannel walls readily adsorbed the dye molecules, con-firming the adsorptive properties of glass noted by Zhu etal. [20]. We noted an insignificant amount of leakage; asshown in Fig. 5B the leakage did not extend into thedetection zone. The rapid adsorption of dye moleculesonto the channel walls just after a dye plug injection cre-ated a “labeling zone.”
To determine the extent of the labeling zone, we observedthe separation and postcolumn labeling of DNA frag-ments with a fluorescence microscope; see Figs. 6, 7.Figure 7 contains several fluorescence images (extractedfrom Video 2, as provided in the supplementary informa-tion) of the migration of the 271/281/310bp DNA frag-ments down the separation channel (65–75 mm) duringthe separation phase of a PROD experiment. At 65 mm
2005 WILEY-VCH Verlag GmbH & Co. KGaA, Weinheim
4738 V. J. Sieben and C. J. Backhouse Electrophoresis 2005, 26, 4729–4742
Figure 5. Images (A)–(D) are time-lapsed fluorescencepictures of a TO-PRO-3 dye plug injection at 1250 V/cmand separation at 300 V/cm. Dye injection electro-phoretically moves TO-PRO-3 from the dye reservoir to-ward the separation channel in the first image (A), thenacross the separation channel and toward the dye wastewell as shown in the second image (B). Separation phaselaunches a dye plug (C), marked by arrow, that is rapidlyadsorbed (D); the predicted location of the plug is markedby an arrow. Adsorption of dye onto channel walls isreadily observable as the dye plug diffuses rapidly within15 mm of the dye intersection creating the labeling zone.Point 1 leads to the dye well, point 2 leads to the dyewaste well, point 3 leads to the buffer waste well, andpoint 4 leads to the buffer well. Channel between points 1and 2 is the dye injection channel, and the channel be-tween points 3 and 4 is the separation channel.
Figure 6. Plot of the 271 bp fragment fluorescenceintensity versus the separation distance. These data areextracted from a video (see results) that tracked theseparation of the dsDNA fragment from 60 to 76 mm (dyeintersection) clearly depicting that derivatization occursrapidly at the end of the separation channel (about 67 mmfor the 271 bp fragment). Minor intensity fluctuations seenfrom 60 to 65 mm are under investigation; however, thelarge rise at 67 mm is seen in all such measurements.
(Fig. 7A), the fragments are relatively unlabeled and invi-sible. When the fragments pass through the labeling zonestarting at 67 mm (Fig. 6), they become brightly fluores-cent. This confirms that labeling occurs in the last 10–15 mm of the separation channel. It was observed thatwhen a large sample concentration was used (0.5 mg/mL),
Figure 7. Time-lapsed fluorescence images of the 271/281/310 bp dsDNA fragments accumulating TO-PRO-3dye molecules as the fragments pass through the post-column labeling zone. These images are extracted from avideo (see text) that tracks the separation of the dsDNAfragments from 60 to 76 mm, clearly showing that deriva-tization occurs rapidly at the end of the separation chan-nel. (A) At 65 mm, the fragments are relatively unlabeledand invisible. Arrows indicated the predicated positions ofthe fragments. (B) At 70 mm, the 271 bp fragment hasbeen intensely labeled and the 281/310 bp fragments arebecoming visible. (A) At 75 mm, all three of the fragmentsare brightly labeled. A small amount of EOF can benoticed in (C). Point 1 leads to the buffer well and point 2leads to the buffer waste well. Channel between points 1and 2 is the separation channel. A total DNA concentra-tion of 0.5 mg/mL was used to provide sufficient fluores-cence intensity to record the video referred to in the sup-plementary material. Subsequently, it can be observed inthe above images that successive fragment peaks arelabeled progressively further down the channel. Since theconcentrated small fragments are the first to pass throughthe labeling zone, they absorb the first available dyemolecules; therefore, the trailing fragments must absorbdye molecules further down the labeling zone. In the (A)and (B) images, the blurring is due to the movement of themicroscope stage during the camera exposure time;however, the movement is small in comparison to thewidths of the fragment peaks, hence does not affect theirdetection.
2005 WILEY-VCH Verlag GmbH & Co. KGaA, Weinheim
Electrophoresis 2005, 26, 4729–4742 Rapid on-chip postcolumn labeling 4739
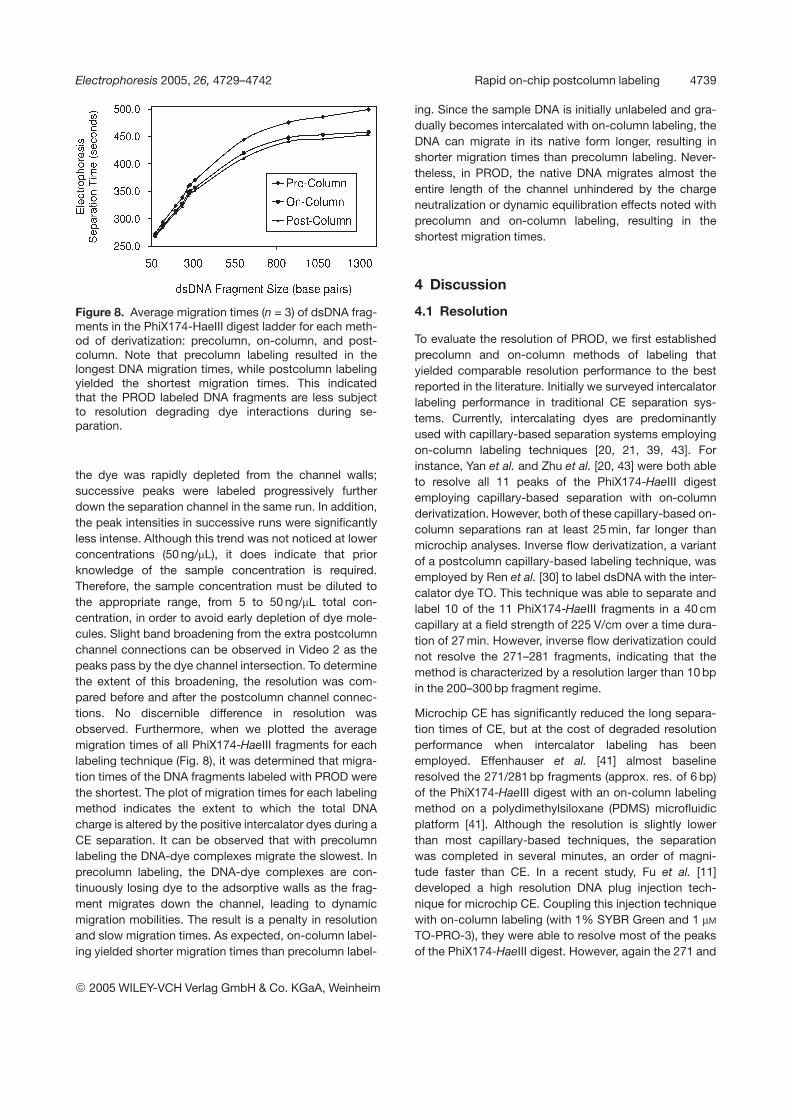
Figure 8. Average migration times (n = 3) of dsDNA frag-ments in the PhiX174-HaeIII digest ladder for each meth-od of derivatization: precolumn, on-column, and post-column. Note that precolumn labeling resulted in thelongest DNA migration times, while postcolumn labelingyielded the shortest migration times. This indicatedthat the PROD labeled DNA fragments are less subjectto resolution degrading dye interactions during se-paration.
the dye was rapidly depleted from the channel walls;successive peaks were labeled progressively furtherdown the separation channel in the same run. In addition,the peak intensities in successive runs were significantlyless intense. Although this trend was not noticed at lowerconcentrations (50 ng/mL), it does indicate that priorknowledge of the sample concentration is required.Therefore, the sample concentration must be diluted tothe appropriate range, from 5 to 50 ng/mL total con-centration, in order to avoid early depletion of dye mole-cules. Slight band broadening from the extra postcolumnchannel connections can be observed in Video 2 as thepeaks pass by the dye channel intersection. To determinethe extent of this broadening, the resolution was com-pared before and after the postcolumn channel connec-tions. No discernible difference in resolution wasobserved. Furthermore, when we plotted the averagemigration times of all PhiX174-HaeIII fragments for eachlabeling technique (Fig. 8), it was determined that migra-tion times of the DNA fragments labeled with PROD werethe shortest. The plot of migration times for each labelingmethod indicates the extent to which the total DNAcharge is altered by the positive intercalator dyes during aCE separation. It can be observed that with precolumnlabeling the DNA-dye complexes migrate the slowest. Inprecolumn labeling, the DNA-dye complexes are con-tinuously losing dye to the adsorptive walls as the frag-ment migrates down the channel, leading to dynamicmigration mobilities. The result is a penalty in resolutionand slow migration times. As expected, on-column label-ing yielded shorter migration times than precolumn label-
ing. Since the sample DNA is initially unlabeled and gra-dually becomes intercalated with on-column labeling, theDNA can migrate in its native form longer, resulting inshorter migration times than precolumn labeling. Never-theless, in PROD, the native DNA migrates almost theentire length of the channel unhindered by the chargeneutralization or dynamic equilibration effects noted withprecolumn and on-column labeling, resulting in theshortest migration times.
4 Discussion
4.1 Resolution
To evaluate the resolution of PROD, we first establishedprecolumn and on-column methods of labeling thatyielded comparable resolution performance to the bestreported in the literature. Initially we surveyed intercalatorlabeling performance in traditional CE separation sys-tems. Currently, intercalating dyes are predominantlyused with capillary-based separation systems employingon-column labeling techniques [20, 21, 39, 43]. Forinstance, Yan et al. and Zhu et al. [20, 43] were both ableto resolve all 11 peaks of the PhiX174-HaeIII digestemploying capillary-based separation with on-columnderivatization. However, both of these capillary-based on-column separations ran at least 25 min, far longer thanmicrochip analyses. Inverse flow derivatization, a variantof a postcolumn capillary-based labeling technique, wasemployed by Ren et al. [30] to label dsDNA with the inter-calator dye TO. This technique was able to separate andlabel 10 of the 11 PhiX174-HaeIII fragments in a 40 cmcapillary at a field strength of 225 V/cm over a time dura-tion of 27 min. However, inverse flow derivatization couldnot resolve the 271–281 fragments, indicating that themethod is characterized by a resolution larger than 10 bpin the 200–300 bp fragment regime.
Microchip CE has significantly reduced the long separa-tion times of CE, but at the cost of degraded resolutionperformance when intercalator labeling has beenemployed. Effenhauser et al. [41] almost baselineresolved the 271/281bp fragments (approx. res. of 6 bp)of the PhiX174-HaeIII digest with an on-column labelingmethod on a polydimethylsiloxane (PDMS) microfluidicplatform [41]. Although the resolution is slightly lowerthan most capillary-based techniques, the separationwas completed in several minutes, an order of magni-tude faster than CE. In a recent study, Fu et al. [11]developed a high resolution DNA plug injection tech-nique for microchip CE. Coupling this injection techniquewith on-column labeling (with 1% SYBR Green and 1 mM
TO-PRO-3), they were able to resolve most of the peaksof the PhiX174-HaeIII digest. However, again the 271 and
2005 WILEY-VCH Verlag GmbH & Co. KGaA, Weinheim
4740 V. J. Sieben and C. J. Backhouse Electrophoresis 2005, 26, 4729–4742
281 bp fragments could not be baseline-resolved. Ourresults for precolumn and on-column labeling, as shownin Figs. 2A and B, are comparable to the high-resolutionelectropherograms presented by Fu et al. Just as thesegroups and others [3, 42], we could not fully baselineresolve the 271 and 281 bp fragments when we per-formed precolumn or on-column labeling with TO-PRO-3. This indicated that our precolumn and on-columnmethods of intercalator labeling achieved comparableresolutions to the best microchip CE resolutions cur-rently reported and provides an accurate representationof the current state of microchip CE labeling methods.Furthermore, the electropherograms presented inFigs. 2A and B are optimal experiments and we typicallyfound that the 271/281 bp fragments merged with theprecolumn and on-column labeling techniques. However,of the three labeling methods we examined, postcolumnlabeling demonstrated an overall improved resolutionwhen compared with precolumn and on-column deriva-tization as shown in Table 1. In our experiments, the peakheights for all three methods of labeling were compara-ble in magnitude (near full intercalation) indicating theresolution performance was primarily due to the labelingmethod employed. In addition, postcolumn labelingreproducibly baseline-resolved the 271/281 bp frag-ments. Although a small amount of EOF was evident inthe chip (as detected by fluorescence microscopy inFig. 7C), this did not significantly affect resolution. ThePROD method achieves higher resolution for inter-calator-labeled microchip CE than reported in the litera-ture to date.
For comparison, we also evaluated the performance ofan end-labeled ladder, known as GeneScan-500 (GS-500), used as a size standard in single bp sequencingapplications. The separation of GS-500 (without the mo-bility shifts introduced by stochastic distributions ofintercalators) indicates the highest resolution possiblewith this system (i.e., for this combination of sieving me-dium, electric fields, running buffer, microchip, and mTK).From Table 1 it can be observed that GS-500 doesindeed achieve the highest resolution on this setup;however, the resolution of the PROD labeling method iscomparable. Applied Biosystems (ABI) mentions theincidence of a sieving matrix dependence of the mobilityof some fragments when separating dsDNA. We attributethe anomalous resolution seen for the 450 bp fragmentto such an effect. This minor anomaly for one peak doesnot contribute to a significant variation in the averageresolution. When the GS-500 size standard is separatedon POP-6 (another sieving medium, Applied Biosystems)or on the Genescan polymer without Glycerol, theanomalous migration rate for the 450 bp fragment is notobserved.
4.2 Reproducibility
The RSD values of our experiments compare well with theresults achieved in other studies of intercalation methodsof labeling. Rampal et al. [39] performed a detailed studysolely on TOPRO-3 using on-column labeling and foundthat the migration times were reproducible with RSD per-centages of less than 0.7% in six consecutive runs. Inter-estingly, their capillary had to be thoroughly rinsed withrunning buffer between runs to ensure this level of repro-ducibility.
Wainright et al. [17] also performed on-column labelingwith TO in combination with sample preconcentration andwas able to establish good reproduciblility with RSDvalues ranging from 0.7 to 1.3%. With inverse flow deri-vatization, Ren et al. [30] was able to acquire RSD valuesof less than 0.21%. Similarly, commercial systems suchas the DNA 500 LabChip kit, used in Agilent Technologies2100 Bioanalyzer, currently yield RSDs of less than 1.0%intraday and of less than 7% interday [45]. Therefore, thereproducibility of postcolumn labeling, with an RSD of themigration time of 0.32%, is comparable to most setups,including commercially available systems.
In terms of the peak area RSD, the values we achievedbetween experimental runs were not as consistent as theRSD values reported in the literature. For instance, litera-ture values for inverse flow derivatization are character-ized by peak area RSD values of less than 6%, remark-ably lower than the percentages we noted for all threemethods of labeling. The difference may be attributed tothe platforms used to employ the labeling techniques;inverse flow labeling is accomplished in a capillary-basedsystem, whereas the derivatization methods performedfor this study were completed on microchips. The run torun variation of peak area may be due to minor fluctua-tions that are substantial on microchips, but are averagedout in capillary systems characterized by long separationchannels and long separation times. Although PRODresults in large peak area RSD values between runs, thelinear behavior noted in Fig. 3 enables the quantitation ofunknown DNA concentrations provided that a standard ofknown concentration is included in the injection andseparation. The inclusion of a standard would also cir-cumvent the concentration bias associated with electro-kinetic injection resulting from field-amplified sampleinjection and sample stacking [43].
4.3 Mechanism
The rapid adsorption of dye molecules onto channel walls(Fig. 5), the short fragment migration times (Fig. 8), andthe labeling of fragments in the last 15 mm of the separa-
2005 WILEY-VCH Verlag GmbH & Co. KGaA, Weinheim
Electrophoresis 2005, 26, 4729–4742 Rapid on-chip postcolumn labeling 4741
tion channel (Fig. 7), indicate that the PROD method oflabeling occurs postcolumn, thereby permitting the nativeseparation of DNA over most of the separation channellength. As mentioned, the adsorption of dye onto glasswalls has been noted by Zhu et al. with glass capillaries.They first separated TOTO-DNA complexes in a newcapillary, rinsed the column and refilled it with fresh buffercontaining no dye, and then separated unlabeled DNAfragments which were easily detectable. Vahedi et al. [12]also took advantage of this mechanism by flushing inter-calator through the separation channel in order to passi-vate the walls with dye molecules. PROD builds upon thelabeling techniques noted in these studies by adding theability to control this adsorption mechanism. The electro-phoretic injection of dye plugs provides a controllable wayto coat the channel walls with dye molecules, while elec-trophoretic purging can be used to remove dye moleculesfrom the channel walls. This degree of control is criticalwhen labeling DNA postcolumn to achieve high intensityand high-resolution separations of DNA. It may be possi-ble to improve resolution beyond what we report here byshortening the labeling zone (inject the dye plug moreslowly or purge more often), but the resolution achieved isalready comparable to that of the end-labeled sizestandard. Additionally, push back voltages maybeemployed for more precise control of reagents to avoidleakage, but they are not required.
4.4 Concluding remarks
We demonstrate here an improved integration of on-chipintercalator-based labeling techniques and microchip CEto achieve the rapid, sensitive, and high-resolution sizingof DNA fragments. The microfluidic chip design presentedhere allows intercalator dye to be accurately positionedand removed from the separation channel, permitting acontrolled manner of labeling. We rapidly label DNA afterthe separation (postcolumn), avoiding time-intensivesample preparation procedures, and circumventing thedegradation of resolution performance noted with inter-calators in other work. The PROD method of labeling iscompatible with many existing genetic assays, such asheteroduplex analysis, that may require an unmodifiedDNA helix structure during a CE separation. In addition,the ability to intensely label DNA without a significant lossof resolution will allow the utilization of cost-effectivedetection schemes based on photodiodes. Furthermore,PROD labeling achieves superior resolution performancewhen compared with on-column and precolumn labeling,approaching the resolution of end-labeled DNA. To ourknowledge, PROD yields the highest resolution reportedto date for microchip CE that uses intercalator-labeledDNA.
This work was supported by the Natural Sciences andEngineering Research Council (NSERC) of Canada,Western Economic Diversification, the Canadian Founda-tion for Innovation, the Alberta Ingenuity Fund, and iCore.The authors would also like to thank the technical staff forassistance, in particular, Alex Stickel.
Received June 23, 2005Revised August 31, 2005Accepted September 5, 2005
5 References
[1] Manz, A., Graber, N., Widmer, H. M., Sens. Actuators B1990, 1, 244–248.
[2] Harrison, D. J., Manz, A., Fan, Z. H., Ludi, H., Widmer, H. M.,Anal. Chem. 1992, 64, 1926–1932.
[3] Woolley, A. T., Mathies, R. A., Proc. Natl. Acad. Sci. USA1994, 91, 11348–11352.
[4] Woolley, A. T., Mathies, R. A., Anal. Chem. 1995, 67, 3676–3680.
[5] Woolley, A. T., Hadley, D., Landre, P., deMello, A. J., et al.,Anal. Chem. 1996, 68, 4081–4086.
[6] Jacobson, S. C., Koutny, L. B., Hergenroder, R., Moore, A.W., Ramsey, J. M., Anal. Chem. 1994, 66, 3472–3476.
[7] Jacobson, S. C., Hergenroder, R., Koutny, L. B., Warmack,R. J., Ramsey, J. M., Anal. Chem. 1994, 66, 1107–1113.
[8] Jacobson, S. C., Hergenroder, R., Koutny, L. B., Ramsey, J.M., Anal. Chem. 1994, 66, 1114–1118.
[9] Ramsey, J. M., Jacobson, S. C., Knapp, M. R., Nat. Med.1995, 1, 1093–1096.
[10] Lichtenberg, J., de Rooij, N. F., Verpoorte, E., Talanta 2002,56, 233–266.
[11] Fu, L. M., Lin, C. H., Electrophoresis 2004, 25, 3652–3659.
[12] Vahedi, G., Kaler, C., Backhouse, C. J., Electrophoresis2004, 25, 2346–2356.
[13] Shi, Y. N., Simpson, P. C., Scherer, J. R., Wexler, D., et al.,Anal. Chem. 1999, 71, 5354–5361.
[14] Backhouse, C., Caamano, M., Oaks, F., Nordman, E., et al.,Electrophoresis 2000, 21, 150–156.
[15] Lin, Y. W., Chiu, T. C., Chang, H. T., J. Chromatogr. B 2003,793, 37–48.
[16] Auroux, P. A., Koc, Y., deMello, A., Manz, A., Day, P. J. R.,Lab Chip 2004, 4, 534–546.
[17] Wainright, A., Nguyen, U. T., Bjornson, T., Boone, T. D.,Electrophoresis 2003, 24, 3784–3792.
[18] Marino, M. A., Devaney, J. M., Davis, P. A., Girard, J. E., J.Chromatogr. B 1999, 732, 365–374.
[19] Rye, H. S., Yue, S., Wemmer, D. E., Quesada, M. A., et al.,Nucleic Acids Res. 1992, 20, 2803–2812.
[20] Zhu, H. P., Clark, S. M., Benson, S. C., Rye, H. S., et al., Anal.Chem. 1994, 66, 1941–1948.
[21] Kim, Y. S., Morris, M. D., Anal. Chem. 1994, 66, 1168–1174.
[22] Gibson, T. J., Sepaniak, M. J., J. Capil. Electrophor. 1998, 5,73–80.
[23] Carlsson, C., Jonsson, M., Akerman, B., Nucleic Acids Res.1995, 23, 2413–2420.
[24] Yan, X. M., Habbersett, R. C., Cordek, J. M., Nolan, J. P., etal., Anal. Biochem. 2000, 286, 138–148.
2005 WILEY-VCH Verlag GmbH & Co. KGaA, Weinheim
4742 V. J. Sieben and C. J. Backhouse Electrophoresis 2005, 26, 4729–4742
[25] Pentoney, S. L., Huang, X. H., Burgi, D. S., Zare, R. N., Anal.Chem. 1988, 60, 2625–2629.
[26] Tsuda, T., Kobayashi, Y., Hori, A., Matsumoto, T., Suzuki, O.,J. Chromatogr. 1988, 456, 375–381.
[27] Rose, D. J., Jorgenson, J. W., J. Chromatogr. 1988, 447,117–131.
[28] Nickerson, B., Jorgenson, J. W., J. Chromatogr. 1989, 480,157–168.
[29] Albin, M., Weinberger, R., Sapp, E., Moring, S., Anal. Chem.1991, 63, 417–422.
[30] Ren, J. C., Fang, N. H., Wu, D., Anal. Chim. Acta 2002, 470,129–135.
[31] Colyer, C. L., Mangru, S. D., Harrison, D. J., J. Chromatogr.A 1997, 781, 271–276.
[32] Liu, Y. J., Foote, R. S., Jacobson, S. C., Ramsey, R. S.,Ramsey, J. M., Anal. Chem. 2000, 72, 4608–4613.
[33] Beard, N. P., Edel, J. B., deMello, A. J., Electrophoresis2004, 25, 2363–2373.
[34] Khandurina, J., Guttman, A., J. Chromatogr. A 2002, 943159–183.
[35] GeneScan Reference Guide, Chemistry Reference for theABI310-Applied Biosystems, 2000, Applied Biosystems,Foster City, CA, USA.
[36] Footz, T., Wunsam, S., Kulak, S., Crabtree, H. J., et al.,Electrophoresis 2001, 22, 3868–3875.
[37] Ma, R. B., Crabtree, H. J., Backhouse, C. J., Electrophoresis2005, 26, 2692–2700.
[38] Crothers, D. M., Biopolymers 1968, 6, 575–584.[39] Rampal, S., Liu, M. S., Chen, F. T. A., J. Chromatogr. A 1997,
781, 357–365.[40] Heller, C., Slater, G. W., Mayer, P., Dovichi, N., et al., J.
Chromatogr. A 1998, 806, 113–121.[41] Effenhauser, C. S., Bruin, G. J. M., Paulus, A., Ehrat, M.,
Anal. Chem. 1997, 69, 3451–3457.[42] Liu, Y. J., Ganser, D., Schneider, A., Liu, R., et al., Anal.
Chem. 2001, 73, 4196–4201.[43] Yan, X. M., Hang, W., Majidi, V., Marrone, B. L., Yoshida, T.
M., J. Chromatogr. A 2002, 943, 275–285.[44] Belder, D., Deege, A., Kohler, F., Ludwig, M., Electrophoresis
2002, 23, 3567–3573.[45] Jabasini, M., Zhang, L. H., Dang, F. Q., Xu, F., et al., Elec-
trophoresis 2002, 23, 1537–1542.
2005 WILEY-VCH Verlag GmbH & Co. KGaA, Weinheim