Estimation of introgression in cutthroat trout populations using microsatellites
Upload
independentCategory
view
1download
0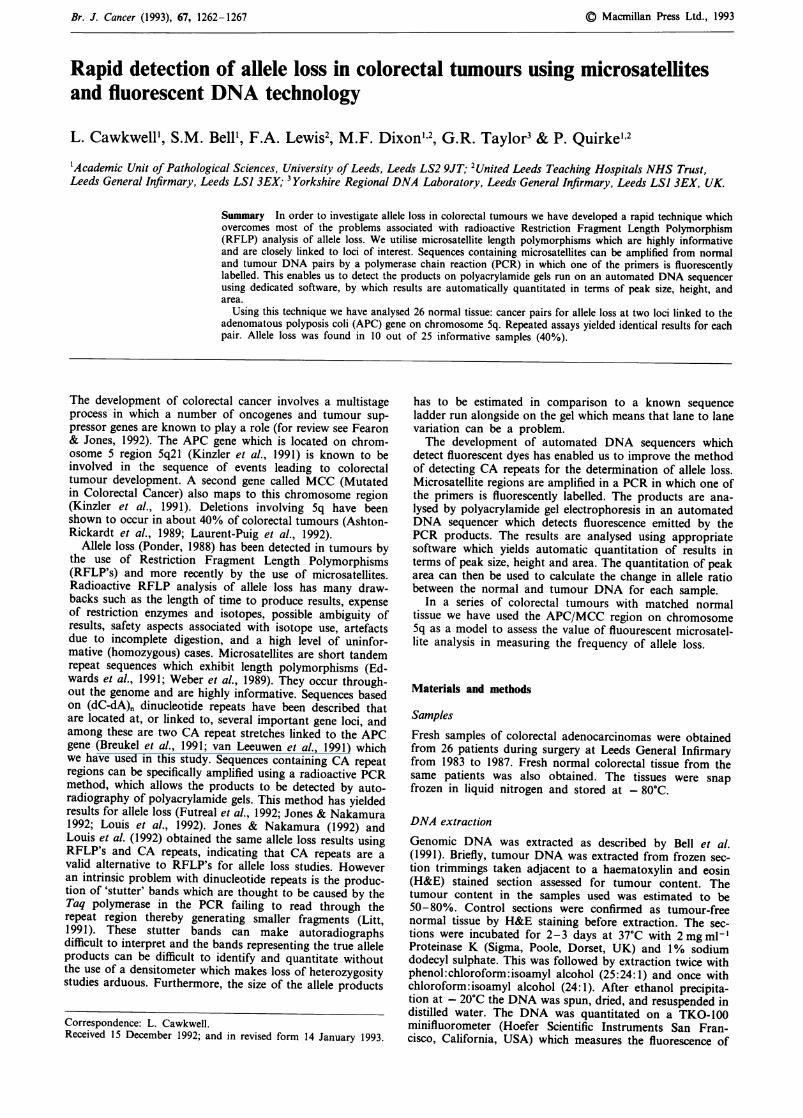
Br. J. Cancer (1993), 67, 1262-1267 Press Ltd., 1993
Rapid detection of allele loss in colorectal tumours using microsatellitesand fluorescent DNA technology
L. Cawkwell', S.M. Bell', F.A. Lewis2, M.F. Dixon',2, G.R. Taylor3 & P. Quirke' 2'Academic Unit of Pathological Sciences, University of Leeds, Leeds LS2 9JT; 2United Leeds Teaching Hospitals NHS Trust,Leeds General Infirmary, Leeds LSJ 3EX; 'Yorkshire Regional DNA Laboratory, Leeds General Infirmary, Leeds LSJ 3EX, UK.
Summary In order to investigate allele loss in colorectal tumours we have developed a rapid technique whichovercomes most of the problems associated with radioactive Restriction Fragment Length Polymorphism(RFLP) analysis of allele loss. We utilise microsatellite length polymorphisms which are highly informativeand are closely linked to loci of interest. Sequences containing microsatellites can be amplified from normaland tumour DNA pairs by a polymerase chain reaction (PCR) in which one of the primers is fluorescentlylabelled. This enables us to detect the products on polyacrylamide gels run on an automated DNA sequencerusing dedicated software, by which results are automatically quantitated in terms of peak size, height, andarea.
Using this technique we have analysed 26 normal tissue: cancer pairs for allele loss at two loci linked to theadenomatous polyposis coli (APC) gene on chromosome Sq. Repeated assays yielded identical results for eachpair. Allele loss was found in 10 out of 25 informative samples (40%).
The development of colorectal cancer involves a multistageprocess in which a number of oncogenes and tumour sup-pressor genes are known to play a role (for review see Fearon& Jones, 1992). The APC gene which is located on chrom-osome 5 region 5q21 (Kinzler et al., 1991) is known to beinvolved in the sequence of events leading to colorectaltumour development. A second gene called MCC (Mutatedin Colorectal Cancer) also maps to this chromosome region(Kinzler et al., 1991). Deletions involving 5q have beenshown to occur in about 40% of colorectal tumours (Ashton-Rickardt et al., 1989; Laurent-Puig et al., 1992).
Allele loss (Ponder, 1988) has been detected in tumours bythe use of Restriction Fragment Length Polymorphisms(RFLP's) and more recently by the use of microsatellites.Radioactive RFLP analysis of allele loss has many draw-backs such as the length of time to produce results, expenseof restriction enzymes and isotopes, possible ambiguity ofresults, safety aspects associated with isotope use, artefactsdue to incomplete digestion, and a high level of uninfor-mative (homozygous) cases. Microsatellites are short tandemrepeat sequences which exhibit length polymorphisms (Ed-wards et al., 1991; Weber et al., 1989). They occur through-out the genome and are highly informative. Sequences basedon (dC-dA)n dinucleotide repeats have been described thatare located at, or linked to, several important gene loci, andamong these are two CA repeat stretches linked to the APCgene (Breukel et al., 1991; van Leeuwen et al., 1991) whichwe have used in this study. Sequences containing CA repeatregions can be specifically amplified using a radioactive PCRmethod, which allows the products to be detected by auto-radiography of polyacrylamide gels. This method has yieldedresults for allele loss (Futreal et al., 1992; Jones & Nakamura1992; Louis et al., 1992). Jones & Nakamura (1992) andLouis et al. (1992) obtained the same allele loss results usingRFLP's and CA repeats, indicating that CA repeats are avalid alternative to RFLP's for allele loss studies. Howeveran intrinsic problem with dinucleotide repeats is the produc-tion of 'stutter' bands which are thought to be caused by theTaq polymerase in the PCR failing to read through therepeat region thereby generating smaller fragments (Litt,1991). These stutter bands can make autoradiographsdifficult to interpret and the bands representing the true alleleproducts can be difficult to identify and quantitate withoutthe use of a densitometer which makes loss of heterozygositystudies arduous. Furthermore, the size of the allele products
has to be estimated in comparison to a known sequenceladder run alongside on the gel which means that lane to lanevariation can be a problem.The development of automated DNA sequencers which
detect fluorescent dyes has enabled us to improve the methodof detecting CA repeats for the determination of allele loss.Microsatellite regions are amplified in a PCR in which one ofthe primers is fluorescently labelled. The products are ana-lysed by polyacrylamide gel electrophoresis in an automatedDNA sequencer which detects fluorescence emitted by thePCR products. The results are analysed using appropriatesoftware which yields automatic quantitation of results interms of peak size, height and area. The quantitation of peakarea can then be used to calculate the change in allele ratiobetween the normal and tumour DNA for each sample.
In a series of colorectal tumours with matched normaltissue we have used the APC/MCC region on chromosomeSq as a model to assess the value of fluourescent microsatel-lite analysis in measuring the frequency of allele loss.
Materials and methods
SamplesFresh samples of colorectal adenocarcinomas were obtainedfrom 26 patients during surgery at Leeds General Infirmaryfrom 1983 to 1987. Fresh normal colorectal tissue from thesame patients was also obtained. The tissues were snapfrozen in liquid nitrogen and stored at - 80°C.
DNA extraction
Genomic DNA was extracted as described by Bell et al.(1991). Briefly, tumour DNA was extracted from frozen sec-tion trimmings taken adjacent to a haematoxylin and eosin(H&E) stained section assessed for tumour content. Thetumour content in the samples used was estimated to be50-80%. Control sections were confirmed as tumour-freenormal tissue by H&E staining before extraction. The sec-tions were incubated for 2-3 days at 37°C with 2 mg ml-'Proteinase K (Sigma, Poole, Dorset, UK) and 1% sodiumdodecyl sulphate. This was followed by extraction twice withphenol:chloroform:isoamyl alcohol (25:24: 1) and once withchloroform:isoamyl alcohol (24: 1). After ethanol precipita-tion at - 20°C the DNA was spun, dried, and resuspended indistilled water. The DNA was quantitated on a TKO-100minifluorometer (Hoefer Scientific Instruments San Fran-cisco, California, USA) which measures the fluorescence of
Correspondence: L. Cawkwell.Received 15 December 1992; and in revised form 14 January 1993.
'." Macmillan Press Ltd., 1993Br. J. Cancer (1993), 67, 1262-1267

DETECTION OF ALLELE LOSS 1263
Hoescht 33258 (Polysciences Inc., Warrington, PA, USA) inthe presence of DNA.
Primers
The primer sequences used were as described by Breukel etal. (1991) for the CA repeat proximal to APC located at theD5S82 locus, and as described by van Leeuwen et al. (1991)for the CA repeat at the D5S299 locus linked to APC. Bothrepeats have been assigned to chromosome region 5(q15-q23). The primers were synthesised on a Model 391 DNASynthesiser (Applied Biosystems, Foster City, California,USA). One primer of each pair was coupled at the 5' end toan aminohexyl linker (aminolink 2) using a standard DNAsynthesis cycle on the DNA synthesiser. After standardcleavage and deprotection a fluorescent dye-NHS ester wascoupled to the oligonucleotide via this linker. The fluorescentprimer was purified successively through a NAP 10 column(Pharmacia, Milton Keynes, UK), followed by cartridgepurification on an OPC column (Applied Biosystems, FosterCity, California, USA) and finally by thin layer chromato-graphy (Surepure oligonucleotide purification system, UnitedStates Biochemicals, Cleveland, Ohio, USA). The purifiedfluorescent primer was eluted from the TLC plate in distilledwater and stored at - 20°C. Only one primer in each pairwas fluorescently labelled so that only one DNA strand wasdetected on the gel, which made interpretation easier. Non-fluorescent primers required no purification before use inPCR and were stored in concentrated ammonia at - 20°C.The ammonia was removed prior to each PCR by evapora-tion in a vacuum desiccator.
Polymerase chain reaction
The target DNA sequences were amplified by the PCR in25 yl of 1 x Taq polymerase reaction buffer (Promega Cor-poration, Madison, WI, USA) containing 12.5 pmoles ofeach primer (one fluorescent), 0.75 units Supertaq Taq poly-merase (HT Biotechnology Ltd. Cambridge, UK), 1.5 mMMgCl2, 50 tLM each of dATP, dCTP, dGTP, dTTP and25-50 ng of sample DNA. This was overlaid with mineraloil. The DNA was amplified in a thermal cycler (GeneticResearch Instrumentation Ltd., Dunmow, Essex, UK) by onecycle at 95°C for 5 min, 55°C for 1 min followed by anaverage of 22 cycles consisting of 95°C for 30 s and 55°C for1 min. The cycle number was optimised for each DNA sam-ple to ensure that the PCR products were detectable but werenot over-amplified, as this caused the quantitation results forthe peaks to be inaccurate and therefore unusable. A ther-moprobe was included in a dummy sample tube to ensurethat the samples reached the programmed cycle temperaturebefore the timing of the cycle began.
Polyacrylamide gel electrophoresisPCR products were analysed on 6% polyacrylamide (Gelmix-6, Gibco BRL, Uxbridge, Middlesex, UK) denaturing gels in1 x TBE buffer in a Model 373A automated fluorescentDNA sequencer (Applied Biosystems, Foster City, Califor-nia, USA), which is a four colour detection system. One tlI ofeach PCR reaction was combined with 4 jil formamide and0.5 gl of a fluorescent size marker (GS2500P, Applied Bio-systems, Foster City, California, USA). This mix was dena-tured for 3 min at 90°C after which 5 ;d was loaded into eachwell on the prewarmed gel. The tumour DNA samples wereloaded 10 min after the normal samples so that any lane tolane spillage would not affect the subsequent quantitation.The internal size standard for each sample enables staggeredloading to be carried out. The gel was run for 4 h at 30Wand 40°C. Whilst the samples were undergoing electro-phoresis the fluorescence detected in the laser scanning regionwas collected and stored using the Genescan Collection soft-ware (Applied Biosystems, Foster City, California, USA).
Data analysisThe fluorescent gel data collected during the run was auto-matically analysed by the Genescan Analysis program (Ap-plied Biosystems, Foster City, California, USA) at the end ofthe run. Each fluorescent peak was quantitated in terms ofsize (in base pairs), peak height and peak area.
Calculation of allele ratios
The peaks produced by the normal DNA sample were usedto determine whether the sample was homozygous (one peakonly is seen) or heterozygous (two peaks are seen). For aheterozygous sample the sizes of the two alleles were assignedaccording to the two peaks of greatest height. The valuesgiven for peak area of the two alleles in the paired normaland tumour samples were used to assign a figure for alleleloss essentially as described by Solomon et al. (1987). Theratio of alleles was calculated for each normal and tumoursample and then the tumour ratio was divided by the normalratio i.e. Ti:T2/Nl:N2 where TI and Ni are the area valuesof the shorter length allele product peak for the tumour andnormal sample respectively, and T2 and N2 are the areavalues of the longer length allele product peak for thetumour and normal sample respectively. In cases where theallele ratio calculated by this equation was above 1.00 weconverted the ratio using 1/[Tl:T2/Nl:N2] to give a resultrange of 0.00-1.00. At least four results were used in thisstudy to give a mean overall value. However, in some caseswhere the tumour sample did not show allele loss and theallele ratio was therefore around 1.00, then experimentalvariation from run to run produced ratios both slightlyabove and below 1.00. Thus, some ratios and means areabove 1.00.
Before beginning the study we assigned a ratio of less thanor equal to 0.50 to be indicative of loss on the basis thattumours containing no normal contaminating cells and show-ing complete allele loss would theoretically give a ratio of0.00, but because some tumours in the series contained anestimated 50% normal cells then complete allele loss in thesetumours would give an allele ratio of only 0.50.
Results
The proportion of samples which were informative (i.e.heterozygous) with the D5S299 primers was 77% and for theD5S82 primers this value was 69%. We found 50% of thesamples were informative with both sets of primers and onlyone sample out of 26 was not informative with either primerset. Thus information about allele loss was obtained in 96%of cases. Non informative samples are easily determined, asonly one fluorescent peak is seen for those samples (Figure1).The PCR product size range observed was 158-192 and
173-181 base pairs for the D5S299 and D5S82 primer pairsrespectively as sized by the GS2500P size standard. Sampleswith allele size differences of as little as two base pairs couldeasily be resolved using the Genescan software.A sample with a normal allele ratio, approaching 1.0, as
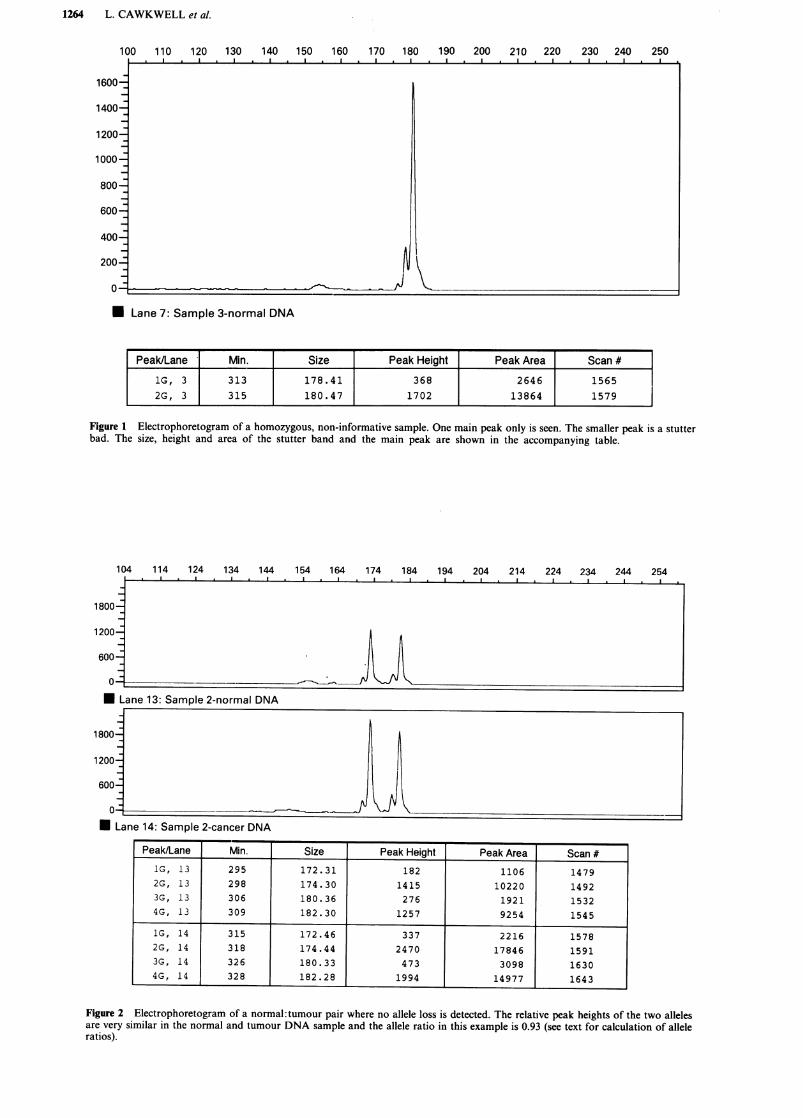
calculated from peak areas is shown in Figure 2. The relativeheights of the two alleles are similar in both the normal andtumour sample. This can be compared with Figure 3a wherea sample with definite visual allele loss, with a ratio of 0.28,is shown. The Genescan software enables the fluorescentpeaks from a patients normal and tumour DNA (twoseparate gel lanes) to be overlaid, by changing the printoutcolour for one of the lanes. This enhances the visual effect ofallele loss, as seen from Figure 3b where the normal andtumour pair have amplified to about the same extent. How-ever, allele loss was not always so apparent visually, espe-cially when the normal and tumour DNA samples were notamplified to the same extent in the PCR. This means that thequantitated values of peak height and area are crucial forassessing loss.
Repeated assays showed consistent values for allele ratios
1264 L. CAWKWELL et al.
100 110 120 130 140 150 160 170 180 190I I I
1600 _
1400 -
1200-
1000
800-
600-
400-
200-_
0-
200 210 220 230 240 250
Lane 7: Sample 3-normal DNA
Peak/Lane | Min. Size Peak Height Peak Area Scan #1G, 3 313 178.41 368 2646 15652G, 3 315 180.47 1702 13864 1579
Figure 1 Electrophoretogram of a homozygous, non-informative sample. One main peak only is seen. The smaller peak is a stutterbad. The size, height and area of the stutter band and the main peak are shown in the accompanying table.
114 124 134 144 154 164 174 184 194 204 214 224 234
Lane 13: Sample 2-normal DNA
1800-
1200_
600-
04
* La mne 14: Sample 2-cancer DNA
Figure 2 Electrophoretogram of a normal: tumour pair where no allele loss is detected. The relative peak heights of the two allelesare very similar in the normal and tumour DNA sample and the allele ratio in this example is 0.93 (see text for calculation of alleleratios).
X~~~~~~~'
Peak/Lane Min. Size Peak Height Peak Area Scan #IG, 13 295 172.31 182 1106 14792G, 13 298 174.30 1415 10220 14923G, 13 306 180.36 276 1921 15324G, 13 309 182.30 1257 9254 1545
1G, 14 315 172.46 337 2216 15782G, 14 318 174.44 2470 17846 15913G, 14 326 180.33 473 3098 16304G, 14 328 182.28 1994 14977 1643
I
1--
I
DETECTION OF ALLELE LOSS 1265
a120 130 140 150 160 170 180 190
I200 210 220 230 240 250
u -I
Lane 8: Sample 3-cancer DNA
1C
Peak/Lane Min. Size Peak Height Peak Area Scan #
1G, 7 304 172.30 161 1117 1524
2G, 7 307 174.25 1303 9969 1537
3G, 7 313 178.41 244 1841 1565
4G, 7 315 180.32 1174 8805 1578
1G, 8 327 174.44 366 2617 1635
2G, 8 332 178.37 210 1574 1661
3G, 8 334 180.33 1045 8389 1674
b100 110 120 130 140 150 160 170 180 190 200 210 220 230 240 250
)00-
300-
200
0-FU Lane 7: Sample 3-normal DNA U Lane 8: Sample 3-cancer DNA
Peak/Lane Min. Size Peak Height Peak Area Scan #
1G, 7 304 172.30 161 1117 1524
2G, 7 307 174.25 1303 9969 1537
3G, 7 313 178.41 244 1841 1565
4G, 7 315 180.32 1174 8805 1578
1G, 8 327 174.44 366 2617 1635
2G, 8 332 178.37 210 1574 1661
3G, 8 334 180.33 1045 8389 1674
Figure 3 a Electrophoretogram of a normal: tumour pair where allele loss is detected. An indication of loss of the smaller sized
allele in the tumour DNA can be seen by the decrease in height of this peak. The calculation of the allele ratio in this example givesa value of 0.28 which confirms the loss. b, Stacked electrophoretograms of a sample showing allele loss. The electrophoretogramsfrom a, have been overlaid, with the tumour peaks now shown in magenta, to emphasise the change in height of the smaller sized
allele between the normal and the tumour DNA.
100 110
800-
400-
.-- I---
a .
n
-
I.
1266 L. CAWKWELL et al.
10-8 Number of samples
8-
4-
2-
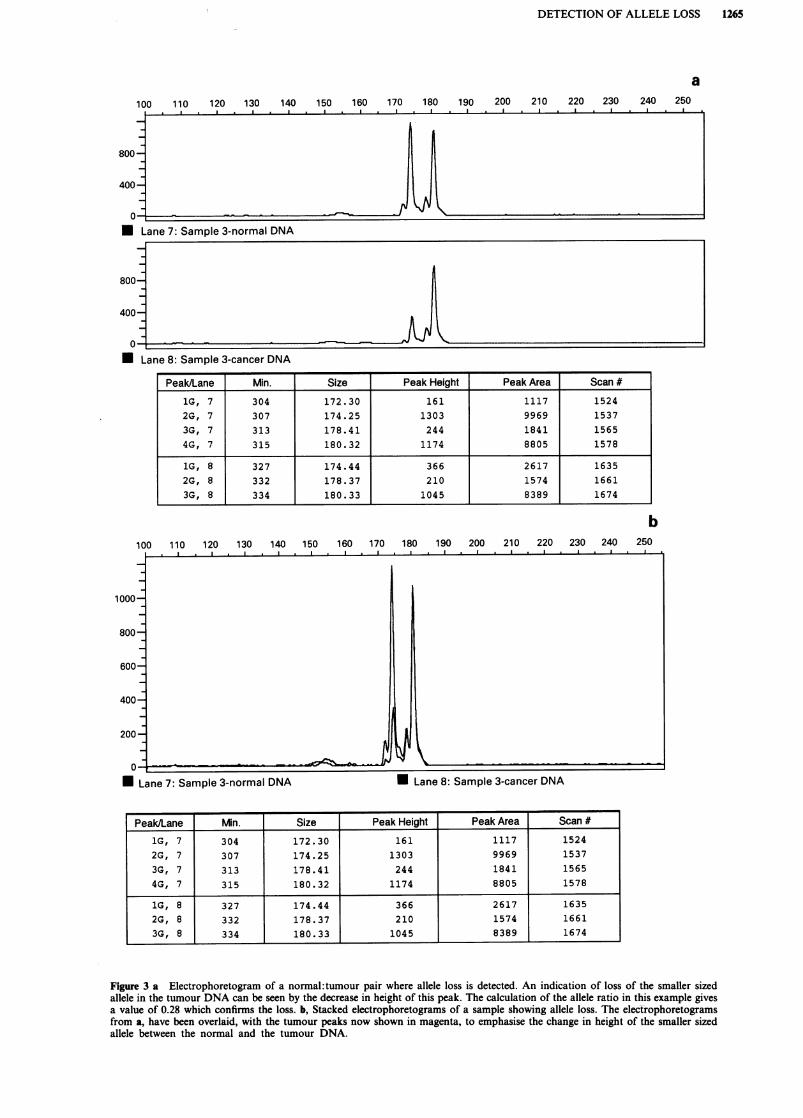
0-0-0.09 0.1-0.19 0.2-0.29 0.3-0.39 0.4-0.49 0.5-0.59 0.6-0.69 0.7-0.79 0.8-0.89 0.9-0.99 1.0-1.09
Allele ratio (Ti :T2/N1: N2)
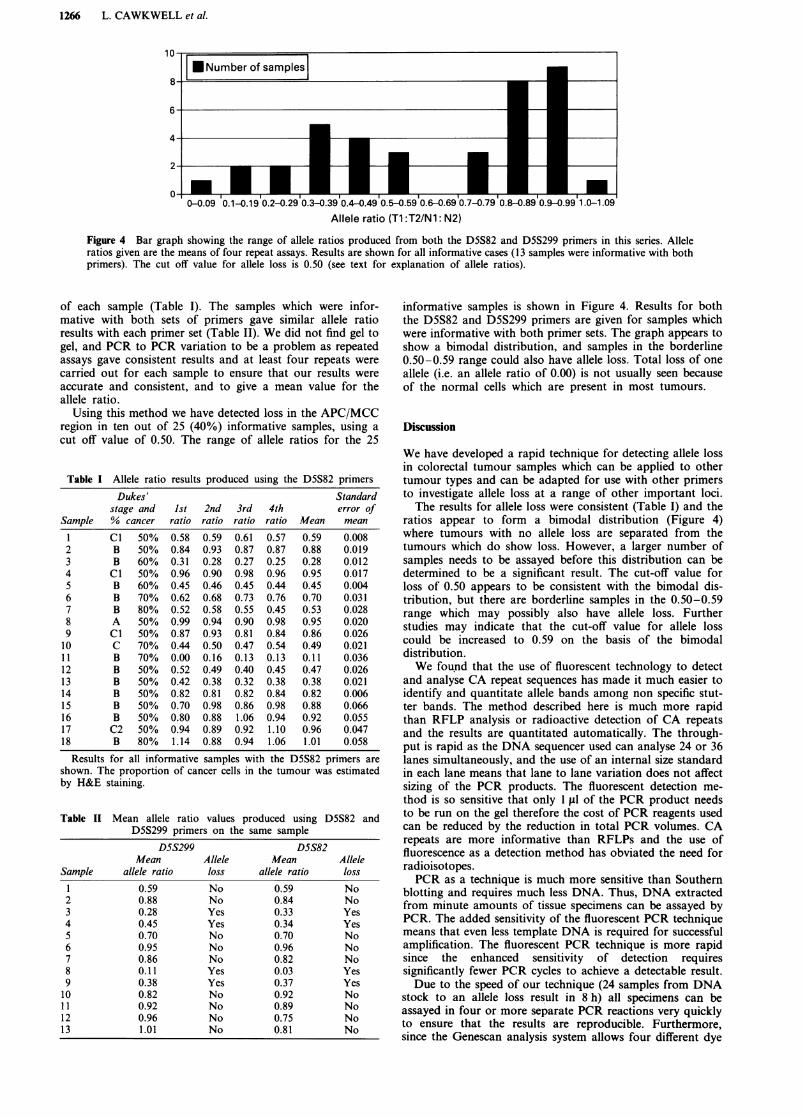
Figure 4 Bar graph showing the range of allele ratios produced from both the D5S82 and D5S299 primers in this series. Alleleratios given are the means of four repeat assays. Results are shown for all informative cases (13 samples were informative with bothprimers). The cut off value for allele loss is 0.50 (see text for explanation of allele ratios).
of each sample (Table I). The samples which were infor-mative with both sets of primers gave similar allele ratioresults with each primer set (Table II). We did not find gel togel, and PCR to PCR variation to be a problem as repeatedassays gave consistent results and at least four repeats werecarried out for each sample to ensure that our results wereaccurate and consistent, and to give a mean value for theallele ratio.
Using this method we have detected loss in the APC/MCCregion in ten out of 25 (40%) informative samples, using acut off value of 0.50. The range of allele ratios for the 25
Table I Allele ratio results produced using the D5S82 primersDukes' Standard
stage and Ist 2nd 3rd 4th error ofSample % cancer ratio ratio ratio ratio Mean mean
1 Cl 50% 0.58 0.59 0.61 0.57 0.59 0.0082 B 50% 0.84 0.93 0.87 0.87 0.88 0.0193 B 60% 0.31 0.28 0.27 0.25 0.28 0.0124 Cl 50% 0.96 0.90 0.98 0.96 0.95 0.017S B 60% 0.45 0.46 0.45 0.44 0.45 0.0046 B 70% 0.62 0.68 0.73 0.76 0.70 0.0317 B 80% 0.52 0.58 0.55 0.45 0.53 0.0288 A 50% 0.99 0.94 0.90 0.98 0.95 0.0209 Cl 50% 0.87 0.93 0.81 0.84 0.86 0.02610 C 70% 0.44 0.50 0.47 0.54 0.49 0.02111 B 70% 0.00 0.16 0.13 0.13 0.11 0.03612 B 50% 0.52 0.49 0.40 0.45 0.47 0.02613 B 50% 0.42 0.38 0.32 0.38 0.38 0.02114 B 50% 0.82 0.81 0.82 0.84 0.82 0.00615 B 50% 0.70 0.98 0.86 0.98 0.88 0.06616 B 50% 0.80 0.88 1.06 0.94 0.92 0.05517 C2 50% 0.94 0.89 0.92 1.10 0.96 0.04718 B 80% 1.14 0.88 0.94 1.06 1.01 0.058
Results for all informative samples with the D5S82 primers areshown. The proportion of cancer cells in the tumour was estimatedby H&E staining.
Table II Mean allele ratio values produced using D5S82 andD5S299 primers on the same sample
D55299 D5S82Mean Allele Mean Allele
Sample allele ratio loss allele ratio loss1 0.59 No 0.59 No2 0.88 No 0.84 No3 0.28 Yes 0.33 Yes4 0.45 Yes 0.34 Yes5 0.70 No 0.70 No6 0.95 No 0.96 No7 0.86 No 0.82 No8 0.11 Yes 0.03 Yes9 0.38 Yes 0.37 Yes10 0.82 No 0.92 No11 0.92 No 0.89 No12 0.96 No 0.75 No13 1.01 No 0.81 No
informative samples is shown in Figure 4. Results for boththe D5S82 and D5S299 primers are given for samples whichwere informative with both primer sets. The graph appears toshow a bimodal distribution, and samples in the borderline0.50-0.59 range could also have allele loss. Total loss of oneallele (i.e. an allele ratio of 0.00) is not usually seen becauseof the normal cells which are present in most tumours.
Discussion
We have developed a rapid technique for detecting allele lossin colorectal tumour samples which can be applied to othertumour types and can be adapted for use with other primersto investigate allele loss at a range of other important loci.The results for allele loss were consistent (Table I) and the
ratios appear to form a bimodal distribution (Figure 4)where tumours with no allele loss are separated from thetumours which do show loss. However, a larger number ofsamples needs to be assayed before this distribution can bedetermined to be a significant result. The cut-off value forloss of 0.50 appears to be consistent with the bimodal dis-tribution, but there are borderline samples in the 0.50-0.59range which may possibly also have allele loss. Furtherstudies may indicate that the cut-off value for allele losscould be increased to 0.59 on the basis of the bimodaldistribution.We found that the use of fluorescent technology to detect
and analyse CA repeat sequences has made it much easier toidentify and quantitate allele bands among non specific stut-ter bands. The method described here is much more rapidthan RFLP analysis or radioactive detection of CA repeatsand the results are quantitated automatically. The through-put is rapid as the DNA sequencer used can analyse 24 or 36lanes simultaneously, and the use of an internal size standardin each lane means that lane to lane variation does not affectsizing of the PCR products. The fluorescent detection me-thod is so sensitive that only 1 sLI of the PCR product needsto be run on the gel therefore the cost of PCR reagents usedcan be reduced by the reduction in total PCR volumes. CArepeats are more informative than RFLPs and the use offluorescence as a detection method has obviated the need forradioisotopes.PCR as a technique is much more sensitive than Southern
blotting and requires much less DNA. Thus, DNA extractedfrom minute amounts of tissue specimens can be assayed byPCR. The added sensitivity of the fluorescent PCR techniquemeans that even less template DNA is required for successfulamplification. The fluorescent PCR technique is more rapidsince the enhanced sensitivity of detection requiressignificantly fewer PCR cycles to achieve a detectable result.Due to the speed of our technique (24 samples from DNA
stock to an allele loss result in 8 h) all specimens can beassayed in four or more separate PCR reactions very quicklyto ensure that the results are reproducible. Furthermore,since the Genescan analysis system allows four different dye

DETECTION OF ALLELE LOSS 1267
colours to be assayed simultaneously, multiplex fluorescentPCR's are possible enabling more than one locus to beanalysed at the same time in one PCR tube (L.C. unpub-lished results). If multiplex PCR is not possible for all primercombinations then multiple separate fluorescent PCR reac-tion products can be loaded into a single lane for electro-phoresis. For both multiplex PCR and multiple loading theloci under test have to be separated either by the fluorescentlabel or the size range of the products.The technique also works well using DNA extracted from
formalin fixed, paraffin embedded material (results notshown). This is an important factor since paraffin embeddedmaterial is more common in historical series where follow updata is known. In our hands the technique works well onDNA prepared by the method described by Bell et al. (1991).The PCR protocol is as in Materials and methods but morePCR cycles are performed (typically 25-30).
In summary, the advantages of this allele loss detectiontechnique are quantitation of allele loss; accurate sizing ofPCR products; rapid generation of results as compared toRFLP/radioactive CA repeat analyses; high sample through-put; the possibility of assaying several markers simultaneous-ly by multiplex PCR or multiple loading; the requirement forvery little DNA (from fresh or paraffin embedded tissue); andthe non-radioactive nature of the assay. Thus results on alleleloss can be produced rapidly, for several loci simultaneously,for many samples. The speed and reproducibility of this
technique could enable it to be used as a diagnostic orprognostic test in neoplasia.
This is the first description of detection of allele loss in theAPC/MCC region determined by the use of fluorescent CArepeats. Our finding of loss in this region in 40% of colorec-tal samples is comparable to figures given by Ashton-Rickardt et al. (1989) and Laurent-Puig et al. (1992) usingRFLP probe techniques for 5q21-22. Any microsatelliteswhich are found to map within the APC gene itself wouldmake our assay more specific for APC loss, as small deletionsmay be missed, thus underestimating the frequency of loss,with the primers used in this study to validate the techniqueof allele loss detection.A larger series of colorectal cancer samples analysed in this
way, accompanied by patient survival data, will enable us todetermine whether deletions in the APC/MCC region, andalso in other regions of the genome, are important for patientprognosis and this is now underway. As the range ofVNTR's and microsatellites identified that are linked toimportant cancer genes increases, the development of a singlemultiplexed molecular test for loss of heterozygosity in com-mon cancers will become a distinct possibility.This work was supported by the Yorkshire Cancer Research Cam-paign and we are endebted to the Leeds General Infirmary SpecialTrustees for the purchase of the Applied Biosystems automatedDNA sequencer with Genescan software. We would also like tothank Mrs J. Fearnley for assistance in typing the manuscript.
References
ASHTON-RICKARDT, P.G., DUNLOP, M.G., NAKAMURA, Y., MOR-RIS, R.G., PURDIE, C.A., STEEL, C.M., EVANS, H.J., BIRD, C.C. &WYLLIE, A.H. (1989). High frequency of APC loss in sporadiccolorectal carcinoma due to breaks clustered in 5q21-22. Onco-gene, 4, 1169-1174.
BELL, S.M., KELLY, S.A., HOYLE, J.A., LEWIS, F.A., TAYLOR, G.R.,THOMPSON, H., DIXON, M.F. & QUIRKE, P. (1991). c-Ki-ras genemutations in dysplasia and carcinomas complicating ulcerativecolitis. Br. J. Cancer, 64, 174-178.
BREUKEL, C., TOPS, C., VAN LEEUWEN, C., VAN DER KLIFT, H.,NAKAMURA, Y., FODDE, R. & KHAN, P.M. (1991). CA repeatpolymorphism at the D5S82 locus, proximal to adenomatouspolyposis coli (APC). Nucleic Acids Res., 19, 5804.
EDWARDS, A., CIVITELLO, A., HAMMOND, H.A. & CASKEY, C.T.(1991). DNA typing and genetic mapping with trimeric andtetrameric tandem repeats. Am. J. Hum. Genet., 49, 746-756.
FEARON, E.R. & JONES, P.A. (1992). Progressing toward a moleculardescription of colorectal cancer development. FASEB J, 6, 2783-2790.
FUTREAL, P.A., SODERKVIST, P., MARKS, J.R,. IGLEHART, J.D.,COCHRAN, C., BARRETT, J.C. & WISEMAN, R.W. (1992). Detec-tion of frequent allelic loss on proximal chromosome 17q insporadic breast carcinoma using microsatellite length polymor-phisms. Cancer Res., 52, 2624-2627.
JONES, M.H. & NAKAMURA, Y. (1992). Detection of loss of hetero-zygosity at the human TP53 locus using a dinucleotide repeatpolymorphism. Genes, Chromosomes & Cancer, 5, 89-90.
KINZLER, K.W., NILBERT, M.C., SU, L., VOGELSTEIN, B., BRYAN,T.M., LEVY, D.B., SMITH, K.J., PREISINGER, A.C., HAMILTON,S.R., HEDGE, P., MARKHAM, A., CARLSON, M., JOSLYN, G.,GRODEN, J., WHITE, R., MIKI, Y,. MIYOSHI, Y., NISHISHO, I. &NAKAMURA, Y. (1991). Identification of FAP locus genes fromchromosome 5q21. Science, 253, 661-665.
LAURENT-PUIG, P., OLSCHWANG, S., DELATTRE, O., REMVIKOS,Y., ASSELAIN, B., MELOT, T., VALIDIRE, P., MULERIS, M., GIR-ODET, J., SALMON, R.J. & THOMAS, G. (1992). Survival andacquired genetic alterations in colorectal cancer. Gastroenter-ology, 102, 1136-1141.
LITT, M. (1991). PCR of TG microsatellites. In PCR: A PracticalApproach, McPherson, M.J., Quirke, P., Taylor, G.R. (eds) pp.85-99. New York: Oxford University Press.
LOUIS, D.N., VON DEIMLING, A. & SEIZINGER, B.R. (1992). A (CA).dinucleotide repeat assay for evaluating loss of allelic heterozy-gosity in small and archival human brain tumor specimens. Am.J. Pathol., 141, 777-782.
PONDER, B. (1988). Gene losses in human tumours. Nature, 335,400-402.
SOLOMON, E., VOSS, R., HALL, V., BODMER, W.F., JASS, J.R., JEFF-REYS, A.J., LUCIBELLO, F.C., PATEL, I. & RIDER, S.H. (1987).Chromosome 5 allele loss in human colorectal carcinomas. Na-ture, 328, 616-619.
VAN LEEUWEN, C., TOPS, C., BREUKEL, C., VAN DER KLIFT, H.,FODDE, R. & KHAN, P.M. (1991). CA repeat polymorphism at theD5S299 locus linked to adenomatous polyposis coli (APC).Nucleic Acids Res., 19, 5805.
WEBER, J.L. & MAY, P.E. (1989). Abundant class of human DNApolymorphisms which can be typed using the polymerase chainreaction. Am. J. Hum. Genet., 44, 388-396.
Copyright © 2022 FDOKUMEN