The relevance and impact of MICA allele mismatching and ...
348
1 The relevance and impact of MICA allele mismatching and MICA antibodies on renal transplantation outcome Steven T. Cox University College London (UCL) October 2011 A thesis submitted to University College London for the degree of Doctor of Philosophy
-
Upload
khangminh22 -
Category
Documents
-
view
3 -
download
0
Transcript of The relevance and impact of MICA allele mismatching and ...

1
The relevance and impact of MICA allele
mismatching and MICA antibodies on renal
transplantation outcome
Steven T. Cox
University College London (UCL)
October 2011
A thesis submitted to University College London for the degree of
Doctor of Philosophy

2
Declaration
I, Steven T. Cox, confirm that the work presented in this thesis is my own. Where
information has been derived from other sources, I confirm that this has been
indicated in the thesis.
Signed: …………………………………..
Date: ……………………………………..

3
This thesis is dedicated to my
late grandmother, Marjorie Bates.

4
Abstract
Even when kidney allografts are well matched for HLA antigens and anti-HLA
antibodies are undetected, graft rejection still occurs. There is evidence of hyperacute
rejection in the absence of HLA antibodies, implicating other alloantigens. Studies
have shown that some patients with graft rejection or loss have antibodies specific
for the highly polymorphic MHC class I-related chain A (MICA) antigens.
This thesis investigated whether mismatching MICA alleles associates with MICA
antibody production and graft rejection, survival or dysfunction. Using commercial
assays, MICA and HLA antibody screening of 442 recipients was performed and
specificities were confirmed in a sub-group of 227 recipients using single antigen
(SAg) multiplex technology. MICA antibody specificity was assigned using three
independent SAg assays. In addition, MICA alleles of 227 recipients and donors
were determined by development and application of DNA sequence based typing.
Acute rejection (AR) was assessed by renal pathologists and classified as acute
cellular rejection (ACR) or acute antibody-mediated rejection (aAMR). Graft
function was assessed by estimated glomerular filtration rate (eGFR) and serum
creatinine measurements.
Among the cohort of 442 recipients, 33 (7.5%) produced MICA antibodies, which
correlated with ACR (P=0.03). Analysis of the MICA typed cohort revealed 17
patients (7.5%) had MICA antibodies and 13 (6%) developed MICA donor-specific
antibodies (DSA). Multivariate analysis revealed MICA mismatching as a
significant factor associated with the presence of MICA antibodies (P=0.009) and 14
mismatched MICA residues significantly correlated with MICA antibody production.
MICA and HLA antibodies significantly associated with AR and MICA-DSA and
HLA-DSA correlated with decreased graft function by univariate and multivariate
analysis. To conclude, mismatching of specific MICA epitopes in renal
transplantation is a mechanism leading to production of MICA antibodies and
MICA-DSA that associate with AR and graft dysfunction.
5
Acknowledgements
Firstly I would like to thank my supervisor, Professor Alejandro Madrigal, for
allowing me the time to pursue a PhD and supporting me throughout the process, I
am very grateful. I am also immensely grateful to my supervisor, Ann-Margaret
Little, whose guidance, support and advice from beginning to end was invaluable in
maintaining my motivation.
This project would not have been possible without the co-operation of staff from the
UCL Department of Nephrology. I would like to thank Henry Stephens for diligent
and close support with manuscript preparation, Ray Fernando and Aliyye Karasu for
friendly help, advice and technical assistance and all members of the team for
guiding me through the technicalities of renal transplantation. I particularly
appreciate the help provided by Mark Harber who enabled me to understand clinical
aspects of transplantation and who provided important clinical data that was crucial
for this thesis. I am also extremely grateful to Professor Alexander Howie for
helpful discussions and detailed graft rejection data, and our collaborators - Professor
Peter Stastny and Yizhou Zou for expert advice and Luminex testing.
I would like to thank Anthony Nolan Research Institute staff and students, past and
present for their inspiration, support and friendship (and sometimes their blood!)
throughout the years. I particularly thank fellow students Mehri, Daniel, Neema,
Samir, Michelle, Martha and Isabela who shared a similar experience and often
offered valuable advice. I am also grateful to Angus, Nush, Shem, Jennifer,
Bronwen, Aurore, Richard and Jim for technical help and advice and to Hazel for
organising the lab and keeping me „safe‟.
Finally, I thank my family and friends who have tolerated my long absences during
this very demanding time in my life. In particular I thank my mother for her
unwavering faith in my ability to succeed, and my brother Matthew for genuine
interest in my project and the process of obtaining a PhD (got there in the end!).
Lastly, to my late grandmother, „Nan‟, for her knowledge and wisdom during my
formative years, I hope this achievement would have made you proud.

Contents
6
Table of Contents
Declaration 2
Dedication 3
Abstract 4
Acknowledgements 5
Table of Contents 6
List of Figures 13
List of Tables 17
Abbreviations 20
Chapter 1: Introduction 23
1.1 The immune system 23
1.1.1 Innate immunity 23
1.1.2 Acquired immunity 26
1.1.3 Generation of effector B-cells 27
1.1.4 Generation of effector T-cells 28
1.1.5 The Major Histocompatibility Complex 29
1.1.6 HLA Polymorphism 31
1.2 Solid Organ Transplantation 33
1.2.1 The immune response in organ transplantation 34
1.2.2 Classification of allograft rejection 36
Hyperacute rejection 36
Accelerated rejection 37
Acute rejection 37
Chronic Allograft Dysfunction 38
1.2.3 Prevention and treatment of immunological allograft rejection 40
Screening and Crossmatching 40
HLA matching 41
Immunosuppression 42
1.2.4 Other factors associated with rejection and morbidity 45
1.2.5 Antibodies and their role in transplantation 47
1.2.6 HLA antibodies and graft rejection 49
HLA antibodies present before transplantation 49
Post-transplant de novo HLA antibody production 50
Donor-specific HLA antibody production 51
The relevance of HLA antibodies detected post-transplant 54
Treatment of antibody-mediated rejection 55
Antibody responses directed against non-HLA antigens 56
1.3 MICA antibody prevalence and its significance in solid organ
transplantation 57
1.3.1 Genetic organisation and structure of MIC gene products 57
1.3.2 MICA/B expression on cells and tissues 59
1.3.3 Polymorphism and evolution of MICA and MICB genes 60
1.3.4 MICA alleles and disease association 62
1.3.5 Role of MICA in innate immunity 63
NK-cell-mediated lysis evasion by tumor cells 63
NK-cell-mediated lysis evasion by viruses 65
1.3.6 MICA allele frequencies in different populations 67

Contents
7
1.3.7 MICA antibodies and solid organ transplantation 69
1.4 Methods for detection of MICA alleles and MICA antibodies 79
1.4.1 MICA allele genotyping methods 79
Methods based on exon 5 GCT repeat polymorphism 79
Sequence Based Typing (SBT) of MICA alleles 81
MICA typing using conformational analysis 83
MICA typing using PCR and Sequence Specific Primers (SSP) 84
MICA typing with PCR and Sequence Specific
Oligonucleotide Primers (SSOP) 85
1.4.2 MICA antibody detection methods 86
MICA antibody detection CDC 86
MICA antibody detection using ELISA 87
MICA antibody detection using flow cytometry 89
Detecting MICA antibodies in patient and donor crossmatching 90
1.5 Aims of this Thesis 92
Chapter 2: Materials and Methods 93
2.1 Study Cohorts 93
2.1.1 Recruitment and ethical approval 93
2.1.2 Specimen Collection 93
2.1.3 Healthy adult controls 93
2.2 Molecular Biology 94
2.2.1 General methods 94
DNA extraction from whole blood 94
Nucleic acid quantification 94
Quantification of total RNA 94
Polymerase Chain Reaction 94
Primer Design 95
2.2.2 Sequence-based typing for MICA allele assignment 95
PCR amplification of the MICA gene 95
DNA electrophoresis 97
Post-PCR amplification clean up 97
Cycle sequencing reaction for direct sequencing and
sequencing based typing (SBT) 98
Sequencing Analysis and Heterozygous MICA typing 98
2.2.3 Short Tandem Repeat (STR) Analysis of MICA Exon 5
using Genescan 98
PCR Primers and Amplification of Exon 5 of the MICA gene 98
Typing of Trinucleotide Repeat Polymorphism in the TM
region of MICA gene 99
Assignment of Alleles 99
2.2.4 Production of cDNA from RNA 99
RNA Extraction and DNase Treatment 99
Reverse-Transcriptase (RT) PCR – cDNA synthesis 100
2.2.5 Generation of plasmid constructs for protein expression
in Escherichia coli 100
PCR Amplification of MICA and MICB from cDNA 100
Purification of PCR cDNA from a gel slice 100
Ligation of MICA cDNA into pCR4-TOPO
plasmid 100
Transformation of TOP10 chemically competent cells 101

Contents
8
Miniprep isolation of plasmid DNA 101
DNA endonuclease restriction enzyme digestion 102
Restriction Digestion to release MICA fragments from
pCR
4-TOPO
102
Digestion with BamH1 to Linearise Plasmid pAC-5 103
Ligation of plasmid pAC-5 with purified MICA PCR product 103
Transfection of AVB101 expression host with pAC-5 – MICA
construct 103
Induction of protein expression 104
Inclusion body purification 104
Measurement of protein concentration 106
2.2.6 Generation of pCMV plasmid constructs for protein
expression in 293T mammalian cells 106
Amplification of the MICA gene from cDNA 106
Purification of PCR amplified product and ligation into
pGEM-T Easy vector 107
Transformation of JM109 competent cells using pGEM-T
Easy vector ligation reactions 107
Sub-cloning MICA DNA into pCMV mammalian expression vector 108
Endonuclease-free plasmid purification 109
2.2.7 Generation of pIEx-4 plasmid constructs for MICA protein
expression in Sf9 insect cell line 109
2.3 Biochemistry 110
2.3.1 Sodium Dodecyl Sulphate (SDS) Polyacrylamide Gel
Electrophoresis (PAGE) 110
2.3.2 Setting up, Loading and Running Gels 110
2.3.3 Western Blot Analysis 111
2.3.4 Sandwich ELISA for detection of human soluble MICA molecules 112
2.3.5 Concentrating recombinant MICA proteins 112
2.4 Serological Assays 112
2.4.1 Luminex Mixed Bead Antibody Detection Screening Assay 112
2.4.2 Luminex HLA-Class I and II antibody specificity identification 113
2.4.3 Luminex MICA antibody specificity identification 113
LABScreen
MICA Single Antigen beads (One Lambda) 113
Detection of MICA antibodies by Luminex developed by
Prof. Peter Stastny (Dallas, USA) 113
Lifecodes LSA -MIC Single Antigen beads (Gen-Probe, CA, USA) 114
2.4.4 Procedure for antibody detection using Luminex 114
Specimen collection and preparation 114
General Test procedure 114
Importing templates for data acquisition in the Luminex™
Fluoroanalyzer 115
Amendments to procedure for Gen-Probe MICA antibody
Luminex™ 115
2.5 Cell Culture 115
2.5.1 General cell culture procedures 115
Culture media 115
Cell Separation 116
Counting cells and checking viability 116
Cryopreservation of cells 116

Contents
9
2.5.2 Cell lines used to obtain MICA cDNA 116
The use of commercial cell lines to locate MICA cDNA 116
The Use other Cell Lines to Locate MICA cDNA 117
2.5.3 Cell lines used to produce recombinant MICA 117
E. coli strain AVB101 117
Human embryonic kidney (HEK) 293T cells 118
Spodoptera frugiperda-derived insect cells(Sf9) 118
2.5.4 Transfection procedures 119
Transient transfection of 293T cells 119
Transient transfection of Sf9 cells 119
2.6 Data storage and statistical analysis 120
Chapter 3: Development of techniques for MICA allele typing and MICA
antibody detection 122
3.1 Introduction and Aims 122
3.2 Development of MICA sequence based typing 123
3.2.1 Amplification of exons 2-5 of the MICA gene 124
3.2.2 Selection of MICA sequencing primers 124
3.2.3 MICA allele typing results using exons 2-4 127
3.2.4 MICA exon 5 sizing using Genescan 128
3.2.5 Determining exon 5 GCT triplet number using sequence analysis 131
3.2.6 MICA ambiguous allele combinations not resolved 134
3.2.7 MICA international DNA exchange scheme 135
3.2.8 Strategies for resolving MICA amplification „allele dropout‟ 135
3.3 Production of recombinant MICA in E. coli 137
3.3.1 Cell Lines for MICA cDNA Amplification and Cloning 137
3.3.2 Obtaining cDNA from cell lines and ligation with plasmid vector 138
3.3.3 Cloning procedures for bacterial expression of MICA protein 139
3.4 Production of rMICA in 293T HEK mammalian cells 145
3.4.1 Generation of plasmid constructs for MICA expression 146
3.4.2 Liposome-mediated transient transfection of 293T HEK cells 152
3.5 Production of rMICA in Spodoptera frugiperda (Sf9) insect cells 158
3.5.1 Generation of plasmid constructs for MICA expression 159
3.5.2 Liposome-mediated transient transfection of Sf9 insect cells 160
3.6 General Discussion 166
Chapter 4: Evaluation of MICA antibody detection in renal patients
and healthy controls using fluorescent bead-based assays 170
4.1 Introduction and aims 170
4.2 Identification of MICA antibodies by One Lambda Luminex
screening beads 172
4.2.1 Calculations used for assignment of positivity with the
One Lambda mixed bead assay 172
4.2.2 MICA antibody frequencies - kidney transplant recipients 173
4.2.3 MICA antibody frequencies - ESRD patients waiting for
transplant 173
4.2.4 MICA antibody frequencies - healthy controls 173

Contents
10
4.3 Identification of MICA antibodies by One Lambda Luminex single
antigen beads 174
4.3.1 Calculation of results for baseline Mean Fluorescence Intensity 175
4.3.2 MICA antibody frequencies - kidney transplant recipients 175
4.3.3 MICA antibody frequencies - patients with ESRD, awaiting transplant 175
4.3.4 MICA antibody frequencies - healthy controls 176
4.4 Identification of MICA antibodies using a flow cytometry-based technique
with recombinant MICA molecules produced from insect cells 177
4.4.1 Calculation of Mean Fluorescence Intensity and interpretation
of results 177
4.4.2 MICA antibody frequencies - kidney transplant recipients 177
4.4.3 MICA antibody frequencies - patients with ESRD, awaiting transplant 178
4.4.4 MICA antibody frequencies - healthy controls 178
4.5 Identification of MICA antibodies using Gen-Probe MICA single antigen
Luminex assay 178
4.5.1 Calculation of adjusted Median Fluorescence Intensity 179
4.5.2 MICA antibody frequencies - kidney transplant recipients 180
4.5.3 MICA antibody frequencies - patients with end-stage renal
disease, awaiting transplant 180
4.5.4 MICA antibody frequencies - healthy controls 180
4.6 Comparison of MICA antibody testing results obtained with three methods 181
4.7 Identifying patterns of MICA antibody allorecognition of MICA antigenic
determinants 185
4.8 Discussion 192
4.8.1 MICA antibody frequencies using One Lambda screening and SAg
beads 193
4.8.2 MICA antibody frequencies using Stastny‟s MICA Luminex single
antigen assay 194
4.8.3 MICA antibody frequencies using Gen-Probe Lifecodes MICA
Luminex single antigen assay 195
4.8.4 Comparison of three MICA single antigen Luminex assays 195
4.8.5 Possible reasons for false positive reactions using One Lambda
Luminex assays 196
4.8.6 Identifying patterns of MICA antibody specificity 198
4.8.7 Differences of MICA antibody specificity using different MICA
Luminex assays 203
Chapter 5: MICA allele mismatching, production of MICA antibodies
and acute rejection in renal transplantation 204
5.1 Introduction and aims 204
5.2 Study cohorts 206
5.3 MICA allele typing in a renal transplant cohort 207
5.3.1 Identification of two novel MICA alleles: MICA*054 and MICA*056 207
5.3.2 Comparison of HLA-B antigen and MICA allele frequencies in
UK renal transplant recipients and donors 208
5.3.3 HLA-B - MICA haplotype frequencies in UK graft recipients
and donors 211
5.3.4 Analysis of MICA allele mismatching at the amino acid level 212
Contents
11
5.4 Clinical characteristics and transplantation variables associated with
the presence or absence of MICA antibodies 217
5.4.1 Significance of clinical characteristics with the production of
MICA antibodies 217
5.4.2 Significance of MICA allele and antigen mismatching with
the production of MICA antibodies 218
5.4.3 Association of HLA antigen mismatches with
production of MICA antibodies 219
5.4.4 Significance of HLA class I and/or HLA class II antibodies
and re-transplantation with the production of MICA antibodies 220
5.4.5 Association of MICA antibodies with biopsy-proven acute
graft rejection 221
5.4.6 Statistically significant associations of „strong‟ MICA antibodies
with other transplantation variables 223
5.4.7 Multivariate analysis of variables significantly associated
with the production of MICA antibodies 224
5.4.8 Correlation of HLA and/or MICA antibodies with ACR and aAMR 225
5.4.9 Identification of donor-specific MICA antibodies 228
5.5 Discussion 230
5.5.1 MICA allele polymorphism and mismatching in UK renal graft
recipients and donors 230
5.5.2 Association of MICA antibody production with general renal
transplant variables 234
5.5.3 Association of MICA allele mismatching and MICA antibody
production with acute renal graft rejection 237
Chapter 6: MICA antibody production and evolution in renal transplant
recipients: a longitudinal analysis 241
6.1 Introduction and aims 241
6.2 Detection of MICA antibodies 243
6.3 Patients and sera 243
6.4 Assessment of graft function 243
6.5 Longitudinal testing of individual patients for MICA antibodies 244
6.6 Results and Discussion 255
6.6.1 Association of MICA antibody production and change in eGFR 255
6.6.2 MICA antibody specificity 258
6.6.3 First appearance of MICA antibodies and evolutionary course 260
6.6.4 MICA antibody „strength‟ 261
6.6.5 Long-term renal graft recipients and MICA antibodies 261
Chapter 7: Soluble MICA/B in renal transplantation and association of
MICA antibodies with graft survival and function 263
7.1 Introduction and aims 263
7.2 Soluble MICA and MICB in renal transplantation 265
7.2.1 Association of sMICA and sMICB with general clinical
characteristics 266
7.2.2 Association of sMICA and sMICB with HLA antigen and
MICA allele and antigen mismatches 267
7.2.3 Association of sMICA and sMICB with MICA or HLA
antibodies and AR 269

Contents
12
7.2.4 Association of sMICA and sMICB with reduced graft function 272
7.2.5 Five-year renal graft survival and the impact of sMICA and sMICB 272
7.3 Five-year renal graft survival analysis of association with transplantation
variables 274
7.3.1 Inclusion criteria for survival analysis 274
7.3.2 Transplant variables included for survival analysis 274
7.3.3 Univariate statistical analysis 275
7.3.4 Overall five-year survival and the impact of source of
donor, gender and age 275
7.3.5 Overall five-year survival and the impact of number of
transplants, MICA antibodies or HLA antibodies 275
7.3.6 Overall five-year survival and the impact of ACR and
aAMR 278
7.3.7 Multivariate analysis using Cox regression 278
7.4 Renal graft function analysis 279
7.4.1 Assessment of chronic renal damage and renal function 279
7.4.2 Association of general transplantation variables with
reduced graft function 280
7.4.3 Association of HLA and/or MICA antibodies with reduced
graft function 284
7.4.4 Graft function multivariate analysis – linear regression model 287
7.4.5 Assessment of chronic renal damage by morphometric analysis 290
7.5 Discussion 291
7.5.1 Soluble MICA and soluble MICB in renal transplantation 291
7.5.2 Five-year kidney graft survival analysis 293
7.5.3 Renal graft function analysis 295
7.5.4 Possible mechanisms of allograft injury by MICA antibodies 299
7.5.5 Limitations of this study 304
Chapter 8: Conclusions 305
Appendix A – Publications and presentations 312
Appendix B – Staff consent form 315
Appendix C – Renal graft recipient and donor MICA types 317
Appendix D – EMBL summary flatfiles 324
References 328

Figures
13
List of Figures
CHAPTER 1
Figure 1.1.1: Antigen processing and presentation my MHC
class I and class II molecules 31
Figure 1.1.2: Genomic organisation of the MHC region 32
Figure 1.2.1: Diagrammatic representation of cellular events leading
to an alloimmune response 35
Figure 1.2.2: Histological features of antibody-mediated rejection 38
Figure 1.2.3: Immunofluorescence method of Cd4 deposition detection 39
Figure 1.2.4: Immunological and non-immunological factors contributing
to late allograft loss due to chronic allograft dysfunction 47
Figure 1.3.1: Genomic organisation of the MHC region 57
Figure 1.3.2: Ribbon model derived from X-ray crystallographic analysis
of the extracellular domains of the MICA molecule 58
Figure 1.3.3: Amino acid variation of the extracellular domains of
the MICA molecule. 60
Figure 1.3.4: Common MICA allele frequencies in nine different populations 68
Figure 1.4.1: PCR Amplification strategy to generate fluorescently labelled
fragments for size analysis using Genescan software and an
automated ABI 377 sequencer 80
Figure 1.4.2: Diagram showing stages involved in PCR-SBT of the MICA gene. 81
Figure 1.4.3: Sequence electropherogram showing sense and antisense sequence
from exon 4 of the MICA gene 82
Figure 1.4.4: Reference Strand-mediated conformational analysis (RSCA) 83
Figure 1.4.5: Detection of novel MICA alleles using RSCA 84
Figure 1.4.6: MICA antibody detection using CDC 87
Figure 1.4.7: MICA antibody detection using ELISA 88
Figure 1.4.8: Principle of the Luminex single antigen assay to detect MICA
Antibodies 90
Figure 1.4.9: XM-ONE
crossmatch assay to detect non-HLA antibodies
directed against EC antigens 91
CHAPTER 3
Figure 3.2.1: Amplification of the MICA gene 124
Figure 3.2.2: Exon 2 sequences with Zwirner MICA sequencing primers 126
Figure 3.2.3: Exon 3 and 4 sequence obtained using Zwirner‟s primers and
cell line JY DNA 127
Figure 3.2.4: PCR amplification of exon 5 of the MICA gene using a
5‟ 6-Fam fluorescently labelled primer 129
Figure 3.2.5: MICA exon 5 size results generated using Genescan software 130
Figure 3.2.6: Heterozygous MICA sequence patterns obtained from sequencing
exon 5 134
Figure 3.2.7: MICA intron 1 region used for amplification of the MICA gene 136
Figure 3.3.1: MIC-specific products (MICA and MICB) amplified using cDNA
from cell lines 139
Figure 3.3.2: Restriction digestion of pCR
4-TOPO
ligated with MICA*008
cDNA 140

Figures
14
Figure 3.3.3: Sequence alignment of MICA*008 coding sequence with
sequence of pAC-5 plasmid containing a MICA DNA insert 141
Figure 3.3.4: SDS-PAGE analysis of MICA protein with Coomassie Blue
Staining 142
Figure 3.3.5: SDS-PAGE gel Western Blot Analysis 143
Figure 3.3.6: SDS-PAGE analysis of scaled-up MICA protein production 143
Figure 3.3.7: Measurement of protein concentration from MICA inclusion
body purification 144
Figure 3.4.1: PCR amplification of cell line cDNA 147
Figure 3.4.2: Restriction enzyme digestion with Xho1 and Kpn1 of pGEM
plasmid ligated with MICA*008 cDNA amplicons 148
Figure 3.4.3: Cloned MICA inserts and pBK-CMV plasmid vector digested with
Xho1 and Kpn1 restriction enzymes and purified by gel excision 148
Figure 3.4.4: Plasmid map of pBK-CMV 149
Figure 3.4.5: Endonuclease-free plasmid extraction using the Qiagen maxi kit 150
Figure 3.4.6: Sequence alignment of four MICA alleles ligated into
pBK-CMV protein expression plasmid 151
Figure 3.4.7: Amount of rMICA*008 produced with varying quantities of
plasmid DNA 153
Figure 3.4.8: Effect of varying amount of 0-30 l of Polyfect reagent
on rMICA*008 production 154
Figure 3.4.9: Production of rMICA*008 by transfected 293T cells over eleven
Days 155
Figure 3.4.10: Expression of rMICA using four different MICA pBK-CMV
Constructs 157
Figure 3.4.11: SDS-PAGE results after electrophoresis of a commercial rMICA
(lane 1), rMICA*004 (lane 2) and rMICA*008 (lane 3) produced
by 293T cells 158
Figure 3.5.1: Map of plasmid pIEx-4 showing restriction enzyme sites and
Features 160
Figure 3.5.2: Sequence alignment of two MICA alleles ligated into
pIEx-4 protein expression plasmid 161
Figure 3.5.3: Concentration of rMICA protein produced using MICA*002 and
MICA*008 plasmid DNA and either Cellfectin reagent or
GeneJuice reagent 163
Figure 3.5.4: Concentration of rMICA secreted into culture medium and lysed
from cells 164
Figure 3.5.5: Concentration of rMICA produced by transfection of 10 ml
suspension cultures 165
Figure 3.5.6: SDS-PAGE results after electrophoresis of rMICA 166
CHAPTER 4
Figure 4.2.1: Frequencies of MICA antibodies by Luminex screening assay 174
Figure 4.3.1: Frequencies of MICA antibodies by single antigen Luminex assay 176
Figure 4.4.1: Frequencies of MICA antibodies using the Stastny Luminex assay 179
Figure 4.5.1: Frequencies of MICA antibodies detected using Gen-Probe single
antigen Luminex assay 181
Figure 4.6.1: Comparison of MICA antibodies detected in renal graft recipients
using three independent MICA single antigen Luminex assays 182

Figures
15
Figure 4.6.2: Comparison of MICA antibody frequencies detected with three
single antigen Luminex methods 183
Figure 4.6.3: MICA antibody reaction patterns detected with One Lambda
Luminex but not confirmed with the Stastny and Gen-Probe assays 184
Figure 4.7.1: Typical example of serum reactive with Thr at residue 24 185
Figure 4.7.2: Typical example of patient serum reactive with MICA-G1 epitopes 188
Figure 4.7.3: Typical example of patient serum reactive with MICA-G2 epitopes 189
Figure 4.7.4: Frequencies of different MICA antibody recognition patterns 189
Figure 4.7.5: Typical example of a patient serum with possible mixed MICA
antibody specificity 1 190
Figure 4.7.6: Typical example of a patient serum with possible mixed MICA
antibody specificity 2 191
Figure 4.7.7: Example of a patient serum reactive with only one MICA antigen 192
Figure 4.8.1: Polymorphic MICA residues on the MICA molecule shown in
3 views 201
CHAPTER 5
Figure 5.3.1: Nucleotide sequence alignment of exons 1-5 of the MICA gene 209
Figure 5.3.2: Histogram comparing the frequency of mismatched MICA amino
acid residues between MICA antibody positive (n=17) and
negative (n=210) renal graft recipients and their donors 213
Figure 5.3.3. MICA amino acid alignment of polymorphic MICA residues
across the 1-3 domains of the MICA molecule 214
Figure 5.3.4. -1, -2 and -3 extracellular domains of the MICA molecule 216
CHAPTER 6
Figure 6.5.1: Longitudinal MICA antibody analysis of patient 986EL 245
Figure 6.5.2: Longitudinal MICA antibody analysis of patient 300RA 245
Figure 6.5.3: Longitudinal MICA antibody analysis of patient 521HJ 246
Figure 6.5.4: Longitudinal MICA antibody analysis of patient 396BS 246
Figure 6.5.5: Longitudinal MICA antibody analysis of patient 194AH 247
Figure 6.5.6: Longitudinal MICA antibody analysis of patient 881AM 247
Figure 6.5.7: Longitudinal MICA antibody analysis of patient 690MO 248
Figure 6.5.8: Longitudinal MICA antibody analysis of patient 728JP 248
Figure 6.5.9: Longitudinal MICA antibody analysis of patient 057SR 249
Figure 6.5.10: Longitudinal MICA antibody analysis of patient 599EM 249
Figure 6.5.11: Longitudinal MICA antibody analysis of patient 197TW 250
Figure 6.5.12: Longitudinal MICA antibody analysis of patient 977HB 250
Figure 6.5.13: Longitudinal MICA antibody analysis of patient 495RT 251
Figure 6.5.14: Longitudinal MICA antibody analysis of patient 561JB 251
Figure 6.5.15: Longitudinal MICA antibody analysis of patient 953OW 252
Figure 6.5.16: Longitudinal MICA antibody analysis of patient 598AM 252
CHAPTER 7
Figure 7.2.1: Comparison of mean concentrations of sMICA and sMICB (pg/ml) 268
Figure 7.2.2: Effect of sMICA/B concentration on occurrence of acute rejection 271
Figure 7.2.3: Analysis of graft function in patients with eGFR 272
Figure 7.2.4: Association of sMICA and sMICB with five-year renal graft survival 273

Figures
16
Figure 7.3.1: Association of source of donor (deceased or living), patient
or donor gender and patient or donor age with five-year
overall renal GS 276
Figure 7.3.2: Association of the number of transplants, MICA antibodies, HLA
class I antibodies, HLA class II antibodies, HLA class I and class II
antibodies or HLA-DSA with five-year overall renal GS 277
Figure 7.3.3: Association of ACR or aAMR with five-year overall renal
GS 278
Figure 7.4.1: Error bar charts showing eGFR (ml/min/1.73m2) of patients
with and without ACR episodes 282
Figure 7.4.2: Error bar charts showing mean eGFR (ml/min/1.73m2) of
patients with and without MICA antibodies overall, MICA-DSA
and strong MICA antibodies 287
Figure 7.5.1: Indirect allorecognition, MICA, NKG2D and the immune
response in transplantation 303

Tables
17
List of Tables
CHAPTER 1
Table 1.1.1: The allelic repertoire of classical HLA genes 32
Table 1.2.1: Types of solid organ transplantation and conditions they
are used to treat 34
Table 1.2.2: Methods of immunosuppression in clinical use 45
Table 1.4.1: Relative sizes of exon 5 in different MICA alleles 80
CHAPTER 2
Table 2.2.1: Primers used for amplification and sequencing MICA
from genomic DNA (SBT) and sequencing of cDNA 96
Table 2.2.2: Reagents and volumes required for genomic DNA PCR
amplification of exons 2-5 of the MICA gene 96
Table 2.2.3: PCR cycling conditions for MICA gene amplification 97
Table 2.2.4: DNA endonuclease restriction enzymes, digestion sites
and optimum buffers 102
Table 2.2.5: DNA Ligation reaction for T4 DNA ligase and pGEM-T
Easy Vector 107
CHAPTER 3
Table 3.2.1: MICA PCR amplification primers targeting exons 2-5 of
the MICA gene 123
Table 3.2.2: MICA sequencing primers from Katsuyama study 125
Table 3.2.3: MICA sequencing primers from Zwirner study 125
Table 3.2.4: Cell line DNA MICA typing using exons 2-4 compared
with IMGT/HLA entry 128
Table 3.2.5: MICA allele typing results of cell line DNA using both
SBT and Genescan analysis 131
Table 3.2.6: Exon 5 sequences of TM polymorphisms and heterozygous
combinations of MICA alleles with differing TM-STRs 133
Table 3.2.7: MICA TM-STR exon 5 polymorphisms associated with
different MICA alleles 133
Table 3.3.1: Common MICA and HLA-B haplotype frequencies
and their linkage disequilibrium 138
Table 3.4.1: Concentration and purity of endonuclease-free plasmid DNA 150
Table 3.5.1: Conditions for transient transfection of Sf9 cells in 24-well
plates using either Cellfectin or Genjuice transfection reagents
and pIEx-4 with MICA DNA inserts 162
Table 3.6.1: Characteristics of MICA proteins loaded onto SDS-PAGE gels 168
CHAPTER 4
Table 4.2.1: MICA antibody frequencies in 442 renal graft recipients,
200 untransplanted patients and 116 healthy controls using
One Lambda screening beads 174
Table 4.3.1: MICA antibody frequencies among 76 renal graft recipients,
21 untransplanted patients and 14 healthy controls testing positive
using One Lambda MICA single antigen beads 176

Tables
18
Table 4.4.1: MICA antibody frequencies among 76 renal graft recipients,
21 untransplanted patients and 14 healthy controls using
insect cell rMICA single antigen beads (Stastny assay) 179
Table 4.5.1: MICA antibody frequencies among 76 renal graft recipients,
21 untransplanted patients and 14 healthy controls using
Gen-Probe single antigen Luminex beads 181
Table 4.7.1: Alignment of MICA polymorphic amino acid residues across
the -1 to -3 extracellular regions of the MICA molecule.
A „-„ denotes identity with MICA*001 185
Table 4.8.1: Protein alignment of polymorphic MICA residues shown
experimentally to be involved in allorecognition by MICA antibodies.
Each colour represents a different antigenic determinant that can be
recognised by MICA antibodies 201
CHAPTER 5
Table 5.3.1: MICA allele and HLA-B antigen frequencies in 301
renal graft recipients and their donors 210
Table 5.3.2: HLA-B – MICA haplotype linkage disequilibrium frequencies
in UK renal transplant recipients 211
Table 5.3.3: HLA-B – MICA haplotype linkage disequilibrium frequencies
in UK renal transplant donors 212
Table 5.4.1: Clinical characteristics of 442 renal transplant recipients 217
Table 5.4.2: Clinical characteristics of 200 renal patients awaiting transplant
and 116 healthy controls 218
Table 5.4.3: MICA allele and amino acid residue matching and association
with production of MICA antibodies in 442 renal graft recipients 219
Table 5.4.4: Association of HLA class I (HLA-A, B, C) and class II
(HLA-DR, DQ) antigen mismatches with the production
of MICA antibodies in renal transplantation 220
Table 5.4.5: Association of the production of HLA class I and HLA class II
antibodies and re-transplantation with the presence of MICA
antibodies in 442 renal graft recipients 221
Table 5.4.6a: ACR and aAMR and association with the production of MICA
antibodies among 391 renal graft recipients 222
Table 5.4.6b: ACR and aAMR and association with the production of „strong‟
MICA antibodies in 391 renal graft recipients 223
Table 5.4.7: Transplantation variables significantly associated with the presence
of „strong‟ MICA antibodies among 442 renal transplant recipients 224
Table 5.4.8: Univariate and multivariate analysis of renal transplantation
variables associated with MICA antibody status and MICA antibody
strength in 442 renal graft recipients 225
Table 5.4.9: Association of different categories of HLA and MICA antibodies
with acute cellular and acute antibody-mediated rejection 226
Table 5.4.10: Association of different categories of HLA and MICA antibodies
with acute cellular and acute antibody-mediated rejection 227
Table 5.4.11: Details of individual MICA antibody positive renal graft
recipients indicating recipient and donor MICA types
and MICA antibodies detected in recipients pre- and
post-transplantation 229

Tables
19
CHAPTER 6
Table 6.5.1: Transplant details of patients enrolled in the longitudinal study 253
Table 6.5.2: Summary of MICA and HLA antibody profiles for longitudinal
study patients 254
Table 6.6.1: Protein alignment of polymorphic MICA residues shown
experimentally to be involved in allorecognition by MICA
antibodies. Each colour represents a different antigenic
determinant that can be recognised by MICA antibodies 258
CHAPTER 7
Table 7.2.1: Clinical characteristics of 201 renal graft recipients and association
with sMICA detected in serum one year post-transplant 266
Table 7.2.2: Clinical characteristics of 200 renal graft recipients and association
with sMICB detected in serum one year post-transplant 267
Table 7.2.3: HLA antigen and MICA allele/antigen mismatching in 201 renal
graft recipients and association sMICA detected in serum one year
post-transplant 268
Table 7.2.4: HLA antigen and MICA allele/antigen mismatching in 200 renal
graft recipients and association with sMICB detected in serum one
year post-transplant 269
Table 7.2.5: HLA antibodies, MICA antibodies and rejection in 201 renal
graft recipients and association with sMICA detected in serum
one year post-transplant 270
Table 7.2.6: HLA antibodies, MICA antibodies and rejection in 200 renal
graft recipients and association with sMICB detected in serum
one year post-transplant 270
Table 7.3.1: Kaplan-Meier and Cox regression analysis of overall survival data 279
Table 7.4.1: Comparison of mean eGFR in renal transplant recipients with
risk factors for chronic allograft dysfunction at one, two and three
years post-transplant 281
Table 7.4.2: Comparison of mean rank serum creatinine values with risk factors
for chronic allograft dysfunction 283
Table 7.4.3: Comparison of mean eGFR in renal transplant recipients with
different categories of HLA/MICA antibodies at one, two
and three years post-transplant 285
Table 7.4.4: Mean rank serum creatinine comparisons with different HLA and/or
MICA antibody categories at one and two years post-transplant 287
Table 7.4.5: Linear regression analysis of factors associated with eGFR
decrease in renal graft recipients 288
Table 7.4.6: Linear regression analysis of factors associated with mean rank
serum creatinine increase in renal graft recipients 290

Abbreviations
20
Abbreviations
aAMR acute Antibody-Mediated Rejection
ACR Acute Cellular Rejection
ADAM A Disintregin And Metalloproteinase
ADCC Antibody-Dependent Cellular Cytoxicity
APC Antigen Presenting Cell
APS Ammonium Persulphate
AR Acute Rejection
AT1R Angiotensin Type 1 Receptor
ATG Anti-Thymocyte Globulin
BCA Bicinchoninic Acid
BD Behçet‟s Disease
BLCL B-Lymphoblastoid Cell Line
BSA Bovine Serum Albumin
CAD Chronic Allograft Dysfunction
CAN Chronic Allograft Nephropathy
CCD Charge-Coupled Device
CD Chronic Damage
CDC Complement Dependent Cytotoxicity
CI Confidence Interval
CKD Chronic Kidney Disease
CNI Calcineurin Inhibitor
CRP C-Reactive Protein
CsA Cyclosporin A
CTL Cytotoxic T-Lymphocyte
CTS Collaborative Transplant Study
DC Dendritic Cell
DGF Delayed Graft Function
DMSO Dimethyl Sulphoxide
DTT Dithiothreitol
ECACC European Collection of Cell Cultures
DNA Deoxyribonucleic acid
ESTDAB European Searchable Tumour Database
dNTP deoxyNucleotide TrisPhosphate
DSA Donor Specific Antibody
EBV Epstein-Barr Virus
EC Endothelial Cell
ESRD End-Stage Renal Disease
eGFR estimated Glomerular Filtration Rate
ELISA Enzyme Linked Immunosorbant Assay
ER Endoplasmic Reticulum
FACS Fluorescence Activated Cell Sorting
FasL Fas/Fas Ligand
FC Flow Cytometry
FC-XM Flow Cytometry crossmatch

Abbreviations
21
FPLC Fast Protein Liquid Chromatography
GS Graft Survival
GvHD Graft versus Host Disease
HAR Hyperacute Rejection
HCMV Human Cytomegalovirus
HEK Human Embryonic Kidney (cell)
HI-FCS Heat Inactivated Foetal Calf Serum
HLA Human Leucocyte Antigen
HRP Horse-Raddish Peroxidase
HSCT Haematopoietic Stem Cell Transplantation
IFN Interferon
IHIWC International Histocompatibility and Immunogenetics Workshop and
Conference
Ig Immunoglobulin
IHC Immunohistochemistry
IPTG Isopropyl-β-D-thiogalactoside
IUB International Union of Biochemists
IVIG Intra-Venous Immunoglobulin
KIR Killer-cell Inhibitory Receptor
LB Luria Bertani
LD Linkage Disequilibrium
LPS Lipopolysaccharide
MBL Mannose Binding Lectin
MDRD Modification of Diet in Renal Disease
MFI Mean Fluorescence Intensity
MICA MHC class I-related Chain A
MICB MHC class I-related Chain B
MHC Major Histocompatibility Complex
MLE Maximisation Likelihood Estimate
MMF Mycophenolate Mofetil
NBR Normalised Background Ratio
NC Negative Control
NF-AT Nuclear Factor of Activated T-cells
NDSA Non-Donor Specific Antibody
NK Natural Killer
OD Optical Density
OR Odds Ratio
OS Overall Survival
PAGE Polyacrylamide Gel Electrophoresis
PAMP Pathogen-Associated Molecular Patterns
PBMC Peripheral Blood Mononuclear Cell
PE Phycoerythrin
PEX Plasma Exchange
PBS Polybuffered Saline
PCR Polymerase Chain Reaction
PRA Panel Reactive Antibody
PRR Pattern Recognition Receptors

Abbreviations
22
Rae Retinoic acid early inducible
RAET-1 Retinoic Acid Early Transcript-1
RNA Ribonucleic acid
RSCA Reference Strand-mediated Conformational Analysis
RT Reverse Transcriptase
SAg Single Antigen
SBT Sequence Based Typing
SCr Serum creatinine
SDS Sodium Dodecyl Sulphate
Sf9 Spodoptera frugiperda-9 (cell)
SFM Serum-Free Medium
SSOP Sequence-Specific Oligonucleotide Probing
SSP Sequence-Specific Priming
STR Short Tandem Repeat
TAP Transporter Associated Protein
Taq Thermus aquaticus
TBE Tris-Boric acid-EDTA
TCR T-Cell Receptor
TEMED Tetramethylethylenediamine
Th T-helper
TLR Toll-Like Receptors
TM Transmembrane Region
Tm Melting temperature
TNF Tumour Necrosis Factor
ULBP UL16-Binding Protein
UNOS United Organ Sharing scheme
WHO World Health Organisation

Chapter 1
23
CHAPTER 1
Introduction
1.1 The Human Immune System
The immune system in humans employs of a variety of mechanisms involving interactions
between different cells and tissues in the body, with the aim of protecting the host from
infections and cellular abnormalities. There are several levels of defence involved in
preventing unwanted pathogens such as bacteria, viruses, parasites and fungi from entering
the body and causing damage. The skin is the main barrier against infection and when
penetrated, cells and factors of the innate immune system can quickly eradicate pathogens,
as the first line of cellular defence. The next level of defence is provided by the adaptive
immune system where cells can acquire „memory‟ of their first encounter with their specific
antigen and when presented with the same antigen again, can react with a fast and efficient
response. The adaptive immune response has evolved to provide an army of lymphocytes,
with each cell capable of recognising a separate antigen from an almost infinite variety.
Therefore these specialist cells possess specificity and memory for any substance that is not
a constituent of „self‟ providing the capacity to eradicate most pathogens that can be
encountered in a lifetime (Bonilla and Oettgen, 2010).
1.1.1 Innate Immunity
Innate immunity, as the name suggests, is present from birth and lasts for the lifetime of the
individual. The term non-specific immunity can also be used, referring not only to cell-
mediated defence against pathogens but also the physical and anatomical barriers that are
designed to prevent entry of organisms into the body. The first physical defence that must
be breached for a pathogen to establish an infection are the epithelial surfaces, such as the
skin, which provide the first defence against infection with a tough and impenetrable
barrier. The epithelial surfaces lining the body orifices of the respiratory, gastrointestinal
and urogenital tracts are more vulnerable to infection. They are known as the mucosal
surfaces or mucosa and are constantly bathed in mucous secreted by the epithelia forming a
thick fluid layer containing glycoproteins, proteoglycans and enzymes that protect the
epithelial cells and limit opportunistic infections (Knight and Holgate, 2003; M. W. Russell
and Mestecky, 2010; Turner, 2009). For example, secretions such as tears and saliva
Chapter 1
24
contain enzymes that have anti-bacterial properties, such as lysozyme (McClellan, 1997).
To keep respiratory airways free from dust and microorganisms, specialised goblet-cells
secret mucous, and their protruding cilia beat in a wave-like manner to move mucous and
particles towards the oesophagus where they can then be swallowed (Knight and Holgate,
2003). Material that enters the stomach is also a potential source of infection however the
acidic environment helps eliminate pathogens (Skillman and Silen, 1972). Thus, our body‟s
physical and chemical barriers can defend us against the magnitude of pathogens present in
the external environment. However, these barriers can be breached by physical damage,
such as wounds or burns, allowing entry of pathogens into the body where they face the
next level of defence: the inflammatory response.
Effector cells such as neutrophils, macrophages and dendritic cells (DC) have the primary
function of identifying, ingesting and destroying microorganisms. Together, effector cells
mediate the inflammatory response. The process by which particles or bacteria are engulfed
is called phagocytosis, therefore neutrophils, macrophages and DCs can collectively be
referred to as phagocytes. Macrophages are long-lived cells residing in infected tissues and
are the first phagocytic cells to come into contact with an invading microorganism,
secreting soluble proteins called cytokines that attract other cells such as neutrophils to the
site of infection. Other factors are also secreted by macrophages and act as anti-bacterial
agents that amplify the inflammatory response (Valledor et al., 2010). Neutrophils are
short-lived cells specialised for phagocytosis of pathogens and are the primary and most
abundant cell in inflamed tissues. They are rapidly mobilised, can act in aerobic and non-
aerobic conditions and often die at the site of infection giving rise to pus (Summers et al.,
2010). Cytokines secreted by phagocytes can induce local dilation of blood capillaries and
change the adhesive properties of the vascular epithelium allowing phagocytes and other
white blood cells to bind and migrate out of the blood into the inflamed tissue (Ley et al.,
2007). Infiltration of cells into inflamed tissues increases swelling, redness and dilation of
blood vessels allowing leakage of plasma into the inflamed area (oedema) and factors
secreted by effector cells can produce local pain. These physical features of inflammation
have been known for a long time and are traditionally defined by the Latin: calor, dolor,
rubor and tumor, meaning heat, pain, redness and swelling (White et al., 2005).
Phagocytes can become activated by specific recognition of structures that are unique to
pathogens through interaction of their Toll-Like Receptors (TLR) with microbial antigens
such as lipopolysaccharide (LPS) (Trinchieri and Sher, 2007). There are an increasing
number of TLRs being recognised in humans and are defined as pattern recognition

Chapter 1
25
receptors (PRR) that recognise pathogen-associated molecular patterns or PAMPs such as
LPS or deoxyribonucleic acid/ribonucleic acid (DNA/RNA) (Meylan et al., 2006). As well
as cell-bound PRR, soluble recognition molecules can enter sites of inflammation via
infiltrating plasma as a result of oedema. One member of the pentraxin family of plasma
proteins is C-reactive protein (CRP), which can bind to several different species of bacteria
and fungi. A member of the collectin family of plasma proteins is mannose-binding lectin
(MBL) and binds carbohydrates with a terminal mannose, typically found in microbial cell
surface glycoproteins and glycolipids (Apostolopoulos and McKenzie, 2001). Therefore
both CRP and MBL have specificity for pathogen-derived molecular patterns and have the
function of „opsonising‟ or coating the microorganism to allow the mechanism of
complement activation. Complement is the name for a group of plasma proteins involved
in an enzymatic cascade, initiated by the binding of complement component C1q to CRP or
MBL on the surface of the microbe. Complement activation is a general effector
mechanism of the immune system, responsible for antibody-mediated cell lysis associated
with humoral adaptive immunity in addition to innate immunity (Tomlinson, 1993).
Complement proteins bound to pathogens associate with specific complement receptors
expressed by phagocytes, triggering their engulfment and elimination. The soluble
complement fragments released during the enzymatic cascade enable recruitment of
additional phagocytic effector cells to the site of inflammation, enhancing pathogen
clearance (Tomlinson, 1993).
Another important cellular component of the innate immune response is a cell related to the
lymphocyte called the Natural Killer (NK) cell. NK-cells are derived from the same
lymphoid stem cell progenitor as T and B-cells and are characterised by their expression of
CD56 and absence of the CD3 molecule found on all T-cells (Rees, 1990). They recognise
infected or stressed cells and respond quickly and directly, killing them by secretion of
potent inflammatory cytokines that mediate killing without prior activation, resulting in the
term „Natural Killer‟ (Kiessling et al., 1975a; Kiessling et al., 1975b). The effector
functions of NK-cells are to kill infected or stressed cells and activate macrophages to
destroy phagocytosed microbes by secreting interferon-gamma (IFN-). NK-cells contain
protein granules that are released by exocytosis and act on adjacent cells. One of the
granules, called perforin, initiates lysis by making a hole in the target cell through which
other granules called granzymes can enter the cell cytoplasm and cause the cell to undergo
apoptosis. NK-cells have several important roles in the defence against intracellular
microbes and are able to directly kill virally infected cells in the early phase of viral
infection. When effector T-cells are formed and arrive at the site of infection, they become

Chapter 1
26
the main source of IFN- and cell-mediated cytotoxicity and secrete an inhibitory cytokine
called IL-10, deactivating NK-cells (Biron et al., 1999).
An important feature of NK-cells is their sensitivity to cells lacking HLA class I molecules,
allowing them to identify virally infected cells that have escaped detection by T-cells,
known as the „missing-self hypothesis‟ (Karre et al., 1986). Cell surface molecules
expressed by NK-cells can induce activatory and inhibitory signals to regulate their activity
and diverge into three groups called Killer-cell Immunoglobulin-like Receptors (KIR), the
C-type lectin domain and Leucocyte Immunoglobulin-like Receptors (LIR) (Sawicki et al.,
2001). Activating signals must be blocked by inhibitory signals to prevent NK-cell
activation which is achieved by the binding of KIRs to their HLA class I ligands.
Deficiency of HLA class I molecules leads to NK-cell activation (Karre et al., 1986; Lanier,
2005; Vilches and Parham, 2002). Activating receptors on NK-cells also recognise ligands
expressed on cells that have undergone stress, been infected by a virus or become
malignantly transformed, activating NK-cells without the requirement of a second signal.
One of the most studied NK-cell receptors is NKG2D and its ligands are structurally similar
to HLA class I molecules (Bauer et al., 1999; Wu et al., 1999). In humans these ligands are
MHC class I-related Chain A and B (MICA and MICB) and UL16-binding proteins
(ULBP1-6) (Eagle and Trowsdale, 2007, Champsaur & Lanier, 2010). Among these,
MICA has been the most widely studied as it displays considerable polymorphism, may be
involved in autoimmunity and transplant rejection and has recently become recognised as
an important molecule in tumour immunosurveillance (Salih et al., 2002). MICA
expression is up-regulated in response to stress as a danger signal to NK-cells, effectively
marking the MICA-bearing cell for destruction by engagement of NKG2D and NK-cell
degranulation (Bauer et al., 1999). Therefore NK-cells are important for the normal day-to-
day surveillance of the body‟s cells, able to rapidly respond to changes that indicate viral
infection or malignant transformation.
1.1.2 Adaptive Immunity
Just as the innate immune system relies on specialised cellular functions, the adaptive
immune response has evolved complex and specialised mechanisms. The properties that
make these cells distinct from innate immunity are their specificity for a particular antigen
and their capacity for memory of antigenic encounters. The ability to remember a primary
encounter with an antigen enables subsequent exposure to result in a much faster and more
potent cytotoxic response (Bonilla and Oettgen, 2010). This role is carried out by

Chapter 1
27
lymphocytes descended from a common lymphoid progenitor, called T-cells and B-cells;
their names reflecting the different sites at which they undergo maturation: the Thymus (T-
cells) or the Bone marrow (B-cells) (Prchal et al., 1978). T-cells and B-cells can be
characterised by their distinct cell surface markers. T-cells express CD3 in addition to
either CD4 or CD8 molecules while B-cells are characterised by expression of CD19, CD20
and CD21. T-cells are further categorised as either the more common or -T-cell
depending on the extracellular subunits of their T-cell receptor (TCR) and have slightly
different functions (Kang and Raulet, 1997).
1.1.3 Generation of effector B-cells
Upon activation, B-cells differentiate into plasma cells and have a unique function in
immunity, as they are the only cell type able to synthesise and secrete antibody. Antibodies
are variable antigen-specific proteins known as immunoglobulins (Ig) that circulate the
body as a major constituent of plasma in blood and lymph and specifically target their
antigen by binding to it. There are five classes or isotypes of immunoglobulin: IgG, IgA,
IgM, IgD and IgE that differ in their structure and effector functions. The binding of
antibody renders the pathogen susceptible to other components and cells of the immune
system, heralding its destruction. Each antibody has a unique specificity for a particular
antigen covering a vast array of substances that may be encountered in a person‟s lifetime.
Antibodies are glycoproteins consisting of a basic unit of four polypeptide chains forming
two identical heavy chains and two identical but smaller light chains that create a structure
resembling the letter „Y‟. Polypeptide chains of different antibodies vary considerably in
their amino acid sequence but this variability is concentrated in one area called the variable
region. This variability is responsible for antigenic specificity and the heavy and light chain
variable regions form the two antigen binding sites. The remaining part of the antibody
does not differ and is called the constant region. Most genes are encoded by exons and
introns that are readily transcribed and this is the case for the leader peptide and constant
regions of Ig. However, the variable regions are encoded by two variable light chain and
three variable heavy chain gene segments and rearrangement is required to produce an exon
that can be transcribed. The light chain variable region is encoded by variable (V) and
joining (J) gene segments and the heavy chain has an additional set of diversity (D) gene
segments. The V, J and D gene segments have a number of variants and can be randomly
rearranged by cutting and splicing the DNA, known as DNA recombination (Fanning et al.,
1996). This process occurs during the development of B-cells in the bone marrow and is

Chapter 1
28
called somatic recombination. The unique rearrangement of V, D and J gene segments
leads to the extreme diversity and specificity of immunoglobulin binding sites. Once the
antibody molecule encounters its antigen, the specificity can be enhanced by single
nucleotide changes within the variable region in a process known as somatic hypermutation
(Weill and Reynaud, 1996). This final change in specificity ensures that only B-cells
producing antibody with the strongest affinity will become antibody-secreting plasma cells
(Hozumi and Tonegawa, 1976; Lefranc and Lefranc, 1980).
Naïve B-cells circulate the body and carry out immunosurveillance via their membrane
bound antigen-specific IgM or IgD molecules. B-cells can become activated by an
encounter with antigen and undergo somatic hypermutation and clonal expansion leading to
the development of effector, plasma cells secreting antibody, and memory B-cells. The
soluble IgM secreted by plasma cells is monoclonal and can inactivate antigens such as
extracellular pathogens or soluble toxins by neutralisation, opsonisation and complement
activation. Multiple epitopes can also be a target for B-cell receptors, giving rise to
polyclonal antibodies against a single antigen. Memory B-cells remain in the lymphatic
system and following a secondary exposure to the same antigen, can become plasma cells
and instead of IgM, produce IgG by isotype switching, giving rise to long-term immunity to
an antigen (Gowans and Uhr, 1966). Approximately 80% of serum Ig is in the form of IgG.
B-cells can also be activated by synergistic interplay with another cell of the adaptive
immune response, the T-cell (Gowans, 1966).
1.1.4 Generation of effector T-cells
T-cells are the main component of the adaptive immune response and although originating
in the bone marrow, undergo education and maturation in the thymus. T-cells can perform
cell-mediated immunity against intracellular pathogens including viruses, bacteria and
parasites, and like B-cells generate memory as well as specificity. There are two broad
subsets of T-cells based on their expression of cell-surface markers CD4 or CD8 and each
have distinct functions. CD8+ T-cells are known as cytotoxic T lymphocytes (CTLs) and
can directly kill or lyse cells that have been infected (Landegren et al., 1982). CD4
expressing T-cells give „help‟ to other cell types and are known as T-helper (Th) cells that
can be divided into Th1, Th2 and Th17 subtypes based on differential phenotypic
expression, cytokine secretion and the type of cells they help. Th1 cells can stimulate and
activate macrophages and B-cells via cytokine secretion (Stout and Bottomly, 1989). Th2
cells can activate B-cells that have encountered their antigen via synergic recognition of an

Chapter 1
29
antigenic peptide presented on the B-cell receptor, thus giving help to B-cells to
differentiate into antibody-secreting plasma cells. Th2 cell effector function is carried out
in the lymphoid tissues whereas Th1 and CD8 CTLs must migrate to the site of infection
(Mosmann and Coffman, 1989a, b). Th17 cells are a new addition to the T-helper cell
group, characterised by secretion of IL-17A with the role of mediating recruitment of
neutrophils and macrophages to the site of infection (Bettelli et al., 2007).
Recognition of antigen by T-cells is facilitated by the highly specific TCR. There are two
types of TCR, the and the , the former being the most commonly expressed, while T-
cells bearing -TCR are relatively few (Kreslavsky and von Boehmer, 2010). The -
TCR is a membrane-bound glycoprotein heterodimer composed of and heavy chains
with variable regions at their distal domains. The specificity of the TCR variable region is
determined by gene segment rearrangement but does not interact with or recognise intact
antigens, rather individual peptides (Lanier et al., 1987). Therefore T-cells must be
presented with their specific antigen via other cell types known as professional antigen
presenting cells (APC), such as DCs or B-cells. The Human Leucocyte Antigen (HLA)
gene in humans, located within the Major Histocompatibility Complex (MHC), encodes the
cell surface molecules responsible for peptide presentation to T-cells. TCRs can only
respond appropriately to an antigen if presented by an HLA molecule of the host, a
phenomenon termed MHC restriction and originally observed by Zinkernagel and Doherty
(Zinkernagel and Doherty, 1974, 1979).
1.1.5 The Major Histocompatibility Complex
MHC molecules are essential for ensuring that the appropriate T-cell class is activated by
stimulation with a particular source of infection. There are two types, or classes, of MHC
molecules known as MHC class I and MHC class II, with each presenting peptides to CD8
and CD4 T-cells, respectively. CD8 T-cells recognise peptides of intracellular origin
presented by MHC class I molecules and CD4 T-cells present peptides from antigens of
extracellular origin via MHC class II molecules. Specific interactions between CD4 or CD8
glycoproteins and MHC class I or II occur when a TCR recognises its specific peptide and
MHC molecule. This involvement of CD4 and CD8 with immune recognition gives them a
role as co-receptors (McMichael, 1980).

Chapter 1
30
MHC class I and class II molecules have similar three-dimensional structures comprised of
differing elements. The MHC class I molecule has a transmembrane heavy -chain non-
covalently complexed with a protein called 2-microglobulin. The three extracellular
domains of the heavy chain are called -1, -2 and -3, with the folding of the -1 and -2
domains forming the peptide-binding region, which is supported by 2-microglobulin
(Bjorkman et al., 1987). The -3 domain provides the binding site for CD8 co-receptors
(Norment and Littman, 1988). MHC class II molecules comprise two transmembrane and
heavy chains each having two extracellular domains. The distal and domains form
the peptide binding groove and the 2-domain nearest the cell membrane provides a
binding site for CD4 co-receptors (Stern and Wiley, 1994).
Proteins derived from bacteria or viruses as well as proteins derived from self-molecules
must be processed and presented as peptides by MHC class I and II molecules in order to be
recognised by a TCR. Proteins from within the cell are processed by the MHC class I
pathway and extracellular proteins by the MHC class II pathway as illustrated and described
in Figure 1.1.1.
HLA class I and class II molecules also differ by the size of peptide that can be bound.
Peptides presented by HLA class I molecules are around nine amino acids in length and
bind the HLA molecule via anchor residues at either end of the peptide. Peptides associated
with class II molecules are generally longer, between 10-34 amino acids, and are fixed by
multiple anchor residues. Openings at either end of the binding groove allow extended
lengths of peptide to protrude (Madden, 1995).
The TCR is capable of recognising an infinite number of peptides by rearrangement of gene
segments in a similar manner to antibody hypervariable regions. In addition, thymic
education attempts to ensure that immune responses are not inappropriately generated
against self-antigens by a mechanism known as peripheral tolerance (Walker and Abbas,
2002). Immune responses against pathogenic or non-self antigens can also be enhanced by
the conformation of peptides bound to HLA molecules and depending on the HLA
molecule, a different repertoire of peptides may bind. These attributes, acquired through
polymorphism of HLA molecules, have occurred through evolution and natural selection as
a mechanism of ensuring that during pandemic infections, some individuals will remain
infection-free (Bodmer, 1975; Parham et al., 1989; Piazza et al., 1980).

Chapter 1
31
Figure 1.1.1: Antigen processing and presentation by MHC class I and class II molecules. Peptides
presented by HLA class I molecules are produced by proteosomal digestion of intracellular components,
including pathogens, within the cytosol of cells and are shuttled to the Endoplastic Reticulum (ER) by a
protein called the Transporter associated with Antigen Presentation (TAP). Within the ER, MHC class I
molecules are transcribed and stabilised by chaperone molecules before binding with 2-m. Peptides
derived from proteosomal digestion of proteins associate with newly formed HLA class I molecules
making them stable. Complexes are transported in vesicles to the cell surface to engage with CD8+
TCRs. By contrast, HLA class II peptides are derived from extracellular antigens engulfed by the cell in
a process called endocytosis and transported inwards inside vesicles. Increasing acidity activates
proteases and hydrolases within the vesicle, degrading the antigen and producing peptides from the
proteins and glycoproteins. Inside the ER, newly transcribed class II molecules are stabilised by
chaperone molecules and are prevented from binding peptides by association with an invariant chain.
The class II:invariant chain complex then leaves the ER in vesicles where the invariant chain is degraded
by enzymes, activated in changing pH, leaving a small fragment called CLIP in the peptide binding
groove. The vesicle then fuses with a vesicle containing peptides where a vesicle membrane protein,
HLA-DM releases CLIP. Peptides then become bound to HLA class II molecules and the complexes are
carried to the cell surface by outward-bound vesicles where they present their peptide to CD4+ T-cells
(Trombetta and Mellman, 2005).
1.1.6 HLA Polymorphism
The MHC molecules and other proteins involved in antigen processing and presentation, are
encoded by the MHC genes situated on the short arm of chromosome 6 (6p21.3) (Ziegler et
al., 1990). The striking feature of HLA class I and II molecules is their extensive
variability between individuals, termed polymorphism. HLA class I molecules are encoded
by HLA-A, B and C genes and class II molecules by HLA-DR, DQ and DP genes as shown
in Figure 1.1.2.

Chapter 1
32
Figure 1.1.2: Genomic organisation of the MHC region. The human MHC region encompasses 3.6
Megabases on chromosome 6 and contains over 200 gene loci including all HLA genes and many
immune regulatory genes. HLA-A, B and C genes are encoded within the class I region and HLA-DR,
DQ and DP genes within the class II region. (Klein and Sato, 2000).
HLA class I and II molecules are encoded by inherited genes and ensure diversity by two
mechanisms. For each loci, two genes are expressed, one inherited from the mother and the
other from the father, thus a total of twelve different HLA molecules can be expressed from
the six classical HLA gene loci. The second mechanism of generating diversity of the
MHC is by genetic polymorphism that arises from changes in the nucleotide structure of
HLA gene loci and hence the amino acid structure can be altered. This has resulted in the
evolution of thousands of HLA allelic variants making the HLA genes the most
polymorphic genetic system to be discovered. Currently (IMGT/HLA Release 3.4.0 April
2011) there are over 6400 HLA alleles, and those encoded by the classical HLA loci are
detailed in Table 1.1.1 (Robinson et al., 2001).
Table 1.1.1: The allelic repertoire of classical HLA genes1
HLA class I loci Alleles HLA class II loci Alleles
HLA-A 1601 HLA-DRB 1027
HLA-B 2125 HLA-DQB1 153
HLA-C 1102 HLA-DPB1 149
1IMGT/HLA release 3.4.0, April 2011

Chapter 1
33
Extensive polymorphism of HLA alleles ensures that most individuals will inherit a
different allele from each parent and therefore become heterozygous for all their HLA
genes. This is known as the heterozygote advantage as there is a greater chance that
infection can be overcome with two versions of an HLA molecule, able to present slightly
different peptides (Hughes and Nei, 1988). Genetic variation of HLA alleles has evolved
through positive selection resulting in differences that are concentrated in the regions
involving peptide binding and interaction with the TCR (-1 and -2 regions of the class I
loci and the -1 region of class II gene products). The combination of alleles that can be
inherited on each chromosome 6 is called a haplotype and heterozygous individuals have
two haplotypes.
1.2 Solid Organ Transplantation
Human organ transplantation is one of the most remarkable developments in medical
science in recent times, providing a routine life-enhancing procedure and facilitating
emergency life-saving intervention. The first successful living-related donor kidney
transplant between identical twins took place in 1954, performed by Dr. Joseph E. Murray
at Peter Bent Brigham Hospital in Boston, USA. The transplant was from Ronald Herrick
into his identical twin Richard who lived for a further eight years. Murray became a winner
of the 1990 Nobel Prize along with E.D. Thomas “for their discoveries concerning organ
and cell transplantation in the treatment of human disease” (Murray, 1994). An increasing
understanding of the immunological mechanisms of graft rejection and the development of
drugs to inhibit them has brought about a revolution in organ transplantation.
An organ transplant or „graft‟ has several classifications. An autograft is from one site on
an individual to another, for example a skin graft. An isograft (also called syngeneic graft)
is between genetically syngeneic individuals, i.e., identical twins. An allograft is between
members of the same species but who are genetically different, for example siblings and
finally, a xenograft is between different species. The main two categories used are
autograft and allograft and these treat or cure many conditions as listed in Table 1.2.1. It
was recognised over a 100 years ago that autografts and isografts would succeed whereas
allografts failed (Karamehic et al., 2008). Modern transplantation dates back to World War
II when many burned airforce pilots were treated by attempting skin grafts, which was a
complete failure (Medawar, 1948). Peter Medawer described the inflammatory reaction
that was observed as rejection. “Skin grafts between genetically unrelated individuals will

Chapter 1
34
undergo necrosis and fall off in seven to ten days” (Medawar, 1956). A repeat transplant
using the same pair rejected more rapidly and experiments in mice and rabbits led to the
conclusion that the „accelerated‟ rejection of a second graft can be adoptively transferred by
lymphocytes and that graft rejection exhibits both memory and specificity (Medawar,
1956). Other observations forming evidence of rejection being an immunological
phenomenon are infiltration of lymphocytes and monocytes as seen in biopsies of rejected
allografts.
Table 1.2.1: Types of solid organ transplantation and conditions they are used to treat
Transplanted Organ Reason
Kidney End-stage renal failure
Lung, heart/lung Pulmonary hypertension, cystic fibrosis
Liver Cirrhosis, cancer, biliary atresia
Heart Cardiomyopathy, congenital heart disease
Cornea Dystrophy, keratitis
Pancreas or islets Diabetes
Small bowel Cancer
Skin Burns
1.2.1 The immune response in organ transplantation
There are three stages involved in the immune response to alloantigens. The first stage is
the recognition of alloantigens presented to naïve host T-cells either directly or indirectly.
The second stage is proliferation and activation of primed alloreactive T-cells and the third
stage is allograft destruction by effector cells. Figure 1.2.1 depicts and describes the three
stages of the alloreactive response via the direct and indirect pathways.
Direct allorecognition occurs when donor APCs, mainly DCs migrate to the lymph nodes
and spleen where they stimulate CD4+ and CD8+ T-cells directly via donor MHC
molecules on the surface of the DC (Rogers and Lechler, 2001). Indirect allorecognition is
where host DCs engulf donor antigens (class I or class II and also minor histocompatibility
antigens) that have been shed from the graft and after processing present them as peptides
to CD4+ T-cells in the context of self-MHC (of the recipient) thus stimulating host CD4+
T-cells leading not only to cell-mediated immunity but also antibody production by B-cells
(Baker et al., 2001; Gokmen et al., 2008).

Chapter 1
35
Figure 1.2.1: Diagrammatic representation of cellular events leading to an alloimmune response. Antigen is recognised directly or indirectly by T-cells interacting with donor or recipient DCs, activating
effector cells. Activated cytotoxic CD8 cells recognising foreign MHC class I migrate to the allograft
where the release of perforin and granzyme granules kills cells. Effector CD4 cells recognising foreign
MHC class II kill graft cells by the interaction of Fas/FasL. Activated macrophages release cytotoxic
granules, and antibodies to graft antigens cause activation of complement. Modified from Le Moine et
al., 2002 (Permission granted by Wolters Kluwer Health).
The interaction of the TCR with antigen has high specificity but low affinity requiring a
second signal, or co-stimulation, before T-cell activation can occur. Stimulation of the TCR
without the second signal results in the T-cell becoming anergised (Matzinger, 1999). Co-
stimulatory molecules are expressed on activated donor and recipient APCs. B7 and CD40
ligands interact with CD28 and CD40L respectively on the T-cell membrane resulting in the
induction of several intracellular signals. Interaction of CD28 with B7 results in production
and secretion of IL-2 by the CD4+ T-cell recognising intact donor class II molecules via the
direct pathway and donor-derived MHC peptides via the indirect pathway (Gokmen et al.,
2008). Either way, IL-2 activates host CD8+ T-cells that recognise class I peptides of the
donor presented by donor DCs via direct allorecognition. The CD8+ cells become activated
and secrete IFN- that acts on CD4+ T-cells involved in direct and indirect allorecognition,
leading to a Th1 response. Alloreactive B-cells interact with Th1 CD4+ cells, arising from
the indirect pathway, and produce alloantibodies (Le Moine et al., 2002; Pettigrew et al.,
1998). The end result is the production of effector cells. CD4+ and CD8+ T-cells
recognise donor antigens and proliferate in response to IL-2. The production of IFN- by

Chapter 1
36
the activated T-cells activates macrophages and antigen recognition by B-cells together
with help from activated CD4+ T-cells leads to the proliferation of plasma cells secreting
alloantibodies. IFN- also up-regulates the expression of donor MHC on the allograft
creating more targets for tissue destruction (Le Moine et al., 2002).
Alloreactive T-cells migrate out of the lymph node to the site of the graft, guided by a
chemo-attractant gradient of chemokines released from the graft mainly due to ischaemia
and reperfusion injury (inflammation) but also by infiltrating alloreactive cells. The T-cells
are now cytotoxic and can to kill their targets by two main mechanisms, perforin/granzyme
and Fas/Fas-ligand (FasL). CD8+ cytotoxic T-cells synthesise and release perforin and
granzyme granules (Berke, 1995), leading to apoptosis. Fas/FasL interaction is the most
important mechanism for cytotoxic CD4+ T-cells and results in the death inducing signal
complex leading to target cell apoptosis. Activated macrophages release toxic molecules,
for example nitric oxide and tumour necrosis factor-alpha (TNF-) which also kills target
cells. Alloreactive B-cells engulf the Ig and HLA complex and present the peptides via
their class II molecule to CD4+ Th1 cells originating from the indirect pathway. The co-
stimulatory signal is provided by interaction of CD40L expressed on the Th1 cell and CD40
expressed on the B-cell. Th1 cells give help to the B-cell in the form of IL-2 to mature into
plasma cells and produce antibodies, which opsonise the target cell (Chinen and Buckley,
2010). The subsequent binding of IgM and IgG1 activates the complement cascade, giving
rise to the membrane attack complex and target cell apoptosis. Additionally, NK-cells may
bind IgG1 with their Fc (CD16) receptor on antibody-coated cells. The cross-linking of
NK-cells and Fc causes perforin/granzyme-mediated NK cytotoxicity, known as antibody-
dependent cellular cytotoxicity (ADCC). Cytokines and factors, released by all effector
cells, attract other inflammatory cells to the site, leading to more immune-mediated damage
(Le Moine et al., 2002).
1.2.2 Classification of Allograft Rejection
Rejection may occur at any time following a transplant and the patient must be monitored to
detect problems and given treatment accordingly. The classification of rejection into early,
short-term and long-term reflects the differing immunological mechanisms involved.

Chapter 1
37
Hyperacute rejection
Hyperacute rejection (HAR) occurs rapidly, following re-vascularisation of an allograft,
caused by preformed antibodies to the graft present in the serum of the patient. Anti-HLA
antibodies that occur in response to prior blood transfusions, multiple pregnancies, previous
transplants or antibodies against the ABO blood group system all have the potential to cause
HAR (McAlack et al., 1987; Rego et al., 1987). HAR damages the endothelial cell lining
of the blood vessels. Leakage of cells and fluid causes aggregation of platelets that block
the microvasculature, leading to ischaemia (restriction in blood supply) and loss of function
(Olszewski and Lukasiewicz, 1973). HAR can be avoided by performing ABO blood group
matching, HLA antibody screening and crossmatching (described later).
Accelerated Rejection
Accelerated rejection can occur within days or weeks of an organ transplant. If a graft is
given to someone who has been pre-sensitised to antigens expressed on the organ, a
secondary reactivation of memory B and T-cells can occur, leading to an accelerated or
antibody-mediated rejection response. This can occur even if the crossmatch is negative,
although crossmatching significantly decreases the risk (Anderson and Newton, 1975).
Acute rejection
Acute cellular rejection (ACR) occurs within a few weeks or months following a
transplant and early diagnosis is important to allow treatment. Most
immunosuppressive therapy is aimed at preventing T-cell responses to allografts. The
incidence of ACR is around 5-10% in the first year of transplantation for patients
without pre-formed HLA antibodies (Colvin, 2007). Characteristic histological features
of ACR are accumulation of mononuclear cells in the interstitium with inflammation of
the tubules and sometimes arteries. Mononuclear cells, mainly CD4+ and CD8+ T-
cells, are found in the interstitial space around tubules and cause graft damage (Colvin,
2007). Infiltration of T-cells and macrophages into the tubular epithelium is called
tubulitis and is a characteristic lesion for ACR diagnosis.
Acute antibody-mediated rejection (aAMR) is now widely accepted as a separate rejection
mechanism (Colvin, 2007) and antibodies directed against donor antigens cause
approximately 25% of AR episodes. Risk factors are pre-formed HLA antibodies, the
degree of HLA mismatching and decreased immunosuppression (non-compliance). In
addition, aAMR is resistant to all immunosuppression regimes and is therefore difficult to

Chapter 1
38
treat (Lorenz et al., 2004). Acute AMR usually occurs together with ACR, but can occur
independently, effecting targets other than HLA on endothelial cells such as ABO blood
group antigens. The symptoms for aAMR are similar to ACR and a biopsy is required to
confirm diagnosis. The histological pattern for diagnosis shows necrosis of graft vessel
walls with acute inflammation with accumulation of neutrophils and monocytes in
peritubular and glomerular capillaries as shown in Figure 1.2.2 (Racusen et al., 2003).
Figure 1.2.2: Histological features of antibody-mediated rejection. A. Glomerulitis showing
infiltrating monocytes and swollen endothelial cells in capillaries. B. Immunoperoxidase staining of
monocytes and macrophages (top arrow) and peritubular capillaries (lower arrow) magnification 400x.
Racusen et al., 2003 (Permission for reproduction granted by John Wiley and Sons).
Classic signs and symptoms of AR include swelling and tenderness of the allograft. In the
case of renal transplantation, decrease in renal function can be diagnosed by a decrease in
urine volume and estimated glomerular filtration rate (eGFR) or increasing blood urea,
nitrogen and creatinine levels (Torpey et al., 2010, p. 237).
Chronic Allograft Dysfunction
Chronic rejection of renal allografts can involve either or both cellular and antibody-
mediated mechanisms, occurs over months to years and can be recognised by fibrosis
and vascular abnormalities with loss of graft function occurring over a prolonged
period. The pathogenesis of chronic rejection is less well understood than AR and has
become a major cause of allograft loss. Many processes, both immunological and non-
immunological, are thought to be involved. The predominant cause of chronic
rejection, leading to organ failure, is arterial occlusion as a result of proliferation of
intimal smooth muscle cells (Vathsala, 2005). This process is called transplant
arteriopathy and is often seen in failed cardiac and renal allografts. Initially called
chronic rejection, this condition has been renamed chronic allograft dysfunction (CAD)

Chapter 1
39
(Racusen et al., 1999) and can occur within six months to a year after transplantation
with progressive dysfunction occurring over many years.
Other histological features of CAD are transplant glomerulopathy, peritubular
capillaropathy, transplant arteriopathy, interstial fibrosis and tubular atrophy. These
lesions, and their severity in renal biopsies, form the basis of diagnosis of CAD as detailed
by the 2003 Banff Classification of Renal Allograft Pathology (Racusen et al., 1999, 2003).
Transplant glomerulopathy is characterised by duplication of the glomerular basement
membrane and most cases are associated with the presence of donor-specific HLA class II
antibodies with approximately 30-50% demonstrating C4d deposition in the peritubular
capillaries (Colvin, 2007; Lorenz et al., 2004). Histological proof of antibody-mediated
rejection has become possible by the introduction of the C4d stain by Feucht (Feucht,
2003). C4d is an inactive component of the classical complement pathway and remains in
the tissue for several days after AMR. C4d deposition is visualised using
immunofluorescence as intense ring pattern staining in the majority of peritubular
capillaries as shown in Figure 1.2.3. An alternative method using immunoperoxidase can
be used although this is less sensitive. Transplant glomerulopathy revealed by histological
changes and C4d deposition by circulating donor-specific antibodies is diagnostic of CAD.
Figure 1.2.3: Immunofluorescence method of C4d deposition detection. Immunofluorescence shows
peritubular capillary staining of C4d as bright ring patterns, indicating AMR. Racusen et al., 2003
(Permission for reproduction granted by John Wiley and Sons).
Duplication or lamination of the basement membrane, as seen in glomeruli of patients with
transplant glomerulopathy, may also be seen in peritubular capillaries. When damaged
endothelium repairs itself, it forms a new basement membrane layer and multilamination
occurs by repeated injury caused to the graft by alloantibody. This can occur sub-clinically
and only become apparent following CAD or chronic rejection (Lerut et al., 2007).
Chapter 1
40
Interstitial fibrosis and tubular atrophy is not specific for rejection but is an important
histological feature of CAD. Formerly, this lesion was known as chronic allograft
nephropathy (CAN) but this definition is now removed from the Banff system (Solez et al.,
2007). Evidence of these changes indicates donor-specific AMR or T-cell-mediated
rejection.
1.2.3 Prevention and treatment of immunological allograft rejection
Screening and Crossmatching
ABO blood group testing is performed uniformly for all transplants to prevent HAR.
However it is possible to perform transplants from ABO incompatible donors when an
otherwise suitable live donor is found. In this situation there would be time to plan and
prepare the recipient who would require immunodepletion of anti-ABO antibodies by a
process known as plasmapheresis (Thielke et al., 2007).
Patients awaiting organ transplantation are screened for the presence of preformed
antibodies reactive with allogeneic HLA molecules. These antibodies may have arisen
from previous pregnancies, transfusions or transplants and are a risk factor for hyperacute
or acute vascular rejection, both mediated by antibodies. There are a number of different
tests used to screen organ transplant recipients for the presence of HLA specific antibodies.
Complement-Dependant Cytotoxicity (CDC) utilises panels of volunteer sera with known
HLA antibodies and can define specificity and distinguish complement binding IgG and
IgM, but may not be sensitive enough to define all specificities that can potentially be
recognised by the recipient. ELISA (Enzyme-linked immunosorbent assay) can also be
used to detect HLA antibody and specificity directed against immobilised, affinity purified
HLA molecules. Finally, flow cytometry (FC) and Luminex bead technology, are methods
similar to ELISA but more sensitive and can detect specific antibodies against donor
antigens. According to British Transplantation Society guidelines, patients should be
screened every three months and following any sensitisation event, for example blood
transfusion (www.bts.org.uk/transplantation/standards-and-guidelines/).
If a potential donor is identified, the crossmatch test will determine whether or not the
patient has antibodies that will react specifically with cells of the donor organ.
Crossmatching is performed pre-transplant in a similar manner to the detection of HLA
antibody specificity with the CDC test, except the patient‟s serum is only tested for
reactivity with the particular donor‟s lymphocytes. The introduction of CDC-

Chapter 1
41
crossmatching dramatically reduced the incidence of HAR (Patel and Terasaki, 1969)
however, up to 20% of patients still experienced early antibody-mediated AR. This
suggested that the CDC-crossmatch did not detect all DSA leading to the introduction of
more sensitive techniques, including prolonging incubation times (Amico et al., 2008). The
flow-cytometry crossmatch (FC-XM) became available in the 1980‟s and involves
incubating donor lymphocytes with recipient serum and the presence of antibody reactive
with these cells is detected by FC. A positive CDC-crossmatch reflects high titre DSA that
may cause HAR and is contraindication to transplant. However, a positive T-cell FC-XM
with a negative CDC-crossmatch may only indicate increased risk of acute antibody-
mediated rejection. As only B-cells express HLA class II, a B-cell positive, T-cell negative
FC-XM indicates donor specific HLA-DR, DQ or DP antibodies may be present. If B-cell
and T-cell FC-XM are both positive then the recipient has HLA class I and possibly class II
alloantibodies (Tait et al., 2009).
Alloantigens not expressed by B-cells or T-cells such as molecules displayed on renal
endothelial surfaces, may also be targets of antibodies produced by the graft recipient. As a
consequence, T-cell and B-cell FC-XM cannot detect these non-HLA antibodies and current
BTS guidelines do not require their identification. However, methods are being developed
to enable detection of antibodies reactive with donor endothelial cell antigens in organ
transplant recipients as discussed further at the end of this chapter.
HLA Matching
The perfectly matched donor and recipient would be syngeneic, for example monozygotic
twins, however this is rare and major and minor histocompatibility differences between the
donor and recipient usually exist. For kidney transplants from deceased donors it is only
necessary to match for broad HLA antigens and can be achieved in a few hours by
serological methods or PCR-SSP, prior to harvesting the organ from the donor. In practice,
matching is only performed for HLA-A, -B and –DR based on criteria for allocation of
donor organs where a score is given for the number of mismatched HLA antigens. For
example a completely matched donor and recipient would have the score 0-0-0 and a
recipient and donor with a score of 2-2-2 would have all HLA-A, B and DR antigens
mismatched. Often the most suitable recipient is not a complete HLA match and
compromises are made to allow usage of all available organs.
Matching for HLA antigens has a beneficial effect on graft survival (GS) by reducing or
eliminating one or more arms of the immune response to alloantigens. Direct and indirect

Chapter 1
42
activation of T-cells responsible for ACR is dependent on differences in the structure of
class I and class II molecules expressed on the allograft and by the recipient. As HLA
matching is only performed for HLA-A, B and DR, differences at other loci such as HLA-
C, HLA-DQ and HLA-DP may occur. Additionally, minor histocompatibility (H)
mismatches will exist between related and unrelated individuals and may cause ACR,
although more slowly and less intense. For example, cellular responses to proteins encoded
on the male Y chromosome, known as H-Y antigens can occur in females with a graft from
a male.
Patients who require more than one graft are complicated by the additional risk of
sensitisation to HLA and other antigens expressed by their first graft and may require closer
matching of a subsequent graft. HLA matching data from the United Organ Sharing
scheme (UNOS) show that 25% of re-grafted renal transplant patients had no HLA
mismatches (Cecka, 1998). However, this means the patient will have to wait longer for a
suitable kidney with good HLA matching and some patients with rare HLA types may
never find a suitably matched donor. For these patients it may be possible to match only for
HLA-DR and compensate with heavier immunosuppression (Opelz, 1996) although this
does increase the risk of further sensitisation if the graft fails.
Immunosuppression
The strategies used in clinical practice to avoid or delay rejection are known as
immunosuppression. Immunosuppression is the major approach for the prevention and
management of organ rejection and can be tailored to the patient‟s needs. Different
combinations of immunosuppressive drugs can be used at three main stages before and after
transplantation. The first stage is induction therapy, given before the transplant as
prophylaxis against early AR. The combination of drugs taken routinely by patients
following an organ transplant is the second stage, known as maintenance
immunosuppression and can be adjusted by dose. In the event of AR episodes, increased
dose or different drugs can be used (third stage).
Drugs that inhibit or kill T-cells are the most widely used, the most important of which is
cyclosporine. Cyclosporin A (CsA) is a fungal macrolide produced by soil organisms
(Borel and Kis, 1991) and inhibits the transcription of genes by T-cells that encode
cytokines, most notably IL-2. CsA binds with high affinity to a ubiquitous cellular protein
called cyclophilin; the complex of CsA and cyclophilin binds to and inhibits the enzymatic
activity of the protein phosphatase, calcineurin. Calcineurin function is required to activate

Chapter 1
43
the transcription factor NF-AT (nuclear factor of activated T-cells) thus blocking the
transcription of IL-2 and other cytokines, which abrogates IL-2 dependent growth and
differentiation of T-cells (Walsh et al., 1992). FK506, now known as tacrolimus, is another
fungal macrolide with immunosuppressive properties similar to CsA (Tanaka et al., 1987).
Tacrolimus, and its binding protein FKBP, has the ability to bind calcineurin and inhibit its
action, blocking the transcription of IL-2 by activated T-cells. Tacrolimus is less toxic than
CsA and is most frequently used in liver transplant recipients and in cases where CsA has
not properly controlled kidney rejection (Fung et al., 1991; Shapiro et al., 1991).
Another type of immunosuppressive drug is the antibiotic rapamycin (also called sirolimus),
which has a different mode of action but its principal effect is to inhibit T-cell proliferation.
Rapamycin binds FKBP in a similar manner to tacrolimus but the rapamycin and FKBP
complex does not inhibit calcineurin but binds to another molecule called MTOR
(mammalian target of rapamycin). The mechanism inhibiting T-cell proliferation is not
fully understood but may regulate a protein kinase that participates in cell cycle control.
Combination of cyclosporin A and rapamycin blocks IL-2 synthesis and IL-2 driven
proliferation, and are powerful inhibitors of T-cell responses (Vathsala, 2005).
Metabolic toxins inhibit the maturation of lymphocytes from immature precursors and also
kill proliferating mature T-cells that have been stimulated by alloantigens. The first such
drug to be developed for the prevention and treatment of rejection was azathioprine. This
drug is still used but is toxic to precursors of lymphocytes in the bone marrow and
enterocytes in the gut. The newest and most widely used drug in this group is
mycophenolate mofetil (MMF). MMF is metabolised to mycophenolic acid, which blocks a
lymphocyte-specific isoform of inosine monophosphate dehydrogenase, an enzyme
required for de novo synthesis of guanine nucleotides. There are few toxic effects because
MMF selectively inhibits the lymphocyte-specific isoform of this enzyme (Mele and
Halloran, 2000). MMF is now routinely used in combination with cyclosporin A to prevent
AR (Chadban et al., 2008).
Polyclonal T-cell depleting antibodies known as anti-thymocyte globulin (ATG) target CD3
CD4, CD8, HLA class I, HLA class II, cytokine receptors and adhesion molecules. The
ubiquitous targeting of ATG has numerous effects on immunosuppression but can also lead
to T-cell activation (Mohty, 2007). ATG is used for induction therapy in 35% of kidney
and 60% pancreas transplants in the USA but is used less often in the UK (Torpey et al.,
2010, p. 150). Antibodies that react with TCRs and deplete or inhibit T-cells are used for

Chapter 1
44
induction therapy and to treat AR episodes. A mouse monoclonal antibody called OKT3 is
the most widely used and is specific for human CD3. OKT3 acts either as a lytic antibody
by activating the complement system to eliminate T-cells, or opsonises T-cells for
phagocytosis. Another antibody in clinical use targets CD25, the -subunit of the IL-2
receptor. There are two types of this drug called basiliximab (chimeric monoclonal
antibody) and daclizumab (humanised monoclonal antibody) and is used for induction
therapy, preventing T-cell activation by blocking IL-2 binding to activated T-cells, or
depleting CD25-expressing activated T-cells by mechanisms similar to OKT3 (Waid et al.,
1991). Alemtuzumab or Campath 1H is a monoclonal antibody specific for CD52
expressed on T-cells, B-cells, NK-cells, monocytes and macrophages. CD52+ cells are
rapidly cleared from the circulation either by complement-mediated lysis or removal of
opsonised cells in the lymphoid organs (Torpey et al., 2010, p. 154).
Anti-inflammatory drugs are also routinely used for the prevention and treatment of graft
rejection, the most powerful of which are corticosteroids. These natural hormones and their
analogues block the synthesis and secretion of cytokines, including TNF- and IL-1, by
macrophages as well as lymphocytes and DCs. This reduces graft endothelial cell
activation and recruitment of inflammatory cells. Corticosteroids may also block other
effector mechanisms of macrophages, such as the generation of prostaglandins, reactive
oxygen intermediates and nitric oxide. Table 1.2.2 summarises the immunosuppressive
drugs used and their mode of action.
The challenge facing the clinical transplantation team is to balance the individual needs of
each patient with drug efficacy and toxicity to provide adequate protection from AR and
prevent early graft loss. For many years „triple therapy‟ using CsA, azathioprine and
corticosteroids was the gold standard immunosuppressive protocol for all solid organ
transplantation. The introduction of newer drugs such as tacrolimus and MMF and
widespread use of induction therapy drugs such as OKT3 have further decreased AR
however, nephrotoxic effects of calcineurin inhibitors such as CsA, increased
cardiovascular risk and development of malignancy associated with immunosuppression
have also become important considerations. An effective immunosuppression protocol
should provide prophylaxis against AR and maintenance immunosuppression sufficient to
prevent immunological graft damage and also limit toxic effects of drugs by using lower
doses or alternative products.

Chapter 1
45
Table 1.2.2: Methods of immunosuppression in clinical use
Drug Use and Mode of Action
Cyclosporin A and Tacrolimus
Induction and maintenance therapy. Blocks
transcription of genes by T-cells that encode
cytokines, most notably IL-2.
Azathioprine
Induction and maintenance therapy. Blocks
proliferation of lymphocyte precursors by preventing
DNA synthesis.
Mycophenolate mofetil (MMF)
Induction, maintenance and AR therapy. Blocks
lymphocyte proliferation by inhibiting guanine
nucleotide synthesis in lymphocytes.
Rapamycin (Sirolimus)
Maintenance therapy. Binds MTOR preventing T-cell
proliferation.
Anti-thymocyte globulin (ATG)
Induction therapy. Polyclonal antibody that targets
and depletes cells via numerous surface receptors
including CD3, CD4, CD8 and HLA molecules.
OKT3
Induction and AR therapy. Monoclonal antibody.
Depletes T-cells by binding to CD3 and promoting
phagocytosis or complement-mediated lysis.
Basilizimab/Daclizumab
Induction therapy. Monoclonal antibody. Targets
CD25 on activated T-cells and binding prevents IL-2
driven expansion of alloreactive T-cells.
Alemtuzumab (Campath 1H)
Induction therapy. Monoclonal antibody targeting
CD52 expressed on T-, B- and NK-cells, monocytes
and macrophages resulting in depletion by
phagocytosis or complement-mediated lysis.
Corticosteroids Induction, maintenance and AR therapy. Reduces
inflammation by inhibiting cytokine secretion.
1.2.4 Other factors associated with rejection and morbidity
Mechanisms that cause rejection can be due to either immunological or non-immunological
clinical factors, they may also be early or late events after transplantation. Despite
advances in immunosuppressive therapy, 10-30% of kidney allografts are affected by AR
episodes, although organ loss in the first few months has become rare due to improved
procedures (Pascual et al., 2002). The challenge remaining is overcoming chronic allograft
failure.

Chapter 1
46
In renal transplantation, the type of donor kidney used is one of the most important factors
determining long-term allograft survival. Organs from living donors lead to improved short
and long-term outcomes by avoiding the cold-ischaemic injury that occurs during the time
between organ retrieval and reperfusion (Bryan et al., 2001). There is also an avoidance of
long waiting lists and progressive disease in the patient. Donor age is known to have a
considerable influence on GS and nullifies the effect of HLA-matching with donors over 60
years (Arnol et al., 2008; Koka and Cecka, 1990).
Later in the post-transplant course, there may be problems with inadequate graft function
and malignancy. A particular problem is post-transplant lymphoproliferative disorder
which is a lymphoma resulting from the reactivation of Epstein Barr virus (EBV) (Colleoni
et al., 2000). This is more of a problem when an EBV positive donor organ is given to an
EBV negative recipient (Le Moine et al., 2002). Primary problems in all transplants post-
operatively include wound infection, early rejection, bleeding and graft thrombosis
(Vathsala, 2005). Conditions such as co-morbid diabetes mellitus, hypertension,
hyperlipidaemia or the toxic effects of immunosuppressive drugs are also factors, along
with those described above, associated with chronic allograft failure in solid organ
transplantation (Pascual et al., 2002). As the liver has the ability to regenerate itself,
chronic allograft failure is not such a problem.
Sub-optimal immunosuppression can lead to long-term chronic allograft failure as a result
of inadequate dosage by the clinician or non-compliance of the patient with the
immunosuppressive drug regime (Vathsala, 2005). In addition to chronic allograft failure,
some of these factors (as well as smoking and obesity) are also responsible for the
exacerbation of pre-existing conditions such as cardiovascular disease, which is the major
cause of patient death with a functioning allograft. Other causes of death with a functioning
allograft are infections (Le Moine et al., 2002) and malignancy (Agraharkar et al., 2004).
Figure 1.2.4 summarises many of the factors involved in CAD.

Chapter 1
47
Figure 1.2.4: Immunological and non-immunological factors contributing to late allograft loss due
to CAD. Modified from Le Moine et al., 2002 (Permission granted by Wolters Kluwer Health).
1.2.5 Antibodies and their role in transplantation
The extent to which antibodies are implicated with graft destruction and rejection has been
the centre of an on-going debate for many decades. During Medawer‟s experiments, he
attempted to prove a link between rejection of allografts with the production of antibodies
(Medawar, 1948) and in 1950, Peter Gorer took this work further and established an
association of tumour graft destruction with the production of alloantigen-specific
antibodies (Gorer, 1950). However, it was not proven at this time that antibodies caused
any injury to the graft and some investigators questioned whether graft destruction was
actually an immunological mechanism. A few years later, it was found that cells, not
antibodies, were responsible for graft destruction and rejection (Mitchison, 1958) and since
then most attempts at limiting the immune response to transplanted organs have focussed on
suppression of cellular immunity. Modern immunosuppression targeting T-cell function
shows improved short-term GS of 88-95% in the first year of renal and cardiac
transplantation (Colvin and Smith, 2005).
Chronic Allograft
Dysfunction

Chapter 1
48
The first study of antibodies in renal patients following graft loss was published in 1968
(Morris et al., 1968) and revealed 38% of recipients with failed grafts had HLA antibodies.
In 1970, a strong association of circulating donor HLA-specific antibodies and chronic
allograft arteriopathy was found (Jeannet et al., 1970). Later experimental mouse cardiac
allografts showed that passive transfer of alloantibodies induced the development of chronic
allograft arteriopathy but B-cell deficient mice did not develop these lesions (P. S. Russell
et al., 1997).
The percentage of patients with detectable HLA antibodies before graft rejection has
increased over time with improved techniques for their detection. Using FC, 95% of
patients who rejected a kidney were found to have HLA antibodies (Harmer et al., 1995).
In 2002, Lee and Terasaki published a study of 139 renal transplant recipients who were
followed up for eight years and regularly tested for HLA antibodies using ELISA.
Although this is a rather small study, the authors found all 29 patients who developed
chronic rejection produced HLA antibodies before graft failure (P. C. Lee et al., 2002).
The association of HLA antibodies with rejection is evident but does not prove that
antibodies are causing rejection and so the argument has continued to the present day. The
difficulty was visualising the HLA antibodies histologically using the complement product
C3 as a marker, which was not easy to detect in renal tissues. A breakthrough was made in
the 1990s with the advent of C4d deposition in grafts as a marker of complement fixation
(Feucht et al., 1993) and was followed by the discovery that C4d deposition is usually
associated with donor-specific antibodies (A. B. Collins et al., 1999). This improvement in
diagnosis of antibody-mediated rejection together with advances in methods to detect
antibodies with greater sensitivity and specificity, has led to resurgence in the study of
antibody-mediated allograft rejection.
There have been many studies investigating whether a relationship exists between the
production of HLA antibodies and graft failure. The problem is that the results are
extremely variable ranging from 1.6 to 60% (Akalin and Pascual, 2006) of patients with
detectable HLA antibodies post-transplant, probably relating to differences in methods used
to detect antibodies. This is complicated further by some centres measuring DSA and
others only detecting panel reactive antibodies (PRA). To complicate matters even further,
there is considerable variation in the patient populations that are studied, for example some
centres use randomly selected patients while others may select only patients with acute or
chronic rejection. The time of sample collection and testing also varies.

Chapter 1
49
The assays used to detect antibodies are discussed more fully later, but fall into two main
groups. The CDC is a cellular assay that detects HLA antibodies present in the patient‟s
serum by reactivity with a panel of cells collected from cell donors with common and rare
HLA types (PRA). Antibodies against HLA class I or II can be detected by using either T
or B-cells, respectively and results are reported as %PRA, for example if the patient‟s
serum reacts with 20 of 40 different cells, the PRA would be 50%. Other tests are known as
solid-phase assays and use purified or recombinant HLA antigens fixed to a solid surface.
The ELISA was the first solid-phase assay to detect HLA antibodies with greater sensitivity
than CDC but sensitivity was considerably increased with the introduction of FC beads,
coated with HLA antigens. Beads used for antibody detection may be coated with many
different HLA antigens for use in a screening assay, or an individual antigen can be used
with a specific-coloured bead to identify the exact specificities of the antibodies in a
patient‟s serum (Luminex). These sensitive techniques have the advantage of detecting
specificities undetected by CDC and as such are not a risk for HAR but may have
implications for aAMR in the early transplant period. Sensitive antibody detection is also
useful to detect the rise of de novo HLA antibodies after transplantation. These tests are
however restricted to detecting anti-HLA antibodies in routine practice but other non-HLA
antibodies may also be clinically relevant.
1.2.6 HLA antibodies and graft rejection
HLA antibodies present before transplantation
Most studies aimed at identifying HLA antibodies as a risk factor for acute and chronic
rejection focus on de novo antibody production post-transplant, but it has been found that
pre-formed HLA antibodies can also affect GS. In an analysis conducted for the
Collaborative Transplant Study (CTS) (Susal and Opelz, 2002), 4136 recipients of kidneys
from deceased donors from 28 centres were tested pre-transplant by ELISA for HLA class I
and II antibodies and GS at two years was analysed. The study revealed pre-sensitisation to
either HLA class I or II was not a risk factor for graft loss whereas having both types of
antibody associated with graft rejection (P<0.001). This was confirmed by the CTS in
another series of 5315 patients where, as before, patients who simultaneously produced both
classes of HLA antibody had an increased risk of graft failure (P<0.001), however
association of donor-specific HLA antibodies was not investigated (Susal et al., 2009). In
another, albeit smaller study (Q. Zhang et al., 2005b) 20 of 49 patients (41%) were
sensitised to HLA antigens pre-transplant, seven had class I antibodies, four had class II and

Chapter 1
50
nine had both types as determined by ELISA. The presence of class I and/or class II HLA
antibodies was significantly associated with aAMR (P=0.005), but not ACR. The donor-
specificity of pre-existing HLA antibodies was not investigated, although presumably the
presence of HLA antibodies specific for donor antigens would have been a contraindication
to transplant. It is possible that patients with pre-existing HLA antibodies who developed
AR had non-donor-specific antibodies that cross-reacted with donor antigens.
Alternatively, these patients may have been more likely to develop HLA antibodies and
rejection was associated with de novo production of donor-specific HLA antibodies.
Post-transplant de novo HLA antibody production
Studies have also investigated whether the type of HLA antibody, class I or class II,
developed de novo associates with acute or chronic rejection. In an early study (Martin et
al., 1987) it was demonstrated using CDC-PRA that most de novo antibodies were anti-
HLA class I (50%) and 36% had both classes I and II. Shortly after, a study by Halloran
(Halloran et al., 1992) investigated HLA class I antibodies by CDC in 64 patients within
three months of transplant. They found that all the patients with de novo class I antibodies
developed AR compared to 41% of those with no antibodies. Moreover, those with class I
antibodies had more severe rejection that occurred earlier with a greater incidence of graft
loss.
In Zhang‟s study (Q. Zhang et al., 2005b) de novo HLA antibodies were detected by ELISA
and the results show 12 of 49 patients developed class I antibodies (24%), eight (16%)
developed class II antibodies and 10 (20%) developed both classes of HLA antibody and de
novo HLA antibodies significantly associated with aAMR and ACR. Often cited is a paper
published by Worthington (Worthington et al., 2003) where 60% of patients with HLA
antibodies developed them before rejection, and again the majority had class I antibodies.
An association was also found between the post-transplant production of HLA antibodies
detected by ELISA and AR and graft loss in another study (Fernandez-Fresnedo et al.,
2003). These authors found 62.5% of patients with HLA antibodies (predominantly class I)
developed aAMR and all but one of the patients with HLA class I antibodies lost their grafts
due to AR. In a study of chronic rejection (P. C. Lee et al., 2002) 139 patients were
followed-up for eight years and tested for HLA antibodies using ELISA. Among 29
patients with chronic rejection, 14 developed de novo antibodies, all had class I antibodies
and 86% had class II antibodies. Details were not provided of HLA class I and class II
mismatching by Lee et al, but in the study by Worthington and colleagues and that of
Fernandez-Fresnedo et al, class I mismatching was more frequent. This may indicate that

Chapter 1
51
the higher frequency of class I antibodies detected post-transplant reflects increased HLA
class I mismatching and not that class I antibodies are more likely to be produced.
Alternatively, as discussed further below, HLA class I antibodies may be produced earlier
than class II antibodies, accounting for higher frequencies.
Pelletier and colleagues (Pelletier et al., 2002) used FlowPRA beads to detect HLA
antibodies, revealing a different pattern to that emerging from the literature. In this study
pre-transplant sera was also tested and 18% of 277 recipients developed de novo HLA
antibodies. However, contrary to previous studies, most of these patients produced HLA
class II antibodies only (68%) and multivariate analysis revealed that production of class II
antibodies and not class I was significantly associated with chronic rejection independent of
AR. Unfortunately it was not possible to deduce from this paper whether there was less
HLA class I mismatching. Another study (Campos et al., 2006) also found association of
HLA class II antibodies (ELISA) with chronic graft loss, although pre-transplant sera were
not tested. In this study of 512 first kidney recipients, sera were tested 4.4 years median
time post-transplant. Twenty (4%) had class I HLA antibodies, 55 (11%) had class II and
16 (3%) had both, however details of mismatching was not provided. Univariate analysis
showed that female gender, pregnancies and blood transfusions were associated with class I
antibodies and deterioration in graft function was associated with class II antibodies. Using
multivariate analysis, HLA class II antibodies were an independent risk factor for CAD.
A very large study of 4943 kidney graft recipients from 45 centres was carried out as part of
the 14th International Histocompatibility and Immunogenetics Workshop and Conference
(IHIWC) (Ozawa et al., 2007). In total, 27.2% developed HLA antibodies after more than
six months post-transplant detected by ELISA, Flow beads or Luminex beads, and the
method of detection did not significantly influence the results. A separate analysis of HLA
class I and II antibodies showed association with chronic rejection was highest when both
antibody types were present (9.7%), 7.1% with class II only and 6.1% with class I only.
Donor-specific HLA antibody production
In a study of 263 renal allograft recipients (Supon et al., 2001) the authors used a screening
ELISA and a more specific ELISA to detect DSA (HLA-A, B, C, DR and DQ) and
observed significant association between the presence of DSA against class II HLA
antigens and acute and chronic rejection. Additionally, all five patients with both class I
and class II HLA-DSA lost their grafts. Worthington (Worthington et al., 2003) used the
same methods to detect HLA-DSA and graft recipients were categorised as failure (previous

Chapter 1
52
graft loss) or functioning. All were negative for HLA antibodies before transplantation and
sera was taken at regular intervals for follow-up. Among the 112 patients in the failure
group, 51% produced DSA compared to 1.6% of 123 patients with functioning grafts
(P<0.0001). In 60% of the HLA antibody positive recipients, antibody specificities were
defined before graft failure with seventeen having class I-DSA, fourteen class II-DSA and
three with both HLA class I and II-DSA. These authors also noted a difference in time
taken to develop either class I-DSA or class II-DSA post-transplant, as class I-DSA were
produced at a mean time of 627 days compared to 1542 days for class II-DSA.
One of the first studies to use beads coated with recombinant HLA single antigens (SAg)
was published by Zhang and co-workers (Q. Zhang et al., 2005b). In addition to ELISA
screening and DSA identification for HLA class I and II antibodies, the authors also used
the Labscreen SAg HLA Class I Luminex assay (One Lambda). Forty-nine patients were
prospectively monitored for the development of HLA-DSA and eight (16%) developed
aAMR, eleven (22.4%) were diagnosed with ACR and all patients were negative by CDC
and FC-XM. Sensitisation prior to transplant was revealed in 20 of the 49 patients (41%)
among whom seven (35%) had class I, four (20%) had class II and nine (45%) had both
antibody types. There was a significant correlation of pre-transplant class I and/or class II
HLA antibodies with aAMR (P=0.005) but no association was found with ACR. Serial
analysis of post-transplant sera from the 49 patients showed 22.4% developed DSA whilst
39% of patients had non-donor-specific antibodies (NDSA). Among those who developed
DSA, five had class I-DSA, three had class II-DSA and three had both class I and class II-
DSA. There was a highly significant correlation with HLA-DSA and both aAMR and ACR
(P<0.001) although seven of the eleven patients with ACR had concomitant aAMR, two
patients with HLA-DSA had ACR only. Patients who had only NDSA did not associate
with aAMR or ACR.
The concept that HLA-DSA are dangerous and NDSA are harmless was taken further by
Hourmant (Hourmant et al., 2005) who investigated 1229 renal graft recipients by
prospective annual screening for HLA-DSA during a period of five years using Luminex
and ELISA screening followed by ELISA HLA SAg testing. The screening results showed
16.8% had HLA antibodies post-transplant and 5.5% of patients developed HLA-DSA.
NDSA were detected in 11.3% and appeared between 1 and 5 years whereas DSA were
detected between 5 and 10 years. In multivariate analysis, HLA-DR mismatching, prior
sensitisation and AR significantly associated with the development of both DSA and NDSA
with patients producing HLA antibodies having lower GS and inferior function.
Chapter 1
53
A recent study (P. C. Lee et al., 2009) described SAg Luminex testing for class I and class
II HLA antibodies in two groups of renal graft recipients, with a follow-up of twelve years.
One group of 25 recipients had graft failure due to chronic rejection and a total of 230 sera
were tested while the other group had functioning grafts and 305 sera were tested. Sixty
percent of the failure group developed HLA antibodies within one year compared to none
with functioning grafts and ten-year GS was 27% versus 80%. It was also found that HLA
class I antibodies were produced sooner at a median of 6.6 months and associate with rapid
graft loss, compared to class II antibodies which appeared by a median of 12.5 months and
associated with chronic graft loss. Interestingly, a study of patient‟s early biopsies or
biopsies for clinical indication of rejection found that early biopsies did not associate with
HLA antibodies but de novo HLA class II-DSA associated with late biopsies and
subsequent graft failure (Hidalgo et al., 2009).
Lachmann (Lachmann et al., 2009) included 1014 deceased donor kidney recipients for
analysis of chronic graft loss and HLA antibodies. Thirty percent were found to have HLA
antibodies post-transplant and a third of these patients had HLA-DSA associating with
significantly lower GS of 49% versus 83% in the HLA antibody negative group. This study
showed that HLA-NDSA also associated with reduced GS of 70% versus 83%.
Gaston (Gaston et al., 2010) also investigated late graft failure and association with HLA-
DSA and included C4d deposition analysis. A total of 173 renal graft recipients with new
onset late kidney graft dysfunction were divided into four groups: C4d+ with and without
HLA-DSA and C4d- with and without HLA-DSA. Among the 173 patients, 68 (39%)
demonstrated significant C4d staining whereas 105 (61%) had negative C4d staining.
Among those who were positive for HLA-DSA (41%) using SAg Luminex (One Lambda),
40 stained positive for C4d and 31 were negative. Altogether, 99 of the 173 patients (57%)
with graft dysfunction had C4d, DSA or both

Chapter 1
54
The relevance of HLA antibodies detected post-transplant
The main finding by all the studies discussed above is that HLA antibodies are more
frequent in graft recipients who experience aAMR (or defined as AR) and/or chronic
dysfunction, and both conditions associate with reduced GS. In the majority of studies
investigating de novo production of HLA antibodies, HLA class I antibodies are implicated
with AR. In Halloran‟s study (Halloran et al., 1992) he stated that HLA class I antibodies
are injurious to the graft but class II antibodies are of little or no consequence since class II
antigen expression is limited. However, the study by Worthington (Worthington et al.,
2001) found that class I antibodies generally led to rapid graft failure whereas class II
antibodies were more associated with chronic graft deterioration. This was evidenced by
the differential time taken by each class of antibody to lead to graft failure and agrees with
Pelletier (Pelletier et al., 2002) and Hidalgo‟s findings (Hidalgo et al., 2009). It is probable
Halloran did not detect significant association with class II antibodies because of the time-
point for antibody testing. The relatively short follow-up period of six-months may not
have allowed sufficient time for class II sensitisation and hence did not appear significant.
With improvements in the detection of HLA antibodies due to the introduction of solid-
phase assays such as ELISA and fluorescent bead technology, the identification of
antibodies specific for donor HLA antigens has become possible and is carried out routinely
in many laboratories. What is less clear is how DSA are defined and the relevance of
antibody detected in the periphery. While many studies find significant associations with
the presence of HLA-DSA and graft dysfunction compared to those without DSA, some
studies also show that NDSA can also affect graft outcomes. As HLA antibodies recognise
specific epitopes on HLA antigens, antibody cross-reactivity has been a problem since the
beginning of histocompatibility testing by serology. This has led to the establishment of
cross-reactive groups or CREGs based on epitopes that are shared between different HLA
antigens and, if mismatched, could lead to an alloresponse. Therefore, HLA antibodies
classed as NDSA may in fact be able to react with epitopes expressed on the graft by
recognising a particular epitope and therefore able to cause rejection. Alternatively, a
theory often used to explain non-detection of peripheral HLA antibodies prior to rejection
that can then be detected after nephrectomy, is that alloantibodies are fixed to the graft
where they are causing damage. In this case patients undergoing rejection may not have
detectable HLA-DSA because they are concentrated in the graft whereas NDSA are not and
may be detected in the periphery.

Chapter 1
55
What is not provided by all of the earlier studies and most studies from the mid-1990‟s, is
actual proof that the antibodies are the cause of the rejection and not the result. This can be
determined with the use of Feucht‟s C4d assay (Feucht et al., 1993) but requires the
availability of biopsy samples and highly skilled preparation and analysis by clinical
pathologists. The presence of both circulating DSA and evidence of C4d deposition is a
requirement of the Banff criteria for classification of chronic dysfunction (Racusen et al.,
2003). Several studies have, however, used C4d deposition analysis in conjunction with
DSA detection, including the one described above (Gaston et al., 2010). However, the
results of many other studies show conflicting and inconclusive results. This could be due
to differences in interpretation of results, the different methods used – immunofluorescence
or immunohistochemistry, or other technical difficulties. Now that C4d deposition testing
is used routinely in diagnosis, a clearer correlation with antibody-mediated rejection may be
possible in the near future.
Overall, it is evident HLA antibodies are involved, at least in part, in the pathogenesis of
rejection and that the initial targets of graft destruction leading to early graft loss are HLA
class I antigens. These antibodies may be pre-formed, de novo, donor-specific or non-
donor-specific as all have been implicated in aAMR. HLA class II antibodies also associate
with AR but tend to appear later than class I, perhaps due to less ubiquitous expression of
HLA class II antigens, and are often associated with chronic or late graft failure following
many years. Finally, most studies show co-production of HLA class I and II antibodies are
predictive of a poorer prognosis.
Treatment of antibody-mediated rejection
Rejection of grafts by alloantibodies cannot be treated in the same way as cellular rejection
and treatment is usually much less effective. One approach is to remove antibodies from
the circulation to eliminate further antibody-mediated injury in a process known as plasma
exchange (PEX). PEX requires daily treatment together with solid-phase detection of DSA
until levels begin to fall and must be accompanied by intravenous immunoglobulin (IVIG)
administration. PEX also removes complement components, which further decreases
humoral rejection. An alternative approach is HLA-DSA neutralisation using high dose
IVIG (Jordan et al., 2003) and intense immunosuppression using MMF in place of
azathioprine or CsA has been shown to reduce antibody levels (Dudley et al., 2005).
Immunoadsorption with protein A was evaluated in a randomised trial and it was found that
aAMR was reversed in all five cases whereas four of five patients without
immunoabsorption lost their grafts (Bohmig et al., 2007). Furthermore, it has also been

Chapter 1
56
demonstrated that MICA antibodies (discussed below) can be removed by
immunoadsorption with protein A (Yao et al., 2011). Once antibodies are successfully
removed, treatment with Rituximab (anti-CD20 monoclonal antibody) can be effective by
eliminating B-cells and limiting re-synthesis, although this treatment is expensive and
plasma cells (CD20-) are unaffected, therefore DSA production is not blocked (Torpey et
al., 2010, p. 254). However, none of these treatments have been shown to be completely
effective and success depends on the titre of antibody before treatment.
Antibody responses directed against non-HLA antigens
In a report published by Terasaki (Terasaki, 2003) he stated that 38% of graft failures were
due to non-HLA, 18% to HLA and 43% to non-immunological factors. This implies that
targets other than HLA antigens may also be involved in antibody-mediated graft injury.
The clinical importance of non-HLA antigens is emphasised by reports of HAR of HLA-
identical sibling transplants (Amico et al., 2008) and suggests that non-HLA antibody
targets are important in the pathogenesis of organ rejection. Many of these putative
antigens are tissue-specific such as vimentin, which is expressed on renal tubular and
stromal cells. Autoimmune responses to vimentin associate with acute and chronic
rejection of kidney and heart allografts (Jurcevic et al., 2001) and antibody-mediated
responses to vimentin have been shown to associate with the generation of vimentin-
specific autoreactive CD8 T-cells (Barber et al., 2004). Other non-HLA autoantibodies
include antinuclear, antinucleoprotein, anti-DNA and anti-cytoplasmic antibodies among
others (Nakano et al., 2007). Another non-HLA target of antibodies may be the angiotensin
type 1 receptor (AT1R), which is a receptor for angiotensin II in the glomerulus, regulating
arterial blood pressure and salt balance and is also expressed in other areas of the kidney.
Studies have shown that removal of AT1R antibodies by PEX improved renal function and
GS (Dragun et al., 2005).
Another target of alloantibodies that has emerged over the past ten years is the non-classical
MICA and MICB antigens. The genes that encode these molecules are not only co-
dominantly expressed, as with HLA, but are also highly polymorphic and have emerged as
important targets for rejection in kidney, heart and lung transplantation. Furthermore,
recipients with MICA antibodies can be identified and associate with rejection or reduced
GS, as revealed by the results of many studies and discussed fully in the next section.

Chapter 1
57
1.3 MICA antibody prevalence and its significance in solid organ
transplantation
In 1994 two groups of researchers independently described a new family of genes encoded
within the MHC and related to HLA class I genes called MHC class I-related chain A and B
(MICA and MICB) (Bahram et al., 1994) or Perth Beta block transcript 11 (PERB11)
(Leelayuwat et al., 1994). The World Health Organisation (WHO) nomenclature
committee for factors of the HLA system decided on the more descriptive name adopted by
Bahram and colleagues as official designation. The genes encode molecules that are
strikingly similar to HLA class I, however MICA and MICB do not associate with 2M or
bind or present peptides to T-cells. MICA and MICB are ligands for the NK-cell
activatory receptor NKG2D and expression is up-regulated due to stress such as infection
and malignancy (Bauer et al., 1999). Furthermore, MICA and MICB gene products are
highly polymorphic with 76 MICA and 31 MICB alleles (Release 3.4.0, April 2011)
currently listed on the IMGT/HLA database (Robinson et al., 2001).
1.3.1 Genetic organisation and structure of MIC gene products
The MICA and MICB genes are situated within the MHC region of the genome on
chromosome 6p21.3 centromeric to HLA-B in the class I region (as shown in Figure 1.3.1).
Figure 1.3.1: Genomic organisation of the MHC region. The human MHC region encompasses 3.6
Mb on chromosome 6, contains over 200 gene loci including all HLA genes and many immune regulatory
genes. MICA and MICB are situated centromeric to HLA-B in the class I region. (Klein and Sato, 2000).

Chapter 1
58
The MIC family consists of two expressed genes, MICA and MICB, and five pseudogenes,
MICC-MICG. MICA is in very close proximity to HLA-B with a distance of only 46.4 Kb
(Shiina et al., 1999) between the two genes resulting in a very strong linkage disequilibrium
effect between MICA and HLA-B alleles. The MICA gene has 30% homology to HLA
class I genes, spans 11.7 Kb and comprises six exons separated by five introns with intron
1, between exons 1 and 2, being the largest (Bahram, 2000). The MICA coding sequence of
1383 nucleotide base pairs is transcribed as a 383 amino acid polypeptide of 43 kDaltons
including the leader peptide (Bahram et al., 1994) consisting of three extracellular domains
1-3 encoded by exons 2-4 (Figure 1.3.2), a transmembrane region encoded by exon 5
and a cytoplasmic tail region encoded by exon 6. The MICA crystal structure was
discovered by collaboration between Strong and Spies and revealed structural differences
between MICA and HLA class I molecules (P. Li et al., 1999). As can be seen in Figure
1.3.2, the structure of MICA is very similar to HLA class I but the -2 helix is disordered
and flexible and the resulting groove is not suited for peptide binding.
Figure 1.3.2: Ribbon model derived from X-ray crystallographic analysis of the extracellular
domains of the MICA molecule. The three alpha regions are indicated with -3 nearest the cell
membrane.
In further contrast to HLA class I molecules, the platform formed by the 1 and 2 regions
of the MICA molecule does not face outwards from the cell as with HLA class I, but is
flipped over by an angle of 113.5 and points downwards towards the cell membrane,
exposing its underside to the extracellular space. However, when MICA engages NKG2D,

Chapter 1
59
the flexible 2 helix becomes ordered by a further two alpha-helical turns and the 1 and
2 domains flip back 96 (P. Li et al., 1999). The crystal structure for MICB has also been
elucidated and shows structural similarity with MICA (Holmes et al., 2002), having 83%
amino acid homology (Bahram, 2000). Although also a ligand for NKG2D, MICB is less
polymorphic than MICA and does not display GCT triplet variation in exon 5 that
distinguishes many MICA allelic variants and subsequently attention has focussed more
specifically on the MICA gene.
1.3.2 MICA/B expression on cells and tissues
Compared with the wide expression of HLA molecules on most cells and tissues, MICA
and MICB expression is limited. Bahram and colleagues examined different cell lines for
the presence of MICA and MICB messenger RNA (mRNA) and found that expression was
restricted to fibroblasts and epithelial cells (Bahram et al., 1994). Groh et al discovered that
MICA is constitutively expressed at high levels in the gastrointestinal epithelium and
postulated that its expression may be induced by cellular stress (Groh et al., 1998). Zwirner
and colleagues demonstrated by Western blot analysis that freshly isolated monocytes,
keratinocytes and umbilical vein endothelial cells express MICA molecules but freshly
isolated CD4+ and CD8+ T-cells and CD19+ B-cells do not (Zwirner et al., 1999). These
authors found that MICA does not associate with 2M or become up-regulated by IFN-
and by using FC, also discovered that there were differences in surface expression of MICA
on endothelial cells and fibroblasts compared with keratinocytes and monocytes.
Molinero (Molinero et al., 2006) showed that CD4+ and CD8+ T-cells express MICA
molecules when activated by IL-2 but as Zwirner found, was not expressed on resting T-
cells. However, using confocal microscopy they found low-level surface expression, which
they concluded might indicate a safeguard mechanism to protect them from NK-cell attack,
especially during a T-cell dependent immune response. Once the final phase of the immune
response is completed due to antigen exhaustion, activated T-cells need to be removed and
this is when expression of MICA could contribute to their elimination by NK-cells.
Using a Northern blot technique, Schrambach (Schrambach et al., 2007) performed a total
body tissue scan of both MICA and MICB transcription which clearly showed that with the
exception of the central nervous system, both genes are widely transcribed and therefore
possibly translated and membrane-bound. MICA and MICB are upregulated in situations

Chapter 1
60
of stress and in malignancy; therefore expression in any tissue appears to be a signal for
destruction by NK-cells.
1.3.3 Polymorphism and evolution of MICA and MICB genes
A feature of MICA and MICB genes is the high degree of polymorphism and although
MICA and MICB polymorphism is not as extensive as HLA class I, the allelic repertoire
continues to grow. In contrast to the polymorphism displayed by class I molecules, which
is concentrated around the location of the peptide-binding groove, all three extracellular 1-
3 domains of MICA and MICB are polymorphic with the greatest variability in the 2
domain, encoded by exon 3. The allelic variation of MICA is generated by single amino
acid substitutions resulting in dimorphism (except residues 156 and 251) as shown in Figure
1.3.3.
Figure 1.3.3: Amino acid variation of the extracellular domains of the MICA molecule. Updated
from Stephens, 2001 (Permission granted by Elsevier).
Polymorphisms are also found in the transmembrane and cytoplasmic tail region of the
MICA molecule, in particular, exon 5 sequences show alleles can vary in the number of
GCT repeats with either four, five, six, seven, eight, nine and ten repetitions, a feature not
shared by MICB. One group of alleles (mostly MICA*008 variants) has a nucleotide
insertion of „g‟ after the second of five GCT repeats resulting in a premature stop codon and

Chapter 1
61
truncated trans-membrane region. The number of GCT repeats is important in
distinguishing particular alleles as extracellular domains can be identical with alleles only
differing by their GCT triplet number. These features are designated A4, A5, A6, A7, A8,
A9, A10 and A5.1 (g insertion) and their identification are critical for allele level MICA
genotyping (discussed later).
Choy and colleagues attempted to resolve the high polymorphism of MICA by suggesting a
possible polyphyly of MICA evolution (Choy and Phipps, 2003). The authors show that
MICA alleles branch into two lineages, which they designated LI and LII, when a
phylogenetic tree is constructed using a common 821-nucleotide MICA sequence across
exons 2-4. The four variable nucleotide positions in exon 4 distinguishing the two lineages
are at positions 684, 685, 697 and 713 and encode polymorphisms in the 3 domain.
Position 684 is synonymous and substitutions at nucleotide positions 685, 697 and 713 lead
to amino acid substitutions at resides 206, 210 and 215. MICB alleles appear to be closely
related to the LII lineage because they encode amino acids at residues 206, 210 and 215 that
are homologous to MICA LII alleles. Concerning polymorphism in exon 5, A5.1 and A6
alleles are found in both MICA lineages but A4, A7, A8, A9 and A10 are only found in
lineage LI and A5 is specific for LII. Variation of GCT triplet repeats within both lineages
suggests that further polymorphism occurred after they diverged. Phylogenetic studies of
the MICA gene in non-human primates have so far revealed that most species have either
MICA/MICB or MICD/MICE and rarely both (Cattley et al., 1999; Doxiadis et al., 2007).
Furthermore, the MIC gene of the gorilla (Gorilla gorilla) shares homology with MICA-LI
and MIC sequences of the pygmy chimpanzee (Pan paniscus) and the chimpanzee (Pan
troglodytes) are related to MICA-LII (Choy and Phipps, 2003).
These authors proposed three ancestral types of MIC genes: MICA-L1, MICA-LII/MICB
and MICD/MICE and one or more of these types could have been acquired by different
primate species and evolved into the existing MICA and MICB alleles. The authors go on
to say that MICA-LI evolved into human MICA-LI alleles and gorilla MIC, MICA-
LII/MICB evolved into human MICA LII and MICB and non-human primate MICA LII,
MICB and MICA/MICB alleles. MICD/MICE evolved into human MICD and MICE
pseudogenes and non-human primate MICD and MICE genes. This hypothesis for the
evolution of MIC genes may explain the variable allelic frequencies in different human
populations. MICA-LII alleles such as MICA*008 and MICA*009 are prevalent in
European, North American, Brazilian, Korean, Thai, Moroccan and Japanese populations,
whereas MICA*002 is MICA-LI lineage and the most frequent allele in several American

Chapter 1
62
Indian populations. This may suggest that MICA alleles are polyphyletic, having evolved
from two distinct ancestral types (Oliveira et al., 2008).
1.3.4 MICA alleles and disease association
Figure 1.3.1 shows the MICA gene in very close proximity to HLA-B and HLA-C and the
products of these genes are associated with various disorders, mostly autoimmune. Since
HLA-B (and therefore HLA-C) alleles are in linkage disequilibrium with inherited MICA
alleles it was thought that MICA polymorphism might affect recognition through NKG2D
expressed on T-cells, which are involved in autoimmunity (Bahram, 2000). Many
diseases that were known to be associated with HLA-B and HLA-C alleles were
investigated for MICA polymorphism association. However, most studies focussed on the
GCT triplet repeat number in exon 5 of the MICA gene rather than the allele defined by the
extracellular regions of the molecule.
One of the first diseases studied was Ankylosing spondylitis (AS), which is known for its
association with HLA-B27. Among the first published studies was by Goto and colleagues
(Goto et al., 1997) who studied MICA polymorphism in Caucasoid (European) patients
with AS and found highly significant association with MICA-A4 alleles (four GCT repeats
in exon 5). Two separate studies (Ricci-Vitiani et al., 2000; Yabuki et al., 1999) later
confirmed this in a similar population. MICA*007 and *010 were found to be highly
significantly associated with AS in Japanese patients (Tsuchiya et al., 1998) but only HLA-
B27 was associated in a study of Caucasoid, African and Asian patients (Martinez-Borra et
al., 2000). A more recent study (Amroun et al., 2005) found juvenile AS was associated
with a polymorphism at residue 129 where both haplotypes expressed methionine as
opposed to valine. This polymorphism is thought to be associated with strong (valine) or
weak binding (methionine) with NKG2D (Steinle et al., 2001).
Behçet‟s disease (BD) has also been found by numerous studies to be associated with
MICA alleles with 6 GCT repeats (A6) or MICA*009 but HLA-B51 is also highly
correlated. The first published study was of Japanese BD patients (Mizuki et al., 1997)
where association was found with A6 and HLA-B51, however a significant number of B51
negative patients also had MICA-A6, suggesting an independent and primary role of MICA
and association with BD. However, a later study (Mizuki et al., 2000) involving
microsatellite analysis of genes clustered around HLA-B in Japanese, Greek and Spanish
patients, found only HLA-B51 was significantly associated with BD and the authors

Chapter 1
63
concluded that association with other genes was the result of linkage disequilibrium. In
2002, a study of MICA association with BD in Korean patients found significant
association with MICA-A6, which they claimed was independent of HLA-B51 (Park et al.,
2002) but Mizuki et al confirmed their findings of no association in a study of Turkish
patients where stratification analysis revealed B51 alone was associated with BD (Mizuki et
al., 2007).
Other diseases investigated for association with MICA alleles are psoriasis, insulin-
dependent diabetes mellitus, Addison‟s disease, Kawasaki disease, ulcerative colitis,
Chrohn‟s disease, coeliac disease, Grave‟s disease and leprosy. The problem is that usually
there is an HLA association, the numbers of patients studied is often low and very few
studies are confirmed in the same population or confirm the same MICA specificity
responsible. Thus, there is still a lack of clear evidence for primary association of MICA
alleles with any of these diseases.
1.3.5 Role of MICA in innate immunity
MICA and MICB together with ULBP1-6 in humans are all ligands for the C-type lectin-
like NKG2D receptor found on all NK-cells, and CD8+ T-cells and NKT-cells (Eagle
and Trowsdale, 2007, Champsaur & Lanier, 2010). ULBP1-6 genes are also referred to as
Retinoic Acid Early Transcript-1 in humans (RAET-1I, 1H, 1N, 1E, 1L, 1G, respectively)
and these genes are polymorphic, particularly RAET-1E (Radosavljevic et al., 2002;
Antoun et al., 2010). Mice do not have MIC genes but express proteins homologous to
RAET1 called Retinoic acid early inducible (Rae-), H60 and MULTI-1 (Krmpotic et al.,
2005; Champsaur & Lanier, 2010). There may be a certain amount of redundancy
associated with NKG2D ligands as 3.8% of Japanese people have the MICA/MICB null
haplotype and even homozygotes are healthy, indicating that other NKG2D ligands
compensate their function (Komatsu-Wakui et al., 1999).
NKG2D recognises its ligand in association with a transmembrane signalling adaptor
protein, DAP-10 (Wu et al., 1999) and activates perforin and granzyme based cytotoxicity
in NK-cells or co-stimulates CD8+ T-cells (Groh et al., 2001). NKG2D ligands are
upregulated on cells that are stressed by viral infection or malignant transformation (Groh et
al., 1998) targeting them for destruction.

Chapter 1
64
NK-cell-mediated lysis evasion by tumour cells
Wide expression of MICA and MICB has been found on biopsy specimens from
carcinomas of the lung, breast, kidney, ovary, prostate, and colon (Groh et al., 1999) and it
is thought that expression of NKG2D ligands is important to activate anti-tumour responses
of NK and T-cells. Groh and colleagues (Groh et al., 2002) found that compared to CD8+
T-cells from healthy subjects, patients with malignancies had decreased NKG2D expression
on CD8 T-cells by 60-70%. Substantially reduced expression of NKG2D was also
observed on CD56+ NK-cells and T-cells. The authors found that sera from patients
with tumours had detectable amounts of soluble MICA (sMICA) whereas in healthy control
sera it was absent. These results suggested that tumour-derived sMICA in peripheral blood
of individuals with cancer caused downregulation of NKG2D. This hypothesis was
confirmed by experiments showing that sera from individuals with MIC-positive tumours,
but not negative controls, downregulated NKG2D expression on CD8+ T-cells among
normal PBMCs even when sMICA was undetectable by ELISA. Therefore, tumours may
be able to evade immune detection by shedding of MICA (and possibly MICB), which also
leads to downregulation of NKG2D on effector cells, reducing their ability to target MICA
on the tumour.
The phenomenon termed MICA shedding was eventually explained as the result of
proteolytic cleavage (Salih et al., 2002) and Kaiser and colleagues showed that on the
surface of tumour cells, MICA associates with Endoplasmic Reticulum protein 5 (ERp5),
which usually assists in the folding of nascent proteins inside cells (Kaiser et al., 2007).
Pharmacological inhibition of thioreductase activity and ERp5 gene silencing revealed that
cell-surface ERp5 function was required for MICA shedding. ERp5 and the 3 domain of
membrane anchored MICA formed transitory mixed disulphide complexes and soluble
MICA was released after proteolytic cleavage near the cell membrane, involving a large
conformational change to allow cleavage by ADAM (a disintregin and metalloproteinase)
proteases (Waldhauer et al., 2008).
During an immune response to a tumour, various cytokines are produced by immune and
non-immune cells, as well as by the tumour itself. It has been demonstrated that IFN- and
downregulate expression of the NKG2D ligand H60 on mouse sarcomas (Bui et al., 2006)
and IFN- downregulates MICA on human melanoma cell lines (Schwinn et al., 2009).
IFN- has also been to shown to downregulate NKG2D on human NK-cells (C. Zhang et
al., 2005a). Thus, high levels of IFN- can downregulate both NKG2D and its ligands but

Chapter 1
65
can also upregulate HLA class I molecules on tumour cells, thereby inhibiting NK-cells via
their inhibitory class I receptors. Another cytokine that can downregulate both NKG2D and
its ligands is TGF- as shown with mouse models (Dasgupta et al., 2005) and in cancer
patients (J. C. Lee et al., 2004). Substantial amounts of TGF- can be found in the sera of
cancer patients and cultured cancer cell-lines (Eisele et al., 2006). Additionally, studies
have shown that regulatory T-cells are a source of TGF-, which modulates their
immunosuppressive function (Horwitz et al., 2008).
Soluble MICA levels were originally reported as elevated in the sera of patients with breast
and lung cancer (Groh et al., 2002) and subsequently many other types of cancer including
leukaemia (Salih et al., 2003), pancreatic carcinomas (Marten et al., 2006) and colon
carcinoma (Doubrovina et al., 2003). This has led to the use of sMIC as diagnostic
biomarkers for tumour progression (Yokoyama, 2002). Studies have now confirmed that
sMICA can be used as a diagnostic marker for cancer in the early stages and sMICB levels
correlate with advanced cancer and metastasis (Holdenrieder et al., 2006).
NK-cell-mediated lysis evasion by viruses
Human cytomegalovirus (HCMV) is a member of the Herpes-viridae family and is
prevalent around the world with an incidence of between 50-100% (Sissons et al., 2002).
HCMV infection in healthy individuals is asymptomatic but can result in severe disease and
mortality in immunocompromised individuals (Ho, 2008). HCMV can downregulate
expression of HLA class I molecules, evading lysis by CD8+ T-cells (Barnes and Grundy,
1992) but this renders the cell vulnerable to NK-cell lysis due to a lack of HLA class I
inhibitory ligands. HCMV has evolved several mechanisms in an attempt to prevent lysis
by NK-cells including expression of molecules that engage with inhibitory NK receptors
and downregulation of ligands for NK-cell activatory receptors (Wilkinson et al., 2008).
Infection by HCMV results in upregulation of NKG2D ligands such as MICA, MICB and
ULBP1-6. Thus, vulnerability to NK-cell attack is further increased and HCMV has
evolved mechanisms to downregulate these NKG2D ligands. It was found that the HCMV
glycoprotein UL142 modulates expression of full-length MICA proteins but does not affect
the truncated MICA*008 molecule or MICB (Chalupny et al., 2006). Another HCMV
protein, UL16, has been shown to selectively prevent expression of MICB and ULBP1/2 by
retaining these molecules in the ER (Cosman et al., 2001). Therefore most NKG2D
ligands, except MICA*008 are prevented from being expressed on the cell surface,
abrogating NK-cell-mediated lysis.

Chapter 1
66
The Adenoviride virus family are associated with acute pharyngitis, conjunctivitis,
diarrhoea and cystitis in immunocompromised individuals. In particular,
immunosuppressed paediatric transplant recipients can develop systemic spread of
adenovirus that significantly affects morbidity and mortality (McSharry et al., 2008).
Adenoviruses have been demonstrated to encode functions to promote evasion of both
adaptive and innate immune responses (Burgert et al., 2002) and the E3 early transcription
unit has been associated with these immunomodulatory functions (Lichtenstein et al.,
2004). E3/10K is an E3 protein that has been shown to impair cell surface expression of
HLA class I molecules by retaining them in the ER (Andersson et al., 1987) and, as with
HCMV, adenovirus-infected cells become susceptible to NK-cell-mediated lysis. A group
headed by Gavin Wilkinson were interested in the role of NK-cells in controlling
adenovirus infections. They investigated immediate-early adenovirus (E1A) gene
expression, which is known to induce cell surface expression of NKG2D ligands on
infected cells (McSharry et al., 2008). We collaborated with these authors on this study and
I determined high-resolution MICA genotyping for cell lines used in the experiments. The
results showed that infection with wild-type adenovirus increases synthesis of MICA and
MICB proteins, but their expression is actively suppressed by retaining immature MICA
and MICB molecules in the ER. Furthermore, by examining a range of cell lines and
adenoviruses with mutated E3 genes, E3/19K was identified as the gene responsible.
Unlike UL142, which does not affect MICA*008 expression in HCMV infection, E3/19K
can sequester a broad range of MICA allelic variants, including MICA*008.
These mechanisms indicate that polymorphism of MICA and MICB may have been
generated by selective pressure. Not only is MICA*008 the only allele with a truncated
cytoplasmic region but it is the most frequent allele in most populations (discussed in the
next section). It seems likely that expression of MICA*008 confers resistance against
HCMV and possibly other viruses by promoting NK-cell lysis via NKG2D in contrast to
other MICA allelic variants. However, other viruses such as the adenovirus can prevent cell
surface expression of a broad range of MICA allelic variants, including MICA*008. These
studies highlight important roles for MICA in innate immunity and it is possible that other,
unknown mechanisms involving NKG2D ligands in innate and adaptive immunity have
generated the polymorphism of MICA and MICB genes.

Chapter 1
67
1.3.6 MICA allele frequencies in different populations
Several studies have investigated MICA allele frequencies in different populations and
although not as extensive as HLA population studies, these reports give an insight into
differential MICA allele frequencies around the world. Figure 1.3.4 shows frequencies of
MICA alleles in nine different populations. The first of these studies (Petersdorf et al.,
1999) revealed the most frequent MICA allele in North American Caucasoids was
MICA*008 with a frequency of 55%. The second most frequent allele was MICA*002
(13%) followed by MICA*004 (6%). This contrasts with MICA allele frequencies in South
American Indian tribes where MICA*002 is most prevalent with a frequency of 42%
followed by MICA*027 (32%) and MICA*010 (21%) (Y. Zhang et al., 2002). Similar
frequencies of MICA*010 are found in Koreans (19%) (Sohn et al., 2009), Thais (18%)
(Romphruk et al., 2001) and Chinese Han (19%) (Tian et al., 2010) while most other
populations except Japanese, with MICA*010 frequency of 11% (Ota et al., 1997), have
frequencies under 10%. The MICA*010 molecule has a proline at residue 6, resulting in
loss of cell surface expression as it suggested that proline at this residue interferes with
protein folding (Z. Li et al., 2000).
South American Indians are the only studied population not to have a frequency of
MICA*008 above 10% and instead express MICA*027 which is identical in the
extracellular domains but differs from MICA*008 in the transmembrane region, where
MICA*027 has the A5 GCT repeat and MICA*008 has A5.1, with an insertion of „g‟
leading to truncation of the transmembrane region. Previous studies determined that South
American Indians have restricted HLA polymorphism (Erlich et al., 1997; Monsalve et al.,
1998; Tsuneto et al., 2003) possibly due to a genetic bottleneck created by disease outbreak
following population of the American continent by European settlers. This is also true for
MICA polymorphism as 95% of South American Indian MICA alleles consist of just three
variants. MICA molecules may have a role in defence against pathogens as they have been
shown to be upregulated following infection with HCMV (Groh et al., 2001) and
polymorphism may have evolved to circumvent immune evasion strategies by viruses. It is
thought that modern American Indians migrated from North to South America and could
have encountered different pathogens along the way, creating a MICA allelic repertoire that
was better suited to these pathogens. Additionally, viruses introduced by European settlers
may have had a more recent impact. The similarity between MICA alleles expressed by

Chapter 1
68
Figure 1.3.4: Common MICA allele frequencies in nine different populations: Moroccan (Piancatelli et al., 2005), Korean (Pyo et al., 2003), Japanese (Komatsu-Wakui et
al., 1999), Turkish (Mizuki et al., 2007), Thai (North Eastern) (Romphruk et al., 2001), Caucasian (Petersdorf et al., 1999), African-American (Petersdorf et al., 1999),
Chinese Han (Zhu et al., 2009) and South American Indian (Y. Zhang et al., 2002).

Chapter 1
69
South American Indians and Asian populations (Korean, Thai, Chinese Han, Japanese)
gives credence to the hypothesis that South American Indian tribes originated from
individuals who crossed the Bering Strait from Asia (Hoffecker et al., 1993; Parham and
Ohta, 1996). With the exception of South American Indians, most populations studied are
dominated by MICA*008 expression with the next most frequent allele being MICA*002
followed by MICA*009. However, African-Americans are characterised by high
frequencies of MICA*002, 004 and 008, comprising 70% of their MICA alleles, suggesting
that diversity may have been driven as populations moved out of Africa, populating the
world. Most other MICA alleles in all populations are detected with a frequency of less
than 5%.
1.3.7 MICA antibodies and solid organ transplantation
Transplantation is the treatment of choice for patients with end-stage renal disease (ESRD)
and heart, liver, lung and pancreatic diseases, among others, facilitating a return to near
normal health and extending the life expectancy of graft recipients. Improvements in
immunosuppressive therapy, aimed at limiting the effects of T-cell-mediated immune
responses to the graft, have increased overall GS (Meier-Kriesche et al., 2004) and reduced
acute rejection (AR). However, rejection due to antibody-mediated graft damage arising
from B-cell responses to mismatched HLA antigens remains a problem. The production of
post-transplant, de novo DSA to HLA antigens is associated with acute and chronic
allograft rejection (Trpkov et al., 1996). Despite renal transplant rejection being strongly
associated with HLA antibodies, some 11-20% of patients without HLA antibodies develop
CAD (P. C. Lee et al., 2002). Furthermore, HAR can occur in the absence of HLA
antibodies, thus implicating other non-HLA alloantigens (Brasile et al., 1986) including the
highly polymorphic MICA and MICB antigens also encoded by genes within the human
MHC (Bahram et al., 1994).
It was first suggested that MICA antigens could be a target for graft destruction in solid
organ transplantation, after expression of MICA antigens on the surface of endothelial cells
was demonstrated (Zwirner et al., 1999). This was followed by evidence that antibodies in
patient‟s serum could specifically react with different recombinant MICA molecules in an
ELISA technique, thus polymorphisms of MICA could be recognised by allo-specific
antibodies (Zwirner et al., 2000). Methods for genotyping MICA alleles were also being
developed and included Sequence-Based Typing (SBT) (Katsuyama et al., 1999),

Chapter 1
70
Reference Strand-mediated Conformational Analysis (RSCA) (Perez-Rodriguez et al.,
2000) and Polymerase Chain Reaction - Sequence-Specific Oligonucleotide Priming (PCR-
SSOP) (Y. Zhang et al., 2001). MICA was found to be expressed on renal and pancreatic
allograft biopsies (Hankey et al., 2002), confirmed as a target for CDC with both mouse
MICA monoclonal antibodies and human alloantibodies, providing a method to detect
MICA antibodies (Zou et al., 2002) and confirmed to be co-dominantly expressed like HLA
molecules (Molinero et al., 2002b) providing evidence that MICA expression in graft
tissues could lead to antibody-mediated lysis.
Once established that MICA antigens and antibodies may play a role in rejection of solid
organ grafts, several studies were carried out investigating the relevance of MICA
antibodies in patient‟s serum and correlation with rejection. A study of 69 patients with
acute renal rejection and 70 with no rejection showed a significant correlation with graft
loss and MICA-specific antibodies pre- and post-transplant (Sumitran-Holgersson et al.,
2002). In 2005, a serial ten-year follow up of HLA and MICA antibody production prior to
kidney graft failure was carried out (Mizutani et al., 2005) and 95% of the 39 patients who
rejected their grafts had HLA or MICA antibodies, compared to 58% with functioning
grafts (p<0.01). This was followed by another study from the same authors, revealing that
among 34 recipients with functioning transplants and with HLA antibodies, 24% had MICA
antibodies and 19% of 32 patients without HLA antibodies produced MICA antibodies.
Among 46 patients who lost grafts with HLA antibodies, 26% also produced MICA
antibodies, and among 27 failed patients without HLA antibodies, 37% were positive for
MICA antibodies. This study indicated that MICA antibodies detected pre-transplant could
have a role in aAMR (Mizutani et al., 2006b).
Until 2006, methods used to detect MICA antibodies were based on CDC using transfected
cell lines expressing different MICA antigens with the advantage of mammalian cell
expression in the native form compared to recombinant MICA antigen production using
bacterial expression. The latter method was employed to produce recombinant MICA
molecules for use in an ELISA assay and were manufactured „in-house‟ often using only
recombinant MICA*008 or a few allelic variants. In 2006, One Lambda launched a new
Luminex bead SAg assay using eleven MICA antigens, and also included two screening
beads for MICA antibodies with their HLA antibody screening kit, free of charge. In
addition, Peter Stastny‟s group in Dallas, USA, developed their own Luminex bead assay
(Zou et al., 2006b) using recombinant MICA molecules produced in insect cells, a
procedure that produces molecules more similar to mammalian products, compared to

Chapter 1
71
molecules produced by bacteria. The application of the solid-phase assay, as with HLA
antibody detection, provided a reliable, convenient way to detect MICA antibodies and
resulted in many more studies investigating the effect of MICA antibodies on graft
outcome.
Zou and co-workers published a study of MICA antibody production in renal transplant
recipients, detected using a Luminex assay produced in-house utilising recombinant
MICA*001, 002, 004, 008, and 009 from insect cell transfection (Zou et al., 2006b). They
found 25% of 85 recipients awaiting a subsequent transplant produced MICA antibodies, as
did 23% of 66 patients transplanted within four years. Among 59 acid eluates from
nephrectomy specimens of patients who had immunological rejection, 19% contained
MICA antibodies. Among those, six recipients were positive for HLA antibodies and five
were not, suggesting an independent role for MICA antibodies. Mizutani and colleagues
used Luminex methods to detect HLA antibodies and a transfected mammalian cell line
expressing eight different MICA alleles to detect MICA antibodies with CDC (Mizutani et
al., 2006a). They found 65% of 63 patients who rejected grafts had HLA antibodies and
52% produced MICA antibodies, compared to 45% of those with functioning grafts who
produced HLA antibodies and 21% with MICA antibodies. In all, 92% of patients with
either type of antibody had graft failure compared to 70% of those with functioning grafts,
suggesting involvement of HLA, MICA or both antibodies in chronic rejection. However,
these are small studies and although the results are significant, they only give an indication
that MICA antibodies are causing rejection.
As part of the 13th and 14th IHIWC, 1329 recipients of renal grafts from deceased or living
donors from 21 participating centres, were tested for HLA and MICA antibody production
(Terasaki et al., 2007). Only recipients who did not produce HLA antibodies pre-transplant
(pre-transplant testing for MICA antibodies was not performed) and who survived for more
than six months were included in this study. HLA antibodies were detected with either
CDC, ELISA or Luminex and MICA antibodies were detected using eight different
recombinant MICA molecules produced in HMY2.C1R cells, isolated and coated on
Luminex beads. At one year post-transplant, survival for 1329 patients with no HLA
antibodies was 96% compared to 94% survival for 344 patients with HLA antibodies and
83% survival for 33 patients with MICA antibodies. After four years of engraftment,
survival among 806 patients who were negative for HLA antibodies after one year of
transplantation was 81% compared to 58% for 158 recipients with HLA antibodies and 72%
for 69 patients with MICA antibodies. Multivariate analysis at both time-points revealed

Chapter 1
72
MICA antibodies were significantly and independently associated with reduced GS,
providing strong evidence for involvement of MICA antibodies with graft rejection.
Using ELISA to detect post-transplant HLA and MICA antibodies in 185 renal graft
recipients, significantly reduced two-year GS for patients with MICA antibodies was found,
particularly if both HLA and MICA antibodies were detected, where survival was only 17%
compared to 89% of those with no antibodies (Panigrahi et al., 2007a). In addition, patients
with only MICA antibodies or only HLA antibodies had significantly reduced survival of
71%.
A study was performed to investigate a relationship between MICA antibody production
and heart allograft rejection in 44 recipients (Suarez-Alvarez et al., 2007). MICA
antibodies were detected using both MICA transfected cell lines in a CDC assay and a
commercial assay that had just been released by One Lambda using Luminex beads to
detect MICA*001, 002, 004, 007, 008, 009, 012, 017, 018 and 019. MICA antibodies were
detected in 11 (25%) patients by CDC and seven (16%) by Luminex assay. Nine patients
had rejection and testing by CDC showed 61% had rejection and were positive for MICA
antibodies compared to five (14%) with no rejection. Analysis by Luminex revealed 55.5%
of rejecters were positive for MICA antibodies compared to 6% with no rejection. These
authors also included MICA allele typing for donors and recipients where the recipient was
positive for MICA antibodies by either CDC or Luminex assay and found that all patients
with MICA antibodies and AR had MICA-DSA although five patients also had auto-
antibodies. This study was limited by the small number of patients, nevertheless it was the
first study to show correlation of MICA-DSA with AR.
A study of 1910 pre-transplant serum samples from cadaveric renal transplants was carried
out in a multi-centre study organised by the CTS (Zou et al., 2007). This study has been
much discussed and was the first large investigation to correlate MICA sensitisation pre-
transplant with poorer GS. It was found that 217 patients of 1910 (11.4%) had MICA
antibodies and their one-year GS rate was 88.3% compared to 93% in the group with no
MICA antibodies. Among those who received their first renal graft, survival was even
lower with 87.8% GS compared with 93.5% for those without MICA antibodies. Separate
analysis of 326 patients with 0 or 1 HLA-A, -B or DR mismatches also showed that
recipients with MICA antibodies had poorer survival of 83.2% compared to 95.1% of those
with no MICA antibodies. However, no MICA allele typing was performed for patients or
donors and no association with donor-specificity could be made and as this was a study of

Chapter 1
73
pre-transplant sera, the relative contribution of de novo MICA antibodies could not be
made.
Amico (Amico et al., 2008) used MICA typing of renal graft recipients who were positive
for MICA antibodies detected by MICA LABScreen SAg Luminex (One Lambda). One
out of ten patients with early aAMR had a definitive MICA-DSA and two had possible
MICA-DSA and taken together the results showed that of 433 patients the incidence of
early aAMR due to MICA-DSA was only 0.7%, leading the authors to conclude that early
graft loss due to non-HLA-DSA was rare. A study of nineteen renal transplant recipients,
who fulfilled the criteria for aAMR, including C4d deposition, also investigated
involvement of MICA-DSA (Alvarez-Marquez et al., 2009). The authors found four
patients had MICA-DSA antibodies and were C4d-positive (21%) compared to 3 of a
control group of 39 patients who were C4d-negative (7.7%) and although not significant
suggested a trend for MICA antibodies associating with aAMR. Additionally, two of the
patients had only MICA-DSA detected, indicating a primary association independent of
HLA antibodies although, again, the numbers of patients are low. Another study (Gautier et
al., 2009) included MICA typing of 43 recipients of third renal transplants and testing for
MICA antibodies using LABScreen MICA SAg Luminex (One Lambda) on the day of
transplant and after one year. Patients with two MICA mismatches were more frequent in
the group of patients with AR (40%), however patients with zero or one MICA mismatch
also experienced graft losses and MICA-DSA were equally associated with functional and
failed grafts. This could potentially have been a very interesting study as they typed all
patients and donors, not just those positive for MICA antibodies, and could have examined
the nature of the mismatches between those who produced de novo MICA antibodies and
those that did not. Unfortunately this was missing from the study, as was the use of
statistical methods.
Up until around 2009, the specificity of MICA antibodies and epitopes recognised by
MICA antibodies had received very little attention. Evidence from studies using techniques
to detect MICA antibodies show, overall, a polyspecific response to MICA antigens with
sometimes donor-specific antibodies detected among them. Many MICA alleles share
particular polymorphisms and it could be hypothesised that MICA antibodies recognise
polymorphisms associated with one or more alleles. Duquesnoy (Duquesnoy et al., 2008)
determined, with the use of a computer algorithm, that there were 38 potential eplets
(immunogenic groups of amino acids) and correlated shared polymorphisms with MICA
antibody profiles detected in sera with LABScreen MICA SAg Luminex (One Lambda).

Chapter 1
74
This hypothesis was tested empirically by employing absorption and elution experiments
using MICA transfected fibroblasts to sequentially absorb MICA antibodies followed by
testing with MICA SAg Luminex (Zou et al., 2009). This analysis revealed several MICA
residues recognised by MICA antibodies including a group of amino acids in the 3 domain
(exon 4) separating MICA antigens into two groups corresponding to the MICA-LI and LII
ancestral MICA lineages proposed by Choy (Choy and Phipps, 2003).
Suarez-Alvarez and colleagues combined a clinical study of MICA antibody production in
deceased donor renal transplantation with MICA epitope analysis (Suarez-Alvarez et al.,
2009a). In this study of 161 recipients tested post-transplant, 30 (18.6%) developed MICA
antibodies and 8/27 (30%) had AR compared with 13/98 (13%) without MICA antibodies
(P<0.05). Using LABScreen MICA SAg Luminex (One Lambda), they determined by
epitope mapping with a synthesised library of overlapping peptides from the extracellular
domains of MICA molecules, nine antigenic regions reactive with MICA antibodies in
patient‟s serum. These regions included sites common to all MICA antibodies and also
polymorphisms, confirming the conclusions of Duquesnoy and Zou‟s studies.
Li et al used a novel technique to detect de novo HLA and MICA antibodies in fifteen
patients after renal transplantation (L. Li et al., 2010). Pre and post-transplant serum were
profiled using the Invitrogen Protoarray Human Protein Microarray platform containing
5056 nonredundant human proteins, purified from insect cells. They found de novo MICA
antibodies in eleven of the 15 transplant patients. The mean MICA antibody signal
intensity was higher in recipients with AR and C4d+ compared to those who were C4d-
with AR. Additionally, integrative genomics predicted localisation of MICA antigen to the
glomerulus in the normal kidney, confirmed by immunohistochemistry showing MICA
staining of the podocytes within the glomeruli along with the presence of infiltrating
monocytes, B-cells, T-cells and NK-cells. They concluded that MICA antibody-mediated
immune responses occurred irrespective of graft rejection and MICA antibody levels
increase in aAMR but not with cellular rejection, therefore serial measurement of MICA
antibodies may detect a significant rise in antibody titre that could occur before or during
aAMR.
Recently, Lemy and colleagues (Lemy et al., 2010) studied MICA antibody production in
sera from 494 healthy controls and 597 patients with chronic kidney disease (CKD) stage V
among them, 425 received kidney transplants (tested pre-transplant). MICA antibodies
were detected using LSA-MIC (Gen-Probe), a new addition to the commercially available

Chapter 1
75
MICA SAg Luminex assays. This study is interesting because it highlights many of the
deficiencies that still remain in this area of research, including epidemiology and specificity
of MICA antibodies and impact on AR and GS. The prevalence of MICA antibodies in
healthy subjects, immunising events leading to MICA antibody production and donor-
specificity of MICA antibodies are also far from clear and Lemy sought to address these
issues. Among 425 CKD patients who received transplants, univariate analysis revealed
male gender, younger age, haemodialysis, transfusion, pregnancy, previous graft and
presence of HLA antibodies all associated with MICA antibody production. Factors
remaining significantly associated with MICA antibodies after logistic regression analysis
were blood transfusions, previous transplantation and females with two or more
pregnancies. However, Zou and colleagues found no significant association with blood
transfusion and MICA antibodies in 1242 renal graft recipients, although five transfusions
were required for categorisation as „transfused‟ compared to only one in Lemy‟s study (Zou
et al., 2007). These authors found MICA antibodies at a frequency of 4.6% among 494
healthy controls, 14.9% in 597 CKD patients and 13.9% of 425 transplant recipients,
although in this group only 3% had both HLA and MICA antibodies. MICA antibodies
were also more frequent in men rather than women in the cohort as a whole (14% versus
7%) and also among individual groups, and patients were more likely to have HLA
antibodies in addition to MICA antibodies as previously observed (Zou et al., 2007).
Regarding sensitisation to MICA antigens, a third of patients with MICA antibodies and
CKD stage V had no sensitisation events identified, implicating unknown mechanisms and
the higher frequency of MICA antibodies in males rather than females is intriguing.
Additionally, 20% of CKD patients who were typed for MICA alleles using an SSOP
method (One Lambda) had MICA antibodies that were auto-reactive, a rare finding with
HLA antibodies (Morales-Buenrostro et al., 2008) but also observed with MICA antibodies
in the study of heart transplant recipients by Suarez-Alvarez and colleagues (Suarez-
Alvarez et al., 2009a).
Compared to Zou‟s study (Zou et al., 2007), there was no significant association of pre-
transplant MICA antibodies with overall one-year GS found by Lemy. In fact, Lemy‟s
study found those with MICA antibodies had a better ten-year GS compared with those with
no MICA antibodies. As re-transplantation was the only independent significant factor
associated with graft loss, the authors also analysed a group of patients with primary grafts.
Again, graft recipients with MICA antibodies had slightly better, but not significant, GS.

Chapter 1
76
Recent evidence has emerged of association of MICA antibodies with chronic rejection,
known as bronchiolitis obliterans syndrome (BOS) in lung transplantation (Angaswamy et
al., 2010). Angaswamy and colleagues analysed sera from 80 lung transplant recipients for
MICA antibodies using LABScreen and MICA SAg Luminex and HLA antibodies using
FlowPRA beads (One Lambda). Development of either only MICA antibodies or MICA
and HLA antibodies significantly correlated with the development of BOS (P<0.01). The
same research group, in another published study, also found significant association with
MICA antibody production and the development of cardiac allograft vasculopathy in heart
transplantation (n=95) (Nath et al., 2010). A finding from both studies was that HLA-DSA
preceded the development of MICA antibodies. In the lung transplant study, HLA
antibodies were detected 7.6 ± 4.7 months post-transplant and MICA antibodies were
detected at 10 ± 3.5 months after transplantation. Heart transplant recipients developed
antibodies sooner; HLA-DSA were detected 2.7 ± 1.4 months post-transplant and MICA
antibodies emerged by 6.5 ± 2.1 months post-transplant. An explanation for this could be
that binding of HLA antibodies within the graft may increase expression of MICA antigens
and allo-reactivity leading to MICA sensitisation.
A recent study of 68 heart transplant recipients (Pavlova et al., 2009) for association of
HLA and MICA antibodies with aAMR and ACR found that recipients with pre-transplant
HLA-DSA had significantly lower aAMR-free survival of 50% compared with 90% for
patients with no HLA antibodies and 92% when recipients had HLA-NDSA (P=0.005).
There was no significant association of HLA antibodies with ACR. However, patients with
pre-transplant MICA antibodies (n=9, 14%) did not significantly associate with aAMR or
ACR, although a trend was associated with aAMR (P=0.06). A previous study of 491 heart
transplant recipients tested pre-transplant also found no significant correlation of MICA
antibodies with AR, or decreased three and five-year GS (Smith et al., 2009). The outcome
for GS, excluding patients with HLA antibodies, was similar to the findings of Lemy et al,
in that patients with MICA antibodies had better survival compared to MICA negative
recipients after one and five years (89% and 83% versus 72% and 64%; P=0.051). A study
of MICA antibody production in liver allograft recipients also found no significant
association with rejection or any other clinical parameters (Uzunel et al., 2008).
Histological analysis revealed that MICA is not normally expressed on liver cells and its
expression is not induced during rejection episodes. However, patents were found who
only produced MICA antibodies after transplantation and there was a trend for MICA
antibodies to associate with aAMR, therefore further studies of liver transplants are
required.

Chapter 1
77
Despite all of these studies investigating association of MICA antibodies with graft
rejection and survival, there is still no strong evidence implicating these antibodies with
worse outcomes. Moreover, it is still unclear how people become sensitised to MICA
antigens, although the evidence does suggest that previous transplantation is one factor, it is
not known if MICA mismatching of donors and recipients is the cause, as is the case with
HLA antibodies, or whether certain mismatches are more detrimental than others. Some
studies find association with MICA antibody production and pregnancy but many studies
also find that more males have MICA antibodies than females (Lemy et al., 2010; Smith et
al., 2009; Zou et al., 2007) and this is not usually the case with HLA antibodies where more
females are sensitised. It is also unclear if blood transfusion was a source of MICA
immunisation with Zou finding no association compared to HLA sensitisation but in the
study by Lemy, there was significant association of MICA antibodies with transfusion
however, differences in study design may have influenced the results as already mentioned.
It is also interesting that Lemy and colleagues found a third of their patients with MICA
antibodies had no known sensitisation event for MICA antibody production and 4.6% of
494 healthy controls also had MICA antibodies with a higher percentage being male,
suggesting pregnancy is not the main reason for MICA sensitisation in healthy subjects.
The association of previous transplants with MICA antibody production is also not
convincingly demonstrated and reports are conflicting. In the study of 161 renal graft
recipients (Suarez-Alvarez et al., 2009a), no statistical significance was correlated with
MICA antibodies and in the large CTS study of pre-transplant MICA antibodies in renal
graft recipients (Zou et al., 2007) there was also no association with re-transplantation and
production of MICA antibodies. However, Lemy (Lemy et al., 2010) found that 27% of 74
patients with a previous renal transplant had MICA antibodies compared with 11% of 351
patients not previously transplanted and was highly significant (P<0.001). Many other
studies do not make the comparison, therefore previous transplantation as a MICA
sensitising event has not been proven, although it seems likely that allo-responses to
mismatched MICA antigens is a factor leading to development of MICA antibodies.
Most studies of MICA antibodies in transplant recipients concentrate on association with
acute or chronic graft rejection but, with the exception of two meta-studies, most studies are
relatively small in terms of numbers of patients. Interpretation of data from these studies is
complicated by differences in study design such as testing for MICA antibodies pre- or
post-transplant, deceased or living donors and many other factors as is the case with studies
investigating association of HLA antibodies with graft outcomes. Similarly, the method of

Chapter 1
78
testing for MICA antibodies may also affect the results from these studies, as there was no
international serum exchange scheme to establish reference sera standards for MICA
antibody detection. Most studies since 2006 have used the Luminex SAg assay from One
Lambda but the reliability of this method has not been evaluated and some centres report
unexpectedly high frequencies of MICA*019 detection that is not detected when another
method is used (Zou and Stastny, 2009). In addition studies have demonstrated the
presence of autoantibodies to MICA antigens using the One Lambda assay, even when
patients do not have an autoimmune disease. Lemy‟s study also found unexpectedly high
frequencies of MICA autoantibodies using the SAg assay from Gen-Probe (Lemy et al.,
2010). A possible reason for detection of these antibodies is that they could be cross-
reactive with other MICA antigens and Zou and colleagues have demonstrated that this can
be the case (Zou et al., 2009) alternatively, denatured antigens on beads used in the assay
may expose cryptic epitopes that are recognised by these antibodies. It would be beneficial
for future studies to verify their results with another method, as there are now currently two
commercial MICA SAg Luminex assays available.
The studies by Zou (Zou et al., 2007) and Lemy (Lemy et al., 2010) are similar in design
with pre-transplant testing for MICA antibodies, but the outcomes are broadly dissimilar in
terms of GS. Although there are differences in numbers of patients between the two
studies, it is surprising that Lemy found better survival when patients were positive for
MICA antibodies, albeit insignificantly. However, analysis of immunosuppression
protocols between the two studies showed that Lemy‟s group of patients were more heavily
immunosuppressed. A third of the patients in Zou‟s study received induction therapy
compared to nearly all patients in the Lemy study, the predominant calcineurin inhibitor
was cyclosporine A in Zou‟s study and tacrolimus in Lemy‟s study and two thirds of
patients in Zou‟s study were given mycophenolic acid compared to nearly all of Lemy‟s
patients. Therefore the incidence and impact of MICA antibodies could be reduced in
patients who are more heavily immunosuppressed. If this can be proven in well-controlled
large studies, a case could be argued for MICA allele and antibody testing in transplantation
as changes to immunosuppression may affect the outcome. Perhaps this putative effect of
immunosuppression was also the reason why there was no association with MICA
antibodies found in the study by Smith and colleagues (Smith et al., 2009).
To evaluate the impact of MICA allele mismatching and the production of MICA
antibodies in renal transplantation it is necessary to MICA type all patients and donors
included in the study and not just patients who are found to have MICA antibodies. This

Chapter 1
79
could enable definition of mismatches associating with development of MICA antibodies.
Also, as with HLA antibodies, it is important to show that MICA antibodies are actually
causing rejection, which can be achieved with C4d immunohistochemistry and has been
demonstrated by some studies. However, the problem facing all researchers in this field
currently is the method of detecting MICA antibodies, as none can be verified with
reference serum standards and all methods can produce false negative or positive results.
Using more than one assay to detect MICA antibodies and verify the results may enable a
better understanding of their involvement in rejection of organ allografts.
1.4 Methods for detection of MICA alleles and MICA antibodies
Following the discovery of the MICA and MICB genes and the finding that their products
are polymorphic, efforts were made to produce typing methods for allele identification and,
later, to identify the presence and specificity of anti-MICA antibodies in patients sera.
Although MICB antibodies may also be involved in transplant rejection, the less
polymorphic nature of MICB has led to attention being focussed mainly on MICA
antibodies. Methods have evolved along the same lines as HLA allelic typing and antibody
identification as the similar structure and genomic organisation of MICA coding regions
means similar methods can be employed. There are, however, some major differences
associated with MICA compared to HLA. Firstly, unlike HLA where for each locus exons
are the same length, exon five of MICA genes is not only polymorphic but also differs in
length due to varying numbers of GCT triplets encoding different numbers of alanine
repeats in the transmembrane (TM) region. Secondly, MICA has limited tissue distribution
compared to HLA and, importantly, is not expressed on peripheral CD4+ or CD8+ T-cells
eliminating serological analysis as a method to detect antigenic polymorphism.
Furthermore this also means that the traditional crossmatch CDC or FC assays cannot be
used, however, methods have been developed to circumvent these obstacles.
1.4.1 MICA allele genotyping methods
Methods based on exon 5 GCT repeat polymorphism
MICA allele polymorphism became the focus of disease association and population
frequency studies shortly after the discovery of the MICA gene and discrimination of alleles
was initially based on exon 5 polymorphisms, in particular the number of GCT repeats. In
1997 Ota published a report detailing a method for determining the size of exon 5 fragments

Chapter 1
80
in homozygous and heterozygous DNA samples to discriminate the known exon 5
polymorphisms at that time (A4, A5, A5.1, A6 and A9) and used the data to determine
MICA allele frequencies in different populations (Ota et al., 1997). For this assay, an
automated DNA sequencer was used and the first generation of these machines used a slab
polyacrylamide gel as the resolution medium. Software was available from the
manufacturers (Genescan, ABI, CA) to resolve differences in nucleotide length by a
minimum of one nucleotide. To generate fragments for Genescan analysis primer pairs
were designed flanking exon 5 in intron 4 and intron 5, with the 5‟ primer (intron 4)
labelled with a fluorescent dye (6-Fam) as shown in Figure 1.4.1.
Figure 1.4.1: PCR Amplification strategy to generate fluorescently labelled fragments for size
analysis using Genescan software and an automated ABI 377 sequencer (Applied Biosystems). (Ota
et al., 1997).
The PCR fragments were then purified and loaded onto a denaturing polyacrylamide gel
alongside a fluorescent size marker and PCR products from B-cell lines of known size
defined by nucleotide sequencing of exon 5. The results generated by the Genescan
software represent the number of base pairs (bp) in the DNA fragment and were compared
to predetermined sizes for the different number of GCT repeats as shown in Table 1.4.1.
Table 1.4.1: Relative sizes of exon 5 in different MICA alleles
MICA microsatellite Cell line or Nationality Size (bp)
A4 BTBa 179
A5 MLF 182
A5.1 CGM1a 183
A6 MOUa 185
A7 Spanishb 188
A8 Italianc 191
A9 YARa 194
A10 25/1506d 197
a(Ota et al., 1997);
b(Rueda et al., 2002);
c(Gambelunghe et al., 2006);
d(Perez-Rodriguez et al.,
2000).

Chapter 1
81
Sequence Based Typing (SBT) of MICA alleles
DNA sequencing is the determination of the sequential order of deoxynucleotide
triphosphates (dNTPs; dATP, gGTP, dCTP and dTTP) in a given sample of genomic DNA
(gDNA) or coding DNA (cDNA). Sequencing methods have now been automated but are
still based on the chain-termination method described by Sanger (Sanger et al., 1977).
DNA sequences can be obtained from DNA vectors such as plasmids and cosmids and also
from gDNA or cDNA that is amplified by PCR to produce a template. The template is then
mixed with a sequencing primer designed to cover the region of interest in either the 5‟ to
3‟ (sense) direction or 3‟ to 5‟ (antisense) direction. Fluorescently labelled dNTPs called
dideoxynucleotides (ddNTPs) and non-fluorescently labelled dNTPs are added to build the
new DNA, which is synthesised by DNA polymerase. This process is called cycle
sequencing and during each round, primer anneals to the template, is extended by
incorporation of dNTPs and chain elongation is terminated when a ddNTP is incorporated.
The DNA is then denatured (by heating) producing an extension product and the original
template and the process begins again, finally producing differing lengths of DNA that can
be sorted into the correct order by electrophoresis. This process is shown if Figure 1.4.2.
Figure 1.4.2: Diagram showing stages involved in PCR-SBT of the MICA gene. The region of
interest is amplified by PCR, purified and added to DNA primers, dNTPs, ddNTPs and DNA polymerase
and subjected to several rounds of cycle sequencing. DNA sequence is determined by electrophoresis
where differing sizes of product have different mobilities.

Chapter 1
82
Methods for SBT of MICA alleles have been described where either exons 2-4 (Katsuyama
et al., 1999) or exons 2-5 are amplified (Visser et al., 1999; Zwirner et al., 2000) and
primers were designed for bidirectional sequencing of the polymorphic exons. As with
HLA typing, codominant expression of MICA alleles means that at polymorphic nucleotide
positions, there can be two different nucleotides detected as shown in Figure 1.4.3.
Figure 1.4.3: Sequence electropherogram showing sense and antisense sequence from exon 4 of the
MICA gene. Two peaks may be seen at polymorphic nucleotide positions representing a different
nucleotide for each MICA allele.
International Union of Biochemistry (IUB) codes are assigned at these positions, for
example nucleotides C and T together are given the code „Y‟. It is necessary to use a
computer algorithm to deduce the possible alleles present and the allele type is sometimes
ambiguous, resulting in more than two allele types being possible due to sharing of
polymorphic nucleotides. Sequencing more exons can resolve this further, however, with
MICA allele typing, exon 5 cannot be sequenced in heterozygous samples as differing
number of GCT repeats mean the sequences will become out of sync and therefore
unreadable. This can be overcome by sequencing exons 2-4 using SBT and sizing of exon
5 to reduce ambiguous allele combinations. If exon 5 is included in the PCR fragment,
further ambiguities can be resolved. For example MICA*002 and *052 have identical exon
5 GCT repeats are identical in exons 2-4 but differ by one nucleotide towards the end of
exon 5 that can be determined by manual analysis. Using a combination of sequencing
exons 2-5 and sizing of exon 5, almost allele level typing for MICA can be achieved, except
MICA*009 and *049 cannot be distinguished unless exon 6 is also included and
MICA*00801 and *00804 can only be resolved by amplification and sequencing of exon 1.

Chapter 1
83
MICA typing using conformational analysis
A method that can achieve allele level typing for MICA and simultaneously incorporate
analysis of exon 5 is Reference Strand-mediated Conformational Analysis (RSCA), and was
developed as a tool for HLA allele identification (Arguello et al., 1998; Arguello and
Madrigal, 1999) and later adapted for MICA allele typing (Perez-Rodriguez et al., 2000).
The principle of this technique as applied to HLA-A typing is shown in figure 1.4.4. An
automated DNA sequencer is required.
Figure 1.4.4: Reference Strand-mediated Conformational Analysis (RSCA). Sample DNA and a
fluorescently labelled reference DNA are heated to denature then allowed to cool. Heteroduplexes are
formed by reannealing of sense or antisense strands obtained from sample or reference DNA. The
fluorescently labelled reference strand can anneal to its complimentary strand (homoduplex) or with one
of each of the alleles, resulting in three peaks being detected by a laser.
The incorporation of a fluorescent reference ensures that only three peaks will be detected
by the laser and confusing multiple bands seen with other conformational techniques are
avoided. Alleles are identified as they have unique mobilities in polyacrylamide gel
electrophoresis (PAGE) with a particular reference and can be compared to a ladder
comprised of alleles of known type. RSCA is a useful technique as novel alleles can be
detected as well as known alleles. A disadvantage is that mobilities for each allele have to
be pre-determined using cell line DNA, which may not be available for every allele. An
example of the output generated by the software is given in Figure 1.4.5.

Chapter 1
84
Figure 1.4.5: Detection of novel MICA alleles using RSCA. The sample 25/1506 in the bottom lane
was analysed by RSCA and showed a different mobility in the gel when hybridised with fluorescent
reference MICA*004. One peak in this sample corresponded with MICA*001 and the other was
unknown. Sequence analysis of exon 5 revealed a novel allele with ten GCT repeats. Perez-Rodriguez et
al., 2002 (Permission for reproduction granted by John Wiley and Sons).
MICA typing using PCR and Sequence Specific Primers (SSP)
PCR-SSP utilises amplification primers specifically designed to anneal with known
polymorphisms within the MICA gene. It was also originally developed for HLA allele
typing (Olerup and Zetterquist, 1992) and later developed for MICA typing (R. W. Collins
et al., 2002; Stephens et al., 1999). Primers are designed so that polymorphic target
nucleotides are situated on the 3‟ end of the primer and an amplicon will only be generated
if the specific polymorphism is present. Resolution of possible allele combinations is
improved with the addition of further primer pairs to cover all known polymorphisms
within the gene. To ensure a negative result is because the nucleotide mutation is not
detected, a control „housekeeping‟ gene is amplified from the same sample. Therefore if
the housekeeping gene is amplified and the specific amplicon is not generated, the
polymorphism is not present. All primer reactions are loaded onto an agarose gel, resolved
by electrophoresis and visualised by ethidium bromide staining and photography. SSP is
popular because it is rapid, results can be achieved in two hours and only basic molecular
biology laboratory equipment is required. However, only polymorphisms that are known
can be detected unless a novel allele generates anomalous results due to unexpected positive
or negative reactivity. Point mutations that create novel polymorphic positions are not

Chapter 1
85
detected with this method unless they affect primer binding. Furthermore, manual reaction
setup and gel loading renders this technique less suited to testing large numbers of
individuals and can be expensive due to the large number of PCR reactions required.
MICA typing with PCR and Sequence Specific Oligonucleotide Primers (SSOP)
SSOP was another method developed for HLA allele typing (Saiki et al., 1986) and later
developed for MICA typing (Mendoza-Rincon et al., 1999; Y. Zhang et al., 2001). Firstly,
PCR of exons 2-5 of the MICA gene is carried out for each sample. For high-throughput
this is usually done in a 96-well PCR tray so that a robot, or some other system, can directly
transfer the amplified DNA to the membranes after being heat denatured. The membranes
are cut to size to allow room for the 96 „blots‟ and one membrane is used for each DNA
probe which will bind to complimentary sequences in the DNA. Once the DNA has dried
onto the membranes they are placed in a UV cross-linker, which covalently binds the DNA
to the membrane so that it cannot be washed off. Each membrane is coated in a solution
containing the probe, which is known as hybridisation. In most protocols, the probe is
labelled with digoxygenin-ddUTP (DIG-ddUTP) so that hybridisation can be detected later,
and excess probe is removed by washing. The hybrids are detected with an antibody-
enzyme conjugate, anti-DIG-alkaline phosphate and visualised by adding a substrate which
reacts with the alkaline phosphate to produce a chemiluminescent signal which can be
detected by autoradiography film. The result is a pattern of reactions or positive signals that
can be interpreted to give the combination of alleles present. It is important to include
controls in each batch of samples to ensure the procedure is working correctly, positive
controls are DNA samples with well-defined MICA types, expected to react with the probes
used and negative controls detect contamination. The level of resolution is dependent on
the number of probes utilised.
This technique has the advantage of being suited to high-throughput analysis, for example,
population studies of MICA allele frequencies or where large numbers of individuals are
screened for disease association studies. A major limitation is with results analysis, which
can be difficult and tedious. Currently, the only available commercial assay for MICA
typing is based on this technique and overcomes many of the difficulties associated with the
traditional method. The commercial assay is based on Luminex X-MAP technology
(Dunbar, 2006) and developed by One Lambda. The Luminex X-MAP system is a
multiplexed microsphere-based suspension array platform capable of analysing and
reporting up to 100 different reactions in a single reaction tube. PCR amplicons are
generated, as with other MICA typing assays, by PCR, except one primer has been

Chapter 1
86
biotinylated. The amplicons are denatured and mixed with the bead suspension where
hybridisation of DNA complimentary to the probe coated on the bead takes place.
Detection of hybridised amplicons is enabled with the use of streptavidin-phycoerythrin (PE
reporter fluorochrome) and complex formation with biotin. Sample analysis is performed
using a flow cytometer, which has two lasers, one that detects the fluorescence of the bead
(identifies the probe) and the other to detect the reporter fluorochrome (positive
hybridisation). Computer software is used to generate reports and eliminates complicated
analysis and risk of human error.
1.4.2 MICA antibody detection methods
MICA antibody detection CDC
As MICA is not normally expressed on peripheral blood lymphocytes, the traditional CDC
test cannot be used either to detect MICA antibodies in patient serum or to perform a CDC-
crossmatch. However, cells can be used for MICA antibody detection if DNA encoding
MICA molecules is transfected into a B-lymphoblastoid cell line (BLCL). HMY2.C1R cell
line does not express MICA antigens on the cell surface and can be transfected by
electroporation with MICA cDNA encoding extracellular, transmembrane and cytoplasmic
domains. Co-transfection of a gene allowing resistance to the antibiotic drug G418 permits
growth of cells that have incorporated the transfected gene while non-transfected cells die.
Individual MICA alleles are transfected into separate cultures of HMY2.C1R cells to
produce of panel of cells expressing single MICA antigens that can be used in a CDC assay
as depicted in Figure 1.4.6.

Chapter 1
87
Figure 1.4.6: MICA antibody detection using CDC. In this example, three MICA alleles have been
transfected into BLCLs – MICA*001, 002 and 008. A. Cells are placed into individual wells of a
„Terasaki‟ micro-well plate and B. patient serum is added. C. Following incubation, complement is added
to the wells causing a membrane attack complex where antibody is bound. D. Lysis (positive result) is
visualised with a fluorescent dye that stains dead cells red while live cells appear green by fluorescent
microscopy.
MICA antibody detection using ELISA
As CDC requires live, viable cells, a method where MICA antigen is immobilised on a solid
support (solid phase) is preferable. Also, antibody-mediated graft damage (anti-HLA) in
transplantation has been reported, in the absence of a positive result by CDC, indicating
more sensitive techniques are required. The easiest way to achieve this is to produce
recombinant MICA molecules representing the extracellular portion of the antigen
recognised by antibodies. Soluble recombinant MICA molecules can be produced using
bacterial, insect cell or mammalian cell systems with bacteria producing the largest amount
of antigen at the lowest cost and mammalian cells producing the least protein and is the
most expensive system to develop. Insect cell transfection and recombinant molecule
production falls somewhere between the other two in terms of cost and amount of antigen
produced.
Purified, recombinant MICA (rMICA) molecules are adhered to a solid support, usually a
96-well plastic plate. When patient serum is added, only antibodies specific for the

Chapter 1
88
particular MICA antigen will bind, thus avoiding non-specific binding that can occur with
CDC. If MICA specific antibodies are present in the patient‟s serum they can be detected
bound to the antigen by addition of a secondary anti-human IgG antibody labelled with
biotin (or some other detection system). Biotin strongly binds to streptavidin, which is
conjugated with horse-raddish peroxidase (HRP), an enzyme that is catalysed by the
addition of a substrate to produce a colour reaction. The intensity of colour produced, and
hence the amount of antibody present in patient serum, is measured by spectrophotometry
and recorded as optical density (OD). The ODs are compared with MICA positive and
negative controls to determine a cut-off value for assigning a positive reaction. A
disadvantage with this method is that it takes many hours to perform, involves numerous
washes and incubations and requires several hundred microlitres of serum, depending on
the number of MICA alleles tested. However, it is more sensitive than CDC, detecting the
presence of antibodies at much lower concentrations, and the information gained is useful
for clinicians especially when donor-specific antibodies are detected. The main stages
involved in performing an ELISA to detect MICA antibodies are shown in Figure 1.4.7.
Figure 1.4.7: MICA antibody detection using ELISA. A. rMICA molecules are adhered to the surface
of a 96-well plate. B. Patient serum is added and allowed to incubate with the antigens. C. Anti-human
IgG conjugated with biotin is added. D. Streptavidin/Horse-raddish peroxidase (enzyme) is then added
which binds with biotin, if present. E. A substrate is added and is catalysed by the enzyme to produce a
colour reaction. F. An automatic ELISA plate reader (spectrophotometer) measures the optical density of
each well, which is used to deduce positive and negative reactions relating to the presence or absence of
MICA-specific antibodies in patient serum.

Chapter 1
89
MICA antibody detection using flow cytometry
FC can be used as a platform for solid-phase antibody detection by utilising a series of
polystyrene microspheres (beads) containing a mixture of two fluorochromes of varying
concentration, embedded within the bead giving them unique fluorescence intensity. This
technology was developed by the Luminex Corporation (TX, USA) and adopted originally
by One Lambda (CA, USA) as a solid-phase support for recombinant HLA molecules in
order to detect HLA antibodies. The Luminex bead method for antibody detection (referred
to henceforth as „Luminex‟) is discussed at length in Chapter 4. Briefly, soluble rMICA, or
MICA molecules cleaved from the surface of cells, are attached to the beads as either a
mixture of antigens on one bead or individual SAgs on separate beads. If single-antigen
beads are used they can be conveniently mixed together and assayed as a multiplex in a
single well of a 96-well plate. Beads are incubated with patient serum, followed by
washing and the addition of a PE-labelled anti-human antibody. When the beads are run
through a flow cytometer, the two lasers detect the differential fluorescence intensity of the
beads and also the presence of PE, thereby identifying which antigen is on the beads and
whether there is a positive reaction with patient serum. The output from the instrument is in
the form of mean fluorescence intensity (MFI) and adjusted using a negative control MFI
and a positive control can be included to ensure the assay performed correctly. Empirical
testing using reference standard sera can establish cut-off values for assigning a positive
reaction, however, sera standards for MICA testing are currently unavailable.
Luminex has many advantages over alternative methods of antibody detection and has
transformed the histocompatibility laboratory. Multiplexing allows analysis of multiple
analytes in one tube therefore many individual tests can be performed at once, saving time
and manpower while at the same time increasing sensitivity up to 10% compared to ELISA
methods (Tait et al., 2009). Luminex can easily distinguish between HLA class I and II
antibodies and it is now possible to detect antibodies directed at antigens of loci such as
HLA-DRB3, -DRB4, -DRB5, -DQB1 and DPB1 which are expressed independent of HLA-
DRB1. It is also possible to detect antibodies reactive with HLA-C antigens, completing
the repertoire of potentially clinically relevant HLA antibodies.
In 2006, One Lambda introduced a Luminex SAg assay to detect MICA antibodies and for
the first time many more laboratories were able to investigate the clinical relevance of these
antibodies in transplantation. This was followed by the release of a second commercial
Luminex MICA SAg assay by Tepnel Lifecodes (now produced by Gen-Probe, CA, USA)
in 2008, setting the scene for future research into the effects of MICA antibodies in acute

Chapter 1
90
and chronic allograft rejection. The principle of the Luminex antibody detection assay is
depicted in Figure 1.4.8.
Figure 1.4.8: Principle of the Luminex single antigen assay to detect MICA antibodies. A. Single rMICA antigens are attached to beads with specific fluorescent properties and mixed together.
B. Patient serum is mixed with pooled Luminex beads and allowed to incubate. C. Antibodies in patient
serum, specific for individual MICA antigens, bind to the MICA molecule. D. Anti-human IgG
conjugated with PE is added and binds with MICA antibodies, if present. E. Flow cytometry is
performed for each patient being tested. Two lasers detect the presence of antibody (PE) and the bead
specificity (bead fluorescence) and a charge-coupled device (CCD) camera detects the emitted light. F.
Individual beads form distinct groups (gates) based on their fluorescence and computer software
calculates results and produces a report.
Detecting MICA antibodies in patient and donor crossmatching
MICA antigens are not expressed on peripheral blood lymphocytes rendering the traditional
crossmatch unsuitable for detecting clinically relevant non-HLA antibodies that are
expressed on endothelial cells. These include angiotensin II type I receptor (Dragun et al.,
2005), vimentin, MICA and MICB (Q. Zhang and Reed, 2010). A commercially available
endothelial cell crossmatch assay is now available.
The XM-ONE (Absorber, Stockholm, Sweden) endothelial cell (EC) crossmatch assay kit
contains magnetic beads for EC isolation from peripheral blood of the donor that target the
TIE-2 receptor expressed on ECs and also T- and B-cells. Once isolated, the cells can be
incubated with patient sera, as in the traditional crossmatch assay, followed by detection of
bound patient antibody with anti-human IgG antibody conjugated with PE and FACS

Chapter 1
91
analysis. Lymphocytes and endothelial cells can be separated by size using forward scatter
and side scatter and gated, allowing separate analysis and, therefore, T- and B-cell and EC
crossmatch can be performed simultaneously (Alheim et al., 2010). If the lymphocyte
crossmatch is negative but EC crossmatch is positive, potentially harmful antibodies to
donor EC antigens are present in the patient‟s serum, however, they could be directed
against any alloantigen expressed on the EC, including MICA. If the T- or B-cell
crossmatch is positive it is impossible to tell if non-HLA antibodies are present as ECs also
express both HLA class I and II antigens. In either case, a positive result could be a
contraindication to transplant. A multicentre evaluation of this assay has been carried out
and it was found that 24% of patients had antibodies to EC antigens and among these
patients, 46% had rejection episodes compared to 12% without such antibodies. These
results suggest that patients who would normally be crossmatch negative are at risk of
rejection if non-HLA antibodies directed against EC antigens are present (Breimer et al.,
2009). The principle of this technique is illustrated in Figure 1.4.9
Figure 1.4.9: XM-ONE
crossmatch assay to detect non-HLA antibodies directed against EC
antigens. A. Magnetic isolation of EC and lymphocytes from peripheral blood, targeting the TIE-2
receptor. B. Cells are incubated with patient serum followed by antihuman IgG labelled with PE. C.
Flow cytometry analysis detects bound antibodies. D. Separate analysis of the EC gate and lymphocyte
gate determines result.

Chapter 1
92
1.5 Aims of this Thesis
Renal transplantation can transform the lives of patients with ESRD and improvements in
immunosuppressive therapy have limited the effects of T-cell mediated alloimmunity,
reducing AR. However, rejection due to antibody-mediated graft damage arising from B-
cell responses to mismatched HLA antigens remains a problem and the production of de
novo HLA-DSA post-transplant is associated with acute and chronic graft rejection.
Despite renal transplant rejection being strongly associated with HLA antibodies, 11-20%
of patients without HLA antibodies develop chronic allograft rejection and furthermore,
HAR can occur in the absence of HLA antibodies, implicating other non-HLA alloantigens.
A possible candidate is the highly polymorphic MICA antigen as expression can be
upregulated by stress on endothelial cells within renal grafts and has been shown to
associate with acute and chronic graft rejection.
The mechanisms by which individuals develop MICA antibodies are largely unknown but
MICA sensitisation can possibly be induced by pregnancy and blood transfusion, however
it is has not been clearly shown that mismatching of MICA alleles in transplantation results
in the production of antibodies. Therefore, the aims of this thesis were to develop an SBT
strategy to genotype patients and their donors for MICA alleles at high resolution and
develop methods for detection of MICA antibodies in recipients.
Following establishment of assays for MICA allele typing and MICA antibody detection,
the aim was to determine whether mismatching of MICA alleles results in the production of
de novo MICA antibodies directed against MICA antigens of the donor. A correlation with
AR determined by biopsy analysis was investigated for patients who developed de novo
MICA antibodies or had pre-existing MICA antibodies and compared to recipients without
MICA antibodies. Statistical analysis to determine MICA antibody association with five-
year GS and function assessed by eGFR measurement after one, two and three years post-
transplant was carried out. In addition, longitudinal analysis of MICA antibody production
was performed to investigate changes in MICA antibody levels over time. Some studies
suggest that the presence of soluble MICA proteins in patient serum may have an
immunomodulatory role and protect patients from graft rejection mediated by MICA
antibodies and this was also investigated.

Chapter 2
93
CHAPTER 2
Materials and Methods
The materials and methods described in this chapter were used to perform the research work
referred to throughout the chapters of this thesis.
2.1 Study Cohorts
2.1.1 Recruitment and ethical approval
All renal patients included in this study provided written consent for diagnostic testing for
the presence of alloantibodies that may be a contraindication to transplant. The analysis of
data in this study did not require any additional patient samples or consent.
2.1.2 Specimen collection
Genomic DNA, extracted from whole blood, and serum samples were collected from
patients who received a renal graft or with ESRD and treated at the UCL Department of
Nephrology, The Royal Free Hampstead, London. Specimens were stored at the Anthony
Nolan Histocompatibility Laboratories and available for testing, relevant to this study.
2.1.3 Healthy adult controls
Sera and DNA from normal healthy individuals, who had donated blood for testing to join
The Anthony Nolan Trust volunteer hematopoietic stem cell donor register, were
anonymized and used for quality control validation of the methods and approved by the
Anthony Nolan UK Medical and Scientific Advisory Committee in 2008. Additionally,
plasma, sera and DNA specimens were obtained from healthy volunteers from the Anthony
Nolan Research Institute, London after obtaining informed consent (Appendix B).

Chapter 2
94
2.2 Molecular Biology
2.2.1 General methods
DNA extraction from whole blood
Patient, donor and healthy control DNA used in this study was extracted using an
automated robotic system and Qiagen reagents and performed by the histocompatibility
laboratories at Anthony Nolan following guidelines and procedures for a professionally
accredited laboratory.
Nucleic acid quantification
Nucleic acids were quantified using a modified form of the Beer-Lambert law on a
Shimadzu Mini1240 Spectrophotometer (Shimadzu, Duisburg, Germany) or on a Nanodrop
ND-1000 Spectrophotometer (Nanodrop, Wilmington, DE. USA). One OD unit was
assumed to be on average equivalent to 50 μg/ml of double stranded DNA (dsDNA) or 38
μg/ml of single stranded DNA (ssDNA). The Nanodrop software automatically adjusted
the absorbance measurements in order to compensate for the 1 μm path length when
calculating OD values on this instrument. Purity of the nucleic acid solutions was assessed
by the ratio of the absorbance measurements taken at 260 and 280 nm (OD260:OD280)
where a pure dsDNA solution has an OD260 absorbance that is exactly twice the value of
its OD280 absorbance. Nucleic acid stocks were stored at 4°C or -20°C for longer storage
duration.
Quantification of total RNA
To determine the yield of total RNA, the OD was determined using UV spectrophotometry.
RNA absorbs light at 260 nm. One OD unit is equivalent to 40 g/ml of single-stranded
RNA.
Polymerase Chain Reaction (PCR)
PCR enables de novo synthesis of a target region of genomic or cDNA, flanked by two
primers complimentary to the 3‟ and 5‟ strands. The reaction comprises three steps,
denaturation which separates the double-stranded DNA to form two strands, annealing to
allow binding of the primers to their complimentary sequence and extension during which,
Thermus aquaticus (Taq) DNA polymerase synthesises new copies of the DNA, flanked by
the primers. The three steps were repeated a number of times to amplify the DNA region of

Chapter 2
95
interest. The reaction required the addition of deoxynucleotides to provide energy and
nucleotides for the synthesis of new DNA, heat stable polymerase, specific 5‟ and 3‟
primers, DNA template and buffer containing magnesium. Amplification conditions
(temperature and duration) must be optimised based on nucleotide composition of the
primers and length of the desired DNA product. Magnesium concentration must be
optimised as it is mandatory for activation and fidelity of Taq polymerase and affects
primer annealing.
Primer Design
Primers for PCR amplification were custom made and complimentary to the sequences
flanking the DNA region of interest. Primers were typically 15-30 nucleotides long and in
addition to the sequence complimentary to the DNA template, additional sequence could be
added and incorporated into the amplified DNA product. The melting temperature (Tm) is
the temperature at which half of the DNA in the reaction is single-stranded and half is
double stranded and was calculated for oligonucleotides with the following formula:
Tm (C) = 2 (nA + nT) + 4 (nG + nC). In this formula, n is the number of A (adenine), T
(thymidine), G (guanine) and C (cytosine) nucleotides. The temperature for annealing of
primers was 4C below the calculated Tm for a given primer.
2.2.2 Sequence-based typing for MICA allele assignment
PCR amplification of the MICA gene
Primers used for amplification of exons 2-4 or 2-5 of the MICA gene and for bi-directional
sequencing of exon 2-4 (and exon 5 for GCT triplet identification) are given in Table 2.2.1.
PCR reactions were performed in an MJ Research PTC-200 thermal cycler (MJ Research
Inc, Watertown, MA, USA). Reaction volumes of 25 l were set up using amplification
primers listed in Table 2.2.1 and reaction mixtures described in Table 2.2.2. Reactions were
set up on ice and placed in a thermal cycler using the cycling conditions outlined in Table
2.2.3.

Chapter 2
96
Table 2.2.1: Primers used for amplification and sequencing MICA from genomic DNA (SBT)
and sequencing of cDNA
Name Sequence Description
MICA-Shaoa CAC CTG TGA TTT CCT CTT
CCC CAG AGC 5‟ amplification primer intron 1
MICA8999b GAT GCT GCC CCC ATT CCC
TTC CCA A 3‟ amplification primer intron 5
5MICA-1Cc GAG CCC CAC AGT CTT CGY
TAT
Exon 2 sequencing primer
forward
MICA2Rb GTG CCG GCT CAC CTC CCC
TGC T
Exon 2 sequencing primer
reverse
MICA3Fb CCC TGG GCT GAG TTC CTC Exon 3 sequencing primer
forward
MICA3Rb ATA GCA CAG GGA GGG TTT Exon 3 sequencing primer
reverse
MICA4Fb CAG AGT GAG AAC AGT GAA Exon 4 sequencing primer
forward
MICA4Rb AGG GAC TTG TTA TAC ACT Exon 4 sequencing primer
reverse
MICA5Rd CCT TAC CAT CTC CAG AAA
CTG C
Exon 5 sequencing primer
reverse a(Shao et al., 2004); b
(Zwirner et al., 2000); c(Molinero et al., 2002b);
d(Ota et al., 1997);
c
Table 2.2.2: Reagents and volumes required for genomic DNA PCR amplification of
exons 2-5 of the MICA gene
PCR Reagent Volume (l)
TDMHa 8
5‟ primer (25 pmol/l) 0.25
3‟ primer (25 pmol/l)b 0.25
TAKARA Taq polymerase (8 Units/l) 0.2
DNA template 2.5
Distilled H2O 13.8
Total Volume 25
aTDMH – Ten times PCR buffer, dNTPs, MgCl2, H2O. (42.25 l 10X PCR buffer; 12 l dNTPs; 26 l
25mM MgCl2; 82 l distilled H2O).
bPrimer MICA 8999 situated in intron 5 allows amplification of exon 5.

Chapter 2
97
Table 2.2.3: PCR cycling conditions for MICA gene amplification
Step Temp C Duration
1 95 5 mins
2 95 30 secs
3 67 1 min 30 secs
4 72 2 mins 30 secs
5 Repeat steps 2-4 for 34 cycles
6 72 10 mins
7 4 Hold
DNA electrophoresis
To confirm successful PCR amplification of the target gene, agarose gel electrophoresis
was performed. In an electric field, the negatively charged DNA migrates towards the
anode at a speed relative to the size of the DNA fragment, enabling separation of fragments
of different lengths. The 1% agarose gel was prepared by dissolving 1g of electrophoresis
grade agarose (Invitrogen, Paisley, UK) in 100 ml Tris-boric acid-EDTA (TBE) buffer
(TBE: 0.1 M Tris, 0.09 M boric acid, 1 mM EDTA, Bio Whittaker, Maryland, USA).
Ethidium bromide (1 g/ml final concentration, Sigma, UK) was added to the gel for
ultraviolet (UV) light visualisation of the DNA. The gel was poured into a sealed gel tray
(Biorad, Hercules, Ca, USA) and allowed to solidify after placing gel combs in the gel to
create the wells. The gel was submerged in 1X TBE buffer in an electrophoresis tank
before loading the samples. One tenth of the PCR reaction volume (2.5 l) was mixed with
1 l 6X blue loading dye solution (Fermantas Inc, Maryland, USA). To enable sizing
and/or quantification of the amplified products, a range of molecular weight markers were
available in a ready to use format. Hyperladder I (Bioline, London UK) was used with PCR
products in the expected range of 1000 bp to 10000 bp and Hyperladder IV (Bioline,
London UK) used with fragments <1000 bp. If 5 l (720 ng) is loaded onto lanes adjacent
to the PCR products, the quantity (ng) of DNA as well as the size can be determined by
referring to the product insert.
Post-PCR amplification clean up
PCR-amplified DNA was purified using a GFX PCR DNA purification kit (Amersham
Pharmacia Biotech, Piscataway, USA) according to manufacturer‟s instructions. For
purification of DNA from agarose gels, an agarose slice containing the DNA of interest was

Chapter 2
98
excised from the gel using a clean scalpel blade. The DNA was eluted by the addition of 75
l of distilled H2O (diluting the PCR DNA 1:3). If the DNA was to be used for cloning,
only 50 l of distilled H2O was used for elution.
Cycle sequencing reaction for direct sequencing and SBT
Sequencing primers, as listed in Table 2.2.1, were used for cycle sequencing. Sequence
reactions were performed using Big Dye Terminator V3.1 cycle sequencing kit (Applied
Biosystems, Foster City, CA, USA) in an MJ Research PTC-200 thermal cycler.
Conditions for cycle sequencing were as follows: 25 cycles of denaturation at 96C for 10
seconds, annealing at 50C for 5 sec and extension at 60C for 4 minutes. Products were
precipitated in 30 l 100% ethanol and 2.5 l 125 mM EDTA for 15 minutes at room
temperature and recovered by centrifugation at 1800g for 15 minutes. Pellets were washed
with 30 l of 75% ethanol followed by centrifugation at 1800g for 30 minutes. Products
were resuspended in 10 l of HiDi Formamide (ABI, CA, USA) and sequenced for 50
minutes on a 3730xl ABI Genetic Analyser.
Sequencing Analysis and Heterozygous MICA typing
Sequencing Analysis and MICA typing was performed using AssignSBT (Connexio
Genomics, Australia) based on exons 2-4 of the MICA gene. Ambiguous types were
analysed further if distinguishable by the number of GCT repeats in exon 5 using Genescan
(Applied Biosystems, Foster City, CA, USA) or analysis of overlapping sequence patterns
as described (Zou et al., 2006a) and is discussed further in Chapter 3.
2.2.3 Short Tandem Repeat (STR) Analysis of MICA Exon 5 using Genescan
PCR Primers and Amplification of Exon 5 of the MICA gene
PCR primers flanking exon 5 (trans-membrane region) were ordered based on the work of
Ota (Ota et al., 1997). Primer details are as follows, MICA5F:
CCTTTTTTTCAGGGAAAGTGC; MICA5R: CCTTACCATCTCCAGAAACTGC.
MICA5R was labelled at the 5‟ end with the fluorescent amidite reagent, 6-FAM (Applied
Biosystems, USA). The MICA5F primer corresponds to the boundary region within intron
4 and exon 5 and MICA5R is located in intron 5. PCR was carried out in a 50 l reaction
volume (Amplitaq Gold – ABI, CA, USA) containing 50 ng of template genomic DNA, 200
M of each primer, 1.25 mM of each dNTP, 2 mM MgCl2, 1.8 U TaqGold and 1X PCR
buffer. The reaction mixture was placed in an MJ Research PTC-200 thermal cycler:

Chapter 2
99
denaturation at 94C for 2 minutes followed by 30 cycles of: 94C for 1 minute, 55C for 1
minute and 72C for 2 minutes. A negative control was included to detect contamination.
Amplified products were checked on a 1% agarose gel as previously described.
Typing of Trinucleotide Repeat Polymorphism in the TM region of MICA gene
A gel loading cocktail was prepared as follows, per sample: 2.5 l formamide, 0.5 l Blue
Dextran (50 mM EDTA, 50 mg/ml Blue Dextran), 0.5 l Genescan Rox 500 size standard
(Applied Biosystems). Three volumes of PCR product were tested for optimal results per
sample – 1.0 l, 0.5 l and 0.3 l made up to 1.5 l with water. For electrophoresis an ABI
377 DNA sequencer was used with Genescan software (Applied Biosystems). A 4%
denaturing acrylamide gel was prepared using 36 cm well to read plates. Immediately prior
to loading samples on the gel, 1.5 l of sample was mixed with 3.5 l of loading cocktail in
MicroAmp tubes and placed in an MJ Research PTC-200 thermal cycler at 95C for 5
minutes. Samples were then placed on ice until ready to load. A 36 well comb was used
and 1.5 l of denatured sample mixture was loaded into separate wells. Electrophoresis
was performed for 2 hours under conditions appropriate for the plates as recommended by
the manufacturer.
Assignment of Alleles
The designation of MICA type was based on the number of repeat units present in the
amplified allelic products of MICA exon 5. The alleles have 4, 5, 6, or 9 GCT repetitions
(alleles with 7, 8 or 10 GCT repeats were not detected). In addition, alleles with 5 GCT
repeats may also have an additional insertion of „g‟ and will be referred to as 5.1. The
amplified sizes are expected to be as follows: 180 bp (4 GCT), 183 bp (5 GCT), 184 bp
(5.1 GCT), 186 bp (6 GCT) and 195 bp (9 GCT).
2.2.4 Production of cDNA from RNA
RNA Extraction and DNase Treatment
Total RNA was isolated from cultured cells using RNeasy Mini Kit (Qiagen, GmBH,
Germany). This allows the purification of up to 100 g RNA from animal cells and tissues.
An aliquot of 5-10 x 106 cells were used per extraction following manufacturer‟s
instructions. The mRNA was used immediately as a template for complementary
deoxyribonucleic acid (cDNA) synthesis or stored at -70C until required.

Chapter 2
100
Reverse-Transcriptase (RT) PCR – cDNA synthesis
10 l of mRNA from the previous step was added to a 1.5 ml Eppendorf tube. 1 l of 0.5
g/ml Random Primers (Promega, Wisconsin, USA) and 1l 10M dNTPs (Bioline,
London, UK) was added to the tube containing RNA and incubated in a water bath at 65C
for 5 minutes. Tubes were then placed on ice and 4 l 5 x Buffer (Promega), 2 l 0.1M
Dithiothreitol (DTT) (Promega), 1 l RNase inhibitor (Promega) and 1 l Maloney-Murine
Leukaemia Virus (Promega) was added bringing the total volume to 20 l. The RT-PCR
reactions were placed in a water bath at 37C for 50 minutes followed by 70C for 10
minutes and reactions were kept on ice or frozen until needed.
2.2.5 Generation of plasmid constructs for protein expression in Escherichia coli
PCR Amplification of MICA and MICB from cDNA
MICA and MICB exons 2-4 were amplified in a 50 l reaction volume (ABgene, Surrey,
UK) containing 10-50ng template cDNA, 600 M of MICA/B forward and reverse primers
(described below), 1.25 mM of each dNTP, 2.5 mM MgCl2, 5 U RedHot Taq and 1xPCR
buffer. PCR: 95C for 30 seconds followed by 30 cycles of: 95C for 30 seconds, 55C for
30 seconds and 72C for 2 minutes. Amplified products of 800 bp. were checked on a 1%
agarose gel. The 5‟ primer originally used for MICB cDNA amplification by my colleague,
Jenny Luxton, contained an Xba1 restriction endonuclease site and the 3‟ primer contained
a restriction endonuclease site for BamH1, however, the Xba1 site was found within the
MICA sequence that was not present in MICB and the only alternative was to also use
BamH1 on the 5‟ primer and screen for correctly orientated inserts in the latter stages.
MICA/B Forward primer: ggatccaatgccccacagtctt, MICA/B Reverse primer:
ggatccccagagggcac. Underlined sequence is the BamH1 restriction site.
Purification of PCR cDNA from a gel slice
The PCR product was run on a 1% agarose gel for gel excision and purification using GFX
PCR DNA and gel band purification as described above.
Ligation of MICA cDNA into pCR4-TOPO plasmid
This preliminary cloning step using TOPO TA cloning kit for sequencing (Invitrogen,
Paisley, UK) was carried out to enable screening of a large number of transfectants as many
were expected to have MICB sequences or nucleotide misincorporations. The TOPO TA
cloning kit utilises an efficient enzymatic ligation reaction facilitated by topoisomerase I.

Chapter 2
101
Topoisomerase I from the Vaccinia virus binds to duplex DNA at specific sites and cleaves
the phophodiester backbone after 5‟-CCCTT in one strand (Shuman, 1991). The energy
from the broken phosphodiester bond is conserved by formation of a covalent bond between
the 3‟ phosphate of the cleaved strand and a tyrosyl residue (Tyr-274) of topoisomerase I.
The main advantage of this system is that ligation is efficient and can be carried out in five
minutes at room temperature using the following method. A volume of 4 l of purified
MICA PCR product was mixed with 1 l of salt solution and 1 l of pCR4-TOPO vector
(both provided with kit) and made up to a final volume of 10 l with 4 l of distilled H2O.
Reactions were gently mixed and incubated at room temperature (22-23C) for five
minutes.
Transformation of TOP10 chemically competent cells
The competent cells were thawed on ice and 3 l ligation reaction was added and mixed
with the cells by stirring with a pipette tip. The cells and vector were incubated on ice for 5
minutes then heat-shocked at 42C in a water bath for exactly 30 seconds and transferred to
ice for 2 minutes. 250 l of SOC medium was added and the tube was placed horizontally
in a shaking incubator set at 37 C for 1 hour. Luria Bertani (LB) agar plates were prepared
(1% tryptone, 0.5% yeast extract, 1% NaCl, pH 7.0) containing 50 g/ml kanamycin as
pCR4-TOPO contains a kanamycin resistance gene. In order to ensure well-separated
colonies, 2 plates were prepared for the transformation reaction – one plated with 10 l and
one with 50 l of transformation reaction. The agar plates were incubated at 37C
overnight. Individual colonies were then picked and transferred to Falcon 2059 14 ml tubes
(Becton Dickinson and Co., New Jersey, USA) containing 2 ml LB medium containing 50
g per ml kanamycin and incubated in a shaking incubator overnight (about 16 hours).
Miniprep isolation of plasmid DNA
A Strataprep Plasmid Miniprep Kit (Stratagene, Ca, USA) was used for the extraction of
plasmid DNA following manufacturers instructions. Sequencing of plasmids was
performed to ensure ligated DNA was MICA specific and contained no nucleotide
misincorporations. This required the design of new primers situated in exon 3, allowing
sufficient overlap to enable the sequencing of the whole insert with these two primers:
5MICAint: 5‟-ATC CAT GAA GAC AAC AGC AC-3‟
3MICAint: 5‟-AGT CCT CCA GAG CTC AGA CC-3‟

Chapter 2
102
DNA endonuclease restriction enzyme digestion
DNA endonulceases and their respective buffers were purchased from Gibco BRL,
(Paisley, UK). The specific DNA sequences recognised and digested by restriction
enzymes used in experiments are given in Table 2.2.4. In brief, 1 to 5 l of DNA
(maximum 5 g) was transferred to a sterile microcentrifuge tube with 1 l reaction buffer,
1 l restriction enzyme (when two different restriction enzymes were used, 0.5 l of each
was added) and made up to a final volume of 10 l with sterile, double distilled water. The
digestion was carried out for 1 to 2 hours at 37C in a water bath.
Specific DNA sequences recognised by restriction enzymes used in this study are listed in
Table 2.2.4. The arrows indicate digestion sites and the reactions were carried out in the
presence of optimal buffers as indicated. The optimal buffer for Kpn1 is buffer 1, however,
buffer 2 has 75% activity and was used to allow dual digestion with Xho1.
Table 2.2.4: DNA endonuclease restriction enzymes, digestion sites and optimum buffers
Name Recognition site Reaction conditions
EcoR1 5‟-GAATTC-3‟
3‟-CTTAAG-5‟
REACT buffer 3
50 mM Tris-HCl (pH
8)
10 mM MgCl2
100 mM NaCl
BamH1
5‟-GGATCC-3‟
3‟-CCTAGG-5‟
Kpn1 5‟-GGTACC-3‟
3‟-CCATGG-5‟
REACT buffer 2
50 mM Tris-HCl (pH
8)
10 mM MgCl2
50 mM NaCl
Xho1
5‟-CTCGAG-3‟
3‟-GAGCTC-5‟
Restriction Digestion to release MICA fragments from pCR4-TOPO
Restriction digestion was carried out using BamH1 restriction sites encoded by PCR
amplification primers at either end of the amplicon to release the verified MICA insert from
this plasmid. 20 l of pCR4-TOPO plasmid, containing the desired MICA insert was
used in a 30 l reaction volume containing 1U of BamH1 (1 l) and 2 l REACT buffer 3.
The reactions were incubated at 37C for 2 hours in a water bath before loading the entire

Chapter 2
103
digest on a 1% agarose gel to isolate the MICA fragment using GFX purification columns
as described above.
Digestion with BamH1 to Linearise Plasmid pAC-5
Restriction digests were also carried out using 10 l of pAC-5 plasmid (a total of around 7
g plasmid DNA) in a 20 l reaction containing 1U of BamH1 and the REACT buffer 3 as
above.
Ligation of plasmid pAC-5 with purified MICA PCR product
Ligation reactions for each MICA allele were set up in a 20 l volume containing 10 l
buffer, 2 l vector and 4 l purified cloned PCR product and 2 l T4 DNA ligase (Promega,
Maddison, WI, USA). The ligation reaction was carried out at 16C overnight.
Transfection of AVB101 expression host with pAC-5 – MICA construct
The protein expression system chosen for the production of rMICA was Biotin Avitag
(Avidity, Colorado, USA), a simple and efficient method for the production of any
biotinylated protein. The plasmid pAC-5 was selected because it enabled construction of a
sequence in the correct reading frame.
AVB101 E. coli cells were grown up and made competent by the following method. A
scraping of AVB101 cells was taken from glycerol stocks and plated onto 2TY (2%
tryptone, 0.5% yeast extract, 0.1 M NaCl, 0.01 M MgCl2) agar medium containing 10 g/ml
chloramphenicol and placed at 37C overnight. A single colony was picked from the plate
using a pipette tip, which was then ejected into 10 ml of 2TY medium containing 10 g/ml
chloramphenicol and placed in a shaking incubator until an O.D.600 of 0.5 was reached. The
tube was centrifuged at 5000g for 15 minutes at 4C. The supernatant was removed on ice
before adding 80 ml of TFBI (30 mM KOAC, 50 mM MnCl2, 100 mM KCl, 10 mM CaCl2
and 15% glycerol pH to 5.8 using 0.2 M acetic acid and filter sterilised), ensuring the pellet
was dissolved. The tubes and contents were left on ice for 30 minutes, then centrifuged at
3000g for 10 minutes at 4C. The supernatant was removed on ice and 8 ml of TFBII (10
mM MOPS pH 7.0, 75 mM CaCl2, 10 mM KCl, 15% glycerol, pH to 6.5 using KOH/glaciel
acetic acid) was added, ensuring pellet was dissolved. 200 l was aliquoted into Eppendorf
tubes and stored at -70C. Stocks were also replaced by making glycerol stock – 1 ml of
cells + 50% glycerol and stored at -70C.

Chapter 2
104
For the transformation reaction, 2 l of purified plasmid DNA containing the MICA allele
was heat shocked into 200 l of competent AVB101 cells (using the same method as was
used to transfect TOP10 cells) and 10 l and 50 l aliquots were spread on LB plates
containing 100 g/ml ampicillin and 10 g/ml chloramphenicol and incubated at 37C
overnight. Individual colonies of transfected AVB101were picked and transferred to a
Falcon 2059 tube (Becton Dickinson and Co., New Jersey, USA) containing 2 ml LB
medium + 100 g/ml ampicillin and 10 g/ml chloramphenicol, and grown for 16 hours at
37C in a shaking incubator set to 125rpm. Plasmid DNA was extracted using a miniprep
kit (Stratagene, CA, USA) as described earlier in this section. MICA cDNA insert
orientation and reading frame was verified by sequencing with MICA internal sequencing
primers.
Induction of protein expression
Bacterial glycerol stocks, harbouring correctly constructed plasmids, were prepared for
future use by taking 500 l of the overnight culture, placing in a cryotube vial (Nunc,
Kamstrupvej, Norway) and adding 75 l sterile 100% glycerol. The tubes were mixed by
vortexing and stored at -70C. 100 l of the overnight culture was added to a fresh Falcon
2059 tube containing 1.9 ml of fresh LB medium + 100 g/ml ampicillin and 10 g/ml
chloramphenicol. The tubes were then placed in a shaking incubator at 37C for about 1
hour or until the O.D. at 550 nm reached 0.5. For the 0 hour (uninduced) time-course
sample, 100 l of each culture was removed and placed in a microcentrifuge tube and
centrifuged at 13,000 rpm for 1 minute to pellet the cells. The supernatant was removed
and 20 l of 2X SDS protein sample buffer (100 mM Tris pH 6.8, 4% SDS, 0.2%
bromophenol blue, 20% glycerol, 200 mM DTT) was added to each tube, which was then
stored at -20C. To induce protein expression, 2 l of 100 mM isopropyl-β-D-
thiogalactoside (IPTG) was added to each of the cultures to give a concentration of 1 mM.
The tubes were then placed in a shaking incubator at 37C for 4 hours. Further samples
were taken for SDS-PAGE analysis at 1, 2, 3 and 4 hourly intervals.
Inclusion body purification
Proteins synthesised as inclusion bodies in E. coli strains such as AVB101 require
purification from other bacterial proteins, which can be achieved with the following
method. Transformed AVB101 cells were inoculated into 30 ml LB medium (10g tryptone,
5g yeast, 10g NaCl in 1L distilled H20) containing 100 g/ml ampicillin and 10 g/ml
chloramphenicol and incubated overnight in a shaking incubator at 37C. 6 ml aliquots of
Chapter 2
105
the 30 ml overnight culture was transferred to six flasks containing 1L of LB medium
fortified with antibiotics as above, and placed in a shaking incubator until optical density
reached 0.6 at 600 nm. A 1 ml aliquot of culture was removed for later analysis prior to
protein induction and stored at -20C. The remaining culture was induced by adding 1M
IPTG to a final concentration of 1 mM, and placed in a shaking incubator for a further 4
hours at 37C. An aliquot of 0.5 ml post-induction culture was removed and stored at -
20C for later analysis. The culture was transferred to 1L Beckman polypropylene screw
top centrifuge bottles and centrifuged in a Beckman Avanti J-20 centrifuge with JLA
8.1000 rotor at 4000 rpm for 15 minutes at 4C. Bacterial pellets were pooled and
resuspended in PBS to a total volume of 60 ml.
The resuspended bacteria was transferred to a 100 ml polypropylene beaker containing a
half-inch magnetic stirrer and placed on a stirring plate at half speed. The following were
added drop-wise to the stirring mixture: 1.2 ml 50 mg/ml lysozyme (final = 1 mg/ml), 300
l 1.0M MgCl2 (final = 5mM), 1.5 ml 2 mg/ml DNAse I in 50% glycerol containing 75 mM
NaCl, 600 l Triton-X 100 (final 1%), 600 l 1M DTT (final = 10 mM).
The 100 ml beaker containing the bacterial lysate was placed into a disposable 500 ml
polypropylene beaker containing ice, ensuring the smaller beaker was firmly held in place.
The beakers and contents were placed on the lab jack inside a sonicator and the CL4
ultrasonic converter was placed in the 100 ml beaker containing the lysate. The ultrasonic
converter was adjusted to its maximum depth without touching the beaker. The solution
was sonicated for 90 seconds at 0.5 second alternations on power 4. Lysate was transferred
to three 25 x 89 mm Beckman tubes and centrifuged for 10 minutes at maximum speed at
4C in a Beckman CS-15R centrifuge with FO 630 rotor. The supernatant was discarded
and the pellet resuspended using a glass rod in 1-2 ml of wash buffer (100 ml 1M Tris pH
8.0, 40 ml 5M NaCl, 4 ml 5M EDTA, 20 ml 10% Na Azide and 0.5% v/v Triton-X to a
final volume of 2L) then topped up to 15 ml with wash buffer. The solution was sonicated
on ice for 90 seconds as above before centrifugation as above. The supernatant was
discarded and the wash step was repeated 3x until the pellet was white and the supernatant
clear. Pellets were then resuspended in wash buffer (as above but without Triton-X)
followed by centrifugation as above. After discarding the supernatant, 200-1000 l distilled
H2O was added to form a white paste, which was then resuspended in 10 ml of 8M urea
solution (1.25 ml MES (2-N-morpholino-ethane-sulphonic acid), 24 g urea, 1 ml EDTA
made up to 50 ml with distilled H2O).

Chapter 2
106
The 10 ml of inclusion bodies was centrifuged for 10 minutes as above before transferring
the supernatant to a 15 ml polypropylene tube (saving a small aliquot for SDS-PAGE
analysis and determination of protein concentration).
Measurement of protein concentration
Protein concentration in solution was measured using the Micro BCA assay kit (Pierce,
UK). The principle of this assay is based on protein quantification by the Lowry methods.
The peptide bond reduces Cu+2 in alkaline solution to produce Cu+1 that chelates two
molecules of bicinchoninic acid (BCA). A purple-coloured reaction was produced that
strongly absorbs at 562 nm with intensity linear and proportional to the protein
concentration of the sample, determined by comparison with a protein standard curve
produced with proteins of known concentration. Bovine serum albumin (BSA) is included
in the kit as a protein standard at a concentration of 2 mg/ml and serial dilutions were
prepared ranging from 0-32 g/ml.
2.2.6 Generation of pCMV plasmid constructs for protein expression in 293T mammalian
cells
Amplification of the MICA gene from cDNA
PCR primers for amplification of MICA exons 1-4 from cDNA were redesigned according
to previously published work (Zou et al., 2006a) to incorporate the correct restriction sites
for ligation into pBK-CMV vector. The primers included sequence of the restriction site
Xho1 on the 5‟ primer and the 3‟ primer included sequence for restriction site Kpn1, and a
DNA tag encoding the BirA recognition sequence for enzymatic biotinylation. A six-His
sequence for protein purification utilising the affinity of histidine with nickel was also
included. For mammalian cell protein expression, the leader peptide sequence (exon 1) is
required therefore the 5‟ primer was designed to anneal to the first 18 bases of exon 1 and
the 3‟ primer annealed to the last 21 nucleotides of exon 4.
XhoI
5‟ forward amplification primer: 5‟ACT ATC TAC CTC GAG GCC ATG GGG CTG GGC
CCG GTC 3‟
3‟ reverse amplification primer: 5‟ AGC ACT CAC CCT GTG CCC TCT GGA TCC GGT
GGC GGT CTG AAC GAC ATC TTC GAG GCT CAG AAA ATC GAA TGG CAC GAA CAC
CAC CAC CAC CAC CAC TAG GGT ACC CAT GCG CAT 3‟
KpnI

Chapter 2
107
BirA biotinylation enzyme recognition sequence is in italics; six-His tag for up-stream
purification is indicated by bold font and restriction enzyme sequences are underlined.
Purification of PCR amplified product and ligation into pGEM-T Easy vector
The resulting fragments were analysed by electrophoresis, cut from the gel and purified as
described above. The Taq polymerase used for amplification of the MICA gene did not
have proofreading capability therefore there was a high chance that amplicons contained
nucleotide mis-incorporations. This first round of cloning enabled screening of multiple
clones to find one with the correct sequence of the MICA gene, which was checked by
DNA sequencing using MICA internal primers described above. The following procedures
were carried out using pGEM-T Easy vector cloning kit II (Promega Corp., Madison, WI,
USA).
The ligation reactions were set up as outlined in Table 2.2.5 and volumes and ratios of DNA
and vector were determined by empirical optimisation experiments.
Table 2.2.5: DNA Ligation reaction for T4 DNA ligase and pGEM-T Easy Vector
Reagent Standard
Reaction
Positive
Control
Background
Control
2X Rapid Ligation Buffer 5 l 5 l 5 l
pGEM-T Easy Vector (50 ng) 1 l 1 l 1 l
PCR product 2 l - -
Control Insert DNA - 2 l -
T4 DNA Ligase (3 Weiss units/l) 1 l 1 l 1 l
Sterile water to final volume of 10 l 10 l 10 l
The reactions were mixed by pipetting and incubated at room temperature for one hour.
Alternatively, to obtain the maximum number of transformants, the incubation was carried
out at 4C overnight.
Transformation of JM109 competent cells using pGEM-T Easy vector ligation
reactions
JM109 high efficiency competent cells were used for transformation reactions. As previous
experience with this cloning system showed most colonies contained a DNA insert,

Chapter 2
108
blue/white screening was not necessary and was omitted from the protocol. LB plates were
prepared containing 100 g/ml of ampicillin and two for each ligation reaction prepared,
plus two plates for determining the transformation efficiency. LB plates were equilibrated
at room temperature before use. Tubes containing the ligation reaction were centrifuged,
briefly, to collect the contents in the bottom of the tube. Two microlitres of each ligation
reaction was placed in a sterile 1.5 ml microcentrifuge tube on ice. Another tube was set up
on ice containing 0.1 ng of uncut plasmid to determine transformation efficiency of the
competent cells. Tube(s) of frozen JM109 competent cells were removed from storage and
thawed on ice for five minutes and the contents mixed by gently flicking the tube. A
volume of 50 l of JM109 cells was carefully added to each tube prepared above, mixed by
gentle flicking and incubated on ice for 20 minutes. To introduce DNA into the competent
cells, heat-shocking was carried out at 42C for 45 seconds before returning the
transformation reactions to ice for a further two minutes. At room temperature, 950 l of
SOC medium was added to each transformation, which was then placed in a shaking
incubator set at 37C (150 rpm) for 1.5 hours. Using the two LB plates prepared for each
transformation, one was spread with 50 l and the other 100 l of the transformation
reaction mixture. Plates were placed in an incubator at 37C for 16-24 hours. When
distinct colonies of about 1 mm diameter were present, colonies were picked from the plate
and transferred to a 15 ml Falcon tube, and 2 ml of LB medium containing 100 g/ml was
added before loosely capping the tubes and placing in a shaking incubator (220 rpm) at
37C for 18 hours, or overnight. Plasmid DNA was extracted from the cultures as
described above and sequenced to confirm the presence of and integrity of the MICA insert
sequence. Plasmid DNA extractions confirmed as having correct inserts were set aside for
future work and all others were discarded.
Sub-cloning MICA DNA into pCMV mammalian expression vector
DNA endonuclease restriction enzyme digestion was carried out using Xho1 and Kpn1
enzymes to release the insert from the pGEM-T Easy vector, which was isolated and
purified by gel electrophoresis as described. The pCMV vector was cut with the same
restriction enzymes to prepare it for ligation with the MICA DNA insert. Ligation and
transformation was carried out exactly as previously described, except that LB plates and
medium contained 50 g/ml of kanamycin instead of ampicillin. Also, as nucleotide mis-
incorporation was no longer a problem, only six colonies, per transformation, were picked
for sequence analysis.

Chapter 2
109
Endonuclease-free plasmid purification
Once correct pCMV/MICA DNA constructs were identified from plasmid minipreps,
plasmid preparation was scaled up using the EndoFree Plasmid Maxi Kit (Qiagen, Crawley,
UK) designed for purification of up to 500 g endotoxin-free plasmid DNA. The procedure
was performed following manufacturer‟s instruction and the DNE pellet was dissolved in
75 l of endotoxin-free TE buffer. The yield of DNA was then determined by UV
spectrophotometry. The purified plasmid DNA was then ready to be used for transfection
of 293T cells as detailed in section 2.5.3.
2.2.7 Generation of pIEx-4 plasmid constructs for MICA protein expression in Sf9 insect
cell line
MICA amplicons were generated with restriction sites for XhoI and KpnI as with 293T
HEK cells, except that the restriction sites were reversed for ligation into pIEx-4 and were
re-ordered as follows:
KpnI
5‟ forward amplification primer: 5‟ACT ATC TAC GGT ACC GCC ATG GGG CTG GGC
CCG GTC 3‟
3‟ reverse amplification primer: 5‟ AGC ACT CAC CCT GTG CCC TCT GGA TCC GGT
GGC GGT CTG AAC GAC ATC TTC GAG GCT CAG AAA ATC GAA TGG CAC GAA CAC
CAC CAC CAC CAC CAC TAG CTC GAG CAT GCG CAT 3‟
XhoI
The problems of amplification of MICB and MICA pseudogenes are associated with PCR
amplification from genomic DNA and were avoided by using a one in ten dilution of
purified MICA DNA fragments used to generate pBK-CMV constructs. Purified, amplified
MICA DNA and pIEx-4 were digested with Kpn1 and Xho1 restriction enzymes and ligated
using T4 DNA ligase as shown in Table 2.2.5. Sequencing was performed to check for
successful ligation and correct nucleotide sequence before scaling-up for production of
endonuclease-free plasmid DNA, ready for transfection into the cellular host, Sf9, as
detailed in section 2.5.3.

Chapter 2
110
2.3 Biochemistry
2.3.1 SDS-PAGE
SDS-PAGE allows the separation of proteins according to their relative size. Using
reducing conditions and heat, proteins dissociate into negatively charged polypeptides that
bind with SDS and migrate through the gel under an electric current. Polyacrylamide gels
have two phases, a stacking gel (high porosity) which concentrates proteins on the surface
of a resolving gel that separates proteins. The sample protein size is estimated by
comparison with a protein size ladder of known molecular weight.
2.3.2 Setting up, Loading and Running Gels
The apparatus used for protein gel analysis was Bio-Rad Mini-Protean II (Bio-Rad
Laboratories, Hercules, Ca, USA) with outer glass plate 10 and inner plate mini PII 10,
1mm spacers and combs. Care was taken to ensure equipment was as clean as possible to
avoid possible protein contamination, before assembling the apparatus according to
manufacturer‟s instructions. The gel was made up of two parts: the separating (resolving)
gel (30% acrylamide, 1.5M Tris pH 8.8, 10% SDS) made up to 30 ml. 5 ml per gel was
used and 50 l 10% ammonium persulphate (APS) (Amersham Biosciences,
Buckinghamshire, UK) and 5 l tetramethylethylenediamine (TEMED) (Amersham
Biosciences, Buckinghamshire, UK) was added immediately prior to casting the gel, as
polymerisation begins as soon as these 2 reagents are mixed together. Once the gel was
cast it was allowed to polymerise for 30 minutes. Next, the stacking gel was prepared (30%
acrylamide, 1M Tris pH 8.0, 10% SDS). A total of 30 ml was prepared and 2 ml was used
per gel with 20 l APS/2 l TEMED added prior to casting. The comb was inserted and the
gel was allowed to polymerise for 30 minutes. The frozen samples from the time-course
assay were boiled for 5 minutes to denature the protein, after adding an equal volume of 2X
loading buffer (0.5 ml 1 M Tris.HCl pH6.8; 2 ml 10% SDS; 10 mg bromophenol blue; 1 ml
10% glycerol and 6.5 ml distilled H2O. For reducing gels, 30 l 1M DTT was added to 270
l of loading buffer). A molecular weight size ladder (Bio-Rad pre-stained SDS-PAGE
standard, low range) was added (5 l) to the outside lanes. Ten microlitres of each time-
course sample, for each clone was added to individual lanes, working quickly to avoid
diffusion of sample between lanes. A 1X solution of running buffer (5X running buffer:
15.1 g Tris; 94 g glycine pH 8.3 pure grade and 50 ml 10% SDS made up to 1000 ml) was

Chapter 2
111
added to the tank and electrophoresis was performed at 150V for 1.25 to 1.5 hours or until
the dye front had reached the bottom of the gel. The gel was removed from the apparatus
and transferred to a tray containing sufficient Coomassie stain to cover (1.25 g Coomassie
brilliant blue, 50 ml glacial acetic acid, 225 ml methanol and 225 ml distilled H2O). The
tray, gel and stain were placed on an orbital shaker on a gentle speed for 30 minutes. The
stain was poured away (and retained for future use) and the gel was covered with de-stain
solution (100 ml glacial acetic acid, 450 ml Methanol, and 450 ml d.H2O). The tray, gel
and de-stain were placed on an orbital shaker on a gentle speed for 4 hours or until bands
became visible.
This procedure was also performed for recombinant MICA molecules produced in 293T
and Sf9 cells, except the protein collected from cell supernatants was concentrated using
Centricon tubes with a 30 kD molecular weight cut-off (Millipore, MA, USA) as described
by the manufacturer. An appropriate volume was then mixed with loading buffer and SDS-
PAGE carried out as above.
2.3.3 Western Blot Analysis
Proteins were run on polyacrylamide gels, as described above, before being transferred to
nitrocellulose membranes using the Mini Trans-Blot Electrophoretic Transfer Cell
(Biorad, Ca, USA) containing transfer buffer (25 mM Tris base, 200 mM glycine, 20% v/v
methanol) and applying a current of 200 mA for 2 hours at 4C. Nitrocellulose membranes
were blocked overnight in PBS containing 0.05% v/v Tween 20 and 5% BSA followed by
rinsing with PBS containing 0.05% v/v Tween 20. The primary anti-human MICA/B
monoclonal antibody stock concentration was 500 g/ml in sterile PBS which was diluted
1/500 with PBS containing 0.05% v/v Tween 20 and 5% BSA and incubated with the
nitrocellulose membranes for 2 hours at room temperature. Membranes were washed five
times with PBS containing 0.05% v/v Tween 20 for 5 minutes using gentle agitation. The
secondary antibody (peroxidase conjugated goat anti-mouse whole immunoglobulin) was
diluted 1/1000 in PBS containing 0.05% v/v Tween 20 and 5% BSA and incubated with the
membranes for 30 minutes at room temperature. Membranes were washed as above. The
membranes were then treated with a final wash in substrate solution (Fast DAB with colour
enhancer (Sigma, Steinhelm, Germany)) for 3 or 4 minutes or until the colour had
developed sufficiently. Rinsing with distilled H2O stopped the reaction. A permanent
record of the membrane was made using gel imaging apparatus and software.

Chapter 2
112
2.3.4 Sandwich ELISA for detection of human soluble MICA molecules
The ELISA assay is a widely used laboratory method for the detection of antibodies in
serum and is described in Chapter 1, section 1.4.2. The method can be adapted to detect
specific antigens or proteins in patient serum by first incubating the plates with a capture
antibody specific for the antigen of interest. Following incubation with patient serum,
bound antigen is detected with a specific antibody and is why this assay is known as the
„sandwich ELISA‟. A commercially available kit was used for detection of soluble MICA
in human sera or culture medium, called Human MICA DuoSet ELISA (Cat no. DY1300,
R&D Systems, Minneapolis, USA) and was performed according to manufacturer‟s
instructions.
2.3.5 Concentrating recombinant MICA proteins
Recombinant MICA proteins produced in 293T HEK and Sf9 insect cells were secreted into
the culture medium, retained for concentrating MICA protein and detected as described
above (section 2.3.4). Centricon Plus-70 centrifugal filter devices with a molecular
weight cut-off of 100 kDaltons were used for this procedure (Millipore, CA, USA). These
devices were designed for single use but could be re-used several times if used for the same
protein (MICA antigen) and could concentrate 70 ml of medium containing protein down to
around 300 l. Prior to concentration, dead cells and debris were removed from solution by
centrifugation and filtration using 0.45-micron Minisart syringe filters (Sartorious,
Goettingen, Germany). Samples were concentrated following manufacturer‟s instructions.
2.4 Serological Assays
2.4.1 Luminex Mixed Bead Antibody Detection Screening Assay
LABScreen LSM12 Mixed Bead assay (LSM12BD, One Lambda, Ca., USA) utilises
fluorescent micro-beads (up to 100 different beads) coated with purified HLA class I, class
II and MICA antigens and pre-optimised reagents for their detection in human serum. Test
serum is first incubated with LABScreen beads. Any HLA or MICA antibodies present in
the test serum bind the antigens, which are then labelled with PE-conjugated goat anti-
human IgG (GAH-IgG-PE). The LABScan 100 flow analyser detects the fluorescent

Chapter 2
113
emission of PE from each bead (that has bound antibody) and the unique fluorescence of
each bead. The reaction pattern of the test serum is compared to the lot-specific worksheet
defining the antigen array to assign HLA and/or MICA antibody specificity.
2.4.2 Luminex HLA-Class I and II antibody specificity identification
The specificities of HLA class I antibodies can be determined using LABScreen LS1PRA
micro-beads (LSP1B, One Lambda, Ca., USA). Specificities suggested by this assay can be
confirmed using LABScreen SAg LS1A01 (group 1 – LSP1AB01, group 2 – LSP1AB02,
group 3 – LSP1AB03, One Lambda, Ca., USA). The specificities of HLA class II
antibodies can be determined using LABScreen LS2PRA micro-beads (LSP2B, One
Lambda, Ca., USA). Specificities suggested by this assay can be confirmed using
LABScreen SAg LS2A01 (group 1 – LSP2AB01, One Lambda, Ca., USA).
2.4.3 Luminex MICA antibody specificity identification
Three independent SAg Luminex assays were used for the detection of MICA-specific
antibodies in this analysis.
LABScreen MICA Single Antigen beads (One Lambda)
The specificities of MICA antibodies detected with LABScreen LSM12 were determined
with the use of LABScreen LSMICA001, MICA SAg beads (LSPMABD01, One Lambda,
Ca., USA). A separate bead was used for the individual detection of antibodies directed
against MICA*001, *002, *004, *007, *008, *009, *012, *017, *018 and *019 (also detects
MICA*027 which is identical to MICA*008 in the extracellular domains).
Detection of MICA antibodies by Luminex developed by Prof. Peter Stastny (Dallas,
USA)
Our sera, which reacted with the MICA specific LSM12 beads, was further tested by our
collaborators based at the University of Texas South-Western Medical Center, Dallas, USA,
headed by Professor Peter Stastny. Lumavidin beads were conjugated with biotinylated
recombinant MICA (rMICA) produced by expression in insect cellsas detailed (Zou et al.,
2006b). MICA proteins encoded by MICA*001, *002, *004, *006, *007, *008, *009,
*012, *017, *018 and *019 were used in this assay.

Chapter 2
114
Lifecodes LSA -MIC Single Antigen beads (Gen-Probe)
The specificities of MICA antibodies detected with LABScreen LSM12 were determined
with the use of Lifecodes LSA -MIC SAg beads (LSAMIC, Gen-Probe). A separate bead
was used for the individual detection of antibodies directed against 28 MICA antigens,
including MICA*001, *002, *004, *006, *007, *008, *009, *012, *017, *018 and *019
(also detects MICA*027 which is identical to MICA*008 in the extracellular domains).
2.4.4 Procedure for antibody detection using Luminex
Specimen collection and preparation
Serum samples were extracted from clotted blood samples by centrifugation at 3000 rpm
for 10 minutes and aliquots stored at -700C. Positions A1 and A2 of a 96-well plate were
assigned to negative and positive control sera. Serum samples to be tested were thawed and
mixed thoroughly before transferring 100 l into 0.45 m filter plates (Cat # MSHVN4510,
Millipore, USA). A receiving 96 well microplate was placed under the filter plate and
centrifuged at 1300-1500g for 5 minutes. The top filter plate was removed and the
receiving plate was re-centrifuged at 4000g for 5 minutes to precipitate any impurities.
General Test procedure
Filters to be used in the assay were pre-wetted and the beads were mixed thoroughly by
gently vortexing and pipetting up and down several times. 2.5 l was placed into filter
wells, followed by addition of 10 l negative control, positive control or test serum. Plates
were covered with a foil seal, vortexed to mix and incubated for 30 minutes at room
temperature on a plate shaker (250rpm). During the incubation, the GAH-IgG-PE was
prepared by diluting 1 l of 100X stock solution with 99 l of wash buffer per sample.
After incubation, 250 l of 1x wash buffer was added to each well used to wash the beads.
Wash buffer was removed with a vacuum manifold. This was repeated for an additional 4
times.
100 l of GAH-IgG-PE was added to each well and the pate was covered with a foil seal
and vortexed briefly. The tray was placed on a plate shaker set at position 3 and incubated
for 30 minutes at room temperature. The plates were washed with buffer 5 times as above
and the beads were resuspended in 80 l of 1X sheath fluid, sealed and placed on plate
shaker for 10 minutes. The samples were then processed in the Luminex analyser or

Chapter 2
115
stored for up to 24 hours in the dark at 4°C. The data was saved automatically in the data
collection computer.
Importing templates for data acquisition in the Luminex™ fluoroanalyser
The template for new batches of beads (determined by Lot No.) was either obtained from
the CD provided by the supplier or by downloading from the following URL:
http://www.download.onelamda.com/pub/software_update/. The correct template for the
new lot of beads (eg. LS1PRA Lot 005 V1.idt) was saved to disc before copying the saved
file to the computer.
Amendments to procedure for Gen-Probe MICA antibody Luminex™
Sample filter plates were pre-wetted with distilled water instead of wash buffer. To each of
the assigned wells, including negative and positive controls, 20 l of bead mix was added,
followed by 5 l of patient‟s serum. Plates were then incubated as described above before
washing three times with wash buffer (100 l wash buffer for the first wash, then 250 l).
The GAH-IgG-PE (included with the kit and LOT –specific) was diluted by adding 22.5 l
of buffer to 2.5 l of GAH-IgG-PE concentrate per sample. Beads were resuspended in 25
l of diluted GAH-IgG-PE, the plates were covered with a foil plate sealer and placed and
the plate shaker, set at position 3, for 30 minutes. Prior to data acquisition, a further 65 l
of wash buffer was added to the samples to give a final reading volume of 90 l.
2.5 Cell Culture
2.5.1 General cell culture procedures
All cell culture techniques were carried out in a laminar-flow tissue-culture cabinet using
aseptic technique and sterile lab ware and consumables.
Culture media
Media used for general cell culture was RPMI 1640 medium with L-glutamine
supplemented with 10% heat-inactivated (55C for 1 hour) foetal bovine serum (FBS) and
1% penicillin/streptomycin solution - 1U/ml penicillin and 1 g/ml streptomycin (all from
BioWhittaker, Wokingham, UK). This is referred to as „basic media‟.

Chapter 2
116
Cell Separation
Peripheral blood mononuclear cells (PBMCs) were isolated from whole blood
supplemented with 1% heparin (Monoparin 1000 U/ml, CP Pharmaceuticals, UK) by
density gradient centrifugation. Whole blood was layered onto an equal volume of
Lympholyte-H ficoll separation medium (Cedarlane Laboratories, Canada), taking care
not to disturb the layer at the interface by slow pipetting. The tubes were centrifuged at
2400 rpm for 30 minutes without braking to ensure no disruption to the layered
lymphocytes. The lymphocyte layer was collected using a Pasteur pipette, transferred to a
50 ml Falcon tube, washed with basic media and centrifuged again for 15 minutes at 1800
rpm. The wash was repeated to ensure all of the ficoll medium was removed and cells were
resuspended in 10 ml of basic media for enumeration.
Counting cells and checking viability
Lymphocytes were counted using the Trypan Blue dye exclusion method. An aliquot of 10
l of the cell suspension was mixed with an equal volume of 0.4% Trypan Blue solution
(Sigma, UK) and transferred to a haemocytometer counting chamber with a depth of 0.1
mm. Cells were visualised and counted, excluding dead cells dyed blue, using a phase
contrast Leica BM LB microscope (Meyer Instruments).
Cryopreservation of cells
Cells requiring storage for later use were cryopreserved in cooled freezing media (heat
inactivated FBS and 10% dimethyl sulphoxide (DMSO), BDH, UK). Cells were aliquoted
into cryotubes (Nunc, Denmark) at a concentration of 5-106 cells/ml and immediately
transferred to a polystyrene box and placed in a -80C freezer for 24 hours (cooling rate is
1C per minute) before transferring to liquid nitrogen for long-term storage.
2.5.2 Cell lines used to obtain MICA cDNA
The use of commercial cell lines to locate MICA cDNA
Cell line Hela (ECACC, Wiltshire, UK) is known to express MICA*008. Cell line HCT116
(ECACC) is known to express MICA*009:02. Cells were despatched in 1 ml cryotubes
containing FCS + 10% DMSO. To resuscitate the cells, the vials were left at room
temperature for 1 minute then transferred to a water bath at 37C, for 1-2 minutes until fully
thawed. For Hela cells, the culture medium was Eagles Minimal Essential Medium (Gibco,
Invitrogen, The Netherlands) + 2 mM Glutamine (Gibco, Invitrogen, The Netherlands) +

Chapter 2
117
1% non-essential amino acids (Gibco, Invitrogen, The Netherlands) + 10% HI-FCS. For
HCT116 cells, the culture medium was McCoy‟s 5a (Gibco, Invitrogen, The Netherlands) +
2 mM Glutamine + 10% HI-FCS. Cells were slowly pipetted into flasks containing 25 ml
of the appropriate pre-warmed medium and incubated at 37C with 5% CO2. Both cell
types are adherent and half media changes were made 2-3 times per week until confluence
was around 80%. The culture medium was decanted and the cell monolayer washed with
PBS twice. 2 ml of trypsin/EDTA solution (Gibco, Invitrogen, The Netherlands) was added
to the flask, ensuring all cells were covered. The excess trypsin/EDTA solution was
decanted. The cells were incubated at 37C for 2-10 minutes or until cells had become
detached. The cells were washed, counted and re-suspended in pre-warmed fresh medium
at a density of 1-3 x 10000 cells per cm2. For freezing of stocks and use in RNA extraction,
cells were harvested at 80-90% confluence. Freezing was carried out as for B-LCLs except
that only 2-4 x 10⁶ cells were frozen per cryovial.
The Use other Cell Lines to Locate MICA cDNA
A cell line expressing MICA*002 and/or *004 was sought to obtain cDNA for two other
MICA antigens of high frequency. The European Searchable Tumour Database (ESTDAB:
http://www.ebi.ac.uk/cgi-bin/ipd/estdab) and Cell Bank provide a service enabling
investigators to search online for HLA typed, immunologically characterised tumour cells
as part of the European Commission Fifth Framework Infrastructures Program. With the
aid of previous Linkage Disequilibrium (LD) studies of MICA with HLA-B (Gao et al.,
2006; Petersdorf et al., 1999), a cell was searched for that expressed HLA-B*3501 and/or
B*4403 which are in strong LD with MICA*004 and *002 respectively, and several cells
were selected to screen for MICA types. A cell line called ESTDAB-172 (or alternatively
Ma-Mel-39a) was found and the HLA type was listed on the database as HLA-
B*35:01/02/03/04/06, *4102. To confirm whether the cell line also encodes sequence for
MICA*002 and *004, MICA-SBT was carried out using genomic DNA as described. That
result showed that this cell line was positive for MICA*002 and *004 and FACS
characterisation data provided on the ESTDAB database showed this cell did not express
HLA but had good cell surface MICA expression.
2.5.3 Cell lines used to produce recombinant MICA
E. coli strain AVB101
Strain AVB101, an E. coli B strain (hsdR, lon11, sulA1), contains pBirAcm, an IPTG
inducible plasmid containing the BirA gene engineered into pACYC184. It is compatible

Chapter 2
118
with most cloning vectors and is maintained with chloramphenicol (10 µg/ml). This strain
is recommended for protein expression because of its robust growth and the absence of the
OmpT and Lon proteases. Avidity, LLC (Colorado, USA) provides the strain in three
forms - glycerol stock (AVB101), chemically competent cells (CVB101), and
electrocompetent cells (EVB101). Glycerol stocks were obtained and competent cells were
produced with the method described in section 2.2.5.
Human embryonic kidney (HEK) 293T cells
The 293T HEK cell line was a kind gift from Rob Anderson (formerly of Haematology
Dept., The Royal Free Hampstead, UK). A frozen vial of 5x10⁶ 293T cells was placed in a
water bath at 37C until it began to thaw and then resuspended in 10 ml of basic media.
The tube and contents were centrifuged at 1800rpm for three minutes and resuspended in 10
ml of basic media before centrifuging again to remove traces of freezing mix. A total of
1.2x10⁶ cells were added to 5 ml of CD 293 medium (Invitrogen, Paisley, UK)
supplemented with 10% FCS and 1% penicillin/streptomycin in 25cm2 vented culture flasks
(Sarstedt, NC, USA) and placed in a 37C incubator with 5% CO2. HEK 293T cells grow
as an adherent monolayer and were grown to a density of 40-80% confluence before
splitting into fresh flasks (24-48 hours). After 2-3 passages cells were healthy, fast growing
and ready for transfection. Cells that have been passaged for an extended number of times
(>50) change their growth behaviour, morphology and transfectability therefore this was
avoided.
Spodoptera frugiperda-derived insect cells (Sf9)
After thawing, Sf9 insect cells (Novagen, USA) can be grown as a semi-adherent
monolayer in tissue culture flasks at 28C with no CO2. The vial of Sf9 cells was revived
by placing in a water bath at 28C for 2 minutes with gentle swirling. The cells were
slowly pipetted into a 50 ml Falcon tube and 10 ml of pre-warmed 28C BacVector Insect
cell Medium (Novagen, USA) without serum or antibiotics was added drop-wise. The
solution was gently pipetted 3-5 times and transferred to a 75cm2 vented culture flask and
gently rocked to disperse the cells before placing in a 28C incubator for 30-60 minutes
(without CO2). After this time, cells were adherent and medium could be removed with a
pipette and replaced with 10 ml fresh pre-warmed BacVector medium. Incubation was
continued until cells were 85-95% confluent, checking viability and confluence every other
day using a microscope. Sf9 cells required several passages before becoming healthy and
growing exponentially. Healthy Sf9 cells appeared rounded with distinct cell boundaries

Chapter 2
119
and unhealthy cells appeared granular. Sf9 cells were not grown beyond confluency as they
detach and float in the medium, although they are still viable and able to divide. Cultures
were split until cell numbers doubled every 48 hours before proceeding to transfection.
2.5.4 Transfection procedures
Transient transfection of 293T cells
Optimum conditions for transfection were determined empirically and are described more
fully in Chapter 3. The day before transfection, 2.4 x10⁶ 293T cells from a healthy culture
were seeded in a 175cm2 vented culture flask containing 20 ml of CD 293 medium
supplemented with FBS and antibiotics as described. Cells were grown in a 37C incubator
with 5% CO2 and were about 60% confluent on the day of transfection. A total of 8 g of
endotoxin-free plasmid DNA containing the relevant MICA allele gene was diluted in
RPMI 1640 containing no FCS or antibiotics (decreases transfection efficiency) to a final
volume of 300 l. To this, 80 l of Polyfect (Qiagen, Crawley, UK) transfection reagent
was added and the tube contents were mixed by vortexing for 10 seconds and incubated at
room temperature for 10 minutes to allow complex formation. During this time, the
medium was aspirated and the cells washed with 10 ml of 1X polybuffered saline (PBS)
before adding 17.5 ml of fresh medium (with supplements). A volume of 2 ml of CD 293
medium (supplemented) was added to the transfection complexes, mixed by pipetting up
and down twice before transferring the entire volume to the cells in a 175cm2 vented culture
flask followed by gentle rocking to disperse the complexes. The flask was placed in a 37C
incubator with 5% CO2 for 24 hours to allow transfection to take place. After 24 hours, the
medium was collected and stored at -80C ensuring an aliquot of 500 l was also collected
to test for rMICA protein concentration. The medium was replaced with 20 ml of fresh CD
293 medium with supplements. This procedure was repeated every 72 hours for up to two
weeks, or until cell death was noticeable.
Transient transfection of Sf9 cells
Optimum conditions for transfection were determined and are described more fully in
Chapter 3. Sf9 cells were passaged until rapidly dividing (doubling every 48 hours) prior to
transfection. On the day of transfection, 1x10⁷ Sf9 cells were seeded into a 125 ml
Erlenmeyer flask containing 8 ml SF900 II serum-free insect cell medium (Invitrogen,
Paisley, UK). In a sterile tube, 20 g of endotoxin-free pIEx-4 plasmid containing the
MICA allele of interest was diluted in 1 ml of insect cell medium with no supplements. In a
Chapter 2
120
separate tube, 100 l of Insect Genejuice transfection Reagent (Novagen, USA) was diluted
with 1 ml of insect cell medium with no supplements. The DNA solution was added
dropwise to the Genejuice solution and mixed gently with vortexing to prevent
precipitation, before incubating for 15 minutes. The transfection mixture was then added to
the cells and the flask placed in an orbital shaker set at 150 rpm and incubated for 48 hours
at 28C.
2.6 Data storage and Statistical analysis
A database of renal graft recipient and donor demographic, clinical and genetic data was
established by myself and maintained on a password-protected file using Filemaker Pro
Software (Filemaker Inc., Santa Clara, CA, USA). Access to this database was restricted to
my supervisors and myself.
The prevalence of various risk factors, clinical characteristics and immunological features
and the presence or absence of MICA antibodies was compared using Pearson‟s chi-square
test or Fisher‟s exact test. For odds ratios (OR), 95% confidence intervals (CI) were used.
A two-sided P value of less than 0.05 was considered significant. Bonferroni‟s correction
(Pc) for multiple comparisons was applied for analysis of MICA amino acid mismatches
between patients and donors. Pc values less than or equal to 0.05 were considered highly
significant. Data examining age differences, eGFR and follow-up in study cohorts were
expressed as mean ± standard deviation and differences between means were assessed by
Student‟s t-test for independent variables. Serum creatinine values produced a skewed
frequency distribution therefore the non-parametric Mann-Whitney U test was used for
univariate analysis. Binary logistic and linear regression was used for multivariate analysis.
For time-dependent statistics, overall survival (OS) was assessed using the Kaplan Meier
method using the log rank statistic and Cox regression was used for multivariate analysis.
In binary logistic, linear and Cox regression models, covariates were included where P<
0.100. SPSS 17.0 was used for analysis (SPSS Inc., Chicago, IL).
MICA and HLA-B haplotype and allele frequencies were generated by Hazael Maldonado-
Torres, a former PhD student of the Anthony Nolan Research Institute, using a statistical
program he designed himself, called Cactus. Statistical analysis was performed by
implementing the Expectation-Maximisation (EM) algorithm (Dempster et al., 1977) for
calculating an estimate of haplotype frequencies (Excoffier and Slatkin, 1995). The

Chapter 2
121
population samples represented unrelated individuals requiring calculation of haplotypes
based on gene-counting and the EM algorithm, as opposed to family studies. The analysis
calculated allele and haplotype frequencies from genotypic data that was demonstrated to
comply with the principle of Hardy-Weinberg equilibrium. The reliability of the Cactus
program has been verified using a number of other statistical packages, including Arlequin
(Excoffier et al., 2005).

Chapter 3
122
CHAPTER 3
Development of techniques for MICA allele typing and MICA
antibody detection
3.1 Introduction and aims
In 2005 when this research was begun, commercial methods for both MICA allele typing
and MICA antibody detection were unavailable, requiring development of „in-house‟
techniques. The method chosen for MICA allele typing of patients and their donors was
SBT as this can potentially offer the highest resolution of MICA types and, compared to
PCR-SSOP or SSP, did not require large numbers of primers or probes or large volumes of
DNA. My previous experience in the field of HLA typing involved establishing SBT
methods for HLA class I allele identification, therefore this approach for MICA allele
typing seemed the most straightforward to set up. A disadvantage of using SBT over other
methods such as PCR-SSOP is that results analysis can create a bottleneck in the
throughput, particularly when SBT of three different exons is required, as is the case for
MICA typing. In addition, many types can only be unambiguously resolved by
characterisation of the number of GCT repeats in exon 5 and this cannot normally be
achieved with heterozygous sequencing as differing lengths in exon 5 render the sequences
unreadable. This can be overcome by molecular sizing of exon 5 fragments or alternatively
identifying the number of GCT repeats carried by each allele by comparison with sequence
patterns obtained with all possible combinations of GCT triplet polymorphisms, and both
methods are explored in this chapter.
Obtaining a method to detect MICA antibodies was more problematic and required the use
of methodologies unfamiliar to me. We decided to attempt to produce an ELISA method
using rMICA molecules produced from Eschericia coli (E. coli) bacterial cell hosts, using a
plasmid DNA vector. Other systems for native rMICA production were also explored,
including a mammalian cell host, HEK 293T and an insect cell host Spodoptera frugiperda
(Sf9), using liposome-based transient transfection protocols.

Chapter 3
123
3.2 Development of MICA sequence based typing
The final, developed MICA-SBT protocol is described in Chapter 2, section 2.2.2.
3.2.1 Amplification of exons 2-5 of the MICA gene
Previous work by other researchers was available to devise a strategy for amplification of
the MICA gene. The amplification primers used for targeting exons 2-5 of the MICA gene
(Fodil et al., 1996) were also used in the study by Katsuyama (Katsuyama et al., 1999) and
Zwirner and colleagues (Zwirner et al., 2000) for their MICA-SBT strategies. These
generic primers are situated in introns 1 and 5 and amplify a 2201-bp MICA gene fragment
encompassing exons 2, 3 and 4 (and also the transmembrane domain encoded by exon 5).
The 5‟ (forward) primer was redesigned by Zwirner et al to include a polymorphism (C –
C/T (Y)) that was previously unknown and presumably was included to avoid non-
amplification of one of the alleles (known a „allele dropout‟), although they did not mention
the reason in their paper. The MICA amplification primers are given in Table 3.2.1.
Table 3.2.1: MICA PCR amplification primers targeting exons 2-5 of the MICA gene
Primer Name Primer Sequence (5‟ – 3‟)
5MICAa CGT TCT TGT CCC TTT GCC CGT GTG GC
MICA 6823b CGT TCT TGT CCC TTT GCC YGT GTG GC
MICA 8999a,b GAT GCT GCC CCA TTC CCT TCC CAA
a(Fodil et al., 1996);
b(Zwirner et al., 2000)
As the redesigned 5‟ MICA primer reflects a previously unknown polymorphism (intron 1
sequences are generally unavailable for the MICA gene, therefore it is unclear which alleles
may be affected), I decided to purchase this version rather than the original. The PCR
amplification protocol is given in Chapter 2, section 2.2.2 and is based on my previous
work for amplification of full-length HLA-B genes (3.2 Kb) using a total volume of 25 l.
The Taq polymerase used was TaKaRa (Takara Bio Inc., Japan) and had proven to be
reliable for amplification of larger products with better results than other similar products.
Figure 3.2.1 shows the amplified region of the MICA gene and amplification results using
100 ng/ml BLCL DNA.

Chapter 3
124
Figure 3.2.1: Amplification of the MICA gene. B-lymphoblastoid cell line DNA (100 ng/ml) was used
to test amplification of exons 2-5 of the MICA gene.
The amplification of the MICA fragment was successful for most of the cell line DNA used
with weaker amplification of cell line DNA AMAI and KAS116 and no amplification of
BRUG. Usually an intense band of the correct size was produced with no other bands
present. A different preparation of AMAI, KAS116 and BRUG DNA was used to repeat
the amplification and was successful (not shown).
Following visualisation of 2.5 l (one tenth of the PCR volume) of the amplified DNA on a
1% agarose gel, the reactions were purified to remove excess primer and dNTPs using
GFX PCR DNA and gel band purification kit (GE Healthcare, UK) as described in
Chapter 2, section 2.2.2. Purified DNA was eluted in 75 l of distilled H2O ready for cycle
sequencing.
3.2.2 Selection of MICA sequencing primers
To ensure that MICA sequencing was carried out for both sense and antisense DNA strands,
primers were selected to give bi-directional sequence of exons 2-4 of the MICA gene. The
two studies giving comprehensive details of primers for cycle sequencing MICA DNA
fragments were from Katsuyama and Zwirner (Katsuyama et al., 1999; Zwirner et al.,
2000). The primer details and sequences from these two studies are given in Tables 3.2.2
and 3.2.3.

Chapter 3
125
Table 3.2.2: MICA sequencing primers from Katsuyama studya
Primer Name Sequence Exon coverage
MICA51 ATT TCC TGC CCC AGG AAG GTT GG Exon 2 forward
3AIn2/127 GTG CCG GCT CAC CTC CCC TGC T Exon 2 reverse
5Ain/107 GTG AGG AAT GGG GTC AGT GGA A Exon 3 forward
MICA3 CAA CTC TAG CAG AAT TGG AGG GAG Exon 3 reverse
5An3/516 AAG AGA AAC AGC CCT GTT CCT CTC C Exon 4 forward
3An4/34 TCC CTG CTG TCC CTA CCC TG Exon 4 reverse a(Katsuyama et al., 1999)
Table 3.2.3: MICA sequencing primers from Zwirner studya
Primer Name Sequence Exon coverage
MICA6838 GCC YGT GTC CAT TTC CTG Exon 2 forward
MICA7302 TGA GCC AGA TCC AGT GGG Exon 2 reverse
MICA7403 CCC TGG GCT GAG TTC CCT C Exon 3 forward
MICA7843 ATA GCA CAG GGA GGG TTT Exon 3 reverse
MICA8263 CAG AGT GAG AAC AGT GAA Exon 4 forward
MICA8705 AGG GAC TTG TTA TAC ACT Exon 4 reverse a(Zwirner et al., 2000)
The MICA amplified cell line DNA, described in the previous section, was used to test
effectiveness of the primers from each study. Cycle sequencing reactions were set up as
described in Chapter 2, section 2.2.2. Briefly, 10 l reaction volumes comprised 2 l
purified, PCR DNA template, 1 l primer (1.6 pmol/l) and 7 l Big Dye Terminator
V3.1 mixture (Applied Biosystems, CA, USA) (1 l Big Dye reagent, 0.5 l 5X sequencing
buffer and 5.5 l distilled H2O) were placed in a thermal cycler. Conditions for cycle
sequencing were: 25 cycles of denaturation at 96C for 10 sec, annealing at 50C for 5 sec
and extension at 60C for 4 minutes. Products were precipitated in 30 l 100% ethanol and
2.5 l 125 mM EDTA (BioWhittaker, UK) for 15 minutes at room temperature and
recovered by centrifugation at 1800g for 15 minutes. Pellets were washed with 30 l of
75% ethanol followed by centrifugation at 1800g for 30 minutes. Products were
resuspended in 10 l of HiDi Formamide (ABI, CA, USA) and sequenced for 50 minutes
on a 3730xl ABI Genetic Analyser. Sequences of exons 2-4 were analysed for MICA allele
assignment using Assign software (Conexio Genomics, Australia). The sequences obtained
using these primers were, in general, very good, however Zwirner‟s primers usually gave
better sequences or were more reliable. There was one problem area, in exon 2, where
Katsuyama‟s exon 2 forward primer (MICA51) consistently failed and Zwirner‟s exon 2
forward primer (MICA6838) also failed. Following a search of the literature, I found
another primer that appeared suitable as an exon 2 forward sequencing primer – MICA-1C

Chapter 3
126
(Molinero et al., 2002b). Testing of this primer, which is situated in intron 1 and
extending into exon 2, gave acceptable results although the first 50 bases of exon 2 were
unusable as shown in Figure 3.2.2.
Figure 3.2.2: Exon 2 sequences with Zwirner MICA sequencing primers. A. Coverage of exon 2 –
red shading indicates poor sequence. B. Beginning of exon 2 with exon 2 reverse primer (2R). C.
Beginning of exon 2 with exon 2 forward primer (2F). D and E - Exon 2 forward and reverse sequences
at the end of exon 2.
MICA sequences for exons 3 and 4 were very good with all the cell line DNA tested using
Zwirner‟s primers. Although Katsuyama‟s primers produced good sequence that was only
slightly noisier than with Zwirner‟s primers, two different primers failed with two of the
A
B
C
D
E

Chapter 3
127
cell line DNAs and possibly indicates that these primers are not so robust. An example of
exon 3 and 4 sequence obtained with Zwirner‟s primers using cell line JY is given in Figure
3.2.3 and is representative of all the cell line DNA tested.
Figure 3.2.3: Exon 3 and 4 sequence obtained using Zwirner’s primers and cell line JY DNA. A.
Good coverage in both directions was achieved. B. Exon 3 sequence in both directions. C. Exon 4
sequences in both directions.
3.2.3 MICA allele typing results using exons 2-4
MICA typing results of homozygous and heterozygous cell line DNA, selected for alleles
with high frequencies in various populations, were generated using Assign software and
the latest allele libraries obtained from the IMGT/HLA database. The results are given in
Table 3.2.4 and are compared to the official MICA typing for the cell obtained from the
IMGT/HLA database.
A
B
C

Chapter 3
128
Table 3.2.4: Cell line DNA MICA typing using exons 2-4 compared with IMGT/HLA entry
Cell Name IMGT/HLA entry SBT result (exons 2-4)
DUCAF MICA*001 MICA*001
SLUGEO MICA*002, *008 MICA*002:01, *008:01/008:04/027/048 or
MICA*008:01/04/*027, *020/023/052 or
MICA*020/*023, *027/*48
RSH MICA*004 MICA*004
KAS116 MICA*006 MICA*006
BM92 MICA*007:01 MICA*007:01/*026
JY MICA *008:01 MICA*008:01/04/*027/*048
LCL721 MICA*008, *009 MICA*008:01/04, 009:01/*049 or
MICA*009:01, *027/*048 or
MICA*027/*048, *049
BOLETH MICA*010 MICA*010
KT3 MICA*012:01 MICA*012:01
BM16 MICA*018:01 MICA*018:01
It can be seen from the results that heterozygous MICA allele combinations give very
ambiguous typing results. Although most of the homozygous cell lines gave unambiguous
MICA allele types, cell line BM92 produced a MICA type of MICA*007:01 that could not
be distinguished from MICA*026. The difference between these two alleles is solely based
on the exon 5 GCT triplet number and MICA*008 and MICA*027 also only differ in this
transmembrane region. These problems affect common and rare MICA alleles therefore
identification of the GCT triplet number in exon 5 is crucial for MICA allele level typing.
3.2.4 MICA exon 5 sizing using Genescan
Many of the MICA typing strategies employed to detect polymorphisms associated with
diseases and MICA allele frequencies in different populations mainly focussed on
determining the number of GCT short tandem repeats in exon 5. As discussed in Chapter 1,
GCT repeats encode four to ten alanine residues, referred to as A4, A5, A6, A7, A8, A9 and
A10. Another group of alleles, mainly MICA*008 have an insertion of „g‟ after the second
of five GCT repeats resulting in a premature stop codon and is designated A5.1. As these
polymorphisms determine the size of exon 5 DNA fragments, accurate sizing of PCR
amplicons is a useful way to identify and discriminate MICA allelic combinations. One

Chapter 3
129
such technique (Ota et al., 1997) utilises Genescan software (Applied Biosystems, CA,
USA) on an automated sequencing platform, in our case it was an ABI 377 sequencer
(Applied Biosystems). Details of the full method are given in Chapter 2 section 2.2.3 and
involves PCR amplification of MICA exon 5 with one primer labelled with a fluorescent tag
as shown in Figure 3.2.4. The amplicons are loaded onto a denaturing polyacrylamide gel
alongside a fluorescent DNA size marker and the software calculates the size of the
fragments relative to the size marker.
Figure 3.2.4: PCR amplification of exon 5 of the MICA gene using a 5’ 6-Fam fluorescently labelled
primer. The size of the products varies at around 200 base pairs when run on a 1% agarose gel.
The purified MICA exon 5 fragments were then run on the ABI 377 with Genescan
software to accurately determine the number of nucleotides present in the MICA allele(s).
Typical results are shown in Figure 3.2.5.

Chapter 3
130
Figure 3.2.5: MICA exon 5 size results generated using Genescan software. A. Homozygous cell-
line RSH typed by SBT as MICA*004 produced 2 peaks of 186 and 187 base pairs (bp). The 186 bp
fragment corresponds to MICA-A6 and the 187 bp fragment has an additional non-template adenosine
base generated by the PCR. A mixture of both types was present with all samples. B. Heterozygous cell
line LCL721 generated two peaks specific for MICA-A5.1 (184bp) and MICA-A6 (186bp).
The Genescan assay was successful, although an artefact of the PCR reaction was a
fragment equal to the length of the fragment +1 base pair formed by the addition of
adenosine to the blunt ended PCR product. As the gel is denaturing, only the fragment with
the fluorescent tag is detected hence only one additional nucleotide. The PCR artefact

Chapter 3
131
formed the majority of the products as seen by the peak height in Figure 3.3.5, however a
sufficient number of amplicons were the correct size and were easily detected. The results
were combined with the SBT results and are shown in Table 3.2.5.
Table 3.2.5: MICA allele typing results of cell line DNA using both SBT and Genescan
analysis
Cell
Name
IMGT/HLA
entry SBT result (exons 2-4) Exon 5 size (TM)
DUCAF MICA*001 MICA*001 180 bp (A4)
SLUGEO MICA*002, *008 MICA*002:01/*052, *008:01/04 184 bp (A5.1), 195 bp (A9)
RSH MICA*004 MICA*004 186 bp (A6)
KAS116 MICA*006 MICA*006 186 bp (A6)
BM92 MICA*007:01 MICA*007:01 180 bp (A4)
JY MICA *008:01 MICA*008:01/04 184 bp (A5.1)
LCL721 MICA*008, *009 MICA*008:01/04, 009:01/*049 184 bp (A5.1), 186 bp (A6)
BOLETH MICA*010 MICA*010 183 bp (A5)
KT3 MICA*012:01 MICA*012:01 180 bp (A4)
BM16 MICA*018:01 MICA*018:01 180 bp (A4)
TM = transmembrane region
Ambiguity in allele assignment was reduced considerably for heterozygous samples using
both SBT and Genescan sizing. MICA*008:01 and *008:04 cannot be distinguished from
one another as they only differ in exon 1 and MICA*009:01 and *049 are also identical in
exons 2-5, differing by one nucleotide in exon 6. MICA*002:01 and *052 are also identical
in exons 2-4 and have the same number of GCT repeats. However, as exon 5 is included in
the amplified MICA product used for SBT, scrutiny of exon 5 sequences can resolve this
ambiguity.
3.2.5 Determining exon 5 GCT triplet number using sequence analysis
Although sizing of exon 5 MICA fragments could accurately determine the TM-STR
present for each allele, it is not well suited to high-throughput MICA typing. Since I
planned to MICA type several hundred patients and at least 200 donors, requiring at least
six sequences each, the workload including exon 5 sizing would have been immense.
However, in 2006 a paper was published describing a method of resolving exon 5 MICA

Chapter 3
132
polymorphism by direct sequence analysis (Zou et al., 2006a). As exon 5 was already
included in the PCR amplification strategy for the MICA gene, the addition of an extra
primer to sequence exon 5 was the only modification required to employ the method of Zou
et al. Conveniently, the unlabelled exon 5 amplification primer used for Genescan analysis
was ideal as a reverse sequencing primer for exon 5. The principle of this method is that
sequences of alleles with different lengths will overlap with heterozygous DNA samples,
creating unique sequence patterns that can identify the various combinations of TM
polymorphisms. The IUB coding system for heterozygous sequence peaks was used and
the various patterns observed are reproduced in Table 3.2.6.
The exon 5 TM-STR polymorphisms of individual MICA alleles are shown in Table 3.2.7.
Exon 5 sequences are unavailable for all MICA alleles rendering 25 alleles with unknown
exon 5 polymorphisms, of which only 10 MICA sequences have been confirmed by a
different laboratory or sequencing of a different cell. Most of these alleles were relatively
rare in most populations and have polymorphisms in the extracellular domains defining
them as a novel allele, and could be detected with regular SBT.
There are three further TM polymorphisms – MICA*050 (A7), MICA*055 (A8) and MICA
*020 (A10), but these MICA alleles are rare and associated with ethnic diversity.
MICA*050 has a unique polymorphism in exon 3, MICA*020 is mainly associated with
American Indian populations and MICA*050 with East Asians, therefore I decided to
investigate these for MICA exon 5 polymorphism only if required.

Chapter 3
133
Table 3.2.6: Exon 5 sequences of TM polymorphisms and heterozygous combinations of MICA
alleles with differing TM-STRs. Modified from Zou et al., 2009. Permission granted by
Springer.
TM MICA antisense nucleotide sequence
A4 AGC AGC AGC AGC AAC AGC AGA AAC ATG GAA TGT CT
A5 --- --- --- --- -G- -A- --C -GA -AC ATG GAA TG
A5.1 --- --- --- CAG C-G CAA CAG C-G -AA C-T G-A A-
A6 --- --- --- --- -G- --- -AC -G- -GA A-C ATG GA
A9 --- --- --- --- -G- --- --C -G- -GC A-C A-C AG
A4/A5 --- --- --- --- -R- -R- --M -RM -WS RWR KRW YK
A4/5.1 --- --- --- MRS M-S MRM MRR M-S -WR S-W K-W MT
A4/A6 --- --- --- --- -R- --- -RM –R- -KR R-M WKK SW
A4/A9 --- --- --- --- -R- --- --M –R- -KS R-M W-Y MK
A5/A5.1 --- --- --- MRS MRS MAM MRS MRR -AM MWK GRA WK
A5/A6 --- --- --- --- --- -R- -RC -GM -RM AWS RWR KR
A5/A9 --- --- --- --- --- -R- --C -GM -RC AWS RRM WG
A5.1/A6 --- --- --- MRS MRS MRM MAS MRS -RA M-Y RKR RW
A5.1/A9 --- --- --- MRS MRS MRM MRS MRS -RM M-Y R-M AK
A6/A9 --- --- --- --- -G- --- -RC –G- -GM A-C AKS RR
Notes: IUB codes - A+G = R; A+C = M; A+T = W; C+T = Y; C+G = S; G+T = K
Table 3.2.7: MICA TM-STR exon 5 polymorphisms associated with different MICA alleles
MICA Allele
A4 A5 A5.1 A6 A9
001 010 008:01 004 002:01
007:01 016 008:02 006 015
007:03 019 008:04 009:01 017
012:01 027 023 009:02 041
018:01 033 028 011 046
018:02 048 053 026 052
029 054 058 030
043 056 047
045 049
051
061
Notes: Other TM polymorphisms: MICA*050 (A7); MICA*055 (A8); MICA*020 (A10)

Chapter 3
134
The sequences obtained using the exon 5 reverse sequencing primer were acceptable and
the heterozygous patterns easily recognisable when compared to the predicted patterns.
Typical results are shown in Figure 3.2.6 where four different patterns identify MICA-
A4/A6 (A), MICA-A6/A9 (B), MICA-A5.1/A9 and MICA-A5.1/A6. Exon 5 sequences
were checked when ambiguous allele combinations were present or to confirm
homozygosity.
Figure 3.2.6: Heterozygous MICA sequence patterns obtained from sequencing exon 5.
Comparisons with Table 3.2.6 reveal - A. MICA-A4/A6. B. MICA-A6/A9. C. MICA-A5.1/A9.
D. MICA-A5.1/A6
3.2.6 MICA ambiguous allele combinations not resolved
The only MICA allele heterozygous combination that could not be resolved was
MICA*009:01 and *049 which differ in exon 6, outside the region amplified.
MICA*008:01 and 008:04 also could not be distinguished as they differ in exon 1.
A
B
C
D

Chapter 3
135
3.2.7 MICA international DNA exchange scheme
To ensure high quality MICA allele typing and detect any problems that may be inherent in
the system, I enrolled on the MICA International DNA Exchange program organised by
Marie Lau and colleagues from University College of Los Angeles (UCLA, USA). This
program began in May 2007 and involved MICA typing of four cell line DNAs three times
a year. I have submitted results for each of the eleven exchanges up until December 2010.
The participation in this program has increased from seven centres to 22 centres now
currently enrolled. Most centres use the reverse SSO technique (One Lambda, CA, USA)
however Peter Stastny‟s group and myself were the two original submitters using SBT,
including exon 5 analysis and currently a further two groups use this method. My results
were mostly concordant with the consensus and reports can be downloaded from
http://www.hla.ucla.edu/cellDNA/Cell/summaryMica.htm.
Participation in the MICA DNA exchange was extremely useful for not only gaining
confidence in the MICA typing results but also for highlighting problems that could not be
foreseen. In particular a problem with MICA „allele dropout‟, where one of the alleles was
not amplified or amplified with a weak signal, is discussed in the next section.
3.2.8 Strategies for resolving MICA amplification ‘allele dropout’
A problem of no or low amplification of MICA*001 was initially noticed from the results
of the 3rd MICA exchange and confirmed again in the 5th exchange where I noticed that one
of the alleles in one sample had a low signal. In both cases the allele affected was
MICA*001. I discovered a publication that indicated some MICA primers used for
amplification or sequencing, located in intron 1, may be problematic (Shao et al., 2004) and
decided to investigate this further. However, the problems highlighted by these authors
should not have affected my sequencing as the amplification primer was located before the
problem area and the sequencing primer was located after as shown in Figure 3.2.7.

Chapter 3
136
MICA Intron 1
Pattern 1: TCC CAC CCT CAC AGT TTT CTT TGT ATA TGA AAT CCT CGT TCT
Pattern 2: --- --- --- --- --- --- --- --- --- --- --- --- --- ---
Pattern 3: --- --- --- --- --- --- --- --- --- --- --- --- --- ---
MICA6823: cgt tct
Pattern 1: TGT CCC TTT GCC CGT GTG CAT TTC CTG CCC C-- -AG GAA GGT
Pattern 2: --- --- --- --- --- --- --- --- --- --- --- --- --- ---
Pattern 3: --- --- --- --- --- --- --- --- --- --- -CT C-- --- ---
tgt ccc ttt gcc ygt gtg c (amp primer1)
Pattern 1: TGG GAC AGC AGA CCT GTG TGT TAA ACA TCA ATG TGA AGT TAC
Pattern 2: --- --- --- --- --- --- --- --- --- --- --- --- --- ---
Pattern 3: --- --- --- --- --- --- -A- --- --- --- --- --- --- ---
Intron 1|
gag
Pattern 1: TTC CAG GAA GAA GTT TCA CCT GTG ATT TCC TCT TCC CCA GAG
Pattern 2: --- --- --- --- --- --- --- A-- --- --- --- --- --- ---
Pattern 3: --- --- --- --- --- --- --- --- --- --- --- --- --- ---
MICA new amp primer MICA-Shao: ca cct rtg att tcc tct tcc cca gag2
MICA Exon 2
ccc cac agt ctt cgy tat (modified exon 2 forward primer - MICA-1C3)
Pattern 1: CCC CAC AGT CTT CGC TAT
Pattern 2: --- --- --- --- --T ---
Pattern 3: --- --- --- --- --T ---
Figure 3.2.7: MICA intron 1 region used for amplification of the MICA gene. 1Amplification primer
(Zwirner et al., 2000) located before a three-nucleotide insertion present in some MICA alleles. 2Redesigned primer (Shao et al., 2004), located after the three-nucleotide insertion and extending one
nucleotide into exon 2 (italics). 3MICA exon 2 forward sequencing primer (Molinero et al., 2002b) was
modified to accommodate a polymorphism present in some alleles. Alignment modified from Shao et al.,
2004 (Permission granted by Nature Publishing Group).
I decided to try the forward amplification primer described by Shao, in place of the MICA
6823 primer and repeated amplification and SBT with a MICA*001 homozygous cell line
(DUCAF) and the two heterozygous MICA DNA exchange samples that typed as
MICA*001 in previous MICA exchanges. This time there was no problem identifying
heterozygous sequence peaks and the homozygous MICA*001 cell line DNA also typed
successfully, as previously. Some heterozygous samples were also successfully typed for

Chapter 3
137
MICA*001 previously, indicating that dropout of MICA*001 did not always occur.
Although there were no apparent reasons why one primer should be more specific for
MICA*001 than the other (MICA 6823 Vs MICA-Shao), there may be MICA intron 1
polymorphisms that are not well defined or known of that could affect the efficiency of
MICA 6823 primer. Nevertheless, using the new primer I could avoid allele dropout of
MICA*001 and decided to permanently replace the forward amplification primer with that
designed by Shao. I tested a range of cell line and patient DNA encoding common MICA
alleles to ensure there were no other problems and found the combination of 5‟MICA-Shao
and 3‟MICA 8999 gave consistent results.
As I had already carried out some patient and donor MICA typing, I checked the results for
homozygosity that may have been the result of MICA*001 dropout although this allele has
low frequency in most populations. This was facilitated by linkage disequilibrium with
HLA-B alleles where HLA-B*18:01 is the predominant allele associated with MICA*001
in European-American and African-American populations (Gao et al., 2006) with an
haplotype frequency of just over 1%. Two further samples were found to be positive for
MICA*001 after repeat amplification with MICA-Shao primer, whereas typing using the
original MICA amplification primer did not detect this allele.
One other problem that I was unaware of was that the exon 2 forward sequencing primer
which is located at the beginning of exon 2, extends into a polymorphic area affecting
MICA*002:03, 010, 025, 054 and 062. These alleles encode a „c‟ instead of the consensus
„t‟ at nucleotide position 87, therefore I reordered the primer with a „y‟ at that position to
avoid problems with non-priming that particularly could affect MICA*010 sequencing as
this allele had a frequency of 4-5% in our renal patient and donor cohorts. However, the
reverse exon 2 primer gave excellent coverage and the polymorphism at position 87 was
easily detected.
3.3 Production of recombinant MICA in E. coli
3.3.1 Cell Lines for MICA cDNA Amplification and Cloning
To produce a MICA DNA fragment that can be used for recombinant MICA (rMICA)
molecule production, it was decided to obtain cells expressing MICA that were used in
previous published studies utilising rMICA for the detection of MICA antibodies (Molinero

Chapter 3
138
et al., 2002b; Zwirner et al., 2000). HeLa and HCT116 tumor cell lines express
MICA*008 and *009:02 respectively in contrast to BLCLs where MICA is not expressed
and therefore not transcribed from messenger RNA into cDNA, the essential template for
cloning. Another cell line that expressed MICA was obtained from ESTDAB
(http://www.ebi.ac.uk/cgi-bin/ipd/estdab). ESTDAB 172 (melanoma) was typed for MICA
by SBT, among other available cells, after being selected based on linkage disequilibrium
with HLA-B using data shown in Table 3.3.1. The B-locus HLA type for this cell as listed
on the ESTDAB database was B*35:01/02/03/04/06, B*41:02 and the MICA type
determined by my own typing was MICA*002, 004, the two most frequent MICA alleles
after MICA*008. The ESTDAB database also contains FACS characterisation data
showing no expression of HLA but good cell surface expression of MICA. This cell was
therefore ideal for obtaining cDNA for MICA*002 and 004 in addition to MICA*008 and
009 using the other two cell lines.
Table 3.3.1: Common MICA and HLA-B haplotype frequencies and their linkage
disequilibrium
MICA HLA-B Haplotype
Frequency1
Linkage
Disequilibrium1
*008 *08:01 0.206 0.095
*008 *07:02 0.120 0.054
*008 *44:02 0.106 0.048
*008 *40:01 0.050 0.022
*004 *44:03 0.048 0.044
*010 *44:03 0.015 0.012
*010 *15:01 0.047 0.045
*002 *35:01 0.053 0.046 1Frequencies found in North American Caucasoids (Gao et al., 2006)
3.3.2 Obtaining cDNA from cell lines and ligation with plasmid vector
RNA extraction and RT-PCR was performed according to methods described in Chapter 2,
section 2.2.4. A MICA cDNA fragment was amplified from cDNA produced by RT-PCR
using the following primers:
MICA/B Forward: 5‟-GGA TCC AAT GCC CCA CAG TCT T-3‟
MICA/B Reverse: 3‟-GGA TCC CCA GAG GGC AC-5‟
Underlined sequence is the BamH1 restriction site.

Chapter 3
139
cDNA obtained from cell lines Hela (MICA*008) and HCT116 (MICA*009:02) were
amplified using MIC specific primers as detailed above. For comparison, cDNA extracted
from patient and donor BLCLs were also included and results are shown in Figure 3.3.1.
Figure 3.3.1: MIC-specific products (MICA and MICB) amplified using cDNA from cell lines. Hela (lane 1), HCT116 (lane 2) cDNA and cDNA extracted from BLCLs from two potential BMT donors
and patients are shown. A band equal to just over 800 base pairs was obtained from tumor cell line DNA
and one of the BMT patents BLCL cDNA.
A band equal to the expected size of around 800 base pairs was obtained with cDNA from
both tumor cell lines. BLCL cDNA was not expected to produce a MIC-specific band,
however one of the patient‟s cDNA produced a band equal to the size of the MIC amplicon,
which was not present in the other BLCL cDNAs. This interesting result may relate to
unknown cellular processes occurring in response to bone marrow transplantation or the
drug regimen associated with the transplant.
As MICA contained an internal sequence identical to the Xba1 restriction site, this enzyme
could not be used. The only solution was to use BamH1 at both ends of the insert and
screen carefully to ensure the product was ligated in the correct orientation in the expression
plasmid (pAC-5), requiring analysis of the plasmid sequence preceding and following the
MICA insert using the MICA internal primers as follows: 5MICAint: 5‟-ATC CAT GAA
GAC AAC AGC AC-3‟, 3MICAint: 3‟-GGT CTG AGC TCT GGA GGA CT-5‟.
3.3.3 Cloning procedures for bacterial expression of MICA protein
As MIC amplified products from cDNA could be MICA, MICB or MIC pseudogenes and
because nucleotide misincorporations could also be present in cloned DNA fragments, a

Chapter 3
140
first round of cloning in pCR4-TOPO vector and TOP10 chemically competent E. coli
cells using TA cloning, detailed in Chapter 2, section 2.2.6, was used as a simple procedure
to screen several clones for the desired insert. Successful ligation of MIC inserts with
pCR4-TOPO plasmid was verified using restriction enzyme digestion with BamH1 and
results are shown in Figure 3.3.2. Sequences were verified by direct sequencing of plasmid
DNA using the MICA bi-directional internal sequencing primers detailed above.
Figure 3.3.2: Restriction digestion of pCR
4-TOPO
ligated with MICA*008 cDNA. Digestion
with BamH1 cut the DNA either side of the insert at BamH1 restriction sequences incorporated into the
MIC amplification primers. The two main bands observed correspond to the pCR
4-TOPO
vector
(3957 bp) and the MICA fragment (836 bp). The remaining bands are partially digested and supercoiled
plasmids with different mobilities.
Several of the clones contained inserts that had many differences compared to MICA*008,
that were more related to MICB or possibly pseudogenes, which can also be amplified with
the amplification primers used. Some clones had nucleotide misincorporations but several
were identical to the sequence of MICA*008 and selected for sub-cloning into the pAC-5
protein expression plasmid.
A larger volume of 20 l pCR4-TOPO vector DNA containing verified MICA*008
cDNA sequence was used to prepare MICA fragments for subcloning in pAC-5 expression
plasmid. Restriction digestion with BamH1 of the pAC-5 plasmid was carried out to
prepare it for ligation with MICA fragments, which were released from pCR4-TOPO by
restriction digestion with BamH1 and isolated by gel excision. The linearised pAC-5
plasmid DNA and MICA*008 DNA fragments were ligated and then sequenced using
MICA internal sequencing primers. All methods are described in Chapter 2, section 2.2.6.
4000
5000
800
1500

Chapter 3
141
A total of six ligation reactions were performed as it was predicted that some MICA
fragments could have a reverse orientation rendering them unsuitable for protein
expression. pAC-5 plasmid DNA containing MICA*008 in the correct orientation and
reading frame was identified as shown in Figure 3.3.3.
Figure 3.3.3: Sequence alignment of MICA*008 coding sequence with sequence of pAC-5 plasmid
containing a MICA DNA insert. The 5‟ plasmid sequence shows that the promoter region is in frame
and continuous with the MICA sequence. The MICA coding sequence, highlighted in red is also in frame
with the biotin Avitag peptide sequence (blue) at the 3‟ end of the MICA sequence, which includes a stop
codon to terminate transcription.
A protein coding sequence of 305 amino acids, including the biotin tag sequence was
produced and the full protein sequence was as follows:
MFLEDPMPHSLRYNLTVLSWDGSVQSGFLAEVHLDGQPFLRYDRQKCRAKPQGQWAEDVLGNKTWDRETR
DLTGNGKDLRMTLAHIKDQKEGLHSLQEIRVCEIHEDNSTRSSQHFYYDGELFLSQNLETEEWTVPQSSR
AQTLAMNVRNFLKEDAMKTKTHYHAMHADCLQELRRYLESGVVLRRTVPPMVNVTRSEASEGNITVTCRA
SSFYPRNIILTWRQDGVSLSHDTQQWGDVLPDGNGTYQTWVATRICRGEEQRFTCYMEHSGNHSTHPVPS
GDPGQACLGGGLNDIEFAQKIEWHE
The predicted molecular weight of the molecule produced by the protein sequence above
was estimated to be 35.0 kilo Daltons (kDa) by the bioinformatics tool available on the
website: http://bioinformatics.org/sms/prot_mw.html. AVB101 transformants containing
pAC-5 with MICA*008 inserts were induced for protein expression and samples taken at 0,
1, 2, 3 and 4 hour intervals as detailed in Chapter 2, section 2.2.5. SDS-PAGE analysis
results are shown in Figure 3.3.4.

Chapter 3
142
Figure 3.3.4: SDS-PAGE analysis of MICA protein with Coomassie Blue staining. The gel images
show protein induction by IPTG of MICA*008 at 0, 1, 2, 3 and 4 hours for 5 different samples. Arrows
indicate likely position of induced MICA protein band, predicted to be 35.0 kDa by the internet tool:
http://bioinformatics.org/sms/prot_mw.html
SDS-PAGE analysis revealed the presence of a band corresponding to around 30 kDa that
was present after one hour of protein induction but since other bacterial proteins were also
present the result by SDS-PAGE alone was inconclusive. To verify with more certainty
that a band was present that was specifically MICA-derived, Western blotting was used
with detection of MICA protein using a mouse anti-human MICA/B specific antibody as
detailed in Chapter 2, section 2.3.3. Six samples were tested by Western blot using 0 hour
and 4-hour post-induction samples and the results are shown in Figure 3.3.5.
*008.1 *008.2 *008.3
*008.3 *008.4 *008.5
MW (Da)

Chapter 3
143
Figure 3.3.5: SDS-PAGE gel Western Blot Analysis. Six different samples comparing uninduced (0
hours) with 4 hours post-induction with IPTG are shown. A stronger band of around 33 kDa is seen in
the post-induction samples indicated by the arrow. Sample 6 has 0 hours omitted due to lack of space on
the gel. These results confirm those shown in Figure 3.3.4 and, in addition, show the induced band is
MICA specific.
As the miniprep testing confirmed the production of a MICA specific induced protein band,
cultures were scaled up for inclusion body purification, to remove contaminating bacterial
proteins and produce milligram quantities of MICA protein as detailed in Chapter 2 section
2.2.5. The SDS-PAGE results of pre and post-induction and purified inclusion bodies are
shown in Figure 3.3.6.
Figure 3.3.6: SDS-PAGE analysis of scaled-up MICA protein production. 1. Pre-induction. 2. Post-
induction. 3. Purified inclusion bodies.
The concentration of MICA protein obtained from inclusion body purification was
determined using the Micro BCA assay (Pierce Scientific, UK) as detailed in Chapter 2,
35,000
28,600
MW (Da)
MW (Da)

Chapter 3
144
section 2.2.5. The results are given in Figure 3.3.7 and show a mean concentration of
purified protein of 4.6 mg/ml.
Figure 3.3.7: Measurement of protein concentration from MICA inclusion body purification. Test
samples were compared to a BSA standard curve of known concentration and the OD for the blank (no
protein) was subtracted from the test ODs. The mean concentration of protein in test samples was 4.6
mg/ml.
This work was carried out, in part, with a post-doctoral colleague Jenny Luxton, who
wanted to produce recombinant MICA molecules to construct MICA tetramers for a
separate study. While I was preparing MICA*008 protein, my colleague worked on
producing MICA*009 from the cDNA that I produced from HCT116 cells. My colleague
encountered a problem at the protein re-folding stage, which was the next step to follow on
from the work described above. The re-folding method was based on that of Steinle
(Steinle et al., 2001), who also produced MICA molecules in E. coli. The principle was to
dialyse from 8M urea, in which the inclusion bodies were resuspended, through 4M, 2M
1M and no urea solutions, gently allowing the proteins to fold into their native
conformation. Following this procedure folded proteins can be purified by fast protein
liquid chromatography (FPLC) and the fractions obtained tested for purity. Once pure
refolded protein is obtained the final stage is to use the BirA enzyme for enzymatic
biotinylation utilising the Avitag peptide incorporated into the cloned molecule.

Chapter 3
145
My colleague, who encountered problems with protein coming out of solution and
aggregating, could not successfully demonstrate the re-folding of the MICA molecule
despite spending a considerable amount of time trying to perfect this technique. As
correctly folded MICA molecules were essential to produce an ELISA assay to detect
clinically relevant MICA antibodies it was not possible to continue this line of
investigation.
At around the same time, during 2006, One Lambda released commercial products to detect
MICA antibodies for the first time. This solid-phase assay utilised Luminex technology
as described in Chapter 1, with MICA screening and SAg beads. The MICA screening
assay comprised two beads, each coated with a mixture of MICA antigens, that were
included free of charge with the HLA antibody Luminex screening assay. The MICA SAg
assay, although not free, was available to confirm the MICA specificities detected by
screening, covering a range of 11 frequent MICA antigens. As our renal histocompatibility
laboratories were already testing patients with the HLA antibody Luminex screening beads
that included the MICA screening beads, it was decided to continue the project using
Luminex to detect MICA antibodies in renal transplant patients.
3.4 Production of rMICA in 293T HEK mammalian cells
Although I carried out this study using commercial Luminex assays to detect MICA
antibodies, I was still interested in how rMICA molecules produced in different systems
interacted with MICA antibodies. This interest arose during testing of renal patients for the
presence of MICA antibodies using three different Luminex assays, where differences in
reactivity were observed between the different tests as discussed at length in Chapter 4.
The variable MICA antibody reactivity with rMICA antigens using the same serum sample
indicates that there are differences in the rMICA molecules attached to beads used in the
assays. These differences may be structural (native or denatured), conformational, related
to differing degrees of glycosylation or due to fusion tags or molecules used to attach
recombinant MICA proteins to the beads.
The aim of this part of the study was to produce two or three different recombinant MICA
molecules as secreted, native products, produced by either mammalian HEK 293T cells or
Sf9 insect cells. Once enough recombinant protein had been generated, reactivity with

Chapter 3
146
MICA positive human sera would be compared with Luminex beads coated in 293T-cell
derived or Sf9 cell derived MICA antigens to investigate any differences.
In this section I discuss the production of rMICA molecules using 293T HEK cells. These
cells were originally generated in Alex Van der Eb's laboratory in Leiden in the early
1970s by using sheared adenovirus type 5 DNA to transform normal human embryonic
kidney cells obtained from a healthy, aborted foetus. Frank Graham, who published his
findings in the late 1970s (Graham et al., 1977), carried out the transformation experiments
and the number 293 relates to his practice of numbering his experiments. Today, HEK
293T cells are widely used in molecular biology for mammalian recombinant protein
production because they are readily transfected and easy to culture.
3.4.1 Generation of plasmid constructs for MICA expression
For molecular cloning in eukaryotic systems, it is necessary to include the leader sequence
encoded by exon 1, in contrast to cloning in prokaryotes where it is not required. The PCR
amplification is detailed in Chapter 2, section 2.2.5. PCR primers for amplification of
MICA exons 1-4 from cDNA were redesigned according to previously published work (Zou
et al., 2006b) to incorporate the correct restriction sites for ligation into pBK-CMV vector.
The primers included sequence of restriction site Xho1 on the 5‟ primer and Kpn1 on the 3‟
primer. A DNA tag encoding the BirA recognition sequence for enzymatic biotinylation
and a six-His sequence for protein purification utilising the affinity of histidine with nickel
was also included on the 3‟ primer. The 5‟ forward primer was designed to anneal to the
first 18 bases of exon 1. The 3‟ reverse primer annealed to the last 21 nucleotides of exon
4. The size of the fragment generated was 1082 base pairs.
XhoI
5‟ forward amplification primer: 5‟ACT ATC TAC CTC GAG GCC ATG GGG CTG GGC
CCG GTC 3‟
3‟ reverse amplification primer: 5‟ AGC ACT CAC CCT GTG CCC TCT GGA TCC GGT
GGC GGT CTG AAC GAC ATC TTC GAG GCT CAG AAA ATC GAA TGG CAC GAA CAC
CAC CAC CAC CAC CAC TAG GGT ACC CAT GCG CAT 3‟
KpnI
The gel image shown in Figure 3.4.1 is the result of using the above primers to amplify
cDNA obtained from Hela (MICA*008), HCT116 (MICA*009) and ESTDAB-172

Chapter 3
147
(MICA*002 and 004) cDNA. A single band around 1000 bp is clearly visible compared to
the negative control lane.
Figure 3.4.1: PCR amplification of cell line cDNA. MICA*008 (lane 1), MICA*009 (lane 2) and
MICA*002/004 (lane 3). Lane 4 is the negative control (water instead of DNA).
The remaining PCR amplification products were run on another agarose gel for excision
and purification of the correctly sized DNA band as detailed in Chapter 2, section 2.2.2.
The Taq polymerase used for amplification of the MICA gene did not have proofreading
capability, therefore amplicons could have nucleotide misincorporations. A first round of
cloning enabled screening of multiple clones to find one with the correct sequence of the
MICA gene, which was checked by DNA sequencing using MICA internal primers
described above. As I previously encountered some problems using the TOPO-TA cloning
kit from Invitrogen, where ligation was often unsuccessful, I used the pGEM-T Easy vector
cloning kit II (Promega Corp., Madison, WI, USA) instead with very good results. The
method is described in detail in Chapter 2, section 2.2.6. Following identification of pGEM
clones with MICA inserts without misincorporations, restriction digestion using Xho1 and
Kpn1 enzymes was carried out as detailed in Chapter 2, section 2.2.5. The results are
shown in Figure 3.4.2.
1000 bp
500 bp
1500 bp
1 2 3 4

Chapter 3
148
Figure 3.4.2: Restriction enzyme digestion with Xho1 and Kpn1 of pGEM plasmid ligated with
MICA*008 cDNA amplicons. Seven of the 12 clones (lanes 3,4,5,6,8,10,11) contained a MICA insert
shown by the band corresponding to 1000 bp.
The clones yielding a correctly sized band after restriction digestion were sequenced with
MICA internal sequencing primers to verify the integrity of the cloned sequences. One
clone with correct sequence for each of the alleles was selected for ligation with pBK-CMV
mammalian expression vector. 20 l pGEM plasmid DNA was digested with Kpn1 and
Xho1 restriction enzymes to release the insert, which was recovered by agarose gel
electrophoresis and gel excision and purification as previously described. The pBK-CMV
vector was also digested with the same enzymes. The prepared MICA DNA inserts and
pBK-CMV plasmid are shown in Figures 3.4.3 and 3.4.4.
Figure 3.4.3: Cloned MICA inserts and pBK-CMV plasmid vector digested with Xho1 and Kpn1
restriction enzymes and purified by gel excision. The MICA inserts are 1082 bp and pBK-CMV vector
is 4518 bp.
1 2 3 4 5 6 8 7 9 10 11 12
1000 bp 500 bp
5000 bp

Chapter 3
149
Figure 3.4.4: Plasmid map of pBK-CMV. This plasmid has multiple cloning sites and a strong CMV
promoter for improving protein expression. The Kpn1 and Xho1 restriction enzyme sites used to clone
MICA fragments are indicated by the black arrows. Direction of transcription indicated by large green
arrows. Source: http://www.lablife.org compiled from data collected by Addgene.
MICA*002, 004 and 008 inserts were ligated with pBK-CMV using the same protocol used
for ligation with pGEM as described in Chapter 2, section 2.2.6. The ligation reactions
were used to transform JM109 cells and selected using kanamycin resistance encoded by
the pBK-CMV plasmid. Six colonies for each MICA allele were selected and cultured
overnight at 37C in LB medium containing kanamycin. Plasmid minipreps were prepared
as described and sequenced using MICA internal sequencing primers to check integrity of
sequence and reading frame. A map of pBK-CMV indicating restriction enzyme sites used
for ligation of the MICA insert is shown in Figure 3.4.4. One correctly constructed plasmid
for each MICA allele (*002, 004, 008 and 009) was selected for scaling-up endonuclease-
free plasmid preparations as described in Chapter 2, section 2.2.6. The results after
extraction of MICA*004 and 008 plasmid DNA using the Endofree Plasmid Maxi Kit
(Qiagen, UK) are shown in Figure 3.4.5

Chapter 3
150
Figure 3.4.5: Endonuclease-free plasmid extraction using the Qiagen maxi kit. Test samples were
taken during the extraction procedure to monitor efficiency. A. Lane 1: lysate; lane 2: lysate after DNA
binding on columns; lane 3: column wash solution; lane 4: Eluted DNA. B. Endonuclease-free plasmid
DNA for MICA*004 (lane 1) and MICA*008 (lane 2) constructs.
The plasmid constructs of pBK-CMV with MICA*002, 004, 008 and 009 are shown in
Figure 3.4.6 and the position of the CMV promoter, primers, restriction sites, coding
sequence, BirA biotinylation tag and six-His tag are indicated. Plasmid constructs were
prepared for MICA*002, 004, 008 and 009 and the concentration of endonuclease-free
plasmid DNA was determined using a Nanodrop ND-1000 spectrophotometer (Nanodrop,
DE, USA) as described in Chapter 2, section 2.2.1. The results are shown in Table 3.4.1.
Table 3.4.1: Concentration and purity of endonuclease-free plasmid DNA
MICA allele Concentration (g/l) 260nm/280nm ratio
*002 4.0 1.8
*004 3.1 1.8
*008 4.7 1.7
*009 1.8 1.8
B
5000 bp
3000 bp
1 2
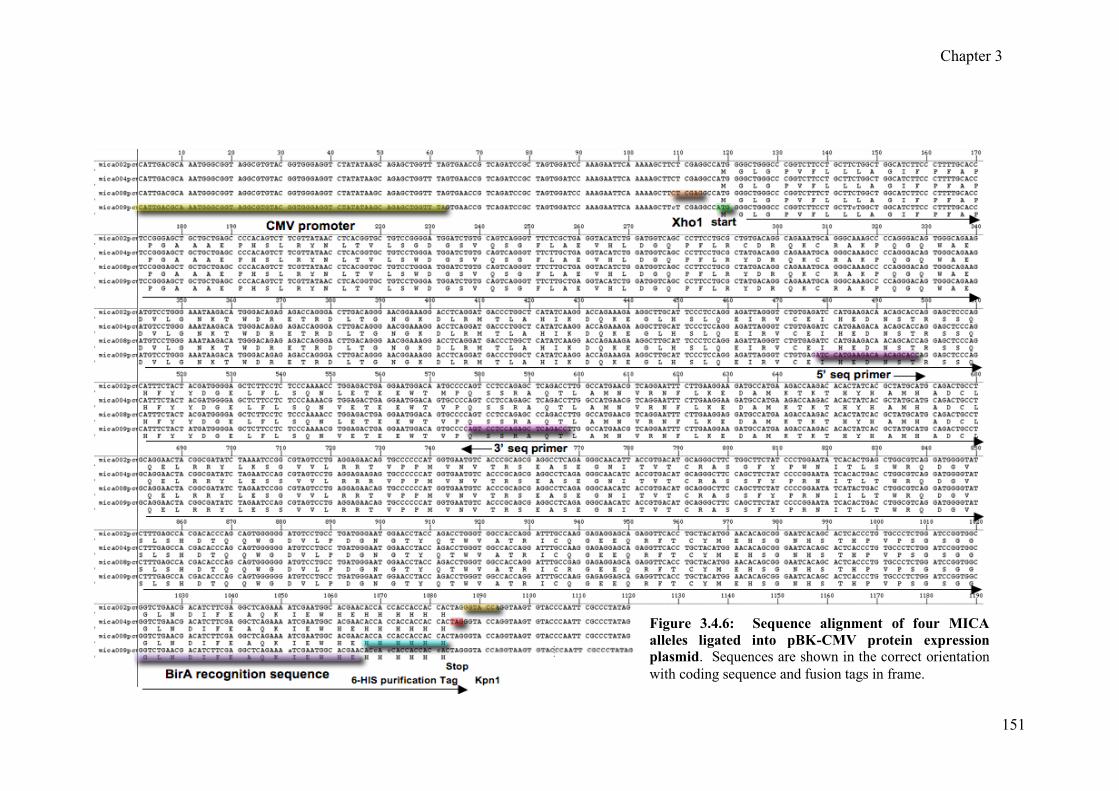
Chapter 3
151
Figure 3.4.6: Sequence alignment of four MICA
alleles ligated into pBK-CMV protein expression
plasmid. Sequences are shown in the correct orientation
with coding sequence and fusion tags in frame.

Chapter 3
152
3.4.2 Liposome-mediated transient transfection of 293T HEK cells
The cells used for transfection had a low passage number and were maintained in cell
culture using CD 293 protein-free media (Invitrogen, Paisley, UK) supplemented with
antibiotics as described in Chapter 2, section 2.5.3. Cells were grown at 37C with 5% CO2
as an adherent monolayer, split to new flasks when the cell density reached 40-80%
confluence and after 2-3 passages cells were healthy and ready for transfection.
The transfection reagent chosen was Polyfect (Qiagen, UK) consisting of liposomes
possessing a defined spherical architecture, with branches radiating from a central core and
terminating at charged amino groups. Polyfect reagent assembles DNA into compact
structures to optimise entry into the cell. The Polyfect-DNA complexes have a net
positive charge allowing them to bind negatively charged receptors on the surface of
eukaryotic cells. Once inside the cell, Polyfect reagent buffers the lysosome after it has
fused with the endosome, leading to pH inhibition of lysosomal nucleases ensuring stability
of Polyfect-DNA complexes and the transport of intact DNA into the nucleus (Polyfect
transfection handbook, 09/2000).
To find optimal requirements for transfection and protein production efficiency, testing was
carried out in 6-well tissue culture plates testing parameters including DNA concentration,
Polyfect (Qiagen, UK) liposome reagent concentration and time post-transfection. The
first test was with varying amounts of MICA*008 plasmid DNA either 2, 4 or 6 g and the
recommended 20 l of Polyfect reagent. The day before transfection (24 hours), 6x10⁵
293T-cells were seeded into each of 5 wells of a tissue culture plate and transfected as
follows:
Well 1: No DNA
Well 2: No Polyfect reagent
Well 3: 2 g plasmid DNA
Well 4: 4 g plasmid DNA
Well 5: 6 g plasmid DNA
Aliquots of medium were removed to analyse MICA-specific protein concentration after 16,
24 and 48 hours using the soluble MICA sandwich ELISA as described in Chapter 2,
section 2.3.4. Concentration of MICA protein was determined using a MICA protein

Chapter 3
153
standard curve of 4000, 2000, 1000, 500, 250, 125 and 62.5 pg/ml. Results are shown in
Figure 3.4.7. It can clearly be seen from the chart in Figure 3.4.7 (B) that 2 g of plasmid
DNA achieved the highest concentration of rMICA*008 produced by 293T cells, where 3
ng/ml was produced after 48 hours.
Figure 3.4.7: Amount of rMICA*008 produced with varying quantities of plasmid DNA. A. Protein
standard curve produced from known concentrations of rMICA using an ELISA sandwich technique. B.
Amount of rMICA*008 produced 16, 24 and 48 hours post-transfection using 2, 4 and 6 g of
MICA*008 plasmid DNA. The cells transfected with 2 g of produced more rMICA after 24 and 48
hours.
B
A

Chapter 3
154
The Polyfect reagent was the most expensive part of the procedure, therefore it was
important to determine the correct amount to use, not only to produce the most recombinant
protein but also to reduce costs by using only what was necessary. The experiment was
again carried out in 6-well tissue culture plates as above, using 2 g MICA*008 plasmid
DNA with 5, 10, 15, 20 or 30 l of Polyfect reagent. Testing for rMICA production was
performed 48 hours post-transfection. The results are shown in figure 3.4.8.
Figure 3.4.8: Effect of varying amount of 0-30 l of Polyfect reagent on rMICA*008 production.
The cells transfected using 20 l of Polyfect reagent produced the most rMICA*008 protein at 2.8
ng/ml.
The results of optimisation experiments carried out at this point determined that 2 g of
plasmid DNA and 20 l of Polyfect reagent in a 6-well format produced optimal amounts
of rMICA molecules, as recommended by Qiagen. However, due to an ambiguous part of
the Polyfect reagent transfection handbook, I had made a mistake in the transfection
procedure. This related to the time cells were incubated with Polyfect reagent and DNA
complexes, as I believed the complexes were toxic to the cells and should not be left on too
long. I had been using a 2 hour incubation of cells with DNA complexes before removing
the media containing the complexes and replacing with fresh protein-free media. As I was
unsure I was carrying out the protocol correctly I contacted technical support at Qiagen who
confirmed that the Polyfect reagent and DNA complexes can be incubated with the cells

Chapter 3
155
for 24-48 hours. They recommended an incubation time of 24 hours as 48 hours could be
too long and result in some cell death.
I repeated the transfection using the previously determined optimal amounts of MICA*008
plasmid DNA and Polyfect reagent which were incubated with the cells at 37C with 5%
CO2 for 24 hours. Four transfections were carried out in a 6-well plate with a negative
control (no DNA). An aliquot of medium was retained from each well before removing the
entire medium with the complexes and replacing with fresh protein-free media. The ELISA
results for rMICA production showed that after 24 hours there was an average of 5000
pg/ml rMICA protein determined from one in ten dilutions of the retained media. The
results showed a five-fold increase in rMICA production compared to the results shown in
Figure 3.4.7 where only 1000 pg/ml was produced using the same DNA and Polyfect
conditions.
This experiment was continued with media changes every 48 hours until the 293T cells
began to die, storing all the harvested media at -80C for later recovery of rMICA. The
results of this time-course experiment of rMICA production are shown in Figure 3.4.9.
Figure 3.4.9: Production of rMICA*008 by transfected 293T cells over eleven days. DNA
complexes were removed after 24 hours and changes of protein-free media made every 48 hours until day
11 post-transfection. Media was collected and stored and aliquots tested by ELISA for rMICA
production.

Chapter 3
156
The time-course experiment showed that rMICA could be produced for up to eleven days
after transfection. The amount of rMICA produced declined gradually after day 3, which is
most likely related to cell death as detached cells became noticeable when harvesting the
media. However, the mean amount of protein produced was 5 ng/ml for almost two weeks.
The low level of protein expression compared with prokaryotic cloning and expression
became a concern as the amount of rMICA necessary for conjugation with Luminex
beads was quoted to be 500 l of 5 g/ml (Zou et al., 2006b). This amount would be
sufficient for conjugation with 2.5x10⁶ Luminex beads, equivalent to 1 vial of beads as
supplied, therefore could be scaled down slightly. However, this amount of recombinant
protein is post-purification and biotinylation and it would be likely that a certain amount
would be lost during these steps. To obtain this amount of unpurified rMICA it would be
necessary to harvest around one litre of media containing rMICA. I calculated that this
could be achieved by scaling-up production using large 175 cm2 tissue culture flasks
(Sarstedt, NC, USA) seeded with 2.4x10⁶ 293T cells in 20 ml of protein-free media 24
hours before transfection. Using ten 175 cm2 tissue culture flasks with six media harvests at
48 hour intervals (first harvest after 24 hours) it was possible to obtain 10 x 20 x 6 = 1200
ml of medium, equal to about 6 g of rMICA. It was therefore possible to obtain enough
rMICA to create MICA molecule-coated Luminex beads, but would require a lot of time
and effort.
As I could only produce a maximum of two different rMICA antigens with sufficient
quantity for conjugation with Luminex beads using 293T cells, I was interested in
producing a construct of pBK-CMV with MICA*002 cDNA obtained with cell line
ESTDAB-172 in addition to rMICA*008. This would enable the production of beads to
detect antibodies directed against the two main MICA ancestral lineages as discussed in
Chapter 1. However, despite several attempts at re-cloning and endonuclease-free DNA
purification, where the yield was 2.2 g/l and 260:280 nm ratio was 1.87, all attempts with
these constructs to transfect 293T cells were unsuccessful. I decided to try a small-scale
transfection test, with four MICA plasmid constructs (MICA*002, 004, 008 and 009) in a
six-well plate format using the defined optimal conditions and testing for rMICA
production after 24 hours. The results are shown in Figure 3.4.10
There was no obvious explanation why the MICA*002 construct was the only one where
protein expression could not be achieved. The construction of the plasmids was the same

Chapter 3
157
for all constructs and there were no sequence mutations in the CMV promoter region
inhibiting transcription or MICA coding region causing a premature stop codon.
Figure 3.4.10: Expression of rMICA using four different MICA pBK-CMV constructs. Using the
same conditions for the different constructs, no expression was obtained with MICA*002 compared with
MICA*004, 008 and 009 where expression was at the expected levels.
I tried releasing the MICA*008 insert from its plasmid and ligating MICA*002 with this
plasmid as I knew it worked successfully previously, but this was also unsuccessful with
MICA*002 DNA. The successful transfection using MICA*004, 008 and 009 alleles may
be related to their MICA-L2 lineage, whereas MICA*002 is MICA-L1 lineage which may
have affected the transcription and expression, although this is unlikely.
Although not having rMICA molecules representative of the MICA-L1 lineage was a
problem, time constraints did not permit further investigation and I decided to focus my
efforts on producing adequate quantities of rMICA*004 and 008 molecules. Several rounds
of transfection, using ten 175 cm2 tissue culture flasks each time, were performed. The
large volumes of medium containing rMICA molecules were concentrated using
Centricon Plus-70 (Millipore, USA) as described in Chapter 2 section 2.3.5. Using these
protein concentrators it was possible to reduce 70 ml of medium to 200-500 l.
Concentrated rMICA proteins were quantified using the soluble MICA ELISA technique
with a 1:10,000 dilution of rMICA protein, revealing a concentration of 1-2 g/ml. A total
of 22.8 g rMICA*004 and 44.3 g rMICA*008 was produced. This higher productivity

Chapter 3
158
compared to earlier tests and the projected forecast may have been related to personal
improvements in carrying out the tissue culture and transfection procedures, resulting in
better expression. Alternatively, the high dilution used with concentrated MICA protein
may have allowed more accurate quantification by the soluble MICA ELISA assay.
Concentrated rMICA proteins were analysed by SDS-PAGE to visualise and estimate their
size and purity. The MICA protein standard from the ELISA kit (R&D systems, USA) was
used to compare with recombinants produced in 293T cells. A 0.5 l volume of MICA
standard and 2 l of rMICA*004 (1 g/ml) and *008 (2 g/ml) was loaded on the gel and
results are shown in Figure 3.4.11.
Figure 3.4.11: SDS-PAGE results after electrophoresis of a commercial rMICA (lane 1),
rMICA*004 (lane 2) and rMICA*008 (lane 3) produced by 293T cells. The protein produced in 293T
cells was purer than the commercial rMICA and both types were estimated to be 45-50 kDa.
3.5 Production of rMICA in Spodoptera frugiperda (Sf9) insect cells
Mammalian cells such as 293T HEK are an attractive means of obtaining recombinant
proteins if the purpose is to use the protein in assays designed to detect molecules, for
example antibodies, in other mammalian subjects such as humans. However, low
expression of protein, evident in experiments described above, is a common problem. An
alternative that has become very popular is to use insect cells for transfection as native
protein very similar to the mammalian counterpart can be obtained in much higher
quantities using similar methods. Spodoptera frugiperda or „Fall Armyworm‟ is the
101.4
87.5
52.7
35.9
27.9
1 2 3 MW (kDa)

Chapter 3
159
caterpillar stage of a moth and cells derived from this organism, called Sf9, originate from
cell line OPLB Sf21-AE. This cell line has been tested for optimal growth and use in
transfection, plaque assays, virus production and protein expression (Novagen User
Protocol TB329 Rev C0108). As with 293T HEK cells, Sf9 cells can be transfected for
protein expression with liposome-mediated reagents for transient or stable expression.
In this section I describe the production of rMICA*002 and rMICA*008 by transient
transfection of Sf9 cells with liposome-based reagents.
3.5.1 Generation of plasmid constructs for MICA expression
The vector chosen for transfection of Sf9 cells was pIEx-4 (Novagen, Cat. No. 71235-3)
and was designed for cloning and high-level expression of proteins in transiently transfected
Sf9 insect cells. Transcription is driven by the AcNPV-derived hr5 enhancer and
intermediate early promoter, IE1. Conveniently, the same restriction enzymes used to
construct pBK-CMV-MICA plasmid were used with pIEx-4 but were situated at opposite
ends of the MICA insert. Therefore primers were obtained with restriction sites for Kpn1
and Xho1 at the 5‟ and 3‟ ends respectively as follows:
Kpn1
5‟ forward amplification primer: 5‟ACT ATC TAC GGT ACC GCC ATG GGG CTG GGC
CCG GTC 3‟
3‟ reverse amplification primer: 5‟ AGC ACT CAC CCT GTG CCC TCT GGA TCC GGT
GGC GGT CTG AAC GAC ATC TTC GAG GCT CAG AAA ATC GAA TGG CAC GAA CAC
CAC CAC CAC CAC CAC TAG CTC GAG CAT GCG CAT 3‟
Xho1
BirA biotinylation enzyme recognition sequence is in italics; six-His tag for up-stream
purification is indicated by bold font and restriction enzyme sequences are underlined.
The plasmid map for pIEx-4 showing the available restriction sites is shown in Figure 3.5.1.

Chapter 3
160
Figure 3.5.1: Map of plasmid pIEx-4 showing restriction enzyme sites and features. A MICA
amplicon was generated with Kpn1 and Xho1 restriction sites for ligation between the IE1 promoter and
terminator.
To avoid amplification of MICB, MICA pseudogenes and misincorporation of nucleotides,
gel-excision purified MICA inserts, used in 293T HEK cell transfection, were used for
amplification using the new primers. A one in ten dilution of the MICA DNA was made
and utilised for PCR amplification as described in Chapter 2, section 2.2.5. Cloning in
pGEM was not necessary therefore new MICA amplicons and pIEx-4 were digested with
Kpn1 and Xho1 restriction enzymes and ligated using T4 DNA ligase as described in
Chapter 2, Table 2.2.5. Sequencing was carried out using the MICA internal sequencing
primers and the correctly assembled pIEx-4-MICA constructs for MICA alleles MICA*002
and *008 are shown in Figure 3.5.2.
3.5.2 Liposome-mediated transient transfection of Sf9 insect cells
The protocol for culture and maintenance of Sf9 insect cell cultures is detailed in Chapter 2,
section 2.5.3. A vial of Sf9 cells, as supplied by the manufacturer (Novagen, USA) and
stored in liquid nitrogen, was used as a starting culture. Cells were cultured as a semi-
adherent monolayer in tissue culture flasks and passaged until healthy and rapidly dividing
which took 3-4 weeks of culture after revival from liquid nitrogen. Cells were initially split
two times a week and more often as they became healthier and were passaged 7 or 8 times
prior to transfection. The maximum manufacturer recommended number of passages was
20-25 in order to maintain experimental consistency.
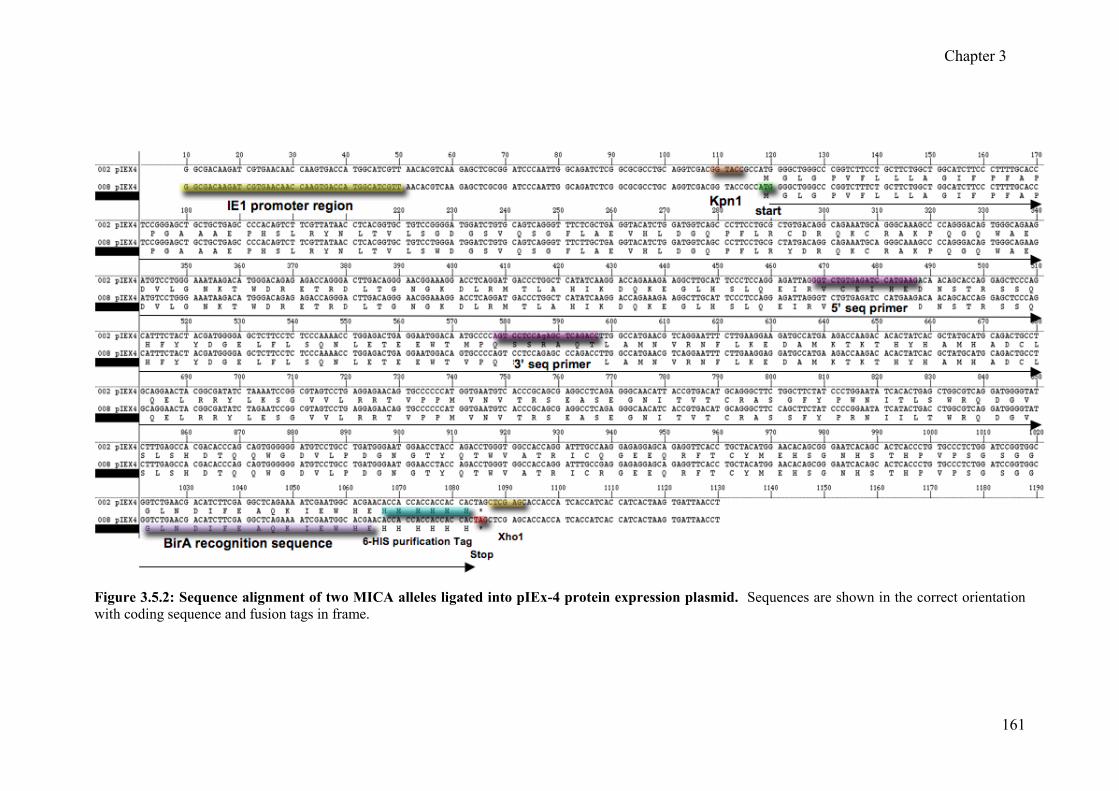
Chapter 3
161
Figure 3.5.2: Sequence alignment of two MICA alleles ligated into pIEx-4 protein expression plasmid. Sequences are shown in the correct orientation
with coding sequence and fusion tags in frame.

Chapter 3
162
As I was limited by time, I chose to use liposome-mediated transient transfection using
plasmid DNA to produce rMICA proteins, as baculovirus transfection was a much longer
and more complicated process. It was expected that protein expression with insect cells
would be much higher than with 293T cells.
There was a vial of two different insect cell liposome transfection reagents in the
laboratory, and I decided to compare them for transfection and protein expression
efficiency. One was called Insect GeneJuice (Novagen USA), a proprietary liposome
formulation optimised for transfection of Sf9 cells. This reagent has extremely low
cytotoxicity, can be used in serum-containing or serum-free media and is ideal for large-
scale protein expression in Sf9 suspension cultures when using pIEx plasmid vectors.
Cellfectin® II Reagent is a cationic-lipid formulation designed for optimal transfection of
insect cells and is an improved version of the original Cellfectin®. Cellfectin® II Reagent
is suitable for transient transfection and consistent and efficient transfection of Sf9 cells.
Healthy, rapidly dividing cells were used in these experiments. The concentration of
endonuclease-free pIEx-4:MICA plasmid DNA was 4.8 g/l for MICA*002 and 5.0 g/l
for MICA*008 and both had a 260:280 nm ratio of 1.7. The conditions for transfection in
24-well tissue culture plates using both reagents with manufacturer‟s recommended
volumes are shown in Table 3.5.1.
Table 3.5.1: Conditions for transient transfection of Sf9 cells in 24-well plates using either
Cellfectin or Genjuice transfection reagents and pIEx-4 with MICA DNA inserts
Transfection of Plasmid DNA Cellfectin II GeneJuice
Number of cells 2x10⁵ 2x10⁵
Culture volume before transfection 500 l 500 l
Amount of plasmid DNA 0.4 g 0.4 g
Volume of transfection reagent 2 0 l 2 0 l
Total volume of media and transfection complexes 40 l 50 l
Total volume serum-free medium1 added to
transfection complexes after incubation2.
160 l 200 l
Incubation time of DNA complexes with cells 4 hours 4 hours
1Grace‟s unsupplemented medium was used with Cellfectin and SF900 II serum-free medium was used
with GeneJuice. 2incubation time was 15 minutes.

Chapter 3
163
The day before transfection, wells of a 24-well tissue culture plate were seeded with 2x10⁵
healthy Sf9 cells grown in serum free medium (SFM). On the day of transfection, wells
were 60-80% confluent (as an adherent monolayer). For each well to be transfected, 0.4 g
of DNA was diluted with 20 l SFM (25 l for Cellfectin II) and 2 l of transfection
reagent was diluted with 20 l SFM (30 l for Cellfectin II). The DNA was added slowly,
drop-wise to the diluted transfection reagent and immediately vortexed gently to avoid
precipitation. The DNA and transfection reagent mixture was incubated at room
temperature for 15 minutes before aspirating medium from cells and replacing with the
transfection complex mixture. Covers were placed on the plates and left to incubate for 4
hours at 28C to allow transfection to take place. The transfection complexes were then
removed from the cells, replaced with SFM and tested 48 hours later for recombinant
protein production. The results given in Figure 3.5.3 show transfection with Cellfectin II
reagent produced a concentration of 100 ng/ml rMICA*002 and 500 ng/ml rMICA*008.
Transfection with GeneJuice reagent produced a concentration of 200 ng/ml rMICA*002
and 700 ng/ml rMICA*008.
Figure 3.5.3: Concentration of rMICA protein produced using MICA*002 and MICA*008 plasmid
DNA and either Cellfectin reagent or GeneJuice reagent.
The results show that rMICA produced using GeneJuice reagent was more successful and
therefore, was used in all subsequent experiments. These results also show that more

Chapter 3
164
protein was produced with the MICA*008 plasmid than with MICA*002, even though both
had the same concentration and purity.
The rMICA produced was secreted into the surrounding medium as soluble molecules but
rMICA may also be inside the cells. To test whether it was worthwhile lysing the Sf9 cells
to extract more recombinant protein, I separated the medium from the cells (using 6-well
culture format), replaced with an equal volume of fresh SFM and lysed the cells using
Insect PopCulture reagent (Novagen, USA). Briefly, a 200 l volume of Insect PopCulture
reagent and 0.4 l (10U) Benzonase Nuclease (Novagen, USA) per 1 ml of medium was
added to the wells and allowed to incubate for 15-30 minutes. I then analysed the amount
of rMICA present in the culture medium and cells separately, after culturing for four days
post-transfection. The results are given in Figure 3.5.4 and show that most of the rMICA is
secreted into the surrounding medium with only a small proportion remaining inside the
cells. There was also much more MICA*008 produced than MICA*002, confirming the
previous experiments.
Figure 3.5.4: Concentration of rMICA secreted into culture medium and lysed from cells.
As only a small amount of rMICA was present inside cells and because protein from cell
lysates would contain a lot of other contaminating proteins, I decided not to use lysis as a
method of recovering rMICA protein

Chapter 3
165
The results also showed an improvement in yield of rMICA, especially with MICA*008
transfected cells, and this may be related to improvements in carrying out the procedures
and the Sf9 cells becoming more healthy. Therefore I decided to try scaling up to
transfection of 10 ml suspension cultures in 125 ml Erlenmeyer conical flasks. Briefly,
three transfections were carried out for each of the two MICA plasmids (MICA*002 and
*008) using 20 g of plasmid DNA and 100 l of GeneJuice reagent. A total of 1x10⁷
cells from an exponentially growing culture were seeded into the flasks, DNA and
GeneJuice transfection complexes were added to the cells after incubation for 15 minutes.
Flasks were then placed in an orbital shaker (150 rpm) at 28C for 48 hours, to allow
transfection and production of rMICA to take place, and tested for rMICA production. The
results are given in Figure 3.5.5 and show that again, more rMICA*008 is produced than
MICA*002 where a mean concentration of 6.3 g/ml was produced by MICA*008
transfectants and 1.5 g/ml by MICA*002 transfected cells.
Figure 3.5.5: Concentration of rMICA produced by transfection of 10 ml suspension cultures. The
test was carried out in triplicate and assayed for rMICA after 48 hours post-transfection.
This method produced the best rMICA production in terms of yield but a lower amount of
rMICA*002. In total, from this experiment 44 g of rMICA*002 and 190 g of
rMICA*008 was produced. SDS-PAGE was performed using 0.5 l of the rMICA standard
from the MICA ELISA assay and 6 l of rMICA*002 (1.5 g/ml) and *008 (2.5 g/ml)
produced by the above experiment and results are shown in Figure 3.5.6.

Chapter 3
166
Figure 3.5.6: SDS-PAGE results after electrophoresis of rMICA. Proteins loaded were a commercial
rMICA (lane 1), rMICA*002 (lane 2) and rMICA*008 (lane 3) produced by Sf9 insect cells. The protein
produced in Sf9 insect cells was purer than the commercial rMICA and both types were estimated to be
45-50 kDa.
3.6 General Discussion
The MICA-SBT worked well in conjunction with analysis of exon 5 sequence patterns,
consequently I was able to carry out in excess of 600 individual MICA typings including
the identification of two novel MICA alleles (discussed in Chapter 5). No further problems
were encountered with allele dropout and the method generally proved to be reliable and
robust. The application of SBT for MICA typing in a routine laboratory is feasible although
currently there is no easy solution to the problem of characterising exon 5 polymorphism.
However, with sufficient demand heterozygous sequence typing algorithms, such as
Assign, could be adapted by the manufacturer to automatically identify exon 5 sequence
patterns, enabling implementation, and commercial MICA-SBT typing kits would soon
follow.
The production of recombinant MICA to identify MICA antibodies in patient serum proved
to be problematic and ultimately was unsuccessful. Fortunately, commercial methods
became available enabling me to concentrate on obtaining results and characterising the
renal patients for MICA antibody status. As discussed at length in the next chapter, three
different MICA Luminex assays were used to detect MICA antibodies and there were
differences in the results obtained. It is probable that these differences were related to the
various methodologies used to produce the rMICA molecules attached to the beads, leading
to differences in antibody specificity. The aim of my experiments to generate rMICA
101.4 87.5
52.7
35.9
27.9
1 2 3
MW (kDa)

Chapter 3
167
molecules from 293T mammalian and Sf9 insect cells was to produce Luminex beads with
homologous rMICA molecules from each cell line and compare their reactivity with patient
serum that was well-characterised for MICA antibodies. I did not have time to complete
this aim but did produce MICA proteins from 293T cells and Sf9 cells in addition to rMICA
produced using E. coli.
The use of E. coli to produce recombinant molecules is the first system that should be
attempted as it is relatively straightforward, cheap and milligram quantities can be obtained.
The final preparation of rMICA*008 isolated from inclusion bodies contained a
concentration of 4.6 mg/ml and would have been more than sufficient to prepare an assay if
the proteins had refolded correctly. The reason why it would not refold is unclear but could
be related to the technique as it was achieved in other laboratories. Alternatively it is
possible that rMICA molecules are particularly difficult to fold into their native structure
because, unlike HLA class I molecules, they do not bind peptides or associate with -2
microglobulin. This renders the MICA molecule more flexible but also less rigid and is
evident from x-ray crystallographic analysis (Bahram et al., 1994). This could indicate that
MICA protein produced in E. coli may not refold stably and become unfolded again,
leading to linear proteins being used in assays to detect MICA antibodies that could react
with clinically irrelevant patient antibodies.
The second method used to produce rMICA using 293T HEK cells did produce folded
MICA that was determined using a MICA sandwich ELISA technique utilising antibodies
that recognise MICA epitopes of native molecules. The problem was that 293T cells did
not produce very large quantities of native MICA molecules. In contrast, Sf9 insect cells
produced much greater quantities of folded MICA proteins and proved to be an efficient
method. In hindsight it would have been more productive to use insect cell transfection first
and develop the techniques for HIS-tag purification, biotinylation and conjugation to beads,
while collecting the rMICA produced by 293T cells.
It is puzzling why I was unable to produce rMICA*002 with 293T cells and consistent
relatively low amounts of MICA*002 was produced with Sf9 cells. A reason, in addition to
those discussed above, could be that 293T cells were transcribing and producing
MICA*002 protein but it was all in a linear form and not detected using the ELISA.
Similarly Sf9 cells may have produced the same amounts of rMICA*002 compared with
rMICA*008 but less was refolded, perhaps relating to differing amino acid composition.
Unfortunately I did not save any supernatant from MICA*002 transfected 293T-cell

Chapter 3
168
cultures for analysis on an SDS-PAGE gel to identify a protein band equal to the size of
MICA molecules to prove or disprove this theory. However, SDS-PAGE analysis of
MICA*002 and MICA*008 produced in Sf9 cells shows that, relative to the concentration
of protein loaded on the gel, there were equal amounts of protein. Therefore, at least as far
as Sf9 cells are concerned, there was simply less protein produced by MICA*002
transfected cells than with MICA*008 transfected Sf9 cells.
Another observation relating to native and linear rMICA was made by comparison of SDS-
PAGE analysis of MICA proteins from all three methods. I was initially concerned that in
contrast to rMICA derived from E. coli, the low amounts of protein detected by ELISA
would not be visible with regular Coomassie Blue staining. The protein detection limit
using Coomassie Blue is 0.3-1 g per lane. Therefore if I used 10 l of rMICA with a
concentration of 2 g/ml about 20 ng of MICA would be loaded onto the gel, below the
detection limit. Before investigating more sensitive techniques, I decided to analyse
MICA*008 produced by 293T cells with Coomassie Blue and was very surprised that the
protein band of around 50 kDa had overloaded the gel. I repeated the SDS-PAGE analysis
with the same amounts (2.5 ng) of rMICA produced in my experiments and also included
the protein standard from the MICA ELISA (70 pg). A summary is given in Table 3.6.1.
Table 3.6.1: Characteristics of MICA proteins loaded onto SDS-PAGE gels
Source MICA allele rMICA conc. Vol. loaded Quant. loaded
293T cells 004 2.5 g/ml 1 l 2.5 ng
008 2.5 g/ml 1 l 2.5 ng
Sf9 cells 002 1.25 g/ml 2 l 2.5 ng
008 2.5 g/ml 1 l 2.5 ng
MICA standard1 - 140 ng/ml 0.5 l 70 pg 1MICA sandwich ELISA (R&D systems) reconstituted as per manufacturer‟s instructions giving a final
concentration of 140 ng/ml.
Result:
Firstly, only 70 pg of rMICA standard was loaded on the gel but this is the most intense
band compared with rMICA produced from 293T or Sf9 cells. Coomassie blue is unable to
52.7
293T-cells Sf9 cells
*004 *008 *002 *008
rMICA
Standard
MW (kDa)
Chapter 3
169
detect this amount of protein therefore what is seen on the gel must represent linear MICA
protein. Similarly, the amounts of native protein produced by 293T and Sf9 and loaded on
the gel would be barely detectable, if at all. These results show that most of the
recombinant protein produced in these systems is linear, however less linear MICA
products are observed with Sf9 cell rMICA production.
Another observation relates to the size of the proteins, estimated to be 45-50 kDaltons in the
results shown above. This is larger than the protein isolated from inclusion bodies with E.
coli transfection, which was approximately 33 kDaltons. This corresponds to a MICA
protein produced using E. coli (Zwirner et al., 2000), estimated to be 33 kDaltons. The
larger size of MICA protein produced by eukaryotic cells is most likely due to heavy N-
linked glycosylation that has been reported previously (Zou et al., 2006b) and this is known
to increase the apparent molecular weight of recombinant proteins (Lu et al., 1997). It is
interesting that rMICA produced by 293T cells (mammalian) is the same size as that
produced by Sf9 cells, indicating they are equally glycosylated.
In conclusion, the presence of linear MICA protein, and heavy N-linked glycosylation have
implications regarding the use of these molecules in assays to detect MICA antibodies. Co-
purified linear forms of the MICA protein will ultimately become conjugated with Luminex
beads (or other solid-phase support) and may cross-react with irrelevant antibodies leading
to false positive results. Conversely, a heavily glycosylated MICA molecule may mask
epitopes important for MICA antibody recognition, and a false negative result may be
obtained. The results of these experiments show that rMICA production in Sf9 insect cells
is more efficient compared with 293T HEK cells, more protein is re-folded and products are
of equal size. The testing of renal transplant recipients for the presence of MICA antibodies
using three independent MICA Luminex, assays was carried out and is discussed in the next
chapter. One of these assays used rMICA produced in insect cells, developed in Professor
Peter Stastny‟s laboratories (University of Texas, USA).

Chapter 4
170
CHAPTER 4
Evaluation of MICA antibody detection in renal patients and
healthy controls using fluorescent bead-based assays
4.1 Introduction and aims
It is now approaching 50 years since the advent of CDC testing for HLA antibodies, first
described in 1964 (Terasaki and McClelland, 1964). This was followed, five years later, by
the introduction of CDC as a pre-transplant crossmatch test (Patel and Terasaki, 1969),
which had a dramatic effect by reducing hyperacute and AR associated with a positive
crossmatch in renal transplantation. This technique remained the mainstay of HLA
antibody testing for over 40 years, providing a reliable estimate of risk associated with
potential donors in terms of pre-sensitisation of the patient to HLA antigens. During the
last decade there has been a revolution in this field enabling increased sensitivity and
specificity of HLA antigens, namely the solid-phase assay.
The solid-phase assay for HLA antibody detection utilises recombinant HLA molecules or
HLA antigens cleaved from the surface of cells, immobilised on a solid surface such as
wells of a plastic plate (ELISA) or a polystyrene fluorescent micro-bead (Luminex). The
latter has emerged as the current „gold standard‟ (arguably) because of its superior
sensitivity and multiplexing allowing extremely high throughput in a relatively short period
of time using automation and computerised interpretation of results. The term „Luminex‟
has been adopted by the H&I community to describe this technology after the company that
developed the polystyrene fluorescent beads and instrumentation used in most assays of this
type (Luminex Corp., Austin, TX, USA). It is now possible to test for HLA antibodies that
were difficult or impossible to detect with the CDC assay for example antibodies to HLA-C
and HLA-DP can now be tested for routinely. Also available are beads to detect HLA-
DQ, -DQ and MICA antibodies, allowing their clinical relevance in transplantation to be
assessed.
There are three levels of HLA antibody detection using Luminex technology based on the
number of different beads and the array of antigens on those beads. The first level utilises
beads with a large number of different HLA class I or class II antigens on the surface,

Chapter 4
171
which essentially provides the investigator with a screening method to obtain a positive or
negative result. The second level employs a panel of 32 beads coated with different
purified Class I or Class II antigens. The 32 different antigen beads in each test are divided
into four HLA Groups with eight antigen beads in each group. This test can reveal antibody
specificities at an antigenic level and is a cheaper alternative to the next level. The third
level employs beads, which each have a different antigen, for a wide range of HLA
antigens, attached to individual beads and is known as the single antigen (SAg) Luminex
assay. This assay is very useful because it identifies the precise HLA antibody specificities
present in patient serum, enabling avoidance of potential donor organs expressing those
antigens.
As already discussed in the introduction, patients with antibodies to MICA pre-transplant,
or who develop MICA antibodies post-transplant, may be at increased risk of acute and/or
chronic graft rejection and loss. One Lambda was the first company to include MICA
Luminex beads in their first level mixed HLA antigen bead assay and also a SAg MICA
antibody detection assay (third level) to identify individual MICA antibody specificities that
could be purchased separately. This was chosen as the method to identify MICA antibodies
and the specificities of those antibodies in a cohort of renal transplant patients from our
centre.
In 2008, I attended the IHIWC in Brazil, where I met a number of leading scientists and
pioneers in this field, including Professor Peter Stastny whose group had developed their
own bead-based Luminex assay for MICA antibody detection. Realising our group faced
the same problems as many others who were interested in MICA antibody testing, Professor
Stastny offered to test our sera with their technique at their laboratories. In addition,
another commercial method for MICA antibody detection using Luminex technology
became available late 2008 (Gen-Probe, previously Tepnel Lifecodes) and was also used to
test the same patient cohort. This chapter deals with the evaluation of these assays, the
elucidation of MICA antibody reactivity with MICA antigens and establishing criteria for
assigning test subjects as either MICA antibody positive or MICA antibody negative.
Chapter 4
172
4.2 Identification of MICA antibodies by One Lambda Luminex
screening beads
The first test used for identification of individuals who may have MICA antibodies was the
Labscreen Mixed LSM12 (One Lambda, CA, USA). This Luminex antibody screening
kit incorporates beads conjugated with mixed antigens to detect HLA class I (12 beads),
HLA class II (5 beads) and MICA (2 beads). The specificities identified were limited to the
range of antigens conjugated to the bead with a positive reaction, as this assay does not
identify single antibody specificities. The two MICA beads, bead 16 and bead 17, each
identify five MICA antibodies based on antigens encoded by the most frequent MICA
alleles. Bead 16 was conjugated with MICA*001, 004, 008/027, 012, 018 and bead 17 was
conjugated with MICA*002, 007, 009, 017 and 019 antigens.
4.2.1 Calculations used for assignment of positivity with the One Lambda mixed bead
assay
The following calculation was applied to the data obtained by the Luminex instrument to
obtain a normalised background ratio (NBR) using negative control (NC) beads and NC
serum:
NBR =
Sample specific fluorescent value for bead N - Sample specific fluorescent value for NC bead
Background NC serum fluorescent value for bead N - Background NC serum fluorescent value for NC
bead
At this point in time, there were no internationally recognised sera standards for MICA
antibodies and, therefore it was not possible to accurately determine the cut-off value as
detailed in the product literature. Therefore, the manufacturer‟s recommended cut-off value
of NBR equal to or greater than 2.2 was used to assign MICA antibody positivity, to be re-
assessed later, following confirmatory testing with MICA SAg beads. Calculations were
performed with the dedicated software supplied with the product (HLA Visual 2.2.0, One
Lambda).

Chapter 4
173
A total of 758 individuals consisting of 442 transplant recipients, 200 ESRD patients who
were awaiting transplant and 116 healthy controls were screened for HLA and MICA
antibodies. This assay was performed by the renal team from the Anthony Nolan H&I
laboratories, Royal Free Hampstead for patient samples and by myself for healthy controls
and selected patients.
4.2.2 MICA antibody frequencies - kidney transplant recipients
In total, sera from 150 of the 442 renal graft recipients (34%) were positive for MICA
antibodies. Twenty-two individuals had positive reactions with bead 16 only (5%) and 55
were positive for bead 17 (12%). Both beads together reacted with the sera from 73 of the
442 recipients (16.5%).
4.2.3 MICA antibody frequencies – ESRD patients waiting for transplant
A MICA antibody frequency of 23% was detected in the serum of 46 out of 200 patients
awaiting transplant (Untransplanted). Bead 16 was positive with 7 out of 200 serum
samples (3.5%) and bead 17 was positive with 23 individuals (11.5%). Both beads 16 and
17 were positive with sixteen sera (8%).
4.2.4 MICA antibody frequencies - healthy controls
Among the 116 healthy control sera, there were a total of 33 positive reactions (28%).
Eighteen sera (15.5%) reacted with bead 16 and 26 (22%) reacted with bead 17. Both beads
16 and 17 were positive with eleven of the 116 sera (9.5%).
Comparisons of frequencies are detailed in Table 4.2.1 and Figure 4.2.1.
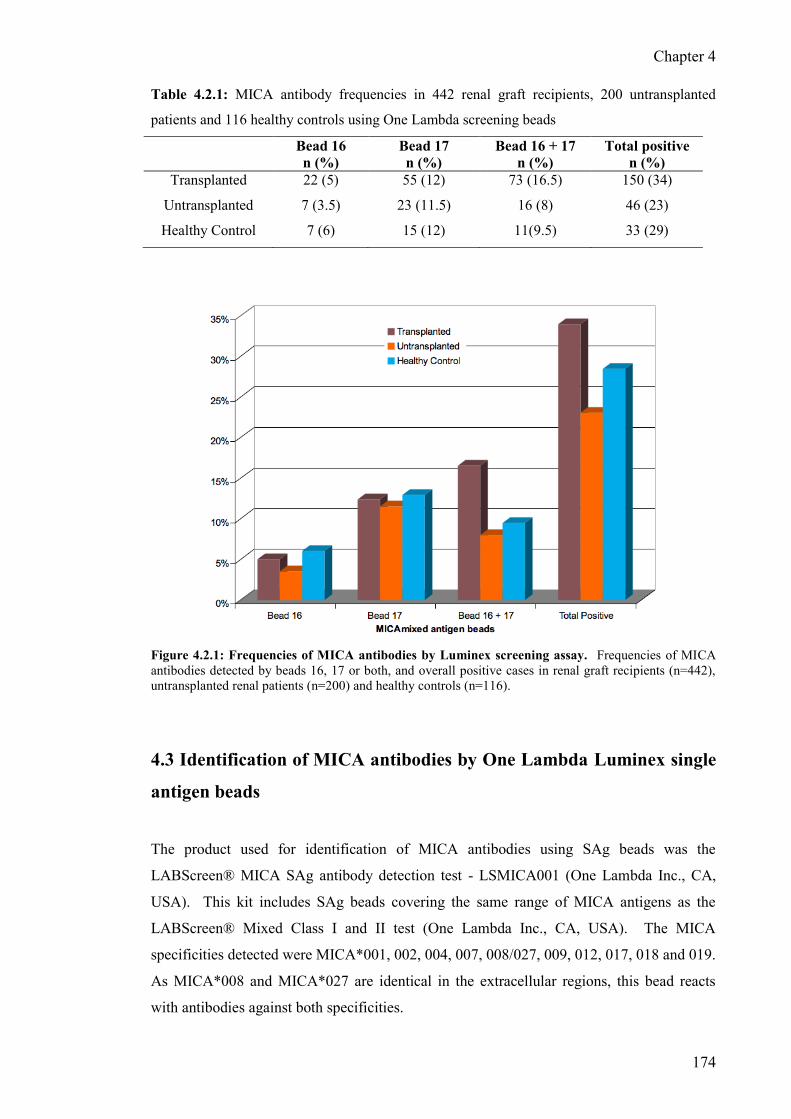
Chapter 4
174
Table 4.2.1: MICA antibody frequencies in 442 renal graft recipients, 200 untransplanted
patients and 116 healthy controls using One Lambda screening beads
Bead 16
n (%)
Bead 17
n (%)
Bead 16 + 17
n (%)
Total positive
n (%)
Transplanted 22 (5) 55 (12) 73 (16.5) 150 (34)
Untransplanted 7 (3.5) 23 (11.5) 16 (8) 46 (23)
Healthy Control 7 (6) 15 (12) 11(9.5) 33 (29)
Figure 4.2.1: Frequencies of MICA antibodies by Luminex screening assay. Frequencies of MICA
antibodies detected by beads 16, 17 or both, and overall positive cases in renal graft recipients (n=442),
untransplanted renal patients (n=200) and healthy controls (n=116).
4.3 Identification of MICA antibodies by One Lambda Luminex single
antigen beads
The product used for identification of MICA antibodies using SAg beads was the
LABScreen® MICA SAg antibody detection test - LSMICA001 (One Lambda Inc., CA,
USA). This kit includes SAg beads covering the same range of MICA antigens as the
LABScreen® Mixed Class I and II test (One Lambda Inc., CA, USA). The MICA
specificities detected were MICA*001, 002, 004, 007, 008/027, 009, 012, 017, 018 and 019.
As MICA*008 and MICA*027 are identical in the extracellular regions, this bead reacts
with antibodies against both specificities.

Chapter 4
175
4.3.1 Calculation of results for baseline Mean Fluorescence Intensity
The following calculation was applied to the raw data obtained by the Luminex instrument
to obtain baseline MFI using negative control (NC) beads and NC serum:
Baseline MFI =
Sample specific MFI value for bead N - Sample specific MFI value for NC bead
Background NC serum MFI value for bead N - NC serum MFI value for NC bead
Again, it was not possible to accurately determine the cut-off value as detailed in the
product literature due to no MICA antibody reference sera. Therefore, the manufacturer‟s
recommended cut-off – baseline MFI> 1000 was used. Calculations were performed with
the dedicated software supplied with the product (HLA Visual 2.2.0) using lot-specific
values.
4.3.2 MICA antibody frequencies - kidney transplant recipients
Screening for MICA antibodies using the One Lambda mixed bead assay revealed 34% of
renal graft recipients (150 of 442 patients) were possibly positive. Testing for MICA
antibodies using the One Lambda SAg assays showed that, of the 150 who were positive for
MICA antibodies by screening beads, only 76 (51%) were positive. Full results are given in
Table 4.3.1 and Figure 4.3.1. The most frequent MICA antibody detected in this group of
76 with One Lambda MICA SAg beads was MICA*019 (71%). The next most frequent
MICA antibody was MICA*001, detected in 49% followed by MICA*018 with a frequency
of 43%. The least frequent antibody detected was MICA*009 and tested positive in 9/76
recipients (11.8%).
4.3.3 MICA antibody frequencies - patients ESRD, awaiting transplant
A total of 46 of the 200 untransplanted patients (23%) tested positive for MICA antibodies
with the screening method described above. Of these, 21 were confirmed positive by One
Lambda SAg beads (45.6%). The most frequent antibody detected in this group of 21
patients was MICA*019 (48%). None of the patients had MICA*004 antibodies in this
group.

Chapter 4
176
4.3.4 MICA antibody frequencies - healthy controls
Sera from 116 healthy controls were tested with the One Lambda mixed Luminex assay and
33 were positive for MICA antibodies with a frequency of 28.4%. Confirmatory testing
using One Lambda SAg beads revealed 14 had MICA antibodies (42.4%). The most
frequently detected MICA antibody was MICA*001 (71%), MICA*019 had a frequency of
43%, MICA*018 was 29% and MICA*002 and MICA*008 antibodies were detected with a
frequency of 14%. One of the healthy controls (7.1%) had antibodies detected against
MICA*017.
Table 4.3.1: MICA antibody frequencies among 76 renal graft recipients, 21 untransplanted patients
and 14 healthy controls testing positive using One Lambda MICA single antigen beads
MICA antibody Transplanted
n (%)
Untransplanted
n (%)
Healthy Control
n (%)
001 37 (49) 8 (38) 10 (71)
002 23 (30) 4 (19) 2 (14)
004 12 (16) 0 (0) 0 (0)
007 12 (16) 2 (9.5) 0 (0)
008/027 18 (24) 4 (19) 2 (14)
009 9 (12) 1 (5) 0 (0)
012 17 (22) 1 (5) 0 (0)
017 15 (20) 1 (5) 1 (7)
018 33 (43) 3 (14) 4 (29)
019 54 (71) 10 (48) 6 (43)
Figure 4.3.1: Frequencies of MICA antibodies by single antigen Luminex assay. MICA antibody
frequencies detected by One Lambda SAg Luminex testing of renal transplant recipients, untransplanted
patients and healthy controls.

Chapter 4
177
4.4 Identification of MICA antibodies using a flow cytometry-based
technique with recombinant MICA molecules produced from insect
cells
This assay was developed at the laboratories headed by Professor Peter Stastny in Dallas,
USA (Zou et al., 2006b) and will be referred to as the „Stastny assay‟. The recombinant
MICA (rMICA) molecules used for conjugation with Luminex beads were produced using
an insect cell (Sf9) transfection system. This assay includes SAg beads covering the same
range of antibodies detected by the LABScreen® Mixed Class I and II test (One Lambda
Inc., CA, USA). The MICA specificities detected were MICA*001, 002, 004, 007,
008/027, 009, 012, 017, 018 and 019. Testing was carried out to confirm the positive
reactions with MICA antibodies observed using the One Lambda MICA SAg beads – 76
graft recipients, 21 untransplanted patients and 14 healthy controls. Full results are given in
Table 4.4.1 and Figure 4.4.1
4.4.1 Calculation of Mean Fluorescence Intensity and interpretation of results
Yizhou Zou from Professor Stastny‟s laboratories in Dallas, USA, carried out this assay and
analysis of results. Data files were generated with the bead numbers and their median
fluorescence intensities (MFI) in Excel format. Standard curves were plotted to calculate
the relative amount of MICA antibody for each sample, using aliquoted serial dilutions of a
positive control serum. The raw data MFI obtained by Luminex FC were normalized to the
relative amount of MICA antibodies according to a standard curve using a computer
program developed in their laboratory. The means of the relative amount plus threefold SD
of IgG binding in serum from normal subjects were used to set the threshold for this assay.
Based on the relative amount of each MICA allele-specific antibody and the threshold for
each antigen bead, scores were assigned as follows: negative, < threshold; doubtful, >
threshold and < threshold + 200; weak positive, > threshold + 200 and < threshold + 600;
positive, > threshold + 600.
4.4.2 MICA antibody frequencies - kidney transplant recipients
Testing for MICA antibodies with this assay revealed that 29 of the 76 graft recipients, who
were positive with the One Lambda SAg beads, had MICA antibodies detected (38%). The
most frequent MICA antibody detected was MICA*007 with a frequency of 26%. The next

Chapter 4
178
most frequent antibody was MICA*002 detected in 24% followed by MICA*017 (18%).
MICA*001 and MICA*018 had a frequency of 17%. The two least frequent MICA
antibodies detected in transplant recipients with this assay were MICA*004 and MICA*009
which were each detected with a frequency of 8%.
4.4.3 MICA antibody frequencies - patients with ESRD, awaiting transplant
Three patients from the untransplanted group of 21 were positive for MICA antibodies with
this method (14%). Two patients had antibodies directed against MICA*002 (9.5%) and
MICA*001, *004, *009, *009 and *019 antibodies were each detected in one patient (5%).
No patients in this group had MICA*007, *012, *017 or *018 antibodies.
4.4.4 MICA antibody frequencies - healthy controls
Only one of fourteen healthy controls tested for MICA antibodies showed a positive result,
with two specificities detected – MICA*002 and MICA*017, accounting for a frequency of
7%.
4.5 Identification of MICA antibodies using Gen-Probe MICA single
antigen Luminex assay
Towards the end of 2008, another commercial method became available for the detection of
MICA antibodies using Luminex technology. This assay identifies a wider range of MICA
antibodies compared to One Lambda SAg or the Stastny SAg beads, which identify ten
MICA antigens. However, MICA specificities MICA*001, 002, 004, 007, 008, 009, 012,
017, 018 and 019 only were considered, to allow comparison with the other techniques.
Testing was carried out to confirm the positive reactions with MICA antibodies observed
using the One Lambda MICA SAg beads – 76 graft recipients, 21 untransplanted patients
and 14 healthy controls and full results are given in Table 4.5.1 and Figure 4.5.1.

Chapter 4
179
Table 4.4.1: MICA antibody frequencies among 76 renal graft recipients, 21 untransplanted
patients and 14 healthy controls using insect cell rMICA single antigen beads (Stastny assay)
MICA antibody Transplanted
n (%)
Untransplanted
n (%)
Healthy Control
n (%)
001 13 (17) 1 (5) 0 (0)
002 18 (24) 2 (9.5) 1 (7)
004 6 (8) 1 (5) 0 (0)
007 20 (26) 0 (0) 0 (0)
008/027 9 (12) 1 (5) 0 (0)
009 6 (8) 1 (5) 0 (0)
012 12 (16) 0 (0) 0 (0)
017 14 (18) 0 (0) 1 (7)
018 13 (17) 0 (0) 0 (0)
019 11 (14.5) 1 (5) 0 (0)
Figure 4.4.1: Frequencies of MICA antibodies using the Stastny Luminex assay. MICA antibody
frequencies detected in transplant recipients, untransplanted patients and healthy controls who previously
tested positive using the One Lambda Luminex assay.
4.5.1 Calculation of adjusted Median Fluorescence Intensity
To determine if a bead was positive, the background MFI was subtracted from the raw MFI,
for each bead, to give the Adjusted Value 1. The background MFI is the background noise
due to bead variation and was included on the lot-specific recording sheet provided with the
kit. The Adjusted Value 1 was divided by the MFI of the calculated control (CalcCON) to
generate the Adjusted value 2. The CalcCON is the raw MFI value of the lowest ranked
antigen bead.

Chapter 4
180
Adjusted Value 2 for antigen‟x‟ =
Individual Bead Raw MFI – Background MFI
CalcCON MFI
Adjusted Value 3 was generated by dividing Adjusted Value 2 by the relative amount of
antigen on each bead as detailed in the lot-specific recording sheet which also lists the
antigens present on each bead and the suggested cut-offs for estimating a positive or
negative result. Higher or lower sensitivities can be achieved by adjusting the cut-off. The
calculations were performed using the analysis software (Quicktype for Lifematch version
2.5) using the recommended cut-off MFI of 3000.
4.5.2 MICA antibody frequencies - kidney transplant recipients
Overall, 31 of the 76 graft recipients‟ sera tested for MICA antibodies had reactions against
at least one MICA specificity, representing 41% of recipients who originally tested positive
using the One Lambda SAg assay. The most frequently detected MICA antibody was
MICA*001 (26%). MICA*018 was detected with a frequency of 25% and MICA*007 was
detected in 22%. The MICA antibodies detected with the lowest frequencies were
MICA*004 and MICA*009 detected in 13% and 10.5% respectively.
4.5.3 MICA antibody frequencies - patients with ESRD, awaiting transplant
A total of five patients in this group tested positive for MICA antibodies out of 21 who
were positive using One Lambda SAg beads, accounting for 24%. The most frequently
detected MICA antibody was MICA*019 in three patients (14%) followed by MICA*001,
*004, *008 and *018 each with a frequency of 9.5%. MICA*009 and *012 antibodies were
detected in one patient (5%). None of the patients in this group had MICA*007 or
MICA*017 antibodies detected.
4.5.4 MICA antibody frequencies - healthy controls – Not performed due to insufficient
sera.
Results are shown in Table 4.5.1 and Figure 4.5.1.

Chapter 4
181
Table 4.5.1: MICA antibody frequencies among 76 renal graft recipients and 21 untransplanted
patients using Gen-Probe single antigen Luminex beads
MICA antibody Transplanted
n (%)
Untransplanted
n (%)
001 20 (26) 2 (9.5)
002 13 (17) 0 (0)
004 10 (13) 2 (9.5)
007 17 (22) 0 (0)
008/027 14 (18) 2 (9.5)
009 8 (10.5) 1 (5)
012 15 (20) 1 (5)
017 13 (17) 0 (0)
018 19 (25) 2 (9.5)
019 12 (16) 3 (14)
Figure 4.5.1: Frequencies of MICA antibodies detected using Gen-Probe single antigen Luminex
assay. MICA antibody frequencies in transplant recipients and renal patients awaiting transplant
4.6 Comparison of MICA antibody testing results obtained with three
methods
Whilst analysing the data obtained from MICA antibody testing using the three different
assays it became apparent that many of the individuals who were assigned as positive for
MICA antibodies using the One Lambda SAg Luminex assay were negative for MICA
antibodies using the other two assays. Figure 4.6.1 compares frequencies of MICA

Chapter 4
182
antibodies detected in the graft recipient cohort as a percentage of the 76 recipients who
tested positive with the One Lambda SAg assay. The chart reveals that many of the
positive cases defined using One Lambda‟s assay, in particular those with antibodies
detected against MICA*001, *018 and *019, were not so frequently detected using the
other two assays. MICA*001 had a frequency of 49% using One Lambda‟s assay
compared to 17% using the Stastny assay and 26% with Gen-Probe‟s assay. Similarly,
MICA*018 was detected in 43% of recipients with One Lambda‟s assay, 17% with the
Stastny assay and 25% with the Gen-Probe assay. The largest discrepancy was with
detection of antibodies specific for MICA*019 and detected in 71% of recipients using the
One Lambda assay compared to 14.5% with the Stastny assay and 16% with the Gen-Probe
assay.
Figure 4.6.1: Comparison of MICA antibodies detected in renal graft recipients using three
independent MICA single antigen Luminex assays. Percentages relate to the number of patients
testing positive out of the cohort of 76 individuals positive by the One Lambda MICA SAg assay.
The overall frequencies of MICA antibodies detected in the graft recipients (n=442),
untransplanted patients (n=200) and healthy controls (n=116) are shown in Figure 4.6.2.
There is a clear difference between the frequencies detected using One Lambda‟s assay
compared to the other two methods and these differences are statistically significant. In the
graft recipient group, MICA antibodies were detected with a frequency of 17.2% with the
One Lambda assay, 6.6% with the Stastny assay (P<0.0001) and 7% with the Gen-Probe
assay (P<0.0001). In the untransplanted cohort, MICA antibodies were detected with a

Chapter 4
183
frequency of 10.5% using One Lambda‟s assay, 1.5% with the Stastny assay (P=0.0002)
and 2.5% with the Gen-Probe assay (P=0.001). MICA antibodies were detected with a
frequency of 12% in healthy controls using One Lambda‟s assay compared to 1% with the
Stastny assay (P=0.0005).
Figure 4.6.2: Comparison of MICA antibody frequencies detected with three single antigen
Luminex methods. Overall frequencies of MICA antibody positive individuals among transplant
recipients, untransplanted renal patients and healthy controls.
The MICA antibody reactions causing the higher frequency of MICA antibody detection
using the One Lambda assay were easily identified by alignment of MFI values for each
SAg bead and each assay. The main patterns of reactivity seen using the One Lambda
assay but not the Stastny assay or the Gen-Probe assay (Figure 4.6.3) were with MICA*001
only, MICA*001 and *018, MICA*001 and *019, MICA*002 and *019, MICA*008 only
or MICA*019 only. MICA*001 antibody only was detected in four of 76 (5%) graft
recipients, one of the 21 untransplanted patients (5%) and four of fourteen healthy controls
(29%). Reactions for both MICA*001 and *008 were positive for 5% of graft recipients,
14% of untransplanted patients 21% of healthy controls. MICA*001 and *019 were
positive for 4% of transplanted recipients, 5% of untransplanted patients and 21% of
healthy controls. MICA*002 and *019 were positive with 5% transplant recipients, 14%
S
S
S
S

Chapter 4
184
untransplanted patients and one healthy control (7%). MICA*008 antibodies only were
detected in 2.5% graft recipients, 14% untransplanted patients and 14% healthy controls.
MICA*019 only was detected in 17% graft recipients, 29% untransplanted patients and
none of the healthy controls. There was also a difference in the antibody specificities
detected between the different groups. In the healthy control group, frequencies above 20%
were seen with reactions involving antibodies to MICA*001. In the recipient and
untransplanted patient groups, higher frequencies were observed for MICA*019 antibodies.
Figure 4.6.3: MICA antibody reaction patterns detected with One Lambda Luminex but not
confirmed with the Stastny and Gen-Probe assays. These reactions were mainly limited to
identification of MICA*001 only, MICA*001 and *018, MICA*001 and *019, MICA*002 and *019,
MICA*008 only or MICA*019 only.
As there are differences between the methodologies used to detect MICA antibodies and
there are no reference standards of sera with known MICA specificities, I decided to use a
consensus of the three methods to assign positive or negative cases. MICA antibody
positivity was assigned if at least two methods were positive for a given MICA specificity
in the same serum. Using this approach the final frequencies of MICA antibodies in the
three groups were as follows. In the graft recipient group, 33 individuals were positive for
MICA antibodies (7.5%), in the untransplanted patient group six of 200 patients had MICA
antibodies (3%) and one of the healthy control subjects had MICA antibodies (1%).

Chapter 4
185
4.7 Identifying patterns of MICA antibody allorecognition of MICA
antigenic determinants
Once a strategy for assigning MICA antibody status was decided and extra, possibly non-
specific reactions were removed, it became easier to identify polymorphic MICA residues
that may be antigenic determinants recognised by MICA antibodies. Table 4.7.1 provides
an alignment of the polymorphic amino acids across the -1 to -3 domains of the MICA
molecule. Unlike HLA molecules, where amino acid residues can be highly polymorphic,
most of the polymorphic MICA residues are dimorphic. MICA polymorphism is mainly
generated by inter-allelic recombination of polymorphic nucleotide motifs in exons 2, 3 and
4 encoding the extracellular -1 to -3 domains. Therefore, MICA antibodies could be
cross-reactive and not specific for MICA allelic variants. In addition, more than one MICA
antibody specificity may be present, further confounding interpretation.
After further analysis of MICA polymorphism and patterns of MICA antibody reactivity, it
was possible to identify shared polymorphisms among the specificities in the sera of some
patients. For example MICA*001, *012 and MICA*018 often produced positive reactions
together and was reproduced by sera from different individuals. Figure 4.7.1 shows MFI
values produced by the three assays with serum from one individual, using cut-off MFI
values as follows: One Lambda 1000, Stastny 700, Gen-Probe 3000.
Figure 4.7.1: Typical example of serum reactive with Thr at residue 24. MICA antibodies reactive
with MICA*001, 012, 018 antigens may have specificity for an epitope where 24T is expressed rather
than 24A.

Chapter 4
186
Table 4.7.1: Alignment of MICA polymorphic amino acid residues across the -1 to -3 extracellular regions of the MICA molecule. A „-„ denotes
identity with MICA*001.
MICA 6 14 24 26 36 90 91 105 114 122 124 125 129 142 151 156 173 175 176 181 206 208 210 213 215 221 251 255 268 271
001 R W T V C L Q R G L T K M V M H K G V T G Y W T S V Q Q S P
002 - G A - - - - - - - - E - - - - - - - - - - - - - - - - - -
004 - - A - Y - - - - V - E V - - - E S - R S - R - T - - - - -
005 - - A - Y - - - - - - E V - - - - - - - S - R - T - R - - -
006 - - A - Y - - - - V - E V - - - E S I - S - R - T - - - - -
007 - - A - - - - - - - - E - - - - - - - - - - - - - - - - - -
008 - - A - Y - - - - - - E V - - - E - - - S - R I T - R - - -
009 - - A - Y - - - - V - E V - - - E S - - S - R - T - - - - -
010 P - A - Y - - - - - - E V - - - E S - - S - R I T - R - - -
011 - G A - - - - - - - - E - - V - - - - - - - - - - - - - - A
012 - - - - - - - - - - - E - - - L - - - - - - - - - - - - - -
013 - G A - - - - - - - - E V - - - E - - - - - - - - - R - - -
014 - G A - - - - R - - - E - - - - E - - R - - - - - - - - - -
015 - G A - - - - R - - - E - - - - - - - - - - - - - - - - - -
016 - - A - Y - - - - - - E V - - - E S - - S - R I T L R - - -
017 - G A - - - R - - - - E - - - - - - - - - - - - - - - - - -
018 - - - - - - - - - - - E - - - - - - - - - - - - - - - - - -
019 - - A - Y - - - - - - E V - - - E S - - S - R I T - R - - -
020 - G A - - - - - - - - E - - - - - - - - - - - - - - - - - -
021 - - - - - - - - - - - E - - - - - - - - - - - - - - - - - -
022 - G A - Y - - - - - - E V - - - E S - - S - R I T - R - - -
023 - G A - - - - - - - - E - - - - - - - - - - - - - - - - - -
024 - - A - Y - - - - - - E V - - - E - - - S - R - T - - - - -
025 P - A - Y - - - - - - E - - - - - - - - - - - - - - - - - -
026 - - A - - - - - - - - E - - - - - - - - - - - - - - - - - -
027 - - A - Y - - - - - - E V - - - E - - - S - R I T - R - - -
028 - - A - Y - - - - - - E V - - - E - - - - - - - - - - - - -
029 - - A - - - - - - - - E - I - - - - - - - - - - - - - - - -
030 - G A - - - - - - - - E - - - - - - - - - - - - - - - - - -
031 - - A - Y - - - - - - - - - - - - - - - - - - - - - - - - -
032 - - A - Y - - - - - - E - - - L - S - R - - - - - - - - - -
033 - - A - Y - - - - - S E V - - - E S - - S - R I T - R - - -

Chapter 4
187
Table 4.7.1: Continued.
MICA 6 14 24 26 36 90 91 105 114 122 124 125 129 142 151 156 173 175 176 181 206 208 210 213 215 221 251 255 268 271
001 R W T V C L Q R G L T K M V M H K G V T G Y W T S V Q Q S P
034 - - A - - - - - - - - E - - - - - - - - S - R - T - - - - -
035 - G A - Y - - - - - - E - - - - - - - - S - R I T - R - - -
036 - G A - - - - K - - - E - - - - E S - - - - - - - - - - - -
037 - - A - - - - - - - - E - - - - - - - - S - R I T - R - - -
038 - - A - - - - - - - - E - - - - - - - - S - R - T - - - - -
039 - - A - - - - - - - - E - - - - E - - - S - R I T L R - - -
040 - - A - - - - - - - - - - - - - - - - - - - - - - - - - - -
041 - G A G - - - - - - - E - - - - - - - - - - - - - - - - - -
042 - - A - Y - - - - - - E - - - - - - - - S - R I T - R - - -
043 - - A - - - - - - - - E - - - R - - - - - - - - - - - - - -
044 - G A - Y - - - - V - E V - - - E S - R S - R - T - - - - -
045 - - A - - - - - - - - E - - - - - - - - - - - - - - - - - -
046 - G A - - - - - - - - E - - - - - - - - - C - - - - - - - -
047 - G A G - - - - - - - E - - - - - - - - - - - - - - - - - -
048 - - A - Y - - - - - - E V - - - E - - - S - R I T - - - - -
049 - - A - Y - - - - V - E V - - - E S - - S - R - T - - - - -
050 - G A - - F - - - - - E - - - - - - - - - - - - - - - - - -
051 - - A - Y - - - - - - E - - - - - - - - - - - - - - - - - -
052 - G A - - - - - - - - E - - - - - - - - - - - - - - - - - -
053 - G A - - - - - - - - E V - - - E - - - S - R I T - R - - -
054 P - A - Y - - - - - - E V - - - E S - - S - R I T - R - G -
055 - G A - - - - - - - - E - - - - - - - - - - - - - - - - - -
056 - - A - Y - - - - - - E V - - - E S - - S - R I T - R S - -
057 - - A - Y - - - - - - E V - - - E S - - S - R I T - - - - -
058 - - A - Y - - - - - - E V - - - E - - - S - R I T - R - - -
059 - - A G - - - - - - - E - - - - - - - - - - - - - - E - - -
060 - - - - - - - - - - - E - - - - - - - - - - - - - L R - - -
061 - - - - - - - - - - - E - - - - - - - - - - - - - L - - - -
062 P - A - Y - - - - - - E V - - - E S - - S - R I T - R - G -

Chapter 4
188
Analysis of protein alignments (Table 4.7.1) revealed these three MICA antigens share
threonine (T) at residue 24 in the -1 domain and all other MICA antigens (used in the
MICA antibody detection assays) expressed alanine (A).
Other patterns correlated with a dimorphic motif comprising a long epitope across the -1
to -3 domains. One motif, termed MICA-G1 is characterised by residue 36 cysteine (C),
129 methionine (M), 173 lysine (K), 206 glycine (G), 210 tryptophan (W) and 215 serine
(S). Alternatively MICA-G2 epitopes share residue 36 tyrosine (Y), 129 valine (V), 173
glutamic acid (E), 206 serine (S), 210 arginine (R) and 215 threonine (T). For example
MICA*001, 002, 007, 012, 017 and 018 were found to react together in different sera,
correlating with MICA-G1 as shown in Figure 4.7.2.
Figure 4.7.2: Typical example of patient serum reactive with MICA-G1 epitopes. MICA antibodies
reacting with MICA*001, 002, 007, 012, 017 and 018 may be recognising 36C, 129M, 173K, 206G,
210W and 215S (MICA-G1) across the 1 to -3 domains of the MICA molecule.
Conversely, MICA*004, 008, 009 and 019 would react together and correlate with the
MICA-G2 motif as shown in Figure 4.7.3. The patterns could not be deduced in some
samples, presumably because more than one MICA antibody specificity was present in the
sera.

Chapter 4
189
Figure 4.7.3: Typical example of patient serum reactive with MICA-G2 epitopes. MICA antibodies
reacting with MICA*004, 008, 009 and 019 may recognise 36Y, 129V, 173E, 206S, 210R and 215T
(MICA-G2).
The most common patterns of antibody recognition found by this analysis are shown in
Figure 4.7.4. In some cases the reaction patterns belonged to single MICA specificities but
often the patterns were mixed and reflected two or more specificities in the same serum.
Figure 4.7.4: Frequencies of different MICA antibody recognition patterns. Shared polymorphisms
giving rise to putative antigenic determinants in 33 renal graft recipients confirmed as positive for MICA
antibodies by three assays.

Chapter 4
190
Starting from the -1 domain and moving towards the -3 domain, they were G at residue
14, T at residue 24, MICA*007 with unknown specificity, MICA-G1, MICA-G2 and a
specificity unique to MICA*008 and *019 with isoleucine (I) at residue 213 and R at
residue 251. The 14G specificity was identified in the sera of 12% of graft recipients
positive for MICA antibodies and MICA antibody recognition of 24T was observed in 24%.
MICA antibodies reacting with the MICA-G1 epitope were detected with a frequency of
24% and the MICA-G2 specificity was present in 9%. The 213I/251R specificity reacted
with MICA*008 and *019 in 24%. Antibodies possibly having more than one MICA
specificity were more difficult to characterise. For example, as shown in Figure 4.7.5, this
patient‟s serum had reactions with all MICA beads except MICA*002 and MICA*017
(patient is MICA*002 homozygous) which appears to be a reaction to W at residue 14,
however analysis of the differential MFI values indicates that at least two MICA antibodies
may be present, one specific for 24T and the other for MICA-G2 epitope.
Figure 4.7.5: Typical example of a patient serum with possible mixed MICA antibody specificity 1.
This serum appears to react with all MICA single antigen beads except MICA*002 and MICA*017.
However, it can be seen that there are two MICA specificities with different strengths (titres). One
specificity relates to Thr at residue 24 (MICA*001, 012 and 018). The other specificity relates to alleles
with MICA-G2 epitopes (MICA*004, 008, 009, 019). MICA*007 may be an extra reaction.
MICA*007 is also positive and, although not seen in isolation, reactivity with this antigen
was fairly common (21% of MICA antibody positive cases) and could accompany any of
the other specificities with any of the Luminex assays used.

Chapter 4
191
There were some reactions showing MICA*001 specificity, in addition to other MICA
specificities, for example MICA-G2, as shown in Figure 4.7.6. These MICA antibodies
could be reacting with epitopes defining MICA-G2 and also L at residue 125, a
polymorphism unique to MICA*001 with the assays used but is also seen with MICA*031
and *040 alleles, although rarely. There are three other MICA antigens that may be
detected by allele-specific MICA antibodies. MICA*012 has L at residue 156, MICA*017
has R at residue 91 and MICA*004 has R at position 181. Allele-specific reactions for
MICA*012 or MICA*017 were not observed, unless masked by other specificities,
however there was one clear example showing only reactivity with MICA*004 beads and,
could be recognising R at residue 181 and is shown in Figure 4.7.7. Also seen in this serum
are extra, non-specific reactions only seen with the One Lambda assay, as described earlier.
Figure 4.7.6: Typical example of a patient serum with possible mixed MICA antibody specificity 2.
Mixed MICA antibody specificities, that may be recognising Lys at residue 125 (unique to MICA*001)
and MICA-G2 alleles (MICA*004, 008, 009 and 019).

Chapter 4
192
Figure 4.7.7: Example of a patient serum reactive with only one MICA antigen. All three Luminex
assays show positive reactions with MICA*004 single antigen beads and patient serum, possibly reactive
with Arg at residue 181. One Lambda single antigen beads also react with MICA*001 and MICA*018 in
this serum and was a frequent observation with this assay only.
4.8 Discussion
When this study began in 2005, little was known of the frequency of MICA antibodies in
healthy individuals, patients with ESRD or renal graft recipients, although it was generally
agreed that many solid organ transplant recipients who rejected their grafts had MICA
antibodies detected in their serum. Studies up to that point had used either CDC with fresh
721.221 or HMY2.C1R cells transfected with cDNA from MICA alleles (Mizutani et al.,
2005; Sumitran-Holgersson et al., 2002) or recombinant MICA proteins produced in E coli,
immobilised to wells of a plastic plate to detect MICA antibodies using ELISA (Zwirner et
al., 2000). My own attempts to produce recombinant MICA molecules from E. coli for use
in an ELISA test were unsuccessful but, with the release in 2006 of a commercial MICA
antibody detection Luminex assay from leaders in the field One Lambda, MICA antibody
detection became possible. I could now reliably detect MICA antibodies in our patient and
healthy control cohorts and, together with MICA typing of patients and their donors, gain
novel insights into the relationship of MICA allele mismatching with the production of
MICA antibodies.

Chapter 4
193
4.8.1 MICA antibody frequencies using One Lambda screening and SAg beads
It became apparent, whilst using the One Lambda mixed bead screening and SAg Luminex
beads, that the frequency of MICA alleles detected by screening beads was much higher
than was being confirmed by the SAg beads. For example, 34% of all graft recipients had
positive reactions using screening beads but only 17% using One Lambda‟s SAg beads,
which is approximately half of those originally positive for MICA antibodies. This could
have been an indication that the cut-off threshold for the normalised background ratio,
based on manufacturer‟s recommendations, was too low. Upon further analysis, the cut-off
ratio was raised to 4.2 from 2.2 since there were no confirmed positive reactions with
MICA antibodies below a ratio of 4.2. However, this only accounted for a small percentage
of those identified as MICA antibody positive by the screening assay and by raising the
threshold further, true positives could be excluded.
The MICA antibody profiles identified by One Lambda SAg beads did not correlate with
expected frequencies based on MICA allele frequencies. Why was the MICA*001 antibody
detected with high frequency in healthy controls and why was MICA*019 so frequent
among the MICA positive renal graft recipients? MICA*001 has an allele frequency of 3%
in Caucasoid and non-Caucasoid populations (Petersdorf et al., 1999), 2.5% in Caucasoids
(Y. Zhang et al., 2002) and 15% in Northeastern Thais (Romphruk et al., 2001). Since
there is unlikely to be a high proportion of Northeastern Thais among UK organ donors, the
low frequency of these alleles is not concordant with the high frequency of MICA
antibodies directed against their antigenic products. Additionally there were also several
instances where graft recipients had MICA antibodies detected against their own MICA
antigens, which should not happen unless the patient‟s primary disease was autoimmune,
for example systemic lupus erythematosus. One Lambda‟s UK representatives were unable
to answer my questions regarding these anomalies however, they did say that other groups
using the SAg Luminex assay had also found high frequencies of MICA*019 antibodies.
Nevertheless, I continued with analysis of MICA mismatching and other transplant
variables and correlating association with MICA antibodies, and submitted an abstract for
the 15th IHIWC that was to be held in Brazil in September, 2008. My abstract was accepted
for an oral presentation in a session chaired by Professor Peter Stastny. I attended the
MICA component workshop discussion groups, comprised of well-known individuals from
the field of H&I, and organised by Peter Stastny. After showing my results, the unanimous
verdict from the group was that the MICA*019 antigen on One Lambda‟s SAg Luminex

Chapter 4
194
beads was very over-reactive and, not only MICA*019, but other antigens as well.
Suggestions for possible reasons for these „false positives‟ were natural antibodies in the
serum that could recognise exposed epitopes on denatured or partially folded MICA
molecules. As I observed with my experiments to produce soluble MICA molecules in
different systems, most of the MICA protein that was isolated from mammalian and insect
cells was denatured and not in the native form. Alternatively, MICA molecules produced
by cleavage from MICA transfected cells may partially unfold during the manufacturing
process and expose epitopes that cross-react with natural antibodies. It was suggested at the
workshop that I should analyse my data again and exclude the data obtained by the
MICA*019 bead.
During the general discussion following my presentation, Professor Stastny, who chaired
the session, commented that my MICA frequencies were high and that patients should not
have antibodies towards their own MICA antigens, and this was the result of using the One
Lambda Luminex assays. In a private discussion between Professor Stastny, my PhD
supervisor and myself, Professor Stastny offered to test all of our positive sera with their
beads at their laboratories in the US. The bead assay he referred to was that used to detect
MICA antibodies in patient‟s serum for the MICA component of the workshop, constructed
using recombinant MICA molecules produced in Sf9 insect cells.
4.8.2 MICA antibody frequencies using Stastny’s MICA Luminex single antigen assay
I was initially very surprised that when I received the results from Professor Stastny‟s lab,
as many of those positive by One Lambda‟s SAg assay, including all that were positive for
MICA*019 only, were negative with their assay. Overall frequencies of MICA antibodies
in the transplanted, untransplanted and healthy control groups were considerably lower than
previously determined with the One Lambda assay. For example, in the graft recipient
group, there was a MICA antibody positive frequency of 7% with the Stastny MICA SAg
assay compared to 34% with One Lambda SAg beads. There were also noticeable
differences in individual bead frequencies between the two assays. Detection of
MICA*001 in positive serum (n=76) using Stastny‟s assay was down from 49% to 17%,
MICA*018 was positive for 17% recipients with Stastny‟s assay compared to 43% with
One Lambda and MICA*019 was detected in 14.5% of recipients using Stastny‟s SAg
assay compared to the very high frequency of 71% with One Lambda‟s SAg assay.
Interestingly, detection of MICA*007 was increased with Stastny‟s assay from 16% to
26%. This testing confirmed my original concerns, that One Lambda‟s mixed antigen and

Chapter 4
195
SAg MICA antibody detection assays may be producing false positive reactions.
Frequencies of individuals with MICA antibodies were also considerably reduced in the
untransplanted group and healthy controls. Of the 200 untransplanted individuals, 23% had
MICA antibodies detected with the One Lambda SAg assay but was only 1.5% when tested
with Stastny‟s assay. Similarly, 28% of healthy controls were positive for MICA antibodies
with One Lambda‟s SAg assay compared to 1% (only one individual) with Stastny‟s assay
and none of the healthy control sera with reactions against MICA*001 were confirmed.
4.8.3 MICA antibody frequencies using Gen-Probe MICA Luminex single antigen assay
Another commercially available MICA SAg Luminex assay became available towards the
end of 2008, manufactured by Tepnel Lifecodes (now Gen-Probe), however a screening
assay was not released. This assay included a further eighteen MICA specificities on SAg
beads for approximately the same cost as One Lambda‟s SAg assay. It was decided to also
re-test all those originally positive with One Lambda SAg beads using this assay. Results
were, in general, similar to those obtained using Stastny‟s SAg bead assay although there
were differences in individual beads frequencies. MICA*001 was detected with a
frequency of 26% in transplant recipients using Gen-Probes‟s assay but was 17% with
Stastny‟s assay and MICA*018 was detected in 25% graft recipients with Gen-Probe‟s SAg
beads compared to 17% with the Stastny assay. Again, none of those with antibodies to
MICA*019 alone detected using One Lambda‟s assay were confirmed as positive with this
method. The overall frequency of MICA antibodies detected in graft recipients using Gen-
Probe SAg beads was 7%, the same frequency found by Stastny‟s SAg beads.
4.8.4 Comparison of three MICA single antigen Luminex assays
By comparing the results obtained by each of the MICA SAg bead assays, it became
apparent that there were differences, some subtle and others obvious. Figure 4.6.1 shows
frequencies for each of the MICA SAg beads detected with each of the three assays. The
most obvious observation is that MICA*001, 018 and *019 are all much higher when One
Lambda‟s SAg assay is used compared to the other two methods. Comparing overall
frequencies between the three assays for the three different groups of subjects, the
difference between One Lambda frequencies and those obtained by testing with Stastny‟s or
Gen-Probe‟s MICA SAg beads was statistically significant. Some reaction patterns were
only seen using the One Lambda assay and Figure 4.6.3 compares their frequencies in
transplanted, untransplanted renal patients and healthy control subjects. This showed a

Chapter 4
196
difference in the specificity of these „MICA‟ antibodies between the different groups of
patients. Although I have confirmed that these types of reactions are not real MICA
specificities, what could be causing this reactivity?
4.8.5 Possible reasons for false positive reactions using One Lambda Luminex assays
As I mentioned already, it was suggested at the IHIWC MICA component discussion group
that denatured or partially folded MICA molecules could be the cause of some non-specific
reactions. Another explanation could be that antibodies induced by epitopes found in
microorganisms, ingested proteins or allergens cross react with antigenic MICA epitopes,
and there is plenty of evidence for this with HLA antigenic determinants. It was first
reported 40 years ago that the streptococcal M1 protein inhibits cytotoxic reactions with
seven different HLA specificities, inferring that the M1 protein has a structure common to
HLA antigens (Hirata and Terasaki, 1970). Also, some de-esterified lipopolysaccharides
from E. coli and Salmonella have been shown to inhibit seventeen different HLA
specificities (Hirata et al., 1973). The crystal structure of staphylococcal entertoxin that
forms a complex with HLA class II antigens has been identified (Fernandez et al., 2006)
and it has been reported that Klebsiella pneumoniae antibodies can cross react with HLA-
B27 (Archer, 1981). Luminex technology now makes it possible to study these types of
cross-reacting antibodies and a study published in 2008 (and presented by Paul Terasaki at
the 15th IHIWC) investigated the frequency of „natural‟ HLA antibodies in non-
alloimmunised healthy male blood donors (Morales-Buenrostro et al., 2008). The
possibility of these reactions being a consequence of artefacts on the SAg beads was
eliminated by repeated testing and observation that the same specificity and the same
antibody „strength‟ was produced each time. Also, to eliminate the possibility the reactions
were particular to the use of One Lambda SAg beads, they also used beads from Gen-Probe,
with the same outcomes. It is interesting that the HLA specificities found in these blood
donors are rare such as A*3002, A*8001 and B*1512 and match those found in pre-
transplant patients who were not expected to be sensitised (Idica et al., 2006). The high
frequencies of MICA*001 and MICA*019 found in healthy controls and renal patients in
my study are also unexpected because these alleles are relatively rare. Their detection
could also be a consequence of cross reactivity with micro-organism-derived antibodies in a
similar manner. However, this argument does not hold because the reactions with
MICA*001 and MICA*019 were not reproduced using other independent Luminex assays.

Chapter 4
197
It is, therefore, more likely that the unexpected reactivity seen when using the One Lambda
assay is caused by antibodies (which could be generated as described above) recognising
linear epitopes exposed by partially folded or denatured MICA molecules. The high
frequency of reactivity against the MICA*019 SAg bead in the One Lambda assays has
now been reported by other groups facing the same problem as myself. Smith et al
postulate cross-reactivity with bacterial or endemic entities (Smith et al., 2009) and exposed
epitopes on denatured MICA*019 antigens in the One Lambda assay may be responsible
not only for the high frequency of detection but also for the relatively large incidence of
autoantibodies. These autoantibodies were against MICA*008 and MICA*019 and in their
study, MICA*019 was also more frequently detected using the One Lambda SAg assay. In
another study aimed at identifying epitopes and immunodominant regions on the MICA
molecule, MICA*019 was also found at unexpectedly high frequencies using the One
Lambda SAg assay for MICA antibodies (Suarez-Alvarez et al., 2009a). Using their
method of epitope mapping, they state that antibodies reacting with MICA*019, often in
isolation as with my study, may be recognising a linear epitope exposed by misfolding of
the MICA*019 molecule.
It seems logical, therefore, that these „extra‟ reactions seen when using the One Lambda
SAg Luminex assay are indeed caused by natural antibodies reacting with epitopes exposed
by protein misfolding. But why do different groups of patients and healthy controls have
differential recognition patterns? The false MICA*019 only reaction was very frequent in
renal patients, either wait-listed (some of these would have had a previous transplant) or
transplanted but absent in healthy controls. Conversely, MICA*001 only reactions were
much more frequent in healthy controls. It is possible that reactions involving MICA*019
arise from antibodies generated by events associated with transplantation such as other
mismatched polymorphic antigens or perhaps from immunosuppression therapy or
transfusions. It is unlikely to be specific to renal disease as the same observations with
MICA*019 were also made with heart transplant patients (Suarez-Alvarez et al., 2007).
Perhaps the higher frequency of false reactivity with MICA*001 seen in healthy controls
reflects antibodies generated against allergens. The mean age of the control group was 33.8
± 9.9 compared to 42.2 ± 16.0 in recipients or 51.9 ± 13.8 in untransplanted patients.
Younger people are more likely to have allergies that may be due to an increase in
prevalence of allergy to ingested proteins (Sicherer et al., 2010) and other environmental
factors. The healthy control subjects were potential bone marrow donors and, incidentally,
many of them mentioned allergy in medical questionnaires. Whatever the reason for natural
antibody production, cross-reactivity with exposed epitopes on denatured or partially folded

Chapter 4
198
MICA molecules, observed when using the One Lambda beads, seems to be the most likely
cause of non-specific reactivity.
4.8.6 Identifying patterns of MICA antibody specificity
Cracking the code of MICA epitope recognition by MICA antibodies seemed a daunting
task when faced with the results from One Lambda Luminex mixed and SAg beads. Even
assuming that MICA antibodies recognise their antigenic determinants in the same way as
HLA antibodies, by cross-reactive recognition of shared polymorphism and recognition of
unique epitopes on the surface of the molecules, there were often no clear-cut patterns that
made sense. The main problem, as it turned out, were the extra reactions or false positives,
which confounded this analysis. Removing these reactions by confirmatory testing with
two other methods revealed a much clearer picture and the patterns of MICA antibody
reactivity could be related to the protein structure of the MICA molecules. Even so, this
analysis would have been only hypothetical and anecdotal in isolation. However, there are
currently three separate publications directly addressing the issue of MICA epitope
specificity, which corroborate with and give credence to the findings of this study.
The first paper to emerge and shed light on how MICA antibodies recognise MICA epitopes
was published by Rene Duquesnoy in collaboration with Tepnel Lifecodes Inc. (Duquesnoy
et al., 2008). Rene Duquesnoy is well-known in the field of H&I for his work with the
HLAMatchmaker computer algorithm that predicts HLA mismatching based on structurally
defined HLA mismatches. The algorithm utilises the concept that an HLA (or MICA)
epitope is represented by a configuration of polymorphic surface residues with other
residues within a radius of around 3 Ångströms. The term „eplet‟ describes a potentially
functional epitope consisting of polymorphic and conserved residues. This analysis shows
that most MICA eplets are single residues and in five cases, two polymorphic MICA
residues are close to each other, constituting a single eplet.
The second paper was published a few months later (Zou et al., 2009) and provided proof of
MICA antibody specificity. This well designed study utilised HMY2.C1R cells transfected
with MICA*001, 002, 008 and 009 in absorption and elution experiments using well
characterised patient sera testing positive for MICA antibodies. Specificities were
determined by testing with their MICA SAg Luminex assay, described above. To define
key epitopes involved in recognition of MICA antigens recognising the two broad groups of
antigens, MICA-G1 and MICA-G2, hybrid recombinant MICA proteins were constructed

Chapter 4
199
having part of MICA*002 (MICA-G1) and part of MICA*008 (MICA-G2). Two other
hybrid MICA molecules were constructed one was MICA*002 with a change of K to E at
residue 173 and MICA*008 with residue 129 changed from V to M. The patterns of
reactivity after absorption and elution of MICA antibodies in these experiments provide
evidence of MICA antibody specificities.
Six months later, a study was published which analysed the sera of MICA antibody positive
renal transplant patients and mapped MICA epitopes by screening with a synthetic library
of overlapping peptides from the extracellular domains of the MICA molecule (Suarez-
Alvarez et al., 2009a). In this study, One Lambda mixed antigen and SAg beads were used
to identify patients with MICA antibodies. They found nine antigenic regions were reactive
with MICA antibodies and four of those epitopes mapped to polymorphic MICA residues.
To enable a more thorough understanding of the results obtained from this analysis, I will
discuss them in the context of the findings from the published work. Table 4.8.1 is based
on a table published by Zou and shows, with the use of different colours, the various
specificities of MICA antibodies that can be present in serum as confirmed by MICA
antibody absorption and elution experiments (Zou et al., 2009). Figure 4.8.1 shows the
polymorphic MICA residues on the 3D space-filling MICA molecule shown in 3 views.
Table 4.8.1 and Figure 4.8.1 only show the ten MICA antigens used in the assays but, other
antibody specificities with the same polymorphisms may also be detected.
MICA antibodies reacting with 14G were identified by this analysis and were characterised
by positive reactions for MICA*002 and MICA*017 bearing beads. This residue is
prominent on the surface of the MICA molecule, located on the -strand in the -1 domain
and forms the start of a coil loop, which is highly exposed. The study by Zou and
colleagues showed reactivity to MICA*002 and MICA*017 with patient sera was removed
by adsorption with MICA*002 transfected cells, however the authors did not confirm
allorecognition of the alternate 14W as no examples were found. The study by Suarez-
Alvarez et al, however, did observe reactivity in MICA positive patient serum with
synthetic peptides that included W at residue 14, although these were linear peptides and
the conformational epitope may be different.
Another amino acid in the -1 domain of the MICA molecule that frequently appeared to be
reactive with MICA antibodies was 24T, characterised by reactivity with MICA*001, 012,
and 018 SAg beads. Analysis using the MICA Matchmaker algorithm (Duquesnoy et al.,

Chapter 4
200
2008) revealed residues 24 and 36, both polymorphic, come together and comprise the same
MICA eplet. Although both residues 24 and 36 are only partially visible on the surface of
the MICA molecule, the substitution of T for A is non-conservative with polar differences
while C and Y differ structurally, therefore MICA antibodies may be reactive with both
substitutions. The study by Zou and colleagues found that sera reacting with MICA*001,
012 and 018 beads lost reactivity with all MICA single SAg in their assay when incubated
with cells transfected with MICA*001, confirming that the polyspecificity was linked to a
shared epitope.
Several sera were identified with reactivity against MICA*008 and MICA*019 antigens on
SAg beads and share polymorphic residues at positions 213 (I) and 251 (R). This was
confirmed in the study by Zou as it was demonstrated that reactivity to both antigens could
be removed by adsorption with MICA*008 transfected cells. Both amino acid substitutions
are non-conservative, result in polarity differences and are prominent on the surface of the
MICA molecule.
Table 4.8.1 shows MICA alleles arranged according to sequence similarity forming long
epitopes differentially recognised by MICA antibodies, dividing the MICA alleles into two
broad immunodominant groups.

Chapter 4
201
Table 4.8.1: Protein alignment of polymorphic MICA residues shown experimentally to be
involved in allorecognition by MICA antibodies. Each colour represents a different antigenic
determinant that can be recognised by MICA antibodies. Modified from Zou et al., 2009
(Permission granted by Springer).
Domain: -1 -2 -3
Residue:
0
1
4
0
2
4
0
3
6
0
9
1
1
2
2
1
2
5
1
2
9
1
5
6
1
7
3
1
7
5
1
8
1
2
0
6
2
1
0
2
1
3
2
1
5
2
5
1
Antigen MICA*001 W T C Q L K M H K G T G W T S Q
MICA*012 - - - - - E - L - - - - - - - -
MICA*018 - - - - - E - - - - - - - - - -
MICA*007 - A - - - E - - - - - - - - - -
MICA*002 G A - - - E - - - - - - - - - - MICA*017 G A - R - E - - - - - - - - - -
MICA*004 - A Y - V E V - E S R S R - T -
MICA*009 - A Y - V E V - E S - S R - T -
MICA*008 - A Y - - E V - E - - S R I T R
MICA*019 - A Y - - E V - E S - S R I T R
Figure 4.8.1: Polymorphic MICA residues on the MICA molecule shown in 3 views. Based on
polymorphic residues of MICA*001, *002, *004, *007, *008, *009, *012, *017, *018 and *019.
Stereochemical modelling of MICA*001 using CN3D (PDB code 1B3J).
It could be postulated that the differences in the -3 domain could be responsible as they
are in close proximity but this is not certain. In the study by Zou (Zou et al., 2009),
reactivity by two different types of MICA antibody was confirmed by removing reactivity
with antigens expressing 36C, 129M, 173K, 206G, 210W and 215S (MICA-G1) by
adsorption with cells transfected with MICA*001 and MICA*002. The reactivity with

Chapter 4
202
MICA antigens expressing 36Y, 129V, 173E, 206S, 210R and 215T (MICA-G2) could be
removed by adsorption with cells transfected with MICA*008 and MICA*009. Mutant
MICA proteins were produced, having part of MICA*002 and part of MICA*008. Other
MICA mutants had position 173E changed from 173K on a MICA*002 backbone and
129M changed from 129V on a MICA*008 backbone. These constructs were used to try
and eliminate some of the reactivity to the long epitopes. It was concluded from these
experiments that positions 129 and 173 were not essential for MICA antibody recognition
but MICA-G1 antibodies recognised polymorphisms in the -1 region (36C) and/or the -3
region (206G, 210W, 215S) and MICA-G2 antibodies had specificity for polymorphisms in
the -3 region (206S, 210R, 215T). It was found by Duquesnoy that position 206 and 210
form part of the same eplet (Duquesnoy et al., 2008) and although residue 206 is only
barely visible, residue 210 is highly prominent on the cell surface, whereas residue 215 is
some distance away and would not be accessible to the same antibody (Duquesnoy et al.,
2008).
Both analyses described above were performed before more informative MICA beads were
included in the MICA SAg array provided by the Gen-Probe assay (formerly Tepnel).
When I started using this kit the SAg array had been increased to 28 and included beads for
antigens that have interesting polymorphisms. Notably, MICA*028 and and MICA*051
are essentially MICA-G1 type molecules but have 36Y as opposed to 36C. Analysis of
MICA-G1 and MICA-G2 antibody reactivity detected using the Gen-Probe assay revealed
that all sera with MICA-G1 antibodies reacted with all MICA-G1 SAg beads, except
MICA*028 and 051. By contrast, all sera with MICA-G2 reactivity also included positive
reactions for MICA*028 and 051. Therefore these antibodies must be specific for either
36C or 36Y. This is contrary to the absorption and elution experiments performed by Zou
and colleagues, where mutant transfectants with 36Y, that must have resembled MICA*028
and 051, failed to react in this way (Zou et al., 2009). Possibly the mutant transfectants
were not performing correctly and the specificity of MICA-G1 and MICA-G2 antibodies
requires clarification.
Only a few MICA alleles (in this analysis) differ by a single amino acid detectable by allele
specific MICA antibodies. Examples were found for allorecognition of 125K which is
unique to MICA*001 and also examples of MICA antibodies directed against 181R, unique
to MICA*004. Antibodies to MICA*012 or MICA*017 reacting with 156L or 91R
respectively, were not found or were present in combination with other antibodies and could
not be determined. There were also no examples of allele-specific MICA antibodies against

Chapter 4
203
MICA*012 or MICA*017 found by Zou and colleagues (Zou et al., 2009) even though
many thousands of different sera that were tested, leading to the conclusion that if they exist
they are extremely rare.
4.8.7 Differences of MICA antibody specificity using different MICA Luminex assays
Comparisons of MFI values between the different tests revealed some possible false
negativity with the Stastny and the Gen-Probe MICA SAg assays. There were several
examples where detection of antibodies specific for 14G was weak or negative using the
Gen-Probe assay, but clearly positive with the other two assays. Other examples showed
weaker reactivity with MICA-G1 specific antibodies using the Gen-Probe assay, where
reactions with all or some of the MICA-G1 antigens were weak and below the cut-off MFI
threshold, compared to the other two tests. Similarly, unexpected negative results were also
observed by analysis using the Stastny MICA SAg Luminex. In three of the eight sera
where MICA antibodies recognised 24T, the results using the Stastny assay were
completely negative but clearly positive by the other two methods. Also, in one serum
where antibodies reacted with MICA-G2 with the One Lambda and Gen-Probe assay, the
result was negative with the Stastny assay. I also observed that when positive results had
MFI values that were very high, for example, over three times the recommended MFI cut-
off value for MICA positivity, then all three assays produced concordant results that
correlated extremely well with MICA antibody epitope recognition.
The reactivity with the MICA*007 antigen was very frequent but unexpected. This bead
was often positive with all three assays when accompanied by other specific reactions but
never occurred in isolation. Reactions where MICA antibody epitope recognition of
MICA-G2, 24T and 213I/251R were identified usually included reactions with the
MICA*007 bead, although there are no shared epitopes that could be cross-reactive. The
only explanation, based on the evidence so far, is that there is a conformational epitope
unique to MICA*007 that can cross-react with other MICA antibody specificities.
To understand MICA sensitising events in renal transplant recipients, it is necessary to have
information regarding the MICA allele types of the recipient and the donor of the graft.
There are currently no studies of more than a few patients regarding MICA types of both
the patient and donor, therefore I have determined the MICA allelic and antigenic
compatibility in 227 recipient and donor pairs and the results are presented in the next
chapter.

Chapter 5
204
CHAPTER 5
MICA allele mismatching, production of MICA antibodies
and acute rejection in renal transplantation
5.1 Introduction and aims
Despite numerous studies aimed at identifying the presence of MICA antibodies in renal
graft recipients, to date there has been very little MICA genotyping of the recipients and
even less data is available of donor MICA genotypes. Studies published so far have
focused on the relationship of pre-transplant or post-transplant MICA antibodies and
associations with acute or chronic graft rejection, but lack information regarding the MICA
types of the donors. The MICA gene is polymorphic and as with HLA, this polymorphism
leads to allelic and antigenic mismatches between patient and donor. It is known that HLA
antigen mismatches can lead to development of DSA against mismatched epitopes
expressed on donor organs. However, due to the paucity of information available, it has not
been proven that renal graft recipients produce antibodies specific for mismatched epitopes
of MICA antigens or that mismatching MICA alleles leads to development of MICA
antibodies.
HLA antibodies have been shown by many studies to associate with AR in the early post-
transplant period. Both T-cell mediated (ACR) and humoral graft rejection (aAMR) have
been implicated. ACR occurs in 10-25% of renal graft recipients, commonly within the
first three months post-transplant and more than 90% of AR episodes develop in the first six
months. ACR is unusual within the first five days of transplantation as the cellular immune
response requires at least this long to develop, however aAMR can occur within the first
week, particularly if pre-formed donor-reactive antibodies are present and the risk
associated with HLA antibodies is avoided by pre-transplant cross-matching (Torpey et al.,
2010, p. 126). AR can be avoided with modern immunosuppression in most cases but is
highly associated with reduced graft function and survival.
The presence of MICA antibodies has been implicated with AR but whether or not this
associates with MICA-DSA has not been established. Knowledge of MICA types of the
donor, together with information regarding the specificities of MICA antibodies produced
by the recipient is essential in assessing the relationship between MICA allele mismatches

Chapter 5
205
and the production of antibodies to mismatched MICA epitopes. In the 50 years since the
emergence of renal transplantation, much has been learned of the nature of HLA antibody
recognition of mismatched HLA antigens. HLA antigens can be categorised into groups
based on the sharing of epitopes that are known to induce the production of HLA
antibodies. Thus, HLA antibodies can cross-react with different HLA antigens, usually
encoded by the same locus, but not always, on the basis of having a shared antigenic
epitope. This knowledge enables prediction of mismatches that may be antigenic, and
therefore dangerous, and also those that can be tolerated. This is essential for preventing
HAR in solid organ transplantation as discussed in Chapter 1. Because HAR has been
known to occur in the absence of HLA-DSA, pre-existing antibodies to MICA, which are
donor-specific, may also have the potential to initiate this type of rejection, particularly if
the antibodies are present in high-titre. There is also the potential for pre-formed MICA
antibodies to initiate aAMR in the early post-transplant period. The development of DSA
post transplant can associate with AR episodes during the first year of engraftment and,
over a period of time, can associate with CAD impairing function and eventually leading to
a loss of adequate renal function and return to haemodialysis.
Therefore, to fully understand the role of MICA antibodies in solid organ transplantation,
MICA allele typing of both recipients and their donors is paramount. So too is the reliable
assignment of MICA antibody status and specificity. To this end, the aims of this chapter
are to determine the MICA alleles present in renal transplant recipients and donors for as
many transplant pairs as possible. To enable high-resolution detection of MICA antibodies
in the sera of renal graft recipients, a sensitive flow-cytometry based technique was used to
screen patients utilising mixed MICA antigens attached to micro-sphere beads and to
identify the specificities of the MICA antibodies, beads with single MICA antigens attached
were used in three independent assays (as discussed in the previous chapter). The
information gained from MICA allele typing and MICA antibody identification was then
used to correlate the presence of MICA antibodies and MICA-DSA with various
transplantation variables including MICA mismatching and AR. Some of the results
presented in this chapter have been published in a peer-reviewed journal (Cox et al., 2011).

Chapter 5
206
5.2 Study cohorts
The patient cohort included 442 renal graft recipients (386 primary and 56 re-transplants)
and 200 end-stage renal failure patients awaiting transplant. General immunosuppression
included calcineurin inhibitors (cyclosporine A or tacrolimus), an antiproliferative agent
(mycophenolic acid or azathioprine) and corticosteroids (prednisolone). MICA typing was
performed for 227 recipient-donor pairs transplanted between January 2003 and October
2008. A further 74 recipient/donor pairs transplanted between November 2008 and August
2009 were also MICA typed but details of biopsy-proven rejection was not available for
these patients. Additionally I wanted to ensure enough time had passed after the transplant
to allow for development of antibodies and for these reasons only the 227 MICA typed
pairs were used for statistical analysis of transplantation variables. All patients and donors
were typed by the H&I department for HLA-A, B, C, DRB1, 3, 4, 5 and DQB1 by PCR-
SSP (One Lambda, CA) or PCR-SSO (Luminex™, One Lambda, CA). Sera from 116
healthy controls, 58 male and 58 female (with no known pregnancies) were also screened
by the same methods. Biopsies investigating suspected AR were performed on 391 of the
larger cohort of 442 recipients and mean follow-up time was 5.9 years.
Pre- and post-transplant screening of patients was performed for HLA and MICA antibodies
using LABScreen® Mixed assay (LSM12 – One Lambda inc., CA). Mean time of testing
for antibodies was 7 months post-transplant. MICA antibodies were confirmed using three
different methods: MICA LABScreen® MICA SAg kit (One Lambda inc., CA), Gen-Probe
LSA™ MICA kit, and an „in-house‟ bead-based MICA antibody detection assay, as
previously described (Zou et al., 2006b). All three methods identify MICA IgG antibodies
directed against MICA*001, *002, *004, *007, *008, *009, *012, *017, *018, *019 and
*027. Recommended MFI values for each method were used as the threshold for antibody
positivity. MICA antibody specificities were considered positive if confirmed by at least
two methods. DSA against MICA were identified if any of the antibodies were directed
against the known MICA mismatches of the donor.
HLA antibody specificity was confirmed after positive screening among the 227-patient
cohort, with the same serum sample used to detect MICA antibodies. SAg bead testing for
HLA antibodies was performed using LABScreen® HLA Class I - Combi and HLA Class
II – Group 1 (LS1A04 and LS2A01 - One Lambda inc., CA). These beads detect antibody
specificities against HLA-A, -B, -C, -DRB1, -DQB1 and –DPB1. DSA was defined as a

Chapter 5
207
positive reaction above the empirically determined MFI cut-off of 2000, with antigens
expressed by the donor.
5.3 MICA allele typing, frequency and haplotype analysis in a renal
transplant cohort
In total, 301 renal graft recipients and their donors were MICA allele typed by MICA-SBT
methodology using an in-house protocol developed for this project and described in Chapter
3. Hazael Maldonado-Torres, a former PhD student at the Anthony Nolan Research
Institute, performed analysis of MICA allele frequencies, HLA-B antigen frequencies and
haplotype estimation. The computer program used to perform the analysis was called
Cactus and developed by Hazael. Further details of this statistical method are provided in
Chapter 2, section 2.6.
Alleles and haplotypes, linkage equilibrium and disequilibrium
An allele is defined as a variant of a gene with the same function but differing by
genetic polymorphism in the coding (exon) or non-coding (intron) regions.
Traditionally, a haplotype is defined as the genetic constitution of a single chromosome,
referring to the combinations of genes or alleles at particular genetic loci (Ceppellini et
al., 1955).
Linkage equilibrium and disequilibrium are parameters to determine the nature of
recombination of multiple genes or alleles within a haplotype. Linkage equilibrium is
observed when the frequency of a haplotype and its genetic elements is equal to what
would be expected by random chance. Linkage disequilibrium (LD) is defined as a
non-random combination of genes or alleles, and their haplotype frequencies can be
either higher or lower than expected by random chance.
5.3.1 Identification of two novel MICA alleles: MICA*054 and MICA*056
During SBT analysis of MICA alleles of recipients and donors, two novel polymorphisms
were detected that did not agree with heterozygous combinations of MICA alleles (Figure
5.3.1). Once it was determined that these polymorphisms represented the presence of novel
alleles, DNA cloning was performed to separate the alleles and sequencing of exons 2-5
was performed as described in Chapter 2.

Chapter 5
208
MICA*054 allele was identified in a Caucasoid kidney donor (501DW) who was originally
typed by SBT as MICA*008, *010 with one novel nucleotide substitution. Cloning
revealed an allele identical to MICA*010 except for a novel non-synonymous
polymorphism of nucleotide 871 (codon 268) of A to G, which encodes a novel amino acid
change of serine to glycine in the -3 domain.
MICA*056 allele was identified in an African-Caribbean kidney donor (208RP) SBT typed
as MICA*008, *019 with one novel nucleotide belonging to the allele most similar to
MICA*019. MICA*056 has a non-synonymous mutation at nucleotide position 758 (codon
230) of G to C encoding a novel amino acid change of tryptophan to serine in the -3
domain. Serine is a small, polar amino acid (MW=105.09) whereas tryptophan is larger and
non-polar (MW=204.23). An alignment of MICA sequences comparing MICA*054 and
MICA*056 with the reference MICA*001 is provided in Figure 5.3.1.
The names MICA*054 (EMBL accession number AM899996) and MICA*056
(AM944063) were officially assigned by the WHO nomenclature committee in March 2008
and a report was published in Tissue Antigens (Cox et al., 2009). The EMBL flatfile
summaries for these submissions are provided in Appendix D.
5.3.2 Comparison of HLA-B antigen and MICA allele frequencies in UK renal
transplant recipients and donors
Despite the less polymorphic nature of MICA compared to HLA and the strong linkage
disequilibrium between MICA and HLA-B, most recipient and donor pairs were
mismatched. Overall 30% were fully MICA matched, 49% had one allele mismatch and
21% had 2 allele mismatches. Twenty-seven different MICA alleles were identified at least
once among recipients and donors. MICA*002 allele showed statistically significant
frequency differences between patients and donors (P=0.02) and the frequencies of
MICA*007 were also significantly different (P=0.01). Full details of MICA allele
frequencies are given in Table 5.3.1. The four most frequent MICA alleles (highlighted)
were as follows: MICA*008 (36.9% recipients versus 39.4% donors) MICA*002 (17.4%
versus 12.6%), MICA*004 (11.6% versus 9.3%) and MICA*009:01 (8% versus 7.6%). A
full list of recipient and donor MICA types is provided in Appendix C.

Chapter 5
209
|Exon 2
10 20 30 40 50 60 70 | 80 90 100
MICA*001 ATGGGGCTGG GCCCGGTCTT CCTGCTTCTG GCTGGCATCT TCCCTTTTGC ACCTCCGGGA GCTGCTGCTG |AGCCCCACAG TCTTCGTTAT AACCTCACGG
MICA*010 ********** ********** ********** ********** ********** ********** ********** |---------- -----C---- ----------
MICA*054 ********** ********** ********** ********** ********** ********** ********** |---------- -----C---- ----------
MICA*019 ********** ********** ********** ********** ********** ********** ********** |---------- ---------- ----------
MICA*056 ********** ********** ********** ********** ********** ********** ********** |---------- ---------- ----------
110 120 130 140 150 160 170 180 190 200
MICA*001 TGCTGTCCTG GGATGGATCT GTGCAGTCAG GGTTTCTCAC TGAGGTACAT CTGGATGGTC AGCCCTTCCT GCGCTGTGAC AGGCAGAAAT GCAGGGCAAA
MICA*010 ---------- ---------- ---------- -------TG- ---------- ---------- ---------- -----A---- ---------- ----------
MICA*054 ---------- ---------- ---------- -------TG- ---------- ---------- ---------- -----A---- ---------- ----------
MICA*019 ---------- ---------- ---------- -------TG- ---------- ---------- ---------- -----A---- ---------- ----------
MICA*056 ---------- ---------- ---------- -------TG- ---------- ---------- ---------- -----A---- ---------- ----------
210 220 230 240 250 260 270 280 290 300
MICA*001 GCCCCAGGGA CAGTGGGCAG AAGATGTCCT GGGAAATAAG ACATGGGACA GAGAGACCAG AGACTTGACA GGGAACGGAA AGGACCTCAG GATGACCCTG
MICA*010 ---------- ---------- ---------- ---------- ---------- ---------- G--------- ---------- ---------- ----------
MICA*054 ---------- ---------- ---------- ---------- ---------- ---------- G--------- ---------- ---------- ----------
MICA*019 ---------- ---------- ---------- ---------- ---------- ---------- G--------- ---------- ---------- ----------
MICA*056 ---------- ---------- ---------- ---------- ---------- ---------- G--------- ---------- ---------- ----------
|Exon 3
310 320 | 330 340 350 360 370 380 390 400
MICA*001 GCTCATATCA AGGACCAGAA AGAAG|GCTTG CATTCCCTCC AGGAGATTAG GGTCTGTGAG ATCCATGAAG ACAACAGCAC CAGGAGCTCC CAGCATTTCT
MICA*010 ---------- ---------- -----|----- ---------- ---------- ---------- ---------- ---------- ---------- ----------
MICA*054 ---------- ---------- -----|----- ---------- ---------- ---------- ---------- ---------- ---------- ----------
MICA*019 ---------- ---------- -----|----- ---------- ---------- ---------- ---------- ---------- ---------- ----------
MICA*056 ---------- ---------- -----|----- ---------- ---------- ---------- ---------- ---------- ---------- ----------
410 420 430 440 450 460 470 480 490 500
MICA*001 ACTACGATGG GGAGCTCTTC CTCTCCCAAA ACCTGGAGAC TAAGGAATGG ACAATGCCCC AGTCCTCCAG AGCTCAGACC TTGGCCATGA ACGTCAGGAA
MICA*010 ---------- ---------- ---------- ---------- -G-------- ---G------ ---------- ---------- ---------- ----------
MICA*054 ---------- ---------- ---------- ---------- -G-------- ---G------ ---------- ---------- ---------- ----------
MICA*019 ---------- ---------- ---------- ---------- -G-------- ---G------ ---------- ---------- ---------- ----------
MICA*056 ---------- ---------- ---------- ---------- -G-------- ---G------ ---------- ---------- ---------- ----------
510 520 530 540 550 560 570 580 590 600
MICA*001 TTTCTTGAAG GAAGATGCCA TGAAGACCAA GACACACTAT CACGCTATGC ATGCAGACTG CCTGCAGGAA CTACGGCGAT ATCTAAAATC CGGCGTAGTC
MICA*010 ---------- ---------- ---------- ---------- ---------- ---------- ---------- ---------- -----G---- -A--------
MICA*054 ---------- ---------- ---------- ---------- ---------- ---------- ---------- ---------- -----G---- -A--------
MICA*019 ---------- ---------- ---------- ---------- ---------- ---------- ---------- ---------- -----G---- -A--------
MICA*056 ---------- ---------- ---------- ---------- ---------- ---------- ---------- ---------- -----G---- -A--------
|Exon 4
610 | 620 630 640 650 660 670 680 690 700
MICA*001 CTGAGGAGAA CAG|TGCCCCC CATGGTGAAT GTCACCCGCA GCGAGGCCTC AGAGGGCAAC ATTACCGTGA CATGCAGGGC TTCTGGCTTC TATCCCTGGA
MICA*010 ---------- ---|------- ---------- ---------- ---------- ---------- --C------- ---------- ---CA----- ------C---
MICA*054 ---------- ---|------- ---------- ---------- ---------- ---------- --C------- ---------- ---CA----- ------C---
MICA*019 ---------- ---|------- ---------- ---------- ---------- ---------- --C------- ---------- ---CA----- ------C---
MICA*056 ---------- ---|------- ---------- ---------- ---------- ---------- --C------- ---------- ---CA----- ------C---
710 720 730 740 750 760 770 780 790 800
MICA*001 ATATCACACT GAGCTGGCGT CAGGATGGGG TATCTTTGAG CCACGACACC CAGCAGTGGG GGGATGTCCT GCCTGATGGG AATGGAACCT ACCAGACCTG
MICA*010 ------T--- --C------- ---------- ---------- ---------- ---------- ---------- ---------- ---------- ----------
MICA*054 ------T--- --C------- ---------- ---------- ---------- ---------- ---------- ---------- ---------- ----------
MICA*019 ------T--- --C------- ---------- ---------- ---------- ---------- ---------- ---------- ---------- ----------
MICA*056 ------T--- --C------- ---------- ---------- ---------- -------C-- ---------- ---------- ---------- ----------
|Exon 5
810 820 830 840 850 860 870 880 890 | 900
MICA*001 GGTGGCCACC AGGATTTGCC AAGGAGAGGA GCAGAGGTTC ACCTGCTACA TGGAACACAG CGGGAATCAC AGCACTCACC CTGTGCCCTC TG|GGAAAGTG
MICA*010 ---------- ---------- G--------- ---------- ---------- ---------- ---------- ---------- ---------- --|--------
MICA*054 ---------- ---------- G--------- ---------- ---------- ---------- ---------- G--------- ---------- --|--------
MICA*019 ---------- ---------- G--------- ---------- ---------- ---------- ---------- ---------- ---------- --|--------
MICA*056 ---------- ---------- G--------- ---------- ---------- ---------- ---------- ---------- ---------- --|--------
910 920 930 940 950 960 970 980 990 1000
MICA*001 CTGGTGCTTC AGAGTCATTG GCAGACATTC CATGTTTCTG CTGTTGCTGC TGCTGCT...ATT TTTGTTATTA TTATTTTCTA TGTCCGTTGT TGTAAGAAGA
MICA*010 ---------- ---------- ---------- ---------- ---------- -------GCT--- ---------- ---------- ---------- ----------
MICA*054 ---------- ---------- ---------- ---------- ---------- -------GCT--- ---------- ---------- ---------- ----------
MICA*019 ---------- ---------- ---------- ---------- ---------- -------GCT--- ---------- ---------- ---------- ----------
MICA*056 ---------- ---------- ---------- ---------- ---------- -------GCT--- ---------- ---------- ---------- ----------
1010 1020
MICA*001 AAACATCAGC TGCAGAGGGT CCAG
MICA*010 ---------- ---------- ----
MICA*054 ---------- ---------- ----
MICA*019 ---------- ---------- ----
MICA*056 ---------- ---------- ----
Figure 5.3.1: Nucleotide sequence alignment of exons 1-5 of the MICA gene. MICA*054 nucleotide
sequence is compared with MICA*010 and MICA*056 nucleotide sequence is compared with MICA*019
and all sequences are compared with the reference MICA*001 sequence. Asterisk denotes no available
sequence, dash denotes homology to reference sequence and full-stop denotes nucleotide deletion (for
differentiation of GCT triplet repeats in exon 5). Cox et al, 2009 (Reproduced with permission from John
Wiley and Sons).

Chapter 5
210
Most recipients were also mismatched for HLA-B, with 15% fully matched, 66.5% with
one mismatch and 18.5% with two antigen mismatches. As shown in Table 5.3.1, the HLA-
B antigenic repertoire was higher among recipients than donors. Five HLA-B antigens had
significantly different frequencies between recipient and donor as indicated in Table 5.3.1.
The highest HLA-B antigen frequencies (recipients) were as follows: B44 (12.0% recipients
versus 15.6% donors) B35 (11.5% versus 10.5%), B7 (8.3% versus 11.8%) and B8 (6.6%
versus 7.6%).
Table 5.3.1: MICA allele and HLA-B antigen frequencies in 301 renal graft recipients and their
donors
Recipient
(N=301) Donor (N=301)
Recipient
(N=301)
Donor
(N=301)
MICA* n Freq. n Freq. HLA-
B n Freq. n Freq.
001 5 0.0083 7 0.0116 7 50 0.0831c 71 0.1179
c 002:01 105 0.1744
a 76 0.1262 a 8 40 0.0664 46 0.0764
004 70 0.1163 56 0.0930 13 13 0.0216 12 0.0199 006 1 0.0017 - - 18 20 0.0332 30 0.0498 007 16 0.0266
b 33 0.0548 b 27 13 0.0216
d 26 0.0432 d
008 222 0.3688 237 0.3937 35 69 0.1146 63 0.1047 009:01 48 0.0797 46 0.0764 37 6 0.0100 6 0.0100 009:02 8 0.0133 15 0.0249 38 20 0.0332
e 8 0.0133 e
010 13 0.0216 16 0.0266 39 10 0.0166 9 0.0150 011 13 0.0216 19 0.0316 41 7 0.0116 - -
012:01 17 0.0282 14 0.0216 42 11 0.0183f - -
012:02 - - 1 0.0017 44 72 0.1196 94 0.1561 013 1 0.0017 - - 45 6 0.0100 9 0.0150 015 1 0.0017 2 0.0033 49 12 0.0199 8 0.0133 016 18 0.0299 11 0.0183 50 7 0.0116 8 0.0133 017 8 0.0133 11 0.0183 51 29 0.0482 20 0.0332
018:01 20 0.0332 27 0.0448 52 13 0.0216 13 0.0216 018:02 - - 1 0.0017 53 12 0.0199 15 0.0249
019 22 0.0365 15 0.0249 55 15 0.0249 12 0.0199 027 7 0.0116 9 0.0150 57 25 0.0415 21 0.0349 029 2 0.0033 2 0.0033 58 19 0.0316 14 0.0233 030 3 0.0050 - - 60 23 0.0382 17 0.0282 035 2 0.0033 - - 61 12 0.0199 10 0.0166 038 - - 1 0.0017 62 22 0.0365 32 0.0532 041 - - 2 0.0033 63 7 0.0116 - - 054 - - 1 0.0017 64 7 0.0116 7 0.0116 056 - - 1 0.0017 65 16 0.0266 16 0.0266
71 11 0.0183f - -
72 7 0.0116 - - 75 7 0.0116 - -
Only frequencies above 1% are shown
aP=0.02;
2=5.5.
bP=0.01;
2=6.1.
cP=0.04;
2=4.0.
dP=0.03;
2=4.5.
eP=0.02;
2=5.3.
fP=0.001;
2=11.1

Chapter 5
211
5.3.3 HLA-B - MICA haplotype frequencies in UK graft recipients and donors
Table 5.3.2 lists HLA-B – MICA haplotype frequencies 301 UK renal transplant recipients.
Highest frequencies are highlighted and were found for B7 – MICA*008 (7.9%), B35 –
MICA*002 (7.0%), B44 – MICA*008 (6.8%) and B8 – MICA*008 (6.3%).
Table 5.3.2: HLA-B – MICA haplotype linkage disequilibrium frequencies in UK renal
transplant recipients
Haplotype UK Renal Graft Recipients (N=301)
HLA-B MICA 1Frequency
2D’ 2
P-value
7 008 0.079275 0.9279 46.51 < 0.001 35 002:01 0.069684 0.5251 74.36 < 0.001 44 008 0.067579 0.3109 7.52 0.006 8 008 0.062836 0.9139 36.10 < 0.001
44 004 0.045343 0.3071 42.78 < 0.001 51 009:01 0.041524 0.8478 184.34 < 0.001 60 008 0.033213 0.7930 15.62 < 0.001 35 016 0.026535 0.8729 93.80 < 0.001 38 002:01 0.025321 0.7119 39.61 < 0.001 18 018:01 0.024917 0.7414 309.29 < 0.001 58 002:01 0.024487 0.7285 39.40 < 0.001 55 012:01 0.021595 0.8628 373.40 < 0.001 13 008 0.021595 1.0000 14.05 < 0.001 49 004 0.019934 1.0000 80.59 < 0.001 71 008 0.018272 1.0000 11.89 < 0.001 27 007 0.018272 0.8420 328.55 < 0.001 65 011 0.016611 0.7629 269.77 < 0.001 42 004 0.016595 0.8961 59.33 < 0.001 62 010 0.014950 0.6806 152.97 < 0.001 57 017 0.013289 1.0000 176.97 < 0.001 52 009:01 0.013289 0.5759 38.13 < 0.001 39 002:01 0.013289 0.7577 22.44 < 0.001 53 002:01 0.012407 0.5426 13.81 < 0.001 50 009:02 0.011628 1.0000 61.90 < 0.001
Only significant haplotype frequencies above 1% are shown 1Maximisation Likelihood Estimate (MLE) – estimated frequency of observed haplotypes
2D‟ (Delta‟) indicates degree of LD. Values are between -1 and 1 and LD is indicated by values closest to
-1 or 1.
Table 5.3.3 lists HLA-B – MICA haplotype frequencies 301 UK renal transplant donors.
Highest frequencies are highlighted and were found for B7 – MICA*008 (11.3%), B44 –
MICA*008 (8.7%), B8 – MICA*008 (7.3%) and B44 – MICA*004 (6.0%).

Chapter 5
212
Table 5.3.3: HLA-B – MICA haplotype linkage disequilibrium frequencies in UK renal
transplant donors
Haplotype UK Renal Graft Donors (N=301)
HLA-B MICA 1Frequency 2Delta’ 2 P-value
7 008 0.112875 0.9292 57.24 < 0.001 44 008 0.087054 0.2702 6.41 0.011 8 008 0.073082 0.9281 37.00 < 0.001
44 004 0.060482 0.5854 87.53 < 0.001 35 002:01 0.052096 0.4253 68.90 < 0.001 27 007 0.038110 0.8756 324.85 < 0.001 18 018:01 0.034849 0.7361 274.86 < 0.001 60 008 0.026569 0.9024 12.93 < 0.001 51 009:01 0.024800 0.7179 82.15 < 0.001 62 010 0.023256 0.8680 203.30 < 0.001 65 011 0.019934 0.7419 261.66 < 0.001 52 009:01 0.019753 0.9051 84.88 < 0.001 35 016 0.018272 1.0000 84.26 < 0.001 13 008 0.018179 0.8548 8.19 0.004 55 012:01 0.016611 0.8294 338.61 < 0.001 53 002:01 0.016549 0.6157 34.38 < 0.001 58 002:01 0.013731 0.5312 23.89 < 0.001 57 017 0.013289 0.7174 151.17 < 0.001 39 002:01 0.013289 0.8728 41.46 < 0.001 38 002:01 0.013289 1.0000 48.38 < 0.001 50 009:02 0.011628 0.8609 47.26 < 0.001 18 001 0.011628 1.0000 126.82 < 0.001 45 009:02 0.011628 0.7527 40.64 < 0.001 35 008 0.010208 -0.7522 14.03 < 0.001
Only significant haplotype frequencies above 1% are shown 1Maximisation Likelihood Estimate (MLE) – estimated frequency of observed haplotypes
2D‟ (Delta‟) indicates degree of LD. Values are between -1 and 1 and LD is indicated by values closest to
-1 or 1.
5.3.4 Analysis of MICA allele mismatching at the amino acid level
To enable a more thorough understanding of MICA mismatching in renal transplantation, it
was necessary to compare MICA residues expressed by patient MICA antigens with those
expressed on the donated organ. This was achieved by aligning the possible expression
patterns of polymorphic MICA residues encoded by both alleles (if heterozygous) of the
recipient with those of the donor, using an excel spreadsheet. Mismatches were counted if a
residue expressed on the donor organ was different to either residue encoded by the
recipient MICA alleles, for each polymorphic residue. This was carried out for 210
recipient and donor pairs where the recipient was negative for MICA antibodies and
seventeen recipient and donor pairs where the recipient was confirmed to be MICA
antibody positive. The frequencies of mismatched MICA residues for the MICA negative
group and MICA positive group were then compared using chi-squared analysis.

Chapter 5
213
Figure 5.3.2 shows fourteen MICA residues significantly mismatched between recipients
with MICA antibodies and those without. Bonferroni‟s correction was used, by multiplying
the P value by the number of mismatched residues to give Pc. Mismatches were considered
highly statistically significant if Pc was < 0.05.
Figure 5.3.2: Histogram comparing the frequency of mismatched MICA amino acid residues
between MICA antibody positive (n=17) and negative (n=210) renal graft recipients and their
donors. There were nineteen MICA residues mismatched across the 1-3 regions (exons 2-4) and
fourteen of these mismatched residues were significantly correlated with MICA antibody production.
The corrected P values for 19 comparisons are indicated. (Cox et al., 2011). Reproduced with permission
from Elsevier.
Figure 5.3.3 shows a MICA amino acid alignment of polymorphic residues across the 1-
3 domains of the MICA molecule with alleles listed according to their amino acid
similarity. The boxed areas indicate highly significant mismatched amino acid residues in a
cohort of 227 transplant pairs.

Chapter 5
214
Figure 5.3.3. MICA amino acid alignment of polymorphic MICA residues across the 1-3
domains of the MICA molecule. Alleles are listed according to similarity of protein sequence, dividing
them into two broad groups, MICA-G1 and MICA-G2 that are differentially recognized by MICA
antibodies (Zou et al., 2009). Mismatched MICA residues found to be significant between patients and
donors, (or a trend Pc=0.06) after P correction are indicated by the boxed areas. Modified from Zou et al.,
2009 (Permission granted by Springer).
The most frequently mismatched MICA residues were 213 and 251 in the 3-domain. In
the MICA antibody negative group, 23.8% of recipient and donor pairs were mismatched
compared to 70.6% of those who produced MICA antibodies (P<0.001; Pc=0.002). The
next most frequently mismatched residue in the MICA antibody positive group was position
175 with a frequency of 52.9% compared to 16.7% when no
MICA antibodies were detected (P=0.001; Pc=0.02). Residues 36, 129 and 173 were highly
significantly mismatched with equal frequency between the MICA antibody negative and
positive groups. A frequency 17.1% of recipient and donor pairs were mismatched when
the recipient did not have MICA antibodies, compared to 52.9% with mismatches where the
recipient was positive for MICA antibodies (P=0.002; Pc=0.04). Residue 122 was
mismatched in 15.2% of recipient and donor pairs without MICA antibodies, compared to
47.1% in the MICA antibody positive group and was significant (P=0.003). Residue 151
was mismatched in 2.9% of the MICA antibody negative group compared to 23.6% for
those with MICA antibodies (P=0.003). Residue 181 was mismatched in 8.1% of transplant
pairs without MICA antibodies, compared to 35.3% for those with MICA antibodies
(P=0.003). Residues 206, 210 and 215 were mismatched equally in 19% of recipients with
no MICA antibodies, compared to 52.9% of recipients with MICA antibodies (P=0.003)
Residue 271 was mismatched with a frequency of 1.4% in the MICA antibody negative
group and 17.6% of the MICA antibody positive group (P=0.006). Finally, residue 14 was
mismatched in 14.3% when negative for MICA antibodies (14.3%) and 41.2% when the
recipient was positive for MICA antibodies (P=0.01).

Chapter 5
215
Figure 5.3.3 shows amino acids expressed at mismatched residues. The two residues with
most mismatches were expressed by MICA*008 and MICA*019 corresponding to I at
residue 213 and R at residue 251 as opposed to 213T and 251Q encoded by most other
alleles. A frequent type of mismatching occurred between alleles of the MICA-G1 and
MICA-G2 groups and involved mismatches in the -1 to -3 domains (Zou et al., 2009)
(residues 36, 206, 210 and 215), occurring in 53% of those with MICA antibodies and 19%
without MICA antibodies. Residues 151 and 271 were more frequently mismatched in
MICA antibody positive recipients, and although not highly significant, associates with a
polymorphism in the MICA*011 allele encoding 151V and 271A. MICA*011 was to found
to have an allele frequency of 2% in recipients and 3% of donors and is therefore a
relatively frequently occurring MICA allele in this transplant cohort.
Figure 5.3.4 shows the relative positions of the MICA amino acid residues found to be
significantly mismatched from this analysis using computerised models based on x-ray
crystallographic analysis (P. Li et al., 1999). Space-filling models are used in A and C and
ribbon models in B and D. Arrows indicate amino acid residues significantly mismatched
between recipient and donor (before correction). The diagrams reveal that mismatched
residues are exposed and visible to the extracellular environment. Many of these residues
are on highly exposed loops between -strands, across the 1-3 domains.

Chapter 5
216
Figure 5.3.4. -1, -2 and -3 extracellular domains of the MICA molecule. Space-filling models are used in A and
C and ribbon models in B and D. The models are shown in two orientations, AB (from underneath/behind) and CD
(from in front/above). Arrows indicate amino acid residues significantly mismatched between recipient and donor. The
diagrams reveal that mismatched residues are exposed and visible to the extracellular environment and across the 1-3
domains. Images from Molecular Modelling Database (MMDB), The National Centre for Biotechnology Information
(NCBI) and visualized using Pymol (DeLano, W.L. The PyMOL Molecular Graphics System (2002) on World Wide
Web http://www.pymol.org, and Cn3D http://www.ncbi.nlm.nih.gov/Structure/CN3D/cn3d.shtml. Cox et al., 2011.
Reproduced with permission from Elsevier.

Chapter 5
217
5.4 Clinical characteristics and transplantation variables associated
with the presence or absence of MICA antibodies
5.4.1 Significance of clinical characteristics with the production of MICA antibodies
The association of MICA antibodies with general clinical characteristics of 442 graft
recipients is analysed in Table 5.4.1. Variables considered were recipient and donor gender
and age, time of follow-up and whether the transplant was performed using grafts from
living or deceased donors. Overall 59% of graft recipients were male and 41% were
female.
Table 5.4.1: Clinical characteristics of 442 renal transplant recipients
Data for ages and time are means ± standard deviation
There was a slightly higher frequency of MICA antibodies detected in males (8.5%)
compared to females (6%) but this was not statistically significant. There was also no
significant association of donor or patient gender or age with production of MICA
antibodies. Mean time of follow-up was 6.7 ± 5.8 years for recipients without MICA
antibodies and 7.1 ± 5.8 years for recipients with MICA antibodies. Kidney transplants
from living donors were performed for 28% of recipients and 72% received a graft from a
deceased donor. There was a slightly higher frequency of MICA antibodies (7.9%)
Recipients
MICA Ab
negative
(n=409)
MICA Ab
positive
(n=33)
MICA
Ab.
(%)
P
Value 2
Odds Ratio
(95% CI)
Recipient - no.
(%)
0.33 0.96 1.5 (0.7 – 3.1)
Male 237 (58) 22 (67) 8.5
Female 172 (42) 11 (33) 6
Donor - no. (%)
Male 141/263 8/19 2.8 0.35 0.94 0.6 (0.2 – 1.6
Female 122/263 11/19 3.9
Recipient age - yrs 42.2 ± 16.0 43.0 ± 16.2 0.18
Donor age - yrs 45.5 ± 16.4 49.0 ± 14.2 0.51
Follow-up - yrs 6.7 ± 5.8 7.1 ± 5.8 0.17
Donor - no. (%) 0.4 0.80 1.5 (0.6 – 3.8)
Living 107/387 (28) 6/30 (20) 5
Deceased 280/387 (72) 24/30 (80) 7.9

Chapter 5
218
detected in those who received grafts from deceased donors compared to 5% who received
a graft from a living donor but this was not statistically significant.
Gender and age of 200 end-stage renal patients awaiting transplant and 116 healthy
controls were analysed for association with the presence of MICA antibodies and results
are shown in Table 6.4.2. There was no significant association with any variable with the
presence of MICA antibodies. Only one of the 116 healthy controls had MICA antibodies
detected and this individual was male.
Table 5.4.2: Clinical characteristics of 200 renal patients awaiting transplant and 116 healthy
controls
Untransplanted
Patients
MICA Ab
negative
(n=194)
MICA Ab
positive
(n=6)
MICA
Ab (%)
P
Value
Odds Ratio
(95% CI)
Gender - no. (%) 1.0 0.9 (0.2 – 4.6)
Male 107 (55) 3 (50) 2.7
Female 87 (45) 3 (50) 3.3
Age 51.9±13.8 50.3±14.9 0.47
Healthy Controls (n=115) (n=1)
Gender - no. (%) 1.0 2.1 (0.2 – 24.4)
Male 57 (48) 1 (100) 1.7
Female 58 (52) 0 (0) 0
Age 33.8±9.9 45 0.35
5.4.2 Significance of MICA allele and antigen mismatching with the production of
MICA antibodies
Table 5.4.3 shows analysis of MICA allele and amino acid mismatching and association
with the production of MICA antibodies. The number of MICA allele mismatches
significantly correlated with the presence of MICA antibodies (P=0.006). None of the
patients matched for MICA alleles developed antibodies compared to 10% with one MICA
allele mismatch and 15% with two MICA allele mismatches. Mismatching of MICA
alleles at the amino-acid level was more significantly associated with the presence of
MICA antibodies (P=0.001). One of 103 graft recipients without a MICA amino acid

Chapter 5
219
mismatch (1%) developed MICA antibodies compared to 13% of graft recipients with
MICA amino acid mismatches.
Table 5.4.3: MICA allele and amino acid residue matching and association with production of
MICA antibodies in 442 renal graft recipients
5.4.3 Association of HLA antigen mismatches with production of MICA antibodies
To assess whether mismatching of HLA antigens also associates with the production of
MICA antibodies, HLA-A, B, C, DR and DQ antigen mismatches were compared in the
MICA antibody positive group and the MICA antibody negative group (Table 5.4.4).
There was no significant difference with HLA class I or class II mismatches and MICA
antibodies. There was also no significant difference when individual HLA loci were
compared (not shown). However, none of the recipients who were matched for class I loci
developed MICA antibodies compared to 8% with 1-3 class I mismatches and 6% of those
with 4-6 HLA class I mismatches. The opposite was true for HLA class II mismatching as
7.5% had MICA antibodies with no mismatches and none of the recipients with 3-4 class II
mismatches developed MICA antibodies.
Variable
MICA
Ab
negative
(n=210)
MICA Ab
positive
(n=17)
MIC
A Ab
(%)
P
Value 2
Odds Ratio
(95% CI)
MICA allele
mm - no. (%)
0.006 10.2
0 75 (36) 0 (0) 0
1 102 (49) 10 (65) 10
2 33 (15) 7 (35) 15
MICA allele
mm no (%)
No 75 (36) 0 (0) 0 0.003 9.1
Yes 135 (64) 17 (100) 7.5
MICA residue
mm no. (%)
0.001 10.6 14 (1.8 - 106)
No 102 (49) 1 (6) 1
Yes 108 (51) 16 (94) 13

Chapter 5
220
Table 5.4.4: Association of HLA class I (HLA-A, B, C) and class II (HLA-DR, DQ) antigen
mismatches with the production of MICA antibodies in renal transplantation
5.4.4 Significance of HLA class I and/or HLA class II antibodies and re-
transplantation with the production of MICA antibodies
Table 5.4.5 analyses the relationship between the presence of HLA class I or HLA class II
antibodies and the effect of re-transplantation with the production of MICA antibodies. In
total 120 recipients developed antibodies against HLA class I antigens representing 27% of
the 442 graft recipients. Sixteen of those with HLA class I antibodies also had MICA
antibodies (13%) compared to a total of seventeen patients with MICA antibodies among
320 patients without HLA class I antibodies (5%). Thus, HLA class I antibodies were
significantly associated with the presence of MICA antibodies in renal graft recipients
(P=0.004). HLA class II antibodies were detected in 21% of recipients. Thirteen of the 93
recipients with HLA class II antibodies were also positive for MICA antibodies (14%) and
of the 349 recipients with no HLA class II antibodies, 20 had MICA antibodies (6%).
These findings were statistically significant (P=0.007).
The effect of re-transplantation on the production of MICA antibodies was also evaluated.
Among the 442 graft recipients there were 386 (87%) primary transplants and 56 (13%) re-
transplants. Five percent of primary graft recipients developed MICA antibodies compared
to 20% of re-transplanted patients. Re-transplantation was strongly associated with the
production of MICA antibodies (P<0.001).
Variable
MICA Ab
negative
(n=409)
MICA Ab
positive
(n=33)
MICA
Ab (%) P Value 2
HLA-A, B, C mm -
no./total no. (%)
0.29 2.5
0 25/303 (8) 0/22 (0) 0
1-3 143/303 (47) 13/22 (59) 8
4-6 135/303 (45) 9/22 (41) 6
HLA-DR, DQ mm -
no./total no. (%)
0.39 1.9
0 99/303 (33) 8/22 (36) 7.5
1-2 180/303 (59) 14/22 (64) 7
3-4 24/303 (8) 0/22 (0) 0

Chapter 5
221
Table 5.4.5: Association of the production of HLA class I and HLA class II antibodies and re-
transplantation with the presence of MICA antibodies in 442 renal graft recipients
5.4.5 Association of MICA antibodies with biopsy-proven acute graft rejection
AR was diagnosed histologically by renal pathologists, following guidelines of the Banff
Conference Report, as updated in 2007 (Solez et al., 2008) and designated type I and type
II T-cell-mediated rejection (for simplicity called acute cellular rejection, ACR) or acute
antibody-mediate rejection (aAMR). Acute AMR with complement deposition was
investigated by immunohistological investigation of C4d following Banff guidelines
(Racusen et al., 2003; Solez et al., 2007) using a rabbit antibody to C4d (Biomedica,
Vienna) in an indirect immunoperoxidase method on paraffin sections following antigen
retrieval by heating to 100°C in EDTA buffer pH 8. As in the Banff guidelines, significant
C4d deposition was considered to be when immunostaining was present in the endothelium
of at least half of intertubular capillaries.
Protocol biopsies and biopsies investigating suspected rejection, were performed on 391 of
the larger cohort of 442 recipients and mean follow-up was 5.9 years. Patients diagnosed
with ACR or aAMR and those without rejection episodes were analysed for association
with the production of MICA antibodies. The results are shown in Table 5.4.6a and reveal
70/391 recipients with ACR (18%) and 31/391 recipients with aAMR (8%). Nine of the 70
Variable
MICA
Ab
negative
(n=409)
MICA
Ab
positive
(n=33)
MICA
Ab (%)
P
Value 2
Odds Ratio
(95% CI)
HLA Class I sensitisation
- no. (%)
0.004 8.4 2.8 (1.4 – 5.7)
Class I antibodies 104 (25) 16 (48) 13
No class I antibodies 305 (75) 17 (52) 5
HLA Class II
sensitisation - no. (%)
0.007 7.2 2.7 (1.3 – 5.6)
Class II antibodies 80 (20) 13 (40) 14
No class II antibodies 329 (80) 20 (60) 6
Transplantation number -
no. (%)
<0.001
13.8 4.0 (1.8 – 8.9)
Successive
transplant(s)
45 (11) 11 (33) 20
First transplant 364 (89) 22 (67) 6

Chapter 5
222
patients diagnosed with ACR produced MICA antibodies (13%), compared to 17 of 321
patients with no ACR (5%) and was statistically significant (P=0.021). Only one of the 31
recipients with biopsy proven aAMR had MICA antibodies (3%) but showed no evidence
of C4d deposition, compared to 25 of 360 recipients (7%) with no aAMR who were
positive for MICA antibodies (not significant).
Table 5.4.6a: ACR and aAMR and association with the production of MICA antibodies among
391 renal graft recipients
It became apparent whilst performing the MICA antibody testing that some patients
produced results with much higher MFI values than others and it is generally agreed among
the H&I community that high MFI values by Luminex antibody testing, correlate with
high-titre antibodies. Since I have not performed titration experiments I will refer to this
type of antibody as „strong‟ and was categorised as such if the MFI value was equal to or
greater than three times the recommended, or defined, cut-off value for MICA antibody
positivity. Table 5.4.6b compares recipients with strong MICA antibodies or moderate/no
MICA antibodies and ACR or aAMR. Strong MICA antibodies were detected in nine of
the recipients with ACR (13%) compared to three of 321 patients (1%) with strong MICA
antibodies and no ACR (P<0.001). There was no significant correlation of strong MICA
antibodies with aAMR.
Recipients
MICA Ab
negative
(n=365)
MICA Ab
positive
(n=26)
MICA
Ab (%)
P
Value 2
Odds Ratio
(95% CI)
ACR - no. (%) 0.021 5.3 2.6 (1.1 – 6.2)
Yes 61 (17) 9 (35) 13
No 304 (83) 17 (65) 5
aAMR – no. (%) 0.4 0.6 0.4 (0.1 –3.3)
Yes 30 (8) 1 (4) 3
No 335 (92) 25 (96) 7

Chapter 5
223
Table 5.4.6b: ACR and aAMR and association with the production of „strong‟ MICA
antibodies in 391 renal graft recipients
5.4.6 Statistically significant associations of ‘strong’ MICA antibodies with other
transplantation variables
Overall, 33 of the 442 patients had MICA antibodies and using the criteria above for
defining those with strong MICA antibodies, fourteen were eligible for inclusion in this
category. A re-analysis of association with transplantation variables, as carried out for
MICA antibodies, was performed to enable a separate multivariate analysis. In addition to
ACR, described above, there were statistically significant correlations with strong MICA
antibodies and HLA class I antibodies, HLA class II antibodies and re-transplantation.
Of the 56 re-transplanted patients, eight had strong MICA antibodies (14%) compared to six
of the 386 patients receiving a primary graft (1.6%) and this difference was highly
significant (P<0.001). Of the recipients sensitised to HLA class I antigens, 8% had MICA
antibodies that were strong compared to 1.5% of recipients with no HLA class I antibodies.
This difference was also statistically significant (P=0.001). The presence of HLA class II
antibodies was also associated with strong MICA antibody production in seven of 94
recipients (7.5%) compared to seven (2%) of 349 recipients who did not have class II
antibodies (P=0.007).
Recipients
‘Strong’
MICA Ab
negative
(n=379)
‘Strong’
MICA Ab
positive
(n=12)
MICA
Ab (%)
P
Value 2
Odds Ratio
(95% CI)
ACR - no. (%) <0.001 27.5 15.6 (4.2 – 6.2)
Yes 61 (16) 9 (75) 13
No 318 (84) 3 (25) 1
aAMR – no.(%) 1.0
Yes 30 (8) 1 (4) 3
No 349 (92) 11 (96) 7

Chapter 5
224
Table 5.4.7: Transplantation variables significantly associated with the presence of „strong‟
MICA antibodies among 442 renal transplant recipients
5.4.7 Multivariate analysis of variables significantly associated with the production of
MICA antibodies
Multivariate analysis was performed using binary logistic regression for association of
MICA antibodies or strong MICA antibodies including covariates with a P value of less
than or equal to 0.100 and the results are shown in Table 5.4.8. Covariates included in the
binary logistic regression model for MICA antibodies were HLA class I antibodies, class II
antibodies, ACR, re-transplantation and MICA residue mismatching. Significant
independent variables were re-transplantation (P=0.020) and MICA residue mismatching
(P=0.008). Variables included in the model for strong MICA antibodies were HLA class I
antibodies, class II antibodies, ACR and re-transplantation. Two variables were
independently significant after regression analysis, ACR (P=0.001) and re-transplantation
(P=0.008).
Variable
Strong
MICA Ab
negative
(n=428)
Strong
MICA Ab
positive
(n=14)
MICA
Ab (%)
P
Value 2
Odds Ratio
(95% CI)
Transplant number
no. (%)
<0.001
25.8 10.6 (3.5 – 31.7)
Re-graft 48 (11) 8 (57) 14
Primary graft 380 (89) 6 (43) 1.6
HLA Class I Abs
no. (%)
0.001 10.2 5.2 (1.7 – 15.8)
Positive 110 (26) 9 (64) 8
Negative 318 (74) 5 (36) 1.5
HLA Class II Abs
no. (%)
0.007 7.3 4.0 (1.4 – 11.6)
Positive 86 (20) 7 (50) 7.5
Negative 342 (80) 7 (50) 2

Chapter 5
225
Table 5.4.8: Univariate and multivariate analysis of renal transplantation variables associated
with MICA antibody status and MICA antibody strength in 442 renal graft recipients
Antibodies Variable Univariate
P value
Multivariate
OR CI (95%) P value
MICA Class I antibodies 0.004 0.5 0.1 – 3.3 0.485
Class II antibodies 0.007 1.5 0.2 – 10.3 0.663
ACR 0.021 1.1 0.3 – 4.2 0.827
Re-transplantation <0.001 5.8 1.3 – 25.6 0.020
MICA residue mm 0.001 16 2.0 – 127 0.009
Strong MICA Class I antibodies 0.001 2.5 0.5 – 12.5 0.249
Class II antibodies 0.007 1.1 0.2 – 5.7 0.880
ACR <0.001 9.9 2.4–40.2 0.001
Re-transplantation <0.001 6.9 1.6 – 28.8 0.008
5.4.8 Correlation of HLA and/or MICA antibodies with ACR and aAMR
So far I have only considered association of MICA antibodies with ACR or aAMR, but it
was important to also consider what effects the presence of HLA antibodies or HLA and
MICA antibodies together might have in relation to AR. In total 391 patients out of the
cohort of 447 had biopsy information regarding diagnosis of ACR or aAMR and the results
of the full analysis are presented in Table 5.4.9. A separate analysis was also performed
using the smaller cohort of 227 MICA-typed transplant pairs as they were confirmed by
SAg testing for both MICA and HLA antibodies and allowed categorisation of donor-
specific HLA antibodies as shown in Table 5.4.10.
From the larger cohort, statistically significant associations were found with ACR and HLA
antibodies overall (P=0.042), MICA antibodies overall (P=0.021) HLA and MICA
antibodies together (P<0.001), HLA class I (P=0.012) and strong MICA antibodies
(P<0.001). Significant associations with aAMR were HLA antibodies overall (P=0.001),
HLA class I (P<0.001), HLA class II (P=0.024) and co-production of HLA class I and II
(P=0.001).

Chapter 5
226
Table 5.4.9: Association of different categories of HLA and MICA antibodies with acute cellular and acute antibody-mediated rejection
Antibodies
ACR1 n (%)
P value 2
Odds Ratio
(95% CI)
aAMR1 n (%)
P value 2
Odds Ratio (95%
CI) Neg
n=321
Pos
n=70
Neg
n=360
Pos
n=31
HLA Overall 93 (29) 29 (41) 0.042 4.2 1.7 (1.0 – 3.0) 104 (29) 18 (58) 0.001 11.3 3.4 (1.6 – 7.2)
MICA overall 17 (5) 9 (13) 0.021 5.3 2.6 (1.1 – 6.2) 25 (7) 1 (3) NS -
HLA and MICA 5 (2) 7 (10) <0.001 13.8 7.0 (2.2 – 22.8) 11 (3) 1 (3) NS -
HLA Class I 73 (23) 26 (37) 0.012 6.3 2.0 (1.2 – 7.5) 83 (23) 16 (52) <0.001 12.3 3.6 (1.7 – 7.5)
HLA Class II 62 (19) 16 (23) NS - 67 (21) 11 (35) 0.024 5.1 2.4 (1.1 – 5.3)
HLA Class I + II 44 (10) 14 (20) NS - 47 (13) 11 (35) 0.001 11.4 3.7 (1.6– 8.2)
Strong MICA 3 (1) 9 (13) <0.001 27.5 15.7 (4.1 – 59) 11 (3) 1 (3) NS -
1N=391 (51 patients had no biopsy details from the 447 cohort).

Chapter 5
227
Table 5.4.10: Association of different categories of HLA and MICA antibodies with acute cellular and acute antibody-mediated rejection
Antibodies
ACR1 n (%)
P value 2
Odds Ratio
(95% CI)
aAMR2 n (%)
P value 2 Odds Ratio (95%
CI) Neg
n=184
Pos
n=41
Neg
n=207
Pos
n=17
HLA Overall 51 (28) 16 (39) NS - 54 (26) 12 (70) <0.001 15.0 6.8 (2.3 – 20.2)
MICA overall 11 (6) 5 (12) NS - 15 (7) 1 (6) NS -
MICA-DSA 8 (4) 5 (12) 0.051 3.8 3.1 (0.9 – 9.9) 12 (6) 1 (6) NS
HLA and MICA 4 (2) 4 (10) 0.018 5.6 4.9 (1.2 – 20.3) 7 (3) 1 (6) NS -
HLA Class I 40 (22) 15 (37) 0.045 4.0 2.1 (1.0 – 4.3) 43 (21) 11 (65) <0.001 16.6 7.0 (2.5 – 20.0)
HLA Class II 35 (19) 12 (29) NS - 36 (17) 11 (65) <0.001 21.2 8.7 (3.0 – 25.0)
HLA Class I + II 24 (13) 11 (27) 0.028 4.8 2.4 (1.1 – 5.5) 25 (12) 10 (59) <0.001 26.0 10.4 (3.6– 29.8)
HLA Class I-DSA 11 (6) 4 (10) NS - 8 (4) 7 (41) <0.001 35.0 17.4 (5.3 – 57.6)
HLA Class II-DSA 10 (5) 5 (12) NS - 7 (4) 8 (47) <0.001 48.0 25.4 (7.5– 85.5)
Class I + II-DSA 6 (3) 2 (5) NS - 2 (1) 6 (35) <0.001 53.8 56 (10.1 – 310)
Strong MICA 0 (0) 5 (12) <0.001 22.9 1.1 (1.0 – 1.3) 1 (0.5) 4 (23) NS -
1N=225 (two patients from the 227 cohort had no biopsy details);
2N=224 (three patients had no biopsy details)

Chapter 5
228
Among the MICA-typed transplant pair cohort, 225 recipients had biopsies available for
ACR diagnosis and 224 for aAMR. Significant associations with ACR were HLA and
MICA antibodies together (P=0.018), HLA class I antibodies (P=0.045) both HLA class I
and II (P=0.028), and strong MICA antibodies (P<0.001). There was a trend of association
with MICA-DSA and ACR (P=0.051). Significant associations with aAMR were HLA
antibodies overall (P<0.001) and all other categories with HLA antibodies were also highly
significant (P<0.001). There was no significant association of aAMR with MICA
antibodies.
5.4.9 Identification of donor-specific MICA antibodies
Seventeen graft recipients from the cohort of 227 with DNA available for both patient and
donor were confirmed as positive for MICA antibodies. Those who were found to have
MICA antibodies were also tested with pre-transplant sera to establish whether MICA
sensitisation was „de novo’ meaning a new alloresponse to the transplanted organ, and
results are shown in Table 5.4.11. The table also shows whether or not the patient had a re-
transplant and whether they have HLA class I or class II DSA or NDSA (non-donor-
specific antibody).
Analysis revealed four patients with the same antibody profile before and after
transplantation, three of them having had more than one transplant. Thirteen patients (76%)
who had no antibodies to MICA before transplantation, developed de novo MICA
antibodies post-transplant and eleven of these recipients (92%) had antibodies against
MICA-DSA. In total, thirteen patients of the seventeen with MICA antibodies had MICA-
DSA.
Eight patients out of the seventeen developed MICA antibodies but no HLA antibodies and
seven developed MICA-DSA with HLA antibodies. Six patients had HLA-NDSA and four
of them had a previous transplant. Two of the three patients with HLA-DSA also had
MICA-DSA.

Chapter 5
229
Table 5.4.11: Details of individual MICA antibody positive renal graft recipients indicating recipient and donor MICA types and MICA antibodies detected pre- and post-
transplantation
1Confirmed with single antigen Luminex testing for HLA class I/II.
3 MICA*016 antibody was detected using the Gen-Probe Luminex assay but not confirmed.. MICA-DSA and corresponding donor
alleles are indicated in bold typeface. Where patients had more than one transplant, testing for pre-transplant MICA antibodies was assessed prior to their latest graft.
Pat. No.
Sex Donor Year Txp Patient MICA
type
Donor MICA
type
MICA Abs
pre-transplant
MICA Abs
post-transplant Re-Tx HLA Class I
1 HLA Class II
1
1 F DD 2006 002, 004 008, 00901/049 Negative 008, 019 Yes No DSA
2 M DD 2006 004 001, 00901/049 Negative 001, 007, 012, 018 No No No
3 M 1. DD 1. 2004
008, 00902 1. 002
Negative 001, 002, 007, 012,
017, 018 Yes NDSA No
2. LD 2. 2006 2. 004, 00902
4 M DD 2006 002 002, 008 001, 004, 007, 008,
009, 012, 018, 019
001, 004, 007, 008,
009, 012, 018, 019 Yes NDSA NDSA
5 M DD 2007 002, 01801 011, 016 004, 008, 009, 016
2,
019
004, 008, 009, 0162,
019 Yes NDSA NDSA
6 M DD 2004 008 004, 008 Negative 004 No No No
7 M DD 2005 011, 016 002, 008 Negative 002, 017 No No No
8 F LD 2005 004, 008 008, 00901/049 001, 002, 007, 017 001, 002, 007, 017 Yes DSA No
9 M LD 2006 010, 011 008, 010 Negative 001, 012, 018 Yes No No
10 M DD 2007 002, 008 008, 00901/049 Negative 004, 009 Yes DSA DSA
11 M DD 2007 008 002, 041 Negative 002, 017 No No No
12 M LD 2007 008 011, 01801 Negative 018, 019 No NDSA No
13 M LD 2008 002 002, 00901/049 Negative 004, 008/027, 009, 019 No No No
14 M DD 2008 004, 010 008 Negative 001, 012, 018 No No No
15 F DD 2008 008 004, 008 Negative 001, 004, 008, 009,
019 No No No
16 M DD 2008 00902 002, 008 Negative 002, 017 No No NDSA
17 F DD 2008 00901/049, 017 008, 01201 001, 012, 018 001, 012, 018 No No No

Chapter 5
230
5.5 Discussion
5.5.1 MICA allele polymorphism and mismatching in UK renal graft recipients and
donors
There are currently 76 MICA alleles listed on the IMGT/HLA database, release 3.4.0, April
2011 (Robinson and Marsh, 2007). This number has increased steadily since the discovery
of the MICA gene and the initial flood of new MICA allele reports in the 1990‟s and is
likely to continue to rise as more ethnically diverse populations are investigated for MICA
polymorphism. My own investigation of MICA polymorphism in UK renal transplant
recipients and donors, involving MICA sequencing of around 600 individuals, yielded two
new MICA allelic variants (Cox et al., 2009). MICA*054 and MICA*056 were identified
in Caucasoid and African-Caribbean kidney donors respectively, both with non-
synonymous amino acid substitutions in the -3 domain. Interestingly MICA
polymorphism can occur equally in any of the three -1 to -3 domains in contrast to HLA
polymorphism, which is mostly restricted to the -1 and -2 regions around the peptide-
binding site of the TCR.
There have been several population studies carried out to determine MICA allele
frequencies and linkage disequilibrium with HLA-B to date. These include American-
Indians (Y. Zhang et al., 2002), African-Americans and European-Americans (Gao et al.,
2006), Japanese (Nishiyama et al., 2004), Koreans (Mok et al., 2003), Chinese (Tian et al.,
2006), Brazilians (Tian et al., 2006) and Moroccans (Piancatelli et al., 2005). These studies
were often carried out to establish disease association or susceptibility to certain epithelial
carcinomas with MICA alleles. However, this data is limited and not as comprehensive as
that for HLA polymorphism, which has been carried out extensively. Nevertheless, enough
data is available to gain an insight into how frequent certain alleles are in different regions
of the world and the conclusion can be made that as with HLA, MICA polymorphism is
driven by evolution under pressures that differ in ethnic groups, for example disease and
environment.
When considering how MICA polymorphism may influence mismatching in renal
transplantation, information regarding the frequencies of MICA alleles for both patient and
donor cohorts is essential. There are reasons to suppose that based on ethnicity there may
be differences between a very ethnically heterogeneous patient population from the London

Chapter 5
231
region of the UK and the mainly Caucasoid population of donors from the UK as a whole.
However, the frequencies of MICA alleles in 301 patients and donors were, in fact, very
similar overall. The only MICA alleles with a significant difference in frequency between
recipients and donors were MICA*002 (P=0.02) and MICA*007 (P=0.01). While
MICA*007 is an infrequent allele, MICA*002 is very common and the frequency was
highest in recipients compared to the donors (17.4% and 12.6% respectively). The reason
MICA*002 was more frequent in our cohort of patients may be that there are many of South
Asian (Indian and Pakistani) ethnic origin due partly to UK demographics and the fact that
CKD is more prevalent, affecting 10-15% (Bhowmik et al., 2008). Information of MICA
allele frequencies in South Asian populations would be useful but is not available. It is
possible that the higher frequency of MICA*002 in this cohort of renal graft recipients may
reflect differences in ethnicity, compared with UK donors. There was also significant
variation of HLA-B antigens between recipients and donors. B7 and B27 had a higher
frequency among donors (P=0.04 and P=0.03, respectively), and B35 and B42 had higher
frequencies in recipients (P=0.02 and P=0.001, respectively).
The MICA allele frequencies overall were similar between patients and donors but analysis
revealed that most donor and recipient pairs were mismatched for MICA alleles, despite
strong linkage disequilibrium between HLA-B and MICA genes. However, from a total of
301 renal transplants, only 15% were fully matched for HLA-B antigens, 66.5% had one
mismatch and 18.5% had two mismatches, indicating MICA mismatching was also very
likely. Surprisingly, MICA matching was better than HLA-B with 30% fully matched, 49%
with one allele mismatch and 21% with 2 allele mismatches. These observations indicate
that knowledge of MICA allele frequencies and HLA-B – MICA haplotype frequencies and
linkage disequilibrium is necessary.
There were 27 different MICA alleles identified in this study, although frequencies of 13
alleles were below 1%. The highest frequencies of MICA alleles in both recipient and
donor groups were associated with MICA*002:01, 004, 008 and 009:01 and accounted for
75% and 69% of allele frequencies in the two groups, respectively. These data are
remarkably similar to published work (Gao et al., 2006) where MICA allele and HLA-B –
MICA haplotype frequencies in European-American (N=1238) and African-American
(N=587) populations were compared. The results of my study show similarities with results
obtained from European-Americans, although there are obvious differences. The frequency
of MICA*008 was lower in renal graft recipients (37%) than in UK donors (39%) or
European-Americans (43%). In contrast, the frequency of MICA*004 was higher in UK

Chapter 5
232
renal graft recipients (12%) than in UK donors (9%) or European-Americans (7.5%).
Comparison with data for African-Americans (Gao et al., 2006) reveals similarities with
UK kidney recipients as MICA*008 frequency is lower (26%) and MICA*004 is very high
(19%). Again, these data highlight the heterogeneity of UK renal transplant recipient
ethnicity, particularly in the London area.
HLA-B and MICA haplotype and LD analysis provided further information important for
this study. Highest LD frequencies were found for B7 – MICA*008 in both groups but was
higher in donors. The results indicate that different HLA-B antigens can associate with the
same MICA allele, for example HLA-B7 and B8 are in strong LD with MICA*008 and
B35, 38, 39, 53 and 58, associate with MICA*002. The sequence homology of B35, 53 and
58 and that of B38 and 39 indicate they have originated from a common progenitor allele
and association with MICA*002 existed before HLA-B allelic divergence. MICA sub-
types such as MICA*009:01 and 009:02 were also found to associate with different HLA-B
antigenic groups. MICA*009:01 was found to be in strong LD with HLA-B5 subtypes,
B51 and B52 and the variant MICA*009:02 correlated with B45 and B50, which are known
to be closely related (Hildebrand et al., 1992). For this analysis it was only possible to
provide serological types for HLA-B (this was not ideal, however I could not obtain high-
resolution data in time for the analysis). Nevertheless, as noted by Gao and colleagues
(Gao et al., 2006), in general HLA-B serological specificities associate with individual
MICA alleles, with two important exceptions. HLA-B44 showed frequent association in
both recipients and donors (highest in donors) with two different MICA alleles, MICA*008
and MICA*004. The analysis by Gao, using high-resolution HLA-B typing, revealed
MICA*008 was in LD with B*44:02 and MICA*004 was in LD with B*44:03. Similarly,
B*35:01 associated with MICA*002, B*35:02 with MICA*016 and B*35:03 with
MICA*009:01.
Improving HLA-B matching in renal transplantation may help matching for MICA alleles,
as HLA-B antigens frequently associate with individual MICA alleles. Even if matching is
only considered for HLA-B antigen cross-reactive groups, the common lineage of these
antigens would be likely to result in matching for MICA. However, MICA mismatching
can commonly occur with allelic subtypes of the same HLA-B antigen (B44 or B35) and
reliable matching could only result from high resolution MICA genotyping of recipients and
donors.

Chapter 5
233
MICA amino acid mismatching
To enable an assessment of MICA allele mismatches that can be tolerated and those that
may be responsible for the production of MICA antibodies in renal graft recipients, analysis
of mismatching at the amino acid level was performed. This analysis showed nineteen
residues across the 1-3 domains were mismatched at least once between renal transplant
recipients and donors and frequencies were always highest in the group who were positive
for MICA antibodies. Fourteen MICA residues were significantly mismatched and highly
significant corrected probabilities were achieved at twelve residues. Residues 213 and 251
were mismatched in 71% of MICA antibody producers, some of them having MICA-DSA
for MICA*008, compared to 24% with no detectable MICA antibodies. These residues
differ in both MICA*008 and MICA*019 alleles and this polymorphism has been
demonstrated as responsible for MICA antibody recognition (Zou et al., 2009). Since
MICA*008 is very frequent in both recipients and donors (around 50%) there is an equal
chance of being matched or mismatched but when mismatched could be a very
immunogenic difference leading to MICA sensitisation. Mismatching of residue 175
(expressing G or S) was also very frequent as 53% of MICA antibody positive recipients
were mismatched compared to 17% who were mismatched without MICA antibodies.
MICA antibodies have been found to react specifically with S at residue 175. Serine is
expressed at this residue by MICA*004, *006, *009 and *019 antigens and could be
considered an unacceptable MICA mismatch for recipients who do not have any of these
alleles. The most striking observation involved mismatching residues that comprise the
long epitope discriminating MICA-G1 alleles from MICA-G2 alleles (described in Chapter
4) and includes six residues mismatched in 53% of MICA antibody producers and around
18% of those recipients with no MICA antibodies. The epitope responsible for
allorecognition of this mismatch was mapped to the -3 domain (Zou et al., 2009). In
simple terms, matching for MICA-G1 and MICA-G2 groups would avoid many of the
mismatches that have been observed and would be an important consideration if matching
strategies were to be implemented to reduce de novo MICA sensitisation. Mismatching of
individual MICA alleles also associated with the production of MICA antibodies.
MICA*011 had a frequency of 4-5% in recipients and donors and mismatches at residues
specific for this allele were significantly more frequent in MICA antibody positive
recipients. Similarly, MICA*004 encodes R at residue 181, a highly exposed loop region,
and antibodies can react specifically with this residue (Zou et al., 2009). Mismatching for
residue 181 was significantly more frequent in the group producing MICA antibodies.

Chapter 5
234
An analysis of amino acid mismatches and association with the production of MICA
antibodies was also carried out. The results show that mismatching MICA residues was
more significantly associated with a positive MICA antibody status compared to MICA
allele mismatches. Multivariate analysis by logistic regression revealed MICA residue
mismatching as a significant independent factor associated with the presence of MICA
antibodies. This novel finding indicates mismatching of group-specific MICA epitopes, as
well as polymorphisms defined by individual MICA alleles, are important considerations if
the aim were to minimise sensitisation to MICA antigens in renal transplantation.
5.5.2 Association of MICA antibody production with general renal transplant
variables
The observation of increased frequencies of MICA antibodies in solid organ transplant
recipients, compared to patients awaiting transplant or healthy controls, infers that an event
specific to transplantation is responsible. As described above, MICA allele and amino acid
mismatching may be one factor, and significantly associated with MICA antibody
production in this study. However, other factors such as recipient and donor age and
gender, whether the donor was deceased or living, previous transplantation, HLA
mismatching, HLA antibodies and rejection may also influence MICA sensitisation. These
particular patient demographics have not been examined in most published studies
investigating the significance of MICA antibodies in organ transplantation.
A study of MICA antibodies and heart transplantation (Suarez-Alvarez et al., 2007) in a
fairly small cohort of 44 heart transplant recipients found no significant association with
donor or patient age or gender. In a large study, using sera obtained from the Collaborative
Transplant Study organised by Gerhard Opelz, 1910 kidney transplant recipients were
tested for MICA antibodies using pre-transplant sera (Zou et al., 2007). No significant
association of donor or patient age with MICA antibody production was found. The gender
of the donor was not considered in this study, however, a statistical trend was observed with
recipient gender (P=0.07) and the highest frequency of MICA antibody producers was in
the male group where 14% were positive for MICA antibodies compared to 11% of female
recipients. Another study of 425 renal graft recipients (Lemy et al., 2010) found, as with the
study by Zou, that more male recipients had MICA antibodies than female recipients (15%
versus 11%). My study of 442 renal graft recipients found no significant association of
MICA antibodies with recipient or donor age or gender, although this study also found a
higher number of males with MICA antibodies (8.5%) compared to female recipients (6%).

Chapter 5
235
The fact that more male graft recipients develop MICA antibodies than females seems to be
a paradox as studies have been published suggesting pregnancy is a sensitisation event for
MICA antibodies. The study by Mizutani and colleagues was not large and their pregnancy
cohort of fourteen (only three with MICA antibodies) did not achieve statistical significance
when compared to sera from individuals with no pregnancies (Mizutani et al., 2006b).
From the evidence available it appears that there is no influence on the production of MICA
antibodies by the age or gender of the donor. The finding from three separate, reasonably
large studies that more male graft recipients have MICA antibodies than females seems to
suggest that, unlike HLA antibody production, MICA sensitisation is not induced by
pregnancy and further studies are warranted.
It is known that long-term GS is improved with renal transplants performed from live
donors compared to deceased donors (Fuggle et al., 2010.). This is thought to be because of
increased ischaemia time after removal of the organ and some studies investigating MICA
antibodies in transplantation make comparisons with the length of cold or warm ischaemia
time and the presence of MICA antibodies. Details of ischaemic time were not available to
me for this study but the large study of pre-transplant MICA antibodies in 1910 renal graft
recipients (Zou et al., 2007) found significant association (P=0.007) with cold-ischaemia
time and the production of MICA antibodies. However, the MICA positive group had a
lower ischaemic time of 18.1 hours compared to 19.7 hours for MICA negative recipients.
As only pre-transplant serum was tested in this group of patients, the reason for this
comparison is unclear as the ischaemia event occurs after testing for MICA antibodies. The
renal transplant study of post-transplant sera (Suarez-Alvarez et al., 2009a) found no
significance with the production of MICA antibodies and cold-ischaemia time although
patients with MICA antibodies had a 1.3 hour longer cold-ischaemia time compared to
MICA negative recipients. In another study (Lemy et al., 2010), there was also no
significant association with the production MICA antibodies post-transplant. The MICA
antibody positive group had a cold-ischaemia time of 16.6 hours compared to 15.7 hours for
recipients with no MICA antibodies. Increased cold-ischaemia time could have an
influence on the production of MICA antibodies as it could induce expression of allogeneic
MICA antigen within the graft vasculature and increase the possibility of sensitisation. This
remains to be proven as the results of these studies, although not significant, show a longer
cold-ischaemia time in MICA positive recipients.
Previous exposure to allogeneic transplants is a known factor significantly associated with
the production of HLA class I and II antibodies but it is unclear whether this is also an event

Chapter 5
236
associated with the production of MICA antibodies. Only a few studies have investigated
re-transplantation in relation to MICA antibodies in transplantation. Zou and colleagues
found no significant association although recipients who had previous transplants had a
higher frequency of MICA antibodies compared to recipients of their first transplant (13.4%
versus 11%) (Zou et al., 2007). The smaller study by Suarez-Alvarez (Suarez-Alvarez et
al., 2009a) also did not find significant association with re-transplantation and MICA
antibody production. Moreover, in this group of 131 patients, 16% had MICA antibodies
and a first transplant compared to 11% with MICA antibodies and a re-transplant.
However, the larger study of 425 renal graft recipients by Lemy (Lemy et al., 2010) found
that re-transplantation was highly significantly associated with MICA antibodies (P<0.001).
They found that 27% of re-transplanted patients had MICA antibodies compared to 11%
who had their first graft and was significant after multivariate analysis (P=0.016). It is also
worth remarking that the authors of this study used the LSA-MIC assay from Gen-Probe to
identify MICA antibodies and, as discussed in Chapter 4, this assay is probably more
reliable than the other commercially available product from One Lambda. The results were
very similar to those obtained from my study of 442 renal graft recipients. Among the re-
transplanted patients, 20% had MICA antibodies compared to 6% of recipients of first
transplants (P<0.001). After logistic regression multivariate analysis, re-transplantation
was an independent significant factor associated with MICA antibodies (P=0.020).
Therefore it is highly likely that re-transplantation is an event associated with the
production of MICA antibodies in renal graft recipients.
I also included the presence or absence of HLA class I/II antibodies to investigate
correlation of their presence with MICA antibody status. Zou and colleagues also carried
out this analysis in their study and found that 17% of recipients with class I antibodies also
had MICA antibodies compared to 11% with class I antibodies and no MICA antibodies
(Zou et al., 2007). Likewise 17% of recipients with HLA class II antibodies had MICA
antibodies compared to 11% with class II antibodies and no MICA antibodies (P=0.007
respectively). This was very similar to the outcome from my own analysis where 16% of
recipients with either class I or II antibodies had MICA antibodies compared to 5% of
recipients without either HLA class I or II antibodies (P<0.004 and P=0.007 respectively).
This could mean that cellular events post-transplantation that result in the generation of
HLA antibodies can also result in the production of MICA antibodies. Alternatively, it
could be that the statistical association of HLA and MICA antibodies arises because both
are more frequently detected in re-transplanted patients as discussed. There was also a
significant association of HLA class I or II antibodies with re-transplantation (P<0.001) and

Chapter 5
237
if patients with both HLA and MICA antibodies were analysed (P<0.001). Additionally,
HLA class I or II antibodies were not independent significant factors associated with MICA
antibodies after multivariate analysis by logistic regression. It is therefore probable that
events leading to HLA sensitisation do not necessarily generate the production of MICA
antibodies and vice versa. Separate immunological events involving MICA antigens and
antibodies may be additional events involved in the aetiology of ACR or aAMR and will be
discussed next.
5.5.3 Association of MICA allele mismatching and MICA antibody production with
acute renal graft rejection
The observation that many transplant recipients with rejection have antibodies to MICA
was made over ten years ago (Zwirner et al., 1999; Zwirner et al., 2000) and numerous
studies have since investigated MICA antibodies and graft rejection. Around a quarter of
kidney transplant recipients experience ACR or aAMR, often in the first year post-
transplant. Improvements in immunosuppressive therapy, aimed at limiting the effects of
T-cell mediated immune responses to the graft, have increased overall GS (Meier-Kriesche
et al., 2004) and reduced AR. However rejection due to antibody-mediated graft damage
arising from B-cell responses to mismatched HLA antigens remains a problem. The
production of post-transplant, de novo DSA to HLA antigens is associated with acute and
chronic allograft rejection (P. C. Lee et al., 2002; Trpkov et al., 1996). Although many
renal transplant recipients with rejection have developed HLA antibodies, previous studies
suggest that 11-20% of patients without HLA antibodies may develop CAD (P. C. Lee et
al., 2002; Worthington et al., 2001). Additionally, HAR can occur in the absence of HLA
antibodies, implicating other alloantigens (Brasile et al., 1986; Sumitran-Karuppan et al.,
1997; Zou et al., 2006b). Possible candidates are the polymorphic proteins encoded by the
MICA and MICB genes.
For this study, diagnosis of rejection from biopsy analysis was available for 391 of 442
graft recipients. Patients were categorised as having no rejection, ACR or aAMR. The
results show that ACR was significantly associated with the presence of MICA antibodies
in graft recipients but no association was found with MICA antibodies and aAMR. This is
in contrast to the highly significant association of HLA antibodies with aAMR episodes.
For example, 70% of patients with both HLA class I-DSA and class II-DSA had aAMR
compared to 26% without both types of HLA antibody (P<0.001). However, in a recent
study of heart transplant recipients, 72 patients and donors were typed for MICA alleles and

Chapter 5
238
the authors found significant association (P=0.01) of MICA-DSA with aAMR (Q. Zhang et
al., 2011).
The detection of C4d in the endothelium of intertubular capillaries is generally accepted as
the hallmark of antibody-mediated immune responses within the graft (Feucht, 2003). Only
one patient confirmed as positive for MICA antibodies experienced aAMR and
immunoperoxidase analysis for C4d deposition was negative (Racusen et al., 2003). By
contrast 50% of the six recipients with co-production of HLA class I+II-DSA had
significant C4d staining. One study specifically investigated the association of MICA
antibodies with C4d staining (Alvarez-Marquez et al., 2009). MICA allele typing was also
performed for both patients and donors (n=58) to investigate MICA donor specificity but no
details of MICA types were provided. The authors found that of the 19 patients who were
C4d+, four patients had MICA antibodies (21%) compared to three patients (7.7%) with
MICA antibodies and no C4d staining, however this was not significant. It remains unclear
whether MICA antibody-mediated graft damage can be detected with C4d staining and may
implicate involvement of other, non-complement mediated, mechanisms of MICA antibody
allorecognition.
Most studies investigating the presence of MICA antibodies with graft rejection classify
rejection as either acute or chronic. Significant association has been observed with both
types of rejection and I will focus on AR in this section. Unless the purpose was to identify
antibody-mediated rejection involving MICA antibodies, no study has stated whether the
rejection was ACR or aAMR. In this study ACR was found to be significantly associated
with the presence of MICA antibodies and indicates cellular rejection processes are either a
trigger for MICA antibody production or the involvement of MICA antibodies exacerbates
cellular rejection to pathological levels. A study of 44 heart transplant recipients (Suarez-
Alvarez et al., 2007), using One Lambda‟s MICA SAg Luminex assay, revealed 55.5% of
recipients with MICA antibodies had AR compared to 44% without MICA antibodies
(P=0.002) and was confirmed by CDC using MICA transfected cells. All patients in this
study were tested within the first year post-transplant. This compares to ACR occurring in
35% of renal graft recipients with MICA antibodies in my study with significant association
(P=0.021). The higher frequency of MICA antibodies detected within the first year of heart
transplantation by Suarez-Alvarez and colleagues correlates with the high degree of AR in
the early post-transplant period. In a study of 139 kidney transplants (Mizutani et al.,
2006b), 37% of recipients with MICA antibodies (detected by MICA transfected CDC) and

Chapter 5
239
no HLA antibodies had graft rejection compared to 19% with functioning grafts and MICA
antibodies but no HLA antibodies (P<0.01).
Another finding from my study was that some patients with ACR have very high MFI
values when tested with MICA Luminex assays. Using an arbitrary cut-off, patients were
categorised as having „strong‟ MICA antibodies and compared to patients who did not have
strong MICA antibodies. In this analysis there was a highly significant association between
strong MICA antibodies and ACR (P<0.001) and was confirmed by logistic regression
multivariate analysis (P=0.001). It was also observed that all of the recipients with MICA
antibodies who experienced ACR had strong MICA antibodies.
The association of ACR across different categories of HLA and/or MICA antibodies was
also examined and revealed association with both HLA and MICA antibodies
independently and together. The combination of both MICA and HLA antibodies has been
shown previously to have detrimental effects leading to rejection or decreased GS (Mizutani
et al., 2006a; Panigrahi et al., 2007b). In my study there was also association with MICA-
DSA and ACR, although only approaching significance (P=0.051).
I was able to determine the association of donor-specific MICA antibodies with transplant
rejection and outcomes for seventeen donor and recipient pairs where the recipient was
positive for MICA antibodies. This analysis showed that 71% of the seventeen MICA
positive individuals developed de novo MICA antibodies post-transplant and within this
group 92% developed antibodies reactive with MICA antigens expressed by the donor
organ. Five of the seventeen MICA positive individuals had MICA antibodies defined as
strong and all five had ACR rejection. Among them, three patients had strong MICA-DSA
and ACR but no HLA donor-specific antibodies, confirmed by HLA SAg Luminex. One of
the patients currently has very poor function (eGFR<15 ml/min/1.73m2) and a biopsy
examined within nine months of the AR episode showed a chronic damage (CD) index of
59% and a CD index >40% is considered highly predictive of renal graft failure (Howie et
al., 2004). This patient first tested positive for MICA antibodies one-year post transplant
(two days after biopsy was taken) with moderate strength. Eight months later these MICA
antibodies, with the same specificities, increased to strong MFI and at this time HLA-DSA
DQ9 was detected but was weak and below cut-off for assigning positivity. Serial serum
sample analysis of the five patients with AR and MICA antibodies revealed that all
developed MICA antibodies after the AR episode. This is in contrast to previous studies
where it was stated that „most‟ had MICA antibodies detected before the rejection episode

Chapter 5
240
(Panigrahi et al., 2007b; Suarez-Alvarez et al., 2007). It is very clear from my study
however that the MICA antibodies, which were strong, were detected following the ACR
episode. Alternatively, MICA antibodies could be involved in the pathogenesis of ACR but
were not detected prior to rejection because they were adsorbed within the graft where they
were causing complement-mediated damage via interaction with mismatched allogeneic
MICA antigens. Consequently the MICA antibodies could be depleted and undetectable in
the periphery as is known to occur with HLA antibodies (Terasaki and Cai, 2005). In this
case, once the AR episode subsides, the MICA antibodies may re-enter the periphery where
they are detected with strong MFI.
From these results, it is likely that T-cell allorecognition of mismatched MICA epitopes can
give rise not only to T-cell help for the production of IgG antibodies against MICA, but also
cell-mediated immunity resulting in cellular rejection. By comparison, a study
investigating MICA matching and graft versus host disease (GvHD) in hematopoietic stem
cell transplantation found a significantly higher rate of grade II-IV acute GvHD in MICA
mismatched patients, indicating a T-cell response to mismatched MICA antigens (Parmar et
al., 2009). This type of immune response to solid organ transplants is the hallmark of
indirect allorecognition and may occur where allogeneic, MICA peptides from necrotic or
apoptotic graft cells are taken up by recipient APCs such as DCs or B-cells and presented to
recipients naïve T-cells in the lymph nodes. The end result is the production of effector
cells and a cellular and antibody-specific response against mismatched allogeneic MICA
molecules leading to graft destruction.
The association of AR with MICA antibodies remains unclear and the finding that ACR is
associated needs to be clarified. A large study of patients with rejection, several hundred if
not more, together with MICA antibody testing and MICA allele typing of both patient and
donor would be required to draw conclusions of any certainty. Collaborative studies are the
easiest way of achieving this and currently Peter Stastny is organising a MICA component
for the next IHIWC to be held in the UK in 2012.
In Chapter 7, I investigate association of MICA antibodies with five-year GS and decreased
graft function, as determined by measurement of eGFR post-transplant, in an attempt to
correlate the presence of MICA antibodies with the longer-term pathogenesis of CAD. In
the next chapter (Chapter 6) I carry out a time-course investigation of several renal graft
recipients with MICA antibody production to determine any association of events post-
transplant with changes in MICA antibody MFI as detected by Luminex.

Chapter 6
241
CHAPTER 6
MICA antibody production and evolution in renal transplant
recipients: a longitudinal analysis
6.1 Introduction and aims
Undoubtedly, the most important advance leading to a reduction in T-cell mediated
rejection in renal transplantation was the introduction of cyclosporine as an
immunosuppressive agent (Calne and Wood, 1985). Twenty-six years later, little has
changed in the prevention of late graft rejection due to chronic rejection associated with
both immune and non-immune factors (Thorogood et al., 1992). CAD and death with a
functioning graft remain the largest cause of graft loss after the first year of transplantation
with a loss rate of 3-5% each year (Pascual et al., 2002). One of the factors associated with
CAD is the presence of HLA antibodies (Terasaki and Cai, 2005; Vasilescu et al., 2006)
and evidence is also accumulating that implicates MICA antibodies with chronic
dysfunction (Mizutani et al., 2005; Terasaki et al., 2007). HLA and/or MICA antibodies
are frequently found before graft failure and can occur many years after the transplant. It is
thought that HLA antibodies initiate a slow process of damage and repair to the graft
endothelium leading to luminal occlusion and loss of function (Terasaki and Cai, 2005).
MICA antibodies may also be involved in the same processes and particularly target the
glomerulus in renal transplantation, as MICA expression is high in this compartment (L. Li
et al., 2010; L. Li et al., 2009).
The development of fluorescent micro-bead assays (Luminex) for the detection of HLA and
MICA antibodies has enabled a more precise evaluation of their role in renal transplantation
and whether or not antibody specificities are directed towards the donor. It is thought that
up to 60% of CAD in organ transplants is caused by HLA antibodies (Piazza et al., 2001)
and HLA-DSA are highly associated. Lee and colleagues found that all patients with graft
loss due to chronic rejection had developed de novo HLA antibodies (P. C. Lee et al.,
2002). In a five-year longitudinal study of 54 renal graft recipients, serial serum analysis
revealed extremely high association with HLA-DSA and graft failure in thirteen of fifteen
cases (Mao et al., 2007). Additionally the appearance of HLA antibodies always came
before an elevation of SCr creating a window of opportunity for therapeutic intervention.
Rise in SCr also preceded the appearance of MICA antibodies in recipients with no HLA

Chapter 6
242
antibodies in a similar study (Kinukawa et al., 2006) but in one case, levels of SCr began to
rise before MICA antibodies were detected. In another longitudinal study of 266 patients
for HLA and MICA antibody production, 11.6% were found to have MICA antibodies and
21% of recipients with graft failure had MICA antibodies compared to only 7.2% of
patients with successful grafts (Ozawa et al., 2006). However in the study by Ozawa and
colleagues, all but one of the MICA antibody positive recipients also had HLA antibodies
and no MICA typing information of the donors was available in their study or that of
Kinukawa.
There are currently no detailed published studies investigating the long-term course of
MICA antibodies in renal transplant recipients and many questions remain unanswered. If
MICA antibodies have a pathological role in transplantation it is important to know whether
the appearance of antibodies identified in renal graft recipients for this study represents a
permanent MICA antibody status or a transient phenomenon in the post-transplant period.
It is known that HLA antibodies can be detected within twelve months but often disappear
completely and have no effect on transplant outcome (Ozawa et al., 2006) and this could
also be the case with MICA antibodies. The results presented in Chapter 5 show that most
recipients with de novo MICA antibodies have specificities directed towards antigens or
group-specific epitopes expressed on the donor organ but how long do they take to appear
and do they persist? MICA antibodies having high MFI values associated with ACR in this
study, but does the strength of MICA antibodies remain high or decline? Most importantly,
does the continued presence of MICA antibodies affect graft function or lead to failure?
The logical way to begin to answer the above questions is by serial analysis of serum
samples from graft recipients, and this has been carried out extensively with regard to HLA
antibodies. Current Luminex technology now allows sensitive detection of antibodies and it
is possible to detect very low levels. Thus, it is possible to detect sub-clinical appearance of
antibodies that may predict the emergence of higher-titre antibodies that could be
implicated with acute or chronic dysfunction. It is also possible to define DSA pre and
post-transplantation. Pre-transplant HLA and MICA antibodies can be implicated with
aAMR (Lefaucheur et al.; Zou et al., 2007) and crossmatch negative HLA-DSA are highly
associated with AR. Development of de novo HLA antibodies may also be a mechanism
involved in CAD (Lachmann et al., 2006). Therefore, Luminex is an excellent tool to
investigate the longitudinal development of MICA antibodies in renal transplant recipients.

Chapter 6
243
In this chapter I analyse a group of MICA antibody positive renal graft recipients by
longitudinal serum sample testing using Luminex antibody detection technology. With this
approach, I was able to determine the time-period between transplantation and the de novo
appearance of MICA antibodies. The relative MFI values of MICA-DSA and NDSA, the
association with ACR and decreased function as measured by eGFR, was also assessed. In
patients who were transplanted too long ago to determine the MICA types of the donor,
serial serum analysis enabled a „snapshot‟ of MICA antibody production many years post-
transplant. Taken together these analyses reveal novel insights into MICA antibody
production and evolution in renal graft recipients.
6.2 Detection of MICA antibodies
MICA antibodies were originally detected using three independent fluorescent bead assays
as described in Chapter 4. For longitudinal analysis, the primary method for MICA
antibody detection was the Gen-Probe MICA SAg Luminex assay, carried out as described
in Chapter 2. Most of the serum samples were also confirmed for specificity and MFI
strength by the Stastny MICA SAg Luminex assay in their laboratories in Dallas, USA.
6.3 Patients and sera
Among the 33 recipients with MICA antibodies only sixteen were selected for longitudinal
analysis, mainly due to the high cost of commercial Luminex assays and the high number of
sera to be tested. Patients with MICA typing details of their donors were of primary
importance, especially those with ACR and were selected on the basis of serum availability.
Other patients with older transplants were also selected to evaluate antibody production in
long-term recipients. The time-points of serum samples depended on availability but
ideally included a sample at one month pre-transplant followed by all available serum in the
first three months post-transplant and every three or six months after that for two or three
years of follow-up. In total, 108 serial serum samples from the sixteen recipients were
analysed for MICA antibodies.
6.4 Assessment of graft function
To investigate association of MICA antibodies with graft function, eGFR was calculated
from serum creatinine values and expressed as ml/min/1.73m2 according to the 4-point

Chapter 6
244
Modification of Diet in Renal Disease method (MDRD) as described (A.S. Levey et al.,
2006), (Burden and Tomson, 2005). Measurements of eGFR were taken at one, two and
three years post-transplant and were available for the MICA-typed pair cohort only. An
eGFR <30 is considered poor function and indicates chronic renal damage. Assessment of
chronic renal damage in confirmed MICA antibody positive recipients was made by renal
pathologists on renal biopsies using a morphometric index of chronic damage (CD), which
expresses the cross-sectional area of chronically damaged cortex as a percentage of the
cross-sectional area of the renal cortex. An index >40% was strongly predictive of renal
failure (Howie et al., 2004).
6.5 Longitudinal testing of individual patients for MICA antibodies
The data obtained from MICA antibody testing were used to plot charts of MFI against time
(months) for each of the sixteen patients included in this part of the study. The first time-
point was the earliest sample to be tested, in most cases around one month before the
transplant. Also included in the charts are the eGFR measurements for up to three years of
follow-up and their values are indicated on the secondary axis. MICA specificities and
major events such as transplantation or ACR are indicated by arrows on the charts. Where
appropriate, the MICA types of the patient and donor are displayed and the MICA-DSA and
NDSA are indicated. Some MICA antibody specificities, not related to the donor, may also
be detected due to cross-reaction with specific shared epitopes as described in Chapter 4
and are indicated by bold typeface on the charts (epitope-specific).

Chapter 6
245
Figure 6.5.1: Longitudinal MICA antibody analysis of patient 986EL. MICA antibody production
occurred between nine and twelve months post-transplant when MICA*004, 007, 008, 009 and 019
antibodies were detected with low MFI. At the same time MICA antibodies were detected, biopsy
evidence showed ACR. The fluorescence intensity of MICA*008 (DSA) and *019 then increased to high
levels while in the same period eGFR decreased. In addition, this patient has CAD with an index of 59%
chronic damage in the renal cortex.
Figure 6.5.2: Longitudinal MICA antibody analysis of patient 300RA. Only HLA antibodies with
weak specificity were found and the patient developed MICA antibodies by 6 weeks post-transplant.
MFI then increased steadily over the following months with highest values achieved by previous donor-
specific MICA*002 and epitope-specific (14G) MICA*017. No MICA antibodies directed towards the
current graft were detected. ACR was diagnosed before the appearance of MICA antibodies. By
nineteen months post-transplant, MICA antibodies were almost undetectable. After an initial
improvement in eGFR during the second year of transplant, a decline was evident after three years.

Chapter 6
246
Figure 6.5.3: Longitudinal MICA antibody analysis of patient 521HJ. No HLA antibodies were
detected in this patient. MICA antibodies were not detected until ten months post-transplant but
sensitisation could have occurred between eight and ten months. Sera collected four days before
diagnosis of ACR showed a weak positive signal for MICA*001, *012 and *018 which rose to high
levels two months later in addition to MICA*007. MFI for all MICA antibodies fell to 6000 over the
next five months. The rise and fall of MICA antibodies was followed by a decline in eGFR after 24
months.
Figure 6.5.4: Longitudinal MICA antibody analysis of patient 396BS. This patient produced MICA-
DSA and NDSA pre-transplant and had a previous graft failure in 2003. No HLA-DSA was detected.
Following re-transplantation in 2006 there was a rise in MFI for MICA-DSA and epitope-specific
antibodies and a decline with NDSA. All antibodies declined to low levels by 24 months post-transplant
when a decline in eGFR was also recorded.

Chapter 6
247
Figure 6.5.5: Longitudinal MICA antibody analysis of patient 194AH. No HLA antibodies were
detected in this patient who was negative for MICA antibodies prior to transplant, developing low levels
of DSA MICA*004 after two months post-transplant. MICA*004 MFI then increased to positive levels
and remained steady for up to two years before disappearing completely and still undetectable by three
years post-transplant. The presence of MICA*004 DSA coincided with a steep decline in eGFR between
the second and third year of transplantation.
Figure 6.5.6: Longitudinal MICA antibody analysis of patient 881AM. This patient had a failed
transplant in 2001 following ACR and was re-transplanted in 2007. Pre-transplant sera was negative for
MICA antibodies but detectable MICA-DSA and epitope-specific antibodies were present three weeks
after transplantation and by twelve months had increased to high positive levels. After 24 months MICA
antibody MFI-levels declined slightly but were still high. There was also a modest decline in eGFR 12-
24 months post-transplant.

Chapter 6
248
Figure 6.5.7: Longitudinal MICA antibody analysis of patient 690MO. This patient, transplanted in
2007, was negative for MICA antibodies pre-transplant and had received a previous graft. At one month
post-transplant there were detectable MICA*004 and *009 DSA but these disappeared the next month.
At six months post-transplant MICA antibodies were positive and increased steadily over the next ten
months before declining slightly at around 24 months post-transplant. There was an improvement in
eGFR, which was initially very poor but shows signs of further decline after three years post-transplant.
Figure 6.5.8: Longitudinal MICA antibody analysis of patient 728JP. This patient did not test
positive for MICA antibodies until twelve months post-transplant when MICA*008 DSA and MICA*019
(shared epitope) were detected with high MFI, rising higher over the next twelve months. Between one
and two years post-transplant there was also a modest decline in eGFR.

Chapter 6
249
Figure 6.5.9: Longitudinal MICA antibody analysis of patient 057SR. This patient had no HLA
antibodies, was originally transplanted in 1990 and recently lost the graft due to chronic dysfunction.
High MFI MICA antibodies were present and detected ten months prior to failure. After graft failure
MICA antibodies had a much lower MFI but were still positive. A few months after re-transplantation,
MICA antibody MFI values for the same specificities became high again.
Figure 6.5.10: Longitudinal MICA antibody analysis of patient 599EM. This patient was positive for
MICA antibodies prior to transplantation in 2008. MICA*004 DSA were present pre-transplant with the
highest MFI. Following transplantation there was an initial decline in MICA antibodies. MICA*002,
004 and 017 became undetectable whereas MICA*007 and 019 antibodies increased to high levels five
months after transplantation. There was also a large decline in eGFR during the first year of
transplantation. This patient did not develop HLA antibodies and died with a functioning graft of
unrelated cause fifteen months after transplantation.
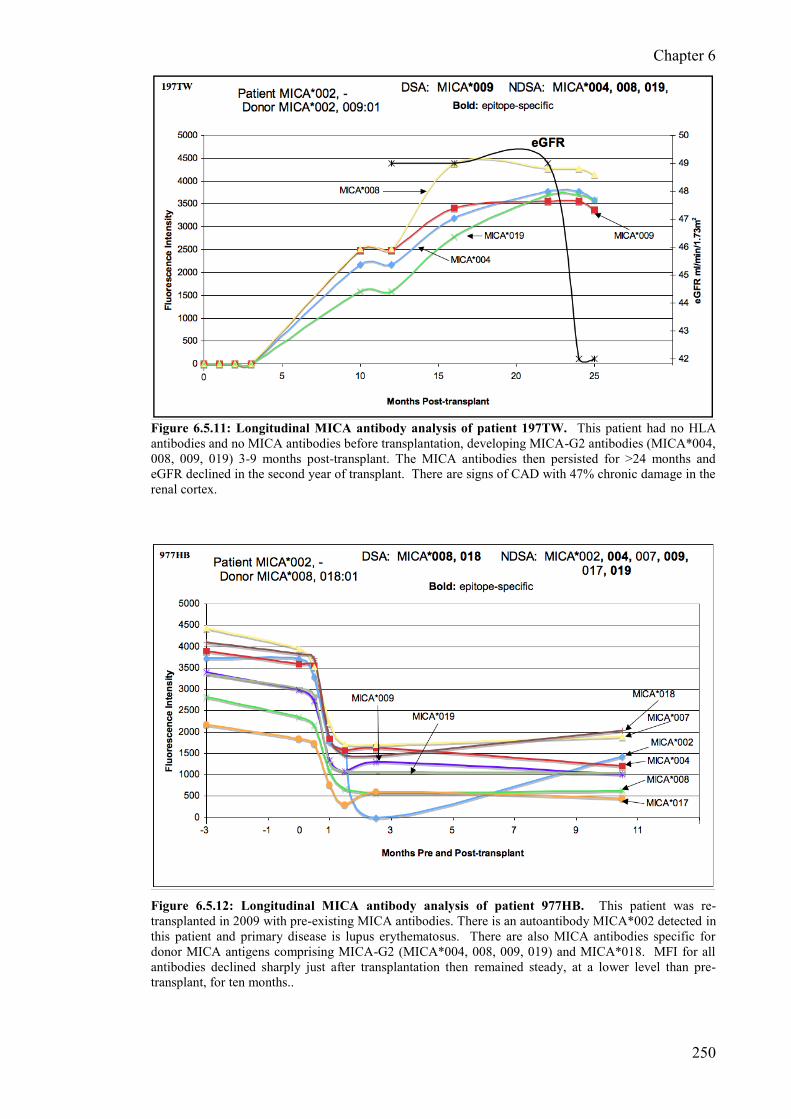
Chapter 6
250
Figure 6.5.11: Longitudinal MICA antibody analysis of patient 197TW. This patient had no HLA
antibodies and no MICA antibodies before transplantation, developing MICA-G2 antibodies (MICA*004,
008, 009, 019) 3-9 months post-transplant. The MICA antibodies then persisted for >24 months and
eGFR declined in the second year of transplant. There are signs of CAD with 47% chronic damage in the
renal cortex.
Figure 6.5.12: Longitudinal MICA antibody analysis of patient 977HB. This patient was re-
transplanted in 2009 with pre-existing MICA antibodies. There is an autoantibody MICA*002 detected in
this patient and primary disease is lupus erythematosus. There are also MICA antibodies specific for
donor MICA antigens comprising MICA-G2 (MICA*004, 008, 009, 019) and MICA*018. MFI for all
antibodies declined sharply just after transplantation then remained steady, at a lower level than pre-
transplant, for ten months..

Chapter 6
251
Figure 6.5.13: Longitudinal MICA antibody analysis of patient 495RT. This patient has a
functioning graft transplanted in 1994, with an early AR episode. There appears to be two groups of
antibodies with different MFI values. MICA*008 and 019 share polymorphisms at residues 213 and 251
and have similar fluorescence intensity values. MICA*002 and 017 both have G at residue 14 and are
below the threshold of MICA antibody positivity.
Figure 6.5.14: Longitudinal MICA antibody analysis of patient 561JB. This patient was transplanted
in 1985 with an unknown rejection history during the early stages of transplantation. The MICA antibody
profile shows two types of antibody may be present. MICA-G2 antibodies are all present (MICA*004,
008, 009 and 019) and MICA*001, 012 and 018 which each express T at residue 24. The presence of
MICA*007, as with many of these patients, remains unexplained. Despite slight fluctuations, the level of
antibodies appears to be steady.

Chapter 6
252
Figure 6.5.15: Longitudinal MICA antibody analysis of patient 953OW. This patient did not
experience AR and appears to have developed MICA antibodies against 24T shared by MICA*001, 012
and 018. MICA*007 is also present and has the highest fluorescence intensity.
Figure 6.5.16: Longitudinal MICA antibody analysis of patient 598AM. MICA*002 and MICA*017
antibodies were detected in this patient possibly via allorecognition of 14G although no typing was
available for the donor, the patient typed as MICA*008, -. The level of fluorescence intensity decreased
gradually over 3 years and the last sera tested in the series have low MFI.

Chapter 6
253
Table 6.5.1: Transplant details of patients enrolled in the longitudinal study
ID Fig.
No. Gender
Age at
Txp Donor
Re-
txp Date of txp
Latest
eGFR1 %CD2
986EL 6.5.1 F 28 DD Yes 12/01/2006 <15 59
300RA 6.5.2 M 53 LD Yes 22/03/2006 38 25
521HJ 6.5.3 M 59 DD No 09/02/2006 25 28
396BS 6.5.4 M 26 DD Yes 10/11/2006 29 23
194AH 6.5.5 M 52 DD No 06/12/2004 36 -
881AM 6.5.6 M 37 DD Yes 12/07/2007 41 -
690MO 6.5.7 M 38 DD Yes 15/05/2007 43 28
728JP 6.5.8 F 37 DD No 22/03/2008 36 -
057SR 6.5.9 M 33 DD Yes 09/08/2009 - -
599EM 6.5.10 F 63 DD No 30/04/2008 30 -
197TW 6.5.11 M 22 LD No 20/02/2008 42 47
977HB 6.5.12 F 55 DD Yes 02/05/2009 - -
495RT 6.5.13 F 40 DD Yes 20/09/1994 - -
561JB 6.5.14 F 25 DD No 24/07/1995 - -
953OW 6.5.15 F 41 DD No 06/06/1997 - -
598AM 6.5.16 M 53 - No 01/01/1988 - -
1eGFR – estimated glomerular filtration rate ml/min/1.73m
2
2Morphometric analysis - index of % chronic damage in renal cortex (Howie et al., 2004)

Chapter 6
254
Table 6.5.2: Summary of MICA and HLA antibody profiles for longitudinal study patients
ID Fig. No.
No.
sera
tested
MICA
Ab first
found
MICA-
DSA MICA-NDSA
HLA-
DSA HLA-NDSA
Acute
Rejection
986EL 6.5.1 14 9-12m 008, 009 007, 019 DQ9 A11, 66; DQ6, 7, 8 ACR
300RA 6.5.2 11 1-1.5m 002 001,007,012,017,018 - A30,31; B35,51,52,53,75,78 ACR
521HJ 6.5.3 6 8-10m 001 007, 012, 018 - - ACR
396BS 6.5.4 7 - 008 001,004,007,009,012,018,019 - A2,34,A68,69; Cw6; DQ4,5,6,8,9 No
194AH 6.5.5 3 - 004 - - - No
881AM 6.5.6 5 21d 016 004, 006, 009, 019, 008 - A23,25; B13,38,39,44,51,53,58, 67 No
690MO 6.5.7 9 6m 009 004 A2; DQ2 A34,66,68,69; B57; DQ4,5,7,8,9 unknown
728JP 6.5.8 6 12m 008 007, 019 - A68; B13,44,45,46,57 No
057SR 6.5.9 4 - - 001, 002, 007, 012, 017, 018 - - No
599EM 6.5.10 7 - 004 001, 009, 008, 019 - - No
197TW 6.5.11 10 3-9m 009 004, 008, 019 - - No
977HB 6.5.12 7 - 008, 018 002, 004, 006, 007, 009, 017, 019 A24 A29 No
495RT 6.5.12 5 unknown 008, 019 B7 A23,24,66,69; B13,27,42,46,48,57,58,61,73 No
561JB 6.5.13 4 unknown 002, 004, 007, 008, 009, 018,019 A30; B44 A1,23,24,31,74,80;B76,44,82,45,50,38,49 No
953OW 6.5.14 6 unknown 001, 007, 012, 018 B27, 35 A66, multi-B, multi-DR No
598AM 6.5.15 4 unknown 002, 017 - B46, 62 (wk) No

Chapter 6
255
6.6 Results and Discussion
For my investigation into the relationship of MICA antibodies and renal transplant clinical
course, I performed a longitudinal analysis of sixteen renal graft recipients with a total of
108 serial serum samples collected over a period of around two years. Among these
patients, twelve had MICA typing information for patient and donor and six of these were
negative for HLA antibodies as assessed by SAg Luminex testing. The finding that so
many recipients with MICA antibodies did not have HLA antibodies is unusual as most
previous studies report nearly all those with MICA antibodies as having HLA antibodies as
well. Nevertheless, the HLA antibody status was confirmed as accurately as possible and
fortuitously affords the opportunity to assess the role of MICA antibodies alone with regard
to graft function measured by eGFR.
6.6.1 Association of MICA antibody production and change in eGFR
The results of the longitudinal analysis, presented in Figures 6.5.1-6.5.16, include eGFR
measurements taken yearly for up to three years post-transplant and is a more accurate
measurement of graft function than serum creatinine values (Marcen et al., 2010). A
common observation was that increasing MICA antibody fluorescence intensity often
accompanied decreasing eGFR in the first two years of transplantation. Eight of a possible
nine recipients showed this association with seven of them involving MICA-DSA and one
with MICA-NDSA. Additionally, patients 521HJ (Figure 6.5.3), 194AH (Figure 6.5.5),
599EM (Figure 6.5.10) and 197TW (Figure 6.5.11) had no positive results with SAg HLA
Luminex analysis and the other four recipients did not have HLA-DSA detected with the
exception of 986EL where donor-specific DQ9 was detected.
Patient 986EL received a re-transplant from a living related donor in January 2006 and is an
interesting case for several reasons. Despite a 010 A-B-DR mismatch, two MICA alleles
were mismatched and the patient was negative for MICA antibodies in five serum samples
tested in the first nine months of transplantation. This was followed by a slight rise in
MICA-DSA and NDSA fluorescence intensity and coincided with a diagnosis of ACR at
twelve months post-transplant. Additionally, this patient had HLA-DQ9 DSA with MFI
rising to positive levels shortly after a rise in MICA antibody MFI. After an initial peak
there was a sharp rise in MFI for MICA*008 and *019 antibodies. MICA*008 antibody
was donor-specific and MICA*019 shares an epitope expressed at residues 213 (I) and 251
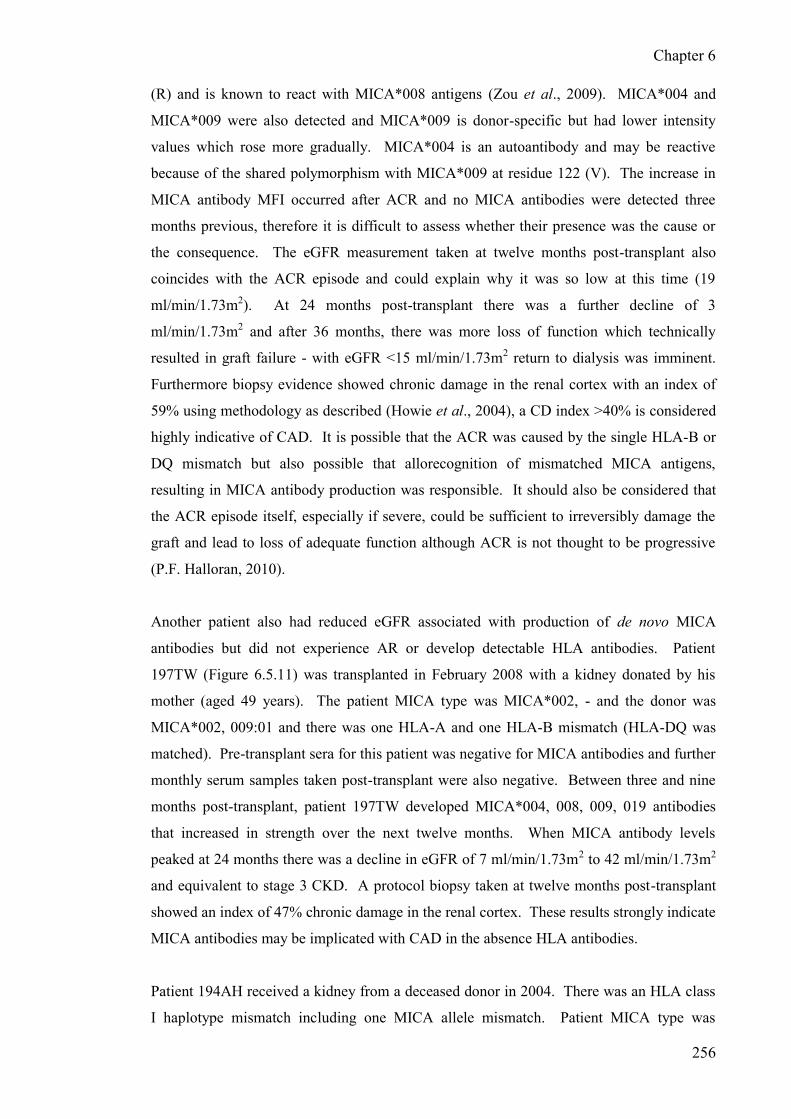
Chapter 6
256
(R) and is known to react with MICA*008 antigens (Zou et al., 2009). MICA*004 and
MICA*009 were also detected and MICA*009 is donor-specific but had lower intensity
values which rose more gradually. MICA*004 is an autoantibody and may be reactive
because of the shared polymorphism with MICA*009 at residue 122 (V). The increase in
MICA antibody MFI occurred after ACR and no MICA antibodies were detected three
months previous, therefore it is difficult to assess whether their presence was the cause or
the consequence. The eGFR measurement taken at twelve months post-transplant also
coincides with the ACR episode and could explain why it was so low at this time (19
ml/min/1.73m2). At 24 months post-transplant there was a further decline of 3
ml/min/1.73m2 and after 36 months, there was more loss of function which technically
resulted in graft failure - with eGFR <15 ml/min/1.73m2 return to dialysis was imminent.
Furthermore biopsy evidence showed chronic damage in the renal cortex with an index of
59% using methodology as described (Howie et al., 2004), a CD index >40% is considered
highly indicative of CAD. It is possible that the ACR was caused by the single HLA-B or
DQ mismatch but also possible that allorecognition of mismatched MICA antigens,
resulting in MICA antibody production was responsible. It should also be considered that
the ACR episode itself, especially if severe, could be sufficient to irreversibly damage the
graft and lead to loss of adequate function although ACR is not thought to be progressive
(P.F. Halloran, 2010).
Another patient also had reduced eGFR associated with production of de novo MICA
antibodies but did not experience AR or develop detectable HLA antibodies. Patient
197TW (Figure 6.5.11) was transplanted in February 2008 with a kidney donated by his
mother (aged 49 years). The patient MICA type was MICA*002, - and the donor was
MICA*002, 009:01 and there was one HLA-A and one HLA-B mismatch (HLA-DQ was
matched). Pre-transplant sera for this patient was negative for MICA antibodies and further
monthly serum samples taken post-transplant were also negative. Between three and nine
months post-transplant, patient 197TW developed MICA*004, 008, 009, 019 antibodies
that increased in strength over the next twelve months. When MICA antibody levels
peaked at 24 months there was a decline in eGFR of 7 ml/min/1.73m2 to 42 ml/min/1.73m2
and equivalent to stage 3 CKD. A protocol biopsy taken at twelve months post-transplant
showed an index of 47% chronic damage in the renal cortex. These results strongly indicate
MICA antibodies may be implicated with CAD in the absence HLA antibodies.
Patient 194AH received a kidney from a deceased donor in 2004. There was an HLA class
I haplotype mismatch including one MICA allele mismatch. Patient MICA type was

Chapter 6
257
MICA*008, - and the donor was MICA*008, 004 and there was no diagnosis of AR. The
patient did not produce HLA antibodies but MICA*004 DSA was produced by three
months post-transplant remaining steady for around two years before disappearing
completely. By this time there was a sharp decline in eGFR from 50 to 38 ml/min/1.73m2
and a biopsy at eleven months showing 32% CD index. MICA antibodies were still
undetected at three years post-transplanted and longer analysis would be required to know
whether this is permanent.
Patient 521HJ had reduced eGFR, MICA-DSA but no HLA antibodies and was diagnosed
with ACR just before a steep rise in fluorescence intensity for MICA antibodies. A
reduction in eGFR of 7 ml/min/1.73m2 to 25 ml/min/1.73m2 occurred after 12 months and
remained the same the following year.
Patient 057SR (Figure 6.5.9) did not have detectable HLA antibodies and lost his graft after
almost twenty years. High levels of MICA antibodies were detected prior to failure.
Interestingly, the fluorescence intensity of MICA antibodies decreased sharply shortly after
graft failure and may have been absorbed by the graft. Following re-transplantation, MICA
antibodies had almost returned to their original levels. It is possible that MICA antibodies
were a major factor leading to chronic dysfunction and graft loss in this patient.
Although published studies of MICA antibody longitudinal analysis using Luminex assays
do not provide MICA typing details of the donor, they do show similar results to my study.
A longitudinal study of mainly renal graft recipients with HLA antibodies by Van Den
Berg-Loonen and co-workers (van den Berg-Loonen et al., 2006) showed results of one
recipient with MICA antibodies but no HLA antibodies. After detection of low levels of
MICA antibodies at five months post-transplant, a very large increase in fluorescence
intensity occurred by two years and was associated with an increase in serum creatinine and
graft failure after three years post-transplant. In another study (Kinukawa et al., 2006)
longitudinal analysis up to ten years post-transplant of eight patients with MICA antibodies
was provided. Seven of these renal graft recipients had lost their grafts to rejection and one
died with a functioning graft. In four recipients, no HLA antibodies were detected. One
patient produced MICA*012 antibody twelve months post-transplant with increasing MFI
that correlated with an increase in serum creatinine and the graft failed by sixteen months.
Another patient developed antibodies to MICA*004, 008 and 009 by 42 months post-
transplant and followed a rise in serum creatinine. MICA antibody strength continued to
increase along with serum creatinine and the graft failed at six months. Another patient

Chapter 6
258
with no HLA antibodies suddenly developed antibodies to MICA*001, and 018 in the
eighth year of transplant when serum creatinine levels began to rise and the graft was lost
two years later. Finally, a patient who had MICA*001, 012, 018 antibodies throughout the
course of their transplant had graft failure after ten years following a steady increase in
serum creatinine in the five years previous.
Taken together the results of this and published studies show that even when patients have
no detectable HLA antibodies, the presence of MICA antibodies is associated with reduced
eGFR (or increased serum creatinine) with evidence of CAD from biopsies or graft failure.
In the next chapter I will perform univariate and multivariate analysis of GS and mean
eGFR in patients with and without MICA antibodies and MICA-DSA to investigate
whether these observations are statistically significant.
6.6.2 MICA antibody specificity
In Chapter 4 various MICA epitopes were identified in MICA positive recipients that have
been shown in published studies (Zou et al., 2009) to react with MICA antibodies and
which share particular amino acid polymorphisms. The MICA amino acid alignment from
Chapter 4 is reproduced here to aid interpretation (Table 6.6.1).
Table 6.6.1: Protein alignment of polymorphic MICA residues shown experimentally to be
involved in allorecognition by MICA antibodies.. Modified from Zou et al., 2009 (Permission
granted by Springer).
Domain: -1 -2 -3
Residue:
0
1
4
0
2
4
0
3
6
0
9
1
1
2
2
1
2
5
1
2
9
1
5
6
1
7
3
1
7
5
1
8
1
2
0
6
2
1
0
2
1
3
2
1
5
2
5
1
Antigen MICA-G1 MICA*001 W T C Q L K M H K G T G W T S Q
MICA*012 - - - - - E - L - - - - - - - -
MICA*018 - - - - - E - - - - - - - - - -
MICA*007 - A - - - E - - - - - - - - - -
MICA*002 G A - - - E - - - - - - - - - - MICA*017 G A - R - E - - - - - - - - - -
MICA-G2 MICA*004 - A Y - V E V - E S R S R - T -
MICA*009 - A Y - V E V - E S - S R - T -
MICA*008 - A Y - - E V - E - - S R I T R
MICA*019 - A Y - - E V - E S - S R I T R

Chapter 6
259
The two largest groups of MICA antibodies were called MICA-G1 and MICA-G2 and
divide the MICA antibodies into two broad groups, in a similar way to the Bw4 and Bw6
epitopes of class I HLA molecules, and is thought to represent two ancestral lineages of
MICA alleles (Choy and Phipps, 2010). There are also amino acid differences with
individual MICA antigens, as well as groups of two or three antigens.
In some patients only one MICA specificity was identified for example 194AH (Figure
6.5.5) where only one antibody, MICA*004 was detected and antibodies may be specific
for R at residue 181. Another patient, 690MO (Figure 6.5.7) had MICA*004 and
MICA*009 antibodies detected and both antigens uniquely express V at residue 122. Other
patients seemed to have more than one specificity which differed by their fluorescence
intensity and a good example is 396BS (Figure 6.5.4) who has MICA*001, 012, 018 (T at
residue 24) which have declining fluorescence intensity while the other group-specific
epitope, MICA-G2, contains a MICA-DSA and fluorescence intensity increased after
transplantation. This can also be clearly seen with patient 300RA (Figure 6.5.2) who has
antibodies to MICA*001, 012, 018 (T at residue 24) that have half the fluorescence
intensity of MICA*002, 017 antibodies that may be reactive with G at residues 14.
The reactivity with MICA*007, observed in 50% of these cases is unexpected and
perplexing. This antigen does not have any unique amino acids or polymorphisms that may
make it cross-reactive in any way other than would be expected. MICA*007 is detected in
some sera where only MICA-G2 antibodies are otherwise present as seen with 986EL
(Figure 6.5.1) or when only MICA-G1 antibodies are detected, for example 521HJ (Figure
6.5.3) or 057SR (Figure 6.5.9). Possibly, MICA*007 has a unique conformational epitope
that is recognised by antibodies. Unfortunately there were no examples of patients with
grafts expressing a mismatched MICA*007 so its „true‟ reactivity cannot be assessed. It
may be that the antibody binding associated with the MICA*007 bead is the result of
misfolded MICA molecules on the bead exposing epitopes that are reactive with non-MICA
antibodies as I discussed in Chapter 4 but this occurs with all three Luminex bead assays
and, as can be seen by this analysis, it is consistently detected.
These data extend and enhance the observations noted in Chapter 4. Not only are
antibodies specific for epitopes based on unique or shared polymorphism in the
extracellular domains but are consistently detected in serial serum samples with no
disappearance of individual MICA antibodies or the sudden appearance of other MICA

Chapter 6
260
antibodies. It is also evident that the epitope specificity can result in differing fluorescence
intensities by MICA antibodies giving credence to the shared epitope reactivity hypothesis.
6.6.3 First appearance of MICA antibodies and evolutionary course
Seven patients in this series produced de novo MICA antibodies post-transplant. The
earliest post-transplant time-point for MICA positivity in one patient was three weeks as
seen with patient 881AM (Figure 6.5.6) and another early appearance of MICA antibodies
occurred with patient 300RA (Figure 6.5.2). The longest time for MICA antibodies to
appear was twelve months as observed with patients 986EL (Figure 6.5.1) and 728JP
(Figure 6.5.8). Three patients became positive for MICA antibodies at around six months
post-transplant as shown in Figures 6.5.3, 6.5.7 and 6.5.11. Therefore these results show
that MICA antibodies can be produced as early as three weeks but up to twelve months
post-transplant or perhaps even longer. This is very similar to the first appearance of HLA
antibodies in renal transplantation (van den Berg-Loonen et al., 2006). However, in a
longitudinal study up to ten years post-transplant, some patients did not develop MICA
antibodies until after many years and in one case MICA antibodies did not appear for eight
years (Kinukawa et al., 2006).
In three patients (Figures 6.5.1, 6.5.2 and 6.5.7) the initial detection of low-titre MICA
antibodies disappeared in the next serum but returned in the subsequent sample with high
fluorescence intensity, producing a characteristic small peak followed by a larger peak.
This may be the result of antibody class switching and affinity maturation giving rise to
much more efficient antibody binding.
Another three patients had MICA antibodies with increased fluorescence intensity post-
transplant, which then declined steadily or sharply within two years to negative or
undetectable levels. Patient 300RA (Figure 6.5.2) suddenly became negative for MICA
antibodies eighteen month post-transplant and the subsequent sample was also negative.
Patient 396BS (Figure 6.5.4) had very low levels of MICA antibodies by fifteen month
post-transplant and patient 194AH lost reactivity with MICA*004 beads by 24 months post-
transplant and was still negative after three years of engraftment. However, all three
patients associated with a decrease in eGFR during the period when MICA antibodies were
detected.

Chapter 6
261
6.6.4 MICA antibody ‘strength’
Mizutani demonstrated a highly significant correlation of HLA antibody strength (high
MFI) with graft failure, in particular patients with incremental increases in antibody
strength (Mizutani et al., 2007). Terasaki and colleagues previously found that strong HLA
antibodies were highly associated with graft failure in the first year of transplantation
compared to recipients with moderate HLA antibodies (Terasaki et al., 2007) and in another
study increasing strength of both HLA and MICA antibodies was associated with graft
failure (Mizutani et al., 2005). The authors of these studies suggest that the strength of the
antibodies measured by MFI is as important as donor-specificity in antibody-mediated graft
loss. In Chapter 5 I found that strong MICA antibodies were highly significantly associated
with ACR but it was difficult to ascertain whether the antibodies were a consequence or the
cause. The results presented in this chapter show that increasing fluorescence intensity for
de novo MICA antibodies usually coincides with a reduction in eGFR but most patients also
had MICA-DSA so it is difficult to assess whether the strength of the antibody was an
additional factor. This is also the case in the published study where graft failure was
implicated with a rise in MICA antibody fluorescence intensity (Kinukawa et al., 2006).
More studies involving larger numbers of patients are required to prove this hypothesis but
it may be worthwhile monitoring patients for MICA in addition to HLA antibodies, at least
in the first year of transplantation. If de novo MICA antibodies specific for donor antigens
are found with increasing strength there may be time for therapeutic intervention to prevent
aAMR, chronic loss of function or graft failure.
6.6.5 Long-term renal graft recipients and MICA antibodies
I also carried out longitudinal analysis of four patients who were transplanted between
thirteen and 25 years ago and have MICA antibodies but otherwise enjoy good graft
function. In all of these patients, MICA antibodies remained detectable throughout the
period of investigation, although there were fluctuations, and in all cases the same MICA
specificities were detected. It was not possible to test serum from the beginning of the
transplants as they were such a long time ago but it is possible that these patients had MICA
antibodies for many years and yet have had a functioning graft much in excess of the usual
half-life for renal transplants. This is a paradox if MICA antibodies are deleterious to GS,
and is also observed in patients with HLA antibodies and good long-term graft function. At
the 15th IHIWC in Brazil, Paul Terasaki attempted to explain this phenomenon during a

Chapter 6
262
presentation about HLA and MICA antibodies. He used the analogy that smoking has been
well documented as causing lung cancer BUT not all smokers develop lung cancer. In other
words, some people may be more susceptible to graft damage by antibodies than others just
as some people are more resistant to developing lung cancer. Another theory is that
antibody „accommodation‟ could be the reason. In this situation the organ becomes
resistant to antibody-mediated injury evidenced by C4d deposition on renal biopsies in the
absence of other signs of rejection. The detection of complement fixation shows that
antibodies still recognise and bind to their antigens and the lack of lysis may implicate a
regulatory mechanism (Yu et al., 1996). Whatever the reason, it is clear that some patients
are not affected by the presence of MICA antibodies and do not lose their grafts as a
consequence.
In the next chapter I will carry out univariate and multivariate analysis to investigate
whether there is a statistically significant relationship between the production of MICA
antibodies and reduced GS or function. I also analyse graft recipients for soluble MICA
and MICB production, which may be implicated with improved GS.

Chapter 7
263
CHAPTER 7
Soluble MICA/B in renal transplantation and association of
MICA antibodies with graft survival and function
7.1 Introduction and aims
Much evidence has been generated over the past ten years associating expression of MICA
and MICB on tumours with regulation of anti-tumour immune responses (Groh et al.,
1999). These studies have led to the concept that MIC molecules can be shed from tumours
in the soluble form leading to decreased surface expression of MIC molecules on the
tumour, reducing immunogenicity and circumventing NK-mediated lysis. In addition, the
soluble forms of MICA and MICB (and other NKG2D ligands) can engage with NKG2D
activatory receptors on NK-cells and T-cells resulting in internalisation and degradation of
the NKG2D complex, thereby decreasing NKG2D expression on NK-cells and T-cells and
impairing their anti-tumour function (Groh et al., 2002). This mechanism has important
implications for immunotherapy in cancer patients and attempts at prevention of MIC
molecule shedding by identifying the biochemical pathways leading to MIC cleavage are
evident from the literature (Salih et al., 2006; Zwirner et al., 2007). These studies have led
to the hypothesis that the soluble form of MICA may have a protective effect against
rejection in solid organ transplantation (Suarez-Alvarez et al., 2006a; Suarez-Alvarez et al.,
2006b). However, the study by Suarez-Alvarez and colleagues involved less than 50 heart
transplant recipients and there are currently no published studies investigating the role of
soluble MICA in renal transplantation.
Despite improvements in immunosuppression reducing the incidence and severity of AR
(Meier-Kriesche et al., 2004), little has changed in 30 years with respect to late graft failure
due to chronic decline in graft function. Chronic damage in renal transplantation has a
multifactorial aetiology involving both immunological and non-immunological
mechanisms. Non-immune factors such as donor or patient gender or age, the source of the
donor (living or deceased), race and primary kidney disease can all affect graft function and
foreshorten GS. Immunological mechanisms associated with chronic damage include ACR
and aAMR. The traditional way to assess these risk factors is by time-dependent statistical
analysis of GS by the Kaplan-Meier method for univariate analysis and Cox regression
multivariate analysis can then reveal independent risk factors. These studies are important

Chapter 7
264
in understanding which factors impact on GS and whether different techniques or therapies
can improve OS.
Measurement of renal function is a non-invasive method of monitoring changes that may
relate to infection or rejection or other complications that may require therapeutic
intervention or further investigation by biopsy. Tests for renal function assess how
efficiently the kidneys filter blood and as this cannot be measured directly, clearance of a
filtration marker is used. Measurement of serum creatinine was until recently the most
common method of measuring renal function. Creatinine is a breakdown product of
creatine phosphate in muscles and is produced at a constant rate by the body, dependent on
body mass. Creatinine is filtered out of the blood by the kidneys and rising levels in the
blood can be measured and used to calculate the creatinine clearance, reflecting the
glomerular filtration rate (GFR) and hence renal function. Blood creatinine clearance is
now recognised as an unreliable measure of GFR as serum creatinine is affected by age,
weight, muscle mass, race and various medications. To compensate for variations of
creatinine production between individuals, several equations have been developed to take
into account anthropometric factors including age, gender ethnicity and body mass. Two
formulae are widely used in clinical practice for adults: the Cockcroft-Gault (C-G) equation
(Cockcroft and Gault, 1976) and the more recently developed MDRD equation (A. S. Levey
et al., 1999). The C-G equation was based on 249 patients and estimates creatinine
clearance but is not normalised for body mass, uses an out-dated assay for creatinine
measurement and the results should be considered with caution. The original MDRD
equation was based on 1628 patients with CKD and estimates GFR adjusted for body
surface area using age, gender, ethnicity, serum creatinine, urea, nitrogen and albumin (A.
S. Levey et al., 1999). In 2000, a simplified method was introduced that performed as well
as the original MDRD equation but required only serum creatinine, age, gender and
ethnicity (African-Caribbean descent) (A. S. Levey et al., 2000) and is currently the most
widely used equation, particularly in the UK.
Estimated GFR (eGFR) is expressed as ml/min/1.73m2 and an eGFR >90 ml/min/1.73m2 is
considered normal. CKD can be categorised by eGFR values and also correlates with stages
of rejection in renal transplantation. Stage 1 CKD is where eGFR is greater than 90
ml/min/1.73m2 but urine analysis, structural abnormalities or a genetic trait indicate kidney
disease. Stage 2 CKD shows mildly reduced kidney function with eGFR between 60-89
ml/min/1.73m2 with other indicators of kidney disease (as in stage 1). Stage 3 CKD reflects
moderately reduced function of 30-59 ml/min/1.73m2. Stage 4 CKD is where eGFR is

Chapter 7
265
severely reduced and between 15-29 ml/min/1.73m2 and stage 5 is very severe or end-stage
renal failure (<15 ml/min/1.73m2). Most kidney transplant recipients have eGFR in stage 3
CKD and progression to stage 5 indicates graft failure, and the patient is prepared to return
to dialysis (Burden and Tomson, 2005). The measurement of eGFR in renal transplant
recipients provides a factor that can be used for clinical management and also allows
analysis of transplantation variables to be correlated with renal function in transplantation
outcome studies as an alternative to GS.
In this chapter I evaluate soluble MICA and MICB production in renal transplant recipients
and correlate the presence or absence with transplantation variables to assess whether the
soluble form of MIC products associate with variables such as HLA or MICA mismatching,
production of antibodies or, importantly, with less AR. This has not been reported in renal
transplantation but a small study of heart transplant recipients did associate less AR with the
presence of sMICA (Suarez-Alvarez et al., 2007). A GS study of our renal transplant
cohort was also carried out, primarily to assess whether MICA antibodies are associated
with reduced GS and to also to investigate which factors were responsible for graft loss in
this cohort. Finally, I carried out a thorough univariate and multivariate statistical
evaluation of graft function assessed by eGFR using the MDRD method to investigate
whether MICA antibody production in renal graft recipients is independently associated
with reduced graft function and therefore implicated with CAD. Most results presented in
this chapter have been published in a peer-reviewed journal (Cox et al., 2011).
7.2 Soluble MICA and MICB in renal transplantation
To investigate whether soluble MICA or soluble MICB (sMICA or sMICB) present in the
serum of renal transplant patients has a positive impact in terms of less AR as has been
reported in heart transplant recipients, sera from renal graft recipients was tested
approximately one year post-transplant.
Using a sandwich ELISA method to detect sMICA and sMICB, as detailed in Chapter 2,
201 graft recipients transplanted since 2003 were tested for sMICA and 200 patients were
tested for sMICB. This test is very sensitive, capable of detecting as little as 62.5 pg/ml
soluble MICA protein (156.25 pg/ml soluble MICB). I analysed association with general
clinical characteristics, HLA and MICA mismatching, MICA/HLA antibodies and ACR or
aAMR.

Chapter 7
266
7.2.1 Association of sMICA and sMICB with general clinical characteristics
The overall frequency of sMICA (n=201) was 12.5% and sMICB (n=200) was 41%; higher
levels of sMICB were detected in renal graft recipients compared to sMICA as shown in
Figure 7.2.1. There was no statistical significance with any of the variables in association
with sMICA as listed in Table 7.2.1, although there was a statistical trend with younger
recipient age (P=0.061) and transplant number (P=0.095).
Table 7.2.1: Clinical characteristics of 201 renal graft recipients and association with sMICA
detected in serum one year post-transplant
Variable sMICA
pos (n=25)
sMICA
neg (n=176)
2 P-value
Gender 0.5 0.470
Male 12 (48%) 98 (56%)
Female 13 (52%) 78 (44%)
Recipient Age1 38.5 ± 13 44 ± 14 0.061
Donor Age1 46 ± 10 46 ± 15 0.889
Donor status 1.7 0.189
Living 10 (40%) 48 (27%)
Deceased 15 (60%) 128 (73%)
Transplant No. 2.8 0.095
Primary 18 (72%) 150 (85%)
Re-transplant 7 (28%) 26 (15%) 1Age ± SD, groups were compared using Student‟s t-test (independent variables).
In association with sMICB, (Table 7.2.2) recipient age was significantly different between
the two groups (P=0.015) and a trend was observed for donor status (P=0.056) and
transplant number (P=0.088). Levels of sMICB were generally higher with a mean of 300
pg/ml compared with sMICA which showed a mean concentration of 100 pg/ml (Figure
7.2.1).

Chapter 7
267
Table 7.2.2: Clinical characteristics of 200 renal graft recipients and association with sMICB
detected in serum one year post-transplant
Variable sMICB
pos (n=82)
sMICB
neg (n=118)
2 P-value
Gender 0.1 0.751
Male 44 (53%) 66 (56%)
Female 38 (47%) 52 (44%)
Recipient Age1 41 ± 14 46 ± 14 0.015
Donor Age1 44 ± 15 48 ± 15 0.106
Donor status 3.6 0.056
Living 17 (21%) 39 (33%)
Deceased 65 (79%) 79 (67%)
Transplant No. 2.9 0.088
Primary 65 (79%) 104 (88%)
Re-transplant 17 (21%) 14 (22%) 1Age ± SD, groups were compared using Student‟s t-test (independent variables).
Figure 7.2.1: Comparison of mean concentration of sMICA and sMICB (pg/ml) detected
in renal transplant recipient serum one year post-transplant.
7.2.2 Association of sMICA and sMICB with HLA antigen and MICA allele and antigen
mismatches
As shown in Table 7.2.3, there was no significant correlation between the presence of
sMICA and HLA class I mismatches and analyses of individual loci also revealed no
association. HLA-DR mismatching did not associate with detectable sMICA but analysis
of HLA-DQ mismatching revealed highly significant association (P=0.003). MICA allele
or residue mismatching was not associated with the presence of sMICA.

Chapter 7
268
Table 7.2.3: HLA antigen and MICA allele/antigen mismatching in 201 renal graft recipients
and association sMICA detected in serum one year post-transplant
Variable sMICA
pos (n=25)
sMICA
neg (n=176)
2 P-value
HLA-A, -B, -C mm 5.5 0.479
0 1 (4%) 16 (9%)
1-3 16 (64%) 86 (49%)
4-6 8 (32%) 74 (42%)
HLA-DR mm 0.1 0.937
0 11 (44%) 74 (42%)
1 12 (48%) 84 (48%)
2 2 (8%) 18 (10%)
HLA-DQ mm
0 11 (44%) 105 (60%) 11.4 0.003
1 11 (44%) 69 (39%)
2 3 (12%) 2 (1%)
MICA allele mm 0.2 0.924
0 8 (32%) 58 (33%)
1 13 (52%) 85 (48%)
2 4 (16%) 33 (19%)
MICA amino acid mm 0.849
Matched 11 (44%) 81 (46%)
Mismatched 14 (56%) 95 (54%) mm = mismatch
Table 7.2.4 reveals significant association of sMICB and HLA class I mismatching
(P=0.010). A detailed analysis of individual HLA loci showed mismatching for HLA-B
was responsible (P=0.045). There was no significant association of sMICB with
mismatching HLA class II loci or MICA allele or residue mismatching.

Chapter 7
269
Table 7.2.4: HLA antigen and MICA allele/antigen mismatching in 200 renal graft recipients
and association with sMICB detected in serum one year post-transplant
Variable sMICB
pos (n=82)
sMICB
neg (n=118)
2 P-value
HLA-A, -B, -C mm 16.8 0.010
0 10 (12%) 7 (6%)
1-3 40 (49%) 60 (51%)
4-6 32 (4%) 51 (43%)
HLA-B mm
0 17 (21%) 13 (11%) 6.9 0.045
1 47 (57%) 87 (74%)
2 18 (22%) 18 (15%)
HLA-DR mm 0.7 0.701
0 36 (44%) 62 (53%)
1 39 (48%) 57 (48%)
2 3 (4%) 14 (12%)
HLA-DQ mm 4.4 0.113
0 53 (65%) 62 (53%)
1 26 (32%) 54 (46%)
2 3 (4%) 2 (2%)
MICA allele mm 1.6 0.452
0 30 (37%) 37 (31%)
1 35 (43%) 61 (52%)
2 17 (21%) 20 (17%)
MICA amino acid mm 0.936
Matched 38 (46%) 54 (46%)
Mismatched 44 (54%) 64 (54%)
7.2.3 Association of sMICA and sMICB with MICA or HLA antibodies and AR
There was no significant association of sMICA/B with HLA antibodies, MICA antibodies,
ACR or aAMR (Tables 7.2.5 and 7.2.6).

Chapter 7
270
Table 7.2.5: HLA antibodies, MICA antibodies and rejection in 201 renal graft recipients and
association with sMICA detected in serum one year post-transplant
Variable sMICA
pos (n=25)
sMICA
neg (n=176)
2 P-value
HLA class I antibodies 0.4 0.509
Positive 5 (20%) 46 (26%)
Negative 20 (80%) 130 (74%)
HLA class II antibodies 0.842
Positive 4 (16%) 31 (18%)
Negative 21 (84%) 145 (82%)
MICA antibodies 0.913
Positive 2 (8%) 13 (7%)
Negative 23 (92%) 163 (93%)
ACR 0.807
Positive 5/24 (21%) 33 (19%)
Negative 19/24 (79%) 143 (81%)
aAMR 0.875
Positive 2/24 (8%) 13/175 (7%)
Negative 22/24 (92%) 162/175 (93%)
Table 7.2.6: HLA antibodies, MICA antibodies and rejection in 200 renal graft recipients and
association with sMICB detected in serum one year post-transplant
Variable sMICB
pos (n=82)
sMICB
neg (n=118)
2 P-value
HLA class I antibodies 1.1 0.302
Positive 17 (21%) 32 (27%)
Negative 65 (79%) 86 (73%)
HLA class II antibodies 0.6 0.430
Positive 16 (20%) 18 (15%)
Negative 66 (80%) 100 (85%)
MICA antibodies 0.4 0.513
Positive 6 (7%) 6 (5%)
Negative 76 (93%) 112 (95%)
ACR 0.1 0.727
Positive 16/81 (20%) 21 (18%)
Negative 65/81 (80%) 97 (82%)
aAMR 1.3 0.259
Positive 4/80 (5%) 11 (9%)
Negative 76/80 (95%) 107 (91%)
The concentration (pg/ml) of sMICA and sMICB was compared in recipients with and
without ACR or aAMR. Analysis by Student‟s t-test (not shown) revealed no statistical
difference in mean concentration of sMICA or sMICB between recipients with biopsy
confirmed rejection and those with no rejection as can be clearly seen in Figure 7.2.2.

Chapter 7
271
The mean concentration of sMICA was 296 pg/ml for patients without rejection and 236
pg/ml for those with ACR. The concentration mean of sMICB was 1431 pg/ml for
recipients without rejection and 1687 pg/ml for patients with ACR. For aAMR, the mean
concentration of sMICA was 301 pg/ml for patients without rejection and 95 pg/ml for
those with aAMR. The mean concentration of sMICB was 1473 pg/ml for recipients
without rejection and 2060 pg/ml for patients with aAMR.
Figure 7.2.2: Effect of sMICA/B concentration on occurrence of AR. Comparison of mean
concentration of soluble MICA (n=24) and soluble MICB (n=81) (pg/ml) detected one year after
transplantation for those with or without ACR and aAMR.

Chapter 7
272
7.2.4 Association of sMICA and sMICB with reduced graft function
To assess graft function in patients with and without soluble MIC protein detected in serum,
comparisons of eGFR measurement taken at one, two and three years post-transplant were
made, but revealed no significant difference. However, if patients were categorised
according to eGFR < 30 ml/min/1.73m2 (stage 4 CKD) or > 30 ml/min/1.73m2, a statistical
trend (P=0.078) was observed for patients without sMICA having poorer function, five
years post-transplant. Ninety percent of 19 patients with sMICA had eGFR > 30
ml/min/1.73m2 compared to 45% of 156 patients with no detectable sMICA. No statistical
significance was associated with sMICB (Figure 7.2.3).
Figure 7.2.3: Analysis of graft function in patients with eGFR < 30 ml/min/1.73m2 (stage IV CKD)
or > 30 ml/min/1.73m2 and sMICA or sMICB. At five years post-transplant, 90% of patients with
sMICA had eGFR or > 30 ml/min/1.73m2 compared to 45% of patients with no detectable sMICA. No
difference was observed with sMICB.
7.2.5 Five-year renal graft survival and the impact of sMICA and sMICB
Association of sMICA or sMICB with five-year GS is shown in Figure 7.2.4. Although not
significant, a decline in OS was observed and occurred around three years post-transplant.
Patients with sMICA and/or sMICB had 98% OS after five years compared to the negative
group who had OS of 83%. There was less of a difference for graft recipients with sMICA.
Five-year OS was 90% for those with sMICA compared to 86% of recipients with no
Log rank P=0.078 Log rank P=0.430
n=156
n=19 n=105
n=70

Chapter 7
273
sMICA. Patients with sMICB had five-year OS of 98% compared to 85% of patients with
no detectable sMICB.
Figure 7.2.4: Association of sMICA and sMICB with five-year renal graft survival.
n=169
n=23
n=116
n=76
n=106
n=68

Chapter 7
274
7.3 Five-year renal graft survival analysis and association with
transplantation variables
7.3.1 Inclusion criteria for survival analysis
For this analysis it was necessary to gather clinical information that was not available on
local databases or paper records. This required help from the clinical renal consultant at the
Royal Free Hampstead Trust, Dr Mark Harber. I chose to focus this study only on patients
where MICA typing information was available for the donors and patients. Secondly, all
patients in the analysis were transplanted no earlier than 31st October 2003 and no later than
31st October 2008. Using these criteria, a total of 227 patients were included in the request
for information regarding loss of graft and the date when it occurred as study end-points. In
addition, patients with functioning grafts with eGFR less than 15 ml/min/1.73m2 were also
included as a graft loss at the time when the eGFR was first recorded as <15
ml/min/1.73m2. Patients were omitted if lost to follow-up (moved to a different region) or
the graft was lost due to non-compliance with immunosuppressive regime or technical
problems. A valid graft loss was counted if the patient returned to haemodialysis, was re-
transplanted or eGFR was less than 15 ml/min/1.73m2. A total of 216 patients were
included in analysis for five-year GS. Ten patients had graft failure - five patients returned
to haemodialysis, two patients were re-transplanted and three patients had eGFR <15
ml/min/1.73m2. There were six patients with graft failure that were not included in the
analysis - two were non-compliant, one had an infected graft removed, one had a cancerous
graft removed and two lost grafts for technical reasons i.e reperfusion problems or primary
non-function. A further five patients died within the study period with a functioning graft.
7.3.2 Transplant variables included for survival analysis
Transplant variables considered in this analysis were patient and donor gender, patient and
donor age, source of donor (living or deceased), number of transplants (primary or re-graft),
HLA class I and class II antibodies and MICA antibodies. MHC mismatching was
considered for antigenic mismatches of HLA-A, -B, -C, -DR, -DQ loci and allelic
mismatches of the MICA locus. Rejection was considered for ACR and aAMR.

Chapter 7
275
7.3.3 Univariate statistical analysis
Univariate analysis was performed for OS estimates using the Kaplan-Meier method and
level of significance was assessed using the log rank statistic. P value of < 0.05 was
considered significant.
7.3.4 Overall five-year survival and the impact of source of donor, gender and age
Figure 7.3.1 shows five-year survival associated with donor source (living or deceased),
patient or donor gender and patient or donor age. No significant difference was found with
any of these variables. However, male patients with grafts from male donors had survival
of 90% and survival was 61% with grafts from female donors, revealing a statistical trend
(log rank P=0.060). The patient age group 50-59 years had 100% survival and lowest
survival of 74% was observed with patients over 60 years. The donor age group with
highest graft survival in recipients was 18-34 years.
7.3.5 Overall five-year survival and the impact of number of transplants, MICA
antibodies or HLA antibodies
Significantly decreased GS (Figure 7.3.2) was observed with repeat transplantation (log
rank p=0.002) with 80% GS in re-transplanted patients compared to 88% for patients with
no previous grafts. No significant correlation was found for GS in patients with MICA
antibodies. HLA class I antibodies associated with significantly reduced GS of 82% versus
90% for patients with no class I antibodies (log rank p=0.001). Similarly, but more
significantly, after five years post-transplant, recipients with HLA class II antibodies had
reduced GS of 75% compared to 90% for those with no class II antibodies (log rank
p<0.001). The effect of HLA antibodies on GS was much stronger when recipients had
both HLA class I and class II antibodies as observed in 54% compared to 91% (log rank
p<0.001). HLA donor-specific antibodies also correlated with reduced survival (log rank
p=0.020).

Chapter 7
276
Figure 7.3.1: Association of source of donor (deceased or living), patient or donor gender and
patient or donor age with five-year overall renal GS.
n=159
n=57
n=92
n=124
n=30
n=54 n=56
n=55

Chapter 7
277
Figure 7.3.2: Association of the number of transplants, MICA antibodies, HLA class I antibodies,
HLA class II antibodies, HLA class I and class II antibodies or HLA-DSA with five-year overall
renal GS.
n=181 n=35
n=200
n=16

Chapter 7
278
7.3.6 Overall five-year survival and the impact of ACR and aAMR
Figure 7.3.3 shows the effect of AR on five-year GS. ACR was significantly associated
with reduced survival (log rank p=0.001) affecting 68% compared to 91% of patients with
no ACR. There was also a significant correlation with aAMR and decreased OS (log rank
p=0.048). Patients having aAMR had 87% survival compared to those with no aAMR
having OS of 88%, although after three years this group had OS of 98%.
Figure 7.3.3: Association of ACR or aAMR with five-year overall renal GS.
7.3.7 Multivariate analysis using Cox regression
Multivariate statistical analysis was performed by Cox regression. Variables considered in
the multivariate model were source of donor, patient gender, donor gender, age of patient
and donor, number of transplants, MICA antibodies, HLA class I antibodies, HLA class II
antibodies, HLA antigen mismatch (HLA-A, -B, -DR), MICA allele mismatch and ACR
and aAMR. Variables were selected for inclusion in the Cox regression model if the
univariate analysis using the Kaplan-Meier method achieved a log rank statistic of P<0.100.
The results are presented in Table 7.3.1.
n=174 n=40
ACR aAMR

Chapter 7
279
Table 7.3.1: Kaplan-Meier and Cox regression analysis of overall survival data
Variable Univariate P
Value
Multivariate hazard
ratio (95% CI)
Multivariate
P Value
HLA class I antibodies 0.001 2.6 (0.4 –17.5 0.330
HLA class II antibodies <0.001 17.2 (2.2 – 132) 0.006
HLA-DSA 0.020 0.8 (0.2 – 3.8) 0.766
ACR 0.001 8.5 (1.7 – 42.0) 0.009
aAMR 0.048 9.7 (1.3 – 71.7) 0.025
Number of transplants 0.002 0.8 (0.2 – 3.8) 0.978
The variables achieving statistical significance with Kaplan-Meier univariate analysis were
HLA class I and II antibodies, HLA-DSA, ACR and aAMR and number of transplants
(primary or re-graft). HLA class I antibodies, HLA-DSA and number of transplants were
not independent significant factors affecting OS by Cox regression multivariate analysis.
Variables significantly and independently affecting OS were the presence of HLA class II
antibodies (hazard ratio 17.2; P=0.006), ACR (hazard ratio 8.5; P=0.009) and aAMR
(hazard ratio 9.7; P=0.025).
7.4 Renal graft function analysis
7.4.1 Assessment of chronic renal damage and renal function
Assessment of chronic renal damage in confirmed MICA antibody positive recipients in the
same cohort was made on renal biopsies using a morphometric index of chronic damage
(CD), which expresses the cross-sectional area of chronically damaged cortex as a
percentage of the cross-sectional area of the renal cortex. An index >40% was strongly
predictive of renal failure (Howie et al., 2004).
To assess renal function and associations of antibodies and other transplant variables with
clinical course, eGFR was calculated from serum creatinine values and expressed as
ml/min/1.73m2 according to the 4-point MDRD as described (Burden and Tomson, 2005;
A.S. Levey et al., 2006). Measurements of eGFR were taken one, two and three years post-
transplant for patients available for follow-up and alive (205/227 MICA-typed pairs).

Chapter 7
280
Analysis of eGFR using the MDRD method has been described as the „gold standard‟ for
assessment of renal function and is a relatively recent development. Previously, and still
widely used, function was assessed using serum creatinine (SCr) values. I also analysed the
data using SCr values to compare the two types of measurement, although this data was
only available for one and two years post-transplant.
Statistical analysis was performed using Student‟s t-test for independent variables (2-tailed)
to compare eGFR means for dichotomous variables (most variables were normally
distributed). Where Levene‟s test for equality of variances achieved a probability of
<0.100, the statistic for unequal variances was used. Non-parametric univariate testing
(Mann-Whitney U) was used for serum creatinine (SCr) analysis, as most variables did not
show a normal frequency distribution. The Z value statistic is included in this analysis,
where values of significant association lie outside the 95% confidence interval of -1.96 to
+1.96 standard deviations.
General transplantation variables included were patient and donor gender and age, source of
donor, number of transplants (primary or re-transplant), ACR and aAMR. Categories of
MICA and/or HLA antibodies used for analysis were HLA antibodies overall, MICA
antibodies overall, HLA antibodies only, MICA antibodies only, HLA and MICA
antibodies together, HLA-DSA, MICA-DSA, class I-DSA, class II-DSA and strong MICA
antibodies. All factors achieving a probability of P <0.100 were included in a multivariate
analysis model (antibody categories chosen were MICA-DSA, HLA class I-DSA and class
II-DSA). Analysis was performed for each eGFR or SCr measurement time-point using
linear regression. Significant independent variables revealed by linear regression had a
probability of P < 0.05.
7.4.2 Association of general transplantation variables with reduced graft function
Analysis of post-transplant eGFR revealed significant association with donor gender,
patient and donor age, donor source, re-transplantation and ACR/aAMR as shown in Table
7.4.1. Significantly decreased eGFR occurred with grafts from female donors after one year
(P=0.006) and two years (P=0.007) post-transplant with a mean difference of 7.9 and 8.9
ml/min/1.73m2, respectively. Patient age >50 years significantly associated with decreased
eGFR after one-year post-transplant (P=0.020) but then stabilised. The age of the donor
associated with highly significantly decreased graft function (P<0.001) at all three time-
points and donors >50 years old resulted in an average decrease of 14 ml/min/1.73m2

Chapter 7
281
compared with donors <50 years old. Patients with grafts from deceased donors had
significantly decreased eGFR after one year post-transplant (P=0.021) but not after the
second year, with a mean difference of 7.0 ml/min/1.73m2.
Table 7.4.1: Comparison of mean eGFR in renal transplant recipients with risk factors for CAD
at one, two and three years post-transplant
Variable Yr eGFR1 mean ± SD (n) P Value2
Mean
Diff.
Male Female
Patient
1
2
51.2 ± 17.2 (117)
51.4 ± 17.9 (107)
54.4 ± 21.9 (88)
54.3 ± 24.3 (73)
NS
NS
3.1
2.9
3 49.3 ± 19.9 (66) 50.5 ± 20.9 (45) NS 1.2
Donor
1
2
55.8 ± 20.4 (104)
57.0 ± 22.1 (88)
47.9 ± 18.0 (82)
48.1 ± 19.0 (75)
0.006
0.007
7.9
8.9
3 52.8 ± 20.8 (48) 47.3 ± 19.6 (54) NS 5.6
Patient
<50 years >50 years
1 54.9 ± 20.9 (128) 48.8 ± 16.0 (77) 0.020 6.1
2 55.3 ± 22.1 (115) 49.5 ± 17.7 (65) NS 4.8
3 51.9 ± 21.1 (73) 45.8 ± 18.1 (38) NS 6.1
Donor
1 58.0 ± 20.7 (106) 47.1 ± 15.4 (95) <0.001 10.8
2 60.5 ± 21.0 (95) 43.6 ± 16.4 (84) <0.001 16.1
3 57.2 ± 20.4 (59) 41.9 ± 16.3 (51) <0.001 15.4
Donor
Source
Deceased Living
1
2
50.6 ± 20.0 (148)
51.9 ± 21.2 (131)
57.6 ± 17.0 (57)
54.3 ± 19.4 (49)
0.021
NS
7.0
2.4
3 48.9 ± 20.6 (83) 52.5 ± 19.1 (28) NS 3.6
No. Txps
Primary Re-transplant
1
2
53.2 ± 18.1 (173)
53.1 ± 19.8 (152)
49.1 ± 25.6 (32)
49.7 ± 25.0 (28)
NS
NS
4.1
3.4
3 51.9 ± 19.6 (92) 39.4 ± 20.6 (17) 0.013 12.5
ACR
Negative Positive
1
2
54.7 ± 18.8 (168)
55.2 ± 20.4 (145)
43.0 ± 19.6 (36)
41.5 ± 18.5 (34)
0.001
<0.001
11.7
13.7
3 54.3 ± 19.8 (84) 35.6 ± 15.0 (26) <0.001 18.7
aAMR
1
2
53.5 ± 18.7 (189)
52.7 ± 20.6 (169)
36.2 ± 20.5 (13)
44.6 ±19.0 (8)
0.001
NS
17.3
8.1
3 50.2 ± 20.4 (105) 37.7 ± 16.3 (4) NS 12.5 1 estimated glomerular filtration rate (ml/min/1.73m
2).
2Student‟s t-test for independent variables
Re-transplanted patients had significantly reduced eGFR after three years post-transplant
with eGFR of 39.4 ml/min/1.73m2 compared with 51.9 ml/min/1.73m2 (P=0.013) and a

Chapter 7
282
mean difference of 12.5 ml/min/1.73m2. ACR was highly significantly associated with
reduced eGFR after one year (P=0.001), two years (P<0.001) and three years (P<0.001)
with increasing mean differences of 11.7, 13.8, 18.7 ml/min/1.73m2, respectively
(illustrated in Figure 7.4.1). Incidence of aAMR associated with decreased eGFR after one
year (P=0.001) with a mean difference of 17.3 ml/min/1.73m2.
Figure 7.4.1: Error bar charts showing eGFR (ml/min/1.73m2) of patients with and without ACR
episodes. eGFR measurements taken 1 (A), 2 (B) and 3 (C) years post-transplant.
Analysis of SCr levels at years one and two post-transplant (Table 7.4.2) also showed
significant correlation with several of the variables examined.
A B
C
P<0.001 P<0.001
P<0.001
ACR ACR
ACR

Chapter 7
283
Table 7.4.2: Comparison of mean rank serum creatinine values with risk factors for CAD
Variable Yr
PT Creatinine
1 mean rank
2 (n) P Value Z Value
Male Female
Patient 1
2
107.1 (103)
97.0 (107)
73.9 (81)
69.3 (65)
<0.001
<0.001
-4.2
-3.5
Donor 1
2
76.4 (96)
70.2 (82)
93.1 (70)
86.8 (73)
0.025
0.022
-2.2
-2.3
<50 years >50 years
Patient 1 93.5 (111) 91.0 (73) NS -0.3
2 89.1 (109) 82.1 (63) NS -0.9
Donor 1 78.8 (94) 104.2 (87) 0.001 -3.3
2 70.5 (89) 102.8 (82) <0.001 -4.3
Donor
Source
Deceased Living
1
2
97.4 (134)
88.6 (125)
79.5 (50)
80.8 (47)
0.043
NS
-2.0
-0.9
No. Txps
Primary Re-transplant
1
2
90.7 (156)
84.8 (145)
102.5 (28)
95.5 (27)
NS
NS
-1.1
-0.3
ACR
Negative Positive
1
2
85.7 (149)
80.8 (138)
119.5 (34)
107.9 (33)
0.001
0.005
-3.4
-2.8
aAMR 1
2
89.9 (170)
84.7 (161)
113.8 (11)
99.1 (8)
NS
NS
-1.5
-0.9 1
serum creatinine (mol/l). 2Mann-Whitney U test. Reproduced with permission from Elsevier (Cox et
al., 2001)
Patient gender associated with significant differences in SCr at one (Z=-4.2; P<0.001) and
two (Z=-3.5; P<0.001) years post-transplant, where males had higher values. By contrast,
donor female gender correlated with significantly higher creatinine values at one (Z=-2.2;
P=0.025) and two (Z=-2.3; P=0.022) years post-transplant. Significantly higher SCr values
were found with donors aged >50 years after year one (Z=-3.3; P=0.001) and year two (Z=-
4.3; P<0.001), deceased donors after year one (Z=-2.0; P=0.043) and ACR after year one
(Z=-3.4; P=0.001) and year two (Z=-2.8; P=0.005).

Chapter 7
284
7.4.3 Association of HLA and/or MICA antibodies with reduced graft function
Table 7.4.3 shows univariate mean eGFR comparisons with different categories of HLA
and/or MICA antibodies and reveals patients with MICA antibodies overall had
significantly decreased eGFR of 14.3 ml/min/1.73m2 (P=0.002) after two years post-
transplant. HLA-DSA associated with a significantly decreased eGFR of 10.7
ml/min/1.73m2 in the second year post-transplant (P=0.027) and 26.8 ml/min/1.73m2 after
the third year. There was a trend associating MICA-DSA with reduced eGFR after one year
post-transplant but was highly significant in the second year (P=0.001) with a mean
difference of 17.1 ml/min/1.73m2 and significant after the third year with a mean difference
of 17.5 ml/min/1.73m2 (P=0.038). Patients with HLA-DSA only (no MICA antibodies) had
significantly reduced eGFR after three years post-transplant with a mean difference of 27
ml/min/1.73m2 (P=0.001). MICA-DSA only (no HLA antibodies) associated with a
decreased eGFR of 18 ml/min/1.73m2 after the second year of transplantation (P=0.001).
HLA class I-DSA were significantly associated with a decreased eGFR at one (P=0.028),
two (P=0.045) and three years (P=0.007) post-transplant with decreased eGFR and a mean
difference ranging from 13-25 ml/min/1.73m2. There was a significant correlation with
HLA class II-DSA production and decreased eGFR after the first year of transplantation, of
10.6 ml/min/1.73m2 and also after the third year (P=0.002) with a mean difference of 25.6
ml/min/1.73m2. Patients with HLA class I+II-DSA, significantly associated with decreased
eGFR at one year post-transplant (P=0.019) with a mean difference of 17.3 ml/min/1.73m2
and a trend after three years (P=0.066). Strong MICA antibodies were associated with
lower eGFR values at two (P=0.039) and three years (P=0.036) post-transplant with a
difference of 19.2 and 21.5 ml/min/1.73m2, respectively. Figure 7.4.2 shows error bar
charts with levels of eGFR associated with the groups positive and negative for MICA
antibodies.

Chapter 7
285
Table 7.4.3: Comparison of mean eGFR in renal transplant recipients with different categories
of HLA/MICA antibodies at one, two and three years post-transplant
Antibodies Yrs
PT
eGFR1 mean ± SD
1 year N=205; 2 year N=180; 3 year N=112
Negative n Positive n P
Value2
Mean
Diff.
HLA
1 53.7 ± 18.5 146 43.3 ± 21.0 59 NS 4.4
2 53.0 ± 19.4 129 50.3 ± 23.2 51 NS 2.7
3 51.7 ± 19.6 83 44.1 ± 21.1 29 0.083 7.6
MICA
1 53.1 ± 19.7 189 44.4 ± 12.4 16 0.084 8.7
2 53.4 ± 20.6 165 39.1 ± 14.4 15 0.002 14.3
3 50.6 ± 20.2 104 38.1 ± 16.6 8 0.091 12.5
HLA & MICA
1 52.8 ± 19.5 197 43.6 ± 14.4 8 NS 9.2
2 52.7 ± 20.5 172 42.0 ± 18.6 8 NS 10.7
3 50.2 ± 20.1 107 40.4 ± 20.6 5 NS 9.8
HLA-DSA
1 53.3 ± 18.8 186 43.8 ± 23.0 19 NS 9.5
2 53.3 ± 20.1 164 41.4 ± 22.2 16 0.027 11.9
3 51.6 ± 19.2 104 24.8 ± 15.4 8 <0.001 26.8
MICA-DSA
1 53.1 ± 19.6 192 43.2 ± 12.1 13 0.073 9.9
2 53.4 ± 20.5 168 35.7 ± 11.2 12 <0.001 17.7
3 50.7 ± 20.1 106 33.2 ± 13.2 6 0.038 17.5
HLA-DSA Only
1 53.0 ± 18.8 189 45.6 ± 24.1 16 NS 7.4
2 52.9 ± 20.2 167 43.4 ± 23.0 13 0.100 9.5
3 51.2 ± 19.5 106 24.2 ± 14.9 6 0.001 27.0
MICA-DSA Only
1 52.7 ± 19.5 198 45.5 ± 11.8 7 NS 7.2
2 52.8 ± 20.5 174 34.8 ± 7.6 6 0.001 18.0
3 50.1 ± 20.2 109 34.3 ± 8.6 3 NS 15.8
Class I-DSA
1 53.2 ± 19.0 193 40.6 ± 21.5 12 0.028 12.6
2 53.0 ± 20.4 170 39.6 ± 18.9 10 0.045 13.4
3 50.8 ± 19.8 107 26.2 ± 13.5 5 0.007 24.6
Class II-DSA
1 53.2 ± 18.7 191 42.6 ± 24.8 14 0.047 10.6
2 52.8 ± 20.0 169 42.4 ± 20.6 11 NS 10.4
3 51.1 ± 19.5 106 25.5 ± 16.4 6 0.002 25.6
Class I + II-DSA
1 53.0 ± 19.0 198 35.7 ± 23.6 7 0.019 17.3
2 52.6 ± 20.3 175 40.0 ± 24.5 5 NS 12.6
3 50.3 ± 20.0 109 28.7 ± 13.6 3 0.066 21.6
Strong MICA
1 52.8 ± 19.3 200 37.6 ± 14.0 5 0.082 15.2
2 52.8 ± 20.4 175 33.6 ± 15.8 5 0.039 19.2
3 50.5 ± 20.0 108 29.0 ± 14.8 4 0.036 21.5 1estimated glomerular filtration rate (ml/min/1.73m
2).
2Student‟s t-test for independent variables.
Reproduced with permission from Elsevier (Cox et al., 2001)

Chapter 7
286
Figure 7.4.2: Error bar charts showing mean eGFR (ml/min/1.73m2) of patients with and without
MICA antibodies overall, MICA-DSA and strong MICA antibodies. eGFR measurements were taken
at 2 years post-transplant.
Analysis using SCr values at one and two years post-transplant (Table 7.4.4) also revealed
significant association of increased values in graft recipients with MICA and HLA
antibodies. Significant differences were observed in patients with MICA antibodies after
one year (Z=-2.0; P=0.046) and two years (Z=-2.9; P=0.004). Co-production of HLA and
MICA antibodies associated with increased SCr after one year (Z=-2.4; P=0.017) with an
equivalent trend after two years (Z=-1.9; P=0.054). There was a trend of association with
HLA-DSA after one year of transplantation that became significant after the second year
(Z=-2.5; P=0.014). Similarly, MICA-DSA associated with a trend for increased SCr after
one year but correlated significantly after year two (Z=-3.2; P=0.001). Significant
differences also associated MICA-DSA alone following the second year of transplantation
P=0.008 P=0.001
P=0.027

Chapter 7
287
(Z=-2.0; P=0.044). Significant increases in SCr were observed with HLA class I-DSA after
the first year (Z=-2.2; P=0.025) and second year (Z=-2.7; P=0.007) of engraftment, whereas
HLA class II-DSA significantly associated with increased values only after two years (Z=-
2.1; P=0.039). Production of both class I and II HLA-DSA correlated with increased SCr at
one year (Z=-2.4; P=0.019) and two years (Z=-2.5; P=0.013) post-transplant. Strong MICA
antibodies (producing high-MFI) also showed significant association with increased SCr
after one year (Z=-2.4; P=0.015) and two years post-transplant (Z=-2.0; P=0.042).
Table 7.4.4: Mean rank serum creatinine comparisons with different HLA and/or MICA
antibody categories at one and two years post-transplant
Antibodies Yr
PT
Creatinine1 mean rank
2 (n)
1 year N=184; 2 year N=172
Negative Positive P Value Z Value
HLA 1 89.5 (131) 100.1 (53) NS -1.2
2 83.9 (125) 93.4 (47) NS -1.1
MICA 1 90.3 (171) 120.9 (13) 0.046 -2.0
2 83.5 (160) 126.8 (12) 0.004 -2.9
HLA and MICA 1 90.8 (178) 143.7 (6) 0.017 -2.4
2 85.1 (166) 125.0 (6) 0.054 -1.9
HLA-DSA 1 90.5 (169) 115.1 (15) 0.086 -1.7
2 83.6 (157) 116.6 (15) 0.014 -2.5
MICA-DSA 1 90.7 (174) 123.3 (10) 0.060 -1.8
2 83.6 (163) 138.6 (9) 0.001 -3.2
HLA-DSA Only 1 91.4 (171) 106.4 (13) NS -1.0
2 84.5 (159) 110.7 (13) 0.068 -1.8
MICA-DSA Only 1 92.4 (178) 96.8 (6) NS -0.2
2 85.2 (167) 130.7 (5) 0.044 -2.0
HLA class I-DSA 1 90.5 (175) 131.4 (9) 0.025 -2.2
2 84.1 (163) 130.4 (9) 0.007 -2.7
HLA class II-DSA 1 91.0 (173) 116.4 (11) NS -1.5
2 84.5 (161) 116.4 (11) 0.039 -2.1
Class I+II-DSA 1 91.0 (179) 147.4 (5) 0.019 -2.4
2 84.9 (167) 140.9 (5) 0.013 -2.5
Strong MICA 1 91.1 (180) 156.4 (4) 0.015 -2.4
2 85.3 (168) 136.6 (4) 0.042 -2.0 1serum creatinine (mol/l). 2Mann-Whitney U test.
7.4.4 Graft function multivariate analysis – linear regression model
Multivariate analysis of eGFR measurements taken at one (n=205), two (n=180) and three
years (n=112) post-transplant and SCr data for one (n=184) and two years (n=172) post-
transplant was performed using linear regression. Factors that were significant or a trend

Chapter 7
288
(P<0.100) by univariate analysis, were entered into the model at each time-point and results
are shown in Tables 7.4.5 and 7.4.6.
Table 7.4.5: Linear regression analysis of factors associated with eGFR decrease in renal graft
recipients
Year Variable Univariate
P-Value B
1 CI (95%)
Multivariate
P-Value
1
ACR 0.001 12.3 5.5 – 19.1 <0.001
aAMR 0.001 17.2 3.6 – 30.7 0.022
Donor > 50yrs <0.001 11.1 5.9 – 16.4 <0.001
Patient > 50yrs 0.020 3.7 - 0.172
Donor source 0.021 6.9 1.0 – 12.7 0.022
Donor female 0.006 7.1 1.9 – 12.2 0.007
HLA class I-DSA 0.028 3.6 - 0.575
HLA class II-DSA 0.047 8.8 - 0.166
MICA-DSA 0.073 6.5 - 0.251
2
ACR <0.001 12.8 5.4 – 20.1 0.001
Donor > 50yrs <0.001 17.3 11.7 – 22.8 <0.001
Donor female 0.007 6.3 0.8 – 11.9 0.026
HLA class I-DSA 0.045 11.2 0.4 – 22.3 0.050
MICA-DSA <0.001 16.1 3.9 – 28.2 0.010
3
ACR <0.001 15.9 8.2 – 23.6 <0.001
Donor > 50yrs <0.001 14.5 8.1 – 20.9 <0.001
Re-transplantation 0.013 1.0 - 0.985
HLA class I-DSA 0.007 18.8 0.3 – 37.4 0.046
HLA class II-DSA 0.002 1.7 - 0.860
MICA-DSA 0.059 10.8 - 0.172
1B – coefficient of variation, refers to difference in eGFR between positive and negative cases.
Covariates were included in the model where P< 0.100 by univariate analysis. Reproduced with
permission from Elsevier (Cox et al., 2001).
Linear regression analysis of factors associated with decreased graft function and
measurements of eGFR taken at one-year post-transplant revealed association with several
independent variables. At one year post-transplant, ACR and aAMR were independently
correlated with decreased eGFR (P<0.001 and P=0.022 respectively), both with high
coefficient of variation (B). Although ACR was more significant, aAMR associated with a

Chapter 7
289
larger decrease in eGFR of 17.2 ml/min/1.73m2 compared to 12.3 ml/min/1.73m2. Donors
aged > 50 years old highly correlated with decreased eGFR of 11.1 ml/min/1.73m2
(P<0.001) and the donor source (deceased) associated with a decrease of 6.9 ml/min/1.73m2
(P=0.022). Female donor was also an independent risk factor with a reduced eGFR of 7.1
ml/min/1.73m2 (P=0.007). MICA-DSA or HLA-DSA antibodies were not independent
variables at one year post-transplant. At two years post-transplant, significant independent
variables were ACR (P=0.001), donors aged > 50 years old (P<0.001), female donor gender
(P=0.026), HLA class I-DSA (P=0.050) and MICA-DSA (P=0.010). The independent
variable with the lowest reduction in eGFR was female donor (6.9 ml/min/1.73m2) whereas
the largest difference was observed with donors aged > 50 years old and resulted in a
decrease of 17.3 ml/min/1.73m2. MICA-DSA associated with a decrease of 16.1
ml/min/1.73m2, compared with 11.2 ml/min/1.73m2 with HLA class I-DSA. Among the
variables entered into the regression model for the three-year post-transplant time-point,
ACR (P<0.001), donors aged > 50 years old (P<0.001) and HLA class I-DSA (P=0.046)
were independent variables with eGFR differences of 15.9, 14.5 and 18.8 ml/min/1.73m2,
respectively
Linear regression analysis was also performed for variables showing significant association
or a trend with increased SCr. After one year of transplantation, variables significantly and
independently associated with a rise in SCr were ACR (P<0.001) and deceased donor
(P=0.018). Following the second year of transplantation, significant, independent variables
were ACR (P=0.024), donors > 50 years (P<0.001), male patients (P=0.014), HLA class I-
DSA (P=0.002) and MICA-DSA (P=0.001). Results are shown in Table 7.4.6.

Chapter 7
290
Table 7.4.6: Linear regression analysis of factors associated with mean rank serum creatinine
increase in renal graft recipients
Year Variable Univariate
P-Value B
1 CI (95%)
Multivariate
P-Value
1
ACR 0.001 64.1 31.8 – 96.4 <0.001
Donor > 50yrs 0.001 18.6 - 0.149
Deceased donor 0.043 35.1 6.0 – 64.2 0.018
Donor female 0.025 21.7 - 0.096
Patient male <0.001 2.8 - 0.825
HLA class I-DSA 0.025 30.9 - 0.289
MICA-DSA 0.060 21.5 - 0.461
2
ACR 0.005 24.0 3.3 – 44.7 0.024
Donor > 50yrs <0.001 32.3 16.4 – 48.2 <0.001
Donor female 0.022 14.7 - 0.071
Patient male <0.001 20.6 4.2 – 36.9 0.014
HLA class I-DSA 0.007 62.7 22.7 – 103 0.002
MICA-DSA 0.001 67.5 28.9 – 106 0.001
1B – coefficient of variation, refers to difference in SCr between positive and negative cases. Covariates
were included in the model where P< 0.100 by univariate analysis.
7.4.5 Assessment of chronic renal damage by morphometric analysis
Of seventeen MICA antibody positive graft recipients, ten had biopsies taken for arbitrary
reasons at an average of nine months post-transplant. Among the ten biopsies, three (30%)
had an index >40% chronic damage in the renal cortex and these patients did not have HLA
class I or class II antibodies detected by HLA SAg Luminex assay.
Chapter 7
291
7.5 Discussion
7.5.1 Soluble MICA and soluble MICB in renal transplantation
It has become increasingly evident in recent years that the soluble forms of MICA and
MICB molecules have the potential to engage the NK-cell activatory receptor NKG2D and
down-regulate expression (Groh et al., 2002). This has the effect of reducing the potential
of NK-cells to lyse target cells via NKG2D and is proposed as a tumour immune evasion
mechanism. Soluble MICA and MICB can be detected at high levels in patients with
various carcinomas (Marten et al., 2006) and has been associated with poorer prognosis.
Soluble MICA levels have also been found to be higher in haematopoietic stem cell
transplantation (HSCT) patients than in healthy controls, moreover higher levels of sMICA
were significantly associated with chronic GvHD (cGVHD) (Boukouaci et al., 2009). It is
likely that sMICA found in patients with cGVHD is a consequence of inflammatory events
taking place post-transplant rather than an involvement of sMICA with the pathogenesis of
cGVHD. These authors also found that having MICA antibodies associated with a lower
incidence of sMICA detection and may indicate that MICA antibodies can neutralise
sMICA.
The hypothesis was made that sMICA detected in the sera of heart transplant recipients may
have an immunosuppressive effect and decrease incidence of AR (Suarez-Alvarez et al.,
2006a; Suarez-Alvarez et al., 2006b). Since there are no publications investigating the
relationship of sMICA and rejection in renal transplant recipients and the study by Suarez-
Alvarez was not very large (n=34 and only ten patients had rejection), I decided to analyse
the smaller recipient cohort for the presence of sMICA (n=200, 53 with rejection) and
sMICB (n=201, 52 with rejection). The results for this part of the study show that 12.4% of
200 graft recipients had detectable sMICA in their serum at one year post-transplant and
41% of 201 recipients had detectable sMICB. Generally the mean concentration of sMICB
was higher than for sMICA. In this study there was no significant association of soluble
MIC with any transplantation variable except for sMICB with younger recipient age
(P=0.015) and number of HLA-A, -B, -C mismatches (P=0.010). The sMICB negative
group curiously had more HLA mismatches than the sMICB positive group. There was
also no significant association with sMICA or sMICB with the presence of HLA or MICA
antibodies or with rejection in this study. The contrast in findings between the Suarez-
Alvarez study and this one may relate to the type of transplantation, theirs was heart
Chapter 7
292
transplants and sMICA expression may be more frequent than in renal transplants as their
frequencies were much higher. More likely it is the size of the study as only 34 patients in
total were analysed, compared to 200 patients in this study.
Analysis of eGFR in patients with or without sMICA or sMICB showed patients with
sMICA had better graft function compared to those without. Although only a statistical
trend (P=0.078), 45% less patients had eGFR > 30 ml/min/1.73m2 if they were negative for
sMICA. Interestingly, although not significant, Kaplan-Meier analysis (discussed in the
next section) revealed a tendency for recipients with sMICA or sMICB to have better
overall GS (98%) at five years compared to sMICA or sMICB negative recipients (83%).
Analysis of sMICA and sMICB individually showed less of a difference with sMICA (90%
versus 86%) than with sMICB (98% versus 85%). Therefore it is possible that soluble
NKG2D ligands detected in serum can protect against graft dysfunction and loss.
7.5.2 Five-year kidney graft survival analysis
Although it was of interest to analyse the kidney recipients for five-year overall GS, this is a
relatively small cohort (216 patients). The ten patients eligible for the study (a small
number for this kind of analysis) with graft failure represent a loss rate of 5% over five
years and, therefore, a five-year graft OS of 95% for this cohort. Including all patients who
lost grafts or died, overall GS for five years was 90%. There are many factors that associate
with decreased renal GS, as discussed in Chapter 1, and I have included as many risk
factors as possible where information was available and the numbers were not too small to
render statistical analysis meaningless.
Live donors are associated with improved patient survival as well as GS. The results from
this study revealed grafts from living donors had a survival of 98% after 5 years compared
to 82% from deceased donors, however this was not statistically significant. Five-year
patient survival was better than average in this cohort with 97% of patients with grafts from
living donors and 97% of patients with deceased donor grafts still alive after five years.
Thus, in terms of patient survival there was no difference between live and deceased donor
transplants found in this study.
There are many studies investigating the effect of donor gender on GS. The largest
European study was by the CTS and included 124,911 kidney transplants (Zeier et al.,
2002). Inferior graft outcome was apparent when male recipients received renal grafts from

Chapter 7
293
female donors. Female patients also had poorer GS when the donor was female although
the effect was more pronounced in male recipients and took several years to become
apparent in both groups. My study also revealed a gender bias with GS based on gender of
the donor. There was virtually no difference in survival when the recipient was female.
The effect of donor gender was much stronger when the patient was male and the organ was
from a female donor where 60% were still functioning after five years compared to 89%
when the donor was male (Log rank p=0.06). Much of this difference only occurred after
three years post-transplant and may explain why statistical significance was not achieved. A
suggested reason is nephron under dosing with grafts from female donors (Brenner et al.,
1992). In allogeneic or syngeneic transplants, reduction of nephron mass had adverse
effects on graft function and morphology (Azuma et al., 1997). Therefore female donated
kidneys have shorter survival because they are smaller, although this remains controversial,
not least because it has been confirmed that males receiving livers from female donors also
show poorer GS (Brooks et al., 1997). Studies have also found that a significantly higher
number of male recipients of female donor kidneys required treatment for rejection within
the first year of transplantation (Vereerstraeten et al., 1999; Zeier et al., 2002).
Another non-immunological factor that may influence GS is age of the donor or recipient.
It has been recognised for some time that there may be a negative impact on long-term
kidney GS with increasing donor age (CTS, 1991) and was verified in a very large cohort of
kidney transplants (Opelz, 2000). Donor age is now recognised as a major risk factor for
long-term GS. In general older renal graft recipients and donors over 60 years of age do
less well. Both age-related immune and non-immune factors can influence GS in elderly
patients. The results from my study are not significant but show decreased GS when the
recipient is over 60 years and a stepwise reduction in survival with increasing donor age
associating with decreased survival. Donors aged between 50 and 59 years associated with
five-year renal GS of 80% and donors over 60 years, 68%. This compares to donors aged
18-34 years associating with GS of 96% and donors aged 35-49 years associating with GS
of 94%. Again, these differences were only noticeable after three years post-transplant.
The association of re-transplantation with significantly decreased GS of 80% compared to
90% for primary transplants (Log rank p=0.002) may correlate with pre-sensitisation to
HLA and/or MICA antigens. Chi-squared analysis showed MICA antibodies associated
with re-transplantation (P<0.001) as discussed above and in a separate analysis, HLA class I
and II antibodies were also highly significantly associated with re-transplantation
(P<0.001). It is therefore likely that the decreased GS associated with re-transplanted

Chapter 7
294
patients is a consequence of HLA and/or MICA antibody production. However, MICA
antibodies did not significantly associate with decreased GS in this study. This is possibly
due to the relatively small number of MICA positive individuals and only one patient
reaching the study end-point (graft failure), which has reduced statistical power. Previous
studies have demonstrated association of MICA antibodies with inferior GS (Mizutani et
al., 2005; Panigrahi et al., 2007b; Panigrahi et al., 2007c; Zou et al., 2007). However, in a
recent study of 425 patients (Lemy et al., 2010) using the Gen-Probe Luminex assay, the
authors also found no significant difference in GS after ten years between patients with and
without MICA antibodies. Moreover, patients without MICA antibodies actually had
slightly worse GS. Although the study by Zou and co-workers (Zou et al., 2007) revealed
convincing evidence for association of pre-formed MICA antibodies with decreased GS, it
remains unclear whether MICA antibodies produced post-transplant associate with
decreased GS and highlights a need for large, collaborative, multicentre studies.
In the early days of kidney transplantation, matching donor and recipient for class I HLA-A
and HLA-B and class II HLA-DR antigens had a major impact on both patient and GS
(Persijn et al., 1978). A study by the CTS shows a direct correlation with the number of
HLA mismatches and GS. A stepwise reduction in GS clearly shows completely matched
grafts (HLA-A, B, DR) have superior survival and a six-antigen mismatch has the poorest
GS. Results from my study did not show a significant correlation between the degree of
HLA matching and five-year GS. This could be because it is a relatively small single-
centre study and the six categories of 0-6 mismatches render each group even smaller for
example, only three patients had six mismatches. Analysis of each locus (including HLA-C
and –DQ) also revealed no significant association with mismatching and GS. I also carried
out analysis for MICA allele mismatching in relation to five-year GS. This too did not
reveal significance, although a survival rate of 76% was observed with two MICA allele
mismatches compared to 90% with one mismatch or 88% with no mismatches. This is, to
my knowledge, the first time analysis with MICA matching and GS has been carried out
and only future multicentre and collaborative studies will be able to address this issue with
any reliability.
The final variable considered for analysis of GS was ACR or aAMR. Early AR (within 6
months) has been shown by many studies to be an important prognostic factor for reduced
GS. A study of 219 primary transplants from living related donors found early AR was
significantly correlated with the subsequent detection of biopsy proven CAD (Basadonna et
al., 1993). Interestingly, Cox regression analysis of my data revealed significant risk

Chapter 7
295
factors for graft loss to be HLA class II antibodies, ACR and aAMR leading to eventual
chronic loss of function and loss of the graft. This would make sense as cellular rejection
can be successfully treated with immunosuppressive drugs but causes permanent damage to
the graft and little can be done routinely to prevent antibody-mediated graft injury from
accumulating. I was unable to obtain data of diffuse C4d staining in peritubular capillaries
for all patients diagnosed with aAMR but many were not C4d positive, possibly because the
method for detection was immunoperoxidase staining rather than the more sensitive
immunofluorescence technique. There was, however, a highly significant correlation
between HLA class I and II-DSA and aAMR in univariate analysis and 50% of recipients
with both types of HLA DSA had C4d deposition detected.
7.5.3 Renal graft function analysis
Known risk factors affecting long-term renal allograft survival include source of the donor
(deceased or living), gender and age of the donor or patient, AR and sensitisation to HLA
antigens. Other major risk factors known to have a negative impact on GS and function are
calcineurin inhibitor use (CNI) and delayed graft function (DGF). DGF is very frequent
with deceased donors, occurring with 50% of non-heart beating donors and 30% of heart
beating donors, compared with only 5% of living donors (personal communication, Mark
Harber). Unfortunately, details of DGF and CNI use were not available for this analysis
and their contribution to reduced graft function and CAD cannot be assessed. However, as
most patients with DGF received grafts from deceased donors, the impact of DGF would be
included by analysis of donor source.
The mean eGFR for all patients at one and two years post-transplant was 52.6
ml/min/1.73m2 and after three years was 49.8 ml/min/1.73m2. This represents a gradual
decline over the years with most patients having the equivalent of CKD stage 3, similar to
other studies (Karthikeyan et al., 2004; Marcen et al., 2005).
Donor gender was discussed in the previous section in the context of GS and the poorer
survival of female donor organs also correlates with decreased graft function. Female
donor organs significantly associated with reduced eGFR after one and two years post
transplant. Based on averages of eGFR over the three years of follow-up, there was a
significant difference of 7.5 ml/min/1.73m2 in favour of male kidneys although this was
only significant in the first two years post-transplant, perhaps indicating that although
responsible for lower eGFR, this situation is not progressive. Analysis of serum creatinine

Chapter 7
296
values indicated female kidneys associated with higher values but was not as highly
significant as analysis of eGFR. Interestingly, there was no significant difference of eGFR
between male or female recipients but comparison of mean rank serum creatinine levels
revealed highly significantly increased levels in male recipients. This probably relates to
the fact that men have a higher muscle mass than women and produce more creatinine,
highlighting the usefulness of the eGFR MDRD method of analysis. Furthermore, the
decreased significance of female organs by SCr analysis, compared to eGFR analysis is
likely to be related to higher SCr values in male recipients, reducing the differential.
Older patients associated with a decline in graft function but only significantly in the first
year post-transplant and this was not verified by serum creatinine analysis. By contrast,
older donors significantly associated with worse outcomes by both eGFR and SCr analysis,
in agreement with previous studies (Almond et al., 1993; Jain et al., 2010; Oien et al., 2007;
Pessione et al., 2003; Zeier et al., 2002). Both eGFR and SCr analysis identified significant
outcome differences with deceased donors after one year of transplantation. Conversely, re-
transplantation only associated with significantly reduced eGFR after three years and could
indicate a correlation with the increased presence of HLA antibodies in these patients.
ACR was highly correlated with reduced function at each time-point with increased eGFR
mean difference and SCr. Although ACR is injurious to the graft, causing nephron cell
death if untreated, this also is thought to be non-progressive once the AR episode is
alleviated (Halloran, 2010). The further deterioration that is observed in these patients may
relate to the production of antibodies after the rejection episode. Acute AMR was only
associated with significantly reduced eGFR after one year post-transplant by univariate
analysis. There was no significant association of aAMR with increased SCr, although
levels were higher. The significant reduction of eGFR could be related to both pre-formed
antibodies as well as sensitisation to donor antigens occurring in the early post-transplant
period when the organ is more inflamed due to cold or warm ischaemia-reperfusion injury.
As my study did not show an association of MICA antibodies with significantly decreased
GS as observed by some other studies, I focussed on investigating correlation of MICA and
HLA antibodies with impaired graft function using SCr and eGFR measurements taken
post-transplant. Analysis of all patients eligible for this part of the study revealed no
significant correlation with HLA antibodies overall, although there was evidence of a trend
after three years for reduced eGFR. Interestingly, significant association of decreased graft
function, with large eGFR and SCr differences, was observed in recipients with MICA
antibodies. The strongest associations were after two years post-transplant, particularly

Chapter 7
297
patients with MICA-DSA antibodies, resulting in a mean eGFR difference of 17.7
ml/min/1.73m2 (P<0.001). Recipients with strong MICA antibodies also associated with
decreased function although only four patients were included in the positive group,
accounting for the lower P values. It is interesting that among six recipients with MICA-
DSA but no HLA antibodies, there was highly significant association (P=0.001) with a
decreased eGFR of 18 ml/min/1.73m2 following the second year of transplant by both eGFR
and SCr analysis. This contrasts with HLA-DSA where significance with reduced eGFR
was not reached until after the third year of engraftment (P<0.001), also involving six
patients. The reduction in eGFR was, however, higher than MICA-DSA resulting in a
reduced eGFR of 27 ml/min/1.73m2.
HLA class I-DSA associated with a significant and steady decrease in graft function with a
mean eGFR difference ranging from 12.6 to 24.6 ml/min/1.73m2 between years one and
three post-transplant, most significantly after three years. HLA class II-DSA associated
with significantly decreased graft function after one-year post-transplant and may relate to
aAMR, as there was no progressive damage evident at two years post-transplant. However,
by three years post-transplant, HLA class II-DSA was highly significantly associated with a
decrease of 25.6 ml/min/1.73m2 and could indicate that these antibodies require several
years to cause chronic damage and CAD as reported in studies discussed above. There was
a significant correlation with reduced eGFR and increased SCr if patients had both HLA
class I and II-DSA, particularly after the first year of transplantation and possibly indicates
damage caused by pre-formed and de novo HLA antibodies, leading to aAMR. However,
both types of HLA-DSA associated with a trend for reduced eGFR after three years of
engraftment, whereas individually, class I or II-DSA where highly significant at three years
post-transplant.
Linear regression analysis of transplantation variables revealing significant or trend
association with reduced eGFR or increased SCr by univariate analysis was performed. The
results from the eGFR statistical model indicated independent transplant variables at one-
year post-transplant were ACR, aAMR, donors > 50 years old, deceased donors and female
donor gender but not MICA or HLA antibodies. The SCr model also identified ACR and
deceased donors as independent variables and revealed no independent relationship with
male recipients. However, donor age or gender were not independently significant factors
as revealed by eGFR measurement, which may relate to limitations of SCr analysis. The
SCr linear regression model failed to identify MICA or HLA antibodies as independent
variables associated with graft dysfunction after one year of transplantation, confirming

Chapter 7
298
results of eGFR analysis. This finding seems to indicate that in the first year of
transplantation, it is factors relating to the donor (age, gender, deceased or living) in
addition to AR that are the main factors affecting graft function.
Risk factors for reduced eGFR after two years post-transplant found to be significant
independent variables were ACR, donors > 50 years old, female donors, HLA class I-DSA
and MICA-DSA. All variables entered into this model remained as significant independent
factors associated with graft dysfunction. The SCr linear regression model revealed similar
results, however male recipients also independently associated with reduced graft function
but this may be due to males producing more SCr. Importantly, both methods of analysis
showed independent association of MICA-DSA with graft dysfunction and this is a novel
finding.
After three years post-transplant, significant independent variables associated with
decreased eGFR were ACR, donors > 50 years old and HLA class I-DSA. It is likely that a
lack of association with MICA-DSA is due to only six individuals with MICA-DSA
remaining in the study after three years. Although not significant, there was still a
reduction of 10.8 ml/min/1.73m2 in recipients with MICA-DSA compared to an eGFR
reduction of 18.8 ml/min/1.73m2 for recipients with HLA class I-DSA.
Overall, the effect of MICA antibodies had a persistent association with decreased eGFR
and accounted for a large difference in function between those with or without MICA
antibodies. Significant independent association with graft dysfunction correlated with
MICA-DSA, becoming apparent at two years post-transplant. HLA class I-DSA also have
a role in CAD and appears to occur around the same time as MICA-DSA association with
reduced function. The results show HLA class II antibodies take longer to correlate with
reduced function as HLA class II-DSA had more of an effect at the three-year time-point in
contrast to MICA-DSA or HLA class I-DSA. These data show that it takes time for
antibodies to have an independent effect and different types of antibody associate with a
decline in graft function at different time points, possibly reflecting independent
mechanisms of graft injury.
The finding that recipients with MICA-DSA are likely to have decreased eGFR, the
apparent differential time kinetics of MICA or HLA antibody-mediated graft damage and
their significant independent association with reduced function, indicates that two or more
separate immunological mechanisms may be at play. Although there was less of a

Chapter 7
299
reduction in eGFR with MICA-DSA compared to HLA-DSA, the reduction caused by
MICA-DSA was almost as severe as that caused by donor organs > 50 years of age, as
revealed by linear regression analysis. Additionally, assessment of chronic renal damage by
morphometric analysis showed that three patients of the ten with biopsies taken at nine
months post-transplant had an index of >40% chronic damage in the renal cortex, strongly
indicative of CAD. Importantly, these three patients only had MICA antibodies as HLA
antibodies were undetected and verified using an HLA SAg Luminex assay.
7.5.4 Possible mechanisms of allograft injury by MICA antibodies
A correlation between MICA antibodies and ACR suggests cellular mechanisms culminate
in MICA sensitisation. Further multivariate analysis revealed only patients with strong
MICA antibodies developed AR. It is likely that T-cell indirect allorecognition of
mismatched MICA epitopes can give rise not only to T-cell help for the production of IgG
antibodies against MICA, but also cell-mediated immunity resulting in cellular rejection.
By comparison, a study investigating MICA matching and GvHD in hematopoietic stem
cell transplantation found a significantly higher rate of grade II-IV acute GvHD in MICA
mismatched patients, indicating a T-cell response to mismatched MICA antigens (Parmar et
al., 2009). This mechanism is illustrated in Figure 7.5.1 (A) showing uptake of cell debris
or sMICA molecules by recipient DCs or B-cells and subsequent presentation to naïve
alloreactive CD4+ T-cells to produce T-effector cells and antibody-producing B-cell clones.
Analysis of serial serum samples from patients with strong MICA antibodies who
experienced ACR revealed that antibodies were not present before the ACR episode and
therefore not the cause. The higher level of MICA antibodies in patients who had ACR
may relate to an increased expression of MICA during an inflammatory alloresponse.
Nevertheless, de novo or pre-existing MICA antibodies may be implicated in the longer
process of CAD.
Evidence from recent studies investigating the role of NK-cells and its activatory receptor,
NKG2D, in solid organ transplantation suggest these innate immune cells participate in the
allo-immune response directly and indirectly by cross-talk with cells of the adaptive
immune response. The dogma that has been upheld is that NK-cells do not participate in
rejection as earlier studies showed rats depleted of NK-cells still rejected skin, heart or liver
allografts (Heidecke et al., 1985). Additionally, T-cell depletion resulted in allografts being
accepted, indicating that only T-cells are important. However since then phenotypic
characteristics of NK-cells relating to inhibitory and activatory receptors have been

Chapter 7
300
revealed and among them, NKG2D has emerged as an important activatory receptor (Bauer
et al., 1999).
As already discussed, MICA is abundantly expressed in renal and pancreatic grafts
following transplantation (Hankey et al., 2002) and a more recent study has shown that in
mice, NKG2D ligands are rapidly up-regulated in response to injury associated with cardiac
transplantation and associate with an innate immune response. This was followed by a
second wave of NKG2D ligand up-regulation mediated by the adaptive immune response
(Kim et al., 2007). Blockade of NKG2D in CD28 negative mice or in the context of B7
blockade resulted in extending the allograft survival. NK-cells can become activated in
response to ligands expressed on allografts and secrete cytolytic enzymes such as granzyme
A and B and perforin as well as inflammatory cytokines IFN- and TNF- that enhance
antigen-specific T-effector cell activity and DC function (Obara et al., 2005). Thus,
NKG2D ligation with MICA molecules expressed on allografts may provide a link between
the innate and adaptive immune responses leading to acute and chronic graft rejection
(Kitchens et al., 2006).
The definitive role of NK-cells in allograft rejection awaits clarification but NK-cells have
been implicated with both transplant rejection and tolerance depending on their activation
status and cross-talk between NK and other cells (Suarez-Alvarez et al., 2009b). It appears
from the literature that in solid organ transplantation, MHC class-I mismatching between
donor and recipients is necessary but not sufficient to mediate rejection of allografts via
KIR receptors by NK-cells (Uehara et al., 2005), possibly because of the requirement for
co-expression of other receptors as well as KIR, unlike NKG2D where no co-stimulation is
required for activation. In a mouse skin transplant model, NK-cells stimulated with IL-15
differentiated and acquired additional effector functions that mediated graft rejection
independent of an adaptive immune response (Kroemer et al., 2008). However, in the
resting state or in the absence of inflammation, NK-cells can favour tolerance by killing
donor DCs or suppressing T-cell activation. In addition, pro-inflammatory cytokines such
as IL-12, IL-15 and IL-18 can up-regulate expression of NKG2D and its ligands, thus
enhancing NKG2D effector functions. NKG2D ligands may also be upregulated on DCs in
response to TNF- or IFN- and the reciprocal production of IL-15 by DCs could further
amplify NKG2D-mediated immunity. Macrophages are prominent in rejecting tissues and
are highly responsive to TNF- and IFN-, resulting in activation and up-regulation of
NKG2D expression, which may enhance effector functions and lysis of graft cells via
engagement with MICA (Figure 7.5.1 (C)) and provide a further source of IL-15 (Liu and

Chapter 7
301
Li, 2010). Cytokines produced by activated NK-cells can also stimulate MHC class I and II
expression on target cells, rendering them susceptible to attack by antigen-specific effector
T-cells as shown in Figure 7.5.1. Conversely, NK-cells may lyse activated CD4+ and
CD8+ T-cells via engagement of NKG2D with MICA, in a perforin-dependent manner as
described by Molinero and co-workers (Molinero et al., 2002a), thereby participating in
transplant tolerance. NK-cells exposed to IL-15 may also be able to influence T-regulatory
(Treg) cell involvement by engagement of NKG2D with ULBP1 (only NKG2D ligand to be
found on expanded Tregs) and direct lysis by the NK-cells, thereby reducing their numbers
(Roy et al., 2008) as shown in Figure 7.5.1 (D). Another mechanism that could lead to graft
tolerance and already discussed is down-regulation of NKG2D by engagement with sMICA
that can be detected in the serum of some patients (Figure 7.5.1 (E)). My own experiments
did not show reduced AR in patients with sMICA in contrast to a published study (Suarez-
Alvarez et al., 2006b) although I have confirmed that this molecule induces down-
regulation of NKG2D and when detected in renal graft recipients, associates with a trend
showing higher eGFR.
The results of these more recent studies indicate a role for NK-cells in acute and chronic
graft rejection by amplifying adaptive immune responses via cross-talk between cells of
innate and acquired immunity. NK-cells have different functions depending on certain
conditions and can either participate in and enhance rejection processes or support
tolerance. Moreover, studies have revealed that CsA does not inhibit alloreactive NK-cell
cytotoxicity or proliferation (Petersson et al., 1997). In addition, tacrolimus, MMF and
short-term azathioprine are ineffective in suppressing NK-cells (Alamartine et al., 1994;
Pedersen and Beyer, 1986; Shapira et al., 2005). However, a recent publication has shown
that proliferation of IL-2 activated healthy donor NK-cells is inhibited in the presence of
these drugs and MMF can reduce surface expression of NK-cell activatory receptors,
including NKG2D (Ohata et al., 2011). More studies are clearly required to elucidate the
effect of immunosuppression on NK cell activity. Attempts have been made to limit NK-
cell activation in transplantation by blocking activatory receptors. Blockade of NKG2D in
CD28 negative mice or in the context of B7 blockade resulted in extending allograft
survival (Kim et al., 2007) and may also be applicable to humans. Importantly, these
authors found blockade of NKG2D did not deplete CD8+ T-cells or NK-cells or prevent
their infiltration into cardiac grafts, suggesting NKG2D blockade results in effector function
inhibition. Thus, MMF use or NKG2D blockade in renal transplantation in humans may
have the potential to tip the balance in favour of tolerance and prevent or limit rejection.

Chapter 7
302
Integrative genomics analysis of serological responses against MICA antigens after renal
transplantation identified the glomerulus as a specific target (L. Li et al., 2009).
Immunohistochemistry (IHC) was performed which localised expression of MICA to
podocytes within the glomeruli (L. Li et al., 2010). In addition, the presence of infiltrating
mononuclear cells, B-cells, CD8+ T-cells and NK-cells in renal transplant biopsies
confirming AR was indicated by IHC staining with antibodies against cell-specific markers.
Post-transplant, functionally significant damage in the renal cortex include AR, infection
and allorecognition of compartment-specific antigens. It is feasible that MICA antibodies
reacting with over-expressed MICA antigens in these compartments activate complement-
dependent cytotoxicity and may also facilitate direct lysis by degranulation of NK-cells
engaging NKG2D with MICA ligands or activated via FcRIIIA (CD16) through antibody
interaction (Figure 7.5.1 (G)). Alternatively, binding of antibodies with MICA molecules
may initiate complement-independent mechanisms of graft damage by inducing a
prothrombotic phenotype resulting in vascular thrombosis and loss of graft function
(Sumitran-Holgersson et al., 2002). These authors observed that antithrombotic molecules
such as perlecan and thrombomodulin were decreased and prothrombotic molecules
increased when endothelial cells were incubated with sera from patients who were positive
for MICA antibodies. Furthermore, complement-independent mechanisms of graft injury
may explain association of MICA antibodies with rejection in the absence of C4d
deposition.

Chapter 7
303
Figure 7.5.1: Indirect allorecognition, MICA, NKG2D and the immune response in transplantation. (A) Allogeneic MICA peptides from apoptotic cell material or
shed sMICA is presented to CD4+ T-cells by recipient DCs or B-cells resulting in effector T-cells and MICA antibody producing B-cells. (B) Expansion of alloreactive T-
cells and B-cell clones. (C) Cytokines produced by activated NK-cells upregulate NKG2D on macrophages enhancing the lytic function. (D) NK-cells limit Treg expansion
by engagement of NKG2D with ULBP1 and NK-cell-mediated lysis. (E) Soluble MICA shed from the graft causes down-regulation of NKG2D receptors. (F) Over-
expression of MICA in grafted tissue enables NK-mediated direct lysis. (G) Deposition of antibodies enables ADCC via the NK FcRIII receptor. (H) NK-cells can engage
NKG2D with MICA expressed on immature DCs leading to DC maturation. (I) Antibody-mediated lysis by complement deposition (J) NK-cell expansion and additional
effector functions via IL-15. (K) NK-cell activation by KIR recognition of mismatched MHC class I. IFN- and TNF- amplify the immune response by enhancing T-
effector function and up-regulating MHC class I and II expression.

Chapter 7
304
7.5.5 Limitations of this study
This study has certain limitations, firstly analysis within different groups, such as deceased
or living donors and primary or re-transplanted patients, was not possible as this
considerably reduced the size of the cohorts and would not be statistically robust. Also, I
have not considered the effect of immunosuppression protocol differences due to the data
not being available to me, and it is known that the use of CNI associates with
nephrotoxicity and chronic renal damage (Nankivell et al., 2004). However a study of 161
kidney recipients found no association with drug therapy and MICA antibody status
(Suarez-Alvarez et al., 2009a) and a slight, but significant, increase in mycophenolic acid
use in MICA antibody positive recipients, but not CNI was found by Zou (Zou et al., 2007).
The possibility remains, however, that CNI use may impact on long-term eGFR and
function. We have also not considered recipient primary disease, however in a similar
study this too was not significant in terms of MICA antibodies (Suarez-Alvarez et al.,
2009a) but may also have an effect on long-term function. DGF is a known risk factor for
acute and chronic graft rejection (Troppmann et al., 1995) but again, this information was
not available. The definition of MICA antibody positivity was dependent on concordant
results from two out of three tests and was only performed for sera that tested positive by
MICA Luminex screening (One Lambda, CA, USA), therefore I may have underestimated
the prevalence of MICA antibody positivity due to variations within the methodologies
used. In addition, the mean time of testing for MICA and HLA antibodies was only seven
months post-transplant and many of the patients transplanted in 2008 (when most of the
testing was done) only had sera available between one and three months post-transplant.
Therefore some patients may not have been transplanted for a sufficient period to allow
time for sensitisation to donor antigens. Finally, although the immobilised MICA proteins
used for detection of MICA antibodies cover the most common MICA alleles defined, it is
possible that I may have missed detection of antibodies reactive with rare MICA proteins,
again underestimating the prevalence of MICA antibody positivity.
The results from this study highlight a need for further work to clarify the role of MICA
antibodies and MICA mismatching in renal AR and CAD and future, larger, multi-centre
studies addressing the issues discussed in this and previous chapters may confirm my
findings with greater certainty

Chapter 8
305
CHAPTER 8
Conclusions
It is now more than half a century since Murray and colleagues performed the first
successful kidney transplant and over this time refinements of HLA typing, HLA antibody
detection and crossmatching, immunosuppression and organ preservation have improved
both patient and GS. In the UK, around 2519 renal transplants are performed each year,
increasing by 8% per year. UK one-year GS rates of 95% for living donor and 93% for
deceased kidney donors are now achieved and continue to improve gradually year on year.
However, 2-4% of renal transplants fail each year, half of these are a consequence of death
of the patient with a functioning graft and the other half due to progressive graft
dysfunction. For these reasons the longer term outcomes in renal transplantation are not as
impressive, showing ten-year GS rates of 78% for living and 67% for deceased donors and
in contrast to one-year GS, these figures have remained unchanged (statistics from UK
Transplant Activity Report, 2009/10, reproduced with kind permission).
As described in Chapter 1, many factors both immunological and non-immunological can
contribute to progressive graft dysfunction, termed chronic allograft dysfunction (CAD), in
organ transplantation. Evidence has been increasing of involvement of HLA antibodies
with CAD progression (Terasaki and Ozawa, 2004) and results of the chronic rejection
component of the 13th IHIWC project revealed 40% of chronic rejection graft loss could be
attributable to HLA antibodies (Ozawa et al., 2007). As there remain a proportion of
chronic graft failures that have not resulted from death with a functioning graft or HLA
antibodies, attention has also focussed on non-HLA antigens as targets of immune
destruction by antibodies. Moreover, HAR has been documented in patients without HLA
antibodies, implicating other alloantigens (Sumitran-Karuppan et al., 1997). Several non-
polymorphic antigens expressed on endothelial cells have been identified in organ
transplantation and are possible candidates, including angiotensin type I receptor, vimentin
and glutathione-S-transferase T1. More importantly, the antigenic products of the MICA
and MICB genes are expressed on endothelial tissues and become upregulated due to stress
and inflammation. Furthermore, these genes are highly polymorphic, in close proximity to
HLA-B, expressed in a co-dominant manner and their products are ligands for the NK-cell
activatory receptor, NKG2D. For these reasons investigations of MICA and MICB alleles

Chapter 8
306
and antigens in the field of transplantation have been carried out since their discovery
almost twenty years ago.
It has now been established that the presence of MICA antibodies detected in organ
transplant recipients either pre- or post-transplantation can result in AR, CAD or reduced
GS. However, no study has provided detailed analysis of MICA matching between
recipients and their donors, therefore the relevance of MICA polymorphism in
transplantation and the development of MICA antibodies has not been fully investigated.
MICA typing of donors is also essential to determine whether MICA-DSA is detrimental to
GS, as is the case with HLA-DSA, or whether MICA-DSA associate with graft dysfunction.
The aim of my PhD project was to attempt to resolve some of these issues by carrying out a
study investigating MICA allele mismatching, development of MICA antibodies post-
transplant and correlations with AR, GS and CAD in a large, single centre renal graft
recipient cohort. To evaluate the relevance of MICA diversity in the transplant setting, I
developed a SBT approach for MICA typing to enable high-resolution characterisation of
MICA alleles in 227 kidney recipients and their donors.
MICA typing of over 600 individuals for this analysis revealed two novel MICA alleles,
further increasing the diversity of the MICA gene. This suggests that the MICA allelic
repertoire could be much larger than the 76 variants characterised so far (IMGT/HLA
database release 3.4.0, April 2011), for two main reasons. Firstly, MICA typing by SBT is
not widely carried out and is the only method capable of identifying novel alleles whenever
they are encountered (with the exception of RSCA). Most studies involving MICA typing
now use the commercially available Luminex-based SSOP method (One Lambda) or
concentrate only on the number of GCT repeats in the transmembrane region. Therefore
nucleotide mutations outside probe target regions or in the extracellular domains will not be
detected with these methods. Secondly, in contrast to HLA typing, characterisation of
MICA alleles in recipients and donors is not a requirement for transplantation and
subsequently carried out in only a few centres, again impeding the elucidation of the extent
of MICA polymorphism. For these reasons, and bearing in mind the exponential rise of
new HLA alleles that resulted from the introduction of molecular HLA typing methods, the
number of different MICA alleles in the human population could be far greater than is
currently appreciated. Nevertheless, my analysis confirmed previous observations that the
majority of expressed MICA molecules were limited to a few allelic variants common in
various populations (Gao et al., 2006). The MICA typing carried out for this project was

Chapter 8
307
performed with as many patient and donor pairs as possible, utilising a DNA resource that
was established at Anthony Nolan. I was able to analyse MICA allelic profiles for 227
pairs (from a total of 301) transplanted between 2003 and 2008 and examine statistical
relationships with MICA mismatching and the development of MICA antibodies and the
impact of MICA antibodies and MICA-DSA on AR, graft dysfunction and five-year GS.
The analysis detailed in Chapter 5 showed highly significant association of MICA allele
and MICA amino acid residue mismatching with the development of MICA antibodies
post-transplant. Further analysis showed MICA amino acid mismatching was
independently associated with the presence of MICA antibodies. Moreover, analysis of
mismatched MICA amino acid residues revealed strong, significant association with
mismatches involving residues that differ between two MICA ancestral lineages, or unique
polymorphisms associated with particular MICA alleles. There was also a significant
correlation with the presence of MICA antibodies detected in patients who had previous
transplants as previously reported (Lemy et al., 2010), suggesting prior MICA mismatching
resulted in MICA sensitisation, as is the case with HLA antibodies. It is therefore highly
likely that mismatching MICA alleles between recipient and donor in renal transplantation
is a factor resulting in the development of antibodies directed against MICA antigens.
There is evidence that HLA antibodies not only correlate strongly with aAMR, but also
associate with ACR (Halloran et al., 1992; Q. Zhang et al., 2005b). The analysis of
MICA antibodies discussed in Chapter 5 revealed a similar trend with ACR. However, the
risk of developing ACR increased if graft recipients developed both MICA and HLA
antibodies and was highly significant if patients had MICA antibodies showing high MFI
values. By contrast, the incidence of aAMR did not associate with MICA antibodies while
HLA class I, class II and DSA were highly significant. These results may indicate that it
takes longer to develop MICA antibodies and may also occur due to up-regulation of MICA
antigens during ACR and aAMR responses to mismatched HLA antigens. Therefore this
process may not have fully developed at the time of testing for HLA and MICA antibodies,
often within three months post-transplant, and could also explain the low incidence of
MICA antibodies compared to other studies. If testing was performed, for example, one
year after transplantation, there may have been an association of both ACR and aAMR with
MICA antibodies. Nevertheless it is possible from these results that indirect allorecognition
of mismatched MICA antigens can lead to cellular immune responses and production of
high-titre MICA antibodies. Furthermore, the longitudinal analysis of MICA antibody

Chapter 8
308
production discussed in Chapter 6 shows three patients who clearly developed high-MFI
MICA antibodies directly after an ACR episode.
The next part of this study investigated the relevance of MICA antibodies and impact on
longer-term graft outcomes, assessed by five-year GS and eGFR measurement. There was
no significant association of MICA antibodies with reduced GS although only sixteen of the
216 patients analysed had MICA antibodies and only one of those had graft failure.
Analysis for factors independently associated with decreased GS in this cohort was
performed using Cox regression and revealed significant correlation with HLA class II
antibodies, ACR and aAMR.
By contrast, analysis of post-transplant graft function assessed by eGFR measurement
revealed strong significant association of deceased eGFR and increased SCr in the presence
of MICA antibodies, especially MICA-DSA. HLA class I and class II antibodies also
associated with reduced function but significantly decreased eGFR also occurred in patients
with only MICA antibodies, suggesting an independent role. It became apparent from this
analysis that reduction in eGFR associating with HLA or MICA antibodies occurred at
different times. The strongest association of MICA antibodies with graft dysfunction
occurred after two years whereas HLA antibodies showed stronger association after year
three post-transplant. Additionally, decreased eGFR associated with HLA class I antibodies
before HLA class II antibodies. In terms of the amount of graft dysfunction caused by the
different antibodies, HLA-DSA antibodies associated with larger decreases in eGFR than
MICA-DSA but if the MICA antibodies had high MFI values the damage caused was about
the same as with HLA antibodies and also occurred sooner. These observations indicate
differences in expression of antibody targets correlating the ubiquitous expression of HLA
class I molecules and up-regulation of MICA molecules in the early post-transplant period
with earlier graft dysfunction. Linear regression analysis of both eGFR and SCr parameters
revealed that by the end of the second year post-transplant, both HLA class I-DSA and
MICA-DSA were independently associated with graft dysfunction. Furthermore, MICA-
DSA was more highly significantly associated and resulted in more dysfunction. This is the
first study to show an independent and significant correlation of MICA-DSA with graft
dysfunction and larger, multicentre studies are required to confirm these findings and
establish whether the presence of MICA-DSA associate with progressive graft damage over
a longer time-period.

Chapter 8
309
For this study I used a very stringent method to characterise MICA antibodies in renal graft
recipients. This arose from initial testing using the One Lambda Luminex MICA antibody
detection assays, which revealed unexpectedly high frequencies of particular MICA
antibodies. These patterns of MICA antibody detection, also noted by other researchers,
were not reproduced when using a similar assay developed in Peter Stastny‟s laboratory
using recombinant MICA molecules produced in insect cells. Furthermore, the results
obtained using the One Lambda assays were not confirmed using a third Luminex assay for
MICA antibody detection, produced by Gen-Probe. The Gen-Probe MICA antibody
Luminex assay results were generally in agreement with those generated using Professor
Stastny‟s Luminex beads, although some minor variations existed. It appears that the
method of rMICA production may lead to these variations as discussed in Chapter 3. Large
amounts of linear or incorrectly folded MICA protein on Luminex beads may be
responsible for false positive reactions. For these reasons I would recommend using the
Luminex assay manufactured by Gen-Probe, which also has a larger array of MICA
antigens.
The differences in results obtained using different Luminex assays highlights the need for
international exchange and characterisation of MICA antibody-containing sera. Fortunately
efforts are underway as part of the 16th IHIWC to fulfil this need. A program of MICA
antibody testing using well characterised sera as part of an international, multicentre
collaborative project has been organised by Peter Stastny. The results should identify
problem areas in MICA antibody testing and could lead to the development of more reliable
assays.
Based on the findings of this study, the following recommendations may lead to improved
outcomes in renal transplantation and further understanding of MICA antibody involvement
in graft rejection and dysfunction:
MICA antibody detection
Patients with ESRD should be screened for MICA antibodies prior to
transplantation.
If MICA antibodies are detected they should be characterised by SAg Luminex
methods.
H&I laboratories should participate in international serum exchange schemes for
MICA antibody testing.

Chapter 8
310
Patients with MICA antibodies, and more importantly those showing high MFI
values, should be crossmatched with potential donors using an endothelial cell
crossmatch assay such as XM-ONE (Absorber, Sweden) to minimise the risk of
hyperacute or AR.
All patients should be monitored for MICA antibodies post-transplant. For patients
with high-risk MICA mismatches (see below) this should be carried out at three
months post-transplant. All other renal graft recipients should be tested for MICA
antibodies 6-12 months post-transplant.
Recipients diagnosed with AR should be tested for MICA antibodies using a SAg
Luminex technique to identify MICA-DSA.
Recipients with MICA-DSA should be closely monitored for changes in graft
function assessed by eGFR.
Patients with high-MFI MICA antibodies showing signs of declining graft function
may benefit from plasma exchange and drug therapy aimed at limiting antibody
production.
MICA genotyping and matching
Renal graft recipients and their donors should ideally be typed for MICA alleles
prior to transplantation to minimise mismatching, however this may not be possible.
As a compromise, closer matching for HLA-B antigen and cross-reactive groups
may result in improved MICA matching through haplotypic association and linkage
disequilibrium.
Post-transplant, renal graft recipients and their donors should be typed for MICA
alleles, preferably to allele level resolution using MICA-SBT and MICA exon 5
microsatellite analysis.
H&I laboratories should participate in international DNA exchange schemes for
MICA allele typing.
Mismatching of MICA alleles belonging to MICA-G1 or MICA-G2 ancestral
lineages or mismatches involving unique amino acid polymorphisms may indicate
increased risk for developing MICA antibodies. Patients with high risk MICA
allele mismatches should be closely monitored for the development of MICA
antibodies (see above).
In conclusion, this study has shown that mismatching MICA alleles is a significant,
independent factor leading to the development of MICA antibodies in some renal graft

Chapter 8
311
recipients. The presence of MICA antibodies associated with ACR and MICA-DSA
independently associated with decreased graft function. Graft recipients with MICA
antibodies also showed a correlation with graft dysfunction even when HLA antibodies
were absent. Despite a proportionately small number of patients developing MICA
antibodies, these observations indicate that these antibodies, in addition to HLA antibodies,
associate with poorer graft outcome warranting further investigation in larger collaborative
studies. Furthermore, MICA typing of patients and donors together with MICA antibody
screening, especially for re-transplanted patients, may identify those at risk of AR and
chronic allograft dysfunction, allowing therapeutic intervention to influence the
management of transplant survival.

Publications
312
Appendix A
Publications and Presentations
Journal Articles 1. “SEQUENCE OF A NOVEL HLA-A*0301 INTRONIC VARIANT
(A*03010103).” N. Mayor, S. Cox, A. McWhinnie, J. Arguello, B. Shaw, A-M.
Little, J. A. Madrigal, S. G. E. Marsh. Tissue Antigens. 2005, 65:1 107-109.
2. “HIGH-RESOLUTION MOLECULAR CHARACTERISATION OF THE HLA
CLASS I AND II IN THE TARAHUMARA AMERINDIAN POPULATION.”
J. Garcia-Ortiz`, L. Sandoval-Ramirez, H. Rangel-Villalobos, H. Maldonado-
Torres, S. Cox, C. Garcia-Sepulveda, L. Figuera, S.G.E. Marsh, A-M. Little, J.
A. Madrigal, J. Moscoso, A. Arnaiz-Villena and J. Arguello. Tissue Antigens.
2006, 68:135-146.
3. “A NEW HLA-A*31 NULL ALLELE, A*3114N.” D. Smith, W. Gardner, J.
Baker, S. Cox, and L. Kresie. Tissue Antigens. 2006, 68:526-527
4. “AN UNLIKELY RARE RESULT OF HLA-A*0236, *3601 MASKING THE
PRESENCE OF A NOVEL ALLELE A*0114.” J. Crowley, C. Dunne, S. Cox
and A-M. Little. Tissue Antigens. 2007, 69:200-1
5. “ADENOVIRUS E3/19K PROMOTES EVASION OF NK-CELL
RECOGNITION BY INTRACELLULAR SEQUESTRATION OF THE
NKG2D LIGANDS MAJOR HISTOCOMPATIBILITY COMPLEX CLASS I
CHAIN-RELATED PROTEINS A AND B.” B. McSharry, H-G. Burgert, D.
Owen, R. Stanton, V. Prod‟homme, M. Sester, K. Koebernick, V. Groh, T.
Spies, S. Cox, A-M. Little, E. Wang, P. Tomasec and W. Wilkinson. Journal of
Virology. 2008, 82:9 4585-4594.
6. “IDENTIFICATION OF TWO NOVEL MICA ALLELES: MICA*054 AND
MICA*056.” S. Cox, H. Stephens, R. Fernando, J. Grant, A. J. Madrigal and A-
M Little. Tissue Antigens. 2009, 73(1): 85-87.

Publications
313
7. “MICA ALLELE MISMATCHING, MICA ANTIBODIES AND REJECTION
IN RENAL TRANSPLANTATION.” S. Cox, H. Stephens, R. Fernando, A.
Karasu, M. Harber, S. Powis, Y. Zou, P. Stastny, J. A. Madrigal, and A-M.
Little. Human Immunology. 2011, 72(10): 827-834.
Presentations and Published Abstracts
1. “15 NEW CLASS I AND CLASS II ALLELES DISCOVERED IN HSCT
PATIENTS AND DONORS TYPED BY SEQUENCE BASED TYPING.” S. T.
Cox, F. Partheniou, A. McWhinnie, R. Adams, J. Dey, M. Gibson, S. Wallis-
Jones, J. A. Madrigal & A-M. Little. 17th Annual BSHI Conference, Sheffield,
UK. 2006. Poster Presentation. International Journal of Immunogenetics. 2006,
33(4).
2. “MICA ANTIBODY SCREENING IN RENAL TRANSPLANT PATIENTS.” S.
T. Cox, R. Fernando, H. A. F. Stephens, J. A. Madrigal and A-M. Little. 18th
Annual BSHI Conference, Birmingham, UK. 2007. Best Abstracts, Oral
Presentation. International Journal of Immunogenetics. 2007, 34(4).
3. “MICA ANTIBODY SCREENING IN RENAL TRANSPLANT PATIENTS.” S.
T. Cox, R. Fernando, A. Karuso, J. Grant, A-M. Little, and H. A. F. Stephens. 21st
Annual European Federation of Immunogenetics Conference, Barcelona, Spain.
2007. Poster Presentation. Tissue Antigens. 2007, 72(3).
4. “MICA ALLELE MISMATCHES AND PRODUCTION OF MICA
ANTIBODIES IN RENAL TRANSPLANT PATIENTS.” S. T. Cox, R. Fernando,
H. A. F. Stephens, J. A. Madrigal and A-M. Little. 22nd Annual European
Federation of Immunogenetics Conference, Toulouse, France. 2008. Poster
Presentation. Tissue Antigens. 2008, 71(4).

Publications
314
5. “A SIGNIFICANT CORRELLATION BETWEEN MICA ANTIGEN
MISMATCHES AND PRODUCTION OF MICA ANTIBODIES IN RENAL
TRANSPLANT PATIENTS.” S. T. Cox, H. A. F. Stephens, R. Fernando, M.
Harber, S. Powis, J. A. Madrigal and A-M. Little. 15th International
Histocompatibility and Immunogenetics Workshop and Conference, Rio de
Janeiro, Brazil. 2008. Oral Presentation. Tissue Antigens. 2008, 72(3).
6. “A SIGNIFICANT CORRELLATION BETWEEN MICA ANTIGEN
MISMATCHES AND PRODUCTION OF MICA ANTIBODIES IN RENAL
TRANSPLANT PATIENTS.” S. T. Cox, H. A. F. Stephens, R. Fernando, M.
Harber, J. A. Madrigal and A-M. Little. 34th Annual Meeting of the American
Society for Histocompatibility and Immunogenetics, Toronto, Canada. 2008.
Oral Presentation (R. Fernando). Human Immunology. 2008, 69, Supplement 1.
7. “MICA ALLELE MISMATCHING, MICA ANTIBODIES AND REJECTION IN
RENAL TRANSPLANT RECIPIENTS.” S. T. Cox, H. A. F. Stephens, R.
Fernando, M. Harber, A. Howie, S. Powis, Y. Zou, P. Stastny, J. A. Madrigal and
A-M. Little. 24th Annual European Federation of Immunogenetics Conference,
Florence, Italy. 2010. Oral Presentation. Tissue Antigens. 2010, 75(5).
8. “MICA ANTIBODY DETECTION IN RENAL TRANSPLANTATION USING
FLUORESCENT BEAD TECHNOLOGY: FREQUENCIES, EPITOPE
SPECIFICITY AND LONGITUDINAL ANALYSIS.” S. T. Cox. Gen-Probe user
meeting, Primosten, Croatia. May 29th – June 1st 2011. Oral Presentation.

Appendices
315
Appendix B
Staff Consent Form
RESEARCH INSTITUTE
CONSENT & REQUEST FOR BLOOD
THE ANTHONY NOLAN TRUST RESEARCH INSTITUTE The Royal Free Hospital, Fleet Road, London NW3 2QG
Tel: 020 7284 8315 Fax: 020 7284 8331, www.anthonynolan.org.uk
DEPARTMENT:
PROJECT MANAGER:
SCIENTIST REQUESTING BLOOD:
SURNAME:
DATE OF BIRTH:
FIRST NAME:
Extn:
GENDER:
ETHNIC ORIGIN:
COMMENTS AT TIME OF COLLECTION:
DATE AND TIME OF BLOOD COLLECTION:
CONSENT: Please ensure the consent form (on the reverse of this form) is completed.
TESTS REQUESTED:
Routine tests for (i) HLA typing: 2 x 4ml blood in EDTA (ii) CMV/ABO: 1x 4ml tube clotted.
(iii) 20 - 50ml blood in anticoagulant. Please ensure your blood tubes are labelled with your name and DOB.
(i) HLA typing
ii) CMV/ABO
(iii) Research project
Blood will be used at the laboratory above and will be processed between 9am-7pm Mon-Fri DO NOT REFRIGERATE BLOOD.
For laboratory use only Project Name ------------------- Consent Form Number ANRI/000? Date of Sample taken --------------------- Sample Number --------------------- Signature of staff --------------------------- Phlebotomist Signature --------------- Form to Health & Safety Manager YES NO H/S Manager Signature --------------------------------

Appendices
316
Please ensure the accompanying request form (on the reverse of this form) is completed.
Name of member of staff
I agree to my blood and or DNA being used in research tests related to: Histocompatibility factors
CMV virology Blood group type
Cellular assays for immune function All are important factors that are being investigated in relation to haematopoietic stem cell transplantation. I agree that a small quantity of my blood and or DNA will be retained by the laboratory for any future tests that relate to transplantation techniques.
yes no
yes no no
The Institute may undertake studies of immunological markers that may be of importance in transplantation. I agree that some of my stored blood or DNA may be used anonymously in these studies for the benefit of patients.
yes no
I give explicit consent to the Anthony Nolan Trust to store any sensitive personal data* relating to me, held by it. * For the research tests that we are conducting we need to collect
data, which the Data Protection Act defines as sensitive, such as ethnicity).
I agree that during the course of laboratory tests, my blood may be screened for markers for infectious diseases including Hepatitis B & C and HIV and I agree to this as an automatic procedure.
I understand and accept that in the event of a needlestick injury my blood may become a source of contamination and I would therefore be routinely approached for a blood sample for further testing on blood borne virus. The results of these tests would then be disclosed to the source recipient and the information obtained would be stored confidentially.
yes no yes no
Signature of consenting individual: Date:

Appendices
317
Appendix C
Renal graft recipient and donor MICA types
Patient MICA_1 MICA_2 Donor MICA_1 MICA_2
524JA 004 530NM 004 00901/049
533CB 008 012 601RB 00702 008
877LB 00901/049 010 634JC 008 010
961PB 008 018 124WK 001 00902
696IC 008 320RH 004 019
336CC 004 016 705BK 008
976ES 016 018 992EB 002 007
488DG 008 00901/049 072KG 007 008
861YH 010 019 504GH 017 019
449JH 002 008 453JW 002
502SJ 004 008 570CJ 004 00901/049
521HJ 004 397CW 001 00901/049
133JK 008 010 793TK 00701 010
368JL 002 010 755JU 008 010
074HM 008 247DM 008
619KM 008 015 134BD 008 017
519NP 004 008 368TP 004 011
220PP 002 030 423KC 002 008
396BS 002 350SM 002 008
548NS 002 00901/049 675BR 002 010
149CW 002 008 853RH 004 007
733SA 00802 019 022AM 004 019
057GA 008 001SC 008 018
479BB 004 287DR 008
977HB 002 212GS 008 01801
787TD 008 00901/049 291JM 00901/049 011
388GP 008 027 392RM 00201 008
350LO 004 223LN 008 00901/049
960MB 008 016 456LB 008
727MM 008 035 052EK 002 008
182RO 002 004 686DT 008 011
181JR 004 019 382YR 002 019
381FC 008 579MR 008 00902
362MJ 002 004 915RJ 002 008
945VS 008 017 805NS 002 018
451PK 008 746CH 008
367DZ 008 029 457DZ 008 029
173RO 004 019 171MC 008 019
562ST 002 008 779EF 008 010

Appendices
318
970ED 004 012 471NC 008 01802
380CW 008 033AW 008
603JB 008 035 261GC 002 010
219GM 011 018 834JL 004 008
379BB 002 00802 541SL 004 038
679RD 002 007 747KR 002 010
995GC 008 00901/049 229JC 002 008
159KC 002 019 085JJ 002 010
075PL 002 008 262JC 002 008
776RA 004 012 531MA 004 018
864FR 007 00901/049 748AB 008 00901/049
090KB 004 012 091MB 004 019
355EB 008 011 807FB 008 011
621CO 004 008 706JC 004 00802
669DC 008 00901/049 199TP 004 00901/049
050SC 002 00901/049 192JB 002 018
380RA 002 008 797JJ 002 008
157IT 008 522LK 008 011
870AL 008 010 634JC 008 010
372NF 002 016 562DC 002 018
134RD 002 008 159DB 00202 008
237CR 002 004 928TW 00902 012
295PM 008 019 868CE 002 018
059VC 004 010 171MC 008 019
435HH 004 008 263SR 004 018
987NI 016 151UF 008 011
852DI 00201 008 854DA 002 008
832HJ 008 00901/049 044PR 008 00901/049
051LM 006 008 623PS 008
304JM 002 008 305BM 002 008
373AG 00901/049 123NM 004 00901/049
385GA 008 504GH 017 019
121BE 008 122DD 002 008
505PA 004 019 225IB 002 00901/049
118LB 002 345LA 004 008
185MB 00901/049 017 225IB 008 012
366PB 002 00702 992EB 002 007
528DB 002 017 255RW 008 017
139DB 002 018 140GB 002 010
535RB 002 010 756SM 007 019
329MB 007 011 522LK 008 011
461BB 008 018 223JF 004 00901/049
502CB 004 010 121AB 004 00901/049
293MC 008 697PC 008
357DC 008 012 803DC 007 008
875CC 008 208SC 00702 008

Appendices
319
756FC 008 027 375ML 008
228RD 008 00901/049 216CL 008 00902
174BD 002 00901/049 154GC 008 016
621VD 008 00901/049 836DS 008 00902
218ND 008 00901/049 219LP 008 00902
054NE 004 008 392RM 002 008
219JE 008 848GM 002 041
020TF 001 008 522JP 004 007
210AF 008 00902 885HF 00901/049
945EF 008 012 552AF 008 012
934PF 008 011 498FC 002 019
361JG 004 030 926MH 008
347VG 002 008 192JE 008
817IG 019 108SR 007 012
314DH 008 00901/049 739FO 004 008
374NH 004 008 002SC 004 008
994LH 008 865BF 008
867RH 011 016 376SH 002 011
868DH 002 011 634CH 008 00901/049
462LJ 002 004 215AL 00902 012
917UK 002 004 587CE 002 008
794BK 007 008 629CK 00901/049 011
724FK 002 004 251GF 008 018
736MK 008 945NI 008
880DK 004 008 545JK 008 007
264PL 004 008 002MN 007 008
171KL 004 008 311JB 00802 00901/049
035RL 008 012 372ML 008
128BL 001 00901/049 968PL 001 00901/049
185AL 016 019 672LL 008 019
834HL 00802 019 562DC 002 018
693MM 002 007 162MB 008
373SM 002 387JM 002 011
749SM 004 008 436JL 004 009
609PM 00901/049 027 240AS 004 012
971PM 004 008 003SC 008
677VN 004 008 198CB 002 004
732SN 008 00901/049 889PM 008
777AN 008 462DB 008
822AO 002 008 823MT 008 015
892AO 002 004 XXXPJ 008
284SP 018 019 462NH 008 018
738AP 017 01801 168PW 002 018
728JP 007 00901/049 394BQ 008
727JQ 00901/049 029 136AF 008
758AR 002 00901/049 004SC 002 010

Appendices
320
498RM 001 008 449KY 001 007
736JR 008 564BT 008
126MR 008 00802 851PL 008 018
910OS 008 916JS 011 018
516NS 008 00901/049 637FB 008 00901/049
286ES 001 004 205JR 008
927PS 00901/049 019 144PH 008
975NS 008 102KJ 008
386JS 002 00901/049 579MR 008 00902
027TS 002 008 142TD 002 008
832DT 008 018 312PA 002 008
130AT 008 004 166ST 008 019
522DT 008 832JH 008 00901/049
731DU 008 018 251GF 008 018
039JV 002 019 160RT 002 00901/049
389AW 008 247MH 002 008
662AS 008 012 876JW 008
447RA 002 00902 526JJ 004
896HR 002 008 292BC 008
962MA 00902 707HS 002 008
638YG 008 013 966DH 00902 018
953MJ 00802 074MJ 008
414MK 012 019 927LW 010 012
040PK 002 007 595JK 002 007
690SM 002 019 480DV 011 016
460NM 00901/049 717RS 008 00901/049
881AM 002 018 075IK 011 016
039JP 008 00901/049 856AW 008 00901/049
057SR 008 207SM 008 00901/049
497AR 018 066MR 017 018
512RS 002 008 498FC 002 019
528JS 002 004 768DB 004
042AK 00802 044PK 008
313HL 008 481PL 002 008
657RL 008 016 123HB 016
079EE 016 018 040AM 002 018
663PL 008 017 065PH 002 004
517GK 00201 008 732DA 007 027
690MO 002 008 115ZM 008 00901/049
323GS 002 011 325VS 016
580OA 002 004 651MA 008 018
244JD 008 018 682SB 002 008
397SD 004 00901/049 768DB 004
895SH 00901/049 027 812XE 008 029
029RL 008 262EM 008
700JM 002 004 996PW 002
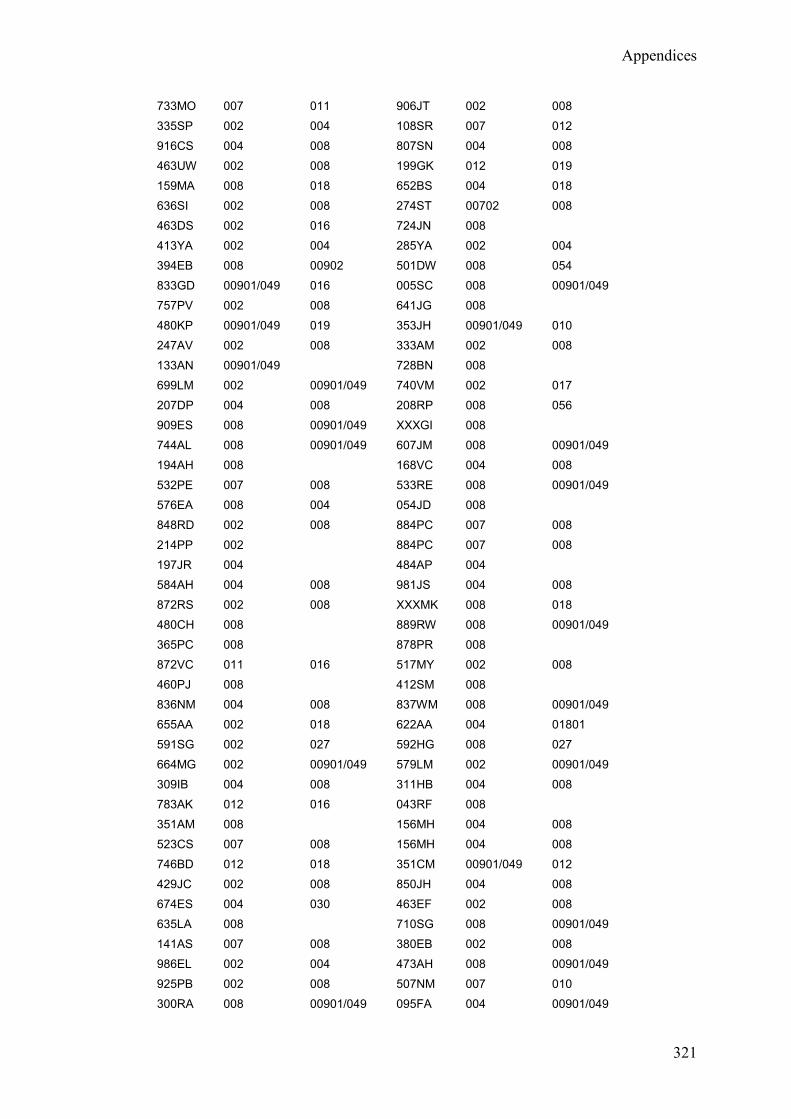
Appendices
321
733MO 007 011 906JT 002 008
335SP 002 004 108SR 007 012
916CS 004 008 807SN 004 008
463UW 002 008 199GK 012 019
159MA 008 018 652BS 004 018
636SI 002 008 274ST 00702 008
463DS 002 016 724JN 008
413YA 002 004 285YA 002 004
394EB 008 00902 501DW 008 054
833GD 00901/049 016 005SC 008 00901/049
757PV 002 008 641JG 008
480KP 00901/049 019 353JH 00901/049 010
247AV 002 008 333AM 002 008
133AN 00901/049 728BN 008
699LM 002 00901/049 740VM 002 017
207DP 004 008 208RP 008 056
909ES 008 00901/049 XXXGI 008
744AL 008 00901/049 607JM 008 00901/049
194AH 008 168VC 004 008
532PE 007 008 533RE 008 00901/049
576EA 008 004 054JD 008
848RD 002 008 884PC 007 008
214PP 002 884PC 007 008
197JR 004 484AP 004
584AH 004 008 981JS 004 008
872RS 002 008 XXXMK 008 018
480CH 008 889RW 008 00901/049
365PC 008 878PR 008
872VC 011 016 517MY 002 008
460PJ 008 412SM 008
836NM 004 008 837WM 008 00901/049
655AA 002 018 622AA 004 01801
591SG 002 027 592HG 008 027
664MG 002 00901/049 579LM 002 00901/049
309IB 004 008 311HB 004 008
783AK 012 016 043RF 008
351AM 008 156MH 004 008
523CS 007 008 156MH 004 008
746BD 012 018 351CM 00901/049 012
429JC 002 008 850JH 004 008
674ES 004 030 463EF 002 008
635LA 008 710SG 008 00901/049
141AS 007 008 380EB 002 008
986EL 002 004 473AH 008 00901/049
925PB 002 008 507NM 007 010
300RA 008 00901/049 095FA 004 00901/049

Appendices
322
191SP 010 012 096SS 007 010
529IV 002 00902 156DM 002 00902
499AA 002 192JB 002 018
026CP 001 008 641SM 008
136LV 011 016 796PH 004 00901/049
392AS 007 008 596DT 008
737PN 010 011 738AN 008 010
195RM 008 00901/049 165AM 008 00901/049
412PY 008 759SJ 008
461VH 00802 955AP 002 007
857MC 002 00901/049 955AP 002 007
700EE 004 00901/049 402CT 008
168JA 00902 019 223JF 004 00901/049
670RO 002 008 482LB 002
183EY 00901/049 00901/049 330RT 00902
684RO 008 011 980AF 017
112AT 008 002MN 007 008
484LT 002 008 236LH 008 016
516NP 002 012 236LH 008 016
079ST 008 00901/049 312CG 008
489AH 008 132PH 004 008
900VJ 002 004 604JA 002 041
567NR 012 017 528SJ 00902
924TO 002 414SS 007
514JG 00901/049 018 414SS 007
197TW 002 643FW 002 00901/049
581IA 002 008 230DM 027
338RN 002 008 230DM 027
506TM 007 008 240AS 004 012
554PM 004 010 006SC 008
486SF 008 842NF 008 00901/049
156AS 008 016 904FM 002 015
556JP 002 018 906JT 002 008
833MS 008 203JQ 008
674MB 019 439GB 008
638DM 008 027 262DC 008 027
646BA 002 004 630RL 001
995LW 008 00901/049 349SM 007 008
476LC 002 008 640AC 002 008
443ZR 008 017 052EK 002 008
102MS 002 008 028AS 002 008
364AV 008 403LP 004 008
852CF 008 008KC 008 011
807ZN 002 008 008KC 008 011
718DM 008 XXXJB 008 00901/049
335SR 007 016 148DD 007 008

Appendices
323
053JJ 004 008 148DD 007 008
808HK 002 019 142SK 002 027
756MW 004 116HG 002 004
132AS 00901/049 019 002MG 008 017
354SA 007 008 102NA 004 008
269JN 008 011 718VR 011
182MP 008 718VR 011 018
140ME 004 717RS 008 00901/049
518PP 008 012 199GK 012 019
261NM 002 008 938MM 004 008
200ND 008 144PH 008
235KG 016 393HG 00201 004
513CP 002 00901/049 124DA 00702 00901/049
644AM 004 008 211AN 008 016
796PW 004 008 211AN 008 016
732KS 002 004 212GS 008 018
468SK 008 227PK 008 027
430SG 002 012 436JG 012 017
604DP 008 942DH 008
920MH 002 027 262EM 008
372JK 002 008 385PB 004 007
219BO 012 018 924LJ 001 004
187SD 002 008 928MG 002 008
281CT 002 008 504SC 002 008
501GO 002 004 894OA 008 011
792KC 002 008 620HS 008
983TK 004 008 193EK 004 008
192MK 002 004 196AK 00901/049 018
803DG 008 995GC 008
139KS 008 017 579NS 017 018
599EM 008 310PL 004 008
520YA 010 148AG 00902 01202

Appendices
324
Appendix D
EMBL flatfile Summaries
MICA*054 EMBL Flatfile
ID AM899996; SV 1; linear; genomic DNA; STD; HUM; 1257 BP. XX AC AM899996; XX DT 09-OCT-2007 (Rel. 93, Created) DT 13-JAN-2009 (Rel. 99, Last updated, Version 3) XX DE Homo sapiens partial MICA gene for MHC class I chain-related protein A, DE MICA*010v allele, exons 2-5 XX KW major histocompatibility complex; MHC class I chain-related protein A; KW MICA gene; MICA*010v allele. XX OS Homo sapiens (human) OC Eukaryota; Metazoa; Chordata; Craniata; Vertebrata; Euteleostomi; Mammalia; OC Eutheria; Euarchontoglires; Primates; Haplorrhini; Catarrhini; Hominidae; OC Homo.
XX
RN [1]
RP 1-1257
RA Cox S.T.
RT
RL Submitted (08-OCT-2007) to the EMBL/GenBank/DDBJ databases.
RL Cox S.T., The Royal Free Hospital, Anthony Nolan Research Institute,Pond
RL Street, Hampstead, London, NW3 2QG, UNITED KINGDOM.
XX
RA Cox S.T., Stephens H.A.F., Fernando R., Grant J., Madrigal J.A., Little A.-.M.
RT "Two novel MICA alleles, MICA*054 and MICA*056"
RL Tissue Antigens 73(1):85-87(2009).
XX
DR IMGT/HLA; HLA03157; MICA*054
XX
FH Key Location/Qualifiers
FH
FT source 1..1257 FT /organism="Homo sapiens"
FT /chromosome="6p"
FT /mol_type="genomic DNA"
FT /tissue_type="blood"
FT /db_xref="taxon:9606"
FT CDS join(<1..255,356..643,744..1022,1123..>1257)
FT /codon_start=3
FT /gene="MICA"
FT /allele="MICA*010v"
FT /product="MHC class I chain-related protein A"
FT /db_xref="GOA:Q29983"
FT /db_xref="HGNC:7090"
FT /db_xref="InterPro:IPR001039"
FT /db_xref="InterPro:IPR003597"
FT /db_xref="InterPro:IPR007110"
FT /db_xref="InterPro:IPR011161"
FT /db_xref="InterPro:IPR011162"
FT /db_xref="InterPro:IPR013783"
FT /db_xref="PDB:1B3J"
FT /db_xref="PDB:1HYR"
FT /db_xref="UniProtKB/Swiss-Prot:Q29983"
FT /protein_id="CAP12057.1"
FT /translation="PHSLPYNLTVLSWDGSVQSGFLAEVHLDGQPFLRYDRQKCRAKPQ
FT GQWAEDVLGNKTWDRETRDLTGNGKDLRMTLAHIKDQKEGLHSLQEIRVCEIHEDNSTR
FT SSQHFYYDGELFLSQNLETEEWTVPQSSRAQTLAMNVRNFLKEDAMKTKTHYHAMHADC
FT LQELRRYLESSVVLRRTVPPMVNVTRSEASEGNITVTCRASSFYPRNIILTWRQDGVSL
FT SHDTQQWGDVLPDGNGTYQTWVATRICRGEEQRFTCYMEHSGNHGTHPVPSGKVLVLQS
FT HWQTFHVSAVAAAAAIFVIIIFYVRCCKKKTSAAEGP"
FT exon 1..255
FT /gene="MICA"

Appendices
325
FT /allele="MICA*010v"
FT /number=2
FT gap 256..355
FT /estimated_length=unknown
FT exon 356..643
FT /gene="MICA"
FT /allele="MICA*010v"
FT /number=3
FT gap 644..743
FT /estimated_length=unknown
FT exon 744..1022
FT /gene="MICA"
FT /allele="MICA*010v"
FT /number=4
FT variation 1001
FT /allele="MICA*010v"
FT /replace="a"
FT /compare=AF085057.1
FT gap 1023..1122
FT /estimated_length=unknown
FT exon 1123..1257
FT /gene="MICA"
FT /allele="MICA*010v"
FT /number=5
XX
SQ Sequence 1257 BP; 241 A; 245 C; 267 G; 204 T; 300 other
agccccacag tcttccttat aacctcacgg tgctgtcctg ggatggatct gtgcagtcag 60
ggtttcttgc tgaggtacat ctggatggtc agcccttcct gcgctatgac aggcagaaat 120
gcagggcaaa gccccaggga cagtgggcag aagatgtcct gggaaataag acatgggaca 180
gagagaccag ggacttgaca gggaacggaa aggacctcag gatgaccctg gctcatatca 240
aggaccagaa agaagnnnnn nnnnnnnnnn nnnnnnnnnn nnnnnnnnnn nnnnnnnnnn 300
nnnnnnnnnn nnnnnnnnnn nnnnnnnnnn nnnnnnnnnn nnnnnnnnnn nnnnngcttg 360
cattccctcc aggagattag ggtctgtgag atccatgaag acaacagcac caggagctcc 420
cagcatttct actacgatgg ggagctcttc ctctcccaaa acctggagac tgaggaatgg 480
acagtgcccc agtcctccag agctcagacc ttggccatga acgtcaggaa tttcttgaag 540
gaagatgcca tgaagaccaa gacacactat cacgctatgc atgcagactg cctgcaggaa 600
ctacggcgat atctagaatc cagcgtagtc ctgaggagaa cagnnnnnnn nnnnnnnnnn 660
nnnnnnnnnn nnnnnnnnnn nnnnnnnnnn nnnnnnnnnn nnnnnnnnnn nnnnnnnnnn 720
nnnnnnnnnn nnnnnnnnnn nnntgccccc catggtgaat gtcacccgca gcgaggcctc 780
agagggcaac atcaccgtga catgcagggc ttccagcttc tatccccgga atatcatact 840
gacctggcgt caggatgggg tatctttgag ccacgacacc cagcagtggg gggatgtcct 900
gcctgatggg aatggaacct accagacctg ggtggccacc aggatttgcc gaggagagga 960
gcagaggttc acctgctaca tggaacacag cgggaatcac ggcactcacc ctgtgccctc 1020
tgnnnnnnnn nnnnnnnnnn nnnnnnnnnn nnnnnnnnnn nnnnnnnnnn nnnnnnnnnn 1080
nnnnnnnnnn nnnnnnnnnn nnnnnnnnnn nnnnnnnnnn nnggaaagtg ctggtgcttc 1140
agagtcattg gcagacattc catgtttctg ctgttgctgc tgctgctgct atttttgtta 1200
ttattatttt ctatgtccgt tgttgtaaga agaaaacatc agctgcagag ggtccag 1257

Appendices
326
MICA*056 EMBL Flatfile
ID AM944063; SV 1 linear; genomic DNA; STD; HUM; 1257 BP
XX
AC AM944063
XX
DT 01-APR-2008 (Rel. 95, Created)
DT 13-JAN-2009 (Rel. 99, Last updated, Version 3)
XX
DE Homo sapiens partial MIC gene for MHC class-I chain related protein A,
DE MICA*019variant allele, exons 2-5
XX
KW
XX
OS Homo sapiens (human)
OC Eukaryota; Metazoa; Chordata; Craniata; Vertebrata; Euteleostomi; Mammalia;
OC Eutheria; Euarchontoglires; Primates; Haplorrhini; Catarrhini; Hominidae;
OC Homo.
XX
RN [1]
RP 1-1257
RA Cox S.T.
RT
RL Submitted (29-FEB-2008) to the EMBL/GenBank/DDBJ databases.
RL Cox S.T., The Royal Free Hospital, Anthony Nolan Research Institute, Pond
RL Street, Hampstead, London, NW3 2QG, UNITED KINGDOM.
XX
RN [2]
RA Cox S.T., Stephens H.A.F., Fernando R., Grant J., Madrigal J.A.,
RA Little A.-.M.;
RT "Two novel MICA alleles, MICA*054 and MICA*056"
RL Tissue Antigens 73(1):85-87(2009).
XX
DR IMGT/HLA; HLA03255; MICA*056.
XX
FH Key Location/Qualifiers
FH
FT source 1..1257
FT /organism="Homo sapiens"
FT /chromosome="6p"
FT /mol_type="genomic DNA"
FT /db_xref="taxon:9606"
FT CDS join(<1..256,357..643,744..1023,1124..>1257)
FT /codon_start=3
FT /gene="MIC"
FT /allele="MIC*019variant"
FT /product="MHC class-I chain related protein A"
FT /function="ligand for NKG2D"
FT /db_xref="GOA:Q29983"
FT /db_xref="HGNC:7090"
FT /db_xref="InterPro:IPR001039"
FT /db_xref="InterPro:IPR003597"
FT /db_xref="InterPro:IPR007110"
FT /db_xref="InterPro:IPR011161"
FT /db_xref="InterPro:IPR011162"
FT /db_xref="InterPro:IPR013783"
FT /db_xref="PDB:1B3J"
FT /db_xref="PDB:1HYR"
FT /db_xref="UniProtKB/Swiss-Prot:Q29983"
FT /protein_id="CAQ16171.1"
FT /translation="PHSLRYNLTVLSWDGSVQSGFLAEVHLDGQPFLRYDRQKCRAKPQ
FT GQWAEDVLGNKTWDRETRDLTGNGKDLRMTLAHIKDQKEGLHSLQEIRVCEIHEDNSTR
FT SSQHFYYDGELFLSQNLETEEWTVPQSSRAQTLAMNVRNFLKEDAMKTKTHYHAMHADC
FT LQELRRYLESSVVLRRTVPPMVNVTRSEASEGNITVTCRASSFYPRNIILTWRQDGVSL
FT SHDTQQSGDVLPDGNGTYQTWVATRICRGEEQRFTCYMEHSGNHSTHPVPSGKVLVLQS
FT HWQTFHVSAVAAAAAIFVIIIFYVRCCKKKTSAAEGP"
FT exon <1..256
FT /gene="MIC"
FT /allele="MIC*019variant"
FT /number=2
FT gap 257..356
FT /estimated_length=unknown
FT exon 357..643
FT /gene="MIC"
FT /allele="MIC*019variant"
FT /number=3

Appendices
327
FT gap 644..743
FT /estimated_length=unknown
FT exon 744..1023
FT /gene="MIC"
FT /allele="MIC*019variant"
FT /number=4
FT variation 888
FT /replace="g"
FT /compare=AJ250804.1
FT gap 1024..1123
FT /estimated_length=unknown
FT exon 1124..>1257
FT /gene="MIC"
FT /allele="MIC*019variant"
FT /number=5
XX
SQ Sequence 1257 BP; 242 A; 245 C; 266 G; 204 T; 300 other;
agccccacag tcttcgttat aacctcacgg tgctgtcctg ggatggatct gtgcagtcag 60
ggtttcttgc tgaggtacat ctggatggtc agcccttcct gcgctatgac aggcagaaat 120
gcagggcaaa gccccaggga cagtgggcag aagatgtcct gggaaataag acatgggaca 180
gagagaccag ggacttgaca gggaacggaa aggacctcag gatgaccctg gctcatatca 240
aggaccagaa agaaggnnnn nnnnnnnnnn nnnnnnnnnn nnnnnnnnnn nnnnnnnnnn 300
nnnnnnnnnn nnnnnnnnnn nnnnnnnnnn nnnnnnnnnn nnnnnnnnnn nnnnnncttg 360
cattccctcc aggagattag ggtctgtgag atccatgaag acaacagcac caggagctcc 420
cagcatttct actacgatgg ggagctcttc ctctcccaaa acctggagac tgaggaatgg 480
acagtgcccc agtcctccag agctcagacc ttggccatga acgtcaggaa tttcttgaag 540
gaagatgcca tgaagaccaa gacacactat cacgctatgc atgcagactg cctgcaggaa 600
ctacggcgat atctagaatc cagcgtagtc ctgaggagaa cagnnnnnnn nnnnnnnnnn 660
nnnnnnnnnn nnnnnnnnnn nnnnnnnnnn nnnnnnnnnn nnnnnnnnnn nnnnnnnnnn 720
nnnnnnnnnn nnnnnnnnnn nnntgccccc catggtgaat gtcacccgca gcgaggcctc 780
agagggcaac atcaccgtga catgcagggc ttccagcttc tatccccgga atatcatact 840
gacctggcgt caggatgggg tatctttgag ccacgacacc cagcagtcgg gggatgtcct 900
gcctgatggg aatggaacct accagacctg ggtggccacc aggatttgcc gaggagagga 960
gcagaggttc acctgctaca tggaacacag cgggaatcac agcactcacc ctgtgccctc 1020
tggnnnnnnn nnnnnnnnnn nnnnnnnnnn nnnnnnnnnn nnnnnnnnnn nnnnnnnnnn 1080
nnnnnnnnnn nnnnnnnnnn nnnnnnnnnn nnnnnnnnnn nnngaaagtg ctggtgcttc 1140
agagtcattg gcagacattc catgtttctg ctgttgctgc tgctgctgct atttttgtta 1200
ttattatttt ctatgtccgt tgttgtaaga agaaaacatc agctgcagag ggtccag 1257

References
328
References
Agraharkar, M.L., Cinclair, R.D., Kuo, Y.F., Daller, J.A., and Shahinian, V.B. (2004). Risk of
malignancy with long-term immunosuppression in renal transplant recipients. Kidney Int
66, 383-389.
Akalin, E., and Pascual, M. (2006). Sensitization after kidney transplantation. Clin J Am Soc
Nephrol 1, 433-440.
Alamartine, E., Sabido, O., and Berthoux, F. (1994). In-vitro effects of cyclosporin A, FK506,
6-mercaptopurine, and prednisolone on lymphokine-activated killer cells. Nephrol Dial
Transplant 9, 1456-1461.
Alheim, M., Johansson, S.M., Hauzenberger, D., Grufman, P., and Holgersson, J. (2010). A
flow cytometric crossmatch test for simultaneous detection of antibodies against donor
lymphocytes and endothelial precursor cells. Tissue Antigens 75, 269-277.
Almond, P.S., Matas, A., Gillingham, K., Dunn, D.L., Payne, W.D., Gores, P., Gruessner, R.,
and Najarian, J.S. (1993). Risk factors for chronic rejection in renal allograft recipients.
Transplantation 55, 752-756; discussion 756-757.
Alvarez-Marquez, A., Aguilera, I., Gentil, M.A., Caro, J.L., Bernal, G., Fernandez Alonso, J.,
Acevedo, M.J., Cabello, V., Wichmann, I., Gonzalez-Escribano, M.F., and Nunez-
Roldan, A. (2009). Donor-specific antibodies against HLA, MICA, and GSTT1 in
patients with allograft rejection and C4d deposition in renal biopsies. Transplantation 87,
94-99.
Amico, P., Honger, G., Bielmann, D., Lutz, D., Garzoni, D., Steiger, J., Mihatsch, M.J., Dragun,
D., and Schaub, S. (2008). Incidence and prediction of early antibody-mediated rejection
due to non-human leukocyte antigen-antibodies. Transplantation 85, 1557-1563.
Amroun, H., Djoudi, H., Busson, M., Allat, R., El Sherbini, S.M., Sloma, I., Ramasawmy, R.,
Brun, M., Dulphy, N., Krishnamoorthy, R., et al. (2005). Early-onset ankylosing
spondylitis is associated with a functional MICA polymorphism. Hum Immunol 66, 1057-
1061.
Anderson, C.B., and Newton, W.T. (1975). Accelerated human renal allograft rejection. Arch
Surg 110, 1230-1232.
Andersson, M., McMichael, A., and Peterson, P.A. (1987). Reduced allorecognition of
adenovirus-2 infected cells. J Immunol 138, 3960-3966.
Angaswamy, N., Saini, D., Ramachandran, S., Nath, D.S., Phelan, D., Hachem, R., Trulock, E.,
Patterson, G.A., and Mohanakumar, T. (2010). Development of Antibodies to HLA
Precedes Development of Antibodies to MICA and Are Significantly Associated With
Development of Chronic Rejection Following Human Lung Transplantation. Hum
Immunol.
Antoun, A., Jobson, S., Cook, M., O'Callaghan, C.A., Moss, P., and Briggs, D.C. (2010).
Single nucleotide polymorphism analysis of the NKG2D ligand cluster on the long
arm of chromosome 6: Extensive polymorphisms and evidence of diversity between
human populations. Hum Immunol 71, 610-620.
Apostolopoulos, V., and McKenzie, I.F. (2001). Role of the mannose receptor in the immune
response. Curr Mol Med 1, 469-474.
Archer, J.R. (1981). Search for cross-reactivity between HLA B27 and Klebsiella pneumoniae.
Ann Rheum Dis 40, 400-403.
Arguello, J.R., Little, A.M., Bohan, E., Goldman, J.M., Marsh, S.G., and Madrigal, J.A. (1998).
High resolution HLA class I typing by reference strand mediated conformation analysis
(RSCA). Tissue Antigens 52, 57-66.

References
329
Arguello, J.R., and Madrigal, J.A. (1999). HLA typing by Reference Strand Mediated
Conformation Analysis (RSCA). Rev Immunogenet 1, 209-219.
Arnol, M., Prather, J.C., Mittalhenkle, A., Barry, J.M., and Norman, D.J. (2008). Long-term
kidney regraft survival from deceased donors: risk factors and outcomes in a single
center. Transplantation 86, 1084-1089.
Azuma, H., Nadeau, K., Mackenzie, H.S., Brenner, B.M., and Tilney, N.L. (1997). Nephron
mass modulates the hemodynamic, cellular, and molecular response of the rat renal
allograft. Transplantation 63, 519-528.
Bahram, S. (2000). MIC genes: from genetics to biology. Adv Immunol 76, 1-60.
Bahram, S., Bresnahan, M., Geraghty, D.E., and Spies, T. (1994). A second lineage of
mammalian major histocompatibility complex class I genes. Proc Natl Acad Sci U S A
91, 6259-6263.
Baker, R.J., Hernandez-Fuentes, M.P., Brookes, P.A., Chaudhry, A.N., and Lechler, R. (2001).
Comparison of the direct and indirect pathways of allorecognition in chronic allograft
failure. Transplant Proc 33, 449.
Barber, L.D., Whitelegg, A., Madrigal, J.A., Banner, N.R., and Rose, M.L. (2004). Detection of
vimentin-specific autoreactive CD8+ T cells in cardiac transplant patients.
Transplantation 77, 1604-1609.
Barnes, P.D., and Grundy, J.E. (1992). Down-regulation of the class I HLA heterodimer and
beta 2-microglobulin on the surface of cells infected with cytomegalovirus. J Gen Virol
73 ( Pt 9), 2395-2403.
Basadonna, G.P., Matas, A.J., Gillingham, K.J., Payne, W.D., Dunn, D.L., Sutherland, D.E.,
Gores, P.F., Gruessner, R.W., and Najarian, J.S. (1993). Early versus late acute renal
allograft rejection: impact on chronic rejection. Transplantation 55, 993-995.
Bauer, S., Groh, V., Wu, J., Steinle, A., Phillips, J.H., Lanier, L.L., and Spies, T. (1999).
Activation of NK cells and T cells by NKG2D, a receptor for stress-inducible MICA.
Science 285, 727-729.
Berke, G. (1995). The CTL's kiss of death. Cell 81, 9-12.
Bettelli, E., Korn, T., and Kuchroo, V.K. (2007). Th17: the third member of the effector T cell
trilogy. Curr Opin Immunol 19, 652-657.
Bhowmik, D., Pandav, C.S., and Tiwari, S.C. (2008). Public health strategies to stem the tide of
chronic kidney disease in India. Indian J Public Health 52, 224-229.
Biron, C.A., Nguyen, K.B., Pien, G.C., Cousens, L.P., and Salazar-Mather, T.P. (1999). Natural
killer cells in antiviral defense: function and regulation by innate cytokines. Annu Rev
Immunol 17, 189-220.
Bjorkman, P.J., Saper, M.A., Samraoui, B., Bennett, W.S., Strominger, J.L., and Wiley, D.C.
(1987). The foreign antigen binding site and T cell recognition regions of class I
histocompatibility antigens. Nature 329, 512-518.
Bodmer, W.F. (1975). Evolution of HL-A and other major histocompatibility systems. Genetics
79 Suppl, 293-304.
Bohmig, G.A., Wahrmann, M., Regele, H., Exner, M., Robl, B., Derfler, K., Soliman, T., Bauer,
P., Mullner, M., and Druml, W. (2007). Immunoadsorption in severe C4d-positive acute
kidney allograft rejection: a randomized controlled trial. Am J Transplant 7, 117-121.
Bonilla, F.A., and Oettgen, H.C. (2010). Adaptive immunity. J Allergy Clin Immunol 125, S33-
40.
Borel, J.F., and Kis, Z.L. (1991). The discovery and development of cyclosporine
(Sandimmune). Transplant Proc 23, 1867-1874.
Boukouaci, W., Busson, M., Peffault de Latour, R., Rocha, V., Suberbielle, C., Bengoufa, D.,
Dulphy, N., Haas, P., Scieux, C., Amroun, H., et al. (2009). MICA-129 genotype, soluble

References
330
MICA, and anti-MICA antibodies as biomarkers of chronic graft-versus-host disease.
Blood 114, 5216-5224.
Brasile, L., Rodman, E., Shield, C.F., 3rd, Clarke, J., and Cerilli, J. (1986). The association of
antivascular endothelial cell antibody with hyperacute rejection: a case report. Surgery 99,
637-640.
Breimer, M.E., Rydberg, L., Jackson, A.M., Lucas, D.P., Zachary, A.A., Melancon, J.K., Von
Visger, J., Pelletier, R., Saidman, S.L., Williams, W.W., Jr., et al. (2009). Multicenter
evaluation of a novel endothelial cell crossmatch test in kidney transplantation.
Transplantation 87, 549-556.
Brenner, B.M., Cohen, R.A., and Milford, E.L. (1992). In renal transplantation, one size may
not fit all. J Am Soc Nephrol 3, 162-169.
Brooks, B.K., Levy, M.F., Jennings, L.W., Abbasoglu, O., Vodapally, M., Goldstein, R.M.,
Husberg, B.S., Gonwa, T.A., and Klintmalm, G.B. (1997). Influence of donor and
recipient gender on the outcome of liver transplantation. Transplant Proc 29, 475-476.
Bryan, C.F., Luger, A.M., Martinez, J., Muruve, N., Nelson, P.W., Pierce, G.E., Ross, G.,
Shield, C.F., 3rd, Warady, B.A., Aeder, M.I., and Helling, T.S. (2001). Cold ischemia
time: an independent predictor of increased HLA class I antibody production after
rejection of a primary cadaveric renal allograft. Transplantation 71, 875-879.
Bui, J.D., Carayannopoulos, L.N., Lanier, L.L., Yokoyama, W.M., and Schreiber, R.D. (2006).
IFN-dependent down-regulation of the NKG2D ligand H60 on tumors. J Immunol 176,
905-913.
Burden, R., and Tomson, C. (2005). Identification, management and referral of adults with
chronic kidney disease: concise guidelines. Clin Med 5, 635-642.
Burgert, H.G., Ruzsics, Z., Obermeier, S., Hilgendorf, A., Windheim, M., and Elsing, A. (2002).
Subversion of host defense mechanisms by adenoviruses. Curr Top Microbiol Immunol
269, 273-318.
Calne, R.Y., and Wood, A.J. (1985). Cyclosporin in cadaveric renal transplantation: 3-year
follow-up of a European multicentre trial. Lancet 2, 549.
Campos, E.F., Tedesco-Silva, H., Machado, P.G., Franco, M., Medina-Pestana, J.O., and
Gerbase-DeLima, M. (2006). Post-transplant anti-HLA class II antibodies as risk factor
for late kidney allograft failure. Am J Transplant 6, 2316-2320.
Castriconi, R., Cantoni, C., Della Chiesa, M., Vitale, M., Marcenaro, E., Conte, R., Biassoni, R.,
Bottino, C., Moretta, L., and Moretta, A. (2003). Transforming growth factor beta 1
inhibits expression of NKp30 and NKG2D receptors: consequences for the NK-mediated
killing of dendritic cells. Proc Natl Acad Sci U S A 100, 4120-4125.
Cattley, S.K., Longman, N., Dawkins, R.L., Gaudieri, S., Kulski, J.K., and Leelayuwat, C.
(1999). Phylogenetic analysis of primate MIC (PERB11) sequences suggests that the
representation of the gene family differs in different primates: comparison of MIC
(PERB11) and C4. Eur J Immunogenet 26, 233-238.
Cecka, J.M. (1998). The UNOS Scientific Renal Transplant Registry. Clin Transpl, 1-16.
Ceppellini, R., Siniscalco, M., and Smith, C.A. (1955). The estimation of gene frequencies in a
random-mating population. Ann Hum Genet 20, 97-115.
Chadban, S., Morris, R., Hirsch, H.H., Bunnapradist, S., Arns, W., and Budde, K. (2008).
Immunosuppression in renal transplantation: some aspects for the modern era. Transplant
Rev (Orlando) 22, 241-251.
Chalupny, N.J., Rein-Weston, A., Dosch, S., and Cosman, D. (2006). Down-regulation of the
NKG2D ligand MICA by the human cytomegalovirus glycoprotein UL142. Biochem
Biophys Res Commun 346, 175-181.
Champsaur, M., and Lanier, L.L. (2010). Effect of NKG2D ligand expression on host
immune responses. Immunol Rev 235, 267-285.

References
331
Chinen, J., and Buckley, R.H. (2010). Transplantation immunology: solid organ and bone
marrow. J Allergy Clin Immunol 125, S324-335.
Choy, M.K., and Phipps, M.E. (2003). Possible polyphyletic origin of major histocompatibility
complex class I chain-related gene A (MICA) alleles. J Mol Evol 57, 38-43.
Choy, M.K., and Phipps, M.E. (2010). MICA polymorphism: biology and importance in
immunity and disease. Trends Mol Med.
Cockcroft, D.W., and Gault, M.H. (1976). Prediction of creatinine clearance from serum
creatinine. Nephron 16, 31-41.
Colleoni, G.W., Oliveira, J.S., Borducchi, D.M., Fernandes, M.A., Da Silva, H.T., Alves, A.C.,
De Franco, M.F., Kerbauy, J., and Pestana, J.O. (2000). Post-transplant
lymphoproliferative disorders (PTLD) after renal transplantation: management and
evolution of seven cases among 1002 renal transplants in Sao Paulo, Brazil. Leuk
Lymphoma 39, 145-150.
Collins, A.B., Schneeberger, E.E., Pascual, M.A., Saidman, S.L., Williams, W.W., Tolkoff-
Rubin, N., Cosimi, A.B., and Colvin, R.B. (1999). Complement activation in acute
humoral renal allograft rejection: diagnostic significance of C4d deposits in peritubular
capillaries. J Am Soc Nephrol 10, 2208-2214.
Collins, R.W., Stephens, H.A., Clare, M.A., and Vaughan, R.W. (2002). High resolution
molecular phototyping of MICA and MICB alleles using sequence specific primers. Hum
Immunol 63, 783-794.
Colvin, R.B. (2007). Antibody-mediated renal allograft rejection: diagnosis and pathogenesis. J
Am Soc Nephrol 18, 1046-1056.
Colvin, R.B., and Smith, R.N. (2005). Antibody-mediated organ-allograft rejection. Nat Rev
Immunol 5, 807-817.
Cosman, D., Mullberg, J., Sutherland, C.L., Chin, W., Armitage, R., Fanslow, W., Kubin, M.,
and Chalupny, N.J. (2001). ULBPs, novel MHC class I-related molecules, bind to CMV
glycoprotein UL16 and stimulate NK cytotoxicity through the NKG2D receptor.
Immunity 14, 123-133.
Cox, S.T., Stephens, H.A., Fernando, R., Grant, J., Madrigal, J.A., and Little, A.M. (2009). Two
novel MICA alleles, MICA*054 and MICA*056. Tissue Antigens 73, 85-87.
Cox, S. T., Stephens, H.A., Fernando, R.,Karasu, A., Harber, M., Howie, A. J., Powis, S., Zou,
Y., Stastny, P., Madrigal, J.A., and Little, A.M. (2011). MICA allele mismatching, MICA
antibodies and rejection in renal transplantation. Hum Immunol 72 (10), 827-834.
CTS (1991). Collaborative Transplant Study Newsletter 5:1991. (Heidelber, Germany,
University of Heidelberg).
Dasgupta, S., Bhattacharya-Chatterjee, M., O'Malley, B.W., Jr., and Chatterjee, S.K. (2005).
Inhibition of NK cell activity through TGF-beta 1 by down-regulation of NKG2D in a
murine model of head and neck cancer. J Immunol 175, 5541-5550.
Dempster, A., Laird, N., and Rubin, D. (1977). Maximum likelihood estimation from
incomplete data using the EM algorithm. J Royal Stat Soc B 39, 1-38.
Doubrovina, E.S., Doubrovin, M.M., Vider, E., Sisson, R.B., O'Reilly, R.J., Dupont, B., and
Vyas, Y.M. (2003). Evasion from NK cell immunity by MHC class I chain-related
molecules expressing colon adenocarcinoma. J Immunol 171, 6891-6899.
Doxiadis, G.G., Heijmans, C.M., Otting, N., and Bontrop, R.E. (2007). MIC gene
polymorphism and haplotype diversity in rhesus macaques. Tissue Antigens 69, 212-219.
Dragun, D., Muller, D.N., Brasen, J.H., Fritsche, L., Nieminen-Kelha, M., Dechend, R.,
Kintscher, U., Rudolph, B., Hoebeke, J., Eckert, D., et al. (2005). Angiotensin II type 1-
receptor activating antibodies in renal-allograft rejection. N Engl J Med 352, 558-569.
Dudley, C., Pohanka, E., Riad, H., Dedochova, J., Wijngaard, P., Sutter, C., and Silva, H.T., Jr.
(2005). Mycophenolate mofetil substitution for cyclosporine a in renal transplant

References
332
recipients with chronic progressive allograft dysfunction: the "creeping creatinine" study.
Transplantation 79, 466-475.
Dunbar, S.A. (2006). Applications of Luminex xMAP technology for rapid, high-throughput
multiplexed nucleic acid detection. Clin Chim Acta 363, 71-82.
Duquesnoy, R.J., Mostecki, J., Hariharan, J., and Balazs, I. (2008). Structurally based epitope
analysis of major histocompatibility complex class I-related chain A (MICA) antibody
specificity patterns. Hum Immunol 69, 826-832.
Eagle, R.A., and Trowsdale, J. (2007). Promiscuity and the single receptor: NKG2D. Nat Rev
Immunol 7, 737-744.
Eisele, G., Wischhusen, J., Mittelbronn, M., Meyermann, R., Waldhauer, I., Steinle, A., Weller,
M., and Friese, M.A. (2006). TGF-beta and metalloproteinases differentially suppress
NKG2D ligand surface expression on malignant glioma cells. Brain 129, 2416-2425.
Erlich, H.A., Mack, S.J., Bergstrom, T., and Gyllensten, U.B. (1997). HLA class II alleles in
Amerindian populations: implications for the evolution of HLA polymorphism and the
colonization of the Americas. Hereditas 127, 19-24.
Excoffier, L., Laval, G., and Schneider, S. (2005). Arlequin (version 3.0): an integrated software
package for population genetics data analysis. Evol Bioinform Online 1, 47-50.
Excoffier, L., and Slatkin, M. (1995). Maximum-likelihood estimation of molecular haplotype
frequencies in a diploid population. Mol Biol Evol 12, 921-927.
Fanning, L.J., Connor, A.M., and Wu, G.E. (1996). Development of the immunoglobulin
repertoire. Clin Immunol Immunopathol 79, 1-14.
Fernandez, M.M., Guan, R., Swaminathan, C.P., Malchiodi, E.L., and Mariuzza, R.A. (2006).
Crystal structure of staphylococcal enterotoxin I (SEI) in complex with a human major
histocompatibility complex class II molecule. J Biol Chem 281, 25356-25364.
Fernandez-Fresnedo, G., Pastor, J.M., Lopez-Hoyos, M., Ruiz, J.C., Zubimendi, J.A., Gonzalez-
Cotorruelo, J., Rodrigo, E., De Francisco, A.L., and Arias, M. (2003). Relationship of
donor-specific class-I anti-HLA antibodies detected by ELISA after kidney
transplantation on the development of acute rejection and graft survival. Nephrol Dial
Transplant 18, 990-995.
Feucht, H.E. (2003). Complement C4d in graft capillaries -- the missing link in the recognition
of humoral alloreactivity. Am J Transplant 3, 646-652.
Feucht, H.E., Schneeberger, H., Hillebrand, G., Burkhardt, K., Weiss, M., Riethmuller, G.,
Land, W., and Albert, E. (1993). Capillary deposition of C4d complement fragment and
early renal graft loss. Kidney Int 43, 1333-1338.
Fodil, N., Laloux, L., Wanner, V., Pellet, P., Hauptmann, G., Mizuki, N., Inoko, H., Spies, T.,
Theodorou, I., and Bahram, S. (1996). Allelic repertoire of the human MHC class I MICA
gene. Immunogenetics 44, 351-357.
Fuggle, S.V., Allen, J.E., Johnson, R.J., Collett, D., Mason, P.D., Dudley, C., Rudge, C.J.,
Bradley, J.A., and Watson, C.J. (2010). Factors affecting graft and patient survival after
live donor kidney transplantation in the UK. Transplantation 89, 694-701.
Fung, J.J., Todo, S., Tzakis, A., Alessiani, M., Abu-Elmagd, K., Jain, A., Bronster, O., Martin,
M., Gordon, R., and Starzl, T.E. (1991). Current status of FK 506 in liver transplantation.
Transplant Proc 23, 1902-1905.
Gambelunghe, G., Brozzetti, A.L., Ghaderi, M., Tortoioli, C., and Falorni, A. (2006). MICA
A8: a new allele within MHC class I chain-related A transmembrane region with eight
GCT repeats. Hum Immunol 67, 1005-1007.
Gao, X., Single, R.M., Karacki, P., Marti, D., O'Brien, S.J., and Carrington, M. (2006).
Diversity of MICA and linkage disequilibrium with HLA-B in two North American
populations. Hum Immunol 67, 152-158.

References
333
Gaston, R.S., Cecka, J.M., Kasiske, B.L., Fieberg, A.M., Leduc, R., Cosio, F.C., Gourishankar,
S., Grande, J., Halloran, P., Hunsicker, L., et al. (2010). Evidence for antibody-mediated
injury as a major determinant of late kidney allograft failure. Transplantation 90, 68-74.
Gautier, A.C., Devys, A., Cheneau, M.L., Simon, P.H., Martin, C., Allard, S., Hourmant, M.,
and Bignon, J.D. (2009). MICA compatibility and immunization in third kidney
transplantations. Transplant Proc 41, 663-665.
Gokmen, M.R., Lombardi, G., and Lechler, R.I. (2008). The importance of the indirect pathway
of allorecognition in clinical transplantation. Curr Opin Immunol 20, 568-574.
Gorer, P.A. (1950). Studies in antibody response of mice to tumour inoculation. Br J Cancer 4,
372-379.
Goto, K., Ota, M., Ohno, S., Mizuki, N., Ando, H., Katsuyama, Y., Maksymowych, W.P.,
Kimura, M., Bahram, S., and Inoko, H. (1997). MICA gene and ankylosing spondylitis:
linkage analysis via a transmembrane-encoded triplet repeat polymorphism. Tissue
Antigens 49, 503-507.
Gowans, J.L. (1966). Life-span, recirculation, and transformation of lymphocytes. Int Rev Exp
Pathol 5, 1-24.
Gowans, J.L., and Uhr, J.W. (1966). The carriage of immunological memory by small
lymphocytes in the rat. J Exp Med 124, 1017-1030.
Graham, F.L., Smiley, J., Russell, W.C., and Nairn, R. (1977). Characteristics of a human cell
line transformed by DNA from human adenovirus type 5. J Gen Virol 36, 59-74.
Groh, V., Rhinehart, R., Randolph-Habecker, J., Topp, M.S., Riddell, S.R., and Spies, T.
(2001). Costimulation of CD8alphabeta T cells by NKG2D via engagement by MIC
induced on virus-infected cells. Nat Immunol 2, 255-260.
Groh, V., Rhinehart, R., Secrist, H., Bauer, S., Grabstein, K.H., and Spies, T. (1999). Broad
tumor-associated expression and recognition by tumor-derived gamma delta T cells of
MICA and MICB. Proc Natl Acad Sci U S A 96, 6879-6884.
Groh, V., Steinle, A., Bauer, S., and Spies, T. (1998). Recognition of stress-induced MHC
molecules by intestinal epithelial gammadelta T cells. Science 279, 1737-1740.
Groh, V., Wu, J., Yee, C., and Spies, T. (2002). Tumour-derived soluble MIC ligands impair
expression of NKG2D and T-cell activation. Nature 419, 734-738.
Halloran, P.F. (2010). T cell-mediated rejection of kidney transplants: a personal viewpoint. Am
J Transplant 10, 1126-1134.
Halloran, P.F., Schlaut, J., Solez, K., and Srinivasa, N.S. (1992). The significance of the anti-
class I response. II. Clinical and pathologic features of renal transplants with anti-class I-
like antibody. Transplantation 53, 550-555.
Hankey, K.G., Drachenberg, C.B., Papadimitriou, J.C., Klassen, D.K., Philosophe, B., Bartlett,
S.T., Groh, V., Spies, T., and Mann, D.L. (2002). MIC expression in renal and pancreatic
allografts. Transplantation 73, 304-306.
Harmer, A.W., Koffman, C.G., Heads, A.J., and Vaughan, R.W. (1995). Sensitization to HLA
antigens occurs in 95% of primary renal transplant rejections. Transplant Proc 27, 666-
667.
Heidecke, C.D., Araujo, J.L., Kupiec-Weglinski, J.W., Abbud-Filho, M., Araneda, D., Stadler,
J., Siewert, J., Strom, T.B., and Tilney, N.L. (1985). Lack of evidence for an active role
for natural killer cells in acute rejection of organ allografts. Transplantation 40, 441-444.
Hidalgo, L.G., Campbell, P.M., Sis, B., Einecke, G., Mengel, M., Chang, J., Sellares, J., Reeve,
J., and Halloran, P.F. (2009). De novo donor-specific antibody at the time of kidney
transplant biopsy associates with microvascular pathology and late graft failure. Am J
Transplant 9, 2532-2541.
Hildebrand, W.H., Madrigal, J.A., Belich, M.P., Zemmour, J., Ward, F.E., Williams, R.C., and
Parham, P. (1992). Serologic cross-reactivities poorly reflect allelic relationships in the

References
334
HLA-B12 and HLA-B21 groups. Dominant epitopes of the alpha 2 helix. J Immunol 149,
3563-3568.
Hirata, A.A., McIntire, F.C., Terasaki, P.I., and Mittal, K.K. (1973). Cross reactions between
human transplantation antigens and bacterial lipopolysaccharides. Transplantation 15,
441-445.
Hirata, A.A., and Terasaki, P.I. (1970). Cross-reactions between streptococcal M proteins and
human transplantation antigens. Science 168, 1095-1096.
Ho, M. (2008). The history of cytomegalovirus and its diseases. Med Microbiol Immunol 197,
65-73.
Hoffecker, J.F., Powers, W.R., and Goebel, T. (1993). The colonization of beringia and the
peopling of the new world. Science 259, 46-53.
Holdenrieder, S., Stieber, P., Peterfi, A., Nagel, D., Steinle, A., and Salih, H.R. (2006). Soluble
MICB in malignant diseases: analysis of diagnostic significance and correlation with
soluble MICA. Cancer Immunol Immunother 55, 1584-1589.
Holmes, M.A., Li, P., Petersdorf, E.W., and Strong, R.K. (2002). Structural studies of allelic
diversity of the MHC class I homolog MIC-B, a stress-inducible ligand for the activating
immunoreceptor NKG2D. J Immunol 169, 1395-1400.
Horwitz, D.A., Zheng, S.G., Wang, J., and Gray, J.D. (2008). Critical role of IL-2 and TGF-beta
in generation, function and stabilization of Foxp3+CD4+ Treg. Eur J Immunol 38, 912-
915.
Hourmant, M., Cesbron-Gautier, A., Terasaki, P.I., Mizutani, K., Moreau, A., Meurette, A.,
Dantal, J., Giral, M., Blancho, G., Cantarovich, D., et al. (2005). Frequency and clinical
implications of development of donor-specific and non-donor-specific HLA antibodies
after kidney transplantation. J Am Soc Nephrol 16, 2804-2812.
Howie, A.J., Ferreira, M.A., Lipkin, G.W., and Adu, D. (2004). Measurement of chronic
damage in the donor kidney and graft survival. Transplantation 77, 1058-1065.
Hozumi, N., and Tonegawa, S. (1976). Evidence for somatic rearrangement of immunoglobulin
genes coding for variable and constant regions. Proc Natl Acad Sci U S A 73, 3628-3632.
Hughes, A.L., and Nei, M. (1988). Pattern of nucleotide substitution at major histocompatibility
complex class I loci reveals overdominant selection. Nature 335, 167-170.
Idica, A., Sasaki, N., Hardy, S., and Terasaki, P. (2006). Unexpected frequencies of HLA
antibody specificities in the sera of pre-transplant kidney patients. Clin Transpl, 161-170.
Jain, N., Airy, M., Kumari, P., Hull, D., and Ranga, K.V. (2010). Significant decrease in
glomerular filtration rate at 5 years posttransplantation in the recipients of live donor
kidneys 50 years of age or older. Transplant Proc 42, 1648-1653.
Jeannet, M., Pinn, V.W., Flax, M.H., Winn, H.J., and Russell, P.S. (1970). Humoral antibodies
in renal allotransplantation in man. N Engl J Med 282, 111-117.
Jordan, S., Cunningham-Rundles, C., and McEwan, R. (2003). Utility of intravenous immune
globulin in kidney transplantation: efficacy, safety, and cost implications. Am J
Transplant 3, 653-664.
Jurcevic, S., Ainsworth, M.E., Pomerance, A., Smith, J.D., Robinson, D.R., Dunn, M.J.,
Yacoub, M.H., and Rose, M.L. (2001). Antivimentin antibodies are an independent
predictor of transplant-associated coronary artery disease after cardiac transplantation.
Transplantation 71, 886-892.
Kaiser, B.K., Yim, D., Chow, I.T., Gonzalez, S., Dai, Z., Mann, H.H., Strong, R.K., Groh, V.,
and Spies, T. (2007). Disulphide-isomerase-enabled shedding of tumour-associated
NKG2D ligands. Nature 447, 482-486.
Kang, J., and Raulet, D.H. (1997). Events that regulate differentiation of alpha beta TCR+ and
gamma delta TCR+ T cells from a common precursor. Semin Immunol 9, 171-179.

References
335
Karamehic, J., Masic, I., Skrbo, A., Drace, Z., Delic-Sarac, M., and Subasic, D. (2008).
Transplantation of organs: one of the greatest achievements in history of medicine. Med
Arh 62, 307-310.
Karre, K., Ljunggren, H.G., Piontek, G., and Kiessling, R. (1986). Selective rejection of H-2-
deficient lymphoma variants suggests alternative immune defence strategy. Nature 319,
675-678.
Karthikeyan, V., Karpinski, J., Nair, R.C., and Knoll, G. (2004). The burden of chronic kidney
disease in renal transplant recipients. Am J Transplant 4, 262-269.
Katsuyama, Y., Ota, M., Ando, H., Saito, S., Mizuki, N., Kera, J., Bahram, S., Nose, Y., and
Inoko, H. (1999). Sequencing based typing for genetic polymorphisms in exons, 2, 3 and
4 of the MICA gene. Tissue Antigens 54, 178-184.
Kiessling, R., Klein, E., Pross, H., and Wigzell, H. (1975a). "Natural" killer cells in the mouse.
II. Cytotoxic cells with specificity for mouse Moloney leukemia cells. Characteristics of
the killer cell. Eur J Immunol 5, 117-121.
Kiessling, R., Klein, E., and Wigzell, H. (1975b). "Natural" killer cells in the mouse. I.
Cytotoxic cells with specificity for mouse Moloney leukemia cells. Specificity and
distribution according to genotype. Eur J Immunol 5, 112-117.
Kim, J., Chang, C.K., Hayden, T., Liu, F.C., Benjamin, J., Hamerman, J.A., Lanier, L.L., and
Kang, S.M. (2007). The activating immunoreceptor NKG2D and its ligands are involved
in allograft transplant rejection. J Immunol 179, 6416-6420.
Kinukawa, T., Kato, M., Terasaki, P.I., and Ozawa, M. (2006). Retrospective antibody analysis
of thirty patients with kidney graft failure. Clin Transpl, 291-303.
Kitchens, W.H., Uehara, S., Chase, C.M., Colvin, R.B., Russell, P.S., and Madsen, J.C. (2006).
The changing role of natural killer cells in solid organ rejection and tolerance.
Transplantation 81, 811-817.
Klein, J., and Sato, A. (2000). The HLA system. First of two parts. N Engl J Med 343, 702-709.
Knight, D.A., and Holgate, S.T. (2003). The airway epithelium: structural and functional
properties in health and disease. Respirology 8, 432-446.
Koka, P., and Cecka, J.M. (1990). Sex and age effects in renal transplantation. Clin Transpl,
437-446.
Komatsu-Wakui, M., Tokunaga, K., Ishikawa, Y., Kashiwase, K., Moriyama, S., Tsuchiya, N.,
Ando, H., Shiina, T., Geraghty, D.E., Inoko, H., and Juji, T. (1999). MIC-A
polymorphism in Japanese and a MIC-A-MIC-B null haplotype. Immunogenetics 49,
620-628.
Kreslavsky, T., and von Boehmer, H. (2010). gammadeltaTCR ligands and lineage
commitment. Semin Immunol 22, 214-221.
Krmpotic, A., Hasan, M., Loewendorf, A., Saulig, T., Halenius, A., Lenac, T., Polic, B., Bubic,
I., Kriegeskorte, A., Pernjak-Pugel, E., et al. (2005). NK cell activation through the
NKG2D ligand MULT-1 is selectively prevented by the glycoprotein encoded by mouse
cytomegalovirus gene m145. J Exp Med 201, 211-220.
Kroemer, A., Edtinger, K., and Li, X.C. (2008). The innate natural killer cells in transplant
rejection and tolerance induction. Curr Opin Organ Transplant 13, 339-343.
Lachmann, N., Terasaki, P.I., Budde, K., Liefeldt, L., Kahl, A., Reinke, P., Pratschke, J.,
Rudolph, B., Schmidt, D., Salama, A., and Schonemann, C. (2009). Anti-human
leukocyte antigen and donor-specific antibodies detected by luminex posttransplant serve
as biomarkers for chronic rejection of renal allografts. Transplantation 87, 1505-1513.
Lachmann, N., Terasaki, P.I., and Schonemann, C. (2006). Donor-specific HLA antibodies in
chronic renal allograft rejection: a prospective trial with a four-year follow-up. Clin
Transpl, 171-199.

References
336
Landegren, U., Ramstedt, U., Axberg, I., Ullberg, M., Jondal, M., and Wigzell, H. (1982).
Selective inhibition of human T cell cytotoxicity at levels of target recognition or
initiation of lysis by monoclonal OKT3 and Leu-2a antibodies. J Exp Med 155, 1579-
1584.
Lanier, L.L. (2005). Missing self, NK cells, and The White Album. J Immunol 174, 6565.
Lanier, L.L., Serafini, A.T., Ruitenberg, J.J., Cwirla, S., Federspiel, N.A., Phillips, J.H., Allison,
J.P., and Weiss, A. (1987). The gamma T-cell antigen receptor. J Clin Immunol 7, 429-
440.
Le Moine, A., Goldman, M., and Abramowicz, D. (2002). Multiple pathways to allograft
rejection. Transplantation 73, 1373-1381.
Lee, J.C., Lee, K.M., Kim, D.W., and Heo, D.S. (2004). Elevated TGF-beta1 secretion and
down-modulation of NKG2D underlies impaired NK cytotoxicity in cancer patients. J
Immunol 172, 7335-7340.
Lee, P.C., Terasaki, P.I., Takemoto, S.K., Lee, P.H., Hung, C.J., Chen, Y.L., Tsai, A., and Lei,
H.Y. (2002). All chronic rejection failures of kidney transplants were preceded by the
development of HLA antibodies. Transplantation 74, 1192-1194.
Lee, P.C., Zhu, L., Terasaki, P.I., and Everly, M.J. (2009). HLA-specific antibodies developed
in the first year posttransplant are predictive of chronic rejection and renal graft loss.
Transplantation 88, 568-574.
Leelayuwat, C., Townend, D.C., Degli-Esposti, M.A., Abraham, L.J., and Dawkins, R.L.
(1994). A new polymorphic and multicopy MHC gene family related to nonmammalian
class I. Immunogenetics 40, 339-351.
Lefaucheur, C., Loupy, A., Hill, G.S., Andrade, J., Nochy, D., Antoine, C., Gautreau, C.,
Charron, D., Glotz, D., and Suberbielle-Boissel, C. Preexisting donor-specific HLA
antibodies predict outcome in kidney transplantation. J Am Soc Nephrol 21, 1398-1406.
Lefranc, G., and Lefranc, M.P. (1980). Discontinuous genes and DNA sequence transposition: a
model for immunoglobulin chain synthesis. J Immunogenet 7, 207-214.
Lemy, A., Andrien, M., Wissing, K.M., Ryhahi, K., Vandersarren, A., Racape, J., Heylen, C.,
Ghisdal, L., Broeders, E., Vereerstraeten, P., et al. (2010). Major Histocompatibility
Complex Class 1 Chain-Related Antigen A Antibodies: Sensitizing Events and Impact on
Renal Graft Outcomes. Transplantation.
Lerut, E., Naesens, M., Kuypers, D.R., Vanrenterghem, Y., and Van Damme, B. (2007).
Subclinical peritubular capillaritis at 3 months is associated with chronic rejection at 1
year. Transplantation 83, 1416-1422.
Levey, A.S., Bosch, J.P., Lewis, J.B., Greene, T., Rogers, N., and Roth, D. (1999). A more
accurate method to estimate glomerular filtration rate from serum creatinine: a new
prediction equation. Modification of Diet in Renal Disease Study Group. Ann Intern Med
130, 461-470.
Levey, A.S., Coresh, J., Greene, T., Stevens, L.A., Zhang, Y., Hendriksen, S., Kusek, J.W., and
Van Lente, F. (2006). Using Standardized Serum Creatinine Values in the Modification of
Diet in Renal Disease Study Equation for Estimating Glomerular Filtration Rate. Annals
of Internal Medicine 145, 247-254.
Levey, A.S., Greene, T., Kusek, J.W., and Beck, G. (2000). A simplified equation to predict
glomerular filtration rate from serum creatinine. Am Soc Nephrol 11, 155.
Ley, K., Laudanna, C., Cybulsky, M.I., and Nourshargh, S. (2007). Getting to the site of
inflammation: the leukocyte adhesion cascade updated. Nat Rev Immunol 7, 678-689.
Li, L., Chen, A., Chaudhuri, A., Kambham, N., Sigdel, T., Chen, R., and Sarwal, M.M. (2010).
Compartmental localization and clinical relevance of MICA antibodies after renal
transplantation. Transplantation 89, 312-319.

References
337
Li, L., Wadia, P., Chen, R., Kambham, N., Naesens, M., Sigdel, T.K., Miklos, D.B., Sarwal,
M.M., and Butte, A.J. (2009). Identifying compartment-specific non-HLA targets after
renal transplantation by integrating transcriptome and "antibodyome" measures. Proc Natl
Acad Sci U S A 106, 4148-4153.
Li, P., Willie, S.T., Bauer, S., Morris, D.L., Spies, T., and Strong, R.K. (1999). Crystal structure
of the MHC class I homolog MIC-A, a gammadelta T cell ligand. Immunity 10, 577-584.
Li, Z., Groh, V., Strong, R.K., and Spies, T. (2000). A single amino acid substitution causes loss
of expression of a MICA allele. Immunogenetics 51, 246-248.
Lichtenstein, D.L., Toth, K., Doronin, K., Tollefson, A.E., and Wold, W.S. (2004). Functions
and mechanisms of action of the adenovirus E3 proteins. Int Rev Immunol 23, 75-111.
Liu, W., and Li, X.C. (2010). An overview on non-T cell pathways in transplant rejection and
tolerance. Curr Opin Organ Transplant 15, 422-426.
Lorenz, M., Regele, H., Schillinger, M., Exner, M., Rasoul-Rockenschaub, S., Wahrmann, M.,
Kletzmayr, J., Silberhumer, G., Horl, W.H., and Bohmig, G.A. (2004). Risk factors for
capillary C4d deposition in kidney allografts: evaluation of a large study cohort.
Transplantation 78, 447-452.
Lu, D., Xie, R.L., Rydzewski, A., and Long, G.L. (1997). The effect of N-linked glycosylation
on molecular weight, thrombin cleavage, and functional activity of human protein S.
Thromb Haemost 77, 1156-1163.
Madden, D.R. (1995). The three-dimensional structure of peptide-MHC complexes. Annu Rev
Immunol 13, 587-622.
Mao, Q., Terasaki, P.I., Cai, J., Briley, K., Catrou, P., Haisch, C., and Rebellato, L. (2007).
Extremely high association between appearance of HLA antibodies and failure of kidney
grafts in a five-year longitudinal study. Am J Transplant 7, 864-871.
Marcen, R., Morales, J.M., Fernandez-Rodriguez, A., Capdevila, L., Pallardo, L., Plaza, J.J.,
Cubero, J.J., Puig, J.M., Sanchez-Fructuoso, A., Arias, M., et al. (2010). Long-term graft
function changes in kidney transplant recipients. NDT Plus 3, ii2-ii8.
Marcen, R., Pascual, J., Tenorio, M., Ocana, E.J., Teruel, J.L., Villafruela, J.J., Fernandez, M.,
Burgos, F.J., and Ortuno, J. (2005). Chronic kidney disease in renal transplant recipients.
Transplant Proc 37, 3718-3720.
Marten, A., von Lilienfeld-Toal, M., Buchler, M.W., and Schmidt, J. (2006). Soluble MIC is
elevated in the serum of patients with pancreatic carcinoma diminishing gammadelta T
cell cytotoxicity. Int J Cancer 119, 2359-2365.
Martin, S., Dyer, P.A., Mallick, N.P., Gokal, R., Harris, R., and Johnson, R.W. (1987).
Posttransplant antidonor lymphocytotoxic antibody production in relation to graft
outcome. Transplantation 44, 50-53.

References
338
Martinez-Borra, J., Gonzalez, S., Lopez-Vazquez, A., Gelaz, M.A., Armas, J.B., Kanga, U.,
Mehra, N.K., and Lopez-Larrea, C. (2000). HLA-B27 alone rather than B27-related class
I haplotypes contributes to ankylosing spondylitis susceptibility. Hum Immunol 61, 131-
139.
Matzinger, P. (1999). Graft tolerance: a duel of two signals. Nat Med 5, 616-617.
McAlack, R.F., Bannett, A.D., Raja, R., Kim, P., Romano, E., and Lauzon, G. (1987). Delayed
hyperacute rejection in an ABO-incompatible renal transplant. Transplant Proc 19, 4558-
4560.
McClellan, K.A. (1997). Mucosal defense of the outer eye. Surv Ophthalmol 42, 233-246.
McMichael, A.J. (1980). HLA restriction of human cytotoxic T cells. Springer Semin
Immunopathol 3, 3-22.
McSharry, B.P., Burgert, H.G., Owen, D.P., Stanton, R.J., Prod'homme, V., Sester, M.,
Koebernick, K., Groh, V., Spies, T., Cox, S., et al. (2008). Adenovirus E3/19K promotes
evasion of NK cell recognition by intracellular sequestration of the NKG2D ligands major
histocompatibility complex class I chain-related proteins A and B. J Virol 82, 4585-4594.
Medawar, P.B. (1948). Tests by tissue culture methods on the nature of immunity to
transplanted skin. Q J Microsc Sci 89, 239-252.
Medawar, P.B. (1956). The immunology of transplantation. Harvey Lect, 144-176.
Meier-Kriesche, H.U., Schold, J.D., and Kaplan, B. (2004). Long-term renal allograft survival:
have we made significant progress or is it time to rethink our analytic and therapeutic
strategies? Am J Transplant 4, 1289-1295.
Mele, T.S., and Halloran, P.F. (2000). The use of mycophenolate mofetil in transplant
recipients. Immunopharmacology 47, 215-245.
Mendoza-Rincon, J., Arguello, J.R., Perez-Rodriguez, M., McWhinnie, A., Marsh, S.G.,
Fischer, G., and Madrigal, J.A. (1999). Characterization of the MICA polymorphism by
sequence-specific oligonucleotide probing. Immunogenetics 49, 471-478.
Meylan, E., Tschopp, J., and Karin, M. (2006). Intracellular pattern recognition receptors in the
host response. Nature 442, 39-44.
Mitchison, N.A. (1958). Tissue transplantation and cellular heredity. Symp Soc Exp Biol 12,
225-241.
Mizuki, N., Meguro, A., Tohnai, I., Gul, A., and Ohno, S. (2007). Association of Major
Histocompatibility Complex Class I Chain-Related Gene A and HLA-B Alleles with
Behcet's Disease in Turkey. Jpn J Ophthalmol 51, 431-436.
Mizuki, N., Ota, M., Kimura, M., Ohno, S., Ando, H., Katsuyama, Y., Yamazaki, M.,
Watanabe, K., Goto, K., Nakamura, S., et al. (1997). Triplet repeat polymorphism in the
transmembrane region of the MICA gene: a strong association of six GCT repetitions with
Behcet disease. Proc Natl Acad Sci U S A 94, 1298-1303.
Mizuki, N., Ota, M., Yabuki, K., Katsuyama, Y., Ando, H., Palimeris, G.D., Kaklamani, E.,
Accorinti, M., Pivetti-Pezzi, P., Ohno, S., and Inoko, H. (2000). Localization of the
pathogenic gene of Behcet's disease by microsatellite analysis of three different
populations. Invest Ophthalmol Vis Sci 41, 3702-3708.
Mizutani, K., Terasaki, P., Bignon, J.D., Hourmant, M., Cesbron-Gautier, A., Shih, R.N., Pei,
R., Lee, J., and Ozawa, M. (2006a). Association of kidney transplant failure and
antibodies against MICA. Hum Immunol 67, 683-691.
Mizutani, K., Terasaki, P., Hamdani, E., Esquenazi, V., Rosen, A., Miller, J., and Ozawa, M.
(2007). The importance of anti-HLA-specific antibody strength in monitoring kidney
transplant patients. Am J Transplant 7, 1027-1031.
Mizutani, K., Terasaki, P., Rosen, A., Esquenazi, V., Miller, J., Shih, R.N., Pei, R., Ozawa, M.,
and Lee, J. (2005). Serial ten-year follow-up of HLA and MICA antibody production
prior to kidney graft failure. Am J Transplant 5, 2265-2272.

References
339
Mizutani, K., Terasaki, P.I., Shih, R.N., Pei, R., Ozawa, M., and Lee, J. (2006b). Frequency of
MIC antibody in rejected renal transplant patients without HLA antibody. Hum Immunol
67, 223-229.
Mohty, M. (2007). Mechanisms of action of antithymocyte globulin: T-cell depletion and
beyond. Leukemia 21, 1387-1394.
Mok, J.W., Lee, Y.J., Kim, J.Y., Lee, E.B., Song, Y.W., Park, M.H., and Park, K.S. (2003).
Association of MICA polymorphism with rheumatoid arthritis patients in Koreans. Hum
Immunol 64, 1190-1194.
Molinero, L.L., Domaica, C.I., Fuertes, M.B., Girart, M.V., Rossi, L.E., and Zwirner, N.W.
(2006). Intracellular expression of MICA in activated CD4 T lymphocytes and protection
from NK cell-mediated MICA-dependent cytotoxicity. Hum Immunol 67, 170-182.
Molinero, L.L., Fuertes, M.B., Rabinovich, G.A., Fainboim, L., and Zwirner, N.W. (2002a).
Activation-induced expression of MICA on T lymphocytes involves engagement of CD3
and CD28. J Leukoc Biol 71, 791-797.
Molinero, L.L., Marcos, C.Y., Mirbaha, F., Fainboim, L., Stastny, P., and Zwirner, N.W.
(2002b). Codominant expression of the polymorphic MICA alloantigens encoded by
genes in the HLA region. Eur J Immunogenet 29, 315-319.
Monsalve, M.V., Edin, G., and Devine, D.V. (1998). Analysis of HLA class I and class II in Na-
Dene and Amerindian populations from British Columbia, Canada. Hum Immunol 59, 48-
55.
Morales-Buenrostro, L.E., Terasaki, P.I., Marino-Vazquez, L.A., Lee, J.H., El-Awar, N., and
Alberu, J. (2008). "Natural" human leukocyte antigen antibodies found in
nonalloimmunized healthy males. Transplantation 86, 1111-1115.
Morris, P.J., Williams, G.M., Hume, D.M., Mickey, M.R., and Terasaki, P.I. (1968). Serotyping
for homotransplantation. XII. Occurrence of cytotoxic antibodies following kidney
transplantation in man. Transplantation 6, 392-399.
Mosmann, T.R., and Coffman, R.L. (1989a). Heterogeneity of cytokine secretion patterns and
functions of helper T cells. Adv Immunol 46, 111-147.
Mosmann, T.R., and Coffman, R.L. (1989b). TH1 and TH2 cells: different patterns of
lymphokine secretion lead to different functional properties. Annu Rev Immunol 7, 145-
173.
Murray, J.E. (1994). The Nobel Lectures in Immunology. The Nobel Prize for Physiology or
Medicine, 1990. The first successful organ transplants in man. Scand J Immunol 39, 1-11.
Nakano, T., Goto, S., Lai, C.Y., Hsu, L.W., Kao, Y.H., Lin, Y.C., Kawamoto, S., Chiang, K.C.,
Ohmori, N., Goto, T., et al. (2007). Experimental and clinical significance of antinuclear
antibodies in liver transplantation. Transplantation 83, 1122-1125.
Nankivell, B.J., Borrows, R.J., Fung, C.L., O'Connell, P.J., Chapman, J.R., and Allen, R.D.
(2004). Calcineurin inhibitor nephrotoxicity: longitudinal assessment by protocol
histology. Transplantation 78, 557-565.
Nath, D.S., Angaswamy, N., Basha, H.I., Phelan, D., Moazami, N., Ewald, G.A., and
Mohanakumar, T. (2010). Donor-specific antibodies to human leukocyte antigens are
associated with and precede antibodies to major histocompatibility complex class I-
related chain A in antibody-mediated rejection and cardiac allograft vasculopathy after
human cardiac transplantation. Hum Immunol.
Nishiyama, M., Takahashi, M., Manaka, K.C., Roosihermiatie, B., Kuriyama, T., and Nakae, K.
(2004). Research report: Frequencies of mica gene polymorphism: a comparison between
Indonesians on Bacan Island and suburban Japanese. Southeast Asian J Trop Med Public
Health 35, 195-201.
Norment, A.M., and Littman, D.R. (1988). A second subunit of CD8 is expressed in human T
cells. EMBO J 7, 3433-3439.

References
340
Obara, H., Nagasaki, K., Hsieh, C.L., Ogura, Y., Esquivel, C.O., Martinez, O.M., and Krams,
S.M. (2005). IFN-gamma, produced by NK cells that infiltrate liver allografts early after
transplantation, links the innate and adaptive immune responses. Am J Transplant 5,
2094-2103.
Ohata, K., Espinoza, J.L., Lu, X., Kondo, Y., and Nakao, S. (2011). Mycophenolic Acid inhibits
natural killer cell proliferation and cytotoxic function: a possible disadvantage of
including mycophenolate mofetil in the graft-versus-host disease prophylaxis regimen.
Biol Blood Marrow Transplant 17, 205-213.
Oien, C.M., Reisaeter, A.V., Leivestad, T., Dekker, F.W., Line, P.D., and Os, I. (2007). Living
donor kidney transplantation: the effects of donor age and gender on short- and long-term
outcomes. Transplantation 83, 600-606.
Olerup, O., and Zetterquist, H. (1992). HLA-DR typing by PCR amplification with sequence-
specific primers (PCR-SSP) in 2 hours: an alternative to serological DR typing in clinical
practice including donor-recipient matching in cadaveric transplantation. Tissue Antigens
39, 225-235.
Oliveira, L.A., Ribas, F., Bicalho, M.G., Tsuneto, L.T., and Petzl-Erler, M.L. (2008). High
frequencies of alleles MICA*020 and MICA*027 in Amerindians and evidence of
positive selection on exon 3. Genes Immun 9, 697-705.
Olszewski, W., and Lukasiewicz, H. (1973). Studies on the mechanism of hyperacute rejection
of rabbit-to-dog liver transplants. Acta Med Pol 14, 113-122.
Opelz, G. (1996). Five-year results of renal transplantation in highly sensitized recipients.
Collaborative Transplant Study. Transpl Int 9 Suppl 1, S16-19.
Opelz, G. (2000). Factors influencing long-term graft loss. The Collaborative Transplant Study.
Transplant Proc 32, 647-649.
Ota, M., Katsuyama, Y., Mizuki, N., Ando, H., Furihata, K., Ono, S., Pivetti-Pezzi, P., Tabbara,
K.F., Palimeris, G.D., Nikbin, B., et al. (1997). Trinucleotide repeat polymorphism within
exon 5 of the MICA gene (MHC class I chain-related gene A): allele frequency data in the
nine population groups Japanese, Northern Han, Hui, Uygur, Kazakhstan, Iranian, Saudi
Arabian, Greek and Italian. Tissue Antigens 49, 448-454.
Ozawa, M., Rebellato, L.M., Terasaki, P.I., Tong, A., Briley, K.P., Catrou, P., and Haisch, C.E.
(2006). Longitudinal testing of 266 renal allograft patients for HLA and MICA
antibodies: Greenville experience. Clin Transpl, 265-290.
Ozawa, M., Terasaki, P.I., Lee, J.H., Castro, R., Alberu, J., Alonso, C., Alvarez, I., Toledo, R.,
Alvez, H., Monterio, M., et al. (2007). 14th International HLA and Immunogenetics
Workshop: report on the Prospective Chronic Rejection Project. Tissue Antigens 69 Suppl
1, 174-179.
Panigrahi, A., Gupta, N., Siddiqui, J.A., Margoob, A., Bhowmik, D., Guleria, S., and Mehra,
N.K. (2007a). Monitoring of anti-HLA and anti-Major histocompatibility complex class I
related chain A antibodies in living related renal donor transplantation. Transplant Proc
39, 759-760.
Panigrahi, A., Gupta, N., Siddiqui, J.A., Margoob, A., Bhowmik, D., Guleria, S., and Mehra,
N.K. (2007b). Post transplant development of MICA and anti-HLA antibodies is
associated with acute rejection episodes and renal allograft loss. Hum Immunol 68, 362-
367.
Panigrahi, A., Siddiqui, J.A., Rai, A., Margoob, A., Khaira, A., Bhowmik, D., Tiwari, S.C.,
Guleria, S., and Mehra, N.K. (2007c). Allosensitization to HLA and MICA is an
important measure of renal graft outcome. Clin Transpl, 211-217.
Parham, P., Lawlor, D.A., Lomen, C.E., and Ennis, P.D. (1989). Diversity and diversification of
HLA-A,B,C alleles. J Immunol 142, 3937-3950.

References
341
Parham, P., and Ohta, T. (1996). Population biology of antigen presentation by MHC class I
molecules. Science 272, 67-74.
Park, S.H., Park, K.S., Seo, Y.I., Min, D.J., Kim, W.U., Kim, T.G., Cho, C.S., Mok, J.W., and
Kim, H.Y. (2002). Association of MICA polymorphism with HLA-B51 and disease
severity in Korean patients with Behcet's disease. J Korean Med Sci 17, 366-370.
Parmar, S., de Lima, M., Zou, Y., Patah, P., Liu, P., Cano, P., Rondon, G., Pesoa, S., de Padua
Silva, L., Qazilbash, M.H., et al. (2009). Donor-recipient mismatches in MHC class I
chain-related gene A in unrelated donor transplantation lead to increased incidence of
acute graft-versus-host disease. Blood.
Pascual, M., Theruvath, T., Kawai, T., Tolkoff-Rubin, N., and Cosimi, A.B. (2002). Strategies
to improve long-term outcomes after renal transplantation. N Engl J Med 346, 580-590.
Patel, R., and Terasaki, P.I. (1969). Significance of the positive crossmatch test in kidney
transplantation. N Engl J Med 280, 735-739.
Pavlova, Y.A., Malek, I., Honsova, E., Netuka, I., Sochman, J., Lodererova, A., Kolesar, L.,
Striz, I., Skibova, J., and Slavcev, A. (2009). Hepatocyte growth factor and antibodies to
HLA and MICA antigens in heart transplant recipients. Tissue Antigens 76, 380-386.
Pedersen, B.K., and Beyer, J.M. (1986). A longitudinal study of the influence of azathioprine on
natural killer cell activity. Allergy 41, 286-289.
Pelletier, R.P., Hennessy, P.K., Adams, P.W., VanBuskirk, A.M., Ferguson, R.M., and Orosz,
C.G. (2002). Clinical significance of MHC-reactive alloantibodies that develop after
kidney or kidney-pancreas transplantation. Am J Transplant 2, 134-141.
Perez-Rodriguez, M., Corell, A., Arguello, J.R., Cox, S.T., McWhinnie, A., Marsh, S.G., and
Madrigal, J.A. (2000). A new MICA allele with ten alanine residues in the exon 5
microsatellite. Tissue Antigens 55, 162-165.
Persijn, G.G., Gabb, B.W., van Leeuwen, A., Nagtegaal, A., Hoogeboom, J., and van Rood, J.J.
(1978). Matching for HLA antigens of A, B, and DR loci in renal transplantation by
Eurotransplant. Lancet 1, 1278-1281.
Pessione, F., Cohen, S., Durand, D., Hourmant, M., Kessler, M., Legendre, C., Mourad, G.,
Noel, C., Peraldi, M.N., Pouteil-Noble, C., et al. (2003). Multivariate analysis of donor
risk factors for graft survival in kidney transplantation. Transplantation 75, 361-367.
Petersdorf, E.W., Shuler, K.B., Longton, G.M., Spies, T., and Hansen, J.A. (1999). Population
study of allelic diversity in the human MHC class I-related MIC-A gene. Immunogenetics
49, 605-612.
Petersson, E., Qi, Z., Ekberg, H., Ostraat, O., Dohlsten, M., and Hedlund, G. (1997). Activation
of alloreactive natural killer cells is resistant to cyclosporine. Transplantation 63, 1138-
1144.
Pettigrew, G.J., Lovegrove, E., Bradley, J.A., Maclean, J., and Bolton, E.M. (1998). Indirect T
cell allorecognition and alloantibody-mediated rejection of MHC class I-disparate heart
grafts. J Immunol 161, 1292-1298.
Piancatelli, D., Del Beato, T., Oumhani, K., El Aouad, R., and Adorno, D. (2005). MICA
polymorphism in a population from north Morocco, Metalsa Berbers, using sequence-
based typing. Hum Immunol 66, 931-936.
Piazza, A., Menozzi, P., and Cavalli-Sforza, L.L. (1980). The HLA-A,B gene frequencies in the
world: migration or selection? Hum Immunol 1, 297-304.
Piazza, A., Poggi, E., Borrelli, L., Servetti, S., Monaco, P.I., Buonomo, O., Valeri, M., Torlone,
N., Adorno, D., and Casciani, C.U. (2001). Impact of donor-specific antibodies on chronic
rejection occurrence and graft loss in renal transplantation: posttransplant analysis using
flow cytometric techniques. Transplantation 71, 1106-1112.

References
342
Prchal, J.T., Throckmorton, D.W., Carroll, A.J., 3rd, Fuson, E.W., Gams, R.A., and Prchal, J.F.
(1978). A common progenitor for human myeloid and lymphoid cells. Nature 274, 590-
591.
Pyo, C.W., Hur, S.S., Kim, Y.K., Choi, H.B., Kim, T.Y., and Kim, T.G. (2003). Distribution of
MICA alleles and haplotypes associated with HLA in the Korean population. Hum
Immunol 64, 378-384.
Racusen, L.C., Colvin, R.B., Solez, K., Mihatsch, M.J., Halloran, P.F., Campbell, P.M., Cecka,
M.J., Cosyns, J.P., Demetris, A.J., Fishbein, M.C., et al. (2003). Antibody-mediated
rejection criteria - an addition to the Banff 97 classification of renal allograft rejection.
Am J Transplant 3, 708-714.
Racusen, L.C., Solez, K., Colvin, R.B., Bonsib, S.M., Castro, M.C., Cavallo, T., Croker, B.P.,
Demetris, A.J., Drachenberg, C.B., Fogo, A.B., et al. (1999). The Banff 97 working
classification of renal allograft pathology. Kidney Int 55, 713-723.
Radosavljevic, M., Cuillerier, B., Wilson, M.J., Clement, O., Wicker, S., Gilfillan, S., Beck,
S., Trowsdale, J., and Bahram, S. (2002). A cluster of ten novel MHC class I related
genes on human chromosome 6q24.2-q25.3. Genomics 79, 114-123.
Rees, R.C. (1990). MHC restricted and non-restricted killer lymphocytes. Blood Rev 4, 204-
210.
Rego, J., Prevost, F., Rumeau, J.L., Modesto, A., Fourtanier, G., Durand, D., Suc, J.M., Ohayon,
E., and Ducos, J. (1987). Hyperacute rejection after ABO-incompatible orthotopic liver
transplantation. Transplant Proc 19, 4589-4590.
Ricci-Vitiani, L., Vacca, A., Potolicchio, I., Scarpa, R., Bitti, P., Sebastiani, G., Passiu, G.,
Mathieu, A., and Sorrentino, R. (2000). MICA gene triplet repeat polymorphism in
patients with HLA-B27 positive and negative ankylosing spondylitis from Sardinia. J
Rheumatol 27, 2193-2197.
Robinson, J., and Marsh, S.G. (2007). The IMGT/HLA database. Methods Mol Biol 409, 43-60.
Robinson, J., Waller, M.J., Parham, P., Bodmer, J.G., and Marsh, S.G. (2001). IMGT/HLA
Database--a sequence database for the human major histocompatibility complex. Nucleic
Acids Res 29, 210-213.
Rogers, N.J., and Lechler, R.I. (2001). Allorecognition. Am J Transplant 1, 97-102.
Romphruk, A.V., Naruse, T.K., Romphruk, A., Kawata, H., Puapairoj, C., Kulski, J.K.,
Leelayuwat, C., and Inoko, H. (2001). Diversity of MICA (PERB11.1) and HLA
haplotypes in Northeastern Thais. Tissue Antigens 58, 83-89.
Roy, S., Barnes, P.F., Garg, A., Wu, S., Cosman, D., and Vankayalapati, R. (2008). NK cells
lyse T regulatory cells that expand in response to an intracellular pathogen. J Immunol
180, 1729-1736.
Rueda, B., Pascual, M., Lopez-Nevot, M.A., Gonzalez, E., and Martin, J. (2002). A new allele
within the transmembrane region of the human MICA gene with seven GCT repeats.
Tissue Antigens 60, 526-528.
Russell, M.W., and Mestecky, J. (2010). Tolerance and protection against infection in the
genital tract. Immunol Invest 39, 500-525.
Russell, P.S., Chase, C.M., and Colvin, R.B. (1997). Alloantibody- and T cell-mediated
immunity in the pathogenesis of transplant arteriosclerosis: lack of progression to
sclerotic lesions in B cell-deficient mice. Transplantation 64, 1531-1536.
Saiki, R.K., Bugawan, T.L., Horn, G.T., Mullis, K.B., and Erlich, H.A. (1986). Analysis of
enzymatically amplified beta-globin and HLA-DQ alpha DNA with allele-specific
oligonucleotide probes. Nature 324, 163-166.
Salih, H.R., Antropius, H., Gieseke, F., Lutz, S.Z., Kanz, L., Rammensee, H.G., and Steinle, A.
(2003). Functional expression and release of ligands for the activating immunoreceptor
NKG2D in leukemia. Blood 102, 1389-1396.
References
343
Salih, H.R., Goehlsdorf, D., and Steinle, A. (2006). Release of MICB molecules by tumor cells:
mechanism and soluble MICB in sera of cancer patients. Hum Immunol 67, 188-195.
Salih, H.R., Rammensee, H.G., and Steinle, A. (2002). Cutting edge: down-regulation of MICA
on human tumors by proteolytic shedding. J Immunol 169, 4098-4102.
Sanger, F., Air, G.M., Barrell, B.G., Brown, N.L., Coulson, A.R., Fiddes, C.A., Hutchison,
C.A., Slocombe, P.M., and Smith, M. (1977). Nucleotide sequence of bacteriophage phi
X174 DNA. Nature 265, 687-695.
Sawicki, M.W., Dimasi, N., Natarajan, K., Wang, J., Margulies, D.H., and Mariuzza, R.A.
(2001). Structural basis of MHC class I recognition by natural killer cell receptors.
Immunol Rev 181, 52-65.
Schrambach, S., Ardizzone, M., Leymarie, V., Sibilia, J., and Bahram, S. (2007). In vivo
expression pattern of MICA and MICB and its relevance to auto-immunity and cancer.
PLoS One 2, e518.
Schwinn, N., Vokhminova, D., Sucker, A., Textor, S., Striegel, S., Moll, I., Nausch, N.,
Tuettenberg, J., Steinle, A., Cerwenka, A., et al. (2009). Interferon-gamma down-
regulates NKG2D ligand expression and impairs the NKG2D-mediated cytolysis of MHC
class I-deficient melanoma by natural killer cells. Int J Cancer 124, 1594-1604.
Shao, W., Lobashevsky, E.S., Kaslow, R.A., and Dorak, M.T. (2004). MICA intron 1 sequences
of conserved extended HLA haplotypes: implications for sequencing-based typing. Genes
Immun 5, 371-374.
Shapira, M.Y., Hirshfeld, E., Weiss, L., Zeira, M., Kasir, J., Or, R., Resnick, I.B., and Slavin, S.
(2005). Mycophenolate mofetil does not suppress the graft-versus-leukemia effect or the
activity of lymphokine-activated killer (LAK) cells in a murine model. Cancer Immunol
Immunother 54, 383-388.
Shapiro, R., Jordan, M., Scantlebury, V., Fung, J., Jensen, C., Tzakis, A., McCauley, J., Carroll,
P., Ricordi, C., Demetris, A.J., and et al. (1991). FK 506 in clinical kidney
transplantation. Transplant Proc 23, 3065-3067.
Shiina, T., Tamiya, G., Oka, A., Takishima, N., Yamagata, T., Kikkawa, E., Iwata, K.,
Tomizawa, M., Okuaki, N., Kuwano, Y., et al. (1999). Molecular dynamics of MHC
genesis unraveled by sequence analysis of the 1,796,938-bp HLA class I region. Proc Natl
Acad Sci U S A 96, 13282-13287.
Shuman, S. (1991). Recombination mediated by vaccinia virus DNA topoisomerase I in
Escherichia coli is sequence specific. Proc Natl Acad Sci U S A 88, 10104-10108.
Sicherer, S.H., Munoz-Furlong, A., Godbold, J.H., and Sampson, H.A. 2010. US prevalence of
self-reported peanut, tree nut, and sesame allergy: 11-year follow-up. J Allergy Clin
Immunol 125, 1322-1326.
Sissons, J.G., Carmichael, A.J., McKinney, N., Sinclair, J.H., and Wills, M.R. (2002). Human
cytomegalovirus and immunopathology. Springer Semin Immunopathol 24, 169-185.
Skillman, J.J., and Silen, W. (1972). Gastric mucosal barriers. Surg Annu 4, 213-237.
Smith, J.D., Brunner, V.M., Jigjidsuren, S., Hamour, I.M., McCormack, A.M., Banner, N.R.,
and Rose, M.L. (2009). Lack of effect of MICA antibodies on graft survival following
heart transplantation. Am J Transplant 9, 1912-1919.
Sohn, Y.H., Cha, C.H., Oh, H.B., Kim, M.H., Choi, S.E., and Kwon, O.J. (2009). MICA
polymorphisms and haplotypes with HLA-B and HLA-DRB1 in Koreans. Tissue
Antigens 75, 48-55.
Solez, K., Colvin, R.B., Racusen, L.C., Haas, M., Sis, B., Mengel, M., Halloran, P.F., Baldwin,
W., Banfi, G., Collins, A.B., et al. (2008). Banff 07 classification of renal allograft
pathology: updates and future directions. Am J Transplant 8, 753-760.
Solez, K., Colvin, R.B., Racusen, L.C., Sis, B., Halloran, P.F., Birk, P.E., Campbell, P.M.,
Cascalho, M., Collins, A.B., Demetris, A.J., et al. (2007). Banff '05 Meeting Report:

References
344
differential diagnosis of chronic allograft injury and elimination of chronic allograft
nephropathy ('CAN'). Am J Transplant 7, 518-526.
Steinle, A., Li, P., Morris, D.L., Groh, V., Lanier, L.L., Strong, R.K., and Spies, T. (2001).
Interactions of human NKG2D with its ligands MICA, MICB, and homologs of the
mouse RAE-1 protein family. Immunogenetics 53, 279-287.
Stephens, H.A., Vaughan, R.W., Collins, R., Kondeatis, E., Theron, J., and Payne, A. (1999).
Towards a molecular phototyping system for allelic variants of MICA, encoded by
polymorphisms in exons 2, 3 and 4 of MHC class I chain-related genes. Tissue Antigens
53, 167-174.
Stern, L.J., and Wiley, D.C. (1994). Antigenic peptide binding by class I and class II
histocompatibility proteins. Structure 2, 245-251.
Stout, R.D., and Bottomly, K. (1989). Antigen-specific activation of effector macrophages by
IFN-gamma producing (TH1) T cell clones. Failure of IL-4-producing (TH2) T cell
clones to activate effector function in macrophages. J Immunol 142, 760-765.
Suarez-Alvarez, B., Alonso-Arias, R., Bravo-Mendoza, C., Lopez-Vazquez, A., Ortega, T.,
Baltar, J.M., Coto, E., Ortega, F., and Lopez-Larrea, C. (2009a). Identification of epitopes
and immunodominant regions on the MICA protein defined by alloantibodies from kidney
transplant patients. Transplantation 88, S68-77.
Suarez-Alvarez, B., Lopez-Vazquez, A., Baltar, J.M., Ortega, F., and Lopez-Larrea, C. (2009b).
Potential role of NKG2D and its ligands in organ transplantation: new target for
immunointervention. Am J Transplant 9, 251-257.
Suarez-Alvarez, B., Lopez-Vazquez, A., Diaz-Molina, B., Bernardo-Rodriguez, M.J., Alvarez-
Lopez, R., Pascual, D., Astudillo, A., Martinez-Borra, J., Lambert, J.L., Gonzalez, S., and
Lopez-Larrea, C. (2006a). The predictive value of soluble major histocompatibility
complex class I chain-related molecule A (MICA) levels on heart allograft rejection.
Transplantation 82, 354-361.
Suarez-Alvarez, B., Lopez-Vazquez, A., Diaz-Pena, R., Diaz-Molina, B., Blanco-Garcia, R.M.,
Alvarez-Lopez, M.R., and Lopez-Larrea, C. (2006b). Post-transplant soluble MICA and
MICA antibodies predict subsequent heart graft outcome. Transpl Immunol 17, 43-46.
Suarez-Alvarez, B., Lopez-Vazquez, A., Gonzalez, M.Z., Fdez-Morera, J.L., Diaz-Molina, B.,
Blanco-Gelaz, M.A., Pascual, D., Martinez-Borra, J., Muro, M., Alvarez-Lopez, M.R.,
and Lopez-Larrea, C. (2007). The relationship of anti-MICA antibodies and MICA
expression with heart allograft rejection. Am J Transplant 7, 1842-1848.
Sumitran-Holgersson, S., Wilczek, H.E., Holgersson, J., and Soderstrom, K. (2002).
Identification of the nonclassical HLA molecules, mica, as targets for humoral immunity
associated with irreversible rejection of kidney allografts. Transplantation 74, 268-277.
Sumitran-Karuppan, S., Tyden, G., Reinholt, F., Berg, U., and Moller, E. (1997). Hyperacute
rejections of two consecutive renal allografts and early loss of the third transplant caused
by non-HLA antibodies specific for endothelial cells. Transpl Immunol 5, 321-327.
Summers, C., Rankin, S.M., Condliffe, A.M., Singh, N., Peters, A.M., and Chilvers, E.R.
(2010). Neutrophil kinetics in health and disease. Trends Immunol 31, 318-324.
Supon, P., Constantino, D., Hao, P., Cagle, L., Hahn, A., Conti, D.J., and Freed, B.M. (2001).
Prevalence of donor-specific anti-HLA antibodies during episodes of renal allograft
rejection. Transplantation 71, 577-580.
Susal, C., Dohler, B., and Opelz, G. (2009). Presensitized kidney graft recipients with HLA
class I and II antibodies are at increased risk for graft failure: a Collaborative Transplant
Study report. Hum Immunol 70, 569-573.
Susal, C., and Opelz, G. (2002). Kidney graft failure and presensitization against HLA class I
and class II antigens. Transplantation 73, 1269-1273.

References
345
Tait, B.D., Hudson, F., Cantwell, L., Brewin, G., Holdsworth, R., Bennett, G., and Jose, M.
(2009). Review article: Luminex technology for HLA antibody detection in organ
transplantation. Nephrology (Carlton) 14, 247-254.
Tanaka, H., Kuroda, A., Marusawa, H., Hashimoto, M., Hatanaka, H., Kino, T., Goto, T., and
Okuhara, M. (1987). Physicochemical properties of FK-506, a novel immunosuppressant
isolated from Streptomyces tsukubaensis. Transplant Proc 19, 11-16.
Terasaki, P.I. (2003). Deduction of the fraction of immunologic and non-immunologic failure in
cadaver donor transplants. Clin Transpl, 449-452.
Terasaki, P.I., and Cai, J. (2005). Humoral theory of transplantation: further evidence. Curr
Opin Immunol 17, 541-545.
Terasaki, P.I., and McClelland, J.D. (1964). Microdroplet Assay of Human Serum Cytotoxins.
Nature 204, 998-1000.
Terasaki, P.I., and Ozawa, M. (2004). Predicting kidney graft failure by HLA antibodies: a
prospective trial. Am J Transplant 4, 438-443.
Terasaki, P.I., Ozawa, M., and Castro, R. (2007). Four-year follow-up of a prospective trial of
HLA and MICA antibodies on kidney graft survival. Am J Transplant 7, 408-415.
Thielke, J., Kaplan, B., and Benedetti, E. (2007). The role of ABO-incompatible living donors
in kidney transplantation: state of the art. Semin Nephrol 27, 408-413.
Thomas, M., Boname, J.M., Field, S., Nejentsev, S., Salio, M., Cerundolo, V., Wills, M., and
Lehner, P.J. (2008). Down-regulation of NKG2D and NKp80 ligands by Kaposi's
sarcoma-associated herpesvirus K5 protects against NK cell cytotoxicity. Proc Natl Acad
Sci U S A 105, 1656-1661.
Thorogood, J., van Houwelingen, J.C., van Rood, J.J., Zantvoort, F.A., Schreuder, G.M., and
Persijn, G.G. (1992). Factors contributing to long-term kidney graft survival in
Eurotransplant. Transplantation 54, 152-158.
Tian, W., Cai, J.H., Wang, F., and Li, L.X. (2010). MICA polymorphism in a northern Chinese
Han population: The identification of a new MICA allele, MICA*059. Hum Immunol 71,
423-427.
Tian, W., Li, L.X., Wang, F., Luo, Q.Z., Yan, M.Y., Yu, P., Guo, S.S., and Cao, Y. (2006).
MICA-STR, HLA-B haplotypic diversity and linkage disequilibrium in the Hunan Han
population of southern China. Int J Immunogenet 33, 241-245.
Tomlinson, S. (1993). Complement defense mechanisms. Curr Opin Immunol 5, 83-89.
Torpey, N., Moghal, N.E., Watson, E., and Talbot, D. (2010). Renal Transplantation, 1 edn
(New York: Oxfor University Press).
Trinchieri, G., and Sher, A. (2007). Cooperation of Toll-like receptor signals in innate immune
defence. Nat Rev Immunol 7, 179-190.
Trombetta, E.S., and Mellman, I. (2005). Cell biology of antigen processing in vitro and in vivo.
Annu Rev Immunol 23, 975-1028.
Troppmann, C., Gillingham, K.J., Benedetti, E., Almond, P.S., Gruessner, R.W., Najarian, J.S.,
and Matas, A.J. (1995). Delayed graft function, acute rejection, and outcome after cadaver
renal transplantation. The multivariate analysis. Transplantation 59, 962-968.
Trpkov, K., Campbell, P., Pazderka, F., Cockfield, S., Solez, K., and Halloran, P.F. (1996).
Pathologic features of acute renal allograft rejection associated with donor-specific
antibody, Analysis using the Banff grading schema. Transplantation 61, 1586-1592.
Tsuchiya, N., Shiota, M., Moriyama, S., Ogawa, A., Komatsu-Wakui, M., Mitsui, H., Geraghty,
D.E., and Tokunaga, K. (1998). MICA allele typing of HLA-B27 positive Japanese
patients with seronegative spondylarthropathies and healthy individuals: differential
linkage disequilibrium with HLA-B27 subtypes. Arthritis Rheum 41, 68-73.
Tsuneto, L.T., Probst, C.M., Hutz, M.H., Salzano, F.M., Rodriguez-Delfin, L.A., Zago, M.A.,
Hill, K., Hurtado, A.M., Ribeiro-dos-Santos, A.K., and Petzl-Erler, M.L. (2003). HLA

References
346
class II diversity in seven Amerindian populations. Clues about the origins of the Ache.
Tissue Antigens 62, 512-526.
Turner, J.R. (2009). Intestinal mucosal barrier function in health and disease. Nat Rev Immunol
9, 799-809.
Uehara, S., Chase, C.M., Kitchens, W.H., Rose, H.S., Colvin, R.B., Russell, P.S., and Madsen,
J.C. (2005). NK cells can trigger allograft vasculopathy: the role of hybrid resistance in
solid organ allografts. J Immunol 175, 3424-3430.
Uzunel, M., Kasimu, H., Joshi, M., Ge, X., Liu, J., Xu, B., Jaksch, M., Jorns, C., Nowak, G.,
and Sumitran-Holgersson, S. (2008). Evidence for no relevance of anti-major
histocompatibility complex class I-related chain a antibodies in liver transplantation.
Liver Transpl 14, 1793-1802.
Valledor, A.F., Comalada, M., Santamaria-Babi, L.F., Lloberas, J., and Celada, A. (2010).
Macrophage proinflammatory activation and deactivation: a question of balance. Adv
Immunol 108, 1-20.
van den Berg-Loonen, E.M., Terasaki, P., Kohanof, S., and Christiaans, M.H. (2006).
Longitudinal testing of seventy-six renal allograft patients for HLA antibodies: Maastricht
experience. Clin Transpl, 305-322.
Vasilescu, E.R., Ho, E.K., Colovai, A.I., Vlad, G., Foca-Rodi, A., Markowitz, G.S., D'Agati, V.,
Hardy, M.A., Ratner, L.E., and Suciu-Foca, N. (2006). Alloantibodies and the outcome of
cadaver kidney allografts. Hum Immunol 67, 597-604.
Vathsala, A. (2005). Preventing renal transplant failure. Ann Acad Med Singapore 34, 36-43.
Vereerstraeten, P., Wissing, M., De Pauw, L., Abramowicz, D., and Kinnaert, P. (1999). Male
recipients of kidneys from female donors are at increased risk of graft loss from both
rejection and technical failure. Clin Transplant 13, 181-186.
Vilches, C., and Parham, P. (2002). KIR: diverse, rapidly evolving receptors of innate and
adaptive immunity. Annu Rev Immunol 20, 217-251.
Visser, C.J., Tilanus, M.G., Tatari, Z., van der Zwan, A.W., Bakker, R., Rozemuller, E.H.,
Schaeffer, V., Tamouza, R., and Charron, D. (1999). Sequencing-based typing of MICA
reveals 33 alleles: a study on linkage with classical HLA genes. Immunogenetics 49, 561-
566.
Waid, T.H., Lucas, B.A., Thompson, J.S., Munch, L.C., Brown, S., Kryscio, R., Prebeck, R.,
VanHoy, M.A., and Jezek, D. (1991). Treatment of acute rejection with anti-T-cell
antigen receptor complex alpha beta (T10B9.1A-31) or anti-CD3 (OKT3) monoclonal
antibody: results of a prospective randomized double-blind trial. Transplant Proc 23,
1062-1065.
Waldhauer, I., Goehlsdorf, D., Gieseke, F., Weinschenk, T., Wittenbrink, M., Ludwig, A.,
Stevanovic, S., Rammensee, H.G., and Steinle, A. (2008). Tumor-associated MICA is
shed by ADAM proteases. Cancer Res 68, 6368-6376.
Walker, L.S., and Abbas, A.K. (2002). The enemy within: keeping self-reactive T cells at bay in
the periphery. Nat Rev Immunol 2, 11-19.
Walsh, C.T., Zydowsky, L.D., and McKeon, F.D. (1992). Cyclosporin A, the cyclophilin class
of peptidylprolyl isomerases, and blockade of T cell signal transduction. J Biol Chem 267,
13115-13118.
Weill, J.C., and Reynaud, C.A. (1996). Rearrangement/hypermutation/gene conversion: when,
where and why? Immunol Today 17, 92-97.
White, F.A., Bhangoo, S.K., and Miller, R.J. (2005). Chemokines: integrators of pain and
inflammation. Nat Rev Drug Discov 4, 834-844.
Wilkinson, G.W., Tomasec, P., Stanton, R.J., Armstrong, M., Prod'homme, V., Aicheler, R.,
McSharry, B.P., Rickards, C.R., Cochrane, D., Llewellyn-Lacey, S., et al. (2008).
Modulation of natural killer cells by human cytomegalovirus. J Clin Virol 41, 206-212.

References
347
Worthington, J.E., Martin, S., Al-Husseini, D.M., Dyer, P.A., and Johnson, R.W. (2003).
Posttransplantation production of donor HLA-specific antibodies as a predictor of renal
transplant outcome. Transplantation 75, 1034-1040.
Worthington, J.E., Martin, S., Dyer, P.A., and Johnson, R.W. (2001). An association between
posttransplant antibody production and renal transplant rejection. Transplant Proc 33,
475-476.
Wu, J., Song, Y., Bakker, A.B., Bauer, S., Spies, T., Lanier, L.L., and Phillips, J.H. (1999). An
activating immunoreceptor complex formed by NKG2D and DAP10. Science 285, 730-
732.
Yabuki, K., Ota, M., Goto, K., Kimura, T., Nomura, E., Ohno, S., Mizuki, N., Katsuyama, Y.,
Makysymowych, W.P., Bahram, S., et al. (1999). Triplet repeat polymorphism in the
MICA gene in HLA-B27 positive and negative caucasian patients with ankylosing
spondylitis. Hum Immunol 60, 83-86.
Yao, Q.C., Wang, W., Li, X.B., Yin, H., and Zhang, X.D. (2011). Expression characteristics of
major histocompatibility complex class I-related chain A antibodies and
immunoadsorption effect in sensitized recipients of kidney transplantation. Chin Med J
(Engl) 124, 669-673.
Yokoyama, W.M. (2002). Immunology: catch us if you can. Nature 419, 679-680.
Yu, P.B., Holzknecht, Z.E., Bruno, D., Parker, W., and Platt, J.L. (1996). Modulation of natural
IgM binding and complement activation by natural IgG antibodies: a role for IgG anti-Gal
alpha1-3Gal antibodies. J Immunol 157, 5163-5168.
Zeier, M., Dohler, B., Opelz, G., and Ritz, E. (2002). The effect of donor gender on graft
survival. J Am Soc Nephrol 13, 2570-2576.
Zhang, C., Zhang, J., Wei, H., and Tian, Z. (2005a). Imbalance of NKG2D and its inhibitory
counterparts: how does tumor escape from innate immunity? Int Immunopharmacol 5,
1099-1111.
Zhang, Q., Cecka, J.M., Gjertson, D.W., Ge, P., Rose, M.L., Patel, J.K., Ardehali, A.,
Kobashigawa, J.A., Fishbein, M.C., and Reed, E.F. (2011). HLA and MICA: Targets of
Antibody-Mediated Rejection in Heart Transplantation. Transplantation 91, 1153-1158.
Zhang, Q., Liang, L.W., Gjertson, D.W., Lassman, C., Wilkinson, A.H., Kendrick, E., Pham,
P.T., Danovitch, G.M., Gritsch, H.A., and Reed, E.F. (2005b). Development of
posttransplant antidonor HLA antibodies is associated with acute humoral rejection and
early graft dysfunction. Transplantation 79, 591-598.
Zhang, Q., and Reed, E.F. (2010). Non-MHC antigenic targets of the humoral immune response
in transplantation. Curr Opin Immunol 22, 682-688.
Zhang, Y., Lazaro, A.M., Lavingia, B., and Stastny, P. (2001). Typing for all known MICA
alleles by group-specific PCR and SSOP. Hum Immunol 62, 620-631.
Zhang, Y., Lazaro, A.M., Zou, Y., Lavingia, B., Moraes, E.M., Moraes, R.J., and Stastny, P.
(2002). MICA polymorphism in South American Indians. Immunogenetics 53, 900-906.
Zhu, F., Zhao, H., He, Y., Zhang, W., He, J., Xu, X., and Yan, L. (2009). Distribution of MICA
diversity in the Chinese Han population by polymerase chain reaction sequence-based
typing for exons 2-6. Tissue Antigens 73, 358-363.
Ziegler, A., Field, L.L., and Sakaguchi, A.Y. (1990). Report of the committee on the genetic
constitution of chromosome 6. Cytogenet Cell Genet 55, 118-121.
Zinkernagel, R.M., and Doherty, P.C. (1974). Restriction of in vitro T cell-mediated
cytotoxicity in lymphocytic choriomeningitis within a syngeneic or semiallogeneic
system. Nature 248, 701-702.
Zinkernagel, R.M., and Doherty, P.C. (1979). MHC-restricted cytotoxic T cells: studies on the
biological role of polymorphic major transplantation antigens determining T-cell
restriction-specificity, function, and responsiveness. Adv Immunol 27, 51-177.

References
348
Zou, Y., Han, M., Wang, Z., and Stastny, P. (2006a). MICA allele-level typing by sequence-
based typing with computerized assignment of polymorphic sites and short tandem
repeats within the transmembrane region. Hum Immunol 67, 145-151.
Zou, Y., Heinemann, F.M., Grosse-Wilde, H., Sireci, G., Wang, Z., Lavingia, B., and Stastny, P.
(2006b). Detection of anti-MICA antibodies in patients awaiting kidney transplantation,
during the post-transplant course, and in eluates from rejected kidney allografts by
Luminex flow cytometry. Hum Immunol 67, 230-237.
Zou, Y., Mirbaha, F., Lazaro, A., Zhang, Y., Lavingia, B., and Stastny, P. (2002). MICA is a
target for complement-dependent cytotoxicity with mouse monoclonal antibodies and
human alloantibodies. Hum Immunol 63, 30-39.
Zou, Y., Qin, Z., Silveus, A., Fan, Y., and Stastny, P. (2009). Polymorphisms of MICA
recognized by human alloantibodies. Immunogenetics 61, 91-100.
Zou, Y., and Stastny, P. (2009). The role of major histocompatibility complex class I chain-
related gene A antibodies in organ transplantation. Curr Opin Organ Transplant 14, 414-
418.
Zou, Y., Stastny, P., Susal, C., Dohler, B., and Opelz, G. (2007). Antibodies against MICA
antigens and kidney-transplant rejection. N Engl J Med 357, 1293-1300.
Zwirner, N.W., Dole, K., and Stastny, P. (1999). Differential surface expression of MICA by
endothelial cells, fibroblasts, keratinocytes, and monocytes. Hum Immunol 60, 323-330.
Zwirner, N.W., Fuertes, M.B., Girart, M.V., Domaica, C.I., and Rossi, L.E. (2007). Cytokine-
driven regulation of NK cell functions in tumor immunity: role of the MICA-NKG2D
system. Cytokine Growth Factor Rev 18, 159-170.
Zwirner, N.W., Marcos, C.Y., Mirbaha, F., Zou, Y., and Stastny, P. (2000). Identification of
MICA as a new polymorphic alloantigen recognized by antibodies in sera of organ
transplant recipients. Hum Immunol 61, 917-924.