mRNA expression profiling of phyllodes tumours of the breast: identification of genes important in...
10
Journal of Pathology J Pathol 2008; 216: 408–417 Published online 28 August 2008 in Wiley InterScience (www.interscience.wiley.com) DOI: 10.1002/path.2439 Original Paper mRNA expression profiling of phyllodes tumours of the breast: identification of genes important in the development of borderline and malignant phyllodes tumours AM Jones, 1 R Mitter, 2 R Poulsom, 3 C Gillett, 4 AM Hanby, 5 Phyllodes Tumour Consortium, 6 IPM Tomlinson 1 and EJ Sawyer 1,7 * 1 Molecular and Population Genetics Laboratory, Cancer Research UK, 44 Lincoln’s Inn Fields, London WC2A 3PX, UK 2 Bioinformatics, Cancer Research UK, 44 Lincoln’s Inn Fields, London WC2A 3PX, UK 3 Histopathology Unit, Cancer Research UK, 44 Lincoln’s Inn Fields, London WC2A 3PX, UK 4 Breast Tissue Bank, Guy’s Hospital, St Thomas Street, London SE1 9RT, UK 5 Leeds Institute of Molecular Medicine, Yorkshire Cancer Research and Liz Dawn Pathology and Translational Sciences Centre, Section of Pathology and Tumour Biology, St James’s University Hospital, Beckett Street, Leeds, LS9 7TF, UK 6 The Phyllodes Tumour Study Consortium, UK † 7 Guys, Kings, St. Thomas’ Cancer Centre, Guy’s Hospital, St. Thomas’ Street, London SE1 9RT, UK *Correspondence to: EJ Sawyer, Molecular and Population Genetics Laboratory, Cancer Research UK, 44 Lincoln’s Inn Fields, London WC2A 3PX, UK. E-mail: [email protected] No conflicts of interest were declared. Received: 13 February 2008 Revised: 3 August 2008 Accepted: 18 August 2008 Abstract The aim of this study was to identify genes involved in the development of borderline and malignant phyllodes tumours of the breast (PTs). Expression profiling of 23 PTs (12 benign, 11 borderline/malignant) was performed using Affymetrix U133A GeneChips. mRNA expression in the borderline/malignant PTs was compared to the benign PTs. A group of 162 genes was over-expressed in the borderline/malignant group with a fold change >2 and FDR <0.1. Four of these genes were chosen for further investigation: PAX3, SIX1, TGFB2 and HMGA2. Over-expression was validated in a separate set of formalin-fixed, paraffin-embedded (FFPE) tumours, using either in situ hybridization or immunohistochemistry. This confirmed that expression of PAX3, SIX1, TGFB2 and HMGA2 in the stromal component of PTs was associated with the borderline/malignant phenotypes (p = 8.7 × 10 −5 , p = 0.05, p = 0.009, p = 0.003, respectively; Fisher’s exact test). The functional consequences of down-regulating these genes were studied using siRNA in short- term cultures and cell lines established from PTs. mRNA ‘knock-down’ of PAX3 resulted in significantly decreased cell proliferation in both a malignant and a borderline PT cell culture. mRNA ‘knock-down’ of SIX1 and HMGA2 resulted in decreased cell proliferation only in the malignant PT cell line, and ‘knock-down’ of TGFB2 resulted in decreased cell proliferation only in the borderline PT cell culture. This study shows that these four genes are involved in the development of borderline/malignant PTs. SIX1 over-expression was most marked in the highly malignant PTs, with particularly high expression in one case of metastatic PT. PAX3, TGFB2 and HMGA2 were expressed predominantly in borderline/malignant PTs, but showed some expression in benign tumours; they may be important in the transition from the benign to borderline/malignant phenotype. Copyright 2008 Pathological Society of Great Britain and Ireland. Published by John Wiley & Sons, Ltd. Keywords: phyllodes tumours; PAX3; HMGA2; TGFB2; SIX1 ; expression profiling † The Phyllodes Tumour Consortium are: Rosemary Walker, Department of Cancer Studies and Molecular Medicine, University of Leicester, Leicester Royal Infirmary; Sarah Pinder, Addenbrooke’s Hospital, Cambridge; Louise Jones, St Bartholomew’s Hospital, London; Ian Ellis, Nottingham Breast Institute, City Hospital, Nottingham; Puay Hoon Tan, Department of Pathology, Singapore General Hospital (Singapore); James Macartney, Walsgrave Hospital, Coventry; David Green, Queens Hospital, Burton upon Trent; Sally Hales and Claudia Harding-Mackean, Countess of Chester Hospital, Chester; Angela Colclough and Fiona MacNeill, Essex County Hospital, Colchester; David Rowlands, New Cross Hospital, Wolverhampton; Christopher Smith, Frimley Park Hospital NHS Trust, Frimley; Ian Fentiman and Paul Cane, Guy’s and St Thomas’ NHS Foundation Trust; Anil Desai and Rashida Goderya, Princess Royal University Hospital, Farnborough; Ashutosh Nerurkar, The Royal Marsden Hospital, London; Mark Kissin and Peter Jackson, Royal Surrey County Hospital, Guildford. Copyright 2008 Pathological Society of Great Britain and Ireland. Published by John Wiley & Sons, Ltd. www.pathsoc.org.uk
Transcript of mRNA expression profiling of phyllodes tumours of the breast: identification of genes important in...
Journal of PathologyJ Pathol 2008; 216: 408–417Published online 28 August 2008 in Wiley InterScience(www.interscience.wiley.com) DOI: 10.1002/path.2439
Original Paper
mRNA expression profiling of phyllodes tumours of thebreast: identification of genes important in thedevelopment of borderline and malignant phyllodestumoursAM Jones,1 R Mitter,2 R Poulsom,3 C Gillett,4 AM Hanby,5 Phyllodes Tumour Consortium,6 IPM Tomlinson1
and EJ Sawyer1,7*1Molecular and Population Genetics Laboratory, Cancer Research UK, 44 Lincoln’s Inn Fields, London WC2A 3PX, UK2Bioinformatics, Cancer Research UK, 44 Lincoln’s Inn Fields, London WC2A 3PX, UK3Histopathology Unit, Cancer Research UK, 44 Lincoln’s Inn Fields, London WC2A 3PX, UK4Breast Tissue Bank, Guy’s Hospital, St Thomas Street, London SE1 9RT, UK5Leeds Institute of Molecular Medicine, Yorkshire Cancer Research and Liz Dawn Pathology and Translational Sciences Centre, Section of Pathologyand Tumour Biology, St James’s University Hospital, Beckett Street, Leeds, LS9 7TF, UK6The Phyllodes Tumour Study Consortium, UK†
7Guys, Kings, St. Thomas’ Cancer Centre, Guy’s Hospital, St. Thomas’ Street, London SE1 9RT, UK
*Correspondence to:EJ Sawyer, Molecular andPopulation Genetics Laboratory,Cancer Research UK, 44Lincoln’s Inn Fields, LondonWC2A 3PX, UK.E-mail:[email protected]
No conflicts of interest weredeclared.
Received: 13 February 2008Revised: 3 August 2008Accepted: 18 August 2008
AbstractThe aim of this study was to identify genes involved in the development of borderlineand malignant phyllodes tumours of the breast (PTs). Expression profiling of 23 PTs(12 benign, 11 borderline/malignant) was performed using Affymetrix U133A GeneChips.mRNA expression in the borderline/malignant PTs was compared to the benign PTs. Agroup of 162 genes was over-expressed in the borderline/malignant group with a foldchange >2 and FDR <0.1. Four of these genes were chosen for further investigation:PAX3, SIX1, TGFB2 and HMGA2. Over-expression was validated in a separate set offormalin-fixed, paraffin-embedded (FFPE) tumours, using either in situ hybridization orimmunohistochemistry. This confirmed that expression of PAX3, SIX1, TGFB2 and HMGA2in the stromal component of PTs was associated with the borderline/malignant phenotypes(p = 8.7 × 10⁻⁵, p = 0.05, p = 0.009, p = 0.003, respectively; Fisher’s exact test). Thefunctional consequences of down-regulating these genes were studied using siRNA in short-term cultures and cell lines established from PTs. mRNA ‘knock-down’ of PAX3 resultedin significantly decreased cell proliferation in both a malignant and a borderline PT cellculture. mRNA ‘knock-down’ of SIX1 and HMGA2 resulted in decreased cell proliferationonly in the malignant PT cell line, and ‘knock-down’ of TGFB2 resulted in decreasedcell proliferation only in the borderline PT cell culture. This study shows that these fourgenes are involved in the development of borderline/malignant PTs. SIX1 over-expressionwas most marked in the highly malignant PTs, with particularly high expression in onecase of metastatic PT. PAX3, TGFB2 and HMGA2 were expressed predominantly inborderline/malignant PTs, but showed some expression in benign tumours; they may beimportant in the transition from the benign to borderline/malignant phenotype.Copyright 2008 Pathological Society of Great Britain and Ireland. Published by JohnWiley & Sons, Ltd.
Keywords: phyllodes tumours; PAX3; HMGA2; TGFB2; SIX1 ; expression profiling
†The Phyllodes Tumour Consortium are: Rosemary Walker, Department of Cancer Studies and Molecular Medicine, University of Leicester,Leicester Royal Infirmary; Sarah Pinder, Addenbrooke’s Hospital, Cambridge; Louise Jones, St Bartholomew’s Hospital, London; Ian Ellis,Nottingham Breast Institute, City Hospital, Nottingham; Puay Hoon Tan, Department of Pathology, Singapore General Hospital (Singapore);James Macartney, Walsgrave Hospital, Coventry; David Green, Queens Hospital, Burton upon Trent; Sally Hales and Claudia Harding-Mackean,Countess of Chester Hospital, Chester; Angela Colclough and Fiona MacNeill, Essex County Hospital, Colchester; David Rowlands, NewCross Hospital, Wolverhampton; Christopher Smith, Frimley Park Hospital NHS Trust, Frimley; Ian Fentiman and Paul Cane, Guy’s and StThomas’ NHS Foundation Trust; Anil Desai and Rashida Goderya, Princess Royal University Hospital, Farnborough; Ashutosh Nerurkar, TheRoyal Marsden Hospital, London; Mark Kissin and Peter Jackson, Royal Surrey County Hospital, Guildford.
Copyright 2008 Pathological Society of Great Britain and Ireland. Published by John Wiley & Sons, Ltd.www.pathsoc.org.uk
Expression profiling of phyllodes tumours 409
Introduction
Phyllodes tumours (PTs) are rare fibroepithelial neo-plasms and account for about 0.5% of all breasttumours [1]. Like the more common fibroadenoma,they are composed of stromal and epithelial elements,although the stromal element is more cellular andcan outgrow the epithelium. Clinically, most of thesetumours tend to behave in a benign fashion but, unlikefibroadenomas, they can recur locally and undergomalignant progression to sarcoma. Histologically, PTsare classified as benign, borderline malignant or malig-nant on the basis of stromal cellularity, nuclear atypia,mitotic activity, stromal overgrowth and type of border(infiltrating or pushing). Borderline malignant PTs arethose tumours with some, but not all, of the featuresof malignant PTs. However, this histological classifica-tion does not always correlate with clinical behaviour.This may be explained by the presence of unfavourablesub-clones not easily identified by histology. We haveshown that such sub-clones exist [2]. Genetic analysishas shown that copy number changes are uncommon inbenign PTs, but become more frequent with increasingmalignancy. However, many of these changes affectwhole chromosome arms and it has been difficult toidentify genes important in malignant transformationof PTs, with the exception of 9p21 loss, which targetsp16INK4a [2]. It is therefore still not clear what drivesmalignant transformation in these tumours. The aim ofthis study was to use mRNA expression array analy-sis to identify genes important in the development ofborderline and malignant PTs.
Methods
Sample collection
Fresh frozen tissue from 23 PTs and formalin-fixed,paraffin-embedded (FFPE) tissue from a further 49PTs were collected from 15 centres across the UK withethical approval (MREC No. 03/12/083). Fresh tumourtissue samples were obtained at surgery, snap-frozen inliquid nitrogen and stored at −80 ◦C. All tumours werereviewed by a histopathologist (AH) to confirm thediagnosis (see Supporting information, Tables S1 andS2). Tumours were classified as benign, borderline ormalignant, as previously described [3] (see Supportinginformation).
Expression arrays
Twenty-three whole fresh frozen PTs underwentmRNA expression profiling using Affymetrix U133AGeneChips; this included 12 benign and 11 border-line/malignant (eight borderline malignant and threemalignant). RNA was extracted using the GenElutemammalian total RNA miniprep kit (Sigma). In fourborderline malignant tumours (10T, 12T, 13T and19T) the stroma and epithelium were microdissectedfrom frozen sections using a PALM laser capture
microscope, and RNA was extracted using an Arcturuspicopure RNA isolation kit (MDS Analytical Tech-nologies).
RNA was quantified using a Nanodrop spec-trophotometer (Labtech). The quality and amount ofstarting RNA were confirmed using a Bioanalyser2100 (Agilent) prior to labelling and hybridization.The Affymetrix U133A GeneChips (http://www.affymetrix.com/products/arrays/specific/hgu133plus.affx)were processed at the Paterson Institute (Manchester,UK) to obtain expression data. cDNA preparation,labelling, hybridization and scanning were performedaccording to the manufacturer’s protocol and aredescribed in detail at http://bioinf.picr.man.ac.uk/mbcf/protocols.shtml. The microarray data are min-imum information about a microarray experiment(MIAME)-compliant and accessible via MIAME VICE(http://bioinformatics.picr.man.ac.uk/mvice/index.jsp).
Expression array analysis
In order to maximize the power to detect genesinvolved in progression of PTs, we compared mRNAexpression in the 11 borderline/malignant tumourswith that in the 12 benign tumours. Data were analysedusing Bioconductor 1.9 running on R 2.4.0. Probe setexpression measures were calculated using the ‘Affy’package’s Robust Multi-chip Average (RMA) defaultmethod. Differential gene expression was assessedbetween benign and borderline/malignant replicategroups using an empirical Bayes’ t-test, as imple-mented in the ‘limma’ package. The resultant p valueswere adjusted for multiple testing using the Benjaminiand Hochberg method. Any probe sets that exhibitedan adjusted p value ≤ 0.1 and absolute fold change≥2 were classed as differentially expressed. 2D hier-archical clustering of signals from the differentiallyexpressed genes was performed across all benignand borderline/malignant samples. Samples and geneswere clustered using a Euclidean distance matrix andaverage linkage clustering.
A power calculation was performed, based on theestimates of within-group noise derived from theexperiment and on p values of genes below our FDRcut-off value. A two-tailed t-test, with n = 11 and ana priori effect size of 1 on a log2 scale, gave estimatedpower of >0.9990, based on an observed standarddeviation (SD) of 0.356 and an α level of 0.005. Theselatter two values are commensurate with the values wetraditionally use to do power calculations at a designstage, viz. SD = 0.3 on the log scale, and α levels of0.001.
Quantitative RT–PCR
mRNA levels were analysed using TaqMan technologyon the ABI7900HT. 2 µg total RNA were reverse-transcribed using the First-Strand cDNA SynthesisKit (Amersham Biosciences), and purified using theQIAquick PCR Purification Kit (Qiagen). Each sample
J Pathol 2008; 216: 408–417 DOI: 10.1002/pathCopyright 2008 Pathological Society of Great Britain and Ireland. Published by John Wiley & Sons, Ltd.
410 AM Jones et al
was run in triplicate and the data obtained wereanalysed by using the comparative Ct method [4].
Array CGH
Array CGH (aCGH) on 1 Mb density BAC arrayswas performed on 7 malignant, 12 borderline and21 benign PTs and fibroblast cell cultures establishedfrom PTs. This included all the PTs that under-went mRNA expression profiling. DNA extraction andarray construction and hybridization was performed asdescribed by Fiegler et al [5,6].
siRNA analysis
Small interfering RNA (siRNA) oligonucleotidesagainst PAX3, SIX1, TGFB2 and HMGA2 (100 nM
ON-TARGETplus SMARTpool oligos, Dharmacon)were transfected using Dharmafect 3 transfectionreagent (Dharmacon) into a malignant PT cell line(RW-972) and a short-term culture established from aborderline PT (STC-3) (see Supporting information).Control cell incubations were carried out using non-target siRNA (Dharmacon), GAPDH siRNA oligonu-cleotides, Dharmafect 3 transfection reagent alone, andmedium only. Proliferation and apoptosis were per-formed as described in the Supporting information.
Rapid amplification of cDNA ends (RACE)
3′-RACE was performed with the SMART RACEcDNA amplification kit, using a PAX3-specific forwardprimer (5′-AACGGCAGGCCGCTGCCCAACC-3′)and the GeneRacer 3′-RACE cDNA synthesis reverseprimer, followed by a nested PCR reaction using a sec-ond PAX3-specific forward primer (5′-ATCGTGGA-GATGGCCCACCACG-3′) and the 3′-RACE cDNAsynthesis nested reverse primer. PCR products werecloned into pGEM T -Easy Vector and sequenced (DyeTerminator Sequencing kit; Applied Biosystems).
Details of cell culture, western blot, proliferationand apoptosis assays, M-FISH [7], in situ hybridiza-tion (ISH), immunohistochemistry (IHC) and mutationscreening methods can be found in the Supportinginformation.
Results
Expression arrays
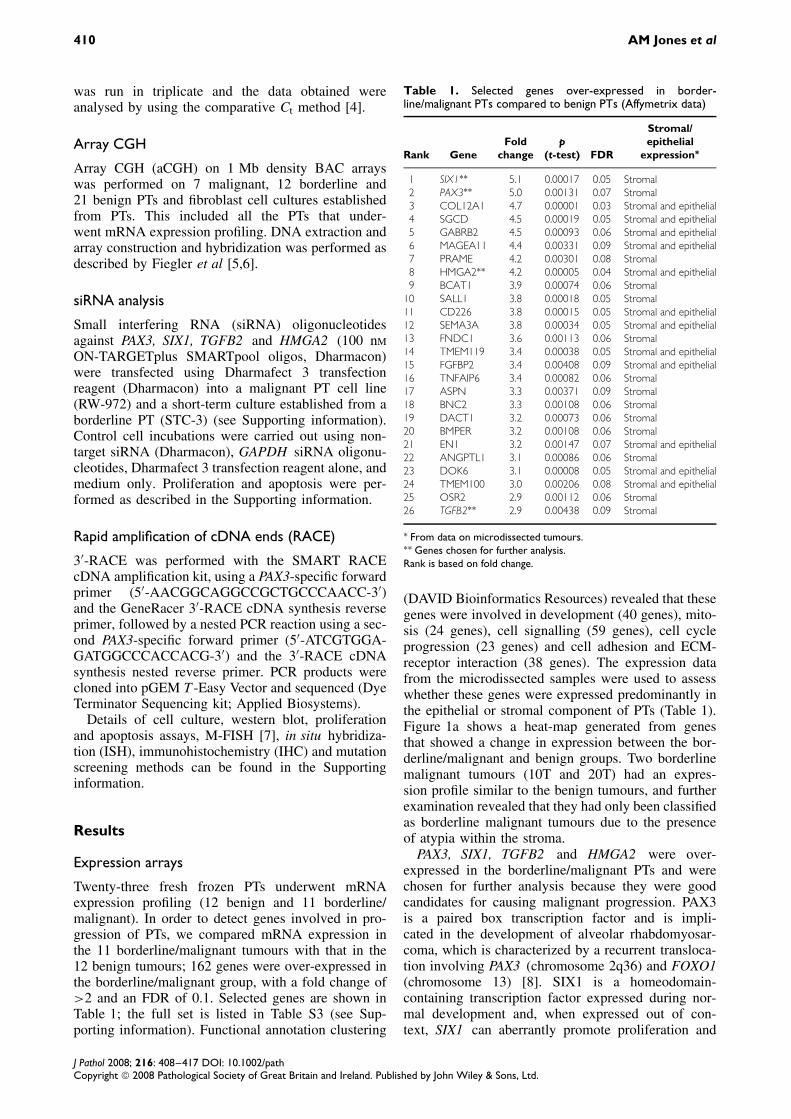
Twenty-three fresh frozen PTs underwent mRNAexpression profiling (12 benign and 11 borderline/malignant). In order to detect genes involved in pro-gression of PTs, we compared mRNA expression inthe 11 borderline/malignant tumours with that in the12 benign tumours; 162 genes were over-expressed inthe borderline/malignant group, with a fold change of>2 and an FDR of 0.1. Selected genes are shown inTable 1; the full set is listed in Table S3 (see Sup-porting information). Functional annotation clustering
Table 1. Selected genes over-expressed in border-line/malignant PTs compared to benign PTs (Affymetrix data)
Rank GeneFold
changep
(t-test) FDR
Stromal/epithelial
expression∗
1 SIX1∗∗ 5.1 0.00017 0.05 Stromal2 PAX3∗∗ 5.0 0.00131 0.07 Stromal3 COL12A1 4.7 0.00001 0.03 Stromal and epithelial4 SGCD 4.5 0.00019 0.05 Stromal and epithelial5 GABRB2 4.5 0.00093 0.06 Stromal and epithelial6 MAGEA11 4.4 0.00331 0.09 Stromal and epithelial7 PRAME 4.2 0.00301 0.08 Stromal8 HMGA2∗∗ 4.2 0.00005 0.04 Stromal and epithelial9 BCAT1 3.9 0.00074 0.06 Stromal
10 SALL1 3.8 0.00018 0.05 Stromal11 CD226 3.8 0.00015 0.05 Stromal and epithelial12 SEMA3A 3.8 0.00034 0.05 Stromal and epithelial13 FNDC1 3.6 0.00113 0.06 Stromal14 TMEM119 3.4 0.00038 0.05 Stromal and epithelial15 FGFBP2 3.4 0.00408 0.09 Stromal and epithelial16 TNFAIP6 3.4 0.00082 0.06 Stromal17 ASPN 3.3 0.00371 0.09 Stromal18 BNC2 3.3 0.00108 0.06 Stromal19 DACT1 3.2 0.00073 0.06 Stromal20 BMPER 3.2 0.00108 0.06 Stromal21 EN1 3.2 0.00147 0.07 Stromal and epithelial22 ANGPTL1 3.1 0.00086 0.06 Stromal23 DOK6 3.1 0.00008 0.05 Stromal and epithelial24 TMEM100 3.0 0.00206 0.08 Stromal and epithelial25 OSR2 2.9 0.00112 0.06 Stromal26 TGFB2∗∗ 2.9 0.00438 0.09 Stromal
∗ From data on microdissected tumours.∗∗ Genes chosen for further analysis.Rank is based on fold change.
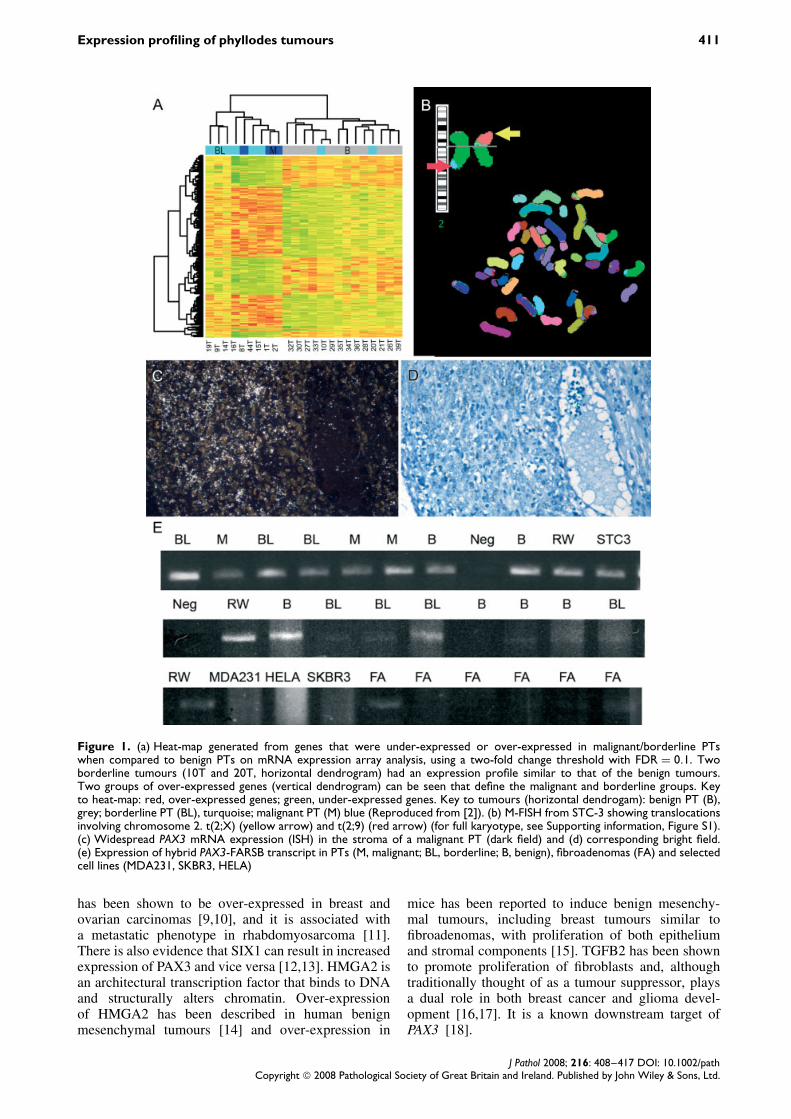
(DAVID Bioinformatics Resources) revealed that thesegenes were involved in development (40 genes), mito-sis (24 genes), cell signalling (59 genes), cell cycleprogression (23 genes) and cell adhesion and ECM-receptor interaction (38 genes). The expression datafrom the microdissected samples were used to assesswhether these genes were expressed predominantly inthe epithelial or stromal component of PTs (Table 1).Figure 1a shows a heat-map generated from genesthat showed a change in expression between the bor-derline/malignant and benign groups. Two borderlinemalignant tumours (10T and 20T) had an expres-sion profile similar to the benign tumours, and furtherexamination revealed that they had only been classifiedas borderline malignant tumours due to the presenceof atypia within the stroma.
PAX3, SIX1, TGFB2 and HMGA2 were over-expressed in the borderline/malignant PTs and werechosen for further analysis because they were goodcandidates for causing malignant progression. PAX3is a paired box transcription factor and is impli-cated in the development of alveolar rhabdomyosar-coma, which is characterized by a recurrent transloca-tion involving PAX3 (chromosome 2q36) and FOXO1(chromosome 13) [8]. SIX1 is a homeodomain-containing transcription factor expressed during nor-mal development and, when expressed out of con-text, SIX1 can aberrantly promote proliferation and
J Pathol 2008; 216: 408–417 DOI: 10.1002/pathCopyright 2008 Pathological Society of Great Britain and Ireland. Published by John Wiley & Sons, Ltd.
Expression profiling of phyllodes tumours 411
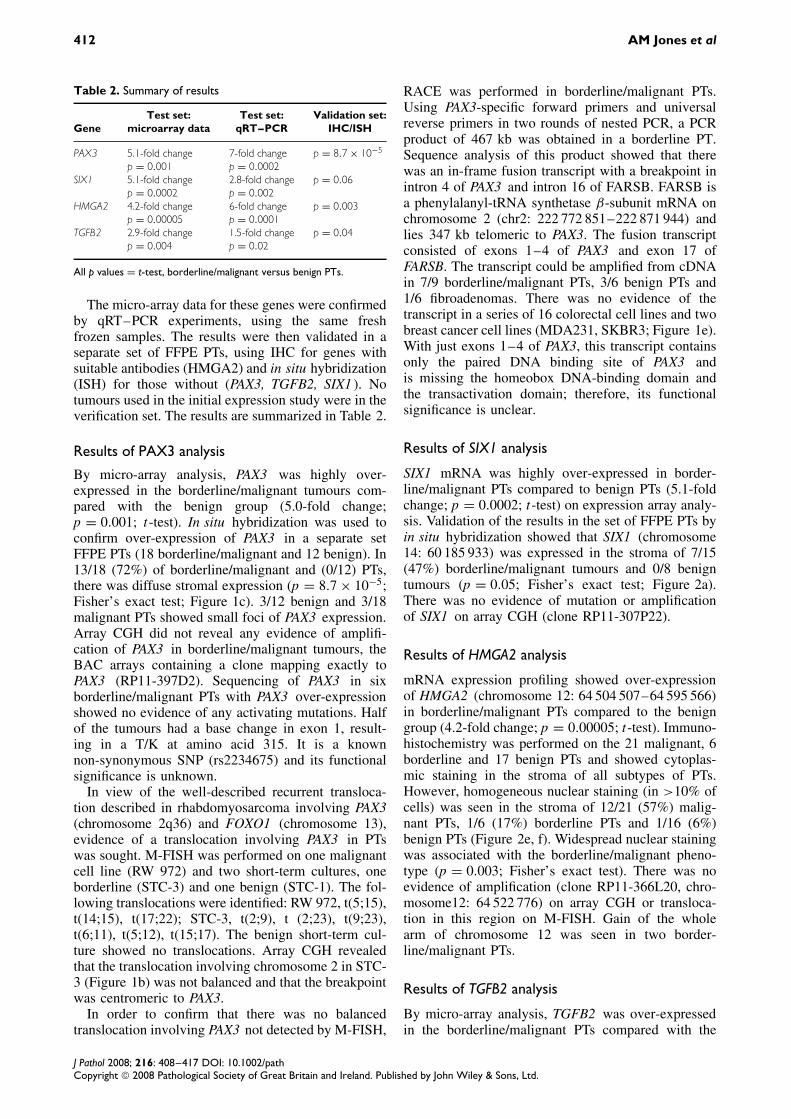
Figure 1. (a) Heat-map generated from genes that were under-expressed or over-expressed in malignant/borderline PTswhen compared to benign PTs on mRNA expression array analysis, using a two-fold change threshold with FDR = 0.1. Twoborderline tumours (10T and 20T, horizontal dendrogram) had an expression profile similar to that of the benign tumours.Two groups of over-expressed genes (vertical dendrogram) can be seen that define the malignant and borderline groups. Keyto heat-map: red, over-expressed genes; green, under-expressed genes. Key to tumours (horizontal dendrogam): benign PT (B),grey; borderline PT (BL), turquoise; malignant PT (M) blue (Reproduced from [2]). (b) M-FISH from STC-3 showing translocationsinvolving chromosome 2. t(2;X) (yellow arrow) and t(2;9) (red arrow) (for full karyotype, see Supporting information, Figure S1).(c) Widespread PAX3 mRNA expression (ISH) in the stroma of a malignant PT (dark field) and (d) corresponding bright field.(e) Expression of hybrid PAX3-FARSB transcript in PTs (M, malignant; BL, borderline; B, benign), fibroadenomas (FA) and selectedcell lines (MDA231, SKBR3, HELA)
has been shown to be over-expressed in breast andovarian carcinomas [9,10], and it is associated witha metastatic phenotype in rhabdomyosarcoma [11].There is also evidence that SIX1 can result in increasedexpression of PAX3 and vice versa [12,13]. HMGA2 isan architectural transcription factor that binds to DNAand structurally alters chromatin. Over-expressionof HMGA2 has been described in human benignmesenchymal tumours [14] and over-expression in
mice has been reported to induce benign mesenchy-mal tumours, including breast tumours similar tofibroadenomas, with proliferation of both epitheliumand stromal components [15]. TGFB2 has been shownto promote proliferation of fibroblasts and, althoughtraditionally thought of as a tumour suppressor, playsa dual role in both breast cancer and glioma devel-opment [16,17]. It is a known downstream target ofPAX3 [18].
J Pathol 2008; 216: 408–417 DOI: 10.1002/pathCopyright 2008 Pathological Society of Great Britain and Ireland. Published by John Wiley & Sons, Ltd.
412 AM Jones et al
Table 2. Summary of results
GeneTest set:
microarray dataTest set:
qRT–PCRValidation set:
IHC/ISH
PAX3 5.1-fold change 7-fold change p = 8.7 × 10⁻⁵
p = 0.001 p = 0.0002SIX1 5.1-fold change 2.8-fold change p = 0.06
p = 0.0002 p = 0.002HMGA2 4.2-fold change 6-fold change p = 0.003
p = 0.00005 p = 0.0001TGFB2 2.9-fold change 1.5-fold change p = 0.04
p = 0.004 p = 0.02
All p values = t-test, borderline/malignant versus benign PTs.
The micro-array data for these genes were confirmedby qRT–PCR experiments, using the same freshfrozen samples. The results were then validated in aseparate set of FFPE PTs, using IHC for genes withsuitable antibodies (HMGA2) and in situ hybridization(ISH) for those without (PAX3, TGFB2, SIX1 ). Notumours used in the initial expression study were in theverification set. The results are summarized in Table 2.
Results of PAX3 analysis
By micro-array analysis, PAX3 was highly over-expressed in the borderline/malignant tumours com-pared with the benign group (5.0-fold change;p = 0.001; t-test). In situ hybridization was used toconfirm over-expression of PAX3 in a separate setFFPE PTs (18 borderline/malignant and 12 benign). In13/18 (72%) of borderline/malignant and (0/12) PTs,there was diffuse stromal expression (p = 8.7 × 10⁻⁵;Fisher’s exact test; Figure 1c). 3/12 benign and 3/18malignant PTs showed small foci of PAX3 expression.Array CGH did not reveal any evidence of amplifi-cation of PAX3 in borderline/malignant tumours, theBAC arrays containing a clone mapping exactly toPAX3 (RP11-397D2). Sequencing of PAX3 in sixborderline/malignant PTs with PAX3 over-expressionshowed no evidence of any activating mutations. Halfof the tumours had a base change in exon 1, result-ing in a T/K at amino acid 315. It is a knownnon-synonymous SNP (rs2234675) and its functionalsignificance is unknown.
In view of the well-described recurrent transloca-tion described in rhabdomyosarcoma involving PAX3(chromosome 2q36) and FOXO1 (chromosome 13),evidence of a translocation involving PAX3 in PTswas sought. M-FISH was performed on one malignantcell line (RW 972) and two short-term cultures, oneborderline (STC-3) and one benign (STC-1). The fol-lowing translocations were identified: RW 972, t(5;15),t(14;15), t(17;22); STC-3, t(2;9), t (2;23), t(9;23),t(6;11), t(5;12), t(15;17). The benign short-term cul-ture showed no translocations. Array CGH revealedthat the translocation involving chromosome 2 in STC-3 (Figure 1b) was not balanced and that the breakpointwas centromeric to PAX3.
In order to confirm that there was no balancedtranslocation involving PAX3 not detected by M-FISH,
RACE was performed in borderline/malignant PTs.Using PAX3-specific forward primers and universalreverse primers in two rounds of nested PCR, a PCRproduct of 467 kb was obtained in a borderline PT.Sequence analysis of this product showed that therewas an in-frame fusion transcript with a breakpoint inintron 4 of PAX3 and intron 16 of FARSB. FARSB isa phenylalanyl-tRNA synthetase β-subunit mRNA onchromosome 2 (chr2: 222 772 851–222 871 944) andlies 347 kb telomeric to PAX3. The fusion transcriptconsisted of exons 1–4 of PAX3 and exon 17 ofFARSB. The transcript could be amplified from cDNAin 7/9 borderline/malignant PTs, 3/6 benign PTs and1/6 fibroadenomas. There was no evidence of thetranscript in a series of 16 colorectal cell lines and twobreast cancer cell lines (MDA231, SKBR3; Figure 1e).With just exons 1–4 of PAX3, this transcript containsonly the paired DNA binding site of PAX3 andis missing the homeobox DNA-binding domain andthe transactivation domain; therefore, its functionalsignificance is unclear.
Results of SIX1 analysis
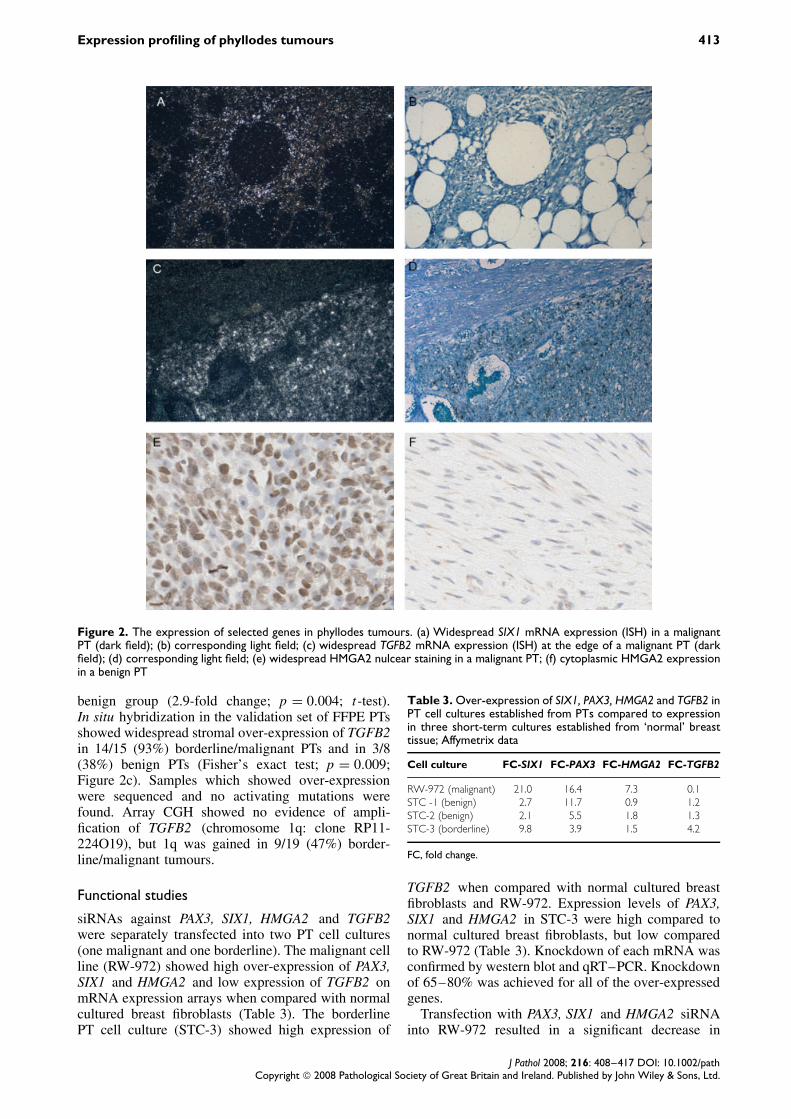
SIX1 mRNA was highly over-expressed in border-line/malignant PTs compared to benign PTs (5.1-foldchange; p = 0.0002; t-test) on expression array analy-sis. Validation of the results in the set of FFPE PTs byin situ hybridization showed that SIX1 (chromosome14: 60 185 933) was expressed in the stroma of 7/15(47%) borderline/malignant tumours and 0/8 benigntumours (p = 0.05; Fisher’s exact test; Figure 2a).There was no evidence of mutation or amplificationof SIX1 on array CGH (clone RP11-307P22).
Results of HMGA2 analysis
mRNA expression profiling showed over-expressionof HMGA2 (chromosome 12: 64 504 507–64 595 566)in borderline/malignant PTs compared to the benigngroup (4.2-fold change; p = 0.00005; t-test). Immuno-histochemistry was performed on the 21 malignant, 6borderline and 17 benign PTs and showed cytoplas-mic staining in the stroma of all subtypes of PTs.However, homogeneous nuclear staining (in >10% ofcells) was seen in the stroma of 12/21 (57%) malig-nant PTs, 1/6 (17%) borderline PTs and 1/16 (6%)benign PTs (Figure 2e, f). Widespread nuclear stainingwas associated with the borderline/malignant pheno-type (p = 0.003; Fisher’s exact test). There was noevidence of amplification (clone RP11-366L20, chro-mosome12: 64 522 776) on array CGH or transloca-tion in this region on M-FISH. Gain of the wholearm of chromosome 12 was seen in two border-line/malignant PTs.
Results of TGFB2 analysis
By micro-array analysis, TGFB2 was over-expressedin the borderline/malignant PTs compared with the
J Pathol 2008; 216: 408–417 DOI: 10.1002/pathCopyright 2008 Pathological Society of Great Britain and Ireland. Published by John Wiley & Sons, Ltd.
Expression profiling of phyllodes tumours 413
Figure 2. The expression of selected genes in phyllodes tumours. (a) Widespread SIX1 mRNA expression (ISH) in a malignantPT (dark field); (b) corresponding light field; (c) widespread TGFB2 mRNA expression (ISH) at the edge of a malignant PT (darkfield); (d) corresponding light field; (e) widespread HMGA2 nulcear staining in a malignant PT; (f) cytoplasmic HMGA2 expressionin a benign PT
benign group (2.9-fold change; p = 0.004; t-test).In situ hybridization in the validation set of FFPE PTsshowed widespread stromal over-expression of TGFB2in 14/15 (93%) borderline/malignant PTs and in 3/8(38%) benign PTs (Fisher’s exact test; p = 0.009;Figure 2c). Samples which showed over-expressionwere sequenced and no activating mutations werefound. Array CGH showed no evidence of ampli-fication of TGFB2 (chromosome 1q: clone RP11-224O19), but 1q was gained in 9/19 (47%) border-line/malignant tumours.
Functional studies
siRNAs against PAX3, SIX1, HMGA2 and TGFB2were separately transfected into two PT cell cultures(one malignant and one borderline). The malignant cellline (RW-972) showed high over-expression of PAX3,SIX1 and HMGA2 and low expression of TGFB2 onmRNA expression arrays when compared with normalcultured breast fibroblasts (Table 3). The borderlinePT cell culture (STC-3) showed high expression of
Table 3. Over-expression of SIX1, PAX3, HMGA2 and TGFB2 inPT cell cultures established from PTs compared to expressionin three short-term cultures established from ‘normal’ breasttissue; Affymetrix data
Cell culture FC-SIX1 FC-PAX3 FC-HMGA2 FC-TGFB2
RW-972 (malignant) 21.0 16.4 7.3 0.1STC -1 (benign) 2.7 11.7 0.9 1.2STC-2 (benign) 2.1 5.5 1.8 1.3STC-3 (borderline) 9.8 3.9 1.5 4.2
FC, fold change.
TGFB2 when compared with normal cultured breastfibroblasts and RW-972. Expression levels of PAX3,SIX1 and HMGA2 in STC-3 were high compared tonormal cultured breast fibroblasts, but low comparedto RW-972 (Table 3). Knockdown of each mRNA wasconfirmed by western blot and qRT–PCR. Knockdownof 65–80% was achieved for all of the over-expressedgenes.
Transfection with PAX3, SIX1 and HMGA2 siRNAinto RW-972 resulted in a significant decrease in
J Pathol 2008; 216: 408–417 DOI: 10.1002/pathCopyright 2008 Pathological Society of Great Britain and Ireland. Published by John Wiley & Sons, Ltd.
414 AM Jones et al
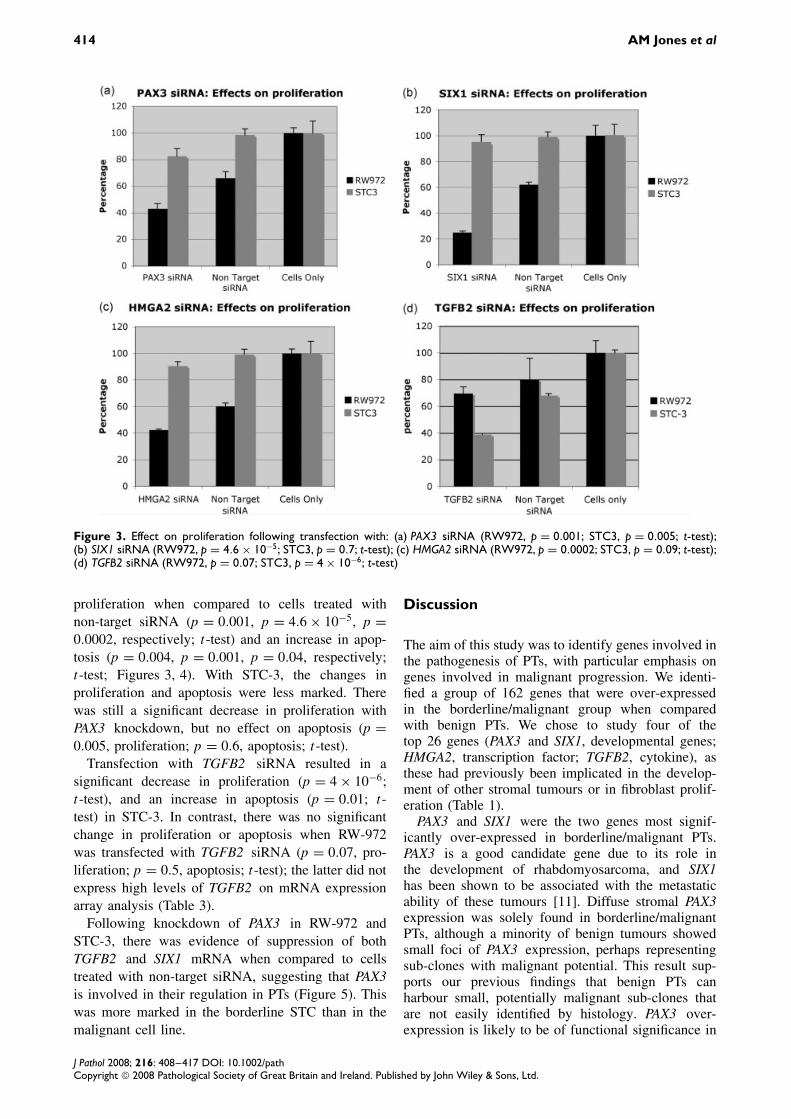
Figure 3. Effect on proliferation following transfection with: (a) PAX3 siRNA (RW972, p = 0.001; STC3, p = 0.005; t-test);(b) SIX1 siRNA (RW972, p = 4.6 × 10⁻⁵; STC3, p = 0.7; t-test); (c) HMGA2 siRNA (RW972, p = 0.0002; STC3, p = 0.09; t-test);(d) TGFB2 siRNA (RW972, p = 0.07; STC3, p = 4 × 10⁻⁶; t-test)
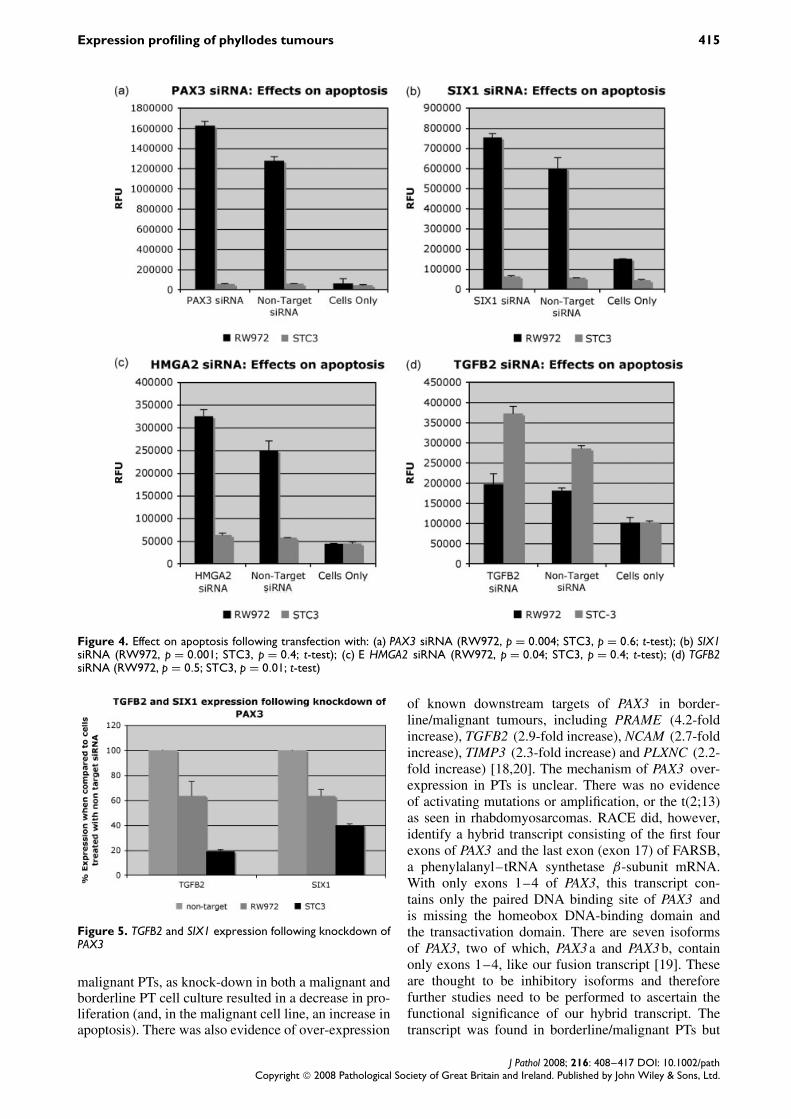
proliferation when compared to cells treated withnon-target siRNA (p = 0.001, p = 4.6 × 10⁻⁵, p =0.0002, respectively; t-test) and an increase in apop-tosis (p = 0.004, p = 0.001, p = 0.04, respectively;t-test; Figures 3, 4). With STC-3, the changes inproliferation and apoptosis were less marked. Therewas still a significant decrease in proliferation withPAX3 knockdown, but no effect on apoptosis (p =0.005, proliferation; p = 0.6, apoptosis; t-test).
Transfection with TGFB2 siRNA resulted in asignificant decrease in proliferation (p = 4 × 10⁻⁶;t-test), and an increase in apoptosis (p = 0.01; t-test) in STC-3. In contrast, there was no significantchange in proliferation or apoptosis when RW-972was transfected with TGFB2 siRNA (p = 0.07, pro-liferation; p = 0.5, apoptosis; t-test); the latter did notexpress high levels of TGFB2 on mRNA expressionarray analysis (Table 3).
Following knockdown of PAX3 in RW-972 andSTC-3, there was evidence of suppression of bothTGFB2 and SIX1 mRNA when compared to cellstreated with non-target siRNA, suggesting that PAX3is involved in their regulation in PTs (Figure 5). Thiswas more marked in the borderline STC than in themalignant cell line.
Discussion
The aim of this study was to identify genes involved inthe pathogenesis of PTs, with particular emphasis ongenes involved in malignant progression. We identi-fied a group of 162 genes that were over-expressedin the borderline/malignant group when comparedwith benign PTs. We chose to study four of thetop 26 genes (PAX3 and SIX1, developmental genes;HMGA2, transcription factor; TGFB2, cytokine), asthese had previously been implicated in the develop-ment of other stromal tumours or in fibroblast prolif-eration (Table 1).
PAX3 and SIX1 were the two genes most signif-icantly over-expressed in borderline/malignant PTs.PAX3 is a good candidate gene due to its role inthe development of rhabdomyosarcoma, and SIX1has been shown to be associated with the metastaticability of these tumours [11]. Diffuse stromal PAX3expression was solely found in borderline/malignantPTs, although a minority of benign tumours showedsmall foci of PAX3 expression, perhaps representingsub-clones with malignant potential. This result sup-ports our previous findings that benign PTs canharbour small, potentially malignant sub-clones thatare not easily identified by histology. PAX3 over-expression is likely to be of functional significance in
J Pathol 2008; 216: 408–417 DOI: 10.1002/pathCopyright 2008 Pathological Society of Great Britain and Ireland. Published by John Wiley & Sons, Ltd.
Expression profiling of phyllodes tumours 415
Figure 4. Effect on apoptosis following transfection with: (a) PAX3 siRNA (RW972, p = 0.004; STC3, p = 0.6; t-test); (b) SIX1siRNA (RW972, p = 0.001; STC3, p = 0.4; t-test); (c) E HMGA2 siRNA (RW972, p = 0.04; STC3, p = 0.4; t-test); (d) TGFB2siRNA (RW972, p = 0.5; STC3, p = 0.01; t-test)
Figure 5. TGFB2 and SIX1 expression following knockdown ofPAX3
malignant PTs, as knock-down in both a malignant andborderline PT cell culture resulted in a decrease in pro-liferation (and, in the malignant cell line, an increase inapoptosis). There was also evidence of over-expression
of known downstream targets of PAX3 in border-line/malignant tumours, including PRAME (4.2-foldincrease), TGFB2 (2.9-fold increase), NCAM (2.7-foldincrease), TIMP3 (2.3-fold increase) and PLXNC (2.2-fold increase) [18,20]. The mechanism of PAX3 over-expression in PTs is unclear. There was no evidenceof activating mutations or amplification, or the t(2;13)as seen in rhabdomyosarcomas. RACE did, however,identify a hybrid transcript consisting of the first fourexons of PAX3 and the last exon (exon 17) of FARSB,a phenylalanyl–tRNA synthetase β-subunit mRNA.With only exons 1–4 of PAX3, this transcript con-tains only the paired DNA binding site of PAX3 andis missing the homeobox DNA-binding domain andthe transactivation domain. There are seven isoformsof PAX3, two of which, PAX3 a and PAX3 b, containonly exons 1–4, like our fusion transcript [19]. Theseare thought to be inhibitory isoforms and thereforefurther studies need to be performed to ascertain thefunctional significance of our hybrid transcript. Thetranscript was found in borderline/malignant PTs but
J Pathol 2008; 216: 408–417 DOI: 10.1002/pathCopyright 2008 Pathological Society of Great Britain and Ireland. Published by John Wiley & Sons, Ltd.
416 AM Jones et al
was also detected in some benign PTs and a fibroade-noma.
In contrast to PAX3, SIX1 stromal expression wasconfined to highly malignant PTs in the validationset. There was particularly high expression in amalignant PT that was known to have metastasized.This suggests that expression of SIX1 is importantin the malignant phenotype, consistent with findingsin rhabdomyosarcoma, where it is associated withmetastatic ability [11]. All SIX1-positive tumours alsoexpressed PAX3, but only half the tumours expressingPAX3 expressed SIX1. Knockdown of PAX3 resultedin a decrease in SIX1 mRNA expression in PTs,suggesting that PAX3 may be regulating expressionof SIX1. Knockdown of SIX1 in a malignant cell linehad a dramatic effect on proliferation and apoptosisbut had no effect in a borderline PT culture.
TGFB2 is a known downstream target of PAX3.TGFB2 showed widespread expression in border-line/malignant and some benign PTs, and knockdownproduced a decrease in proliferation and an increasein apoptosis in a borderline PT short-term culture.Although knockdown of PAX3 resulted in a decreasein TGFB2 mRNA expression in PTs, it is unlikely thatTGFB2 over-expression is solely due to PAX3 expres-sion, as TGFB2 expression was more widespreadin benign PTs than PAX3 expression. We have alsofound evidence of two other genes that may con-tribute to TGFB2 expression in PTs: PDGF andthrombospondin 1 (THBS1 ) are both over-expressedin malignant and borderline PTs (see Supporting infor-mation, Table S1). TGFB2 has been shown to promoteproliferation of fibroblasts in the presence of PDGF[21] and THBS1 can antagonize TGFB2 inhibition[22]. Interestingly, although there was no evidenceof activating mutations or amplification of TGFB2,TGFB2 is located on 1q, which is commonly gainedin borderline/malignant PTs [2,23].
HMGA2 was selected for further investigation, as itis commonly expressed in both benign and malignantstromal tumours and mis-expression in mice inducesbreast tumours similar to fibroadenomas, with prolifer-ation of both epithelium and stromal components [15].We showed a difference in expression between theborderline/malignant PTs and benign PTs on mRNAexpression array analysis, and immunohistochemistryshowed that nuclear HMGA2 staining was associatedwith borderline/malignant PTs. Our functional datafurther support the involvement of HMGA2 in themalignant transformation of PTs, as knock-down onlyaffected proliferation and apoptosis in the malignantcell culture and not the borderline cell culture. Again,the mechanism of over-expression is not clear; therewas no evidence of amplification on aCGH and noevidence of translocations involving HMGA2.
In conclusion, we have used expression profiling toidentify genes that are important in the developmentof borderline/malignant PTs. Of the 162 genes thatwere over-expressed in borderline/malignant PTs, fourwere chosen for further analysis on the basis of
previous reports suggesting a role in stromal tumoursor fibroblast proliferation. We have confirmed that allfour of these genes, SIX1, PAX3, HMGA2 and TGFB2,are over-expressed in borderline/malignant PTs and wehave shown the functional effects of knocking downthese genes in PT cell cultures. SIX1 over-expressionwas confined to malignant PTs, with particularly highexpression in a case that metastasized, suggestingthat SIX1 expression may be a marker for metastaticability in PTs as it is in rhabdomyosarcoma. PAX3,HMGA2 and TGFB2 were expressed predominantlyin borderline/malignant PTs, but with some expressionin benign PTs; they may be important in the transitionfrom the benign to borderline/malignant phenotype.
Acknowledgements
We are grateful to the patients in the study and colleaguesinvolved in patient ascertainment and sample collection. Manythanks to LM Tibbetts, Department of Pathology, RogerWilliams General Hospital, Providence, USA, for the kinddonation of cell line RW-972. Help was also kindly providedby the Yvonne Hey Molecular Biology Core Facility, PatersonInstitute for Cancer Research, Christie Hospital NHS Trust andEquipment Park, London Research Institute, Cancer ResearchUK. ES and AJ are funded by a Department of Health ClinicianScientist Grant.
References
# References 24 and 25 are cited in the Supporting information tothis article.
1. Rosen PP, Dershaw D, Liberman L. Breast Pathology. Lippincott,Williams and Wilkins: Philadelphia, 1999.
2. Jones AM, Mitter R, Springall R, Graham T, Winter E, Gillett C,et al. A comprehensive genetic profile of phyllodes tumoursof the breast detects important mutations, intra-tumoral geneticheterogeneity and new genetic changes on recurrence. J Pathol2008;214(5):533–544.
3. Sawyer EJ, Hanby AM, Ellis P, Lakhani S, Ellis I, Boyle S,et al. Molecular analysis of phyllodes tumours reveals distinctchanges in the epithelial and stromal components. Am J Path2000;156(3):1093–1098.
4. Livak KJ, Schmittgen TD. Analysis of relative gene expressiondata using real-time quantitative PCR and the 2[−��C(T)]method. Methods 2001;25(4):402–408.
5. Fiegler H, Carr P, Douglas EJ, Burford DC, Hunt S, Scott CE,et al. DNA microarrays for comparative genomic hybridizationbased on DOP–PCR amplification of BAC and PAC clones. GenesChromosomes Cancer 2003;36(4):361–374.
6. Jones AM, Douglas EJ, Halford SE, Fiegler H, Gorman PA,Roylance RR, et al. Array-CGH analysis of microsatellite-stable,near-diploid bowel cancers and comparison with other types ofcolorectal carcinoma. Oncogene 2005;24(1):118–129.
7. Greulich KM, Kreja L, Heinze B, Rhein AP, Weier HG, BrucknerM, et al. Rapid detection of radiation-induced chromosomal aber-rations in lymphocytes and hematopoietic progenitor cells bymFISH. Mutat Res 2000;452(1):73–81.
8. Mercado GE, Barr FG. Fusions involving PAX and FOX genes inthe molecular pathogenesis of alveolar rhabdomyosarcoma: recentadvances. Curr Mol Med 2007;7(1):47–61.
9. Reichenberger KJ, Coletta RD, Schulte AP, Varella-Garcia M,Ford HL. Gene amplification is a mechanism of SIX1 over-expression in breast cancer. Cancer Res 2005;65(7):2668–2675.
J Pathol 2008; 216: 408–417 DOI: 10.1002/pathCopyright 2008 Pathological Society of Great Britain and Ireland. Published by John Wiley & Sons, Ltd.
Expression profiling of phyllodes tumours 417
10. Behbakht K, Qamar L, Aldridge CS, Coletta RD, Davidson SA,Thorburn A, et al. SIX1 over-expression in ovarian carcinomacauses resistance to TRAIL-mediated apoptosis and is associatedwith poor survival. Cancer Res 2007;67(7):3036–3042.
11. Yu Y, Khan J, Khanna C, Helman L, Meltzer PS, Merlino G.Expression profiling identifies the cytoskeletal organizer ezrinand the developmental homeoprotein Six-1 as key metastaticregulators. Nat Med 2004;10:175–181.
12. Grifone R, Demignon J, Houbron C, Souil E, Niro C, Seller MJ,et al. SIX1 and Six4 homeoproteins are required for PAX3 and Mrfexpression during myogenesis in the mouse embryo. Development2005;132(9):2235–2249.
13. Ridgeway AG, Skerjanc IS. PAX3 is essential for skeletalmyogenesis and the expression of SIX1 and Eya2. J Biol Chem2001;276(22):19033–19039.
14. Italiano A, Cardot N, Dupre F, Monticelli I, Keslair F, Piche M,et al. Gains and complex rearrangements of the 12q13–15 chro-mosomal region in ordinary lipomas: the ‘missing link’ betweenlipomas and liposarcomas? Int J Cancer 2007;121(2):308–315.
15. Zaidi MR, Okada Y, Chada KK. Misexpression of full-lengthHMGA2 induces benign mesenchymal tumors in mice. CancerRes 2006;66(15):7453–7459.
16. Oft M, Heider KH, Beug H. TGFβ signaling is necessaryfor carcinoma cell invasiveness and metastasis. Curr Biol1998;8(23):1243–1252.
17. Nickl-Jockschat T, Arslan F, Doerfelt A, Bogdahn U, Bosser-hoff A, Hau P. An imbalance between Smad and MAPK pathwaysis responsible for TGF-β tumor promoting effects in high-gradegliomas. Int J Oncol 2007;30(2):499–507.
18. Mayanil CS, Pool A, Nakazaki H, Reddy AC, Mania-Farnell B,Yun B, et al. Regulation of murine TGFβ2 by PAX3 during earlyembryonic development. J Biol Chem 2006;281(34):24544–24552.
19. Parker CJ, Shawcross SG, Li H, Wang QY, Herrington SC,Kumar S, et al. Expression of Pax3 alternatively splicedtranscripts and identification of two new isoforms in human tumorsof neural crest origin. Int J Cancer 2004;108:314–320.
20. Begum S, Emani N, Cheung A, Wilkins O, Der S, Hamel PA. Celltype-specific regulation of distinct sets of gene targets by PAX3 andPAX3 /FKHR. Oncogene 2005;24(11):1860–1872.
21. Roberts AB, Anzano MA, Wakefield LM, Roche NS, Stern DF,Sporn MB. Type β transforming growth factor: a bifunctionalregulator of cellular growth. Proc Natl Acad Sci USA1985;82(1):119–123.
22. Harpel JG, Schultz-Cherry S, Murphy-Ullrich JE, Rifkin DB.Tamoxifen and estrogen effects on TGF-β formation: role ofthrombospondin-1, αvβ3, and integrin-associated protein. BiochemBiophys Res Commun 2001;284(1):11–14.
23. Daniel C, Wiede J, Krutzsch HC, Ribeiro SM, Roberts DD,Murphy-Ullrich JE, et al. Phyllodes tumors of the breast segregatein two groups according to genetic criteria. Mod Pathol2007;20(4):435–444.
24. Sawyer EJ, Hanby AM, Rowan AJ, Gillett CE, Thomas RE,Poulsom R. The Wnt pathway, epithelial–stromal interactionsand malignant progression in phyllodes tumours. J Pathol2002;196(4):437–444.
25. MacCallum J, Poulsom R, Hanby AM, Miller WR. Expressionand distribution of TGFB mRNA isoforms in a small group ofhuman breast cancers examined by in situ hybridisation. Breast1995;4:289–296.
J Pathol 2008; 216: 408–417 DOI: 10.1002/pathCopyright 2008 Pathological Society of Great Britain and Ireland. Published by John Wiley & Sons, Ltd.