Rapid changes in ozone mixing ratios at Cerro Tololo (30°10′S, 70°48′W, 2200 m) in connection...
15
Rapid changes in ozone mixing ratios at Cerro Tololo (30 °10 0 S, 70 °48 0 W, 2200 m) in connection with cutoff lows and deep troughs R. Rondanelli 1 Departamento de Geofı ´sica, Universidad de Chile, Santiago, Chile L. Gallardo Centro de Modelamiento Matema ´tico, Universidad de Chile, Santiago, Chile R. D. Garreaud Departamento de Geofı ´sica, Universidad de Chile, Santiago, Chile Received 25 September 2001; revised 6 March 2002; accepted 3 April 2002; published 3 December 2002. [1] Rapid changes in surface ozone mixing ratios (up to 15 ppbv over 12 hours) at the Cerro Tololo (CT) station (70°W, 30°S, 2200 m) over the period 1996 – 2000 are analyzed. These changes explain most of the wintertime variability of the ozone data at CT. Since the wintertime data show no significant diurnal cycle, local circulations and in situ photochemical processes cannot account for the sudden changes in ozone. Rather, a synoptic-scale forcing of the changes is described on the basis of composite analyses of reanalysis data. Synoptic configurations associated with sudden changes in ozone were separated into W and D cases, according to the local evolution of humidity. W cases are characterized by humidity values in excess of 4 hPa lasting one or two days before the ozone maximum. D cases show no significant change in humidity before the ozone maximum. Both in W and in D cases, stratospheric air appears to be advected from polar latitudes to midlatitudes and subtropical latitudes during the development of cutoff lows and deep troughs. The origin of the air arriving at CT during a W and a D case study was assessed using mesoscale numerical simulations. The model calculations for the W case show a deep stratospheric intrusion reaching the lower troposphere in subtropical latitudes during the amplification and mature stages of a cutoff low. For D cases the stratospheric intrusion is mostly confined to midlatitudes and to an oceanic area far from the site of study. Analyses of trajectories show that in both cases, high ozone mixing ratios at the surface occur in connection with air parcels having a stratospheric history. INDEX TERMS: 3362 Meteorology and Atmospheric Dynamics: Stratosphere/troposphere interactions; 0365 Atmospheric Composition and Structure: Troposphere—composition and chemistry; 3329 Meteorology and Atmospheric Dynamics: Mesoscale meteorology; 9360 Information Related to Geographic Region: South America; KEYWORDS: stratosphere-troposphere exchange, ozone, cutoff lows Citation: Rondanelli, R., L. Gallardo, and R. D. Garreaud, Rapid changes in ozone mixing ratios at Cerro Tololo (30°10 0 S, 70°48 0 W, 2200 m) in connection with cutoff lows and deep troughs, J. Geophys. Res., 107(D23), 4677, doi:10.1029/2001JD001334, 2002. 1. Introduction [2] The spatial and temporal distribution of ozone is crucial in the understanding of tropospheric chemistry. Model calculations have been used to establish the relative importance of different sources and sinks in the tropospheric budget of ozone suggesting that on the global scale, the dominant fluxes are related to photochemical processes [Crutzen et al., 1999, and references therein]. However, the influx of stratospheric air may explain the origin of nearly 40% of tropospheric ozone especially in the sub- tropics [Roelofs and Lelieveld, 1997]. Crutzen et al. [1999], on the basis of results of a three-dimensional (3-D) chemical transport model, suggest that the main region of influx of ozone from the stratosphere is near 30° of latitude in both hemispheres, associated with breaks of the subtropical tropopause. The majority of regional studies concerning stratosphere-troposphere exchange (STE) processes related to ozone have focused on the midlatitudes of the Northern Hemisphere [e.g., Wakamatsu et al., 1989; Ebel et al., 1991; Beekmann et al., 1994; Ancellet et al., 1994; Davies and Schuepbach, 1994; Cox et al., 1995]. In these works, subsidence in connection with cutoff lows (closed cyclonic midtropospheric circulation generated from a precursor JOURNAL OF GEOPHYSICAL RESEARCH, VOL. 107, NO. D23, 4677, doi:10.1029/2001JD001334, 2002 1 Now at Program in Atmospheres, Oceans and Climate, Massachusetts Institute of Technology, Cambridge, Massachusetts, USA. Copyright 2002 by the American Geophysical Union. 0148-0227/02/2001JD001334 ACL 6 - 1
Transcript of Rapid changes in ozone mixing ratios at Cerro Tololo (30°10′S, 70°48′W, 2200 m) in connection...
Rapid changes in ozone mixing ratios at Cerro Tololo
(30���100S, 70���480W, 2200 m) in connection
with cutoff lows and deep troughs
R. Rondanelli1
Departamento de Geofısica, Universidad de Chile, Santiago, Chile
L. GallardoCentro de Modelamiento Matematico, Universidad de Chile, Santiago, Chile
R. D. GarreaudDepartamento de Geofısica, Universidad de Chile, Santiago, Chile
Received 25 September 2001; revised 6 March 2002; accepted 3 April 2002; published 3 December 2002.
[1] Rapid changes in surface ozone mixing ratios (up to 15 ppbv over 12 hours) at theCerro Tololo (CT) station (70�W, 30�S, 2200 m) over the period 1996–2000 are analyzed.These changes explain most of the wintertime variability of the ozone data at CT. Sincethe wintertime data show no significant diurnal cycle, local circulations and in situphotochemical processes cannot account for the sudden changes in ozone. Rather, asynoptic-scale forcing of the changes is described on the basis of composite analyses ofreanalysis data. Synoptic configurations associated with sudden changes in ozone wereseparated into W and D cases, according to the local evolution of humidity. W cases arecharacterized by humidity values in excess of 4 hPa lasting one or two days before theozone maximum. D cases show no significant change in humidity before the ozonemaximum. Both in W and in D cases, stratospheric air appears to be advected from polarlatitudes to midlatitudes and subtropical latitudes during the development of cutoff lowsand deep troughs. The origin of the air arriving at CT during a W and a D case studywas assessed using mesoscale numerical simulations. The model calculations for the Wcase show a deep stratospheric intrusion reaching the lower troposphere in subtropicallatitudes during the amplification and mature stages of a cutoff low. For D cases thestratospheric intrusion is mostly confined to midlatitudes and to an oceanic area far fromthe site of study. Analyses of trajectories show that in both cases, high ozone mixing ratiosat the surface occur in connection with air parcels having a stratospheric history. INDEX
TERMS: 3362 Meteorology and Atmospheric Dynamics: Stratosphere/troposphere interactions; 0365
Atmospheric Composition and Structure: Troposphere—composition and chemistry; 3329 Meteorology and
Atmospheric Dynamics: Mesoscale meteorology; 9360 Information Related to Geographic Region: South
America; KEYWORDS: stratosphere-troposphere exchange, ozone, cutoff lows
Citation: Rondanelli, R., L. Gallardo, and R. D. Garreaud, Rapid changes in ozone mixing ratios at Cerro Tololo (30�100S, 70�480W,
2200 m) in connection with cutoff lows and deep troughs, J. Geophys. Res., 107(D23), 4677, doi:10.1029/2001JD001334, 2002.
1. Introduction
[2] The spatial and temporal distribution of ozone iscrucial in the understanding of tropospheric chemistry.Model calculations have been used to establish the relativeimportance of different sources and sinks in the troposphericbudget of ozone suggesting that on the global scale, thedominant fluxes are related to photochemical processes[Crutzen et al., 1999, and references therein]. However,
the influx of stratospheric air may explain the origin ofnearly 40% of tropospheric ozone especially in the sub-tropics [Roelofs and Lelieveld, 1997]. Crutzen et al. [1999],on the basis of results of a three-dimensional (3-D) chemicaltransport model, suggest that the main region of influx ofozone from the stratosphere is near 30� of latitude in bothhemispheres, associated with breaks of the subtropicaltropopause. The majority of regional studies concerningstratosphere-troposphere exchange (STE) processes relatedto ozone have focused on the midlatitudes of the NorthernHemisphere [e.g., Wakamatsu et al., 1989; Ebel et al., 1991;Beekmann et al., 1994; Ancellet et al., 1994; Davies andSchuepbach, 1994; Cox et al., 1995]. In these works,subsidence in connection with cutoff lows (closed cyclonicmidtropospheric circulation generated from a precursor
JOURNAL OF GEOPHYSICAL RESEARCH, VOL. 107, NO. D23, 4677, doi:10.1029/2001JD001334, 2002
1Now at Program in Atmospheres, Oceans and Climate, MassachusettsInstitute of Technology, Cambridge, Massachusetts, USA.
Copyright 2002 by the American Geophysical Union.0148-0227/02/2001JD001334
ACL 6 - 1
trough) and upper-level fronts arise as responsible for thetransport between the stratosphere and the troposphere.Also, convective and turbulent mixing processes have beenproposed as the exchange mechanisms to explain increasesin ozone mixing ratios, low humidity and high stability oftropospheric air observed in the STE events [Price andVaughan, 1993]. Concerning the Southern Hemisphere,recent studies emphasize the role of the subtropical jetstream [e.g., Gouget, 2000] and the Hadley circulation inthe STE [e.g., Baray et al., 2000; Meloen et al., 2001].Moreover, tropopause foldings in the Southern Hemisphereare believed to be less deep than the Northern Hemisphereones [Meloen et al., 2001]. In this work, modeling andobservational evidence of stratospheric intrusions influenc-
ing the ozone at the surface in a synoptic scale will beshown.[3] In this paper we focus on the surface ozone measured
at the mountain site of Cerro Tololo (CT). CT is located nearthe western coast of South America in a region where theAndes mountains have an average altitude of 4000 m and awidth of �200 km. This region is characterized by the yearround influence of the subsiding branch of the Hadley cell.It is placed in a transition zone between the hyper-aridconditions of the Atacama Desert (to the north of 25�S) andthe Mediterranean climate of Central Chile [Miller, 1976].All the precipitation at CT (less than 100 mm per year) takesplace in winter during a few episodes (frontal systems andcutoff lows) whose frequency and intensity have a large
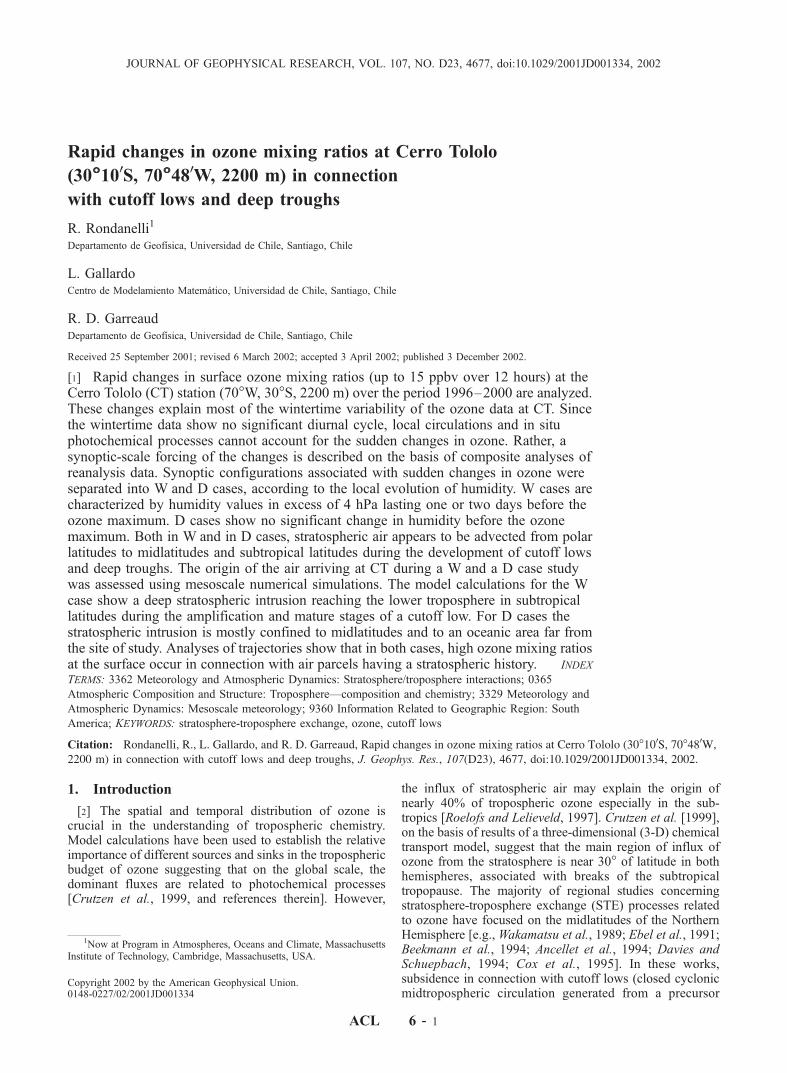
Figure 1. (a) Hourly ozone mixing ratios during 1997. (b) Ozone mixing ratios (thick line) and watervapor pressure measured at CT during July, August and September 1997. Enclosed in boxes labeled WorD are the sudden increases episodes recorded during this period. (c) A closer view of a W episoderegistered around July 13, 1997.
ACL 6 - 2 RONDANELLI ET AL.: RAPID CHANGES IN OZONE AT CERRO TOLOLO
interannual variability [Rutllant and Fuenzalida, 1991;Pizarro and Montecinos, 2000].[4] One of the objectives of this work is to contribute to
the overall characterization of the CT station that belongs tothe Global Atmospheric Watch (GAW) program developedsince the mid 90’s in Chile by the World MeteorologicalOrganization (WMO). Preliminary work by Gallardo et al.[2000] established that CT appears to be representative ofbackground conditions of the subtropics of the SouthernHemisphere (SH). The seasonal cycle of ozone at CT has anearly spring maximum (35 ppbv October average) and a latesummer minimum (25 ppbv March average). The relativelysmall amplitude of the diurnal ozone cycle during winter(�2 ppbv) suggests that in situ photochemical processes areweak at least in the scale of days. In summer, there is a morepronounced diurnal cycle linked to the strengthening of thelocal thermally driven circulations, which appear to bringozone- poor air to the station in the afternoon hours. Thereader is referred to Kalthoff et al. [2002] for a character-ization of the local circulation and its influence on the ozonemeasurements at CT in summer.[5] The features earlier described are illustrated in Figure 1.
Figure 1a shows the time series of ozone for 1997. In summer,increases and decreases in ozone (�20 ppbv) occur in time-scales that span from days to weeks, with ozone and humidityvalues at the CT station anti-correlated (not shown). Lowhumidity values generally reflect high static stability and freetropospheric conditions, while high values reflect transportfrom themarine boundary layer (MBL), which is, on average,poorer in ozone than free tropospheric air. The air within the
MBL has typically suffered ozone depletion due to photo-chemical destruction that takes place in absence of significantsources of nitrogen oxides over the ocean. During the rest ofthe year, the stronger static stability and the weaker thermallydriven circulation restrict the transport fromMBL up to CT toepisodes of strong mid tropospheric ascent, as will be seen inthe next sections.[6] During winter and spring, rapid changes in ozone are
observed (Figure 1b), with increases as large as 15 ppbv in12 hours. Some of these rapid increases are preceded byhigh values of humidity and we refer to these episodes to asW cases. Those increases with no previous change inhumidity are referred to as D cases. We hypothesize thatin both W and D cases the increase in ozone mixing ratiosare related with STE processes, as documented for otherregions of the world. Davies and Schuepbach [1994] show acase study of an intense stratospheric intrusion in a moun-tain site at Junfraujoch (46� 490N, 07�590E, 3580 m.a.s.l.) onthe Swiss Alps, reaching ozone mixing ratios of 90 ppbvafter the passage of a cold front and an upper level trough.Also, an ozone increase of about 40 ppbv in 12 hours inconnection with subsidence in the southwestern part of anupper level trough has been documented by Tsutsumi et al.[1998] for a station at the summit of Mount Fuji (35�210N,138�440E, 3776 m.a.s.l.) in Japan.[7] The paper is organized as follows. Data sets are
described in section 2. An objective definition of the ozonechanges or episodes is discussed in section 3. To describecommon features and differences between the W and Dcases in the synoptic scale, compositing analyses of mete-
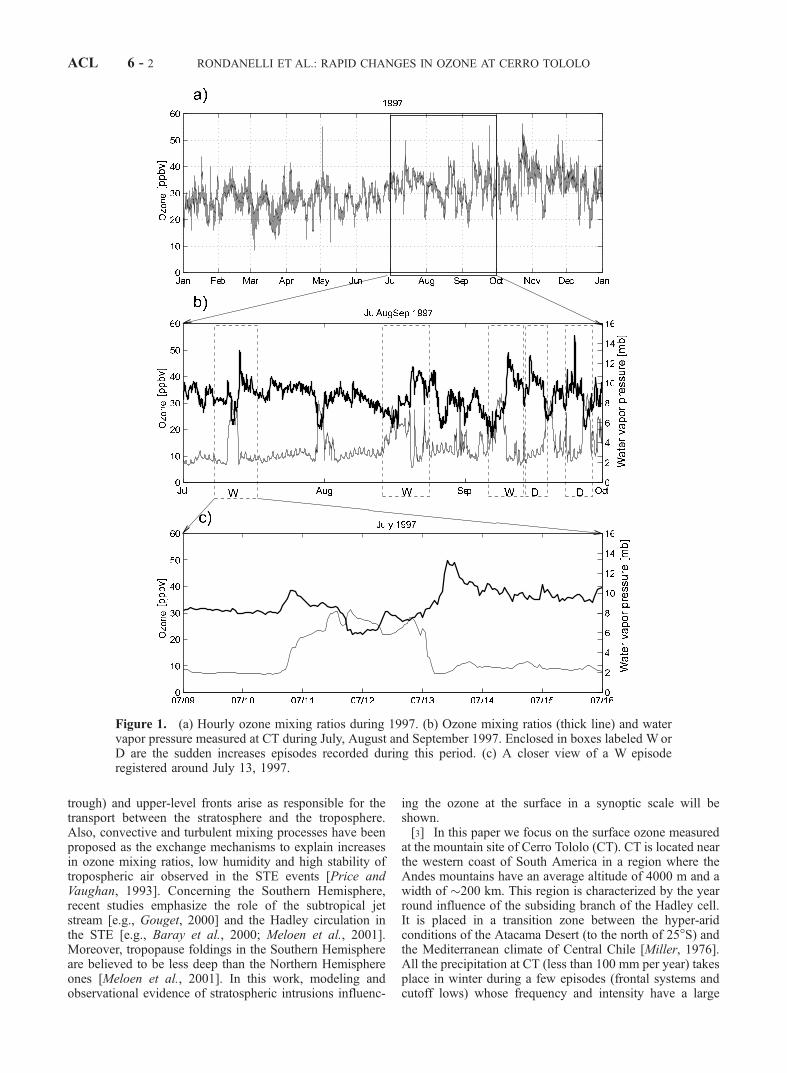
Figure 2. The upper panels show composite time series of ozone anomalies (solid curve) and watervapor pressure anomalies (dashed curve) for (a) W and (b) D cases relative to average values for theselected episode. The lower panels show the 12h-window running mean omega velocity (from NCEP/NCAR reanalysis) composites for (c) Wand (d) D cases at two different vertical levels over a grid point at30�S and 70�W. Recall that negative values indicate upward motion. Dashed vertical lines indicate theinitial increase in ozone. The solid curve represents 500-hPa, and the dashed curve represents 200-hPa.
RONDANELLI ET AL.: RAPID CHANGES IN OZONE AT CERRO TOLOLO ACL 6 - 3
orological fields are presented in section 3. To furtherdescribe the transport mechanism at play, high-resolutionnumerical simulations of typical W and D cases wereperformed. These results are analyzed in section 4. Finallyin section 5 summary and conclusions are presented.
2. Data
[8] Since late 1995 the Chilean Meteorological Bureau,within the context of the GAW program under the WMO,has carried out continuous measurements of ozone at CT.Mixing ratios of ozone are measured with an ozone analyzersensor (TECHO 49-003) whose principle of operation is theattenuation of ultraviolet (UV) light at 254 nm due to theozone content in the sample. Two photometers operatesynchronously measuring this attenuation in the air sampleand in a reference gas. The ozone mixing ratio is obtainedthrough the Beer-Lambert law, corrected by internal temper-ature and pressure. The instrument has a sensitivity of ±1ppbv, a precision of 2 ppbv and a response time of 20seconds to reach 95% of response [Thermo EnvironmentalInstruments (TEI ), 1994]. The quality of the collected datais regularly checked following the procedures of WMO forGAW stations.[9] Together with the ozone instrumentation, a complete
automatic weather station is operated. It measures atmos-
pheric pressure, temperature, humidity, total radiation, pre-cipitation and wind speed and direction. The meteorologicaland the ozone data are recorded as 15-minute averages. Inthis work the data are analyzed for the period betweenMarch 1996 and May 2000. In addition, we consider a shortperiod of data during September 2001.[10] A reanalysis data set from the National Centers for
Environmental Prediction/Atmospheric Research (NCEP/NCAR) is used to characterize the large-scale meteorolog-ical features. The reader is referred to Kalnay et al. [1996]and Kistler et al. [2001] for details of the reanalysis data set.Spatial resolution is 2.5�latitude � 2.5�longitude in thehorizontal and 12 levels in vertical between 1000 and 100hPa. The temporal resolution is six hours. The fields used inthis study are geopotential height, wind, temperature andomega velocity (dp/dt). Although data are in isobaricvertical coordinates, for some analyses, they will be inter-polated to isentropic surfaces.
3. Composite Analyses
3.1. Rapid Increases in Ozone
[11] To objectively define the existence of a rapid in-crease of ozone, two criteria had to be met: (1) The ozonemixing ratio increases more than 15 ppbv over 12 hours. (2)The ozone maximum must be higher than the corresponding
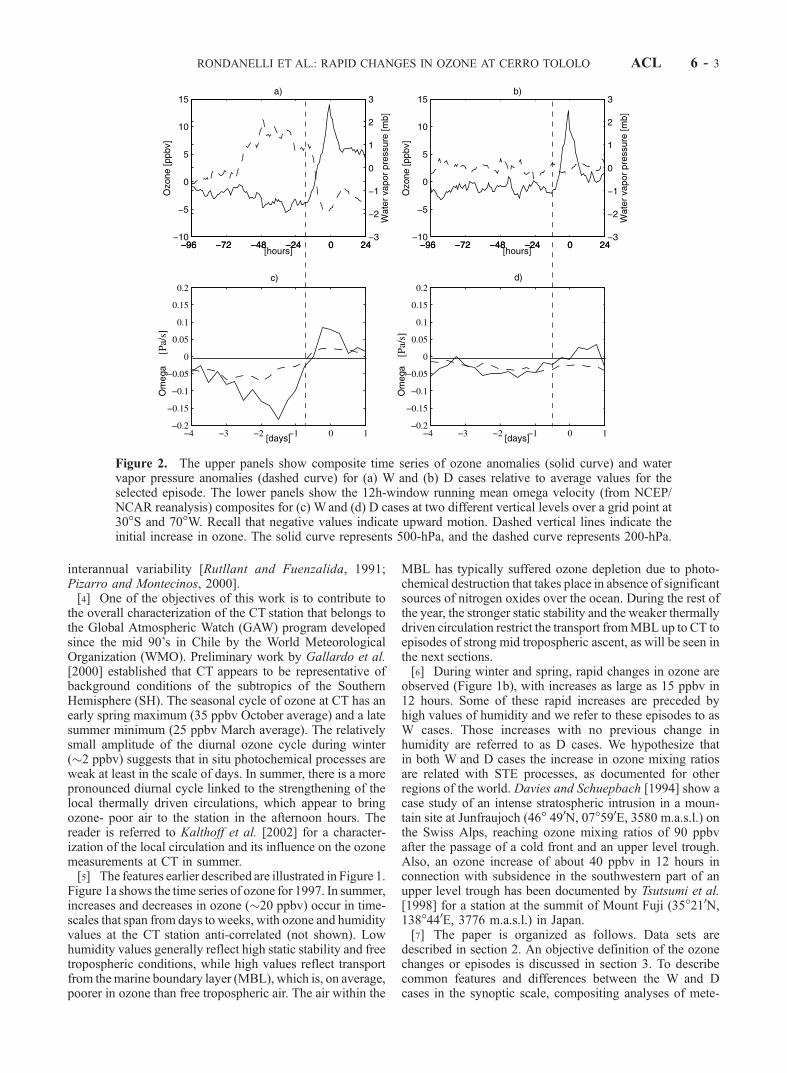
Figure 3. Composite map of 500-hPa surface for W cases. Solid contours represent geopotential heightin meters. Areas with significant ascent (omega < �0.1 Pa/s) are indicated in dark grey whereas areaswith significant descent (omega > 0.1 Pa/s) are shown in grey. Areas of a statistically significant lowheight according to Monte Carlo’s tests are shown enclosed in dashed contours. The approximate positionof CT is indicated in each panel by a black dot.
ACL 6 - 4 RONDANELLI ET AL.: RAPID CHANGES IN OZONE AT CERRO TOLOLO
monthly average ozone mixing ratio plus one standarddeviation of the daily average.[12] Since the amplitude of the diurnal cycle is small (2
ppbv in winter and 5 ppbv in summer), the criteria filter outtypical diurnal variations related to the local thermal circu-lation or in situ photochemical activity. The events werefurther divided according to water vapor pressure, a proxyfor MBL air, in two groups. A first group (called W) iscomposed by cases with high humidity values (up to 4 hPain water vapor pressure) lasting one or two days before theozone maximum. A second group (called D) is composedby cases showing low humidity values between two daysbefore and one day after the ozone maximum. Three Wcases and two D cases are shown in Figure 1b. In 4 years ofdata 11 W cases, and 6 D cases were found: 9 in winter, 5 inspring, 3 in autumn and none in summer. W cases are morefrequent during winter and D cases during spring. Visualscreening of the 500 hPa height field during these episodesreveals a number of common synoptic-scale features amongthem, so a compositing analysis of W and D cases is used tohighlight their mean features. The compositing analysisconsists in the average of time series or spatial fields forthe selected episodes sorted in time with respect to the timeof the ozone maximum, referred to as day 0. In the case ofthe reanalysis data, available at 00, 06, 12 and 18 Z, theozone maximum time of each episode was approximated bythe nearest of the four.[13] Figures 2a and 2b show the composite time series of
anomalies of ozone mixing ratio and water vapor pressure
for W and D cases respectively. The anomalies are calcu-lated with respect to the average values during an episode(an episode spans from four days before to one day after themaximum in ozone). Figures 2c and 2d show the compositetime series of omega velocity at 500 and 200 hPa in a gridpoint located at 30�S and 70�W. In W cases, high humidityvalues (one or two days before the ozone maximum) areassociated with marked ascent in the middle and uppertroposphere. In the D cases, very weak midlevel ascentoccurs before the ozone maximum, and humidity remainsalmost constant during the whole period. In both cases, theinitial increase in ozone occurs about 12–18 h before themaximum, when the vertical motion is still upward, indicat-ing that the ozone increment is not merely explained bydescent of midtropospheric air over CT. Two or three daysafter the maximum, ozone mixing ratios remain higher thanthe previous values, especially during W cases.
3.2. Geopotential Height and Omega Velocity
[14] To further describe the synoptic-scale circulationassociated with the rapid increases in ozone we haveperformed a compositing analysis of relevant reanalyzedfields: 500 hPa geopotential height and omega verticalvelocity. Statistically significant regions of low geopotentialheight anomalies at 5% confidence level were definedthrough a Monte Carlo method. This method consists inthe generation of a large number (1000 in the present study)of groups composed by N spatial samples randomly chosenfrom the 5 year reanalysis data (N = 11 for W cases and N = 6
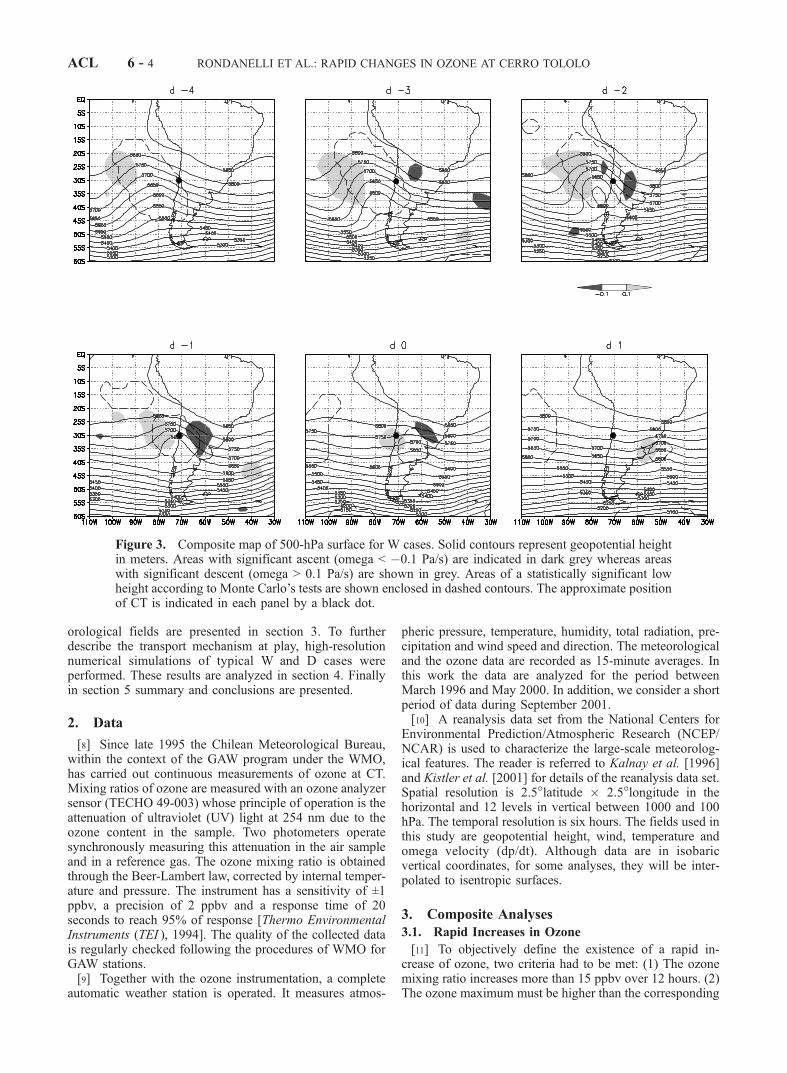
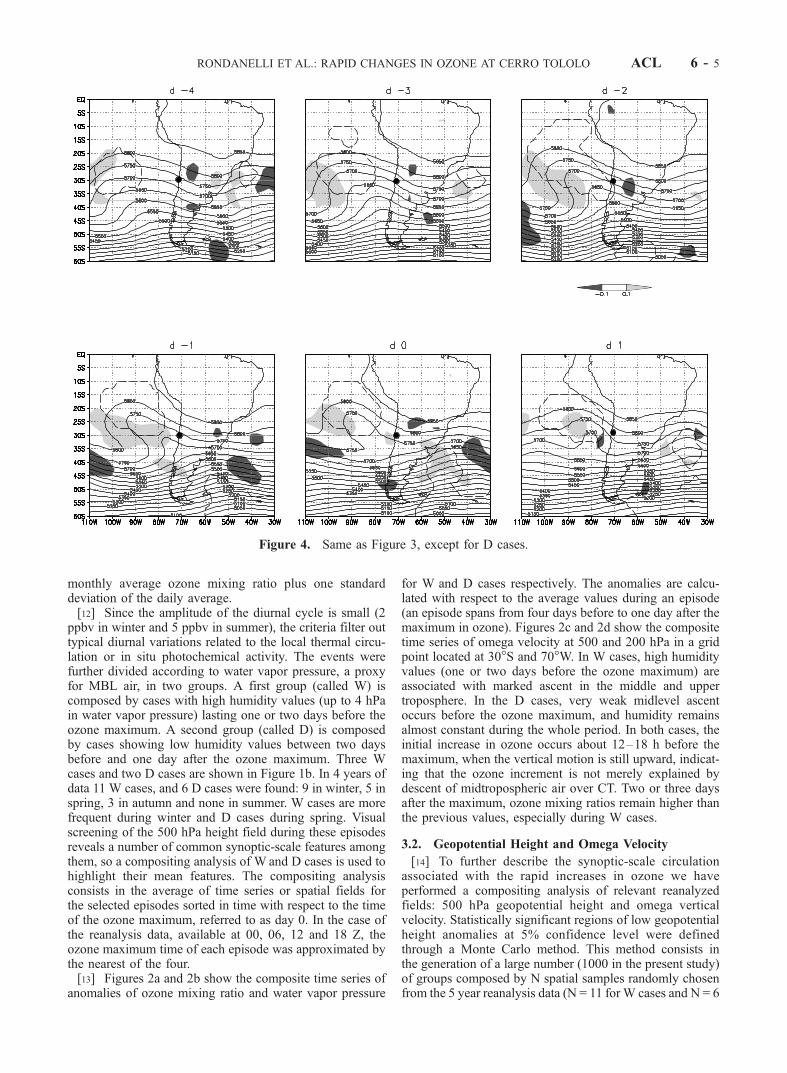
Figure 4. Same as Figure 3, except for D cases.
RONDANELLI ET AL.: RAPID CHANGES IN OZONE AT CERRO TOLOLO ACL 6 - 5
for D cases). For each one of the one 1000 N-elementsgroups, the average is calculated obtaining the empiricaldistribution of the average at each grid point. Then, aprobability of occurrence is assigned comparing the actualaverage with the empirical distribution.3.2.1. W Cases[15] The composite pattern of 500 hPa geopotential
height and omega velocity for the W cases is presented inFigure 3. By day �4 a deep trough is observed over thePacific Ocean and it is oriented in the northwest-southeastdirection. Strong descent (in excess of 0.1 Pa/s) is observedupstream of the trough axis. As the trough approaches thecontinent, the magnitude and the extent of the descendingvertical motion increases. By day �2 a closed low in thegeopotential field is observed, with its center near 35�S and75�W over the ocean. By day �1 the trough axis is still tothe west of the Andes together with a symmetric structure inthe vertical motion field. The area of descending motionreaches CT by day 0, with values near 0.1 Pa/s or 42 hPa/12h. By day +1 the trough has moved to the east of thesubtropical Andes, but relative vorticity and vertical motionhave considerably weakened. This weakening is found inmost individual cases and it could be associated with therelease of latent heat in regions of deep convection over theslope of the Andes. This process may also contribute to
irreversible exchange of air between troposphere and strato-sphere [e.g., Price and Vaughan, 1993].[16] In brief, the composite picture of theW cases suggests
that the ozone maximum at CT is related to the developmentof a cutoff low reaching its mature stage a couple of daysbefore this maximum. High values of ozone could beassociated with the subsidence induced by the cutoff cyclone.However, the resolution of reanalysis data precludes adescription of the mesoscale structures typically associatedwith cutoff lows such as upper level fronts and tropopausefoldings. Mesoscale modeling of a case study will be helpfulto clarify this point (see section 4.1). High humidity and lowozone values, registered two or three days before the ozonemaximum, are explained by the upward motion at low andmiddle levels ahead of the incoming midtroposphericcyclonic perturbation (Figure 3, panels d �2 and d �1).The uplift of MBL is further discussed in section 4. ThisMBL air mixing mechanism could be extrapolated to theevents in which ozone decreases associated with humidityincreases are observed without a subsequent rapid ozoneincrease (e.g. at the end of July 1997 in Figure 1b).3.2.2. D Cases[17] Figure 4 shows the 500 hPa composite patterns for D
cases. By day �4 a midlatitude long-wave can be observedwith a trough over the Pacific Ocean and a ridge over the
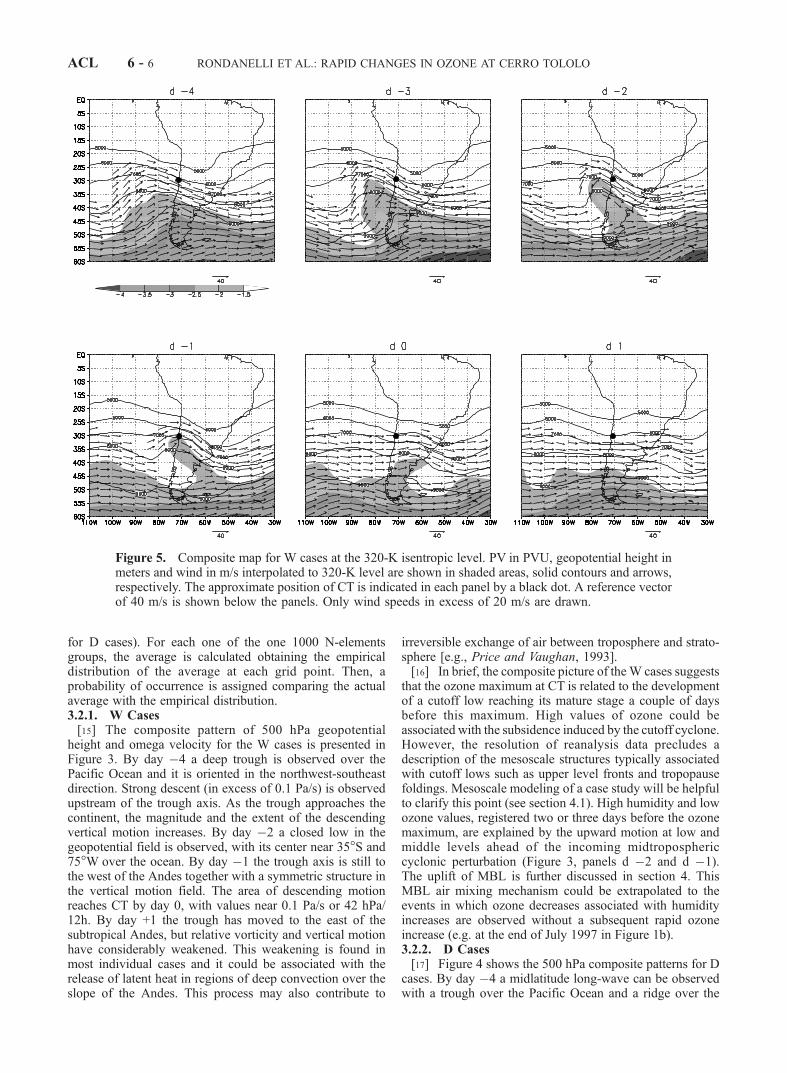
Figure 5. Composite map for W cases at the 320-K isentropic level. PV in PVU, geopotential height inmeters and wind in m/s interpolated to 320-K level are shown in shaded areas, solid contours and arrows,respectively. The approximate position of CT is indicated in each panel by a black dot. A reference vectorof 40 m/s is shown below the panels. Only wind speeds in excess of 20 m/s are drawn.
ACL 6 - 6 RONDANELLI ET AL.: RAPID CHANGES IN OZONE AT CERRO TOLOLO
continent. Approaching the day of maximum ozone, thetrough amplifies and further tilts in the northwest-southeastdirection. By day �2 the strongest subsidence at 500 hPaoccurs in a large region far from the continent (110�W to90�W). By day�1 the southern part of the trough hasmoved towards the Atlantic Ocean and a subtropical cutofflow appears located near 25�S and 90�W. In the followingdays (0, +1) the cyclonic perturbation weakens over theocean, without a significant influence in the vertical motionover CT. In contrast to the W cases, the axis of themidtropospheric trough in subtropical latitudes remains farfrom the coast, leading to a very weak upward motion overthis region. Therefore no significant transport of humidity toCT occurs in D cases.
3.3. Potential Vorticity
[18] In the absence of vertical profiles of ozone in the areaof study, STE processes become difficult to assess. How-ever, dynamical and chemical fields available may be usedas tracers of stratospheric air. The Ertel-Rossby’s potentialvorticity (PV) has been widely used as a dynamical proxy ofatmospheric motions [e.g., Hoskins et al., 1985]. With someapproximations, the PV defined in isentropic coordinatescan be written as:
PV x; y; qð Þ ¼ �g zq þ fð Þ dq=dpð Þ ð1Þ
where zq is the relative vorticity at isentropic surfaces, f isthe planetary vorticity, zq + f is the absolute vorticity at
isentropic surfaces, q is the potential temperature, p is theatmospheric pressure and dq/dp is a measure of the stabilityof the atmosphere. The most salient property of PV is itsconservation in absence of friction and diabatic processes,established by the Ertel’s theorem. Many studies haveconfirmed the agreement between PV and other strato-spheric tracers such as specific humidity, radioactivity andozone [e.g., Danielsen, 1968]. A detailed discussion aboutthe so-called PV-chemical analogy and its limitations isgiven by Haynes and McIntyre [1990].[19] Figures 5 and 6 show the composite patterns for PV,
horizontal wind and geopotential height interpolated to the320 K isentropic level for cases W and D, respectively. The320 K isentropic surface is a cross-tropopause level locatedin the troposphere for low and subtropical latitudes and inthe stratosphere in midlatitudes and high latitudes [Hoskinset al., 1985]. The shaded values of PV shown in Figure 5are smaller than �1.5 potential vorticity units (PVU, 1PVU= (10�6m2s�1Kkg�1)), which are found in the stratosphereof the Southern Hemisphere.3.3.1. W Cases[20] Four days before the ozone maximum at CT, high
values of jPVj are intruding from the so-called polarstratospheric reservoir into the southern part of SouthAmerica (Figure 5). This intrusion becomes narrower andreaches 30�S by day �2 when a closed contour of �2 PVUis observed over Central Chile. During days �2 and �1 aclear inversion of the climatological gradient of PV at 70�W
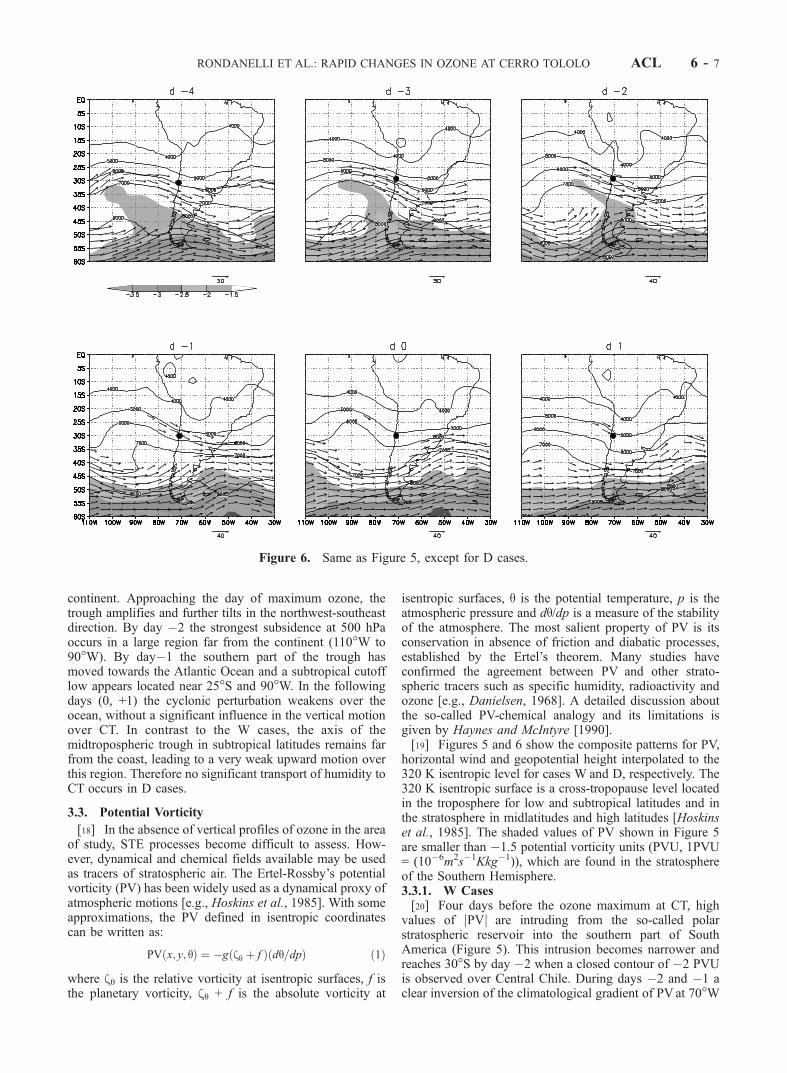
Figure 6. Same as Figure 5, except for D cases.
RONDANELLI ET AL.: RAPID CHANGES IN OZONE AT CERRO TOLOLO ACL 6 - 7
between 50�S and 35�S can be identified. The wind blowsnearly parallel to the isopleths of geopotential height exceptin the northwestern extreme of the PV anomaly. In this partof the system, the isentropic wind is crossing the heightcontours indicating that adiabatic descent is occurring. Byday 0, the PV anomaly crossed the Andes, and by day +1 ithas disappeared and the zonal configuration resembles theclimatological distribution of the depicted variables.3.3.2. D Cases[21] For the D cases, the composite shows an anomaly of
PV in the form of a tongue oriented from southeast tonorthwest that reaches 30�S with stratospheric values of PV
during day �3 (Figure 6). This tongue seems to be erodedrather than advected (from day �4 to day �2) suggestingthat nonconservative processes, such as convection andsmall-scale turbulence, may have taken place. Again, south-erly isentropic winds (not strong enough to be shown inFigure 6) cross the height contours in the northwestern partof the PV anomaly coinciding with the area of descendingmotion seen in the omega field (compare Figure 3). Finally,only tropospheric values of PV (i.e., jPVj less than 1.5PVU) are found north of 40�S from day �1 to day +1.Nevertheless, traces of the cyclonic anomaly remain in theheight and wind fields. Unlike the W cases, no significant
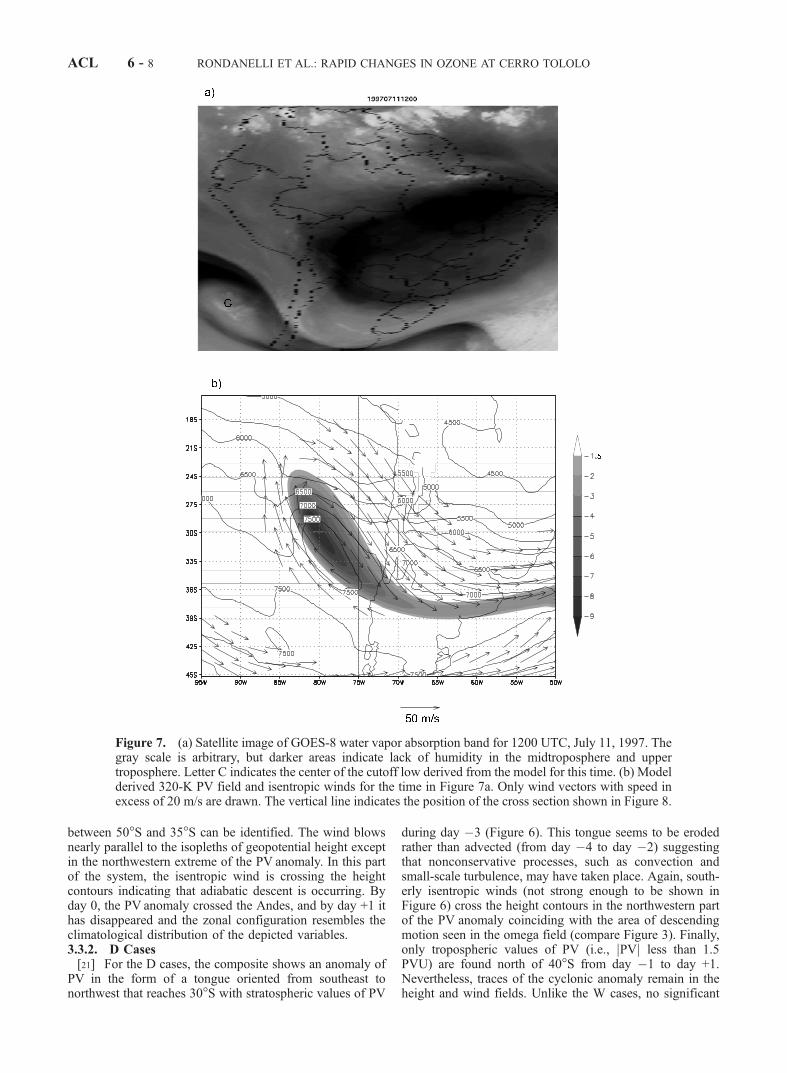
Figure 7. (a) Satellite image of GOES-8 water vapor absorption band for 1200 UTC, July 11, 1997. Thegray scale is arbitrary, but darker areas indicate lack of humidity in the midtroposphere and uppertroposphere. Letter C indicates the center of the cutoff low derived from the model for this time. (b) Modelderived 320-K PV field and isentropic winds for the time in Figure 7a. Only wind vectors with speed inexcess of 20 m/s are drawn. The vertical line indicates the position of the cross section shown in Figure 8.
ACL 6 - 8 RONDANELLI ET AL.: RAPID CHANGES IN OZONE AT CERRO TOLOLO
vertical transport near CT can be inferred from this com-posite. However, regions of mesoscale descent could bemasked due to the coarse resolution of reanalysis data.Besides, air descending during the decaying stages of thesystem off the coast of South America could be subse-quently transported to CT. The strong subtropical jet streamover CT during these episodes could also influence thevertical motion and the transport down to the lowertroposphere. For instance, the breaking of gravity waves
excited by the concurrence of the topography and the jetstream may lead to an irreversible exchange of air from thestratosphere to the troposphere, as observed in othermountain regions [Lamarque, 1996]. As in the W cases,these hypothesis derived from the coarse resolutionreanalysis data will be tested in our numerical simulationof a typical D case.
4. Mesoscale Simulations
[22] The composite patterns shown in section 3 suggestthat stratospheric air is advected from polar to subtropicallatitudes together with the development of cutoff cyclones(in W cases) and deep troughs (in D cases), with afrequency of four to five episodes per year mainly duringwinter and early spring. However, the way in which ozone-rich air could be transported to the lower free troposphere isstill unclear. The temporal and spatial resolution of thereanalysis data is not enough to calculate accurate trajecto-ries or to observe mesoscale features such as fronts ortropopause foldings. For this reason, we explore in detailthe transport of ozone-rich air for both cases by means ofsub-synoptic numerical simulations.[23] Non-hydrostatic numerical simulations were per-
formed using the Fifth-Generation Pennsylvania StateUniversity-National Center for Atmospheric Research Mes-oscale Model (MM5) (for details, see Grell et al. [1995]).The selected domain covers the region 95�W–45�W, 45�S–15�S centered at CT, with a horizontal resolution of 60 kmand 37 vertical sigma (s) levels from s = 0.995 to s = 0.05.Model outputs were interpolated to 14 pressure levelsbetween 1000 and 100 hPa. The physical parameterizationsused in this simulation include simple ice microphysics
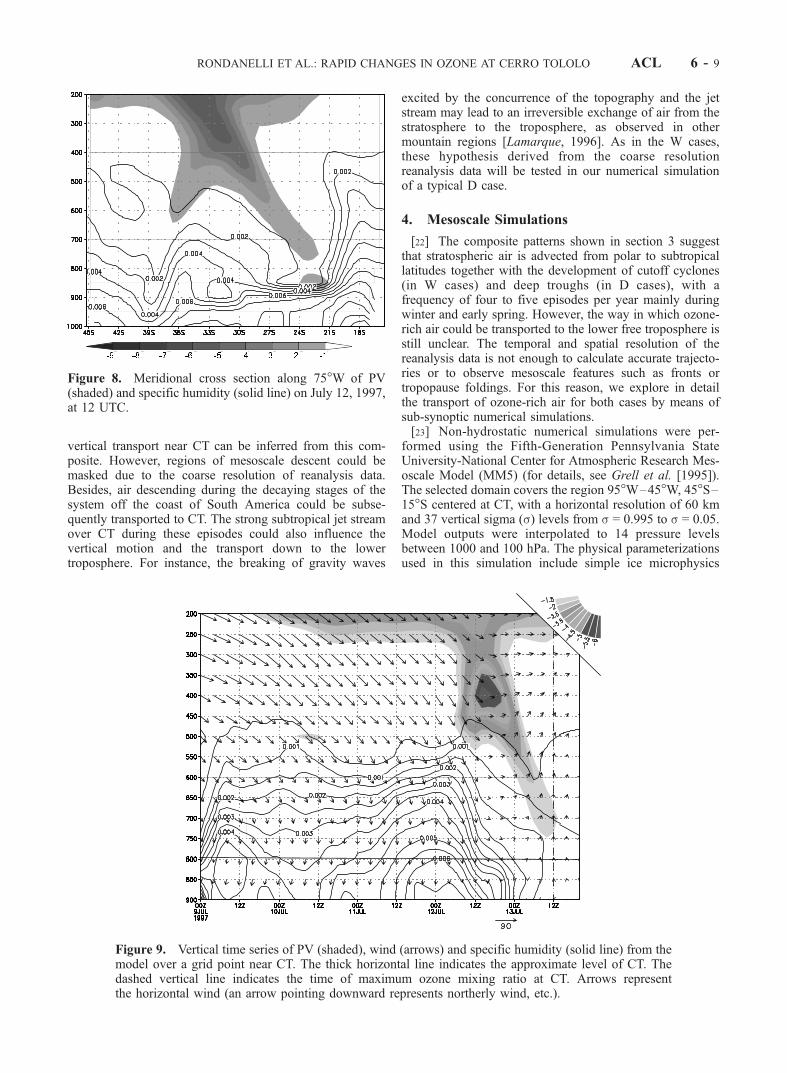
Figure 8. Meridional cross section along 75�W of PV(shaded) and specific humidity (solid line) on July 12, 1997,at 12 UTC.
Figure 9. Vertical time series of PV (shaded), wind (arrows) and specific humidity (solid line) from themodel over a grid point near CT. The thick horizontal line indicates the approximate level of CT. Thedashed vertical line indicates the time of maximum ozone mixing ratio at CT. Arrows representthe horizontal wind (an arrow pointing downward represents northerly wind, etc.).
RONDANELLI ET AL.: RAPID CHANGES IN OZONE AT CERRO TOLOLO ACL 6 - 9
[Dudhia, 1989], the Kain-Fritsch convective scheme [Kainand Fritsch, 1993], the Blackadar boundary layer scheme[Blackadar, 1979] and a cloud-radiation scheme. Initialconditions and time-dependent boundary conditions wereobtained by interpolating global NCEP surface and upperair analysis available every 12 h. MM5 simulations usingsimilar physical parameterizations, and spatial resolutionover this region have been successfully performed in earlierworks [e.g., Garreaud, 1999].
4.1. W Case
[24] The selected W case took place between July 9 and13 1997. Figure 1c shows the ozone mixing ratios and thewater vapor pressure during that episode. Ozone mixingratios increase from 25 ppbv on July 12 00Z to about 50ppbv on July 13 12Z. This case was selected because it isrepresentative of a strong enhancement of ozone and also anintense upper level frontogenesis, as shown later.[25] The main features observed in this particular case
coincide with those observed in the composite maps of Wcases (compare Figures 3 and 5), namely, the developmentof a deep trough in the geopotential field, an upper levelcyclone passing over CT area and the weakening of the midtropospheric system downstream the Andes. The compar-ison between the water vapor (WV) satellite images andtheir corresponding isentropic PV and wind maps is illus-trative of the capability of MM5 in reproducing the cutofflow structure. An example of this correspondence is shownin Figure 7. The darkest zone in the northern part of the
cyclone in Figure 7a coincides closely with the area in whichthe stratospheric PV values are found deeper in the tropo-sphere. The dark strip crossing the southern part of SouthAmerica and linking the precursor trough with the cutoff low(Figure 7a) has also its counterpart in Figure 7b as a highjPVj band or ‘‘streamer’’ along 37�S (see Appenzeller et al.[1996] for a complete discussion of the atmospherictransport patterns inferred from WV images). These featuresof the simulation suggest a realistic representation of thesynoptic-scale processes instrumental in the STE.[26] Meridional cross sections of PV and humidity de-
rived from the model confirm the existence of a deepintrusion of stratospheric air, surrounding the core of thecyclone and being deeper in its equatorial side (Figure 8). InFigure 9, The time evolution of vertical profiles of PV, windand humidity over a grid point near CT is shown in Figure 9.Small cyclonic values of PV and northwesterly winds arefound in the troposphere before July 12 00Z. Later, lowhumidity and stratospheric values of PV can be found atmiddle and low levels in the troposphere. Dry and stable airis associated with southwesterly winds on July 13 15 00Z,concurrently with the increase in ozone at CT. The down-ward intrusion of stratospheric PV values is observed tooccur by July 13 between 00Z and 12Z. Noteworthy, thetime of jPVj maximum at 800 hPa (close to CT level)coincides with the time in which the ozone maximummixing ratios were registered at CT.[27] From the model output, 3-D 48h-backward trajecto-
ries arriving at CT were calculated (Figure 10). Trajectories
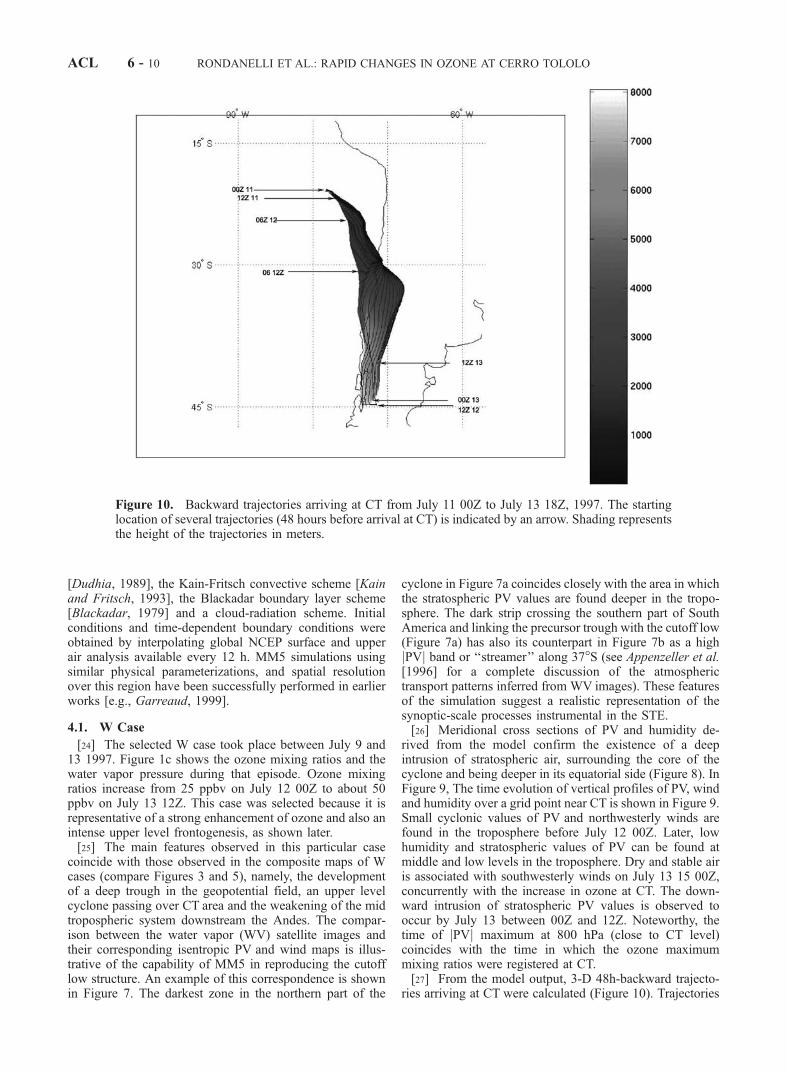
Figure 10. Backward trajectories arriving at CT from July 11 00Z to July 13 18Z, 1997. The startinglocation of several trajectories (48 hours before arrival at CT) is indicated by an arrow. Shading representsthe height of the trajectories in meters.
ACL 6 - 10 RONDANELLI ET AL.: RAPID CHANGES IN OZONE AT CERRO TOLOLO
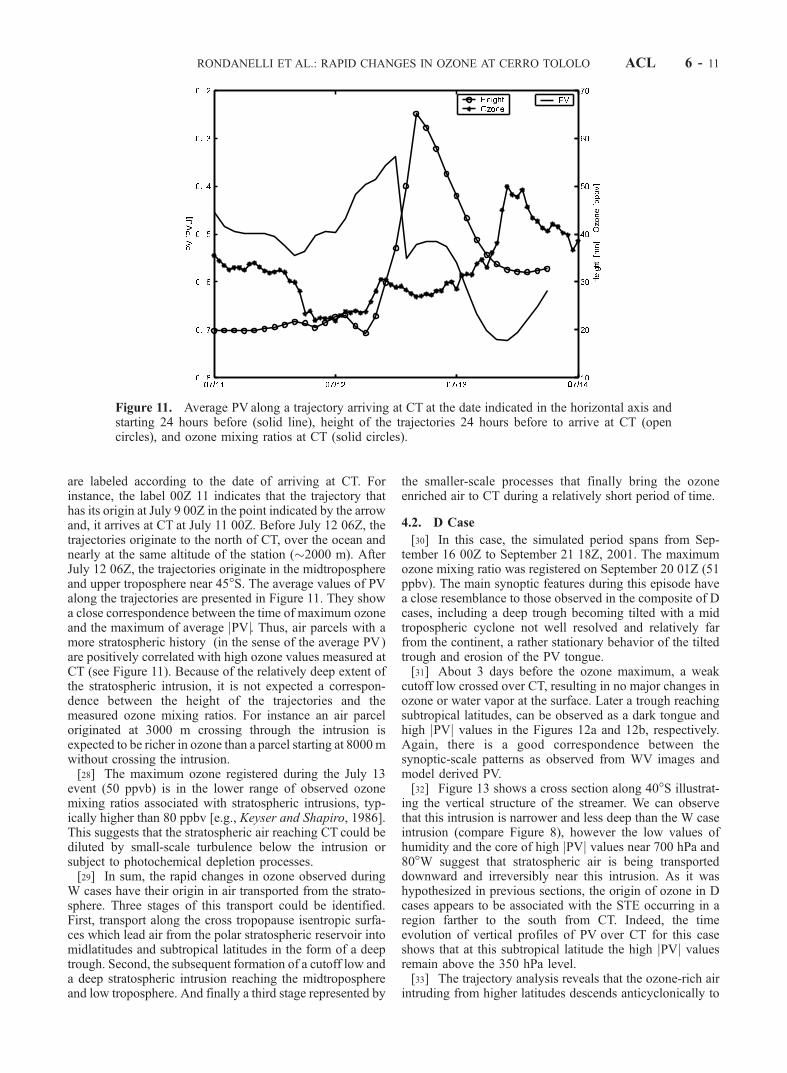
are labeled according to the date of arriving at CT. Forinstance, the label 00Z 11 indicates that the trajectory thathas its origin at July 9 00Z in the point indicated by the arrowand, it arrives at CT at July 11 00Z. Before July 12 06Z, thetrajectories originate to the north of CT, over the ocean andnearly at the same altitude of the station (�2000 m). AfterJuly 12 06Z, the trajectories originate in the midtroposphereand upper troposphere near 45�S. The average values of PValong the trajectories are presented in Figure 11. They showa close correspondence between the time of maximum ozoneand the maximum of average jPVj. Thus, air parcels with amore stratospheric history (in the sense of the average PV)are positively correlated with high ozone values measured atCT (see Figure 11). Because of the relatively deep extent ofthe stratospheric intrusion, it is not expected a correspon-dence between the height of the trajectories and themeasured ozone mixing ratios. For instance an air parceloriginated at 3000 m crossing through the intrusion isexpected to be richer in ozone than a parcel starting at 8000mwithout crossing the intrusion.[28] The maximum ozone registered during the July 13
event (50 ppvb) is in the lower range of observed ozonemixing ratios associated with stratospheric intrusions, typ-ically higher than 80 ppbv [e.g., Keyser and Shapiro, 1986].This suggests that the stratospheric air reaching CT could bediluted by small-scale turbulence below the intrusion orsubject to photochemical depletion processes.[29] In sum, the rapid changes in ozone observed during
W cases have their origin in air transported from the strato-sphere. Three stages of this transport could be identified.First, transport along the cross tropopause isentropic surfa-ces which lead air from the polar stratospheric reservoir intomidlatitudes and subtropical latitudes in the form of a deeptrough. Second, the subsequent formation of a cutoff low anda deep stratospheric intrusion reaching the midtroposphereand low troposphere. And finally a third stage represented by
the smaller-scale processes that finally bring the ozoneenriched air to CT during a relatively short period of time.
4.2. D Case
[30] In this case, the simulated period spans from Sep-tember 16 00Z to September 21 18Z, 2001. The maximumozone mixing ratio was registered on September 20 01Z (51ppbv). The main synoptic features during this episode havea close resemblance to those observed in the composite of Dcases, including a deep trough becoming tilted with a midtropospheric cyclone not well resolved and relatively farfrom the continent, a rather stationary behavior of the tiltedtrough and erosion of the PV tongue.[31] About 3 days before the ozone maximum, a weak
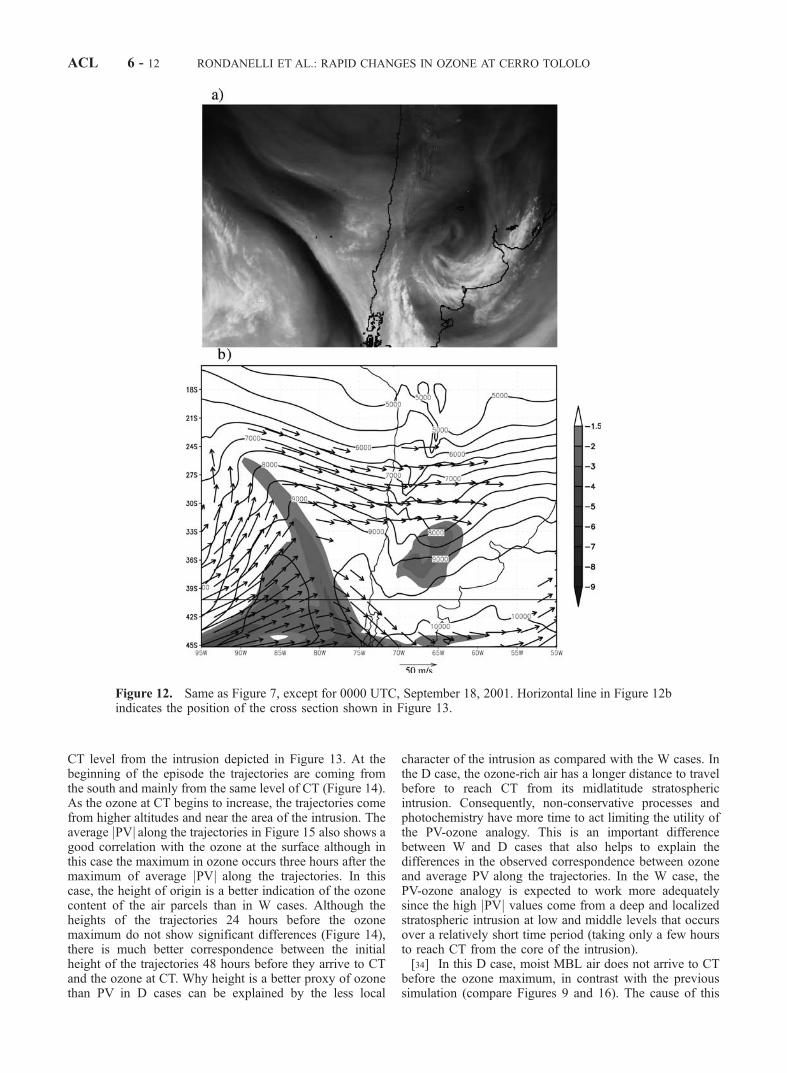
cutoff low crossed over CT, resulting in no major changes inozone or water vapor at the surface. Later a trough reachingsubtropical latitudes, can be observed as a dark tongue andhigh jPVj values in the Figures 12a and 12b, respectively.Again, there is a good correspondence between thesynoptic-scale patterns as observed from WV images andmodel derived PV.[32] Figure 13 shows a cross section along 40�S illustrat-
ing the vertical structure of the streamer. We can observethat this intrusion is narrower and less deep than the W caseintrusion (compare Figure 8), however the low values ofhumidity and the core of high jPVj values near 700 hPa and80�W suggest that stratospheric air is being transporteddownward and irreversibly near this intrusion. As it washypothesized in previous sections, the origin of ozone in Dcases appears to be associated with the STE occurring in aregion farther to the south from CT. Indeed, the timeevolution of vertical profiles of PV over CT for this caseshows that at this subtropical latitude the high jPVj valuesremain above the 350 hPa level.[33] The trajectory analysis reveals that the ozone-rich air
intruding from higher latitudes descends anticyclonically to
Figure 11. Average PV along a trajectory arriving at CT at the date indicated in the horizontal axis andstarting 24 hours before (solid line), height of the trajectories 24 hours before to arrive at CT (opencircles), and ozone mixing ratios at CT (solid circles).
RONDANELLI ET AL.: RAPID CHANGES IN OZONE AT CERRO TOLOLO ACL 6 - 11
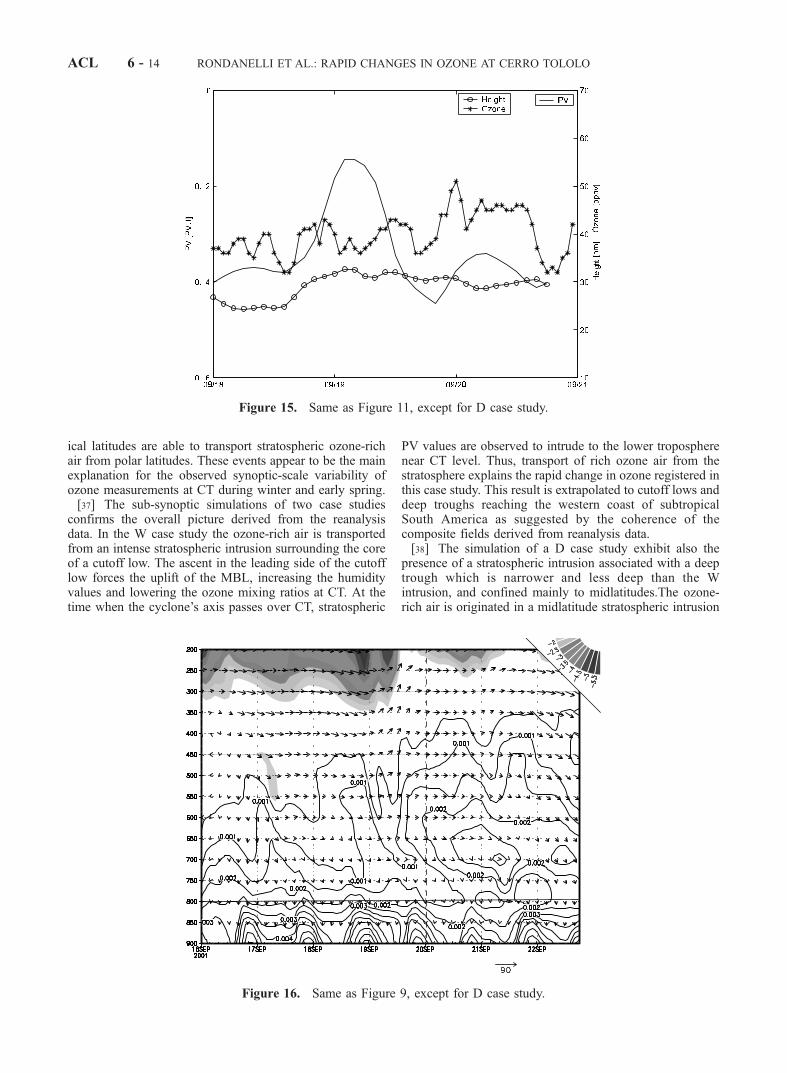
CT level from the intrusion depicted in Figure 13. At thebeginning of the episode the trajectories are coming fromthe south and mainly from the same level of CT (Figure 14).As the ozone at CT begins to increase, the trajectories comefrom higher altitudes and near the area of the intrusion. Theaverage jPVj along the trajectories in Figure 15 also shows agood correlation with the ozone at the surface although inthis case the maximum in ozone occurs three hours after themaximum of average jPVj along the trajectories. In thiscase, the height of origin is a better indication of the ozonecontent of the air parcels than in W cases. Although theheights of the trajectories 24 hours before the ozonemaximum do not show significant differences (Figure 14),there is much better correspondence between the initialheight of the trajectories 48 hours before they arrive to CTand the ozone at CT. Why height is a better proxy of ozonethan PV in D cases can be explained by the less local
character of the intrusion as compared with the W cases. Inthe D case, the ozone-rich air has a longer distance to travelbefore to reach CT from its midlatitude stratosphericintrusion. Consequently, non-conservative processes andphotochemistry have more time to act limiting the utility ofthe PV-ozone analogy. This is an important differencebetween W and D cases that also helps to explain thedifferences in the observed correspondence between ozoneand average PV along the trajectories. In the W case, thePV-ozone analogy is expected to work more adequatelysince the high jPVj values come from a deep and localizedstratospheric intrusion at low and middle levels that occursover a relatively short time period (taking only a few hoursto reach CT from the core of the intrusion).[34] In this D case, moist MBL air does not arrive to CT
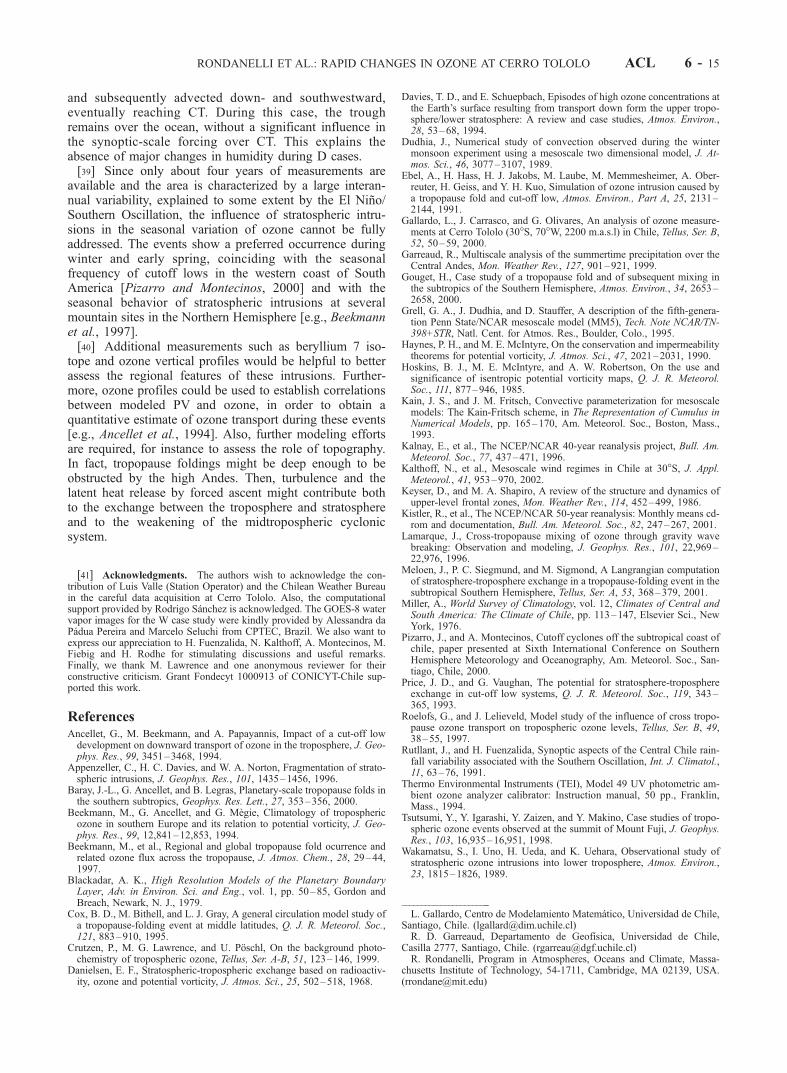
before the ozone maximum, in contrast with the previoussimulation (compare Figures 9 and 16). The cause of this
Figure 12. Same as Figure 7, except for 0000 UTC, September 18, 2001. Horizontal line in Figure 12bindicates the position of the cross section shown in Figure 13.
ACL 6 - 12 RONDANELLI ET AL.: RAPID CHANGES IN OZONE AT CERRO TOLOLO
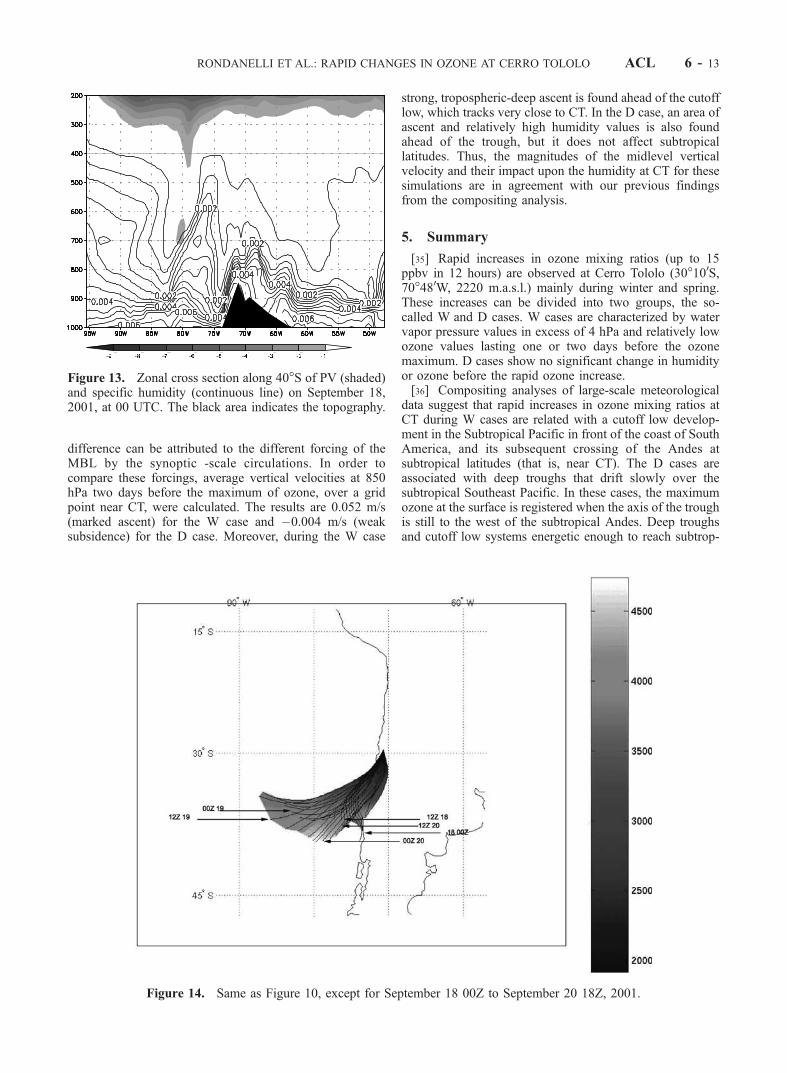
difference can be attributed to the different forcing of theMBL by the synoptic -scale circulations. In order tocompare these forcings, average vertical velocities at 850hPa two days before the maximum of ozone, over a gridpoint near CT, were calculated. The results are 0.052 m/s(marked ascent) for the W case and �0.004 m/s (weaksubsidence) for the D case. Moreover, during the W case
strong, tropospheric-deep ascent is found ahead of the cutofflow, which tracks very close to CT. In the D case, an area ofascent and relatively high humidity values is also foundahead of the trough, but it does not affect subtropicallatitudes. Thus, the magnitudes of the midlevel verticalvelocity and their impact upon the humidity at CT for thesesimulations are in agreement with our previous findingsfrom the compositing analysis.
5. Summary
[35] Rapid increases in ozone mixing ratios (up to 15ppbv in 12 hours) are observed at Cerro Tololo (30�100S,70�480W, 2220 m.a.s.l.) mainly during winter and spring.These increases can be divided into two groups, the so-called W and D cases. W cases are characterized by watervapor pressure values in excess of 4 hPa and relatively lowozone values lasting one or two days before the ozonemaximum. D cases show no significant change in humidityor ozone before the rapid ozone increase.[36] Compositing analyses of large-scale meteorological
data suggest that rapid increases in ozone mixing ratios atCT during W cases are related with a cutoff low develop-ment in the Subtropical Pacific in front of the coast of SouthAmerica, and its subsequent crossing of the Andes atsubtropical latitudes (that is, near CT). The D cases areassociated with deep troughs that drift slowly over thesubtropical Southeast Pacific. In these cases, the maximumozone at the surface is registered when the axis of the troughis still to the west of the subtropical Andes. Deep troughsand cutoff low systems energetic enough to reach subtrop-
Figure 13. Zonal cross section along 40�S of PV (shaded)and specific humidity (continuous line) on September 18,2001, at 00 UTC. The black area indicates the topography.
Figure 14. Same as Figure 10, except for September 18 00Z to September 20 18Z, 2001.
RONDANELLI ET AL.: RAPID CHANGES IN OZONE AT CERRO TOLOLO ACL 6 - 13
ical latitudes are able to transport stratospheric ozone-richair from polar latitudes. These events appear to be the mainexplanation for the observed synoptic-scale variability ofozone measurements at CT during winter and early spring.[37] The sub-synoptic simulations of two case studies
confirms the overall picture derived from the reanalysisdata. In the W case study the ozone-rich air is transportedfrom an intense stratospheric intrusion surrounding the coreof a cutoff low. The ascent in the leading side of the cutofflow forces the uplift of the MBL, increasing the humidityvalues and lowering the ozone mixing ratios at CT. At thetime when the cyclone’s axis passes over CT, stratospheric
PV values are observed to intrude to the lower tropospherenear CT level. Thus, transport of rich ozone air from thestratosphere explains the rapid change in ozone registered inthis case study. This result is extrapolated to cutoff lows anddeep troughs reaching the western coast of subtropicalSouth America as suggested by the coherence of thecomposite fields derived from reanalysis data.[38] The simulation of a D case study exhibit also the
presence of a stratospheric intrusion associated with a deeptrough which is narrower and less deep than the Wintrusion, and confined mainly to midlatitudes.The ozone-rich air is originated in a midlatitude stratospheric intrusion
Figure 15. Same as Figure 11, except for D case study.
Figure 16. Same as Figure 9, except for D case study.
ACL 6 - 14 RONDANELLI ET AL.: RAPID CHANGES IN OZONE AT CERRO TOLOLO
and subsequently advected down- and southwestward,eventually reaching CT. During this case, the troughremains over the ocean, without a significant influence inthe synoptic-scale forcing over CT. This explains theabsence of major changes in humidity during D cases.[39] Since only about four years of measurements are
available and the area is characterized by a large interan-nual variability, explained to some extent by the El Nino/Southern Oscillation, the influence of stratospheric intru-sions in the seasonal variation of ozone cannot be fullyaddressed. The events show a preferred occurrence duringwinter and early spring, coinciding with the seasonalfrequency of cutoff lows in the western coast of SouthAmerica [Pizarro and Montecinos, 2000] and with theseasonal behavior of stratospheric intrusions at severalmountain sites in the Northern Hemisphere [e.g., Beekmannet al., 1997].[40] Additional measurements such as beryllium 7 iso-
tope and ozone vertical profiles would be helpful to betterassess the regional features of these intrusions. Further-more, ozone profiles could be used to establish correlationsbetween modeled PV and ozone, in order to obtain aquantitative estimate of ozone transport during these events[e.g., Ancellet et al., 1994]. Also, further modeling effortsare required, for instance to assess the role of topography.In fact, tropopause foldings might be deep enough to beobstructed by the high Andes. Then, turbulence and thelatent heat release by forced ascent might contribute bothto the exchange between the troposphere and stratosphereand to the weakening of the midtropospheric cyclonicsystem.
[41] Acknowledgments. The authors wish to acknowledge the con-tribution of Luis Valle (Station Operator) and the Chilean Weather Bureauin the careful data acquisition at Cerro Tololo. Also, the computationalsupport provided by Rodrigo Sanchez is acknowledged. The GOES-8 watervapor images for the W case study were kindly provided by Alessandra daPadua Pereira and Marcelo Seluchi from CPTEC, Brazil. We also want toexpress our appreciation to H. Fuenzalida, N. Kalthoff, A. Montecinos, M.Fiebig and H. Rodhe for stimulating discussions and useful remarks.Finally, we thank M. Lawrence and one anonymous reviewer for theirconstructive criticism. Grant Fondecyt 1000913 of CONICYT-Chile sup-ported this work.
ReferencesAncellet, G., M. Beekmann, and A. Papayannis, Impact of a cut-off lowdevelopment on downward transport of ozone in the troposphere, J. Geo-phys. Res., 99, 3451–3468, 1994.
Appenzeller, C., H. C. Davies, and W. A. Norton, Fragmentation of strato-spheric intrusions, J. Geophys. Res., 101, 1435–1456, 1996.
Baray, J.-L., G. Ancellet, and B. Legras, Planetary-scale tropopause folds inthe southern subtropics, Geophys. Res. Lett., 27, 353–356, 2000.
Beekmann, M., G. Ancellet, and G. Megie, Climatology of troposphericozone in southern Europe and its relation to potential vorticity, J. Geo-phys. Res., 99, 12,841–12,853, 1994.
Beekmann, M., et al., Regional and global tropopause fold ocurrence andrelated ozone flux across the tropopause, J. Atmos. Chem., 28, 29–44,1997.
Blackadar, A. K., High Resolution Models of the Planetary BoundaryLayer, Adv. in Environ. Sci. and Eng., vol. 1, pp. 50–85, Gordon andBreach, Newark, N. J., 1979.
Cox, B. D., M. Bithell, and L. J. Gray, A general circulation model study ofa tropopause-folding event at middle latitudes, Q. J. R. Meteorol. Soc.,121, 883–910, 1995.
Crutzen, P., M. G. Lawrence, and U. Poschl, On the background photo-chemistry of tropospheric ozone, Tellus, Ser. A-B, 51, 123–146, 1999.
Danielsen, E. F., Stratospheric-tropospheric exchange based on radioactiv-ity, ozone and potential vorticity, J. Atmos. Sci., 25, 502–518, 1968.
Davies, T. D., and E. Schuepbach, Episodes of high ozone concentrations atthe Earth’s surface resulting from transport down form the upper tropo-sphere/lower stratosphere: A review and case studies, Atmos. Environ.,28, 53–68, 1994.
Dudhia, J., Numerical study of convection observed during the wintermonsoon experiment using a mesoscale two dimensional model, J. At-mos. Sci., 46, 3077–3107, 1989.
Ebel, A., H. Hass, H. J. Jakobs, M. Laube, M. Memmesheimer, A. Ober-reuter, H. Geiss, and Y. H. Kuo, Simulation of ozone intrusion caused bya tropopause fold and cut-off low, Atmos. Environ., Part A, 25, 2131–2144, 1991.
Gallardo, L., J. Carrasco, and G. Olivares, An analysis of ozone measure-ments at Cerro Tololo (30�S, 70�W, 2200 m.a.s.l) in Chile, Tellus, Ser. B,52, 50–59, 2000.
Garreaud, R., Multiscale analysis of the summertime precipitation over theCentral Andes, Mon. Weather Rev., 127, 901–921, 1999.
Gouget, H., Case study of a tropopause fold and of subsequent mixing inthe subtropics of the Southern Hemisphere, Atmos. Environ., 34, 2653–2658, 2000.
Grell, G. A., J. Dudhia, and D. Stauffer, A description of the fifth-genera-tion Penn State/NCAR mesoscale model (MM5), Tech. Note NCAR/TN-398+STR, Natl. Cent. for Atmos. Res., Boulder, Colo., 1995.
Haynes, P. H., and M. E. McIntyre, On the conservation and impermeabilitytheorems for potential vorticity, J. Atmos. Sci., 47, 2021–2031, 1990.
Hoskins, B. J., M. E. McIntyre, and A. W. Robertson, On the use andsignificance of isentropic potential vorticity maps, Q. J. R. Meteorol.Soc., 111, 877–946, 1985.
Kain, J. S., and J. M. Fritsch, Convective parameterization for mesoscalemodels: The Kain-Fritsch scheme, in The Representation of Cumulus inNumerical Models, pp. 165–170, Am. Meteorol. Soc., Boston, Mass.,1993.
Kalnay, E., et al., The NCEP/NCAR 40-year reanalysis project, Bull. Am.Meteorol. Soc., 77, 437–471, 1996.
Kalthoff, N., et al., Mesoscale wind regimes in Chile at 30�S, J. Appl.Meteorol., 41, 953–970, 2002.
Keyser, D., and M. A. Shapiro, A review of the structure and dynamics ofupper-level frontal zones, Mon. Weather Rev., 114, 452–499, 1986.
Kistler, R., et al., The NCEP/NCAR 50-year reanalysis: Monthly means cd-rom and documentation, Bull. Am. Meteorol. Soc., 82, 247–267, 2001.
Lamarque, J., Cross-tropopause mixing of ozone through gravity wavebreaking: Observation and modeling, J. Geophys. Res., 101, 22,969–22,976, 1996.
Meloen, J., P. C. Siegmund, and M. Sigmond, A Langrangian computationof stratosphere-troposphere exchange in a tropopause-folding event in thesubtropical Southern Hemisphere, Tellus, Ser. A, 53, 368–379, 2001.
Miller, A., World Survey of Climatology, vol. 12, Climates of Central andSouth America: The Climate of Chile, pp. 113–147, Elsevier Sci., NewYork, 1976.
Pizarro, J., and A. Montecinos, Cutoff cyclones off the subtropical coast ofchile, paper presented at Sixth International Conference on SouthernHemisphere Meteorology and Oceanography, Am. Meteorol. Soc., San-tiago, Chile, 2000.
Price, J. D., and G. Vaughan, The potential for stratosphere-troposphereexchange in cut-off low systems, Q. J. R. Meteorol. Soc., 119, 343–365, 1993.
Roelofs, G., and J. Lelieveld, Model study of the influence of cross tropo-pause ozone transport on tropospheric ozone levels, Tellus, Ser. B, 49,38–55, 1997.
Rutllant, J., and H. Fuenzalida, Synoptic aspects of the Central Chile rain-fall variability associated with the Southern Oscillation, Int. J. Climatol.,11, 63–76, 1991.
Thermo Environmental Instruments (TEI), Model 49 UV photometric am-bient ozone analyzer calibrator: Instruction manual, 50 pp., Franklin,Mass., 1994.
Tsutsumi, Y., Y. Igarashi, Y. Zaizen, and Y. Makino, Case studies of tropo-spheric ozone events observed at the summit of Mount Fuji, J. Geophys.Res., 103, 16,935–16,951, 1998.
Wakamatsu, S., I. Uno, H. Ueda, and K. Uehara, Observational study ofstratospheric ozone intrusions into lower troposphere, Atmos. Environ.,23, 1815–1826, 1989.
�����������������������L. Gallardo, Centro de Modelamiento Matematico, Universidad de Chile,
Santiago, Chile. ([email protected])R. D. Garreaud, Departamento de Geofısica, Universidad de Chile,
Casilla 2777, Santiago, Chile. ([email protected])R. Rondanelli, Program in Atmospheres, Oceans and Climate, Massa-
chusetts Institute of Technology, 54-1711, Cambridge, MA 02139, USA.([email protected])
RONDANELLI ET AL.: RAPID CHANGES IN OZONE AT CERRO TOLOLO ACL 6 - 15