Quantitative and Regional Analysis of Lung Function ...
87
4/8/2019 Thesis/Dissertation Cover and Approval Pages https://seas.virginia.edu/forms/thesis-cover-approval.php 1/2 Quantitative and Regional Analysis of Lung Function Assessed by Hyperpolarized Xe-129 MRI A Thesis Presented to the faculty of the School of Engineering and Applied Science University of Virginia in partial fulfillment of the requirements for the degree Master of Science by Zixuan Lin May 2019
-
Upload
khangminh22 -
Category
Documents
-
view
0 -
download
0
Transcript of Quantitative and Regional Analysis of Lung Function ...

4/8/2019 Thesis/Dissertation Cover and Approval Pages
https://seas.virginia.edu/forms/thesis-cover-approval.php 1/2
Quantitative and Regional Analysis of LungFunction Assessed by Hyperpolarized Xe-129
MRI
A Thesis
Presented to
the faculty of the School of Engineering and Applied Science
University of Virginia
in partial fulfillment of the requirements for the degree
Master of Science
by
Zixuan Lin
May 2019

4/8/2019 Thesis/Dissertation Cover and Approval Pages
https://seas.virginia.edu/forms/thesis-cover-approval.php 2/2
APPROVAL SHEET
This Thesis is submitted in partial fulfillment of the requirements
for the degree ofMaster of Science
Author Signature:
This Thesis has been read and approved by the examining committee:
Advisor: Kun Qing
Committee Member: Craig H. Meyer
Committee Member: Y. Michael Shim
Committee Member:
Committee Member:
Committee Member:
Accepted for the School of Engineering and Applied Science:
Craig H. Benson, School of Engineering and Applied Science
May 2019

c© Copyright by Zixuan Lin, 2019.
All rights reserved.

Abstract
Lungs handle human gas exchange with atmosphere through respiration, bringing in
oxygen required by cell metabolism, and expelling carbon dioxide containing wastes
of the body. Nowadays, more and more people suffer from respiratory disorders. In
2016, chronic lower respiratory diseases were the 4th leading cause of death in the
United States, with more than 150 thousand people dying from them, and millions
more suffering from them without being diagnosed [1].
Under this situation, effective techniques for assessing lung function are strongly
desired. Conventional techniques being used in clinic include pulmonary function
tests (e.g., spirometry, lung volumes, quantitation of diffusing capacity for carbon
monoxide) and radiological imaging (e.g., chest X-ray, chest CT). However, their lack
of regional or functional information limits their application. Quantitative techniques
with the ability to provide regional information of lung structure and function are
valuable in lung disease diagnosis and treatment.
Hyperpolarized gas (HPG) MRI, as it provides the image of lung structure and
function with high spatial and temporal resolution, gives an opportunity to quantita-
tively and regionally assess lung function. Hyperpolarized Xenon-129 ventilation MRI
has the ability to detect ventilation defects where are absent or have relatively low
signal intensity within the lung [2, 3]. Dissolved-phase MRI can measure gas uptake
by lung parenchyma and blood flow [4]. Progress in deep learning makes it possible
to quantify ventilation defect percentage and gas uptake ratios among different lung
lobes, providing valuable information for regional analysis of these measurements [5].
However, current HPG imaging lacks standardization, making it difficult to in-
terpret study results among different subjects and institutions. In this study, we
investigated the ventilation defect percentage (VDP) of 50 healthy subjects diver-
sified race, gender, age, BMI and smoking history. Our findings would serve as a
reference for the VDP in health subjects. For dissolved-phase MRI, we found the
iv

lung volume during MRI scan influences the resulting gas uptake ratios. We inves-
tigated a total of 17 subjects including 11 healthy subjects and 5 COPD patients
who underwent dissolved-phase MRI in three different lung inflation levels. We got
strong inverse correlations between lung inflation level and gas uptake measurements
obtained by hyperpolarized Xe-129 MRI. Regional distribution of gas uptake and the
influence of different inflation levels on each lobe were further investigated. These
results would benefit the standardization and popularity of hyperpolarized Xe-129
MRI in the application of assessing lung function.
v

To my parents.
vi

Acknowledgements
I would like to thank all the people helping me make this thesis research possible, and
anyone giving me instruction and support during my master’s study at the University
of Virginia.
To begin with, I would like to give my sincere appreciate to my advisor, Dr. Kun
Qing, who guided me during my entire time at UVa. He helped me a lot not only in
research, but also in study and life. With his help, I was able to quickly adapt to the
environment in the United States, and realize my study and research goals step by
step. He was always patient with every question I had, offered me resources I might
need, and showed me how to conduct scientific research studies. I would also like
to thank my graduate committee chair, Dr. Craig Meyer, for his instructions in the
Biomedical Measurement Principles course and the efforts he made on advising my
thesis. I benefited a lot from his abundant knowledge in MRI and attitude toward
research. I also learned a lot from another committee member, Dr. Y. Michael Shim.
He always offered me the insights in lung physiology, and led me understanding the
results physiologically. He also instructed me a lot in seeking appropriate approach
for analyzing data.
I would like to greatly thank Dr. Nick Tustison, Dr. John Mugler, III and Dr.
Jaime Mata in our HPG imaging team. Dr. Tustison mentored me in the deep
learning part in my research. His expertise in medical image processing and deep
learning gave me a chance to improve myself in computer science field. I also obtained
substantial help from Dr. Mugler. Each time I met problems, I always found answers
from him, whether in MRI or pulmonary physiology aspects. Dr. Mata also gave me
a lot of help and support during my research in medical imaging.
I would like to thank Dr. Xue Feng. With his patient instruction, I gradually
learn how to develop software and how to deploy our research on web application to
benefit users. I would also like to thank Dr. Ching Yee Tan and Dr. Lukasz Myc,
vii
who worked together with me in projects on healthy and COPD subjects. We often
discussed on the data and approaches, which gave me lots of inspiration on my thesis.
I would also like to thank all my classmates and colleagues ever studying and working
with me. I will never forget the wonderful time we spent on each course and project.
Those are my cherished memories at UVa.
At last, I would like to give my thanks to my beloved parents and family who
stand behind me and support me all the time. The achievements I have attained
would not been possible without their constant love.
I apologize I can’t mention every person who helped me ever. My single achieve-
ment is the result of everybody’s efforts.
viii

Table of Contents
Abstract iv
Dedication vi
Acknowledgements vii
List of Tables xiii
List of Figures xiv
Acronyms xvi
1 Introduction 1
1.1 Physiology Background . . . . . . . . . . . . . . . . . . . . . . . . . . 1
1.1.1 Lung Function and Anatomy . . . . . . . . . . . . . . . . . . 1
1.1.2 Normal Lung Airflow Physiology . . . . . . . . . . . . . . . . 3
1.1.3 Normal Lung Gas Exchange Physiology . . . . . . . . . . . . . 5
1.1.4 Abnormal Lung Function and Respiratory Diseases . . . . . . 6
1.2 Tools for Assessing Lung Physiology . . . . . . . . . . . . . . . . . . 8
1.2.1 Pulmonary Function Tests (PFTs) . . . . . . . . . . . . . . . 8
1.2.2 Clinical Imaging . . . . . . . . . . . . . . . . . . . . . . . . . 11
1.3 New Techniques . . . . . . . . . . . . . . . . . . . . . . . . . . . . . . 13
1.3.1 Molecular Imaging . . . . . . . . . . . . . . . . . . . . . . . . 13
ix

1.3.2 Hyperpolarized Gas (HPG) Magnetic Resonance Imaging (MRI) 14
1.4 Thesis Overview . . . . . . . . . . . . . . . . . . . . . . . . . . . . . . 15
2 Rationale 17
2.1 Limitation of Conventional Modalities . . . . . . . . . . . . . . . . . 17
2.2 Advantages of Hyperpolarized Xe-129 MRI Compared to Conventional
Modalities . . . . . . . . . . . . . . . . . . . . . . . . . . . . . . . . . 19
2.3 Current Shortcomings of HPG MRI . . . . . . . . . . . . . . . . . . . 19
3 Normal Lung Airflow Physiology Assessed by Hyperpolarized Xe-
129 Ventilation MRI 20
3.1 Introduction . . . . . . . . . . . . . . . . . . . . . . . . . . . . . . . . 20
3.2 Normal Lung References with Spirometry . . . . . . . . . . . . . . . . 21
3.3 The Assessment of Airflow Physiology Using Hyperpolarized Xe-129
MRI . . . . . . . . . . . . . . . . . . . . . . . . . . . . . . . . . . . . 21
3.3.1 HPG Ventilation MRI . . . . . . . . . . . . . . . . . . . . . . 21
3.3.2 Quantification of Ventilation Defects Using Convolutional Neu-
ral Network (CNN) . . . . . . . . . . . . . . . . . . . . . . . . 23
3.3.3 Airflow Physiology in Healthy Subjects Assessed by Hyperpo-
larized Xe-129 MRI . . . . . . . . . . . . . . . . . . . . . . . . 30
4 Assess gas uptake using dissolved-phase MRI 37
4.1 Introduction . . . . . . . . . . . . . . . . . . . . . . . . . . . . . . . . 37
4.2 Hyperpolarized Xe-129 Dissolved-Phase MRI . . . . . . . . . . . . . . 38
4.3 Current Issues and the Variability in Protocol . . . . . . . . . . . . . 40
5 The Effects of Lung Inflation Levels on the Results of the Dissolved-
Phase MRI 41
5.1 Introduction . . . . . . . . . . . . . . . . . . . . . . . . . . . . . . . . 41
x

5.2 Materials and Methods . . . . . . . . . . . . . . . . . . . . . . . . . . 42
5.2.1 Human Subjects . . . . . . . . . . . . . . . . . . . . . . . . . 42
5.2.2 MR Measurements . . . . . . . . . . . . . . . . . . . . . . . . 43
5.2.3 Data Analysis . . . . . . . . . . . . . . . . . . . . . . . . . . . 44
5.3 Results . . . . . . . . . . . . . . . . . . . . . . . . . . . . . . . . . . . 46
5.3.1 Gas uptake measures obtained at different lung inflation levels
were significantly different . . . . . . . . . . . . . . . . . . . . 46
5.3.2 Strong inverse relationships between lung inflation level and gas
uptake measures were found for healthy subjects . . . . . . . . 47
5.3.3 Younger people had higher gas uptake than older people at the
same lung inflation level . . . . . . . . . . . . . . . . . . . . . 47
5.3.4 Gas uptake measures at intermediate lung inflation level can
be predicted using the highest and lowest inflation levels for
COPD subjects . . . . . . . . . . . . . . . . . . . . . . . . . . 48
5.4 Conclusion . . . . . . . . . . . . . . . . . . . . . . . . . . . . . . . . . 49
6 Lobar Analysis of Gas Uptake and the Effects of Lung Inflation Level 51
6.1 Introduction . . . . . . . . . . . . . . . . . . . . . . . . . . . . . . . . 51
6.2 Materials and Methods . . . . . . . . . . . . . . . . . . . . . . . . . . 51
6.2.1 Image Processing . . . . . . . . . . . . . . . . . . . . . . . . . 52
6.2.2 Data Analysis . . . . . . . . . . . . . . . . . . . . . . . . . . . 53
6.3 Results . . . . . . . . . . . . . . . . . . . . . . . . . . . . . . . . . . . 53
6.3.1 Gas uptake ratios under same lung inflation level were signifi-
cantly different among lobes . . . . . . . . . . . . . . . . . . . 53
6.3.2 Strong inverse relationships between gas uptake ratios and lung
volume still existed in each lobe . . . . . . . . . . . . . . . . . 55
xi
6.3.3 The rates of change of gas uptake ratios in response to the
change of lung inflation level in healthy subjects were signifi-
cantly different among different lobes, but not in COPD patients 56
6.4 Conclusion . . . . . . . . . . . . . . . . . . . . . . . . . . . . . . . . . 57
7 Discussion and Future Work 60
References 61
xii
List of Tables
3.1 Parameters for CNN models. . . . . . . . . . . . . . . . . . . . . . . 28
3.2 Proton lung segmentation accuracy. . . . . . . . . . . . . . . . . . . . 29
3.3 Ventilation-based quantification accuracy. . . . . . . . . . . . . . . . . 29
3.4 Subject demographics. . . . . . . . . . . . . . . . . . . . . . . . . . . 31
3.5 VDP ranges of healthy subjects included in the study. . . . . . . . . . 32
5.1 Demographics and baseline spirometry results in lung inflation level
study. . . . . . . . . . . . . . . . . . . . . . . . . . . . . . . . . . . . 43
5.2 Regression analysis between gas uptake ratios and normalized lung
volume. . . . . . . . . . . . . . . . . . . . . . . . . . . . . . . . . . . 48
6.1 Regression analysis between tissue-to-gas value and normalized lung
volume in each lobe. . . . . . . . . . . . . . . . . . . . . . . . . . . . 55
6.2 The slopes of linear regression lines of tissue-to-gas vs normalized lung
volume by TLC of each lobe in all healthy subjects. . . . . . . . . . 58
xiii
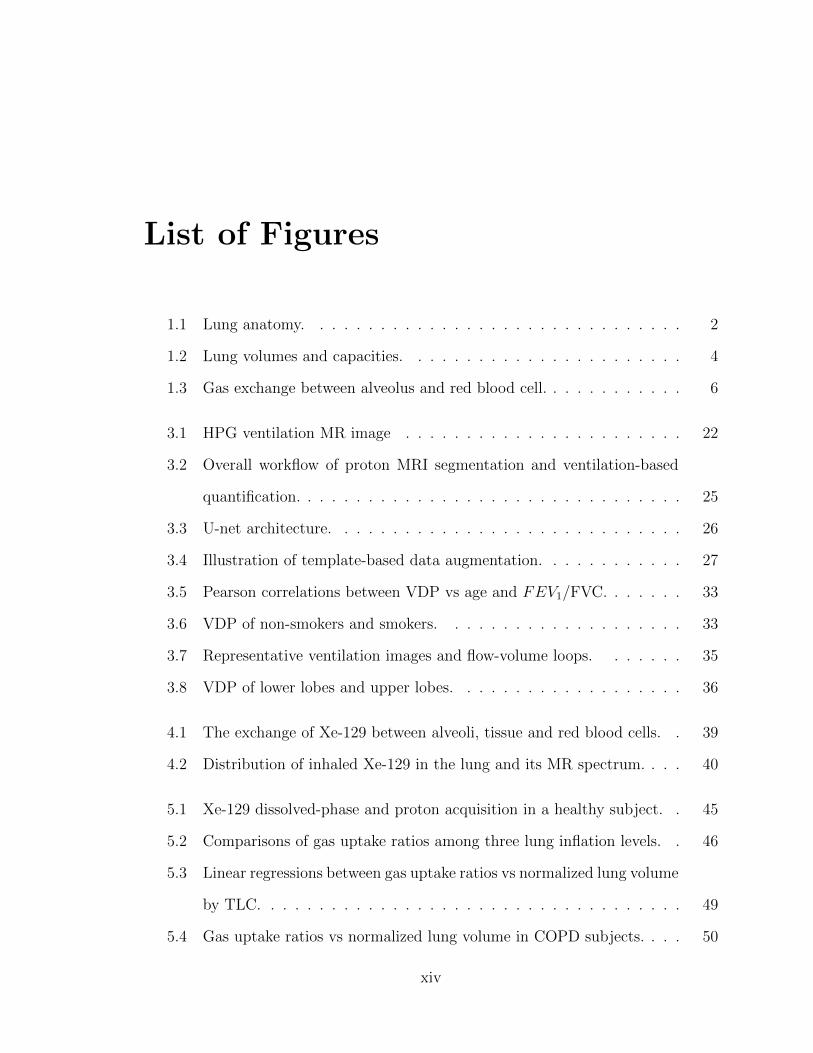
List of Figures
1.1 Lung anatomy. . . . . . . . . . . . . . . . . . . . . . . . . . . . . . . 2
1.2 Lung volumes and capacities. . . . . . . . . . . . . . . . . . . . . . . 4
1.3 Gas exchange between alveolus and red blood cell. . . . . . . . . . . . 6
3.1 HPG ventilation MR image . . . . . . . . . . . . . . . . . . . . . . . 22
3.2 Overall workflow of proton MRI segmentation and ventilation-based
quantification. . . . . . . . . . . . . . . . . . . . . . . . . . . . . . . . 25
3.3 U-net architecture. . . . . . . . . . . . . . . . . . . . . . . . . . . . . 26
3.4 Illustration of template-based data augmentation. . . . . . . . . . . . 27
3.5 Pearson correlations between VDP vs age and FEV1/FVC. . . . . . . 33
3.6 VDP of non-smokers and smokers. . . . . . . . . . . . . . . . . . . . 33
3.7 Representative ventilation images and flow-volume loops. . . . . . . 35
3.8 VDP of lower lobes and upper lobes. . . . . . . . . . . . . . . . . . . 36
4.1 The exchange of Xe-129 between alveoli, tissue and red blood cells. . 39
4.2 Distribution of inhaled Xe-129 in the lung and its MR spectrum. . . . 40
5.1 Xe-129 dissolved-phase and proton acquisition in a healthy subject. . 45
5.2 Comparisons of gas uptake ratios among three lung inflation levels. . 46
5.3 Linear regressions between gas uptake ratios vs normalized lung volume
by TLC. . . . . . . . . . . . . . . . . . . . . . . . . . . . . . . . . . . 49
5.4 Gas uptake ratios vs normalized lung volume in COPD subjects. . . . 50
xiv

6.1 Lobar segmentation of tissue-to-gas images under different lung infla-
tion levels. . . . . . . . . . . . . . . . . . . . . . . . . . . . . . . . . 52
6.2 Comparisons of gas uptake ratios among 5 lung lobes under three lung
inflation levels. . . . . . . . . . . . . . . . . . . . . . . . . . . . . . . 54
6.3 Linear regressions between tissue-to-gas vs normalized lung volume in
each lobe of healthy subjects. . . . . . . . . . . . . . . . . . . . . . . 56
6.4 Tissue-to-gas vs normalized lung volume in each lobe of COPD sub-
jects. . . . . . . . . . . . . . . . . . . . . . . . . . . . . . . . . . . . 57
6.5 The slopes of linear regression lines of tissue-to-gas vs normalized lung
volume of each lobe. . . . . . . . . . . . . . . . . . . . . . . . . . . . 59
xv

Acronyms
FEV1 forced expiratory volume in one second. xiv, 9, 21, 30, 32–34, 43
ADC apparent diffusion coefficient. 48
ATS American Thoracic Society. 7
BMI Body mass index. iv, 30, 32
CDC Centers for Disease Control and Prevention. 7
CNN Convolutional Neural Network. x, xiii, 23, 25, 28, 29
COPD chronic obstructive pulmonary disease. v, viii, xi, xii, xiv, xv, 7–11, 17–20,
23, 37, 38, 42, 43, 45, 48–50, 52, 53, 55–59
CT computed tomography. iv, 12, 13, 17, 18
DLCO diffusing capacity for carbon monoxide. 10, 11, 38, 39
DP dissolved-phase. 44, 47–50
ERV expiratory reserve volume. 4
FRC functional residual capacity. 9, 10
FVC forced vital capacity. xiv, 4, 9, 21, 30, 32–34, 42, 44–46, 48, 52, 54
xvi
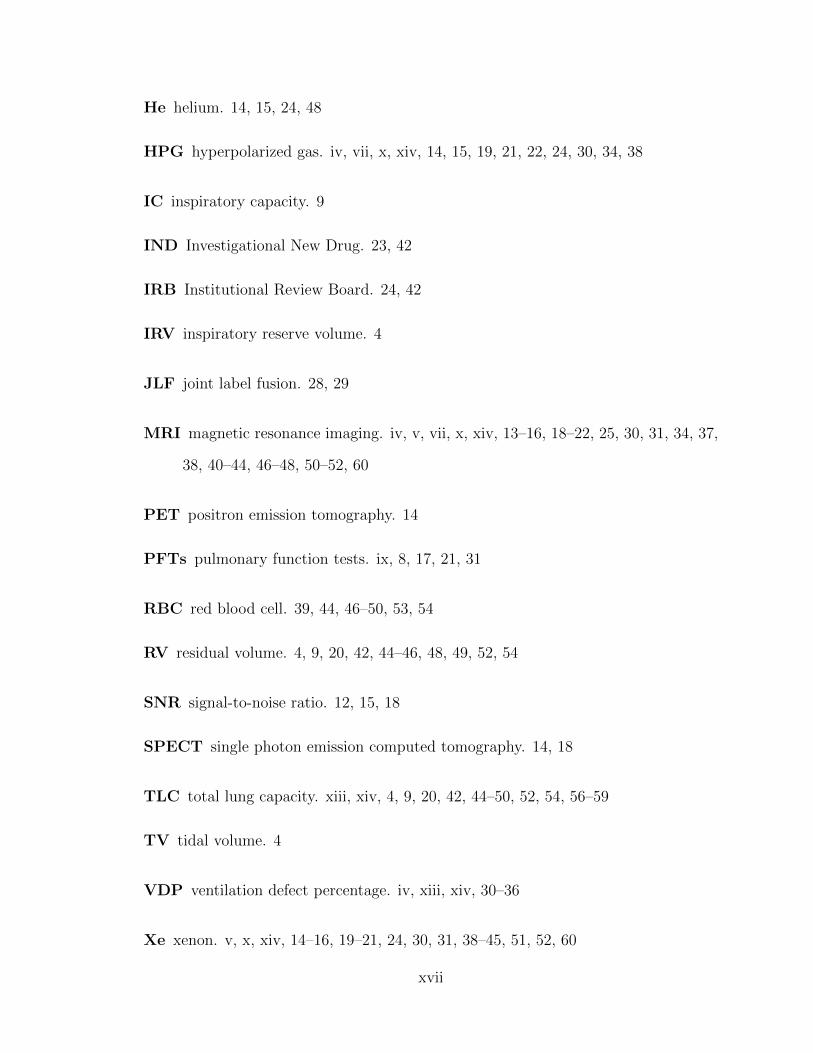
He helium. 14, 15, 24, 48
HPG hyperpolarized gas. iv, vii, x, xiv, 14, 15, 19, 21, 22, 24, 30, 34, 38
IC inspiratory capacity. 9
IND Investigational New Drug. 23, 42
IRB Institutional Review Board. 24, 42
IRV inspiratory reserve volume. 4
JLF joint label fusion. 28, 29
MRI magnetic resonance imaging. iv, v, vii, x, xiv, 13–16, 18–22, 25, 30, 31, 34, 37,
38, 40–44, 46–48, 50–52, 60
PET positron emission tomography. 14
PFTs pulmonary function tests. ix, 8, 17, 21, 31
RBC red blood cell. 39, 44, 46–50, 53, 54
RV residual volume. 4, 9, 20, 42, 44–46, 48, 49, 52, 54
SNR signal-to-noise ratio. 12, 15, 18
SPECT single photon emission computed tomography. 14, 18
TLC total lung capacity. xiii, xiv, 4, 9, 20, 42, 44–50, 52, 54, 56–59
TV tidal volume. 4
VDP ventilation defect percentage. iv, xiii, xiv, 30–36
Xe xenon. v, x, xiv, 14–16, 19–21, 24, 30, 31, 38–45, 51, 52, 60
xvii

Chapter 1
Introduction
1.1 Physiology Background
Respiration is a sequence of events that result in the exchange of oxygen and carbon
dioxide between the atmosphere and cells. Every 3 to 5 seconds, nerve impulses
stimulate the breathing process, or ventilation and moves air through a series of
passages into and out of the lungs. Exchange of gases between the lungs and the
blood is called external respiration. The blood transports the gases to and from the
tissue cells. Exchange of gases between the blood and tissue cells is called internal
respiration. Finally, cells utilize the oxygen for their biologic activities, and this is
called cellular metabolism, or cellular respiration. Together, these activities constitute
respiration.
1.1.1 Lung Function and Anatomy
Lung is an organ performing gas exchange with atmosphere. During inspiration and
expiration, the body brings in oxygen needed for cellular metabolism, and expels
carbon dioxide containing metabolic wastes. This cyclic respiration process ensures
the continuous supply of oxygen necessary to maintain life.
1

The lungs are spongy, air-filled organs located on either side of the chest. The
right lung is shorter, broader, and has a greater volume than the left lung. Each
lung is composed of smaller units called lobes. Fissures separate these lobes from
each other. The right lung consists of three lobes: the superior (upper), middle, and
inferior (lower) lobes. The left lung consists of two lobes: the superior (upper) and
inferior (lower) lobes. A bronchopulmonary segment is a division of a lobe, and each
lobe houses multiple bronchopulmonary segments. Each segment receives air from its
own tertiary bronchus and is supplied with blood by its own artery. Some diseases of
the lungs typically affect one or more bronchopulmonary segments, and in some cases,
the diseased segments can be surgically removed with little influence on neighboring
segments. The bronchopulmonary segments are further subdivided into lobules as
the bronchi branch into bronchioles. Each lobule receives its own large bronchiole
that has multiple branches. An interlobular septum is a wall composed of connective
tissue, which separates lobules from one another.
Figure 1.1: Lung anatomy. The right lung (left in the picture) is composed of threelobes: superior (upper), middle and inferior (lower). The left lung has two lobes:superior (upper) and inferior (lower). Lobes are separated by fissures. Reprintedfrom [6].
2

1.1.2 Normal Lung Airflow Physiology
Pulmonary ventilation, or breathing, is the movement of air through the conducting
passages between the atmosphere and the lungs. The air moves because of pressure
gradients between the atmosphere and the negative pressure in the alveoli produced by
contraction of the diaphragm and thoracic muscles. Muscular breathing movements
and recoil of the elastic tissues (bone and cartilage) create the changes in pressure
that result in ventilation.
Lung volumes, or respiratory volumes, refer to the volumes of gas in the lungs
at a given time during the respiratory cycle. Lung capacities are sums of two or
more lung volumes. The amount of air in the lungs can be subdivided into four
standard volumes (tidal, inspiratory reserve, expiratory reserve, and residual) and
four capacities (inspiratory, functional residual, vital and total lung capacities). The
relationships among the lung volumes and capacities are shown in Figure 1.2 and
listed below [7]:
Tidal Volume (TV): the amount of air that can be inhaled and exhaled during
one normal (quiet) breathing cycle (about 500 ml for men & women).
Inspiratory Reserve Volume (IRV): the amount of air that can be forcibly and
maximally inhaled beyond a tidal inhalation (about 3,000 ml for men & 2,000 ml for
women).
Expiratory Reserve Volume (ERV): the amount of air that can be forcibly and
maximally exhaled from end-tidal volume to point of maximal exhalation (RV).
(about 1200 ml for men & 700 ml for women).
Residual Volume (RV): the amount of air remaining in lungs after maximal exha-
lation (about 1,200 ml in men & women).
Inspiratory Capacity (IC): maximum inspiration from end-tidal volume to total
lung capacity, sum of TV and IRV.
3

Vital (FRC): volume of air remaining in chest at the end of a tidal volume breath,
sum of ERV and RV.
Vital Capacity (VC): maximum volume exhaled after maximum inspiration.
Total Lung Capacity (TLC): volume of air in lungs at end of maximal inspiration,
sum of IRV, TV, ERV and RV.
Figure 1.2: Lung volumes and capacities. Reprinted from [8].
Lung volumes are an important aspect of pulmonary function testing because
they can provide information about the physical condition of the lungs. Factors such
as depth of respiration, ethnicity, age, gender, body composition [9], and physical
conditioning influence lung volumes and capacities. A number of the lung volumes
can be measured by Spirometry: TV, IRV, and ERV. However, measurements of
RV, FVC, and TLC are through body plethysmography, nitrogen washout or helium
dilution techniques, which are described in detail in Section 1.2.1.
4

1.1.3 Normal Lung Gas Exchange Physiology
Gas exchange occurs at two sites in the body: in the lungs, where oxygen is picked up
and carbon dioxide is released at the respiratory membrane, and at the tissues, where
oxygen is released and carbon dioxide is picked up. The former one is the exchange
of gases with the external environment, called external respiration, and the latter one
is the exchange of gases with the internal environment, called internal respiration.
The actual exchange of gases occurs due to simple diffusion which follows pressure
gradients. Energy is not required to move oxygen or carbon dioxide across mem-
branes. The anatomy of the lungs maximizes the diffusion of gases: the respiratory
membrane is highly permeable to gases, minimizes the distance of diffusion with very
thin respiratory and blood capillary membranes, and maximizes the surface area for
gas exchange throughout the lungs.
Pulmonary ventilation transports air to the alveoli for external gas exchange pro-
cess. The alveoli are surrounded by a mesh of capillaries. Oxygen from the inhaled
air passes through the alveolar epithelium and into the blood. The pulmonary artery
carries deoxygenated blood into the lungs from the heart, where it branches and
eventually becomes the capillary network composed of pulmonary capillaries. These
pulmonary capillaries create the respiratory membrane with the alveoli. As the blood
is pumped through this capillary network, gas exchange occurs (Figure 1.3). At the
respiratory membrane, where the alveolar and capillary walls meet, gases move across
the membranes, with oxygen entering the bloodstream and carbon dioxide exiting.
Most of the oxygen is picked up by erythrocytes (red blood cells) and oxygenated
blood returns to the heart through the pulmonary veins. Carbon dioxide is released
in the opposite direction of oxygen, from the blood to the alveoli. It is through this
mechanism that blood is oxygenated and carbon dioxide, the waste product of cellular
respiration, is removed from the body. After absorbing oxygen, the blood leaves the
lungs and is carried to your heart. Your heart then pumps it through your body to
5

provide oxygen to the cells in organs and tissues. As the cells use the oxygen, carbon
dioxide is produced and absorbed into the blood. The blood then carries the carbon
dioxide back to your lungs, where it is removed from the body during the exhalation.
Figure 1.3: Gas exchange between alveolus and red blood cell. Reprinted from [10].
1.1.4 Abnormal Lung Function and Respiratory Diseases
Respiratory disease is an important health issue in the United States. In 2016, chronic
lower respiratory diseases (including asthma and chronic obstructive pulmonary dis-
ease) were the 4th leading cause of death in the United States, with more than 150
thousand people dying from them, and millions more suffering from them but without
being diagnosed [1].
6
Asthma
Asthma is a chronic inflammatory disorder of the airways characterized by variable
and recurring symptoms, airflow obstruction and bronchial hyperresponsiveness [11].
According to statistics and analysis by U.S. Centers for Disease Control and Preven-
tion (CDC), more than 26 million (8.2%, 1 in 13) people in the U.S. have asthma
(2016) [1], and it is one of the most common chronic diseases of childhood, affect-
ing an estimated 6 million children [11]. The common symptoms of asthma include
cough, wheezing, chest tightness and shortness of breath. These episodes are usually
associated with widespread but variable airflow obstruction that is often reversible
either spontaneously or with treatment [11]. The causes of asthma involve host fac-
tors (particularly genetics) and environmental exposures that occur at a crucial time
in the development of the immune system. A definitive cause of the inflammatory
process leading to asthma has not yet been established. Methods which help assess
airway anatomy, regional lung mechanics and associated lung function (e.g., gas ex-
change) can promote understanding of the differences between the lungs of healthy
subjects versus those with asthma, or of the severity of asthma [12]. Although there
are therapeutic approaches for controlling symptoms, reducing airflow limitation and
preventing exacerbations [11], various phenotypes of asthma and complex pathol-
ogy still desire new approach to provide better understanding and treatments of the
disease.
Chronic obstructive pulmonary disease (COPD)
As defined by the American Thoracic Society (ATS), chronic obstructive pulmonary
disease (COPD) is a preventable and treatable disease state characterized by airflow
limitation that is not fully reversible. The airflow limitation is usually progressive
and is associated with an abnormal inflammatory response of the lungs to noxious
particles or gases, primarily caused by cigarette smoking [13]. According to CDC,
7
approximated 16 million adults have been reported to be diagnosed with COPD
(2013) [14], and millions more suffer from COPD without being diagnosed [15].
COPD comprises pathological changes in four different compartments of the lungs
(central airways, peripheral airways, lung parenchyma and pulmonary vasculature),
which are variably present in individuals with the disease [16, 17, 18, 19, 20]. The
physiological abnormalities in COPD include: mucous hypersecretion and ciliary
dysfunction; airflow limitation and hyperinflation; gas exchange abnormalities; pul-
monary hypertension; and systemic effects [21, 22]. The diagnosis of COPD usually
depends on spirometry as a global assessment of pulmonary physiology.
1.2 Tools for Assessing Lung Physiology
1.2.1 Pulmonary Function Tests (PFTs)
Airflow and lung volume measurements can be used to differentiate obstructive from
restrictive pulmonary disorders, to characterize severity, and to measure responses to
therapy. Measurements are typically reported as absolute flows and volumes or as
percentages of predicted values using data derived from large populations of reference
cohorts presumed to have normal lung function. Variables used to predict normal
values include age, sex, ethnicity, and height. PFTs are often used in a variety of
lung disease diagnosis. PFTs mainly contain spirometry, spirometry before and after
a bronchodilator, lung volumes, and quantitation of diffusing capacity for carbon
monoxide. Additional PFTs, such as measurement of maximal respiratory pressures,
flow-volume loops, submaximal exercise testing, and bronchoprovocation challenge,
are useful in specific clinical circumstances.
8

Spirometry
Spirometry is the most widely used PFT in clinic. It quantifies the airflow moving
in and out of the lungs. In the assessments, the volume of air exhaled at specific
time points during forceful and complete exhalation after a maximal inhalation is
recorded by an instrument called spirometer. The volumes measured include the total
exhaled volume, known as the FVC, the volume exhaled in the first second, known
as the forced expiratory volume in one second (FEV1), and their ratio (FEV1/FVC)
[23]. The test takes 10 to 15 minutes and carries minimal risk (e.g., rarely syncope).
Performance of spirometry before and after bronchodilator is used to determine the
degree of reversibility of airflow limitation.
Spirometry is a key diagnostic test for asthma and COPD (when performed before
and after bronchodilator) and is useful to assess for asthma or other causes of airflow
obstruction. In patients with asthma, bronchodilator administration often results in
improvement, and in some patients with asthma, post-bronchodilator testing may
improve to normal spirometry values. Among patients with COPD, administration
of bronchodilator sometimes leads to a significant change in FEV1 but reversal to
normal spirometry rules out a diagnosis of COPD [24]. Bronchodilators may also
lead to improvement in flow in the small airways and a reduction in air trapping.
While criteria for assessment of reduced air trapping have not been formalized, an
increase in IC and a decrease in FRC are thought to reflect this response.
Lung Volume Measurements
Respiratory (pulmonary) volumes are important aspect of PFT because they can
provide information about the physical condition of the lungs. RV constitutes part
of FRC as well as TLC, and simple spirometer is incapable of measuring these pa-
rameters. The procedures used for measurement of RV, FVC and TLC are based on
radiological, plethysmographic or dilutional techniques [25].
9

Gas dilutional techniques include helium dilution and nitrogen washout methods.
With nitrogen washout, the patient exhales to FRC and then breathes from a spirom-
eter containing 100% oxygen. The test ends when the exhaled nitrogen concentration
is zero. The collected volume of exhaled nitrogen is equal to 81% of the initial FRC.
With helium equilibration, the patient exhales to FRC and then is connected to a
closed system containing known volumes of helium and oxygen. Helium concentra-
tion is measured until it is the same on inhalation and exhalation, indicating it has
equilibrated with the volume of gas in the lung, which can then be estimated from
the change in helium concentration that has occurred.
Both of these techniques may underestimate FRC because they measure only the
lung volume that communicates with the airways. In patients with severe airflow
limitation, such as moderate to severe COPD patients, a considerable volume of
trapped gas may communicate very poorly or not at all, because they do not access
under or nonventilated areas.
Body plethysmography is the gold standard for measurement of lung volumes.
It’s more accurate than dilution techniques in patients who have significant airflow
obstruction [26]. Body plethysmography uses Boyle’s law (P1V1 = P2V2) to measure
the compressible gas volume within the thorax. While sitting in an airtight box,
the patient tries to inhale against a closed mouthpiece from FRC. As the chest wall
expands, the pressure in the closed box rises. Knowing the pre-inspiratory box volume
and the pressure in the box before and after the inspiratory effort allows for calculation
of the change in box volume, which must equal the change in lung volume.
Diffusing capacity of carbon monoxide (DLCO)
Single-breath diffusing capacity for carbon monoxide (DLCO), also known as trans-
fer factor of carbon monoxide (TLCO), measures the quantity of carbon monoxide
transferred from alveolar gas to red blood cells in pulmonary capillaries per minute.
10

Measuring DLCO is a quick, safe and useful way to evaluate restrictive and obstruc-
tive lung diseases, as well as pulmonary vascular disease. In the setting of restrictive
lung diseases, DLCO helps to distinguish between interstitial lung diseases, in which
DLCO is usually reduced, and other causes of restriction, in which DLCO is usually
normal []. In obstructive disease, the DLCO helps to distinguish between emphy-
sema and other causes of chronic airway obstruction. The DLCO is also used in the
assessment of pulmonary vascular disease (e.g., thromboembolic disease, pulmonary
hypertension), which typically causes a reduction in DLCO in the absence of signifi-
cant restriction or obstruction.
1.2.2 Clinical Imaging
There is growing need to evaluate newly developed therapies and to better understand
the underlying mechanisms leading to development of pulmonary diseases. Imaging
techniques that can provide regional information on the structure and function of the
lung are highly desirable to help address this need.
Chest X-ray
The chest radiograph, or chest X-ray, is the oldest and the most frequently used radi-
ological procedure in lung disease screening and diagnosis. As it provides structural
information in and around the thorax, and it is often the first step in the radiological
evaluation of patients with suspected respiratory diseases. Specifically, chest X-ray
provides general testing as an initial diagnostic study and is especially useful in the di-
agnosis of pneumonia, cancer, and COPD. Fluoroscopy (an X-ray technique by which
respiratory movement is visualized directly) is used mainly for guidance of biopsy of
peripheral lung lesions and for differential diagnosis of an elevated diaphragm. Mod-
ern radiography offers high image quality and lower radiation dose, making it is still
the standard technique for initial investigations, especially in cases of infectious, ma-
11
lignant, or obstructive airway disease [27]. However, conventional chest X-ray is of
limited use since pulmonary lobules cannot be visualized with plain film radiography.
Chest computed tomography (CT) scan
Chest CT is a standard procedure in diagnosing many lung diseases [28]. Compared
to chest X-ray, CT has higher spatial resolution and signal-to-noise ratio in assessing
lung parenchyma and surrounding structures [29]. Chest CT is highly recommended
if there is doubt of the diagnosis and in preparation for bullectomy or lung volume-
reduction surgery, determine the extent of cancer, and detect presence of interstitial
lung diseases. Progress in multidetector CT (MDCT) makes it possible to obtain
high and isotropic resolution images at the same radiation exposure in a 10-second
breath-hold, allowing the image dataset to be viewed in any plane desired [29, 30].
Specific CT techniques can be applied in varied lung disease diagnosis. Low-dose
CT is used in follow-up and serial early lung cancer detection [31]. High-resolution
CT (HRCT) techniques improve the diagnosis of interstitial lung disease, emphy-
sema and bronchiolitis considerably [29] by allowing direct measurements of airway
wall thickness in the same patients at the same time with inspiratory and expiratory
breath-hold maneuver [32, 33]. Besides assessment of morphological changes in the
lung parenchyma, CT can be used to gain functional information – perfusion, with
the inherent high spatial resolution [34]. The newest MDCT scanners are equipped
with dual- energy technology, meaning that two different energies/tube voltages are
used at the same time. Because of the energy dependence of absorption, particu-
lar tissue characteristics can be emphasized, e.g., iodine distribution after contrast
administration as a surrogate for regional perfusion [35].
12

Proton magnetic resonance imaging (MRI)
Because of the absence of ionizing radiation, magnetic resonance imaging (MRI) is a
promising alternative to the CT in providing structural and functional information of
the body. MRI employs magnetic resonance of hydrogen protons to generate images
containing structural and functional information. As body content is mainly fluid
(H2O), MRI provides unique contrast between tissues with varying degrees of fluid
content.
Proton MRI is useful in assessment of superior sulcus tumors, possible cysts, and
other lesions that abut the mediastinum and chest wall. Because of the excellent
visualization of vascular structures, proton MRI has a role in the diagnostic investi-
gation of vascular diseases such as pulmonary hypertension, or complex diseases such
as cystic fibrosis [28].
However, proton MRI has inherent shortcomings in pulmonary imaging, as there
is very low abundance of fat and water, corresponding to weak H-1 signal. To make
up this shortcomings, hyperpolarized gases used as contrast agents can be employed
to image the lung with MRI, which will be talked in detail in Section 1.3.2.
1.3 New Techniques
1.3.1 Molecular Imaging
Continued progression of treatment options for chronic pulmonary diseases has led
to the increasing need to develop molecular imaging tools for diagnosis, treatment
planning, drug discovery and therapy monitoring [36]. Molecular imaging has its
advantages over current clinical tools as it has the ability to detect the alternations
of molecular activities underlying diseases. This specific subcellular level detection
allows earlier and more accurate diagnosis than detecting overall late morphologic
13
manifestations. It also permits the detection of drug or treatment responses to be
much earlier. Positron emission tomography (PET) and single photon emission com-
puted tomography (SPECT) are the most common imaging modalities for molecular
imaging.
Lung inflammation, infection, pulmonary physiology and lung malignancies are
major pulmonary disorders that can be investigated by molecular imaging. In the
early phases of inflammation, there may be not obvious morphologic alternations that
can be detected by conventional imaging techniques. Molecular imaging, however,
can potentially detect these abnormal events, the infectious agent itself and also the
increased metabolic activity. Molecular imaging approaches may also facilitate the
translation of effective targeted therapies for lung disease. The identification and
validation of lung-specific biomarkers that can assess the response to a particular
targeted pathway during a therapeutic intervention could dramatically increase the
efficiency of drug development.
1.3.2 Hyperpolarized Gas (HPG) Magnetic Resonance Imag-
ing (MRI)
As we talked in Section 1.2.2, proton MRI has limitations in pulmonary imaging
as low water content in lung. Using hyperpolarized noble gases helium-3 (He-3) or
xenon-129 (Xe-129) as inhaled contrast agents makes up this shortcoming of proton
MRI for evaluating airways and airspaces.
In proton MRI, the spin polarization which is used for imaging is determined by
the Boltzmann equilibrium. However, the concentration of inhaled noble gas in vivo is
small to allow MR imaging. To overcome this obstacle, the nuclear moments of He-3
and Xe-129 can be hyperpolarized five magnitudes above the Boltzmann equilibrium
through transfer of angular momentum using optical pumping, compensating for their
1000 times lower densities in vivo compared with liquid state hydrogen concentrations
14
in tissue [37]. By having a large nuclear polarization, they can be easily detected with
an MR scanner tuned to the appropriate resonant frequency [38]. Moreover, recent
advancements in gas polarization technologies improve Xe-129 production rates with
order-of-magnitude, to liter per hour at 50% polarization [39], allowing clinical lung
imaging with hyperpolarized Xe-129 to be more feasible [39, 40].
The applications of He-3 have been well demonstrated. However, He-3 has ex-
tremely low solubility in blood, and it is not widely used due to its limited supply
and rising price [41, 42, 43, 44, 45]. For these reasons, Xe-129 has become an at-
tractive alternative as its unlimited supply in the atmosphere and relatively low cost.
Moreover, it is extraordinarily sensitive to its chemical environment, which results
in large range of chemical shifts upon solution [46]. These characteristics of Xe-129
make it possible to explore certain lung structures and function, such as pulmonary
airspaces, lung microstructure, regional ventilation, perfusion and alveolar gas up-
take. Hyperpolarized gas imaging overcomes the SNR challenge faced in proton MRI
and allows for the direct imaging of lung airspaces.
1.4 Thesis Overview
This thesis is organized as follows.
Chapter 2 describes the rationale of this thesis. It explains the limitation of current
clinical tools in assessing lung function, and the advantage of HPG MRI over them
in regional and quantitative analysis. It also points out the lack of standardization
of current HPG MRI techniques. The rest work of this thesis will address this need.
Chapter 3 describes the application of hyperpolarized Xe-129 MRI in quantifying
ventilation defects. Specifically, a basic explanation of the HPG ventilation MRI, as
well as the quantification method realized by deep learning, is provided. Our work in
analyzing ventilation defects in healthy subjects is also described in this chapter.
15
Chapter 4 describes the application of Xe-129 MRI in assessing gas uptake by lung
tissue and red blood cells. The basics of dissolved-phase MRI is explained here. This
chapter also pointed out the current issue of dissolved-phase MRI – the variation in
protocols, and proposed lung volume as an important parameter in dissolved-phase
imaging.
Chapter 5 describes the study in analyzing the relationships between lung inflation
level and gas uptake measures acquired by corresponding MRI acquisitions.
Chapter 6 describes the lobar analysis of gas uptake ratios. The effects of lung
inflation level on lobar dissolved-phase MRI results are also discussed here.
Chapter 7 summaries the work in this thesis and discusses the possibilities of
future developments.
16

Chapter 2
Rationale
2.1 Limitation of Conventional Modalities
Common techniques to diagnose asthma and COPD include medical history, physical
examination, PFTs, chest radiography and X-ray CT. Since there is growing need for
improved tools for applications like monitoring the lung functional response to new
treatments or aiding in the rapid development of novel respiratory drugs targeting
COPD, tools for regional quantification of lung function are needed.
Currently available tools are not sensitive to early detection and provide little
information as to the regional distribution of diseases. The shortcoming of PFTs is
reflected in the recent 2017 GOLD group classification system: escalation of medical
therapy in the longitudinal management of COPD is now exclusively based upon the
functional status of the patient and their exacerbation frequency, rather than the
spirometry-based classification system in the past.
Chest X-ray CT has emerged as the choice for comprehensive assessment of the
lung by providing a detailed assessment of the airway and vascular trees, parenchyma,
pulmonary blood volume [47], and regional ventilation [48]. However, it is still lim-
ited in assessing lung function. With the current limits of CT resolution, the small
17

airways are not well resolved [29]. Moreover, current CT techniques are not very
sensitive to the early changes of the lung during initial stages of COPD, and are not
sensitive enough to monitor gradual disease progression. Although CT allows assess-
ment of pulmonary function by obtaining images with inhalation of xenon gas and
determining the wash-in and wash-out rates, the image resolution and repeatability
of these techniques under current technical conditions are limited. Concern about
ionizing radiation further hinders its feasibility, as well as that of techniques such as
single photon emission computed tomography (SPECT), particularly when repeated
imaging is needed longitudinally or the target subjects are children.
Clinical proton MRI of the lung is also under challenges. The inherently low water
and fat density and short T2* in lung tissues compared to other tissues in the human
body result in images with a poor quality [49, 50]. Furthermore, the multitude of
air-tissue interfaces within the lung also create significant magnetic field distortions,
commonly described as susceptibility artifacts, which further diminish the lung MR
H-1 signal. Additionally, respiratory and cardiac motion during image acquisition
degrades pulmonary MR image quality [29]. Although there has been progress in
proton MRI of the lungs using ultra-short echo time sequences to increase signal-to-
noise ratio (SNR) [51, 52], proton MRI still has shortcomings in evaluating pulmonary
structure and function. For example, it cannot directly image the airspaces, and is
limited in exploring the physiological function of the lungs.
In summary, it remains challenging to obtain in vivo regional depiction and quan-
tification of the most basic physiological functions of the lung – gas delivery to the
airspaces and gas uptake by the lung parenchyma and blood – in a manner suitable
for routine application in humans.
18

2.2 Advantages of Hyperpolarized Xe-129 MRI
Compared to Conventional Modalities
Hyperpolarized Xe-129 MRI has some advantages over conventional modalities in
several aspects. First, MRI is a technique that doesnt expose subjects to radiation,
allowing it to be repeated multiple times in a single day if desired. Second, MR im-
ages could provide regional information of the lung. The regional ventilation and gas
uptake-exchange throughout the lungs can be assessed to gain a better understand-
ing of pulmonary physiology and disease progression [53]. For example, HPG MRI
is useful in identifying ventilation-perfusion mismatch in patients with pulmonary
embolism, in staging and tracking the success of therapeutic approaches in patients
with chronic obstructive airway diseases, and in identifying candidates for lung trans-
plantation or reduction surgery [54].
2.3 Current Shortcomings of HPG MRI
Although Xe-129 MRI provides valuable information in assessing lung function, it still
has several limitations, such as the lack of standardization. Because each institution
has its own protocol and workflow, there is not a unified protocol for imaging [55,
4, 56]. Therefore, the results obtained from one institution may not be interpreted
in the same way in another institution. In this study, we are trying to build unified
reference within healthy and COPD patients, making it possible for HPG MRI to be
more widely applied.
19
Chapter 3
Normal Lung Airflow Physiology
Assessed by Hyperpolarized
Xe-129 Ventilation MRI
3.1 Introduction
Through ventilation, oxygen is brought into the lungs from the atmosphere and car-
bon dioxide carried into the lungs in the mixed venous blood is expelled from the
body. Regional ventilation abnormalities, such as airway narrowing, air trapping
and airway inflammation are associated with airway diseases. As mentioned in Sec-
tion 1.1.4, obstructive respiratory disorders (e.g. asthma, COPD) are characterized
by a reduction in airflow [57, 58]. With decreased airflow, expiration time may be-
come longer than usual, and lung volumes such as TLC and RV may also increase
due to air trapping [59]. In patients with asthma and COPD, it may help the clinical
decisions to monitor the evolution of these defects as the diseases progress over time
during clinical, longitudinal studies.
20

Not only patients with respiratory disorders, people with normal lung function
also show variations in ventilation patterns [60]. Thus, a good starting point is to
establish normal lung reference about ventilation. This becomes the main goal of this
part of our work.
3.2 Normal Lung References with Spirometry
Normal lung references with spirometry was well illustrated in third National Health
and Nutrition Examination Survey (NHANES III) [61]. This study developed spiro-
metric reference values based on 7,429 asymptomatic, lifelong non-smoking partici-
pants. Factors including race, height, age and gender were considered. It showed
that Caucasians had higher FVC and FEV1 values than Mexican- and African-
Americans had across the entire age range, but these values of Caucasians and
Mexican-Americans were similar with respect to height between Caucasians and
Mexican-Americans, whereas African-Americans had lower values. These results may
partially due to the differences in body build: observed Caucasian subjects were
taller than Mexican-Americans of the same age, and had larger trunk-to-leg ratio
than African-American subjects had. These reference values have provided extensive
benefit in clinical diagnosis as well as in research utilizing PFTs as a diagnostic tool.
3.3 The Assessment of Airflow Physiology Using
Hyperpolarized Xe-129 MRI
3.3.1 HPG Ventilation MRI
Spirometry is the primary method to detect abnormal ventilation and establish ob-
structive lung diseases. However, obstructive diseases often show inhomogeneous
ventilation distribution which cannot be detected by spirometry [3], especially in
21

early pathogenesis involving small airways [62, 63]. The advancements in HPG MRI
enable better understanding of lung airflow physiology by visualizing subtle changes
in ventilation [12]. Ventilation detected by HPG MRI has shown consistency with
spirometry results in both healthy and diseased subjects [64, 12, 65].
HPG MRI can detect areas of abnormal ventilation in the lungs with excellent
sensitivity and regional specificity. In general, static ventilation imaging is performed
during a single breath-hold after inhaling gas mixture containing a known volume of
hyperpolarized noble gas [66]. In ventilation images, normal functional parts of the
lung show high signal, while ventilation defects – regions where airflow is partially
or totally obstructed, are absent of or have relatively low signal [2, 3], as shown in
Figure 3.1.
Figure 3.1: HPG ventilation MR image. Normal functional regions are showed highsignal, while ventilation defects are absent of signal or shown relatively low signal.
Studies have shown HPG MRI is able to detect ventilation changes in the lung
with high sensitivity [67, 64]. For instance, ventilation imaging showed the capability
to detect regional airway closure in moderate to severe asthma [64], and changes
22

before/after breathing albuterol [68]. It also showed sensitivity and regional specificity
for detecting obstructive lung diseases like COPD [69].
3.3.2 Quantification of Ventilation Defects Using Convolu-
tional Neural Network (CNN)
Rational and Objectives
With the need of quantitatively analyzing lung ventilation function, computational
techniques for the segmentation of MR images are desired. However, previous re-
ported methodologies for identifying proton lung masks and quantifying ventilation
defects, including [70, 71], usually require huge time and computational resources.
Recent development in machine learning, specifically deep learning [72], gives a pos-
sibility to analyze images with high accuracy and time efficiency. By developing and
training multiple layers of neural networks, deep learning is able to perform computer
vision tasks such as image classification and voxel-wised segmentation. In this work,
we developed convolutional neural networks to segment lung masks and quantify
ventilation defects [5].
Large data requirement is a key obstacle when training deep learning models [73].
In this work, we deployed a template-based data augmentation strategy [5]. Differ-
ent from common randomized simulated linear (e.g., translation, rotation and affine),
elastic transformations and intensity adjustments (e.g., brightness and contrast), our
strategy is shape-based and addresses the characteristics of medical images [5]. Ac-
curacy and time-efficiency are expected by applying this CNN framework.
Materials and Methods
Image acquisition The studies were conducted under U.S. Food and Drug Admin-
istration Investigational New Drug (IND) Application for MR imaging with hyper-
23
polarized gas, and the study protocols were approved by the University of Virginia’s
Institutional Review Board (IRB). All human subjects signed informed consent after
being explained the details of study procedure prior to the studies. HPG ventilation
images were composed of both He-3 and Xe-129 acquisitions. MR acquisitions were
performed using a 1.5T whole-body MR scanner (Siemens Avanto, Siemens Medi-
cal Solutions, Malvern, PA). Hyperpolarized gas chest radiofrequency coils (Rapid
Biomedical, Rimpar, Germany; IGC Medical Advances, Mil- waukee, WI; or Clini-
cal MR Solutions, Brookfield, WI) were also used. This study included two imaging
protocols to acquire images, both of which combined a gas imaging (both He-3 or
Xe-129) and a proton imaging in the same breath-hold. One protocol used a 3-D
balanced steady-state free-precession or spoiled gradient echo pulse sequences with
isotropic resolution = 3.9 mm, TR = 1.75–1.85 ms, TE = 0.78–0.82 ms, flip angle
= 9–10◦, bandwidth per pixel =1050–1100 Hz/Pixel, total duration = 10–20 s. The
other protocol used a contiguous, coronal, 2-D gradient echo pulse sequence with in-
terleaved spiral sampling scheme, in-plane resolution = 24 mm, slice thick- ness = 15
mm, TR = 8–8.5 ms, TE = 0.8–1.0 ms, flip angle=20◦ interleaves=12–20 (plus 2 for
field map), total duration = 3–8 s.
Overall workflow Our proposed workflow is illustrated in Figure 3.2. We devel-
oped one proton U-net model and one ventilation U-net model for proton lung mask
segmentation and ventilation-based quantification respectively [5]. The input images
of both models were preprocessed using N4 bias correction and denoising algorithm
[74]. The predicted lung masks from the proton U-net model were used as an input
channel for the ventilation model. Proton masks helped identify region of interest for
functional quantification [71, 75, 76].
24

Training both models were offline before individual subject processing. Data aug-
mentation was performed during each model training. The offline training was com-
putationally intensive but was only performed once.
Figure 3.2: Overall workflow of proton MRI segmentation and ventilation-based quan-tification [5].
CNN Architecture Both our proton and ventilation CNN models were developed
based on U-net architecture [77]. U-net has symmetric encoding and decoding paths
that linked together via skip paths for enhanced feature detection. Both paths are
fully convolutional neural networks [78] and each series is composed of two convolu-
tional layers. We modified the original U-net architecture by adding a dropout layer
between two convolutional layers in each series to avoid overfitting. There’s also a
max pooling layer between each series to produce feature map for the next layer.
Template-based data augmentation To build an effective neural network, large
training data is usually a prerequisite [73]. Unlike computer vision area with access to
large open-source datasets for training, such as the well-known ImageNet [79], similar
25

Figure 3.3: The modified U-net architecture for proton lung segmentation andventilation-based quantification. Network layers are represented as boxes in differentcolors. Main parameter values are marked above each layer box. Reprinted from [5].
dataset in medical imaging is not easily available. Moreover, common geometric-based
(e.g., translation, rotation, affine) and intensity-based (e.g., brightening, contrast)
data augmentation methods are not able to address the shape variation information
in medical images.
In this work, we proposed a template-based data augmentation strategy to ex-
pand the training set [5]. We generated a representative template averaging in shape
and intensity from sampled MR images [80]. Transformations to & from each in-
dividual image were also generated. This allows each image mapping to the space
of another image in the training set. Specifically, for an individual subject Sk, the
template-building process generates a transformation to the template ϕk, and an in-
verse transformation from the template ϕ−1k . During the model training, a new image
Snew can be created by randomly selecting a source image and a target image, and
doing the mapping
26

Snew = Ssource(ϕ−1target(ϕsource))
By performing this data augmentation, a size of N dataset is possible to be expanded
to the size of N2.
Figure 3.4: Illustration of template-based data augmentation for proton (left) andventilation (right) U-net model training. Reprinted from [5].
Processing specifics 205 proton images and 73 ventilation images were included
in the model training sets. The smaller ventilation dataset was used to ensure class
balance. The U-net model for proton image segmentation was 3-D in order to take
advantage of the 3-D shape of the lungs. The ventilation U-net model was 2-D, as ven-
tilation images lack sophisticated 3-D shape, and 2-D model takes much less training
and predicting time than 3-D while has comparable performance [81]. More practi-
cally, the second ventilation acquisition protocol has lower through-plane resolution
where 2-D model is more capable with both protocols.
The image size across subjects was not identical, so we resampled proton images
to the size of 128 x 128 x 64, and ventilation images to the size of 128 x 128. During
proton data augmentation, a “coin flip” was used to randomly vary the intensity
27

profile of the warped proton images between their original profiles and the intensity
profile of the randomly selected reference image [5]. The parameters for CNN models
are listed in Table 3.1
Table 3.1: Parameters for CNN models [5].
Adam optimizationproton model learning rate 0.00001ventilation model learning rate 0.0001
Number of epochs 150
Training/validation data split 80/20
Convolution layerskernel size 5 x 5(x 5)activation rectified linear units (ReLU) [82]number of filters doubled at every layer starting with N =
16 (proton) and N = 32 (ventilation)
Dropout layersrate 0.2
Max polling layerssize 2 x 2(x 2)stride length 2 x 2(x 2)
Upsampling/transposed convolution (i.e., deconvolution) layerskernel size 5 x 5(x 5)stride length 2 x 2(x 2)activation rectified linear units (ReLU) [82]
Results Evaluation of proton lung segmentation were performed on 62 proton im-
ages. We compared the CNN results with a modified joint label fusion (JLF)-based
method [70]. The accuracy in terms of Dice overlap for both methods are shown in
Table 3.2. Although the accuracy of CNN is slightly lower than JLF, its processing
time is significantly shorter: less than 1 second compared to JLF’s 25 minutes per
subject.
40 ventilation images were tested to evaluate the ventilation model performance.
We compared the CNN performance with Atropos software [71] and manual segmen-
28

Table 3.2: Proton lung segmentation accuracy (in terms of Dice overlap).
Left Lung Right Lung Whole Lung
CNN 0.93 ± 0.03 0.94 ± 0.02 0.94 ± 0.02JLF 0.95 ± 0.02 0.96 ± 0.01 0.96 ± 0.01
tation. Because of the absence of ground truth, the STAPLE algorithm [83] was used
to create a consensus labeling. The Dice overlap coefficients of three methods are
shown in Table 3.3. The processing time for U-net model was less than 1 second
per subject, while Atropos was slightly less than 1 minutes, and human readers were
30–45 minutes.
Table 3.3: Ventilation-based quantification accuracy.
Total Normal Lung Ventilation DefectRegions
CNN 0.94 ± 0.03 0.96 ± 0.03 0.70 ± 0.3Atropos 0.92 ± 0.03 0.94 ± 0.03 0.71 ± 0.3Expert reader 1 0.89 ± 0.07 0.91 ± 0.06 0.60 ± 0.3Expert reader 2 0.92 ± 0.05 0.94 ± 0.04 0.57 ± 0.3Expert reader 3 0.94 ± 0.03 0.96 ± 0.03 0.63 ± 0.3
Conclusion and Discussion The proposed framework yields comparable accuracy
with previously reported methods as well as human readers. Meanwhile, the com-
putational time was significantly shorter than any other methods. This framework
permits to enhance analyses of large meta data set which may be commonly present
in clinical settings.
There are also several limitations of this framework. The U-net model for
ventilation-based quantification was 2-D and therefore the predictions were limited
to the coronal view which we were used. 3-D model may achieve better performance
from this point. Additionally, other evaluations using clinical measures may be
helpful in assessing lung function.
29
3.3.3 Airflow Physiology in Healthy Subjects Assessed by
Hyperpolarized Xe-129 MRI
Rational and objectives
Patients with obstructive diseases often show inhomogeneous ventilation, while the
ventilation of people with normal lung function is generally regarded to be homoge-
neous throughout the lungs [3]. Abnormal ventilation can be detected by spirometry
in clinic, but the distribution information of ventilation is absent. Recent advance-
ments in HPG MRI has enabled better detection of small airway physiology and
ventilation patterns [12]. It is able to provide quantitative and regional information
of ventilation patterns by computing ventilation defect volume to total lung volume
ratio, known as ventilation defect percentage (VDP) [84], among different regions of
the lungs.
Ventilation defects also emerge in normal lungs [85]. It’s known that the normal
ranges of spirometry are decreased with age and height. Determining the ventilation
patterns of subjects whose spirometry is normal is an essential step to standardize the
results obtained by using HPG MRI. This work is to establish a reference of normal
lungs with hyperpolarized Xe-129 ventilation MRI.
Materials and Methods
50 healthy subjects within normal spirometry ranges (FEV1/FVC > 0.7, FEV1%Pred
> 80%, FVC%Pred > 80%) and without any chronic respiratory conditions were
included in this study. Demographics and spirometry metrics are shown in Table 3.4.
41 of them were never-smokers and 9 were smokers. Since non-smokers and smokers
were significantly different in age and BMI, their effects should be excluded when
considering smoking history as a factor. Spirometry results between non-smokers and
30
smokers were not significantly different, indicating spirometry cannot differentiate
them.
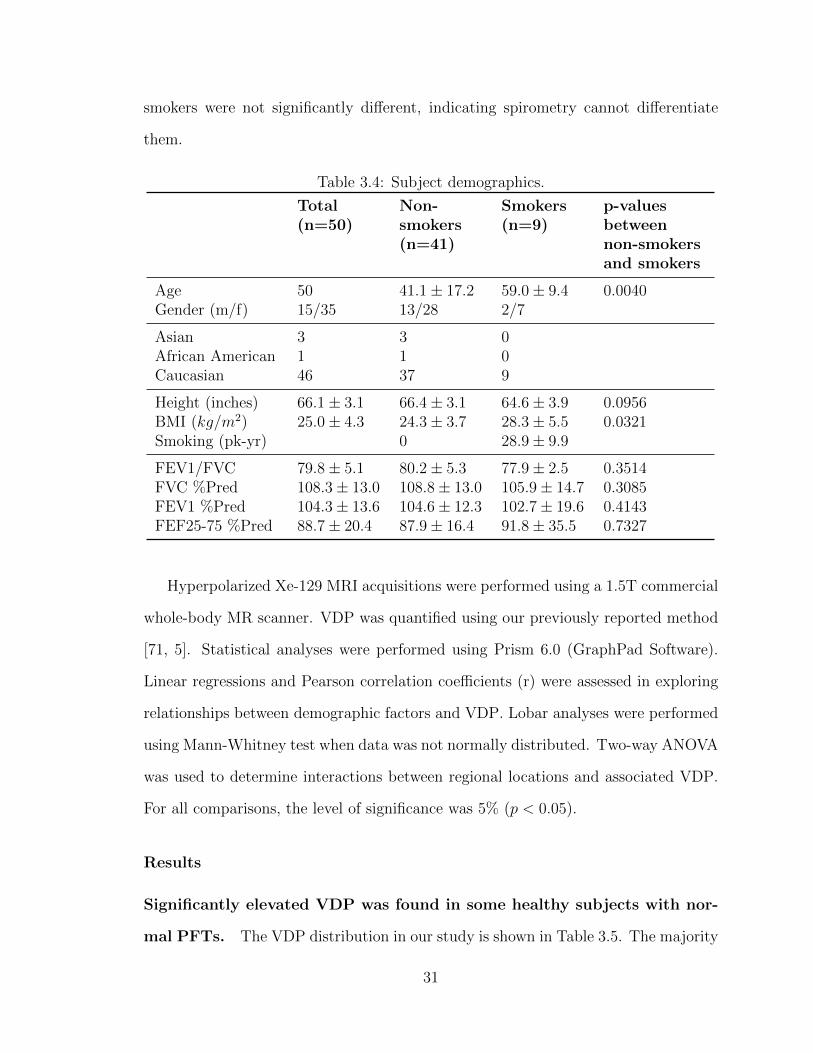
Table 3.4: Subject demographics.
Total(n=50)
Non-smokers(n=41)
Smokers(n=9)
p-valuesbetweennon-smokersand smokers
Age 50 41.1 ± 17.2 59.0 ± 9.4 0.0040Gender (m/f) 15/35 13/28 2/7
Asian 3 3 0African American 1 1 0Caucasian 46 37 9
Height (inches) 66.1 ± 3.1 66.4 ± 3.1 64.6 ± 3.9 0.0956BMI (kg/m2) 25.0 ± 4.3 24.3 ± 3.7 28.3 ± 5.5 0.0321Smoking (pk-yr) 0 28.9 ± 9.9
FEV1/FVC 79.8 ± 5.1 80.2 ± 5.3 77.9 ± 2.5 0.3514FVC %Pred 108.3 ± 13.0 108.8 ± 13.0 105.9 ± 14.7 0.3085FEV1 %Pred 104.3 ± 13.6 104.6 ± 12.3 102.7 ± 19.6 0.4143FEF25-75 %Pred 88.7 ± 20.4 87.9 ± 16.4 91.8 ± 35.5 0.7327
Hyperpolarized Xe-129 MRI acquisitions were performed using a 1.5T commercial
whole-body MR scanner. VDP was quantified using our previously reported method
[71, 5]. Statistical analyses were performed using Prism 6.0 (GraphPad Software).
Linear regressions and Pearson correlation coefficients (r) were assessed in exploring
relationships between demographic factors and VDP. Lobar analyses were performed
using Mann-Whitney test when data was not normally distributed. Two-way ANOVA
was used to determine interactions between regional locations and associated VDP.
For all comparisons, the level of significance was 5% (p < 0.05).
Results
Significantly elevated VDP was found in some healthy subjects with nor-
mal PFTs. The VDP distribution in our study is shown in Table 3.5. The majority
31

of subjects had VDP range between 10%–20%. However, there were two subjects (4%)
showed elevated VDP above 40%. This indicates healthy people can also have severe
ventilation defects, even though the spirometry indicates normal.
Table 3.5: VDP ranges of healthy subjects included in the study.
VDP Range Number of Subjects Percentage
0–10 4 8%10–20 26 52%20–30 11 22%30–40 7 14%40–50 2 4%
In healthy subjects, VDP is directly correlated with aging and inverselyRe
correlated with FEV1/FVC. However, VDP is not significantly correlated
with gender, height and weight. We conducted linear regressions between global
VDP and each demographic/spirometric factor. Significantly correlation between
VDP and age was found (r=0.61, p < 0.05, Figure 3.5 left), which indicated older
people tend to have more ventilation defects. There was also an inverse correlation
between VDP and FEV1/FVC (r=-0.29, p < 0.05, Figure 3.5 right), which consisted
with the common knowledge that FEV1/FVC reflects airflow conditions. However,
correlations between VDP and gender, height and BMI were not found.
VDP is similar between healthy smokers and age-matched healthy non-
smokers, but their ventilation patterns are highly heterogeneous. There
was a significantly difference in VDP between non-smokers and smokers (19.43% ±
11.13% for non-smokers vs 31.99% ± 10.27% for smokers, p < 0.05, Figure 3.6).
However, when comparing age-matched non-smokers and smokers, this difference was
not existing any more (26.03% ± 12.14% for non-smokers vs 31.99% ± 10.27% for
smokers, Figure 3.6).
32

Figure 3.5: Pearson correlations between VDP vs age (left) and FEV1/FVC (right).Reprinted from [86].
Figure 3.6: VDP of non-smokers and smokers. Open circle represents young non-smoking subjects, closed circle represents older non-smoking subjects age-matched tothe smokers, closed triangle represents smoking subjects. Reprinted from [86].
Even though VDP of non-smokers and smokers is similar, they showed very dif-
ferent patterns of ventilation defects. Healthy young subjects showed homogeneous
ventilation (Figure 3.7 row 1). Older smokers with low VDP had more heteroge-
neous patterns of ventilation defects than old non-smokers with similar VDP value
(Figure 3.7 row 2&3). Different patterns were also found when comparing older non-
smokers and smokers with similar elevated VDP values (Figure 3.7 row 4&5).
33
Right upper and left upper lobes contribute significantly more to the total
VDP. When exploring regional distribution of ventilation among healthy subjects,
we found upper lobes (including right upper lobe and left upper lobe) had higher VDP
than the other lobes (right middle lobe, right lower lobe and left lower lobe) (9.172%±
5.629% for middle and lower lobes vs 12.52% ± 7.893% for upper lobes, Figure 3.8).
This suggested upper lobes are more likely to develop abnormal ventilation.
Discussion
Our study showed significant variations in the patterns of ventilation are detectable
in “healthy” subjects with normal spirometry. Normal healthy subjects do have
a certain degree of abnormal ventilation with unclear clinical significance to one’s
healthy status. This abnormality can be detected by HPG MRI, demonstrating its
superior diagnostic power to spirometry for detecting subclinical abnormalities in hu-
man lungs. Through quantitatively analysis, we found VDP by HPG MRI is directly
correlated with aging and inversely correlated with subtle drop in FEV1/FVC. Com-
bining the results with lobar analysis, we conclude that older healthy subjects have
disproportionally more significant VDP in upper zones of the lungs.
This work has reflected the ventilation patterns and provided references of healthy
subjects at some degree. By continuing collect physiological data from HPG imaging,
we believe functional MRI can be more widely applied in assessing lung function.
34

Figure 3.7: Representative ventilation images and flow-volume loops. Row 1: youngsubject with low VDP, row 2: older non-smoker with low VDP, row 3: older smokerwith low VDP, row 4: older non-smoker with high VDP, row 5: older smoker withhigh VDP. Reprinted from [86].
35

Figure 3.8: VDP of lower lobes (right middle, right lower, left lower) and upper lobes(right upper, left upper). Reprinted from [86].
36

Chapter 4
Assess gas uptake using
dissolved-phase MRI
4.1 Introduction
Gas uptake occurs in external respiration. There are two stages in the uptake of
alveolar gases [87] – gas in alveoli diffuses through a semi-solid membrane composed
of the alveolar epithelium and capillary walls, and then oxygen in the gas binds to
the hemoglobin in the blood flow. The first stage is determined primarily by the
thickness and surface area of the membrane, and the second stage depends on the
reaction rate with the blood and the capillary blood volume.
Effective pulmonary gas exchange relies on the free diffusion of gases across the
thin tissue barrier separating airspace from the capillary red blood cells. Pulmonary
pathologies, such as inflammation, fibrosis and edema which cause an increased blood-
gas barrier thickness, impair the efficiency of this exchange [88]. Abnormal gas ex-
change can cause symptomatic shortness of breath, and in severe disease can progress
to respiratory failure and death. Patients with lung diseases such as asthma and
COPD showed abnormal gas uptake resulted from pathological alterations of lung
37

tissue or of local blood flow [89, 90]. Thus, effective analysis of lung gas uptake is
needed to understanding fundamental process of gas exchange, how heterogeneous
diseases such as COPD affect gas exchange, and evaluating new therapeutics for lung
diseases [4].
Although our knowledge of gas-exchange status in individual patients is derived
primarily from whole-lung measurements, gas exchange can vary substantially within
the lung, especially for heterogeneous conditions like COPD and asthma. Thus,
quantitative regional assessment of gas uptake would be highly demanded. Although
diffusing capacity can be measured by DLCO or stereological methods, DLCO can
only provide information of gas exchange, whereas stereological methods cannot yield
information in vivo [91]. HPG MRI has the ability to easily and noninvasively quantify
regional gas uptake by the lung parenchyma and blood.
4.2 Hyperpolarized Xe-129 Dissolved-Phase MRI
Gas uptake by lung parenchyma and red blood cells can be assessed by Xe-129 MRI.
Upon inhalation, the majority of Xe-129 gas resides in the airspace (gas phase), but
there is still 1–2% dissolved in the lung parenchyma, plasma and blood (dissolved
phase) [92], following the same physical gas-transfer pathway as oxygen does to reach
the red blood cells in the pulmonary capillary bed (Figure 4.1). The dissolved-phase
and gaseous xenon atoms continually exchange driven by diffusion in a dynamic equi-
librium. The atoms in different compartments have distinctly different resonance
frequencies, permitting gas uptake and exchange to be assessed using hyperpolarized
Xe-129 MRI. Although the fraction of inhaled xenon dissolved in the lung parenchyma
and blood is small, three spectral peaks can still be observed in whole lung spectrum,
associated with different compartments: airspaces, lung tissue and red blood cells
(Figure 4.2) [38, 93, 94, 91, 89]. The quantitative characteristics of the process of gas
38

exchange and uptake are determined by parameters of physiological relevance, such
as the thickness of the blood-gas barrier [88], the ratio of the functional tissue vol-
ume to alveolar volume [95], and the surface-to-volume ratio [96]. By measuring this
progress, we can acquire information on the functional status of healthy and diseased
lungs.
Figure 4.1: The exchange of Xe-129 between alveoli, tissue and red blood cells.Reprinted from [38].
Based on this, a three-dimensional, multi-echo, radial-trajectory pulse sequence
was developed to obtain ventilation (gaseous Xe-129), tissue, and red blood cell (RBC)
images in a breath-hold acquisition of less than 20 seconds [4]. Through these images,
Xe-129 signal ratios (total dissolved-Xe-129-to-gas, tissue-to-gas, RBC-to-gas and
RBC-to-tissue) can be calculated for quantitative regional comparisons [4].
These ratios are closely related to important lung physiological factors: the RBC-
to-gas ratio represents the overall gas exchange efficiency from lung airspaces to the
blood, similar to what DLCO measures globally. The tissue-to-gas ratio mainly re-
flects tissue density and alveolar surface-area-to-volume ratio. The RBC-to-tissue
ratio is affected by pulmonary perfusion and gas-blood barrier thickness.
39

Figure 4.2: Distribution of inhaled Xe-129 in the lung and its MR spectrum.Reprinted from [38].
4.3 Current Issues and the Variability in Protocol
Although Xe-129 dissolved-phase MRI provides valuable information in assessing lung
gas uptake, it encounters an issue – the lack of standardization. Each institution
has its own protocol and workflow, there is not a unified protocol for dissolved-
phase imaging [55, 4, 56]. Therefore, the results obtained from one institution are
meaningless in a different institution. One of the parameters that cannot be ignored
is the lung volume. As mentioned in Section 1.1.2, lung volume is in continuous
change during respiration. Previous studies have shown a strong dependence of gas
uptake measures on lung inflation level [90, 55]. In the next section, we explored the
relationships between the lung inflation level when MRI is taken and the gas uptake
ratios we acquired through corresponding images.
40

Chapter 5
The Effects of Lung Inflation
Levels on the Results of the
Dissolved-Phase MRI
5.1 Introduction
Previous studies showed that gas uptake ratios acquired from hyperpolarized Xe-
129 MRI were remarkably affected by the level of lung inflation at which the MRI
data was acquired during a single breath-hold [4, 90, 55, 89]. Specifically, the ratios
would decrease as lung inflation increased [90, 55, 89]. This might lead to unreason-
able results when evaluating lung function of subjects under different inflation levels.
Thus, it’s essential to investigate the quantitative relationship between the two. With
that, better control over lung inflation in future experiments could be realized and
normalized gas uptake measurements could be acquired.
In this study, we systematically investigated the change of gas uptake measured
from Xe-129 dissolved-phase MRI upon different lung inflation levels. We assumed
there are inverse correlations between gas uptake ratios and lung inflation level. In
41

the work described below, subjects underwent a combined Xe-129 dissolved-phase [4]
and proton MRI acquisition in a single breath-hold, to get both gas uptake results
and lung volumes. Images were acquired under three different lung inflation levels:
1.) total lung capacity (TLC); one-third of forced vital capacity (1/3 FVC); and 3.)
residual volume (RV) (COPD patients usually have higher RV due to hyperinflation).
Statistical analysis was performed to explore the correlations between gas uptake
ratios and lung volume.
5.2 Materials and Methods
5.2.1 Human Subjects
The studies were conducted under U.S. Food and Drug Administration IND Ap-
plication for MR imaging with hyperpolarized Xe-129, and the study protocol was
approved by the University of Virginia’s IRB. All human subjects signed informed
consent after being explained the details of study procedure prior to the studies.
The study group was composed of 12 healthy, non-smoking subjects and 5 COPD
subjects (1 current smoker and 4 former smokers). The healthy subjects were sep-
arated into a younger group (5 subjects) aged from 20 to 27 and an older group (7
subjects) aged from 44 to 70 matching to COPD group aged from 56 to 80. Spirom-
etry was performed to each subject immediately before MRI scan to evaluate their
pulmonary function and acquire their FVC. The demographics and pulmonary func-
tion test results are shown in Table 5.1.
Per IND requirements, 12-lead electrocardiography (HP Pagewriter XLi; Hewlett
Packard Co., Palo Alto, CA) was performed in subjects 40 yo or older immediately
before and after MR imaging. Female subjects received a urine pregnancy test before
imaging and were excluded from participation if pregnant. All studies were supervised
by physicians.
42
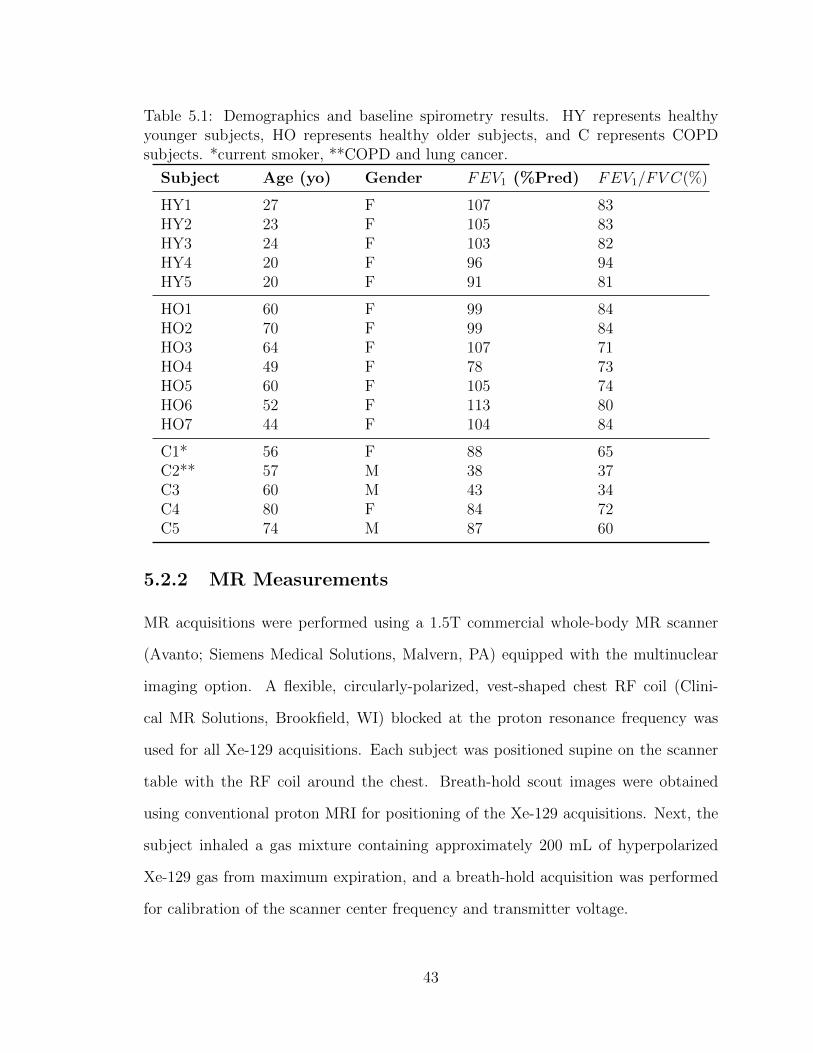
Table 5.1: Demographics and baseline spirometry results. HY represents healthyyounger subjects, HO represents healthy older subjects, and C represents COPDsubjects. *current smoker, **COPD and lung cancer.
Subject Age (yo) Gender FEV1 (%Pred) FEV1/FV C(%)
HY1 27 F 107 83HY2 23 F 105 83HY3 24 F 103 82HY4 20 F 96 94HY5 20 F 91 81
HO1 60 F 99 84HO2 70 F 99 84HO3 64 F 107 71HO4 49 F 78 73HO5 60 F 105 74HO6 52 F 113 80HO7 44 F 104 84
C1* 56 F 88 65C2** 57 M 38 37C3 60 M 43 34C4 80 F 84 72C5 74 M 87 60
5.2.2 MR Measurements
MR acquisitions were performed using a 1.5T commercial whole-body MR scanner
(Avanto; Siemens Medical Solutions, Malvern, PA) equipped with the multinuclear
imaging option. A flexible, circularly-polarized, vest-shaped chest RF coil (Clini-
cal MR Solutions, Brookfield, WI) blocked at the proton resonance frequency was
used for all Xe-129 acquisitions. Each subject was positioned supine on the scanner
table with the RF coil around the chest. Breath-hold scout images were obtained
using conventional proton MRI for positioning of the Xe-129 acquisitions. Next, the
subject inhaled a gas mixture containing approximately 200 mL of hyperpolarized
Xe-129 gas from maximum expiration, and a breath-hold acquisition was performed
for calibration of the scanner center frequency and transmitter voltage.
43

Three combined hyperpolarized Xe-129 dissolved-phase and proton MRI acqui-
sitions were performed at three different inflation levels. The RV level acquisition
was performed at the maximum expiration after inhaling a gas mixture containing 1L
hyperpolarized Xe-129 and nitrogen from maximum expiration. For 1/3 FVC acqui-
sition, subject inhaled gas from maximum expiration to a total volume of one-third of
the subject’s FVC as determined by spirometry. The TLC acquisition was performed
after inhaling the gas mixture as much as possible.
Parameters used in the Xe-129 acquisitions were same as described in [4] (ac-
quisition time 11 s), except for a lower spatial resolution (15.2 x 15.2 x 17.6 mm3)
to ensure sufficient signal-to-noise ratio. Three ratio maps (tissue-to-gas, RBC-to-
gas and RBC-to-tissue) were generated from dissolved-phase MRI for quantitative
comparison among subjects (Figure 5.1). Meanwhile, four gas uptake ratios were
calculated: tissue-to-gas, RBC-to-gas, total dissolved-phase-to-gas (DP-to-gas) and
RBC-to-tissue. A 3-D proton gradient-echo sequence was used to measure lung vol-
ume following the dissolved-phase acquisition in the same breath-hold (Figure 5.1).
Two additional proton image sets were acquired independently before or after the
dissolved-phase acquisitions to measure TLC and RV. Proton image resolution was
3.9 x 3.9 x 3.9 mm3, and the acquisition time was 4 seconds.
5.2.3 Data Analysis
Four gas uptake ratios were included in this study: tissue-to-gas, RBC-to-gas, total
DP-to-gas, RBC-to-tissue. We performed Friedman tests to see whether gas uptake
ratios differ among three lung inflation levels. Multiple comparisons were performed
when the result of Friedman test was significant. Then we assumed there were in-
versely proportional relationships between gas uptake measures and normalized lung
volume by TLC in healthy subjects. To test this assumption, linear regressions were
applied. Healthy subjects were analyzed within two groups (younger and older). The
44

Figure 5.1: Results from the combined Xe-129 dissolved-phase and proton acquisitionin a healthy subject. The first row shows coronal proton images acquired at threeinflation levels and the segmented lung regions (red: right lung, green: left lung).The second row shows the corresponding measured tissue-to-gas ratio maps. Higherratios were measured at lower lung inflation levels, as expected.
coefficient of determination r2 and the slope of regression line k were evaluated for
each group.
We assumed a similar linearity in COPD subjects. However, because of the great
variance of disease among subjects (COPD GOLD stage 1 to 3), regression analysis
was not suitable for COPD group. Instead, we evaluated the linearity by predicting
the gas uptake values measured at intermediate inflation level (i.e., 1/3 FVC) based
on those at the highest (i.e., TLC) and the lowest (i.e., RV) inflation levels. Relative
errors of predicted values compared with actual values were evaluated.
Data was analyzed offline using Prism (GraphPad, San Diego, CA) and MATLAB
(MathWorks, Natick, MA).
45
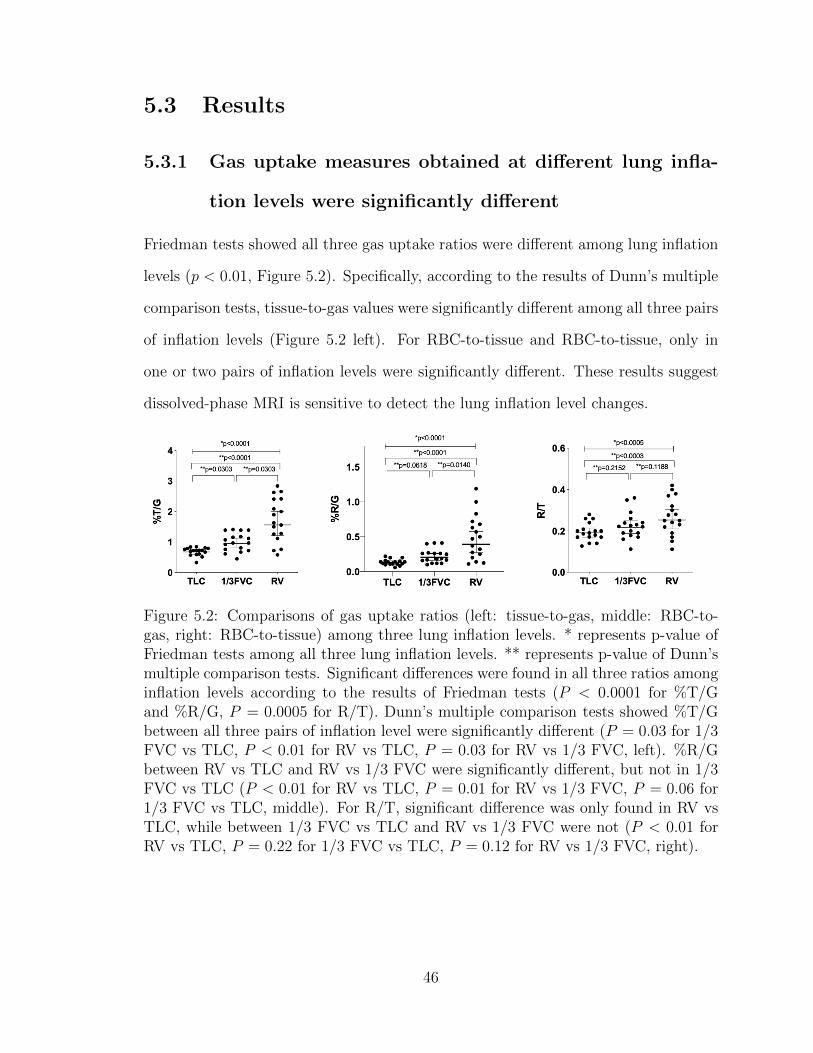
5.3 Results
5.3.1 Gas uptake measures obtained at different lung infla-
tion levels were significantly different
Friedman tests showed all three gas uptake ratios were different among lung inflation
levels (p < 0.01, Figure 5.2). Specifically, according to the results of Dunn’s multiple
comparison tests, tissue-to-gas values were significantly different among all three pairs
of inflation levels (Figure 5.2 left). For RBC-to-tissue and RBC-to-tissue, only in
one or two pairs of inflation levels were significantly different. These results suggest
dissolved-phase MRI is sensitive to detect the lung inflation level changes.
Figure 5.2: Comparisons of gas uptake ratios (left: tissue-to-gas, middle: RBC-to-gas, right: RBC-to-tissue) among three lung inflation levels. * represents p-value ofFriedman tests among all three lung inflation levels. ** represents p-value of Dunn’smultiple comparison tests. Significant differences were found in all three ratios amonginflation levels according to the results of Friedman tests (P < 0.0001 for %T/Gand %R/G, P = 0.0005 for R/T). Dunn’s multiple comparison tests showed %T/Gbetween all three pairs of inflation level were significantly different (P = 0.03 for 1/3FVC vs TLC, P < 0.01 for RV vs TLC, P = 0.03 for RV vs 1/3 FVC, left). %R/Gbetween RV vs TLC and RV vs 1/3 FVC were significantly different, but not in 1/3FVC vs TLC (P < 0.01 for RV vs TLC, P = 0.01 for RV vs 1/3 FVC, P = 0.06 for1/3 FVC vs TLC, middle). For R/T, significant difference was only found in RV vsTLC, while between 1/3 FVC vs TLC and RV vs 1/3 FVC were not (P < 0.01 forRV vs TLC, P = 0.22 for 1/3 FVC vs TLC, P = 0.12 for RV vs 1/3 FVC, right).
46

5.3.2 Strong inverse relationships between lung inflation
level and gas uptake measures were found for healthy
subjects
To quantitatively analyze the effects of lung inflation level at which the MRI scan
was taken, we normalized lung volumes by subject’s TLC determined from the inde-
pendent proton MR image. We found very strong correlations between tissue-to-gas,
RBC-to-gas and total DP-to-gas ratios vs lung volume for both younger and older
groups (r <= −0.78, p < 0.01, Table 5.2). These measures involve the process that
gas in alveolar diffusion into red blood cells determined by the surface-area-to-volume
ratio of alveolar. As the lungs inflating, more xenon gas can be detected, the volume
of gas in alveolar increases, then the surface-area-to-volume ratio decreases, leading to
decreased gas uptake ratios. Linear regression results showed inversely proportional
relationships between these ratios and normalized lung volume (r2 > 0.6, Table 5.2,
Figure 5.3).
RBC-to-tissue ratio, however, didn’t show very strong correlation vs inflation
level as the other ratios did, especially for the older subjects. This could be caused
by changes in lung blood volume and/or pulmonary venous flow due to changes of
the transpulmonary pressure, consistent with the literature [97]. However, an inverse
changing trend was still observed in our study (Figure 5.3 lower right).
5.3.3 Younger people had higher gas uptake than older peo-
ple at the same lung inflation level
Slopes of regression lines were calculated to compare younger and older healthy sub-
jects (Table 5.2, Figure 5.3). The slopes of all four ratios in younger group were
steeper than those in older group. This means younger subjects had higher gas up-
take than older subjects at the same lung inflation level. Previously, hyperpolarized
47

Table 5.2: Regression analysis between gas uptake ratios and lung volume. Pearsoncorrelation coefficient r, coefficient of determinate r2, significance p and slope k ofeach group.
%T/G %R/G TotalDP/G
R/T
Youngerr -0.94 -0.91 -0.93 -0.85r2 0.88 0.83 0.87 0.73p < 0.0001 < 0.0001 < 0.0001 < 0.0001k -2.87 -1.24 -4.11 -0.25
Olderr -0.88 -0.78 -0.86 -0.46r2 0.77 0.61 0.75 0.21p < 0.0001 < 0.0001 < 0.0001 0.0374k -2.34 -0.61 -2.95 -0.09
He-3 diffusion MRI studies have shown that the He-3 apparent diffusion coefficient
(ADC) values increase with aging [98], which could explain the lower tissue-to-gas
ratio observed in older subjects – because of decreased tissue density or surface-to-
volume ratios. The decrease of the RBC-to-tissue ratios with age could be caused by
a decreased cardiac output [99].
5.3.4 Gas uptake measures at intermediate lung inflation
level can be predicted using the highest and lowest in-
flation levels for COPD subjects
The inverse relationships between gas uptake measures and lung inflation level were
also found in COPD group. We predicted the gas uptake ratios at intermediate
inflation level (i.e., 1/3 FVC) using the values at the highest (i.e., TLC) and lowest
(i.e., RV) inflation volumes. The relative errors of the predicted values compared with
the actually acquired values were calculated. The mean and standard deviation of the
absolute values of relative errors for the predicted tissue-to-gas, RBC-to-gas, total DP-
to-gas and RBC-to-tissue values were 7.68%± 6.51%, 9.23%± 6.91%, 8.11%± 5.60%
48

Figure 5.3: Linear regressions between gas uptake ratios (upper left: tissue-to-gas,upper right: RBC-to-gas, lower left: total DP-to-gas, lower right: tissue-to-gas) vsnormalized lung volume by TLC. Healthy subjects were divided into two groups(younger and older).
and 6.63% ± 3.09%, respectively. These relatively small predicting errors suggested
similar linear relationships also exist in COPD patients.
5.4 Conclusion
Significant variations of the dissolved-phase results were found from the smallest val-
ues with TLC to largest with RV. Normalization of the dissolved-phase lung volume to
49

Figure 5.4: Gas uptake ratios (upper left: tissue-to-gas, upper right: RBC-to-gas,lower left: total DP-to-gas, lower right: tissue-to-gas) vs normalized lung volume inCOPD subjects.
TLC substantially mitigated this variation. Strong inverse relationships were found
between gas uptake ratios and normalized lung volume. This normalization strat-
egy can be possibly exploited to assist data analyses involving multiple centers with
variably MRI techniques.
50

Chapter 6
Lobar Analysis of Gas Uptake and
the Effects of Lung Inflation Level
6.1 Introduction
According to the results in Section 3.3.3, ventilation can be heterogeneous among
individual lobes, and more ventilation defects are usually observed in upper lobes. In
this chapter, regional distribution of gas uptake measured by hyperpolarized Xe-129
MRI is described among different lobes. In addition, based on the results from Chap-
ter 5, we found that dissolved-phase MRI has close association with lung inflation
level. Influence of different inflation levels on each lobe will be further interrogated
in this chapter. The lobar analysis of gas uptake results would provide further un-
derstanding of human lung gas exchange and help to standardize the quantitative
measurements of dissolved-phase MRI.
6.2 Materials and Methods
Human subjects and MRI protocol used in this study are identical as described in
Chapter 5.
51
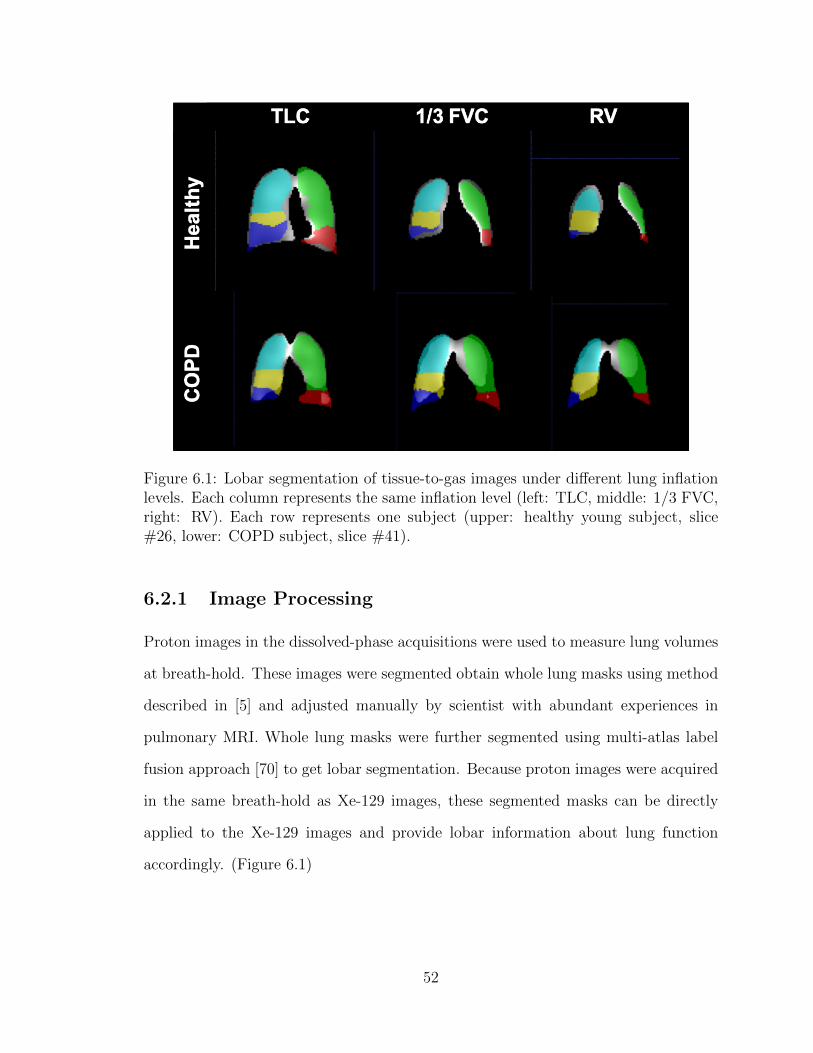
Figure 6.1: Lobar segmentation of tissue-to-gas images under different lung inflationlevels. Each column represents the same inflation level (left: TLC, middle: 1/3 FVC,right: RV). Each row represents one subject (upper: healthy young subject, slice#26, lower: COPD subject, slice #41).
6.2.1 Image Processing
Proton images in the dissolved-phase acquisitions were used to measure lung volumes
at breath-hold. These images were segmented obtain whole lung masks using method
described in [5] and adjusted manually by scientist with abundant experiences in
pulmonary MRI. Whole lung masks were further segmented using multi-atlas label
fusion approach [70] to get lobar segmentation. Because proton images were acquired
in the same breath-hold as Xe-129 images, these segmented masks can be directly
applied to the Xe-129 images and provide lobar information about lung function
accordingly. (Figure 6.1)
52

6.2.2 Data Analysis
Friedman tests were performed to see whether gas uptake ratios under same lung
inflation level were different among lobes. Multiple comparisons were performed
when the result of Friedman test was significant. Then we assumed that there were
inversely proportional relationships between gas uptake measures and normalized lung
volume in each lobe for healthy subjects. To test this assumption, linear regressions
were applied. Healthy subjects were analyzed within two groups (younger and older).
The coefficient of determination r2 and the slope of regression line k were evaluated
for each group. For COPD subjects, because of the high variance of diseases, linear
regression was not performed. We only plot gas uptake ratios vs normalized lung
volume to analyze this correlation qualitatively.
To further explore the association between gas uptake measures and lung inflation
level in different lobes, we calculated the slopes of linear regression lines for each lobe
of each subject. Friedman tests were performed to see whether these five lobes had
the same slopes of change in gas uptake in response to the change of lung volumes
for both healthy and COPD groups.
Data was analyzed offline using Prism (GraphPad, San Diego, CA).
6.3 Results
6.3.1 Gas uptake ratios under same lung inflation level were
significantly different among lobes
According to the results of Friedman tests, all three gas uptake ratios (tissue-to-gas,
RBC-to-tissue, RBC-to-tissue) were significantly different in different lobes under the
same lung inflation level (p < 0.05, Figure 6.2). Dunn’s multiple comparisons showed
53

gas uptake ratios in middle right lobe were very likely smaller compared with other
lobes.
Figure 6.2: Comparisons of gas uptake ratios (row 1: tissue-to-gas, row 2: RBC-to-gas, row 3: RBC-to-tissue) among five lung lobes under three lung inflation levels(left: TLC, middle: 1/3 FVC, right: RV). Significant differences were found in allthree ratios among lobes according to the results of Friedman tests (P < 0.0001 forall tests).
54

6.3.2 Strong inverse relationships between gas uptake ratios
and lung volume still existed in each lobe
Very strong inverse correlations between gas uptake ratios in each lobe and lung
volume were found for both healthy younger and older subjects, which consisted with
the results in global analysis. Linear regression results showed inversely proportional
relationships between these ratios in each lobe and normalized lung volume (r2 > 0.6,
Table 6.1, Figure 6.3). Younger subjects still have higher gas uptake than older
subjects under the same inflation level in each lobe, shown as steeper regression lines
in Figure 6.3.
Table 6.1: Regression analysis between tissue-to-gas value and lung volume. Coeffi-cient of determinate r2, significance p and slope k of each group.
LowerLeft
UpperLeft
LowerRight
MiddleRight
UpperRight
Youngerr2 0.89 0.88 0.80 0.84 0.82p < 0.0001 < 0.0001 < 0.0001 < 0.0001 < 0.0001k -2.44 -2.03 -2.64 -1.24 -1.78
Olderr2 0.78 0.78 0.75 0.62 0.71p < 0.0001 < 0.0001 < 0.0001 < 0.0001 < 0.0001k -1.70 -1.50 -1.92 -0.79 -1.31
Inverse relationships were also found in COPD subjects in each lobe. Because
of the variation of diseases, linear regressions were not performed. However, the
decreasing trend of gas uptake measures in respond to the increased lung inflation
level were still observed in Figure 6.4.
55

Figure 6.3: Linear regressions between tissue-to-gas value vs normalized lung volumeby TLC in each lobe of healthy subjects. Upper left: lower left lobe, upper right:upper left lobe, lower left: lower right lobe, lower middle: middle right lobe, lowerright: upper right lobe. Healthy subjects were divided into two groups (younger:solid line, older: dashed line). Younger groups had steeper slopes than older groups.
6.3.3 The rates of change of gas uptake ratios in response to
the change of lung inflation level in healthy subjects
were significantly different among different lobes, but
not in COPD patients
The slopes of linear regression lines of gas uptake ratio vs normalized lung volume
associated with each lobe were calculated for each subject and shown in Table 6.2.
Within each subject, the slopes associated with 5 lobes were not statistically identical
(p > 0.05, Table 6.2). Friedman test showed the slopes of 5 lobes in all healthy sub-
jects were significantly different (p < 0.05, Figure 6.5 upper right). Dunn’s multiple
comparisons indicated except middle right lobe, there were no significant differences
56

Figure 6.4: Tissue-to-gas value vs normalized lung volume by TLC in each lobe ofCOPD subjects. Upper left: lower left lobe, upper right: upper left lobe, lower left:lower right lobe, lower middle: middle right lobe, lower right: upper right lobe.
between the other lobes (p >= 0.05, Figure 6.5 upper right). Middle right lobe showed
to have the least sensitivity to the change of lung volume in terms of measured gas
uptake ratios. COPD subjects, however, showed similar slopes among different lobes
(p < 0.05, Figure 6.5 lower right).
6.4 Conclusion
Gas uptake ratios were significantly different among lobes, which indicates the ex-
istence of gas uptake heterogeneity. The inverse correlations between gas uptake
measures and lung volume were also found in each lobe for both healthy and COPD
subjects. In healthy subjects, this correlation was further proved to be proportional.
This result is consistent with the conclusion we made for global measurements in
Chapter 5.
57
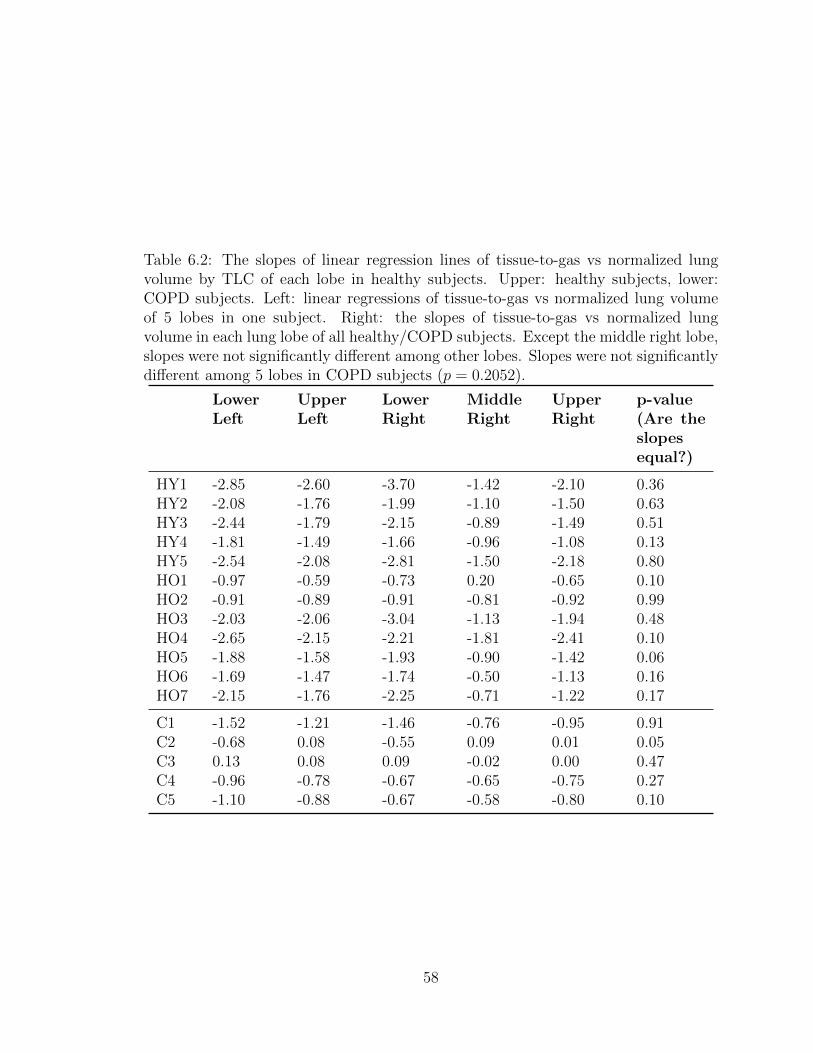
Table 6.2: The slopes of linear regression lines of tissue-to-gas vs normalized lungvolume by TLC of each lobe in healthy subjects. Upper: healthy subjects, lower:COPD subjects. Left: linear regressions of tissue-to-gas vs normalized lung volumeof 5 lobes in one subject. Right: the slopes of tissue-to-gas vs normalized lungvolume in each lung lobe of all healthy/COPD subjects. Except the middle right lobe,slopes were not significantly different among other lobes. Slopes were not significantlydifferent among 5 lobes in COPD subjects (p = 0.2052).
LowerLeft
UpperLeft
LowerRight
MiddleRight
UpperRight
p-value(Are theslopesequal?)
HY1 -2.85 -2.60 -3.70 -1.42 -2.10 0.36HY2 -2.08 -1.76 -1.99 -1.10 -1.50 0.63HY3 -2.44 -1.79 -2.15 -0.89 -1.49 0.51HY4 -1.81 -1.49 -1.66 -0.96 -1.08 0.13HY5 -2.54 -2.08 -2.81 -1.50 -2.18 0.80HO1 -0.97 -0.59 -0.73 0.20 -0.65 0.10HO2 -0.91 -0.89 -0.91 -0.81 -0.92 0.99HO3 -2.03 -2.06 -3.04 -1.13 -1.94 0.48HO4 -2.65 -2.15 -2.21 -1.81 -2.41 0.10HO5 -1.88 -1.58 -1.93 -0.90 -1.42 0.06HO6 -1.69 -1.47 -1.74 -0.50 -1.13 0.16HO7 -2.15 -1.76 -2.25 -0.71 -1.22 0.17
C1 -1.52 -1.21 -1.46 -0.76 -0.95 0.91C2 -0.68 0.08 -0.55 0.09 0.01 0.05C3 0.13 0.08 0.09 -0.02 0.00 0.47C4 -0.96 -0.78 -0.67 -0.65 -0.75 0.27C5 -1.10 -0.88 -0.67 -0.58 -0.80 0.10
58

Figure 6.5: The slopes of linear regression lines of tissue-to-gas vs normalized lungvolume by TLC of each lobe in healthy subjects. Upper: healthy subjects, lower:COPD subjects. Left: linear regressions of tissue-to-gas vs normalized lung volumeof 5 lobes in one subject. Slopes were not significantly identical (p = 0.36 for healthy,p = 0.27 for COPD). Right: the slopes of tissue-to-gas vs normalized lung volumein each lung lobe of all healthy/COPD subjects. Slopes were significantly differentamong 5 lobes in healthy subjects (p < 0.0001). Specifically, the slopes betweenlower left vs middle right and lower right vs middle right were significantly different(p < 0.0001 for both pairs). Slopes were not significantly different among 5 lobes inCOPD subjects (p = 0.2052).
The association between gas uptake measures and lung inflation level in individual
lobes were also investigated. Within each subject, the rates of change of gas uptake
ratios in respond to the changes in lung inflation level were not the same in different
lobes. When investigate all healthy subjects together, this difference still existed.
However, no differences were shown among all COPD subjects.
59

Chapter 7
Discussion and Future Work
In this work, we illustrated the application of hyperpolarized Xe-129 MRI in evalu-
ating lung airflow and gas uptake by lung tissue and red blood cells. We summarized
findings of ventilation defects in healthy subjects by quantifying unventilated per-
centage using deep learning. We also explored the relationships between global and
regional gas uptake measures and lung volume at breath-hold. These results provide
valuable reference in the clinical application of hyperpolarized Xe-129 MRI.
There is still a lot of work can be done in the future. For example, in this work,
we showed that the gas uptake measured in older healthy subjects were significantly
lower than those in younger healthy subjects. With increasing number of collected
data, we may be able to also establish a reference line, like we did for the ventilation
data in healthy subjects. By doing this, we can further identify whether the gas
uptake results that we obtained from patients are in the normal range. Furthermore,
we can extend this reference line to different regions of the lung using the image
analysis tools that we illustrated in this work.
60

References
[1] Melonie Heron. Deaths: Leading causes for 2016. National Vital Statistics Re-ports, 67(6), Jul 2018.
[2] J R MacFall, H C Charles, R D Black, H Middleton, J C Swartz, B Saam,B Driehuys, C Erickson, W Happer, G D Cates, G A Johnson, and C E Ravin.Human lung air spaces: potential for mr imaging with hyperpolarized he-3. Ra-diology, 200(2):553–558, 1996. PMID: 8685356.
[3] H U Kauczor, D Hofmann, K F Kreitner, H Nilgens, R Surkau, W Heil, A Pot-thast, M V Knopp, E W Otten, and M Thelen. Normal and abnormal pul-monary ventilation: visualization at hyperpolarized he-3 mr imaging. Radiology,201(2):564–568, 1996. PMID: 8888259.
[4] Kun Qing, Kai Ruppert, Yun Jiang, Jaime Mata, G Wilson Miller, Yun Shim,Chengbo Wang, Iulian C Ruset, F William Hersman, Talissa A Altes, and JohnMugler. Regional mapping of gas uptake by blood and tissue in the human lungusing hyperpolarized xenon-129 mri. Journal of magnetic resonance imaging :JMRI, 39, 02 2014.
[5] Nicholas J. Tustison, Brian B. Avants, Zixuan Lin, Xue Feng, Nicholas Cullen,Jaime F. Mata, Lucia Flors, James C. Gee, Talissa A. Altes, III John P. Mugler,and Kun Qing. Convolutional neural networks with template-based data augmen-tation for functional lung image quantification. Academic Radiology, 26(3):412– 423, 2019. Special Issue: Pulmonary Functional Imaging.
[6] Ashish Kumar. Clinical anatomy of lungs, 2017.
[7] Mohamed Faisal Lutfi. The physiological basis and clinical significance of lungvolume measurements. Multidisciplinary Respiratory Medicine, 12(1):3, Feb2017.
[8] Wikipedia contributors. Lung volumes — Wikipedia, the free encyclopedia, 2019.[Online; accessed 23-April-2019].
[9] Carmela Maiolo, Ehab Mohamed, and M G Carbonelli. Body composition andrespiratory function. Acta Diabetologica, 40 Suppl 1:S32–8, Oct 2003.
[10] OpenStax. Anatomy and Physiology, chapter 22. OpenStax, 2019.
61

[11] Asthma Education National and Program Prevention. Expert panel report 3(epr-3): guidelines for the diagnosis and management of asthma-summary report2007. The Journal of allergy and clinical immunology, 120(5 Suppl):S94, 2007.
[12] Eduard E de Lange, Talissa A Altes, James T Patrie, John D Gaare, Jeffrey JKnake, John P Mugler III, and Thomas A Platts-Mills. Evaluation of asthmawith hyperpolarized helium-3 mri: correlation with clinical severity and spirom-etry. Chest, 130(4):1055–1062, 2006.
[13] B.R. Celli, W. MacNee, A. Agusti, A. Anzueto, B. Berg, A.S. Buist, P.M.A.Calverley, N. Chavannes, T. Dillard, B. Fahy, A. Fein, J. Heffner, S. Lareau,P. Meek, F. Martinez, W. McNicholas, J. Muris, E. Austegard, R. Pauwels,S. Rennard, A. Rossi, N. Siafakas, B. Tiep, J. Vestbo, E. Wouters, and R. ZuWal-lack. Standards for the diagnosis and treatment of patients with copd: a sum-mary of the ats/ers position paper. European Respiratory Journal, 23(6):932–946,2004.
[14] Anne G Wheaton, Timothy J Cunningham, Earl S Ford, and Janet B Croft.Employment and activity limitations among adults with chronic obstructive pul-monary diseaseunited states, 2013. MMWR. Morbidity and mortality weeklyreport, 64(11):289, 2015.
[15] David M Mannino, Robert C Gagnon, Thomas L Petty, and Eva Lydick. Ob-structive lung disease and low lung function in adults in the united states: datafrom the national health and nutrition examination survey, 1988-1994. Archivesof internal medicine, 160(11):1683–1689, 2000.
[16] Marina Saetta, Antonino Di Stefano, Graziella Turato, Fabrizio M Facchini,Laura Corbino, Cristina E Mapp, Piero Maestrelli, Adalberto Ciaccia, andLeonardo M Fabbri. Cd8+ t-lymphocytes in peripheral airways of smokers withchronic obstructive pulmonary disease. American journal of respiratory and crit-ical care medicine, 157(3):822–826, 1998.
[17] STEPHENI. RENNARD. Inflammation and repair processes in chronic obstruc-tive pulmonary disease. American Journal of Respiratory and Critical CareMedicine, 160(supplement 1):S12–S16, 1999. PMID: 10556162.
[18] VICTORIVO PEINADO, JOANALBERT BARBER, PIETRO ABATE, JOSEPRAMREZ, JOSEP ROCA, SALUD SANTOS, and ROBERT RODRIGUEZ-ROISIN. Inflammatory reaction in pulmonary muscular arteries of patients withmild chronic obstructive pulmonary disease. American Journal of Respiratoryand Critical Care Medicine, 159(5):1605–1611, 1999. PMID: 10228134.
[19] R Rodriguez-Roisin and W MacNee. Pathophysiology of chronic obstructivepulmonary disease. European Respiratory Monograph, 38:177, 2006.
[20] Terence C O’Shaughnessy, Tareq W Ansari, Neil C Barnes, and Peter K Jeffery.Inflammation in bronchial biopsies of subjects with chronic bronchitis: inverse
62

relationship of cd8+ t lymphocytes with fev1. American journal of respiratoryand critical care medicine, 155(3):852–857, 1997.
[21] K Matsuba, JL Wright, BR Wiggs, PD Pare, and JC Hogg. The changes in air-ways structure associated with reduced forced expiratory volume in one second.European Respiratory Journal, 2(9):834–839, 1989.
[22] Denis E O’donnell, Susan M Revill, and Katherine A Webb. Dynamic hyperinfla-tion and exercise intolerance in chronic obstructive pulmonary disease. Americanjournal of respiratory and critical care medicine, 164(5):770–777, 2001.
[23] Bruce H. Culver, Brian L. Graham, Allan L. Coates, Jack Wanger, Cristine E.Berry, Patricia K. Clarke, Teal S. Hallstrand, John L. Hankinson, David A.Kaminsky, Neil R. MacIntyre, Meredith C. McCormack, Margaret Rosenfeld,Sanja Stanojevic, and Daniel J. Weiner. Recommendations for a standard-ized pulmonary function report. an official american thoracic society techni-cal statement. American Journal of Respiratory and Critical Care Medicine,196(11):1463–1472, 12 2017.
[24] D. P. Tashkin, B. Celli, M. Decramer, D. Liu, D. Burkhart, C. Cassino, andS. Kesten. Bronchodilator responsiveness in patients with copd. European Res-piratory Journal, 31(4):742–750, 2008.
[25] Gregg L Ruppel. What is the clinical value of lung volumes? Respiratory Care,57(1):26–38, 2012.
[26] J. Wanger, J. L. Clausen, A. Coates, O. F. Pedersen, V. Brusasco, F. Burgos,R. Casaburi, R. Crapo, P. Enright, C. P. M. van der Grinten, P. Gustafsson,J. Hankinson, R. Jensen, D. Johnson, N. MacIntyre, R. McKay, M. R. Miller,D. Navajas, R. Pellegrino, and G. Viegi. Standardisation of the measurement oflung volumes. European Respiratory Journal, 26(3):511–522, 2005.
[27] Klaus Dalhoff, Santiago Ewig, et al. Adult patients with nosocomial pneumo-nia: epidemiology, diagnosis, and treatment. Deutsches Arzteblatt International,110(38):634, 2013.
[28] Tobias Welte. Imaging in the diagnosis of lung disease: more sophisticatedmethods require greater interdisciplinary collaboration. Deutsches rzteblatt In-ternational, 111(11):179–180, March 2014.
[29] Harvey O. Coxson, John Mayo, Stephen Lam, Giles Santyr, Grace Parraga,and Don D. Sin. New and current clinical imaging techniques to study chronicobstructive pulmonary disease. American Journal of Respiratory and CriticalCare Medicine, 180(7):588–597, 2009. PMID: 19608719.
[30] Mark O Wielputz, Claus P Heußel, Felix JF Herth, and Hans-Ulrich Kauczor.Radiological diagnosis in lung disease: factoring treatment options into the choiceof diagnostic modality. Deutsches Arzteblatt International, 111(11):181, 2014.
63
[31] G John Gibson, Robert Loddenkemper, Yves Sibille, and Bo Lundback. Europeanlung white book. European Respiratory Society, 2013.
[32] Yasutaka Nakano, Shigeo Muro, Hiroaki Sakai, Toyohiro Hirai, Kazuo Chin,Mitsuhiro Tsukino, Koichi Nishimura, Harumi Itoh, Peter D Pare, James CHogg, et al. Computed tomographic measurements of airway dimensions andemphysema in smokers: correlation with lung function. American journal ofrespiratory and critical care medicine, 162(3):1102–1108, 2000.
[33] Yasutaka Nakano, Nestor L Muller, Gregory G King, Akio Niimi, Steven EKalloger, Michiaki Mishima, and Peter D Pare. Quantitative assessment of air-way remodeling using high-resolution ct. Chest, 122(6):271S–275S, 2002.
[34] Sebastian Ley. Lung imaging. European Respiratory Review, 24(136):240–245,2015.
[35] Jane P Ko, Scott Brandman, Joseph Stember, and David P Naidich. Dual-energy computed tomography: concepts, performance, and thoracic applications.Journal of thoracic imaging, 27(1):7–22, 2012.
[36] DP Schuster and T Blackwell. Lung biology in health and disease. 2005.
[37] H.-U. Kauczor, R. Surkau, and T. Roberts. Mri using hyperpolarized noble gases.European Radiology, 8(5):820–827, Jun 1998.
[38] John P. Mugler III and Talissa A. Altes. Hyperpolarized 129xe mri of the humanlung. Journal of Magnetic Resonance Imaging, 37(2):313–331, 2013.
[39] F. William Hersman, Iulian C. Ruset, Stephen Ketel, Iga Muradian, Silviu D.Covrig, Jan Distelbrink, Walter Porter, David Watt, Jeffrey Ketel, John Brack-ett, Aaron Hope, and Samuel Patz. Large production system for hyperpolarized129xe for human lung imaging studies. Academic Radiology, 15(6):683 – 692,2008.
[40] I. C. Ruset, S. Ketel, and F. W. Hersman. Optical pumping system design forlarge production of hyperpolarized 129Xe. Phys. Rev. Lett., 96:053002, Feb 2006.
[41] Michael Salerno, Talissa A Altes, John P Mugler, Masashi Nakatsu, HirotoHatabu, and Eduard E de Lange. Hyperpolarized noble gas mr imaging of thelung: Potential clinical applications. European Journal of Radiology, 40(1):33 –44, 2001.
[42] Shin Matsuoka, Samuel Patz, Mitchell S Albert, Yanping Sun, Rahim R Rizi,Warren B Gefter, and Hiroto Hatabu. Hyperpolarized gas mr imaging of thelung: current status as a research tool. Journal of thoracic imaging, 24(3):181188,August 2009.
64
[43] Sean Fain, Mark L. Schiebler, David G. McCormack, and Grace Parraga. Imag-ing of lung function using hyperpolarized helium-3 magnetic resonance imaging:Review of current and emerging translational methods and applications. Journalof Magnetic Resonance Imaging, 32(6):1398–1408, 2010.
[44] Yanping Sun, Brian P. O’Sullivan, John P. Roche, Ronn Walvick, Austin Reno,Dawn Baker, Joey K. Mansour, and Mitchell S. Albert. Using hyperpolarized 3hemri to evaluate treatment efficacy in cystic fibrosis patients. Journal of MagneticResonance Imaging, 34(5):1206–1211, 2011.
[45] Sean B. Fain, Frank R. Korosec, James H. Holmes, Rafael O’Halloran, Ronald L.Sorkness, and Thomas M. Grist. Functional lung imaging using hyperpolarizedgas mri. Journal of Magnetic Resonance Imaging, 25(5):910–923, 2007.
[46] Keith W Miller, Nicholas V Reo, AJ Schoot Uiterkamp, Diane P Stengle,Thomas R Stengle, and Kenneth L Williamson. Xenon nmr: chemical shiftsof a general anesthetic in common solvents, proteins, and membranes. Proceed-ings of the National Academy of Sciences, 78(8):4946–4949, 1981.
[47] Franois Pontana, Jean-Baptiste Faivre, Martine Remy-Jardin, Thomas Flohr,Bernhard Schmidt, Nunzia Tacelli, Vittorio Pansini, and Jacques Remy. Lungperfusion with dual-energy multidetector-row ct (mdct): Feasibility for the eval-uation of acute pulmonary embolism in 117 consecutive patients. AcademicRadiology, 15(12):1494 – 1504, 2008.
[48] Eric A. Hoffman and Deokiee Chon. Computed tomography studies of lung ven-tilation and perfusion. Proceedings of the American Thoracic Society, 2(6):492–498, 2005. PMID: 16352755.
[49] Hiroto Hatabu, David C Alsop, John Listerud, Mathieu Bonnet, and Warren BGefter. T2* and proton density measurement of normal human lung parenchymausing submillisecond echo time gradient echo magnetic resonance imaging. Eu-ropean journal of radiology, 29(3):245–252, 1999.
[50] Klaus W Stock, Qun Chen, Hiroto Hatabu, and Robert R Edelman. Magneticresonance t2 measurements of the normal human lung in vivo with ultra-shortecho times. Magnetic Resonance Imaging, 17(7):997 – 1000, 1999.
[51] Yoshiharu Ohno, Hisanobu Koyama, Takeshi Yoshikawa, Keiko Matsumoto,Masaya Takahashi, Marc Van Cauteren, and Kazuro Sugimura. T2* mea-surements of 3-t mri with ultrashort tes: capabilities of pulmonary functionassessment and clinical stage classification in smokers. American Journal ofRoentgenology, 197(2):W279–W285, 2011.
[52] G. Wilson Miller, John P. Mugler III, Rui C. S, Talissa A. Altes, G. Kim Prisk,and Susan R. Hopkins. Advances in functional and structural imaging of thehuman lung using proton mri. NMR in Biomedicine, 27(12):1542–1556, 2014.
65
[53] Kuniyoshi Sakai, Anastacia M Bilek, Eduardo Oteiza, Ronald L Walsworth,Dilip Balamore, Ferenc A Jolesz, and Mitchell S Albert. Temporal dynamics ofhyperpolarized129xe resonances in living rats, 1996.
[54] M.S. Albert and D. Balamore. Development of hyperpolarized noble gas mri.Nuclear Instruments and Methods in Physics Research Section A: Accelerators,Spectrometers, Detectors and Associated Equipment, 402(2):441 – 453, 1998. Pro-ceedings of the 7th RCNP International Workshop on Polarized He Beams andGas Targets and Their Application.
[55] S. Sivaram Kaushik, Matthew S. Freeman, Zackary I. Cleveland, John Davies,Jane Stiles, Rohan S. Virgincar, Scott H. Robertson, Mu He, Kevin T. Kelly,W. Michael Foster, H. Page McAdams, and Bastiaan Driehuys. Probing theregional distribution of pulmonary gas exchange through single-breath gas- anddissolved-phase 129xe mr imaging. Journal of Applied Physiology, 115(6):850–860, 2013. PMID: 23845983.
[56] S. Sivaram Kaushik, Scott H. Robertson, Matthew S. Freeman, Mu He, Kevin T.Kelly, Justus E. Roos, Craig R. Rackley, W. Michael Foster, H. Page McAdams,and Bastiaan Driehuys. Single-breath clinical imaging of hyperpolarized 129xe inthe airspaces, barrier, and red blood cells using an interleaved 3d radial 1-pointdixon acquisition. Magnetic Resonance in Medicine, 75(4):1434–1443, 2016.
[57] E. D. Bateman, S. S. Hurd, P. J. Barnes, J. Bousquet, J. M. Drazen, M. FitzGer-ald, P. Gibson, K. Ohta, P. O’Byrne, S. E. Pedersen, E. Pizzichini, S. D. Sullivan,S. E. Wenzel, and H. J. Zar. Global strategy for asthma management and pre-vention: Gina executive summary. European Respiratory Journal, 31(1):143–178,2008.
[58] Jrgen Vestbo, Suzanne S. Hurd, Alvar G. Agust, Paul W. Jones, Claus Vo-gelmeier, Antonio Anzueto, Peter J. Barnes, Leonardo M. Fabbri, Fernando J.Martinez, Masaharu Nishimura, Robert A. Stockley, Don D. Sin, and RobertoRodriguez-Roisin. Global strategy for the diagnosis, management, and preven-tion of chronic obstructive pulmonary disease. American Journal of Respiratoryand Critical Care Medicine, 187(4):347–365, 2013. PMID: 22878278.
[59] Harpreet Ranu, Michael Wilde, and Brendan Madden. Pulmonary function tests.The Ulster medical journal, 80(2):84, 2011.
[60] Sylvia Verbanck, Bruce R Thompson, Daniel Schuermans, Harpal Kalsi, MartynBiddiscombe, Chris Stuart-Andrews, Shane Hanon, Alain Van Muylem, ManuelPaiva, Walter Vincken, and Omar Usmani. Ventilation heterogeneity in theacinar and conductive zones of the normal ageing lung. Thorax, 67(9):789–795,2012.
[61] JOHNL. HANKINSON, JOHNR. ODENCRANTZ, and KATHLEENB.FEDAN. Spirometric reference values from a sample of the general u.s. popula-
66
tion. American Journal of Respiratory and Critical Care Medicine, 159(1):179–187, 1999. PMID: 9872837.
[62] Paul D Robinson, Michael D Goldman, and Per M Gustafsson. Inert gas washout:theoretical background and clinical utility in respiratory disease. Respiration,78(3):339–355, 2009.
[63] Sarah Svenningsen, Miranda Kirby, Danielle Starr, Harvey O Coxson, Nigel A MPaterson, David G McCormack, and Grace Parraga. What are ventilation defectsin asthma? Thorax, 69(1):63–71, 2014.
[64] Talissa A Altes, Patrick L Powers, Jack Knight-Scott, Gary Rakes, Thomas AEPlatts-Mills, Eduard E de Lange, Bennett A Alford, John P Mugler III, andJames R Brookeman. Hyperpolarized 3he mr lung ventilation imaging in asth-matics: preliminary findings. Journal of Magnetic Resonance Imaging: An Of-ficial Journal of the International Society for Magnetic Resonance in Medicine,13(3):378–384, 2001.
[65] Yang-Sheng Tzeng, Kenneth Lutchen, and Mitchell Albert. The difference inventilation heterogeneity between asthmatic and healthy subjects quantified us-ing hyperpolarized 3he mri. Journal of Applied Physiology, 106(3):813–822, 2009.PMID: 19023025.
[66] David M.L. Lilburn, Galina E. Pavlovskaya, and Thomas Meersmann. Perspec-tives of hyperpolarized noble gas mri beyond 3he. Journal of Magnetic Reso-nance, 229:173 – 186, 2013. Frontiers of In Vivo and Materials MRI Research.
[67] Hans-Ulrich Kauczor, Michael Ebert, Karl-Friedrich Kreitner, Helge Nilgens,Reinhard Surkau, Werner Heil, Dirk Hofmann, Ernst W Otten, and ManfredThelen. Imaging of the lungs using 3he mri: preliminary clinical experiencein 18 patients with and without lung disease. Journal of Magnetic ResonanceImaging, 7(3):538–543, 1997.
[68] Saba Samee, Talissa Altes, Patrick Powers, Eduard E de Lange, Jack Knight-Scott, Gary Rakes, John P Mugler III, Jonathan M Ciambotti, Bennet A Alford,James R Brookeman, et al. Imaging the lungs in asthmatic patients by usinghyperpolarized helium-3 magnetic resonance: assessment of response to metha-choline and exercise challenge. Journal of Allergy and Clinical Immunology,111(6):1205–1211, 2003.
[69] Helen Marshall, Martin H Deppe, Juan Parra-Robles, Susan Hillis, Catherine GBillings, Smitha Rajaram, Andrew Swift, Sam R Miller, Joanna H Watson, JanWolber, et al. Direct visualisation of collateral ventilation in copd with hyper-polarised gas mri. Thorax, 67(7):613–617, 2012.
[70] Hongzhi Wang, Jung W. Suh, Sandhitsu R. Das, John Pluta, Caryne Craige,and Paul A. Yushkevich. Multi-atlas segmentation with joint label fusion. IEEETrans. Pattern Anal. Mach. Intell., 35(3):611–623, March 2013.
67

[71] Nicholas J. Tustison, Brian B. Avants, Lucia Flors, Talissa A. Altes, Eduard E.de Lange, John P. Mugler III, and James C. Gee. Ventilation-based segmenta-tion of the lungs using hyperpolarized 3he mri. Journal of Magnetic ResonanceImaging, 34(4):831–841, 2011.
[72] Yann LeCun, Yoshua Bengio, and Geoffrey Hinton. Deep learning. nature,521(7553):436, 2015.
[73] Luke Taylor. Improving deep learning with generic data augmentation. 2018IEEE Symposium Series on Computational Intelligence (SSCI), pages 1542–1547,2018.
[74] Jos V. Manjn, Pierrick Coup, Luis Mart-Bonmat, D. Louis Collins, and Montser-rat Robles. Adaptive non-local means denoising of mr images with spatiallyvarying noise levels. Journal of Magnetic Resonance Imaging, 31(1):192–203,2010.
[75] Miranda Kirby, Mohammadreza Heydarian, Sarah Svenningsen, Andrew Wheat-ley, David G McCormack, Roya Etemad-Rezai, and Grace Parraga. Hyperpolar-ized 3he magnetic resonance functional imaging semiautomated segmentation.Academic radiology, 19(2):141–152, 2012.
[76] Mu He, S Sivaram Kaushik, Scott H Robertson, Matthew S Freeman, Rohan SVirgincar, H Page McAdams, and Bastiaan Driehuys. Extending semiautomaticventilation defect analysis for hyperpolarized 129xe ventilation mri. Academicradiology, 21(12):1530–1541, 2014.
[77] Olaf Ronneberger, Philipp Fischer, and Thomas Brox. U-net: Convolutionalnetworks for biomedical image segmentation. In International Conference onMedical image computing and computer-assisted intervention, pages 234–241.Springer, 2015.
[78] E. Shelhamer, J. Long, and T. Darrell. Fully convolutional networks for semanticsegmentation. IEEE Transactions on Pattern Analysis and Machine Intelligence,39(4):640–651, April 2017.
[79] J. Deng, W. Dong, R. Socher, L.-J. Li, K. Li, and L. Fei-Fei. ImageNet: ALarge-Scale Hierarchical Image Database. In CVPR09, 2009.
[80] Brian B. Avants, Paul Yushkevich, John Pluta, David Minkoff, Marc Kor-czykowski, John Detre, and James C. Gee. The optimal template effect inhippocampus studies of diseased populations. NeuroImage, 49(3):2457 – 2466,2010.
[81] Nicholas C. Cullen and Brian B. Avants. Convolutional Neural Networks forRapid and Simultaneous Brain Extraction and Tissue Segmentation, pages 13–34. Springer New York, New York, NY, 2018.
68

[82] Vinod Nair and Geoffrey E. Hinton. Rectified linear units improve restrictedboltzmann machines. In Proceedings of the 27th International Conference onInternational Conference on Machine Learning, ICML’10, pages 807–814, USA,2010. Omnipress.
[83] S. K. Warfield, K. H. Zou, and W. M. Wells. Simultaneous truth and performancelevel estimation (staple): an algorithm for the validation of image segmentation.IEEE Transactions on Medical Imaging, 23(7):903–921, July 2004.
[84] Nicholas J. Tustison, Talissa A. Altes, Gang Song, Eduard E. de Lange, John P.Mugler III, and James C. Gee. Feature analysis of hyperpolarized helium-3 pul-monary mri: A study of asthmatics versus nonasthmatics. Magnetic Resonancein Medicine, 63(6):1448–1455, 2010.
[85] R Scott Harris, Hanae Fujii-Rios, Tilo Winkler, Guido Musch, Marcos F VidalMelo, and Jose G Venegas. Ventilation defect formation in healthy and asthmasubjects is determined by lung inflation. PLoS One, 7(12):e53216, 2012.
[86] Chingyee Tan, Kun Qing, Lukasz Myc, Jiyoung Shin, Zixuan Lin, Nicholas J.Tustison, Jamie F. Mata, Amanda Shim, Emmaline Calhoun, Fiona Bradshaw,Theresa A. Altherr, Sarah Struchen, Joanne M. Cassani, Talissa A. Altes, HuangY, III Mugler, John P., and Yun Michael Shim. Hyperpolarized-xenon ventila-tion magnetic resonance imaging of healthy subjects with normal spirometry.submitted.
[87] F. J. W. Roughton and R. E. Forster. Relative importance of diffusion andchemical reaction rates in determining rate of exchange of gases in the humanlung, with special reference to true diffusing capacity of pulmonary membraneand volume of blood in the lung capillaries. Journal of Applied Physiology,11(2):290–302, 1957. PMID: 13475180.
[88] Bastiaan Driehuys, Gary P. Cofer, Jim Pollaro, Julie Boslego Mackel, Lau-rence W. Hedlund, and G. Allan Johnson. Imaging alveolar–capillary gas trans-fer using hyperpolarized 129xe mri. Proceedings of the National Academy ofSciences, 103(48):18278–18283, 2006.
[89] John P. Mugler, Talissa A. Altes, Iulian C. Ruset, Isabel M. Dregely, Jaime F.Mata, G. Wilson Miller, Stephen Ketel, Jeffrey Ketel, F. William Hersman,and Kai Ruppert. Simultaneous magnetic resonance imaging of ventilation dis-tribution and gas uptake in the human lung using hyperpolarized xenon-129.Proceedings of the National Academy of Sciences, 107(50):21707–21712, 2010.
[90] Kun Qing, John P. Mugler III, Talissa A. Altes, Yun Jiang, Jaime F. Mata,G. Wilson Miller, Iulian C. Ruset, F. William Hersman, and Kai Ruppert. As-sessment of lung function in asthma and copd using hyperpolarized 129xe chem-ical shift saturation recovery spectroscopy and dissolved-phase mri. NMR inbiomedicine, 27(12):1490–1501, 2014.
69
[91] Zackary I. Cleveland, Gary P. Cofer, Gregory Metz, Denise Beaver, John Nouls,S. Sivaram Kaushik, Monica Kraft, Jan Wolber, Kevin T. Kelly, H. PageMcAdams, and Bastiaan Driehuys. Hyperpolarized 129xe mr imaging of alveolargas uptake in humans. PLOS ONE, 5(8):1–8, 08 2010.
[92] Kai Ruppert, James R Brookeman, Klaus D Hagspiel, and John P Mugler III.Probing lung physiology with xenon polarization transfer contrast (xtc). Mag-netic Resonance in Medicine: An Official Journal of the International Societyfor Magnetic Resonance in Medicine, 44(3):349–357, 2000.
[93] John P. Mugler III, Bastiaan Driehuys, James R. Brookeman, Gordon D. Cates,Stuart S. Berr, Robert G. Bryant, Thomas M. Daniel, Eduard E. De Lange,J. Hunter Downs, Christopher J. Erickson, et al. Mr imaging and spectroscopyusing hyperpolarized 129xe gas: preliminary human results. Magnetic Resonancein Medicine, 37(6):809–815, 1997.
[94] Kuniyoshi Sakai, Anastacia M. Bilek, Eduardo Oteiza, Ronald L. Walsworth,Dilip Balamore, Ferenc A. Jolesz, and Mitchell S. Albert. Temporal dynamics ofhyperpolarized129xe resonances in living rats. Journal of Magnetic Resonance,Series B, 111(3):300 – 304, 1996.
[95] Isabel Dregely, John P. Mugler III, Iulian C. Ruset, Talissa A. Altes, Jaime F.Mata, G. Wilson Miller, Jeffrey Ketel, Steve Ketel, Jan Distelbrink, F.W. Hers-man, and Kai Ruppert. Hyperpolarized xenon-129 gas-exchange imaging of lungmicrostructure: First case studies in subjects with obstructive lung disease. Jour-nal of Magnetic Resonance Imaging, 33(5):1052–1062, 2011.
[96] JP Butler, RW Mair, D Hoffmann, MI Hrovat, RA Rogers, GP Topulos,RL Walsworth, and S Patz. Measuring surface-area-to-volume ratios in softporous materials using laser-polarized xenon interphase exchange nuclear mag-netic resonance. Journal of Physics: Condensed Matter, 14(13):L297, 2002.
[97] R Brower, Robert A Wise, C Hassapoyannes, B Bromberger-Barnea, and S Per-mutt. Effect of lung inflation on lung blood volume and pulmonary venous flow.Journal of Applied Physiology, 58(3):954–963, 1985.
[98] Talissa A. Altes, Jaime Mata, Eduard E. de Lange, James R. Brookeman,and John P. Mugler III. Assessment of lung development using hyperpolar-ized helium-3 diffusion mr imaging. Journal of Magnetic Resonance Imaging,24(6):1277–1283, 2006.
[99] MARTIN BRANDFONBRENER, MILTON LANDOWNE, and NATHAN W.SHOCK. Changes in cardiac output with age. Circulation, 12(4):557–566, 1955.
70