REGIONAL - InterRegioNovation -
98
REGIONAL INNOVA IONS ISSN 2273-2640 N4 2016 t i m e f o r e x p e r t s Les nouvelles frontières numériques 5 24 51 38 12 77 63 46 China’s economic development Cross-border functional region Cross-border cooperation in Belarus La délimitation des frontières Foreign businesses in China and India State banks in Ukraine: border areas Boundaries clarification and designation DEMARCATION, BORDER MANAGEMENT, CROSS-BORDER COOPERATION
-
Upload
khangminh22 -
Category
Documents
-
view
0 -
download
0
Transcript of REGIONAL - InterRegioNovation -

REGIONALINNOVA IONSISSN 2273-2640
N42016
t i m e f o r ex
pe
r
ts
Les nouvelles frontières
numériques
5
24
51
38
12
77
63
46China’s
economic development
Cross-border functional
region
Cross-border
cooperation
in Belarus
La délimitation
des frontières
Foreign
businesses in
China and India
State banks in
Ukraine: border
areas
Boundaries clarification
and designation
DEMARCATION, BORDER MANAGEMENT, CROSS-BORDER COOPERATION
Regional Innovations - 4, 2016 Page 2
Editorial Board
Jean-Francois Devemy,
Publishing Director,
President, FranceXP, Paris, France
Xavier Givelet,
Magistrate at the Court of Accounts, Lyon, France
Dr Adrian Campbell,
University of Birmingham, International Development
Department, School of Government and Society, Birmingham, UK
Prof Tetiana Zatonatska,
Taras Shevchenko National University of Kyiv, Kyiv, Ukraine
Dr Liga Baltina,
University of Latvia, Faculty of Economics and Management,
Riga, Latvia
Dr Tatjana Vertinskaya
Institute of Economy, Academie of Sciences of Belarus, Minsk,
Belarus
Prof Oleksandr Dluhopolskyi,
Ternopil National Economic University, Ternopil, Ukraine
Dr Fuad Shahvaliyev,
Independent Expert in Economics and Finance, Baku,
Azerbaijan
Dr Du Hong Wei,
Independent Expert on Philosophy and Economy, Beijing, China
Dr Alexei Kiryukhin,
Karazin Kharkiv National University, Kharkiv, Ukraine
Dr Tetiana Kornieieva,
President, InterRegioNovation,
International Business Institute, Paris, France
Olga Zubkova,
Technical Director
ISSN 2273-2640
Regional Innovations is indexed in: Advance Science Index
GIF – Global Impact Factor
EconPapers Registry of Open Access Repositories
IDEAS REPEC
OCLC WorldCat RINC
Google Scholar
Under evaluation: Ulrich's Periodicals Directory
Index Copernicus Scopus
About InterRegioNovation
InterRegioNovation is the International Association devoted to
the transfer and exchange of knowledge and innovations at all
regional levels (country, region, city, community etc.) between
knowledge transfer professionals (business, research institutions,
policy makers, government agencies, individuals, others) in all
countries of the enlarged Europe, CIS countries and from other
continents for stimulating and enhancing economic and social
growth in the regions.
This is a policy and research association that brings together all
knowledge transfer professionals who are interested in
delivering efficient, flexible, innovative and cost-effective
services across the private and public sectors. We work closely
with business, research and educational institutions, government
agencies, policy makers, NGOs, media, individuals and other
stakeholders to promote the interests of their industries.
Our members understand the changing needs of the transfer and
exchange of knowledge and innovations and through continuous
professional development, marketing and networking
opportunities offered in this association, we keep current with the
latest knowledge trends and issues that challenge people in their
work and life journey. We also offer expansive opportunities for
partner connection through our networks.
Journal “Regional Innovations” is one of the Association’s tools
for innovators and everybody who is interested in any aspects of
innovation development.
www.irn.center
Contacts:
E-mail: [email protected]
Address: 16, rue de la Roche,
Crégy-lès-Meaux, 77124, France
Tel. : +33 6 48 18 86 95

Regional Innovations - 4, 2016 Page 3
About journal
On behalf of the Editorial Board, it gives us a great pleasure to welcome you to the forth and the last issue of 2016 of the
Regional Innovations Journal. This is a thematic special issue dedicated to broad aspects of demarcation, border
management and cross-border cooperation.
The Regional Innovations publishes original research papers, policy analyses, review papers and book reviews in order to
establish an effective channel of communication between business, research institutions, policy makers, government
agencies, and individuals relative to the analysis of various aspects of knowledge and innovations transfer and exchange
within regional dimensions.
This is an independent, peer-reviewed, Internet-based international journal devoted to publishing original research papers of
highest quality, sharing ideas and discussing innovation sector within regional dimensions. Normally, four issues are
prepared each year. The journal welcomes to submit research papers by exceptional innovators, leading universities,
globally recognized business, government agencies, policy makers and political leaders.
We intend that our readers will be exposed to the most central and significant issues in innovations development. We wish
to publish papers that exemplify the highest standards of clarity, and that promise to have significant impact on existing
front-line debates or to lead to new ones. The journal explores key priorities of the knowledge and innovations transfer and
exchange in terms of critical aspects of human life (economy, law, science, business, health, education, culture etc.). We
therefore welcome submissions not only from established areas of research, but also from new and emerging fields and
those which are less well represented in existing publications, e.g. engineering studies, biomedical research etc.
We also strive to ensure that being under expert evaluation, each submission will receive developmental and supportive
comments to enhance the article. Our refereeing process will involve that each submission will be reviewed by one or more
specialists in the relevant field. Articles will be added to the volumes and the journal audience will receive e-mails updates
to encourage them to the new articles.
We are delighted with, and immensely grateful to the large numbers of colleagues, both members of the Associations
InterRegioNovation and FranceXP (France), representatives from many universities in France, Latvia, UK, Azerbaijan,
China, Belarus, Ukraine and other institutions, who have supported the editorial process. And we are very proud of the
expertise that they collectively bring, which we believe is unsurpassed by any contemporary innovative journal.
We are immensely grateful to our colleagues for their support and advice through the process of setting the journal up, and
for the confidence they have placed in us in supporting this initiative at a time of economic uncertainty.
In the development of the Regional Innovations to date, we would like to enlist the support of a number of organisations
who wish to promote this online journal to their experts. To ensure its sustainability, we would also like to invite other
organisations, networks, conferences and meetings to associate themselves with the Regional Innovations. We therefore aim
for the Regional Innovations to become the leading online forum to globally disseminate outstanding research papers on
innovation sector in regional dimensions. Being an online periodical, the Regional Innovations is also a forum for exchange
of imaginative ideas readers wish to share. Contributions of articles on innovations sector and your comments about this
issue are very welcome.
To this end, if you lead, represent, or are a member of any such organisation, please contact us to offer your support and
commit to promoting the Regional Innovations as a publication outlet for research undertaken by your experts.
We do hope you enjoy and benefit from the Regional Innovations! And many thanks for staying with us in 2016!
Jean-François Devemy
Publishing Director

Regional Innovations - 4, 2016 Page 4
Contents
LES NOUVELLES FRONTIERES NUMERIQUES ET
PARTAGEES DE LA FRANCE
Pierre Vergez
STATE BANKS IN UKRAINE: RISKS OF DEBT FINANCING
OF BORDER AREAS
Viktor Fedosov
Olena Derevko
INTERACTION OF THE DEPENDENCE OF CHINA’S
ECONOMIC DEVELOPMENT ON IMPORTED PETROLEUM
AND INTERNATIONAL RELATIONS
Du Hong Wei
CROSS-BORDER COOPERATION BETWEEN REPUBLIC OF
BELARUS AND REGIONS OF MEMBER COUNTRIES EU,
EAEU AND UKRAINE: COMPARATIVE ANALYSIS OF
MANAGING MECHANISM
Tatiana Vertinskaya
CHINA: FROM A PRODUCER TO A CONSUMER.
PROSPECTS FOR SMALL AND MEDIUM FOREIGN
BUSINESSES IN CHINA AND INDIA
Maria Shkulipa
STABILITY OF CROSS-BORDER FUNCTIONAL REGION IN
THE CONTEXT OF COUNTER INTEGRATIONS. PART I.
THEORETICAL AND HISTORICAL ASPECTS
Alexei Kiryukhin
WORLD PRACTICE OF BOUNDARIES CLARIFICATION AND
DESIGNATION: EXPERIENCE FOR UKRAINE
Tetiana Zatonatska
Tetiana Kornieieva
LA REPARTITION DES COMPETENCES RELATIVES A LA
DELIMITATION DES FRONTIERES
Jean-Francois Devemy
About authors
Requirements for articles
5
12
24
38
46
51
63
77
94
97

Regional Innovations - 4, 2016 Page 5
Résumé 1
Pour la mise en œuvre des politiques ayant un impact sur l’environnement, l’Union européenne a besoin de
données géographiques à grande échelle. La directive INSPIRE répond à ce besoin, en demandant aux Etats
membres de mettre à disposition dès 2018 ces données de façon interopérable. Les données requises par
INSPIRE comprennent les lignes administratives de premier niveau c’est-à-dire les frontières entre Etats. En
France le MEEM (Ministère de l’environnement de l’énergie et de la mer) est le point de contact national
pour la mise en œuvre de la directive INSPIRE. En ce qui concerne les agences nationales de cartographie
et de cadastre, la mise en œuvre de la directive est coordonnée par EuroGeographics au sein de la
plateforme ELF (European Location Framework), qui a organisé en 2016 la création des premiers raccords
entre les bases de données des pays voisins, ce qui implique le partage d’une ligne frontière unique. La
mission IGN d’appui au CNIG (Conseil national de l’information géographique), structure de coordination
pour la mise en œuvre de la directive INSPIRE en France, répond à l’objectif de création d’une ligne
frontière nationale numérique et partagée avec les pays frontaliers.
Mots clés: frontière, ligne partagée, Directive INSPIRE, interopérabilité, donnée numérique.
Abstract2
For its environmental issues, the European Union needs geographic data at large scale, the administrative
first level lines are "between states", namely the boundaries. In France it is the responsibility of the Ministry
of environment (MEEM) to enforce the INSPIRE Directive, which requires these data to be interoperable
and made available by all European countries from 2018 onwards. Regarding national mapping and
cadastral agencies (NMCA), the actual implementation of the Directive is coordinated by EuroGeographics
within the ELF platform (European Location Framework), which organized in 2016 the first edge-matchings
between neighboring countries. This implies the sharing of a single boundary line between them. The IGN
mission supporting the CNIG, the French coordinating structure according to INSPIRE, meets therefore the
goal of creating a digital and shared boundary line. After a brief history, this article presents the current
revolution in the design of European borders and its effects on the French territory. The new inventory is not
yet final, but the approach initiated can claim a permanent determining of those limits. It will only stand the
two iconic questions of the metropolitan border that are the Mont-Blanc area and the mouth of the Bidassoa.
1 Cet article a initialement été publié dans la Revue XYZ, #148, 3 trimestre 2016. L’auteur a proposé de l’adapter (avec quelques modifications),
avec l’accord de l’éditeur, en vue de sa publication dans le numéro thématique «frontières» de la revue «Innovations Régionales».
2 This paper was already published in the Journal XYZ, # 148, 3 trimester 2016. It was proposed by the author (with some modifications) with an
accordance with the Editorial Board of the Journal XYZ, for its publication in this thematic issue on border management of the Regional
Innovations Journal.
Regional Innovations - 4, 2016 Page 6
LES FRONTIÈRES JUSQU’À 2015
Des textes
La ligne frontière est héritée des Limes, les limites de
l’arpentage, succédant aux marches et confins tous
relatifs aux extrémités évasives de la souveraineté sur
un territoire.
Le premier texte frontalier pour la France, est le Traité
des Pyrénées, signé en 1659 à l’occasion du mariage
de Louis XIV avec l’infante d’Espagne, sur l’île des
Faisans restée depuis cette occasion l’unique
condominium du territoire. Extrait :
« les monts Pyrénées qui avaient anciennement divisé
les Gaules des Espagnes seront aussi dorénavant la
division des deux mêmes royaumes …par la crête des
montagnes qui forment les versants des eaux »
Des conventions et accords de délimitations viendront
préciser le détail de la division et les modalités
d’abornement afin de matérialiser les descriptifs sur le
terrain.
Par la suite, les autres frontières géographiques de la
France seront aussi détaillées dans des textes au fur et
à mesure des Traités (le dernier a été signé en 2012
avec Andorre). Ils sont la référence de la définition
des frontières. Les documents associés aux traités sont
d’autant plus imprécis que l’on remonte dans le temps
et sont considérés comme des compléments.
Les descriptions des Traités sont rédigées sous
l’autorité des diplomates, avec l’appui technique des
géographes, le respect de leur application étant
délégué aux préfets des régions frontalières.
On retrouve aujourd’hui ces 3 niveaux dans les
commissions mixtes réglant les questions frontalières.
Des représentations cartographiques
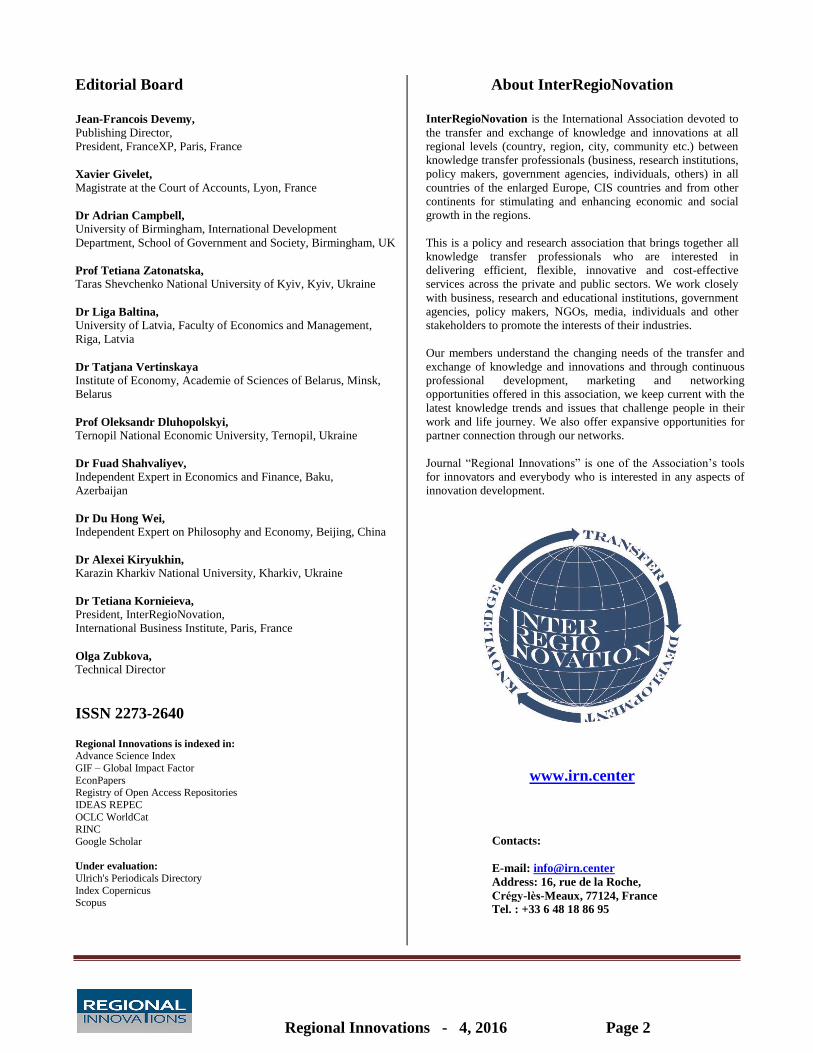
Le premier partage frontalier cartographié juridique
semble être en 1500 celui du traité de Tordesillas,
partageant le monde entre portugais et espagnols. Les
lignes frontières apparaissent sur les cartes vers 1600
avec la dislocation des seigneuries médiévales au
profit des souverainetés, nouveau principe
d’organisation en Europe.
C’est le début d’une très lente progression qui verra
leurs tracés devenir de plus en plus précis.
Figure 1. Carte du traité de Tordesillas
Le mont-Blanc apparait sur les cartes vers 1786, avec
le début d’une cartographie détaillée des massifs
montagneux, jusque-là représentés sous formes
symboliques.
Malgré l’avènement des bases numériques, chaque
pays possède encore sa propre représentation
cartographique de la ligne frontière. Leurs divergences
sur des petites zones pouvaient rester encore
invisibles. Jusqu’en 2014, la représentation numérique
française de la ligne frontière ne pouvait ainsi garantir
une précision meilleure que 30 m sur 80% de sa
longueur.
Et puis les échanges de données entre pays dans des
formats compatibles sont devenus possibles. Avec la
mise en place des systèmes géodésiques
internationaux et la possibilité des transformations
précises de coordonnées, ces écarts de tracés sont
désormais devenus évidents en comparant les données
numériques transfrontalières.
La mission CNIG (conseil national de l’information
géographique http://cnig.gouv.fr/) de l’IGN, structure
de coordination pour la mise en œuvre de la directive
INSPIRE en France, a pris ce dossier en main avec
pour objectif la création d’une ligne frontière
numérique unique et partagée sur tout le pourtour du
territoire national.

Regional Innovations - 4, 2016 Page 7
LA LIGNE NUMÉRIQUE UNIQUE PARTAGÉE
L’effet moteur de la directive INSPIRE
L’article 10.2 de la Directive INSPIRE en 2007, met
pour la première fois en évidence la nécessité de
constituer une ligne unique : «Afin de garantir la
cohérence des données géographiques concernant un
élément géographique qui englobe la frontière entre
deux États membres ou plus, les États membres
décident d’un commun accord, le cas échéant, de la
représentation et de la position de ces éléments
communs».
Chaque pays fait donc son possible pour être au
rendez-vous en 2018, échéance affichée par le
règlement pour la thématique des limites
administratives.
Le projet European Location Framework (ELF :
http://www.elfproject.eu/), coordonné par
EuroGeographics, vise à mettre en œuvre la Directive
Inspire pour ce qui concerne les agences nationales de
cartographie et de cadastre, et demande à ses membres
les plus actifs (dont l’IGN) de raccorder les bases de
données limitrophes. Sans ligne numérique unique
partagée, cela aurait été impossible.
Les accords…
Autant à moyenne échelle sur les produits européens
d’EuroGeographics (EBM, ERM), les divergences
majeures n’apparaissent pas, autant à grande échelle,
surgissent une quantité d’interprétations
cartographiques différentes des textes. Sur chacun de
ces points, une confrontation des arguments
techniques a dû être débattue afin d’obtenir un accord
bilatéral.
Les établissements nationaux (Centres du cadastre,
Instituts géographiques nationaux, Instituts militaires)
ont collaboré sur la définition technique d’une limite
commune. Partant des textes descriptifs de la
frontière, des mesures ont été effectuées de part et
d’autre pour établir techniquement un tracé. Quand
cela a été possible, ces rapprochements ont été initiés
sous couvert des commissions bilatérales officielles,
en tenant compte des responsabilités de chacun.
Ainsi, des lignes uniques à grande échelle sur toutes
les frontières françaises ont été validées par divers
types d’accords. Qu’ils soient oraux, temporaires, ou
ratifiés par des conventions, les processus de
validation sont en marche, s’appuyant sur un savoir
technique (la mesure GPS, les restitutions
photogrammétriques, les levers Lidar) dont la
reconnaissance commune fait autorité.
Des premiers textes prenant en compte ces évolutions
ont désormais été signés et reconnaissent la
prééminence des coordonnées sur la matérialisation,
même si le texte des Traités reste la référence absolue.
La certification juridique bilatérale sera lente dans
certains contextes, mais le besoin partagé de ligne
unique permet de lever les obstacles qui semblaient
jusque-là incontournables. D’ailleurs, un à un, tous les
responsables concernés en comprennent l’enjeu et la
situation évolue très favorablement.
En absolu, la précision de la ligne frontière numérique
unique s’appuie sur des mesures qui vont du cm
(GPS) au métrique (de 1 à 5m :restitutions). Mais dans
les conventions, les jeux de coordonnées, vont asseoir
la ligne sur une position commune au millimètre qu’il
sera difficile de faire bouger par la suite.
…et désaccords
Figure 2. Apparition du mont-Blanc sur les cartes ? à gauche : 1691 Carte d’origine du Père
Placide, ingénieur géographe, mais corrigée et augmentée… à droite, en 1792 par
Dezauche, géographe d’après les ouvrages de Guillaume Delisle (1675-1726)
Regional Innovations - 4, 2016 Page 8
En métropole, il y a deux zones de désaccords
diplomatiques historiques : elles ont été éliminées
d’office lors des transactions pour ne pas devenir des
obstacles aux échanges techniques et négociations : le
secteur du mont-Blanc et l’embouchure de la
Bidassoa.
Outremer, des divergences frontalières subsistent
aussi : le Suriname revendique près de 10% de la
Guyane, côté sud-ouest, entre Litani et Marouini.
Pour l’île de Saint-Martin, les Pays-Bas ont demandé
une régularisation à partir d’un texte non délimité sur
le terrain en 2016. Une confrontation est en cours à
propos de l’étang aux Huîtres que revendiquent les
Néerlandais sur toute sa surface.
Avec Andorre, aucune description écrite de la
frontière ne préexistait. Des échanges de territoires ont
été l’occasion de mettre à plat les divergences et
depuis 2015 le traité délimitant la frontière est entré en
vigueur, après approbation par le Sénat et par
l’Assemblée Nationale.
Les échanges et constructions d’ouvrages, les ententes
cadastrales lors de poses de bornes ou de
remembrements ont permis ponctuellement des mises
en accord sur les frontières.
Les divergences créent des « no man’s land » où tout
est possible : freins au développement structurel…ou
prétexte à de nouveaux types d’accords
transnationaux. C’est sans doute par des intérêts
économiques communs que les Etats finiront par
résoudre leurs gros désaccords.
Le concept de ligne temporaire
Avec l’évolution du numérique, chaque citoyen peut
accéder à l’information géographique et en constater
la fidélité. Chacun est à même de consulter des
territoires représentés à une échelle toujours plus
grande et assemblés le plus précisément possible. La
rapidité de cette révolution culturelle bouscule les
organisations historiques.
Pour la ligne, les pays peuvent être amenés à
s’entendre sur un accord temporaire en attendant
mieux. Voici deux exemples pour comprendre les
méandres du processus :
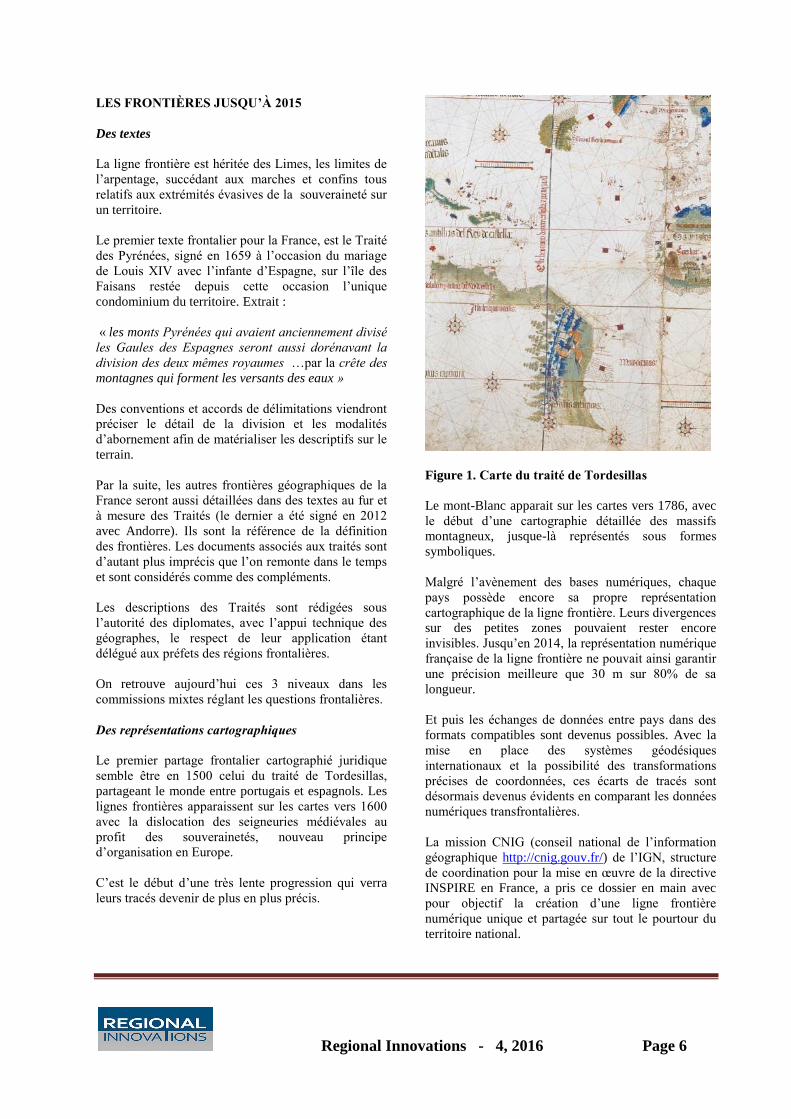
Dans les Pyrénées, la ligne a été créée à partir d’un
consensus entre les restitutions photogrammétriques.
Cependant elle doit être cohérente avec les
coordonnées des bornes qui matérialisent jusqu’à
présent la frontière. Seule la moitié ayant été mesurée,
il a été admis bilatéralement que le caractère définitif
de la ligne en ces endroits attendrait les mesures GPS.
De plus, une dizaine de points douteux resteront à
visiter dans les années à venir, afin de trancher
techniquement sur le passage de la ligne de partage
des eaux.
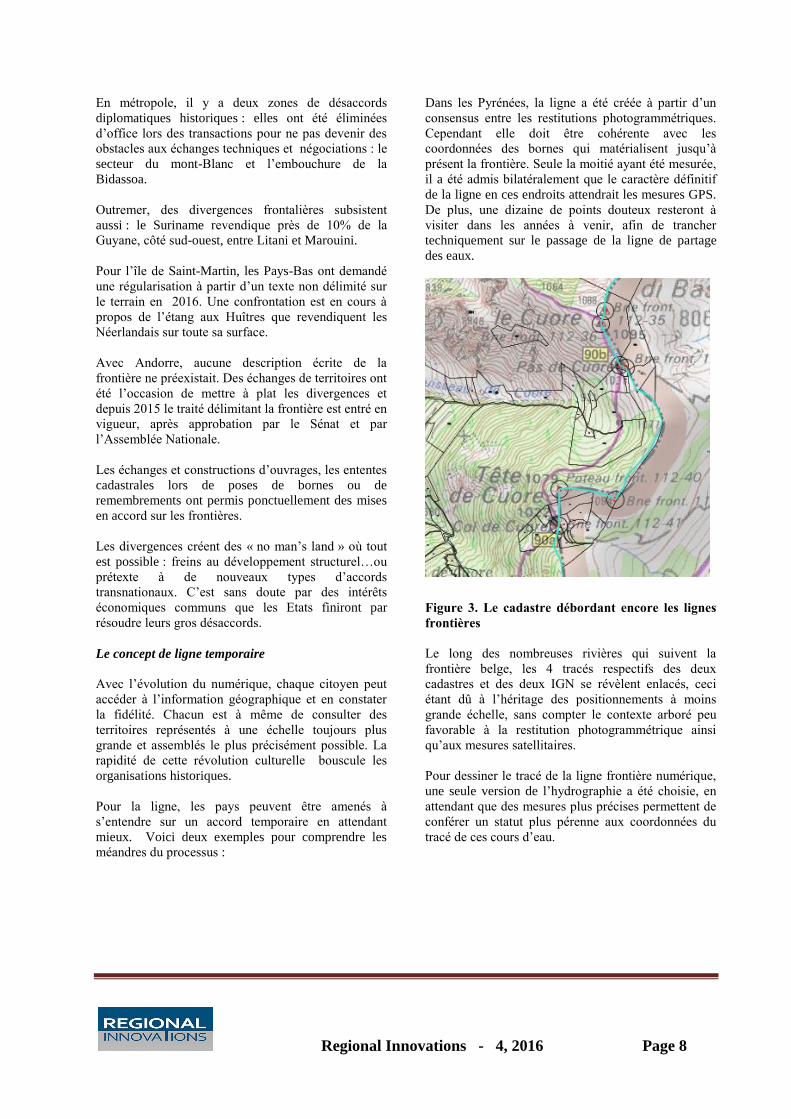
Figure 3. Le cadastre débordant encore les lignes
frontières
Le long des nombreuses rivières qui suivent la
frontière belge, les 4 tracés respectifs des deux
cadastres et des deux IGN se révèlent enlacés, ceci
étant dû à l’héritage des positionnements à moins
grande échelle, sans compter le contexte arboré peu
favorable à la restitution photogrammétrique ainsi
qu’aux mesures satellitaires.
Pour dessiner le tracé de la ligne frontière numérique,
une seule version de l’hydrographie a été choisie, en
attendant que des mesures plus précises permettent de
conférer un statut plus pérenne aux coordonnées du
tracé de ces cours d’eau.
Regional Innovations - 4, 2016 Page 9
Figure 4. En bleu, la ligne franco espagnole validée, à son arrivée sur la Méditerranée
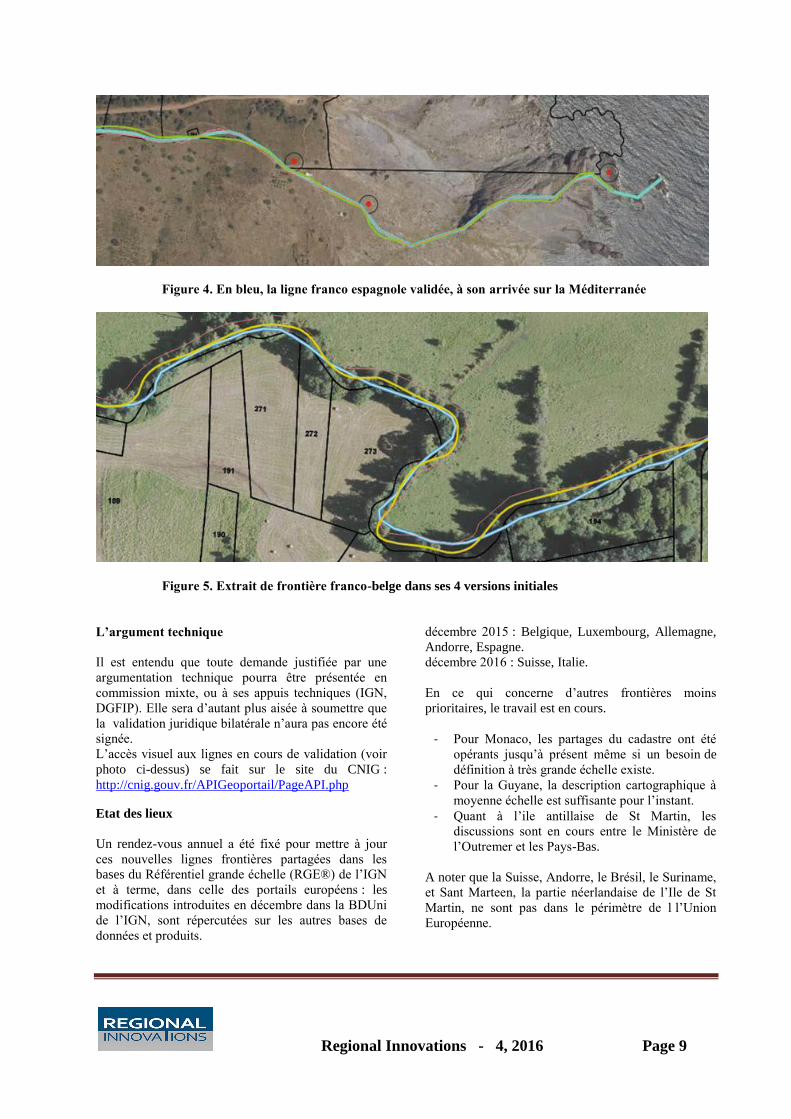
Figure 5. Extrait de frontière franco-belge dans ses 4 versions initiales
L’argument technique
Il est entendu que toute demande justifiée par une
argumentation technique pourra être présentée en
commission mixte, ou à ses appuis techniques (IGN,
DGFIP). Elle sera d’autant plus aisée à soumettre que
la validation juridique bilatérale n’aura pas encore été
signée.
L’accès visuel aux lignes en cours de validation (voir
photo ci-dessus) se fait sur le site du CNIG :
http://cnig.gouv.fr/APIGeoportail/PageAPI.php
Etat des lieux
Un rendez-vous annuel a été fixé pour mettre à jour
ces nouvelles lignes frontières partagées dans les
bases du Référentiel grande échelle (RGE®) de l’IGN
et à terme, dans celle des portails européens : les
modifications introduites en décembre dans la BDUni
de l’IGN, sont répercutées sur les autres bases de
données et produits.
décembre 2015 : Belgique, Luxembourg, Allemagne,
Andorre, Espagne.
décembre 2016 : Suisse, Italie.
En ce qui concerne d’autres frontières moins
prioritaires, le travail est en cours.
- Pour Monaco, les partages du cadastre ont été
opérants jusqu’à présent même si un besoin de
définition à très grande échelle existe.
- Pour la Guyane, la description cartographique à
moyenne échelle est suffisante pour l’instant.
- Quant à l’ile antillaise de St Martin, les
discussions sont en cours entre le Ministère de
l’Outremer et les Pays-Bas.
A noter que la Suisse, Andorre, le Brésil, le Suriname,
et Sant Marteen, la partie néerlandaise de l’Ile de St
Martin, ne sont pas dans le périmètre de l l’Union
Européenne.
Regional Innovations - 4, 2016 Page 10
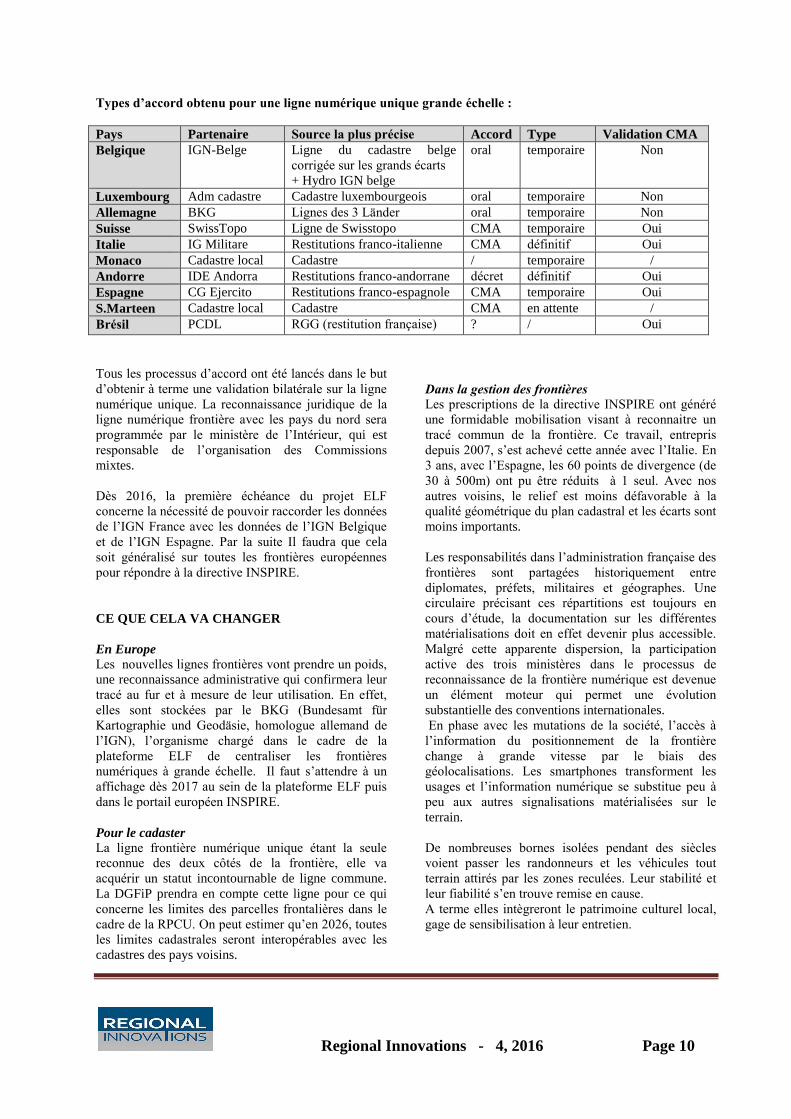
Types d’accord obtenu pour une ligne numérique unique grande échelle :
Pays Partenaire Source la plus précise Accord Type Validation CMA
Belgique IGN-Belge Ligne du cadastre belge
corrigée sur les grands écarts
+ Hydro IGN belge
oral temporaire Non
Luxembourg Adm cadastre Cadastre luxembourgeois oral temporaire Non
Allemagne BKG Lignes des 3 Länder oral temporaire Non
Suisse SwissTopo Ligne de Swisstopo CMA temporaire Oui
Italie IG Militare Restitutions franco-italienne CMA définitif Oui
Monaco Cadastre local Cadastre / temporaire /
Andorre IDE Andorra Restitutions franco-andorrane décret définitif Oui
Espagne CG Ejercito Restitutions franco-espagnole CMA temporaire Oui
S.Marteen Cadastre local Cadastre CMA en attente /
Brésil PCDL RGG (restitution française) ? / Oui
Tous les processus d’accord ont été lancés dans le but
d’obtenir à terme une validation bilatérale sur la ligne
numérique unique. La reconnaissance juridique de la
ligne numérique frontière avec les pays du nord sera
programmée par le ministère de l’Intérieur, qui est
responsable de l’organisation des Commissions
mixtes.
Dès 2016, la première échéance du projet ELF
concerne la nécessité de pouvoir raccorder les données
de l’IGN France avec les données de l’IGN Belgique
et de l’IGN Espagne. Par la suite Il faudra que cela
soit généralisé sur toutes les frontières européennes
pour répondre à la directive INSPIRE.
CE QUE CELA VA CHANGER
En Europe
Les nouvelles lignes frontières vont prendre un poids,
une reconnaissance administrative qui confirmera leur
tracé au fur et à mesure de leur utilisation. En effet,
elles sont stockées par le BKG (Bundesamt für
Kartographie und Geodäsie, homologue allemand de
l’IGN), l’organisme chargé dans le cadre de la
plateforme ELF de centraliser les frontières
numériques à grande échelle. Il faut s’attendre à un
affichage dès 2017 au sein de la plateforme ELF puis
dans le portail européen INSPIRE.
Pour le cadaster
La ligne frontière numérique unique étant la seule
reconnue des deux côtés de la frontière, elle va
acquérir un statut incontournable de ligne commune.
La DGFiP prendra en compte cette ligne pour ce qui
concerne les limites des parcelles frontalières dans le
cadre de la RPCU. On peut estimer qu’en 2026, toutes
les limites cadastrales seront interopérables avec les
cadastres des pays voisins.
Dans la gestion des frontières
Les prescriptions de la directive INSPIRE ont généré
une formidable mobilisation visant à reconnaitre un
tracé commun de la frontière. Ce travail, entrepris
depuis 2007, s’est achevé cette année avec l’Italie. En
3 ans, avec l’Espagne, les 60 points de divergence (de
30 à 500m) ont pu être réduits à 1 seul. Avec nos
autres voisins, le relief est moins défavorable à la
qualité géométrique du plan cadastral et les écarts sont
moins importants.
Les responsabilités dans l’administration française des
frontières sont partagées historiquement entre
diplomates, préfets, militaires et géographes. Une
circulaire précisant ces répartitions est toujours en
cours d’étude, la documentation sur les différentes
matérialisations doit en effet devenir plus accessible.
Malgré cette apparente dispersion, la participation
active des trois ministères dans le processus de
reconnaissance de la frontière numérique est devenue
un élément moteur qui permet une évolution
substantielle des conventions internationales.
En phase avec les mutations de la société, l’accès à
l’information du positionnement de la frontière
change à grande vitesse par le biais des
géolocalisations. Les smartphones transforment les
usages et l’information numérique se substitue peu à
peu aux autres signalisations matérialisées sur le
terrain.
De nombreuses bornes isolées pendant des siècles
voient passer les randonneurs et les véhicules tout
terrain attirés par les zones reculées. Leur stabilité et
leur fiabilité s’en trouve remise en cause.
A terme elles intègreront le patrimoine culturel local,
gage de sensibilisation à leur entretien.

Regional Innovations - 4, 2016 Page 11
Bibliographie
1. Bacchus M. 2004, Évolution des méthodes de tenue à jour des cartes et bases de données géographiques à
l’IGN, Bull. Comité Français de Cartographie n° 182, 52-58, Paris, CFC.
http://www.lecfc.fr/new/articles/218-article-5.pdf
2. Capdevila J. 2009, Historia del deslinde de la frontera hispano-francesa, Madrid, CNIG.
3. Clergeot P. 2007, limites intercommunales : les difficultés d’une définition complexe, Géomètre n° 2038,
30-38, Paris, Topex.
4. Devemy J-F. 2015, la répartition des compétences relatives à la délimitation des frontières, Regional
Innovations - 1, 2015, Crégy-lès-Meaux, InterRegioNovation. www.irn.center
5. Habchi V. 2008, Genève et Savoie : une histoire, une frontière, Géomatique Expert n° 62, 32-40, Noisy le
Grand, Cimax.
6. Lecordix F. 2013, Cartographie transfrontalière pour la Nouvelle Carte de Base au 1:25 000, Cartes &
Géomatique n° 218, 31-38, Paris, CFC. http://www.lecfc.fr/new/articles/218-article-3.pdf
7. Puiseux A. 2012, Dossier ”frontières nationales”, IGN Magazine n° 66, 6-12, St-Mandé, IGN.
8. Razemon O. 2007, L’Europe précise ses frontières, Géomètre n° 2038, 20-21, Paris, Topex.
9. Wisard J-P. 2006, Inventaire des bornes-frontière du canton de Genève, Genève, SITG.
Annex 1.
Eventuel Tableau récapitulatif des frontières
Frontière franco-
espagnole
Longueur 623 km
700 bornes : de 1 à 602
+ enclave de Llivia
Traité des Pyrénées
(1659)
délimitation de 1856 à
1868 (Traités de
Bayonne).
Dernière rectification en
1982 à Arette (27 ares)
Frontière franco-andorrane
Longueur 57 km. Une rectification et 29 points
fixés en 2000, mais pas de bornes. Traité de
délimitation signé en 2012.
Frontière franco-luxembourgeoise
Longueur 73 km
Environ 400 bornes
Traité des Limites (Courtrai 1820).
Dernière rectification : en 2007,
échange de 9 hectares
Frontière franco-belge
Longueur 620 km
Traité d’Utrecht
(1713)
Traité de Paris (1815)
Traité de Courtrai
(1820)
Réglé entre cadastres
Frontière avec les
Antilles néerlandaises
(Saint-Martin)
Longueur 13 km
Frontière franco-
surinamienne (Guyane)
Longueur 520 km
Accord de 1915 sur un
quart de la longueur du
fleuve Maroni.
Frontière franco-
brésilienne (Guyane)
Longueur 730 km
Accord de délimitation
signé en 1980. 10 points
observés en 1937 (1),
1954 (1), 1955 (5) et
1991 (3).10 bornes
implantées en 1937 (1),
1961 (3), 1962 (3) et
1991 (3).
2913 km de frontières
métropolitaines
3424 km de côtes
métropolitaines
1263 km de frontières
outremer
2000 km outremer
Frontière franco-allemande
Longueur 448 km
900 bornes avec la Rhénanie-
Palatinat, 900 avec la Sarre.
En application du traité de
Versailles (1919),
délimitations : 1925 et 1937,
Rectification en 2000 (Rhin).
Frontière franco-suisse
Longueur 573 km
Plusieurs traités (1780,
1816, 1824, 1826, 1891) et
échanges de territoires
(1862, 1953, 1959, 1963,
1977, 1984, 1996, 2002).
ont 2900 bornes et points,
déterminés par Les
géomètres cantonaux,
archivées par Swistopo
Frontière franco-italienne
Longueur 515 km
Traité d’Utrecht (1713,
démarcation 1825),
Traité de Turin (1860,
démarcation 1861-62),
Traité de Paris (1947,
démarcation 1947-1948,
1962-1963, 1975, 1989).
Une rectification en 1967
à Clavières.
Toutes les bornes ont
depuis 2008 des
coordonnées déterminées
en commun.
Frontière franco-
monégasque
Longueur 4 km
Regional Innovations - 4, 2016 Page 12
Abstract
Border areas in Ukraine are characterized by considerable unevenness of development. To finance the
investment in the border areas by the Government of Ukraine provided the use of international technical
assistance and resources of international financial institutions (such as government borrowing) which could
be channeled for the implementation of investment projects through state banks. However the peculiarities of
state banks in Ukraine pose an additional burden on the debt sector. The article examines the changing risks
related to the state debt, due to the impact factor of the capitalization of state banks by issuing T-bonds. The
spectrum of risks regulated by "On Approval of the Procedure for monitoring the risks associated with the
management of the state (local) debt" decree from 01.08.2012 №815 issued by the Cabinet of Ministers of
Ukraine is analyzed. It is shown that during 2008-2016 years capitalization carried through T-bonds of state
banks led to 88.1 billion UAH of borrowing and the need for expenditure in the amount of 39.87 billion UAH
aimed at servicing securities. The last factor increased the budget risk and provoked the emergence of "debt
spiral": annual increase in expenditure on maintenance capitalization of government T-bonds in those
volumes increased size of the budget deficit and growth of further government borrowing. In addition to the
above, from 2016 begin repayment capitalization bonds, it will cause additional impact on debt refinancing
risk.
With a view to easing the budgetary risk due to impact of maintenance capitalization of T-bonds it is
proposed, similar to the approach in the provision of state guarantees to business entities, to develop a
mechanism of partial (or complete) compensation of securities service by profits of state banks. In addition
to the above, from 2016 begin repayment capitalization bonds, it will cause additional impact on debt
refinancing risk.
Key words: capitalization of state banks; the public debt risks; compensation mechanism of refund the bonds
maintenance
Border areas in Ukraine today are characterized by
unevenness of development, the growth of inter-
regional social and economic disparities, considerable
differentiation of regions and cities long time featured
with simultaneous decline in economic activity and a
decrease in population.To solve these urgent problems
the State Regional Development Strategy for the
period until 2020, approved by the Cabinet of
Ministers of Ukraine dated August 6, 2014, № 385
was developed. One of the important objectives of the
Strategy is to develop border infrastructure and
cooperation between local communities of
neighboring countries through the development and
implementation of joint cross-border social,
humanitarian, economic, cultural, and environmental
projects. Substantial investments are needed to
achieve this goal. One of the sources for investment in
the Strategy is the state budget, which will be
transferred on places as part of decentralization.
Another source is the use of international technical
assistance and resources of international financial
institutions (such as government borrowing), which
may be directed to implementation of investment
projects through state-owned banks.Lets analyze the
risks of using the latter mechanism given the
peculiarities of state banks in Ukraine, and their role
as debt creating factor.

Regional Innovations - 4, 2016 Page 13
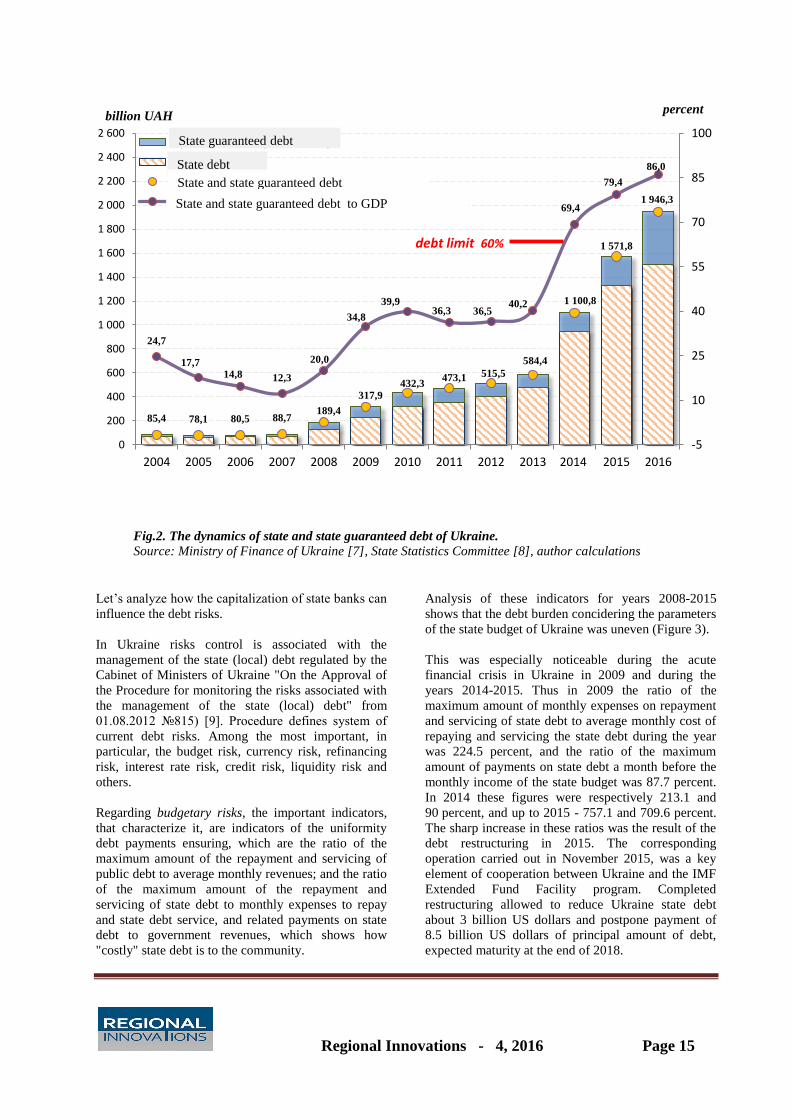
During the years 2014-2016 the debt burden in
Ukraine exceeded the level of 60% of GDP, which is
defined as marginal in the Budget Code of Ukraine.
At the end of 2016 the ratio of state and state
guaranteed debt could reach 86.0% of GDP. Service
of the state debt burdens increasingly burdens the
expenditure side of the State Budget of Ukraine: in
2016 the corresponding planned expenditures may
reach 15.8% of the revenue part of the budget. In
these circumstances, the urgent task is to study
burden-making factors and risks which they form, and
develop measures that would help to reduce the state
burden and the costs of servicing the state debt. One
of such factors is the capitalization of state banks,
funded by government borrowings.
In foreign scientific literature the impact of the
financial and the banking system in particular on the
development of state debt, as well as compensatory
reimbursement mechanisms of state aid provided
during crisis of 2008-2009 are thoroughly analyzed [1,
2]. However, approaches to solving this problem are
not fully formed.
In Ukraine several works are dedicated to the issue of
state-owned banks efficiency, peculiarities of their
interaction with the Ministry of Finance of Ukraine
and the National Bank of Ukraine, including [3].
Regarding the aspect of impact of the ongoing
capitalization of these banks to leverage and explore
of the possibilities of reducing it, no research
conducted enough.
The purpose of this research is to study the scope of
state debt risks related to exposure to the state banks
capitalization, and study of proposals for debt
management policy, which would allow reducing
these risks.
Review of the complex of instruments of state support
for the banking sector during the last financial crisis
points to two main varieties of such aid: the
capitalization of banks, or providing them with
liquidity [1, 2]. The last of these is widespread;
however, such aid is effective only for a short period
of time.
Table 1 shows the information on the total amount of
state aid to the banking sector in the EU member
states and some other countries during 2007-2011, and
amounts of money spent on the capitalization of banks
at this time. The last column contains information on
IMF growth of general government debt sector during
this period [6].
As the table shows, the largest amount of state aid to
financial institutions has been granted in Ireland
(80.1% of GDP), Iceland (44.2% GDP), Greece
(27.3%). These countries are the leaders of state aid
given to banks in the form of capitalization 40.7; 26.1;
23.0% of GDP respectively.
Table 1
The volume of state aid given to financial institutions in some countries during 2007-2011
Country Capitalization,
% GDP
The total amount of
state aid, % GDP
Changes of debt burden in the general
government sector, % GDP
Austria 2,9 4,9 12,0
Belgium 5,8 6,0 14,4
Denmark 2,7 3,1 12,4
France 0,5 1,0 22,1
Germany 1,7 1,8 16,3
Greece 23,0 27,3 57,9
Hungary 0,1 2,7 13,5
Iceland 26,1 44,2 70,1
Ireland 40,7 80,1 80,1
Italy 0,3 0,3 17,0
Kazakhstan 2,4 3,7 5,0
Latvia 3,1 5,6 30,0
Luxembourg 4,2 7,7 14,2
Mongolia 4,2 4,2 0,0
Netherlands 6,6 12,7 20,9

Regional Innovations - 4, 2016 Page 14
Slovenia 0,8 3,6 24,2
Spain 2,0 3,8 32,2
Sweden 0,2 0,7 -2,8
Switzerland 1,1 1,1 -7,3
Ukraine 4,5 4,5 24,2
The United Kingdom 5,0 8,8 38,6
Source: [4,5,6]
State support for the bank sector and, above all,
capitalization, determine the allocation of significant
financial resources often by increasing state debt.
Explore the relationship between the change in the
debt burden of the general government sector (y) and
the amount of capitalization (x) carried out during the
period 2007-2011 (Table 1).
Simulation results are presented in Figure 1.
Fig.1. Dependence of changes in debt burden of the general government sector of the world countries
during the years 2007-2011 and the volume of capitalization of financial institutions.
Source: author calculations
The initial construction of the linear-factor
econometric model generally allowed to confirm the
presence of close relationship (with a coefficient of
determination R2=0,754) in the form of mathematical
dependence y=1,88x+11,25. The model is adequate,
but heteroscedasticity was found in this model.
Carrying out appropriate procedures eliminated this
disadvantage, and the dependence transformed to the
form y=1,81x+12,58 with coefficient of determination
R2=0,886. Autocorrelation is absent in the latest
models. The high coefficient of determination
confirms the unique dependence between the debt
burden of the general government sector in the world
countries during 2007-2011 years and activities in
capitalization of financial institutions. This may
indicate that the capitalization of banks can be a
significant debt-making factor, and this relationship
should be explored in more detail for each country.
Fig. 2 shows the dynamics of state and state
guaranteed debt of Ukraine, and the debt burden over
the years 2004-2016. Apparently, the most rapid
growth in debt burden occurred in 2014 (from 40.2 to
69.4% of GDP), further its rate decreased, but the
trend has not changed. At the end of 2016 expected
debt burden is 86.0% of GDP.
y = 1,81x + 12,58R² = 0,89
-20,0
0,0
20,0
40,0
60,0
80,0
100,0
0 5 10 15 20 25 30 35 40 45Ch
ange
s in
deb
t b
urd
en o
f th
e ge
ner
al
gove
rnm
ent
sect
or
du
rin
g th
e ye
ars
20
07
-20
11
% G
DP
Volume of banks capitalization , % GDP
Regional Innovations - 4, 2016 Page 15
Fig.2. The dynamics of state and state guaranteed debt of Ukraine.
Source: Ministry of Finance of Ukraine [7], State Statistics Committee [8], author calculations
Let’s analyze how the capitalization of state banks can
influence the debt risks.
In Ukraine risks control is associated with the
management of the state (local) debt regulated by the
Cabinet of Ministers of Ukraine "On the Approval of
the Procedure for monitoring the risks associated with
the management of the state (local) debt" from
01.08.2012 №815) [9]. Procedure defines system of
current debt risks. Among the most important, in
particular, the budget risk, currency risk, refinancing
risk, interest rate risk, credit risk, liquidity risk and
others.
Regarding budgetary risks, the important indicators,
that characterize it, are indicators of the uniformity
debt payments ensuring, which are the ratio of the
maximum amount of the repayment and servicing of
public debt to average monthly revenues; and the ratio
of the maximum amount of the repayment and
servicing of state debt to monthly expenses to repay
and state debt service, and related payments on state
debt to government revenues, which shows how
"costly" state debt is to the community.
Analysis of these indicators for years 2008-2015
shows that the debt burden concidering the parameters
of the state budget of Ukraine was uneven (Figure 3).
This was especially noticeable during the acute
financial crisis in Ukraine in 2009 and during the
years 2014-2015. Thus in 2009 the ratio of the
maximum amount of monthly expenses on repayment
and servicing of state debt to average monthly cost of
repaying and servicing the state debt during the year
was 224.5 percent, and the ratio of the maximum
amount of payments on state debt a month before the
monthly income of the state budget was 87.7 percent.
In 2014 these figures were respectively 213.1 and
90 percent, and up to 2015 - 757.1 and 709.6 percent.
The sharp increase in these ratios was the result of the
debt restructuring in 2015. The corresponding
operation carried out in November 2015, was a key
element of cooperation between Ukraine and the IMF
Extended Fund Facility program. Completed
restructuring allowed to reduce Ukraine state debt
about 3 billion US dollars and postpone payment of
8.5 billion US dollars of principal amount of debt,
expected maturity at the end of 2018.
85,4 78,1 80,5 88,7189,4
317,9
432,3473,1 515,5
584,4
1 100,8
1 571,8
1 946,3
24,7
17,714,8 12,3
20,0
34,8
39,936,3 36,5
40,2
69,4
79,4
86,0
-5
10
25
40
55
70
85
100
0
200
400
600
800
1 000
1 200
1 400
1 600
1 800
2 000
2 200
2 400
2 600
2004 2005 2006 2007 2008 2009 2010 2011 2012 2013 2014 2015 2016
Гарантований державою борг
Державний борг
Державний та гарантований державою борг
Державний та гарантований державою борг до ВВП
billion UAH
debt limit 60%
percent
State guaranteed debt
State debt
State and state guaranteed debt
State and state guaranteed debt to GDP

Regional Innovations - 4, 2016 Page 16
As for the cost of debt service to government
revenues, it is worth noting that after 2008 there was a
steady growth trend of this ratio. If this ratio in 2008
was 3.7 percent, in the coming fiscal years it has
changed as follows: in 2009 - to 8.7 percent, in 2014 -
12.0 percent, and in 2015 - to 15.8 percent (Figure 3).
This is an indication that the scope of debt factors
every year more and more influence on balancing the
budget in Ukraine.
Fig. 3. Analysis of debt risk for 2008-2015 years
Source: [7, 8,10], author calculations
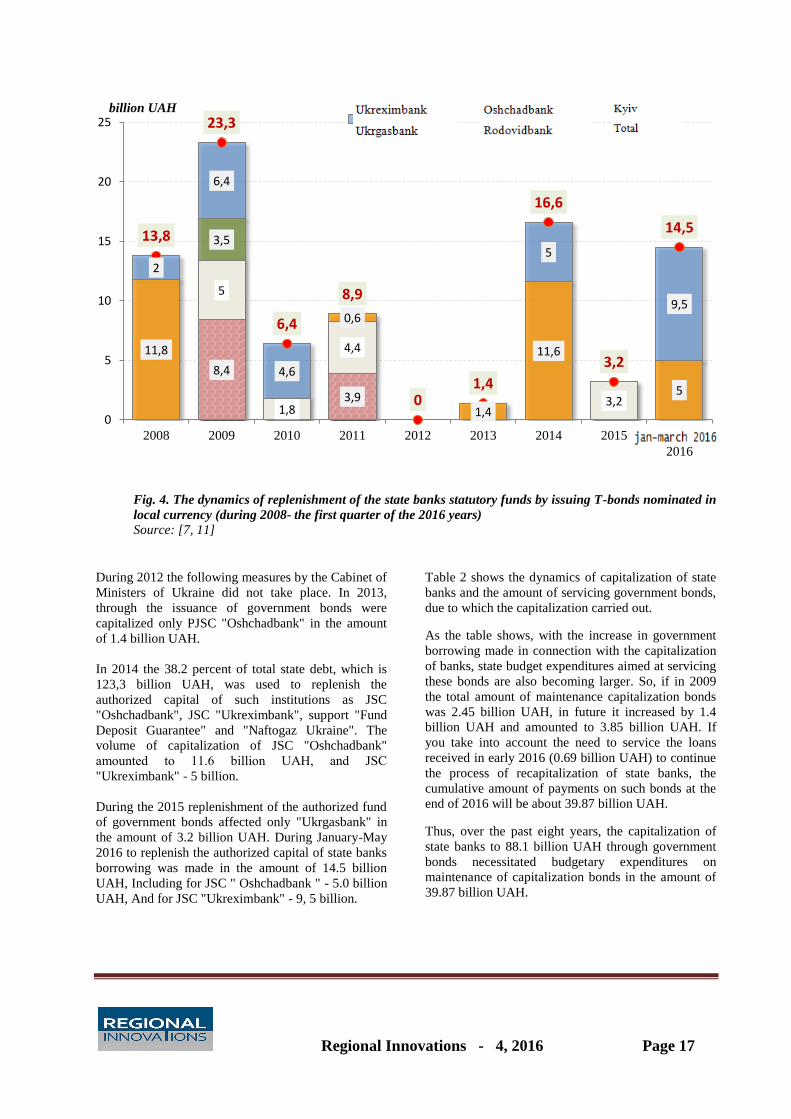
Let’s check operations of support of the state banks in
the course of capitalization through the issuance of
government bonds in this trend. Figure 4 shows the
dynamics of replenishment of the state banks statutory
funds by issuing T-bonds nominated in local currency.
In 2008 13.8 billion USD were given to the
«Oshchadbank» and "Ukreximbank". The largest
volume of capitalization of state banks was about
23.3 billion USD observed in 2009. In that period, the
greatest amount has been allocated to "Rodovidbank"
and "Ukreximbank". During 2010, the capitalization
of state banks was about 6.4 billion, and in 2011 - 8.9
billion UAH.
178,9224,5
122,4 137,9
207152,8
213,1
757,1
16,4
87,7
2445,2 54,7 42,7 90
709,6
3,7
8,7
7,4
11,1
7
7,9
12
15,8
0
2
4
6
8
10
12
14
16
18
0
100
200
300
400
500
600
700
800
2008 2009 2010 2011 2012 2013 2014 2015
Відношення максимальної суми виплат за державним боргом (погашення, обслуговування) за місяць до
середньомісяних виплат за державним боргом
Відношення максимальної суми виплат за державним боргом (погашення, обслуговування) за місяць до
середньомісяних доходів державного бюджету
Відношення платежів з обслуговування державного боргу до доходів державного бюджету за рік
right scale, percent
The ratio of the maximum amount of payments on state debt (repayment and maintenance) per month to
monthly average payments on state debt
The ratio of the maximum amount of payments on public debt (repayment and maintenance) per month
to the state budget monthly average revenues
The ratio of payments on state debt to the state budget revenues for the year
Regional Innovations - 4, 2016 Page 17
Fig. 4. The dynamics of replenishment of the state banks statutory funds by issuing T-bonds nominated in
local currency (during 2008- the first quarter of the 2016 years)
Source: [7, 11]
During 2012 the following measures by the Cabinet of
Ministers of Ukraine did not take place. In 2013,
through the issuance of government bonds were
capitalized only PJSC "Oshchadbank" in the amount
of 1.4 billion UAH.
In 2014 the 38.2 percent of total state debt, which is
123,3 billion UAH, was used to replenish the
authorized capital of such institutions as JSC
"Oshchadbank", JSC "Ukreximbank", support "Fund
Deposit Guarantee" and "Naftogaz Ukraine". The
volume of capitalization of JSC "Oshchadbank"
amounted to 11.6 billion UAH, аnd JSC
"Ukreximbank" - 5 billion.
During the 2015 replenishment of the authorized fund
of government bonds affected only "Ukrgasbank" in
the amount of 3.2 billion UAH. During January-May
2016 to replenish the authorized capital of state banks
borrowing was made in the amount of 14.5 billion
UAH, Including for JSC " Oshchadbank " - 5.0 billion
UAH, And for JSC "Ukreximbank" - 9, 5 billion.
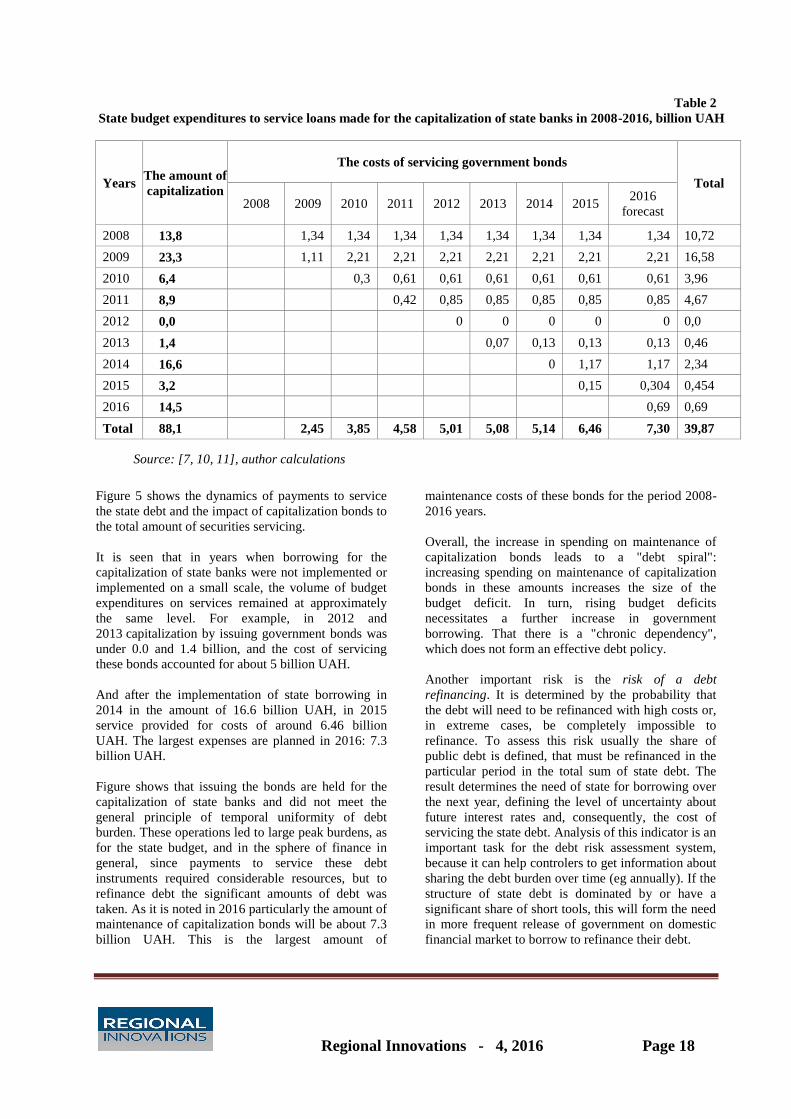
Table 2 shows the dynamics of capitalization of state
banks and the amount of servicing government bonds,
due to which the capitalization carried out.
As the table shows, with the increase in government
borrowing made in connection with the capitalization
of banks, state budget expenditures aimed at servicing
these bonds are also becoming larger. So, if in 2009
the total amount of maintenance capitalization bonds
was 2.45 billion UAH, in future it increased by 1.4
billion UAH and amounted to 3.85 billion UAH. If
you take into account the need to service the loans
received in early 2016 (0.69 billion UAH) to continue
the process of recapitalization of state banks, the
cumulative amount of payments on such bonds at the
end of 2016 will be about 39.87 billion UAH.
Thus, over the past eight years, the capitalization of
state banks to 88.1 billion UAH through government
bonds necessitated budgetary expenditures on
maintenance of capitalization bonds in the amount of
39.87 billion UAH.
8,4
3,9
5
1,8
4,4
3,2
3,5
11,8
0,6
1,4
11,6
5
2
6,4
4,6
5
9,5
13,8
23,3
6,4
8,9
01,4
16,6
3,2
14,5
0
5
10
15
20
25
2008 2009 2010 2011 2012 2013 2014 2015 січ-тр.
2016
Укрексімбанк "Ощадбанк" "Київ"billion UAH
Regional Innovations - 4, 2016 Page 18
Table 2
State budget expenditures to service loans made for the capitalization of state banks in 2008-2016, billion UAH
Years The amount of
capitalization
The costs of servicing government bonds
Total
2008 2009 2010 2011 2012 2013 2014 2015 2016
forecast
2008 13,8 1,34 1,34 1,34 1,34 1,34 1,34 1,34 1,34 10,72
2009 23,3 1,11 2,21 2,21 2,21 2,21 2,21 2,21 2,21 16,58
2010 6,4 0,3 0,61 0,61 0,61 0,61 0,61 0,61 3,96
2011 8,9 0,42 0,85 0,85 0,85 0,85 0,85 4,67
2012 0,0 0 0 0 0 0 0,0
2013 1,4 0,07 0,13 0,13 0,13 0,46
2014 16,6 0 1,17 1,17 2,34
2015 3,2 0,15 0,304 0,454
2016 14,5 0,69 0,69
Total 88,1 2,45 3,85 4,58 5,01 5,08 5,14 6,46 7,30 39,87
Source: [7, 10, 11], author calculations
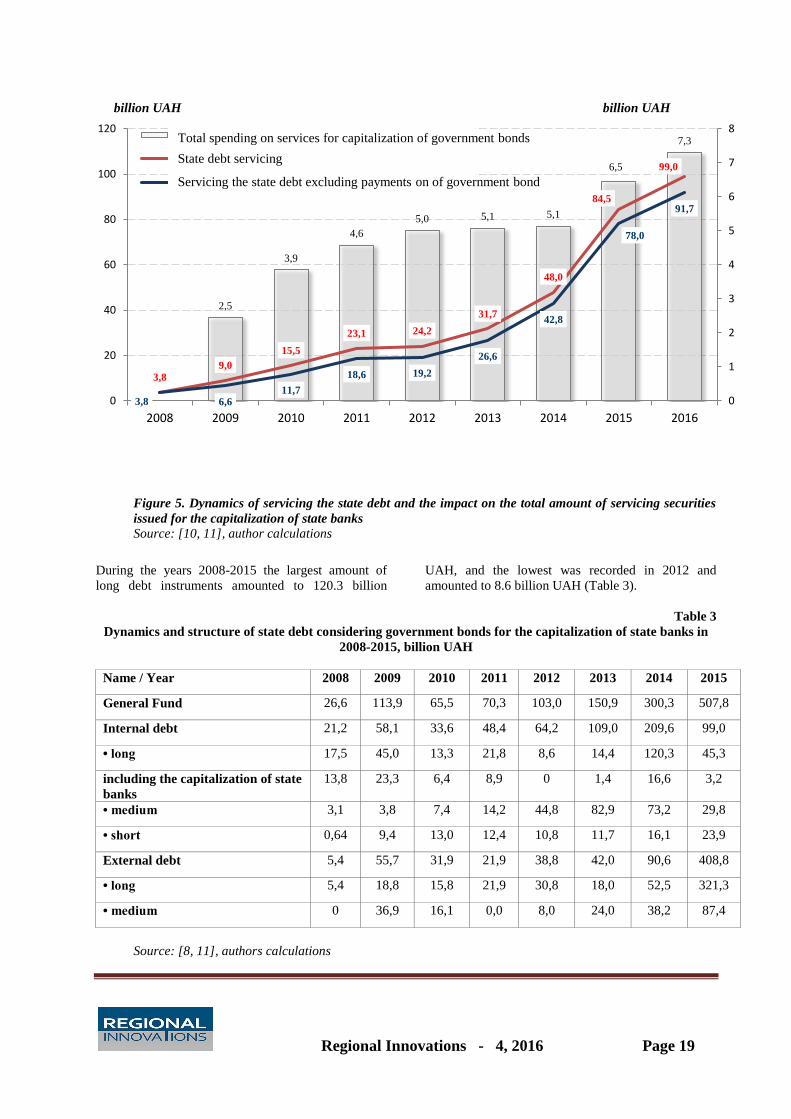
Figure 5 shows the dynamics of payments to service
the state debt and the impact of capitalization bonds to
the total amount of securities servicing.
It is seen that in years when borrowing for the
capitalization of state banks were not implemented or
implemented on a small scale, the volume of budget
expenditures on services remained at approximately
the same level. For example, in 2012 and
2013 capitalization by issuing government bonds was
under 0.0 and 1.4 billion, and the cost of servicing
these bonds accounted for about 5 billion UAH.
And after the implementation of state borrowing in
2014 in the amount of 16.6 billion UAH, in 2015
service provided for costs of around 6.46 billion
UAH. The largest expenses are planned in 2016: 7.3
billion UAH.
Figure shows that issuing the bonds are held for the
capitalization of state banks and did not meet the
general principle of temporal uniformity of debt
burden. These operations led to large peak burdens, as
for the state budget, and in the sphere of finance in
general, since payments to service these debt
instruments required considerable resources, but to
refinance debt the significant amounts of debt was
taken. As it is noted in 2016 particularly the amount of
maintenance of capitalization bonds will be about 7.3
billion UAH. This is the largest amount of
maintenance costs of these bonds for the period 2008-
2016 years.
Overall, the increase in spending on maintenance of
capitalization bonds leads to a "debt spiral":
increasing spending on maintenance of capitalization
bonds in these amounts increases the size of the
budget deficit. In turn, rising budget deficits
necessitates a further increase in government
borrowing. That there is a "chronic dependency",
which does not form an effective debt policy.
Another important risk is the risk of a debt
refinancing. It is determined by the probability that
the debt will need to be refinanced with high costs or,
in extreme cases, be completely impossible to
refinance. To assess this risk usually the share of
public debt is defined, that must be refinanced in the
particular period in the total sum of state debt. The
result determines the need of state for borrowing over
the next year, defining the level of uncertainty about
future interest rates and, consequently, the cost of
servicing the state debt. Analysis of this indicator is an
important task for the debt risk assessment system,
because it can help controlers to get information about
sharing the debt burden over time (eg annually). If the
structure of state debt is dominated by or have a
significant share of short tools, this will form the need
in more frequent release of government on domestic
financial market to borrow to refinance their debt.
Regional Innovations - 4, 2016 Page 19
Figure 5. Dynamics of servicing the state debt and the impact on the total amount of servicing securities
issued for the capitalization of state banks
Source: [10, 11], author calculations
During the years 2008-2015 the largest amount of
long debt instruments amounted to 120.3 billion
UAH, and the lowest was recorded in 2012 and
amounted to 8.6 billion UAH (Table 3).
Table 3
Dynamics and structure of state debt considering government bonds for the capitalization of state banks in
2008-2015, billion UAH
Name / Year 2008 2009 2010 2011 2012 2013 2014 2015
General Fund 26,6 113,9 65,5 70,3 103,0 150,9 300,3 507,8
Internal debt 21,2 58,1 33,6 48,4 64,2 109,0 209,6 99,0
• long 17,5 45,0 13,3 21,8 8,6 14,4 120,3 45,3
including the capitalization of state
banks
13,8 23,3 6,4 8,9 0 1,4 16,6 3,2
• medium 3,1 3,8 7,4 14,2 44,8 82,9 73,2 29,8
• short 0,64 9,4 13,0 12,4 10,8 11,7 16,1 23,9
External debt 5,4 55,7 31,9 21,9 38,8 42,0 90,6 408,8
• long 5,4 18,8 15,8 21,9 30,8 18,0 52,5 321,3
• medium 0 36,9 16,1 0,0 8,0 24,0 38,2 87,4
Source: [8, 11], authors calculations
2,5
3,9
4,6
5,0 5,1 5,1
6,5
7,3
3,8
9,0
15,5
23,1 24,2
31,7
48,0
84,5
99,0
3,8 6,611,7
18,6 19,2
26,6
42,8
78,0
91,7
0
1
2
3
4
5
6
7
8
0
20
40
60
80
100
120
2008 2009 2010 2011 2012 2013 2014 2015 2016
Всього видатки на обслуговування ОВДП для капіталізації
Обслуговування державного боргу
Обслуговування державного боргу без урахування виплат за ОВДП для капіталізації
billion UAH billion UAH
Total spending on services for capitalization of government bonds
State debt servicing
Servicing the state debt excluding payments on of government bond

Regional Innovations - 4, 2016 Page 20
For state debt management system it is considered to
be the most favorable even distribution of amounts
repayment of debt, so the implementation of peak
borrowings in significant quantities results in
increased refinancing risk in subsequent periods. It
should be borne in mind that repayment of these large-
volume loans may reflect the redemption of others, as
large-sized loans received in previous years. This
match of maturities will significantly increase the risk
of refinancing the state debt.
Long instruments are an important element of the debt
policy because they help the government to reach
certain stabilization in the financial markets and to
make its members’ steps more predictable.
As shown in Figure 6 ratio of long debt to the amount
of internal state debt was essential in 2008-2009,
respectively 82.5 and 77.5 percent. However, in
subsequent years, except in 2014, this ratio did not
exceed 50 percent.
Thus the government bonds issued for the
capitalization of state banks since 2008 has not
affected the refinancing risk, as the fall of maturities
starting from the fourth quarter of 2016. During this
period it is planned the repayment of government
bonds that were issued in 2008 for the capitalization
of JSC " Oshchadbank" in the amount of 11.8 billion
UAH and JSC "Ukreximbank" of 2 billion UAH. To
refinance these loans Ministry of Finance of Ukraine
in 2016 will be required to enter the primary debt
market and get the resource volume 13.8 billion UAH.
In 2017 the Ministry of Finance government
borrowing program already provides volume almost
twice the amount of borrowings in 2016 to refinance
debt, formed by operations to ensure the capitalization
of state-owned banks - 23.3 billion UAH. This
significant amount of repayment of state debt in 2017
significantly increases the risk of refinancing. Thus,
since 2016 the influence of capitalization bonds on the
formation of refinancing risk will only increase.
Note that when assessing the analysis of refinancing
risk also take into account additional factors,
including the structure of refinanced debt in terms of
sources of borrowing capacity and overall condition of
the financial markets.
Averaged integral indicator for risk assessment to
calculate the refinancing is the weighted average of
state debt maturity, which is obtained by weighing the
timing for each obligation in the amount of these
obligations. It should be noted that the eight-year
long-term government bonds used for the
capitalization of banks, significantly influenced the
increase in the average maturity of state debt, as their
total volume amounted to nearly 90 billion UAH.
Interest rate risk is determined likely to increase the
cost of debt due to changes in interest rates due to the
impact of factors that shape the conditions for
domestic and foreign financial markets. Changing
interest rates for debt instruments both in national and
foreign currencies affect the cost of debt service (if the
rate is floating) and the cost of future borrowing.
As a result, short-term debt or debt with a floating
rate, usually considered more risky than long-term
debt with a fixed rate, as the latter depends weakly on
changes occurring in financial markets.
Given that the interest rate risk by definition is
associated with an increase in floating rates, for its
evaluation it is commonly used data on the amount of
state and state guaranteed debt to which such rates
apply. The share of public debt with floating interest
rates reflects the level of uncertainty of the future cost
of servicing the public debt in the future, and therefore
the extent of the risk of increasing costs.
During the years 2008-2015 the share of debt with
floating rates has been constantly changing. Thus in
2008 and in 2009 this ratio was the largest in the range
of 2008-2015 and were respectively 45.1 percent and
46.9 %, while it’s lowest level was recorded in 2013
as 19.5 %.
It should be noted that the capitalization of state banks
used only bonds with a fixed rate. In these
circumstances, we can say that the issue of debt
instruments did not influence the increase in interest
rate risk. The decision to use debt instruments with
variable rate in large volumes can be considered quite
risky since in the crisis times volatility of these
instruments in the financial market is growing.
All debt instruments used for the capitalization of
state banks, denominated in Ukrainian hryvnia, the
rate at which borrowing were taken is 9,5-9,75%. Due
to this, the realization of foreign exchange risk is
impossible. Thus, increasing the share of debt
instruments using capitalization bonds in local
currency decreased the level of currency risk; and
increase of share of loans with a fixed rate reduced the
level of interest rate risk in the total Ukraine debt
portfolio.
Other risks associated with government debt, and
defined by the CMU from 01.08.2012 № 815. «On
approval of the control of risks associated with the
management of the state (local) debt" [9], are not
amplified by the capitalization of state banks.

Regional Innovations - 4, 2016 Page 21
Fig. 6. Long-term debt instruments as a share of internal State debt during 2008-2015
Source: [7,10], author calculations
To reduce debt risks related to the production and
maintenance of capitalization bonds, it is advisable to
develop new reasonable legal and economic
mechanisms. One of them may be linked to the
compensation made by banks in favor of the state
budget on servicing these securities using the expense
of profits. Indeed, capitalization of state banks by
government bonds is carried out on non-market terms.
This distorts competition in the financial market.
To correct the situation it is possible to start at least by
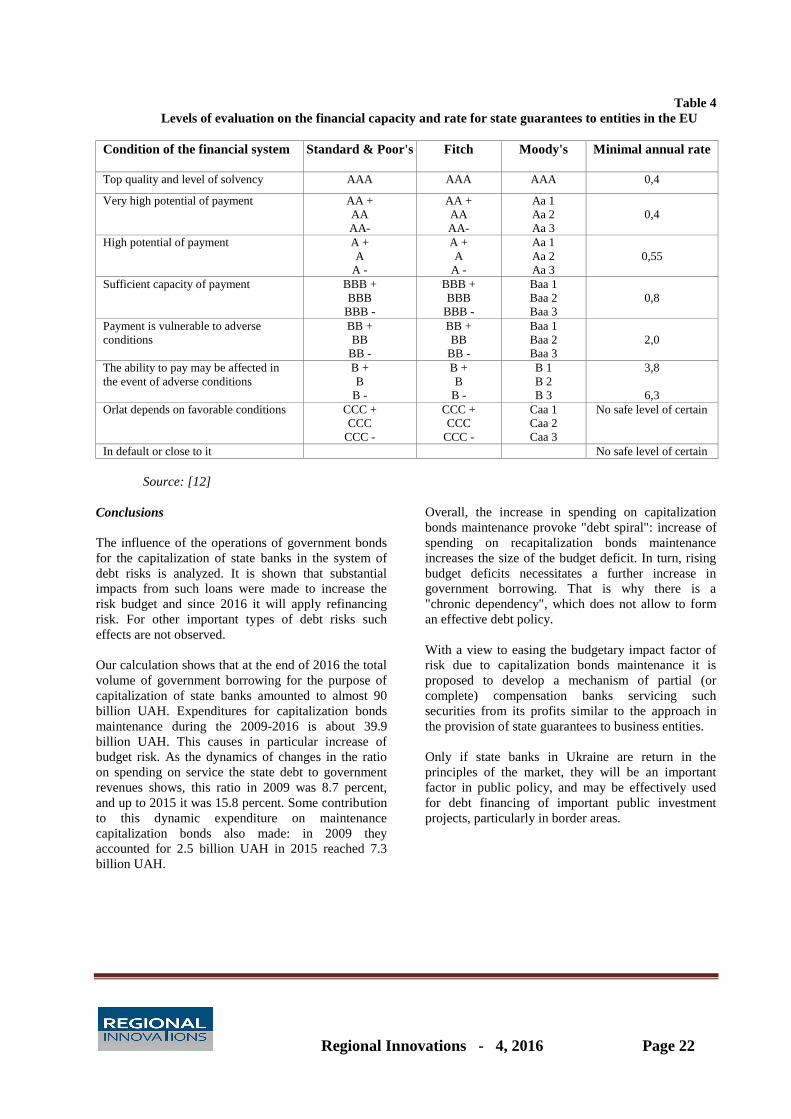
analogy with the provision of state guarantees.
Table 4 shows the information on the rates for
reimbursement for providing state guarantees to
entities in the EU. Apparently the price for guarantees
is differentiated depending on the amount of financial
resources, such as principal (legal entity for which the
guarantee) and the risk level. As noted in [12], the
most common size guarantees rates range is between
1-2 percent per annum. This is rarely applied rate
based on a full risk assessment.
We believe that state banks could compensate the
state budget maintenance costs for bonds
capitalization through its profit at least at the rate of
1-2%. For example, according to Government
Resolution "Some Issues of Public Joint Stock
Company of "State Savings Bank of Ukraine
[Oshchadbank]"[13] The bank's profit after taxes and
other compulsory payments is to be distributed
according to the decision of the Supervisory Board in
the manner and terms determined by law.
Therefore if a bank owned by the state makes a profit,
it will be possible to use it for reimbursement of
expenses incurred by the state budget for the payment
of interest payment on bonds for the capitalization of
this bank.
82,5
77,5
39,6
45,0
13,4 13,2
57,4
45,8
78,9
51,848,1
40,8
0,0
9,713,8
7,1
0
10
20
30
40
50
60
70
80
90
2008 2009 2010 2011 2012 2013 2014 2015
Частка довгих боргових інструментів внутрішнього державного боргу
Частка капіталізаційних ОВДП у довгих боргових інструментах внутрішнього державного боргу
percent
Share of long debt instruments in internal state debt
Share of capitalizationalal government bonds in long debt instruments of internal public debt
Regional Innovations - 4, 2016 Page 22
Table 4
Levels of evaluation on the financial capacity and rate for state guarantees to entities in the EU
Condition of the financial system
Standard & Poor's Fitch Moody's Minimal annual rate
Top quality and level of solvency AAA AAA AAA 0,4
Very high potential of payment AA +
AA
AA-
AA +
AA
AA-
Aa 1
Aa 2
Aa 3
0,4
High potential of payment A +
A
A -
A +
A
A -
Aa 1
Aa 2
Aa 3
0,55
Sufficient capacity of payment BBB +
BBB
BBB -
BBB +
BBB
BBB -
Baa 1
Baa 2
Baa 3
0,8
Payment is vulnerable to adverse
conditions
BB +
BB
BB -
BB +
BB
BB -
Baa 1
Baa 2
Baa 3
2,0
The ability to pay may be affected in
the event of adverse conditions
B +
B
B -
B +
B
B -
B 1
B 2
B 3
3,8
6,3
Orlat depends on favorable conditions CCC +
CCC
CCC -
CCC +
CCC
CCC -
Caa 1
Caa 2
Caa 3
No safe level of certain
In default or close to it No safe level of certain
Source: [12]
Conclusions
The influence of the operations of government bonds
for the capitalization of state banks in the system of
debt risks is analyzed. It is shown that substantial
impacts from such loans were made to increase the
risk budget and since 2016 it will apply refinancing
risk. For other important types of debt risks such
effects are not observed.
Our calculation shows that at the end of 2016 the total
volume of government borrowing for the purpose of
capitalization of state banks amounted to almost 90
billion UAH. Expenditures for capitalization bonds
maintenance during the 2009-2016 is about 39.9
billion UAH. This causes in particular increase of
budget risk. As the dynamics of changes in the ratio
on spending on service the state debt to government
revenues shows, this ratio in 2009 was 8.7 percent,
and up to 2015 it was 15.8 percent. Some contribution
to this dynamic expenditure on maintenance
capitalization bonds also made: in 2009 they
accounted for 2.5 billion UAH in 2015 reached 7.3
billion UAH.
Overall, the increase in spending on capitalization
bonds maintenance provoke "debt spiral": increase of
spending on recapitalization bonds maintenance
increases the size of the budget deficit. In turn, rising
budget deficits necessitates a further increase in
government borrowing. That is why there is a
"chronic dependency", which does not allow to form
an effective debt policy.
With a view to easing the budgetary impact factor of
risk due to capitalization bonds maintenance it is
proposed to develop a mechanism of partial (or
complete) compensation banks servicing such
securities from its profits similar to the approach in
the provision of state guarantees to business entities.
Only if state banks in Ukraine are return in the
principles of the market, they will be an important
factor in public policy, and may be effectively used
for debt financing of important public investment
projects, particularly in border areas.
Regional Innovations - 4, 2016 Page 23
References
1. Freefall: America, Free Markets, and the Sinking of the World Economy / Joseph Stiglitz; translation from
English V.Lopatka.-M.:Eksmo, 2011.-512 p. (Economy: global trends).
2. Crisis Economics: A Crash Course in the Future of Finance / Nouriel Roubini, Stephen Mihm.; translation
from English V.Lopatka.-M.:Eksmo, 2011.- 384 p. (Economy: global trends).
3. Lyubich A., Bortnikov H., Drobyasko A. Early warning signals of banking crises // Finance Ukraine. - 2015. -
№ 7. - pp. 24-38.
4. L. Laeven and F. Valencia. “Systemic Banking Crises Database: An Update”. Access regime:
https://www.imf.org/external/pubs/ft/wp/2012/wp12163.pdf.
5. World economic Outlook, October 2012 / Coping with high debt and slugging growth // The official website
of the International Monetary Fund.
Access regime: https://www.imf.org/external/pubs/ft/weo/2012/02/pdf/text.pdf
6. S. Londar, A. Londar. State debt policy of Ukraine in the context of the experience of post-socialist EU
countries: monograph (edited by V. Fedosov) / S.Londar A.Londar; Bila Tserkva: Publisher Pshonkivskyy O.,
2016. - 242 p.
7. The official website of the Ministry of Finance of Ukraine.
Access regime: http://www.minfin.gov.ua/news/borg
8. The official website of the State Statistics Service of Ukraine. Access regime: http://www.ukrstat.gov.ua/
9. Decree of Cabinet of Ministers of Ukraine "On Approval of the Procedure for monitoring the risks associated
with the management of the state (local) debt" (01.08.2012 №815).
Access regime: http://zakon5.rada.gov.ua/laws/show/815-2012-%D0%BF
10. The official website of the State Treasury Service of Ukraine. Access regime:
http://www.treasury.gov.ua/main/uk/index
11. The official site of the National Bank of Ukraine. Access regime: https://www.bank.gov.ua/control/uk/index
12. Commission Notice on the application of Articles 87 and 88 of the EC Treaty to State aid in the form of
guarantees. Access regime:
http://eur-lex.europa.eu/LexUriServ/LexUriServ.do?uri=OJ:C:2008:155:%200010:0022:%20EN:PDF
13. Decree of Cabinet of Ministers of Ukraine "Some issues of Public Joint Stock Company" State Savings Bank
of Ukraine» (25.02.2003 №261). Access regime: http://zakon2.rada.gov.ua/laws/show/261-2003-%D0%BF
Regional Innovations - 4, 2016 Page 24
中国经济发展对进口石油的依赖与国际关系的相互影响
Abstract
Foreign economy and diplomatic route of China in recent years are related to China’s energy demand to a very
large degree. Along with rapid development of industrialization and sustained economic growth, China has
become a great power of energy consumption. Since 2015, it has exceeded America and become global largest
country in respect to petroleum import volume. In 2015, petroleum consumption of China broke
through540,000,000t, over 60% of which were imported. Along with the expansion of petroleum trade, the scope
of diplomatic activities has also been expanded and petroleum trade has been expanded to the countries in
Central Asia, America and Africa. With the increase of purchased petroleum volume, China has also enhanced
the friendly cooperative relations with petroleum output countries in diplomacy, imposed significant impacts on
international regional economy through petroleum trade, and played a more and more important role in
changing world economic pattern.
In addition, China is the second largest economic community in the world. It has the political views different
from Europe & America in international relations and diplomatic affairs and has become the competitor of
America and other developed countries in international trade and geopolitics. International conflicts often occur
due to petroleum economics. It’s of significant reality & urgency to analyze and learn about the interaction of
China’s economic development between international petroleum trade and international relation.
摘要:
中国近年的对外经济和外交路线很大程度上与中国的能源需求有关。随着工业化的快速发展和经济持续增长,中国已成为能源消耗大国,2015 年开始,超过美国成为石油进口量世界第一大国,2015 年中国石油消费量突破 5,4 亿吨,其中有 60%以上来自进
口。随着石油贸易的扩大,外交活动的范围也在扩大,将石油贸易从中东扩大到中 亚、美洲和非洲国家。随着中国石油购买量的增加,外交上加大了与石油输出国的友好互助关系,通过石油贸易对国际区域经济产生重要影响,在改变世界经济格局中扮演越来越重要的角色。
Key words: China’s economy, energy dependence, petroleum monopoly, economic diplomacy, future trend
关键词:中国经济、能源依赖、石油垄断、经济外交、未来趋势
Regional Innovations - 4, 2016 Page 25
1. Rapid development of China’s economy has
enlarged the dependence on petroleum import.
Along with the growth of economic index, China’s
petroleum demand is on the rise. Since 2015,
petroleum consumption of China has broken
through 540,000,000 t, over 60% of which have been
imported. China has exceeded America and become
world No. 1 in imported petroleum volume: in April
2015, daily imported crude oil of China reached
7,370,000 barrels, accounting for 15% of world
petroleum import volume. However, daily imported
crude oil of America was only 7,200,000 barrels in the
corresponding period. According to relevant data,
foreign-trade dependence of China’s crude oil
approached 60% in 2013, and foreign-trade
dependence of natural gas exceeded 30%. Petroleum
trade becomes the key factor affecting national
economic development of China. At present, more than
ten countries in the world have petroleum trading
relations with China, including Russia, Kazakhstan,
Tajikistan, Congo, Angola, Libya, Brazil, Venezuela,
etc. Traditionally, China mainly imports petroleum
from the Persian Gulf, for example, Saudi Arabia, Iran,
Iraq, Oman, etc.
At present, Angola is the country exporting the most
petroleum to China. According to the data issued by
General Administration of Customs of the People’s
Republic of China on Monday (October 24), China
imported 4,190,000t crude oil from Angola in
September with daily average import of 1,020,000
barrels and the increase of 46% on a year-on-year
basis. Angola has become the largest petroleum
supplier of China for the second time following July.
Iraq just followed Angola and China imported
4,070,000t crude oil from Iraq with the rise of 58% on
a year-on-year basis. Russia is the third largest
petroleum supplier of China. In September, China
imported 3,960,000t crude oil from Russia with the
decrease of 2.1% on a year-on-year basis. Saudi Arabia
and Iran are the 4th and 5th largest petroleum suppliers
of China respectively. In the same month, China
imported 3,900,000t crude oil from Saudi Arabia with
the decrease of 1.3% on a year-on-year basis and
2,020,000t crude oil from Iran with the rise of 18% on
a year-on-year basis. Angola becoming the largest
petroleum import country of China reflects the
diversification of crude oil import of China, which has
provided guarantee for macroeconomic stability &
national security.
China becomes the largest crude oil import country in
the world, which is the result of economic
development, and also the result of strategic reserve
made for national security on the other hand. At
present, decline of petroleum price has provided a good
1, 中国经济的快速发展增加了对
石油进口的依赖
随着经济指数的增长 中国对石油需求呈
上升趋势。 从 2015 年开始,中国石油
消费量突破 5,4 亿吨,其中有 60%以上来
自进口。每年进口石油量超过美国居世界
第一位:2015 年 4 月中国日进口原油达
到 737 万桶 ,占世界石油进口量的
15%。美国同期为 720 万桶。数据显示,
2013年中国原油对外依存度接近 60%,天
然气对外依存度超过 30%。 石油贸易
成为影响中国国民经济发展的关键因
素。 目前世界上有十几个国家与中国有
石油贸易关系:俄罗斯、哈萨克斯坦和塔
吉克斯坦、刚果、安哥拉、利比亚、巴
西、委内瑞拉等。传统上中国主要从波斯
湾国家进口石油,如:沙特阿拉伯、伊
朗、伊拉克和阿曼等国。
目前向中国出口石油量最多的国家是安哥
拉。 根据中国海关总署周一(10月 24
日) 发布数据显示,中国 9月从安哥拉进
口原油 419万吨,日均进口 102万桶,同
比大增 46%。这是继 7月之后,该国第二
次成为中国最大供油国。伊拉克则紧随其
后,来自该国的进口原油为 407万吨,同
比上升 58%。俄罗斯为中国第三大供油
国。中国 9月从俄罗斯进口原油 396万
吨,同比下降 2.1%。沙特和伊朗则分居
第四和第五。当月从沙特进口原油 390万
吨,同比下降 1.3%。从伊朗进口原油
202万吨,同比上升 18%。安哥拉成为中
国最大的石油进口国反映了中国原油进口
的多元化,这为宏观经济的稳定和国家安
全提供了保障。
中 国成为世界最大的原油进口国,是经
济发展的结果,另一原因是为了国家安全
而做的战略储备的结果。当前石油价格走

Regional Innovations - 4, 2016 Page 26
opportunity for crude oil reserve of China. To prevent
petroleum crisis, some Western countries with
developed industrialization have also legislated
successively to ensure strategic reserve of petroleum.
For example, America has stipulated Energy Policy
and Protection Law, Germany has
formulated Petroleum and Petroleum Products Reserve
Method, France has compiled No. 58-1106 Laws on
Industrial Petroleum Reserve Stock Structure, and
Japan has also issued Petroleum Reserve Law, all of
which have stipulated reserve objective & scale
explicitly. With governmental reserve and folk reserve,
petroleum reserves of America, Germany, France and
Japan are equivalent to petroleum consumption of 158
days, 117 days, 96 days an 169 days of these countries
respectively. China is accelerating the legislation of
strategic petroleum reserve and strives to realize that
China’s petroleum reserve can reach safe consumption
of 180 days several years later.
In international petroleum trade, China also exports its
drilling technologies and equipment to petroleum
producing countries. For example, China Petroleum
Technical Import & Export Company has set up
overseas agencies in global 27 countries to export
China’s petroleum exploitation equipment & petroleum
products to European, African, Asian and Middle East
countries. It has exported 184 sets of drilling machine,
456 sets of workover rig equipment and over 5,000km
oil pipelines accumulatively with annual signing
amount of more than 2 billion dollars. At present, 8
countries including America, Sudan, Indonesia, Brazil,
etc. have 4 assembly factories and 6 equipment repair
factories established by China. Plenty of imported
petroleum has increased business opportunities for oil
refining enterprises and petroleum deep processing
industry. While importing petroleum, Chinese
enterprises also invest in overseas petroleum industry.
Except Yaxing Chemical, Zhenghe Industrial Group
and Meidu Holdings, listed companies such as
Guanghui Energy, Fengfan Power Equipment Co.,
Ltd., etc. also begin to invest in overseas petroleum
projects this year. In the overall background of
domestic industrial transformation and national
encouragement on overseas investment, private
enterprises purchasing oil & gas resource projects
overseas will be increased continuously. At present, the
largest state-owned enterprises of China—Sinopec and
PetroChina are cooperating with Myanmar for
petroleum exploitation projects. China has built Sino-
Myanmar petroleum transmission pipelines and
petroleum from the Middle East can be transmitted to
China by way of Myanmar. Imported petroleum of
China is mainly used in four aspects: energy
consumption, industrial raw material, strategic reserve
and refined oil product. China is a great power of
refined oil product refining industry. At present, China
低为中国原油储备提供了良机。为预防石
油危 机,工业化发达的一些西方国家还
先后立法以确保石油的战略储备。如美国
制定了《能源政策与保护法》,德国有石
油及石油制品储备法》、法国制定了《关
于工 业石油储备库存结构的 58-1106 号
法》,日本也有《石油储备法》,都明确
规定了储备目标和规模。政府储备加上民
间储备,美、德、法、日的石油储备量分
别相当于本国 158 天、117 天、96 天和
169 天的石油消费。中国正加快战略石油
储备的立法工作,力争在几年之后中国的
石油储备能够达到 180天的安全消费量。
在国际石油贸易中,中国也将自己的钻探
技术和设备出口到产油国。例如,中国石
油技术进出口公司已在全球 27 个国家设
有海外机构,将中国石油开采设备和石油
产品出口到欧洲、非洲、亚洲和中东国
家。累计出口 184 台钻机、456 台修井机
设备、5000 多公里的输油管道。年签约
额超过 20 亿美元。 目前在美国、苏
丹、印 尼、巴西等 8个国家有中国组
建的 4 家组装工 厂、6 家 设备维
修厂。大量进口石油为炼油企业和石油深
加工行业增加了商 机。进口石油的同
时,中国企业也在向国外石油产业投资。
除亚星化学、正和股 份、美都控股,
今 年还有广汇能源、风范股份等上市公
司开始投资海外石油项目。在国内产业转
型和国家鼓励海外投资的大背景下,到海
外收购油气资源项目的民营企业将继续增
加。 目前中国最大国有企业中石化和中
石油正与缅甸合作石油开采项目。中国已
经建成中缅石油输出管道,来自中东的石
油可以经过缅甸输到中国。中国进口石油
的用途 主要有 4个主要方面:能源消
费、工业原料、战略储备、成品 油。
中国是成品油提炼产业大国。目前成品油

Regional Innovations - 4, 2016 Page 27
ranks in the second place in terms of annual export
volume of refined oil products. According to the latest
data released by General Administration of Customs,
during January-October 2016, export volume of refined
oil products of China reached 38,110,000t with the
increase of 37.4% on a year-on-year basis, which has
exceeded the total volume in the past year. It’s
predicted that before 2021, new petroleum refining
projects or petroleum refining expansion projects will
reach 142,500,000t/year. Though export of refined oil
products doesn’t profit at present, the purpose of
occupying international market by a low price has been
realized.
According to relevant data, in the premise that China
keeps annual GDP growth rate of 7% by 2020 and
petroleum use efficiency of China is unchanged, by
2020, China will consume 849,000,000t petroleum,
which is equivalent to petroleum consumption of
America in 2011 (833,000,000t). Considering that
petroleum consumption level is decreasing, while its
petroleum output is increasing, in such case, China will
be the largest petroleum consuming country and also
the largest petroleum import country in the world at
that time.
It can be inferred that China will have larger influence
and more right of speech in international petroleum
trade in future. On the one hand, world economy will
be more stabilized due to stable development of
China’s economy. In addition, China's economic
development will also intensify the complication of
international relations.
2. Petroleum trade and international conflict.
China is playing a more and more important role in
international affairs by diplomatic strategy and foreign
trade policy carried out by it centering on petroleum
trade in recent years. China’s increasing demand on
petroleum year on year is of great significance for
maintaining economic stability of petroleum export
country. Besides, in future global trade, China and
petroleum supplier countries will form an international
union with China as the core due to close cooperation
in economic field. More countries will keep consistent
with China in international affairs due to economic
interests, for example, some African and American
countries. However, America, Japan, etc. will also
enhance diplomatic suppression on China.
Except for international petroleum trade, protection of
petroleum resources will also become the primary
mission of China in diplomatic activities. For example,
the South China Sea dispute troubling China at present.
Rich petroleum and natural gas reserves make South
年出口量占世界第二位。海关总署最新发
布的数据显示:2016 年 1 月至 10 月份,
中国成品油出口量达到 3811 万吨,同比
增长 37.4%,已经超过去年全年总量。
预计 2021 年之前,中国新建或扩建炼油
项目将达到 14250 万吨/年。虽然目前成
品油出口并不盈利,但以低价占领国际市
场的目的已经达到。
数据表明,在到 2020 年中国保持 GDP 年
均增速 7%的前提下,中国的石油使用效
率不变,那么到 2020 年中国将消费 8.49
亿吨石油,这相当于美国 2011 年石油消
费量(8.33 亿吨)。考虑到美国石油消
费水平在下降,而自身石油产量上升,在
这种情境下,中国届时既是世界第一大石
油消费国也是第一大石油进口国。
可以推断,中国在未来国际石油贸易中会
有更多的影响力和话语权。一方面,世界
经济会因为中国经济的稳定发展而增加稳
定性,同时,中国经济发展对石油资源的
依赖也将加剧国际关系的复杂化。
2, 石油贸易与国际冲突
中 国近年来围绕石油贸易展开的外交战
略和对外贸易政策使中国正在国际事务中
扮演重要角色。中国对石油逐年提升的需
求,对维持石油出口国的经济稳定具有重
要意 义。同时,在未来全球贸易中,中
国与石油供应国之间会因为经济领域的紧
密合作而形成以中国为核心的国际联合阵
营,在国际事务中会因为经济利益而有更
多国家 与中国保持一致,如:一些非洲
和美洲国家。而美国、日本等国也加紧对
中国实施外交围剿。
除了国际石油贸易,对所属石油资源的保
护也成为中国外交活动的主要任务。例
如;目前困扰中国的南海争端问题。丰富
Regional Innovations - 4, 2016 Page 28
China Sea issue become very sensitive. China has had
maritime conflicts with the Philippines and Vietnam
for many times. The interference of America, Japan,
etc. makes South China Sea issue more complex.
Though oil fields at the South China Sea are of crucial
economic significance, China always advocates
peaceful settlement and common development in South
China Sea dispute, and keeps self-restraint attitude for
a long term, which is the main reason for South China
Sea failing to become the second Middle East so far. In
addition, China endeavors to seek for new petroleum
supplier partners in America, South America and
Central Asia, which has guaranteed energy demands
for China’s economic development.
According to detection results, total petroleum reserve
stored in the South China Sea can rival with the Persian
Gulf (the proven petroleum reserve of Persian Gulf is
more than 49 billion tons, accounting for half of
worldwide petroleum reserves, while petroleum reserve
of the South China Sea is about 30 billion tons). Except
for the countries surrounding the South China Sea such
as Vietnam, the Philippines, etc., without China’s
approval, America, Japan, Russia and some Western
petroleum companies have begun to carve up the oil
fields at South China Sea. Now over 200 international
petroleum companies have carried out exploitation
operation in oil fields at South China Sea with total
well drilling quantity of over 1,000 sets. In addition,
early in the 1980s, the Soviet Union has had
cooperated with Vietnam to exploit petroleum at the
South China Sea of China, and has developed 8 oil
fields successively. The Soviet Union has 50% of the
profits from petroleum sales of Vietnam. In the 1980s,
the reason why Soviet Union became one of worldwide
petroleum producing countries was mainly related to
petroleum exploitation at the South China Sea.
Petroleum trade intensifies Sino-USA economic
interest conflicts. Though China and America do not
have direct petroleum trading relation, dollar is closely
associated with petroleum. China is the largest creditor
of America, the second largest economic community,
and the largest petroleum import country and the
second largest refined oil product export country, while
America is the largest refined oil product export
country and the second largest petroleum import
country. These complex factors convert their own
trading behaviors into their competition directly. One
belt & one road international cooperation model of
China will objectively affects geopolitics & economic
interests of America directly. Especially, RMB
settlement trend of China in international market and
the establishment of AIIB will affect the dollar’s
influence directly. America and European countries get
used to considering China’s rise as challenge or threat.
Therefore, as the response, diplomatic thoughts &
的石油和天然气储备让南海问题变得十分
敏感,在中国和菲律宾之间,中国与越南
之间多次发生海上冲突。美国、日本等国
家的干涉让南海问题变得更加复杂。 尽
管南海油田对中国有至关重要的经济意
义,但在南海争端中中国一直主张和平解
决共同开发,并长期保持克制态度,这是
至今南海地区没有成为第二个中东的主要
原因。同时,中国尽力在非洲、南美洲和
中亚寻找新的石油供应伙伴,保障了中国
经济发展的能源需求。
据探测结果,南海储藏的石油总量可与波
斯湾媲美(波斯湾已探明的石油储量约为
490 多亿吨,约占世界石油储量的一半,
南海约为 300亿吨)。除越南、菲律宾等
南海周边国家,在未经中方同意情况下,
美国、日本、俄罗斯和一些西方石油公司
已开始瓜分南海油田,现有 200多家国际
石油公司在南海油田进行开采作业,钻井
总数在 1000台以上。而早在 80年代苏联
就已同越南合作在中国南海开采石油,先
后开辟出 8座油田。苏联拥有越南石油销
售的 50%利润。80 年代苏联所以成为世界
产油大国之一,主要与南海石油开采有
关。
石 油贸易加剧中美经济利益冲突。虽然
中美之间没有直接的石油贸易关系,但美
元与石油密切相关,中国是美国最大债权
国,又是第二大经济共同体,是最大石油
进口 国和第二大成品油出口国,而美国
是第一大成品油出口国和第二大石油进口
国。这些复杂因素让各自的贸易行为直接
转化为彼此的竞争。中国推行的一带一路
国际合 作模式客观上直接影响美国的地
缘政治和经济利益,尤其中国在国际市场
中人民币结算的趋势和亚投行的成立都直
接影响了美元的影响力。美国和欧洲国家
习惯把中 国的崛起视为挑战或威胁。因

Regional Innovations - 4, 2016 Page 29
actions of European & American countries often have
striking aggressivity & pertinence. Along with the
expansion of international petroleum trade of China,
America imposes larger and larger diplomatic pressure
on China through surrounding countries of the South
China Sea of China. For example, diplomatic relations
between China and the Philippines, Japan, Australia &
Vietnam are strained all the time. however, these
international disputes will be settled due to China’s
strength. Forced by the temptation of China’s
economic interests and military expenditures, the
Philippines has begun to make peace with China. As to
the dispute over the island, China always advocates to
lay the dispute aside, which is for winning time to
realize powerful military affairs.
3. China promotes multilateral diplomacy by
virtue of petroleum trade.
Traditionally, China’s main petroleum import countries
are in the Middle East and Persian Gulf regions. Due to
marine transport, over 70% of imported petroleum is
transported to China by way of Strait of Malacca. This
lifeline has become the throat for hostile countries to
strangle China, and also made China in passive
position in international political conflicts & military
conflicts. Along with the promotion of economic
strength and military strength, China is paying great
attention to the security of petroleum transportation in
a positive attitude. In the past several years, China
assigned warships to the Gulf of Aden for escort
aiming at Somali pirates. Since the petroleum imported
from Persian Gulf countries by China is also
transported by way of the South China Sea waters,
petroleum resources reserved in the South China Sea
make China become tougher gradually in South China
Sea dispute, and it’s a new policy of China for foreign
trade to expand petroleum import channels and reduce
petroleum dependence, more than ten countries have
exported petroleum to China at present. Except Saudi
Arabia, Iran and Oman, Brazil, Venezuela, Angola,
Kazakhstan, Turkmenistan, etc. have also signed
petroleum and natural gas trade agreements with
China. China’s strategy of importing petroleum from
many regions and many countries have enhanced
China’s initiative in international petroleum trade and
international relations. Especially, it has established
China-Myanmar petroleum pipelines, China-
Kazakhstan petroleum pipelines and China-Russia
western front petroleum pipelines, and relieved the
threat of locking of marine transport line.
Petroleum trade has become the cold war tool of great
powers and an important factor for changing
international relations. In the Cold War period, the
Soviet Union caused deadly strike to China’s economy
by stopping supplying petroleum to China and cracking
此,作为反应,欧美国家的外交言行常具
有明显的攻击性和针对性。随着中国国际
石油贸易的扩大,美国通过中国南海周边
国家向中国 施加的外交压力也越来越
大,如;中菲、中日、中澳、中越的外交
关系一直紧张。但这些国际争端将因中国
的强大而和解。迫于来自中国的经济利益
的诱惑和军费压力,菲律宾已经开始与中
国和好。对争议岛屿问题中国一贯主张搁
置争论,这是为军事强大赢得时间。
3,中国通过石油贸易推行多边外交
传统上中国的主要石油进口国在中东和波
斯湾地区,由于海上运输,有 70%以上的
进口石油是通过马六甲海峡运往中国的。
这一条生命线成为与中国敌对国家扼杀中
国的咽喉,也使中国在国际政治冲突和军
事冲突中处在被动地位。 随 着经济实
力和军事实力的提升,中国正以积极态度
关注石油运输的安全问题。前几年针对索
马里海盗派出军舰到亚丁湾护航。由于中
国从波斯湾国家进口的石油也要 经过南
海水域,加之南海蕴藏的石油资源使得中
国在南海问题争端中逐渐变得强硬。同
时,扩大石油进口渠道、减少石油依赖是
中国对外贸易的新政策。目前向中国 出
口石油的国家发展到十几个,除沙特、伊
朗、阿曼等国,先后有巴西、委内瑞拉、
安哥拉、哈色克斯坦和土库曼斯坦等国与
中国签订了石油和天然气贸易协定。中
国从多地、多国进口石油的战略,大大增
加了中国在国际石油贸易和国际关系中的
主动性。尤其建立了中缅甸石油管道、中
国萨克斯坦石油管道和中俄西线石油管
道,缓解了海上运输线被封锁的威胁。
石油贸易成为大国之间的冷战工具和改变
国际关系的重要棋子。冷战时期,苏联通
过停止供应石油制裁中国,给中国经济造
成致命打击。出于当前新的国际关系的需

Regional Innovations - 4, 2016 Page 30
down on China. Due to the demands of new
international relations at present, Russia becomes
China’s strategic partner again, and bilateral trade has
been expanded ceaselessly. Russia has become an
important petroleum output country of China. In June
2013, China signed 25-year petroleum trade agreement
with Russia, and China would purchase petroleum
valuing 270 billion dollars from Russia during the 25
years. Due to the pressure of international economic
sanction, Russia needs economic support from China
urgently, and petroleum trade makes international
relations between China and Russia show warming
tendency. In return, Russia also carries out cooperation
with China in diplomatic, cultural & military fields.
Besides, in significant international issues, China and
Russia always hold the same standpoint. For example,
in respect to Iraq issue, Libya issue, Iran issue and
Syria issue, China and Russia contend against America
and Western union jointly. What’s not coincidental
really is that countries sanctioned and struck by
America in military field in recent years are exactly
those countries having close economic cooperation
with China and Russia, for example, Syria, Libya, etc.
During the 1960s-1970s, China’s foreign economic
behaviors were impelled by political interests, and it
once assisted some socialist countries free of charge,
for example, Vietnam, Cuba and Albania, and also
assisted Tanzania & Zambia to build railways freely.
Besides, China once also exchanged diplomatic
cooperation by petroleum export and begun to export
petroleum to some countries since the 1960s, for
example, political partners North Korea, ASEAN
countries and Panama. Since the 1970s, China also
begun to export petroleum to Japan. However, since
the 1980s, China exported petroleum mainly for the
purpose of getting foreign exchange in return. Till the
middle period of the 1990s, over 70% of foreign
exchange of China was realized by petroleum
exchange. In recent years, a certain quantity of
petroleum exploited from oil fields in China’s territory
with Australia & America jointly is exported to
America and Australia. China has also guaranteed
petroleum supply of Hong Kong all the time. China is
considering economic interests as the starting point of
diplomatic policy and changing traditional political
economy into economic politics & economic
diplomacy. Especially in recent years, China’s policy
of loan-petroleum exchange carried out in Venezuela,
etc. has not only helped some petroleum output
countries get out of economic plight, but also won the
initiative of petroleum trade and promoted China’s
diplomatic influence in these regions. In international
affairs of the Middle East, the Persian Gulf, etc.,
diplomatic selection of China is also established on the
basis of its own economic interests. In the past several
years, America proposed economic sanction to Iran and
EU countries carried out oil embargo to Iran, but China
求,俄罗斯又重新成为中国的战略合作伙
伴,双边贸易不断加大。俄罗斯成为中国
重要的石油输出国。2013 年 6 月,中国
同俄罗斯签署了 25 年的石油贸易协定,
中国在 25 年间将向俄罗斯购买 2700 亿
美元的石油。由于国际经济制裁的压力,
俄罗斯急需中国的经济支持,石油贸易让
中国同俄罗斯的国际关系呈现加温的态
势。作为回报,俄罗斯也同中国开展外
交、 文化和军事领域的合作。并在重大
国际问题上中俄持有同样的立场。如:在
伊拉克问题、利比亚问题、伊朗问题和叙
利亚等问题上中国与俄罗斯一起抗衡美国
和西方 阵营。而并非巧合的是,美国近
年制裁和军事打击的国家也正是与中国和
俄罗斯有紧密经济合作的国家。如:叙利
亚、利比亚等。
从六十年代到七十年代末,中国的对外经
济行为是受政治利益驱使的,曾无偿援助
一些社会主义国家,如:越南,古巴和阿
尔巴尼亚,并无偿援建坦桑尼亚和赞比亚
铁路。中国也曾通过石油出口换取外交合
作,60 年代就开始向一些国家出口石
油,如:政治伙伴北朝鲜、东盟国家和巴
拿马,70 年代初开始也向日本出口石
油。但从 80 年代开始,中国出口石油主
要为换取外汇,直到 90 年代中期,中国
的外汇 70%以 上是靠石油换来的。近年
中国在自己领海与澳大利亚和美国联合开
采的油田也有一定数量是出口到美国和澳
大利亚的。中国也一直保障了香港的石油
供应。中国正在 把经济利益作为对外政
策的出发点,将传统的政治经济改变为经
济政治和经济外交。尤其近几年中国在委
内瑞拉等国实行的贷款换石油的政策,即
帮助了一些石油输 出国摆脱经济困境,
也赢得了石油贸易的主动性,提升了中国
在该地区的外交影响力。在中东和波斯湾
等国际事务中,中国的外交选择也是建立
在自身经济利益之上 的。前几年 ,美
国提出对伊朗经济制裁,欧盟国家对伊朗
实行石油禁运。中国 坚持从伊朗进口石
Regional Innovations - 4, 2016 Page 31
insisted on exporting petroleum from Iran and relieved
Iran’s economic pressure. The stable petroleum policy
carried out by Iran for China in recent years has also
relieved China’s energy crisis. In addition, Angola
becomes China’s petroleum output country, which is
not only based on economic development demands of
China, but also the demands of international relations.
Angola has sought for financial assistance from China
for many times. The president of Angola requested
China to extend its loan repayment period for two years
or a longer time during the visit to China in June 2015,
and also hoped to get new credit extension. Before this,
Reuters had reported that similar to Venezuela, Angola
bound petroleum output and early-stage loan
agreement, and started to increase petroleum export to
China to repay the loan since February of this year. To
maintain the income and expenses, Angola has sold
crude oil to other countries in a large scale. According
to OPEC data, as of September, Angola had become
the country of the largest export volume of crude oil in
Africa for 6 months continuously with daily average
export of 1,775,000 barrels. By virtue of crude oil
import & export trade, China has satisfied the demands
of economic interests, and also strengthened
international partnership with cooperative countries. In
recent years, China has also exported refined oil
products to surrounding countries such as Malaysia, the
Philippines, Australia, Singapore, etc. Due to price
advantage, these countries have great dependence on
the demands of China’s refined oil products. China has
been intensifying its great power status in geopolitics
by virtue of petroleum economy.
Petroleum crisis has facilitated the adjustment of world
economic pattern. Dependence on imported petroleum
forces China to pay attention to new energy
development. In recent 30 years, China has built
several large-scale hydroelectric power stations and
thermal power stations successively, and begun to
develop wind power generation, solar power generation
& nuclear power generation projects in recent years. As
to Germany, France, etc. of wind energy technology &
nuclear energy technological advantages and other
countries of renewable energy technological
advantages, China is the potential cooperative partner.
China needs to make improvement in high-efficiency
energy utilization. For example, the energy consumed
by Germany to produce automobiles of the same model
and quantity only accounts for 60% of that consumed
by China. Many Chinese enterprises damage more
precious ecological resources while creating economic
benefit. In respect to social behaviors, Chinese people
still lack sufficient environmental consciousness &
public consciousness. Many people possess German
cars, but lack traffic awareness and national quality of
Germans. It’s not enough to possess automobiles
merely but no automobile culture. Eastern and Western
油,缓解了伊朗的经济压力。多年来伊朗
对中国的稳定的石油政策也缓解了中国的
能源危机。而安哥拉成为对中国的石油输
出国即是基于中国经济 发展需求,也是
国际关系的需求。安哥拉曾多次向中国寻
求资金援助。该国总统去年 6月访华期间
曾请求中国将其偿还贷款的期限延长两年
或更长时间,同时希望获得新的授信。路
透此前报道,与委内瑞拉类似,安哥拉将
石油产出与先期贷款协议捆绑,今年 2月
开始增加对华石油出口以偿还贷款。为维
持收支,安哥拉大规模对外出售原油。据
OPEC 数据,截止 9 月,该国已连续 6 个
月成为非洲原油出口量最多的国家,日均
出口 177.5 万 桶。中国通过原油进出口
贸易满足了经济利益需求,同时也加强了
与合作国的国际伙伴关系。近些年,中国
也向周边国家如:马来西亚、菲律宾、澳
大利亚和新加坡 等国出口成品油。由于
价格优势,使这些国家对中国成品油需求
产生依赖。中国通过石油经济在地缘政治
中不断强化自己的大国地
位。
石油 危机促进了世界经济格局的调整。
对进口石油的依赖迫使中国关注新的能源
开发。在最近 30年间,中国先后修建了
数个大型水利发电站、火力发电站,近年
开始发展风能发电、太阳能发电和核能发
电项目。对于拥有风能技术和核能技术优
势的德国、法国等国以及其它有再生能源
技术优势的国家,中国是潜在的合作伙
伴。
在高效利用能源方面中国还有待改进,
如:生产同等型号和数量的汽车所消耗的
能源德国只占中国的 60%。 很多中国企
业在创造经济效益的同时在破坏更宝贵的
生态资源。在社会行为上中国人还缺少足
够的环保意识和公共意识。很多人拥有德
国的小汽车,但缺少德国人的 交通意识
和国民素质。仅拥有汽车而没有汽车文化
是不够的。东西方文化差距为中国与欧洲
Regional Innovations - 4, 2016 Page 32
cultural gap has provided wide prospects for close
cooperation of China and European developed
countries in cultural education field.
4. China’s dependence on petroleum trade will
be transformed into world economy’s dependence
on China.
In globalized today, world economic development is
interactive. Though international petroleum output and
demand-supply relation have huge influence on
China’s economic development, since China’s
economic rise has also driven prosperity of world
economy, China is an indispensable link in world
economic chain. The dependence of China’s economy
on petroleum trade will be projected into international
market by virtue of the influence of China’s economy.
China imports petroleum and also exports refined oil
products in quantity. The exported industrial products
contain plenty of petrochemical synthetic materials.
For example, raw materials of tires, plastic products,
clothing, etc. exported by China mainly come from
petroleum, for example, synthetic rubber, PE and
chemical fiber. Lack of petroleum means that China
will reduce the production of industrial products related
to petroleum raw materials. These products occupy
important shares in international market, for example,
output of chemical fertilizer: 67,406,000t, accounting
for 35% of total output in the world; output of plastics:
55,500,000t, accounting for 20% of total output in the
world; output of chemical fiber: 30,900,000t,
accounting for 42.6%of total output in the world. Other
products of China closely related to petroleum energy
also occupy significant shares in international market:
computer output: 246,000,000 sets with year-on-year
growth of 35% and accounting for 68% of total output
in the world; output of color TV: 118,000,000 sets with
year-on-year growth of 19.5% and accounting for 50%
of total output in the world; refrigerator output:
73,000,000 sets with year-on-year growth of 23% and
accounting for 65% of total output in the world; output
of air conditioners: 109,000,000 sets with year-on-year
growth of 35% and accounting for 80% of total output
in the world; output of mobile phones: 998,000,000
sets with year-on-year growth of 61% and accounting
for over 70% of total output in the world.
Export volume of refined oil products of China is rising
year by year. In June 2016, total export volume of
finished fuel products of China increased by 38% on
year-on-year basis and reached 4,200,000t with daily
average export of about 1,020,000 barrels. According
to the data released by General Administration of
Customers of the Peoples’ Republic of China on July
21, gasoline export volume of China doubled in June
and set a new record of 1,100,000t or daily average
export of 312,000 barrels. In the first half year of 2016,
发达国家在文化教育领域的紧密合作提供
了广泛前景。
4, 中国对石油贸易的依赖将转化为世
界经济对中国的依赖
在 全球化的今天,世界经济发展是相互
制约的。虽然国际石油产量和供需关系对
中国经济发展有巨大影响力,但由于中国
经济崛起也带动了世界经济的繁荣,中国
在世 界经济链中是不可或缺的环节。中
国经济对石油贸易的依赖会通过中国经济
的影响力投射到国际市场中。中国进口石
油,也大量输出石油产品。出口的工业品
中,包 含大量石化合成材料,如:中国
出口的轮胎、塑料制品、服装等产品使用
的原材料主要来自石油:如:合成橡胶、
聚乙 烯、化纤。缺少石油,意味着中国
会减少生产 与石油原料有关的工业产
品,这些产品在国际市场占有重要份额,
如:化肥产量:6740.6 万吨,占世界总
产量的 35%,塑料产量:5550万吨,占世
界总产量的 20%,化纤产量:3090 万
吨, 占世界总产量的 42.6%。与石油能
源有密切关系的其它中国产品也在国际市
场占有重要份 额:计算机产量:2.46
亿台,同比增长 35%,占世界总产量的
68%,彩电产量:1.18 亿台,同比增长
19.5%,占世界总产量的 50%,冰箱产
量:7300万台,同比增长 23%,占世界总
产量的 65%,空调产量:1.09亿台,同比
增长 35%, 占世界总产量的 80%,手机
产量:9.98亿部,同比增长 61%, 超过
世界总产量的 70%。
中国成品油出口量逐年上升。今年 6月,
中国成品燃料总出口量同比飙升 38%至
420万吨,每天出口接近 102万桶。中国
海关总署 7月 21日发布的数据显示,中
国 6月汽油出口同比翻了一倍至创纪录高
位 110万吨,或者每天 31.2万桶。2016
年上半年,柴油出口量增长逾两倍,至
Regional Innovations - 4, 2016 Page 33
export volume of diesel oil increased by over double
times and reached 6,600,000t. In June 2016, China
processed about 11,000,000 barrels of petroleum every
day and gasoline output increased by 8.7% to historical
highest level. By the end of May, commercial gasoline
inventory set a new record to 7,830,000t. Import &
export trade of petroleum products makes China’s
petroleum industry become an indispensable
constituent part of world economic development. So to
speak, China’s industrial development and world
economy are on the same boat.
The complexity of petroleum trade and city haze
arising from fuel oil & gas facilitate China to
popularize electric automobiles in big cities. China has
new R&D achievements in car battery field. For
example, Yinlong battery developed by China Zhuhai
Yinlong New Energy Auto Manufacturing Company
has the service life of 30 years, can be fully charged by
6 minutes, and can keep normal operation for 500km at
the temperature range from 60℃ to -50℃. It has
opened up a new way for world new energy industry.
5. Introspection on sociology brought by
petroleum economy.
Economic construction of many countries nowadays is
still in barbarous development state. Once the
dependence of macroeconomic development on
petroleum trade is larger, the government is required
more to carry out ration control of petroleum industry,
otherwise, it can’t guarantee healthy & stable economic
development of the country, nor guarantee the
reputation in international trade. National monopoly
has ensured that fluctuation of petroleum price always
keeps consistent with national macroscopic interests
and considers the stability of international market. It
can avoid the phenomenon that petroleum oligopoly
controlled macroeconomy appearing in Russia at the
early stage of the 1990s. According to the demands of
international energy market and domestic economic
development, China’s petroleum industry will be
nationalized for a long term. As a matter of fact, rapid
development and gradual maturity of China’s
petroleum industry mainly benefit from enterprise
nationalization. Except for petroleum enterprises, other
industries involving in national basic strategic security
are also operated by state enterprises, for example,
electronic industry, communication industry, traffic
industry, electric industry, etc. It’s an important factor
for the success of China’s reform & opening-up policy
to nationalize important core industries in China. Since
only nationalization can guarantee capital demands of
enterprise development and guarantee due social
responsibility of state-owned enterprises during the
development. In the society with unsound laws,
economic behaviors of private enterprises often escape
660万吨。今年 6 月,中国大约每天加工
1100万桶石油,汽油产出增长 8.7%至有
史以来的最高水平。截止 5月底,商业汽
油库存升至创纪录高位 783万吨。石油产
品的进出口贸易让中国石油产业成为世界
经济发展不可缺少的组成部分。可以说,
中国工业发展与世界经济在同一条船上。
石油贸易的复杂性和燃油燃气引发的城市
雾霾促使中国在大城市推广电力汽车。在
车用蓄电池领域有新的研发成果, 如:
中国珠海银隆新能源汽车制造公司研发的
银隆电池,使用寿命 30年,6分钟充满
电,高温 60度,零下 50度内保持正常运
行 500公里。为世界新能源产业开辟了一
条新路。
5,石油经济带给社会学的反思:
当 今很多国家的经济建设还处在野蛮发
展状态,宏观经济发展对石油贸易的依赖
越大,越是需要政府对石油产业进行理性
控制,否则无法保证本国经济的健康、稳
定发 展,也难以保证在国际贸易中的信
誉。国家垄断确保了石油价格的波动总是
与国家宏观利益保持一致,并兼顾到国际
市场的稳定。避免 90年 代初期在俄罗斯
出现的由石油寡头控制宏观经济的现象。
根据国际能源市场和国内经济发展的需
求,中国石油产业将长期国有化。事实
上,中国石油行业的快速发展 和日趋成
熟主要得力于企业的国有化。除石油企
业,其它涉及国家基本战略安全的行业也
是由国家企业经营。如:电子、通讯、交
通、电力等行业。将国家重要核心 行业
国有化是中国改革开放成功的重要因素。
因为国有化才保证了企业发展的资本需
求,也在发展中保证了国企应有的社会担
当。在法律不健全的社会,私企的经济
Regional Innovations - 4, 2016 Page 34
from social supervision and have illegal business
phenomena. Important industries which are allowed to
carry out private operation by China such as real estate
and mining have become industries of extravagant
profits and endangering social interests since they’re
out of control of the government. However, economic
behaviors of state-owned enterprises will accept social
inspection from the perspective of international
environment and national interests. State-owned
enterprises have larger high-tech R&D platforms and
are more attractive to sophisticated talents. These
factors enable state-owned enterprises to have huge
industrial competitiveness.
Employing Western successful economic & political
theories shall combine with social reality and
educational level & cultural awareness of the public.
Economic backwardness in Soviet Union period and
before the 1980s of China is not only due to
productivity backwardness, but also related to
detachment of economic policy and social reality.
Economic achievements of China’s reform & opening-
up policy lie in that decision makers have found out
appropriate joint point between economic theory and
backward social reality.
China’s huge potential in petroleum economy makes
Western countries alert. The Globalist in America
published an article on December 15 declares, “world
pattern is changing from America challenge to China
challenge and China becomes the new leader of
globalization”. In case China’s rise is the challenge to
the world, such challenge is distinguishing: America
dominates world pattern with EU countries and
developed countries such as Japan, South Korea, etc. as
strategic partners to make developed countries have
more international discourse right. However, China’s
partners are mainly some developing countries in
Africa, Asia & America, most of them are still in the
stage of getting rid of poverty, and the public lacks
education, including that China itself still fails to form
cultural values corresponding to the economic
influence. In global awareness and mainstream culture,
China doesn’t have dominant position. Therefore,
China still doesn’t have the comprehensive national
strength challenging America from the perspective of
the gap in cultural soft power and scientific &
technological level. But the statements of “China
challenge” and “China is a new leading country” will
be confused with China threat theory easily. It’s
excluded as a kind of publicity strategy.
Many scientists and entrepreneurs have made
contributions to the progress of petroleum industry and
their efforts make petroleum bring wealth for human
beings. However, human weakness embodied in
petroleum getting method and petroleum economy of
行为常常会逃避社会监管存在非法经营现
象。中国允许私营的重要行业如房地产、
矿山开采都由于政府失控而成为危害社会
利益的暴利产业。而国有企业的经济行为
是从国际环境和国家利益出发接受社会检
验的。国有企业有更大的高科技研发平
台,对尖端人才有更大的吸引力。这些因
素让国企有巨大的行业竞争力。
采用西方成功的经济学和政治学理论要与
社会现实结合,与民众的教育水平和文化
意识相结合。苏联时期和中国 80年代以
前的经济落后,不仅是因为生产力落后,
也与经济政策同社会现实相脱节有关。中
国改革开放的经济成就在于决策者在先进
的经济学理论与落后的社会现实之间找到
了恰当的结合点。
中国在石油经济中的巨大潜力领西方警
觉。美国《全球主义者》12 月 15 日发表
文章,称:“世界格局正从美国挑战到中
国挑战。中国成为全球化的新领军者“。
如果中国崛起就是对世界的挑战,那这种
挑战是有区别的:美国是以欧盟国家和日
本、韩国等发达国家为战略伙伴主宰世界
局势,让发达国家拥有更多的国际话语
权。而中国的合作对象主要是非洲、亚洲
和美洲一些发展中国家,他们中大多数处
在摆脱贫困的阶段,民众,缺少教育,包
括中国自身也没有形成与经济影响力相应
的文化价值观。在全球意识和主流文化上
中国没有主导地位。因此,从文化软实力
和科技水平等差距上看中国还不具有挑战
美国的综合国力。而“中国挑战””中国
是新的领军国家“这样的说法很容易与中
国威胁论混为一 谈。不排除是一种宣传
战略。
很多科学家、企业家为石油工业的进步作
出了贡献,他们的努力让石油为人类带来
财富。但人类获取石油的方式和在石油经
济中体现的人性的弱点是不值得尊敬
Regional Innovations - 4, 2016 Page 35
human beings are not respectable. Further, before
petroleum was discovered, human civilization had
existed for several thousand years. However, petroleum
human civilization and world economy have been
kidnapped: petroleum industry has gathered all
achievements of modern science & technology of
human beings and drawn the attention of all politicians
& careerists, but doesn’t embody due wisdom of
human beings merely. In terms of fundamental
interests of human beings, what’s the most important in
future isn’t how to use or get extravagant profits of
petroleum by high-tech means, but how to learn the
wisdom of avoiding dog-eat-dog and getting well along
with each other from historical lesson.
Now that petroleum resources have brought so many
problems and disasters for human beings, why don’t
we select other ways? Now that rapid development of
science & technology has exceeded the cultivation
speed of moral self-consciousness of human beings, as
to human weakness exhibited in front of material
wealth, we shall try to establish the approaches for
getting rid of realistic difficulties from the perspective
of spiritual values.
Social progress needs spiritual energy more. In the long
run, it’s key to develop education to improve human
moral quality. While introducing in overseas energy,
China shall introduce humanistic thoughts & legal
concept of developed countries actively. Both real
great power and great nation need great spirits. In case
human beings only make scientific & technological
progress rather than growth of the heart, it’s not
progress, but degradation.
Conclusion:
1. Dependency on energy will make China become
the competitor of European & American countries in
international petroleum trade in future, and therefore it
will intensify the complexity of international relation.
Due to risks of marine transport, China will establish
stable & good partnership with petroleum output
countries beyond Persian Gulf region. To maintain
these relations, China will provide economic support
for these countries by means of capital output.
2. Constant improvement of petroleum import
volume of China also means that export volume of
industrial products with petroleum as raw materials is
also increased gradually. The dependence of China’s
economic development on petroleum resources will be
transformed into world economy’s dependence on
China’s manufacturing partially. Along with gradual
increase of China’s investment in international
petroleum industry and increase of China’s petroleum
的。进一步说,在没有发现石油之前,人
类文明已存在数千年。而由于石油人类文
明和世界经济都已被绑架:石油工业凝聚
了人类现代科技的所有成果,吸引了所有
政治家和野心家的眼球,却唯独没有体现
出人类应有的智慧。对人类的根本利益而
言,未来最重要的不是如何利用,高科技
手段去获取石油暴利,而是如何从历史的
教训中学到避免自相残杀和友好相处的智
慧。
既然石油资源为人类带来这么多问题和灾
难,为何不选择其它出路?既然科学技术
的快速发展超过人类道德自觉的培养速
度,在物质财富面前展示出的人性的弱
点,我们应该尝试从精神价值观出发建立
摆脱现实困境的途径。
社会进步更需要精神能源。长远看,发展
教育提高人的道德素质才是关键。在引入
国外能源的同时,中国应该积极引入发达
国家的人文思想和法制观念。真正的强国
和伟大的民族都需要有伟大的精神。人类
若只有科技的进步而没有心灵的成长这不
是进步而是退化。
总结:
1, 对能源的依赖会使中国在未来国际
石油贸易中成为与欧美国家竞争的对手,
因而会加剧国际关系的复杂化。由于海上
运输的风险性,中国将同波斯湾地区之外
的石油输出国建立稳定而良好的伙伴关
系,为维持这些关系中国将以输出资本的
形式对这些国家给予经济支持。
2, 中国石油进口量的不断提升也意味着
以石油为原料的工业产品出口量的逐步增
长,中国经济发展对石油资源的依赖会部
分的转化为世界经济对中国制造的依赖。
随着 中国在国际石油产业的投资逐渐增
加,以及中国石油开采,设备出口量的增
Regional Innovations - 4, 2016 Page 36
exploitation & equipment export volume, China’s
capital will be joined in more overseas oil field
exploitation projects. Except for the export of refined
oil products, China will transform into petroleum
output country from petroleum import country due to
possessing oil producing shares of overseas oil fields.
On the one hand, confronted with fierce international
energy dispute, China will concentrate on developing
new investment projects and avoid head-on
confrontation with America & Japan. On the other
hand, rapid improvement of China’s military strength
will enhance China’s tough attitude in settling
territorial sea dispute.
3. As to the country, petroleum industry needs
government’s control. However, from the perspective
of global security and world economic interests,
international petroleum industry shall break the
monopoly: several petroleum crises are manipulated
by a minority of petroleum monopolizing countries.
Helping more petroleum producing countries to get rid
of great power’s monopoly is an important factor to
guarantee petroleum industry and world economic
stable development.
4. China’s demand on green energy has provided
cooperative prospects for those countries with relevant
scientific & technological advantages, for example,
Germany and France. It’s convinced that in the near
future, China will widely popularize the new energy
substituting petroleum and become new energy export
country.
5. Descartes says, “the ability of management
aptitude is more important than aptitude itself”. The
same principle is also applicable to economic behaviors
& power domination of human society today. Human
tragedy is really just as what Descartes says, human
beings have had much before learning how to dominate
their own spiritual wealth & material wealth. Rich
petroleum resources make human beings crazy on the
contrary. Wish human beings can dominate their own
wealth & wisdom rationally during the process of
pursuing social utility.
加,中国资本将会加入到更多的国外油田
开采项目中,除了成品油出口,中国将因
拥有国 外油田的产油份额而由石油进口
国转为石油输出国。一方面,面对国际能
源激烈争端中国会把精力用在开辟新的投
资项目上而回避同美国和日本的正面冲
突;另一方 面,中国军力的快速提升会
增加中国在解决领海争端中的强硬态度。
3, 对于国家而言,石油产业需要政府
的把控, 但从全球安全和世界经济利益
考 虑,国际石油行业却应该打破垄断:
几次石油危机是由少数石油垄断国家操控
的。让更多的石油生产国脱离大国垄断,
是保证石油产业和世界经济稳定发展的重
要因素。
4, 中国对绿色能源的需求为那些有相
关科技优势的国家提供了合作前景,如:
德国和法国。相信不久的将来中国会广泛
普及替代石油的新能源并成为新能源的出
口国。
5,笛卡尔说:“拥有管理才能的能力比
才能更重要”。同样的道理也适用于今天
人类社会的经济行为和权力支配。人类的
悲剧真的如笛卡尔所言,还没有学会如何
理性的支配自己的精神财富和物质财富,
就已经拥有了很多,丰富的石油资源反而
让人类变得疯狂。但愿人类在追求社会功
利的过程中能理性的支配自己的财富和智
慧。
Regional Innovations - 4, 2016 Page 37
References:
1. CIEN, November 2016
2. Petroleum Business Newspaper, October 2015
3. JRJ.com, July 2016
4. Sina Finance
5. Sohu Finance
6. Global Times, December 2016
参考资料:
1,中国产经新闻报 2016年 11月
2,石油商报 2015,10
3,金融界网站 2016.07
4, 新浪财经网
5,搜狐财经网
6,环球时报 2016.12 月
杜宏伟 哲学博士
Du Hongwei, Doctor of Philosophy
中国北京
Beijing, China
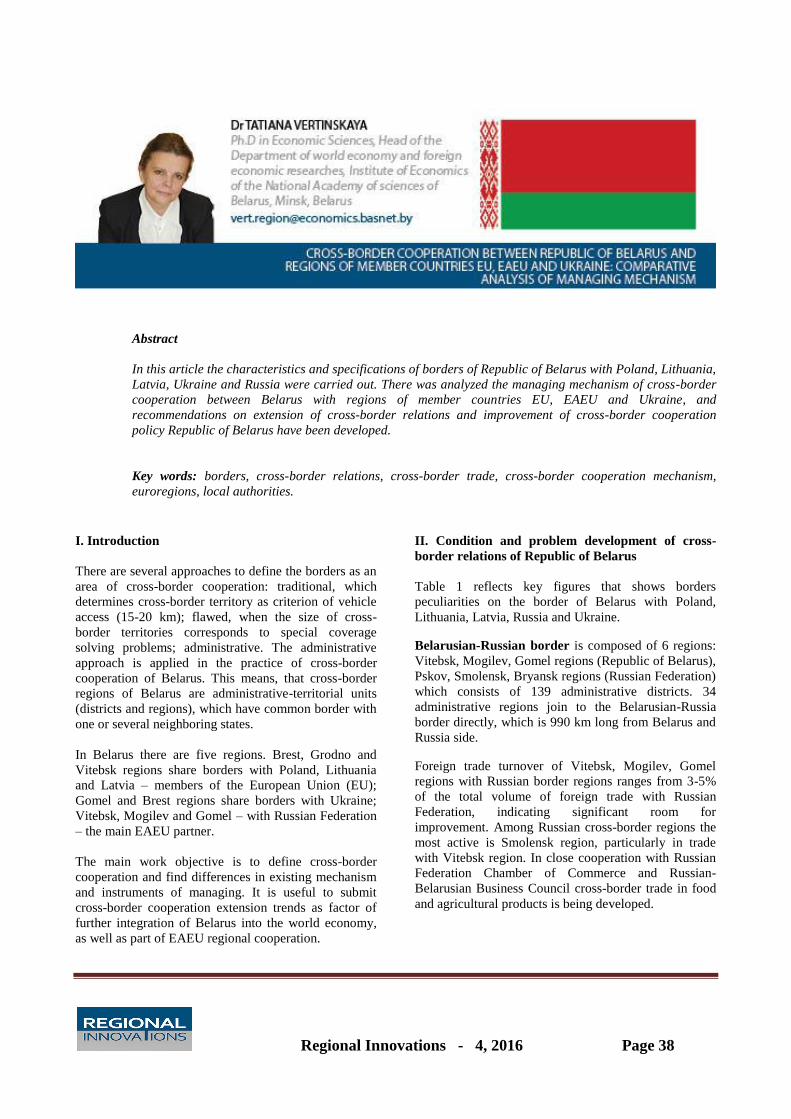
Regional Innovations - 4, 2016 Page 38
Abstract
In this article the characteristics and specifications of borders of Republic of Belarus with Poland, Lithuania,
Latvia, Ukraine and Russia were carried out. There was analyzed the managing mechanism of cross-border
cooperation between Belarus with regions of member countries EU, EAEU and Ukraine, and
recommendations on extension of cross-border relations and improvement of cross-border cooperation
policy Republic of Belarus have been developed.
Key words: borders, cross-border relations, cross-border trade, cross-border cooperation mechanism,
euroregions, local authorities.
I. Introduction
There are several approaches to define the borders as an
area of cross-border cooperation: traditional, which
determines cross-border territory as criterion of vehicle
access (15-20 km); flawed, when the size of cross-
border territories corresponds to special coverage
solving problems; administrative. The administrative
approach is applied in the practice of cross-border
cooperation of Belarus. This means, that cross-border
regions of Belarus are administrative-territorial units
(districts and regions), which have common border with
one or several neighboring states.
In Belarus there are five regions. Brest, Grodno and
Vitebsk regions share borders with Poland, Lithuania
and Latvia – members of the European Union (EU);
Gomel and Brest regions share borders with Ukraine;
Vitebsk, Mogilev and Gomel – with Russian Federation
– the main EAEU partner.
The main work objective is to define cross-border
cooperation and find differences in existing mechanism
and instruments of managing. It is useful to submit
cross-border cooperation extension trends as factor of
further integration of Belarus into the world economy,
as well as part of EAEU regional cooperation.
II. Condition and problem development of cross-
border relations of Republic of Belarus
Table 1 reflects key figures that shows borders
peculiarities on the border of Belarus with Poland,
Lithuania, Latvia, Russia and Ukraine.
Belarusian-Russian border is composed of 6 regions:
Vitebsk, Mogilev, Gomel regions (Republic of Belarus),
Pskov, Smolensk, Bryansk regions (Russian Federation)
which consists of 139 administrative districts. 34
administrative regions join to the Belarusian-Russia
border directly, which is 990 km long from Belarus and
Russia side.
Foreign trade turnover of Vitebsk, Mogilev, Gomel
regions with Russian border regions ranges from 3-5%
of the total volume of foreign trade with Russian
Federation, indicating significant room for
improvement. Among Russian cross-border regions the
most active is Smolensk region, particularly in trade
with Vitebsk region. In close cooperation with Russian
Federation Chamber of Commerce and Russian-
Belarusian Business Council cross-border trade in food
and agricultural products is being developed.
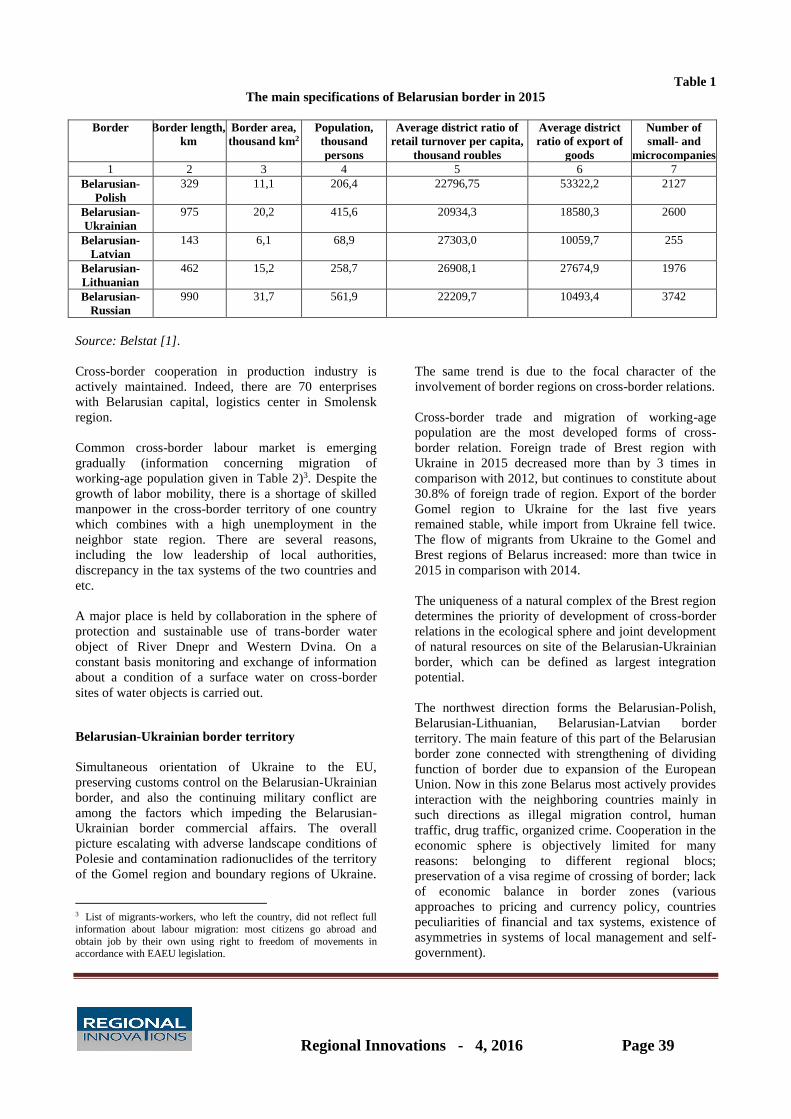
Regional Innovations - 4, 2016 Page 39
Table 1
The main specifications of Belarusian border in 2015
Border Border length,
km
Border area,
thousand km2
Population,
thousand
persons
Average district ratio of
retail turnover per capita,
thousand roubles
Average district
ratio of export of
goods
Number of
small- and
microcompanies
1 2 3 4 5 6 7
Belarusian-
Polish
329 11,1 206,4 22796,75 53322,2 2127
Belarusian-
Ukrainian
975 20,2 415,6 20934,3 18580,3 2600
Belarusian-
Latvian
143 6,1 68,9 27303,0 10059,7 255
Belarusian-
Lithuanian
462 15,2 258,7 26908,1 27674,9 1976
Belarusian-
Russian
990 31,7 561,9 22209,7 10493,4 3742
Source: Belstat [1].
Cross-border cooperation in production industry is
actively maintained. Indeed, there are 70 enterprises
with Belarusian capital, logistics center in Smolensk
region.
Common cross-border labour market is emerging
gradually (information concerning migration of
working-age population given in Table 2)3. Despite the
growth of labor mobility, there is a shortage of skilled
manpower in the cross-border territory of one country
which combines with a high unemployment in the
neighbor state region. There are several reasons,
including the low leadership of local authorities,
discrepancy in the tax systems of the two countries and
etc.
A major place is held by collaboration in the sphere of
protection and sustainable use of trans-border water
object of River Dnepr and Western Dvina. On a
constant basis monitoring and exchange of information
about a condition of a surface water on cross-border
sites of water objects is carried out.
Belarusian-Ukrainian border territory
Simultaneous orientation of Ukraine to the EU,
preserving customs control on the Belarusian-Ukrainian
border, and also the continuing military conflict are
among the factors which impeding the Belarusian-
Ukrainian border commercial affairs. The overall
picture escalating with adverse landscape conditions of
Polesie and contamination radionuclides of the territory
of the Gomel region and boundary regions of Ukraine.
3 List of migrants-workers, who left the country, did not reflect full
information about labour migration: most citizens go abroad and
obtain job by their own using right to freedom of movements in accordance with EAEU legislation.
The same trend is due to the focal character of the
involvement of border regions on cross-border relations.
Cross-border trade and migration of working-age
population are the most developed forms of cross-
border relation. Foreign trade of Brest region with
Ukraine in 2015 decreased more than by 3 times in
comparison with 2012, but continues to constitute about
30.8% of foreign trade of region. Export of the border
Gomel region to Ukraine for the last five years
remained stable, while import from Ukraine fell twice.
The flow of migrants from Ukraine to the Gomel and
Brest regions of Belarus increased: more than twice in
2015 in comparison with 2014.
The uniqueness of a natural complex of the Brest region
determines the priority of development of cross-border
relations in the ecological sphere and joint development
of natural resources on site of the Belarusian-Ukrainian
border, which can be defined as largest integration
potential.
The northwest direction forms the Belarusian-Polish,
Belarusian-Lithuanian, Belarusian-Latvian border
territory. The main feature of this part of the Belarusian
border zone connected with strengthening of dividing
function of border due to expansion of the European
Union. Now in this zone Belarus most actively provides
interaction with the neighboring countries mainly in
such directions as illegal migration control, human
traffic, drug traffic, organized crime. Cooperation in the
economic sphere is objectively limited for many
reasons: belonging to different regional blocs;
preservation of a visa regime of crossing of border; lack
of economic balance in border zones (various
approaches to pricing and currency policy, countries
peculiarities of financial and tax systems, existence of
asymmetries in systems of local management and self-
government).
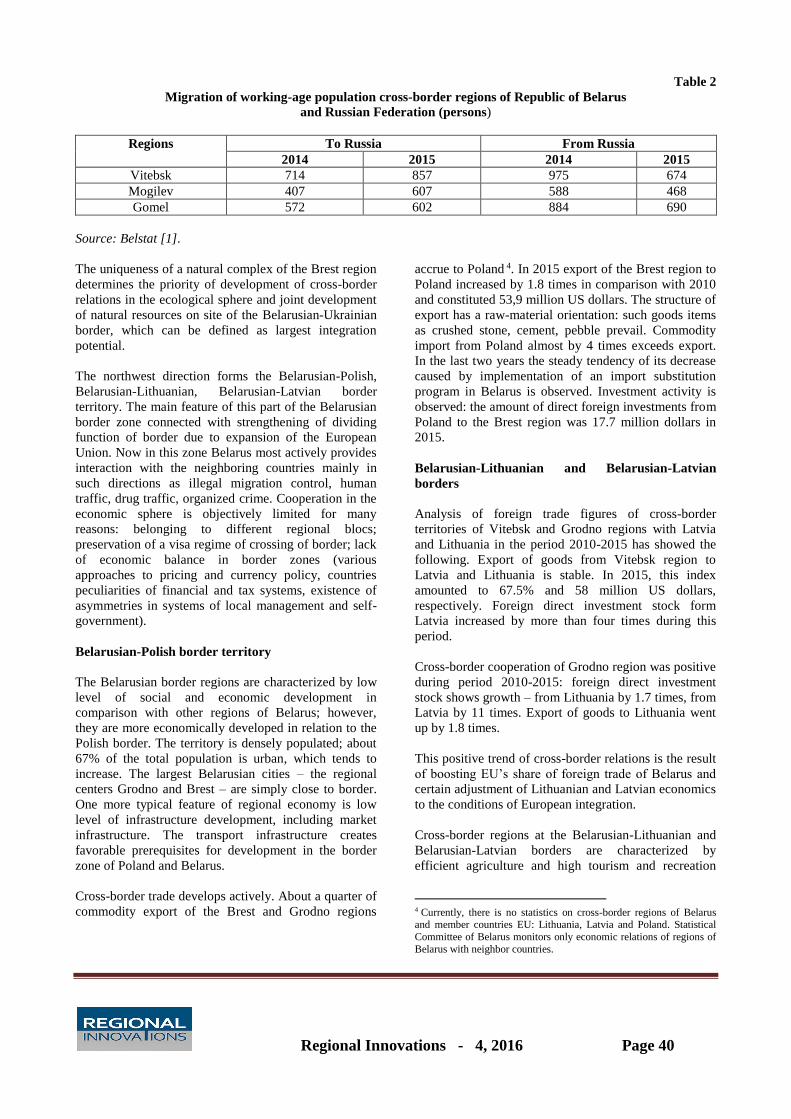
Regional Innovations - 4, 2016 Page 40
Table 2
Migration of working-age population cross-border regions of Republic of Belarus
and Russian Federation (persons)
Regions To Russia From Russia
2014 2015 2014 2015
Vitebsk 714 857 975 674
Mogilev 407 607 588 468
Gomel 572 602 884 690
Source: Belstat [1].
The uniqueness of a natural complex of the Brest region
determines the priority of development of cross-border
relations in the ecological sphere and joint development
of natural resources on site of the Belarusian-Ukrainian
border, which can be defined as largest integration
potential.
The northwest direction forms the Belarusian-Polish,
Belarusian-Lithuanian, Belarusian-Latvian border
territory. The main feature of this part of the Belarusian
border zone connected with strengthening of dividing
function of border due to expansion of the European
Union. Now in this zone Belarus most actively provides
interaction with the neighboring countries mainly in
such directions as illegal migration control, human
traffic, drug traffic, organized crime. Cooperation in the
economic sphere is objectively limited for many
reasons: belonging to different regional blocs;
preservation of a visa regime of crossing of border; lack
of economic balance in border zones (various
approaches to pricing and currency policy, countries
peculiarities of financial and tax systems, existence of
asymmetries in systems of local management and self-
government).
Belarusian-Polish border territory
The Belarusian border regions are characterized by low
level of social and economic development in
comparison with other regions of Belarus; however,
they are more economically developed in relation to the
Polish border. The territory is densely populated; about
67% of the total population is urban, which tends to
increase. The largest Belarusian cities – the regional
centers Grodno and Brest – are simply close to border.
One more typical feature of regional economy is low
level of infrastructure development, including market
infrastructure. The transport infrastructure creates
favorable prerequisites for development in the border
zone of Poland and Belarus.
Cross-border trade develops actively. About a quarter of
commodity export of the Brest and Grodno regions
accrue to Poland 4. In 2015 export of the Brest region to
Poland increased by 1.8 times in comparison with 2010
and constituted 53,9 million US dollars. The structure of
export has a raw-material orientation: such goods items
as crushed stone, cement, pebble prevail. Commodity
import from Poland almost by 4 times exceeds export.
In the last two years the steady tendency of its decrease
caused by implementation of an import substitution
program in Belarus is observed. Investment activity is
observed: the amount of direct foreign investments from
Poland to the Brest region was 17.7 million dollars in
2015.
Belarusian-Lithuanian and Belarusian-Latvian
borders
Analysis of foreign trade figures of cross-border
territories of Vitebsk and Grodno regions with Latvia
and Lithuania in the period 2010-2015 has showed the
following. Export of goods from Vitebsk region to
Latvia and Lithuania is stable. In 2015, this index
amounted to 67.5% and 58 million US dollars,
respectively. Foreign direct investment stock form
Latvia increased by more than four times during this
period.
Cross-border cooperation of Grodno region was positive
during period 2010-2015: foreign direct investment
stock shows growth – from Lithuania by 1.7 times, from
Latvia by 11 times. Export of goods to Lithuania went
up by 1.8 times.
This positive trend of cross-border relations is the result
of boosting EU’s share of foreign trade of Belarus and
certain adjustment of Lithuanian and Latvian economics
to the conditions of European integration.
Cross-border regions at the Belarusian-Lithuanian and
Belarusian-Latvian borders are characterized by
efficient agriculture and high tourism and recreation
4 Currently, there is no statistics on cross-border regions of Belarus and member countries EU: Lithuania, Latvia and Poland. Statistical
Committee of Belarus monitors only economic relations of regions of
Belarus with neighbor countries.
Regional Innovations - 4, 2016 Page 41
capacity of ecosystems. This characteristics define the
priority of development of the cross-border relations in
such spheres, as well as in the area of border
infrastructure development to perform a liaison function
between the countries (construction of border crossings,
customs control).
"Lake District" euroregion, which participants are cross-
border regions of Lithuania, Latvia and Belarus, is
focused on the development of tourism, agriculture,
with the participation of small and medium-sized
businesses. On the Belarusian-Polish border set up and
operate three euroregions: "Bug", "Neman", Bialowieza
Forest [2]. Development of tourism, environment,
culture and education on a project basis are the main
directions of their activities. Despite of institutionalism,
there are no special mechanisms and operating modes of
euroregions.
The opportunity to participate in joint projects for
EU programs:
Possibility of participation not only euro-regions in joint
projects of the programs of the EU «Cross-border
cooperation Belarus-Poland-Ukraine» and «Cross-
border cooperation: Belarus-Lithuania-Latvia», but also
in general regions of Belarus lowered a role of the euro-
regions in development of cross-border ties.
For instance, the priorities of implementation of joint
projects of Belarus with the EU for the period 2017-
2020 are:
According to the program of a cross-border cooperation
Lithuania-Latvia-Belarus - promotion of social
integration and reduction of poverty; enhancing the
access to social and other services for vulnerable
groups; stimulating employment through
entrepreneurship and innovations; increasing capacity of
local and regional authorities to tackle common
challenges; strengthening society; promotion and
preserving cultural and historical heritage and
traditional skills.
According to the program of a cross-border cooperation
Belarus-Poland–Ukraine - promotion of local culture
and preservation of historical; improvement of
accessibility to the regions, development of sustainable
and climate-proof transport and communication
networks and systems; promotion of border
management and border security, mobility and
migration management.
Project activities in the field of development of cross-
border cooperation are possible in other directions. The
overview of the financial instruments of the EU
available for regions of Belarus showed the possibility
of participation of regions of Belarus, including border
programs of the EU with use of the following of
thematic, two-sided, regional tools [3]:
Civil society organization and local authorities
program;
Cross-border cooperation;
Territorial cooperation under the Eastern
Partnership;
Territorial cooperation under the European
Regional Development Fund;
Community-led urban strategies;
Pact of mayors – East;
Demonstration projects of sustainable
development of the cities;
European neighborhood program for agriculture
and rural development.
III. Comparative analysis of mechanism for cross-
border cooperation with regions of the member
countries EU, EAEU and Ukraine
As criteria for the comparative analysis were identified
key components of cross-border cooperation
mechanism. This is the directions and spheres of cross-
border relations, managerial levels, which are involved
in the regulation of cross-border contact, as well as the
most frequently used forms and methods of
management development of cross-border relations.
As information and analytic base was used legislative
and regulatory framework for development cross-border
relations, analysis of news flow (content analysis) and
internet analysis (web analytics), as well as several
economic and statistics indicators.
The results of expert assessment by three criteria are
presented in Tables 3-5.

Regional Innovations - 4, 2016 Page 42
Table 3
Areas and spheres of cross-border cooperation between Republic of Belarus
and regions of member countries EU, EAEU and Ukraine
№ Areas and spheres of cooperation EU ЕAEU Ukraine
1 Cross-border trade + ++ +
2 Ecology and environment control ++ ++ ++
3 Education and culture ++ ++ +
4 Tourism ++ ++ +
5 Urban development + – -
6 Rural development + + +
7 Innovative cooperation + +
8 Infrastructure creation:
-cross-border infrastructure and border checkpoints ;
- market infrastructure;
- local infrastructure (local road network, water delivery
system, etc.)
++
++
++
+
+
+
+
9 Social sphere + + -
10 Migration and mobility of population + ++ ++
11 Human development and relationships ++ + -
12 Production sphere
13 Promotion of entrepreneurship ++ + +
14 Investment interaction ++ + +
15 Energy efficiency and harnessing of renewable energy
resources (RER)
++ + -
16 Organization of regional development institutions ++ – -
17 International cooperation between local authorities and
civil institutions (NGO, NPO, etc.)
++
+
+
18 Safety and emergency control + + -
Note: «–» - no practice;
«+» - have experience;
«++» - strong cooperation.
Generalization of given results of analysis enable to
conclude the following.
1. There is no substantial difference in spheres and areas
of cross-border cooperation of Republic of Belarus with
regions of member countries EU, EAEU and Ukraine.
There is divergence in priorities and intensify of
cooperation in single areas.
For instance, EU policy is focused on the organization
of institutions of cross-border cooperation and
infrastructural assets, as well as cooperation of cross-
border regions in the sphere of innovation, human
development, public sector inclusion. The prevalent
direction of cross-border cooperation with EAEU
countries are migration neighbor territories, direct trade
and production relations between business entities.
2. In integration mechanism of cross-border regions of
member states of EAEU prevail the national managerial
and business entities levels. At the same time cross-
border mechanism of cooperation EU member states is
three-level. Moreover, financial and organizational
institutes acting on supranational level. Cross-border
regions of Belarus can receive financing from special
funds of EU.
More active participants of EU cross-border relations
are the regional and local levels. However, in cross-
border relations management of Belarus with states of
EU, as well as EAEU, local authorities have low
engagement by reason of differences in scope of
jurisdiction.

Regional Innovations - 4, 2016 Page 43
Table 4
Participation of different management levels in cross-border cooperation development
between Republic of Belarus and regions of the member countries EU, EAEU and Ukraine
№
пп
Management level Regions of the
member country
EU
Regions of the
member country
EAEU
Ukraine
1 Supranational level of regional association ++ – *
2 National level + ++ +
3 Regional and local level ++ + +
Note:
* - no supranational level ( Ukraine is not a member of EU and EAEU);
«+» - low influence;
«++» - strong influence;
«–» - no special management structure.
3. The most vary forms and methods of the mechanism of cross-border cooperation on the border with the EU, EAEU
and Ukraine.
Table 5
Forms of cross-border cooperation and management tools used by Republic of Belarus
with regions of the member countries EU, EAEU and Ukraine
№ Forms of cross-border cooperation and
management tools
Regions of the
member
country EU
Regions of the
member
country EAEU
Cross-border regions
of Ukraine
1 Emerging of euroregions and other target
areas
+ + +
2 Project management (project realization)
under international programs
+ – +
3 Generation of institutional environment for
cross-border integration of region
+ – +
4 Realization of investment projects + + +
5 Forecasting and strategic planning – – –
6 Regulation of prices and tariffs within
cross-border territory
– + –
7 Financing of programs and projects in the
sphere of cross-border cooperation
+ – +
8 Organization of distribution system and
other objects of market infrastructure
+
++
+
9 Exhibition and auction organization + ++ +
10
Tariff and visa regulation within cross-
border territories
+ - -
11 Regulation of migration flows and
increasing labour mobility
++ + +
12 Collective organization, providing social
(public) services to the population
+ – +
13 Industrial cooperation + ++ +
14 Direct contacts of business entities + ++ +
15 Establishing of joint production and
foreign enterprises
++ ++ +
16 Organization of cross-border clusters + + +
Note: «–» - no practice;
«+» - have experience;
«++» - strong cooperation.

Regional Innovations - 4, 2016 Page 44
Eurasian variant of cross-border relations is a traditional
foreign economic ties of business entities. The
mechanism of management and development related to
organization of joint ventures, production co-operation,
products promotion on regional markets through
distribution channels establishment, organization of
selling exhibitions and etc. Moreover, conditions of
common economic space allow to use the instrument of
strategic planning and forecasting. Hence, cross-border
cooperation between Belarus and Russia, first of all, is a
part of foreign economy strategy of Belarus and one of
directions of integrational policy of EAEU.
European policy cross-border cooperation consider such
relations as tool to reduce regional differences and
cohesion of regions cross-border countries. This is the
tool of realization both regional integration and
supranational regional policy. The main method is
project activities in areas which closely connected with
regional development (ecology, social services,
education and etc.).
Recently we can observe some trends in cross-border
relations between Belarus and Ukraine. Firstly, the
market relations between business entities and
population are the main opportunity for development
which comes from price difference for goods and
services. Secondly, cooperation within the euroregions
“Bug” and “Dnepr”, which focused on educational,
cultural contacts and solving environmental problems.
Third, the migration flows of population of Ukraine
cross-border regions to Belarus caused by military
operations.
Carried out the comparative analysis of cross-border
cooperation of Belarus enables to draw following
typology cross-border relations [4; 5]:
1. Institutionalized relation within euroregions;
2. Cross-border relations between business entities
develop spontaneous driven by market forces;
3. Cross-border relations as form of international
controlled by traditional methods of international
policy;
4. Cross-border relations as part of regional
cooperation focused on solving regional problems
cross-border territory with the participation of
local authorities, public sector of cities and towns;
5. Cross-border relations which get main opportunity
for development within common economic space
of integrational cooperation.
In practice, relation types are closely connected.
However, given typology is important from point of
view of understanding their development and
organization of improvement measures of mechanism
cross-border relations.
IV. Conclusions and practical recommendations
1. General recommendations
It is necessary to enhance the role of local
authorities in Belarus in the development of cross-
border relations within the limits of legislation
enacted at the national level. Their goal should be
the elimination of fragmentarity industrial
approaches to cross-border cooperation, guarantee
of inclusion of growth factor related to local
conditions and resources.
To take effective measures directed at economic
diversification of cross-border regions for the
purpose of expanding the participants of these
relations and decrease of periphery of cross-border
areas.
To strengthen orientation of the investment policy
in cross-border regions to achieve synergies from
investment projects implementation (innovation,
ecology, job creation, local development, etc.)
To engage integrative and export potential of free
economic zones, industrial parks and other
territories with a special regime, located in the
cross-border regions of Belarus in order to
intensify cross-border cooperation.
To carry out graded policy of cross-border
cooperation concerning administrative and
territorial units (ATU) of various ranks (small and
medium size towns; major cities; rural
communities), as well as various economic entities
(large business, small and medium size enterprises,
objects of communal property).
To shape a common database with cross-border
countries and create information and
communication platform for cross-border relations.
2. Recommended measures for the further
development of cross-border cooperation with
Russian regions as major partner of Belarus as
part of EAEU.
Suggestions related to more comprehensive
implementation conditions of common economic space
EAEU are the following:
To define an approved and interconnected
strategies of regional development and plans of
socioeconomics development cross-border regions;
To develop scheme of integrated territorial
organization cross-border territory of Belarus and
Russia, thus presupposing coordinated spatial
ordering and city planning on cross-border
territory;
To enhance cooperation at the level of local
authorities and guarantee of inclusion of the public
in order bigger orientation on cross-border

Regional Innovations - 4, 2016 Page 45
cooperation to problem solving of local
development;
To put in place the development programs of
institutional integrated environment on cross-
border territories;
To create a legal framework and special
administrative bodies and financial institutes at the
level of supranational bodies of EAEU in order to
support the development cross-border relations
between regions of member countries of regional
integration;
To implement a project management approach in
order to extend cross-border relations on the
border of Belarus and Russia;
To strengthen regional specialization of cross-
border territories as part of common economic
space in order to promote competitive
opportunities.
3. Priorities for improving policy of cross-border
cooperation of Belarus with EU member countries.
Development of measures to deepen cross-border
cooperation between Belarus and the European Union
should take into account the implementation of the
border several functions: separation of two regional
associations – EU and EAEU; national economies of
cross-border countries, as well as regions.
The following actions are recommended:
To reduce existing institutional and socio-
economic disparities between cross-border regions
of neighbor countries (active on going to market
transformation of Belarussian economy towards
convergence models of socio-economic
development with European countries and
organization of economic entities, suitable market
environment and the economy of cross-border
areas of EU member states).
To remove existing unbalance in local authorities
on the both sides of border. This may involve the
following mechanisms:
1. To delegate on a time basis of specific
functions on the local level to carry out cross-
border projects;
2. To create an institute responsible for national
authorities on the cross-border territory;
3. To emerge the urban associations, rural
communities for collective indication of local
development in cross-border cooperation policy.
4. To organize the cross-border clusters in the
following spheres: tourism; recycling; collective
use of natural and local resources, etc.
5. To grant legal status to local initiatives, to
develop clear criteria to allot grants by tender from
local budget for the implementation of local
initiatives.
6. To expand sources of funding through co-
financing from local budget projects on cross-
border cooperation on the part of Belarus.
References
1. Regions of Republic of Belarus. Statistical book. – Minsk, Belasta.2015
2. Euroregions of Republic of Belarus [Electronic resource].Mode of
access:http://beleuroregion.by/index.php?option=com_content&view=category&layout=blog&id=48&Itemid=
55 – Date of access:11.12.2016.
3. EU monetary aid for local and regional authorities in Eastern Partnership Countries. – Committee of the
Regions. – 2015 – P.38.
4. L.B.Vardomskiy. Cross-border cooperation on “new and old” Russian borders // Eurasian economic
integration, №1, 2008. P.90-108.
5. Cross-border cooperation of regions of Russia, Belarus and Ukraine // A.M.Anisimov, L.B.Berdomskiy,
T.S.Vetinskaya // Report № 17 – Saint Petersburg, 2013.

Regional Innovations - 4, 2016 Page 46
Abstract
The main objective of the article is to provide an overview on China’s recent reorientation for domestic
consumption and to study China’s and India’s future consumption growth. The research also studies consumer
behavior in China and India and examines prospects for small and medium businesses in the two countries.
Key words: domestic consumption, consumption growth, e-commerce, Fintech.
China is becoming a country with the highest purchasing
power. It is expected that there will be about 320 million
middle-class families in China by 2020. With the growth
of domestic consumption there is an increase in demand
for mass-produced goods for the domestic market. Many
Chinese manufacturers, who previously worked for the
export industry, have switched to providing for the needs
of the local market. Chinese consumers want more than
they can afford; they want wealth, luxury, and beauty. At
the same time, overproduction has increased demand for
food, real estate, transportation, education, and healthcare.
All of the above have caused inflation of goods,
shortcomings in quality control, and price volatility.
Prices often do not depend on the quality of the product,
but rather on the image, prestige, and sale location.
India and China experience intense competition, so they
look for special business approaches that will help them to
survive the rivalry. However, such conditions of the
constant battle also induce these countries to discover new
ways of doing business. Fintech and services markets in
China have risen to unbelievable heights. Many
companies, such as Tencent, Alibaba, and Taobao, which
did not exist 15-20 years ago, have a significant share of
the market today. Commercial and private construction is
growing fast. Right after the Shanghai World Financial
Center had been completed and announced the third tallest
building in the world, a new megatall skyscraper, the
Shanghai Tower, was constructed next to it and became
the second tallest after the Burj Khalifa.
China’s International Investments And Trade
Relations With The World
Over the past 40 years China was an unprecedented
example of a large-scale and rapidly growing economy.
According to World Bank, China had overtaken Germany
in 2007 and became world third-largest economy. In 2010
China overtook Japan, and it is projected to overtake the
USA by 2029. Income and production growth and the
increase of middle-class families will cause the rise in the
level of education and further GDP and salaries growth,
yet together with the recently revoked “one child policy”
in China, it will also cause smaller family sizes and the
aging of the Chinese nation.
The Chinese development model is considered to be
special, but it was originally developed in post-war Japan,
which was then adopted by South Korea, Taiwan,
Singapore and Hong Kong. Later it was adopted by China
and spread to Southeast Asia.
Regional Innovations - 4, 2016 Page 47
The government has retained control of the financial
system, transport infrastructure, and large industrial
enterprises, but it supported the creation of joint foreign-
Chinese enterprises. Most of the foreign investments were
contributed by Chinese diaspora, as well as Hong Kong,
Taiwanese, and Singaporean businessmen, who moved
production to mainland China where the resources were
unlimited and cheap. However, since the early 2000s, the
number of foreign investors investing in the Chinese
economy had been decreasing, which, to a large extent,
was the result of the concerted efforts of the Chinese
government.
While China is already the second-largest economy in
terms of its overall GDP, it still ranks very low in terms of
per capita GDP. In 2015, GDP per capita (PPP) in China
was $13,400, which was significantly less than that of
Japan and Germany, with $35,804 and $47,268,
respectively [1]. In China, the GDP per capita (PPP) is 2
times higher than the nominal GDP, which is common for
developing countries. The same situation is in India,
where the GDP per capita (PPP) is $5,730, which is
almost 5 times more than the nominal GDP. As
previously-used resources are unable to provide China the
rate of development that was experienced in the past,
public consumption becomes the last reserve of its
development. Since the beginning of its reforms, the
financial policy of China was oriented on stimulating its
domestic demand. However, for the first two decades of
the 40-year growth, it had been neglected. Now the
government supports and encourages the increase in the
monetization of the economy, which will have a positive
impact on production and the level of savings. It is the
domestic demand and the moderate savings rate that will
become the main support of economic growth in the
future and help to decline China’s dependence on global
demand for Chinese exports.
At the same time, China is developing a large-scale
program for investment worldwide. China is the second
large investor after the US in developing countries in
Africa. In October 2016, China became the main investor
of the new industrial city in Egypt. According to China's
Ministry of Commerce, the amount invested into this
project is about $20 billion, where the total investment
amount is estimated to be $45 billion.
According to the prime minister Li Keqiang, China plans
to give an aid of at least $2 billion to prevent and control
malaria and conduct research on traditional medicine in
Angola, Cape Verde, Guinea Bissau, Mozambique, and
Timor-Leste. In addition to this, they plan to invest in
developing agriculture and facilitating trade and
investment in these countries.
In general, according to official data of the Ministry of
Trade, the sum of China’s investment outflow in 2015 was
$118 billion, which increased by 10% from the previous
year and broke the record for the last 13 years.
In pursuit of cheap labor and availability of transport
infrastructure for export, Chinese investments have
progressively flowed to South-East Asia. As such, in
2014, according to Vice Minister of Commerce Gao Yan,
China-Vietnam bilateral trade reached $83.6 billion, an
increase of 28% from the previous year. Vietnam became
the second largest trade partner of China in ASEAN,
while China has been the largest trade partner of Vietnam
for 11 consecutive years. Accumulated investments of
Chinese enterprises in Vietnam reached $8 billion in 2014
[2].
China and India aim to develop trade cooperation in
economic and investment fields, but at the same time there
is a competition between the two countries. China is one
of India's main trading partners, but India also has its
largest trade deficit with China, with a sum of $41 billion.
China ranks first in the list of countries from which India
imports, but it is in fourth place in the list of countries to
which India exports. In 2015, India imported goods worth
$61.6 billion from Mainland China, with a partner share
of 15.77%. However, India’s exports to Mainland China
was worth $9.6 billion, with a partner share of 3.62%.
India’s export to Hong Kong was worth $12.1 billion,
with a partner share of 4.59% [3]. China manly supplies
steel industry products, electrical engineering,
telecommunications equipment, turbines, and computers
to India. Indian exports to China is represented mainly by
Indian mineral ores, yarn and fabrics, metals, and precious
stones.
China’s Reorientation For Domestic Consumption
And Rapid Development Of E-Commerce
Recently, India has become one of China's competitors in
production and domestic consumption. Though India still
needs some time to catch up with and exceed China's
growth rate, in the upcoming decades, India has very good
prospects. The rapid growth of the two countries was due
to their development models, which are very similar by
their economic reforms focused on rapid economic
growth, orientation on export, and a greater influence of
government on the economy. However, the two models
have a few differences that affect the local business
opportunities and their prospects.
Unlike China, India has a significant trade deficit.
However, India is a market leader in technology, having
considerably more well-known companies that have gone
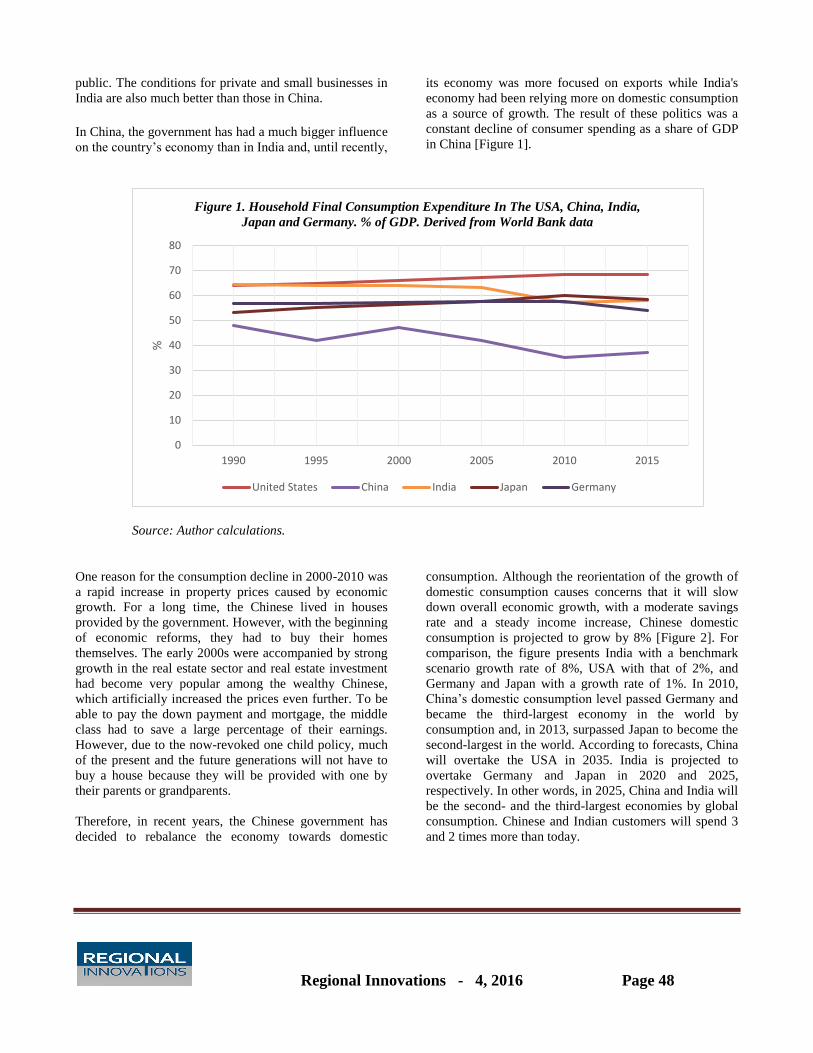
Regional Innovations - 4, 2016 Page 48
public. The conditions for private and small businesses in
India are also much better than those in China.
In China, the government has had a much bigger influence
on the country’s economy than in India and, until recently,
its economy was more focused on exports while India's
economy had been relying more on domestic consumption
as a source of growth. The result of these politics was a
constant decline of consumer spending as a share of GDP
in China [Figure 1].
Source: Author calculations.
One reason for the consumption decline in 2000-2010 was
a rapid increase in property prices caused by economic
growth. For a long time, the Chinese lived in houses
provided by the government. However, with the beginning
of economic reforms, they had to buy their homes
themselves. The early 2000s were accompanied by strong
growth in the real estate sector and real estate investment
had become very popular among the wealthy Chinese,
which artificially increased the prices even further. To be
able to pay the down payment and mortgage, the middle
class had to save a large percentage of their earnings.
However, due to the now-revoked one child policy, much
of the present and the future generations will not have to
buy a house because they will be provided with one by
their parents or grandparents.
Therefore, in recent years, the Chinese government has
decided to rebalance the economy towards domestic
consumption. Although the reorientation of the growth of
domestic consumption causes concerns that it will slow
down overall economic growth, with a moderate savings
rate and a steady income increase, Chinese domestic
consumption is projected to grow by 8% [Figure 2]. For
comparison, the figure presents India with a benchmark
scenario growth rate of 8%, USA with that of 2%, and
Germany and Japan with a growth rate of 1%. In 2010,
China’s domestic consumption level passed Germany and
became the third-largest economy in the world by
consumption and, in 2013, surpassed Japan to become the
second-largest in the world. According to forecasts, China
will overtake the USA in 2035. India is projected to
overtake Germany and Japan in 2020 and 2025,
respectively. In other words, in 2025, China and India will
be the second- and the third-largest economies by global
consumption. Chinese and Indian customers will spend 3
and 2 times more than today.
0
10
20
30
40
50
60
70
80
1990 1995 2000 2005 2010 2015
%
Figure 1. Household Final Consumption Expenditure In The USA, China, India,
Japan and Germany. % of GDP. Derived from World Bank data
United States China India Japan Germany
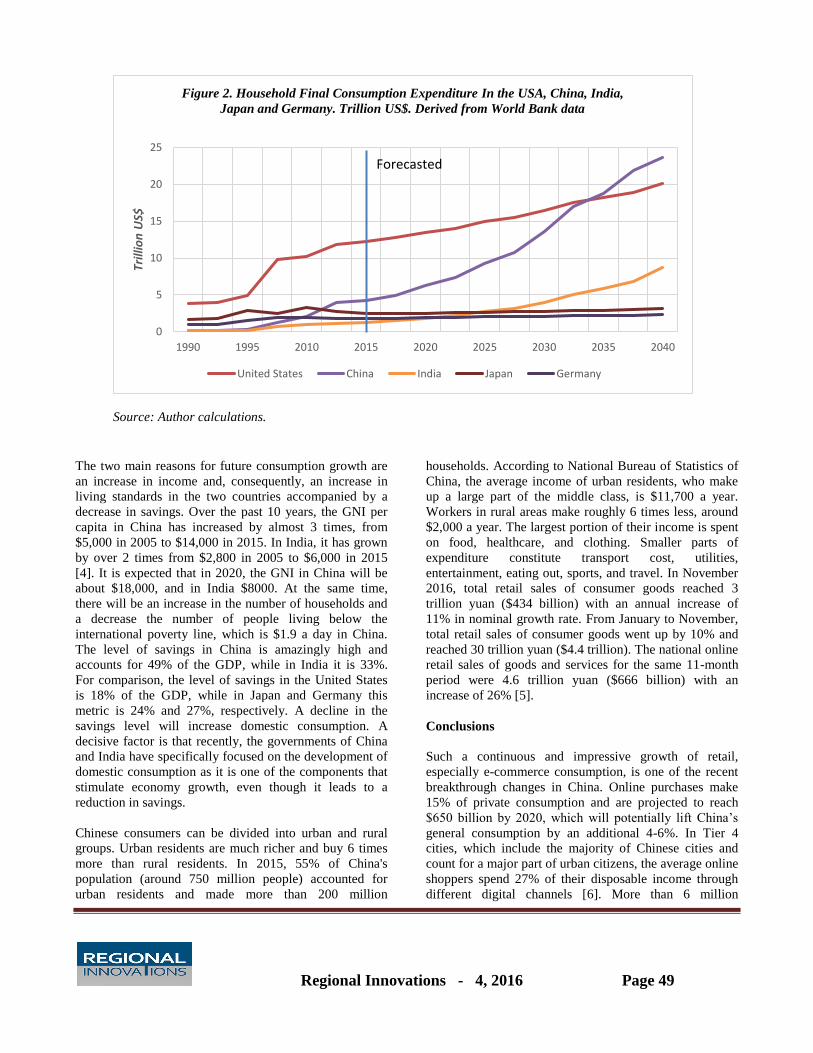
Regional Innovations - 4, 2016 Page 49
Source: Author calculations.
The two main reasons for future consumption growth are
an increase in income and, consequently, an increase in
living standards in the two countries accompanied by a
decrease in savings. Over the past 10 years, the GNI per
capita in China has increased by almost 3 times, from
$5,000 in 2005 to $14,000 in 2015. In India, it has grown
by over 2 times from $2,800 in 2005 to $6,000 in 2015
[4]. It is expected that in 2020, the GNI in China will be
about $18,000, and in India $8000. At the same time,
there will be an increase in the number of households and
a decrease the number of people living below the
international poverty line, which is $1.9 a day in China.
The level of savings in China is amazingly high and
accounts for 49% of the GDP, while in India it is 33%.
For comparison, the level of savings in the United States
is 18% of the GDP, while in Japan and Germany this
metric is 24% and 27%, respectively. A decline in the
savings level will increase domestic consumption. A
decisive factor is that recently, the governments of China
and India have specifically focused on the development of
domestic consumption as it is one of the components that
stimulate economy growth, even though it leads to a
reduction in savings.
Chinese consumers can be divided into urban and rural
groups. Urban residents are much richer and buy 6 times
more than rural residents. In 2015, 55% of China's
population (around 750 million people) accounted for
urban residents and made more than 200 million
households. According to National Bureau of Statistics of
China, the average income of urban residents, who make
up a large part of the middle class, is $11,700 a year.
Workers in rural areas make roughly 6 times less, around
$2,000 a year. The largest portion of their income is spent
on food, healthcare, and clothing. Smaller parts of
expenditure constitute transport cost, utilities,
entertainment, eating out, sports, and travel. In November
2016, total retail sales of consumer goods reached 3
trillion yuan ($434 billion) with an annual increase of
11% in nominal growth rate. From January to November,
total retail sales of consumer goods went up by 10% and
reached 30 trillion yuan ($4.4 trillion). The national online
retail sales of goods and services for the same 11-month
period were 4.6 trillion yuan ($666 billion) with an
increase of 26% [5].
Conclusions
Such a continuous and impressive growth of retail,
especially e-commerce consumption, is one of the recent
breakthrough changes in China. Online purchases make
15% of private consumption and are projected to reach
$650 billion by 2020, which will potentially lift China’s
general consumption by an additional 4-6%. In Tier 4
cities, which include the majority of Chinese cities and
count for a major part of urban citizens, the average online
shoppers spend 27% of their disposable income through
different digital channels [6]. More than 6 million
0
5
10
15
20
25
1990 1995 2010 2015 2020 2025 2030 2035 2040
Trill
ion
US$
Figure 2. Household Final Consumption Expenditure In the USA, China, India,
Japan and Germany. Trillion US$. Derived from World Bank data
United States China India Japan Germany
Forecasted
Regional Innovations - 4, 2016 Page 50
manufacturers and retailers have online stores on Taobao
and Tmall platforms, which are the largest trading
platforms in China. There are also less-popular, but still
famous, websites such as Jingdong, Alibaba, and some
smaller online marketplaces. A new marketplace on the
base of WeChat messenger is gaining more popularity and
is predicted to overtake TaoBao. The demand for online
stores in Tier 4 cities is particularly high because there are
few offline retail offerings.
In addition to increase in overall consumption, e-tail
drives the growth for various services. Since
manufacturing is a comparatively easy process in China
and the added value of the products is low, it has become
much more of a difficult process to competitively sell the
products against numerous other online sellers. There is a
growing demand for online advertising and marketing,
express delivery services, and IT services, which include
the rapidly-developing Chinese Fintech and various
payment systems. The internet finance sector has also
been booming in China recently, driven by a highly-
developed e-commerce sector. More than 30% of China's
population use internet payment systems because of its
convenience and the popularity of the internet and smart
phones. Due to the rapid growth of online-to-offline
payment systems, some Chinese companies have become
leaders in innovative Fintech. For example, Alibaba, with
its payment system Alipay, controls about 65% of Chinese
online payments and about 80% of the general mobile
payments.
The increase in domestic Chinese consumption does not
imply an increase in imports of consumer goods into
China nor the growth of foreign trade companies in the
Chinese market. China has made great efforts to ensure its
economic independence, persistently pursuing a policy of
import substitution in many sectors of its economy. For
instance, in 2013 China’s level of food self-sufficiency
reached 97%, which allowed for the significant decrease
of grain imports. Therefore, China’s share in global
imports of goods is quite low, standing at about 2%.
In countries like China or India, considering their import-
substitution policies, only businesses with goods that
cannot be reproduced locally have a chance to survive in
the long run. This may be, for example, certain cosmetics
or foods, such as coffee, chocolate, cheese, or inexpensive
high quality wine. Although recently, the Yunnan
province in China has cultivated and exported local coffee
at low prices and there is a tendency to learn and
reproduce many of the world-famous products very
quickly in China. To operate successfully in huge and
rapidly changing markets such as China and India,
companies need a strategy that considers consumer
preferences, quickly responds to market shifts, and adjusts
to new technologies. A very important condition is a
presence in mobile and social media. In order to have a
good range of products, it is crucial to consider the
categories for which the demand will remain in the future.
Start-ups should also consider almost-unrealistic
ambitions in business, high speed development, and
originality, which are inherent for these markets. At the
same time, their customers are very demanding. Other
than China and India, there is no other world market so
oversupplied with cheap goods. Moreover, after becoming
accustomed to low prices, customers pay attention to
quality. High quality and cheap price are two
contradictory requirements that, nevertheless, a lot of
local companies still adhere to. Many of the technology
companies like Huawei, Xiaomi, and others have
successfully entered international market due to this
concept. These large-scale sales will remain a big
influence on the global business.
References
1. The World Bank. GDP per Capita, PPP: http://data.worldbank.org/indicator/NY.GDP.PCAP.PP.CD
2. Ministry of Commerce, Peoples Republic of China:
http://english.mofcom.gov.cn/article/zt_chinaportugeseministerial/news/201610/20161001408853.shtml
3. Ministry of Commerce, Peoples Republic of China:
http://english.mofcom.gov.cn/article/newsrelease/policyreleasing/201602/20160201251488.shtml
4. The World Bank. GNI per capita, PPP: http://data.worldbank.org/indicator/NY.GNP.PCAP.PP.CD?locations=IN
5. National Bureau of Statistics of China Total Retail Sales of Consumer Goods in the First Eleven Months of 2016.
December, 2016: http://www.stats.gov.cn/english/PressRelease/201612/t20161214_1441640.html
6. McKinsey Global Institute “China’s E-Tail Revolution”. March, 2013: http://www.mckinsey.com/global-
themes/asia-pacific/china-e-tailing
7. World Integrated Trade Solutions: http://wits.worldbank.org/CountrySnapshot/en/IND/textview
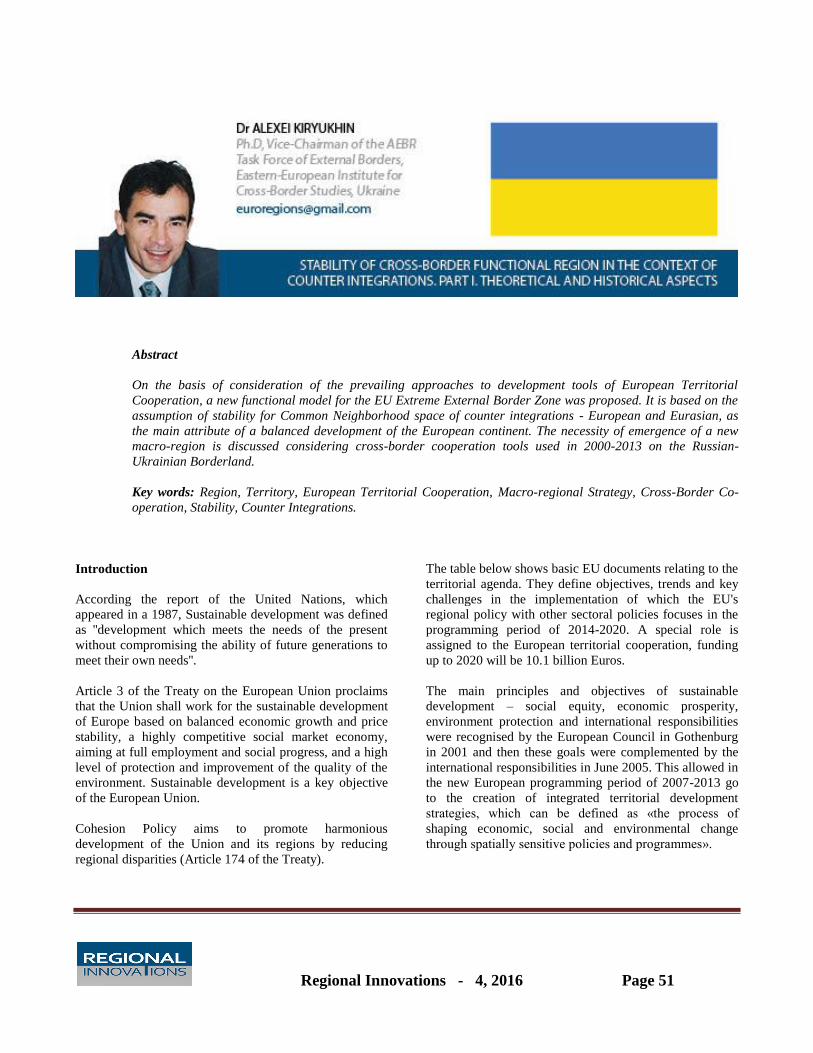
Regional Innovations - 4, 2016 Page 51
Abstract
On the basis of consideration of the prevailing approaches to development tools of European Territorial
Cooperation, a new functional model for the EU Extreme External Border Zone was proposed. It is based on the
assumption of stability for Common Neighborhood space of counter integrations - European and Eurasian, as
the main attribute of a balanced development of the European continent. The necessity of emergence of a new
macro-region is discussed considering cross-border cooperation tools used in 2000-2013 on the Russian-
Ukrainian Borderland.
Key words: Region, Territory, European Territorial Cooperation, Macro-regional Strategy, Cross-Border Co-
operation, Stability, Counter Integrations.
Introduction
According the report of the United Nations, which
appeared in a 1987, Sustainable development was defined
as ''development which meets the needs of the present
without compromising the ability of future generations to
meet their own needs''.
Article 3 of the Treaty on the European Union proclaims
that the Union shall work for the sustainable development
of Europe based on balanced economic growth and price
stability, a highly competitive social market economy,
aiming at full employment and social progress, and a high
level of protection and improvement of the quality of the
environment. Sustainable development is a key objective
of the European Union.
Cohesion Policy aims to promote harmonious
development of the Union and its regions by reducing
regional disparities (Article 174 of the Treaty).
The table below shows basic EU documents relating to the
territorial agenda. They define objectives, trends and key
challenges in the implementation of which the EU's
regional policy with other sectoral policies focuses in the
programming period of 2014-2020. A special role is
assigned to the European territorial cooperation, funding
up to 2020 will be 10.1 billion Euros.
The main principles and objectives of sustainable
development – social equity, economic prosperity,
environment protection and international responsibilities
were recognised by the European Council in Gothenburg
in 2001 and then these goals were complemented by the
international responsibilities in June 2005. This allowed in
the new European programming period of 2007-2013 go
to the creation of integrated territorial development
strategies, which can be defined as «the process of
shaping economic, social and environmental change
through spatially sensitive policies and programmes».
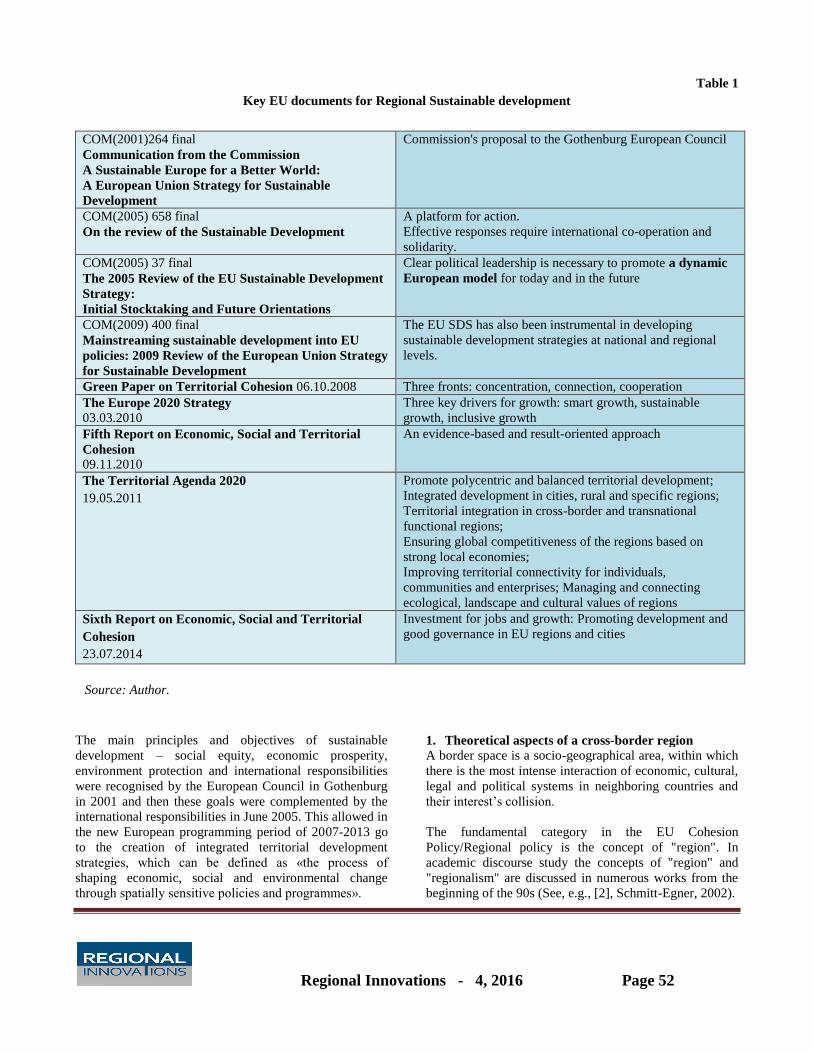
Regional Innovations - 4, 2016 Page 52
Table 1
Key EU documents for Regional Sustainable development
COM(2001)264 final
Communication from the Commission
A Sustainable Europe for a Better World:
A European Union Strategy for Sustainable
Development
Commission's proposal to the Gothenburg European Council
COM(2005) 658 final
On the review of the Sustainable Development
A platform for action.
Effective responses require international co-operation and
solidarity.
COM(2005) 37 final
The 2005 Review of the EU Sustainable Development
Strategy:
Initial Stocktaking and Future Orientations
Clear political leadership is necessary to promote a dynamic
European model for today and in the future
COM(2009) 400 final
Mainstreaming sustainable development into EU
policies: 2009 Review of the European Union Strategy
for Sustainable Development
The EU SDS has also been instrumental in developing
sustainable development strategies at national and regional
levels.
Green Paper on Territorial Cohesion 06.10.2008 Three fronts: concentration, connection, cooperation
The Europe 2020 Strategy
03.03.2010
Three key drivers for growth: smart growth, sustainable
growth, inclusive growth
Fifth Report on Economic, Social and Territorial
Cohesion
09.11.2010
An evidence-based and result-oriented approach
The Territorial Agenda 2020
19.05.2011
Promote polycentric and balanced territorial development;
Integrated development in cities, rural and specific regions;
Territorial integration in cross-border and transnational
functional regions;
Ensuring global competitiveness of the regions based on
strong local economies;
Improving territorial connectivity for individuals,
communities and enterprises; Managing and connecting
ecological, landscape and cultural values of regions
Sixth Report on Economic, Social and Territorial
Cohesion
23.07.2014
Investment for jobs and growth: Promoting development and
good governance in EU regions and cities
Source: Author.
The main principles and objectives of sustainable
development – social equity, economic prosperity,
environment protection and international responsibilities
were recognised by the European Council in Gothenburg
in 2001 and then these goals were complemented by the
international responsibilities in June 2005. This allowed in
the new European programming period of 2007-2013 go
to the creation of integrated territorial development
strategies, which can be defined as «the process of
shaping economic, social and environmental change
through spatially sensitive policies and programmes».
1. Theoretical aspects of a cross-border region
A border space is a socio-geographical area, within which
there is the most intense interaction of economic, cultural,
legal and political systems in neighboring countries and
their interest’s collision.
The fundamental category in the EU Cohesion
Policy/Regional policy is the concept of "region". In
academic discourse study the concepts of "region" and
"regionalism" are discussed in numerous works from the
beginning of the 90s (See, e.g., [2], Schmitt-Egner, 2002).
Regional Innovations - 4, 2016 Page 53
The European Commission defines a “region” as a tract of
land with more or less definitely marked boundaries,
which often serves as an administrative unit below the
level of the nation state. Regions have an identity which is
made up of specific features such as their landscape,
climate, language, ethnic origin or shared history [20].
In turn, Border regions have become a laboratory of
European integration and cohesion policies because of the
increased mobility of people, intensification of movement
of goods and services across national borders.
Since the late 90's - early 2000's appeared a wide
discourse and applied research on cross-border
regionalism and cross-border regions (Euroregions), as
basic processes / instruments of European integration in
the internal and external borders of the EU [16, 8, 17, 26).
The cross-border space may be considered:
as the result of interactions and retroactions, past and
present;
as the product of all kinds of encounters - from
material and financial planning to the networking of
actors, from social relations to the definition of
political strategies;
as a complex reality due to the presence of border
which both separates and links different territorial
systems. This production takes part in the dynamic
of territorial reconfiguration and engenders new
rationales of development and spatial practice.
Cross-border integration as a dynamic and multi-
dimensional process of bringing territories closer together
and strengthening of social bonds by lowering the barriers
associated with border and by the development of
cooperation between territorial systems.
Cross-border integration is also impermanent: it is made
up of diverse elements which develop independently of
each other, following different rhythms and time-scales
[5].
2. The European experience of cross-border
cooperation of 1989-2016
European territorial co-operation is understood to be an
increasingly intensive/extensive and deliberate interaction
among public and nonpublic actors located at various
governance levels in different countries that take
advantage, in a mutually beneficial way, of their
respective specialisations (or complementarity) and of the
territorial proximity effects, existing at various
geographical scales. This interaction has progressively led
to a stronger integration of the cross-
border/transnational/interregional co-operation areas
concerned and thus contributes, in the long run, to
achieving a harmonious, balanced and sustainable
development of the entire European territory [7, p.15].
The appearance of the first cross-border region EUREGIO
on the German-Dutch border in 1958 and then creation of
the Association of European border regions in 1971 has
launched formation of the whole system of territorial
cooperation. Since 1989, when the European Commission
launched a pilot project (Phase PILOTE), regional
initiatives have got systemic support as the first
instrument of INTERREG launched in 1990 for the border
regions of the EU.
In the countries of Central Europe since 1994 has been
launched the PHARE CBC instrument and in Eastern
European countries started to act a feebler instrument
TACIS CBC. A detailed analysis of the results of these
community initiatives INTERREG I-V were given in a
series of related AEBR reviews [181,2], as well as in the
newest review, prepared by the MOT at the request of the
European Commission [12].
For its part, the Council of Europe regularly publishes
critical reviews on implementation of programmes and
projects of cross-border cooperation, supported by the
Congress of local and regional authorities and its standing
committees, as well as pan-European organizations such
as AER and CEMR [19].
3. The European Neighbourhood Policy
The Union's external action under the Instruments should
contribute to clear results (covering outputs, outcomes and
impacts) in countries benefiting from the Union's external
financial assistance. Whenever possible and appropriate,
the results of the Union's external action and the
efficiency of a particular Instrument should be monitored
and assessed on the basis of pre-defined, clear, transparent
and, where appropriate, country-specific and measurable
indicators, adapted to the specificities and objectives of
the Instrument concerned (Regulation (EU) No
236/2014)2.
Within the framework of the principles and objectives of
the Union's external action and of the European
1 Practical Guide to Cross-border Cooperation, 1st edition 1995; 2nd
edition 1997; 3rd edition 2000. 2 Regulation (EU) No 236/2014 of the European Parliament and of the Council of 11 March 2014 laying down common rules and procedures
for the implementation of the Union's instruments for financing external
action

Regional Innovations - 4, 2016 Page 54
Consensus and agreed modifications thereto: cooperation
under this Regulation shall contribute to fostering
sustainable economic, social and environmental
development.
The ‘Global Public Goods and Challenges’ programme
aims at strengthening cooperation, exchange of
knowledge and experience and partner countries'
capacities with a view to contribute to poverty eradication,
social cohesion and sustainable development. This
programme shall be drawn from the following areas of
cooperation, ensuring a maximum synergy amongst them
in light of their strong interconnection:
a. increasing the integration and mainstreaming of
climate change and environmental objectives in
Union development cooperation through support for
methodological and research work on, in and by
developing countries, including monitoring,
reporting and verification mechanisms, ecosystem
mapping, assessment and valuation, enhancing
environmental expertise and promoting innovative
actions and policy coherence;
b. strengthening environmental governance and
supporting international policy development to
improve the coherence and efficiency of global
governance of sustainable development, by assisting
regional and international environmental monitoring
and assessment, and by promoting effective
compliance and enforcement measures in developing
countries for multilateral environmental agreements
(Regulation (EU) No 233/2014)3.
4. What happened to the Russian-Ukrainian border
in the period of 2000-2013
Ukrainian-Russian relations mean for Eastern Europe the
same thing that the Franco-German ones for Western
Europe (John Morrison). At the same time, the Ukrainian-
Russian border is becoming a more important key link in
the system of the European borders, because it reflects
two different geopolitical models of the European Union -
an affiliate, which Russia focuses on, and full European
integration - strategic direction for Ukraine.
3 Regulation (EU) No 233/2014 of the European Parliament and of the Council of 11 March 2014 establishing a financing instrument for
development cooperation for the period 2014-202
Ukraine realizes this long-term aspiration through signing
and ratification of the Association Agreement with the EU
(September 2014) and implementation of sectoral and
regional policies in the practice of social and economic
development.
However, a new regional architecture of the European
continent with the participation of European CIS countries
can be successfully built only on condition of simultaneity
of structural modernization of all segments of Belarusian-
Russian-Ukrainian border, convergence of border space in
the European processes of economic, social and territorial
cohesion [3].
Regulation (EU) No 230/2014 of the European Parliament
and of the Council of 11 March 2014 establishing an
instrument contributing to stability and peace (Article 1
Subject-matter and objectives 1). This Regulation
establishes an instrument (the ‘Instrument contributing to
Stability and Peace’) which provides, for the period from
2014 to 2020, direct support for the Union's external
policies by increasing the efficiency and coherence of the
Union's actions in the areas of crisis response, conflict
prevention, peace-building and crisis preparedness, and
in addressing global and trans-regional threats.
The specific objectives of this Regulation shall be:
a. in a situation of crisis or emerging crisis, to
contribute swiftly to stability by providing an
effective response designed to help preserve,
establish or re-establish the conditions essential to
the proper implementation of the Union's external
policies and actions in accordance with Article 21;
b. to contribute to the prevention of conflicts and to
ensuring capacity and preparedness to address pre-
and post-crisis situations and build peace;
c. to address specific global and trans-regional threats
to peace, international security and stability.
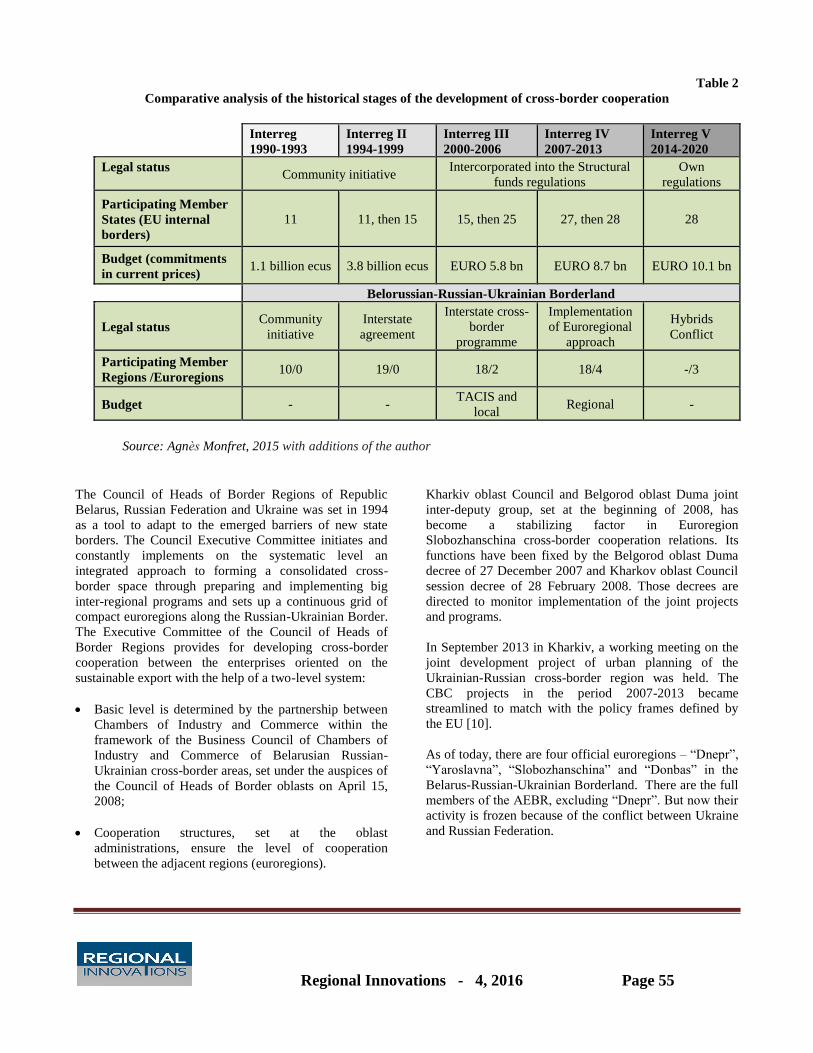
Regional Innovations - 4, 2016 Page 55
Table 2
Comparative analysis of the historical stages of the development of cross-border cooperation
Interreg
1990-1993
Interreg II
1994-1999
Interreg III
2000-2006
Interreg IV
2007-2013
Interreg V
2014-2020
Legal status Community initiative
Intercorporated into the Structural
funds regulations
Own
regulations
Participating Member
States (EU internal
borders)
11 11, then 15 15, then 25 27, then 28 28
Budget (commitments
in current prices) 1.1 billion ecus 3.8 billion ecus EURO 5.8 bn EURO 8.7 bn EURO 10.1 bn
Belorussian-Russian-Ukrainian Borderland
Legal status Community
initiative
Interstate
agreement
Interstate cross-
border
programme
Implementation
of Euroregional
approach
Hybrids
Conflict
Participating Member
Regions /Euroregions 10/0 19/0 18/2 18/4 -/3
Budget - - TACIS and
local Regional -
Source: Agnès Monfret, 2015 with additions of the author
The Council of Heads of Border Regions of Republic
Belarus, Russian Federation and Ukraine was set in 1994
as a tool to adapt to the emerged barriers of new state
borders. The Council Executive Committee initiates and
constantly implements on the systematic level an
integrated approach to forming a consolidated cross-
border space through preparing and implementing big
inter-regional programs and sets up a continuous grid of
compact euroregions along the Russian-Ukrainian Border.
The Executive Committee of the Council of Heads of
Border Regions provides for developing cross-border
cooperation between the enterprises oriented on the
sustainable export with the help of a two-level system:
Basic level is determined by the partnership between
Chambers of Industry and Commerce within the
framework of the Business Council of Chambers of
Industry and Commerce of Belarusian Russian-
Ukrainian cross-border areas, set under the auspices of
the Council of Heads of Border oblasts on April 15,
2008;
Cooperation structures, set at the oblast
administrations, ensure the level of cooperation
between the adjacent regions (euroregions).
Kharkiv oblast Council and Belgorod oblast Duma joint
inter-deputy group, set at the beginning of 2008, has
become a stabilizing factor in Euroregion
Slobozhanschina cross-border cooperation relations. Its
functions have been fixed by the Belgorod oblast Duma
decree of 27 December 2007 and Kharkov oblast Council
session decree of 28 February 2008. Those decrees are
directed to monitor implementation of the joint projects
and programs.
In September 2013 in Kharkiv, a working meeting on the
joint development project of urban planning of the
Ukrainian-Russian cross-border region was held. The
CBC projects in the period 2007-2013 became
streamlined to match with the policy frames defined by
the EU [10].
As of today, there are four official euroregions – “Dnepr”,
“Yaroslavna”, “Slobozhanschina” and “Donbas” in the
Belarus-Russian-Ukrainian Borderland. There are the full
members of the AEBR, excluding “Dnepr”. But now their
activity is frozen because of the conflict between Ukraine
and Russian Federation.

Regional Innovations - 4, 2016 Page 56
Figure 1. Multi-level spatial planning development of Belarus-Russian-Ukrainian border areas
Source: [3, 10]
New regional architecture of the European continent with
participation of CIS European countries (Euro-East) could
only be successfully constructed on the condition of
simultaneous structural upgrading of all Belarus-Russian-
Ukrainian cross-border issues, convergence of the
Neighbourhood areas into the all-European processes of
economic, social and territorial cohesion.
The most detailed surveys on cross-border cooperation
between Russia and Ukraine are given in the following
publications [11, 24, 3, and 10].
Weak institutionally euroregions to which emphasis was
placed while implementation of the European instruments
of cross-border cooperation into the EU's external area
were absolutely useless in smoothing the armed conflict in
the east of Ukraine and overcoming the escalation of
inter-state Russian-Ukrainian relations.
Integration initiatives, which the EU had in the early
2000s in its outer region was thus completely blurred. The
advantage was replaced by parity and for the next phase –
stabilization in the area of counter integrations – one
requires a new approach that will be built on the account
of the interests of both sides.
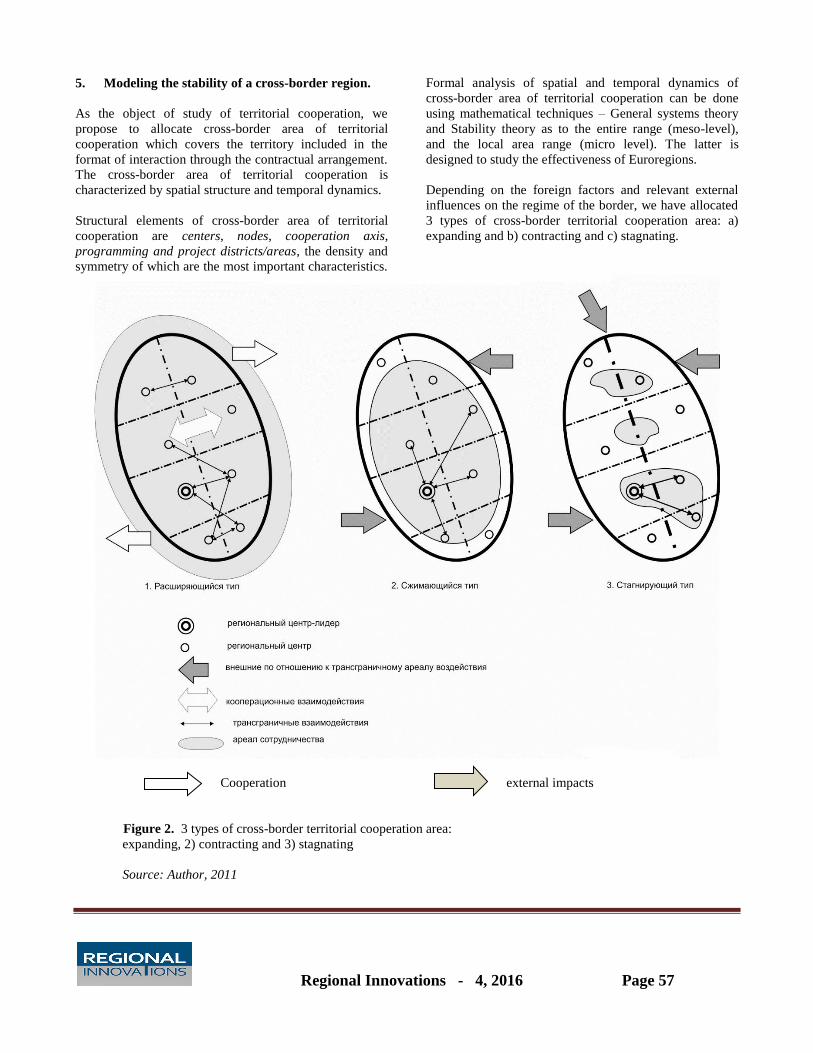
Regional Innovations - 4, 2016 Page 57
5. Modeling the stability of a cross-border region.
As the object of study of territorial cooperation, we
propose to allocate cross-border area of territorial
cooperation which covers the territory included in the
format of interaction through the contractual arrangement.
The cross-border area of territorial cooperation is
characterized by spatial structure and temporal dynamics.
Structural elements of cross-border area of territorial
cooperation are centers, nodes, cooperation axis,
programming and project districts/areas, the density and
symmetry of which are the most important characteristics.
Formal analysis of spatial and temporal dynamics of
cross-border area of territorial cooperation can be done
using mathematical techniques – General systems theory
and Stability theory as to the entire range (meso-level),
and the local area range (micro level). The latter is
designed to study the effectiveness of Euroregions.
Depending on the foreign factors and relevant external
influences on the regime of the border, we have allocated
3 types of cross-border territorial cooperation area: a)
expanding and b) contracting and c) stagnating.
Cooperation external impacts
Figure 2. 3 types of cross-border territorial cooperation area:
expanding, 2) contracting and 3) stagnating
Source: Author, 2011
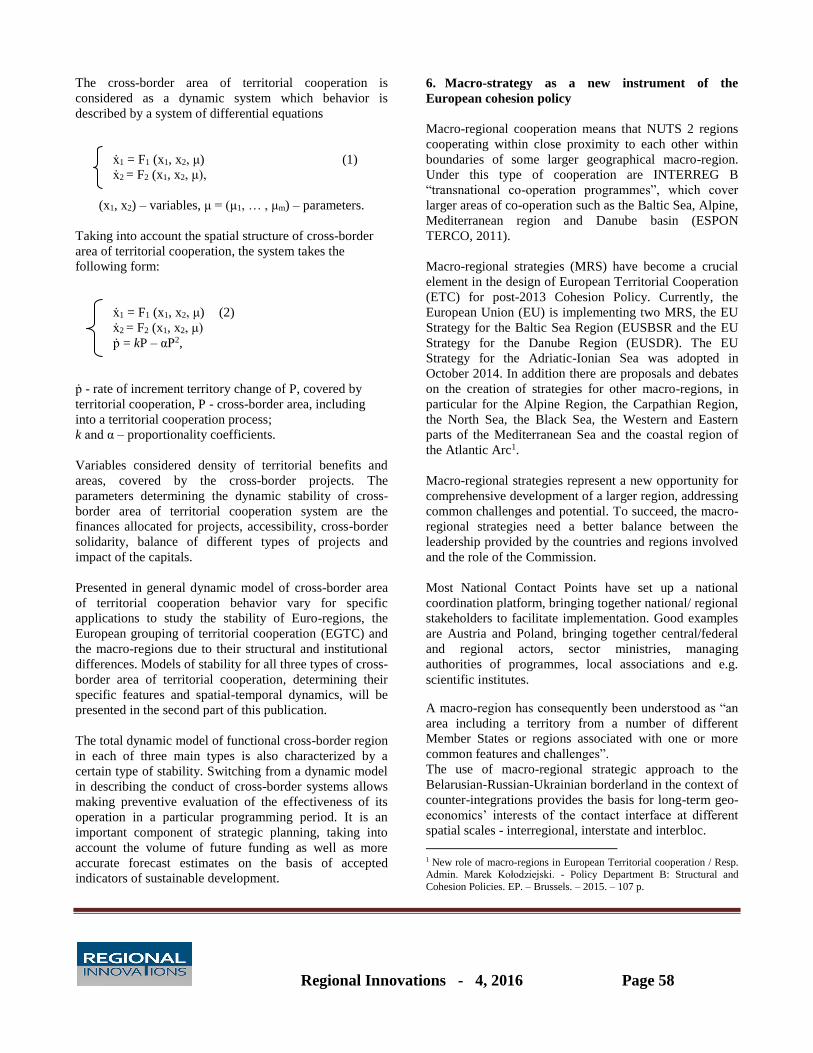
Regional Innovations - 4, 2016 Page 58
The cross-border area of territorial cooperation is
considered as a dynamic system which behavior is
described by a system of differential equations
ẋ1 = F1 (x1, x2, μ) (1)
ẋ2 = F2 (x1, x2, μ),
(x1, x2) – variables, μ = (μ1, … , μm) – parameters.
Taking into account the spatial structure of cross-border
area of territorial cooperation, the system takes the
following form:
ẋ1 = F1 (x1, x2, μ) (2)
ẋ2 = F2 (x1, x2, μ)
ṗ = kP – αP2,
ṗ - rate of increment territory change of P, covered by
territorial cooperation, P - cross-border area, including
into a territorial cooperation process;
k and α – proportionality coefficients.
Variables considered density of territorial benefits and
areas, covered by the cross-border projects. The
parameters determining the dynamic stability of cross-
border area of territorial cooperation system are the
finances allocated for projects, accessibility, cross-border
solidarity, balance of different types of projects and
impact of the capitals.
Presented in general dynamic model of cross-border area
of territorial cooperation behavior vary for specific
applications to study the stability of Euro-regions, the
European grouping of territorial cooperation (EGTC) and
the macro-regions due to their structural and institutional
differences. Models of stability for all three types of cross-
border area of territorial cooperation, determining their
specific features and spatial-temporal dynamics, will be
presented in the second part of this publication.
The total dynamic model of functional cross-border region
in each of three main types is also characterized by a
certain type of stability. Switching from a dynamic model
in describing the conduct of cross-border systems allows
making preventive evaluation of the effectiveness of its
operation in a particular programming period. It is an
important component of strategic planning, taking into
account the volume of future funding as well as more
accurate forecast estimates on the basis of accepted
indicators of sustainable development.
6. Macro-strategy as a new instrument of the
European cohesion policy
Macro-regional cooperation means that NUTS 2 regions
cooperating within close proximity to each other within
boundaries of some larger geographical macro-region.
Under this type of cooperation are INTERREG B
“transnational co-operation programmes”, which cover
larger areas of co-operation such as the Baltic Sea, Alpine,
Mediterranean region and Danube basin (ESPON
TERCO, 2011).
Macro-regional strategies (MRS) have become a crucial
element in the design of European Territorial Cooperation
(ETC) for post-2013 Cohesion Policy. Currently, the
European Union (EU) is implementing two MRS, the EU
Strategy for the Baltic Sea Region (EUSBSR and the EU
Strategy for the Danube Region (EUSDR). The EU
Strategy for the Adriatic-Ionian Sea was adopted in
October 2014. In addition there are proposals and debates
on the creation of strategies for other macro-regions, in
particular for the Alpine Region, the Carpathian Region,
the North Sea, the Black Sea, the Western and Eastern
parts of the Mediterranean Sea and the coastal region of
the Atlantic Arc1.
Macro-regional strategies represent a new opportunity for
comprehensive development of a larger region, addressing
common challenges and potential. To succeed, the macro-
regional strategies need a better balance between the
leadership provided by the countries and regions involved
and the role of the Commission.
Most National Contact Points have set up a national
coordination platform, bringing together national/ regional
stakeholders to facilitate implementation. Good examples
are Austria and Poland, bringing together central/federal
and regional actors, sector ministries, managing
authorities of programmes, local associations and e.g.
scientific institutes.
A macro-region has consequently been understood as “an
area including a territory from a number of different
Member States or regions associated with one or more
common features and challenges”.
The use of macro-regional strategic approach to the
Belarusian-Russian-Ukrainian borderland in the context of
counter-integrations provides the basis for long-term geo-
economics’ interests of the contact interface at different
spatial scales - interregional, interstate and interbloc.
1 New role of macro-regions in European Territorial cooperation / Resp. Admin. Marek Kołodziejski. - Policy Department B: Structural and
Cohesion Policies. EP. – Brussels. – 2015. – 107 p.
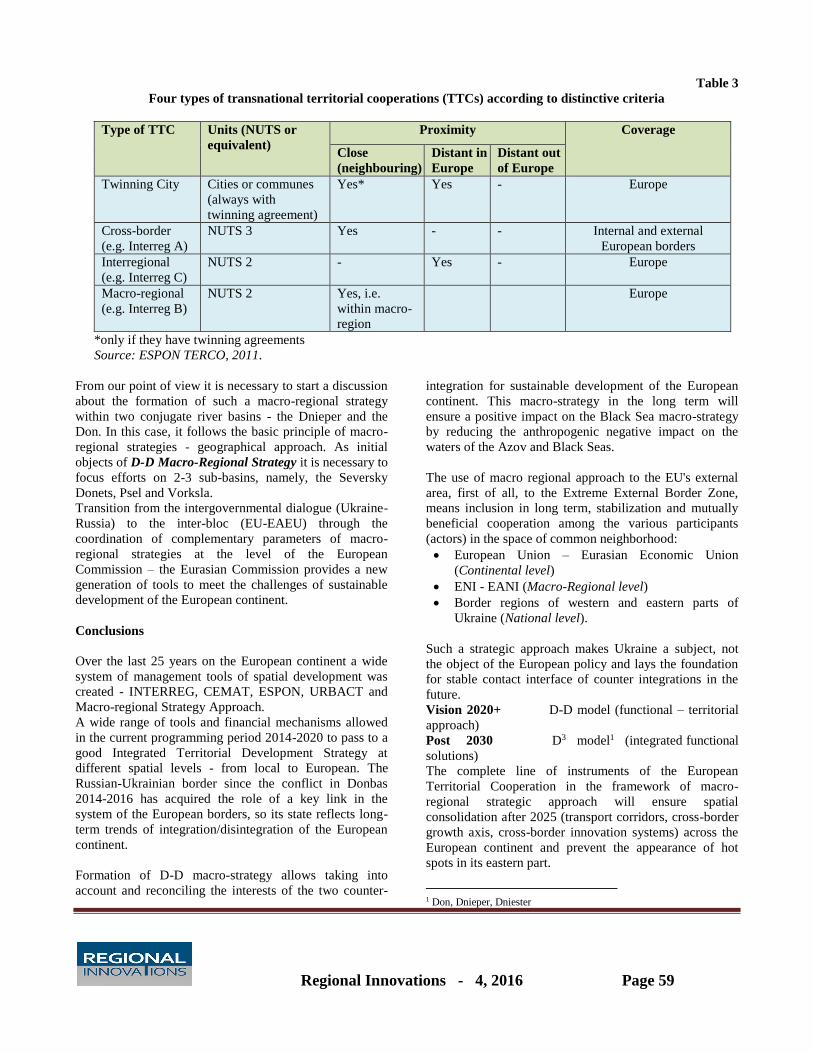
Regional Innovations - 4, 2016 Page 59
Table 3
Four types of transnational territorial cooperations (TTCs) according to distinctive criteria
Type of TTC Units (NUTS or
equivalent)
Proximity Coverage
Close
(neighbouring)
Distant in
Europe
Distant out
of Europe
Twinning City Cities or communes
(always with
twinning agreement)
Yes* Yes - Europe
Cross-border
(e.g. Interreg A)
NUTS 3 Yes - - Internal and external
European borders
Interregional
(e.g. Interreg C)
NUTS 2 - Yes - Europe
Macro-regional
(e.g. Interreg B)
NUTS 2 Yes, i.e.
within macro-
region
Europe
*only if they have twinning agreements
Source: ESPON TERCO, 2011.
From our point of view it is necessary to start a discussion
about the formation of such a macro-regional strategy
within two conjugate river basins - the Dnieper and the
Don. In this case, it follows the basic principle of macro-
regional strategies - geographical approach. As initial
objects of D-D Macro-Regional Strategy it is necessary to
focus efforts on 2-3 sub-basins, namely, the Seversky
Donets, Psel and Vorksla.
Transition from the intergovernmental dialogue (Ukraine-
Russia) to the inter-bloc (EU-EAEU) through the
coordination of complementary parameters of macro-
regional strategies at the level of the European
Commission – the Eurasian Commission provides a new
generation of tools to meet the challenges of sustainable
development of the European continent.
Conclusions
Over the last 25 years on the European continent a wide
system of management tools of spatial development was
created - INTERREG, CEMAT, ESPON, URBACT and
Macro-regional Strategy Approach.
A wide range of tools and financial mechanisms allowed
in the current programming period 2014-2020 to pass to a
good Integrated Territorial Development Strategy at
different spatial levels - from local to European. The
Russian-Ukrainian border since the conflict in Donbas
2014-2016 has acquired the role of a key link in the
system of the European borders, so its state reflects long-
term trends of integration/disintegration of the European
continent.
Formation of D-D macro-strategy allows taking into
account and reconciling the interests of the two counter-
integration for sustainable development of the European
continent. This macro-strategy in the long term will
ensure a positive impact on the Black Sea macro-strategy
by reducing the anthropogenic negative impact on the
waters of the Azov and Black Seas.
The use of macro regional approach to the EU's external
area, first of all, to the Extreme External Border Zone,
means inclusion in long term, stabilization and mutually
beneficial cooperation among the various participants
(actors) in the space of common neighborhood:
European Union – Eurasian Economic Union
(Continental level)
ENI - EANI (Macro-Regional level)
Border regions of western and eastern parts of
Ukraine (National level).
Such a strategic approach makes Ukraine a subject, not
the object of the European policy and lays the foundation
for stable contact interface of counter integrations in the
future.
Vision 2020+ D-D model (functional – territorial
approach)
Post 2030 D3 model1 (integrated functional
solutions)
The complete line of instruments of the European
Territorial Cooperation in the framework of macro-
regional strategic approach will ensure spatial
consolidation after 2025 (transport corridors, cross-border
growth axis, cross-border innovation systems) across the
European continent and prevent the appearance of hot
spots in its eastern part.
1 Don, Dnieper, Dniester

Regional Innovations - 4, 2016 Page 60
Figure 4. Macro-regional strategy areas
Source: ÖIR 2014
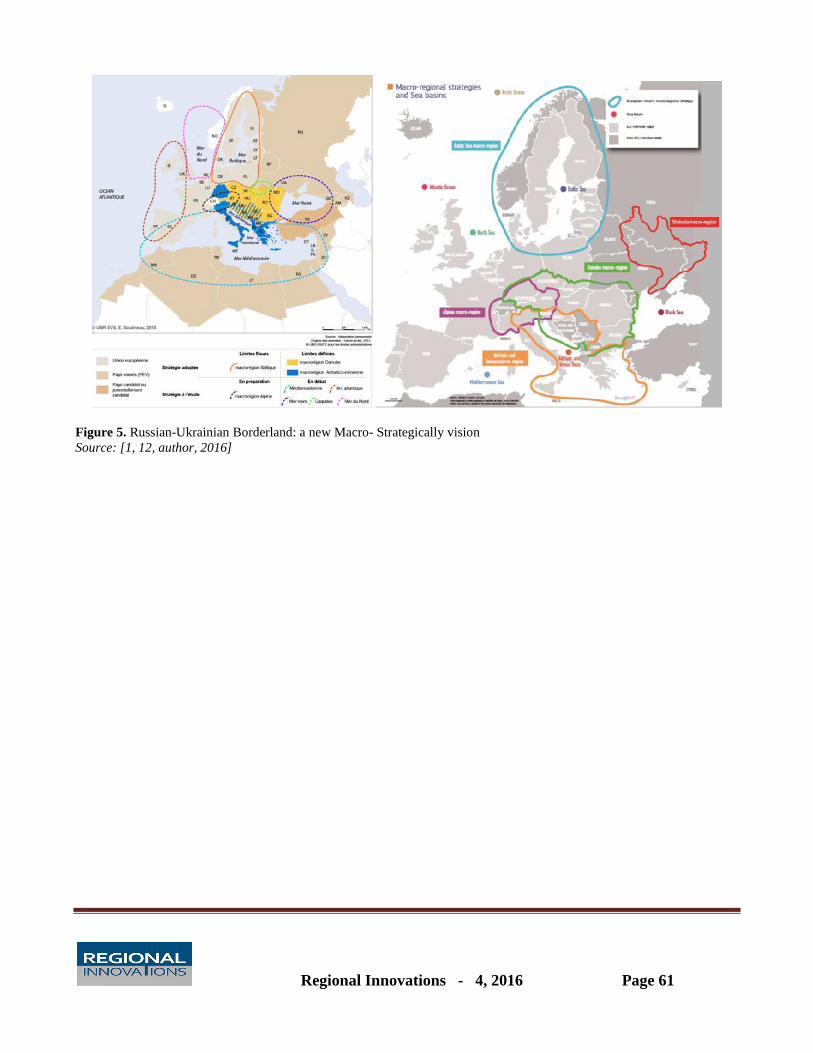
Regional Innovations - 4, 2016 Page 61
Figure 5. Russian-Ukrainian Borderland: a new Macro- Strategically vision
Source: [1, 12, author, 2016]
Regional Innovations - 4, 2016 Page 62
References
1. Boulineau E. La coopération territoriale entre l’Union européenne et ses voisinages orientaux et balkaniques.
Contribution à une géographie politique de l’européanisation. École Normale Supérieure de Lyon. 2015. – 217 p.
2. Cooperation between European Border Regions – Reviews and Perspectives / Gabbe J., von Malchus V., Stumm T.
– Nomos. – 2008. – 137 p.
3. Cross-border cooperation of regions of Russia, Belarus and Ukraine / Report of the Centre for Integration Studies,
Eurasian Development Bank. – 2013. – 100 p.
4. Directive 2001/42/EC of 27 June 2001 on the assessment of the effects of certain plans and programmes on the
environment.
5. Durand F. First steps towards a theoretical reflection about the production of cross-border space / ABS First World
Conference 9-13 June 2014.
6. Emploi et territoire. En détail. CGET. Paris. - 2016. - 148 p. http://www.observatoire-des-
territoires.gouv.fr/publication/rapport-2016/index.html#page=1
7. Ex-Post Evaluation of INTERREG 2000-2006 Initiative. Inception report to the European Commission DG
REGIO. – 2009. – 217 p.
8. Häkli J. Cross-Border Regionalisation in the ‘New Europe’ – Theoretical Reflection with Two Illustrative
Examples // Geopolitics, vol. 3:3. - 1998. – P. 83-103.
9. Kiryukhin A. The Russian-Ukrainian Borderland: theoretical approaches to the evolution of cross-border systems //
Human Geography Journal. – 2011. – N 10(1). – P. 178-182. (Rus.).
10. Kiryukhin A. Cross-border cooperation as a factor in the consolidation of counter integrations // Regional
Innovations. – N3. – 2014. – P. 36-40.
11. Колосов В.А., Кирюхин А.М. Приграничное сотрудничество в российско-украинских отношениях //
Полития № 1 (19). - 2001. - С.141 – 165.
12. La coopération territoriale en Europe – Une perspective historique / Wassenberg B., Reitel B. – Luxembourg.
2015. – 172 p.
13. Laine J. New Civic Neighborhood: Cross-border Cooperation and Civil Society Engagement at the Finnish-
Russian Border / Dissertations in Social Sciences and Business Studies, N 58. UEF. – 2013. – 461 p.
14. New Borders for a Changing Europe. Cross-border Cooperation and Governance / Ed. By Anderson J., O’Dowd
L., Wilson T. – 2004. - 223 p.
15. New role of macro-regions in European Territorial cooperation / Resp. Admin. Marek Kołodziejski. - Policy
Department B: Structural and Cohesion Policies. EP. – Brussels. – 2015. – 107 p.
16. Paasi A. Constructing Territories, Boundaries and Regional Identities // Contested Territory. Border Disputes at the
Edge of the Former Soviet Empire / ed. by Thomas Forsberg. Aldershot: Edward Elgar Publishing Limited, 1995.
P. 43.
17. Perkmann M. Cross-border regions in Europe significance and drivers of regional cross-border co-operation //
European Urban and Regional Studies 2003. - 10(2):pp.153–171.
18. Practical Guide to Cross-border Cooperation. AEBR. Gronau. – 2000. – 216 p. (Association of European Border
Regions / European Commission: LACE-GUIDE – Practical Guide to Cross-border Co-operation (1st edition
1995; 2nd edition 1997; 3rd edition 2000).
19. Prospects for effective Transfrontier co-operation in Europe / Breda Pečan, CG(25)9 final 31 October 2013. – 16 p.
20. Regional and Urban Statistics Reference Guide. Eurostat. – 2009. – 247 p.
21. Review of adopted European territorial cooperation programmes / Levarlet F., Preku A., Lorgeoux E., Brignani N.,
Wills Timothy J. B. - Policy Department B: Structural and Cohesion Policies. EP. – Brussels. – 2016. – 106 p.
22. Schmitt-Egner P. The concept of ‘Region’: theoretical and methodological notes on its reconstruction // European
Integration, 2002, Vol. 24, No. 3, pp. 179–200.
23. Territorial cohesion in future EU cohesion policy. Final report for the research project “The territorial dimension of
future EU cohesion policy”. – Berlin. – 2012. – 58 p.
24. The Russian-Ukrainian Borderland: Twenty years of separated unity / Ed. by V. Kolossov and O. Vendina. – New
chronograph. – 2011. – 352 p. (Rus.).
25. Typologie socio-économique des régions frontalières de l’Union Européenne (2000-2012) / Guérois M., Feredj A.,
Giraud T., Lambert N. et all. – UMS RIATE, - 2016. – 47 p.
26. Яровой Г. О. Регионализм и трансграничное сотрудничество в Европе – СПб.: Норма, 2007. – 280 с.
Regional Innovations - 4, 2016 Page 63
Abstract
Since Ukraine declared its independence, one of the most difficult problems that arose, and remains urgent today,
is delimitation and demarcation of the State border and security of country territorial integrity. The border
question therefore has always been a central issue in Ukrainian peace and security strategies. As a result,
Ukrainian leaders have adopted a number of decisions to tackle the border issue as a security concern. The
principle of the respect of borders and subsequent political and legal actions is a key tool to reduce the conflict-
inducing characteristics of Ukrainian’s borders. The aim of this paper is to study modern experience in
demarcation and delimitation of borders and the possibility of its use in Ukraine.
Key words: state border, delimitation, demarcation, boundary signs, territories.
Topicality. Land and sea borders of many states have
been set up historically. Under international law they are
inviolable. The provision on recognition of borders
between states and countries that have been established
after the Second World War and was adopted in Helsinki
in 1975 during the Conference on Security and
Cooperation in Europe.
Nowadays length of the state border of Ukraine holds one
of the first places among other European countries. Its
length is about 7000 kilometres. Ukraine borders with
seven countries: Poland, Slovakia, Hungary, Romania,
Moldova, Russia and Belarus.
The current work on delimitation and demarcation of the
State border of Ukraine is characterized by the use of
different data on border objects spatial localization and
information on spatial data with regard to a particular
place and space, including topographic maps and plans,
nautical charts, aero- and satellite images, orthophotos,
protocols descriptions of passing the border line, reports
and directories coordinate border signs, tables with
information about the islands and their belongings, lists of
geographical names found in the protocol describing the
contract documents. Work on delimitation, demarcation
and verification of the state border line is an important
factor in optimizing the geographic, geopolitical situation
of the country.
There are number of questions to be clarified such as the
boundary conditions in conditions of landscapes change
and other natural disasters. Thus, one of the key problems
of the border between Ukraine and Romania was its
modification through changing the natural landscape. The
lower bank of the river Tisza is Ukrainian due to
geographical position, he gradually goes deep into our
territory, releasing water from the Romanian coast. Since
1961, the Ukrainian side has lost 270 hectares of land as a
result of this change.
Since Ukraine has proclaimed its course to EU integration
this course should be supported by actions towards
providing proper conditions of integration. The countries
that have territorial contradictions can not become full
members of the EU. That is why the matter of
demarcation works completion throughout Ukraine border
has become urgent.
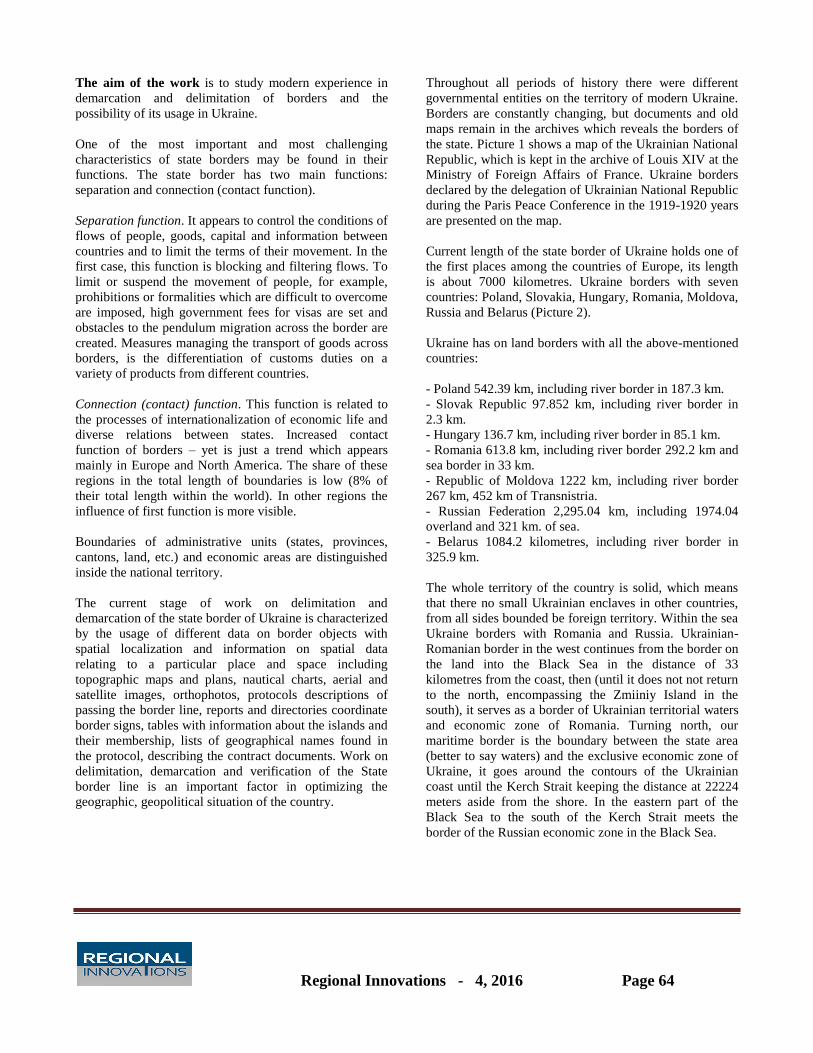
Regional Innovations - 4, 2016 Page 64
The aim of the work is to study modern experience in
demarcation and delimitation of borders and the
possibility of its usage in Ukraine.
One of the most important and most challenging
characteristics of state borders may be found in their
functions. The state border has two main functions:
separation and connection (contact function).
Separation function. It appears to control the conditions of
flows of people, goods, capital and information between
countries and to limit the terms of their movement. In the
first case, this function is blocking and filtering flows. To
limit or suspend the movement of people, for example,
prohibitions or formalities which are difficult to overcome
are imposed, high government fees for visas are set and
obstacles to the pendulum migration across the border are
created. Measures managing the transport of goods across
borders, is the differentiation of customs duties on a
variety of products from different countries.
Connection (contact) function. This function is related to
the processes of internationalization of economic life and
diverse relations between states. Increased contact
function of borders – yet is just a trend which appears
mainly in Europe and North America. The share of these
regions in the total length of boundaries is low (8% of
their total length within the world). In other regions the
influence of first function is more visible.
Boundaries of administrative units (states, provinces,
cantons, land, etc.) and economic areas are distinguished
inside the national territory.
The current stage of work on delimitation and
demarcation of the state border of Ukraine is characterized
by the usage of different data on border objects with
spatial localization and information on spatial data
relating to a particular place and space including
topographic maps and plans, nautical charts, aerial and
satellite images, orthophotos, protocols descriptions of
passing the border line, reports and directories coordinate
border signs, tables with information about the islands and
their membership, lists of geographical names found in
the protocol, describing the contract documents. Work on
delimitation, demarcation and verification of the State
border line is an important factor in optimizing the
geographic, geopolitical situation of the country.
Throughout all periods of history there were different
governmental entities on the territory of modern Ukraine.
Borders are constantly changing, but documents and old
maps remain in the archives which reveals the borders of
the state. Picture 1 shows a map of the Ukrainian National
Republic, which is kept in the archive of Louis XIV at the
Ministry of Foreign Affairs of France. Ukraine borders
declared by the delegation of Ukrainian National Republic
during the Paris Peace Conference in the 1919-1920 years
are presented on the map.
Current length of the state border of Ukraine holds one of
the first places among the countries of Europe, its length
is about 7000 kilometres. Ukraine borders with seven
countries: Poland, Slovakia, Hungary, Romania, Moldova,
Russia and Belarus (Picture 2).
Ukraine has on land borders with all the above-mentioned
countries:
- Poland 542.39 km, including river border in 187.3 km.
- Slovak Republic 97.852 km, including river border in
2.3 km.
- Hungary 136.7 km, including river border in 85.1 km.
- Romania 613.8 km, including river border 292.2 km and
sea border in 33 km.
- Republic of Moldova 1222 km, including river border
267 km, 452 km of Transnistria.
- Russian Federation 2,295.04 km, including 1974.04
overland and 321 km. of sea.
- Belarus 1084.2 kilometres, including river border in
325.9 km.
The whole territory of the country is solid, which means
that there no small Ukrainian enclaves in other countries,
from all sides bounded be foreign territory. Within the sea
Ukraine borders with Romania and Russia. Ukrainian-
Romanian border in the west continues from the border on
the land into the Black Sea in the distance of 33
kilometres from the coast, then (until it does not not return
to the north, encompassing the Zmiiniy Island in the
south), it serves as a border of Ukrainian territorial waters
and economic zone of Romania. Turning north, our
maritime border is the boundary between the state area
(better to say waters) and the exclusive economic zone of
Ukraine, it goes around the contours of the Ukrainian
coast until the Kerch Strait keeping the distance at 22224
meters aside from the shore. In the eastern part of the
Black Sea to the south of the Kerch Strait meets the
border of the Russian economic zone in the Black Sea.
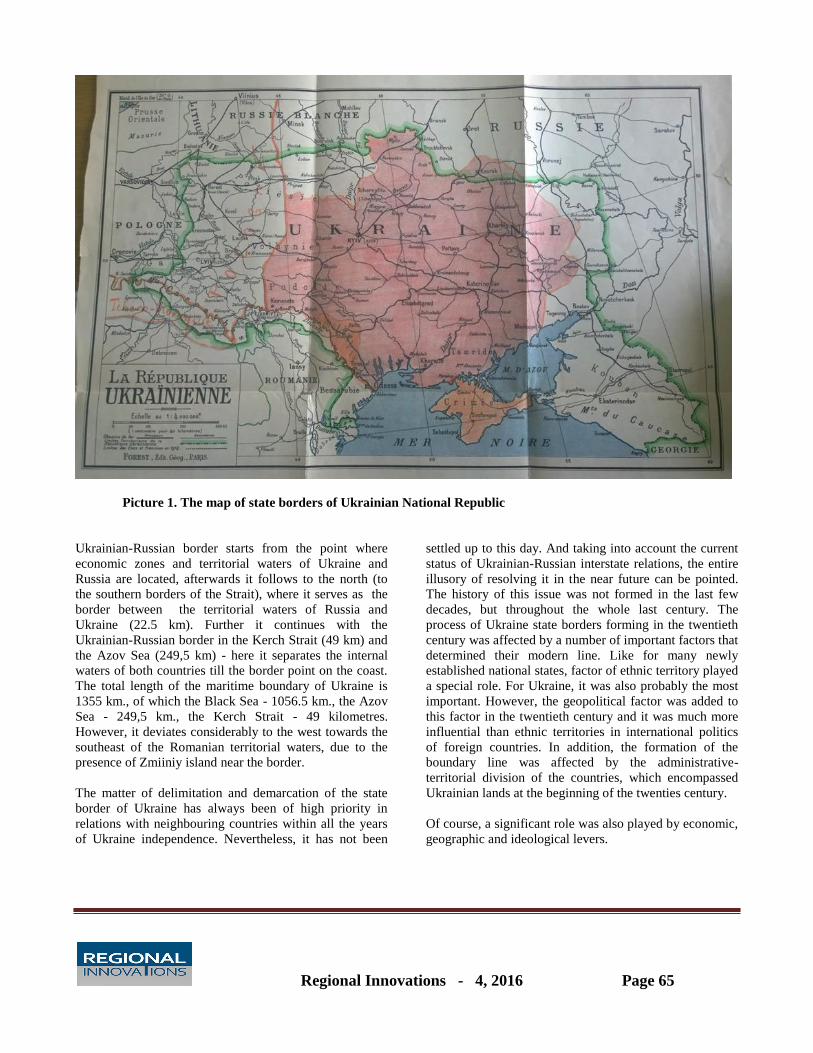
Regional Innovations - 4, 2016 Page 65
Picture 1. The map of state borders of Ukrainian National Republic
Ukrainian-Russian border starts from the point where
economic zones and territorial waters of Ukraine and
Russia are located, afterwards it follows to the north (to
the southern borders of the Strait), where it serves as the
border between the territorial waters of Russia and
Ukraine (22.5 km). Further it continues with the
Ukrainian-Russian border in the Kerch Strait (49 km) and
the Azov Sea (249,5 km) - here it separates the internal
waters of both countries till the border point on the coast.
The total length of the maritime boundary of Ukraine is
1355 km., of which the Black Sea - 1056.5 km., the Azov
Sea - 249,5 km., the Kerch Strait - 49 kilometres.
However, it deviates considerably to the west towards the
southeast of the Romanian territorial waters, due to the
presence of Zmiiniy island near the border.
The matter of delimitation and demarcation of the state
border of Ukraine has always been of high priority in
relations with neighbouring countries within all the years
of Ukraine independence. Nevertheless, it has not been
settled up to this day. And taking into account the current
status of Ukrainian-Russian interstate relations, the entire
illusory of resolving it in the near future can be pointed.
The history of this issue was not formed in the last few
decades, but throughout the whole last century. The
process of Ukraine state borders forming in the twentieth
century was affected by a number of important factors that
determined their modern line. Like for many newly
established national states, factor of ethnic territory played
a special role. For Ukraine, it was also probably the most
important. However, the geopolitical factor was added to
this factor in the twentieth century and it was much more
influential than ethnic territories in international politics
of foreign countries. In addition, the formation of the
boundary line was affected by the administrative-
territorial division of the countries, which encompassed
Ukrainian lands at the beginning of the twenties century.
Of course, a significant role was also played by economic,
geographic and ideological levers.

Regional Innovations - 4, 2016 Page 66
Picture 2. Topographic and geodetic, mapping and surveying works on demarcation and delimitation of Ukrainian
state border
Since Ukraine declared its independence one of the most
difficult problems that arose and left up to the present
time, is state border development. According to the law of
Ukraine "On State Border of Ukraine" in the legal
interpretation "Ukraine state border is a line and a vertical
surface passing along this line, which define the territory
of Ukraine - land, water, minerals, air space." State
borders "is a reflection of the territorial integrity, political
and economic independence, sovereignty and unity of
Ukraine".
Legal registration of state borders is one of the priorities
of Ukraine's foreign policy, the implementation of which
should ensure the sovereignty and the legal personality of
Ukraine in the international arena, to guarantee its
inviolability and territorial integrity. Legally state border
is one of the main conditions of stability in the political,
economic, military and defence relations between the
neighbouring countries.
In post-Soviet countries, new interstate borders have not
been legitimized properly - the incomplete process of
delimitation and demarcation causes uncertainty in the
border areas and border relationships. If with Poland,
Slovakia and Hungary we managed to reach agreements
on the recognition and legal registration of the borders in
short time, resolving this issue with Romania, Moldova,
Belarus and Russia was delayed.
In the Ukrainian-Polish intergovernmental agreement "On
neighbourhood, friendship and cooperation" from May 18,
1992 it is noted that the parties "have no mutual territorial
claims, and will not nominate them in the future." Next
year, on January 12, 1993, the agreement "On legal
regime of the Ukrainian-Polish border, cooperation and
mutual assistance in border issues’’ was signed in Kiev.
The agreement "On neighbourliness, partnership and
cooperation," was signed between Hungary and Ukraine
in 1992, which emphasized the territorial integrity and
inviolability of borders. In May 1992 it was supplemented
by agreements "On a simplified procedure for crossing the
border by the citizens living in border areas", "On the
crossing points across the state border", "On the transfer
and receiving of people across the common state border. "

Regional Innovations - 4, 2016 Page 67
An agreement between Ukraine and the Republic of
Hungary "On the regime of the Ukrainian-Hungarian
border, cooperation and mutual assistance on border
issues." was signed on May 19, 1995 in Kiev. Verification
of borders between Ukraine and Hungary was done during
1996-2003 years.
In the second article of the Agreement "On
Neighbourliness, Friendship and Cooperation Between
Ukraine and the Slovak Republic" dated 24 June 1993 it is
emphasized that states recognize the inviolability of
existing borders between them. On this basis, a joint
commission was immediately formed, and due to the
results of its work agreements between Ukraine and the
Slovak Republic "On the common state border" and "On
the regime of Ukrainian-Slovak state border, cooperation
and mutual assistance in border issues " were signed in
Bratislava on 14th of October 1993. After their ratification
on July 15, 1993 legal framework of functioning of
Ukrainian-Slovak border was complemented with the
agreement "On the transfer and receival of people across
the common state border." Verification of borders
between Slovakia and Ukraine started again in 2003 (after
1989-1994.)
The issue of the border with Romania was settled with the
signing of the agreement between Romania and Ukraine
"On the regime of the Romanian-Ukrainian state border,
cooperation and mutual assistance in border issues" on 17
June 2003. Both sides recognized the demarcation of land
boundary area that was carried out between the USSR and
Romania some time ago. The status of Zmiiniy Island in
the Black Sea was left not fully resolved, which affected
on the determination of the limits of the continental shelf
and exclusive economic zone. In 2004 Romania sues to
the International Court of Justice in The Hague statement
on the delimitation of the continental shelf and special
economic zones of Ukraine and Romania in the Black
Sea, insisting that Snake is not an island but a rock, and
therefore it can not be taken into consideration during the
delimitation line. The Court announced its decision on
February 3, 2009. The final decision was not subject to
appeal, the Court has put the two countries in the status
quo. Zmiiniy was recognized as an island in all the
documents, but not a rock, as it was required by Romania.
However, preservation of the status of Zmiiniy Island
does not provide Ukraine with the right to increase the
exclusive economic zone in the Black Sea.
Thus, Romania formally confirmed the principle of
"inviolability" of existing borders with Ukraine, but the
border remained without legal confirmation (later the
situation was repeated during the signing of the relevant
agreement between Romania and Moldova) [1].
In addition to issue with Zmiiniy Island, another problem
of the border between Ukraine and Romania was its
modification by change of the natural landscape. This was
the area of Rakhiv and Tyachiv district (Transcarpathian
region) of Ukrainian-Romanian border. According to the
Agreement on the regime of the Soviet-Romanian border,
cooperation and mutual assistance in border issues from
1961 boundary line here lies in the middle of the Tisza
river. However, this channel as the channel of any other
river changes with time. The main reason for the change
of riverbeds are floods which take place here several times
a year and erode the coast. It was formed geographically
that the lower Ukrainian shore, gradually goes deeper into
our territory, releasing the Romanian coast from water
from. Since 1961, the Ukrainian side has lost 270 hectares
of land in this way [2].
Since the change of the river was caused by primarily
natural factors, to prevent this process completely is
impossible, but to weaken it significantly and to make it
manageable – is quite feasible task, which may be
implemented by establishing reliable embankments. The
loss of the territory by Ukraine may be stopped by signing
with Romania documents on demarcation, under which
the state border would become permanent, relevant
arrangements of Ukraine with Hungary, Slovakia and
Poland may be used as example.
In November 1994, Ukraine and Moldova signed an
agreement "On cooperation in border issues." A draft of
fifth border passage on the map was approved later and
one of the main problems was outlining of starting point
of the state border in the south, near the mouth of the river
Prut. Kyiv was insisting that the Moldovan-Ukrainian
border is defined by the agreement from 1940, which says
that it starts on the river Prut, leaving the village.
Giurgiuleshti in the Moldavian SSR. However, Moldova
was supporting the position that the border must be lying
on the river Dunai. This would give them the opportunity
to get access to the Black Sea and to build an oil terminal
there. One of the solutions to the problem could become
the exchange. Moldova passed the part of the road Odessa
- Ismael to Ukraine, and for that the country received
territorial concessions in Bessarabia. That it was taken as
a basis for future compromise. Delimitation of border with
Moldova was made during 1995-1999 years. Agreement
between Ukraine and Moldova on the state border was
signed on August 18, 1999. From 2002, works on
demarcation are continuing. Picture 3 shows the
demarcation of the state border between Ukraine and
Moldova. And Picture 4 shows a fragment of demarcation
map scale of 1: 5000 of the state border between Ukraine
and Moldova. Picture 5 shows the protocols of the border

Regional Innovations - 4, 2016 Page 68
signs, and Picture 6 reveals catalogue of coordinates of
border signs.
The European Union is ready to contribute to taking the
final decision on practical initiation of process of
demarcation of the central (Transnistrian) area of the
Ukrainian-Moldovan state border by parties. Such
willingness of the European Union was expressed by the
Head of European Commission in assistance in the
matters of the border between Moldova and Ukraine
(EUBAM), Ferenc Banafi, who highly appreciated the
level of cooperation between the EU mission with the
Ukrainian side, which is an important factor in
strengthening security in the region [3, p. 56].
Otherwise, there was a process of delimitation of the
Ukrainian-Belarusian border. Already in December 1992,
the Prime Minister of Ukraine Leonid Kuchma signed an
agreement with the Republic of Belarus "On cooperation
on border and customs issues as well as visa-free border
crossings." Completion of delimitation process took place
in May 12, 1997 with the signing of the agreement "On
the border." On June 18, 2013 Ukraine and Belarus have
exchanged instruments of ratification of the agreement on
state border between Ukraine and Belarus from 12 May
1997 and the initiation of work on the demarcation of the
Ukrainian-Belarusian border. Picture 7 provides the
demarcation of the state border between Ukraine and
Belarus. Picture 8 shows a fragment of delimitation map
in scale of 1:10 000 with the project boundary signs at the
state border between Ukraine and Belarus. Picture 9
describes the border between Ukraine and Belarus.
Picture 3. Demarcation of State border between Ukraine and the Republic of Moldova
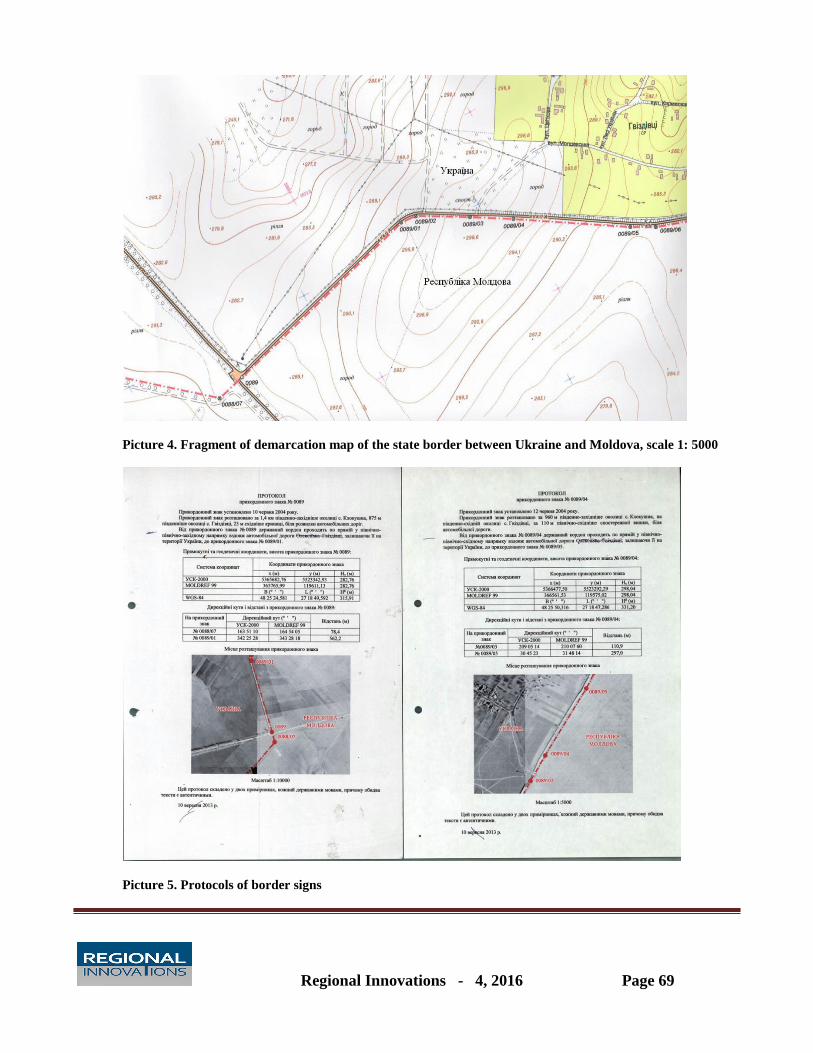
Regional Innovations - 4, 2016 Page 69
Picture 4. Fragment of demarcation map of the state border between Ukraine and Moldova, scale 1: 5000
Picture 5. Protocols of border signs

Regional Innovations - 4, 2016 Page 70
Picture 6. Catalogue of coordinates of border signs
Picture 7. The demarcation of the state border between Ukraine and Belarus

Regional Innovations - 4, 2016 Page 71
Picture 8. Fragment of delimitation map with the project boundary signs at the state border between Ukraine
and Belarus, scale 1:10 000
Picture 9. The border between Ukraine and Belarus
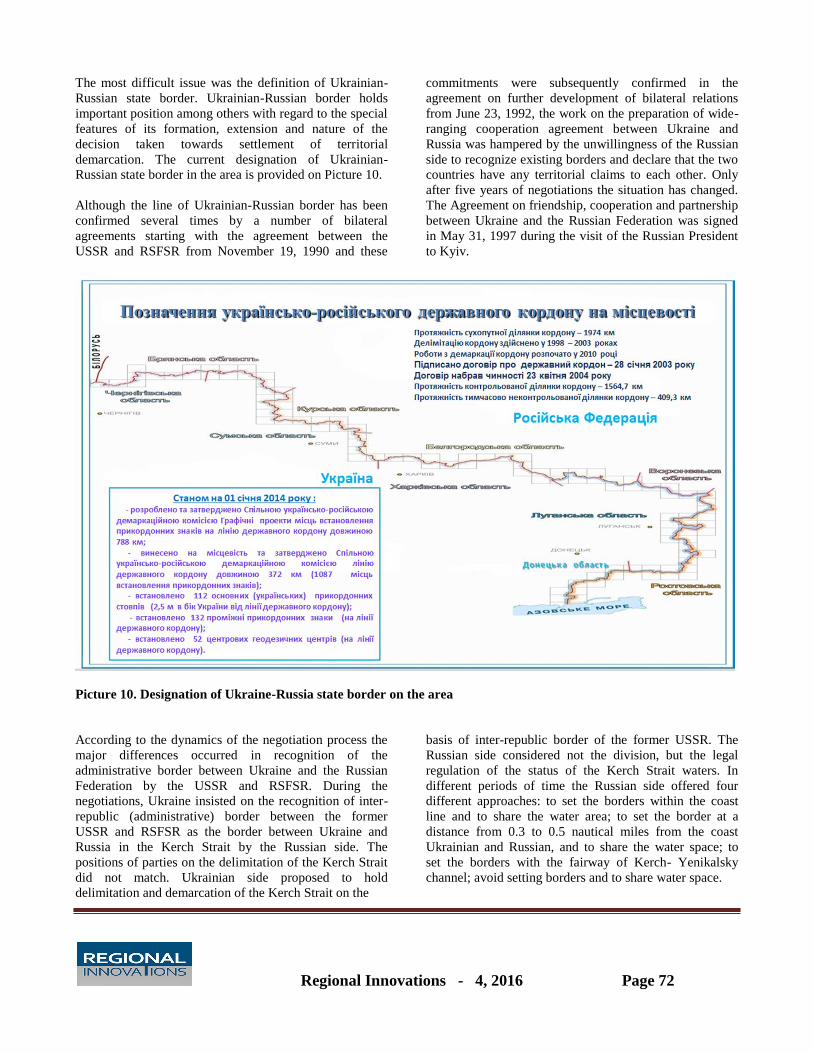
Regional Innovations - 4, 2016 Page 72
The most difficult issue was the definition of Ukrainian-
Russian state border. Ukrainian-Russian border holds
important position among others with regard to the special
features of its formation, extension and nature of the
decision taken towards settlement of territorial
demarcation. The current designation of Ukrainian-
Russian state border in the area is provided on Picture 10.
Although the line of Ukrainian-Russian border has been
confirmed several times by a number of bilateral
agreements starting with the agreement between the
USSR and RSFSR from November 19, 1990 and these
commitments were subsequently confirmed in the
agreement on further development of bilateral relations
from June 23, 1992, the work on the preparation of wide-
ranging cooperation agreement between Ukraine and
Russia was hampered by the unwillingness of the Russian
side to recognize existing borders and declare that the two
countries have any territorial claims to each other. Only
after five years of negotiations the situation has changed.
The Agreement on friendship, cooperation and partnership
between Ukraine and the Russian Federation was signed
in May 31, 1997 during the visit of the Russian President
to Kyiv.
Picture 10. Designation of Ukraine-Russia state border on the area
According to the dynamics of the negotiation process the
major differences occurred in recognition of the
administrative border between Ukraine and the Russian
Federation by the USSR and RSFSR. During the
negotiations, Ukraine insisted on the recognition of inter-
republic (administrative) border between the former
USSR and RSFSR as the border between Ukraine and
Russia in the Kerch Strait by the Russian side. The
positions of parties on the delimitation of the Kerch Strait
did not match. Ukrainian side proposed to hold
delimitation and demarcation of the Kerch Strait on the
basis of inter-republic border of the former USSR. The
Russian side considered not the division, but the legal
regulation of the status of the Kerch Strait waters. In
different periods of time the Russian side offered four
different approaches: to set the borders within the coast
line and to share the water area; to set the border at a
distance from 0.3 to 0.5 nautical miles from the coast
Ukrainian and Russian, and to share the water space; to
set the borders with the fairway of Kerch- Yenikalsky
channel; avoid setting borders and to share water space.
Regional Innovations - 4, 2016 Page 73
Significant differences in the positions of Ukraine and
Russia on the delimitation of the Kerch Strait stipulated
the situation where solving the entire block of issues
concerning delimitation of maritime spaces between the
two countries was actually blocked. Russian diplomats
were including in a single package the matter of
delimitation of the Black and Azov seas with the adoption
of their position on the delimitation of the Kerch Strait.
Ukrainian diplomats were prepared to accept the package,
but not through giving up Ukrainian territory. As a result,
negotiations were stalled.
Starting from the middle of 1990s there were
diametrically opposite approaches of the settlement of a
number of issues related to the common border in
Ukrainian-Russian relations. Ukraine is a proponent of
settling disputes under existing international law and the
political/legal standards, and the Russian Federation is
trying to impose surrogate forms of "agreement" that
would ensure its strategic interests in the region.
Russia considers the borders within the CIS as "internal"
and their demarcation as optional, unwanted and even one
that impedes partnership relations. Ukraine insists on
borders demarcation with Russia, based on the principle
of equal status for all its borders. The core of the conflict
lies in the history of the problems territorial delimitation
settlement between Russia and Ukraine throughout the
twentieth century.
The events of 2003 related to the conflict over the island
of Tuzla, highlighted another problem of the Ukrainian-
Russian border demarcation. Although its origin dates
back to the period when Crimea was considered as a part
of Russia, with the accession of Crimea to Ukraine and
the next almost 50 years' borders calm period " the new
confusion was faced in the territorial settlement, but not
between the Soviet republics, and between independent
states.
The dialogue with Russia on the matter of Tuzla island
belonging to Ukraine lasted nearly for two years. Only in
July 2005 the Russian side declared its Ukraine’s Tuzla
island ownership.
The total length of the state border between Ukraine and
Russia is 2,295.04 km as of today, including a land border
- 1974.04 km and sea area - 321 km. The agreement on
the Ukrainian-Russian state border from 28 January 2003
defined border line on land. With ratification of this
document on 20 April, 2004 and the Agreement on
cooperation in the usage of the Azov Sea and Kerch Strait
on December 24, 2003 legal registration of line border on
land was completed and also the necessary political and
legal basis for the revitalization of the negotiation process
on delineation of waters were created. The agreement on
the demarcation of Ukrainian-Russian state border was
signed on May 17, 2010, and it came in force on July 29,
2010 that created legal basis for initiating the process of
designation of the Ukrainian-Russian State border on land.
In April 2010 the Russian side agreed to resume
negotiations on the demarcation of the land border. In the
third meeting of URMK an agreement between Ukraine
and Russia on demarcation of the Ukrainian-Russian state
border was signed in Kyiv by the presidents of both
countries on May 17, 2010 in which the parties approved
creation of a joint Ukrainian-Russian Demarcation
Commission (Art. 2). The commission finally agreed on a
plan of the demarcation of the state border on the first part
of Chernihiv-Bryansk area on 25-27 October, 2011 in
Chernihiv, specifying points where to establish border 631
signs within the distance of 222 km. The joint Ukrainian-
Russian demarcation commission determined in
September, 2012 the coordinates of the first pillar between
Ukraine and Russia on the territory of the village
Senkivsk, Chernihiv region. Thus, on November 7, 2012
the first border post was established at the Ukrainian-
Russian border. However, the demarcation work was
carried out very slowly. The absence of the border has
obviously a negative effect on the legality of its operation.
At the beginning of 2014 the Ukrainian-Belarusian-
Russian negotiations on the draft of the agreement
between the Cabinet of Ministers of Ukraine and the
Government of the Republic of Belarus and the Russian
Federation on the junction point of the state borders of
Ukraine, Belarus and Russia were held in Moscow.
The tenth meeting of the joint working group of the Joint
Ukrainian-Moldovan demarcation commission was held
in Chisinau (Republic of Moldova) on 15-18 April 2013
to prepare the final documents on demarcation of the
Ukrainian-Moldovan State border.
Efforts of the commission also were focused on finalizing
the proposals on the demarcation of the state border near
the buffer hydroelectric Dniester hydropower complex
and Giurgiulesht. During the meeting of the Joint
Commission it was agreed to demarcate the frontier buffer
area in the middle of hydropower facilities, which crosses
the river Dniester. Since 2012 94 km of the state border
have been located in the district and 295 places have been
identified for installation of border signs. Remains is
taken line of the state border on the section length of
about 45 km. 240 border signs have been installed by
Ukrainian side out of 1019 planned.
Regional Innovations - 4, 2016 Page 74
In contrast to borders with other former Soviet Union
republics, the problem of demarcation of the land part of
the Ukrainian-Russian border, the differences in positions
on the issue of delimitation of the Azov Sea and the Kerch
Strait remain "frozen" matters in bilateral relations for
years. Russia felt advantageous from this situation of
uncertainty due to geopolitical considerations for a long
time, which often led to the escalation of political passions
and "confusion" in international relations. However, taken
into account the recent events in 2014 related to the
treacherous aggression of the Russian Federation towards
Ukraine and annexation of Crimea contrary to all
international legal norms, consideration of these issues is
irrelevant [4].
It is fundamentally important to point that EU
enlargement led to fundamental, qualitative changes in the
geopolitical situation on the continent, which, in fact, was
reflected in expanding eastward interests and territory of
EU with distinguishing clear contours of Central and
Eastern Europe - and consequently - the changing nature
of new eastern border of the EU, the formation of a new
border between Ukraine and the EU.
The formation of new international border during 2003-
2004 between EU, Central European states and Ukraine,
de facto between international organization the EU and
Ukraine as a subject of international relations puts on the
agenda the following issues: the changing nature of the
eastern borders of Central and Eastern Europe, the
presence of a number of issues of new eastern borders of
the EU, especially in the context of protection and the
regime of intersection [5, p. 151-152].
During analysis of changes in the geopolitical situation in
the region including CE, the key role is played by the new
border, especially in the context of its delimitation and
demarcation.
In fact, any boundary is "artificial", so it reflects the value
of specific power at a particular period of time, and
throughout history the boundaries were established both
within the so-called natural boundaries, historical
boundaries, sometimes ethnic boundaries, but mostly
because of wars - as delineating borders of power, sphere
of influence of the winners. There are no eternal borders,
each boundary is set, transferred, specified by certain
event in the history. And perhaps a new modern border
between the EU and Ukraine will not become permanent.
Moreover, in accordance to the internal logic of
development, the new border has to evolve over the
century. Since this will depend not only on the internal
development of the enlarged EU during the XXI century,
but also on its newest neighbours nearby the new border,
and thus on internal development of Ukraine [6, p. 47].
The preparatory process of transforming of the EU border
has been already launched in 2002, which was reflected in
settlement of practical issues of border management in
building and organizing the "new" eastern borders of the
EU according to the European standards on borders,
including Ukraine. Due to changes in the essence of the
EU borders, simultaneously the change of nature of the
eastern borders of the EU took place as well as the
countries of Central Europe (as full EU member since
2004), that are currently happening and the changing
nature of border management between Ukraine and its
neighbours - Poland, Hungary and Slovakia.
Considering the main standard-setting documents of the
European Union, it should be noted that in light of the
investigated issues of greatest interest, in our view, are the
following: Helsinki Final Act dated from 1975, The
Declaration of EU Council from June 1993, known as the
Copenhagen criteria, which set conditions for the
including to the EU, the agreement on European Union
from 07.02.1992 with the changes introduced by the
Amsterdam agreement from 02.10.1997 and Nice
agreement from 26.02.2001, the agreement on Accession
from 2003, Athens agreement dated from 01.02.2003. The
most important part of the Athens agreement is the Act
concerning the conditions of accession and changes to
contracts, on which EU is based.
These documents determine the policy of the European
Union in relation to addition of new members, entry
conditions and requirements that apply to candidate
countries.
In accordance with art. 49 of the EU, candidate country
should have "European" spirit, so culture, political and
legal traditions of countries - new members should be
European. The candidate countries before their accession
to the EU should adjust their political and economic
system to the standards of the EU to survive in the
domestic market and become full members. As for the
geographical position in Europe, then this condition -
desirable, but obviously not required, we can take as
example such countries such as Malta (closer to Africa
than to Europe) and Cyprus (located in Asia) and a
candidate country Turkey (Asia).
In accordance with art. 6 of the EU agreement the
candidate must respect democratic principles of the
constitutional order (freedom, democracy, human and
civil rights, the rule of law).
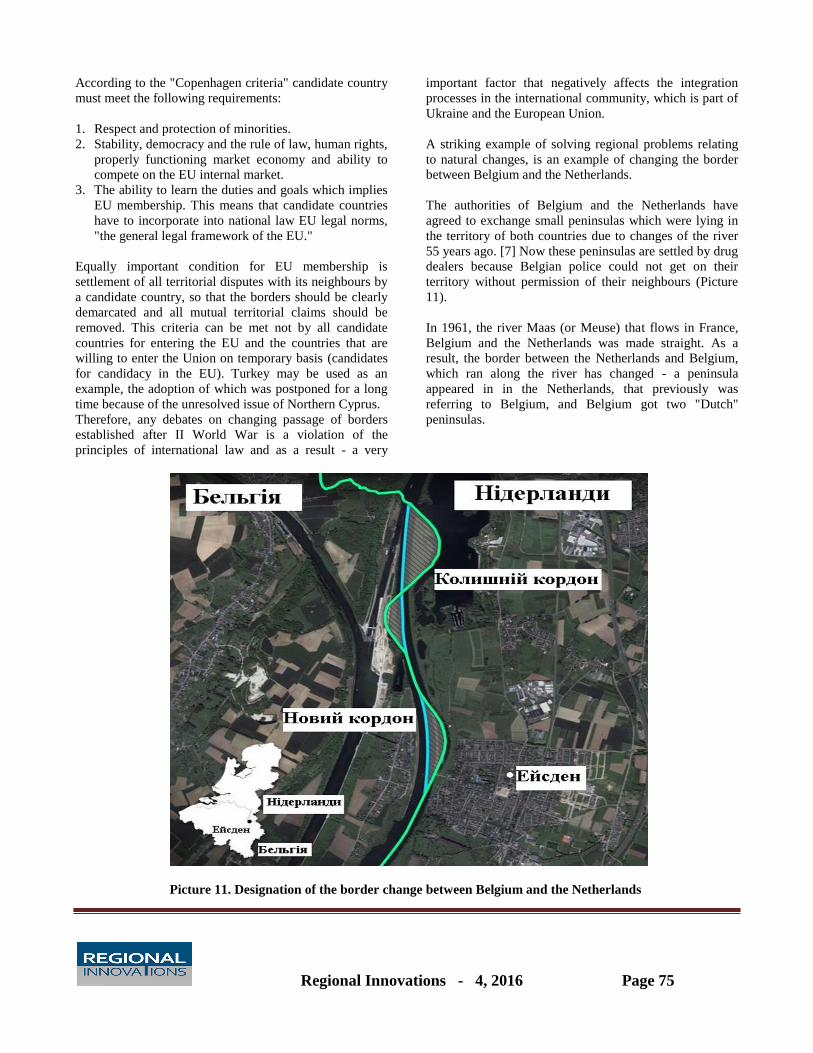
Regional Innovations - 4, 2016 Page 75
According to the "Copenhagen criteria" candidate country
must meet the following requirements:
1. Respect and protection of minorities.
2. Stability, democracy and the rule of law, human rights,
properly functioning market economy and ability to
compete on the EU internal market.
3. The ability to learn the duties and goals which implies
EU membership. This means that candidate countries
have to incorporate into national law EU legal norms,
"the general legal framework of the EU."
Equally important condition for EU membership is
settlement of all territorial disputes with its neighbours by
a candidate country, so that the borders should be clearly
demarcated and all mutual territorial claims should be
removed. This criteria can be met not by all candidate
countries for entering the EU and the countries that are
willing to enter the Union on temporary basis (candidates
for candidacy in the EU). Turkey may be used as an
example, the adoption of which was postponed for a long
time because of the unresolved issue of Northern Cyprus.
Therefore, any debates on changing passage of borders
established after II World War is a violation of the
principles of international law and as a result - a very
important factor that negatively affects the integration
processes in the international community, which is part of
Ukraine and the European Union.
A striking example of solving regional problems relating
to natural changes, is an example of changing the border
between Belgium and the Netherlands.
The authorities of Belgium and the Netherlands have
agreed to exchange small peninsulas which were lying in
the territory of both countries due to changes of the river
55 years ago. [7] Now these peninsulas are settled by drug
dealers because Belgian police could not get on their
territory without permission of their neighbours (Picture
11).
In 1961, the river Maas (or Meuse) that flows in France,
Belgium and the Netherlands was made straight. As a
result, the border between the Netherlands and Belgium,
which ran along the river has changed - a peninsula
appeared in in the Netherlands, that previously was
referring to Belgium, and Belgium got two "Dutch"
peninsulas.
Picture 11. Designation of the border change between Belgium and the Netherlands
Regional Innovations - 4, 2016 Page 76
During the visit of Belgium King Philip to the
Netherlands on 28 of November the parties signed an
agreement on new boundaries. Belgium agreed to give
two peninsulas to the Netherlands and the Netherlands
gave one to Belgium. Consequently, the Netherlands
increased slightly - about 10 hectares were added. The
new border will come in force only in January 2018,
before that the parliaments of both countries must approve
the transfer of territories.
The last time the Netherlands and Belgium shared
territory was 1830 year - there was a revolution in
Belgium, as a result of which it was separated from the
neighbouring country. As the majority of publications that
have written about the transfer of peninsulas, this time
everything went much more peacefully. "Rarely the
section of territories is done without firing a shot," - said
the head of the province of Limburg in the Netherlands.
Conclusions
1. The land and sea borders of many states have
developed historically. Under international law they are
inviolable. In 1975 during Helsinki Conference on
Security and Cooperation in Europe clause on the
recognition of borders between states and countries that
have developed after the Second World War was
approved.
2. If the borders are lying in the middle of the river, the
landscape may change, so there is a need for borders
clarification. Since the change of the river is caused by
primarily natural factors, it is completely impossible to
prevent this process, but it is possible to significantly
weaken this process by establishing reliable
embankments. Thus, according to the agreement on the
regime of the Soviet-Romanian border, cooperation and
mutual assistance in border issues 1961, boundary line
runs along the middle of the channel of the Tisza.
However, this channel, like any other river has changed
over time. Since 1961, the Ukrainian side has lost 270
hectares of its territory in this way.
3. International treaties and agreements signed a few
centuries ago, old maps etc. are used actively in
addressing controversial issues to clarify the boundaries
nowadays.
4. Ukraine has a number of unresolved problems with
determination and ensuring the protection of its frontiers.
The relationship established between Romania and
Ukraine due to the need to settle the problems of the state
border line on the river Dunai from the locality Paridno to
the Black Sea and a question of delimitation of the
continental shelf has already been solved, as well as
defining maritime economic zones of both countries in the
Black Sea. There are several disputes with Russia as well.
This includes determining the boundary line on the Azov
sea etc.
5. Lack of territorial disputes with the neighbours is one
of the key conditions for entering the European Union.
Therefore, Ukraine should complete delimitation and
demarcation of its border as soon as possible. It is
recommended to attract international experts and
international organizations to the demarcation
commissions and to accelerate the signing of agreements
between countries to conduct a complete border
demarcation.
References
1. A. Ermolaev NATO and the EU support Romania in the revision of the boundaries with Ukraine// Ukrainian News
agency REGNUM [Online resource]. - Access mode: http://www.regnum.ru/news/1058515.html
2. The Ukrainian Foreign Ministry keeps silent regarding the Romanian claims on Zmiiniy Island, as it is busy with
fighting with the Russian Federation // Web-site NEWSru.com [Online resource]. - Access mode:
http://www.newsru.com/world/11sep2008/zmeiny.html
3. EU Enlargement: impact on Ukraine's relations with its Central European neighbours. / Institute for Regional and
Euro-Integration Studies "EuroRegio Ukraine." - K .: "K.I.S", 2004. - 360 p.
4. Delimitation and demarcation of the state border of Ukraine: Problems and Priorities // Regional History of Ukraine -
Collection of papers [Online resource]. – Access mode: http://history.vn.ua/book/regionalna/6.html
5. E. Kish Boundaries and their value in terms of European integration processes // Study of World Politics: Coll.
Science. w. / Institute of World Economy and International Relations of NAS of Ukraine. - 2003. - Vol. 24 - S. 148 -
157
6. E. Kish Security issues on the new eastern borders of the European Union / E. Kish // Strategic Panorama. - 2004. -
№1. - P. 44-50
7. The Netherlands and Belgium have agreed to exchange parts of their territories // News agency UNIAN [Online
resource]. - Access: http://www.unian.ua/world/1648997-niderlandi-ta-belgiya-domovilis-pro-obmin-chastinami-
teritoriy.html
Regional Innovations - 4, 2016 Page 77
Résumé1
Cet article fait le point sur la répartition actuelle des compétences en France en matière de délimitation et de
démarcation des frontières. Après avoir recensé les principaux textes applicables, Constitution, traités et textes de
droit interne – notamment ceux qui définissent les compétences des principaux ministères et administration
concernées -, il distingue les différentes étapes de la démarcation des frontières: définition, établissement des signes
démarcatifs, puis surveillance, vérifications et entretien ou rétablissement. Il trace les perspectives d’évolution des
signes démarcatifs et de changement de statut juridique, soulignant que la mise en œuvre de la directive européenne
INSPIRE, à partir de 2018, pourrait rendre à termes caducs les signes physiques de démarcation au profit de lignes
repérées électroniquement. Il suggère enfin des pistes de clarification de la distribution des compétences entre
administrations françaises.
Mots clés: frontières, limites, délimitation, marquage, démarcation, abornement.
Abstract2
This article settles the present situation about the distribution of competences in France in the area of borders
determination and demarcation. It takes at first a census of the existing texts in force – Constitution, treaties, and
internal rules – in particular those determining the competences of the main ministries and administrations involved.
Then it proceeds with the different steps of borders demarcation: determination, establishing bounds and markers,
then survey, checking and maintaining or restoring it. It draws some perspective evolution of the borders markers
and its potential change of juridical status, underscoring the fact that starting from 2018, the implementation of the
INSPIRE directive might in the future nullify physical marks for the benefit of lines determined by electronic means.
It suggests at last ways of clarifying the competences among French administrations dealing with it.
Key words: border, limits, boundaries, marking, demarcation, borders markers.
1 Cet article a initialement été publié dans la revue «Innovations Régionales» (2015, #1). L’auteur a proposé de l’adapter (avec quelques modifications),
avec l’accord de l’éditeur, en vue de sa publication dans le numéro thématique «frontières» de la revue «Innovations Régionales». 2 This paper was already published in the Regional Innovations Journal (2015, #1). It was proposed by the author (with some modifications and additional
information) for its publication in this thematic issue on border management of the Regional Innovations Journal.
Regional Innovations - 4, 2016 Page 78
La délimitation des frontières, leur démarcation, leur
entretien, et la surveillance de ces limites induisent de
nombreuses conséquences d’ordre diplomatique, juridique,
politique, sécuritaire, économique, patrimonial,
environnemental, social ou culturel. Elles relèvent de
compétences multiples dont la répartition relève souvent
autant de la coutume ou de l'habitude que du droit écrit.
En faisant le point des principales dispositions existantes,
cet article a pour objectif d'amorcer les réflexions sur les
ambiguïtés liées à la situation actuelle en France, et de
pointer les voies possibles d’une clarification de la norme.
I/ Les principaux textes existants
Les textes sont de deux ordres : traités ou conventions
internationaux d’une part, lois et réglementations internes
d’autre part.
A/ La Constitution
Norme suprême en France, elle indique en particulier la
nécessité d’une loi pour ratifier ou approuver les traités
qui modifient le territoire (art 53), la soumission de la loi
aux traités internationaux (art 55), et la compétence du
Président de la République pour négocier, ratifier ou
approuver les traités et accords internationaux (art 52).
Elle confie également au «représentant de l’Etat dans les
collectivités territoriales» (i.e. le préfet) la charge des
intérêts nationaux et du respect des lois, ainsi que la
représentation de chacun des membres du gouvernement
(art 72). Cette disposition lui confère donc en particulier la
responsabilité du respect des traités ou accords concernant
la frontière, et l’institue comme représentant local du
ministre des affaires étrangères pour les questions
relatives aux frontières.
B/ les traités et accords
Ils sont de deux ordres : multilatéraux, à portée générale,
ou bilatéraux, ne concernant que deux pays souverains.
Les traités multilatéraux tendent à s’imposer, en cas de
contradiction, aux traités bilatéraux. Ainsi la commission
internationale des Pyrénées, dans sa 40ème session du 2
décembre 2014, a-t-elle eu l’occasion de rappeler que les
dispositions particulières des traités bilatéraux conclus
entre la France et l’Espagne ne pouvaient déroger aux
dispositions contraignantes des directives européennes.
Les traités bilatéraux recouvrent, quant à eux, trois
catégories d’accords internationaux:
Les accords ou traités généraux comportant
attribution de territoires (exemple : traité des
Pyrénées 1659, traité d’Utrecht 1713, traités de Paris
des 30 mai 1814 et 20 novembre 1815, traité de
Versailles 28 juin 1919). Ils fixent, parmi d’autres
dispositions, les principes de la distribution de
territoires entre deux Etats. Ils ne rentrent pas dans
les détails et nécessitent en général d’être précisés.
Les traités ou accords de délimitation (exemple :
traité de Courtrai du 28 mars 1820 avec les Pays-Bas
(= aujourd’hui, Belgique et Luxembourg), traités de
Bayonne de 1852, 1856, 1868, avec l’Espagne, traité
de Paris du 14 août 1925 avec l’Allemagne). Ils
précisent, en tant que de besoin, la distribution
exacte des territoires et la ligne des frontières. Ils
peuvent aussi comporter des indications ou des
prescriptions sur le marquage de ces frontières ou sur
leur entretien, et peuvent aussi servir à régler
certaines questions frontalières courantes (pâturage,
pêche, construction, usage des eaux, vie
transfrontalière d’une manière générale).
Les conventions ou accords de démarcation ou
d’abornement. Textes autonomes ou additionnels
aux précédents, ils servent le plus souvent à
déterminer, sur le terrain, l’emplacement exact des
repères ou le mode précis de détermination des
frontières.
Cette distribution en trois niveaux ou catégories de traités
bilatéraux n’est ni systématique ni parfaite. Des
conventions supplémentaires viennent parfois préciser ou
modifier un point ou un autre de ces traités. Elle est
néanmoins assez générale, et pas uniquement entre la
France et ses partenaires.
Point particulier, ces textes contiennent assez souvent des
dispositions à effet interne, y compris sur l’organisation
administrative française (répartition des missions entre
autorités administratives et même entre administrations
d’Etat, commissions ou associations transfrontalières ou
syndicats mixtes de gestion bi-nationaux, propriété, droit
de la construction, droit d’usage ou de passage, etc.).
C/ les textes de droit interne
Excepté les lois et décrets ratifiant ou publiant les actes
internationaux, et qui déterminent leur entrée en vigueur
dans le droit français, il n’y a pas de texte général
déterminant précisément la distribution des compétences
entre autorités administratives dans le domaine de la
gestion et de la surveillance des frontières. Il faut donc
rechercher ailleurs, dans la combinaison des textes propres
Regional Innovations - 4, 2016 Page 79
à chaque administration, la distribution des rôles sur la
surveillance et l’entretien des frontières.
La Constitution prévoit que les « ministres responsables »
contresignent les actes du Président de la République (art
19), et les « ministres chargés de leur exécution » ceux du
Premier ministre (art 22). A contrario, et quand bien même
les dits actes distribuent des missions aux préfets, sous-
préfets, administrations communales et autres
administrations territoriales, le ministre de l’intérieur ne
contresignant ni les décrets de promulgation des traités ni
aucun des actes relatifs à ces traités, n’est ni responsable,
ni chargé de l’exécution desdits traités, qui incombe au
ministre des affaires étrangères – contresignataire quant à
lui -. Cette lecture confirme le principe ci-dessus évoqué
selon lequel, en matière de délimitation et de surveillance
de la démarcation des frontières, les préfets agissent
comme délégués du ministre des affaires étrangères. C’est
à lui qu’ils doivent donc directement des comptes en la
matière, et non au ministre de l’intérieur qui n’intervient
le cas échéant que pour les questions pratiques nécessitées
par la coordination et la cohérence de l’action des préfets
sur le territoire. Dans la pratique par exemple, la
commission internationale des Pyrénées (CIP), invite ainsi
directement le ou les préfets ou sous-préfets concernés à
participer à celles de ses séances où leur présence est
jugée utile. Il peut aussi lui arriver de confier au ministère
de l’intérieur la présidence de la commission mixte
d’abornement (CMA) qui est, sur la frontière espagnole et
sur celle-ci seulement, une sous-commission de la CIP.
Le ministère des affaires étrangères
Décret n° 2014-400 du 16 avril 2014 relatif aux
attributions du ministre des affaires étrangères et du
développement international
Décret n° 2012-1511 du 28 décembre 2012 portant
organisation de l'administration centrale du ministère
des affaires étrangères
Décret n°87-389 du 15 juin 1987 relatif à
l'organisation des services d'administration centrale
(rôle des secrétaires généraux)
Décret impérial du 25 décembre 1810 sur les
attributions du ministre des relations extérieures
Le décret du 16 avril 2014 ne mentionne que les
compétences nouvelles du ministère en matière d’action
économique extérieure et de tourisme. Les autres
attributions ne sont pas expressément énumérées. Seuls les
textes relatifs à l’organisation de l’administration centrale
du ministère (notamment le décret du 28 décembre 2012)
permettent donc de préciser les contours de ces
attributions.
Il en ressort que les questions de délimitation,
démarcation et surveillance des frontières, sans être
expressément mentionnées, peuvent relever en premier
lieu du secrétaire général, au titre de sa mission de
coordination générale (décret du 15 juin 1987), des
directions géographiques concernées par chacune des
frontières communes avec la France, mais également de la
direction des affaires juridiques (participation à la
négociation des traités), de la direction des archives
(conservation des traités, élaboration de cartes), ainsi que
de la délégation pour l'action extérieure des collectivités
territoriales (cohérence entre l'action extérieure de l'Etat et
celle des pouvoirs publics locaux, conseil aux
collectivités sur leur action extérieure, coopération
transfrontalière, conseil aux préfets sur le contrôle de
légalité).
A la direction de l'Union européenne, un ambassadeur est
spécialement chargé des «Commissions
intergouvernementales, [de] la coopération et [d]es
questions frontalières», mais sa compétence ne s'étend pas,
compte-tenu de son rattachement, aux territoires d'Outre-
mer.
Par ailleurs, si le décret impérial de 1810 interdit par
principe les relations directes entre administrations
françaises et autorités diplomatiques extérieures, certains
traités de limites autorisent les relations directes entre
autorités locales frontalières limitrophes (préfets,
gouverneurs, maires agissant à la fois en tant qu'autorités
de l’État et représentant les intérêts locaux de leurs
concitoyens, ingénieurs de l’État ou des collectivités
locales, géomètres ou représentants du cadastre, délégués
à l'abornement, etc.), pour l’exécution des conventions de
délimitation.1
Le ministère de l’intérieur
Décret n° 2014-408 du 16 avril 2014 relatif aux
attributions du ministre de l'intérieur
Décret n° 2013-728 du 12 août 2013 portant
organisation de l'administration centrale du ministère
de l'intérieur et du ministère des outre-mer
Décret n°87-389 du 15 juin 1987 relatif à
l'organisation des services d'administration centrale
(rôle des secrétaires généraux)
1 Voir, par exemple, article 11 du Règlement conclu entre la Belgique et
les Pays-Bas pour l’entretien et la conservation des bornes de
démarcation plantées sur la frontière des deux pays, en exécution de la convention des limites du 8 août 1843, qui autorise les contacts entre
gouverneurs des provinces limitrophes. , ou articles 1, 2 et 3 de l’acte
additionnel du 28 mai 1866 avec l’Espagne, ou article 9 de l’accord du 10 mars 1965 avec la Suisse.
Regional Innovations - 4, 2016 Page 80
«Le ministre de l'intérieur prépare et met en œuvre la
politique du Gouvernement en matière de sécurité
intérieure, de libertés publiques, […] d'administration
territoriale de l’État, […]. En liaison avec le ministre de la
décentralisation, […] il prépare et met en œuvre la
politique du Gouvernement à l'égard des collectivités
territoriales» (décret du 16 avril 2014).
Le ministère de l'intérieur peut être impliqué dans la
démarcation et la surveillance des limites du territoire
national au titre de l'administration du territoire, de la
relation avec les collectivités territoriales, de la sécurité
intérieure ou des libertés publiques. Peuvent être
impliqués à ce titre, le secrétariat général, soit au titre de
son rôle de coordination générale, soit au titre de
directions spécialisées dans l'administration du territoire
(DMAT – direction de la modernisation et de
l'administration territoriale), la DGOM (direction générale
des outre-mer), la DGCL (la direction générale des
collectivités locales), la gendarmerie ou la police (unités
générales ou spécialisées comme la police aux frontières).
Mise à part la mission spécifique de la police aux
frontières, «chargée de veiller au respect des textes relatifs
à la circulation transfrontière et d’assurer, en liaison avec
la direction générale des douanes et droits indirects, le
contrôle des personnes franchissant les frontières
nationales» (art 20 du décret du 12 août 2013), aucune
autre direction ou service n'a de compétence directe sur la
délimitation et la surveillance de la démarcation des
frontières. Néanmoins la mention spécifique des frontières
dans ce texte implique nécessairement cette direction,
ainsi que l'administration des douanes, dans la
connaissance, la surveillance et la démarcation des
frontières.
Le ministère de l'écologie, du développement durable
et de l'énergie (MEDDE) et son EPA l’IGN
Décret no 2014-401 du 16 avril 2014 relatif aux
attributions du ministre de l'écologie, du
développement durable et de l'énergie
Décret no2008-680 du 9 juillet 2008 portant
organisation de l'administration centrale du ministère
de l'écologie, de l'énergie, du développement durable
et de l'aménagement du territoire
C'est le ministère de la gestion du territoire. Aux frontières,
ce ministère peut notamment être impliqué par la
protection de la nature, des paysages et des sites, la
protection du littoral et de la montagne, la police et la
gestion de la pêche en eau douce, la protection, la police
et la gestion des eaux, la police des installations classées
et de l'exploitation des carrières, et la politique de
réduction et de traitement des déchets, la politique
d'aménagement de l'espace rural et de la forêt,
l'occupation des sols, les transports ferroviaires, guidés et
routiers et leur infrastructure.
C'est notamment au titre de sa compétence spéciale en
matière d'infrastructures et d'équipement qu'il a été, par le
passé, mis à contribution et impliqué dans la mise en place,
la surveillance et l'entretien des signes de démarcation des
frontières.2
Ce ministère est responsable de la mise en œuvre de la
directive INSPIRE, (directive 2007/2/CE du Parlement
européen et du Conseil du 14 mars 2007 établissant une
infrastructure d'information géographique dans la
Communauté européenne)
En outre, ce ministère assure la tutelle de l'IGN,
intervenant principal de la délimitation et de la
démarcation, chargé fonctionnellement du repérage
cartographique des frontières. Il décide à ce titre de la
liste des bases de données géographiques et des fonds
cartographiques à constituer et mettre à jour par l’IGN.
(décret du 27 octobre 2011).
L'IGN (Institut national de l'information
géographique et forestière)
Directive 2007/2/CE du Parlement européen et du
Conseil du 14 mars 2007 établissant une
infrastructure d'information géographique dans la
Communauté européenne (INSPIRE)
Décret n° 2011-1371 du 27 octobre 2011 relatif à
l'Institut national de l'information géographique et
forestière (IGN)
Héritier des ingénieurs et géographes royaux, puis des
services d’État-major chargés de missions à caractère
géographique, l'IGN est l'opérateur historique de la
délimitation des frontières. Le plus souvent, c'est en
pratique un ingénieur ou géographe royal, ou des services
géographiques de l'Etat-Major, ou de l'IGN depuis 1940,
qui a reçu la charge de la négociation et de la mise en
œuvre initiale des traités et conventions de délimitation ou
de démarcation des frontières de la France.3
2Par exemple, article 46 du Traité de délimitation du 14 août 1925 avec
l'Allemagne. 3Ainsi le commissaire nommé par la France pour la négociation et la conclusion de l'accord de délimitation avec la Prusse, en 1829, est-il un
colonel du corps royal des ingénieurs-géographes ; le délégué du
commissaire est un chef de bataillon du génie chargé de faire établir des poteaux (de délimitation) par les soins du ou des ingénieurs attachés à la
commission. Pour le traité de Courtrai (Traité de limites entre S. M. le roi
de France et S. M. le roi des Pays-Bas ; signé à Courtray, le 28 mars 1820), c'est aussi un officier du corps royal des ingénieurs géographes
Regional Innovations - 4, 2016 Page 81
«L'institut a pour vocation de décrire, d'un point de vue
géométrique et physique, la surface du territoire national
et l'occupation de son sol, […] ainsi que de faire toutes les
représentations appropriées […].
L'institut est chargé des missions suivantes:
1° Concevoir et constituer une infrastructure géodésique
cohérente avec les systèmes internationaux […];
2° Réaliser et renouveler périodiquement la couverture en
imagerie aérienne ou satellitaire de l'ensemble du
territoire national;
3° Constituer et mettre à jour sur l'ensemble du territoire
les bases de données géographiques et les fonds
cartographiques dont la liste est fixée par arrêté du
ministre chargé du développement durable, notamment le
référentiel à grande échelle (RGE). Le référentiel à grande
échelle, système intégré d'information géographique
couvrant l'ensemble du territoire national, est composé de
bases de données numérisées et interopérables décrivant
les thèmes, dénominations géographiques, unités
administratives, adresses, parcelles cadastrales issues du
plan cadastral, réseaux de transport, hydrographie, altitude,
occupation des terres, ortho-imagerie et bâtiments
mentionnés aux annexes I, II et III de la directive du 14
mars 2007 susvisée. Les modalités de constitution et de
mise à jour du référentiel à grande échelle sont fixées par
arrêté du ministre chargé du développement durable
[…].
10° Mettre en place et administrer le portail INSPIRE de
l'Etat pour ce qui concerne les services de consultation
prévus à l'article L. 127-4 du code de l'environnement et
les services de transformation prévus au même article
lorsque ces services sont dédiés aux changements de
référentiel de coordonnées […].
13° Concourir aux travaux menés en France et dans un
cadre international en matière d'organisation et de
normalisation de l'infrastructure d'information
géographique […].
Article 4
Pour l'accomplissement de ses missions, l'institut peut:
1° Contribuer à l'élaboration et à la mise en œuvre
d'accords de coopération internationale, notamment dans
le cadre de partenariats européens […].
qui négocie (le même Etienne-Nicolas Rousseau, qui n'est alors que
lieutenant-colonel). En 1955, c’est un ingénieur général de l’IGN qui
conduit la délégation française pour l’installation de la commission de délimitation de la frontière franco-brésilienne.
Il peut apporter son concours, par convention, à des
administrations, collectivités et services publics, aux
collectivités d'outre-mer pour l'exercice de leurs
compétences propres, à des organismes internationaux et à
des États étrangers ou, si les services ou travaux
présentent un caractère d'intérêt général, à des organismes
ou des personnes privés […].
Le ministère des finances (douanes, cadastre, domaine).
Décret n° 2014-403 du 16 avril 2014 relatif aux
attributions du ministre des finances et des comptes
publics
« Le ministre des finances et des comptes publics est
compétent pour: […]
― les impôts, le cadastre et la publicité foncière;
― les douanes et droits indirects; […]»
La direction des douanes a notamment vocation à exercer
la surveillance de la «frontière terrestre du territoire
douanier» et exerce le contrôle aux frontières des
personnes et des marchandises (e.g. Art 67 quater du code
des douanes – contrôle des personnes dans la zone des 20
km de la frontière terrestre; art 44 rayon des douanes ; art
43 zone de surveillance spéciale le long des frontières dite
«rayon des douanes»; art 51 «barrières, bureaux, postes ou
clôtures destinés à la garde et à la surveillance des
frontières»; article 208 registre spécial du bétail).
L’Administration du cadastre, structure organique de la
DGFIP (direction générale des finances publiques - GF3),
remplit quant à elle quatre types de missions:
Foncière: identification des propriétaires et
description physique des biens,
Fiscale: évaluation de tous les biens, détermination
des bases d’imposition,
Technique: confection, maintenance du plan et
gestion de l’informatisation du plan,
Documentaire: diffusion de données littérales et
cartographiques. 4
Cette Administration emploie, pour les besoins de ses
missions foncières, un peu moins de 1300 géomètres
répartis sur le territoire national et notamment à proximité
des frontières. Certains traités internationaux prévoient
expressément son implication dans la fonction de
démarcation des frontières.5
4Étude DS Services non datée (2010?) réalisée pour le secrétariat général dans le cadre du rapprochement SIP - CDIF 5 Voir par exemple, pour la Belgique, la convention des limites du 8 août
1843, article 7: présence des ingénieurs-vérificateurs du cadastre ou de leurs délégués requise lorsque des bornes doivent être replacées.
Regional Innovations - 4, 2016 Page 82
Le ministère de la défense
S'il est historiquement impliqué au titre des services
géographiques ou du génie (voir plus exemples plus haut),
ou au titre de sa contribution à la surveillance et à
l’entretien des frontières, il ne lui reste plus guère en ce
domaine que des compétences résiduelles, avec cependant
quelques notables exceptions : ainsi les traités franco-
espagnols prévoient-ils la compétence propre du chef de la
station navale de Hendaye pour la co-présidence de la
CTMB (commission technique mixte de la Bidassoa
prévue par la convention sur la pêche de 1959). Il est
cependant le seul à pouvoir assurer une présence et une
surveillance concrète des signes démarcatifs et de la
frontière sur certaines zones difficiles d''accès (Guyane et
forêt amazonienne en particulier).
Les représentants de l'Etat sur le territoire
Préfets, sous-préfets, maires pour certaines fonctions
déléguées, sont les représentants territoriaux de l’État sur
le territoire français. Aucun texte interne n'attribue aux
préfets la conservation de la démarcation des frontières,
sauf à se reporter au texte général de la Constitution qui
leur confie la charge des intérêts nationaux. (Constitution
article 72). Leur action en matière de surveillance des
frontières et de leurs signes démarcatifs relève donc
exclusivement, à ce jour, de la mise en œuvre des traités
internationaux pour le compte du ministère des affaires
étrangères.
Selon le cas, les préfets, les sous-préfets (dans le cas de
l'Allemagne), les maires des communes limitrophes
(Espagne, Pays-Bas et Luxembourg notamment), leurs
délégués et les administrations qu'ils désignent, ont
vocation à surveiller ou faire surveiller périodiquement
l'état et l'emplacement des signes démarcatifs implantés
sur le terrain, et à les faire entretenir, relever ou réparer le
cas échéant. Des inspections communes sont le plus
souvent prévues à échéances, voire dates régulières (tous
les ans le au mois d’août pour les communes limitrophes
de l'Espagne, tous les ans le premier mai pour le
Luxembourg, tous les 5 ans depuis 1926 avant le mois
d'octobre pour l'Allemagne, etc.).
Les mêmes autorités ont également la charge de la
surveillance et de l'entretien des éléments physiques
formant frontière (chemins mitoyens par exemple).
Un tableau détaille en annexe 1 les dispositions propres à
chaque frontière en l'état actuel du droit positif.
Les collectivités locales (régions – départements –
communes)
En dehors des fonctions dévolues aux maires, ci-dessus
rappelées, aucun texte interne spécifique n'évoque le rôle
des collectivités territoriales en la matière 6 . Ces
collectivités demeurent cependant compétentes a minima
pour les infrastructures limitrophes de leur ressort (routes,
chemins, bâtiments) ou pour la gestion des ressources
communes transfrontalières (eaux potables et usagées,
pêche notamment).
II/ La nécessité d'une mise en ordre
Certains États ont clairement établi les responsabilités
administratives en matière de démarcation et de
surveillance des frontières. La loi luxembourgeoise, par
exemple, assigne clairement cette mission à l'ACT,
l’administration du cadastre et de de la topographie :
L'article 2.c) de la loi organique du 25 juillet 2002 réserve
à cette administration tous les travaux ayant trait aux
limites d'Etat du Grand-Duché de Luxembourg, des
cantons, des communes et des sections. Dans d'autres
Etats, comme en France, l'habitude et la coutume le
disputent à la loi et au règlement.
La combinaison des textes existants permet cependant
d'établir comme suit les principales missions et
responsabilités:
1/ Détermination et démarcation initiale des limites
d'Etat :
Cette responsabilité incombe au ministre des affaires
étrangères, qui négocie les traités et contresigne seul les
décrets de promulgation. Elle inclut la détermination des
limites sur le terrain, sur les cartes ou représentations
figurées, la mise en place le cas échéant de repères ou
signes démarcatifs et leur description. Ces signes
démarcatifs peuvent prendre toute forme adaptée et agréée
par les deux États concernés: bornes en granite ou dans un
autre matériau durable, poteaux en chêne, croix gravées et
peintes sur des rochers, etc.
Les travaux qui y sont liés, dits «d'abornement», ont pour
objet de permettre de repérer le tracé de la frontière avec
certitude. On dit, et on écrit dans les traités, - expression
plusieurs fois employée - que «L’abornement doit être
établi et maintenu de manière que le tracé soit bien
déterminé et puisse être repéré facilement sur toute son
6 Sauf à considérer que l’expression « autorité administrative
supérieure », parfois employée, puisse désigner une collectivité
territoriale aujourd’hui ou demain. En l’état actuel du droit, il n’existe pas de hiérarchie entre collectivités territoriales.
Regional Innovations - 4, 2016 Page 83
étendue», ou encore, que les parties s’engagent à
«maintenir la frontière dans un état tel qu’elle puisse être
suivie d’une extrémité à l’autre» (traité de délimitation de
1825 avec l’Allemagne). Ils comprennent la fabrication, le
marquage, la pose des signes démarcatifs, mais aussi le
dégagement des zones frontières permettant leur parcours
(défrichement d'une bande de 2 à 5 mètres de part et
d'autre par exemple).
Pour ces opérations initiales, le ministère des affaires
étrangères peut s'appuyer notamment sur les spécialistes
que sont les ingénieurs de l'IGN, soit comme négociateurs,
soit comme techniciens chargés de traduire les décisions
et les ententes politiques sur le terrain. Cette
responsabilité initiale pourrait trouver à s'appliquer
prochainement avec l'Andorre, avec qui un traité de
délimitation, prévoyant la mise en place d'un bornage, est
en cours de ratification.
S'il le souhaite, le ministère des affaires étrangères peut
s'appuyer sur tel ou tel fonctionnaire du ministère de
l'intérieur pour participer au processus des négociations: la
commission mixte dite d'abornement ou CMA est ainsi
chargée de rendre compte de ses travaux à la commission
internationale des Pyrénées, et rien ne s'oppose à ce
qu'elle propose à celle-ci, au terme de ses débats
techniques, telle solution consensuelle pour le règlement
d'une difficulté particulière. Cette commission est
traditionnellement co-présidée, du côté français, par un
haut-fonctionnaire du ministère de l'intérieur. Les CMA –
commissions mixtes d'abornement – créées, avec ou sans
traité de limites, pour le suivi et la surveillance des autres
frontières, n'ont pas formellement reçu cette mission de la
part du ministre des affaires étrangères (Italie, Suisse,
Brésil sont les commissions existantes, et il pourrait en
être créé une autre avec la Belgique qui en a exprimé le
souhait). Cependant l’accord du 25 mai 1983 signé avec
l’Italie prévoit que lorsque les décisions de la CMA ne
peuvent faire l’objet d’un consensus, elle en rend compte
au ministère des affaires étrangères. Cette commission est
présidée, du côté italien, par un diplomate professionnel
délégué par son propre ministère des affaires étrangères.
De cette responsabilité initiale de détermination des lignes,
relève la mise en œuvre de la directive INSPIRE sur les
frontières: s'il appartient bien au MEDDE et à l'IGN de
mettre en œuvre cette directive, lorsqu'il s'agit de fixer la
ligne frontière, cette mission s'effectue sous le contrôle du
ministère des affaires étrangères, garant du respect des
traités et conventions internationales.
2/ Surveillance, entretien, restauration des limites
d'Etat et de leurs signes démarcatifs
Si la responsabilité de ces missions relève également du
ministre des affaires étrangères, seul ministre appelé à
contresigner les décrets de promulgation des traités, sa
mise en œuvre est le plus souvent dans la main des préfets
et des administrations dont celui-ci coordonne l'action, de
leurs délégués (le plus souvent dénommés «délégués à
l'abornement»), des communes, voire des propriétaires
concernés.
Sur certaines frontières – Suisse, Italie, Espagne
notamment, les fonctions des délégués à l'abornement (ou
«agents responsables» pour la frontière franco-italienne)
sont déterminées avec précision. Un tableau présenté en
annexe résume les principales dispositions applicables
lorsqu'elles sont précisées.
Les délégués actuellement désignés par les préfets
relèvent de diverses administrations (douanes, cadastre,
équipement, police aux frontières, enseignement supérieur
et recherche notamment), caractérisant selon le cas la
logique fonctionnelle ou géographique 7 privilégiée. On
pourrait concevoir de même d'étendre le champ des
administrations impliquées à ce titre à l'ONF (zones
frontalières fortement boisées), la gendarmerie (zones de
haute montagne où celle-ci dispose d'unités spécialisées et
mobiles), ou l'armée de terre (zones de forêt amazonienne
où seules se rendent les unités spécialisées de l'armée de
terre).
Les budgets dévolus aux travaux impliqués par la
reconstruction ou la restauration des signes démarcatifs
sont centralisés au ministère de l'intérieur, qui exerce ainsi
une coordination de l'action des préfets pour l'exécution
de cette fonction. Cette coordination est actuellement
effectuée par la cellule de coopération internationale du
cabinet du secrétaire général. L'IGN apporte un appui
scientifique et technique à cette cellule.
III/ La nécessité d'une mise en ordre – les pistes à
explorer
L'organisation des administrations françaises n'a pas
donné de bons résultats dans un passé récent: Les secteurs
dévolus à la France sont en général en déshérence depuis
plusieurs années (pour autant que les rapports de visite
continuent à être rédigés et transmis), les travaux
d'entretien des bornes frontières, voire de simple
reconnaissance, sont effectués dans les seuls secteurs
7 Fonction notamment de l’implantation des organes administratifs mobilisables.

Regional Innovations - 4, 2016 Page 84
relevant des pays frontaliers, aucun programme n'est établi,
les budgets consacrés sont en forte diminution. Certains
secteurs n’ont pas ou n'ont plus même de délégué à
l'abornement.
Par ailleurs, la mise en œuvre de la directive INSPIRE
impose aux États membres de l'Union européenne, lorsque
cela est possible, de fournir des données communes aux
frontières pour 2018.
Bien que ni le MEDDE ni l'IGN n'aient inscrit la question
des frontières au titre de leurs priorités, l'impasse ne
pourra être faite totalement sur ce dossier auquel sont
intéressés les autres pays-membres. Il en résulte qu'à la fin
de 2018, une part importante, voire la majeure partie des
lignes frontières sera identifiée de manière commune et
conjointe, à l'aide de données cartographiques et de
coordonnées GPS de précision métrique. Le repérage
traditionnel et multiséculaire des frontières à l'aide de
bornes n'aura plus, sur ces secteurs, qu'un intérêt
symbolique, historique ou culturel, et ne constituera plus
une véritable contrainte pratique.
Le moment est donc venu de revoir le dispositif
administratif et juridique qui régit la question de la
démarcation des frontières.
5 hypothèses de travail peuvent être retenues : une refonte
ou une adaptation des traités, une loi interne, un décret, un
arrêté du Premier ministre, et/ou une simple circulaire.
Elles ne sont pas exclusives l'une de l'autre, et le travail
peut être initié parallèlement, cumulativement,
successivement ou alternativement sur chacune d'entre
elles.
Hypothèse 1: mise à jour des traités
Cette hypothèse est la plus complexe à mettre en œuvre,
compte-tenu du formalisme à respecter et de la
multiplicité des acteurs à impliquer. Il ne faut pas l'écarter
d'emblée cependant. Les voisins de la France, non plus
qu'elle-même, n'ont d'intérêt particulier à continuer à
surveiller, restaurer ou réimplanter des bornes ou d'autres
signes démarcatifs qui n'auraient plus de raison d'être que
culturelle ou folklorique. Ce sont des coûts et des
procédures administratives que tout gouvernement ou
Administration verrait favorablement diminuer ou
disparaître.
Par ailleurs, il n'est nul besoin de reprendre le détail des
traités ou conventions de limites conclus avec chacun de
nos voisins. Une formule unique suffirait, précisant que
partout où les deux États auront arrêté des limites
communes de précision métrique et déterminables par
GPS ou tout autre système commun de positionnement
satellitaire, les dispositions antérieures relatives à la
démarcation et à l'entretien des frontières sont caduques.
Hypothèse 2: loi interne
Une loi pourrait contribuer à traiter certains aspects
incertains ou imparfaits de ce sujet, et notamment:
1. Dévolution patrimoniale des signes démarcatifs:
actuellement, ces signes relèvent du patrimoine de l'Etat
(cas des bornes ou poteaux situés sur le territoire français
exclusivement) ou des deux Etats voisins (cas des bornes
ou poteaux situés sur la ligne frontière même qu'ils
déterminent). Le transfert de ces signes au patrimoine des
communes sur le territoire desquels elles se trouvent
permettrait d'en assurer un suivi de proximité, tout en
accompagnant ou en anticipant un futur changement du
statut juridique international de ces signes. Dans
l'hypothèse d'une modification des traités dans le sens
évoqué en effet, l'intérêt juridique et fonctionnel de ces
signes s'effacerait - au fur et à mesure de la détermination
commune des lignes par d'autres moyens techniques - au
profit d'un intérêt patrimonial, culturel et historique.
2. D'autre sujets éventuels, comme le rôle des préfets,
des collectivités territoriales et des propriétaires en
matière de surveillance et d'entretien des lignes frontières
et de leurs signes démarcatifs (actuellement ces
compétences sont dispersées entre plusieurs traités qui
établissent des règles différentes et inapplicables ou
inappliquées).
Certains textes de niveau législatif pourraient aussi être
modifiés à cette occasion, si la discussion
interministérielle venait à mettre en évidence cette
nécessité (code général des impôts, code des douanes,
code de la sécurité intérieure, code de la défense, code de
la construction et de l'habitation, code civil
éventuellement etc.). Il peut s'agir par exemple de
l'imposition de servitudes publiques communes sur les
terrains se trouvant à proximité de la ligne frontière, ou de
l'introduction dans la loi des prescriptions non aedificandi
au droit des lignes frontières, ou de pouvoirs de contrôle
de certaines administrations sur la zone frontière (par
exemple, pouvoirs de constatation d'infractions
spécifiques par des militaires de l'armée de terre dans
certaines zones difficiles d'accès aux autres
administrations).
Hypothèse 3: décret
Du décret relève la répartition des missions entre
administrations. Le recensement des textes effectué plus
haut montre que la compétence administrative sur la
surveillance et l’entretien des signes démarcatifs de la
ligne frontière n'est pas clairement établie. Un décret
pourrait y pourvoir, en complément ou en substitution de
textes de meilleur niveau. Son principal intérêt serait
d'identifier une administration chef de file sur ce dossier,
qui pourrait être l'IGN ou le cadastre.

Regional Innovations - 4, 2016 Page 85
Hypothèse 4: arrêté du Premier ministre
Le constat actuel, d''une faible implication administrative
et d''un dossier en déshérence sur certaines zones, pourrait
plaider en faveur de la désignation d'un coordonnateur
temporaire sur chaque zone frontière. Un préfet de région,
ou un préfet de département, pourrait être désigné sur
chaque frontière (Espagne, Italie, Suisse, Allemagne,
Luxembourg, Belgique) par arrêté du Premier ministre
pour coordonner le suivi et la mise à jour du dossier à
l'horizon 2018 (date de mise en œuvre théorique de
l'annexe II de la directive INSPIRE qui concerne les
frontières).
Hypothèse 5 : circulaire
Parallèlement ou indépendamment des textes de niveau
supérieur évoqués plus haut, une circulaire ministérielle
(intérieur) ou interministérielle (Premier ministre ou
ministère des affaires étrangères) pourrait rappeler l'état
actuel du droit (essentiellement le contenu des deux
premières parties et les annexes de la présente note) et
donner des indications plus directives pour la désignation
et le contrôle de l'activité des délégués à l'abornement
(notamment, unification de l'administration
d'appartenance des délégués à l'abornement, ou au
contraire spécification de l'administration la plus adaptée
selon les zones comme suggéré plus haut).
Références
Textes (références partielles - voir tableau en annexe pour plus de détails)
1. Constitution française (1958, modifiée)
Traités de paix (e.g.: traité des Pyrénées 1659, traité d’Utrecht 1713, traités de Paris des 30 mai 1814 et 20 novembre 1815, traité de
Versailles 28 juin 1919)
2. Traités de délimitation: (e.g. : traité de Courtrai du 28 mars 1820 avec les Pays-Bas (= aujourd’hui, Belgique et Luxembourg), traités
de Bayonne de 1852, 1856, 1868, avec l’Espagne, traité de Paris du 14 août 1925 avec l’Allemagne, Traité de limites entre S. M. le
roi de France et S. M. le roi des Pays-Bas; signé à Courtray, le 28 mars 1820, traité de limites et abornement entre Lorraine et
Bourgogne 1703)
3. Conventions d’abornement: (ex: France - Italie 1983, France- Suisse 1965, France –Espagne 1973, accord de délimitation avec la
Prusse 1829, etc.)
Directive européenne: 4. Directive 2007/2/CE du Parlement européen et du Conseil du 14 mars 2007 établissant une infrastructure d'information géographique
dans la Communauté européenne (INSPIRE)
Textes de définition des compétences administratives: 5. Décret n° 2014-400 du 16 avril 2014 relatif aux attributions du ministre des affaires étrangères et du développement international
6. Décret n° 2012-1511 du 28 décembre 2012 portant organisation de l'administration centrale du ministère des affaires étrangères
7. Décret n°87-389 du 15 juin 1987 relatif à l'organisation des services d'administration centrale (rôle des secrétaires généraux)
8. Décret impérial du 25 décembre 1810 sur les attributions du ministre des relations extérieures
9. Décret n° 2014-408 du 16 avril 2014 relatif aux attributions du ministre de l'intérieur
10. Décret n° 2013-728 du 12 août 2013 portant organisation de l'administration centrale du ministère de l'intérieur et du ministère des
outre-mer
11. Décret n°87-389 du 15 juin 1987 relatif à l'organisation des services d'administration centrale (rôle des secrétaires généraux)
12. Décret no 2014-401 du 16 avril 2014 relatif aux attributions du ministre de l'écologie, du développement durable et de l'énergie
13. Décret no2008-680 du 9 juillet 2008 portant organisation de l'administration centrale du ministère de l'écologie, de l'énergie, du
développement durable et de l'aménagement du territoire
14. Décret n° 2011-1371 du 27 octobre 2011 relatif à l'Institut national de l'information géographique et forestière (IGN)
15. Décret n° 2014-403 du 16 avril 2014 relatif aux attributions du ministre des finances et des comptes publics
Articles et autres sources (quelques exemples inter alia): 1. Journal des opérations de la Commission d’abornement de la frontière Quảng-Tây, pendant la campagne 1893-1894
2. Les frontières de la France (Gérard Lang , 2007, in « projet label – le code officiel géographique»)
3. Article « abornement » - Encyclopédie universelle –
4. The maintenance of bordary pillars and boundary lines in France (Michel Bacchus, IGN, Rome, 2004).
5. France – Brésil : un pont géopolitique, par Hervé THERY, le 20 juin 2011.

Regional Innovations - 4, 2016 Page 86
Annexe 1
Principaux extraits des textes passés ou en vigueur et relevant, selon le cas:
1/ la qualité et l’origine administrative des autorités ayant négocié ou mis en œuvre les conventions d’abornement et traités
de limites (y compris, à titre d’exemple ou de marque de la tradition, pour des traités caducs);
2/ l’objet des opérations d’abornement;
3/ la désignation des autorités et/ou agents chargés de la surveillance et de l’entretien des signes de démarcation des
frontières;
4/ la périodicité des visites, réunions et rapports;
5/ le rôle des délégués à l’abornement ou agents responsables lorsque celui-ci est précisé;
6/ autres dispositions pratiques éventuelles.
Pays Source Opérations Compétence Périodicité Autres/textes Espagne
Décret n° 75-321 du
28 avril 1975
portant publication
de l’accord entre la
France et l’Espagne
relatif à l’abornement
et à l’entretien de la
frontière du 8 février 1973
«L’abornement
doit être établi et
maintenu de
manière que le
tracé soit bien
déterminé et puisse être repéré
facilement sur
toute son étendue».
NDR: texte adopté «Sur proposition
de la «commission
internationale des Pyrénées»
Délégués permanents
à l’abornement (article 6 détaille les
fonctions)
Préfets
NDR : le texte est
quasi identique à
celui- de l’accord de 1965 avec la Suisse.,
ou de celui de 1983
avec l'Italie, à la différence notable près
que sur la frontière
suisse, l’autorité compétente pour
recevoir les rapports
n’est pas le préfet mais une
administration
centrale.
PV des délégués
adressés
annuellement aux
préfets et
gouverneurs
compétents
Art. 6 L’abornement et l’entretien de la frontière
sont confiés à des délégués permanents à
l’abornement dont les tâches sont les suivantes: a.
Assurer la surveillance et le contrôle des bornes et
autres signes de démarcation de la frontière. Il est
entendu cependant que chaque Etat a la faculté de faire assurer la surveillance et le contrôle des
bornes et autres signes de démarcation par des
services ou des organes administratifs autres que les délégués permanents; b. Constater et
communiquer aux autorités dont ils relèvent tous
faits contraires aux dispositions prévues aux art. 1 , 4 et 5 du présent accord;c. Dresser d’un commun
accord un état annuel des travaux à effectuer pour
l’entretien ou le remplacement des bornes et autres signes de démarcation; cet état doit comporter
notamment un devis des frais relatifs à ces travaux;
d. Faire exécuter, après accord des autorités visées à l’art. 10, les travaux incombant à leur Etat ou à
effectuer par l’un des deux Etats pour le compte de
l’autre. Cependant, lorsqu’il s’agit de travaux ayant un caractère d’urgence, les délégués permanents à
l’abornement peuvent prendre directement les
mesures qu’ils jugent opportunes; e. Etablir un rapport annuel sur l’exécution des travaux
d’entretien ou de remplacement des bornes et autres
signes de démarcation; ce rapport doit indiquer les frais relatifs aux travaux exécutés. Les opérations
prévues au présent article feront l’objet d’un
procès-verbal, établi en deux exemplaires originaux, signé par les délégués compétents des
deux Etats; ce procès-verbal sera adressé aux
Préfets et aux Gouverneurs compétents ; copie en sera donnée à la commission mixte prévue à
l’article 10.
Espagne
Décret n° 75-321 du 28 avril 1975
portant publication
de l’accord entre la France et l’Espagne
relatif à
l’abornement et à l’entretien de la
frontière du 8 février
1973
Commission mixte de 4 délégués de chaque
pays (article 10
détaille les compétences)
Réunion annuelle alternativement en
France et en
Espagne
Président des commissions mixtes pas déterminé dans chaque pays. Minint? préfet? MAE?
Espagne
Décret du 27 juillet
1985
Traité de délimitation du 2
décembre 1856
Commission
internationale des
Pyrénées, « sous-commission de
l’abornement et de la
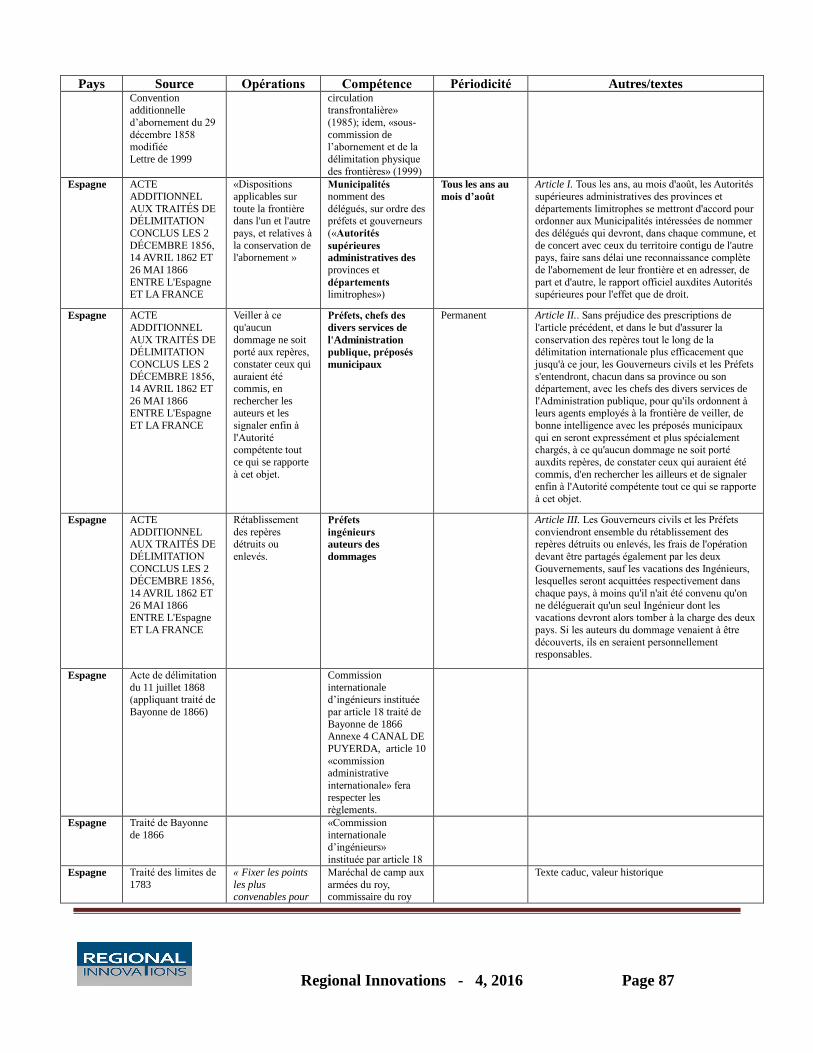
Regional Innovations - 4, 2016 Page 87
Pays Source Opérations Compétence Périodicité Autres/textes Convention
additionnelle
d’abornement du 29
décembre 1858 modifiée
Lettre de 1999
circulation
transfrontalière»
(1985); idem, «sous-
commission de l’abornement et de la
délimitation physique
des frontières» (1999)
Espagne ACTE
ADDITIONNEL
AUX TRAITÉS DE DÉLIMITATION
CONCLUS LES 2
DÉCEMBRE 1856, 14 AVRIL 1862 ET
26 MAI 1866
ENTRE L'Espagne ET LA FRANCE
«Dispositions
applicables sur
toute la frontière dans l'un et l'autre
pays, et relatives à
la conservation de l'abornement »
Municipalités nomment des
délégués, sur ordre des préfets et gouverneurs
(«Autorités
supérieures
administratives des provinces et
départements limitrophes»)
Tous les ans au
mois d’août
Article I. Tous les ans, au mois d'août, les Autorités
supérieures administratives des provinces et
départements limitrophes se mettront d'accord pour ordonner aux Municipalités intéressées de nommer
des délégués qui devront, dans chaque commune, et
de concert avec ceux du territoire contigu de l'autre pays, faire sans délai une reconnaissance complète
de l'abornement de leur frontière et en adresser, de
part et d'autre, le rapport officiel auxdites Autorités supérieures pour l'effet que de droit.
Espagne ACTE
ADDITIONNEL
AUX TRAITÉS DE DÉLIMITATION
CONCLUS LES 2
DÉCEMBRE 1856, 14 AVRIL 1862 ET
26 MAI 1866 ENTRE L'Espagne
ET LA FRANCE
Veiller à ce
qu'aucun
dommage ne soit porté aux repères,
constater ceux qui
auraient été commis, en
rechercher les auteurs et les
signaler enfin à
l'Autorité compétente tout
ce qui se rapporte
à cet objet.
Préfets, chefs des
divers services de
l'Administration
publique, préposés
municipaux
Permanent Article II.. Sans préjudice des prescriptions de
l'article précédent, et dans le but d'assurer la
conservation des repères tout le long de la délimitation internationale plus efficacement que
jusqu'à ce jour, les Gouverneurs civils et les Préfets
s'entendront, chacun dans sa province ou son département, avec les chefs des divers services de
l'Administration publique, pour qu'ils ordonnent à leurs agents employés à la frontière de veiller, de
bonne intelligence avec les préposés municipaux
qui en seront expressément et plus spécialement chargés, à ce qu'aucun dommage ne soit porté
auxdits repères, de constater ceux qui auraient été
commis, d'en rechercher les ailleurs et de signaler enfin à l'Autorité compétente tout ce qui se rapporte
à cet objet.
Espagne ACTE
ADDITIONNEL AUX TRAITÉS DE
DÉLIMITATION
CONCLUS LES 2 DÉCEMBRE 1856,
14 AVRIL 1862 ET
26 MAI 1866 ENTRE L'Espagne
ET LA FRANCE
Rétablissement
des repères détruits ou
enlevés.
Préfets
ingénieurs
auteurs des
dommages
Article III. Les Gouverneurs civils et les Préfets
conviendront ensemble du rétablissement des repères détruits ou enlevés, les frais de l'opération
devant être partagés également par les deux
Gouvernements, sauf les vacations des Ingénieurs, lesquelles seront acquittées respectivement dans
chaque pays, à moins qu'il n'ait été convenu qu'on
ne déléguerait qu'un seul Ingénieur dont les vacations devront alors tomber à la charge des deux
pays. Si les auteurs du dommage venaient à être
découverts, ils en seraient personnellement responsables.
Espagne
Acte de délimitation
du 11 juillet 1868 (appliquant traité de
Bayonne de 1866)
Commission
internationale d’ingénieurs instituée
par article 18 traité de
Bayonne de 1866 Annexe 4 CANAL DE
PUYERDA, article 10
«commission administrative
internationale» fera
respecter les règlements.
Espagne
Traité de Bayonne
de 1866
«Commission
internationale d’ingénieurs»
instituée par article 18
Espagne Traité des limites de
1783
« Fixer les points
les plus convenables pour
Maréchal de camp aux
armées du roy, commissaire du roy
Texte caduc, valeur historique
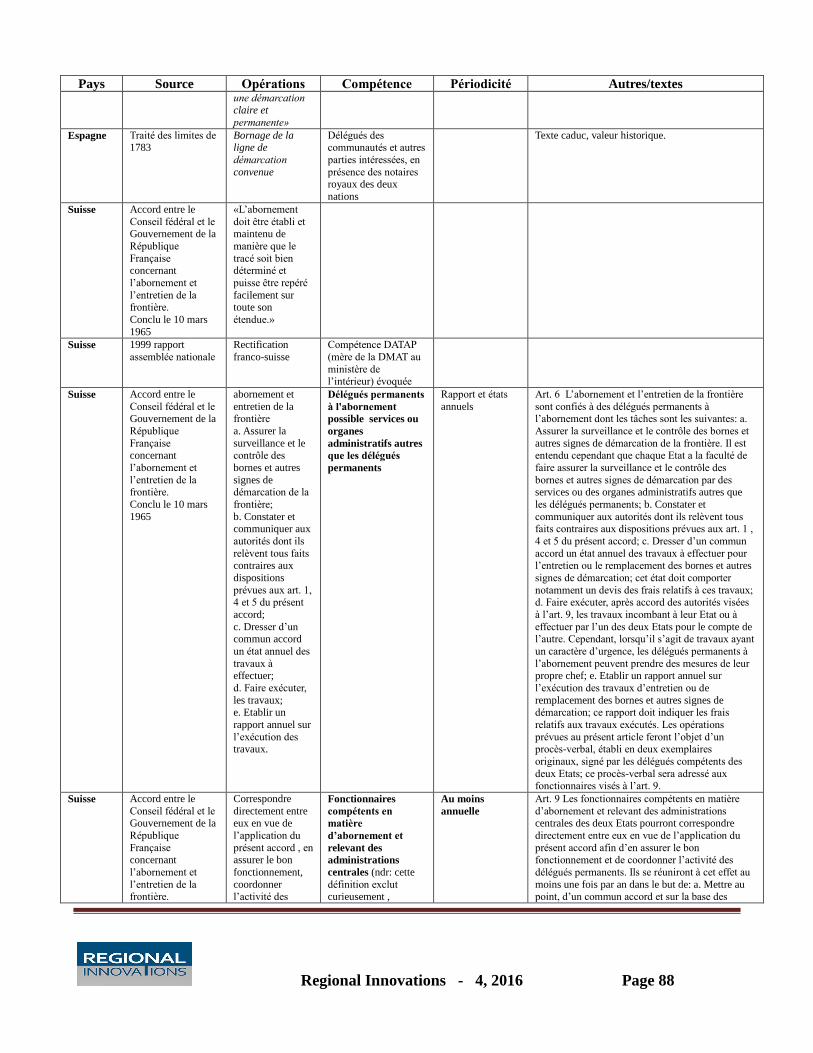
Regional Innovations - 4, 2016 Page 88
Pays Source Opérations Compétence Périodicité Autres/textes une démarcation claire et
permanente»
Espagne Traité des limites de 1783
Bornage de la ligne de
démarcation
convenue
Délégués des communautés et autres
parties intéressées, en
présence des notaires royaux des deux
nations
Texte caduc, valeur historique.
Suisse Accord entre le
Conseil fédéral et le Gouvernement de la
République
Française concernant
l’abornement et
l’entretien de la frontière.
Conclu le 10 mars
1965
«L’abornement
doit être établi et maintenu de
manière que le
tracé soit bien déterminé et
puisse être repéré
facilement sur toute son
étendue.»
Suisse 1999 rapport
assemblée nationale
Rectification
franco-suisse
Compétence DATAP
(mère de la DMAT au
ministère de l’intérieur) évoquée
Suisse Accord entre le
Conseil fédéral et le Gouvernement de la
République
Française concernant
l’abornement et
l’entretien de la frontière.
Conclu le 10 mars
1965
abornement et
entretien de la frontière
a. Assurer la
surveillance et le contrôle des
bornes et autres
signes de démarcation de la
frontière;
b. Constater et communiquer aux
autorités dont ils
relèvent tous faits
contraires aux
dispositions
prévues aux art. 1, 4 et 5 du présent
accord;
c. Dresser d’un commun accord
un état annuel des
travaux à effectuer;
d. Faire exécuter,
les travaux; e. Etablir un
rapport annuel sur
l’exécution des travaux.
Délégués permanents
à l'abornement
possible services ou
organes
administratifs autres
que les délégués
permanents
Rapport et états
annuels
Art. 6 L’abornement et l’entretien de la frontière
sont confiés à des délégués permanents à l’abornement dont les tâches sont les suivantes: a.
Assurer la surveillance et le contrôle des bornes et
autres signes de démarcation de la frontière. Il est entendu cependant que chaque Etat a la faculté de
faire assurer la surveillance et le contrôle des
bornes et autres signes de démarcation par des services ou des organes administratifs autres que
les délégués permanents; b. Constater et
communiquer aux autorités dont ils relèvent tous faits contraires aux dispositions prévues aux art. 1 ,
4 et 5 du présent accord; c. Dresser d’un commun
accord un état annuel des travaux à effectuer pour
l’entretien ou le remplacement des bornes et autres
signes de démarcation; cet état doit comporter
notamment un devis des frais relatifs à ces travaux; d. Faire exécuter, après accord des autorités visées
à l’art. 9, les travaux incombant à leur Etat ou à
effectuer par l’un des deux Etats pour le compte de l’autre. Cependant, lorsqu’il s’agit de travaux ayant
un caractère d’urgence, les délégués permanents à
l’abornement peuvent prendre des mesures de leur propre chef; e. Etablir un rapport annuel sur
l’exécution des travaux d’entretien ou de
remplacement des bornes et autres signes de démarcation; ce rapport doit indiquer les frais
relatifs aux travaux exécutés. Les opérations
prévues au présent article feront l’objet d’un procès-verbal, établi en deux exemplaires
originaux, signé par les délégués compétents des
deux Etats; ce procès-verbal sera adressé aux
fonctionnaires visés à l’art. 9.
Suisse Accord entre le
Conseil fédéral et le Gouvernement de la
République
Française concernant
l’abornement et
l’entretien de la frontière.
Correspondre
directement entre eux en vue de
l’application du
présent accord , en assurer le bon
fonctionnement,
coordonner l’activité des
Fonctionnaires
compétents en
matière
d’abornement et
relevant des
administrations
centrales (ndr: cette
définition exclut curieusement ,
Au moins
annuelle
Art. 9 Les fonctionnaires compétents en matière
d’abornement et relevant des administrations centrales des deux Etats pourront correspondre
directement entre eux en vue de l’application du
présent accord afin d’en assurer le bon fonctionnement et de coordonner l’activité des
délégués permanents. Ils se réuniront à cet effet au
moins une fois par an dans le but de: a. Mettre au point, d’un commun accord et sur la base des
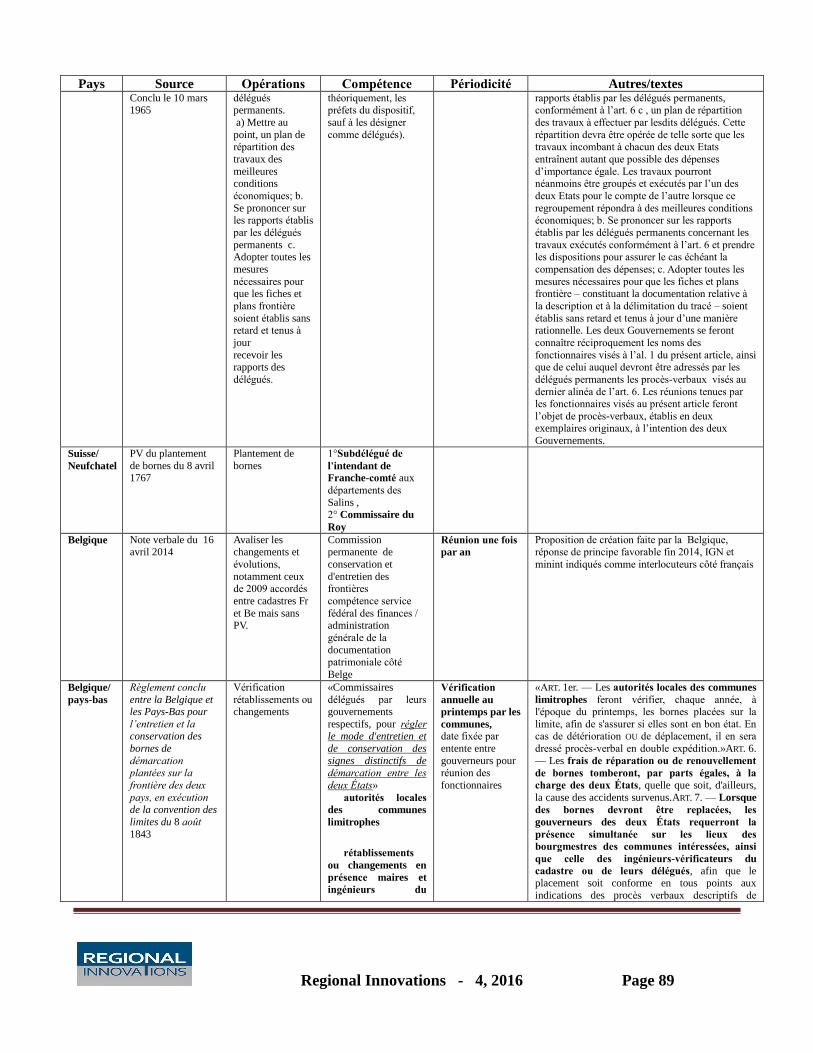
Regional Innovations - 4, 2016 Page 89
Pays Source Opérations Compétence Périodicité Autres/textes Conclu le 10 mars
1965
délégués
permanents.
a) Mettre au
point, un plan de répartition des
travaux des
meilleures conditions
économiques; b.
Se prononcer sur les rapports établis
par les délégués
permanents c. Adopter toutes les
mesures
nécessaires pour que les fiches et
plans frontière
soient établis sans retard et tenus à
jour
recevoir les rapports des
délégués.
théoriquement, les
préfets du dispositif,
sauf à les désigner
comme délégués).
rapports établis par les délégués permanents,
conformément à l’art. 6 c , un plan de répartition
des travaux à effectuer par lesdits délégués. Cette
répartition devra être opérée de telle sorte que les travaux incombant à chacun des deux Etats
entraînent autant que possible des dépenses
d’importance égale. Les travaux pourront néanmoins être groupés et exécutés par l’un des
deux Etats pour le compte de l’autre lorsque ce
regroupement répondra à des meilleures conditions économiques; b. Se prononcer sur les rapports
établis par les délégués permanents concernant les
travaux exécutés conformément à l’art. 6 et prendre les dispositions pour assurer le cas échéant la
compensation des dépenses; c. Adopter toutes les
mesures nécessaires pour que les fiches et plans frontière – constituant la documentation relative à
la description et à la délimitation du tracé – soient
établis sans retard et tenus à jour d’une manière rationnelle. Les deux Gouvernements se feront
connaître réciproquement les noms des
fonctionnaires visés à l’al. 1 du présent article, ainsi que de celui auquel devront être adressés par les
délégués permanents les procès-verbaux visés au
dernier alinéa de l’art. 6. Les réunions tenues par les fonctionnaires visés au présent article feront
l’objet de procès-verbaux, établis en deux exemplaires originaux, à l’intention des deux
Gouvernements.
Suisse/
Neufchatel
PV du plantement
de bornes du 8 avril 1767
Plantement de
bornes
1°Subdélégué de
l'intendant de
Franche-comté aux
départements des
Salins , 2° Commissaire du
Roy
Belgique Note verbale du 16 avril 2014
Avaliser les changements et
évolutions,
notamment ceux de 2009 accordés
entre cadastres Fr
et Be mais sans PV.
Commission permanente de
conservation et
d'entretien des frontières
compétence service
fédéral des finances / administration
générale de la
documentation patrimoniale côté
Belge
Réunion une fois
par an
Proposition de création faite par la Belgique, réponse de principe favorable fin 2014, IGN et
minint indiqués comme interlocuteurs côté français
Belgique/
pays-bas
Règlement conclu
entre la Belgique et les Pays-Bas pour
l’entretien et la conservation des
bornes de
démarcation plantées sur la
frontière des deux
pays, en exécution de la convention des
limites du 8 août
1843
Vérification
rétablissements ou changements
«Commissaires
délégués par leurs gouvernements
respectifs, pour régler le mode d'entretien et
de conservation des
signes distinctifs de démarcation entre les
deux États»
autorités locales
des communes
limitrophes
rétablissements
ou changements en
présence maires et
ingénieurs du
Vérification
annuelle au
printemps par les
communes,
date fixée par
entente entre
gouverneurs pour réunion des
fonctionnaires
«ART. 1er. — Les autorités locales des communes
limitrophes feront vérifier, chaque année, à l'époque du printemps, les bornes placées sur la
limite, afin de s'assurer si elles sont en bon état. En cas de détérioration OU de déplacement, il en sera
dressé procès-verbal en double expédition.»ART. 6.
— Les frais de réparation ou de renouvellement
de bornes tomberont, par parts égales, à la
charge des deux États, quelle que soit, d'ailleurs,
la cause des accidents survenus.ART. 7. — Lorsque
des bornes devront être replacées, les
gouverneurs des deux États requerront la
présence simultanée sur les lieux des
bourgmestres des communes intéressées, ainsi
que celle des ingénieurs-vérificateurs du
cadastre ou de leurs délégués, afin que le placement soit conforme en tous points aux
indications des procès verbaux descriptifs de

Regional Innovations - 4, 2016 Page 90
Pays Source Opérations Compétence Périodicité Autres/textes cadastre.
les gouverneurs
s’entendent
directement entre eux.
délimitation et des cartes de limite déposés dans les
archives des communes. A cet effet, les
gouverneurs s'entendront pour fixer l'époque delà
réunion des fonctionnaires susmentionnés.» ART. 11. — Les gouverneurs des provinces
limitrophes des deux États entreront directement en
relations entre eux pour tout ce qui concerne les prescriptions du présent règlement.
Pays-Bas
(Belgique)
/France
Traité de limites entre S. M. le roi de
France et S. M. le
roi des Pays-Bas ; signé à Courtray, le
28 mars 1820.
PV de limites; Etat des bornes à
planter
Commissaires
appartiennent au
Corps royal des
ingénieurs
géographes
Commission de
délimitation
ARTICLE PREMIER. — Afin de déterminer d'une manière précise et invariable la ligne de limite entre
les deux États, il a été dressé des procès-verbaux
descriptifs du cours de celte limite, lesquels ont été formés d'après le levé exact de toute la frontière,
fait contradictoirement par les ingénieurs et
géomètres nommés de part et d'autre, et sous la direction du sieur Étienne-Nicolas Rousseau,
lieutenant-colonel au corps royal des ingénieurs-
géographes, chevalier de l'ordre royal et militaire
de S'-Louis et de l'ordre royal de la Légion
d'honneur, pour la France, et du sieur Jean-Egbert
Van Gorkuin, lieutenant-colonel de l'état-major du quartier-maître général, chevalier de l'ordre
militaire de Guillaume, pour les Pays-Bas, et tous
deux membres de la commission de délimitation ; lesdits procès-verbaux se trouvent, de plus,
accompagnés de croquis visuels, ou plans
figuratifs, dressés sur une grande échelle, pour servir à leur explication en cas de besoin, et des
états des bornes à planter. Cette limite, qui s'étend
depuis la mer du Nord jusqu'à la Moselle, a été divisée en six sections ; les procès-verbaux, ainsi
que les feuilles de levés de chaque section, ont été
arrêtés et signés par les commissaires,
Pays-Bas
(Belgique)
/France
Traité de limites
entre S. M. le roi de France et S. M. le
roi des Pays-Bas ;
signé à Courtray, le 28 mars 1820.
ENTRETIEN DES
CHEMINS
MITOYENS
Gouverneurs des
provinces et préfets
des départements
limitrophes
ART. 68. — Les chemins dits mitoyens sont à
l'usage des deux États, sans qu'il soit attenté aux
droits de propriété des particuliers à qui ces
chemins mitoyens pourraient appartenir. Aucun des
deux royaumes ne peut exercer sur ces chemins d'acte de souveraineté, si ce n'est ceux nécessaires
pour prévenir ou arrêter les délits ou crimes qui
nuiraient à la liberté et sûreté du passage. Les gouverneurs des provinces et préfets des
départements limitrophes veilleront au bon
entretien de ces chemins.
Pays-Bas
(Belgique)
/France
Traité de limites
entre S. M. le roi de
France et S. M. le roi des Pays-Bas ;
signé à Courtray, le
28 mars 1820.
Abornement
PRISE DE
POSSESSION DES
TERRAINS
ECHANGES OU
CEDES.
Exécuté par service
d’Etat-major de
l’armée ou deux membres des
commissions de
délimitation . présence des délégués
des préfets de
département pour la
prise de possession des
terrains échangés ou cédés.
ART. 71. — Pour l'exécution du présent traité, les
sieurs DE CASTRES, colonel au corps royal de l'état-
major, chevalier de l'ordre royal et militaire de S'-Louis, de l'ordre royal de la Légion d'honneur et de
l'ordre militaire de Maximilien de Bavière, pour la
France; et BEHR, colonel de l'état-major général, chevalier de l'ordre militaire de Guillaume, pour les
Pays-Bas, (ou deux membres des commissions respectives de délimitation , seront chargés de faire
exécuter l'abornement de la frontière conformément
à ce qui a été arrêté à l'égard du matériel de l'abornement par le plan annexé an procès-verbal
de la 4e section et d'après ce qui a été indique, à cet
égard, tant dans les procès-verbaux de délimitation des six sections que dans les tableaux qui y sont
annexés; ils procéderont, en outre, en présence des
délégués des préfets des départements ( pour la
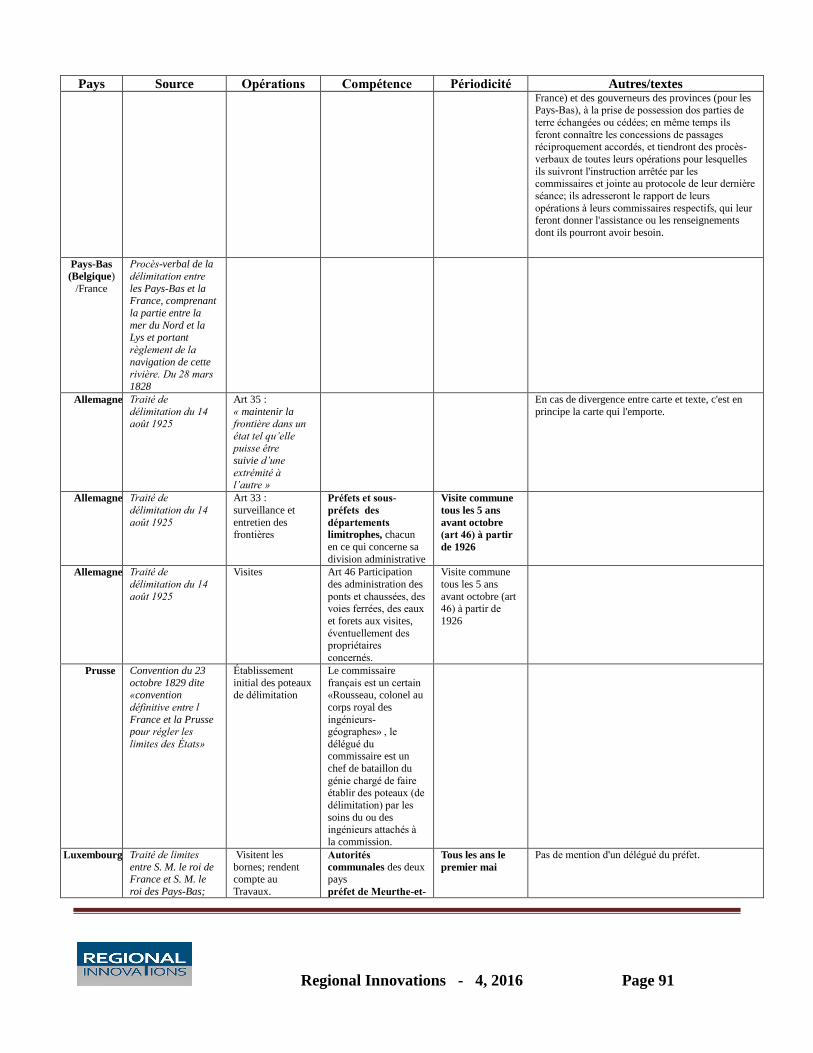
Regional Innovations - 4, 2016 Page 91
Pays Source Opérations Compétence Périodicité Autres/textes France) et des gouverneurs des provinces (pour les
Pays-Bas), à la prise de possession dos parties de
terre échangées ou cédées; en même temps ils
feront connaître les concessions de passages réciproquement accordés, et tiendront des procès-
verbaux de toutes leurs opérations pour lesquelles
ils suivront l'instruction arrêtée par les commissaires et jointe au protocole de leur dernière
séance; ils adresseront le rapport de leurs
opérations à leurs commissaires respectifs, qui leur feront donner l'assistance ou les renseignements
dont ils pourront avoir besoin.
Pays-Bas
(Belgique)
/France
Procès-verbal de la
délimitation entre
les Pays-Bas et la France, comprenant
la partie entre la
mer du Nord et la
Lys et portant
règlement de la
navigation de cette rivière. Du 28 mars
1828
Allemagne Traité de
délimitation du 14 août 1925
Art 35 :
« maintenir la frontière dans un
état tel qu’elle puisse être
suivie d’une
extrémité à l’autre »
En cas de divergence entre carte et texte, c'est en
principe la carte qui l'emporte.
Allemagne Traité de
délimitation du 14
août 1925
Art 33 :
surveillance et
entretien des frontières
Préfets et sous-
préfets des
départements
limitrophes, chacun
en ce qui concerne sa
division administrative
Visite commune
tous les 5 ans
avant octobre
(art 46) à partir
de 1926
Allemagne Traité de
délimitation du 14
août 1925
Visites Art 46 Participation
des administration des
ponts et chaussées, des voies ferrées, des eaux
et forets aux visites,
éventuellement des propriétaires
concernés.
Visite commune
tous les 5 ans
avant octobre (art 46) à partir de
1926
Prusse Convention du 23
octobre 1829 dite «convention
définitive entre l
France et la Prusse pour régler les
limites des États»
Établissement
initial des poteaux de délimitation
Le commissaire
français est un certain «Rousseau, colonel au
corps royal des
ingénieurs-géographes» , le
délégué du commissaire est un
chef de bataillon du
génie chargé de faire établir des poteaux (de
délimitation) par les
soins du ou des ingénieurs attachés à
la commission.
Luxembourg Traité de limites
entre S. M. le roi de France et S. M. le
roi des Pays-Bas;
Visitent les
bornes; rendent compte au
Travaux.
Autorités
communales des deux pays
préfet de Meurthe-et-
Tous les ans le
premier mai
Pas de mention d'un délégué du préfet.
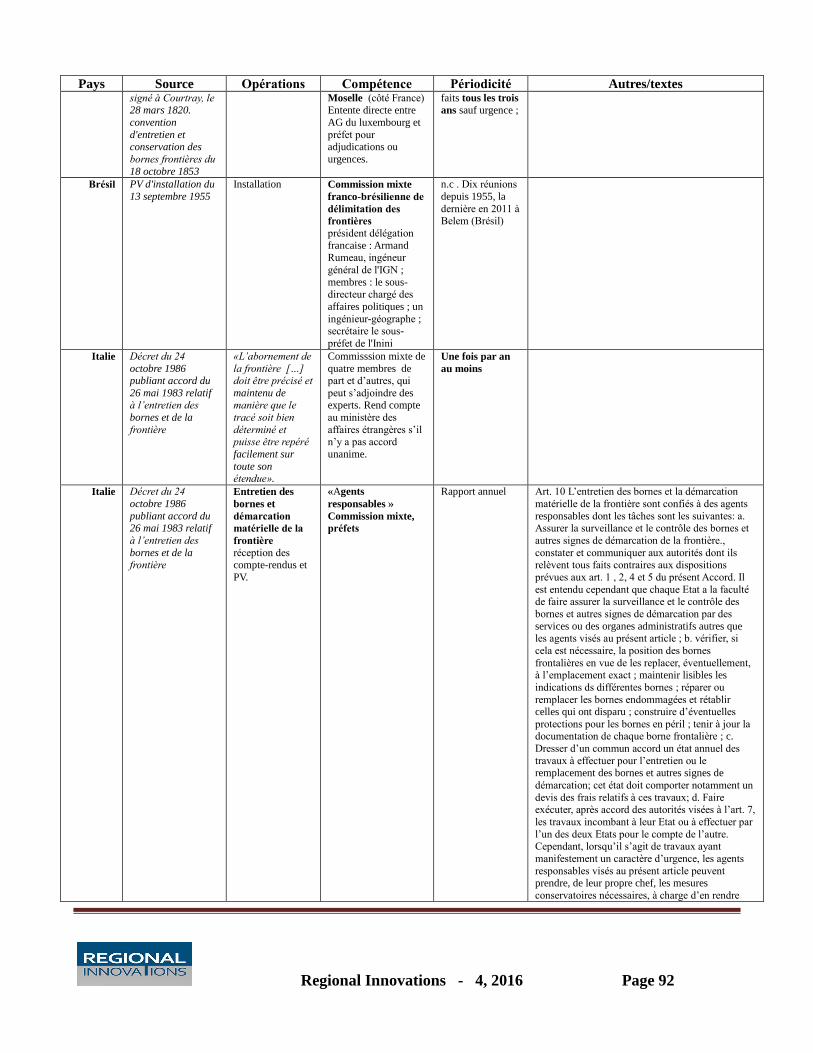
Regional Innovations - 4, 2016 Page 92
Pays Source Opérations Compétence Périodicité Autres/textes signé à Courtray, le 28 mars 1820.
convention
d'entretien et conservation des
bornes frontières du
18 octobre 1853
Moselle (côté France)
Entente directe entre
AG du luxembourg et
préfet pour adjudications ou
urgences.
faits tous les trois
ans sauf urgence ;
Brésil PV d'installation du
13 septembre 1955
Installation Commission mixte
franco-brésilienne de
délimitation des
frontières
président délégation
francaise : Armand Rumeau, ingéneur
général de l'IGN ;
membres : le sous-directeur chargé des
affaires politiques ; un
ingénieur-géographe ; secrétaire le sous-
préfet de l'Inini
n.c . Dix réunions
depuis 1955, la
dernière en 2011 à Belem (Brésil)
Italie Décret du 24
octobre 1986 publiant accord du
26 mai 1983 relatif à l’entretien des
bornes et de la
frontière
«L’abornement de
la frontière […] doit être précisé et
maintenu de manière que le
tracé soit bien
déterminé et puisse être repéré
facilement sur
toute son étendue».
Commisssion mixte de
quatre membres de part et d’autres, qui
peut s’adjoindre des experts. Rend compte
au ministère des
affaires étrangères s’il n’y a pas accord
unanime.
Une fois par an
au moins
Italie Décret du 24
octobre 1986
publiant accord du 26 mai 1983 relatif
à l’entretien des
bornes et de la frontière
Entretien des
bornes et
démarcation
matérielle de la
frontière
réception des
compte-rendus et
PV.
«Agents
responsables »
Commission mixte,
préfets
Rapport annuel Art. 10 L’entretien des bornes et la démarcation
matérielle de la frontière sont confiés à des agents
responsables dont les tâches sont les suivantes: a. Assurer la surveillance et le contrôle des bornes et
autres signes de démarcation de la frontière.,
constater et communiquer aux autorités dont ils
relèvent tous faits contraires aux dispositions
prévues aux art. 1 , 2, 4 et 5 du présent Accord. Il
est entendu cependant que chaque Etat a la faculté de faire assurer la surveillance et le contrôle des
bornes et autres signes de démarcation par des
services ou des organes administratifs autres que les agents visés au présent article ; b. vérifier, si
cela est nécessaire, la position des bornes
frontalières en vue de les replacer, éventuellement, à l’emplacement exact ; maintenir lisibles les
indications ds différentes bornes ; réparer ou
remplacer les bornes endommagées et rétablir celles qui ont disparu ; construire d’éventuelles
protections pour les bornes en péril ; tenir à jour la documentation de chaque borne frontalière ; c.
Dresser d’un commun accord un état annuel des
travaux à effectuer pour l’entretien ou le remplacement des bornes et autres signes de
démarcation; cet état doit comporter notamment un
devis des frais relatifs à ces travaux; d. Faire exécuter, après accord des autorités visées à l’art. 7,
les travaux incombant à leur Etat ou à effectuer par
l’un des deux Etats pour le compte de l’autre. Cependant, lorsqu’il s’agit de travaux ayant
manifestement un caractère d’urgence, les agents
responsables visés au présent article peuvent prendre, de leur propre chef, les mesures
conservatoires nécessaires, à charge d’en rendre
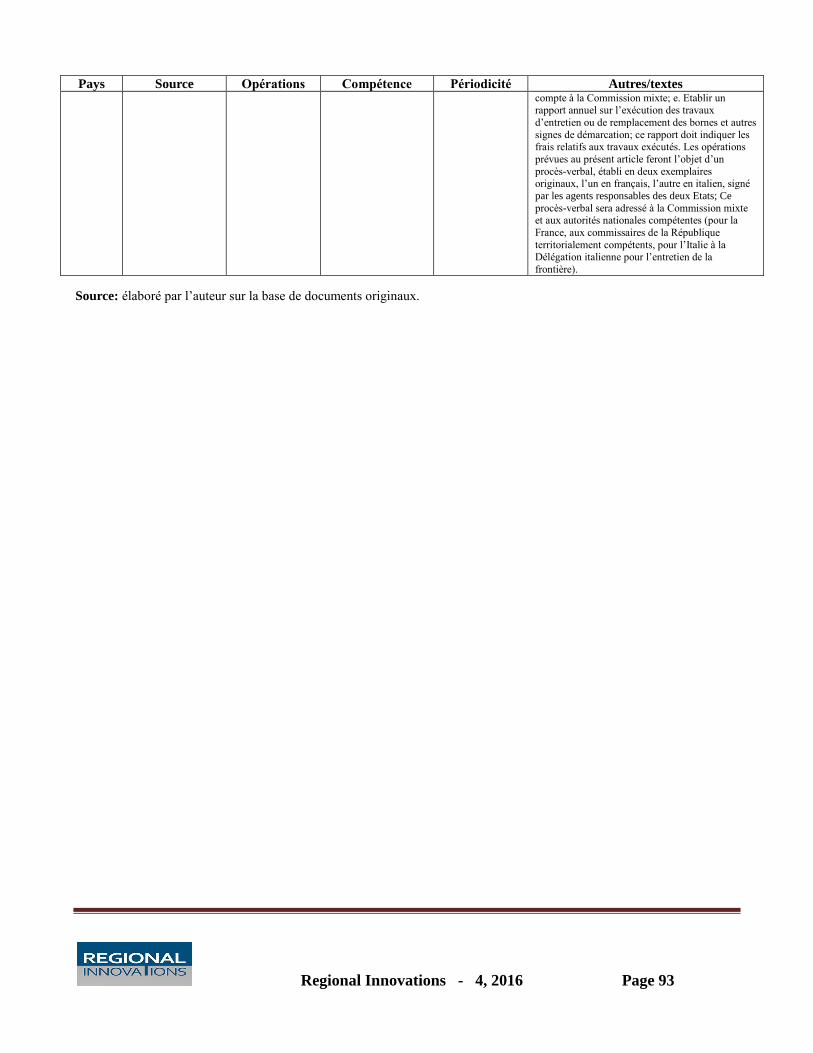
Regional Innovations - 4, 2016 Page 93
Pays Source Opérations Compétence Périodicité Autres/textes compte à la Commission mixte; e. Etablir un
rapport annuel sur l’exécution des travaux
d’entretien ou de remplacement des bornes et autres
signes de démarcation; ce rapport doit indiquer les frais relatifs aux travaux exécutés. Les opérations
prévues au présent article feront l’objet d’un
procès-verbal, établi en deux exemplaires originaux, l’un en français, l’autre en italien, signé
par les agents responsables des deux Etats; Ce
procès-verbal sera adressé à la Commission mixte et aux autorités nationales compétentes (pour la
France, aux commissaires de la République
territorialement compétents, pour l’Italie à la Délégation italienne pour l’entretien de la
frontière).
Source: élaboré par l’auteur sur la base de documents originaux.

Regional Innovations - 4, 2016 Page 94
About authors
PIERRE VERGEZ
Chargé de mission CNIG et frontières,
CNIG (French National Council for Geographic Information),
IGN, France
Pierre VERGEZ is a Chargé de mission in the French National Council for Geographic Information and
borders, National Geographic Institute (IGN), France.
Scientific interests: electronic borders, geographic information, networks, cartography, geodesy, open data.
VIKTOR FEDOSOV
Doctor of Sc., Professor,
Head of the Financial department of the Finance and Economic faculty,
Vadym Hetman Kyiv National Economics University, Ukraine
Viktor FEDOSOV ia a Doctor of Science, Professor, Head of the Financial department of the Finance and Economic faculty of the Vadym Hetman Kyiv National Economics University. He is an Honoured Scientist
and Technologist of Ukraine.
Scientific interests: public finance.
OLENA DEREVKO
Chief Economist, Financial Markets Department,
Ministry of Finance of Ukraine, Ukraine
olena. [email protected]
Olena DEREVKO is a Chief Economist of the Financial Markets Department of the Ministry of Finance of Ukraine.
Scientific interests: public finance.
DU HONG WEI
Professor of Philosophy, China
Du HONG WEI is a Professor of Philosophy, China. He has graduated Chinese and Ukrainian universities and
continues working as a Professor of philosophy, Chinese language, business development. He works on development of the experts’ network between China, France and Ukraine on cultural and economic exchanges.
Scientific interests: cultural exchanges, business communications, economic development, international cooperation, linguistic philosophy.

Regional Innovations - 4, 2016 Page 95
TATIANA VERTINSKAYA
Doctor of Economics, the Institute of Economics, National Academy of Science, Belarus
Tatjana VERTINSKAYA is a Doctor of Economics in the National Academy of Science of Belarus. She is a Head of the Department of the world economy and interational economic relations in the Institute of
Economics of the National Academy of Science of Belarus.
Scientific interests: international econpomic relations, regional economy, regional integration,
competitiveness, world economy, sustainable development, local self-government.
MARIA SHKULIPA
M.A., International Economics,
M.A., Chinese Language and Literature,
Production Manager, FiveUltimate
Beijing, China
Maria SHKULIPA has M.A. in International Economics and Chinese Language and Literature. She works as a production manager at FiveUltimate, Beijing, China.
Scientific interests: global economics, international business management, consumer behavior, operations and
technology management.
ALEXEI KIRYUKHIN
Ph.D, Doctor of Geology, Karazin Kharkiv National University, Ukraine
Alexei KIRYUKHIN is Doctor of Geology, Karazin Kharkiv National University, Ukraine; Vice-Chairman
of the Task Force of External Borders, Association of European Border Regions. He is a specialist with a wide experience in cross-border co-operation programmes and projects in regional planning and environmental
protection.
Scientific interests: regional economy, cross-border co-operation, spatial planning, European integration,
water protection, innovations, sustainable development, regional innovation systems.
TETIANA ZATONATSKA
Doctor of Sc., Professor,
Department of Economic Cybernetics,
Taras Shevchenko National University of Kyiv, Ukraine
Tetiana ZATONATSKA is a Doctor of Economics, Professor in the Economic Cybernetics Department of the Taras Shevchenko National University (Kyiv, Ukraine); the part-time Head of the Financial and Economic
Forecasting Department of the Academy of Financial Management under the Ministry of Finance of Ukraine;
Member of the Editorial Board of the "Research papers NDFI" Journal (Ukraine)
Scientific interests: government invests, fiscal regulation, planning of state budget, electronic commerce.
Regional Innovations - 4, 2016 Page 96
TETIANA KORNIEIEVA
Ph.D, Professor, President, InterRegioNovation,
International Business Institute, France
Tetiana KORNIEIEVA has achieved her PhD on “The Government Policy on Knowledge Economy
Development” in the Institute of Economy and Forecasting, National Academy of Science of Ukraine. She
works as a Professor in the International Relations Department of the International Business Institute (Paris, France), she runs the International association InterRegioNovation and implements functions of a country
representative in France of the International Regional Studies Association, UK.
Scientific interests: innovation development, knowledge transfer, governance, local and regional
development, infrastructure and business development.
JEAN-FRANCOIS DEVEMY
President, FranceXP,
Charge de mission for international cooperation, Ministry of Interior, France
Jean-Francois DEVEMY is a sous-préfet, former diplomat and former officer in the engineers. His career was almost equally distributed among army, regional governance and public administration, and international
activity, the latest both in the administration (ministry of foreign affairs as councilor in Ukraine, ministry of
interior as chargé de mission for international cooperation) and private sector in technical expertise or assistance. He founded FRANCeXP, the first association exclusively devoted to developing and supporting the
interests of international experts of French culture.
Scientific interests: administrative and regional/territorial governance, public administration reform, security,
public and private law.
Regional Innovations - 4, 2016 Page 97
Requirements for articles
Articles are accepted in English and French. Good English and French spelling and punctuation are
preferred. Papers should be written in a third person, impersonal style and any use of ‘I/we’ should be avoided.
Articles should not normally exceed 10,000 words. All articles are refereed by acknowledged experts in the
subject.
Abstracts of approximately 100 words are required for all articles (abstract in English and French is required for
articles written in French).
Article should include no more than 7 keywords.
Articles should be compiled in the following order: title page; abstract; keywords; main text; acknowledgments;
appendixes; references.
The introduction should clearly define the nature of the problem being considered. The new contribution the paper
makes should be identified and situated in relation to the relevant scientific literature and, wherever possible, the
practical relevance of its results should be indicated. The “Regional Innovations” journal will publish papers that
evaluate important topics relevant to new areas of emerging research and policy.
All the authors of an article should include their full names, affiliations, postal addresses, telephone numbers and
email addresses on the cover page of the article. One author should be identified as the corresponding author.
For all articles non-discriminatory language is mandatory.
Tables should be prepared on separate sheets; they should not be embedded within the text. Each table should have
an appropriate caption.
All photographs, maps, charts and diagrams should be referred to as “Figures”, and should be numbered
consecutively in the order in which they are referred to in the text. They should be prepared on separate sheets.
Endnotes should be marked clearly in the text at a point of punctuation, and listed consecutively at the end of the
paper. They should not be listed at the bottom of each relevant page.
The full references should be listed at the end of the paper. They must include the names and initials of all the
authors, the year of publication in parentheses, the full title of the article (or book), the full name of the journal, the
volume number and pages and, for books, the publisher's name and city of publication. The references in the text
should be done in square brackets (for example, [2; 4; 15]).
Reproduction of copyright material
As an author, you are required to secure permission to reproduce any proprietary text, illustration, table, or other material,
and any supplemental material you propose to submit. This applies to direct reproduction as well as “derivative
reproduction” (where you have created a new figure or table which derives substantially from a copyrighted source).