Chapter 4 Regional Economy
227
4 - 1 Chapter 4 Regional Economy 4.1 Overview 4.1.1 Demography The Northwestern Region geographically lies in latitude 20°20"N to 22°40"N and in longitude 102°40"E to 105°50"E. The Region borders on both China and Laos. The demographic information of eight (8) geographical regions of Vietnam is presented in Table 4.1.1. The Region occupies 37,534 km 2 or 11.3% of the total area of Vietnam. Its population is 2.65 million accounting for 3.1% of the national population (2007). Table 4.1.1 Area and Population of Eight (8) Regions of Vietnam Region Area (km 2 ) Population (,000 persons) Population Density (persons/km 2 ) Whole Nation 331,211.6 85,154.9 257 1. North-West 37,533.8 2,652.1 71 2. Red River Delta 14,862.5 18,400.6 1,238 3. North-East 64,025.2 9,543.9 149 4. North Central Coast 51,551.9 10,722.7 208 5. South Central Coast 33,166.1 7,185.2 217 6. Central Highland 54,659.6 4,935.2 90 7. South East 34,807.8 14,193.2 408 8. Mekong River Delta 40,604.7 17,524.0 435 Source:GSO National Census (2007) The Red River Delta region that including Hanoi is a highly populated area with a population density of 1,218 persons/km 2 . Although the Region adjoins the Red River Delta, it is sparsely populated with the density of 71 persons/km 2 , which is the lowest among all the regions. The Region administratively belongs to four provinces, namely Lai Chau, Dien Bien, Son La and Hoa Binh. Their demographic conditions are presented in Table 4.1.2. Table 4.1.2 Areas and Populations of the Study Area (2007) The Study Area Description Lai Chau Dien Bien Son La Hoa Binh Total Total of Vietnam Regional Share (%) Land Area (km 2 ) 9,112.3 9,562.9 14,174.4 4,684.2 37,533.8 331,211.6 11.3 Population (1,000 persons) 330.5 467.8 1,024.3 829.5 2,652.1 84,155.8 3.2 Population density (persons/km 2 ) 36 49 72 177 71 257 - Source: Statistical Yearbook of Vietnam 2007, Statistical Publishing House As presented in Table 4.1.3, the primary sector including agriculture, livestock, fishery and forestry is the prime industry in the Region as far as the employment opportunity is concerned. The labor employment
-
Upload
khangminh22 -
Category
Documents
-
view
0 -
download
0
Transcript of Chapter 4 Regional Economy

4 - 1
Chapter 4
Regional Economy
4.1 Overview
4.1.1 Demography
The Northwestern Region geographically lies in latitude 20°20"N to 22°40"N and in longitude 102°40"E to
105°50"E. The Region borders on both China and Laos. The demographic information of eight (8)
geographical regions of Vietnam is presented in Table 4.1.1. The Region occupies 37,534 km2 or 11.3%
of the total area of Vietnam. Its population is 2.65 million accounting for 3.1% of the national population
(2007).
Table 4.1.1 Area and Population of Eight (8) Regions of Vietnam
Region Area (km2)
Population (,000 persons)
Population Density
(persons/km2) Whole Nation 331,211.6 85,154.9 257 1. North-West 37,533.8 2,652.1 71 2. Red River Delta 14,862.5 18,400.6 1,238 3. North-East 64,025.2 9,543.9 149 4. North Central Coast 51,551.9 10,722.7 208 5. South Central Coast 33,166.1 7,185.2 217 6. Central Highland 54,659.6 4,935.2 90 7. South East 34,807.8 14,193.2 408 8. Mekong River Delta 40,604.7 17,524.0 435 Source:GSO National Census (2007)
The Red River Delta region that including Hanoi is a highly populated area with a population density of
1,218 persons/km2. Although the Region adjoins the Red River Delta, it is sparsely populated with the
density of 71 persons/km2, which is the lowest among all the regions.
The Region administratively belongs to four provinces, namely Lai Chau, Dien Bien, Son La and Hoa Binh.
Their demographic conditions are presented in Table 4.1.2.
Table 4.1.2 Areas and Populations of the Study Area (2007)
The Study Area Description Lai Chau Dien Bien Son La Hoa Binh Total Total of Vietnam
Regional Share (%)
Land Area (km2) 9,112.3 9,562.9 14,174.4 4,684.2 37,533.8 331,211.6 11.3
Population (1,000 persons) 330.5 467.8 1,024.3 829.5 2,652.1 84,155.8 3.2
Population density (persons/km2) 36 49 72 177 71 257 -
Source: Statistical Yearbook of Vietnam 2007, Statistical Publishing House
As presented in Table 4.1.3, the primary sector including agriculture, livestock, fishery and forestry is the
prime industry in the Region as far as the employment opportunity is concerned. The labor employment

4 - 2
Growth of GDP in 2001 to 2005
0
1,500
3,000
4,500
Lai Chau Dien Bien Son La Hoa Binh
Billion VND
2001
2005
in both of the second and tertiary industrial sectors is so far limited to few percent, except the service
sub-sector of which the public service share more than 5% in all four provinces.
Table 4.1.3 Proportional Extent of Labour Population by Economic Sector (2005)
Economic Sectors Primary Sector Secondary Sector Tertiary Sector Provinces
Agriculture Fishery Mining Manufacture Construction Commerce Services Others Lai Chau 86.26 0.35 0.39 1.38 1.76 3.25 6.44 0.17Dien Bien 79.14 0.46 0.41 2.08 3.53 3.58 10.66 0.14Son La 86.75 0.01 0.17 1.27 1.55 3.57 6.54 0.14Hoa Binh 82.35 3.38 0.59 2.61 1.27 3.31 6.41 0.08
Average 83.60 1.35 0.37 1.93 1.84 3.47 7.31 0.12Source: Annual Statistics of each respective 4 provinces (2006) Data of Lai Chau province is still under confirmation.
4.1.2 Economic Structure
Gross Domestic Products (GDP) of Vietnam
amounted to 837,858 billion VND, of which the
GRDP of the Region was 10,575 billion VND
accounting only for 1.3% of the GDP in 2005.
The per capita GDP of Vietnam was US$634 in
2005, while one of the study area was US$ 259 or
only 40% of the national average, i.e. US$273 for
Dien Bien, US$266 for Son La, US$263 for Hoa
Binh and US$212 for Lai Chau. The regional
economy has significantly grown by 160% to
200% from 2001 to 2005 as seen in Figure 4.1.1.
In particular, GRDP of Son La has been grown in term of both annual growth rates and amounts. The
shares among the economic sectors have also been changed. The regional economy is still dependent
highly upon the primary sector of which share was 44% in 2005, while 22% for the secondary sector and
34% of the tertiary sector as seen in Table 4.1.4.
Table 4.1.4 Shares of Economic Sectors in the Study Area (2005) Unit: Billion VND (%)
The Study Area Description Lai Chau Dien Bien Son La Hoa Binh Total Total of Vietnam
Regional Share (%)
Total GDP 1,058 1,951 4,177 3,389 10,575 (100) 837,858 1.3 Primary Sector 479 729 1,813 1,561 4,582 (44) 175,048 2.6 Secondary Sector 269 520 902 684 2,375 (22) 343,807 0.7 Third Sector 310 702 1,463 1,144 3,619 (34) 319,003 1.1
Source: Statistical Yearbook of Vietnam 2005, Statistical Publishing House and Statistical Yearbooks 2005 Note: Primary Sector : Agriculture, forestry, fishery and livestock industries etc. Secondary Sector : Manufacturing, construction and mining industries etc. Third Sector : Service industries
The details of GRDP by sector are presented in Table 4.1.5.
Figure 4.1.1 Economic Growth of the Study Area

4 - 3
Table4.1.5 Regional Gross Domestic Product (RGDP) of Each Respective Province
Unit: Billion VND Respective Provinces (Billion VND)
Lai Chau Dien Bien Son La Hoa Binh Particulars GDP (%) GDP (%) GDP (%) GDP (%)
Primary Sector 479,048 45.28 730,900 37.46 1,831,900 43.85 1,561,308 37.29-Agriculture 344,128 32.52 534,360 27.38-Forestry 115,538 10.92 185,650 9.51
1,812,900 43.40 1,521,611 36.34
-Fishery 19,387 1.83 10,890 0.56 18,760 0.45 39,697 0.95Secondary Sector 259,531 24.53 490,805 25.15 824,620 19.74 604,638 14.44-Mining & Quarry 21,800 2.06 18,500 0.95 166,400 3.98 48,715 1.16-Construction 69,826 6.60 154,625 7.92 243,997 5.83-Manufacturing 167,905 15.87 317,680 16.28 658,220 15.76 311,926 7.45Tertiary Sector 319,494 30.20 729,638 37.39 1,520,730 36.41 2,020,806 48.27-Trade & Commerce 61,171 5.78 321,351 16.47 636,060 15.23 481,845 11.51-Services 192,158 18.16 210,405 10.78 355,160 8.50 1,326,319 31.68-Others 66,165 6.25 197,882 10.14 529,510 12.68 212,640 5.08
Total 1,058,073 100.0 1,951,343 100.0 4,177,010 100.0 4,186,752 100.0Note: Unit is at “million VND”. Source: Annual Statistics (2006) of the respective 4 provinces.
It is notable that the service sub-sector in Hoa Binh province has in 2005 achieved 1,326.3 billion VND or
32% of the provincial GDP through rapid expansion of the services both of the public and private
enterprises under direct-cum-favorable impact by the most active economy in Hanoi.
The trend of changes in shares of economic sectors in recent years is illustrated in Figure 4.1.2
Figure 4.1.2 Changes of Shares in Economic Sectors (2001-2005)
There is a clear tendency in changes of economic sector share in the study area. All four provinces show
分野別GDP占有率の推移
ライチャウ省
50%
45%
23%
25%
28%
29%
0% 20% 40% 60% 80% 100%
2003年
2005年
第1次産業
第2次産業
第3次産業
分野別GDP占有率の推移
ディエンビエン省
41%
37%
21%
27%
38%
36%
0% 20% 40% 60% 80% 100%
2001年
2005年
第1次産業
第2次産業
第3次産業
分野別GDP占有率の推移
ソンラ省
57%
43%
12%
22%
31%
35%
0% 20% 40% 60% 80% 100%
2001年
2005年
第1次産業
第2次産業
第3次産業
分野別GDP占有率の推移
ホアビン省
47%
46%
18%
20%
35%
34%
0% 20% 40% 60% 80% 100%
2001年
2005年
第1次産業
第2次産業
第3次産業
Change in Sector SharesLai Cha
Change in Sector SharesDien Bien
Change in Sector SharesSon La
Change in Sector SharesHoa Binh
PrimarySecondaryTertiary
PrimarySecondaryTertiary
200
PrimarySecondaryTertiary
PrimarySecondaryTertiary
200
200
200
200
200
200
200

4 - 4
the expansion of shares of the secondary sector from 2001 to 2005, while the share of the primary sector
was reduced. In particular, the secondary sector of Son La increased its share due to the growth of
construction sub-sector encouraged by the on-going Son La hydro-power project
4.1.3 Food Security
Vietnam is the second largest rice exporting country in the world. The national paddy production of
Vietnam amounted to 35.79 million ton, of which 3.27 million ton or 9.1% were exported in 2005. It is
estimated that the national paddy consumption is 21.48 million ton taking into account rice consumed by
agro-processing of rice for noodle production and brewery, animal feed and seed. Paddy of 21.48 million
ton is equivalent to 258 kg of paddy or 168 kg of milled rice per capita.
The paddy production of the Region was as low as 0.54 million ton, or limited only to 1.7% of the national
paddy production, which is equivalent to 211 kg of paddy or 137 kg of milled rice on per capita basis. It
means that the per capita availability of rice in the Region is 31 kg (168 kg - 137 kg) less than or only 82%
of the national average. Furthermore, the demand and supply balance of rice is changed by province in
the Region. The per capita availability of milled rice in Lai Chau was 192 kg (114% of the national
average) and 185 kg (110%) in Dien Bien, where rice is self-sufficient in the provinces. In contrast, rice
supply is less than demand in the other two Provinces, namely 153 kg (91%) in Hoa Binh and 85 kg (59%)
in Son La.
The demand and supply balance of milled rice in the Region is preliminarily analyzed as presented in Table
4.1.6.
Table 4.1.6 Demand and Supply Balance of Milled Rice in the Northwestern Region
Item Lai Chau
Dien Bien
Son La Hoa Binh
Total/ Average
Paddy Production (1,000 t)* 93 128 128 192 541 Rice Production (1,000 t)** 60 83 83 124 351 Per Capita Paddy Production (kg/year) 295 284 130 236 211 Per Capita Rice Production (kg/year) 192 185 85 153 137 Comparison to the National Average (%) 114 110 50 91 82
Note 1:* estimated on the basis of Statistical Yearbook of Vietnam 2005 and Statistical Yearbook 2005 2:**estimated milling recovery rate at 65%
Rice demand of Hoa Binh and Son La is partly fulfilled by rice supplied from the Red River Region and the
other regions under rather favorable access conditions for distribution of imported rice. On the other hand,
the demand and supply of rice is balanced with a little surplus in Lai Chau and Dien Bien as a whole.
However, surplus rice can not be smoothly distributed to every corner of the Provinces due to poor
accessibility. In both Provinces, maize plays the important role in food security by supplementing
shortage of rice.

4 - 5
4.1.4 Border Trade
The Region is located along the borders to China and Laos. The Study made the review on prospects of
the border trade with both countries so as to verify necessary measures to promote export-oriented products
and to encourage regional economic development as a whole. Improvement of balance of payment is one
of the important issues for the national economy of Vietnam. It is important to rationalize functions of the
Region in external trade.
JICA carried out the study on the border trade in January 2007. According to “A Report on Vietnam
Northwest Border Trade Situation” submitted in February 2007, the general situation of the border trade in
the Region is summarized below.
Table 4 .1.7 Summary of Border Trade in the Northwestern Region Unit: US$ million
Province Trade with 2000 2001 2002 2003 2004 2005 2006Lai Chau China - 1.2 1.7 4.7 2.0 6.3 3.7Dien Bien Laos - 0.8 1.6 1.2 1.1 1.4 -
Son La Laos 0.8 1.0 1.3 1.0 1.1 1.2 - (Lao Cai) China 132.2 209.9 254.6 279.3 350.9 400.0 460.0
Source:A Report on Vietnam Northwest Border Trade Situation, JICA Viet Nam, 2007
The trade at the Lao Cai gate sharply increased from US$132 million in 2000 to US$460 million in 2006.
The proportion of import and export is 7:3. Import items are represented by chemicals, machinery, steels,
etc., of which chemicals including pesticides occupy some 20% of the total import amounts. On the other
hand, the major export items are raw materials for industries and fresh food including iron ore, fruits and
vegetables, spices, seafood, etc. There is a direct route from the North-western Region to China at Ma Lu
Thang of Lai Chau province. The total trade at Ma Lu Thang is limited only to US$ 3.7 million, which is
less than 1% of the total trade at Lao Cai. Export is more predominant occupying over 90% of the total
trade. Major export items are tea leaves, cardamon, bamboo pulp, etc. The total export amount is
equivalent to 9.4% of GRDP of Lai Chau province. Although the amount is limited, the economic impact
to the regional trade is not negligible (Table 4.1.8).
Table 4.1.8 Share of Export Amount in GRDP Unit:%
Province Country 2000 2001 2002 2003 2004 2005 Lai Chau China n/a 2.08 3.17 3.53 8.84 9.41 Dien Bien Laos n/a 1.19 2.64 1.36 0.89 0.87 Son La Laos n/a 0.78 1.06 0.68 0.64 0.60 (Lao Cai) China 8.38 33.26 18.79 15.13 18.73 16.65
Source: A Report on Vietnam Northwest Border Trade Situation, JICA Viet Nam, 2007(original : Reports of Province’s Socio-Economic Situation in 2001-2005)
(1) Border Trade with China through Lai Chau
There are two border gates at Ma Lu Thang and Muong Te, of which only Ma Lu Than is currently
operational. Table 4.1.9 presents the past trend of the border trade with China.

4 - 6
Table 4.1.9 Past Trend of Border Trade with China through Lai Chau
Unit US$ million Item 2001 2002 2003 2004 2005 2006 Total Trade 0.1 1.7 4.7 2.0 6.3 3.7
Export 0.1 1.6 4.6 1.9 6.1 3.4 Import 0.1 0.1 0.1 0.2 0.2 0.3
Source: A Report on Vietnam Northwest Border Trade Situation, JICA Viet Nam, 2007(original: Lai Chau Department of Trade)
Table 4.1.10 presents the major items of import and export with China at Ma Lu Thang. In recent years,
export of cardamom has been drastically increased.
Table 4.1.10 Import and Export Items of Border Trade with China through Lai Chau
Items 2001 2002 2003 2004 2005 2006 Export
Tea (ton) 80 120 150 250 300 1,865 Cardamom (ton) 100 150 150 250 410 410 Bamboo Pulp (ton) 100 200 450 450 Iron Ore (ton) 400 800 1,200 35,500 45,000 34,420 Black stone (piece) 400,000 400,000 Agro-products (ton) 0.25 0.33 0.30 0.35 0.35 0.35
Import (US$ million) Machinery 0.30 0.40 0.20 0.38 1.60 0.29Raw Materials 0.13 0.15 0.10 0.10 2.00 0.50Daily Commodity 0.17 0.45 1.50 1.50 6.40 1.50
Source : A Report on Vietnam Northwest Border Trade Situation, JICA Viet Nam, 2007(original: Lai Chau Department of Trade)
(2) Border Trade with Laos through Dien Bien
Dien Bien has borders with both Laos and China. The border trade with Laos through Thai Trang is
officially recognized. The trade amount is as low as US$ 1.4 million. Table 4.1.11 shows the past trend
of the trade amount and Table 4.1.12 presents the major items of the trade.
Table 4 .1.11 Past Trend of Border Trade with Laos through Dien Bien
Unit US$ thousand Item 2001 2002 2003 2004 2005 Total Trade 764 1,584 1,189 1,108 1,413
Export 564 1,370 771 584 647 Import 200 214 418 524 775
Source: A Report on Vietnam Northwest Border Trade Situation, JICA Viet Nam, 2007(original: Ministry of Trade, Viet Nam)
Table 4.1.12 Import and Export Items of Border Trade with Laos through Dien Bien
Item 2001 2002 2003 2004 2005 Export
Timber (m3) - 92 100 250 240 Commodity (US$1,000) 152 428 555 174 200
Import Machinery・Raw Materials (US$1,000) 111 102 224 424 600 Timber (m3) 89 209 195 100 450
Source: A Report on Vietnam Northwest Border Trade Situation, JICA Viet Nam, 2007(original: Dien Bien Department of Trade)

4 - 7
(2) Border Trade with Laos through Son La
The border trade with Laos is made at several points in Son La. The official trade amount is only US$1.5
million.
Table 4.1.13 Past Trend of Border Trade with Laos through Son La
Unit US$ thousand Item 2000 2001 2002 2003 2004 2005 Total Trade 830 960 1,311 950 1,085 1,215
Export 670 649 958 685 735 802 Import 161 311 353 300 350 412
Source:A Report on Vietnam Northwest Border Trade Situation, JICA Viet Nam, 2007(original: Son La Department of Trade)
4.2 Local Administration
4.2.1 Administrative Units
The Region administratively consisted of four provinces, which were further divided into two (2) cities,
three (3) towns and 32 districts as of January 2007, when the Study was started. In May 2008, it was
officially decided by the Government of Vietnam that four communes of Hoa Binh Province are to be
separated and integrated into Hanoi city. In addition, Xuan Nha Commune of Moc Chau District of Son
La Province was devided into three, whileTuan Giao District of Dien Bien Province was split into Tuan
Giao District and the new district of Muong Ang. As a result, the administrative structure of the Region
are changes as of August 2008 as presented in Table 4.2.1.
Table 4.2.1 Administrative Units in the Study Area
Province City Town Districts Communes & Wards Villages
Lai Chau 0 1 5 94 1,060 Dien Bien 1 1 8 98 1,473 Son La 0 1 10 206 3,033 Hoa Binh 1 0 10 210 3,724
Total 2 3 33 608 9,290 Source:Based on information provided by the four provinces
The administration maps of four provinces are presented in Fingures 4.2.1 to 4.2.4.

4 - 8
Figure 4.2.1 Administration Map of Lai Chau Province
Figure 4.2.2 Administration Map of Dien Bien Province

4 - 9
Figure 4.2.3 Administration Map of Son La Province
Figure 4.2.4 Administration Map of Hoa Binh Province

4 - 10
4.2.2 Local Administration for Agricultural and Rural Development
Administrative structure of the respective four provinces is, under supervision of the Provincial Peoples’
Committee (PPC), composed of 16 Departments or so for extending administrative service activities,
including the DARD that is the counterpart function in province for the Study.
PPC is constituted with the PPC Chairman and 2 to 3 Vice-chairmen who are directly appointed by the
Central Government, and Administration Office as the secretary function. PPC Chairman as the top leader
of province takes full responsibility for executing the socio-economic development and management of the
provincial administration.
Vice-chairmen assist Chairman in general administration services for the provincial activities, and at the
same time, they as the executive persons supervise and manage such specific activities as the general
administration sector including finance and planning, technical administration sector including agriculture
and rural development, transportation-communication-commerce sector, and education, culture and
environment sector.
The general organization flow of PPC and the respective departments is as shown in Figure 4.2.5 as per
attached hereto.
Figure 4.2.5 Organization Chart of Provincial Administration
Chairman of PPC
Vice-Chairman III
Vice-Chairman I
Vice-Chairman II
Vice-Chairman IV
Administration Office (Secretary Function to PPC)
Provincial Peoples' Committee
DARD
DOIT
Project Management Board
DOLISA
DOJ
DOP
DOST
DOCST
DOH
DOET
DPI
DOF
DOH
DNRE DOT
Respective Department for Administrative Service

4 - 11
Note: DARD: Department of Agriculture & Rural
Development DPI: Department of Planning & Investment DOF: Department of Finance DOLISA: Department of Labour Warf Invalid &
Social Affairs DOIT: Department of Industry and Trade DOST: Department of Science & Technology DOCST: Department of Culture, Sports and
Truism
DOH: Department of Health DNRE: Department of Natural Resources &
Environment DOET: Department of Education &
Training DOJ: Department of Justices DOPS: Department of Police Security DOT: Department of Transportation DOHA: Department of Home Affairs
Project Management Board (PMB) is organized from time to time under the respective department for
execution and management of the subjected project. PMB is composed of a “Director (full-time)” and
working staff to be assigned as required.
The Provincial DARD is responsible for execution of agricultural and rural development as well as
management of agricultural production and O&M of rural infrastructures. Each department in general
administration sector has working sections or service units more or less than 13 to 15 numbers. In most
cases, the officers are not enough to be assigned for all the working sections or service units, and
accordingly, one officer has to be seconded more than two posts in general. The organization structure of
DARD is as shown in Figure 4.2.6.
Figure 4.2.6 Organization Chart of the Provincial DARD
Administrative Divisions Technical Working Divisions AdD: Administration Division AED: Agricultural Extension Division PID: Planning & Investment Division FD: Forestry Division PLD: Personnel & Labour Division IWD: Irrigation & Water Division TD: Technical Division AqD: Aquaculture Division ID: Inspection Division VD: Veterinary Division PPD: Plant Protection Division
DPI takes a responsibility for preparation of the annual working plan and budget, and then, prepare the
application of those plan and budget to PPC. When someone development plan is approved, DARD
organizes a “Project Management Board” and assigns a Director in charge and working staff as required for
execution and management of the subjected project/scheme.
Project Management
Board
PID AdD TD PLD ID FD AE AqDIWD VD PPD
Technical Working Units and Farms
Director of DARD
Vice-Directors (Agriculture) (Irrigation & Water) (Forest)

4 - 12
Each district has the (District) Division of Agriculture and Rural Development (District FARD). The
details of the organization structures of Division of Agriculture and Rural Development (District DARD) in
the study area are presented in Table 4.2.2. Shortage of the staff is one of the most serious constraints in
provision of the public services in the relevant districts.
Table 4.2.2 Present Conditions of the District DARD in the Study Area
North-west Region Particulars Lai Chau Dien Bien Son La Hoa BinhI. Administrative Division
1.1 Board of Directors x x x x 1.2 Administration Division x x x x 1.3 Planning & Accounting Division x x x x 1.4 Personal & Labour Division x x x x 1.5 Technical & Technology Division x x x 1.6 Inspection Division x x x
II. Technical Working Division 2.1 Agricultural Extension Division x x 2.1.1 Agricultural Extension Center x x x 2.1.2 Agro-forestry Extension Centre x 2.1.3 Plant Variety Centre x 2.1.4 Fishery Centre x x x 2.2 Rural Agric & Forestry Processing Division x x x 2.3 Irrigation & Water Management Division x x x 2.3.1 Irrigation Schemes & Water Sources Management x 2.3.2 Rural Sanitation & Water Supply Center x x x x 2.3.3 Rural Infrastructure Sector Project x x 2.4 Fixed Cultivation & Resettlement Division x x 2.4.1 Agriculture Policy Project x 2.4.2 Funded Project Management Units x 2.4.3 Rural Agric. Sector Project x x 2.5 Forest Development Division x x x x 2.5.1 Forestry Planning & Inspection Team x x x x 2.6 Co-operative Movement Division x 2.7 Plant Protection Division x x x x 2.8 Veterinary Division x x x x 2.9 Trade Union x
Communes have simple structures as
presented in Figure 4.2.7. Only one
officer in charge is assigned for each
service section. All of them are not
fulltime employees but work on the
contract bases. To execute
development projects, the “Project
Coordinating Committee” is organized
within the administrative structure
under Chairman of CPC. Since
working staff is not sufficiently at
commune offices, the representative of
respective villages is also appointed as
members of Committee.
Chairman of CPC
Vice Chairman CPC
Administration & Statistics
Security (police)
Agric.,Fores., Irrig. & Transport
Land Admi. & Construction
Culture & Information
Finance & Planning
Justice
Project Coordinat. Committee
Figure 4.2.7 Organization of Commune

4 - 13
4.3 Ethnic Compositions
4.3.1 Ethnic Compositions of Vietnam
Vietnam is a multi-ethnic country with 54 different ethnic groups. The Kinh, the majority group, accounts
for 86% of the whole population, while the rest is made up of 54 minority groups. The ethnic groups in
Vietnam are presented in Table 4.3.1.
Table 4.3.1 Ethnic Groups in Vietnam (Classification based on Language) Language Family Language Group Ethnic Group Remark
1 Ha Nhi, Akha 2 La Hu 3 Phu La 4 Lo Lo 5 Coong
Tibeto-Burman
6 Sila
Many live in the North-West (especially Muong Te District, Lai Chau Province) Population is smaller than that of Hmong and Dao Highland Swiddeners They also live in northern Myanmar, Northern Thailand, Northern Laos and Southern China
7 Hmong, Meo 8 Dao, Yao Miao-Yao 9 Pathen
Migrated from South-Western China within the last 300 years They also live in Southern China, Northern Myanmar, Northern Thailand and Northern Laos Highland Swiddeners; Hmong have a strong clan-based society
10 Tay, Tho 11 Thai, Tai 12 Nung 13 San Chay 14 Giay, Nhang 15 Lao 16 Lu
Tai/Thai
17 Bo Y
Lowland-Wet Rice Cultivators Original inhabitants of Lai Chau, Dien Bien and Son La They also live in Assam (India), South-Western China, Northern Myanmar, Northern Thailand and Northern Laos Some say Tai migration to Vietnam started in the days before Christ, but generally believed as the early 10th century.
18 La Chi 19 La Ha 20 Co Lao Kadai
21 Pu Peo
Closest to the Tai/Thai group in terms of language
22 Hoa 23 Ngai
Sino-Tibetan
Chinese 24 San Ziu
Related to Chinese Said to have the lowest poverty rate among the 54 ethnic groups
25 Kinh, Viet 26 Muong 27 Tho Annnam-Muong
28 Chut
The Muong are the closest to the Kinh and are original inhabitants of Hoa Binh and Tan Hoa Provinces
29 Khmer 30 Bahnar 31 Sedang 32 Kohor, Co Ho 33 Hre 34 Mnong 35 Stieng, Xtieng 36 Bru-Van Kieu 37 Co Tu 38 Gie-Trieng 39 Ma 40 Kho Mu 41 Chor 42 Ta Oi 43 Cho Ro 44 Xinh Mun 45 Mang 46 Brau 47 O Du 48 Ro Mam
Austro-Asian
Mon-Khmer
49 Khang
(Mon-Khmer language group: Widespread from Assam Region in India to Indochina Peninsula) In Vietnam, many are in the South and the Central Highland: Khamu, Xin Munh, Khang and Mang live in the mountainous area in the North-West Many live in mid-area between highland and lowland in Laos, which may apply to Vietnam also
50 Gia Rai 51 Ede, Rhade 52 Cham 53 Raglai
Austro-nesian Malayo-Polynesian
54 Chu Ru
(Ausutronesian language group:Widespread from Madagascar to Indonesia, Philippines, Taiwan, Melanesia, Micronesia, Polynesia) Cannot be found in the North-West

4 - 14
4.3.2 Ethnic Compositions of the Study Area
In the study area, the Kinh accounts for about 20% of the population and number-wise, the Kinh are not the
majority ethnic group there. Ethnic composition in the study area is thus very unique and different from
the overall ethnic composition in Vietnam (Table 4.3.2).
Table 4.3.2 Ethnic Composition of the Study Area Lai Chau
(20 groups) Dien Bien
(22 groups) Son La
(12 groups) Hoa Binh (7 groups)
Group %* Group % Group % Group % Thai 35.2 Thai 40.0 Thai 54.8 Muong 63.0 Hmong 21.9 Hmong 30.9 Kinh 17.4 Kinh 28.0 Kinh 12.7 Kinh 20.1 Hmong 13.0 Thai 2.7 Dao 11.8 Khamu 3.5 Muong 8.2 Dao 1.7 Hanhi 5.1 Lao 1.1 Xin Mun 1.9 Hmong 0.6 *: percentage among the provincial population Source:Data obtained in each province
Distribution patterns of popularion and ethnic minorities of the Region are illustrated in Figures 4.3.1 and
4.3.2.
Indigenous people of Lai Chau, Dien Bien and Son La are the Thai. In these provinces, the Thai have the
largest population of over one-third of the regional population in each province. The Thai began their
migration from the south-western part of China to the Region probably in the early 10th century, and
created feudal chiefdoms in valleys. After the Thai came the Dao, the Hmong and other hilltribe groups.
It was in 1950s and 1960s, after the Vietnam’s independence from France, that a large number of the Kinh
migrated to the Region. The original inhabitants of Hoa Binh are the Muong who belong to the same
language group as the Kinh. Today more than 60% of the population of Hoa Binh is the Muong. The
characteristics of minority groups in the Region are described in Attachment 4.1. Ethnic Groups in the
Region can be categorized into two groups according to their historical patterns of lifestyles (Table 4.3.3).
Table 4.3.3 Ethnic Group Categorization based on Historical Features
Lowland-Sedentarist Highland-Migrants Area of Residence Lowland Highland (Mountainous Areas)
House On stilts or on ground Many on ground, some on stilts Patterns of Living Sedentary Non-Sedentary, Continuous Migration
Agriculture Rice Paddy (Main) Swidden Upland Rice, Opium Poppy, Maize
History (Leader, Territory)
Feudal Lord, Chiefdom / Territory No Territories No big leaders
Majority-Minority The Majority Had relations with the majority as minorities (non-isolation)
Writing Have writing system and record history No writing system, Oral tradition
Ethnic Groups
Annam-Muong language group - Kinh, Muong Chinese language group - Hoa (Chinese) Tai-Kadai language group - Thai, Tay, Nhang, Lao, Laha, etc.
Miao-Yao language group - Hmong, Dao, etc. Burma-Tibetan language group - Hanhi, Lahu, Phula, Sila, Khamu, Khang, Xinh Mun, Mang, etc.

4 - 15
Figure 4.3.1 Population Distribution Pattern in the Northwestern Region
Figure 4.3.2 Ethnic Minorities in the Northwestern Region
⊗
Lai Chau
Lai Chau Province
Muong Te
MuongNhe
Muong Lay
Sin Ho Tam Duong
Phong Tho
TuaChuaThan Uyen
Tuan Giao
Dien Bien Dong
Dien Bien Phu
⊗
Dien Bien
Son La ProvinceSop Cop
Song Ma
Mai Son
Thuan Chau
QuynhNhai
Muong La
Bac Yen
Yen Chau
Phu Yen
Moc Chau
⊗Son La
Da Bac
Mai Chau
TanLac
LacSonYenThuy
LacThuy
Kim Boi
LuongSon
KySon
CaoPhong
Hoa Binh
⊗
Hoa Binh Province
Dien Bien ProvinceMuong Cha
⊗
Lai Chau
Lai Chau Province
Muong Te
MuongNhe
Muong Lay
Sin Ho Tam Duong
Phong Tho
TuaChuaThan Uyen
Tuan Giao
Dien Bien Dong
Dien Bien Phu
⊗
Dien Bien
Son La ProvinceSop Cop
Song Ma
Mai Son
Thuan Chau
QuynhNhai
Muong La
Bac Yen
Yen Chau
Phu Yen
Moc Chau
⊗Son La
Da Bac
Mai Chau
TanLac
LacSonYenThuy
LacThuy
Kim Boi
LuongSon
KySon
CaoPhong
Hoa Binh
⊗
Hoa Binh Province
Dien Bien ProvinceMuong Cha
Population Density (person/km2) Up to 30 31 to 60 61 to 100 101 to 200 More than 201
Ha NhiLa HuTay / ThaiH’MongKinhMuongKho muM’nong
⊗
⊗
⊗
Mai Chau
⊗
Dien Bien
Lai Chau
Hoa Binh
Son La
Ha NhiLa HuTay / ThaiH’MongKinhMuongKho muM’nong
⊗
⊗
⊗
Mai Chau
⊗
Dien Bien
Lai Chau
Hoa Binh
Son La

4 - 16
Figure 4.3.3 General Location of Ethnic Groups
General Location of Ethnic Groups & Language Groups
Viet-Muong
Kinh, Chinese
Hmong
Thai, Tay, Nhang, Nung, Lao, Lue, Laha, etc.
Muong
Dao
Tai-Kadai
Mon-Khmer
Tibeto-BurmanMiao-Yao
Khamu, Xinh Mun, Khang, etc.
Sila, Lolo, Hanhi, Lahu, etc.
Chinese
Mostly near Viet/China border
Altit
ude
One is a sedentary group and the other is a
non-sedentary group. The former practices
wet-rice agriculture and lead a sedentary life
while the latter practices swidden agriculture and
move from place to place. Although these two
patterns of lifestyles are rather stereotypical ones
that no longer fit well to the current living
conditions of the Region, these patterns provide
historical background and broad characteristics of
ethnic groups in the Region, useful in
understanding the nature of group differences.
Figure 4.3.3 shows the location of ethnic groups based on the altitudes of the residence, which clearly
reveals the concentration of different language groups.
4.3.3 Ethnic Compositions by District
The population of ethnic groups in each district, province and the Region is presented in Attachment 4.2.
Except for Son La, the Kinh account for more than 50% of the population of the main districts of the 4
provinces where the provincial offices are located. As the Kinh are about 20% of all the population of the
Region, this shows a high concentration of the Kinh in urban areas. Furthermore, in Dien Bien Phu City,
Hoa Binh City and Muong Lay Town in Dien Bien province whose poverty rates are 3.88%, 4.58% and
13.1%, the Kinh account for 78%, 72% and 60% of the population. This clearly demonstrates a strong
relationship between the Kinh and economic development/wealth..
4.4 Poverty Rate
4.4.1 Poverty Line
Poverty rate in Vietnam can be defined as the ratio (percentage) of poor households. Whether a household
is poor or not is determined by use of a poverty line. Vietnam has 3 poverty lines which are 1) General
Poverty Line, 2) Food Poverty Line and 3) MOLISA Poverty Line. The first two poverty lines are set by
the Government Statistics Office with assistance from the World Bank and are based on the Household
Living Standard Survey which is carried out by MOLISA every other year. The third poverty line is set
by MOLISA as the name shows. The General and Food Poverty Lines are based on the cost of food that
meets 2,100 calories, the minimum daily intake calories necessary for a person in Vietnam. The total cost
of food is calculated by using consumer prices. As this calculation method is rather difficult and
complicated, these poverty lines are mostly used in reports that were written for international readers. For
Vietnamese readers, especially in local provinces and districts, the MOLISA Poverty Line is most often

4 - 17
used.
Actual values of the three poverty lines are as follows:
I. General Poverty Line:Ratio of Poor Person (Set by GSO and WB) Year 2002: 160,000VND/person/month Year 2004: 173,000VND/person/month
II. Food Poverty Line:Ratio of Poor Household (Set by GSO and WB) Year 2002: 146,000VND/person/month (urban) 112,000VND/person/month (rural) Year 2004: 163,000VND/person/month (urban) 124,000VND/person/month (rural)
III. MOLISA Poverty Line:Ratio of Poor Household (Set by MOLISA) Year 2001: 150,000VND/person/month (urban) 100,000VND/person/month (rural plains) 80,000VND/person/month (mountains and islands) Year 2005 260,000VND/person/month (urban) 200,000VND/person/month (rural)
Poverty rate in Vietnam changed drastically when MOLISA raised its poverty line in 2005 from 100,000
VND/person/month to 200,000 VND/person/month. As a result, many households fell into the category
of “poor”. In one province, poverty rate jumped from 11% to 46%. Based on the new poverty line, the
poverty rate of the Study area was 39.4% in 2006, the lowest among the 8 regions of Vietnam. This
means that no other regions in Vietnam have more poverty than the Region.
Table 4.4.1 Regional Poverty Rate in Vietnam
Year 2004 Year 2006
General Poverty
(%)
Food Poverty
(%)
New MOLISA
Poverty (%)
General Poverty
(%)
New MOLISA
Poverty (%)Whole Nation 19.5 6.9 18.1 15.97 15.5 1. North-West 58.6 21.8 46.1 49.0 39.4 2. Red River Delta 12.1 4.6 12.9 8.8 10.1 3. North-East 29.4 9.4 23.2 25.0 22.2 4. North Central Coast 31.9 12.2 29.4 29.1 26.6 5. South Central Coast 19.0 7.6 21.3 12.6 17.2 6. Central Highland 33.1 12.3 29.2 28.6 24.0 7. South East 5.4 1.8 6.1 5.8 4.6 8. Mekong River Delta 19.5 5.2 15.3 10.3 13.0
Source:Result of the Vietnm Household Living Standards Survey 2006
Similar to what the poverty rate indicates, per capita income and expenditure in the Region are the lowest in the nation.

4 - 18
Table 4.4.2 Per Capita Monthly Income and Expenditure in Vietnam
Unit:1,000VND income Expenditure
Y2002 Y2004 Y2002 Y2004 Whole Nation 356.1 484.4 269.1 359.7 Urban 622.1 815.4 460.8 595.4 Rural 275.1 378.1 211.1 283.5 1. North-West 197.0 265.7 179.0 233.2 2. Red River Delta 353.1 488.2 271.2 373.5 3. North-East 268.8 379.9 220.2 293.8 4. North Central Coast 235.4 317.1 192.8 252.7 5. South Central Coast 305.8 414.9 247.6 330.8 6. Central Highland 244.0 390.2 201.8 295.3 7. South East 619.7 833.0 447.6 577.0 8. Mekong River Delta 371.3 471.1 258.4 335.1
Source:GSO National Census (2005)
The table below shows the changes of poverty rates of the Kinh/Hoa as one group and the ethnic minorities.
Although the poverty rates are on the decline, the rate of decline of the ethnic minorities is much slower
than that of the Kinh/Hoa. Economic gap between those who have and those who haven’t is thus
widening, and this is one of the reasons why so many poverty reduction programs target the ethnic
minorities.
Table 4.4.3 Transition of Poverty Rate of Majorities and Minorities Unit:%
1993 1998 2002 2004 Kinh and Hoa 53.9 31.1 23.1 13.5 Minorities 86.4 75.2 69.3 60.7 Source:WB Report (2007)(Estimation by GSO and WB Staff)
4.4.2 Quality of Life
According to various statistical data, both the rate of access to electricity and the literacy rate in the Region
are the lowest among the 8 regions.
Table 4.4.4 Rate of Access to Basic Infrastructure and Literacy Rate
Access to Basic Infrastructure (%)
Literacy Rate(%) (over 10 years old) ***
Rural Water* Electricity** total Male Female Whole Nation 57.7 77.1 92.96 95.87 90.21 1. North-West 53.2 48.4 80.04 89.02 71.27 2. Red River Delta 63.0 98.6 96.17 98.56 93.92 3. North-East 57.7 76.1 93.05 96.15 90.06 4. North Central Coast 56.1 85.2 94.13 97.11 91.28 5. South Central Coast 52.9 82.4 93.35 96.52 90.43 6. Central Highland 47.1 52.9 87.71 91.41 84.04 7. South East 62.1 82.8 94.48 96.38 92.76 8. Mekong River Delta 59.4 54.8 90.60 93.57 87.77
Source:*National Program on Clean Water and Rural Environmental (N-W and N-E Combined) **Human Development Report-Vietnamese Version (2001)***Household Living Standards Survey (2004)

4 - 19
The rate of access to rural water is the third lowest in Vietnam. These data show the low quality of life
associated with poverty in the Region, reflecting the geophysical and socio-cultural conditions of the region
such as mountainous area with difficult access to basic infrastructures, low population density, existence of
many ethnic groups whose native tongues are not Vietnamese. Special attention should be paid that the
literacy rate of the women in the Region is extremely low.
4.4.3 Demography and Poverty Rate of Provinces and Districts
While Son La province has the largest population among the 4 provinces in the Region, Hoa Binh province
has the highest population density among the four. As for the monthly per capita income, Lai Chau and
Dien Bien provinces have the lowest amount among all the provinces in Vietnam.
Table 4.4.5 Average Monthly Per Capita Income
Monthly Income
(1,000 VND) Rank among 64
Provinces Remark
Lai Chau 273.0 64th Dien Bien 305.0 63rd Son La 394.0 61th Hoa Binh 416.0 55th
National average: 636,500 VND Highest: HCM (1,479,900 VND) 2nd highest: Dinh Duong(1,215,000 VND) 3nd highest: Hanoi (1,050,900 VND)
Source:Household Living Standards Survey (2006)
Lai Chau province which is located at the Region edge of the study area is said to be the most remote
province with extremely difficult access. Its poverty rate is 63.57%, the highest among the four provinces
and in the nation. Muong Te District of Lai Chau province, which shares a national border with China,
has the highest poverty rate (77.43%) among all the districts in the 4 provinces.
Lai Chau province has 7,320 urban households and 48,540 rural households. In other words, 86.9% of all
the households in the province are located in the rural areas. Economic gap between the urban and rural
areas in the province are extremely high as the poverty rates are 12.7% in urban areas and 71.2% in rural
areas.
Table 4.4.6 Demography and Poverty Rate of Lai Chau Province
City/Town/ District
No. of Communes
PopulationArea
(km2)
Population Density
(persons/km2)
No. of House-Hold
Poverty rate (%)
Average HH Size (persons)
1.TX Lai Chau 5 18,408 70.8 260.00 4,064 13.51 4.53 2.Muang Te 15 44,336 3,678.8 12.05 7,303 77.43 6.07 3.Phong Tho 16 50,012 819.1 61.06 8,756 74.59 5.71 4.Sin Ho 24 76,089 2,038.8 37.32 11,900 74.10 6.39 5.Tam Duong 13 43,719 757.6 57.71 7,673 56.42 5.70 6.Than Uyen 17 91,101 1,700.0 53.59 16,164 59.58 5.64
Total 90 323,665 9,065.0 35.70 55,860 63.57 5.79 Source:Interview Survey in Province 2007
Demography and poverty rates of the remaining 3 provinces (Dien Bien, Son La and Hoa Bin) are as
follows (Table 4.4.7 to 4.4.9)

4 - 20
Table 4.4.7 Demography and Poverty Rate of Dien Bien Province
City/Town/ District
No. of Communes
Population Area (km2)Population
Density (persons/km2)
No. of House-Hold
Poverty rate (%)
Average HH Size (persons)
1.TP Dien Bien Phu 8 43,863 60.10 729.83 11,159 3.8 3.84 2.TX Muong Lay 3 9,526 114.06 83.52 3,600 13. 3.95 3.Dien Bien 19 99,759 1,639.90 60.83 21,446 39.5 4.07 4.Dien Bien Dong 14 48,315 1,206.40 40.05 7,698 57.0 6.16 5.Muong Cha 19 49,242 1,763.85 27.92 7,463 45.8 6.04 6.Muong Nhe 11 35,089 2,507.90 13.99 6,075 75.4 6.05 7.Tua Chua 12 42,583 679.40 62.68 7,140 56.5 6.02 8.Tuan Giao 21 104,255 1,582.60 65.88 18,040 57.2 6.15
Total 107 432,632 9,554.00 45.28 82,62 44.0 5.18 Source:Interview Survey in Province 2007
Table 4.4.8 Demography and Poverty Rate of Son La Province
City/Town/ District
No. of Communes
Population (1,000)
Area (km2)Population
Density (persons/km2)
No. of House-H
old
Poverty rate (%)
Average HH Size (persons)
1.TX Son La 12 81.3 324.93 250.21 18,652 8.90 4.36 2.Bac Yen 16 53.1 1103.71 48.11 9,697 57.76 5.48 3.Mai Son 22 129.6 1432.47 90.47 28,177 35.10 4.60 4.Moc Chau 29 147.6 2061.50 71.60 33,525 37.99 4.40 5.Muong La 16 84.7 1426.71 59.37 15,856 49.18 5.34 6.Phu Yen 27 104.1 1236.55 84.19 22,004 44.11 4.73 7.Quynh Nhai 13 66.3 1060.9 62.49 13,047 44.63 5.08 8.Song Ma 19 115.5 1646.16 70.16 21,073 37.48 5.48 9.Sop Cop 8 37.2 1480.88 25.12 6,685 51.92 5.56 10.Thuan Chau 29 139.4 1541.26 90.45 25,129 40.76 5.55 11.Yen Chau 15 65.5 859.37 76.22 12,567 40.80 5.21
Total 206 1024.3 14.174.44 84.40 206,412 38.71 5.07Source:Interview Survey in Province 2008
Table 4.4.9 Demography and Poverty Rate of Hoa Binh Province
City/Town/ District
No. of Communes
Population Area (km2)Population
Density (persons/km2)
No. of House-Hold
Poverty rate (%)
Average HH Size (persons)
1.TP Hoa Binh 14 77,578 132.79 584.22 20,412 4.58 3.802.Cao Phong 13 39,402 254.60 154.76 8,632 24.78 4.563.Da Bac 21 51,652 820.19 62.98 11,395 48.77 4.534.Kim Boi 37 140,841 680.76 206.89 28,930 43.07 4.875.Ky Son 10 33,058 202.04 163.62 7,579 16.69 4.366.Lac Son 29 132,382 581.42 227.69 26,382 43.28 5.027.Lac Thuy 13 51,462 282.16 182.39 12,064 28.30 4.278.Luong Son 18 82,947 374.69 221.38 17,616 12.20 4.719.Mai Chau 22 48,783 520.38 93.74 10,974 39.41 4.4510.Tan Lac 24 77,643 530.90 146.25 16,730 40.30 4.6411.Yen Thuy 13 63,594 293.72 216.51 13,483 30.85 4.72
合計 214 799,342 4,673.65 171.03 174,197 31.32 4.59Source:Interview Survey in Province 2007

4 - 21
4.4.4 Gender
(1) General Situation in Vietnam
According to Vietnam Country Gender Assessment (December, 2006), over the last few decades, Vietnam
has made striking progress in improving people’s well-being and reducing gender disparities. Vietnam
ranks 109th out of 177 countries in UNDP’s human development index (UNDP, 2006), which places it in
the group of countries of medium human development. In the South East Asia region, Vietnam stands out
for its success in closing gender gaps in the last 20 years. It ranks 80th (out of 136 countries) on the Gender
Development Index (GDI). These efforts have resulted in high adult literacy rates for men (96%) and
women (91%) (2004), school enrolment data that show little difference between boys and girls, and the
highest percentage of women in national parliament in the Asia-Pacific region (27% since 2002). Vietnam
also has one of the highest Economic Participation Rates (EPR) in the world: 85 % of men and 83 % of
women between the ages of 15 and 60 participated in the labor force in 2002 (Table4.4.10).
Table 4.4.10 Gender-related Indices in Vietnam (2006)
Index Rank Valuation HDI 109th (out of 177 countries) Medium human development GDI 80th (out of 136 countries) EPR 85% men
83% women One of the highest in the world
Source: Vietnam Country Gender Assessment (December, 2006)
Despite such remarkable progress, Table 4.3.2 represents a considerable gap for enrolment between boys
and girls (age 15-17) of ethnic minorities. With respect to ethnic minorities, the enrolment rate of girls
(61%) is much lower than that of boys (73%), while there is a little difference between the sexes with
respect to Kinh/ Chinese group (Table4.4.11).
Table 4.4.11 Enrolment Rates of Boys and Girls (Age 15-17)
Boys Girls
Kinh/ Chinese 73% 71%
Ethnic Minorities 73% 61%
Source: World Bank (2006)
(2) Northwestern Mountainous Region of Vietnam
Table 4.4.12 shows that the percentage of girls among the total schoolchildren (Grade 5) in the region is
also the lowest in Northwest (44.9%). The table represents also the Family Environment (including
socioeconomic background, time needed for going to school, and time spent for chores around the house)
Index by sex. In spite of the fact that fewer girls are enrolled than boys, there is only a little gap between
boys and girls with respect to the basic family environment. This phenomenon is similar from one region
to another at nationwide level.

4 - 22
Table 4.4.12 Gap between Boys and Girls (Grade 5, Elementary school, 2001)
Family Environment Index
Boys Girls Gap between Boys and Girls
M(B) SE(B) M(G) SE(G) M(G)-M(B) SE(M(G)-M(B))
Whole Nation 48.1% 0.0 0.01 0.0 0.01 0.0 0.021. North-West 44.9% -1.7 0.09 -1.6 0.10 0.1 0.132. Red River Delta 48.9% 0.4 0.02 0.4 0.02 0.0 0.023. North-East 48.5% -0.4 0.03 -0.4 0.03 0.0 0.044. North Central Coast 47.7% 0.2 0.05 0.2 0.05 0.0 0.085. South Central Coast 48.8% 0.2 0.04 0.1 0.04 -0.1 0.066. Central Highland 45.5% -0.4 0.07 -0.3 0.09 0.1 0.117. South East 48.0% 0.2 0.03 0.2 0.03 0.0 0.048. Mekong River Delta 48.1% 0.0 0.02 0.0 0.02 0.0 0.03
Ratio of girls to totalschoolchildren (Grade 5,
Elementary school,2001)
Region
Source: “Cooperation for International Education (Hiroshima Univ.), Vol. 10”, Report by Mr. SAITOH Mioko, M: Median, SE: Sample Error
In spite of the fact that gender disparities are rather small in childhood, adult women seem to have gender-
related problems on daily basis.
Table 4.4.13 shows that the percentage of non-Vietnamese speakers among the total population of the entire
region is the highest in North-west (22%). This phenomenon attributes to the high rate of ethnic minority
population living there (78%). According to Indigenous People/ Ethnic Minorities and Poverty Reduction,
Vietnam (ADB), men often speak Vietnamese more than women. This fact can be one of the main reasons
why women are marginalized in various programs and training courses and not selected as trainees, as the
Vietnamese language has been used as the communication tool. Women’s being incapable of speaking
Vietnamese could also limit their access to the market, which is important for promoting and selling
products.
Table 4.4.13 Background of the Northwestern Mountainous Region
RegionMOLISA
Poverty Line(2005)
Ethnic Minority Rate(2001)
Ratio of Non-Vietnamese Speakers
(2001)
Whole Nation 26.0% 13% 3%1. North-West 62.3% 78% 22%2. Red River Delta 19.8% 1% 0%3. North-East 36.1% 34% 8%4. North Central Coast 39.7% 11% 3%5. South Central Coast 23.3% 5% 2%6. Central Highland 52.2% 26% 8%7. South East 10.2% 8% 2%8. Mekong River Delta 20.8% 6% 1%
Source: “Cooperation for International Education (2007, Hiroshima Univ.), Vol. 10”, Report by Mr. SAITOH Mioko/ GSO: General Statistics Office
Table 4.4.14 shows that 64.6% of women in North-West Region gave birth at home with no professional

4 - 23
assistance. This proportion in Region is much higher than national average and other poor regions in
Vietnam.
Table 4.4.14 Proportion of women who gave birth at home with no
assistance from qualified health workers in 2002
Source: Vietnam Development Report 2004, Poverty
Birth is a burden for women in the Region for other reasons also. According to the living standard survey
(2004), the average household size in the Region (5.15 persons/ household) is the largest among all the
regions (National average is 4.36 persons/ household.), which suggests larger number of children in a
family, that women in the Region bear more children. In addition to this, the fact that clean water s difficult
to get in many remote places in the Region makes births difficult and dangerous for women.
Moreover, Participatory Poverty Reduction Planning with Ethnic Minorities in Vietnam, Workshop Report
(Dec. 2002) addresses that the land use rights certificates, which are very important for poor families in
terms of borrowing capital and using their land, are not given to men and women equally. The report also
shows that women have had difficulty getting their names on these certificates, which usually list only the
head of a household.
From the above findings, it can be concluded that it is only in their childhood that various human rights are
equally enjoyed between men and women in North-West Mountainous Region. Gender gap could become
more and more considerable on daily basis as people grow up and age due to inequality of opportunities.
(3) Strategy for improvement in gender gap
According to the Comprehensive Poverty Reduction and Growth Strategy (CPRGS), Hanoi, November,
2003, the poorest provinces also rank lowest in the countrywide Human Development Index (HDI) and the
Gender Development Index (GDI). In this context, with respect to state budget expenditures, priority
should be given to provinces and cities with low HDI and GDI indicators with the aim of reducing the gap
between regions and encouraging provinces to promote policies that benefit the poor. Actually, Vietnam’s
Development Objectives stated in CPRGS include gender equality and advancement of women: Increase
the number of women in elective bodies and in government bodies at all levels (national, provincial, district
and commune). Increase the participation of women in agencies and sectors at all levels by an additional
3-5% in the next 10 years. This is the most important in Region where the ratio of minorities is the
highest in the country and the poverty still dominates.
Though the gender gap of schoolchildren at household level is not remarkable in Region, education shall be
enhanced especially for girls of ethnic minorities. According to Vietnam Country Gender Assessment, there
Whole Nation 16.6%
1. North-West 64.6%
2. North-East 32.6%
3. Central Highland 40.3%

4 - 24
is scope for multiplier effects for solving other gender issues, since providing girls with education is known
to be a good investment in terms of improving the welfare and opportunities of the next generation –
especially for their female children.
4.5 Land Use and Tenure System
4.5.1 Present Land Use
Each province has been processed the Land-sat digital information and statistical data of the present land
use, and then, compiled the vegetation and land use map, successfully. The present land use in each
province is summarised in Table 4.5.1.
Table 4.5.1 Present Land Use of the Study Area (2005) Unit: 1000 ha
The Study Area Land Categories
Lai Chau Dien Bien Son La Hoa Binh Total Total Area of Province 906.5 998.8 1,412.5 466.3 3,784.1A. Agricultural Land 437.0 711.2 828.2 267.9 2,244.3
1. Arable Land 77.3 117.9 246.4 66.5 508.1 Paddy Field 30.5 40.0 39.0 41.8 151.4 Upland Field 40.5 73.6 173.8 3.8 291.7
Tea, Orchard, etc. 6.3 1.6 33.6 20.9 62.3 Other Fields 0.0 2.7 0.0 0.0 2.8
2. Pasture & Grassland 0.5 0.6 1.7 0.4 3.23. Fish-pond, etc. 0.4 0.7 2.1 0.8 4.04. Forest 359.3 591.9 578.0 200.2 1,729.45. Others 0.0 0.1 0.0 0.0 0.1
B. Non-agricultural Land 16.9 19.5 42.2 45.5 124.16. House & Building 2.5 3.27 6.6 6.3 18.57. Land for Special Use 4.5 7.1 13.7 28.4 53.78. Public Cemetery 0.3 0.6 2.7 0.0 3.59. Water Surface 9.7 8.5 19.1 10.9 48.110.Others 0.0 0.0 0.1 0.0 0.2
C. Non-used Land 452.6 268.2 542.1 152.8 1,415.7Source: Land Use Maps and Statistical Date prepared by the Land Office, Department of Natural Resources & Environment
of the respective 4 provinces
The arable land (cultivated land) in each province is limited to small extent that is representing at 17% in
Lai Chau, 16% in Dien Bien, 29% in Son La and 24% in Hoa Binh to the total agricultural land,
respectively. According to the statistical data presented above as well as the result of the field
investigation, an arable land has been reclaimed entirely, and then, no more room for expansion of the farm
land in future. In fact, many farmers are now obliged to cultivate their own food crops in such critical
land as rocky field, extremely steep slope, shallow-cum-gravely/stony soils, etc. Thus, it is so anxious
that in very near future when the land fragmentation is more progressed along with the generation changes,
the land holding size per farm household would become small to a critical extent as the same to present
situation of Red River Delta. Accordingly, farmers shall have to pay further effort to increase crop yield
more than double of the present yielding conditions so as to maintain their livelihood to a favourable level.

4 - 25
4.5.2 Land Tenure System
After dissolution of the “Peoples’ Corporation System”, the “Land Office “of the Department of Natural
Resources & Environment (DNRE) takes full responsibility for use and control of all the land.
Agricultural land is defined as productive land such as arable land for crop production, pasture land for
livestock grazing, forest including not only artificially planted forest but also natural forest, water surface
for aquaculture, etc. To use all of the lands as well as the resources to be obtainable from the said land,
either personal or organisation should submit the application to and then acquire the permission from the
state government. The certified users are in general obliged to pay a land/resources utilisation tax1 to the
state. Up to present, the land and/or resources utilisation certificates have been issued to the following
applicants, such as individual farm households, state farm enterprises, commune, private enterprises, social
organisation in the Region, and other organisation.
The present land use by the certified land users is demonstrated in the following Table 4.5.2 that is
representing in two cases of Lai Chau and Dien Bien provinces. As seen in Table, the land use certified
for individual farm household shares almost all of the arable land. In contrast, the state enterprises share
the forest land for resource conservation. In Dien Bien province, the individual farm household also shares
large part of forest. This is owing to the provincial promotion programme on use of forest product for
generation of the farm income.
In Lain Chau, the practical performance progress on issuance of the land certificate is as high as 98.67% in
case of the forest land (application by 1.0 ha in unit). In contrast, it is far poor progress representing at
less than 50% in case of the arable land, fish-pond, etc. This is due to a lot of applications that have a
small land unit, i.e., 1,000 m2 for arable land and 100 m2 for fish-pond, etc.
Table 4.5.2 Present Land Use by Certified Land Users (2005) Unit: %
Land Categories
Individual Farmers Communes Private
EnterprisesPublic
OrganizationState
Enterprises Others Total
In case of Lai Chau Province Farm Land 98.98 0.40 0.00 0.57 0.05 0.00 100.00 Plantation 85.63 1,92 3.02 0.02 9.41 100.00 Forest 36.61 0.00 5,64 0.00 51.73 6.02 100.00 Fish-pond, etc. 93.29 1.62 0.00 0.00 2.72 2.37 100.00 In case of Dien Bien Province Farm Land 98.49 0.00 0.19 0.00 1.32 0.00 100.00 Plantation 92.08 0.00 5.69 0.00 1.66 0.57 100.00 Forest 72.83 0.10 1.17 1.42 24.03 0.45 100.00 Fish-pond, etc. 91.40 0.00 0.00 0.58 5.95 2.07 100.00
Note: In the above, the plantation in land category includes tea, coffee, orchard, etc.Figures in columns show the proportional extent (%) that is to the total extent of each land category.
Source: Statistical data of the Land Office of Lai Chau and Dien Bien province (2005)
1 In case of the North-west Mountainous Region, the land and resources utilization tax is as a favourable treatment for the rural poor being fully exempted in agriculture, forestry, animal husbandry and fishery activities.

4 - 26
4.6 Agricultural Ecology
4.6.1 Agro-climate
The study area is located climatically under domination of the tropical monsoon, and then, it has distinct
two seasons, namely, cool and dry winter season and warm and rainy summer season. Precipitation in the
summer season generally exceeds over 2000 mm though it largely fluctuates annually. It is also notable
that a monthly mean precipitation is as much as 200 mm or more during 4 month period from May to
August. In winter season, it also rains with a monthly mean at 10 to 20 mm, and makes possible to grow
someone green vegetables even without irrigation (Figure 4.6.1).
It is the coolest season in December and January, representing the daily minimum air temperature at 15oC
or less. Local farmers so far recognised such cool temperature is not a critical constraint for growing
varieties of crops. In future when cropping is intensified, it should pay particular attention to this cool air
temperature and take proper measure when nursery work is carried out in December and January. In Son
La province, some farmers used plastic films for protection of paddy nursery against cool temperature in
early February. In summer season, it is warm and no extremely hot day though over the season. But, it
should take care and properly conserve the crop and land against a heavy precipitation especially in the
steep slope-land.
The relative humidity is favourable representing at 75% in the winter season and 85% in summer season.
The daily sun-shine hours are rather short at 4 to 5 hr. /day throughout the year except May.
4.6.2 Topography and Land Reclamation System
The Region lies in the mountainous ranges with peaks of 2,000 m or higher in elevation. Its topographics
are rolling to hilly with steep slopes. Flat lans are limited only on narrow river valley bottoms formed
along the Da river, the Ma river, the Nam Rom river and their tributaries. The topographical analyses
were made by using the ASTER satellite imageries with pixels size of 15m x 15m with an aid of the GIS
software. The results are summarized in Table 4.6.1.
Table 4.6.1 Areas by Elevation Range in the Region
Lai Chau Dien Bien Son La Hoa Binh Northwestern Elevation Range
(m a.s.l.) Area (km2)
Prop-ortion(%)
Area (km2)
Prop-ortion(%)
Area (km2)
Prop-ortion(%)
Area (km2)
Prop-ortion(%)
Area (km2)
Prop-ortion(%)
101-500 1,262 13.9 594 6.2 2,929 20.8 3,586 76.8 8,373 22.4501-1000 3,988 43.9 5,627 59.0 6,896 48.9 918 19.6 17,428 46.61001-1500 2,276 25.1 3,063 32.1 3,505 24.8 99 2.1 8,943 23.91501-2000 1,049 11.5 237 2.5 559 4.0 0 0.0 1,845 4.92001-2500 375 4.1 1 0.0 136 1.0 0 0.0 512 1.42500-3000 49 0.5 0 0.0 15 0.1 0 0.0 35 0.1
error 83 0.9 17 0.2 71 0.5 69 1.5 240 0.6 9,085 100.0 9,538 100.0 14,112 100.0 4,671 100.0 37,406 100.0
Remarks:imageries were recorded in 2000-2004. Errors are areas covered by clouds.
About 50% of the Region lies in the elevation range between 500 m a.s.l. and 1,000 m a.s.l. Over 30% of the provincial areas of Lai Chau, Dien Bien and Son La are located over 1,000 m a.s.l., while some 70% of Hoa Binh are lower than 1,000 m a.s.l.

4 - 27
Figure 4.6.1 Climatic Conditions of the Study Area
0
150
300
450
600Ja
n
Feb
Ma
r
Ap
r
Ma
y
Jun Jul
Aug Se
p
Oc
t
No
v
De
c
Mon
thly
Ra
infa
ll (m
m)
10
15
20
25
30
Mon
thly
ave
rage
tem
per
atu
r(℃
)
Lai Chau
0
150
300
450
600
Jan
Feb
Ma
r
Ap
r
Ma
y
Jun Jul
Aug Se
p
Oc
t
No
v
De
c
Mon
thly
Ra
infa
ll (m
m)
10
15
20
25
30
Mon
thly
ave
rage
tem
per
atu
re (℃
)
Dien Bien
0
150
300
450
600
Jan
Feb
Ma
r
Ap
r
Ma
y
Jun Jul
Aug Se
p
Oc
t
No
v
De
c
Mon
thly
Ra
infa
ll (m
m)
10
15
20
25
30
Mon
thly
ave
rage
tem
per
atu
re(℃
)
Son La
0
150
300
450
600
Jan
Feb
Ma
r
Ap
r
Ma
y
Jun Jul
Aug Se
p
Oc
t
No
v
De
c
Mon
thly
Ra
infa
ll (m
m)
10
15
20
25
30
Mon
thly
ave
rage
tem
per
atu
re (℃
)
Hoa Binh

4 - 28
The slope classification of the Region is presented in Table 4.6.2. According to the FAO criteria, land
over 30% slope gradietnts are not suitable for agriculture. As seen in Table 4.6.2, 16,000 km2 or 40% of
the regional land are classified into not suitable land for agriculture. The existing farmland of the Region
amounts to 5,502 km2 including 613 km2 of paddy field. It deems that almost all of the land with slope
gradietnts of 16% or less are used for current agricultural activities.
Table 4.6.2 Slope Classification of the Region
Lai Chau Dien Bien Son La Hoa Binh Northwestern Slope Range (%.)
Area (km2)
Prop- ortion (%)
Area (km2)
Prop-ortion(%)
Area (km2)
Prop-ortion(%)
Area (km2)
Prop- ortion (%)
Area (km2)
Prop-ortion(%)
<2 77 0.9 107 1.1 122 0.9 338 7.2 645 1.72-5 133 1.5 196 2.0 346 2.4 438 9.4 1,112 3.05-8 169 1.9 266 2.8 425 3.0 352 7.5 1,212 3.2
8-16 643 7.1 1,063 11.1 1,445 10.2 757 16.2 3,907 10.416-30 1,931 21.3 2,772 29.1 3,612 25.6 1,132 24.2 9,446 25.330-45 2,692 29.6 2,920 30.7 4,241 30.1 899 19.3 10,754 28.745< 3,356 36.9 2,197 23.0 3,852 27.3 685 14.7 9,950 26.6
error 83 0.9 17 0.2 71 0.5 69 1.5 240 0.6 9,085 100.0 9,538 100.0 14,112 100.0 4,671 100.0 37,406 100.0
Remarks:imageries were recorded in 2000-2004. Errors are areas covered by clouds.
4.6.3 Soils
Soil classification of the study area is presented in Table 4.6.3.
Table4.6.3 Soils in the Respective 4 Province Area
Great Soil Groups Soil Types Remarks
Lai Chau Province Infertile Sandy Soils
Soils are originated from Igneous Rocks and most popular in the north-west part of the province area.
Moderately Deep Soils
Soils are originated from the Sedimentary Rocks, and being predominant in the mountain and hilly slopes.
Complex of Oxisols and Cambisols
Deep Soils Soils are developed on the weathered rocks, which are being extended in the Dien Bien Tuan Giao valley
Fluvisols Fertile Deep Soils Soils are from alluvium deposited in the flood plain of the major rivers Dien Bien Province
Infertile Sandy Soils
Soils are originated from Igneous Rocks and most popular in the north-east part of Dien Bien District area.
Moderately Deep Soils
Soils are originated from the Sedimentary Rocks, and being predominant in the mountain and hilly slopes.
Complex of Oxisols and Cambisols
Deep Soils Soils are developed on the weathered rocks, which are being extended in the Dien Bien Tuan Giao valley
Fluvisols Fertile Deep Soils Soils are from alluvium deposited in the flood plain of the major rivers Son La Province Complex of 8 Soil Groups, i.e., Oxisols & Cambisols
Complex of 24 Types of Soils
Deep Soils(effective soil layer more than 100 cm deep) 33.5% Moderately Deep Soils(effective soil layer 50 – 100 cm deep) Shallow Soils(effective soil layer less than 50 cm deep) 30.4%
Fluvisols 3 Types of Fertile Deep Soils
Soils are from alluvium deposited in the flood plain of the major rivers
Hoa Binh Province Infertile Deep Soils
Most predominant Soils in province (71.6% to the total provincial area). Soils are arable but need careful fertilization for crop production
Oxisols
Infertile Shallow Soils
Soils in higher part of mountains (9.66% to the total provincial area). Soils are not arable due to steep slope & shallow effective soil layer. Careful land conservation measure is required even in forestation work.
Regosols Strong Acid & Gravelly Soils
Soils are from colluviums deposited through the fan-formation in valley area. Soils are strong acid (pH=4.0 to 4.2) and contain a large quantity of gravels and stones through over the soil layer. A part of the soils is used for paddy and vegetable production (1% around to the provincial area)

4 - 29
Great Soil Groups Soil Types Remarks
Cambisols Infertile Shallow Soils
Soils are the residue on a steep mountain slope, and share 3.13% to the total provincial area. Due to consecutive erosion, rainy season and season, an effective soil depth becomes shallow at critical ranges, and thus, land conservation is crucially needed.
Deep Fertile Soils, partly Gravely Soils
Soils are the typical alluvial soil that has been developed on the flood plain of the Da, Boi and Buoi rivers. Soils share 2.9% to the provincial area, and at present, paddy is intensively cultivated under irrigated conditions.
Fluvisols
Fertile Deep Black Soils
Soils are also from the alluvium, which is being deposited in valley of Yen Thuy district. Proportional extent of the soils is only 0.8% to the provincial area. Soils are being cultivated with sugarcane as well as paddy intensively.
Peat/Mushy Mushy Peaty Soils
Soils, which are originated from swamp deposition, are developed only in swamp and mushy land in Luong Son district. Occupation of these soils is as small as 0.08% to the provincial area. Soils are being so far not used for economic activities.
Source: Soil Map and statistical data provided by Department of Natural Resources & Environment, Lai Chau、Dien Bien、Son La、Hoa Binh provinces, respectively
Higher elevated and steep mountains occupy almost 85%, the plateaus and fan formations at the foot of
mountains share 13%, and the low-lying plain is only limited to few % of the total study area.
With such above topographic situations, the soils in the study area are broadly classified into three soil
groups, i.e., residual soils that are being developed on the base rock; colluvial soils on the plateau and fan
formations; and alluvial soils in the flood plain along the rivers. These soils have recently been classified
into great soil groups and soil types in conformity with the soil classification system of “Soil Map of the
World” defined by FAO/UNESCO. Most of the soils have no structural development in those bodies, and
thus, firmly compact through over the layers. Accordingly, the soils are capable for construction of
terrace field; also suitable for effective operation of irrigation without serious water seepage losses.
Amongst the soil types classified, deep Oxisols or Cambisols, deep fertile Fluvisols are selected as a
priority soils for reclamation. However, moderately deep Oxisols or Cambisols, moderately deep rocky
Cambisols are also used in a part of the mountain area where no deep soils are available.
4.7 Agricultural Production
4.7.1 Agricultural Sector in GRDP
The agricultural sector in GRDP of the study area is presented in Table 4.7.1
Table 4.7.1 Gross Regional Domestic Product (GRDP) of Agricultural Sector Unit: million VND
Respective ProvincesParticulars Lai Chau Dien Bien Son La Hoa Binh Total
Agric. Production 365,623 620,040 1,371,178 1,200,876 3,557,717-Cereals 252,435 414,196 789,182 768,695 2224,508-Tubers 39,065 40,524 153,177 - 232,766-Pulse & Vegetable 13,419 77,303 16,242 109,352 216,316-A-industrial Crops 24,274 73,932 102 205,889 304,197-P-industrial Crops 33,113 5,048 16,242 9,406 63,809-Fruits 3,214 8,078 116,218 106,334 233,844-Spices & Herb 61 595 280,015 1,202 281,873-Others 42 - - - 42Livestock Production 113,591 171,567 56,2491 426,565 1,274,214Agricultural Services 773 5,719 14,422 3,136 24,050
Total 479,987 797,326 1,948,091 1,630,579 4,855,983Source:Agricultural Statistics of respective 4 provinces,(2006)

4 - 30
The agricultural sector of the study area generated 4.9 billion VND in 2006, of which 73% or 3.6 billion VND were produced by crop production and 26% or 1.3 billion VND were under animal husbandry. Out of crop production, 63% were generated by cereals, 10% by industrial crops, 8% by spices, 7% by fruits 6% by tuber crops, and 6% by pulses and vegetables.
In the study area where it is even having a remoteness, agricultural commercialisation has recently been progressed step by step thereafter liberation of market economy. The following is the current situation of agricultural sector of the study area.
1) In Lai Chau province, arable land is limited to a subsistence extent due to mountains topography in
most part of the provincial territory. The provincial administration attaches a priority not only to
export-oriented industrial crops, e.g. tea, but also achievement of self-sufficiency of food for the
local inhabitant by improving rural accessibility. A special support fund for agricultural development
was provided by the central government in introduction of high-yielding varieties of crops,
improvement of farming practices, intensification of cropping pattern, enlargement of planting
acreage, etc. As a result, the per capita production of rice and maize has increased from 290 kg in
2003 to 350 kg in 2005.
2) In Dien Bien province, the agriculture sector sustains a livelihood of the most 83% of total population
(63,000 farm households or 183,000 persons). The current development program has been
progressed and brought a marketable surplus of rice. Amongst the industrial crops, plantation of
soybeans and groundnut has much been activated, and in 2005, achieved 8,000 ton and 1,400 tons of
production respectively that are almost 4 times of that in 2000. The gross agricultural product then
increased with an annual increment at 5.37%, and highly contributed for activation of the regional
economy in the province.
3) In Son La province, agricultural production pattern is being under amendment from the subsistence
farming to commercialization oriented farming. The agricultural production structure has much
been improved through crop diversification and intensification of crop farming as well as
commercialization of crop product with an intensive supporting assistance in technology (extension
service) and finance (investment). The planting acreages of soybeans and groundnut as well as such
provincial specialties as fruits, tea, coffee, etc. has also been enlarged recently. Accordingly, in near
future, those cash crops would bring much production and then contribute directly to the provincial
economy as well as the farm household economy.
4) In Hoa Binh province, the agriculture sector is the main stay, maintaining livelihood of more than
80% of the total inhabitant. The agriculture sector shares almost 50% of regional GDP, amounting at
VND1,042.8 billion in 2000 at the 1994 constant price bases, and increasing with an annual
incremental rate at 6.7% (or VND289.9 billion per annum). Per capita rice production has been
achieved at 350 kg in the recent year. Accordingly, it has produced a large marketable surplus of rice
every year. A good performance of the above agricultural development is being appreciated as the

4 - 31
results of technical renovation, i.e., “introduction of high-yielding varieties of crops”, “propagation of
appropriate farming practices”, and “practical operation of wide-area plant protection”, etc.
The agricultural development achieved self-sufficiency of Lai Chau and Dien Bien of
remote-cum-mountainous provinces has just achieved food self sufficiency, and subsequently, the
per-capita-GDP in agricultural sector is becoming at a little over than VND10 million level. In contrast, the
said GDP is exceeded over VND105 million in a case of Son La and Hoa Binh provinces where the
provincial area is located near by the great Hanoi city and being directly influenced with advanced
economic activities and/or effect.
4.7.2 Type of Farming
As stated in Section 4.5.2 hereof, there are broadly three types of farming unit in the Study Area, namely,
“Individual Farms” managed by small-holder farmers, “State Farms” managed by the state enterprises or
agencies and “Private Farms” that have been recently established by the private investors.
(1) Individual Farms (small-holder farmers)
The individual farms are further divided into three sub-types of farming, i.e., traditional shifting cultivation
in the higher-part of mountain area; settled farming with terrace field formation; and
intensified-cum-commercialized farming in the floodplain. In a part of the settled farming, farmers are
being diversified cash crops, i.e., tea, coffee, fruits, etc., and challenged commercialization of crop
productions. For all three farming types, it is notable that a land fragmentation is being started through
current generation changes, and the unit land holding size per household is becoming to small at 0.5 to 0.7
ha on an average. According to the “Farmers’ Needs Survey (2003)”, population pressure to the arable
land has been becoming to a serious extent. A size of each farm household is being reduced to 0.32 ha
and 0.74 ha on an average in case of
Red River Delta and North-west
region, respectively. The North-west
region still keep more than double of
farm size than that in Red River Delta,
however, the land productivity is
smaller due to steep mountain
topography and poor soils (Figure
4.7.1).
(2) Agricultural Enterprises
State Farms
All of the state farms except a large
scale sugarcane plantation in Son La
and Hoa Binh provinces have been
0 10 20 30
<0.1
0.1-0.2
0.2-0.3
0.3-0.4
0.4-0.5
0.5-1.0
1.0-2.0
2.0<
Lan Holding Size (ha)
Frequency of Farm Households (%)
North West
Red River Delta
Figure 4.7.1 Land Holding Sizes in Red River Delta and
Northwestem Region

4 - 32
transferred to the local government; and major part of the farms are now under management of the
respective communes. At present, crop production activities from seeding up to harvesting are undertaken
by the individual farmers on the contract bases. Thus, the farm operation in the state farm is practically
the same to the individual farms. Regarding the sugarcane plantation in both Son La and Hoa Binh
provinces, plantation of sugarcane is also being entrusted to the individual farmers. The state farm is
undertaking only a sugar processing work and marketing of the sugar product. Since sugar prices dropped
in the international sugar market, the sugar factory is being obliged to decline the purchasing price of
sugarcane at factory gate. Accordingly, farmers are being much discouraged and broken away from the
contract. As the result, works of the sugar factory has recently been reducing to critical level, representing
at around 40% to the normal working capacity.
Agro-business in Private Sector
In the private sector in the Study Area, the agro-business has recently set up using such local specialities as
tea, fruits, spices, pharmaceutical crops, etc. A part of the enterprises also involve in the reforestation as
well as forest conservation works. Almost all of the private farm enterprises are the joint ventures that are
inviting a foreign capital investment (foreign and domestic capital = 50%:50%). In the current performance
of land registration, the private farm enterprises successfully registered is still limited to 5% to the total
applications.
4.7.3 Major Crops and Predominant Varieties
Crop production activities in the Study Area has been much activated recently especially after adoption of
the Doi Moi policy, and promoted commercialization of the agriculture sector under the policy in
diversification to the socialism marketing economy from the previous planned economy system. Through
the above, it has been achieved crop diversification as well as intensification of the crop production,
successfully. In fact, such industrial crops as soybean, groundnut, sesame, etc. are introduced in addition
to the traditional cereals and tuber crops, and besides, varieties of fruit trees and Arabica coffee are also
introduced in succession to tea, spices, pharmaceutical crops, etc. Major crops growing in each respective
province are as summarized as follows:
(1) Essential Food Crops
Higher-part of Mountains: Mountain Slope: Upland Rice, Maize, Cassava Lower-part of Mountains: Terrace Field: Paddy, Maize, Sweet-potatoes, Cassava Low-lying Plain: Irrigated Field: Paddy, Vegetables
Table 4.7.2 Essential Food Crops and Predominant Varieties
Respective Provinces Crops & Varieties Lai Chau Dien Bien Son La Hoa Binh
Nep Hat Tron Nep Hat Tron LC-95-1 - Upland Rice(Glutinous) Nep Hat Dai Nep Hat Dai Te Meo -
Te Do Te Do Nep Tam - Te Thai Lan Te Thai Lan Nep-87 -
Upland Rice(Ordinary)
93 - 1

4 - 33
Respective Provinces Crops & Varieties Lai Chau Dien Bien Son La Hoa Binh
Vu -352 Vu -352 Vu Mua Paddy(Glutinous) Vu Mua IR-352 IR-64, TH-1 IR-64, TH-1 IR-64 IR-64 Paddy(Ordinary) Khang Don Bac Vu-903 Khang Don VN10 VN10 VN10 LVN-10 Ngo Thu Dong Bio-seeds 9681 DK Thu Dong Bio-seeds 9681 Thu Dong LVN-10 Bio-seeds 9681
Maize
P-11 Sweet-potatoes Local Variety Local Variety KT-2 KT-2 Cassava Local Variety Local Variety Local Variety Local Variety Potatoes Trung Quoc - - -
Note: Vu Dong Xuan-352, Paddy (glutinous) is the same variety to IR-352 Source: Data & Information provided by Agricultural Extension Office, respective 4 provinces
In Hoa Binh area except two mountain districts, cultivation of upland rice has been fully replaced under the
current crop diversification and 5 million ha re-forestation campaign. Most of the land used for upland rice
cultivation has been then shift to orchard, i.e., longan, litchi, mangoes, oranges, etc. In the Region, the food
production especially rice would keep its position as the most important sub-sector in agriculture as well as
the regional economy. Recently, under the “Socio-Economic Renovation Campaign”, the Region has
achieved a high growth rate in food production. These food outputs especially rice and maize has not only
been exceeded a self-sufficiency over the regional demand but also brought a large surplus for
commercialization.
At the household level, however, it is still crucial issue so as to ensure food security especially in the
northern mountainous districts, i.e. Muong Nha, Muong Cha, Tuan Giao, Dien Bien Dong in Dien Bien
province and Phong Tho in Lai Chau province. To this end, the respective provinces should pay utmost
effort for successful set up of crop diversification with introduction of profitable industrial crops, and then,
intensification of such industrial crop production with adoption of a modern farming practices so as to
allow access to an available food even at the individual farm household level...
(2) Major Industrial Crops
Higher-part of Mountains: Mountain Slope: Cotton, Soybean Lower-part of Mountains: Terrace Field: Soybean, Groundnut Low-lying Plain: Irrigated Field: Sweet-potatoes, Soybean, Groundnut
Table 4.7.3 Major Industrial Crops Prevailed in Provinces
Respective Provinces Crops Lai Chau Dien Bien Son La Hoa Binh
Tea Green Tea ● ● ●
Coffee Arabica ● ●
Sugarcane ● ● ● ●
Cotton ● ● ● -
Soybean ● ● ● ●
Groundnut ● ● ● ●
Sesame ● ● - -
Source: Information provided by DARD of each respective 4 province (2006)

4 - 34
(3) Particular Cash Crops
Higher-part of Mountains: Mountain Slope: Spices and Herb Lower-part of Mountains: Terrace Field: Fruits, Tea and Coffee Low-lying Plain: Irrigated Field: Vegetables and Herb
Table4.7.4 Major Cash Crops Prevailed in Provinces
Respective Provinces Crop Species Kind of Crops Lai Chau Dien Bien Son La Hoa Binh
Mango ● ● ● ●
Banana ● ● ● ●
Pineapple ● ● ●
Citrus ● ●
Litchi & Longan ● ●
Apricot ● ●
Orchard
Plum ● ●
Spices Cardamon
Mulberry Tree ● ●
Cabbage ● ● ● ●
Chinese Cabbage ● ●
Lettuce ● ● ● ●
Green Mustard ● ● ● ●
Dry Onion ● ● ●
Green Onion ● ● ● ●
Carrot ● ● ●
Tomatoes ● ● ● ●
Cucumber ● ● ● ●
Egg-plant ● ● ●
Cauliflower ● ● ●
Broccoli ● ● ● ●
Pumpkin ● ●
Green Peas ● ● ●
Vegetables
String Beans ● ●
Rose ● ●
Chrysanthemum ● ●
Gladiolus ●
Gerbera ●
Cut-flower
Lilies ●
Source: Information provided by Extension Office, DARD of respective 4 provinces
4.7.4 Typical Cropping Pattern
As it has been stated in the preceding Sections, crop diversification as well as intensification of crop
production has been well progressed in the low-lying plain and its peripheral mountain foots where soil and
topographic conditions are favourable for farming, and also good support is available in transportation and
communication service system. Commercialisation of crop products is also being gradually performed in
the local market, and more or less, contributed to the farm household economy.
The typical cropping patterns have been prepared on the bases of the crop information provided by the
agricultural extension officers as well as crop production in charges in the respective provinces as
illustrated in Attachment 4.3. The typical cropping patterns demonstrate the most popular season of each
crop, crop prevailed area, crop planting acreage (ha) and its proportional extent (%), working days to be
required in essential farming practices, etc. As it has been classified the farming types in the preceding

4 - 35
Section 4.7.2, there are three farming types, i.e., shifting farming (cultivation) in higher-pert of mountains,
settled farming with terrace field formation in the lower-part of mountains, and intensive paddy cultivation
with irrigation in the low-lying plain. These three farming types are characterised by the specific crops
that are, area by area, introduced under crop diversification campaign. For instance, upland rice, maize
and cassava are the staple crops in the higher-part of mountains. Amongst 4 respective provinces,
plantation of “cardamon” is distinctive in the said farming type of mountain area especially in Lai Chau
province.
In case of the lower-part of mountains, rice production has been diversified from upland rice to paddy, and
besides, such industrial crops as soybean and groundnut are being introduced as an important cash earning
sources. In this area, sweet-potatoes are also introduced as a complementary crop to cassava which has a
long growing term (more than one year) for maturation. Other than the said annual crops, such perennial
crops as tea, coffee, fruits, etc. are also grown under crop diversification campaign. The area-specific
characteristics especially in the cash crop production are basically depending on accessibility to the central
market. Namely, farmers in Son La and Hoa Binh province get an advantage for access to the great Hanoi
market, and accordingly, grow fruit tree and vegetables. In contrast, tea plantation has been much
activated through border-trade with China in case of Lai Chau province.
In the low-lying plain, double cropping of paddy has been popularised under irrigated conditions. Besides,
vegetable is growing as the secondary crop especially in the winter season. In case of Hoa Binh province,
farmers also grow “cut-flowers” and “dwarf trees” for Hanoi market, and earn the secondary income for
their livelihood following to the crop production.
4.7.5 Farming Practices
The farming practices prevailed in the study area are still at traditional and extensive methods, except
advanced technology adapted to such commercialised crop production as cut-flowers, vegetables, spices,
etc. As for operation and management of the plantation farming on tea, coffee, sugarcane, etc., an
improved farming technology is being adopted through learning from the advanced countries. However,
those technologies are not all applicable to the local conditions of the study area.
In general, farmers purchase “good seeds (improved varieties and/or hybrid)”for production of paddy,
industrial crops, spices, herbs, etc. However, due to traditional farming practices and poor farm
management in most of farming cases, farmers could not obtain high enough yield of crop, and more over,
being affected by big field losses and poor quality of product. Table 4.7.5 demonstrates how the local
farmers carry out field works in the prevailed farming practices.

4 - 36
Table 4.7.5 Farming Practices Prevailing in the Study Area
Farming Practices Tools & Equipment Working Power Remarks Ploughing & Harrowing
Hoe Plough
Man-power Animal-power
Higher part of mountain Lower part of mountain & plain
Puddling & Levelling
Soil-puddler Animal-power Paddy cultivation in lower part of mountain & plain
Sowing Man-power For all of the annual crops Transplanting Man-power Paddy cultivation in lower part of mountain & plainWeeding Hoe Man-power For all of the annual crops (use of rotary-weeders is
so far to limited cases). In a case of paddy cultivation in the plain area, herbicides are used regularly, at present.
Plant Protection Knapsack-sprayer Man-power Use of agro-chemicals is only to the limited area where road system has been developed.
Harvesting Sickles Man-power Sickles are used only for rice harvesting. Other crops are harvested by hand.
Threshing Power-thresher Cereal-beater
Diesel Man-power
Power-thresher is used only in the area where road system has been developed. Beat-threshing is predominant practices in most area.
Drying & Cleaning Drying yard Grain-dryer
Man-power Coal & Husk
Sun-shin drying in house yard Power-dryer still has a problem how to supply fuel steadily.
Source: Observation by JICA Study Team (February to June 2007)
As seen in Table above, the agricultural production in the Region is being made mostly using the “internal
producers’ goods (inputs)”, inclusive of family labour force, animal power, and farming implements and/or
tools. Use of the “external producers’ goods (inputs)” such as seeds, chemical fertilizers and
agro-chemicals, machinery and/or equipment are limited only in the area where road network has been
consolidated favorably for transportation of the said goods.
(1) Farming Tools and Equipment
In the study area, the farm mechanisation has been progressed only in the sugarcane plantation in the state
farm. Farm tractors that have more than 45HP are being used for soil-ploughing and harrowing work and
transportation means for harvested cane to factory.
In the private farms, farm mechanisation is not so popular up to present. Hand-tractors and power-threshers
are available in villages, but practical use in farming is so far limited to a small extent where village road is
networked favourably. In case of paddy cultivation, use of water-buffalos is predominant for doing
soil-ploughing and puddling works. For upland cropping, however, majority of farmers plough soils by
use of handy hoes. As it has been demonstrated in Table 4.6.5, most part of crop cultivation is practised
by hand using the traditional simple-tools/implements. Accordingly, working efficiency of each farming
practice is as low at subsistence level.
In most cases, farmers dry the harvested product in the sun. Since the sun-shine hour is as short as 5 hrs per
day or less in most months, drying efficiency is not all able to satisfy. In taking countermeasure to the
above end, the power-dryers have been prevailed in some communes for drying paddy and maize grains,
cassava chips, etc. However, in steady supply of fuel is a critical constraint in operation of the said
power-dryers.

4 - 37
(2) Seeds
In Vietnam, seed is produced by variety of organisations and/or agencies, such as “agricultural university”,
“research institutes”, “central and provincial seed agencies” and “private seed companies”. The research
institutes not only breed varieties of crops but also multiply seeds, and sell seeds directly to farmers.
Similarly, the central and provincial seeds agencies produce all categories of seeds. To the above end,
only limited testing is conducted by the “National Centre for Variety Evaluation and Seed Certification
(NCVESC)”. The seed producer, with no external verification, thus carries out self-certification.
Repackaging of seed by seed dealers further reduces a confidence of farmers. Due to the above problems,
use of the purchased seeds is becoming small.
In Lai Chau province, there are no seeds and/or nursery farms. Accordingly, farmers purchase all of the
seeds and seedlings from other provinces. The seeds purchased annually are as summarised in Table 4.7.6
here below. Farmers in Lai Chau have no technology for processing their own seeds and seedlings, so far.
Table 4.7.6 Annual Seed Use in Lai Chau Province unit:kg
Crops Seeds Procured Crops Seeds Procured Paddy 149,500 Soybean 10,240 Maize 2,757 Groundnut 11,100 Sweet-potatoes 2,000
Source: Agricultural Statistics in Lai Chau province (2005)
In Dien Bien province, there are two seeds companies, i.e., “North-west Forest Seeds Enterprise” and
“Dien Bien Agricultural Seed Company”. These companies have a dual functions for processing own
seeds and trade and marketing services on the external seeds. For instance, the Dien Bien Agricultural Seed
Company produces 500 tons of paddy seeds, 65 tons of maize, 117 tons of soybeans and 12 tons of
groundnuts. The company handles 900 to 1,000 tons of seeds annually, of which about 70% is of the own
seeds and remaining 30% is of the external seeds. For propagation of the “high-yielding variety of crops”,
the subjected crops or varieties and related farming technology are demonstrated in the technical
demonstration farm plots which will be established in the village area and operate/manage through
inter-cooperation amongst DARD, key farmers and seeds company.
In Son La province, numbers of seed farm and nursery have been established and extending seeds supply
services to farmers under management of provincial DARD (Table 4.7.7).
The state government has recently shared VND437.4 million to the cereal seed farms using the special fund
for relief poor provinces, and accordingly, the seed producing function in the said seed farms is being
reinforced, successfully and satisfactorily.

4 - 38
Table 4.7.7 Seed Farm & Nursery in Son La Province
Seed Farm & Nursery Locations
(Nos.) Farm Size
(ha) Remarks
10 2000 m2for preparation of graft-seedlings
322 For production of bamboo seedlings(Chinese & Taiwanese Bamboo for green shoot production)
Nursery for Forest Trees
10
100 Bamboo seedlings for native variety Nursery for
Agro-Forestry 10 200
Tea (Maca Chinese Tea), Coffee (Arabica) & Fruit Trees Production capacity is 10-15 million seedlings per year
Nursery for Fruit Trees 5 50 Nursery of major fruit trees is available.
Seed Farm 7 Possible to supply Maize (LVN-10) 500 ton & Paddy (Bac Vu-903) 100ton a year
Source: Data provided by DARD, Son La province(2005)
In Hoa Binh province, the seed centre was established under management of the provincial DARD, and
undertakes seeds/seedlings processing and supply services. A few private seed companies also extend
their commercial seed services. For propagation of the “high-yielding variety of crops”, the provincial
DARD first organises the technical training courses for the extension workers. DARD also assist district
and/or commune offices for establishing the technical demonstration farm plots for demonstrating the
subjected crops or varieties and related farming technology. Besides, the provincial government issues
subsidy for purchasing the seeds, chemical fertilisers, agro-chemicals, etc. For instance, the subsidy granted
in 2004 is VND8.3 billion for assisting procurement of the farm inputs without discrimination.
The seed supply in all provinces includes the hybrid seeds of paddy and maize which are imported from
China. Those hybrid varieties of paddy and maize are being prevailed entirely in the respective 4
provinces. Since no specific cultivation technology is propagated properly, majority of farmers grow
hybrid varieties of paddy and maize without application of fertilizers, at present. In fact, in spite of
widespread use of hybrid seeds, paddy yields have been stagnated and maize yields are as low at 1.7 ton/ha
on an average in the mountain slope, and 2.7 tons/ha in the advanced plain area.
(3) Fertilizers and Agro-chemicals
To use of such external producers’ goods as chemical fertilisers, agro-chemicals, etc. (Table4.7.8), the local
government provides technical orientation as well as workshop for transfer of related technology to farmers.
In reality, however, practical users are only limited to an advanced area where road system has been
developed favourably. In fact, the total consumption of chemical fertilisers is as small as 2,000 to 4,000
tons a year even though the government subsidizes transportation of fertilisers.
Table4.7.8 Use of Chemical Fertilizers
Unit: ton Fertilizers Lai Chau Dien Bien Son La Hoa Binh Total
N-Fertilisers 2,300 3,760 2,950 4,120 13,130 P-Fertilisers 2,730 2,930 1,840 4,890 12,390 K-Fertilisers 290 910 190 790 2,180 NPK Compound 2,300 210 - 500 3,010
Total 7,620 7,810 4,980 10,300 30,710 Source: Agricultural Statistics of respective 4 provinces (2006)

4 - 39
For plant protection works, the “Integrated Protection Management (IPM)” has been organised in each
commune and village, and has been functioning for operating systematic plant protection in wide area
under the technical supervision of the expert in charge in the provincial DARD (Table4.7.9). Fortunately,
it was no outbreak of insects, pest and diseases up to present, and no experience in taking IPM action.
Table 4.7.9 Use of Agro-chemicals
Unit: kg Agro-chemical Lai Chau Dien Bien Son La Hoa Binh Total
Fungicides 9,240 11,600 1,190 22,030 Insecticides 3,640 4,000 240 7,880 Herbicides 5,040 3,400 - 8,440 Rats bane 20 5,600 - 5,620 Plant Hormone 150 - - 150
Total 9,000 18,090 24,600 1,430 44,150 Source: Agricultural Statistics of respective 4 provinces (2006)
4.7.6 Present Conditions of Major Crop Production
The present conditions of major crop production in the Region could be grasped using the agricultural
statistics of each province covering the years from 2000 to 2005.
(1) Food Crops
Upland rice is a particular food for the local people in the higher-part of mountains. Even though upland
rice especially of the glutinous varieties is generally recognised as low productive crop (one ton/ha or
around), the local farmers are being grown it widely in the mountain slopes. In case of Hoa Binh province,
upland rice cultivation has been recently diversified to fruits production under promotion campaign on
agro-forest plantation.
Paddy is being regularly cultivated as the staple crop in the low-lying plain. With performance of
irrigation development, double cropping of paddy is popularised in the plain area. In the lower-part of
mountains, farmers have diversified the staple crop from upland rice to paddy as much as terrace field is
prepared in success. Paddy is grown successfully under the rain-fed conditions during the month period
from mid-May to mid-October, and being brought production with a reasonably high yield at 2 to 3 tons/ha.
In the plain area, farmers achieved paddy yield at 4 to 5 tons/ha under technically advanced conditions,
inclusive of irrigation, fertiliser and agro-chemical application, weeding by use of herbicides.
Maize is the staple crop in the upland field, and accordingly, being shared wider acreage amongst the crops
introduced in Region. Recently, many farmers challenge to grow hybrid maize, and achieved higher yield at
2.5 ton/ha on a regional average. In reality, however, a large increment of maize yield is only observed in
Son La and Hoa Binh where infrastructure development has been progressed well in success. In contrast,
maize yield in Lai Chau and Dien Bien is still low at subsistence level (Table4.7.10).

4 - 40
Table 4.7.10 Planted Area, Yield and Production of Staple Food Crops
Respective Provinces Crops Particulars Lai Chau Dien Bien Son La Hoa Binh
Paddy Planting Acreage (ha) 21,221 21,925 24,496 41,814 Yield (ton/ha) 3.91 4.67 4.55 4.39 Production (ton) 83,028 104,279 111,354 192,216Upland Rice Planting Acreage (ha) 9,293 18,102 14,534 0 Yield (ton/ha) 1.04 1.16 1.16 0 Production (ton) 9,694 23,257 16,848 0Maize Planting Acreage (ha) 15,945 25,524 80,903 33,872 Yield (ton/ha) 1.79 1.75 2.83 2.72 Production (ton) 28,574 49,066 228,030 96,778Sweet-potatoes Planting Acreage (ha) 611 713 613 4,927 Yield (ton/ha) 5.29 2.93 5.95 4.38 Production (ton) 3,232 2,940 36,450 23,893Cassava Planting Acreage (ha) 5,524 7,167 10,806 10,711 Yield (ton/ha) 7.63 6.97 10.80 8.50 Production (ton) 42,129 51,796 192,271 102,060
Source:Agricultural Statistics of respective 4 provinces,(2006)
(2) Industrial Crops
As far as tea and coffee plantations are concerned, processing technology and facilities have been available
and functioning enough for practical processing of the product and its marketing. In Son La and Hoa Binh
province areas, sugarcane was previously grown as the main product of the state farms. At present,
sugarcane is grown by individual farmers under the production contract between farmers and the state farm.
The cane yield is favourably maintained as high as 54 ton/ha on an average through provision of advanced
services of the state farm in technical extension, supply of seedlings as well as fertilisers, etc. In case of
Lai Chau and Dien Bien province, sugarcane is grown in a small area mainly for the local consumption.
(Table 4.7.11)
Table 4.7.11 Planted Area, Yield and Production of Major Industrial Crops
Respective Provinces Crops Particulars Lai Chau Dien Bien Son La Hoa Binh Tea Planting Acreage (ha) 4.176 199 4,144 - Yield (ton/ha) 1.80 1.17 4.96 - Production (ton) 4,126 138 20,553 -Coffee Planting Acreage (ha) - 323 2,866 Yield (ton/ha) - 2.06 1.05 Production (ton) - 347 3,022 Sugarcane Planting Acreage (ha) 176 85 3,468 6,589 Yield (ton/ha) 43.56 22.21 43.96 54.92 Production (ton) 7,666 350 152,436 389,275Cotton Planting Acreage (ha) 759 813 1,769 0 Yield (ton/ha) 0.45 0.56 0.89 0 Production (ton) 341 787 1,580 0Soybean Planting Acreage (ha) 1,682 8,509 12,093 2,185 Yield (ton/ha) 0.80 1.10 1.12 1.28 Production (ton) 1,344 10,590 13,549 3,178Groundnut Planting Acreage (ha) 1,053 1,276 1,453 4,599 Yield (ton/ha) 0.87 0.90 0.83 0.81 Production (ton) 920 1,267 1,206 3,736Sesame Planting Acreage (ha) 89 54 Yield (ton/ha) 0.33 0.43 Production (ton) 29 23
Source:Agricultural Statistics of respective 4 provinces,(2006)

4 - 41
Production of cotton and sesame is made mainly for the local consumption except Son La. Cotton
cultivation in Son La has recently been promoted by the private cotton company for textile fabrics. Since
most farmers have not enough working capital, cotton and sesame are grown without application of
fertilisers. Accordingly, yield of both crops is as low at subsistence level.
Soybeans and groundnut are produced as an edible oil resource and for practical commercialisation.
Recently, plantation acreage of these two crops has been increasing, year and year, successfully. However,
yield of both crops is as low at subsistence level since the cultivation technology is not guided satisfactorily.
To achieve a reasonably high enough yield, it shall be essential and crucially needed to clarify the best
applicable planting spaces as well as an economic dosage of fertilisers through practical field experimental
works.
(3) Other Cash Crops
All of the perennial tree crops are being traditionally grown in Region since long years ago. Recently,
under the agricultural commercialisation campaign, the local government has paid utmost effort for
refreshing the varieties to improve a quality of product to be applicable to the practical trade. Most of
trees are young at this moment, and accordingly, yield in unit acreage is still limited to a small quantity for
marketing. However, these trees would be growing up to maturation stage within a few years. (Table4.7.12)
Table 4.7.12 Planting Acreage, Yield & Production of Essential Cash Crops
Respective Provinces Crops Particulars Lai Chau Dien Bien Son La Hoa Binh Cardamon Planting Acreage (ha) 2.338 0 Yield (ton/ha) 0.40 0 Production (ton) 359 0Litchi & Longan Planting Acreage (ha) 203 13,498 Yield (ton/ha) 2.37 2.76 Production (ton) 630 37,304 Mango Planting Acreage (ha) 4,217 Yield (ton/ha) 2.59 Production (ton) 10,942 Citrus Planting Acreage (ha) 226 Yield (ton/ha) 2.71 Production (ton) 573 Apricot Planting Acreage (ha) - - 901 Yield (ton/ha) - - 3.71 Production (ton) - - 3,343 Plum Planting Acreage (ha) - - 2,686 Yield (ton/ha) - - 6.47 Production (ton) - - 17,378 Mulberry Planting Acreage (ha) - - 357 - Yield (ton/ha) - - 7.11 - Production (ton) - - 2,541 -
Source:Agricultural Statistics of respective 4 provinces,(2006)
Regarding the post-harvesting process on the spice production (Cardamom), establishment of “green-fruit
drying function (power-dryer)” is indispensable so as to dry the harvested green-fruits
promptly-cum-timely with in short hours. As for the post-harvest-handling of the fruits, it is essential and
crucially needed to establish such marketing supporting function as cold stores and such primary
processing factories as dry-fruit, syrup-preserving fruit, jam, juice, fruit-wine, etc. for sustaining

4 - 42
smooth-cum-effective marketing, and then, achieving successful commercialisation of the subjected
product.
4.8 Institutional Supporting Services in Agricultural Sector
4.8.1 Farmers Organization and Agricultural Cooperatives
(1) Lai Chau Province
In Lai Chau province, there is a Farmers’ Union organised as a branch of the Vietnam Farmers’ Union
(VFU). The Farmers’ Union established in each administrative stratum, i.e., Commune Farmers’ Union,
District Farmers’ Union, and Provincial Farmers’ Union. Besides, the Union also has Youth Union and
Women Union as an internal structural function for group and/or gender activities. Participation to the
Union is allowed thereafter 18 years old, and need permission from the executive committee of the Union.
District Farmers’ Union have currently worked quite well especially on implementation of the
socio-economic development schemes, inclusive of village development, road construction, irrigation and
electricity service, preservation of breeders, supply of farm inputs, etc. Some of NGOs is being extended
technical assistance and guidance to these activities. The essential purposes of Unions’ activities are (i) to
raise technical features of each farmer and build up capacity to activities; (ii) to eradicate poverty in farm
households; and (iii) to improve and rise up living standard of farm households. Other than the above
Union, there are 5 formal units of farmers’ organizations in the province:
i) Production oriented co-operative 2 units Irrigation O&M and inputs supply ii) Multipurpose co-operative 2 units Supply of farm inputs and technical
extension services iii) Civil & electricity service co-operative 1 unit Contract services on civil work and
works in electricity supply
(2) Dien Bien Province
In Dien Bien province, there is a “Farmers’ Union” that has been organised as a member of the VFF. The
Farmers’ Union established in each administrative stratum, i.e., Provincial Farmers’ Union, District
Farmers’ Union (8 units), and Commune Farmers’ Union (88 units). Besides, the Union has recently
promoted to organise the Sub-union at each village, and up to present 1,405 Sub-unions was established in
total and participants increased to 44,854 farmers that is equivalent to 32% of the total farmers. The
essential purposes of Unions’ activities are practically the same to VFU as organised in Lai Chau province.
Other than the above VFF, there are 64 units of Water Users’ Association which have been organised under
irrigation project assisted by EU. Besides, it has also been organised 73 groups of farmers; 15 agricultural
co-operatives, and more than 1,000 of the rural credit oriented groups in the entire province.
(3) Son La Province
In Son La province, the Farmers Union in direct descent from VFU has been organized as the same to Lai

4 - 43
Chau, and takes activities in the province as well as in the respective districts and commune areas. Other
than the Unions, there are 1,506 units of farmers’ organizations in the entire province either those are
formal or informal units. The Water Users Association has also organized at least one unit in every
communes.
(4) Hoa Binh Province
In Son La province, the Farmers Union of VFU descent as the same to Lai Chau and Son La has been
organized, and takes similar activities in the province as well as the respective districts and communes.
Besides, there are lots of agricultural co-operatives and water users’ associations in the entire province
though majority of them are still on the informal units.
Either formal or informal organization units, the farmers’ organizations have the following problems and/or
constraints in those operation and management of the business activities:
1) Lack of persons who have a capable talent and/or skill for taking leadership 2) Lack of knowledge and technical skill for taking executive works in operation and management of
the co-operative activities 3) Lack of facilities, equipment and other related functions for operation and management of the
co-operative activities 4) Lack of information to be required for maintaining the co-operative activities, such as new
production technology, trade and marketing of the commodities, etc. 5) Lack of capital fund for taking action and business
4.8.2 Agricultural Research and Extension Services
(1) Agricultural Research
Vietnam has recently achieved self-sufficiency of food, and shifted one’s position to rice export to the
international market as the second largest rice exporter. In contrast, however, it is essential and crucially
needed to pay continuous efforts to exploitation of new technology for maintaining sustainable food
security as well as rural economy through further activation of agricultural commercialization. To this
end, it has been focused on the following aspects (refer to Master Plan for Reinforcement of Agricultural
Research & Experimental Services Activities).
1) Unit yields of agricultural products, especially of staple food crops are stagnated, and an effectiveness
of applied technology and financial investment (irrigation, farm inputs, labour works, etc.) is being
balanced at a lower level, and as the results, production increment is becoming to a small extent.
Comment:
The above article caught only a surface of the present conditions of the crop production, shallowly,
and accordingly, not directly applicable to the the Region. In fact, there are many positive problems
for improvement even in the farming practices, for instance in paddy cultivation;

4 - 44
i) Planting system be shift to transplanting method from direct seeding method,
ii) Diversify the plant spacing to control adequate seedling population from the present dense seedling
population,
iii) Planting the most active seedlings (18 to 20 day ages or 4 to 4.5 leaf stage),
iv) 4-split application of fertilizers at the most essential growing stages,
v) Use of appropriate farming tools, etc.
If the above problems are solved properly, rice production could be increased more than double to the
present conditions.
For proceeding technical improvement or development as regards the production practices/technology for
all of the diversified crops, there are two essential ways, namely:
- Technical improvement without (or to be not required) capital investment but crucially need
“changing mind” of the local farmers; and
- Technical improvement/development with (or to be required) capital investment for facilitating
to achieve the subjected target.
Amongst the farming practices and those related technology, the nursery preparation and planting works are
the most essential key points for doing improvement of the present crop production. Even without capital
investment, improvement of the farming practices would be effective enough for maintaining crop yield at
reasonable level, and contributable to a financial amendment of the farm budget.
2) People of Vietnam are being successfully improved ones’ living standard in performance of the
socio-economic development, and in the said ways, it has been changing ones’ favourite on food from
the traditional simple product to sophisticated product, i.e. low-fat meat, quality fruits and vegetables,
etc. A demand of such favourite food is also increased on a way where the marketing system is
diversified from the traditional trade to a trade with large quantity unit in super-market, etc.
Comment:
To cope with the above demand, it should improve farming practices on crop production and/or
fertilisation practices on livestock. Introduction of favourable varieties of crops and livestock is
indispensable counter-solution, accordingly.
3) Rice has become a staple product for exportation. To maintain a reasonable export prices for rice, it is
required to keep high enough quality and quantity since most Asian countries also achieved or nearly
achieving self-sufficiency of rice, and rather over supply of rice in the international rice market, at
present. Thus for producing the exportable rice continuously, it is crucially needed to breed new rice
varieties to be favourable for international trade as well as to improve farming practices for not only
maintaining a quality of product but also favourable balance I farming economy.

4 - 45
Comment:
At the first step, the farming practices for rice production should be satisfied through practical field
experimental works. To maintain bargain force in rice trading field, it is also essentially needed to
achieve reasonably high enough land productivity of paddy field through consolidation of farm plots as
well as intensification of cropping using the diversified cash crops.
4) Since food supply conditions has been secured successfully and satisfactorily, it should control
planting acreage of paddy. To this end, paddy so far planted in unfavorable area should be replaced,
and diversify to more suitable-cum-profitable industrial crops
Comment:
In case of the Region, upland rice and maize should be cultivated within the gently slope land and/or
plateau, and steep slope land should put under conservation measurement, such as reforestation, fruit
tree plantation, bamboo plantation, etc. To this concern, it is recommendable that mulberry plantation
and then promote sericulture would be one of the promising scheme specifically applicable to the
Region.
5) Under the promotion campaign on farm inputs utilization, consumption of the chemical fertilizers and
agro-chemicals are being gradually increasing, year and year, even in the Region, and as the results, the
natural environment especially in the eco-river system is now facing a hazardous contamination.
Accordingly, an eco-balance study as well as monitoring on farm input utilization should be
programmed on and execute promptly.
Comment:
The subjected area (the Region) is located at the most upper-and middle-leaches of the Red River Basin
that shall be a function for reserving the water resource for the great Hanoi city. Accordingly the
water reservoir should keep free from the hazardous contamination even in a small part. Thus, to
maintain the eco-system and making eco-balance between the natural environment and agricultural
activities, satisfactorily and successfully, it should establish the specific crop production system and
achieve production of a clean-cum-safe crop product using only the internal producers’ inputs and
natural resources available within the Region. Promotion of resources-cycle-utilization farming,
which is practically use of the by-products of crop production, is highly contributable not only to effect
for crop/soil fertilization in paddy cultivation but also upland crop production increase, livestock,
poultry and fishery development, e.g., by returning straws and husks to uplands field as organic manure
and/or mulching materials, and by feeding livestock, poultry and fishes with bran and fine broken rice,
etc.
The Region plays an important role as one of the principal sources of domestic water supply for Hanoi
and other urban centers. Therefore, special attention should be paid to water quality control by
appropriate use of chemical fertilizers and biocides through improvement of farming techniques. In
Vietnam, the on-farm cycle management of organic matters so-called the VAC system is widely known.

4 - 46
VAC is the abbreviation consisting of Vietnamese letters, i.e. Vuon (Garden), Ao (Pond) and Chuong
(Stall). At individual farm level, recycle of organic matters are practices among vegetable gardening,
animal husbandry and fish pond in order improve food security and farm family income. The VAC
system also encourages effective use of organic matters such as by-products of crops and barnyard
manures for promotion of organic agriculture in Vietnam.
(2) Agricultural Extension Services
Previously in Vietnam, the agricultural extension services to farmers were being undertaken by the Peoples’
Corporation one’s-self for maintaining crop production within its administrative territory. After structural
break-up the Peoples’ Corporation, the agricultural extension services system was fully stopped and
suspended its function till 1992. The present agricultural extension service system was then established
newly in conformity with the “Ordinance 13-CP” issued on March 1993. The followings are the present
conditions of the agricultural extension services structures and its staffing.
Table 4.8.1 Employment of Extension Staff in Each Service Unit (unit: persons) unit:persons
Respective Provinces Extension Service Units Lai Chau Dien Bien Son La Hoa Binh Provincial Extension Centre 20 17 36 18 District Extension Office 32 42 50 110 Commune Extension Office 75 81 218 214
Total 125 140 304 342 No. of Farm Households/Ex-staff 392 471 483 363
Source:Agricultural Statistics of respective 4 provinces,(2005)
Recently, the government has pursued restructuring of the administrative organisation and its staffing, and
being under elaboration about privatisation of the technical services, in which it is scheduled to invite
“volunteers” for staffing and apply a “reward system” in the technical services. Accordingly, it is
untouchable to reinforce staffing for the present service system (Table 4.8.1).
In the study area, a presence of agricultural extension agencies is limited only 66% to the total communes.
The extension agencies are the extension workers who are employed by each commune at the
temporary-cum-short term contract bases. Commune could not employ more than one. Majority of these
extension staff are not specialised as agricultural technician or agriculturalist; however, being entrusted to
undertake mostly field inspection works, such as (i) growing conditions of each crop, (ii) seasonal
appearance of insect and disease influences, (iii) climatic disaster and damages of properties, etc. Practical
agricultural extension services are unfortunately absent in all the cases. Farmers contact with their
commune extension agents irregularly at the rate of once to twice a year.
In the provincial DARD, the agricultural extension officers are also not directly engaging in the extension
services, but concurrently hold two or more service jobs in usual. Eventually, the specialised extension
staff is not all assigned as the extension officer in charge.
The Provincial Agricultural Extension Centre (PAEC) organises a short-term training courses 5 to 6 times a
year for the extension staff of district and communes. The Department of Agricultural Extension (DOAE)

4 - 47
of MARD provides technical and administrative supervision services to this end. In close collaboration
with Farmers’ Union, Youth Union, Women’ Union, etc. the district extension officer, who got training
courses in the above, establish the “technical demonstration farm plots (TDFP)” and demonstrates
subjected farming technology to propagation. In reality, however, establishment and then operation of the
said TDFP is not equal to the scheduled plan in most cases due mainly to a lack of fund as well as shortage
of technical knowledge and experiences.
It has been recognised that the agricultural extension services should be in onerous, and thus, the
beneficiaries be liable for the cost of services that are provided either by the officers, researchers or
extension workers. At present, a salary paid by the local government to the extension staff is
VND300,000 to 500,000 per month. Accordingly, the extension staffs are much discouraging in deal with
the said poor financial situations. The followings are the present constraints and/or problems lying in the
practical operation and management of the agricultural extension services:
1) Shortage of extension staff:
As stated in the preceding paragraph, the government is now under restructuring of the local
administrative organization and its staffing. Therefore, it is difficult to reinforce extension staffing at
this moment. To this end, the government is being elaborated about a plan on privatization of the
technical services, including such idea as “employment of volunteers for staffing” and “application of
reward system to the technical services”. Practically, no persons who own technical knowledge and
skills for the extension services are available in the local area. Thus, the said privatization plan
should review more precisely before step forwarding to execution.
2) A lack of incentives for extension services:
A lack of reasonable incentives for the extension services; as stated in the preceding paragraph, the
monthly rate of salary to the extension staff is abnormally small at subsistence level at this time. The
budget allocation to such related cost as transportation, communication, hotel accommodation
allowance, etc. is also negligible small. For instance, the staff own motor-cycle shall be used for
movement on field services; to this end, budget is allocated only for fuel supply but covering not fully
for the total requirement. With such poor incentives, the extension staff never contact with a poor
farmers, but frequently approaching to the rich farmers.
3) A lack of adequate agricultural technology and skill of extension staff
In performance of the current crop diversification campaign, it has appeared a deep gap (or mismatch)
in between the own technology of extension staff and the technical demand of the beneficiaries. To
cope with the said trouble, the provincial DARD organised the technical training courses for the
extension staff; however, the transferred technology has been old enough and not sufficiently effective
in many cases . On the contrary, it is highly required to introduce fresh technology, up-dated
marketing information, processing technology, etc. so as to properly manage the commercial operation
of the crop production under the marketing economy.

4 - 48
4) A lack of state budget for agricultural extension services:
At present, the extension services that are provided by the state government are too short to the total
demand of services. These short portions are then supported by the informal sectors, such private
organisation as Farmers’ Union, Youth Union, Women Union, agricultural co-operatives, private
agricultural enterprises, etc. In case of the private agricultural enterprises, the technical extension
services is extended as a part of the commercial activities, and directly provided to the beneficiaries
but limited only to the subjected crops production under the contract with the enterprises.
Other than the above, someone NGO also extends the services and either directly or indirectly assists the
beneficiary farmers. For instance, Helvetas from Switzerland is being worked at Hoa Binh, and SNV from
Netherlands is extending the extension technology at Son La, Lai Chau and Dien Bien.
4.8.3 Agricultural and Rural Credit Services
There are several credit organizations serving in rural areas. These are Vietnam Bank for Agriculture and
Rural Development (VBARD) established in 1990 as a formal credit organization for agriculture
development, and Vietnam Bank for Social Policies (VBSP), which is the former Vietnam Bank for the
Poor (VBP), and started its operation in 2003.
VBARD has 91 branches and 513 district service points and recently opened service points at commune
level. VBARD is preparing to sell shares to the public by the end of 2008 and expected to become a joint
stock company. VBSP took over operation of its predecessor VBP financing for the poor. VBSP has 64
provincial branches, 597 district service points, and 8,076 transaction points in communes. VBSP also
provides support for job creation activities by small-scale enterprises and financial support for tuition fee
for the poor children. The table below presents lending performance for the last five years for VBARD
and VBSP of Dien Bien Branches and shows that loan for the poor has been transferred from VBARD to
VBSP since 2003.
Table 4.8.2 Last Five Years Performance of VBARD and VBSP Dien Bien Branches
Source: Hearing at VBARD and VBSP Dien Bien Provincial Branches, August 2007.
VBARD Dien Bien Branch 2002 2003 2004 2005 2006 Total Lending Amount (Million VND) 415,111 569,668 538,769 706,237 833,933
Total Repayment Amount (Million VND) 322,869 516,579 742,448 694,064 781,598
Total Number of Borrowers 32,562 31,426 22,650 25,858 25,287 Share of the Poor Borrowers defined by MOLISA Standard 36% 22% 7.80% 0 0
VBSP Dien Bien Branch 2002 2003 2004 2005 2006 Total Lending Amount (Million VND) 62,360 48,136 108,558 129,411 140,172
Total Repayment Amount (Million VND) 46,011 42,960 33,489 49,100 61,740
Total Number of Borrowers 16,520 17,428 17,545 16,500 17,462 Share of the Poor Borrowers defined by MOLISA Standard 100% 100% 100% 100% 100%

4 - 49
In Dien Bien Province, VBARD has 5-6 times of lending amount of VBSP. Nationwide, VBARD has
capital of 267 trillion VND, while VBSP has about 5 trillion VND. In terms of capital amount, VBARD is
overwhelming. However, VBSP plays very important roles in lending to the poor in Northwest Region,
where the poverty rate exceeds 60%.
While the lending amount grew double in the past five years for both VBARD and VBSP, total number of
borrowers has not been drastically changed. This indicates increase in lending amount per cusotomer.
MOLISA’s poverty definitions are revised according to national economic growth and inflation rate and the
povery line tends to be raised nationwide. Thus, potential number of poor households entitled for VBSP
lending services is expected to increase in Northwest Region where economic growth rate is relatively
lower than in the other region, since poverty rate in the region is more likely to go up due to the revision of
poverty definition by MOLISA.
The followings are lending conditions and procedures of VBSP.
VBSP Lending Condtions for the Poor Household
The following conditions are applicable for production activities in agriculture and animal husbandry, while
VBSP carries other conditions for the purpose of house repair, electric equipment, water supply and flood
damage recovery.
1) Households are included in the List of Poor Households at commune/ward/town under the poverty
standard specified by MOLISA.
2) The borrowing poor households are not required to have collaterals and are exempted from
administration fees upon conditions that they are members of and proposed by credit and savings
groups
3) Loan Period: Short-Term (less than 1 year), Medium-Term (less than 5 years), Long-Term (more
than 5 years)
4) Interest Rates: 0.6-0.65%/month or 7.2-7.8%/year (about half of VBARD), more difficult communes
specified in Program 135 is offered at 0.45%/month. In case of overdue, 130% of initial rate unless
overdued becasause of accidental forces.
5) Limit of the Amount: 30 million VND per household (In fact, short and medium-term loans with less
than 10 million VND is the most popular)
VBSP Lending Procedures for the Poor Household
1) Poor households write the requests for borrowing and submit it to the Savings & Credit Group.
2) Savings & Credit Group selects the households to be entitled to borrow and submits the list of
borrowers to the Commune Poverty Reduction Board and Commune People’s Committee (CPC).

4 - 50
3) The Commune Poverty Reduction Board and the CPC certify and pass the list of poor households to
VBSP for consideration
4) VBSP approves and announces to the CPC about the results of the approved list of borrowers, the
schedule and location of disbursement and VBSP directly disburses to the borrowers.
It is concerned that the data of Dien Bien Province indicates greater gap between lending amount and
repayment amount every year. Yet, according to the lending procedures mentioned above, series of
checking functions such as loan application through the Savings & Credit Group, collective responsibility
of the belonging village, prior check and approval by the CPC are likely to control credit losses.
4.9 Marketing System of Agricultural Products
In the Study Area, commercialization of the agriculture has been challenged by the state farms in plantation
of such cash crop as tea, coffee, sugarcanes, etc. On the other hand, such traditional food crops as rice,
cassava, sweet potatoes as well as the traditional industrial crops as cotton, hemp, etc., are being grown by
the farmers for their self consumption. A small surplus from those crops is also consumed within a village
and/or commune, and not commercialized practically.
Under socio-economic renovation to the Socialism Marketing Economy in the later 1980s, it has permitted
to operate private farming by individual farmers, and then, being popularized commercialization of crop
production at reasonably profitable bases. In the said ways, the government is being promoted crop
diversification and propagated maize, soybeans, groundnuts, various species of fruits, etc. so as to develop
farm household economy. As for such traditional food crops as rice, cassava, sweet potatoes, etc. the
government also paid utmost effort for regularizing a commercialization of surplus products thereafter
achievement of self sufficiency.
In 2000s, the Region has achieved food self sufficiency in response to the government subsidiary support in
farm input supply. Accordingly, commercialization of the surplus food product is being accelerated in
progress. F Since a lack of information on a quantity of product that is being actually traded on each trading
route, it is so far difficult to grasp a total quantity of crop trade. The followings are the trading conditions
very preliminarily assumed according to the information obtained from the local rice millers, crop
processing factories in provinces, and intermediate buyers who engaging in crop trading.
1) As for the food production, almost 50% is purchased by the intermediate buyers at each farm gate,
while about 40% is sold by individual farmers to the rice mills, maize flour mills, etc., and thus, trading
in the central market in terms of the primary processed product. The marketing oriented co-operatives
might so far handle as small as 5% or less. On the other hand, farmers directly access (street stall or
stall in local market) to the consumers by themselves, and sell the product, representing about 5% of
the total marketable product.
The industrial crops subjected to commercialization are sold almost half (40 to 50%) to the
intermediate buyers as similar ways to the food crops. The remaining half is then purchased by the

4 - 51
processing companies through their own collection routes.
2) Amongst the particular cash crops, the harvested tea leaves are all purchased by the state farm, and
selling to the market thereafter processing at the own tea factories. In case of the Study Area, a
greater part of the processed tea is exported to the neighboring countries, i.e., China, Laos, and
Thailand.
3) Trade of sugarcane also made as the same to tea plantation. The state farm handles all the harvested
cane, and processed at the own sugar factory. The refined sugar is then sold to the consumers through
specific marketing channel. A greater part of the sugar product is also share to exportation for earning
the foreign exchanges. Sugarcane grown in Lai Chau and Dien Bien provinces is consumed within
the local market after processing the crude sugar (brown sugar).
4) Fruits and vegetables are in most cases purchased by the intermediate buyers at the farm gate. Only a
small part is sold by farmers at the street stall or local market by themselves
4.10 Animal Husbandry
4.10.1 Animal Population
In Vietnam, various livestock such as cattle, buffaloes, horses, chickens, pigs, goats, ducks, and bees
(beekeeping) is raised. The animal population of all over Vietnam are as shown in Table 4.10.1.
Table 4.10.1 Animal Population of Vietnam
Buffalo (unit: thousand)
Cattle (unit: thousand)
Pig (unit: thousand)
Poultry (unit: million)
2000 2,897 4,128 20,194 196 2001 2,808 3,900 21,800 218 2002 2,815 4,063 23,170 233 2003 2,835 4,394 24,885 255 2004 2,870 4,908 26,144 218 2005 2,922 5,541 27,435 220 2006 2,921 6,511 26,855 215
Average 2,867 4,778 24,355 223 Source: Statistical year-book of Vietnam 2007
Main livestock in the North-western Region includes cattle, buffaloes, pigs, and poultry. Buffaloes and
cattle are used as draft animal for farming practices and transportation, in addition to as meat and dairy
sources. Meanwhile, pigs and chickens are kept for meat. According to agriculture and forestry
statistics in 2005 (General Statistics Office), the livestock numbers at the end of fiscal 2005 are as shown in
Table 4.10.2. Part of the table contents is complemented by the information obtained from each local
province.

4 - 52
Table 4.10.2 Animal Population in the Northwestern Region (2005)
Buffalo
(unit: thousand) Cattle
(unit: thousand) Pig
(unit: thousand) Poultry
(unit: thousand) Lai Chau 75.9 10.5 139.5 555.7 Dien Bien 93.7 24.1 192.4 1,050.1
Son La 135.3 107.2 443.1 3,190.4 Hoa Binh 121.0 57.1 371.3 3,169.0
Total 425.9 198.9 1,146.3 7,965.2 Source: Statistical year-book of Vietnam 2005
In each province, the numbers of buffaloes, cattle, and pigs show healthy growth every year. For poultry,
the number thereof was once decreased due to the influence of avian influenza in 2004, but the number was
recovered in next years up to the number in an average year. As long as the livestock is not largely
influenced by livestock infectious diseases and as long as feed can be supplied, the livestock numbers can
be further increased.
Meanwhile, agricultural works and transportation have been mechanized. Accordingly, buffaloes and
cattle that have been raised as draft buffaloes and draft cattle are shifted to meat use. Further, people's
standard level and diet modification have been improved. Thus, it is predicted that the meat consumption
of each province will be increased. In the future, it is necessary to consider increasing the livestock
numbers and improving sales and distribution of livestock and meat, in view of large consuming regions
outside the relevant region as well.
4.10.2 Purposes and Practices of Animal Husbandry
In the North-western Region, the number of farm households specialized in livestock breeding is small, and
the livestock numbers per one farm household are small. Buffaloes and cattle are bred as draft animals,
and are used for cultivation and transportation of harvested products. The livestock number of pigs per
one farm household is also small, and pigs are mainly bred for personal consumption. Part of the
livestock is sold to local traders dealing livestock. Such livestock is slaughtered, sold and cashed in the
market. Accordingly, as to the raising method, livestock is rarely raised in the livestock barn. Buffaloes
and cattle are tied up in the yard or are left in the roadside or agricultural fields after harvest and freely fed.
In the rainy season, they can take abundant grass. Meanwhile, in the dry season, they cannot take
sufficient feed, and it is often the case that they hardly maintain or increase the weight. Pigs and chickens
are generally range-fed.
In the future, it is expected that farm households projecting large scale breeding will be shown. For such
large scale breeding, comprehensive knowledge of reproduction, fattening, and livestock breeding, and
knowledge and techniques of feed production are required. In addition, it is necessary to fully pay
attention to livestock hygiene and preventive actions for epidemic diseases.
When fattening livestock, it is important to secure introduced feeder's cattle and piglets, feed production,
and a purchase route of purchase feed such as a feed mixture, and to secure purchasers of the livestock. It

4 - 53
is also important to pay attention to the stock market of the meat market in a large city such as Hanoi.
That is, it is not possible to carry on large scale livestock breeding if focusing on selling livestock only in a
local market as these days. In Dien Bien province, a pig farmer fattening 200 hybrid pigs, a farm
household specialized in fattening 70 sows to breed piglets, and a farm household breeding 6 boars for
artificial insemination such as Doric and Landrace exist. In addition, in the province, cost is reduced by
adding self-made ground maize to the feed purchased from a feed company in farm households specialized
in pig fattening.
4.10.3 Hygiene of Livestock
According to the information obtained from each local province, in the past 5 years, commencing with
foot-and-mouth disease, avian influenza, anthrax, hog cholera (infectious disease designated as legally
designated infectious disease in Japan) were broken out almost every year. In particular, foot-and-mouth
disease is spread around each local province. Each province strives to implement vaccination to prevent
the disease, but no preventive effects have been shown. Foot-and-mouth disease is scaring worldwide,
since once foot-and-mouth disease is broken out, cloven-hoofed animal in the vicinity of the outbreak
source is subject to infection. When infected livestock (cattle, pigs, goats and the like) are not dead, a
farm household having no knowledge of livestock infectious diseases does not pay attention thereto,
resulting in further spreading the disease around the farm household. In each province, when the infected
livestock is slaughtered and disposed, about 50% of the current price of the disposed livestock is
compensated to the relevant farm household. However, damage to the livestock breeding farm household
is enormous, leading to national loss.
In recent years, livestock infectious diseases have gotten into the media or the like, and thus the citizens
have recognized such diseases. However, accurate information on the outbreak state of livestock
infectious diseases and the economical loss due to the outbreak thereof is not sufficiently given to the
citizens. The survey target regions are under the same conditions. The economical loss due to livestock
infectious diseases is major in the entire livestock breeding industry.
In each province, vaccination is implemented twice a year to take a preventive action for livestock
infectious diseases. However, the vaccination seems to be insufficient, and thus infectious diseases are
sporadically broken out in various regions every year. As the traffic sector is developed, livestock
infectious diseases may influence not only the adjacent countries but also all the countries of the world.
Therefore, in the future, it is necessary to further take a preventive action for livestock infectious diseases.
Specifically, it is necessary to implement the following actions. Vaccine manufacturing facilities should
be expanded and increased. People having knowledge, techniques, and experiences on preventive actions
for livestock infectious diseases should be grown. Preventive actions for livestock infectious diseases
such as complete vaccination for all livestock should be implemented. In addition, it is necessary to
collect information from locality such as a commune, record the result, and establish the system with which
such resultant data is usable in a long range.

4 - 54
In the adjacent countries, China, Laos, and Cambodia, livestock infectious diseases such as foot-and-mouth
disease have been broken out seriously. Therefore, it is also necessary to cooperate with these
surrounding countries to completely take a preventive action together. Lai Chau has a border with China
and Laos. Dien Bien and Son La have a border with Laos. Therefore, such provinces should closely
exchange information on livestock infectious diseases with these countries to implement preventive actions
for livestock infectious diseases together with these countries.
4.10.4 Feed Production
Feed mixtures should be transported from remote regions such as Hanoi. Therefore, the feed mixtures are
expensive and thus the usage amount is small. The survey relevant regions include feed factories in 3
provinces of Dien Bien, Hoa Binh, and Son La (Moc Chau). The feed factory in Bien Dien province is a
joint feed company with China (Viet-Trung Animal Feed Company). This company produces feed for
pigs, chickens, and fish made of local produced maize and cassava, and sells it to local purchasers and
surrounding each province. In Hoa Binh province, Tuan Mins Company was established at the end of
2006. In Son La province, there is a factory to produce feed for dairy cows (daily output: about 10 tons)
of Moc Chau Cattle Breeding Co.
Meanwhile, out of the farm households that breed livestock, there are some cases of adding self-made
ground maize to purchased feed such as the above-mentioned pig fattening farm household, or there are
some cases of growing pasture glass in fields such as a cattle fattening farm household. However, in
general, in almost all farm households, they directly supply vegetable wastes, crop wastes, maize, cassava,
rice straw and the like to livestock, or livestock takes weeds in the roadside. Supplying feed with
considering nutrition and feed efficiency is not generally made.
4.10.5 Artificial Insemination and Breed Improvement
For beef cattle and dairy cows, in Moncada artificial insemination center of Viet-Nam Ruminant Breeding
Company, livestock breed improvement has been implemented by producing cattle frozen semen, or by
importing frozen semen from abroad and thereby creating a crossbred with a Vietnam local breed. In
Moncada artificial insemination center, in the past, breed improvement was made by crossing between a
Vietnam local breed and a foreign large-sized breed with the use of pellet type frozen semen. In the center,
breed improvement for dairy cows was also made by crossing the Holstein and a local breed to increase the
milk amount. In recent years, the center is supported by JICA (from September, 2000 to September, 2005)
to change their method to straw type frozen semen method being in widespread use worldwide. In the
straw type frozen semen method, the each original bull can be individually recognized. While
maintaining the apparatuses, the facilities, and the high technology, the center produced about 0.8 million
pieces of frozen semen and supplied them throughout the nation last year.
In the center, commencing with 7 Holstein seed male bulls imported from the USA and Australia, 67 seed
male bulls in total including 44 Brahman bulls exist. Further, in March 2007, the center planned to import
10 beef type cattle bulls, and exported about 0.25 million pieces of frozen semen to China, Laos, and

4 - 55
Cambodia. In this fiscal year, the center plans to further increase the production up to 1 million pieces of
frozen semen. Currently, the center sells the frozen semen at 17,000 VND/piece domestically. The
average technical fee of an artificial insemination operator is 50,000 VND per one artificial insemination.
For large scale pig farming and broiler chicken farming, grand parent stock pigs and grand parent stock
broiler type chickens are introduced with the aid of capital investment from foreign companies and
Vietnamese companies to implement large scale fattening (meat production) business.
4.10.6 Livestock Products and Market Distribution
In developed countries, there are regularly held livestock markets in which live cattle and live pigs are dealt
with the use of "auction" Vietnam has no livestock market, and thus livestock is not dealt with the use of
"auction" However, in Vietnam, the following traders exist:
1) Livestock traders who regularly come to farm households 2) Traders who assemble live cattle and live pigs in the specified place in each region, send them as meat
use to urban areas such as Hanoi, and sell them 3) Traders who assemble pigs, self-slaughter them, and then sell the pork meat in the market or the like 4) Traders who buy piglets from other province vaccinate and habituate them, and sell them to local pig
farmers
As above, in each province, livestock dealing is made in various forms.
In Ho Chi Minh City, there is a governmental modern slaughter house. In other regions, there are only
small size private slaughter houses that do not satisfy the minimum meat hygiene and the minimum safety
standards. Thus, in such regions, there is no sufficient hygiene management from assembling live
livestock, slaughtering it, to selling it in the market. They say regulations on conditions of installing a
slaughter house, a meat processing plant and the like, processing conditions, and meat inspection; or legal
rules for inspections, supervision, guidance and the like exist. However, meat inspectors in each province
do not observe slaughtering and only inspect the actual product in the market. Despite this, they receive
5,000 VND as an inspection fee from a distributive trader, and give a permit for the sale of the actual
product to the distributive trader (in the case of Hoa Binh province). In result, self slaughter is daily made
at their house back yard in various regions. The self-slaughtered meat is sold as meat in the meat shop
space of the market for ordinary people.
4.10.7 Dairy Farming
As Vietnamese eating habit has been changed and improved, dairy products have been increasingly
demanded. In the past, supplying the dairy products depended on importing them from Australia.
However, since 2001, Vietnamese government has aimed at improving the self-sufficiency rate of dairy
products, has promoted dairy farming, and has promoted expansion of dairy products consumption. With
the aid of JICA's technical cooperation, the plan for improving product techniques of dairy farming has
been already implemented. The project target regions of the plan include the Moc Chau dairy farming

4 - 56
region in Son La province. In addition to Son La province, several hundreds of dairy cows are milking in
Hoa Binh province. Meanwhile, in the other 2 provinces out of the survey target regions, they are not
much interested in dairy farming.
4.10.8 Support Service
(1) Animal health center
In each local province, the animal health center is arranged. In the center, veterinarians and
collage-educated staffs are working mainly on prevention of livestock infectious diseases. In Son La
province, a district veterinary station exists instead of the animal health center. In the entire province,
there are about 120 relevant people including Vet-Shop staff. Veterinarians are assigned as follows: 18
for the province, 67 for the districts, and 35 for the Vet-Shop.
The animal health center in Dien Bien province has a district animal health station in each district. The
numbers of staffs working on business are 59 in total, including 19 veterinarians and 35 animal health
technical staffs. Their main business is taking preventive actions for livestock infectious diseases.
Twice a year (March, April and September, October), vaccination is made. Such vaccination includes
foot-and-mouth disease vaccination for cattle and pigs, cattle pasteurella infection vaccination, cattle
blackleg vaccination, anthrax vaccination, and hog cholera vaccination. As for livestock infectious
diseases such as foot-and-mouth disease, preventive actions have given good results and the number of
infectious diseases has been decreased. However, it is difficult to eradicate infectious diseases for the
following reasons. Since a personal in charge at the work site still lacks knowledge and experiences, the
person in charge has a problem to diagnose the infectious diseases. Further, since the site where an
infectious disease is broken out is located in an inconvenient place, discovering the infectious disease is
delayed. Furthermore, the preventive actions do not establish into the mountains area. In the province,
technical experts have been trained in 93 communes, but approximately one third only thereof has been
completed.
Lai Chau province has the animal health center, and the districts have the animal health station. In the
center, 3 veterinarians and 7 animal health technique staffs are assigned. In each station, 1 veterinarian
and 1 animal health technical staff are assigned.
(2) Promotion of livestock industry technique
It is needless to say that for developing livestock industry, promotion staffs working on the front lines are
required. Each province is trying to train promotion staffs and make them acquire knowledge and skills in
order to promote appropriate promotion activities. However, knowledge, skills, and experiences
necessary for the promotion staffs in livestock industry are manifold. It takes a lot of time to acquire such
knowledge, skills, and experiences. In addition, it is difficult to promote the business without win
farmers' trust. Therefore, in each province, the number of the promotion staffs specialized in livestock
industry is small yet. Out of the survey target provinces, some provinces (Lai Chau province and Son La

4 - 57
province) have no promotion staffs specialized in livestock industry.
4.10.9 Environmental Issues
As livestock breeding has been developed, there is a fear of environmental pollution. In the past, a
problem occurs as follows. In southern Vietnam, Mekong Delta, the number of pigs was increased but the
excrements disposal capacity was ignored then. In result, the excrements were accumulated, produced a
bad odder, and were flown into the Mekong River. However, in the survey target regions, there are no
companies or large farm households that fatten lots of livestock, and thus there has been no problem.
Farmers are not conscious of environmental pollution, and thus buffaloes, cattle, pigs, and chickens that are
left in the field discharge untreated excrements everywhere. In the future, consideration should be given as
follows. That is, leaving livestock in the field should be changed to feeding in the shed. In the shed
feeding method, the excrements should be effectively used (home gas by a bio digester, production of
organic soil and the like). Currently, the JOCV members dispatched to Hoa Binh are in charge of
promotion.
4.11 Inland Fishery
4.11.1 Overview of Fisheries in Vietnam
In 1995 to 2004, landings of capture fisheries increased less than twice folds, while production of
aquaculture forth folds. In total, the production of fisheries increased to twice folds in the past ten years in
Vietnam (Table4.11.1, Table4.11.2).
Table 4.11.1 Comparison of Production in Agriculture, Forestry and Fisheries
Unit: 1000 ton 1995 1996 1997 1998 1999 2000 2001 2002 2003 2004Capture fisheries 1,195.3 1,278.0 1,315.8 1,357.0 1,526.0 1,660.9 1,724.8 1,802.6 1,856.1 1,940.0Aquaculture 389.1 423.0 414.6 425.0 480.8 589.6 709.9 844.8 1,003.1 1,202.5Total 1,584.4 1,701.0 1,730.4 1,782.0 2,006.8 2,250.5 2,434.7 2,647.4 2,859.2 3,142.5
Source: Statistical Year Book of Vietnam 2005
Table 4.11.2 Landings of Capture Fisheries and Aquaculture
Unit: million VND 1995 1996 1997 1998 1999 2000 2001 2002 2003 2004Capture fisheries 10,884.4 12,016.8 12,944.1 13,938.8 14,737.7 15,356.6 15,848.2 17,279.7 19,706.6 10,884.4Aquaculture 5,260.9 5,499.0 6,362.9 6,803.9 11,761.2 16,842.2 21,282.6 26,184.8 34,271.1 5,260.9Total 16,145.3 17,515.8 19,307.0 20,742.7 26,498.9 32,198.8 37,130.8 43,464.5 53,977.7 16,145.3
Source: Statistical Year Book of Vietnam 2005
In the past ten years, proceeds of the capture fisheries increased to less than twice folds, but that of
aquaculture to sixth folds. This demonstrates that aquaculture proceeds may contribute too much compared
with proceeds of capture fisheries in the total proceeds of fisheries sector.
(1) Marine fisheries and inland fisheries
Landing of marine fisheries occupies about 90 % of total landings of Vietnam fisheries. Landings of inland

4 - 58
fisheries might mainly be based on aquaculture (Table4.11.3).
Table 4.11.3 Comparison of Landings of Marine and Inland Fisheries Unit: 1000 ton
Year Marine catch Inland catch Total 1995 990.3 205.0 1,195.3 1996 1,058.7 219.3 1,278.0 1997 1,098.7 217.1 1,315.8 1998 1,155.2 201.8 1,357.0 1999 1,314.6 211.4 1,526.0 2000 1,419.6 241.3 1,660.9 2001 1,481.2 243.6 1,724.8 2002 1,575.6 227.0 1,802.6 2003 1,647.1 209.0 1,856.1 2004 1,733.4 206.6 1,940.0
Source: Statistical Year Book of Vietnam 2005
4.11.2 Policy of Ministry of Fisheries
The master plan of the fisheries development as approved by the prime minister in January of 2006,
aquaculture production should reach 980,000 ton. Land of aquaculture area should reach 600,000 ha.
About fifth folds of the aquaculture production has been proposed, so the strong support is directed to the
aquaculture activity in these years.
Regarding the fish processing, capacity of equipment for frozen fishes should be 3,500-4,000 ton per day,
which is parallelly proposed with new technology and new facilities. And until 2010 safety, hygiene and
fish pathology should be in accordance with that of the world standard. Diversity of fish processing
products and high value added fresh products should be highly required and export products should
increased to obtain US$400 million with export quantity of 891,000 ton.
Regarding the Northwest and Central Highlands, aquaculture especially for that in the reservoirs should be
highly developed and the VAC system should be extended to produce Tilapia, giant prawn, common carp
and grass carp.
4.11.3 Assistance to Fisheries Sector
(1) Japan
The past and on-going technical assistance provided by JICA are presented in Table 4.11.4, one fisheries
resources survey, one expert dispatch, one fisheries port and one research station. This survey is the first
assistance to both in the fisheries and in the Region. The SEAFDEC (Southeastern Fisheries
Development Center) office is located in Haiphong and JIRCAS is jointly studying the fisheries resources
with Cantho University. OFCF is dispatching an expert at the RIA 3 in Nha Trang (Table 4.11.4).

4 - 59
Table 4.11.4 JICA Assistance to Fisheries Sector
year Contents Field 1998 Fisheries resources survey in the off shore area Fisheries resources 1999 Construction of Catlo fisheries port, Bung Tau Infrastructure 2000 Dispatch of expert Technical Transfer 2004 Construction of Aquaculture research station in Nha Trang Infrastructure
Source: the JICA Study Team
(2) Other Foreign Donors
Assistances form the foreign donors other than Japan are listed in Table 4.11.5.
Table 4.11.5 Fisheries Sector Support from Other Donors
Year Donors Contents 1986-1997 UNDP/FAO Strengthen research capacity, develop an extension network for the
promotion of low-cost aquaculture to small scale farmers 1995- AIT/SIDA Extend on-farm research to integrated agriculture-aquaculture systems in
Red River Delta 1997- AIT/SIDA Support a dialogue with the northern mountain provinces to introduce the
potentials of such technologies for poverty alleviation 1998- NORAD Capacity building to support poverty issues in rural and coastal areas 1999- UNDP/FAO Follow a more participatory approach in three northwest highland provinces2000- AIT/SIDA Following UNDP approach 2000- DANIDA Provide broad support to the fisheries sector, with poverty alleviation as one
core objective 2000- NACA、OFID、
FAO Aquaculture for sustainable livelihood development, regional network
2000- ACIAR etc. Small-scale research projects to support the small scale aquaculture Source: Le Than Luu (Sustainable aquaculture for poverty alleviation)
4.11.4 Fisheries in the Northwestern Region
(1) Landings of the Region
The landings are 6,988 tons in total which is only about 0.2% of total landings of this country. The reason
might be only inland fisheries and promotion of aquaculture is only poorly developed.
Table 4.11.6 Landings of the Region Unit: ton
2,000 2,001 2,002 2,003 2,004Dien Bien 373 632Lai Chau
527.0 603.0 640297 638
Son La 2,181 2,335 2,942 3,065 3,205Hoa Binh 1,291.0 1,734.0 2,048 2,334 2,513Northwest total 3,999.0 4,672.0 5,630 6,069 6,988Whole country 2,250,499.0 2,434,649.0 2,647,408 2,859,200 3,142,478
Source: Statistical Year Book of Vietnam 2005
(2) Proceeds of capture fisheries and aquaculture in the Region
Proceeds of both capture fisheries and aquaculture are about 0.05%, quite low level in this country.
Capture fisheries is most high in Son La, which might be from the reservoir fisheries. In Lai Chau and

4 - 60
Dien Bien province, the proceeds of the capture fisheries is small despite the existence of three big rivers.
In aquaculture proceeds, again the Son La province if highest followed by Hoa Binh (Table4.11.7 and Table
4.11.8).
Table 4.11.7 Precedes of the Capture Fisheries in the Region Unit: ton
2,000 2,001 2,002 2,003 2,004Dien Bien 67.0 70.0Lai Chau
195.0 151.0 150.083.0 94.0
Son La 543.0 622.0 694.0 684.0 772.0Hoa Binh 346.0 432.0 483.0 534.0 549.0Northwest total 1,084.0 1,205.0 1,327.0 1,368.0 1,485.0Whole country 1,660,904.0 1,724,758.0 1,802,599.0 1,856,105.0 1,939,992.0
Source: Statistical Year Book of Vietnam 2005
Table 4.11.8 Proceeds of Aquaculture in the Region Unit: ton
2,000 2,001 2,002 2,003 2,004Dien Bien 306.0 452.0Lai Chau
332.0 452.0 490.0214.0 544.0
Son La 1,638.0 1,713.0 2,248.0 2,381.0 2,433.0Hoa Binh 945.0 1,302.0 1,565.0 1,800.0 1,964.0Northwest total 2,915.0 3,467.0 4,303.0 4,701.0 5,503.0Whole country 589,595.0 709,891.0 844,809.0 1,003,095.0 1,202,486.0
Source: Statistical Year Book of Vietnam 2005
(3) Fish suitable for pond aquaculture in the northwest
Chinese common carp, Bighead carp, Grass carp, and Indian carp are suitable for pond aquaculture in the
northwest. Characteristics of each fish are as follows. All the photographs were taken during this
Master Plan Study.
1) Chinese common carp
Vietnamese: Ca chep Scientific name: Cyprinus carpio
This fish can be found in Europe and Asia. Carp in Japan originally came from China in the 14th
century. It is omnivorous and strong against dysoxic (not enough oxygen) water. It grows fast and
tastes good. It is benthic with habitable temperature of 3 to 35 degrees Celsius. Habitable water
area is wide, and prefers water area that is deep
and has flow of warm water. Its breeding season
is from spring to summer, and the eggs are
attached to plants. 50 cm-long female lays 3,000
eggs. It can grow up to 120 cm, but the ones for
commercial sale are less than 50 cm long.
Fry production of this fish is generally easy. Although viral carp herpes is a big cause for concern,
possibility of outbreak in the northwest is low because fries do not come from outside regions. It has

4 - 61
high resistance to general fish diseases. Quality of fish meat is high and it is favored by people.
2) Bighead carp
Vietnamese: Ca me Scientific name: Aristichthys nobilis
It is one of the four major fish in China. Its place of
origin is China and it transmigrated to Laos,
Thailand and Cambodia. It is an important fish for
farming. It is animal plankton-eating fish and
grows fast. It can grow up to 110 cm, but the ones
for commercial sale are less than 50 cm. It is
characterized by big head and big eyes. Production
of fries is rather difficult.
Quality of fish meat is high. It is favored by local people and eaten often. It maintains firmness
even if it is cooked in soup. Resistance to diseases is high. It is plankton-eating fish, thus at a low
tropic level.
3) Grass Carp
Vietnamese: Ca tram Scientific name: Ctenopharyngodon idella
It is one of the four major fish in China. Its place of
origin is China and it is spread out all the way to the
Amur river basin. It is grass-eating fish. Lately it
has been widely believed that grass carp cannot
break cellulose. However, this is not
understandable, considering the fact that it grows fast. It can be used to exterminate water hyacinth.
Habitable water area is wide, and prefers water area that is deep and has flow of warm water. It can
live in water of temperature between 0 to 38 degrees Celsius. It lays eggs in water area with fast flow.
It can grow up to 150 cm, but the ones for commercial sale are less than 70 cm. Production of fries is
fairly easy.
Quality of fish meat is high. It is favored by local people and eaten often. It maintains firmness
even if it is cooked in soup. Resistance to fish diseases is rather low, but can be solved by
management of water quality and prevention measures. It is a host of protozoan parasites, and the
parasites may spread out by transmigration. It is grass-eating fish, thus at a low tropic level.
4) Indian carp
Vietnamese: Ca troi Scientific name: Labeo rohita
It originated in India, and can be found in Pakistan, Bangladesh, Myanmar and Nepal.

4 - 62
It transmigrated to Southease Asia. It lay between
300,000 to 2.8 million eggs in monsoon season. It is
grass-eating fish and grows up to 200 cm. Production
of fries is fairly easy.
Quality of fish meat is high. It is favored by people
and eaten often. It maintains firmness even if it is
cooked in soup. Resistance to fish diseases is rather low, but can be solved by management of water
quality and prevention measures. It is grass-eating fish, thus at a low tropic level.
(4) Seeds production and their distribution to farmers in the northwest
Nature of the seeds production in the northwest is 1) water is cold and pure, 2) hatchery stations are
recently constructed with recent-most technology and techniques, 3) staffs of the stations are young. This
nature also indicates that staffs do not have high skills and director class persons do not have experience to
manage the stations.
In Dien Bien, there are one public station and four private stations.
The seeds production started only this year and at present staffs are energetically doing the seeds
production of Tilapia, Oreochrmois niloticus. Pairs of adult fishes are put into the hatching tank and
females spawn and males let the eggs be fertilized. Larvae are aggregated in the bottom tanks. After
absorbing the yolk, post larvae are transferred to the small pans and they are fed by primary foods made of
cereals. When they grow up to juveniles, they are transferred to nursery ponds. Farmers come to
stations to buy those seeds in the nursery ponds.
As explained in the former sentences, the following facilities and equipments are necessary for the hatchery
station.
Facility: stock ponds for adult fishes; hatchery tanks; area for primary foods for larvae and juveniles; house
for staffs to stay during the hatching of larvae; storage. Equipments: seine net to catch adult fishes; iron
cages for hatchery tank; small mesh to catch larvae; pans for larvae and juveniles; oxygen cylinders to put
oxygen in the bag transferring the juveniles. The number of staffs of the station is eight. They received
training at the Research Institute of aquaculture 1 in the Bac Ninh province, so they have high experience in
the technique for seeds production. Staffs of the private hatchery stations have more skills for seeds
production.
Prices of the seeds are shown in Table 4.11.9 in which weight of one individual will be 10g. Farmers will
come to the stations to buy seeds. Or, intermediate persons transfer the seeds to the communes. There is
not data for the number of fingerlings since the seeds production in the public station has been just started.

4 - 63
Table 4.11.9 Price of fingerlings
Fish value(VND/kg) Tilapia 15,000 Indian carp 30,000 Grass carp 50,000 Common carp 30,000 Bighead carp 80,000
Sizes of the private hatchery stations are not large. Larvae are kept in the nursery tanks with water
hyacinths and transferred to the juvenile tanks when they grow.
There is no concern for water temperature using the water from streams, which are suspected to be 25 to 30
degrees Celsius. For the survival of the larvae, Oxygen demand (DO= Dissolved oxygen) will be more than
3.0 mg/L which are already available.
There are one public hatchery station and seven private ones in the Lai Chau province. The public station is
now under the construction and will be completed in the spring of 2009. The owner of a private hatchery
station has high skills in the seeds production and he produces 1 ton of fingerlings every month. He is
respected by the staffs of the fisheries department of DARD. The owner of the hatchery station in the
Tam Duong district also produces plenty of fingerlings. Only available data for seeds production in the
Lai Chau province is 1 ton per one month.
There are one public and 13 private hatchery stations in the Son La province. 42 million of fingerlings are
produced by the public station which reaches half of the total production of the fingerlings in the province.
There are three public hatchery stations and one private one in the Hoa Binh province. New public station
is now under construction. After the completion of the new station, it may provide total demand of seeds
in the province.
4.12 Agricultural Industry
4.12.1 Industries and Employees
The industrial sector in the North-western Region is still in developing. Apart from agro-industry, limited
number of small enterprises is operational in construction materials (sand and aggregates), wooden
products (furniture), daily commodity production, pulp, etc. The total number of enterprises and
employees are 1,044 and 51,000 respectively as presented in Table 4.12.1.
Table 4.12.1 Enterprises in North-western Region
Description Lai Chau Province
Dien Bien Province
Son La Province
Hoa Binh Province
Total of 4-Provinces
Total of Vietnam
Share of 4-Provinces in Vietnam
Nos. of enterprises 129 251 274 390 1,044 91,755 1.1% Nos. of employees(as of the end of 2004)
Nos. of employee 4,338 12,413 14,663 19,941 51,355 5,770,201 0.9% Ratio of employees in total population (%) 1.4% 2.8% 1.5% 2.5% 2.0% 6.9%

4 - 64
Description Lai Chau Province
Dien Bien Province
Son La Province
Hoa Binh Province
Total of 4-Provinces
Total of Vietnam
Share of 4-Provinces in Vietnam
Average capital amount of enterprises (as of the end of 2004) unit: Billion VND 301 1,967 2,529 1,801 6,598 1,966,163 0.3%
Net sales amount (as of the end of 2004) unit: Billion VND 317 1,397 1,580 1,824 5,118 1,719,401 0.3%
Direct investment project from overseas (2005) Number of investment 1 2 3 970 0.3% Sum of investment (Billion US$) 0.1 4.2 4.3 6,839.8 0.1%
Source: Statistical Yearbook of Vietnam 2005, Statistical Publishing House
The scale of enterprises in the North-western Region is micro to small. Because of lack of statistical data
and information, further study is required to verify their current position. Apart from forestry products,
agro-industry including rice milling, flour milling, tea processing, coffee processing, sugar processing and
bamboo pulp, etc. was studied. Details are mentioned below.
4.12.2 Rice Milling
Rice (paddy) production status of 4 provinces in 2005 is shown in Table 4.12.2.
Table 4.12.2 Rice (paddy) Production in the Region in 2005
Description Lai Chau Province
Dien Bien Province
Son La Province
Hoa Binh Province
Total of 4-Provinces
Total of Vietnam
Share of 4-Provinces in Vietnam
Rice (paddy, ton) 92,722 127,536 128,202 192,216 540,676 35,790,800 1.5%
Source: Statistical Yearbook of Vietnam 2005, Statistical Publishing House, etc.
Common feature regarding rice processing industry in 4 provinces is that the large scale rice milling plant
is very few, and almost of all rice is processed by small scale rice mills having capacity of less than 1ton
paddy per hour, which are operated in the villages. About 80% of rice milling machines of such small scale
rice mills is simple one box type and remaining 20% is integrated type rice mill which can process higher
quality rice compared with one box type.
Above small rice milling machines are usually purchased and operated by individual farmers who have
financial muscle comparatively. Such farmers not only process his own produced rice but other farmers’
rice who don’t have rice milling equipment by getting milling charge. Some rice millers sometimes
purchase paddy from other farmers, and resell it to middle man of the paddy, they can be called as “Rice
Miller-cum-Middle man”.
In 4 provinces, especially Lai Chau and Dien Bien provinces, since road condition etc. are severe by the
geographical feature, transportation of paddy and/or milled rice is difficult. Therefore processing and
distribution of agricultural products within the area is the main current.
Under the present circumstances, self-consumption rates of rice are high especially among the farmers of a
mountain slope, and they probably not feel the necessity of increase of the milled rice quality.

4 - 65
However, when rice will be sold in order to obtain a money income, the rice milling facilities which can
produce higher quality of rice should be prepared. However, the improvement of these processing
equipments cannot be made independently. It can accomplish with an improvement of infrastructures,
such as road and electricity, and will be synchronized with carrying out of synthetic rural-community
infrastructure building.
Almost same amount of required volume of rice is produced in Lai Chau and Dien Bien provinces, and it
seems that there is no transfer to out of provinces not much. By the Son La province and the Hoa Binh
province, production of rice does not fulfill consumption but is considered that a considerable amount of
rice is flowing in from other provinces.
In Dien Bien province, the value-added “Dien Bien rice” which has good taste and high quality is
successful as top-grade rice, and is lengthening distribution and sale in many fields including capital Ha
Noi. The centers of production of “Dien Bien rice” are Dien Bien district and Tran Giao district, and the
high quality brand rice is mainly milled and processed by following large scale plants.
1) Dien Bien Industrial Tree Co., Ltd.: Former state-operated factory and now semi-privatized
company. 1,500 ton of milled rice is processed per year and sold as Dien Bien rice in 3wholesale
shops in Ha Noi.
2) Agricultural Engineering and Construction Company: Modern rice milling plant has been installed
and began the operation, with daily processing capacity of 8 ton.
Although in 4 provinces, mainly one-box type small-scale rice milling machines are used, the point that all
use the rubber roll-type rice milling machine is very much characteristic, and no Engelberg type milling
machine (husking and rice milling are performed at the same process, and it causes high broken rice ratio
and quality of rice decreases) was seen.
A rubber roll type rice-milling machine is used also in a remote area to ensure higher quality rice. This is
the one good example of the long history of rice of Vietnam.
4.12.3 Flour Milling Industry
Maize production of 4provinces in 2005 is shown in Table 4.12.3.
Table 4.12.3 Maize Production in the Region in 2005
Description Lai Chau Province
Dien Bien Province
Son La Province
Hoa Binh Province
Total of 4-Provinces
Total of Vietnam
Share of 4-Provinces in Vietnam
Maize (ton) 28,574 49,066 228,030 96,778 402,448 3,756,300 10.7%Source:Statistical Yearbook of Vietnam 2005, Statistical Publishing House etc.
Like rice milling industry, it is dotted with many small flour mills having milling capacity of about 1
ton/hour. The owner of a small flour mill is owner of a small rice-polishing machine simultaneously in
many cases. In Dien Bien Phu, a joint venture with People's Republic of China is operating the

4 - 66
animal-feed production plant of 5,000 to 7,000 ton of annual output which is made from the main material
of maize. In Son La province, the animal-feed production plant of 7,500 ton of annual output is in
operation.
4.12.4 Tea Processing
Status of tea processing industry of 4provinces in 2005 is shown in Table 4.12.4.
Table 4.12.4 Status of Tea Processing Industry in the Region in 2005
Description Lai Chau Province
Dien Bien Province
Son La Province
Hoa Binh Province
Total of 4-Provinces
Total of Vietnam
Share of 4-Provinces in Vietnam
Processed Tea (ton) 4,126 138 20,553 0 24,817 106,840 23.2%Source: Statistical Yearbook of Vietnam 2005, Statistical Publishing House etc. Note: Total processed tea production in Vietnam is calculated from weight of fresh tea leaves (534,000ton) based on the processing
yield of 20%
Features of tea industry of each province are as follows;
Son La province: The largest tea production province in 4 provinces. There are 20 tea processing factories
in province. Out of them, 6 factories are managed by government and remaining 14 are joint ventures of
50% of the Vietnam domestic capital and 50% of overseas capital.
Lai Chau province: In recent year national tea farm is divided into a small unit, and each farming family is
performing contract farming and management. A state farm buys the fresh tea leaves which contract
farming family produced as a crude material, and make them into green tea. Tea processing is performed
in 100 or smaller scale house industry, besides seven larger processing plants. The main processing plants
under operation are as follows
1) San Thang Tea Factory: Private tea factory in Lai Chau suburbs. The raw tea of annual 2,000 ton
is processed and it ships as a finished product of 400 ton.
2) Tam Duong Tea Factory: Management of DARD Lai Chau. 5,000 to 7,000 ton of fresh tea leaves
are processed annually. Half processed product is shipped to Kim Anh Factory of Ha Noi, and also
final products which are manufactured in-house are shipped.
4.12.5 Coffee Processing
Coffee is produced in Son La and Dien Bien provinces. Status of coffee production of both provinces in
2005 is shown in Table 4.12.5.
Table 4.12.5 Status of Coffee Processing Industry in the Region in 2005
Description Lai Chau Province
Dien Bien Province
Son La Province
Hoa Binh Province
Total of 4-Provinces
Total of Vietnam
Share of 4-Provinces in Vietnam
Coffee (ton) 0 347 3,022 0 3,369 767,700 0.4% Source: Statistical Yearbook of Vietnam 2005, Statistical Publishing House etc.
Most of coffee from Vietnam is produced in the central highland now, and the majority variety is Lobster,

4 - 67
because the climate condition of high temperature and humidity of the central highland is suitable for
cultivation of the Lobster variety.
On the other hand, the northern-part of Vietnam has climate condition of cold in winter season and a lot of
rain which is suitable for cultivation of Arabica variety. Although the history of the coffee cultivation in
the northwestern part is short and is small, the production increase of Arabica variety which has a high
added value is desirable.
Features of coffee processing industry in both provinces are as follows.
Province Features
Son La
• Largest coffee production province in 4 provinces. About 3,000 to 4,000ton of green coffee (processed coffee before roast) is produced per year.
• Cong Ty CAFE Vay An Qua Son La Company in Son La town is managed by provincial government and largest processing factory in province. About 25% of green coffee is processed by this factory and all products are exported, as USA, Germany and Japan etc.
Dien Bien • Coffee cultivation and production has just started. • Nursery coffee trees are planted mainly on Tuan Giao and Dien Bien district, and production increase is
aimed.
Most of coffee processing factory in object area is using the wet processing method during the process from
fresh fruit coffee into coffee with husks (called parchment coffee). Although this method has an
advantage to process coffee beans into high quality compared with the dry processing method, however the
sewage is generated in this process. It is necessary to take a suitable management measure so that the waste
water may not flow out to the exterior.
4.12.6 Sugar Processing
Status of sugarcane production of 4provinces in 2005 is shown in Table 4.12.6.
Table 4.12.6 Status of Sugarcane Production in the Region in 2005
Description Lai Chau Province
Dien Bien Province
Son La Province
Hoa Binh Province
Total of 4-Provinces
Total of Vietnam
Share of 4-Provinces in Vietnam
Sugarcane (ton) 7,666 350 152,436 389,275 549,727 14,730,500 3.7%Source: Statistical Yearbook of Vietnam 2005, Statistical Publishing House etc.
A considerable amount of sugarcane is grown in 4 provinces with Hoa Binh province as a center.
However as a result of the downturn of sugar price in recent years causing the fall of a sugarcane price, and
the farmer's motivation for the cultivation have been lose and planted area is decreasing. In Hoa Binh
province, there is sugar processing factory having capacity of 700 to 1,000 ton on material sugarcane.
Approximately 11,000 ton of crude sugar was produced in 1999/2000 season. Son La province is a 2nd
largest production area of sugar in 4 provinces. In the Hat Lot area along the national-highway No.6, the
sugar processing plant with capacity of 1,500 t (crude-material sugarcane weight) is working.
4.12.7 Paper/Pulp Manufacturing
Other than the paper-manufacturing from the wood, manufacturing of paper material is also done by using

4 - 68
the bamboo as material. A fiber is extracted from a bamboo and from it material for a paper
manufacturing is processed. It is used as pulp for a paper manufacturing. Other than the paper material,
this also used as the material of corrugated roofing sheet like a slate, after mixed with cement. In the
suburbs of Dien Bien town, Agricultural Engineering & Construction Co. operates the processing plant in
which about 1,500ton of the paper material is produced per year. Moreover, Key Son area in Hoa Binh,
Vietnam National Paper Corporation is operating the bamboo paper factory.
In the production process of the paper pulp from the bamboo, sodium hydroxide etc. are used. Such
chemical should not be discharged to outside of the factory as drainage. It is not thought that the
wastewater treatment etc. is performed in fact now, but it is necessary to fully implement an environmental
measure from now on.
4.12.8 Others
Other than the above main products processing, following small-scale processings are performed in some
provinces.
1) Production of the tapioca starch from cassava. 2) Production of the starch from the root stock of edible canna. The produced starch is mainly used as
a crude material of noodles. 3) Processing of cardamom, a kind of spices. 4) Dry processing of bamboo shoot. 5) Manufacture of dry fruits and fruit wine, etc.
In Lai Chau province, cardamom is one of the most important agricultural product and also important
export product. The volume of production is also increasing with cultivation area. The status of the
cardamom production in Lai Chau province is as in Table 4.12.7.
Table4.12.7 Status of Cardamom Production in Lai Chau Province in 2005
Description 2004 2005 Cultivated area (ha) 1,582 1,950 Production (ton) 302 336 Source: A Report on Vietnam Northwest Border Trade Situation, JICA Viet Nam, 2007
4.13 Forest Conservation and Forest Utilization
4.13.1 Recent Status of Forest Sector in Vietnam
(1) Status of forests
Forest areas in Vietnam is estimated as 12,616,700 ha, which is 37% of total land area, as of December
2005 (Decision No.1970/QD/BNN-KL, dated on 6 July, 2006). Forests in Vietnam are categorized into
three (3) management classifications as regulated by the Article 4 in the amended Law on Forest Protection
and Development (No. 29/2004/QH11), as follows:

4 - 69
1) Production forests: Forests which are used mainly for production and trading of timber and
non-timber forest products in combination with protection, thus contributing to environmental
protection.
2) Protection forests: Forests which are used mainly to protect water sources and land, prevent erosion
and desertification, restrict natural calamities and regulate climate, thus contributing to
environmental protection,
3) Special-use forests: Forests which are used mainly for conservation of nature, specimens of the
national forest ecosystems and forest biological gene sources; including national parks, nature
conservation zones, and sanctuaries, managed by MARD. Scientific researches and service of
recreation are permitted in the special-use forests.
Forest areas by forest categories are shown in Table 4.13.1.
Table 4.13.1 Forest Areas by Forest Categories in 2005 Unit: ha
Forest Classification Special-Use Forests
Protection Forests
Production Forests
Total
Total Forest Areas(ha) 1,929,304 6,199,682 4,487,714 12,616,700 Natural Forests 1,849,049 5,328,450 3,105,674 10,283,173 Artificial Forests 80,255 871,232 1,382,040 2,333,526 Ratio (%) 15.3 49.1 35.6 100.0 Sources: Decision No. 1970/QD/BNN-KL dated 06/7/2006 of the Minister of MARD on announcement on
national forest status in 2005
The transition of forest areas in Vietnam is shown in the Table 4.13.2. The areas of natural forests
gradually decreased up to 1990s, and are gradually increasing by the latter 1990s. From 1990s, forestation
activities have been implemented in active way, and forest coverage ratios in the whole country are
increasing, accompanying with increment of reforestation areas.
Table 4.13.2 Transition of Forest Areas in Vietnam Unit: Million ha
Forest Category Year Natural Forests Artificial
Forests Total Ratio to Total
Land Area (%)
1943 14.0 0 14.0 43.0 1976 11.077 0.092 11.169 33.8 1980 10.486 0.422 10.608 32.1 1985 9.892 0.584 9.892 30.0 1990 8.430 0.745 9.175 27.2 1995 8.252 1.050 9.302 28.1 1999 9.470 1.524 10.995 33.4 2002 9.865 1.919 11.784 35.8 2004 10.088 2.219 12.307 37.3 2005 10.283 2.334 12.617 37.0
Sources: For data between 1943 to 2002: NATURAL ENVIRONMENT & FOREST DATA IN VIETNAM, Forest Sector Manual、Hanoi、August 2003; for data between 2004 to 2005: MARD(2005)Decision No. 1116/QD/BNN-KL dated 18/5/2005 of the Minister of MARD on gazettement of forest area and unused land nationwide in 2004, and MARD(2006)Decision No. 1970/QD/BNN-KL dated 06/7/2006 of the Minister of MARD on announcement on national forest status in 2005.

4 - 70
Forests are distributed in different ratio by regions; highest in the Central Highland Region, continuing
from the northern areas to the South Central Coast Region. Forest ratios are low in the Red River Delta
Region, South East Region and Mekong River Delta Region (Table 4.13.3).
Table 4.13.3 Forest Distribution in Vietnam (2005) Unit: ha
Forest Category Region
Total Geographical Areas by Region Natural
Forests Artificial Forests
Total Forest Area (ha, %)
Red River Delta 1,262,544 49,702 45,504 95,206 (7.5) North East 6,598,826 2,231,174 824,938 3,056,112 (46.3) North West 3,733,675 1,376,952 100,924 1,477,876 (39.6)
North Central Coast 5,151,713 1,999,855 484,840 2,484,694 (48.2) South Central Coast 4,466,539 1,448,666 315,108 1,763,774 (39.5)
Central Highland 5,451,217 2,827,342 144,393 2,971,735 (54.5) South East 2,356,083 292,038 164,591 456,630 (19.4)
Mekong River Delta 3,999,015 57,446 253,227 310,672 (7.8) Total 33,019,611 10,283,173 2,333,526 12,616,699 (38.2)
Sources: MARD(2006)Decision No. 1970/QD/BNN-KL dated 06/7/2006 of the Minister of MARD on announcement on national forest status in 2005
(2) Forest Utilization
According to the Statistical Year Book of Vietnam 2005, timber yield volumes increase from 2000 to 2005
in the whole country. However, timber yield volumes in the Region are decreasing in these 6 years (Table
4.13.4). Table 4.13.4 Timber Yield Volume of Vietnam
Unit: 1,000 m3
Region Year 2000 2001 2002 2003 2004 2005
Red River Delta 133.0 117.5 112.7 98.4 93.1 99.6North East 489.1 519.7 530.0 525.2 638.5 719.2North West 245.5 247.4 207.3 185.0 171.3 171.4
North Central Coast 237.0 235.2 226.8 293.6 292.2 296.6South Central Coast 275.9 278.3 314.3 324.9 428.9 490.5
Central Highland 372.8 395.2 419.8 313.0 324.1 286.3South East 160.0 145.1 132.7 113.9 110.6 86.2
Mekong River Delta 462.3 458.8 560.4 581.8 569.1 553.2Total 2,375.6 2,397.2 2,504.0 2,435.8 2,627.8 2,703.0
Source: Statistical Year Book of Vietnam 2005
Transition of output value of forestry in Vietnam (constant 1994 price) is shown in the Table 4.13.5.
Table 4.13.5 Output Value of Forestry in Vietnam (constant 1994 price) Unit: BillionVND
Region Year 2000 2001 2002 2003 2004 2005
Red River Delta 259.0 237.0 228.7 210.4 206.1 224.3North East 1,761.1 1,786.9 1,816.9 1,854.9 1,895.6 1,912.4North West 719.8 638.2 641.2 657.1 633.2 640.4
North Central Coast 1,112.3 1,158.8 1,180.9 1,210.2 1,217.9 1,233.2South Central Coast 416.7 441.9 459.6 477.0 489.8 501.5
Central Highland 404.5 463.5 473.3 453.4 456.2 441.9South East 345.6 367.7 377.5 379.1 370.9 384.6
Mekong River Delta 882.6 920.0 929.5 932.7 972.7 979.0Total 5,901.6 6,014.0 6,107.6 6,174.8 6,242.4 6,317.3
Source: Statistical Year Book of Vietnam 2005

4 - 71
(3) Forest-Related Industries
Forest-related industries shown in the Statistical Year Book 2005 of Vietnam are manufacture of wood and
wooden products, paper and paper products and furniture. Gross outputs of each industry have been
doubled in value, and output of furniture manufacturing increases the number in four. However, the
output of furniture manufacturing accounts for approximately 4% of all the industries, and the total outputs
of forest-related industries occupy approximately 11% of the total (Table 4.13.6).
Table 4.13.6 Industrial Output at Current Prices by Industrial Activity
Unit: Billion VND Kinds of Industries Year
2000 2002 2003 2004 Wood and wooden products 6,059.3 8,587.0 11,249.0 14,786.8Paper and paper products 6,086.1 9,163.3 11,440.4 15,210.6Furniture 7,435.5 12,971.6 20,719.7 30,356.7Sub-total of forest-related industries 30,101.4 48,055.9 66,430.4 92,781.0Total of all the industries 336,100.3 476,350.0 620,067.7 808,958.3
Source: Statistical Year Book of Vietnam 2005
(4) Shortcomings in Forest Sector
Shortcomings and weaknesses for forest sector are mentioned in the Vietnam Forestry Development
Strategy 2006-2020 (MARD, 2007), as follows:
i) Although the forest area is increasing, the quality and biodiversity of the natural forests in many
locations have been continuously reduced.
ii) The growth of the forestry sector is low and unsustainable.
iii) Although the timber processing industry has developed rapidly in recent year, it is still ad hoc and
unstable. No trademarks have been established in the international market.
iv) The impacts of forestry sector on poverty reduction are still limited.
4.13.2 Forest Status in the Study Areas
(1) Forest Areas
The Region is located on the eastern slope of Annamite Mountains, so that main parts are high mountainous
areas and large areas of natural forests are distributed. Forest areas in the Region are 1.47 million ha in
2005, and forest coverage ratio is approximately 40% (Table 4.13.7).
Table 4.13.7 Forest Areas in the Region from 2003 to 2005
Unit: ha Year Forest Areas
Geographical
Areas Artificial Forest
Total Natural Forest Sub-total Under 3
years
Unused Land and
Mountainous Areas
Other Landuse
Forest Coverage
Ratio (%)
Dien Bien 2003 955,411 367,398 356,173 11,225 1,336 411,642 176,371 38.52004 955,411 367,681 356,242 11,439 445 411,217 176,513 38.52005 955,410 372,030 360,082 11,948 1,227 406,787 176,592 38.9

4 - 72
Year Forest Areas
Geographical Areas Artificial Forest
Total Natural
Forest Sub-total Under 3 years
Unused Land and
Mountainous Areas
Other Landuse
Forest Coverage
Ratio (%)
Lai Chau 2003 906,512 302,559 289,465 13,094 1,375 483,379 120,574 33.42004 906,512 318,466 303,758 14,708 1,615 467,255 120,791 35.12005 906,512 332,111 315,747 16,364 3,568 453,480 120,921 36.6Son La* 2003 1,405,500 494,561 468,609 25,952 4,256 383,212 527,727 35.22004 1,405,500 526,722 497,429 29,293 4,345 389,427 489,351 37.52005 1,405,500 571,069 550,921 20,148 4,065 342,271 492,160 40.6Hoa Binh 2003 466,252 197,449 150,867 46,583 5,514 128,859 139,944 42.32004 466,253 200,210 150,267 49,943 4,593 126,082 139,961 42.92005 466,253 202,666 150,202 52,464 14,081 124,431 139,155 43.5Total of the Region 2003 3,733,675 1,361,967 1,265,113 96,854 12,481 1,407,092 964,616 36.52004 3,733,676 1,413,079 1,307,696 105,383 10,998 1,393,982 926,615 37.82005 3,733,675 1,477,876 1,376,952 100,924 22,940 1,326,970 928,829 39.6
Source: MARD(2005)Decision No. 1116/QD/BNN-KL dated 18/5/2005 of the Minister of MARD on gazettement of forest area and unused land nationwide in 2004, MARD(2006)Decision No. 1970/QD/BNN-KL dated 06/7/2006 of the Minister of MARD on announcement on national forest status in 2005
Note*: Son La province pointed out the forest coverage be 43%, instead of 41%.
Approximately 33% of land areas in Dien Bien are natural forests and over 35% of land areas in Dien Bien,
Lai Chau and Son La provinces are natural forests, including bamboo forests and rattan forests. On the
other hands, relatively low lands are distributed in large extent in Son La and Hoa Binh provinces, that are
located eastern parts of the Region, so that there can be seen large extent of agricultural fields. Rocky
mountain forests, bare lands and denuded hills are distributed in Dien Bien and Son La provinces with over
40% in areas, and approximately 30% of land areas in Lai Chau are grass lands and areas of reeds.
Forest coverage ratios in all the four provinces increase gradually, and go up to 43% in 2005 in Hoa Binh.
Natural forest coverage ratios there are between 30% and 40%. Regarding artificial forests, Hoa Binh
province has 11% of artificial forest ratio, whereas other three provinces have only 1% of artificial forest
ratios. That is because three provinces other than Hoa Binh province are located in the hilly-mountainous
regions, so that ratio for unused lands and mountainous lands are high (Dien Binh: 43% and Lai Chau:
50%) and other usage, including agricultural field, are high (Son La: 35% and Hoa Binh: 30%).
Summarized forest areas by land categories and forest functions in the Region are shown in Table 4.13.8
(details are shown in Attachment 4.4). Regarding forest functions, the protection forests, such as
watershed protection forests, are distributed in more than double compared with the national average (about
41%) in the Region. Areas of production forests, however, are lower than the national average in the three
provinces other than Hoa Binh province. That is because those large extents of areas have
hilly-mountainous geographical features, so those large amounts of areas are not suitable for planting
production forests. There can be found wide areas without any tree vegetation, therefore high potential to
reforestate is recognized in the Region.

4 - 73
Table 4.13.8 Forest Areas by Land Categories and Forest Functions in Four Provinces in 2005 Forest and land category Total Divided by functions (ha)
(ha) Special-use Protection Production Dien Bien Physical area 955,409.7 - - - I. Forested land 372,030.1 112,477.5 258,521.2 1,031.4 A. Natural forests 360,081.6 112,477.5 247,604.1 - B. Plantations 11,948.5 - 10,917.1 1,031.4 II. Bare land, denuded hills 406,787.2 - 406,787.2 - III. Other land types 176,592.4 - - - Lai Chau Physical area 906,512.3 - - - I. Forested land 332,110.6 33,360.1 273,125.9 25,624.6 A. Natural forests 315,747.2 33,360.1 260,343.0 22,044.1 B. Plantations 16,363.4 0.0 12,782.9 3,580.5II. Bare land, denuded hills 453,480.1 48,930.2 242,015.4 162,534.5 5. Invaded sandy and mud area 0.0 III. Other land types 120,921.6 - - - Son La Physical area 1,405,500.0 - - - I. Forested land 571,069.0 55,072.1 479,080.6 36,916.3 A. Natural forests 550,920.7 55,043.1 466,018.8 29,858.8 B. Plantations 20,148.3 29.0 13,061.8 7,057.5 II. Bare land, denuded hills 342,271.3 25,532.8 184,557.8 132,180.7 III. Other land types 492,159.7 - - - Hoa Binh Physical area 466,253.1 - - - I. Forested land 202,666.3 20,201.3 141,019.5 41,445.5 A. Natural forests 150,202.1 19,589.6 119,340.1 11,272.4 B. Plantations 52,464.2 611.7 21,679.4 30,173.1II. Bare land, denuded hills 124,431.4 2,740.1 72,069.0 49,622.3III. Other land types 139,155.4 - - - Source: Source: MARD (2006) Forest Plan for Forest Area and Unused Land
(2) Plantation and Tending
Main activities in plantation and tending works in the Region are planting to the protection forests and
production forests (Table 4.13.9).
Table 4.13.9 Plantation and Tending Activities in the Region from 2003 to 2005 Unit: ha
Year New Plantation (ha) Tending (ha) Total Special-
Use Forest
Protection Forest
Production Forest
Industrial Plantation
Assisted Natural
Reforestation +Enrichment
Total Assisted Natural
Reforest.
Protection
Dien Bien Total 9,187 0 6,871 2,316 0 360 39,910 32,670 7,2402003 3,600 0 3,257 343 0 0 7,338 5,519 1,8192004 3,632 0 2,832 800 0 0 11,877 11,080 7972005 1,955 0 782 1,173 0 360 20,695 16,071 4,624
Lai Chau Total 7,914 0 4,769 3,145 0 22,147 196,960 100,053 96,9072003 4,003 0 1,946 2,057 0 20,717 70,242 28,250 41,9922004 1,588 0 1,313 275 0 1,350 72,081 38,258 33,8232005 2,323 0 1,510 813 0 80 54,637 33,545 21,092
Son La Total 14,065 183 7,727 6,155 0 4,284 702,622 109,489 593,1332003 6,205 0 3,137 3,068 0 1,984 221,833 11,473 210,3602004 4,488 0 2,526 1,962 0 2,300 227,063 37,546 189,5172005 3,372 183 2,064 1,125 0 0 253,726 60,470 193,256
Hoa Binh Total 15,722 178 8,800 6,744 0 4,162 235,538 17,605 217,9332003 6,120 148 1,691 4,281 0 1,349 75,287 7,180 68,1072004 6,615 30 5,322 1,263 0 1,710 74,974 4,507 70,467

4 - 74
Year New Plantation (ha) Tending (ha) Total Special-
Use Forest
Protection Forest
Production Forest
Industrial Plantation
Assisted Natural
Reforestation +Enrichment
Total Assisted Natural
Reforest.
Protection
2005 2,987 0 1,787 1,200 0 1,103 85,277 5,918 79,359Total of the Region
Total 46,888 361 28,167 18,360 0 30,953 1,175,030 259,817 915,2132003 19,928 148 10,031 9,749 0 24,050 374,700 52,422 322,2782004 16,323 30 11,993 4,300 0 5,360 385,995 91,391 294,6042005 10,637 183 6,143 4,311 0 1,543 414,335 116,004 298,331
Source: MARD, 7-2006
(3) Timber production
Timber production in the Region is 171,400 m3 in volume and approximately 6% of national production
volume (Table 4.13.10). Timber production in Vietnam is gradually increasing, whereas those of the
Region are decreasing. That is because i) harvesting from the natural forests are decreasing, ii) artificial
forest ratios are smaller than the national average, and iii) many areas of artificial forests have not yet
reached to the cutting period as most of artificial forests planted there are young forests.
Table 4.13.10 Wood Production in the Region Unit: 1,000 m3
Province Year 2000 2001 2002 2003 2004
Dien Bien 61.5 63.7Lai Chau 108.6 113.9 117.8 11.9 9.7
Son La 87.1 67.6 47.6 57.5 54.1Hoa Binh 49.8 65.9 41.9 54.1 43.8
Northwest total 245.5 247.4 207.3 185.0 171.3Whole country 2,375.6 2,397.2 2,504.0 2,435.8 2,627.8
Source: Statistical Year Book of Vietnam 2005
(4) Non-Timber Forest Products (NTFPs)
Typical non-timber forests products (NTFPs) in the Region are shown in Table 4.13.11. Main NTFPs
there are bamboos (materials for construction and paper making and fresh/ dried bamboo shoots), rattans
(materials for handicrafts) and reeds (materials for making brooms). Tree fruits, such as Hạt Trẩu, for
extracting oil for cosmetics, vine trees, such as Huyết giác and Thien nhien kien, and lac for materials for
making lacquer are also produced there. However, as there are fewer facilities to process those materials
in the Region, almost all those materials are now transported to sell to the neighboring provinces , such as
Hanoi, and so on, as raw materials.
Table 4.13.11 Typical Non-Timber Forest Products in the Region
Category Vietnamese Name Outline Dien Bien Lai Chau Son La Hoa Binh
Food Măng khô Dried bamboo + + + Sat truc Small bamboo +
Medicine Sa Nhân + +
Huyết giác (dây máu chó) Kinds of vines + +
Khuc khac + Oil Hạt trẩu Tree fruits + +
Resin Cánh kiến Lac. Lac insects are the must. + +

4 - 75
Category Vietnamese Name Outline Dien Bien Lai Chau Son La Hoa Binh
Materials Song mây Rattan + + Tre nứa Bamboo pulp + + + +
Bông chit Reed. Materials for making broom +
Source: Interviews to each Sub-DOF (DARD) Note: “+” in the above table indicates materials, which are managed by Sub-DOF of each province, by issuing licenses to collectors. In fact, many other kinds of materials are produced in each province which are difficult to grasp the production volumes, as the Sub-DOF do not manage.
Production volume of fuelwoods and bamboos for construction and paper-making materials in the Region
are shown in the tables below (Table 4.13.12 and Table 4.13.13). Production of fuelwoods is relatively
stable in these years. Production volume of bamboos for construction, paper-making materials and
handicrafts is increasing in Dien Bien, whereas is unstable in Son La and Hoa Binh.
Table 4.13.12 Production of Fuelwoods in the Region Unit: 1,000 Ste
Province Year 2000 2001 2002 2003 2004 2005
Dien Bien N.A 520.195 551.407 568.0 596.3 631.6Lai Chau N.A N.A N.A 692 707 721
Son La 1,319.6 1,369.7 1,397.9 1,485.6 1,425.6 1,394.7Hoa Binh 1,156 1,006 963 1,206 1,066.2 1,250.0
Northwest total (2,475.6) (2,895.9) (2,912.3) 3,951.6 3,795.1 3,997.3Source: Statistic Year Book, 2005, of each province
Table 4.13.13 Production of Bamboo (Tre, Nua, Luong) in the Region Unit: 1,000 pieces
Province Year 2000 2001 2002 2003 2004 2005
Dien Bien N.A 4,131 4,713 4,851 5,046 5,267Lai Chau N.A N.A N.A 1,405 1,434 1,463
Son La 5,549 6,887 7,084 5,836 5,415 5,099Hoa Binh 9,526 9,100 10,500 6,100 5,952 7,142
Northwest total (15,075) (20,118) (22,297) 18,192.0 17,847.0 18,971.0Source: Statistic Year Book, 2005, of each province
Conditions and features of NTFPs in the Region are as follows:
Dien Bien province 1) Edible bamboos are produced in some amount every year with varying in quantity. Dead bamboo
stands are scattered about the mountains after flowering.
2) Bamboos for construction and processing and rattans are produced in some amount every year
with varying in quantity. Dead bamboo stands are scattered about the mountains after flowering.
3) Lac production is increasing recently. That is because that host trees, such as Cọ khiết (Delbergia
hupeana), have been planted in large areas and the areas of stands of host trees that grow enough
to be able to produce lac are increasing.
4) Production of Bông chit (Thysanolaena maxima), kinds of reeds, is increasing. As Bông chit is
one of vegetation which grow after harvesting of trees, relationships between varying in areas of
forests and production of Bông chit should be taken into consideration.

4 - 76
Lai Chau province 1) Edible bamboos are produced in some amount every year with varying in quantity. Dead bamboo
stands are scattered about the mountains after flowering.
2) Production of bamboos for construction and processing are increasing rapidly in recent years.
That is because that production of bamboo pulps are increasing, accompanying with improvement
of capacity of factories for making bamboo pulps. Dead bamboo stands are scattered about the
mountains after flowering.
3) Lac production is increasing recently.
4) Productions of many kinds of NTFPs, which are not managed by responsible organizations in other
provinces, are managed by Sub-DOF in Lai Chau province.
Son La province 1) Production of bamboos is managed by Sub-DOF by issuing licenses for exploitation. Productions
of NTFPs other than bamboos are not managed by any organizations, including Sub-DOF, so that it
is difficult to grasp the quantity of production and distribution.
2) Production of lac and oil-producing trees, such as hat trau, has beed decreasing, because of
decrement of demands of them.
Hoa Binh province 1) Production of bamboos is managed by Sub-DOF by issuing licenses for exploitation. Productions
of NTFPs other than bamboos are not managed by any organizations, including Sub-DOF, so that it
is difficult to grasp the quantity of production and distribution.
2) Production of brooms made by Bông chit is very popular activity in Hoa Binh, so that produced
brooms are exported to the South-East Asia countries, China and Europe.
Except some activities, such as production of Lac and Huyết giác (Máu chó) in Dien Bien, production of
NTFPs are not main income sources and remain as supplementary income sources.
(5) Forest-related industries
1) Forest-related industries in the Region
Forest-related industries shown in the Statistical Year Book 2005 of each province are manufacture of wood
and wooden products, paper and paper products and furniture (Table 4.13.14). Manufacturing furniture is
increasing stably within these industries. Ratios of manufacturing furniture in three provinces rather than
Hoa Binh province are between 3.5% in Lai Chau and 5.4% in Dien Bien. Ratio of manufacturing
furniture is quite low (0.8%), but gross production of manufacturing furniture in Hoa Binh is more than
those in other three provinces and is increasing in quantity. According to the report from RENFODA
project (2006), bamboos in Hoa Binh are used to produce furniture in Ha Tay province under the license of
IKEA, which is Swedish Furniture Company, and exported to Europe.

4 - 77
Table 4.13.14 Industrial Output at Current Prices in the Region Unit: Million VND
Kinds of Industries Year 2000 2001 2002 2003 2004 2005
Dien Bien Wood and wooden products N.A. 7,038.0 8,142.0 3,340.0 2,223.0 3,483.0
Paper and paper products N.A. 0.0 0.0 270.0 1,320.0 1,546.0Furniture N.A. 19,328.0 18,839.0 22,879.0 26,075.0 29,860.0
Sub-total of forest-related industries N.A. 26,366.0 26,981.0 26,489.0 29,618.0 34,889.0
Total of all the industries N.A. 261,523.0 314,593.0 386,254.0 462,107.0 556,017.0Lai Chau
Wood and wooden products N.A. N.A. N.A. 348.0 377.0 1,120.0Paper and paper products N.A. N.A. N.A. 0.0 466.0 39.0
Furniture N.A. N.A. N.A. 1,813.0 2,567.0 2,600.0Sub-total of forest-related
industries N.A. N.A. N.A. 2,161.0 3,410.0 3,759.0
Total of all the industries N.A. N.A. N.A. 50,253.0 66,385.0 74,838.0Son La
Wood and wooden products 1,300.0 2,979.0 2,850.0 7,365.0 10,751.0 6,939.0Paper and paper products 0.0 0.0 1,202.0 293.0 0.0 0.0
Furniture 10,729.0 10,681.0 12,890.0 21,857.0 25,302.0 28,561.0Sub-total of forest-related
industries 12,029.0 13,660.0 16,942.0 29,515.0 36,053.0 35,500.0
Total of all the industries 213,668.0 261,936.0 304,035.0 451,347.0 525,589.0 670,997.0Hoa Binh
Wood and wooden products 16,306.0 13,716.0 21,740.0 36,654.0 31,795.0 47,251.0Paper and paper products 13,102.0 8,105.0 16,715.0 19,985.0 19,844.0 25,096.0
Furniture 20,758.0 18,970.0 18,014.0 37,450.0 31,321.0 35,772.0Sub-total of forest-related
industries 50,166.0 40,791.0 57,543.0 95,650.0 83,594.0 109,154.0
Total of all the industries 3,866,032.0 4,084,954.0 4,118,972.0 4,469,404.0 4,709,054.0 4,676,460.0Source: Statistic Year Book, 2005, of each province
2) Forest-related industries and industries for NTFPs in Son La province
Present status of wood processing facilities in Son La province is shown in Table 4.13.15, according to
DARD Report No. 42/BC-SNN dated on 29 March 2007 on statistics of timber and non-timber products
processing workshop. There are 195 numbers of wood processing facilities in Son La province licensed
by Sub-DOF of Son La province, in which five are managed by cooperatives and rest of them are by
individuals.
Table 4.13.15 Wood processing facilities in Son La province in 2006
Total Volume of round wood (m3)
SN Name of District
Number of Timber
Processing Places
Total Imported Products
Local products
Total human labor
Total practical
production capacity (m3/y)
Export to foreign
countries (USD)
1 TX. Son La 27 1,374.54 144 1,230.54 110 3,805 -2 Muong Lay Dis. 19 212.00 0 212.00 53 212 -3 Quynh Nhai Dis. 8 690.00 0 690.00 42 690 -4 Yen Chau Dis. 24 566.00 0 566.00 51 566 -5 Phu Yen Dis. 33 416.00 0 416.00 84 5,045 -6 Moc Chau Dis. 15 408.00 0 408.00 72 283 -7 Thuan Chau Dis. 14 283.00 0 283.00 39 283 -8 Bac Yen Dis. 4 85.00 0 85.00 8 85 -9 Sop Cop Dis. 6 270.00 0 270.00 23 130 -
10 Song Ma Dis. 33 476.00 0 476.00 68 374 -11 Mai Son Dis. 12 121.20 0 121.20 31 121 -
Total 195 4,901.74 144 4,757.74 581 11,594 0Source:Son La DARD (2007): DARD Report No. 42/BC-SNN dated on 29 March 2007 on statistics of timber and non-timber products processing workshop

4 - 78
Practical production capacities of most facilities are relatively small, from 3 to 40 m3, and numbers of
labors are between 1 from 5, mainly. There can be found 6 numbers of large facilities with practical
production capacity of over 100 m3. However, there are many factories/ workshops of which volumes of
round wood for processing are quite small, as compared with the practical production capacities. Average
rate of operation for the factories with practical production capacity of over 100 m3 is 19%, whereas 42% in
total (Table 4.13.16). Regarding facilities for processing NTFPs, it is reported in the same report that
there are no facilities to process NTFPs in Son La province.
Table 4.13.16 Wood Processing Facilities in Son La Province in 2006 (over 100m3/y Production Capacity)
SN Name of District
Number of Timber
Processing Places
Total Volume of round wood
(m3)
Total human labor
Total practical production
capacity (m3/y)
Rate of Operation (%)
1 TX. Son La 1 1,011.54 30 3,000 34% 1 27.56 3 100 28%
3 Quynh Nhai Dis. 1 200.00 7 200 100% 1 150.00 4 150 100%
5 Phu Yen Dis. 1 60.00 5 800 8% 1 4.00 15 3,500 0.11%Total over 100m3/y 6 1,453.10 64 7,750 19%Total below 100m3/y 189 3,448.64 517 3,844 90%Total 195 4,901.74 581 11,594 42%Source: Son La DARD (2007): DARD Report No. 42/BC-SNN dated on 29 March 2007 on statistics of timber and non-timber products processing workshop
4.13.3 Natural Condition of the Study Area
(1) Site Condition
1) Special-Use Forests in the Region
Special-use forests in Vietnamese forest classification consist in the national parks, nature
conservation areas and landscape protection areas, according to the Law on Forest Protection and
Development in 2005. In advance, BirdInternational in Indochina and MARD2 assigned 15
numbers of existing and proposed protected areas in the Region in 2002. MARD also developed
guidelines on the management of protected areas, including the special-use forests, by formulating
the management strategy of protected areas3 in 2003. In the management strategy, 12 numbers of
special-use forests in total, including 3 numbers of National Parks and 9 numbers of Nature
Conservation Areas, were mentioned in the management stratedy as existing and proposed
special-use forests. Activities in the special-use forests are strictly restricted by many kinds of
regulations, including the Law on Forest Protection and Development. However, in the fact, people
are living inside the special-use forests, and many areas are used as agricultural fields. In addition,
conditions on production forests and protection forests also have been changed. Therefore, current
conditions of the special-use forests differed from the existing data and information, the Forest
Protedtion Department (FPD) in MARD has conducted to review the special-use forests in Vietnam
2 BirdLife International in Indochina and MARD (2002) Sourcebook of Existing and Proposed Protected Areas in Vietnam: Second Edition 3 Management Strategy for a Protected Area System in Viet Nam to 2020

4 - 79
in 2006. According to the review4, eleven numbers of special-use forests are assigned in the Region.
Existing and proposed special-use forests mentioned in the report by BirdInternational in Indochina
and MARD, the management strategy and the review in the Region are summarized in Table 4.13.17.
Existing and proposed special-use forests in the Region mentioned in the report by BirdInternational
in Indochina and MARD are shown in Figure 4.13.1
Table 4.13.17 Existing and Proposed Special-use Forests in the Region
I. National Park M.S
(2003) B.I.
(2002) Review (2006)
Name Location Area (ha) Description
2 - - Ba Vi Ha Tay, Hoa Binh
12,023 Evergreen forest on low mountains; main flora, Libocedrus macrolepis, Podocarpus neniifolius, and endemic primate species, Tonkin Snubnose: Pygathrix avunculus
12 - - Cuc Phuong Ninh Binh, Thanh Hoa, Hoa Binh
22,200 Primary forest on limestone mountains. Diverse flora and fauna; Delacour’s Langur (Semnopithecus francoisi delacouri)
13 + - Lao Cai、 28,500
13 + -
Hoang Lien
Lai Chau 7,500
Evergreen forest on highest mountain in Viet Nam. Many threatened and endemic gymnosperm species and precious medicinal plants; Hylobates concolor and endemic bird species.
II. Nature Conservation Area IIa. Nature Reserve
M.S (2003)
B.I. (2002)
Review (2006)
Name Location Area (ha) Description
7 + 5 Copia Son La 11,996 Forest on island with many Rhesus Macaque: Macaca mulatta.
19 + 1 Muong Nhe Dien Bien 44,940
+ 2 Muong Te Lai Chau 33,775
Evergreen, broad-leaved forest; many large mammal species. The relevant parts in each province are now managed by each rovince after division of former Lai Chau province into Dien Bien and Lai Chau province.
27 + 7 Hang Kia - Pa Co
Hoa Binh 5,258 Evergreen forest on limestone mountains; Pinus kwangtungensis; Paphiopedilum spp., new orchid variety.
30 + 9 Phu Canh Hoa Binh 5,647 Evergreen forest on low mountains; high biodiversity.
37 + 3 Sop Cop Son La 17,369 Located in the steep and mountainous region. Evergreen forests still remain at high elevation, however, the natural vegetation there has been extensively cleared and replaced by scrub.
40 + 6 Ta Sua Son La 13,412 Ever-green tropical forests on the ridges of the mountains; Black-cheeked Crested Gibbon: Nomascus (Hylobates) concolor)
45 + 8 Thuong Tien Hoa Binh 5,873 Ever-green tropical forests on the low mountain region.
48 + 4 Xuan Nha Son La 16,317 Forest on limestone mountains; Podocarpus nagi and many Angiosperm species.
- + 10 Ngoc Son – Ngo Luong
Hoa Binh 15,891 The proposed nature reserve lies on the north-eastern flank of the limestone range that extends in a north-westerly direction from Cuc Phuong National Park to Son La province. Tropical forests on the limestone karsts. The globally critically endangered and endemic primate,
4 FPD internal data (2006). According to the Directive No. 38/2005/CT-TTg, each province has prepared “Report of Results on Review and Planning on Three (3) Categories of Forests under the Directive No. 38/CT-TTg” in 2006. FPR organized and summarized the reports from all of the provinces.

4 - 80
M.S (2003)
B.I. (2002)
Review (2006)
Name Location Area (ha) Description
Delacour's Leaf Monkey Trachypithecus delacouri has been recorded in several contiguous areas of similar habitat.
- + - Nam Don Son La 18,000 This reserve is situated on the south-western flank of a mountain range that runs parallel to the main chain of the Hoang Lien mountains. The main objective of the nature reserve was the protection of a population of Gaur Bos gaurus that previously occurred in the area.
III. Landscape protected area M.S
(2003) B.I.
(2002) Review (2006)
Name Location Area (ha) Description
15 + - Dao Ho Song Da
Hoa Binh 3,000 Island in the Da river water reservoir.
- + 2 Muong Phang Dien Bien 936 The site protects the base of General Vo Nguyen Giap, the commander-in-chief of the Viet Minh forces during the Dien Bien Phu campaign of 1954. The site is only 40 km from Dien Bien Phu town.
Source: M.S. (2003): MARD, 2003 (Management Strategy for a Protected Area System in Viet Nam to 2020). B.I. (2002): BirdLife International in Indochina and MARD, 2002, Sourcebook of Existing and Proposed Protected Areas in Vietnam: Second Edition Review (2006): FPD data (2006) which were organized and summarized with “Report of Results on Review and Planning on Three (3) Categories of Forests under the Directive No. 38/CT-TTg” from each province. Serial numbers in three colomns from the left in the table are concurrent with those in the tables in three kinds of reports mentioned above.
Figure 4.13.1 Existing and Proposed Special-Use Forests in the Northwestern Region Source: Sourcebook of Existing and Proposed Protected Areas in Vietnam: Second Edition
2) Wetlands necessary to be protected except for the special-use forests
Wetlands necessary to be protected in the Region are summarized in Table 4.13.18. Those wetlands

4 - 81
should be protected as recognized as important wetlands regionally and internationally.
Table 4.13.18 Wetlands necessary to be protected in the Region
I. Wetlands with high values on biodiversity and environment No. Name Province Area (ha) Coordinates Characteristics
1. Hoa Binh Lake Hoa Binh 72,800 20°00' - 21°30' N, 103°00' - 106°00' E Reservoir Source: Viet Nam Environment Protection Agency (2005). Overview of Wetlands Status in Viet Nam Following 15 Years of Ramsar
Convention Implementation.
II. Important Bird Area (IBA) (a) Important Bird Area (IBA)
IBA Code Name Criteria Province Coordinates of the center
Area (ha) Altitude (m)
VN018 Che Tao A1, A2, A3 Son La,Yen Bai 104o 2' E 21o 42' N 16,000 260 - 2512
VN034 Cuc Phong A2, A3 Hoa Binh, Ninh Binh, Thanh Hoa
105o 37' E 20 o 19' N 22,200 50 - 648
VN057 Fan Si Pan A1, A2, A3 Lai Chau, Lao Cai 103 o 53' E 22 o 16' N 49,584 380 - 3143Source: BirdLife International (2005). BirdLife's online World Bird Database: the site for bird conservation. Version 2.0. Cambridge, UK:
BirdLife International. Available: http://www.birdlife.org (accessed 30/11/2006)
(2) Biodiversity in the Region
There can be seen many existing and proposed nature reserves in the Region. Rare species of fauna and
flora are staying there as their habitats. Not only the nature reserves but also the whole areas of the
Region are the habitats for te rare fauna and flora.
The Sub-Department of Forest Protection (Sub-DFP) of each province shall establish the management plan
of those nature reserves, i.e. the special-use forests, and conduct management of those nature reserves,
however, not for all the nature reserves the management plans have yet been compiled. Information of the
rare fauna and flora of two (2) nature reserves in the Region, i.e. Sop Cop Nature Reserve and Ta Xua
Nature Reserve, in the management plans, which can be obtained by now, are described below.
Fauna
Nearly 60 kinds of wild fauna are listed in the Vietnam Red Data Book5 as the rare species in the Ta Xua
Nature Reserve (Table 4.13.19).
Table 4.13.19 Number of Rare Animals which are Confirmed in Existing in Ta Xua Nature
Reserve in Son La Province
Vietnam Red Data Book Number of Species Listed in the Vietnam Red Data Book (1989) Mammal Avis Reptile Amphibia Total
E Endangered 5 3 1 9 V Vulnerable 12 5 17 T Threatened 7 7 4 3 21 R Rare 8 1 2 1 12 Total 32 11 12 4 59
Source: PROJECT 611 – Ta Xua Nature Reserve Area in Son La province
5 As the Vietnam Red Book has been revised in 2007, the new criteria for the rare flora and faune are to be employed for the surveys on the special-use forests later on.

4 - 82
Main species include Bear Macaque (Khỉ mặt đỏ, Macaca arctoides), Phayre’ Langur (Vọc xám,
Trachypithecus phayrei), Black-cheeked Crested Gibbon (Vượn đen, Nomascus (Hylobates) concolor),
Asiatic Black Bear (Gấu ngựa, Ursus thibetanus), Clouded Leopard (Báo gấm, Neofelis nebulosa).
Over 70 kinds of wild fauna are named as the rare species in the Sop Cop Nature Reserve in the Vietnam
Red Data Book, IUCN Red Data Book, and Decree No.18/HDBT (1992). Out of over 70 species, those
species below are listed in the Vietnam Red Book (Table 4.13.20).
Table 4.13.20 Number of Rare Animals which can be Confirmed in Existing in Sop Cop Nature
Reserve in Son La Province
Vietnam Red Data Book Number of Species Listed in the Vietnam Red Data Book (2000) Mammal Avis Reptile Amphibia Total
CR Critically Endangered 6 1 2 0 9 EN Endangered 7 1 8 0 16 VU Vulnerable 13 3 4 1 21 LR Lower Risk 2 4 0 0 6 DD Data Deficient 1 1 0 0 2
Total 29 10 14 1 54 Source: Activity Management Plan for Sop Cop Nature Reserve Area Period 2006-2010(2005)
Out of those fauna, such species as Rufous-necked Hornbill (Niệc Cổ Hung, Aceros nepanensis), Phayre's
Langur (Vọc xám, Trachypithecus phayrei), White-Cheeked Gibbon (Vượn bạc má, Nomacus leucogenys),
are recognized as severe rare fauna in Vietnam.
Flora
Nearly 60 kinds of rare species can be seen in Ta Xua Nature Reserve, and almost all the species are listed
in the Vietnam Red Data Book and Decree No. 18/HDBT6, and need to be conserved. Main species are
listed in Table 4.13.21.
Table 4.13.21 Rare Flora Species which can be Confirmed in Existing in Ta Xua Nature
Reserve
Family Name Species Name Vietnamese NameVietnam
Red Book IUCN (1997)
CUPRESSACEAE Fokienia hodginsii A.H Pơ mu K LR/nt PODOCARPACEAE Podocarpus neriifolius D.Don Thông tre LR/lc MELIACEAE Chukrasia tabularis Ajuss Lát Hoa LR/lc
BIGNONIACEAE Markhamia stipulate (Wall.) Schum, Markhamia pierrei Dop
Đinh V
DIPTEROCARPACEAE Parashorea chinensis Wanghsic Chò chỉ EN LAURACEAE Cinnamomum balansae Lee. Vù hương K EN
Source: PROJECT 611 – Ta Xua Nature Reserve Area in Son La province
Among the 640 kinds of flora in the Sop Cop Nature Reserve, 27 kinds of flora are listed in the Vietnam
Red Data Book (Table 4.13.22) and 15 kinds of flora are listed in the IUCN Red Book (1998). Main
6 Decree o. 18/HDBT (1992/01/17): The former decree on management and protection of rare and precious species on the basis of the previous Law on Forest Protection and Development (1991). Decree No. 18/HDBT was revised by Decree No. 48/2002/ND-CP (2002/04/22) at once; furthermore, the list in Decree No. 48/2002/ND-CP was amended by Official Dispatch No. 3399/VPCP-NN (2002/06/21).

4 - 83
species are shown in Table 4.13.23.
Table 4.13.22 Number of Rare Flora Species which can be Confirmed in Existing in Sop Cop
Nature Reserve
Endangered Rare Vulnerable Threatened Unknown Total Vietnam Red Data Book (2000) E R V T K
Number of Plants 2 5 11 3 6 27 Source: Activity Management Plan for Sop Cop Nature Reserve Area Period 2006-2010 (2005)
Table 4.13.23 Major Rare Flora Species which can be Confirmed in Existing in Sop Cop Nature
Reserve
Family Name Species Name Vietnamese
Name Vietnam
Red Book IUCN (1997)
CUPRESSACEAE Calocedrus macrolepis Kurz Bách Xanh E VU BIGNONIACEAE Markhamia stipulata (Wall.) Schum Đinh V PINACEAE Keteleeria evelyniana Mast Du sam V TAXACEAE Amentotaxus argotaenia (Hance) Pilg. Sam bông R VU
Source: Activity Management Plan for Sop Cop Nature Reserve Area Period 2006-2010 (2005)
(3) Management of the special-use forests
As mentioned above, the special-use forests are managed by the Forest Protection Department (FPD) in
MARD. In the provincial level, the provincial Department of Forest Protection was independent from
DARD and directly managed by the PPC to manage and protect the special-use forests. However,
controls of management of the special-use forests were complicated; supplementary planting was
conducted by the Sub-DOF to the special-use forests, whereas protection and patrol for the special-use
forests were by provincial DFP.
In order to unify management of the special-use forests, MARD has instructed to each province to merge
the provincial DFP into DARD through Decree No.119/2006/ND-CP and Joint Circular
No.22/2007/TTLT-BNN-BNV7. As the results, the provincial DFP in Hoa Binh has been merged into
DARD in 2007, and in 2008 for Dien Bien, Lai Chau and Son La provinces. Therefore, the adequate
management of the special-use forests are expected through cooperation with Sub-DOF and Sub-DFP in the
provincial level.
4.13.4 Targets and Progress of 5 Million Hectare Reforestation Program (Program 661) in the Region
(1) Targets and progress
Each province of the Region has formulated the master plan for reforestation for each province and
implements reforestation due to their plans. Targets and progress by 2005 on reforestation by each
province are shown in Table 4.13.24.
7 Government Decree No.119/2006/ND-CP of Octover 16, 2006, on organization and operation of the forest protection service. Joint Circular No.22/2007/TTLT-BNN-BNV on March 27, 2007, guiding duties, rights, and organization structure of Forest protection in localities (by MARD and Ministry of Internal Affairs)

4 - 84
Table 4.13.24 Targets and Progress of 5 Million Hectare Reforestation Program in the Region
in 2005
Province Whole plan (1998-2010)
Term-I (1998–2000)
Term-II (2001–2005)
Term-III (2006–2010)
National targets
Restoration of 5.0million ha forests
1.05 million ha 1.95 million ha 2.00 million ha
Forest coverage ratio: 43%
43%(2010)
Dien Bien Target 38%(2005) 50%(2010) Result 30.2%(2000) 39%(2005) - Lai Chau Target 38%(2005) 45%(2010) Result 35%(2004) - Son La Target 55%(2010) Result 23.6%(2000) 41%(2005) - Hoa Binh Target 37%(2000) 45%(2005) 50-55%(2010) Result 38%(1999) 43.7%(2005) -
Source: National Five Million Hectare Reforestation Programme (1998 – 2010), Master Plan for Social Economic Development for each province, and Master Plan for Forest Development for each province
According to the documents from Forest Department (MARD, 2007), the progress of the 5 Million Hectare
Program of each province are shown in Table 4.13.25.
Achievement rates for the results of the special-use forests and protection forests in the Region are between
97% and 175%, totaling 132% in average. However, establishment of production forests and industrial
forests in the Region have not been conducted so much as same as national level. Achievement rates for
forest protection activities for the special-use forests and protection forests in Lai Chau and Dien Bien are
on the 50%, whereas approximately 170% for Dien Bien and Son La, resulting to 103% in average for the
Region.
Table 4.13.25 Details of Progress of 5 Million Hectare Reforestation Program in the Region in
2005
New Plantation No. Name of Provinces Total Special-use
and protection forestation
plan
Special-use Forest
Protection forest
Percentage Production forest
Permanent industrial
trees
The Region 132,366 58,990 913 77,344 132.7 53,886 2231 Dien Bien 17,531 15,000 162 14,440 97.4 2,929 2 Lai Chau 25,232 13,690 14,220 103.9 11,012 3 Son la 43,148 15,800 358 27,419 175.8 15,371 4 Hoa Binh 46,455 14,500 393 21,265 149.4 24,574 223
Forest Protection In which: Special-use and protection forest
No. Name of Provinces Total
State plan Result Percentage The Region 20,734 15,693 16,241 103.5
1 Dien Bien 1,276 751 1,276 169.92 Lai Chau 2,824 4,620 2,759 59.73 Son la 12,357 5,252 9,438 179.74 Hoa Binh 4,277 5,070 2,768 54.6Source: Documents from Forest Department, MARD (2007)

4 - 85
(2) Shortcomings to 5 Million Hectare Reforestation Program and measures
Encouragement of participation of villagers by increasing the management costs
By the Program 661, the forest lands are allocated to the villagers by contract basis, and villagers conduct
to plant seedlings which are delivered by the Sub-DOF and conduct to manage and control the planted
forests. Management costs which are paid to the villagers by the Sub-DOF are 50,000 VND/ha/year, and
the amount of the management costs are too low for the villagers to accelerate the participation to this
program.
Under these circumstances, each Sub-DOF has taken into considerations to increase the management costs
in order to encourage for the villagers to participate in this program, as follows:
- Dien Bien: increase to 100,000 VND/ha/year
- Lai Chau: increase to 100,000 VND/ha/year
- Son La: no change (50,000 VND/ha/year) (Decision No. 1265/2007/QD-UBND)
- Hoa Binh: increase to 100,000 VND/ha/year (Decision No.03/2007/QD-UBND)
Necessity to diversify planting tree species
Keo trees (Acacia sp.) are nowadays planted mainly as planting tree species for the production forests in
place of Bạch đàn (Eucalyptus sp.), because commercial values of Keo trees are increasing recently,
compared with Bạch đàn. Regarding for the production forests, it does not matter if single tree species is
planted in case of planting on relatively small areas from the points of easiness of management and
harvesting.
However, single tree species planting can be seen for the protection forests by using single tree species,
such as Thông ba lá (Pinus kesiya), Keo lá tràm (Acacia auriculiformis). That is mainly because it is easy
to produce seedlings at nurseries, and conduct planting and tending after planting. Single tree species
planting is not desirable for protection forests from the viewpoints of sustaining biodiversity, preventing
from natural calamities and producing NTFPs.
In case of Son La province, although the Sub-DOF supplies seedlings to villagers on free and indicates the
place to plant to them, the Sub-DOF sometime leaves planting activity to villagers. Therefore, the
villagers start planting at the places which are easy to access and to plant trees, so that many places in the
forests can be seen without any planted trees, especially on the upper sides.
Accordingly, reforestation activities are implemented in each province under the Program 661 with
responsibilities of DARDs. Although planted areas of forests have been increasing in quantity, large areas
of forests are established with low quality of forests and biodiversity.

4 - 86
4.13.5 Forest Utilization in Timber Production
Plantation to the production forests
Keo (Acacia sp.) are mainly planted to the production forests. That is because that Keo can be harvested
within 5 to 7 years after planting, and commercial values of Keo trees are increasing recently, compared
with Bạch đàn (Eucalyptus sp.), which were used to be planted.
Bamboo plantation is also popular there. Nurseries at each province grow and nurse the bamboo seedlings
and sell them to farmers.
Those considerations should be taken for timber production in the Region as follows:
Planting of tree species which meet market demands
Most of timbers used for wood processing factories in the Region are supplied within each province.
However, some kinds of tree species, such as Pơ Mu (Fokienia hodginsii), which could be supplied within
provinces before, are now imported from Laos in Dien Bien and Son La as harvesting those trees are now
prohibited because of shortage of resources. According to the interview results to the wood processing
factories in Dien Bien, it is desirable for them to procure those timbers within the region if those timbers
can be supplied within this region.
Although recently single tree species, such as Keo, is planted for production forests in term of high
commercial value, it is necessary to select and plant those tree species which have high demands by wood
processing industries.
4.13.6 Forest Utilization in Production of NTFPs
Production areas of raw materials
As mentioned in the Forest Development Strategy of Vietnam, the Region have high potential to be the
production areas of raw materials, and in fact those four provinces also produce many kinds of raw
materials. In case of lac production, inhabitant of lac-producing insects, such as lac scale insects (Laccifer
lacca), and stands of host trees, such as Cọ khiết (Delbergia hupeana), are the must. Vine trees, such as
Máu chó, prevent for planted trees and trees in the natural forests from growing in healthy ways by
climbing up and winding up the tree trunks. Therefore, cutting and collecting of vine trees can not only
improve tree growth but also utilize cut vines as NTFPs. Those considerations should be taken for
production of NTFPs in the North-western region, as follows:
Shortage of techniques, information and facilities on NTFPs
There are quite few facilities to conduct preliminary processing of many kinds of NTFPs in the Region,
except for bamboos (edible purposes, construction materials and bamboo pulps) and reeds (materials for
brooms). Therefore, in most cases, NTFPs are sold to middlemen as raw materials after collected and
kept temporarily.

4 - 87
Even though villagers are collecting NTFPs, there can be found that even villagers do not know the
destination of collected NTFPs and produced materials from NTFPs, because of lack of information.
Market and distribution
Brooms produced in Hoa Binh province are exported to Asian countries and European counties through
middlemen in Hanoi. Moreover, broom manufacturing factories export brooms directly to China by
themselves.
Bamboo pulps produced in Lai Chau are exported to China, and bamboo pulps in Hoa Binh are transported
to the paper manufacturing company in Binh Phuc province.
In case of NTFPs which are sold to other provinces as raw materials other than bamboos and reeds,
middlemen in neighboring cities and towns, such as Hanoi, come and visit at each villagers regularly and
buy and collect NTFPs as raw materials directly from the villagers.
4.13.7 New Way of Utilization of Forests
Rubber plantation
The Government of Vietnam has formulated the Master Plan for rubber tree plantation for the whole
country (General review of rubber, 2000). Detailed target areas of this plan are the Central Coast, Central
Highland and South East Regions. Recently, the Government of Vietnam has started to consider the
possibility to implement rubber plantation in the northern areas in Vietnam, and the conference on
“Scientific Base and Development Orientation for Rubber Tree in North Mountainous Provinces” was held
on May 2007. According to this Announcement, it was mentioned that rubber tree plantation would be
promoted in the Region, which had been considered to be unsuitable for rubber tree plantation.
Under these circumstances, the Sub-DOF in Lai Chau province has started to nurse rubber tree seedlings
from 2006, and implemented experimental planting of rubber trees (provenance: Vietnam) from 20078. A
private company in Lai Chau planted rubber trees (provenance: China) as experimental basis in 2006 in
cooperation with Sub-DOF. The Sub-DOF has a plan to implement provenance tests of rubber trees and
evaluate and select the suitable provenance of rubber trees.
Jatropha curcas L.
Bio-originated energies are highly paid attention globally as supplementary energy sources by the recent
running-up of crude oil price. Accordingly, MARD has been beginning in earnest to try to consider
planting Jatropha curcas L., namely physic nuts, as the raw materials of the biodiesel in nationwide
according to the Prime Minister’s Decision No. 177/2007/QĐ-TTg dated 20th November 2007 on
approving “Project proposal on development of biofuel until 2015 and vision to 2025” and issuring the
Minister’s Decision No. 1842/2008/QD-BNN-LN concerning the approval of the program on research,
8 Announcement No. 3029/2007/TB-BNN-VP dated on June 6, 2007 on Vice Minister Diep Kinh Tan's Conclusion Opinion at the Conference on "Scientific Base and Development Orientation for Rubber Tree in North Mountainous Provinces"

4 - 88
development and product use of Jatropha curcas L. in Vietnam in period 2008-2015 and vision until 2025”
on June, 2008.
Jatropha curcas L., namely Jatropha or physic nuts, can be planted even on the bare lands and denuded
lands in the Region below 1,400 m, yearly percipitation 480mm to 2,400 mm, and yearly mean temparature
of 18 to 28 oC, and also taken no damage from livestock and less damage from insects by contained latex in
trunks and leaves, and toxic substances in seeds. Oils can be extracted from the seeds, with nearly 30%
oil contents, and can be used to produce biodiesel. The minimum capacity of small oil processing lines
are said to be 3,000 ton/year, and 1,000 to 1,500 ha of Jatropha the minimum extent for that minimum
capacity of the processing lines. Although it is not admireble to have the quite large areas of the uniform
forests by single tree species on the points of view of biodiversity and disaster prevention, it is
recommended to spread some amount of large areas of blocks of the single tree species in order for easy
and efficient transportation of the taken fruits to the processing facilities.
Regarding research aspect, MARD assigned the Center for Biotechnology in Forestry (CBF) of FSIV to
conduct the scientific research on Jatropha in four years (2007-2010). Contents of those theme include
pilot demonstration plantations, testing seed provenances. The Experiment and Research Center of Thanh
Tay University has established 1 ha seed orchard with 16 provenances from Vietnam and five foreign
countries, including China, Thailand, Indonesia, India and Malaysia. In the experimental forests for seed
provanance of Thanh Tay University, planted Jatropha trees show high growth with 3 to 4 m in height just
after 15 months after planting and already have born fruits.
Regarding production aspect, there are ten domestic companies and five foreign companies planting
Jatropha with small areas or promoting formulation of the investment projects in Lang Son, Son La, Ninh
Thuan, Binh Thuan, Ninh Thuan, and so on. Those foreign companies include those from Germany,
Malaysia, Canada, Korea and Japan.
As Jatropfa can be planted even on the denuded areas in the Region and can be the new income-generating
materials for the rural people, plantation of Jatropha is recommendable for those rural mountaneous areas
in the Region.
4.14 Handicraft
4.14.1 Introduction
(1) Objectives of the preliminary field data collection for handicraft
The development of primary industries in Vietnam was achieved as a result of rationalization of the
business management. This has led to various issues such as excessive laborers in the rural areas and
widening gaps in income levels. In Vietnam, handicraft inherits a wealth of traditional skills grounded in
the people’s way of lives, which could be considered as an advantage to develop local industries through
creating opportunities for employment and income generation.

4 - 89
In recent years, substantial outcomes were observed in handicraft industries through export promotion and
foreign investment. Such successful cases raised awareness towards the role and importance of the
non-agriculture economic activities such as handicraft in rural development. In Vietnam, handicraft
development has been recognized as a means to achieve poverty reduction and economic development.
Various interventions have been implemented while the results are not yet visible.
This data collection on handicraft industries intends to assess the potentials and possible approaches for the
development of handicraft industries in the Region and design a feasible development plan. In this study,
handicraft is defined as productive activities utilizing the traditional skills which remain as part of the
livelihoods in the rural areas and provides an important means of earning income either as full time or part
time work of the rural households. Local industries are defined as the processes of management, marketing
and production is managed by the locally organized industries and people.
(2) Methods of data collection
The field data collection was conducted between July and October 2007 in three stages. Firstly, the
review of the relevant policy documents and project reports was conducted followed by the field visits in
the South and Northwest regions. Lastly, the problem analysis was conducted with the stakeholders in
handicraft industries in the Region to conclude the data collection. The outline of each stage of data
collection is presented bellow.
1) Key informant interviews, documentary review and analysis
Key informants were identified among the government offices and local consultants. The interviews
were conducted by NIAPP counterpart. The reports of preceding projects such as “The study on
Artisan Craft Development plan for Rural Industrialization (JICA, 2004)”, “Basic Design Study on the
Project for Improvement of Rural Bridges in Northern Mountainous Provinces” and draft report on “1
Village-1 Product Movement in Northwest Mountainous Rural Community” were reviewed to grasp
the overview of the handicraft industries in Vietnam. he offices visited and items of data collection
were summarized in Table 1 of Attachment 4.5.
2) Field Reconnaissance
Field visits were conducted three times between August and September 2007 in the Northwest, South
and Central Regions. The purpose of field visits include was to investigate the current status of
handicraft industries, supporting services and market environment in Vietnam. The JICA study team
selected the government offices, organizations and vocational institutions which were considered to
be representative of Vietnamese handicraft industries and visited them for interviews. The interview
schedules were summarized in Attachment 4.5.
3) Problem Analysis
Towards the end of the fieldwork in the Region, the problem analysis was carried out with participation
of stakeholders in the local handicraft industries. The objectives of the problem analysis include 1) to

4 - 90
gain insights on the problems of the handicraft industries in the Region from the local perspectives; 2)
to reflect on the findings from the field work conducted by the study team, and 2) to select the most
relevant and urgent issues to be dealt with in the long term development program for promotion of
handicraft industries in the region. The results of the problem analysis are discussed in the Chapter 8.
Supplementary study to investigate further details will be carried out after May 2008.
4.14.2 Overview of the Handicraft industries in Vietnam
(1) Overview of handicraft
Handicraft industries are mostly locally operated light industries or handicraft industries (tieu thu cong
nghiep). According to the Statistical Yearbook of Vietnam issued by the Statistical Publishing House
shows, those who engaged in handicraft are “non-governmental (ngoai quoc doanh)” organizations and
individuals excluding state and foreign businesses. In other words, those who produce handicraft in
Vietnam are mostly cooperatives, NGOs, private enterprises and households.
Main handicraft products in Vietnam include rash products, bamboo/rattan products, embroidery,
textiles/weaving, wood processing and metal work. These are produced both as non consumable goods
and souvenirs for the domestic and overseas markets.
The following section intends to provide the landscape of the handicraft industries in Vietnam based on the
data from the report on the Study on Artisan Craft Development Plan for Rural Industrialization (JICA,
2004), which studied “craft village” in the country.
(2) Craft village and handicraft industries
In the national handicraft mapping conducted in 2002 (JICA/ MARD), “craft village” was defined as the
village where 20% of the total households engaged in the local industries or where the handi- and artisan
crafts were considered to be an important industries by the commune. According to this definition, 2,017
villages were identified as “craft village” in the country. In these villages, 1.35 million persons or 2.3% of
the total population of “handicraft villages” solely depended on their income from hand and artisan crafts.
The average number of handicraft makers in these villages in Vietnam was 668 persons. Among regions,
the Red River Delta region having the largest number of the handicraft makers of 929 persons per village
followed by the southeast region with 928 persons. The same for other regions indicated far bellow the
national average ranging between 300 and 500 persons per village. The basis and summary of this
calculation is indicated in Table 4.14.1.

4 - 91
Table 4.14.1 The number of handicraft villages and households engaged in handicraft
Craft village Household engaged in handicraft
Region The number
of people engaged in handicraft
Number of village
The number of people engaged in handicraft/
village
Full time(%)
Part time(%)
Non farming
(%)
Households engaged in
primary industries (%)
National 1,348,359 2017 668 7.6 50.6 41.8 75.61.Red River Delta 848,805 866 929 4.2 80.8 15.1 69.32.Northeast 35,044 164 302 13.1 48.4 38.5 89.73.Northwest 104,210 247 422 12.0 32.7 55.3 96.04.Northcentral coast 137,568 341 403 10.4 44.4 45.3 79.95.South central coast 44,730 87 514 17.3 47.2 35.5 72.76.Central highland 0 0 - 0.0 41.6 58.4 90.37.South east 93,716 101 928 3.6 27.8 68.6 57.38.Mekong Delta 84,286 211 399 9.8 21.7 68.4 73.6Source: Compiled from JICA Study on development of local industries for regional development (Master Plan). 2004. Vol 1.
p4-6,9.
In this JICA study, the handicraft makers were categorized into three; full time or part time farm household
or non-farming household. In the Red River Delta, 80% of the handicraft makers were part time farm
households and 15.1% were non-farming households. In the southeast region, the non-farming households
who engaged in handicraft accounted for 68.6%, while 27.8% engaged in part time farming. Such
differences seemed to have derived from the lower agriculture potential and development of the secondary
industries. Further, since both regions are located near the Hanoi and Ho Chi Min, the percentage of
handicraft makers whose main livelihoods was farming was low.
The number of handicraft villages and their main products were summarized in Table 4.14.2.
Table 4.14.2 Overview of the handicraft production in Vietnam (Unit: village)
Note: 1) The number of villages exceeds the actual number of handicraft villages as multiple products could be reported as main products of one village. 2) Other products include lacquer ware, ceramics, stone curving, hand made mulberry paper, wood block printings, rash woven products, products using small machineries/ equipments, fish nets, incense, and construction material (i.e. tiles and bricks).
Source: Compiled from JICA Study on development of local industries for regional development (Master Plan). 2004. Vol 1. p4-1.
The most common handicraft products throughout Vietnam were bamboo and rattan followed by
textile/weaving, wood processing, and embroidery. Other products included lacquer ware, ceramics, and
hand made mulberry paper, wood block printings in the Red River Delta and stone curving in the central
Region Rash Bamboo/ Rattan
Embroidery
Textile/weaving,
Wood processing Metal Others Total
National 281 713 341 432 342 204 658 2,9711)1.Northwest 1 45 81 222 24 16 27 416(%) 0.4 6.3 23.8 51.4 7.0 7.8 4.1 14.02.Redriver 108 337 225 67 182 108 341 13683.Northeast 5 77 12 42 20 19 44 2194.Northcentralcoast 72 121 15 74 61 31 103 477North 185 535 252 183 263 158 488 2,064(%) 65.8 75.0 73.9 42.4 76.9 77.1 74.2 69.55.South central coast 22 34 0 5 5 9 25 1006.Central highland 0 0 0 0 0 0 0 07.South east 6 26 2 11 17 6 51 1198.Mekong Delta 67 73 6 11 33 15 67 272South 95 133 8 27 55 30 143 491(%) 33.8 18.7 2.3 6.3 16.1 14.6 21.7 16.5

4 - 92
coast region.
(3) Policy and Government Support
The development policy for non-agriculture sector in Vietnam was issued in 1993 in order to achieve the
following two objectives. One was to minimize the gap between the urban and rural areas by creating
employment opportunities and increasing income in the rural areas. The second aim was to restructure the
agriculture production system and rural economy through rural industrialization and modernization of
agriculture. The excerpts of the relevant policy documents are provided bellow.
1) No.132/2000/QD-TTg, Prime Minister’s Decision on Some Policies to Promote Rural Industrial
Development (hereinafter referred as “The Prime Minister’s Decision 132”)
The Prime Minister’s decision on some policies to promote rural industrial development was issued in
2000 and defined the rural industrialization policy. MARD proposed the policy and took an initiative
in implementation. The policy recognized hand and art crafts as one of the rural development
strategies in addition to agriculture, forestry and fisheries and declared to provide support in finance,
consultation on advice, information sharing, marketing and designing of the projects. MARD also
intended to promote research on technology development and to develop necessary infrastructures.
The Prime Minister’s Decision 132 stated the following preferential treatment and policy.
i. Conversion and leasing of land
ii. Investment and credit
iii. Tax and other costs
iv. Identifying markets and marketing channel
v. Development and improvement of products and environmental consideration
vi. Human resource (handicraft makers and successors) development
As a result of this policy, traditional9 and artisan crafts industries having high potential for exports had
grown. On the other hand, agriculture and fisheries based industries, which were the main sources of
livelihoods in the rural areas, did not mange to take advantage of this policy.
2) Protocol on development of rural industries No.134/2004/ND-CP (hereinafter referred as Protocol
No. 134)
In 2004, the government issued a Protocol No 134 to implement strategies to develop diverse
non-agriculture sector in the rural areas.
In achieving rural industrialization, a number of interventions to promote export and investment were
proposed in the document by the Ministry of Industry. The protocol envisages industrial development
9 Traditional crafts originate in pre19th centuries. The skills to produce artifacts were succeeded from one generation to another and maintained up to present. Some may take advantage
of the modern machineries though to the limited extent. Some of the traditional artifacts faces extinction due to the deterioration of the production system and may require conservation or
further development due to the changes in socio/economic condition (MARD “Draft Circular on the Guidance of the Procedures for Approval and Acknowledgement of Traditional Artisan
Craft, Craft Village and Traditional Craft Village”).

4 - 94
Cooperative11 and NGOs. They are expected to take the leadership of
the development of handicraft industry in the future.
ii) Handicraft Makers: The handicraft makers include households and individuals who make
crafts mostly for household use or to supplement their income during the
non-farming season. The former type of handicraft makers is mostly
women. In the latter case, the entire household is involved in the
activities. They either sell the raw materials or sub-contract the
production. The handicraft makers of this category are considered as
an active stakeholder group and create the foundation of the handicraft
industries.
(2) Main Handicraft Products
In the Region, the following products were commonly found as handicraft.
• Crafts using materials harvested in forest: Broom, Knitting (bamboo/ rattan products) , hand made mulberry paper, wood processing
• Crafts using traditional textile: Bag, blanket, garment, embroidered cloth, clothes dyed with indigo
• Others: farming tools, silver work
The above products utilize naturally harvest raw materials within the locality and require traditional skills.
However, they were not unique to the locality and failed to take advantage of rarity. Only limited number
of products was exported and sold as souvenirs while many of them were marketed as low quality –low
value products. Furthermore, historically most of the handicrafts were produced at the households for
their own use rather than to be marketed on the commercial basis. The skills were transferred and
maintained within the community (commune, village, household).
The main products of the handicraft villages were summarized in Figure 4.14.1.
11 The cooperative collects the subscription fees from its members in order to carry out its activities. It is registered with National Centre for Agriculture Extension under the People’s Committee. Association of cooperatives is established at each province; district and commune level by the People’s Committee and provides supports and advice for establishing a cooperative and organizational management.

4 - 95
Figure 4.14.1 Main handicraft products in the Region and other regions
As a characteristic to the Region, textile and embroidery products are common handicraft products. As
Figure 4.14.1 shows, 53.4% of the households engage in textile production which was much higher than
other regions. The reason for this is that the handicraft makers in the Regions are mostly small ethnic
groups who made textile/weaving, as their tradition. However, in general, these textiles/weavings, products
are low in profit which creates the economic gap with other regions.
The average monthly income per capita in handicraft villages is compared by gender and products in Table
4.14.3.
Table 4.14.3 Income of the Handicraft makers in Vietnam
(Unit:1000 VND)
Region RushBamboo / Rattan
Embroidery
Textile/weaving
Wood work
Metal China Average Northwest
Average 296 288 212 222 589 666 658 366 181
Male 271 333 251 365 599 759 560 396 246
Female 304 258 207 187 551 467 326 311 116Source: Compiled from JICA Study (2004) Vol1.3-11, 4-11
The average monthly income in the Region is 246,000VND for male and 116,000VND for female. The
latter only accounts for 40-60% of the national average. Such gender difference in income level in the
region could have been created by the objectives of making handicraft. Men mostly produce handicraft
for selling and to increase the household income. Therefore, all the products that they produce are likely
to be sold in the market. On the other hand, the products of women were meant for household use and
only the remaining would be sold in the market. Therefore, the volume sold in the market varies between
men and women are different and therefore, income differs between gender.
9.0%
19.3%
9.5%
10.8%
25.9%
27.1%
24.0%
19.5%
12.2%
1.6%
11.5%
53.4%
8.9%
5.5%
14.5%
5.8%
12.7%
11.2%
11.5%
3.8%
7.7%
6.1%
6.9%
6.5%
23.6%
29.1%
22.1%
0% 10% 20% 30% 40% 50% 60% 70% 80% 90% 100%
北西部
北部
南部
全国
い草 竹・籐製品 刺繍 織物 木工 金属加工品 その他
rash, bamboo/rattan embroidery textile wood metal work others
National
South
North
Northwe

4 - 96
4.14.4 Cases Studies and Reflection on Handicraft Industries and in Vietnam
From the literature review provided in 4.14.2 and 4.14.3, some regional differences in structure and system
of handicraft industries emerged. In the field visits, natures of such differences were further explored. In
structuring the field work, three aspects of handicraft industries were investigated in the South, South
Central and Northwest regions: 1) management of the enterprises/ organizations and problems; 2) overview
of the technical extension system, and 3) the government support.
The findings from the interviews are presented in Attachment 4.5
1) Comparison of Enterprises/Organizations in South and North Regions
The successful cooperatives, company and organization in the south has established export or fair
trade oriented production system. On the other hand, the size of business and marketing in the
North was rather considered to be premature. Further, in the south, the foreign language skills and
market information are quickly introduced as essential part of their business operation. Such
differences in skills and knowledge in running business seemed to have affected the motivation of
the executives of the enterprises/ organizations.
2) Production and Marketing
In the South region, various handicrafts from other parts of the countries are manufactured. The
products from the north are often marketed as sub-contracted products of other regions. And there
is a severe competition due to small-scale (niche) markets. Therefore, creating a status as a region
in the market is challenging.
In the Region, various types of production skills are available and therefore more variations in the
types of textiles produced. It is unique in the Region and could become a means of income
generation among the landless households. Once the textile is promoted as a regional handicraft, it
will contribute to preserve the unique textile looming skills originated in the region, which has also
been concerns of the government offices and other stakeholders. However, marketing of the
traditional textile often depends on the preference of the consumers which leads to the fluctuating
sales. The successful manufacturers such as Craft Link has overcame such difficulties by producing
high quality products of good design based on the careful market analysis and targeting of the
consumer group.
Current consumers of the Vietnamese handicraft are mostly in overseas or among foreign community
within the country. This may require mass production of the handicraft through mechanization or
modernization of the production process. However, this could also mean the loss of the precious
value derived from the traditional hand work, which cannot easily be recovered. Therefore, the
viability of such modernization could be carefully examined before launching the intervention.
Furthermore, existing products must be protected against illegal duplications. Their design and
quality should be improved depending on the market. For this, long term advices are required.
As an alternative means of livelihoods in the rural area, handicraft development may also embrace

4 - 97
household industries and food processing.
3) Considerations for Technical Extension
When planning a project to develop handicraft industries, assistance to extend production skills is not
sufficient. Whether one industry to be sustained or not depends on the profitability. Therefore, the
realistic cost benefit analysis shall be conducted and such skills must be transferred to the project
beneficiaries. Furthermore, skills of marketing are also critical in developing industry, which
requires some time to be acquired. If the project duration is not long enough to do so, assistance
through NGOs, which can work at the grass roots for longer term, may be effective.
The CLC could also become an important provider of technical trainings. However, the current
CMU members are not fully satisfied with the management system and the lack of funds to upgrade
or extend their facilities caused as they lack the system to accumulate their own capital pose some
challenges to the role of CLC in technical extension. In the long run, there is a concern that the
capacity of CLC may not be sufficient to cope with diversified and advanced needs of the
community members. Thus, the collaboration with the government offices and People’s Committee
is essential. Further, the opportunities for the community members to be exposed to the information
should be created through technical and financial assistances from overseas donor organizations and
NGOs.
4) Support from the Government Offices
In the urban areas, many of the government supports were extended as seen in the case of HCMC
vocational training center. On the other hand, limited supports have been provided for
non-agriculture sector development in Region. Handicraft development could be regarded as an
effective intervention in the region which has not fully facilitated the employment of the local
population.
Some policy interventions were implemented and proved to be effective in the Northeast Region and
Red River Delta. Bat Trang Village (traditional artisan ceramic), Dong Ky village (Wood works),
Van Phuc Village (Silk textile) in those regions benefited from the promotion of investment and
export. Recently, small scale handicraft estates were established around the known production
areas to strengthen and expand the production of the handicraft. The factors led to such successes
could be summarized as following.
i. Accumulation of traditional skills and experiences
ii. Minimal initial investment
iii. Flexibility to meet the market demand
iv. Elastic development to cope with tourism sector which is not yet developed

4 - 98
Figure 4.14.2 Handicraft making Rural area (Ma Quai Commune, Lai Chau)
1段目:伝統的綿織物を行うZao族の女性 日用品(ラタンの腰掛)を製作する女性2段目:藍染のためにラックを煮出した液 庭先で行われる藍染(H.Mong族)3段目:コミューン唯一の手芸品を扱う売店 雨天時に軒先で裁縫を行うThai族の女性4段目:手作りの道具を使用し作られる地酒 籾殻を取り除くために使う手作りの団扇
1st : Marketing of the traditional textile (Zao) Knitting (rattan products) by households 2nd: Producing Lac and collection of lime stone Indigo dye by households (H.Mong) 3rd: Only one shop sold goods of handicraft Embroidery/ tailoring in the rain (Thai) 4th: Local alcohol made by rice Production of threshing tools

4 - 99
Figure 4.14.3 Handicraft industries in Northwest (Cooperatives, Household, CLC)
1段目:Ngoc Minh合作社の作業場で行われる箒生産 政府支援の機織機を使って行われる織物生産
2段目:合作社を設立し、織物生産を行う(Lai Chau) 参加者の意見交換の場となったワークショップ(Dien Bien)
3段目:村内研修で織物技術の保全に努めるNoong ung村 糸巻きを学ぶ若い村の女性たち(Dien Bien)
4段目:老朽化しても貴重な集いの場となるCLC施設(Lai Chau)NGOが支援する、きのこ栽培研修(Bao Bo CLC)
1st : Ngoc Minh Cooperative producing brooms (Hoa Binh) Producing of textile (Support by the local government) 2nd: Producing textiles at the Cooperative (Lai Chau) The problem analysis carried out with Cooperatives (DB) 3rd: Training to preserve traditional craft skills in Noong ung village The training on textile making for young women (DB) 4th: Ban Bo CLC (Established in 2001 with assistance from UNICEF) Technical training on mushroom culture by NGO

4 - 100
4.15 Rural Tourism
Tourists to Dien Bien province count for approximately 200,000 yearly. Around 10% of them come from abroad and are equal to 0.5% of total number of foreign tourists to Vietnam. Majority of tourists to Dien Bien are from Australia and Europe, and the French are the most, whereas majority of tourists to the southern Vietnam are from Japan, South Korea and Republic of China. As there are many spots on ruins of the Battle of Dien Bien Phu between France Union forces and Vietnamese Viet Minh forces in Dien Bien Phu, those ruins and relics make many French people and Vietnamese visit at Dien Bien Phu. Museums and war ruins around Dien Bien Phu city are the main tourist points for the most of the tourists to Dien Bien.
As Dien Bien province is the frontier with China and Laos, the interchange and exchange of people and materials have been becoming active between those countries, including the tourists to/from China, Laos, and Thailand. According to the distribution situations of ethnic tribes in those countries, great expectations have been placed on economic exchanges such as trading and tourism with continuously developing neighboring countries. Therefore, many kinds of preparations on infrastructures, facilities, and trainings have been in progress in Dien Bien in order to become the hub areas for exchange of transportation.
The Trade & Tourism Department of Dien Bien province practiced the “Tourism Campaign” in 2004 and conducted public relations activities on the cultures, traditional performance arts, local food, history, accompanying with making the tourist maps, in accordance with the results of the Master Plan Sutudy for Tourism in Dien Bien (2003). The Department also has conducted many kinds of programs on the tourism development, trainings to ethnic minorities, and infrastructure development on tourism at some villages nearby the national borders and historical relics.
The study results are mentioned in detail in Atachment 4.6 and summarized below.
1) Although the rural-area-type tourism development can be found there by utilizing the natural environments and ethnic indigenous cultures, and so on, among the local resources, relationships between rural-area-type tourism development and primary industries, such as agriculture, animal husbandry, and inland fisheries, seem to be insufficient and should be strengthened. Provision of qualified foodstuffs, such as dairy products, hams/sausages, and so on, by promotion of primary industries, and development of special local products, such as original goods, can be the key factors to achieve great success in the rural area tourism development.
2) Material resources and human resources are insufficient for facilitating tourism industries. Necessities can be found in facilitating the participation of local residences and capacity buildings as well as assistances utilizing overseas capitals and management know-how of the private companies.
3) At implementation stage, monitoring activities and enlightening activities should be included in the program and conducted on consciousness and motivation of local residences, as no prosperous changes in their minds and activities can be come out after the training programs on tourism in 2005 as expected.

5 - 1
Chapter 5
Rural Infrastructure
5.1 Introduction
Rural infrastructure is one of the basic conditions to ensure economic development and livelihood
improvement of local people. In recent years, the Government of Vietnam has directed their efforts to
infrastructure development in line with nationwide poverty reduction programs such as Program 135. In
the Region, public investment for infrastructure development is rather small despite the fact that its regional
poverty rate is highest in the country. Although the Region needs more infrastructures, it was not given
the priority for infrastructure construction. The main reason seems poor accessibility in and around the
Region. In addition, cost performance of the development projects, i.e. development cost per beneficiary,
is generally lower in sparsely populated areas. Construction costs tend to increase due to mountainous
topographic conditions. Due to such reasons, the development priority of the Region is low even though a
wider range of government supports is urgently required.
The Region faces several difficulties when diversification and modernization of livelihood of local people,
of which approximately 80% are ethnic minorities, are envisaged. In the mountainous areas, large-scale
crop production and animal grazing are not suitable because of limited farmland. Consequently, poverty
rate of the Region is the highest in Vietnam. The Government of Vietnam carries out poverty reduction
programs such as Program 135. The Region is one of the target areas of poverty reduction programs but
its past achievement was not sufficient.
Poverty reduction programs in Vietnam focus on development of rural infrastructure, namely rural roads,
irrigation, water supply, electrification, school, medical facilities, markets, etc. Chapter 5 deals with the
progress in the rural infrastructure development in the Region and the future prospects toward 2020.
Disaster prevention is one of the crucial issues for local people in the Region. Past records/data of floods,
land sliding and others were analyzed.
5.2 Rural Road
5.2.1 Major Road Networks in and around the Study Area
(1) Objectives of Transport Development
The development strategy of transport in Vietnam till 2020 was approved as the decision
No.206/2004/QD-TTg on December 10, 2004. Road transport is to be developed, achieving the
objectives of making Vietnam an industrialized and modernized country by 2020. The trunk road
networks, i.e. national highways and most provincial roads, are to be upgraded to meet rapidly increasing
transport demand by expanding the existing roads, extending new highways, and improving the roads to
meet the official technical standards.

5 - 2
The rural road network will also be improved to link all the commune centers and to ensure year-round
transportation the rural area. In 2020, both asphalt roads and concrete roads shall be over 50% of the total
length of rural roads.
The road networks of the Region are strategically planned as parts of the northern key economic regions, in
which all the provincial capitals and other important urban centers are linked. The highway passing from
Hanoi to Lao Cai through Viet Tri and Yen Bai is prioritized as a main trunk road for border trading
between Vietnam and China.
Major national roads passing through the Study Area, namely Nos. 4, 6, 12, 32, and 279, are to link with
one another, and be fully upgraded as national highways in the northern belt road system to ensure
borderline belt routes. Detours/Roads bypassing the reservoir of Son La hydropower plant are to be built.
The strategy on rural road development is:
1) To maintain, consolidate and upgrade the existing traffic networks according to the current
technical standards.
2) To concentrate on building roads to central of communes and communes clusters where no road
exists, and to agricultural and forestry farms, rural industrial zone.
3) To continue building the inter-villages and inter-communes road systems to establish overall traffic
networks to villages and communes.
4) To connect the rural transport network with the national transport network and to build the system
of approach bridges and flyovers at intersections of express ways, national highways and local
roads.
5) To develop small-sized motorized transport such as tractors suitable with the conditions of rural
infrastructure.
(2) Present Situation of Major Road Networks inside and outside the Study Area
Volume of transport of domestic goods in Vietnam between 1999 and 2005 shows that road transport
remains the second highest following coastal transport, accounting for 8% of annual increase in ton-km.
In passenger transport, road accounts for 65% of all the passenger-km, which is higher than railways,
waterways, and aviation. Road is becoming the most important mode of transportation.
Present road networks in Vietnam consist of 17,300 km of national road, 17,449 km of provincial road,
36,372 km of commune road and 131,455 km of village road. The percentage of paved roads is a useful
indicator of the quality of a country’s road networks. 83.5% of national roads, 53.6% of provincial roads,
20.2% of commune roads and 2.2% of village roads are paved (Data source: Vietnam Road Association,
2004).
The passenger transport volume in the Region is ranked the lowest at 367 million passenger-km that is only
1% of the whole country volume, 31,471.9 million passenger-km. The figure shows development of road
networks is necessary for the four provinces.

5 - 3
National roads in the Region are inside road and out side road networks, connecting provinces and cities.
National roads in the Region are divided into two groups: the group of national routes lying in North-South
direction, consisting of No.6, No.12, No.32, No.70 that are directed toward Hanoi and the other group of
national routes lying in East-West direction, consisting of No.4D, No.279, No.37. These national roads
are indicated in Figure 5.2.1.
Roads are to be constructed at the right and the left banks of the Da River to connecting ports in Hoa Binh
reservoir and Son La reservoirs. These roads are to avoid areas that were inundated due to the
construction of Son La hydro-power plant, and play a role in improvement of socio-economic activities,
social security and national defense.
Longitudinal direction: National roads No.6 and No.12 connecting the four provinces to Hanoi are
important transportation routes of northwestern road net work. National roads No.32, No.70 and the Hanoi-
Lao Cai railway support national road No.6 and No.12. As a result, the road No.6 ceases to be the only
one route to connect the Region to the Red River delta.
Latitudinal direction: This Master Plan is to examine the linkage of road networks of all national roads
belonging to northern ring roads. Study is to be also conducted to establish border ring roads and to avoid
inundation of road networks due to building Son La hydro-power plant.
Ring road belt I national roads No. 4A, 4B, 4C, 4D, 4G and No.34
Ring road belt II national roads No.279 and No.12
Ring road belt III national roads No.37
Figure 5.2.1 National Road Networks in Four Provinces
Dien Bien
Kim Boi
1270 2
4D
6
1
32
279
Lai Chau Province
Muong Te
MuongNhe
Muong Lay
Sin HoTamDuong
Phong Tho
TuaChua
Than Uyen
Dien Bien Dong
Son La Province
Sop Cop
Song Ma
Mai Son
QuynhNhai
Muong La
Bac Yen
YenChau
PhuYen
Moc Chau
Da Bac
Mai Chau
TanLac
LacSonYenThuy
LacThuy
LuongSon
KySon
Cao Phong
Hoa Binh Province
Dien Bien Province
CHINA
LAO
Ha Noi
Lao Cai
⊗ Tuyen Quang
Viet Tri⊗
Yen Bai⊗
Lai Chau
Dien Bien Phu
Hoa Binh
Son La
Ha Giang ⊗
Tuan Giao
ThuanChau
Muong Cha
32
279
6
37
37
Dien Bien
Kim BoiKim Boi
1270 2
4D
6
1
32
279
Lai Chau Province
Muong Te
MuongNhe
Muong Lay
Sin HoTamDuong
Phong Tho
TuaChua
Than Uyen
Dien Bien Dong
Son La Province
Sop Cop
Song Ma
Mai Son
QuynhNhai
Muong La
Bac Yen
YenChau
PhuYen
Moc Chau
Da Bac
Mai Chau
TanLac
LacSonYenThuy
LacThuy
LuongSon
KySon
Cao Phong
Hoa Binh Province
Dien Bien Province
CHINA
LAO
Ha Noi
Lao Cai
⊗ Tuyen Quang
Viet Tri⊗
Yen Bai⊗
Lai Chau
Dien Bien Phu
Hoa Binh
Son La
Ha Giang ⊗
Tuan Giao
ThuanChau
Muong Cha
32
279
6
37
37

5 - 4
5.2.2 Classification of Technical Grade of Auto-Road
In planning and design, technical grades of auto-road are based on Vietnam Standard TCVN 4054-2005
‘Auto-Road Design Standard’ in effect dated on 7th February, 2006. It was issued by MST according to
Decision No.151/QD-BKHCN dated on 7th February, 2006. This standard specifies requirements on design
of rehabilitation, improvement and new construction taking into consideration the master plan study of road
networks until 2020 year for national roads, local roads including provincial roads, district roads, commune
roads and village roads.
Table5.2.1 Technical Grade of Auto-Road
Designed grade of road
Designed vehicle discharge
(vehicle/day-night) Function of road
Highway >25,000 Main route, designed according to TCVN 5729:1997 Grade I >15,000 Main route connecting important economic, politic and cultural centers of
country. National road Grade II >6,000 Main route connecting important economic, politic and cultural centers of
country. National road Grade III >3,000 Main route connecting important economic, politic and cultural centers of
country and regions. National road, provincial road Grade IV >500 Road connecting centers of regions, residential areas. National road,
provincial road, district road Grade V >200 Road for serving regional transportation. Provincial road, district road,
commune road Grade VI <200 District road, commune road
Figures of the discharge in the table are used for reference. Selection of designed grade of road is based mainly on function of road and topographic condition
Table 5.2.2 Minimum Width of Factors in Cross-Section for Plain and Hilly Area
Designed grade of road I II III IV V VI Designed velocity, km/h 120 100 80 60 40 30 Minimum number of lane 6 4 2 2 2 1 Lane width (m) 3.75 3.75 3.75 3.50 2.75 3.50 Width of lane (m) 2x11.25 2x7.50 7.00 7.00 5.50 3.50 Width of division stretch(m) 3.00 1.50 0 0 0 0 Width of edge and protection edge(m)
3.50(3.00) 3.00(2.50) 2.50(2.00) 1.00(0.50) 1..50(0.50) 1.50
Width of road basement (m) 32.5 22.5 12.00 9.00 7.50 6.50 Figures in bracket are width of protected road edge. When possible all road edge should be protected, especially roads have no edge for rudimentary vehicles.
The design standard for rural road can be applied to appropriate road grades such as grades IV, V and VI in
Vietnam Standard TCVN 4054-2005 ‘Auto-Road Design Standard’. District roads connecting to the
commune centers are divided into two classes; Standards AH and AHMN according to Decision
No.1528/1999/QD-BGTVT dated on July 1st, 1999. Roads from commune to village, from village to
village, and from village to farmland are divided into two classes A, and B according to Sector Standard No.
221CN210-92.

5 - 5
Table 5.2.3 Main Technical Standards of Rural Roads
District road to commune center Road in commune Main parameters Class AH Class AHMN Class A Class B
Designed velocity 25(20) 20(15) 15 10 Road surface width(m) 3.5x1 3.0x1 3.5(3.0) 3.0(2.5) Road basement width(m) 5.5 5.0 5.0(4.0) 4.0(3.5) Radius of minimum bend in topographic map(m)
25(20) 20(15) 15 10
Note: Figures in brackets are minimum figures in difficult condition or initial step of construction stage
5.2.3 Existing Rural Road Networks
(1) Consolidation of Rural Road Networks in the Four Provinces
According to road intensity per 1,000 residents in each district (unit: km/1000), Lai Chau province is 2.71,
Dien Bien 2.54, Son La 1.80, and Hoa Binh 4.75. Road intensity in the Region is generally lower than
that in the other regional provinces. Road intensity of all the districts in Lai Chau province do not vary,
but that of Dien Bien province varies from 6.08 in Dien Bien Duong district to 0.56 at Muong Lay town,
lowering the average intensity.
Based on Socio-Economic Statistical Data 2005, rural access to motor way leading to commune center
shows more than 80 % of the total communes, but access to such road is only limited to the dry season.
During the rainy season, most villages become isolated due to river flooding, landslide, erosion of road
surface as they block the traffic with muddy road surface.
Existing conditions of rural road networks in four provinces are shown in Table 5.2.4 to Table 5.2.7.
(2) Existing Road Networks in Lai Chau Province
Provincial Road: At present, there are four lines of provincial road with total length of 216km, consisting of
No.127, No.128, No.129 and No.130. Among these roads, asphalt macadam road is 131km length,
accounting for 61% and gradation road is 85 km length, 39%.
Technical standard of most provincial road lines is low, mainly road grade VI with narrow road surface,
poor quality, bridges and drains with 10 or 13 tons of low weighted-load. Moreover, road gradient is not
sufficient to meet requirements of the technical standard because of high longitudinal slope. Accordingly,
such negative elements result in frequent traffic accidents and restrict economic development in districts
and towns. With regard to provincial road intensity per 100 km2, Lai Chau province has the second lowest
provincial road density with 2.38km/100 km2.
For this reason, Lai Chau provincial road networks are required to improve. New roads should be built to
replace the existing roads affected by construction of Son La and Nam Nhun hydropower plants.
Rural Road: Rural road networks consist of district roads, commune and inter-commune roads and village
roads. The total length of district and commune roads is 912km, of which asphalt concrete road is 37 km

5 - 6
long accounting for 4%; asphalt macadam road is 40km long (4%), gradation road is 90km (57%) and the
unpaved road is 319km (35%). The district road networks are unevenly distributed, mainly concentrated
in economic areas such as Lai Chau provincial center, Tam Duong district, Phong Tho district where
national, provincial and urban road networks were established in addition to favorable topographic
conditions.
Muong Te, Sin Ho and Than Uyen districts, on the other hand, are mountainous, remote and boundary
districts far from provincial administrative offices. Road densities per 100 km2 in these districts are
6.6km, 10.7km and 9.1 km, respectively. Development of road networks in Muong Te district is not
progressing smoothly due to the complicated topographical and weather conditions and high construction
cost for rural roads to commune centers or among communes. The living conditions of people in Muong
Te district are low and poverty rate is the highest in the province.
Table 5.2.4 Present Conditions of Rural Roads(Lai Chau Province) Unit: km
Length of rural roads Name of district Population
Provincial District Total Density of roads1
TX. Lai Chau 19,307 20.0 16.9 36.9 1.91 H. Muong Te 47,494 91.0 158.8 249.8 5.26 H. Phong Tho 50,785 27.0 128.3 155.3 3.06 H. Sin Ho 73,903 78.0 138.7 216.7 2.93 H. Tam Duong 43,451 - 102.5 102.5 2.36 H. Than Uyen 92,269 - 125.5 125.5 1.36 Total 327,209 216.0 670.7 886.7 2.71 Source: Master Plan Report for Road Development of Lai Chau Province, 2006, and Statistical Yearbook of Lai Chau
Province, 2006 1: Density of roads is presented in km / 1,000 persons.
The total length of village road networks is 1,458.9 km, of which village road networks are not well
consolidated with small road basement and narrow surface. Related structures such as drains, bridges and
safety fences for roads are not only temporarily built but also insufficient to meet requirements of road
grade. As road is not paved by gradation, vehicles can pass only during the dry season.
(3) Existing Road Networks in Dien Bien Province
Provincial Road: Dien Bien province has five provincial road lines consisting of No.126, No.129, No.130,
No.131, and No.133, of which 79 km of asphalt gravel pavement account for 52%; 74 km of macadam
pavement accounts for 48% of the total length.
Most provincial road lines were constructed based on a low technical standard, mainly grade VI with
narrow width, poor quality of pavement, low-weighted – H13 or H10 bridges and drains. High
longitudinal slopes do not comply with technical standard, leading to traffic accidents.
Rural Road: Total length of rural road networks including district, commune and village roads is 3,119.5
km of which 23.6 km is asphalt macadam road; 24.4 km concrete cement road: 640 km gravel road and
2,331.1 km earth road. The district road networks are distributed unevenly concentrated mainly in

5 - 7
districts located near a city. 12% of the total length of district roads is paved by asphalt and the remaining
88% is gravel and earth paved road.
Presently, most road lines are of only classes A and B of rural road standard; most bridges, spillway and
drains along roads are constructed as temporary structures, therefore, traffic conditions are not safe. As road
signs and safety equipments are not installed, management of traffic safety is not sufficient. If
maintenance works is not carried out frequently, rural roads would be certainly degraded and deteriorated
very fast. Urgent improvement of district networks is required within the coming years. Commune and
village road networks consist of earth roads with poor quality of road surface and 1.3 to 3m wide roads.
Vehicles for transport are only available in the dry season.
Table 5.2.5 Present Conditions of Rural Roads (Dien Bien Province) (Unit: km)
Length of rural roads Name of District Population
Provincial District Total Density of roads1
TP. Dien Bien Phu 46,954 - 68.9 68.9 1.47 TX. Muong Lay 14,009 10.0 2.6 12.6 0.90 H. Dien Bien 104,267 6.0 201.2 207.2 1.99 H. Dien Bien Dong 51,157 47.0 263.9 310.9 6.08 H. Muong Cha 46,322 30.0 47.9 77.9 1.68 H. Muong Nhe 36,834 40.0 102.5 142.5 3.87 H. Tua Chua 43,707 20.0 161.9 181.9 4.16 H. Tuan Giao 107,431 - 141.0 141.0 1.31 Total 450,684 153.0 989.9 1,142.9 2.54
Source: Master Plan Report for Road Development of Dien Bien Province, 2006, and Statistical Yearbook of Lai Chau Province, 2006
1: Density of roads is presented in km / 1,000 persons.
(4) Existing Road Networks in Son La Province
Provincial Road: There are 16 lines of provincial road with the total length of 589 km, consisting No.101,
103, 103A, No.104 to No.109, No.110 to No.117 of which asphalt concrete and macadam road is 311 km
length, accounting for 53% and the remaining roads are unpaved. Most provincial road lines have low
technical standard such as narrow road surface of 3.5 m, low-weighted load level of 13 tons.
Rural Road: The total length of district road is 1,214 km, of which asphalt macadam and gradation roads is
44 km length accounting for 4 % and the unpaved road is 96% of the total length. Four out of the total
189 communes are without roads to commune centre. Village roads of 1,012 km length are all unpaved,
and in the dry season, only bicycles and motorbikes are used for transportation.
Due to topographical conditions in the mountainous areas, existing road networks have many difficulties in
terms of transport and passengers such as low quality of road networks with narrow and unpaved surface
and road blocking during the rainy season.

5 - 8
Table 5.2.6 Present Conditions of Rural Roads (Son La Province) (Unit: km)
Length of rural roads Name of District Population
Provincial District Total Density of
roads1 TX. Son La 76,266 45.0 14.0 59.0 0.77 H. Bac Yen 51,220 55.0 139.0 194.0 3.79 H. Mai Son 126,064 103.0 96.0 199.0 1.58 H. Moc Chau 143,513 22.0 186.0 208.0 1.45 H. Muong La 83,861 29.0 167.0 196.0 2.34 H. Phu Yen 103,131 70.0 183.0 253.0 2.45 H. Quynh Nhai 66,818 75.0 22.0 97.0 1.45 H. Song Ma 111,658 30.0 154.0 184.0 1.65 H. Sop Cop 36,307 54.0 56.0 110.0 3.03 H. Thuan Chau 136,825 25.0 157.0 182.0 1.33 H. Yen Chau 63,902 81.0 40.0 121.0 1.89 Total 999,565 598.0 1,214.0 1,803.0 1.80
Source: Master Plan Report for Road Development of Son La Province, 2006, and Statistical Yearbook of Lai Chau Province, 2006
1: Density of roads is presented in km / 1,000 persons.
(5) Existing Road Networks in Hoa Binh Province
Provincial Road: There are 16 lines of provincial road with total length of 364 km, consisting of No. 431,
No.432, No.433, No.434, No.435B, No.436, No.437, No.438, No.439, No.441, No.443, No.444, No. 445,
No.446, No.447 and others. The asphalt and concrete road is 198 km length, accounting for 54% and the
remaining macadam and earth road is 165 km length. Most provincial road lines are of low technical
standard, mainly grade IV.
Rural Road: Total length of rural road networks including district, commune and village is 3,485 km of
which 521 km asphalt or asphalt concrete road, accounting for 15% and 2,964 km macadam or earth road
(85%). Since rural road networks mainly consist of roads to district towns and commune centers, access
to communes and villages is very difficult especially during the rainy season. Rural road networks are not
well maintained due to the lack of local fund.
Table 5.2.7 Present Conditions of Rural Road(Hoa Binh Province) (Unit: km)
Length of rural roads Name of District Population
Provincial District Total Density of
roads1 TX.Hoa Binh 83,607 25 69 94 1.13 H.Cao Phong 41,014 33 175 208 5.07 H.Da Bac 51,800 81 416 497 9.59 H.Kim Boi 142,370 41 621 662 4.65 H.Ky Son 35,307 23 134 157 4.45 H.Lac Son 132,384 27 592 619 4.68 H.Lac Thuy 50,140 31 246 277 5.52 Luong Son 82,014 21 264 285 3.48 H.Mai Chau 49,670 22 255 277 5.58 H.Tan Lac 78,791 32 460 492 6.24 H.Yen Thuy 63,033 27 253 280 4.44 Total 810,130 363 3,485 3,848 4.75
Source: Master Plan Report for Road Development of Hoa Binh Province, 2006, and Statistical Yearbook of Lai Chau Province, 2006
1: Density of roads is presented in km / 1,000 persons.

5 - 9
5.2.4 Administrative Support on Rural Road Development
Administrative support on rural road development is given based on the organization law of Peoples’
Council and PPC. Each provincial administration office in the northwestern areas prepares the rural road
development plan, which will be implemented after the approval by PPC. In actuality, PPC assigns DOT
to preside and collaborate with DPI and Department of Finances. The head of PPC, directors of DPI,
Finance and Transportation, chairman of DPC, leaders of relevant departments and sectors have
responsibility to implement the plan.
Provincial DOT has the following regulatory and oversight responsibilities for rural road.
To develop provincial, district and commune transport strategies
To plan and manage the construction of provincial road networks
To maintain provincial road networks
To support district and commune governments in planning the maintenance of their road net works
PPC has a responsibility of approving provincial strategies and plans. District Departments of Transport
and CPC have responsibilities for a) approval of transport plans for districts and communes and b)
maintenance of road net works.
5.3 Irrigation and Drainage
5.3.1 Existing Conditions of Irrigation Development
Growth in the agricultural sector in Vietnam depends largely on the contribution of irrigation development.
Nonetheless, industrial and urban growth is straining available water resources. It is expected in the near
future, that the need to manage water among competing users within river basins will increase. Under
such circumstances, the dominance of irrigated rice production based on abundant water supplies will give
way to more diversified cropping systems such as value-added industrial and horticultural crops that
demand more efficient use of water resources. In addition, to cope with the increasing needs for
double-cropping/two-time rice cropping, it becomes essential to develop irrigation systems, which can
serve water throughout the year.
As of 2001, there were 8,265 hydraulic works of all kind, which consist of 743 medium and large-scale
reservoirs, 1,017 weirs, 4,712 medium and large-scale irrigation and drainage intakes, approximately 2,000
pumping stations, about 8,000 km closure dyke for flood control in the Mekong delta and ten thousands
kilometer length of canals and related structures with total investment costs at 100,000 billion VND
(equivalent to approximately US$6.0 billion). This amount does not include investment costs of local
budget, financial support from NGOs and local people’s contribution at about 25% to 30% of total
investment costs.
Irrigation systems presently being utilized include the facilities constructed during the colonial period in
addition to the above. These are much deteriorated and many have exceeded their service lives. Due to

5 - 10
the shortage of funds for maintenance of these systems, no adequate maintenance has been conducted, and
as a result, deterioration and damages of the irrigation systems have been accelerated. In addition, only
the main portions of these deteriorated facilities have been renovated recently, and other important
structures such as secondary and tertiary canals as well as on-farm structures were left behind
renovation/rehabilitation.
According to the statistics recorded by DWRSM (at present, DI) under MARD, irrigated paddy area in
2002 was over 7.0 million hectares, of which winter-spring paddy area of 3,229,000 ha, summer-autumn
paddy area of 2,340,000 ha, and rainy season paddy of 1,264,000 ha, industrial and upland crop area of
774,000 ha were cultivated.
Most of irrigation systems are designed to convey water by means of gravity. In some areas, however,
irrigation is practiced by pumping up water from shallow wells, and by manually lifting water from drains
or shallow wells. As a result, production cost becomes high and net income becomes low.
High priority should be given to improvement of the existing irrigation systems to raise water use
efficiency in future, so as to increase irrigated area with such high efficiency, then the initial investment
costs for new development for irrigation would be reduced. As s result, irrigation area can be increased
with less expenditure.
In Vietnam, there are various problems regarding irrigation and drainage as stated hereinafter: (i) existing
irrigated systems do not cover 100% of water demand of the designed irrigation area, that results in serious
water shortage during the dry season, (ii) poor operation and maintenance of irrigation systems due to
everlasting IMC fund shortage as discussed in the later paragraph, (iii) lack of transparency and
accountability on management and financial matters, (iv) delay in maintenance of irrigation system and its
accumulation, and (v) shortage of fund for rehabilitation and new construction of irrigation systems. On
the other hand, irrigation and drainage sector has merits and properties such as (i) abundant water resources
available for irrigation, (ii) capable professionals and farmers, (iii) competent government organization, (iv)
energetic agriculture sector, and (v) strong will for reform and improvement.
5.3.2 Irrigation and Drainage Sector Institutional Arrangements
In Vietnam, management, construction, maintenance, and operation (distribution of irrigation water and
collection of water charge) of irrigation and drainage sector are carried out by the following institutions.
(1) Central Government
At the central government level, MARD is responsible for the overall policy framework. The Department
of Policy is in charge of overall adjustment for agricultural and rural development policies. Respective
central ministries make adjustment of the local governments’ strategies through their policies and
guidelines. MPI is responsible for adjustment of overall plans and programs, allocation of national budget,
and preparation of annual programs among central ministries, which are subject to approval of the Prime
Minister.
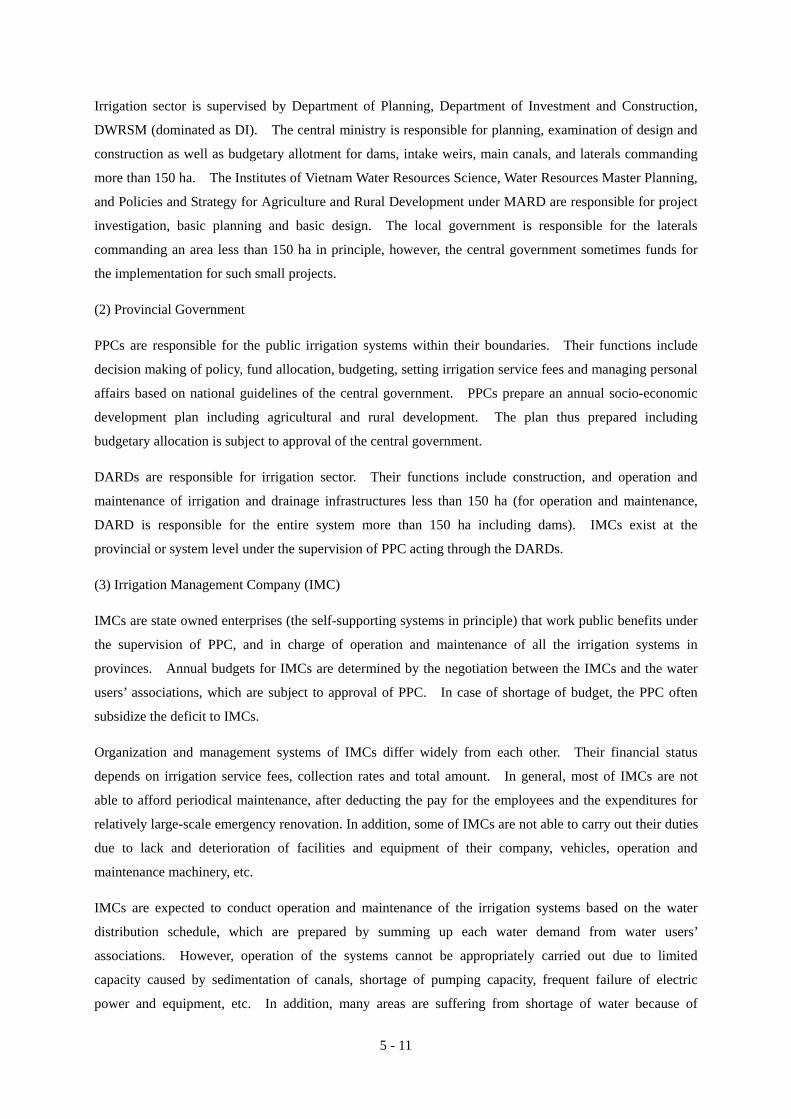
5 - 11
Irrigation sector is supervised by Department of Planning, Department of Investment and Construction,
DWRSM (dominated as DI). The central ministry is responsible for planning, examination of design and
construction as well as budgetary allotment for dams, intake weirs, main canals, and laterals commanding
more than 150 ha. The Institutes of Vietnam Water Resources Science, Water Resources Master Planning,
and Policies and Strategy for Agriculture and Rural Development under MARD are responsible for project
investigation, basic planning and basic design. The local government is responsible for the laterals
commanding an area less than 150 ha in principle, however, the central government sometimes funds for
the implementation for such small projects.
(2) Provincial Government
PPCs are responsible for the public irrigation systems within their boundaries. Their functions include
decision making of policy, fund allocation, budgeting, setting irrigation service fees and managing personal
affairs based on national guidelines of the central government. PPCs prepare an annual socio-economic
development plan including agricultural and rural development. The plan thus prepared including
budgetary allocation is subject to approval of the central government.
DARDs are responsible for irrigation sector. Their functions include construction, and operation and
maintenance of irrigation and drainage infrastructures less than 150 ha (for operation and maintenance,
DARD is responsible for the entire system more than 150 ha including dams). IMCs exist at the
provincial or system level under the supervision of PPC acting through the DARDs.
(3) Irrigation Management Company (IMC)
IMCs are state owned enterprises (the self-supporting systems in principle) that work public benefits under
the supervision of PPC, and in charge of operation and maintenance of all the irrigation systems in
provinces. Annual budgets for IMCs are determined by the negotiation between the IMCs and the water
users’ associations, which are subject to approval of PPC. In case of shortage of budget, the PPC often
subsidize the deficit to IMCs.
Organization and management systems of IMCs differ widely from each other. Their financial status
depends on irrigation service fees, collection rates and total amount. In general, most of IMCs are not
able to afford periodical maintenance, after deducting the pay for the employees and the expenditures for
relatively large-scale emergency renovation. In addition, some of IMCs are not able to carry out their duties
due to lack and deterioration of facilities and equipment of their company, vehicles, operation and
maintenance machinery, etc.
IMCs are expected to conduct operation and maintenance of the irrigation systems based on the water
distribution schedule, which are prepared by summing up each water demand from water users’
associations. However, operation of the systems cannot be appropriately carried out due to limited
capacity caused by sedimentation of canals, shortage of pumping capacity, frequent failure of electric
power and equipment, etc. In addition, many areas are suffering from shortage of water because of

5 - 12
leakage of water from canals and structures and seepage of water from sandy earth canals, lack of control
structures, etc.
Shortage of irrigation water is caused by deterioration of irrigation systems and inappropriate operation and
maintenance. Collection of irrigation service fee is difficult due to shortage of irrigation water. Financial
status of IMCs is worsened by poor collection rate of irrigation service fee, and as a result, their activities
become no more appropriate for operation and maintenance of irrigation systems.
(4) Communes or Agricultural Cooperatives
Within the IMC systems, there are more than 10,000 communes and agricultural cooperatives (including
water user’s associations). The cooperative has both a production unit and an organization unit. In the
production unit, some work such as plowing, sowing and irrigation is carried out collectively by teams.
The leader of irrigation team is in charge of distribution of water to the paddy and perennial crop fields.
Work of the production unit includes preparation of irrigation schedule, maintenance of field ditches, and
collection of irrigation service fee instead of the IMC.
(5) Organizational and Institutional Constraints
The government management organization of irrigation sector from central level to local level is not unified
(out of 64 provinces and cities, 17 provinces founded Branch Department of Irrigation, 3 provinces founded
Branch Department of Water Resources and Hydraulic Facility Management, 24 provinces founded Branch
Department of Water Resources Management and Flood and Typhoon Protection, 16 provinces founded
Irrigation Sections). As a result, direction and management works that are implemented from central level
to local one are very complicated and not unified. Figure 5.3.1 shows the management model of irrigation
system from the central level (MARD) to the end users (water user’s association).
Management fields of many IMCs are diversified, some IMCs that have managed from the headworks to
the on-farm systems, especially in the northern provinces. Management has not been always
comprehensively conducted, but restricted to lands of small pieces. As a result, farmers have not been
managed irrigation water economically or efficiently.
The policy of all the IMCs is to distribute irrigation water equally in terms of quantity and quality to the
paddy fields, but such efforts have not been reflected in the income of IMCs staffs, resulting in neglecting
their duties. This status will reduce creating the works of IMCs staffs because the policy has not tied their
duties to interest. Moreover, the scope of the work for the IMCs staffs is not clearly defined.
As the irrigation organizations have been formed (or imposed) spontaneously without uniformity, they have
not played intermediary roles between the government and the farmers, resulting in limitation of local
community’s contribution in maintenance, management and protection of irrigation systems, which have
produced a erroneous concept that “the ownership of irrigation systems is the government, so any of their
damage is to be repaired by the government”.

5 - 13
Administrative Management Structural Management (Business-Production)
Notes: - Administrative management - Administrative and technical management - Production relationship
Figure 5.3.1 Management Model of Irrigation Systems
5.3.3 Development Investments by the Government and Irrigation Fees
(1) Development Investments by the Government
Government subsidies to IMCs are for (a) pumped drainage, (b) pumped irrigation exceeding planned
norms, (c) overhauling and upgrading irrigation and drainage works, (d) fees which cannot be collected due
to natural disasters, and (e) rehabilitating irrigation and drainage works destroyed by natural disasters.
Costs of normal depreciation and replacement are also not recovered from beneficiaries. This trend to
create a short-term perspective on the part of managers and farmers and to defer maintenance until it
becomes “overhauling and upgrading” at which time Government subsidies can be obtained.
(2) Irrigation Fees
Irrigation fees paid by farmers ranged from 2-5% of rice production. However, only about half of the fees
assessed were actually collected with the end result being just under half of annual O&M costs.
One fundamental problem with the fee assessment system was that it was not done with respect to the costs
of operation and maintenance incurred in a particular system but was based on political factors for an entire
region. Irrigation fees were determined regardless of amount of irrigation water and effectiveness of
irrigation systems. Irrigation fee was specified by absolute and fixed figures, meanwhile all inputs or
MARD Department of irrigation
Provincial People’s
Committee
District People’s
Committee
Commune People’s
Committee
DARD
District section of
agriculture & rural
development
Branch department of irrigation
Irrigation teams
Government select agency, private organization
Form of Contract
Competitive bidding
Place an order
Water user’s
Associa- tions 1
(Manage-ment of
facilities)
Water user’s
Associa- tions 2
(Manage-ment of
facilities)
Water user’s
Associa- tions 3
(Manage-ment of
facilities)
Irrigation staffs

5 - 14
productions depend on market fluctuation, thus were not suitable. Subsidies to the farmers were paid
regardless of commodity prices, however there was no limitation in the amount of water, and hence waste
of water occurred.
In Vietnam, funding for irrigation development was provided on a grant basis. O&M of the large and
medium-scale systems were practiced by IMCs, not by the beneficiaries. In order to implement the policy
of irrigation management, MARD issued Circular No. 75/2004/TT-BNN in 2004 and provided the
guidelines on the establishment, strengthening and development of WUOs. Nonetheless WUOs are
inactive. Some international donors are assisting in promoting strengthening of WUOs in the completed
irrigation projects. The government issued Decree No. 154/2007/ND-CP in 2007 in which irrigation
service fee was exempted. The decree also states that IMCs shall change their management modalities.
5.3.4 National Strategies for Irrigation and Drainage Sector
(1) Basic Strategy for Development
Basic strategies of irrigation and drainage development have been clearly mentioned in CPRGS
(2006-2020). In particular, a priority has been given to the development of rural infrastructure, of which
irrigation and drainage are included. CPRGS provides major policies and measures for agriculture and
rural economy. It plans to create (a) increasing efficiency and diversifying agricultural production, (b)
changing the structure of the economy and marketing agricultural products, (c) agricultural diversification
and development of rural profession, (d) shift towards large-scale labor intensive production.
The Government places high priority on key sector issues such as irrigation modernization, dam safety, and
improved water resources management. The overall “Strategy of Socio-Economic Development
2001-2010” presented by the Central Committee at the 9th National Congress highlighted the importance
of these issues. One of the major objectives is “to speed up agricultural and rural industrialization and
modernization geared toward forming a large-scale commodity agriculture relevant to market demands and
ecological conditions of individual regions”. Modernization of irrigation and drainage systems will result
in more reliable, efficient, and equitable water services, which is indispensable for agricultural
modernization.
Vietnam has a number of strengths on which to build an improved irrigation and drainage sector. A
number of macro-level reform efforts provide a strong impetus for change. Another strength is the formal
existence of the IMC corporate form. The formal separation of the service provider (the IMC) from the
regulator resources manager (MARD/DARDs) is an important hallmark of a maturing water economy.
Some important relationships, such as between the IMCs and the communes, are governed by formal
constraints rather than informal agreements, which provide a sound base for future improvements.
No documentation has been made for the strategy of the function of water users’ associations. However,
an institute suggests that to strengthen participatory role of community, water users should be the
independent and autonomous form. In short-term, small canals and structures with an irrigation area less

5 - 15
than 500 ha should be handed over to water users’ community to manage, and they will select the form of
proper management organization that will specify contents and means of activity, and balance of all costs,
expenditures and revenue based on current relevant law and complying with local customs and regulations.
The Government only specifies water charge policy for the parts managed by the Government. Water
charge level for the parts managed by community of water users will be decided by themselves.
The irrigation-based management unit should be changed into organizational model of “Water User’s
Association.” The water user’s association is a community’s organization consisting of farmer’s
households using water for irrigation and drainage on the same canals and irrigated area, they voluntarily
cooperate each other for implementation tasks for management, operation and water distribution aiming at
bringing highest economic effectiveness to water users. The water user’s association can manage directly
through an apparatus elected by members of the association or hire a private organization to manage
through a management contract.
It can be said that the shortage of budget in the central and local governments caused the delay in adequate
maintenance of irrigation and drainage systems, and deterioration and damages of the systems have been
accelerated. As a result, distribution of the irrigation water into the terminal systems and collection of
water service fees have become difficult, and hence the irrigation facilities have not been fully maintained
and functionality of the facilities has declined.
In order to break this “vicious circle”, the Government intends to improve the efficiency of the entire
irrigation systems. This can be realized by improving (rehabilitating) the facilities with the aim of
recovering the function of the irrigation schemes by applying the technical and financial assistance from the
international donors. The Government has commenced to put in serious efforts to tackle the following
issues:
1) To rehabilitate and upgrade the existing irrigation and drainage systems,
2) To promote participatory irrigation management (PIM) program for the strengthening of the water
user’s associations,
3) To upgrade the technical and management capabilities of the staffs of the central and local
governments (MARD, DARDs, IMCs),
4) To promote the most appropriate water application systems and establishment of research institutes
for the national program on “reinforcement and modernization of irrigation and drainage”.
(2) Review of Irrigation and Drainage
The Vietnam Water Resources Sector Review (the 1996 WS Review) covers policy and planning,
strengthening institutions, high priority investment and investment requiring further basin planning and
management. The recommendations under policy and planning, and strengthening institutions give the
framework for the recommended areas of focus under the investment. One of the recommended areas of
focus under high priority investment is “Agricultural water control and rehabilitation projects that will

5 - 16
improve dry season water supply”. On the other hand, “Irrigation projects that require additional dry
season water” is put under investment requiring further basin planning and management.
The 1996 WS Review acknowledged the change in the food production status of Vietnam from a net
importer to a net exporter of rice. Also, the low labor productivity of rice compared with those of other
crops, and the needs for diversification to perennial and other annual crops were acknowledged. However,
putting the emphasis on the food security and rice export, the 1996 WS Review accepted the need to double
the annual paddy production over the 30 years through increasing the cropping pattern intensity. Hence
accorded priority to increase the area to be cropped to paddy by rehabilitating irrigation and drainage
infrastructure while qualifying that irrigation projects that required additional dry season water should be
undertaken after the basin planning and management.
5.3.5 National Strategies on Priority Projects
The “Water Resources Management and Development Strategy (2000-2020)” covers the national strategies
on (a) Improvement and modernization of hydraulic works systems, (b) Multi-purpose reservoir
development, (c) Water resources development services for agriculture-rural area economic structure
shifting, (d) Flood protection and disaster mitigation, (e) Water resources protection, (f) Water resources
management. Strategies related to small irrigation and drainage development are as follows:
(1) Improvement and Modernization of Hydraulic Works Systems
Objectives
The objectives are to improve the stability of head-works and canals, decrease losses, save water and
enhance the efficiency of water supply both designed capacity and performance of existing systems.
Contents
- Review existing structures and management of the systems,
- Study proper technical solutions for improvement and modernization of canals and head-works,
- Invest in the implementation of repairing, upgrading, improving and modernization of works and
equipment,
- Enhance the capacity of effective management of systems.
(2) Water Resources Development Services for Agriculture-Rural Area Economic Structure Shifting
Objectives
The objectives are to develop water infrastructure to timely meet the demand on water in suitable and
flexible way, serving for agriculture-rural area economic structure shifting in the immediate stage that does
not contradict with developing demand in the long-term period in the process of economic structure
strengthening and to ensure the sustainable development.

5 - 17
Contents
- Check, adjust and supplement socio-economic development planning, shifting of agriculture-rural
area economic structure following the industrialization and modernization orientation at specific
regions and provinces,
- Assess water source potential and existing condition of irrigation infrastructure at each area,
- Research and provide technical method on water supply and water resource protection for the
development of the people and agricultural economy at each region,
- Arrange proper personnel source to exploit water supply works.
(3) Water Resource Protection
Objectives
The objectives are to protect water sources from pollution and exhaustion so as to ensure the sustainable
development of water resources, meeting the requirements in the immediate time as well as in the
long-term development of social-economic sectors.
Contents
- Investigate and assess water resource at both quantity and quality, real situation and forecasting of
water pollution and exhaustion, flow requirement to ensure ecological environment,
- Research, propose and implement water resource protection measures for each river basin.
(4) Water Resource Management
Objectives
Good management of water resources at river basins, ensure the exploitation of water resources being
carried out in sensible and economical way, effectively serve for the immediate development of
socio-economic sectors without any reversed affect to the long-term development requirement.
Contents
- Improve legal documents relating water resource management, mechanism and policy,
- Strengthen organization mechanism in water source management. Reinforce and improve capacity
for staff working in water resource management,
- Basic investigate water resource,
- Complete and periodically check and adjust water resource protection and development planning at
river basin, economic zones and provinces so as to have a foundation for water resource management
and formulate annual and the 5 year plans for irrigation investment.
5.3.6 Water Resources and Existing Irrigation Systems
Water resources for the irrigation in the Region consist of three major rivers, namely the Da River, Ma River and Nua River. Characteristics of these rivers are as follows (refer to Figure 5.3.2):

5 - 18
The Da River is an international river, which rises from Yunnan province of China. Total length of the Da River is 1,010 km, of which upper 45% is situated in China and lower 55% in Vietnam. The length of the river is 10 times of the width of the river basin. It joins the Red river at 70 km downstream the Hoa Binh hydropower station being operated at present. Major tributaries consist of, from the left bank, the Na River and Mu River, and from the right bank, the Po River and Muc River. Irrigation water is not drawn off these mainstream and tributaries, but drawn off the smaller tributaries meeting these rivers.
The Ma River originates from Dien Bien province, crosses the Son La province, enters into Laos at midstream, returns to Hoa Binh province, and flows into the Gulf of Tonkin. Total length of the Ma River is approximately 500 km, of which midstream 90 km is located in Laos, and upper stream and lower stream 410 km in Vietnam. The basin is long and narrow. Major tributaries consist of, from the left bank, the Thi River, and from the right bank, the Long River and Le River.
The Nua River is an international river, which rises from the north of Dien Bien province, crosses the Dien Bien city and basin, enters in Laos and finally flows into the Mekong. Slope of the Nua River in its upstream is very steep and flows down as many falls, and its slope becomes gentle in the Dien Bien basin. Major tributaries of the Nua River consist of the Phang River, Khua River, Hu River, Co River, etc.
Figure 5.3.2 Major Rivers in and around the Region

5 - 19
Catchment areas of the rivers and tributaries of the respective provinces in the Region are shown in Table
5.3.1.
Table 5.3.1 Catchment Areas of Each Province in the Region Unit: km2
Name of river Lai Chau Dien Bien Son La Hoa Binh Total
Song Da 9,065 5,904 8,913 1,605 25,488Nam Ma 2,049 4,894 1,509 8,452Nam Nua (Mekong tributary) 1,601 1,602Nam Mua (Nam Hong tributary) 194 194Nam Boi 1,040 1,040Nam Hong tributarues 508 508Total 9,065 9,554 14,001 4,663 37,283
Major rivers and river systems in the respective provinces are described in the following paragraphs:
(1) Lai Chau Province
Major rivers in Lai Chau province are the Da River and its tributaries, Nam Ma and Nam Na. These
major rivers flow southward crossing the boundaries of province and district, but their minor tributaries are
located within one district in the most case. In general, irrigation water is not taken from the three large
rivers, but from the minor tributaries in the district level. Due to limitation of water and land resources,
average irrigated area of one system is approximately 20 ha, and mostly less than 50 ha.
Main rivers, major tributaries, number of irrigation systems and irrigated area of each district in the Lai
Chau province are as shown in Table 5.3.2.
Table 5.3.2 Water Resources and Irrigated Areas in Lai Chau Province
Name of District Name of Main Rivers Name of Major Tributaries No. of Systems
Irrigated Area of Dry Season
Paddy (ha) TX. Lai Chau Song Da/Nam Na Song Mu, Song So, Nam Pat 18
15
H. Muong Te Song Da Nam La, Nam Ma, Nam Cum, Sg. Kha U, Nam Chau, Nam Xi Lung, Nam Bum, Nam Nha, Nam Mhat
220
862
H. Phong Tho Song Da/Nam Na/Nam Ma
Meng La Ho, Nam Cum, Nam Lum, Nam Pat, Nam So, Nam Na, Nam Phin Ho
148
1,341
H. Sin Ho Song Da/Nam Na Nam Ban, Nam Cuoi, Nam Ma, Nam Cuoi 213
684
H. Tam Duong Song Da/Nam Mu/Nam Na
Nam Mu, Nam So, Nam Ma 122
1,323
H. Than Uyen Song Da/ Nam Mu Nam Mu, Nam Ui, Nam Chit, Sg. Mit Luong, Nam Ma, Nam Kim
274
2,402
Total 995 6,627Source: Master Plan Report for Irrigation Development of Lai Chau Province, 2005
(2) Dien Bien Province
River system in the Dien Bien province is divided into two, one is the Da River system, which flows into
the Red River and the other is the Nam Nua River system, which pours into the Mekong River through
Laos. Irrigation water for the northern agricultural lands in the Dien Bien province is taken from the

5 - 20
tributaries of the Da River meeting on the right bank, for the midland areas from the tributaries of the Ma
River, and for the southern lands from the tributaries of the Song Ma. The Dien Bien basin is irrigated by
the water of the Nam Rom dam constructed on the Nam Nua. In the Dien Bien province, large-scale
irrigation is practiced only in the Dien Bien basin and approximate area of other irrigation systems is as
small as 20 ha on average.
Main rivers, major tributaries, number of irrigation systems and irrigated area of each district in the Dien
Bien Province are as shown in Table 5.3.3.
Table 5.3.3 Water Resources and Irrigated Areas in Dien Bien Province
Name of District Name of Main Rivers Name of Major Tributaries No. of
Systems Irrigated Area of Dry
Season Paddy (ha) TP. Dien Bien Phu Mekong River/
Nam Nua Nam Nua, Nam Rom, Nam Lua, Nam Khau, Nam Hu 23 135
TX. Muong Lay Song Da Nam Na, Nam He 11 423H. Dien Bien Mekong River/
Nam Nua Nam Nua, Nam Rom, Nam Khua, Nam Hu, Nam Rua, Nam Ngam, Song Ma 177 4,801
H. Dien Bien Dong Song Da/ Song Ma
Song Ma, Nam He, Suoi Lu, Nam Man, Suoi Duong 86 463
H. Muong Cha Song Da Nam Nhat, Nam Po, Nam He, Nam Muc, Nam Chim, Nam Na, Nam Lay 167 423
H. Muong Nhe Song Da Nam Ma, Sg. Ban Bo Ho, Nam Nhat, Nam Nhe, Nam Po, Nam Cha 62 167
H. Tua Chua Song Da Song Ma, Nam Ma, Nam Bay 36 326H. Tuan Giao Song Da/ Song
Ma Song Ma, Nam Muc, Nam Sat, Nam Hua, Nam Ma 175 1,272
Total 737 8,010Source: Master Plan Report for Irrigation Development of Dien Bien Province, 2005
(3) Son La Province
River system in the Son La Province is divided into two, one is the Da River system, which flows into the
Red River and the other is the Ma River system, which pours directly into the Gulf of Tonkin.
Approximately 70% of the total agricultural lands located in north, midland and east of the Son La province
is irrigated by the tributaries of the Da River, and 30% of the total agricultural lands located in southeast of
the province by the tributaries of the Ma River system. Average irrigated area of one system is about 10
ha. It is important to note that there exist two river systems in the Thuan Chau district, and hence careful
study is necessary for the formulation of master plan.
Main rivers, major tributaries, number of irrigation systems and irrigated area of each district in the Son La
province are as shown in Table 5.3.4.

5 - 21
Table 5.3.4 Water Resources and Irrigated Areas in Son La Province
Name of District Name of Main Rivers Name of Major Tributaries No. of
Systems Irrigated Area of Dry Season Paddy (ha)
TX. Son La Song Da Mam Bu 74 335H. Bac Yen Song Da Suoi Lum, Suoi Bon Lay, Suoi Chim, Suoi
Luong, Suoi Be 165 295
H. Mai Son Song Da Nam Bu, Nam Pan, Suoi Hoc 162 690H. Moc Chau Song Da Suoi Giang, Suoi Loi, Suoi Tan, Suoi Sap,
Nam Ma, Suoi Dong 251 644
H. Muong La Song Da Nam Mu, Nam Chang, Nam Pam, Suoi Chien, Nam Pia, Suoi Lum 89 553
H. Phu Yen Song Da Suoi Be, Ngoi Lao, Suoi Toc, Suoi Lum, Song Mua 145 1,499
H. Quynh Nhai Song Da Nam Mu, Nam Kim, Suoi Tra, Nam Chen, Nam Gion 290 716
H. Song Ma Song Ma Nam Ma, Nam Soi, Nam Ty, Nam Cong, Nam Cat 356 1,108
H. Sop Cop Song Ma Nam Ma, Nam Soi, Nam Khoai, Nam Pac, Nam Con, Nam Ty 215 554
H. Thuan Chau Song Da / Song Ma
Suoi Muoi, Nam Bu, Nam Tac, Nam Ty, Nam Ma 249 1,185
H. Yen Chau Song Da Suoi Sap, Nam Pan, Suoi Sap Viet, Suoi Sap 141 600Total 2,137 8,180
Source: Master Plan Report for Irrigation Development of Son La Province (Summary Report)
(4) Hoa Binh Province
River system in the Hoa Binh province is divided into two, one is the Da River system, which flows into
the Red River and the other is the Ma River system, which pours directly into the Gulf of Tonkin.
Approximately 95% of the total agricultural lands located in north, midland and east of the Hoa Binh
province is irrigated by the tributaries of the Da River, and 5% of the total agricultural lands located in Mai
Chau district, southeast of the Province by the tributaries of the Ma River system. Average irrigated area of
one system in this province is about 30 ha, which are fairly large compared to the average of the four
provinces.
Main rivers, major tributaries, number of irrigation systems and irrigated area of each district in the Hoa
Binh province are as shown in Table 5.3.5
Table 5.3.5 Water Resources and Irrigated Areas in Hoa Binh Province
Name of District Name of Main Rivers Name of Major Tributaries No. of Systems
Irrigated Area of Dry season
Paddy (ha) TX. Hoa Binh Song Da Suoi Ngoi Su, Suoi Ca 30 215H. Cao Phong Song Da/Song Boi Suoi Vang, Suoi Cai, Song Boi, Suoi Treo 56 518H. Da Bac Song Da Suoi Cai, Suoi Lao 61 443H. Kim Boi Song Da/Song Boi Suoi Buc, Suoi Loi, Song Ca, Song Boi, Suoi
Treo 194 2,164
H. Ky Son Song Da Suoi Anh 56 940H. Lac Son Song Da/Song Day Song Day, Suoi Song, Suoi Buoi, Suoi Sao,
Suoi Cai 236 1,634
H. Lac Thuy Song Da/Song Day Song Day, Song Boi, Sg. Can Bau 104 856H. Luong Son Song Da/Song Hong Song Hong, Song Con, Song Bui 81 1,180H. Mai Chau Song Da/Song Ma Song Ma, Song Da, Suoi Thai, Song Ma 106 804H. Tan Lac Song Da/Song Day Song Day, Suoi Sao, Suoi Cai 177 2,015H. Yen Thuy Song Da/Song Day Song Day, Song Roc, Song Buoi 108 1,280Total 1,209 12,049
Source: Master Plan Report for Irrigation Development of Hoa Binh Province, 2005

5 - 22
5.3.7 Existing Conditions of Irrigation in Four Provinces
Table 5.3.6 shows the cropped areas of summer-autumn paddy (wet season) and winter-spring paddy (dry
season), the cropped areas in the improved systems and traditional systems for the respective wet and dry
seasons, and proportional extent of irrigated area of the dry season paddy to the wet season paddy. Total
cropped area in the four provinces of paddy in the wet season is 61,282 ha, and total cropped area in the dry
season is 34,866 ha, totaling 96,148 ha. Percentage of cropped area in the dry season is 56.9% of the
cropped area in the wet season. Ratio of cropped area of dry season paddy to wet season paddy in the
improved systems is 64.8%, whilst that in the traditional systems is as low as 38.2%. The fact indicates
that the irrigation systems which have been improved are much effective in increasing the efficiency of dry
season irrigation. It is also important to note that the cropped area of paddy in the dry season to the wet
season in Lai Chau province is as low as 48.8%, which is the lowest among the four provinces.
Table 5.3.6 Existing Conditions of Irrigation in Four Provinces (Unit: ha)
Summer-Autumn Paddy (Wet Season) Winter-Spring Paddy (Dry Season) Name of Province
Improved Traditional Total Improved Traditional Total
Proportional Extent1
(%)Lai Chau 9,393 4,180 13,573 5,385 1,242 6,627 48.8Dien Bien 9,135 4,943 14,078 6,342 1,668 8,010 56.9Son La 9,401 4,607 14,008 6,914 1,266 8,180 58.4Hoa Binh 15,195 4,428 19,623 9,293 2,756 12,049 61.4Total 43,124 18,158 61,282 27,934 6,932 34,866 56.9Source: Master Plan Report for Irrigation Development of Lai Chau, Dien Bien, Son La and Hoa Binh Provinces, 2005 1: Percentage of irrigated area of winter-spring paddy (dry season paddy) to summer-autumn paddy (wet season paddy)
Alignment of most of the traditional irrigation systems are (a) temporary weirs constructed by piling stones
across the river to raise water level, and (b) temporary earth canals excavated by manpower, and in some
parts where canals are located in the river bed is constructed by piling stones. Both the weir and canals not
functioning appropriately due to frequent corruption and leakage of large amount of water through the
weirs and canals. As a result, the systems are not appropriately operated and maintained.
Improved weirs are divided into two types depending on dimension of the river basins. One (for large
rivers) is fixed concrete weirs with intake facilities equipped with gates for controlling water. In some cases,
main canals are concrete lined with water controlling facilities (Nam Rom Project in the Dien Bien basin).
The other (for small rivers or streams) is fixed concrete weirs without water controlling structures which
cannot be appropriately operated and maintained even after rehabilitation.
(1) Lai Chau Province
Geographical area of the Lai Chau Province is 9,112.3 km2 (912,230 ha), out of which area of paddy field
occupies 13,573 ha which is equivalent to only 1.5% of the geographical area. Area of paddy field is quite
limited due to steep-sloped mountainous area. In such steep slope areas, where cultivation of paddy is
difficult, the government recommends to cultivate perennial crops, and industrial crop such as tea.

5 - 23
Table 5.3.7 in the next page shows the cropped areas of summer-autumn paddy (wet season) and
winter-spring paddy (dry season), the cropped areas in the improved systems and traditional systems for the
respective wet and dry seasons, and proportional extent of irrigated area of the dry season paddy to the wet
season paddy.
The table indicates that the conditions of irrigation in the Lai Chau Province are as follows:
1) Total cropped area of paddy in Lai Chau province in the wet season is 13,573 ha, and that in the
dry season is 6,627 ha, totaling 20,200 ha. Percentage of cropped area in the dry season is 48.8% to
that in the wet season. Ratio of cropped area of dry season paddy to wet season paddy in the
improved systems is 57.3%, whilst that in the traditional systems is only 29.7%, which is the
lowest among the four provinces.
2) Percentage of irrigated paddy field in the dry season to the wet season paddy field is 48.8% in the
Lai Chau Province, varying from 66.2% to 3.5% among districts. As the resources of water and
land are not well balanced, there are plenty of paddy fields depending on rain.
3) Average area of paddy field (wet season) in this province is as small as 13.6 ha per system, and it is
difficult to consolidate these systems for efficient water management. As a result, number of
irrigation systems is as large as 995 (improved systems: 264, traditional systems: 731).
4) In this province, there is no scheme such as stable irrigation system with large-scale reservoir or by
pumping-up water. No underground water irrigation is practiced either.
Table 5.3.7 Existing Conditions of Irrigation in Lai Chau Province (Unit: ha)
Summer-Autumn Paddy (Wet Season) Winter-Spring Paddy (Dry Season)
District
Improved Traditional Total Improved Tradition
al Total
Proportional Extent1
(%)
TX. Lai Chau 345 78 423 15 - 15 3.5H. Muong Te 795 1,036 1,831 500 362 862 47.1H. Phong Tho 1,348 679 2,027 1,051 290 1,341 66.2H. Sin Ho 1,221 824 2,045 648 36 684 33.4H. Tam Duong 1,982 583 2,565 973 350 1,323 51.6H. Than Uyen 3,702 980 4,682 2,198 204 2,402 51.3Total 9,393 4,180 13,573 5,385 1,242 6,627 48.8
Source: Master Plan Report for Irrigation Development of Lai Chau Province, 2005 1: Percentage of irrigated area of winter-spring paddy (dry season) to summer-autumun paddy (wet season paddy)
(2) Dien Bien Province
Geographical area of Dien Bien Province is 9,562.9 km2 (956,290 ha), out of which area of paddy field
(wet season) occupies 14,078 ha which is equivalent to only 1.5% of the geographical area. Area of arable
lands is quite limited due to steep-sloped mountainous area. In such steep slope areas, where cultivation of
paddy is difficult, the government recommends to cultivate annual crops, industrial crops such as tea and
coffee.

5 - 24
Table 5.3.8 shows the cropped areas of summer-autumn paddy (wet season) and winter-spring paddy (dry
season), the cropped areas in the improved systems and traditional systems for the respective wet and dry
seasons, and proportional extent of irrigated area of the dry season paddy to the wet season paddy.
Especially in this province, most of the paddy fields are terraced due to unsuitable steep slope for paddy
fields, except for the Dien Bien basin in which large-scale consolidated irrigation is practiced.
Table 5.3.8 Existing Conditions of Irrigation in Dien Bien Province
(Unit: ha)
Summer-Autumn Paddy (Wet Season)
Winter-Spring Paddy (Dry Season)
Name of district
Improved Traditional Total Improved Tradition
al Total
Proportional Extent1
(%)
TP. Dien Bien Phu
202 119 321 98 37 135 42.1
TX. Muong Lay 449 1,092 1,541 254 169 423 27.4H. Dien Bien 4,793 1,033 5,826 4,218 583 4,801 82.4H. Dien Bien Dong
817 216 1,033 412 51 463 44.8
H. Muong Cha 449 1,092 1,541 254 169 423 27.4H. Muong Nhe 741 - 741 167 - 167 22.5H. Tua Chua 947 - 947 326 - 326 34.4H. Tuan Giao 737 1,391 2,128 613 659 1,272 59.8Total 9,135 4,943 14,078 6,342 1,668 8,010 56.9
Source: Master Plan Report for Irrigation Development of Dien Bien Province, 2005 1: Percentage of irrigated area of winter-spring paddy (dry season) to summer-autumn paddy (wet season paddy)
The table indicates that the conditions of irrigation in the Dien Bien Province are as follows:
1) Total cropped area of paddy in Dien Bien province in the wet season is 14,078 ha, and that in the
dry season is 8,010 ha, totaling 22,088 ha. Percentage of cropped area in the dry season is 56.9% to
that in the wet season. Ratio of cropped area of dry season paddy to wet season paddy in the
improved systems is 69.4%, whilst that in the traditional systems is 33.7%.
2) Percentage of the irrigated paddy field in the dry season to the wet season paddy field is 56.9% in
Dien Bien Province, varying from 62.4% to 22.5% among districts. As the resources of water and
land are not well balanced, there are plenty of paddy fields depending on rain.
3) Average area of paddy field (wet season) in this province is 19.1 ha per system, and it is difficult to
consolidate these systems for efficient water management, except for the Dien Bien basin
(irrigation ratio in the dry season: 82.4%) where large-scale consolidated irrigation is practiced. As
a result, number of irrigation systems is as large as 737 (improved systems: 280, traditional
systems: 557).
4) In this province, there are 88 irrigation systems which have reservoirs aiming at stable perennial
irrigation, and 14 irrigation systems which are irrigated by pumping up water. However no
underground irrigation is practiced.

5 - 25
(3) Son La Province
Geographical area of the Son La Province is 14,174.4 km2 (1,417,440 ha), out of which area of paddy field
occupies 14,008 ha which is equivalent to only 1.0% of the geographical area. Area of arable lands is quite
limited due to steep-sloped mountainous area. In such steep slope areas, where cultivation of paddy is
difficult, the government recommends to cultivate perennial crops, industrial crops, such as tea and coffee.
Table 5.3.9 shows the cropped areas of summer-autumn paddy (wet season) and winter-spring paddy (dry
season), the cropped areas in the improved systems and traditional systems for the respective wet and dry
seasons, and proportional extent of irrigated area of the dry season paddy to the wet season paddy.
Especially, in this province, most of the paddy fields are terraced due to unsuitable steep slope for paddy
fields, except for the tributaries along the Song Da and Song Ma.
Table 5.3.9 Existing Conditions of Irrigation in Son La Province (Unit: ha)
Summer-Autumn Paddy (Wet Season)
Winter-Spring Paddy (Dry Season)
Name of District
Improved Traditional Total Improved Traditional Total
Proportional Extent1
(%)
TX. Son La 537 63 600 320 15 335 55.8H. Bac Yen 370 490 860 221 74 295 34.3H. Mai Son 898 324 1,222 627 63 690 56.5H. Moc Chau 1,185 595 1,780 474 170 644 36.2H. Muong La 760 325 1,085 437 117 554 51.1H. Phu Yen 1,400 350 1,750 1,349 150 1,499 85.7H. Quynh Nhai 708 592 1,300 663 53 716 55.1H. Song Ma 1,201 601 1,802 821 287 1,108 61.5H. Sop Cop 443 458 901 553 1 554 61.5H. Thuan Chau 1,113 508 1,621 892 293 1,185 73.1H. Yen Chau 786 301 1,087 557 43 600 55.2Total 9,401 4,607 14,008 6,914 1,266 8,180 58.4
Source: Master Plan Report for Irrigation Development of Son La Province (Summary Report) 1: Percentage of irrigated area of winter-spring paddy (dry season) to summer-autumn paddy (wet season paddy)
The table indicates that the conditions of irrigation in the Son La Province are as follows:
1) Total cropped area of paddy in Son La province in the wet season is 14,008 ha, and that in the dry
season is 8,180 ha, totaling 22,188 ha. Percentage of cropped area in the dry season is 58.4% to
that in the wet season. Ratio of cropped area of dry season paddy to wet season paddy in the
improved systems is 73.5%, whilst that in the traditional systems is as low as 27.5%.
2) Percentage of irrigated paddy field in the dry season is 58.4% in the Son La Province, changing
from 85.7% to 34.3% among districts. As the resources of water and land are not well balanced,
there are plenty of paddy fields depending on rain.
3) Average area of paddy field (wet season) in this province is 6.6 ha per system, and it is difficult to
consolidate these systems for efficient water management. As a result, number of irrigation
systems is as large as 2,137 (improved systems: 1,193, traditional systems: 944). It should be noted
that relatively large existing irrigation systems which are expected to be submerged in the Son La

5 - 26
reservoir have been excluded from the total irrigation systems.
4) In this province, there are 518 irrigation systems which have reservoirs aiming at stable perennial
irrigation, 577 irrigation systems of which intake structures and canals are improved, 41 lift
irrigation systems by utilizing water head, and 57 irrigation systems which are irrigated by
pumping up water. However no underground irrigation is practiced.
(4) Hoa Binh Province
The administrative area of the Hoa Binh Province is 4,684.2 km2 (468,420 ha), of which 19,623 ha or 4.2%
are covered with paddy field. In the steep slope areas, where cultivation of paddy is difficult, farmers
cultivate perennial crops, fruit trees and industrial crops.
Table 5.3.10 shows the cropped areas of summer-autumn paddy (wet season) and winter-spring paddy (dry
season), the cropped areas in the improved systems and traditional systems for the respective wet and dry
seasons, and proportional extent of irrigated area of the dry season paddy to the wet season paddy.
Especially in this province, most of the paddy fields are terraced due to unsuitable steep slope for paddy
fields, except for the flat lands located in the Da Bac and Lac Thuy Districts.
Table 5.3.10 Existing Conditions of Irrigation in Hoa Binh Province (Unit: ha)
Summer-Autumn Paddy (Wet Season) Winter-Spring Paddy (Dry Season) Name of District
Improved Traditional Total Improved Traditional Total
Proportional Extent1
(%) TX. Hoa Binh 297 30 327 195 20 215 65.7H. Cao Phong 659 268 927 341 177 518 55.9H. Da Bac 584 61 645 386 57 443 68.7H. Kim Boi 2,538 660 3,198 1,688 476 2,164 67.7H. Ky Son 1,217 186 1,403 805 135 940 67.0H. Lac Son 1,261 1,193 2,454 801 833 1,634 66.6H. Lac Thuy 1,234 17 1,251 846 10 856 68.4H. Luong Son 1,261 526 1,787 801 379 1,180 66.0H. Mai Chau 1,086 140 1,226 711 93 804 65.6H. Tan Lac 2,538 424 2,962 1,688 327 2,015 68.0H. Yen Thuy 2,520 923 3,443 1,031 249 1,280 37.2Total 15,195 4,428 19,623 9,293 2,756 12,049 61.4
Source: Master Plan Report for Irrigation Development of Hoa Binh Province, 2005 1: Percentage of irrigated area of winter-spring paddy (dry season paddy) to summer-autumn paddy (wet season paddy)
The table indicates that the conditions of irrigation in Hoa Binh Province are as follows:
1) Total cropped area of paddy in Hoa Binh province in the wet season is 19,623 ha, and that in the
dry season is 12,049 ha, totaling 31,672 ha. Percentage of cropped area in the dry season is 61.4%
to that in the wet season, which is the highest among the four provinces. Ratio of cropped area of
dry season paddy to wet season paddy in the improved systems is 61.2%, whilst that in the
traditional systems is as high as 62.2%.
2) Percentage of irrigated paddy field in the dry season is 61.4% in Hoa Binh Province, ranging from
68.7% to 37.2%, which is the largest among the four provinces. As the resources of water and land
are still not well balanced, there are plenty of paddy fields depending on rain.

5 - 27
3) Average area of paddy field (wet season) in this province is 16.2 ha per system, which are the
largest among the four provinces, nonetheless it is difficult to consolidate these systems for
efficient water management except for the Da Bac District (irrigation ratio: 68.7%) and Lac Thuy
District (Irrigation ratio: 68.4%). As a result, number of irrigation systems is as large as 1,209
(improved systems: 543, traditional systems: 666).
4) In this province, there are 218 improved irrigation systems which have reservoirs aiming at stable
perennial irrigation, 277 irrigation systems of which intake structures and canals are improved, 21
lift irrigation systems by utilizing water head, and 27 irrigation systems which are irrigated by
pumping up water. However no underground irrigation is practiced.
5.4 Rural Water Supply
5.4.1 Existing Conditions of Rural Water Supply and Development Plans
(1) Percentage of Rural Water Supply
Table 5.4.1 shows the percentage of rural water supply for the respective regions in Vietnam in 2004 and
estimated figures for 2005 (excluding large cities). In every region, percentage of rural water supply is
steadily progressing. According to the actual result in 2004, ratio of rural water supply in the whole
Vietnam was only 57.7%, and the rural water supply in the Red River Delta Region, which has the highest
record, was 63.0%, and that in the Central Highlands Region, which has the lowest record, was 47.1%, less
than one half of the population. Similar trend is observed in the estimated figures for 2005, and the
average water supply ratio is 62.4% in the whole country. The combined region of Northeastern &
Regions is the second lowest with water supply ratio of 56.1%, followed by the lowest Central Highlands
Region of 52.3%.
Table 5.4.1 Comparison of Rural Water Supply in Each Region
Year 2004 Year 2005 (Estimated) Regions Population in Rural Area Water
Supplied Percentage Water Supplied Percentage
North East & North West 9,903,500 5,267,300 53.2 5,559,500 56.1Red River Delta 14,743,500 9,284,800 63.0 9,742,800 66.1North Central Coast 9,420,000 5,287,600 56.1 5,707,700 60.6South Central Coast 6,852,100 3,622,800 52.9 3,923,500 57.3Central Highlands 3,048,000 1,434,900 47.1 1,593,700 52.3South East 4,806,600 2,987,100 62.1 3,259,100 67.8Mekong Delta 15,213,800 9,035,700 59.4 10,126,300 66.6Total 63,987,500 36,920,400 57.7 39,912,600 62.4
Source: National Program on Clean Water and Rural Environmental Hygiene, 2005
(2) Major Rural Water Supply and Sanitation Policy
The Government of Vietnam issued major policies on rural water supply and sanitation consisting of short,
middle and long-term strategies as shown in Table 5.4.2. According to the long-term National Rural Clean
Water Supply and Sanitation Strategy (by 2020), the Government aims that 100% of rural population will
have access to national-standard clean water of minimum 60 liters/day/person and use hygienic latrines.

5 - 28
NRWSS is clearly referenced in CPRGS. In particular, a priority is given in government spending to the
development of rural infrastructure, of which Rural Water Supply and sanitation is a part of the strategies
stated above.
Apart from the CPRGS, government policy is articulated through NRWSS. The underlying principle of
NRWSS is sustainability as well as speed of implementation. Information, Education and Communication
(IEC) activities have been recognized as a vital element of NRWSS and give particular emphasis to
promoting construction of hygienic latrines and their proper use as well as on making people fully aware of
the relationship between sanitation and facilities, water supply and health. The objectives call for the
improved health and living conditions of the rural population as well as reduced environmental pollution
from human and livestock excreta through active promotion of community participation and a demand
responsive approach. NRWSS is underpinned by the principles of allocating decision-making and
management at the lowest appropriate level, and emphasizing the participation of women in management.
At the national level, MARD is the lead ministry to coordinate all issues related to National RWSS.
MARD has delegated this responsibility to CERWASS, which is a center under MARD. NTP on RWSS is
the umbrella for all programs (region-transversal development programs) and projects (region-wise
projects) within the RWSS sector and is considered as a tool to implement NRWSS.
Table 5.4.2 Major Rural Water Supply and Sanitation Policies
Main WSS Policies Rural Water Supply Sanitation
Strategies of the Government of Vietnam
The National Rural Clean Water Supply and Sanitation Strategy: By 2020, 100% of rural population having access to national-standard clean water of minimum 60 l/day and use hygienic latrines. By 2010, 85% of the rural population having access to national-standard clean water of minimum 60 l/day and 70% of rural households using hygienic latrines. By 2005, 50% of the country’s households using hygienic sanitation facilities and 80% having “domestic quality water.
Comprehensive Poverty Reduction and Growth Strategy (CPRGS)
By 2005, 60 l/day of the rural population with access to clean water with an average daily supply of 50 l/day/capita and by 2010, 85% of the rural population obtains 60 l/day/capita. Special emphasis in the short-term on providing clean water in nursery schools, kindergartens, schools and health clinics in rural areas
By 2005, 50% of rural households having toilets that meet basic sanitation standards. By 2010, 75% of rural households having toilets that meet basic sanitation standards. Special emphasis in the short-term on providing environmental sanitation in nursery schools, kindergartens, school and health clinics in rural areas.
Vietnam Development Goals (VDGs)
By 2005, 60% of the rural population having access to clean and safe water and by 2010, 85%
The VDGs do not yet include targets on rural sanitation
GOV 2010 Environmental Strategy
By 2010, 85%rural access to clean drinking water
Source: Water Supply and Sanitation Strategy, Building on a solid foundation, World Bank in Vietnam, 2006

5 - 29
5.4.2 Water Resources and Water Quality
(1) Water Resources
Small scale rural water supply provision exists in Vietnam in rural and urban areas both as a sole source of
drinking water and a less expensive addition to piped water consumption in order to decrease the total cost
of supply to the household.
Traditionally, the rural areas would collect water from mountain streams, ponds, canals and other
uncovered open wells in community locations or installed in their homes. Others will collect rain water.
The rural water supply provision could also come from community-installed hand pumps.
The quality of water suffers excessive pollution in some areas or is questionable. Considering the health
impact and time/cost forgone in obtaining water, the real cost of the rural water supply provision to a
household is often higher than the connection to piped schemes.
(2) Water Quality
After 2006, it became necessary to pay special attention to management, assessment and monitoring of
quality of water for the implementation of sustainable rural water supply systems. For the water supply
systems targeting less than 500 persons, procedures and indexes for monitoring of quality of water have to
be based on Decision No. 09/2005/QD/BYT. For the rural drinking water supply systems for more than 500
persons, indexes of the water quality based on Decision No. 1329/2002/QD/BYT issued by MOH is
provisionally applied.
However, it is necessary to prepare comprehensive national guidelines commonly applicable to all the types
of clean water supply systems, from the viewpoints of recent increase of water demand due to
socio-economic development, and from the necessity of technical and administrative improvements.
5.4.3 Existing Conditions of the Existing Rural Water Supply
(1) Water Tariffs
Tariffs are set by PCs after the water supply company (WSC) submits their tariff proposal and often after
the PCs obtain the consent of the People’s Council. Tariffs are reviewed annually. The implementation of
Circular 03/1999, stating local government must gradually increase water tariffs to fully recover costs, has
been slow. In November 2004, MOF and MOC issued a joint circular stipulating the common tariff
framework for the whole country, including rural areas, based on the principle of full cost recovery and a
reasonable profit. MOF assumed the prime responsibility for enforcing the joint circular. Since then, the
water tariffs have been increased or adjusted significantly in most WSCs in the country, helping to improve
the financial status of the water sector.

5 - 30
Urban water tariffs are typically in the range VND 1,600 to 2,700/m3 although there are examples outside
this band. In 2003 the average residential tariff was VND 2,181/m3, an increase of 4% over the previous
year. There is a positive trend towards increasing tariffs,
Current district water tariffs in Vietnam range between VND 1,000 and VND 4,000 per m3 and domestic
tariff are typically VND 2,000 to VND 2,500/m3. This covers only the direct operating costs and does not
usually include the full costs of depreciation. The connection fee ranges from VND 300,000 to VND 1
million or more. Cooperative and community-based water supply systems, funded with contributions
from local residences or private sector investment, agree water prices amongst themselves. Still, the tariffs
need to be endorsed by PC.
(2) Affordability
The average percentage of the cost of water and wastewater services in the total household income is
usually used to measure the consumer ability to pay. For planning purposes, a rule of thumb of around 3%
for water and 5% for water and sanitation is used. Current tariffs in Vietnam are typically below 2% of
the average household income. Household that already have piped water are reluctant to pay more than
the current tariff and conversely, communities that have no access to piped water are willing to pay much
more than the current tariff.
Small Towns and Townlets1 water supply affordability: Connection costs are a major obstacle to achieving
greater coverage of water supply services in small towns and town lets. Although tariffs are well below 3%
of the average household income, connection fees could reach as high as 10-35%. Cross subsidies may be
useful in some cases but more research is needed to understand how the people can benefit from targeted
external subsidies and/or cross subsidies. Furthermore, the removal of connection fees can also be
considered as a way to reduce the connection barrier.
Rural water supply affordability: Surveys of time and money spent on obtaining drinking water in Vietnam2
indicates that rural communities, including the poor, are willing to contribute to the capital and
maintenance costs of water and sanitation, provided that they have made an informed choice for the service
level provided. To some extent, rural communities have also demonstrated a willingness to support poorer
members through cross-subsidies.
5.4.4 Operation and Maintenance of Rural Water Supply Systems
(1) Water Supply Utility Provision
There are four types of provision of water supply services in Vietnam:
1) Utility provision by state-owned WSCs
1 In Vietnam, administrative division in the central part is made as follows: (1) Class 3; Provincial cities with population of 100,000-250,000, (2) Class 4; District towns with population of 50,000-100,000, and Class 5; Townlets with population of 4,000-50,000 2 Water Supply and Sanitation Strategy, the World Bank in Vietnam, 2006

5 - 31
2) Small towns/townlets provision
3) Self-provision – households and communes that obtain water for themselves
4) Local private sector in rural areas
Over the past 10 years, the utility provision of water supply and drainage services has been decentralized
from central to provincial level of the government and the utilities have been established as legally distinct
state-owned economic entities. Despite decentralization, the level of autonomy of the water supply
companies remains limited. Water supply tariffs are set by the provincial PCs at levels which cover O&M
costs but are insufficient to fully recover the costs of capital needed by the utility. Key management and
operating decisions such as overall production levels, capital investment and maintenance expenses, staff
salary and benefits, and senior management appointments still require government approval. WSCs do
not have ownership rights over water resources or public land usage. Although the province exercises
ownership on the assets of WSC, there are no contractual relationships between the two parties to govern
this right. Most of PWCs are Public Service Enterprises, operating under the Enterprise Law, except the
water tariffs, as mentioned above, are set by the respective PPC.
(2) Small Water Supply Provision
WSS services are provided by a wide variety of management models in small towns with the diversity
being much higher in townlets:
1) Direct management by Small Town People’s Committee in small towns and Commune People’s
Committee in townlets,
2) Community management,
3) Cooperatives,
4) Provincial WSCs (pWSCs). They are responsible for providing water supply services to Class 4
towns, but recently have seen their mandate extended to also provide their services to small towns,
Class5,
5) Other state-owned enterprises mainly consisting of district water supply companies and/or
environmental service companies, and
6) Private water companies.
The PPC makes the decision on ownership for small towns water supply projects. The project owner is
usually pWSC, pCERWASS, District PC or small towns’ PC. Local agriculture cooperatives or private
organizations may become the owners mainly in townlets and rural areas. For larger projects, project owner
must obtain a water license. Private investors have participated in construction of a number of townlet
projects in areas with good economic prospects, high demand for clean water, and scare water resources by
investing sums of between VND 300 million to 1 billion.

5 - 32
5.4.5 Administrative Support in Water Supply
There are two types of funding of NTP-PR. The first is routine funds for construction of water systems
and sanitation coverage/IEC. The second type of funding is investment subsidies for water supply,
especially for schools and kindergartens, hospitals, Community Health Stations, and rural markets.
The levels of grants stated in National RWSS Strategy are 80% of construction costs for water supply of
very poor households and 60% of construction costs for poor households. In addition, users can obtain
loans up to 75% of total construction costs from the Government of Vietnam rural water and sanitation fund.
For gravity water systems in high mountain areas, the subsidy cannot exceed 90%. For water piped
schemes in a standard single village, the subsidy levels could reach 40% of the total construction cost,
whereas for more difficult sites in mountainous, island and border areas, the national government subsidy
can be as much as 60% to be supplemented by provincial government funds.
5.4.6 Water Resources for the Existing Rural Water Supply Systems
(1) Lai Chau Province
Major rivers in the Lai Chau province are the Da River and its tributaries, Nam Ma and Nam Na. These
major rivers flow southward crossing the boundaries of province and district, but their minor tributaries are
located within one district in the most cases. In general, water for rural supply is not taken from the three
large rivers, but from the minor tributaries in the district level.
(2) Dien Bien Province
River system in the Dien Bien province is divided into two, one is the Da River system, which flows into
the Red River and the other is the Nam Nua system, which pours into the Mekong through Laos. Water
for rural supply in the northern areas in the Dien Bien province is taken from the tributaries of the Da River
meeting on the right bank, in the midland areas from the tributaries of the Ma River, and in the southern
lands from the tributaries of the Ma River.
(3) Son La Province
River system in the Son La province is divided into two, one is the Da River system, which flows into the
Red River and the other is the Ma River system, which pours directly into the Gulf of Tonkin.
Approximately 70% of the water for rural supply for the areas located in north, midland and east of the Son
La province is served by the tributaries of the Da River, and 30% of the water for rural supply for the areas
located in southeast of the province by the tributaries of the Ma River system.
(4) Hoa Binh Province
River system in the Hoa Binh province is divided into two, one is the Da River system, which flows into
the Red River and the other is the Ma River system, which pours directly into the Gulf of Tonkin.
Approximately 95% of water for rural supply for the areas located in north, midland and east of Hoa Binh

5 - 33
province is served by the tributaries of the Da River, and 5% of the water for rural supply for the areas
located in Mai Chau district, southeast of the province by the tributaries of the Song Ma system.
5.4.7 Rural Water Supply in Four Provinces
Table 5.4.3 shows the total household, total population, number of persons who are supplied with rural
water, number of persons who are not supplied with rural water and percentage of water supplied
population to the total population of each province in the Region in 2005. Number of population in the
four provinces is 2,587,588, population who are receiving water from the rural water systems are 1,054,225,
number of rural water systems is 6,756, and percentage of water supplied population to the total population
is 40.7%, which is much lower than the national target of 50% in 2005.
Table 5.4.3 Percentage of Persons supplied with Rural Water
in Northwestern Mountainous Region
Unit: person Rural water supplied or not Name of province Total
household Population
Supplied Not supplied No. of
systems Percentage 1
(%) Lai Chau 59,460 327,209 126,181 201,028 3,420 36.8Dien Bien 86,694 450,684 236,548 214,136 2,139 52.5Son La 190,000 999,565 407,462 592,103 937 40.8Hoa Binh 154,120 810,130 284,034 526,096 260 35.1Total 490,274 2,587,588 1,054,225 1,533,363 6,756 40.7
Source: Master Plan Report for Rural Water Supply Development of four Provinces, 2005, and Statistical yearbook of four Provinces, 2005 1: Percentage of people who are supplied with rural water to the total population
(1) Lai Chau Province
Table 5.4.4 shows the total household, total population, number of persons who are supplied with rural
water, number of persons who are not supplied with rural water and percentage of water supplied
population to the total population of the Lai Chau province in 2005. Number of population in the
province is 327,209, population who are receiving water from the rural water systems are 126,181, number
of rural water systems is 3,420, and percentage of water supplied population to the total population is
36.8%, which is the second lowest in the region.
Table 5.4.4 Percentage of Persons supplied with Rural Water in Lai Chau Province
Unit: person Rural water supplied or not Name of district Total
household Population
Supplied Not supplied No. of
systems Percentage1
(%) TX. Lai Chau 4,326 19,307 15,098 4,209 488 78.2H. Muong Te 7,774 47,494 28,730 18,764 172 60.5H. Phong Tho 9,320 50,785 22,228 28,557 759 43.8H. Sin Ho 12,668 73,903 41,553 32,350 183 56.2H. Tam Duong 8,166 43,451 17,327 26,124 1,072 39.9H. Than Uyen 17,206 92,269 16,343 75,926 746 17.7Total 59,460 327,209 126,181 201,028 3,420 36.8
Source: Master Plan Report for Rural Water Supply Development of Lai Chau Province, 2005, and Statistical yearbook of Lai Chau Province, 2005
1: Percentage of people who are supplied with rural water to the total population
The table indicates that the conditions of rural water supply in Lai Chau province are as follows:

5 - 34
1) Percentage of population who are supplied with rural water to the total population is 36.8% in Lai
Chau province, ranging largely from 78.2% to 17.7% among districts.
2) Rural water supply systems consist of 2,400 of gravity surface water supply, and 1,020 of dug
wells in the households, totaling 3,420. It should be noted that there is no deep well water supply
system in this province.
3) As there are large variations in the water table of the dug shallow wells, it is not necessarily
possible to supply water using shallow wells throughout the year.
(2) Dien Bien Province
Table5.4.5 shows the total household, total population, number of persons who are supplied with rural
water, number of persons who are not supplied with rural water and percentage of water supplied
population to the total population of the Dien Bien province in 2005. Number of population in the
province is 450,684, population who are receiving water from the rural water systems are 236,584, number
of rural water systems is 2,139, and percentage of water supplied population to the total population is
52.5%, which is the highest in the region.
Table 5.4.5 Percentage of Persons supplied with Rural Water in Dien Bien Province Unit: household
Rural water supplied or not Name of District Total household
Population Supplied Not supplied
No. of systems
Percentage1 (%)
TP. Dien Bien Phu 11,749 46,954 41,789 5,165 409 89.0TX. Muong Lay 3,553 14,009 n.a.2 n.a.2 n.a.2 n.a.2H. Dien Bien 21,535 104,267 58,240 46,027 436 55.9H. Dien Bien Dong 8,000 51,157 33,229 17,928 184 65.0H. Muong Cha 7,819 46,322 19,503 26,819 145 42.1H. Muong Nhe 6,276 36,837 7,914 28,923 116 21.5H. Tua Chua 7,602 43,707 24,448 19,259 125 55.9H. Tuan Giao 20,160 107,431 51,425 56,006 288 47.9Total 86,694 450,684 236,548 214,136 2,139 52.5
Source: Master Plan Report for Rural Water Supply Development of Dien Bien Province, 2005, and Statistical yearbook of Dien Bien Province, 2005
1: Percentage of people who are supplied with rural water to the total population 2: Muong Lay Town was recently separated from Muong Cha district, and water supplied population and number of systems is included in
Muong Cha district
The table indicates that the conditions of rural water supply in the Dien Bien province are as follows:
1) Percentage of population who are supplied with rural water to the total population is 52.5% in Dien
Bien province, varying largely from 89.0% to 21.5% among districts.
2) Rural water supply systems consist of 1,916 of gravity surface water supply, and 223 of deep wells,
totaling 2,139. Other than the above, there are 11,174 dug wells by local people, water of which
is lifted by man-power or hand driven pumps.
3) As there are large variations in the water table of the dug shallow wells, it is not necessarily
possible to supply water using shallow wells throughout the year. However, water table of such
dug wells by local people along the relatively large river seems to be stable.

5 - 35
(3) Son La Province
Table 5.4.6 shows the total household, total population, number of persons who are supplied with rural
water, number of persons who are not supplied with rural water and percentage of water supplied
population to the total population of the Son La province in 2005. Number of population in the province
is 999,565, population who are receiving water from the rural water systems are 407,462, number of rural
water systems is 934 except 15,000 dug wells by local people, and percentage of water supplied population
to the total population is 40.8%, which is the second highest in the region, but still low.
Table 5.4.6 Percentage of Persons supplied with Rural Water in Son La Province Unit: person
Rural water supplied or not Name of District Total household
Population Supplied Not supplied
No. of systems
Percentage1 (%)
TX. Son La 18,030 76,266 61,232 15,034 21 80.3H. Bac Yen 8,110 51,220 32,394 18,826 86 63.2H. Mai Son 25,800 126,064 10,004 116,060 77 7.9H. Moc Chau 31,200 143,513 42,993 100,520 106 30.0H. Muong La 13,970 83,861 27,916 55,945 89 33.3H. Phu Yen 20,480 103,131 72,061 31,070 178 69.9H. Quynh Nhai 11,040 66,818 39,856 26,962 72 59.6H. Song Ma 20,000 111,658 29,174 82,484 85 26.1H. Sop Cop 5,400 36,307 7,625 28,682 36 21.0H. Thuan Chau 22,300 136,825 43,775 93,050 109 32.0H. Yen Chau 13,630 63,902 40,432 23,470 78 63.3Total 190,000 999,565 407,462 592,103 937 40.8
Source: Master Plan Report for Rural Water Supply Development of Son La Province, 2005, and Statistical yearbook of Son La Province, 2005
1: Percentage of people who are supplied with rural water to the total population
The table indicates that the conditions of rural water supply in Son La province are as follows:
1) Percentage of population who are supplied with rural water to the total population is as low as
40.8% in Son La province, ranging largely from 80.3% to 7.9% among districts. Ratio of rural
water supply is high in the flat basin of the Son La basin and low in the mountainous areas.
2) Rural water supply systems consist of 922 of gravity surface water supply, and 15 of deep wells,
totaling 937. Other than the above, there are 15,000 dug wells by local people, water of which is
lifted by man-power or by hand driven pumps.
3) As there are large variations in the water table in the dug shallow wells, it is not necessarily
possible to supply water using shallow wells throughout the year. However, water table of such
dug wells by local people along the relatively large river seems to be stable.
(4) Hoa Binh Province
Table 5.4.7 shows the total household, total population, number of persons who are supplied with rural
water, number of persons who are not supplied with rural water and percentage of water supplied
population to the total population of Hoa Binh province in 2005. Number of population in the province is
810,130, population who are receiving water from the rural water systems are 284,034, number of rural
water systems is 260 except 2,954 dug wells by local people, and percentage of water supplied population
to the total population is 35.1%, which is the lowest in the region.

5 - 36
The table indicates that the conditions of rural water supply in the Hoa Binh province are as follows:
1) Percentage of population who are supplied with rural water to the total population is 35.1% in Hoa
Binh province, varying largely from 92.3% to 10.3% among districts. Ratio of rural water supply
is high in the flat basins and low in the mountainous areas.
2) Rural water supply systems consist of 254 of gravity surface water supply, and 6 of deep wells,
totaling 260. Other than the above, there are 2,954 dug wells by local people, water of which is
lifted by man-power or by hand driven pumps.
Table 5.4.7 Percentage of Persons supplied with Rural Water in Hoa Binh Province
Unit: person Rural water supplied or not Name of District Total
household Population
Supplied Not supplied No. of
systems Percentage1
(%) TX. Hoa Binh 16,080 83,607 8,608 74,999 4 10.3H. Cao Phong 7,890 41,014 13,934 27,080 19 34.0H. Da Bac 9,850 51,800 47,790 4,010 65 92.3H. Kim Boi 27,380 142,370 42,135 100,235 9 29.6H. Ky Son 6,710 35,307 7,476 27,831 12 21.2H. Lac Son 25,170 132,384 37,275 95,109 21 28.2H. Lac Thuy 9,640 50,140 16,290 33,850 2 32.5H. Luong Son 15,600 82,014 22,099 59,915 3 26.9H. Mai Chau 9,440 49,670 33,978 15,692 62 68.4H. Tan Lac 14,900 78,791 37,069 41,722 45 47.0H. Yen Thuy 11,460 63,033 17,380 45,653 18 27.6Total 154,120 810,130 284,034 526,096 260 35.1
Source: Master Plan Report for Rural Water Supply Development of Hoa Binh Province, 2006, and Statistical yearbook of Hoa Binh Province, 2005
1: Percentage of people who are supplied with rural water to the total population
3) As there are large variations in the water table in the dug shallow wells, it is not necessarily
possible to supply water using shallow wells throughout the year. However, water table of such
dug wells by local people along the relatively large river seems to be stable.
5.5 Rural Electrification
5.5.1 Existing Conditions and Plan of Rural Electrification
The Government of Vietnam has been developing rural electrification in order to improve the living
standard and income generation for people living in the rural areas. At present, 96% of districts, 82% of
communes and 73.5% of rural households are receiving electricity through national grid. Out of eight
regions, Red River Delta, Mekong Delta, Southeastern regions are 100% electrified, though the other
regions still remain as low electrified areas, especially the Region is ranked at the lowest electrified area,
accounting for 65% among the whole country.
In Vietnam, a commune is defined as electrified if its commune center receives electricity from the national
grid or off-grid. In this definition, there remain non-electrified villages belonging to existing electrified
communes.
Table 5.5.1 to Table 5.5.4 shows existing conditions of electricity supply in the four provinces.

5 - 37
1) Rate of electrification for each province is 42.6% of Lai Chau, 63.9% of Dien Bien, 74.7% of
Son La, and 88.8% of Hoa Binh. Average rate of the Northwest Region is low, comparing with
rate of the whole country (88%).
2) Rate of electrification in most of districts of Lai Chau province is less than 50% except Lai Chau
town (89.5%) and Tam Duong district (67.4%).
3) Dien Bien Phu city and Muong Lay district of Dien Bien province were electrified at 100%.
The rate of Muong Nhe district is exceedingly low at 5.5% due to difficult settings of power grid
in mountainous areas bordering on Laos
4) Rates of electrification in Son La province are evenly distributed ranging from 70 to 97 % in
most of districts excluding Quynh Nhai district (47%).
5) Comparing with the other provinces, Hoa Binh province has a high rate of electrification with
over 80%, excluding 78.5% of Lac Son district.
(1) Lai Chau Province
Eighty percent (80%) of the whole Lai Chau province’s households are to be electrified under the national
grid before 2010. The remaining part of about 11,200 households in remote and mountainous areas has
difficult access to the national grid, especially in Muong Te and Sin Ho districts. It is necessary to study
the use of local energy sources such as small-scale hydropower or renewable energy for electric supply to
those areas.
In such mountainous areas, the potential of hydropower is very high, taking into consideration that rivers
and streams can be developed with abundant river discharge by 2,500 to 2,700 mm of annual rainfall. Lai
Chau province planned 30 medium- and small-scale hydropower stations (total) with output capacity of one
to 30 MW (total capacity: 281 MW). In addition, thousands of extremely small-scale hydropower stations
with 300 to 500 W capacities are considered by the province to supply the electricity. In the past, 19 small
hydropower stations with 1,438 kW capacities were built in the province. However, operation of these
stations is inefficient due to unsystematic construction, deteriorated equipments, limitation of operation and
maintenance.
In remote areas far from the national grid, about 5,000 extremely small- scale hydropower stations with 300
to 500 W capacities were installed by residents themselves, and are used for lighting and radio at home.
Before 2010, four hydropower stations are to be constructed and be connected to the national grid. MOIT
is currently running a pilot project for electric supply to non-electrified remote communes (total of 1,200
households) in Muong Te district by constructing small-scale hydropower stations financed by World Bank.
There are about 10,000 households in remote, mountainous villages where the national grid is unable to
reach. Five thousand (5,000) extremely small-scale hydropower stations are needed to attain 100% of
electrification.
According to the data on sunshine hours, it is not appropriate to set up solar power-generation system in
place of hydropower generation system in Lai Chau. In respect to the construction cost, solar energy

5 - 38
stations requires larger cost than extremely small-scale hydropower stations. For this reason, this solar
power-generation system can be established in villages where hydropower stations cannot be constructed
due to topographical and river conditions.
Table 5.5.1 Present Condition of Electrification in Lai Chau Province Unit: household
Electricity available or not Name of District Total household
PopulationAvailable Not available
Percentage1 (%)
TX. Lai Chau 4,326 19,307 3,873 453 89.5 H. Muong Te 7,774 47,494 1,171 6,603 15.1 H. Phong Tho 9,320 50,785 3,141 6,179 33.7 H. Sin Ho 12,668 73,903 4,222 8,446 33.3 H. Tam Duong 8,166 43,451 5,507 2,659 67.4 H. Than Uyen 17,206 92,269 7,415 9,791 43.1 Total 59,460 327,209 25,329 34,131 42.6 1: Percentage of electricity available households to the total households
(2) Dien Bien Province
Eight (8) districts in Dien Bien province are 100% electrified at 100% by the national grid. As for
communes, 65 out of total 98 have electricity supplied by the national electric networks. In term of
households, 55,414 out of total 86,694 are electrified at 64% through the national grid. Two models of
electricity supply management can be found, 1) to sell electricity directly to users 2) to manage electricity
through cooperatives.
Table5.5.2 Present Condition of Electrification in Dien Bien Province Unit: household
Electricity available or not Name of District Total household
PopulationAvailable Not available
Percentage1 (%)
TP. Dien Bien Phu 11,749 46,954 11,749 0 100.0 TX. Muong Lay 3,553 14,009 3,553 0 100.0 H. Dien Bien 21,535 104,267 17,882 3,653 83.0 H. Dien Bien Dong 8,000 51,157 3,249 4,751 40.6 H. Muong Cha 7,819 46,322 3,449 4,370 44.1 H. Muong Nhe 6,276 36,837 345 5,931 5.5 H. Tua Chua 7,602 43,707 2,538 5,064 33.4 H. Tuan Giao 20,160 107,431 12,649 7,511 62.7 Total 86,694 450,684 55,414 31,280 63.9 1: Percentage of electricity available households to the total households
(3) Son La Province
Son La Electricity Agency has invested in construction of medium-voltage transmission lines and
transformer stations covering all the 201 communes, and towns. Because of the shortage of investment
capital for the provisions of low-voltage transmission lines, 21 communes do not receive electricity from
the national grid. In June 2006, 128 out of the 201 communes in the province received electricity from the
national grid system, reaching 89.6%. The number of households receiving electricity becomes 141,913
out of total households 190,000 reaching to 74.7%.
In rural areas, there are 168 (88.9%) out of the total 189 communes receive electricity. The number of
household receiving electricity is 97,959 out of total of 161,401, accounting for 60.7%. Electricity Price

5 - 39
in Rural Areas: At present, electricity is sold to each household at the price of less than 700VND/kWh.
Rural Electricity Supply Management: Son La province has completed the shift of rural electricity
management. Rural electricity management systems in Son La province comply with Decision
27/QD-BCN issued by MOIT.
- Son La Electricity of Agency manages electricity trading in 157 communes consisting of 85,940
households, accounting for 89%.
- Electricity service cooperatives manage electricity sold to 9,855 households (accounting for 89%of
total number of household being available for electricity) in 13 electrified communes in the following
districts: Mai Son (6 communes), Yen Chau (5communes) and Moc Chau (2 communes).
- Private electricity trading households: Two organizations manage electricity sold to 789 households
in two communes, Dong Sang and Van Ho in Moc Chau district.
Table 5.5.3 Present Condition of Electrification in Son La Province Unit: household
Electricity available or not Name of District Total household
Population Available Not available
Percentage1 (%)
TX. Son La 18,030 76,266 17,481 549 97.0 H. Bac Yen 8,110 51,220 7,789 321 96.0 H. Mai Son 25,800 126,064 20,431 5,369 79.2 H. Moc Chau 31,200 143,513 23,075 8,125 74.0 H. Muong La 13,970 83,861 7,673 6,297 54.9 H. Phu Yen 20,480 103,131 17,444 3,036 85.2 H. Quynh Nhai 11,040 66,818 5,186 5,854 47.0 H. Song Ma 20,000 111,658 11,927 8,073 59.6 H. Sop Cop 5,400 36,307 4,110 1,290 76.1 H. Thuan Chau 22,300 136,825 13,643 8,657 61.2 H. Yen Chau 13,670 63,902 13,154 516 96.2 Total 190,000 999,565 141,913 48,084 74.7 1: Percentage of electricity available households to the total households
(4) Hoa Binh Province
According to Electricity Agency in Hoa Binh province, all (100%) of the communes and precincts in the
province were electrified by the national grid before 2003; 87% in terms of number of household.
Regarding electricity price in rural areas, Hoa Binh province sells electricity to households at the price of
700 VND/kWh. From September 2004, Hoa Bin Province has two legal electricity models; one for
agricultural use and the other for business cooperatives’ services.
In the past, many local people spent their own money to install mini hydropower equipments to get
electricity for their household because their villages were far from the national grid. Most equipments
stopped operation due to instability of water discharge amount or faulty equipment. There are two types
of mini hydropower generators.
Kaplan turbine: low water head ranging from one to four meters, discharge varying from 20 to 40 liters/s,
capacity ranging from 200 to 1,000W. Capsule turbine: high water head ranging from four to eight meters,
small discharge

5 - 40
Mini hydropower generation has been declining year by year according to the following reasons:
1) Water discharge is not available for nine months during the dry season.
2) In rainy season, it is difficult to maintain equipments in order to protect equipments from floods.
3) The river bed is very steep, leading to high velocity of river flow.
4) Installation of equipment is not complied with the technical standards and actual firm capacity is
lower as compared to nominal capacity.
5) Spare parts such as flume, suction pipe are temporary and electric wires are not safe, easy to cause
accidents.
6) Service life is short at only two to three years.
The above issues indicate that application of mini hydropower equipments has been more and more
narrowed with expansion of national grid. According to the Hoa Binh Province Electricity Development
Plan in the period of 2006-2010 with consideration to2015, Decision No.13/QD-BCN approved by the
Ministry of Industry, the province has a plan to increase electricity rate on household level from 91 % to
95% in short term and to reach to over 98% in late 2010. Concerning solar and wind energies, the above
plan mentions that commercial exploitation under Hoa Binh province is not feasible in connection with
price of equipment, technical knowledge.
Table 5.5.4 Present Condition of Electrification in Hoa Binh Province Unit: household
Electricity available or not Name of District Total household(A)
Populationavailable(B) Not available
Percentage1 (%)
TX. Hoa Binh 20,291 83,607 20,280 11 99.9 H. Cao Phong 8,827 41,014 8,189 638 92.8 H. Da Bac 11,460 51,800 9,653 1807 84.2 H. Kim Boi 29,453 142,370 25,967 3,486 88.2 H. Ky Son 7,919 35,307 7,851 68 99.1 H. Lac Son 25,282 132,384 19,839 5,443 78.5 H. Lac Thuy 11,876 50,140 11,579 297 97.5 H. Luong Son 18,975 82,014 17,584 1,391 92.7 H. Mai Chau 11,365 49,670 9,657 1,708 85.0 H. Tan Lac 16,591 7,791 13,877 2,714 83.6 H. Yen Thuy 14,718 63,033 12,414 2,304 84.3 Total 176,767 810,130 156,890 19,867 88.8
1: Percentage of electricity available households to the total households
5.5.2 Existing Electrical Facilities
(1) Lai Chau Province
There are two transformer stations in Phong Tho and Than Uyen with 110 KV which supply electricity of
35 KV to all the other districts in the province excluding Muong Te district. Electricity in Muong Te
district is supplied from the Nam Si Luong hydropower station with the capacity of 500 KW. Each district
has transformer sub-stations of 35/0.4 KV, where low-voltage electricity 400 V is supplied to households.
In the province, 19 small hydropower plants were established with the capacity of 1,438 KW, but most of
them have been ruined and only seven stations remain. There are about 5,000 extremely small-scale
hydropower stations built by residents themselves in off-grid areas.

5 - 41
(2) Dien Bien Province
Electric supply facilities to districts in Dien Bien province consist of two transformer stations (the one in
Tuan Giao 110 kKV/35 kV, and the other in Dien Bien 110 kV/35/22 kV) and three intermediary
transformer stations (Muong Lay 35/10 kV, Tuan Giao 35/10 kV and Dien Bien 35/10 kV). Electricity is
supplied to each district through middle voltage transmission line networks. Each district has transformer
sub-stations which lower/change the voltage of the received electricity and supply electricity to each
household. In addition, there are nine hydropower plants, four of which connects to the national grid with
10 kV or 35 kV networks.
(3) Son La Province
In 2005, total trading electricity outputs of the whole province reached 115.4 million kWh. Electric
sources in the province consist of the followings:
1) Most of additional discharges are supplied from North national grid through Son La capital, Moc
Chau, Muong La transformer stations 110 kV with total installed capacity of 66 MVA and
supported from Nghia Lo transformer stations 110 V (Yen Bai province).
2) Small scale hydropower stations generating power to national grid:
Chieng Ngam hydropower stations (Thuan Chau district) with capacity of 1.92 MW
Nam Cong hydropower station (Song Ma district) with capacity of 250 kW
3) Power generation station belonging to Son La Sugarcane-sugar Company with capacity of 2 x 1500
kW, supplying electricity for production of the sugar factory and generating electricity to
transmission network when surplus power is generated.
4) Diesel generator units of production bases in Moc Chau district with 6 units with total capacity of
1,364 kVA.
5) In remote mountainous districts, there are about 20 mini hydropower equipment units generating
and supplying electricity for production requirement and domestic consumption. They are
scattered in Thuan Chau, Quynh, Nhai, Son La capital, Moung La, Mai Son, Moc Chau, Song Ma,
Bac Yen districts.
6) Transmission networks in the province consist of voltage levels as 110, 35, 22, 10, 6 kV.
(4) Hoa Binh Province
Hoa Binh province has the Hoa Binh Hydropower Plant with capacity of 8 x 240 MW, the biggest
hydropower plant in Vietnam, supplying eight billion kWh/year of power output. Electricity generated by
this plant is connected to the national grid through Hoa Binh transformer stations 220 V and 500 kV. Hoa
Binh province has been receiving electricity from the national grid through 110kV transformer stations
such as Hoa Binh, Lac Son and Luong Son. In general, power supply sources for Hoa Binh province is
the national grid under favorable and highly reliable conditions.
Currently, there are 10 small-scaled hydropower plants with capacity of 205 kW. They were constructed

5 - 42
in combination with irrigation and drainage, but they generate electricity only during the rainy season for
three months a year to supply to small residential areas located far from the national grid. In addition,
there are over 2,000 extremely small-scale hydropower equipments with capacity of 0.3 to 0.5 kW per one
unit for domestic use.
5.5.3 Operation and Maintenance of Electric Facilities
Establishment of electric distribution network in rural areas follows the principle of “joint action by the
State and the People”. The State invests in development of high-tension power grid lines, power
transformations and master electricity meters. Communes, on the other hand, are responsible for
arranging their own distribution network to sell power from the master electricity meters to each household.
Such principle is managed under the following alternative manners:
- By a commune’s Board of Electricity Management
- Directly by electricity companies
- By co-operatives
- By private entities/individuals selected
- By provincially managed state owned companies
- By centrally managed state owned companies
Power companies sell electricity to the above-mentioned entities at a wholesale price fixed by the State
(VND 360/kwh). The electricity prices payable by households fluctuate between VND 500-900/kWh.
Once power distribution lines reach a commune, households are expected to invest in connecting the line
from master electricity meters to their homes and acquiring other electric appliances. Since many poor
households cannot pay these connection costs, it hampers access to electricity even though the distribution
reaches the communes. In most of the poorest communes with access to electricity, the power lines reach
only the commune center through one to two transformers, and power consumption often stands at a low
level.
5.5.4 Administrative Support on Rural Electrification
In most rural areas, local communities own and operate the low-voltage electricity distribution systems.
The basic approach adopted for rural electrification in Vietnam has been for EVN’s Power Companies
(PCs) to develop the medium-voltage network, and for local communities to develop the low-voltage
system.
PPC has oversight for rural electrification in their provinces, and provide substantial financial support for
the local share of investment. Until 2004, handling of local power distribution was made through
informal commune electricity groups or other informal entities. According to Government regulations,
however, all of these entities are now required to convert to formal entities, such as cooperatives or
joint-stock companies. Developed initially at cooperatives or commune levels, but also as district-level
joint stock companies in some cases even at this stage, these companies need to consolidate and expand, in

5 - 43
order to be important commercial actors in the overall power system.
5.6 Other Rural Infrastructure Facilities
5.6.1 School
(1) Number of Schools and Enrollment
According to the Vietnam Development Report (2005), primary school enrolment rate jumped from 88% in
1998 to 91% in 2002. During the same period, secondary school enrolment rate increased from 62% to
72%. Despite such rapid improvement, about 10% of school-age children do not enroll in schools, and
46% of those children who do not go to school are ethnic minorities. The rest of those who do not go to
school are street children, migrant children, and children with disabilities. In terms of scholastic
achievement/ability, a wide regional gap exists among the children in schools. Children with low
scholastic achievement/ability are concentrated in northern mountain, central highland and Mekong delta
regions where the poverty rate is very high.
MOET formulates and executes educational policies and manages higher education. While each province
is to manage secondary schools and districts and communes are to manage primary schools and nursery
schools/kindergartens, actual allocation of school management varies widely from province to province.
With on-going decentralization of power from the central to local governments, educational assistance has
been given out by local governments to children in mountainous areas and of ethnic minorities as a part of
their poverty reduction measures.
The primary objective of Vietnam’s educational sector strategies is to increase enrolment rate of lower and
higher education especially in disadvantaged communities. The secondary objective of the sector is to
improve the quality of education. As for primary and secondary school education, the goal of the primary
school education is to achieve full (100%) enrolment rate among all the school-age children. For the
secondary school education, the goal is to increase the number of pupils in the areas, where the school
enrolment rate is lower than the national average, by school fee exemption, classroom construction and so
on.
Activities to achieve the above-mentioned goals and objectives have been continuously supported through
public spending. Figures show that the share of government spending on education is higher for poor
households than for wealthy households. However, these figures need to be examined with a caution
because this may be due to a larger average number of children in a poor household. Household spending
on education has been an economic burden to poor households in Vietnam, while at the same time such
out-of-pocket spending is mitigating the public spending. Table 5.6.1 and Table 5.6.2 show the condition
of education in the Study Area:

5 - 44
Table 5.6.1 Number of Schools and Pupils in the Four Provinces
2000 2001 2002 2003 2004 2005Lai Chau Province 1. Number of Schools 179 210 259 Nursery/Kindergarten 26 42 64 Primary & Secondary 153 168 1952. Number of classes 3,237 3,657 4,253 Nursery/Kindergarten 347 566 730 Primary & Secondary 2,890 3,091 3,5233. Number of teachers 3,695 4,556 5,381 Nursery/Kindergarten 403 672 949 Primary & Secondary 3,292 3,884 4,4324. Number of pupil 66,835 63,184 79,832 Nursery/Kindergarten 6,738 1,838 13,494 Primary & Secondary 60,097 61,346 66,338Dien Bien Province 1. Number of Schools 205 220 246 285 300 Nursery/Kindergarten 37 35 45 51 53 Primary & Secondary 168 185 201 234 2472. Number of classes 4,145 4,549 4,850 5,215 5,413 Nursery/Kindergarten 329 387 463 485 770 Primary & Secondary 3,816 4,162 4,387 4,730 4,6433. Number of teachers 5,415 5,973 6,545 6,656 7,754 Nursery/Kindergarten 589 601 631 698 1,113 Primary & Secondary 4,826 5,372 5,914 5,958 6,6414. Number of pupil 100,389 106,761 113,931 118,473 122,384 Nursery/Kindergarten 7,357 7,717 10,954 11,789 17,050 Primary & Secondary 93,032 97,044 102,977 106,684 105,334Son La Province 1. Number of Schools 393 432 470 537 595 644 Nursery/Kindergarten 57 64 70 111 150 168 Primary & Secondary 339 368 400 426 445 4762. Number of classes 9,544 9,605 10,420 10,623 11,034 13,812 Nursery/Kindergarten 1,261 1,352 1,527 1,620 1,724 1,866 Primary & Secondary 8,283 8,253 8,893 9,003 9,310 10,0803. Number of teachers 11,794 12,726 13,327 14,135 14,516 15,147 Nursery/Kindergarten 1,508 1,696 1,801 1,954 1,992 2,084 Primary & Secondary 10,286 11,030 11,526 12,181 12,524 13,0634. Number of pupil 243,959 253,194 261,178 266,394 268,296 234,463 Nursery/Kindergarten 23,203 24,455 29,330 31,523 34,818 3,745 Primary & Secondary 220,756 228,739 231,848 234,871 233,478 230,718Hoa Binh Province 1. Number of Schools 568 590 613 618 655 667 Nursery/Kindergarten 144 146 155 156 180 188 Primary & Secondary 424 444 458 462 475 4792. Number of classes 9,228 8,900 9,225 10,488 7,802 8,257 Nursery/Kindergarten 2,283 2,043 2,562 2,913 1,363 1,969 Primary & Secondary 6,945 6,857 6,663 7,575 6,439 6,2883. Number of teachers 12,651 13,362 3,876 14,407 12,850 13,915 Nursery/Kindergarten 2,578 2,641 2,840 2,863 1,772 2,958 Primary & Secondary 10,073 10,721 11,036 11,544 11,078 10,9574. Number of pupil 233,262 226,047 214,785 220,793 196,454 195,863 Nursery/Kindergarten 39,801 36,867 32,025 40,028 25,374 31,353 Primary & Secondary 193,461 182,760 182,760 180,765 171,080 164,510
Source:Interview survey in each province(2005 Data)

5 - 45
Table 5.6.2 Number of Schools in Districts
Number of Schools Number of
Schools per 1000 persons District Population
Nursery Primary and Secondary Total
Lai Chau Province 327,209 64 195 259 0.79Tx. Lai Chau 19,307 8 H Muong Te 47,494 15 H. Phong Tho 50,785 12 H. Sin Ho 73,903 6 H. Tam Duong 43,451 13 H. Tam Uyen 92,269 10 Dien BienProvince 450,684 53 247 300 0.67TP. Dien Bien Phu 46,954 TX. Muong Lay 14,009 H. Dien Bien 104,267 H. Dien Bien Dong 51,157 H. Muong Cha 46,322 H. Muong Nhe 36,834 H. Tua Chua 43,707 H. Tua Chua Giao 107,431 Son La Province 999,565 168 476 644 0.64TX. Son La 76,266 15 32 47 0.62H. Bac Yen 51,220 7 29 36 0.7H. Mai Son 126,064 19 74 93 0.67H. Moc Chau 143,513 34 63 97 0.68H. Muong La 83,861 11 34 45 0.69H. Phu Yen 103,131 22 49 71 0.69H. Quynh Nhai 66,818 4 26 30 0.45H. Song Ma 111,658 9 41 50 0.45H. Sop Cop 36,308 6 18 24 0.66H. Thuan Chau 136,825 25 68 93 0.68H. Yen Chau 63,902 16 42 58 0.91Hoa BinProvince 810,130 188 479 667 0.82 Tx. Hoa Binh 83,607 38 H. Cao Phong 41,014 28 H. Da Bac 51,800 50 H. Kim Boi 142,370 82 H. Ky Son 35,307 23 H. Lac Son 132,384 64 H. Lac Thuy 50,140 28 H. Luong Son 82,014 47 H. Mai Chau 49,670 40 H. Tan Lac 78,791 51 H. Yen Thuy 63,033 28
Source:Interview survey in each province(2005 Data)
(2) Field Observation:
A total of 15 communes in 11 districts, 4 provinces were visited for observation and interviews in the two
time periods; from February to March 2007 and from May to June 2007 (Table 5.6.3).
In Muong Phang commune in Dien Bien Phu city primary and lower secondary schools are located in the
commune center as in any other communes. While some communes have separate facilities/buildings for
its primary and lower secondary schools, Na Son commune in Dien Bien Dong, Dien Bien province has
one facility for both schools: Classrooms are used in the morning to teach primary school children, and in
the afternoon they are used to teach lower secondary children.
As these schools are for the whole communes, school access rate of each commune is estimated to be 100%
and, theoretically speaking, school enrollment rate can also be 100% as long as they do not have children
with physical disabilities. Despite that, in reality communes are made up of villages, some of which may
be more than 10km away from the commune centers, and many roads from villages and commune centers

5 - 46
suffer from bad conditions especially in the rainy season. The rate of children actually going to the school
is likely to be different from the enrolment rate of that school.
Many villages have educational facilities called sub-schools which were built locally and provide
nursery/kindergarten education or the first 2 or 3 grades (years) of primary education. Those sub-schools
visited in Muong Phang Commune in Dien Bien Phu, Chieng Xom commune and Chieng Mai commune in
Mai Son district, Son La province looked shabby with mud floor and mud walls. Despite such shabbiness,
they are equipped with blackboards, desks, chairs, etc. and seem to have enough number of teachers
provided by the government. In Chieng Coi commune in Son La town which is a small village with small
number of children, a teacher taught two groups of children (= two grades) sitting back to back in a
classroom by moving back and forth between the ends of classroom. According to Department of
Education and Trainings in the 4 provinces, a sub-school is to cover a group of small villages as a cluster
school.
Table 5.6.3 Districts and Communes Visited
Province District Commune/Ward Other Dien Bien Nua Ngam Commune Special assistance by DARD and P.135 Dien Bien Dong Na Son Commune Near district town, Semi-boarding schoolDien Bien Dien Bien Phu Town
Muong Thanh Ward, Muong Phang Commune
No longer under P.135., Lower secondary school
Lai Chau Town Quyet Thang Ward Nhang ethnic group, urban poor Muong So Commune Textile company, near Chinese borader
Phong Tho La Nhi Thang Commune Upland community with Dao, Hmong, etc.
Nung Nang Commune All Hmong, in the mountains behind the Hotel and provincial gov’t buildings
Lai Chau
Tam Duong Binh Lu Commune Ba Be Village (Lu), textiles
Son La Town Chieng Coi Commune Na Co Village, Thai Chieng Mai Commune Polyclinic, Thai Son La Mai Son Chieng Xom Commune Very low poverty rate
Yen Thuy Huu Loi Commune Lowland Muong commune Cao Son Commune Dao Da Bac Tua Ly Commune Lowland Dao village Hoa Binh
Tan Lac district Dong Lai Commune Muon Village (Muong) : 2nd farthest from the commune center
A sub-school constructed by P135 was visited in Cong Binh village in Nua Ngam commune, Dien Bien
district; it had bamboo walls and a thatched roof, and a teacher slept in a room next to a classroom in the
school building. This teacher fetched water from the near-by river just like other villagers did and cooked
her meals at school. Sub-schools in Vietnam play a key role in education in remote areas, showing strong
dedication and commitment to education by the government.
Sub-school was not mentioned in interview survey on education unless it was brought out as a special
discussion topic. Similarly, the number of sub-schools could not be found in national census and
provincial census data books. Such books deal only with schools that cover communes. Sub-schools
may well be considered as branch schools of commune-wide schools.
As for the development needs of education, the following three were often mentioned by district and
commune officers and teachers;

5 - 47
1) Construction of permanent buildings; Making temporary and semi-permanent buildings into
permanent buildings: (In communes with no secondary school, construction of secondary schools
with permanent buildings)
2) Improvement of teaching equipment and materials
3) Capacity building of teachers and administrators
The first topic is about primary and secondary schools in commune centers. A not-so-old concrete school
building was explained as a non-permanent building as it had a corrugated metal roof. Teaching
equipment and materials included photocopiers, projectors, computers, globes, etc. Development needs
for sub-schools were not mentioned. Development of sub-schools seems to come after the improvement
of buildings and equipments for primary and secondary schools that cover a commune,
Many officers of provincial education said that it was extremely difficult to equip primary and secondary
schools in every village in places like the Region where the population density was very low. According
to their plan, small children are to go on foot from their homes to sub-schools for 2 or 3 years. After that
they are to go to village-cluster school or commune primary school for the 4th and 5th grades, and further
on to the commune secondary schools. The officers said that they would like to have more village-cluster
schools built.
Provinces and most districts in the Region have Ethnic Boarding School (EBS) which offer primary and
secondary school education to ethnic minority children from remote areas. An EBS has about 250
students/residents and 2-story buildings that look similar to primary and secondary schools in communes.
Living environment in some boarding schools was not very good with insufficient number of toilets, a
dining room that is too small to hold all the students, difficulty in securing domestic water, a double-bunk
bed holding 4 students, no space for relaxation, etc. As a countermeasure against such difficulties, some
districts have plans to build or relocate EBS, which shows governmental efforts to improve the EBS.
School and accommodation fees for EBS are free, and each student receives 300,000 VND from the
government when he/she enters the school. Every month, he/she receives 360,000 VND, out of which
he/she pays for food and buys personal items such as beddings and clothing, etc. To enter EBS, one has to
have a good educational record, be from an ethnic group other than the Kinh, have no experience of
studying at EBS, have no other family members in EBS. Those who were not accepted by EBS go to
semi-boarding schools (school with dormitories). A student at a semi-boarding school receives
considerably less support from the government. Although the actual amount varies from school to school,
each semi-boarding school student receives about 30,000 VND per month; one tenth of what an EBS
student receives. Most expenses for the semi-boarding school students are thus covered by their families.
According to interviews, some semi-boarding schools were built through NGO assistance, while some
others, especially the dormitories, were built by local residents just like sub-schools.
The following comments on ethnic minority students were given by EBS teachers: that gender balance of
Thai and Lue students is more equal than that of any other ethnic groups, that hilltribe students from remote

5 - 48
villages (e.g. in Lai Chau, from communes/villages near China) tend to drop out of school due to
homesickness, that the drop out rate of the Hmong is high due to marriage in early age, that Nhang and Dao
students are dedicated to education and get high academic records. Ethnic minorities, thus, have different
attitudes and behavior toward education based on their unique socio-cultural backgrounds.
In thinking about development of the educational sector, living environment of teachers, who leave their
families at home to live and work in their schools, needs to be taken into account together with educational
environment of primary school, secondary school, sub-school, EBS and semi-boarding school. In an EBS
in a district next to China in Lai Chau province was a young female teacher with a baby. The rest of her
family was in Hoa Binh province where she went back only a few times a year. While the central and
local governments play a major role in education in Vietnam, it is also supported by teachers like her.
5.6.2 Medical Facilities
(1) Medical Services in Vietnam and in the North-West
Condition of Vietnam’s health and medical services is good, comparing its health indicators with those of
countries of similar level of economic development. According to the World Health Organization,
average life expectancies of Vietnam ranks 116th among 191 countries, almost reaching the level of
developed nations’. Both infant mortality rate and under-five mortality rate of Vietnam have been
constantly declining.
Until twenty years ago, the central government had a strong grip on health care. Proportion of medical
payments borne by patients has been recently on the rise with rapid growth of the private sectors in the
medical field and decentralization of public finances. As a part of the new public policy, public
assistances on medical expenses and medical insurance to the poor households have started. Financing of
these assistance come through two channels; one based on the size of population and the other by a national
health care program, but the two are not well coordinated.
Wealthy households hold higher share of public spending on health care than poor households. This is
probably because public hospitals are located in cities, towns and provincial capitals where the wealthy
have easy access. Despite high administrative costs of hospitals in remote areas where poor people live,
one third of public spending on health care is spent on people at the top layer of per capita income, who are
only 25% of all the people in Vietnam and are likely to be in urban areas. In Vietnam a total of 96,604
medical staff are working in 116,359 villages, and only 1.4% of the communes lack a medical station.
(2) Medical Facilities in the 4 Provinces
Table 5.6.4 shows the number of medical facilities in the Region. Except for Dien Bien province, the
number of health establishments increased from year 2000 to 2005. The number of beds and medical staff
increased in all the provinces.

5 - 49
Table 5.6.4 Medical Facilities in Four Provinces
2000 2001 2002 2003 2004 2005Lai Chau Province 1. Number of Health Establishments Hospital 5 7 8 Clinics 10 10 11 Sanatorium 0 0 0 Health Unit in Commune/Township 86 86 90 Total 101 103 1092. Number of Beds 670 791 8183. Number of Medical Staff excluding Pharmacy Staff Doctor 72 76 91 Others 559 844 992 Total 631 920 1,083Dien Bien Province 1. Number of Health Establishments Hospital 7 7 7 8 8 Clinics 16 17 18 18 20 Sanatorium 1 1 1 1 1 Health Unit in Commune/Township 87 91 87 82 88 Others 3 4 5 61 63 Total 114 120 118 170 1802. Number of Beds 963 1,019 1,016 1,126 1,1743. Number of Medical Staff excluding Pharmacy Staff Doctor 195 206 206 199 258 Others 1,109 1,006 897 904 968 Total 1,304 1,212 1,103 1,103 1,226Son La Province 1. Number of Health Establishments Hospital 12 12 12 12 15 14 Clinics 13 13 12 12 15 15 Sanatorium 1 1 1 1 1 1 Health Unit in Commune/Township 201 201 201 201 201 201 Others 8 8 9 9 9 12 Total 235 235 235 235 241 2432. Number of Beds 2,585 2,575 2,555 2,560 2,815 2,9053. Number of Medical Staff excluding Pharmacyy Staff Doctor 268 305 350 425 364 385 Others 1,747 1,840 1,803 1,781 1,843 1,888 Total 2,015 2,145 2,153 2,206 2,207 2,273Hoa Binh Province 1. Number of Health Establishments Hospital 12 12 13 13 13 13 Clinics 26 27 27 28 28 28 Sanatorium 0 0 0 0 0 0 Health Unit in Commune/Township 214 214 214 214 214 214 Total 252 253 254 256 256 2562. Number of Beds 1,931 1,958 1,893 1,845 1,836 1,9643. Number of Medical Staff excluding Pharmacy Staff Doctor 305 306 325 333 354 351 Others 1,851 1,690 1,569 1,578 1,651 610 Total 2,156 1,996 1,894 1,911 2,005 1,961
Note: Others include [cac tam trung tam chuyen khoa tinh ]and [phong kham tu nhan]. Source:Interview survey in each province(2005 Data)
Medical establishments in districts are presented in Table 5.6.5.

5 - 50
Table 5.6.5 Medical Establishments in Districts
Name of District Population Number of Medical Establishments
Number of Establishments per
1,000 persons Lai Chau Province TX. Lai Chau 19,307 H. Muong Te 47,494 H. Phong Tho 50,785 H. Sin Ho 73,903 H. Tam Duong 43,451 H. Tam Uyen 92,269 Total 327,209 109 0.33
Dien Bien Province TP. Dien Bien Phu 46,954 42 0.89 TX. Muong Lay 14,009 6 0.43 H. Dien Bien 104,267 32 0.31 H.Dien Bien Dong 51,157 17 0.33 H. Muong Cha 46,322 19 0.41 H. Muong Nhe 36,834 9 0.24 H. Tua Chua 43,707 19 0.43 H. Tua Chua Giao 107,431 36 0.34 Total 450,684 180 0.4
Son La Province TX. Son La 76,266 25 0.32 H. Bac Yen 51,220 16 0.31 H. Mai Son 126,064 28 0.22 H. Moc Chau 143,513 30 0.21 H. Muong La 83,861 17 0.2 H. Phu Yen 103,131 31 0.3 H. Quynh Nhai 66,818 16 0.24 H. Song Ma 111,658 24 0.21 H. Sop Cop 36,308 8 0.22 H. Thuan Chau 136,825 31 0.23 H. Yen Chau 63,902 17 0.27 Total 999,565 243 0.24
Hoa Binh Province Tx. Hoa Binh 83,607 H. Cao Phong 41,014 H. Da bac 51,800 H. Kim Boi 142,370 H. Ky Son 35,307 H. Lac Son 132,384 H. Lac Thuy 50,140 H. Luong Son 82,014 H. Mai Chau 49,670 H. Tan Lac 78,791 H. Yen Thuy 63,033 Total 810,130 256 0.31
Source:Interview survey in each province(2005 Data)
5.6.3 Communication
(1) Communication in Vietnam
Communication network in Vietnam has been developing rapidly. The number of telephone subscribers
grew nearly 3-fold from 1.16 million in 1996 to 3.28 million in 2000 with average annual increase of
37.3%. During the same time period, telephone subscribers in rural communes grew from 183,000 to
474,000 with annual increase of 27%. Telephone coverage rate of communes grew from 31.5% to 84.4%
also. Post offices (POs) and Village Post and Cultural Points (VPCPs) are important information centers
in rural areas of Vietnam. Their numbers grew from 2,825 in 1996 to 7,895 in 2000.

5 - 51
Vietnamese government’s promotion of post and telecommunication has been bearing fruit, and people in
rural areas have easier access to post and telecommunication services. Despite increasing public spending
on post and telecommunication in rural areas, volume of usage and the rate of users are generally low.
As can be seen from Table 5.6.6, the numbers of communes with POs and VPCPs vary widely among
different regions with poor regions having smaller number of POs and VPCPs. In Northern Upland where
the Region is located and in Central Highlands, 53% and 51.2% of the communes have neither post offices
nor VPCPs. Hence, postal and telecommunication infrastructures in the poor communes are still
underdeveloped.
Table 5.6.6 Post Offices and Village Post and Cultural Points in Vietnam (April 2000))
Number of Communes Region
Number of Communes
VPCPS Post Office (PO)
Number of Communes with no
PO and VPCPS
Rate of Communes on the left
Average Population of commune on the left
Northern Upland 2,637 850 392 1,398 53.0 8,906.4Red River Delta 1,680 849 421 395 23.7 9,199.2Central Coasts 2,456 1,016 465 837 36.1 9,157.6Central Highlands 498 134 56 199 51.2 12,441.8Southeast 458 223 289 185 26.5 12,416.4Mekong Delta 1,201 457 467 2883 23.8 14,479.9Total 8,930 3,529 2,090 3,302 37.0 10,394.7Source: Enhancing Access to Basic Infrastructure (June 2002)
VPCPs provide people in remote areas not only postal services but also means of communication with the
outside world, and serve as information center of the commune. Vietnam Posts and Telecommunications
Group (VNTP) started savings services in 2000, giving access to reliable savings to poor people in rural
areas. Increasing the numbers of post offices and cultural points is, thus, an effective way to provide the
poor with easy access to communication.
(2) Communication in Study Area
Number of telephone subscribers grew fourfold in the period between 2000 and 2005. The number of
telephone per 1,000 people in provincial capitals is 4 to 9 times the number of those in rural districts,
showing a large rural-urban gap as in education and health care (Table5.6.7, Table 5.6.8).
Table 5.6.7 Number of Telephone Subscribers in Four Provinces
Province 2000 2001 2002 2003 2004 2005 Lai Chau Dien Bien 6,249 8,549 12,389 18,655 25,917 23,195 Son La 9,831 12,536 16,388 22,797 30,200 47,633 Hoa Binh 10,242 12,631 17,762 24,279 31,172 33,299 Total 26,322 33,716 46,539 65,731 87,289 114,262 Note: Data in the year 2000 to 2004 is based on Statistical Year Book of Vietnam. Data in the year 2005 is based on Statistical Year Book of Each Province.

5 - 52
Table 5.6.8 Number of Telephone Subscriber in Districts (31/Dec/ 2005)
Name of District Population Number of Telephones
Number of Telephones per 1,000 population
Lai Chau Province TX. Lai Chau 19,307 5,403 280 H. Muong Te 47,494 832 18 H. Phong Tho 50,785 851 17 H. Sin Ho 73,903 868 9 H. Tam Duong 43,451 753 17 H. Tam Uyen 92,269 1628 18 Total 327,209 10,135 31 Dien Bien Province TP. Dien Bien Phu 46,954 12,548 268 TX. Muong Lay 14,009 1,339 96 H. Dien Bien 104,267 4,874 47 H.Dien Bien Dong 51,157 512 10 H. Muong Cha 46,322 703 15 H. Muong Nhe 36,834 11 0.3 H. Tua Chua 43,707 791 18 H. Tua Chua Giao 107,431 2,417 23 Total 450,684 23,195 51 Son La Province TX. Son La 76,266 20,762 272 H. Bac Yen 51,220 914 18 H. Mai Son 126,064 5,420 43 H. Moc Chau 143,513 7,689 54 H. Muong La 83,861 2,571 31 H. Phu Yen 103,131 2,457 24 H. Quynh Nhai 66,818 620 9 H. Song Ma 111,658 2,365 21 H. Sop Cop 36,308 452 12 H. Thuan Chau 136,825 2,700 20 H. Yen Chau 63,902 1,683 26 Total 999,565 47,633 48 Hoa Binh Province Tx. Hoa Binh 83,607 15,049 180 H. Cao Phong 41,014 750 18 H. Da bac 51,800 1,200 23 H. Kim Boi 142,370 2,963 21 H. Ky Son 35,307 1,750 50 H. Lac Son 132,384 1,920 15 H. Lac Thuy 50,140 1,835 37 H. Luong Son 82,014 3,000 37 H. Mai Chau 49,670 1,480 29 H. Tan Lac 78,791 1,700 22 H. Yen Thuy 63,033 1,672 27 Total 810,130 33,299 41
Source: Statistical Year Book of Each Province
5.7 Disaster Prevention
5.7.1 Natural Disaster in the Study Area
The Region is located in the watershed of Da river (tributary of Hong river), Ma river, Nua river (tributary
of Mekong), Bua river (tributary of Hong river) and Boi river and has steep mountains. A small estuary
alluvial plain is in Hoa Binh Province. Other plains are in valleys, small-scale alluvial fans, river terraces
and high plains. The Dien Bien Basin, which is the largest plain in the Region, is about 10,000 ha.
The areas of land which can be used for commerce, industry, residence and farming are less than 20% of
the total area in Hoa Binh Province, and less than 10% in the other 3 provinces. The remaining are steep
slopes which are difficult to make into land with high added values.
As for disasters, the Region has no plains which are easily and widely inundated for a long time. Sizes of
the major watersheds are calculated based on 1:50,000 topographic maps and summarized by province in

5 - 53
Table 5.7.1
Table 5.7.1 Watershed of Major Rivers in Four Provinces
Name of river Catchment Area (km2) Dien Bien province Da river 5,904 Ma river 2,049 Nua river (Tributary of MeCong) 1,601 Total 9,554 Lai Cha province Da river 9,065 Son La province Da river 8,913 Ma river 4,894 Mua river (Tributary of Hong river) 194 Total 14,001 Hoa Binh province Da river 1,606 Buoi river (Tributary of Ma river) 1,509 Boi river 1,040 Tributaries of Hong river 508 Total 4,663
Many small and medium river streams in the Region have riverbed slope of over 10% where flash floods
and mudflows occur frequently.
The population density of Hoa Binh Province is 177 persons/km2, and those of the other three provinces are
between 36 to 72 persons/km2. These figures are very low, compared with the 257 persons/km2 of the
national average. Eighty (80) to 90% of the population in the Region lives in agricultural villages. A
few small-scale disaster preventing facilities exist.
Each province has FASC (Flood and Storm Control Steering Board) and action plans on disaster prevention
for each department, district and commune. Disaster records compiled by FASC compiled are shown in
Table 5.7.2 to 5.7.5.
In consideration of prevention measures against disasters as shown in the tables, special attention should be
paid to the followings:
1) Slope collapse on the sides of roads:
Most slope collapse is due to road construction methods. As slope protection work is not carried
out, slope collapse may occur easily with the ordinary rain. To prevent slope collapse, road
construction methods and O&M need to be examined carefully for improvement.
2) Weirs and canals that are considered to be temporary structures:
Irrigation weirs and canals, which are constructed with an assumption of collapse in every rainy
season because of fund shortage, etc., are mentioned. Such weirs and canals should be handled not
as disaster item, but as O&M issues.
3) Wind damage to roofs:
For the wind damage to roofs of ordinary houses, an issue arises as to what extent public fund should
be used.
Based on the above considerations, half of the amount of damage listed in the tables is likely to be reduced

5 - 54
by infrastructure improvement (Table5.7.2 to Table 5.7.5).
Table 5.7.2 Damage Caused by Natural Disaster in Lai Chau Province (2001-2005)
Item Damage Human Dead 19 Injured 16 House Totally Collapsed 65 Partially Collapsed 803 Agriculture Paddy 277 ha Cereal、Fruit 9331 ha Aquaculture 20.5 ha Irrigation Facility Canal 5.6 km Water supply 5 location Transportation Sliding 221,000 m3 Slope protection 821 m3 Bridge, drainage 419 nos. Suspension bridge 47nos. Amount of Damage (2 years) 47 billion Dong Average (2005-2006) 23.5 billion Dong
Table 5.7.3 Damage Caused by Natural Disaster in Dien Bien Province (2001-2005)
Item Damage Human Dead 2 Injured 19 House Collapsed 188 Roof 25030 Agriculture Paddy (Total) 1,020 ha paddy (Partial) 1,246 ha Cereal、Fruit 738.5 ha Aquaculture 64.45 ha Livestock 45 heads Irrigation Facility Headworks (Low Quality) 491 nos. Water supply 85 locations Transportation Sliding 772,000 m3 Slope protection 821 m3 Bridge, Drainage 419 locations Amount of Damage (5 years) 155 billion Dong Average (2001-2005) 31 billion Dong
Table 5.7.4 Damage Caused by Natural Disaster in Son La Province (2001-2005)
Item Damage Human Dead 62 Injured 119 House Collapsed 523 Flooded 9,708 Evacuated 169 Agriculture Corn 21,199 ha Coffee 272 ha Tea 26 ha Sugarcane 105 ha Fruit 1,362 ha Irrigation Facility Headworks 9nos. Gabion 234 nos. Dry masonry 1,593 nos. Intake 21nos. Canal 209 km Transportation Sliding 1,018,000 m3 Silting 281,000 m3 Surface erosion 127 m2
Drainage culvert 535 nos. Suspension bridge 47nos. Amount of Damage (5 years) 106.9 billion Dong Average (2001-2005) 21.4 billion Dong

5 - 55
Table 5.7.5 Damage Caused by Natural Disaster in Hoa Binh Province (2001-2005)
Item Damage
Human Dead 7 Injured 17 Building House 2,228 Office 13 School 100 class rooms Agriculture Paddy 9,000 ha (500ha totally damaged) Cereal 3877 Tree 733 Irrigation Facility 90 locations Transportation Sliding 40,000 m3 Others Fisher boat 16 Post for electricity 8 nos. Telephone posts 100 nos. Amount of Damage (5 years) 85 billion Dong Average (2001-2005) 17 billion Dong
5.7.2 Disaster Prevention Measures
Each FASC of the 4 provinces formulates annual and long-term policies on disaster control. Works on
disaster control are mostly on fixing of damages reported by villages and communes.
Damages of disasters are generally divided into 5 groups as follows. As the self-sufficiency rate of daily
necessities is high in the Region, 1) and 3) apply to the disasters in the Region. 2), 4) and 5), on the other
hand, do not apply as they occur most often in urban areas.
1) Existence of victims
2) Danger to life/existence due to shortage of food and daily necessaries
3) Damage to goods/assets
4) Damage and losses of public assets
5) Suspension of public services necessary for human existence
Main features of natural disasters in the Region are as follows:
1) Disaster area is limited
2) Duration of inundation is comparatively short
3) Many slopes on the sides of roads collapse
4) Mud and oil flashings cause damages. However, areas affected by the damages are not
big/wide due the topography of the Region and site conditions of villages/communes.
Characteristics of the local communities in the Region are as follows:
1) Public and personal assets as well as infrastructures are not formed/established
2) Rate of improvement of infrastructure such as roads and bridges is very low
Based on the above characteristics, disaster prevention measures should combine the measures to 1) deter
damages and 2) reduce damages, and A) measures on hardware and B) measures on software. Measure
appropriate for the Region should be considered by examining regional characteristics, costs, rational
management, etc.

5 - 56
As mentioned earlier, improvement of infrastructure is much likely to prevent disasters.
One of the important issues on disaster prevention is physical isolation of villages. When a village is
isolated, appropriate measures cannot be carried out in times of emergency. For this reason, securement
of road access is an essential element of disaster prevention. As the road network in the Region is not
well developed, some villages become isolated during the rainy season. If items of public investment are
not prioritized, an incident may happen in which people injured by increase of river water cannot be
transported even if flash flood was prevented. In the Region, improvement of road network is essential in
terms of not only area development and economic development, but also disaster prevention.
As mentioned earlier, cost-effectiveness of investment in facilities to prevent disasters in a wide area is
often low in the Region where social assets are not well established. In order to maintain balance with
infrastructure, large-scale disaster prevention works are not needed. In terms of hardware, damage
reduction measures that are small-scale and focused on specific areas are required.
For example, a small reservoir has a function to prevent mud/soil flow that is harmful to paddies in the
downstream. By introducing low cost methods that can be carried out by tools used in everyday life,
people’s awareness of disaster prevention is improved.
According to the local residents, disaster by mud and rock flow occurred 20 years ago. The sum of
damage cost and rehabilitation costs was about US$10,000. If erosion control work had been carried out
then, it would have cost US$500,000. This mud and rock flow was not due to extremely heavy rainfall
that occurs every 20 to30 years. Instead, it was caused by a strong rain when accumulated mud and sand
were easy to flow. In this respect, forecast of flush flood and mud and rock flow is extremely difficult.
Dam against mud and rock flow is an effective measure, but large investment in hardware cannot be
expected due to low cost-effectiveness in the Region. Disaster protection and reduction can be carried out
by improvement of software.
According the questionnaire survey, irrigation offices in many districts organized a group which regularly
observes river conditions. This system of observance at the district level should be strengthened and
extended to the commune level. By combining the findings from the observance and action plans, disaster
prevention and reduction become more effective. For example, when accumulation of sand and mud is
observed in the upper stream, disaster can be forecasted. Furthermore, removal of accumulated sand mud
is likely to bring the minimal damage.
As small-scale alluvial fans are formed by a series of mud and rock flow and flush flood, disaster is much
likely to occur unless prevention facilities are constructed.
Damage by disaster can be reduced by teaching the local residents about the mechanisms of disaster
outbreak.
The following disaster prevention measures should be taken in the Region:

5 - 57
1) Improvement of roads and bridges
2) Strengthening organizations for disaster prevention in districts and communes
3) Publicity to local residents
4) Introduction of construction method for disaster prevention/mitigation, using tools used in everyday
life and materials found/obtained in the area
5.8 Resettlement Program under Son La Hydropower Project
5.8.1 Introduction
Government of Vietnam is putting great effort into energy development to attain the annual economic
growth rate of 7-8%. While the need for energy is expected to increase rapidly, hydropower generation,
for which Vietnam’s rich water resources are utilized, is to play the central role in energy development.
The annual electric power consumption in 2020 is expected to reach 250 billion kWh/ year, and this rate is
about 4 times that of 2005.
The potential of hydropower generation in Vietnam is estimated to be 300 billion kWh/year, and the
economically feasible hydropower generation is estimated to be 72billion kWh/year in 360 locations. With
great expectation for the development of hydropower power generation, the Government of Vietnam plans
to boost the hydropower power generation to 60billions kWh/ year (25billion kWh/ year in 2007,) by 2020.
In line with such policy, the Son La hydropower project with designed electric generating capacity of
2.4Mw and annual supply of 10 billion kWh is currently under way as one of the largest state project with a
budget of 37 trillion VND. This project will be completed in 2012.
To assure stable economic growth, energy policy on electric power is essential. In hydropower
development, relocation of inhabitants may make social impacts. In relocation/resettlement, those who
come (resettlers) and those who receive (hosts) are both affected materially and psychologically.
Resettlement may result in mixing people of different cultures and different habits, which may cause
friction if not managed properly.
Sites whose inhabitants are to relocate because of the Son La hydropower project are along the Da River.
Poverty rates of those sites are as high as 70 %. The project must be managed properly so that the
relocation will not increase the poverty level. In addition to short-term compensation for relocation,
poverty reduction should be pursued with a long-term perspective.
5.8.2 Basic Approach of Government of Vietnam to Resettlement for the Son La Dam
The Government of Vietnam proclaimed a basic law to resettlement operation, “Prime Minister’s Decision
459/QD-TTg" in 2004. Later in January 2007, “Prime Minister’s Decision No. 02/2007/QD-TTg" was
proclaimed as a revised version.
According to a presentation document of the ADB Project TA 4690 published in October 2007, 10.2 trillion
VND, which is equal to 28% of the total project cost (37 trillion VND), is allocated for resettlement

5 - 58
operation. Out of this 10.2 trillion VND, 540 million VND is spent on each household as compensation
for relocation.
MARD made a draft review report in December 2006 on the integrated resettlement plan (Decision 196,
February 2004). As of September 2007, it is still awaiting for the official approval by the Government.
According to the draft report, the number of the households by province which are to resettle is as shown in
Table 5.8.1.
Table 5.8.1 Number of Relocating Households (Draft Review, Dec. 2006)
Province Total (till 2010)
Completed by Dec. 2006
2007 2008 2009 2010
Total Household 19,729 3,139 6,855 5,181 3,286 1,268
% (Each Year) 100 16 35 26 17 6
% (Cumulative) 100 16 51 77 94 100
1. Điện Biên 3,900 85 1,020 1,330 1,175 290
2. Lai Châu 3,350 468 1,335 827 611 109
3. Sơn La 12,479 2,586 4,500 3,024 1,500 869
Source: NIAPP
Son La Province accounts for 63.3% (12,479 households) of all the households concerned. As for the
schedule, 50.7%, 76.9%, and 93.6% of all the households will be relocated by 2007, 2008, and 2009,
respectively. Relocation is to be completed in 2010.
As for the destination sites, 26.0% of the households will resettle in urban areas, and 74.0% of the
households in rural areas (Table 5.8.2). The urban-rural ratio is different among the provinces. In Dien
Bien Province, 83.4% of the households will resettle in urban areas, while 80.2% and 88.8% in rural areas
in Lai Chau and Son La Provinces, respectively.
Table 5.8.2 Number of Households Resettling in Urban Area/ Rural Area
(Draft Review, Dec. 2006)
Province Urban % Rural % Total %Total 5,132 26.0% 14,597 74.0% 19,729 100.0%
1 Dien Bien 3,000 84.3% 560 15.7% 3,560 100.0%2 Lai Chau 732 19.8% 2,958 80.2% 3,690 100.0%3 Son La 1,400 11.2% 11,079 88.8% 12,479 100.0%
Source: NIAPP
The resettlement master plan is formulated by MARD which is the head of Steering Committee for
resettlement. Practical management of the resettlement work is commissioned to 3 provinces and 14
districts. District governments have carried out small projects on small budgets, but they do not have
enough management experience with a big project like the Son La hydropower project. Their
management capacity for large projects has not been fully developed. How much resettlement operation
can be carried out as proclaimed by the central government, and how the needed capacity development is
carried out are the two main essential matters.

5 - 59
5.8.3 Progress of Resettlement
According to the resettlement schedule, 91,000 people of 19,000 households will be relocated to 260
resettlement sites in 3 provinces by 2009. As of may 2007, 5,100 households in Son La Province, 1,400
households in Lai Chau Province, and 200 households in Dien Bien Province (total: 6,700 households)
were relocated to the resettlement areas.
Not only dam/hydropower works, but also public works which involves relocation of people have wider
social impacts. In order to analyze social impact of resettlement of the Son La hydropower project, it
needs to be examined whether such impacts are attributed specifically to a) relocation projects, b)
conditions of the resettlement/destination areas, or c) conditions that can be found throughout Vietnam.
Without such examination, the real nature of the impacts cannot be understood. In addition to the present
impacts that can be easily observed, impacts which may come out in the future also need to be studied and
analyzed.
(1) Earthworks in resettlement sites
Land development of the resettlement sites is mainly earthwork. Appropriate land development requires
earthwork based on the quality standard. For this, the followings are recommended:
1) In this region, slopes are generally not protected. Many slopes are eroded, so that slope protection
(protection of cut earth and earth fill) should be carried out to prevent disasters and secure the
minimum safety.
2) Waste soil of the earth work is dumped in the valleys. This might lead to the secondary disasters
caused by rivers such as slope sliding, silting, mud flow and flash flood. Waste soil should be
moved to a safe area where no secondary disasters are likely to occur. Protection wall should be
built if necessary.
3) Houses built on embankment with insufficient compaction may collapse due to unequal settling. To
prevent from such collapse, compaction of embankment should be carried out based on the design
standard.
(2) Water Supply
One of the big issues in resettlement sites is water shortage. This water issue is caused by wrong
estimation of available water due perhaps to a mistake in calculation.
(3) Work Schedule Control
In some resettlement sites, people move into the sites before the completion of physical construction, i.e. in
this case, school construction is incomplete and water supply system is not fully operating. Monitoring
system is needed to harmonize the resettlement project management and construction schedule
control/management.

5 - 60
5.8.4 Human Resource Development Project by ADB
(1) Project purpose
ADB is carrying out Strengthening Institutional Capacity of Local Stakeholder for Implementation of Son
La Livelihood and Resettlement Plan. This is a poverty reduction project targeting those who are
concerned with the resettlers and the hosts.
As many as 91,000 and 5,000 people are going to be displaced in Son La and Huoi Quang hydropower
projects respectively. For effective planning and implementation of such large-scale resettlement works,
this ADB project aims to develop institutional and technical capacity of national/ministerial, provincial,
district and commune officers.
As for the fund contribution, ADB provides $ 1,000,000 from the Poverty Reduction Fund, and the
Government of Vietnam provides $ 250,000.
(2) The outline of the project
Resettlement is scheduled to complete by 2009. Pilot resettlement sites were established in three province
and 3,375 people were resettled there in 2004. Some resettlement issues surfaced including 1)
inappropriate system to estimate the compensation values, 2) inadequate information disclosure on
livelihood assistance, 3) friction between resettlers and hosts, and 4) defective system to process and
respond to claims.
With understanding of the above resettlement situation, the project hires experts on 1)resettlement planning,
2)land use, 3)upland farming and 4) fishery and natural resource management and conducts a series of
training of national/ministerial, provincial, district and commune officers. The training is to strengthen
the local government support on livelihood through improvement of a) local government services, b) their
technical capacity, c) on-going resettlement activities and construction, and d) agriculture.

6 - 1
Chapter 6
Legal Framework on Environmental and Social Considerations
6.1 Introduction
The Master Plan which will be formulated by this Study does not target for the large magnitude of
development by using the land resources and water resources as mush as possible. Therefore, there seem
to be a small scale of burden on the natural environment. However, there can be some amount of negative
impacts on the ethnic minorities by implementing the Master Plan, because of the large portion of ethnic
minorities in the Region. There are also the region with many kinds of rare fauna and flora. Therefore,
the detailed environmental impact assessments should be conducted only for the prioritized projects, which
would be implemented promptly, simultaneously formulating the feasibility study reports for those projects,
according to the Vietnamese regulations related to the environmental and social considerations, and the
negative impacts from those projects should be minimized as much as possible. Accordingly, the
organizations and regulations on the environmental and social considerations, which should be considered
in formulation of the Master Plan, and results of preliminary examination on the environmental and social
considerations at this stage for the Master Plan, are summarized and organized in this Chapter.
6.2 Environmental and Social Consideration
6.2.1 Legislations, Standards and Regulations regarding Environmental and Social Consideration
(1) International treaties and multilateral treaties
1) International treaties
The Government of Vietnam setup the frameworks on the international treaties by establishing the
Ordinance on the Conclusion and Implementation of International Treaties in 1993. According to
this ordinance, the Government of Vietnam ratified many kinds of international treaties. The
international treaties which are ratified by the Government of Vietnam regarding the environmental
and social considerations are listed below.
- Convention Concerning the Protection of World Cultural and Natural Heritage (Oct., 1987)
- Convention on Wetlands of International Importance Especially as Waterfowl Habitat (Ramsar
Convention), (Jan., 1989)
- Protocol of 1978 relating to the International Convention for the Prevention of Pollution from
Ships, 1973 (Aug., 1991)
- Montreal Protocol on Substances that Deplete the Ozone Layer, 1987 (Jan., 1994)
- Vienna convention for the protection of the zone layer, 1985 (Apr., 1994)
- United Nations Framework Convention on Climate Change (UNFCCC or FCCC) (Nov., 1994)
- Convention on Biological Diversity (Biodiversity Convention) (Nov., 1994)

6 - 2
- Convention on International Trade in Endangered Species of Wild Fauna and Flora (Washington
Convention/CITES) (Apr., 1994)
- Basel Convention on the Control of Transboundary Movements of Hazardous Wastes and Their
Disposal (Basel Convention) (Mar., 1995)
- International declaration on cleaner production (Sep., 1999)
- Kyoto Protocol to the United Nations Framework Convention on Climate Change (Sep., 2002)
- Cartagena Protocol on Biosafety to the Convention on Biological Diversity (Jan., 2004)
2) Multilateral treaties
GMS (Greater Mekong Sub-region) is the organization for discussion and coordination on the
environmental and social impacts around the Mekong river watershed. Member countries include
Vietnam, Cambodia, Laos, Myanmar and China.
Vietnam has signed for and joined in the ASEAN Declaration on Heritage Parks on December 2003,
which targets conservation and management of the ASEAN Heritage Parks in order to assist and
support for development and implementation of the regional action plan for conservation and
management in the ASEAN.
(2) Legislation systems in Vietnam
1) Natural environmental issue
- Environment Protection Law (enforced in 1994. Revised in July 2006)
- Decree on Detailing and Guiding the Implementation of a Number of Articles of the Law on
Environmental Protection (Decree No. 80/2006/ND-CP, August, 2006)
This law and decree stipulate the object projects, strategies and plans that are subject to
preparation of EIA reports and SEA reports, and relevant organizations and authorities which
have responsibilities for reviews and approvals, and so on. Under the new Law on
Environmental Protection, there are no need to conduct Preliminary Evaluation of
Environmental Effect and/or Initial Environmental Examination (IEE), which were obliged to
conduct by the former law on environmental protection.
- Circular on Guiding the implementation of the contents of strategic environmental assessment,
environmental impact assessment and environmental protection commitment (Circular No.
08/2006/TT-BTNMT, September, 2006)
- Decree No. 21/2008/ND-CP dated February 28 amending and supplementing a number of the
Government Decree No. 80/2006/ND-CP dated August 9, 2006, detailing and guiding the
implementation of a number of articles of the Law on Environmental Protection.
The list of projects subject to making of environmental impact assessment reports included in
Appendix I of Decree 80/2006/ND-CP was replaced.

6 - 3
- Vietnam Environmental Standards (TCVN: Tiu Chuen Vietnam)
Vietnam Environmental Standards are those standards for environment related issues and
emission in the industries. The Vietnam Environmental Standards have been established one by
one, according to setting up of the former Law on Environmental Protection 1993 and Decree
No. 175/1994/CP1, and publicizing by the Decision No. 35/2002/QD-BKHCNMT2. However,
as it has passed long time after establishing the standards, many of them are now not
well-adapted to the current environmental conditions. Therefore, many of them are now under
revision. In 2005, standards on air quality and industrial waste water were revised.
- Guideline for Preparation and Appraisal of Environmental Impact Assessment Reports
The specific guidelines for preparation and appraisal of Environmental Impact Assessment
Reports were prepared in 1999 for nearly 15 kinds of sector projects, i.e. the hydropower,
thermal power plants, urban development, industrial zones, and so on, respectively. All the
guidelines are now under revision according to enforcement of the new Law on Environmental
Protection in July, 2006.
- Law on Forest Protection and Development (No. 29/2004/Q11)
- Decree No.23/2006/ND-CP of March 3, 2006, on the Implementation of the Law on Forest
Protection and Development
This law is object for the sustainable development and protection of the forests in Vietnam.
The law also stipulates the three (3) types of forests, including the special-use forests for the
protected areas in Vietnam.
- Decree No. 32/2006/ND-CP of March 30, 2006, on Management of Endangered, Precious and
Rare Forest Plants and Animals
Specific species of flora and fauna, which should be protected in Vietnam, are stipulated by this
decree, according to the listing up of target protection species under the Law on Forest
Development and Protection.
- Decree 109/2003/ND-CP on the conservation and sustainable development of wetlands areas
(Decree No. 109/2003/ND-CP, Sep., 2003)
This decree is the first regulation in Vietnam to set down the protection and development of
wetland ecosystems.
2) Social environmental issue
- Law on Land (No. 13/2003/QH11)
This Law governs the powers and responsibilities of the State as representative of the ownership
of land by the entire people. The Law also stipulates the registration of land inventory, land use
1 The Government’s Decree No. 175/CP guiding the implementation of the Law on Protection of the Environment 2 Decision No. 35/2002/QD-BKHCNMT of June 25, 2002 Publicizing the List of Vietnamese Environmental Standards for Compulsory Application

6 - 4
right, certificate of land use right, and so on.
- Decree No. 197/2004/ND-CP of December 3, 2004 on Compensation, Support and Resettlement
when Land is Recovered by the State (Decree No.197/2004/ND-CP, December, 2004)
This Decree provides for the compensation, support and resettlement when land is recovered by
the State for defense and security purposes, for national interests, public interests and economic
development purposes.
- Ordinance on Protection and Usage of Historical, Cultural Heritage and Scenery for Sustainable
Development (1984)
This ordinance stipulates the authorization, conservation and usage of the historical, cultural
heritage and scenery areas in Vietnam.
6.2.2 Concerned Organizations
(1) Concerned organizations on environmental and social consideration
The section for review and appraisal of EIA was transferred from ex-MOSTE (Ministry of Science,
Technology and Environment) to newly set-up MONRE (Ministry of Natural Resources and Environment)
in 2003. MONRE has now responsibility to approve the EIA reports against the proposed projects which
would be large in quantity and have great impacts on the environment (Decree No.80/2006/ND-CP).
DONRE (Department of Natural Resources and Environment) in each province has responsibility for
approval on the EIA reports for other kinds of projects. MONRE has the sole responsibility for
management and inspection on the activities for the SEA (Circular No. 08/2006/TT-BTNMT).
(2) Responsibility of project owners
Project owners have the responsibility to prepare and submit environmental impact assessment reports for
review and approval by the competent State agencies, together with the feasibility study report. The
project owners3 have all the responsibilities for conducting the compensations on and procedures for the
involuntary resettlement, loss of property, degradation of land, and so on.
6.3 Environmental and Social Consideration on Formulation of the M/P
6.3.1 Evaluation of Environmental Impacts
Three (3) kinds of evaluation methods of environment are laid down by the Law on Environmental
Protection; i.e. i) Strategic Environmental Assessment (SEA), ii) Environmental Impact Assessment (EIA)
and iii) Environment Protection Commitment.
(1) Strategic Environmental Assessment (SEA)
Strategic Environment Assessment (hereinafter referred to as “SEA”) means the analysis and prediction of
potential environmental impacts of strategic projects and development planning and plans prior to approval
3 For example, the Electricity of Vietnam (EVN), shall be the project proponent for the construction of power plants.

6 - 5
in order to ensure the achievement of sustainable development. Strategies, planning and plans which have
responsibility to prepare the Strategic Environmental Assessment Reporting are those strategies and plans
on national socio-economic development, the sectoral development, and so on (Table 6.3.1). The Law on
Environmental Protection stipulates the details of the SEA, such as the objects that are subject to SEA
reporting. In terms of legislative documents relating to SEA in Vietnam, although some documents, such
as Decree No.80/2006/ND-CP, Circular No. 13/2006/TT-BTNMT, and Circular No. 13/2006/TT-BTNMT
mentioned above, have been issued to operate SEA, no legal guidance on financial mechanisms and costs
of SEA, and stakeholder participation for SEA and no technical guidance on SEA have not yet prepared.
Such documents, which have not yet prepared, will be issued and the existing documents will be revised
and modified, according to the trial operations and technical assistances by donors.
Table 6.3.1 Objects that are Subject to Strategic Environment Assessment Reporting 1. National socio-economic development strategies, planning and plans 2. Sectoral development strategies, planning and plans of national scale 3. Socio-economic development strategies, planning and plans of provinces and cities directly under the Central
Government (hereinafter called “Provincial Level”) and regions 4. Land-use planning; forest protection and development; other natural resource exploitation and use at least at
inter-provincial and inter-regional levels 5. Focal economic zone development planning 6. Integrated river basin planning at inter-provincial level
Source: Article 14, Law on Environmental Protection
In terms of assistance on SEA operation in Vietnam, the process of donor coordination and harmonization
has commenced in April, 2006, with the SEA coordination meeting between MONRE and donors/NGOs4.
The main output of the meeting was the “Road Map” for SEA capacity building in Vietnam and it has also
bee proposed that the “Road Map” would be developed into an agreed “Framework for Donor Coordination
and Cooperation on SEA Capacity Building in Vietnam”. The objectives of the SEA coordination
framework are as follows:
i) Finalize legal and technical guidance for SEA in Vietnam. ii) Support SEA capacity building through SEA training and curriculum development and pilot
projects. iii) Support information dissemination and communications networks for SEA.
In case of the SEA operations, the World Bank and the ex-Ministry of Industry (current Ministry of Trade
and Industry) examined the impact assessment methods on the biodiversity for the hydropower generation
as one of the pilot studies5, and the Asian Development Bank conducted the SEA as one of the pilot studies
for the hydropower sector in Vietnam6. According to the framework above, more than 13 pilot projects
for preparing SEA reports are being conducted on hydropower development plan, social-economic
development plan, land use plan, and so on, with supports by the World Bank, ADB, GTZ, Swiss
4 Strategic Environmental Assessment in Vietnam: A Framework for Donor Coordination & Cooperation (Draft version), MONRE, Aug. 2007. The SEA coordination meeting consists in representatives from the World Bank, German Technical Cooperation (GTZ); Swedish International Development Agency (SIDA); Danish International Development Agency (DANIDA); World Wide Fund for Nature (WWF); the International Centre for Environmental Management (ICEM); and the Strengthening Environmental Management for Land Administration in Viet Nam (SEMLA: SIDA supported Project). 5 SEA Pilot Study: Methodology for analysing the biodiversity impacts of Vietnam’s hydropower plan (draft), World Bank, 2006 6 Strategic Environmental Assessment of the Hydropower Master Plan in the Context of the PDP VI (draft), ADB, 2007

6 - 6
Development Cooperation (SDC) and SIDA (via SEMLA). Apart from the donor-supporting projects, the
SEA reports on fishery sector, and so on, have been prepared only by Vietnamese side7.
As the SEA had been conducted as pilot-study base, the SEAs had not been conducted before even for the
projects, such as those listed in Table 6.3.1. According to the officials in the competent department on
EIA of MONRE (Department of EIA and Appraisal) in reply to the inquiry from the JICA Study Team
through the C/P organization, the SEA studies were/are to be conducted after formulating the plans for the
necessities of the SEAs when getting approval by the Government8,9. Moreover, in order to obtain
approval by the Government of Vietnam for this Master Plan, the SEA should also be conducted for this
Master Plan as same as the other Master Plans pursuant to the Law on Environmental Protection.
However, further consideration of implementing the SEA study for this Master Plan should be taken into
account; when, who, and how.
(2) Environmental Impact Assessment (EIA)
Environmental Impact Assessment means the analysis and prediction of potential impacts of specific
investment projects on the environment in order to propose measures to protect the environment when the
implementation of projects takes place. The projects that are subject to Preparation of Environmental
Impact Assessment Reports were categorized in two (2) categories in the former law of environmental
protection, whereas, the new Law on Environmental Protection stipulates seven categories which are
subject to preparation of Environmental Impact Assessment Reports as shown in Table 6.3.2. The 102
kinds of projects subject to making of environmental impact assessment reports were stipulated in the list in
the Decree No.80/2006/ND-CP. Thereafter, the list of 102 number of projects included in the Appendix of
Decree No.80/2006/ND-CP are to be replaced with the list in the Appendix of Decree No. 21/2008/ND-CP
with 162 numbers of the projects. Lists of projects subject to making environmental impact assessment
reports and those with environmental impact assessment reports to be appraised and approved by MONRE
are shown in Attachment 6.1.
Table 6.3.2 Objects that are Subject to Preparation of Environmental Impact Assessment Reports 1. Projects of national importance 2. Projects that use part of land of, or are likely to cause adverse impact to, natural reserves, national parks,
historical-cultural relics, natural heritage and famed beauty spots that are designated 3. Projects that are likely to impose risks of adverse impacts on water resources of river basins, coastal areas
and protected ecosystem areas 4. Projects on infrastructure development in economic areas, industrial parks, hi-tech parks, export- processing
zones and craft village clusters 5. Projects on new urban center and centered residential area development 6. Projects on large-scale groundwater and other natural resources exploitation and use 7. Other projects that may impose potential risks of adversely environmental impacts
Source: Article 18, Law on Environmental Protection
7 SEA for Planning for culturing sea fishes by 2015, vision to 2020, Institution of Fisheries Economics and Planning (IFEP), 2007 8 As of Feb., 2008. 9 For example, although “Master Plan for Socio-Economic Development in Bac Giang Province for the Period 2006 to 2020” was formulated in 2005, the SEA report had not been prepared. The SEA report for the Master Plan was prepared by the Bac Giang PPC in July, 2007, and was submitted to and proved by MONRE.

6 - 7
(3) Environment Protection Commitment
For household scaled production, business and service units and objects that have no responsibilities to
prepare the EIA reports, Proponents of projects shall have responsibility to prepare the environmental
protection commitments to show their undertakings on the environmental protection. After the
registration of the commitment of environmental protection, the project proponents will be allowed to
operate their production, business and service units.
6.3.2 Implementation Process of the Strategic Environmental Assessment (SEA)
(1) Organizations to make SEA reports
Agencies/organizations that are assigned to formulate projects subject to Strategic Environmental
Assessment Reporting shall have the responsibilities to prepare the strategic environmental assessment
reports. Agencies/organizations that should conduct SEA report have the responsibility to establish the
SEA mission group including environmentalists, related scientists who have professions and qualifications
to the characteristics of the project in order to conduct the strategic environmental assessment (Chapter 14
and Chapter 15 of the Law of Environmental Protection, and 2.1, Circular No. 08/2006/TT-BTNMT).
(2) Contents of the SEA reports
Structures and contents of the SEA report are defined as follows (Appendix 1, Circular No.
08/2006/TT-BTNMT). Detail contents of the SEA report are shown in the Attachment 6.2.
Introduction
Chapter 1: General Introduction about the Aim, Scale and Characteristics of the
Environmental-Related Project
Chapter 2: General Description of Natural, Socio-Economic and Environmental Conditions
related to the Project
Chapter 3: Forecast of Possible Negative Environmental Impacts during the Project
Implementation Process
Chapter 4: Guidance on Sources of Statistic, Data and Assessment Methods
Chapter 5: The Proposal of General Orientation, Solution to Environmental Problems during
the Implementation of the Project
Conclusions and Recommendations
(3) Appraisal Councils for the SEA reports
The SEA reports shall be appraised by the appraisal councils. The Appraisal Councils shall be organized
by the competent appraising agencies by the kinds of the projects (Table 6.3.3).

6 - 8
Table 6.3.3 Agencies/Organizations that Shall Have Responsibilities to Establish the Appraisal Councils of the SEA Reports (Competent Appraising Agency)
Kinds of Projects Competent Appraising Agencies which Comprise Appraisal Council
Projects that are subject to the approval of the National Assembly, the Government and the Prime Minister
MONRE
Projects that are subject to the approval of the line ministries, ministry-level agencies and Government body
Line ministries, ministry-level agencies and Government body
Projects that are subject to the competence of the provincial level People’s Committee and same level People’s Committee
Provincial level People’s Committee
Source: Law on Environmental Protection, Article 17
Compositions of the Appraisal Councils are shown in Table 6.3.4. A membership of the Appraisal
Councils as stipulated in Table 6.3.4 must comprise at least 50% of their members who are qualified in
terms of their professional knowledge of environmental protection and of other relevant fields relating to
the contents of the projects. Those who participate in the preparation of the SEA reports shall not be
eligible to the membership of the Appraisal Council.
Table 6.3.4 Compositions of the Appraisal Councils of the SEA Reports Kinds of Projects Compositions of the Appraisal Council
Projects of national and inter-provincial scale
Representatives from the agencies that are responsible for the project approval; representatives from relevant ministries, ministry-level agencies, Government bodies and provincial-level People’s Committees; qualified experts whose specific professions are appropriate to the contents of the projects, and representatives from other organizations and individuals decided by the competent agencies
Provincial-level projects
Provincial level People’s Committees; specialized agencies of the environmental protection and other relevant provincial departmental qualified experts whose specific professions are appropriate to the contents of the projects, and representatives from other organizations and individuals decided by the competent agencies
Source: Law on Environmental Protection, Article 17
(4) Evaluation and Appraisal of the SEA reports
The project owners shall have responsibility to send documents to require the appraisement of the SEA
reports to the competent appraisal councils listed in the Table 6.3.3. Numbers and forms of document
required for are listed in Table 6.3.5 (Circular No. 08/2006/TT-BTNMT). In case that the competent
appraisal councils exceeds seven (7) members, or in other necessary cases as the requirements for the
appraisement, the project owners shall have responsibility to complement the number of the reports on
strategic environmental assessment as required by the councils. The flowchart of appraisal of the SEA
reports is shown in Figure 6.3.1.
Table 6.3.5 Document Required for Appraisement of the SEA reports
Kinds of Documents Sets Remarks Application requiring the appraisement of the SEA reports
1 set -
SEA reports 7 sets Signed by the project owner with full name and position together and sealed by the agency on supplementary cover of each copy
Draft strategy/planning/plan 1 set - Source: Circular No. 08/2006/TT-BTNMT, 2.2

6 - 9
Figure 6.3.1 Flowchart of Appraisal of the SEA Reports
- Within 45 working days:Projects that are subject to the approval of the Prime Minister, the Government or the National Assembly, and inter-ministry and inter-province projects
- Within 30 working days:Projects other than those mentioned above
Preparation of SEA Report
Appraisement of the SEA reports
Conducted by Appraisal Council
Not approved
Project Owners Competent Appraising Agencies
Report Preparation Stage
Appraisal Council
- MONRE - Ministries, ministry-level
agencies, - PPC
Document Examination
Re-arrangement of SEA Report
Return the documents
5 working days
Invalid
Requiring Appraisement of the SEA reports
- Application requiring the appraisement
- SEA reports - Draft strategy / planning
/ plan
Prepare to establish Appraisal Council
Establishment of Appraisal Council
Valid
- Appraisal results - Minutes of Meetings
Informing results of appraisal
Re-preparation of SEA reports
Re-appraisal
Reporting results of appraisal
MONRE
Ministries, ministry-level agencies, PPC
Prime Minister, Government and National Assembly
Head of ministries, ministry-level agencies, PPC
Approved
Requiring re-appraisement of the
SEA report
Evaluation Stage
Task
Source: Decree No. 80/2006/ND-CP

6 - 10
(5) Organize and implement the appraisement of the SEA reports
After receiving sufficient documents requiring the appraisement as mentioned above, the Permanent
Appraising Agency will process the following processes (Circular No. 08/2006/TT-BTNMT, 2.3):
i) In case of invalid, insufficient documents as the requirement for the appraisement:
Within five (5) working days since receiving the documents mentioned above, the Permanent
Appraising Agency shall report to the competent appraising agency to inform the project owner by
document about the reasons and return the documents.
ii) In case of the documents are valid and meet with the requirement for the appraisement:
The Permanent Appraising Agency shall carry out the preparation of the establishment of the
Appraising Council and submit for the decision of the competent appraising agency.
Results of the appraisal of SEA reports shall be expressed in the form of minutes of meetings of the
appraisal councils, which shall fully content the meeting proceedings, conclusions and signatures of the
council’s chairman and the secretary. The MONRE shall report to the Prime Minister, the Government
and the National Assembly on results of appraisal of the SEA reports of projects, together with the minutes
of meetings of the appraisal council. Specialized environmental protection agencies of ministries,
ministry-level agencies, government-attached agencies and provincial/municipal People’s Committees shall
report the heads of ministries or agencies who are competent to approve projects on results of appraisal of
the SEA reports of the projects, enclosed with the minutes of meetings of the appraisal councils (Decree No.
80/2006/ND-CP, Article 10).
Duration for appraisal of the SEA reports is shown in Table 6.3.6. In case the SEA report is not approved
and thereafter needs to be re-appraised, the duration for re-appraisal shall be as provided in Table 6.3.6.
Table 6.3.6 Duration for Appraisal of SEA Reports
Kinds of Projects Duration for Appraisal Projects that are subject to the approval of the Prime Minister, the Government or the National Assembly, and inter-ministry and inter-province projects
Within 45 working days since receiving the documents that are valid and meet with the requirement for the appraisement
Projects other than those mentioned above Within 30 working days since receiving the documents that are valid and meet with the requirement for the appraisement
Source: Decree No. 80/2006/ND-CP, Article 12
(6) Violation of regulations on the SEA reports
Fines of between VND 30,000,000 and VND 40,000,000 shall be imposed for acts of failing to make a SEA
report, for cases where the SEA reports are required (Decree No. 81/2006/ND-CP, Article 9). Thereafter,
the project owner shall prepare the SEA reports to submit to the competent appraising agencies for
approval.

6 - 11
6.3.3 Implementation Process of the Environmental Impacts Assessment (EIA)
(1) Organizations to make EIA reports
The project owners shall have the responsibilities to prepare and submit the environmental impact
assessment reports for approval by the competent appraising agencies concurrently with the formulation of
the project feasibility study reports. The project owners may conduct by themselves or contract out the
preparation of environmental impact assessment reports to consultancy service organizations (Chapter 19,
the Law of Environmental Protection).
(2) Contents of the EIA reports
Structures and contents of the EIA report are defined as follows (Appendix 4, Circular No.
08/2006/TT-BTNMT). Detail contents of the EIA report are shown in Attachment 6.3.
Introduction
Chapter 1: Brief Description of the Project
Chapter 2: Natural, Environmental and Socio-Economic Conditions
Chapter 3: Environmental Impact Assessment
Chapter 4: Measures to Reduce Harmful Impacts, Prevent and Cope with Environmental
Incidents
Chapter 5: Commitment of Implementing Measures for Protection the Environment
Chapter 6: Environmental Treatment Constructions and environmental Management and
Monitoring Program
Chapter 7: Budget Estimation of Environmental Construction
Chapter 8: Public Consultations
Chapter 9: Guidance on Sources of Statistic, Data and Assessment Methods
Conclusions and Recommendations
(3) Appraisal Councils for the EIA reports
The appraisal of the EIA reports shall be conducted under the responsibilities of the Competent Appraising
Agencies and conducted by an Appraisal Council or an Appraisal Service Organization. The Appraisal
Councils shall be organized by the competent appraising agencies by the kinds of the projects (Table 6.3.7).
Compositions of the Appraisal Councils are shown in Table 6.3.8. A membership of the Appraisal
Councils as stipulated in Table 6.3.8 must comprise at least 50% of their members who are qualified in
terms of their professional knowledge of environmental protection and of other relevant fields relating to
the contents of the projects. Those who participate in the preparation of the EIA reports shall not be
eligible to the membership of the Appraisal Council.

6 - 12
Table 6.3.7 Agencies/Organizations that shall have Responsibilities to Establish the Appraisal Councils of the EIA Reports (Competent Appraising Agency)
Kinds of Projects Competent Appraisal Agencies
Remarks
Projects that are subject to the approval of the National Assembly, the Government and the Prime Minister, and inter-branch or inter-provincial projects
MONRE MONRE shall have the responsibility to establish the Appraisal Council or select the Appraisal Service Organizations
Projects that are subject to the approval of the line ministries, ministry-level agencies and Government body
Line ministries, ministry-level agencies and Government body
Organizations listed in the left column shall have the responsibility to establish the Appraisal Council or select the Appraisal Service Organizations
Projects that are subject to the competence of the provincial level People’s Committee and same level People’s Committee
Provincial-level People’s Committee
Provincial-level People’s Committees shall have the responsibility to establish the Appraisal Council or select the Appraisal Service Organizations
Source: Law on Environmental Protection, Article 21
Table 6.3.8 Compositions of the Appraisal Councils of the EIA Reports
Kinds of Projects Compositions of the Appraisal Council Projects of national and inter-provincial scale
Representatives from the agencies that are responsible for the project approval; representatives from relevant ministries, ministry level agencies, Government bodies and provincial level People’s Committees; qualified experts whose specific professions are appropriate to the contents of the projects, and representatives from other organizations and individuals decided by the competent agencies
Provincial-level projects
Provincial level People’s Committees; specialized agencies of the environmental protection and other relevant provincial departmental qualified experts whose specific professions are appropriate to the contents of the projects, and representatives from other organizations and individuals decided by the competent agencies
Source: Law on Environmental Protection, Article 21
(4) Evaluation and Appraisal of the EIA reports
The project owners shall have responsibility to send documents to require the appraisement of the EIA
reports to the competent appraisal councils listed in Table 6.3.7. Numbers and forms of document
required for are listed in Table 6.3.9 (Circular No. 08/2006/TT-BTNMT).
Table 6.3.9 Document Required for Appraisement of the EIA Reports
Kinds of Documents Sets Remarks Application requiring the appraisement of the EIA reports
1 set -
EIA reports 7 sets Signed by the project owner with full name and position together and sealed by the agency on supplementary cover of each copy
Draft of the feasibility study reports or investment report of the project
1 set -
Source: Circular No. 08/2006/TT-BTNMT, 3.3
(5) Organize and implement the appraisement of the EIA reports
After receiving sufficient documents requiring the appraisement as mentioned above, the Permanent
Appraising Agency will process the following processes (Circular No. 08/2006/TT-BTNMT):

6 - 13
i) In case of invalid, insufficient documents as the requirement for the appraisement:
Within five (5) working days since receiving the documents mentioned above, the Permanent
Appraising Agency shall report to the competent appraising agency to inform the project owner by
document about the reasons and return the documents.
ii) In case of the documents are valid and meet with the requirement for the appraisement:
The Permanent Appraising Agency shall carry out the preparation for the appraisement by the
Appraisal Council or selected Appraisal Service Organization.
The Permanent Appraising Agency shall inform the project owner by document about the result of the
appraisement and requirements for the completion of the EIA report.
Duration for appraisal of the EIA reports is shown in Table 6.3.10. In case the EIA report is not approved
and thereafter needs to be re-appraised, the duration for re-appraisal shall be as provided in Table 6.3.10.
Table 6.3.10 Duration for Appraisal of EIA Reports
Kinds of Projects Duration for Appraisal Projects that are subject to the approval of the Prime Minister, the Government or the National Assembly, and inter-ministry and inter-province projects
Within 45 working days since receiving the documents that are valid and meet with the requirement for the appraisement
Projects other than those mentioned above Within 30 working days since receiving the documents that are valid and meet with the requirement for the appraisement
Source: Decree No. 80/2006/ND-CP, Article 12
(6) Completion of the EIA reports
According to the announcement of the Permanent Appraising Agency and in case the EIA report needs to
be completed, the project owner shall complete the EIA report. And the project owner shall send the EIA
reports to the competent Appraising Agency in order to consider and approve them (Circular No.
08/2006/TT-BTNMT, 3.4 and 3.5).
(7) Organize and implement approval of EIA reports
In case the EIA report meets the requirement to be approved, the chief of the competent appraising agency
must approve the EIA report of the project, within 15 working days since receiving the documents.
In case that the EIA report does not meet the requirement to be approved and the approving decision has
not been made within the time limit, the competent appraisal agency must have documents or commission
the permanent appraising agency to inform the reasons to the project owner by document (Circular No.
08/2006/TT-BTNMT, 3.6).
(8) Conduct, appraisal and approve the supplementary EIA report
The supplementary EIA reports shall be prepared in the following cases (Decree No. 80/2006/ND-CP,
Article 13):

6 - 14
i) There are changes in the location, size, design capacity and technology of the project,
ii) The project fails to be executed within 24 months after approval of its EIA report.
In case of there are no change in the design capacity, technology and ambient environment, project owners
do not have to prepare the supplementary EIA but shall have to send explanation document to the
competent appraising agency.
The appraisement of the supplementary EIA reports is carried out by collecting opinions in documents from
scientists, managers who have appropriate qualifications. In case the supplementary EIA report meets the
requirement to be approved, the competent appraising agency shall examine and approve the
supplementary EIA report within 30 working days since receiving the valid documents.
(9) Violation of regulations on the EIA reports
The project owner shall be fined for the following acts on the EIA reports (Decree No. 81/2006/ND-CP,
Article 9).
Table 6.3.11 Violations on Regulations on the EIA Reports and Fines
Contents of Violations Fines (mil. VND) Forcible Measures Acts of improperly realizing one of contents in an approved EIA report and other requirements in the decision approving such EIA report
8 – 10 - Forcible realization of contents in approved EIA reports and other requirements in decisions approving such EIA reports,
- Forcible application of measures to remedy the environmental pollution
Acts of failing to fully realize contents in an approved EIA report and other requirements in the decision approving such EIA report
11 – 15 - Forcible realization of contents in approved EIA reports and other requirements in decisions approving such EIA reports,
- Forcible application of measures to remedy the environmental pollution
Acts of proceeding with the construction of a work or putting a work into operation without any EIA report, for cases that EIA reports are required
20 – 30 - Forcible making of EIA reports for submission to a competent appraising agency for approval within 45 working days after receiving the administrative violation sanctioning decisions, in case that projects has not yet put into operation,
- Forcible treatment of environmental elements to attain the standards within 180 working days after receiving the administrative violation sanctioning decisions, in case that projects has already put into official operation,
- Forcible application of measures to remedy the environmental pollution
Source: Decree No. 81/2006/ND-CP, Article 9
Fines between 5,000,000 and 40,000,000 VND shall be imposed for the consultancy services for practicing
the EIA and preparing the EIA reports in case that i) practicing the consultancy service for the EIA or
appraisal services at variance with practice licenses, ii) practicing the consultancy service for the EIA
without permits of the competent appraising agency, and iii) practicing the appraisal services of the EIA
without permits of the competent appraising agency (Decree No. 81/2006/ND-CP, Article 28).

7 - 1
Cheaper 7
Poverty Reduction Programs
7.1 Policy Background of Poverty Reduction
7.1.1 Historical Background
Before 1990 Vietnam had no special programs on poverty reduction. It was the 7th Congress of the
Communist Party of Vietnam in which poverty was first recognized as a stumbling block to economic
development. The Congress called the government to pay more attention to provide more social services
and infrastructure improvement. In the following year, the administration of Ho Chi Minh City made an
action plan on hunger eradication and poverty reduction and, with support from the central government,
started their activities. Ho Chi Minh City’s experience in hunger eradication and poverty reduction
quickly spread to other provinces. In 1995, 45 out of 53 provinces had activities on hunger eradication
and poverty reduction with their own fund and donations by individuals.
Between 1992 and 1995 the Government of Vietnam took actions on poverty reduction in 14 national
development programs on reforestation, job creation, provision of credit, literacy education, reduction of
child malnutrition, etc. The government spent a total of 2.855 trillion VND on these national development
programs. Out of this amount, 47% were spent on provision of credits to households, 29% on
infrastructure construction including roads, electricity, irrigations, schools, and clinics, and 22% on
provision of essential goods such as food, salt, clothing, blankets, and kerosene. In addition to the
national fund, 425 billion VND was donated by local individuals, and in 1995 Bank for the Poor (presently
Bank for Social Policies) was established.
The National Target Program for Hunger Eradication and Poverty Reduction (HEPR) was established by
the government in 1996 to coordinate poverty reduction activities and mobilize more resources. In 1998
program activities for the first phase started. For the period between 2001 and 2005, job creation
component was added and became the National Target Program for Hunger Eradication, Poverty Reduction
and Job Creation (HEPR-JC or Program 143). In 2006, it changed its name again to the National Target
Program for Poverty Reduction (NTP-PR), and has been going to last until 2010. As the central
government just approved this program in 1997, the details are still unknown.
The Program for Socio-Economic Development in Communes Faced with Extreme Difficulties, which has
been a pillar of Vietnam’s poverty reduction programs, was promulgated in 1998. This program is called
Program 135. Soon after the promulgation, national target projects for support to especially
disadvantaged households of ethnic minorities, sedentarization, and construction of inter-commune centers
were integrated into Program 135. From 2000 Program 135 dealt with poverty reduction in the poorest
communes of ethnic minorities in the mountainous areas. Phase I of the Program 135 (Program 135-1)
lasted until 2005, and Currently, the Phase II of that (Program 135-2) is going on.
In addition to HEPR and Program 135, Vietnam has many other programs and projects on poverty

7 - 2
reduction which are on social protection, health insurance, exemption of educational fees, support for
improvement of private housing, supply of safe water, allocation of land, support for ethnic minorities, etc.
National Target Programs that deal directly with poverty reduction are as follows:
Table 7.1.1 National Target Programs in Vietnam
National Target Program 2001-2005 Investment
(billion VND) Ministry that Plays Major Role
1 HEPR-JC 2,700-2,800 Ministry of Labour Invalid and
Social Affairs (MOLISA) 2 Clean water and hygienic rural environment 8,000-8,500 MARD 3 Population and family planning 3,500-4,000 MOH 4. Prevention of communicable and dangerous
diseases and HIV/AIDS 5,000-5,500 MOH
5. Cultural development 1,500-2,000 Ministry of Culture and
Information 6. Education and training 6,500-7,000 MOET 7. Program .135 8,500-9,000 CEMA 8. Five million hectare forestry 10,000-11,000 MARD
Total 70-75 trillion VND
(=US$5.0-5.5 billion) -
Source:www.mpi.gov.vn
7.1.2 National Target Program for Hunger Eradication and Poverty Reduction (HEPR)
Objectives of HEPR for the period between 2001 and 2005 were 1) reduction of poverty rate from 17% in
2001 to lower than 10% in 2005 with an average annual reduction of 1.5 to 2.0% through the provision of
essential infrastructure to poor commune, and 2) reduction of urban unemployment rate of 5 to 6% and
increase of employment time in rural areas to 80% by creating 1.4 to 1.5 million new jobs. HEPR is not a
program in which activity implementation is at its core, but is a planning and management mechanism for
coordination of activities and resource use. HEPR consists of the following 12 projects and 6 policies:
Table 7.1.2 Overview of HEPR
Projects Outcome Targets (2001-2005)
Budget (2001-2005) Billion VND
Implementing Agency
HEPR total 9,110 Poverty Reduction Component 4,240
1. Credit 5 million loans (average loan/household = 2.5 to 3.5 million VND)
750 State Bank, Bank of Social Policies
2. Extension services (business, agriculture, fisheries, forestry, etc.)
4,000 extension workers trained 1.5 million poor households attended training courses
100 MARD
3. Establishment and replication of HEPR models in poor communes
Good models replicated in minority, coastal and disaster prone regions 100 MOLISA
4. Basic infrastructure for poor communes 700 communes not covered by Program 135 1,400 MARD
5. Production assistance and promotion of trade/off-farm occupations in poor communes
15 models tested and transferred 90 MARD

7 - 3
Projects Outcome Targets (2001-2005)
Budget (2001-2005) Billion VND
Implementing Agency
6. Training of HEPR staff 10,000 staff trained (province/ district) 40,000 staff trained (commune) 100 MOLISA
7. Resettlement to new economic zones
70,000 hhs voluntarily resettled 50,000 ha of forest recovered 130,000 hhs voluntarily relocated to new economic zones
1,400 MARD
8. Sedentarization of ethnic minorities 150,000 ethnic minority households settled 700 MARD
Job Creation Component: 3,270 9. National credit fund to support
small-scale employment projects 1.5 to 1.6 million jobs created in 5 years 3,000 MOLISA
10. Strengthening of employment service centers
1 million free consultations Vocational training for 1 million people Job placement for 40,000 to 50,000 people
210 MOLISA
11. Labor market survey and information system Statistical data available 30 MOLISA
12. Training for staff involved in employment management Training 30 MOLISA
Support Policies 1,600
(non-refundable)
1. Low cost, easier access and better quality medical care for the poor
Free medical care (treatment, health insurance) Improvement of local medical services (infrastructure and staff capacity)
500 MOH
2. More opportunity for education Reduced or exempted school fees Free textbooks and notebooks Free scholarships and vocational training
- MOET
3. Special support for ethnic minorities in poorest regions
Provision of basic needs, production inputs, technical extension and technology transfer - Provinces
4. Special support for vulnerable people (those affected by natural disasters, migrants, etc.)
Provision of basic needs, housing repair, production inputs, technical extension and technology transfer
150 CEMA
5. Support for housing improvement
Provide materials and money for poor households, especially in flood areas, high mountainous regions
250 Provinces
6. Support with production tools and cultivated land
Reclaim, recover and reallocate cultivated land, supply boats, fishing nets, hand tools, etc.
700 MOLISA
Source:Implementation of the National Program for Poverty Reduction by Vu Tuan Anh
HEPR makes a decision on budget structure and directs program implementation. It is managed by its
national steering committee which is chaired by one of the Vice Prime Ministers. Committee members
include ministers and vice ministers of the related ministries such as MPI, Ministry of Finances, MOLISA,
MARD, MOH, MOET, CEMA, etc. MOLISA is the standing agency which is in charge of committee
management. On the local level in provinces, districts and communes, People’s Committees are the
implementing agencies, and Committees for Hunger Eradication and Poverty Reduction are established on
each level. Local committees for HEPR play the role of consultant and monitor implementations.
Committee members include leaders of the related government agencies and mass organizations such as
Communist Party of Vietnam, Fatherland Front, Women’s Union, Youth Union, Farmers Union, etc.
Many HEPR projects are implemented by districts in which Project and Construction Management Board
are established.

7 - 4
7.1.3 Program 135
Program 135 was authorized in July 1998 and was called “Support Program for the Communes in the Most
Difficult and Remote Areas”. It consists of projects whose main aim is infrastructure construction for
poverty reduction in mountainous, remote and ethnic minority areas. The difference between
HEPR/NTP-PR and Program 135 is that the target base of the former is a poor household while the latter is
based on geographical areas.
Originally Program 135 aimed to 1) reduce poverty rate in communes faced with extreme difficulties to
less than 25% in 2005, and 2) ensure provision of adequate clean water, over 70% school-age children
attend school, give further training on production for the poor, control dangerous and social diseases,
construct/improve roads to inter-commune centers, and develop rural markets. In 1998, Program 135 was
implemented in 1,715 communes of which 1,568 were in mountainous regions and 147 in lowland while its
beneficiaries were 6 million individuals in 1.1 million households. In 2001, it was extended to 2,362
communes. The funding of Program 135 mainly comes from the central government, provinces, various
investments, and local communes. Many international aid agencies and donors have been planning their
development projects alongside Program 135.
Similar to HEPR, Program 135 is managed by its national steering committee whose chair is a Vice Prime
Minister. Committee members are leaders of the related government agencies, and CEMA (ex-CEMMA)
is in charge of coordination and management. Management Boards are established in Program 135 target
communes, districts and provinces.
Phase I of Program 135 (Program 135-1) lasted until 2005 in which 95% of the program cost was spent on
infrastructure construction at the commune and inter-commune levels, 3% on production development
(agriculture), and less than 1% on sedentarization and capacity development of commune cadres.
Weaknesses of Program 135-1 have been pointed out that the program fund was equally divided among the
target communes without any regards for the development needs of the communes, and that some
communes which had escaped poverty kept receiving the program assistance due to lack of proper
monitoring. Despite such weaknesses, many infrastructure facilities were constructed and the project was
highly evaluated by international donors. Furthermore, Program 135 receives much attention by other
countries because of its large-scale nation-wide development assistance to minority ethnic groups, which
rarely exists in other places.
Since 2006, Phase II (Program 135-2) has been taking place to which more and more international donors
including WB, AusAID, IFAD, SIDA, Ireland, and Finland give sector budget assistance instead of the
program assistance like before. Currently, financial assistance by the international donors is about to
reach 30% of the whole program budget (2006 to 2010) of 850 million dollars1. In addition to the
financial assistance UNDP has been giving technical assistance to CEMA on program coordination. With
much interest in program monitoring and evaluation, coordination of the related agencies, and sustainable
1 Brief Eight - The impact of budget support and future of program 135: Sector Budget Support in Vietnam (www.sbsvietnam.org)

7 - 5
operation and management of infrastructure facilities, the donors assist Program 135-2 in setting up the
monitoring and evaluation framework and the communication strategies, and offer comments and advices
to CEMA.
In Program 135-2, 1,644 poor communes were selected from the Phase I communes as target communes.
These communes are going to be monitored regularly so that communes which escaped poverty will be
excluded from the project and the total number of target communes will decrease. The government of
Vietnam has been showing their intention that this will be the last phase of Program 135 and that there will
be no Phase III starting from 2010.
Program 135-1 may be called as a infrastructure construction program. Although the percentage of the
program budget on infrastructure construction is still high in Program 135-2, their program activities cover
wider field than that in Phase I. Program 135-2 places new emphasis on operation and maintenance of
constructed facilities, monitoring and evaluation and capacity building. Program 135-2 not only defines
development and progress in terms of the number of constructed facilities, but also makes much of
understanding people’s lives, especially the effects of program activities on people’s lives. Hence, in
addition to counting “quantities”, Program 135-2 looks at “qualities” of people’s lives and tries to
understand people’s reactions through the bottom-up perspective.
Alongside the Grassroots Democracy emphasized by the Government of Vietnam, Program 135 makes
much of participatory development and ownership of constructed facilities by communes. It is, however,
not clear who analyzes the development situations and needs of the communes or who formulates the plan
of activities. As the guidelines for participatory planning is to be published this year, such matters are
likely to be included in the guidelines.
Similarly, despite much emphasis on capacity building, it is also unclear how the level of commune and
district staff’s capacity and needs for capacity building are determined. It looks as if commune and
district staff’s capacity is strengthened only if they participate in training for program management. It
also looks as if the number of participants in the training reflects the improved capacity. This matter will
also be clarified when Program 135-2’s capacity building framework is introduced in the near future.
Details of the two phases of Program 135 are as follows:
Table 7.1.3 Overview of Program 135 Phase I Phase II
Duration 1998~2005 2006~2010
Target Commune
2,410 Communes(52 provinces)in 2005 - 1,938 extremely poor / difficult communes (Mainly in
mountainous and underprivileged zones, and partially include temporary stable zone below the mountainous zone)
- 389 border communes - 83 war foundation communes (contribution to the
war)
1,644 communes (45 provinces) in 2006

7 - 6
Phase I Phase II Duration 1998~2005 2006~2010
Commune Selection Criteria
1. More than 70% households are poor and fulfill at least three of the followings;
A. More than 25% of households have temporary houses B. More than 10% of households are those of migrants C. More than 50% of households lack domestic water D. More than 50% of households have no electricity
2. Fulfills at least two of the followings; A. More than 20% of households do not have enough land
for cultivation B. More than 50% of households do not have agricultural
irrigation C. Inappropriate cultivation methods (No visit by
extension workers) 3. No B-level roads between villages and the commune
center, and fulfills at least two of the followings; A. Not enough primary school classrooms B. Commune center does not have a radio station to
broadcast towards villages C. No culture houses in villages
Based on the results of studies of Phase I communes, under developed communes were selected Target communes will be evaluated every year to release non-poor communes, which decreases the overall number of the target communes.
Program Components and Investment Allocation
(Allocation of Investment by the Central Government) Infrastructure construction in communes 72.30% Inter-commune infrastructure construction 23.00% Sedentary agriculture (relocation) 0.66% Production development 3.11% Training of commune staff 0.91%
Investment 1.Basic infrastructure development 67.56% Operation and maintenance 6.75% 2. Production development 17.18% 3. Improvement of life 4.05% 4. Capacity development 4.05% 5. Management and monitoring 0.38%
Share (Item 1 through 4 above)
Central government 75% Local government 10% Local contribution 5% Int’l donors 10%
(Item 5) Central government and Int’l donors 50% Local government 25% Local contribution and others 25%
Outputs/ Targets
Number of Infrastructure Constructed up to Y. 2004 Road 6,652 Irrigation 3,608 School 4,654 Rural water 2,346 Electricity 1,298 Medical centers 487 Market 237 Others 426
Percentage of target communes that had infrastructure improvement
Small-scale irrigation 81% Primary school 86% High school 73% Health center 96% Electricity 84% Post office 60% Radio Station 84% Plan of safe water 58% Market 44%
- Radically accelerate production - Promote an agro-economic structural shift in the
direction of market-driven production - Sustain improvement of spiritual and material living
conditions of ethnic people in extremely difficult communes and villages
- Narrow the development gap between ethnic groups and other regions
- By 2010, basically there are no hunger-stricken households in the targeted areas and the number of poor households drops below 30% of the poverty line
Characterizes-tics and Remarks
• Selection of target communes was weak (some poor communes were not selected)
• Those communes that escaped poverty during the program implementation stayed on the target commune list
• Concentration on infrastructure construction • Not much participation by people • Some facilities were constructed without matching the
needs and condition of the communes (insufficient planning) → Market structures without stores, cultural centers without any activities, etc. were constructed
• Investment fund was equally divided among the target communes regardless of their needs
• Very weak in monitoring (supervision of construction), feedback and evaluation.
• Activities were assigned to various government agencies without communication and information sharing among them
• EU, WB, IFAD, etc. carried out their poverty reduction projects in target communes (parallel projects)
• Despite its weaknesses in planning and implementation, it was evaluated highly by international donors because it was a rare program that deals with poverty among ethnic minorities and a significant number of infrastructure facilities were constructed.
• Rate of investment on infrastructure decreased, but still high compared with other components
• Investment is allocated based on commune needs • Aims for participatory development activities and
improved planning, monitoring, evaluation and operation and management
• Ethnic Committee in each province is leading the activities in the province
• Aims for planning, implementation and financial management by each commune (Full Ownership)
• Increased number of international donors are giving financial assistance (to the common basket) as well as suggestions and advices to CEMA
• UNDP is coordinating the donors • Some donors choose to give out project support
instead of budget support • Many key words and expressions of
socio-economic development such as self-help, self-reliance, democracy, transparency, auditing, ownership, participatory planning, and monitoring & evaluation are used in reports, which seems to reflect the donors’ viewpoints/ conditions for financial assistance
• Baseline study has been taking place, the results of which are to be used for monitoring and evaluation

7 - 7
7.1.4 Poverty Reduction Programs by International Agencies
The poverty reduction programs with financial assistance by the international agencies are listed in Table
7.1.4.
Table 7.1.4 Poverty Reduction Programs by International Agencies
Project/Program Finance (US$ million)
Approved
World Bank 1,222.3 Poverty Reduction Support Credit 250.0 2001 Community Based Rural Infrastructure 103.8 2001 Northern Mountainous Poverty Reduction Project (NMPRP) 110.0 2001 Second Rural Finance Project 200.0 2002 Second Poverty Reduction Support Operation 100.0 2003 Third Poverty Reduction Support Operation 100.0 2004 Forest Sector Development Project 39.5 2004 Second Rural Energy Project 220.0 2004 Fourth Poverty Reduction Support Credit 100.0 2005 Asian Development Bank 359.0 Provincial Roads Improvement 70.0 2001 Second Red River Basin Sector Project 70.0 2001 Central Region Livelihood Improvement 43.1 2001 Third Provincial Towns Water Supply and Sanitation 60.0 2001 Support to Implementation of Poverty Reduction Program 6.4 2004 Central Region Transport Networks Improvement Sector Project 94.5 2005 Support to Implementation of Poverty Reduction Program II 15.0 2005
Source : JBIC Hanoi Office
Northern Mountainous Poverty Reduction Project (NMPRP) was implemented by obtaining financial
assistance from World Bank in 2002-2007. The project covered 368 communes of 44 districts under four
(4) provinces. Out of 368 communes, 98% are categorized into poverty communes under Program 135.
The total project cost for Phase I amounted to US$132.5 million, of which US$110 million was financed by
World Bank IDA and US$ 10.5 million was financed by DFID for capacity building. Investment to
communes was ranged between US$28,000 and US$560,000. The total investment was US$ 27 million to
Lao Cai, US$17 million to Son La and Yen Bai each, US$15 million for Bac Giang, Phu Tho and Hoa
Binh.
NMPRP Phase II is to be implemented under Program 135 with the following framework.
1) Objectives i. Extension of government services and sustainable infrastructure development in NMPRP ii. Capacity building of Districts and Communes in NMPRP
2) Project Components i. markets and roads ii. small scale irrigation, drinking water supply and extension iii. health, education, capacity building of teachers and medical staff iv. commune development v. capacity building and training

7 - 8
vi. project formulation and management
7.1.5 Poverty Reduction Programs by Japan Bank for International Cooperation (JBIC)
Japan has continued financial assistance to Rural Infrastructure Development and Living Standard
Improvement / Small-Scale Pro-poor Infrastructure Development Project called Sector Project Loan (SPL)
since 1995. The objective of this project is to strengthen the agricultural and industrial sectors, to enhance
infrastructures in rural areas and, eventually, to improve people's living standards, by the way of developing
such rural infrastructures as road network, water supply systems and power distribution systems. The
proceeds of the loans are for civil works, equipment, and consulting services. The project also includes
financing for partnership arrangements with NGOs engaging in rural development activities. The general
features of SPL are summarized in Table 7.1.5.
Table 7.1.5 Summary of SPL
Project Year of Commencement
Commit- ment
(million yen)
Component Performance
SPL I Rural Infrastructure Development and Living Standard Improvement (I)
1995 7,000 • Rural Roads • Rural electrification• Rural water supply
• Rural Roads:154 projects with a total length of 1,140.82 km(provincial roads 1,381 km、district roads 628 km、others 185 km)
• Rural electrification: 168 projects, distribution lines 8,381.3 km, transformers 221,546 kVA
• Water supply:13 urban centres SPL II Rural Infrastructure Development and Living Standard Improvement (II)
1996 4,000 • Rural Roads • Rural electrification
• Rural Roads:142 projects with a total length of 1,056.25 km
• Rural electrification: 191 projects, distribution lines 3,632 km 、
transformers 71,952 kVA SPL III Rural Infrastructure Development and Living Standard Improvement (III)
1998 12,000 • Rural Roads • Rural electrification• Rural water supply • Irrigation • Forestation
• Under implementation in 44 provinces
• Forestry : central 5 provinces
SPL IV Small-Scale Pro-poor Infrastructure Development Project (I)
2003 10,562 • Rural Roads • Rural electrification• Rural water supply • Irrigation • NGO partnership
arrangement
• Under implementation in 22 provinces
SPL V Small-Scale Pro-poor Infrastructure Development Project (II)
2005 14,788 • Rural Roads • Rural electrification• Rural water supply • Irrigation • NGO partnership
arrangement
• Under implementation in 41 provinces
Total 48,350 Source:JBIC Hanoi Office

7 - 9
SPL is allocated to important provinces and districts selected in accordance with Vietnam’s poverty lines
and HDI. Candidate projects are selected among SEDP, which are prepared by DPI, and studied for
preparation of F/S. Projects among the candidate projects are finally selected by MPI. The selection
criteria of the SPL projects are summarized in Table 7.1.6.
Table 7.1.6 Selection Criteria for SPL
Sector Selection Criteria General • Candidates projects requested to MPI with approval by PPC
• Data and information necessary for assessment are available. • Project without large-scale resettlement (50HH)
Roads • Road categories • Priority roads • Maximum length of roads • Daily traffic • Priority bridges • Conditions of design • Unit cost optimum
• Provincial and district roads • Roads not passable during the rainy seasons and roads
between district and commune centres • 20 km • 150 (PCU/day) or more (vehicles) • bottleneck bridge within road network • Not over-invested design • Roads: 2.0 billion VND or less、Bridge: 10 million VND
per m2 Electrification • Project owner
• Project component • Project cost • Power source • Not feasible projects
• Provincial Department of Industry r DPI • New installation of middle and low voltage lines or
installation/rehabilitation of transformers • 25.0 billion VND or less • EVN grid • Projects including large-scale resettlement and
deforestation for transmission of 220 kV or more or 15 km or longer
Water Supply • Target area • Water sources • Beneficiaries • Water volume • Total Project Cost • Cost per beneficiary
• Urban centers within district • Confirmed by F/S or summary sheets • 4,000 persons or more • 1000ton per day • 25.0 billion VND or less • 1.35 million VND or less
Irrigation • Project scale • Not feasible projects • Priority project
• 50ha or more、25.0 billion VND • Project including tunnels and construction of new
reservoir of 15 m high, 100ha and 10 million m3 • Rehabilitation projects including reinforcement of canals
and embankment of reservoir, etc. Source:JBIC Hanoi Office
7.1. 6 Other Programs on Poverty Reduction
(1) Health Care
The Government of Vietnam has various healthcare policies including free medical examination and
treatment, free medical insurance for the poor, subsidizing the cost of transporting medicine to the
mountainous areas, and infrastructure improvement of grassroots healthcare in districts, communes and
villages. Provincial health care fund was established based on the Decision No. 139/2002/QD-TTg which
had been issued in 2002 with an aim to increase the number of poor individuals receiving medical services.
This fund is used to pay for the medical insurance and out-of-pocket costs for the poor.
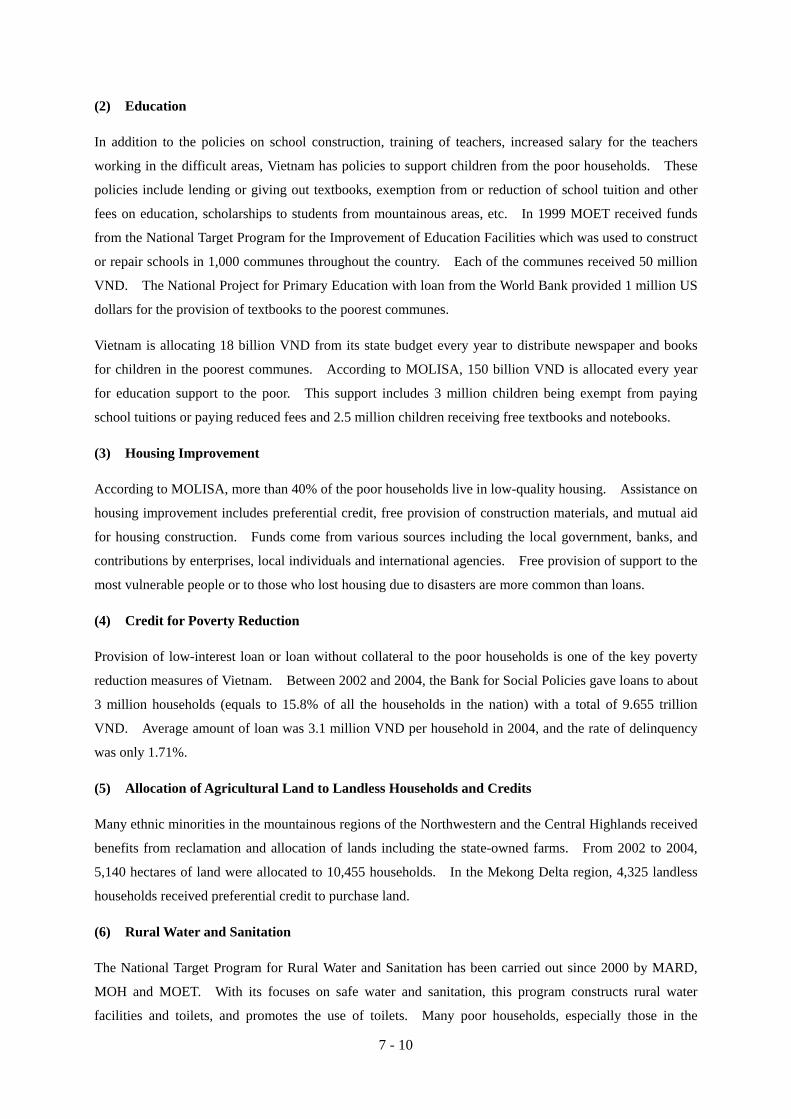
7 - 10
(2) Education
In addition to the policies on school construction, training of teachers, increased salary for the teachers
working in the difficult areas, Vietnam has policies to support children from the poor households. These
policies include lending or giving out textbooks, exemption from or reduction of school tuition and other
fees on education, scholarships to students from mountainous areas, etc. In 1999 MOET received funds
from the National Target Program for the Improvement of Education Facilities which was used to construct
or repair schools in 1,000 communes throughout the country. Each of the communes received 50 million
VND. The National Project for Primary Education with loan from the World Bank provided 1 million US
dollars for the provision of textbooks to the poorest communes.
Vietnam is allocating 18 billion VND from its state budget every year to distribute newspaper and books
for children in the poorest communes. According to MOLISA, 150 billion VND is allocated every year
for education support to the poor. This support includes 3 million children being exempt from paying
school tuitions or paying reduced fees and 2.5 million children receiving free textbooks and notebooks.
(3) Housing Improvement
According to MOLISA, more than 40% of the poor households live in low-quality housing. Assistance on
housing improvement includes preferential credit, free provision of construction materials, and mutual aid
for housing construction. Funds come from various sources including the local government, banks, and
contributions by enterprises, local individuals and international agencies. Free provision of support to the
most vulnerable people or to those who lost housing due to disasters are more common than loans.
(4) Credit for Poverty Reduction
Provision of low-interest loan or loan without collateral to the poor households is one of the key poverty
reduction measures of Vietnam. Between 2002 and 2004, the Bank for Social Policies gave loans to about
3 million households (equals to 15.8% of all the households in the nation) with a total of 9.655 trillion
VND. Average amount of loan was 3.1 million VND per household in 2004, and the rate of delinquency
was only 1.71%.
(5) Allocation of Agricultural Land to Landless Households and Credits
Many ethnic minorities in the mountainous regions of the Northwestern and the Central Highlands received
benefits from reclamation and allocation of lands including the state-owned farms. From 2002 to 2004,
5,140 hectares of land were allocated to 10,455 households. In the Mekong Delta region, 4,325 landless
households received preferential credit to purchase land.
(6) Rural Water and Sanitation
The National Target Program for Rural Water and Sanitation has been carried out since 2000 by MARD,
MOH and MOET. With its focuses on safe water and sanitation, this program constructs rural water
facilities and toilets, and promotes the use of toilets. Many poor households, especially those in the

7 - 11
mountainous regions, experience extreme difficulties in obtaining safe water. As a result, diarrhea and
water-borne diseases are common. Many poor communes do not have toilets.
Many programs and projects for poverty reduction are taking place in Vietnam, showing strong
determination and commitment by the government to reduce poverty as a way to bring socio-economic
growth. Despite this, it is very difficult to understand the poverty situations because there are so many
similar policies, programs and projects whose activities overlap one another. Like in the cases of HEPR
and Program 135, the existence of many similar programs and projects makes each of the relevant
government offices participates in many different steering committees, boards, and councils at the same
time. Such existence of similar projects also makes some offices implement the same types of
development activities under different projects. Under such circumstances, each office is likely to be
experiencing difficulties and complications in arranging and organizing the poverty reduction programs and
activities they are involved in.
In addition to Program 135 activities, many non- Program 135 activities also take place in Program 135
communes such as provision of free medical insurance and roofing tiles by MOLISA, reduction of medical
fees or improvement of medical facilities by MOH, provision of free textbooks by MOE, provision of
low-interest credit to the poor, etc. Due to the presence of so many development activities and not enough
numbers of district and commune staff, local government officers seem to have their hands full with
required day-to-day administrative work for the on-going activities. It is rather understandable that they
hardly have time or energy to overview the entire development plan of their areas and check the
development progress.
7.2 Monitoring and Evaluation in the Poverty Reduction Programs
As for the poverty reduction programs in Vietnam are executed such as “National Targeted Program for
Hunger Eradication and Poverty Reduction (HEPR)”, “Program for Socio-Economic Development in
Communes Faced with Extreme Difficulties (Program 135)” which were established by the Government of
Vietnam and a lot of support programs with financial assistance has been done so far by donors and
international agencies. Each project is used for the infrastructure construction such as the road
construction that connect some villages, the school construction, and the irrigation system, the soft
components such as agricultural training, and etc. It is commonly understood that the program
contributed somehow to poverty reduction. However, it is of understanding that the impacts and effects of
the program is not sufficiently assessed due to lack of monitoring and evaluation system. Accordingly, the
JICA Study Team conducted fact finding survey on the poverty reduction projects implemented in the
Region and examined needs for a monitoring and evaluation system of the poverty reduction programs.
7.2.1 Present Conditions of Project Monitoring and Evaluation System under the Poverty
Reduction Program
In this sub-clause, the present conditions and issues on Program 135, one of the largest poverty reduction
program implemented by the Government of Vietnam are overviewed.

7 - 12
(1) General Background of Program 135 (P135)
Primary target of P135 is on the communes in socioeconomic difficulty, particularly on improvement of
living standards on the ethnic minorities. During 1998-2005, various infrastructures such as intra and
inter commune roads, small-scale irrigation systems, schools, clinics, water and electricity supplies were
developed under the management of Committee for Ethnic Minority and Mountainous Areas (CEMMA).
P135-Phase I completed in 2005, and Phase II for the next five years are now ongoing with assistance of
World Bank. Under P135-Phase I, VND 8,434 billion (US$562 million) by 2005 were spent and 25,000
communal infrastructure facilities and 498 inter-communal infrastructures facilities were built throughout
2,412 communes with special difficulties in 52 provinces. It is considered that this achievement,
somehow, created necessary conditions for the poverty reduction in ethnic minority and mountainous areas.
(2) Commune Selection and Funding Process under P135-Phase I
The initial target communes of the two programs (P135 and NTP managed by MOLISA) were 1,715
communes with special difficulties, of which 1,000 communes were given the highest priorities. The list
of communes with special difficulties was prepared by CEMMA and was used for P135 Phase-I, while
selection criteria and procedures were unclear and not transparent.
Under Program 135, capital funds are allocated to poor communes according to the number of eligible
communes in each province and according to requirements specified in the Ministry of Planning and
Investment Circular 66. Each eligible commune receives a fixed sum (VND 500 million in 2004) and
usually districts are delegated to manage investment projects. The DPC determined type of projects for
each commune according to household poverty rate and the level of infrastructure developments.
As mentioned above, project funds were allocated to communes as revenue share for regional development.
The main drawback of the funding mechanism can be listed as follows:
1) Rationale for Selection Criteria:
Communes with a larger number of poor people receive less funding per poor person. Communes with relatively low poverty rate on average but a lager number of poor households are less likely to be selected.
2) Geographic Conditions: Disadvantages for remote areas due to lump sum allocation of fund per commune
3) Fund Allocation Issue: It is difficult to ensure that the funds reach the poorest of the poor or the remotest village
4) Clarification of Accountability:
Unclear procedure of disbursement at district level was not clear and insufficient accountability
(3) Monitoring and Evaluation System of P135-Phase I
According to the previous research2, some of the issues in Monitoring and Evaluation (M&E) system were
observed. There was lack of legal / regulation framework about coordination between line ministries and
the province in running the Monitoring and Evaluation tasks. The organization of the Monitoring and
2 Nguyen Van Cuong, Research Report to propose community- participatory M&E mechanism for Socio-Economic Development Programme for Ethic and Mountainous Communes with Special Difficulties, July 2005

7 - 13
Evaluation system and institutional arrangement in roles and responsibilities have been not clear. The
program has a set of Monitoring and Evaluation indicators to some extent. These indicators are
introduced in Circular No.894/2001 Guidance on Statistical Data Collection. In reports from provinces
and districts, the following indicators were collected.
Table 7.2.1 M&E Indicators in P135-Phase I
Types of Indicator Contents of Indicator Input indicators Name of sub-project / civil work, total investment (planned and disbursed) by commune Output indicators Number of sub-projects/civil works, name of households receiving assistance in
forestry/agricultural extension services, number of trainings and trainees, total area of forestation (total investment and total disbursement)
Impact indicators Poverty rates and other statistical data Source:JICA Study Team
These indicators are mostly quantitative. There were few indicators reflecting the quality and time of
implementation. In addition, the indicators set were not assigned clearly to each management level.
The following table summarizes the critiques on Monitoring and Evaluation system under the Program
135-I.
Table 7.2.2 Critical Points of M&E System under P135-Phase I
Items Observation M&E Indicators - Indicators were not well defined and not well designed to capture the project impacts.
- At provincial level, the disbursement rate was only emphasized as an indicator to monitor the overall program progress.
Reporting system - A reporting system was set up at commune, district, provincial and central levels. - However, it seemed there was no common outline being used consistently across
provinces, and even across communes in a province. - Feedback from upper management levels to lower levels was very limited, affecting the
quality of the reports. Baseline survey - Comprehensive baseline survey was not conducted.
- Project review was done. However, it was not satisfactory in terms of internationally accepted standards.
- Monitoring indicator was limited to only project output and project impact assessment was not done.
Source: Nguyen Van Cuong, 2005.
7.2.2 Underlying Issues and Improvement Measures
(1) Application of Geographic Information System to Project Monitoring and Evaluation
It can not be judged whether the project has achieved its target or still required further intervention in
particular areas, duly because project accountability of the implementation agencies and related line
ministries are not clearly defined and the project information is not managed through a unified system in
the current practice of poverty reduction programs.
This exacerbates difficulties in procurement of the past details and accurate information regarding the
implemented poverty reduction projects without ground truth at the project site. In order to mitigate such
difficulties in data and information management, it will be necessary to establish a unified information

7 - 14
system for monitoring and evaluation.
Geographic Information Systems (GIS) can offer to enable to integrate various type of data into unified
system. GIS is an effective tool for monitoring and evaluation of poverty reduction programs in Vietnam,
where number of small-scale infrastructures disperse nation-wide. GIS application can offer the following
specific benefits for information management:
i) To clarify project objectives and target beneficiaries and enable to ensure collaboration among
the project as well as to avoid duplication,
ii) To enable to prepare rural development planning smoothly and effectively for districts and
communes,
iii) To enable easier project management and progress monitoring.
(2) Future Monitoring and Evaluation System to be established
Considering the existing problems and issues in M&E, the following suggestions can be made.
Table 7.2.3 Recommendable M&E System
Items Remarks 1. Setting clear objectives and project
scale Preparation of logical framework can provide comprehensive project management framework.
2. Preparation of commune resource maps as basis for development programs
This could basically be done nation wide. However, maps could be prepared gradually as government programs extend in the poverty areas.
3. Participatory project planning In planning to assist poverty areas, community needs should be assessed carefully based on the above-mentioned commune resource maps, which are expected to tell all about what are needed.
4. Baseline survey In the targeted areas, baseline survey should be conducted at early stage of the programs. Baseline data should include qualitative and quantitative data. Once data are collected, these should be incorporated in the commune resource map.
5. Participatory project monitoring It is necessary to establish communication channels so that commune residents can report to either commune or district officers about problems of infrastructures and facilities (i.e. card survey for village people)
6. Unified project data and information management
There is a need to assign specific tasks of monitoring and updating resource maps to an authorized and capable institution (i.e. NIAPP)
7.3 Case Study of GIS Application in Project Monitoring and Evaluation
7.3.1 Objectives and Methodology
This is a preliminary practice to clarify validity of GIS application in monitoring and evaluation. The
figure below illustrates the general procedures of this case study.

7 - 15
Source: JICA Study Team
Figure 7.3.1 Procedures of the Case Study for GIS Application in Project Monitoring and Evaluation
The following four (4) communes were selected among 32 communes for which the trail formulation of
Communes Development Plan (CDP) was carried out as mentioned in Chapter 8.
1) Dien Bien Province : Muong Phang Commune
2) Lai Chau Province : Ma Quai Commune
3) Son La Province : Chieng Khoang Commune
4) Hoa Binh Province : Cao Son Commune
First, the Study Team collected the project list of the poverty reduction programs implemented for the
target commune in the past from DARD, DPC, and CPC, and also conducted the interview survey to the
government officers. Past programs were arranged in a project list according to village units. However,
information in the list is very limited and do not include necessary basic information for project monitoring
such as specification of the facilities, number of beneficiaries. Moreover, there is no appropriate map
which shows the exact position of the villages and the correct village name, and even DPC and CPC
officers were not able to point a village position on the map.
Therefore, in reference to 1:50,0003 scale topographical maps (update in 2004) that officially published in
Vietnam, the survey required to visit all villages using GPS to confirm the exact position, accessibility of
all villages, and the current status of all facilities installed by the poverty reduction program.
The results of the field survey are presented in the following sections from Sections 7.3.2 to 7.3.5.
7.3.2 Muong Phang Commune in Dien Bien Province
(1) Basic information organized by GIS application
The Study Team arranged exisitng key information of socioeconomic conditions in the commune, and
3 As a result of the field survey, the description mistakes were confirmed in Muong Phang Commune (17 places), in Ma Quai Commune (7 places), in Chien Khoang Commune (8 places) and in Cao Son Commune (1 place) in the official published topographical map (Scale 1:50,000).
ProjectListDPC
ProjectListCPC
Healing Survey
ListBefore thesite survey
ProjectList
Map
GPS
Site Survey
DataBaseMap
Unify Managementof Projects
List(Before thesite survey)
Additional Project(find in the site)

7 - 16
collected a list of rural infrastrucutres provided by poverty reduction programs from DARD, DPC and CPC
with interviewing to local government officers. Then, the Study Team prepard a GIS database, while
exact position of the villages and facilities were verified by visiting each location using GPS. The collected
data and information are presented in the following pages.
Table 7.3.1 Outline of Muong Phang Commune
Table 7.3.2 Project List of Poverty Reduction Programs in Muong Phang Commune
Figure 7.3.2 Location Map of Communes in Dien Bien Province
Figure 7.3.3 Topographic Map and Village Location Map of Muong Phang Commune
Figure 7.3.4 Present Land Use Map (2005)
Figure 7.3.5 Land Use Planning Map (2015)
Figure 7.3.6 Ethnic Group and Number of Household Map
Figure 7.3.7 Village Poverty Rate Map
Figure 7.3.8 Location Map of Facilities provided by Poverty Reduction Programs
Figure 7.3.9 Photograph of Field Survey in Muong Phang Commune
(2) Result of GIS Based Field Survey
The poverty reduction programs in the commune provided various types of assistance such as provisions of
roof top for poverty households, water tanks, school construction, domestic water supply, small-scale
irrigation facilities, and access roads. Thus, although there are differences in scale and quality of the
provided facilities, all villages in the commune received more than one facility. Key findings can be
summarized as follows.
1) Gap of project distributions according to accessibility
The commune has relatively good access located near Dien Bien Phu and most of villages are
accessible by vehicle. The commune received relatively large scale projects funded by foreign
donors such as EU and NGO (Action Aid Vietnam). However, these projects are limited to the
villages adjacent to major access roads, while the villages in the remote areas received assistance
only from government of Vietnam.
2) Negative impacts caused by project implementation per village unit
31 villages are registered in the commune administration, while the actual numbers of villages are 44.
This is due to the fact that some villages were subdivided into several villages because of population
growth (i.e., Long Luong village was divided into two and Cang village into four.)
As for subdivided villages, they are officially one village, and the poverty reduction programs are
introduced at original village unit bases, although residential areas and production units are different
and dispersed in subdivided villages. This implies that if water supply facility is installed in a
subdivided village, it can be considered that water is provided with the entire village (before

7 - 17
subdivided village). This could be a prevailing example that insufficient information management
potentially creates a gap in interpretation of the project impacts between project management level
and the actual ground level.
3) Facility conditions in post-project implementation
It was observed that some facilities provided by poverty reduction program were not in use or
already malfunctioned as presented in Figure 7.3.9. In particular, eight water supply facilities out of
23 are already broken. There were water supply facilities which are not used by beneficiaries due to
contamination of water sources. Therefore, there is a high possibility that water supply rate of the
commune is officially recorded based on misinterpretation that all 23 facilities are effectively used.

7 - 18
Table 7.3.1 Outline of Muong Phang Commune
NO Village Name Ethnic Group Total HH Poverty HH Poverty Rate(%) Electricity Supply Project
1 Long Hay Mong 42 21 50.0 4, 122 Long Luong I 29 17 58.63 Long Luong II 20 11 55.04 Long Nghiu Mong 27 16 59.3 3, 125 Co Duong Thai 25 15 60.0 ○ 2, 126 Khau Cam Thai 29 17 58.6 3, 127 Cang 1 34 18 52.98 Cang 2 23 12 52.29 Cang 3 31 18 58.110 Cang 4 13 8 61.511 Yen 1 27 14 51.912 Yen 2 43 20 46.513 Yen 3 16 12 75.014 Co man 1 39 18 46.215 Co man 2 17 11 64.716 Ban Banh Thai 41 19 46.3 ○ 1217 Phang 1 42 12 28.618 Phang 2 33 18 54.519 Phang 3 21 14 66.720 Tan Binh Thai 28 12 42.9 12
21 Khau Thai 30 14 46.7 11, 12
22 Che Can Thai 75 37 49.3 ○ 1, 7
23 Trung Tam Kinh 29 7 24.1 ○ 1124 Bua Thai 41 28 68.3 ○ 2, 6, 7, 11, 12
25 Dong Met 1 48 21 43.826 Dong Met 2 52 26 50.027 Co Thon Thai 23 12 52.2 ○ 1, 11, 13
28 Xom 1 48 18 37.529 Xom 2 51 29 56.930 Xom 3 43 21 48.831 Keo Kho Mu 33 20 60.6 1, 6, 10, 11, 1232 Cong Kho Mu 23 11 47.8 1, 6, 11, 12
33 Ten Kho Mu 26 12 46.2 1, 11, 1234 Nghiu 1 33 9 27.335 Nghiu 2 30 14 46.736 Muong Kho Mu 19 15 78.9 2, 12, 1337 Ha Thai 40 21 52.5 2, 6, 7, 1238 Phieng Sang Thai 20 10 50.0 2, 12
39 Bo Thai 23 11 47.8 6, 12
40 Co Cuom Kho Mu 38 19 50.0 ○ 1, 1241 Pu Sung Kho Mu 46 29 63.0 ○ 2, 7, 10, 12
42 Vang 1 35 13 37.143 Vang 2 45 25 55.644 Pa Tra Thai 15 9 60.0 6, 1245 Co Liu Thai 15 11 73.3 7, 12
1,461 745 52.5
Ethnic Group Total HHs Ethnic Rate (%) Poverty (HH) Poverty Rate (%)Electricity Supply
(HH)Electricity Supply
(%)Mong 118 8.1 65 55.1 0 0.0Thai 1,049 71.8 529 50.4 644 61.4
Kho Mu 265 18.1 144 54.3 164 61.9Kinh 29 2.0 7 24.1 29 100.0Total 1,461 745 52.5 837 57.3
Project : 1: Water Supply Project - Completed 2: Water Supply Project (Program 134) - Completed3: Water Supply Project (Program 252)4: Water Supply Project (ActionAidVietnam)5: Water Supply Project (Program 134) - Planning Stage6: School Construction Project (Kindergarten, Primary and Upper Primary School)7: Irrigation System8: Irrigation System (Program 135)9: Irrigation System (Program 252)10: Wair and Irrigation channel11: Transportation Road12: Rooftop Provide (Program 134)13: Bridge Construction14: Hydro dam Construction
Thai
4, 6, 9, 12
Total
6, 7, 11, 12
1, 6, 11, 12, 13
1, 6, 12
5, 6, 11, 12
5, 11, 12
1, 6, 8, 12
1, 12
1, 12
○Thai
Thai
Thai ○
○
Mong
○Kho Mu
Thai
○
Thai
Thai
○

7 - 19
NOVi
llage
Nam
eEt
hnic
Gro
upPr
ojec
tYe
arM
emo
- Act
ionA
id V
ietn
am (A
AV);
Wat
er S
uppl
y4
or 5
HHs
/ 1
Tap
- Pro
gram
134
; Roo
ftop
Prov
ide
2005
5 HH
s - A
ctio
nAid
Vie
tnam
(AAV
); W
ater
Sup
ply
4 or
5 H
Hs /
1 Ta
p - P
rogr
am 1
34; R
oofto
p Pr
ovid
e20
054
HHs
(Luo
ng I)
, 4 H
Hs (L
uong
II)
- Pro
gram
252
; Irr
igat
ion
Syst
em20
03W
eir C
onst
ruct
ion
- PED
C P
roje
ct; S
choo
l Con
stru
ctio
n20
02-2
004
Prim
ary
Educ
atio
n fo
r Dis
adva
ntag
ed C
hild
ren
Proj
ect
Fund
ed b
y EU
and
Vie
tnam
Gov
.- P
rogr
am 1
34; R
oofto
p Pr
ovid
e20
055
HHs
- Pro
gram
252
; Wat
er S
uppl
y20
07- P
rogr
am 1
34; R
oofto
p Pr
ovid
e20
056
HHs
- Pro
gram
134
; Wat
er S
uppl
y20
07To
tal 6
tank
s- P
rogr
am 1
34; R
oofto
p Pr
ovid
e20
053
HHs
- Pro
gram
252
; Wat
er S
uppl
y20
07W
ell-d
iggi
ngC
ang
1- P
rogr
am 1
34; R
oofto
p Pr
ovid
e20
053
HHs
(Can
g 1)
, 4 H
Hs (C
ang
2), 3
HHs
(Can
g 3)
, 3 H
Hs (C
ang
4)C
ang
2- W
ater
Sup
ply
(by
Viet
nam
Gov
t)20
02-2
003
Not
Wor
king
Can
g 3
- Sch
ool C
onst
ruct
ion;
Sub
Sch
ool
Can
g 4
Yen
1- P
rogr
am 1
34; R
oofto
p Pr
ovid
e20
055
HHs
(Yen
1),
9 HH
s (Y
en 2
), 6
HHs
(Yen
3)
Yen
2- W
ater
Sup
ply
(by
Viet
nam
Gov
t)20
02-2
003
Not
Wor
king
Yen
3- P
rogr
am 1
34; R
oofto
p Pr
ovid
e20
051
HH (C
o M
an 1
), 2
HHs
(Co
Man
2)
- Wat
er S
uppl
y (b
y Vi
etna
m G
ovt)
2002
-200
3N
ot W
orki
ng (T
otal
3 ta
nks)
- Irr
igat
ion
chan
nel
1.3
km (C
o Li
u to
Co
Man
)9
Ban
Banh
Thai
- Pro
gram
134
; Roo
ftop
Prov
ide
2005
4 HH
s- P
rogr
am 1
34; R
oofto
p Pr
ovid
e20
057
HHs
(Pha
ng 1
), 5
HHs
(Pha
ng 2
), 2
HHs
(Pha
ng 3
)- T
rans
porta
tion
Roa
d20
04Ph
ang
to K
hau
1.6
km- I
rrig
atio
n ch
anne
lBu
a to
Pha
ng 1
.3 k
m
- Jap
an-V
ietn
am O
il fu
nd; P
rimar
y Sc
hool
Nipp
on O
il C
oope
ratio
n fu
nd11
Tan
Binh
Thai
- Pro
gram
134
; Roo
ftop
Prov
ide
2005
5 HH
s- P
rogr
am 1
34; R
oofto
p Pr
ovid
e20
053
HHs
- Tra
nspo
rtatio
n R
oad
2004
Phan
g to
Kha
u 1.
6 km
- Wat
er S
uppl
y (b
y Vi
etna
m G
ovt)
Not
Wor
king
- Wei
r and
irrig
atio
n ch
anne
l20
0414
Trun
g Ta
mKi
nh- T
rans
porta
tion
Roa
d; E
U fu
nd6.
5 km
; Tr
ung
Tam
- Bu
a - D
ong
Met
- C
o Th
on -
Xon
- Keo
- Te
n - C
ong
- Pro
gram
134
; Roo
ftop
Prov
ide
2005
4 HH
s- P
rogr
am 1
34; W
ater
Sup
ply
Wel
l-dig
ging
- Irr
igat
ion
chan
nel
Bua
to P
hang
1.3
km
- P
rogr
am 1
59; K
inde
rgar
ten
2004
- Sch
ool C
onst
ruct
ion;
Sub
Sch
ool
- Tra
nspo
rtatio
n R
oad;
EU
fund
6.5
km ;
Trun
g Ta
m -
Bua
- Don
g M
et -
Co
Thon
- Xo
n - K
eo -
Ten
- Con
g- P
rogr
am 1
34; R
oofto
p Pr
ovid
e20
055
HHs
(Don
g M
et 1
), 6
HHs
(Don
g M
et 2
)- P
rogr
am 3
27; W
ater
Sup
ply
Not
Wor
king
- Upp
er P
rimar
y Sc
hool
- Brid
ge C
onst
ruct
ion
Dom
g M
et -
Co
Thom
- T
rans
porta
tion
Roa
d; E
U fu
nd6.
5 km
; Tr
ung
Tam
- Bu
a - D
ong
Met
- C
o Th
on -
Xon
- Keo
- Te
n - C
ong
- Brid
ge C
onst
ruct
ion
Dom
g M
et -
Co
Thom
- P
rogr
am 3
27; W
ater
Sup
ply
Not
Wor
king
- Tra
nspo
rtatio
n R
oad;
EU
fund
6.5
km ;
Trun
g Ta
m -
Bua
- Don
g M
et -
Co
Thon
- Xo
n - K
eo -
Ten
- Con
g17
Co
Thon
Thai
Upd
ated
by
Aug
ust 2
007
8Th
aiC
o M
an 1
Co
Man
2
15Bu
aTh
ai
16D
ong
Met
1D
ong
Met
2Th
ai
5 10Th
ai
Che
Can
Thai
Phan
g 1
Phan
g 2
Phan
g 3
12Kh
auTh
ai
136 7Th
ai
Thai
1Lo
ng H
ayM
ong
2M
ong
Long
Luo
ng I
Long
Luo
ng II
3Lo
ng N
ghiu
Mon
g
4C
o D
uong
Thai
Khau
Cam
Thai
Ta
ble
7.3.
2 Pr
ojec
t List
of P
over
ty R
educ
tion
Prog
ram
s in
Muo
ng P
hang
Com
mun
e (1
)

7 - 20
NOVi
llage
Nam
eEt
hnic
Gro
upPr
ojec
tYe
arM
emo
- Pro
gram
134
; Roo
ftop
Prov
ide
2005
2 HH
s (X
om 1
), 2
HHs
(Xom
2),
3 HH
s (X
om 3
)- P
rogr
am 1
34; W
ater
Sup
ply
(Pra
nnni
ng S
tage
)20
07St
art f
rom
Sep
tem
ber 2
007
(Tot
al 1
7 ta
nks)
- PED
C P
roje
ct; S
choo
l Con
stru
ctio
n20
02-2
004
Prim
ary
Educ
atio
n fo
r Dis
adva
ntag
ed C
hild
ren
Proj
ect
Fund
ed b
y EU
and
Vie
tnam
Gov
.- T
rain
ing
Prog
ram
Agro
-fore
st, A
quac
ultu
re p
rogr
am- T
rans
porta
tion
Roa
d; E
U fu
nd6.
5 km
; Tr
ung
Tam
- Bu
a - D
ong
Met
- C
o Th
on -
Xon
- Keo
- Te
n - C
ong
- Pro
gram
134
; Roo
ftop
Prov
ide
2005
19 H
Hs- W
ater
Sup
ply
(by
Viet
nam
Gov
t)N
ot W
orki
ng- S
choo
l Con
stru
ctio
n; S
ub S
choo
lPr
imar
y Sc
hool
No2
; Keo
-Ngh
iu C
omm
unes
- Wei
r and
irrig
atio
n ch
anne
l- T
rans
porta
tion
Roa
d; E
U fu
nd6.
5 km
; Tr
ung
Tam
- Bu
a - D
ong
Met
- C
o Th
on -
Xon
- Keo
- Te
n - C
ong
- Pro
gram
134
; Roo
ftop
Prov
ide
2005
6 HH
s- W
ater
Sup
ply
(by
Viet
nam
Gov
t)20
02To
tal 4
tank
s. (3
tank
s ar
e ou
t of o
rder
)- P
EDC
Pro
ject
; Sch
ool C
onst
ruct
ion
2002
-200
4Pr
imar
y Ed
ucat
ion
for D
isad
vant
aged
Chi
ldre
n Pr
ojec
t Fu
nded
by
EU a
nd V
ietn
am G
ov.
- Tra
nspo
rtatio
n R
oad;
EU
fund
6.5
km ;
Trun
g Ta
m -
Bua
- Don
g M
et -
Co
Thon
- Xo
n - K
eo -
Ten
- Con
g- P
rogr
am 1
34; R
oofto
p Pr
ovid
e20
056
HHs
- Wat
er S
uppl
y (b
y Vi
etna
m G
ovt)
1989
Not
Wor
king
- Wat
er S
uppl
y (b
y Vi
etna
m G
ovt)
2006
Tota
l 6 ta
nks
- Tra
nspo
rtatio
n R
oad
6.5
km ;
Trun
g Ta
m -
Bua
- Don
g M
et -
Co
Thon
- Xo
n - K
eo -
Ten
- Con
g- P
rogr
am 1
34; R
oofto
p Pr
ovid
e20
054
HHs
(Ngh
iu 1
), 3
HHs
(Ngh
iu 2
)- P
rogr
am 1
34; W
ater
Sup
ply
(Pra
nnni
ng S
tage
)20
07- T
rans
porta
tion
Roa
d; E
U fu
nd6.
5 km
; Tr
ung
Tam
- Bu
a - D
ong
Met
- C
o Th
on -
Xon
- Keo
- Te
n - C
ong
- Pro
gram
134
; Roo
ftop
Prov
ide
2005
8 HH
s- P
rogr
am 1
34; W
ater
Sup
ply
2004
Tota
l 4 ta
nks
- Brid
ge C
onst
ruct
ion
(by
Viet
nam
Gov
t)- P
rogr
am 1
34; R
oofto
p Pr
ovid
e20
0515
HHs
- Pro
gram
134
; Wat
er S
uppl
y- S
choo
l Con
stru
ctio
n; S
ub S
choo
lHa
New
are
a- S
choo
l Con
stru
ctio
nHa
Orig
inal
are
a- I
rrig
atio
n Sy
stem
2002
-200
3- P
rogr
am 1
34; R
oofto
p Pr
ovid
e20
053
HHs
- Pro
gram
134
; Wat
er S
uppl
y20
04To
tal 5
tank
s- P
rogr
am 1
34; R
oofto
p Pr
ovid
e20
051
HH- S
choo
l Con
stru
ctio
n (b
y Vi
etna
m G
ovt)
- Pro
gram
134
; Roo
ftop
Prov
ide
2005
13 H
Hs- W
ater
Sup
ply
(by
Viet
nam
Gov
t)To
tal 2
tank
s- P
rogr
am 1
34; R
oofto
p Pr
ovid
e20
0513
HHs
- Pro
gram
134
; Wat
er S
uppl
y20
07To
tal 7
tank
s- D
am C
onst
ruct
ion
(Sm
all h
ydro
)20
042M
W- W
eir a
nd ir
rigat
ion
chan
nel (
by V
ietn
am G
ovt)
2002
- Pro
gram
134
; Roo
ftop
Prov
ide
2005
4 HH
s (V
ang
1), 3
HHs
(Van
g 2)
- Pro
gram
327
; Wat
er S
uppl
y20
00To
tal 5
tank
s- P
rogr
am 1
35; I
rrig
atio
n ch
anne
l and
ditc
h4.
0 km
; 2/3
Con
cret
e- S
choo
l Con
stru
ctio
n; 3
fund
sou
rces
1. P
rogr
am 3
27 (1
999)
, 2. P
EDC
Pro
ject
(200
5), 3
. EU
(200
2)- P
rogr
am 1
34; R
oofto
p Pr
ovid
e20
053
HHs
- Sch
ool C
onst
ruct
ion
(by
Viet
nam
Gov
t)R
oofto
p an
d 1t
on o
f con
cret
e- P
rogr
am 1
34; R
oofto
p Pr
ovid
e20
051
HH- I
rrig
atio
n Sy
stem
(by
Viet
nam
Gov
t)20
041.
3 km
(Co
Liu
to C
o M
an)
- Irr
igat
ion
Sysy
tem
(by
EU)
30Pa
Tra
Thai
31C
o Li
uTh
ai
28Pu
Sun
gKh
o M
u
29Va
ng 1
Vang
2Kh
o M
u
26Bo
Thai
27C
o C
uom
Kho
Mu
24Ha
Thai
25Ph
ieng
San
gTh
ai
Nghi
u 1
Nghi
u 2
22Th
ai
23M
uong
Kho
Mu
20C
ong
Kho
Mu
21Te
nKh
o M
u
18Xo
m 1
Xom
2Xo
m 3
Thai
19Ke
oKh
o M
u
Upd
ated
by
Aug
ust 2
007
Tabl
e 7.
3.2
Proj
ect L
ist o
f Pov
erty
Red
uctio
n Pr
ogra
ms i
n M
uong
Pha
ng C
omm
une
(2)

7 - 21
Figu
re 7
.3.2
Lo
catio
n M
ap o
f Com
mun
es in
Die
n Bi
en P
rovi
nce

7 - 22
Figure 7.3.3 Topographic Map and Village Location Map of Muong Phang Commune

7 - 23
Figure 7.3.4 Present Land Use Map (2005)
Figure 7.3.5 Land Use Planning Map (2015)

7 - 24
Figure 7.3.6 Ethnic Group and Number of Household Map
Figure 7.3.7 Village Poverty Rate Map

7 - 25
NO Village Name Ethnic Group Project NO Village Name Ethnic Group Project
- ActionAid Vietnam (AAV); Water Supply - Program 134; Rooftop Provide- Program 134; Rooftop Provide - Program 134; Water Supply (Prannning Stage)- ActionAid Vietnam (AAV); Water Supply - PEDC Project; School Construction- Program 134; Rooftop Provide - Training Program- Program 252; Irrigation System - Transportation Road; EU fund- PEDC Project; School Construction - Program 134; Rooftop Provide- Program 134; Rooftop Provide - Water Supply (by Vietnam Govt)- Program 252; Water Supply - School Construction; Sub School- Program 134; Rooftop Provide - Weir and irrigation channel- Program 134; Water Supply - Transportation Road; EU fund- Program 134; Rooftop Provide - Program 134; Rooftop Provide- Program 252; Water Supply - Water Supply (by Vietnam Govt)
Cang 1 - Program 134; Rooftop Provide - PEDC Project; School ConstructionCang 2 - Water Supply (by Vietnam Govt) - Transportation Road; EU fundCang 3 - School Construction; Sub School - Program 134; Rooftop ProvideCang 4 - Water Supply (by Vietnam Govt)Yen 1 - Program 134; Rooftop Provide - Water Supply (by Vietnam Govt)Yen 2 - Water Supply (by Vietnam Govt) - Transportation RoadYen 3 - Program 134; Rooftop Provide
- Program 134; Rooftop Provide - Program 134; Water Supply (Prannning Stage)- Water Supply (by Vietnam Govt) - Transportation Road; EU fund- Irrigation channel - Program 134; Rooftop Provide
9 Ban Banh Thai - Program 134; Rooftop Provide - Program 134; Water Supply- Program 134; Rooftop Provide - Bridge Construction (by Vietnam Govt)- Transportation Road - Program 134; Rooftop Provide- Irrigation channel - Program 134; Water Supply- Japan-Vietnam Oil fund; Primary School - School Construction; Sub School
11 Tan Binh Thai - Program 134; Rooftop Provide - School Construction- Program 134; Rooftop Provide - Irrigation System- Transportation Road - Program 134; Rooftop Provide- Water Supply (by Vietnam Govt) - Program 134; Water Supply- Weir and irrigation channel - Program 134; Rooftop Provide
14 Trung Tam Kinh - Transportation Road; EU fund - School Construction (by Vietnam Govt)- Program 134; Rooftop Provide - Program 134; Rooftop Provide- Program 134; Water Supply - Water Supply (by Vietnam Govt)- Irrigation channel - Program 134; Rooftop Provide- Program 159; Kindergarten - Program 134; Water Supply- School Construction; Sub School - Dam Construction (Small hydro)- Transportation Road; EU fund - Weir and irrigation channel (by Vietnam Govt)- Program 134; Rooftop Provide - Program 134; Rooftop Provide- Program 327; Water Supply - Program 327; Water Supply- Upper Primary School - Program 135; Irrigation channel and ditch- Bridge Construction - School Construction; 3 fund sources- Transportation Road; EU fund - Program 134; Rooftop Provide- Bridge Construction - School Construction (by Vietnam Govt)- Program 327; Water Supply - Program 134; Rooftop Provide- Transportation Road; EU fund - Irrigation System (by Vietnam Govt)
- Irrigation Sysytem (by EU)
Vang 1Vang 2
Kho Mu
30 Pa Tra Thai
Bo Thai
27 Co Cuom Kho Mu
Muong Kho Mu
24 Ha Thai
18Xom 1Xom 2Xom 3
Thai
19 Keo Kho Mu
20
31 Co Liu Thai
28 Pu Sung Kho Mu
29
25 Phieng Sang Thai
26
22 Nghiu 1Nghiu 2
Thai
23
Cong Kho Mu
21 Ten Kho Mu
17 Co Thon Thai
8 ThaiCo Man 1Co Man 2
15 Bua Thai
16 Dong Met 1Dong Met 2
Thai
10 Thai
Che Can Thai
Phang 1Phang 2Phang 3
12 Khau Thai
13
Khau Cam Thai
6
7 Thai
Thai
5
1 Long Hay Mong
2 MongLong Luong ILong Luong II
3 Long Nghiu Mong
4 Co Duong Thai
Figure 7.3.8 Location Map of Facilities provided by Poverty Reduction Programs

7 - 26
Figure 7.3.9 Photograph of Field Survey in Muong Phang Commune
1st : General View of Muong Phang Commune (left & right) 2nd : Water Supply Facilities(properly working: left & right) 3rd : Water Supply Facilities (broken after installation: left & right)

7 - 27
7.3.3 Ma Quai Commune in Lai Chau Province
(1) Basic information organized by GIS application
The Study Team arranged exisitng key information of socioeconomic conditions in the commune, and
collected a list of rural infrastrucutres provided by poverty reduction programs from DARD, DPC and CPC
with interviewing to local government officers. Then, the Study Team prepard a GIS database, while
exact position of the villages and facilities were verified by visiting each location using GPS. The collected
data and information are presented in the following pages.
Table 7.3.3 Outline of Ma Quai Commune
Table 7.3.4 Project List of Poverty Reduction Programs in Ma Quai Commune
Figure 7.3.10 Location Map of Communes in Lai Chau Province
Figure 7.3.11 Topographic Map and Village Location Map of Ma Quai Commune
Figure 7.3.12 Ethnic Group and Number of Household Map
Figure 7.3.13 Village Poverty Rate Map
Figure 7.3.14 Location Map of Facilities provided by Poverty Reduction Programs
Figure 7.3.15 Photograph of Field Survey in Ma Quai Commune
(2) Result of GIS Based Field Survey
Ma Quai commune is located in undulating mountain area, where altitudes are ranging between 250
m-1,600 m. Farm roads within the commune is about 24 km, of which 4km is paved and transportation
during rainy season becomes considerably difficult.
The poverty reduction programs in the commune provided various types of assistance such as provisions of
roof top for poverty households and water tanks provided by the government, road and school construction
by EU. Thus, although there are differences in scale and quality of the provided facilities, all villages in
the commune received more than one facility. Key findings can be summarized as follows.
1) Gap of project distributions according to accessibility
Six villages (Co Cooc, Bang Ban, Can Ho, Pa Pao, Luong Thang, Ma Quai Thang) are located along
or near the roads, which are fully passable by vehicle and supported by EU. These villages received
various assistances such as school, irrigation facilities by the government and EU. The roads
connecting these six villages were initially constructed by the village residents through provision of
labor. Meanwhile, EU provided a fund for expansion of the roads in 2003. Relatively large scale
projects were implemented by EU fund for these six villages, while other villages located in remote
area within the commune received only government support.
2) Definition of poverty rate
The definition of the poverty household in Muong Phang commune is monthly income less than

7 - 28
200,000VND/person according to the new MOLISA guideline. In Ma Quai commune, it is defined
as less than 80,000VND/person for more detail definition for the poorest of the poor. In Ma Quai
commune, Program 05 by the government provided the roof top material and the water tank to the
poor household defined by the latter standard (80,000VND/person).
3) Issues in provision of roof top materials
As mentioned above, Program 05 provided roof top materials to the classified poverty households.
It is found that the provision has following issues and problems.
i) The provision is limited to only those who satisfy the standard (80,000VND /month/person).
There are many cases that the provided roof tops are not used and left piled up (the reason are
iii, iv, v, vi).
ii) Provided quantities are sometimes insufficient, thereby they become useless.
iii) There was no explanation, training, guidance for installation of the materials. The recipients
had to install by themselves.
iv) Since the houses of real poor household are not strong enough to be installed, the materials are
unused and left piled up.
v) Some real poor households are likely to receive some sort of benefits by renting the provided
materials to other households.
vi) The households living in remote area had to visit at the central commune (Can Ho) and collect
the provided materials by themselves.

7 - 29
Table 7.3.3 Outline of Ma Quai Commune
NO Village Name Ethnic GroupTotal HH
(2007/09/20 Fax)Total HH
2007Poverty HH
2006*1Poverty Rate(%)
2006Poverty HH
2007*1Poverty Rate(%)
2007Electricity Supply*2 Project
1 Co Cooc Thai 40 44 15 34.1 14 31.8 × 4, 7, 12, 142 Vang Bon Dao 41 43 21 48.8 14 32.6 × 4, 5, 6, 12, 14
Thai 20Lu 15
Mong 36Dao 4
Nhang 5Hoa 2Lao 1Lu 90
Thai 5Thai 45Mong 5Dao 1
6 Ma Quai Thang Lu 70 71 4 5.6 4 5.6 × 4, 5, 12, 14Mong 13Thai 52
8 Song Con Thai 26 26 11 42.3 8 30.8 × 12, 159 Ding Danh Thai 21 22 13 59.1 10 45.5 × 12, 13, 15, 1710 Phin Ho Lu 81 94 24 25.5 19 20.2 × 7, 12, 13, 1511 Nam Ma Thai Thai 85 89 20 22.5 14 15.7 × 5, 8, 12, 13, 15, 1612 Nam Ma Dao Dao 52 49 7 14.3 6 12.2 × -13 Can Ty 1 Mong 37 37 3 8.1 3 8.1 × 12, 13, 1714 Can Ty 2 Mong 39 36 4 11.1 4 11.1 × 2, 8, 12, 1315 Can Ty 3 Mong 35 40 4 10.0 4 10.0 × 2, 8, 12, 13, 1516 Pa Pao Mong 18 19 7 36.8 2 10.5 × 12, 14, 15
839 885 215 27.6 180 22.0
*1:Poverty Households = 80,000VND/Month/Person*2:Electricity Supply = Some individual Households installed Pico-Hydro
Ethnic Group Total HHs Ethnic Rate (%)
Thai 294 35.0Dao 98 11.7Mong 183 21.8Lu 256 30.5Hoa 2 0.2Lao 1 0.1
Nhang 5 0.6Total 839
Project : 1: Water Supply Project - DCDC 10: Irrigation System (Program 135)2: Water Supply Project (Program 135) 11: Irrigation System (EU)3: Water Supply Project (Program 500) 12: Rooftop Provide Project (Program 05)4: Water Supply Project (EU) 13: Household Water Tank Provide Project(Program 05)5: Primary School Construction Project (EU) 14: Transportation Road6: Primary School Construction Project (Program 135) 15: Program 05 for Poor Household7: Primary School Construction Project (Program 159) 16: Hang Bridge Construction8: Other School Construction Project (Kindergarten, Upper Primary School) 17: One set of TV9: Health Center Construction Project (Program 135)
7 Lung Cu 80 26
5 Lung Thang 47 29
9
4 Can Ho 97 17 14
11.0
17.5
Nam Bo3 91 10
61.7
32.5
×
×
9.9
14.4
61.7
32.5
Total
2, 5, 11, 12, 14, 15
2, 6, 8, 9, 12, 14
7, 12, 14
7, 10, 12
29
26
×
×

7 - 30
Table 7.3.4 Project List of Poverty Reduction Programs in Ma Quai Commune
NO Village Name Ethnic Group Project Year Memo
- EU; Water Supply Project 2004 Total 5 Water Tanks- Program 135; Primary School Construction 2005 School, Water Tank (Out of Order), Toilet- Program 05; Rooftop Provide Provide Rooftop for poor households- EU; Transportation Road 2003 Ma Quai Thang, Can Ho, Vang Bon, Co Cooc, Pa Pao- EU; Water Supply Project 2004 Total 4 Water Tanks- Program 135; Primary School Construction 2005- EU; School Construction 2006 Class room, Water Tank- Program 05; Rooftop Provide Provide Rooftop for poor households- EU; Transportation Road 2003 Ma Quai Thang, Can Ho, Vang Bon, Co Cooc, Pa Pao
Thai - Program 135; Water Supply Project One Water TankLu - EU; Irrigation System 2005 2Km
Mong - EU; School Construction 2004 Class room, Water Tank, ToiletDao - Program 05; Provide fertilizer
Nhang - Program 05; Rooftop Provide Provide Rooftop for poor households (15HH)Hoa - EU; Transportation Road 2003 Ma Quai Thang, Can Ho, Vang Bon, Co Cooc, Pa PaoLao
- Program 135; Water Supply Project Total 5 Water Tanks (One tank is out of order)- Program 135; Primary School Construction 1999 157m2, 6 compartment, 3 classrooms- Program 135; Upper Primary School Construction 2005
Lu - Program 135; Kindergarten Construction 2007 3 Classrooms, 1 teacher room,Thai - Program 135; Health Center 2006 210.6m2
- Program 186; House of Health Office 2004 54.26m2- Resolute 37; Teachers House 2007 Under Construction, Upper Primary School No1, No2- Program 05; Rooftop Provide Provide Rooftop for poor households - EU; Transportation Road 2003 Ma Quai Thang, Can Ho, Vang Bon, Co Cooc, Pa Pao
Thai - Program 159; Primary School Construction 2003Mong - Program 05; Rooftop Provide Provide Rooftop for poor households Dao - EU; Transportation Road 2003 Ma Quai Thang, Can Ho, Vang Bon, Co Cooc, Pa Pao
- EU; Primary School Construction 2003 Class room, Water Tank, Toilet (Out of Order)- EU; Water Supply Project Total 5 Water Tanks (Include School Water Tank)- Program 05; Rooftop Provide Provide Rooftop for poor households - EU; Transportation Road 2003 Ma Quai Thang, Can Ho, Vang Bon, Co Cooc, Pa Pao- Program 135; Irrigation System 2002 35 ha- Program 159; Primary School Construction 2003- Program 05; Rooftop Provide Provide Rooftop for poor households - Program 05; Rooftop Provide Provide Rooftop for poor households - Program 05; Training Agricultural Training- Program 05; Rooftop Provide Provide Rooftop for poor households - Program 05; Domestic Water Tank for Poor HH Provide 500 liter Water Tank for poor househods- Program 05; TV set One set of TV- Program 05; Training Agricultural Training, etc (13 HH)- Program 159; Primary School Construction 2004- Program 05; Rooftop Provide Provide Rooftop for poor households - Program 05; Domestic Water Tank for Poor HH Provide 500 liter Water Tank for poor househods- Program 05; Training, etc 2004-2006 Agricultural Training, etc (24 HH), Total 3 times (2004, 2005, 2006)- Primary School; by Government 2006 Education for the special difficult area- EU; Primary School Construction 2005 Class room, Water Tank, Toilet (Out of Order)- Program 05; Rooftop Provide Provide Rooftop for poor households - Program 05; Domestic Water Tank for Poor HH Provide 500 liter Water Tank for poor househods- Program 05; Training, etc Agricultural Training, etc- Program 135; Bridge 2006
12 Nam Ma Dao Dao No Information- Program 05; Rooftop Provide Provide Rooftop for poor households - Program 05; Domestic Water Tank for Poor HH Provide 500 liter Water Tank for poor househods- Program 05; TV set One set of TV- Program 135; Water Supply Project Total 4 Water Tanks (One tank is out of order)- Program 500; Primary School Construction 2006 2 Classrooms- Program 05; Rooftop Provide Provide Rooftop for poor households - Program 05; Domestic Water Tank for Poor HH Provide 500 liter Water Tank for poor househods- Program 135; Water Supply Project Total 4 Water Tanks (3 tanks are out of order)- Program 186; Primary School Construction 2006 3 Classrooms- Program 05; Rooftop Provide Provide Rooftop for poor households - Program 05; Domestic Water Tank for Poor HH Provide 500 liter Water Tank for poor househods- Program 05; Credit Loan 7,000,000VND/H in 3 year, interest rate 0.6%/year. Gov support 70% interest- Program 05; Rooftop Provide Provide Rooftop for poor households - Program 05; Training, etc Agricultural Training, Provide fertilizer, medicine, etc.- EU; Transportation Road 2003 Ma Quai Thang, Can Ho, Vang Bon, Co Cooc, Pa Pao
15 Can Ty 3 Mong
MongPa Pao16
MongCan Ty 214
Can Ho
11 Nam Ma Thai Thai
Can Ty 1 Mong13
9 Ding Danh Thai
10 Phin Ho Lu
2 Van Bon Dao
7 Lung Cu MongThai
4
6
Updated by September 2007
1 Co Cooc Thai
8 Song Con Thai
Nam Bo
5 Lung Thang
Ma Quai Thang Lu
3

7 - 31
Figu
re 7
.3.1
0 Lo
catio
n M
ap o
f Com
mun
es in
Lai
Cha
u Pr
ovin
ce

7 - 32
Figure 7.3.11 Topographic Map and Village Location Map of Ma Quai Commune

7 - 33
Figure 7.3.12 Ethnic Group and Number of Household Map
Figure 7.3.13 Village Poverty Rate Map

7 - 34
Figure 7.3.14 Location Map of Facilities provided by Poverty Reduction Programs
NO Village Name Ethnic Group Project NO Village Name Ethnic Group Project
- EU; Water Supply Project - Program 135; Irrigation System- Program 135; Primary School Construction - Program 159; Primary School Construction - Program 05; Rooftop Provide - Program 05; Rooftop Provide- EU; Transportation Road - Program 05; Rooftop Provide- EU; Water Supply Project - Program 05; Training- Program 135; Primary School Construction - Program 05; Rooftop Provide- EU; School Construction - Program 05; Domestic Water Tank for Poor HH- Program 05; Rooftop Provide - Program 05; TV set- EU; Transportation Road - Program 05; Training
Thai - Program 135; Water Supply Project - Program 159; Primary School Construction Lu - EU; Irrigation System - Program 05; Rooftop Provide
Mong - EU; School Construction - Program 05; Domestic Water Tank for Poor HHDao - Program 05; Provide fertilizer - Program 05; Training, etc
Nhang - Program 05; Rooftop Provide - Primary School; by GovernmentHoa - EU; Transportation Road - EU; Primary School ConstructionLao - Program 05; Rooftop Provide
- Program 135; Water Supply Project - Program 05; Domestic Water Tank for Poor HH- Program 135; Primary School Construction - Program 05; Training, etc- Program 135; Upper Primary School Construction - Program 135; Bridge
Lu - Program 135; Kindergarten Construction 12 Nam Ma Dao Dao No InformationThai - Program 135; Health Center - Program 05; Rooftop Provide
- Program 186; House of Health Office - Program 05; Domestic Water Tank for Poor HH- Resolute 37; Teachers House - Program 05; TV set- Program 05; Rooftop Provide - Program 135; Water Supply Project- EU; Transportation Road - Program 500; Primary School Construction
Thai - Program 159; Primary School Construction - Program 05; Rooftop ProvideMong - Program 05; Rooftop Provide - Program 05; Domestic Water Tank for Poor HHDao - EU; Transportation Road - Program 135; Water Supply Project
- EU; Primary School Construction - Program 186; Primary School Construction - EU; Water Supply Project - Program 05; Rooftop Provide- Program 05; Rooftop Provide - Program 05; Domestic Water Tank for Poor HH- EU; Transportation Road - Program 05; Credit Loan
- Program 05; Rooftop Provide- Program 05; Training, etc- EU; Transportation Road
Mong
15 Can Ty 3 Mong
Thai
13 Can Ty 1 Mong
Thai
10 Phin Ho Lu
16 Pa Pao Mong
14 Can Ty 2
11 Nam Ma Thai
7 Lung Cu MongThai
8 Song Con Thai
Can Ho
2 Van Bon Dao
4
6
1 Co Cooc Thai
9 Ding Danh
Nam Bo
5 Lung Thang
Ma Quai Thang Lu
3

7 - 35
Figure 7.3.15 Photograph of Field Survey in Ma Quai Commune
1st : General View of Ma Quai Commune (left & right)2nd : Water Supply Project (properly working: left & right)
4th : School by EU Fund (left), School and water tank by the Government of Vietnam (right) 3rd : Irrigation project (left), Water supply project (right)– EU funded projects

7 - 36
7.3.4 Chieng Khoang Commune in Son La Province
(1) Basic information organized by GIS application
The Study Team arranged exisitng key information of socioeconomic conditions in the commune, and
collected a list of rural infrastrucutres provided by poverty reduction programs from DARD, DPC and CPC
with interviewing to local government officers. Then, the Study Team prepard a GIS database, while
exact position of the villages and facilities were verified by visiting each location using GPS. The
collected data and information are presented in the following pages.
Table 7.3.5 Outline of Chieng Khoang Commune
Table 7.3.6 Project List of Poverty Reduction Programs in Chieng Khoang Commune
Figure 7.3.17 Location Map of Communes in Son La Province
Figure 7.3.18 Topographic Map and Village Location Map of Chieng Khoang Commune
Figure 7.3.19 Ethnic Group and Number of Household Map
Figure 7.3.20 Village Poverty Rate Map
Figure 7.3.21 Location Map of Facilities provided by Poverty Reduction Programs
Figure 7.3.22 Photograph of Field Survey in Chieng Khoang Commune
(2) Result of GIS Based Field Survey
Chieng Khoang Commune extends from east to west long, and 15 villages including Khoang that is the
commune center are located along the road No. 107 on the east side of commune. On the other hand, four
villages located on the west side are connected with the accsess road which come from Phong Lai
Commune, Thuan Chau district. Phong Lai Commune is connected not the road No. 107 but No. 6,
therefore the east side and the west side of Chieng Khoang Commune are belonged to the different
livelihood sphere. There are ranges of mountain between villages in east and west, and when
intercommunicate commune, it is necessary to use inner-commune footpath of two or three hours walk or
to use 50km way by motorable road.
To sum up the matter, Chien Khoang Commune is one commune, however the actual condition of this
commune is devided into parts to the east side and the west side, and it can be said that the livelihood
sphere of both sides are totally different.
The poverty reduction programs in the commune provided various types of assistance were executed as
same with other communes that the Study Team conducted in other province. However, the all poverty
reduction programs were supported by the government, and there is no support program of foreign donors
such as EU and NGOs. Key findings can be summarized as flows.

7 - 37
1) Gap of eastern side and western side of Commune
Four villages (Son, Phieng Tau, Ban Ly, Hua
Ly) are located near the road No. 6 which is
close to Chieng Pha Commune, Thuan Chau
district than the commune center of Chieng
Khoang Commune, therefore these four
villages are set their life based on Chieng Pha
Commune. It seems that enough support had
not been received in these four villages
because it was away from the center of
commune though four remote area villages
were under Chieng Khoang Commune on the
administration. As for the poverty reduction
programs actually executed in four villages
were only small scale projects such as provided
the roof top material and the water tank to the poor household though it can be said that this four
villages are classified into the poverty area in Chieng Khoang Commune, the electrification rate is
0% and the average of poverty rate is exceeding 50%.
2) Issues in construction of school
There are only two schools are constructed in Chieng Khoang Commune, one school is located in the
commune center (eastern side) for 15 villages and the other is in Ban Ly village (western side) for
four villages though the primary school was constructed in almost every village by the support of the
government or other donor agencies in Muong Phang Commune, Dien Bien province and Ma Quai
Commune, Lai Chau province. Therefore, some students are forced on one hour or one and a half
hour walk to school every day.
3) Demand for electrification project
The Study team conducted the interview survey to each village that the priority project of this village
in the future. Many villages answered that they need the electrification project. Such an opinion
was able to be understood for six villages including four villages on western side because of 0% at a
present electrification rate of these areas, yet there were same opinions to hope for the electrification
project with electrification rate never low villages. The reasons to hope for the electrification
project are as follows.
i) Electricity is not stably supplied in the electrified villages
ii) The reasonable amount of electricity is not supplied in the electrified villages
iii) There are some households where electricity cannot be used though their villages has already
been electrified
No.6No. 107
15 villages, along with road 107th
4 villages, along with road 6th
Figure 2.3.16 Chieng Khoang

7 - 38
Thus, the issues shown in the above-mentioned has been exposed in the electrified villages, however
such issues are not reported to the government under the present situation. It is difficult for
electrified villages to introduce the new electricity project in the future. This can be said that there
are issues in the lack of monitoring and evaluation sysytem of the project, and in an absence of
villagers who are beneficiary of the project.
Table 7.3.5 Outline of Chieng Khoang Commune
No. Name of village Ethnic Group Total HH Population Poverty HH Poverty Rate(%)
Electricity Supply(%) Project
1 Na Do Thai 56 325 24 42.9 1, 2, 32 Na Pat Thai 60 351 23 38.3 1, 3, 93 Ca Thai 60 368 25 41.7 1, 2, 3
Thai 63 398 30 47.6Kinh 1 5 0 0.0
5 Hua Thai 68 356 29 42.6 45.0 1, 3, 5, 66 Na Hoi Thai 41 221 18 43.9 48.8 1, 3, 5, 6
Thai 43 257 23 53.5 93.0Kinh 15 72 0 0.0 100.0
8 Khoang Thai 44 214 20 45.5 65.9 3, 6, 79 Nang Cau Thai 45 245 20 44.4 33.3 1, 3, 4, 7
10 Cang Thai 44 232 18 40.9 56.8 1, 3, 4, 711 Han A Thai 77 425 30 39.0 50.0 1, 3, 4, 6
Thai 79 438 30 38.0Kinh 1 1 0 0.0Thai 62 369 16 25.8Kinh 1 2 0 0.0
14 Na Hy Thai 57 309 25 43.9 0.0 1, 3, 815 Dong Thai 72 409 30 41.7 0.0 3, 616 Phieng Tau Thai 35 915 16 45.7 0.0 317 Ly Thai 105 597 45 42.9 0.0 1, 3, 618 San Thai 78 438 35 44.9 0.0 1, 319 Hua Ly H'Mong 9 47 8 88.9 0.0 3, 10
1,116 6,994 465 44.8 34.0
Ethnic Group Total HHs Ethnic Rate (%) Poverty (HH) Poverty Rate (%) Electricity Supply(%)
Thai 1,089 97.6 457 42.0 40.3Kinh 18 1.6 0 0.0 100.0
H'Mong 9 0.8 8 88.9 0.0Total 1116 465 41.7 39.6
1 Program 925: Water Supply (Water tank or Well)2 Program 925: Irrigation Program3 Program 135: Rooftop Provide4 Program 134: Sanitation Program (Loan)5 Father Land Front Fund (Loan)6 Road Construction Government Program7 Irrigation and Weir Rural Infrastructure Sector Project8 Training Program Agricultural Training or Provide seed, fertilizer9 Plantation Program Oil, Rubber
10 Program 135: Water Supply (Water tank or Well)
Chieng Khoang commune
80.0
25.0
47.6
Duc
Hua Muong
Han B
He
4
7
Total
12
13
1, 2, 3
3, 4, 7
1, 3, 4, 6, 8
1, 3, 4, 5, 6

7 - 39
Table 7.3.6 Project List of Poverty Reduction Programs in Chieng Khoang Commune
NO Village Name Ethnic Group Project Year Memo
- Program 925; Irrigation Program 2004 Na Do -> Ca -> Duc -> Na Hoi -> Hua (total 2 km)- Program 135; Rooftop Provide 2 HH- Program 925; Water Supply 2000 Not Working (water tank and connection pipe)- Program 925; Water Supply 2000 Not Working (water tank and connection pipe)- Program 135; Rooftop Provide 2 HH- Planntation Program; Oil Seed 2008 2.7 ha in Na Pat Village- Planntation Program; Rubber Tree 2008 (Plannning) 15 ha in Na Pat Village, 540ha in Commune- Program 925; Irrigation Program 2004 Na Do -> Ca -> Duc -> Na Hoi -> Hua (total 2 km)- Program 925; Water Supply Not Use (Bad Water quality)- Program 135; Rooftop Provide 2 HH- Program 925; Irrigation Program 2004 Na Do -> Ca -> Duc -> Na Hoi -> Hua (total 2 km)- Program 925; Water Supply 30 HH (Water tank material)- Program 135; Rooftop Provide 3 HH- Program 925; Irrigation Program 2004 Na Do -> Ca -> Duc -> Na Hoi -> Hua (total 2 km)- Program 135; Rooftop Provide 5 HH- Program 925; Access Road 950 m village road (Government provide material, Hua and Na Hoi)- Father Land Front Fund; Loan 2006 6,000,000 VND (Interest charge 0.65%), 2HH (Toilet, Bathroom, Water Tank)- Program 925; Irrigation Sysytem 2004 4 ha irrigation, Weir and water channel for Hua and Na Hoi village- Program 925; Irrigation Program 2004 Na Do -> Ca -> Duc -> Na Hoi -> Hua (total 2 km)- Program 925; Access Road 950 m village road (Government provide material, Hua and Na Hoi)- Program 135; Rooftop Provide 1 HH- Program 925; Irrigation Sysytem 2004 4 ha irrigation, Weir and water channel for Hua and Na Hoi village- Rural Infrastructure Sector Project; Irrigation and Weir 1970/2004 This system cover Cong, Hua Muong, Khoang and Nang Cau- Program 135; Rooftop Provide 5 HH- Program 134; Sanitation Program 6,000,000 VND (Interest charge 0.65%), 6HH (Toilet, Bathroom, Water Tank)- Sub station Provide electricity Cang, Khoang, Nang Cau and Hua Muong- Accsess Road Construction Village Center to Han A- Rural Infrastructure Sector Project; Irrigation and Weir 1970/2004 This system cover Cong, Hua Muong, Khoang and Nang Cau- Program 135; Rooftop Provide 10 HH- House Provide 1 HH. Gov supply one house- Water Pomp Station Under construction, supply 15 villages- Rural Infrastructure Sector Project; Irrigation and Weir 1970/2004 This system cover Cong, Hua Muong, Khoang and Nang Cau- Program 134; Sanitation Program 6,000,000 VND (Interest charge 0.65%), 3HH (Toilet, Bathroom, Water Tank)- Program 135; Rooftop Provide 4HH- Program 925; Well 2001 2HH use.- Program 92; Well 2000 Rural Water Supplyu Program ; Not for drinking- National Grid Connection; Loan 2,000,000 - 2,500,000 VND / HH, Connect to the National Grid- Program 925; Well 2000 Not Use (Bad Water quality)- Program 135; Rooftop Provide 4HH, 1HH from Fatherland Front Program, 1 or 2 HH / Year- Rural Infrastructure Sector Project; Irrigation and Weir 1970/2004 This system cover Cong, Hua Muong, Khoang and Nang Cau- Program 134; Sanitation Program 6,000,000 VND (Interest charge 0.65%), 2 HH (Toilet, Bathroom, Water Tank)- Accsess Road Construction Village Center to Han A- Program 925; Water Supply 2000 1 Water source share with Han B- Irrigation + Water Supply 2004 Government Program, Irrigation Sysytem + Public Bath + Water Supply- Program 135; Rooftop Provide 5HH, 1 family / Year (5 years)- Program 134; Sanitation Program 2006 6,000,000 VND (Interest charge 0.65%), 12HH (Toilet, Bathroom, Water Tank)- Extension Program (Training) 2000, 2007 Agricultural Technical Training (include provide seed)- Accsess Road Construction Village Center to Han A- Program 135; Rooftop Provide 8HH, 1HH from Fatherland Front Program, 1 or 2 HH / Year- Program 925; Water Supply 2000 1 Water source share with Han A- Program 134; Sanitation Program 2006 6,000,000 VND (Interest charge 0.65%), 6 HH (Toilet, Bathroom, Water Tank)- Father Land Front Fund; Loan 2006 6,000,000 VND (Interest charge 0.65%), 1HH (Toilet, Bathroom, Water Tank)- Program 925; Water Supply 2002 Not Working, 3 Water tank and 1 pipe line (6 months)- Program 135; Rooftop Provide 3 HH, 1 family / Year- Program 134; Sanitation Program 2006 6,000,000 VND (Interest charge 0.65%), 5 HH (Toilet, Bathroom, Water Tank)- Father Land Front Fund; Loan 2006 6,000,000 VND (Interest charge 0.65%), 1 HH (Toilet, Bathroom, Water Tank)- Program 925; Water Supply 2000 / 2002 4 Well- Extension Program (Training) 2000, 2007 Agricultural Technical Training (include provide seed)- Program 135; Rooftop Provide 4HH- Program 135; Rooftop Provide 5 HH, 1 family / Year- Program 925; Accsess Road 2003 Government provide material
16 Phieng Tau Thai - Program 135; Rooftop Provide 1 HH- Program 925; Water Supply 2000 Government provide material of Water tank, bathroom and toilet- Program 135; Rooftop Provide 19 HH- Road update; Paved and Wide Government provide material, Update the accsess road from Ly to Commune Center- Program 925; Water Supply Water Tank, Government provide material- Program 135; Rooftop Provide 12 HH- Program 135; Rooftop Provide 3 HH- Program 135; Water Supply 2006 2 Water tank- Water supply; material provide 5 Water tank material- Small Bridge construction 2005 3 small bridges in this village- Health; Mosquito Net Government provide one mosquito net for each household
10 Cang
13
Thai11
12 Han B
Thai
ThaiKinh
ThaiKinh
Project List of Chieng Khoang Commune
ThaiKinh
Updated by December 2007
1 Na Do Thai
2
Hua Muong
Na Pat Thai
3 Ca Thai
4 Duc ThaiKinh
ThaiHua5
6 Na Hoi Thai
7
Thai
9 Nang Cau Thai
8 Khoang
He
Han A
ThaiNa Hy14
15 Dong Thai
19 Hua Ly H'Mong
17 Ly Thai
18 San Thai

7 - 40
Figu
re 7
.3.1
7 Lo
catio
n M
ap o
f Com
mun
es in
Son
La
Prov
ince

7 - 41
Figure 7.3.18 Topographic Map and Village Location Map of Chieng Khoang Commune

7 - 42
Figure 7.3.19 Ethnic Group and Number of Household Map
Figure 7.3.20 Village Poverty Rate Map

7 - 43
NO Village Name Ethnic Group Project NO Village Name Ethnic Group Project
- Program 925; Irrigation Program - Program 925; Well- Program 135; Rooftop Provide - Program 135; Rooftop Provide- Program 925; Water Supply - Rural Infrastructure Sector Project; Irrigation and Weir- Program 925; Water Supply - Program 134; Sanitation Program- Program 135; Rooftop Provide - Accsess Road Construction- Planntation Program; Oil Seed - Program 925; Water Supply- Planntation Program; Rubber Tree - Irrigation + Water Supply- Program 925; Irrigation Program - Program 135; Rooftop Provide- Program 925; Water Supply - Program 134; Sanitation Program- Program 135; Rooftop Provide - Extension Program (Training)- Program 925; Irrigation Program - Accsess Road Construction- Program 925; Water Supply - Program 135; Rooftop Provide- Program 135; Rooftop Provide - Program 925; Water Supply- Program 925; Irrigation Program - Program 134; Sanitation Program- Program 135; Rooftop Provide - Father Land Front Fund; Loan- Program 925; Access Road - Program 925; Water Supply- Father Land Front Fund; Loan - Program 135; Rooftop Provide- Program 925; Irrigation Sysytem - Program 134; Sanitation Program- Program 925; Irrigation Program - Father Land Front Fund; Loan- Program 925; Access Road - Program 925; Water Supply- Program 135; Rooftop Provide - Extension Program (Training)- Program 925; Irrigation Sysytem - Program 135; Rooftop Provide- Rural Infrastructure Sector Project; Irrigation and Weir - Program 135; Rooftop Provide- Program 135; Rooftop Provide - Program 925; Accsess Road- Program 134; Sanitation Program 16 Phieng Tau Thai - Program 135; Rooftop Provide- Sub station - Program 925; Water Supply- Accsess Road Construction - Program 135; Rooftop Provide- Rural Infrastructure Sector Project; Irrigation and Weir - Road update; Paved and Wide- Program 135; Rooftop Provide - Program 925; Water Supply- House Provide - Program 135; Rooftop Provide- Water Pomp Station - Program 135; Rooftop Provide- Rural Infrastructure Sector Project; Irrigation and Weir - Program 135; Water Supply- Program 134; Sanitation Program - Water supply; material provide- Program 135; Rooftop Provide - Small Bridge construction- Program 925; Well - Health; Mosquito Net- Program 92; Well- National Grid Connection; Loan
15 Dong Thai
Han A Thai
12 Han B ThaiKinh
11
13 He ThaiKinh
14 Na Hy Thai
19 Hua Ly H'Mong
17 Ly Thai
18 San Thai
10 Cang Thai
7
Thai
9 Nang Cau Thai
8 Khoang
ThaiKinh
ThaiHau5
6 Na Hoi Thai
1 Na Do Thai
2
Hua Muong
Na Pat Thai
3 Ca Thai
4 Duc ThaiKinh
Figure 7.3.21 Location Map of Facilities provided by Poverty Reduction Programs

7 - 44
Figure 7.3.22 Photograph of Field Survey in Chieng Khoang Commune
1st : General View of Chieng Khoang Commune (left & right)2nd : Water Supply Project (left & right)
4th : School for 4 villages (left), Commune road supported by villagers (right) 3rd : Irrigation project (left), Water supply project (right)

7 - 45
7.3.5 Cao Son Commune in Hoa Binh Province
(1) Basic information organized by GIS application
The Study Team arranged exisitng key information of socioeconomic conditions in the commune, and
collected a list of rural infrastrucutres provided by poverty reduction programs from DARD, DPC and CPC
with interviewing to local government officers. Then, the Study Team prepard a GIS database, while
exact position of the villages and facilities were verified by visiting each location using GPS. The
collected data and information are presented in the following pages.
Table 7.3.7 Outline of Cao Son Commune
Table 7.3.8 Project List of Poverty Reduction Programs in Cao Son Commune
Figure 7.3.24 Location Map of Communes in Hoa Binh Province
Figure 7.3.25 Topographic Map and Village Location Map of Cao Son Commune
Figure 7.3.26 Land Use Map (2005)
Figure 7.3.27 Land Use Planning Map (2015)
Figure 7.3.28 Ethnic Group and Number of Household Map
Figure 7.3.29 Village Poverty Rate Map
Figure 7.3.30 Location Map of Facilities provided by Poverty Reduction Programs
Figure 7.3.31 Photograph of Field Survey in Cao Son Commune
(2) Result of GIS Based Field Survey
Cao Son Commune accepted the residents from the Hoa Binh dam reservor area and three villages out of
nine, in other word, 40% of residents of this commune were resettlemente people. The ressetlment project
have gradually carried out since 1982, and 20 years has already passed from the project start. Some
support projects including the electricity install were bing excuted in this commune as for accepting the
relsettlement people commune named “Resettlement Area Support Project” by the government”. In
addition, school construction, water supply, and afforestation project, etc. were excuted as in return the
residents who lived originally in this commune who offered their land to the government. Except two
World Bank fund project, more than 90% implemented projects in this commune were supported by the
government though this commune located near the capital city of Hoa Binh province and most of villages
are bounded to the traffic road. Key findings can be summarized as follows.
1) The government support program for commune which accepted the resettlement people
The government conducted the support program to this commune for accepting the resettlement
people from Da reservoir area named “Project on socio-economic stabilization and development for
resettles from Da reservoir”. This project provided 100% electricity not only middle voltage
distribution line but also low voltage in-house line, water supply system and reforestation project,
etc.

7 - 46
2) Issues in government programs of supporting for the resettlement people
Agricultural training was executed to the resettlement people as a part of social economic program
for their stability of new land. This training finished in two years, and after training ended, the
crops were reaped from the training fields and other crops were planted by residents. According to
the CPC officer, residents would select and judge the crops which were more appropriate for their
new land and high value as a commercial crop than the training crops. One problem of agricultural
training by guidance of the government was brought into relief.
3) Issues in water supply project
Typhoon No.5 hit the Hoa Binh province in October, 2007, and it dealt a serious blow to Cao Son
Commune. This typhoon gave serious damage to water supply facilities in Cao Son Commune.
Thirty one facilities out of 57 which were installed by the government program 474 were broken of
the water pipe that connects to the water source to tank, however there is no plan to repair of these
facilities. Moreover, in the water supply facilities operating now, it is impossible to use them as a
drinking water but use for only the washing and bathing because agricultural chemicals, the fertilizer,
and the wastewater get mixed with the water tank. The officers of Cao Son Commune mentioned
that the priority project of this commune is the water supply project including the repair and
enhancing existing water supply facilities. Now they try to request the support to the government
and also to Japanese Government.
4) School construction project
As for Cao Son Commune that has dispersed villages, one primary school is set up in each village
except Seo village; however students in Seo village are able to walk to the commune center primary
school. Six out of eight primary schools were constructed with support of the government or other
foreign donor’s and two remainders were constructed by the resident’s contribution in the village.
The primary school in Rang village which is supported by the Vietnamese government is located at
the entrance of the village touched in the traffic road. The center of this village is 2 km away from
the entrance; therefore it takes one and a half hours to go to school everyday for students. Then
there was a village where a new primary school was constructed by the support of a Japanese private
company.
Figure 7.3.23 Old school building (left) and new school building
(right) supported by Japanese private companey

7 - 47
In Tam village, a new school building was constructed with the support of the project which
construct of schools in regions in Vietnam lacking such facilities.
(refer to web page, http://web.canon.jp/scsa/education/vietnam_aid/index.html)
Table 7.3.7 Outline of Cao Son Commune
No. Name of village Ethnic Group Total HH Poverty HH Poverty Rate(%)
Electricity Supply Resettlement Project
1 Sung Dao 52 38 73.1 100% 6, 7, 82 Bai Dao 56 42 75.0 100% 6, 7, 83 Son Lap Muong 49 27 48.9 100% 100% 64 Tam Dao 75 41 54.7 100% 2, 65 Lanh Tay 51 37 72.5 100% 2, 6, 76 Na Chieu Muong 112 40 35.7 100% 100% 2, 6
7 Son Phu Muong 190 100 52.6 100% 100% 68 Rang Tay 85 60 70.6 100% 2, 6
Muong 83 83 100.0Kinh 90 0 0.0
843 468 55.5 100%
Ethnic Group Total HHs Ethnic Rate (%) Poverty (HH) Poverty Rate (%) Electricity Supply(HH)
Electricity Supply(%)
Kinh 90 10.7 0 0.0 90 100.0Dao 183 21.7 121 66.1 183 100.0
Muong 434 51.5 250 56.9 434 100.0Tay 136 16.1 97 71.3 136 100.0Total 843 468 55.2 843 100.0
1234
56 Project 472※2:7 Project 66189 World Bank Project: Road upgrade
Protection of soil erosion on slope land
National Targeted Project on Reforestation of 5 million haProgram for Fixed cultivation and permanent settlement
Aquaculture Development in the NorthernUplands of Vietnam (VIE/98/009/01/NEX)FFI Vietnam Program
Plantation
Technical transfer on plantation and forest plantation.Support for aquaculture cultivation
Support program for protecting limestone range and its wildlifeProject on socio-economic stabilization and development for resettlers from Da reservoir
Cao Son commune
9 Seo 100% 6
Total
Program 134: Support programs for cultivation land, residential land, house and domestic waterProgram 135※1: Support programs for electricity supply , roads, schools, health stations, inter-commune centers, and training.

7 - 48
Tabl
e 7.
3.8
Proj
ect L
ist o
f Pov
erty
Red
uctio
n Pr
ogra
ms i
n C
ao S
on C
omm
une
NOVi
llage
Nam
eEt
hnic
Gro
upPr
ojec
tYe
arM
emo
- Gov
; Hea
lth C
ente
r20
0227
m2,
1 o
r 2 ti
me/
mon
th- P
rimar
y Sc
hool
2000
Gov
ernm
ent p
rovi
de m
ater
ial a
nd la
bor f
ee- P
rigra
m 7
47(4
72);
Wat
er S
uppl
y20
02To
tal 6
Tan
ks- P
rogr
am 1
35; A
cces
s R
oad
2003
Tota
l 4km
Acc
sess
road
, Bai
to S
ung
- Pro
gram
661
; Pla
ntat
ion
Fore
st P
lant
atio
n to
tal 8
ha- P
rogr
am 1
35; P
lant
atio
n20
03-2
005
Tea
Plan
tatio
n; 1
5ha(
2003
), 10
ha(2
004)
, 15h
a(20
05)
- Irr
igat
ion
Syst
em30
0m ir
rigat
ion
chan
nel,
3ha
irrig
ated
- Wor
ld B
ank;
Wat
er S
uppl
y Pr
ojec
tUp
date
the
exis
ting
wate
r sup
ply
syst
em- P
rogr
am 1
35; A
cces
s R
oad
2003
Tota
l 4km
Acc
sess
road
, Bai
to S
ung
- Pro
gram
134
; Hou
se C
onst
ruct
ion
Supp
ort
6,00
0,00
0 VN
D ,
6 HH
- Pov
erty
Red
uctio
n Pr
ogra
m; K
inde
rgar
ten
2006
- Pov
erty
Red
uctio
n Pr
ogra
m; P
rimar
y Sc
hool
2006
- Prig
ram
747
(472
); W
ater
Sup
ply
Tota
l 5 T
anks
, Not
Wor
king
(All
tank
s we
re d
estro
yed
by th
e ty
phoo
n in
Oct
, 200
7)- P
rigra
m 7
47(4
72);
Wat
er S
uppl
y20
02To
tal 5
Tan
ks (3
tank
s we
re d
estro
yed
by th
e ty
phoo
n in
Oct
ober
, 200
7)- P
rogr
am 1
34; H
ouse
Con
stru
ctio
n Su
ppor
t6,
000,
000
VND
, 6
HH- P
rigra
m 7
47(4
72);
Fore
st P
lant
atio
n36
ha B
ambo
o- K
inde
rgar
ten
Unde
r-co
nstru
ctio
n- P
rigra
m 7
47(4
72);
Wat
er S
uppl
yTo
tal 6
Tan
ks (3
tank
s ar
e wo
rkin
g an
d 3
tank
s ar
e no
t wor
king
) - W
orld
Ban
k; R
oad
Proj
ect
2004
Upgr
ade
the
exis
ting
acce
ss ro
ad (R
ang
to T
anm
)- P
over
ty R
educ
tion
Prog
ram
; Kin
derg
arte
n20
06Ki
nder
garte
n +
1 W
ater
Tan
k- P
rogr
am 1
34; H
ouse
Con
stru
ctio
n Su
ppor
t6,
000,
000
VND
, 4
HH- P
rigra
m 7
47(4
72);
Wat
er S
uppl
yTo
tal 6
Tan
ks (3
tank
s ar
e wo
rkin
g an
d 3
tank
s ar
e no
t wor
king
) - E
duca
tion
Prog
ram
; Upp
er-P
rimar
y Sc
hool
1998
Educ
atio
n Pr
ogra
m fo
r res
ettle
men
t are
a- P
rogr
am 1
34; H
ouse
Con
stru
ctio
n Su
ppor
t6,
000,
000
VND
, 6
HH- P
rigra
m 7
47(4
72);
Wat
er S
uppl
y20
02To
tal 5
Tan
ks (2
tank
s ar
e wo
rkin
g an
d 3
tank
s ar
e no
t wor
king
) - P
rogr
am 1
35; H
ealth
care
Sta
tion
- Pro
gram
134
; Hou
se C
onst
ruct
ion
Supp
ort
6,00
0,00
0 VN
D ,
8 HH
- Pro
gram
135
; Prim
ary
Scho
ol- P
rigra
m 7
47(4
72);
Wat
er S
uppl
y20
02To
tal 7
Tan
ks (5
tank
s ar
e wo
rkin
g an
d 2
tank
s ar
e no
t wor
king
) - W
orld
Ban
k; R
oad
Proj
ect
2004
Upgr
ade
the
exis
ting
acce
ss ro
ad (R
ang
to T
anm
)- P
rogr
am 1
35; P
rimar
y Sc
hool
2km
awa
y fro
m th
e vi
llage
cen
ter
- Prig
ram
747
(472
); W
ater
Sup
ply
Tota
l 11
Tank
s (1
tank
s ar
e wo
rkin
g an
d 10
tank
s ar
e no
t wor
king
, by
the
typh
oon
in O
ct, 2
007)
- P
rogr
am 1
35; P
rimar
y Sc
hool
2006
- Pro
gram
135
; Kin
derg
arte
n20
06- P
rigra
m 7
47(4
72);
Wat
er S
uppl
y20
02To
tal 7
Tan
ks (5
tank
s ar
e wo
rkin
g an
d 2
tank
s ar
e no
t wor
king
)
Pro
ject
Lis
t of C
ao S
on C
omm
une
Upd
ated
by
Dec
embe
r 200
7
Dao
Sung
1
Na C
hieu
Muo
ng
2Ba
iD
ao
3So
n La
pM
uong
7So
n Ph
uM
uong
Tam
Dao
4 5La
nhTa
y
6 8R
ang
Tay
9Se
oM
uong

7 - 49
Figu
re 7
.3.2
4 Lo
catio
n M
ap o
f Com
mun
es in
Hoa
Bin
h Pr
ovin
ce

7 - 50
Figure 7.3.25 Topographic Map and Village Location Map of Cao Son Commune

7 - 51
Figure 7.3.26 Land Use Map (2005)
Figure 7.3.27 Land Use Planning Map (2015)

7 - 52
Figure 7.3.28 Ethnic Group and Number of Household Map
Figure 7.3.29 Village Poverty Rate Map

7 - 53
NO Village Name Ethnic Group Project NO Village Name Ethnic Group Project
- Gov; Health Center - Prigram 747(472); Water Supply- Primary School - World Bank; Road Project- Prigram 747(472); Water Supply - Poverty Reduction Program; Kindergarten- Program 135; Access Road - Program 134; House Construction Support- Program 661; Plantation - Prigram 747(472); Water Supply- Program 135; Plantation - Education Program; Upper-Primary School- Irrigation System - Program 134; House Construction Support- World Bank; Water Supply Project - Prigram 747(472); Water Supply- Program 135; Access Road - Program 135; Healthcare Station- Program 134; House Construction Support - Program 134; House Construction Support- Poverty Reduction Program; Kindergarten - Program 135; Primary School- Poverty Reduction Program; Primary School - Prigram 747(472); Water Supply- Prigram 747(472); Water Supply - World Bank; Road Project- Prigram 747(472); Water Supply - Program 135; Primary School- Program 134; House Construction Support - Prigram 747(472); Water Supply- Prigram 747(472); Forest Plantation - Program 135; Primary School- Kindergarten - Program 135; Kindergarten
- Prigram 747(472); Water Supply
6 Na Chieu Muong
7 Son Phu Muong
4 Tam Dao
5 Lanh Tay
8 Rang Tay
9 Seo Muong
DaoSung1
2 Bai Dao
3 Son Lap Muong
Figure 7.3.30 Location Map of Facilities provided by Poverty Reduction Programs

7 - 54
Figure 7.3.31 Photograph of Field Survey in Cao Son Commune
1st : General View of Cao Son Commune (left), Move resident's new house by Hoa Binh dam construction (right) 2nd : Road Construction Project, already paved road (left), The vehicle cannot pass unpaved road after raining (right)
4th : Kindergarten & Primary school (left), Primary school constructed near the road (right) 3rd : Water supply project, however, because the water quality is bad, it is not used as a drinking water. (left & right)

![Brazil-India Relations Through the Lens of Political Economy [Book Chapter, 2014]](https://static.fdokumen.com/doc/165x107/63200d4501d52108cc0195cc/brazil-india-relations-through-the-lens-of-political-economy-book-chapter-2014.jpg)