Chapter 13: The Global Economy and Policy
42
Macroeconomics in Context, Fourth Edition – Sample Chapter for Early Release DRAFT 1 Macroeconomics in Context, Fourth Edition Chapter 13 The Global Economy and Policy Do you know how many Philippine pesos, South African rand, or Peruvian nuevos soles you can get for a U.S. dollar? No? If you traveled to one of these countries, you might be surprised to find out that the average person on the street in any city can often easily quote you the going exchange rate between their currency and the U.S. dollar. People in smaller economies have always been very vulnerable to international economic conditions and hence make it a habit to stay current on the rate. In contrast, because the United States has a large economy and its currency has historically dominated the world financial system, people living in the United States often tend to be relatively unaware of global economic conditions. But this has been changing, as recent events have made increasingly clear the degree to which national economies are interdependent. Global financial imbalances exposed first by the 2007– 8 financial crisis, and more recently by the global COVID-19 pandemic, led to world economic downturns that weakened the relative standing of the U.S. economy. Thus far, the dollar remains the preeminent international currency, but there is continuing discussion about possible alternatives. International money flows, as we will see, are partly determined by international trade flows. The U.S.–China trade imbalance continues to be a concern, with many arguing that the large U.S. trade deficit means that the United States owes too much money to China and that this will cause economic problems in the future. The great size of the U.S. economy makes it more capable of handling its indebtedness—both domestic and international—than many smaller countries. But many developing countries around the world face immense economic and financial challenges, with international debts far greater than their GDPs. Other political events, such as Britain’s exit from the European Union and inflation in Turkey and Argentina, have also led to fluctuation in national currency values. How can we evaluate these and similar issues from an international economic perspective? 1 Macroeconomics in a Global Context In earlier chapters, our macro model has generally limited its scope to the three main economic sectors: households, businesses, and the government. We have seen how each of these—through consumption, investment, and government spending— contributes to aggregate expenditure. It is now time to open things up a bit and introduce the foreign sector. Doing so can provide insight into how national economies are linked, and also into the opportunities and problems that such linkages can create. 1.1 Global Connections An economy with no international linkages is called a closed economy, while one that participates in the global economy is called an open economy. The economic linkages among countries can take many forms, including: • international trade flows, when goods and services that have been created in one country are sold in another, or when multiple countries are involved in different stages of production as part of a global supply chain.
-
Upload
khangminh22 -
Category
Documents
-
view
4 -
download
0
Transcript of Chapter 13: The Global Economy and Policy

Macroeconomics in Context, Fourth Edition – Sample Chapter for Early Release
DRAFT 1
Macroeconomics in Context, Fourth Edition
Chapter 13 The Global Economy and Policy
Do you know how many Philippine pesos, South African rand, or Peruvian nuevos soles you can get for a U.S. dollar? No? If you traveled to one of these countries, you might be surprised to find out that the average person on the street in any city can often easily quote you the going exchange rate between their currency and the U.S. dollar. People in smaller economies have always been very vulnerable to international economic conditions and hence make it a habit to stay current on the rate.
In contrast, because the United States has a large economy and its currency has historically dominated the world financial system, people living in the United States often tend to be relatively unaware of global economic conditions. But this has been changing, as recent events have made increasingly clear the degree to which national economies are interdependent. Global financial imbalances exposed first by the 2007–8 financial crisis, and more recently by the global COVID-19 pandemic, led to world economic downturns that weakened the relative standing of the U.S. economy. Thus far, the dollar remains the preeminent international currency, but there is continuing discussion about possible alternatives.
International money flows, as we will see, are partly determined by international trade flows. The U.S.–China trade imbalance continues to be a concern, with many arguing that the large U.S. trade deficit means that the United States owes too much money to China and that this will cause economic problems in the future. The great size of the U.S. economy makes it more capable of handling its indebtedness—both domestic and international—than many smaller countries. But many developing countries around the world face immense economic and financial challenges, with international debts far greater than their GDPs. Other political events, such as Britain’s exit from the European Union and inflation in Turkey and Argentina, have also led to fluctuation in national currency values. How can we evaluate these and similar issues from an international economic perspective?
1 Macroeconomics in a Global Context In earlier chapters, our macro model has generally limited its scope to the three main economic sectors: households, businesses, and the government. We have seen how each of these—through consumption, investment, and government spending—contributes to aggregate expenditure. It is now time to open things up a bit and introduce the foreign sector. Doing so can provide insight into how national economies are linked, and also into the opportunities and problems that such linkages can create. 1.1 Global Connections An economy with no international linkages is called a closed economy, while one that participates in the global economy is called an open economy. The economic linkages among countries can take many forms, including:
• international trade flows, when goods and services that have been created in one country are sold in another, or when multiple countries are involved in different stages of production as part of a global supply chain.

Macroeconomics in Context, Fourth Edition – Sample Chapter for Early Release
DRAFT 2
• international income flows, when capital incomes (profit, rent, and interest), labor incomes, or transfer payments go from one country to another
• international transactions in assets, when people trade in financial assets such as foreign bonds or currencies, or make investments in real foreign assets such as businesses or real estate
• international flows of people, as people migrate from one country to another, either temporarily or permanently
• international flows of technological knowledge, cultural products, and other intangibles, which can profoundly influence patterns of production and consumption, as well as tastes and lifestyles
• international sharing of, and impact on, common environmental resources, such as deep-sea fisheries and global climate patterns
• the institutional environment created by international monetary institutions, international trade agreements, international military and aid arrangements, and banks, corporations, and other private entities that operate at an international scale.
global supply chain: A network of countries directed at transforming resource inputs into finished products for delivery to the consumer.
Any one of these forms of interaction may be crucially important for understanding the macroeconomic experience of specific countries at specific times. Mexico and Turkey, for example, receive significant flows of income from remittances sent home by citizens working abroad. Trade in “intellectual property,” such as technology patents and music copyrights, continues to be an issue of hot dispute. And as made clear by the COVID-19 pandemic, diseases that threaten human health or pests that damage agriculture can travel along with people and goods—with grave consequences.
Thoroughly describing the international economic system is too large a project for even a whole textbook, never mind one or two chapters. This chapter will therefore focus on the critical foundational material required to understand the global economy. It looks at two distinct but interrelated phenomena: trade, or specifically how trade in goods and services affects aggregate expenditure; and finance, or the flows of money across borders for commercial as well as investment purposes. Additionally, we look at how trade and finance influence the exchange rate of a country’s currency. As we will see, these international issues can all affect living standards and macroeconomic stabilization. Later chapters look in more detail at issues of growth and sustainability. 1.2 Major Policy Tools We say that a country’s economy is “open” if it exports and imports large amounts relative to its GDP and “closed” if it exports and imports relatively small amounts. Governments can try to control the degree of openness or “closedness” of their economy through a variety of policy tools. Yet why would a country even want its economy to be “closed?” Is trade with other countries not unambiguously favorable? Those who favor globalization believe so; those more inclined to “protectionism” are more skeptical.

Macroeconomics in Context, Fourth Edition – Sample Chapter for Early Release
DRAFT 3
The traditional view, which dates back two centuries to Adam Smith and David Ricardo, is that trade is indeed an unmistakable benefit. One of the chief supporting ideas is that through trade, a country can expand the market for its products and therefore increase the benefit of specializing in products in which it has a productive advantage. Specialization, moreover, is seen as promoting productive efficiency and thus helping to increase economic output. Finally, through trade a country can translate its improved productivity to greater consumption of a variety of relatively low-priced products available from other countries—hence achieving higher living standards.
While there is a strong economic argument to support such claims, trade skeptics focus on the potential problems. First, trade can sometimes leave a country exceedingly vulnerable to market changes and instability. If, for example, the price of a critical raw material or food item unexpectedly rose and a country specializing in other products no longer produced that item domestically, the country might suffer severe adverse consequences if unable to pay the higher price.
Second, it matters in what products a country specializes. If a country focuses on aircraft and other high-tech products, for example, there is not necessarily a problem as long as it finds sufficient external market demand for these items. On the other hand, if a country specializes in producing bananas and coffee, there are two potential problems. First, such items often yield relatively meager earnings and employment potential, even if trade with other countries is extensive. Second and more problematic, planning an economy around the production of such primary products commits a large portion of the country’s valuable resources to the production of such goods, seriously hampering a country’s potential to become richer and more diversified.
Trade can also lead some countries, especially those that are poor, to maintain low standards for worker or environmental protection. Lower standards make for “cheaper” production, hence more competitive prices. While richer countries on the whole have lower tolerance for labor and environmental abuses, countries with impoverished populations will sometimes regard lax or even non-existent regulation in these areas as the “price” of trade competitiveness.
Finally, even if trade produces generalized benefits for all participating countries, it does not mean that everyone within a country benefits. In particular, workers in import-competing industries may face lower wages or job loss as a result of cheaper imports. Perhaps the most common example given for restricting trade (often labeled protectionism) is that doing so protects domestic workers’ jobs—even if at the cost of limiting domestic consumer choice. protectionism: the practice of limiting the extent of trade with other countries through direct policy intervention
Because of such controversies, as well as others, few if any countries adopt
completely “open” policies. Various restrictions on trade have remained common even as global trade has expanded. What are some of the ways in which a country can restrict trade?
One means of doing so is a trade quota, which does not eliminate trade but sets limits on the quantity of a good that can be imported or exported. By restricting supply, a quota generally raises the price that can be charged for the good within the country. This helps domestic producers of the good by shielding them from lower-price competition. It hurts foreign producers because it limits what they can sell in the

Macroeconomics in Context, Fourth Edition – Sample Chapter for Early Release
DRAFT 4
domestic market. Some foreign producers may, however, get some benefit in the form of additional revenues from the artificially higher price. trade quota: a restriction on the quantity of a good that can be imported or exported
A second sort of policy—which has been used often throughout history and which is still the most widely used tool of trade policy—is a tariff (or “duty”). Tariffs are taxes charged on imports or exports. Tariffs, like quotas, can reduce trade because they make internationally traded goods more costly to buy or sell. Often misunderstood, tariffs are taxes paid to the government of the importing country by the importing company or entity, not by the exporting country. Even if a country wanted to tax its trading partners, it would have no manner of compelling them to pay. Taxing the country’s own importing entity nevertheless discourages trade with the other country since the product price goes up. Consumers are therefore the ones who ultimately “pay” for the tariff in the form of a higher retail price. tariffs: taxes on imports or exports
Like quotas, import tariffs benefit domestic producers while raising prices to
consumers. Unlike quotas, however, tariffs provide monetary benefit to the government that imposes them. Also, they do not give foreign producers an opportunity to increase prices—in fact, foreign producers may be forced to lower prices in order to remain competitive with domestic producers that do not pay the tariff.
There are also various non-tariff barriers to trade that can be imposed. These include the use of specific licensing requirements, standards, or regulations on imported goods, which permit trade but may limit its extent. These may take the form of “disguised” trade barriers that are not always easy to distinguish from reasonable standards or regulations. Perhaps as a consequence, we have seen quite a variety of such non-tariff trade barriers. One well-known case was a German law requiring all the beer that the country imports to be made of a few select ingredients (namely water, barley, and hops). Beer “purity” might have been a plausible pretext, but in 1987 the European Court of Justice found the centuries-old law to be in violation of commercial agreements among European Union member countries, and Germany was required to admit imports of beer that was not “pure.” Eventually, Germany even permitted domestic production of “impure” beer, as long as it was not labeled “beer.” non-tariff barriers to trade: use of licensing or other requirements to limit the volume of trade
The last important major category of trade-related policies—trade-related
subsidies—may be used to either expand or contract trade. These are increasingly prevalent as less “visible” alternatives to tariffs or quotas. Export subsidies, paid to domestic producers when they market their products abroad, are motivated by a desire to increase the flow of exports. Countries can also use subsidies to promote a policy of import substitution, by giving domestic producers extra payments to encourage the production of certain goods for domestic markets, with a goal of reducing the quantity of imports.

Macroeconomics in Context, Fourth Edition – Sample Chapter for Early Release
DRAFT 5
trade-related subsidies: payments given by governments to producers to encourage more production, either for export or as a substitute for imports import substitution: the policy of subsidizing domestic producers to make products that can be used in place of imported goods
Government policies can also influence international capital transactions (financial
flows). Central banks often participate in foreign exchange markets with policy goals in mind, buying or selling foreign currencies, as discussed in detail later in this chapter. Countries also sometimes institute capital controls, which are restrictions or taxes on transactions in financial assets such as currency, stocks, or bonds, or on foreign ownership of domestic assets such as businesses or land. Restrictions on how much currency a person can take out of a country, for example, are one type of capital control. More sweeping capital controls can restrict investment flows into or out of a country, sometimes based on the concern that rapid large investment flows could destabilize the domestic economy.
capital controls: the regulation or taxation of international transactions involving assets
Countries may also regulate the form that foreign business investments can take.
Some have required that all business ventures within their borders be at least partially owned by domestic investors. Some have required that all traded manufactured goods include at least a given percentage of parts produced by domestic companies. Countries that have adopted such domestic content requirements include China, Indonesia, Mexico, and the Philippines; the 2020 U.S.-Mexico-Canada Agreement (USMCA) also contains a regional content requirement. Sometimes such controls are related to a development strategy, while in other cases they simply reflect a desire to avoid foreign domination of domestic markets.
domestic content requirement: laws requiring traded goods to contain a certain percentage of goods produced by domestic companies
Some trade policies are enacted to try to attract foreign investment by, for example,
giving foreign companies tax breaks and other incentives. A popular form of this is the foreign trade zone, a designated area of the country within which many tax, tariff, and perhaps regulatory policies that usually apply to manufacturing are suspended. By attracting foreign investment, countries may hope to increase employment or gain access to important technologies.
A well-known example is the maquiladora policy in Mexico under which manufacturing plants can import components and produce goods for export free of tariffs. U.S. companies on the other side of the border also benefit from Mexican exports made with much cheaper labor. Maquiladoras and similar foreign trade zones are controversial; critics highlight their frequent labor rights violations, exceedingly low wages, and environmental pollution. Mexican maquiladoras today face far more competition than 30 years ago. Other countries with an abundance of low skilled labor, like China, India, and Pakistan, are now a much bigger factor in the global economy than they once were.

Macroeconomics in Context, Fourth Edition – Sample Chapter for Early Release
DRAFT 6
foreign trade zone: a designated area of a country within which foreign-owned manufacturers can operate free of many taxes, tariffs, and regulations
Migration controls are another important aspect of international policy. Countries
generally impose restrictions on people who visit or move to their territory, and a few also impose tight regulations on people when leaving the country. Although beliefs about national culture and population size are often the most obvious concerns behind the shaping of these controls, economic interests also play an important role. For example, policies may be affected by concerns about the skill composition of the domestic labor force, the issue of a “brain drain” of skilled workers, or concern about immigrants competing for jobs with domestic workers.
But migration controls may create their own problems. For example, Brexit brought about the end of unrestricted labor flows from the European Union to Britain. While hailed by some supporters, this has led to severe labor shortages in a number of British industries. More generally, some labor economists argue that aging populations in many industrialized countries will eventually require an influx of young workers from other countries, merely to support the growing ranks of pensioners economically. Finally, intensifying climate change almost ensures that international migration will increase over time regardless, as populations abandon homes made inhospitable by rising sea levels, dangerously high temperatures, and other climate-related disasters. migration controls: restrictions on the flow of people into and out of a country
Countries do not necessarily choose sets of policies that consistently lead toward
openness or consistently toward “closedness.” Often there is a mix—policies are chosen for a wide variety of reasons and can even be at cross purposes. Nor do countries choose their policies in a vacuum. Not only must policymakers take into account the preferences of their country’s population, but they must also consider reactions to their policies by foreign governments. Increasingly, they also need to pay attention to whether their policies are in compliance with international agreements. 1.3 Patterns of Trade and Finance Economists would say that national economies are, on the whole, more “open” than in the past, even if global trade has trended slightly downward in the past few years. One way of measuring a county’s economic “openness” is to calculate the sum of its imports and exports of goods and services as a percentage of GDP. Growth in trade according to this measure is shown for 1970–2020 in Figure 13.1. Although trade is a lower proportion of GDP in the United States than in many other countries, a similar pattern of significantly increasing trade over the period 1970-2010 is also evident for the U.S., with a slight downturn in the 2010-2020 decade.
Why has trade grown over time? The first and probably most important reason is that many governments have, over time, lowered their tariffs and other barriers to trade. Since the end of World War II, there has been a push for freer trade at the global level. The General Agreement on Tariffs and Trade (GATT), established in 1947, and the World Trade Organization (WTO), succeeding it in 1994, have overseen many rounds of tariff reduction. The WTO, with 164 member countries

Macroeconomics in Context, Fourth Edition – Sample Chapter for Early Release
DRAFT 7
representing over 98 percent of global trade and GDP, also serves as the world’s arbiter on trade disputes. It has thus far consistently ruled against countries engaging in trade restrictions and aims for a world in which countries cannot discriminate against one another through unfavorable trade policies. Despite general agreement on these broad principles, the WTO has often run into difficulties and disagreements among member nations, especially on issues such as agricultural trade. This may have contributed to the recent stall in expansion of global trade evident in Figure 13.1.
World Trade Organization: An international organization that conducts negotiations aimed at lowering trade barriers, and mediates trade disputes between countries
Figure 13.1 Trade Expressed as a Percentage of Production, World and United States, 1970–2020
Source: World Development Indicators, World Bank, 2021.
Note: Since this measure includes both imports and exports, it does not mean that over 50 percent of all produced goods and services in the world are traded—it counts the same goods both as exports from one country and imports to another.
Further complicating matters is the existence throughout the world of so-called “trade blocs”—groups of countries integrating their economies for commercial advantage. Members of a trade bloc grant preferential market access to other participants, usually within the same geographical area. Such economic integration effectively creates a hierarchy of trade preference in which bloc members are favored—with, for example, elimination of tariffs or quotas—even if the goods traded are produced less efficiently or competitively than they could be outside the bloc. It could therefore be said that trade blocs, while promoting free trade within a specific region, countervail the main objectives of the WTO.

Macroeconomics in Context, Fourth Edition – Sample Chapter for Early Release
DRAFT 8
The United States-Mexico-Canada Agreement (USMCA)* is an example of one type of trade bloc that is known as a free trade area. The participating countries agree, among other things, not to impose tariffs on imports from each other. Members can pursue independent trade policies with countries outside the free trade bloc (for example, Canada has a separate trade agreement with the European Union).
A customs union is a free trade area that goes one step further: It also defines common tariffs towards the rest of the world. The Southern African Customs Union (SACU), consisting of Botswana, Eswatini (sometimes referred to as ‘Swaziland’), Lesotho, Namibia, and South Africa, is one example. Yet more integrated is a common market, which is like a customs union that additionally provides for free movement of labor and capital, as well as goods and services, among its member countries. The European Economic Area (EEA), which encompasses the European countries, Norway, Iceland, and Liechtenstein, is an example of a common market.
An economic union is a common market that, in addition, adopts a common set of economic policies. As an example, the Maastricht Treaty (1992) stipulated “convergence criteria” (fiscal policy requirements) for countries belonging to the European Union. Other examples of such unions are MERCOSUR (Argentina, Brazil, Paraguay, and Uruguay) and the Central American Integration System (SICA).
Finally, a monetary union refers to an economic union that additionally shares a single currency. The Eurozone (the region that shares the Euro currency) is the by far most well-known example of a monetary union. Some, but not all, members of the European Union participate in the Eurozone. (Denmark and Sweden are examples of European Union members that do not participate in the Eurozone.) The Eastern Caribbean Currency Union is the only other example of note, and it is a subset of the Caribbean Single Market and Economy (CSME), another economic union.
free trade area: A group of countries that have abolished tariffs and quotas for goods produced in the area and traded between these countries customs union: A group of countries that have abolished tariffs and quotas among themselves, and have introduced a common external tariff common market: A group of countries forming a customs union and additionally permitting free movement of labor and capital between participating countries economic union: A group of countries forming a common market and additionally adopts a common set of economic policies economic and monetary union: An economic union in which participating countries share a single currency
A second reason for the increase in trade flows is improvements in transportation technology. The costs and time lags involved in shipping products by air, for example, are far less now than in 1950. Fruit from Chile and flowers from Colombia or Costa Rica are now flown into the United States every day—and are still fresh when they arrive. Container ships have hugely reduced the costs of long-distance transport.
* USMCA came into force in 2020, succeeding the earlier North American Free Trade Agreement (NAFTA). USMCA is sometimes referred to as “NAFTA 2.0.”

Macroeconomics in Context, Fourth Edition – Sample Chapter for Early Release
DRAFT 9
The third reason for increased trade is advances in telecommunications. The infrastructure for phone, fax, and electronic communication has improved dramatically. Better telecommunications make it possible for many kinds of services, such as customer support and many technical functions, to be directly imported from, for example, call centers in India. Figure 13.2 Top Purchasers of Goods from the United States and Suppliers of Goods to the United States, 2021
Source: U.S. Census Bureau, Foreign Trade Statistics, Top Trading Partners, 2021. Figure 13.2 shows the volume of exports that the United States sells to the top
eight buyers of its goods and the volume of its imports that come from the top eight countries that sell to it. Historically, the closest neighbors of the United States—Canada and Mexico—have been very important trading partners. Germany, the United Kingdom, and Japan, not surprisingly, have also been leading trade partners.
Over the last several decades, China has become a major source of U.S. imports. Until about 1980, U.S. trade with China was negligible. Since then, U.S. importation of Chinese products—especially electronics (including computers and televisions) as well as clothing, toys, and furniture—has boomed. Although China buys some U.S. goods, including agricultural products and aircraft, the value of U.S. imports from China far exceeds the value of U.S. exports to China, creating a trade deficit with China of over $300 billion in 2020.
1.4 Transnational Corporations and Global Supply Chains Trade relations have also grown increasingly complex over time. We have thus far been assuming that countries produce all products from start to finish and then sell them to their trading partners. But as the world’s markets become progressively more interlinked, private companies known as transnational corporations (TNCs) often

Macroeconomics in Context, Fourth Edition – Sample Chapter for Early Release
DRAFT 10
find it advantageous to schedule different stages of production in different countries through global supply chains. So, for example, goods as diverse as automobiles and clothing are often produced in more than one country. The presence of TNCs in multiple countries means that much of the “international trade” that goes on actually occurs within one company.
transnational corporation: a company that produces goods or services in more than one country.
By organizing production and sale through global supply chains, TNCs gain efficiency advantages that increase profits. They are able to arrange each production stage in a country where, for example, labor or vital resource inputs are cheapest. Doing so helps save them considerable amounts of money. Technological advances in transportation and communications have facilitated this progress. Additionally, sophisticated algorithms have in recent years enabled companies to, for example, better anticipate consumer demand. This means that it is often no longer necessary to spend large sums of money storing inventory, as products are increasingly timed to ship as they are needed. Such developments have, over the years, helped increase the interconnectedness of markets. The efficiency gains of such modern trade networks have greatly helped increase TNC profits. But they have also come under criticism, for example for allowing TNCs to choose to operate where safety or environmental standards are most lax.
Global supply chains can also be vulnerable to unexpected events. Today’s computer algorithms, increasingly driven by artificial intelligence or ‘AI,’ have immense computing potential. But when it comes to predicting sudden “shocks” to the system, they often fall short. This was vividly illustrated during the pandemic years of 2020-2022, as disruptions in some sectors spilled over into others, creating a “domino effect” with substantial adverse impacts on global commerce, prices, and employment. Despite optimism that the worst is over, fear remains that global supply chain problems will persist indefinitely (see Box 13.1). Box 13.1 Global Supply Chain Crisis Could Last Another Two Years Industry experts warn that the pandemic-induced supply chain crisis that began in 2020/2021 could last for up to two years. Many markets are affected. In Britain, for example, it is alcohol; in Canada, maple syrup; in Australia it is a crucial additive for diesel trucks; and in New Zealand it is brown sugar.
Maersk, one of the big three shipping companies, said the worst delays were on the US west coast, creating a “ripple effect” around the world. Among consequences are too many containers in some ports in the US and Europe, but not enough in ports throughout Asia.
Inflation touched decades-long highs in western economies not only because of higher shipping costs, but due to greater demand from consumers stuck at home for months and unable to spend any money on treats such as holidays and nights out.
Tiffany Compres, a partner at international law firm FisherBroyles based in Florida, said: “It will take time to get better, for companies to adjust, and for the legal framework to adapt. To add to the challenge, this is very much a political

Macroeconomics in Context, Fourth Edition – Sample Chapter for Early Release
DRAFT 11
issue, and nations will need to cooperate to really get us to a new sustainable way of operating the supply chain. It seems to be a tall order in our polarized era.” And Dennis Unkovic, a US corporate lawyer, trade expert and author of
Transforming the Global Supply Chain, says that for anyone “expecting the post-pandemic world to return to ‘normal,’ forget it. Whatever was considered normal before the pandemic is not coming back.”1
Regardless of how the supply chain problem is resolved, there also exists a longer-term political challenge. Concern is growing that TNCs may eventually become so large that they will wield absolute power over the countries that host them. An American or European company might, for example, pressure the government of Brazil to loosen earlier restrictions on deforestation on grounds that more land is needed for cattle ranches or soybean farms. Major agribusiness corporations already wield considerable power over agricultural policy in many African countries. Such cases could mean that private companies would have sovereign rights over the governing of independent countries. As TNCs become more dominant in the global economy, this is not an idle concern.
Discussion Questions
1. How do international linkages affect your own life? Can you give examples of the sorts of linkages listed in Section 1.1 that have had direct effects on you or your family?
2. Production of apparel has been widely globalized in recent years. Before going to class, check the labels on a number of items of clothing that you own. Which countries are represented?
2 The Trade Balance: Completing the Picture How does trade affect the economy? In a number of important ways. Consumers who go to any U.S. shopping mall, for example, cannot help but notice that a large proportion of the products available for sale are imported. Many U.S. jobs are in industries that depend on export markets. We often hear concern expressed about the trade deficit. In 2021, the U.S. trade deficit equalled nearly 4 percent of GDP.2 This means that people in the United States were spending much more on foreign goods and services (importing) than the United States was selling to foreign buyers (exporting). In other words, U.S. net exports (exports minus imports) were negative. In many other countries, the situation is reversed. China, for example, is a large net exporter, meaning that it carries an annual trade surplus. Were it not for the United States, however, China would be a much smaller net exporter. Of its $366 billion in net exports in 2020, about $286 billion consisted of its bilateral surplus with the United States.3
trade deficit: an excess of imports over exports, causing net exports to be negative trade surplus: an excess of exports over imports, causing net exports to be positive

Macroeconomics in Context, Fourth Edition – Sample Chapter for Early Release
DRAFT 12
2.1 The Circular Flow Revisited Our trade balance is also related to the circular flow discussed in earlier chapters. In this section, we look at the impact of our exports and imports on aggregate expenditure and GDP. We can introduce trade into our macroeconomic model by adding net exports (NX) into the equation for aggregate expenditure:
AE = C + II+ G + NX As discussed in Chapter 4, net exports (NX) equals exports minus imports (X –
IM). Exports, like intended investment (II) and government spending (G), represent a positive contribution to aggregate expenditure. More exports means more demand for domestically produced goods and services. Imports, however, are a negative in the equation. That means they represent a leakage from U.S. aggregate expenditure—a portion of income that is not spent on U.S. goods and services.
Negative net exports (when X < IM) therefore represent a net subtraction from demand for the output of U.S. businesses and a net leakage from the circular flow. In Chapters 8 and 9, we identified savings and net taxes as leakages from the circular flow; now we need to add imports as a third source of leakage. We can also add exports to intended investment and government spending as a third source of injection into the circular flow. A decrease in exports (or an increase in imports) reduces the circular flow of domestic income, spending, and output. An increase in net exports, on the other hand, encourages a rise in GDP and employment. For example, an increase in U.S. purchases of foreign cars and a decrease in purchases of domestic cars would lower aggregate expenditure in the United States (and raise it in other car-exporting countries). But an increase in foreign sales by the U.S. computer software industry would raise U.S. aggregate expenditure and employment.
Adding exports and imports completes our basic macroeconomic model. We started with a very simple economy, with just consumers and businesses, then added government spending, taxes, and the international sector. We now have a more complex model, with three leakages (saving, taxes, and imports) and three injections (intended investment, government spending, and exports). Imports are considered leakages because, like saving and taxes, they draw funds away from the domestic income-spending flow. Exports, like intended investment and government spending, add funds to the flow. We can modify our original circular flow diagram to show all these flows (Figure 13.3).
Macroeconomic equilibrium thus involves balancing the three types of leakage with the three types of injection. A change in one or more of the leakages or injections alters the equilibrium level of output. This equilibrium, however, is a moving target. The equilibrium to which the economy tends depends on the interaction of all leakages and injections, which are constantly changing. For instance, an increase in foreign car imports lowers the equilibrium level that would balance the economy. But this change might be offset by, for example, an increase in intended investment or government spending.
The model that we have constructed allows us to understand how all these factors are related to levels of income and employment. We put it to use shortly to explain how saving and investment are linked to the global economy. But first we look at the multiplier effects of exports and imports.

Macroeconomics in Context, Fourth Edition – Sample Chapter for Early Release
DRAFT 13
Figure 13.3 Leakages and Injections in a Complete Macroeconomic Model
2.2 Effects on the Multiplier The multiplier effect for an increase in exports is essentially the same as that for an increase in II or G. Using the same model as in Chapter 9 (with a multiplier of 5), an increase of exports of 40, for example, leads to an increase of 200 in economic equilibrium.
∆Y = mult ∆X We can use exactly the same logic for a lump-sum increase in imports—the effect
on equilibrium income just goes in the opposite direction. An increase in imports of 40 would lower the equilibrium level of income by 200, and a decrease in imports of 40 would raise the equilibrium by 200.
The multiplier logic becomes a little more complicated, however, when we consider how import levels are determined. In general, when people receive more income in an open economy, they spend some of it on domestically produced goods and some on imports. The proportion spent on imports, as we noted above, is a “leakage” that does not add to domestic demand. If we want to account for this fully, we need to modify our multiplier logic.
The effect is similar to that of a proportional income tax (see Chapter 9, Appendix 2): it tends to flatten the aggregate expenditure curve, for the same reason. When people receive additional income, a portion of it “leaks” away into imports, just as taxation causes a “leakage” of a portion of extra income. This portion does not stimulate the domestic economy, so multiplier effects are smaller and the economic response a bit less dynamic. Multipliers in the neighborhood of four or five are seldom observed in the real world, because mpc is affected not only by our marginal propensity to save but also by the rate of taxation and our marginal propensity to import. For a full treatment of this effect, see the Appendix to this chapter.

Macroeconomics in Context, Fourth Edition – Sample Chapter for Early Release
DRAFT 14
In an open economy, a portion of any aggregate expenditure increase goes to stimulate someone else’s economy via imports. Thus, U.S. consumers who buy imported goods from Canada are creating jobs and income in Canada, not the United States. Does this mean that imports are bad for the United States? Not necessarily. Two other factors are important to consider.
The first is that U.S. consumers and U.S. industry benefit from cheaper imported goods and services, raw materials, and other industrial inputs. The second is that at least some of the money spent on imports is likely to return to the United States either as demand for U.S. exports—which, as we have seen, stimulates an increase in GDP and employment—or as foreign investment in the United States, which is generally beneficial to the U.S. economy overall. More generally, the U.S. economy, and overall quality of life in the United States, improves when other countries have healthier economies and diminishes when other countries are suffering economic setbacks. A prosperous world is a happier world for all. Thus, in the largest sense, if China or Canada benefit from exporting to the United States, to some extent this benefits everyone. Problems can arise, however, when trade deficits (negative net exports) are too large for too long. We explore this issue in more detail later in the chapter.
2.3 Balance Between Savings, Investment, and Net Borrowing We can use our macro model to demonstrate that saving and investment are related not only to net exports but also to foreign lending and borrowing. Understanding this link is critical to making sense of much that happens in the global economy.
We start with the usual equation breaking down GDP into consumption, investment, and government spending. In addition, we follow the convention—seen earlier in Chapter 4—of breaking government spending down into “government consumption” and “government investment,” which results in the following equation:
GDP = Personal consumption + private investment + government
consumption + government investment + net exports or
GDP = C + II + GC + GI + NX Rearranging, we obtain
GDP — C — GC = II + GI + NX
Because saving is what is left over from income after spending on consumption
(the left-hand side of the equation above), if we combine private and government savings* into a single term Stotal and private and government investment into a single term Itotal, we get:
Stotal = Itotal + NX
or: Total saving = Total investment + net exports
* Government savings would occur if government had a surplus of net tax revenues over government consumption; if government consumption exceeded net tax revenues, government savings would be negative.

Macroeconomics in Context, Fourth Edition – Sample Chapter for Early Release
DRAFT 15
Thinking about these quantities in terms of valuable goods and services, this
important identity says, intuitively, that goods and services that are produced in our domestic economy in excess of what we currently use for consumption can become investment goods—additions to our stock of manufactured assets (including replacement of depreciated assets)—or can be sold to foreign countries (in excess of the value of what we import from them).
Another way of understanding this is in terms of macroeconomic equilibrium. If, say, total domestic saving exceeded investment, a net leakage from the circular flow would occur. In order to obtain an equilibrium, this leakage would need to be offset by a trade surplus (an excess of exports over imports, creating a net injection). If total investment exceeded saving, the opposite would result—that is, there would be a trade deficit. In this case, the net leakage from an excess of imports over exports would balance the net injection caused by investment exceeding savings.
Yet another way to look at the relation of saving, investment, and trade is to think of how the various sectors finance their purchases of goods and services. In a contemporary economy, goods are rarely traded for goods; rather, money is used as a means of exchange. So, corresponding to any flow of goods and services transacted in exchanges, there is an equivalent flow of monetary funds.
Consider, for a moment, a closed economy. In this case the last equation would reduce to:
Stotal = Itotal
This says that, in a closed economy, the total amount that is not spent on
consumption goods is available for spending on investment goods. How does financial saving get turned into tangible investments?
In the national accounts, it is primarily businesses and the government that are counted as investing (although households may also “invest”, for example in second homes). They finance their investment expenditures either from their own savings or by borrowing someone else’s savings (by getting a loan from their commercial bank). Savings, in the form of income not spent on consumption, can be made available for investment by the other sectors—as when the funds in a household’s bank deposit are lent to a business or when a household or business buys a government bond. The “saving = investment” identity tells us that at an aggregate national level in a closed economy, only what the country as a whole saves out of current income can be available to finance investment for the future.
When we consider an open economy, things get more complicated. Now the country as a whole can also borrow from, or lend to, the foreign sector, and the relevant identity, as noted above, is:
Stotal = Itotal + NX
If net exports are positive, we sell more goods abroad than we buy. How would
people abroad pay for all our goods, if the value of what we sell to them exceeds the value of what they sell to us? They are not earning enough from their sales to pay us! The main way for them to finance their purchases of our goods is by borrowing from us. They would need to borrow the amount by which our exports to them exceed our imports from them. So, the identity can be (approximately) rewritten as:

Macroeconomics in Context, Fourth Edition – Sample Chapter for Early Release
DRAFT 16
Stotal = Itotal + net foreign lending
That is, if we have extra savings, above and beyond what is being used for domestic investment, we can lend it to foreigners so that they could buy our goods. The equation above is only approximate, because foreigners can also get more goods and services from us than they sell to us by receiving our goods as gifts, paying for them out of transfer income, or selling us their assets, such as land or businesses, in return. We discuss these possibilities in greater detail in the next section.
In recent years the United States has tended to have net exports that are negative. That is, we tend to buy more from foreign countries than we sell. This means that we need to borrow from them. In this case, we can rewrite the savings/investment identity as:
Stotal = Itotal – net foreign borrowing
(This means exactly the same thing as the previous equation but is easier to use
to represent a situation with a trade deficit.) When we are in a situation of borrowing from abroad, then the amount we are really “putting away for the future”—that is, saving—is less than what we would assume if we looked only at what we are investing. Although we may be investing domestically, if we are using “net foreign borrowing” to obtain investment funds, we are also creating future indebtedness to other countries by borrowing from them.
Should we worry that our country has to borrow from foreigners? As in the case of your personal finances, it makes a difference what the purpose of the borrowing is. If the borrowing financed the purchase of productive new private or government investment goods, then it might be a way of actually improving the country’s outlook for the future. As mentioned in Chapter 1, for many decades international authorities encouraged low-income countries to borrow heavily for development projects, using exactly this reasoning.
But if the funds borrowed went largely into investments that did not pay off financially, or if the borrowing only financed a high level of consumption, there would be reason to worry. A country that borrows a lot may be in trouble when it comes time to pay back its loans. In recent years, some countries have found themselves unable to pay even the interest on the foreign debts that they have built up over the years—much less repay the principal. In the case of the United States, the country’s creditworthiness has not been seriously questioned, and to date paying interest and principal on foreign debt (known as “servicing” the debt) has never posed problems. However, as discussed further in Chapter 15, a high level of international indebtedness has potential costs over the long term. Discussion Questions
1. What will be the likely effect of increased imports on U.S. GDP? Do imported goods undercut employment in the United States? What other developments in the economy might counteract this effect?
2. Savings, imports, and taxes are all considered “leakages” from aggregate expenditure. Are they bad for the economy? Or is there an important function for each? How are their levels related to equilibrium GDP, income, and employment?

Macroeconomics in Context, Fourth Edition – Sample Chapter for Early Release
DRAFT 17
3 International Finance In addition to trade in goods, countries are also linked through exchange of currencies, flows of income, and purchases and sales of real and financial assets across national borders. As we consider how international finance is related to trade and to domestic macroeconomic policies, the realization that “everything is linked to everything else” can become overwhelming. Most topics that we have discussed earlier in this book—such as supply and demand, interest rates, inflation, aggregate expenditure, and the Fed—will here come back into play. In order to ease into the topic, we begin with a few basic concepts and models. The first is currency exchange rates, followed by purchasing power parity adjustments. 3.1 Exchange Rates The exchange rate refers to the rate at which one country’s currency can trade for another’s. Consider, for example, the exchange rate between U.S. dollars (US$) and euros (€). As of early 2022, US$1 was worth about €0.889. Equivalently, we could say that one euro was worth US$1.125. The two rates are inverses of one another. When we cite “the exchange rate” for the dollar in terms of a foreign currency, what we mean is the number of units of the foreign currency that you can get in exchange for a dollar.
exchange rate: the number of units of one currency that can be exchanged for one unit of another currency
What makes exchange rates go up and down? Currencies are traded against each other all over the world, as people offer to buy and sell. The supply-and-demand model explained in Chapter 3 can be applied to foreign exchange markets, once we realize that an exchange rate is really just another kind of price—a price for a national currency.
Figure 13.4 shows an idealized foreign exchange market in which U.S. dollars are traded for euros. The quantity of dollars traded is shown on the horizontal axis, and the “price” of a dollar is given on the vertical axis, in terms of the number of euros it takes to buy a dollar.
Figure 13.4 A Foreign Exchange Market for Dollars
Macroeconomics in Context, Fourth Edition – Sample Chapter for Early Release
DRAFT 18
In a well-behaved foreign exchange market, domestic residents largely determine the supply curve of dollars, by deciding how many dollars they are willing to offer in order to buy foreign-produced goods and services and foreign assets. Because foreign-produced goods, services, and foreign assets must be paid for in the currency of the country from which they will be purchased, dollars must be traded in the foreign exchange market. Professional currency traders and banks usually do the actual trading. The more euros that U.S. residents can get for their dollars, the cheaper that European items are to them, and the more they will want to buy from Europe rather than from domestic producers. Thus, the higher the exchange rate, the more dollars they will offer on the market. The supply curve slopes upward.
It is residents of other countries who largely determine the demand curve for dollars. They may want to buy goods and services from the United States or to invest in U.S. bonds or businesses. To make these purchases, they must acquire dollars. The more euros, or other currencies, they have to pay to get a dollar, the more likely they are to go somewhere other than the United States for what they want and the lower will be the quantity of dollars that they demand. But if the U.S. dollar is relatively cheap in terms of euros, they will want to demand more dollars. So, the demand curve slopes downward. Market equilibrium is established at point E.†
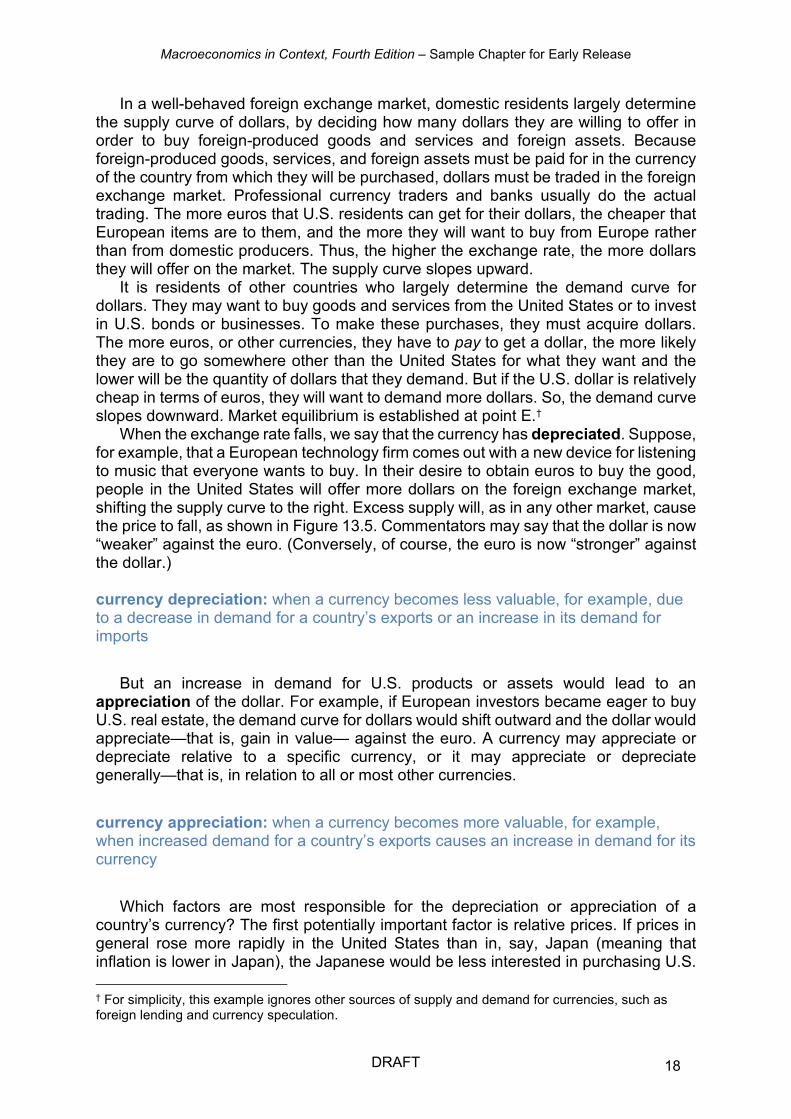
When the exchange rate falls, we say that the currency has depreciated. Suppose, for example, that a European technology firm comes out with a new device for listening to music that everyone wants to buy. In their desire to obtain euros to buy the good, people in the United States will offer more dollars on the foreign exchange market, shifting the supply curve to the right. Excess supply will, as in any other market, cause the price to fall, as shown in Figure 13.5. Commentators may say that the dollar is now “weaker” against the euro. (Conversely, of course, the euro is now “stronger” against the dollar.) currency depreciation: when a currency becomes less valuable, for example, due to a decrease in demand for a country’s exports or an increase in its demand for imports
But an increase in demand for U.S. products or assets would lead to an
appreciation of the dollar. For example, if European investors became eager to buy U.S. real estate, the demand curve for dollars would shift outward and the dollar would appreciate—that is, gain in value— against the euro. A currency may appreciate or depreciate relative to a specific currency, or it may appreciate or depreciate generally—that is, in relation to all or most other currencies.
currency appreciation: when a currency becomes more valuable, for example, when increased demand for a country’s exports causes an increase in demand for its currency
Which factors are most responsible for the depreciation or appreciation of a
country’s currency? The first potentially important factor is relative prices. If prices in general rose more rapidly in the United States than in, say, Japan (meaning that inflation is lower in Japan), the Japanese would be less interested in purchasing U.S.
† For simplicity, this example ignores other sources of supply and demand for currencies, such as foreign lending and currency speculation.

Macroeconomics in Context, Fourth Edition – Sample Chapter for Early Release
DRAFT 19
goods, ceteris paribus, and we would be more interested in purchasing theirs. What this means in terms of the foreign exchange market is that the United States would supply more dollars (in order to obtain yen to make purchases from Japan), and the Japanese would demand fewer dollars to purchase our higher-priced goods.
A rightward shift in supply coupled with a leftward shift in demand unambiguously lowers the yen “price” of the dollar, meaning that the dollar would depreciate relative to the yen (and the yen would appreciate relative to the dollar). Note that, in this example, the dollar would not depreciate with respect to all other currencies—it would merely depreciate relative to the yen.
A second factor influencing exchange rates may be a country’s GDP growth rate relative to that of its trading partners. If, for example, the United States experienced rapid growth in employment and output, it means that imports would also, ceteris paribus, increase relatively rapidly, since people would spend part of their increased disposable income on imports. This would lead the United States to demand more foreign currencies (to purchase imports) relative to the foreign demand for our dollars. Our greater demand for foreign currencies (and greater supply of dollars to purchase them) would cause the dollar to depreciate. Figure 13.5 A Supply Shift in a Foreign Exchange Market
One might conclude from this discussion that countries that consistently import
more than they export should have a persistently weak currency. The United States has, in fact, imported significantly more than it has exported for many years. Yet the dollar not only has not collapsed but remains one of the most stable currencies. How is this possible?
One reason might have to do with interest rates, which are a third key factor in determining exchange rates. If the interest rate on, say, the six-month U.S. Treasury bill were higher than the rate on comparable investments in other countries, the United States might attract flows of money from foreign investors seeking to exploit the interest rate differential. Because Treasury bills are denominated in dollars, the foreign money would be seeking to buy dollars, raising dollar demand. The result would be an appreciation in the value of the dollar. As a general rule, then, higher relative interest

Macroeconomics in Context, Fourth Edition – Sample Chapter for Early Release
DRAFT 20
rates tend to raise demand for the domestic currency and hence lead to a currency appreciation.
Yet it would be misleading to attribute dollar stability solely, or possibly even at all, to higher interest rates. Rates in the United States have been at historically low levels for the past decade and a half. Yet a strong foreign appetite for U.S. assets such as government bonds persists, and it probably explains much of the steady and reliable demand for dollars. Generally speaking, it is a country’s relative investment attractiveness that influences its currency exchange rate; the prevailing interest rate is merely one variable in what makes the country attractive to investors. Because U.S. government bonds, as well as other investments in the U.S. such as real estate, are widely regarded as safe and desirable, there is a steady flow of foreign demand for dollars to purchase these assets—independent of the inter-country interest rate differential.
In addition to currency needs for trade and investment, many traders buy and sell currency for speculative reasons. As discussed in Chapter 3, sometimes people buy something not because they need it (e.g., in this case, for facilitating a trade in real items), but because they are betting that its price will go up or down in the future. Speculative buying and selling of currencies often plays a large role in foreign exchange markets.
Unfortunately, because the ability of a country to participate in global trade critically depends on its exchange rate, such “bets” have the potential to produce real economic effects that are not always beneficial. As the role of speculation grows in importance relative to other factors that influence exchange rates, the ability of financial decisions to affect entire economies—especially small, relatively vulnerable economies—only increases. As discussed in Chapters 6 and 10, the relationship between speculation and finance, on the one hand, and the “real” economy, on the other, can affect the stability of the domestic economy, and this is also true internationally.
Many confuse domestic currency depreciation with inflation since the latter is often (correctly) understood to be a decline in the “value” of the currency. But “value” can have more than one meaning. Price inflation refers to when a currency weakens in terms of domestic purchasing power (i.e., higher average prices mean that the currency is worth relatively less) while depreciation is the weakening of currency in relation to other currencies (a reduction of its exchange rate). The two concepts are related, but not always equivalent.
What really matters for trade is the real exchange rate between currencies. Economists use the real exchange rate to express the combined effect of exchange rates and domestic inflation. For example, if a country experiences 10 percent inflation while its currency exchange rate is unchanged, the real exchange rate, which measures what foreign buyers can get for their money, is said to fall by 10 percent.†
real exchange rate: the exchange rate between two currencies, adjusted for inflation in each country
Most foreign exchange transactions are made in “strong” currencies or currencies that other countries would generally not hesitate to accept as payment for goods and
† The example presumes no inflation in the foreign country or countries. If, say, the other country experienced a five percent inflation, then the real exchange rate in the first country would fall by the inflation rate differential between the two countries, or 5 percent.

Macroeconomics in Context, Fourth Edition – Sample Chapter for Early Release
DRAFT 21
services or for some investments. The U.S. dollar tops the list, but the euro and the yen also qualify. Beyond this, the Swiss franc, famed for its remarkable stability, and possibly the British pound sterling, could be considered members of this exclusive club. Many speculate that it is only a matter of time before the Chinese currency makes this short list, but not everyone agrees. Regardless, the dollar, the euro, and the yen stand out as the top three. These currencies are the ones often referred to as foreign exchange due to their general acceptability for foreign transactions.
foreign exchange: the class of currencies that is broadly acceptable by foreigners in commercial or investment transactions. Generally limited to three currencies—the dollar, the euro, and the yen
Weak economies seldom if ever accept one another’s currencies, and usually not
even their own currency, as international payment for goods, services, or assets. As will become clear, it benefits them to be paid in strong currencies. Thus, the overwhelming majority of global currency trades are in dollars, euros, or yen. 3.2 Purchasing Power Parity Purchasing power parity (PPP) refers to the notion that, under certain idealized conditions, the exchange rate between the currencies of two countries should be such that the purchasing power of currencies is equalized. If, for example, one US dollar can fetch 115 Japanese yen in the market, a coffee maker selling for $100 in the United States should cost exactly 11,500 yen in Japan. If this were not so, the purchasing power of the two currencies would not be equal, and the purchasing power theory would not hold.
purchasing power parity (PPP): the theory that exchange rates should reflect differences in purchasing power among countries
If currencies could be traded freely against one another, if goods were freely traded
and identical across countries, and if transportation costs were trivial, then there would be a strong logic to the theory of purchasing power parity. Take, as another example, a winter jacket that costs US$200 in New York. If you lived in the United States and changed US$200 into euros, the theory of PPP says that the number of euros you would receive in exchange for your dollars in this idealized world should be exactly enough for you to buy the identical winter jacket in Paris. If the exchange rate were 0.80 euros per dollar and the jacket cost €160 (= US$200 × 0.80 euros per dollar) in Paris, PPP would hold. If economies were in fact as smoothly integrated as we are assuming in this idealized world, any item (whether a winter jacket or an hour of labor services) should cost the same, no matter where you are.
If this were not true, there would be pressures leading toward change. Suppose that the jacket costs US$200 in New York and €160 in Paris, but the exchange rate is higher, at €1: US$1. Why, in this case, would anyone buy a jacket in New York, if by changing their money into euros they could order it from Paris and save US$40? For jackets to be sold in both locations—in this idealized world—the price in New York would have to be bid down, the price in Paris would have to be bid up, or the exchange rate would have to fall.

Macroeconomics in Context, Fourth Edition – Sample Chapter for Early Release
DRAFT 22
But the real world is far from ideal. National economies are not nearly as integrated as the PPP theory assumes. Transportation costs are often significant; there are many varieties of goods; markets for goods and services do not work as quickly, smoothly, and rationally as is often assumed; and exchange rates are often “managed” by governments and central banks (see Section 4.4).
Any of these factors can mean that converting monetary amounts from one country to another using the prevailing exchange rates may be misleading. Travelers often notice that a particular category of goods, such as books or clothing, are more expensive in one country than another; this could reflect real-world factors such as transportation costs, as well as tariffs or other market imperfections.
Sometimes we see comparisons of international income levels expressed “in PPP terms.” Rather than simply using current exchange rates to convert all the various income levels into a common currency, PPP adjustments try to take into account the fact that the cost of living varies among countries. For example, converting Mexican average per capita income figures from pesos to dollars would probably understate the living standard of the average Mexican. Even though the conversion would be “correct”—in the sense that there exists a peso–dollar exchange rate that can easily be used for such an adjustment—many domestic goods and services in Mexico (e.g., haircuts or fresh produce) are generally much less expensive than in the United States. So, the dollar equivalent of what the average Mexican earns each year goes much further in Mexico. Prices tend to vary much more for goods and services that cannot be traded; haircut prices, for example, vary much more across borders than camera or jewelry prices.
purchasing power parity (PPP) adjustments: adjustments to international income statistics to take into account the differences in the cost of living across countries
The “Big Mac Index” published every year by The Economist is a somewhat light-
hearted attempt to determine how much exchange rates and the price of goods vary from PPP predictions, by comparing the prices (converted into dollars using market exchange rates) of a McDonald’s hamburger across various countries. More sophisticated analysis uses a larger “basket” of goods to make such comparisons and estimate appropriate PPP adjustments.
3.3 The Balance of Payments The flows of foreign exchange payments into and out of a country are summed up in its balance of payments (BOP) account. Table 13.1 shows the BOP account for the United States in 2020. The top part of the table tallies the current account, which tracks flows arising from trade in goods and services, earnings, and transfers. The trade account refers exclusively to the portion of the current account related to exports and imports.
balance of payments (BOP) account: the national account that tracks inflows and outflows arising from international trade, earnings, transfers, and transactions in assets

Macroeconomics in Context, Fourth Edition – Sample Chapter for Early Release
DRAFT 23
current account (in the BOP account): the national account that tracks inflows and outflows arising from international trade, earnings, and transfers trade account (part of the current account): the portion of the current account that tracks inflows and outflows arising exclusively from international trade in goods and services
Various kinds of transactions lead to payments flowing into this country (hence to a demand for dollars in the foreign exchange market). When we export goods, we receive payments in return. So, the first entry under current account inflows is the US$1.4 trillion that the United States earned from exports of goods. Exports of services (such as travel, financial, or intellectual property) also bring in inflows, as do incomes earned abroad (as profits or interest) by U.S. residents. All told, inflows into the United States from exports, incomes, and transfers totalled almost US$3.3 trillion in 2020.
Other transactions lead to payments going abroad (and to a supply of dollars to the foreign exchange market). When we import goods and services, we need to make payments to foreign residents. Foreign residents can take home incomes earned in the United States. The BOP account also includes a line for transfers abroad. The account consists of monies paid out in government foreign aid programs as well as remittances—money sent home to families from the host country by foreign workers. All told, outflows of payments from the United States totalled just under US$3.9 trillion in 2020.
Table 13.1 U.S. Balance of Payments Account, 2020 (billions of dollars) Current account
Trade Account Inflows: Payments for exports of goods 1,429 Payments for exports of services 705 Total exports 2,134 Outflows: Payments for imports of goods –2,351 Payments for imports of services –460 Total imports –2,811 Trade Balance –677 Other Flows Income receipts 958 Income payments –769 Transfer receipts 166 Transfer payments –294 Total 61 Balance on current account (= inflows – outflows) –616
Capital account
Inflows: Borrowing from abroad, and portfolio investment or FDI
1,457

Macroeconomics in Context, Fourth Edition – Sample Chapter for Early Release
DRAFT 24
Outflows: Lending, portfolio investment, or FDI abroad
–806
Derivatives and other misc. flows, net 6 Balance on capital account (= inflows – outflows) 657
Official reserve account –9
Statistical discrepancy –32 Balance of payments 0
Source: U.S. Bureau of Economic Analysis, U.S. International Transactions Accounts Data, Table
1, with rearrangements and simplifications by authors.
The balance on the current account is measured as inflows minus outflows. Because outflows exceeded inflows on the current account in 2020, the United States had a current account deficit of US$616 billion. The trade deficit, including just imports and exports, was slightly larger at US$677 billion. This is because other flows in the current account (incomes and transfers) added up to a net positive of US$61 billion. As you can see in Figure 13.6, the United States has had trade deficits fairly steadily since about 1980, with the gap between imports and exports widening to about 6 percent of GDP in some years, but more recently narrowing to about 3 percent. Figure 13.6 U.S. Imports and Exports of Goods and Services, 1960–2020
Source: BEA NIPA Tables 4.1 and 1.1.5, 2021
How can a country steadily import more than it exports? If you, personally, wanted
to buy something that costs more than you have the income to pay for, you might take out a loan or perhaps sell something that you own, such as your bicycle or your car.

Macroeconomics in Context, Fourth Edition – Sample Chapter for Early Release
DRAFT 25
Likewise, countries can finance a trade deficit by borrowing or by selling assets. These are the sorts of transactions listed in the capital account.
capital account (in the BOP account): the account that tracks flows arising from international transactions in assets
To the extent the United States lends abroad (e.g., when the government extends
loans to other countries, foreigners borrow from U.S. banks, or people in the United States buy foreign bonds), capital outflows are generated. This terminology may be confusing. Think about capital flows as going in the direction of the country that ends up with “the cash” or the power to purchase goods, and away from the country that provides the cash or purchasing power. In the case of a loan, the borrower received “the cash,” while the creditor receives a bond or other security representing a promise to repay; thus, a loan is an outflow from the lender and an inflow from the perspective of the borrower.
Similarly, in the case of a U.S. firm engaged in portfolio investment—investment in the stocks or bonds of a foreign country or company—or foreign direct investment (FDI)—the buying of all or part of a business in another country—it is the people abroad who would end up with “the cash,” while the U.S. company would receive the asset. This is also counted as an outflow from the United States. From Table 13.1, we can see that the United States had US$806 billion in capital outflows during 2020.
portfolio investment: investment in stocks or bonds of a foreign country or company foreign direct investment (FDI): investment in a business in a foreign country
Capital outflows can have widely differing meanings and impacts, depending on where they occur. When a country with a large current account surplus such as China invests the proceeds from its exports abroad, say by buying U.S. Treasury bonds, it increases China’s claims against the United States, but does not necessarily have negative impacts on either country. Holding U.S. bonds may provide China with a secure investment, while the inflow of capital may promote economic activity in the U.S.
Weak, unstable economies are much more vulnerable to large capital flows, and frequently suffer from what is known as capital flight, which occurs when investors fear investment losses and rush to move their assets to “safer” countries like the United States, the member countries of the European Union, and Japan. Capital flight may represent international investors rushing to take their money out of a weak country—as happened with South Korea, Indonesia, and the Philippines during the East Asian financial crisis of 1997—or wealthy elites seeking to take money out of their own countries. In many such cases, capital flight has the potential to destabilize economies by making foreign exchange scarce, and governments will often go to great lengths to try to stop it (see Box 13.2). capital flight: rapid movement of capital assets out of a country

Macroeconomics in Context, Fourth Edition – Sample Chapter for Early Release
DRAFT 26
Box 13.2 Africa Loses $89 Billion a Year to Capital Flight African countries lose almost $90 billion each year, equivalent to 3.7 percent of the continent’s economic output, in illicit capital flight, according to a recent UN Economic Development in Africa Report.4 A report by the UN Conference on Trade and Development’s (UNCTAD) states that stopping capital flight would have the potential to generate enough capital by 2030 to finance almost 50 percent of the $2.4 trillion needed by African countries for climate change adaptation and mitigation policies.
“Illicit Financial flows (IFFs) rob Africa and its people of their prospects, undermining transparency and accountability and eroding trust in African institutions,” UNCTAD Secretary-General Mukhisa Kituyi said in a statement accompanying the report. The report calls for increased transparency and cooperation between global governments and within the continent to tackle tax evasion and tax avoidance. It also urges the African Tax Administration Forum to become a platform for regional cooperation among African countries. UNCTAD also reports that African countries with the most IFFs spend 25 percent less than countries with low IFFs on health care, and 58 percent less on education.
“The fact remains that the funds involved [in illicit financial flows] often come from jurisdictions with scarce resources for development financing, depleted foreign reserves, a drastic reduction in collectable revenue, tax underpayment or evasion and poor investment in-flows,” said Nigerian President Muhammadu Buhari. As a result of the pandemic, a handful of African states face debt distress, and countries like Chad and Zambia have warned that they will have to default on commercial payments.
“Curbing IFF presents a key policy measure for governments, particularly in Africa, to generate the necessary financial resources to mitigate the impact of COVID-19-induced economic crisis,” Alvin Mosioma, executive director of Tax Justice Network Africa, told EURACTIV.
As we have noted, a country receives capital inflows when it borrows from
foreigners or when foreigners purchase assets there. In the case of the United States, many people abroad buy U.S. government bonds because they are considered a very secure investment. For similar reasons, many also put funds into bank accounts here. These are both capital inflows—the sellers of the U.S. securities and the U.S. banks receive “the cash.” Likewise, if a foreign multinational bought an interest in a U.S. publishing company, it would be a capital inflow. Another large source of inflows is foreign investment in U.S. real estate. In addition, a growing though still relatively minor source of net inflows were financial derivatives and similar instruments used primarily for speculation. In total, the United States received close to US$1.5 trillion in capital inflows in 2020.
As with the current account, the balance on the capital account is measured as inflows minus outflows. Thus, the United States had a US$657 billion capital account surplus in 2020. It was the willingness of foreigners to buy U.S. securities (and other assets) that financed the deficit in the current account (as you can see from Table 13.1 the positive balance on the capital account largely cancels out the negative balance on the current account).
Does this mean that the United States is putting itself in a vulnerable position by relying on borrowing to “spend beyond its means” on imports? Notice that present-day

Macroeconomics in Context, Fourth Edition – Sample Chapter for Early Release
DRAFT 27
capital inflows create the obligation to pay future income outflows: The interest due in the future on U.S. government bonds sold abroad this year, and future profits made by firms located in the United States that were bought by foreign parties this year, will become part of “income payments” in the outflows section of the current account, in years to come.
Depending on how confident we are that the U.S. economy will be able to handle these payments, we may not need to be concerned about a current account deficit – and indeed some countries have run moderate current account deficits for decades with no ill effects, generating positive economic benefits from foreign investment. But if a current account deficit is very large or lasts for a prolonged period, it could lead to future problems, as has been the case for many developing countries that borrowed too heavily on international markets.
Finally, we have what is known as the official reserve account. It represents the foreign exchange market operations of the country’s central bank (in the United States, the Federal Reserve). Why the central bank? Here it is probably more helpful to consider the position of a developing country—say, Indonesia. Like any other country, it needs to import some goods and services. How can it pay for the imports? Its currency, the rupiah, will not do. Most exporters will insist on being paid in foreign exchange—that is, dollars, euros, or yen. This presents a problem for Indonesia because it cannot produce its own dollars. It can, however, obtain them.
official reserve account: the account reflecting the foreign exchange market operations of a country’s central bank
For example, when Indonesia exports coffee, it can insist on being paid not in rupiah but in foreign exchange such as dollars. In this way, it has a strong currency available to pay for its imports. It works the same way with the capital account. Indonesia has creditors to whom it owes interest every year (reflected in the income section of the current account) that require payment in foreign exchange. Indonesia obtains this foreign exchange not only by exporting coffee and other products but also by attracting foreign capital, which it also insists should come in the form of dollars, euros, or yen.
Bank Indonesia, the country’s central bank, holds reserves of foreign currency, so that it can make up for a balance of payments deficit if necessary. Of course, it cannot do so indefinitely. If the central bank runs short of foreign exchange reserves, the country will have to cut back on imports. But in the short term the central bank can supply foreign exchange to cover a balance of payments deficit or acquire foreign exchange if there is a balance of payments surplus. If the central bank supplies foreign exchange, it is recorded as a positive item in the official reserve accounts; if it acquires foreign exchange, it is recorded as a negative item.
In some versions of the BOP, the official reserve account is lumped with the capital account.‡ When this is done, the total inflows and outflows from the current and capital accounts always “balance.” When treated separately, the official reserve account, as we have seen, offsets the discrepancy between current and capital accounts. The
‡ In recent years, for example, the International Monetary Fund has adopted the practice of calling the capital account the “financial account,” with the latter calculated to include the official reserve account. We prefer to present the traditional approach to the BOP, finding it more transparent about whether a country is truly in surplus or in deficit.

Macroeconomics in Context, Fourth Edition – Sample Chapter for Early Release
DRAFT 28
United States reduced its official reserve account by about US$9 billion in 2020, which means that the Fed’s holdings of these assets increased by this amount. If this is confusing, think of it as the negative sign signifying that the Fed removed US$9 billion in reserve assets (mostly foreign exchange) from the U.S. economy.
One additional caveat is the statistical discrepancy. It represents an inability of the BEA to make the accounts balance precisely, given problems in the quality of the data, and some small items in the accounts that we do not get into here. Allowing for this discrepancy, the balances in the current account, the capital account, and the official reserve account must add up to zero (the “balance of payments”). The difference between the current and capital accounts must be “balanced” by a flow of foreign exchange to or from the central bank. Any gap can be fully attributed to measurement error, which is what the statistical discrepancy reflects. Discussion Questions
1. Is it better for the United States to have a strong or weak dollar? What are the advantages and disadvantages of each?
2. Is a nation’s balance of payments analogous to a company or household income statement? Is it necessarily a bad thing for a country’s trade balance to be in deficit?
4 Macroeconomics in an Open Economy In earlier chapters, our discussion of how fiscal and monetary policy can be used to influence aggregate expenditure was limited to a “closed” economy. We are now ready to consider a more complete picture of the effects of such policies in an “open” economy. The bottom line of what is laid out in sections 4.1 and 4.2 is simple to state: The intended effects of monetary policy are strengthened, or amplified, by interactions with the foreign sector; while trade with foreign partners may either strengthen or weaken fiscal policy actions. The reasons why this is so, however, are rather complex. The value of working through them is that it is a way of showing in action some of the principles of macroeconomic supply and demand that have been laid out thus far. We will then apply our open economy model to the emergency circumstances underlying the global pandemic, and then consider how these, along with exchange rate policy, can bring about serious sovereign debt problems. 4.1 Fiscal Policy Recall from our earlier concept of a macroeconomic equilibrium that, for equilibrium to be present, injections must equal leakages. We know from Chapter 9 that a budget deficit is a net injection because it occurs when government spending (injection) is greater than tax revenue (leakage). If we assume that private savings and investment are in balance, a government budget deficit requires a net leakage from the foreign sector for macroeconomic equilibrium to be achieved—that is, imports must exceed exports (again, disregarding for now the transfers and net income).
In other words, a government’s budget balance is correlated with the country’s trade balance—a government deficit, not financed from domestic savings, implies a trade deficit. In common-sense terms, if the government does not obtain the funds it needs from domestic savings, it must borrow from abroad. But what is the economic

Macroeconomics in Context, Fourth Edition – Sample Chapter for Early Release
DRAFT 29
mechanism by which they are related? A country’s budget balance can influence its trade balance through at least two separate channels, each related to the exchange rate of its currency.
First, we have seen that deficit spending has the potential, in economies at or near full employment, to lead to higher interest rates—either through the classical argument of crowding out or through the central bank reacting to growing inflationary pressure with rate hikes. In an open economy, the higher interest rates are likely to attract more foreign investment in the form of bond purchases. If foreigners demand more U.S. bonds as a result of the higher interest rates that they offer, the demand for dollars increases (because U.S. bonds are all denominated in U.S. dollars). The resulting increase in demand for dollars, ceteris paribus, leads to an appreciation of the dollar compared to other currencies.
We have also seen that a stronger currency makes a country’s goods relatively more expensive in the global markets. In other words, if the U.S. dollar appreciated, we would expect the United States to be able to export less than before. At the same time, imports would increase because a stronger dollar makes other countries’ goods (denominated in their currencies) appear cheaper. Through this sequence, an increase in the budget deficit might increase the size of the trade deficit.
Notice, however, that while both deficits grow, the economic effect of the rising trade deficit is to offset the expansionary effect of the budget deficit. Imports (leakage from the circular flow) increase while exports (injection) decrease. Because we do not know the magnitude of each of these changes, we are not saying that the open economy effect cancels out the original effect of the fiscal stimulus. What we can say is that it probably dampens it somewhat.
The other channel is a more direct consequence of the fiscal expansion. Deficit spending boosts aggregate expenditure, increasing spending and generating greater employment and more income. Yet, as the economy grows, all spending grows, including spending on imports. The greater demand for imports increases the global supply of dollars, as U.S. citizens demand more foreign currency to purchase imports. This causes the dollar to depreciate, reversing the process, because a weaker dollar results in more exports and fewer imports.
Depreciation of the dollar will tend to narrow the trade deficit, resulting in a net injection to the circular flow and reinforcing the initial fiscal stimulus. Since the two effects we have described go in opposite directions, we cannot say anything specific about the magnitude of the changes, nor can we say overall whether the “open economy” on balance reinforces or countervails the domestic fiscal policy. But we can say that the effect of deficit spending is complicated by consideration of foreign sector effects. 4.2 Monetary Policy In Chapter 11 we discussed monetary policy in a closed economy. In an open economy, monetary policy is more effective in changing aggregate expenditure, because, unlike fiscal policy, its global effects unambiguously reinforce the domestic policy.
Suppose that the Fed believes the U.S. economy needs a boost and acts to promote lower interest rates in an attempt to increase aggregate expenditure. As we saw in Chapter 11, the decrease in interest rates should encourage investment spending. But in an open economy, the fall in interest rates should also increase net exports, another component of aggregate expenditure.

Macroeconomics in Context, Fourth Edition – Sample Chapter for Early Release
DRAFT 30
This is because a reduction in U.S. interest rates is likely to reduce inflows of foreign financial capital. If interest rates in the U.S. fall, people abroad will be less inclined to buy U.S. government bonds or put their money in U.S. bank accounts. As they send their financial capital elsewhere, the demand for U.S. dollars will decrease. This can be portrayed as a leftward shift of the demand curve in the foreign exchange market. As discussed above (refer to Figure 13.4) a decrease in the demand for dollars would cause the dollar to depreciate.
A depreciation in the dollar means that a dollar now buys fewer units of foreign exchange, which, you will recall, discourages spending on imports. Meanwhile, the fact that a dollar can be purchased for fewer units of foreign exchange means that U.S. exports become “cheap” for foreign buyers. Exports should increase. As we have discussed, an increase in net exports (caused in this case by both a rise in exports and a fall in imports) raises aggregate expenditure. This reinforces the original stimulus effect of the expansionary monetary policy.
The openness of the economy can be thought of as adding an extra loop to the chain of causation discussed in Chapter 11, as illustrated below:
Yet this is not the end of the story. Just as in the earlier case of deficit spending, an increase in aggregate expenditure tends to produce an increase in imports. As we have seen, this leads to dollar depreciation, as U.S. citizens trade dollars for other currencies so that they can purchase imported products.
The effect is to further reinforce the initial domestic stimulus, since a weaker dollar tends to narrow the trade deficit and thus increase aggregate expenditure, ceteris paribus. So, in contrast to the fiscal policy case, where “opening up” the economy produces ambiguous effects in relation to a domestic fiscal stimulus, for monetary policy the international trade consequences clearly reinforce the domestic policy. A monetary stimulus, in other words, is amplified in an open economy. We should note that a monetary contraction would also be magnified; the same causal mechanisms would be in effect, only in reverse.
4.3 A Special Case: Economic Stimulus in the Pandemic Era
The pandemic experience illustrates a variety of country experiences with macroeconomic policy and its impacts. The initial economic fallout from COVID-19 threatened to plunge the world into a full-blown depression. It is arguably thanks to widespread fiscal and monetary stimulus throughout the world that such an outcome was avoided. Yet not all countries benefited equally from economic stimulus.

Macroeconomics in Context, Fourth Edition – Sample Chapter for Early Release
DRAFT 31
Widespread illness and death, along with an imposed economic slowdown in hopes of stemming the pandemic’s spread, effectively put a brake on most economies. Most countries pursued fiscal and monetary stimulus in response to the negative economic effects of the pandemic, but with varying degrees of success. In particular, as we might expect from the discussion of fiscal policy in the previous section, countries that attempted very large spending increases did not necessarily see comparable benefits. Some of the benefits of increased spending could “leak” away in the international market, leaving the country with large increases in debt. Public health policy was also a major factor in economic health outcomes: invariably, countries that imposed stricter lockdowns and were slower in inoculating their populations suffered more adverse economic consequences (See Box 13.3). Box 13.3 The Pandemic Stimulus Backfired in Some Emerging Markets According to an analysis in the Financial Times, some of the developing countries that stimulated most aggressively got little payoff in terms of faster recovery.5
More rapid inflation, higher interest rates, and currency depreciation at least partly cancelled out the effects of stimulus in a number of countries. Hungary, Brazil, the Philippines, and Greece, all of which spent at least 16 percent of GDP on stimulus, saw limited results. But the higher deficits and debt that they ran up “will leave them with less ammunition to fight the next battle,” according to Ruchir Sharma, global strategist for Morgan Stanley.
Moreover, developing nations often lack the financial resources and the global credibility to increase spending substantially without unbalancing the economy. Those that overspend tend to get punished by global markets.
Comparing countries on an index that includes factors like inflation, currency value, interest rates, and budget deficit highlights the difference between the big spenders and countries that were more conservative. Hungary, Brazil and the Philippines were among the worst scorers, while light spenders like Taiwan, South Korea, and Mexico scored the best.
According to Sharma, nations that spend in haste are often forced to repent at leisure. Those that attempted to “go big” during the pandemic mostly got less added growth than they imagined and considerably more trouble, in the form of higher deficits and debt. It figures to be a major challenge in the future, as many believe that another international debt crisis looms.
It matters a great deal whether the country pursuing fiscal or monetary policy is a rich country like the United States or a developing country like the Philippines. Quite simply, markets respond very differently when a country that cannot “afford” a sizable stimulus—often requiring a sizable debt to finance—attempts to undertake one regardless. Developing countries are hurt more even by moderate inflation because it means either higher interest rates, currency depreciation, or both. Either one has the effect of nullifying the impact of the initial stimulus. Countries with stable currencies need not fear such consequences, at least not to the same extent.
The logic underlying fiscal and monetary policy links to the global economy is of less concern to a large economy such as United States. The U.S. also enjoys the benefits of possessing the dollar, the world’s premier international currency. What this means, for example, is that the United States government can borrow large

Macroeconomics in Context, Fourth Edition – Sample Chapter for Early Release
DRAFT 32
sums without worrying unduly about having to offer higher interest rates. Why? U.S. government debt and the currency in which it is dominated continues, arguably at least, to offer global investors the safest existing investment. Consequently, foreigners generally continue to lend to the United States, even at a low interest rate. Unlike other currencies, the dollar is not as likely to depreciate as a result of continued low rates, because investors will be expected to invest in the U.S. economy regardless.
In short, while there exist important links between a country’s domestic economic policies and the global economy, we must keep in mind that the picture is invariably complicated by such factors as pandemics and other global shocks, the relative strength of the economy or its currency, or international politics. These intersecting considerations limit the extent to which we can predict the likely global consequences of domestic economic policies. 4.4 Managed Versus Flexible Foreign Exchange Thus far, we have assumed that exchange rates are determined by market forces, as modelled in Figures 13.4 and 13.5. In a flexible or floating exchange rate system, countries allow their exchange rates to be determined by the forces of supply and demand. But in practice this may not always be the case: countries may often attempt to control or manage their exchange rates.
flexible (floating) exchange rate system: a system in which exchange rates are determined by the market forces of supply and demand
Flexible exchange rates can create significant uncertainties in an economy. A manufacturer may negotiate the future delivery of an imported component, for example, only to find that exchange rate changes make it much more expensive than expected to complete the deal. Foreign exchange markets can also be susceptible to wild swings from speculation. A mere rumor of political upheaval in a country, for example, can sometimes create a rush of capital outflows as people try to move their financial assets into foreign banks, causing a precipitous drop in the exchange rate. Or an inability to obtain short-term foreign loans may send an economy into crisis—and its exchange rate swinging—even if over a longer period the economy would be considered financially sound. It can be hard to maintain normal economic activities when exchange rates fluctuate wildly.‡
Many countries have tried to control the value of their currencies to create a more predictable environment for foreign trade. The strictest kind of control is a fixed exchange rate system. In this case, a group of countries commits to keeping their currencies trading at fixed ratios over time. Starting in 1944, many countries, including the United States, had fixed exchange rates under what is known as the Bretton Woods system (named after the international monetary conference in Bretton Woods, New Hampshire that created a post-war financial order including the Intentional Monetary Fund and the World Bank).
‡ It is for this reason that importers and exporters frequently resort to futures markets in order to “lock in” a given exchange rate between two currencies hence avoid any risk from such fluctuation. But such markets can also be, and often are, used for financial speculation. Perhaps as a result, futures markets are generally more a focus of finance than of economics.

Macroeconomics in Context, Fourth Edition – Sample Chapter for Early Release
DRAFT 33
fixed exchange rate system: a system in which currencies are traded at fixed ratios Bretton Woods system: a system of fixed exchange rates established after World War II, lasting until 1972
The exchange rates in such a system, however, do not usually remain perfectly fixed. For one thing, to fix an exchange rate precisely, the central bank would need to have perfect (and continuously perfect) information about all trades—something that is not feasible in real-world conditions. What the countries that participated in the Bretton Woods conference did—and countries today that fix their currency generally do—is set a “band” or range around a “target rate” and allow the “fixed” rate to fluctuate within this band. In the case of the countries that were part of the Bretton Woods system, the band was very narrow—on the order of plus or minus 1 percent.
Over the long term, the target rate can change, at the government’s discretion. When a government lowers the level at which it fixes its exchange rate, what is called a devaluation occurs, and when it raises it, a revaluation takes place. But the system can be undermined if there are too many changes, and when key currencies such as the dollar come under too much selling pressure a fixed exchange rate system can break up. This is what happened to the Bretton Woods system in 1972. The U.S. dollar had been the linchpin of the system and had been convertible to gold. When the United States suffered large currency outflows, the U.S. eliminated gold convertibility and allowed the currency to float, which was quickly followed by other major countries floating their currencies also.
devaluation: lowering an exchange rate within a fixed exchange rate system revaluation: raising an exchange rate within a fixed exchange rate system
After the Bretton Woods system ended, many countries moved to a “floating” system, while others tried to exert some management over their currencies. Such management is performed by trying to maintain certain target exchange rates, by “pegging” the currency to a particular foreign currency or by letting it “float” but only within certain bounds (something like the Bretton Woods system, only with a much wider band).
How does a country keep its exchange rate fixed, or at least within bounds? A government has at its disposal two main tools. The first is imposing capital controls. For example, a country that wants to limit foreign exchange trading may require that importers apply for licenses to deal in foreign exchange or impose quotas on how much they can obtain. By only allowing highly regulated transactions, it can control the prices at which exchange transactions are made.
The second is foreign exchange market intervention. As we saw earlier in our discussion of official reserve accounts, central banks have the power to intervene in foreign exchange markets. They may do this under a floating exchange rate regime, with the object of raising or lowering the rate, or to build up or lower their holdings of foreign exchange. When a country is committed to a fixed exchange rate, it is the responsibility of the central bank to respond to upward or downward pressures on the rate with appropriate intervention in order to keep the rate at the prescribed level.

Macroeconomics in Context, Fourth Edition – Sample Chapter for Early Release
DRAFT 34
foreign exchange market intervention: an action by central banks to buy or sell foreign exchange reserves in order to keep exchange rates at desired levels
To see how intervention works, consider Figure 13.7. Suppose that the government would like to keep the exchange rate of its domestic currency at the level e*, but market pressures are represented by the curves Smarket and Dmarket. At the exchange rate e*, there is an excess supply (surplus) of domestic currency, and so there is pressure on the exchange rate to fall. The central bank must artificially create more demand for the domestic currency, as shown by demand curve Dwith intervention. It does this by going into the market and exchanging foreign currency for domestic currency—essentially "soaking up" the surplus domestic currency.
The problem is that the central bank can do this only as long as it has sufficient reserves of foreign exchange on hand. If it ran out of foreign exchange, it would be unable to support the currency and be forced to devalue. Devaluation is, in fact, fairly common among countries with a deficit in their current account and insufficient surplus in the capital account to cover these deficits. In particularly severe cases, countries can experience a balance of payments crisis, in which a lack of foreign exchange means that the country cannot purchase needed imports or make payments on its debt.
balance of payments crisis: when a country gets precariously close to running out of foreign exchange and is therefore unable to purchase imports or service its existing debt
Is devaluation a bad thing? The answer to this question is complex. Devaluation is generally thought to be good for exporters, because it makes the country’s goods cheaper abroad. But it also means that people in the country will find that imports are now more expensive. And sometimes devaluation is taken as a sign of instability or poor policy in a country, which can lead to rapid outflows of capital, forcing further devaluation.
Figure 13.7 Foreign Exchange Intervention

Macroeconomics in Context, Fourth Edition – Sample Chapter for Early Release
DRAFT 35
Imagine, for example, an investor who is considering investing US$100 million in Bolivian government bonds. If it seemed likely that the country’s currency—the sucre—would at some point be devalued, the best strategy would be to avoid investing in Bolivia. If the exchange rate today were 5,000 sucres to the dollar, the investor could purchase 500 billion sucres worth of bonds with US$100 million. But if the currency were in fact later devalued—to the point where 10,000 sucres would be needed to purchase a dollar—the investment would subsequently only be worth US$50 million if the investor decided to sell the bonds and convert back to dollars. Because of the potential problems resulting from currency devaluation, many economists have grown cautious about recommending devaluation as a cure for international imbalances.
Not surprisingly, countries will always prefer to plan a devaluation rather than be pressured into one by circumstances. Countries that are either export competitive or attractive to foreign investors are able to amass large amounts of foreign reserves and supply much domestic currency on the market. Doing so enables such countries to keep their exchange rates lower than market forces would dictate. China is generally known to have used this tactic in the past, keeping the value of its currency, the renminbi, artificially low to stimulate exports (the value of renminbi is often cited in terms of its most common unit, the yuan) and, in the process, becoming a large holder of U.S. dollars as well as other currencies. But China has also intervened in the opposite direction, to revalue the renminbi, particularly between 2014 and 2017 when it sold over $1 trillion from its reserves to support the currency.
One complication with fixed exchange rates is that they make it impossible for a country to conduct independent monetary policy. The reason is that intervention by its central bank on money markets to buy and sell its currency for foreign exchange reasons necessarily affects the country’s domestic money supply, and consequently (as we saw in Chapter 11) its interest rates. If the domestic interest rate is influenced to a significant degree by the country’s exchange rate policy (specifically its desire to fix its rate), this severely limits the effectiveness of monetary policy. If, on the other hand, the central bank intervenes for monetary policy reasons (e.g., to control inflation), the resulting change in the money supply would affect the relative international value of the currency, so it would be impossible to keep the exchange rate fixed. A country, therefore, can set its exchange rate or its interest rate, but not both. If it keeps its exchange rate fixed relative to another currency, the interest rates in the two countries will tend to move together. 4.5 Developing Country Problems: Balance of Payments and Debt Crises Most developing countries opt for some variation of a “managed” exchange rate regime. For them, monetary policy is often necessarily a secondary concern. Their need for scarce foreign exchange is paramount. On the one hand this makes sense, since it is important that the value of an exporting country’s currency not rise too much. Allowing it to do so would make exports more expensive, hence less competitive, in global markets.
Yet it is a delicate balancing act. Too weak a currency severely hampers a country’s ability to import. Perversely, developing countries with limited import potential will sometimes even go without necessities since the luxury-consuming middle class have preferential access to scarce foreign exchange. An exceedingly weak currency is also a big liability when it comes to servicing a country’s external debt. Creditors always insist on being paid in foreign exchange; the weaker a

Macroeconomics in Context, Fourth Edition – Sample Chapter for Early Release
DRAFT 36
developing country’s currency, therefore, the more of its scarce stock of foreign exchange must go to paying interest on the debt.
The problem is that poor countries often fall short in their balance of payments. The current account and capital account need not fully offset; as we have seen, the central bank balances things through the operation of the official reserve account. Unfortunately, a country that is a relatively weak exporter (meaning fewer foreign exchange inflows) still depends on imports and must service its debt (both outflows). Consequently, the central bank “makes up the difference” by putting some of its scarce foreign exchange reserves into circulation. Doing so repeatedly is what provokes balance of payments crises requiring emergency lending.
The worst such case on record is probably the debt crisis of the 1980s, during which several Latin American countries fell into balance of payments crises and required emergency bailouts. There have been numerous similar instances in more recent years, such as in Mexico (1994) and East Asia (1997), Russia (1998), Turkey (1999), Argentina (2001), Ecuador (2008), Greece (2012 and 2015), and Venezuela (2017)—to name only the most prominent.
Many fear that a new debt crisis is brewing, possibly more consequential than any earlier one. Dozens of countries have recently applied for emergency assistance (see Box 13.4). The main cause is the unanticipated need for pandemic support. Wealthy nations can afford to “do without” for an extended period, have more fiscal clout, and also have more resources to stem the spread of diseases—in some cases not requiring their populations to undergo strict lockdown. Developing country economies have been hit especially hard because of economic paralysis and insufficient government funds. The global markets have also not favored them. Box 13.4 Poor Countries Facing a New Debt Crisis The world’s poor countries have had their finances destroyed by the global pandemic. Tanzania has called on “our rich brothers” to cancel its debt, and Argentina recently defaulted for the ninth time in its history.
“This is really unlike anything we have seen,” said Mitu Gulati, a law professor at Duke University. “The last time we had this many countries likely to go under at the same time was in the 1980s.” In Latin America, that period was known as La Década Perdida—The Lost Decade.
While poor countries have historically been able to borrow from the World Bank and International Monetary Fund (IMF), in recent years their debt has become popular with private investment firms. Unfortunately for debtor nations, such entities have their own interests and their own rules.
Argentina’s multiyear dispute with a group of hedge funds including Elliott Management is a wakeup call. Elliott and other investors bought Argentine bonds shortly before the country defaulted in 2001 and held out for full repayment—at one point even seizing an Argentine naval vessel—rather than settle through a debt restructuring. It worked. Elliott eventually received nearly 400 percent of its original investment.
As investors around the world seek refuge in the dollar, currencies in many developing countries have plummeted in value. That means it takes more of their own currency to buy the dollars they need to pay their debts, while they have also spent heavily on the logistical response to the COVID-19 pandemic. “The abruptness of this shock is much larger than the 2008 global financial crisis,” said Ramin Toloui, assistant Treasury secretary for international finance under Obama.

Macroeconomics in Context, Fourth Edition – Sample Chapter for Early Release
DRAFT 37
The International Monetary Fund has already expanded two emergency loan programs, and more than 100 countries have applied. The programs will help in the short term, Mr. Toloui said, but much more financial assistance will be required. The IMF itself has estimated the borrower countries’ total current need, from all sources, at $2.5 trillion.6
As we have seen, persistent balance of payments deficits tend to provoke vicious
cycles of continued debt dependence, except in the rare case when a country is able to export its way out of trouble. The recent economic crisis caused by the pandemic has only intensified an already chronic problem, as many countries find themselves in dire need of external assistance. While the pandemic might only be temporary, its financial consequences on developing countries could persist for decades. Together with the mounting challenges that developing countries face related to climate change, many are likely to experience an unprecedented imbalance in their foreign exchange payments. That might require widespread and massive debt forgiveness to avoid economic collapse.
Discussion Questions
1. Having an “open” economy complicates a country’s conduct of fiscal and monetary policy, since international effects must be considered, and these may either reinforce or counteract the original policy. Does this mean that it might be better to have a “closed” economy? What are some of the advantages and disadvantages of “openness”?
2. Why did countries fix their exchange rates in the past? Why did many stop doing so? What are some potential problems involved in letting a country’s exchange rate “float”?
5 International Financial Institutions
The Bretton Woods system of fixed exchange rates was only one aspect of the international financial structure established in the 1940s. Also formed during this period were the International Bank for Reconstruction and Development (IBRD), later expanded into the World Bank, with the goal of promoting economic development through loans and programs aimed at poorer countries, and the International Monetary Fund (IMF), established to oversee international financial arrangements. Although fixed exchange rates among the major currencies have been abandoned, the World Bank and the IMF continue—with considerable controversy—to play significant roles in international affairs.
World Bank: an international agency charged with promoting economic development, through loans and other programs International Monetary Fund (IMF): an international agency charged with overseeing international finance, including exchange rates, international payments, and balance of payments management

Macroeconomics in Context, Fourth Edition – Sample Chapter for Early Release
DRAFT 38
When it was created, the IMF was charged with overseeing exchange rates, international payments, and balance of payments management and with giving advice to countries about their financial affairs. The IMF has a complicated governance structure based on voting shares allocated to member countries, but in fact its policymaking has historically been dominated by the United States and certain countries in Europe. The appointed members of its executive board represent the United States, the United Kingdom, Germany, France, and Japan. In 2010 the IMF restructured its voting system to give China, South Korea, Turkey, and Mexico slightly larger shares. Both the World Bank and IMF have their headquarters in Washington, DC.
When a country is in financial trouble—for example, when it is unable to pay the interest that it owes on its foreign debts or is experiencing wild swings in its exchange rate—the IMF (in conjunction with the World Bank, if the country is poor) often advises the government on how to remedy the problem. The IMF has tended to encourage low- and middle-income countries with debt problems to remove their barriers to trade and capital flows, arguing that such liberalization promotes economic growth. The countries are also advised to minimize the size of their government and its expenditures, as a way to reduce the need for borrowing. They are told to keep their inflation rates down and are often advised about their exchange rate policies as well.
The policy prescriptions of trade liberalization, privatization, deregulation, and small government became known during the 1980s and 1990s as the Washington Consensus (described in more detail in Chapter 16). The policies have also become the source of much controversy, as many economists have come to believe that rigid, “one-size-fits-all” application of such policies often works against, rather than for, human welfare and international stability. In particular, as prominent Malaysian economist Jomo Kwame Sundaram has argued, forcing smaller countries to open their borders to capital flows leaves them vulnerable to crisis caused by capital flight. This occurred in the Asian financial crisis of 1997 when an “East Asian miracle” of economic growth was rapidly replaced by economic collapse in Indonesia, Malaysia, the Philippines, and elsewhere.7 High current debt levels, as we have noted, make renewed crises of this kind very likely.
Washington Consensus: specific economic policy prescriptions used by the IMF and World Bank with a goal of helping developing countries to avoid crisis and maintain stability. They include openness to trade and investment (liberalization), privatization, budget austerity, and deregulation
Many observers are currently calling for reforms in the international financial system and perhaps for new international institutions. Dissatisfaction over the IMF prescriptions for liberalization has caused some changes within the organization itself. But some argue that these changes are not sufficient and that more radical changes are necessary. Suggestions include greater regulation of international banking, substantial reforms and increased transparency in multinational corporate governance, restrictions on short-term capital flows, a tax on speculative transactions in foreign exchange, and establishment of an international bankruptcy court.

Macroeconomics in Context, Fourth Edition – Sample Chapter for Early Release
DRAFT 39
Discussion Questions
1. To check your understanding of international linkages, consider the following hypothetical scenario. Suppose that people overseas become less interested in buying U.S. government bonds (perhaps because they start to think of them as less secure). What would be the effect on: a. The BOP financial account? b. The supply or demand for U.S. dollars? c. The value of the U.S. dollar? d. The BOP current account?
2. Have international trade or financial imbalances, or actions of the IMF, been in the news lately? What are the current controversies?
Review Questions
1. What are the major ways in which economies connected internationally?
2. List three policies related to international trade.
3. List two policies related to international capital transactions.
4. Briefly describe the recent history of United States and world trade and list the major U.S. trading partners.
5. What are some international organizations and agreements dealing with trade relations?
6. List some major reasons why countries often limit trade.
7. What is the theory of “purchasing power parity”?
8. Who creates the supply of a currency on the foreign exchange market? Who creates the demand?
9. Draw a carefully labelled graph illustrating a depreciation of the dollar against the euro.
10. What are the two principal accounts in the balance of payments, and what do they reflect?
11. How and why is an imbalance (surplus or deficit) in the current account related to an imbalance in the capital account?
12. Does having an open economy make monetary policy stronger or weaker? Why?
13. What is the effect of an open economy on fiscal policy?
14. Distinguish between floating and fixed exchange rate systems.
15. How and why might a central bank “intervene” on a foreign exchange market?
16. What is the “Washington Consensus”?
17. What reforms have been suggested for the international financial system?

Macroeconomics in Context, Fourth Edition – Sample Chapter for Early Release
DRAFT 40
Exercises
1. Singapore is a natural-resource-poor country that has built its economy on the basis of massive imports of commodities and raw materials and similarly massive exports of refined and manufactured goods and services. In Singapore, exports were 176 percent of GDP in 2020! But how can a country export more than its GDP? (Hint: Remember that imports are subtracted to obtain the measure of net exports that is part of GDP.)
2. Classify each of the following as a trade flow, income flow, or asset transaction:
a. A U.S. software company sells its products to European consumers b. A Saudi investor buys real estate in Europe c. A U.S. retailer imports Chinese-made appliances d. A worker in the UK sends some of her wages back to her family in
India e. A Mexican manufacturer pays interest on a loan from a Canadian
bank
3. Suppose that, due to rising interest rates in the United States, the Japanese increase their purchases of U.S. securities.
a. Illustrate in a carefully labelled supply-and-demand diagram how this would affect the foreign exchange market and the exchange rate expressed in terms of yen per dollar.
b. Is this an appreciation or depreciation of the dollar? c. Would we say that the yen is now “stronger”? Or “weaker”? d. If the rise in interest rates was due to a deliberate Fed policy, does
this international connection make such policy more, or less, effective? Explain in a few sentences.
4. Determine, for each of the following, whether it would appear in the current account or capital account section of the U.S. balance of payments accounts and whether it would represent an inflow or an outflow.
a. Payments are received for U.S.-made airplanes sold to Thailand b. A resident of Nigeria buys a U.S. government savings bond c. A U.S. company invests in a branch in Australia d. A Japanese company takes home its profits earned in the United
States e. The U.S. government pays interest to a bondholder in Canada
5. Match each concept in Column A with a definition or example in Column B. Column A Column B
a. Tariff 1. Makes international incomes comparable, by accounting for differences in the cost of living
b. Current account 2. A rise in the value of a currency in a floating exchange rate system

Macroeconomics in Context, Fourth Edition – Sample Chapter for Early Release
DRAFT 41
Column A Column B
c. Currency appreciation 3. An organization charged with providing loans for development
d. Purchasing power parity adjustment
4. Investing in a foreign business
e. Balance of payments crisis 5. Tracks flows arising from trade, earnings, and transfers
f. Quota 6. A tax put on an internationally traded item
g. Non-tariff barriers to trade 7. When a country runs short of foreign exchange
h. World Bank 8. A rise in the value of a currency, under a fixed exchange rate system
i. International Monetary Fund 9. Using measures such as standards and licensing to restrict trade
j. Capital controls 10. When a central bank buys or sells foreign exchange
k. Revaluation 11. A fall in the value of a currency under a floating exchange rate system
l. Foreign Direct Investment 12. Putting a quantity limit on imports or exports
m. Currency depreciation 13. Government intervention to reduce or eliminate international capital flows
n. Foreign exchange market intervention
14. An organization charged with overseeing international finance
References
Martin Farrer, “Global supply chain crisis could last another two years, warn experts,” The Guardian, December 18, 2021.
Zoran Radosavljevic. 2020. “Africa Loses $89 Billion a Year to Illicit Capital Flight,
UN Report Finds,” EURACTIV MEDIA NETWORK, September 28. Sharma, Ruchir. 2021. “The Pandemic Stimulus Has Backfired in Emerging
Markets,” Financial Times, October 25. Sundaram, Jomo Kwame. “1997 Asian Crisis Lessons Lost.” Inter Press Service
News, July 25, 2017.

Macroeconomics in Context, Fourth Edition – Sample Chapter for Early Release
DRAFT 42
U.S. Census Bureau. 2021. Trade in Goods with China.www.census.gov/foreign-
trade/balance/c5700.html. Walsh, Mary Williams and Matt Phillips. 2020. “Poor Countries Face a Debt Crisis
‘Unlike Anything We Have Seen,” The New York Times, June 1. World Bank. 2020. World Development Report. Appendix: An Algebraic Approach to the Multiplier, in a Model with Trade Just as we modified the multiplier in the appendix to Chapter 9 to take account of the impact of taxes, we can now go a step further to consider the effect of trade. Suppose that, in addition to consumption’s depending on income, imports depend on income according to the equation IM = mpim Y, where mpim is the marginal propensity to import (the proportion of additional income spent on imports). The mpim is a fraction. Starting with the equation for aggregate expenditure with a proportional tax that we had derived in the appendix to Chapter 9, we can get an equation for aggregate expenditure in an economy including trade, as follows:
AE = → C + II + G + X - IM = → C̄ + mpc(Y — tY + TR) + II + G + X — mpim Y = → (C̄ + mpc TR + II + G + X) + [mpc (1 - t) - mpim] Y
The AE curve now has the intercept given by the first term in parentheses. Changes
in exports shift the curve upward or downward. The new slope is given by the term in brackets. The slope is flatter, due to the subtraction of mpim.
Solving for Y (using the same method as in the appendix to Chapter 10—but leaving out some of the intermediate steps) yields:
𝑌𝑌 −𝑚𝑚𝑚𝑚𝑚𝑚(1 − 𝑡𝑡)𝑌𝑌 + 𝑚𝑚𝑚𝑚𝑚𝑚𝑚𝑚𝑚𝑚 𝑌𝑌 = 𝐶𝐶 + 𝑚𝑚𝑚𝑚𝑚𝑚 𝑇𝑇𝑇𝑇 + 1𝐼𝐼 + 𝐺𝐺 + 𝑋𝑋𝑌𝑌
= [1
1 −𝑚𝑚𝑚𝑚𝑚𝑚 (1− 𝑡𝑡) + 𝑚𝑚𝑚𝑚𝑚𝑚𝑚𝑚](𝐶𝐶
¯+ 𝑚𝑚𝑚𝑚𝑚𝑚 𝑇𝑇𝑇𝑇 + 𝐼𝐼1 + 𝐺𝐺 + 𝑋𝑋)
The term in brackets is a new multiplier that includes both proportional taxes and
imports that depend on domestic income. This multiplier here is even smaller than the previous two. For example, if mpc = .8, t = .2, and mpim = .1, the new multiplier is 1/(1 – .64 + .1) or 1/(0.46) or approximately 2.2. This is because any increase in Y now “leaks” not only into saving and taxes but also into increases in imports (which takes away from demand for domestic products).
1 Farrer, 2021. 2 World Bank, 2020. 3 U.S. Census Bureau, 2020. 4 Radosavljevic, 2020. 5 Sharma, 2021. 6 Walsh and Phillips, 2020. 7 Sundaram, 2017.