Measurement of Regional
10
P Kowallik, R Schulz, BD Guth, A Schade, W Paffhausen, R Gross and G Heusch microspheres Measurement of regional myocardial blood flow with multiple colored ISSN: 1524-4539 Copyright © 1991 American Heart Association. All rights reserved. Print ISSN: 0009-7322. Online 72514 Circulation is published by the American Heart Association. 7272 Greenville Avenue, Dallas, TX 1991, 83:974-982 Circulation http://circ.ahajournals.org/content/83/3/974 located on the World Wide Web at: The online version of this article, along with updated information and services, is http://www.lww.com/reprints Reprints: Information about reprints can be found online at [email protected] Fax: 410-528-8550. E-mail: Kluwer Health, 351 West Camden Street, Baltimore, MD 21202-2436. Phone: 410-528-4050. Permissions: Permissions & Rights Desk, Lippincott Williams & Wilkins, a division of Wolters http://circ.ahajournals.org//subscriptions/ Subscriptions: Information about subscribing to Circulation is online at by guest on July 10, 2011 http://circ.ahajournals.org/ Downloaded from
-
Upload
independent -
Category
Documents
-
view
2 -
download
0
Transcript of Measurement of Regional
P Kowallik, R Schulz, BD Guth, A Schade, W Paffhausen, R Gross and G Heuschmicrospheres
Measurement of regional myocardial blood flow with multiple colored
ISSN: 1524-4539 Copyright © 1991 American Heart Association. All rights reserved. Print ISSN: 0009-7322. Online
72514Circulation is published by the American Heart Association. 7272 Greenville Avenue, Dallas, TX
1991, 83:974-982Circulation
http://circ.ahajournals.org/content/83/3/974located on the World Wide Web at:
The online version of this article, along with updated information and services, is
http://www.lww.com/reprintsReprints: Information about reprints can be found online at [email protected]: 410-528-8550. E-mail: Kluwer Health, 351 West Camden Street, Baltimore, MD 21202-2436. Phone: 410-528-4050. Permissions: Permissions & Rights Desk, Lippincott Williams & Wilkins, a division of Wolters http://circ.ahajournals.org//subscriptions/Subscriptions: Information about subscribing to Circulation is online at
by guest on July 10, 2011http://circ.ahajournals.org/Downloaded from
974
Laboratory Investigation
Measurement of Regional Myocardial BloodFlow With Multiple Colored Microspheres*
Peter Kowallik, MD; Rainer Schulz; Brian D. Guth, PhD; Andreas Schade;
Wolfgang Paffhausen, PhD; Rainer Gross, MD; and Gerd Heusch, MD, FESC
Background. The use of radioactive microspheres (RM) for the measurement of regionalmyocardial blood flow (RMBF) is limited and inaccessible to many investigators due toradiation safety concerns and radioactive waste disposal problems. Therefore, a new method forthe measurement of RMBF using colored microspheres (CM) was developed.Methods and Results. Polystyrene spheres (diameter, 15+±0.1 [SD] gm; density, 1.09 g/ml)
were dyed with one of five colors. With the injection of CM into the left atrium or into a coronaryperfusion line, RMBF and its distribution can be determined. CM are extracted from themyocardium and blood by digestion with potassium hydroxide and subsequent microfiltration.The dyes are then recovered from the CM within a defined volume of a solvent, and theirconcentrations are determined by spectrophotometry. The separation of composite absorbancespectra by spectrophotometry with the CM technique was as good as the separation of energyspectra by a -ycounter using the RM technique. Leaching of dye from the CM was less than0.1% during a 2-month period in vitro. Significant leaching of dye from the microspheres alsodid not occur during 8 hours in the blood and myocardium of four anesthetized dogs in vivo.For further validation of this method, pairs of CM and RM (15.5±0.1 [SD] ,um) weresimultaneously injected under five different RMBF conditions (range, 0-10 ml/[min.g]) into theleft anterior descending coronary artery of four anesthetized pigs, with coronary inflow as a flowreference, or into the left atrium of four anesthetized dogs using aortic blood withdrawal as areference. The relation between RMBF determined by CM and RM was CM=0.01+1.00 RM(r=0.98, n=1,080 data points) in the pigs, and CM=-0.19+0.92* RM (r=0.97, n=1,813 datapoints) in the dogs.
Conclusions. Measurement ofRMBF with CM yields values very similar to those of RM. Theiruse is less expensive and avoids all the disadvantages related to radioactivity, thus offering analternative method for as many as five RMBF measurements in a single experiment. (Circulation1991;83:974-982)
In 1967, plastic, radioactively labeled micro-spheres (RM) were introduced for the mea-surement of regional perfusion.1 One year later,
Makowski et a12 introduced the reference bloodwithdrawal technique for the quantification of re-gional blood flow. In 1969, Domenech et a13 first
*All editorial decisions for this article, including selection ofreviewers and the final decision, were made by a guest editor. Thisprocedure applies to all manuscripts with authors from the Uni-versity of California San Diego or UCSD Medical Center.From the Department of Pathophysiology (P.K., R.S., B.D.G.,
G.H.), Center of Internal Medicine, University of Essen MedicalSchool, Essen; and Bayer AG (A.S., W.P., R.G.), Wuppertal,FRG.
Supported by grants He 1320/3-1 and 3-2 from the GermanResearch Foundation. B.D.G. is the recipient of a scholarshipfrom the Alexander von Humboldt-Foundation.Address for correspondence: Prof. Dr. Gerd Heusch, Depart-
ment of Pathophysiology, Center of Internal Medicine, Universityof Essen Medical School, Hufelandstrasse 55, 4300 Essen, FRG.
Received March 12, 1990; revision accepted October 18, 1990.
validated the use of RM for the measurement ofregional myocardial blood flow (RMBF). Thereafter,this method has become the standard technique forthe measurement of RMBF in various experimentalsettings. However, because of the precautionary mea-sures needed to minimize radiation exposure, use ofRM is restricted to specially licensed laboratories.Storage of microspheres, as well as disposal of radio-active waste, is expensive and an environmentalhazard.To avoid some of these limitations inherent in the
RM method, Hale et a14 proposed a method formeasuring RMBF with nonradioactive, colored mi-crospheres (CM). According to this technique, sam-ples are digested by a combination of enzymatic andchemical methods. Aliquots of the microspherestrapped within a given sample are then counted in ahemacytometer by an investigator using light micros-copy. There are, however, significant limitations to
by guest on July 10, 2011http://circ.ahajournals.org/Downloaded from

Kowallik et al Colored Microspheres 975
this technique: 1) RMBF is extrapolated from only asmall aliquot of the microspheres actually trappedwithin the sample, thereby entailing a substantialstatistical error in RMBF calculations. 2) The useof only three different colors was validated in only asmall number of samples, whereas it is clearlydesirable to be able to make more than threemeasurements of RMBF in many experimentalprotocols. 3) There was a considerable variation inthe diameter of the CM used in their study, asadmitted by Hale et al.4 4) This method requiressubstantial time for the tedious counting of individ-ual microspheres. 5) In preliminary experiments, wefound it almost impossible to visually distinguishthe nine commercially available microsphere colorsin the reddish background of digested myocardium.
Recently, an alternative, nonradioactive method formeasuring RMBF was developed by Morita et a15using x-ray fluorescence excitation of microspheresloaded with elements of high atomic number. So far,only two different labels were validated by comparisonwith RM after intracoronary injection in two dogs.This method could be hampered by leaching of thelabel from the microspheres over years. Another dis-advantage is the need for sophisticated and relativelyexpensive equipment for x-ray excitation and fluores-cence detection that is not commercially available.To circumvent these limitations, we have devel-
oped a new method for measuring RMBF, featuringeasy tissue processing and quantitative, automatedcounting of all CM within an individual sample. Innearly 3,000 individual myocardial samples, we vali-dated this method by comparison with RM over arange of RMBF from 0 to 10 ml/(min * g).
MethodsPreparation of Colored Microspheres
Polystyrene microspheres (15+±0.1 gm, mean±SD)(Dynospheres, Dyno Particles A- S, Lillestr0m, Nor-way) were purchased as a 10% aqueous suspensionfrom Paesel GmbH & Co., Frankfurt, FRG. Fivehundred microliters (approximately 28x106 micro-spheres) of the colorless microsphere suspension wasput into a closed, nonairtight test tube. For purifica-tion, the microspheres were washed twice with 70%ethanol and vacuum dried. The microspheres werethen dyed with one of five different colors: white(Blankophor MAR), yellow (Resolin-Brillant-Gelb1OGN 200%), violet (Resolin-Rot-Violett FBL200%), and blue (Resolin-Brillant-Blau BGLN200%) obtained from Bayer AG, Leverkusen, FRG;and red (Terasil Rot E-BST) obtained from CIBA-GEIGY AG, Wehr, FRG. For purification beforeuse, the yellow and blue dyes were recrystallized indichloromethane. For dyeing of red or violet micro-spheres, 400 mg dye, 2 ml double-distilled water, and1 ml 1% aqueous emulsion of Levegal PTN (BayerAG) were combined in the test tube containing thedried microspheres from 500 gl of the original sus-pension. For white and blue microspheres, 8 ml
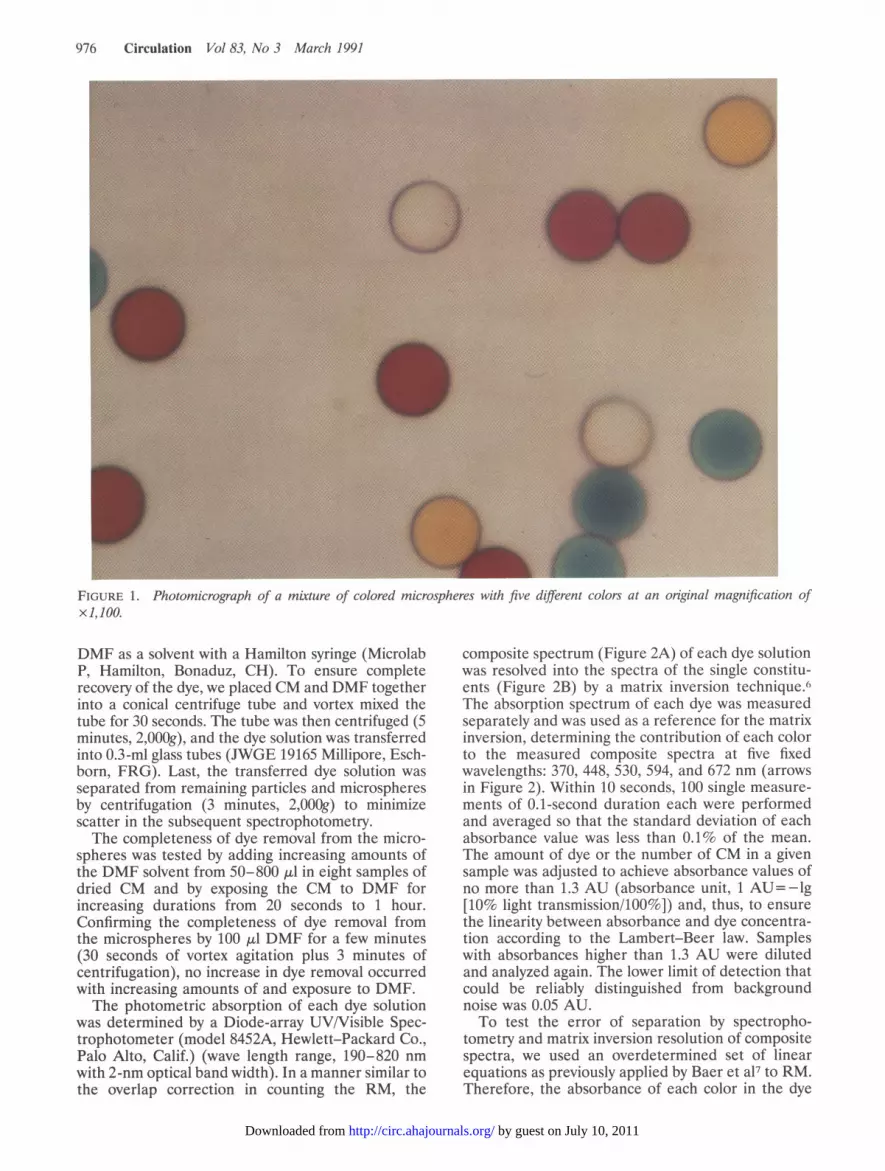
solvent-mixture of toluene-dimethylformamide(DMF) (85%/15% vol/vol), saturated with the dye at80°C (white dye) or 100°C (blue dye), was added tothe dried microspheres. For yellow microspheres, 100mg dye and 1 ml 1,2,4-trichlorobenzene were addedto the dried microspheres. These mixtures were thenheated in a boiling water bath for 5 (yellow dye) or 90(white, red, and violet dye) minutes or in a paraffinbath at 125°C for 90 minutes (blue dye). The white,yellow, and blue microspheres were recovered byfiltration through polyester microfilters (pore size, 8,um; diameter, 47 mm; Nuclepore, Tiibingen, FRG).Any remaining free dye between the filtered micro-spheres (white, yellow, and blue) or the solutioncontaining the red and violet microspheres waswashed out with absolute ethanol. For that purpose,the microspheres were resuspended in absolute eth-anol, ultrasonicated, centrifuged (3 minutes, 2,500g),and the supernatant was drawn off. The purified CMwere vacuum dried, resuspended in isodense solutionof glycerol/Tween 80/double-distilled water (25%/0.5%/79.5% vol), ultrasonicated, and divided intoappropriate portions, that is, four portions containingapproximately 7 x 10⁶ CM each, for later use. CMwere washed twice with 70% ethanol and vacuumdried before their final suspension in physiologicalsaline solution for injection.A photomicrograph of a mixture of CM of different
colors is shown in Figure 1. The amount of thepreviously mentioned dyeing reagents can be extrap-olated up to the production of 100 x 106 CM. Aportion of dried microspheres of each color has beenstored for more than 12 months without any effect ontheir usability.To test the stability of dye attachment to the
microspheres in vitro, we suspended 5 x 10⁵ CM ofeach color in 2 ml saline and stored each for 2months. When we analyzed the dye content in thesupernatant after microfiltration of four 2-ml sam-ples for each color, less than 0.1% of dye wasrecovered. To test the homogeneity of staining, wedetermined the difference in dye recovered from sixaliquots containing 400-1,000 CM of each color andfound the difference to be less than 1.5%.The density of our CM is 1.09 g/ml as measured by
density gradient centrifugation. To test for potentialalterations in the size distribution by the chemical,mechanical, and thermic dyeing procedures, 2,000 mi-crospheres dyed with different colors were examined byscanning electron microscopy. The small deviation fromthe average size of 15 ,gm, which was indicated by themanufacturer (15 ±0.1 gm, mean+ SD), was confirmed.There were no microspheres smaller than 14 ,gm, andonly eight of 2,000 were as large as 17 ,um. In 100 RM(Du Pont NEN Products, Dreieich, FRG), which wereused for comparison, the small deviation from theaverage size indicated by the manufacturer (15.5+±0.1,gm, mean±+SD) was also confirmed.
Quantification of Colored MicrospheresCM were quantified by their dye content. The dye
was recovered from the microspheres by adding 100Ml
by guest on July 10, 2011http://circ.ahajournals.org/Downloaded from
976 Circulation Vol 83, No 3 March 1991
A
FIGURE 1. Photomicrograph of a mixtlre of colored microspheres with five diffetenit colors at ani orginal mZagnlificationt ofx1,100.
DMF as a solvent with a Hamilton syringe (MicrolabP, Hamilton, Bonaduz, CH). To ensure completerecovery of the dye, we placed CM and DMF togetherinto a conical centrifuge tube and vortex mixed thetube for 30 seconds. The tube was then centrifuged (5minutes, 2,000g), and the dye solution was transferredinto 0.3-ml glass tubes (JWGE 19165 Millipore, Esch-born, FRG). Last, the transferred dye solution was
separated from remaining particles and microspheresby centrifugation (3 minutes, 2,000g) to minimizescatter in the subsequent spectrophotometry.The completeness of dye removal from the micro-
spheres was tested by adding increasing amounts ofthe DMF solvent from 50-800 gl in eight samples ofdried CM and by exposing the CM to DMF forincreasing durations from 20 seconds to 1 hour.Confirming the completeness of dye removal fromthe microspheres by 100 ul DMF for a few minutes(30 seconds of vortex agitation plus 3 minutes ofcentrifugation), no increase in dye removal occurredwith increasing amounts of and exposure to DMF.The photometric absorption of each dye solution
was determined by a Diode-array UV/Visible Spec-trophotometer (model 8452A, Hewlett-Packard Co.,Palo Alto, Calif.) (wave length range, 190-820 nm
with 2-nm optical band width). In a manner similar tothe overlap correction in counting the RM, the
composite spectrum (Figure 2A) of each dye solutionwas resolved into the spectra of the single constitu-ents (Figure 2B) by a matrix inversion technique.,The absorption spectrum of each dye was measuredseparately and was used as a reference for the matrixinversion, determining the contribution of each colorto the measured composite spectra at five fixedwavelengths: 370, 448, 530, 594, and 672 nm (arrowsin Figure 2). Within 10 seconds, 100 single measure-ments of 0.1-second duration each were performedand averaged so that the standard deviation of eachabsorbance value was less than 0.1% of the mean.The amount of dye or the number of CM in a givensample was adjusted to achieve absorbance values ofno more than 1.3 AU (absorbance unit, 1 AU=-lg[10% light transmission/100%]) and, thus, to ensurethe linearity between absorbance and dye concentra-tion according to the Lambert-Beer law. Sampleswith absorbances higher than 1.3 AU were dilutedand analyzed again. The lower limit of detection thatcould be reliably distinguished from backgroundnoise was 0.05 AU.To test the error of separation by spectropho-
tometry and matrix inversion resolution of compositespectra, we used an overdetermined set of linearequations as previously applied by Baer et a17 to RM.Therefore, the absorbance of each color in the dye
by guest on July 10, 2011http://circ.ahajournals.org/Downloaded from

Kowallik et al Colored Microspheres 977
Composite Spectrum To test the completeness of recovery of each dye bythe matrix inversion resolution of a composite spec-trum, the same set of data was used. The increase intotal absorbance after addition of a fifth dye to agiven four-color set was measured. After calibrationof total absorbance within the spectral range with theabsorbance value at the predetermined wavelengthfor each color separately, the measured increase intotal absorbance after addition of a fifth color couldbe compared with the absorbance value attributed tothis fifth color by matrix inversion resolution of thecomposite spectrum.
.......i ' ' In Vivo Validation of Colored Microspheres320 420 520 620 720 820
Wavelength [nml
Single Spectra
- - white..... yellow.-- red--- violet
.blue'cc
' ,..
cc
*
320 420 520 620 720
Wavelength [nml
FIGURE 2. Panel A: Composite spectrum of five differentcolors of the dye solution recovered from microspheres of anindividual sample. Panel B: Single spectra of the five differentcolors contributing to the composite spectrum in panel A.
solution was determined at three different wave-lengths: at the normally used wavelength as describedabove and at 10 nm above and below this wavelength.A prerequisite for this approach is an equal varianceof absorbance or a normalization with respect to thevariance. Therefore, the square of the differencebetween the measured and the calculated absorbancevalues was weighted with the variance of 100 consec-
utive measurements. It must be realized that thevariance of consecutive measurements of the sameamount of absorbance by the CM technique is a
variance different from that of increasing durationsof counting radioactivity by the RM technique. Nev-ertheless, the goodness of fit or so-called x2 was
determined in the same way as described by Baer eta17 for RM.To test potential interactions of different colors
within a composite spectrum, six increasing concen-trations of a fifth dye were added to a given four-color set. A linear regression analysis was performedbetween increasing absorbance of the added fifthcolor and the absorbance of the remaining fourcolors, using mean values of sixfold determinationsfor each added color.
Animals used in this study were handled in accord-ance with the guidelines of the animal welfare regu-lations of the American Physiological Society, and theexperimental protocol was approved by the BioethicalCommittee of the District of Dusseldorf, FRG.
Protocol 1: Stability of dye attachment in vivo. Fourbeagle dogs (13-18 kg body weight) were anesthetizedwith thiamylal sodium (15 mg/kg) administeredthrough a brachial vein. An endotracheal tube waspositioned and connected to a respirator equipped withan enflurane vaporizer (Spiromat 650, Drager, Essen,FRG). Anesthesia was maintained with enflurane (0.5-1.5%) with a mixture of nitrous oxide and oxygen, andventilation was adjusted to keep Pco2 between 35 and40mm Hg, Po2 greater than 100 mm Hg, and pH withinthe normal range. One common carotid artery wascannulated with a large polyethylene catheter thatserved as the blood supply for an extracorporeal circuit.The other carotid artery was cannulated with a smallpolyethylene catheter for pressure measurement (type4-327-I, Bell & Howell, Pasadena, Calif.) and bloodsampling. An internal jugular vein was cannulated toreturn blood from the extracorporeal circuit beforecoronary cannulation, and a second jugular vein wascannulated for saline infusion.A left lateral thoracotomy was performed in the
fourth intercostal space, and the pericardium wasopened and sutured to cradle the heart. A catheter-tipped manometer (type 501-869/2, Braun-Melsun-gen AG, FRG) was placed in the left ventriclethrough the right femoral artery for measurement ofleft ventricular pressure. The first derivative of leftventricular pressure (dP/dt) was calculated from dig-itized left ventricular pressure data using CORDATsoftware8 on an AT-type computer.
Ultrasonic crystals were implanted in the anteriorwall within the perfusion area of the left anteriordescending coronary artery (LAD) to measure mid-wall segment shortening according to standard tech-niques9 (System 6, Triton Technology, San Diego,Calif.). A second set of ultrasonic crystals was im-planted in the posterolateral wall within the perfu-sion area of the left circumflex coronary artery. Theproximal LAD was dissected free from surroundingtissue for a distance of approximately 1 cm. After thedogs were heparinized (20,000-IU bolus, 10,000 IUhourly), the LAD was ligated and rapidly cannulated.
A
1.2
1.0
< 0.8
a)Uc 0.6.0.0
.D 0.4
0.2
B1.0
0.8
3a, 0.6
as.0E0 0.4CO.0
0.2
nn --- P +-e
o.C
v.v
by guest on July 10, 2011http://circ.ahajournals.org/Downloaded from

978 Circulation Vol 83, No 3 March 1991
Perfusion pressure was measured through a distalsidearm of the cannula. Blood was supplied by anextracorporeal circuit with two side ports: one formicrosphere injection and one for regional druginfusion. The extracorporeal circuit included an oc-clusive pump (Masterflex, Cole-Parmer InstrumentCo., Chicago), which was servocontrolled to regulatecoronary pressure, and a 50-ml windkessel. Themicrosphere injection port was just distal to thepump and windkessel in the extracorporeal circuit,and a mixing chamber with a vortex mixer waspositioned just distal to the injection port. Thoroughmixing of microspheres with blood by this perfusionsystem has been documented previously. '( Arterialand left ventricular pressures, coronary arterial pres-sure, coronary blood flow to the LAD, and segmentlength of the anterior and the posterolateral wallswere recorded on an eight-channel recorder (modelMK 200 A, Statham-Gould, Oxnard, Calif.) andon-line converted to digital data for subsequentanalysis using the CORDAT software.To test for a potential leaching of the dyes from the
microspheres in blood or tissue, we compared CMdissolved in saline and immediately processed withCM injected into and kept in blood or myocardium.Previously portioned and dried CM were resus-pended in 9 ml saline containing 0.02% Tween 80and ultrasonicated for 1 minute. Before their injec-tion, CM were thoroughly dispersed by vortex mixing,and 1.5 ml of this suspension was drawn up with anautomatic Hamilton syringe. As indicated by themanufacturer, this syringe can reproducibly draw upthe same volume of a fluid with an error of less than0.3%. Identical (within this range of accuracy)amounts of CM were then injected: 1) through asaline-filled copy of the perfusion system from themicrosphere injection port to the cannula tip, and theperfusion system was flushed with 50 ml saline, 2)through another copy of the perfusion system filledwith freshly withdrawn heparinized blood, and theperfusion system was flushed with 50 ml blood, and 3)into the above-described coronary perfusion line offour anesthetized dogs. The number of injected CMvaried among 75,000 (red), 330,000 (white), 400,000(violet), 500,000 (yellow), and 550,000 (blue) to accountfor their different absorbance characteristics. The sa-line and blood perfusates were collected in Teflon-sealed 16-ml screw-cap glass tubes (Schott, Mainz,FRG) in 3.5-ml portions. The saline samples wereimmediately processed and served as the 100% refer-ence. The blood samples were stored for 8 hours beforefurther processing. The four dogs were kept in stablehemodynamic condition for 8 hours. Before euthaniza-tion by potassium chloride injection, the LAD-perfusedmyocardium was delineated by methylene blue injec-tion into the perfusion line. The entire delineated areawas then removed and further processed.
Protocol 2: Comparison of CM to RM after intracoro-nary injection. Four swine (25-35 kg body weight) wereinitially sedated with ketamine hydrochloride (30mg/kg i.m.) and then anesthetized with thiamylal so-
dium (250-500 mg) administered through an ear vein.A tracheostomy was performed through a midlinecervical incision, and an endotracheal tube was posi-tioned and connected to a respirator equipped with anenflurane vaporizer. Anesthesia was maintained asdescribed above. The further instrumentation was alsoidentical to that described above for the four beagledogs, except that transmural wall thickening was mea-sured instead of midwall segment shortening.
Protocol 3: Comparison ofCM to RM after left atrialinjection. Four beagle dogs (15-18 kg body weight)were anesthetized and instrumented as describedabove. However, in these four dogs, the LAD was notcannulated for perfusion, and coronary arterial inflowwas measured with an electromagnetic flow probe(Statham-Gould). Microspheres were injectedthrough a Teflon catheter into the left atrium. Asecond Teflon catheter was inserted into the descend-ing aorta for withdrawal of reference blood samples.RMBF distribution in protocols 2 and 3 was mea-
sured using 15.5 ±0.1-u-m RM labeled with one of thefollowing radionuclides: cerium-141, chromium-51,ruthenium-103, niobium-95, or scandium-46 simulta-neously with one of the CM. For each intracoronaryinjection in the four pigs, approximately 130,000 RMwere injected. The number of CM injected variedamong 80,000 (red), 300,000 (yellow), 400,000 (vio-let), and 500,000 (white and blue) to account for thedifferent absorbance characteristics of the CM. Onthe day of the experiment, the previously portionedand dried CM were resuspended in 3 ml saline(containing 0.02% Tween 80) for intracoronary injec-tion and 6 ml saline (containing 0.02% Tween 80) forintra-atrial injection and were ultrasonicated for 1minute. Before injection, RM suspended in salinewere thoroughly dispersed by vortex mixing and werethen added to the vial containing the CM, and themixture was vortex agitated again for an additionalminute. Each microsphere injection was followed bya flush of saline solution. For each measurement inthe four dogs, approximately 3 x 10⁶ RM and 1.8 x 10⁶(red) to 7X 10⁶ (white, yellow, violet, and blue) CMwere injected. After occlusion of the LAD, morecolored spheres (20x 106) were injected to improvethe precision of RMBF measurements in this low-flow situation. Stable steady-state conditions of sys-temic hemodynamics, regional myocardial function,and coronary blood flow before and during micro-sphere infusion and the withdrawal period wereensured under each condition in all experiments. Inthe dog studies with left atrial injection, referencearterial blood samples were collected through theaortic catheter starting 10 seconds before injection ofthe microspheres and continuing for 100 seconds at arate of 6.3 ml/min.
Five different myocardial blood flow conditionswere produced for the pigs and dogs. During steady-state conditions, one pair of colored and randomlymatched RM was simultaneously injected.
In the four pigs, the first RMBF measurement wasobtained under baseline conditions. LAD blood flow
by guest on July 10, 2011http://circ.ahajournals.org/Downloaded from

Kowallik et al Colored Microspheres 979
was then increased in three steps by intracoronaryadenosine infusion (100-400 gg/min) at a constantcoronary perfusion pressure, and measurementswere again obtained at stable steady states of ele-vated flow. Last, coronary perfusion pressure wasreduced to produce regional myocardial akinesia,and a last measurement was obtained during steady-state ischemia.
In the four dogs, after control measurements,coronary blood flow was increased in three steps byintravenous infusion of dipyridamole (0.1-0.3 mg/kg) and epinephrine (0.5-3 gg/[kg. min]), and mea-surements were obtained at the respective steadystates. A final measurement was begun after 3 min-utes of complete occlusion of the LAD during steady-state regional myocardial dysfunction.
After completion of the study, animals were eutha-nized. The hearts were removed and carefully dis-sected free from epicardial fat. In the four dogs ofprotocol 1 and in the four pigs of protocol 2, theLAD-perfused myocardium was delineated by meth-ylene blue injection into the perfusion line beforeeuthanization. The stained myocardium was cut intosamples of 0.3-1.8 g (mean, 1.1 g), and these wereplaced into Teflon-sealed 16-ml screw-cap glasstubes (Schott). The mean number of samples peranimal was 54 in the four pigs of protocol 2 and 91 inthe four dogs of protocol 3. The left ventricularsamples were divided into transmural thirds. In thefour dogs of protocol 3, both ventricles and atria wereprocessed in the same way. After counting gammaradioactivity in a 3-in. Nal (Tl) well detector (modelBF5300, Berthold, Wildbad, FRG) for 1 minute witha multichannel pulse-height analyzer, the sampleswere processed for CM quantification.
Seven milliliters of a 4 M KOH solution containing2% Tween 80 was added to each sample for digestionof the tissue. The glass tubes were closed, placed in awater bath shaker for 4 hours at 72°C, and hand mixedevery hour. A high-grade steel vacuum filtration cham-ber was fitted to a polyester filter (pore size, 8 gLm;diameter, 25 mm; Nuclepore). The digested tissuesolution was mixed with a Teflon-coated magneticstirring bar and then placed on the filter with aburette, while the filter was rinsed with 2% Tween 80solution. To avoid a loss of microspheres, the test tubeand burette were rinsed twice with 2% Tween 80solution, which was then filtered, as was the tissuesolution.The reference blood samples were processed in the
same manner as the tissue samples. Each blood sam-ple and 2% Tween 80 washing fluid (7 ml twice) of theblood withdrawal syringe were divided into 3.5-mlportions for the counting of RM. For subsequentdigestion, 1.1 ml 16 M KOH and 0.5 ml 20% Tween 80solution were added. Thus, the KOH and Tween 80concentrations were the same as in the tissue samples.The further preparation of the blood samples was notdifferent from that of the tissue samples.
For use in the calculation of RMBF in the pigs(protocol 2), the radioactivity and dye content of the
entire perfusion area were determined. Hence, in thefour pigs, RMBF, corrected for wet weight, wascalculated with the equation: (X per sample dividedby blood flow to sample) = (total tissue X divided bycoronary inflow), where X is the number of countsper minute for the RM or the specific absorbance forthe CM.10 The total tissue radioactivity content wasdetermined by totaling all counts from the perfusionbed, whereas the amount of dye injected was deter-mined by totaling the absorbance of all samples.Coronary inflow was set by the extracorporeal coro-nary perfusion circuit. In the dogs (protocol 3),RMBF, corrected for wet weight of the tissue, wascalculated with standard techniques2: (X per sampledivided by blood flow to sample) = (X in arterialwithdrawal divided by reference withdrawal rate).
Comparisons With Other Microsphere RMBFMeasurement Techniques
Time requirements. For all RMBF techniques, cut-ting and weighing of tissue samples is necessary. Withour technique, the further processing of an individualtissue or blood sample requires approximately 8-10minutes and an additional 3 minutes for the spectro-photometric measurement. For all samples together,an additional 4 hours are necessary for the digestionprocedure. With the technique proposed by Hale etal,4 processing of an individual sample requires 45minutes. However, the time for microscopic countingof an aliquot of microspheres in a hemacytometerwas not mentioned. With the technique proposed byMorita et al,5 tissue samples have to be further cut toachieve a homogeneous distribution within the irra-diated volume of the vial, and blood samples have tobe further processed and suspended in gelatin for ahomogeneous distribution of microspheres in thevial. The measurement, as such, requires an addi-tional 10 minutes per sample.
Costs. The costs for the measurement of RMBFunder five different flow conditions in a 30-kg dog,including preparation and dyeing of our CM as well astissue and blood processing of 100 samples, amount toapproximately $150. No special and expensive disposalof carcasses is necessary. Shelf life of our CM is notlimited as is that of RM, which individually are subjectto different half-life characteristics. Such differentialdecay times complicate inventory keeping and causeadditional costs. Measurement of only four flow situa-tions and processing of only 10 tissue samples and fourblood samples cost $350 with the method proposed byHale et al.4 With RM from Du Pont NEN Products,five flow measurements also cost approximately $350.Information about the costs of microspheres by thetechnique of Morita et a15 is not available.Equipment. Laboratory equipment for microsphere
dyeing and sample processing (centrifuge, ultrasoni-cator, vortex mixer, magnetic stirrer, shaking waterbath, and glassware) costs approximately $15,000.However, most of this equipment is already pos-sessed by most laboratories. The cost of the countingunit is approximately $15,000 for the spectrophotom-
by guest on July 10, 2011http://circ.ahajournals.org/Downloaded from

980 Circulation Vol 83, No 3 March 1991
TABLE 1. Interactions for Five-Color Set
Average slope
Color added White Yellow Red Violet Blue
White -0.41 -0.05 -0.05 -0.18Yellow -2.7 -0.99 -0.22 -0.76Red -2.3 -0.93 -0.18 -0.42Violet -1.2 -0.93 -0.59 -0.16Blue -0.16 -0.72 -0.71 -0.59
Values represent 100 times the slope of the regression equation.Average slope calculated by (absorbance other color/absorbance
added color) x 100.
eter and approximately $40,000 for a sodium iodidegamma counter including an autosampler. For thetechnique proposed by Hale et al,4 a light microscopeand a hemacytometer are required, again in additionto standard laboratory equipment (centrifuge, ultra-sonicator, vortex mixer, water bath, and glassware).The equipment for x-ray fluorescence excitation anddetection according to the technique of Morita et a15is estimated to cost approximately $120,000.
Data AnalysisThe regression analyses were based on a least-
squares fitting method using the commercial softwareprogram SYSTAT on an IBM AT. To test the hypoth-esis that measurement of RMBF would be identicalwith RM and CM, slope and intercept were com-pared to the line of identity (intercept=0, slope=1)by two-tailed F tests.
ResultsIn Vitro StudiesThe interaction of single colors within a composite
spectrum was negligible, as evidenced by minimalchanges in the absorbance of a given four-color set byadding increasing concentrations of a fifth color(Table 1).The recovery of dye by matrix inversion resolution
of composite spectra was almost complete becauseslopes of regression lines between the real and thecalculated absorbance values were within 5% of theline of identity (Table 2).The x2 value as an indicator of the goodness of
separation of colors by spectrophotometry and matrixinversion was between 50 and 200, and the variationcoefficient determined for each calculated absor-
TABLE 2. Recoveries for Five-Color Set
Variation coefficientColor added Slope (%)
White 0.957 3.636Yellow 1.028 3.346Red 1.021 1.525Violet 1.009 1.287Blue 0.984 1.513
All correlation coefficients were greater than 0.998.
A 4
-_C
E
-
0vz
a
0
0
0
0
U.cD
a:
3
2
1
0
0 1 2 3 4
RMBF (radioactive microspheres) mil/(min*g)l
B
0 1 2 3 4
300
200 -,
Ea)
0._
'a
'DCO
(D
100
0-
-100
-200
-300
Estimate lmt/(min*g)l
FIGURE 3. Panel A: Regression plot of all regional myocar-dial blood flow (RMBF) values (n=1, 080) measured byradioactive and colored microspheres during systematic flowvariations in four pigs by intracoronary microsphere injection.Each point represents one tissue sample. SEE, standard error
of the estimate; res., mean percentage of the residuals. PanelB: Plot of percentage residuals versus estimated flow for alldata points ofpanel A.
bance value by use of the respective x2 was less than1% for each color.
In Vivo StudiesA significant leaching of dye from microspheres
either injected into blood ex vivo or trapped in myo-cardium in vivo during an 8-hour period did not occurfor any color compared with the immediately pro-cessed microspheres exposed to saline only (Table 3).
In the pigs, in 1,080 samples, RMBF measured byintracoronary injection of RM and CM was almostidentical. The linear regression was not differentfrom identity (Figure 3). Subdividing the regression
N = 4 pigsn = 1080 data pointsy = 0.01 + 1.00 x
~,..b ...,_
F:wIe. ..@.
I. . . . . . . . . . .
a
by guest on July 10, 2011http://circ.ahajournals.org/Downloaded from
Kowallik et al Colored Microspheres 981
TABLE 4. Regression Data for Individual Animals
Animal Slope Intercept r SEE
Pig 1 0.99 0.00 0.99 0.08Pig 2 0.98 0.01 0.98 0.11Pig 3 0.96 0.05 0.98 0.17Pig 4 1.07 -0.02 0.98 0.15
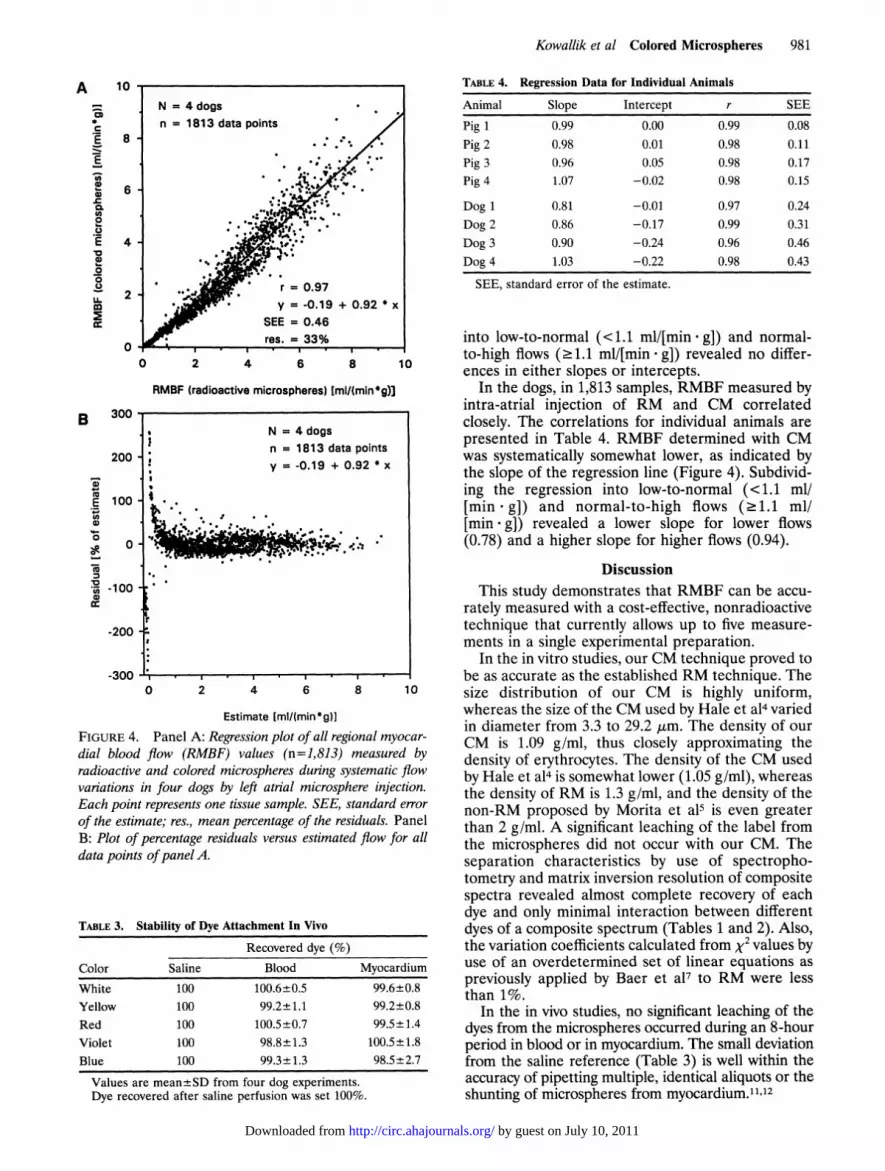
Dog 1 0.81 -0.01 0.97 0.24Dog 2 0.86 -0.17 0.99 0.31Dog 3 0.90 -0.24 0.96 0.46Dog 4 1.03 -0.22 0.98 0.43
SEE, standard error of the estimate.
res. =33% into low-to-normal (<1.1 ml/[min g]) and normal-0 2 4 6 8 10 to-high flows (.1.1 ml/[min -g]) revealed no differ-
ences in either slopes or intercepts.RMBF (radioactive microspheres) [mI/(ming)] In the dogs, in 1,813 samples, RMBF measured by
intra-atrial injection of RM and CM correlated
N = 4 dogs closely. The correlations for individual animals are= 1813 data points presented in Table 4. RMBF determined with CM
n= .1813data points |was systematically somewhat lower, as indicated by-0.19 + the slope of the regression line (Figure 4). Subdivid-ing the regression into low-to-normal (<1.1 ml/[min g]) and normal-to-high flows (>1.1 ml/
: ;..:-. : ;* . .[min. g]) revealed a lower slope for lower flows(0.78) and a higher slope for higher flows (0.94).
6 8 . 1
6 8 10
DiscussionThis study demonstrates that RMBF can be accu-
rately measured with a cost-effective, nonradioactivetechnique that currently allows up to five measure-ments in a single experimental preparation.
In the in vitro studies, our CM technique proved tobe as accurate as the established RM technique. Thesize distribution of our CM is highly uniform,whereas the size of the CM used by Hale et a14 variedin diameter from 3.3 to 29.2 pum. The density of ourCM is 1.09 g/ml, thus closely approximating thedensity of erythrocytes. The density of the CM usedby Hale et a14 is somewhat lower (1.05 g/ml), whereasthe density of RM is 1.3 g/ml, and the density of thenon-RM proposed by Morita et a15 is even greaterthan 2 g/ml. A significant leaching of the label fromthe microspheres did not occur with our CM. Theseparation characteristics by use of spectropho-tometry and matrix inversion resolution of compositespectra revealed almost complete recovery of eachdye and only minimal interaction between differentdyes of a composite spectrum (Tables 1 and 2). Also,the variation coefficients calculated from V2 values byuse of an overdetermined set of linear equations aspreviously applied by Baer et a17 to RM were lessthan 1%.
In the in vivo studies, no significant leaching of thedyes from the microspheres occurred during an 8-hourperiod in blood or in myocardium. The small deviationfrom the saline reference (Table 3) is well within theaccuracy of pipetting multiple, identical aliquots or theshunting of microspheres from myocardium.11"12
Estimate [mi/(min*g)]
FIGURE 4. Panel A: Regression plot of all regional myocar-
dial blood flow (RMBF) values (n=1,813) measured byradioactive and colored microspheres during systematic flowvaniations in four dogs by left atrial microsphere injection.Each point represents one tissue sample. SEE, standard error
of the estimate; res., mean percentage of the residuals. PanelB: Plot of percentage residuals versus estimated flow for alldata points ofpanel A.
TABLE 3. Stability of Dye Attachment In Vivo
Recovered dye (%)Color Saline Blood MyocardiumWhite 100 100.6+0.5 99.6±0.8Yellow 100 99.2+1.1 99.2±0.8Red 100 100.5±+0.7 99.5±1.4Violet 100 98.8±1.3 100.5 ±1.8Blue 100 99.3±1.3 98.5±2.7
Values are mean+SD from four dog experiments.Dye recovered after saline perfusion was set 100%.
A 10
8
6
4
2
00E
0).C
to._
mh-C
0
B
0
E00
u,
0
oN9'ffm
ut
cc
300
200
100
0
-100
-200
-3000 2 4
- 1.1-.- -- --. --.
-
1
1
1 a~~~~~~~~~~~~~~
by guest on July 10, 2011http://circ.ahajournals.org/Downloaded from
982 Circulation Vol 83, No 3 March 1991
During the in vivo comparison of CM and RM,higher numbers of CM than of RM were used formeasuring RMBF. However, left atrial injection of13 x 106 microspheres13 or serial injections of up to48 x 106 microspheres7 have been reported to bewithout significant effects on systemic hemodynam-ics. Thus, the injection of this many CM obviously didnot result in a critical embolization of the coronaryvasculature in our experiments. That would havebeen indicated by a deterioration of regional myocar-dial function, which correlates closely with myocar-dial perfusion under ischemic conditions.14
After intracoronary administration, there was nodifference in RMBF measured by CM or RM. How-ever, after intra-atrial injection, RMBF calculatedfrom RM was slightly higher than that determinedwith CM. Whether this difference between RMBFmeasurements by CM and RM reflects an additionalstatistical error by the additional analysis of refer-ence blood samples or represents a systematic errorintroduced by the reference blood withdrawal as suchcannot be distinguished. Fewer RM than CM beingsampled in the reference blood withdrawal relative tothe myocardium would result in higher RMBF calcu-lated from RM than from CM. However, a preferen-tial streaming of RM with the direction of higherflow, for example, aorta versus the withdrawal sy-ringe, has been documented for microspheres oflarger diameter1516 but not for microspheres of equaldiameter and different density.17 In any event, thedensity of our CM is closer to that of erythrocytes,and the difference between RMBF measurements byCM and RM is small.
In conclusion, measurement of RMBF with our new
technique with CM yields values very similar to thoseyielded by RM. Our technique avoids all problemsrelated to radioactivity and is cost effective. To avoidradioactivity, more time for dyeing of microspheres andfor tissue and blood sample processing is required, thatis, about 8 hours for preparing a batch of 100x 106 CMand about 20 hours for processing of 100 samples.Potentially, this time can be reduced by the future useof an autosampler in conjunction with the spectropho-tometer. An extension for use of more colors is alsoconceivable. This technique enables laboratories with-out access to RM to measure RMBF and enablesothers to perform more sequential measurements.
AcknowledgmentsWe thank Dr. Konrad Venjakob, Department of
Anatomy, University of Essen, FRG, for the scanningelectron microscopic examinations and Dipl. Ing.Ralf Beckmann for the analysis of spectral separationcharacteristics by an overdetermined set of linearequations. The technical assistance of Ms. BethinaBlank and Ms. Barbara Muller is appreciated.
References1. Rudolph AM, Heymann MA: The circulation of the fetus in
utero: Methods for studying distribution of blood flow, cardiacoutput and organ blood flow. Circ Res 1967;21:163-184
2. Makowski EL, Meschia G, Droegemueller W, Battaglia FC:Measurement of umbilical arterial blood flow to the sheepplacenta and fetus in utero: Distribution to cotyledons and theintercotyledonary chorion. Circ Res 1968;23:623-631
3. Domenech RJ, Hoffman JIE, Noble MIM, Saunders KB,Henson JR, Subijanto S: Total and regional coronary bloodflow measured by radioactive microspheres in conscious andanesthetized dogs. Circ Res 1969;25:581-596
4. Hale SL, Alker KJ, Kloner RA: Evaluation of nonradioactive,colored microspheres for measurement of regional myocardialblood flow in dogs. Circulation 1988;78:428-434
5. Morita Y, Payne BD, Aldea GS, McWattes C, Huseini W,Mori H, Hoffman JIE, Kaufmann L: Local blood flow mea-
sured by fluorescence excitation of nonradioactive micro-spheres. Am J Physiol 1990;258:H1573-H1584
6. Schosser R, Arfors K-E, Messmer K: MIC-1I-A program forthe determination of cardiac output, arterio-venous shunt andregional blood flow using the radioactive microsphere method.Comput Programs Biomed 1979;9:19-38
7. Baer RW, Payne BD, Verrier ED, Vlahakes GJ, MolodowitchD. Uhlig PN, Hoffman JIE: Increased number of myocardialblood flow measurements with radionuclide-labeled micro-spheres. Am J Physiol 1984;246:H418-H434
8. Schulz R, Hucking G, Heusch G: 4'CORDAT'-A new dataacquisition and reduction program (abstract). Eur Heart J1989;10:309
9. Sasayama S, Franklin D, Ross J Jr, Kemper WS, McKown D:Dynamic changes in left ventricular wall thickness and theiruse in analyzing cardiac function in the conscious dog. Am JCardiol 1976;38:870-879
10. Schulz R, Miyazaki S, Miller M, Thaulow E, Heusch G, RossJ Jr, Guth BD: Consequences of regional inotropic stimulationof ischemic myocardium on regional myocardial blood flowand function in anesthetized swine. Circ Res 1989;64:1116-1126
11. Utley J, Carlson EL, Hoffman JIE, Martinez HM, BuckbergGD: Total and regional myocardial blood flow measurementswith 25,t, 15g, 9,u and filtered 1-10OLL diameter microspheresand antipyrine in dogs and sheep. Circ Res 1974;34:391-404
12. Fan FC, Schuessler GB, Chen RYZ, Chien S: Determinationsof blood flow and shunting of 9- and 15-,tm spheres inregional beds. Am J Physiol 1979;237:H25-H33
13. von Ritter C, Hinder RA, Womack W, Bauerfeind P, FimmelCJ, Kvietys PR, Granger DN, Blum AL: Microsphere esti-mates of blood flow: Methodological considerations. Am JPhysiol 1988;254:G275-G279
14. Gallagher KP, Kumada T, Koziol JA, McKown MD, KemperWS, Ross J Jr: Significance of regional wall thickening abnor-malities relative to transmural myocardial perfusion in anes-thetized dogs. Circulation 1980;62:1266-1274
15. Phibbs RH, Wyler F, Neutze J: Rheology of microspheresinjected into circulation of rabbits. Nature 1967;216:1339-1340
16. Phibbs RH, Dong L: Nonuniform distribution of microspheresin blood flowing through a medium-size artery. Can J PhysiolPharmacol 1970;48:415-421
17. Reed JH Jr, Wood EA: Effect of body position on verticaldistribution of pulmonary blood flow. J Appl Physiol 1970;28:303-311
KEY WORDS * regional myocardial blood flow * microspheres,colored * microspheres, radioactive
by guest on July 10, 2011http://circ.ahajournals.org/Downloaded from