Can regional strain and strain rate measurement be performed during both dobutamine and exercise...
10
ORIGINAL ARTICLES Can Regional Strain and Strain Rate Measurement Be Performed During Both Dobutamine and Exercise Echocardiography, and Do Regional Deformation Responses Differ With Different Forms of Stress Testing? Giedrius Davidavicius, MD, Miroslaw Kowalski, MD, R. Ian Williams, MB, BCh, MRCP, MBA, Jan D’hooge, PhD, Giovanni Di Salvo, MD, Gilbert Pierre-Justin, MD, Piet Claus, PhD, Frank Rademakers, MD, PhD, Marie-Christine Herregods, FESC, Alan G. Fraser, FRCP, FESC, Luc A. Pierard, FESC, Bart Bijnens, PhD, and George R. Sutherland, FESC, Lueven and Liege, Belgium Background: Regional strain () and strain rate (SR) measurement could be the optimal approach to quantifying stress echocardiography images. How- ever, signal noise could preclude their use. Study Aims: Our aim was to compare the feasibility of regional peak systolic (p) velocity (Vel), pSR/ measurement, and their normal responses during upright (group 1, n 10) and supine (group 2, n 10) bicycle exercise and (group 3, n 10) dobut- amine stress. Methods: For each type of stress study, pVel/pSR/ data were acquired at baseline, low (100-120 bpm), and peak (140-160 bpm) heart rate (HR); and during recovery. Results: During dobutamine pVel/pSR/ were inter- pretable in >95% of segments at every stress stage, whereas in groups 1 and 2 pSR/ responses were noninterpretable in >36% of segments (P < .0002). The highest proportions of data exclusions were from the lateral and anterior walls. In all groups, regional systolic pVel and SR values increased lin- early and reached maximal value at peak HR (P < .0006 vs baseline). P showed a biphasic response, initially increasing at low HR, and then remaining constant or falling at peak HR. Conclusion: PSR/p quantification of stress echocar- diography may currently be restricted to dobut- amine as increased signal noise precludes adequate data acquisition during exercise. For all forms of stress both pSR and pVel increased linearly, whereas p response was biphasic as a result of the reduced filling at higher HRs. (J Am Soc Echocardiogr 2003;16: 299-308.) Stress echocardiography is a noninvasive tool that offers both cost-effective diagnostic and prognostic information in patients with suspected coronary artery disease. It is most commonly performed using either exercise (supine or upright bicycle ergometry or treadmill) or a graded dobutamine infusion (DSE). 1 However, the interpretation of stress echo- cardiographic images is operator-dependent and is influenced both by image quality 2 and by the ability of the observer to interpret motion. 3 A method that could quantify stress echocardiography images ob- jectively would overcome these limitations. Analysis of velocity (Vel) obtained by Doppler myocardial imaging has already been applied to the quantitation of wall motion. It reflects changes in regional myocardial systolic motion both at rest and during stress. Several studies have demonstrated that Vels can identify alterations in regional left-ventric- ular (LV) contractile function induced by pharmaco- logic inotropic modulation. 4,5 However, the main limitation of using Vel profiles to represent regional contractile function is that they cannot distinguish between motion induced by local contraction from that induced by either contraction in adjacent seg- ments or motion related to overall cardiac motion. 6 A better approach, and one that should overcome the above limitations, might be to measure local deformation. To do this, a new color Doppler– based algorithm that calculates regional strain rate (SR) and strain () from regional Doppler myocardial Vel Department of Cardiology, University Hospital Gasthuisberg, Leuven, Belgium; Wales Heart Research Institute, University Hos- pital of Wales, Cardiff, United Kingdom (R.I.W.); and Depart- ment of Cardiology, University Hospital Sart Tilman, Liege, Bel- gium (G.P-J.) Reprint requests: George R. Sutherland, FESC, Department of Cardiology, University Hospital Gasthuisberg, Herestraat 49, B-3000, Leuven, Belgium. (E-mail: George.Sutherland@ uz.kuleuven.ac.be). Copyright 2003 by the American Society of Echocardiography. 0894-7317/2003/$30.00 0 doi:10.1016/S0894-7317(02)74428-3 299
Transcript of Can regional strain and strain rate measurement be performed during both dobutamine and exercise...
ORIGINAL ARTICLES
Can Regional Strain and Strain RateMeasurement Be Performed During Both
Dobutamine and Exercise Echocardiography,and Do Regional Deformation Responses
Differ With Different Forms of Stress Testing?Giedrius Davidavicius, MD, Miroslaw Kowalski, MD, R. Ian Williams, MB, BCh, MRCP,
MBA, Jan D’hooge, PhD, Giovanni Di Salvo, MD, Gilbert Pierre-Justin, MD,Piet Claus, PhD, Frank Rademakers, MD, PhD, Marie-Christine Herregods, FESC,
Alan G. Fraser, FRCP, FESC, Luc A. Pierard, FESC, Bart Bijnens, PhD, andGeorge R. Sutherland, FESC, Lueven and Liege, Belgium
Background: Regional strain (�) and strain rate (SR)measurement could be the optimal approach toquantifying stress echocardiography images. How-ever, signal noise could preclude their use.Study Aims: Our aim was to compare the feasibilityof regional peak systolic (p) velocity (Vel), pSR/�measurement, and their normal responses duringupright (group 1, n � 10) and supine (group 2, n �10) bicycle exercise and (group 3, n � 10) dobut-amine stress.Methods: For each type of stress study, pVel/pSR/�data were acquired at baseline, low (100-120 bpm),and peak (140-160 bpm) heart rate (HR); and duringrecovery.Results: During dobutamine pVel/pSR/� were inter-pretable in >95% of segments at every stress stage,whereas in groups 1 and 2 pSR/� responses were
noninterpretable in >36% of segments (P < .0002).The highest proportions of data exclusions werefrom the lateral and anterior walls. In all groups,regional systolic pVel and SR values increased lin-early and reached maximal value at peak HR (P <.0006 vs baseline). P� showed a biphasic response,initially increasing at low HR, and then remainingconstant or falling at peak HR.Conclusion: PSR/p� quantification of stress echocar-diography may currently be restricted to dobut-amine as increased signal noise precludes adequatedata acquisition during exercise. For all forms ofstress both pSR and pVel increased linearly, whereasp� response was biphasic as a result of the reducedfilling at higher HRs. (J Am Soc Echocardiogr 2003;16:299-308.)
Stress echocardiography is a noninvasive tool thatoffers both cost-effective diagnostic and prognosticinformation in patients with suspected coronaryartery disease. It is most commonly performed usingeither exercise (supine or upright bicycle ergometryor treadmill) or a graded dobutamine infusion(DSE).1 However, the interpretation of stress echo-cardiographic images is operator-dependent and isinfluenced both by image quality2 and by the ability
of the observer to interpret motion.3 A method thatcould quantify stress echocardiography images ob-jectively would overcome these limitations.
Analysis of velocity (Vel) obtained by Dopplermyocardial imaging has already been applied to thequantitation of wall motion. It reflects changes inregional myocardial systolic motion both at rest andduring stress. Several studies have demonstrated thatVels can identify alterations in regional left-ventric-ular (LV) contractile function induced by pharmaco-logic inotropic modulation.4,5 However, the mainlimitation of using Vel profiles to represent regionalcontractile function is that they cannot distinguishbetween motion induced by local contraction fromthat induced by either contraction in adjacent seg-ments or motion related to overall cardiac motion.6
A better approach, and one that should overcomethe above limitations, might be to measure localdeformation. To do this, a new color Doppler–basedalgorithm that calculates regional strain rate (SR) andstrain (�) from regional Doppler myocardial Vel
Department of Cardiology, University Hospital Gasthuisberg,Leuven, Belgium; Wales Heart Research Institute, University Hos-pital of Wales, Cardiff, United Kingdom (R.I.W.); and Depart-ment of Cardiology, University Hospital Sart Tilman, Liege, Bel-gium (G.P-J.)Reprint requests: George R. Sutherland, FESC, Department ofCardiology, University Hospital Gasthuisberg, Herestraat 49,B-3000, Leuven, Belgium. (E-mail: [email protected]).Copyright 2003 by the American Society of Echocardiography.0894-7317/2003/$30.00 � 0doi:10.1016/S0894-7317(02)74428-3
299
profiles (and, thus, measures local deformation) hasbeen developed.6,7 A series of experiments studieshave confirmed that these deformation parameterscan (1) identify and quantify the spectrum ofchanges in segmental function during induced isch-emia,8-10 (2) differentiate transmural from nontrans-mural myocardial infarction after reperfusion,11 (3)define the normal segmental response to a DSEchallenge, and (4) differentiate stunning from eitheracute or chronic regional ischemia using a low-doseDSE challenge.12 In the clinical setting, ultrasound-based SR and � imaging has been shown to quantifysegmental changes in function after acute coronaryartery occlusion13 and to define the regional myo-cardial deformation properties of both infarcted andnormal myocardium.14
Experiments in normal hearts have shown thatchanges in regional peak systolic (p)� are related tochanges in stroke volume, whereas changes in pSRcorrelate better with changes in dP/dt. Thus, one ofthese deformation parameters, �, is more linked toglobal function, whereas the other, SR, may betterreflect regional contractility.15 Together, they mayoffer a new approach to understanding and quanti-fying normal and abnormal responses during stressechocardiography. To date there are few data ontheir implementation in quantifying stress echocar-diography. In addition, it is not known how theincrease in heart rate (HR), respiration, and bodymotion influences the applicability of systolic SR and� indices to stress studies. Acoustic artefacts inducedby respiratory and body movements during exerciseechocardiography could preclude their use.
Thus, the aims of our study were to: (1) explorethe feasibility of recording and analyzing regionalpVel, pSR, and p� during 3 standard forms of stressechocardiography, upright and supine bicycle exer-cise and DSE; and (2) investigate the ability ofpSR/p� to quantify changes in myocardial functionand to compare their normal responses with eachtype of stress. Patients undergoing graded treadmillstress studies were not to be included, as a pilotstudy showed that the acquisition of Vel data suffi-ciently noise-free to allow SR/� calculation wascurrently not feasible during a treadmill exercisetest.
METHODS
We studied 30 volunteers, 10 in each of 3 groups. Groups1 and 2 underwent upright and supine bicycle exercise,respectively. Group 3 had DSE. The local research andethics committees in each institution approved the studybefore commencing the investigations and all participantsgave informed consent.
Both the bicycle exercise studies and the DSE protocolwere subdivided into 4 stages: baseline, low HR, peak HR,
and recovery stage. The stage was defined as low HRwhen 100 to 120 bpm were achieved. The peak HR stagehad a target HR 140 to 160 bpm. For both bicycle stressmodalities the study stages were defined by the HRresponse to a known workload. DSE study stages weredefined by the HR response. The regional myocardialresponse to the stress test was also evaluated during therecovery period at the point at which HR returned to thebaseline value.
Upright Bicycle (Group 1)
This group included 10 healthy men (aged 28 � 5 years)with no clinical evidence of cardiac disease either in theirclinical history, physical examination, standard 12-leadelectrocardiogram, or cardiac ultrasound examination.
The exercise test was performed using an uprightexercise bicycle with a workload of 50 W. This wasincreased by 50 W every 3 minutes until the target HR wasachieved. Ultrasound data were acquired at baseline withthe patient in the upright position; and just before thestart of exercise, at the end of the low HR stage and atpeak HR, while the patient was still cycling. Data werealso acquired at the end of the recovery period.
Supine Bicycle (Group 2)
This group included 10 healthy volunteers: 9 men and 1woman (aged 37 � 8 years). The exercise test wasperformed using supine bicycle ergometry with the bicy-cle mounted on a tilting exercise table. The table wastilted at 30 degrees and the patient was studied in the leftlateral decubitus position.
Supine bicycle exercise was commenced at a workloadof 50 W. This was increased by 50 W every 3 minutes untilthe target HR was achieved. Data were acquired at base-line, low and peak HR exercise, and during recovery withthe patient in the cycling position on the exercise table.Data were acquired in the same manner as described forgroup 1.
DSE Stress Echocardiography (Group 3)
This group included 10 patients (7 men and 3 womenmean age 55 � 8 years). All had been referred forinvestigation of chest pain. All had angiographically nor-mal epicardial coronary arteries. None were on cardiovas-cular medication at the time of DSE testing. A standardDSE/atropine protocol was performed.16
Echocardiographic Data Acquisition
Patients were studied using an ultrasound system (SystemV, GE Vingmed Ultrasound, Horten, Norway) and a 2.5-MHz transducer. Ultrasound data were acquired in both2-dimensional (2D) gray-scale and 2D color Doppler Velmodes (115 frames/s; sector angle 45 degrees). The 2Dgray-scale images were assessed visually. The color Dopp-ler Vel data were processed offline to derive Vel andregional SR/� curves for both radial and longitudinaldeformation. For analysis, a 14-segment model of the LVwas used. The following segments were included: the
Journal of the American Society of Echocardiography300 Davidavicius et al April 2003

basal segment of the posterior wall with data sets re-corded from both the parasternal long- and short-axisviews. The 2 data sets from this segment were the onlyones used to assess changes in radial deformation. Apical4- and 2-chamber views were used to evaluate longitudinaldeformation. For longitudinal function each wall wassubdivided into 3 segments (basal, midventricular, andapical). Longitudinal data were acquired from the septum,lateral, inferior, and anterior walls. In total, data wereobtained from 560 segments for each group (14 segments� 4 stages � 10 patients). All echocardiographic imageswere recorded at passive end-expiration to minimizeglobal cardiac movement. All 2D studies were performedusing second harmonic imaging. Aliasing was eliminatedfrom the color Doppler data sets by setting appropriatelyhigh pulse repitition frequency (PRF) values (range 28 to32 cm/s) for data acquisition. The depth of imaging andthe sector angle in each view were adjusted to obtain thehighest possible frame rates for myocardial color Doppleracquisition, while keeping the whole LV in view; the goalwas a frame rate of �110/s. All images acquired werestored in the digital memory of the machine and down-loaded to the workstation for offline analysis.
Echocardiographic Data Analysis
All the CDMI data sets were analyzed offline, in thedepartment of cardiology at University Hospital Gasthuis-berg, by 2 investigators (GD and MK) using dedicatedsoftware (TVI 6.0, GE Vingmed). Regional pVel wasmeasured for radial motion in the basal posterior segmentwall of the LV and for longitudinal motion in each of the3 segments of the septal, lateral, inferior, and anterior LVwalls. Regional SR/� was estimated during offline analysis(Speqle [software package for echocardiographic quanti-fication], University of Leuven, Leuven, Belgium), with acomputation area of 5 mm for radial function (parasternalview, both long and short axis) and 10 mm for longitudi-nal function (apical views), and using the same method-ology described previously.17
The feasibility study. The feasibility of both Vel and SRanalysis was determined by the ability to measure a givenwaveform by its conformity to an expected shape.
A normal regional SR curve is not dissimilar to theregional Vel profiles from which it is calculated. Only thepolarity may be reversed. For radial SR the curves aredisplayed with the same polarity as the Vel profiles. Forlongitudinal SR, the curves are displayed with the oppo-site polarity to the Vel data.
Those waveforms with an apparently random structurewere excluded from further analysis.
Regional systolic response. We then attempted to char-acterize the normal regional systolic myocardial responseusing a combination of pVel and pSR/� measurements.The basal posterior segment wall was analyzed to quantifyradial function. Longitudinal function was analyzed usingdata from the septum and inferior walls, as these were themost complete data sets.
Statistical Analysis
Statistical analysis was performed with software (Statview,SAS Institute, Cary, NC). Continuous values are expressedas mean � SD. All values measured were grouped seg-mentwise and their means were compared. Qualitativevalues were compared using Fisher exact test (2-tailed).To evaluate intragroup and intergroup variability we usedanalysis of variance with Bonferroni post hoc test. A Pvalue of �.05 was considered statistically significant.
Interobserver variability was assessed by analyzing 10regions in different, randomly chosen patients by 2 inde-pendent investigators (GD and GRS). For intraobservervariability 10 regions were analyzed by the same investi-gator (GD) 2 times within an interval of 1 week.
RESULTS
Hemodynamic responses to stress as measured bychanges in blood pressure and HR were similarbetween groups (P � not significant). All patientsachieved the predicted increases in HR (Table 1).
For the 2D echocardiography study, visual analy-sis of wall motion was feasible in 89% to 79% ofsegments (baseline and peak HR, respectively) in theDSE group; 77% to 70% of segments (baseline, andpeak exercise, respectively) in group 1; and 81% to70% (baseline and peak exercise, respectively) of allsegments in group 2.
We excluded segments in which CDMI measure-ments proved to be impossible (Table 2).
The reasons for exclusion were either acousticartefacts (15%) or a poor signal-to-noise ratio thatprecluded postprocessing (85%).
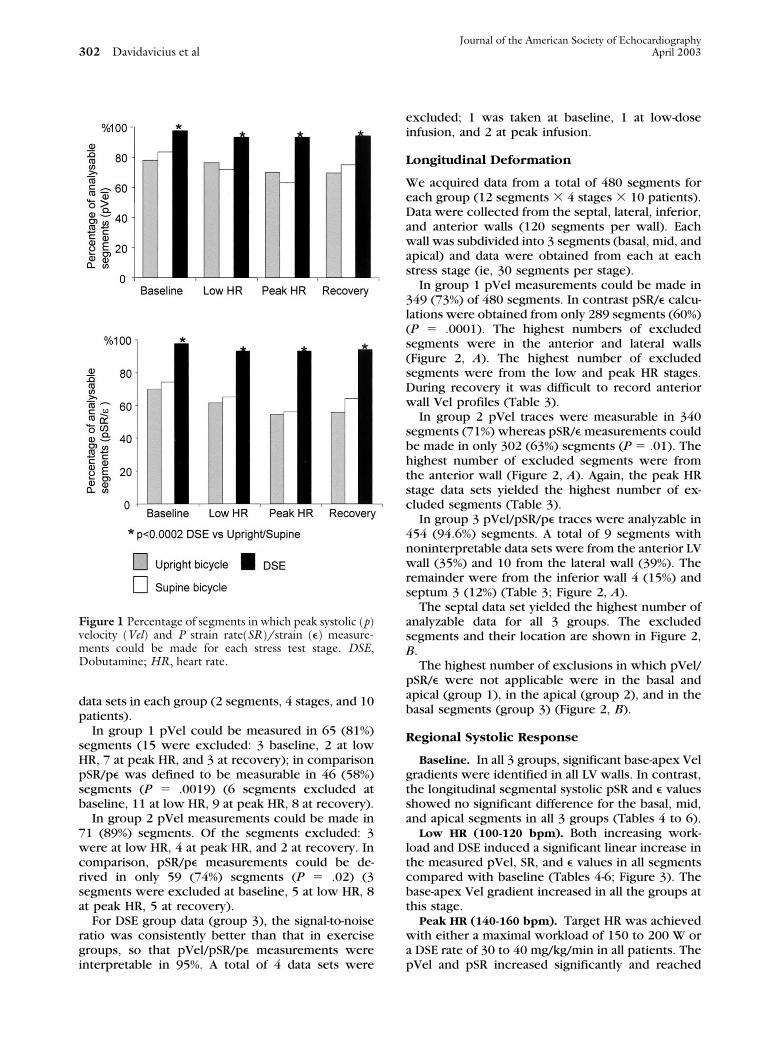
The feasibility of pVel and pSR/� data extractionfor each segment and at each stress test stage foreach group is shown in Figure 1. Baseline data setsyielded the highest percentage of analyzable data foreach group. The highest number of segments thathad to be excluded occurred in the low and peak HRstages. This was true for all 3 groups. For DSE, thenumber of segments in which pVel and pSR/� tracescould be measured was significantly higher for everyprotocol stage compared with both groups 1 and 2(P � .001) (Figure 1). In addition, in the DSE groupthere was no difference between the numbers ofsegments in which pVel versus deformation datacould be obtained (Table 2). In contrast, in bothbicycle groups we were able to measure pVel in ahigher number of segments compared with pSR/�measurements at the different exercise stages (lowHR P � .03; peak HR P � .05; recovery P � .05).
Radial Deformation
Both parasternal long- and short-axis views wereused to evaluate the radial function of the LVbasal-posterior segment. There were, therefore, 80
Journal of the American Society of EchocardiographyVolume 16 Number 4 Davidavicius et al 301
data sets in each group (2 segments, 4 stages, and 10patients).
In group 1 pVel could be measured in 65 (81%)segments (15 were excluded: 3 baseline, 2 at lowHR, 7 at peak HR, and 3 at recovery); in comparisonpSR/p� was defined to be measurable in 46 (58%)segments (P � .0019) (6 segments excluded atbaseline, 11 at low HR, 9 at peak HR, 8 at recovery).
In group 2 pVel measurements could be made in71 (89%) segments. Of the segments excluded: 3were at low HR, 4 at peak HR, and 2 at recovery. Incomparison, pSR/p� measurements could be de-rived in only 59 (74%) segments (P � .02) (3segments were excluded at baseline, 5 at low HR, 8at peak HR, 5 at recovery).
For DSE group data (group 3), the signal-to-noiseratio was consistently better than that in exercisegroups, so that pVel/pSR/p� measurements wereinterpretable in 95%. A total of 4 data sets were
excluded; 1 was taken at baseline, 1 at low-doseinfusion, and 2 at peak infusion.
Longitudinal Deformation
We acquired data from a total of 480 segments foreach group (12 segments � 4 stages � 10 patients).Data were collected from the septal, lateral, inferior,and anterior walls (120 segments per wall). Eachwall was subdivided into 3 segments (basal, mid, andapical) and data were obtained from each at eachstress stage (ie, 30 segments per stage).
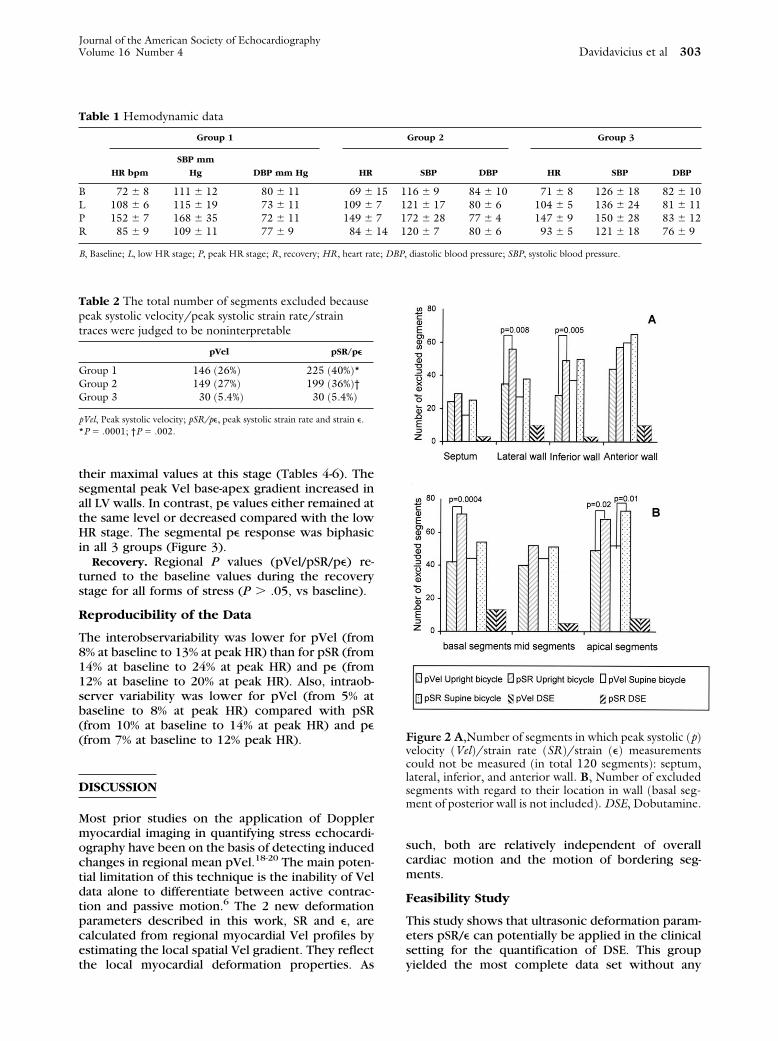
In group 1 pVel measurements could be made in349 (73%) of 480 segments. In contrast pSR/� calcu-lations were obtained from only 289 segments (60%)(P � .0001). The highest numbers of excludedsegments were in the anterior and lateral walls(Figure 2, A). The highest number of excludedsegments were from the low and peak HR stages.During recovery it was difficult to record anteriorwall Vel profiles (Table 3).
In group 2 pVel traces were measurable in 340segments (71%) whereas pSR/� measurements couldbe made in only 302 (63%) segments (P � .01). Thehighest number of excluded segments were fromthe anterior wall (Figure 2, A). Again, the peak HRstage data sets yielded the highest number of ex-cluded segments (Table 3).
In group 3 pVel/pSR/p� traces were analyzable in454 (94.6%) segments. A total of 9 segments withnoninterpretable data sets were from the anterior LVwall (35%) and 10 from the lateral wall (39%). Theremainder were from the inferior wall 4 (15%) andseptum 3 (12%) (Table 3; Figure 2, A).
The septal data set yielded the highest number ofanalyzable data for all 3 groups. The excludedsegments and their location are shown in Figure 2,B.
The highest number of exclusions in which pVel/pSR/� were not applicable were in the basal andapical (group 1), in the apical (group 2), and in thebasal segments (group 3) (Figure 2, B).
Regional Systolic Response
Baseline. In all 3 groups, significant base-apex Velgradients were identified in all LV walls. In contrast,the longitudinal segmental systolic pSR and � valuesshowed no significant difference for the basal, mid,and apical segments in all 3 groups (Tables 4 to 6).
Low HR (100-120 bpm). Both increasing work-load and DSE induced a significant linear increase inthe measured pVel, SR, and � values in all segmentscompared with baseline (Tables 4-6; Figure 3). Thebase-apex Vel gradient increased in all the groups atthis stage.
Peak HR (140-160 bpm). Target HR was achievedwith either a maximal workload of 150 to 200 W ora DSE rate of 30 to 40 mg/kg/min in all patients. ThepVel and pSR increased significantly and reached
Figure 1 Percentage of segments in which peak systolic (p)velocity (Vel) and P strain rate(SR)/strain (�) measure-ments could be made for each stress test stage. DSE,Dobutamine; HR, heart rate.
Journal of the American Society of Echocardiography302 Davidavicius et al April 2003
their maximal values at this stage (Tables 4-6). Thesegmental peak Vel base-apex gradient increased inall LV walls. In contrast, p� values either remained atthe same level or decreased compared with the lowHR stage. The segmental p� response was biphasicin all 3 groups (Figure 3).
Recovery. Regional P values (pVel/pSR/p�) re-turned to the baseline values during the recoverystage for all forms of stress (P � .05, vs baseline).
Reproducibility of the Data
The interobservariability was lower for pVel (from8% at baseline to 13% at peak HR) than for pSR (from14% at baseline to 24% at peak HR) and p� (from12% at baseline to 20% at peak HR). Also, intraob-server variability was lower for pVel (from 5% atbaseline to 8% at peak HR) compared with pSR(from 10% at baseline to 14% at peak HR) and p�(from 7% at baseline to 12% peak HR).
DISCUSSION
Most prior studies on the application of Dopplermyocardial imaging in quantifying stress echocardi-ography have been on the basis of detecting inducedchanges in regional mean pVel.18-20 The main poten-tial limitation of this technique is the inability of Veldata alone to differentiate between active contrac-tion and passive motion.6 The 2 new deformationparameters described in this work, SR and �, arecalculated from regional myocardial Vel profiles byestimating the local spatial Vel gradient. They reflectthe local myocardial deformation properties. As
such, both are relatively independent of overallcardiac motion and the motion of bordering seg-ments.
Feasibility Study
This study shows that ultrasonic deformation param-eters pSR/� can potentially be applied in the clinicalsetting for the quantification of DSE. This groupyielded the most complete data set without any
Table 1 Hemodynamic data
Group 1 Group 2 Group 3
HR bpm
SBP mm
Hg DBP mm Hg HR SBP DBP HR SBP DBP
B 72 � 8 111 � 12 80 � 11 69 � 15 116 � 9 84 � 10 71 � 8 126 � 18 82 � 10L 108 � 6 115 � 19 73 � 11 109 � 7 121 � 17 80 � 6 104 � 5 136 � 24 81 � 11P 152 � 7 168 � 35 72 � 11 149 � 7 172 � 28 77 � 4 147 � 9 150 � 28 83 � 12R 85 � 9 109 � 11 77 � 9 84 � 14 120 � 7 80 � 6 93 � 5 121 � 18 76 � 9
B, Baseline; L, low HR stage; P, peak HR stage; R, recovery; HR, heart rate; DBP, diastolic blood pressure; SBP, systolic blood pressure.
Table 2 The total number of segments excluded becausepeak systolic velocity/peak systolic strain rate/straintraces were judged to be noninterpretable
pVel pSR/p�
Group 1 146 (26%) 225 (40%)*Group 2 149 (27%) 199 (36%)†Group 3 30 (5.4%) 30 (5.4%)
pVel, Peak systolic velocity; pSR/p�, peak systolic strain rate and strain �.*P � .0001; †P � .002.
Figure 2 A,Number of segments in which peak systolic (p)velocity (Vel)/strain rate (SR)/strain (�) measurementscould not be measured (in total 120 segments): septum,lateral, inferior, and anterior wall. B, Number of excludedsegments with regard to their location in wall (basal seg-ment of posterior wall is not included). DSE, Dobutamine.
Journal of the American Society of EchocardiographyVolume 16 Number 4 Davidavicius et al 303

difference in the feasibility of either pVel or pSR/p�measurement (Figure 1). Conversely, for both up-right and supine bicycle groups the increased signalnoise induced by exercise precluded reliable datacollection. Cycling, regardless of the patient posi-tion, induced a degradation in the quality of data asa result of the combination of an increase in bodymovement, and deeper and faster respiration. Thisfinding is in agreement with prior stress echocardi-ography studies that had demonstrated that imagequality deteriorates during dynamic exercise.21
However, even the baseline measurements in bothbicycle groups showed a reduction in data yield. Incontrast, during DSE the more variable ultrasoundwindow that was available during the DSE studiesallowed a better alignment (and realignment) of theultrasound beam to the direction of deformation andresulted in a measurably higher yield and quality ofacquired data. Wilkenshoff et al19 previously dem-onstrated that mean pVel could be obtained in morethan 90% of segments during bicycle stress test evenwhen gray-scale image was suboptimal. However,
Table 3 Percentage of excluded segments from each wall at different stress stages (in total, each wall data set contains 30segments per stage
Group 1
Baseline Low HR Peak HR Recovery
pVel % pSR/� % pVel % pSR/� % pVel % pSR/� % pVel % pSR/� %
SW 20 20 7 23 20 30 23 23LW 23 40 33 50 33 50 33 47IW 20 27 20 43 20 47 33 50AW 30 40 33 40 40 57 43 60Group 2SW 10 13 27 30 17 23 0* 17LW 3† 20‡ 27 27 40 53 20 27IW 23 37 33 47 37 37 30 47AW 40 43 33 43 67§ 67 60 63Group 3SW 0 0 3 3 7 7 0 0LW 3 3 10 10 13 13 7 7IW 0 0 3 3 7 7 3 3AW 3 3 10 10 13 13 3 3
pVel, Peak systolic velocity; pSR/p�, peak systolic strain rate and strain; HR, heart rate; SW, septum; LW, lateral wall; IW, inferior wall; AW, anterior wall.*P � .004 vs peak HR and baseline; †P � .001 vs low HR and peak HR; ‡P � .01 vs peak HR; §P � .02 vs baseline and low HR.
Figure 3 Regional myocardium response to each form of stress: longitudinal deformation (septumbasal-mid-apical segments). B, Baseline; DSE, dobutamine; HR, heart rate; L, low; p, peak systolic; P,peak; R, recovery; SR, strain rate; Vel, velocity; �, strain.
Journal of the American Society of Echocardiography304 Davidavicius et al April 2003
the number of segments rejected was higher inour work as in both bicycle groups we excludeddata sets in which gray-scale image was subopti-mal as we had previously found we could notextract either sufficient visual or quantitative datafrom such data. Even then, among the segmentswith apparently acceptable image quality, theyield of analyzable segmental deformation datasets was lower compared with Vel data because ofthe magnification in signal noise during the offlineprocessing required to derive the SR curves.17
Analyzing the quality of data in individual walls, itwas interesting to note that anterior and lateralwall data had worse 2D gray-scale image qualityand the number of segments excluded from Veland deformation estimation from these walls werehigher (Figure 2). Not surprisingly, the apicalsegment was the hardest one from which tocollect reliable data. This had already been notedin previous studies.22
The Regional Response to Stress
pVel/SR. Stress induced a similar regional pVel/SR/� rate response in all 3 groups. We observed alinear increase of pVel and pSR values in all LVsegments (Figure 3) with highest values at peak HR,when myocardial contractility would be expected tobe maximal. Similar results have been shown inother Vel-based clinical studies that have shown thatan almost linear increase in regional pVel is thenormal myocardial reaction to stress.19,23 Weide-mann et al15 have also shown in the experimentalsituation that regional pSR linearly increased duringDSE inotropic stimulation and correlated with themaximal rate of change in LV pressure (dP/dt).
P�. In contrast, p� showed a biphasic responsefor both radial and longitudinal deformation. Thiswas independent of the stress type used (exercisevs pharmacologic). P� increased only initially (atlow HRs) and did not show a further significantrise at higher HRs (Figure 3). A previous experi-mental study had also shown that p� values de-cline at HRs more than 150 bpm and demon-strated a significant correlation with a decrease inLV stroke volume.15 It has also been shown pre-viously that during DSE, stroke volume increase bysome 27% from baseline during infusion rates of10 to 20 �g/kg/min, but shows no further increaseat higher doses.24 Such a biphasic response hasalso been observed in normal hearts during exer-cise.25 The most likely explanation for these find-ings is that during the progressive HR increase,diastole shortens while the duration of systole ismaintained nearly constant. The resultant shorten-ing in filling time results in a progressive decreasein preload. This in turn results in a decrease instroke volume (after an initial rise). Thus, thebiphasic p� response reflects the changes in
stroke volume induced by the HR increase and iscommon to all forms of stress.
Upright versus supine bicycle. At rest, the up-right bicycle position should result in a decreasein venous return compared with the supine. Thisshould result in lower end-diastolic pressures, areduced right-ventricular and LV stroke volume,and a slightly higher HR. Such changes shouldresult in a decreased value of p� as it is a volumedependent parameter. These differences were ob-served at rest in the 2 bicycle exercise groups(Tables 4 and 5). However, the difference be-tween upright and supine position became mini-mal during exercise as the major adaptation to theexercise is on the basis of an increase in HR witha progressive shortening in diastole with a lessercontribution coming from the adaptive Starling’smechanism. This could explain the similarity inexercise response we obtained from the 2 bicyclemodalities.25
Segmental pVel/pSR/p� distribution. As wouldbe expected from our previous work19 a normalbase-apex Vel gradient was recorded at everystage of stress in all 3 groups. In contrast, pSR or� values did not differ significantly from base toapex either at rest (P � .05) or on exercise. Otherauthors have also reported that regional LV sys-tolic SR and � values are homogenous in thelongitudinal direction in healthy participants atrest.26
Limitations
In its current format, the CDMI data acquisitiondoes not increase the time required for standardDSE, 2D, gray-scale imaging as 2 data sets aretaken at the same time. However, in this study,data postprocessing was time consuming takingup to 6 hours per study. This has now beensubstantially reduced with the introduction ofimproved analysis software. The usual limitationsinherent in the angle dependency of all echocar-diographic Doppler techniques apply equally toSR and � derived by ultrasonic auto-correlation.Thus, care was taken to align the ultrasound beamwith the interrogated direction of myocardial mo-tion during each study. In addition, for somewalls, a suboptimal insonation angle could haveresulted in an underestimation of SR/� values.Also, the signal noise had a marked deleteriouseffect on the calculation of regional deformationparameters as any noise in the myocardial Vel dataset will be processed and amplified during SRcalculation. As the number of patients was low,we did not establish any age-related referencepatterns for SR/� response during stress test andwe could not assess the relation between strokevolume and � in this study. In addition, we cannotexclude that the higher number of analyzable
Journal of the American Society of EchocardiographyVolume 16 Number 4 Davidavicius et al 305

segments in DSE group may also be a result of thedifferent composition of study groups. Indeed, inupright and supine groups patients were younger,with smaller hearts and more difficult apical win-dows. However, we consider that this was a truedifference, being only minimally related to thedifferent age of the patients in each group.
Conclusions and Clinical Implications
Our study suggests that the application of the newultrasonic myocardial deformation parameters SR/�to quantify DSE is feasible. Both parameters have tobe measured to accurately evaluate regional myocar-dial function as each provides different information
Table 4 The regional myocardial responses in both the radial (short axis) and longitudinal directions for group 1
Group 1 Baseline Low HR
Segments
Vel (cm/
s) SR (1/s) � (%)
Vel (cm/
s) SR (1/s) � (%)
BSPW 4.2 � 0.7 2.4 � 0.7 35.1 � 2 6.2 � 1.4 3.6 � 0.7 51 � 2*Septbasal 4.6 � 2 1.4 � 0.3 17 � 3 7 � 2 1.7 � 0.2 23 � 2Septmid 3.5 � 1 1.3 � 0.5 16 � 6 5.4 � 2 1.9 � 0.3 27 � 5†�
Septapic 2 � 0.8 1.2 � 0.3 15 � 5 3.3 � 1.3 1.9 � 0.5 26 � 2Infbasal 5.5 � 2 1.2 � 0.1 15 � 2 7.5 � 0.9 2.3 � 0.4§ 26 � 1†Infmid 3.9 � 2 1.2 � 0.2 13.3 � 4 5.6 � 1 1.7 � 0.4† 23 � 6†�
Infapic 2.8 � 1.8 1.4 � 0.5 14 � 4.5 3.7 � 1.4 2.1 � 0.4 26.5 � 2*†
BSPW, Basal segment of the posterior wall (Short axis); HR, heart rate; Vel, velocity; SR, strain rate; �, strain; Sept, septal; apic, apical; Inf, inferior.*P � .0006 vs baseline; †P � .003 vs recovery; ‡P � .008 vs low HR; §P � .05 vs recovery; �P � .001 vs baseline.
Table 5 The regional myocardial responses in both the radial (short axis) and longitudinal directions for group 2
Group 1 Baseline Low HR
Segments Vel (cm/s) SR (1/s) �(%) Vel (cm/s) SR (1/s) � (%)
BSPW 4.4 � 1.5 2.3 � 0.3 41 � 4.4 6.2 � 1.4 3.8 � 0.9 49 � 10Septbasal 5.6 � 0.9 1.4 � 0.4 21 � 4 7.1 � 2� 1.8 � 0.6 24 � 5Septmid 4.4 � 1 1.4 � 0.2 20 � 3 4.8 � 1 1.8 � 0.4 24 � 4.5Septapic 2.9 � 1 1.6 � 0.4 22 � 3.6 3.1 � 1 2 � 0.5 29 � 3�
Infbasal 6.9 � 0.8 1.2 � 0.3 18.9 � 2 9.5 � 2.4 1.7 � 0.2 20 � 3Infmid 5.3 � 1 1.4 � 0.3 21.5 � 2 8 � 2.6*† 1.7 � 0.4 24 � 6Infapic 4.1 � 1 1.4 � 0.1 21 � 7 6.1 � 2.6 2.1 � 0.7 31 � 5
BSPW, Basal segment of the posterior wall (short axis); HR, heart rate; Vel, velocity; SR, strain rate; �, strain; Sept, septal; apic, apical; Inf, inferior.*P � .0006 vs baseline; †P � .003 vs recovery; ‡P � .008 vs low HR; §P � .05 vs recovery; �P � .001 vs baseline.
Table 6 The regional myocardial responses in the radial and longitudinal directions for group 3
Group 1 Baseline Low HR
Segments
Vel (cm/
s) SR (1/s) � (%) Vel (cm/s) SR (1/s) � (%)
BSPW 3.9 � 0.8 2.1 � 0.1 37 � 3 5.1 � 1.2 3.2 � 1 44 � 6Septbasal 4.7 � 1.2 1.1 � 0.2 18 � 5 8.4 � 0.9 1.5 � 0.4 24 � 2Septmid 3.6 � 1 1.2 � 0.3 18 � 4 6.3 � 1.4*† 1.8 � 0.6 23 � 5Septapic 2.1 � 1 1.1 � 0.3 18 � 9 3.9 � 1 1.7 � 0.4 23 � 6Infbasal 5.4 � 0.7 1.2 � 0.5 17 � 7 9.6 � 2.4*† 1.8 � 0.4 22 � 5§Infmid 4.2 � 0.9 1.2 � 0.6 17 � 7 7.5 � 2.2 1.8 � 0.5 23 � 7Infapic 2.8 � 1 1.2 � 0.4 18.7 � 6 4.9 � 2 2.1 � 0.6† 24 � 6
BSPW, Basal segment of the posterior wall (short axis); HR, heart rate; Vel, velocity; SR, strain rate; �, strain; Sept, septal; apic, apical; Inf, inferior.*P � .0006 vs baseline; †P � .003 vs recovery; ‡P � .008 vs low HR; §P � .05 vs recovery; �P � .001 vs baseline.
Journal of the American Society of Echocardiography306 Davidavicius et al April 2003
on the global and regional changes induced bystress. In contrast to DSE (and using the currentlyavailable methodology) it may be impractical tomeasure either Vel or deformation during bothupright and supine bicycle exercise tests as aresult of the relatively low yield of segmental dataas a result of the increased signal noise andrespiratory artefacts in such data sets.
REFERENCES
1. Leischik R, Bartel T, Mohlenkamp S, Bruch C, Buck T, HaudeM, et al. Stress echocardiography: new techniques. EurHeart J 1997;18:D49-56.
2. Hoffmann R, Lethen H, Marvick T, Arnese M, Fioretti P,Pingitore A, et al. Analysis of interinstitutional observer agree-
Peak HR Recovery
Vel (cm/s) SR (1/s) � (%)
Vel (cm/
s) SR (1/s) � (%)
10 � 2*†‡ 4.3 � 1† 37 � 7‡ 4.3 � 1.3 2.4 � 0.8 30 � 4.39.7 � 3*† 2.3 � 0.8*†‡ 22 � 6.6§ 4.3 � 2 1.3 � 0.3 15 � 4.87.6 � 2*† 2.8 � 0.3*†‡ 27 � 6†� 2.9 � 1.8 1.4 � 0.6 14 � 36 � 3*†‡ 2.5 � 0.8*† 26 � 7†‡� 2.8 � 1.2 1.4 � 0.4 14 � 211.7 � 3*†‡ 2.4 � 0.5†� 15 � 4.8‡ 5.3 � 1.1 1.3 � 0.2 12 � 3.79.5 � 2*†‡ 2 � 0.4*† 20 � 6§ 4.3 � 1 1.1 � 0.3 9.1 � 47.6 � 2.3*‡§ 2.5 � 0.3*† 23 � 7.4‡§ 3.7 � 0.9 1.6 � 0.2 13 � 3.5
Peak HR Recovery
Vel (cm/s) SR (1/s) �(%) Vel (cm/s) SR (1/s) � (%)
8.6 � 1.8*†‡ 4.1 � 88 46 � 8 5.8 � 0.9 2.7 � 0.8 40 � 810 � 3*†‡ 1.9 � 0.8*†‡ 18 � 5 7 � 2 1.4 � 0.4 21 � 6.57 � 2.3� 2.3 � 0.5*†‡ 25.4 � 6 5.5 � 2 1.6 � 0.4 21 � 66 � 2.5‡§ 2.1 � 0.6 28.6 � 4� 3.4 � 1 1.9 � 0.5 22 � 513 � 4.7� 1.9 � 0.4� 19.1 � 8 8.4 � 3 1.6 � 0.2 21 � 211 � 4*† 2 � 1.1§ 19 � 12 7.5 � 3 1.3 � 0.2 19 � 69.5 � 3.8� 2.2 � 1 22 � 9.8 6.2 � 2.7 1.8 � 0.5 22 � 8
Peak HR Recovery
Vel (cm/s) SR (1/s) � (%) Vel (cm/s) SR (1/s) � (%)
8.3 � 2.4� 5.4 � 0.4*†‡ 39 � 8.8 5.4 � 2 2.7 � 0.7 40 � 1510 � 2.3 2.3 � 0.6 18 � 4 5.3 � 1.3 1.2 � 0.2 17 � 28 � 1.8*†‡ 2.4 � 1*† 19 � 5 4.5 � 1 1.2 � 0.3 18 � 76.2 � 2*†‡ 2.4 � 0.8*†‡ 19 � 7 2.3 � 1 1.2 � 0.5 19 � 512 � 2.4*† 2 � 0.5 17 � 6 6.3 � 2 1.3 � 0.3 13 � 59.6 � 2* 2.3 � 1*† 19.6 � 8 4 � 1 1.2 � 0.4 17 � 57.6 � 3*†‡ 2.5 � 0.6*‡ 23 � 7 3.2 � 1 1.1 � 0.2 21 � 5
Journal of the American Society of EchocardiographyVolume 16 Number 4 Davidavicius et al 307
ment in interpretation of dobutamine stress echocardiograms.J Am Coll Cardiol 1996;27:330-6.
3. Kvitting JP, Wigstrom L, Strotmann JM, Sutherland GR.How accurate is visual assessment of synchronicity in myocar-dial motion? An In vitro study with computer-simulated re-gional delay in myocardial motion: clinical implications for restand stress echocardiography studies. J Am Soc Echocardiogr1999;12:698-705.
4. Gorcsan J III, Strum DP, Mandarino WA, Gulati VK, PinskyMR. Quantitative assessment of alterations in regional leftventricular contractility with color-coded tissue Dopplerechocardiography: comparison with sonomicrometry andpressure-volume relations. Circulation 1997;95:2423-33.
5. Von Bibra H, Tuchnitz A, Klein A, Schneider-Eicke J,Schomig A, Schwaiger M. Regional diastolic function bypulsed Doppler myocardial mapping for the detection of leftventricular ischemia during pharmacologic stress testing: acomparison with stress echocardiography and perfusion scin-tigraphy. J Am Coll Cardiol 2000;36:444-52.
6. Edvardsen T, Skulstad H, Aakhus S, Urheim S, Ihlen H.Regional myocardial systolic function during acute myocardialischemia assessed by strain Doppler echocardiography. J AmColl Cardiol 2001;37:726-30.
7. Heimdal A, Stoylen A, Torp H, Skjaerpe T. Real-time strainrate imaging of the left ventricle by ultrasound. J Am SocEchocardiogr 1998;11:1013-9.
8. Jamal F, Kukulski T, Strotmann J, Szilard M, D’hooge J,Bijnens B, et al. Quantification of the spectrum of changes inregional myocardial function during acute ischemia in closedchest pigs: an ultrasonic strain rate and strain study. J Am SocEchocardiogr 2001;14:874-84.
9. Derumeaux G, Ovize M, Loufoua J, Andre-Fouet X, MinaireY, Cribier A, et al. Doppler tissue imaging quantitates regionalwall motion during ischemia and reperfusion. Circulation1998;97:1970-7.
10. Derumeaux G, Ovize M, Loufoua J, Pontier G, Andre-FouetX, Cribier A. Assessment of nonuniformity of transmuralmyocardial velocities by color-coded tissue Doppler imaging:characterization of normal, ischemic, and stunned myocar-dium. Circulation 2000;101:1390-5.
11. Derumeaux G, Loufoua J, Pontier G, Cribier A, Ovize M.Tissue Doppler imaging differentiates transmural from non-transmural acute myocardial infarction after reperfusion ther-apy. Circulation 2001;103:589-96.
12. Jamal F, Strotmann J, Weidemann F, Kukulski T, D’hooge J,Bijnens B, et al. Noninvasive quantification of the contractilereserve of stunned myocardium by ultrasonic strain rate andstrain. Circulation 2001;104:1059-65.
13. Kukulski T, Jamal F, D’Hooge J, Bijnens B, De Scheerder I,Sutherland GR. Acute changes in systolic and diastolic eventsduring clinical coronary angioplasty: a comparison of regionalvelocity, strain rate, and strain measurement. J Am Soc Echo-cardiogr 2002;15:1-12.
14. Voigt JU, Arnold MF, Karlsson M, Hubbert L, Kukulski T,Hatle L, et al. Assessment of regional longitudinal myocardial
strain rate derived from doppler myocardial imaging indexesin normal and infarcted myocardium. J Am Soc Echocardiogr2000;13:588-98.
15. Weidemann F, Jamal F, Kowalski M, Kukulski T, D’hooge J,Bijnens B, et al. Can strain rate and strain quantify changes inregional systolic function during dobutamine infusion, b-blockade and atrial pacing-implications for quantitative stressechocardiography. J Am Soc Echocardiogr 2002;15:416–24.
16. McNeill AJ, Fioretti PM, el-Said SM, Salustri A, Forster T,Roelandt JR. Enhanced sensitivity for detection of coronaryartery disease by addition of atropine to dobutamine stressechocardiography. Am J Cardiol 1992;70:41-6.
17. D’hooge J, Heimdal A, Jamal F, Kukulski T, Bijnens B,Rademarkers F, et al. Regional strain and strain rate measure-ments by cardiac ultrasound: principles, implementation andlimitations. Eur J Echocardiogr 2000;1:154-70.
18. Pasquet A, Armstrong G, Rimmerman C, Marwick T. Corre-lation of myocardial Doppler velocity response to exercisewith independent evidence of myocardial ischemia by dual-isotope single-photon emission computed tomography. Am JCardiol 2000;85:536-42.
19. Wilkenshoff UM, Sovany A, Wigstrom L, Olstad B, Lind-strom L, Engvall J, et al. Regional mean systolic myocardialvelocity estimation by real-time color Doppler myocardialimaging: a new technique for quantifying regional systolicfunction. J Am Soc Echocardiogr 1998;11:683-92.
20. Yamada E, Garcia M, Thomas JD, Marwick TH. MyocardialDoppler velocity imaging–a quantitative technique for inter-pretation of dobutamine echocardiography. Am J Cardiol1998;82:806-9 , A9-10..
21. Berberich SN, Zager JR, Plotnick GD, Fisher ML. A practicalapproach to exercise echocardiography: immediate postexer-cise echocardiography. J Am Coll Cardiol 1984;3:284-90.
22. Gorcsan J, Deswal A, Mankad S, Mandarino WA, Mahler CM,Yamazaki N, et al. Quantification of the myocardial responseto low-dose dobutamine using tissue Doppler echocardio-graphic measures of velocity and velocity gradient. Am JCardiol 1998;81:615-23.
23. Katz WE, Gulati VK, Mahler CM, Gorcsan J. Quantitativeevaluation of the segmental left ventricular response to dobut-amine stress by tissue Doppler echocardiography. Am J Car-diol 1997;79:1036-42.
24. Pellikka PA, Roger VL, McCully RB, Mahoney DW, BaileyKR, Seward JB, et al. Normal stroke volume and cardiacoutput response during dobutamine stress echocardiographyin subjects without left ventricular wall motion abnormalities.Am J Cardiol 1995;76:881-6.
25. Poliner LR, Dehmer GJ, Lewis SE, Parkey RW, BlomqvistCG, Willerson JT. Left ventricular performance in normalsubjects: a comparison of the responses to exercise in theupright and supine positions. Circulation 1980;62:528-34.
26. Kowalski M, Kukulski T, Jamal F, D’hooge J, Weidemann F,Rademakers F, et al. Can natural strain and strain rate quantifyregional myocardial deformation? A study in healthy subjects.Ultrasound Med Biol 2001;27:1087-97.
Journal of the American Society of Echocardiography308 Davidavicius et al April 2003