Micro-CT imaging assessment of dobutamine-induced cardiac stress in rats
15
Micro-CT imaging assessment of dobutamine-induced cardiac stress in rats Cristian T. Badea a , Laurence W. Hedlund a , James Cook a , Brian R. Berridge b , and G. Allan Johnson a Cristian T. Badea: [email protected]; Laurence W. Hedlund: [email protected]; James Cook: [email protected]; Brian R. Berridge: [email protected]; G. Allan Johnson: [email protected] a Center for In Vivo Microscopy, Department of Radiology, Box 3302 Duke University Medical Center, Durham, NC U.S.A. 27710 b GlaxoSmithKline Safety Assessment, 5 Moore Drive, Research Triangle Park, NC U.S.A. 27709 Abstract Introduction—Dobutamine (DOB) stress in animal models of heart disease has been imaged so far using echocardiography and magnetic resonance imaging. The purpose of this study was to assess normal response to DOB stress in rats using anatomical and functional data using microcomputed tomography (CT). Methods—Ten normal adult male rats were first injected with a liposomal-based blood pool contrast agent and next infused with DOB via a tail vein catheter. Using prospective gating, 5 pairs of systole/diastole micro-CT images were acquired (a) pre-infusion baseline; (b) at heart rate plateau during infusion of 10 μg/kg/min DOB; (c) at post-DOB infusion baseline; (d) at heart rate plateau during infusion of 30 μg/kg/min DOB; and (e) after post-infusion return to baseline. Heart rate, peripheral and breathing distensions were monitored by oximetry. Micro-CT images with 88- micron isotropic voxels were segmented to obtain cardiac function based on volumetric measurements of the left ventricle. Results—DOB stress increased heart rate and cardiac output with both doses. Ejection fraction increased above baseline by an average of 35.9% with the first DOB dose and 18.4% with the second dose. No change was observed in relative peripheral arterial pressures associated with the significant increases in cardiac output. Discussion—Micro-CT proved to be a robust imaging method able to provide isotropic data on cardiac morphology and function. Micro-CT has the advantage of being faster and more cost- effective than MR and is able to provide higher accuracy than echocardiography. The impact of such an enabling technology can be enormous in evaluating cardiotoxic effects of various test drugs. Keywords cardiac; small animal imaging; lung; micro-CT; stress; dobutamine © 2010 Elsevier Inc. All rights reserved. Correspondence: Cristian T. Badea, Center for In Vivo Microscopy, Box 3302 Duke University Medical Center, Durham, NC 27710, Telephone: 919 684-7509 Fax: 919 684-7158, [email protected]. Publisher's Disclaimer: This is a PDF file of an unedited manuscript that has been accepted for publication. As a service to our customers we are providing this early version of the manuscript. The manuscript will undergo copyediting, typesetting, and review of the resulting proof before it is published in its final citable form. Please note that during the production process errors may be discovered which could affect the content, and all legal disclaimers that apply to the journal pertain. NIH Public Access Author Manuscript J Pharmacol Toxicol Methods. Author manuscript; available in PMC 2012 January 1. Published in final edited form as: J Pharmacol Toxicol Methods. 2011 ; 63(1): 24–29. doi:10.1016/j.vascn.2010.04.002. NIH-PA Author Manuscript NIH-PA Author Manuscript NIH-PA Author Manuscript
Transcript of Micro-CT imaging assessment of dobutamine-induced cardiac stress in rats

Micro-CT imaging assessment of dobutamine-induced cardiac
stress in rats
Cristian T. Badea a, Laurence W. Hedlund a, James Cook a, Brian R. Berridge b, and G. AllanJohnson a
Cristian T. Badea: [email protected]; Laurence W. Hedlund: [email protected]; James Cook:[email protected]; Brian R. Berridge: [email protected]; G. Allan Johnson: [email protected] for In Vivo Microscopy, Department of Radiology, Box 3302 Duke University MedicalCenter, Durham, NC U.S.A. 27710
bGlaxoSmithKline Safety Assessment, 5 Moore Drive, Research Triangle Park, NC U.S.A. 27709
Abstract
Introduction— Dobutamine (DOB) stress in animal models of heart disease has been imaged sofar using echocardiography and magnetic resonance imaging. The purpose of this study was toassess normal response to DOB stress in rats using anatomical and functional data usingmicrocomputed tomography (CT).
Methods— Ten normal adult male rats were first injected with a liposomal-based blood poolcontrast agent and next infused with DOB via a tail vein catheter. Using prospective gating, 5 pairsof systole/diastole micro-CT images were acquired (a) pre-infusion baseline; (b) at heart rateplateau during infusion of 10 µg/kg/min DOB; (c) at post-DOB infusion baseline; (d) at heart rateplateau during infusion of 30 µg/kg/min DOB; and (e) after post-infusion return to baseline. Heartrate, peripheral and breathing distensions were monitored by oximetry. Micro-CT images with 88-micron isotropic voxels were segmented to obtain cardiac function based on volumetricmeasurements of the left ventricle.
Results— DOB stress increased heart rate and cardiac output with both doses. Ejection fractionincreased above baseline by an average of 35.9% with the first DOB dose and 18.4% with thesecond dose. No change was observed in relative peripheral arterial pressures associated with thesignificant increases in cardiac output.
Discussion— Micro-CT proved to be a robust imaging method able to provide isotropic data oncardiac morphology and function. Micro-CT has the advantage of being faster and more cost-effective than MR and is able to provide higher accuracy than echocardiography. The impact ofsuch an enabling technology can be enormous in evaluating cardiotoxic effects of various testdrugs.
Keywords
cardiac; small animal imaging; lung; micro-CT; stress; dobutamine
© 2010 Elsevier Inc. All rights reserved.
Correspondence: Cristian T. Badea, Center for In Vivo Microscopy, Box 3302 Duke University Medical Center, Durham, NC 27710,Telephone: 919 684-7509 Fax: 919 684-7158, [email protected].
Publisher's Disclaimer: This is a PDF file of an unedited manuscript that has been accepted for publication. As a service to ourcustomers we are providing this early version of the manuscript. The manuscript will undergo copyediting, typesetting, and review ofthe resulting proof before it is published in its final citable form. Please note that during the production process errors may bediscovered which could affect the content, and all legal disclaimers that apply to the journal pertain.
NIH Public AccessAuthor ManuscriptJ Pharmacol Toxicol Methods. Author manuscript; available in PMC 2012 January 1.
Published in final edited form as:J Pharmacol Toxicol Methods. 2011 ; 63(1): 24–29. doi:10.1016/j.vascn.2010.04.002.
NIH
-PA
Author M
anuscriptN
IH-P
A A
uthor Manuscript
NIH
-PA
Author M
anuscript

1. Introduction
Dobutamine (DOB) stress is commonly used with echocardiographic imaging incontemporary medical practice to evaluate myocardial viability and contractile reserve inpatients with different cardiac diseases like myocardial ischemia and valvular disorders(Krahwinkel, et al., 1997). DOB stress echocardiography has also been used to study cardiacdisease in large laboratory animals such as dogs and pigs (Handke, et al., 2003; McEntee, etal., 1998; McEntee, et al., 1996), but has also been used more recently in rodents (Plante, etal., 2005).
Cardiac studies in small animals are very challenging from an imaging perspective.Currently, two modalities—echocardiography and MR—are used to measure cardiacfunction in rodents. Although echocardiography has been the most widely used method,results are very operator-dependent. Moreover, echocardiography uses model-basedestimation of the ventricle volumes that relies on geometric assumptions that work well onlyin normal hearts (Camici, 2003; Hoit & Walsh, 2001).
Alternatively, the gold standard for cardiac imaging in rodents has been considered to beMR microscopy (MRM), which refers to MR imaging applied at the microscopic scale.MRM has been applied to assess both cardiac morphology and function in rodents (Brau,Hedlund, & Johnson, 2004; Franco, Dubois, Peshock, & Shohet, 1998; Ruff, et al., 1998;Slawson, Roman, Williams, & Koretsky, 1998; Wiesmann, et al., 2000) . Moreover, MRMhas also been used to measure dose-responsive changes in cardiac function with gradeddoses of dobutamine (Daire, et al., 2008). However, with some exceptions (Bucholz,Ghaghada, Qi, Mukundan, & Johnson, 2008) , most of the MRM and echocardiographystudies are not providing isotropic resolution, and therefore multiplanar reformations requireinterpolations to account for non-cubic voxels.
We proposed a micro-CT-based method appropriate for in vivo characterization of cardiacstructure and function in mice (C Badea, Fubara, Hedlund, & Johnson 2005), where truefourdimensional (4D) datasets are collected with an isotropic spatial resolution less than 100microns and a temporal resolution of 10 ms. We have shown that cardiac micro-CT usinghigh flux x-ray tubes, careful physiologic gating, and blood pool contrast agents can produceimage sets with 10–50 times higher spatial resolution than with MR (Nahrendorf, et al.,2001; Wiesmann, et al., 2000). Higher resolutions allow for more accurate segmentation,and therefore better accuracy in the volumetric measurements. Measurements of leftventricular (LV) volumes at different points in the cardiac cycle can provide indices ofcardiac function, such as ejection fraction (EF) and cardiac output (CO). Our goals in thisstudy were to develop and validate a protocol for assessing cardiac function in vivo in ratsusing micro-CT and to use of this technology for detecting a DOB-induced change incardiac function.
2. Materials and Methods
2.1 Animal preparation
All animal procedures were approved by the Duke University Institutional Animal Care andUse Committee. Ten male SD SAS rats (Charles-River, Wilmington, MA) 6–8 week old(average 214 g, 200–250 g) were used. Animals were anesthetized with isoflurane (1.5%)mixed with 50% oxygen and balanced with nitrogen that was delivered by nose cone. ECGwas monitored with electrodes (Blue Sensor, Medicotest, UK) taped to the footpads andbody temperature was maintained using heat lamps, a rectal probe, and feedback controller(Digi- Sense®, Cole Parmer, Chicago, IL). A pneumatic pillow on the thorax was used tomonitor breathing. All physiologic signals were processed with Coulbourn modules
Badea et al. Page 2
J Pharmacol Toxicol Methods. Author manuscript; available in PMC 2012 January 1.
NIH
-PA
Author M
anuscriptN
IH-P
A A
uthor Manuscript
NIH
-PA
Author M
anuscript
(Coulbourn Instruments, Allentown, PA) and displayed on a computer monitor using acustom-written LabVIEW application (National Instruments, Austin, TX). Additionally,heart and breathing rates, pulse and breathing distentions, and oxygen saturation weremonitored by a pulse oximeter placed on the hind paw (MouseOx, StarrLife Sci, PA). Pulsedistention (PD) is a surrogate of arterial pressure and provides a relative measure ofperipheral arterial pressure. Breathing distention (BD) is a surrogate of intrapleural pressurereflecting breathing effort (MouseOx User Manual, Rev.4.0). Since the distinction betweenblood and myocardium in micro-CT is low, contrast agents are essential. An intravascularcatheter (24 ga, BD Medical Systems, UT) was placed in the lateral tail vein for iodinatedcontrast injection and DOB infusion. DOB infusions were controlled by syringe pump(Harvard Apparatus, MA). Before the start of imaging, a liposomal-based blood poolcontrast agent (Mukundan, et al., 2006) (12 ml/kg, 80 mg Iodine/ml) was hand-injected intothe tail vein. For imaging, the animal was placed in an acrylic cradle containing a nose conefor isoflurane delivery, upper incisor clamp, and pneumatic pillow for recording breathingmotion (Howles, Nouls, Qi, & Johnson, 2009). This cradle assembly was then seatedvertically in a rotatable base controlled by a stepper motor.
2.2 Imaging
Imaging was performed using our dual tube/detector micro-CT system, which (C. Badea, etal., 2008) describes in detail. The x-ray tubes and the detectors are arranged orthogonally.The system includes: (a) 2x G-297 x-ray tubes (Varian Medical Systems, Palo Alto, CA)with 0.3/0.8 mm focal spot size; (b) 2x Epsilon High Frequency x-ray generators (EMDTechnologies, Quebec, Canada); (c) 2x XDI-VHR 2 CCD x-ray detectors (Photonic Science,East Sussex, UK) with a Gd2O2S phosphor and 22-micron pixels, which are typicallybinned to 88 microns. The sampling is controlled by a sequencing application written inLabVIEW. Only one of the imaging chains has been used in this study.
The imaging parameters were 80 kVp, 160 mA, with 10 ms exposures. Each 3D image setconsisted of 250 projections acquired over 190-degree arc. The acquisition time was 4–5minutes. Imaging was cardio-respiratory gated using a prospective strategy during end-expiration and at two phases of the cardiac cycle—at diastole at time of the R peak andduring systole after a delay from the R peak equal to 35% of the RR interval. The projectionimages were used to reconstruct tomograms with a Feldkamp algorithm using Parkerweighting (Feldkamp, Davis, & Kress, 1984). For this purpose, we used the Cobra EXXIMsoftware package (EXXIM Computing Corp, Livermore, CA). 3D image arrays (5123) wereproduced with a voxel size of 883 microns.
The imaging protocol consisted of acquiring 5 pairs of systole/diastole images from 10animals at (i) pre-infusion baseline (Pre10); (ii) at heart rate plateau during infusion of 10µg/kg/min DOB (PK10); (iii) at post-DOB infusion baseline (Pre30); (iv) at heart rateplateau during infusion of 30 µg/kg/min DOB (PK30); and (v) after post-infusion return tobaseline (Post30). DOB infusion lasted 15 minutes with imaging starting during the middleof these periods when the heart rate plateau has been reached. The return to baseline heartrates post DOB infusions occurred within 10 to 15 minutes. The total radiation dose peranimal was 0.6 Gy.
2.3 Image Analysis
Quantitative analysis of cardiac function based on the left ventricle (LV) volumetricmeasurements was performed using ImageJ <http://rsb.info.nih.gov/ij/> and theSegmentation Assistant plugin. The segmentation procedure is semi-automatic. 3D stackswere imported into ImageJ, where the images were cropped to include only slices throughthe heart. The top of the LV was defined as the first slice caudal to the aortic root. The
Badea et al. Page 3
J Pharmacol Toxicol Methods. Author manuscript; available in PMC 2012 January 1.
NIH
-PA
Author M
anuscriptN
IH-P
A A
uthor Manuscript
NIH
-PA
Author M
anuscript

threshold-based segmentation used the contrast difference between the contrast enhancedblood and the myocardium. After the segmentation, the LV volume was computed as thetotal number of voxels corresponding to blood multiplied by voxel volume. The LVvolumetric measurements were performed for both end-diastolic volume (EDV) and end-systolic volume (ESV). Stroke volume (SV) and ejection fraction (EF) were calculated withthe EDV and ESV (SV= EDV- ESV; EF=SV/EDV). For cardiac output (CO), SV wasmultiplied by heart rate (HR).
3. Results
Representative coronal micro-CT images during diastole and systole and corresponding tothe 5 stages of the imaging protocol are shown in Fig. 1. Because the micro-CT datasetshave isotropic resolution (88-micron voxels), the same image quality is possible in anyimaging plane. Note the dramatic decrease in LV volume at end-systole during the DOBinfusion (Figs. 1B and D) and return to baseline volume after infusion (Figs. 1C and E).
Table 1 summarizes the major changes of cardiac function after two doses of DOB (10 and30 µg/kg). Results are presented as means, and standard errors of the mean. For statisticalcomparisons, we performed one-way analysis of variance (ANOVA). Statistical significancewas set for Bonferroni corrected p values of 0.05 or less. There was a statistically significantincrease in heart rate (HR) during infusion of both doses and this was associated withincreases in cardiac output (Fig. 2; HR vs. CO) but without reaching statistical significance.These changes indicate the drug has a strong chronotropic effect. Also associated with theincreases in HR with both doses are significant decreases in ESV and but non-significantdecreases in EDS volumes (see Fig. 3; HR vs. ESV and Fig. 4; HR vs. EDV). Also, weobserved significant increases in EF associated with the increase in HR indicating a stronginotropic effect of the drug at both doses (see Fig. 5; HR vs. EF). The plot of CO vs. pulsedistension (PD) (Fig. 6) and Table 1 indicate there is no statistically significant change inperipheral arterial pressure associated with the significant increases in cardiac output. It iswell established that DOB has a peripheral vasodilatory effect that essentially blocks anyincrease in arterial pressure associated with the increases in CO (Segreti, Marsh,Polakowski, & Fryer, 2008). There were statistically non-significant increases in breathdistention (BD) during both DOB doses (see Fig.7).
4. Discussion
Evaluating the response of the small animal heart to stress in vivo is a challenging imagingtask due to the demands for higher spatial and temporal resolution. In this study, we showedthat micro-CT can be used to detect and measure DOB stress-induced changes in cardiacfunction in the rat. DOB infusion is safe, quick, and yields important information about therat’s response to adrenergic stress.
The micro-CT methods used in this study provided multiple 3D datasets with isotropicresolution of 88 microns (voxel volume=0.6 µl), with relatively rapid acquisition (<10 minfor two phases of the heart), and provided what we believe to be the most accurate imagingmethod currently available for measuring cardiac function. Echocardiography, whilerelatively inexpensive and easily performed, only provides a cross-section of the heart.Volume calculations rely on assumptions about the cardiac shape and results are verydependent on the operator. MR has been used to study DOB cardiac effects (Daire, et al.,2008), but the spatial resolution in this previous study (0.28 mm2 in-plane by 2 mm slice)was not isotropic. Moreover, the 156-µl nonisotropic voxels were more than 250-timeslarger than the (0.6 µl) voxels in this study. To minimize radiation dose, we acquired onlyend-diastolic and end-systolic images and not multiple phases of the entire cardiac cycle.
Badea et al. Page 4
J Pharmacol Toxicol Methods. Author manuscript; available in PMC 2012 January 1.
NIH
-PA
Author M
anuscriptN
IH-P
A A
uthor Manuscript
NIH
-PA
Author M
anuscript

Multiple phases of the complete cycle could be obtained with micro-CT using retrospectivegating and fast 4D acquisitions (Drangova, Ford, Detombe, Wheatley, & Holdsworth, 2007).However, unlike MR cardiac imaging, CT does not allow wall tagging for analysis of thecircumferential wall strain. But wall motion analysis is possible with 4D micro-CT based onregistration and analysis of deformation fields (Schreibmann, Badea, & Fox, 2008) .
The MR imaging study (Daire, et al., 2008) performed in Sprague Dawley rats reportedresults similar to ours. The SV was reported to be increased by 19% and the cardiac outputby 45% from baseline at a DOB dose of 10 µg/kg/min. In our study, the changes in SV andCO were 25.8% and 42%, respectively. DOB stress echocardiography has been used fornoninvasive, serial evaluation of the heart in Wistar rats (Plante, et al., 2005). DOB wasinfused intravenously at a constant rate of 10 µg/kg/min until a plateau was reached in theLV EF for at least 2 minutes. The echocardiography-based study found that the effects ofDOB were more prominent on end-systolic dimensions. The study reported a 24% increasein EF from baseline versus 35% in our work (see Table 1). The difference may be associatedwith variation in dose response between the different strains of animals, but we also believeit may be due to the inaccuracies associated with the M-mode measurements on which thisstudy was based (C. T. Badea, et al., 2007).
One limitation of micro-CT versus other imaging modalities is the use of ionizing radiation.The dose associated with micro-CT methods is not negligible. In the application reportedhere, the dose is approximately 12-times less than the whole body lethal dose (LD 50/30) inrats of approximately 7.1 Gy (Kouzmanova, Ivanov, Nankova & Traykov, 1997). We areexploring a number of interesting possibilities for dose reduction that include iterativereconstruction algorithms. In reference (Song, Liu, Johnson, & Badea, 2007), we introduceda sparseness prior-based iterative reconstruction based on total variation, which providedadequate image quality with as low as 95 projections with a random angular distribution.
Cardiovascular safety is an important concern in contemporary drug development and asignificant contributor to safety-related attrition of novel drugs in development. In vivostudies in laboratory rodents are used early in drug development to identify drug safetyissues that may impact clinical development of a novel molecule. Accordingly, sensitivemethods for identifying and characterizing cardiovascular safety concerns in rodents arenecessary. The best methods are those that integrate both structural and functionalendpoints, as well as those that have predictive capability (where “predictive” refers to theability to identify long-term risks in short-duration studies). Micro-CT imaging of thefunctioning heart under stress meets these needs. Micro-CT has extraordinary spatialresolution that allows precise quantitation of anatomic structures throughout the cardiaccycle. The addition of dobutamine permits evaluation of functional cardiac reserveincreasing opportunity to identify drug-related effects in the heart that may progress withcontinued dosing or have deleterious effects in a patient with pre-existing cardiac disease.
5. Conclusions
Dobutamine (DOB) stress micro-CT is a sensitive and potentially predictive method toevaluate cardiac function and functional reserve in rats. Micro-CT proved to be a robustimaging method able to provide isotropic data on cardiac morphology and function. Micro-CT has the advantage of being faster and more cost-effective than MR and is able to providehigher accuracy than echocardiography (C. T. Badea, et al., 2007). The potential impact ofsuch an enabling technology can be enormous in evaluating cardiotoxic effects of newpharmaceuticals.
Badea et al. Page 5
J Pharmacol Toxicol Methods. Author manuscript; available in PMC 2012 January 1.
NIH
-PA
Author M
anuscriptN
IH-P
A A
uthor Manuscript
NIH
-PA
Author M
anuscript

AcknowledgmentsAll work was performed at the Duke Center for In Vivo Microscopy, NCRR National Biomedical TechnologyResearch Center (P41 RR005959), with additional support from NCI (U24 CA092656), and a collaborativeresearch agreement with GlaxoSmithKline Safety Assessment. We thank our collaborators Drs. Ketan B. Ghaghadaand Ananth Annapragada (University of Texas) for providing the liposomal blood pool contrast agent used in thisstudy.
References
Badea C, Fubara B, Hedlund L, Johnson G. 4D micro-CT of the mouse heart. Molecular Imaging2005;4:110–116. [PubMed: 16105509]
Badea, C.; Johnston, S.; Johnson, B.; De Lin, M.; Hedlund, LW.; Johnson, GA. JS, Hsieh; Ehsan.SPIE, Medical Imaging. Vol. Vol. 6913. San Diego, CA: SPIE; 2008. A Dual Micro-CT System forSmall Animal Imaging; p. 691342-691310.
Badea CT, Hedlund LW, Mackel JF, Mao L, Rockman HA, Johnson GA. Cardiac micro-computedtomography for morphological and functional phenotyping of muscle LIM protein null mice.Molecular Imaging 2007;6:261–268. [PubMed: 17711781]
Brau ACS, Hedlund LW, Johnson GA. Cine magnetic resonance microscopy of the rat heart usingcardiorespiratory-synchronous projection reconstruction imaging. Journal of Magnetic ResonanceImaging 2004;20:31–38. [PubMed: 15221806]
Bucholz E, Ghaghada K, Qi Y, Mukundan S, Johnson GA. Four-dimensional MR microscopy of themouse heart using radial acquisition and liposomal gadolinium contrast agent. Magnetic Resonancein Medicine 2008;60:111–118. [PubMed: 18581419]
Camici PG. Gated PET and ventricular volume. Journal of Nuclear Medicine 2003;44:1662. [PubMed:14530483]
Daire JL, Jacob JP, Hyacinthe JN, Croisille P, Montet-Abou K, Richter S, Botsikas D, Lepetit-CoiffeM, Morel D, Vallee JP. Cine and tagged cardiovascular magnetic resonance imaging in normal ratat 1.5 T: a rest and stress study. Journal of Cardiovascular Magnetic Resonance 2008;10:48.[PubMed: 18980685]
Drangova M, Ford NL, Detombe SA, Wheatley AR, Holdsworth DW. Fast Retrospectively GatedQuantitative Four-Dimensional (4D) Cardiac Micro Computed Tomography Imaging of Free-Breathing Mice. Investigative Radiology 2007;42:85–94. [PubMed: 17220726]
Feldkamp LA, Davis LC, Kress JW. Practical cone-beam algorithm. Journal of the Optical Society ofAmerica 1984;1:612–619.
Kouzmanova M, Ivanov S, Nankova V, Traykov L. Effects of ionizing and nonionizing radiation onrat hemopoiesis, Electro- and Magnetobiology. 1997;16(2):161–168.
Franco F, Dubois SK, Peshock RM, Shohet RV. Magnetic resonance imaging accurately estimates LVmass in a transgenic mouse model of cardiac hypertrophy. American Journal of Physiology1998;274:H679–H683. [PubMed: 9486274]
Handke M, Heinrichs G, Magosaki E, Lutter G, Bode C, Geibel A. Threedimensionalechocardiographic determination of cardiac output at rest and under dobutamine stress:comparison with thermodilution measurements in the ischemic pig model. Echocardiography2003;20:47–55. [PubMed: 12848697]
Hoit, BD.; Walsh, RA. Cardiovascular Physiology in the Genetically Engineered Mouse. KluwerAcademic Publishers; 2001.
Howles GP, Nouls JC, Qi Y, Johnson GA. Rapid production of specialized animal handling devicesusing computer-aided design and solid freeform fabrication. J Magnetic Resonance Imaging2009;30:466–471.
Krahwinkel W, Ketteler T, Godke J, Wolfertz J, Ulbricht LJ, Krakau I, Gulker H. Dobutamine stressechocardiography. European Heart Journal 1997;18 Suppl D:D9–D15. [PubMed: 9183605]
McEntee K, Amory H, Clercx C, Soyeur D, Michaux C, Vanhaeverbeek O, Jacqmot O, Henroteaux M.Physiologic response to dobutamine infusion during cardiac stress testing of dogs. AmericanJournal of Veterinary Research 1998;59:1160–1165. [PubMed: 9736396]
Badea et al. Page 6
J Pharmacol Toxicol Methods. Author manuscript; available in PMC 2012 January 1.
NIH
-PA
Author M
anuscriptN
IH-P
A A
uthor Manuscript
NIH
-PA
Author M
anuscript

McEntee K, Clercx C, Pypendop B, Peeters D, Balligand M, D'Orio V, Henroteaux M. Cardiacperformance in conscious healthy dogs during dobutamine infusion. Research in VeterinaryScience 1996;61:234–239. [PubMed: 8938854]
Mukundan S, Ghaghada K, Badea C, Hedlund L, Johnson G, Provenzale J, Bellamkonda R,Annapragada A. A Nanoscale, Liposomal Contrast Agent for Preclincal MicroCT Imaging of theMouse. American Journal of Roentgenology 2006;186:300–307. [PubMed: 16423931]
Nahrendorf M, Wiesmann F, Hiller KH, Hu K, Waller C, Ruff J, Lanz TE, Neubauer S, Haase A, ErtlG, Bauer WR. Serial cine-magnetic resonance imaging of left ventricular remodeling aftermyocardial infarction in rats. Journal of Magnetic Resonance Imaging 2001;14:547–555.[PubMed: 11747006]
Plante E, Lachance D, Drolet MC, Roussel E, Couet J, Arsenault M. Dobutamine stressechocardiography in healthy adult male rats. Cardiovascular Ultrasound 2005;3:34. [PubMed:16250913]
Ruff J, Wiesmann F, Hiller K-H, Voll S, von Kienlin M, Bauer WR, Rommel E, Neubauer S, Haase A.Magnetic resonance microimaging for noninvasive quantification of myocardial function and massin the mouse. Magnetic Resonance in Medicine 1998;40:43–48. [PubMed: 9660551]
Schreibmann, E.; Badea, C.; Fox, T. AAPM: Medical Physics. 2008. Registration Based AutomaticSegmentation and Wall Motion Analysis for 4D Cardiac Micro-CT in Mice.
Segreti, JA.; Marsh, KC.; Polakowski, JS.; Fryer, RM. Evoked Changes in Cardiovascular Function inRats by Infusion of Levosimendan, OR-1896 [(R)-N-(4-(4- Methyl-6-oxo-1,4,5,6-tetrahydropyridazin-3-yl)phenyl)acetamide], OR-1855 [(R)-6-(4- Aminophenyl)-5-methyl-4,5-dihydropyridazin-3(2H)-one], Dobutamine, and Milrinone: Comparative Effects on PeripheralResistance, Cardiac Output, dP/dt, Pulse Rate, and Blood Pressure. Vol. Vol. 325. 2008. p.331-340.
Slawson SE, Roman BB, Williams DS, Koretsky AP. Cardiac MRI of the normal and hypertrophiedmouse heart. Magnetic Resonance in Medicine 1998;39:980–987. [PubMed: 9621922]
Song J, Liu QH, Johnson GA, Badea CT. Sparseness prior based iterative image reconstruction forretrospectively gated cardiac micro-CT. Medical Physics 2007;34:4476–4483. [PubMed:18072512]
Wiesmann F, Ruff J, Hiller KH, Rommel E, Haase A, Neubauer S. Developmental changes of cardiacfunction and mass assessed with MRI in neonatal, juvenile, and adult mice. American Journal ofPhysiology, Heart and Circulatory Physiology 2000;278:H652–H657. [PubMed: 10666098]
Badea et al. Page 7
J Pharmacol Toxicol Methods. Author manuscript; available in PMC 2012 January 1.
NIH
-PA
Author M
anuscriptN
IH-P
A A
uthor Manuscript
NIH
-PA
Author M
anuscript
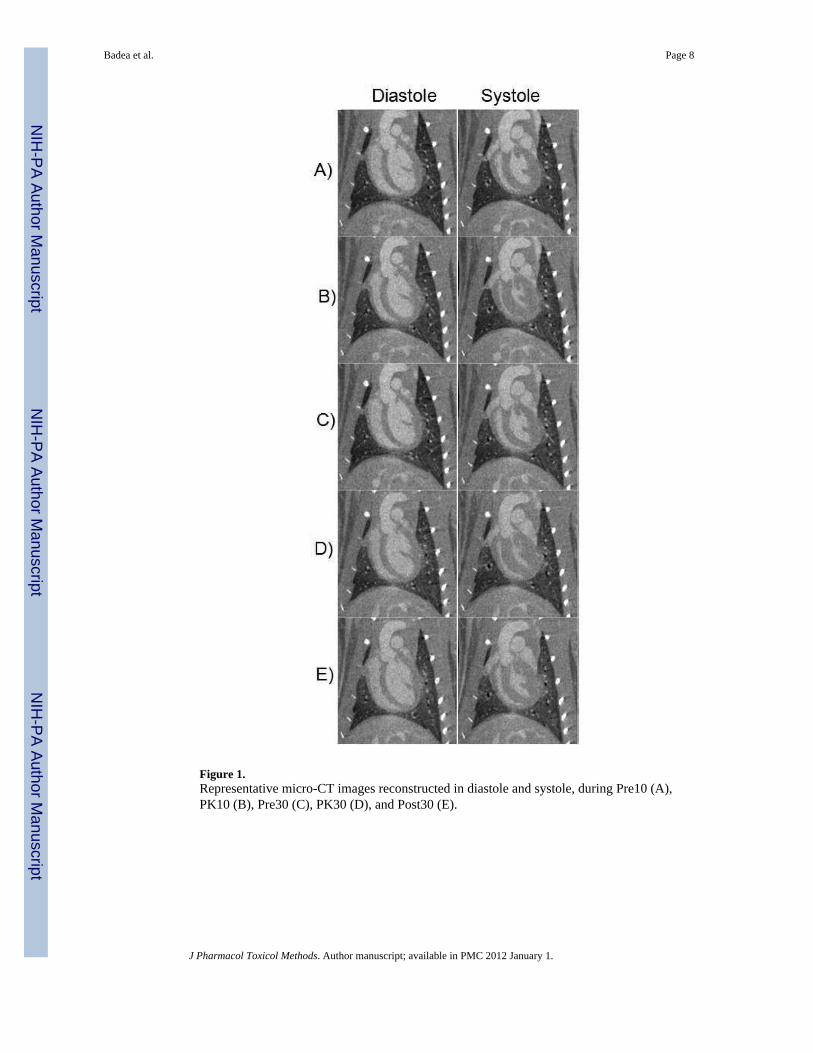
Figure 1.Representative micro-CT images reconstructed in diastole and systole, during Pre10 (A),PK10 (B), Pre30 (C), PK30 (D), and Post30 (E).
Badea et al. Page 8
J Pharmacol Toxicol Methods. Author manuscript; available in PMC 2012 January 1.
NIH
-PA
Author M
anuscriptN
IH-P
A A
uthor Manuscript
NIH
-PA
Author M
anuscript

Figure 2.Plot of heart rate (HR) and cardiac output (CO) at 5 points of the study; baseline (Pre10),during peak effect of 10 µg infusion (PK10), baseline after 10 µg/kg/min DOB (Pre30),during peak effect of 30 10 µg/kg/min DOB infusion (PK30), and return to baseline after 30µg/kg/min DOB (Post30). *Asterisks indicate significant difference compared to pre-challenge baseline (p <0.05, actual p values are shown in Table 1). Error bars representstandard errors of the mean.
Badea et al. Page 9
J Pharmacol Toxicol Methods. Author manuscript; available in PMC 2012 January 1.
NIH
-PA
Author M
anuscriptN
IH-P
A A
uthor Manuscript
NIH
-PA
Author M
anuscript

Figure 3.Plot of heart rate (HR) and end-systolic volume (ESV) at 5 points of the study. *Asterisksindicate significant difference compared to pre-challenge baseline (p <0.05, actual p valuesare shown in Table 1). Error bars represent standard errors of the mean.
Badea et al. Page 10
J Pharmacol Toxicol Methods. Author manuscript; available in PMC 2012 January 1.
NIH
-PA
Author M
anuscriptN
IH-P
A A
uthor Manuscript
NIH
-PA
Author M
anuscript

Figure 4.Plot of heart rate (HR) and end-diastolic volume (EDV) at 5 points of the study. *Asterisksindicate significant difference compared to pre-challenge baseline (p <0.05, actual p valuesare shown in Table 1). Error bars represent standard errors of the mean.
Badea et al. Page 11
J Pharmacol Toxicol Methods. Author manuscript; available in PMC 2012 January 1.
NIH
-PA
Author M
anuscriptN
IH-P
A A
uthor Manuscript
NIH
-PA
Author M
anuscript

Figure 5.Plot of heart rate (HR) and ejection fraction (EF) at 5 points of the study. *Asterisks indicatesignificant difference compared to pre-challenge baseline (p <0.05, actual p values areshown in Table 1). Error bars represent standard errors of the mean.
Badea et al. Page 12
J Pharmacol Toxicol Methods. Author manuscript; available in PMC 2012 January 1.
NIH
-PA
Author M
anuscriptN
IH-P
A A
uthor Manuscript
NIH
-PA
Author M
anuscript

Figure 6.Plot of cardiac output (CO) and pulse distention (PD) at 5 points of the study. Error barsrepresent standard errors of the mean.
Badea et al. Page 13
J Pharmacol Toxicol Methods. Author manuscript; available in PMC 2012 January 1.
NIH
-PA
Author M
anuscriptN
IH-P
A A
uthor Manuscript
NIH
-PA
Author M
anuscript

Figure 7.Plot of cardiac output (CO) and breath distention (BD) at 5 points of the study. Error barsrepresent standard errors of the mean.
Badea et al. Page 14
J Pharmacol Toxicol Methods. Author manuscript; available in PMC 2012 January 1.
NIH
-PA
Author M
anuscriptN
IH-P
A A
uthor Manuscript
NIH
-PA
Author M
anuscript

NIH-PA Author ManuscriptNIH-PA Author ManuscriptNIH-PA Author Manuscript
Badea et al.
Page 15
Table 1
Cardiovascular parameters from rats before, during, and after perfusion of 10 and 30 µg/kg/min of dobutamine.
HR EDV ESV SV CO EF PD BD
b/min µl µl µl ml/min %
Pre10 370.5 443.0 177.9 265.1 98.2 59.7 35.0 25.8
SEM 8.8 37.1 21.1 26.9 8.8 3.1 4.3 3.356
PK10 418.3 415.5 82.0 333.5 139.5 81.0 34.2 41.23
SEM 7.2 37.4 12.4 27.7 10.7 1.7 5.1 5.87
%ChgPrePK 12.9 −6.2 −53.9 25.8 42.0 35.9 −2.1 59.8
Pre30 372.3 502.2 166.5 335.7 125.0 67.1 39.8 28.467
SEM 8.8 37.1 21.1 26.9 8.8 3.1 7.9 2.675
PK30 450.4 420.1 86.6 333.5 150.2 79.4 34.9 37.21
SEM 8.3 35.0 10.4 28.5 11.9 1.9 4.6 5.019
%ChgPrePK 21.0 −16.4 −48.0 −0.6 20.7 18.4 −12.3 30.7
Post30 377.5 513.6 163.9 349.7 132.0 67.7 28.2 25.48
SEM 9.5 38.9 21.2 36.9 11.9 3.9 3.1 3.9
p values for F 0.0001 0.2110 0.0002 0.3052 0.0179 0.0001 0.6973 0.0411
Bonferroni Corrected p values
Pre10/PK10 0.0013 1 0.0046 1 0.0911 0.0001 1 0.1555
Pre30/PK30 0.0001 1 0.0291 1 0.9646 0.0451 1 1
Pre10/Pre30 1 1 1 1 0.9079 0.7889 1 1
Pre30/Post30 1 1 1 1 1 1 1 1
HR=heart rate; EDV=end-diastolic volume; ESV=end-systolic volume; SV=stroke volume; CO=cardiac output; EF=ejection fraction; PD=pulse distention, BD=breath distention. Data presented for n=10animals with the exception of PD and BD where n=9.
J Pharm
acol Toxicol M
ethods. Author m
anuscript; available in PM
C 2012 January 1.