A study of low-strain and medium-strain grain boundary engineering
12
A study of low-strain and medium-strain grain boundary engineering Valerie Randle * , Mark Coleman Materials Research Centre, School of Engineering, Swansea University, Swansea SA2 8PP, UK Received 22 January 2009; received in revised form 1 April 2009; accepted 1 April 2009 Available online 4 May 2009 Abstract Grain boundary engineering (GBE) processing schedules, involving low-strain (5% deformation) iterative treatments, have been car- ried out on copper. Misorientation and grain boundary plane statistics have been derived, plus tensile and hardness measurements. The R3 length fraction and R9/R3 number ratio decreased during the first two processing iterations, whereas maximum GBE misorientation statistics were achieved after three processing iterations. Analysis of mechanical properties data revealed an accumulation of strain energy throughout the first three processing iterations, sufficient to provide enough driving force for extensive R3 n interactions. The den- sity of R3 boundaries had a larger effect on the rate of hardening than did the density of grain boundaries. This finding indicates the effectiveness of R3 interfaces as barriers to plastic flow, which plays an important role in the early stages of GBE processing. Data from samples that had undergone the low-strain iterations were also compared to medium-strain (25% deformation) processing iterations. Ó 2009 Acta Materialia Inc. Published by Elsevier Ltd. All rights reserved. Keywords: Copper; Electron backscattering diffraction (EBSD); Grain boundary twin 1. Introduction Grain boundary engineering (GBE) is based on specific thermomechanical processing in order to increase the pro- portion of ‘‘special” boundaries, where special boundaries are those whose close-fitting interfacial geometry leads to improved properties [1]. Most GBE is based on exploita- tion of multiple annealing twinning in low stacking-fault energy metals alloys in order to give a high proportion of R3 boundaries, in coincidence site lattice notation. Typical GBE thermomechanical processing in such materials involves applying several iterations of cold deformation followed by annealing. Two types of GBE processing have evolved over recent years. These are commonly known as ‘‘strain-anneal”, which uses low levels of deformation, typically 5–10%, and ‘‘strain-recrystallization”, which uses medium levels of deformation, typically 20–30% [1,2]. The most widely used GBE processing, which is exploited commercially, involves the latter. A typical processing schedule would be 4–7 cycles of 20–30% deformation followed by an anneal of a few minutes at a temperature just above the recrystallization temperature (e.g. [3]). Transmission elec- tron microscopy (TEM) studies have suggested that ‘‘strain-recrystallization” is an inaccurate description of the process because insufficient strain is localized at grain boundaries to allow in the short annealing time the forma- tion of recrystallization nucleation sites [4]. On the other hand strain-anneal GBE involves a lower level of applied strain than strain-recrystallization GBE, followed by annealing at a sufficiently high temperature to allow strain-enhanced grain boundary migration. Recrystalliza- tion is ruled out at these combined temperature/strain lev- els. There are three variants on strain-anneal GBE processing: long duration annealing [5], multicycle short- duration annealing [6] and one cycle plus short duration anneal [7]. Although both the strain-recrystallization and strain- anneal GBE processing routes have been quite frequently investigated, there has been no direct comparison between the two routes to evaluate their relative merits. Both can 1359-6454/$36.00 Ó 2009 Acta Materialia Inc. Published by Elsevier Ltd. All rights reserved. doi:10.1016/j.actamat.2009.04.002 * Corresponding author. E-mail address: [email protected] (V. Randle). www.elsevier.com/locate/actamat Available online at www.sciencedirect.com Acta Materialia 57 (2009) 3410–3421
Transcript of A study of low-strain and medium-strain grain boundary engineering

Available online at www.sciencedirect.com
www.elsevier.com/locate/actamat
Acta Materialia 57 (2009) 3410–3421
A study of low-strain and medium-strain grain boundary engineering
Valerie Randle *, Mark Coleman
Materials Research Centre, School of Engineering, Swansea University, Swansea SA2 8PP, UK
Received 22 January 2009; received in revised form 1 April 2009; accepted 1 April 2009Available online 4 May 2009
Abstract
Grain boundary engineering (GBE) processing schedules, involving low-strain (5% deformation) iterative treatments, have been car-ried out on copper. Misorientation and grain boundary plane statistics have been derived, plus tensile and hardness measurements. TheR3 length fraction and R9/R3 number ratio decreased during the first two processing iterations, whereas maximum GBE misorientationstatistics were achieved after three processing iterations. Analysis of mechanical properties data revealed an accumulation of strainenergy throughout the first three processing iterations, sufficient to provide enough driving force for extensive R3n interactions. The den-sity of R3 boundaries had a larger effect on the rate of hardening than did the density of grain boundaries. This finding indicates theeffectiveness of R3 interfaces as barriers to plastic flow, which plays an important role in the early stages of GBE processing. Data fromsamples that had undergone the low-strain iterations were also compared to medium-strain (25% deformation) processing iterations.� 2009 Acta Materialia Inc. Published by Elsevier Ltd. All rights reserved.
Keywords: Copper; Electron backscattering diffraction (EBSD); Grain boundary twin
1. Introduction
Grain boundary engineering (GBE) is based on specificthermomechanical processing in order to increase the pro-portion of ‘‘special” boundaries, where special boundariesare those whose close-fitting interfacial geometry leads toimproved properties [1]. Most GBE is based on exploita-tion of multiple annealing twinning in low stacking-faultenergy metals alloys in order to give a high proportion ofR3 boundaries, in coincidence site lattice notation. TypicalGBE thermomechanical processing in such materialsinvolves applying several iterations of cold deformationfollowed by annealing.
Two types of GBE processing have evolved over recentyears. These are commonly known as ‘‘strain-anneal”,which uses low levels of deformation, typically 5–10%,and ‘‘strain-recrystallization”, which uses medium levelsof deformation, typically 20–30% [1,2]. The most widelyused GBE processing, which is exploited commercially,
1359-6454/$36.00 � 2009 Acta Materialia Inc. Published by Elsevier Ltd. All
doi:10.1016/j.actamat.2009.04.002
* Corresponding author.E-mail address: [email protected] (V. Randle).
involves the latter. A typical processing schedule wouldbe 4–7 cycles of 20–30% deformation followed by ananneal of a few minutes at a temperature just above therecrystallization temperature (e.g. [3]). Transmission elec-tron microscopy (TEM) studies have suggested that‘‘strain-recrystallization” is an inaccurate description ofthe process because insufficient strain is localized at grainboundaries to allow in the short annealing time the forma-tion of recrystallization nucleation sites [4]. On the otherhand strain-anneal GBE involves a lower level of appliedstrain than strain-recrystallization GBE, followed byannealing at a sufficiently high temperature to allowstrain-enhanced grain boundary migration. Recrystalliza-tion is ruled out at these combined temperature/strain lev-els. There are three variants on strain-anneal GBEprocessing: long duration annealing [5], multicycle short-duration annealing [6] and one cycle plus short durationanneal [7].
Although both the strain-recrystallization and strain-anneal GBE processing routes have been quite frequentlyinvestigated, there has been no direct comparison betweenthe two routes to evaluate their relative merits. Both can
rights reserved.

V. Randle, M. Coleman / Acta Materialia 57 (2009) 3410–3421 3411
increase the proportion of R3 boundaries and incorporatethese boundaries into the grain boundary network, whichis a hallmark of a GBE microstructure [8]. There arereports that it is more difficult to control grain size bythe strain-anneal route, and sometimes grain growth resultswhich is generally undesirable [1].
The present work is a controlled study to evaluate andto compare the effects of strain-recrystallization (25%strain) vs. strain-annealing (5% strain) GBE processingon the microstructure, grain boundary parameters andmechanical properties (tensile data and hardness) in cop-per. Analysis of the stress–strain behaviour gives an indica-tion of the balance between deformation and annealinginvolved in the iterative processing. Because strain-recrys-tallization may be an inaccurate term in this context, wewill refer instead to medium-strain (25% deformation)and low-strain (5% deformation) GBE processing, respec-tively. Data from the medium-strain series have been previ-ously reported [8].
2. Materials and methods
Specimens of copper, 99.99% purity, were obtained fromGoodfellow Metals. The as-received (AR) material was‘‘half hard”, such that grains were slightly elongated ratherthan equiaxed. The AR material was given a single-steptreatment of an anneal for 45 min at 750 �C, with the aimof achieving full softening. Tensile specimens were madefrom the ‘‘single-step” specimen and five sequential pro-cessing iterations were carried out, consisting of 5% tensiledeformation in each processing iteration followed by 180 sannealing in air at 750 �C, which is 0.75Tm. For each iter-ation two tensile specimen series were used: one to test tofailure and a second for microstructure analysis. The ARand single-step specimens were also tested to failure.Microhardness measurements, 25 from each specimen,were also obtained.
Representative samples were metallographically pre-pared in the normal way. They were subsequently etchedin 50:50 ammonia and hydrogen peroxide for 3–5 s. Orien-tation data were collected using an HKL TechnologyChannel 5 electron backscatter diffraction (EBSD) systeminterfaced to a Philips XL30 scanning electron microscopeoperated at 20 kV. Orientation maps were acquired fromthe multistep specimens after each iteration, and also fromthe AR and single-step specimen, using a 1 lm step size. Inorder to obtain the misorientation statistics, an average of15,000 grains was sampled from each specimen, from ran-dom locations on the specimen surfaces. The orientationmaps were analyzed using Channel 5 Tango software.The Brandon criterion [9] was used to classify R3n bound-aries, both as a length fraction and as a number fraction,with n 6 3, i.e. R3, R9 and R27. The accuracy of a misori-entation measurement obtained by EBSD is 0.5�.
The five-parameter distribution, i.e. encompassing bothmisorientation and interface planes, was carried out on thethird-iteration specimen. Orientation data from this partic-
ular specimen were collected from 36,000 grains for theanalysis. Interface positions were reconstructed and dis-played using an algorithm in the TSL (TexSEM Laborato-ries Ltd) suite of EBSD software. The density distributionof boundary planes was then obtained by use of softwarecode designed in the Department of Materials Scienceand Engineering at Carnegie Mellon University. The meth-odology is described in detail elsewhere [10,11]. The distri-butions, which have a resolution of 10�, were calculated as‘‘multiples of a random distribution” (MRD), and dis-played as density contours in stereographic projection.
3. Results
Fig. 1 shows the general microstructure of a sample afterthree processing iterations. This microstructure, which isdominated by prolific R3 generation, is typical of all theiteratively processed specimens. The average grain sizeincreased from 7 lm in the as-received specimen to12.4 lm after the second processing iteration, at whichapproximate value it stabilized during the remaining pro-cessing. The grain size and grain size spread for each sam-ple is shown in Fig. 2.
As expected after GBE-type processing, a high propor-tion of R3 boundaries is evident in the microstructure.The R3 proportions after each processing iteration areshown in Fig. 2, both as a fraction of total boundary length(Fig. 2a) and as a fraction of total numbers of boundaries(Fig. 2b). The R9 and R27 fractions are also included onFig. 2. A high number fraction of these boundaries (espe-cially R9) indicates interactions between R3 boundaries,as has been documented elsewhere [8,12]. The proportionof R3 increased greatly after the single-step treatment,but the subsequent iterative treatments show that the R3fraction has reduced during the iterative treatments, exceptfor the third iteration which has resulted in a peak R3 valueof 67% by length. Likewise the R9 proportions haveincreased after the single-step treatment, but showed anerratic profile as a result of the iterative processing, withthe peak value also after the third iteration. The R9/R3length fraction ratio is between 0.05 and 1.0, whereas theR9/R3 number fraction ratio is less consistent and has val-ues between 0.14 and 0.35, peaking at the third iteration.Several orientation maps from each specimen were col-lected in order to obtain the grain size and R statistics.There was little intra-specimen variation in the R values.This is illustrated in Table 1, which is typical of all thespecimens.
The tensile data for each sample are shown in Fig. 3a interms of true stress–true strain plots. Five tensile tests werecarried out for each specimen, and the plots shown inFig. 3a are representative of each series. There was little var-iation of the tensile data within each of the specimen series;for example after the first processing iteration the tensilestrength varied from 194 to 203 N mm�2. Both the tensilestrength and strain-to-failure increased considerably afterthe single-step treatment, and subsequently increased further
Fig. 1. Typical orientation map, taken from the third processing iteration. R3, R9 and R27 interfaces are red, blue and yellow, respectively. Random high-angle boundaries are black and low-angle boundaries are grey. The map background is shaded according to a diffraction pattern quality parameter. (Forinterpretation of the references to colour in this figure legend, the reader is referred to the web version of this article.)
3412 V. Randle, M. Coleman / Acta Materialia 57 (2009) 3410–3421
after the first processing iteration compared to the single-step treatment. Thereafter the strain-to-failure reduced afterall the other iterations except the third iteration, and thetensile strength remained approximately constant. Therewas a correlation between the strain-to-failure and the lengthfraction of R3s, as shown in Fig. 3b. For each processingstage the strain-hardening exponent has been calculatedfrom the slope of the log–log plot of the true stress–truestrain curves, which are shown in Fig. 3c. The strain-harden-ing exponent for the single-step treatment was 0.61, whereasafter the iterative processing the strain-hardening exponentswere in the range 0.32–0.43 except for the third iteration(0.60) and the fifth iteration (0.58).
Fig. 4 shows the average hardness for each specimen. Itis clear that the single-step processing, which was 750 �Cfor 45 min, allowed full softening of the specimen becausethe hardness reduced by half. Thereafter the hardnessrecovered slightly during the first two processing iterations,reduced during the third iteration and finally increasedslightly during the final two iterations.
4. Discussion
The misorientation data have revealed that compared tothe single-step specimen, the iterative treatments only pro-duce extra GBE after the third iteration, and the other iter-ations actually reduce the R3n fraction compared to thesingle-step treatment. It is suggested that this effect canbe understood in terms of strain retention and work-hard-ening rate as follows. During the first two iterations strainhas accumulated in the microstructure and there has beenlittle interface migration. The evidence for this is that the
hardness increased, whereas the R3 fractions and grain sizedecreased. It took until the third iteration for sufficientstrain to accumulate in the lattice to activate the strain-induced interface migration necessary to increase the R3and R9 population in the grain boundary network, fosteredby interactions between these boundaries. The averagegrain size increased slightly as a consequence of the grainboundary migration (Fig. 2), and the work-hardening rateincreased. Concomitantly the hardness decreased as dislo-cations were annihilated in the moving interfaces (Fig. 4).Hence the accumulated strain energy was expended duringthe third iteration. The fourth and fifth iterations essen-tially echoed the first and second iterations in that theGBE misorientation statistics decreased.
Hence a cyclical nature to the iterative processing isrevealed, with a period of three iterations. This is the num-ber of iterations required to build up sufficient strain toprovide a driving force for interface migration and R3n
interactions, as described above. We could speculate there-fore that a sixth iteration would result in a GBE peakagain. However such a peak would probably be smallerthan the peak at the third iteration because the GBE mis-orientation statistics for the fourth and fifth iterations aresmaller than those for the first and second iterations, andso this would not be a practically useful exercise.
Annealing twins, a subset of R3 boundaries, play a keyrole in strain retention as a necessary part of GBE by iter-ative processing. This role has been described previouslywith respect to medium-strain GBE processing [8]. Theessential point is that in the early stages of GBE iterativeprocessing strain retention at interfaces is necessary, asconfirmed in the present results. Grain boundaries, and
Fig. 2. Proportions of R3, R9 and R27 boundaries in each sample according to: (a) fraction of total interface length and (b) fraction of total number ofboundaries. The average grain size is also included.
Table 1Variation in grain size and R length proportions (%) in the third-iteration specimen, in the seven regions (3a–3g) sampled.
Sample Grain size (lm) No. of grains R3 R9 R27a R27b
3a 11.69 2841 66.7 7.55 1.26 1.183b 12.37 2519 65.8 7.55 1.35 1.173c 11.67 7899 67.4 7.98 1.82 1.53d 11.52 1860 66.9 7.71 1.78 1.273e 12.36 7584 66.9 7.95 1.57 1.443f 11.20 7572 66.4 7.76 1.39 1.353g 11.83 6050 67.3 8.46 1.16 1.24Average 11.81 36,325 66.8 7.85 1.48 1.31Standard deviation 0.43 – 0.55 0.32 0.25 0.13
V. Randle, M. Coleman / Acta Materialia 57 (2009) 3410–3421 3413
more especially twin boundaries, are effective barriers fordislocation pile-up. Some examples are as follows. In alu-minium bicrystals having a R3 misorientation, an appliedstrain of 20% resulted in inhomogeneous deformation
along the interface, and subsequent annealing resulted instrain-induced migration [13]. For this particular case,screw dislocations were transmitted easily through theinterface, whereas edge dislocations piled up against the

(a)
(b)
0
10
20
30
40
50
60
70
0
0.05
0.1
0.15
0.2
0.25
0.3
0.35
0.4
0.45
0.5
AR Single-Step 1st 2nd 3rd 4th 5th
Percen
tage len
gthStr
ain
to
fai
lure
Sample
True Strain to Failure %Sig 3
(c)
Fig. 3. (a) True stress–true strain plots for each sample. (b) R3 length vs. strain-to-failure for each sample. (c) Log stress vs. log strain for each sample. Thework-hardening exponent is calculated from the straight portion of each plot.
3414 V. Randle, M. Coleman / Acta Materialia 57 (2009) 3410–3421
boundary. In a nickel-based alloy, R3s and some other CSLboundaries were shown to be more likely to trap extrinsic
grain boundary dislocations than were random high-angleboundaries, resulting in matrix hardening. Increased strain

0
10
20
30
40
50
60
70
80
90
100
AR Single-Step 1st 2nd 3rd 4th 5th
Ave
rage
Vic
kers
Har
dnes
s
Sample
Fig. 4. Average Vickers hardness for each sample. Error bars are included.
Fig. 5. (a) Projected interface length fraction as a function of average hardness, for each sample. The relationship trend for R3 boundaries, grainboundaries and total interface length (i.e. R3 plus grain boundaries) is shown as a dotted, dashed and dashed-and-dotted line, respectively. (b) Projectedinterface length fraction as a function of average hardness for previously reported data from brass (adapted from Ref. [16]).
V. Randle, M. Coleman / Acta Materialia 57 (2009) 3410–3421 3415
3416 V. Randle, M. Coleman / Acta Materialia 57 (2009) 3410–3421
hardening in a specimen containing a higher proportion ofCSLs was observed after high-temperature deformation[14]. Nanocrystalline copper containing a high density oftwins showed a tensile strength an order of magnitudehigher than coarse-grained copper, due to the blockage ofdislocation motion by the numerous twin boundaries [15].
The greater effectiveness of twins compared to grainboundaries was previously demonstrated in brass nearly50 years ago, by analysis of the relationship between inter-face area fraction and hardness, for both twins and grainboundaries [16]. A linear relationship was found betweenboth twin fraction and grain boundary fraction and hard-ness, and the gradient for the twin/hardness plot was stee-per than that for the grain boundary/hardness plot. Wehave adapted the methodology from Ref. [16] to analyze
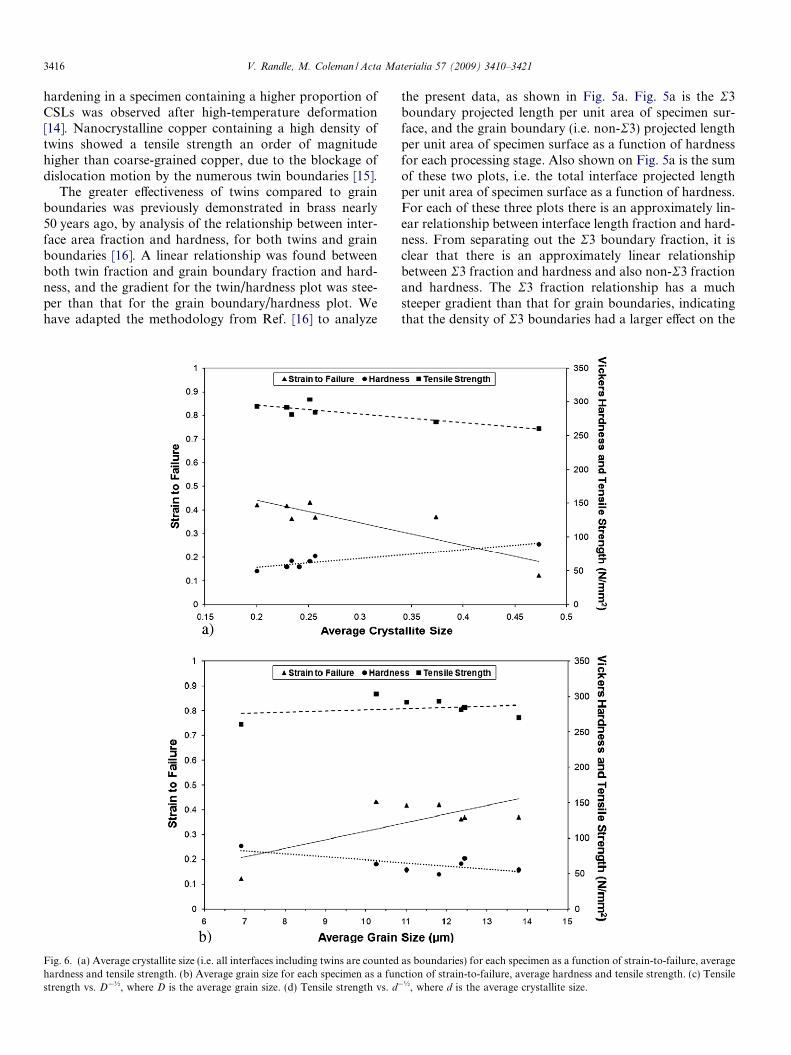
Fig. 6. (a) Average crystallite size (i.e. all interfaces including twins are countedhardness and tensile strength. (b) Average grain size for each specimen as a funstrength vs. D�½, where D is the average grain size. (d) Tensile strength vs. d�
the present data, as shown in Fig. 5a. Fig. 5a is the R3boundary projected length per unit area of specimen sur-face, and the grain boundary (i.e. non-R3) projected lengthper unit area of specimen surface as a function of hardnessfor each processing stage. Also shown on Fig. 5a is the sumof these two plots, i.e. the total interface projected lengthper unit area of specimen surface as a function of hardness.For each of these three plots there is an approximately lin-ear relationship between interface length fraction and hard-ness. From separating out the R3 boundary fraction, it isclear that there is an approximately linear relationshipbetween R3 fraction and hardness and also non-R3 fractionand hardness. The R3 fraction relationship has a muchsteeper gradient than that for grain boundaries, indicatingthat the density of R3 boundaries had a larger effect on the
as boundaries) for each specimen as a function of strain-to-failure, averagection of strain-to-failure, average hardness and tensile strength. (c) Tensile½, where d is the average crystallite size.

Fig 6. (continued)
V. Randle, M. Coleman / Acta Materialia 57 (2009) 3410–3421 3417
rate of hardening than did the density of grain boundaries.These data indicate the effectiveness of R3 interfaces as bar-riers to plastic flow, which accords with the suggestion thatR3s play an important role in strain accumulation in theearly stages of GBE processing. Fig. 5b shows for compar-ison the earlier hardness vs. interface fraction data frombrass, obtained by other workers [16], where the twin frac-tions had been obtained by simple linear intercept count-ing. It is clear that the data in Fig. 5b for brass has thesame form to that of the present data for copper shownin Fig. 5a.
The role of R3 boundaries in the development ofmechanical properties of GBE processed specimens canalso be highlighted by consideration of a so-called ‘‘crystal-lite size” in addition to the conventional grain size. Nor-mally, twins are omitted from calculation of grain sizeand only grain boundaries are counted as interfaces. Thisis reasonable because for applications concerning transportalong grain boundaries, annealing twins are inactive [17].
However, for situations where interfaces are acting as dis-location pile-up agents it is more meaningful to specify a‘‘crystallite size”, i.e. all interfaces including twins arecounted as boundaries, so that the contribution of twinsas barriers to dislocations is included. The crystallite sizeis hence smaller than the grain size and reflects the propor-tion of R3s in the microstructure. Fig. 6a shows the rela-tionship between the crystallite size and hardness, tensilestrength and strain-to-failure for all the samples. A trendfor increasing hardness and tensile strength with decreasingcrystallite size and conversely an increasing strain-to-fail-ure (i.e. ductility) with crystallite size is apparent, whichfurther underlines the role of twins in the development ofmechanical properties. For comparison Fig. 6b shows therelationship between the grain size (rather than the crystal-lite size) and hardness, tensile strength and strain-to-failurefor all the samples. Apart from the data point for the as-received sample (which has the smallest grain size) thereis little relationship between the tensile properties and grain
3418 V. Randle, M. Coleman / Acta Materialia 57 (2009) 3410–3421
size. On the other hand the relationship between tensileproperties and grain size has usually been found to con-form to a Hall–Petch type relationship, i.e.
r ¼ rf þ kD�1=2;
where r is a measure of the stress for a slip band to pene-trate a grain boundary (here the tensile strength), rf and k
are constants, and D is the average grain size. Fig. 6c showsthe relationship between D�½ and tensile strength, whichshows that Hall–Petch type behaviour is obeyed becausethere is a linear relationship between r and D�½. Fig. 6dshows tensile strength as a function of average crystallitesize, d�½, rather than average grain size. In Fig. 6d theHall–Petch relationship is not obeyed, which again under-lines the different behaviour of twins and grain boundaries.Further work is required to explore this point in detail.
The data have shown that the maximum GBE effect hasbeen achieved after a single-step pretreatment followed bythree processing iterations. Here, the ‘‘GBE effect” isjudged by misorientation measurements. The two most sig-nificant measures of the level of misorientation-relatedGBE that has been achieved during a processing step isthe R3 length fraction accompanied by the R9/R3 numberratio. The justification for this statement is that a highlength fraction of R3s is required firstly to retain strainand subsequently to replace random grain boundaries inthe grain boundary network, and the R9/R3 number ratioprovides an indication of whether or not the R3s are just‘‘neutral” annealing twins, which do not form part of thegrain boundary network. A high R9/R3 number ratio isrequired since it indicates that R3s have been replenishedand incorporated into the boundary network via interac-tions such as R3 + R3 ? R9 followed by R3 + R9 ? R3[12]. The R3 length fraction and R9/R3 number ratio cantherefore be referred to as the essential ‘‘GBE misorienta-tion statistics”. On this basis for the present data therewas a significant GBE effect after the single-step treatmentfollowed by stagnation during the first two processing iter-ations, but then succeeded by the maximum GBE effectafter the third processing iteration when the length fractionof R3 peaked at 67% and the R9/R3 number ratio peaked at0.35. The fourth and fifth iterations showed a more pro-nounced decline in the GBE misorientation statistics.
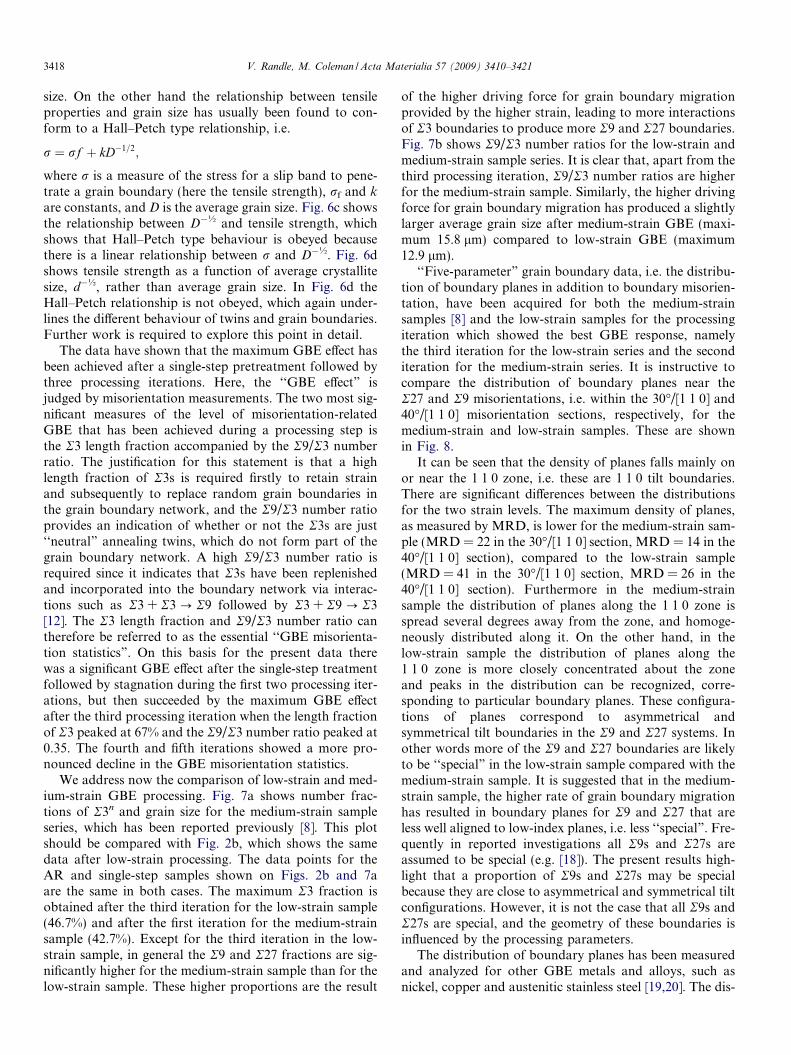
We address now the comparison of low-strain and med-ium-strain GBE processing. Fig. 7a shows number frac-tions of R3n and grain size for the medium-strain sampleseries, which has been reported previously [8]. This plotshould be compared with Fig. 2b, which shows the samedata after low-strain processing. The data points for theAR and single-step samples shown on Figs. 2b and 7aare the same in both cases. The maximum R3 fraction isobtained after the third iteration for the low-strain sample(46.7%) and after the first iteration for the medium-strainsample (42.7%). Except for the third iteration in the low-strain sample, in general the R9 and R27 fractions are sig-nificantly higher for the medium-strain sample than for thelow-strain sample. These higher proportions are the result
of the higher driving force for grain boundary migrationprovided by the higher strain, leading to more interactionsof R3 boundaries to produce more R9 and R27 boundaries.Fig. 7b shows R9/R3 number ratios for the low-strain andmedium-strain sample series. It is clear that, apart from thethird processing iteration, R9/R3 number ratios are higherfor the medium-strain sample. Similarly, the higher drivingforce for grain boundary migration has produced a slightlylarger average grain size after medium-strain GBE (maxi-mum 15.8 lm) compared to low-strain GBE (maximum12.9 lm).
‘‘Five-parameter” grain boundary data, i.e. the distribu-tion of boundary planes in addition to boundary misorien-tation, have been acquired for both the medium-strainsamples [8] and the low-strain samples for the processingiteration which showed the best GBE response, namelythe third iteration for the low-strain series and the seconditeration for the medium-strain series. It is instructive tocompare the distribution of boundary planes near theR27 and R9 misorientations, i.e. within the 30�/[1 1 0] and40�/[1 1 0] misorientation sections, respectively, for themedium-strain and low-strain samples. These are shownin Fig. 8.
It can be seen that the density of planes falls mainly onor near the 1 1 0 zone, i.e. these are 1 1 0 tilt boundaries.There are significant differences between the distributionsfor the two strain levels. The maximum density of planes,as measured by MRD, is lower for the medium-strain sam-ple (MRD = 22 in the 30�/[1 1 0] section, MRD = 14 in the40�/[1 1 0] section), compared to the low-strain sample(MRD = 41 in the 30�/[1 1 0] section, MRD = 26 in the40�/[1 1 0] section). Furthermore in the medium-strainsample the distribution of planes along the 1 1 0 zone isspread several degrees away from the zone, and homoge-neously distributed along it. On the other hand, in thelow-strain sample the distribution of planes along the1 1 0 zone is more closely concentrated about the zoneand peaks in the distribution can be recognized, corre-sponding to particular boundary planes. These configura-tions of planes correspond to asymmetrical andsymmetrical tilt boundaries in the R9 and R27 systems. Inother words more of the R9 and R27 boundaries are likelyto be ‘‘special” in the low-strain sample compared with themedium-strain sample. It is suggested that in the medium-strain sample, the higher rate of grain boundary migrationhas resulted in boundary planes for R9 and R27 that areless well aligned to low-index planes, i.e. less ‘‘special”. Fre-quently in reported investigations all R9s and R27s areassumed to be special (e.g. [18]). The present results high-light that a proportion of R9s and R27s may be specialbecause they are close to asymmetrical and symmetrical tiltconfigurations. However, it is not the case that all R9s andR27s are special, and the geometry of these boundaries isinfluenced by the processing parameters.
The distribution of boundary planes has been measuredand analyzed for other GBE metals and alloys, such asnickel, copper and austenitic stainless steel [19,20]. The dis-
0
0.05
0.1
0.15
0.2
0.25
0.3
0.35
0.4
AR Single-step 1st 2nd 3rd 4th 5th
Σ9/Σ
3 R
atio
Sample
Medium-strain
Low-strain
a)
b)
Fig. 7. (a) Proportions of R3, R9 and R27 boundaries according to fraction of total number of boundaries for the medium-strain series of specimens. Theaverage grain size is also included. Compare with Fig. 2b. (b) R9/R3 number ratios for both the low-strain and the medium-strain specimen series. The ARand single-step specimens are common to both series.
V. Randle, M. Coleman / Acta Materialia 57 (2009) 3410–3421 3419
tributions for all these specimens also showed a strongpreference for 1 1 0 tilt boundaries with differences in thedistribution of planes along the 1 1 0 zone, which is dis-cussed in the relevant publications.
Turning now to compare the rate of strain hardening forthe medium-strain and low-strain specimens, Fig. 9 showsthe strain-hardening rates for both specimen series. Thesingle-step specimen, which is the precursor to both speci-men series, had a work-hardening index of 0.61. For themedium-strain series the strain-hardening index increasedprogressively throughout each processing iteration to reacha maximum value of 0.79. This pattern is in contrast to thelow-strain specimens where the work-hardening rates arelower, as expected as a consequence of the lower appliedstrain, and also more erratic. The cyclical effect of the pro-cessing iterations for the low-strain series is only partiallymimicked for the medium-strain series, in that strain accu-
mulates during the first processing iteration to give the bestGBE overall effect after the second iteration. In this respectit is similar to the low-strain series, except that the higherstrain allows the maximum GBE to be reached morequickly. It can be seen from comparison of Fig. 9 withFig. 7b that there is a correlation between the work-hard-ening rate and the R9/R3 number fraction ratio for bothspecimen series.
The results presented here allow the overall effect ofGBE by low-strain and medium-strain iterations to becompared. The results reveal that the GBE misorientationstatistics achieved are a balance between deformation,strain accumulation and microstructure restoration duringprocessing. The microstructure parameters were more erra-tic for the low-strain series than for the medium-strain ser-ies, indicating that processing iterations using low strainsare not the most efficient way to carry out GBE. Even

Fig. 8. Grain boundary plane distributions in the 30�/[1 1 0] (near R27a) and 40�/[1 1 0] (near R9) misorientation sections for the medium-strain and low-strain samples. The distributions are shown as multiples of a random distribution (MRD) in stereographic projection. (a) 30�/[1 1 0], low-strain sample.(b) 30�/[1 1 0], medium-strain sample. (c) 40�/[1 1 0], low-strain sample. (d) 40�/[1 1 0], medium-strain sample.
0
0.1
0.2
0.3
0.4
0.5
0.6
0.7
0.8
0.9
AR Single-Step 1st 2nd 3rd 4th 5th
Wor
k H
arde
ning
rate
Sample
Medium Strain
Low Strain
Fig. 9. Work-hardening rates for the low-strain and medium-strain sample series, as calculated from a representative true stress–true strain curve in eachcase. The AR and single-step specimens are common to both series.
3420 V. Randle, M. Coleman / Acta Materialia 57 (2009) 3410–3421
though previous investigations had indicated that strain-anneal GBE could be accompanied by grain growth [1],the present combination of low-strain and short annealingtimes successfully restrained grain growth, whereas therewas slight grain growth in the medium-strain samples. In
both cases the maximum GBE misorientation statisticswere achieved after a small number of iterations, renderingthe last two or three iterations redundant. This was proba-bly because the initial single-step processing resulted in aparticularly high proportion of R3 boundaries (58% by

V. Randle, M. Coleman / Acta Materialia 57 (2009) 3410–3421 3421
length). Low-strain processing without iterations may stillbe of value for GBE because previous investigations haveshown that a combination of low strain coupled withlow-temperature, long-duration anneals bring about GBEby alteration of the boundary plane population [21].
5. Conclusions
Low-strain (5% cold deformation) iterative GBE pro-cessing schedules have been carried out on pure copper.The misorientation, and in some cases grain boundaryplane statistics, have been derived accompanied by tensileand hardness measurements. Data from samples that hadundergone the low-strain iterations were compared to med-ium-strain (25% deformation) processing iterations. Thefollowing conclusions have been drawn.
� The effectiveness of GBE processing, where this is basedon misorientation measurements alone, can be identifiedby a combination of R3 length fraction and R9/R3 num-ber ratio. These GBE misorientation statistics decreasedduring the first two processing iterations, whereas max-imum GBE misorientation statistics were achieved afterthree processing iterations. Analysis of the mechanicalproperties data revealed an accumulation of strainenergy throughout the first three processing iterations,which was only then sufficient to provide enough drivingforce for extensive R3n interactions, resulting inincreased fractions of R3s and R9s. The GBE misorien-tation statistics again decreased during the final two pro-cessing iterations, revealing a cyclical nature to theprocessing.� The density of R3 boundaries had a larger effect on the
rate of hardening than did the density of grain bound-aries. There was also a correlation between work-hard-ening rate and R9/R3 ratio number. These findingsindicate the effectiveness of R3 interfaces as barriers toplastic flow, which plays an important role in strainaccumulation in the early stages of GBE processing. Atrend for increasing hardness and tensile strength withdecreasing crystallite size and conversely an increasing
strain-to-failure (i.e. ductility) with crystallite size wasapparent, where ‘‘crystallite size” is defined as all inter-faces including twins counted as boundaries.� The microstructure parameters and mechanical property
data were more erratic for the low-strain series than forthe medium-strain series, indicating that processing iter-ations using low strains are less efficient than those usingmedium strains to carry out iterative GBE processing.Although more R9 and R27 boundaries were generatedduring medium-strain iterative processing compared tolow-strain iterative processing, a higher proportion ofthose with ‘‘special” boundary planes were generatedduring low-strain GBE processing.
References
[1] Randle V. Acta Mater 2004;52:4067.[2] Zelinski JA. MEng. thesis, Massachusetts Institute of Technology;
2005.[3] Kumar M, King WE, Schwartz AJ. Acta Mater 2000;48:2081.[4] Kumar M, Schwartz AJ, King WE. Acta Mater 2002;50:2599.[5] Shimada M, Kokawa H, Wang ZJ, Sato YS, Karibe I. Acta Mater
2002;50:2331.[6] Alexandreanu B, Capell B, Was GS. Mater Sci Eng 2001;A300:94.[7] Mandal M, Sivaprasad PV, Raj B, Sarma S. Met Mater Trans
2008;39A:3298.[8] Coleman M, Randle V. Met Mater Trans A 2009;A39:2175.[9] Brandon DG. Acta Metall 1996;14:1479.
[10] Saylor DM, Adams BL, El-Dasher BS, Rohrer GS. Metall MaterTrans 2003;34A:1.
[11] Saylor DM, Morawiec A, Rohrer GS. Acta Mater 2003;51:3663.[12] Randle V. Acta Mater 1999;47:4187.[13] Kashihara K, Inoko F. Acta Mater 2001;49:3051.[14] Alexandreanu B, Sencer BH, Thaveeprungsriporn V, Was GS. Acta
Mater 2003;51:3831.[15] Lu L, Shen Y, Chen X, Qian L, Lu K. Science 2004;304:422.[16] Babyak WJ, Rhines FN. Trans Met Soc AIME 1960;218:21.[17] Lehockey EM, Brennenstuhl AM, Thompson I. Corros Sci
2004;46:2383.[18] Tan L, Sridharan K, Allen TR, Nanstad RK, McClintock DA. J Nucl
Mater 2008;374:270.[19] Randle V, Rohrer GS, Miller HM, Coleman M, Owen GT. Acta
Mater 2008;56:2363.[20] Jones R, Owen G, Randle V. Mater Sci Eng 2008;A496:256.[21] Hu Y, Randle V, Rohrer GS. J Mater Sci 2008;43:3782.