3D Strain OLE
16
ELSEVIER Oprics and Lasers in Engineering 26 (1997) 43-58 Copyright 0 1996 Elsevier Science Limited Printed in Northern Ireland. All rights reserved 0143~8166/97/$1500 01~8166(94)om9-5 An Electra-optic Holographic Technique for the Measurement of the Components of the Strain Tensor on Three-dimensional Object Surfaces Gopalakrishna K. Bhat” Department of Mechanical and Aerospace Engineering, Illinois Institute of Technology, Chicago, IL 60616, USA (Received 11 May 1994; revised version received and accepted 29 March 1996) ABSTRACT An electro-optic holographic technique (also called electronic speckle pattern interferometry or TV holography) for the measurement of displacements and strains on three-dimensional object surfaces is presented. The three components of the displacement vector, in a fixed coordinate system, are separated using four independent illumination beams. The interferometric phase for each illumination beam is extracted using the phase stepping technique. Displacements in the fixed coordinate system are projected on to the object surface using the tensor transformation law. Equations for the computation of surface strains using the projected displacements and the surface geometry are developed. The technique is applied for the measurement of strains on the surface of a cylindrical vessel subjected to internal pressure. Copyright 0 1996 Elsevier Science Ltd. INTRODUCTION Electra-optic holography is an attractive technique for the measure- ment of strains in the field of experimental stress analysis. This technique employs a TV camera to record the images of the test object illuminated with laser light and a digital image processor to extract the displacement and strain fields from the recorded images. In order to obtain the displacement field, two images of the test object are recorded: one before deformation and the other after deformation. Subtractive superposition of the two images produces a fringe pattern a Present address: Strainoptic Technologies, Inc., 108 West Montgomery Avenue, North Wales, PA 19454, USA. 43
-
Upload
independent -
Category
Documents
-
view
0 -
download
0
Transcript of 3D Strain OLE

ELSEVIER
Oprics and Lasers in Engineering 26 (1997) 43-58 Copyright 0 1996 Elsevier Science Limited
Printed in Northern Ireland. All rights reserved 0143~8166/97/$1500
01~8166(94)om9-5
An Electra-optic Holographic Technique for the Measurement of the Components of the Strain Tensor
on Three-dimensional Object Surfaces
Gopalakrishna K. Bhat”
Department of Mechanical and Aerospace Engineering, Illinois Institute of Technology, Chicago, IL 60616, USA
(Received 11 May 1994; revised version received and accepted 29 March 1996)
ABSTRACT
An electro-optic holographic technique (also called electronic speckle pattern interferometry or TV holography) for the measurement of displacements and strains on three-dimensional object surfaces is presented. The three components of the displacement vector, in a fixed coordinate system, are separated using four independent illumination beams. The interferometric phase for each illumination beam is extracted using the phase stepping technique. Displacements in the fixed coordinate system are projected on to the object surface using the tensor transformation law. Equations for the computation of surface strains using the projected displacements and the surface geometry are developed. The technique is applied for the measurement of strains on the surface of a cylindrical vessel subjected to internal pressure. Copyright 0 1996 Elsevier Science Ltd.
INTRODUCTION
Electra-optic holography is an attractive technique for the measure- ment of strains in the field of experimental stress analysis. This technique employs a TV camera to record the images of the test object illuminated with laser light and a digital image processor to extract the displacement and strain fields from the recorded images. In order to obtain the displacement field, two images of the test object are recorded: one before deformation and the other after deformation. Subtractive superposition of the two images produces a fringe pattern
a Present address: Strainoptic Technologies, Inc., 108 West Montgomery Avenue, North Wales, PA 19454, USA.
43

44 Gopalakrishna K. Bhat
corresponding to the deformation field. Extensive literature on the application of electro-optic holography for the measurement of static and dynamic displacements can be found in Ref. 1.
In holography, even though the object surface may be three- dimensional, the image recorded by the TV camera is two-dimensional. Therefore, the measurement process provides the displacements on a plane parallel to the surface of the camera detector and in the direction perpendicular to it (fixed coordinate system). However, in practical applications, test objects have non-flat surfaces and the desired strains are on a plane tangential to the object surface at each point (local coordinate system).
In a previous work by Sciammarella and Ahmadshahi, holographic moire was used to obtain strains on arbitrary 3-D object surfaces.24 Holographic fringes corresponding to the components of the displace- ment vector in a fixed coordinate system were obtained using four illumination beams. Holograms were recorded on a film and the fringe pattern was digitized and processed using a TV camera and a digital image processor. Digital filtering was used to separate the displacement signal from noise, and the signals-in-quadrature technique was used to obtain the displacement field. The derivatives of the ‘displacement components in the fixed coordinate system’ were computed along two fixed coordinate axes (in the plane of the hologram). Derivatives of the ‘displacement components in the fixed coordinate system’ along the third fixed coordinate axis (normal to the plane of the hologram) were computed using the chain rule of differentiation, along with the knowledge of the surface profile of the object. The strain components on the object surface (local coordinate system) were then obtained by applying tensor transformation law to the displacement derivatives computed along the fixed coordinate axes. Constraints have to be imposed during tensor transformation, to ensure that the strain components in the local coordinate system satisfy the boundary conditions. On a free surface, since the normal stress along the surface normal and shear stresses tangential to the surface are zero, the strain components along the surface normal will be related to the strain components tangential to the surface.
In this paper, application of electro-optic holography for the meas- urement of the components of the strain tensor on arbitrary three- dimensional object surfaces is presented. As in Refs 2-4, the displace- ment components in the fixed coordinate system are obtained using four illumination beams. The phase stepping technique, supplemented by the signals-in-quadrature technique, is employed to extract displace- ment fields from the noisy fringe patterns. A modified theory, which
Electra-optic holographic technique 45
automatically satisfies the boundary conditions, for the computation of surface strains in the local coordinate system, starting from the displacement components in the fixed coordinate system, is described. In Refs 2-4, displacement components in the fixed coordinate system are first differentiated along the fixed coordinate axes, and the tensor transformation law is used to transform these derivatives into the local coordinate system (object surface) to obtain the surface strains. Such a transformation needs constraints to be imposed, to satisfy the boundary conditions. In the modified theory, the displacement vector is first transformed into the local coordinate system and the displacement components in the local coordinate system are differentiated along the local coordinate axes to obtain the surface strains. Since the derivatives are computed along the surface coordinates, the boundary conditions are automatically satisfied.
DISPLACEMENT SENSITIVITY IN ELECTRO-OPTIC HOLOGRAPHY
Consider the electro-optic holographic system shown in Fig. 1. The test object is illuminated with a collimated laser beam and imaged on to the detector of a TV camera. The light arriving from the object is mixed with an in-line reference beam and the resulting interference pattern on the camera detector is recorded and processed using a digital image processing system.
Beam spliner
computer
?I Image Processor
I I3 TV Monitor
Fig. 1. Electra-optic holographic system for the measurement of displacements.

46 Gopalakrishna K. Bhat
The intensity distribution in the image recorded before object deformation can be expressed as
I;:(& y) = Zo(x, y) + Z&9 y) cos 44% y), (1)
where ZO(x, y) is the background intensity, Z1(x, y) is the amplitude and 4(x, y) is the relative phase between the two interfering light waves.
The intensity distribution in the image after object deformation (ignoring the small amplitude change of speckles) can be written as
Z,G, Y> =I,&Y) +4(x, ~1~0s M&Y) + A+@,Y )I, (2) where A~(x, y) is the phase change due to the deformation field.
The phase change is related to the displacement vector through the expression
A~(x, y) = y(16 - ki) l d(x, J’), (3)
where ki and b are the illumination and observation vectors (unit vectors, shown in Fig. 1) respectively, d(x, y) is the displacement vector and A is the wavelength of the laser light.
TECHNIQUE TO OBTAIN THE THREE COMPONENTS OF THE DISPLACEMENT VECTOR
In order to separate the three components of the displacement vector, at least three measurements have to be performed. To make the computational process simple, four measurements are made, using four illumination beams as shown in Fig. 2. Two beams (beam L and beam
Beam-T
k,
Beam-L
(a)
%
Beam-B
(b)
Fig. 2. Illumination geometries to separate the components of the displacement vector.

Electra-optic holographic technique 47
R) lie in the horizontal plane @z-plane) and the other two (beam B and beam T) lie in the vertical plane (yz-plane). Each illumination beam is used independently with the reference beam. Let A&(x, y), A&(x, y),
A&(x, y) and A&(x, y) d enote the phase changes due to the deforma- tion fields obtained using the left (L), right (R), bottom (B) and top (T) illumination beams, respectively. They are related to the displacement vector d(x, y) through the relations
A&(x, y) = y(14, - k) - d(x, y) (44
A4& Y> = +o - kd. d(x, y> w
(44
where kL, kR, k, and kT are the illumination vectors as shown in Fig. 2. Let u(x, y), v(x, y) and w(x, y) denote the components of the
displacement vector along the x, y and z directions, respectively. Then,
A&(x, Y I= && Y) - W& Y 1
4n =hU(x,y)sine
Ad& Y > = A&(X, Y I- W& Y >
47r = h u(x, y) sin 8
A&(x, y) = Ad& Y) + A~L(x, Y)
= A&(X, Y > + WB(X, Y >
=?(I + co.5 Eqw(x, y),
(54
where W,(x, y), W,(x, Y > and A~,(x, y) are the phase changes corresponding to u(x, y), u(x, y) and w(x, y), respectively. The three components of the displacement vector in the fixed coordinate system can be obtained using eqns (5a-c).

48 Gopalakrishna K. Bhat
COMPUTATION OF SURFACE STRAINS
In order to obtain the surface strains, a local coordinate system has to be constructed at each point on the object surface, which requires the surface profile of the object to be known. If the object surface is regular, the profile can be obtained using theoretical equations. However, if the surface is arbitrary, the profile has to be obtained experimentally.
Let the local orthogonal Cartesian coordinate system be designated by OXYZ. The local X- and Y-axes lie on a plane tangential to the object surface at the point of interest. The local Z-axis is normal to the object surface at that point. Let Oxyz represent the fixed coordinate system. The fixed xy-plane is parallel to the surface of the camera detector and the z-axis is normal to the detector surface. Then, the components of the displacement vector in the local coordinate system can be obtained using the relations
u = n&4 + nxru + n,,w (64
v = nyJ.4 + nyyu + nyzw 633)
w = n&4 + nzru + n,,w. (64
Here, U, V and W are the displacement components along the local X-, Y- and Z-axes, respectively, and u, v and w are the displacement components in the fixed coordinate system. n,, nx,, and nxz are the direction cosines of the local X-axis, IE~,, nyy and ny, are the direction cosines of the local Y-axis, and n,, nzy and n,, are the direction cosines of the local Z-axis.
In order to obtain the surface strains the surface displacements have to be differentiated with respect to the local coordinates. The surface strains are given by
au E xx=z (W
av E YY = ljy (7b)
au av ‘yxu=-+-.
aY ax (74

Electra-optic holographic technique 49
Since local coordinates are functions of the fixed coordinates, we can write
However,
Then,
E auax auay
---+--
xx - ax ax ay ax
& avax avay
w=axar+ayz auax auay avax
Y xy= [ --+-- + axav ay aY 1 c axz+
ax z=nyx
aY z= nXy
dY ry = nvy.
au & xx=z n, + %lxy
aY
av av & YY=iFyx ay +--Yy
au au yxy =-nyx
ax + -nyy + “lnxx +
aY ax
avay -~ ay ax I ’
av - nxy. aY
(84
(W
(84
(104
uw
ww Therefore, the strains in the local coordinate system can be obtained
by differentiating the displacements in the local coordinate system with respect to the fixed coordinates and then using eqns (lOa-c).
APPLICATION TO THE MEASUREMENT OF STRAINS ON A CYLINDRICAL SURFACE
The technique discussed in the previous sections is applied for the measurement of strains on the surface of a cylindrical vessel subjected

50 Gopalakrishna K. Bhal
to internal pressure. The test specimen is a plastic pipe, 300mm long, 50~8mm in diameter (external) and 6.35 m thick, with closed ends. The pipe is held vertically by fixing the bottom end to a rigid base and the internal pressure is applied by passing regulated compressed air through a hose connected to the top end. Internal pressure produces radial and axial deformations in the pipe. The optical configuration consists of four illumination beams (left, right, bottom and top), each making a 30” angle with the viewing direction, and a reference beam in line with the viewing direction. The illumination beams are operative one at a time. To obtain the deformation fringes, two images of the object are recorded for each illumination beam: one before deformation and the other after deformation. Subtractive superposition of these two images produces fringes corresponding to the deformation field. Figure 3a-d shows the fringes obtained using the left, right, bottom and top illumination beams, respectively, in the region of analysis (midway between the two ends) on the pipe surface.
00 Fig. 3. Fringe patterns obtained using: (a) left; (b) right; (c) bottom; and (d) top
illumination beams.

Electra-optic holographic technique 51
For each illumination configuration, the phase change due to deformation is obtained using the phase stepping technique with four phase steps.5 The intensity distribution in the image of the object before deformation can be expressed as
I,(-& y, 4 = &(x, Y) + 4(x, y> cos [4(x, y) + 4, (11)
where (Y is an arbitrary phase which can be varied by translating a mirror in the path of the reference beam using a piezoelectric crystal, and the other terms are as defined in eqn (1). Four images, with phase steps of 0”, 90”, 180” and 270”, are recorded and the phase map 4(x, y) is obtained using the relation
f#+, y) = arctan 4(x, Y, 270) -4(x, Y, 90)
I;(& y, 0) - 4(x, y, 180) * (12)
The intensity distribution in the image of the object after deformation can be expressed as
I+, y, 4 = I&, Y> +A&, Y> ~0s [d& Y> + Ad+, Y> + 4, (13)
where Ac$(x, y) is the phase change due to deformation. Again, the phase map after deformation is computed using the phase stepping technique, and the phase change due to deformation is obtained by subtracting the phase map before deformation from that after deformation.
The phase map obtained above is noisy due to several causes, such as decorrelation of speckles due to object deformation, unmodulated speckles, saturated camera detectors, etc. The noisy phase map is encoded on a computer-generated carrier and the spatial filtering property of the Fourier transform method of fringe analysis is used to filter out the noise and retrieve the clean phase map.6*7 When the phase map is converted into a fringe pattern, the impulsive phase noise is converted into impulsive intensity noise. Spatial filter cannot be applied on the phase map itself, because that would smooth out the 2~ phase boundaries. A computer-generated carrier is used to preserve the sign information.
The intensity distribution in the fringe pattern obtained by encoding the noisy phase on the computer-generated carrier can be written as
1(x, y) = hdl + ~0s [2@ + W(x, y)]) + L(x, y), (14)
where 1, is a constant, f is the carrier frequency, A~(x, y) is the noise-free phase map due to deformation and 1,(x, y) is the intensity noise introduced by the impulsive phase fluctuations.

52 Gopalakrishna K. Bhaf
Equation (14) can be rewritten as
Z(x, y) = Zd +fi(x, JJ)~“~ +fT(x, y)e-j2*f”) + L(-G y), (15)
where
j (x, y) = f &A+(x’Y) (16)
and an asterisk implies the complex conjugate. Fourier transform of eqn (15) yields
F([, 7) =zoqt, q) + Z&(5 -f, 7) + 4Jw-5 -f, -4 + F,@ 771, (17)
where S(& 77) is the impulse function, F, (5, 7) is the Fourier transform of fi(x, y) and F,(& 7) is the Fourier transform of I,&, y).
A digital filter is designed to pass only the second term on the right hand side of eqn (17). After filtering, the spectrum is shifted towards the origin by an amount equal to f and the inverse Fourier transform is computed. The computation yields a complex quantity given by
I’(4 y> = zr&, y> + iZI(X~ Y >J (18) where
I&, y) = 1~0s AC+ Y > (19a)
I,@, y) = 1 sin A~(x, y). (19b)
Then, the noise-free phase map is obtained using the relation
I,(x, Y> A~(x, y) = arctan - Z&P Y)~
(20)
The phase map so obtained is wrapped and hence the two-dimensional phase unwrapping technique* is employed to obtain the continuous phase.
The continuous phase map for each illumination beam is obtained using the above technique, and the phase maps corresponding to the three components of the displacement vector in the fixed coordinate system are obtained using eqns (5a-c). The displacement fields are obtained by multiplying the phase maps by the sensitivity constants.

Elecrro-optic holographic technique 53
GO
w Fig. 4. Displacement components in the fixed coordinate system: (a) u(x, y); (b)
4x3 Yh Cc> 4x, Y)

54 Gopalakrishna K. Bhar
fig. 5. Fixed
Z i
and local coordinate systems on the cylinder surface.
Figure 4a-c shows the three-dimensional plots of the u, v and w displacement fields in the fixed coordinate system.
The configurations of the fixed and local coordinate systems on the surface of the cylinder are shown in Fig. 5. The direction cosines of the local coordinate axes are given by
rlXX = cos 0, nxY - , -0 nxz = -sin8 (2la)
nyZ = 0, nyy- 9 -1 nyZ = 0 (2Ib)
n, = sin 0, nzY = 0, n, = cos 8. (2 14 The displacement components in the local coordinate system are
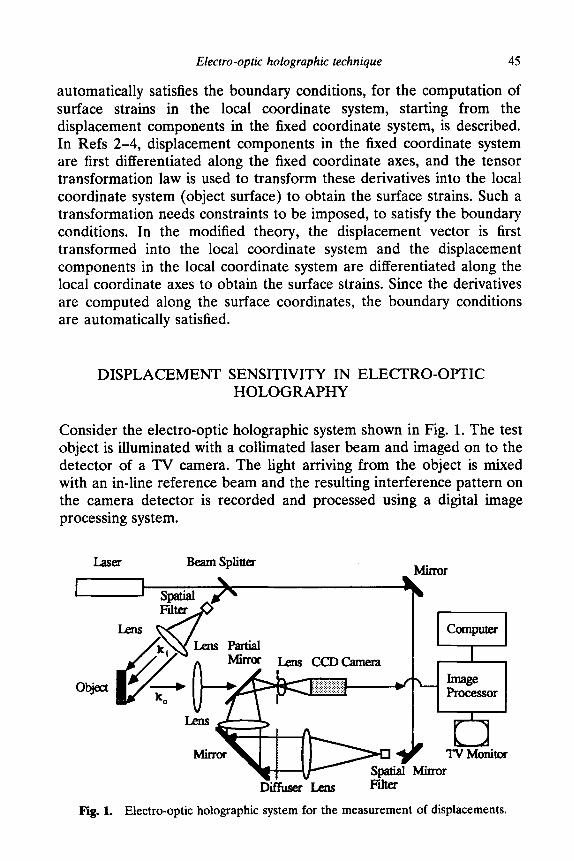
computed using eqns (6a-c). Figure 6a-c shows respectively the U, V and W displacement fields plotted in the fixed coordinate system. The surface displacements are differentiated numerically with respect to the fixed coordinates and the surface strains are obtained using eqns (lOa-c). Figure 7a-c shows respectively the strains cxx, cyy and ‘yxv on the surface of the cylinder. The normal strains cxx and ,sW have to be theoretically uniform throughout the cylinder surface and the shear strain yxy has to be zero. The deviations of the experimentally determined strains from the theoretical values are within k2 microstrains.
DISCUSSION AND CONCLUSIONS
In holographic interferometry, to separate the three components of the displacement vector at least three independent measurements have to be performed. In the technique presented in this paper, the three
Electra-optic holographic technique 55
60
w Fig. 6. Displacement components in the local coordinate system: (a) U(x, y); (b)
V(x, y); (c) wx, Y).

56 Gopalakrishna K. Bhar
Fig. 7. Strain fields &xx (a), E,,,, (b) and yxy (c) on the cylinder surface.

Electra-optic holographic technique 57
components of the displacement vector are separated using four independent illumination beams. Due to the two-dimensional nature of the recording device, the displacements obtained in the experiment are in a plane parallel to the surface of the camera detector and in a direction perpendicular to it. A local coordinate system is constructed at each point on the object surface and the surface displacements are obtained using the tensor transformation law. Construction of the local coordinate axes requires the surface contour of the object, which can be obtained either theoretically or experimentally. Using the equations developed in this paper, the surface strains are obtained by computing the derivatives of the surface displacements with respect to the fixed coordinates and using the direction cosines of the local coordinate axes. The proposed technique is applied for the measurement of strains on the surface of a cylindrical vessel subjected to internal pressure. The deviations of the experimentally determined strains from the theoretical values are found to be within two microstrains.
ACKNOWLEDGEMENTS
The research work presented in this paper was carried out when the author was at the Illinois Institute of Technology, Chicago. The financial assistance and encouragement of Prof. C. A. Sciammarella is gratefully acknowledged.
REFERENCES
1. Jones, R. & Wykes, C., Holographic and Speckle Interferometry. Cambridge University Press, Cambridge, UK, 1989.
2. Sciammarella, C. A. & Ahmadshahi, M. A., Computer based holographic inteferometry to analyze 3-D surfaces. Proc. IMEKO XI, Instrumentation for the 21st Century, Metrology ZZ, Triennial World Congress of IMEKO, Houston, Texas, 1989, pp. 675-84.
3. Sciammarella, C. A. & Ahmadshahi, M. A., Computer aided holographic moirC technique to determine strains on arbitrary surfaces vibrating in resonant modes. Proc. SEM Spring Conf on Experimental Mechanics, Boston, MA, 1989, pp. 579-87.
4. Sciammarella, C. A. & Ahmadshahi, M. A., Non-destructive evaluation of turbine blades vibrating in resonant modes. In Moire! Techniques, Holo- graphic Interferometry, Optical NDT, and Applications to Fluid Mechanics, SPZE Proc., ed. Fu-Pen Chiang, Vol. 1154B, pp. 743-53, 1991.
5. Creath, K., Phase-measurement interferometry techniques. In Progress in Optics, ed. E. Wolf, Vol. XXVI, pp. 349-393. Elsevier Science, Amsterdam, 1988.
58 Gopalakrishna K. Bhat
6. Sciammarella, C. A. & Bhat, G., Computer assisted techniques to evaluate fringe patterns. In Laser Interferometry IV: Computer-Aided Interferometry, SPIE Proc., ed. R. J. Pryputniewicz, Vol. 1553, pp. 252-262, 1991.
7. Sciammarella, C. A. & Bhat, G., Two dimensional Fourier transform methods for fringe pattern analysis. Proc. Wth SEM International Congress on Experimental Mechanics, Las Vegas, Nevada, 1992, pp. 1530-38.
8. Macy, W. W. Jr., Two-dimensional fringe-pattern analysis. Appl. Opt., 22 (1983), 3898-3901.