Grain Transportation Report - Agricultural Marketing Service
22
A weekly publication of the Agricultural Marketing Service www.ams.usda.gov/GTR December 11, 2014 Contents Article/ Calendar Grain Transportation Indicators Rail Barge Truck Exports Ocean Brazil Mexico Grain Truck/Ocean Rate Advisory Data Links Specialists Subscription Information -------------- The next release is December 18, 2014 Preferred citation: U.S. Dept. of Agriculture, Agricultural Marketing Service. Grain Transportation Report. December 11, 2014. Web: http://dx.doi.org/10.9752/TS056.12-11-2014 Grain Transportation Report Contact Us WEEKLY HIGHLIGHTS USDA Raises the Forecast of Soybean Exports In its December World Agricultural Supply and Demand Estimates report, USDA raised its forecast of the 2014/15 marketing year soybean exports to 1.76 billion bushels, up 40 million bushels from the November forecast and 113 million bushels more than last year. The new forecast reflects the record export pace in recent weeks and prospects for additional sales and shipments ahead of the South American harvest. With production and other demand unchanged, soybean ending stocks are projected at 410 million bushels, down 40 million bushels from last year, but still the highest since 2006/07. USDA did not change its projected average farm prices, leaving it in the range of $9 to $11 per bushel. For the week ending December 6, soybeans represented 62 percent of the downbound grain barge tonnages, while corn shipments were 37 percent of the grain tonnages. Based on the 5-year average, soybeans are typically 50 percent and corn is 47 percent of the total downbound barge tonnages during the fourth quarter. Year-to-date, total grain moved on locking portion of the river system was 32.6 million tons, 17 percent higher than the five year average. Grain Inspections Down But Soybeans Increase For the week ending December 4, total inspections of grain (corn, wheat, soybeans) from all major export regions reached 3 million metric tons (mmt), down 5 percent from the past week, down 4 percent from last year, but 20 percent above the 3-year average. The decrease was caused primarily by a 30 percent drop in week to week corn inspections. Despite the drop in total grain inspected, soybean inspections (2.2 mmt) increased 4 percent from the past week. Pacific Northwest (PNW) soybean inspections jumped 56 percent from the previous week as shipments to Asia rebounded. Total grain inspections in the PNW increased 47 percent from the past week. Diesel Fuel Prices Continue to Fall Despite Brief Disruption in Early November During the week ending December 8, diesel fuel prices fell 7 cents per gallon and a total of 14 cents over the past 4 weeks. Continued strong crude oil supplies in the United States and a report from OPEC that production will remain steady have encouraged diesel prices to continue the downward trend. The trend was disrupted briefly the week of November 10 mainly due to an increase in prices in the Midwest. The Energy Information Administration (EIA) reports that inventories in the Midwest region typically draw down quite steeply in autumn, but this year’s decrease was particularly pronounced due to the coincident timing of a large harvest, planned refinery maintenance and unplanned disruptions to refinery operations. EIA also reported with the harvest mostly complete, and refinery utilization rates returning to higher levels, inventories are increasing—as of November 28, Midwest distillate inventories were 23.7 million bbl. Snapshots by Sector Export Sales During the week ending November 27, unshipped balances of wheat, corn, and soybeans totaled 37.7 mmt, down 13 percent from the same time last year. Corn weekly net export sales reached 1.17 mmt, up 24 percent from the last week; wheat—319,200 mt, down 26 percent; and, soybeans—1.18 mmt, down 16 percent from last week, but 5 percent above the prior 4-week average. Rail U.S. railroads originated 20,221 carloads of grain during the week ending November 29, down 11 percent from last week, down 2 percent from last year, and 6 percent higher than the 3-year average. During the week ending December 4, average December non-shuttle secondary railcar bids/offers per car were $225 above tariff, the same as last week and $263 lower than last year. Average shuttle bids/offers per car were $38 below tariff, up $25 from last week and $1,600 lower than last year. Barge During the week ending December 6 barge grain movements totaled 854,026 tons—7.8 percent lower than the previous week but 11 percent higher than the same period last year. During the week ending December 6, 551 grain barges moved down river, down 7.6 percent from last week; 777 grain barges were unloaded in New Orleans, down 15 percent from the previous week. Ocean During the week ending December 4, 49 ocean-going grain vessels were loaded in the Gulf, 8.9 percent more than the same period last year. Seventy three vessels are expected to be loaded within the next 10 days, 5.8 percent more than the same period last year. During the week ending December 5, the ocean freight rate for shipping bulk grain from the Gulf to Japan was $42.50 per mt, down 2 percent from the previous week. The cost of shipping from the PNW to Japan was $23 per mt, down 4 percent from the previous week.
-
Upload
khangminh22 -
Category
Documents
-
view
0 -
download
0
Transcript of Grain Transportation Report - Agricultural Marketing Service

A weekly publication of the Agricultural Marketing Service
www.ams.usda.gov/GTR
December 11, 2014
Contents
Article/
Calendar
Grain
Transportation
Indicators
Rail
Barge
Truck
Exports
Ocean
Brazil
Mexico
Grain Truck/Ocean
Rate Advisory
Data Links
Specialists
Subscription
Information
--------------
The next
release is December 18, 2014
Preferred citation: U.S. Dept. of Agriculture, Agricultural Marketing Service. Grain Transportation Report. December 11, 2014.
Web: http://dx.doi.org/10.9752/TS056.12-11-2014
Grain Transportation Report
Contact Us
WEEKLY HIGHLIGHTS
USDA Raises the Forecast of Soybean Exports
In its December World Agricultural Supply and Demand Estimates report, USDA raised its forecast of the 2014/15 marketing year
soybean exports to 1.76 billion bushels, up 40 million bushels from the November forecast and 113 million bushels more than last
year. The new forecast reflects the record export pace in recent weeks and prospects for additional sales and shipments ahead of the
South American harvest. With production and other demand unchanged, soybean ending stocks are projected at 410 million bushels,
down 40 million bushels from last year, but still the highest since 2006/07. USDA did not change its projected average farm prices,
leaving it in the range of $9 to $11 per bushel. For the week ending December 6, soybeans represented 62 percent of the downbound
grain barge tonnages, while corn shipments were 37 percent of the grain tonnages. Based on the 5-year average, soybeans are
typically 50 percent and corn is 47 percent of the total downbound barge tonnages during the fourth quarter. Year-to-date, total grain
moved on locking portion of the river system was 32.6 million tons, 17 percent higher than the five year average.
Grain Inspections Down But Soybeans Increase For the week ending December 4, total inspections of grain (corn, wheat, soybeans) from all major export regions reached 3 million
metric tons (mmt), down 5 percent from the past week, down 4 percent from last year, but 20 percent above the 3-year average. The
decrease was caused primarily by a 30 percent drop in week to week corn inspections. Despite the drop in total grain inspected,
soybean inspections (2.2 mmt) increased 4 percent from the past week. Pacific Northwest (PNW) soybean inspections jumped 56
percent from the previous week as shipments to Asia rebounded. Total grain inspections in the PNW increased 47 percent from the
past week.
Diesel Fuel Prices Continue to Fall Despite Brief Disruption in Early November
During the week ending December 8, diesel fuel prices fell 7 cents per gallon and a total of 14 cents over the past 4 weeks. Continued
strong crude oil supplies in the United States and a report from OPEC that production will remain steady have encouraged diesel
prices to continue the downward trend. The trend was disrupted briefly the week of November 10 mainly due to an increase in prices
in the Midwest. The Energy Information Administration (EIA) reports that inventories in the Midwest region typically draw down
quite steeply in autumn, but this year’s decrease was particularly pronounced due to the coincident timing of a large harvest, planned
refinery maintenance and unplanned disruptions to refinery operations. EIA also reported with the harvest mostly complete, and
refinery utilization rates returning to higher levels, inventories are increasing—as of November 28, Midwest distillate inventories were
23.7 million bbl.
Snapshots by Sector
Export Sales
During the week ending November 27, unshipped balances of wheat, corn, and soybeans totaled 37.7 mmt, down 13 percent from the
same time last year. Corn weekly net export sales reached 1.17 mmt, up 24 percent from the last week; wheat—319,200 mt, down 26
percent; and, soybeans—1.18 mmt, down 16 percent from last week, but 5 percent above the prior 4-week average.
Rail
U.S. railroads originated 20,221 carloads of grain during the week ending November 29, down 11 percent from last week, down 2
percent from last year, and 6 percent higher than the 3-year average.
During the week ending December 4, average December non-shuttle secondary railcar bids/offers per car were $225 above tariff,
the same as last week and $263 lower than last year. Average shuttle bids/offers per car were $38 below tariff, up $25 from last week
and $1,600 lower than last year.
Barge
During the week ending December 6 barge grain movements totaled 854,026 tons—7.8 percent lower than the previous week but 11
percent higher than the same period last year.
During the week ending December 6, 551 grain barges moved down river, down 7.6 percent from last week; 777 grain barges were
unloaded in New Orleans, down 15 percent from the previous week.
Ocean
During the week ending December 4, 49 ocean-going grain vessels were loaded in the Gulf, 8.9 percent more than the same period
last year. Seventy three vessels are expected to be loaded within the next 10 days, 5.8 percent more than the same period last year.
During the week ending December 5, the ocean freight rate for shipping bulk grain from the Gulf to Japan was $42.50 per mt, down 2
percent from the previous week. The cost of shipping from the PNW to Japan was $23 per mt, down 4 percent from the previous
week.
December 11, 2014
Grain Transportation Report 2
Feature Article/Calendar
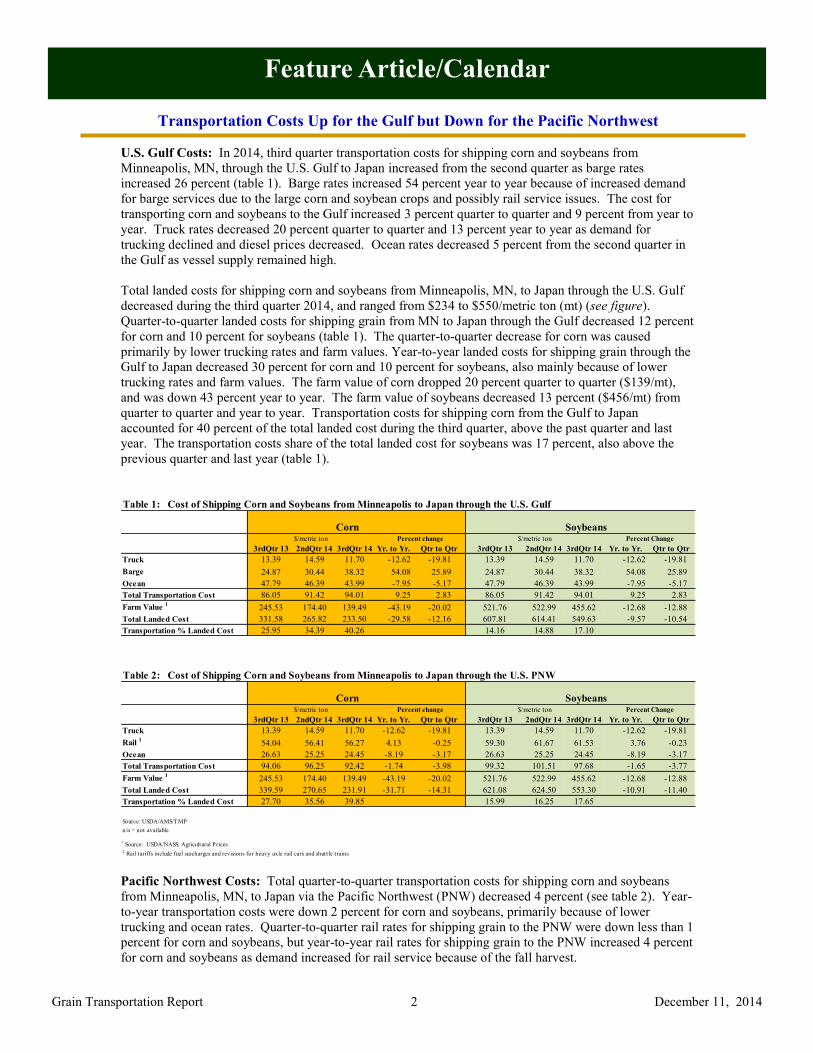
Transportation Costs Up for the Gulf but Down for the Pacific Northwest
U.S. Gulf Costs: In 2014, third quarter transportation costs for shipping corn and soybeans from
Minneapolis, MN, through the U.S. Gulf to Japan increased from the second quarter as barge rates
increased 26 percent (table 1). Barge rates increased 54 percent year to year because of increased demand
for barge services due to the large corn and soybean crops and possibly rail service issues. The cost for
transporting corn and soybeans to the Gulf increased 3 percent quarter to quarter and 9 percent from year to
year. Truck rates decreased 20 percent quarter to quarter and 13 percent year to year as demand for
trucking declined and diesel prices decreased. Ocean rates decreased 5 percent from the second quarter in
the Gulf as vessel supply remained high.
Total landed costs for shipping corn and soybeans from Minneapolis, MN, to Japan through the U.S. Gulf
decreased during the third quarter 2014, and ranged from $234 to $550/metric ton (mt) (see figure).
Quarter-to-quarter landed costs for shipping grain from MN to Japan through the Gulf decreased 12 percent
for corn and 10 percent for soybeans (table 1). The quarter-to-quarter decrease for corn was caused
primarily by lower trucking rates and farm values. Year-to-year landed costs for shipping grain through the
Gulf to Japan decreased 30 percent for corn and 10 percent for soybeans, also mainly because of lower
trucking rates and farm values. The farm value of corn dropped 20 percent quarter to quarter ($139/mt),
and was down 43 percent year to year. The farm value of soybeans decreased 13 percent ($456/mt) from
quarter to quarter and year to year. Transportation costs for shipping corn from the Gulf to Japan
accounted for 40 percent of the total landed cost during the third quarter, above the past quarter and last
year. The transportation costs share of the total landed cost for soybeans was 17 percent, also above the
previous quarter and last year (table 1).
Pacific Northwest Costs: Total quarter-to-quarter transportation costs for shipping corn and soybeans
from Minneapolis, MN, to Japan via the Pacific Northwest (PNW) decreased 4 percent (see table 2). Year-
to-year transportation costs were down 2 percent for corn and soybeans, primarily because of lower
trucking and ocean rates. Quarter-to-quarter rail rates for shipping grain to the PNW were down less than 1
percent for corn and soybeans, but year-to-year rail rates for shipping grain to the PNW increased 4 percent
for corn and soybeans as demand increased for rail service because of the fall harvest.
Table 1: Cost of Shipping Corn and Soybeans from Minneapolis to Japan through the U.S. Gulf
Corn Soybeans
3rdQtr 13 2ndQtr 14 3rdQtr 14 Yr. to Yr. Qtr to Qtr 3rdQtr 13 2ndQtr 14 3rdQtr 14 Yr. to Yr. Qtr to Qtr
Truck 13.39 14.59 11.70 -12.62 -19.81 13.39 14.59 11.70 -12.62 -19.81
Barge 24.87 30.44 38.32 54.08 25.89 24.87 30.44 38.32 54.08 25.89
Ocean 47.79 46.39 43.99 -7.95 -5.17 47.79 46.39 43.99 -7.95 -5.17
Total Transportation Cost 86.05 91.42 94.01 9.25 2.83 86.05 91.42 94.01 9.25 2.83
Farm Value 1
245.53 174.40 139.49 -43.19 -20.02 521.76 522.99 455.62 -12.68 -12.88
Total Landed Cost 331.58 265.82 233.50 -29.58 -12.16 607.81 614.41 549.63 -9.57 -10.54
Transportation % Landed Cost 25.95 34.39 40.26 14.16 14.88 17.10
Table 2: Cost of Shipping Corn and Soybeans from Minneapolis to Japan through the U.S. PNW
Corn Soybeans
3rdQtr 13 2ndQtr 14 3rdQtr 14 Yr. to Yr. Qtr to Qtr 3rdQtr 13 2ndQtr 14 3rdQtr 14 Yr. to Yr. Qtr to Qtr
Truck 13.39 14.59 11.70 -12.62 -19.81 13.39 14.59 11.70 -12.62 -19.81
Rail 1
54.04 56.41 56.27 4.13 -0.25 59.30 61.67 61.53 3.76 -0.23
Ocean 26.63 25.25 24.45 -8.19 -3.17 26.63 25.25 24.45 -8.19 -3.17
Total Transportation Cost 94.06 96.25 92.42 -1.74 -3.98 99.32 101.51 97.68 -1.65 -3.77
Farm Value 1
245.53 174.40 139.49 -43.19 -20.02 521.76 522.99 455.62 -12.68 -12.88
Total Landed Cost 339.59 270.65 231.91 -31.71 -14.31 621.08 624.50 553.30 -10.91 -11.40
Transportation % Landed Cost 27.70 35.56 39.85 15.99 16.25 17.65
Source: USDA/AMS/TMP
n/a = not available
1 Source: USDA/NASS, Agricultural Prices
2 Rail tariffs include fuel surcharges and revisions for heavy axle rail cars and shuttle trains
$/metric ton Percent change $/metric ton Percent Change
$/metric ton Percent change $/metric ton Percent Change

December 11, 2014
Grain Transportation Report 3
PNW landed costs decreased 14 percent for corn and 11 percent for soybeans quarter to quarter (see table
2). Quarter-to-quarter total landed costs for shipping corn and soybeans through the PNW decreased as
trucking rates and farm values dropped significantly. Landed costs for soybeans shipped through the PNW
ranged from $232 to $553/mt (see figure). Year-to-year PNW landed costs decreased 32 percent for corn
and 11 percent for
soybeans, primarily
because of the drop in
ocean and trucking rates,
and farm values.
Transportation costs for
corn shipped through the
PNW to Japan
accounted for about 40
percent of the total
landed costs during the
third quarter, greater
than the previous quarter
and last year. Third
quarter transportation
costs for soybeans
shipped through the
PNW to Japan
accounted for 18 percent
of the total landed cost, also greater than the previous quarter and last year. The farm value of corn
accounted for 60 percent of the total landed cost for shipping to Japan from the PNW during the third
quarter, while soybean farm value accounted for 83 percent of the landed cost.
Outlook: USDA’s World Agricultural Supply and Demand Estimates (WASDE) report for December
projects corn exports for the 2014/15 marketing year to decrease8 percent from last year and unchanged
from the November projection. The estimate was lowered despite a projected increase in corn production
and yield per acre compared to last year. The December WASDE 2014/15 soybean exports projection is 3
percent above the November estimate and 7 percent above last year. [email protected]

December 11, 2014
Grain Transportation Report 4
Grain Transportation Indicators
The grain bid summary illustrates the market relationships for commodities. Positive and negative adjustments in differential
between terminal and futures markets, and the relationship to inland market points, are indicators of changes in fundamental mar-
ket supply and demand. The map may be used to monitor market and time differentials.
Table 2
Market Update: U.S. Origins to Export Position Price Spreads ($/bushel)
Commodity Origin--Destination 12/4/2014 11/28/2014
Corn IL--Gulf -0.89 n/a
Corn NE--Gulf -1.02 n/a
Soybean IA--Gulf -1.52 n/a
HRW KS--Gulf -1.57 n/a
HRS ND--Portland -3.98 n/a
Note: nq = no quote
Source: Transportation & Marketing Programs/AMS/USDA
Table 1
Grain Transport Cost Indicators1
Truck Barge Ocean
Week ending Unit Train Shuttle Gulf Pacific
12/10/14 237 257 212 279 190 163- 1% - 2 1% 5 % - 10 0 % - 10 0 %
12/03/14 242 257 211 319 n/a n/a
1Indicator: Base year 2000 = 100; Weekly updates include truck = diesel ($/gallon); rail = near-month secondary rail market bid and monthly tariff rate
with fuel surcharge ($/car); barge = Illinois River barge rate (index = percent of tariff rate); and ocean = routes to Japan ($/metric ton)
Source: Transportation & Marketing Programs/AMS/USDA
Rail
Figure 1
Grain bid Summary
December 11, 2014
Grain Transportation Report 5
Rail Transportation
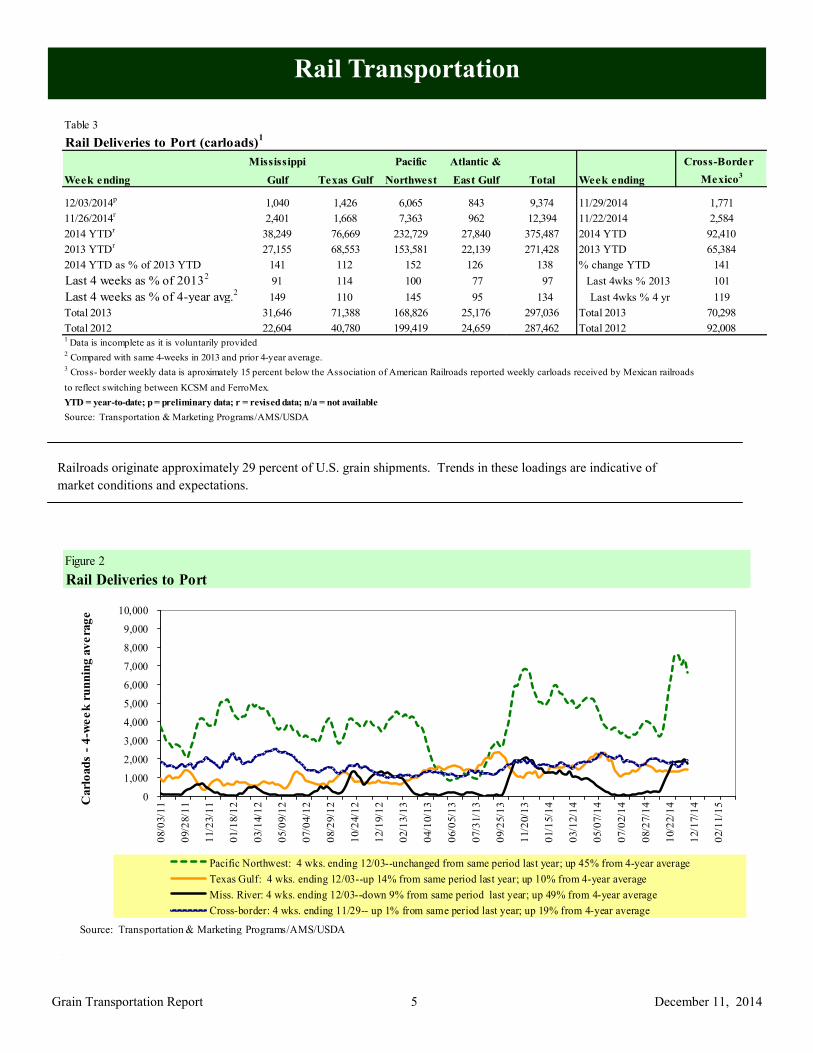
Railroads originate approximately 29 percent of U.S. grain shipments. Trends in these loadings are indicative of
market conditions and expectations.
Figure 2
Rail Deliveries to Port
0
1,000
2,000
3,000
4,000
5,000
6,000
7,000
8,000
9,000
10,000
08/0
3/1
1
09/2
8/1
1
11/2
3/1
1
01/1
8/1
2
03/1
4/1
2
05/0
9/1
2
07/0
4/1
2
08/2
9/1
2
10/2
4/1
2
12/1
9/1
2
02/1
3/1
3
04/1
0/1
3
06/0
5/1
3
07/3
1/1
3
09/2
5/1
3
11/2
0/1
3
01/1
5/1
4
03/1
2/1
4
05/0
7/1
4
07/0
2/1
4
08/2
7/1
4
10/2
2/1
4
12/1
7/1
4
02/1
1/1
5Carl
oad
s -
4-w
ee
k r
un
nin
g a
ve
rag
e
Pacific Northwest: 4 wks. ending 12/03--unchanged from same period last year; up 45% from 4-year average
Texas Gulf: 4 wks. ending 12/03--up 14% from same period last year; up 10% from 4-year average
Miss. River: 4 wks. ending 12/03--down 9% from same period last year; up 49% from 4-year average
Cross-border: 4 wks. ending 11/29-- up 1% from same period last year; up 19% from 4-year average
Source: Transportation & Marketing Programs/AMS/USDA
Table 3
Rail Deliveries to Port (carloads)1
Mississippi Pacific Atlantic & Cross-Border
Week ending Gulf Texas Gulf Northwest East Gulf Total Week ending Mexico3
12/03/2014p
1,040 1,426 6,065 843 9,374 11/29/2014 1,771
11/26/2014r
2,401 1,668 7,363 962 12,394 11/22/2014 2,584
2014 YTDr
38,249 76,669 232,729 27,840 375,487 2014 YTD 92,410
2013 YTDr
27,155 68,553 153,581 22,139 271,428 2013 YTD 65,384
2014 YTD as % of 2013 YTD 141 112 152 126 138 % change YTD 141
Last 4 weeks as % of 20132
91 114 100 77 97 Last 4wks % 2013 101
Last 4 weeks as % of 4-year avg.2
149 110 145 95 134 Last 4wks % 4 yr 119
Total 2013 31,646 71,388 168,826 25,176 297,036 Total 2013 70,298
Total 2012 22,604 40,780 199,419 24,659 287,462 Total 2012 92,0081
Data is incomplete as it is voluntarily provided2 Compared with same 4-weeks in 2013 and prior 4-year average.
3 Cross- border weekly data is aproximately 15 percent below the Association of American Railroads reported weekly carloads received by Mexican railroads
to reflect switching between KCSM and FerroMex.
YTD = year-to-date; p = preliminary data; r = revised data; n/a = not available
Source: Transportation & Marketing Programs/AMS/USDA

December 11, 2014
Grain Transportation Report 6
Table 5
Railcar Auction Offerings1 ($/car)
2
Week ending
12/4/2014 Dec-14 Dec-13 Jan-15 Jan-14 Feb-15 Feb-14 Mar-15 Mar-14
BNSF3
COT grain units 7 no offer 102 no offer 85 no offer 84 no
COT grain single-car5
no offer no offer 101. .800 no offer 77. .600 no offer 79. .400 1. .300
UP4
GCAS/Region 1 no offer no bids no offer 61 no offer no bids n/a n/a
GCAS/Region 2 no offer no bids no offer 105 no offer 1 n/a n/a1Auction offerings are for single-car and unit train shipments only.
2Average premium/discount to tariff, last auction
3BNSF - COT = Certificate of Transportation; north grain and south grain bids were combined effective the week ending 6/24/06.
4UP - GCAS = Grain Car Allocation System
Region 1 includes: AR, IL, LA, MO, NM, OK, TX, WI, and Duluth, MN.
Region 2 includes: CO, IA, KS, MN, NE, WY, and Kansas City and St. Joseph, MO.5Range is shown because average is not available. Not available = n/a.
Source: Transportation & Marketing Programs/AMS/USDA.
Delivery period
Table 4
Class I Rail Carrier Grain Car Bulletin (grain carloads originated)
U.S. total
Week ending CSXT NS BNSF KCS UP CN CP
11/29/14 2,179 2,789 8,755 874 5,624 20,221 4,982 4,511
This week last year 2,304 2,611 9,238 980 6,275 21,408 5,296 5,249
2014 YTD 91,096 137,260 427,510 43,174 268,313 967,353 219,002 251,086
2013 YTD 77,372 124,939 421,094 31,400 200,833 855,638 173,991 253,654
2014 YTD as % of 2013 YTD 118 110 102 137 134 113 126 99
Last 4 weeks as % of 2013 90 89 104 99 92 96 102 82
Last 4 weeks as % of 3-yr avg.1
104 103 99 148 115 105 123 84
Total 2013 86,466 137,915 454,262 34,412 222,258 935,313 190,125 272,753 1As a percent of the same period in 2009 and the prior 3-year average. YTD = year-to-date.
Source: Association of American Railroads (www.aar.org)
East West Canada
Figure 3
Total Weekly U.S. Class I Railroad Grain Car Loadings
Source: Association of American Railroads
15,000
17,000
19,000
21,000
23,000
25,000
27,000
29,000
12/2
8/1
3
01/2
5/1
4
02/2
2/1
4
03/2
2/1
4
04/1
9/1
4
05/1
7/1
4
06/1
4/1
4
07/1
2/1
4
08/0
9/1
4
09/0
6/1
4
10/0
4/1
4
11/0
1/1
4
11/2
9/1
4
12/2
7/1
4
Carl
oad
s -
4-w
ee
k r
un
nin
g a
vg
.
4-week period endingCurrent year 3-year average
For 4 weeks ending Nov. 29: down 3.9 percent from last
week; down 2.7 percent from last year; and up 6 percent
from the 3-year average.

December 11, 2014
Grain Transportation Report 7
The secondary rail market information reflects trade values for service that was originally purchased from the railroad carrier
as some form of guaranteed freight. The auction and secondary rail values are indicators of rail service quality and demand/
supply.
Figure 5
Bids/Offers for Railcars to be Delivered in January 2015, Secondary Market
Non-shuttle bids include unit-train and single-car bids. n/a = not available.
Source: Transportation & Marketing Programs/AMS/USDA
-400
100
600
1100
1600
2100
2600
6/1
9/1
4
7/3
/14
7/1
7/1
4
7/3
1/1
4
8/1
4/1
4
8/2
8/1
4
9/1
1/1
4
9/2
5/1
4
10/9
/14
10/2
3/1
4
11/6
/14
11/2
0/1
4
12/4
/14
12/1
8/1
4
1/1
/15
1/1
5/1
5
Non-shuttle Shuttle
Non-shuttle avg. 2012-14 (same week) Shuttle avg. 2012-14 (same week)
BNSF UP
Non-shuttle $200 n/a
Shuttle $100 $25
Averag
e p
rem
ium
/dis
cou
nt
to t
arif
f ($
/car)
Non-shuttle bids/offers are the same as last week and are at the peak.
Shuttle bids/offers are $62.50 above tariff this week and are $1,938 below the peak.
Figure 4
Bids/Offers for Railcars to be Delivered in December 2014, Secondary Market
Non-shuttle bids include unit-train and single-car bids. n/a = not available.
Source: Transportation & Marketing Programs/AMS/USDA
-400
100
600
1100
1600
2100
2600
3100
5/1
5/1
4
5/2
9/1
4
6/1
2/1
4
6/2
6/1
4
7/1
0/1
4
7/2
4/1
4
8/7
/14
8/2
1/1
4
9/4
/14
9/1
8/1
4
10/2
/14
10/1
6/1
4
10/3
0/1
4
11/1
3/1
4
11/2
7/1
4
12/1
1/1
4
Non-shuttle Shuttle
Non-shuttle avg. 2011-13 (same week) Shuttle avg. 2011-13 (same week)
BNSF UP
Non-shuttle $300 $150
Shuttle $100 -$175
Averag
e p
rem
ium
/dis
cou
nt
to t
arif
f ($
/car)
Non-shuttle bids/offers remained the same and are $625 below the peak.
Shuttle bids/offers rose $25 this week and are $2,538 below the peak.

December 11, 2014
Grain Transportation Report 8
Table 6
Weekly Secondary Railcar Market ($/car)1
Week ending
12/4/2014 Dec-14 Jan-15 Feb-15 Mar-15 Apr-15 May-15
Non-shuttle
BNSF-GF 300 200 n/a n/a n/a n/a
Change from last week - - n/a n/a n/a n/a
Change from same week 2013 (600) (150) n/a n/a n/a n/a
UP-Pool 150 n/a n/a n/a n/a n/a
Change from last week - n/a n/a n/a n/a n/a
Change from same week 2013 75 n/a n/a n/a n/a n/a
Shuttle2
BNSF-GF 100 100 n/a n/a n/a n/a
Change from last week 225 n/a n/a n/a n/a n/a
Change from same week 2013 (2,725) n/a n/a n/a n/a n/a
UP-Pool (175) 25 n/a n/a n/a n/a
Change from last week (175) (50) n/a n/a n/a n/a
Change from same week 2013 (475) (75) n/a n/a n/a n/a1Average premium/discount to tariff, $/car-last week
2Shuttle bids are a new data series; prior to this we provided only non-shuttle rates.
Note: Bids listed are market INDICATORS only & are NOT guaranteed prices,
n/a = not available; GF = guaranteed freight; Pool = guaranteed pool
Sources: Transportation and Marketing Programs/AMS/USDA
Data from James B. Joiner Co., Tradewest Brokerage Co.
Delivery period
Figure 6
Bids/Offers for Railcars to be Delivered in February 2015, Secondary Market
Non-shuttle bids include unit-train and single-car bids. n/a = not available.
Source: Transportation & Marketing Programs/AMS/USDA
-100
0
100
200
300
400
500
600
7/1
7/1
4
7/3
1/1
4
8/1
4/1
4
8/2
8/1
4
9/1
1/1
4
9/2
5/1
4
10/9
/14
10/2
3/1
4
11/6
/14
11/2
0/1
4
12/4
/14
12/1
8/1
4
1/1
/15
1/1
5/1
5
1/2
9/1
5
2/1
2/1
5
Non-shuttle Shuttle
Non-shuttle avg. 2012-14 (same week) Shuttle avg. 2012-14 (same week)
BNSF UP
Non-shuttle n/a n/a
Shuttle n/a n/a
Averag
e p
rem
ium
/dis
cou
nt
to t
arif
f
($/c
ar)
There are no non-shuttle bids/offers this week.
There are no shuttle bids/offers this week.
December 11, 2014
Grain Transportation Report 9
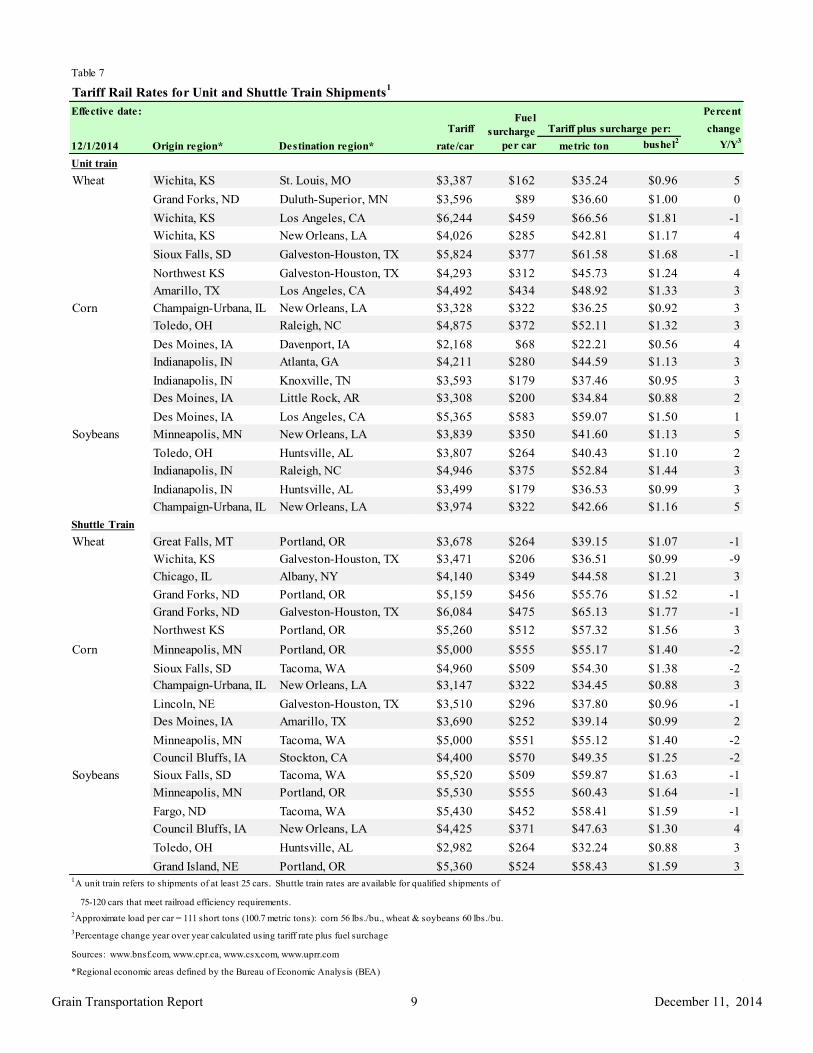
Table 7
Tariff Rail Rates for Unit and Shuttle Train Shipments1
Effective date: Percent
Tariff change
12/1/2014 Origin region* Destination region* rate/car metric ton bushel2
Y/Y3
Unit train
Wheat Wichita, KS St. Louis, MO $3,387 $162 $35.24 $0.96 5
Grand Forks, ND Duluth-Superior, MN $3,596 $89 $36.60 $1.00 0
Wichita, KS Los Angeles, CA $6,244 $459 $66.56 $1.81 -1
Wichita, KS New Orleans, LA $4,026 $285 $42.81 $1.17 4
Sioux Falls, SD Galveston-Houston, TX $5,824 $377 $61.58 $1.68 -1
Northwest KS Galveston-Houston, TX $4,293 $312 $45.73 $1.24 4
Amarillo, TX Los Angeles, CA $4,492 $434 $48.92 $1.33 3
Corn Champaign-Urbana, IL New Orleans, LA $3,328 $322 $36.25 $0.92 3
Toledo, OH Raleigh, NC $4,875 $372 $52.11 $1.32 3
Des Moines, IA Davenport, IA $2,168 $68 $22.21 $0.56 4
Indianapolis, IN Atlanta, GA $4,211 $280 $44.59 $1.13 3
Indianapolis, IN Knoxville, TN $3,593 $179 $37.46 $0.95 3
Des Moines, IA Little Rock, AR $3,308 $200 $34.84 $0.88 2
Des Moines, IA Los Angeles, CA $5,365 $583 $59.07 $1.50 1
Soybeans Minneapolis, MN New Orleans, LA $3,839 $350 $41.60 $1.13 5
Toledo, OH Huntsville, AL $3,807 $264 $40.43 $1.10 2
Indianapolis, IN Raleigh, NC $4,946 $375 $52.84 $1.44 3
Indianapolis, IN Huntsville, AL $3,499 $179 $36.53 $0.99 3
Champaign-Urbana, IL New Orleans, LA $3,974 $322 $42.66 $1.16 5
Shuttle Train
Wheat Great Falls, MT Portland, OR $3,678 $264 $39.15 $1.07 -1
Wichita, KS Galveston-Houston, TX $3,471 $206 $36.51 $0.99 -9
Chicago, IL Albany, NY $4,140 $349 $44.58 $1.21 3
Grand Forks, ND Portland, OR $5,159 $456 $55.76 $1.52 -1
Grand Forks, ND Galveston-Houston, TX $6,084 $475 $65.13 $1.77 -1
Northwest KS Portland, OR $5,260 $512 $57.32 $1.56 3
Corn Minneapolis, MN Portland, OR $5,000 $555 $55.17 $1.40 -2
Sioux Falls, SD Tacoma, WA $4,960 $509 $54.30 $1.38 -2
Champaign-Urbana, IL New Orleans, LA $3,147 $322 $34.45 $0.88 3
Lincoln, NE Galveston-Houston, TX $3,510 $296 $37.80 $0.96 -1
Des Moines, IA Amarillo, TX $3,690 $252 $39.14 $0.99 2
Minneapolis, MN Tacoma, WA $5,000 $551 $55.12 $1.40 -2
Council Bluffs, IA Stockton, CA $4,400 $570 $49.35 $1.25 -2
Soybeans Sioux Falls, SD Tacoma, WA $5,520 $509 $59.87 $1.63 -1
Minneapolis, MN Portland, OR $5,530 $555 $60.43 $1.64 -1
Fargo, ND Tacoma, WA $5,430 $452 $58.41 $1.59 -1
Council Bluffs, IA New Orleans, LA $4,425 $371 $47.63 $1.30 4
Toledo, OH Huntsville, AL $2,982 $264 $32.24 $0.88 3
Grand Island, NE Portland, OR $5,360 $524 $58.43 $1.59 31A unit train refers to shipments of at least 25 cars. Shuttle train rates are available for qualified shipments of
75-120 cars that meet railroad efficiency requirements.
2Approximate load per car = 111 short tons (100.7 metric tons): corn 56 lbs./bu., wheat & soybeans 60 lbs./bu.
3Percentage change year over year calculated using tariff rate plus fuel surchage
Sources: www.bnsf.com, www.cpr.ca, www.csx.com, www.uprr.com
*Regional economic areas defined by the Bureau of Economic Analysis (BEA)
Tariff plus surcharge per:Fuel
surcharge
per car

December 11, 2014
Grain Transportation Report 10
Figure 7
Railroad Fuel Surcharges, North American Weighted Average1
Sources: www.bnsf.com, www.cn.ca, www.cpr.ca, www.csx.com, www.kcsi.com, www.nscorp.com, www.uprr.com
$0.00
$0.10
$0.20
$0.30
$0.40
$0.50
$0.60
$0.70
$0.80
Dec
-12
Jan
-13
Feb
-13
Mar
-13
Ap
r-1
3
May
-13
Jun
-13
Jul-
13
Au
g-1
3
Sep
-13
Oct
-13
Nov
-13
Dec
-13
Jan
-14
Feb
-14
Mar
-14
Ap
r-1
4
May
-14
Jun
-14
Jul-
14
Au
g-1
4
Sep
-14
Oct
-14
Nov
-14
Dec
-14
Do
lla
rs p
er
railca
r m
ile
Fuel Surcharge* ($/mile/railcar)
3-year Monthly Average
1 Weighted by each Class I railroad's proportion of grain traffic for the prior year.
* Mileage-based fuel surcharges for March and April 2007 are estimated. Beginning January 2009, the Canadian Pacific fuel surcha rge is
computed by a monthly average of the bi-weekly fuel surcharge.
** BNSF strike price (diesel price when fuel surcharges begin) changed from $1.25/gal. to $2.50/gal starting March 1, 2011. As a result, the
weighted average fuel surcharge for March 2011 was $0.227/mile instead of $0.331/mile.
December 2014: $0.279, down 7% from last month's surcharge of $0.299/mile; down 12% from the December
2013 surcharge of $0.318/mile; and down 15% from the December prior 3-year average of $0.328/mile.
$0.279
Table 8
Tariff Rail Rates for U.S. Bulk Grain Shipments to MexicoEffective date: 12/1/2014 Percent
Tariff change
Commodity Destination region rate/car1
metric ton3
bushel3
Y/Y4
Wheat MT Chihuahua, CI $6,760 $482 $74.00 $2.01 5
OK Cuautitlan, EM $6,465 $586 $72.04 $1.96 3
KS Guadalajara, JA $7,049 $566 $77.81 $2.12 5
TX Salinas Victoria, NL $3,885 $221 $41.95 $1.14 30
Corn IA Guadalajara, JA $8,049 $666 $89.04 $2.26 0
SD Celaya, GJ $7,656 $631 $84.68 $2.15 -1
NE Queretaro, QA $7,535 $591 $83.03 $2.11 1
SD Salinas Victoria, NL $5,880 $480 $64.98 $1.65 -1
MO Tlalnepantla, EM $6,887 $575 $76.24 $1.93 0
SD Torreon, CU $6,722 $529 $74.08 $1.88 -1
Soybeans MO Bojay (Tula), HG $8,111 $562 $88.61 $2.41 2
NE Guadalajara, JA $8,572 $642 $94.14 $2.56 0
IA El Castillo, JA $8,855 $627 $96.89 $2.63 -1
KS Torreon, CU $6,989 $398 $75.48 $2.05 1
Sorghum TX Guadalajara, JA $6,953 $411 $75.24 $1.91 2
NE Celaya, GJ $7,287 $573 $80.31 $2.04 -1
KS Queretaro, QA $6,795 $360 $73.10 $1.86 -4
NE Salinas Victoria, NL $5,500 $422 $60.50 $1.54 -3
NE Torreon, CU $6,318 $470 $69.36 $1.76 -11Rates are based upon published tariff rates for high-capacity shuttle trains. Shuttle trains are available for qualified
shipments of 75--110 cars that meet railroad efficiency requirements.2Fuel surcharge adjusted to reflect the change in Ferrocarril Mexicano, S.A. de C.V railroad fuel surcharge policy as of 10/01/2009
3Approximate load per car = 97.87 metric tons: Corn & Sorghum 56 lbs/bu, Wheat & Soybeans 60 lbs/bu
4Percentage change year over year calculated using tariff rate plus fuel surchage
Sources: www.bnsf.com, www.uprr.com, www.kcsouthern.com
Fuel
surcharge
per car2
Tariff plus surcharge per:Origin
state

December 11, 2014
Grain Transportation Report 11
Barge Transportation
Figure 8
Illinois River Barge Freight Rate1,2
1Rate = percent of 1976 tariff benchmark index (1976 = 100 percent);
24-week moving average of the 3-year average.
Source: Transportation & Marketing Programs/AMS/USDA
0
200
400
600
800
1000
12001
2/1
0/1
3
12/
24/
13
01/
07/
14
01/
21/
14
02/
04/
14
02/
18/
14
03/
04/
14
03/
18/
14
04/
01/
14
04/
15/
14
04/
29/
14
05/
13/
14
05/
27/
14
06/
10/
14
06/
24/
14
07/
08/
14
07/
22/
14
08/
05/
14
08/
19/
14
09/
02/
14
09/
16/
14
09/
30/
14
10/
14/
14
10/
28/
14
11/
11/
14
11/
25/
14
12/
09/
14
Per
cen
t o
f tar
iff
Weekly rate
3-year avg. for the week
Week ending December 9: down 12 percent from last
week, down 7 percent from last year, and down 4
percent from the 3-yr average.
Table 9
Weekly Barge Freight Rates: Southbound Only
Twin
Cities
Mid-
Mississippi
Lower
Illinois
River St. Louis Cincinnati
Lower
Ohio
Cairo-
Memphis
Rate1
12/9/2014 - - 503 333 400 400 317
12/2/2014 - - 575 394 448 448 338
$/ton 12/9/2014 - - 23.34 13.29 18.76 16.16 9.95
12/2/2014 - - 26.68 15.72 21.01 18.10 10.61
Current week % change from the same week:
Last year - - -7 -22 -22 -22 1
3-year avg. 2
- - -4 -23 -19 -19 -10-2 6 6
Rate1
January - - 497 327 397 397 288
March - 470 442 315 367 367 2821Rate = percent of 1976 tariff benchmark index (1976 = 100 percent);
24-week moving average; ton = 2,000 pounds;
Source: Transportation & Marketing Programs/AMS/USDA
Figure 9
Benchmark tariff rates
Calculating barge rate per ton:
(Rate * 1976 tariff benchmark rate per ton)/100
Select applicable index from market quotes included in
tables on this page. The 1976 benchmark rates per ton
are provided in map.
Twin Cities 6.19
Mid-Mississippi 5.32
St. Louis 3.99
Cairo-Memphis 3.14
Illinois 4.64 Cincinnati 4.69
Lower Ohio 4.04

December 11, 2014
Grain Transportation Report 12
Figure 10
Barge Movements on the Mississippi River1 (Locks 27 - Granite City, IL)
1 The 3-year average is a 4-week moving average.
Source: U.S. Army Corps of Engineers
0
100
200
300
400
500
600
700
800
900
12/0
7/1
3
12/2
1/1
3
01/0
4/1
4
01/1
8/1
4
02/0
1/1
4
02/1
5/1
4
03/0
1/1
4
03/1
5/1
4
03/2
9/1
4
04/1
2/1
4
04/2
6/1
4
05/1
0/1
4
05/2
4/1
4
06/0
7/1
4
06/2
1/1
4
07/0
5/1
4
07/1
9/1
4
08/0
2/1
4
08/1
6/1
4
08/3
0/1
4
09/1
3/1
4
09/2
7/1
4
10/1
1/1
4
10/2
5/1
4
11/0
8/1
4
11/2
2/1
4
12/0
6/1
4
12/2
0/1
4
01/0
3/1
5
1,0
00 t
on
s
Soybeans
Wheat
Corn
3-Year Average
Week ending December 6: Up 11.4% from last year but 3% lower than the
3-yr avg
Table 10
Barge Grain Movements (1,000 tons)
Week ending 12/06/2014 Corn Wheat Soybeans Other Total
Mississippi River
Rock Island, IL (L15) 27 0 38 0 65
Winfield, MO (L25) 88 2 241 3 334
Alton, IL (L26) 223 2 318 2 544
Granite City, IL (L27) 229 2 364 2 596
Illinois River (L8) 130 0 56 0 186
Ohio River (L52) 88 3 124 0 215
Arkansas River (L1) 0 0 43 0 43
Weekly total - 2014 317 5 531 2 854
Weekly total - 2013 345 24 397 3 769
2014 YTD1
19,675 2,136 10,546 223 32,579
2013 YTD 8,764 4,045 8,796 227 21,832
2014 as % of 2013 YTD 225 53 120 98 149
Last 4 weeks as % of 20132
94 32 132 22 112
Total 2013 9,504 4,111 10,065 255 23,9351 Weekly total, YTD (year-to-date) and calendar year total includes Miss/27, Ohio/52, and Ark/1; "Other" refers to oats, barley, sorghum, and rye.
2 As a percent of same period in 2013.
Source: U.S. Army Corps of Engineers
Note: Total may not add exactly, due to rounding

December 11, 2014
Grain Transportation Report 13
Figure 11
Source: U.S. Army Corps of Engineers
Upbound Empty Barges Transiting Mississippi River Locks 27, Arkansas River Lock and
Dam 1, and Ohio River Locks and Dam 52
0
100
200
300
400
500
7/5
/14
7/1
2/1
4
7/1
9/1
4
7/2
6/1
4
8/2
/14
8/9
/14
8/1
6/1
4
8/2
3/1
4
8/3
0/1
4
9/6
/14
9/1
3/1
4
9/2
0/1
4
9/2
7/1
4
10/
4/1
4
10/
11/
14
10/
18/
14
10/
25/
14
11/
1/1
4
11/
8/1
4
11/
15/
14
11/
22/
14
11/
29/
14
12/
6/1
4
Nu
mbe
r of
Bar
ges
Locks 27 Lock 1 Locks 52
Week ending December 6: 521 total barges, down 102 barges from the previous week, and 24 percent lower than the 3-year avg.
Figure 12
Grain Barges for Export in New Orleans Region
Source: U.S. Army Corps of Engineers and GIPSA
0
200
400
600
800
1000
1200
6/7
/14
6/1
4/1
4
6/2
1/1
4
6/2
8/1
4
7/5
/14
7/1
2/1
4
7/1
9/1
4
7/2
6/1
4
8/2
/14
8/9
/14
8/1
6/1
4
8/2
3/1
4
8/3
0/1
4
9/6
/14
9/1
3/1
4
9/2
0/1
4
9/2
7/1
4
10/4
/14
10/1
1/1
4
10/1
8/1
4
10/2
5/1
4
11/1
/14
11/8
/14
11/1
5/1
4
11/2
2/1
4
11/2
9/1
4
12/6
/14
Downbound Grain Barges Locks 27, 1, and 52
Grain Barges Unloaded in New Orleans
Nu
mber
of
barg
es
Week ending December 6: 551 grain barges moved down river, down 7.6 percent from the previous week, 777 grain barges were unloaded in New Orleans, down 15 percent from the previous week.

December 11, 2014
Grain Transportation Report 14
The weekly diesel price provides a proxy for trends in U.S. truck rates as diesel fuel is a significant expense for truck grain move-
ments.
Truck Transportation
Table 11
Change from
Region Location Price Week ago Year ago
I East Coast 3.460 -0.049 -0.452
New England 3.525 -0.062 -0.541
Central Atlantic 3.539 -0.051 -0.433
Lower Atlantic 3.386 -0.043 -0.451
II Midwest2 3.623 -0.079 -0.247
III Gulf Coast3
3.434 -0.067 -0.339
IV Rocky Mountain 3.655 -0.072 -0.196
V West Coast 3.593 -0.099 -0.400
West Coast less California 3.519 -0.132 -0.387
California 3.655 -0.071 -0.411
Total U.S. 3.535 -0.070 -0.3441Diesel fuel prices include all taxes. Prices represent an average of all types of diesel fuel.
2Same as North Central
3Same as South Central
Source: Energy Information Administration/U.S. Department of Energy (www.eia.doe.gov)
Retail on-Highway Diesel Prices1, Week Ending 12/8/2014 (US $/gallon)
Figure 13
Weekly Diesel Fuel Prices, U.S. Average
Source: Retail On-Highway Diesel Prices, Energy Information Administration, Dept. of Energy
3.0
3.5
4.0
4.5
06/
09/
14
06/
16/
14
06/
23/
14
06/
30/
14
07/
07/
14
07/
14/
14
07/
21/
14
07/
28/
14
08/
04/
14
08/
11/
14
08/
18/
14
08/
25/
14
09/
01/
14
09/
08/
14
09/
15/
14
09/
22/
14
09/
29/
14
10/
06/
14
10/
13/
14
10/
20/
14
10/
27/
14
11/
03/
14
11/
10/
14
11/
17/
14
11/
24/
14
12/
01/
14
12/
08/
14
Last year Current Year
$ p
er
gal
lon
Week ending December 8: Down 7 cents from the previous week
and 34 cents lower than the same week last year.
December 11, 2014
Grain Transportation Report 15
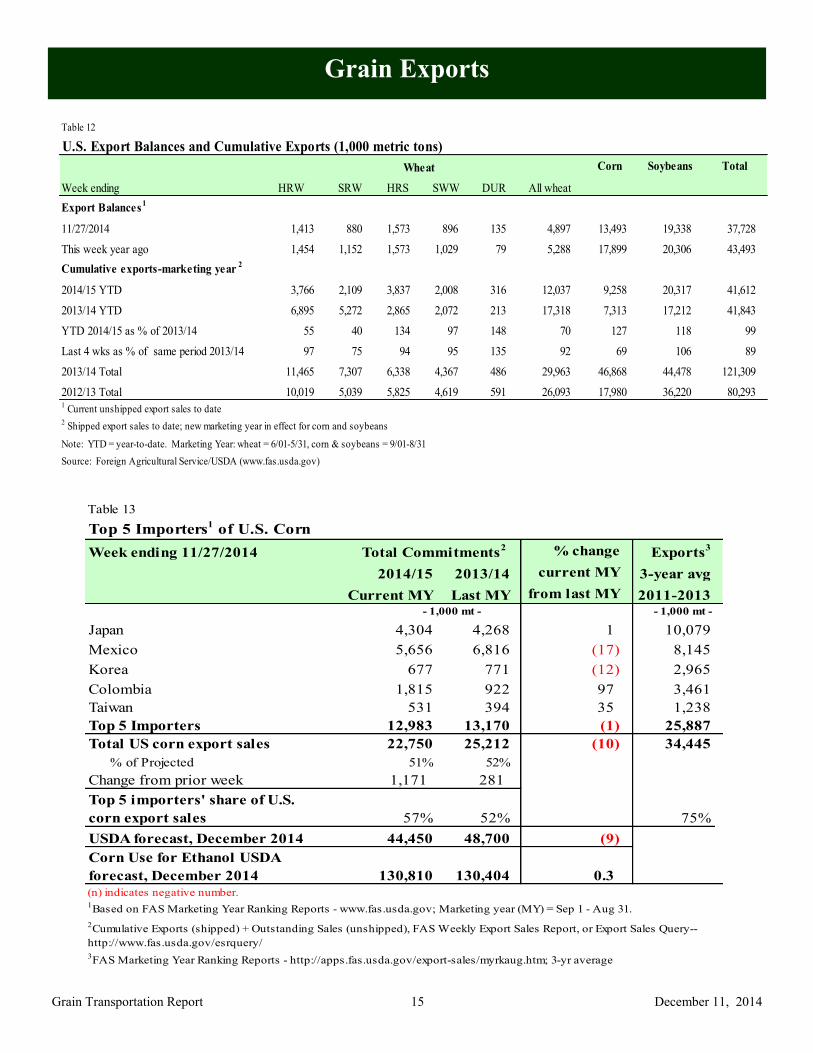
Grain Exports
Table 12
U.S. Export Balances and Cumulative Exports (1,000 metric tons)
Wheat Corn Soybeans Total
Week ending HRW SRW HRS SWW DUR All wheat
Export Balances1
11/27/2014 1,413 880 1,573 896 135 4,897 13,493 19,338 37,728
This week year ago 1,454 1,152 1,573 1,029 79 5,288 17,899 20,306 43,493
Cumulative exports-marketing year 2
2014/15 YTD 3,766 2,109 3,837 2,008 316 12,037 9,258 20,317 41,612
2013/14 YTD 6,895 5,272 2,865 2,072 213 17,318 7,313 17,212 41,843
YTD 2014/15 as % of 2013/14 55 40 134 97 148 70 127 118 99
Last 4 wks as % of same period 2013/14 97 75 94 95 135 92 69 106 89
2013/14 Total 11,465 7,307 6,338 4,367 486 29,963 46,868 44,478 121,309
2012/13 Total 10,019 5,039 5,825 4,619 591 26,093 17,980 36,220 80,2931 Current unshipped export sales to date
2 Shipped export sales to date; new marketing year in effect for corn and soybeans
Note: YTD = year-to-date. Marketing Year: wheat = 6/01-5/31, corn & soybeans = 9/01-8/31
Source: Foreign Agricultural Service/USDA (www.fas.usda.gov)
Table 13
Top 5 Importers1 of U.S. Corn
Week ending 11/27/2014 % change
Exports3
2014/15 2013/14 current MY 3-year avg
Current MY Last MY from last MY 2011-2013 - 1,000 mt -
Japan 4,304 4,268 1 10,079
Mexico 5,656 6,816 (17) 8,145
Korea 677 771 (12) 2,965
Colombia 1,815 922 97 3,461
Taiwan 531 394 35 1,238
Top 5 Importers 12,983 13,170 (1) 25,887
Total US corn export sales 22,750 25,212 (10) 34,445
% of Projected 51% 52%
Change from prior week 1,171 281
Top 5 importers' share of U.S.
corn export sales 57% 52% 75%
USDA forecast, December 2014 44,450 48,700 (9)
Corn Use for Ethanol USDA
forecast, December 2014 130,810 130,404 0.3
1Based on FAS Marketing Year Ranking Reports - www.fas.usda.gov; Marketing year (MY) = Sep 1 - Aug 31.
Total Commitments2
- 1,000 mt -
3FAS Marketing Year Ranking Reports - http://apps.fas.usda.gov/export-sales/myrkaug.htm; 3-yr average
2Cumulative Exports (shipped) + Outstanding Sales (unshipped), FAS Weekly Export Sales Report, or Export Sales Query--
http://www.fas.usda.gov/esrquery/
(n) indicates negative number.

December 11, 2014
Grain Transportation Report 16
Table 15
Top 10 Importers1 of All U.S. Wheat
Week Ending 11/27/2014 % change
Exports3
2014/15 2013/14 current MY 3-yr avg
Current MY Last MY from last MY 2011-2013
- 1,000 mt -
Japan 2,158 1,662 30 3,243
Mexico 1,826 2,141 (15) 3,066
Nigeria 1,680 1,854 (9) 2,960
Philippines 1,458 1,284 14 2,006
China 205 4,088 (95) 1,830
Brazil 1,456 3,226 (55) 1,617
Korea 992 921 8 1,552
Taiwan 697 612 14 969
Indonesia 398 545 (27) 813
Colombia 419 455 (8) 610
Top 10 importers 11,289 16,788 (33) 18,665
Total US wheat export sales 16,933 22,606 (25) 27,696
% of Projected 67% 71%
Change from prior week* 319 229
Top 10 importers' share
of U.S. wheat export sales 67% 74% 67%
USDA forecast, December 2014 25,170 32,010 (21)
1 Based on FAS Marketing Year Ranking Reports - www.fas.usda.gov; Marketing year = Jun 1 - May 31.
Total Commitments2
3 FAS Marketing Year Final Reports - www.fas.usda.gov/export-sales/myfi_rpt.htm.
(n) indicates negative number.
2 Cumulative Exports (shipped) + Outstanding Sales (unshipped), FAS Weekly Export Sales Report, or Export Sales
Query--http://www.fas.usda.gov/esrquery/
- 1,000 mt -
Table 14
Top 5 Importers1 of U.S. Soybeans
Week Ending 11/27/2014 % change
Exports3
2014/15 2013/14 current MY 3-yr avg.
Current MY Last MY from last MY 2011-13
- 1,000 mt -
China 24,974 23,967 4 24,211
Mexico 1,760 1,517 16 2,971
Indonesia 822 890 (8) 1,895
Japan 931 909 2 1,750
Taiwan 1,012 832 22 1,055
Top 5 importers 29,498 28,115 5 31,882
Total US soybean export sales 39,650 37,518 6 39,169
% of Projected 83% 84%
Change from prior week* 1,180 805
Top 5 importers' share of U.S.
soybean export sales 74% 75% 81%
USDA forecast, December 2014 47,900 44,820 7
1Based on FAS Marketing Year Ranking Reports - www.fas.usda.gov; Marketing year (MY) = Sep 1 - Aug 31.
Total Commitments2
- 1,000 mt -
3 FAS Marketing Year Final Reports - www.fas.usda.gov/export-sales/myfi_rpt.htm. (Carryover plus Accumulated Exports)
(n) indicates negative number.
2Cumulative Exports (shipped) + Outstanding Sales (unshipped), FAS Weekly Export Sales Report, or Export Sales Query--
http://www.fas.usda.gov/esrquery/

December 11, 2014
Grain Transportation Report 17
The United States exports approximately one-quarter of the grain it produces. On average, this includes nearly 45 percent of U.S.-grown
wheat, 35 percent of U.S.-grown soybeans, and 20 percent of the U.S.-grown corn. Approximately 61 percent of the U.S. export grain ship-
ments departed through the U.S. Gulf region in 2013.
Table 16
Grain Inspections for Export by U.S. Port Region (1,000 metric tons)
Port Week ending Previous Current Week 2014 YTD as Total1
regions 12/04/14 Week1
as % of Previous 2014 YTD1
2013 YTD1
% of 2013 YTD 2013 3-yr. avg. 2013
Pacific Northwest
Wheat 141 94 149 11,547 10,860 106 108 93 11,571
Corn 31 49 64 7,570 2,379 318 11 16 2,967
Soybeans 750 482 156 10,849 8,368 130 177 240 9,079
Total 922 626 147 29,966 21,606 139 112 140 23,618
Mississippi Gulf
Wheat 12 65 19 4,325 9,518 45 23 32 9,700
Corn 407 567 72 29,061 13,615 213 94 105 14,803
Soybeans 1,149 1,311 88 25,270 18,496 137 138 172 21,436
Total 1,568 1,943 81 58,656 41,629 141 118 144 45,939
Texas Gulf
Wheat 52 73 71 5,958 8,706 68 41 55 9,028
Corn 0 38 0 547 223 245 62 90 255
Soybeans 51 31 165 754 848 89 111 169 907
Total 103 142 72 7,258 9,777 74 59 81 10,190
Interior
Wheat 19 12 156 1,300 1,001 130 101 115 1,242
Corn 79 84 95 5,250 3,566 147 64 68 3,936
Soybeans 161 138 117 3,880 3,005 129 63 213 3,208
Total 260 234 111 10,430 7,572 138 149 122 8,386
Great Lakes
Wheat 36 27 132 789 796 99 66 118 883
Corn 0 0 n/a 281 0 n/a n/a 254 0
Soybeans 49 77 63 710 596 119 136 229 698
Total 85 105 81 1,780 1,392 128 113 192 1,581
Atlantic
Wheat 1 0 n/a 547 644 85 n/a 14 644
Corn 0 0 n/a 816 228 357 5 3 242
Soybeans 57 97 59 1,704 1,333 128 102 130 1,650
Total 57 97 59 3,066 2,206 139 101 124 2,536
U.S. total from ports2
Wheat 261 272 96 24,466 31,524 78 64 71 33,069
Corn 517 737 70 43,525 20,011 218 63 77 22,202
Soybeans 2,217 2,136 104 43,166 32,647 132 147 187 36,980
Total 2,995 3,146 95 111,157 84,182 132 111 137 92,2511 Data includes revisions from prior weeks; some regional totals may not add exactly due to rounding.
Source: Grain Inspection, Packers and Stockyards Administration/USDA (www.gipsa.usda.gov); YTD= year-to-date; n/a = not applicable
Last 4-weeks as % of

December 11, 2014
Grain Transportation Report 18
Figure 14
U.S. grain inspected for export (wheat, corn, and soybeans)
Source: Grain Inspection, Packers and Stockyards Administration/USDA (www.gipsa.usda.gov)
Note: 3-year average consists of 4-week running average
0
20
40
60
80
100
120
140
160
180
01/0
3/1
3
01/3
1/1
3
02/2
8/1
3
03/
28/
13
04/2
5/1
3
05/2
3/1
3
06/
20/
13
07/1
8/1
3
08/1
5/1
3
09/
12/
13
10/
10/
13
11/0
7/1
3
12/0
5/1
3
01/
02/
14
01/3
0/1
4
02/2
7/1
4
03/
27/
14
04/2
4/1
4
05/2
2/1
4
06/
19/
14
07/
17/
14
08/1
4/1
4
09/1
1/1
4
10/
09/
14
11/0
6/1
4
12/0
4/1
4
01/
01/
15
01/2
9/1
5
Mil
lion
bu
sh
els
(m
bu
)
Current week 3-year average
For the week ending Dec. 4: 111.4 mbu, down 5% from the previous
week, down 5% from same week last year, and 19% above the 3-year
average
Figure 15
U.S. Grain Inspections: U.S. Gulf and PNW1 (wheat, corn, and soybeans)
0
10
20
30
40
50
60
70
80
90
100
8/2
/12
9/2
/12
10/2
/12
11/2
/12
12/2
/12
1/2
/13
2/2
/13
3/2
/13
4/2
/13
5/2
/13
6/2
/13
7/2
/13
8/2
/13
9/2
/13
10/2
/13
11/2
/13
12/2
/13
1/2
/14
2/2
/14
3/2
/14
4/2
/14
5/2
/14
6/2
/14
7/2
/14
8/2
/14
9/2
/14
10/2
/14
11/2
/14
12/2
/14
1/2
/15
2/2
/15
3/2
/15
4/2
/15
5/2
/15
6/2
/15
Mil
lio
n b
ush
els
(m
bu
)
Miss. Gulf 3-Year avg - Miss. Gulf
PNW 3-Year avg - PNW
Texas Gulf 3-Year avg - TX Gulf
3.8*
58.7*
34.0*
Source: Grain Inspection, Packers and Stockyards Administration/USDA (www.gipsa.usda.gov); *mbu, this week.
Dec 4: % change from: MS Gulf TX Gulf U.S. Gulf PNW
Last week down 20 down 29 down 20 up 47
Last year (same week) down 4 down 64 down 13 up 17
3-yr avg. (4-wk mov. avg.) up 15 down 32 up 11 up 52

December 11, 2014
Grain Transportation Report 19
Ocean Transportation
Table 17
Weekly Port Region Grain Ocean Vessel Activity (number of vessels)
Pacific Vancouver
Gulf Northwest B.C.
Loaded Due next
Date In port 7-days 10-days In port In port
12/4/2014 38 49 73 14 n/a
11/27/2014 39 51 60 n/a n/a
2013 range (16..60) (20..56) (31..81) (0..24) n/a
2013 avg. 32 33 51 12 n/a
Source: Transportation & Marketing Programs/AMS/USDA
Figure 16
U.S. Gulf1 Vessel Loading Activity
0
10
20
30
40
50
60
70
80
90
100
07/1
7/2
01
4
07/2
4/2
01
4
07/3
1/2
01
4
08/0
7/2
01
4
08/1
4/2
01
4
08/2
1/2
01
4
08/2
8/2
01
4
09/0
4/2
01
4
09/1
1/2
01
4
09/1
8/2
01
4
09/2
5/2
01
4
10/0
2/2
01
4
10/0
9/2
01
4
10/1
6/2
01
4
10/2
3/2
01
4
10/3
0/2
01
4
11/0
6/2
01
4
11/1
3/2
01
4
11/2
0/2
01
4
11/2
7/2
01
4
12/0
4/2
01
4
Nu
mb
er o
f ves
sels
Loaded Last 7 Days Due Next 10 days Loaded 4 Year Average
Source:Transportation & Marketing Programs/AMS/USDA1U.S. Gulf includes Mississippi, Texas, and East Gulf.
Week ending December 4 Loaded Due Change from last year 8.9% 5.8%
Change from 4-year avg. 18.8% 16.8%

December 11, 2014
Grain Transportation Report 20
Figure 17
Grain Vessel Rates, U.S. to Japan
Data Source: O'Neil Commodity Consulting
0
10
20
30
40
50
60
70
Nov
. 12
Jan
. 13
Mar
. 1
3
May
13
July
13
Sep
t. 1
3
Nov
. 13
Jan
. 14
Mar
. 1
4
May
14
July
14
Sep
t. 1
4
Nov
. 14
US
$/m
etri
c to
n
Spread Gulf vs. PNW to Japan Rate Gulf to Japan Rate PNW to Japan
Gulf PNW Spread
Ocean rates for Nov. '14 $44.58 $24.50 $20.08
Change from Nov. '13 -17.3% -15.8% -19.0%
Change from 4-year avg. -16.4% -17.6% -14.9%
Table 18
Ocean Freight Rates For Selected Shipments, Week Ending 12/06/2014
Export Import Grain Loading Volume loads Freight rate
region region types date (metric tons) (US$/metric ton)
U.S. Gulf China Heavy Grain Dec 15/30 5,500 40.25
U.S. Gulf China Heavy Grain Dec 15/20 55,000 50.00
U.S. Gulf China Heavy Grain Dec 10/17 55,000 41.75
U.S. Gulf China Heavy Grain Dec 10/20 60,000 41.25
U.S. Gulf China Heavy Grain Nov 25/30 60,000 43.00
U.S. Gulf China Heavy Grain Nov 20/30 60,000 44.75
U.S. Gulf China Heavy Grain Nov 15/25 55,000 44.25
U.S. Gulf China Heavy Grain Nov 10/20 60,000 44.25
U.S. Gulf China Heavy Grain Nov 5/15 60,000 45.25
U.S. Gulf China Heavy Grain Nov 1/8 58,000 46.00
U.S. Gulf China Heavy Grain Oct 20/30 55,000 42.15
U.S. Gulf China Heavy Grain Oct 20/30 58,000 44.00
U.S. Gulf Brazil Wheat Nov 8/14 25,000 22.00
U.S. Gulf Djibouti1
Wheat/Sorghum Nov 20/30 22,000 68.50
PNW China Heavy Grain Nov 1/30 60,000 26.50
PNW China Grain Oct 20/30 60,000 23.00
Rates shown are for metric ton (2,204.62 lbs. = 1 metric ton), F.O.B., except where otherwise indicates; op = option
150 percent of food aid from the United States is required to be shipped on U.S.-flag vessels.
Source: Maritime Research Inc. (www.maritime-research.com)
5/15

December 11, 2014
Grain Transportation Report 21
In 2013, containers were used to transport 10 percent of total U.S. waterborne grain exports, up 2 percentage points from
2012. Approximately 61 percent of U.S. waterborne grain exports in 2013 went to Asia, of which 16 percent were moved in con-
tainers. Asia is the top destination for U.S. containerized grain exports—97 percent in 2013.
Figure 19
Monthly Shipments of Containerized Grain to Asia
Source: USDA/Agricultural Marketing Service/Transportation Services Division analysis of Port Import Export Reporting Service (PIERS) data
Note: The following Harmonized Tariff Codes are used to calculate containerized grains movements: 100190, 100200, 100300, 100400, 100590, 100700,
110100, 230310, 110220, 110290, 120100, 230210, 230990, 230330, and 120810.
0
5
10
15
20
25
30
35
40
45
50
55
60
65
70
75
80
Jan
.
Feb
.
Mar.
Apr.
May
Jun
.
Jul.
Aug
.
Sep
.
Oct
.
Nov
.
Dec
.
Th
ou
san
d 2
0-f
t eq
uiv
ale
nt
un
its
2013
2014
5-year avg
September 2014: Down 40% from last year and 18% lower than the 5-year average
Figure 18
Top 10 Destination Markets for U.S. Containerized Grain Exports, January-September, 2014
Source: USDA/Agricultural Marketing Service/Transportation Services Division analysis of Port Import Export Reporting Service
(PIERS) data
Note: The following Harmonized Tariff Codes are used to calculate containerized grains movements: 100190, 100200, 100300, 100400,
100590, 100700, 110100, 230310, 110220, 110290, 120100, 230210, 230990, 230330, and 120810.
China39%
Taiwan13%
Indonesia12% Vietnam
8%
Korea5%
Thailand5%
Japan5%
Philippines3%Malaysia
2%Hong Kong
1%
Other7%

December 11, 2014
Grain Transportation Report 22
Coordinators
Surajudeen (Deen) Olowolayemo [email protected] (202) 720 - 0119
Pierre Bahizi [email protected] (202) 690 - 0992
Adam Sparger [email protected] (202) 205 - 8701
Weekly Highlight Editors
Marina Denicoff [email protected] (202) 690 - 3244
Surajudeen (Deen) Olowolayemo [email protected] (202) 720 - 0119
April Taylor [email protected] (202) 295 - 7374
Nicholas Marathon [email protected] (202) 690 - 4430
Grain Transportation Indicators
Surajudeen (Deen) Olowolayemo [email protected] (202) 720 - 0119
Rail Transportation
Marvin Prater [email protected] (540) 361 - 1147
Johnny Hill [email protected] (202) 690 - 3295
Adam Sparger [email protected] (202) 205 - 8701
Barge Transportation
Nicholas Marathon [email protected] (202) 690 - 4430
April Taylor [email protected] (202) 295 - 7374
Truck Transportation
April Taylor [email protected] (202) 295 - 7374
Grain Exports
Johnny Hill [email protected] (202) 690 - 3295
Marina Denicoff [email protected] (202) 690 - 3244
Ocean Transportation
Surajudeen (Deen) Olowolayemo [email protected] (202) 720 - 0119
(Freight rates and vessels)
April Taylor [email protected] (202) 295 - 7374
(Container movements)
Subscription Information: Send relevant information to [email protected] for an electronic copy
(printed copies are also available upon request).
Preferred citation: U.S. Dept. of Agriculture, Agricultural Marketing Service. Grain Transportation Report.
December 11, 2014. Web: http://dx.doi.org/10.9752/TS056.12-11-2014
Contacts and Links
The U.S. Department of Agriculture (USDA) prohibits discrimination in all of its programs and activities on the basis of race, color, national origin, age, disability, and where applicable, sex (including gender identity and expression), marital status, familial status, parental status, religion, sexual orientation, political beliefs,
genetic information, reprisal, or because all or part of an individual's income is derived from any public assistance program. (Not all prohibited bases apply to all
programs.) Persons with disabilities who require alternative means for communication of program information (Braille, large print, audiotape, etc.) should contact USDA's TARGET Center at (202) 720-2600 (voice and TDD).