PORTUGUESE REVIEW OF REGIONAL STUDIES
169
2020 3º Quadrimestre | nº 56 | Avulso €15 José Cadima Ribeiro PORTUGUESE REVIEW OF REGIONAL STUDIES
-
Upload
khangminh22 -
Category
Documents
-
view
0 -
download
0
Transcript of PORTUGUESE REVIEW OF REGIONAL STUDIES

2020
3º Quadrimestre | nº 56 | Avulso €15
José Cadima Ribeiro
PORTUGUESE REVIEW OF REGIONAL STUDIES

2020
3º Quadrimestre | nº 56 | Avulso €15
José Cadima Ribeiro

Revista Portuguesa de Estudos Regionais
Portuguese Review of Regional Studies
Nº 56, 2020, 3º Quadrimestre
Direção Editorial
José Cadima Ribeiro, Universidade do Minho
Comité Editorial
Adriano Pimpão, Universidade do Algarve
Alejandro Cardenete, Univerdidad Loyola
Andalucía
Ana Lúcia Sargento, Inst. Politécnico de Leiria
António Caleiro, Universidade de Évora
António Covas, Universidade do Algarve
António Figueiredo, Universidade do Porto
António Pais Antunes, Univ. de Coimbra
António Rochette Cordeiro, Univ. Coimbra
Armindo Carvalho, Universidade do Porto
Artur Rosa Pires, Universidade de Aveiro
Aurora Teixeira, Universidade do Porto
Carlos Azzoni, Universidade de São Paulo
Carlos Pimenta, Univ. Federal de Itajubá
Carmen Padín, Universidade de Vigo
Celeste Eusébio, Universidade de Aveiro
Conceição Rego, Universidade de Évora
Eduardo Anselmo de Castro, Univ. de Aveiro
Eduardo Haddad, Universidade de São Paulo
Elias Melchor-Ferrer, Universidade de Granada
Elisabeth Kastenholz, Universidade de Aveiro
Eva Sánchez Amboage, Univ. Técnica
Particular de Loja
Fernando Perobelli, Univ. de Juiz de Fora
Francisco Carballo-Cruz, Univ. do Minho
Francisco Diniz, Univ. Trás-os-Montes e AD
Geoffrey D. Hewings, REAL e Univ. de Illinois
em Urbana-Champaing
Isabel Mota, Universidade do Porto
Iva Miranda Pires, Univ. Nova de Lisboa
João Guerreiro, Universidade do Algarve
João Leitão, Universidade da Beira Interior
João Marques, Universidade de Aveiro
João Oliveira Soares, Universidade de Lisboa
Joaquim Antunes, Inst. Politécnico de Viseu
José Freitas Santos, Inst. Politécnico. do Porto
José Pedro Pontes, Universidade de Lisboa
José Reis, Universidade de Coimbra
José Silva Costa, Universidade do Porto
Laurentina Vareiro, Inst. Politécnic do Cá-
vado e do Ave
Lívia Madureira, Univ. Trás-os-Montes e AD
Manuel Brandão Alves, Univ. de Lisboa
María Magdalena Fernandéz, Univ. de A
Coruña
Mário Fortuna, Universidade dos Açores
Mário Rui Silva, Universidade do Porto
Miguel Marquez Paniagua, Universid de
Extremadura
Natasa Urbancikova, Technical University
of Kosice
Nuno Ornelas Martins, Univ. Católica, Porto
Oto Hudec, Technical University of Kosice
Paula Cristina Remoaldo, Univ. do Minho
Paulo Guimarães, Universidade do Porto
Paulo Pinho, Universidade do Porto
Paulo Dias Correia, Universidade de Lisboa
Pedro Costa, ISCTE-Inst. Univ. de Lisboa
Pedro Guedes de Carvalho, Univ. Beira In-
terior
Pedro Nogueira Ramos, Univ. de Coimbra
Peter Nijkamp, Univ. Livre de Amsterdão
Regina Salvador, Universidade Nova Lisboa
Rui Nuno Baleiras, Universidade do Minho
Rui Ramos, Universidade do Minho
Sandra Saúde, Inst. Politécnico de Beja
Teresa Noronha Vaz, Univ. do Algarve
Tiago Freire, University of Camberra
Tomaz Ponce Dentinho, Univ. dos Açores
Valdir Roque Dallabrida, Univ. do Contesta-
do (Canoinhas)
Vasco Reis, Universidade de Lisboa
Xésus Pereira López, Universidade de Santi-
ago de Compostela
Xulio Pardellas de Blas, Univ. de Vigo

Indexação A Revista Portuguesa de Estudos Regionais está referenciada nas seguintes bases
bibliográficas:
EconLit e bases associadas (JEL on CD; e-JEL; Journal of Economic Literature), Qualis
(Brasil), e Scopus [Q3 (2018); SJR (2018) = 0,157; SNIP (2018) = 0,22; Cite Score (%
Cited) (2018) = 0,256].
Secretariado executivo Ana Luísa Ramos
Propriedade e Edição ©APDR
Associação Portuguesa para o Desenvolvimento Regional
Universidade dos Açores, Rua Capitão João D’Ávila
9700-042 – Angra do Heroísmo
+351 295 333 329 (telef/fax) • [email protected]
http://www.apdr.pt/siteRPER/index.html
Periodicidade Quadrimestral (janeiro; maio; setembro)
Preço Avulso 15€ • Assinatura 30€ (Portugal) e 45€ (estrangeiro)
Impressão Studioprint • Tiragem 30 exemplares
Depósito legal 190875/03 • ISSN 1645-586X


5
ÍNDICE 7 The Ruin Problem: Negotiating Cultural Heritage in Macau
Marta Wieczorek, Ph. D.
19 Qualidade em Turismo na Perspetiva dos Decisores Públicos Locais
Portugueses: O Caso da Região Centro de Portugal
Maria do Rosário Campos Mira
Lisete dos Santos Mónico
Zélia Maria de Jesus Breda
Andreia Filipa Antunes Moura
43 Socioeconomic Determinants of Pilgrimages: A Var Approach to
Portuguese Case of Fatima
Matheus Belucio
Glauber Eduardo De Oliveira Santos
Marco Daniel Duarte
José Alberto Fuinhas
Carlos Vieira
65 O Turismo no Douro: Notas Bibliométricas Sobre a Literatura Científica
Nuno André Pinto de Sousa
Maria Teresa Manfredo
85 Caracterização e Análise do Potencial de Desenvolvimento do Turismo
Cultural Literário em Coimbra
Sílvia Quinteiro
Alexandra Rodrigues Gonçalves
Vivina Carreira
101 A Percepção e Atitude na Hotelaria Face ao Mercado LGBT: O Caso do
Norte de Portugal
Sónia de Sousa e Silva
Laurentina Vareiro
113 Labour Content of International Trade in Intermediates: The Case of
Portugal
Enrique Martínez-Galán
Maria Paula Fontoura

135 A Relação Entre as Receitas e as Despesas Públicas nos Municípios
Portugueses: 2009-2017
Leonida Correia
Patrícia Martins
151 Potential Economic Consequences of Migration Arising From Different
Consumption Structures of Nationals and Immigrants: An Input-Output
Approach
José Carlos Coelho
João Carlos Lopes
Vítor Escária
João Ferreira do Amaral

Artigo submetido a 6 de Setembro de 2019; versão final aceite a 20 de Abril de 2020
Paper submitted on September 6, 2019; final version accepted on April 6, 2020
The Ruin Problem: Negotiating Cultural Heritage in
Macau
O Problema das Ruínas: Negociação do Património Cultural em
Macau
Marta Wieczorek, Ph. D.
Assistant Professor in Cultural Anthropology, Department of Humanities and Social Sciences,
Zayed University, Dubai
Abstract/ Resumo
Traditionally, ruins were perceived in China
as undesirable architectural structures that could
“only be meaningful in the present day when
they are completely renovated” (Chen, 2016:
356). They were identified with chaos, disturb-
ance, deficit and misfortune. The traditional,
Chinese principles of wholeness, completeness,
design balance and gestalt pursuit derive from
the Taoist tradition. According to these conven-
tions harmony and aesthetic appeal could have
been valued over the authenticity and historical
truth. Consequently, traditional Chinese stylistic
restoration resorted to practices of rebuilding
what had been previously demolished or lost.
The article intends to consider Macau’s Portu-
guese, famous landmark – Ruins of St. Paul’s –
as a space of negotiation between the “Western”
and the Chinese attitudes toward the heritage
preservation. By way of such analysis, the ulti-
mate goal of the paper can be achieved – to re-
veal Macau’s complex urban identity as exhib-
ited in its cultural heritage. Methods used in this
study included surveying the common character-
istics of Chinese traditional heritage preserva-
tion practices and comparing them against the
Western traditions by means of comparative lit-
erature review and policy documents analysis.
Additional methods combined reviewing
sources, which reveal the social reception of
Chinese heritage preservation practices, together
with first-hand observations. The article’s con-
clusion affirms that St. Paul’s needs to be recog-
nized as a place of manifestation of dissonant
heritage restoration-related visions and an em-
blematic marker of Macau’s complex identity.
Tradicionalmente, as ruínas eram encaradas
na China como estruturas arquitetónicas indese-
jáveis que “só poderiam ter significado nos dias
atuais quando fossem completamente renova-
das” (Chen, 2016: 356 - tradução nossa). Elas
eram identificadas com caos, perturbação, défice
e infortúnio. Os princípios chineses tradicionais
de inteireza, completude, equilíbrio estético e
busca gestalt derivam da tradição Taoista. Se-
gundo essas referências, a harmonia e o apelo es-
tético deveriam ser mais valorizados do que a au-
tenticidade e a verdade histórica. Consequente-
mente, o tradicional modelo chinês de restauro
recorreu a práticas de reconstrução do que havia
sido demolido ou perdido anteriormente. O ar-
tigo toma o caso do famoso marco histórico-cul-
tural português de Macau – as Ruínas de São
Paulo - como exemplo de um espaço de negoci-
ação entre as atitudes "ocidental" e chinesa em
matéria de preservação do património. Através
dessa análise, o objetivo final do artigo pôde ser
alcançado: revelar a identidade urbana complexa
de Macau, com expressão no seu património cul-
tural. Os métodos utilizados neste estudo incluí-
ram o levantamento das práticas tradicionais de
preservação do patrimônio chinês e a respetiva
comparação com as tradições ocidentais, recor-
rendo à revisão da literatura e à análise de docu-
mentos de natureza política. Adicionalmente, re-
correu-se ao levantamento de documentos diver-
sos reveladores da recetividade social mantida
no referente às práticas de preservação do patri-
mónio chinês, juntamente com observações em
primeira mão. A conclusão a que se chegou é que
as ruínas de São Paulo precisam ser reconheci-

Revista Portuguesa de Estudos Regionais, nº 56
8
1. INTRODUCTION
The purpose of this paper is to probe Ma-
cau’s identity by discussing Ruins of St. Paul’s
case study. The city’s complex urban identity is
mirrored by the heterogeneous status of its cul-
tural heritage. The paper starts with a brief
presentation of the amalgam Chinese and Por-
tuguese urban fabric of Macau, to then intro-
duce the Ruins of St. Paul’s complex as a repre-
sentation of that heterogeneous tradition. Here,
historical contextualization of the case study is
laid out. The following part of the article out-
lines the literature discussing the traditional,
cultural perception of ruins in China and their
contrasting receptions in the Western world.
Subsequently, the discussion on the Chinese
and “Western” heritage preservation practices
and differing understanding of the concept of
“authenticity” takes place. The following part of
the article localizes these theoretical frame-
works within the context of Macau while dis-
cussing several projects of heritage conserva-
tion in the former Portuguese colony. Ulti-
mately, St. Paul’s is acknowledged as a marker
of such discordant heritage-related visions and
a testament to Macau’s unique urban identity.
Between 1557 and 1999 Macau was part of
the Portuguese Empire and a significant outpost
for Catholic missions in East Asia. After the
1999 handover, it was proclaimed China’s Spe-
cial Administrative Region (SAR). This plural-
ity of influences, further reinforced through Ma-
cau’s function as a center for trade, contributed
to its distinctly amalgam nature. Between 1557
and 19871 Portuguese administration undertook
the efforts to reaffirm the “Portuguesness” of
that region, thus attempting the territorialization
1 Paula Morais (2014) argues that the final twelve years before the
handover were characterized by the principles of
of Macau (Morais, 2014). This was done vis-a-
vis the persisting Chinese social values and
against the backdrop of China, which continu-
ously questioned the Portuguese “ownership” of
the city. Macau was a non-settler Portuguese
colony: by the second half of the nineteenth cen-
tury about 34000 Chinese and 4000 Portuguese
lived there (Hao, 2011). Just by observing these
demographics one can anticipate immense im-
pact of Chinese modus operandi on the Portu-
guese Macau and its urban morphology. Simul-
taneously, the Portuguese marked their pres-
ence through implementing their original form
of urban planning in certain areas of town.
Physical, physiognomical structures of the His-
toric Route of Macau reflect the Portuguese
means of organic adaptation to the encountered
hilly topography. Their settlements were not or-
ganized in consonance with a pre-designed rig-
orous plan, but conformed to the existing char-
acter of the land. The Portuguese largos
(squares) and travessas (narrow alleys), accom-
pany the Chinese, traditional architectural solu-
tions (fig. 1). Chinese districts emerged mostly
on flat land, close to water and followed the
Feng Shui principles to bring good fortune to
the residents (Tieben, 2009). The relationship
between the Luso-Sino cultural worlds was a
convoluted one. It was characterized by “you
don’t bother me, I don’t bother you” attitude
(Hao, 2011: 113) supported by the separation of
social spaces on one hand and the blending of
cultural influences on the other.
Such polysemous character is noticeable
within the realm of Macau’s heritage. Urban
form has been the recipient and duplicator of the
intricate Sino-Luso relations. The dual culture
and the simultaneous mixing of Portuguese and
Chinese elements in architectural styles are
deterritorialization including efforts toward the erasure of distinct
spatial characteristics and increased development and urbaniza-
tion processes.
Keywords: Macau, Ruins of St. Paul’s, heritage,
urban identity
JEL Code: R14, R19, R58
das como um local de manifestação de visões
dissonantes de restauro do patrimônio, e como
marco emblemático da identidade complexa de
Macau.
Palavras-chave: Macau, Ruinas de São Paulo,
herança, identidade urbana
Código JEL: R14, R19, R58

The Ruin Problem: Negotiating Cultural Heritage in Macau
9
observable in the city’s morphology. Contem-
porarily, Macau’s most visited touristic site is
the Ruins of St. Paul’s (fig. 2 and 3). While this
complex is an undeniable instance of Portu-
guese, mannerist style heritage, one can notice
Chinese aesthetic and symbolic components on
its remaining façade. The church of Madre de
Deus and its adjacent St. Paul’s College were
built by 1640 on a hill in a prominent location.
That reflected the Portuguese preference for el-
evating religious institutions for defense pur-
poses and to mark their separation from the
mundane existence (Baracho, 2001). St. Paul’s
College was a principal training institution for
the Jesuits in East Asia. The complex burned
down in 1595 and 1601 and was rebuilt in the
successive years. In 1835 another fire that ig-
nited in the building of the college reached the
church and destroyed the complex. Thick walls,
which partially survived the fire, were demol-
ished a few years later to prevent their breaking
down. In 1904 a charity program was initiated
to rebuild the church, however, this idea never
materialized (Botas, 2016). The buildings were
not re-erected, and the complex remained in the
state of ruin. The façade has since been bol-
stered with a steel construction on a concrete
base to prevent it from collapsing.
The prominent façade, bits of outer walls,
stone steps and the archeological remains of the
college have been Macau’s famous landmark.
St. Paul’s is an expression of the blending of
cultural influences. The Portuguese adopted
Chinese building practices, interweaving them
with their original concepts. The church’s walls
were constructed using chunambo mixture of
components – a practice widely popular in
China. The condensed blend consisted of soil,
rice straw, clay, river sand, crushed oyster shells
and crumbled rocks. The remaining façade em-
blazons Western, Christian symbolism and ico-
nography such as the representations of the
saints, Jesus, the Holy Spirit and a variety of
biblical themes. These are integrated with the
East Asian carved motifs such as the Chinese
peonies, lions, dragons and characters or Japa-
nese chrysanthemums. The good-evil, life-
death aesthetic dichotomy portrayed in the fa-
çade is mirrored by the Chinese binary nature of
yin-yang philosophy. Traditionally, Western
churches are expected to face west. South-fac-
ing St. Paul’s abstained from that Western tra-
dition to accommodate Chinese belief system
(Tai, 2016).
2. LITERATURE AND METHODS
The subsequent part of this study adopts
comparative literature review approach.
Through this method, Chinese and Western
stances and perception of ruins and cultural her-
itage authenticity can be compared and con-
trasted. In the next step, literature and online
sources revealing Chinese heritage preservation
attitudes are discussed, together with the analy-
sis of heritage policy documents and personal
observations in the context of Macau.
Of particular interest is the fact that St.
Paul’s came to emblematize the city, despite the
highly ambivalent status of ruins in Chinese cul-
ture. As demonstrated above, St. Paul’s is a tes-
tament to the Portuguese architectural trends,
however, it also exhibits intrinsically Chinese
aesthetics. This is one of the many instances of
Macau-specific negotiations between the West-
ern architectural trends and the Chinese vernac-
ular approaches to cultural heritage. As such, St.
Paul’s symbolic connotations have to be con-
sulted vis-á-vis these two socio-cultural con-
texts. In traditional Chinese interpretations ru-
ins represent deficit, lack and are seen as aes-
thetic violations. Wu Hung, author of a book en-
titled “A Story of Ruins: Presence and Absence
in Chinese Art and Visual Culture”, conducted
a survey on the depictions of ruins in Chinese
art and architecture. Among a wide range of ex-
amples of Chinese paintings from the fifth cen-
tury BC to the nineteenth century AD he came
across only six portrayals of damaged buildings.
Looking at pre-twentieth century Chinese archi-
tecture, Hung did not encounter any instances of
intentional preservation of the incomplete or
ravaged characteristics of a building (Hung,
2012). A tendency to abstain from visual repre-
sentations of deficit is also visible in the realm
of traditional Chinese poetry. Whenever the lyr-
icist referred in a poem to “broken roofs” or “ru-
ined entrenchment” of buildings (Hung, 2012:
13), the painting accompanying the text de-
picted these edifices as unimpaired and com-
plete. This reaffirms the traditional Chinese no-
tion that only metaphorical, figurative readings
of ruins are encouraged, not their literal, mi-
metic representations.
Abundance is one of primary Chinese prin-
ciples. The semantic denotation of a ruined
building with its characteristics of deficiency
and absence epitomizes the exact opposite of
the abundance axiom. Shiqiao Li argues that the
cultural importance of the abundance concept is

Revista Portuguesa de Estudos Regionais, nº 56
10
linguistically validated: “(Chinese) encyclope-
dia is described as a book of 100 subjects
(baike), diversity of views as those of 100 fam-
ilies (baijia), antiquity as 1000 years old (qi-
angu), and years of longevity as 10000 years
(wanshou)” (Li, 2014: 10). The author argues
that the functionality and representation of
Hong Kong as a city of billion things is yet an-
other confirmation of the abundance scheme’s
presence. The Chinese have traditionally valued
completeness and balance. According to this
framework, separate elements should exhibit
harmony and fullness of their components. Each
color or sound, Li asserts, in itself represents its
own whole, integral and unabridged quality.
This perception is contrasted with the Western
principle of proportion. In order to achieve the
“golden mean”, Western art allowed for the
mixing of different elements (colors, sights,
sounds etc.) thus watering down and diluting
their individual properties. This practice aimed
at achieving the perfect proportion, rather than
exhibiting the intrinsic fullness of individual
components. Chinese perceive such blending of
individual components as a practice, which
weakens each element’s intrinsic quality and
negates its fullness, completeness.
As fragmented and fractured structures, ru-
ins do not only contradict the fullness principle
but also represent chaos – one of Chinese anxi-
eties. The Taoist tradition values harmony, pru-
dence and fears pandemonium and disarray.
Contrary to that, many Western philosophies
see danger and disorder as developmental
forces. Classical Greeks perceived instability,
war and danger as inescapable, but also forma-
tive and momentous (Li, 2014). Such notion of
war and danger materialized in the Greek fasci-
nation with ruins, which were perceived as aes-
thetic forces. For the Chinese, ruins perpetuate
their chaos anxiety, therefore they are not desir-
able aesthetic objects. The acceptance of chaos,
dramatic, dark forces and pursuit of the uncanny
inspired European fetishization of ruins, which
culminated in the Romanticism era. Fractured
physical constructs were tokens and amplifica-
tions of the underlying mental forces. European
“intellectual fascination with dereliction” (Gar-
ret, 2011: 378) illustrates the fact that ruins in
the West have not been mere visual constructs.
They should be considered as “places of play,
promise, activism, unregulated participation,
unexpected memory” and opportunities for “en-
counters with the uncanny and the sensual”
(Garret, 2011: 379).
Paul Zucker (1961: 119) observes several
viewpoints illustrating the Western “pleasure of
ruins” phenomenon. Between the eighteenth
and nineteenth century the ruins were seen as
carriers and generators of unsettling Romantic
mood. In other periods ruins were perceived as
documents of past, physical and authentic
proofs of the former times. The latter perception
of ruins demonstrates the importance of authen-
ticity in the Western approach to cultural herit-
age. Li (2014) describes Western urban form as
resembling an archive city. Western cityscape,
therefore, displays instances of preserved archi-
tectural structures under their original condi-
tions and locations. Controlled alterations might
be allowed under specific circumstances, how-
ever, the fear of losing this archive is one of
Western anxieties.
In China, the traditionally valued construc-
tion material has been timber. The specificity of
that material includes its vulnerability to natural
and man-made disasters thus implying its tran-
sient and ephemeral nature. Hung (2012) ob-
serves that many of the Chinese timber struc-
tures have been rebuilt, time and again. During
most renovation or reconstruction works, the re-
erecting of buildings or reviving their elements
focused on reconstructing the original complete
and unabridged form. Frequently, such prac-
tices would allow for the inclusion of counter-
feit or unoriginal decorative elements in order
to reinforce the notion of the building’s former
splendor. We can observe a clear mismatch with
the Western practices of maintaining cultural
heritage’s authenticity and representing histori-
cal truth. Li (2014) points out that the very per-
ception of authenticity differs in China. In the
West, preserving the original conditions and
material is an essential requirement while safe-
guarding the authentic character of the building.
In China, however, the preservation of sites is
important, not their original material or loca-
tion. Shiqiao Li (2014) described this Chinese
phenomenon as “memory without location”.
Under this convention, spatial or temporal relo-
cations of buildings are allowed. New, “im-
proved” versions of architectural structures ap-
pertain to the Chinese collective memory of the
past. This memory, unlike in the West, is not
based on the material authenticity of historic
buildings but rather on reviving their grandeur
in the present. The author then proceeds with
expounding that Chinese cities are perceived as
texts, which can be revived through newer

The Ruin Problem: Negotiating Cultural Heritage in Macau
11
editions.
The practice of replacing old architectural
structures with their newer versions and in dif-
ferent locations is visible in the reconstructions
of Central Pier in Hong Kong and Yellow Crane
Tower in Wuhan. The New Central Pier was re-
built with new materials and in a different loca-
tion in 2006. The Yellow Crane Tower burned
down in 1884 and was rebuilt in 1985 with dif-
ferent materials. The structural component of
the building was also affected – the tower’s
newer version has more storyes than the original
one (Li, 2014). If we look at recent renovation
works on the China’s Great Wall, a similar trend
can be observed. Western media have described
a recent attempt to restore a disintegrating part
the wall as “the worst repair job ever”
(Hervieux, 2016). After the renovation proce-
dure, that less touristic part of the Great Wall
resembles a “smooth gray concrete” or “a road”
(Hervieux, 2016). Western social media have
widely condemned this attempt with comments
such as: “Glad Venus de Milo is not in China,
or someone would get her a new arm” (Westcott
& Wang, 2016). In 2006 regimentations were
implemented, according to which a more care-
ful management of touristic sites should have
been carried out. The restoration of that struc-
ture took place in 2014 and in spite of these reg-
ulations. These tendencies were further ignited
by a gossip that in 1931 Chinese government
considered transforming China’s Great Wall
into a highway (Campbell, 2016). Traditionally,
the Chinese perceived urban morphology as
proper, only once it becomes the “right text”
(Li, 2014: 173). Such notion culturally justifies
similar renovation ideas. Western understand-
ing of “relics as texts” (Li, 2014: 175) material-
izes in their fetishization of ruins. Contrary, the
Chinese “text as relic” concept suggested that
fragments of past are historical misrepresenta-
tions and need to be fixed through holistic ap-
proaches (Li, 2014).
All in all, before the twentieth century China
did not associate ruins with potentially aesthetic
or desired objects. This tradition is mirrored by
the Chinese heritage preservation trends. Con-
temporarily, we can observe efforts to alter Chi-
nese heritage maintenance legislation so as to
resemble certain Western concepts. The writing
of “The Principles for the Conservation of Her-
itage Sites in China” was a milestone in the pro-
cess of integrating traditional Chinese ap-
proaches based on intervention philosophy with
the Western and Eurocentric standards (Agnew
& Demas, 2002). In 2009 the revised version of
“The China Principles” included the require-
ment for maintaining authenticity and integrity
of cultural heritage. For the first time in China
“The Principles…” announced the need for the
preservation of the original condition of sites
and minimal alterations to their historic state.
Simultaneously, the traditional perception of ru-
ins in China has been slowly changing. Wu
Hung (2012) discusses the twentieth-century
practices of European ruin representations in
China. At that time Chinese art “ceased to be a
self-contained cultural system and was brought
into a global circulation of images, mediums
and visual technology” (Hung, 2012: 95). After
the Cultural Revolution poets centered around
the Jintian magazine and artists of the Stars
group declared ruins as their tool of creative ex-
pression. Towards the end of the twentieth cen-
tury avant-garde artists used ruin imagery to
challenge urban development trends (Hung,
2012). Within the realm of architecture, there
are several examples of bridging Chinese ver-
nacular approaches with the internationally rec-
ognized Western standards. Ernst Boershmann
(1873-1949), Osvald Siren (1879-1966) and Ito
Chuta (1867-1954) were among those whose
works in China represent such efforts. Western
educated Chinese scholars and architects: Liang
Sicheng (1901-72), Lin Huiyin (1904-55), and
Liu Dunzhen (1897-1968) advocated similar
approaches (Li, 2014).
That being said, all these efforts were partic-
ular either among avant-garde, non-mainstream
groups or architects not particularly large in
numbers. Xi Chen (2016: 354) asserts: “the in-
trinsic cultural character of China continues to
shape its heritage conservation activities”. The
centuries of Chinese philosophy toward herit-
age preservation did not cease to exist immedi-
ately. Shiqiao Li (2014) also argues that the tra-
ditional Chinese debates centred around the de-
sire for abundance and completeness and the
persistent chaos anxiety could not have been
erased promptly. He perceives the Western nar-
rative of scarcity and the Eurocentric notion of
authenticity as artificial constructs within the
Chinese mindset. The authenticity principle,
which was stressed in the Venice Charter, re-
mains a questionable concept within the Chi-
nese cityscape.
Guo Zhan, Vice Chairman of the Interna-
tional Council on Monuments and Sites, brings
to our attention the practical implementation of
“The China Principles”. Zhan participated in the

Revista Portuguesa de Estudos Regionais, nº 56
12
review of restoration works in Beijing’s Forbid-
den City. During the review meeting, the Vice
Chairman expressed his doubts regarding the
reasonableness of this project. He questioned
the logic and righteousness of recreating the for-
mer grandeur of the site. His doubts were re-
jected by a person in charge and laughed-off by
his peers. Guo Zhan recalls: “They told me that
under no circumstances would they agree to the
principle of minimum intervention. Moreover,
they emphasized that the Forbidden City should
be restored to its most majestic historical state.”
(Zhan, 2014: 33). Zhan associates the difficul-
ties of applying “The China Principles”
throughout Chinese territories with linguistic
differences. The term “authenticity” through o
polysemous reading of Chinese characters can
allow a different than English understanding of
this word. The “yuanzhenxing (原真性) of his-
torical sites” (Zhan, 2014: 33) could come to
represent the authentic condition of a particular
site OR the time when it was at its most splendid
state. These gaps in meaning add another layer
to the Western-Chinese debate on heritage
preservation. Zhan wonders if according to the
ambiguous translation of the term authenticity
“original or proper mean the condition of a his-
torical site when it was created or looked the
best, or its overall condition during the course
of history?” (Zhan, 2014: 33). Such inconclu-
sive interpretation of the term might justify the
fact that “although the China Principles had
been established as an important document and
cited by many people, a large number of Chi-
nese conservation specialists did not fully com-
prehend the concepts and principles within it.”
(Zhan, 2014: 33).
Long tradition of Chinese vernacular prac-
tices might also justify recent controversial ren-
ovation works of Angkor Wat, in which China
was engaged. The Khmer complex was added to
the List of World Heritage in Danger. After
UNESCO launched Angkor Wat’s conservation
strategy, Chinese government became involved
in the restoration of Chau Say Tevoda and Ta
Keo temples. This was China’s first interna-
tional heritage conservation project. Critics
state that during the Chau Say Tevoda renova-
tion, the Chinese team practiced intervention
philosophy and did not carry out proper contex-
tual research on the site (Ning, 2014).
2 Many thanks to Lui Tam for her insights on that topic.
3. RESULTS AND DISCUSSION
Naturally, such Western-Chinese negotia-
tions are conspicuously manifested in Macau’s
cityscape. The Ruins of St. Paul’s stand as a tes-
tament to the Western mimetic tradition, the
Euro-centric perception of authenticity and the
– feared by the Chinese – inevitability of danger
and chaos. At the same time, we must remember
about the plans to rebuild the St. Paul’s complex
to recover its former splendor. These attempts
were clear markers of the Chinese impact on
Macau’s architectural legacy. Of particular sig-
nificance is the fact that Chinese residents and
tourists do not refer to St. Paul’s as “the ruins”.
They call it “the gate” (“paifang”). The façade
indeed resembles a gateway, which is a tradi-
tional Chinese arch-like structure. Such seman-
tic representation of St. Paul’s as Chinese pop-
ular architecture symbolically erases its dam-
aged, fractured and incomplete association2.
Phenomenologically, the Chinese do not expe-
rience the ruins while visiting St. Paul’s – they
cross a symbolic gateway to the city instead
(Wieczorek, 2019). At the same time, the site’s
historic transformations and its Portuguese /
English name cannot be forgotten. This adds to
the complexity of St. Paul’s phenomenon.
The in-betweenness of St. Paul’s is deter-
mined through its participation in Western-Chi-
nese debate on heritage preservation. Its limi-
nality is further reinforced through the presence
of Chinese elements in the remaining façade.
This ambiguous nature of St. Paul’s confirms
Macau’s intrinsic “indetermination of place”
(Morais, 2014: 158). Paradoxical and liminal
character of Macau’s representative symbol
makes it a place of a simultaneous contestation
and affirmation; of mediation between authen-
ticity and alteration. It is not a mere facsimile of
Chinese or Western paradigms. It is a space
where both are in dialogue and in opposition –
it is indeed a space of negotiation.
The ideas of rebuilding St. Paul’s did not
materialize, however, there are other renovation
projects in Macau, which visibly portray the
Western-Chinese heritage management ten-
sions. In the last few decades, Macau became
subject to Chinese development pressures. The
pro-growth planning is conspicuously mani-
fested in Macau’s casinos districts. The city’s
historic architectural legacy was not spared
from these development schemes. On the one

The Ruin Problem: Negotiating Cultural Heritage in Macau
13
hand, there have been legislative efforts to insti-
tutionalize heritage preservation in Macau. The
first extensive legislation for the preservation of
cultural heritage was Decree Law no. 34/76/M
executed in 1976. It enumerated the list of
buildings and sites under protection and called
a committee responsible for the defense of cul-
tural heritage. More recently, article 125 of
chapter VI in the Basic Law of the Macau Spe-
cial Administrative Region (MSAR, 2007) was
formulated. The article states that the govern-
ment should be directly involved in and respon-
sible for protecting the integrity of cultural her-
itage. On the other hand, the city’s official vi-
sion statements prioritize the development
schemes and growth of tourism, while the herit-
age protection is not included as one of the first
concerns in the list of city planning guidelines.
These inconsistencies are visible in a few
widely discussed urban projects.
One of the most controversial debates
around such projects included the restoration
plan of Guia Hill. The executive-led project
from 2006 proposed building of multiple, close
to 100-meters tall towers in proximity to the
Guia Hill (Wan, Pinheiro, & Koreanga, 2007).
The historic Guia complex includes a seven-
teenth-century chapel adjacent to the first mod-
ern lighthouse in Chinese territories (fig. 4 and
5). Residents and Guia Lighthouse Protection
Concern Group objected to the proposed devel-
opments by bringing them to the attention of in-
ternational entities. They continuously ex-
pressed concerns that the modern complex
would obstruct the view from the UNESCO-
classified historic hill. Due to these interven-
tions and the warning letter from UNESCO, the
construction of the towers did not come to frui-
tion. This is one of the many instances of West-
ern-driven efforts to respect the historic sites’
authenticity facing the Chinese schemes of al-
ternating the cultural heritage’s original state.
The façadism trend is yet another exemplifica-
tion of such tensions. Mariana Pereira and Ga-
briel Caballero (2016) discussed Macau’s par-
ticipation in the creation of stage-set urban land-
scapes. They argue that in contemporary Macau
“many buildings have been demolished while
building façades have been retained as empty
shells of their previous forms” (Pereira & Ca-
ballero, 2016: 2). Historic looking façades of
Macau’s casinos respond to the Chinese pro-
growth pressures on the one hand and support
presenting buildings in their most glamorous
state, on the other. The latter trend mirrors the
traditional Chinese principle of abundance. Fa-
çadism as a highly controversial approach in ar-
chitecture is based on the idea of erecting a new
façade, which resembles an old, historic build-
ing (Richards, 1994). Such efforts are also visi-
ble in Macau’s Fisherman’s Wharf. In these
cases, we can observe deauthentiticated replicas
of dated buildings deprived of meaning. Aside
from these instances, Macau has also welcomed
façade retention fashion. Such efforts to retain a
building’s original façade while raising a new
structure behind it can be detected in the Banco
Nacional Ultramarino (BNU) building. As a di-
rect response to Chinese development pres-
sures, the modern edifice was erected in front of
the historic urban fabric (Pereira & Caballero,
2016).
Such adaptive reuses and aesthetic clashes
are noticeable in the city’s historic center. In
July 2005 this part of town with its twenty-two
monuments and eight squares was inscribed on
the list of the UNESCO World Heritage sites.
According to the Cultural Affairs Bureau the in-
scription was granted based on the fact that the
historic center “bears a unique testimony to the
first and longest-lasting encounter between the
West and China” (Cultural Affairs Bureau,
2006). In the document issued by UNESCO
(2005), one can read “Macao represents an out-
standing example of an architectural ensemble
that illustrates the development of the encounter
between the Western and Chinese civilisations
over some four and half centuries, represented
in the historical route, with a series of urban
spaces and architectural ensembles, that links
the ancient Chinese port with the Portuguese
city.” It is the city’s unique identity that contrib-
uted to recognizing Macau’s historic center as
having an outstanding universal value. The
combination of Portuguese architecture and ur-
ban planning solutions with local environment
and application of practices connected to,
among others, Feng Shui principles are the core
components of this particular, recognized by
UNESCO urban identity. One conspicuous ex-
ample of such coexistence is the Cathedral
Square in which Portuguese urban planning is
harmoniously intertwined with the said Feng
Shui directives.
The inconsistent application of heritage pro-
tection policies and lack of clear city vision
prompted UNESCO to issue successive warn-
ings to Macau’s officials. The international en-
tity expressed their concern with Macau’s con-
servation areas and the state of its urban fabric

Revista Portuguesa de Estudos Regionais, nº 56
14
(Morais, 2014) One of the alarming issues per-
tain to the lack of visual relationship between
historically significant sites and their adjacent
neighborhoods. St. Paul’s Ruins are surrounded
by plenty of modern residential and commercial
buildings, which invalidate the authentic char-
acter of the site. It has been stated that these in-
compatible environments “create a strong feel-
ing of disharmony to both residents and tour-
ists” (Wan, Pinheiro, & Koreanga, 2007: 22).
Safeguarding the historic urban fabric versus
the construction of high-rises in its vicinity is
yet another representation of the cultural nego-
tiations between authenticity and alteration.
4. CONCLUSIONS
The unique status of Macau compels us to
look at the city’s cultural artifacts as an area of
negotiation between spatial discourses. The in-
consistent application of heritage preservation
approaches, the coexistence of intrusive devel-
opment projects, façadism fashion, neglected
architectural structures and authentic docu-
ments of the past are markers of Macau’s amal-
gam and heterogeneous identity. The politics of
heritage preservation can help decipher social
production of urban morphology. In this re-
search, the city’s identity was probed through
the reading of Macau’s cultural heritage.
The article looked at the negotiation between
discrepant Chinese and Western approaches to
heritage preservation. Ruins of St. Paul’s have
officiated as the city’s representative symbol.
Their convoluted status was tested against Chi-
nese and Euro-centric perception of ruins. The
Western notion of ruination as a desired quality
was contrasted with the Chinese traditional
practices of the avoidance of ruined structures
and their representations. In Macau, Chinese
“rebuilding policies” are negotiated against the
Western protocols of authenticity. St. Paul’s
complex with its conflicted cultural affiliation
has been a pertinent mirror of Macau’s influ-
ences and transformations.
Heritage as a cultural phenomenon evokes
cultural values and meanings. It can be looked
at as an intrinsic element of the production of
urban space mirrored by social forces, which
have been shaping Macau over the centuries.
Paula Morais (2014: 158) states that Macau is
“an extremely complex entity to classify by
one single perspective or discipline”. St. Paul’s
is a place experienced differently by diverse
groups of visitors. For the Chinese it might be
perceived as a paifang gateway to the city. For
the Portuguese it could be a nostalgic reminder
of the era of former colonial expansion. For
some Western tourists St. Paul’s might rein-
force the Western world’s fascination with ru-
ined architectural structures. The building is
dramatic, striking in its incompleteness
(Wieczorek, 2019). Seemingly, it challenges
Chinese cultural frameworks, yet it is rooted in
what Macau in fact is. The ambiguous status of
St. Paul’s Ruins as a symbol of a partially Chi-
nese city reinforces its complex nature. The
traditionally contested ruins reassure Macau’s
status as a place of difference. Representing
the place with a cultural indicator of misery
and chaos is unimaginable in the Chinese con-
text. However, Macau “needed” such an un-
comfortable marker to confirm its conflicted
and convoluted nature. Heritage became a car-
rier of this ambivalence and cross-cultural lim-
inality.
REFERENCES:
Agnew, Neville and Demas, Martha (2002),
Principles for the Conservation of Heritage
Sites in China, Los Angeles, The Getty Conser-
vation Institute
Baracho, Carlos (2001), The Churches of
Macau and Their Placement in Urban Space and
Within the City’s Architectonic Context, Macau
Focus, Vol. 3, pp. 29-45
Botas, João (2016). “Secrets of St Paul's:
The Story Behind Macau's Most Famous Land-
mark”, [online] Available at:
https://www.scmp.com/destination-macau/arti-
cle/1939555/secrets-st-pauls-story-behind-ma-
caus-most-famous-landmark
Campbell, Charlie (2016). “Part of China’s
Great Wall Has Been Cemented Over in a
Shocking ‘Restoration’ Job”, [online] Availa-
ble at: http://time.com/4503809/china-great-
wall-restoration-cement-social-media-weibo-
culture-history-archeology-xiaohekou/
Chen, Xi (2016), Academic Origins and
Characteristics of the Chinese Stylistic
Restoration, Frontiers of Architectural
Research, Vol. 5, pp. 356-359
Cultural Affairs Bureau (2006). “Macao
World Heritage”, [online] Available at:
http://www.macauheritage.net/indexE.asp

The Ruin Problem: Negotiating Cultural Heritage in Macau
15
Garret, Bradley (2011), Review of the book
Ruins of modernity, by Julia Hell and Andreas
Schonle, Environment and Planning D: Society
and Space, Vol. 29, pp. 378-380
Hao, Zhidong (2011), Macau: History and
Society, Hong Kong, Hong Kong University
Press
Hervieux, Linda (2016). “Attempt to Repair
Part of China’s Great Wall Ruins It”, [online]
Available at:
http://www.newser.com/story/231482/attempt-
to-repair-part-of-chinas-great-wall-ruins-
it.html
Hung, Wu (2012), A Story of Ruins: Pres-
ence and Absence in Chinese Art and Visual
Culture, London, Reaktion Books
Li, Shiqiao (2014), Understanding the Chi-
nese City, London, Sage
Morais, Paula (2014), “Macao’s Urban Iden-
tity Question, 1557-1999/2009: Spatializing
Territory” in Wong, Katrine K. and Wei, C. X.
George (coord.), Macao – the Formation of a
Global City, New York, Routledge, pp. 156-185
MSAR (2007). “Macao Basic Law”, [online]
Available at: http://www.imprensa.ma-
cau.gov.mo/bo/i/1999/leibasica/index_uk.asap
Ning, Lu (2014), “Impact of the China Prin-
ciples on Cultural Heritage Conservation” in In-
ternational Principles and Local Practices of
Cultural Heritage Conservation, Conference
Proceedings, Beijing, ICOMOS China &
Tsighua University-National Heritage Center,
pp. 194-212
Pereira, Mariana and Caballero, Gabriel
(2016), “Challenges of the Casino and Historic
City of Macau: Preserving Heritage Amidst the
Creation of Stage-set Townscapes” in Interna-
tional Federation of Landscape Architects
(IFLA), Brussels, IFLA, pp. 1-9
Richards, Jonathan (1994), Façadism, Lon-
don, Routledge
Tai, Yuci (2016). “The Oriental history of
the Ruins of St Paul’s”, [online] Available at:
http://www.wgm8.com/the-oriental-history-of-
the-ruins-of-st-pauls/
Tieben, Hendrik (2009), Urban Image Con-
struction in Macau in the First Decade After the
Handover, 1999-2008, Journal of Current Chi-
nese Affairs, Vol. 38, pp. 49-72
UNESCO (2005). “The Historic Center of
Macao”, [online] Available at:
https://whc.unesco.org/uploads/nomina-
tions/1110.pdf
Wan, Penny Yim King, Pinheiro, Francisco
Vizeu and Koreanga, Miki (2007), Planning for
Heritage Conservation in Macao, Planning and
Development, Vol. 22, pp. 17-26
Wieczorek, Marta (2019), Macau’s Hetero-
topias: Ruins of St. Paul’s as a Spatial and Tem-
poral Disruption, The Asia Pacific Journal of
Anthropology, Vol. 20, pp. 312-327
Westcott, Ben and Wang, Serenite (2016).
“World’s Worst Restoration? China’s Great
Wall Covered in Cement”, [online] Available
at: https://edition.cnn.com/travel/article/great-
wall-china-cement-repair/index.html
Zhan, Guo (2014), “Viewing the China Prin-
ciples in International Context” in International
Principles and Local Practices of Cultural Her-
itage Conservation, Conference Proceedings,
Beijing, ICOMOS China & Tsighua University-
National Heritage Center, pp. 31-39
Zucker, Paul (1961), Ruins: An Aesthetic
Hybrid, The Journal of Aesthetics and Art Crit-
icism, Vol. 20, pp. 119-130

Revista Portuguesa de Estudos Regionais, nº 56
16
ANEXOS
Figure 1: Coexistence of Portuguese largos (squares) and Chinese residential architecture.
Photograph by the author, 2018
Figure 2: Ruins of St. Paul’s – the remaining façade.
Photograph by the author, 2018

The Ruin Problem: Negotiating Cultural Heritage in Macau
17
.
Figure 3: Ruins of St. Paul’s – view from the back.
Photograph by the author, 2018
Figure 4: Guia Hill.
Photograph by the author, 2018.

Revista Portuguesa de Estudos Regionais, nº 56
18
Figure 5: View from the Guia Hill.
Photograph by the author, 2018.

Artigo submetido a 30 de Julho de 2019; versão final aceite a 2 de Março de 2020
Paper submitted on July 30, 2019; final version acceptet on March 2, 2020
Qualidade em Turismo na Perspetiva dos Decisores Públi-
cos Locais Portugueses: O Caso da Região Centro de
Portugal
Quality in Tourism From The Perspective of Local Portuguese
Public Decision-Makers: A Case Study of Portugal’s Centro
Region
Maria do Rosário Campos Mira
Adjunct Professor at the Polytechnic Institute of Coimbra, Coimbra Education School. Full
member of the Research Unit ‘Development and Innovation in Tourism (CITUR/RIPTUR)’.
Lisete dos Santos Mónico
Faculty of Psychology and Educational Sciences, Assistant Professor at the Faculty of Psy-
chology and Educational Sciences, University of Coimbra.
Zélia Maria de Jesus Breda
Assistant Professor at the Department of Economy, Management, Industrial Engineering and
Tourism (DEGEIT), University of Aveiro. Full member of the Research Unit ‘Governance,
Competitiveness and Public Policies’.
Andreia Filipa Antunes Moura
Invited Adjunct Professor at the Polytechnic Institute of Coimbra, Coimbra Education School.
Full member of the Research Unit ‘Development and Innovation in Tourism
(CITUR/RIPTUR)’.
Abstract/ Resumo
Em Portugal o turismo tem-se desenvolvido
muito nos últimos anos, fruto do investimento
que se tem feito na: (i) qualificação dos recursos
humanos; (ii) especialização da oferta; (iii) mo-
dernização dos processos de gestão das empresas
turísticas; (iv) desenvolvimento do marketing;
(v) e, no investimento em infraestruturas e outros
serviços e produtos complementares à ação tu-
rística.Os diversos estudos realizados pelas auto-
ras sobre a perceção dos municípios portugueses
(participaram 125 com o total de 134 respostas
válidas) sobre o que contribui para a qualidade
em turismo, revelou que há um discurso a uma
‘só voz’ quanto à necessidade de diferenciação
In Portugal tourism has developed greatly in
recent years, as a result of the investment made
in the: (i) qualification of human resources; (ii)
specialization of supply; (iii) modernization of
tourism management processes; (iv) marketing
development; (v) and investment in infrastruc-
ture and other services and products complemen-
tary to the tourism sector. This study aims to
identify Portuguese municipalities’ perception
of what contributes to the quality of tourism. To
this end, a quantitative approach was used, with
a questionnaire being distributed to municipali-
ties (125 participated in the study, with a total of
134 valid answers). The results revealed that

Revista Portuguesa de Estudos Regionais, nº 56
20
1. INTRODUCTION
Portugal has witnessed an exponential
growth in tourism in recent years. At the same
time, investment has been made in high-quality
services and products, which has contributed to
the country’s competitive advantage. Improve-
ments in the educational supply at various lev-
els, the construction of infrastructure, the provi-
sion of support for research, product diversifi-
cation, and increased economic activity, both
specific and complementary to the tourism sec-
tor, have also been observed. Despite the need
to keep up the work in various areas in order to
consolidate Portugal as an established tourism
destination, it is already possible to identify the
results of the actions taken in recent years,
namely:
a) Portugal has obtained several tourism
awards, namely the title of ‘best destination in
the world’ in 2017, 2018 and 2019 (Turismo de
Portugal, 2018);
b) the growing socioeconomic relevance
of tourism, being one of the main export activi-
ties, representing about 18% of the country’s
global exports (Turismo de Portugal, 2017) and
contributing to 13.7% of GDP (Instituto
Nacional de Estatística, 2018) in 2017;
c) at the international level, Portugal was
ranked the 14th most competitive destination in
the world (FEM, 2017);
d) according to the UNWTO (2018), in
2017, it ranked 21st in the world in terms of tour-
ism receipts and 17th in terms of arrivals, repre-
senting 3% of the world’s international tourism.
These are encouraging results and a sign that
the path taken so far is based on a ‘winning’
strategy. Therefore, this paper aims to under-
stand what public entities responsible for the de-
velopment of Portuguese tourism regions think
about what quality in tourism is and what it
should be at the local level. It also analyzes
whether Portuguese municipalities identify
themselves with some priority lines defined in
the Tourism Strategy 2027 (Turismo de Portu-
gal, 2017a), jointly proposed by the Ministry of
Economy and Tourism of Portugal, such as: (i)
valuing the territory through structuring of the
tourism supply; (ii) boosting the economy by at-
tracting investment, increasing knowledge, in-
novation and entrepreneurship; (iii) enhancing
the qualification and training of human re-
sources, attracting the most specialized workers
by investing in the improvement of the sector’s
working conditions; (iv) involving stakehold-
ers, and society in general, in tourism develop-
ment supported by networking; and (v) promot-
ing Portugal in international markets, reinforc-
ing investment in tourism companies, bringing
public administration closer to the sector and
using new technologies.
Therefore, knowing the perception of Portu-
guese entities with different levels of responsi-
bilities and impacts on the development of tour-
ism about the concept of quality in their local
destinations constitutes a challenge to which we
seek to respond (Hall, 2000; Pearce, 2013; Sa-
raniemi & Kylänen, 2011). To this end, a quan-
titative approach was used, with a questionnaire
being distributed to all Portuguese municipali-
ties (125 participated in the study, with a total
of 134 valid answers). The results highlight the
necessary terms for quality maintenance in Por-
tuguese destinations and the attributes of mu-
nicipalities as local Destination Management
Organizations (DMOs), their role in the rela-
tionship with other stakeholders and the limits
they recognize to their action.
The paper is organized as follows: first, the
literature on quality in tourism is reviewed,
namely concerning destination development
and competitiveness, following which the strat-
egy for tourism in different Portuguese regions
is addressed. Subsequently, the methodology
used for the empirical study is described in more
detail. Finally, the research findings are
there is a ‘single voice’ discourse regarding the
need to differentiate products, develop destina-
tions emphasizing their identity, strengthen net-
works and differentiate tourism options accord-
ing to their location.
Keywords: Strategy, destinations, quality, tour-
ism system, regions.
JEL Codes: Z32; R11
e France is the second biggest EMU economy
and, as Finland, is not considered a “peripheral”
country.
Keywords: Markov-Switching models; Active
portfolio management; financial market integra-
tion; EMU stock markets integration
de produtos, de desenvolver os destinos salien-
tando a sua identidade, de trabalhar em rede e de
diferenciar as opções turísticas nas diversas regi-
ões.
Palavras-chave: Estratégia, destinos, qualidade,
sistema turístico, regiões.
Códio JEL: Z32; R11
e France is the second biggest EMU economy
and, as Finland, is not considered a “peripheral”
country.
Keywords: Markov-Switching models; Active
portfolio management; financial market integra-
tion; EMU stock markets integration

Qualidade em Turismo na Perspetiva dos Decisores Públicos Locais Portugueses: O Caso …
21
reported and discussed, and their implications
for further research are highlighted.
2. CONCEPTUAL FRAMEWORK
This article explores the issue of quality in
tourism. A holistic approach to tourism is what
best fits the study of quality factors of complex
and multifaceted systems, as is the case of tour-
ism regions. With regard to tourism destina-
tions, it is also considered that the articulation
between regional policies, the exploitation and
application of knowledge, the link between so-
cial and organizational factors, innovation and
endogenous resources are reflected in the organ-
ization of supply, in the sense of quality (Mak-
konen & Rohde, 2016). For Haugland, Ness,
Grønseth and Aarstad (2011: 269), “destina-
tions are complex co-producing networks, and
destination development needs to take into ac-
count the challenges of developing strategies in-
volving a large number of companies and other
actors such as, for example, local and regional
authorities. […] Second, destination develop-
ment is a multilevel phenomenon as it requires
attention to issues at the level of the individual
actor, the level of the destination (inter-firm or
inter-actor), and the level of a larger geographic
or regional area (inter-destination)”.
The European Union has played a very im-
portant role in promoting cooperation and inte-
gration of regions and countries, by stimulating
regional tourism development, launching pro-
grammes to support economic growth, cultural
development and infrastructure, among others
(Nilsson, Eskilsson & Ek, 2010). This was a
strategy to improve the attractiveness of desti-
nations, linking competitiveness to product in-
novation and quality of service, and these to the
identity of the destination (Badulescu, Hoff-
man, Badulescu & Simut, 2016). Destination
competitiveness is no longer triggered or con-
solidated by price alone, being achieved mainly
by the region’s organizational and relational ca-
pacity, which guarantees active stakeholder par-
ticipation. The responsibility of tourism actors
lies in the valorisation and promotion of endog-
enous, specific and non-transferable resources.
The analysis of previous studies on the rela-
tionship between quality and tourism destina-
tions shows this to be associated with the
themes of competitiveness, innovation, devel-
opment, products, policies, planning and gov-
ernance, among others (see Table 1).
Table 1. Relationship between quality of destinations and other research issues Research issue Publications
Competitiveness Blain, Levy & Ritchie(2005); Dwyer & Kim (2003); Gretzel, Hwang & Fesenmaier(2012);
Pearce & Shänzel (2013); Sheehan & Ritchie (2005); Wang (2011&
Cooperation Badulescu et al., (2016); Vodeb & Rudež (2016)
DMO Baena-Graciá et al. (2009); Blain et al. (2005); Bramwell & Lane (2012); Gretzel et al.
(2006); Hristov & Zehrer (2015); Spyriadis et al. (2013); Volgger & Pechlaner (2014)
Development Clavé & Wilson (2017); Makkonen & Weidenfield (2016); Więckowski & Cerić (2016)
Governance Blasco, Guia & Prats(2014); Farmaki (2015); Scuttari, Volgger & Pechlaner, (2016);
Volgger & Pechlaner (2015)
Innovation Booyens (2016); Booyens & Rogerson (2015); Booyens & Rogerson (2016); Makkonen &
Rohde (2016); Weidenfeld (2013)
Marketing De Noni, Orsi & Zanderighi(2014); Sertakova et al., (2016)
Networks Escach & Vaudor (2014); Sanz-Ibáñez & Clavé (2014, 2016)
Planning Blasco et al., (2014); Brouder & Ioannides (2014); Makkonen & Williams (2016); Rovira
(2016); Soares et al., (2015)
Policies Bernabé & Hernandez (2016); Bohlin, Brandt & Elbe (2016); Nilsson et al., (2010); Szyt-
niewski, Spierings & van der Velde(2017); Timothy et al., (2016)
Products Ferdinand & Williams (2013); Getz & Page (2016); Sakharchuk, Kharitonova, Krivosheeva
& Ilkevich (2013); Sarasa (2015); Vermeulen (2015)
Quality Bernabé & Hernández (2016); Blasco (2014); De Noni, Orsi & Zanderighi (2014);
Sakharchuk et al., (2013); Sarasa (2015); Weidenfeld (2013); Więckowski & Cerić (2016) Source: Own elaboration
The specialized literature associates terri-
tory, products and governance models with
structuring factors of tourism destinations.
DMOs have an integrating function of policy
and strategy development, resource preserva-
tion, increasing innovation, management of
stakeholder networks, promotion and
knowledge transfer. They consider it is this in-
tegrated vision of quality that influences desti-
nations’ competitive capacity and economic de-
velopment, mainly at the regional and local
level. The previous analysis also revealed other

Revista Portuguesa de Estudos Regionais, nº 56
22
types of information, which explain the role of
DMOs in the quality and competitiveness of
destinations. This assessment guides a reflec-
tion centred on the relationship between the
constructs of DMOs / Quality of tourism desti-
nations and DMOs / Competitiveness of tour-
ism destinations, which is systematized in Ta-
bles 2 and 3.
Table 2. Relationship between DMOs and quality of tourism destinations Issues DMOs’ functions Authors
Quality
Integrated resource management
Blain et al. (2005); Dwyer & Kim (2003);
Gretzel et al. (2012); Pearce & Shänzel
(2013); Sheehan & Ritchie (2005); Wang
(2011)
Product development and innovation
Marketing strategy
Service and product quality
Outcome Evaluation
Human resources skills
Technology (web-marketing & e-commerce)
Modernization of organizations' internal structures
and processes
Competitive and business opportunity monitoring
Commitment /
Stakeholders
Coordinated planning of stakeholder interests
Bornhorst, Ritchie & Sheehan (2010);
Park & Jamieson (2009); Soteriou & Coc-
cossis (2010); Stevenson, Airey & Mil-
ler(2008); Zach (2012)
Resource sharing negotiation
Community action plans
Creative and innovative partnerships
Feeling of belonging and affective bond with the
brand
Inter-organizational Partnerships
Organizational skills development
Knowledge Sharing
Leadership
Organization of cooperation
Beritelli & Laesser (2014); Hristov & Ze-
her (2015); Spyriadis et al. (2013);
Volgger & Pechlaner (2014)
Participatory and distributed leadership
Stakeholder involvement in destination policies and
decisions
Defining the boundaries of responsibility and deci-
sion-making autonomy
Strategy and decision evaluation
Implementation of standards, designed structures
and processes from the bottom up
Assessment
Tangible and intangible results
Baena-Graciá et al. (2009); Blain et al.
(2005); Bramwell & Lane (2012); Gretzel
et al. (2006); Hristov & Zehrer (2015);
Spyriadis et al. (2013); Volgger & Pechla-
ner (2014)
Benchmarking
Tourism activity
The effectiveness of DMOs in funding manage-
ment, resources and territorial framework
Organizational performance
Tangible and intangible impacts Source: Own elaboration
Table 2 shows that the quality of tourism
destinations implies a leadership model able to
engage people in the target project, to evaluate
results and to help organizations to modernize
and improve their work processes. These are
usually attributes of destination governance
models, with implications for territories’ devel-
opment and economic capacity.This is one of
the functions of DMOs in promoting the quality
of tourism destinations, ie, stimulate the econ-
omy, support stakeholders in business manage-
ment opportunities and create conditions for re-
gions’ development.
Table 3 highlights the issues of economic de-
velopment, product innovation, qualification of
human resources, modernization of organiza-
tions and marketing in the competitiveness of
tourism destinations. In the analysis of destina-
tions, quality and competitiveness address sim-
ilar issues. There is a dimension of integrated
territorial development, which must be reflected
in the quality of products and in the way re-
sources are managed and differentiated, as well
as in supporting companies’ action. Stimulating
the economy presupposes a leveraged strategy
in people, innovation and knowledge. It appears
that it is up to DMOs to articulate the different
components of this system, ensuring that the
supply of differentiated products reflects terri-
tories’ culture and identity. This identity must
support the marketing strategy in promoting a
destination brand, around which innovative and
competitive products are created.

Qualidade em Turismo na Perspetiva dos Decisores Públicos Locais Portugueses: O Caso …
23
Table 3. Relationship between DMOs and competitiveness of tourism destinations Issues DMOs’ functions Authors
Competitiveness
Integrated resource management Armenski, Gomezelj, Djurdjev, Curcic &
Dragin (2012); Blain,Levy & Ritchie
(2005); Dwyer, Cvelbar, Edwards &
Mihalic (2012); Dwyer & Kim (2003);
Estevão & Ferreira (2015); Pearce &
Shänzel (2013); Sheehan & Ritchie
(2005); Wang (2011)
Product development and innovation
Marketing strategy
Service and product innovation
Outcome evaluation
Human resources skills
Business opportunity management
Human and organizational skills development
Resources
Endogenous resources
Bornhorst et al.(2010); Costa (2014); Fer-
reira et al. (2011); Haugland et al. (2011);
Pearce & Schänzel (2013)
Resources and opportunities
Natural and cultural resources
Tourism resources
Technological resources
Resource Study
Accessibilities and infrastructure
Opportunities
Internal and External environment
Dwyer et al. (2012); Estevão & Ferreira
(2015); Fernandes & Eusébio (2014);
Gretzel et al. (2006); Martínez-García et
al (2013)
Markets / business
Investment / Financing
Policies
National and international partnerships
Access to knowledge and information
Marketing
Destination marketing management
Bornhorst et al. (2010)
Haugland et al. (2011); Polese & Min-
guzzi (2010); Zach (2012)
Destination promotion
Affective ties with the brand
Interactive marketing networks
Marketing Innovation
Marketing plan emerges from the relationship
between environment and stakeholders
Collaborative Marketing
Marketing Investment
Innovation
Tourism destinations depend on innovation
Assaf & Dwyer (2013); Daszkiewicz
(2014); Della-Corte (2013); Fernandes &
Eusébio (2014); Neto & Francisco (2011);
Prats, Guia & Molina(2008)
Destinations are places of tourism innovation
Competitiveness of destinations is based on an
innovation strategy
Destination assessment leads to innovation
Innovation strategy
Innovation Skills Diagnosis
Innovative product development
Technological innovation and quality of ser-
vices Source: Own elaboration
Destinations no longer compete only with
their neighbours, but with others that are often
situated far from their borders. Therefore, the
market is global. For this reason, the local eco-
nomic and social vitality, i.e. territorial compet-
itiveness, has the challenge of marketing prod-
ucts and services in the international market,
making them reach the consumer’s door. There
is an economic dimension associated with prod-
ucts’ competitiveness. These must be innova-
tive, have quality and be created through a net-
work to ensure they are competitive enough to
be considered business opportunities. There is
also the territory within which the destination
project must be born.
These aspects motivated the desire to know
what Portuguese DMOs think about these
issues, in different regions of the country. Re-
gional tourism structures, together with Munic-
ipal Councils, have a set of responsibilities in
the development of tourism, at the regional and
local level, namely approval and licensing of
enterprises, construction of infrastructure, at-
tracting investment, support for entrepreneur-
ship and promotion, among others. Therefore,
those responsible for tourism in Municipal
Councils were consulted, through a self-admin-
istered questionnaire, which reflects the dimen-
sions standing out in the literature review: de-
velopment, economy, human resources, prod-
ucts and marketing. In this first phase, the re-
sults were treated at the regional level, and it is
expected to replicate the methodology pre-
sented here at the local level in future

Revista Portuguesa de Estudos Regionais, nº 56
24
investigations, detailing the data related to mu-
nicipalities. Previous publications by the au-
thors focused on what local stakeholders in
tourism in Portugal think about what is meant
by quality in tourism. Based on the tourism
quality factors validated in this model at the na-
tional level, the study presented here seeks to
highlight the differences and similarities in the
way these factors are perceived in the different
regions of Portugal.
The study is based on the premise that terri-
tories have a natural and cultural identity that
facilitates the organization of tourism destina-
tions in three main areas:
a) tourist products that are inspired by the
uniqueness of natural and cultural resources
identified at the local level reflect their quality
and differentiation (Bernabé & Hernández,
2016; Ferdinand & Williams, 2013; Getz &
Page, 2016; Rovira, 2016; Sakharchuk, Khari-
tonova, Krivosheeva, & Ilkevich,2013; Sarasa,
2015; Szytniewski, Spierings & van der Velde,
2017; Vermeulen, 2015);
b) the dynamics of the local economic ac-
tivity observed in the characteristics of the pro-
ductive fabric, in business entrepreneurship ca-
pacity and in strategic management models re-
flect regions’ competitiveness (Assaf & Dwyer,
2013; Bannò, Piscitello & Varum, 2015;
Bohlin, Brandt & Elbe, 2016; Booyens, 2016;
Booyens & Rogerson, 2015; Dwyer, Cvelbar,
Edwards & Mihalic, 2012; Dwyer, Cvelbar,
Mihalic & Koman,2014; Estevão & Ferreira,
2015; Pike & Page, 2014; Ritchie & Crouch,
2010; Vodeb & Rudež, 2016; Więckowski &
Cerić, 2016);
c) stakeholder network governance that
links the territory to the economy guarantees the
presentation of identity and endogenous innova-
tion, facilitating the emergence of regional in-
novation systems (Blasco, Guia & Prats, 2014;
Farmaki, 2015; Fernandes & Eusébio, 2014;
Hall & Campos, 2014; Moulaert, 2005; Mou-
laert & Sekia, 2003; Scuttari, Volgger & Pech-
laner,2016;Stevic & Breda, 2014; Trentin,
2016; Volgger & Pechlaner, 2015).
Reconciling these three aspects (quality,
economic activity planning, and innovation of
the product) stresses the difficulty in managing
and stimulating destinations’ systemic struc-
ture, in terms of their competitive capacity.
These need to adopt strategies to attract custom-
ers worldwide, providing the tourism service at
the local level. To this end, an active and inte-
grated role among suppliers, companies, local
people and governmental structures is funda-
mental (Erkus-Öztürk, 2009), committed to the
quality of supply. This is because regions influ-
ence countries’ economic development in gen-
eral and the development of tourism destina-
tions in particular (Bohlin et al., 2016). Recog-
nizing regional similarities and disparities fos-
ters the linkage between politics and the econ-
omy, and them with knowledge and innovation.
It is this integrated and systemic vision of tour-
ism that ensures the quality of destinations, be-
cause it associates economic development with
knowledge, innovation with quality, and iden-
tity with differentiation.
3. REGIONAL TOURISM STRATEGY
IN PORTUGAL
Portugal has seven regions (Nomenclature of
territorial units for statistical purposes - NUTS
II), whose characteristics and and degree of au-
tonomy are different. The two regions with po-
litical, administrative and financial autonomy
are the archipelagos of Madeira and the Azores.
All other regions are located in mainland Portu-
gal and their action is very dependent on central
government. For historical, social, geographical
and political reasons, there are many differences
between these territories, reflecting different
needs, problems, potentialities and levels of
tourism development. Although regional tour-
ism strategies are based on the national strategic
plan, they are adjusted to the situation of each
region.
This strategic plan, called Tourism Strategy
2027 (Turismo de Portugal, 2017a), is defined
by Turismo de Portugal, under the supervision
of the Ministry of Economy, and links national
guidelines for tourism, being the strategic refer-
ence for the sector in the next decade. The re-
gional structures of this organization - Regional
Tourism Entities (RTE) - are responsible for re-
gional tourism development, in line with these
guidelines. In each of the regions, these entities
work very closely with municipalities and other
stakeholders, encouraging local initiatives and
at the same time ensuring that they fall within
the strategic, regional and national guidelines
defined for the sector. Leading the tourism of
the future focused on people is at the heart of
this strategy, which guides: (i) a vision of af-
firming tourism as a hub for economic, social
and environmental development throughout the
territory; (ii) the ambition position Portugal as
one of the most competitive and sustainable

Qualidade em Turismo na Perspetiva dos Decisores Públicos Locais Portugueses: O Caso …
25
tourist destinations in the world; (iii) the defini-
tion of priorities systematized in five strategic
axes, namely, valuing the territory, boosting the
economy, boosting knowledge, generating net-
works and connectivity, designing Portugal and
committing to economic, social and environ-
mental sustainability goals.These strategic axes
coincide with the theoretical perspective pre-
sented here, which associates quality with de-
velopment, economy, human resources, prod-
ucts and marketing. The perception that quality
results from a systemic perspective affecting
different domains simultaneously led to estab-
lishing the following targets:
a) economic sustainability targets: in-
crease tourist demand throughout the territory
and grow in value;
b) social sustainability targets: reduce sea-
sonality, increase people's qualifications and
guarantee residents' satisfaction;
c) environmental sustainability targets: to
support companies in adopting efficient
measures for the use of energy and water, as
well as developing waste management systems.
These strategic axes, and the proposed goals,
affect the tourism strategy defined in each re-
gion of the country, as well as the products
around which tourism is organized, at this level.
Depending on the endogenous resources, cul-
ture and identity of the territory, associated with
the region’s economic vitality and stage of so-
cial and environmental development, tourism
products and business development is proposed,
and these must fit into the strategic assets de-
fined at the national level: people; climate and
light; history and culture; sea and nature; water;
gastronomy and wines; artistic-cultural, sport-
ing and business events; welfare; living in Por-
tugal. These strategic options were defined
based on the indicators systematized in Table 4.
Table 4. Tourism indicators by region
Region Indicators Norte Centro Lisbon Alentejo Algarve Azores Madeira
Guests 5,3 M 3,9 M 7,5 M 1,5 M 4,7 M 718 mil 1,6 M
Foreign guests 50,9% 41,0% 73,3% 35,4% 72,3% 50,6% 80,6%
Share compared to the
national total 20,9% 15,4% 29,9% 5,8% 18,7% 3,1% 6,4%
Variation 2017/18 +8,0% +2,4% +5,7% +7,4% +4,7% +16,6% -0,7%
Nights 9,8 M 6,8 M 17,5 M 2,7 M 20,4 M 2,1 M 8,3 M
Foreign overnight stays 58,7% 44,3% 78,7% 36,2% 76,3% 57,9% 88,8%
Share compared to the
national total 14,5% 10,0% 25,9% 4,0% 30,2% 3,1% 12,3%
Variation 2017/18 +8,5% +0,2% +4,9% +7,6% +1,2% +14,1% -0,2%
Average stay 1,9 1,7 2,3 1,8 4,3 2,9 5,2
Global income 560 M€ 333 M€ 1 267 M€ 2,7 M 1.145 M€ 105 M€ 427 M€
Room income 431 M€ 235 M€ 1.005 M€ 110 M€ 852 M€ 81 M€ 279 M€
Bed occupancy rates 51,8% 37,6% 59,7% 40,1% 49,2% 48,4% 67,4%
Room occupancy rates 64,1% 45,0% 75,6% 52,2% 63,8% 59,8% 74,0%
RevPar 40,7€ 24,4€ 74,2€ 30,2€ 52,7€ 35,6€ 41,9€
Seasonality 34,5% 37,7% 31,3% 40,8% 43,3% 40,8% 30,9%
Establishments 1.438 1.175 908 625 817 363 1.542
Rooms 30.512 28.150 37.889 10.742 50.983 6.753 19.406
Beds 30.512 60.646 84.184 23.852 131.243 14.902 41.824 Source: Turismo de Portugal (2019)
The 'Tourism Strategy 2027' presents a man-
agement and monitoring model composed of:
(i) managing entity - Turismo de Portugal I.P .;
(ii) Regional Tourism Entities and strategic
tourism laboratories, both regional and the-
matic, promoting the continuous involvement
of actors; and (iii) holding annual, national and
regional forums, to transfer knowledge and con-
solidate stakeholder networks. Table 5 presents
a summary of the main strategies and products
chosen in each of the Portuguese tourist regions.
These regions seek to reconcile modernity
with their vast and ancient cultural and natural
heritage, offering an environment capable of
meeting different motivations and the expecta-
tions of diverse market groups. The main prob-
lems experienced are: seasonality of tourism
flows, desertification of the hinterland, poor
qualification of human resources, difficulty in
accessibility, and the tendency for tourism to
concentrate on the coastal area. What stands out is the importance of investing in tourism’s

Revista Portuguesa de Estudos Regionais, nº 56
26
Table 5. Tourism strategy by region Regions Strategy Guidelines Products
Norte
Develop the attractiveness of the desti-
nation Portugal's ‘Porto and North’ des-
tination should provide visitors
with a holistic experience in the
region
Cultural and landscape
touring
Consolidate and harmonize the quality
of the supply Nature tourism
Invest in promotion and marketing The region's residents are a funda-
mental part of the destination's
tourist experience.
Gastronomy and wine
Develop partnerships with stakeholders Wellness
The development of tourism must
contribute to the preservation and
improvement of the natural, eco-
nomic and social environment of
the region.
Religious tourism
Improve product communication and
distribution channels City breaks
Centro
Reinforcement of sectoral and territorial
coordination
Sustainability and territorial cohe-
sion
Cultural tourism / Herit-
age
Sustainable promotion operationalized
in the efficient use of resources
Development and qualification of
tourism products and agents Nature tourism / Sea
Consolidation of networks and collabo-
rative platforms facilitating synergies
aimed at the economic valuation of
tourism
Entrepreneurship Lifestyle migration
Focus on marketing, professionaliza-
tion, modernization and rationalization Innovation and differentiation Well-being
Internationalization, transfer of results
from the scientific system to the eco-
nomic fabric
Research and training
Scientific and techno-
logical, and residential
tourism
Lisbon Metro-
politan Area
Development of new centralities and
multi-centrality experiences
Deepen the relationship between
Lisbon and the Region
Cultural tourism / Herit-
age
Enhance the diversity of tourism attrac-
tions in the Lisbon Region
Promotion of diversity, modernity
and identity Nightlife
Upgrade the urban area Value the existing assets in the
Lisbon Region
Shopping
Upgrade the offer Cruises
Implement the governance model of the
new centrality Strengthen the international brand
Business and events
Nautical Tourism
Surf / Golf
Gastronomy
Equestrian tourism
Alentejo
Affirm the Tourism Cluster Certified tourism destination
throughout the value chain
Nature Tourism
Work for a regional inter-sectoral vision Have international recognition as
a goal Sun and Sea
Managing prospects by strengthening
skills
Differentiation of tourism experi-
ences based on the identity of the
territory
Nautical Tourism
Institutionalize supply networks in the
Territory
Stimulate the governance of the
destination
Touring / Cultural,
Upgrade and create new tourism prod-
ucts
Gastronomy and Wines
Hunting Tourism
Reinforce digital promotion and mar-
keting Health and Wellness
Algarve
Balance the demand and supply ra-
tio in the Algarve region Environmental sustainability Sun and Sea/ Golf
Qualification and diversification of
tourism Urban structuring Business Tourism
Safeguarding and enhancing the his-
torical-archaeological cultural herit-
age
Territorial rebalancing Gastronomy and wines
Structuring of collective equipment
networks Qualified human resources Residential Tourism
Structuring of transport networks
and logistics Retain skilled human resour-
ces
Touring
Diversify markets and publics Health and Wellness

Qualidade em Turismo na Perspetiva dos Decisores Públicos Locais Portugueses: O Caso …
27
Online product distribution and pro-
motion
Nature Tourism
Nautical Tourism
Madeira
Improve the performance of the var-
ious economic agents, both public
and private
Balancing tourism develop-
ment throughout the archi-
pelago
Cultural and religious
touring
Preserve and enhance the region's
natural, historical and cultural herit-
age
Promote confidence in the
history and future of Ma-
deira
Nature Tourism
Offering innovative, diverse and au-
thentic experiences of tourist solu-
tions
Stimulate cooperation
among the various stake-
holders
Nautical Tourism
Promoting tailor-made trips
Increase the ambition re-
quired to anticipate tourism
trends
Health and Wellness
Increase tourists’ level of satisfac-
tion at all times of the trip
Sun and Sea
Gastronomy and wines
Event / Golf
Residential Tourism
Azores
Promote ongoing cooperation be-
tween public and private stakehold-
ers
Position the Azores as an ex-
clusive destination of exu-
berant nature / environmen-
tal preservation
Nature Tourism
Promote complementarity of supply
between islands and products
Tourism qualification and
sustainable development Nautical Tourism
Qualify supply, infrastructure, and
human resources and raise resi-
dents’ awareness about hospitality
Tourism development as a
tool to boost the regional
economy in all islands
Cultural and Landscape
touring
Improve the destination’s competi-
tiveness and increase tourist flows Health and Wellness
Invest in marketing, digital market-
ing and e-commerce
Sun an Sea
Golf
Improve distribution channels, di-
recting them to the Azores’ strategic
markets
Business Tourism
Source: Based on ACIF (2015), Berger (2014), IPDT (2015, 2016), Machado (2016), NEOTURIS (2013) and Turismo de Portugal (2014,
2017a).
authenticity and quality. Therefore, highlighted
as priority strategies are the qualification of hu-
man resources, networking between local au-
thorities and the private sector and balancing
tourism development throughout the territory.
Some of these aspects are not felt in cities lo-
cated in these regions, but even in the Lisbon
Metropolitan Area, there are micro-destinations
where these problems are observed. To over-
come them, it is assumed that internationaliza-
tion and the transfer of results from the scien-
tific system to the economic fabric are crucial.
This process should be supported by networks,
partnerships and all other forms of collaboration
between stakeholders. A set of strategies is
based on the following values: modernity, au-
thenticity, diversity and an acceptable tourism
density. The big challenge is to maintain this
competitive capacity at the international level,
for which qualification and innovation are fun-
damental. That is why it is fundamental to lead
municipalities to integrate and apply this vision
for tourism, carrying out the sustainable plan-
ning of resources, evaluating the quality of the
results and adjusting their action to the stage of
the destination life cycle (Gretzel, Hwang &
Fesenmaier, 2012; Park & Jamieson, 2009; Pyo,
2010). This implies implementing a model of
network governance with local municipalities,
as well as maintaining the high level of attrac-
tiveness already achieved, ensuring a high qual-
ity of life that also attracts specialized human
resources and entrepreneurs (De Noni, Orsi &
Zanderighi, 2014).
4. METHOD
4.1 Sample
The sample comprises 134 participants from
125 Portuguese municipalities, from the north
to the south of the country and islands, corre-
sponding to 40.6% of the total of 308 Portu-
guese municipalities. The sample’s characteris-
tics are shown in Table 6. Most respondents
were aged from 35 to 49 years old (65.7%), with

Revista Portuguesa de Estudos Regionais, nº 56
28
more female (57.5%) than male (42.5%) partic-
ipants. Almost 60% occupy the position of Sen-
ior Official, more than 80% work in the munic-
ipal tourism department, and 56.7% have been
working in the municipality for more than 10
years. Most of them hold a permanent position
(63.4%) and have a university degree (50.0%),
followed by a master (20.1%) and a postgradu-
ate degree (21.6%). The majority of participants
came from the Centro, Norte, and Alentejo re-
gions.
Table 6. Sample’s characteristics [134 participants from 125 Portuguese municipalities]
Sample n %
Sex:
Male 57 42.5
Female 77 57.5
Age:
Between 18 and 24 years 1 0.7
Between 25 and 34 years 24 17.9
Between 35 and 49 years 88 65.7
Between 50 and 64 years 20 14.9
Over 64 years 1 0.7
Period of employment in the municipality:
Up to 1 year 4 3.0
From 1 to 5 years 22 16.4
From 5 to 10 years 32 23.9
More than 10 years 76 56.7
Positions in the municipality:
Employee 109 68.6
Political position 25 15.7
Mayor 3 1.89
Alderman 9 5.66
Vice President 4 2.52
Other 9 5.66
Hiring regime of workers in the municipality:
Temporary employment contract 4 3.0
Permanent employment contract 85 63.4
Individual work contract 7 5.2
Consultant 6 4.5
Other 7 5.2
Missing-values 25 18.7
Professional category:
Director of services and equivalent positions 1 0.8
Head of Division 14 10.5
Sub director, Director General and equivalent positions 1 0.8
Senior Employee 80 59.7
Other 13 9.7
Missing-values 25 18.7
Qualifications:
Basic education (9th year) 1 0.8
Secondary Education (12th year) 5 3.7
Diploma 4 3.0
Degree 67 50.0
Postgraduate studies 29 21.6
Master 27 20.2
PhD 1 0.8
Regions in Portugal (nº of participants inquired)
Norte 30 22.4
Centro 50 37.3
Lisbon Metropolitan Area 5 3.7
Alentejo 24 17.9
Algarve 8 6.0
Autonomous Region of Madeira 4 3.0
Autonomous Region of Azores 11 8.2
Missing-values 2 1.5 Source: Based on SPSS statistical program (version 22.0) outputs

Qualidade em Turismo na Perspetiva dos Decisores Públicos Locais Portugueses: O Caso …
29
When we compare the number of partici-
pants with the number of municipalities by re-
gion, the results are slightly different. The
majority of participants came from the Azores,
Centre of Portugal, Algarve and Alentejo (Table
7).
Table 7. Percentage of regions’ participation
Regions Municipalities by region Participants inquired by
region %
Regions in Portugal
Autonomous Region of Azores 19 11 57.9
Centro 100 50 50.0
Algarve 16 8 50.0
Alentejo 58 24 41.4
Autonomous Region of Madeira 11 4 36.3
Norte 86 30 34.8
Lisbon Metropolitan Area 18 5 27.7
Missing values 2 1.5
TOTAL 308 134 43.5 Source: Adapted from Portuguese National Association of Municipalities
4.2 Instruments
Five subscales of tourism quality in Portugal
were developed by the authors, and have been
previously validated with a sample of the Portu-
guese population: ‘development’ (three dimen-
sions: ‘planning strategy’, ‘governance’, and
‘innovation policy’), ‘economy’ (three dimen-
sions: ‘development strategy’, ‘economic fac-
tors of demand’, and ‘financial incentives’),
‘human resources’ (five dimensions: ‘work
skills’, ‘employment policy’, ‘business strat-
egy’, ‘training’, and ‘labour market’), ‘product’
(three dimensions: ‘services’, ‘resources and at-
tractions’, and ‘accessibilities and infrastruc-
ture’), and ‘marketing’ (two dimensions: ‘im-
age and promotion’, and ‘product differentia-
tion’). Each subscale is composed of several
items measured on a 5-point Likert scale from 1
= ‘I strongly disagree’ to 5 = ‘I totally agree’.
The five subscales were previously devel-
oped and validated (Mira, Moura, & Mónico,
2017, 2018; Mira, Mónico, Moura, & Breda,
2017; Mira, Moura, Mónico, & Breda, 2018;
Moura, Mónico, & Mira, 2019), with the under-
lying dimensions of the Quality of Tourism Des-
tinations construct. According to the validation
of each subscale, the Quality of Tourism Desti-
nations construct was operationalized through
the Development, Economy, Human Resources,
Product and Marketing subscales. In each of
these subscales specific factors emerged, reflec-
ting valid and reliable dimensions of each com-
ponent of Quality of Tourism Destinations (see
Figure 1).Confirmatory Factor Analysis (CFA)
was performed for the model (Figure 1), in or-
der to test its goodness of fit. We obtained good
fit indices considering CMIN/DF=1.60, NFI=
.811, SRMR= .0614, and CFI= .917, and an ac-
ceptable fit considering RMSEA= .067. The
Cronbach alphas of the global model, consider-
ing the factors of the five subscales, showed
good internal consistency, α = .860.
4.3 Procedures
An online version of the questionnaire was
built using Google Forms and was sent by e-
mail to all Portuguese municipalities. Control of
the responses was carried out monthly through
the ‘Municipality’ variable, a reminder being
sent to the municipalities that had not yet re-
sponded, reinforcing the importance of their
participation in the study. The questionnaire had
the instruction that it should be filled in by rep-
resentatives of the municipality with responsi-
bilities in tourism. Information on the objectives
of the study, completion instructions, the volun-
tary and anonymous nature of participation and
the guarantee of data confidentiality were also
included at the beginning of the questionnaire.
Ethical issues were, thus, taken into account
when collecting data, namely respecting partic-
ipants’ anonymity and data confidentiality, and
measures to avoid bias.

Revista Portuguesa de Estudos Regionais, nº 56
30
Figure 1. CFA for ‘Tourism Destination Quality Model’ measure: Standardized regression weights and
squared multiple correlations
Source: Output from AMOS statistical program (version 22.0)
4.4 Statistical analysis
All the statistical analyses were performed
using the SPSS statistical program and AMOS
version 22.0 for Windows (IBM Corp. Released
2013). Adopting empirical variables as abstract
constructs aimed to contrast data and theory of
Tourism Destination Quality, and so confirma-
tory factor analysis was performed (Fornell &
Bookstein, 1982), using AMOS software (esti-
mation method by maximum likelihood).Good-
ness of fit was analysed by the fit indices NFI,
SRMR, TLI, CFI, and
RMSEA (Schumacker & Lomax, 2016). The
normality of the dimensions’ scores per NUTS
II was evaluated using the coefficients of Skew-
ness and Kurtosis (scores lower than 1 were ob-
tained), and also the Shapiro-Wilk tests (a sig-
nificance level p> .05 was obtained in all NUTS
II), enabling the use of parametric tests. Outliers
were analysed using the Mahalanobis squared
distance (Tabachnick & Fidell, 2013). Internal
consistency was calculated through the
Cronbach alpha.
After descriptive statistics (means M and
standard-deviations SD), Pearson correlations
(r) were performed; the effect size of the asso-
ciations between variables was classified ac-
cording to Cohen (1988): null (r< .10), low (.10
< r< .30), moderate (.30 < r< .50), and high ef-
fect size (r> .50).
5. RESULTS
Table 8 presents the means, standard devia-
tions and inter-correlation matrix between the
Quality of Tourism Destination subscales. The
‘Product’ subscale received the highest score,
followed by ‘Economy’, ‘Marketing’, and ‘De-
velopment’, and finally, ‘Human Resources’. In
general, the correlations between all the Tour-
ism Destination subscales were high (r> .50).
Regarding the descriptive statistics and in-
ter-correlations by NUTS II (Table 4), some

Qualidade em Turismo na Perspetiva dos Decisores Públicos Locais Portugueses: O Caso …
31
Table 8. Means, standard-deviations and inter-correlation matrix between Quality of Tourism Destination
subscales [N = 134]
M SD α 1(DEV) 2(ECO) 3(HR) 4/(PRO) 5(MARK) 6(GS)
1 Development 3.36 .52 .925 .615*** .533*** .509*** .637*** .813***
2 Economy 3.59 .41 .839 1 .547*** .541*** .695*** .816***
3 Human Re-
sources
3.30 .39 .824 1 .516*** .666*** .776***
4 Product 3.91 .43 .822 1 .751*** .801***
5 Marketing 3.49 .55 .876 1 .916***
6 Global Scale 3.53 .38 .860 1 ***p< .001
Source: Output from SPSS statistical program (version 22.0)
differences were found between regions. Con-
sidering the ‘Development’ subscale, the high-
est mean scores were registered in the Algarve
region and in the Lisbon Metropolitan Area,
while the lowest scores were found in the Au-
tonomous Region of Madeira and Alentejo.
Considering the ‘Economy’ subscale, higher
scores were found in the Autonomous Regions
of Azores and Madeira, the lowest score being
registered in the Lisbon Metropolitan Area.
Concerning the ‘Human Resources’ dimension,
higher scores were found in the Autonomous
Regions of Azores and Madeira, and lower
scores in Alentejo, Lisbon Metropolitan Area
and the Algarve. For the ‘Product’ dimension,
the Norte and the Autonomous Region of Ma-
deira stand out with the highest scores, followed
by the Algarve (lowest scores found for
Alentejo). Finally, considering the ‘Marketing’
dimension, the Norte and the Autonomous Re-
gions of Azores and Madeira received the high-
est scores, while Alentejo and the Lisbon Met-
ropolitan Area had the lowest scores.
As for the associations between the Quality
of Tourism Destination subscales, in general,
high effect sizes were found (Table 8). How-
ever, differences between NUTS II can be noted
(Table 9), as perceived by the participants in
this study, in particular considering the Algarve,
the Autonomous Regions of Azores and Ma-
deira, and also the Lisbon Metropolitan Area.
Despite the small effect size, a negative correla-
tion was found between the ‘Economy’ and
‘Human Resources’ subscales; for the Algarve
and the Autonomous Region of Azores (but not
the Autonomous Region of Madeira), a small
effect size correlation between these two sub-
scales was also found, contrasting with the high
effect size correlations found in the remaining
NUTS II (especially in Alentejo and the Auton-
omous Region of Madeira). For the Autono-
mous Region of Azores, a negative and low cor-
relation was found between the ‘Economy’ and
‘Product’ subscales. The region with the lowest
effect size correlations was the Algarve, con-
trasting with Alentejo, Norte, and Centro, with
the highest subscale correlations. ‘Develop-
ment’ and ‘Marketing’ received the highest cor-
relations in Norte and Alentejo, with weak cor-
relations in the Autonomous Region of Azores;
for this region, the ‘Economy’ dimension has no
correlation with ‘Marketing’ and weak correla-
tions with ‘Human Resources’ and ‘Product’,
although a strong correlation with ‘Develop-
ment’ was found. For the Lisbon Metropolitan
Area no correlation was found between ‘Devel-
opment’ and ‘Human Resources’ (also for the
Algarve, with a small effect size correlation),
contrasting with the remaining NUTS II, where
strong correlations were found for Alentejo,
Norte, Centro, and the Autonomous Region of
Azores, and a moderate correlation was found
for the Autonomous Region of Madeira. In all
NUTS II ‘Human Resources’ and ‘Marketing’
were highly associated. Also, in all NUTS II,
the ‘Development’ dimension was strongly cor-
related with ‘Marketing’ (except for the Auton-
omous Region of Azores, were a small effect
size correlation was found) and with ‘Economy’
(except for the Autonomous Region of Madeira,
with a moderate correlation). Excluding the Al-
garve (small correlation), strong correlations
were found between ‘Product’ and ‘Marketing’
in all NUTS II. ‘Economy’ and ‘Product’ were
highly correlated in the Norte, the Lisbon Met-
ropolitan Area, Alentejo, and the Autonomous
Region of Madeira, moderately correlated in
Centro and the Algarve, and negatively and
weakly correlated in the Autonomous Region of
Azores.

Revista Portuguesa de Estudos Regionais, nº 56
32
Table 9. Means, standard-deviations and inter-correlation matrix between Quality of Tourism Destination
subscales by NUTS II NUTS II
Subscales M SD
1
(DEV)
2
(ECO)
3
(HR)
4
(PRO)
5
(MARK)
6
(GS)
Norte [n = 30]
1 Deve-
lopment 3.41 .67 1 .620*** .672*** .524** .837*** .869***
2 Economy 3.60 .39 1 .692*** .756*** .828*** .865***
3 Human
Resources 3.37 .48 1 .679*** .741*** .859***
4 Product 4.07 .41 1 .781*** .825***
5 Marketing 3.64 .53 1 .960***
6 Global
Scale 3.62 .43 1
Centro [n = 50]
1 Deve-
lopment 3.36 .50 1 .551*** .594*** .529*** .578*** .810***
2 Economy 3.62 .41 1 .494*** .440*** .632*** .760***
3 Human
Resources 3.28 .35 1 .646*** .713*** .824***
4 Product 3.88 .41 1 .727*** .810***
5 Marketing 3.48 .48 1 .893***
6 Global
Scale 3.52 .35 1
Lisbon Metropolitan Area [n = 5]
1 Deve-
lopment 3.43 .43 1 .927* .031 .928* .763 .909*
2 Economy 3.39 .21 1 -.172 .938* ..763 .884*
3 Human
Resources 3.22 .20 1 .099 .450 .285
4 Product 3.87 .69 1 .910* .974**
5 Marketing 3.28 .71 1 .962**
6 Global
Scale 3.44 .40 1
Alentejo [n =
24]
1 Deve-
lopment 3.32 .50 1 .884*** .741*** .775*** .829*** .953***
2 Economy 3.46 .51 1 .926*** .697*** .826*** .934***
3 Human
Resources 3.14 .34 1 .496* .603** .775***
4 Product 3.75 .41 1 .768*** .842***
5 Marketing 3.20 .63 1 .926***
6 Global
Scale 3.37 .43 1
Algarve [n = 8]
1 Deve-
lopment 3.44 .47 1 .642 .165 .031 .487 .743*
2 Economy 3.73 .35 1 .146 .366 .099 .682
3 Human
Resources 3.25 .38 1 .387 .827* .705
4 Product 4.03 .27 1 .223 .513
5 Marketing 3.63 .30 1 .767*
6 Global
Scale 3.62 .25 1
Autonomous Region of Madeira
[n = 4]
1 Deve-
lopment 2.98 .49 1 .370 .337 .592 .623 .667
2 Economy 3.62 .46 1 .925 .843 .955* .938
3 Human
Resources 3.46 .45 1 .607 .904 .148
4 Product 4.07 .74 1 .866 .910
5 Marketing 3.64 1.04 1 .994*

Qualidade em Turismo na Perspetiva dos Decisores Públicos Locais Portugueses: O Caso …
33
6 Global
Scale 3.55 .57 1
Autonomous Region of Azores [n
= 11]
1 Deve-
lopment 3.40 .39 1 .510 .631* -.033 .170 .671*
2 Economy 3.69 .28 1 .128 -.135 -.015 .423
3 Human
Resources 3.40 .22 1 .310 .595 .771**
4 Product 3.82 .39 1 .822** .641*
5 Marketing 3.68 .33 1 .796**
6 Global
Scale 3.60 .21 1
*p< .05 **p< .01 ***p< .001
Source: Output from SPSS statistical program (version 22.0)
Table 9 shows that we can group Portuguese
regions in three groups, taking into account the
average scores and the level of magnitude of the
interrelations among the different scales. Norte,
Centro and Alentejo regions present high corre-
lations among the different scales of the ques-
tionnaire (r <.50). It should be highlighted that
the magnitude of the inter-correlation between
‘Human Resources’ and ‘Product’ in the
Alentejo is .496. Because this value is very
close to the reference value considered (r <.50),
it is understood that these three regions show
values of magnitude of the inter-correlations be-
tween scales that are quite high and with levels
of statistical significance of p <.001.
The Lisbon Metropolitan Area and the
Azores present the most puzzling results, with
magnitude values ranging from null to high and
negative correlations between scales and items
of the different scales. These two regions form
a group which will be subject to further analysis
in the following section. Finally, it is noted that
in the Algarve and Madeira the value of the in-
ter-correlations is moderate or low, both be-
tween the ‘Development’, ‘Economy’ and
‘Product’ scales, and between the ‘Human Re-
sources’ scale and the global survey (GS).
6. DISCUSSION
6.1 ‘Tourism Destination Quality Model’
The dimensions, factors and items that com-
pose the 'Tourism Destination Quality Model'
'(see Figure 1) meet some of the strategic lines
identified for Portugal (Turismo de Portugal,
2017a).
The dimensions of ‘Development’, ‘Econ-
omy’, ‘Human Resources’, ‘Product’ and ‘Mar-
keting’, explain the 'Quality Tourism Destina-
tions' concept, and reflect the strategic priorities
set out in 'Tourism Strategy 2027', including:
valuing the territory through structuring of the
tourism supply; (ii) boosting the economy by at-
tracting investment, increasing knowledge, in-
novation and entrepreneurship; (iii) enhancing
the qualification and training of human re-
sources, attracting the most specialized workers
by investing in the improvement of the sector’s
working conditions; (iv) involving stakehold-
ers, and society in general, in tourism develop-
ment supported by networking; and (v) promot-
ing Portugal in international markets, reinforc-
ing investment in tourism companies, bringing
public administration closer to the sector and
using new technologies. This result becomes
more understandable when analysing the high
inter-item correlation magnitude values (r> .50)
among the factors of each of the model's dimen-
sions:
a) ‘Development’ is formed by two fac-
tors: ‘planning strategy’(r = .100) and ‘govern-
ance’(r = .79).
b) ‘Economy’is formed by two factors:
‘development strategy’(r = .100) and ‘economic
factors of demand’.
c) ‘Human Resources’ is formed by three
factors: ‘work skills’ (r = .100),‘employment
policy’ (r =1.11) and ‘business strategy’ (r=
1.38).
d) ‘Product’ is made up of three initial fac-
tors: ‘services’ (r = .100), ‘resources and attrac-
tions’ (r = .69) and ‘accessibilities and infra-
structure’(r= .59).
e) ‘Marketing’ is also composed of two in-
itial factors: ‘image and promotion’(r = .148)
and ‘product differentiation’(r =1.00).
There is a relationship between economic
activity and territorial development. Planning,
governance, employment policies, human re-
sources skills, demand indicators, business
strategy, resources and attractions and the

Revista Portuguesa de Estudos Regionais, nº 56
34
promotion of differentiated products stand out
as key areas for stimulating the economy and
developing destinations. The model points to
territorial development policies that encourage
governance, innovation and planning. This de-
velopment strategy must foster and support eco-
nomic activity. Product innovation and differ-
entiation involve the qualification of people and
the network organization of stakeholders. Mar-
keting is crucial in order to promote a differen-
tiated image of destinations.
In summary, for Portugal to achieve the ob-
jectives defined by Turismo de Portugal (attract
investment, develop knowledge, qualify human
resources, innovate, differentiate products, in-
tensify the use of ICT and work in networks
with stakeholders) and implement the ‘Tourism
Strategy 2027’ (Turismo de Portugal, 2017), the
country needs to create conditions for tourism
destinations to adopt the following guidelines
and have the legitimacy to apply the most ap-
propriate strategies:
a) territorial planning and governance are
key to tourism development;
b) territorial economic development strat-
egy should be leveraged by the results of the
economic indicators of demand;
c) human resource management in tour-
ism must consider measures to attract and retain
people with more personal skills and technical
knowledge of the areas of activity in which they
work. Therefore, it is crucial to define employ-
ment policies that improve conditions and work
in the sector;
d) competitive capacity and differentiation
of tourism products depend on services, re-
sources and attractions, accessibility and infra-
structure; on endogenous products and incorpo-
rating the territory’s identity in the image and
promotion of the destination. To this end, it is
necessary to provide specific budgets for the
different complementary areas of tourism, in
which municipalities have an active voice.
It can even be considered that ‘Marketing’ is
one of the factors of product development and
positioning. For this reason, it is proposed that
the ‘Tourism Destination Quality Model’ be
made up of four dimensions (‘Development’,
‘Economic’, ‘Human Resources’ and ‘Product’)
and 13 factors (‘planning strategy’, ‘govern-
ance’, ‘development strategy’, ‘economic fac-
tors of demand’, ‘work skills’, ‘employment
policy’, ‘business strategy’, ‘services’, ‘re-
sources and attractions’, ‘accessibilities and
infrastructure’, ‘image and promotion’ and
‘product differentiation’).
6.2 Emerging destinations (Norte, Centro
and Alentejo regions)
Norte, Centro and Alentejo regions have
been consolidating a very consistent tourism de-
velopment and promotion strategy in recent
years. However, they still show lower tourism
attraction indicators than other Portuguese re-
gions. Therefore, they are considered emerging
destinations with a great potential, albeit with
many gaps and needs. Perhaps these common
difficulties explain the similarity of results
found for these territories, despite their unique-
ness and different specificities (see Table 9).
These are three destinations with a very distinct
identity in various areas, but with similar prob-
lems in terms of social and economic develop-
ment, qualification of human resources and sup-
ply, product differentiation, investment attrac-
tion, modernization of organizational manage-
ment, improved accessibility and development
of infrastructure. All three regions have a very
developed coastal zone, with a rich cultural, ma-
terial and immaterial heritage, with excellent
and diversified natural resources. However,
each region has a large part of the territory af-
fected by the negative features of inland areas,
particularly depopulation.
The results reflect the objectives defined in
the strategic plan for tourism for the Norte Re-
gion, when it proposes the development and
consolidation of ‘anchor products’ and ‘com-
plementary products’, which are reflected in
true product differentiation. At the same time,
this destination considers it crucial to develop
the quality of the supply. In fact, this study cor-
roborates this need by emphasizing the depend-
ence in the territory between improving the eco-
nomic indicators of demand and training human
resources, product differentiation and modern-
izing marketing.
In the Centre Region, the results associate
the respondents’ concerns about the governance
model necessary to promote the territory’s eco-
nomic development. In fact, governance,
strengthening territorial identity, differentiation
and transfer of knowledge are considered stra-
tegic areas in the official documents guiding the
tourism strategy defined for the region. The
Alentejo region, located in the south of the
country, reveals aspects already analysed in the

Qualidade em Turismo na Perspetiva dos Decisores Públicos Locais Portugueses: O Caso …
35
previous regions, presenting somewhat similar
results to the Centre Region. Once again, there
is emphasis on the governance models associ-
ated with the region’s development, business,
resources and attractions, infrastructure and ac-
cessibility, marketing and human resources. In
its strategic plan for tourism, the Alentejo re-
gion defends a networked organization of stake-
holders, the combination of strategies, resources
and opportunities, and joint definition of the
strategic focus for products and the type of des-
tination it is intended to build and promote. It is
the only region that assumes this work should
be led by a DMO which, at the regional level, is
responsible for the regulation, development and
promotion of tourism.
6.3 Destinations in development (Lisbon
and Azores)
Lisbon and Azores are two contrasting des-
tinations, but both are in high demand, espe-
cially in recent years. Lisbon enjoys unrivalled
cultural resources, reflecting the romanticism
and history attributed to both the city and sur-
rounding areas. The Azores, on the other hand,
along with cultural resources, possesses unique,
unspoiled natural resources, which gives it a
rare and singular beauty. However, these two
regions, despite their high degree of internation-
alization, reveal characteristics of developing
destinations, whose major challenge is their
consistent and lasting consolidation at the inter-
national level. Therefore, they need to promote
an integrated vision of tourism, developing new
centralities that strengthen these brands, as well
as innovative and attractive complementary
products, inspired by their specificity. These
two regions are aware of the need to work
closely with local partners, strengthening joint
working ties around an identity that further dif-
ferentiates and diversifies their supply. The low
or null values of the inter-correlations between
factors are similar to those of the aforemen-
tioned regions.
The common needs of these destinations
(one is a large metropolis and the other is an ar-
chipelago, where nearly pristine nature predom-
inates) are fundamentally observed in the exist-
ence of low or zero correlations between the
factors of the ‘Development’ scale and the fac-
tors of the ‘Human Resources’, ‘Marketing’ and
‘Product’ scales. Apparently, these results are
incongruous or contradictory. However, if we
recall the items that formed the factors of the
‘Development’ scale, previously published by
the authors, it is clear that they point to the re-
sponsibility for defining policies and strategies
for territorial development, as well as for defin-
ing priorities for the allocation of support and
investment funds. These items are associated
with factors known as ‘Planning Strategy’,
‘Governance’ and ‘Innovation Policy’ (Figure
1). These areas have a direct impact on the local
economy and marketing strategy, attracting in-
vestment and investors, on the definition of
tourism products and on the ability to allocate
conditions to attract and retain the most quali-
fied human resources. The results revealed in
the matrix of inter-correlations between the fac-
tors of different scales (see Table 9) point to
similar needs in terms of accessibility and infra-
structure, the planning of tourism services and
products and the establishment of qualified hu-
man resources. Achieving these results depends
on the type of policies defined. Regarding these,
local leaders have no responsibilities and do not
participate in their formulation. However, if it is
understandable that this situation is reflected in
the opinion expressed by the municipalities
making up the Lisbon Metropolitan Area, given
the centralizing feature of the definition of pol-
icies, it seems paradoxical when we observe
similar results in a Portuguese region that en-
joys political, administrative and financial au-
tonomy, which is the case of the Azores. It is as
if the municipalities of the Azores archipelago
feel, in relation to the regional government,
what the mainland municipalities feel in relation
to the national government. In other words, it is
necessary to rethink the organization, autonomy
and legitimacy of DMOs responsible for tour-
ism at the regional and local levels, if these lead-
ers are to be involved in governance models in
which they participate and take responsibility
for meeting quality requirements. This require-
ment stems from the fact that tourism is a stra-
tegic sector for Portugal, which needs to be in-
creasingly competitive internationally and
where destinations at the local level are increas-
ingly contributing to national economic out-
comes. Tourism development in each of these
regions faces different problems. The Azores
struggles with serious consequences of a sea-
sonal demand, especially in some islands with
fewer resources. The negative effects of rapid
tourism growth can be observed in Lisbon with
this not being sustained by a planned and inte-
grated long-term strategy.

Revista Portuguesa de Estudos Regionais, nº 56
36
6.4 Consolidated destinations (Algarve
and Madeira)
Typically, the most common issues with
consolidated destinations are their association
with a single product. In the case of the Algarve
and Madeira, the ‘sun and sea’ prevail. There-
fore, these regions have set product diversifica-
tion and innovation as strategic objectives. In
the Algarve there is growth in golf tourism
alongside luxury tourism, and in Madeira grow-
ing investment in tailor-made travel, organized
around authenticity. As these are the most well-
known Portuguese regions with a more estab-
lished degree of internationalization, they are
also the ones that show some signs of ‘wear and
tear’, characteristic of a destination’s life cycle
when it reaches the point of maturity. In these
regions’ strategic plans, these problems are
identified and relate to the modernization of
supply and infrastructure, the retention of qual-
ified human resources, investment in creative
tourism and the inclusion of technology to serve
stakeholders, tourists and residents. There is
also a need to modernize tourism organizations’
functioning in general. Once more, the question
of tourism quality assessment at the local level
implies, in the perception of municipal leaders,
a relationship between development, the econ-
omy, human resources and output. These seem
to be the dimensions that will have positive or
negative effects on tourism’s attractiveness,
competitiveness, innovation and seasonality,
which even sophisticated marketing campaigns
cannot address. This finding is corroborated by
the results in Table 9. It is understood that local
decision-makers choose social and economic
development, human resources and product as
determinants of tourism quality. And that these
are the main needs felt in Portuguese destina-
tions, regardless of their stage in the life cycle,
whether in the development, consolidation or
decline phases.
Despite what has already been mentioned,
there are some specificities inherent to the terri-
tories. In Madeira the results confirm the need,
already expressed in the documents on the stra-
tegic development of the territory, to modernize
the structures and internal processes of organi-
zations in terms of e-commerce and web mar-
keting. This is fundamental in the international-
ization of destinations, linking products to tour-
ists, tourists, residents and organizations to mar-
kets, and production processes to human re-
sources. However, when DMOs are unable to
intervene in changing the policies that define
accessibility and tourism infrastructure, it is dif-
ficult to adapt their action to implement the
changes required at the stage of the destina-
tion’s life cycle. Paradoxically, this is one of the
functions of the DMO, as it helps to modernize
local organisations’ internal management, con-
tributing to stimulating the economy.
For the Algarve, the situation is even more
critical. Apparently, these results are incongru-
ous or incomprehensible (see Table 9). But if a
region wants to focus on luxury tourism, golf
tourism, slow travel, cruise tourism, how can it
do so if it cannot act in an integrated manner in
social and economic development policies? If it
has no responsibility for defining and imple-
menting the policy and strategy for planning
and development of the territory. If it has nei-
ther the means nor resources that can leverage
the modernization of services, economy, educa-
tion and infrastructure, among others. The rela-
tionship between the high level of territories’
economic development and tourism attractive-
ness is consensual. In this context, it is natural
that the asymmetrical distribution of wealth ob-
served in the region is an unfavourable factor
for the implementation of the aspired strategies
to strengthen the destination’s competitiveness.
In short, we need to rethink the organiza-
tional model of the DMOs at regional and local
levels, as these are increasingly facing various
challenges related to the constant external
changes in tourism, and these public entities
have major responsibilities for how tourism is
carried out at the destination level, having to en-
sure the necessary conditions to satisfy the rapid
changes affecting this economic sector.
REFERENCES
ACIF – Câmara do Comércio e Indústria da
Madeira (2015), Documento Estratégico para o
Turismo na RAM (2015-2020), Funchal, ACIF
/ KPMG.
Armenski, T., Gomezelj, D., Djurdjev, B.,
Curcic, N., & Dragin, A. (2012). Tourism desti-
nation competitiveness: Between two flags.
Economic Research, 25(2), 485-502.

Qualidade em Turismo na Perspetiva dos Decisores Públicos Locais Portugueses: O Caso …
37
Assaf, A. G.; & Dwyer, L. (2013), Bench-
marking international tourism destination,
Tourism Economics, Vol. 19, Issue 6, pp. 1233-
1247.
Badulescu, D.; Hoffman, I.; Badulescu, A; &
Simut, R. (2016), Local authorities’ involve-
ment in fostering Hungarian-Romanian cross-
border cooperation in tourism, Lex Localis,
Journal of Local Self-Government, Vol. 14, Is-
sue 3, pp. 337-358. (doi:10.4335/14.3.337-358)
Baena-Graciá, V., & Cerviño-Fernández, J.
(2009). La internalización de la franquicia espa-
ñola y sus formas de penetración de mercados.
Cuadernos de Economía y Dirección de la Em-
presa, 40(9), 47-82.
Bannò, M.; Piscitello, L.; & Varum, C.
(2015), Determinants of the internationalization
of regions: The role and effectiveness of public
policy measures, Regional Studies, Vol. 49, Is-
sue 7, pp.1208-1222. (doi: 10.1080/00343404.
2013.821570)
Berger, R. (2014), Plano estratégico para o
turismo na região de Lisboa 2015-2019, Lis-
boa, Entidade Regional de Turismo da Região
de Lisboa.
Beritelli, P., & Laesser, C. (2014). Getting
the cash-cow directors on board: An alternative
view on financing DMOs. Journal of Destina-
tion Marketing Management, 2, 213-220.
Bernabé, C.; & Hernández, M. (2016), Tu-
rismo en Albarracín y Comarca: Acción pública
local y dinâmica reciente en clave de desarrollo
turístico sostenible, Anales de Geografía de la
Universidad Complutense, Vol. 36, nº 1, pp.
173-194.
(doi:10.5209/rev_AGUC.2016.v36.n1.52718)
Blain, C., Levy, E., & Ritchie, J. R. (2005).
Destination branding: Insights and practices
from destination management organizations.
Journal of Travel Research, 43(5), 328-338.
Blasco, D.; Guia, J.; & Prats, L. (2014),
Emergence of governance in cross-border desti-
nations, Annals of Tourism Research, Vol. 49,
pp. 159–173. (doi:10.1016/j.annals.2014.09.
002)
Bohlin, M.; Brandt, D.; & Elbe, J. (2016),
Tourism as a vehicle for regional development
in peripheral areas: Myth or reality? A longitu-
dinal case study of Swedish regions, European
Planning Studies,Vol. 24, Issue 10, pp. 1788-
1805. (doi:10.1080/09654313.2016.1194807)
Booyens, I. (2016), Global–local trajectories
for regional competitiveness: Tourism innova-
tion in the Western Cape. Local Economy, Vol.
31, Issue 1–2, pp. 142–157. (doi:10.1177/0269
094215618598)
Booyens, I., & Rogerson, C. M. (2016). Un-
packing the geography of tourism innovation in
Western Cape Province, South Africa. Bulletin
of Geography, Socio-economic Series, 31, 19–
36. doi: 10.1515/bog-2016-0002
Booyens, I.; & Rogerson, C. M. (2015). Cre-
ative tourism in Cape Town: An innovation per-
spective. Urban Forum, Vol. 26, pp. 405–424.
(doi: 10.1007/s12132-015-9251-y)
Bornhorst, J. R., Ritchie, B., & Sheehan, L.
(2010). Determinants of tourism success for
DMOs & destination: An empirical examina-
tion of stakeholder’s perspectives. Tourism
Management, 31, 572-589. doi:10.1016/j.tour-
man.2009.06.008
Bramwell, B., & Lane, B. (2012). Introduc-
tion: Critical research on the governance of
tourism and sustainability. In B. Bramwell, &
B. Lane (Eds.), Tourism governance: Critical
perspectives on governance and sustainability
(pp. 1-11). New York: Routledge, Taylor &
Francis Group.
Brouder, P., Ioannides, D. (2014). Urban
tourism and evolutionary economic geography:
Complexity and co-evolution in contested
spaces. Urban Forum, 25, 419-430. doi:
10.1007/s12132-014-9239-z
Clavé, S., & Wilson, J. (2017). The evolu-
tion of coastal tourism destinations: A path plas-
ticity perspective on tourism urbanisation. Jour-
nal of Sustainable Tourism, 25(1), 96-112. doi:
10.1080/09669582.2016.1177063
Cohen, J. (1988), Statistical power analysis
for the behavioural sciences (2nd ed.), Hills-
dale, NJ, Erlbaum.
Costa, C. (2014). Gestão estratégica do tu-
rismo: Evolução epistemológica dos modelos,
paradigmas, e tendências para o futuro. In C.
Costa, F. Brandão, R. Costa, & Z. Breda (Eds.),
Turismo nos países lusófonos: Conhecimento,
estratégia e territórios (Vol. I, pp. 19-40). Lis-
boa: Escolar Editora.
Daszkiewicz, N. (2014). Small and medium-
sized enterprises in visegrad countries towards
internationalisation challenges in the European
Union. In A. Duréndez, & K. Wach (Eds.), Pat-
terns of business internationalisations in coun-
tries: In search for regional specifics (pp. 179-
191). Cartagena: Universidade Politécnica de
Cartagena (Servicio de Documentación).
De Noni, I.; Orsi, L.; & Zanderighi, L.
(2014), Attributes of Milan influencing city

Revista Portuguesa de Estudos Regionais, nº 56
38
brand attractiveness. Journal of Destination
Marketing & Management, Vol. 3, pp. 218–
226. (doi:10.1016/j.jdmm.2014.06.001)
Della-Corte, V. (2013). Innovation in tradi-
tion-based firms: Dynamic knowledge for inter-
national competitiveness. European Journal of
Innovation Management, 16(4), 405-439.
Dwyer, L, & Kim, C. (2003). Destination
competitiveness: Determinants and indicators.
Current Issues in Tourism, 6(5), 369-414.
Dwyer, L.; Cvelbar, L.; Edwards, D.; &
Mihalic, T. (2012), Fashioning a destination
tourism future: The case of Slovenia, Tourism
Management, Vol. 33, pp. 305-316.
Dwyer, L.; Cvelbar, L.; Mihalic, T.; & Ko-
man, M. (2014), Integrated destination compet-
itiveness model: Testing its validity and data ac-
cessibility, Tourism Analysis, Vol. 19, pp. 1-17.
Erkus-Öztürk, H. (2009), The role of cluster
types and firm size in designing the level of net-
work relations: The experience of the Antalya
tourism region, Tourism Management, Vol. 30,
Issue 4, pp. 589-597.
Escach, N., & Vaudor, S. (2014). Réseaux de
villes et processus de recomposition des ni-
veaux: Le cas des villes baltiques. Cybergeo:
European Journal of Geography, 679, 1-24.
doi:10.4000/cybergeo.26336
Estevão, C.; & Ferreira, J. (2015), A compe-
titividade no setor do turismo: Contributos, de-
safios e implicações, Porto, Edições Idioteque.
Farmaki, A. (2015), Regional network gov-
ernance and sustainable tourism, Tourism Ge-
ographies, Vol. 17, Issue 3, pp. 385-407.
(doi:10.1080/14616688.2015.1036915)
FEM - Fórum Económico Mundial (2017),
The Travel &Tourism Competitiveness Report
2017: Paving the way for a more sustainable
and inclusive future, Retrieved from
http://www3.weforum.org/docs/WEF_TTCR_
2017_web_0401.pdf
Ferdinand, N.; & Williams, N. (2013), Inter-
national festivals as experience production sys-
tems, Tourism Management, Vol. 34, pp. 202-
210. (doi:10.1016/j.tourman.2012.05.001)
Fernandes, S.; & Eusébio, M. C. (2014), Go-
vernança para o desenvolvimento sustentável de
destinos turísticos, Revista Turismo & Desen-
volvimento, Vol. 3, Issue21/22, pp. 249-261.
Gretzel, U.; Hwang, Y. H.; & Fesenmaier,
D. R. (2012), Informing destination recom-
mender systems design and evaluation through
quantitative research, International Journal of
Culture, Tourism and Hospitality Research,
Vol. 6, Issue 4, pp. 297-315.
Hall, M. C. (2000), Tourism panning: Poli-
cies, processes and relationships, Harlow,
Prentice Hall.
Hall, M.; & Campos, M. (2014), Public ad-
ministration and tourism, international and Nor-
dic perspectives: Introduction to the special is-
sue, Scandinavian Journal of Public Admin-
istration, Vol. 18, Issue 1, pp. 3-17.
Haugland, A.; Ness, A.; Grønseth, B.; &
Aarstad, J. (2011), Development of tourism des-
tinations: An integrated multilevel perspective,
Annals of Tourism Research, Vol. 38, Issue 1,
pp. 268–290. (doi:10.1016/j.annals.2010.08.00
8)
Hristov, D., & Zehrer, A. (2015). The desti-
nation paradigm continuum revisited: DMOs
serving as leadership networks. Tourism Re-
view, 70(2), 116-131.
Instituto Nacional de Estatística (2018).
Conta Satélite do Turismo em Portugal: Desta-
que à comunicação social, retrieved on 8th,
June, 2019, from https://www.ine.pt
IPDT - Instituto de Planeamento e Desenvol-
vimento do Turismo (2015), Estratégia de mar-
keting turístico do Porto e Norte de Portugal,
Porto, Turismo do Porto e Norte de Portugal,
E.R.
IPDT – Instituto de Planeamento e Desen-
volvimento do Turismo (2016), Plano estraté-
gico e de marketing do turismo dos Açores,
Porto, IPDT – Turismo e Consultoria.
Machado, P. (2016), Turismo fator de desen-
volvimento, Marinha Grande, Portugal, Turismo
Centro de Portugal.
Makkonen, M.; & Rohde, S. (2016), Cross-
border regional innovation systems: Conceptual
backgrounds, empirical evidence and policy im-
plications, European Planning Studies, Vol. 24,
Issue 9, pp. 1623-1642. (doi:10.1080/09654
313.2016.1184626)
Makkonen, T., & Weidenfeld, A. (2016).
Knowledge-based urban development of cross-
border twin cities. International Journal
Knowledge-Based Development, 7(4), 389–
406.
Makkonen, T., & Williams, A. M. (2016).
Border region studies: The structure of an ‘off-
beat’ field of regional studies. Regional Studies,
Regional Science, 3(1), 355-367. doi:
10.1080/21681376.2016.1209982
Martínez-García, E., & Celma, D. (2013).
Estrategias de internacionalización para desti-
nos turísticos maduros: El caso de las Comarcas
de Girona. Revista Iberoamericana de Turismo,
3(2), 44-61.

39
Moura, A., Mónico, L., & Mira, M. R.
(2019). Measuring quality regarding destination
marketing: Perceptions from local public stake-
holders in Portugal. Tourism & Management
Studies. 15(1), 44-53. doi: https://doi.org/10.1
8089/tms.2019.150104
Mira, M. R., Moura, A., Mónico, L., &
Breda, Z. (2018). The economic dimension of
quality in tourism: Perceptions of Portuguese
public decision makers at the local level. Jour-
nal of Quality Assurance in Hospitality & Tour-
ism, 1-23. https://doi.org/10.1080/1528008X.
2018.1530164
Mira, M. R., Moura, A., & Mónico, L.
(2018). A new measure of the quality of tourism
product. Journal of Tourism and Services, 9
(17), 1-22. doi: https://doi.org/10.29036/jots.
v9i17.54
Mira, M. R., Mónico, L. S., & Moura, A. F.
(2017). Uma proposta de medida da qualidade
dos recursos humanos em turismo. Revista Psi-
cologia: Organizações e Trabalho, 17(4), out-
dez, 260-268. doi: dx.doi.org/10.17652/rpot/2
017.4.13746
Mira, M. R., Mónico, L, Moura, A., &
Breda, Z. (2017). Qualidade do desenvolvi-
mento turístico na perspetiva dos decisores pú-
blicos portugueses: Uma proposta de medida.
Revista Turismo & Desenvolvimento, 28, 1675-
1687.
Moulaert, F. (2005), Social innovation, gov-
ernance and community building, Brussels, DG
Research European Commission.
Moulaert, F.; & Sekia, F. (2003), Territorial
innovation models: A critical survey. Regional
Studies, Vol. 37, Issue 3, pp. 289-302.
NEOTURIS (2013), Documento estratégico
turismo do Alentejo 2014 – 2020: Visão, priori-
dades estratégicas e eixos de intervenção, Beja,
Turismo do Alentejo, ERT.
Nilsson, J. H.; Eskilsson, L.; & Ek, R.
(2010), Creating cross-border destinations: In-
terreg programmes and regionalisation in the
Baltic Sea Area, Scandinavian Journal of Hos-
pitality and Tourism, Vol. 10, Issue 2, pp. 153-
172. (doi:10.1080/15022250903561978)
Park, S-Y; & Jamieson, W. (2009), Devel-
oping a tourism destination monitoring system:
A case of the Hawaii tourism dashboard, Asia
Pacific Journal of Tourism Research, Vol. 14,
Issue 1, pp. 39-57.
Pearce, D., & Schänzel, H. (2013). Destina-
tion management: The tourists’ perspective.
Journal of Destination Marketing &
Management, 2, 137–145. doi: /10.1016/j.jdmm
.2013.06.001
Pearce, D.G. (2013), Toward an integrative
conceptual framework of destinations, Journal
of Travel Research,Vol. 53, Issue 2, pp. 141–
153.
Pike, S.; & Page, S. (2014), Destination mar-
keting organizations and destination marketing:
A narrative analysis of the literature, Tourism
Management, Vol. 41, Issue 4, pp. 202-227.
Pillmayer, M.; & Scherle, N. (2014), The
tourism industry and the process of internation-
alization in the Middle East: The example of
Jordan, International Journal of Tourism Re-
search, Vol. 16, pp. 329-339.
Polese, F, & Minguzzi, A. (2010). Network-
ing approaches for sustainable destination man-
agement. In M. Kozak, J. Gnoth, & L. Andreu
(Eds.), Advances in tourism destination market-
ing: Managing networks (pp.113- 124). United
Kingdom: Routledge.
Prats, L., Guia, J., & Molina, F. (2008). How
tourism destinations evolve: The notion of tour-
ism local innovation system. Tourism and Hos-
pitality Research, 8(3), 178–191.
Pyo, S. (2010), Measuring tourism chain
performance, The Service Industries Journal,
Vol. 30, Issue 10, pp. 1669-1682.
Ritchie, J. R.; & Crouch, G. (2010), A model
of destination competitiveness/sustainability:
Brazilian perspectives, Revista de Admin-
istração Pública, Vol. 44, Issue 5, pp. 1049-
1066.
Rovira, N. (2016), ¿Ciudades en el mapa o
en la guía turística? Venta de la ciudad y sentido
del lugar, Revista CIDOB d’Afers Internacio-
nals, Vol. 113, pp. 89-105.
Sakharchuk, E.; Kharitonova, T.;
Krivosheeva, T.; & Ilkevich, S. (2013), The
study of the present state and prospects of cul-
tural tourism in the Russian Federation (Exem-
plifying Moscow Region), World Applied Sci-
ences Journal, Vol. 27, pp. 309-314.
(doi:10.5829/idosi.wasj.2013.27.elelc.64)
Sanz-Ibáñez, C., & Clavé, S. (2014). The
evolution of destinations: Towards an evolu-
tionary and relational economic geography ap-
proach. Tourism Geographies, 16(4), 563-579.
doi: 10.1080.14616688.2014.925965
Sanz-Ibáñez, C., & Clavé, S. (2016). Strate-
gic coupling evolution and destination upgrad-
ing. Annals of Tourism Research, 56, 1–15. doi:
10.1016/j.annals.2015.10.010
Saraniemi, S.; & Kylänen, M. (2011), Prob

Revista Portuguesa de Estudos Regionais, nº 56
40
lematizing the concept of tourism destination:
An analysis of different theoretical approaches,
Journal of Travel Research, Vol. 50, Issue 2,
pp. 133-143.
Sarasa, J. (2015), Mito y estrategias para un
destino romántico: La ciudad de Teruel, Cua-
dernos de Turismo, Vol. 36, pp. 39-54.
Schumacker, R. E.; & Lomax, R. G. (2016),
A beginner’s guide to structural equation mod-
elling (4rd ed.), New York, N.Y., Routledge,
Taylor & Francis Group.
Scuttari, A.; Volgger, M.; & Pechlaner, H.
(2016), Transition management towards sus-
tainable mobility in Alpine destinations: Reali-
ties and realpolitik in Italy’s South Tyrol region,
Journal of Sustainable Tourism, Vol. 24, Issue
3, pp. 463-483. (doi:10.1080/09669582.2015.1
136634)
Sertakova, E., Koptseva, N., Kolesnik, M.,
Libakova, N., Luzan, V., & Sergeeva, N.
(2016). Brand-management of Siberian cities:
Krasnoyarsk as a case study. International Re-
view of Management and Marketing, 6(S5),185-
191.
Sheehan, L., & Ritchie, J. R (2005). Destina-
tion stakeholders: Exploring identity and sali-
ence. Annals of Tourism Research, 32(1), 711-
734.
Soares, J., Baidal, J., & Gândar, J. (2015). La
evolución de destinos turísticos litorales conso-
lidados: Análisis comparado de balneario Cam-
boriú (Brasil) y Benidorm (España). Anales de
Geografía,35(2), 143-166. doi.org/10.5209/re
v_AGUC.2015.v35.n2.50118
Soteriou, E., & Coccossis, H. (2010). Inte-
grating sustainability into the strategic planning
of national tourism organizations. Journal of
Travel Research, 49(2), 191-205.
Spyriadis, T., Fletcher, J., & Fyall, A.
(2013). Destination management organisational
structures. In C. Costa, E. Panyik, & D. Buhalis
(Eds.), Trends in European tourism planning
and organization (pp.77-91). Bristol: Channel
View Publications.
Stevenson, N., Airey, D., & Miller, G.
(2008). Tourism policy making: The policy-
makers’ perspectives. Annals of Tourism Re-
search, 35(3), 732-750.
Stevic, I.; & Breda, Z. (2014), Tourism des-
tination governance: The case of UNESCO
world heritage site of Oporto city, Revista Tur-
ismo & Desenvolvimento, Vol. 3, Issue 21/22,
pp. 189-199.
Szytniewski, B.; Spierings, B.; & van der
Velde, M. (2017), Socio- cultural proximity,
daily life and shopping tourism in the Dutch-
German border region, Tourism Geographies,
Vol. 19, Issue 1, pp. 63-77.
(doi:10.1080/14616688.2016.1233289)
Tabachnick, B. G.; & Fidell, L. S. (2013),
Using multivariate statistics (6th ed.), New Jer-
sey, NJ, Pearson Education.
Timothy, D., Saarinen, J., & Viken, A.
(2016). Editorial: Tourism issues and interna-
tional borders in the Nordic Region. Scandina-
vian Journal of Hospitality and Tourism, 16(1),
1-13, doi: 10.1080/15022250.2016.1244504
Trentin, F. (2016), Governança turística em
destinos brasileiros: Comparação entre Arma-
ção dos Búzios/RJ, Paraty/RJ e Bonito/MS1,
Revista de Turismo y Património Cultural,
PASOS, Vol. 14, Issue 3, pp. 645-658.
Turismo de Portugal (2014), Plano de mar-
keting estratégico para o turismo do Algarve
2015-2018, Faro, Turismo de Portugal, Al-
garve.
Turismo de Portugal (2017a). Estratégia de
turismo 2017: Liderar o turismo do futuro. Dis-
ponível em http://estrategia.turismodeportu-
gal.pt/lista-documentos, consultado a
17.001.2020.
Turismo de Portugal (2017b), Turismo em
Portugal 2017, Retrieved from http://tra-
velbi.turismodeportugal.pt/pt-pt/Documents/
Turismo%20em%20Portugal/turismo-em-por-
tugal-2017.pdf
Turismo de Portugal (2018), World travel
awards 2018: Portugal é o melhor destino tu-
rístico do mundo, Retrieved from
http://www.turismodeportugal.pt/pt/Noti-
cias/Paginas/world-travel-awards-2018-portu-
gal-melhor-destino-turistico-do-mundo.aspx
UNWTO – United Nations World Tourism
Organization (2018), UNWTO tourism high-
lights - 2018 edition, Retrieved from
https://www.e-unwto.org/doi/pdf/10.181 11/97
89284419876
Vermeulen, R. (2015), Pursuing the periph-
eral path?: A path-dependent analysis of the
Frankfurt and Munich fairs, European Planning
Studies, Vol. 23, Issue 2, pp. 332-348.
(doi:10.1080/09654313.2013.867318)
Vodeb, K.; & Rudež, H. (2016), Possibilities
for inter-destination collaboration in tourism in
the case of Opatija and Portorož: A managerial
perspective, Revija Za Sociologiju, Vol. 46, Is-
sue 2, pp. 205-227. (doi:10.5613/rzs.46.2.4)
Volgger, M.; & Pechlaner, H. (2015), Gov-
erning networks in tourism: What have we
achieved, what is still to be done and learned?,

Qualidade em Turismo na Perspetiva dos Decisores Públicos Locais Portugueses: O Caso …
41
Tourism Review, Vol. 70, Issue 4, pp 298-312.
(doi:10.1108/TR-04-2015-0013)
Wang, Y. (2011). Destination marketing and
management: Scope, definition and structures.
In Y. Wang, & A. Pizam (Eds.), Destination
marketing and management: Theories and ap-
plications (pp. 1-20). Wallingford, UK: CABI
Publishing.
Weidenfeld, A. (2013). Tourism and cross
border regional innovation systems.Annals of
Tourism Research,42, 191-213. doi:
org/10.1016/j.annals.2013.01.003
Więckowski, M.; & Cerić, D. (2016), Evolv-
ing tourism on the Baltic Sea coast: Perspec-
tives on change in the Polish maritime border-
land, Scandinavian Journal of Hospitality and
Tourism, Vol. 16, Issue 1, pp. 98-111.
(doi:10.1080/15022250.2016.1244598)
Zach, F. (2012). Partners and innovation in
American destination marketing organizations.
Journal of Travel Research, 51(4) 412-425.
Acknowledgements
We are grateful for the valuable participation of Portuguese public decision-makers at the local level, who contributed with
their experience and knowledge to this research.


Artigo submetido a 9 de Maio de 2019; versão final aceite a 10 de Outubro de 2019
Paper submitted on May 9, 2019; final version acceptet on October 10, 2019
Socioeconomic Determinants of Pilgrimages: A Var Ap-
proach to the Portuguese Case of Fatima
Determinantes Socioeconómicos das Peregrinações: Uma Aborda-
gem Var do Caso Português de Fátima
Matheus Belucio
ISAG – European Business School, Research Group of ISAG (NIDISAG)
CEFAGE-UE, Department of Economics, University of Évora and Faculty of Economics,
University of Coimbra
Glauber Eduardo De Oliveira Santos
School of Arts, Sciences and Humanities, Universidade de São Paulo
Marco Daniel Duarte
Department of Studies of the Shrine of Fátima
José Alberto Fuinhas
CeBER, Faculty of Economics, University of Coimbra
Carlos Vieira
CEFAGE-UE, Department of Economics, University of Évora
Abstract/ Resumo
Acknowledgements: To the reviewers for their willingness to review our work and their indispensable contributions is acknowledged.
Research supported by CEFAGE, R&D unit funded by the FCT – Portuguese Foundation for Science and Technology, Ministry of Science,
Technology and Higher Education, project UID/ECO/04007/2019.
Este estudo analisa o fenómeno das peregri-
nações ao Santuário de Fátima sob a ótica da
ciência económica. Através de um modelo eco-
nométrico procurou estabelecer a relação entre
o turismo religioso católico e a realidade eco-
nómica portuguesa no curto prazo. Recorrendo
a um modelo Vectorial Autoregressivo e ao uso
de dados anuais de 1994 a 2018, foi detetada
endogeneidade no modelo. Foram testadas as
relações entre as variáveis económicas (Produto
Interno Bruto, taxa de desemprego, população,
índice de globalização informational) e o fenó-
meno das peregrinações. Os resultados revelam
que o desemprego e o Produto Interno Bruto
têm uma relação unidirecional com o fenómeno
This study examines the phenomenon of pil-
grimages to the Shrine of Fatima from the per-
spective of the economic sciences. Through an
economic model, it seeks to establish the rela-
tionship between Catholic religious tourism and
the Portuguese economic reality in the short-
run. An Autoregressive Vector model with an-
nual data from 1994 to 2018 found endogeneity
for the model. Thus, the relationships between a
number of economic variables (Gross Domestic
Product, unemployment rate, population, index
of informational globalisation) and the phe-
nomenon of pilgrimages were confirmed by the
model. The results show that relationships be-
tween a number of economic variables (Gross

Revista Portuguesa de Estudos Regionais, nº 56
44
1. INTRODUTION
Would the city of Fatima (Portugal) stand
out as it stands today, without the Marian phe-
nomenon? It is known that, since May 13,
1917, the city underwent several structural
changes, in addition to housing many im-
portant works (architectural and of art). Today
the city receives millions of people per year, in
large part because of the renowned Shrine ded-
icated to Mary, the Shrine of Our Lady of the
Rosary of Fatima.
National authorities tend to make decisions
that benefit their countries. According to Ay-
din (2016), it is common to find authorities
guiding their economies to receive more reve-
nues from tourism. Like any tourist, pilgrims
also have necessities of consumption. The
decision to make a pilgrimage can directly
impact the various economies along the way,
whether the journey is carried out on foot (a
common practice) or done with the help of
some means of transportation. The destination
city is the one that receives the greatest impact
by the number of people who transit annually.
The scarcity of studies that relate economic
variables to pilgrimages raises several ques-
tions about the behaviour of pilgrims when
faith is not the only motivating factor for pil-
grimages. So, the research’s question is as
follows. Is the economic reality related to the
number of people who visit the Shrine of Fati-
ma?
The economic variables capture phenomena
that are directly linked with pilgrims and that
can provide interesting aspects for the debate
about the religious phenomenon, its motivation
and the economic relation of the phenomenon.
Thus, contributing to the literature of pilgrim-
ages and religious tourism, from the perspec-
tive of the economic sciences.
In 2017, the Shrine of Fatima registered al-
most one million pilgrims, the second-best
number recorded, because in this year the
Shrine celebrated several festivities and re-
ceived the papal visit. For this reason, the pur-
pose of this article is twofold. On the one hand,
to verify the existence of a causal relationship
between economic variables (Gross Domestic
Product, population, unemployment and glob-
alisation) and the number of pilgrims who
travelled to the Shrine of Fatima, using a Vec-
tor Autoregressive (VAR) econometric model.
The empirical results serve as the basis for the
Domestic Product, unemployment rate, popula-
tion, index of informational globalisation) and
the phenomenon of pilgrimages were confirmed
by the model. The results show that unemploy-
ment and Gross Domestic Product are unidirec-
tionally related to the religious phenomenon.
Besides, there is a bivariate relationship be-
tween pilgrimages and the rate of globalisation.
Finally, the results suggest that the relationship
between population and pilgrimage exists
thanks to common factors that drive both phe-
nomena. These results provide policymakers
with a theoretical basis for decision-making
assistance, improving the conditions for the
creation of projects that favour the local econ-
omy and pilgrims. The study also contributes to
the literature because it analyses the Marian
phenomenon from the perspective of economic
science.
Keywords: Economics of religion; Religious
tourism; Pilgrimage; Shrine of Fatima; Auto-
regressive vector.
JEL Codes: Z39; Z12; C13
e France is the second biggest EMU econo-
my and, as Finland, is not considered a “periph-
eral” country.
Keywords: Markov-Switching models; Active
portfolio management; financial market integra-
tion; EMU stock markets integration
religioso, bem como uma relação bidirecional
entre as peregrinações e o indice de globaliza-
ção. Os resultados suportam que a relação entre
a população e a peregrinação existe devido a
fatores comuns a ambas as variáveis. Com base
nesses resultados, os decisores responsaveis
pela implementação de políticas económicas
têm uma base teórica para os auxiliar na tomada
de decisão, nomeadamente incrementando as
condições para a realização de projetos que
favoreçam a economia local e os peregrinos.
Esta investigação contribui para a literatura ao
analisar o fenómeno mariano sob a ótica das
ciências economicas.
Palavras-chave: Economia da religião; Turis-
mo Religioso; Peregrinação; Santuário de Fáti-
ma; Vector Autorregressivo.
Código JEL: Z39; Z12; C13
e France is the second biggest EMU econo-
my and, as Finland, is not considered a “periph-
eral” country.
Keywords: Markov-Switching models; Active
portfolio management; financial market integra-
tion; EMU stock markets integration

Socioeconomic Determinants of Pilgrimages: A Var Approach to Portuguese Case of Fatima
45
discussion of the phenomenon of pilgrimages
and their economic interaction. The time hori-
zon comprises annual data from 1994 to 2018.
Our research hypotheses were inspired by
both several studies and by economic theory:
Mourão (2012) found that changes in the la-
bour market (socioeconomic improvement)
induce future changes in perceived (and pub-
lished) graces in two Portuguese Catholic bul-
letins. Alegre (2013) show that unemployment
and a higher risk of job loss lower significantly
tourism participation and expenditure in Spain.
Therefore, hypothesis 1, is to confirm the
short-run statistical relationship between un-
employment and Gross Domestic Product and
pilgrimages to the Fatima Shrine.
Fuinhas et al., (2017) predicted the number
of pilgrims to the Shrine of Fatima. The au-
thors used the only data available (a variable
that aggregates Portuguese and international
pilgrims). This study, the number of pilgrims is
also aggregated. Therefore, the second hypoth-
esis is to verify if there is a relationship be-
tween Portuguese population growth and pil-
grimages. Finally, the last hypothesis was ad-
vanced based on the analysis of Alves (2011).
This author discusses culture, heritage, identity
(and others) in tourism research, and highlights
that issues like these are answers to the dynam-
ics of globalisation in the face of fear of loss of
cultural roots (e.g. beliefs and traditions).
Therefore, the third hypothesis is to check
whether there is endogeneity between globali-
sation and pilgrimages.
These results favour the managers of the
Shrine of Fatima. First, because they capture
an essential relation of the profane (economics
variables) that relates and can influence the
search for the sacred. The results generate em-
pirical bases to approach the Marian phenome-
non of religious tourism in Portugal. Besides
motivating the elaboration of new studies,
these results will serve to compare to other
shrines and report more economic determi-
nants and effects of the phenomenon of faith.
This article is organised as follows. The
second section presents the literature review,
addressing the main issues debated on the sub-
ject. The third section describes the mathemat-
ical method, the data used and clarifies its ca-
pabilities and limitations. The empirical results
and discussions will be presented in the se-
quence (section 4). The article concludes by
presenting the conclusions and suggesting
some management and policy measures based
on the results.
2. LITERATURE REVIEW
Throughout the world, there are hundreds
of sanctuaries and temples, sacred sites, where
believers (not believers) seek (or not) to com-
mune with the sacred. The historical, cultural
and artistic wealth of some of these places
attract tourists, researchers and students from
various areas, often without relating the reli-
gious value of the place or works. In the se-
quence, we show the links between economics
and religion, economy and tourism religious,
pilgrimage, and the implications for the cities
and peoples.
2.1 Economics and religion
Iannaccone (1998) shows how slowly the
economy of religion has been developing. The
first and second publication in the area were
separated by two centuries (Iannaccone, 1998).
The concept of the economics of religion has
been one of the most useful contributions of
rational choice theories to the sociology of
religion (Bankston III, 2002). The approach
treats religious environments as economies in
which religions and religious groups are com-
panies competing for customers who make
rational choices among available products
(Bankston III, 2002).
There is an understanding that the economic
prosperity of some regions (during the twenti-
eth century) was attributed to the Protestant
religion (e.g. Weber, 2013). Becker & Woess-
mann (2009) collaborate in the debate by
providing an alternative theory in which hu-
man capital is crucial to economic prosperity.
That is, economic prosperity related to the
better education of Protestants because they
practised reading using the Bible. Meanwhile,
Catholic missionaries sought out the remote
regions and collaborated for local infrastruc-
ture respect the mission given by Jesus Christ
was: “Go into all the world and preach the
gospel to every creature” (Mk 16:15, Bíblia de
Jerusalém).
Linck (2005), for example, discusses some
interesting historical aspects of the American
Catholic church, and the plantation founded by
the Jesuits (in Cecil County, Maryland). This
plantation was essential because it provided the

Revista Portuguesa de Estudos Regionais, nº 56
46
basis for missionary endeavours in the region
and colony of Pennsylvania. Another example
is Grover (1993) that shows the importance of
working in education in colonial Brazil and
throughout Latin America, as well as to the
development of libraries in this region.
Iannaccone (1998) still reflects on how
studies of religion promise to improve the
economy. The author proposes that economic
models can be modified to address questions
about belief, norms and values; and exploring
how religion (and, by extension, morality and
culture) affect economic attitudes and activities
of individuals, groups, and societies (Iannac-
cone, 1998).
2.2 Economics and tourism religious
Tourist destinations, in general, seek smart
specialisation, that is, the adoption of a strate-
gy to support socio-economic development
based on the identification of regional voca-
tional areas and industries and the promotion
of local business development (Del Vecchio &
Passiante, 2017). The concept of tourism is
generally linked to development and encom-
passes a growing number of new destinations
(World Tourism Barometer, 2016). Moaven et
al. (2017) state that religious tourism is a large
part of the globalisation process. In the Catho-
lic context, this type of tourism has become
another agent responsible for boosting the local
economy (e.g. Fatima in Portugal, Aparecida
in Brazil, Lourdes in France, among others),
generating demand that need to be met by the
market.
In the table below, we show a summary of
the literature on religious tourism (Table 1). Nonetheless, it is essential to remember that
every pilgrim is a religious tourist. But not all
religious tourists are pilgrims (Bauman, 1998).
They are different because the pilgrim is facing
its interior nature, for purposes of reflection.
The tourist focuses on the outside (e.g. works
of art and architecture) fleeting activities. So, it
is often complex to separate them into classes.
Table 1 – Chronological literature on religious tourism Authors Highlights
Moufahim & Lich-
rou (2019) Consumption enables the materialisation of the experience and acts as a vector of various rituals.
Belucio & Fuinhas
(2019) Weather factors and exchange rate impact number of pilgrims in Shrine of Fatima (Portugal).
Collins-Kreiner
(2018)
Pilgrimages have powerful political, economic, social, and cultural implications, and can even affect
global trade and health.
Graave (2017) This economic impact is relevant to policymakers and other stakeholders dealing with religious tour-
ism in Galicia.
Aulet (2017)
Monasteries attract religious tourists but tailoring the types of tourism can bring sustainability to the
regional economy; The implementation of appropriate measures can result in more income. The
region of the monasteries can go from religious tourism to spiritual and gastronomic tourism.
Fuinhas et al. (2017) They found seasonality in the Marian religious tourism and indicates political measures to deal with
the problem.
Hung et al. (2017)
The commercialisation of sacred places may contradict the values and philosophies of Buddhism. The
study aims to understand the balance between marketing and holiness comprehensively. Based on the
results of the study, a balanced model of religious tourism development is suggested.
Chadha & Onkar
(2016)
The tourism industry in this decade has brought many changes to Indian cities, diversified social and
cultural identity and generated opportunities for economic development.
Fedele (2014)
Their approach to sacred sites is by no means unique but rather the expression of engagement both
with pilgrimage and tourism; Energy and transformation are critical common elements of alternative
pilgrimages to Catholic shrines but also of sacred journeys to historical or archaeological sites de-
scribed as power places.
Vijayanand (2014) Pilgrimage tourism is the type of tourism that entirely or powerfully motivates tourists for the
achievement of religious attitude and practices.
Saayman, (2014) Their research contributes to the literature on the economics of pilgrimages and understanding pil-
grims’ spending behaviour, especially in the African context.
Vukonic, B. (2002) Explains and supports the idea that the economic impacts of religious tourism should not be neglected
or underestimated
Author's elaboration.
The relationship between economics and re-
ligious tourism has been warming the debate
about the various possibilities for sanctuary-
cities. Among the hot topics, could be nomi-

Socioeconomic Determinants of Pilgrimages: A Var Approach to Portuguese Case of Fatima
47
nated the diversification of tourism in the re-
gion (Chadha & Onkar, 2016), or sub-
diversification (Fuinhas et al., 2017). They still
draw the attention of public policymakers and
other stakeholders involved in religious tour-
ism to the theme and its needs (e.g. Aulet et al.
2017; Graave et al., 2017; Fuinhas et al.,
2017).
2.3 Pilgrimage
Pilgrimage is one of the oldest forms of
tourism (Štefko et al., 2015), and one of the
cultural and religious phenomena most com-
mon to human society (Collins-Kreiner, 2010).
It can be performed individually or in groups
and has a specific and sacred purpose (Cole-
man, 2015).
Most places of worship are unknown
worldwide. However, there are several tem-
ples/sanctuaries with "international promi-
nence", which are known as tourist spots be-
cause of their physical and cultural greatness
among religious practitioners and a substantial
part of the world population.
For hundreds of years, trips undertaken for
religious motivations are present throughout
human history. For example, it is from the land
of the Pharaohs that the great pilgrimage of the
Hebrew people has taken place (Pontifical
Council for the Pastoral Care of Migrants and
Itinerant, 1998). This exodus took place around
1250 BC when the people wandered in search
of the land promised by their God, Iahweh1
(De 8:7-10). The same God who had previous-
ly indicated to Abram: “Leave your country,
your kindred, and your father's household, and
go to the land I will show you” (Ge 12:1) is,
we guess, the first pilgrimage motivated by
faith that has been reported by history.
Still in historical context, during the reign
of Solomon, the First Temple was built in Je-
rusalem in the Middle East. This one receives
thousands of pilgrims every year to celebrate
the feast of the liberation (Pessach). The
search for the atonement of one’s sins and the
presentation of the firstborn male were other
religious precepts that justified trips to Jerusa-
lem in the past. Centuries later, after the Arab
conquest of Jerusalem in AC 628 (After
Christ), the encounter with the Christian mem-
ories of the Holy Land became more arduous,
and new itineraries of pilgrimage were opened
1 Iahweh (or others variations) means the name of God which is
for the unpronounceable Hebrews.
in the West. Nowadays, Jerusalem continues to
be visited by groups of pilgrims (e.g. Catho-
lics, Protestants and Jews).
2.4 Pilgrimage implications for the cities
and peoples
For centuries, cities have been concerned
with urban planning. The sacred sites owe their
urban and economic development to the
growth of tourism and the arrival of pilgrims
(Alvarado-Sizzo et al., 2017). In the past, in
Jerusalem, a month before Passover, their
roads were reformed, and the artesian wells
restored, in order to guarantee the maximum
comfort of the pilgrims. Collins-Kreiner (2010)
highlights several implications of pilgrimages,
namely political, economic, social, cultural and
health.
However, Chadha & Onkar (2016) warn
that after studying the Case of Allahabad, cities
with tourism potential are facing urban plan-
ning problems. The authors stress that decades
are necessary for urban planners and designers
to be prepared for the changes in a tourist city.
Well thought public policies collaborate for the
maintenance and economic local development.
That is why tourism planners must understand
the phenomenon, characteristics and desires of
the participants (Collins-Kreiner, 2010).
In short, the phenomenon of pilgrimages is
not a recent one. Moreover, it is highly moti-
vated by doctrinal, ritualistic and psychological
factors. Over the centuries, it has become es-
sential in various cities and creeds around the
world. In cities where Marian sanctuaries were
built, religious tourism has become indispen-
sable to the local economy.
Lim & Putnan (2010) argue that the higher
satisfaction observed among religious people
can be explained, above all, by the level of
attachment that occurs in religious services.
However, Van Ingen & Moor (2015) point out
that the frequency in religious services has
been in a marked decline in the West, but there
is a country-specific variation, so attention
must be paid to each specific case.
Colwell-Chanthaphonh & de Salle-Essoo
(2014) expose how the inhabitants of the Mau-
ritian islands and their diverse cultural and
religious bases interact. Besides that, they
show the various sanctuaries (oratorios) as
intercultural places, because they do not re-
quire explicit justification or rationalisation

Revista Portuguesa de Estudos Regionais, nº 56
48
(Colwell-Chanthaphonh & de Salle-Essoo,
2014). On the other hand, Sells (2003) deals
with the dual role of religion in the war in
Bosnia and Herzegovina. It also shows that
their religious traditions identified the victims.
Besides that, religious manifestations were
seen as incidental to deeper social, political
and economic issues (Sells, 2003).
Since the frequency of religious rites is an
evident measure of the level of religiosity in
each territory, it is natural that the individuals
who practice it become more integrated in
terms of community. Lewis et al. (2013) show
that this effect reinforces the emergence of
support and protection networks. For example,
Samson et al., (2015) looking at ways in which
a (Polish) breast cancer support group uses
religious symbols and practices (including the
pilgrimage to the Black Madonna of Często-
chowa) to achieve its goal of providing emo-
tional support to women at different stages of
the disease.
3. METHODOLOGY AND DATA
This section presents the data and method-
ology used to analyse the phenomenon of pil-
grimages and find their economic determinants
and effects. It was decided to use econometric
methods (mathematical tool) to study the phe-
nomenon and to establish empirical results.
3.1 Econometric methods
From the VAR model proposed by Sims
(1980) to be applied in economic studies, mul-
tivariate data analysis in the context of VAR
models evolved as a standard instrument in
econometrics (Pfaff, 2008). In the economics
literature, several authors applied the VAR and
its variations (Danish et al., 2018; Koengkan,
2018; Marques & Fuinhas, 2015; Pradhan &
Bagchi, 2013; Love & Zicchino, 2006). The
model allows the observation of the short-run
causal relationship between the variables.
Time series models have some conditions
that should be assured for the estimation to be
valid. In accordance, several diagnostic tests
were performed. The Variance Inflation Fac-
tors (VIF) checks multicollinearity and has a
benchmark limit of less than 10. The ADF
(Augmented Dickey-Fuller) and PP (Phillips
Perron) tests are the most common to detect
the presence of unit roots, or nonstationary
variables. They have as a null hypothesis the
presence of unit root. Rejecting the null hy-
pothesis is accepted the stationary tendency or
stationarity. The KPSS (Kwiatkowski-Phillips-
Schmidt-Shin) also test checks stationarity.
Finally, the lag order selection test indicates
the ideal number of lags in the VAR estima-
tion.
In equation 1, we see the VAR model,
proper for time series:
(1)
where: are the endogenous variables;
are coefficient matrices (k x k) for i=1,..., p;
and is a vector of white noise residuals.
The Granger Causality Wald test shows the
causal relationship between the variables and
the statistical significance level of 1%, 5% and
10%, respectively. In the highly endogenous
model, results of 1% significance are expected.
The test can support neutral relationships, uni-
directional relationship or bidirectional rela-
tionships.
It is common to perform robustness tests af-
ter the estimation of an econometric model. In
this article, we present the tests of Wald lag-
exclusion, eigenvalue stability condition, and
normally distributed disturbances.
The Wald lag-exclusion statistic performs
lag exclusion tests. That is, it reveals the opti-
mal number of lags required for the VAR. The
eigenvalue stability condition and the graphical
demonstration allow verifying the stability of
the estimated model. The test for normally
distributed disturbances presents three statistics
of normality: (i) Jarque-Bera; (ii) Skewness;
and (iii) Kurtosis.

Socioeconomic Determinants of Pilgrimages: A Var Approach to Portuguese Case of Fatima
49
Figure 1, outlines the empirical methodology used.
Scheme of the empirical methodology
Author's elaboration.
3.2 Data
The number of official pilgrims of the
Shrine of Our Lady of the Rosary of Fatima is
counted through the various agents that are
part of the structure of the shrine, namely Pil-
grims Service of the Sanctuary and Service of
Promotion and Preservation of the Environ-
ment. To ensure the consistency of the infor-
mation used in this article, we obtained statisti-
cal information through the Service of Studies
and Diffusion (another organ) of the Sanctu-
ary. The variable "pilgrims" includes the num-
ber of Portuguese and foreign pilgrims. We
recall that pilgrims accounted for by the Shrine
is not the overall number of religious tourists
only those, who attend liturgical celebrations
or sign up like pilgrims (e.g. Fuinhas et al.,
2017). Only recently has the Shrine distin-
guished between national and international
pilgrims. Which makes it impossible to use
only the number of Portuguese pilgrims in the
study. For example, in 2018 the total number
of pilgrims was almost 700,000, just under
20% were international pilgrims (Shrine of
Fatima, 2019).
The Gross Domestic Product (GDP), popu-
lation, and unemployment were obtained from
the WorldBank database. The World Devel-
opment Indicators (WDI) is the primary World
Bank collection of development indicators,
compiled from officially recognised interna-
tional sources. For more statistical information
about Portugal see WorldBank (2019). The GDP variable was used in Constant Local Cur-rency Units, a common practice in the econom-ic sciences (e.g. Belucio et al., 2019; Fuinhas, Marques & Lopes, 2019).
To measure unemployment, we use unem-ployment in % of the total labour force, and the population in its total value, i.e. the number of persons able to participate in the process of the social division of labour (active population). Globalisation began with a general term char-acterised for information exchange. As a measure for the Portuguese globalisation, we used the statistical data of the Information Globalisation Index provided by Kof Swiss Economic Institute the index can range from 0 to 100. The value 100 was attributed to the most globalised countries, and the value 0 was attributed to the least globalised countries. Statistical information on the globalization variable is limited. In the time horizon of the study the available period is 23 year, while the other variables have 25 years of data.
When using econometric methods to under-stand only one city, region or country (as is the case), the number of statistical information is of great importance. In the time-series litera-ture, the more years, the better the estimation and the reliability of the results. Our data com-prise annual information from 1994 to 2018. For the VAR estimation, more than 20 years is a reasonable number of observations. In figure 2, we graphically present the behaviour of the variables.

Revista Portuguesa de Estudos Regionais, nº 56
50
Figure 2: Variables
Author's elaboration.
Graphical analysis suggests that the varia-
bles are of a different order of integration.
There is a break at the time of the Subprime
Crisis, but visible in unemployment, GDP and
population. However, the series does not show
high volatility. Table 3, below, presents the
descriptive statistics of variables. In Table 3, data are presented for the years
of statistical information. The mean, standard deviation, minimum and maximum are also presented. Due to the nature of the variables, the KOF index and unemployment were not
transformed. The prefix "l" denotes that the variables were in natural logarithmic.
In the short-run, it is expected that GDP will not influence the population. The econom-ic stability of the country and families can reflect positively in the attraction of immi-grants and the increase of the birth rate, but they require time. However, even in the short-run, GDP can be an economic factor that influ-ences pilgrim demands to the Shrine, in a kind of "thanks" or "supplication" for example, employment or better financial condition (see Figure 3).

Socioeconomic Determinants of Pilgrimages: A Var Approach to Portuguese Case of Fatima
51
Table 3 – Description of the data
Variables Acronyms
Pilgrims pil
Gross Domestic Product gdp
Population total pop
Unemployment total un
Information globalisation index kof
Descriptive statistics
Variable Obs Mean Std. Dev. Min Max
lpir 25 13.4329 0.185544 13.15367 13.89109
lgdp 25 25.84183 0.091349 25.60039 25.93972
lpop 25 16.1535 0.017554 16.11725 16.17382
un 25 8.39696 3.531209 3.809 16.183
kof 23 76.48734 5.77192 65.64501 83.49472 Author's elaboration.
Figure 3: Interaction between the variables
Author's elaboration.
Figure 3 reveals that the relationship be-
tween GDP and unemployment is present in
the short- as well in the long-run, confirming
that variables are strongly linked over time. A
comprehensive approach to the economic rela-
tionship of this variable could be seen in Pinho
& Pinho (2015). These authors studied the
Portuguese case both at the national and re-
gional level. Similarly, unemployment is prob-
ably a motivator of the pilgrimages. While
globalisation is used as a "control variable", it
seeks to capture the effect of the densification
of globalisation in explaining the phenomena
under study from the perspective of the eco-
nomic science. The literature shows that it is
common to use this one of the variables inter-
acting with each other, for example: GDP and
Globalisation (e.g. Fuinhas et al., 2019;
Marques2017); population and GDP (e.g.
Krausmann et al., 2009); unemployment and
GDP (e.g. Hashim, , 2019).
The three previously mentioned tests
(KPSS, ADF and PP) were used to confirm the
stationary character of the series (details in
table 4), using the Bartlett and Newey-West
Bandwidth spectral estimation method and the
Schwartz information criterion. The results
suggest stationarity in first differences, reveal-
ing that all variables are stationary in at least
one of the possibilities tested, level or first
differences, and in the presence of a trend and
constant, only a constant or none).
In this way, the diagnostic checks were con-
tinued. The variables were transformed into the
first differences, as suggested by the unit root
and stationary tests. In table 5, the results of
the VIF statistic can be observed.
Population Globalisation
GDP
Unemployment

Revista Portuguesa de Estudos Regionais, nº 56
52
Table 4 – Stationarity tests
In level In first differences
KPSS ADF PP KPSS ADF PP
lpil
T
he
effe
cts
of
the
eco
-
no
mic
cris
is
and
un
em-
plo
y-
men
t τ 0.153866(1)** -2.994181(0) -3.124492(1) 0.128367(4)* -4.708592(0)*** -7.160013(13)***
μ 0.382682(2)* -2.416836(0) -2.416836(0) 0.150192(5) -4.771646(0)*** -5.369392(7)***
n n.a. 0.117285(0) 0.195855(5) n.a. -4.954070(0)*** -5.567325(7)***
lgd
p τ 0.169549(3)** -2.481033(1) -2.474373(2) 0.151430(2)** -2.435054(0) -2.361320(2)
μ 0.521986(3)** -2.469003(1) -3.467423(2)** 0.339939(3) -2.460394(0) -2.399785(3)
n n.a. 1.062331(1) 1.919922(3) n.a. -2.220895(0)** -2.131114(4)**
lpo
p τ 0.192164(3)** -0.400151(2) 0.119945(2) 0.095151(3) -4.180930(1)** -2.099085(2)
μ 0.383322(3)* -2.762856(3)* -2.139271(3) 0.575457(3)** -0.894817(2) -0.880354(2)
n n.a. -0.608746(3) 0.796746(3) n.a. -1.254635(2) -1.077751(2)
un τ 0.093579(3) -2.071984(1) -1.322884(2) 0.150333(2)* -2.054525(0) -2.043627(1)
μ 0.436839(3)* -1.826534(1) -1.326327(2) 0.167980(2) -2.032433(0) -2.030873(1)
n n.a. -0.935142(1) -0.499930(2) n.a. -2.101163(0)** -2.105094(1)**
ko
f
τ 0.172570(3)** -1.457955(0) -1.457955(0) 0.088836(3) -5.999311(0)*** -6.082376(2)***
μ 0.650570(3)** -1.732907(1) -2.304693(3) 0.262952(0) -5.613750(0)*** -5.574906(1)***
n n.a. 3.314210(0) 3.684129(1) n.a. -3.820387(0)*** -3.870726(2)***
Notes: In () lags numbers; l means natural logarithm; n means none; μ stands for constant; τ means constant and tendency; ***, **
and * denote significance at 1%, 5% e 10% level, respectively; n.a. denotes not available.
Author's elaboration
Table 5 – VIF statistic Variable VIF 1/VIF VIF 1/VIF VIF 1/VIF VIF 1/VIF VIF 1/VIF
dlpil n.a. n.a. 2.20 0.454092 2.37 0.422419 2.04 0.489859 2.22 0.449580
dlgdp 26.98 0.037064 n.a. n.a. 10.43 0.095904 15.70 0.063684 8.99 0.111204
dun 7.67 0.130376 2.76 0.362643 n.a. n.a. 7.04 0.141997 1.52 0.658350
dlpop 9.88 0.101214 6.20 0.161208 10.52 0.095059 n.a. n.a. 10.94 0.091397
dkof 26.95 0.037106 8.89 0.112445 5.68 0.176050 27.39 0.036509 n.a. n.a.
Mean
VIF 17.87 5.01 7.25 13.04 5.92
Notes: n.a. denotes not available
Author's elaboration.
The results of the VIF statistics revealed to
be valid (the values of the mean VIF should be
below 10). Indeed, there are no problems with
multicollinearity, being the best model what
presents the average 5.01. As the econometric
prerequisites were met, the selection of the lags
of the estimation was made, the Stata varsoc
option was used with a maximum of 2 lags.
The results can be seen in table 6.
Table 6 - Lag order selection on estimation
lags LL LR df p FPE AIC HQIC SBIC
0 101.006 4.70E-11 -9.60057 -9.55198 -9.35164
1 153.825 105.64 25 0.000 3.2e-12* -12.3825 -12.0909 -10.8889*
2 183.918 60.187* 25 0.000 3.40E-12 -12.8918* -12.3573* -10.1536 Notes: LR means Likelihood Ratio, FPE (Final Error of Prediction), AIC (Akaike Information Criterion), HQIC
(Hanna and Quinn Information Criterion) and the SBIC (Schwarz Bayesian Criterion). “*” indicates the significance
of the test.
Author's elaboration.
The test of lag order indicated the ideal
number of 2 lags for the model. This result can
be observed through the AIC and HQIC, where
the lowest value is found and highlighted with
the "*".
4. RESULTS AND DISCUSSION
The results presented in this section consid-
er the initial information suggested in the
pre-tests performed earlier. In Table 7, it was

Socioeconomic Determinants of Pilgrimages: A Var Approach to Portuguese Case of Fatima
53
chosen to present the general outputs of the
Granger causality test, that is, the least parsi-
monious model. This test indicated the causal
relationship between the variables, being pre-
sented the relations of the explanatory and
control variables. A summary of the Granger
causalities is presented at the end of the table.
Only statistically significant relationships are
shown to facilitate the understanding of causal
relationships.
Table 7 – Granger causality results Equation Excluded chi2 df Prob>chi2
dlp
il
dlgdp 20.998 1 0.000
dlpop 0.7926 1 0.373
dkofin 9.5355 1 0.002
ddese 19.553 1 0.000
ALL 32.903 4 0.000
dlg
dp
dlpil 0.05255 1 0.819
dlpop 30.098 1 0.000
dkofin 1.6795 1 0.195
ddese 21.428 1 0.000
ALL 71.174 4 0.000
dlp
op
dlpil 2.7308 1 0.098
dlgdp 0.4856 1 0.486
dkofin 0.02586 1 0.872
ddese 12.45 1 0.000
ALL 27.405 4 0.000
dkofi
n
dlpil 3.8936 1 0.048
dlgdp 3.7705 1 0.052
dlpop 1.2065 1 0.272
ddese 3.0402 1 0.081
ALL 9.1106 4 0.058
ddes
e
dlpil 0.86811 1 0.351
dlgdp 5.1053 1 0.024
dlpop 36.038 1 0.000
dkofin 3.0328 1 0.082
ALL 59.917 4 0.000
Causality results resume
Notes: dashed lines mean causal relationships statistically significant at the 10% level; the other
relations have a causality statistically significant at 1% or 5% level.
Author's elaboration.

Revista Portuguesa de Estudos Regionais, nº 56
54
The model is endogenous, its statistical
probability is 1%, except in the globalisation
variable that is endogenous in the 10% model.
The trend was used as an exogenous variable,
as suggested by the pre-tests of stationarity.
The causal relations accepted statistically
are unemployment and GDP cause pilgrimages
at 1%, this being a unidirectional relationship.
Pilgrimages have a bidirectional relationship
with globalisation at 1% and 5%. The control
variable (population) showed a bidirectional
rela- tionship with unemployment and revealed
a unidirectional relationship with GDP.
4.1 Robustness empirical
Robustness tests were applied to the
model. A well-estimated VAR model presents
stability. It is important to remember that in the
time series literature stability is a stationary
condition (e.g. Lütkepohl, 2005). Our results
are within what was expected, i.e., the model is
stable (see the details in table 8).
Table 8 – Eigenvalue Stability Teste Stability Eigenvalue
Roots of the companion matrix
Imag
ina
ry
Real
- Eigenvalue Modulus
-0.4917894 + .6020171i 0.777355
-0.4917894 - .6020171i 0.777355
0.4917894 + .6020171i 0.777355
0.4917894 - .6020171i 0.777355
-0.5595531 + .4337214i 0.707965
-0.5595531 - .4337214i 0.707965
0.5595531 + .4337214i 0.707965
0.5595531 - .4337214i 0.707965
-7.65E-18 + .3274403i 0.32744
-7.65E-18 - .3274403i 0.32744
Author's elaboration.
The normality statistics were tested, the
results of Jarque-Bera, Skewness and Kurtosis
confirmed the normality of residuals (see the
details in table 9).
-1-.
50
.51
Ima
gin
ary
-1 -.5 0 .5 1Real
Roots of the companion matrix

Socioeconomic Determinants of Pilgrimages: A Var Approach to Portuguese Case of Fatima
55
Table 9 - Test of normally distributed disturbances Jarque-Bera
Equation chi2 df Prob>chi2
dlpil 0.391 2 0.82261
dlgdp 0.657 2 0.7199
dun 0.653 2 0.72151
dlpop 0.259 2 0.87843
dkof 0.35 2 0.83934
ALL 2.31 10 0.99336
Skewness
Equation Skewness chi2 df Prob>chi2
dlpil 0.16613 0.092 1 0.76166
dlgdp 0.13058 0.057 1 0.81157
dun -0.0157 0.001 1 0.97714
dlpop -0.24198 0.195 1 0.65864
dkof -0.32406 0.35 1 0.55408
ALL 0.695 5 0.98325
Kurtosis
Equation Kurtosis chi2 df Prob>chi2
dlpil 2.4015 0.299 1 0.58479
dlgdp 2.1512 0.600 1 0.43841
dun 2.1155 0.652 1 0.4194
dlpop 3.2773 0.064 1 0.80019
dkof 3.0166 0.000 1 0.98792
ALL 1.615 5 0.89939 Author's elaboration.
The robustness tests confirmed that the
VAR estimation has the statistical properties
necessary to validate the results.
4.2 Discussion
The results reinforce that the effect of un-
employment is related to pilgrimages. This fact
complements the result found by Mourao
(2012) about the perceived grace, i.e. it is the
result of the grace requested. From this reflec-
tion, a new question is put to debate. Are the
health and physical well-being determinants of
pilgrimages to the Fatima Shrine? This issue
conforms to a case study applied by Samson et
al. (2015).
The results indicate that there is a relation-
ship between pilgrimages and economic varia-
bles (Kato & Progano, 2017; Liutikas, 2017).
That is, in addition to the common factors that
determine: miracles (Higgins & Hamilton,
2016), historical (Štefko, 2015) and income
(Shuo et al., 2009). There is an influence of the
economic variables in the decision process of
the pilgrims. This result corroborates the find-
ings of Fuinhas et al. (2017), that were con-
cerned with the understanding of the phenom-
enon of pilgrimages as a source of local devel-
opment. Also, the research in the area of tour-
ism reveals that income can influence the deci-
sion of the tourist (Alegre et al., 2013).
The pilgrimage has a human/divine rela-
tionship that goes far beyond the choices dic-
tated by the analyses of one-dimensional losses
and gains. So, that relationships that seem to
manifest empirically may be conditional. Giv-
en this limitation of the study, it is essential to
identify variables that express other realities
that induce the human being to practice pil-
grimage. Therefore, it is essential to work to-
gether with the areas of tourism, sociology,
psychology, anthropology and religion to bet-
ter understand the phenomenon.
The importance of the religious tourist to
the city-sanctuary region is well-known. The
consumption of goods and services warms the
local economy, attracts public and private in-
vestment, and benefits from the state with tax
collection to companies that operate the hotel
sector, catering and the sanctuary itself as a
promoter of an end activity. That approach is
not in line with the literature that supports tour-
ism as a source of income for resident families
and the destination companies (Incera & Fer-
nández, 2015).
The relationship between pilgrimages and
globalisation grows as more international pil-
grims come to Fatima. They are suggesting the

Revista Portuguesa de Estudos Regionais, nº 56
56
substantial importance of the recent growth of
the processes and of all possibilities in the
exchange of information, which allows better
dissemination of the Shrine as a place of pil-
grimage and meeting with the Sacred. Moreo-
ver, in the context of pilgrimages, there are
analytical dimensions that may be more deci-
sive than informational globalisation, such as
the evolution of customs, social and political
events. Therefore, we also tested other globali-
sation measures to try to close this gap, but the
results were not robust to our set of variables.
In the appendix there are more details about
social globalisation (Table A1), political glob-
alisation (Table A2), economic globalisation
(Table A3), and cultural globalisation (Table
A4).
Christians must know the "altar of the
world" if they want to welcome millions of
people every year. Plus, four popes in a little
over 50 years may seem like an easy task, but
it does require some attention and much
thought. Events that explore religious tourism
such as World Youth Days Lisbon 2022 and
spiritual retreats would attract people and
would not jeopardise the nature and culture of
the place.
The empirical basis established here, allow
the development of measures to be implement-
ed by regulators. Tourism in central Portugal
can benefit from regulations that promote Fat-
ima as an international destination. Besides the
possibility of measures in partnership with the
Sanctuary to promote events that aim to attract
more pilgrims and national and international
visitors.
An interesting issue for the debate on Cath-
olic religious tourism is the development of
other ways of defending and interpreting pil-
grimage. Fedele (2014) addresses aspects of a
new denomination of pilgrims “the energy
ones”. For the local economy in the short-run,
it is essential to receive pilgrims, but for
Shrine, the loss of identity may not be benefi-
cial in the long-run.
The study of the economic determinants of
pilgrimages allowed us to empirically verify
the relationship between the economy and the
phenomenon of religious tourism. It is well
known that the individual decision of to travel
to the Shrine of Fatima or another sanctuary
goes through the process of analysis of
different factors, and our results only indicate
another area that can motivate the pilgrim's
decision. The results are in line with the
literature suggesting that travellers have
diverse motivations (Liutikas, 2017). In the
next section, we present the main conclusions
regarding this study.
5. CONCLUSION
From the economic perspective, we
analysed the interaction of the number of
pilgrims to the Fatima Shrine and its
relationship with the economic reality. To
achieve the objectives of the study, a Vector
Autoregressive econometric model was
estimated with annual data from 1994 to 2018,
for the longest time span available (the
informational globalisation variable being a
limitation since its ends in 2016). Besides,
empirical findings will provide a theoretical
basis to support further studies.
The econometric model is statistically
significant and revealed the presence of
endogenous relationships. So, the primary
short-term Granger causalities are that Gross
Domestic Product and the unemployment rate
has a strong (unidirectional) relationship with
pilgrimages. Pilgrimages and globalisation
have a bidirectional relationship. The
pilgrimage still has a (unidirectional)
relationship with the population, suggesting the
existence of common factors that drive both
variables.
Based on empirical results, it is proposed
that those responsible for establishing public
tourism (and religious tourism) policies in
Portugal must consider the economic
determinants of the pilgrimage phenomenon.
Indeed, they ought to establish policies that
consider the economic factors as the family
income that may exert a significant impact on
the decision to the pilgrimage. Another
important measure for the promotion of
religious tourism in the Marian context is the
integration of public, private and religious
agents to set projects and establish objectives
together. The dialogue between agents can
favour different sectors of the economy
(hotels, restaurants, transport), especially in the
city where shrines are located and in the
neighbouring cities. Another issue addressed
was the relationship of pilgrimages with
informational globalisation. Perhaps this is the
best time for the Church to promote the
Sanctuary as a place of pilgrimage in a joint
public-private initiative.

Socioeconomic Determinants of Pilgrimages: A Var Approach to Portuguese Case of Fatima
57
Researchers have a fundamental role in
exploring and developing new studies linking
religious pilgrimages/tourism to economic
science. In addition, considering that the homo
religiosus is present all the world, in various
creeds and more and more they take into
account their faith for economics actions.
Which also means considering their economic
life in their actions of faith (e.g. pilgrimages,
tithe, charity, among others).
REFERENCES
Alegre, J., Mateo, S., & Pou, L. (2013).
Tourism participation and expenditure by
Spanish households: The effects of the eco-
nomic crisis and unemployment. Tourism
Management, 39, 37-49. doi. 10.1016/j.t our-
man.2013.04.002.
Alvarado-Sizzo, I.; Frejomil, E. P.; Crispín,
A. S. (2017). Religious tourism in southern
Mexico: Regional scopes of the festival of the
Immaculate Conception. Journal of Geoforum.
Vol. 83, 14–25. doi. 10.1016/j.geoforum.
2017.04.016.
Alves, M. L. B. (2011). Reflexões sobre a
pesquisa qualitativa aplicada ao turismo. Re-
vista Turismo em Análise, 22(3), 599-613. doi.
10.11606/issn.1984-4867.v22i3p599-613.
Aulet, S.; Mundet, L.; Vidal, D. (2017).
Monasteries and tourism: interpreting sacred
landscape through gastronomy. Revista Brasi-
leira de Pesquisa em Turismo, 11, (1), 175-
196. doi. 10.7784/rbtur.v11i1.1221.
Aydin, O. (2016). Tourism Income of Tur-
key: A Panel Data Approach. Procedia econo-
mics and finance, 38, 245-256. doi.
10.1016/S2212-5671(16)30196-4.
Bauman, Z. (1998). O mal-estar da pós-
modernidade. (Trad.) Mauro Gama e Claúdia
Martinelli Gama; revisão técnica Luís Carlos
Fridman. Rio de Janeiro: Jorge Zahar Editor
Ltda.
Bankston III, C. L. (2002). Rationality,
choice and the religious economy: the problem
of belief. Review of Religious Research, 311-
325. doi. 10.2307/3512001.
Becker, S. O., & Woessmann, L. (2009).
Was Weber wrong? A human capital theory of
Protestant economic history. The Quarterly
Journal of Economics, 124(2), 531-596. doi.
10.1162/qjec.2009.124.2.531.
Belucio, M., & Fuinhas, J. A. (2019). Fato-
res que influenciam as visitas turístico-
religiosas ao Santuário de Fátima: uma pers-
pectiva econômica. Estudos de Religião, 33(2),
159-180. doi: 10.15603/2176-1078/er.v33n2p1
59-180.
Belucio, M., Lopes, C., Fuinhas, J. A., &
Marques, A. C. (2019). Energy–growth nexus,
domestic credit, and environmental sustainabil-
ity: a panel causality analysis. In The Extended
Energy-Growth Nexus (pp. 173-197). Academ-
ic Press.
Chadha, H.; Onkar, P. (2016). Changing
Cities in the Perspective of Religious Tourism–
A Case of Allahabad. Procedia Technology,
24, 1706-1713. doi: 10.1016/j.protcy.2016
.05.200.
Coleman, S. (2015). Pilgrimage. The
Blackwell Companion to the Study of Reli-
gion, 385-396. doi. 10.1016/B978-0-08-
097086-8.84026-X
Collins-Kreiner, N. (2010). The geography
of pilgrimage and tourism: Transformations
and implications for applied geography. Ap-
plied geography, 30(1), 153-164. doi.
10.1016/j.apgeo g.2009.02.001.
Colwell-Chanthaphonh, C., & de Salle-
Essoo, M. (2014). Saints and evil and the way-
side shrines of Mauritius. Journal of Material
Culture, 19(3), 253–277. doi. 10.1177/1359183
514540066.
Danish, K., Wang, B., & Wang, Z. (2018).
Imported technology and CO 2 emission in
China: Collecting evidence through bound
testing and VECM approach. Renewable and
Sustainable Energy Reviews. 82(3), 4204-
4214. doi. 10.1016/j.rser.2017.11.002.
Del Vecchio, P., & Passiante, G. (2017). Is
tourism a driver for smart specialization? Evi-
dence from Apulia, an Italian region with a
tourism vocation. Journal of Destination Mar-
keting & Management, 6(3), 163-165. doi.
10.1016/j.jdmm.2016.09.005.
Fedele, A. (2014). Energy and transfor-
mation in alternative pilgrimages to Catholic
shrines: deconstructing the tourist/pilgrim di-
vide. Journal of Tourism and Cultural Change,

Revista Portuguesa de Estudos Regionais, nº 56
58
12(2), 150–165. doi. 10.1080/14766825.2
014.915091.
Fuinhas, J. A., Marques, A. C. & Belucio,
M. (2017). O impacto das peregrinações no
turismo religioso. Análise e previsão do fenó-
meno Mariano de Fátima. In: F. Matias, José
António C. Santos, C. Afonso, C. Baptista, C.
M. Q. Ramos, & M. C. Santos (Eds.), Estudos
de Gestão e Empreendedorismo (pp. 513-532).
Faro: Universidade do Algarve.
Fuinhas, J. A., Marques, A. C., & Lopes, C.
(2019). The Impact of Financial Development
and Globalisation on Economic Growth: Evi-
dence from a Macro Panel of Ten Countries.
Asian Economic and Financial Review, 9(3),
366. doi. 10.18488/journal.aefr.2019.93.366.
388.
Graave, E. J., Klijs, J., & Heijman, W.
(2017). The Economic Impact of Pilgrimage:
An economic impact analysis of pilgrimage
expenditures in Galicia. International Journal
of Religious Tourism and Pilgrimage, 5(3), 7.
doi: 10.21427/D7DD83.
Grover, M. L. (1993). The Book and the
Conquest: Jesuit Libraries in Colonial Brazil.
Libraries and culture, 28(3), 266.
Hashim, M., Mohamad, A., & Sifat, I. M.
(2019). The sustainable development conse-
quences of IMF debt vs. capital control: Com-
paring progress in GPI and GDP terms for
Korea and Malaysia. Journal of Cleaner Pro-
duction, 234, 725-742 doi. 10.1016/j.jclepro.20
19.06.144.
Hung, K.; Yang, X.; Wassler, P.; Wang, D.;
Lin, P.; Liu, Z. (2017). Contesting the Com-
mercialization and Sanctity of Religious Tour-
ism in the Shaolin Monastery, China. Interna-
tional Journal of Tourism Research, 19(2),
145-159. doi. 10.1002/jtr.2093.
Higgins, L., & Hamilton, K. (2016). Mini-
miracles: Transformations of self from con-
sumption of the Lourdes pilgrimage. Journal of
Business Research, 69(1), 25-32. doi. 10.1016
/j.jbusres.2015.07.017.
Iannaccone, L. R. (1998). Introduction to
the Economics of Religion. Journal of econom-
ic literature, 36(3), 1465-1495.
Incera, A. C., & Fernández, M. F. (2015).
Tourism and income distribution: Evidence
from a developed regional economy. Tourism
Management, 48, 11-20. doi.
10.1016/j.tourman.2014.10.016.
Kato, K., & Progano, R. N. (2017). Spiritu-
al (walking) tourism as a foundation for sus-
tainable destination development: Kumano-
kodo pilgrimage, Wakayama, Japan. Tourism
Management Perspectives, 24, 243-251.
Koengkan, M. (2018). The nexus between
consumption of biofuels and economic growth:
An empirical evidence from Brazil. Cadernos
UniFOA, 12(35), 87-98. ISSN: 1809-9475.
Krausmann, F., Gingrich, S., Eisenmenger,
N., Erb, K. H., Haberl, H., & Fischer-
Kowalski, M. (2009). Growth in global materi-
als use, GDP and population during the 20th
century. Ecological economics, 68(10), 2696-
2705. doi. 10.1016/j.ecolecon.2009.05.007.
Lewis, V.A., MacGregor C.A. & Putnan,
R.D. (2013). Religion, networks, and neighbor-
liness: The impact of religious social networks
on civic engagement. Social Science Research.
42(2):331-46. doi: 10.1016/j.ssresearch.2012.
09.011.
Lim, C., & Putnam, R. D. (2010). Religion,
social networks, and life satisfaction. Ameri-
can sociological review, 75(6), 914-933. doi.
10.1177/0003122410386686.
Linck, J. C. (2005). Bohemia, 1704-2004:
A History of St. Francis Xavier Catholic
Shrine in Cecil County, Maryland (review).
The Catholic Historical Review, 91(4), 858.
Liutikas, D. (2017). The manifestation of
values and identity in travelling: the social
engagement of pilgrimage. Tourism Manage-
ment Perspectives, 24, 217-224. doi.
10.1016/j.tmp. 2017.07.014.
Love, I., & Zicchino, L. (2006). Financial
development and dynamic investment behav-
iour: evidence from panel VAR. The Quarterly
Review of Economics and Finance, 46(2), 190-
210, https://doi.org/10.1016/j.qref.2005.1100
7.
Lütkepohl, H. (2005). New introduction to
multiple time series analysis. Springer Science
& Business Media. pp. 25. ISBN 3-540-26239-
3.
Marques, A. C., & Fuinhas, J. A. (2015).
The role of Portuguese electricity generation
regimes and industrial production. Renewable
and Sustainable Energy Reviews, 43, 321-330.
doi. 10.1016/j.rser.2014.11.053.
Marques, L. M., Fuinhas, J. A., & Marques,
A. C. (2017). Augmented energy-growth nex-
us: economic, political and social globalization
impacts. Energy Procedia, 136, 97-101. doi.
10.1016/j.egypro.2017.10.293.
Moaven, Z., Khajenoori, B., Forooghan
Geransaieh, Z., & Rayanpour, R. (2017).
Globalization of Culture and Religious Tour-

Socioeconomic Determinants of Pilgrimages: A Var Approach to Portuguese Case of Fatima
59
ism. European Online Journal of Natural and
Social Sciences: Proceedings, 6(1), 1-12. ISSN
1805-3602.
Moufahim, M., & Lichrou, M. (2019). Pil-
grimage, consumption and rituals: Spiritual
authenticity in a Shia Muslim pilgrimage.
Tourism Management, 70, 322-332. doi.:
10.1016/j.tourman.2018.08.023.
Mourao, P. R. (2012). Does the Economic
Cycle Change Our Prayers? A Discussion
Based on Catholic Bulletins. Kyklos, 65(4),
563-580.
Pfaff, B. (2008). VAR, SVAR and SVEC
models: Implementation within R package
vars. Journal of Statistical Software, 27(4), 1-
32. doi. 10.18637/jss.v027.i04.
Pinho, M.M. & Pinho, M. C. (2015). A re-
lação entre o produto e o desemprego: evidên-
cia nacional e regional em Portugal. revista
portuguesa de estudos regionais, 38(1.º Quad-
rimestre), 19-36. ISSN. 1645-586X.
Pontifical Council for the Pastoral Care of
Migrants and Itinerant (1998). The Pilgrimage
in the Great Jubilee. Disponible in:
http://www.vatican.va/roman_curia/pontifical_
coun-
cils/migrants/documents/rc_pc_migrants_doc_
19980425_pilgrimage_en.htm. Acess in
23/06/2018.
Pradhan, R. P., & Bagchi, T. P. (2013). Ef-
fect of transportation infrastructure on eco-
nomic growth in India: the VECM approach.
Research in Transportation Economics, 38(1),
139-148. doi. 10.1016/j.retrec.2012.05.008.
Saayman, A., Saayman, M., & Gyekye, A.
(2014). Perspectives on the regional economic
value of a pilgrimage. International Journal of
Tourism Research, 16(4), 407-414. doi:
10.1002/jtr.1936.
Samson, J., Jansen, W., & Notermans, C.
(2015). Restoring femininity through religious
symbols after breast cancer. The case of the
Polish Amazonki. Journal of Gender Studies,
24(6), 660-676. doi. 10.1080/09589236.2013
.870463.
Sells, M. (2003). Crosses of blood: Sacred
space, religion, and violence in Bosnia- - Her-
cegovina. Sociology of Religion, 64(3), 309–
331. doi: 10.2307/3712487.
Shrine of Fatima (2018). Número de pere-
grinos no Santuário de Fátima em 2017 supera
todas as expetativas. Available in: https://ww
w.fatima.santuario-fatima.pt/pt/n ews/numero-
de-peregrinos-no-santuario-de-fatima-em-20
17-supera-todas-as-expetativas-2018-02-08.
Acess in: 26/03/2018.
Shrine of Fatima (2019). Santuário de Fá-
tima acolheu 7 milhões de peregrinos em 2018.
Available in: https://www.fatima.pt/pt/news/
santuario-de-fatima-acolheu-7-milhoes-de-
peregrinos-em-2018. Acess in: 26/03/2018.
Sims, C. A. (1980). Macroeconomics and
reality. Econometrica: Journal of the Econo-
metric Society, 48(1), 1-48. doi.
10.2307/1912017.
Shuo, Y. S. S., Ryan, C., & Liu, G. M.
(2009). Taoism, temples and tourists: The case
of Mazu pilgrimage tourism. Tourism Man-
agement, 30(4), 581-588. doi.
10.1016/j.tourman.2008.08.008
Štefko, R., Kiráľová, A., & Mudrík, M.
(2015). Strategic marketing communication in
pilgrimage tourism. Procedia-Social and Be-
havioral Sciences, 175, 423-430. doi.
10.1016/j.sbspro.2015.01.1219
Van Ingen, E., & Moor, N. (2015). Expla-
nations of changes in church attendance be-
tween 1970 and 2009. Social science research,
52, 558-569. doi.
10.1016/j.ssresearch.2015.04004.
Vijayanand, S. (2014). The Issues and Per-
spectives of Pilgrimage Tourism Development
in Tanjur. International Journal of Tourism &
Hospitality Review (IJTHR), 1(1), 45-51. doi.
10.18510/ijthr.2014.117.
Vukonic, B. (2002). Religion, tourism and
economics: A convenient symbiosis. Tourism
Recreation Research, 27(2), 59-64. doi.:
10.1080/02508281.2002.11081221.
Weber, M. (2013). The Protestant ethic and
the spirit of capitalism. Routledge.
World Tourism Barometer (2016). Interna-
tional Tourist Arrivals by Country of Destina-
tion.
World Bank (2019). World bank indicator.
Available in: https://databank.wor ldbank.org
/data/reports.aspx?source=2&series=NY.GDP
.MKTP.KN&country=CHN#. Access in:
22/01/2019.

Revista Portuguesa de Estudos Regionais, nº 56
60
APPENDIX
Table A1 - Model with social globalisation, 2 lags, and trend
Equation Excluded chi2 df Prob >
chi2
dlpil dlgdp 16.195 1 0.000
dlpil dlpop 0.077 1 0.781
dlpil dkofs 2.1368 1 0.144
dlpil ddese 17.314 1 0.000
dlpil ALL 19.651 4 0.001
dlgdp dlpil 0.00139 1 0.970
dlgdp dlpop 32.295 1 0.000
dlgdp dkofs 0.46708 1 0.494
dlgdp ddese 18.472 1 0.000
dlgdp ALL 66.075 4 0.000
dlpop dlpil 2.644 1 0.104
dlpop dlgdp 0.39144 1 0.532
dlpop dkofs 0.03883 1 0.844
dlpop ddese 12.172 1 0.000
dlpop ALL 27.436 4 0.000
dkofs dlpil 0.23792 1 0.626
dkofs dlgdp 2.563 1 0.109
dkofs dlpop 0.06257 1 0.802
dkofs ddese 2.8883 1 0.089
dkofs ALL 3.764 4 0.439
ddese dlpil 1.3118 1 0.252
ddese dlgdp 3.9965 1 0.046
ddese dlpop 37.733 1 0.000
ddese dkofs 0.90786 1 0.341
ddese ALL 52.544 4 0.000

Socioeconomic Determinants of Pilgrimages: A Var Approach to Portuguese Case of Fatima
61
Table A2 - Model with political globalisation, 2 lags, and trend
Equation Excluded chi2 df Prob >
chi2
dlpil dlgdp 14.783 1 0.000
dlpil dlpop 0.11775 1 0.731
dlpil dkofp 1.6018 1 0.206
dlpil ddese 14.216 1 0.000
dlpil ALL 18.692 4 0.001
dlgdp dlpil 0.00085 1 0.977
dlgdp dlpop 31.483 1 0.000
dlgdp dkofp 7.3638 1 0.007
dlgdp ddese 29.288 1 0.000
dlgdp ALL 95.079 4 0.000
dlpop dlpil 2.8588 1 0.091
dlpop dlgdp 0.35401 1 0.552
dlpop dkofp 1.7479 1 0.186
dlpop ddese 14.653 1 0.000
dlpop ALL 31.481 4 0.000
dkofp dlpil 2.1424 1 0.143
dkofp dlgdp 0.13738 1 0.711
dkofp dlpop 0.01074 1 0.917
dkofp ddese 0.94892 1 0.330
dkofp ALL 6.486 4 0.166
ddese dlpil 1.4833 1 0.223
ddese dlgdp 4.8416 1 0.028
ddese dlpop 36.166 1 0.000
ddese dkofp 0.02468 1 0.875
ddese ALL 49.48 4 0.000

Revista Portuguesa de Estudos Regionais, nº 56
62
Table A3 - Model with economic globalisation, 2 lags, and trend
Equation Excluded chi2 df Prob >
chi2
dlpil dlgdp 13.176 1 0.000
dlpil dlpop 0.07386 1 0.786
dlpil dkofe 0.15865 1 0.690
dlpil ddese 13.508 1 0.000
dlpil ALL 16.107 4 0.003
dlgdp dlpil 0.03624 1 0.849
dlgdp dlpop 39.768 1 0.000
dlgdp dkofe 2.0279 1 0.154
dlgdp ddese 22.849 1 0.000
dlgdp ALL 72.639 4 0.000
dlpop dlpil 2.7793 1 0.095
dlpop dlgdp 0.51072 1 0.475
dlpop dkofe 0.0436 1 0.835
dlpop ddese 11.859 1 0.001
dlpop ALL 27.447 4 0.000
dkofe dlpil 0.506 1 0.477
dkofe dlgdp 2.5249 1 0.112
dkofe dlpop 11.845 1 0.001
dkofe ddese 0.26003 1 0.610
dkofe ALL 17.552 4 0.002
ddese dlpil 1.3373 1 0.248
ddese dlgdp 4.5188 1 0.034
ddese dlpop 36.167 1 0.000
ddese dkofe 0.11516 1 0.734
ddese ALL 49.794 4 0.000

Socioeconomic Determinants of Pilgrimages: A Var Approach to Portuguese Case of Fatima
63
Table A4 - Model with cultural globalisation, 1 lag, and trend
Equation Excluded chi2 df Prob >
chi2
dlpil dlgdp 0.73665 1 0.391
dlpil dlpop 0.45828 1 0.498
dlpil dkofc 0.85728 1 0.354
dlpil ddese 0.22954 1 0.632
dlpil ALL 2.2778 4 0.685
dlgdp dlpil 0.23832 1 0.625
dlgdp dlpop 5.5154 1 0.019
dlgdp dkofc 0.00379 1 0.951
dlgdp ddese 2.0448 1 0.153
dlgdp ALL 8.5164 4 0.074
dlpop dlpil 0.09995 1 0.752
dlpop dlgdp 0.04819 1 0.826
dlpop dkofc 0.01698 1 0.896
dlpop ddese 7.573 1 0.006
dlpop ALL 24.388 4 0.000
dkofc dlpil 0.3523 1 0.553
dkofc dlgdp 0.18393 1 0.668
dkofc dlpop 0.29122 1 0.589
dkofc ddese 0.01553 1 0.901
dkofc ALL 1.3297 4 0.856
ddese dlpil 2.2764 1 0.131
ddese dlgdp 0.48608 1 0.486
ddese dlpop 11.422 1 0.001
ddese dkofc 0.80591 1 0.369
ddese ALL 13.576 4 0.009


Artigo submetido a 25 de Março de 2019; versão final aceite a 22 de Setembro de 2019
Paper submitted on March 25, 2019; final version accepted on September 22, 2019
O Turismo no Douro: Notas Bibliométricas Sobre a
Literatura Científica
Douro Tourism: Bibliometric Notes on Scientific
Literature
Nuno André Pinto de Sousa
Bolseiro de investigação no Centro de Estudos Transdisciplinares para o Desenvolvimento
(CETRAD) da Universidade de Trás-os-Montes e Alto Douro (UTAD). Escola de Ciências
Humanas e Sociais.
Maria Teresa Manfredo
Investigadora de Pós-doutoramento no Centro de Estudos Transdisciplinares para o Desenvol-
vimento (CETRAD) da Universidade de Trás-os-Montes e Alto Douro (UTAD). Escola de
Ciências Humanas e Sociais.
Resumo/ Abstract
Este estudo é financiado por: Fundos Europeus Estruturais e de Investimento, na sua componente FEDER, através do Programa Operacional
Competitividade e Internacionalização (COMPETE 2020) [Projeto nº 006971 (UID/SOC/04011); Referência do Financiamento: POCI-01-
0145-FEDER-006971]; por Fundos Nacionais através da FCT – Fundação para a Ciência e a Tecnologia, no âmbito do projeto
UID/SOC/04011/2013; e pelo Projeto de I& DOUROTUR – Tourism and technological innovation in the Douro, n.º da operação NORTE-01-
0145-FEDER-000014, cofinanciado pelo Fundo Europeu de Desenvolvimento Regional (FEDER) através do NORTE 2020 (Programa Ope-
racional Regional do Norte 2014/2020).
This study sought to map the production of
scientific papers focusing on the scientific area
of tourism in the Douro region, trying to under-
stand the aspects and dimensions that have been
highlighted and privileged in the indexed pro-
duction in the WoS and Scopus databases, be-
tween 2000 and 2018. It is intended, therefore,
to present a vision about the scientific produc-
tion that explores an emerging tourist region,
serving as basis for future academic investiga-
tions of tourism in the Douro. In general, part of
the studies fits into the tourism perspective as a
driver of regional development. It has become
clear that the number of publications in these in-
dexed journals has increased significantly since
2013. There is a tendency for authors to explore
topics related to management, networking and
marketing. Also remarkable, are the recent stud-
ies in the area of new technologies aimed at im-
proving the experience of visitors to the region.
Neste estudo procurou-se mapear a produção
de artigos científicos com foco no subcampo ci-
entífico do turismo na região do Douro, tentando
compreender os aspetos e dimensões que têm
vindo a ser destacados e privilegiados na produ-
ção indexada nas bases de dados WoS e Scopus,
entre 2000 e 2018. Pretende-se assim, apresentar
uma visão sobre a produção científica que ex-
plora uma região turística emergente, servindo
de base para futuras investigações académicas
do turismo no Douro. De um modo geral, uma
parte dos estudos enquadra-se na perspetiva do
turismo enquanto motor de desenvolvimento re-
gional. Ficou claro que o número de publicações
nestas revistas com indexação tem aumentado
significativamente desde o ano de 2013. Persiste
uma tendência de os autores explorarem temas
relacionados com gestão, network e marketing.
Destacam-se ainda, estudos recentes na área das
novas tecnologias, que visam melhorar a experi-
ência dos visitantes da região.

Revista Portuguesa de Estudos Regionais, nº 56
66
1.INTRODUÇÃO
Baseado em técnicas de bibliometria, o pre-
sente estudo utiliza métodos de revisão da lite-
ratura através de uma abordagem quantitativa.
O objetivo principal desta investigação consiste
em mapear e analisar um conjunto de artigos ci-
entíficos sobre o turismo no Douro. Partindo do
princípio de que este tipo de análise trata de uma
forma mais alargada e aprofundada a questão de
como as disciplinas, especialidades e publica-
ções estão relacionadas entre si, acaba por criar
uma importante representação estruturada sobre
determinada área ou subcampo. Isto significa
que, através da divisão em diferentes clusters de
elementos (tais como autores, referências e pa-
lavras-chave) presentes nas publicações seleci-
onadas, obtém-se uma representação visual das
classificações que se destacam e, com isso, é
possível traçar um mapeamento do conheci-
mento já produzido sobre o turismo no Douro.
Tal passo é de extrema importância para se
compreender os aspectos e dimensões que têm
vindo a ser destacados e privilegiados na produ-
ção científica a esse respeito. Assim, trata-se de
um estudo de relevância, de natureza explorató-
ria, fundamentado na análise das bases de dados
com maior impacto académico, nomeadamente,
a Web of Science1 (WoS) e a Scopus2.
Como se percebe, o critério para a delimita-
ção do subcampo em foco, além de passar pela
temática de particular interesse dos autores – o
turismo – tem em conta um recorte geográfico
específico. O interesse em analisar a área espe-
cífica do Douro, localizado no norte do territó-
rio português, justifica-se pelo fato de este cons-
tituir um mosaico paisagístico que reúne fatores
naturais conjugados com a ação humana
1 O Web of Science é uma plataforma on-line, disponível por assi-
natura, de indexação de citações de artigos científicos publicados
em jornais e revistas académicas. Ele fornece uma pesquisa abran-
gente de citações de artigos, uma vez que dá acesso a vários ban-
cos de dados que fazem referência a pesquisas interdisciplinares e
também permite a exploração em profundidade de subáreas espe-
cializadas dentro de uma disciplina académica ou científica. 2 Tal como acontece com o WoS, o Scopus é um banco de dados
on-line, disponibilizado para assinantes, de resumos e citações de
artigos para jornais e revistas académicos de diversos campos ci-
entíficos. Também tal o WoS, o Scopus oferece perfis de autores,
que abrangem filiações, o número de publicações e dos seus dados
bibliográficos, referências e detalhes sobre o número de citações
de cada documento publicado que ele tenha recebido.
(Ramos & Fonseca, 2014), facto que tem des-
pertado, um maior interesse para o desenvolvi-
mento de estudos científicos. “Museu vivo da
cultura da vinha e do vinho”, nas palavras de
Madureira (2005), o Douro3 traz consigo grande
potencial turístico, com uma diversidade de pro-
dutos que lhe estão associados, tal como o Tu-
rismo de Natureza, o Turismo Náutico, a Gas-
tronomia e Vinhos e o Touring Cultural. Con-
tudo, o seu consumo turístico é um processo re-
lativamente recente, até porque entre as décadas
de 1980 e 1990 a oferta de alojamento turístico
no Douro era muito reduzida, pouco diversifi-
cada e com fraca capacidade de acolhimento
(Almeida & Pedro, 2003). Com efeito, apenas
na década de 1980 se dá a abertura do rio Douro
à navegabilidade, para embarcações de carga e
passageiros. Além da sua relação com o rio, que
lhe dá o nome, a sua imagem percebida está hoje
em dia altamente ligada à paisagem cultural pa-
trimónio da Humanidade num enquadramento
natural (Carvalho, Salazar & Neves, 2011).
Importa igualmente justificar o recorte tem-
poral dos trabalhos aqui analisados, neste caso,
o critério de delimitação consistiu em integrar
os estudos científicos publicados entre 2000 e
20184. A escolha do ano 2000 como ponto de
partida da análise, deve-se ao fato de, no ano de
2001, a paisagem do Alto Douro Vinhateiro, in-
serida na sub-região administrativa NUT III
Douro, ter recebido a classificação da Organiza-
ção das Nações Unidas para a Educação, a Ci-
ência e Cultura (UNESCO), de Património
Mundial da Humanidade na categoria “Paisa-
gem Evolutiva Viva”. Assim, a opção por esse
período temporal pressupôs uma tentativa de
captar o fluxo de publicações científicas a
3 Bernardo et al., (2018) lembram-nos que o Douro, enquanto des-
tino turístico, pode ser entendido como um território composto por
diversos subterritórios hierarquizados, de acordo com a natureza
do sentido que lhe é atribuído. Assim, sem negar sua consistência
enquanto objeto em análise, devemos ter em mente que não há
uma unicidade da representação do que seja Douro; “O Douro é
um cluster de representações e espaços e, portanto, nenhum pro-
cesso definitório do mesmo (administrativo e/ou científico) pode
chegar a um ponto definitivo e permanente. O Douro escapa como
conceito geográfico e cultural a definições rígidas.” (Bernardo et
al., 2018). 4 A data de recolha da amostra em ambas as bases de dados foi a
05/12/2018.
Palavras-Chave: Turismo; Região do Douro;
Análise bibliométrica; Revisão de Literatura.
Códigos JEL: C38, C88, R11
e France is the second biggest EMU economy
and, as Finland, is not considered a “peripheral”
country.
Keywords: Markov-Switching models; Active
portfolio management; financial market integra-
tion; EMU stock markets integration
Keywords: Tourism; Douro Region; Biblio-
metric analysis; Literature review.
JEL Codes: C38, C88, R11
e France is the second biggest EMU economy
and, as Finland, is not considered a “peripheral”
country.
Keywords: Markov-Switching models; Active
portfolio management; financial market integra-
tion; EMU stock markets integration

O Turismo no Douro: Notas Bibliométricas Sobre a Literatura Científica
67
respeito dessa área empírica, num período adja-
cente ao seu processo de patrimonialização.
Na pesquisa que se apresenta, a definição do
objeto de estudo surge como o primeiro desafio,
cuja delimitação acompanha todo o processo de
investigação que se segue. Tendo por base esse
entendimento e considerando o interesse em
compreender melhor o espólio das publicações
que têm como principal foco o estudo da região
do Douro, este artigo encontra-se subdividido
em quatro partes, nomeadamente, o presente en-
quadramento introdutório, uma segunda secção
dedicada à metodologia, seguindo-se, a apre-
sentação e discussão dos resultados, e por fim,
a conclusão.
Esta investigação focaliza essencialmente
uma visão do desempenho literário sobre a re-
gião do Douro, destacando os principais respon-
sáveis pela criação e disseminação de conheci-
mento científico. Ao fazê-lo, o presente trabalho
traz contributos de natureza bibliométrica e
aplicada para o conhecimento neste domínio,
disponibilizando uma base científica de referên-
cia para futuros estudos neste contexto. Ao nível
conceptual, o estudo realizado permitiu clarifi-
car e ampliar a heurística da temática em discus-
são. Optou-se, preliminarmente, por uma aná-
lise quantitativa da literatura apresentando a fre-
quência de publicações por ano, temática, me-
todologia, área científica e instituição, agre-
gando o resultado da pesquisa nas duas bases de
dados, pretendendo assim, explorar e avaliar em
rigor as publicações científicas no sentido lato e
holístico, com base nos outputs gerados pelo
software VoSViewer, partindo da análise desa-
gregada dos artigos selecionados. Importa refe-
rir que, no intuito de colmatar o facto de os re-
sultados serem provenientes de um processo in-
terpretativo e subjetivo considerando o conte-
údo dos artigos, estes foram submetidos à apre-
ciação do segundo autor, que procurou coerên-
cia e consistência dos clusters propostos.
2. METODOLOGIA
As publicações aqui consideradas foram
submetidas a uma análise bibliométrica apoiada
pelo software VOSViewer, versão 1.6.9. A op-
ção por este tipo de método incide na possibili-
dade de analisar qualquer tipo de estudo, desde
que se verifiquem conexões entre o conteúdo li-
terário dos artigos. Assim, trata-se de um mé-
todo ideal para se examinar padrões dentro de
uma determinada temática ou subcampo – como
é o caso do turismo no Douro.
É importante destacar que, embora o uso de
técnicas de bibliometria nas revisões da litera-
tura não seja recente (Small, 1973), elas só co-
meçaram a ganhar destaque com a disseminação
on-line das bases de dados, por exemplo, a WoS,
que contém as bases de dados Social Science Ci-
tation Index (SSCI) e a Science Citation Index
(SCI), o que facilita o acesso a artigos e citações
(Zupic & Cater, 2015). Atualmente, os estudos
bibliométricos são dominados pela análise de
co-citações, sendo estas recorrentemente utili-
zadas em pesquisas sobre algumas áreas das ci-
ências sociais, por exemplo, gestão e organiza-
ções, como se encontra nos estudos de Hanisch
e Wald (2012), Nosella, Cantarello e Filippini
(2012), Vogel e Guttel (2013).
Outro ponto relativo às vantagens da análise
bibliométrica, e que também justifica a relevân-
cia do presente trabalho, é que, comparativa-
mente à revisão sistemática da literatura tradici-
onal, a análise bibliométrica permite uma visão
mais ampla da amostra tratada, já que procura
encontrar padrões dentro do corpus a que se re-
fere. Enquanto a revisão sistemática tradicional
pode fornecer alguma profundidade, as análises
bibliométricas fornecem uma descrição gráfica
precisa a respeito de um campo de pesquisa (Zu-
pic & Cater, 2015) e é exatamente esse, um dos
aspetos particulares abordados neste artigo,
quando se pensa a respeito da produção cientí-
fica sobre o turismo duriense. Para além disso,
os métodos bibliométricos introduzem rigor
quantitativo na avaliação subjetiva da literatura
que, quando devidamente utilizados, podem
oferecer uma maior objetividade nas revisões da
literatura, exatamente por permitir que o leitor
ou investigador tenha uma visão da origem e
possa basear as suas opiniões, nas opiniões
agregadas, de acordo com os autores que estu-
dam a mesma área. Através do recurso a técni-
cas bibliométricas, os investigadores podem
ainda, avaliar publicações mais antigas, dese-
nhar novas políticas e acima de tudo, tomar de-
cisões editoriais com maior rigor (Zupic & Ca-
ter, 2015), sendo essa uma importante contribui-
ção que se pretende oferecer sobre o turismo no
Douro, a partir dos desenvolvimentos deste es-
tudo. Como referido anteriormente, os dados
utilizados para o presente artigo foram coleta-
dos precisamente no dia 5 de dezembro de 2018,
usando uma combinação de palavras-chave
consideradas relevantes (a saber, Douro

Revista Portuguesa de Estudos Regionais, nº 56
68
Tourism5). A Figura 1 ilustra os critérios de pes-
quisa utilizados, que permitiram aceder à amos-
tra de 33 artigos científicos.
Como se pode observar, inicialmente alcan-
çou-se um total de 46 artigos científicos, 21 de-
les disponíveis na plataforma WoS e 25 na Sco-
pus. Após a aplicação dos critérios de exclusão
(repetição de publicações e/ou publicações dis-
tanciadas da temática), atingiu-se uma amostra-
gem final de 33 artigos considerados válidos
para tratamento. No seguimento de vários en-
saios de pesquisa nas duas plataformas com di-
versas palavras-chave, a combinação “Douro
Tourism” em ambas foi, não só, a que gerou um
maior número de resultados, como também, foi
a que concentrou todo o espólio científico das
tentativas anteriores com “Douro”, “Douro He-
ritage”, “Douro Region”, “Douro Valley”, su-
bentendendo-se dessa forma, como sendo esta a
melhor combinação de palavras de pesquisa.
Figura 1 – Configuração da amostra analisada
Numa fase posterior, procedeu-se a uma aná-
lise de conteúdo em torno dos artigos gerados,
com recurso ao software VOSViewer, com vista
à obtenção de clusters, fundamentais para estu-
dar e compreender a dinâmica das publicações
académicas na temática em foco.
3. APRESENTAÇÃO E DISCUSSÃO
DOS RESULTADOS
A maioria dos estudos bibliométricos efetua
uma análise das citações da área objeto de es-
tudo, evidenciando as categorias mais citadas
em top-N (estudos, autores, revistas, palavras-
chave, etc). Essas citações, são usadas como
uma medida de influência, isto é, se o artigo for
frequentemente citado então este será conside-
rado importante, isto porque, supõem-se que os
autores citam documentos que consideram ser
5 Para a pesquisa, foram utilizadas palavras-chave na língua in-
glesa, porque é essa língua que as plataformas consultadas utili-
zam como padrão para a indexação dos artigos.
os mais relevantes para desenvolver o seu traba-
lho (Usdiken & Pasadeos, 1995).
Os resultados que se seguem são apresenta-
dos de duas formas distintas, agregada, reu-
nindo o conjunto de publicações e desagregada,
considerando o produto de cada base de dados.
A primeira modalidade revelou-se mais ade-
quada para a análise das publicações por ano,
método, instituições, área científica e revistas,
por seu turno, a segunda modalidade possibili-
tou a criação de clusters a partir das palavras-
chave e co-citações.
3.1.Outputs das bases de dados WoS e
Scopus agregadas
O Quadro 1 apresenta o resultado da pes-
quisa nas bases de dados WoS e Scopus, por ano
Douro Tourism- (2000-2018); recolha: 05/12/2018
ScopusWoS
21 artigos 25 artigos
Critérios de exclusão: repetição de artigos e/ou
artigos fora da temática em análise
33 artigos

O Turismo no Douro: Notas Bibliométricas Sobre a Literatura Científica
69
de publicação, número de artigos e respetiva re-
ferência dos autores, tendo em conta a amostra
apontada na Figura 1.
Numa primeira análise, tendo em conta a
amostra, percebe-se um número reduzido de
publicações. A escassez de publicações nas ba-
ses de dados de maior relevância académica,
traduz a fraca atenção da comunidade cientí-
fica para região do Douro, sendo este um dado
que se pretende alertar neste estudo.
Quadro 1 – Número de publicações por ano de ocorrência e respectivas referências – WoS e Scopus
Ano Nº de artigos Referência
2009 1 Cunha, Peres, Morais & Reis (2009)
2010 2 Fazenda, da Silva & Costa (2010); Tavares & de Azevedo (2010)
2011 2 Coelho & Dias (2011); Oliveira, Rodrigues, Nunes, Dias, Coelho, Oliveira, Carrapatoso &
Leitão (2011)
2012 0
2013 1 Feio & Guedes (2013)
2014 3 Correia, & Brito (2014); Correia, Vaughan, Edwards & Silva (2014); Lanzara & Montella
(2014)
2015 3 Vieira, Rodrigues, Fernandes & Pires (2015); Lourenço, Pinto & Rebelo (2015); Rebelo,
Caldas & Guedes (2015)
2016 4 Genç & Filipe (2016); Vieira, Rodrigues & Teixeira (2016); Gonçalves & Maduro (2016);
Guedes & Joukes (2016)
2017 6
Martins, Gonçalves, Branco, Barbosa, Melo & Bessa (2017); Gouveia, Rebelo, Lourenço &
Guedes (2017); Loureiro & Cunha, (2017); Jorge, Belo, Losada, Santana & Pereiro (2017);
Marques & Marques (2017); Meirinhos, Aguiar & Salvado (2017)
2018 11
Cardoso, Martins, Gonçalves, Branco, Moreira & Au-Yong-Oliveira (2018); Rodrigues,
Gonçalves, Teixeira, Martins & Branco (2018); Brandão, Costa & Buhalis (2018); Lopes,
Muñoz & Alarcón-Urbistondo (2018); Borges (2018); Carvalho (2018); Bordonaro (2018);
da Silva, Fernao-Pires & Bianchi-de-Aguiar (2018); Gonçalves (2018); Pereiro, (2018);
Mota & Losada (2018)
Fonte: Elaboração Própria
Observando de forma mais detalhada o Qua-
dro 1, antes de 2009, não existem artigos sobre
turismo no Douro, nas duas bases consultadas,
assim como no ano de 2012. Outro dado inte-
ressante, que importa ser reforçado, prende-se
com o facto de que a partir de 2013 a frequência
de artigos passa a ser crescente. Mais detalha-
damente, no ano de 2009, a amostra revela um
artigo publicado nesse subcampo, já no ano de
2018, aparecem onze artigos. Destaca-se ainda
que, a partir de 2014 o número de publicações
nestas bases de dados aumenta, o que não só
pode indicar um crescimento da produção cien-
tífica nesse subcampo, mas também uma conso-
nância dessa produção com os critérios rígidos
de indexação presentes na WoS e Scopus.
Alguns dos resultados alcançados sobre os
temas recorrentes dentro dessa produção cientí-
fica, estão expostos na Figura 2 de forma agre-
gada. Para um melhor entendimento sobre as te-
máticas que emergem da produção cientifica,
procedeu-se à análise sistemática de cada artigo
individualmente. Partindo do seu entendimento,
subdividiu-se a produção científica em três gru-
pos, admitindo-se que estes ajudam a uma
inteligibilidade mais global do panorama literá-
rio nesta temática. No grupo “Plataformas, e-
commerce e e-turismo”, foram considerados ar-
tigos que desenvolveram softwares e platafor-
mas de apoio ao turismo da região do Douro.
Estas propostas pretendem melhorar a experiên-
cia do visitante, possibilitando maior acessibili-
dade e comunicação com o destino turístico. Os
artigos reunidos no grupo “Gestão, Networking
e Marketing” desenvolveram abordagens cien-
tíficas ao processo e desenvolvimento econó-
mico em tordo dos empreendimentos turísticos
da região do Douro. Destacando na sua maioria,
os processos inerentes à relação entre a procura
e a oferta de serviços turísticos. No caso do es-
pólio cientifico compreendido no grupo “Patri-
mónio, Cultura, Turismo rural e Desenvolvi-
mento”, compreende-se que na sua globalidade
os seus autores focam as características endémi-
cas da região, dando destaque a aspetos diferen-
ciadores em relação a outros destinos turísticos.
Dentro desta temática, percebem-se ainda al-
guns estudos que procuram promover dinâmi-
cas turísticas na região demarcada do Douro vi-
nhateiro.

Revista Portuguesa de Estudos Regionais, nº 56
70
Figura 2 – Principais temas da produção científica sobre o turismo no Douro - WoS e Scopus
Fonte: Elaboração própria
Com base na Figura 2, pode-se afirmar que a
temática denominada gestão, network e marke-
ting, ocorre em 50% das publicações neste sub-
campo em análise. Tal facto pode também refle-
tir uma tendência geral das publicações sobre
turismo, que cada vez mais se aproximam da
área de gestão ou marketing, tal qual afirmado
por Nash (2007) e Réau (2018)6. Ainda segundo
a mesma figura (Figura 2), 42% dos artigos ana-
lisados tratam da temática denominada de patri-
mónio e cultura, turismo rural e desenvolvi-
mento. Esse dado revela o que poderá ser uma
das principais identidades dos estudos realiza-
dos sobre o turismo no Douro. Alguns autores
(Carvalho, Salazar, & Neves 2011; Bernardo et
al., 2018), apontam a ligação da imagem do ter-
ritório Douro à paisagem cultural Património da
Humanidade, uma vez que, como referido ante-
riormente, recebeu em 2001 a classificação da
UNESCO de “paisagem evolutiva viva”. As-
sim, o resultado da grande ocorrência dessa te-
mática muito provavelmente tem a ver com essa
relação quase direta que é comumente atribuída
entre Douro e a sua afamada paisagem.
Por fim, a temática denominada plataformas,
e-comerce e o e-turismo, é a que aparece em
proporção inferior na Figura 2, ocorrendo em
8% dos artigos analisados. Por serem conside-
rados assuntos de vanguarda, muito ligados à
utilização de novas tecnologias, essas temáticas
relacionadas ao turismo podem ser consideradas
emergentes, o que explicaria a sua pequena
6 Esses autores ressaltam que recentemente e de um modo geral, é
possível observar uma influência crescente do poder da indústria
do turismo no processo de pesquisa sobre o assunto. Réau (2018),
apoiado em estudos como os de Nash (2007), afirma que desde
proporção até o momento, para o subcampo em
questão.
Para este estudo, considerou-se igualmente
relevante destacar a metodologia utiliza pelos
autores. Partindo de uma de conteúdo, foi pos-
sível classificar os 33 artigos e agrupar de
acordo a taxonomia que mais de adequa a cada
estudo. Para o efeito, considera-se uma metodo-
logia de cariz conceptual, em estudos que pro-
põem a utilização das TIC (Tecnologias de In-
formação e Comunicação) aplicadas ao turismo,
sem aferir qualquer tratamento estatístico ou de
conteúdo associado ao desenvolvimento das
plataformas que os mesmos propõem. No caso
dos estudos considerados de foro quantitativo,
percebe-se o estudo de variáveis e pressupostos
através de modelos correlacionais que resultam
da recolha de dados através de questionários ou
bases de dados secundárias. Em artigos cujo o
estudo incidiu na análise de conteúdo de entre-
vistas e/ou questionários, estudos de caso, bem
como estudos exploratórios de análise biblio-
gráfica, considerou-se que estes compreendem
uma metodologia qualitativa. Da análise de con-
teúdo aos artigos base (33 artigos), foi possível
ainda considerar artigos com terminologia
mista, isto é, na sua conjetura metodológica
apresentam um estudo que viabiliza a análise de
conteúdo e o estudo de variáveis latentes.
A seguir, na Figura 3, pormenoriza-se essa
classificação, tendo por base a temática da
amostra, mapeando-a por metodologia utili-
zada.
2002-2003, os pesquisadores das áreas de Marketing/Gestão são
os mais representados em estudos de turismo, seguidos pelos pes-
quisadores do campo da Geografia, Sociologia e Antropologia.
Essa condição se revelaria permanente desde então.

O Turismo no Douro: Notas Bibliométricas Sobre a Literatura Científica
71
Figura 3 - Métodos de análise utilizada em cada temática - WoS e Scopus
Fonte: Elaboração própria
Como se observa, os estudos que se concen-
tram no comércio digital e plataformas, associ-
ados ao turismo no Douro, utilizam uma meto-
dologia comum, nomeadamente conceptual.
Trata-se de uma temática muito ligada à inova-
ção, o que talvez explique o caráter exploratório
ao mesmo tempo que descritivo e detalhistas
dos trabalhos publicados. Ainda de acordo o
mesmo gráfico podemos observar que os auto-
res que estudam este subcampo numa perspetiva
de desenvolvimento, ruralidade, património
cultural e cultura, optam por métodos qualitati-
vos, ligados à exploração aprofundada de estu-
dos de caso. Não se pode também esquecer que
esse tipo de temática aproxima-se, por vezes, de
uma visão antropológica, o que também justifi-
caria a opção por métodos qualitativos. Quanto
ticas centradas na esfera da gestão, as mesmas
parecem privilegiar maioritariamente a metodo-
logia quantitativa. Isso nos leva a inferir que,
talvez essa ocorrência se jusitique pelo fato de
esses estudos estarem mais ligados a uma visão
do turismo enquanto indústria e negócios.
A figura seguinte (Figura 4) apresenta o pa-
norama das publicações sobre o turismo no
Douro em função das instituições superiores as-
sociadas a essa produção científica. Neste caso,
a delimitação foi feita de acordo com a afiliação
académica do primeiro autor de cada artigo, no
período entre 2009 e 2018, com 2 ou mais arti-
gos publicados nas bases de dados em estudo,
para um melhor entendimento do gráfico. De sa-
lientar que, entre 2012 e 2014 não foram encon-
trados artigos nas bases de dados em estudo.
Pode-se observar que, a produção científica
sobre turismo no Douro se concentra em insti-
tuições portuguesas. Apesar de existirem cerca
de 17 universidades associadas à produção ci-
entífica da região do Douro, a Universidade de
Trás-os-Montes e Alto Douro (UTAD) é a que
mais se destaca nesse sentido, com cerca de dez
artigos publicados. De entre as restantes, a Uni-
versidade do Porto, Instituto Superior Técnico
de Lisboa, Instituto Politécnico de Bragança
(IPB), Instituto Politécnico de Portalegre (IPP),
Universidade Portucalense, e Instituto Superior
de Maia (ISMAI), apresentam com duas publi-
cações. Com apenas um artigo publicado, temos
a Universidade de Near East, Chipre; ás tema-
Universidade do Minho; Instituto Politécnico de
Viseu; Universidade de Aveiro; Escola Superior
Técnica de Lamego; Instituto Universitário de
Lisboa (ISCTE-IUL); Instituto Politécnico Vi-
ana do Castelo; Universidade de Nápoles Fede-
rico II, Itália; Universidade de Évora e a Uni-
versidade Nova de Lisboa.
Considerando os dados referentes às áreas
científicas que mais produzem sobre o turismo
no Douro, elaborou-se a Figura 5. Tal como na
figura anterior (Figura 4), utilizou-se como cri-
tério as informações referentes ao autor princi-
pal ou primeiro autor de cada artigo da amostra.
0
1
2
3
4
5
6
7
8
9
10
11
12
Plataformas e-Commerce e e-
Turismo
Gestão, Networking e Marketing Patrimonio, Cultura, Turismo
rural e Desenvolvimento
Conceptual Qualitativo Quantitativo Misto

Revista Portuguesa de Estudos Regionais, nº 56
72
Figura 4 – Produção científica anual das universidades com dois ou mais artigos – WoS e Scopus
Figura 5 – Áreas científicas dos autores dos artigos - WoS e Scopus
Fonte: Elaboração própria
De acordo com a Figura 5, apesar de se veri-
ficar alguma diversidade nas áreas recorrentes,
a grande maioria dos autores dos artigos (44%)
está concentrada na área gestão. Em seguida,
aparecem antropologia, economia e engenharia
informática, todas elas com 14%. Em menor es-
cala aparecem arquitetura e engenharia ambien-
tal, ambas com recorrência de 5%. Educação e
ciências alimentares aparecem com 2%, respe-
tivamente.
O quadro que se segue (Quadro 2), compre-
ende a análise do VoSViewer aos artigos da
amostra e o resultado da consulta ao site Sci-
mago Journal & Country Rank (SJR). O
software permitiu destacar os artigos com mais
de uma citação e as revistas a que pertencem,
enquanto através do SJR foi possível quantificar
a produtividade e o impacto das revistas, em
função dos artigos em estudo. Segundo o
VoSViewer, de entre o espólio de 33 artigos,
destacam-se 12, como mais de uma citação, per-
fazendo 27 citações em termos totais. De um
modo geral, a Revista Portuguesa de Estudos
Regionais (RPER) sobressai pelo maior número
de publicações sobre a temática em estudo, se-
guindo-se a European Journal of Tourism Re-
search e a Renewable Energy, com dois artigos
cada. As restantes revistas apresentam apenas
0
1
2
3
4
5
6
7
8
9
10
2009 2010 2011 2012 2013 2014 2015 2016 2017 2018
UPorto UTAD Téc. Lisboa IPB IPP UPortucalence ISMAI
44%
14%
14%
14%
5%
5%
2% 2%
Gestão
Eng. Informática
Economia
Antropologia
Arquitetura
Eng. Ambiental
Educação
Ciências Alimentares

O Turismo no Douro: Notas Bibliométricas Sobre a Literatura Científica
73
um artigo, no entanto, uma delas, assume o ar-
tigo com mais citações, cerca de 11 – Journal of
Destination Marketing and Management.
Acresce referir, que da totalidade das revistas
em destaque, apenas duas se enquadram num
fator de impacto (IF) de maior relevância, res-
petivamente, as revistas Renewable Energy e
Journal of Destination Marketing and Manage-
ment.
Quadro 2 – Revistas associadas aos artigos em análise com uma ou mais citações - WoS e Scopus
Revistas Artigos Citações IF Quartil H Index
Revista Portuguesa de Estudos Regionais 3 1 0,16 Q3 3
European Journal of Tourism Research 2 3 0,14 Q2 12
Renewable Energy 2 4 1,89 Q1 157
International Journal of Wine Business Research 1 1 0,46 Q2 29
International Journal of Business and Systems Re-
search 1 4 0,25 Q3 13
Journal of Destination Marketing and Management 1 11 1,35 Q1 24
Wine Economics and Policy 1 2 0,51 Q1 13
Worldwide Hospitality and Tourism Themes 1 1 0,29 Q3 14
Fonte: VOSViewer e Scimago Journal & Country Rank (2018), adaptado pelos autores.
3.2. Outputs das bases de dados WoS e
Scopus desagregadas
Após a exposição do panorama geral da
amostra dos 33 artigos, parte-se para uma aná-
lise segmentada, com a finalidade de se obter
uma compreensão pormenorizada sobre a pro-
dução nesse subcampo científico. Assim, os
próximos itens dizem respeito à análise desagre-
gada por bases dados. Além da ocorrência das
palavras-chave, tratar-se-á da análise das co-ci-
tações. Isso auxiliará no mapeamento do estado
da arte, da origem de cada temática localizada,
bem como das possíveis limitações, o que pode
gerar subsídios para propostas de investigações
futuras.
3.2.1. Análise da ocorrência das palavras-
chave – formação de clusters
Com o recurso ao software VOSViewer obti-
veram-se alguns mapas das palavras-chave mais
recorrentes nos estudos analisados. O software
em questão não permite que essa averiguação
seja feita de maneira agregada, dos 33 artigos
em conjunto. Desse modo, a Figura 6 revela, a
ocorrência das palavras-chave para os artigos da
base WoS.
Figura 6 - Mapa das palavras-chave: WoS
Fonte: VOSViewer, elaborado pelos autores.

Revista Portuguesa de Estudos Regionais, nº 56
74
Como se pode observar pela Figura 6, exis-
tem três grupos distintos destacados, de acordo
a sua relevância, sendo o grupo representado
pela cor vermelha o de maior peso e ocorrência
(palavras-chave ligadas à consumo e satisfação
do consumidor) e o grupo representado pela cor
azul (palavra-chave enoturismo), o menor,
nesse mesmo sentido. Mediante a avaliação dos
clusters originados pelo software, foi feita uma
reflexão sobre a sua temática, com recurso à
análise do conteúdo dos artigos em questão,
tendo-se chegado a possíveis agrupamentos te-
máticos. O resultado dessa comparação é apre-
sentado no Quadro 3.
Quadro 3 – Composição e descrição de clusters por palavras-chave - WoS
Cluster 1 – Experiência e Satisfação do Consumidor*
Em relação a este cluster podemos verificar que há uma forte tendência por parte dos autores de falar sobre o turismo no
Douro sob a perspetiva do consumidor e da sua relação com o turismo, privilegiando a sua experiência e a satisfação
quando esse usufrui de serviços turísticos na região.
Cluster 2 – Património**
Em relação ao cluster 2, é visível que a questão do território enquanto património tem destaque nos estudos sobre o tu-
rismo. Alguns autores aparentam estar mais envolvidos com as questões espaciais e geográficas do território, salientando
o que para si é a identidade do turismo no Douro.
Cluster 3 – Enoturismo***
O cluster 3 é claramente o reflexo da região Douro ter vocação vitivinícola, bem como do fato de esse tipo de cultura ter
um forte peso em termos de atração turística na região. Este segmento da atividade turístico atrai um grande número de
visitantes motivados pela apreciação do sabor e aroma dos vinhos e das tradições e culturas das localidades locais, desper-
tando assim, o interesse de alguns autores.
* Grupo de palavras-chave representadas pela cor vermelha, na Figura 6; ** Grupo de palavras-chave representadas pela cor verde, na Figura
6; *** Grupo de palavras-chave representadas cor azul, na Figura 6
Fonte: Elaboração própria
À semelhança da figura anterior, a Figura 7
resulta do mesmo tratamento dos dados, tendo
por base as palavras-chave dos artigos da plata-
forma Scopus.
Figura 7 - Mapa das palavras-chave: Scopus
Fonte: VOSViewer, elaborado pelos autores
Como se pode observar, ao analisar as pala-
vras-chave desses artigos, o software destaca
três grupos de ocorrência, sendo que o de maior
evidência está ligado a palavras como consumo
e satisfação do consumidor, tal qual o ocorrido
na Figura 6. Em coerência com os procedimen-
tos realizados com os artigos da plataforma WoS
(Figura 6, Quadro 3), o Quadro 4 foi construído
a partir da análise da Figura 7, juntamente com
a consulta e análise de conteúdo dos artigos pre-
sentes na plataforma Scopus. Assim, o quadro
seguinte propõe um conjunto de temáticas re-
correntes desta amostra.

O Turismo no Douro: Notas Bibliométricas Sobre a Literatura Científica
75
Quadro 4 – Composição e descrição de clusters por palavras-chave – Scopus
Cluster 1 – Experiência e Satisfação do Consumidor*
À semelhança do cluster 1 da tabela 3, também estes autores fazem referência à relação dos turistas com a experiência no
destino. O turismo do Douro enquanto produto consumível tem sido frequentemente alvo de estudo por parte destes auto-
res.
Cluster 2 – Território**
No cluster 2, o software utilizado destaca que na base de dados Scopus os autores têm abordado a questão do território do
Douro como pilar para se pensar o turismo na região. Verifica-se uma tendência em dar destaque ao potencial geográfico
e características endémicas da região nesses artigos.
Cluster 3 – Plataformas***
Este cluster reflete a introdução das novas tecnologias no turismo do Douro. Alguns autores pretendem aprimorar a expe-
riência turística propondo ferramentas multiplataforma que permitem apoiar os visitantes, antes, durante e após a sua ex-
periência na região.
* Grupo de palavras-chave representadas pela cor vermelha, na Figura 7; ** Grupo de palavras-chave representadas pela cor verde, na Figura
7; *** Grupo de palavras-chave representadas cor azul, na Figura 7
Fonte: Elaboração própria
3.2.2. Análise das co-citações - formação
de clusters
A co-citação consiste na frequência com que
duas unidades são citadas em simultâneo, li-
gando documentos, autores ou revistas de
acordo com a frequência com que são mencio-
nados. (Small, 1973). Uma suposição funda-
mental da análise das co-citações é que quanto
mais dois itens são citados em conjunto, mais
provável é que o seu conteúdo esteja relacio-
nado. Este é o fundamento da associação rigo-
rosa, que é frequentemente realizada por espe-
cialistas em matéria de investigação, preten-
dendo citar as publicações que consideram ser
mais importantes para o seu estudo, por exem-
plo (White & McCain, 1998). A análise de co-
citações da área que se pretende analisar evidên-
cia as categorias mais citadas, o que permite
averiguar a sua influência no campo de pes-
quisa, sendo que, quanto mais citadas forem,
mais evidente é sua importância (Üsdiken & Pa-
sadeos, 1995).
Assim, com o objetivo de destacar as contribui-
ções mais influentes, bem como os autores mais
ativos no subcampo científico em foco, reali-
zou-se uma análise para cada base de dados con-
sultada, com a produção de outputs independen-
tes. Dado o tamanho da amostra, o critério
usado para executar a análise de co-citações foi
o autor ser citado pelo menos duas vezes. Neste
ponto, também optou-se por apresentar as com-
ponentes gráficas resultantes do software
VosViewer e o top 5 dos autores (5 autores mais
recorrentes) de cada cluster concebido.
Tal como realizado por outros autores na
área da bibliometria (Waltman, van Eck, & No-
yons, 2010), utilizou-se o software VOSViewer
para a obtenção de uma rede de referências, de
acordo com o objetivo e metodologia deste es-
tudo. A Figura 8 representa a componente grá-
fica gerada dos agrupamentos das referências
utilizadas pelos diferentes autores dos artigos
sobre o turismo no Douro encontrados na WoS.
Figura 8 - Mapa bibliométrico das co-citações e clusters WoS – Top 5 (duas ou mais citações)
Fonte: VOSViewer, elaborado pelos autores
Cluster 2Cluster 1 Cluster 3 Cluster 4

Revista Portuguesa de Estudos Regionais, nº 56
76
De um modo geral, o software VOSViewer
destacou 36 referências existentes na amostra
sobre turismo no Douro, disponíveis na WoS.
Essas, estão divididas em 4 clusters, sendo que
o cluster 1 é composto por 6, o cluster 2 por 12,
e os clusters 3 e 4 por 9 referências cada7.
O programa não só apresenta os autores mais
citados, como também, os separa por possíveis
temáticas. Tendo em conta a sua composição, o
cluster 2 destaca-se pelo maior número de auto-
res com mais de duas citações, tendo sido o
principal foco dos artigos publicados nesse sub-
campo, no WoS, contrariamente aos restantes e
em particular ao cluster 1. Segundo o mesmo
mapa, os clusters centrais, representados nas co-
res vermelho e azul, aparentam ter uma relação
mais evidente, o que leva à inferência de que es-
tes dois grupos de autores citam-se frequente-
mente entre si. Ainda com base na Figura 8,
com exceção do cluster 3, os grupos apresenta-
ram forte coesão intergrupal, podendo indicar
que estes estão mais próximos em termos teóri-
cos (indicada pela aglomeração das esferas, Fi-
gura 8).
Com o objetivo de detalhar o mapeamento
realizado pelo software, observável na Figura 8,
o Quadro 5 apresenta as referências mais citadas
pelos autores dos artigos sobre turismo no
Douro, encontrados na WoS. Para tal, os conte-
údos desses textos foram analisados de maneira
integral, sendo possível identificar algumas ten-
dências da literatura sobre o subcampo em foco.
Por uma questão de espaço e maior inteligibili-
dade, optou-se pela apresentação dos cinco au-
tores mais citados em cada cluster.
Quadro 5 – Clusters das co-citações mais recorrentes, por autores e temáticas - WoS
Autores Citações Clusters
Richards (2001) 5
1 – Património cultural e paisagís-
tico
Marques (2011) 4
McKercher, Ho e du Cros (2005) 3
Ferreira (2003) 2
Henriques (2018) 2
Baggio, Scott e Cooper (2010) 6
2 – Gestão do turismo, inovação,
networking paradigma
Booyens e Christian (2016) 2
Borgatti (2003) 2
Breda (2005) 2
Costa (2005) 2
Charters e Ali-Knight (2002) 6
3 – Marketing no enoturismo
Huang, Backman, Backman, e Moore (2013) 4
Buhalis (2000) 2
Correia, Ascenção e Charters (2004) 2
Ernst e Bülthoff (2004) 2
Bruwer e Alant (2009) 4
4 – O valor e a satisfação no con-
sumo de vinho
Lavrador & Rocha (2010) 4
Hall (2016) 3
Anderson, Fornell, e Lehmann (1994) 2
Palmatier (2008) 2
Fonte: Elaboração própria
No cluster 1, a maior parte dos autores estão
focados em estudar a relação entre património
cultural e o turismo, sendo abordada a impor-
tância que esta relação adquire em regiões com
7 O afastamento ou a aproximação de cada referência, diz respeito
a uma possível separação temática. Contudo, a apreciação dos ar-
tigos por temática, será realizada mais adiante, no Quadro 5.
indicadores de desenvolvimento turístico e des-
tacada herança cultural material ou imaterial. É
ainda discutido por alguns autores o papel do tu-
rismo na ressignificação da identidade dos

O Turismo no Douro: Notas Bibliométricas Sobre a Literatura Científica
77
destinos turísticos, como por exemplo centros
históricos, percursos turístico-culturais, paisa-
gens e tradições.
Numa breve análise dos artigos do cluster 2,
apraz referir que a grande maioria aborda a im-
portância da gestão e inovação da rede de desti-
nos turísticos. De acordo à generalidade dos au-
tores, estes poderão ser os fatores críticos de su-
cesso para um desenvolvimento turístico sus-
tentável. A temática do networking tem ganho
destaque na literatura sobre o turismo, e isso se
reflete nos dados obtidos. Essa rede consiste um
sistema de suporte onde existe partilha de servi-
ços de informação entre indivíduos ou grupos
com interesses em comum, daí a sua relevância
na gestão de serviços turísticos. Existe uma pre-
ocupação evidente por parte de alguns autores
em salientar a importância desta ferramenta do
marketing pessoal, talvez por seu papel promo-
tor de conexão entre a procura e a oferta, o que
aproximaria os interesses em comum no mundo
dos negócios.
Ainda considerando o Quadro 5, o mesmo
revela que, na sua maioria, os artigos gerados
pelo cluster 3 abordam o papel do marketing no
vinho como principal cartão de visita de deter-
minados destinos turísticos. Alguns autores que
compõem este cluster salientam algumas estra-
tégias de marketing como sendo o pilar do
desenvolvimento turístico de determinadas re-
giões, assim como a sua extrema relevância para
o enoturismo. Verifica-se em alguns casos que
a associação do marketing ao enoturismo surge
pela intenção de criar valor ao produto turístico
e disseminá-lo pelos canais de comunicação,
com o objetivo de tornar o serviço turístico atra-
tivo.
Tendo em conta o conteúdo bibliográfico do
cluster 4, pode-se afirmar que existe uma forte
tendência por parte dos autores deste grupo em
abordar as percepções dos consumidores de
bens e serviços turísticos. Estes destacam, o va-
lor, a qualidade e a satisfação, como fatores de-
terminantes na relação e nas experiências leva-
das a cabo pelo consumidor em contexto turís-
tico, mais concretamente, no consumo de vinho.
No mesmo cluster, alguns autores apresentam
algumas perspectivas sobre drivers relacionais
de valor e a satisfação para o cliente. Ainda
nesse grupo, alguns estudos destacam os com-
ponentes que têm um efeito moderador na rela-
ção entre o comportamento do cliente face ao
consumo do produto, tendo em vista o mercado
e a rentabilidade. No que diz respeito à compo-
nente gráfica gerada através dos artigos dispo-
níveis na base Scopus, apresenta-se a seguinte
figura:
Figura 9 - Mapa bibliométrico das co-citações e clusters Scopus – Top 5 (duas ou mais citações)
Fonte: VOSViewer, elaborado pelos autores
Com base nos mesmos critérios de análise
apontados para a Figura 8, na Figura 9 o
VOSViewer destacou 50 referências dos artigos
sobre o turismo no Douro, disponíveis na base
de dados Scopus, distribuídas em 5 grupos. Das
50 referências, 8 estão compreendidas no clus-
ter 1 e 23 no cluster 2, sendo esse o grupo mais
expressivo de autores com mais de duas cita-
ções. No cluster 3 encontramos apenas 3 refe-
rências, enquanto que o cluster 4 é composto
por 7 e por fim, o cluster 5 aparece com 9 refe-
rências.
Evidenciam-se 5 temáticas com que os auto-
res mais citados se relacionam, representadas
por 5 cores diferentes. Observando mais atenta-
mente a Figura 9, verifica-se uma maior proxi-
midade entre os autores da lateral esquerda do
mapa, o que sugere que, apesar de provavel-
mente se localizarem em temáticas diferentes,
estes são citados com regularidade, entre si, na
fundamentação de seus estudos. Ainda segundo
este mapa bibliométrico, o cluster 5 revela uma
maior dispersão intergrupal.
Cluster 1 Cluster 2 Cluster 3 Cluster 4 Cluster 5

Revista Portuguesa de Estudos Regionais, nº 56
78
Com o intuito de compreender e analisar
mais detalhadamente a Figura 9, apresenta-se o
Quadro 5 com as referências mais citadas pelos
investigadores que publicam sobre o turismo no
Douro na base de dados Scopus. À semelhança
do Quadro 5, são apresentados os top- 5 autores
de cada cluster, com exceção do cluster 3, pelo
facto do software ter gerado este grupo com
base em 3 estudos. Os clusters foram classifica-
dos de acordo a interpretação do seu conteúdo
literário, identificando assim, algumas das ten-
dências sobre a temática em estudo.
Quadro 6 – Clusters das co-citações mais recorrentes, por autores e temáticas - Scopus
Autores Citações Clusters
Hakansson, Tunisini e Waluszewski (2006) 9
1 – Marketing e geografia
económica
Ford e McDowell (1999) 6
Bathelt e Glückler (2003) 5
Waluszewski, Harrison e Hakansson (2004) 5
Amin e Thrift (1995) 3
Baggio (2008) 10
2 – Gestão turística
Costa (1996) 10
Buhalis e Peters (2006) 8
Cooper (2008) 8
Getz e Brown (2006) 8
Gonçalves (1999) 8
3 – Mercado e novas tendên-
cias
Martins, Gonçalves, Branco, Barbosa, Melo e Bessa (2017) 7
Rodrigues, Goncalves, Teixeira, Martins e Branco (2018) 5
Ribeiro (1998) 10
4 – Turismo rural
Pereiro (2018) 7
Marques (2009) 6
Santana (2009) 5
Silva (2006) 5
Rebelo e Caldas (2013) 14
5 – Paisagem e ambiente
Elliott e Whitfield (2011) 6
Wood, Guerry, Silver e Lacayo (2013) 6
Guerry e Hunter (2002) 5
Chan, Shaw, Cameron, Underwood & e Daily (2006) 4
Fonte: Elaboração própria
Analisando em profundidade os artigos do
cluster 1, é possível evidenciar a relação entre a
geografia, economia e o marketing como medi-
ador das relações de negócio. A maior parte dos
artigos refere que a perspetiva geográfica está
fortemente relacionada com a alteração da eco-
nomia global, graças à evolução e expansão ori-
ginada pelas redes de negócio, ou seja, a globa-
lização económica. Esta ligação entre economia
e geografia tem sido um denominador comum a
grande maioria dos artigos, verificando-se uma
preocupação constante dos investigadores refe-
renciados em tratar de soluções que incremen-
tem uma melhoria do desenvolvimento regional
e do próprio valor transacionável do turismo.
No caso do cluster 2, os artigos na sua gene-
ralidade referem-se às dinâmicas, práticas e
princípios do turismo, explorando o que pode-
rão ser os fatores críticos de sucesso para as em-
presas. Alguns dos autores neste cluster explo-
ram a questão do desenvolvimento de pequenas
e médias empresas, bem como o seu potencial
de crescimento e de inovação do setor do tu-
rismo. Outros artigos exploram ainda o planea-
mento efetivo e eficiente de estratégias para ex-
plorar o desenvolvimento turístico local.
No que diz respeito ao cluster 3 os estudos
de referência convergem no sentido do desen-
volvimento de novas tendências que o mercado
do turismo exige, como a criação de novas

O Turismo no Douro: Notas Bibliométricas Sobre a Literatura Científica
79
plataformas de apoio ao mercado turístico, com
o objetivo de facilitar e potenciar as experiên-
cias turísticas dos visitantes. Esta tendência tem
sido apontada como um novo segmento de mer-
cado na área do turismo em crescimento, tendo
vindo a ser cada vez mais explorada por autores
que estudam as novas apostas tecnológicas em
paralelo com as necessidades a que o turismo
hoje em dia está sujeito. Verificam-se ainda, al-
guns estudos neste cluster, que apontam para a
globalização como uma forma de desnacionali-
zação, sendo a criação de um mercado transna-
cional que mais contribui para manter essa ten-
dência de cariz económica. Tendo por base os
artigos do cluster 4, a maioria dos autores de re-
ferência fazem uma abordagem do turismo rural
sobre uma perspetiva antropológica. Por um
lado, alguns autores apresentam um estudo mais
exploratório e aprofundado de um determinado
destino turístico, com o intuito de perceber as
motivações, as ofertas e a relação entre os dife-
rentes promotores de serviços turísticos.
Analisando mais aprofundadamente o clus-
ter 5 verifica-se que os artigos abordam na sua
grande maioria questões relacionadas com a
paisagem, ecologia, ecossistema, ambiente e
agricultura. Estes autores na sua generalidade
procuram perceber a capacidade da sustentabi-
lidade dos recursos naturais adjacentes aos ter-
ritórios turísticos, relacionados com a explora-
ção do vinho, agricultura e paisagem. Pesqui-
sando possíveis ligações entre os resultados de-
sagregados das duas bases de dados, é possível
destacar algumas evidências entre as duas pla-
taformas. Se por um lado, em relação às refe-
rências dos artigos da WoS, o enoturismo e con-
sumo de vinho são temas que surgem com fre-
quência, por outro, nas referências relativas à
amostra Scopus, surgem abordagens relativas
ao turismo rural, em detrimento de questões li-
gadas ao vinho.
4. CONCLUSÕES, LIMITAÇÕES E
SUGESTÕES
O presente estudo procurou mapear e discu-
tir uma certa produção académica em diferentes
campos do conhecimento, tentando responder
que aspetos e dimensões vêm sendo destacados
e privilegiados quando se trata de pensar o tu-
rismo no Douro. Nesse sentido, inventariamos e
descrevemos essa produção de artigos científi-
cos indexados nas principais bases de dados, no
desafio de conhecer o já construído e produzido.
Sustentados e movidos pela intenção de dar
conta de um determinado saber, que se evolua
cada vez mais e de divulgá-lo para a sociedade,
foi disponibilizada uma série de informações
que pode servir como ponto de partida para ini-
ciar novos ciclos de investigação nesse sub-
campo científico em concreto.
Analisando as principais áreas científicas
dos autores base destaca-se a área de gestão, se-
guida de antropologia, economia e engenharia
informática (Figura 5). Arquitetura, ciências ali-
mentares, educação e engenharia ambiental
aparecem em menor escala. Essas informações
também podem dar subsídios para um melhor
entendimento sobre a ocorrência dos principais
temas da produção de científica em torno do tu-
rismo no Douro. Numa análise agregada dos 33
artigos, os estudos que se enquadram na temá-
tica gestão, networking e marketing são os mais
recorrentes (Figura 2), seguido da temática do
património e cultura, turismo rural e desenvol-
vimento e do tema plataformas, e-comerce e e-
turism, esse em menor escala. Ainda, tal evidên-
cia é corroborada pelo resultado da análise dos
dados desagregados da ocorrência das palavras-
chave dos artigos. Ela aponta que nas duas bases
de dados há uma prevalência de conteúdos liga-
dos à experiência e satisfação do consumidor;
ou seja, tópicos muito ligados à temática da ges-
tão e marketing.
Em termos de métodos científicos mais re-
correntes, destacam-se as pesquisas qualitati-
vas, o que por si só, demonstra que a produção
científica sobre esta temática foca-se essencial-
mente no caráter exploratório da subjetividade
do objeto de estudo (Figura 3). Estes autores
procuram desta forma compreender e interpre-
tar o comportamento do consumidor, estudando
as suas particularidades e experiências individu-
ais. Aparentemente estes autores procuram tam-
bém identificar hipóteses para um determinado
problema e descobrir as perceções e expectati-
vas dos consumidores em relação a estas.
Quanto à análise das co-citações, conseguiu-
se destacar os principais autores de referência
para os investigadores que escreveram artigos
sobre o turismo no Douro. Esses estudos de ori-
gem trazem temáticas muito semelhantes às que
aparecem nos próprios artigos da amostra. Esse
dado pode revelar pouca diversificação temática
nesse subcampo, com a sensação de que só se
produz sobre o que já se se tem produzido. Em
outras palavras, a análise das co-citações parece
confirmar que os estudos sobre turismo no
Douro tendem a ser mais de cariz confirmatório
do que exploratório.

Revista Portuguesa de Estudos Regionais, nº 56
80
É importante reforçar que, em ciência, a es-
colha e desenvolvimento de estudos ligados a
determinados temas faz parte não só de questões
ligadas a afinidades e aspetos criativos, mas
também de disputas políticas no interior das ins-
tituições de ensino e organizações de suporte.
Considerando-se tudo isso, observou-se que as
áreas científicas que estudam o turismo no
Douro são pouco diversificadas, sendo que as
ciências sociais, mais especificamente as ciên-
cias sociais aplicadas, são campo mais presente
na produção científica.
Pensando-se em possíveis limitações do pre-
sente trabalho, pode-se apontar que não foram
esgotadas todas as possibilidades de mapea-
mento sobre a produção científica sobre turismo
no Douro. Tendo-se a consciência de que neste
estudo a pesquisa restringiu-se a artigos publi-
cados apenas nas bases de dados WoS e Scopus,
é ilusório pensar que estamos a escrever a his-
tória da produção académica desse subcampo
científico, no período delimitado. Estamos,
quanto muito, a escrever uma das possíveis his-
tórias do que vem sendo produzido sobre o tu-
rismo no Douro, construída a partir da leitura
dos artigos encontrados nessas duas bases de
dados. Além disso, o facto de as bases de inde-
xação consultadas estarem confinadas tão so-
mente à atribuição de palavras-chave para reali-
zar a pesquisa, pode condicionar os resultados
em termos de amostra obtida.
Ainda em relação aos métodos utilizados
neste estudo, é visível a presença de alguma
subjetividade, uma vez que, estes procedimen-
tos pressupõem uma interpretação pessoal. Es-
pera-se ainda, com este estudo, ter criado con-
dições para que um maior número de investiga-
dores interessados em pesquisar o turismo no
Douro estabeleça contato com o histórico da bi-
bliografia já produzida, facilitando a circulação
e intercâmbio entre a produção construída e
aquela a construir. Apesar do evidente aumento
de publicações nos últimos anos, considera-se
ainda reduzida a contribuição científica sobre
esta região. Considerando o dinamismo, o forte
crescimento e o destaque que tem vindo a carac-
terizar o turismo no Douro nos últimos anos, es-
perava-se que esse facto desperta-se o interesse
de disciplinas e centros de investigação para o
estudo mais intensivo deste caso em particular.
Embora haja ainda um número escasso de
publicações disponíveis que tratem do turismo
no Douro dentro das bases de dados de referên-
cia académica com maior fator de impacto, ob-
servou-se que essa produção apresenta uma ten-
dência de crescimento a partir de 2014. Ficou
igualmente evidente a baixa dispersão geográ-
fica das instituições que se debruçam sobre esse
subcampo, sendo que a maior parte das institui-
ções que exploram esta região está circunscrita
ao norte de Portugal.
Quanto às sugestões, seria importante para
uma compreensão mais holística do turismo no
Douro que propostas de investigações futuras
fossem ainda mais pluridisciplinares do que as
que já existem. Haveria aí um grande campo a
ser explorado também por outras ciências, como
por exemplo, geografia, geologia ou a arqueo-
logia. Considera-se também que seria enrique-
cedor em termos do debate e intercâmbio cien-
tífico se o turismo no Douro fosse abordado de
maneira mais intensa pelos investigadores inter-
nacionais, bem como de todo território nacional,
não se restringindo maioritariamente às institui-
ções do norte de Portugal. Por fim, seria interes-
sante desenvolver um estudo bibliométrico que
explorasse a literatura científica sobre o turismo
no Douro para além das bases de dados utiliza-
das neste artigo, com ênfase nos repositórios
institucionais de teses de mestrado e doutora-
mento.
BIBLIOGRAFIA
Almeida, M.; Pedro, J. 2003. “A actividade
turística em torno de Lamego: Da vocação his-
tórica as novas oportunidades”, In Santos S.;
Manuel, X. (ed.): La Geografía y la gestión del
turismo. Santiago de Compostela: Universidade
de Santiago de Compostela.
Bernardo, E.; Jorge, F.; Mota, G.; Bordo-
naro, L.; Belo, M.; Losada, N.; Rodrigues, V.;
Pereiro, X. (2018). Para um enfoque territorial
do turismo no Douro. PASOS: Revista de Tu-
rismo y Patrimonio Cultural. Vol.21, nº3,
pp.300-330.
Bordonaro, L. (2018). Interview with Noel
B. Salazar, Cultural Mobilities Research (Cu-
MoRe), Faculty of Social Sciences, KU Leuven,

O Turismo no Douro: Notas Bibliométricas Sobre a Literatura Científica
81
Belgium. AIBR Revista de Antropologia Ibero-
americana, Vol.13, nº3, pp. 315-331.
Borges, I. (2018). The wine tourism in the
Douro demarcated region: The harvest festival
as a tourist product. European Journal of Tour-
ism Research, Vol.19, pp.145-148.
Brandão, F., Costa, C., & Buhalis, D. (2018).
Tourism innovation networks: a regional ap-
proach. European Journal of Tourism Re-
search, Vol.18, pp.33-56.
Cardoso, L., Martins, J., Gonçalves, R.,
Branco, F., Moreira, F., & Au-Yong-Oliveira,
M. (2018). A Proposal for an Electronic Nego-
tiation Platform for Tourism in Low-Density
Regions: Characterizing a Functional Analysis
and Prototype for the Douro Valley, Advances
in Intelligent Systems and Computing, Vol. 865,
pp. 280-292.
Carvalho, L. C., Soutinho, C., Paiva, T., &
Leal, S. (2018). Territorial intensive products as
promoters of regional tourism. The case study
of douro skincare. Holos, Vol.4, pp.122-136.
Carvalho, P., Salazar, A., & Neves, J.
(2011). A imagem percebida e o perfil do turista
de um destino turístico cultural: o caso do Alto
Douro Vinhateiro. Disponível em: <https://bdi-
gital.ufp.pt/bitstream/10284/1970/2/P. COSTA
_MARKETING%5B1%5D.pdf>.
Cobo, M. J., López‐Herrera, A. G., Herrera‐
Viedma, E., & Herrera, F. (2011). Science map-
ping software tools: Review, analysis, and co-
operative study among tools. Journal of the
American Society for Information Science and
Technology, Vol. 62, nº7, pp. 1382-1402.
Coelho A., Dias L. (2011) A Mobile Adver-
tising Platform for eTourism. In: Law R., Fuchs
M., Ricci F. (eds) Information and Communica-
tion Technologies in Tourism 2011(pp.203-
214). Springer, Vienna.
Correia, A., Vaughan, R., Edwards, J., &
Silva, G. (2014). The potential for cooperation
between wine and tourism businesses in the pro-
vision of tourism experiences: the case of the
Douro valley of Portugal. Revista Portuguesa
de Estudos Regionais, Vol.36, nº1, pp. 43-55.
Correia, R. F., & Brito, C. M. (2014). Mutual
influence between firms and tourist destination:
a case in the Douro Valley. International Re-
view on Public and Nonprofit Market-
ing, Vol.11, nº3, pp.209-228.
Cunha, C. R., Peres, E., Morais, R., & Reis,
M. C. (2009). The Inov@ Douro cooperative
network: shaping collaboration among Douro
Region viticulture companies focusing tour-
ism. Knowledge Management and Innovation
in Advancing Economies: Analyses and Solu-
tions - Proceedings of the 13th International
Business Information Management Association
Conference, Vol.3, pp. 271-283.
da Silva, A. L., Fernão-Pires, M. J., & Bian-
chi-de-Aguiar, F. (2018). Portuguese vines and
wines: heritage, quality symbol, tourism as-
set. Ciência e Técnica Vitivinícola, Vol.33, nº1,
pp. 31-46.
Fazenda, N., Nunes da Silva, F., & Costa, C.
(2010). Douro Valley Tourism Plan: The plan
as part of a sustainable tourist destination devel-
opment process. Worldwide Hospitality and
Tourism Themes, Vol.2, nº4, pp. 428-440.
Feio, A., & Guedes, M. C. (2013). Architec-
ture, tourism and sustainable development for
the Douro region. Renewable energy, Vol.49,
pp. 72-76.
Genç, T., & Filipe, J. A. (2016). A fuzzy
MCDM approach for choosing a tourism desti-
nation in Portugal. International Journal of
Business and Systems Research, Vol.10, nº1,
pp. 23-44.
Gonçalves, E. (2018). " Douro in motion,
villages with life"(Portugal). Charter of good
practices". PASOS: Revista de Turismo y Patri-
monio Cultural, Vol.16, nº2, pp. 457-464.
Gonçalves, E. C., & Maduro, A. V. (2016).
Complementarity and interaction of tourist ser-
vices in an excellent wine tourism destination:
The Douro Valley (Portugal). Wine and Tour-
ism: A Strategic Segment for Sustainable Eco-
nomic Development, Vol.1, pp. 123-132.
Gouveia, S., Rebelo, J., Lourenço-Gomes,
L., & Guedes, A. (2017). International demand
for the Douro (Portugal) river cruises: A gravity
model approach. Tourism Economics, Vol.23,
nº8, pp. 1679-1686.
Guedes, A., & Joukes, V. (2016). Hotel ships
on the Douro river and their relationship with
the terroir. Wine and Tourism: A Strategic Seg-
ment for Sustainable Economic Development,
Vol. 1, nº7, pp. 87-105.
Hanisch, B., & Wald, A. (2012). A biblio-
metric view on the use of contingency theory in
project management research. Project Manage-
ment Journal, Vol.43, nº3, pp. 4-23.
Jorge, F., Belo, M., Losada, N., Santana, O.,
& Pereiro, X. (2017). 15 years of Douro World
Heritage: evocative session. PASOS: Revista de
Turismo y Patrimonio Cultural, Vol.15, nº3, pp.
751-754.
Lanzara, E.; Montella, R. (2014). Cultural
Heritage. Best Practice and a new proposal. Best
Practices in Heritage Conservation and

Revista Portuguesa de Estudos Regionais, nº 56
82
Management: from the world to Pompeii, Vol.
46, pp. 1049-1058.
Lopes, A. P. F., Muñoz, M. M., & Alarcón-
Urbistondo, P. (2018). Regional tourism com-
petitiveness using the PROMETHEE ap-
proach. Annals of Tourism Research, Vol.73,
pp.1-13.
Loureiro, S. M. C., & Cunha, N. P. D.
(2017). Wine prestige and experience in en-
hancing relationship quality and outcomes:
wine tourism in Douro. International Journal of
Wine Business Research, Vol.29, nº4, pp. 434-
456.
Lourenço-Gomes, L., Pinto, L. M., &
Rebelo, J. (2015). Wine and cultural heritage.
The experience of the Alto Douro Wine Re-
gion. Wine Economics and Policy, Vol.4, nº2,
pp. 78-87.
Madureira, L. 2005. “Continuidade e mu-
dança na paisagem do Alto Douro Vinhateiro:
percepção, atitudes e preferências dos visitantes
e turistas”. Douro Estudos & Documentos, Vol.
3, nº 19, pp.43-53.
Marques, G. N. R. M., & Marques, J. M.
(2017). Historical and cultural wine heritage on
northwest Portugal as touristic resource. Rosa
dos Ventos, Vol. 9, nº1, pp. 107-119.
Martins, J., Gonçalves, R., Branco, F., Bar-
bosa, L., Melo, M., & Bessa, M. (2017). A mul-
tisensory virtual experience for thematic tour-
ism: A Port wine tourism application proposal.
Journal of destination marketing & manage-
ment, Vol.6, nº2, pp.103-109.
Meirinhos, A., Aguiar, A. R., & Salvado, J.
(2017). Turismo e Identidade Cultural: Os Pen-
dões Mirandeses. Revista Portuguesa de Estu-
dos Regionais, Vol.45, nº1, pp. 93-111.
Mota, G., & Losada, N. (2018). Promoção
Turística nos Websites Municipais: O Caso da
Região do Douro (NUT III). Revista Portu-
guesa de Estudos Regionais, Vol,47, pp. 49-71.
Nash, D. (2007). The study of tourism. An-
thropological and sociological beginnings. Ox-
ford: Elsevier.
Nosella, A., Cantarello, S., & Filippini, R.
(2012). The intellectual structure of organiza-
tional ambidexterity: A bibliographic investiga-
tion into the state of the art. Strategic Organiza-
tion, Vol.10, nº4, pp. 450-465.
Oliveira, L., Rodrigues, A., Nunes, H., Dias,
L., Coelho, A., Oliveira, J. M., ... & Leitão, M.
J. (2011). Web based geographic information
platform for tourism. In 6th Iberian Conference
on Information Systems and Technologies
(CISTI 2011) (pp. 1-6). IEEE.
Pereiro, X. (2018). Abordagem exploratória
do turismo rural de Trás-os-Montes e Alto
Douro (Portugal). Análise Social, Vol.53,
nº226, pp. 58-87.
Ramos, M., & Fonseca, G. (2014). Interpre-
tação do Significado de Paisagem Cultural: o
valor da chancela UNESCO no caso do Alto
Douro Vinhateiro. Disponível em:
<http://www.ccdrn.pt/sites/default/files/fichei-
ros_ccdrn/missaodouro/significado_paisa-
gemcultural_valor_da_chancela_unesco.pdf>.
Réau, B. (2018). “A Produção Científica no
campo do turismo (Tourism Studies): uma abor-
dagem bibliométrica”. Disponível em:
<http://journals.openedition.org/viatourism/23
69>.
Rebelo, J., Caldas, J., & Guedes, A. (2015).
The Douro region: Wine and tourism. Al-
matourism-Journal of Tourism, Culture and
Territorial Development, Vol.6, nº11, pp.75-
90.
Rodrigues, S., Goncalves, R., Teixeira, M.
S., Martins, J., & Branco, F. (2018). Bidirec-
tional e-commerce platform for tourism in low-
density regions: the Douro Valley case study.
In 2018 13th Iberian Conference on Infor-
mation Systems and Technologies (CISTI) (pp.
1-5). IEEE.
Small, H. (1973). Co‐citation in the scien-
tific literature: A new measure of the relation-
ship between two documents. Journal of the As-
sociation for Information Science and Technol-
ogy, Vol.24, nº4, pp. 265-269.
Tavares, C., & Azevedo, A. (2011). Genera-
tion X and Y expectations about wine tourism
experiences: Douro (Portugal) versus Napa val-
ley (USA). Tourism & Management Stud-
ies, Vol.1, pp. 259-269.
Usdiken, B., & Pasadeos, Y. (1995). Organ-
izational analysis in North America and Europe:
A comparison of co-citation networks. Organi-
zation Studies, Vol.16, nº3, pp. 503-526.
Vieira, I., Rodrigues, A. P., & Teixeira, M.
S. (2015). Small historic cities and their visitors:
application to a historic city of North Portu-
gal. PASOS: Revista de Turismo y Patrimonio
Cultural, Vol.13, nº3, pp.521-540.
Vieira, I., Rodrigues, A., Fernandes, D., &
Pires, C. (2016). The role of local government
management of tourism in fostering residents'
support to sustainable tourism development: ev-
idence from a Portuguese historic town. Inter-
national Journal of Tourism Policy, Vol.6, nº2,
pp. 109-135.

O Turismo no Douro: Notas Bibliométricas Sobre a Literatura Científica
83
Vogel, R., & Güttel, W. H. (2013). The dy-
namic capability view in strategic management:
A bibliometric review. International Journal of
Management Reviews, Vol.15, nº4, pp. 426-
446.
Wallin, J. A. (2005). Bibliometric methods:
pitfalls and possibilities. Basic & clinical phar-
macology & toxicology, Vol.97, nº5, pp. 261-
275.
Waltman, L., van Eck, N. J., & Noyons, E.
C. M. (2010). A unified approach to mapping
and clustering of bibliometric networks. Jour-
nal of Informetrics, Vol.4, nº4, pp. 629–635.
White, H. D., & McCain, K. W. (1998). Vis-
ualizing a discipline: An author co-citation anal-
ysis of information science, 1972-1995. Journal
of the American society for information science,
Vol.49, nº4, pp. 327-355.
Zupic, I., & Cater, T. (2015). Bibliometric
methods in management and organization. Or-
ganizational Research Methods, Vol.18, nº3,
pp. 429-472.


Artigo submetido a 5 de Julho de 2019; versão final aceite a 5 de Outubro de 2019
Paper submitted on July 5, 2019; final version acceptet on October 5, 2019
Caracterização e Análise do Potencial de Desenvolvimento
do Turismo Cultural Literário em Coimbra
Characterization and Analysis of the Potential for the Develop-
ment of Cultural Literary Tourism in Coimbra
Sílvia Quinteiro
Escola Superior de Gestão, Hotelaria e Turismo da Universidade do Algarve
CEC - Centro de Estudos Comparatistas da Faculdade de Letras da Universidade de Lisboa
Alexandra Rodrigues Gonçalves
Escola Superior de Gestão, Hotelaria e Turismo da Universidade do Algarve
CinTurs - Centro de Investigação em Turismo, Sustentabilidade e Bem-Estar da Universidade
do Algarve
Vivina Carreira
Escola Superior Agrária, Instituto Politécnico de Coimbra
CERNAS - Centro de Estudos em Recursos Naturais, Ambiente e Sociedade
Resumo/ Abstract
Literary places have been widely recognized
as tourist destinations. The present article aims:
(i) to situate Coimbra in the context of cultural
tourism and literary tourism in Portugal; (ii) to
present the results of the inventory of literary
tourism products existing in Coimbra; (iii) to
present the results of the inventory of literary
places in Coimbra that can be linked to the writ-
ers’ biographies; and (iv) to promote debate on
the city's literary tourism potential. The first
phase of the research included gathering infor-
mation, works and texts that will support both
the empirical analysis and the state of the art of
the literary tourism product in Coimbra. Based
on the results obtained, we assessed their poten-
tial and identified the need to design and make
available a literary cartography of the city, which
enables the development of the literary tourism
niche in Coimbra.
Os lugares literários têm sido amplamente re-
conhecidos como destinos turísticos. O presente
artigo estabeleceu como objetivos: (i) situar Co-
imbra no contexto da oferta de turismo cultural e
turismo literário em Portugal; (ii) apresentar os
resultados dos inventários dos produtos de tu-
rismo literário existentes em Coimbra; (iii) apre-
sentar os resultados do inventário dos lugares li-
terários de Coimbra conectáveis com as biogra-
fias de escritores; e (iv) promover a reflexão so-
bre o potencial turístico-literário da cidade. A
primeira fase da investigação incluiu a recolha
de informação, das obras e textos de suporte para
a análise empírica e do estado da arte do produto
de turismo literário em Coimbra. Partindo dos
resultados obtidos, aferimos o seu potencial e
identificámos a necessidade de desenhar e dispo-
nibilizar uma cartografia literária da cidade, que
viabilize o desenvolvimento do nicho do turismo
literário em Coimbra.

Revista Portuguesa de Estudos Regionais, nº 56
86
1. INTRODUÇÃO
O presente artigo tem como objetivo geral
promover o conhecimento do património literá-
rio de Coimbra e o desenvolvimento do turismo
cultural com base nos lugares associados à lite-
ratura, área na qual tanto a investigação como a
implementação de produtos e experiências no
terreno são ainda muito reduzidas. Com efeito,
no que se refere à investigação, encontrámos
apenas um trabalho com enfoque na relação li-
teratura/turismo em Coimbra (Gomes, 2008). Já
no que se refere aos produtos e experiências, te-
remos oportunidade de ver mais adiante a lista
dos 12 existentes (Tabela 3) e a sua incidência
em apenas 5 autores.
Neste artigo, apresentamos os resultados ob-
tidos na primeira fase de um trabalho de inves-
tigação que visa responder à lacuna acima iden-
tificada. Para tal, procedemos à recolha de toda
a informação primária de suporte para a análise
empírica e do estado da arte do produto de tu-
rismo literário em Coimbra, bem como das
obras e textos que darão suporte ao desenvolvi-
mento futuro.
Este artigo tem como objetivos específicos:
(i) situar Coimbra no contexto da oferta de tu-
rismo cultural e turismo literário em Portugal;
(ii) apresentar os resultados do inventário dos
produtos de turismo literário existentes em Co-
imbra; (iii) apresentar os resultados do inventá-
rio dos lugares literários de Coimbra conectá-
veis com as biografias de escritores; e (iv) pro-
mover a reflexão sobre o potencial turístico-li-
terário da cidade.
Tendo em vista a concretização destes obje-
tivos, organizámos este trabalho em quatro par-
tes: introdução, seguida de uma reflexão sobre
o turismo cultural e o turismo literário (com par-
ticular enfoque na questão central do lugar lite-
rário), em terceiro lugar surge a descrição da
oferta turístico-literária existente em Coimbra e
os dados relativos ao levantamento dos lugares
literários da cidade e, por último, as conclusões.
2. TURISMO CULTURAL E TURISMO
LITERÁRIO
2.1 Turismo Cultural
A cultura é o recurso principal para a atração
do turismo, sendo que este se constitui uma pla-
taforma essencial para a internacionalização do
setor cultural e criativo. Como afirma o funda-
dor e CEO da Skift a propósito das megatendên-
cias das viagens para 2018, “[a] viagem é a ex-
pressão mais progressista da curiosidade hu-
mana” (Skift, 2018: 9, tradução nossa). Com
efeito, os destinos (alvos dessa curiosidade)
apresentam-se hoje como áreas multiproduto
para mercados multissegmentados, para clientes
distintos, de diferentes origens e com várias mo-
tivações. Têm sido associadas grandes vanta-
gens ao desenvolvimento do turismo cultural
nas áreas urbanas e economias em declínio, tra-
duzindo-se estas fundamentalmente numa
forma de diversificação da procura e numa so-
lução para os problemas de declínio de áreas
muito diversas na Europa, como é o caso de re-
giões manufatureiras no norte da Inglaterra, mas
também para os aglomerados das zonas costei-
ras, como sucede em Espanha, por exemplo (Ri-
chards, 1996).
Sendo incontestável que a Europa dispõe de
numerosos recursos naturais e culturais relevan-
tes para o desenvolvimento do turismo, é tam-
bém verdade que em algumas regiões e cidades
se verificam grandes problemas de acessibili-
dade (digital e física), falta de sustentabilidade
das atividades anteriores (atividades primárias
como a agricultura, o artesanato, a gastronomia
local). Determinados destinos são principal-
mente procurados por apenas um ou dois produ-
tos, ou apenas em curtos períodos do ano, le-
vando a problemas de sazonalidade, concentra-
ção de fluxos turísticos num número reduzido
de lugares, gentrificação de centros históricos,
aculturação de tradições e eventos locais, e ou-
tros impactos negativos que comprometem um
Palavras-chave: Turismo; Turismo cultural; Tu-
rismo Literário¸Turismo e desenvolvimento; Coimbra
Códigos JEL: L83; Z32
e France is the second biggest EMU economy
and, as Finland, is not considered a “peripheral”
country.
Keywords: Markov-Switching models; Active
portfolio management; financial market integra-
tion; EMU stock markets integration
Keywords: Tourism; Cultural Tourism; Literary
Tourism¸Tourism and Development; Coimbra
JEL codes: L83; Z32
e France is the second biggest EMU economy
and, as Finland, is not considered a “peripheral”
country.
Keywords: Markov-Switching models; Active
portfolio management; financial market integra-
tion; EMU stock markets integration

Caracterização e Análise do Potencial de Desenvolvimento do Turismo Cultural Literário em Coimbra
87
desenvolvimento sustentável. Neste contexto,
as rotas culturais são um produto cujo fomento
é desejável, uma vez que o seu desenvolvimento
promove o melhoramento das infraestruturas
culturais e equipamentos, dos locais e dos even-
tos e suscita impactos positivos no desenvolvi-
mento do turismo cultural e criativo nos lugares
mais improváveis.
Entendemos, pois, que o turismo cultural é
um mercado-chave, em particular para a Eu-
ropa, sendo que as tendências atuais apresentam
algumas alterações nas motivações, mas tam-
bém nas práticas de turismo cultural, com um
crescente interesse pelas experiências imersivas
(autênticas, únicas, envolventes e criativas)
(Cabeça, Gonçalves & Marques, 2018). Com
efeito, estima-se que, como nota Greg Richards,
quatro em cada dez turistas escolham o seu des-
tino com base na oferta cultural, uma vez que
“[o] turismo cultural foi recentemente reafir-
mado pela UNWTO como um elemento impor-
tante do consumo turístico internacional, repre-
sentando mais de 39% das chegadas de turistas”
(Richards, 2018: 12, tradução nossa).
Alguns estudos têm vindo a demonstrar a
importância do turismo cultural para a redução
da sazonalidade, como sucede com o trabalho
sobre o caso da Andaluzia realizado por Cisne-
ros-Martinez e Fernández-Morales (2015). De
resto, as megatendências de viagens identifica-
das pela agência Skift refletem igualmente a im-
portância futura do turismo cultural: “Para au-
mentar a dispersão de visitantes, cidades e paí-
ses estão a promover o turismo culinário e a cul-
tura local em parcerias com organizações regio-
nais, estimuladas pela procura de experiências
de viagem mais autênticas. Para que essas inici-
ativas gerem um retorno positivo sobre o inves-
timento, é fundamental que as organizações de
turismo trabalhem efetivamente com o governo
local e as agências de desenvolvimento econó-
mico para garantir os fundos públicos necessá-
rios e o comprometimento da comunidade em-
presarial.” (Skift, 2018: 46, tradução nossa).
Um exemplo apresentado pela Skift para
ilustrar esta tendência é o caso dos itinerários
autodirigidos da Irlanda. Trata-se de itinerários
propostos para as costas ocidental e oriental do
país (https://www.authenticireland.com/tours/i
reland-self-drive-tours/), desenvolvidos com a
intenção de promover a dispersão territorial de
uma atividade económica até então centrada
quase exclusivamente na cidade de Dublin
(Skift, 2018).
A opção por um determinado destino em de-
trimento de outros parte de escolhas informa-
das, tomadas com recurso a vários serviços.
Como nos dizem Solima e Minguzzi, a relação
que se estabelece entre o património cultural e o
turismo depende em parte dos serviços turísti-
cos envolvidos: “Antes de visitar um destino,
[as] decisões [dos turistas] são tomadas através
de sistemas de informação, reservas e compras;
durante a sua visita, através de serviços turísti-
cos de boas-vindas e outros serviços destinados
a tornar a sua experiência memorável; no re-
gresso, através de iniciativas com o objetivo de
reforçar a lealdade ao destino.” (Solima & Min-
guzzi, 2014: 9, tradução nossa).
A importância de uma boa utilização dos ser-
viços turísticos em prol da articulação entre cul-
tura e turismo torna-se evidente quando, por
exemplo, observamos os exemplos inovadores
propostos por comunidades que nos são aponta-
dos por Charles Landry (2008). Entre outros, o
autor refere o caso exemplar de Hay-on-Wye.
Nesta pequena aldeia galesa, sem recursos cul-
turais significativos, do trabalho com a comuni-
dade surgiu a ideia de criar um destino de tu-
rismo literário a partir “do nada”. Numa aldeia
sem qualquer tradição turística ou literária, na
qual não se identificavam à partida quaisquer
lugares associáveis a autores ou textos, abriu-se
um número significativo de livrarias (sobretudo
alfarrabistas), criou-se o que é hoje um dos mai-
ores festivais literários do mundo (o Hay Lite-
rary Festival) e designou-se Hay como Cidade
do Livro (Book Town). Este conjunto de ações
levou a que atualmente os cerca de 1500 habi-
tantes de Hay-on-Wye recebam aproximada-
mente um milhão de visitantes por ano. Acres-
centamos ao exemplo apontado por Landry um
caso paradigmático em Portugal, muito seme-
lhante ao de Hay. Referimo-nos a Óbidos, uma
vila que apesar de não ter qualquer tradição li-
terária se reinventou como Vila Literária, a par-
tir de um trabalho que teve início em 2011 e en-
volveu a comunidade e as entidades locais. Gra-
ças a esse trabalho conjunto, Óbidos tem desde
2015 o estatuto de Cidade Criativa da Literatura
da UNESCO (http://obidosvilaliteraria.com/ci-
dade-criativa-da-literatura/).
Em termos de tradição literária e de patrimó-
nio edificado, podemos afirmar que Hay e Óbi-
dos estão nos antípodas da cidade que estuda-
mos neste trabalho, Coimbra. Efetivamente, por
esta cidade de grande tradição universitária pas-
saram muitos vultos do universo literário portu-

Revista Portuguesa de Estudos Regionais, nº 56
88
guês, e não só. Para além disso, Coimbra é inú-
meras vezes referida em textos literários e de-
tentora de um património cultural com reconhe-
cimento de caráter mundial que atrai um nú-
mero significativo de turistas à cidade. No en-
tanto, ainda que a oferta na área do turismo cul-
tural seja efetiva e numerosa em Coimbra, en-
tendemos que existe um enorme potencial em
termos de turismo literário que está por explo-
rar.
Passamos agora a contextualizar a nossa in-
vestigação no âmbito da oferta na área do Tu-
rismo Literário em Portugal. Para este efeito, fi-
zemos um levantamento dos produtos deste ni-
cho existentes no país, partindo do elenco apre-
sentado por Quinteiro e Baleiro em Literatura e
Turismo: Conceitos fundamentais (2019). To-
davia, dado que grande parte dos produtos e ex-
periências de turismo literário por nós identifi-
cados estão frequentemente associados a um
evento casual, assumimos desde logo como cri-
tério elencar apenas aqueles que constituem à
data do levantamento uma oferta acessível ao
público, ou seja, alguns itinerários e os festivais
literários. Foram recolhidos dados a partir de in-
formações cedidas por casas-museu de autor,
câmaras municipais, Comissões de Coordena-
ção e Desenvolvimento Regional, governos au-
tónomos e empresas de animação turística,
quando não acessíveis nos respetivos websites.
No caso dos festivais literários, a informação é
disponibilizada pelo Ministério da Cultura, atra-
vés do website da Direção-Geral do Livro, dos
Arquivos e das Bibliotecas (http://livro.dg
lab.gov.pt/sites/DGLB/Portugues/noticiasE-
ventos/Paginas/FESTIVAIS-LITER%C3%
81RIOS-EM-PORTUGAL.aspx). Conscientes
de que esta lista poderá sempre estar incom-
pleta, dada a dispersão das entidades organiza-
doras e a inexistência de uma plataforma ou as-
sociação que agreguem a informação relativa ao
conjunto dos produtos e experiências de turismo
literário, bem como o facto de a qualquer mo-
mento poderem surgir novas ofertas, ainda as-
sim, entendemos que é importante proceder a
este levantamento para se aferir a dimensão do
fenómeno em Portugal. Para este efeito, e como
referimos, considerámos apenas as ofertas que
são permanentes ou que ocorrem em períodos
regulares, como os festivais literários e os itine-
rários acessíveis ao público em papel ou online,
bem como aqueles que estão sinalizados no ter-
reno e os que estão associados a operadores tu-
rísticos ou a outras entidades que os realizam
com alguma regularidade.
Neste levantamento, não foram também con-
siderados um conjunto de livros que, apesar de
serem apresentados como itinerários ou como
guias para um determinado autor, obra, região
ou mesmo para um tipo específico de lugar lite-
rário dentro de um determinado espaço (caso
dos cafés literários de Lisboa), não são verda-
deiramente itinerários estruturados como pro-
duto turístico. Ou seja, falamos de obras que
elencam lugares, que os descrevem, sugerindo
viagens literárias, e que são um recurso para
quem pretenda desenvolver produtos e experi-
ências de turismo literário, mas que, por si só
não guiam o visitante ao longo de um trajeto.
Regra geral, estes livros não apresentam uma
ordenação coerente dos pontos de interesse,
nem indicam a duração ou a extensão dos “iti-
nerários” nem apresentam sequer, em alguns ca-
sos, um mapa com os lugares assinalados. São
livros que, na sua maioria, consistem na trans-
crição de excertos de obras que fazem corres-
ponder aos pontos geográficos a que se referem.
Constituem exemplos deste tipo de obra os Iti-
nerários Literários: Viajando pela literatura
portuguesa (1998), de Elvira Azevedo e Zaida
Braga; Lisboa em Pessoa (2013), de João Cor-
reia Filho; Roteiro da Lisboa de Eça de Queiroz
(2015), de Campos Matos; Roteiro viagem às
“Terras do Demo”: itinerário aquiliniano
(1997), de Henrique Almeida; a coleção Viajar
com… (2014-2018); Viagem no Portugal de
Eça de Queiroz (1999) e Imagens do Portugal
Queiroziano (2004), de A. Campos de Matos;
Viagens com Garrett (2000), de Isabel Lucas e
Paulo Alexandrino; Lisboa nos Passos de Fer-
nando Pessoa (2011), de Marina Tavares Dias.
Consideramos, contudo, que devemos referir
estes livros e sublinhar o facto de terem come-
çado a surgir em finais dos anos 90 do século
passado, uma vez que tal é sintomático de uma
consciência recente do potencial quer turístico
quer cultural e educativo que resulta da interse-
ção entre a literatura, o espaço físico e o tu-
rismo.
Quanto ao levantamento de produtos e expe-
riências turístico-literários existentes em Portu-
gal apresentado neste trabalho, cabe ainda es-
clarecer que este não se rege por qualquer crité-
rio de qualidade. Logo, não são aqui emitidos
juízos de valor, já que o propósito deste levan-
tamento é conhecer e apresentar a oferta que
está acessível ao eventual consumidor. O inven-
tário foi feito com base no preenchimento de

Caracterização e Análise do Potencial de Desenvolvimento do Turismo Cultural Literário em Coimbra
89
uma grelha, na qual se registaram o tipo de pro-
duto, a designação, o local e a entidade promo-
tora.
De acordo com a relação que fizemos, assi-
nalam-se em Portugal um total de 90 produtos
com as características que definimos como ele-
gíveis para este estudo. Destes, 70 (78%) são iti-
nerários e 20 (22%) são festivais literários (Fi-
gura 1):
Figura 1: Produtos e experiências turístico-literários
Fonte: Elaboração própria.
De entre os itinerários, 25 realizam-se dentro
de Lisboa, 1 em Cascais, 1 em Sintra, 1 em Tor-
res Vedras, 1 em Marvão, 1 em Santarém, 3 em
Évora, 2 no concelho de Loulé, 1 em Faro, 1 em
Olhão, 1 em São Bartolomeu de Messines, 1 em
Mortágua, 1 em Tormes, 1 em Santarém, 2 no
Porto, 8 passam por várias cidades e localidades
do norte de Portugal, 1 em Leiria, 12 em Coim-
bra,1 em Ribeira de Pena, 1 em Angra do Hero-
ísmo, 2 em Ponta Delgada, 1 em Santa Cruz, 1
no Corvo e 1 no Pico (Figura 2).
Figura 2: N.º de itinerários literários por localidade
Fonte: Elaboração própria.
20; 22%
70; 78%
Itinerários
Festivais Literários
N=90
2512
3222
1111111111111111
8
0 10 20 30
Lisboa
Évora
Loulé
Cascais
Torres Vedras
Marvão
Olhão
Mortágua
Leiria
Angra do Heroísmo
Corvo
Várias

Revista Portuguesa de Estudos Regionais, nº 56
90
A predominância de itinerários na capital é
clara e é também aqui que a iniciativa privada
assume maior significado (apenas um está sob a
tutela da Câmara Municipal de Lisboa, os res-
tantes são explorados por particulares). Nos ou-
tros três casos de maior aglomeração de itinerá-
rios, verificamos que os doze itinerários de Co-
imbra são maioritariamente responsabilidade da
Câmara Municipal de Coimbra e da Comissão
Coordenadora da Região Centro, os oito itinerá-
rios no norte foram criados por decisão da Dire-
ção Regional de Cultura do Norte (Escritores a
Norte) e os seis itinerários dos Açores são uma
iniciativa do Governo dos Açores, provando, a
nosso ver, a importância de uma intervenção das
entidades oficiais em destinos menos associa-
dos ao turismo cultural e nos quais a relação au-
tor/espaço físico não é tão óbvia para o visitante
como são os binómios Pessoa/Lisboa, Eça/Lis-
boa ou Camões/Lisboa.
Abrimos aqui um parêntesis para referir que,
no caso dos itinerários oferecidos em sites, pre-
dominam páginas que definem uma cartografia
literária (Tally Jr, 2013) para uma determinada
região, como a página Escritores a Norte
(http://escritoresanorte.pt/roteiros.aspx), os ro-
teiros Queirosiano e Romântico propostos entre
os Roteiros Culturais da Câmara Municipal de
Sintra (https://cm-sintra.pt/atualidade/cul-
tura/roteiros-culturais) e as rotas e circuitos
apresentados pela Associação Douro Histórico
(http://www.dourohistorico.pt/turismo/in-
dex.php?action=getDetalheRota&id=16). To-
das estas páginas associam excertos a elementos
da paisagem que, em alguns casos, estabelecem
a articulação entre a literatura e domínios como
o da gastronomia ou o da natureza, e podem in-
clusive permitir ao visitante criar o seu próprio
percurso.
No que concerne aos vinte festivais literários
que se realizam em Portugal, apenas quatro têm
lugar a sul do Tejo e apenas um, o Festival Li-
terário Internacional de Querença, não é organi-
zado por um município, mas sim por uma fun-
dação. Daí concluímos que, se o papel das enti-
dades locais e regionais no que se refere aos iti-
nerários é inequívoco, no âmbito da organiza-
ção de festivais literários é vital.
Posto isto, acreditamos ser legítimo extrapo-
lar esta realidade nacional para o caso concreto
de Coimbra e presumir que o envolvimento das
entidades locais e regionais será indispensável
para o desenvolvimento da ideia de uma “Coim-
bra Literária”. Como tal, pretendemos que a in-
ventariação dos recursos a que estamos a
proceder constitua também uma forma de aler-
tar as entidades para o potencial que a cidade de
Coimbra tem para se reinventar enquanto des-
tino de turismo literário.
Esta reinvenção integra-se necessariamente
num pensamento estratégico para o destino e
implica, por isso, a tomada de decisões e de me-
didas de gestão que não são possíveis sem base
numa recolha de informação exaustiva e que,
logo à partida, contextualize e permita aferir da
exequibilidade do desafio. Assim, no caso de
um projeto centrado no turismo literário, para
além de um enquadramento prévio da proposta
no âmbito do turismo cultural e do turismo lite-
rário na cidade, é fundamental proceder-se ao
levantamento da informação relativa aos escri-
tores e aos lugares conectáveis com a sua pre-
sença nesse espaço físico, conforme referido na
introdução deste artigo. Esta inventariação
constitui uma etapa fundamental que confere
solidez ao processo, ainda que, numa fase pos-
terior, deva ser complementada com a conexão
texto literário/espaço físico e com a análise das
possibilidades de articulação com outros produ-
tos e experiências de turismo cultural, e não só,
como veremos adiante.
Tal como o próprio nome indica, um inven-
tário é uma relação de bens, logo inventariar os
escritores e lugares que lhes estão associados
num determinado espaço consiste em fazer o le-
vantamento desses bens, em identificá-los e fa-
zer o seu registo. Existindo um propósito turís-
tico, a implementação de um projeto desta natu-
reza implica também que se identifiquem outras
atrações, serviços e equipamentos turísticos; es-
tes serão objeto de inventariação e estudo numa
fase posterior desta investigação.
O nosso intuito nesta fase do trabalho foi
evidenciar o elevado número de lugares que já
existem identificados como lugares literários
(conceito que explicaremos adiante) e aqueles
que têm potencial para serem identificados en-
quanto tal por via da sua conexão a aspetos bio-
gráficos dos autores. Ainda nesta etapa, importa
explicar de que modo a articulação destes luga-
res dos autores com os textos literários (i.e. com
os lugares dos textos) e com produtos de outros
nichos de turismo constituem um enorme ma-
nancial que, devidamente estruturado e inserido
numa estratégia da e para a cidade, a pode valo-
rizar, diversificar a oferta para os turistas cultu-
rais que já procuram Coimbra, atrair novos tu-
ristas e valorizar um património que pode tam-
bém ser usufruído para fins educativos.
Em 2009, um relatório da OCDE sobre os
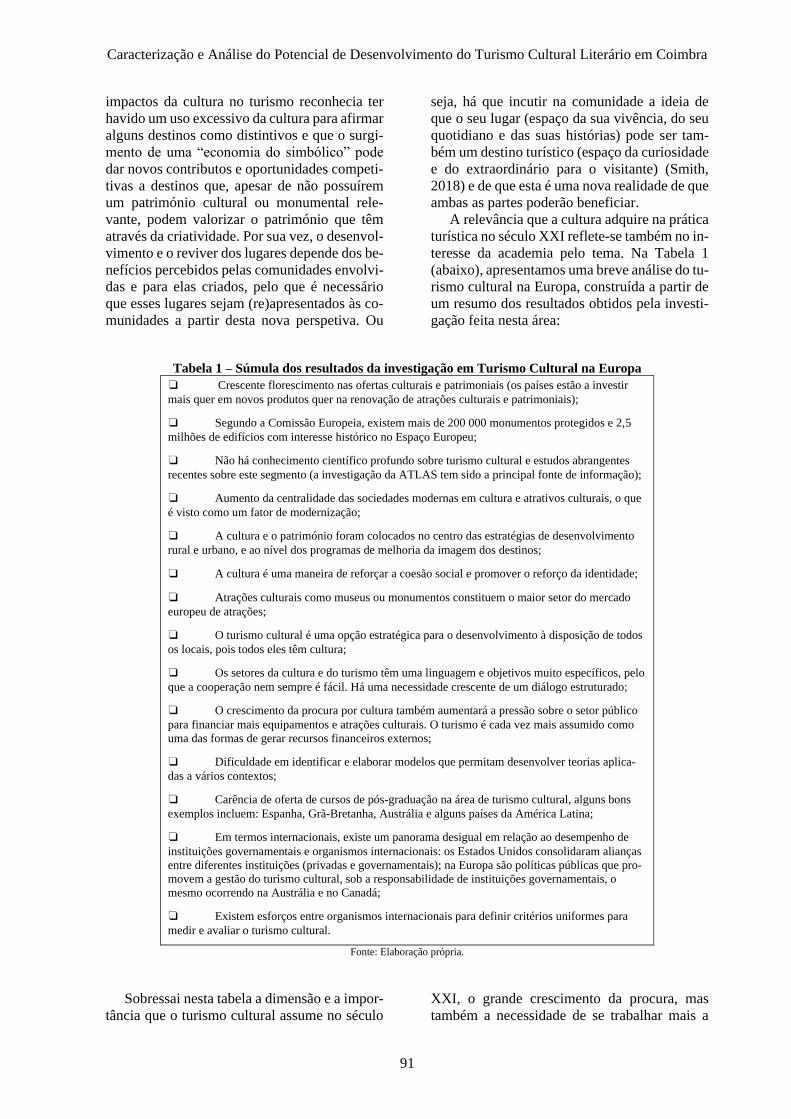
Caracterização e Análise do Potencial de Desenvolvimento do Turismo Cultural Literário em Coimbra
91
impactos da cultura no turismo reconhecia ter
havido um uso excessivo da cultura para afirmar
alguns destinos como distintivos e que o surgi-
mento de uma “economia do simbólico” pode
dar novos contributos e oportunidades competi-
tivas a destinos que, apesar de não possuírem
um património cultural ou monumental rele-
vante, podem valorizar o património que têm
através da criatividade. Por sua vez, o desenvol-
vimento e o reviver dos lugares depende dos be-
nefícios percebidos pelas comunidades envolvi-
das e para elas criados, pelo que é necessário
que esses lugares sejam (re)apresentados às co-
munidades a partir desta nova perspetiva. Ou
seja, há que incutir na comunidade a ideia de
que o seu lugar (espaço da sua vivência, do seu
quotidiano e das suas histórias) pode ser tam-
bém um destino turístico (espaço da curiosidade
e do extraordinário para o visitante) (Smith,
2018) e de que esta é uma nova realidade de que
ambas as partes poderão beneficiar.
A relevância que a cultura adquire na prática
turística no século XXI reflete-se também no in-
teresse da academia pelo tema. Na Tabela 1
(abaixo), apresentamos uma breve análise do tu-
rismo cultural na Europa, construída a partir de
um resumo dos resultados obtidos pela investi-
gação feita nesta área:
Tabela 1 – Súmula dos resultados da investigação em Turismo Cultural na Europa
❏ Crescente florescimento nas ofertas culturais e patrimoniais (os países estão a investir
mais quer em novos produtos quer na renovação de atrações culturais e patrimoniais);
❏ Segundo a Comissão Europeia, existem mais de 200 000 monumentos protegidos e 2,5
milhões de edifícios com interesse histórico no Espaço Europeu;
❏ Não há conhecimento científico profundo sobre turismo cultural e estudos abrangentes
recentes sobre este segmento (a investigação da ATLAS tem sido a principal fonte de informação);
❏ Aumento da centralidade das sociedades modernas em cultura e atrativos culturais, o que
é visto como um fator de modernização;
❏ A cultura e o património foram colocados no centro das estratégias de desenvolvimento
rural e urbano, e ao nível dos programas de melhoria da imagem dos destinos;
❏ A cultura é uma maneira de reforçar a coesão social e promover o reforço da identidade;
❏ Atrações culturais como museus ou monumentos constituem o maior setor do mercado
europeu de atrações;
❏ O turismo cultural é uma opção estratégica para o desenvolvimento à disposição de todos
os locais, pois todos eles têm cultura;
❏ Os setores da cultura e do turismo têm uma linguagem e objetivos muito específicos, pelo
que a cooperação nem sempre é fácil. Há uma necessidade crescente de um diálogo estruturado;
❏ O crescimento da procura por cultura também aumentará a pressão sobre o setor público
para financiar mais equipamentos e atrações culturais. O turismo é cada vez mais assumido como
uma das formas de gerar recursos financeiros externos;
❏ Dificuldade em identificar e elaborar modelos que permitam desenvolver teorias aplica-
das a vários contextos;
❏ Carência de oferta de cursos de pós-graduação na área de turismo cultural, alguns bons
exemplos incluem: Espanha, Grã-Bretanha, Austrália e alguns países da América Latina;
❏ Em termos internacionais, existe um panorama desigual em relação ao desempenho de
instituições governamentais e organismos internacionais: os Estados Unidos consolidaram alianças
entre diferentes instituições (privadas e governamentais); na Europa são políticas públicas que pro-
movem a gestão do turismo cultural, sob a responsabilidade de instituições governamentais, o
mesmo ocorrendo na Austrália e no Canadá;
❏ Existem esforços entre organismos internacionais para definir critérios uniformes para
medir e avaliar o turismo cultural.
Fonte: Elaboração própria.
Sobressai nesta tabela a dimensão e a impor-
tância que o turismo cultural assume no século
XXI, o grande crescimento da procura, mas
também a necessidade de se trabalhar mais a

Revista Portuguesa de Estudos Regionais, nº 56
92
articulação entre cultura e turismo, nomeada-
mente através do ensino superior, da investiga-
ção e do empenho das instituições. Ou seja, há
um fenómeno crescente, com claros impactos
positivos, mas que tem de ser mais bem estu-
dado, mais bem trabalhado e acautelado de
modo a não se vir a incorrer em erros que mar-
caram outros tipos de turismo. Na verdade, a di-
ficuldade que tivemos em obter dados quantita-
tivos relativamente ao Turismo Cultural em Co-
imbra, de que daremos conta adiante, é um re-
flexo claro desta necessidade de investir no
acompanhamento e estudo rigoroso do fenó-
meno.
Ainda assim, e apesar dos aspetos menos po-
sitivos, constata-se uma preocupação acrescida
com a implementação de propostas de turismo
cultural e com a sua sustentabilidade. Todavia,
é importante ressalvar que também o sucesso do
turismo cultural sustentável depende do conhe-
cimento, nomeadamente do conhecimento: do
perfil dos turistas culturais, das expectativas dos
visitantes relacionadas com o turismo cultural,
das atividades e oportunidades de lazer relacio-
nadas com o turismo cultural, da autenticidade
sentida nas experiências dos visitantes nos des-
tinos, do conceito de identidade relacionado
com as experiências, das oportunidades de inte-
ração com as comunidades hospedeiras e da
avaliação da qualidade da atração. A preocupa-
ção com a sustentabilidade do produto turístico
deverá, portanto, partir da consciência dos seus
princípios fundamentais que, segundo Richard
Sharpley, são: “minimizar os impactos ambien-
tais, alcançar os resultados de conservação, ser
diferente, alcançar a autenticidade, refletir os
valores da comunidade, entender e direcionar os
mercados, aprimorar a experiência, agregar va-
lor. Ter bom conteúdo, aprimorando o senso de
lugar através do design, proporcionando benefí-
cios mútuos aos visitantes e anfitriões e cons-
truindo capacidade local” (Sharpley, 2009: 62,
tradução nossa).
Será, pois, desejável que os princípios enun-
ciados por Sharpley sejam aplicados aos mais
variados tipos de turismo, nomeadamente ao tu-
rismo cultural e de base literária, até porque,
para além da questão da sustentabilidade, reco-
nhecemos a relação entre estes e os fatores que
Pocock, Carlsen, Hughes, Frost & Peel (2008)
identificam como fatores de sucesso e de insu-
cesso para o desenvolvimento do turismo com
base no património cultural (Tabela 2).
Tabela 2 - Fatores de Sucesso e de Insucesso do Turismo Cultural e Patrimonial
Fonte: Elaboração própria baseada em Pocock et al. (2008).
No que se refere ao património literário, as
casas-museu, as casas e fundações de escritores,
os museus e festivais literários, assim como os
números de visitantes que se interessam pela li-
teratura, parecem apresentar uma tendência de
aumento (Richards, 2018). Da mesma forma, e
em consequência desse crescente interesse, as
rotas literárias são cada vez mais numerosas e
demonstram como a articulação entre literatura
e espaço físico pode contribuir para a afirmação
de uma memória coletiva, combinando a
herança natural e cultural, e adicionando valor a
recursos por vezes pouco reconhecidos na he-
rança cultural das comunidades (Ruiz Scarfuto,
2013). Falamos de fenómenos associados ao
chamado turismo literário, a que dedicamos a
próxima secção deste artigo.
2.2 Turismo Literário
Apesar de a prática do turismo literário ser
bastante antiga (segundo Hendrix (2007) é
Histórias de insucesso associadas Histórias de sucesso associadas
❏ Falta de compreensão dos gestores do patri-mónio cultural sobre as expectativas do mercado;
❏ Falta de avaliação do potencial turístico do lugar em termos de atratividade e de capacidade de carga;
❏ Ausência de desenvolvimento do potencial turístico;
❏ Falta de relação entre a gestão e desenvolvi-mento do património cultural e a promoção do lugar
para o turismo.
❏ Singularidade e carisma do património cultu-ral material;
❏ Desenvolvimento de uma narrativa ficcional para criar uma história pessoal envolvente (exemplo:
Festival do Contrabando de Alcoutim);
❏ Relação com cultura popular, como é o caso dos filmes;
❏ Presença de figuras célebres como embaixa-dores do lugar.

Caracterização e Análise do Potencial de Desenvolvimento do Turismo Cultural Literário em Coimbra
93
possível fazê-lo remontar ao século XV, ainda
que numa forma rudimentar), enquanto con-
ceito, o turismo literário surge apenas no final
do século XX (Brinkmann, 2006; Busby &
Klug, 2001; Butler, 2000; Herbert, 2001;
Hoppen, 2011; Magadán Díaz & Rivas Garcia,
2012; Pérez Pinzón & Luis Rubén, 2017; Quin-
teiro & Baleiro, 2019; Robinson & Andersen,
2002; Squire, 1996). Não obstante cada uma das
definições propostas por estes autores ser mais
ou menos pormenorizada, estabelecer mais ou
menos relações entre este nicho e alguns tipos
de turismo, ou mesmo entre este e outros nichos,
a verdade é que, tal como a própria designação
indica, o turismo literário é um nicho do turismo
cultural que se distingue por ter como objeto
todos os elementos que num espaço físico te-
nham alguma relação com a literatura e que,
nessa articulação, se possam transformar em lu-
gares literários e integrar um produto ou experi-
ência de turismo literário.
No estudo mais significativo que se realizou
até hoje sobre turismo literário, Researching Li-
terary Tourism (2015), de Charles Mansfield, o
autor divide as diferentes formas que o turismo
literário pode assumir em categorias. A catego-
ria que designa como A tem por base a ligação
entre o texto (personagens e cenários) e o es-
paço físico; a categoria B associa o autor ao es-
paço físico (casa onde nasceu, locais que fre-
quentava, onde trabalhava, onde estudava, se-
pultura); e a categoria C tem a ver com a medi-
ação e a promoção, ou seja, com os livros en-
quanto objetos (os festivais literários, os locais
de gravação de filmes que resultam da adapta-
ção de um texto literário, a alteração da desig-
nação de lugares, destinos ou cidades em função
da associação à literatura).
Considerando a dimensão em termos de po-
tencial turístico-literário de uma cidade com a
História e a tradição universitária de Coimbra,
previmos que a sua avaliação não poderia ser
feita num único momento. Assim, o trabalho
que aqui apresentamos corresponde à fase ini-
cial de um projeto dividido em várias etapas
com objetos e objetivos bem definidos, que vi-
abilizam a construção e alargamento sustentado
de uma base de conhecimento conducente a
uma proposta para esta cidade.
Nesta fase, o nosso foco foi a inventariação
dos recursos resultantes da interseção entre o
autor e o espaço físico (categoria B de Mansfi-
eld). Tomámos como ponto de partida esta ca-
tegoria, a associação autor/espaço físico, por
duas razões:
(i) Porque os lugares dos autores são reco-
nhecidamente os lugares de maior procura por
parte dos turistas literários. Foram estes os pri-
meiros destinos de turismo literário (Hendrix,
2007), e chegam mesmo a motivar peregrina-
ções literárias por parte de grandes conhecedo-
res que demandam uma comunhão com os au-
tores que admiram através da ida aos lugares em
que nasceram, viveram, morreram ou estão se-
pultados. Isto é, são os lugares que mais satisfa-
toriamente respondem à busca de uma proximi-
dade física com o escritor admirado e os seus
objetos (Dávidházi, 1998; Hendrix, 2014; Her-
bert, 2001; Robertson & Radford, 2009; Westo-
ver, 2008);
(ii) Porque os lugares literários são os pila-
res sobre os quais assenta a construção de qual-
quer produto ou experiência de turismo literário
(ressalvando, mais uma vez, o facto de, nesta
fase da investigação, nos centrarmos apenas nos
lugares dos autores).
Cabe, pois, definir o que entendemos por lu-
gar literário.
2.2.1 Lugar Literário
Como referido, inventariámos os lugares li-
terários de Coimbra associados aos elementos
biográficos de autores relativamente aos quais
encontrámos uma ligação física a esta cidade.
Assim, para que fique mais claro o objeto da
nossa investigação, passamos a esclarecer o que
entendemos por lugar literário. Tendo este con-
ceito na sua raiz a ideia de lugar, termo que
constitui a base desta expressão, é, pois, a partir
do conceito de lugar que definiremos o lugar li-
terário.
O lugar é um conceito que tem vindo a ser
objeto de inúmeras definições desde a Antigui-
dade Clássica e, não cabendo neste trabalho a
proposta de uma nova leitura, passamos a citar
um dos maiores pensadores da atualidade, Clau-
dio Magris, que, em Instantâneos (2018), pro-
põe um significado para lugar que vai ao encon-
tro do sentido em que aqui o empregamos. Diz
Magris que: “Lugares significam paisagens, na-
turais ou edificadas pelo Homem, ou melhor,
ambas, o lago e a pequena casa na beira indis-
solúveis numa lírica de Brecht. Lugares signifi-
cam sobretudo pessoas, mais ou menos familia-
res ou quase desconhecidas, mas ainda assim
testemunhas, embora parciais, da nossa existên-
cia.” (Magris, 2018: 154). Com efeito, tal como
Magris, também nós, na linha do que propõem
os geógrafos humanistas (nomeadamente Tuan,

Revista Portuguesa de Estudos Regionais, nº 56
94
[1977] 1983 e Cresswell, 2009 e 2015) entende-
mos que o lugar se constrói na interseção das
pessoas com o espaço, no significado que um
determinado recorte do espaço físico ganha
quando é vivido por um sujeito ou por uma co-
munidade. É também assim que entendemos os
lugares literários, enquanto recortes de espaço
aos quais os autores, os textos ou os eventos cri-
ados em seu torno, ou que a eles se associam,
criam significado literário.
Entendemos ainda que, à semelhança dos
restantes lugares, também os lugares literários
são “pausas no movimento”, como nos diz Tuan
([1977] 1983:151). Segundo este autor, os seres
que se deslocam no espaço param em determi-
nados sítios aos quais reconhecem um determi-
nado valor (os lugares). Esse valor advém da ca-
pacidade que esses sítios têm para responder a
uma necessidade do sujeito em movimento. O
lugar corresponde sempre a uma pausa e a uma
experiência, logo, transpondo esta ideia para o
domínio do turismo literário, podemos concluir
que as pausas que os turistas literários fazem na
sua deslocação se dão em lugares que reconhe-
cem como “centro[s] de reconhecido valor”
(Tuan [1977] 1983:151), neste caso centros aos
quais reconhecem valor literário e que respon-
dem à sua necessidade de contactar com esse
universo.
Os lugares literários apresentam-se sob um
número significativo de formas. Constituem
exemplos de lugares literários: o lugar onde o
escritor nasceu; a casa onde viveu; os lugares
onde escreveu e onde morreu; os cafés, restau-
rantes e livrarias que frequentava; os hotéis em
que pernoitou; a sua sepultura; mas também as
casas e outros lugares de autores contemporâ-
neos; os monumentos dedicados aos escritores;
os lugares que descreveu ou simplesmente men-
cionou na sua obra; os lugares relacionados com
movimentos estéticos ou culturais associáveis a
um autor ou obra; ou mesmo os lugares fictícios
em que decorre a ação de uma obra.
David Herbert foi um pioneiro no estudo dos
lugares literários e, em 2001, identificou as qua-
lidades associadas ao lugar literário que se apre-
sentam no esquema abaixo (Figura 3), adaptado
a partir do autor:
Figura 3: Qualidades do lugar literário
Fonte: Adaptado de Herbert, 2001: 315.
Este esquema das qualidades do lugar literá-
rio proposto por Herbert justifica-se na medida em que o autor entende desde logo o lugar lite-rário como um lugar turístico. Herbert não se li-mita, portanto, ao reconhecimento da conexão literatura/espaço físico, remetendo também para questões como a atratividade do lugar, os servi-ços e infraestruturas, a localização num itine- rário turístico, a acessibilidade, o desenvolvi-mento enquanto atratividade turística, a
preservação ou, até mesmo, as necessidades dos visitantes. Esta é uma perspetiva que vem ao en-contro da investigação que estamos a desenvol-ver, uma vez que o projeto em que se enquadra tem objetivos turísticos.
Como referimos, neste trabalho centramo-
nos apenas nos lugares literários dos autores,
excluindo para já outras duas formas de associar
literatura e espaço físico: a identificação dos lu-
gares dos textos, isto é, dos lugares descritos ou

Caracterização e Análise do Potencial de Desenvolvimento do Turismo Cultural Literário em Coimbra
95
mencionados numa obra (ou que a inspiraram);
e a criação de lugares literários (como é o caso
dos parques literários) (Quinteiro & Baleiro,
2019).
Nesta fase da investigação, identificámos os
lugares dos autores, registando-os numa grelha,
na qual se consideraram o nome, local e data de
nascimento e falecimento do escritor, a natureza
da sua ligação a Coimbra e os lugares do autor
em Coimbra, de modo a perceber quantos auto-
res têm uma ligação à Cidade, quantos lugares
literários podemos associar a cada um deles e
qual a sua dispersão no espaço da cidade. Esta
grelha permite-nos olhar o conjunto dos lugares
dos autores e perceber quais os que têm poten-
cial para ser integrados em produtos turístico-
literários. Posteriormente, esta grelha dará tam-
bém origem a um mapa dos lugares literários.
3. TURISMO LITERÁRIO EM
COIMBRA
De acordo com informação da Direção Re-
gional de Cultura do Centro, na qual se inclui o
distrito de Coimbra, a região participa através
deste organismo em sete rotas: Rota de Sefarad;
Rota das Catedrais; Rede de Castelos e Mura-
lhas Medievais do Mondego; Rota das Aldeias
Históricas de Portugal; Rota Arte Nova; Rota do
Românico; e Rede das Aldeias de Xisto. Destas
rotas e redes apenas três passam por ou incluem
Coimbra: a das Catedrais, a Rede de Castelos e
Muralhas, e a Rota do Românico (vide Rotas |
Redes in https://www.culturacentro.gov.pt/).
De entre os museus, monumentos e palácios
classificados a nível nacional encontram-se sob
a sua gestão direta o Mosteiro de Santa Clara-a-
Velha, o Museu da Cerâmica (Caldas da Rai-
nha), o Museu José Malhoa (Caldas da Rainha)
e o Museu Dr. Joaquim Manso (Nazaré), relati-
vamente aos quais não são disponibilizadas as
estatísticas de visitantes. Por sua vez, no Atlas
Cultural online são identificados para a Região
Centro um conjunto de 935 elementos patrimo-
niais, dos quais 249 se situam no distrito de Co-
imbra (quase 27% do total dos elementos patri-
moniais inventariados para a Região Centro
(vide Atlas em http://culturacentro.gov.pt).
Não havendo dados que nos permitam saber
o número exato de turistas culturais que visitam
Coimbra anualmente (e, consequentemente,
desconhecendo-se o número de turistas literá-
rios), há, no entanto, alguns dados que são indi-
cadores da grande expressividade do turismo
cultural na região em que a cidade se insere.
Os dados relativos aos números totais de vi-
sitantes nos monumentos, museus e palácios
sob a gestão da Direção-Geral do Património
Cultural na Região Centro revelam uma evolu-
ção consolidada do número de visitantes nestes
lugares (total de seis), que se representam no
gráfico abaixo (Figura 4), somando em 2018 um
número final de 1 263 485 visitantes. Este total
de visitantes nos monumentos, museus e palá-
cios da Região Centro representa também um
total de 27% do total dos visitantes dos 23 mo-
numentos, museus e palácios afetos à DGPC em
2018:
Figura 4: N.º de Visitantes dos Museus, Palácios e Monumentos Nacionais da Região Centro (2014-2018)
Fonte:http://www.patrimoniocultural.gov.pt/static/data/museus_e_monumentos/totaism_m_p2014_2018.pdf

Revista Portuguesa de Estudos Regionais, nº 56
96
Por outro lado, importa destacar o volume de
turismo na Região Centro indiciado pelos 1
428,5 milhares de dormidas registadas nas Esta-
tísticas do Turismo em 2017 (INE, 2018), por
outro, sabendo-se que Coimbra é uma cidade
histórica, que a Universidade de Coimbra, a
Alta e a Sofia são Património Mundial da Hu-
manidade e que a sua atratividade em termos de
turismo cultural é enorme, consultámos os da-
dos mais recentes das Estatísticas da Cultura do
INE e constatámos que dos 17,2 milhões de
visitantes de museus em 2017 (mais 1,6 milhões
do que no ano anterior, INE, 2018), 1 992 499
(11,6%) registaram-se na zona Centro (2018).
Não havendo, portanto, dados relativos ao
número de turistas literários que visita Coimbra,
nem mesmo relativos à oferta existente nesta
área, procedemos à identificação dos produtos
de turismo literário oferecidos na cidade. Os re-
sultados são os que apresentamos abaixo, na Ta-
bela 3:
Tabela 3 - Oferta turístico-literária em Coimbra
Designação Operador
Roteiro Literário em Coimbra: De Antero a Torga Roteiros Literários AVG
Viagem Literária: Antero de Quental, entre Coimbra e Bussaco Viagens Literárias
Uma Viagem Literária: Carlos de Oliveira, Coimbra-Gândara Viagens Literárias
Rota das casas de escritores: Casa de Miguel Torga Myown Portugal
Visite Coimbra. Roteiros de Coimbra. Escritores Câmara Municipal de Coimbra
A Coimbra dos Escritores: A Coimbra de António Nobre Câmara Municipal de Coimbra
A Coimbra dos Escritores: Eça de Queirós em Coimbra Câmara Municipal de Coimbra
A Coimbra dos Escritores: Coimbra na Criação do Mundo de Miguel
Torga
Câmara Municipal de Coimbra
Rota dos Escritores: Caminhando… pela Rota de Miguel Torga. Circuito da
Baixa Coimbrã
Comissão Coordenadora da Região
Centro
Rota dos Escritores: Caminhando… pela Rota de Miguel Torga. Circuito da
Alta Coimbrã
Comissão Coordenadora da Região
Centro
Rota dos Escritores: Caminhando… pela Rota de Miguel Torga. Circuito da
Margem Esquerda
Comissão Coordenadora da Região
Centro
Rota dos Escritores: Caminhando pela Rota de Miguel Torga. Circuito dos
Jardins
Comissão Coordenadora da Região
Centro
Fonte: Elaboração própria.
Verificamos na tabela acima que a oferta de
produtos turístico-literários em Coimbra é muito reduzida, que se restringe a itinerários e que, como referido anteriormente, se contam apenas 12. Destes 12, 10 realizam-se integral-mente dentro da cidade de Coimbra e destes, apenas 1 é uma iniciativa privada. Sobressai ainda o facto de estes itinerários terem como foco apenas 5 escritores e de 5 desses 10 itine-rários serem construídos exclusivamente em torno da figura de Miguel Torga. Perante estes dados, poderíamos ser levados a crer que se trata de uma cidade com uma tradição literária mediana e um único autor relevante.
Ora, a informação que recolhemos aponta para um número de escritores que, só por si, in-dica o quanto existe por fazer em termos de ca-pitalização deste património. Com efeito, até ao momento, encontrámos 121 autores relativa- mente aos quais é possível estabelecer uma
ligação com a cidade de Coimbra. Quanto à na-tureza da associação destes escritores a Coim-bra, há uma grande variedade, como veremos em seguida, sendo que é a natureza da ligação que, regra geral, define o maior ou menor nú-mero de lugares associáveis à presença do autor na cidade.
Havendo ainda muito trabalho de investiga-ção a fazer no que se refere ao levantamento dos lugares associáveis aos autores, identificámos para já um total de 248 possíveis ligações au-tor/espaço físico, ou seja, 248 lugares literários. Note-se que ao fazermos esta associação há vá-rios lugares literários que correspondem a um mesmo lugar no espaço físico. Abaixo apresen-tamos um gráfico (Figura 5) que mostra a distri-buição dos lugares identificados em função da natureza da relação que estabelecemos entre o autor e o espaço físico:

Caracterização e Análise do Potencial de Desenvolvimento do Turismo Cultural Literário em Coimbra
97
Figura 5 - N.º de Lugares literários identificados em Coimbra por categoria
Fonte: Elaboração própria.
Verifica-se, portanto, a enorme, e expectá-
vel, relevância assumida pela Universidade de
Coimbra, com 38,7 % dos lugares literários
(soma dos autores que foram estudantes da Uni-
versidade de Coimbra com os que aí foram ou
são docentes). Na verdade, é a partir daqueles
que aí estudaram e/ou lecionaram, nos quais se
incluem grande parte dos 13 autores nascidos e
dos 10 falecidos nesta cidade, que se estabele-
cem a maioria dos lugares literários de Coimbra.
São maioritariamente estas figuras que estão as-
sociadas às tertúlias nos cafés históricos Brasi-
leira, Central e Santa Cruz e nas casas de José
Cochofel e de Amélia Janny. São também estes
os escritores que viveram nas Repúblicas ou
noutras casas nas quais se assinala (ou não) a
sua presença com placas evocativas e que cola-
boraram nos jornais e revistas de Coimbra. A
muitos destes escritores foram também dedica-
dos monumentos e o seu nome atribuído a ruas,
escolas e avenidas da cidade. Assim, temos um
leque de lugares literários que, tendo como
ponto de maior aglomeração a Universidade, se
dispersa um pouco por toda a cidade.
4. CONCLUSÕES
Propusemo-nos com este artigo fazer o le-
vantamento dos produtos de turismo literário
existentes em Portugal e, mais concretamente,
em Coimbra, bem como o levantamento dos re-
cursos passíveis de gerar uma oferta desta natu-
reza com base na interseção entre as biografias
dos “escritores da cidade” e lugares assinaláveis
no espaço físico de Coimbra. As principais con-
clusões a que chegámos foram as seguintes:
(i) a oferta de produtos e experiências de
turismo literário existente a nível nacional é li-
mitada quer em número quer em diversidade e
quase inteiramente da responsabilidade de enti-
dades oficiais, nomeadamente das autarquias;
(ii) a oferta de produtos e experiências de
turismo literário em Coimbra é escassa e re-
sume-se a um tipo de produto, o itinerário;
(iii) a oferta de produtos e experiências de
turismo literário em Coimbra, para além de es-
cassa e de surgir apenas sob a forma de itinerá-
rios literários, é também redutora no que se re-
fere ao número de escritores evocados. Os itine-
rários foram construídos em torno de apenas 5
autores, com particular enfoque em apenas um,
Miguel Torga;
(iv) o potencial relativamente ao desenvol-
vimento de turismo literário na cidade de Coim-
bra é enorme. Identificámos até ao momento
121 autores e 248 lugares literários que permi-
tem um número vastíssimo de combinações en-
tre si;
(v) verifica-se a predominância clara da
Universidade de Coimbra enquanto elemento de
ligação literatura/espaço físico, neste caso au-
tor/espaço lugar literário.
Sobre uma análise mais detalhada dos per-
cursos que se podem viabilizar em torno dos re-
cursos inventariados, será necessário na fase se-
guinte e a partir das fichas de inventariação de
recursos desenvolvidas, começar a especificar
os pontos de interesse para a temática do
86
3122 19 17 13 13 11 10 10 7 6 2 1
0102030405060708090
100

Revista Portuguesa de Estudos Regionais, nº 56
98
percurso e narrativa que se definir. O potencial
identificado é muito diverso, mas há que atender
à dimensão do percurso, ao grau de acessibili-
dade ao património físico, às possibilidades de
interpretação no local, à profundidade da infor-
mação existente, ao maior ou menor grau de vi-
sibilidade dos autores, do estilo literário ou da
época em que estão inseridos, entre outros ele-
mentos que integrarão a fase seguinte deste tra-
balho de investigação.
Novos percursos literários poderão dar um
contributo essencial para a distribuição dos flu-
xos turísticos no território, aumentar a visibili-
dade da nossa cultura literária, promover a edu-
cação para as letras e a literatura portuguesa e,
sobretudo, contribuir para um desenvolvimento
cultural e turístico sustentado de um espaço in-
ternacionalmente reconhecido como Património
da Humanidade.
Como esclarecemos, este é um trabalho em
permanente atualização e ainda numa fase ini-
cial. Acreditamos, por isso, que o potencial de
Coimbra enquanto destino de turismo cultural
de base literária ficará mais evidente à medida
que a investigação for avançando, nomeada-
mente após o estudo da convergência dos textos
literários com o espaço físico da cidade, pró-
ximo passo desta investigação.
BIBLIOGRAFIA
Associação Douro Histórico, Rotas e Circui-
tos, http://www.dourohistorico.pt/turismo/in-
dex.php?action=getDetalheRota& id=16, ace-
dido em 04 de setembro 2019.
Brinkmann, Ulrich (2006), The background
of tourism: Configurations of place in Henry
James (tese de doutoramento não publicada),
Freie Universität Berlin, Berlin.
Busby, Graham & Klug, Julia (2001),
“Movie-induced tourism: The challenge of
measurement and other issues”, Journal of Va-
cation Marketing, Vol. 7, nº 4, pp. 316–332.
Butler, Richard (2000), “ Literary tourism”,
in Jafar Jafari (ed.), Encyclopedia of Tourism,
Londres, Routledge, p. 360.
Cabeça, Sónia; Gonçalves, Alexandra;
Marques, José & Tavares, Mirian (2018), “Con-
tributions of creative tourism to sustainable de-
velopment: the CREATOUR research and incu-
bation project” in Amoêda, R. Lira, S., Pi-
nheiro, C., Zaragoza, JMS, Serrano, JCS & Car-
rillo, FG (Eds.) Heritage 2018 – Proceedings of
the 6th International Conference on Heritage
and Sustainable Development, Granada: Edito-
rial Universidad de Granada / Green Lines In-
stitute for Sustainable Development, Vol 2, pp.
1671-1680.
Câmara Municipal de Sintra, “Roteiros Cul-
turais” in https://cm-sintra.pt/atualidade/cul-
tura/roteiros-culturais, acedido em 16 junho
2019.
Cisneros-Martínez, José David & Fernán-
dez-Morales, Antonio (2015), “Cultural tourism
as tourist segment for reducing seasonality in a
coastal area: the case study, of Andalusia”, Cur-
rent Issues in Tourism, Vol. 18(8), pp. 765-784.
Cresswell, Tim (2009), “Place”, in Interna-
tional Encyclopedia of Human Geography.
Thrift, Nigel &Kitchen, Rob (eds.), Oxford,
Elsevier, Vol. 8, pp. 169-177.
Dávidházi, Peter (1998), The romantic cult
of Shakespeare: Literary reception in anthropo-
logical perspective, Londres, Macmillan Press.
Direção-Geral do Livro, dos Arquivos e das
Bibliotecas, Festivais Literários em Portugal, http://livro.dglab.gov.pt/sites/DGL B/Portu-
gues/noticiasEventos/Paginas/FESTIVAIS-LI-
TER%C3%81RIOS-EM-PORTUGAL.aspx,
acedido em 04 de setembro 2019.
Direção Geral do Património Cultural
(2019), Monumentos, museus e palácios da
DGPC – Estatísticas do visitantes 2014-2018,
http://www.patrimoniocultural.gov. pt/sta-
tic/data/museus_e_monumentos/tota
ism_m_p2014_2018.pdf.
Direção Regional de Cultura do Centro,
“Rotas | Redes” in https://www.culturacen-
tro.gov.pt/, acedido em 16 junho 2019.
Direção Regional da Cultura do Norte, “Es-
critores a Norte” in http://escrito resa-
norte.pt/roteiros.aspx, acedido em 1 de junho
2019.
Gomes, Carina Sousa (2008), “Imagens e
narrativas da Coimbra turística: Entre a cidade
real e a cidade (re)imaginada”, Revista Crítica
de Ciências Sociais, nº 83, pp. 55-78.
Hendrix, Harald (2007), “The early-modern
invention of literary tourism: Petrarch’s houses
in France and Italy” in Hendrix, Harald (ed.),
Writer’s houses and the making of memory,
Nova Iorque, Routledge, pp. 15-30.

Caracterização e Análise do Potencial de Desenvolvimento do Turismo Cultural Literário em Coimbra
99
Hendrix, Harald (2014), “Literature and tou-
rism: Explorations, reflections and challenges”
in Quinteiro, Sílvia & Baleiro, Rita (orgs.),
Lit&tour: Ensaios sobre literatura e turismo,
Vila Nova de Famalicão, Húmus, pp.19-30.
Herbert, David (2001), “Literary places,
tourism and the heritage experience”, Annals of
Tourism Research, Vol. 28, nº 2, pp. 312-333.
Hoppen, Anne (2011), A Study of visitors’
motivations at Daphne du Maurier Festival of
arts and literature (dissertação de mestrado não
publicada), Bournemouth University, Bourne-
mouth.
INE (2017), Estatísticas da Cultura ˗ 2017,
https://www.ine.pt/xportal/xmain?xp
id=INE&xpgid=ine_publicacoes&PUBLICA-
COESpub_boui=320464526&PUBLICACO-
ESmodo=2.
INE (2018), Estatísticas do Turismo ˗ 2017,
https://www.ine.pt/xportal/xmain?
xpid=INE&xpgid=ine_publicacoes&PUBLI-
CACOESpub_boui=320462327&PUBLICA-
COESmodo=2.
Irish Tourism, Ireland self-drive tours,
https://www.authenticireland.com/tours/ire-
land-self-drive-tours/, acedido em 10 de junho
2019.
Landry, Charles (2008), The Creative City.
A tool kit for urban innovators, 2ª edição, Co-
media, Londres.
Magadán, Díaz, Marta & Rivas García, Jesus
(2011), Turismo literario, Oviedo, Septem Edi-
ciones.
Magris, Claudio (2018), Instantâneos, Lis-
boa, Quetzal.
Mansfield, Charles (2015), Researching lit-
erary tourism, Plymouth, TKT, Shadows Books
& Media.
Óbidos Vila Literária, http://obidosvilalite-
raria.com/cidade-criativa-da-literatura/,
acedido em 26 abril 2019.
OECD (2009), The Impact of Culture on
Tourism. Organization for Economic Co-opera-
tion and Development, https://ww
w.oecd.org/cfe/tourism/theimpactofculture on-
tourism.htm.
Pérez Pinzón & Luis Rubén (2017), “Tu-
rismo literario, ambientes históricos y “santan-
dereanidad”: representaciones narrativas sobre
el território santandereano”, Cuadernos de Geo-
grafía: Revista Colombiana de Geografía, Vol.
26, n.º 2, pp. 133-151.
Pocock, Celmara; Carlsen, Jack; Hughes,
Michael; Frost, Warwick & Peel, Vicki (2008)
Towards a cultural heritage tourism research
strategy: developing synergies in Australian re-
search. Technical Report. Sustainable Tourism
CRC, Brisbane, Australia.
Quinteiro, Sílvia & Baleiro, Rita (2019), Es-
tudos em Literatura e Turismo: Conceitos Fun-
damentais. Lisboa: Faculdade de Letras da Uni-
versidade de Lisboa.
Richards, Greg (Ed.) (1996), Cultural tour-
ism in Europe. Wallingford: CABI Publishing.
Richards, Greg (2018) “Cultural tourism: A
review of recent research and trends”, Journal
of Hospitality and Tourism Management, N.º
36, pp. 12-2.
Robertson, Judith & Radford, Linda (2009),
“The Private Uses of Quiet Grandeur: A Medi-
tation on Literary Pilgrimage”, Changing Eng-
lish, Vol. 16, nº 2, pp. 203-209.
Robinson, Mike & Andersen, Hans-Chris-
tian (2002), Literature and tourism: Reading
and writing tourism texts, Londres, Continuum.
Ruiz Scarfuto, Rosalina (2013), “Literary
Routes: Contributions to Natural/Cultural Her-
itage Tourism. How Landscape Transforms Lit-
erature and Tourism”, Alma Tourism, Journal
of Tourism, Culture and Territorial Develop-
ment, nº 8, pp. 1-18.
Sharpley, Richard (2009), Tourism Devel-
opment and Environment: Beyond Sustainabil-
ity, Routledge.
Skift (2018) Megatrends Defining Travel in
2018, https://skift.com/2018 /01/17/the-mega-
trends-defining-travel-in-2018/.
Smith, Jeremy (2018), Transforming Travel.
Realising the potential of sustainable tourism,
Wallingford, Cabi.
Solima, Ludovico & Minguzzi, Antonio
(2014), “Territorial development through cul-
tural tourism and creative activities”, Mondes
du Tourisme, 10, Dezembro 2014, pp. 6–8.
Squire, Shelagh J. (1996), “Literary tourism
and sustainable tourism: Promoting ‘Anne of
Green Gables’ in Prince Edward Island”, Jour-
nal of Sustainable Tourism, Vol. 4, nº 3, pp.
119–134.
Tally Jr., Robert (2013), Spatiality. Nova
Iorque: Routledge.
Tuan, Yi-Fu. [1977] (1983), Espaço e lugar:
a perspectiva da experiência. São Paulo:
DIFEL.
Westover, Paul A. (2008), Traveling to meet
the dead 1750-1860: A study of literary tourism
and necromanticism (tese de doutoramento não
publicada), Indiana University, Bloomington e
Indianapolis


Artigo submetido a 26 de Julho de 2019; versão final aceite a 7 de Novembro de 2019
Paper submitted on July 26, 2019; final version acceptet on November 7, 2019
A Percepção e Atitude na Hotelaria Face ao Mercado
LGBT: O Caso do Norte de Portugal
Hotel Perception and Attitude Towards the LGBT Market: The
Case of Northern Portugal
Sónia de Sousa e Silva
Mestranda em Gestão do Turismo – ESHT/IPCA
Laurentina Vareiro
Docente do IPCA/UNIAG
Resumo/ Abstract
For a destination that wants to build a strong
relationship with the LGBT consumer,
knowledge of the market is vital. The involve-
ment and attraction of the LGBT market, regard-
less of its motivation, should focus on creating a
safe and welcoming environment for LGBT
travellers, interacting with understanding and re-
spect. This study aims to analyse the specificities
of this segment and its acceptance in the accom-
modation offer in the North of Portugal, through
email contacts from two fictional and distinct
couples - one LGBT and one heterosexual. By
requesting information and availability of ac-
commodation by these couples, results indicate
discriminatory behaviour towards homosexual-
ity manifested by the non-response / denial of ac-
cess to accommodation. Nevertheless, when re-
sponding, there are no less friendly, affectionate,
attentive or hospitable, nor even a quality deficit
in the responses.
Keywords: Discrimination; Hospitality; LGBT;
Marketplace; Northern Portugal; Tourism
JEL codes: I31; L83; M14; Z31.
Para um destino que pretenda construir um
forte relacionamento com o consumidor LGBT é
vital o conhecimento do mercado. O envolvi-
mento e atração do mercado LGBT, independen-
temente da sua motivação, deve ter como foco
central a criação de um ambiente seguro e aco-
lhedor para os viajantes LGBT, interagindo com
compreensão e respeito. Este estudo pretende
analisar as especificidades deste segmento e a
sua aceitação no domínio da oferta de aloja-
mento no Norte de Portugal, através de contactos
por e-mail por parte de dois casais ficcionados e
distintos – um LGBT e outro heterossexual. Me-
diante a solicitação de informação e disponibili-
dade de alojamento por parte destes casais, obti-
veram-se resultados que indiciam condutas dis-
criminatórias perante a homossexualidade mani-
festadas pela não resposta/negação ao acesso ao
alojamento. Não obstante, quando obtendo res-
posta não se observam comportamentos menos
amigáveis, afetuosos, atenciosos ou hospitalei-
ros, nem sequer deficit de qualidade nas respos-
tas.
Palavras-chave: Discriminação; Hospitalidade;
LGBT; Mercado; Norte de Portugal; Turismo
Códigos JEL: I31; L83; M14; Z31.

Revista Portuguesa de Estudos Regionais, nº 56
102
1. INTRODUÇÃO
Atualmente, novos nichos de mercado são
alvo de estudo sendo um deles o mercado LGBT
(Baxter, 2010). Os decisores políticos e as em-
presas reconhecem a importância das subcultu-
ras de minorias crescentes em tamanho, o seu
aumento de poder compra e uma maior consci-
ência política e cultural e de orgulho (Cui, 1997;
Penaloza & Gilly, 1999; Sheth et al., 1990 cita-
dos em Baxter, 2010: 127) a par da necessidade
em responder às diferenças dos consumidores
com estratégias de diferenciação e de captação
destes mercados.
De acordo com a World Tourism Organiza-
tion (2017), os turistas LGBT são reconhecidos
como um segmento que viaja com maior fre-
quência e que demonstra padrões de gastos
acima da média. Por essa perspetiva, tem sido
classificado como um segmento de mercado im-
portante com grande potencial de crescimento,
mas que exige uma abordagem mais aprofun-
dada de forma a aprimorar o seu funcionamento.
De facto, ainda são poucos os dados econó-
micos e estudos sobre este mercado, assim
como a compreensão do seu comportamento
como turista ainda não foi profundamente dis-
cutida (WTO, 2017).
Nesse sentido, pretende-se prestar um con-
tributo pelo estudo, análise e avaliação da per-
ceção e atitude no alojamento turístico da região
Norte em relação ao mercado LGBT. Para o su-
cesso deste segmento de mercado há que privi-
legiar o envolvimento, a aceitação e hospitali-
dade de todos. Perceber se o mercado LGBT é
aceite, respeitado, recebido com hospitalidade e
liberdade de expressão foi o cerne desta investi-
gação e que está na génese da viabilidade na
aposta neste segmento.
As unidades de alojamento turístico são sta-
keholders primários cruciais para o sucesso do
turismo no destino, em que a perceção de quali-
dade dos seus serviços e a hospitalidade dos
seus funcionários condiciona diretamente o des-
tino em termos da procura turística. Como tal,
torna-se pertinente averiguar se os turistas
LGBT são, de alguma forma, discriminados em
função da orientação sexual e da identidade do
género por parte das unidades de alojamento da
região Norte de Portugal.
Em termos metodológicos e de estrutura,
este trabalho de investigação assenta em duas
partes complementares: num estudo teórico,
que recorre a dados secundários oriundos de
pesquisa bibliográfica, e num estudo empírico,
que se baseia em dados primários provenientes
de pesquisa de campo. Assim, para este estudo
decidiu-se, com base nos trabalhos de Hower-
ton, Meltzer e Olson (2012) e Rodrigues, Moniz
e Tiago (2017), utilizar o e-mail a solicitar in-
formações e disponibilidade de alojamento, re-
correndo ao uso de clientes mistério (um casal
LGBT e um heterossexual) com o objetivo de
analisar se o casal LGBT é tratado de forma di-
ferente em relação ao heterossexual: rejeição na
disponibilidade de alojamento, atitudes mais
negativas, traços identificativos de menor afeti-
vidade, atenção ou hospitalidade. De acordo
com Howerton et al. (2012), é no contacto não
presencial (via e-mail, por exemplo) que sur-
gem maiores indícios de preconceito, uma vez
que os indivíduos, ao não se sentirem observa-
dos, adotam comportamentos de acordo com os
seus ideais.
Em Portugal, os estudos desenvolvidos so-
bre o turismo LGBT são praticamente inexisten-
tes. Esta investigação pretende ajudar a colma-
tar esta lacuna, sendo direcionada para se assu-
mir como um importante instrumento para os
decisores políticos e empresas que pretendam
apostar no mercado LGBT.
2. REVISÃO DE LITERATURA
2.1. Turismo LGBT
No mundo atual, a atividade turística é reco-
nhecida como fundamental para o crescimento
económico e social dos países e regiões. É in-
dubitável a capacidade deste sector para a cria-
ção de emprego e para o aparecimento de novos
negócios de suporte à atividade turística, funci-
onando como impulsionador do desenvolvi-
mento das infraestruturas de um país (Srihadi,
Sukandar & Soehadi, 2016). Todavia, para o
contínuo sucesso e prosperidade do turismo é
imprescindível um planeamento e gestão efica-
zes numa perspetiva de desenvolvimento sus-
tentável, visando a conciliação dos interesses do
destino e do mercado turístico (Kastenholz,
2006; Vareiro, 2008).
Num cenário cada vez mais competitivo e
exigente torna-se fundamental identificar efi-
cazmente o que o destino tem para oferecer (o
produto), quais as pessoas que têm disponibili-
dade, poder de compra e desejo de visitar o des-
tino (mercado-alvo), e qual a melhor forma de
os contactar e convencer a visitar o destino
(Kastenholz, 2006). Robinson e Novelli (2005)
são da opinião que se os destinos desejam

A Percepção e Atitude na Hotelaria Face ao Mercado LGBT: O Caso do Norte de Portugal
103
usufruir do turismo como um mecanismo para o
desenvolvimento económico da região e/ou
país, a aposta deve passar pelo turismo de nicho,
um turismo que envolve um número reduzido
de turistas, com interesses e/ou atividades mais
enriquecedores, direcionadas para as suas ne-
cessidades e motivações, desenvolvidas em “ce-
nários autênticos”, e segundo os quais oferecem
melhores oportunidades, mais sustentabilidade
e, consequentemente, um menor impacto nega-
tivo no destino, a par da capacidade em atrair
turista com um maior poder de compra.
O fenómeno do turismo de nicho direcio-
nado para o mercado das pessoas lésbicas, gays,
bissexuais e transgéneros engloba diversos con-
ceitos e especificidades que proporcionam a cri-
ação de vários subgrupos e terminologias sujei-
tas a alterações e em permanente evolução ao
longo dos tempos. Segundo a Community Mar-
keting & Insights (CMI) (2019) as terminolo-
gias utilizadas para descrever a comunidade são
o: Queer, LGBT, LGBTQ, LGBTQ+, LGBT+
(o símbolo + representa mais inclusão dentro da
comunidade). Segundo o estudo, as terminolo-
gias mais favoráveis e seguras a utilizar como
representação da comunidade são as LGBT e
LGBTQ. A vantagem da LGBT é que é a prefe-
ria por toda a comunidade (em particular pelas
gerações mais velhas) e é a considerada pelas
organizações a mais “segura”. Nesse sentido,
esta será a terminologia a utilizar ao longo do
presente estudo.
A WTO (2012) define o turismo LGBT
como sendo o desenvolvimento e comercializa-
ção de produtos e serviços turísticos realizados
por e para as lésbicas, gays, bissexuais e
transgéneros (LGBT). Por outro lado, Southall
e Fallon (2011) definem o turismo LGBT como
qualquer atividade de turismo, especificamente
projetado para atrair o mercado LGBT, ou
aquele que, por natureza e/ou design, agrada e é
perseguido pelo mercado LGBT. A interação
entre fornecedores, gestores, facilitadores e
consumidores do produto e serviço de turismo
LGBT e seu relacionamento subsequente é parte
integrante do conceito.
O turismo LGBT é um nicho de turismo que,
além dos impactes positivos associados ao tu-
rismo na sua generalidade, tem suscitado cres-
cente interesse, devido ao seu rápido cresci-
mento e benefício económico para o turismo
(Clift & Forrest, 1999; Holcomb & Luongo,
1996 citados em Monterrubio, Hughes, Miller
& Mason, 2007: 57), como consequência tam-
bém da crescente visibilidade e aceitação das
pessoas da comunidade LGBT no mundo (Jor-
dan & Traveller, 2018). Segundo a WTO
(2017), no ano de 2016, a comunidade LGBT
representou 36 milhões de pernoitas nos desti-
nos internacionais em todo o mundo. Estima-se
que este mercado represente 10% do fluxo mun-
dial anual de viajantes e 15% da faturação das
empresas do setor. Só nos EUA, em 2010, ob-
teve um impacte económico na ordem dos 65
milhares de milhões de USD por ano e, na Ho-
landa, em 2012, mais de 165 milhares de mi-
lhões de USD para gastos com viagens de lazer
(WTO, 2012). Em Portugal, segundo a Varia-
ções, Associação de Comércio e Turismo
LGBTI (s.d.), ao milhão de consumidores
LGBT existente em Portugal podem somar-se
mais de dois milhões de turistas LGBT que vi-
sitam o país anualmente, perfazendo uma esti-
mativa de quase 2.000 milhões de euros de re-
ceitas do setor para a economia nacional.
O turista LGBT é reconhecido, de acordo
com o seu perfil, comportamento e motivações,
como um segmento bastante atrativo e impor-
tante para o crescimento económico de um des-
tino e/ou região (WTO, 2017). Estes turistas vi-
ajam com bastante frequência, preferencial-
mente em épocas baixas e médias, demonstram
uma aptidão para o consumo acima da média e
possuem uma forte tendência à fidelização
quando satisfeitos com o produto/serviço en-
contrado (WTO, 2017). São os denominados
DINK (Dual Income, No Kids - Rendimento
Duplo, Sem filhos), muito apetecíveis para os
agentes turísticos do destino, termo utilizado re-
gularmente para caracterizar o perfil de gays e
lésbicas com rendimentos superiores e que gas-
tam mais do que a média em viagens, entreteni-
mento e moda (WTO, 2012). Todavia, segundo
a CMI (2016), o estereotipo de designar os tu-
ristas LGBT de DINK está a mudar, fruto da le-
galização do casamento e da adotação dos ca-
sais do mesmo sexo. Por exemplo, 51% das mu-
lheres lésbicas e bissexuais, 10% dos homens
gays e bissexuais e 26% dos “Gender Expan-
sive” indicam que têm filhos menores de 18
anos (CMI, 2018b). Para muitos, viajar com fre-
quência representa uma valiosa oportunidade
para o enriquecimento pessoal e de socialização
e para viverem mais livremente, quando não o é
possível no seu local de residência (Jordan &
Traveller, 2018), prevalecendo a escolha por
destinos denominados de gay friendly [abertos
para acolher e receber com hospitalidade a co-
munidade LGBT (Hughes, 2002)], atualmente

Revista Portuguesa de Estudos Regionais, nº 56
104
mais favorável a denominação de “LGBT frien-
dly” (CMI, 2017).
Quanto ao alojamento, a maioria opta por
hotéis de três a cinco estrelas (CMI, 2011 e
2018a). Os homens gays e bissexuais optam
mais por hotéis urbanos (hotéis de luxo, hotéis
de design e hotéis boutique) e as mulheres lés-
bicas e bissexuais tendem a ser mais variadas
nas opções de alojamento (CMI, 2018a). No que
respeita à marca, os turistas ainda consideram
importante permanecer em hotel de marca e
com uma reputação LGBT positiva, sendo,
neste âmbito, as cadeias hoteleiras Hilton e
Marriott as mais populares (CMI, 2018a). As
principais motivações na escolha de um aloja-
mento para além dos requisitos tradicional-
mente solicitados pelos heterossexuais (quartos
silenciosos, camas confortáveis, relação quali-
dade/preço, late-breakfast, internet, localiza-
ção), os turistas da comunidade LGBT valori-
zam, acima de tudo, um ambiente de respeito,
aceitação e não discriminação (CMI, 2011 e
2018a; Paradela, González e Vila, 2014; Poria,
2006). Ao longo dos estudos da CMI, ao ques-
tionar as principais motivações aquando da re-
serva de um hotel, a localização surge sempre
no topo da lista a par da reputação de LGBT
friendly. Todavia, segundo a CMI (2016), a re-
putação como um LGBT friendly desceu da se-
gunda principal motivação para a quarta, em
2016. De acordo com o mesmo estudo, embora
os viajantes da comunidade LGBT ainda dese-
jem ficar alojados em acomodações hospitalei-
ras, estes consideram que praticamente todos os
principais grupos hoteleiros já são LGBT frien-
dly e como tal surgem motivações de reserva
mais práticas.
É importante sublinhar que o turismo LGBT
pode beneficiar económica e socialmente a co-
munidade por via da criação de emprego, au-
mento do rendimento e melhoria da qualidade
de vida da população, a par do combate a pro-
blemas estruturais do destino, como a sazonali-
dade, a superlotação e a gestão dos recursos
(WTO, 2017). Paralelamente, os destinos que
recebem os turistas LGBT transmitem uma ima-
gem forte de aceitação e respeito, de ambiente
social aberto e tolerante, que compreende as di-
ferenças entre os povos e as culturas. Os desti-
nos que defendem os direitos LGBT tornam-se,
consequentemente, defensores globais dos di-
reitos humanos universais (WTO, 2017). Por-
tanto, trata-se de um nicho vantajoso para os
destinos que se declarem LGBT friendly não só
por questões económicas, mas também sociais e
humanas beneficiando assim de uma vantagem
competitiva.
2.2 Hospitalidade como estratégia de di-
ferenciação e competitividade para o
mercado LGBT
A competitividade de um destino turístico
resulta da sinergia criada entre os fatores natu-
rais e humanos no destino, determinada pela ca-
pacidade das empresas turísticas em atrair no-
vos visitantes e aumentar os seus gastos através
da elaboração de bens e serviços de qualidade e
de experiências únicas (Malakauskaite & Na-
vickas, 2010).
Os recursos e atrações do destino são a base
da experiência turística, o chamariz dos visitan-
tes ao destino. Porém, os fatores de suporte e re-
cursos são essenciais para a continuidade e qua-
lidade da atividade turística (Crouch, 2007). Se
estes não estiverem acessíveis, se o setor pri-
vado não criar serviços com qualidade para cap-
tar e fidelizar os mercados, se as infraestruturas
não forem as mais adequadas, se as pessoas re-
sidentes e trabalhadores não forem hospitalei-
ras, com certeza não serão bem-sucedidos na
atração e fidelização dos turistas.
Ao analisar a hospitalidade no destino, não
podemos negar que esta se traduz num fator de
suporte importante para a competitividade e
qualidade do destino e um indicador imprescin-
dível para o mercado LGBT. O sentimento de
ser bem-vindo, a tolerância, a aceitação, o bem
receber e a reputação de um destino LGBT frien-
dly são, na opinião de vários autores, um dos
principais motivadores na escolha do destino
por parte do mercado LGBT (e.g.: CMI, 2011;
Hodes, Vork, Gerritsma & Bras, 2007; Jordan
& Traveller, 2018; Monterrubio, 2008; Prit-
chard, Morgan, Sedgley, Khan, & Jenkins,
2000; WTO, 2012).
Quando abordamos a hospitalidade no con-
texto turístico, esta deve estar presente em todos
os domínios do destino, em ambiente privado,
público/social e comercial, que diretamente ou
indiretamente interferem com o turista. O turista
avalia a sua experiência vivida no destino na sua
“totalidade”, desde o momento de saída da sua
residência, passando pela sua permanência no
destino, até ao momento do seu regresso. Este
avalia as deslocações e meios de transportes uti-
lizados, os produtos e serviços usufruídos, as in-
fraestruturas, o ambiente, a cultura e, mais im-
portante ainda, as pessoas que direta ou indire-
tamente fizeram parte da sua experiência

A Percepção e Atitude na Hotelaria Face ao Mercado LGBT: O Caso do Norte de Portugal
105
(residentes e não residentes) (Brandão, Caval-
cante & Silva, 2013).
No domínio público/social o acolhimento
está diretamente relacionado com os atos e ritu-
ais que envolvem o destino enquanto espaço
quotidiano proporcionador de serviços e recur-
sos, pagos e gratuitos. Na vertente comercial, a
hospitalidade é observada através das empresas
prestadores de serviços como os hotéis, restau-
rantes, entre outras, direcionadas para receber o
cliente (Camargo, 2008 e Lashley, 2004 citados
em Vilkas, 2017: 140).
Independente do domínio sob a qual a hospi-
talidade se desenvolve, esta deve-se estender a
todos os públicos de maneira igualitária, sem
qualquer tipo de distinção, preconceito ou dis-
criminação. A discriminação em função de ori-
entações sexuais é designada e difundida como
homofobia. O sentido original dado ao termo –
homofobia - caracteriza-se por um sentimento
de medo, aversão, repulsa e fobia às pessoas
LGBT. As pessoas homofóbicas qualificam to-
dos os que não são heterossexuais como sendo
inferiores, anormais, fora do universo comum
dos humanos. Esta abordagem homofóbica os-
tenta discursos ou atitudes de receio, desprezo,
hostilidade às pessoas que têm uma atracão se-
xual e/ou envolvimento emocional ou amoroso
por pessoas do mesmo sexo. Como qualquer ou-
tra manifestação de intolerância, a homofobia
“constrói-se em torno de emoções (crenças, pre-
conceitos, convicções, fantasmas...), de condu-
tas (atos, práticas, procedimentos, leis...) e de
um dispositivo ideológico (teorias, mitos, dou-
trinas, argumentos de autoridade...)” (Borrillo,
2001: 28).
É certo que nos últimos anos tem havido mu-
danças positivas face à visibilidade da aceitação
das pessoas da comunidade LGBT, todavia,
como salientam Nogueira e Oliveira (2010: 10)
“existem ainda preconceitos e desinformação
persistente sobre a homossexualidade com dife-
rentes resultados e consequências”. No estudo
realizado por Poria (2006), a maioria dos inqui-
ridos afirmam sentir algum desconforto na sua
experiência em hotelaria, quer por parte dos
funcionários do hotel, ao não considerar que
duas pessoas do mesmo sexo podem ser um ca-
sal de gays ou lésbicas, quer pela documentação
fornecida (ficha de registo, mensagens de
quarto, room amenities…) que assume que os
casais que usufruem dos quartos são heterosse-
xuais. Os participantes sustentam que, quando
os funcionários do hotel descobrem ou suspei-
tam da sua orientação sexual, estes adotam
comportamentos diferentes, geralmente nega-
tivo. De acordo com um estudo realizado Virgin
Holidays (2016), um em cada três viajantes
LGBT (33%) sentem que são tratados de forma
diferente devido à sua orientação sexual quando
estão de férias (6% dos quais afirmam enfrentar
uma ameaça de violência física devido à sua se-
xualidade) e quase um quarto (23%) dos viajan-
tes LGBT mudam a sua própria maneira de agir
tentando camuflar a sexualidade quando estão
de férias.
O sentimento de segurança e a perceção de
comportamentos homofóbicos (expressos ou la-
tentes) são preocupações legítimas para todos os
viajantes LGBT. As pessoas que discriminam
ou que sentem qualquer tipo de preconceito face
aos residentes LGBT terão igualmente a mesma
perceção face aos turistas. As atitudes em rela-
ção aos turistas LGBT tendem a ser influencia-
das por atitudes em relação à discriminação das
pessoas que manifestem orientação sexual ou
identidade/expressão de género diferente dos
padrões hétero normativos. Esta desaprovação
poderá ser suficiente para gerar atitudes negati-
vas em relação aos turistas LGBT (Hughes,
Monterrubio & Miller, 2010).
3. METODOLOGIA
A opção metodológica incidiu sobre o e-
mail, durante muito tempo considerada a princi-
pal ferramenta da internet entre os hotéis glo-
bais (Wei, Ruys, Van Hoof & Combrink, 2001).
Com base na metodologia utilizada por Hower-
ton et al. (2012) e Rodrigues et al. (2017), deci-
diu-se recorrer a clientes mistério com o envio
de email às diversas unidades de alojamento da
Região Norte de Portugal, a solicitar informa-
ções e disponibilidade do alojamento.
Para o universo do estudo, atendendo à ex-
tensão das unidades de alojamento existentes na
região Norte e após a análise do perfil do turista
LGBT (CMI, 2011 e 2018a), considerou-se
como universo a hotelaria (estabelecimentos
hoteleiros, apartamentos, aldeamentos e con-
juntos turísticos) de 4 a 5 estrelas. Esta foi sele-
cionada segundo a listagem oficial do Registo
Nacional de Turismo disponível no portal do
Turismo de Portugal I.P.
Em termos de procedimento foram criadas
duas identidades e contas de e-mail fictícias, um
casal LGBT e um outro casal heterossexual. O
passo seguinte foi o envio dos e-mails em dois
dias diferentes, mas consecutivos de forma a

Revista Portuguesa de Estudos Regionais, nº 56
106
não levantar suspeitas relativamente ao real in-
teresse da estada na unidade de alojamento.
Para a estruturação e construção dos e-mails
decidiu-se para o cliente mistério (casal de ho-
mossexuais) adaptar a estrutura do e-mail de
Howerton et al. (2012). Tendo em conta que os
hóspedes provenientes do Reino Unido repre-
sentam uma parte significativa do total de hós-
pedes nos estabelecimentos de alojamento turís-
tico na região Norte e país optou-se por manter
a identidade britânica (Turismo de Portugal I.P.,
s.d.). Relativamente ao casal heterossexual,
considerou-se oportuno alterar a nacionalidade
dos turistas e o motivo da estada, mantendo as
datas pretendidas e o tipo de quarto, por forma
a conseguir-se efetuar uma análise comparativa
fidedigna em relação à disponibilidade dos
quartos. Para este casal foi atribuída a naciona-
lidade francesa, mercado também predominante
na região Norte (Turismo de Portugal I.P., s.d.)
e recorrendo ao idioma nativo.
Nos e-mails remetidos, os turistas solicita-
vam informações sobre a disponibilidade de
alojamento, as respetivas tarifas para as datas
pretendidas, além de informações sobre ofertas
especiais para a lua de mel (casal LGBT) /ani-
versário de casamento (casal heterossexual) e os
meios de transporte disponíveis para o respetivo
estabelecimento. As datas escolhidas tiveram
em conta a sazonalidade turística, optando-se
pela época baixa uma vez que a probabilidade
de uma resposta afirmativa é superior dada a
maior disponibilidade de quartos. Em relação à
sexualidade dos indivíduos, a orientação sexual
ficou explícita no género dos dois nomes pró-
prios utilizados no texto, Mark e David, nomes
populares no Reino Unido.
Para medir a perceção e atitude na hotelaria
da região Norte face ao mercado LGBT e com
base em Howerton et al. (2012), Law e Kua
(2009) e Rodrigues et al. (2017) a categorização
das variáveis consideradas no estudo foram: ca-
tegoria e localização do alojamento, resposta ao
e-mail (rejeição na disponibilidade), qualidade
do serviço no processo de reserva (tarifas, ame-
nities, transporte), tempo de resposta (1 a 7 dias)
e outros indicadores para avaliar a presença ou
não de preconceito nas respostas, como a ama-
bilidade, afetuosidade, atenção e a hospitali-
dade.
4. ANÁLISE E INTERPRETAÇÃO
DOS RESULTADOS
Considerando que a generalidade das variá-
veis da investigação são qualitativas, procurou-
se quantificar e uniformizar a apresentação dos
resultados nos quadros utilizando valores abso-
lutos, percentagens e médias como dados esta-
tísticos.
Amostra
A amostra deste estudo tem como base duas
variáveis: localização e categoria do estabeleci-
mento que serão seguidamente escrutinadas em
várias dimensões e perspetivas de análise.
Ao nível da categoria de alojamento e se-
gundo o perfil do turista LGBT anteriormente
abordado, as unidades de alojamento a conside-
rar são as de 4 e 5 estrelas. Da amostra de 143
unidades de alojamento da região Norte de Por-
tugal, 124 detêm a categoria de 4 estrelas e 19 a
categoria de 5 estrelas. Geograficamente, a mai-
oria das unidades encontram-se no sub-destino
Porto (aproximadamente 52%), seguido do Mi-
nho com cerca de 32%, o Douro com 8% e as
Terras de Trás-os-Montes com somente 6%.
Dimensão de análise - resposta ao e-mail
Analisando a taxa de resposta ao e-mail,
numa abordagem mais geral, sem qualquer tipo
de diferenciação relativamente aos clientes e
aos tipos de respostas, contabilizam-se 286
emails enviados obtendo resposta por 187 ve-
zes, cifrando-se assim em 65.4 %.
Especificando para o tipo de resposta, inde-
pendentemente do tipo de cliente, a maioria das
respostas são afirmativas mostrando disponibi-
lidade para as datas pretendidas (186 e-mails);
apenas uma unidade informa da não disponibi-
lidade de quartos. Constata-se que, em média,
79 emails são provenientes de empreendimen-
tos de 4 estrelas e 15 são de empreendimentos
de 5 estrelas. No domínio do próprio destino,
como seria expectável, a maioria das respostas
provieram das unidades localizadas no Porto (
= 52), seguido pelo Minho com uma média de
28 unidades/emails. Por outro lado, e em média,
99 unidades de alojamento não responderam aos
e-mails (35%) com uma delimitação média re-
lativamente à categoria de 4 estrelas de 44 uni-
dades e em relação à categoria de 5 estrelas de
5 unidades. Filtrando os sub-destinos, eviden-
ciam as zonas do Porto e do Minho ( = 22 e
= 19 unidades respetivamente).
A ausência de resposta é uma variável que
deve ser tida em conta e a melhor forma de a
interpretar será, porventura, a defendida por Ho-
werton et al. (2012) e Rodrigues et al. (2017)
que entendem a não resposta como uma res-
posta negativa, uma vez que é do interesse dos

A Percepção e Atitude na Hotelaria Face ao Mercado LGBT: O Caso do Norte de Portugal
107
empreendimentos responder aos e-mails recebi-
dos a fim de efetuar reserva e, por conseguinte,
angariar clientes.
Assim, podemos concluir que, independente
do tipo de cliente (LGBT ou heterossexual),
65% dos e-mails enviados, a resposta foi afir-
mativa aludindo disponibilidade para as datas
pretendidas e 35% negativa, não mostrando in-
teresse e disponibilidade de alojamento.
Após a observação geral da taxa e tipo de
respostas dos e-mails enviados, focar-nos-emos
na aferição de eventuais posições discriminató-
rias relativamente à tipologia dos clientes. Ave-
riguar se existe alguma espécie de prevalência
na recusa de alojamento a turistas LGBT em re-
lação a clientes heterossexuais, quando contac-
tados via e-mail, consiste num dos principais
objetivos propostos neste estudo.
Dos e-mails enviados às 143 unidades de ho-
telaria e segundo a orientação sexual dos clien-
tes, o casal de heterossexuais (HETERO) rece-
beu 109 respostas afirmativas de disponibili-
dade de alojamento, mais 21% que o casal
LGBT, que se ficou pelas 78 respostas afirmati-
vas representando uma percentagem de resposta
global de 55%.
Numa perspetiva mais territorial, filtrando as
respostas pelos diferentes sub-destinos, con-
firma-se a maior disponibilidade de alojamento
para o casal heterossexual, com exceções das
unidades hoteleiras de 5 estrelas localizadas em
Trás-os-Montes com dados igualitários (100%
para ambos os casais) e no Minho com dados
inversos à tendência (disponibilidade de 100%
para o casal LGBT em comparação a 67% do
casal heterossexual). Estes dados refletem a
maior disponibilidade de alojamento na
hotelaria 5 estrelas em toda a região Norte de
Portugal para com o casal LGBT em contraciclo
com os empreendimentos 4 estrelas. Em síntese,
a disponibilidade das unidades de alojamento
não é total; no entanto, a indisponibilidade acen-
tua-se, agravando-se a situação para o casal
LGBT em todos os sub-destinos, com destaque
para as terras de Trás-os-Montes com uma per-
centagem diferencial na ordem dos 75 pontos
percentuais (Quadro 1). Como anteriormente
referido, a resposta negativa e a ausência de res-
posta foram assimiladas numa única variável.
Ainda assim, há que evidenciar que a quase to-
talidade da “Não disponibilidade” foram casos
de não resposta com apenas uma unidade a in-
formar o casal HETERO da não disponibilidade
de alojamento para as datas pretendidas.
O Quadro 1 confirma as conclusões do es-
tudo de Howerton et al. (2012), apontando para
a existência de uma disparidade negativa do ca-
sal LGBT em relação ao casal heterossexual por
parte do sector hoteleiro do Norte de Portugal
por via da negação de disponibilidade de aloja-
mento: 65 das unidades de alojamento (45%) re-
jeitaram o casal LGBT e somente 34 (23%) o
casal heterossexual. Mais relevante é a consta-
tação de 43 das 65 unidades que rejeitaram o ca-
sal LGBT enviaram e-mail afirmativo de dispo-
nibilidade de alojamento ao casal de heterosse-
xual, com destaque para as unidades de 4 estre-
las localizadas no Minho e em Trás-os-Montes.
É notário o claro favorecimento das unidades de
alojamento para com o casal de heterossexual,
apresentando uma percentagem inferior na or-
dem dos 22% em comparação com o casal
LGBT.
Quadro 1: (Não) Disponibilidade de alojamento segundo orientação sexual e identidade de género
Fonte: Elaboração própria.
Resposta ao e-mail (%)
Porto Douro Minho Trás-os-Montes PNP
H4* H5* H4* H5* H4* H5* H4* H5* %
Disponibilidade
LBGT 66% 67% 44% 67% 40% 100% 13% 100% 55%
HETERO 76% 75% 78% 100% 71% 67% 88% 100% 76%
Não disponibilidade
LBGT 34% 33% 56% 33% 60% 0% 88% 0% 45%
HETERO 24% 25% 22% 0% 27% 0% 13% 0% 23%

Revista Portuguesa de Estudos Regionais, nº 56
108
Dimensão da análise - qualidade do serviço
no processo de reserva
Para além da confirmada discriminação no
mercado, a presente investigação pretende tam-
bém percecionar a qualidade do serviço no pro-
cesso de reserva e perceber se, também neste
domínio, é verificável alguma dualidade de tra-
tamento para com os tipos de casais. Para esta
abordagem foram analisadas outras variáveis
também importantes: a avaliação do tempo e do
conteúdo das respostas do e-mail ao pedido das
informações solicitadas como as tarifas, a oferta
de amenities e os meios de transportes mais ade-
quados.
Assim, analisando o conteúdo das respostas
dos e-mails e conforme podemos observar atra-
vés do Quadro 2, a maioria das unidades de ho-
telaria com resposta afirmativa - quer no casal
LGBT, quer no HETERO disponibilizou infor-
mações sobre as tarifas. Todavia, observam-se
exceções em termos de empreendimentos 4 es-
trelas nos sub-destinos do Porto e Minho: no
Porto, 15% das respostas ao casal LGBT e 8%
ao heterossexual confirmaram disponibilidade,
mas reencaminharam para a sua página web ofi-
cial a fim de visualizar as tarifas para os quartos
pretendidos. No Minho esta situação observa-se
somente em relação ao casal LGBT (6%).
Quanto ao provimento de informações rela-
tivamente a amenities para a celebração das da-
tas especiais, 53% das unidades que responde-
ram ao e-mail tiveram o cuidado de informar o
casal LGBT e somente 30% o casal heterosse-
xual. Observa-se uma diferença considerável
nos dois tipos de clientes, talvez pelo facto de
considerarem que a lua-de-mel seja uma data
mais especial que a celebração de anos de casa-
dos. Em relação à informação sobre os meios de
transportes disponíveis e de acesso à unidade de
alojamento, esta foi um pouco superior, ainda
que residual, com 62% das unidades a disponi-
bilizar informação ao casal LGBT e 67% ao ca-
sal HETERO.
Sem qualquer destrinça relativamente aos
casais e à categoria das unidades de alojamento,
há que realçar algum deficit de qualidade na in-
formação prestada. Verificam-se valores per-
centuais elevados de empreendimentos que sim-
plesmente ignoram as perguntas adicionais fei-
tas tanto pelo casal LGBT como pelo casal he-
terossexual (43 e 51%, respetivamente). Ainda
assim, constata-se que não foi verificada uma
correlação quanto à orientação sexual e identi-
dade de género dos clientes, uma vez que apesar
das respostas aos e-mails do casal LGBT pro-
jetarem uma qualidade insuficiente, esta foi su-
perior ao casal HETERO.
Quadro 2: Informação disponível segundo orientação sexual e identidade de género
Resposta e-mail: Infor-
mação (%)
Porto Douro Minho Trás-os-Mon-
tes PNP
H 4* H 5* H 4* H 5* H 4* H 5* H 4* H 5*
Tarifas LBGT 85% 100% 100% 100% 94% 100% 100% 100% 91%
HETERO 90% 100% 100% 100% 100% 100% 100% 100% 95%
Amenities
LBGT 49% 75% 25% 0% 61% 33% 100% 100% 53%
HETERO 29% 44% 29% 14% 28% 50% 14% 100% 30%
Transporte LBGT 56% 63% 25% 25% 78% 67% 100% 100% 62%
HETERO 67% 56% 43% 29% 69% 100% 86% 100% 67%
Fonte: Elaboração própria.
Dimensão de análise – tempo de resposta
Relativamente ao tempo de resposta aos e-
mails, pode-se constatar que a maioria das uni-
dades de alojamento prontificaram-se a respon-
der nos dois dias seguintes à receção dos emails
independentemente do tipo de cliente. Anali-
sando os casais separadamente, das 78 respostas
dirigidas ao casal LGBT, cerca de 79%
enviaram resposta num prazo máximo 24 horas
e 17% em 48 horas, com 3 respostas a aconte-
cerem ao sétimo dia. Já quanto ao casal HE-
TERO, 78% das unidades de alojamento envia-
ram as suas respostas no espaço de 24 horas e
10% em 48 horas. O tempo de resposta para este
casal foi mais demorado destacando-se, por ou-
tro lado, a rapidez de resposta ao casal LGBT e

A Percepção e Atitude na Hotelaria Face ao Mercado LGBT: O Caso do Norte de Portugal
109
em particular por parte das unidades de 5 estre-
las (Quadro 3).
Poder-se-á considerar a velocidade de res-
posta como satisfatória. No entanto, as unidades
de alojamento devem estar cientes que uma res-
posta rápida é crucial e decisiva. Atualmente, a
internet veio facilitar o contacto e a reserva de
alojamento por parte dos potenciais clientes e
uma resposta lenta e incompleta pode excluir
um hotel do conjunto de alternativas considera-
das na decisão final do turista.
Quadro 3: Tempo de resposta
Tempo de Resposta (%) Porto Douro Minho
Trás-os-
Montes PNP
H 4* H 5* H 4* H 5* H 4* H 5* H 4* H 5* %
1 dia LGBT 50% 50% 33% 67% 36% 100% 0% 100% 79%
HETERO 65% 50% 56% 67% 60% 67% 37% 0% 78%
2 dias LGBT 13% 17% 11% 0% 44% 0% 0% 0% 17%
HETERO 65% 8% 22% 33% 0% 0% 25% 100% 10%
7 dias ou mais LGBT 33% 0% 0% 0% 0% 0% 12% 0% 4%
HETERO 0% 0% 0% 0% 0% 0% 12% 0% 1%
Fonte: Elaboração própria.
Dimensão de análise – presença ou não de
preconceito nas respostas
Uma outra dimensão de análise a ter em
conta é qualidade das respostas com enfoque na
avaliação da presença ou não de preconceito nas
respostas face ao mercado LGBT. Esta análise
requer a observação cuidada das respostas dos
empreendimentos turísticos do Norte de Portu-
gal e na possível identificação, ainda que subtis,
de aspetos discriminatórios. Variáveis como
Amabilidade, Afetuosidade, Atenção e Hospita-
lidade serão analisadas e comparadas entre os
dois tipos de casais, na prossecução de aspetos
que possam configurar alguma forma de pre-
conceito e tratamento inferior em relação à ori-
entação sexual e identidade de género.
Em estudos similares anteriores, Howerton
et al. (2012) afirmam que os casais LGBT rece-
beram respostas menos amigáveis, afetuosas,
atenciosas e hospitaleiras que os casais heteros-
sexuais. Inversamente, no estudo mais recente
de Rodrigues et al. (2017) não foi detetado qual-
quer tratamento inferior em relação à orientação
sexual e identidade de género.
Na presente investigação, e como podemos
observar através do Quadro 4, o casal LGBT
não recebeu um comportamento inferior em re-
lação ao casal HETERO. Antes pelo contrário,
de todos os e-mails recebidos, nota-se uma
maior Amabilidade, Afetuosidade, Atenção e
Hospitalidade para com o casal LGBT.
Quadro 4: Presença ou não de preconceito
Presença ou não de Preconceito (%) Porto Douro Minho
Trás-os-
Montes PNP
H 4* H 5* H 4* H 5* H 4* H 5* H 4* H 5*
Amabilidade LBGT 88% 88% 100% 100% 100% 100% 100% 100% 93%
HETERO 79% 100% 86% 100% 53% 100% 71% 100% 74%
Afetuosidade LBGT 12% 38% 0% 25% 0% 0% 0% 0% 12%
HETERO 4% 11% 0% 14% 0% 0% 0% 0% 4%
Atenção LBGT 44% 63% 25% 75% 44% 33% 100% 100% 49%
HETERO 27% 44% 29% 14% 34% 50% 29% 100% 32%
Hospitalidade LBGT 29% 50% 75% 50% 17% 33% 0% 100% 33%
HETERO 13% 56% 29% 43% 13% 0% 29% 100% 21%
Fonte: Elaboração própria.
Das quatro variáveis em exame, a Amabili-
dade, foi a que teve uma maior presença, com
cerca de 93% em todas as respostas ao casal
LGBT, mais 19% que o casal HETERO,
expressa em frases e em cumprimentos caloro-
sos, como: “obrigado por escolher o nosso esta-
belecimento”; “Ao V/ dispor para qualquer es-
clarecimento ou informação adicional”.

Revista Portuguesa de Estudos Regionais, nº 56
110
Seguidamente, surge a variável Atenção, com
49% nas respostas ao casal LGBT e uma per-
centagem superior em relação ao casal heteros-
sexual na ordem dos 17 pontos percentuais. Esta
foi observada através da existência de propostas
como pacotes românticos, ofertas de upgrades e
outras atividades complementares, tão impor-
tantes para o sucesso da estada do cliente.
Quanto à Hospitalidade, exteriorizada através
do uso de frases de boas vindas como: “será um
prazer recebê-los”, apesar de uma percentagem
reduzida para os dois casais, o casal LGBT con-
tinua a destacar-se com uma percentagem de
33%, mais 12 pontos percentuais que o casal
HETERO. A Afetuosidade, manifestada pelo
uso de votos de parabéns ou felicitações, apesar
de reduzida (12%), é bem melhor que a refe-
rente ao casal HETERO.
Posto isto, poder-se-á afirmar a não observa-
ção de qualquer tipo de preconceito e/ou discri-
minação perante a homossexualidade pelas uni-
dades de alojamento turístico do Norte de Por-
tugal que responderam aos e-mails. No entanto,
há que destacar negativamente o excesso de pa-
dronização das respostas, sem grande esforço
pela personalização e sem o cunho pessoal de
quem assina os e-mails. Esta situação, é agra-
vada em relação ao casal HETERO notando-se
algumas dificuldades linguísticas pelo facto de
o casal ser francês dando origem a e-mails de-
masiado diretos e breves sendo que, em alguns
casos, a resposta foi redigida na língua inglesa.
4. CONCLUSÕES
É certo que o turismo é uma aposta estraté-
gica para o Norte de Portugal, quer pelas suas
potencialidades, quer porque este setor se apre-
senta competitivo e com uma grande capacidade
exportadora. Todavia, a aposta no turismo por
parte da região deve estar assente num planea-
mento inteligente assegurando o respeito e inte-
gridade de todas as partes envolvidas no setor,
comunidade, turistas e o próprio destino, de
forma a que “todos” beneficiem do turismo.
A análise da perceção e atitude na hotelaria
em relação ao mercado LGBT assume-se como
essencial no planeamento do turismo LGBT no
Norte de Portugal. Os estudos desenvolvidos
nesta investigação permitiram percecionar os
acontecimentos que ocorrem no sector e facul-
tar informações relevantes para a tomada de de-
cisões e para o planeamento e gestão do turismo
LGBT na região. Através destes conseguimos
identificar com objetividade as fragilidades da
hotelaria em relação ao turismo LGBT nomea-
damente em termos da discriminação e precon-
ceito face ao mercado. Observam-se condutas
discriminatórias perante as pessoas LGBT ex-
pressas pela negação ao acesso ao alojamento
por parte das unidades hoteleiras do Norte de
Portugal. Todavia, constata-se que nas respostas
aos e-mails não foi verificada uma correlação
quanto à orientação sexual e identidade de gé-
nero dos clientes, quer em relação ao tempo e
qualidade dos e-mails, quer à presença de res-
postas menos amigáveis, afetuosas, atenciosas e
hospitaleiras. Não obstante, se o Norte de Portugal pre-
tende apostar neste nicho de mercado, estas constatações justificam a necessidade de prepa-rar o terreno para garantir a coerência entre a promessa de marketing e a experiência no des-tino (Jordan & Traveller, 2018: 67). Assim, o destino deve, nomeadamente: trabalhar de forma autêntica com a comunidade local LGBT para que as duas partes possam beneficiar com a parceria (Autenticidade e integração da comu-nidade local); exibir a diversidade LGBT inte-grada na vida real do destino, bem como promo-ver eventos especiais no destino (Autenticidade de mensagens e imagens); fomentar a inclusão no mercado de trabalho para a comunidade LGBT local (Autenticidade significa consistên-cia); realizar ações de formação para os funcio-nários sobre o atendimento aos turistas LGBT (Autenticidade nos serviços aos hóspedes); tra-balhar para aumentar a consciencialização sobre as questões a serem abordadas no combate à dis-criminação contra pessoas LGBT; coordenar a educação e a construção de conhecimento que promova a inclusão e a diversidade LGBT e ga-ranta um serviço de alta qualidade para os visi-tantes LGBT e criar parcerias com o sector pri-vado e desenvolver produtos e pacotes turísticos direcionados ao segmento LGBT (Jordan & Traveller, 2018).
A aplicação deste pacote de medidas deverá ser vista segundo uma perspetiva global e inclu-siva, não permitindo que sejam consideradas isoladamente. Os “aliados” da comunidade LGBT são também um importante grupo para o destino. Nesse sentido, a promoção da inclusão e diversidade não é apenas significativo para pessoas da comunidade LGBT, mas também para os seus colegas, amigos e membros da fa-mília. Esses aliados também são sensíveis às mensagens transmitidas na esfera política e em-presarial. Essas mensagens (positivas e negati-vas) influenciam as suas decisões de consumo, tal como as das pessoas que pertencem à comu-nidade LGBT.

A Percepção e Atitude na Hotelaria Face ao Mercado LGBT: O Caso do Norte de Portugal
111
BIBLIOGRAFIA
Baxter, S. C. (2010). Evidence on the mar-
keting approaches targeting gay and lesbian
consumers. Global Journal of Business Re-
search, 4 (2), 125-139.
Borrillo, D. (2001). Homofobia. Barcelona:
Bellaterra.
Brandão, J. M. F., Cavalcante, E. D. C., &
Silva, A. F. (2013). Por Mais Hospitalidade e
Menos Preconceito: Um estudo da oferta hote-
leira ao público LGBTT, na cidade de João Pes-
soa-PB. In X Seminário da Associação Nacio-
nal Pesquisa e Pós-Graduação em Turismo, 9 a
11 de outubro de 2013. Brasil, Rio Grande do
Sul: Universidade de Caxias do Sul.
Community Marketing & Insights (2016).
21rd Annual LGBTQ Tourism & Hospitality
Survey. USA Overview Report December
2016. USA: Community Marketing, Inc.
Community Marketing & Insights (2017).
11th Annual LGBTQ Community Survey.
USA: Community Marketing, Inc.
Community Marketing & Insights (2018a).
23rd Annual LGBTQ Tourism & Hospitality
Survey. USA Overview Report December
2018. USA: Community Marketing, Inc.
Community Marketing & Insights (2018b).
Understanding & Marketing to LGBTQ Con-
sumers. USA: Community Marketing, Inc.
Community Marketing & Insights (2019).
13th Annual LGBTQ Community Survey.
USA: Community Marketing, Inc.
Community Marketing Inc. (2011). 16th An-
nual Gay & Lesbian Tourism Report, Exploring
tourism and hospitality opportunities in the gay
and lesbian marketplace. 2011-2012. USA:
Community Marketing, Inc.
Crouch, G. I. (2007). Modelling destination
competitiveness: A survey and analysis of the
impact of competitiveness attributes. Australia:
CRC for Sustainable Tourism Pty Ltd.
Hodes S., Vork J., & Gerritsma R. (2007).
Amsterdam as a gay tourism destination in the
twenty-first century. In Greg Richards and Julie
Wilson (eds), Tourism, Creativity and Develop-
ment (pp. 201-211). London: Routledge.
Howerton M. D, Meltzer, A. L. & Olson, M.
A. (2012). Honeymoon Vacation: Sexual-Ori-
entation Prejudice and Inconsistent Behavioral
Responses. Basic and Applied Social Psychol-
ogy, 34 (2), 146-151, DOI: 10.1080/01
973533.2012.655638
Hughes, H. (2002). Gay men's holiday desti-
nation choice: A case of risk and avoidance.
International Journal of Travel Research, 4,
299-312.
Hughes, H., Monterrubio, J. C. & Miller, A.
(2010). ‘Gay’ tourists and host community atti-
tudes. International Journal of Tourism Re-
search, 12 (6), 774-786.
Jordan, P. & Traveller, G. C. (2018). Hand-
book on the Lesbian, Gay, Bisexual,
Transgender and Queer (LGBTQ) travel seg-
ment. Belgium, Brussels: European Travel
Commission (ETC).
Kastenholz, E. (2006). O Marketing de Des-
tinos Turísticos. O seu significado e potencial,
ilustrado para um Destino Rural. Revista Tur-
ismo & Desenvolvimento, 6, 29-41.
Law, R. & Kua, T. (2009). Analyzing the
Quality of E‐mail Responses of Leading Hotels
of the World to Customer Enquiries. Journal of
Quality Assurance in Hospitality & Tourism, 10
(3), 175-193.
Malakauskaite, A. & Navickas, V. (2010).
The role of clusters in the formation process of
tourism sector competitiveness: conceptual
novelties. Economics & Management, 15, 149-
154.
Monterrubio, J. C. (2008). Identity and Sex:
Concurrent Aspects of Gay Tourism. Tour-
ismos: An International Multidisciplinary Jour-
nal of Tourism, 4 (2), 155-167.
Monterrubio, J. C., Hughes, H., Miller, A.,
& Mason, P. (2007). Gay men’s sexual behav-
iour in a holiday destination. e-Review of Tour-
ism Research, 5 (3), 56-63. Disponível em:
http://ertr.tamu.edu
Nogueira, C. & Oliveira, J. M. (Orgs)
(2010). Estudo sobre a discriminação em fun-
ção da orientação sexual e da identidade de gé-
nero. Lisboa: Comissão para a Cidadania e a
Igualdade de Género.
Paradela, A. B. O., González, M. E. A. &
Vila T. D. (2014). Turismo LGTB. Unha apro-
ximación ao caso de Galicia. Revista Galega de
Economía, 23 (1), 79-98.
Poria, Y. (2006). Assessing Gay Men and
Lesbian Women’s Hotel Experiences: An Ex-
ploratory Study of Sexual Orientation in the
Travel Industry. Journal of Travel Research, 44
(3), 327-334.
Pritchard, A., Morgan, N. J., Sedgley, D.,
Khan, E. & Jenkins, A. (2000). Sexuality and
holiday choices: conversations with gay and les-
bian tourists. Leisure Studies, 19 (4), 267-282.

Revista Portuguesa de Estudos Regionais, nº 56
112
Robinson, M. & Novelli, M. (2005). Niche
Tourism: an introduction. In: Novelli, M. (Ed.).
Niche Tourism: contemporary issues, trends
and cases. Oxford: Butterworth-Heinemann
Ltd.
Rodrigues, C., Moniz, A., & Tiago, F.
(2017). Turismo gay: Estão preparados?. Re-
vista Turismo & Desenvolvimento, 27 (28),
2255-2264.
Southall, C. & Fallon, P. (2011). 16 LGBT
Tourism. In P. Robinson, S. Heitmann, P. Dieke
(Eds.). Research Themes for Tourism (pp.218-
232). London: CAB International.
Srihadi, T. F., Sukandar, D. & Soehadi, A.
W. (2016). Segmentation of the tourism market
for Jakarta: Classification of foreign visitors'
lifestyle typologies. Tourism Management
Perspectives, 19, 32-39.
Turismo de Portugal I.P. (s.d.). Turismo de
Portugal Business, Desempenho turístico. Con-
sultado em 27 de dezembro de 2018. Disponível
em: http://business.turismodeportugal.pt/pt/Co-
nhecer/Apresentacao/Desempenho_Turis-
tico/Paginas/default.aspx
Vareiro, L. (2008). O Turismo como Es-
trategia Integradora dos Recursos Locais: caso
da NUT III Minho–Lima. Tese de
Doutoramento em Ciências Económicas, Uni-
versidade do Minho.
Variações, Associação de Comércio e Tu-
rismo LGBTI (s.d.). Consultado em 05 de ja-
neiro de 2019. Disponível em: https://www.va-
riacoes.pt/
Vilkas, A. C. (2017). Hospitalidade e Stake-
holders em Eventos. Uma análise em Florianó-
polis-SC, Brasil. Rosa dos Ventos-Turismo e
Hospitalidade, 10 (1), 136-152.
Virgin Holidays. (2016). The issues facing
LGBT travellers. Acedido em 10 de janeiro de
2019. Disponível em: https://www.vir-
gin.com/virgin-unite/issues-facing-lgbt-travel-
lers
Wei, S., Ruys, H. F., Van Hoof, H. B., &
Combrink, T. E. (2001). Uses of the Internet in
the global hotel industry. Journal of Business
Research, 54 (3), 235-241.
World Tourism Organization (2012). Global
Report on LGBT Tourism – AM Reports, Vol-
ume three. Madrid: UNWTO.
World Tourism Organization (2017). Affili-
ate Members Global Reports. Volume fifteen –
Second Global Report on LGBT Tourism. Ma-
drid: UNWTO.
Agradecimentos: UNIAG, Unidade de I&D financiada pela FCT - Fundação para a Ciência e Tecnologia, Ministério da Ciência, Tecno-
logia e Ensino Superior. Projeto no. UIDB / 04752/2020.

Artigo submetido a 6 de Outubro de 2019; versão final aceite a 29 de Janeiro de 2020
Paper submitted on October 6, 2019; final version accepted on January 29, 2020
Labour Content of International Trade in Intermediates:
The Case of Portugal
O Conteúdo em Mão-De-Obra do Comércio Internacional em
Bens Intermédios: O Caso de Portugal
Enrique Martínez-Galán
CSG (Centre for Research in Social Sciences and Management), ISEG-Lisbon School of Eco-
nomics and Management, Universidade de Lisboa; and The Asian Development Bank
Maria Paula Fontoura
ISEG-Lisbon School of Economics and Management, Universidade de Lisboa,
UECE (Research Unit on Complexity and Economics)/ REM (Research in Economics and
Mathematics), Universidade de Lisboa
Abstract/Resumo
The authors acknowledge the financial support from FCT - Fundação para a Ciência e a Tecnologia (Portugal), national funding through
research grant SFRH/BD/71528/2010 and the Strategic Projects UID/ECO/00436/2019 and UIDB/04521/2020. We are grateful to the anony-
mous referees for their helpful comments. The usual caveat applies for responsibility. The views expressed in this text are those of the authors
and do not reflect the official policy or position of the Asian Development Bank.
Este artigo analisa o conteúdo em mão-de-
obra do comércio português de bens intermédios
exportados e importados. A mão de obra, me-
dida em número de empregos, é considerada no
seu conjunto e desagregada por níveis de quali-
ficação (alto, médio ou baixo). A análise recorre
à primeira versão da base de dados World Input-
Output Database, complementada com as Socio-
Economic Accounts desagregadas por níveis de
qualificação da mão-de-obra. O período da aná-
lise é o mais amplo permitido pela base de dados.
O número de empregos necessário para produzir
bens intermédios importados (exportados) é
usado como proxy do efeito na mão-de-obra da
participação a jusante (montante) da economia
portuguesa em cadeias de valor globais. Conclu-
ímos que, no período analisado, a exportação de
bens intermédios é em grande medida intensiva
em mão-de-obra pouco qualificada, como expec-
tável num país abundante em emprego pouco
qualificado, apesar da melhoria observada nos
níveis de qualificação. Concluímos também que
a importação de bens intermédios é proporcio-
nalmente mais intensiva em mão-de-
This paper addresses the job content with re-
gards to Portugal’s participation in the interna-
tional fragmentation of production. Labour is
considered both at the overall level and also by
skills (high-skill, medium-skill, and low-skill).
The assessment makes use of the World Input-
Output Database complemented by the Socio-
Economic Accounts for labour skill-types. The
period analysed is the longest possible, bearing
in mind the information available in the data-
bases used. The amount of labour (jobs) required
to produce imported intermediates (exported in-
termediates) is taken as a proxy for the job effect
of downward (upward) participation of the coun-
try in Global Value Chains. On one hand, we
conclude that exports of intermediates were
mostly intensive in the use of low-skilled labour,
despite the skill upgrading observed over the pe-
riod analysed. On the other hand, imports of in-
termediates were proportionally more intensive
in the use of skilled labour, predominantly at the
medium skill level, which is an expected result
from a country where low-skilled labour is abun-
dant. We also concluded that the estimated net

Revista Portuguesa de Estudos Regionais, nº 56
114
1. INTRODUCTION
The significant reduction in transaction costs
associated with globalisation, which has mainly
been caused by the widespread use of Infor-
mation and Communication Technologies
(ICT), has enabled the fragmentation of the
stages of production during the second half of
the 20th century, particularly since the 1990s,
which has led to the quick spread of the so
called Global Value Chains (GVCs). This frag-
mentation of production had a particular impact
on cross-border trade in intermediates (inputs),
namely in terms of raw materials, industrial
parts and components, and services. World
Bank et al. (2017, p. 2) estimated that trade as-
sociated to GVCs accounted for between 60%
and 67% of global trade between 2008 and
2014.
To properly account for trade in intermedi-
ates, several initiatives have emerged in recent
years to create internationally-linked Input-Out-
put (IO) datasets1. Examples include, on the one
hand, matrices providing data regarding the
values of domestic production incorporated in
domestically-consumed final goods, interna-
tionally-consumed final goods, domestically-
consumed intermediates, and internationally-
consumed intermediates (rows); and, on the
other hand, data regarding the domestic and for-
eign intermediates incorporated in domestic
production (columns), which are respectively
designated in the IO literature as the upstream
and downstream approaches2. These matrices
1 For a description of the main internationally linked IO data-
bases, see UNCTAD (2013, p. 124).
are the only reliable source of data on trade in
intermediates, as, even when we are working
with highly disaggregated international trade
data, some goods fall into the category of both
intermediate and final goods, and it is only the
IO datasets which allow to make this distinc-
tion.
Equipped with this new powerful IO statisti-
cal resource, many studies set out to measure
the flows of internationally-traded intermedi-
ates and capture the countries’ and country-sec-
tors’ positioning with regards to GVCs and the
propagation of economic shocks along the
world production network (see, for example,
Vieira et al, 2019., for a revision of the litera-
ture). Less studied has been the effect of GVCs
on labour and the job structure of an economy,
however, it is possible to research this domain,
by using the IO data source that we used in this
study - the so-called World Input-Output Data-
base (WIOD), as long as it is complemented by
the Socio-Economic Accounts database (SEA).
Accordingly, this paper aims to contribute to fill
this gap by addressing, for the case of Portugal,
the labour content of trade in intermediates
(hereinafter designated by the GVC-trade) at the
country level, by using the WIOD and SEA da-
tabases. We consider the number of persons em-
ployed (jobs) both at the overall level, and by
skills (high-skill, medium-skill, and low-skill).
In addition, the sectoral disaggregation pro-
vided by the WIOD allows us to perform this
analysis at the sectoral level, which led us to
identify the most benefitted/penalised sectors in
2 For information about how these internationally linked IO ma-
trices are built, see Timmer et al. (2012) and Appendix I.
job content embodied in the international trade
of intermediates at the end of the period under
analysis was, globally, negative to the amount of
51,000 jobs. Regional impacts arising from sec-
toral gains or losses in the job content of ex-
ported intermediates do not appear to have been
relevant.
Keywords: job content of trade; Global Value
Chains; Portugal; trade in intermediates.
JEL codes: C67; F14; F16; F66
e France is the second biggest EMU economy
and, as Finland, is not considered a “peripheral”
country.
Keywords: Markov-Switching models; Active
portfolio management; financial market integra-
tion; EMU stock markets integration
obra qualificada, predominantemente de nível
médio. O conteúdo líquido em mão-de-obra es-
timado a partir do comércio internacional de
bens intermédios foi negativo em 51 mil empre-
gos no final do período analisado. Os impactos
regionais na mão-de-obra em Portugal decor-
rentes da exportação de bens intermédios não
parecem ter sido significativos, atendendo aos
ganhos e perdas por sector.
Palavras-chave: conteúdo em mão-de-obra do
comércio; Cadeias de Valor Globais; Portugal;
comércio de bens intermédios.
Códigos JEL: C67; F14; F16; F66.

Labour Content of International Trade in Intermediates: The Case of Portugal
115
terms of number of jobs involved in GVC-trade.
Finally, calculations were made which aggre-
gated all the countries reported in the WIOD
(i.e. “total” Portuguese GVC-trade) and by trade
partner. In summary, this study aims to shed
light on topics which include the following: (1)
Has the country analysed increased its GVC-
participation as measured by the number of jobs
involved in exports/imports of intermediates?
(2) Has the country’s GVC-trade contributed to
the upgrading of the labour skill of exported in-
termediates? (3) Which trade partners contrib-
uted to the country´s job level being most bene-
fitted/penalised as a result of its GVC-trade? (4)
In which sectors was the job level most benefit-
ted/penalised by the country’s GVC-trade? In-
directly, the results obtained also permit draw-
ing conclusions regarding the expected impact
on jobs which are located in those regions which
host the sectors with the highest GVC-induced
effects on jobs.
The fact that Portugal can still be described
as a labour-abundant country3, with the predom-
inance of the low-skilled type of labour, as
shown in Section 3, even though it has an inter-
mediate level of development4, enables one to
expect the endowment pattern of its intermedi-
ate exports to be labour-intensive, according to
the neoclassical (Heckscher-Ohlin) theory of
trade, albeit with the potential for skill upgrad-
ing as a result of GVC-embeddedness, as sug-
gested by the literature on GCV (World Bank et
al., 2017). Imports, in turn, are characterised by
labour with a higher skilled level than exports.
To calculate the job content of international
trade, we follow a counterfactual exercise
which was first proposed by Groshen et al.
(2005), which was later designated as being
‘trade in jobs’ by Stehrer & Stöllinger (2012).
According to this methodology, the job content
of international trade compares the amount of
labour (number of jobs) that a country uses to
produce its exports with the hypothetical
amount of jobs that would be required to pro-
duce its imports domestically, i.e. just by using
domestic labour input. Jobs linked to the import
of intermediates can be considered as foregone
(potentially, i.e. assuming that the country could
3 By disaggregating Portuguese exports according to the predom-
inance of several determinant factors (natural resources, labour
costs, economies of scale, product differentiation, and R&D),
Fontoura and Serôdio (2017) concluded that, during the last year
analysed (2014), exports based on labour costs still predominated,
even though with a lower weight than during the first year consid-
ered (1999). Together with exports based on natural resources,
produce the imported inputs). By analogy, jobs
linked to the export of intermediates can be con-
sidered as gained. The amount of jobs required
to produce imported intermediates (GVC-fore-
gone jobs) is taken as a proxy for the labour
(job) effect of a country’s downward GVC-em-
beddedness, and the amount of jobs required to
produce exported intermediates (GVC-gained
jobs) is taken as a proxy for the labour (job) ef-
fect of a country´s upward GVC-embed-
dedness. A positive net job effect in interna-
tional trade of intermediates (i.e. GVC-gained
jobs are greater than GVC-foregone jobs) sig-
nals a positive labour (job) effect for the country
by participating in GVCs.
Previous papers which have used the same
methodology as we used in this study, as pre-
sented in Section 3, either focussed on devel-
oped countries, such as Denmark, Japan, or the
United States (US), which all have different
characteristics to those observed in the Portu-
guese economy; or else considered a group of
countries, such as the European Union (EU) or
the Organization for Economic Cooperation and
Development, with few results obtained for
countries individually.
With regard to the choice of IO database, the
WIOD is often used by researchers and is
appropriate for the purpose of our study. WIOD
is an internationally-linked IO database, which
was launched in 2012, coordinated by the Uni-
versity of Groningen, in Netherlands. In its first
edition, the WIOD presents annual data from
1995 to 2011, covering 35 sectors (18 service
sectors)5 and 40 countries, which include the
EU-27 and also 13 other major countries,
namely: Australia, Brazil, Canada, India, Indo-
nesia, Japan, Mexico, the People’s Republic of
China (PRC), the Russian Federation, South
Korea, Taiwan, Turkey and the US. The WIOD
database can be complemented by the SEA,
which is a database that includes country-spe-
cific environmental and socio-economic indica-
tors, such as: industry-level data of capital
stock, investment, wages and jobs (by skill-
type) for each one of the 35 sectors and the 40
countries covered by the WIOD (first revision),
during the period of 1995-20096. The period we
these corresponded to 56% of total exports of manufactured prod-
ucts in 2014. 4 Portugal was ranked by International Monetary Fund (2019) in
the 42nd place in the worldwide ranking of countries by GDP per
capita in purchasing power parity in 2018. 5 See Appendix II for a list of sectors. 6 Published in http://www.wiod.org/new_site/database/seas.htm.
The SEA include the following indicators: (i) gross output by

Revista Portuguesa de Estudos Regionais, nº 56
116
analysed was the longest possible, bearing in
mind the information available from the cross-
ing of the two databases used7.
The paper is organised as follows: Section 2
presents a review of the literature on the meas-
urement of the effects of GVCs on the labour
market, Section 3 presents the calculations
made for Portugal, and Section 4 concludes.
2. PREVIOUS STUDIES ON THE IM-
PACT OF GLOBAL VALUE
CHAINS ON THE LABOUR MAR-
KET
The impact of international trade on the la-
bour market in general and in terms of the inter-
national fragmentation of production has trig-
gered a growing interest, with some variants in
relation to the central focus of the analysis and
the methodologies adopted.
The first studies on this topic analysed the
impact on the remuneration of the labour force.
It was the case of Feenstra & Hanson (1996,
1999) and Feenstra (1998), who concluded that
the international fragmentation of production
was responsible for a significant share of the in-
crease in demand for high-skilled labour force
in the manufacturing industries of the US in the
1980s, contributing to wage inequality. Later
on, Feenstra & Hanson (2003) built a simple
model of outsourcing to estimate the effects of
trade in intermediates on wages in the US be-
tween 1979 and 1995 and concluded that the
wages of employed workers with less than 12
years of schooling were those that decreased the
most with the relocation of economic activities
with a high level of low-skilled labour force out
of the country (by 20.2%), while the wages of
workers with 16 years of schooling or more in-
creased by 3.4%. Several other studies pre-
sented similar conclusions for other regions:
Strauss-Kahn (2003) for France; Geishecker
(2006) and Geishecker & Görg (2008) for Ger-
many (the latter also for Denmark and the
United Kingdom); Hijzen (2007) for the United
Kingdom; Hanson (2007) for Mexico; and
industry at current basic prices; (ii) intermediate inputs at current
purchasers’ prices; (iii) gross value added at current basic prices;
(iv) compensation of employees; (v) labour compensation; (vi)
capital compensation; (vii) nominal Gross Fixed Capital For-
mation (GFCF); (viii) number of persons engaged; (ix) number of
employees; (x) total hours worked by persons engaged; (xi) total
hours worked by employees; (xii) price levels of gross output;
(xiii) price levels of intermediate inputs; (xiv) price levels of gross
value added; (xv) price levels of GFCF; (xvi) gross output; (xvii)
intermediate inputs; (xviii) gross value added; (xix) real fixed
Molnar et al. (2007) for the OECD countries. In
general, the above-mentioned authors con-
cluded that remuneration of labour was affected
by the relocation of production. However, this
impact was not evenly distributed, being clearly
differentiated between low-skilled and high-
skilled jobs. The firm relocating usually
chooses developing countries, which are abun-
dant in low-skilled labour, in search for lower
salaries. This puts a downwards pressure on the
remuneration of the low-skilled workers in the
relocating (developed) country, while relative
demand and salaries for higher-skilled jobs in-
creases. In turn, the relative remuneration of
low-skilled workers increases in the country
(less developed) which receives the economic
activity.
Other groups of studies assessed not the
change in the remuneration of the workforce,
but rather the extent of this change in employ-
ment. The first authors to adopt this approach
were Amiti & Wei (2005), for the services in-
dustry in the US and the UK, and Liu & Trefler
(2008) for the services industry in the US and
its outsourcing to India and the PRC. In both
cases, they found none, or a small significance
for the job losses in these countries due to inter-
national fragmentation of production. However,
McKendrick et al. (2000) concluded that in the
case of jobs in the US hard-drive disk industry,
80% had migrated to Southeast Asia from the
1970s onwards.
None of the research already mentioned re-
sorted to using the internationally-linked IO da-
tabases. With the development of this new more
adequate statistical source, research on the topic
has progressed quickly. Several authors at-
tempted to measure the employment component
of a country’s exports and imports, even though
this did not necessarily take into account the
case of GVC-trade, with the counterfactual ex-
ercise inaugurated by Groshen et al. (2005),
which is also adopted in this study. It is the case
of De Backer & Yamano (2008), who used the
OECD IO database for the year 2000, and found
a negative result for net ‘traded jobs’ in total ex-
ports and imports in the US (which was also
capital stock; (xx) high-skilled labour compensation; (xxi) me-
dium-skilled labour compensation; (xxii) low-skilled labour com-
pensation; (xxiii) hours worked by high-skilled persons engaged;
(xxiv) hours worked by medium-skilled persons engaged; and
(xxv) hours worked by low-skilled persons engaged. 7 A revised version of the WIOD would enable the extension of
the labour data to 2014, however, this version just covers the pe-
riod 2000-2014, with a different number of countries and sectors
(43 and 56 respectively) compared to the first version.

Labour Content of International Trade in Intermediates: The Case of Portugal
117
found in Groshen et al., 2005) and in Japan,
while the results were mixed for European
countries. Subsequently, Stehrer & Stöllinger
(2012) carried out a similar exercise for the EU
between 1995 and 2009, by considering the
overall level of jobs and disaggregating the data
by skill levels and individual occupations. In
general, these authors found a positive net job
effect for international trade and, in spite of dif-
ferent realities, they also found a pattern for the
skill-level of workforce and individual occupa-
tions at the country level, at least in the more
developed countries, which suggests a skill-up-
grading over the period. In the same line of re-
search, Andersen et al. (2015) found that almost
800,000 jobs in Denmark – equivalent to more
than 28 per cent of all Danish jobs in 2011 –,
were dependent on exports, which represented a
moderate increase since 1995. Similar research
was developed by Jiang & Milberg (2013) and
the OECD (2016), but this differed as calcula-
tions for trade in intermediates was included.
The former concluded that GVC-trade produced
demand for 88 million jobs in the countries cov-
ered by the WIOD database in 2009 and con-
tained significantly more medium-skill and
low-skill than high-skill labour content. The
OECD (2016) estimated that, over the period of
1995 to 2011, the majority of jobs in OECD
countries embodied in exports originated in the
service sector, mostly within GVCs, and that the
impact of international trade on the number of
people engaged in each industry is the combina-
tion of several factors, namely the specialisation
patterns and the evolution of productivity. In
terms of the distribution of skills, this latter
study considered the skill shares based both on
educational attainment and on business func-
tions and concluded that the number of jobs em-
bodied in exports which correspond to the core
operations of firms has generally decreased over
the period analysed, whereas jobs either up-
stream or downstream in the value chain in-
creased.
Some research still uses the internationally-
linked IO databases to estimate the impact of in-
ternational trade on employment with other ap-
proaches. This is the case of Foster-McGregor
et al. (2013), who estimated a system of variable
factor demand equations using the WIOD data-
base over the period 1995-2009 and the 40
countries that it covers. These authors con-
cluded that offshoring had impacted negatively
upon all skill levels within industries, the larger
impacts being observed for medium-skilled
workers. Portella-Carbó (2016) extended the
global multiregional IO framework by en-
dogenising demand for both domestic and im-
ported intermediates, as well as private business
investment and household non-durable con-
sumption, to account for the employment con-
sequences of economic integration from 1995 to
2011 in France, Germany, Italy, Japan, the PRC,
Spain, the UK, and the US. The author observed
that the effect of international trade varies
highly across countries. For example: while
during the economic upswing (1995-2007),
Germany, Japan, and the PRC relied heavily on
foreign demand for intermediates to generate
employment, France, Spain, and the UK de-
pended more (Italy and the US exclusively) on
domestic demand. More recently, Reijnders &
de Vries (2018) developed a task-based model
of production in GVCs to examine the role of
offshoring and technological change in employ-
ment in 27 countries over the period 1999-2007.
They concluded that technological change in-
creased demand for non-routine, compared to
routine jobs, whereas the effect of task reloca-
tion from one location to another is less strong.
They also found that both effects work in the
same direction for advanced countries, such as
Germany and the US, but in the opposite direc-
tion for emerging countries, such as Poland and
the PRC.
Finally, it is also worth mentioning the stud-
ies of Feenstra & Sasahara (2017) and Vanden-
bussche et al. (2017), which quantify the effect
of the flows of exports and imports on employ-
ment. The former followed the method of Los et
al. (2015) and trade flow regressions for U.S ex-
ports and imports during the period 1995-2001.
They found that the growth in U.S. merchandise
exports led to a demand for 3.7 million jobs,
whereas US merchandise imports alone from
the PRC accounted for 2 million job losses. The
latter developed a gravity model with sector-
level IO linkages in production, including do-
mestic and GVC linkages between goods and
services, and used the model to predict the im-
pact of the UK’s withdrawal from the EU
(Brexit) in terms of jobs for every individual EU
Member State involved. They found that Brexit
would hit the UK relatively harder than the EU-
27, and that EU-27 losses from Brexit would be
substantially higher than those observed in pre-
vious studies.

Revista Portuguesa de Estudos Regionais, nº 56
118
3. LABOUR CONTENT OF INTERNA-
TIONAL TRADE IN INTERMEDI-
ATES: THE CASE OF PORTUGAL
This section aims at measuring the Portu-
guese job content of international trade in inter-
mediates during the period 1995-2009, at both
the overall level and by skills, following the
counterfactual exercise which was first pro-
posed by Groshen et al. (2005). Specifically, we
measure the following: 1) the number of GVC-
foregone jobs, i.e. the number of domestic jobs
that would be required to produce the inputs im-
ported by Portugal, and, 2) the number of GVC-
gained jobs, i.e. the domestic jobs incorporated
in inputs exported by Portugal. It should be
noted that we are evaluating the jobs embodied
in internationally-traded intermediates, rather
than the impact of that trade on a country’s level
of employment; at the broader level, it may
happen, for instance, that the level of employ-
ment in the country remains unchanged, despite
the trade in intermediates8.
While most papers that also used the same
methodology focussed on the job content of to-
tal international trade (which includes interme-
diates and final goods), the scope of our analysis
is the job content of international trade in inter-
mediates, such as in Jiang & Milberg (2013) and
the OECD (2016). Nonetheless, in our research,
we consider the whole amount of domestic jobs,
in order to be able to frame the empirical evi-
dence obtained in the context of the Portuguese
economy.
As mentioned above, we use data published
by WIOD in its first version, complemented
with the SEA database for skill-types of labour
and considered the 40 countries and 35 sectors
covered by these databases. The WIOD allows
estimating how many dollars Portugal im-
ported/exported in inputs, per sector and
from/for any country of the WIOD database,
while the SEA allows estimating, after some
basic arithmetic transformations, the number of
persons engaged in the economy, per sector, and
per skill.
Whereas calculating the jobs engaged in ex-
ports by country is straightforward, the amount
of domestic jobs required to produce imports is,
as already mentioned, an hypothetical value,
8 If foregone jobs were shifted domestically to other productions
with limited adjustment costs and exported inputs were previously
produced for the domestic market with the same labour input re-
quirements.
which is calculated as follows: first, we estimate
the import flows by country i, which are meas-
ured in USD; and, second, we convert the meas-
urement unit of these flows from USD to
amount of labour, namely to number of persons
engaged9, assuming that those imports are pro-
duced domestically, i.e. with country i’s tech-
nology. Despite being used by many researchers, the
methodology chosen is subject to several criti-cisms (cf. Stehrer & Stöllinger, 2012, p. 4). One is that we are not using the labour content of im-ported inputs, but rather the labour content that would be hypothetically used if those inputs were produced domestically. This restrictive as-sumption implies that Portugal possesses suffi-cient resource endowment and technology to produce those imports domestically, and that they can be produced with the Portuguese level of labour productivity (labour input require-ments). Another criticism is that it does not cap-ture productivity effects10, although these ef-fects can explain, on one hand, the decrease in domestic jobs through labour saving technolog-ical progress, and, on the other hand, the reloca-tion of GVC-foregone jobs to other, relatively more efficient, sectors. A third criticism is that GVC-embeddedness is more complex than simply exporting or importing intermediates, as is implicit in this empirical exercise. In fact, the relation between GVCs and employment is not clear cut, for in the case of GVCs, international trade becomes ‘more granular’, to use Stehrer & Stöllinger (2012)’s expression, in the sense that internationally-traded intermediates can incor-porate, in turn, imported intermediates (the so-called ‘second-round effects of inputs’, which can be of an even higher order). Finally, there is also criticism regarding the limitations of the data, which could influence the results – an ex-ample being that the skill shares in the SEA da-tabase are based on educational attainment, even though workers may be performing tasks that do not necessarily correspond to their level of education. Therefore, the results obtained should be considered as mere estimates, i.e. as proxies for the impact on employment of a country’s GVC-embeddedness.
For the purposes of this paper, direct jobs re-fers to jobs in the sector which produces that good or which provides that service, and indi-rect jobs refers to jobs in other sectors rather
9 ‘Persons engaged’ means ‘salaried employees plus self-em-
ployed and family members’, according to the SEA published by
the WIOD initiative (Timmer et al., 2012). 10 For an attempt to incorporate productivity in a similar research
assessment, see OECD (2016).

Labour Content of International Trade in Intermediates: The Case of Portugal
119
than the sector which produces that good or which provides that service.
We start by considering the suppliers or downstream approach of the internationally-linked IO matrix (Subsection 3.1), which allows us to calculate the foregone jobs associated with imported intermediates. Next, we continue with the users or upstream approach (Subsection 3.2), which allows us to calculate the gained jobs from exported intermediates. Finally, we present the net job content of Portuguese inter-national trade in intermediates (gained jobs, less foregone jobs), disaggregated by trade partners (Section 3.3.). It should be highlighted that, as evidenced above, foregone jobs can be consid-ered as lost jobs for Portugal, albeit only poten-tially, i.e. when assuming that imported inter-mediates could be produced in Portugal with the same job content.
We present calculations for the last year of the period analysed (2009), as well as for the difference between this year and the first one
considered (1995). Results for the remaining years of the period are available upon request.
3.1. The supplier’s approach (or the down-
stream approach)
Table I below presents the estimated domes-tic and GVC-foregone jobs in Portugal in 2009, calculated according to the downstream ap-proach of an IO table. It shows that 304,000 GVC-foregone jobs were recorded during that year, i.e. 6.7% of total domestic jobs in Portugal (which amounted to 4.5 million). Table I also illustrates that GVC-foregone jobs in services have less weight than in manufacturing, even though the difference is small (137,000 and 167,000, respectively). it should be noted that in the case of the domestic economy, this relation is the reverse (785,000 indirect jobs in services and 640,000 jobs in manufacturing).
Table II below shows a similar approach to that of the Table I, but disaggregated by job-skills.
TABLE I - ESTIMATED DOMESTIC AND GVC-FOREGONE JOBS IN THE PORTUGUESE ECONOMY: SUPPLIERS’
APPROACH, PERSONS ENGAGED (IN THOUSANDS, 2009)
All sectors Manufacturing sectors Services
Domestic direct jobs (1) 3,097 673 2,424
Domestic indirect jobs (2) 1,425 640 785
Jobs in Portugal (1+2) 4,521 1,313 3,209
Jobs abroad (GVC-foregone jobs) (3) 304 167 137
Source: Authors’ estimations based on WIOD and SEA. Due to rounding, the numbers presented may not add up precisely to the totals pro-
vided. ‘Direct jobs’ refers to those jobs in the sector which produce that good, or provides that service. ‘Indirect jobs’ refers to jobs in sectors
other than that which produces that good, or provides that service.
TABLE II - ESTIMATED DOMESTIC AND GVC-FOREGONE JOBS IN THE PORTUGUESE ECONOMY: SUPPLIERS’
APPROACH, PERSONS ENGAGED DISAGGREGATED PER SKILLS (IN THOUSANDS, 2009)
All sectors Manufacturing Services
High-skilled domestic direct jobs (1) 503 25 478
High-skilled domestic indirect jobs (2) 169 49 120
High-skilled jobs in Portugal (1+2) 672 74 597
High-skilled jobs abroad (GVC-foregone jobs) (3) 51 22 29
Medium-skilled domestic direct jobs (4) 614 58 555
Medium-skilled jobs domestic indirect jobs (5) 289 103 187
Medium-skilled jobs in Portugal (4+5) 903 161 742
Medium-skilled jobs abroad (GVC-foregone jobs) (6) 116 57 59
Low-skilled domestic direct jobs (7) 1,980 589 1,391
Low-skilled domestic indirect jobs (8) 976 488 479
Low-skilled jobs in Portugal (7+8) 2,947 1,077 1,870
Low-skilled jobs abroad (GVC-foregone jobs) (9) 138 88 49
Source: Authors’ estimations based on WIOD and SEA. Due to rounding, the numbers presented may not add up precisely to the totals pro-
vided. ‘Direct jobs’ refers to those jobs in the sector which produce that good, or provides that service. ‘Indirect jobs’ refer to the jobs in
sectors other than that which produces that good, or provides that service.

Revista Portuguesa de Estudos Regionais, nº 56
120
A relevant conclusion that can be made from
Table II is that Portugal is predominantly an un-
skilled labour user - with the number of un-
skilled of jobs being almost 3 times more than
those in the medium-skilled category (2.9 mil-
lion jobs in the first case, compared with
903,000 jobs in the second category), and 57
times more than those in the high-skilled cate-
gory (672,000). In 2009, GVC-foregone jobs
represented 51,000 high-skilled jobs, 116,000
medium-skilled jobs, and 138,000 low-skilled
jobs, which means that, when compared with
intermediates produced domestically (as given
by indirect jobs), imported intermediates are
represented by a type of labour have a higher
proportion of skilled labour - mainly of the high
skilled category. More precisely, when compar-
ing domestically-produced inputs with im-
ported inputs, the proportion of low-skilled jobs
in comparison to high-skilled ones was 2.14
greater, whereas the ratio of medium-skilled
jobs compared with high-skilled ones was 1.34
greater.
Finally, Tables III and IV below present the
estimated change in GVC-foregone jobs ob-
served between 1995 and 2009, respectively for
both the total number of persons engaged and
when disaggregated by labour skills. For com-
parison purposes, once more we present similar
data for domestic jobs.
In Table III it can be observed that the num-
ber of GVC-foregone jobs increased by 7,000
between 1985 and 2009, driven by services -
which registered an increase of 16,000 jobs
(whereas there was a decrease of 9,000 manu-
facturing jobs). Those 7,000 additional jobs
suggest an increasing downward GVC-partici-
pation of Portugal, albeit for services, which is
not surprising, given that domestic demand for
domestic inputs translated into a decrease of
30,000 manufacturing jobs, while in services
jobs increased by 178,000.
TABLE III - ESTIMATED CHANGE IN DOMESTIC AND IN GVC-FOREGONE JOBS (JOBS ABROAD) IN THE PORTU-
GUESE ECONOMY FROM 1995 TO 2009: SUPPLIERS’ APPROACH, PERSONS ENGAGED (IN THOUSANDS)
All sectors Manufacturing sectors Services
Domestic direct jobs (1) 381 - 228 610
Domestic indirect jobs (2) 148 - 30 178
Total jobs in Portugal (1+2) 529 - 259 788
Jobs abroad (GVC-foregone jobs) (3) 7 - 9 16
Source: Authors’ estimations based on WIOD and SEA. Due to rounding, numbers presented may not add up precisely to the totals pro-
vided. ‘Direct jobs’ refers to those jobs in the sector which produce that good or provides that service. ‘Indirect jobs’ refers to the jobs in
sectors other than that which produces that good, or provides that service.
In terms of job-skills, presented in Table IV, we observe that, over the period analysed, the GVC-foregone jobs were increasingly more skilled, increasing by 21,000 high-skilled la-bour jobs (of which 8,000 were in manufactur-ing and 13,000 were in services), 4,000 me-dium-skilled labour jobs (corresponding to a de-crease of 5,000 in manufacturing and an in-crease of 9,000 in services) and, that there was a decrease of 18,000 jobs in the low-skilled cat-egory (of which 12,000 were in manufacturing, with the remaining being in services).
It is noteworthy that, globally-speaking, Por-tugal also registered a favourable evolution in terms of skilled labour during the period ana-lysed, as the number of jobs used in domesti-cally-produced inputs increased by 84,000 jobs on the high-skilled category and 111,000 in the medium-skilled category, while the number of low-skilled jobs decreased by 46,000. This
11 Data disaggregated by skills are available upon request.
trend of skill-upgrading is much more accentu-ated in terms of the GVC-downward increasing insertion of the country.
Finally, we sought to find out which sectors were responsible for the trend presented above. The answer is shown in Table V below, based on the total number of persons engaged11. In terms of GVC-foregone jobs, ‘Food, beverages and tobacco’ was the sector with the highest es-timated increase in the period between 1995-2009 (19,000), which shows the increasing in-tegration of the production of these goods and services into international production chains through the importation of intermediates, fol-lowed by a lesser degree by ‘Agriculture, hunt-ing, forestry and fishing’ (around 3,000). The former also registered an increase in indirect do-mestic jobs, albeit to a much lesser extent (3,900), which clearly points to an increasing dependency of this sector on imported inputs,

Labour Content of International Trade in Intermediates: The Case of Portugal
121
i.e. downward GVC-embeddedness. In turn, ‘Textiles’ and ‘Leather and footwear’ presented the highest reduction in GVC-foregone jobs - mainly textiles. It should be highlighted that both sectors also registered decreases in domes-tic direct and indirect jobs – which is an
expected result, considering the increased com-petition that these sectors have faced since the beginning of the 2000s, as a consequence of PRC’s entry into the world market and the end of the Multifiber Agreement.
TABLE IV -ESTIMATED CHANGE IN DOMESTIC AND IN GVC-FOREGONE JOBS IN THE PORTUGUESE ECONOMY FROM 1995 TO
2009: SUPPLIERS’ APPROACH, PERSONS ENGAGED, DISAGGREGATED PER SKILLS (IN THOUSANDS)
All sectors Manufacturing sectors Services
High-skilled domestic direct jobs (1) 227 12 215
High-skilled domestic indirect jobs (2) 84 20 63
High-skilled jobs in Portugal (1+2) 311 32 278
High-skilled jobs abroad (GVC-foregone jobs) (3) 21 8 13
Medium-skilled domestic direct jobs (4) 227 1 226
Medium-skilled domestic indirect jobs (5) 111 30 80
Medium-skilled jobs in Portugal (4+5) 337 31 306
Medium-skilled jobs abroad (GVC-foregone jobs) (6) 4 - 5 9
Low-skilled domestic direct jobs (7) - 72 - 241 169
Low-skilled domestic indirect jobs (8) - 46 - 81 35
Low-skilled jobs in Portugal (7+8) - 118 - 322 204
Low-skilled jobs abroad (GVC-foregone jobs) (9) - 18 - 12 - 7
Source: Authors’ estimations based on WIOD and SEA. ‘Direct jobs’ refers to the jobs in the sector which produces that good or provides that
service. ‘Indirect jobs’ refers to those jobs in sectors other than that which produces the good, or provides the service.
TABLE V - ESTIMATED CHANGE IN DOMESTIC (DIRECT PLUS INDIRECT) JOBS AND IN GVC-FOREGONE JOBS IN THE PORTU-
GUESE ECONOMY FROM 1995 TO 2009, PER SECTOR: SUPPLIERS’ APPROACH, PERSONS ENGAGED (IN THOUSANDS)
Code Sector Direct jobs Indirect jobs GVC-fore-
gone jobs
3 Food, beverages and tobacco 5.0 3.9 19.0
34 Other community, social and personal services 30.0 8.4 6.1
27 Post and telecommunications 6.5 14.7 4.4
12 Basic metals and fabricated metals - 2.7 11.1 3.6
33 Health and social work 105.9 13.9 3.4
1 Agriculture, hunting, forestry and fishing - 130.5 - 1.0 3.3
26 Other transport activities and activities of travel agencies 5.2 12.9 2.8
14 Electrical and optical equipment - 0.9 - 1.8 2.4
31 Public Administration 8.8 22.7 2.3
17 Electricity, gas and water supply - 7.1 15.2 2.0
25 Air transport - 2.2 5.6 1.5
19 Sale, maintenance and repair of motor vehicles and retail sale of fuel 34.5 6.3 1.4
13 Machinery nec 0.4 0.6 1.4
10 Rubber and plastics - 0.1 5.7 1.3
15 Transport equipment 3.3 - 4.9 1.0
16 Manufacturing nec and recycling - 1.0 - 1.9 1.0
23 Inland transport 1.4 7.7 0.9
30 Renting of machines and equipment and other business activities 145.5 27.2 0.7
24 Water transport - 0.2 2.2 0.5
22 Hotels and restaurants 62.9 5.2 0.3
28 Financial intermediation - 1.4 35.8 0.2
35 Private households with employed persons 9.4 0.0 0.0
11 Other non-metallic minerals - 15.0 2.4 0.0
2 Mining and quarrying 2.6 - 0.5 - 0.1
9 Chemicals and chemical products - 4.3 3.8 - 0.1
21 Retail trade, except of motor vehicles, and repair of household goods 83.8 8.0 - 0.3
32 Education 62.4 3.2 - 0.4
29 Real estate activities 5.6 - 1.5 - 0.6
18 Construction 74.5 - 11.2 - 2.2
7 Pulp and paper - 10.1 2.5 - 4.7
5 Leather and footwear - 19.8 - 6.0 - 6.5
20 Wholesale trade and commission trade, except motor vehicles - 15.9 2.3 - 7.1
8 Petroleum 0.2 5.7 - 8.6
4 Textiles and textile products - 55.1 - 41.9 - 9.3
6 Wood, products of wood and cork - 0.6 - 7.8 - 12.3
Source: Authors’ estimations based on WIOD and SEA. ‘Direct jobs’ refers to those jobs in the sector which produces the good or provides
the service. ‘Indirect jobs’ refers to those jobs in sectors other than that which produces that good, or provides that service.

Revista Portuguesa de Estudos Regionais, nº 56
122
3.2 The user’s approach (or the up-
stream approach)
A complementary analysis to the previous
subsection estimates the number of GVC-
gained jobs associated with the user’s approach. Note that GVC-gained jobs mentioned in the
Tables of this sub-section are jobs based on the
demand for inputs to be used by other countries,
i.e. exported inputs. Table VI below shows that, in 2009, of the
nearly 5.1 million jobs (persons engaged)12 in
the Portuguese economy, 2.3 million were
based on the demand for inputs from other sec-
tors in the Portuguese economy; 2.2 million
were based on the demand for final consump-
tion in Portugal; 203,000 were based on the for-
eign demand for Portuguese products used in fi-
nal consumption, and 305,000 were based on
the demand for Portuguese inputs used in the
production processes of other countries (GVC-
gained jobs). Therefore, jobs incorporated in ex-
ported inputs represented a share of 6 % of do-
mestic jobs.
TABLE VI – ESTIMATED DOMESTIC JOBS IN THE PORTUGUESE ECONOMY, INCLUDING GVC-GAINED JOBS:
USER’S APPROACH, PERSONS ENGAGED (IN THOUSANDS, 2009)
All sectors Manufactur-
ing Services
Jobs based on the demand for inputs from other sectors in the Portu-
guese economy (1) 2,337 685 1,652
Jobs based on the demand for final consumption in Portugal (2) 2,247 344 1,902
Jobs in Portugal based on domestic demand (1+2) 4,584 1,030 3,554
Jobs based on the demand for inputs to be used in the production pro-
cesses of other countries (GVC-gained jobs) (3) 305 194 112
Jobs based on the demand for final consumption from other countries
(4) 203 175 28
Jobs in Portugal based on foreign demand (3+4) 508 369 139
Total jobs (1+2+3+4) 5,090 1,398 3,693
Source: Authors’ estimations based on WIOD and SEA. Due to rounding, numbers presented may not add up precisely to the totals provided.
Table VII below disaggregates Table VI per
level of skills. It coincides with that of the
downward approach, with the correction ex-
plained in Appendix III. GVC-gained jobs were
mostly of the low-skilled type (29,000 high-
skilled, 57,000 medium-skilled, and 220,000
low-skilled). This bias towards low-skilled
work is much more pronounced in manufactur-
ing. As expected, the pattern of labour used by
Portugal in exported inputs is clearly in line
with that of the economy as a whole, being a re-
sult which is corroborated by the fact that the
proportion between skill-levels in exported in-
puts is rather similar to that of the inputs incor-
porated in other sectors of the Portuguese econ-
omy.
Turning now to the change in domestic jobs
in Portugal between 1995 and 2009, it can be
observed in Table VIII a decrease by 105 thou-
sand due to lower domestic demand for Portu-
guese inputs (around three quarters of them be-
ing in manufacturing sectors and one quarter in
services), while the amount of jobs increased by
127 thousand due to higher foreign demand, of
which 86 thousand correspond to GVC-gained
jobs (67 % in manufacturing and 33% in ser-
vices). Those estimates point to an increasing
upstream participation of Portugal in export ac-
tivity, mainly due to manufacturing activity,
with a clear positive impact on the amount of
employment.
12 The difference between the 5.1 million jobs (estimated accord-
ing to the upstream approach) and the 4.5 million jobs estimated
according to the downstream approach in the previous subsection
(see Table I above) is largely conceptual, as explained in Appen-
dix III.

Labour Content of International Trade in Intermediates: The Case of Portugal
123
TABLE VII - ESTIMATED DOMESTIC JOBS IN THE PORTUGUESE ECONOMY INCLUDING GVC-GAINED JOBS:
USER’S APPROACH, PERSONS ENGAGED, DISAGGREGATED PER SKILLS (IN THOUSANDS, 2009) All sectors Manufacturing
sectors
Services
High-skilled jobs based on the demand for inputs from other sectors in the Por-
tuguese economy (1)
257 24 233
High-skilled jobs based on the demand for final consumption in Portugal (2) 424 12 412
High-skilled jobs in Portugal based on domestic demand (1+2) 681 36 644
High-skilled jobs based on the demand for inputs to be used in the production
processes of other countries (GVC-gained jobs) (3)
29 11 18
High-skilled jobs based on the demand for final consumption from other coun-
tries (4)
12 9 3
High-skilled jobs in Portugal based on foreign demand (3+4) 41 19 22
High-skilled total jobs (1+2+3+4) 721 56 666
Medium-skilled jobs based on the demand for inputs from other sectors in the
Portuguese economy (5)
434 56 378
Medium-skilled jobs based on the demand for final consumption in Portugal (6) 456 29 427
Medium-skilled jobs in Portugal based on domestic demand (5+6) 890 85 805
Medium-skilled jobs based on the demand for inputs to be used in the produc-
tion processes of other countries (GVC-gained jobs) (7)
57 25 32
Medium-skilled jobs based on the demand for final consumption from other
countries (8)
28 21 7
Medium-skilled jobs in Portugal based on foreign demand (7+8) 85 46 39
Medium-skilled total jobs (5+6+7+8) 975 131 844
Low-skilled jobs based on the demand for inputs from other sectors in the Por-
tuguese economy (9)
1,647 606 1,041
Low-skilled jobs based on the demand for final consumption in Portugal (10) 1,366 303 1,064
Low-skilled jobs in Portugal based on domestic demand (9+10) 3,014 908 2,105
Low-skilled jobs based on the demand for inputs to be used in the production
processes of other countries (GVC-gained jobs) (11)
220 258 61
Low-skilled jobs based on the demand for final consumption from other coun-
tries (12)
163 145 17
Low-skilled jobs in Portugal based on to foreign demand (11+12) 382 304 79
Low-skilled total jobs (9+10+11+12) 3,397 1,212 2,183
Source: Authors’ estimations based on WIOD and SEA. Due to rounding, numbers presented may not add up precisely to the totals provided.
TABLE VIII – CHANGE IN DOMESTIC JOBS IN THE PORTUGUESE ECONOMY INCLUDING GVC-GAINED JOBS
BETWEEN 1995 AND 2009: USER’S APPROACH, PERSONS ENGAGED (IN THOUSANDS, 2009) All sectors Manuf. sectors Services
Jobs based on the demand for inputs from other sectors in Portugal (1) - 118 - 70 - 48
Jobs based on the demand for final consumption in Portugal (2) 13 - 4 17
Jobs in Portugal based on domestic demand (1+2) - 105 - 73 - 31
Jobs based on the demand for inputs to be used in the production processes of
other countries (GVC-gained jobs) (3)
86 58 28
Jobs based on the demand for final consumption from other countries (4) 41 30 11
Jobs in Portugal based on foreign demand (3+4) 127 88 39
Total jobs (1+2+3+4) 22 15 8
Source: Authors’ estimations based on WIOD and SEA. Due to rounding, numbers presented may not add up precisely to the totals provided.
By disaggregating the change observed in
domestic jobs in Portugal between 2009 and
1995 according to their level of skills, Table IX
below shows that foreign demand for domestic
inputs corresponds to an increase of the follow-
ing GVC-gained jobs, by skills: (i) 6,000 high-
skilled jobs; (ii) 14,000 medium-skilled jobs,
and; (iii) 66,000 low-skilled jobs. This means
that Portuguese trading in exported inputs re-
sulted in a global increase in jobs for all three
levels of skills, although with a clear predomi-
nance of the low-skilled type, as expected ac-
cording to the observed labour abundancy of
low-skilled jobs in the economy. Interestingly

Revista Portuguesa de Estudos Regionais, nº 56
124
enough, domestic demand of inputs produced in
the country explains a decrease in the number of
jobs of all levels of skills (15,000 high-skilled
jobs, 23,000 medium–skilled jobs, and 80,000
low-skilled jobs), showing that Portugal beca-
me more upstream GVC-embedded and exports
of intermediates more than offset, in terms of
the number of jobs, the reduction observed in
jobs related to the domestic demand for inputs
from other domestic sectors.
TABLE IX – CHANGE IN DOMESTIC JOBS IN THE PORTUGUESE ECONOMY INCLUDING GVC-GAINED JOBS BETWEEN 1995 AND
2009: USER’S APPROACH, PERSONS ENGAGED DISAGGREGATED PER SKILLS (IN THOUSANDS, 2009)
All sectors Manufacturing
sectors
Ser-
vices
High-skilled jobs based on the demand for inputs from other sectors in the Portu-
guese economy (1)
- 15 - 3 - 12
High-skilled jobs based on the demand for final consumption in Portugal (2) 9 1 9
High-skilled jobs in Portugal based on domestic demand (1+2) - 6 - 3 - 3
High-skilled jobs based on the demand for inputs to be used in the production pro-
cesses of other countries (GVC-gained jobs) (3)
6 3 3
High-skilled jobs based on the demand for final consumption from other countries
(4)
1 1 1
High-skilled jobs in Portugal based on foreign demand (3+4) 8 4 4
High-skilled total jobs (1+2+3+4) 1 1 1
Medium-skilled jobs based on the demand for inputs from other sectors in the Por-
tuguese economy (5)
- 23 - 8 - 14
Medium-skilled jobs based on the demand for final consumption in Portugal (6) 8 1 7
Medium-skilled jobs in Portugal based on domestic demand (5+6) - 15 - 7 - 8
Medium-skilled jobs based on the demand for inputs to be used in the production
processes of other countries (GVC-gained jobs) (7)
14 7 7
Medium-skilled jobs based on the demand for final consumption from other coun-
tries (8)
4 2 2
Medium-skilled jobs in Portugal based on foreign demand (7+8) 18 8 9
Medium-skilled total jobs (5+6+7+8) 3 1 2
Low-skilled jobs based on the demand for inputs from other sectors in the Portu-
guese economy (9)
- 80 - 58 - 22
Low-skilled jobs based on the demand for final consumption in Portugal (10) - 4 - 5 1
Low-skilled jobs in Portugal based on domestic demand (9+10) - 83 - 63 - 20
Low-skilled jobs based on the demand for inputs to be used in the production pro-
cesses of other countries (GVC-gained jobs) (11)
66 48 18
Low-skilled jobs based on the demand for final consumption from other countries
(12)
35 28 8
Low-skilled jobs in Portugal based on foreign demand (11+12) 102 76 26
Low-skilled total jobs (9+10+11+12) 18 13 6
Source: Authors’ estimations based on WIOD and SEA. Due to rounding, numbers presented may not add up precisely to the totals provided.
Finally, Table X shows which sectors were more responsible for the increase in jobs be-tween 1995 and 2009 in Portugal, in terms of the upstream approach13. Focussing our atten-tion on those sectors where the increase in do-mestic jobs due to the external demand for Por-tuguese inputs was higher, these were the fol-lowing, in decreasing order: (i) ‘Basic metals and fabricated metals’ (14,600 jobs); (ii) ‘Pulp and paper’ (12,200 jobs); (iii) ‘Agriculture, hunting, forestry and fishing’ (12,100 jobs), and; (iv) ‘Wholesale trade’ (10,000 jobs). All
13 Results by skill category are available upon request.
these sectors show a decrease in the number of jobs incorporated in inputs to the Portuguese economy, which confirms that they became more upstream GVC-embedded. It should also be noted that all these sectors are characterised by low-skilled intensity (with low-skill jobs be-ing, respectively, 80% for (i) and (ii); 97% for (iii), and; 97 % for (iv)), as expected.
Focusing now on those sectors that supply intermediates to demand abroad which have the highest decreases in the number of jobs, these were, according to Table X: (i) ‘Wood and cork’

Labour Content of International Trade in Intermediates: The Case of Portugal
125
(3.400 jobs, 79% in low-skilled jobs); (ii) ‘Other transport activities’ (2,800 jobs, 57% in low-skilled jobs); and (iii) ‘Textile and textile products’ (1,000 jobs, 79% in low-skilled jobs). The first two sectors apparently changed to partly being suppliers to the domestic demand of intermediates, as the number of associated domestic indirect jobs increased by 800 and 200
respectively, although in the textile sector there was also a decrease in the number of jobs asso-ciated with Portuguese demand for domestic in-termediates (by 8,100), which is a result of the restructuring of the sector in the face of in-creased international competition, with associ-ated job losses, either due to a firm exiting, or to an increase in productivity.
TABLE X - CHANGE IN DOMESTIC JOBS IN THE PORTUGUESE ECONOMY INCLUDING GVC-GAINED JOBS BE-
TWEEN 1995 AND 2009 PER SECTOR: USER'S APPROACH, PERSONS ENGAGED (IN THOUSANDS)
Code Sector
Intermedi-
ate con-
sumption in
Portugal
Final con-
sumption in
Portugal
Intermediate con-
sumption in other
countries (GVC-
gained jobs)
Final con-
sumption in
other coun-
tries
12 Basic metals and fabricated metals -14.7 2.9 14.6 0.3
7 Pulp, paper, printing and publishing -12.9 1.1 12.2 0.1
1 Agriculture, hunting, forestry and fishing -12.6 -14.4 12.1 21.9
20 Wholesale trade and commission trade, except
motor vehicles and motorcycles
-24.1 10.2 10.8 5.1
13 Machinery, nec -8.4 2.2 7.4 -1.1
30 Renting of M&Eq and other business activities 8.1 -15.2 6.9 0.4
10 Rubber and plastics -2.6 -3.7 6.3 0.5
23 Inland transport -4.6 -2.7 6.0 1.4
22 Hotels and restaurants 2.6 -10.9 5.1 3.1
11 Other non-metallic minerals -4.2 1.8 4.7 -1.9
16 Manufacturing, Nec; Recycling -3.4 -3.9 4.3 3.7
21 Retail trade, except of motor vehicles and mo-
torcycles, repair of household goods
-14.9 12.3 3.1 1.7
15 Transport equipment -1.8 0.3 2.2 -0.2
9 Chemicals and chemical products -0.5 -1.5 1.1 0.9
19 Sale, maintenance and repair of motor vehicles
and motorcycles; Retail sale of fuel
-5.6 4.8 1.0 0.1
31 Public Admin and Defence; Compulsory social
security
7.9 -8.7 0.8 0.0
3 Food, beverage and tobacco -5.6 -6.9 0.7 11.8
18 Construction 0.7 1.5 0.7 0.0
5 Leather; leather and footwear -3.5 2.0 0.7 0.8
32 Education -18.3 18.1 0.2 0.0
33 Health and social work 13.8 -14.0 0.1 0.1
17 Electricity, gas and water supply 0.3 -0.3 0.0 0.0
29 Real estate activities -1.1 1.1 0.0 0.0
35 Private households with employed persons 0.0 -0.1 0.0 0.0
34 Other community, social and personal services 2.3 -1.5 -0.1 -0.5
24 Water transport 0.1 0.1 -0.1 -0.1
8 Coke, refined petroleum and nuclear fuel 0.3 -0.1 -0.1 -0.1
25 Air transport -1.5 1.2 -0.2 0.4
2 Mining and quarrying 1.4 0.1 -0.5 0.0
14 Electrical and optical equipment 4.1 1.4 -1.3 -3.7
27 Post and telecommunications 0.1 1.8 -1.6 -0.3
28 Financial intermediation -16.4 18.7 -1.6 -0.7

Revista Portuguesa de Estudos Regionais, nº 56
126
4 Textiles and textile products -8.1 14.4 -1.8 -2.9
26 Other supporting and auxiliary transport ac-
tivities and activities of travel agencies
2.9 0.2 -2.8 -0.4
6 Wood and products of wood and cork 2.7 0.8 -3.4 0.1
Source: Authors’ estimations based on WIOD and SEA.
Table X registers another interesting pattern:
in all sectors except for ‘Renting of machines
and equipment and other business activities’
and ‘Textiles and textile products’, the amount
of jobs used to produce inputs declined when
they were produced for the Portuguese econ-
omy, and increased in the case of production for
export, in line with the global tendency to in-
crease export activity, as mentioned above.
3.3. ‘Traded jobs’ by trade partner
Based on the two approaches to estimate the
content in jobs of inputs’ trade presented in the
two previous sub-sections, we now present a
measure for Portugal of the net job content of
‘trade in jobs’ in the year 2009, for the 40 coun-
tries reported in the WIOD database as a whole
and by trade partner. This measure consists in
simply subtracting the number of GVC-fore-
gone jobs to the number of GVC-gained jobs.
Therefore, it is a measure of the net jobs ‘gain’
associated to the GVC-trade. A positive result
means that producing the exported inputs re-
quires more jobs than producing the imported
inputs domestically (with the country´s labour
productivity); therefore, GVC-embeddedness is
favourable in terms of jobs. The calculations are
presented in Table XI below.
TABLE XI – BILATERAL NET JOB CONTENT IN INPUTS’ TRADE OF PORTUGAL (2009) (THOUSAND JOBS)
Country GVC-gained jobs (A) GVC-foregone jobs (B) (A-B)
Spain 75.9 55.0 20.9
France 29.8 9.8 20.0
US 21.4 7.4 14.0
Germany 30.9 20.6 10.3
Belgium 8.9 4.1 4.8
Ireland 7.4 2.9 4.6
UK 16.2 12.0 4.2
Sweden 3.6 1.2 2.4
Austria 4.0 1.8 2.2
Netherlands 8.9 6.8 2.2
Czech Rep. 3.4 1.6 1.7
Italy 10.3 8.8 1.5
Canada 2.6 1.2 1.4
Finland 2.0 1.2 0.8
Denmark 1.8 1.0 0.8
Australia 0.6 0.2 0.4
Greece 0.8 0.4 0.4
Luxembourg 0.7 0.3 0.3
Japan 0.9 0.6 0.3
Cyprus 0.1 0.0 0.1
Slovenia 0.2 0.2 0.1
Malta 0.1 0.1 -0.1
Estonia 0.1 0.1 -0.1
Latvia 0.1 0.2 -0.1
Taiwan 0.3 0.5 -0.2
Slovakia 0.5 0.7 -0.2
Poland 2.9 3.1 -0.2
Lithuania 0.1 0.5 -0.4
South Korea 0.3 0.8 -0.5
Hungary 0.8 2.0 -1.2
Turkey 1.8 3.5 -1.7
Mexico 1.1 3.6 -2.6
Russia 1.2 4.4 -3.2

Labour Content of International Trade in Intermediates: The Case of Portugal
127
Bulgaria 0.3 5.0 -4.7
Indonesia 0.0 8.0 -7.9
Romania 1.8 10.1 -8.3
India 0.3 25.0 -24.7
PRC 3.4 30.9 -27.5
Brazil 7.9 68.6 -60.7
Total 253.414 304.0 -50.6 Source: Authors’ estimations based on WIOD and SEA.
Table XI shows that the Portuguese embed-
dedness in GVCs led to a net loss of almost
51,000 jobs. This result corresponds to the trend
for Portugal during the period 1995-2001
shown in OECD (2016), as in this study the net
job losses in sectors with a high GVC-embed-
dedness registered a decrease of over 20%. The
highest gains are observed in the trade of inputs
with Spain and France, while the highest losses
occurred in Brazil, followed by the PRC and In-
dia. It should be noted that, out of the 40 coun-
tries included in this analysis, in 2009 Spain
was the largest supplier and client of Portugal,
with France being the second largest client and
the third largest supplier to Portugal, while
countries with the highest losses had much less
importance in Portuguese external trade (for ex-
ample, Brazil was the ninth largest supplier and
client, the PRC was the tenth largest supplier
and the thirteenth largest client, and India was
the 24th largest supplier and the 31st largest cli-
ent).
4. CONCLUSIONS
This paper presents the results of the re-
search into the job content of Portuguese GVC-
trade over a recent 14-year period, both at the
overall level and by skills. Although the meth-
odology used aims to provide an estimate of the
effect of GVC- trade on jobs, the issue is inher-
ently complex, as this relationship depends on
several inter-connected effects which are not
easy to separate. Technological progress and
firms’ strategies are often more important forces
than trade for labour adjustments (OECD,
2016), not to mention the functioning of labour
markets and labour market policies. To control
for these possible different influences on the la-
bour/job market, an appropriate multivariate
analysis would be a challenging avenue of re-
search for the case of Portugal. In this context
and bearing in mind the limitations of the
14 This value does not include 53,500 jobs which were gained due to demand for foreign inputs from the Rest of the World. The analogous
number of ‘foregone jobs’ due to the Portuguese demand for foreign inputs cannot be estimated, because there is no data for the Rest of the
World in the SEA.
methodology adopted, we highlight our main
findings below.
Over the period analysed, we observed
a 7,000 increase in the number of jobs embodied
in imported intermediates (GVC-gained jobs)
and an increase of 305,000 in exported inputs
(GVC-foregone jobs), which points to an in-
creasing downward, but (mainly) upward par-
ticipation of the Portuguese economy in GVCs.
There is consensus that trade can play an im-
portant role in creating jobs (OECD, 2016),
however it is less clear what its effect is on jobs
associated with GVC-embeddedness. The evi-
dence for Portugal shows a positive net effect
on jobs resulting from the country’s trading of
intermediates over the period analysed. Even so,
we observed a net loss of 51,000 jobs in the end
of the period as a result of trade in intermedi-
ates, despite job net gains with the most relevant
trade partners of Portugal (Spain and France).
This reduction in the number of jobs raises some
concern regarding the impact of GVC-participa-
tion on jobs in Portugal, even if this needs to be
confirmed for other periods and can only poten-
tially be read to be a negative impact on the job
level of the whole economy, when considering
the meaning of foregone jobs. Furthermore,
what happens with jobs in industries which par-
ticipate in GVCs can have an impact on the rest
of the economy through productivity spillovers.
More relevant for Portugal is the fact that with
all countries included in this analysis, the
amount of gained jobs was positive, highlight-
ing the countries with whom Portugal has a
more intense trade.
In terms of factor intensity, Portugal, being
predominantly a low-skilled labour abundant
country (with a number of this type of jobs in
manufacturing which is almost 7 times higher
than those in the medium-skilled category at the
end of the period analysed), despite the skill up-
grading observed over the period analysed, im-
ported intermediates that relatively had more

Revista Portuguesa de Estudos Regionais, nº 56
128
(increasingly) skilled labour, while exported in-
puts presented a strong bias towards low-skilled
labour, especially for manufacturing. In fact, the
predominant skill-level of jobs embodied in ex-
ports of intermediates was the lowest in contrast
with the results found for the EU as a whole in
Stehrer & Stöllinger (2012), albeit in line with
the OECD’s (2016) results for Portugal. Those
results in terms of the job content of traded in-
termediates, both overall and by skills, are con-
sistent with the theory’s predictions regarding
an economy with the labour endowment charac-
teristics of Portugal and with the expected role
of such a country in the ongoing international
fragmentation of production, where those firms
which relocate labour-intensive parts of their
value-added chains usually choose low-wage
and low-skilled countries. We note, however,
that the offshored production based on low-
skilled labour usually corresponds to tasks of
low value added. A recommended way to re-
verse this tendency and help the country to in-
crease its traded value added is to implement
policies which improve labour skills.
Over the period analysed, services was the main driver of the suppliers’ approach, while in the case of the users’ approach, manufacturing led the growth, even if with only a slight differ-ence in relation to services. The relative weight of these two sectors in our analysis reflects the characteristic trade in intermediates of econo-mies with an intermediate development level, such as Portugal. However, it is interesting to highlight that, over the period analysed, the number of jobs gained in services almost equals the number gained in manufacturing, as it is consensual that trade in services becomes in-creasingly important for a country’s positioning in the GVC. Either way, the effects of services for the economy depend on the type of business function which are traded (such as, among oth-ers, transport, logistics, marketing, sales, engi-neering, administrative support, maintenance, or repairs). Improving this knowledge is an av-enue for further research.
Finally, in terms of labour adjustments at the sectoral level, we concluded that the sector with the highest increases in terms of GVC- foregone jobs was ‘Food, beverages and tobacco’. For the same period under analysis, there were also sec-tors which registered an increase in domestic in-direct jobs (by 3.9 million), but this could have been much greater (by 19 million) had the
15 We do not include foregone jobs associated to imports of inter-
mediates, as these are only potentially translatable into domestic
domestic producers been able to fully supply the domestic inputs’ demand of these sectors. With regard to sectoral GVC-gained jobs, these cor-responded approximately to the number of jobs that decreased in these sectors’ production of inputs for the Portuguese economy, in the sec-tors with the largest increases (‘Basic metals and fabricated metals’, ‘Pulp and paper’ and ‘Agriculture, hunting, forestry and fishing’). The opposite movement, i.e. a reduction in the number of GVC-gained jobs that was compen-sated by a similar increase in the number of jobs incorporated in inputs for the domestic econ-omy, characterises the sectors with the highest losses of GVC-gained jobs, as it is the case of ‘Wood and products of wood and cork’ and ‘Other supporting and auxiliary transport activ-ities of travel agencies’ (and also ‘Post and tel-ecommunications , albeit to a much lesser ex-tent); exceptions were ‘Textile and textile prod-ucts’ and ‘Financial intermediation’.
A relevant dimension of this analysis would have been to identify the regional impacts in Portugal of variations in the number of jobs as-sociated with the export of intermediates15. The database used do not allow us to carry out such an exercise, however the results obtained enable us to also draw some implications at this level. A global view of the location of individual sec-tors in the Portuguese case shows that, in gen-eral, traditional sectors which are more inten-sive in low-skilled labour predominate in the North (Grande Porto and neighbouring re-gions), while the more modern sectors (chemi-cal, metallurgy, and transport) are mainly con-centrated in the Grande Lisboa area, with a sec-ondary focus in the North (Flôres et al., 2007). In this context, the strong bias towards low-skilled labour in GVC-gained jobs is expected to mainly have benefitted the North. However, the sectoral results described above suggest that regional employment levels could not have been significantly affected by upward GVC-partici-pation over the period analysed, as, roughly speaking, it appears that the largest job gains in exported inputs have replaced the job losses in inputs for the domestic market and that the larg-est job losses in exported inputs were offset by similar job gains in inputs which supply the Por-tuguese economy. Nevertheless, not all sectors followed this “rule”, with the textiles being most evident by the widespread reduction in jobs, and further research is needed to illumi-nate also on regional impacts.
jobs for the Portuguese economy, according to the methodology
adopted.

Labour Content of International Trade in Intermediates: The Case of Portugal
129
BIBLIOGRAPHY
Amiti, M. and Wei, S.J. (2005), ‘Fear of ser-
vice outsourcing: is it justified?’, Economic
Policy, 20 (2), pp. 308-347.
Andersen, S.S., Nellemann, P.B. and Thom-
sen, C.R. (2015), ‘Global Value Chains’, Den-
mark’s National Bank Working Paper Series, n.
102.
De Backer, K. and Yamano, N. (2008), ‘The
measurement of globalization using interna-
tional input-output tables’, OECD STI Working
Paper Series, n. 2007/8.
Eurostat (2008), Eurostat Manual of Supply,
Use and Input-Output Tables, Office for official
publications of the European Communities,
Luxembourg.
Feenstra, R.C. (1998), ‘Integration of trade
and disintegration of production in the global
economy’, Journal of Economic Perspectives,
12 (4), pp. 31-50.
Feenstra, R.C. and Hanson, G.H. (1996),
‘Globalization, outsourcing and wage inequal-
ity’, The American Economic Review, 86 (2),
pp. 240-245.
Feenstra, R.C. and Hanson, G.H. (1999),
‘The impact of outsourcing and high-technol-
ogy capital on wages: Estimates for the United
States, 1979-1990’, The Quarterly Journal of
Economics, 114 (3), pp. 907-940.
Feenstra, R.C. and Hanson, G.H. (2003),
‘Global production sharing and rising inequal-
ity: a survey of trade and wages’, Chapter 6 in:
Choi, E.K. and Harrigan, J. (Eds.), Handbook of
International Trade, Volume 1, Blackwell Pub-
lishing.
Feenstra, R. and Sasahara, A. (2017), ‘The
‘China Shock’, Exports and U.S. Employment:
A Global Input-Output Analysis’, National Bu-
reau of Economic Research Working Paper Se-
ries, n. 24,022.
Flôres, R., Fontoura, M. and Santos, R.
(2007), ‘Foreign Direct Investment and Spillo-
vers: Additional Lessons from a Country
Study’, The European Journal of Development
Research, 19 (3), pp. 372-390.
Fontoura, P. and Serôdio, P. (2017), “Portu-
guese Export Performance in the 2000s: an
Evaluation for the European Market”, in: Men-
donça A., Silva, J., Brito, J. and St. Aubyn, M.
(Eds.), Estudos em Homenagem a José Silva
Lopes, Fundação Económicas, Almedina, pp.
483-509.
Foster-McGregor, N., Stehrer, R. and de
Vries, G.J. (2013), ‘Offshoring and the skill
structure of labour demand’, Review of World
Economics, vol. 149, issue 4, pp. 631-662.
Geishecker, I. (2006), ‘Does outsourcing to
Central and Eastern Europe really threaten man-
ual workers’ jobs in Germany?’, The World
Economy, 29 (5), pp. 559-583.
Geishecker, I. and Görg, H. (2008), ‘Win-
ners and losers: a micro-level analysis of inter-
national outsourcing and wages’, Canadian
Journal of Economics, 41, pp. 243-270.
Groshen, E.L., Hobijn, B. and McConnell,
M.M. (2005), ‘US Jobs Gained and Lost
through Trade: A Net Measure’, Federal Re-
serve Bank of New York Current Issues in Eco-
nomics and Finance, vol. 11 (8).
Hanson, G.H. (2007). ‘Globalization, La-
bour Income and Poverty in Mexico’, in: Harri-
son, A. (Ed.), Globalization and Poverty, Na-
tional Bureau of Economic Research Press,
Washington DC, pp. 417-456.
Hijzen, A. (2007), ‘International outsourc-
ing, technological change and wage inequality’,
Review of International Economics, 15 (1), pp.
188-205.
International Monetary Fund (2019), World
Economic Outlook [database], retrieved on 12
April.
Jiang, X. and Milberg. W. (2013), ‘Captur-
ing the jobs from globalization: trade and em-
ployment in global value chains’, SSRN Work-
ing Paper, n. 30.
Liu, R. and Trefler, D. (2008), ‘Much ado
about nothing: American jobs and the rise of
service outsourcing to PRC and India’, National
Bureau of Economic Research Working Paper
Series, n. 14,061, Cambridge, MA, US.
Los, B., Timmer, M.P. and de Vries, G.J.
(2015), ‘How important are exports for job
growth in China? A demand-size analysis’,
Journal of Comparative Economics, 43 (1), pp.
19-32.
McKendrick, D., Doner, R.F. and Haggard,
S. (2000), From Silicon Valley to Singapore:
Location and competitive advantage in the hard
disk drive industry, Stanford, California, Stan-
ford University Press.
Molnar, M., Pain, N. and Taglioni, D.
(2007), ‘The internationalization of production,
international outsourcing and employment in

Revista Portuguesa de Estudos Regionais, nº 56
130
the OECD’, OECD Economics Department
Working Paper Series, n. 561, Paris.
OECD (2016), ‘Global Value Chains and
Trade in Value-Added: An Initial Assessment
of the Impact on Jobs and Productivity’, OECD
Trade Policy Papers, n. 190, OECD Publishing,
Paris.
Portella-Carbó, F. (2016), ‘Effects of inter-
national trade on domestic employment: an ap-
plication of a global multiregional input-output
supermultiplier model (1995-2011)’, Economic
Systems Research, vol. 28 (1), pp. 95-117.
Reijnders, L.S.M. and de Vries, G.J. (2018),
‘Technology, offshoring, and the rise of non-
routine jobs’, Journal of Development Econom-
ics, vol. 135, November, pp. 412-432.
Stehrer, R. and Stöllinger, R. (2012), ‘Trade
in jobs: a counterfactual exercise’, Paper pre-
sented at the WIOD Conference: causes and
consequences of globalization, April 24-26,
Groningen.
Strauss-Kahn, V. (2003), ‘The role of glob-
alization in the within-industry shift away from
unskilled workers in France’, National Bureau
of Economic Research Working Paper Series, n.
9,716, Cambridge, MA, US.
Timmer, M., Erumban, A.A., Los, B., Steh-
rer, R. and De Vries, G. (2012), ‘Slicing Up
Global Value Chains’, WIOD Working Paper
Series, n. 12.
UNCTAD (2013), World Investment Report,
United Nations Conference on Trade and De-
velopment, New York and Geneve.
Vandenbussche, H., Connell, W. and Si-
mons, W. (2017), ‘Global Value Chains, Trade
Shocks and Jobs: An Application to Brexit’,
CPER Discussion Paper, n. 12,303.
Vieira, S., Flôres, R. and Fontoura, M.P.
(2019), ‘The Evolution of the World’s Produc-
tion Fragmentation: 2000 – 2014: a network
analysis’, Working Paper Series of Research in
Economics and Mathematics, n. 86, ISEG-Lis-
bon School of Economics and Management,
University of Lisbon, Portugal.
Wixted, B., Yamano, N. and Webb, C.
(2006), ‘Input-Output analysis in an increas-
ingly globalized world: applications of OECD
harmonized international tables’, OECD Sci-
ence Technology and Industry Working Paper
Series, number 7-2006, OECD, Paris.
World Bank, IDE-JETRO, OECD, Univer-
sity of International Business and Economics,
and WTO (2017), Global Value Chain Devel-
opment Report 2017: Measuring and Analyzing
the Impact of GVCs on Economic Development,
World Bank, Washington DC, US.
Yamano, N. and Ahmad, N. (2006), ‘The
OECD Input-Output Database: 2006 Edition’,
OECD Science Technology and Industry Work-
ing Paper Series, 8-2006, OECD, Paris.

Labour Content of International Trade in Intermediates: The Case of Portugal
131
Appendix I – The structures of an IO table and of internationally-linked IO tables
An IO table provides data on the interactions
between suppliers (rows) and users (columns)
of: (i) domestically-produced and consumed in-
termediates (raw materials, industrial parts and
components, and services), (ii) domestically-
produced and consumed final goods, in private
final consumption, in Government final con-
sumption, or in GFCF; (iii) domestically-pro-
duced and exported final goods, and; (iv) exter-
nally-produced imported intermediates.
In fact, this matrix is a supply and use table
of national production, as referred to in Eurostat
(2008), and not a supply and use table of total
flows in the economy, since the data does not
inform about imports of final goods, including
those re-exported with no value-added in the
domestic economy. However, this missing in-
formation is not relevant for the purpose of as-
sessing the participation of national production
in GVCs.
The basic structure of an IO table is pre-
sented below in Figure 1.
FIGURE 1 - THE BASIC STRUCTURE OF AN IO TABLE
Source: Wixted et al (2006).
In Figure 1, rows show how a given sector of
activity, for example agriculture (Row 1), sup-
plies (i) the production of other sectors (3 units
as inputs in the mining sector, 8,260 units as in-
puts in the manufactures sector, 36 units as in-
puts in the utilities sector, 59 units as inputs in
the construction sector, and 615 units as inputs
in the services sector); (ii) the production in the
same sector (i.e. 2,731 units); (iii) the final con-
sumption in the country (962 units); (iv) the
government final consumption in the country
(62 units); (v) the GFCF in the country (567
units), and; (vi) exports (8,568). Columns show
how the production of a given sector of activity,
for example agriculture (Column 1), disaggre-
gates in terms of: (i) inputs from other sectors
of activity (i.e. 4 units from mining, 3,322 units
from manufactures, 983 units from utilities, 121
16 The basic price is the amount receivable by the producer exclu-
sive of taxes payable on products and inclusive of subsidies re-
ceivable on products (the equivalent for imported products is the
c.i.f. – the cost, insurance, and freight, that is to say, the value at
units from construction, and 2,884 units from
services); (ii) inputs from the same sector (2,731
units from agriculture); (iii) imported inputs
(1,779 units); (iv) taxes on products (129 units),
and; (v) value added in the sector, at basic
prices, representing the sum of wages and sala-
ries (remuneration of labour) plus gross operat-
ing surplus (remuneration of capital) (9,910
units).
The central section of the matrix (Box#1)
shows the intermediates’ matrix, which pro-
vides data about the interactions between do-
mestic suppliers and domestic users of domesti-
cally-produced raw materials, industrial compo-
nents and services. This is by definition, a
squared matrix, and the values recorded can be
either at basic or at purchaser’s prices16. In
Box#3, one can observe the total imported
the border of the importing country). The purchaser price is the
amount payable by the purchaser (which includes trade margins
realised by wholesalers and retailers – which is, by definition,
their output - as well as transport margins - that is to say, any

Revista Portuguesa de Estudos Regionais, nº 56
132
inputs. The supplies of goods that are not con-
sumed by domestic industries are represented in
Box#2.
The international linkage between the IO ta-
bles of several countries can be observed in Fig-
ure 2 below17. This extended matrix just builds
on the matrix observed in Figure 1 above, by
disaggregating the column called ‘Exports’ in
several submatrices, which present, for each one
of the other countries in the sample and the re-
maining Rest of the World (RoW) as a whole,
information about how the goods and services
supplied have been used in those countries as
inputs, per sector; as private final consumption;
as Government final consumption; and as
GFCF. For example, Figure 1 above shows that
agriculture supplies foreign users with 8,568
units. Additionally, Figure 2 shows how those
8,568 units disaggregate per country and per fi-
nal use (e.g., that 343 units were used as inputs
in the production of manufactured goods of
country B, or that 1,285 units were used as pri-
vate final consumption in country B).
FIGURE 2 - THE BASIC STRUCTURE OF AN INTERNATIONALLY LINKED IO TABLE (FOR THREE REGIONS; COUN-
TRY A, COUNTRY B AND REST OF THE WORLD)
Source: Authors, based on Timmer et al. (2012).
Analogously, this extended matrix also
builds on the matrix observed in Figure 1 above,
by disaggregating the row called “Imports” into
several submatrices which present for each one
of the other countries in the sample and the re-
maining RoW as a whole, information about
how the domestic production of goods and ser-
vices are supplied with inputs by each one of the
other countries, per sector. For instance, in
Figure 1 above, the production of the agriculture
sector was supplied by inputs produced abroad
amounting to 1,779 units. Figure 2, addition-
ally, shows that amount disaggregated per coun-
try and per sector (e.g., 71 units of inputs were
originated in the manufacture sector of Country
B, or that 142 units of inputs were originated in
the agriculture sector of countries not individu-
ally covered in the sample).
transport charges paid separately by the purchaser - and also non-
deductible value-added tax (definitions by the Data Helpdesk of
the World Bank, in https://datahelpdesk.worldbank.org/knowl
edgebase/articles/114947-what-is-the-difference-between-pur-
chaser-prices-p).
17 For additional information about how these internationally
linked IO matrices are built, see Yamano & Ahmad (2006),
Wixted et al. (2006), and Timmer et al. (2012).

Labour Content of International Trade in Intermediates: The Case of Portugal
133
Appendix II – List of the 35 sectors included in the WIOD

Revista Portuguesa de Estudos Regionais, nº 56
134
Appendix III – The reconciliation of the downstream and the upstream approaches
The difference between the 5.09 million jobs
which existed in Portugal in 2009 (estimated ac-
cording to the upstream approach) and the 4.5
million estimated by following the downstream
approach is largely conceptual, as explained in
Figure 3 below. This figure shows the reconcil-
iation of both approaches. In one hand, we can
see in the figure’s left side that, following the
downstream approach, the output produced in
Portugal creates a given demand for domestic
and foreign inputs. The domestic and foreign in-
puts needed are produced with both domestic
jobs (Box #1) and with jobs abroad (Box #3),
respectively. On the other hand, the output pro-
duced abroad creates a given demand for do-
mestic and foreign inputs. The domestic and
foreign inputs needed are produced with both
domestic jobs (Box #2) and with foreign jobs
(Box #4), respectively. In sum, Box #1
corresponds to the number of jobs existing in
Portugal due to domestic demand (downstream
approach): 4.521 million according to Table 1.
Box #2 corresponds to the number of jobs exist-
ing in Portugal due to foreign demand (up-
stream approach): 0.508 million jobs, according
to Table VI. Altogether, we concluded that, in
2009, 5.029 million persons were employed in
Portugal. Two other minor reasons explain the
difference between the values of 5.029 million
and 5.090 million: (i) the downstream approach
does not consider jobs existing due to tax/subsi-
dies, and (ii) the upstream approach does not
take into account variations in stocks. Finally,
Box #3 corresponds to the number of jobs exist-
ing abroad due to the Portuguese demand for
foreign inputs (downstream approach): 0.304
million, according to Table 1.
FIGURE 3 - SCHEMATIC OUTLINE OF THE METHODOLOGICAL DIFFERENCES IN THE JOBS ESTIMATED BY THE
DOWNSTREAM AND THE UPSTREAM APPROACHES
Source: Authors.

Artigo submetido a 5 de Setembro de 2019; versão final aceite a 29 de Janeiro de 2020
Paper submitted on September 5, 2019; final version accepted on January 29, 2020
A Relação Entre as Receitas e as Despesas Públicas nos
Municípios Portugueses: 2009-2017
The Relationship Between Revenues and Public Expenditures in
Portuguese Municipalities: 2009-2017
Leonida Correia
Centro de Estudos Transdisciplinares para o Desenvolvimento (CETRAD), Departamento de
Economia, Sociologia e Gestão (DESG), Universidade de Trás-os-Montes e Alto Douro
(UTAD)
Patrícia Martins
Centro de Estudos Transdisciplinares para o Desenvolvimento (CETRAD), Departamento de
Economia, Sociologia e Gestão (DESG), Universidade de Trás-os-Montes e Alto Douro
(UTAD)
Resumo/ Abstract
Este trabalho é financiado por fundos nacionais através da FCT – Fundação para a Ciência e a Tecnologia, I.P., no âmbito do projeto
UID/SOC/04011/2019.
The recent global economic crisis has re-
newed the interest in the debate on the causality
between public revenue and expenditure due to
the important fiscal imbalances experienced by
many countries, particularly in the euro area, and
to the growing concerns about the sustainability
of public finances. This paper analyses the dy-
namic relationship between local revenues and
expenditures for 278 Portuguese municipalities
in the 2009-2017 period. The empirical results of
the unit root and cointegration tests and the esti-
mation of vector error correcting models for
panel data allow us to conclude that the two local
fiscal variables, own revenues and total expend-
itures, adjust to achieve a balanced local budget
balance in the long term. Thus, the results sup-
port the fiscal synchronization hypothesis, which
argues that decisions on revenues and expendi-
tures are carried out simultaneously by the fiscal
authorities, which contributes positively to the
sustainability of local government finances.
A recente crise económica global renovou o
interesse no debate sobre a causalidade entre re-
ceitas e despesas públicas devido aos graves de-
sequilíbrios orçamentais experimentados por
muitos países, sobretudo na área do euro, e às
crescentes preocupações com a sustentabilidade
das finanças públicas. Este artigo analisa a rela-
ção dinâmica entre as receitas e as despesas lo-
cais para 278 municípios portugueses, no perí-
odo 2009-2017. Os resultados da aplicação de
testes de raiz unitária e de cointegração e da es-
timação de modelos com vetor corretor de erros
para dados em painel permitem concluir que as
duas variáveis orçamentais locais, receitas pró-
prias e despesas totais, se ajustam para alcançar
um saldo orçamental local nulo no longo prazo.
Assim, os resultados suportam a hipótese de sin-
cronização orçamental que estabelece que as de-
cisões relativas às receitas e despesas são toma-
das em simultâneo pelas autoridades orçamen-
tais, o que contribui positivamente para a respe-
tiva sustentabilidade das contas públicas dos mu-
nicípios.

Revista Portuguesa de Estudos Regionais, nº 56
136
1. INTRODUÇÃO
A relação intertemporal entre as receitas e as
despesas públicas tem vindo a alimentar uma in-
tensa discussão, quer entre os economistas quer
entre os decisores de política, desde há muito
tempo. O interesse nesta temática deveu-se, por
um lado, ao crescimento do setor público após a
II Guerra Mundial e, por outro, à ocorrência de
défices nas contas públicas na maioria dos paí-
ses desenvolvidos. A recente crise económica
global reforçou a importância deste debate de-
vido aos graves desequilíbrios orçamentais ex-
perimentados por muitos países, sobretudo na
área do euro, e às crescentes preocupações com
a sustentabilidade das finanças públicas. A forte
ligação entre a estabilidade orçamental e a esta-
bilidade macroeconómica é uma motivação adi-
cional para a investigação do que a literatura de-
signa como tax-spend debate ou revenue-expen-
diture nexus.
A literatura empírica desenvolveu-se após
meados dos anos 1980 nos EUA e, posterior-
mente, alargou-se a outros países industrializa-
dos e, com menor expressão, a países menos de-
senvolvidos. O principal objetivo dos estudos
consistia em testar empiricamente as quatro hi-
póteses identificadas na literatura teórica quanto
à causalidade entre receitas e despesas públicas:
(i) as receitas determinam as despesas; (ii) as
despesas determinam as receitas; (iii) as receitas
e despesas são determinadas em simultâneo;
(iv) as receitas e despesas são determinadas de
forma independente. A investigação concen-
trou-se no plano nacional, estabelecendo rela-
ções de causalidade para um ou vários países.
Estes estudos geraram uma diversidade de re-
sultados, dependendo da abordagem metodoló-
gica, especificação do modelo, grau de agrega-
ção temporal ou período analisado, não havendo
consensos relativamente à sustentação de uma
determinada hipótese.
Provavelmente porque em muitos países o
poder local tem pouca interferência no processo
de decisão público, os estudos são muito mais
escassos ao nível dos municípios. Adicional-
mente, há várias especificidades no que se refe-
re ao processo orçamental ao nível local (Payne,
2003). Os municípios não têm a capacidade de
instituir políticas inflacionistas de forma a au-
mentar as receitas como no caso do governo
central e, por outro lado, muitos deles operam
sob requisitos legislativos e constitucionais que
tentam restringir défices orçamentais.
Ao nível das finanças locais, uma regulari-
dade empírica importante a considerar é que os
saldos orçamentais são influenciados pelas
transferências do governo central. A influência
das transferências como fonte de financiamento
das despesas pode gerar o designado flypaper
effect, isto é, o aumento de um euro nas transfe-
rências para os municípios pode gerar mais des-
pesa do que o aumento de um euro no rendi-
mento disponível local. No caso português, os
governos locais dependem consideravelmente
das transferências recebidas do governo central
(Martins e Correia, 2015) e existe evidência de
suporte (Rios e Costa, 2005) para a verificação
do flypaper effect para os municípios portugue-
ses.
No caso específico de Portugal, vários estu-
dos focaram a relação entre receitas e despesas
públicas ao nível nacional (Silvestre, 1997; Kol-
lias e Makrydakis, 2000; Afonso e Christophe,
2009; Bolat, 2014). Contudo, tanto quanto é do
nosso conhecimento, a evidência empírica ao
nível local é inexistente. Desta forma, o pre-
sente artigo vem contribuir para o incremento
da investigação ao nível subnacional, anali-
sando a relação dinâmica entre as receitas pró-
prias e as despesas totais nos municípios portu-
gueses para o período 2009-2017. Para o efeito,
são aplicados vários testes econométricos para
testar a presença de raiz unitária e cointegração
e estimados modelos com vetor corretor de er-
ros (VEC) para verificar qual das quatro hipóte-
ses melhor descreve a relação intertemporal en-
tre receitas e despesas públicas.
Este artigo está organizado da seguinte
forma. A secção 2 descreve as hipóteses do de-
bate receita-despesa e faz uma revisão dos estu-
dos empíricos ao nível subnacional sobre o
tema. A secção 3 analisa e contextualiza os da-
dos e apresenta os métodos utilizados no estudo
Keywords: Causality, Local Government Fi-
nances, Portugal
JEL codes: C33; H71; H72
e France is the second biggest EMU economy
and, as Finland, is not considered a “peripheral”
country.
Keywords: Markov-Switching models; Active
portfolio management; financial market integra-
tion; EMU stock markets integration
Palavras-chave: Causalidade, Finanças Locais,
Portugal
Códigos JEL: C33; H71; H72

A Relação Entre as Receitas e as Despesas Públicas nos Municípios Portugueses: 2009-2017
137
econométrico. A secção 4 contém os principais
resultados empíricos e a sua interpretação. A
secção 5 contém as principais conclusões e su-
gestões para investigação futura.
2. REVISÃO DA LITERATURA
Nesta secção apresentam-se as hipóteses do
debate receita-despesa e procede-se a uma revi-
são dos vários estudos empíricos que explora-
ram esta relação ao nível subnacional.
2.1 Hipóteses do debate receita-despesa
A literatura identifica quatro hipóteses
quanto à relação intertemporal entre receitas e
despesas públicas: hipótese “receita-despesa”;
hipótese “despesa-receita”; hipótese “sincroni-
zação orçamental”; e hipótese “independência
orçamental”.
A hipótese “receita-despesa” (tax-and-
spend) sugere que as receitas determinam as
despesas públicas. Um defensor desta hipótese
é Friedman (1978), que defende que as despesas
se ajustam ao nível que pode ser suportado pelas
receitas. O autor argumenta que aumentar im-
postos, aumentando os recursos disponíveis
numa tentativa de redução do défice orçamen-
tal, apenas levará ao crescimento das despesas
públicas. Consequentemente, um aumento dos
impostos não conduzirá a menores défices,
sendo a diminuição das despesas a única solu-
ção para reduzir o défice orçamental. Uma ver-
são alternativa desta hipótese foi colocada por
Wagner (1976) e Buchanan e Wagner (1977) e
sugere que aumentar as receitas levará a dimi-
nuição das despesas via ilusão fiscal. De acordo
com esta perspetiva, reduzir impostos levará a
maior despesa porque o corte nos impostos é
percebido como redução dos preços dos bens e
serviços públicos. A ilusão fiscal surge no sen-
tido em que, embora não se verificando um pa-
gamento direto de impostos, o público está a pa-
gar de forma indireta através de outros mecanis-
mos fiscais como o imposto inflacionário e a dí-
vida. Logo, na perspetiva de Buchanan e Wag-
ner, um aumento dos impostos pode levar a uma
diminuição das despesas públicas.
A hipótese “despesa-receita” (spend-and-
tax) sugere que alterações nas despesas condu-
zem a variações nas receitas públicas, isto é, pri-
meiro são tomadas as decisões de despesa e pos-
teriormente é que se fazem os ajustamentos nas
receitas para ir ao encontro das despesas. Com
base na proposição da Equivalência Ricardiana,
que sustenta que o governo pede emprestado
hoje em resultado de impostos mais elevados no
futuro, Barro (1979) questionou a ilusão fiscal
avançada na estrutura de Buchanan-Wagner,
contra-argumentando que o financiamento dos
gastos públicos através da emissão de dívida
tem os mesmos efeitos que o financiamento via
impostos. Também no âmbito desta hipótese,
mas seguindo uma abordagem diferente, Ro-
berts (1978) e Peacock e Wiseman (1979) afir-
maram que aumentos temporários nas despesas
públicas devido a situações de “crise” levariam
a maiores impostos de forma permanente. Con-
sequentemente, esta hipótese defende que, em
vez de aumentar a carga tributária, despesas pú-
blicas adicionais devem ser controladas ou res-
tringidas de forma a reequilibrar o saldo orça-
mental.
A hipótese “sincronização orçamental” (fis-
cal synchronization) postula que as receitas e as
despesas são determinadas em simultâneo, ou
conjuntamente, pelo que ambas puxam o saldo
orçamental em direção ao equilíbrio. Neste sen-
tido, os eleitores devem comparar os custos
marginais e os benefícios marginais dos progra-
mas públicos (Meltzer e Richard, 1981).
A hipótese “independência orçamental” (fis-
cal independence) considera que não existe li-
gação entre as receitas e as despesas públicas,
sendo ambas determinadas de forma indepen-
dente (Baghestani e McNown, 1994). Um
exemplo é quando os impostos e as despesas são
determinados por rules of thumb (Hoover e
Sheffrin, 1992), isto é, regras que assentam no
conhecimento prático e não no conhecimento
científico.
2.2 Literatura empírica ao nível sub-
nacional
A partir de meados da década de 1980, uma
extensa literatura empírica explorou as quatro
hipóteses quanto à relação entre receitas e des-
pesas públicas, utilizando diferentes metodolo-
gias, amostras e períodos temporais. Embora a
metodologia específica varie entre estudos, em
geral os trabalhos evidenciam o conceito de
causalidade de Granger (1969), o qual assenta
no poder preditivo de uma variável sobre outra.
Neste contexto, a versão de Friedman da hipó-
tese “receita-despesa” é suportada por uma cau-
salidade unidirecional positiva das receitas para
as despesas, enquanto a versão alternativa de
Buchanan e Wagner da mesma hipótese é sus-
tentada por uma causalidade unidirecional

Revista Portuguesa de Estudos Regionais, nº 56
138
negativa das receitas para as despesas. Quanto
às restantes possibilidades, a hipótese “despesa-
receita” é apoiada se existir uma causalidade
unidirecional das despesas para as receitas, a hi-
pótese de “sincronização orçamental” é supor-
tada pela causalidade bidirecional entre receitas
e despesas enquanto a ausência de causalidade
entre receitas e despesas dá suporte à hipótese
de “independência orçamental”.
A grande maioria dos estudos empíricos fo-
cou o nível nacional não havendo consenso nos
resultados obtidos. Como salientado na revisão
da literatura empírica efetuada por Payne
(2003), a inconsistência dos resultados da inves-
tigação pode ser explicada pelas diferenças nas
características específicas dos países, nos perío-
dos analisados, nas abordagens e instrumentos
usados na modelização da relação, na diferente
agregação temporal ou na inclusão de uma vari-
ável para além das receitas ou despesas. Ao ní-
vel subnacional, a investigação tem sido bem
mais escassa do que ao nível nacional. O quadro
A.1 em Apêndice contém um resumo dos resul-
tados encontrados nos vários estudos empíricos,
os quais utilizaram diferentes tipos de dados
(time series e panel data) e abordagens econo-
métricas.
A maioria dos estudos incidiu sobre os esta-
dos ou governos locais dos EUA, tendo chegado
a resultados diversificados. Considerando, para
o mesmo período, dados agregados dos estados
e dos governos locais em duas amostras separa-
das, Marlow e Manage (1987, 1988) e
Chowdbury (1988) concluíram em favor da hi-
pótese receita-despesa ao nível dos estados, mas
obtiveram evidência discordante ao nível local:
enquanto os resultados de Marlow e Manage,
em geral, dão suporte à hipótese de independên-
cia orçamental, os de Chowdhury são favorá-
veis à hipótese de sincronização orçamental.
Por seu lado, Zaphn e Paine (2009) tomando os
dados agregados em conjunto para os estados e
governos locais americanos concluem a favor
da hipótese despesa-receita. Usando dados indi-
viduais para 48 estados, Payne (1998) obteve re-
sultados de apoio às quatro hipóteses: receita-
despesa para 24 estados, despesa-receita para 8
estados, sincronização orçamental para 11 esta-
dos e independência orçamental para 3 estados.
No caso de dados em painel, destacam-se Holtz-
Eakin et al. (1989) para 171 municípios e de
Westerlund et al. (2011) para 50 estados, ambos
1 https://www.pordata.pt/Municipios.
fornecendo evidência de suporte à hipótese re-
ceita-despesa.
Os resultados empíricos obtidos ao nível
subnacional fora dos EUA são também muito
variados. Por exemplo, aplicando modelos de
vetores autoregressivos (VAR) com dados em
painel e seguindo a abordagem de Holtz-Eakin
et al. (1988), Dahlberg e Johansson (1998) con-
cluem em favor da hipótese despesa-receita para
os municípios da Suécia, enquanto Moisio
(2000) conclui pela hipótese despesa-receita no
primeiro subperíodo e de sincronização orça-
mental no segundo subperíodo para os municí-
pios finlandeses. Em termos regionais, usando
modelos VEC com dados em painel, Ho e Hu-
ang (2009) analisam as províncias chinesas e
Garcia (2012) as regiões espanholas. Os resul-
tados obtidos nestes estudos suportam a hipó-
tese de sincronização orçamental para as pro-
víncias chinesas, enquanto a hipótese receita-
despesa é sustentada para as regiões espanholas.
3. DADOS E MÉTODOS
Nesta secção são apresentados os dados, os
diversos testes usados para testar a presença de
raiz unitária e cointegração e o modelo VEC uti-
lizado para verificar qual das quatro hipóteses
descreve a relação intertemporal entre receitas
próprias e despesas públicas nos municípios
portugueses.
3.1 Dados
No estudo empírico é usada informação es-
tatística anual relativa às receitas próprias e às
despesas totais dos 278 municípios de Portugal
Continental no período entre 2009 e 2017. Este
período foi escolhido de acordo com a disponi-
bilidade dos dados. A fonte de toda a informa-
ção estatística usada é a PORDATA, Base de
Dados de Portugal Contemporâneo1. As variá-
veis estão a preços constantes (ano base de
2009), em termos per capita e expressas em eu-
ros por indivíduo. As receitas próprias corres-
pondem às receitas correntes e de capital efeti-
vas menos as transferências, correntes e de ca-
pital, recebidas pelas câmaras municipais. O es-
tudo da relação intertemporal entre receitas e
despesas públicas ao nível subnacional consi-
dera as receitas próprias e não as receitas totais,
porque as transferências recebidas do governo

A Relação Entre as Receitas e as Despesas Públicas nos Municípios Portugueses: 2009-2017
139
central, incluídas nas receitas totais, não são de-
cididas pelos agentes de política locais. No cál-
culo das variáveis a preços constantes utilizou-
se a taxa de variação do Índice de Preços no
Consumidor da NUTII a que pertence o respe-
tivo município. Para a transformação das variá-
veis em valores per capita, recorreu-se às esti-
mativas da população residente a 31 de dezem-
bro do respetivo ano. Deste modo, alterações
nas receitas e nas despesas decorrentes unica-
mente de variações da população não influen-
ciam os resultados.
3.1.1 Análise dos dados
A média anual, para os 278 municípios, das
receitas próprias e das despesas totais reais per
capita está apresentada na figura 1.
Figura 1: Média anual das receitas próprias e das despesas totais reais per capita (euros por individuo)
Como se pode verificar, após uma diminui-
ção em 2011 de 4%, as receitas próprias apre-
sentam uma tendência ascendente desde 2012,
culminando num valor médio de 372 euros per
capita em 2017. As despesas totais, apesar de
uma evolução descendente ao longo do período,
tiveram um comportamento mais volátil. Entre
2010 e 2016, o valor médio anual das despesas
totais per capita registou um decréscimo global
de 16% (de 1031 euros em 2010 reduziu-se para
861 euros em 2016). Em 2017, as despesas to-
tais per capita voltaram a registar um aumento
de 10%.
Esta evolução das receitas próprias e das
despesas totais traduziu-se numa diminuição do
valor médio anual do défice do saldo local per
capita, para o total dos municípios, de 715 euros
para 579 euros entre 2010 e 2017, o que corres-
ponde a um decréscimo de 19% em termos glo-
bais reais.2 No entanto, a redução mais signifi-
cativa do défice local ocorreu entre 2010 e 2014
2 Sendo o saldo global a diferença entre as receitas totais e as des-
pesas totais, optou-se por definir como saldo local a diferença en-
tre as receitas próprias e as despesas totais.
com uma taxa de variação global real negativa
de 24%.
É de notar que os valores médios encobrem
diferenças expressivas entre os municípios, no-
meadamente no que diz respeito à sua capaci-
dade de gerarem receitas próprias. Enquanto en-
tre 2010 e 2017 no município de Lisboa as re-
ceitas próprias representam, em média, 90% das
receitas totais, o respetivo valor médio no total
dos 278 municípios é apenas 39%. No outro ex-
tremo da distribuição territorial está o município
de Barrancos, no qual as receitas próprias repre-
sentam, em média, no mesmo período, apenas
9% das receitas totais.
3.1.2 Contexto económico e legal
O comportamento evidenciado pelas receitas
próprias, despesas totais e défice local durante o
período 2009-2017 está seguramente associado
às circunstâncias específicas que a economia

Revista Portuguesa de Estudos Regionais, nº 56
140
portuguesa enfrentou em grande parte desse pe-
ríodo, nomeadamente devido aos efeitos da
crise global que se propagou à Europa a partir
de 2008 e que teve fortes implicações negativas
sobre alguns países, como é o caso de Portugal.
A crise veio agravar os desequilíbrios ma-
croeconómicos estruturais da economia portu-
guesa (Correia e Martins, 2019). Pelo que em
2011, face a uma taxa de juro da dívida pública
crescente e às inerentes dificuldades de se finan-
ciar nos mercados financeiros, houve a necessi-
dade de efetuar um pedido de assistência econó-
mica e financeira internacional (Correia, 2016).
Em contrapartida do apoio recebido (78 mil mi-
lhões de euros), as autoridades portuguesas as-
sinaram um memorando de entendimento e ne-
gociaram um programa de assistência econó-
mica e financeira (PAEF) com a União Euro-
peia (UE) e o Fundo Monetário Internacional
(FMI) para o período 2011-2014.3 Portugal
cumpriu com sucesso o PAEF em maio de 2014,
após o que ficou sob vigilância da UE (monito-
rização pós-programa).
O PAEF assentou em três pilares - consoli-
dação orçamental, estabilidade do sistema fi-
nanceiro e transformação estrutural da econo-
mia portuguesa -, tendo implicado a implemen-
tação de um pacote muito exigente de medidas
de austeridade. A necessidade de consolidação
das contas públicas foi transversal aos vários ní-
veis da administração pública, tendo colocado
fortes constrangimentos também ao nível da ad-
ministração local (municípios e freguesias), que
tiveram de realizar um conjunto de reformas es-
truturais, em acordo com o PAEF, no sentido de
aumentar as receitas e reduzir os custos. 4
Ao nível das receitas, o plano de reformas
incluía uma substituição significativa das trans-
ferências do governo central por receitas pró-
prias dos municípios. Desde meados dos anos
oitenta, as receitas próprias têm vindo a crescer,
3 O “Memorando de entendimento sobre as condicionalidades
de política económica” (Banco de Portugal, 2011) foi assi-
nado em 17 de maio de 2011, altura em que foi acordado o
PAEF, também designado como “Programa de ajustamento
económico” (European Commission, 2011), que foi publi-
cado em junho de 2011. 4 Basílio et al. (2019) fornecem uma descrição das medidas
contidas no memorando de entendimento com repercussão
nos governos locais. Os autores analisaram as alterações es-
truturais ocorridas entre 2010 e 2015, antes e depois da inter-
venção da Troika, e concluíram que as reformas implementa-
das não produziram efeitos ao nível da eficiência da adminis-
tração local. 5 Baleiras et al. (2018) resumem as várias justificações econó-
micas enunciadas pela literatura para a existência de transfe-
rências orçamentais a favor dos governos subnacionais. Tam-
bém mostram que, apesar de uma queda significativa, as
nomeadamente devido ao alargamento das atri-
buições e fontes de financiamento municipal
(Baleiras et al., 2018). Contudo, em 2013 à data
da introdução na nova Lei das Finanças Locais
(LFL), os governos locais dependiam ainda
consideravelmente das transferências do Es-
tado.5
Do lado das despesas, uma das medidas mais
importantes foi a reorganização administrativa
do poder local, um plano de consolidação pre-
parado para reorganizar e reduzir significativa-
mente o número de freguesias. Como conse-
quência desta reforma administrativa imple-
mentada em 2012, o número de freguesias pas-
sou de 4260 para 3092 em 2013. Outras medi-
das, decorrentes do PAEF e com o objetivo de
contrariar o aumento das despesas e os desequi-
líbrios orçamentais e financeiros acumulados no
passado, envolveram a redução de contratações
de funcionários públicos e dos custos com os sa-
lários. Por último, somam-se as limitações de fi-
nanciamento junto do setor bancário decorren-
tes da crise. Este conjunto de fatores contribuiu
para a tendência descendente das despesas totais
das autarquias, conforme analisado anterior-
mente.
O comportamento tendencialmente ascen-
dente das receitas próprias e descendente das
despesas totais proporcionou uma descida do
défice local no período em questão, contrari-
ando a evolução passada. De acordo com a aná-
lise realizada por Baleiras et al. (2018), as últi-
mas três décadas foram repletas de défices, pelo
que a redução do défice do saldo global se apre-
senta como um dos desafios mais cruciais para
o poder local em Portugal.6
As alterações do enquadramento legal do
funcionamento das administrações locais foram
um fator decisivo para a evolução registada nos
orçamentos e contas dos municípios portugue-
ses.7 Por um lado, a aprovação da chamada “Lei
transferências continuavam a ser a categoria dominante da re-
ceita efetiva (58% em 1987 e 43% em 2015). 6 Entre 1987 e 2009, apenas em quatro exercícios ocorreram
excedentes globais. Na sequência da crise e das respostas da-
das, verificou-se uma melhoria significativa, pelo que em
2015, último ano da série analisada por Baleiras et al. (2018),
registou-se um excedente global superior a 11% da despesa,
um resultado sem precedentes desde 1987. 7 Portugal é um caso de estudo interessante porque, embora os
municípios tenham orçamentos próprios, estão todos sujeitos
ao mesmo enquadramento legal e institucional (Costa et al.,
2015). Nomeadamente, todos estão sujeitos às mesmas regras
de contabilidade, às mesmas obrigações de reporte e possuem
as mesmas competências de intervenção sobre as mesmas
atribuições, embora o contexto físico, demográfico e econó-
mico em que atuam seja substancialmente diverso (Baleiras
et al., 2018).

A Relação Entre as Receitas e as Despesas Públicas nos Municípios Portugueses: 2009-2017
141
dos Compromissos e Pagamentos em Atraso”
(Lei 8/2012) foi determinante para a contenção
das despesas ao impor que as autarquias só po-
dem assumir compromissos até ao montante dos
fundos disponíveis. Por outro lado, a nova LFL
(Lei nº 73/2013), que entrou em vigor em 2014,
foi uma condicionalidade imposta pelo PAEF e,
por conseguinte, refletiu a necessidade de con-
solidação orçamental e diminuição do endivida-
mento local.8
A nova LFL reforça o princípio da solidarie-
dade nacional recíproca entre o Estado e as au-
tarquias locais (artigo 8º), o que “obriga à con-
tribuição proporcional do setor local para o
equilíbrio das contas públicas nacionais", pelo
que, em "situações excecionais e transitórias", o
Orçamento do Estado pode estabelecer "limites
adicionais à dívida total autárquica" e definir
transferências de montante inferior ao previsto
na própria lei (Martins e Correia, 2015). Entre
as limitações principais impostas pela LFL de
2013 conta-se a orçamentação a médio prazo,
que estabelece a obrigação dos governos locais
apresentarem limites para as despesas e previ-
sões das receitas para os três anos seguintes ao
do orçamento anual.
3.2 Testes de raiz unitária
Para explorar a presença de raízes unitárias
com dados em painel são usados os testes de
Breitung (2000; Breitung e Das, 2005), Phillips-
Perron de Fisher (PP-Fisher) (Choi, 2001) e de
Hadri (2000). Tendo por base um modelo painel
com uma componente autorregressiva de pri-
meira ordem:
𝑦𝑖𝑡 = 𝛿𝑖𝑦𝑖,𝑡−1 + 𝛾𝑖𝑧𝑖𝑡 + 𝜖𝑖𝑡 (1)
e sendo 𝛿𝑖 os coeficientes de autocorrelação
de cada painel i e 𝛾𝑖 o vetor de coeficientes do
termo determinístico que controla os efeitos de
painel específicos e a tendência temporal, os
testes de raiz unitária de Breitung e PP-Fisher
são usados para testar a hipótese nula de exis-
tência de raiz unitária para todos os paíneis
(𝛿𝑖 = 1). O teste de Breitung estabelece como
hipótese simplificadora que todos os painéis
partilham o mesmo coeficiente de autocorrela-
ção (𝛿𝑖 = 𝛿) e assume que o erro 𝜖𝑖𝑡 não está
correlacionado entre i e t. Neste teste, assume-
se como hipótese alternativa a estacionariedade
8 Ver Baleiras et al. (2018) para um melhor entendimento sobre
o quadro legal aplicável à administração local que vigorou em
Portugal desde a primeira LFL em 1979.
para todos os painéis (𝛿 < 1). De modo dife-
rente, o teste PP-Fisher considera que cada pai-
nel apresenta um coeficiente de autocorrelação
específico e assume como hipótese alternativa a
estacionariedade de pelo menos um painel (𝛿𝑖 <1 de pelo menos um i).
Ao contrário dos dois testes anteriores, Hadri
(2000) propõe um teste multiplicador de La-
grange baseado em resíduos (Hadri LM) que as-
sume como hipótese nula que todos os painéis
são estacionários e como hipótese alternativa
que pelo menos um painel inclui uma raiz uni-
tária. É relevante a aplicação deste teste porque
os métodos estatísticos clássicos são definidos
para rejeitarem a hipótese nula apenas quando a
evidência contra essa hipótese é suficiente-
mente esmagadora.
3.3 Testes de cointegração
Quando as séries são não estacionárias, é
adequado realizar testes de cointegração para
determinar se as variáveis têm uma relação de
longo prazo estável, isto é, se estão cointegra-
das. Neste estudo são usados os testes de coin-
tegração de Kao (1999), de Pedroni (1999,
2004) e de Westerlund (2005) que são baseados
no seguinte modelo:
𝑦𝑖𝑡 = 𝜎𝑖𝑥𝑖𝑡 + 𝛾𝑖𝑧𝑖𝑡 + 𝜔𝑖𝑡 (2)
sendo 𝜎𝑖 o vetor de cointegração e 𝛾𝑖 o vetor
de coeficientes do termo determinístico que
controla os efeitos de painel específicos e a ten-
dência temporal. Nestes testes e sob a hipótese
nula, 𝑦𝑖𝑡 e 𝑥𝑖𝑡 são séries não cointegradas (𝜎𝑖 =0).
O teste de Kao (1999) assume um vetor de
cointegração que é igual para todos os painéis
(𝜎𝑖 = 𝜎), estima médias de painel específicas
(efeitos fixos) e não permite a inclusão de uma
tendência temporal. Neste teste, a hipótese al-
ternativa assume que as séries são cointegradas
em todos os painéis com o mesmo vetor de coin-
tegração. São consideradas 4 versões do teste de
Dickey-Fuller: Dickey-Fuller; Dickey-Fuller
não ajustado; Dickey-Fuller modificado e
Dickey-Fuller modificado não ajustado. Nestes
testes, o termo de autocorrelação dos resíduos,
ρ, é o mesmo para todos os painéis, mas os tes-
tes estatísticos diferem na forma como formu-
lam as hipóteses e como controlam a correlação

Revista Portuguesa de Estudos Regionais, nº 56
142
dos resíduos da equação que estima a relação de
cointegração. Os testes Dickey-Fuller e Dickey-
Fuller não ajustado testam se 𝜌 = 1. De modo
diferente, os testes Dickey-Fuller modificado e
Dickey-Fuller modificado não ajustado testam
se 𝜌 − 1 = 0.
O teste de Pedroni (1999, 2004) apresenta
duas diferenças relativamente ao teste de Kao:
para cada painel assume vetores de cointegração
específicos, 𝜎𝑖, e termos de autocorrelação es-
pecíficos, ρi . Por conseguinte, a hipótese alter-
nativa assume que as séries são cointegradas em
todos os painéis com vetores de cointegração
específicos para cada painel. Neste teste, são
apresentadas duas versões do teste Phillips-Per-
ron que consideram diferentes hipóteses relati-
vamente aos termos de autocorrelação dos resí-
duos: o teste Phillips-Perron testa a hipótese
𝜌𝑖 = 1 e o teste Phillips-Perron modificado
testa a hipótese 𝜌𝑖 − 1 = 0.
O teste de Westerlund (2005) inclui um teste
estatístico de rácio da variância que se obtém
testando a existência de raiz unitária dos resí-
duos estimados da regressão Dickey-Fuller que
considera que o termo de autocorrelação dos re-
síduos é o mesmo para todos os painéis. Neste
caso, a hipótese alternativa estabelece que as sé-
ries são cointegradas em todos os painéis.
3.4 Modelos VEC
Se duas variáveis são cointegradas, então
existe uma relação de longo prazo entre estas
duas variáveis. Neste estudo são usados mode-
los VEC para caracterizar a relação de equilí-
brio de longo prazo e o processo dinâmico de
ajustamento no curto prazo entre as receitas pró-
prias e as despesas totais:
∆𝐿𝑛𝑅𝑝𝑖,𝑡 = 𝜃0,𝑖 + ∑ 𝜃1∆𝐿𝑛𝑅𝑝𝑖,𝑡−𝑘𝑘 + ∑ 𝜃2∆𝐿𝑛𝐷𝑡𝑖,𝑡−𝑘 + 𝜆1휀𝑖,𝑡−1 + 𝜂𝑖,𝑡𝑘 (3)
∆𝐿𝑛𝐷𝑡𝑖,𝑡 = 𝜙0,𝑖 + ∑ 𝜙1∆𝐿𝑛𝑅𝑝𝑖,𝑡−𝑘𝑘 + ∑ 𝜙2∆𝐿𝑛𝐷𝑡𝑖,𝑡−𝑘 + 𝜆2𝑒𝑖,𝑡−1 + 𝑣𝑖,𝑡𝑘 (4)
Sendo LnRp o logaritmo natural das receitas
próprias reais per capita, LnDt o logaritmo na-
tural das despesas totais reais per capita9,
∆𝐿𝑛𝑅𝑝 e ∆𝐿𝑛𝐷𝑡 as primeiras diferenças daque-
las variáveis, respetivamente, e k a dimensão do
desfasamento. Nestas equações, os coeficientes
estimados das variações desfasadas das variá-
veis independentes representam a relação de
causalidade no curto prazo e os coeficientes dos
termos corretores de erro 휀𝑖,𝑡−1 e 𝑒𝑖,𝑡−1 permi-
tem aferir o ajustamento de ∆𝐿𝑛𝑅𝑝 e de ∆𝐿𝑛𝐷𝑡
para os respetivos equilíbrios de longo prazo.
Os resíduos 𝜂𝑖,𝑡 e 𝑣𝑖,𝑡 são estacionários e os
termos corretores de erro 휀𝑖,𝑡−1 e 𝑒𝑖,𝑡−1 são de-
finidos da seguinte forma:
휀𝑖,𝑡−1 = 𝐿𝑛𝑅𝑝𝑖,𝑡−1 − 𝛽1𝐿𝑛𝐷𝑡𝑖,𝑡−1 − 𝛼1 (5)
𝑒𝑖,𝑡−1 = 𝐿𝑛𝐷𝑡𝑖,𝑡−1 − 𝛽2𝐿𝑛𝑅𝑝𝑖,𝑡−1 − 𝛼2 (6)
Para atingir o equilíbrio de longo prazo no
saldo local, espera-se que os coeficientes esti-
mados dos termos corretores de erro, 𝜆1 e 𝜆2,
sejam negativos. No caso de 𝜆1, se as despesas
no período anterior ultrapassaram o equilíbrio,
isto é, se o saldo local foi deficitário (휀𝑖,𝑡−1 <
9 As variáveis são transformadas nos seus logaritmos naturais
para reduzir a heteroscedasticidade.
0), então a correção do erro implica uma varia-
ção positiva das receitas próprias para atingir o
equilíbrio de longo prazo, logo 𝜆1 < 0. De
modo semelhante, no caso de 𝜆2, se as receitas
no período anterior não permitiram alcançar o
equilíbrio, isto é, se o saldo local foi deficitário
(𝑒𝑖,𝑡−1 > 0), então a correção do erro implica
uma variação negativa das despesas totais para
atingir o equilíbrio de longo prazo, ou seja, a va-
riação do logaritmo das despesas devem respon-
der negativamente a 𝑒𝑖,𝑡−1, logo 𝜆2 < 0.
Quando os coeficientes estimados de 𝜆1 e 𝜆2
são significativos, existe uma relação de cointe-
gração entre as receita próprias e as despesas to-
tais. A significância estatística destes coeficien-
tes permite verificar qual das quatro hipóteses
descreve a relação intertemporal entre receitas
próprias e despesas públicas: se apenas 𝜆2 é
significativo, então verifica-se a hipótese “re-
ceita-despesa”, isto é, as receitas próprias deter-
minam as despesas totais; quando apenas 𝜆1 tem
significância estatística, prevalece a hipótese
“despesa-receita”, primeiro são tomadas as de-
cisões de despesa e posteriormente são feitos
ajustamentos nas receitas próprias; quando os
dois coeficientes estimados 𝜆1 e 𝜆2 são

A Relação Entre as Receitas e as Despesas Públicas nos Municípios Portugueses: 2009-2017
143
significativos, é suportada a hipótese “sincroni-
zação orçamental” dado que ambas as variáveis
puxam o saldo em direção ao equilíbrio; por úl-
timo, se ambos os coeficientes estimados 𝜆1 e
𝜆2 são não significativos, as receitas próprias e
as despesas são determinadas de forma indepen-
dente pelo que se verifica a hipótese “indepen-
dência orçamental”.
Para estimar os modelos VEC apresentados
nas equações (3) e (4), são usados três métodos:
o estimador “mean-group” (MG), o estimador
“pooled mean-group” (PMG) e estimador de
efeitos fixos dinâmico (“dynamic fixed-ef-
fects”, DFE). O estimador MG estima os parâ-
metros como médias das regressões individuais
para cada um dos painéis. Por conseguinte, este
estimador não explora a dimensão cross-section
da amostra. O estimador PMG estabelece como
restrição que o vetor de coeficientes de longo
prazo tem de ser igual entre painéis, mas per-
mite que os coeficientes de ajustamento e os co-
eficientes de curto prazo sejam específicos para
cada painel. Quando aquela restrição não se ve-
rifica, o estimador PMG é inconsistente. Por úl-
timo, o estimador DFE corresponde ao estima-
dor de efeitos fixos dinâmico e, tal como o esti-
mador PMG, estabelece como restrição que o
vetor de coeficientes de longo prazo tem de ser
igual entre painéis, mas adicionalmente também
estabelece que os coeficientes de ajustamento e
os coeficientes de curto prazo têm de ser iguais
entre painéis. Este estimador pode apresentar
um problema de enviesamento resultante da en-
dogeneidade entre o termo de erro e a variável
dependente desfasada.
É de salvaguardar que as estimações em pai-
nel com amostras temporais reduzidas tendem a
utilizar os estimadores DFE, enquanto os outros
dois estimadores, MG e PMG, são usualmente
aplicados a grandes amostras temporais (Black-
burne III e Frank, 2007). Não obstante a dimen-
são temporal reduzida da amostra, neste estudo
optou-se por usar os três estimadores de forma
a confrontar os respetivos resultados, tendo sido
aplicado o teste de Hausman para escolher entre
o modelo MG e PMG e entre o modelo MG e
DFE.
4. RESULTADOS EMPÍRICOS
Para investigar a estacionariedade das recei-
tas próprias e das despesas totais, são usados os
testes de raiz unitária de Breitung, PP-Fisher e
Hadri LM, cujos resultados estão apresentados
no quadro 1. Dada a análise da evolução das va-
riáveis ao longo do tempo, optou-se por incluir
uma tendência temporal em todos os testes.
Quadro 1: Testes de raiz unitária (com tendência temporal)
Testes de raiz unitá-
ria Variável dependente (𝒚𝒊𝒕) LnRp LnDt ΔLnRp ΔLnDt
Teste de Breitung
Ho: Existência de raiz unitária
para todos os painéis (𝛿 = 1);
Ha: Estacionariedade para to-
dos os painéis (𝛿 < 1)
0,299 0,356 1,705 1,039
(0,618) (0,639) (0,956) (0,851)
Teste PP-Fisher (esta-
tística inversa da nor-
mal Z)
Ho: Existência de raiz unitária
para todos os painéis (𝛿𝑖 = 1);
Ha: Estacionariedade para pelo
menos um painel (𝛿𝑖 < 1)
-31,579 -17,960 -53,369 -55,219
(0,000) (0,000) (0,000) (0,000)
Teste Hadri LM
Ho: Estacionariedade para to-
dos os painéis; Ha: Raiz unitá-
ria para pelo menos um painel
5,470 5,960 -4,200 -4,629
(0,000) (0,000) (1,000) (1,000)
Nota: Os números em parêntesis correspondem aos p-values. Nos testes de Breitung e PP-Fisher são incluídos efeitos painel específicos e são
usados 4 e 3 desfasamentos nas variáveis em níveis e nas variáveis em primeiras diferenças, respetivamente. O rácio da variância do teste Hadri
LM é robusto à heteroscedasticidade.
Para as duas variáveis em níveis (expressas
em logaritmos), os resultados do teste de Brei-
tung suportam a existência de raiz unitária para
todos os painéis, dado que a hipótese nula não é
rejeitada. Nos testes PP-Fisher e Hadri LM, as
respetivas hipóteses nulas são rejeitadas, o que
sugere a existência de estacionariedade ou raiz
unitária, respetivamente, em pelo menos um

Revista Portuguesa de Estudos Regionais, nº 56
144
painel. Para as primeiras diferenças das variá-
veis, a não rejeição da hipótese nula do teste de
Breitung sugere que todos os painéis apresen-
tam uma raiz unitária. Sob o teste PP-Fisher, a
hipótese nula de raiz unitária para todos os pai-
néis é rejeitada, pelo que os resultados sugerem
que pelo menos um painel é estacionário. No
teste Hadri LM, a hipótese nula não é rejeitada
pelo que se conclui que todos os painéis são
estacionários. Assim, apesar dos resultados dos
testes de raiz unitária não serem consensuais,
parece adequado concluir que as variáveis em
níveis não são estacionárias.
As estatísticas estimadas dos testes de coin-
tegração de Kao, de Pedroni e de Westerlund,
usados para aferir a cointegração das duas vari-
áveis das finanças locais, são apresentadas no
quadro 2
. Quadro 2: Testes de cointegração
Testes de cointegração Variável dependente (𝒚𝒊𝒕) LnRp LnDt
Variável independente (𝒙𝒊𝒕) LnDt LnRp
Teste de Kao
H0: as séries são não cointegradas; Ha:
as séries são cointegradas em todos os
painéis (com o mesmo vetor de cointe-
gração)
Dickey-Fuller 0,548 -9,969
(0,292) (0,000)
Dickey-Fuller não ajustado -9,339 -22,127
(0,000) (0,000)
Dickey-Fuller modificado 7,092 3,243
(0,000) (0,001)
Dickey-Fuller modificado não ajustado -3,694 -13,424
(0,000) (0,000)
Teste de Pedroni H0: as séries são não cointegradas; Ha:
as séries são cointegradas em todos os
painéis (com vetores de cointegração
específicos)
Phillips-Perron -33,556 -29,708
(0,000) (0,000)
Phillips-Perron modificado 13,900 14,030
(0,000) (0,000)
Teste de Westerlund H0: as séries são não cointegradas; Ha:
as séries são cointegradas em todos os
painéis
Rácio da variância 4,336 4,904
(0,000) (0,000)
Nota: os números em parêntesis correspondem aos p-values. Todos os testes incluem médias de painel específicas. O teste de Pedroni e o Teste
de Westerlund incluem uma tendência temporal.
Todos os testes estatísticos rejeitam a hipó-
tese nula, indicando que as duas variáveis são
cointegradas em todos os painéis, existindo uma
relação de longo prazo entre as receitas próprias
e as despesas totais.
Os resultados empíricos dos modelos vetori-
ais de correção de erros, considerando um des-
fasamento dos coeficientes de curto prazo
(k=1), estão apresentados no quadro 3.10 Nos
testes de Hausman realizados (e apresentados na
última linha do quadro 3), a hipótese nula não é
rejeitada, pelo que o estimador PMG é eficiente
e preferível ao estimador MG e, por outro lado,
o estimador MG também é preterido em favor
do estimador DFE. Relativamente aos coefici-
entes de curto prazo, os estimadores PMG e
DFE são unânimes em reconhecer que a taxa de
crescimento das despesas desfasadas
(∆𝐿𝑛𝐷𝑡𝑖,𝑡−1) influencia de forma positiva e
significativa a taxa de crescimento das receitas
no período corrente (∆𝐿𝑛𝑅𝑝). Com respeito aos
outros coeficientes de curto prazo, os resultados não são robustos entre os dois estimadores, pelo que não existe forte evidência para suportar a hipótese de causalidade de curto prazo entre as receitas próprias (∆𝐿𝑛𝑅𝑝𝑖,𝑡−1) e as despesas to-tais (∆𝐿𝑛𝐷𝑡).
Os coeficientes estimados dos termos corre-tores de erro, 𝜆1 e 𝜆2, apresentam um sinal ne-gativo o que significa que as receitas próprias e as despesas totais se ajustam a desvios entre as duas variáveis e se aproximam do equilíbrio de longo prazo. É, no entanto, de destacar que a di-mensão absoluta dos coeficientes estimados é maior no caso das despesas totais, o que sugere que as despesas totais apresentam uma veloci-dade de ajustamento maior do que as receitas próprias. Este facto é relevante porque a litera-tura sobre consolidação orçamental sugere que processos assentes na redução de despesa são em geral mais bem sucedidos que os processos que privilegiam os aumentos de receita (Comis-são Europeia, 2014).
10 Como explicitado anteriormente, os estimadores MG e PMG
são usualmente aplicados a grandes amostras temporais,
pelo que os respetivos resultados devem ser interpretados
com alguma cautela.

A Relação Entre as Receitas e as Despesas Públicas nos Municípios Portugueses: 2009-2017
145
Quadro 3: Modelos VEC (k = 1)
Variável dependente ∆𝑳𝒏𝑹𝒑 ∆𝑳𝒏𝑫𝒕
Método de estimação MG PMG DFE MG PMG DFE
Coeficien-
tes de
curto
prazo
∆𝐿𝑛𝐷𝑡𝑖,𝑡−1 0,220*** 0,126*** 0,114*** 0,216*** 0,112*** 0,025
(0,000) (0,000) (0,000) (0,000) (0,000) (0,279)
∆𝐿𝑛𝑅𝑝𝑖,𝑡−1 -0,064 -0,012 -0,120*** -0,267** -0,303*** 0,017
(0,259) (0,703) (0,000) (0,018) (0,000) (0,609)
Coeficien-
tes de
longo
prazo
𝐿𝑛𝐷𝑡𝑖,𝑡−1 -4,341 -0,224*** -0,381***
(0,211) (0,000) (0,000)
𝐿𝑛𝑅𝑝𝑖,𝑡−1 -1,443** 0,291*** -0,095* (0,050) (0,000) (0,052)
Termo corretor de erro -0.687*** -0,595*** -0,506*** -1,206*** -0,924*** -0,880***
(0.000) (0,000) (0,000) (0,000) (0,000) (0,000)
Constante 5,377*** 4,321*** 4,222*** 7,823*** 4,659*** 6,381*** (0,000) (0,000) (0,000) (0,000) (0,000) (0,000)
Teste de Hausman 0,620 0,000 1,940 0,000 (0,4312) (0,9858) (0,1637) (0,980)
*** nível de significância de 1%, ** nível de significância de 5% e * nível de significância de 10%.
Nota: os números em parêntesis correspondem aos p-values.
Como os coeficientes estimados dos termos
corretores de erro são significativos nos mode-
los para as duas variáveis orçamentais, existe
uma causalidade bidirecional de longo prazo en-
tre as receitas próprias e as despesas totais. As-
sim sendo, os resultados suportam a hipótese de
sincronização orçamental que estabelece que as
decisões relativas às receitas próprias e despesas
totais são tomadas em simultâneo pelas autori-
dades orçamentais locais.
O quadro A.2 em Apêndice apresenta as es-
timações dos modelos VEC com o estimador
DFE assumindo um e dois desfasamentos, res-
petivamente, dos coeficientes de curto prazo
(k=1 e k = 2). A comparação entre os dois mo-
delos estimados para cada variável orçamental
confirma as duas principais conclusões anteri-
ormente apresentadas: 1) existe forte evidência
a favor da hipótese de causalidade de curto
prazo das despesas totais para as receitas pró-
prias. Os coeficientes da taxa de crescimento
das despesas desfasadas são significativos indi-
vidualmente e conjuntamente na explicação da
taxa de crescimento das receitas no período cor-
rente; e 2) os coeficientes estimados dos termos
corretores de erro são significativos e negativos,
sendo ainda mais evidente que as despesas to-
tais apresentam uma velocidade de ajustamento
maior do que as receitas próprias para alcançar
o equilíbrio de longo prazo.
Por fim, considerou-se adequado avaliar a
sensibilidade dos resultados obtidos à diferente
capacidade dos municípios gerarem receitas
próprias. Para o efeito, foram identificadas duas
subamostras usando como critério a média do
rácio entre as receitas próprias e as receitas to-
tais (0,39). Dos 278 municípios, 119 apresen-
tam um rácio superior à média da amostra total,
enquanto os restantes 159 exibem um rácio in-
ferior. Conforme a análise do quadro A.3 (em
Apêndice) permite aferir, as principais conclu-
sões não se alteram significativamente com a
capacidade dos municípios gerarem receitas
próprias. No curto prazo, a taxa de crescimento
das despesas desfasadas influencia de forma po-
sitiva e significativa a taxa de crescimento das
receitas próprias no período corrente, não sendo
significativa a relação de causalidade de curto
prazo entre as receitas próprias e as despesas to-
tais. Com respeito aos coeficientes estimados
dos termos corretores de erro, 𝜆1 e 𝜆2, são ne-
gativos e significativos, sendo evidente que a
sua dimensão absoluta é superior no caso das
despesas totais e no caso dos municípios com
uma capacidade de geração da receitas próprias
superior à média dos 278 municípios no período
de 2010 a 2017.
5. CONCLUSÃO
Este trabalho empírico investiga a relação
intertemporal entre as receitas próprias e as des-
pesas totais nos municípios portugueses para o
período 2009-2017. A metodologia empírica
utilizada (testes de raiz unitária e de cointegra-
ção e estimação de modelos VEC para dados em

Revista Portuguesa de Estudos Regionais, nº 56
146
painel) permite suportar a hipótese de sincroni-
zação orçamental: as receitas próprias e as des-
pesas totais são decididas em simultâneo pelas
autoridades orçamentais locais, de modo a al-
cançar um saldo orçamental local nulo no longo
prazo. Este facto tem favorecido a melhoria das
contas públicas dos municípios: a situação defi-
citária do saldo orçamental local melhorou con-
sideravelmente no período observado, nomea-
damente entre 2010 e 2016.
Este artigo constitui uma abordagem preli-
minar do estudo da relação intertemporal entre
as receitas e as despesas locais. Futuramente, é
nosso objetivo aprofundar a investigação, no-
meadamente: a) alargando o período objeto de
análise, de modo a reforçar e dar robustez aos
resultados obtidos; b) incluindo as transferên-
cias recebidas pelos municípios do governo cen-
tral como variável de controlo nos modelos
VEC; e c) analisando de forma mais aprofun-
dada as especificidades dos diferentes municí-
pios para, assim, contribuirmos de forma mais
efetiva para o conhecimento e melhoria do pro-
cesso de decisão orçamental.
BIBLIOGRAFIA
Afonso, A.; C. Rault (2009), "Spend-and-
tax: a panel data investigation for the EU", Eco-
nomics Bulletin, 29(4): 2542-2548.
Baghestani H.; R. McNown (1994), “Do
Revenues or Expenditures Respond to Budget-
ary Disequilibria?”, Southern Economic Jour-
nal, 60(2): 311-322.
Baleiras, R. N. (Coord.); Dias, R.; Almeida,
M. (2018), Finanças Locais: Princípios econó-
micos, instituições e a experiência portuguesa
desde 1987, Lisboa, Conselho das Finanças Pú-
blicas.
Banco de Portugal (2011), Tradução do con-
teúdo do Memorando de Entendimento sobre as
Condicionalidades de Política Económica, Lis-
boa, Banco de Portugal, disponível em
https://www.bportugal.pt/sites/default/fi-
les/anexosmou_pt.pdf. Acedido: 6 de janeiro
2020.
Barro, R. (1979), “On the determination of
public debt”, Journal of Political Economy,
87(5), 940-971.
Basílio, M.; Pires, C.; Borralho, C.; Reis,
J.P. (2019), “Local government efficiency: is
there anything new after Troika’s intervention
in Portugal?”, Eurasian Economic Review,
doi:10.1007/s40822-019-00126-0.
Blackburne III, E.F.; M. W. Frank (2007),
“Estimation of nonstationary heterogeneous
panels”, The Stata Journal, 7 (2): 197- 208.
Bolat, S. (2014), “The relationship between
government revenues and expenditures: boot-
strap panel Granger causality analysis on Euro-
pean countries”, The Economic Research
Guardian, 4(2): 58-73.
Breitung, J. (2000), “The local power of
some unit root tests for panel data”, in Baltagi,
B. H., Advances in Econometrics, Volume 15:
Nonstationary Panels, Panel Cointegration, and
Dynamic Panels, Amsterdam, JAI Press, pp.
161–178.
Breitung, J., S. Das (2005), “Panel unit root
tests under cross-sectional dependence”, Statis-
tica Neerlandica, 59: 414–433.
Buchanan J. M.; R. W. Wagner (1977), De-
mocracy in Deficit: The Political Legacy of
Lord Keynes, New York, Academic Press.
Choi, I. (2001), “Unit root tests for panel
data”, Journal of International Money and Fi-
nance, 20: 249–272.
Chowdhury, A. R. (1988), “Expenditures
and receipts in state and local government fi-
nances: Comment”, Public Choice, 59: 277-
285.
Comissão Europeia (2014), “Report on Pub-
lic finances in EMU”, European Economy n. 9,
Brussels.
Correia, L. (2016), “The European Crisis:
Repercussions on the Portuguese Economy,
Athens Journal of Mediterranean Studies, 2(2):
129-144.
Correia, L.; Martins, P. (2019), “The Euro-
pean crisis: Analysis of the macroeconomic im-
balances in the rescued euro area countries”,
Journal of International Studies, 12(2): 22-45.
Costa, H; Veiga, L. G.; Portela, M. (2015),
“Interactions in Local Governments' Spending
Decisions: Evidence from Portugal”, Regional
Studies, 49 (9): 1441-1456.
Dahlberg, M.; E. Johansson (1998), “The
revenues-expenditures nexus: panel data evi-
dence from Swedish municipalities”, Applied
Economics, 30, 1379-1386.

A Relação Entre as Receitas e as Despesas Públicas nos Municípios Portugueses: 2009-2017
147
European Commission (2011), The Eco-
nomic Adjustment Programme for Portugal.
Occasional Papers, 79, disponível em
https://ec.europa.eu/economy_finance/publica-
tions/occasional_pa-
per/2011/pdf/ocp79_en.pdf. Acedido: 6 de ja-
neiro 2020.
Friedman, M. (1978), “The limitations of tax
limitation”, Policy Review, 5 (78), 7-14.
Garcia, M. J. (2012), “The Revenues-Ex-
penditures Nexus: a Panel Data Analysis of
Spain’s Regions”, International Journal of Aca-
demic Research in Economics and Management
Sciences, 1(1): 24-38.
Granger, C. W. J. (1969), “Investigating
causal relations by econometric models and
cross-spectral methods”, Econometrica, 37(3):
424-438.
Hadri, K. (2000), “Testing for stationarity in
heterogeneous panel data”, Econometrics Jour-
nal 3: 148–161.
Ho, Y-H.; C-J. Huang (2009), “Tax-Spend,
Spend-Tax, or Fiscal Synchronization: A Panel
Analysis of the Chinese Provincial Real Data”,
Journal of Economics and Management, 5 (2):
257-272
Holtz-Eakin, D.; W. Newey; H. S. Rosen
(1988). “Estimating vector autoregressions with
panel data”, Econometrica, 56 (6): 1371-95.
Holtz-Eakin, D.; W. Newey; H. S. Rosen
(1989), “The revenues expenditures nexus: evi-
dence from local government data”, Interna-
tional Economic Review, 30 (2): 415-29.
Hoover, K. ; S. Sheffrin (1992), “Causation,
spending, and taxes: sand in the sandbox or the
tax collector forthe welfare state?”, American
Economic Review, 30: 225–48.
Kao, C. (1999), “Spurious regression and re-
sidual-based tests for cointegration in panel
data”, Journal of Econometrics, 90: 1–44.
Kollias, C.; S. Makrydakis (2000), “Tax and
spend or spend and tax? Empirical evidence
from Greece, Spain, Portugal and Ireland”, Ap-
plied Economics, 32: 533-546.
Lei N.º 73/2013, Regime financeiro das au-
tarquias locais e das entidades intermunicipais,
Diário da República, 1.ª série, N.º 169, 3 de se-
tembro de 2013.
Lei N.º 8/2012, Lei dos compromissos e dos
pagamentos em atraso das entidades públicas,
Diário da República, 1.ª série, N.º 37, 21 de fe-
vereiro de 2012.
Marlow, M., L. Manage (1988), “Expendi-
tures and receipts in state and local government
finances: reply”, Public Choice, 59: 287-90.
Marlow, M.; L. Manage (1987), “Expendi-
tures and receipts: testing for causality in state
and local government finances”, Public Choice,
53: 243-55.
Martins, P.; L. Correia (2015), “Determinan-
tes dos Desvios Orçamentais nos Municípios
Portugueses”, Revista Portuguesa de Estudos
Regionais, 39: 41-64.
Meltzer, A.H.; S.F. Richard (1981), “A Ra-
tional Theory of The Size of Government”,
Journal of Political Economy. 89(5): 914-927.
Moisio, A. (2000), “Spend and tax or tax and
spend? Panel data evidence from Finnish mu-
nicipalities during 1985-1999”, VATT Discus-
sion Papers No. 242: 1-24.
Payne, J. E. (1998), “The tax-spend debate:
Time series evidence from state budgets”. Pub-
lic Choice, 95: 307–320.
Payne, J. E. (2003), “A survey of the inter-
national empirical evidence on the tax-spend
debate”, Public Finance Review, 31: 302–24.
Peacock A.T.; J. Wiseman (1979), “Ap-
proaches to the Analysis of Government Ex-
penditure Growth”, Public Finance Quarterly.
7(1): 3-23.
Pedroni, P. (1999), “Critical values for coin-
tegration tests in heterogeneous panels with
multiple regressors”, Oxford Bulletin of Eco-
nomics and Statistics, 61: 653–670.
Pedroni, P. (2004), “Panel cointegration: As-
ymptotic and finite sample properties of pooled
time series tests with an application to the PPP
hypothesis”, Econometric Theory, 20: 597–625.
Rios, M. E.; J. Costa (2005), “O Efeito
Flypaper nas Transferências para os Municípios
Portugueses”, Revista Portuguesa de Estudos
Regionais, 8: 85-108.
Roberts, P. C. (1978), “Idealism in Public
Choice Theory”, Journal of Monetary Econom-
ics, 4(3): 603-615.
Silvestre, A. L. (1997). “The causal relation-
ship between taxes and expenditures in Portu-
gal: cointegration and error-correction models”,
Estudos de Economia, 18(1): 29-46.
Wagner, R.E. (1976), “Revenue Structure,
Fiscal Illusion, and Budgetary Choice”, Public
Choice, 25(1): 45- 61.
Westerlund, J. (2005), “New simple tests for
panel cointegration”, Econometric Reviews, 24:
297–316.
Westerlund, J.; S. Mahdavi; F. Firoozi
(2011), “The Tax-Spending Nexus: Evidence
from A Panel of US State–Local Governments”,
Economic Modelling, 28(3): 885-890.

Revista Portuguesa de Estudos Regionais, nº 56
148
Zapf, M.; J.E. Payne (2009), “Asymmetric
Modeling of the Revenue-Expenditure Nexus:
Evidence from Aggregate State and Local
Government in the US”, Applied Economics
Letters, 16(9): 871-876.

A Relação Entre as Receitas e as Despesas Públicas nos Municípios Portugueses: 2009-2017
149
APÊNDICE
Quadro A.1: Resumo da literatura empírica sobre o debate receita-despesa ao nível subnacional
Autor(es) Amostra Variáveis Metodologia Conclusões
Marlow e
Manage
(1987; 1988)
1952-1982;
dados anuais
agregados;
Estados e go-
vernos locais
dos EUA
Receitas;
despesas
Testes de causalidade
de Granger (1969)
Hipótese receita-despesa ao nível
agregado dos estados americanos; hi-
pótese de independência orçamental
ao nível agregado dos governos lo-
cais americanos
Chowdhury
(1988)
1952-1982;
dados anuais
agregados;
Estados e go-
vernos locais
dos EUA
Receitas;
despesas
Testes de causalidade
de Granger (1969)
Hipótese receita-despesa ao nível
agregado dos estados americanos; hi-
pótese de sincronização orçamental
ao nível agregado dos governos lo-
cais americanos
Holtz-Eakin
et al. (1989)
1972-1980;
dados anuais
em painel;
171 municí-
pios dos EUA
Receitas;
despesas;
transferên-
cias
VAR em painel se-
guindo Holtz-Eakin et
al. (1988)
Hipótese receita-despesa para os mu-
nicípios americanos
Dahlberg e
Johansson
(1998)
1974-1987;
dados anuais
em painel;
265 municí-
pios da Sué-
cia
Receitas;
despesas;
transferên-
cias
VAR em painel se-
guindo Holtz-Heakin et
al. (1988)
Hipótese despesa-receita para os mu-
nicípios suecos
Payne
(1998)
1942-1992;
dados anuais;
48 estados
dos EUA
Receitas;
despesas
Abordagem de cointe-
gração de Engle-Gran-
ger/Modelo VEC
Hipótese receita-despesa para 24 es-
tados; hipótese despesa-receita para
8 estados; hipótese sincronização or-
çamental para 11 estados; hipótese
de independência orçamental para 3
estados; 2 estados não I(1)
Moisio
(2000)
1985-1999;
dados anuais
em painel;
431 munici-
pios da Fin-
lândia
Receitas;
despesas;
transferên-
cias e em-
préstimos
VAR em painel se-
guindo Holtz-Heakin et
al. (1988)
Hipótese despesa-receita no subperí-
odo 1985-1992 e hipótese de sincro-
nização orçamental no subperíodo
1993-1999, para os municípios fin-
landeses
Ho e Huang
(2009)
1999-2005;
dados anuais
em painel; 31
províncias da
China
Receitas;
despesas
Abordagem de cointe-
gração de Pedroni/ Mo-
delo VEC para painel
Hipótese de sincronização orçamen-
tal para as províncias chinesas
Zaphn e
Payne
(2009)
1959-2005;
dados anuais
agregados;
Estados e go-
vernos locais
dos EUA
Receitas;
despesas
Abordagem de cointe-
gração de Engle-Gran-
ger e de Enders e
Siklos/Modelo VEC
Hipótese despesa-receita ao nível
agregado dos estados e dos governos
locais americanos
Westerlund
et al. (2011)
1963-1997;
dados anuais
em painel; 50
estados dos
EUA
Receitas;
despesas;
quatro va-
riáveis de
controlo
Abordagem de cointe-
gração de Westerlund/
Modelo VEC em pai-
nel
Hipótese receita-despesa para os es-
tados americanos
Garcia
(2012)
1987-2003;
dados anuais
em painel; 15
regiões da Es-
panha
Receitas;
despesas;
PIB como
variável de
controlo
Cointegração de Pe-
droni e de Johansen-
Fisher/Modelos VEC
em painel
Hipótese receita-despesa para as re-
giões espanholas

Revista Portuguesa de Estudos Regionais, nº 56
150
Quadro A.2: Modelos VEC (k = 2 e estimador DFE)
Variável dependente ∆𝑳𝒏𝑹𝒑 ∆𝑳𝒏𝑫𝒕
Dimensão do desfasamento k = 1 k = 2 k = 1 k = 2
Coeficientes de curto
prazo
∆𝐿𝑛𝐷𝑡𝑖,𝑡−1 0,114*** 0,158*** 0,025 0,194***
(0,000) (0,000) (0,279) (0,000)
∆𝐿𝑛𝐷𝑡𝑖,𝑡−2 0,095*** 0,140*** (0,001) (0,000)
∆𝐿𝑛𝑅𝑝𝑖,𝑡−1 -0,120*** -0,103** 0,017 -0,003
(0,000) (0,014) (0,609) (0,941)
∆𝐿𝑛𝑅𝑝𝑖,𝑡−2 -0,034 -0,039 (0,252) (0,198)
Coeficientes de longo
prazo
𝐿𝑛𝐷𝑡𝑖,𝑡−1 -0,381*** -0,398***
(0,000) (0,000)
𝐿𝑛𝑅𝑝𝑖,𝑡−1 -0,095* -0,063 (0,052) (0,178)
Termo corretor de erro -0,506*** -0,558*** -0,880*** -1,114***
(0,000) (0,000) (0,000) (0,000)
Constante 4,222*** 4,725*** 6,381*** 7,876***
(0,000) (0,000) (0,000) (0,000)
Significância estatística
conjunta dos coeficientes
de curto prazo
∆𝐿𝑛𝐷𝑡𝑖,𝑡−k 21,600*** 34,060*** (0,000) (0,000)
∆𝐿𝑛𝑅𝑝𝑖,𝑡−k 6,460** 2,060 (0,040) (0,357)
*** nível de significância de 1%, ** nível de significância de 5% e * nível de significância de 10%.
Nota: os números em parêntesis correspondem aos p-values.
Quadro A.3: Modelos VEC (amostra total e subamostras, estimador DFE)
Variável dependente ∆𝑳𝒏𝑹𝒑 ∆𝑳𝒏𝑫𝒕
Amostra Total Maior Menor Total Maior Menor
Coeficien-
tes de
curto
prazo
∆𝐿𝑛𝐷𝑡𝑖,𝑡−1 0,114*** 0,108*** 0,094*** 0,025 0,019 0,046
(0,000) (0,000) (0,001) (0,279) (0,510) (0,196)
∆𝐿𝑛𝑅𝑝𝑖,𝑡−1 -0,120*** 0,006 -0,185*** 0,017 -0,051 0,039
(0,000) (0,915) (0,000) (0,609) (0,530) (0,240)
Coeficien-
tes de
longo
prazo
𝐿𝑛𝐷𝑡𝑖,𝑡−1 -0,381*** -0,336*** -0,326***
(0,000) (0,000) (0,000)
𝐿𝑛𝑅𝑝𝑖,𝑡−1 -0,095* 0,029 -0,127**
(0,052) (0,807) (0,010)
Termo corretor de erro -0.506*** -0,506*** -0,618*** -0,457*** -0,880*** -0,945***
(0.000) (0,000) (0,000) (0,000) (0,000) (0,000)
Constante 4.222*** 4,222*** 4,961*** 3,640*** 6,381*** 5,887*** (0.000) (0,000) (0,000) (0,000) (0,000) (0,000)
*** nível de significância de 1%, ** nível de significância de 5% e * nível de significância de 10%.
Nota: os números em parêntesis correspondem aos p-values.

Artigo submetido a 27 de Setembro de 2019; versão final aceite a 27 de Fevereiro de 2020
Paper submitted on September 27, 2019; final version acceptet on February 27, 2020
Potential Economic Consequences of Migration Arising
From Different Consumption Structures of Nationals and
Immigrants: An Input-Output Approach
Potenciais Consequências Económicas das Migrações Decorrentes
dos Diferentes Padrões de Consumo de Nacionais e Imigrantes:
Uma Abordagem Input-Output
José Carlos Coelho
ISEG, Lisbon School of Economics & Management – Universidade de Lisboa; UECE –
Research Unit on Complexity and Economics
João Carlos Lopes
ISEG, Lisbon School of Economics & Management – Universidade de Lisboa; REM –
Research in Economics and Mathematics; UECE – Research Unit on Complexity and
Economics
Vítor Escária
ISEG, Lisbon School of Economics & Management – Universidade de Lisboa; UECE –
Research Unit on Complexity and Economics; CIRIUS – Research Centre on Regional and
Urban Economics
João Ferreira do Amaral
ISEG, Lisbon School of Economics & Management – Universidade de Lisboa; UECE –
Research Unit on Complexity and Economics
Abstract/ Resumo
Acknowledgments: Financial support by FCT - Fundação para a Ciência e a Tecnologia (Portugal), is gratefully acknowledged. This article
is an output of the project P-RIDE: “Portugal: Integração Regional da Demografia e da Economia” (PTDC/ATP-DEM/0441/2014). We also
thank the editor and two anonymous referees for useful comments and suggestions.
O principal objetivo deste artigo é contribuir
para uma melhor compreensão das potenciais
consequências económicas das migrações asso-
ciadas às diferentes estruturas de consumo. Para
avaliar esta questão, em primeiro lugar, são ob-
tidas as estruturas de consumo de nacionais e es-
trangeiros, usando os dados do Inquérito às Des-
pesas das Famílias (IDEF) 2010/2011. As famí-
lias são classificadas de acordo com a proporção
The main purpose of this paper is to contrib-
ute for a better understanding of the potential
economic consequences of migration that may
arise from different consumption structures. To
address this question, in a first step, the different
consumption patterns of nationals and foreigners
are measured, using data from a Family Income
and Expenditure Survey in Portugal (Inquérito às
Despesas das Famílias, 2010/2011).

Revista Portuguesa de Estudos Regionais, nº 56
152
1. INTRODUCTION
In the recent years, the analysis of migra-
tions has attracted growing interest, especially
due to the increase of migration flows towards
developed countries. Even in Portugal, which is
not a primary destination for these flows, be-
tween 2008 and 2018, the number of permanent
immigrants has grown 45% and the weight of
foreign residents in total residents increased to
4.8% in 2018.
Economic analysis has focused on the study
of the impact of migrations on economic growth
and labour productivity (Felbermayr et al.,
2010; Boubtane et al., 2016) and its effects on
the labour market (Borjas, 2003; Islam and
Kahn, 2015), trade (Artal-Tur et al., 2014), re-
mittances (Akkoyunlu and Siliverstovs, 2014)
and public finances (Rowthorn, 2008; Dust-
mann and Frattini, 2014).
Other potential dimensions of the impact of
migration on the host economy, for example due
to changes in the structure of GDP or of GDP
growth, have not been the object of analysis,
particularly using the Input-Output framework.
Along this line, we only find the study of Arce
and Mahia (2013) that estimates the direct and
indirect effects of migration on Madrid Region
GDP. At the regional level, there is the refer-
ence paper of Sastry (1992) that estimates the
impacts of elderly immigration on output, earn-
ings and employment and using a regional In-
put-Output model quantifies total impacts for
Florida.
In the short run, there are two main eco-
nomic effects resulting from the entry of immi-
grants. The first one is a production or supply
side effect, associated to the value added gener-
ated by migrant employees and the value added
derived from the economic sectors where they
are employed. The second one is a demand side
effect, resulting from the value added generated
by the consumption expenditures of foreign
households. In this paper, we use the Leontief
Input-Output model to assess to what extent this
second effect is relevant, by considering foreign
specific consumption structures.
Greenwood and McDowell (1999) points the
role of immigrants as consumers that affects
positively the aggregate demand. From a theo-
retical point of view, immigrants contribute to
the expansion of the size of the domestic mar-
ket, rise demand for goods and services allow-
ing for economic and aggregate per capita in-
come growth. This work has two main purposes, both ap-
plied to the Portuguese case. The first purpose is to investigate whether foreign families, fami-lies whose members are all-Portuguese and mixed households (which contain at least one foreign element and one national element)
Households are grouped according to the propor-
tion of foreigners and the consumption structures
of these groups are determined and compared.
This information is useful in assessing the differ-
ences in living conditions across national and
migrant families. In a second step, the sectoral
and macroeconomic impacts (in gross output,
value added, GDP, imports and employment) of
these different consumption structures are simu-
lated, using an Input-Output approach, and they
are also regionalized. These results allow us to
project more accurately the potential demand led
effects of a growing immigration flow to Portu-
gal (both of workers and retirees) expected for
the coming years by using foreign specific con-
sumption structures.
Keywords: migration; consumption structures;
Input-Output model; regionalization
JEL codes: C67, D57, E20, R23
e France is the second biggest EMU economy
and, as Finland, is not considered a “peripheral”
country.
Keywords: Markov-Switching models; Active
portfolio management; financial market integra-
tion; EMU stock markets integration
de estrangeiros e as estruturas de consumo de
cada tipo de família são determinadas e compa-
radas. Esta informação é relevante na averigua-
ção da existência de diferentes condições de vida
entre famílias de nacionais e famílias de imi-
grantes. Em segundo lugar, num enquadramento
Input-Output, são simulados os impactos macro-
económicos e sectoriais (produção, valor acres-
centado, PIB, importações e emprego) das dife-
rentes estruturas de consumo, sendo posterior-
mente regionalizados. Estes resultados permitem
projetar com maior precisão os efeitos potenciais
do lado da procura resultantes do aumento do
fluxo de imigração (trabalhadores e reformados)
esperados para os próximos anos usando estrutu-
ras de consumo específicas das famílias estran-
geiras.
Palavras-chave: migrações; estruturas de con-
sumo; modelo Input-Output; regionalização
Códigos JEL: C67, D57, E20, R23
e France is the second biggest EMU economy
and, as Finland, is not considered a “peripheral”
country.
Keywords: Markov-Switching models; Active
portfolio management; financial market integra-
tion; EMU stock markets integration

Potential Economic Consequences of Migration Arising From Different Consumption …
153
exhibit distinct consumption structures. The second purpose is to study the macroeconomic impacts on GDP, imports and employment re-sulting from the existence of different consump-tion structures associated with the types of fam-ilies mentioned, by quantifying and comparing their effects.
The relevance of this study relies in two fun-damental contributions. The first is the charac-terization and comparison of consumption pat-terns associated with the types of families under analysis. The second is the simulation of the macroeconomic effects, including its regionali-zation, resulting from a different composition of the Portuguese population arising from the en-try of immigrants into Portugal.
The methodology used is based on the Leon-tief Input-Output Model and consists in the quantification of the different direct and indirect effects on the gross output, gross value added, GDP, imports and employment generated from an equivalent variation in private consumption of the different types of families, normalized at 100€. NUTS II regional impacts on gross value added and employment are also computed.1
The Leontief model is based on the assump-
tion that the inter-sectoral relations are un-
changed in the short run and therefore it is a use-
ful tool for estimating the current effect on pri-
vate consumption derived by the different con-
sumption structure of the immigrants compared
to the non-foreign residents. As a simplifying
hypothesis, we will assume that the structure of
consumption of potential immigrants is the
same as the foreigners who already live in Por-
tugal. The remainder of this paper is organized as
follows. In the Section 2, we present the data re-garding the regional distribution, average in-comes, expenditures, and saving rates, distribu-tion of income by deciles and consumption structures of families with all Portuguese ele-ments and families with all foreign elements. Section 3 describes the methodology used for determining macroeconomic impacts and its re-gionalization resulting from the existence of dif-ferent consumption structures of two types of families. Section 4 presents the results obtained. Finally, Section 5 concludes.
2. DATA
In order to identify potential differences in patterns of consumption by type of family, we define six types of families, according to the cri-teria of nationality, namely: i) families with all Portuguese elements, ii) families with all for-eign elements, iii) families with a majority of foreign elements, iv) families with at least a for-eign element, v) families with both foreign cou-ple heads, and vi) families with at least one for-eign couple head. The two first types of families are considered as pure families while the other types of families are considered as mixed fami-lies.
Table 1 presents the distribution of families by type considering the data from Inquérito às Despesas das Famílias (IDEF) 2010/2011, whose sample covers 9,489 families and 24,383 individuals.2
Table 1: Number of families by type (survey and total population)
Types of families Nº of families (survey) Nº of families (total population)
Families with all Portuguese elements 9,054 3,812,201
Families with all foreign elements 162 85,956
Families with a majority of foreign elements 290 168,375
Families with at least a foreign element 435 231,899
Families with both foreign couple heads 110 58,454
Families with at least one foreign couple head 357 198,393
Total of families 9,489 4,044,100
Source: Authors´ calculations based on data from IDEF 2010/2011.
1 NUTS: Nomenclatura das Unidades Territoriais para Fins Esta-
tísticos. These are regional divisions in all member states of Eu-
ropean Union and they are used for construction of regional sta-
tistics by Eurostat. In Portugal, NUTS II are: Norte, Centro, Lis-
boa, Alentejo, Algarve, R. A. Açores and R.A. Madeira.
2 IDEF is a household expenditure survey published by the Portu-
guese Statistical Institute (INE) every five years and it is aims to
collect statistical data on the volume and structure of expenditure
and income amounts of household resident in Portugal.

Revista Portuguesa de Estudos Regionais, nº 56
154
Table 1 shows that in the survey there are
9,054 families only composed by individuals
with Portuguese nationality and 162 only com-
posed by foreigners, in a total of 9,216 pure
families. Furthermore, we can conclude that
there are 273 mixed families, which contains
Portuguese and foreign elements. When we
consider the total population, there are
3,812,201 families with all Portuguese ele-
ments, 85,956 with all foreign elements and
145,943 mixed families.
Table 2 shows the regional distribution by
NUTS II of the families with all Portuguese ele-
ments and families with all foreign elements.
The two types of pure families have a different
regional distribution. The Portuguese-only fam-
ilies are relatively well distributed across re-
gions whereas foreign-only families are pre-
dominantly concentrated in the regions of Lis-
boa and Algarve and with little presence in the
regions of R. A. Açores and R. A. Madeira.
Table 2: Regional distribution by NUTS II by types of pure families
NUTS II
Families with all
Portuguese ele-
ments (%)
Families with all
foreign elements
(%)
Norte 21.2 6.8
Centro 16.1 6.8
Lisboa 14.9 26.5
Alentejo 14.8 7.4
Algarve 13.4 48.8
R.A. Açores 8.6 0.0
R.A. Madeira 11.0 3.7
Source: Authors´ calculations
With data from IDEF 2010/2011, we calcu-
late for each type of family the average income
(total and monetary), the average expenditure
(total and monetary) and the average saving rate
(total and monetary). Table 3 presents these val-
ues.
Table 3: Average Incomes, Expenditures and Saving Rates for pure families
Families with all Portuguese ele-
ments
Families with all
foreign elements
Average Total Income (€) 13,876.17 11,425.24
Average Monetary Income
(€) 11,007.87 9,940.88
Average Total Expenditure
(€) 11,888.70 10,173.52
Average Monetary Expendi-
ture (€) 9,020.40 8,689.16
Average Total Saving Rate
(%) 14.3 11.0
Average Monetary Saving
Rate (%) 18.1 12.6
Source: Authors´ calculations.

Potential Economic Consequences of Migration Arising From Different Consumption …
155
Table 3 shows that families with all Portu-
guese elements have average income (total and
monetary), average expenditure (total and mon-
etary) and average saving rate (total and mone-
tary) higher than families with all foreign ele-
ments.
Table 4 presents the distribution of income
of types of pure families by deciles (equivalised
total income). It shows that the all-Portuguese
families have a more equitable distribution of
income, whereas families with all foreign ele-
ments are more concentrated in the lower in-
come deciles.
Table 4: Distribution of income of types of pure families by deciles
Income Deciles
Families with all
Portuguese ele-
ments (%)
Families with all
foreign elements
(%)
Decile 1 9.8 14.8
Decile 2 11.2 13.0
Decile 3 11.1 10.5
Decile 4 10.9 8.6
Decile 5 10.4 15.4
Decile 6 10.4 8.6
Decile 7 10.2 7.4
Decile 8 9.1 6.8
Decile 9 9.2 6.2
Decile 10 7.8 8.6
Source: Authors’ calculations.
To compute the consumption structures of
the different types of families defined, we use
data from IDEF 2010/2011. This survey classi-
fies consumption expenditure on household
goods and services into twelve categories, ac-
cording to the COICOP (Classification of Indi-
vidual Consumption by Purpose). The catego-
ries of consumption are: food and non-alcoholic
beverages; alcoholic beverages, tobacco and
narcotics; clothing and footwear; housing, wa-
ter, electricity, gas and other fuels; furnishings,
household equipment and routine household
maintenance; health; transport; communication;
recreation and culture; education; restaurants
and hotels; and other goods and services.
Table 5 shows the weight of expenditure in
each expenditure category in relation to total ex-
penditure (the consumption structures) and the
differences between those weights for each cat-
egory between the two types of pure families.
Analysing Table 5, we can conclude that the
two types of families have a different consump-
tion behaviour. More specifically, we find that:
i) all-foreign families expends more in restau-
rants and hotels; housing, water, electricity, gas
and other fuels; transport; alcoholic beverages,
tobacco and narcotics; and communication
compared to all-Portuguese families; and ii) all-
Portuguese families expend more in health;
food and non-alcoholic beverages; education
and others goods and services compared to all-
foreign families. Additionally, there are no dif-
ferences between the two types of families in
the consumption of clothing and footwear; fur-
nishings, household equipment and routine
household maintenance; and recreation and cul-
ture.

Revista Portuguesa de Estudos Regionais, nº 56
156
Table 5: Consumption structures by types of pure families and differences
Categories of expenditures
Families with all Portu-
guese elements
(%)
Families with all for-
eign elements
(%)
Differences for-
eigners / Portu-
guese (p.p.)
Food and non-alcoholic bever-
ages 14 12 – 2
Alcoholic beverages, tobacco
and narcotics 2 3 1
Clothing and footwear 3 3 0
Housing, water, electricity, gas
and other fuels 31 33 2
Furnishings, household equip-
ment and routine household
maintenance
4 4 0
Health 6 3 – 3
Transport 14 16 2
Communication 3 4 1
Recreation and culture 5 5 0
Education 2 1 – 1
Restaurants and hotels 9 12 3
Other goods and services 6 5 – 1
Total 100 100
Source: Authors´ calculations.
After having computed the consumption
structures, a bridge matrix (provided by INE)
was used to match the consumption expenditure
classified by COICOP nomenclature with the
private consumption directed to each of the 64
sectors of the Input-Output (IO) table. The IO
tables use a classification of good and services
different from the COICOP nomenclature,
namely the Classification of Products by Activ-
ity (CPA). This exercise allows us to determine
the vertical (sectoral) consumption for each type
of family, used to build six columns of private
consumption.
The IO table used is based in the Matriz de
Produção Nacional (Domestic Flows Table) of
2013, with 64 products/sectors, provided by
INE and calibrated and adjusted for that year.
Employment data referring to 38 sectors and
was also provided by INE.
3. METHODOLOGY
For the determination of macroeconomic im-
pacts from a variation in the consumption of the
different types of families, we use the Leontief
Input-Output Model (see Miller and Blair,
2009, and Amaral and Lopes, 2018). This meth-
odology allows us to quantify the direct and in-
direct effects on gross output (GO), gross value
added (GVA), GDP, imports (Im) and employ-
ment (E) resulting from a variation in (total) pri-
vate consumption (C) of the different types of
families.
If an economy is modelled according to the
Leontief model, the basic equation is:
x=Ax+y (1)
where x is the column vector of gross output
values of the n sectors of the economy; y is the
final demand vector; and A is the (domestic)
technical coefficients matrix.
The solution of this system is:
x´=(I–A)-1y, (2)
where (I – A)-1 is the inverse matrix of output
multipliers, that can be represented by B, whose
generic element, bij, gives the increase of sec-
tor´s i production caused by an additional uni-
tary final demand directed to sector j.
We define that:
ΔGOk is the variation of column vector of
gross output values of the n sectors of the econ-
omy resulting from variation of private con-
sumption of family of type k;
aCk is the vertical coefficient of consumption
directed to the productive sectors of family of
type k;
av is the (line) vector of value added coeffi-
cients of n sectors (avj = GVAj / GOj);

Potential Economic Consequences of Migration Arising From Different Consumption …
157
al is the (line) vector of employment coeffi-
cients of n sectors (alj = Ej / GOj);
i’ is a line vector of 1’s;
atCk is the vertical coefficient of net indirect
taxes on private consumption of family of type
k;
ΔCk is the variation of private consumption
of family of type k;
ΔGVAk is the variation of gross value added re-
sulting from a variation of private consumption
of family of type k;
ΔGDPk is the variation of GDP resulting
from a variation of private consumption of fam-
ily of type k;
ΔTiZk is the variation of net indirect taxes on
private consumption of family of type k;
ΔImpk is the variation of imports resulting
from variation of private consumption of family
of type k
Therefore, we can write:
ΔGOk=Δx=BΔy=BaCkΔCk (3)
ΔGOk=i’BaCkΔCk (4)
ΔGVAk=avΔGOk=avBaCkΔCk (5)
ΔGDPk=ΔGVAk+ΔTiZk (6)
ΔTiZk=atCkΔCk (7)
Using the previous expression, (6) can be re-
written as:
ΔGDPk = ΔGVAk + ΔTiZk = av B aCk ΔCk + atCk ΔCk = [av B aCk + at
Ck] ΔCk (8)
Additionally, we have:
ΔImpk = ΔCk – ΔGDPk = ΔCk – [av B aCk + atCk] ΔCk = [1 – av B aCk – at
Ck] ΔCk (9)
ΔEk = al ΔGOk = al B Δy = al B aCk ΔCk (10)
Additionally, and in order to regionalize the
macroeconomic impacts on GVA and employ-
ment, we use location quotients for these mac-
roeconomic variables based in the weight for
each sector of regional GVA or employment on
national GVA or employment. Therefore, we de-
fine that:
ΔGVAk,s,r=ΔGVAk,s*GVAs,r/GVAs, (11)
with:
ΔGVAk,s,r: variation of GVA of sector s in the
region r resulting from the variation of con-
sumption of families of type k
ΔGVAk,s: variation of GVA of sector s result-
ing from the variation of consumption of fami-
lies of type k
GVAs,r: GVA of sector s in the region r
GVAs: GVA of sector s
and
ΔEk,s,r=ΔEk,s*Es,r/Es, (12)
with:
ΔEk,s,r: variation of employment of sector s
in the region r resulting from the variation of
consumption of families of type k
ΔEk,s: variation of employment of sector s re-
sulting from the variation of consumption of
families of type k
Es,r: employment of sector s in the region r
Es: employment of sector s
For each sector s, we have: r=1R∑ VABs,r /
VABs = 1 and r=1R∑ Es,r / Es = 1.
Finally, for all families of type k and region
r, we can calculate: ΔVABk,r = s=1S∑ ΔVABk,s,r
and ΔEk,r = s=1S∑ ΔEk,s,r.
4. RESULTS
The simulated impacts on gross output (GO),
gross value added (GVA), GDP, imports (Imp)
resulting from the variation of 100€ of the con-
sumption of each type of family are shown in
Table 6. Due to a scale effect, the impacts on
employment (E) results presented in Table 6 are
computed for a variation of one million euros of
consumption of each type of family.

Revista Portuguesa de Estudos Regionais, nº 56
158
Table 6: Simulation of the macroeconomic impacts
Types of families ΔGO ΔGVA ΔGDP ΔImp ΔE
Families with all Portu-
guese elements 115.438 64.599 78.555 21.445 15.371
Families with all foreign
elements 116.359 65.747 78.937 21.063 14.477
Note: Employment is expressed as number of workers.
Source: Authors´ calculations.
The key findings of our study are as follows.
The variation in private consumption of all-for-
eign families results in a greater variation of
GVA and GDP and a smaller variation of im-
ports and employment. Our results also suggest
that the greater the proportion of foreigners in a
household, the greater the variation of GVA and
GDP and the smaller the variation of imports
and employment that is generated by the same
variation of private consumption. These results
means that foreigners tend to consume rela-
tively more goods and services produced/sup-
plied by sectors with higher value added and
lower imported and labour content, relative to
nationals, which points to a positive demand led
macroeconomic effect of a larger proportion of
immigrants in Portugal, for the same size of
population.
Tables 7 and 8 show the regional distribution
by NUTS II by type of pure families of the var-
iation of GVA and employment, respectively.
Analysing these tables, we can conclude, for
both types of families, that the higher regional
impacts on gross value added and employment
are in Lisboa and Norte and the lower regional
impacts are in R. A. Açores and R. A. Madeira.
Table 7: Regional distribution by NUTS II by types of pure families of the variation of GVA
NUTS II
Families with all
Portuguese ele-
ments
Families with all
foreign elements
Norte 16.779 16.637
Centro 9.877 9.756
Lisboa 29.950 31.476
Alentejo 3.801 3.750
Algarve 1.896 1.869
R.A. Açores 0.996 0.988
R.A. Madeira 1.282 1.261
National 64.599
65.747
Source: Authors´ calculations.

Potential Economic Consequences of Migration Arising From Different Consumption …
159
Table 8: Regional distribution by NUTS II by types of pure families of the variation of employment
NUTS II
Families with all
Portuguese ele-
ments
Families with all
foreign elements
Norte 4.356 4.032
Centro 2.787 2.593
Lisboa 5.878 5.664
Alentejo 1.105 1.040
Algarve 0.565 0.520
R.A. Açores 0.302 0.281
R.A. Madeira 0.371 0.341
National 15.371
14.477
Source: Authors´ calculations.
5. CONCLUSIONS
In line with our expectations, the proportion
of each different item in the consumption basket
of all-Portuguese and all-foreign families, that
is, their consumption structures, are different.
All foreign families tend to spend relatively
more in hotels; housing, water, electricity, gas
and other fuels; and transport; and relatively
less in food and non-alcoholic beverages and
health.
All-foreign families are more concentrated
in Lisboa and Algarve and less prevalent in R
A. Açores and R. A. Madeira. They are also
more concentrated in the first deciles of income
distribution. Additionally, all-foreign families
have on average a significantly lower monetary
income, a slightly lower monetary expenditure
and a significantly lower saving rate.
Private consumption of foreign families has
a larger (relative) impact in gross output and
gross value added, and a lower (relative) impact
in imports and employment. This result means
that foreigners tend to consume, compared to
nationals, relatively more goods and services
produced/supplied by sectors with higher na-
tional value added and lower imported and la-
bour content, which points to a positive demand
led macroeconomic effect of a larger proportion
of immigrants in Portugal, for the same size of
population. This demand effect illustrates how,
besides through the extensive margin, the
differential final demand of immigrants contrib-
utes for the expansion of the economy.
Furthermore, the higher regional impacts on
gross value added and employment are in Lis-
boa and Norte and the lower regional impacts
are in R. A. Açores and R. A. Madeira.
In this study, data from IDEF 2010/2011 and
the Matriz de Produção Nacional (Domestic
Flows Table) of 2013 are used. It is possible that
the specific numeric results might have been
different if we had used the latest IDEF
(2015/2016) and more recent Input-Output ta-
bles (2015). However, we believe that main
conclusions would have not changed.
In fact, what we have demonstrated is that
different types of families have different con-
sumption structures and those different con-
sumption structures generate different macroe-
conomic impacts. These conclusions show that
we need to consider the composition of the pop-
ulation and not only its size to estimate macro-
economic impacts and that immigrants, besides
a quantitative effect associated to its number,
also have a quantitative impact associated with
its different patterns of expenditure.
In the next stage of our research, other con-
sequences of migration will also be studied,
namely, among others, supply side effects (la-
bour force, wages and profits, productivity), ef-
fects on government budget and social security
revenues and expenditure, or effects on demo-
graphic trends.

Revista Portuguesa de Estudos Regionais, nº 56
160
REFERENCES
Amaral, J. F. and J. C. Lopes (2018), Análise
Input-Output: Teoria e Aplicações, Almedina,
Coimbra.
Akkoyunlu, S. and B. Siliverstovs (2014),
“The Role of Remittances for Economic
Growth: Evidence for Turkey”, The Socio-Eco-
nomic Impact of Migration Flows, Springer,
2014.
Arce, R. and R. Mahia (2013), “An Estima-
tion of the Economic Impact of Migrant Access
on GDP: the Case of the Madrid Region”, Inter-
national Migration, Vol. 51, Issue 1, pp. 169-
185.
Artal–Tur, A., V. Pallardó–López and F. Re-
quena–Silvente (2014), “Immigrant´s Net-
works, Distance, and Trade Creation Effects:
An Study Employing Province-Level Data for
Italy, Spain and Portugal”, The Socio-Eco-
nomic Impact of Migration Flows, Springer,
2014.
Borjas, G. (2003), “The labour demand
curve is downward sloping: reexamining the
impact of immigration on the labour market”,
Quarterly Journal of Economics, Vol. 118, Is-
sue 4, pp. 1335-1374.
Boubtane, E., J. – C. Dumont and C. Rault
(2016), “Immigration and economic growth in
the OECD countries 1986-2006”, Oxford Eco-
nomic Papers, Vol. 68, Issue 2, pp. 340-360.
Dustmann, C. and T. Frattini (2014), “The
Fiscal Effects of Immigration to the UK”, Eco-
nomic Journal, Vol. 124, Issue 580, pp. F593-
F643.
Felbermayr, G., S. Hiller and D. Sala (2010),
“Does immigration boost per capita income?”,
Economics Letters, Vol. 107, Issue 2, pp. 177-
179.
Greenwood, M. and J. McDowell (1999),
“Legal US Immigration Influences on Gender,
Age, and Skill Composition”, W. E. Upjohn In-
stitute for Employment Research.
Available at: https://research.upjohn.org/
cgi/viewcontent.cgi?article=1064&context=up
_press.
Islam, F. and S. Khan (2015), “The long run
impact of immigration on labor market in an ad-
vanced economy: Evidence from US data”, In-
ternational Journal of Social Economics, Vol.
42, Issue 2, pp. 356-367.
Miller, R. E. and P. D. Blair (2009), “Input-
Output Analysis: Foundations and Analysis”,
Second Edition, Cambridge University Press,
New York.
Rowthorn, R. (2008), “The fiscal impact of
immigration on the advanced economies”, Ox-
ford Review of Economic Policy, Vol. 24, Issue
3, pp. 560-580.
Sastry, M. L. (1992), “Estimating the Eco-
nomic Impacts of Elderly Migration: An Input-
Output Analysis”, Growth and Change, Vol.
23, Issue 1, pp. 54-79.

NORMAS PARA OS ARTIGOS A SUBMETER À REVISTA
PORTUGUESA DE ESTUDOS REGIONAIS
A. Normas respeitantes à aceitação e
avaliação dos artigos
1. Embora a Revista Portuguesa de Estudos
Regionais (RPER) não seja membro do Com-
mittee on Publication Ethics (COPE), a sua
Direção Editorial decidiu declarar a sua adesão
aos princípios do Código de Conduta do CO-
PE, com efeitos a partir de 1 de Janeiro de
2012
(http://publicationethics.org/files/Code%20of
%20conduct%20for%20jounal%20editors4.
pdf).
2. Só serão em princípio aceites para avali-
ação na RPER artigos que nunca tenham sido
publicados em nenhum suporte (outra revista
ou livro, incluindo livros de Atas). Excetua-se
a divulgação anterior em séries do tipo “wor-
king papers” (eletrónicas ou em papel). Outras
exceções pontuais podem ser aceites pela Dire-
ção Editorial, se os direitos de reprodução esti-
verem salvaguardados.
3. Ao enviar uma proposta de artigo para a
Revista, os autores devem renunciar explicita-
mente a submetê-la para publicação a qualquer
outra revista ou livro até à conclusão do pro-
cesso de avaliação. Para o efeito deverão sem-
pre enviar, juntamente com o artigo que sub-
metem, uma declaração assinada neste sentido.
No caso de recusa do artigo pela Direção Edi-
torial, os autores ficarão livres para o publicar
noutra parte.
4. Os artigos submetidos à Direção Editori-
al para publicação serão sempre avaliados
(anonimamente) por dois especialistas na área,
convidados para o efeito pela Direção Editori-
al. Os dois avaliadores farão os comentários
que entenderem ao artigo e classificá-lo-ão de
acordo com critérios definidos pela Direção
Editorial. Os critérios de avaliação procurarão
refletir a originalidade, a consistência, a legibi-
lidade e a correção formal do artigo. No prazo
máximo de 16 semanas após a submissão do
artigo, os seus autores serão contactados pela
Direção Editorial, sendo-lhes comunicado o
resultado da avaliação feita.
O processo de avaliação tem três desenlaces
possíveis:
(1) O artigo é admitido para publicação tal
como está (ou com meras alterações de porme-
nor) e é inserido no plano editorial da revista.
Neste caso, a data previsível de publicação será
de imediato comunicada aos autores.
(2) O artigo é considerado aceitável mas
sob condição de serem efetuadas alterações
significativas na sua forma ou nos seus conte-
údos. Neste caso, os autores disporão de um
máximo de 6 semanas para, se quiserem, pro-
cederem aos ajustamentos propostos e para
voltarem a submeter o artigo, iniciando-se,
após a receção da versão corrigida, um novo
processo de avaliação.
(3) O artigo é recusado.
5. A RPER poderá organizar números espe-
ciais de natureza temática, na sequência de
conferências, workshops ou outros eventos
relevantes na sua área de interesse. Embora
nestes casos o processo de avaliação dos arti-
gos possa ser simplificado, a RPER manterá
ainda assim, escrupulosamente, o princípio de
revisão pelos pares de todos os artigos.
6. Excecionalmente a RPER poderá contu-
do publicar artigos “por convite”, ou seja não
sujeitos ao crivo de revisores. A singularidade
destes artigos será sempre assinalada, de forma
transparente, na sua primeira página.
7. A RPER reconhece o direito dos mem-
bros da sua Direção Editorial (incluindo o seu
Diretor) a submeterem artigos para publicação.
Sempre que um membro da Direção Editorial é
autor ou coautor de um artigo, então é necessa-
riamente excluído do processo de revisão, em
todos os seus passos, incluindo a decisão final.
8. A RPER reconhece o direito de recurso
de qualquer sua decisão relativa à aceitação de
um artigo para publicação. Esse recurso é en-
dereçado ao Diretor que deverá informar toda a
Direção Editorial. Os termos do recurso serão
enviados aos revisores, que terão um prazo
máximo de 30 dias para se pronunciarem em
definitivo. No caso de não haver acordo entre
os dois referees, a Direção Editorial tem obri-
gatoriamente de indicar um terceiro especialis-
ta. Não existe novo recurso, para uma segunda
decisão que decorra deste processo.

Revista Portuguesa de Estudos Regionais, nº 56
162
9. A RPER encoraja a publicação de críticas
relevantes, por outros autores, a artigos publi-
cados nas suas páginas. Os autores criticados
têm sempre a possibilidade de resposta.
10. Os referees estão sujeitos ao dever de
confidencialidade, quer quanto ao conteúdo
dos artigos que apreciam, quer quantos aos
seus próprios comentários, devendo mais em
geral garantir que todo o material que lhes é
submetido é tratado em confiança. Será sempre
enviada aos revisores a informação sobre os
princípios do Código de Conduta referido em
1.
11. Uma vez o artigo aceite, e feito o traba-
lho de formatação gráfica prévio à sua publica-
ção na revista, serão enviadas ao autor as res-
petivas provas tipográficas para revisão. As
eventuais correções que este quiser fazer terão
de ser devolvidas à Direção Editorial no prazo
máximo de 5 dias úteis a contar da data da sua
receção. Só serão aceites correções de forma.
12. Ao autor e a cada um dos coautores de
cada artigo aceite será oferecido um exemplar
do número da Revista em que o artigo foi pu-
blicado.
13. Os originais, depois de formatados de
acordo com as presentes normas, não poderão
exceder as 30 páginas, incluindo a página de
título, a página de resumo, as notas, os qua-
dros, gráficos e mapas e as referências biblio-
gráficas.
14. As propostas de artigo deverão ser en-
viadas por e-mail para [email protected],
ou pelo correio, para o Secretariado da RPER:
APDR - Universidade dos Açores, Rua Capi-
tão João d’Ávila 9700-042 Angra do Heroísmo
– PORTUGAL. Para comunicação posterior o
contacto com o Secretariado far-se-á pelo:
e-mail: [email protected].
B. Normas respeitantes à estrutura dos
artigos
1. Os autores deverão enviar o artigo com-
pleto (conforme os pontos seguintes), por
e-mail ou em CD-rom, para o os contactos
referidos no ponto 14 das Normas A.
2. Os textos deverão ser processados em
Microsoft Word for Windows (versão 97 ou
posterior). O texto deverá ser integralmente a
preto e branco.
3. Na publicação os gráficos, mapas, dia-
gramas, etc. serão designados por “figuras” e
as tabelas por “quadros”.
4. As eventuais figuras e quadros deverão
ser disponibilizados de duas formas distintas:
por um lado devem ser colocados no texto,
com o aspeto pretendido pelos autores. Para
além disso, deverão ser disponibilizados em
ficheiros separados: os quadros, tabelas e grá-
ficos serão entregues em Microsoft Excel for
Windows, versão 97 ou posterior (no caso dos
gráficos deverá ser enviado tanto o gráfico
final como toda a série de dados que lhe está
na origem, de preferência no mesmo ficheiro e
um por worksheet); para os mapas deverá usar-
se um formato vetorial em Corel Draw (versão
9 ou posterior).
5. As expressões matemáticas deverão ser
tão simples quanto possível. Serão apresenta-
das numa linha (entre duas marcas de parágra-
fo) e numeradas sequencialmente na margem
direita com numeração entre parêntesis curvos.
A aplicação para a construção das expressões
deverá ser ou o Equation Editor (Microsoft) ou
o MathType.
6. Salvo casos excecionais, que exigem jus-
tificação adequada a submeter à Direção Edito-
rial, o número máximo de coautores das pro-
postas de artigo é quatro. Só deverão ser con-
siderados autores os que contribuíram direta e
efetivamente para a pesquisa refletida no traba-
lho.
7. O texto deve ser processado em página
A4, com utilização do tipo de letra Times New
Roman 12, a um espaço e meio, com um espa-
ço após parágrafo de 6 pt. As margens superi-
or, inferior, esquerda e direita devem ter 2,5
cm.
8. A primeira página conterá exclusivamen-
te o título do artigo, em português e em inglês,
bem como o nome, morada, telefone, fax e
e-mail do autor, com indicação das funções
exercidas e da instituição a que pertence. No
caso de vários autores deverá aí indicar-se qual
o contacto para toda a correspondência da Re-
vista. Deve ser também incluída na primeira
página uma nota sobre as instituições financia-
doras da investigação que conduziu ao artigo.
Este nota é obrigatória quando pertinente.
9. A segunda página conterá unicamente o
título e dois resumos do artigo, um em portu-
guês e outro inglês, com um máximo de 800
caracteres cada, seguidos de um parágrafo com

Normas para os artigos a submeter à Revista Portuguesa de Estudos Regionais
163
indicação, em português e inglês, de palavras-
chave até ao limite de 5, e ainda 2 a 5 códigos
do Journal of Economic Literature (JEL) apro-
priados à temática do artigo, a 3 dígitos, como
por exemplo R11. Os títulos, os resumos, as
palavras-chave e os códigos JEL são obrigató-
rios.
10. Na terceira página começará o texto do
artigo, sendo as suas eventuais secções ou ca-
pítulos numerados sequencialmente utilizando
apenas algarismos (não deverão utilizar-se nem
letras nem numeração romana).
11. Cada uma das figuras e quadros deverá
conter uma indicação clara da fonte e ser, tanto
quanto possível, compreensível sem ser neces-
sário recorrer ao texto. Todos deverão ter um
título e, se aplicável, uma legenda descritiva.
12. A forma final das figuras e quadros será
da responsabilidade da Direção Editorial que
procederá, sempre que necessário, aos ajusta-
mentos necessários.
C. Normas respeitantes às referências
bibliográficas
1. A “Bibliografia” a apresentar no final de
cada artigo deverá conter exclusivamente as
citações e referências bibliográficas efetiva-
mente feitas no texto.
2. Para garantir o anonimato dos artigos, o
número máximo de citações de obras do autor
do artigo (ou de cada um dos seus coautores) é
três e não são permitidas expressões que pos-
sam denunciar a autoria tais como, por exem-
plo, “conforme afirmámos em trabalhos anteri-
ores (cfr. Silva (1998:3))”.
3. O estrito cumprimento das normas à fren-
te só é obrigatório na versão final dos artigos,
após aceitação. Ainda assim, recomenda-se
fortemente a sua adoção em todas as versões
submetidas.
4. Os autores citados ao longo do texto se-
rão indicados pelo apelido seguido, entre pa-
rêntesis
curvos, do ano da publicação, de “:” e da(s)
página(s) em que se encontra a citação. Por
exemplo: ao citar-se “Silva (2003: 390-93)”:
está-se a referir a obra escrita em 2003 pelo
autor “Silva”, nas páginas 390 a 393. Deverá
usar-se “Silva (2003: 390-93)” e não “SILVA
(2003: 390-93)”. No caso de uma mera refe-
renciação do autor bastará indicar “Silva
(2003)”.
5. No caso de o mesmo autor ter mais de
um trabalho do mesmo ano citado no artigo,
indicar-se-á a ordem da citação, por exemplo:
Silva (2003a: 240) e Silva (2003b: 232).
6. As referências bibliográficas serão lista-
das por ordem alfabética dos apelidos dos res-
petivos autores no fim do manuscrito. O nome
será seguido do ano da obra entre parêntesis, e
da descrição conforme com a seguinte regra
geral:
Monografias: Silva, Hermenegildo (2007a),
A Teoria dos Legumes, Coimbra, Editora Agrí-
cola
Coletâneas: Sousa, João (2002), “Herbici-
das e estrumes” in Cunha, Maria (coord.), Teo-
ria e Prática Hortícola, Lisboa, Quintal Edito-
ra, pp. 222-244
Artigos de Revista: Martins, Vicente
(2009), “Leguminosas Gostosas”, Revista
Agrícola, Vol. 32, nº 3, pp. 234-275
7. A forma final das referências biblio-
gráficas será da responsabilidade da Dire-
ção Editorial que procederá, sempre que ne-
cessário, aos ajustamentos necessários.

Revista Portuguesa de Estudos Regionais, nº 56
164
NORMS FOR THE SUBMISSION OF PAPERS TO THE
PORTUGUESE REVIEW OF REGIONAL STUDIES
A. Norms concerning papers submission
and evaluation
1. Although the Portuguese Review of Re-
gional Studies (RPER) is not a member of the
Committee on Publication Ethics (COPE), its
Editorial Board decided to adhere to the prin-
ciples of the COPE Code of Conduct, from Ja-
nuary 1st 2012 onwards:
(http://publicationethics.org/files/Code%20of
%20conduct%20for%20journal%20editors4.
pdf).
2. In principle, only papers that have never
been published (in another journal or book,
including conference Proceedings) can be con-
si-dered for publication in RPER. The previous
publication in a series of “working papers”
(electronic or paper format) is an exception to
this rule. The Editorial Board may agree with
other sporadic exceptions, when copyrights are
secured.
3. When a paper is submitted to RPER, au-
thors must explicitly state that it will not be
submitted for publication in any other journal
or book until the reviewing process is complet-
ed. For this purpose, a signed declaration must
be sent along with the paper. If the paper is
rejected by the Editorial Board, the authors are
free to publish it anywhere else.
4. Papers submitted for publication will al-
ways be reviewed (anonymously) by two ex-
perts in the area, invited by the Editorial
Board. Both referees will offer their comments
and classify it in accordance with the criteria
defined by the Editorial Board. The reviewing
criteria include originality, consistency, reada-
bility and the paper’s formal correction. The
authors will be informed by the Editorial
Board of the results of the evaluation within 16
weeks of its receipt. The assessment has three
possible outcomes:
(1) The paper is accepted for publication
just as it is (or with minor changes) and it is
included in the editorial plan. In this case, the
authors are immediately informed of the ex-
pected publication date.
(2) The paper is considered acceptable pro-
vided that major changes are made to its form
or contents. In this case, authors will have a
maximum of six weeks to make such changes
and to submit the paper again. Once the re-
vised version is received, a new assessment
process starts.
(3) The paper is refused.
5. RPER may organize special issues on
specific themes, following conferences, work-
shops, or other events relevant in its area of
interest. Although, in these cases, a simplifying
shorter reviewing process may be adopted, the
principle of peer-review selection will always
be preserved.
6. Exceptionally, RPER may publish arti-
cles “by invitation”, meaning that they are not
subject to the reviewing process. These out-
standing articles, however, are always clearly
signaled as such in their front page.
7. RPER acknowledges the right of the
members of its Editorial Board (including its
Director) to submit papers to the journal. When
an author or co-author is also a member of the
Editorial Board, he/she is excluded from the
reviewing process in all its stages, including
the final decision.
8. RPER acknowledges the authors’ right of
appeal on any publishing decision of the Edito-
rial Board. That appeal is made to the Director
of RPER that will inform the Editorial Board.
The new arguments will be sent to the review-
ers, asking for a final judgment within a 30-
day term. In case of disagreement between the
two referees, the Editorial Board is compelled
to appoint a third reviewer. There is no further
appeal for a second decision ensuing this pro-
cess.
9. RPER positively welcomes cogent criti-
cism on the works it publishes. Authors of
criticized material will have the opportunity to
res-pond.
10. Reviewers are required to preserve the
confidentiality on the contents of the papers
and on their comments, and requested, more
gene-rally, to handle all the submitted material
in confidence. Proper information on the prin-
ciples of the Code of Conduct referred in 1.
will always be provided to the reviewers.
11. Once the paper has been accepted and
formatted for publishing, it will be sent to the

Norms for the submission of papers to the Portuguese Review of Regional Studies
165
author for graphics checking and revision. Any
corrections the author might want to make
must be sent to RPER within five days. Only
formal corrections will be accepted.
12. Each author and co-author of accepted
papers will be offered a number of the pub-
lished issue
13. Articles cannot exceed 30 pages after
being formatted according to the present
norms, including the title page, the summary
page, notes, tables, graphics, maps and refer-
ences.
14. Papers must be sent, by e-mail to
[email protected] or by normal mail, to
the Secretariat of RPER: APDR - Universidade
dos Açores, Rua Capitão João d’Ávila, 9700-
042 Angra do Heroísmo – PORTUGAL. For
future contact please use the e-mail address:
B. Norms concerning papers
structure
1. The authors must send a complete ver-
sion of the paper by e-mail or on a CD-Rom by
mail, in the original Microsoft Word file, to the
contacts specified in point 14 of Norms (A).
2. Texts must be processed in Microsoft
Word for Windows (97 or later version). All
written text must be black.
3. Graphics, maps, diagrams, etc. shall be
referred to as “Figures” and tables shall be
referred to as “Tables”.
4. Figures and Tables must be delivered in
two different forms: inserted in the text, accor-
ding to the author’s choice, and in a separate
file. Tables and graphics must be delivered in
Microsoft Excel for Windows 97 or later.
Graphics must be sent in both the final form
and accompanied by the original data, prefera-
bly in the same file (each graphic in a different
worksheet). Maps must be sent in a vector
format, like Corel Draw or Windows Metafile
Applications.
5. Mathematical expressions must be as
simple as possible. They will be presented on
one line (between two paragraph marks) and
numbered sequentially at the right margin,
with numeration inside round brackets. Equa-
tion Editor (Microsoft) or Math Type are the
accepted Applications for original format files.
6. The paper must have no more than four
co-authors. Exceptions may be accepted when
a reasonable explanation is presented to the
Editorial Board. Authorship must be limited to
actual and direct contributors to the conducted
research.
7. Text must be processed in A4 format,
Times New Roman font, size 12, line space 1.5
and 6 pt space between paragraphs. The upper,
lower, left and right margins must be set to 2.5
cm.
8. The first page shall contain only the pa-
per’s title, the author’s name, address, phone
and fax numbers and e-mail, and the author’s
affiliation. In the case of several authors,
please indicate the contact person for corre-
spondence. A remark on funding institutions of
the research or related work leading to the
article – that is compulsory when it applies –
must be placed as well in this first page.
9. Second page shall contain the title and
the abstract of the paper, in English and, if
possible, in Portuguese as well, with no more
than 800 characters, followed by two lines, one
with the keywords to a limit of 5, and the other
with the proper Journal of Economic Literature
(JEL) codes describing the paper. JEL codes
must be from 2 up to 5, with three digits, as for
example R11. The title, the abstract, the key-
words and the JEL codes area all compulsory,
at least in English.
10. Text starts on the third page. Sections or
chapters are numbered sequentially using Ara-
bic numbers only (letters or Roman numeration
must not be used).
11. Figures and Tables must contain a clear
source reference. These shall be as clear as
possible. Each must have a title and, if appli-
cable, a legend.
12. The final format of Figures and Tables
will be of the responsibility of the Editorial
Board, who will allow some adjustments,
whenever necessary.
C. Norms concerning bibliographic
references
1. The references listed at the end of each
paper shall only contain citations and refer-
ences actually mentioned in the text.
2. To ensure the anonymity of papers, each
author’s self references are limited to three and
no expressions that might betray the authorship
are allowed (for example, “as we affirmed in
previous works (cfr. Silva (1998:3)”).

Revista Portuguesa de Estudos Regionais, nº 56
166
3. Although their meeting in preliminary
versions is recommendable, the bibliographic
norms below are mandatory for the final (ac-
cepted) version only.
4. Authors cited in the text must be indicat-
ed by his/her surname followed, within round
brackets, by year of publication, by “:” and by
the relevant page number(s). For example, the
citation “Silva (2003: 390-93)”, refers to the
work written in 2003 by the author Silva, on
pages 390 to 393. If the author is merely men-
tioned, indication of “Silva (2003)” is suffi-
cient.
5. In case an author has more than one work
from the same year cited in the paper, citation
must be ordered. For example: Silva (2003a:
240) and Silva (2003b: 232).
6. References must be listed alphabetically
by authors’ surnames, at the end of the manus-
cript. The name will be followed by year of pu-
blication inside round brackets and the descrip-
tion, thus:
Monographs: Silva, Hermenegildo (2007a),
The Vegetables Theory, Cambridge, Agricul-
ture Press
Collection: Sousa, João (2002), “Weed Ki-
llers and Manure” in Cunha, Maria (coord.),
Farming - Theories and Practices, London,
Grassland Publishing Company, pp. 222-244
Journal Papers: Martins, Vicente (2009),
Tasty Broccoli, Farmer Review, Vol. 32, nº 3,
pp. 234-275
7. The final format of the references will be
the responsibility of the Editorial Board, who
will allow adjustments whenever necessary


INDICE
7 The Ruin Problem: Negotiating Cultural Heritage in MacauMarta Wieczorek, Ph. D.
19 Qualidade em Turismo na Perspetiva dos Decisores Públicos Locais Portugueses: O Caso da Região Centro de Portugal
Maria do Rosário Campos Mira, Lisete dos Santos Mónico, Zélia Maria de Jesus Breda,Andreia Filipa Antunes Moura
43 Socioeconomic Determinants of Pilgrimages: A Var Approach to Portuguese Case of FatimaMatheus Belucio, Glauber Eduardo De Oliveira Santos, Marco Daniel DuarteJosé Alberto Fuinhas, Carlos Vieira
65 O Turismo no Douro: Notas Bibliométricas Sobre a Literatura Cientí�caNuno André Pinto de Sousa , Maria Teresa Manfredo
85 Caracterização e Análise do Potencial de Desenvolvimento do Turismo Cultural Literário em CoimbraSílvia Quinteiro, Alexandra Rodrigues Gonçalves, Vivina Carreira
101 A Percepção e Atitude na Hotelaria Face ao Mercado LGBT: O Caso do Norte de PortugalSónia de Sousa e Silva, Laurentina Vareiro
113 Labour Content of International Trade in Intermediates: The Case of PortugalEnrique Martínez-Galán, Maria Paula Fontoura
151 Potential Economic Consequences of Migration Arising From Di�erent Consumption Structures of Nationals and Immigrants: An Input-Output Approach
José Carlos Coelho, João Carlos Lopes,Vítor Escária, João Ferreira do Amaral
135 A Relação Entre as Receitas e as Despesas Públicas nos Municípios Portugueses: 2009-2017Leonida CorreiaPatrícia Martins
REVISTA PORTUGUESA DE ESTUDOS REGIONAISPORTUGUESE REVIEW OF REGIONAL STUDIES
3º Quadrimestre | nº 56 | Avulso €15