Auckland Regional Economic Development Strategy Skills Assessment Project
Upload
khangminh22Category
view
0download
0

Edited by
Saman Kelegama
Ratnakar Adhikari
Puspa Sharma
Paras Kharel
Challenges for South Asia during turbulent times
Regional Economic
Integration

Published by : South Asia Watch on Trade, Economics and Environment (SAWTEE), Kathmandu; and South Asia Centre for Policy Studies (SA-CEPS), Kathmandu
Copyright © : 2012, SAWTEE and SACEPS This publication may be reproduced in whole
or in part and in any form for education or non-profi t use, without special permission from the copyright holder, provided acknowl-edgement of the source is made. The publisher would appreciate receiving a copy of any publication which uses this publication as a source.
No use of this publication may be made for resale or other commercial purposes without prior written permission of the publisher.
First Published : 2012ISBN : 978-9937-8504-2-1Cover Design : Abin ShresthaLayout : Bipendra Ghimire, Effect, KathmanduCover Photo : Bjorn Burton (from www.fl ickr.com)Printed at : Jagadamba Press, LalitpurAvailable from : South Asia Watch on Trade, Economics and Environment (SAWTEE) P.O. Box: 19366, Tukucha Marg, Baluwatar, Kathmandu, Nepal Tel: +977-1-4424360/4444438 Fax: +977-1-4444570 E-mail: [email protected] Web: www.sawtee.org
Views expressed in this volume are those of the authors, and do not necessarily refl ect the views of SAWTEE and its member institutions, SACEPS and the organizations the authors are affi liated with.

Motivated by the need for a sustainable platform for the exchange of knowledge, experiences and ideas among stakeholders to make the re-gional integration process in South Asia deliver substantial results on the ground, a group of think tanks in South Asia came together to orga-nize the 1st South Asia Economic Summit (SAES) in 2008. Giving conti-nuity to the forum, the 3rd SAES was held on 17–19 December 2010 in Kathmandu. The core theme of the 3rd SAES was “Regional economic integration, climate change and food security agenda for the Decade 2011–2020”. It was organized by South Asia Watch on Trade, Economics and Environment (SAWTEE) and South Asia Centre for Policy Studies (SACEPS) in partnership with the Asian Development Bank, the Com-monwealth Secretariat, Oxfam Novib, the United Nations Development Programme and the United Nations Economic and Social Commission for Asia and the Pacifi c, and in collaboration with Centre for Policy Dia-logue, Dhaka; Institute of Policy Studies of Sri Lanka, Colombo; and Re-search and Information System for Developing Countries, New Delhi.
The Summit covered a wide range of trade, socio-economic and cli-mate change issues that are critical to enhancing and deepening region-al cooperation in South Asia, including emerging economic outlook and policy challenges for South Asian economies; enhancing merchandise trade in South Asia; regional cooperation on climate change; services trade liberalization in South Asia; trade and climate change issues for South Asia; South Asian action plan on energy cooperation; food securi-ty agenda for South Asia; integration issues for South Asian least-devel-oped countries; trade facilitation and integration in South Asia; labour migration issues for South Asia; and role of people’s representatives, the private sector and other civil society actors and agencies in strengthen-ing regional cooperation. It was participated by policymakers, represen-tatives of governments, political parties, the business community, inter-national and intergovernmental organizations, development partners, civil society, academia and the media from all member countries of the South Asian Association for Regional Cooperation (SAARC).
This book is an outcome of the papers presented and the delibera-tions in the 3rd SAES. Due to various unforeseen glitches, the volume could not be published soon after the Summit as scheduled. However, we believe that the ideas generated in the Summit, which had the par-ticipation of a cross-section of stakeholders, have much to inform the re-
Foreword

iv
gional integration process in South Asia. While readers may fi nd some of the facts and fi gures slightly dated because the articles were written in late 2010 or early 2011 and may also note that some important de-velopments in the region have overtaken some of the points made in a few of them, we feel that the central ideas and arguments continue to remain relevant. Hence we have come up with this publication for wider dissemination of those ideas and arguments. Marking the silver jubilee of SAARC, the 16th SAARC Summit held in Thimphu, Bhutan in April 2010 saw leaders of the region acknowledging that progress had been extremely slow in almost all areas of regional cooperation in the 25 years of the body’s existence. They pledged to make SAARC “truly action oriented”. We hope that this volume will contribute towards that end.
We would like to express our sincere gratitude to all the partners for generously sponsoring the 3rd SAES. Thanks are also due to the col-laborators for their continuous support. We would like to thank the in-dividual authors and the editors for their contributions to the volume, and to all the participants of the 3rd SAES for making it a success.
Posh Raj Pandey, Ph.D. Executive ChairmanSAWTEE

Contents
Chapter 1Introduction 1Saman Kelegama, Ratnakar Adhikari, Puspa Sharma and Paras Kharel
PART 1: MACRO PERSPECTIVE
Chapter 2Changing face: The trials and fortunes of regional cooperation in South Asia 19Saman Kelegama
PART 2: MERCHANDISE AND SERVICES TRADE
Chapter 3Pruning India’s sensitive lists under SAFTA 39Nisha Taneja, Saon Ray, Neetika Kaushal and Devjit Roy Chowdhury
Chapter 4Non-tariff barriers in South Asia: Nature, implications and measures to address the challenges 55Mustafi zur Rahman
Chapter 5Services trade in South Asia: Contours of liberalization and modalities in SAFTA 87Rajan Sudesh Ratna
PART 3: REGIONAL CONNECTIVITY AND TRADE FACILITATION
Chapter 6Air services liberalization in South Asia 103Anushka Wijesinha
Foreword iiiList of tables viiList of fi gures ixList of boxes xiList of maps xiiiAbbreviations and acronyms xv
Chapter 7Improving transport connectivity in South Asia 127M. Rahmatullah
Chapter 8Role of government regulations in trade facilitation: Case of Nepal 143Pushpa Raj Rajkarnikar
PART 4: DEVELOPMENT ISSUES
Chapter 9The fi nancial crisis in the Gulf and its impact on South Asian migration and remittances 171S. Irudaya Rajan and D. Narayana
Chapter 10LDC Integration Fund in South Asia 187Ratnakar Adhikari
PART 5: DRIVERS OF REGIONAL COOPERATION
Chapter 11Roles of peoples’ representatives and non-state actors in strengthening regional cooperation 205Nihal Rodrigo
Chapter 12Private sector in South Asia: Stumbling blocks or building blocks to regional integration? 213Anura Ekanayake
PART 6: CLIMATE CHANGE AND REGIONAL COOPERATION
Chapter 13Trade and climate change: South Asian agenda at the UNFCCC and the WTO 227Nitya Nanda
Chapter 14WTO negotiations on environmental goods and services: South Asia’s interests 253Fahmida Khatun
About the authors and editors 269
vi

List of tables
Table 3.1: HS classifi cation of items in the NLDC sensitive list 42Table 3.2: Items in the sensitive lists 43Table 3.3: Items sensitive to food security 45Table 3.4: Cigarette, tobacco and alcohol 46Table 3.5: List of 22 items reserved for exclusive manufacturing by the small-scale sector 47Table 3.6: Elimination summary and pruned sensitive lists 51Table 3.7: Sector-wise distribution of items in pruned sensitive list 52Table 3.8: Recommended sensitive list 52
Table 4.1: Tariff liberalization programme (TLP) under SAFTA 57Table 4.2: Sensitive lists of SAFTA countries 57Table 4.3: Intra-SAARC trade as percentage of global trade of SAARC countries 58Table 4.4: NTBs reported in ASEAN (as of 2007) 62Table 4.5: Most prevalent NTBs in ASEAN 62Table 4.6: Percentage share of NTBs in all NTBs by SAARC countries 64Table 4.7: NTB-related notifi cations submitted to the Committee of Experts: Complaints and responses 74
Table 6.1: Features of ASAs that restrict air services 109Table 6.2: Air services liberalization indices of South Asian BASAs 111Table 6.3: Weighted Air Services Liberalization Index (WALI) of high-traffi c BASAs 111Table 6.4: ASAs between South Asian and select extra-regional countries 112Table 6.5: Connectivity in South Asia (fl ights per week) 113Table 6.6: Investment in air transport: Developing-country rates of return 119
Table 7.1: The 13 routes analysed by SRMTS 136Table 7.2: Details of the various routes considered by the sub-committee 137

Table 8.1: Doing business in South Asia (rank out of 183 countries) 156Table 8.2: State of trade facilitation in Nepal 160
Table 9.1: Growth of population and GDP in GCC countries 175Table 9.2: Profi le of expatriates in the Gulf, 2009 175Table 9.3: Share of employment (%) across economic activities in GCC countries, 2007 176Table 9.4: Projects affected by the crisis in the GCC 177Table 9.5: Projects affected by sub-sectors, UAE 177Table 9.6: Government expenditure in GCC countries, 2006–2011 (% of GDP) 178Table 9.7: Number of return emigrants in Kerala due to recession in 2009 179Table 9.8: Estimates of return emigrants in South Asia from the Gulf due to fi nancial crisis, 2009 179Table 9.9: Average cost of emigration for different migration corridors from Kerala, 2008 180Table 9.10: Channels of migration by emigrants, 2007 181Table 9.11. Estimates of emigrants who lost their jobs in the Gulf but have not returned, 2009 181Table 9.12: Outfl ow of migrant workers from South Asia to the Gulf, 2005–2009 182Table 9.13: Inward remittances to South Asian countries from migrant workers, 2000–2009 (US$ million) 183
Table 10.1: Regional trade balance of South Asian countries, 2000 and 2008 (US$ million) 191Table 10.2: Select competitiveness rankings and indices, 2010–2011 194Table 10.3: Trading-across-borders indicators for South Asian countries, 2010 195
Table 14.1: Total export and import of EGs (US$ million) 258Table 14.2: South Asia’s EG trade by broad product category, 2007 (US$ million) 259Table 14.3: Tariffs on top fi ve EG imports of South Asian countries, 2007 260
viii

List of fi gures
Figure 5.1: Contribution of agriculture, industry and services to GDP in South Asian countries 91
Figure 6.1: Impact chain of aviation liberalization 106Figure 6.2: Air connectivity in South Asia 113
Figure 8.1: Major problems of trade facilitation in South Asia 161Figure 8.2: Step-by-step approach to developing an electronic single window and paperless trade environment 163
Figure 10.1: Dependence of South Asian countries on regional trade (as % of their global trade), 2008 189Figure 10.2a: LDCs’ dependence on India and Pakistan for their regional exports (percentage), 2008 190Figure 10.2b: LDCs’ dependence on India and Pakistan for their regional imports (percentage), 2008 190Figure 10.3: Share of intra-regional exports of South Asian countries, 2000–2008 191

.

List of boxes
Box 5.1: The four modes of supply of services 89
Box 6.1: Air freedom rights 110
Box 13.1: India’s and China’s proposed texts on unilateral trade measures 233Box 13.2: The shrimp-turtle case 236Box 13.3: A case of border tax adjustment at the WTO 238Box 13.4: Compulsory licensing and the WTO 242Box 13.5: Carbon standards and the WTO 246

.

List of maps
Map 7.1: Asian Highway 129Map 7.2: Trans-Asian Railway 129Map 7.3: Rohanpur−Katihar−Birgunj rail link 134Map 7.4: Rail link between Northeast India and Bangladesh 134

.

ACV Agreement on Customs ValuationADB Asian Development BankAFTA ASEAN Free Trade AreaAH Asian HighwayALI Air Services Liberalization IndexAPEC Asia-Pacifi c Economic CooperationASA Air Services AgreementASEAN Association of Southeast Asian NationsASYCUDA Automated System for Customs DataAWG-LCA Ad Hoc Working Group on Long-Term Cooperative
ActionBASA Bilateral Air Services AgreementBFTA Bilateral free trade agreementBIS Bureau of Indian StandardsCASAC Coalition for Action on South Asian CooperationCBDR Common but differentiated responsibilitiesCBEC Central Board of Excise and CustomsCCC Ceylon Chamber of CommerceCDS Centre for Development StudiesCEPA Comprehensive Economic Partnership AgreementCFL Compact fl uorescent lightCoE Committee of ExpertsCOP Conference of PartiesCPC Central Product Classifi cationCPD Centre for Policy DialogueCTE Committee on Trade and EnvironmentCTESS Committee on Trade and Environment Special SessionCTH Change of tariff headingDOTS Direction of Trade StatisticsDSM Dispute Settlement MechanismEGS Environmental goods and servicesEGs Environmental goodsES Environmental servicesEU European UnionFDI Foreign direct investmentAIFTA ASEAN-India Free Trade AreaFDI Foreign direct investment
Abbreviations and acronyms

FSC Free Sale Certifi cateFSCs Full service carriersFTA Free trade agreementGATS General Agreement on Trade in ServicesGATT General Agreement on Tariffs and TradeGCC Gulf Co-operation CouncilGDP Gross domestic productGEP Group of Eminent PersonsGHGs Greenhouse gasesGMS Greater Mekong Sub RegionGOB Government of BangladeshHS Harmonized Commodity Description and Coding Sys-
temICD Inland container depotICT Information and communications technologyIMF International Monetary FundIMTP Integrated Multi-modal Transport PolicyINR Indian rupeesIPCC Intergovernmental Panel on Climate ChangeIPR Intellectual property rightIPS Institute of Policy Studies of Sri LankaISFTA India-Sri Lanka Free Trade AgreementISO International Organization for StandardizationITC International Trade CentreIWT Inland water transportJIT Just-in-TimeL/C Letter of creditLCCs Low-cost carriersLCS Land Customs StationLDC Least-developed countryLED Light emitting diodeLIF LDC Integration FundLOC Line of creditMercosur Southern Cone Common MarketMFA Multi-fi bre arrangement MFN Most-favoured-nationMOP Meeting of PartiesMPs Members of ParliamentMRAs Mutual recognition agreementsNAFTA North American Free Trade AgreementNAMA Non-agriculture market access
xvi

NITDB Nepal Inter-modal Transport Development BoardNLDCs Non-LDCsNSL Notifi ed Sensitive ListNTBs Non-tariff barriersOBR Output-based rebateOECD Organisation for Economic Co-operation and Develop-
mentOSL Operational Sensitive ListPPMs Processes and production methodsPPP Public-private partnershipPSI Pre-shipment inspectionPSQCA Pakistan Standards and Quality Control AuthorityQUASAR Quantitative Air Services Agreements ReviewRCA Revealed Comparative AdvantageRECA Regional economic cooperation arrangementRIS Research and Information System for Developing Coun-
triesRoO Rules of originRTA Regional trade agreementS&DT Special and differential treatmentSAARC South Asian Association for Regional CooperationSACEPS South Asia Centre for Policy StudiesSADB South Asian Development BankSADs Special additional dutiesSAEU South Asian Economic UnionSAFAS SAARC Framework Agreement on Trade in ServicesSAFTA South Asian Free Trade AreaSAPTA SAARC Preferential Trading ArrangementSARSO SAARC Regional Standardization OrganizationSATIS SAARC Agreement on Trade in ServicesSAWTEE South Asia Watch on Trade, Economics and EnvironmentSMC SAFTA Ministerial CouncilSMEs Small and medium enterprisesSPS Sanitary and phytosanitarySRMTS SAARC Regional Multi-modal Transport StudyTAR Trans Asian RailwayTBT Technical barriers to tradeTLP Tariff liberalization programmeTRIPS Trade-Related Aspects of Intellectual Property RightsTRQ Tariff rate quota
xvii

TTMRA Trans-Tasman Mutual Recognition AgreementUAE United Arab EmiratesUK United KingdomUN United NationsUN/CEFACT United Nations Centre for Trade Facilitation and Elec-
tronic BusinessUNCTAD United Nations Conference on Trade and DevelopmentUNECE United Nations Economic Commission for EuropeUNESCAP United Nations Economic and Social Commission for
Asia and the Pacifi cUNFCCC United Nations Framework Convention on Climate
ChangeUS United StatesVAT Value added taxVER Voluntary export restraintWALI Weighted Air Services Liberalization IndexWITS World Integrated Trade SolutionWTO World Trade Organization
xviii

The South Asian Association for Regional Cooperation (SAARC) has completed 27 years of its existence. Two of the objectives behind the establishment of SAARC are the acceleration of economic growth, so-cial progress and cultural development in the region; and the promo-tion of active cooperation and mutual assistance in the economic, social, technical and scientifi c fi elds. The cooperation element was built-in to facilitate economic growth, social progress and the like in the region. In this context, a number of frameworks have been put in place by SAARC to support economic growth in individual countries via strengthening economic integration in the region.
The signing of the SAARC Preferential Trading Arrangement (SAP-TA) in 1993 was a major fi rst step forward in the direction of economic integration in South Asia. The realization of the need to move to higher levels of economic cooperation resulted in the signing of a Framework Agreement on South Asian Free Trade Area (SAFTA) in 2004, which became operational in 2006. At the 16th SAARC Summit held in Thim-phu in April 2010, SAARC leaders signed the SAARC Agreement on Trade in Services (SATIS). The negotiation on regional services trade liberalization, based on the Agreement, has already commenced and very soon the “offer” and “request” list of all South Asian countries will be known to stakeholders.
Introduction
Chapter 1
Saman Kelegama, Ratnakar Adhikari, Puspa Sharma and Paras Kharel

2
Although frameworks are in place to facilitate economic integration in the region, the results achieved in SAARC are far from satisfactory. For instance, intra-regional merchandise trade, which is one of the most important indicators of the depth of regional economic cooperation , still hovers at around 5 percent of the total merchandise trade of South Asian countries. The liberalization of trade in services has been on the SAARC agenda since 2005, but progress on this is very slow.
Regional economic integration has, therefore, remained a challenge in South Asia compared to many other regional groupings. Numerous studies have attempted to highlight the reasons for the slow movement of economic integration, but new issues keep emerging and have fur-ther complicated the process. Of late, climate change has emerged as a serious threat to all countries of South Asia and it is going to add to the already precarious conditions of people, mostly the poor and vulner-able, living in the region for a number of reasons. It is going to have se-vere implications for the region’s biodiversity on which mostly the poor and women depend for their survival. It is also going to adversely affect other areas of the economies. It has been predicted that climate change is going to worsen agriculture production and productivity in South Asia in such proportions that the region is going to face the greatest yield decline in almost all crops, thereby aggravating food insecurity.
These issues have a direct bearing on the livelihoods of a vast major-ity of people, mostly the poor and vulnerable farmers who constitute a majority of the region’s population. Consequently, they could retard the minimal progress achieved in poverty reduction in the region. Such is-sues have to be taken into consideration when formulating the econom-ic integration agenda for South Asia. Moreover, it is pertinent to have a new and fresh look at the challenges of regional economic integration in the South Asia region. This book attempts to highlight the challenges for regional economic integration in South Asia by examining the current shortcomings and future challenges.
The book is divided into six parts. Part 1 (Chapter 2) highlights the problems and opportunities of regional economic integration. Part 2 (Chapters 3–5) focuses on the impediments to goods and services lib-eralization while Part 3 (Chapters 6–8) examines the issues with regard to regional connectivity and trade facilitation. Part 4 (Chapters 9–10)analyses the fi nancial infl ows to South Asia in the form of remittances at a time of global turbulence and fi nances required for more effective in-tegration of least-developed country (LDC) members of SAARC into the regional economic cooperation framework. Part 5 (Chapters 11–12) then discusses the role of the civil society and the private sector in expediting regional economic integration, and fi nally, Part 6 (Chapters 13–14) ex-
Introduction

Regional Economic Integration Challenges for South Asia during turbulent times
3
amines environmental goods and challenges related to climate change in the region.
In Chapter 2, titled “Changing face: The trials and fortunes of re-gional cooperation in South Asia”, Saman Kelegama provides an assess-ment of the performance of SAARC and its efforts to promote regional cooperation in South Asia. By initially identifying how SAARC has not lived up to its expectations thus far, the author sets the tone for the chapter as he proceeds to identify how a potential still remains for the member states of the region to use regional initiatives under the pur-view of SAARC to their advantage and, accordingly, overcome their in-dividual defi ciencies that deter the achievement of their developmental goals. The author notes, however, that such a reality is conditional upon the ability or willingness of policy makers to recognize the obstacles that have hampered their efforts in the past, and learn from such mistakes to provide the necessary impetus that has thus far been lacking within the efforts of SAARC.
After recognizing the benefi ts of regional integration that are yet to be enjoyed within the South Asia region, the author proceeds to iden-tify the obstacles that have hindered SAARC from achieving the desired transformation aspired within the Group of Eminent Persons (GEP) re-port. While an array of obstacles has been identifi ed, each of which has hindered the efforts to achieve the desired level of regional cooperation, they can be collectively categorized as arising due to three overarching set-backs. First, there are obstacles that have arisen due to the geopoliti-cal tensions present in the region, which has meant that there has been a lack of political commitment towards regional objectives. Second, ob-stacles have arisen due to the lack of domestic infrastructure within the region necessary to stimulate and support intra-regional trade fl ows. The third set-back is the lack of adequate channels being institutional-ized to engage stakeholders (regional business and academic communi-ties) other than government, within the decision-making processes of SAARC. SAARC processes tend to suffer from only being informed by the voices and positions of national governments, which themselves op-erate based on their own agenda.
The author notes that this is easier said than done and that the mag-nitude of reform required could initially benefi t from an acceptance of the environment which it faces and the need, therefore, to adapt to the prevailing reality. He further argues that if such an acceptance can be achieved, the capacity of SAARC to fulfi l its aspirations outlined in the GEP report is strengthened due to the evolving nature of the region, which is refl ected foremost in the change in attitude of India towards regional cooperation, due largely to its fear of China’s increasing pres-

4
ence within the region. Although an array of opportunities (such as spill-over effects generated from India becoming a services hub) exists to revitalize the regional cooperation movement, the author notes that it is essential for the region to incorporate commitments that its member states can satisfy and accommodate.
Chapter 3 is on “Pruning India’s sensitive list under SAFTA”, by Nisha Taneja, Saon Ray, Neetika Kaushal and Devjit Roy Chowdhury. The inability of SAFTA and its predecessor to enhance the levels of in-tra-regional trade in South Asia is a predicament that has continually challenged the efforts of regional policy makers. When one assesses the root cause of this problem, a contributing factor that has been noted is the effect of the sensitive lists maintained by the member states, and how they act as a stumbling block to intra-regional trade.
Although there is a rationale behind the need to use sensitive lists in a preferential or free trade agreement, the reality is that the manner in selecting the items that are included in these lists by countries such as In-dia has undermined the capacity of the trading arrangement to achieve its purported effectiveness. In accordance with the overarching purpose of sensitive lists and the asymmetric responsibility to liberalize imports that is expected of a dominant economy within a region, the chapter argues for the need to prune the size of India’s sensitive lists to a level that refl ects strictly the inclusion of items that are justifi able on grounds of food security, revenue purposes and infant industry protection.
To support this argument, the chapter presents and applies a fi ve-step policy tool based on a revealed comparative advantage approach to illustrate how the items included in India’s sensitive lists under the India-Sri Lanka Free Trade Agreement for Sri Lanka and SAFTA for Bangladesh and Pakistan can be limited to items in which India is not competitive as well as items that are crucial for food security and rev-enue purposes. Interestingly, the fi ndings from the application of this policy tool to India’s sensitive lists for Sri Lanka, Bangladesh and Paki-stan indicate a drastic reduction in the number of items, and hence the possibility to undertake an asymmetric responsibility by India in liber-alizing imports. (The editors note that at the 17th SAARC Summit in the Maldives, India reduced its sensitive list for all SAARC LDCs, retaining only 25 items).
In Chapter 4, titled “Non-tariff barriers in South Asia: Nature, impli-cations and measures to address the challenges”, Mustafi zur Rahman argues that the sustained application of an excessive level of non-tariff barriers (NTBs) by the member states of SAFTA remains as a key factor contributing to the inability of the regional trade agreement to boost intra-regional trade in South Asia. While an array of arguments ex-
Introduction

Regional Economic Integration Challenges for South Asia during turbulent times
5
ists to support the necessity of NTBs under environmental, health and safety grounds, the adoption of such measures on a discretionary basis by countries within the region has become a common occurrence and, therefore, a pitfall that impedes the ability to achieve trade expansion for participating member states through SAFTA. By highlighting the fi ndings from a survey of NTBs reported by SAARC member states to the Committee of Experts, the author reports that the NTBs most im-posed in trade among SAARC countries relate to sanitary and phyto-sanitary measures and technical barriers to trade, quotas, anti-dumping measures, licence requirements, countervailing duties, documentation procedures and SAFTA certifi cation.
In addition to such NTBs, factors such as the lack of physical, in-dustrial and communication infrastructures are also found to create ad-ditional NTBs that restrict trade, as these factors are found to have a negative effect on market access and trade fl ows. By encompassing the experiences of other similar regional arrangements in dealing with such NTBs, the author notes that the region can learn from such experiences and thereby effectively resolve the current NTB-related issues, which are undermining the objectives of SAFTA. To this end, he concludes by suggesting a broad range of policy and institutional initiatives that fall under the purview of trade facilitating measures which must be un-dertaken at the regional level, if the excessive application of NTBs by member countries is to be overcome.
In Chapter 5, “Services trade in South Asia: Contours of liberaliza-tion and modalities in SAFTA”, Rajan Sudesh Ratna begins by provid-ing an illustrative account of the liberalization experience related to trade in services, currently planned in South Asia under the purview of SAARC. The author then highlights the importance of the sector to the region, although he recognizes that the goal of achieving greater re-gional prosperity and development through deeper regional integration is dependent upon the ability of the member states to make a concerted effort to liberalize trade in services. Although a cautionary note is also provided regarding the necessary prerequisites and modalities through which the liberalization of trade in services can be effectively achieved, the author proceeds to acknowledge and praise the current efforts in the region that have led to the signing of SATIS by SAARC member states. The regional approach to liberalizing trade in services has furthermore been considered a viable alternative to the multilateral approach as it allows member states to minimize the risks that could arise under the multilateral approach.
This being said, there are numerous unique challenges in the region which have to be managed if SATIS is to effectively deliver the liberal-

6
ization of trade in services and facilitate the overall vision of building a South Asian community. In this regard, the fi ndings of some key studies conducted on the topic of liberalizing intra-regional trade in services illustrate how these challenges could be alleviated if policy makers are willing to adhere to such recommendations, as those fi ndings illustrate the scope that exists within the region to facilitate trade creation via deeper regional integration.
Chapter 6 is on “Air services liberalization in South Asia” by Anush-ka Wijesinha. After establishing the dynamic nature of the relationship between air connectivity and regional economic integration, the author shows the need to address the lack of air connectivity within the region by identifying factors that are inhibiting air connectivity in South Asia. Accordingly, he suggests policy measures that could lead to greater air connectivity, which simultaneously also facilitates greater economic in-tegration in the region.
After identifying the positive gains that are achievable for the wider economy through the liberalization of the air services sector, the author initiates his analysis of the factors that currently inhibit air connectiv-ity in the region. In so doing, he recognizes the limitations that arise through Air Services Agreements (ASAs) themselves, which are imple-mented to provide the regulatory framework for the sector globally. The author notes that South Asian ASAs in particular are even more restrictive than average ASAs that operate globally, which themselves are known to be relatively restrictive.
The author then proceeds to identify a further set of factors inhib-iting air connectivity in the region that extend beyond the hampering effect of the pertinent ASAs in the region. A primary factor that the author deduces from his consultations with industry stakeholders is how a lack of commercial viability to increase air connectivity within the region due to low level of demand for fl ights, except for the case of India, affects trade in air services. A host of technical factors such as code sharing issues, operational costs, visa bottlenecks, geographic issues and route-specifi c issues has further been identifi ed as contribut-ing towards the current low level of intra-regional air connectivity. To mitigate the specifi c challenge posed by code-sharing restrictions, the liberalization of restrictions on code sharing in ASAs has been identifi ed as a viable policy option. This would allow the region to overcome the current impediment caused by the reluctance of certain national airlines (Sri Lankan Airlines) to enter into arrangements with other national air-lines (Biman Bangladesh Airlines and Nepal Airlines) for certain routes on the grounds that their quality and safety records are not up to the mark.
Introduction

Regional Economic Integration Challenges for South Asia during turbulent times
7
According to the author, the achievement of air connectivity through the liberalization of the sector will be met with a set of supplementary challenges (the entry of low-cost carriers, infrastructural inadequacies and undue political interference in the processes) that are likely to mani-fest as more progress is achieved. In light of such challenges, he advo-cates the need to stay on track and not be deterred by such develop-ments as he emphasizes how the liberalization of air services can spur a virtuous cycle of increased dynamism that can facilitate the attainment of overarching regional goals which encompass national interests as well. In recognition of the lack of experience within the region, he pro-vides a word of advice by stipulating how the region can learn from the phased manner in which air services liberalization has been achieved in other regional arrangements such as the Association of Southeast Asian Nations (ASEAN) and the European Union (EU).
In Chapter 7, titled “Improving transport connectivity in South Asia”, M. Rahmatullah suggests that the fragmented nature of the trans-port network (system) and the high logistical costs in South Asia (13 percent to 14 percent of the commodity value) compared to that in the United States (8 percent of the commodity value) are signifi cant draw-backs that have impinged upon other advancements made to increase intra-regional trade. Thus, improving intra-regional trade fl ows will be dependent on improving overland transport connectivity among SAARC countries. The chapter calls for the need to prioritize projects that target transport connectivity shortcomings within the region to fa-cilitate trade and investment.
In respect of the steps taken to ensure transport connectivity in the region, the chapter recognizes the two regional projects initiated by the United Nations Economic and Social Commission for Asia and the Pacifi c—the Asian Highway (AH) and the Trans Asian Railway (TAR) —as pioneering efforts in the region. The contributions made by the SAARC Regional Multi-modal Transport Study (SRMTS) and the Joint Communiqué between Bangladesh and India, in particular, are identi-fi ed as fundamental steps that have been taken in the right direction to achieve a long-lasting cooperation in transport connectivity in the northeastern sub-region of South Asia.
The author takes the transport fragmentation in Northeast India as a case study to illustrate his arguments and proposes the policy frame-work required to improve connectivity. He shows that the necessary steps that need to be undertaken for the key agreements in the Joint Communiqué to materialize indicate how transport connectivity within the region is a multi-faceted phenomenon. It not only requires a collec-tive (regional) mindset but also supporting measures such as transit

8
agreements to ensure that additional human made trade costs do not arise.
The author categorizes the benefi ts of cooperation to achieve trans-port connectivity under i) benefi ts accrued to users (e.g., transport ef-fi ciency in terms of time and costs, productivity gains, dynamic benefi ts such as employment creation and poverty reduction); and ii) benefi ts accrued to transit facility providers (e.g., transport charges, port charg-es, border crossing charges, toll charges, transit fee earnings). These benefi ts provide the necessary incentives for national governments within the region to honour their commitments, prioritize projects and take necessary actions to address the outstanding problems. The author concludes by highlighting how the natural resources sector in Northeast India could be tapped into, thereby leading to trade creation.
Chapter 8 is on “Role of government regulations in trade facilitation: Case of Nepal”, by Pushpa Raj Rajkarnikar. The author initially postu-lates the importance of trade facilitation within the overall processes of trade reform by depicting how trade facilitation enhances trade com-petitiveness through the reduction of transaction costs that are incurred in international trade transactions. Referring to transaction costs, the au-thor notes that such costs, which can be classifi ed as direct (administra-tive, transportation, communication) and indirect (opportunity costs), arise within international trading procedures and act as a debilitating factor on the ability to perform international trading activities effective-ly and effi ciently. To understand where these transaction costs arise, the author incorporates the International Trade Transaction Model devel-oped by the United Nations Centre for Trade Facilitation and Electronic Business to illustrate the various procedures that are recognized as con-stituting an international trade transaction. In this regard, the author recognizes that government regulations have an ability of infl uencing either positively or negatively i) commercial procedures; ii) transport procedures; iii) regulatory procedures; and iv) fi nance procedures.
Therefore, the goals of trade facilitation are innately related to the act of reducing the inhibiting effects that are created by the direct and indirect costs. These costs exist within the varying procedures that col-lectively constitute an international trade transaction. What the author postulates, therefore, is that an array of government regulations can be found to infl uence those procedures. These regulations generate undue trading costs which hinder the potential ability of enhancing trading levels if they are not properly implemented to stimulate the free trade agenda. These areas of government regulations can be listed as i) trade control regulation; ii) customs regulation; iii) technical regulation; iv) product-specifi c regulation; and v) sectoral regulation. By undertaking
Introduction

Regional Economic Integration Challenges for South Asia during turbulent times
9
a case study of Nepal, the author illustrates the shortcomings that exist in the current efforts made by the Government of Nepal.
Although the policy initiatives undertaken (such as customs reform, transport connectivity reforms, use of information and communication technology to facilitate knowledge dissemination for all stakeholders involved in trading activities) by the Government of Nepal to improve the state of trade facilitation within the country correspond with the recommendations noted in the chapter, the tangible gains achieved in this regard have been negligible, if not non-existent. This predicament is explained by the negligible improvement in the days to export and im-port, and limited improvement in the cost of export and import, despite the measures having been “supposedly” implemented.
In Chapter 9, titled “The fi nancial crisis in the Gulf and its impact on South Asian migration and remittances”, S. Irudaya Rajan and D. Narayana begin by postulating what a number of large-scale migration surveys conducted after the global fi nancial crisis of 2008 had antici-pated. There was fear of a large-scale retrenchment of expatriate labour-ers originating from South Asia in the Gulf region and a signifi cant loss of inward remittances to South Asia. To consider the validity of such claims, the authors investigate three main areas of interest which can be summarized as: i) how has the crisis affected the demand for South Asian migrant workers in the Gulf countries?; ii) what strategies did the emigrants adopt to cope with their situation at their place of work (country of destination) and what is the likely impact of the crisis on the home country in terms of decline in remittances, if any?; and iii) did countries in South Asia see large-scale return emigration and fi nd a decline in the outfl ow of emigrant labour to Gulf countries as well as inward remittances from them?
Using the fi ndings of two surveys, the authors come out with a con-trary conclusion as the overall loss of jobs for South Asian emigrants owing to the crisis is estimated at less than 5 percent. Therefore, a sig-nifi cant reduction in the demand for South Asian migrant workers ow-ing to the crisis is not established. A segment of the emigrant workforce from South Asia who did lose their jobs, however, chose to remain in the Gulf countries and fi nd further employment opportunities, may be even at a lower wage rate. Hence, the fact that they would accept any job at a lower wage and send home some remittance to repay their loans was a contingency strategy that they adopted to manage the implications of the crisis. The fact that 178,000 South Asian emigrants decided to remain in the Gulf out of the total 264,000 South Asian emigrants who lost their jobs indicates that South Asian countries did not experience large-scale return emigration. As a matter of fact, approximately 9.5 million South

10
Asian emigrants continued to reside in the Gulf region even after the 2008 crisis.
The authors, however, observe that there were other factors at play which prevented remittances to South Asia from declining. They are: i) the debts incurred in the migration process obliged them to stay; ii) the anticipated large-scale return emigration did not happen; iii) the initial drop in the outfl ow of emigrants did not signifi cantly impact the stock of South Asian emigrants in the Gulf; iv) the appreciation of the US dol-lar vis-à-vis South Asian currencies; v) the continuous rise in oil prices generating more income in the Gulf; and vi) the reverse migration of the crisis-led return emigrants back to the Gulf.
Chapter 10 is on “LDC Integration Fund in South Asia” by Ratna-kar Adhikari. When commenting on the performance of SAFTA, the regional economic cooperation arrangement (RECA) of South Asia, numerous academics tend to focus on the ineffectiveness of the RECA by illustrating how the arrangement has failed to boost intra-regional trade since its inception. If one considers this as a surface-level problem, the analysis undertaken by Adhikari in this chapter can be considered as dwelling on the root causes of the problem. He recognizes how the overarching problem lies in the inability of the RECA to facilitate an equitable benefi t-sharing arrangement, as LDCs are fi nding themselves and their trading interests marginalized within the regional context. Al-though the author does give recognition to the fact that there could be natural asymmetries in the benefi ts attainable for member states of any RECA, he argues that without taking measures to ensure that benefi ts can be equitably shared by all the participating member states, the sus-tainability of the RECA cannot be ensured.
The author shows how South Asian LDCs are excessively dependent on regional trade in terms of both exports and imports. The problem is primarily occurring due to their export interests being marginalized at the regional level. He notes that this is a problem of severe magnitude as the increasing dependence of LDCs on regional trade for their imports is causing their trade defi cits to widen vis-à-vis their regional trading partners as they are unable to increase their exports to the region. By recognizing the existence of a sense of asymmetry in the distribution of benefi ts between the LDCs and developing countries of the region, he argues that there is need for regional policy makers to take measures to correct this asymmetry. This would help the LDCs of the region to real-ize their development potential and thereby also determine the sustain-ability of SAFTA in future.
The author highlights how other more successful RECAs such as the EU, the Southern Cone Common Market (Mercosur) and the ASEAN
Introduction

Regional Economic Integration Challenges for South Asia during turbulent times
11
Free Trade Area have been guided by the philosophical underpinning of “regional public good.” This concept views regional economic co-operation as a regional public good and thereby ensures that the ben-efi ts accrued are shared more or less equitably by all the participating members. In this context, the author calls for the rebirth of the proposal developed by the Coalition for Action on South Asian Cooperation that had made a plea for the “creation of a reasonably large sized fund” for the development of LDCs’ infrastructure, human resources, export production and diversifi cation of export capacity, and calls upon South Asian policy makers to create an LDC Integration Fund. That would help SAARC LDCs enhance their capacity to better integrate themselves into the regional trade mainstream.
In Chapter 11, “Roles of peoples’ representatives and non-state ac-tors in strengthening regional cooperation”, Nihal Rodrigo argues that the current inability to overcome the diminishing returns of the regional integration efforts under the purview of SAARC is linked to the under-lying lack of commitment to the regional agenda and the absence of ini-tiatives at the domestic level to achieve regional objectives. The author goes on to state that the ability of the region to achieve its desired goals in the future is, therefore, dependent on the degree to which the region-al initiatives undertaken can effectively secure the constructive engage-ment of the people in the region. This consequently also ensures a great-er level of commitment being achieved towards the regional objectives themselves. In this regard, the author underscores the need for regional cooperation efforts to take into consideration the multiple interests and perspectives of various stakeholders—corporate sector representatives, professional organizations, academic groups and civil societies—that can benefi t from or are affected by the regional initiatives.
The author, however, recognizes that the importance of this notion is beginning to surface within the deliberations that take place under the offi cially recognized bodies of SAARC. The draft Charter of Democracy, for example, that is awaiting adoption/ratifi cation, is considered a sig-nal of how there is an increasing acceptance of the value of facilitating broad-based participation of the people in the governance processes. Regional economic cooperation initiatives are found to receive a greater level of commitment at the domestic level due to the sense of owner-ship and responsibility that arises from increased involvement of local stakeholders in the regional processes. Similarly, the engagement of all peoples is found to mitigate the various other debilitating effects on re-gional cooperation.
With hindsight, the author’s argument or prescription is certainly supportable as the greater engagement of the people being secured

12
within the regional processes could have meant, for example, the miti-gation of numerous deadlocks that prevent the attainment of regional cooperation in a more effi cient and effective manner. One such point of reference would be the prolonging of the implementation of SAFTA, which was signifi cantly infl uenced by the breakdown of political rela-tions between the two major economies of the region—India and Paki-stan. This being said, the importance of his fi ndings as a policy prescrip-tion cannot be understated as the regional cooperation process in South Asia stands to derive signifi cant benefi ts from the suggested greater engagement of people.
Chapter 12 is on “Private sector in South Asia: Stumbling blocks or building blocks to regional integration?” by Anura Ekanayake. Even though the importance of increasing intra-regional trade through re-gional economic integration has become increasingly apparent over the years, efforts that have been made to achieve such an outcome in the region have continuously been marred by a range of factors. These include such issues as tariff barriers, NTBs, high trade costs and geo-political tensions which work against the agenda of regional economic integration. To understand why policy makers are unable to overcome such factors even when a vast body of evidence exists in support of the potential gains that are achievable through trade liberalization, the author questions if the problems arise due to the role played by the pri-vate sector and their infl uence on the negotiating positions of national governments in trade policy negotiations.
The author initiates his analysis by noting how trade liberalization, through regional economic integration, entails a set of costs to certain sectors of the economy as liberalization proceeds to restructure and alter the dynamics of markets (creating winners and losers). The lack of protection and increased competition tends to fl ush out uncompeti-tive fi rms within certain sectors. He notes that the resistance to trade liberalization, particularly from import-competing sectors, is a natural phenomenon that arises as the parties that stand to lose from trade liber-alization are likely to invest more heavily in lobbying efforts as a means of preserving their interests. This being said, the author notes that it would be a misconception to consider the role of the private sector as being limited to only voicing the concerns of parties that stand to lose from trade liberalization.
In this regard, he recognizes the importance of fi rms that stand to gain from liberalization mobilizing to counterbalance the conservative pressures of import-competing industries. Such an initiative would help in communicating to the wider economy the benefi ts that are attainable for the overall economy in the long run which may not be as visible
Introduction

Regional Economic Integration Challenges for South Asia during turbulent times
13
in the short run when compared to the costs that arise through trade liberalization.
Accordingly, he postulates that the actions/behaviour of the private sector in South Asia embody stumbling blocks if they hinder the promo-tion of regionalism, and building blocks if they facilitate such efforts. He cites the signing of the Indo-Lanka Comprehensive Economic Partner-ship Agreement being prevented due to the protests by some sections of the business community. The author indicates that the current actions/behaviour of the Sri Lankan private sector can be perceived as hin-dering the achievement of greater regional economic integration and, therefore, constituting a stumbling block. The arguments presented by this sector, according to the author, have been based on a high degree of misinformation, misinterpretation and baseless speculation. He con-cludes, however, by identifying how trade chambers can play a role in making the private sector a building block instead of a stumbling block to regional economic integration efforts. In this regard, the author notes that it is necessary for trade chambers to take a national interest-based position but also try to mitigate any adverse effects on or adjustment costs of specifi c sectors or fi rms.
In Chapter 13, titled “Trade and climate change: South Asian agenda at the UNFCCC and the WTO”, Nitya Nanda begins by outlining the severity of climate change and its implications for the prevailing social, economic and environmental conditions across all regions of the world as debated among academics and policy makers alike. The author then goes on to discuss the context of South Asia where the ramifi cations of climate change have been further heightened due to the dependence of local communities on climate-sensitive sectors such as agriculture and fi sheries for their livelihoods. The centrality of such sectors to the export baskets of South Asian countries makes it urgent to take measures to overcome the impacts of climate change, not least because the region’s macroeconomic and trade performance are clearly dependent upon its ability to sustain growth of such sectors.
Although there is a clear convergence of opinion between developed and developing countries on the need to respond to the global prob-lem, achieving an agreement on the nature of the required approach to combat climate change at the multilateral level has surprisingly proven cumbersome. By illustrating the contrasting positions of developed and developing countries at the United Nations Framework Convention on Climate Change and the World Trade Organization (WTO), the author stresses the need for both groups of countries to understand each other’s underlying interests and accompanying expectations, if progress is to be achieved at the multilateral level. The author supports this argument by

14
illustrating how the relative importance of climate change mitigation and adaptation varies across the two groups. Accordingly, any measure that is adopted to address climate change mitigation per se would fail in achieving commitments from developing countries as it fails to address their developmental interests which are represented by way of climate change adaptation considerations.
Chapter 14 is on “WTO negotiations on environmental goods and services: South Asia’s interests” by Fahmida Khatun. The importance of the topic to South Asia is highlighted by the numerous issues faced by the region as well as the fact that a large proportion of the communities in the region depend on the prevailing conditions of the environment for their livelihoods.
The inadequacy of the efforts made to address such concerns has, however, meant that there is continuous pressure exerted at the level of the multilateral trading regime to provide further leeway for envi-ronmental considerations. This is evidenced within the ongoing Doha Round of trade talks. Paragraph 31(iii) of the Doha Ministerial Declara-tion specifi cally asserts the need to conduct negotiations on “reduction or, as appropriate, elimination of tariff and non-tariff barriers to envi-ronmental goods and services”.
For South Asian policy makers, their ability to continuously reap the benefi ts of trade liberalization and thereby increase trade volumes would be dependent on the extent to which the Doha Round encom-passes their trading interests associated with the liberalization of the environmental goods and services (EGS) sector. The author recognizes that it is important for South Asia to examine the implications of the ne-gotiations currently at the WTO as they must ensure that the outcomes of the Doha Development Round facilitate the addressing of both their trading and environmental concerns. Accordingly, the chapter attempts to bring to attention some of the specifi c issues that arise with respect to negotiations on EGS in South Asia and how they may be resolved by making recommendations for negotiating positions.
The author recognizes that the specifi c issues which arise for South Asia due to the liberalization of trade in environmental services (ES) relate to how there could be detrimental side-effects on regional ob-jectives, such as the elimination of poverty and facilitation of human development. If policy makers are able to negate all these potentially detrimental issues that may arise due to the liberalization of trade in ES, the author supports the need for the continued involvement of South Asian policy makers in multilateral trade negotiations. This is due to the fact that liberalization of trade in ES at the multilateral level pro-vides the countries in the region the potential to export, for example,
Introduction

Regional Economic Integration Challenges for South Asia during turbulent times
15
the expertise that they have accumulated regarding the management of environment-related natural disasters. These include environment-related professional services in the form of studies, assessments and consultancies.

.

1PART
MACRO PERSPECTIVE

.

1. Introduction
The proliferation over the last few decades of organizations to promote regional cooperation refl ects a global society which is acutely aware of, and has come to embrace, its growing interconnectedness. The formal establishment of the South Asian Association for Regional Cooperation (SAARC) in 1985 represents one instance of this. As set out in the orga-nization’s charter, the primary objective of SAARC is to utilize coopera-tion among its member states as a springboard for achieving cohesive development in the economic, cultural and socio-political lives of their citizens. Nevertheless, despite enormous potential for facilitating such development in a region populated by over 40 percent of the world’s poor, SAARC’s effectiveness has been limited and its successes far too few. In acknowledgement of such failings, a Group of Eminent Persons (GEP) Report was commissioned by the organization for consideration at its 1998 summit in Colombo. The Report points to SAARC’s inad-equate role in fostering regional cooperation, and then goes on to ar-
Changing face: The trials and fortunes of regional cooperation in South Asia
Chapter 2
Saman Kelegama

20
ticulate a vision of change, detailing the steps that must be taken in or-der to transform the organization into the fulcrum of a truly integrated and self-sustaining regional society. This article considers the obstacles, which, until now, have hindered SAARC from achieving such a trans-formation. It then discusses a number of new opportunities, which, if appropriately exploited, could provide a means for SAARC to close the gap between the GEP vision of an effective and productive organization for regional cooperation, and its far less desirable reality.
2. The case for regional integration
Despite persistently high levels of poverty, the South Asia region has enjoyed steady economic growth in recent years, notably spurred by a robust Indian economy. A gradual movement away from primary prod-uct dependence to a concentration on manufacturing and services has enabled these states to reposition themselves favourably in the arena of international trade (Muni 2010, 42). As an indicator, the share of ag-riculture in South Asian gross domestic product (GDP) fell from ap-proximately 40 percent in the 1970s to under 20 percent in 2006 (RIS 2008, 18). Nevertheless, these economies’ success in this regard has been somewhat constrained by such factors as lack of infrastructure, insuf-fi cient investment in private enterprise and skill shortages in the labour force. Regional cooperation is, ideally, a means of overcoming such ob-stacles to growth. Accordingly, various intra-regional infrastructure de-velopment projects, the establishment of a Common Investment Area, and the sharing of resources at many levels have all been proposed at SAARC summits and meetings over the years. In the context of trade, increased regionalism would allow these economies to improve their competitiveness, increase the export of services and add value to tradi-tional exports. Particularly at the current juncture, in the aftermath of a global recession that has profoundly impacted many developed econo-mies which are the customary recipients of a large proportion of South Asian exports, cooperation and trade within the region seem increas-ingly important. Given that South Asia is inhabited by approximately 24 percent of the global population, the potential benefi ts to be reaped are extensive and thus, the burden of responsibility to be borne by SAARC is immense.
This is, in fact, the very conclusion arrived at by the GEP in its semi-nal Report on SAARC. The Report, aptly titled SAARC Vision Beyond the Year 2000, “attempts to defi ne a long-range vision for SAARC...including a SAARC agenda for 2000 and beyond” (GEP 1999, 23). In the context of trade, the Report calls for the implementation of a South
Changing face: The trials and fortunes of regional cooperation in South Asia
Regional Economic Integration Challenges for South Asia during turbulent times
21
Asian Free Trade Area (SAFTA)1, the elimination of tariff barriers over an eight-year period, and the removal of all non-tariff barriers (NTBs) to trade. Inspired by the successes of the European Union (EU), the GEP Report further recommends the creation of a similarly integrated South Asian Economic Union (SAEU) by 2020, preceded by the establishment of a Customs Union by 2015. The Report advises the adoption of the fol-lowing measures as fi rst steps towards the achievement of the SAEU: i) the creation of a Single Market for South Asia, involving an integration of transportation, energy, telecommunications and other services; and ii) the espousal of a common competition policy for all states in the re-gion. Nevertheless, given prevailing geopolitical tensions in the region, as well as the fact that the establishment of SAFTA was already well behind schedule, the achievement of these goals by the specifi ed dead-lines seems diffi cult. The ideas of a Common Investment Area, a South Asian Development Bank (SADB), a reshaping of SAARC’s institutional structure and the signing of a Social Charter also feature in the Report, among other recommendations for regional cooperation in terms of in-frastructure, trade in goods and services, investment and fi nance, and macroeconomic policy.
The bulk of such recommendations have not, however, come to frui-tion. Indeed, despite its infl uence, the GEP Report in its entirety has not been fully endorsed by SAARC (Behera 2009, 37). Many of the ideas contained in the Report have been the subject of discussions at subse-quent SAARC summits (examples are the notion of a common currency for South Asia and a “Schengen”-style visa for the region), and research committees have been appointed to consider the viability of some of these options (such as the establishment of the SADB and the creation of a common stock exchange), but few have grown beyond these early stages. In fact, SAARC’s persistent inability to convert ideas into sub-stantive action has long been a point of censure for critics of the orga-nization.2 The reasons for such a failing are both geopolitical and struc-tural in nature, and will be discussed later in this article. First, however, let us consider the scope of its achievements to date.
3. SAARC successes
It must be noted that while SAARC’s practical successes have been few, several are worthy of acknowledgement. The commissioning of the GEP Report is certainly one of them. The formation of a Network of Researchers on Global Financial and Economic Issues to aid SAARC in dealing with macroeconomic concerns is another notable development. Arguably, the most signifi cant of the organization’s achievements to

22
date is the establishment of SAFTA in 2006, although after many de-lays. The SAFTA Agreement calls for goods trade liberalization in the region through the reduction of trade barriers. It envisions the removal of all regional tariffs by 2016 by South Asia’s least-developed countries (LDCs)—Afghanistan, Bangladesh, Bhutan, the Maldives3 and Nepal— and three years earlier by developing countries of the region. Such an agreement is clearly an important step in the direction of fostering re-gional trade opportunities. The foregone benefi ts from regional trade in the absence of an agreement of this nature are considerable: in 2006, potential intra-regional trade was estimated to be approximately US$40 billion, compared to actual trade of US$10.5 billion (RIS 2008, 63). As previously noted, such potential gains are of particular signifi cance in the current global economic climate. Nevertheless, such regional trade agreements are desirable not only as a means of encouraging intra-re-gional trade fl ows but also in enabling states to reorganize their econo-mies in a manner that derives the maximum possible advantage from specialization and economies of scale, following the example of the EU (RIS 2008, 59–60).
A large proportion of this array of potential benefi ts remains to be enjoyed, however, due to a number of factors which have inhibited SAFTA’s effi cacy. To begin with, the lengthy administrative delays in-volved in setting up the agreement mean that SAFTA is signifi cantly behind schedule in its activities. The GEP Report advised that SAFTA be created in 2000, with all of its primary objectives to be completed by 2010. The current projected timeline lags substantially behind this. Sec-ondly, member countries maintain lengthy sensitive lists for regional trade—a state of affairs which the agreement fails to preclude. A 2006 study shows, for instance, that 42 percent of Sri Lankan and 58.5 per-cent of Indian exports to SAARC countries feature on sensitive lists, a fact which severely debilitates the practical workings of the agreement (Weerakoon and Thennakoon 2006). In fact, the existence of parallel trade agreements which offer more favourable trade terms—such as the free trade agreement (FTA) between India and Sri Lanka, and India’s FTAs with Southeast and East Asian nations—impacts negatively on states’ commitment to meeting SAFTA’s targets and, indeed, calls into question its usefulness in the sphere of regional trade.4
Another problem is the continued existence of non-tariff and para-tariff barriers to trade. The GEP Report calls for the removal of all such barriers by 2009 by LDCs and by 2007 by non-LDCs. Despite this, how-ever, SAFTA makes no provision for such removal, and NTBs such as quotas, import licensing requirements, anti-dumping measures, and above all, regulatory barriers, continue to limit trade opportunities in
Changing face: The trials and fortunes of regional cooperation in South Asia

Regional Economic Integration Challenges for South Asia during turbulent times
23
the region. Finally, the fact that SAFTA covers only trade in goods, and not in services, means that the agreement is lamentably parochial in nature. However, the signing of the SAARC Agreement on Trade in Services (SATIS) in 2010 is a positive development in the direction of expanding the scope of the FTA, although much depends on the level of market opening that will actually take place when member states’ schedules of commitments are negotiated.
A criticism frequently made of SAARC is that it has, in the past, lacked a clear sense of direction in its efforts at regional integration. Thus, the SAARC Social Charter was created in an attempt to redress this issue. Like SAFTA, the implementation of the Charter suffered from long delays, but might be considered another stride, however small, in the right direction for SAARC. The Charter was fi nally signed in 2004 at the 12th SAARC Summit in Islamabad, and it outlines a regional plan of action for the organization, setting general targets in the areas of poverty alleviation, population stabilization, the empowerment of women and protection of children, the promotion of health and nutri-tion, and youth mobilization. The Social Charter is frequently lauded for its inclusive nature: its development involved input not only from the governments of SAARC member states, but also from civil society organizations, which were permitted to voice their own opinions con-cerning the important challenges that SAARC should aim to address in the future. Nevertheless, insuffi cient attention has been paid by SAARC to the monitoring of the Charter’s targets, as Lama (2007, 26) observes. This may be attributed partly to a lack of resources on the part of the SAARC Secretariat and a lack of commitment on the part of its indi-vidual member states. Furthermore, the targets outlined in the Charter are broad, and a need remains for more specifi c, numerical targets to be agreed upon, adopted and worked towards if the Charter is to have any practical value.
Two other initiatives that SAARC can count among its partial suc-cesses in recent years are the establishment of the SAARC Energy Cen-tre in Islamabad in 2006 and the South Asian University in New Delhi, which opened for admissions in 2010. The GEP Report emphasizes, among other things, the importance to South Asia of energy coopera-tion. The uneven spread of energy resources throughout the region, with oil, coal and natural gas reserves in India, as well as natural gas reserves in Pakistan and Bangladesh, means that the region as a whole would benefi t greatly from cooperative energy policies. The SAARC Energy Centre is charged with the tasks of developing existing energy resources, promoting conservation and energy effi ciency, and working towards the development of alternative and renewable energy sources.

24
Given the invariably high costs incurred by such endeavours, the pool-ing of regional resources in order to fund energy development projects is important. It remains to be judged, however, whether the Energy Centre is able to achieve, in practice, the aims set out for it on paper.
The South Asian University is still housed at a temporary campus location in New Delhi, with the construction of its permanent home due to begin in South Delhi in 2012. Funded by the Indian government, and with all SAARC members expected to contribute towards its opera-tional costs, the university has the potential to achieve some measure of the cross-border fl ows of skills that regional cooperation is envisaged to generate. Furthermore, in providing students with a regionally recog-nized qualifi cation, the South Asian University goes some way towards achieving the equivalence of qualifi cation that is a desirable characteris-tic of education in a truly integrated region.
Nevertheless, such limited successes remain overshadowed by a his-tory of inaction and ineffi cacy, and some critics contend that the number of SAARC’s achievements is markedly disproportionate to the length of the organization’s existence.5 While the reasons for such a state of af-fairs are multiform, it may be considered that the cloud of geopolitical tension and mistrust that SAARC has laboured under—virtually since its inception—bears a signifi cant proportion of the blame in this respect. The long-prevailing atmosphere of suspicion and animosity that charac-terizes Indo-Pak relations is particularly important here.
4. The burden of inter-state hostilities
Disputes over Kashmir between India and Pakistan, resulting in a num-ber of armed confl icts and highly strained relations between the two countries, have existed since the collapse of British colonialism in the sub-continental region. Attempts to heal the political breach—such as the establishment of the Delhi-Lahore bus service in 1999 in the wake of nuclear tests carried out by both nations, and the Indo-Pak ceasefi re agreement of 2003—occurred at critical moments in the history of the confl ict to cool hostilities. Nevertheless, such events as the attack on the Indian Parliament in 2001 and the 2008 terrorist attacks in Mumbai have led to a resurgence of political mistrust between the two nations. The prolonged existence of such a fraught relationship between SAARC’s largest and most powerful member states has been a signifi cant spoke in the wheel of progress for the organization. The Kargil War of 1999—the last of the formal Indo-Pak wars and the only one to occur after the formation of SAARC—has particularly impeded efforts at regional in-tegration.
Changing face: The trials and fortunes of regional cooperation in South Asia

Regional Economic Integration Challenges for South Asia during turbulent times
25
One of the greatest resultant losses to SAARC was Pakistan’s refusal to grant India most-favoured-nation (MFN) status until the 17th SAARC Summit in the Maldives in 2011, thereby preventing an accrual of ben-efi ts to the region from the largest potential segment of trade within South Asia. A 2006 ADB study estimates the value of potential Indo-Pak trade at up to US$10 billion (ADB 2006, 13). Notably, however, a study in 2008 concludes that trade gains for both India and Pakistan from Ban-gladesh are larger even than gains from trade with each other (ADB and UNCTAD 2008, xix). Even in this respect, however, opportunities have been limited by political mistrust: India maintained a ban on investment in Bangladesh until 2007 as a result of tensions over India’s construction of the Farakka Dam as well as border security concerns. The limited fl ow of investment from Pakistan to India, and the latter’s ban on invest-ment in the opposite direction, have also hindered SAARC’s attempts to redirect foreign direct investment (FDI) fl ows out of South Asia to regional destinations. Nevertheless, China, one of the states granted ”observer” status by SAARC, is gradually increasing its presence in the region, with signifi cant FDI outfl ows to Pakistan, Bangladesh, Nepal and Sri Lanka. Notably, following the 2007 Pakistan-China FTA, Chi-nese investment in Pakistan has increased, with 6.5 percent of Pakistan’s 2008 FDI attributed to China (Sahoo 2010). This growing challenge lays pressure on India to defend its regional dominance, and could lead to more open investment and trade policies in the future.
In addition to characterizing Indo-Pak relations, an atmosphere of mutual suspicion has also doggedly marked India’s dealings with other SAARC member states since the organization’s establishment. In the absence of SAARC, South Asian states would need to engage bilater-ally with the regional giant, India, in a manner that—given the clear economic asymmetries involved—would place the former parties in a highly disadvantageous bargaining position. Therefore, it is certainly in their interest to use SAARC as a means of levelling the diplomatic playing fi eld. Similarly, such a balancing of power would ideally enable India to engage with its neighbours in a setting that posits it favourably, not as an evil overlord bent on achieving its own will but as a fellow member state striving for regional benefi ts. Nevertheless, a distinct fi s-sure exists between idealism and reality in this instance. Most member states have historically viewed India’s participation in SAARC with mistrust, suspecting it of using the organization as an indirect means of exerting control over its neighbours and increasing the scope of its regional dominance. Conversely, India has harboured reservations about SAARC in the past, believing it to be a tool of suppression for the other members in banding together against India. In fact, virtually all

26
its members have displayed a wary attitude towards SAARC, particu-larly during its early years of existence. This is, perhaps, an unfortunate repercussion of relatively recent emergence of most South Asian coun-tries from under the control of British imperialism. The independent nation-states in South Asia are generally young and still evolving. Con-sequently, they guard their sovereignty jealously, and often view the actions of supra-national entities as attempts to usurp their sovereignty. Therefore, most countries have hesitated to accept the powers of organi-zations such as SAARC, and continue to regard them with suspicion.6
5. Member commitment, history and the infrastructure gap: Missing links
Partly as a result of this historical state of affairs, SAARC has suffered from a lack of commitment on the part of its members, a fact that has rendered problematic the formation of policy and the initiation of in-tra-regional projects. Consequently, many of the decisions passed by SAARC have been more for the sake of outward display than actual use-fulness.7 Furthermore, often, even when members have accepted certain SAARC protocols, practical implementation—left largely in the hands of individual states—has not necessarily followed. An example of this is states’ failure to substantially reduce their sensitive lists (although notably India has reduced its sensitive lists for LDCs signifi cantly) and remove NTBs under SAFTA, and SAARC’s inability to impel any action in this respect. Although agreements may be reached at SAARC sum-mits concerning the importance of addressing certain pressing issues, such as poverty and food security in the present context, enthusiasm typically wanes in the aftermath of the summit, and SAARC has little in-stitutional power or ability to sustain its momentum until the next sum-mit. Other factors which impact unfavourably upon states’ commitment to SAARC are the existence of alternative bilateral agreements between members (as previously discussed), as well as states’ membership of parallel organizations such as the World Trade Organization (WTO). Unless SAARC is able to provide clear incentives for its members to pre-fer SAARC initiatives over any of these external options, it is unlikely to be able to inspire the degree of commitment that is required, at the national level, to make SAARC an effective actor in regional affairs.
Conversely, it may be argued that bilateral trade agreements of this nature could become an impetus for, rather than a hindrance to, region-alism and, as such, should not necessarily be discouraged (Kelegama 2001, 37). Yet, this is only true if the bulk of such agreements exist be-tween regional states. In reality, however, many of these FTAs are for
Changing face: The trials and fortunes of regional cooperation in South Asia

Regional Economic Integration Challenges for South Asia during turbulent times
27
the purpose of stimulating trade between a South Asian state and a non-regional partner. Examples are the FTA between China and Pakistan, the Association of Southeast Asian Nations (ASEAN)-India Free Trade Area (AIFTA) and the EU-India FTA (which is under consideration). These clearly run counter to SAARC’s aim of redirecting trade fl ows to regional destinations. Nevertheless, despite its importance as a fi rst step towards regional integration, intra-regional trade has proved diffi cult to stimulate and, indeed, such diffi culties have long occupied the attention of SAARC, though to little productive purpose. Key among the reasons for such a state of affairs to persist is a single factor, namely history.
As a consequence of their shared colonial past, the majority of South Asian states have historically directed their exports towards the mar-kets of their former colonizers and the latter’s neighbours. They also are accustomed to viewing each other as competitors in trade, rather than as potential trade partners, given their exports of similar products. The weight of such a history, and the manner in which it has shaped the di-rection of South Asian trade policy, has certainly hindered SAARC, par-ticularly during its earlier years. Nevertheless, a 2008 ADB-UNCTAD report suggests that the existence of competition between South Asian states is more a matter of perception than a true barrier to trade. The report points out that these countries can achieve complementarities through specialization in different stages of production, or by working towards product differentiation (ADB and UNCTAD 2008, 37). Further, it observes that, in the context of trade in services, various regional states have comparative advantages in different sectors, thereby open-ing potential pathways to regional trade (ibid., 96). Examples of such comparative advantages are transport services for Pakistan and Sri Lan-ka, travel services for the Maldives and Nepal and fi nancial services for Bangladesh.
Nevertheless, states’ ability to take advantage of the benefi ts of trade in services has been limited to a certain extent by a lack of domestic in-frastructure. The 2008 South Asia Development and Cooperation Report notes, for instance, the troubling fact of a growing disparity between infrastructure levels in developed and developing nations (RIS 2008). In recent years, a majority of South Asian countries have experienced rapid economic growth, as well as inherent structural transformations within their economies as they expand from, initially, an almost exclu-sive concentration on agriculture products to include the development of services and knowledge production. The consequently widening in-frastructure gap in these economies is, therefore, an issue that needs to be addressed.8 Thus, projects to integrate transportation, energy and labour markets, as proposed in the GEP Report, would clearly benefi t

28
the region. Nevertheless, while SAARC bears a signifi cant portion of the responsibility for improving regional infrastructure, the lack of such in-frastructure equally hinders its effectiveness. SAARC suffers, therefore, from something of a vicious circle in this regard. Accordingly, the im-petus for escaping this depends largely on the individual commitment of its member states, which, as previously discussed, has been notably lacking in the past.
6. Civil society: The need for alternative SAARC channels
Another factor which might be viewed as limiting SAARC’s effective-ness is an inadequate involvement of regional business and academic communities in the organization’s decision-making processes. SAARC is, by nature of its construction, an organization for cooperation among state actors. Thus, the voices heard at SAARC meetings, and the opin-ions, concerns and ideas expressed there, are largely those of govern-ment offi cials. Yet, in maintaining such insularity, the organization be-comes undesirably parochial in nature. It fails to benefi t from a range of alternative sources of knowledge and expertise, as well as a more nuanced view of challenges and new ideas concerning the ways in which these challenges might be addressed. Indeed, given its purpose of achieving integration, it is somewhat ironic that one of SAARC’s greatest problems has been its inability to achieve an integrated involve-ment of civil society with offi cial government channels in its processes of policymaking and project implementation. One of the reasons that the SAARC Social Charter has been met with approval from critics is, in fact, its implicit acknowledgement that there are important contribu-tions to be made to SAARC from non-governmental sources. Yet the involvement of civil society in the creation of the Social Charter is only a single step in a journey of many towards an integrated institutional structure for SAARC.
Behera (2009) identifi es three schools of thought concerning the man-ner in which civil society could be brought into engagement with offi -cial government channels in SAARC processes: i) by intervention from the top down; ii) by intervention from the bottom up; and iii) through the creation of knowledge. For this purpose, we consider the existence of three parallel “tracks” or channels of involvement in SAARC. Track I is the offi cial channel of inter-governmental decision-making. Tracks II and III represent the involvement of civil society. Track II, the “top-down” approach, consists of a form of “shadow diplomacy”, involving retired policy makers, scholars and other individuals who have ready access to and established relationships with members of Track I. This
Changing face: The trials and fortunes of regional cooperation in South Asia

Regional Economic Integration Challenges for South Asia during turbulent times
29
group ideally serves to bridge the divide between the government and the domestic intelligentsia. Track III, the “bottom-up” approach, in-volves “non-governmental organizations, peoples’ organizations, activ-ist groups and networks that explicitly function apart from or beyond governments” (Behera 2009, 17). While the latter group likely has little or no direct access to government channels, its involvement is intended to broaden the scope of SAARC participation by stimulating public in-terest and thereby encouraging governments to take decisive actions within the SAARC framework.
Knowledge creation within these channels is also an important as-pect of their contribution to Track I dialogues. Research bodies such as the South Asia Centre for Policy Studies (SACEPS), the South Asia Network of Economic Research Institutes (SANEI) and the Coalition for Action on South Asian Cooperation (CASAC) aim to infuse Track I pro-cesses with a more holistic and nuanced understanding of regional mat-ters. Ideally, the formation of such regional networks outside the central sphere of policy makers would facilitate the continuance of discussion and interests concerning SAARC affairs between offi cial summits. Fur-thermore, the dissemination of information through regional journals, magazines and other publications ensures that the wider South Asian community remains cognizant of emerging challenges and opportuni-ties for regional integration, as well as of SAARC’s current initiatives in this respect.
Nonetheless, the full benefi ts of these alternative channels of SAARC participation remain to be enjoyed, largely due to lacunae of communi-cation with Track I. The lack of an inherent structural connection be-tween governmental and non-governmental SAARC participants means that the information sets under which each operates are mutually exclu-sive (Behera 2009, 34). This inevitably creates a cloud of suspicion and, sometimes, hostility that casts a shadow upon interactions between the two parties. Governments are, therefore, less likely to accept the views and policy advices that emerge from Track II and, particularly, Track III. Furthermore, due to the highly personalized nature of prevailing interactions with Track I, it is often the case that the body of information passed from Tracks II and III to Track I is not truly representative of the civil community in its entirety but, rather, is peculiar to certain factions that have preferential access to governments.
In fact, just as decision-making within offi cial government channels is rendered problematic by the existence of confl icting views among domestic political parties, communication among Tracks I, II and III is somewhat garbled by the diverse, fractured and sometimes partisan nature of civil society. The prevalence of populist propaganda and in-

30
feasible suggestions among certain groups robs the entire channel of much of its credibility, and requires a sifting of information from these sources on the part of Track I, which is time-consuming and expends resources wastefully. Thus, the lack of coordination and collaboration among these groups hinders the creation of useful and coherent policy advice by Tracks II and III, as well as Track I’s ability to give credence to, and absorb, such information.
This issue of communication and coordination is one which equally characterizes the institutional structure of SAARC itself. The highly bureaucratic chain of decision-making generates frequent delays in the formulation of policy as well as in its implementation. In fact, the wan-ing of members’ enthusiasm between summits, which has posed such a problem to SAARC initiatives in the past, may partly be attributed to this. Another related concern is that the individual roles of entities within the broader SAARC structure are not clearly defi ned.9 The inac-tivity of SAARC’s Regional Centres may, for instance, be explained in this manner. Such a situation is highly detrimental to the organization’s effectiveness, as it inevitably dissolves any sense of accountability. In the absence of a clear-cut chain of accountability, any progress must be drawn with diffi culty from a well of apathy and torpor.
7. Changing face
The portrait of SAARC’s past is, therefore, a somewhat disconsolate image. Nevertheless, it does not follow that its future should be paint-ed in a similar hue. Rather, changes in geopolitical attitudes and the emergence of important new opportunities within the region provide SAARC, at the current juncture, with the necessary tools for an insti-tutional transformation. Critical among these changes is the fact that India’s attitude towards SAARC has begun to adopt a more positive tone. For instance, it expanded duty-free access to its domestic market for products from SAARC LDCs as well as contributed US$100 million to the SAARC Development Fund, over and above its subscription for projects on social development.10 India’s emergence in the present con-text as a global power is undeniable. In terms of population and recent GDP growth rates, its statistics are impressive. Furthermore, it currently holds a two-year non-permanent seat in the UN Security Council, and is campaigning strongly to be given a permanent seat there. Thus, its involvement in SAARC is of tremendous importance to the organiza-tion’s success.
Moreover, as previously discussed, the promotion of trade in ser-vices is a crucial issue in South Asia, and one which SAARC has con-
Changing face: The trials and fortunes of regional cooperation in South Asia

Regional Economic Integration Challenges for South Asia during turbulent times
31
tinually attempted to facilitate. India’s fashioning of itself as a services hub, engaging in the fi elds of bio-information, drug testing, pharma-ceutical research, engineering design and fi nancial analysis, could have profound spill-over effects for the region and, therefore, is a highly de-sirable development. Exports of information technology services from India, for instance, soared from US$4 billion in 2000 to US$40.4 billion in 2008 (RIS 2008, 39–41). In view of this, the importance of using India’s lead as a springboard for establishing South Asia as a regional infor-mation and communications technology hub has featured strongly in SAARC discussions of late (RIS 2008, 39).
Furthermore, several issues have emerged in recent years that are regional, and often global in scope—diffi cult or even impossible to con-trol at the national level. Consequently, the need for deeper regional integration in order to combat these challenges provides SAARC and its member states with a fresh impetus for collaborative action. Chief among these are an increasing awareness of the threat posed by climate change, concerns about food security in the light of steadily rising global food prices and issues regarding regional migration and the steady in-fl ux of internally displaced persons in South Asia. Accordingly, SAARC has made a certain amount of progress towards an integrated response in this respect. For instance, a common SAARC position was adopted on regional climate issues—such as coastal erosion and the melting of the Himalayan glaciers—at the 2009 United Nations climate summit in Co-penhagen. Member states have also established the SAARC Food Bank, which is awaiting operationalization. They have also recently agreed to establish a SAARC Seed Bank.
Nevertheless, far more effort is required by SAARC if it is to take full advantage of the fresh opportunities afforded to it at the present junc-ture. In particular, a progressive transformation of the organization—in terms of its structure and the manner in which it approaches the task of achieving regional integration—is greatly to be desired. This section, therefore, considers the ways in which SAARC could attempt to over-come the obstacles that have impeded its progress in the past.
As previously discussed, an issue that has relentlessly beleaguered SAARC from the very outset is that of a geopolitical climate character-ized by mutual tension, mistrust and jealously guarded state sovereign-ty. Within such a realm of neorealist politics, the effective functioning of any organization of multiple states is likely always to be obstructed. Therefore, an important step for SAARC is perhaps to acknowledge that such political realities are unlikely to change in the near future. Conse-quently, instead of viewing them as an obstacle to be fought against and thereby overcome, SAARC must fi nd ways of working with them, ide-

32
ally even using them to its advantage wherever possible. This would re-quire, however, subtle and skilled diplomacy on SAARC’s part, through the efforts of individuals who understand the nuances of South Asian politics. For example, the area of infrastructure building is one that mer-its SAARC’s particular attention. This is because the costs of infrastruc-ture development projects are often too high to be borne by a single government (particularly in a region comprised of developing nations and LDCs); therefore, cooperation in this regard is highly desirable.
Nevertheless, region-wide infrastructure development projects have proven diffi cult to implement, largely as a result of political challenges to the process and diffi culty of coordination. Consequently, the pursuance of smaller-scale bilateral deals could be an alternative, and more fea-sible, means of working towards the same goal.11 Furthermore, if peace talks resume between India and Pakistan in earnest, this would provide SAARC with ample opportunity to attempt a deeper involvement of these two nations in SAARC activity. In pursuance of the same goal of turning regional politics to its advantage, another desirable change is for SAARC to develop its relationships with other organizations, par-ticularly regional ones such as ASEAN and the EU,12 from which it can glean support, guidance and, most importantly in this instance, a better standing in the arena of regional power politics.
In addition to improving its skills at playing the game of neorealist politics, SAARC must also consider an overhaul of its organizational structure. The lack of clearly defi ned roles for individual SAARC en-tities, as well as the garbled and clogged lines of communication and authority are, as previously observed, a severe impediment to SAARC activity. Although the establishment of the SAARC Social Charter has gone some way towards remedying this situation, much more work needs to be done by the organization in this respect. Having acknowl-edged the importance of involving civil society in SAARC processes, one of the organization’s key tasks now is to improve the fl ow of inter-actions between Tracks I, II and III. SAARC could, for instance, greatly reduce the inherent segregation of offi cial and non-offi cial spheres of dialogue by encouraging Track I offi cials to participate in Track II and Track III dialogues and to pursue sabbatical work in these alternative tracks. Similarly, greater credence could be ascribed to Tracks II and III by frequently including representatives from these channels in selected Track I dialogues. The extensive participation of all tracks in events such as the SAARC Business Leaders Conclave and the South Asia Business Summit should also be promoted, as these represent arenas in which government offi cials can interact with members of the other tracks free-ly and on fairly even footing.
Changing face: The trials and fortunes of regional cooperation in South Asia

Regional Economic Integration Challenges for South Asia during turbulent times
33
Within the organization, moreover, the roles of Regional Centres and other SAARC entities need to be defi ned in more specifi c terms than those outlined in the SAARC Social Charter. Realistic deadlines must be set for these entities to achieve feasible goals, and a monitoring system needs to be implemented to ensure that they remain on track for meet-ing them. An example is the SAARC Food Bank, an important project in light of food security concerns, whose operationalization should be given a strict deadline by SAARC. In this manner, by setting targets for, and successfully completing, a series of projects (regardless of their size or scope), SAARC can begin to change its reputation of inactivity and ineffi cacy, thereby improving its standing in the eyes of its member states. For this purpose of building confi dence, it is perhaps advisable for SAARC to focus its attention on “soft” projects, as well as those char-acterized by high visibility. The founding of the SAARC University is a good example of a success story in this respect. The creation of a channel for SAARC citizens and a green channel for SAFTA goods at regional airports are other options in a similar vein. SAARC could also work to-wards the promotion of greater regional air connectivity and the devel-opment of regional tourism. The latter, in addition to bearing relatively few political challenges, is important because of the notable spill-over benefi ts that an improved tourism sector would afford economies, both domestically and regionally. In this way, by redirecting its energies into less controversial areas of integration, SAARC can begin to establish it-self as a credible presence within the South Asia region.
Having consolidated its approach to achieving these central aims, SAARC could then seek to improve its effi cacy by a range of other means. Given the centrality of trade to regional integration, measures should be taken to improve the functioning of SAFTA. Signifi cant among these are the shortening of sensitive lists, the removal of NTBs to regional trade and the extension of SAFTA to include trade in services, as previously considered. Furthermore, an allocation of resources for the purpose of hiring consultant experts for SAARC projects is also desirable, as this would prevent resources being wasted on initiatives that ultimately fail to be realized.13
8. Conclusion
Despite its past failings, therefore, SAARC retains the potential to radi-cally impact the process of regional integration in South Asia. In order to fulfi l that potential, however, it must successfully utilize such avail-able tools as the GEP Report, the input of civil society, the advantages wrought by a changing politico-economic climate and its own historical

34
experience to refashion its approach and begin to accumulate a portfolio of successes. Time will tell if, in this way, SAARC is able—in the coming years—to signifi cantly contribute to the synthesized development of its regional community.
Notes
1 SAFTA has come into operation since July 2006.2 See, for instance, Muni (2010, 1–3).3 The Maldives has graduated from LDC status with effect from 1 January
2011.4 This issue is discussed in SACEPS (2008, 8). 5 See, for instance, Muni (2010, 1–2).6 For a discussion of this, see Behera (2009, 30).7 See Behera (2009, 29).8 For a discussion of this, see RIS (2008, 22).9 See SACEPS (2008, 46).10 See SAARC Secretariat (N.d.) for details on the funding mechanism and
sources of the SAARC Development Fund. 11 This is suggested in SACEPS (2008, 62), particularly with regard to improv-
ing the regional energy grid. 12 The importance of this is considered in SACEPS (2008, 50).13 SAARC’s shortcomings in this respect are briefly considered in SACEPS
(2008, 67).
References
ADB (Asian Development Bank) and UNCTAD (United Nations Con-ference on Trade and Development). 2008. Quantifi cation of benefi ts from economic cooperation in South Asia. New Delhi: Macmillan India.
ADB. 2006. South Asia economic report, October. Manila: Asian Develop-ment Bank (ADB).
Behera, Navnita Chadha. 2009. “SAARC & beyond: Civil society and regional integration in South Asia.” SACEPS Paper No. 19. Kath-mandu: South Asia Centre for Policy Studies (SACEPS).
GEP (Group of Eminent Persons). 1999. SAARC vision beyond the year 2000: Report of the SAARC group of eminent persons established by the ninth SAARC summit. New Delhi: Shipra Publications.
Kelegama, Saman (ed.). 2001. “Impediments to regional economic co-operation in South Asia.” FES Publication No. 49. Colombo: FES Publications.
Lama, Mahendra. 2007. ”Monitoring of SAARC policies and pro-gramme.” SACEPS Paper No. 17. Kathmandu: South Asia Centre for Policy Studies (SACEPS).
Muni, S.D. (ed.). 2010. The emerging dimensions of SAARC. New Delhi:
Changing face: The trials and fortunes of regional cooperation in South Asia

Regional Economic Integration Challenges for South Asia during turbulent times
35
Cambridge University Press India.RIS (Research and Information System for Developing Countries). 2008.
South Asia development and cooperation report 2008. New Delhi: Oxford University Press India.
SAARC Secretariat. N.d. Funding mechanism: SAARC development fund. Available at: http://www.saarc-sec.org/areaofcooperation/cat-detail.php?cat_id=58/ (accessed 9 August 2012).
SACEPS. 2008. “Assessing and reformulating SAARC road map.” SA-CEPS Paper No. 18. Kathmandu: South Asia Centre for Policy Stud-ies.
Sahoo, Pravakar. 2010. “China’s growing clout in South Asia.” The Hin-du Business Line, 16 November.
Weerakoon, Dushni and Jayanthi Thennakoon. 2006. “SAFTA: Myth of free trade.” Economic and Political Weekly, Vol. 41, No. 37 (16 Septem-ber): 3920–3.

.

2PART
MERCHANDISE AND SERVICES TRADE

.

1. Introduction
In the last two decades, member countries of the South Asian Associ-ation for Regional Cooperation (SAARC) have made a number of at-tempts to enhance intra-regional trade. Seven of the SAARC member states1—Bangladesh, Bhutan, India, the Maldives, Nepal, Pakistan and Sri Lanka—initiated region-wide trade integration efforts under the SAARC Preferential Trading Arrangement (SAPTA) in 1995. Following SAPTA, the Agreement on South Asian Free Trade Area (SAFTA) en-tered into force in 2006, envisaging a duty-free area by 2016. However, the success achieved under this agreement has been quite limited as intra-SAARC trade continues to be around 5 percent of total trade of all member countries. It has often been debated that one of the reasons for the ineffectiveness of SAFTA is the large sensitive lists maintained by its member countries (Pitigala 2005; Baysan, Panagariya and Pitigala 2006; Taneja and Sawhney 2007). These lists consist of items which are not offered concessional tariffs. The rationale for any sensitive list in a preferential or free trade agreement is to provide preliminary protection to sectors considered unfi t for competition for a variety of reasons. For a
Pruning India’s sensitive lists under SAFTA
Chapter 3
Nisha Taneja, Saon Ray, Neetika Kaushal and Devjit Roy Chowdhury

40
free trade agreement to be effective, such protection should be extended only for a defi nite period of time so as to provide the initial adjustment time to the domestic import-competing sector. Weerakoon (2010) and Weerakoon and Thennakoon (2006) point out that 53 percent of the total intra-regional import trade was excluded from the tariff liberalization programme (TLP). India restricted up to 52 percent (by value) of its total imports from SAFTA members under the sensitive list category.
According to the TLP under SAFTA, member countries are required to review their sensitive lists with a view to reducing the number of items in the lists every four years or earlier, as established by the SAFTA Ministerial Council (SMC), but there is no formal or binding commit-ment. Hence, reduction of sensitive lists is a voluntary decision of each member country.
Keeping in view that India is the largest economy among SAFTA member countries, it should, on its part, take asymmetric responsibility to liberalize imports by pruning its own sensitive lists with respect to other South Asian countries. In that context, the objective of this study is to examine the commodities currently in the sensitive lists of India, and to offer an approach and economic rationale to policy makers for pruning these lists.
Member countries have adopted a variety of criteria to prepare their sensitive lists. One such criterion is to provide protection to vulnerable sectors such as nascent industries (infant industry argument), small-scale manufacturers (socio-economic argument) and agriculture pro-ducers (food security concerns). However, it has been observed that of-ten, during the process of stakeholder consultation, sectors with strong domestic lobbies seeking protection get included in the lists. Sensitive lists, particularly in the case of India, have come to be dominated largely by such sectors.
Several considerations have to be taken into account while pruning the sensitive lists. First, they often include products that cannot be sup-plied by partner countries; their inclusion in the list is, therefore, mean-ingless. Most of the items reserved for exclusive manufacturing by small industries have been there to enable fi rms to become more competitive. However, India’s sensitive lists under SAFTA continue to have several such items which can be removed. Since there is a justifi cation for in-cluding agriculture items for food security concerns, and tobacco and alcohol for revenue purposes, these should be retained in the lists. The remaining products need careful examination to ensure that only those vulnerable to competition stay and the others are eliminated.
We have also used the concept of Revealed Comparative Advantage (RCA)2 to assess the competitiveness of India and the partner country
Pruning India’s sensitive lists under SAFTA

Regional Economic Integration Challenges for South Asia during turbulent times
41
in each of these remaining items. Products in which the partner country is competitive in the international market are suggested for retention in the sensitive lists for a specifi c period. These products, however, should be eventually removed from the lists in a phased manner.
India has maintained two sensitive lists under SAFTA—one for least-developed countries (LDCs), which is applicable to Afghanistan, Bangladesh, Bhutan, the Maldives and Nepal, and another for non-LDCs (NLDCs), which is applicable to Pakistan and Sri Lanka. In ad-dition, India has bilateral free trade agreements (BFTAs) with Nepal, Bhutan and Sri Lanka, and maintains separate sensitive lists under each of these BFTAs. Negotiations regarding the sensitive lists applicable to these countries will be carried out under the respective BFTA. The raison d’être for a BFTA is that it should be more liberal than a regional FTA. Hence, sensitive lists under the bilateral agreements that India has with some SAARC members should be smaller than those maintained under SAFTA. This implies that items that appear in the bilateral sensitive lists but not in the regional sensitive lists should be eliminated.
India’s operational sensitive list for Sri Lanka is the one under the India-Sri Lanka Free Trade Agreement (ISFTA). Therefore, Pakistan is the only country to which the NLDC list is applicable. Among the LDCs in SAARC, India has an FTA with Nepal and Bhutan with a very small sensitive list in the case of the former3 and none in the latter. Afghani-stan and the Maldives are very small economies and though the LDC list is applicable to them, they export only a few commodities. Thus, the focus of this article is on pruning the sensitive lists for Sri Lanka under the ISFTA, and for Bangladesh and Pakistan under SAFTA.
2. Sensitive lists under SAFTA and BFTAs
India has made a number of attempts to prune its sensitive lists over time but these changes do not get refl ected in the notifi ed sensitive lists either under the BFTAs or under SAFTA. The most important form of concession offered by India to Bangladesh has been the grant of duty-free access to readymade garments up to a limit of eight million piec-es per year. Since this concession takes the form of a tariff rate quota (TRQ), it does not get included in the notifi ed sensitive lists. Hence, the operational sensitive lists are different from the notifi ed ones and have to be reconstructed by excluding the items on which concessions have been granted.
In July 2006, when SAFTA became operational, India maintained 743 items for LDCs and 868 items for NLDCs in its sensitive lists.4 Over a span of four years, India has repeatedly made attempts to reduce the

42
items in the sensitive lists as a part of the TLP. In October 2008, a further reduction was made for LDCs from 743 items to 480 items.5
The sensitive list under ISFTA, signed in 2000, consists of 431 items. In 2008, India allowed duty-free import of 216 garment items up to a limit of eight million pieces per year to Sri Lanka, thereby reducing the operational sensitive list to 215 items.6 Of the total 215 items, 86 items do not feature in the SAFTA list of 868 items applicable to the NLDCs, and therefore, should be removed because the ISFTA is a binding agree-ment and should be more liberal than the regional agreement. This is discussed in greater detail later.
Although India does not have a BFTA with Bangladesh, in April 2008, it offered zero duty concession on imports of 164 textile items from Bangladesh up to eight million pieces per year.7 In October 2008, it extended that concession to all LDCs. There is an overlap of 25 items in these two notifi cations. In addition, two items (HS 040900 and HS 040590) are repeated in the list. Adjusting for concessions and discrep-ancies, the operational sensitive list for Bangladesh consists of 331 items only as against 480 items in the LDC list at the HS 6-digit level.
Pakistan is the only country to which the SAFTA NLDC sensitive list consisting of 868 items (Table 3.1) is applicable. Moreover, further data analysis shows that the number of items included in the list is rather 910 (Table 3.2), and not 868.
Table 3.1: HS classifi cation of items in the NLDC sensitive list
HS classification level No. of items in notified sensitive list
% share in notified sensitive list
4-digit code 15 1.76-digit code 386 44.58-digit code 467 53.8Total 868 100
Source: Authors’ calculation.
In 2006, the original sensitive list for Sri Lanka under the ISFTA con-tained 92 percent of plastics and rubber, and textile and related products. With concessions being granted to several products in the latter catego-ry, the former accounted for 47 percent of the products in the operation-al sensitive list. Unlike Sri Lanka, Bangladesh received concessions from India in almost all categories (under concessions offered to LDCs and under bilateral concessions). Sectors where substantial reductions were made included textile and textile-related products, rubber and plastic products, and machinery and electrical equipment. Vegetable products were the largest number of items featuring in the operational sensitive
Pruning India’s sensitive lists under SAFTA

Regional Economic Integration Challenges for South Asia during turbulent times
43
S.N
.D
escr
iptio
nSr
i Lan
kaBa
ngla
desh
Paki
stan
No.
of i
tem
s in
NSL
*N
o. o
f ite
ms
in O
SL*
No.
of i
tem
s in
NSL
No.
of i
tem
s in
OSL
No.
of i
tem
s in
NSL
No.
of i
tem
s in
OSL
1Li
ve a
nim
als
––
1811
2222
2V
eget
able
pro
duct
s2
216
215
316
116
1
3A
nim
al o
r veg
etab
le fa
ts a
nd o
ils–
–30
2930
30
4Pr
epar
ed fo
odst
uffs
1717
6252
6767
5M
iner
al p
rodu
cts
––
88
1616
6Pr
oduc
ts o
f che
mic
al a
nd a
llied
indu
s-tr
ies
––
344
4848
7Pl
astic
s an
d ru
bber
100
100
9711
9898
8W
ood
and
artic
les
of w
ood
55
56
55
9Pa
per p
rodu
cts
1212
133
1515
10Te
xtile
s an
d te
xtile
art
icle
s29
579
197
832
532
5
11Fo
otw
ear,
head
gear
, etc
.–
–17
117
17
(Con
tinue
d in
nex
t pag
e)
Tabl
e 3.
2: I
tem
s in
the
sens
itive
list
s

44
12St
one,
pla
ster
, cem
ent,
asbe
stos
, mic
a,
cera
mic
s an
d gl
assw
are
––
5–
1010
13Ba
se m
etal
s an
d ar
ticle
s of
bas
e m
etal
s–
–60
4160
60
14M
achi
nery
and
mec
hani
cal a
pplia
nces
; el
ectr
ical
equ
ipm
ent
––
27–
2727
15Tr
ansp
ort e
quip
men
ts–
–4
44
4
16O
ptic
al, e
tc. i
nstr
umen
ts a
nd a
ppar
atus
––
2–
22
17A
rms
and
amm
uniti
ons
––
0–
11
18M
isce
llane
ous
––
2–
22
Tota
l43
121
574
333
191
091
0
*Not
ified
Sen
sitiv
e Li
st (N
SL) i
s th
e or
igin
al li
st a
t the
tim
e of
ince
ptio
n of
SA
FTA
.O
pera
tiona
l Sen
sitiv
e Li
st (O
SL) i
s th
e lis
t con
stru
cted
afte
r tak
ing
all C
BEC
Not
ifica
tions
into
acc
ount
.So
urce
: Aut
hors
’ cal
cula
tion.
S.N
.D
escr
iptio
nSr
i Lan
kaBa
ngla
desh
Paki
stan
No.
of i
tem
s in
NSL
*N
o. o
f ite
ms
in O
SL*
No.
of i
tem
s in
NSL
No.
of i
tem
s in
OSL
No.
of i
tem
s in
NSL
No.
of i
tem
s in
OSL
(Con
tinue
d fro
m p
revi
ous p
age)

Regional Economic Integration Challenges for South Asia during turbulent times
45
list, accounting for 46 percent of the total items on the list. Since India did not offer any concessions to NLDCs, the sensitive list for Pakistan has remained the same. Textiles and related products alone account for 37 percent of this list—a category in which India has offered concessions to Sri Lanka and Bangladesh.
It is evident from the above that India has offered maximum conces-sions to Sri Lanka and Bangladesh in textile and textile-related products. Therefore, this article has examined RCAs of these countries in these items to assess whether India has already offered concessions in items in which it is vulnerable. If India has offered concessions in vulnerable sectors, which is a sign of its willingness to face competition in these sectors, it needs to eliminate other items from its sensitive lists in which it is competitive. In 2007, textile and textile-related products accounted for 81 percent and 45 percent of Bangladesh’s and Sri Lanka’s exports, respectively. Therefore, by offering concessions in these items, India has taken a signifi cant step to meet its asymmetric responsibility towards its smaller trading partners in the South Asia region.
3. Methodology
The objective of this article is to fi nd out if there is scope for India to eliminate more items from its sensitive lists. In so doing, the methodol-ogy adopted by the study is discussed below.
The elimination exercise excluded items that are important for food security and revenue purposes. Therefore, these items were fi rst identi-fi ed. The Food Security Bill of India identifi es wheat, rice and coarse cereals such as barley, rye, oat and maize as items that are important for food security. In the sensitive lists maintained by India, at the six-digit level, there are eight items pertaining to food security (Table 3.3). Similarly, there are 25 items pertaining to alcohol (HS Chapter 22) and tobacco (HS Chapter 24) (Table 3.4)8, which are important from the rev-enue point of view. Excluding these items, the sensitive lists under con-sideration is reduced to 199 for Sri Lanka, 298 for Bangladesh and 877 for Pakistan.
Table 3.3: Items sensitive to food security
Sensitive list No. of itemsISFTA 0SAFTA LDC 8SAFTA NLDC 8
Source: Authors’ calculation.

46
Table 3.4: Cigarette, tobacco and alcohol Sensitive list No. of itemsISFTA 16SAFTA LDC 25SAFTA NLDC 25
Source: Authors’ calculation.
Next, the anomalies between bilateral and regional sensitive lists are identifi ed so that sensitive lists under BFTAs are smaller than that un-der SAFTA. There are also several items on the sensitive list that have not been exported by the exporting countries and can, therefore, be re-moved from the sensitive list.
Earlier, India used to maintain an exhaustive list of items reserved for exclusive manufacturing by the small-scale sector. Over time and under the liberalization regime, it has trimmed the list to include only 22 items (Table 3.5). However, India’s sensitive lists continue to contain many of the items which were earlier reserved but have now been re-moved from the reserved list. These items are identifi ed and removed from the sensitive lists. The remaining items are then classifi ed on the basis of RCAs of the exporting country and India to arrive at the pruned sensitive list.
Since RCA is central to the pruning exercise, it is important to ex-plain why this index has been selected as an indicator of competitive-ness. Kathuria (1997) points out that competitiveness can be measured by the extent of successful export performance. Export performance can be measured by export propensity, export market shares or price-based measures like nominal protection coeffi cients, effective rates of protec-tion and domestic resource costs. It is common in the literature to mea-sure comparative advantage with the help of the RCA index. Accord-ing to Siggel (2007), RCA index measures competitiveness rather than comparative advantage, since cost measured in terms of market prices refl ects competitive advantage rather than comparative advantage, which requires equilibrium prices. Dornbusch et al. (1977) fi rst pointed out the necessity of the use of equilibrium prices in the measurement of costs. The use of RCA, hence, captures competitiveness of a coun-try’s export products vis-à-vis each other in the international market. This is very much in line with the Ricardian concept of comparative advantage which proposes that by producing the good in which it is relatively effi cient (relative not to the other country but relative to the other goods), and importing the other good, each country stands to gain (Ricardo [1817] 2002). The concept of RCA can also be used by pairing the RCAs for products of an exporting country with the correspond-
Pruning India’s sensitive lists under SAFTA

Regional Economic Integration Challenges for South Asia during turbulent times
47
ing RCAs of another country. This provides an approach for classifying pairs of items for any two exporting countries on the basis of their com-petitiveness. This can also serve as a rationale for identifying items that are most vulnerable to competition.
In this study, the RCA for each item on India’s sensitive list has been paired with the corresponding RCAs for these items in Bangladesh, Sri Lanka and Pakistan. This procedure has been used to classify the pairs of items on the sensitive lists on the basis of their competitiveness.
The overall exercise of pruning the sensitive lists was carried out in several steps as explained below.
Step 1 involved identifying and eliminating those items in the IS-FTA sensitive list which do not appear in the SAFTA sensitive list. This
Table 3.5: List of 22 items reserved for exclusive manufacturing by the small-scale sector
Product code (NIC)
Product code (HS 2007) Product description
202501 200190 Pickles and chutneys205101 190590 Bread21100102 151491 Mustard oil (except solvent extracted)21100104 150810 Ground nut oil (except solvent extracted)
276001 940330, 940340, 940350, 940360 Wooden furniture and fixtures
285002 482020 Exercise books and registers
30391201 391723 PVC pipes including conduits up to 110mm diameter
30393501 391740 Fittings for PVC pipes including conduits up to 110 mm diameter.
305301 340600 Wax candles314201 340119 Laundry soap317001 360500 Safety matches318401 360410 Fire works319902 330741 Agarbattis321701 701810 Glass bangles340101 940310, 940320 Steel almirah341004 761010 Rolling shutters 34200602 940310, 940320 Steel chairs (All types)34200702 940310, 940320 Steel tables (All other types)342099 940310, 940320 Steel furniture (All other types)343302 830110 Padlocks345207 932393 Stainless steel utensils345202 761519 Domestic utensils (Aluminium)
Source: Authors’ calculation.

48
would ensure that the bilateral sensitive list is smaller than the regional sensitive list.
Step 2 required identifi cation of those items on India’s sensitive lists that have not been exported by the exporting country (Bangladesh, Pak-istan and Sri Lanka) for three consecutive years (2005, 2006 and 2007). Items that have not been supplied by these countries to the rest of the world are unlikely to be exported to India in the near future and will not pose any threat to Indian industry. Such items are therefore eliminated from the sensitive lists.
Step 3 involved identifying and eliminating those items that have been de-reserved. Hussain (1997) contains a list consisting of 1,025 such items. On the basis of the HS codes provided in the report, the items were identifi ed in the sensitive lists and eliminated.
Step 4 involved categorizing the remaining items on the sensitive lists on the basis of RCAs of the exporting country and India. Items in which India was seen to be competitive and those in which neither India nor the partner country was competitive were eliminated. The remain-ing items in which India was seen to be not competitive in the interna-tional market but the partner country was seen to be competitive were retained. The study computed RCA for each commodity on India’s sen-sitive list and paired it with RCA of the exporting country in the same item. Computing RCA for a pair of countries, i.e., India with each of the exporting country, the following four categories were generated:
Category I: IRCA > 1, ERCA < 1Category II: IRCA > 1, ERCA >1Category III: IRCA < 1, ERCA <1Category IV: IRCA < 1, ERCA > 1Here, IRCA denotes India’s RCA and ERCA denotes the exporting
country’s RCA. Category I comprises items in which India is competi-tive but the exporting country is not. Such items should be removed from the sensitive list as the importing country is well-equipped to face competition in the international market and hence, can face competition in the domestic market too. Category II indicates a situation where both India and the exporting country are competitive. These items can also be removed from the sensitive list since India is already competing with the exporting country in the international market. Category III compris-es items where neither India nor the exporting country is competitive. Category IV comprises items in which the exporting country is competi-tive but India is not. Such items can be retained in the sensitive list.
Step 5 involved adding items important on food security and rev-enue grounds to the pruned list to obtain the recommended sensitive list.
Pruning India’s sensitive lists under SAFTA
Regional Economic Integration Challenges for South Asia during turbulent times
49
While the contribution of the study lies in the pairing of RCAs be-tween India and the exporting country to identify competitive items in each country, the concept itself has certain limitations even though it has strong theoretical underpinnings. One problem is that the specifi cation of the concept is usually in terms of pre-trade relative prices whereas the data used is generated by trade fl ows in post-trade equilibria (Vol-rath 1991). While this problem cannot be overcome, the fact that there are gaps between the inferred and true comparative advantage needs to be kept in mind while drawing policy inferences. The other problem arises due to aggregation where the commodity becomes composite and describes an industry or a sector. The present study tries to address this problem to some extent by computing RCA at the six-digit level.
Another limitation of the study is that it relies only on RCAs to as-sess competitiveness. It does not take into account unit values of the exporting country in relation to other competitors, and productivity di-mensions related to the domestic industry.
4. Results
4.1 Sri Lanka
The operational sensitive list for Sri Lanka consists of 215 items, but after excluding items considered sensitive in terms of food security and reve-nue purposes, the elimination exercise was carried out on the remaining 199 items. It was also examined whether duty-free concessions granted to 216 apparel items were those in which India was vulnerable. This exercise was carried out by computing RCAs of both countries in these items and classifying them in the four categories mentioned above.
A step-wise elimination of items in the sensitive list is outlined below.Step 1: Out of the 199 items under consideration for elimination, 38
are not on the SAFTA sensitive list.9 Therefore, these items should be eliminated from the bilateral sensitive list. This leaves 161 items for fur-ther pruning.
Step 2: Of the 161 items, 17 items were not exported at all by Sri Lan-ka to the world in 2005, 2006 and 2007, which indicates that Sri Lanka does not have the capability to supply these items. Hence, these items can be eliminated from the ISFTA sensitive list, which leaves 144 items remaining.
Step 3: Of the 144 items, there are 65 items which were earlier re-served for exclusive manufacturing by the small-scale sector but have now been de-reserved. After eliminating these items, the number of items that remain on the sensitive list is 79.

50
Step 4: For these 79 items, RCAs are computed for India and Sri Lan-ka. Each such pair is classifi ed into four categories based on whether the value of the RCA is greater than or less than unity. The number of items in Category I (India competitive), Category II (India and Sri Lanka both competitive) and Category III (neither India nor Sri Lanka competitive) are 26, 13 and 47 respectively. As discussed earlier, items in these three categories can be eliminated from the sensitive list; thus leaving only nine items on the ISFTA sensitive list.
Regarding the 216 apparel items that are granted duty free access to India, RCAs of both countries were computed, based on which they were classifi ed into the four categories. It was found that 22 fall in Cat-egory I (India competitive), 107 in Category II (both India and Sri Lanka competitive), 27 in Category III (neither India nor Sri Lanka competi-tive) and 60 in Category IV (Sri Lanka competitive). A large number of items falling in Category IV shows that India has opened up its market to Sri Lanka’s apparel even in the most critical category.
4.2 Bangladesh
Step 1: Out of 298 items in the sensitive list for Bangladesh (exclud-ing 33 items important from food security and revenue perspectives), 158 items were not exported by Bangladesh to the world in 2005, 2006 and 2007. Hence, these items were eliminated from the list, thereby leaving 140 items.
Step 2: Of the 140 items, there were 25 items that belonged to the ear-lier list reserved for small-scale manufacturing. Eliminating these, 115 items remained in the sensitive list for further examination.
Step 3: RCAs of both India and Bangladesh in these remaining 115 items were then computed and the items were classifi ed into the four categories. It was found that only eight items belonged to Category IV (Bangladesh competitive).
RCAs of India and Bangladesh in the 146 apparel items in which India granted duty-free access to Bangladesh showed that 49 fell in Category IV (Bangladesh competitive). As in the case of Sri Lanka, this shows that India has provided non-reciprocal and asymmetric facilities to Bangladesh.
4.3 Pakistan
Step 1: Of the 877 items (excluding those important for food security and revenue-sensitive ones), 125 were not exported at all by Pakistan to
Pruning India’s sensitive lists under SAFTA

Regional Economic Integration Challenges for South Asia during turbulent times
51
the world in the three years between 2005 and 2007 and can, therefore, be eliminated. This leaves 752 items in the sensitive list.
Step 2: Of the 752 items, 274 items were reserved for the small-scale sector which have now been de-reserved and hence these items should be removed. This leaves 478 items in India’s sensitive list for Pakistan.
Step 3: These 478 items are categorized into the four categories on the basis of RCAs of the two countries in these products. It was found that 84 items belonged to Category I (India competitive), 109 to Category II (both India and Pakistan competitive) and 218 to Category III (nei-ther India nor Pakistan competitive). The remaining 67 items belonged to Category IV, which means India is likely to face competition from Pakistan in these items in the international market and are, therefore, a possible threat to India.
4.4 Elimination summary and pruned sensitive lists
Table 3.6 provides a summary of the elimination processes carried out in the case of all three countries and the pruned sensitive lists.
Table 3.6: Elimination summary and pruned sensitive lists
Category Sri Lanka Bangladesh Pakistan
Step 1 Items in bilateral sensitive list but not in SAFTA sensitive list 38 - -
Step 2 Zero export items 17 158 125Step 3 De-reserved items 65 25 274
Step 4
RCA categories:Category I: IRCA > 1; ERCA < 1 26 27 84Category II: IRCA > 1; ERCA > 1 13 13 109Category III: IRCA < 1; ERCA < 1 31 67 218Category IV: IRCA < 1; ERCA > 1 9 8 67
Pruned sensitive list 9 8 67
Note: Items sensitive to food security and with revenue considerations have been excluded here.Source: Authors’ calculations.
Sector-wise distribution of the pruned sensitive lists is provided in Table 3.7. For Sri Lanka, seven out of nine items are plastic and rub-ber products, while for Bangladesh, eight items are distributed over fi ve sectors. In the case of Pakistan, 75 percent of the items are vegetable and textile products. After adding items sensitive to food security and with revenue implications (tobacco and alcohol) to the pruned sensitive lists, we get the recommended sensitive lists for India (Table 3.8).

52
Table 3.8: Recommended sensitive list
Sri Lanka Bangladesh PakistanPruned sensitive list 9 8 67Food security items, tobacco and alcohol 16* 33 33Recommended sensitive list 25 41 100
* There are only alcohol and no tobacco and food security items in the operational sensitive list under ISFTA.Source: Authors’ calculations.
It may be pointed out that since India has not offered any conces-sions to Pakistan, the sensitive list is the largest for Pakistan, with tex-tiles and related products having the largest share. These are items in which India has given substantial concessions to Sri Lanka and Bangla-desh. Hence, India can give concessions to Pakistan also in the textile and related products category. Now that Pakistan has given most-fa-voured-nation (MFN) status to India, it should reciprocate by pruning its sensitive list for Pakistan.
5. Conclusion
This article provides a policy tool to prune India’s sensitive lists for Sri Lanka, Bangladesh and Pakistan. The exercise to eliminate items from the sensitive lists started by identifying items that are included in the ISFTA sensitive list but not in the SAFTA sensitive list; items that can-not be supplied by the exporting countries to the world; items that have
Pruning India’s sensitive lists under SAFTA
Table 3.7: Sector-wise distribution of items in pruned sensitive list
S.N. Description Sri Lanka Bangladesh Pakistan1 Live animals 1 22 Vegetable products 1 3 113 Animal/Vegetable fats and oils 14 Prepared foodstuffs 2 15 Mineral products 26 Chemical and allied industries 17 Plastics and rubber 78 Wood and articles of wood 19 Paper products 110 Textiles and textile articles 4711 Footwear, headgear, walking sticks, etc. 112 Base metals and articles of base metals 2
Pruned sensitive list items 9 8 67
Source: Authors’ calculations.

Regional Economic Integration Challenges for South Asia during turbulent times
53
been removed from the list of products reserved for exclusive manufac-turing by the small-scale industry in India; and items in which India is competitive and those in which neither India nor the exporting country is competitive. It is seen from this exercise that India can maintain much shorter sensitive lists for Sri Lanka and Pakistan than it currently does, although it now provides duty-free access to all the products from Ban-gladesh except for 25 items (such as alcohol and tobacco) by virtue of the latter being an LDC.
Even those items that would be retained on the sensitive lists for Pakistan and Sri Lanka in particular are those in which India is not competitive. Hence, retaining them on the sensitive list for long would encourage ineffi ciency. Therefore, it is imperative to retain these items in the list only for a defi nite period of time (three to fi ve years) during which India’s domestic producers make themselves able to face external competition.
Notes
1 Currently, there are eight members in the SAARC after Afghanistan became its newest member in 2008.
2 The RCA index is the ratio of the share of a given product in a country’s ex-ports to the product’s share in world exports (Balassa 1965). RCA is comput-ed using the formula RCAij=(Xij/XI)/(Xwj/XW), where Xij represents coun-try i’s export of commodity j, Xwj represents world exports of commodity j, XI represents the total exports of country I, and XW represents total world exports. The RCA index has been computed by averaging item-wise RCA for each of the years 2005, 2006 and 2007. An RCA index value of greater than unity implies that the country is competitive in exporting that product.
3 Under the India-Nepal FTA signed in 1996, India has maintained a list com-prising only three items, namely alcoholic liquors, cigarettes and tobacco, and perfumes and cosmetics of non-Contracting Party origin.
4 Central Board of Excise and Customs (CBEC) Notification No. 67/2006 dated 30 June 2006.
5 CBEC Notification No. 107/2008 dated 6 October 2008.6 CBEC Notification No. 52/2008 dated 22 April 2008; on sourcing of fabric
from India up to a limit of 3 million pieces.7 CBEC Notification No. 51/2008 dated 21 April 2008.8 The original and the operational sensitive lists for Sri Lanka do not contain
any alcohol and related products.9 As referred to earlier, 86 items in the ISFTA were not included in the SAF-
TA sensitive list. Of these, 48 belonged to the textile sector. 46 textile items were removed from the ISFTA sensitive list under a TRQ in 2008 through the CBEC Notification No. 52/2008, leaving 40 items in the ISFTA sensitive list. This list included two items that were not in the list of TRQ items. Adjusting for these two items, there are 38 items which are in the ISFTA sensitive list but not in the SAFTA sensitive list.

54
References
Balassa, Bela. 1965.“Trade liberalization and ‘revealed’ comparative ad-vantage.” The Manchester School of Economic and Social Studies, Vol. 33: 99–123.
Baysan, Tercan, Arvind Panagariya and Nihal Pitigala. 2006. “Prefer-ential trading in South Asia.” Policy Research Working Paper 3813. Washington, D.C.: The World Bank.
Dornbusch, Rudiger, Stanley Fisher and Paul Samuelson. 1977. “Com-parative advantage, trade and payments in a Ricardian model with a continuum of goods.”American Economic Review, Vol. 67, No. 5: 823–39.
Hussain, Abid. 1997. “Report of the expert committee on small enter-prises.” Government of India.
Kathuria, Sanjay. 1997.“Competitiveness of Indian industry.” In Dilip Mookherjee (ed.), Indian industry: Policies and performance. New Del-hi: Oxford University Press.
Pitigala, Nihal. 2005. “What does regional trade in South Asia reveal about future trade integration?” Policy Research Working Paper 3497. Washington, D.C.: The World Bank.
Ricardo, David. [1817] 2002. On the principles of political economy and taxa-tion. Reprinted version of 3rd edition. London: Empiricus Books.
Siggel, Eckhard. 2007. “International competitiveness and comparative advantage: A survey and proposal for measurement.”Journal of In-dustry, Competition and Trade, Vol. 6, No. 2, 137–59.
Taneja, Nisha and Aparna Sawhney. 2007. “Revitalizing SAARC trade: India’s role at the 2007 summit.” Economic and Political Weekly, 31 March: 1081–4.
Volrath, Thomas. L. 1991. “A theoretical evaluation of alternative trade intensity measures of revealed comparative advantage.” Wel-wirtschaftliches Archiv: 265–80.
Weerakoon, Dushni. 2010. “The political economy of trade integration in South Asia: The role of India.” The World Economy, 916–27.
Weerakoon, Dushni and Jayanthi Thennakoon. 2006. India-Sri Lanka FTA: Lessons for SAFTA. Jaipur: CUTS International.
Pruning India’s sensitive lists under SAFTA

Regional Economic Integration Challenges for South Asia during turbulent times
55
1. Introduction
In recent times, non-tariff barriers (NTBs) have tended to gain growing attention of both businesses and policy makers against the backdrop of a secular decline in tariff barriers arising from trade liberalization policies pursued by most developing countries. Exporters increasingly complain about the NTBs that they have to face in importing countries when doing business.
The reasons for the existence and proliferation of NTBs are varied and diverse. It is true that oftentimes NTBs are put in place for protec-tionist purposes; however, NTB-imposing countries cite a host of argu-ments as to why such barriers are in place and are necessary. According-ly, the defensive interests and offensive interests in the context of NTBs tend to vary depending on the nature of the interest of the exporting/importing countries.
Non-tariff barriers in South Asia: Nature, implications and measures to address the challenges
Chapter 4
Mustafi zur Rahman

56
It is to be noted that NTBs constrain not only bilateral trade fl ows; they have emerged as a stumbling block to trade cooperation in the con-text of many regional trade agreements (RTAs) as well. It is a matter of record that in many RTAs, set up in the fi rst place to enhance intra-re-gional trade fl ows, the emergence of various NTBs has undermined and defeated the very objectives of the RTAs. The South Asian Association for Regional Cooperation (SAARC) has not been an exception in this regard. Indeed, it is precisely because of this that policy makers in the SAARC region have been giving increasing attention to this issue.
Although SAARC was established in 1985, the fi rst institutional ar-rangement for stimulating intra-regional trade was put into motion only in 1993 when the SAARC Preferential Trading Arrangement (SAPTA) got off the ground. Between 1993 and 2005, four rounds of SAPTA nego-tiations were held in all, with each successive round having an increas-ingly large number of goods being accorded preferential tariff treatment by member countries. The margin of preferences was also gradually raised.1 However, SAPTA did not deal with NTB issues in a compre-hensive manner.
SAPTA was succeeded by the Agreement on South Asian Free Trade Area (SAFTA). The SAFTA Agreement, which came into operation in 2006, envisaged to bring down the existing tariff barriers in accordance with a tariff liberalization programme (TLP) agreed by the member countries (Table 4.1). The TLP included three schedules: i) a positive list; ii) a sensitive list; and iii) a residual list. Article 7 of the SAFTA Agree-ment took a two-track approach: one for developing-country members, and the other for least-developed-country (LDC) members. Duties on tariff lines belonging to the positive list were set at zero from the date of implementation of the SAFTA Agreement. However, a large number of tariff lines belonging to the sensitive lists continued to be traded at the existing most-favoured-nation (MFN) tariff rates. The sensitive lists were to be reviewed periodically (every four years).2 Duties on items belonging to the residual list were to be reduced to between 0 and 5 percent by 2013 by developing-country members and by 2016 by LDC members.3
It should, however, be noted that in recent years, both developing countries and LDCs in SAARC have reduced their respective tariffs, pri-marily through various trade liberalization reforms. MFN tariff rates which used to be, on average, in the range of 50–60 percent during the early 1990s had in fact come down to 15–20 percent in recent years. Thus, the preferential margins enjoyed by members under the TLP of the SAFTA Agreement are set to provide a declining dividend. Never-theless, the fact of the matter is that a large number of items continue to
Non-tariff barriers in South Asia: Nature, implications and measures to address the challenges

Regional Economic Integration Challenges for South Asia during turbulent times
57
remain in the respective sensitive lists of SAARC, undermining both the spirit and the effi cacy of SAFTA (Table 4.2).4
Table 4.1: Tariff liberalization programme (TLP) under SAFTA
Phases Countries Existing tariff rates
Tariff rates proposed under SAFTA
Year to be completed
First phaseIndia, Pakistan and Sri Lanka 20% and above 20% max 2008
SAFTA LDCs 30% and above 30% max 2008
Second phase
India, Pakistan 20% or below 0–5% 2013Sri Lanka 20% or below 0–5% 2014SAFTA LDCs 30% or below 0–5% 2016
Source: SAARC Secretariat (2006).
Table 4.2: Sensitive lists of SAFTA countries
Number of tariff lines in sensitive listAfghanistan 1,072Bangladesh 1,233 (for LDCs) and 1,241 (for non-LDCs)Bhutan 150India 480 (for LDCs) and 868 (for non-LDCs)Maldives 681Nepal 1,257 (for LDCs) and 1,295 (for non-LDCs)Pakistan 1,169Sri Lanka 1,042
Source: Author’s compilation.
Despite four rounds of tariff liberalization under SAPTA and tar-iff liberalization under SAFTA, the share of intra-regional trade in the global trade of SAARC countries remains fairly low. A little less than 5 percent of the global trade of SAARC countries is with one another (Table 4.3), compared to 61.7 percent for the European Union (EU), 45.6 percent for the North American Free Trade Agreement (NAFTA) and 23.7 percent for the Association of Southeast Asian Nations (ASEAN). Although the relative shares of trade of individual SAARC countries vary signifi cantly across countries, the fact remains that except for Af-ghanistan, Bhutan and Nepal, intra-regional export is rather low for all other SAARC members. On the other hand, imports are more widely distributed. Intra-regional exports and imports of the region’s domi-nant economy, India, are dismally low (4.5 percent and 0.6 percent of its global exports and imports, respectively).5

58
Table 4.3: Intra-SAARC trade as percentage of global trade of SAARC countries
1985 1990 1995 2000 2005 2008Export 4.89 3.45 4.52 4.56 6.60 6.29Import 2.11 2.18 3.94 4.26 4.70 3.94Total trade 3.04 2.70 4.20 4.39 5.47 4.81
Source: Computed from International Monetary Fund’s Direction of Trade Statistics, various years.
It is often argued that one of the major reasons for this low level of intra-regional trade lies in the presence of a plethora of NTBs that limit the potential benefi ts and opportunities emerging from the free trade accord. NTBs are perceived to be not only limiting the scope of realizing the benefi ts of duty-free market access; they also severely constrain the promotion of intra-regional trade in general. It is true that the SAFTA Agreement has some provisions for reducing NTBs, facilitating cus-toms cooperation and trade facilitation. However, not much progress has been made in this context so far. There is, thus, a need to conduct an in-depth investigation into what the various NTBs to trade in the South Asia region are, how these affect intra-regional trade, how these could be addressed, and what institutional mechanisms may be put in place to resolve the attendant disputes.
This article documents the various NTBs in place in South Asia and identifi es modalities to address these, based on cross-country and cross-regional experiences. Section 2 examines the various concepts and ty-pology of NTBs;6 Section 3 identifi es the nature of the various NTBs in place in South Asia; Section 4 discusses cross-country experiences in addressing NTBs; Section 5 documents how NTBs are being addressed within the SAFTA architecture and the lessons that can be drawn from the experience of other regions; Section 6 provides policy recommenda-tions to address NTBs in the context of SAARC; and Section 7 concludes the article.
2. NTBs: Concept and typology
2.1 Defi nition of NTBs and their classifi cation
While a tariff is a tax imposed on foreign goods and services as these enter a country through customs points, NTBs are non-tax measures which exporters often have to encounter both at the border and behind the border when goods and services are imported by foreign buyers. Such measures could provide some advantage to domestic suppliers
Non-tariff barriers in South Asia: Nature, implications and measures to address the challenges

Regional Economic Integration Challenges for South Asia during turbulent times
59
(by raising their real effective rate of protection) or suppliers from other countries for which such measures are not exercised. Some of the NTBs tend to have relatively unimportant trade effects, e.g., packaging and labelling requirements can impede trade fl ows, but perhaps not sig-nifi cantly. On the other hand, NTBs such as quotas, voluntary export restraints, and other non-automatic import authorizations and variable import levies would have much more signifi cant effects on market entry as well as price competitiveness.
The broadest defi nition of NTBs includes any measure other than a tariff that distorts trade (Linkins 2002). Tariff barriers are easy to mea-sure since these are quantifi able. In contrast, NTBs are often grey and come in various shapes, sizes and forms. NTBs tend to lack concrete fea-tures and are often devoid of precise data and information and involve a lot of areas that are subject to interpretative ambiguities.
The United Nations Conference on Trade and Development (UNCTAD) provides a comprehensive list of NTBs which are classifi ed according to the typology of trade control measures. These fall under fi ve broad categories: Price control measures: Administrative pricing (minimum import pric-
es, administrative pricing); voluntary export price restraint (variable levies, variable components, compensatory elements, fl exible im-port fees, variable charges); anti-dumping measures (anti-dumping investigations, duties, price undertakings).
Finance measures: Advance payment requirements (advance import deposit, cash margin requirement, advance payment of customs du-ties, refundable deposits for sensitive product categories); multiple exchange rates; restrictive offi cial foreign exchange allocation (pro-hibition of foreign exchange allocation, bank authorization, transfer delays, queuing).
Quantitative control measures:– Non-automatic licensing (licence with no specifi c ex ante criteria,
licence for selected purchasers;– Licence for specifi ed use, licence linked with local production
(purchase of local goods, local content requirement, barter or counter trade); licence combined with or replaced by special im-port authorization;
– Authorization for sensitive product categories, licence for politi-cal reasons;
– Quotas: Global quotas (unallocated, allocated to exporting coun-tries), bilateral, seasonal, linked with export performance, linked with purchase of local goods, quotas for sensitive product cat-egories, for political reasons; prohibitions: total, seasonal, tem-
60
porary prohibition, suspension of issuance of licences, import diversifi cation, prohibition for political reasons (embargo);
– Export restraint arrangements: Voluntary export restraint (VER) arrangements, multi-fi bre arrangement (MFA); quota agreement, consultation agreement, administrative co-operation agreement, etc.;
– Enterprise-specifi c restrictions: Selective approval of importers, enterprise-specifi c quota.
Monopolistic measures: Single channel for import (state trading ad-ministration, sole importing agency), compulsory national services (compulsory national insurance, transport);
Technical regulations: Requirements for product characteristics, marking, labelling, packaging, testing, inspection and quarantine, information, requirement to pass through specifi ed customs, etc., pre-shipment inspection (PSI), special customs formalities, return obligation.The above discussion would indicate that NTBs are of fairly diverse
nature and many NTBs operate in grey areas and are subject to interpre-tation. For example, PSI is mandatory in many countries, at times, for values exceeding a certain fi xed amount. But exporters may consider this to be an NTB particularly when the export consignment is of small value, and in view of the additional costs that are to be incurred. It is also diffi cult to separate measures introduced with protectionist intent from measures originating from genuine concerns. The complex nature of NTBs makes these diffi cult to address, and their resolution often in-volve prolonged negotiations and arbitration processes.
2.2 Use of NTBs in international trade
As trade fl ows have increased, so have NTBs, but the structure has changed. If in the past licensing requirements, VERs, multiple exchange rates, price control and monopolistic measure were more prevalent, cur-rently, various types of standards (including private standards), certi-fi cation and technical requirements have emerged as more prominent types of NTBs.
NTBs increasingly include regulations referring to technical require-ments, either directly or by referring to or incorporating the content of a (mandatory or voluntary) standard, technical specifi cation or code of practice, with a view to protecting human or animal life or health (sani-tary regulation), protecting plant health (phytosanitary regulation), pro-tecting the environment and wildlife, ensuring human safety, ensuring national security, and preventing deceptive and unfair practices. In the
Non-tariff barriers in South Asia: Nature, implications and measures to address the challenges

Regional Economic Integration Challenges for South Asia during turbulent times
61
EU, the focus of regulations in recent times has been primarily on envi-ronment, health and safety. Recently, however, there have been tenden-cies by governments to regulate information technology and telecom-munications products in terms of certain features, such as privacy and security.
NTBs often give rise to disputes of various types. It has been seen that control measures such as those in the area of sanitary and phyto-sanitary (SPS) measures, meant to protect humans, animals and plants, have often exceeded multilaterally accepted norms. Often, what is ac-cepted by one country is not accepted by others. Technical barriers to trade (TBT) have often constrained trade fl ows, when standards, regu-lations and assessment systems intended to ensure safety were not ap-plied uniformly. Experience shows that, often, duplication of testing procedures is required although this does not add value to the product but adds to the cost of compliance and undermines competitiveness.
Regulators in developed countries apply stringent rules on food quality, packaging and labelling. For example, exports of poultry prod-ucts are particularly affected by sanitary regulations that encompass rules pertaining to equipment and methods used in the processing and packaging of the products. Obtaining approval often proves to be a lengthy process that involves substantial documentation and tedious bureaucratic procedures.
When perceived as protectionist measures, NTBs often get to be challenged in appropriate forums. When developed countries are mem-bers of an RTA, the dispute settlement mechanism of the RTA are put into effect whenever an aggrieved party lodges a complaint. In some instances, the Dispute Settlement Mechanism (DSM) of the World Trade Organization (WTO) has been put into effect when it was perceived to be a better route to resolve an NTB-related confl ict.
According to UNCTAD, over the last 10 years, there has been a seven-fold increase in government-mandated testing and certifi cation requirements with increasing costs that have to be borne by exporters, who have to comply with the various technical regulations and stan-dards-related requirements. The issue has been debated to such an ex-tent that a special working group has been created in the WTO to deal with NTBs. This working group has identifi ed a wide variety of NTBs based on discussions with and submissions of WTO member countries.
Table 4.4 provides an idea about the prevalence of NTBs in ASEAN, whose RTA far surpasses that of SAARC in performance. It reveals that NTBs come in various forms. Table 4.5 provides data on the tariff lines affected by various NTBs. The information provided in these tables is quite revealing.

62
Table 4.4: NTBs reported in ASEAN (as of 2007)
Country No. of NTBs Typology of NTBs
Cambodia 99 Import licensing, permits, technical measures (SPS), non-automatic licensing, prohibitions
Thailand 134 Technical measures (SPS), tariff rate quotas (TRQ), non-automatic licensing, import licensing, prohibitions
Vietnam 464 Prohibitions, import licensing, internal taxes and charges, labelling requirement, technical regulations
Malaysia 1,017 Import licensing, approved permit, registration certifi-cates, certificate of approval, technical measures (SPS)
Source: ASEAN Secretariat.
It is interesting to note from Table 4.5 that in ASEAN the overwhelm-ing majority of NTBs are related to customs surcharges (70 percent). NTB-imposing countries tend to argue that such measures are necessary on the ground of revenue concerns and providing safeguards to domes-tic producers (often, ostensibly, necessitated by safeguards and incen-tives in place in exporting countries). However, these are not generally expressed explicitly. One would have expected trade barriers to come down with the deepening of trade liberalization. However, this has not happened. What is also interesting to note is that NTBs in the form of SPS and TBT do not fi gure in a signifi cant manner in ASEAN. This is the case mainly because SPS- and TBT-related NTBs were largely resolved through agreements pertaining to mutual recognition of standards and certifi cation. This should be seen as a matter of heightened interest to SAARC members. One could infer that a mechanism such as the one in ASEAN could play an important role in reducing the number of NTBs in South Asia.
Table 4.5: Most prevalent NTBs in ASEAN
Types of NTBs Number (and percent) of tariff lines affected
Customs surcharges 2,683 (69.42)Additional charges 126 (3.26)Single channel for imports 65 (1.68)State trading administration 10 (0.26)Technical measures 568 (14.70)Product characteristic requirements 407 (10.53)Marketing requirements 3 (0.08)Technical regulations 3 (0.08)Total 3,865 (100.00)
Source: ASEAN Secretariat (2005).
Non-tariff barriers in South Asia: Nature, implications and measures to address the challenges

Regional Economic Integration Challenges for South Asia during turbulent times
63
The upshot of the above discussion is that when the issue of NTBs in the context of South Asia is considered, it will be well-advised to keep in mind that NTBs are a widely prevalent phenomenon in global trade and there is hardly any opportunity or scope to wish them away. Cross-country experiences indicate that the best way to go about to addressing the attendant issues is to build up capacities to ensure compliance, and put in place appropriate institutions to resolve the confl icts. In connec-tion with this, it will be relevant to fi rst examine the NTBs in South Asia with a view to identifying the nature of the NTBs and sectors which are most affected by these NTBs.
3. NTBs in South Asia
3.1 NTBs constraining intra-SAARC trade
If the UNCTAD defi nition of NTBs is considered, the menu of NTBs that apply to intra-SAARC trade would be quite an extensive one. A review of relevant sources indicates that all the four major trading part-ners in SAARC (India, Pakistan, Bangladesh and Sri Lanka) have a large number of NTBs in place. While individual members tend to consider most of their own NTBs to be genuine and WTO-compliant, they tend to consider NTBs imposed by trading partners to be trade restrictive, arguing that such NTBs have been put in place with a view to protecting the interests of domestic producers against imports. This diversity of approaches results in frequent disputes in the context of intra-regional trade in South Asia.
Though the SAFTA Agreement requires members to notify the Committee of Experts (CoE) of any NTBs and para-tariff measures, the CoE can only recommend their removal; these recommendations do not entail a binding commitment on the part of the party against which the complaint was submitted in the fi rst place.
A survey of NTBs reported by SAARC member countries to the CoE shows that NTBs that are most frequently imposed on trade among SAARC countries relate to SPS and TBT, quotas, anti-dumping mea-sures, licence requirements, and countervailing measures. Documenta-tion procedures and SAFTA certifi cation for rules of origin (RoO) are also considered NTBs by some exporters. Computerization of trade transac-tions (cargo declaration, licensing, and duty payments) has opened up the need for new standards [e.g., Automated System for Customs Data (ASYCUDA)] and compatibility across regional systems. Those who fail to comply with the related requirements tend to perceive those require-ments also as barriers.

64
A wide range of NTBs, albeit WTO-consistent, are in place in In-dia. These include TRQs on a number of tariff lines at the Harmonized Commodity Description and Coding System (HS) 8-digit level, import restrictions and licensing, and restrictions in the form of entry through particular ports. Under the India-Sri Lanka Free Trade Agreement, for example, tea and garment exports from Sri Lanka to India can only be cleared through specifi ed ports. In Bangladesh, there is a signifi cant ap-plication of para-tariffs (e.g., surcharges and supplementary duties)—estimates are that 38 percent of the average protection is due to para-tar-iffs. Bangladesh continues to maintain quantitative restrictions on eggs, poultry and salt, for which the government has obtained waivers from the WTO. Sri Lanka bans import of tea and spices on the grounds that low-quality imports, if mixed with Sri Lankan products, would reduce the quality of exports and thus affect their marketability.
As can be seen from Table 4.6, information collated by the Asian Development Bank and UNCTAD (ADB and UNCTAD 2008) shows that 86.3 percent of NTBs in the region relate to SPS, TBT and related measures. Thus, the overwhelming majority of NTBs are indeed in areas where compliance with SPS and TBT are major requirements. If such measures are on an MFN basis, non-discriminatory and equally appli-cable for all imports, and if these relate to compliance with relevant na-tional laws, one would be hesitant to call them protectionist measures. It is when these are applied on a discretionary basis and the required stan-dards are more stringent than national laws that these could perhaps be considered as NTBs in the strictest sense of the term.
Table 4.6: Percentage share of NTBs in all NTBs by SAARC countries
Non-tariff barriers ShareSPS, TBT, and other related measures 86.3Tariff quota 9.8Anti-dumping measures 7.4Licence requirement 5.3Countervailing measures 1.2
Note: Percentage shares exceed 100 percent since number of cases varies.Source: ADB and UNCTAD (2008).
A careful review of the various NTBs faced by exporters in South Asia shows that the manifold and diversifi ed NTBs that apply to trade among SAARC countries could be categorized according to the broad areas of: i) on the border NTBs (e.g., surcharges); and ii) behind-the-bor-der NTBs (violation of national treatment, in various forms). Broadly,
Non-tariff barriers in South Asia: Nature, implications and measures to address the challenges
Regional Economic Integration Challenges for South Asia during turbulent times
65
these may be grouped into seven clusters: i) NTBs related to SPS mea-sures; ii) NTBs related to customs regulations; iii) NTBs related to TBT and environmental measures; iv) quantitative restrictions, including ban; v) border-crossing barriers; vi) labelling requirements; vii) RoO; and viii) visa requirement.
3.2 NTBs identifi ed by NAMA Working Group
In the context of the ongoing non-agriculture market access (NAMA) negotiations at the WTO, a special working group was set up to look into NTBs. The NAMA Working Group identifi ed the following NTBs for Bangladesh, India, Pakistan and Sri Lanka.
Bangladesh Customs surcharges in the form of supplementary taxes. Health, religious, environmental and balance of payments pur-
poses. Quantitative restrictions. Import through state trading enterprises (salt). Restricted port of entry.
India Tariff rate quotas. Import through state trading enterprises. Health and sanitary regulations (quarantine fees). Restricted port of entry and inland customs port. Anti-dumping and countervailing duties. Customs valuation.
Pakistan Ban on imports from India of products not on the positive list of
771 items (corresponding to about 1,500 8-digit HS tariff lines). Local content required in the auto industry.
Sri Lanka Import ban (tea and certain spices). Import monopoly (wheat). Health and sanitary regulations.
Imports of particular items face additional duties (other than customs duties) in various SAARC countries in the form of customs surcharges (supplementary taxes), additional charges (lending fee, insurance fee),

66
pre-shipment fees and special additional duties (SADs). Restrictive fi -nancial measures in the form of a bank guarantee, for import values exceeding a certain amount, are also in place in many countries. In many countries, monopolistic measures are in place in the form of re-quirement to take the service of national institutions such as national insurance companies and modes of transport owned nationally such as national fl ag carriers.
3.3 Connectivity barriers as NTBs
Lack of physical, industrial and communication infrastructure in the region has also contributed to restrict trade. This could also be termed NTBs in the context of its broad defi nition. Kabir (2007) provides a sum-mary of the key barriers to trade in this context.
Air and maritime port facilities in South Asia are less competitive compared to those in East Asia, leading to cost escalation. While it takes two hours to clear a vessel in Singapore and Laem Chabang, Thailand, it takes 2–3 days in Chittagong. At Delhi airport, average cargo dwell time is 2.5 days. Some estimates have been made with regard to the magni-tude of the NTBs in the form of lack of connectivity and infrastructure. For example, World Bank (2003) estimates savings arising from switch-ing to rail transport (from road) along the Kolkata-Kathmandu corridor at 22–33 percent of total road cost.
Disparity in infrastructure facilities among South Asian countries has been on the rise in recent years. Additionally, progress in informa-tion technology is also considered to be as important as development of the needed physical infrastructure. This is crucial for customs and stan-dards harmonization among the countries of the region. This is lacking in South Asia, leading to disputes regarding interpretation of customs rules and procedures.
Lack of border infrastructure and traffi c planning is a major con-straint to deepening trade relations in SAARC. Most border crossings among South Asian countries are not designed to handle the volume of traffi c that currently passes through them. This results in severe traffi c congestion and delays in handling shipments.
Land ports at border-crossing points have emerged as major stum-bling blocks from the perspective of the need for providing seamless and multi-modal movement of goods across borders. Since goods are required to be transshipped, precious time is wasted at the borders. About 90 percent of the trade between India and Bangladesh is carried out through 17 land ports. These land ports do not have adequate stor-age facilities; oftentimes, goods have to be off-loaded on no-man’s land
Non-tariff barriers in South Asia: Nature, implications and measures to address the challenges

Regional Economic Integration Challenges for South Asia during turbulent times
67
and are not allowed to be brought to warehouses (e.g., Indian goods exported to Bangladesh). Due to increased trade volumes, storage dwell time has been on the rise at the ports where storage capacity tends to be highly inadequate. At the Petrapole-Benapole border, it takes more time to unload vehicles at the land ports compared to the physical clearance time. All these factors undermine competitiveness and add to cost.
In some of the land ports, there is also lack of adequate human re-sources to deal with customs clearance work. Often, the offi cer is not appropriately trained, and has to send documents to the head offi ce for the opinion of the appropriate authority. This causes inordinate delay. When goods are exported under preferential treatment, delays hap-pen because customs offi cials at the border point do not have a good knowledge about tariff classifi cation and are not adequately equipped to certify the authenticity of the certifi cates of origin for compliance with the relevant RoO. Many of the land customs offi ces at the border lack testing and laboratory facilities and have to send samples to relevant institutions which are situated far away. This is a common phenomenon faced by Bangladeshi exporters of cement and fruit juice to the North-east Indian markets. Absence of appropriate banking facilities (dealing with letters of credit opened for trade) also delays trade transaction and discourages trade.
Traders’ practices also often create bottlenecks for customs authori-ties at border points. Importers often do not submit required clearance documents at customs points on time. Since a signifi cant time is required to collect the formidable array of supporting documents, importers use godowns as storage facilities for the period they require to deal with the fi nancial and documentation work involved. This is also often the case because storage charges tend to be relatively low. There is a need to raise awareness among business people with regard to the need to have the required paperwork ready when dealing with the customs.
A lack of cross-border transport agreements also creates problems for movement of goods when trade takes among SAARC countries. Due to the lack of through-transport movement, there are formidable transport ineffi ciencies at the interface. SAARC countries have about 3.8 million km of road network which account for about 10 percent of world road network; the railway networks are spread over 77,000 km. However, because of a lack of bilateral and multilateral road and rail transport agreements, a seamless movement of goods, and road/rail vehicles and wagons across borders is not possible. This is true for movement between Bangladesh and India, and India and Pakistan. Ma-jor obstacles here include absence of protocols, lack of standardization of technologies, operation and maintenance practices, incompatibility

68
of rolling stock, load restrictions on bridges, differences in rail gauges, braking system and couplings.
At present, there are also restrictions on movements of goods from Nepal and Bhutan through India to Bangladesh that are destined for third countries. Although South Asia has 25 major ports and one of the largest water systems in the world, lack of capacities, and absence of comprehensive protocols hinder cross-border movement of goods. This lack of trade facilitation is a major NTB (in the broad sense of the defi ni-tion) that limits the scope of intra-regional trade and results in costly transshipment.
In recent times, discussions have been initiated, at the bilateral level, to address some of the attendant issues. Existing protocols are being reviewed to explore the possibility of greater transport cooperation among Bangladesh, Nepal, Bhutan and India.7 Some experts have ar-gued that establishing a SAARC rail network will be the best way to move forward at this point of time. Addressing the issues related to transport facilitation to stimulate trade among SAARC countries will require comprehensive negotiations among the member countries to identify win-win options. Only this could lead to successfully address-ing this particular variant of NTBs.
The Joint Communiqué resulting from the visit of Bangladeshi Prime Minister to India is now being followed up with several initiatives in a number of areas to foster greater sub-regional connectivity among Ban-gladesh, Bhutan, Nepal and India. These are to cover rail, road and wa-terways as well as multi-modal transport protocols.8
3.4 Rules of origin
The general criterion of SAFTA RoO is change of tariff heading (CTH) plus 40 percent value addition for non-LDCs and CTH plus 30 percent value addition for LDCs. There are also product-specifi c rules for 191 items on which the general criterion does not apply. Under regional cumulation rules of SAFTA, applicable rules relate to the provision of value addition criterion only. In this case, the regional value addition is 50 percent, of which 20 percent has to be in the fi nal exporting country. As SAFTA moves forward, the RoO will need to be further revised and made more trade friendly to stimulate intra-regional trade.
3.5 Possible barriers to services trade
With the signing of the SAARC Agreement on Trade in Services (SATIS), the services sector has also come within the ambit of a regional arrange-
Non-tariff barriers in South Asia: Nature, implications and measures to address the challenges

Regional Economic Integration Challenges for South Asia during turbulent times
69
ment. Experiences with services trade agreements tend to show that barriers to services trade could be in many forms: exporters could face restrictions in the form of limit on the total value of services transaction, the number of services operations, the number of natural persons to be employed for the supply of a particular service, measures which force a service supplier to supply a service through a particular legal entity, and limits on foreign investment in particular sectors. Also, in connec-tion with the schedule of specifi c commitments, there could be barriers by way of terms, limitations and conditions of market access, conditions and qualifi cations with regard to national treatment, undertakings relat-ing to additional commitments, the time frame for the implementation of such commitments, and the date of entry into force of such commit-ments. Any future framework of dispute settlement will need to keep these possible areas of diversity of interests in perspective.
4. Global experience in addressing NTBs
A majority of RTAs have developed mechanisms to deal with NTBs. They have developed mechanisms for assessment of equivalence of qualifi cation, licensing, and other related documents with a view to im-proving market access. The EU, NAFTA and the Trans-Tasman Mutual Recognition Agreement (TTMRA) (between Australia and New Zea-land) are some examples. A large number of RTAs have signed mutual recognition agreements (MRAs) whereby certifi cation and laboratory tests as well as the standards of one member country are accepted at border points by other members. Such mutually benefi cial arrangements were found to be a good modality to address concerns of RTA member countries with regard to compliance with SPS and TBT requirements.
ASEAN, for example, has signed an agreement on the general framework of a process by which NTBs would be addressed, and subse-quently eliminated. The process involves: i) verifi cation of information on NTBs; ii) prioritization of products/NTBs; iii) developing specifi c work programmes; and iv) obtaining a mandate from the ASEAN Eco-nomic Ministers to implement the work programme.
Member countries verify the list of NTBs and products that are af-fected by the NTBs, which is compiled by the ASEAN Secretariat. Sev-eral criteria have been considered by the Interim Technical Working Group with a view to identifying which products/measures have to be dealt with fi rst. These criteria are to be used individually or in combina-tion with each other in order to set priorities. These criteria, in order of importance, are: i) the number of private sector complaints; ii) differ-ence between domestic and world prices; and iii) trade value.

70
The fi rst criterion would rely on the private sector’s or exporters’ complaints since they are the ones who are in a better position to tell how various measures existing in the country of destination act as a trade barrier. The second criterion relates to the price divergence be-tween domestic and global prices. The price gap provides an indica-tion as to the value of trade which is affected and helps to come to a reasonable understanding on to what extent prices would come down in importing countries if such barriers are not there. However, fi nding appropriate price data to make this type of comparison has not been easy. The third criterion prioritizes those NTB-affected products which are traded most widely (both within and outside the region). The fact that the ASEAN Secretariat has this information certainly helps.
However, it is not easy to prove whether NTBs present in a sector hamper trade or not. If the amount of trade in a particular item is sig-nifi cant, this may indicate that the NTB is not an important hindrance to trade; on the other hand, if that is not the case, the NTB could be identi-fi ed as a major constraint. The criteria may not be mutually exclusive and could also be used jointly. Indeed, where all three criteria converge, this should give a robust indicator of the degree to which NTBs exist in that product or sector and appropriate actions may be initiated depend-ing on this. At present, ASEAN is in the process of doing this.
4.1 NAFTA dispute settlement mechanism
The NAFTA Secretariat deals with complaints regarding NTBs under Chapter 19 and Chapter 20 of NAFTA. Chapter 19 provides for a system of bi-national panel review of decisions by a party authority on anti-dumping and countervailing duty matters. Article 1903 provides that a party may request that amendments to the other party’s anti-dumping or countervailing duties be referred to a bi-national panel for a declara-tory opinion on whether the amendment is consistent with the General Agreement on Tariffs and Trade (GATT) and NAFTA. Bi-national pan-els comprise fi ve independent experts.
In Chapter 20, the process is “applicable to all disputes regarding the interpretation of application of the NAFTA” and “intended to re-solve disputes by agreement, if at all possible”. The process begins with government-to-government consultations, which can then proceed to a meeting of the ministerial-level Free Trade Commission, and fi nally to the creation of a fi ve-member arbitration panel. Panel rules are designed to result in fi nal panel decisions within 315 days of the date of a request for a panel. Within this period, strict deadlines have been established re-lating to the selection of panel members, fi ling of briefs and reply briefs
Non-tariff barriers in South Asia: Nature, implications and measures to address the challenges

Regional Economic Integration Challenges for South Asia during turbulent times
71
and the setting of the date for oral argument. In the event of failure to comply with the decisions of a bi-national panel on statutory amend-ments, the complaining state is free to adopt comparable legislation or equivalent executive action to the violating amendments, or even with-draw from NAFTA.
Chapter 20 also provides for scientifi c review boards which may be selected by a panel in consultation with the disputing Party, to provide a written report on any factual issues concerning environmental, health, safety or other scientifi c matters to assist panels in rendering their deci-sions. Moreover, a third party that believes it has a substantial interest in a disputed matter is entitled to join consultations or a proceeding as a complaining party on written notice.
4.2 NAMA dispute settlement proposal (NAMA 11)
Pointing to the several limitations in the existing WTO mechanisms related to resolution of trade disputes, in 2006, a group of developing countries put forward a proposal for the resolution of NTBs through a facilitative mechanism. Referred to as the NAMA dispute settlement proposal (NAMA 11), it stipulates that the WTO’s DSM “which works on the principles of an adversarial process, is expensive, and the time of up to 2 years taken for an enforceable decision, often frustrates the exporter’s need for a timely solution”.9 Also, particularly for develop-ing countries, the dispute settlement process is costly. Therefore, the proposal calls for the establishment of a “NTB Resolution Mechanism”, which would be guided by the principle of “good faith” and concilia-tory negotiations wherein every member would make a concerted effort to resolve the NTB at hand, under the guidance of a mutually agreed “facilitator”.
According to the proposal, a solution mutually acceptable to the parties concerned and which is consistent with the covered agreements is to be preferred. In the absence of a mutually agreed solution, the fi rst objective of the dispute settlement mechanism is usually to secure with-drawal of the measures concerned if these are found to be inconsistent with the provisions of any of the covered agreements. One of the most important aspects of the proposal is that the recommendations on pos-sible solutions that the facilitator would provide within 60 days would be non-binding. It would be mandatory for the parties concerned to par-ticipate in the NTB resolution procedure, but implementing the recom-mended solutions would not be mandatory. The proposal also mentions that during consultations, members should give special attention to the particular problems and interests of developing-country members.

72
4.3 EU dispute settlement proposal
The EU currently follows the WTO’s DSM to deal with NTBs. How-ever, like the NAMA 11 group of developing countries, it also points to the limitations that the existing WTO mechanism has in addressing dis-putes. Therefore, according to the EU Trade Commission, the following recommendations have been made to strengthen the process: Introduction of a system of more permanent panelists. Clarifi cation of the dispute settlement understanding provisions on
implementation. This covers notably:– The sequencing issue (the steps which need to be taken, and
their order, before determining that the losing party has not complied correctly with the dispute settlement body recom-mendations and reacting accordingly).
– The arbitration procedure on the level of suspending concessions.– The establishment of a procedure to lift suspension of conces-
sions once a losing party has implemented changes. Improvement of the provisions on trade compensation to make
them a more attractive option before suspending the concessions, and speeding up the process whenever this is feasible and justifi ed.
Greater transparency to secure continued public support and confi -dence in the WTO system, while preserving its inter-governmental character.
5. Dispute settlement mechanism in SAFTA and its effi cacy
5.1 SAFTA CoE
The SAFTA CoE, with government offi cials of SAARC countries as its members, is the body that embodies the dispute settlement mechanism under SAFTA. It has been entrusted with dealing with non-tariff re-lated issues and complaints involving SAARC countries.10 Currently, the CoE deals with notifi cations and responses with regard to NTBs. To begin with, contracting states notify the SAARC Secretariat about all non-tariff and para-tariff measures to their trade on an annual basis. The measures are then reviewed by the CoE, established under Article 10, in its regular meetings to examine their compatibility with relevant WTO provisions. The CoE then recommends elimination of the measure or implementation of the measure in the least trade-restrictive manner in order to facilitate intra-SAARC trade. Four sub-group meetings on NTBs have taken place, and most notifi cations and complaints are being dealt through bilateral negotiations.
Non-tariff barriers in South Asia: Nature, implications and measures to address the challenges

Regional Economic Integration Challenges for South Asia during turbulent times
73
In view of the importance of the issue, high-level meetings, both at ministerial and summit levels, have put an emphasis on a coordinated and structured response to address non-tariff and para-tariff measures that impede and discourage intra-SAARC trade. The sub-group on non-tariff measures, which was constituted at the fi rst meeting of the CoE in April 2006, asked all member countries to notify the CoE about the non-tariff measures they were facing while exporting to SAARC partner countries. Member countries, in response, notifi ed non-tariff measures faced by their exporters in their intra-regional trade. The sub-group, in its fourth meeting, categorized the notifi cations under six broad headings: i) SPS measures; ii) technical barriers to trade; iii) para-tariff measures; iv) trade facilitation measures relating to infrastructure, procedures, transparency, standards and testing; v) customs rules and procedures; and vi) others. It was decided that individual SAARC member countries would examine all notifi cations addressed to them by their respective partner countries to decide as to whether those met the basic principles of the WTO relating to non-discrimination and national treatment and whether their application had been made in a trade-friendly manner. It was decided that subsequent meetings of the CoE would review the responses to the notifi cations and identify the way forward.
Table 4.7 provides a specimen of the types of NTB-related queries and requests by SAARC countries and the related responses by partner countries. Each of the three countries, Bangladesh, Pakistan and India, submitted a detailed list of NTBs that, according to these countries, their respective exporters were facing in the markets of the other two partner countries, at and beyond the border. A close examination of the submis-sions and the respective responses indicate that NTBs have been inter-preted by member countries from the perspective of a rather broad defi -nition of barriers to trade. Relevant documents reveal some interesting patterns. A careful examination of the responses also indicate that all member countries have tried to justify their respective measures on the ground that such measures did not violate national treatment and non-discrimination principles of the WTO and that these originated from ad-missible concerns such as health-hygiene and other justifi ed concerns.
A review of the country submissions shows that the NTBs they face mainly relate to: i) market access diffi culties faced on account of requirements relating to SPS/TBT, certifi cation, labelling, registration, laboratory testing and standardization in place in partner countries; ii) diffi culties faced in partner countries due to infrastructural constraints that impede cross-border movement of goods from exporting countries (lack of infrastructure; low handling capacity; lack of warehouse facili-ties, etc.); iii) imposition of para-tariffs, surcharges, cess, VAT, sales tax,

74
Complaints by India Response from Bangladesh
Ban on import (poultry-related products)
To protect human and animal health. In view of the recent partial spread of Avian Influenza, Bangladesh needs to continue such measures.
Same name registration of drug in a developed country (drugs)
Registration and Free Sale Certificate (FSC) duly signed in original by the Health Author-ity of the country of origin and at least one FSC from a developed country.
15% value added tax (VAT) (all goods)
15% VAT is also imposed on domestic prod-ucts. Therefore, imposition of VAT should not be treated as para-tariff.
Allowed through land route only (yarn)
This measure is not applicable for a specific country. The provision has been relaxed for yarn imported under back-to-back L/C through land customs.
L/C requirement (all products)
Bangladesh Bank feels that this instruction is necessary to ensure entry of imported materi-als/goods into the country against paid mon-ey and this has not been applied as an NTB.
Radioactivity test (directly consumable stuff)
All imports of food items require radioactiv-ity test report. However, radioactivity test requirement has been relaxed for SAARC countries.
Non-payment of irrevocable L/Cs by various banks (all exports)
The issue is being addressed by a joint group on the banking sector.
Non-tariff barriers in South Asia: Nature, implications and measures to address the challenges
Complaints by India Response from Pakistan
All products in the positive list
Bilateral trade between both the countries is to be viewed in the context of political rela-tions since independence. The positive list has increased from 42 to over 1,800 tariff lines. 302 new tariff lines were added to the list.
Anti-dumping duty has been levied on import of phthalic anhydride from India
The measure is in line with the WTO Agree-ment on Anti-dumping to protect the local industry.
In many cases, Pakistani banks do not accept L/Cs issued by Indian banks
This issue is under consideration in bilateral dialogue. Understanding has been reached to open bank branches across borders with India.
Pakistan Standards and Quality Control Authority (PSQ-CA) is currently maintaining 15,000 standards
PSQCA developed/adopted 4,900 standards in accordance with ISO guide 21 and they are also in line with CODEX Alimentarius Guidelines.
Table 4.7: NTB-related notifi cations submitted to the Committee of Experts: Complaints and responses

Regional Economic Integration Challenges for South Asia during turbulent times
75
Complaints by Bangladesh Response from IndiaLicence from Bureau of Indian Standards (BIS) for cement, gela-tin, condensed milk, electrical appliances, mineral water, steel products, leather products, x-ray equipments, dry-cell battery, ther-mometer, helmet and gas cylinder
The following steps have been taken: i) the number of items for which certification is needed has been reduced from 109 to 68, ii) marking fees for BIS licence has been reduced for SAARC countries, and iii) processing charge for SAARC countries has been abol-ished.
Requirement of laboratory testing (all products)
100 percent checks are done on only 14 high-risk food items.
Detailed product information (all pre-packaged goods)
These are statutory requirements under the Consumer Protection Act.
Special labelling of country of origin (jute bags/sacks)
The rationale is that the country of origin of the product is to be mentioned because if there is any irregularity in the quality of the imported item, the source could be tracked.
Certificate of non-halogenated hydrocarbon (jute products) Domestic producers face the same stipulation.
Pre-shipment certificate about presence of no hazardous dyes (textiles and textile products)
The provisions are also in effect for domestic industries.
Requirement of import licence (mostly consumer goods)
Requirement of import licences are under exception clauses of Article XX and Article XXI of the GATT.
Source: SAARC Secretariat.
Cotton is allowed to be imported only through port and not by rail/road
The quarantine arrangement in other ports is inadequate.
Inadequate handling capacity at Lahore Land Customs Station (Lahore LCS)
Lahore LCS is in the process of upgrading its infrastructure facilities to handle increasing volumes of trade.
Commercial invoice and packing list must be accompanied with the consignment
This measure is necessary to safeguard gov-ernment revenue and streamline clearance of goods.
and other duties beyond MFN tariffs; iv) requirements of licences and permits from importing countries; v) anti-dumping and countervailing measures; vi) interpretation of rules of origin; and vii) lack of adequate L/C facilities and necessary fi nancial intermediation.
What is perhaps not surprising is that while as a reporting (export-ing) country, members have given generous interpretation of the NTB-related diffi culties faced in trading with (importing) partners, in submit-

76
Non-tariff barriers in South Asia: Nature, implications and measures to address the challenges
ting their own responses, the same partners have attempted to justify similar types of NTBs they themselves have put in place. The respond-ing countries have tended to argue that their own NTBs should not be interpreted as such because: i) SPS/TBT and other related complaints should not be perceived as NTBs since these have been put in place to ensure compliance with relevant national standards, rules and regula-tions; ii) measures perceived as NTBs are MFN in nature, and are not directed at specifi c countries; iii) these measures are WTO-compatible; iv) some of the measures relate to security concerns; v) the complain-ing country has also imposed similar barriers; and vi) lack of domestic capacity to develop necessary infrastructure has led to infrastructure-related constraints in importing countries. In only a few cases did the partner country, in response, mention that it had taken steps to address particular complaints (building of infrastructure) or that relevant au-thorities (often central banks) have been asked to provide clarifi cation as regards a particular complaint. Thus, in spite of the best efforts of the CoE, much remains to be done in resolving the outstanding NTB-related issues.
Indeed, it is understood that at the fi fth meeting of the CoE, it was pointed out that submissions of responses and counter-responses may not be the most helpful way to resolve NTB-related disputes. Rather, efforts should be made to list NTBs which are trade restrictive as per the relevant WTO provisions. The sub-group of the CoE was asked to clarify whether the notifi ed NTBs fall into any of the following catego-ries: i) SPS; ii) TBT; iii) para-tariff measures; iv) trade facilitation mea-sures relating to infrastructure, procedures, transparency standards and testing; v) customs rules and procedures; and vi) others. Based on the categorization, the idea was to identify barriers that were WTO-compat-ible and those that were not, and then propose measures to address the attendant concerns.
While member countries could go on arguing whether trade mea-sures that they were facing were NTBs or not, and whether those were WTO-inconsistent, the fact of the matter is that intra-regional trade fl ows among SAARC countries continue to be signifi cantly constrained because of the “real” or “perceived” NTBs. The task is to take concrete initiatives to address the concerns, in a positive manner, through con-structive engagements at various levels. As would appear from the above discussion, initiatives will need to be taken in four broad areas: i) institutional initiatives such as signing of MRAs; ii) harmonization of customs policies and procedures; iii) capacity building in compliance-related areas; and iv) improving trade facilitation at border points.
Developing MRAs is also critical in the area of trade in services in

Regional Economic Integration Challenges for South Asia during turbulent times
77
view of SATIS. Of particular relevance in this context will be trade in services with regard to Mode 4 (movement of natural persons). Absence of any institutional modality for recognition of qualifi cations, skills and experiences is one of the most common barriers affecting Mode 4 (Chan-da 2005). This either denies market access altogether to foreign services providers or induces such suppliers to perform at a capacity that is be-low their respective levels of qualifi cations (academic or otherwise). These problems will need to be dealt with within the context of SATIS.
6. Policy initiatives to address NTBs
NTBs severely restrained the potential opportunities of trade expansion among SAARC countries and the related issues have often been politi-cized in a manner that have severely undermined the overall spirit of cooperation among member countries. As the discussion above would indicate, in spite of efforts at various levels to deal with the related is-sues, much more needs to be done by way of concrete measures. This is not to deny that some positive movements did take place within the SAARC institutional framework. However, the need of the hour is to build on the progress made thus far, and move forward at a faster pace. What follows is a discussion of a number of steps and initiatives that are required to address the concerns, based on the review of issues un-dertaken in the preceding sections and also taking cognizance of cross-country experiences in dealing with NTBs.
6.1 General principles
SAARC members should work towards some guiding principles with regard to NTBs. In general, the principle should be that NTBs that have not been notifi ed to the WTO, and hence are unlikely to be admissible if contested in the WTO Dispute Settlement Body, should not be imposed on intra-SAARC trade. If a new NTB is to be introduced, if at all, mem-ber countries should be given prior notifi cation for examination and preparation. The principle of MFN and national treatment should be guaranteed in all intra-SAARC trade transactions. An agreement may be made to have the value of all imported products ascertained on the basis of the Agreement on Customs Valuation of the WTO.
6.2 Strengthening SPS/TBT-related capacities
A majority of NTBs relate to certifi cation, testing and SPS/TBT compli-ance. Two practical measures that can be taken to resolve this, which
78
have also been fl oated during SAARC meetings at various levels, are to: i) strengthen national capacities in relevant areas through capacity build-ing of standardization institutions; and ii) put in place MRAs whereby certifi cates issued by standardization/accreditation institutions of one country will be accepted by those of another country. Indeed, India made an offer in the fourth meeting of the SAFTA sub-group on NTBs to assist LDCs to develop the required capacities in the areas of stan-dards, and technical and human resources. These are to be provided on the basis of specifi c requests from member states. India has already started to provide some technical assistance for the strengthening of the Bangladesh Standardization and Technical Institute.
The decision to establish the SAARC Regional Standardization Or-ganization (SARSO) in Dhaka is also a step in the right direction. SARSO is expected to provide assistance in areas of national capacity building in standardization related areas. SARSO could play an important role in the evolution of common standards related to various SPS/TBT, cer-tifi cation and testing-related areas, and could facilitate the signing of MRAs among SAARC countries.
6.3 Designing an appropriate dispute settlement mechanism
A workable dispute settlement mechanism is important to resolve con-fl icts relating to NTBs among SAARC members. As was mentioned earlier, the CoE has served as the dispute settlement authority under SAFTA till now. While the CoE has been trying to address NTB-related disputes and issues as best as it can, the fact remains that it is an ad hoc body, which is able to meet only periodically and does not have the re-quired institutional and human resources to follow up on its decisions. In view of this, there is a need for a more institutionalized approach to deal with NTB issues in SAARC. The experiences of other RTAs such as ASEAN, NAFTA and the EU may be studied thoroughly to come up with an acceptable structure for SAARC in this context. The SAARC Secretariat could take the lead in this respect by i) introducing a sys-tem of permanent panelists; ii) putting in place a transparent system of arbitration; and iii) introducing appropriate procedures for lodging complaints and getting remedies.
6.4 Establishment of accreditation agencies
In order to ensure that certifi cates issued by the relevant agencies in one country are accepted by another country, appropriate accreditation institutions will need to be developed. These agencies will be required
Non-tariff barriers in South Asia: Nature, implications and measures to address the challenges

Regional Economic Integration Challenges for South Asia during turbulent times
79
to have the necessary competence in relevant areas. These could play an important role in resolving many of the compliance-related concerns. Governments should provide incentives so that such accreditation in-stitutions are set up in the private sector. In a good move, a SAARC Arbitration Council has been set up for which nominations have been submitted by member countries for the Governing Board. Some of the administrative and fi nancial matters have been addressed and the prog-ress was reported in the fi rst meeting of the Council held in January 2009.
What is now required is to ensure that the Council has the required capacity and logistical support to deal with disputes as and when need-ed. Indeed, the Council could serve as a clearing house of disputes. It could help keep trade fl ows moving by guaranteeing that trade will not be disrupted till the Council gives a verdict on the dispute being arbi-trated by it. An effective Arbitration Council could play an important role in resolving NTBs such as anti-dumping duties and countervailing duties. If the Council is vested with appropriate authority and capac-ity, it could rule whether a specifi c NTB is WTO-compatible or not. The Council could also suggest ways to keep the damage to the aggrieved parties to the minimum.
6.5 Works of the SAARC Standards Coordination Board
Since varying standards in SAARC countries are one of the major rea-sons for disputes to arise in the fi rst place, it is welcome that the SAARC has constituted a Standards Coordination Board. The Board has already met several times and fi nalized the statutes and by-laws of SARSO. The Board has also identifi ed an initial list of products for which work has commenced with regard to harmonization of standards among coun-tries of the region.11 The important task at hand is to build the infrastruc-ture of SARSO as speedily as possible and to ensure that the logistics and human resource requirements are speedily met. SARSO may be entrusted with the task of harmonization of standards encompassing all tradable goods in SAARC.
6.6 Improving customs cooperation
A frequent reason behind the disputes that hinder cross-border move-ment of goods arises from bottlenecks at customs points. Often, disputes arise because of difference in the interpretation of tariff lines and wheth-er a particular product belongs to a particular tariff line. Exporting-country offi cials tend to be keen on putting items under tariff lines that

80
have zero or lower tariff, or enjoy preferential treatment under SAFTA. Importing-country offi cials, on the other hand, are often interested to put them under tariff lines with MFN duties, particularly when there is an interpretational ambiguity as to which tariff line the item actually belongs to.
There have been some initiatives aimed at customs cooperation among SAARC countries. A SAARC Agreement on Mutual Adminis-trative Assistance in Customs Matters was fi nalized by the sub-group on customs cooperation.12 The focus of attention here should be on ca-pacity building, harmonization of tariff lines at the 8-digit level among member countries, fast-tracking customs clearance procedures, and facilitating the movement of consignments traded under SAFTA. The task at hand is to address the entire spectrum of bottlenecks. In this con-text, speedy completion of the harmonization and computerization of customs clearance processes and procedures at border points and ports should be given priority so that disputes at customs points, particularly at land customs points, can be reduced. It is to be noted here that four of the 17 land customs points in Bangladesh are now operating under private sector management contracts. There is a need for public-private partnership initiatives if these land customs points are to be equipped with appropriate capacities.
6.7 Dealing with para-tariffs
The practice of some SAARC countries to determine assessable values of imported items by fi xing certain percentage of abatement on retail sales, or on the basis of a pre-fi xed tariff value, often gives rise to dis-putes among member countries. In countries with a federal structure, such as India, disputes sometimes arise because exports which enter the border at zero-tariff are subjected to state-level taxes.13 While, per se, such “para-tariffs” can hardly be contested,14 member countries could think of coming to an agreement with regard to not imposing any para-tariffs/surcharges on intra-regional trade fl ows.
6.8 Signing MRAs
An effective way to resolve disputes with regard to SPS/TBT/stan-dards is to go for: i) signing of MRAs with regard to certifi cation, tech-nical regulations, laboratory testing, etc.;15 and ii) putting in place the required capacities in this respect. As was noted, India has offered to provide technical assistance in building and strengthening the capacity of SAARC LDCs in compliance-related areas. However, given the im-
Non-tariff barriers in South Asia: Nature, implications and measures to address the challenges

Regional Economic Integration Challenges for South Asia during turbulent times
81
portance of the issue, and the need to take urgent initiatives in this area, member countries (particularly LDCs) should seek support from other prospective donors in the form of aid for trade, among others, from the European Commission, which has extensive trade-related capacity-building support programmes in place for low-income countries.
6.9 Addressing infrastructure-related trade facilitation bottlenecks
The most oft-mentioned NTBs relate to the lack of trade facilitation at border points, and the bottlenecks come in various shapes. The issue of addressing the “soft ones” (customs valuation, tariff harmonization, computerization, etc.) has been mentioned earlier. However, what hin-ders cross-border movement of goods, to a large extent, is the absence of physical infrastructure at border points. Some of these relate to con-scious policy choices (e.g., when a country does not allow unloading of imports at its warehouses, which then has to be done on no-man’s land) or by default (when appropriate facilities such as testing labora-tories and warehouses are not there). While ensuring seamless move-ment through regional connectivity and multi-modal transport facility is the long-term solution, from the short- to medium-term perspective, there is an urgent need to build the necessary border infrastructure to facilitate cross-border movement of goods. Coordination among part-ner countries in terms of development of infrastructure facilities is also critical to addressing this issue.16
6.10 Services trade and NTBs
An emerging area of dispute, particularly with respect to services trade, relates to the issue of determining equivalence of academic degrees. Approaches to mutual recognition and coverage of MRAs could vary signifi cantly. Two basic approaches have been suggested as the basis for mutual recognition. The so-called vertical approach proposes that rec-ognition be provided on a profession-by-profession basis through the harmonization or coordination among the parties to an MRA with re-gard to education and training being required by each profession (har-monization-based approach) (Zarrilli 2005). The horizontal approach, on the other hand, allows for mutual recognition to be provided without prior harmonization of curricula and training requirements, on the basis of a broad equivalence of qualifi cations (equivalence-based approach). While the vertical approach normally leads to unconditional market access, Zarrilli (2005) argues that the process is a long and laborious one and usually requires signifi cant time and effort. The horizontal ap-

82
proach, on the other hand, leads to much faster and concrete results. It is this attribute that has led more and more countries to rely on the latter as the basis for their MRAs. South Asian countries would be well advised to follow the horizontal approach. A proposal in this vein has been submitted by India and is under consideration by the CoE.
Any progress on the issue of recognition will require initiatives to be taken simultaneously at three levels (Chanda 2005). The fi rst is to im-prove the framework for MRAs. The second is to address, more broadly, the entire concept of recognition, such as the assessment of competence and determination of equivalence. The third is to address the operational diffi culties facing the South Asian countries in negotiating MRAs, given the well-known institutional, technical and fi nancial constraints, and the diffi culties to deal with Mode 4 issues that fall outside the purview of the majority of MRAs. The most common method to achieve recognition has been through bilateral agreements. Article VII of the General Agree-ment on Trade in Services of the WTO recognizes this as permissible. There are signifi cant differences among SAARC countries in the areas of education and examination standards, experience requirements, regula-tory procedures and other related matters. All these make an agreement in the area of mutual recognition, on a multilateral basis, rather diffi cult. In this regard, it has been suggested that bilateral negotiations would be more effective to deal with key issues of mutual interest.
7. Conclusion
In the preceding sections, an attempt was made to situate the discussion on NTBs in South Asia in the context of cross-country experiences. A number of recommendations based on best practices available with var-ious RTAs have also been put forward. There is now a growing recog-nition among SAARC member countries that NTBs not only constrain trade expansion within the region but also add tensions to bilateral re-lations that go beyond trade and commercial aspects and interests. It is, thus, critically important that SAARC members start to apply their collective wisdom to address the attendant issues, taking a long-term view.
This calls for policy initiatives on a number of fronts. First, in many RTAs, some categories of NTBs, particularly those related to SPS and TBT, and health and hygiene concerns, were successfully dealt with by strengthening capacities and putting in place appropriate institutional mechanisms. SAARC member countries should deal with these NTBs in a similar fashion by strengthening domestic capacities of member coun-tries to ensure compliance in the aforesaid areas and by signing MRAs.
Non-tariff barriers in South Asia: Nature, implications and measures to address the challenges

Regional Economic Integration Challenges for South Asia during turbulent times
83
Second, there is a need to put in place a mechanism in the SAARC Secretariat for arbitration of NTB-related disputes which would have transparent procedures for selection of panelists, submission of com-plaints, appeal, remedy and sanctions. Third, many NTBs arise from ambiguities with regard to customs procedures and lack of customs harmonization, and also because of various para-tariffs and surcharg-es in place. The best solution, as has been found in many RTAs, is a move towards graduation to a customs union. While this can be seen as a medium-term solution, individual SAARC member countries, in the meantime, could address such “perceived NTBs” by gradually moving towards a unifi ed customs code that does away with most para-tariffs and surcharges.
Fourth, investment in trade facilitation has emerged as a key fac-tor in addressing NTBs in South Asia. Indeed, initiatives in the form of development of infrastructure both at and behind the border, better connectivity, and putting in place the required protocols, have emerged as the most effective means to deal with many of the NTBs in the South Asian context. If SAARC member countries are to succeed in enhancing intra-regional trade and cooperation, they will need to get on with the aforesaid tasks on an urgent basis.
This article draws substantially on a report prepared earlier on the same theme for the Commonwealth Secretariat, London. Permission of the Common-wealth Secretariat is gratefully acknowledged in this context; however, the au-thor alone remains responsible for the content of the report. The author would like to express his deep appreciation to Mr. Shouro Dasgupta, Research Intern, Centre for Policy Dialogue, Dhaka, for his valuable support in undertaking background research for this study.
Notes
1 This was mainly done through a positive list approach where particular sec-tors/items were identified for preferential treatment, with the preference margin ranging from 10 percent to 100 percent of the most-favoured-nation duties.
2 Members were to have two negative lists: one for LDCs (shorter) and another for developing country members (with additional items). However, not all countries have come up with two lists.
3 Originally, the three developing country members were India, Pakistan and Sri Lanka and the five LDC members were Bangladesh, Nepal, Bhutan and the Maldives, which were joined subsequently by Afghanistan. However, in January 2011, the Maldives graduated from the LDC status.
4 It may be noted here that, in a welcome move, India, the dominant trading partner in SAARC, has offered to accelerate the reduction of its sensitive list

84
through periodic reviews. India has taken out 264 items from its sensitive list, which now stands at 480 items. Additionally, India has also allowed tariff rate quota (TRQ) for 164 items (8 million pieces of apparels) to Bangladesh on an autonomous basis. It is also to be noted that in the recent past India agreed to take out an additional 47 items from its sensitive list.
5 It is to be reckoned that a significant volume of trade in SAARC is conducted through informal channels. While recent data on informal trade are not avail-able, studies conducted in the mid-1990s put the ratio of formal trade to in-formal trade at 1:1.2.
6 It may be noted here that trade flows among India, Pakistan, Bangladesh and Sri Lanka account for about 95 percent of intra-South Asia trade of SAARC members.
7 For example, under a bilateral water protocol signed between Bangladesh and India, Bangladesh allows India to transport goods by waterways up to certain ports in Bangladesh. At present, talks have been initiated between these countries with regard to access of Nepal and Bhutan to global markets through India and allowing India limited connectivity to its northeastern states by extending the remit of the current protocol. During the January 2010 visit of Bangladesh’s Prime Minister to India, an agreement was reached to allow India to use Bangladeshi ports of Khulna and Chittagong and allow Nepal and Bhutan to access Bangladeshi ports through India.
8 The Government of Bangladesh has set up a core group with five sub-com-mittees to study the relevant issues and come up with proposals with regard to possible i) transit routes; ii) transit traffic; iii) stocktaking of key issues; iv) legal issues; and v) economic analysis and transit fees.
9 For details on NAMA 11, refer to the WTO document TN/MA/W/68/Add.1, available at www.wto.org
10 The CoE was constituted as per Article 10 of the SAFTA agreement. The CoE is mandated to review all NTBs and to recommend elimination of such mea-sures or implementation of such measures in the least trade-restrictive man-ner to facilitate intra-SAARC trade.
11 These include cement, sugar, biscuits, skimmed milk power, vegetables, tex-tile fabrics, jute, etc.
12 This was done during the 13th SAARC Summit in Dhaka in November 2005. The Agreement has been ratified by all countries.
13 For example, in India there are state taxes as well as cess (education cess at 4 percent) and other taxes.
14 Member countries (in this case, for example, India) argue that items coming from other states, when they enter the particular state, have to pay similar duties.
15 Indeed, India has offered, and Bangladesh has accepted, the signing of frame-work agreement on mutual recognition.
16 This is important in view of the fact that in the past it has been seen that countries have developed border facilities, particularly land ports, along one border point, while in the other country land port facilities were developed in another border point. Bangladesh and India are good examples of such type of coordination.
Non-tariff barriers in South Asia: Nature, implications and measures to address the challenges

Regional Economic Integration Challenges for South Asia during turbulent times
85
References
ADB (Asian Development Bank) and UNCTAD (United Nations Con-ference on Trade and Development). 2008. Quantifi cation of benefi ts from economic cooperation in South Asia. New Delhi: Macmillan India.
ASEAN Secretariat. 2005. NTBs in ASEAN. Jakarta: ASEAN Secretariat.Chanda, Rupa. 2005. “Trade in services and South Asia.” In CENTAD,
South Asian Yearbook of Trade and Development. New Delhi: CEN-TAD.
Kabir, ASM. 2007. Sanguinity and aspiration toward South Asian re-gional integration: A case study of the SAFTA agreement. MPRA Paper 3871, (unpublished), London.
Linkins, Linda. 2002. Estimating tariff equivalents of non-tariff barriers. Washington, D.C.: US International Trade Commission.
SAARC Secretariat. 2006. SAFTA Agreement. Kathmandu: SAARC Sec-retariat.
World Bank. 2003. Global economic prospects and developing countries: Global opportunities. Washington, D.C.: The World Bank.
Zarrilli, Simonetta. 2005. Moving professionals beyond national bor-ders: Mutual recognition agreements and the GATS, UNCTAD/DITC/ TNCD/2005/2. Geneva: UNCTAD.

.

1. Introduction
The present world economy is dominated by the services sector. Ac-cording to the United Nations Conference on Trade and Development (UNCTAD), during 1990 to 2005, the share of services in the gross do-mestic product (GDP) of developed countries increased from 65 percent to 72 percent. During the same period, developing countries saw the contribution of services to GDP increase from 45 percent to 52 percent. Over the last few years, many countries in the world have liberalized their economies to integrate into the world market. This has been on account of their Uruguay Round Commitments in the World Trade Or-ganization (WTO) in the 1990s and their active participation in regional trade agreements (RTAs) in the 2000s. In that course, the services sector has become very important for their long-term development strategies.
RTAs are proliferating rapidly in the present global trading system. Currently, nearly every country in the world is a member of one or more
Services trade in South Asia: Contours of liberalization and modalities in SAFTA
Chapter 5
Rajan Sudesh Ratna

88
RTAs. According to the WTO’s estimate, the total number of RTAs, in-cluding both notifi ed or otherwise, were more than 300 in 2005, and trade between RTA partners was estimated by the World Bank (2005) to be around 40 percent of total world trade.
Every major RTA has a services dimension. Inclusion of services in RTAs gained momentum after its inclusion in the North American Free Trade Area (NAFTA) in 1994 and thereafter Mexico’s agreements in ser-vices (based on the NAFTA model) with Latin American countries. In the Asia-Pacifi c region, Australia and New Zealand signed a Closer Eco-nomic Relations Trade Agreement in 1986 that included services trade. Similarly, in 1997, the Association of Southeast Asian Nations (ASEAN) Framework Agreement on Services was signed. Now there are several RTAs among developing countries which have included services in the agreements.
2. General Agreement on Trade in Services: History and framework
Before 1995, there were no multilateral disciplines or rules for trade in services. This was mainly due to the lack of knowledge about services trade as well as the fact that while national statistical agencies captured data on goods trade, detailed trade statistics on services trade were never captured. In the late 1970s, private sector groups engaged in the services sector in the United Kingdom (UK) and the United States (US) started lobbying with their governments for a more level playing fi eld in accessing foreign markets.
There was reluctance, initially, on an agreement to begin negotia-tions on services trade under the Uruguay Round. But after rounds of discussions, it was fi nally agreed that services trade would be a part of the negotiations. These early initiatives by services fi rms ultimately resulted in the inclusion of international services transactions in the Uruguay Round by putting in place the General Agreement on Trade in Services (GATS) under the WTO.1
At the heart of GATS is a commitment (stated in the preamble) to “securing an overall balance of rights and obligations”. Central to that balance is the recognition that members have the right to regulate the supply of services within their territories as long as the measures used are administered in a reasonable, objective and impartial manner and are not trade-distorting in their impact. Additionally, members are given the right to defi ne and pursue their own national policy and economic development objectives as long as those objectives do not interfere with the multilateral obligations they have undertaken.
Services trade in South Asia: Contours of liberalization and modalities in SAFTA
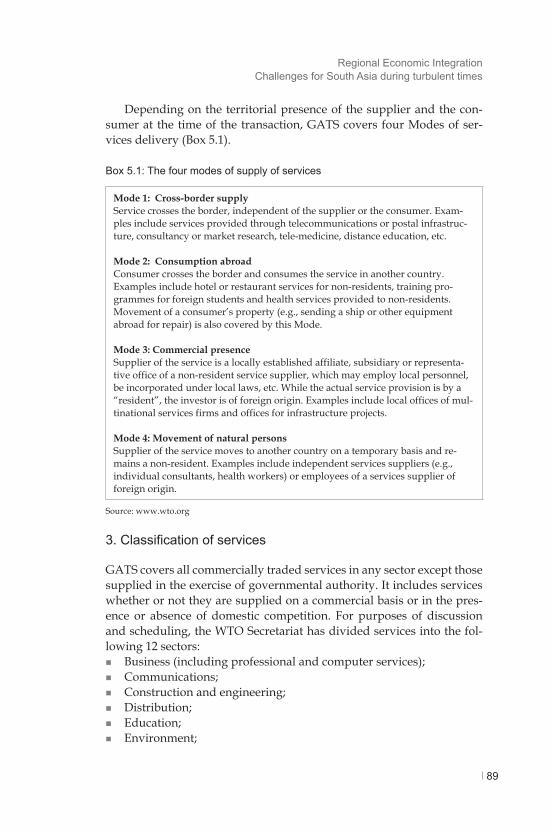
Regional Economic Integration Challenges for South Asia during turbulent times
89
Depending on the territorial presence of the supplier and the con-sumer at the time of the transaction, GATS covers four Modes of ser-vices delivery (Box 5.1).
Box 5.1: The four modes of supply of services
Mode 1: Cross-border supplyService crosses the border, independent of the supplier or the consumer. Exam-ples include services provided through telecommunications or postal infrastruc-ture, consultancy or market research, tele-medicine, distance education, etc.
Mode 2: Consumption abroad Consumer crosses the border and consumes the service in another country. Examples include hotel or restaurant services for non-residents, training pro-grammes for foreign students and health services provided to non-residents. Movement of a consumer’s property (e.g., sending a ship or other equipment abroad for repair) is also covered by this Mode.
Mode 3: Commercial presence Supplier of the service is a locally established affiliate, subsidiary or representa-tive office of a non-resident service supplier, which may employ local personnel, be incorporated under local laws, etc. While the actual service provision is by a “resident”, the investor is of foreign origin. Examples include local offices of mul-tinational services firms and offices for infrastructure projects.
Mode 4: Movement of natural personsSupplier of the service moves to another country on a temporary basis and re-mains a non-resident. Examples include independent services suppliers (e.g., individual consultants, health workers) or employees of a services supplier of foreign origin.
Source: www.wto.org
3. Classifi cation of services
GATS covers all commercially traded services in any sector except those supplied in the exercise of governmental authority. It includes services whether or not they are supplied on a commercial basis or in the pres-ence or absence of domestic competition. For purposes of discussion and scheduling, the WTO Secretariat has divided services into the fol-lowing 12 sectors: Business (including professional and computer services); Communications; Construction and engineering; Distribution; Education; Environment;

90
Finance (including insurance and banking); Health; Tourism and travel; Recreation, cultural and sporting services; Transportation services; and Other services not included elsewhere.
These 12 sectors are further divided into 155 sub-sectors. GATS ad-dresses both the service and the service supplier. For the initial agree-ment, the scope of GATS is wide; however, there are some areas which are not yet covered and can impact service providers. These relate to immigration rules that mostly apply to temporary entry, fi scal policy and taxation measures, exchange rate management, etc.
4. Difference in trade in goods and trade in services
Market structure for services trade differs from that for goods trade. Un-like goods trade, trade in services is slightly more complex. While trade in goods takes place on tangible items, the same does not happen in the case of services. In some cases, services trade is embodied in goods trade (e.g., music or video on CD or DVD, software programme on CD or DVD, etc.). Historically, a number of services have been provided for the public good by the government, e.g., transportation, telecommuni-cations, postal services, banking, insurance and reinsurance, health care, education, etc. Many services provided by the private sector are heavily regulated, often at the sub-federal level. Therefore, constraints to ser-vices trade were due as much to domestic regulatory environments as to trade policies. For a number of service providers (particularly in the professional services sector), it was easier to export services than it was to provide those services in other parts of their own country owing to regulatory restrictions.
As trade negotiators became more familiar with services trade is-sues, it was apparent that some key principles that had guided the liber-alization of goods trade were applicable also to services, e.g., transpar-ency, most-favoured-nation (MFN) treatment, non-discrimination and national treatment. However, they also noted some differences. First, they realized that even if non-discrimination were practised, there could still be structural barriers to market access (e.g., limits on the number of suppliers allowed). Therefore, they needed to introduce the market ac-cess principle into any agreement on services. Second, one of the basic mechanisms for liberalizing goods trade was the negotiation of sched-ules for reducing tariffs. While reductions in non-tariff barriers were
Services trade in South Asia: Contours of liberalization and modalities in SAFTA

Regional Economic Integration Challenges for South Asia during turbulent times
91
also important, tariff concessions were central to trade agreements. But for services trade, the reverse was true. The primary constraints to be negotiated for the liberalization of services trade were non-tariff barri-ers, which did not apply equally to all modes of supply.
5. Economic importance of services for South Asia
With an average growth rate of over 8 percent per annum sustained over the past fi ve years, South Asia has emerged as one of the most dy-namic regions in the world. The services sector has played an important part in this dynamism as is evident from the sector’s contribution to over a half of South Asia’s GDP and a third of its employment. In terms of contribution to GDP, the services sector has overtaken industries and agriculture, which used to be the major contributors, in almost all coun-tries of South Asia (Figure 5.1).
With the exception of Afghanistan and Bhutan, the share of services in GDP of all SAARC members is more than 50 percent. However, in terms of its contribution to total trade, it still lags behind other sectors in most of the countries in the region. It is only India, and some of the countries where tourism is a vital economic sector, that services trade has also contributed immensely to total trade.
Agriculture
80
70
60
50
40
30
20
10
10
IndustryServices
Sri Lan
ka
Pakist
an
Maldives
IndiaNep
al
Bhutan
Banglad
esh
Afghanist
an
Figure 5.1: Contribution of agriculture, industry and services to GDP in South Asian countries (2009*)
* 2008 for Afghanistan and Maldives.Source: www.wto.org

92
India’s exports are driven by other commercial services, which, in 2008, accounted for 77 percent of the total commercial services exports. Over recent years, India has become a leading business process out-sourcing destination (WTO 2011). One of the reasons for the changing composition of trade in services emanates from the fact that liberaliza-tion of trade in services is increasingly taking place in many SAARC countries. Sectors such as higher education, health, and banking and insurance, which were mainly under state monopolies in most of these countries, are gradually being liberalized. Increased tradability of ser-vices due to technological advancement is also an important factor in increasing the trade volumes of the region.
Several studies have pointed out the benefi ts that SAARC members can reap from the liberalization of services. ADB and UNCTAD (2008) have found that trade liberalizing policies with respect to services in SAARC members provide a more favourable environment for regional integration in services compared with that for goods.
6. Services in SAARC: A chronology
The importance of services, especially tourism, in the SAARC region was recognized in the 10th SAARC Summit held in Colombo on 29−31 July 1998. The 13th SAARC Summit held in Dhaka on 12−13 November 2005 recognized the potential of trade in services and decided to con-duct a study to see how services could be integrated into the SAFTA process. The First Meeting of the SAFTA Ministerial Council that took place in Dhaka on 20 April 2006 approved the course of action includ-ing a completion of study on services in a time-bound manner. Subse-quently, the Second Meeting of the SAFTA Ministerial Council held in Kathmandu on 26 February 2007 approved the recommendations of the SAFTA Committee of Experts and directed the SAARC Secretariat to ensure that the study on trade in services should be WTO-compliant, and WTO-plus.
Subsequently, the 14th SAARC Summit held in New Delhi on 3−4 April 2007 agreed to the vision of a South Asian community, where there was smooth fl ow of goods, services, peoples, technologies, knowledge, capital, culture and ideas in the region. The SAARC leaders stressed that to realize its full potential, SAFTA should integrate trade in ser-vices. Consequently, they called for the fi nalization of an agreement in services trade at the earliest.
The Third Meeting of the SAFTA Committee of Experts held in New Delhi on 1−2 March 2008 took note of the revised regional study con-ducted by the Research and Information System for Developing Coun-
Services trade in South Asia: Contours of liberalization and modalities in SAFTA

Regional Economic Integration Challenges for South Asia during turbulent times
93
tries (RIS), New Delhi. Subsequently, the Third Meeting of the SAFTA Ministerial Council held in New Delhi on 3 March 2008 considered the Study on Potential of Trade in Services under SAFTA, including the recommendations of the Third Meeting of the SAFTA Committee of Experts, and recommended that RIS be requested to draft a SAARC Framework Agreement on Trade in Services (SAFAS) by 30 June 2008. It also decided to constitute an Expert Group by 30 June 2008 to com-mence negotiation on the Framework Agreement on Trade in Services.
The 15th SAARC Summit held in Colombo on 2–3 August 2008 ex-pressed satisfaction on the conclusion of the Study on Trade in Services and welcomed the decision of the SAFTA Ministerial Council to com-mence negotiation on the Framework Agreement on Trade in Services. Towards achieving further economic integration, they also directed that the Draft Agreement on Investment Promotion and Protection be fi nal-ized early and the SAARC Arbitration Council be operationalized.
7. Important studies on services in SAARC
Several studies have argued in favour of including services within the ambit of SAFTA. Panchamukhi (1988) has suggested that SAARC mem-bers are more homogeneous than those of ASEAN, and therefore, it would be plausible to have SAFTA cover services trade. Chanda (2005) has argued that South Asia’s trade interests in the services sector are driven by its factor endowments, with export interests in the area of labour-intensive and human resource-based services, and import inter-ests in the area of capital- and technology-intensive services. Ratna and Sidhu (2007) and Ratna (2011) have recommended that SAFTA must swiftly move towards deeper integration that characterizes most recent-ly emerging RTAs by incorporating services, adopting a blueprint for a SAARC Investment Area and enacting agreements/protocols for trade and investment facilitation. Banga (2009) has found that South Asian countries have a competitive edge in different categories of services.
The following section discusses a few other studies and publica-tions that are important regarding their coverage of services trade in SAARC.
7.1 Study on potential for trade in services under SAFTA
In view of the decision of the SAARC Summit in 2007, a Study on Po-tential for Trade in Services under SAFTA Agreement was launched within the framework of the SAARC Network of Researchers on Global Financial and Economic Issues with RIS, New Delhi, as the Coordina-

94
tor. Country studies were to be prepared by designated national focal points with the support of the Asian Development Bank (ADB). The terms of reference for the study, as fi nalized by the inception workshop, were as follows: Importance of the services sector in SAARC economies, and trade
and sectoral composition; regulatory regimes and patterns of liber-alization autonomously as well as under GATS commitments.
Logic and imperatives of regional cooperation on trade in services under SAARC, including complementarities, and a review of ongo-ing attempts for liberalization at bilateral levels.
Potential for services trade expansion in the SAARC region, includ-ing identifi cation of select sectors of high importance and implica-tions of trade liberalization.
Identifi cation of intra-SAARC barriers and constraints on services trade, including domestic regulations in selected sectors.
Recommendations on the approaches for a possible framework for a GATS-consistent and GATS-plus intra-regional arrangement for trade in services, and suggestions on devising policy-instruments to address the prevailing barriers and constraints, including possibili-ties of evolving mutual recognition arrangements (MRAs), exchange of experiences and liberalization of trade. The study summarized the importance of the services sector in the
SAARC economies and examined the potential of trade in services in the region in view of their complementarities. It also looked into the potential of mutual trade in select services sectors. It examined the pat-terns of services trade liberalization undertaken by SAARC countries unilaterally and under their GATS commitments, and highlighted the regulations that could act as barriers. It also discussed the relevance of services trade liberalization in terms of the benefi ts and costs that such liberalization would entail, and listed some sectors of high-priority as identifi ed by the country studies. Some of those high priority sectors included tourism, transport, information technology (IT), IT-enabled services and telecom, energy, education, health, and fi nancial services.
The study proposed to follow a positive list approach to enable pro-gressive, sequential liberalization, and provide special and differential treatment to LDCs as recognized in SAFTA. It recommended that the South Asian countries need to take steps to specialize in those services sectors in which they have the potential to expand in the domestic mar-ket as well as build their export capacity. Integration of services markets in the SAARC region may also assist countries in specializing in certain services sectors and strengthening the competitiveness of their services industry.
Services trade in South Asia: Contours of liberalization and modalities in SAFTA

Regional Economic Integration Challenges for South Asia during turbulent times
95
Finally, the study recommended that the most relevant approach to include services under SAFTA is to move ahead with SAFAS as an adjunct to SAFTA. SAFAS could provide a framework for all SAARC members to mutually benefi t from services trade liberalization in a pro-gressive manner, keeping in view the development policy objectives of all member countries. It also outlined the institutional mechanisms and implementation arrangements for such an agreement.
7.2 Quantifi cation of benefi ts from economic cooperation in South Asia
This was a study jointly undertaken by the ADB and UNCTAD in 2008. The major objective of the study was to provide an in-depth assessment of the changes induced by SAFTA on South Asian countries individu-ally and on the South Asia region as a whole. Among other things, the study has identifi ed sectoral and modal comparative advantages in services trade of each member country and has determined the extent to which complementarities exist. The study also conducted a detailed analysis for the identifi ed services sectors—health and related services, higher education, construction and related services, travel and tourism related services, and telecommunication services—and the possibility of MRAs.
The study has argued that given the faster growth in services in al-most all South Asian countries, they have an opportunity to reap more benefi ts of liberalization by including services in SAFTA. Education and health, being part of the social infrastructure, and construction and telecommunications, being part of basic infrastructure, are fundamen-tal to the overall growth of South Asian economies. While the state of development of these sectors is certainly at different stages in mem-ber countries, in view of the existing complementarities, the study has strongly argued that SAFTA member countries urgently need to expand the scope of SAFTA by including at least these identifi ed fi ve services sectors. It has also pointed out that these countries ought to make wider and deeper commitments than under the GATS. Further, the study has observed that South Asian countries have a competitive edge in differ-ent categories of services. In transport services, Pakistan and Sri Lanka have competitive advantage, while India has a competitive advantage in construction services, computer and information services and other commercial services. The Maldives and Nepal are more competitive in travel services while Bangladesh has a higher competitive edge in fi nan-cial services. It has concluded that construction, education, tourism and health services hold special signifi cance both from export and import interests.

96
7.3 Trade in services in South Asia
This book, which is a compilation of different papers and is edited by Kelegama (2009), has identifi ed the impediments to services trade in South Asia and dealt comprehensively with issues ranging from eco-nomic cooperation, both at the governmental and private sector levels, to the need for collaboration at the political level. It has done so by ex-amining the political economy factors in the region. An important con-tribution of the volume is that it has given the private sector’s perspec-tives regarding regional integration and the role of services in South Asia.
The fact that South Asia will immensely benefi t from regional coop-eration is well recognized at all levels; however, this volume has delved into the many policy and institutional constraints that have contributed to the present state to make South Asia one of the least integrated re-gions of the world. The volume has also warned that liberalization of services in South Asia without proper regulatory mechanisms in place can be costly and has to be avoided.
8. SAARC Agreement on Trade in Services
During the 16th SAARC Summit held in Thimphu, Bhutan in April 2010, SAARC leaders signed the SAARC Agreement on Trade in Servic-es (SATIS). The objectives of SATIS are to promote and enhance trade in services among SAARC members in a mutually benefi cial and equitable manner by establishing a framework for liberalizing and promoting ser-vices trade within the region in accordance with Article V of GATS.
The Agreement provides that negotiations for schedules of specifi c commitments shall take place keeping in view national policy objectives, and the level of development and the size of economies of members, both overall and in individual sectors. It further states that the Agree-ment shall progressively cover liberalization of services trade with broad-based and deeper coverage of the majority of services sectors/sub-sectors with a view to fulfi lling the objectives of Article V of GATS, and that a positive list approach for liberalizing the services sectors will be followed. It also provides that the negotiations for specifi c commit-ments for progressive liberalization would be based on a “request and offer” approach.
SATIS is mostly based on the structure of GATS. As in the case of GATS, services related to government procurement are out of the pur-view of SATIS. Similarly, provisions relating to safeguard action, re-strictions to safeguard balance of payments, and general and security
Services trade in South Asia: Contours of liberalization and modalities in SAFTA

Regional Economic Integration Challenges for South Asia during turbulent times
97
exceptions also form part of this Agreement. SATIS does not apply to subsidies or grants, or to any conditions attached to the receipt or con-tinued receipt of such subsidies or grants, whether or not such subsidies or grants are offered exclusively to domestic services, service consumers or service suppliers. It also provides for having recognition agreements and identifi ed areas of cooperation, including development of regula-tory capacity, among others. Special and differential treatment for the LDC members has also been built in the Agreement.
9. Future road map
Despite the commitments made at various levels, including at a number of SAARC Summits to include services in SAFTA, the signing of SATIS took a long time. SAARC members should realize that liberalization of services under SATIS has to be done in a time-bound manner.
It is encouraging to note that negotiations on schedules of specifi c commitments under SATIS have already started; now they should con-tinue uninterrupted. The commitments should be additional to what the members have committed under GATS or else there will be no meaning of regional integration. Since several studies have identifi ed the strength(s) of each South Asian country in specifi c services sectors, members should take note of these studies and liberalize the sectors of their interests. Members should also cooperate in building the capacity of other members in the sectors in which they are less competitive.
Although the “positive list” and “request and offer” approaches have several limitations, most of the SAARC members are familiar with the process due to their exposure to the process under GATS in the WTO. Hence, the same approach can be followed under SATIS. This would also enable SAARC members to successfully negotiate the com-mitments within the agreed time frame.
10. Challenges ahead
Deepening integration among SAARC members by including services in SAFTA is much desirable for regional prosperity and development; however, the path to such integration is not easy. Despite the existence of complementarities in several services sectors, there are a number of issues that need to be addressed as confl icting and varied interests in some other sectors may impede this effort.
In the process of liberalizing services, each country will be required to make commitments to liberalize their sectors in different Modes. However, the preparedness of members, especially the LDCs, to iden-

98
tify their offensive and defensive interests under SATIS is lacking. They have also not fully understood the implications of committing liberal-ization in services. Another challenge that SAARC members would face relate to their commitments under GATS and the need to commit even more under SATIS. For those members that have already committed to the maximum extent possible to liberalize their services sectors un-der GATS, it might be a challenge to liberalize more under SATIS. And without doing so, there will not be any meaningful liberalization and effective preferential market access.
SAARC members are at various stages of economic development. Therefore, their level of ambition must be realistic. At the same time, it is equally important that effective domestic regulations are put in place. An effective but simple regulatory regime is an essential prerequisite for services liberalization. Unfortunately, very little work has been done in this area. How individual members address this issue will be important for their long-term developmental goals.
One of the historical features of SAFTA has been constant interrup-tions in the progress of liberalization for regional welfare and devel-opment. Most of the time, national interests or bilateral relations have prevailed over the regional vision or goal. Unlike trade in goods, most of the benefi ts in services trade will not come with a bilateral trade fo-cus. Countries need to follow a fast-track approach to conclude MRAs for facilitating services trade.
Given the nature of geographical boundary and porous borders, any liberalization in Mode 4 will have to be pragmatic and affordable. In recent times, many security issues have been raised worldwide on the movement of natural persons, which is applicable in the case of SAARC also. It is likely and understandable that smaller economies in the region may demand market access in Mode 4 and the bigger economies may demand market access in Mode 3. Resolving such complex issues on the negotiating table is going to be a diffi cult task.
One major challenge that SAARC members will be facing relate to lack of detailed and reliable services trade data. No member has detailed disaggregated data and hence no impact assessment—whether ex ante or ex post—can be conducted. Therefore, a larger question that looms ahead is how members would take trade remedial actions if domestic industry would be hurt due to preferential market access.
11. Conclusion
Liberalization of services under SATIS is going to have both positive and negative impacts. While countries can reap the benefi ts of services
Services trade in South Asia: Contours of liberalization and modalities in SAFTA

Regional Economic Integration Challenges for South Asia during turbulent times
99
liberalization in sectors of their comparative advantage, they would also have to face competition in sectors in which others are competi-tive. However, given the historical background of South Asia, there is a strong case for the inclusion of services in SAFTA. Since most coun-tries participating in SATIS are smaller in size, there could be quick benefi ts of liberalization. At the same time, the real or perceived risks of services liberalization would be checked and verifi ed quickly in the regional context. The risks are much less than if the members have to take equivalent commitments at the WTO—with a much larger number of countries. Nevertheless, it should be noted that the smaller countries would need the support of larger countries to overcome their supply constraints apart from gaining market access for their exports.
Services trade is also linked to foreign direct investment. Hence, ser-vices liberalization will offer signifi cant investment opportunities in the region. Given the fact that the services sector is growing faster than ag-riculture and manufacturing in the region, it is essential that the ongo-ing regional integration process encompasses the sector. In view of the comparative advantage that this region has in the services sector, it is expected that the integration of services in SAFTA will provide further momentum for growth and will help sustain that.
Note1 The Uruguay Round was a historic series of trade negotiations covering not
only further liberalization of goods trade but also the establishment of frame-works for liberalizing trade in services, investment measures and trade-relat-ed intellectual property rights. When the Round was launched in Punta del Este (Uruguay) in September 1986, it was assumed that the outcome would be a broadening of the framework of the existing General Agreement on Tariffs and Trade (GATT). The Round concluded in Marrakesh (Morocco) in April 1994, with the formation of the World Trade Organization (WTO) which covered the revised General Agreement on Tariffs and Trade (GATT) 1994 that covered trade in goods, the General Agreement on Trade in Ser-vices (GATS) and the Agreement on Trade-Related Aspects of Intellectual Property Rights (TRIPS).
References
ADB (Asian Development Bank) and UNCTAD (United Nations Con-ference on Trade and Development). 2008. Quantifi cation of benefi ts from economic cooperation in South Asia. New Delhi: Macmillan India.
Banga, Rashmi. 2009. “Liberalizing trade in services: A South Asian per-spective.” In Saman Kelegama (ed.), Trade in services in South Asia. New Delhi: Sage Publications.

100
Chanda, Rupa. 2005. “Trade in services and South Asia.” In CENTAD, South Asian Yearbook of Trade and Development. New Delhi: CEN-TAD.
Kelegama, Saman (ed.). 2009. Trade in services in South Asia: Opportuni-ties and risks of liberalization. New Delhi: Sage Publications.
Panchamukhi, V.R. 1988. “Economic cooperation between SAARC and ASEAN: Prospects and problems.” In Bhabani Sen Gupta (ed.), SAARC-ASEAN: Prospects and problems of inter-regional cooperation. New Delhi: South Asian Publishers.
Ratna, Rajan Sudesh and Geetu Sidhu. 2007. Making SAFTA a success: The role of India. Available at http://www.thecommonwealth.org/files/178426/FileName/SAFTA%20and%20India%20-%20Final%20doc1.pdf
Ratna, Rajan Sudesh. 2011. “South Asian integration: Dream or reality.” In Shahid Ahmed and Shahid Ashraf (eds.), Regional and multilateral trade in developing countries. United Kingdom: Routledge.
World Bank. 2005. Global economic prospects: Trade, regionalism, and devel-opment. Washington, D.C.: The World Bank.
WTO. 2011. Trade in commercial services. Available at www.wto.org
Services trade in South Asia: Contours of liberalization and modalities in SAFTA
Regional Economic Integration Challenges for South Asia during turbulent times
101
3PART
REGIONAL CONNECTIVITY AND TRADE FACILITATION

.

1. Background
The mutual interdependence between regional economic integration and transport connectivity is clear. Transport connectivity is necessary for increased exchange of goods and people-to-people connections, which would, in turn, stimulate investments and business transactions. At the same time, transport linkages will not materialize in a substantial manner unless there is a certain degree of regional integration. There-fore, these two factors are interdependent and mutually reinforcing. It has long been recognized that South Asia is one of the least economi-cally integrated regions in the world, with intra-regional trade stagnat-ing at around 5 percent of the region’s global trade. At the same time, transport connectivity in the region is also weak, characterized by a lack of direct capital-to-capital connectivity in many cases.1 Accordingly, in order to travel between these cities, it is necessary to transit in the Middle East (usually Dubai or Doha) or Southeast Asia (Singapore or Thailand), increasing both cost and time of travel. These limitations in intra-regional connectivity undermine the potential for interaction of traders and investors to engage in business transactions.
Air services liberalization in South Asia
Chapter 6
Anushka Wij esinha

104
In this context, it is important to identify the factors that contribute to limiting connectivity, particularly air connectivity, in the region. Global air services are among the most restricted and regulated sectors of in-ternational exchange. This is infl uenced by the fact that the benefi ciaries of liberalization are numerous and fragmented, and receive relatively small marginal benefi ts, while the losers are large, usually politically infl uential industries such as entrenched domestic airline monopolies. International air services have long been governed by a complex matrix of Bilateral Air Services Agreements (BASAs), which specify limitations on air traffi c rights, number of airlines allowed to operate, methods on setting capacity on a route, and tariffs and destinations that can be oper-ated on fl ights between two countries. Air Services Agreements (ASAs) are notoriously opaque, with many provisions not being available for public consumption due to confi dentiality clauses.
In recent years, as a result of bilateral negotiations, ASAs have be-come more fl exible and liberal on the global scale, but in South Asia they still remain relatively restrictive. Countries in the Organisation for Economic Co-operation and Development (OECD) have made substan-tial headway over the last two decades in liberalizing market access and ownership. A few examples in that regard are the pioneering United States (US) domestic deregulation of 1978, the Australia-New Zealand Single Aviation Market Arrangement of 1996, and the European Single Aviation Market completed in 1997. Moreover, in the last two decades, over 85 “open skies” BASAs providing full market access without re-strictions on designation, traffi c rights, capacity, frequency, tariffs or code sharing have been completed by around 70 countries (Findlay and Goldstein 2004).
Although the current level of air transport activity in South Asia is only a fraction of what exists in other regions, for example in Southeast Asia, there are strong prospects for future growth. Hence, the key objec-tive of this article is to identify the factors which inhibit air connectivity in South Asia, and to suggest policy measures that could lead to greater air connectivity.
2. Economic benefi ts of air services liberalization
The economic impact of the aviation sector, in general, is strong and pervasive. It contributes about US$700 billion to the global tourism in-dustry and to the logistics industry. The industry also has a catalytic economic impact as improved aviation connectivity can contribute to higher national productivity by enhancing access to markets, enhanc-ing communications and interactions between and within fi rms, and
Air services liberalization in South Asia

Regional Economic Integration Challenges for South Asia during turbulent times
105
providing access to a larger labour/talent pool (Tretheway 2010). In a panel regression study covering 48 countries over nine years, Trethe-way (2010) fi nds that a 10 percent increase in aviation connectivity2 per US$1 billion of gross domestic product (GDP) increases labour produc-tivity by 0.07 percent.3
Recent history has shown that the economic benefi ts of liberalized regional air services agreements are substantial and compelling. It is no coincidence that the most developed economic regions in the world enjoy liberal air services markets. Nations have long since recognized that BASAs stifl e regional progress, and steadily push for those agree-ments to be replaced by liberal multilateral agreements. The US was the fi rst to initiate liberalization of air travel, closely followed by the Euro-pean Union (EU). In 1997, the Association of Southeast Asian Nations (ASEAN), inspired by successes in the US and the EU, took signifi cant steps to liberalize regional air travel (Tham 2008).
It may be argued that the rapid worldwide growth in air traffi c over the last few decades is due to the removal of air services restric-tions within economic regions. Accelerated development of air services (through the removal of restrictions) was prompted by the growing development in global and regional production networks and the ad-vent of Just-in-Time (JIT) logistics (Tham 2008). These networks and processes required strong support services, such as air travel. Further, the growth in tourism and trade in newly industrialized and emerging markets necessitated speedy civil transport services. Regarding the dif-ferent benefi ts that relaxation of air services regulations could bring to South Asia, three key areas are identifi ed and discussed below.
2.1 Creation of aviation industry jobs
As stated previously, liberalization of air services stimulates growth, which subsequently creates more jobs in the industry. This, in turn, will have a catalytic effect on the economy as a whole (discussed later). The expansionary effect of liberalization (of air services) is best illustrated through a graphical presentation by Button and Drexler (adapted by Grancay 2009). In his illustration, Grancay compares the effects of liber-alization on supply and demand within the air services market, both at present, and in the future.
According to Balaz and Williams (2006), within the EU, the overall number of employees in civil aviation increased from 435,000 to 489,700 after liberalization in the period 1988 to 1996. Liberalization, which cre-ates increased air services, results in the creation of new airlines, branch offi ces and airports. The new jobs created necessarily include fl ight

106
crews, administrative staff and ground handling staff. For example, the easing of the restrictive Bermuda II agreement between the United Kingdom (UK) and the US resulted in the creation of just over 25,000 jobs in the US and the UK by 2004 (InterVISTAS 2006 cited in Grancay 2009).
In the long-term, liberalization will have a catalytic effect (discussed below), creating more trade and jobs, which results in economies of scale. These economies of scale will create a new price at the predicted equilibrium point. This phenomenon can also be illustrated as a chain as presented in Figure 6.1.
Figure 6.1: Impact chain of aviation liberalization
Source: InterVISTAS (2006) cited in Grancay (2009).
2.2 Trade and economic growth
Removal of air services restrictions opens up new destinations and cre-ates more frequencies and better fl ight connections, which result in new markets for international businesses (Grancay 2009). Piermartini and Rousova (2008) have found that trade development is positively cor-related with increase in international air passenger transport. They state that passenger transport is important for trade because travel is neces-sary to set up and maintain long distance business relationships. Relax-ation of restrictions and falling costs encourage travel, which expedite business negotiations and stimulates investment and commercial trans-actions in the long run. Ease of travel also encourages greater people-to-people connectivity, which has indirect implications for stimulating regional cooperation and commerce. All these factors are of particular signifi cance in the SAARC region.
Additionally, more comprehensive and cost-effi cient air connectiv-ity complements and catalyses global and regional value chain develop-ment. Global value chains have transformed international production fragmentation worldwide, and fi rms are increasingly adopting new strategies of vertical integration and vertical specialization. Better air services connectivity intra-regionally, as well as between this region and others, would help South Asian fi rms better integrate into “global production networks”.
LiberalizationTraffic growth
Economic growth
Jobgrowth
New and better air services
Air services liberalization in South Asia

Regional Economic Integration Challenges for South Asia during turbulent times
107
Also, large multinational corporations treat proximity to airports as an important criterion in deciding where to invest (Grancay 2009). They also consider fl ight routes and fl ight costs to and from a particular ter-ritory before making their investment decisions. Hence, by increasing fl ight frequencies and giving consumers greater choice in fl ight routes and travel packages, liberalization of air travel will encourage multina-tional fi rms to invest in the region.
However, the benefi ts should not only be looked at from an invest-ment point of view. Air transport also enables businesses achieve higher effi ciency through exploiting economies of scale (Grancay 2009). Devel-opments in air travel help strengthen destination networks, which in turn facilitate JIT processes, resulting in diminished warehousing costs. Further, ease of travel allows for freer transfer of human resource across the region and provides companies access to the best human resource.
Finally, liberalization of air services paves way for changes in mar-ket structures (Grancay 2009). Producers and buyers get access to for-eign markets; transport becomes more cost-effi cient and administrative processing is minimized, thus changing market dynamics and increas-ing competition.
2.3 Tourism
Tourism is an economic driver for many developing regions, and South Asia is no exception. Tourism makes a signifi cant contribution to the South Asian GDP, and is one of the top foreign exchange earners for the smaller nations in the region. The industry is entirely dependent on the discretionary spending of travellers, and, therefore, ease of travel will factor heavily in the traveller’s decision on whether to patronize a particular tourist destination. This relationship between tourism and development of air services was recognized and established by Piermar-tini and Rousova (2008) using a gravity type model. They believe the development of air services is essential for the tourism sector, especially for remote locations.
South Asia would also benefi t by promoting tourism in a regional manner, drawing on the vast diversity of attractions in the region, en-abling the promotion of a unique product with several complementary facades. However, to make such options a reality, it is essential that travel within the region can occur in a simple, timely and cost-effective manner. This is far from reality today. It should be noted that tourism was a key reason why ASEAN nations included air services as an area for development in the Action Plan for Transport and Communication in 1997.

108
3. Background to air services regulations
Given the technical nature of the subject, it would be useful at this stage to provide a background of the nature of regulation of the global air services industry.
Civil aviation services for passenger and goods transport have al-ways constituted a sui generis market, possibly with the exception of the pioneering days when entry to global air services was essentially unre-stricted. Some core characteristics distinguish the civil aviation market from the others, and they include4: Dominance of state-ownership of airlines, except in the US and the
UK. High degree of immunity from competition laws, partly on grounds
of national security and national pride. Rigid controls on market entry, capacity and tariffs regarding size of
investment needed and the presence of network externalities. Existence of an international regime with specifi c international orga-
nizations and institutions. High degree of vertical integration, with de jure or de facto control
and ownership links between physical infrastructure and air and ground-handling services.As mentioned in the introduction, global air services are regulated
by a mesh of BASAs between individual countries. These ASAs detail regulatory provisions governing a number of issues (Table 6.1).
Among the most important of these regulations is the grant of rights. There are various degrees of rights which determine the openness of the ASA in question (Box 6.1).
The grant of 1st freedom right through 4th freedom right are stan-dard in any ASA, but the extent of provision of rights from the 5th free-dom and beyond is what infl uences the extent of liberalization in an ASA.
4. Air services agreements in South Asia
This article specifi cally looks at the status of air connectivity among fi ve major economies in the SAARC region, namely, India, Pakistan, Sri Lanka, Bangladesh and Nepal. We begin with an assessment of the restrictiveness of the ASAs that operate within this region using an in-dex created by the WTO. Based on the Quantitative Air Services Agree-ments Review (QUASAR), the WTO secretariat has developed a scoring system that rates the openness of different ASAs in the world. The scor-ing structure of this Air Services Liberalization Index (ALI) selects key
Air services liberalization in South Asia

Regional Economic Integration Challenges for South Asia during turbulent times
109
Table 6.1: Features of ASAs that restrict air services
Restriction Description
Grant of rights Defines the rights of carriers to provide air services between two countries, such as 5th freedom right (transport of freight/passengers of two countries by an airline of a third country, with the flight originating/terminating in the home country of the airline); 7th freedom right (allows an airline to carry passengers between two countries with no connection to the airline’s home country); and cabotage (allows an airline to carry passengers within a country with origin/termination in the home country of the airline).
Capacity Refers to restrictions on volume of traffic, frequency of service and aircraft types. Pre-determination requires that capacity is agreed prior to the commencement of service; Bermuda I regime gives limited right to the airlines to set their capacities without a prior governmental approval and free determination leaves the capacity determination out of regulatory control.
Tariff approval Regulates the regime of price determination. Ranges from dual approval, whereby both parties have to approve the tariff before this can be applied, to free pricing, when prices are not subject to the approval by any party.
Witholding Defines restrictions on the ownership of the foreign airline oper-ating in the country with whom the agreement stands. The most restrictive of these requires the airline to be the flag carrier of the partner country. More liberal regimes include community of in-terests (where country can designate airlines) and principal place of business removes the requirement for substantial ownership.
Designation Defines the number of points between which airlines can operate between the two countries in question.
Cooperative agreements
Regulates the freedom of airlines to enter into code-sharing and alliance formation.
Exchange of statistics
Requirement of airlines to disclose statistics to governments enabling the latter to monitor changes in traffic and other areas. This is, in general, perceived as a restrictive feature.
Source: Author’s compilation.
features of BASAs that affect air traffi c and gives scores according to the degree of liberalization of each feature, i.e., designation, withholding5, tariffs, capacity, traffi c rights, absence of exchange of statistics, allow-ance of cooperative arrangements (e.g., dual approval of tariffs, a very restrictive provision, is attributed zero points, whereas free pricing, the most liberal of the tariff provisions, is given eight points). The ALI has four different rating schemes, each providing a different weight to a particular feature of restrictiveness that may be particularly infl uential

110
Air services liberalization in South Asia
Home Country Country A Country B
Home Country Country A Country B
Home Country Country A
Home Country Country A
Home Country Country A Country B
Country A Home Country Country B
Home Country Country A Country B
Home Country Country A
Box 6.1: Air freedom rights
1st freedom right: The right of an airline of one country to fly over the territory of another country without landing.
2nd freedom right: The right of an airline of one country to land in another coun-try for non-traffic reasons, such as maintenance or refuelling, while en route to another country.
3rd freedom right: The right of an airline to carry freight and passengers from the home country (country of registry) to another country.
4th freedom right: The right of an airline to carry freight and passengers to the home country from another country.
5th freedom right: The right of an airline of one country to carry freight and pas-sengers between two countries outside of its own country, with origin/destina-tion in its home country.
6th freedom right: The right of an airline of one country to carry freight and pas-sengers between two countries on two routes via its home country (combination of 3rd and 4th freedoms).
7th freedom right: The right of an airline to operate stand-alone services entirely outside the territory of its home country, to carry freight and passengers between two foreign countries (on a route with no connection in its home country).
8th freedom right or Cabotage: The right of an airline to carry freight and pas-sengers between two points within the territory of a foreign country (on a route with origin/destination in its home country).
Source: Second Review of the Air Transport Annex, www.wto.org

Regional Economic Integration Challenges for South Asia during turbulent times
111
depending on the nature of an ASA. The fi rst scheme is a standard ALI, the second provides additional weight to the provision of the 5th free-dom right, the third gives additional weight to ownership (withhold-ing) and the fourth gives extra weight to the designation clause. We use this to generate ALI ratings for the ASAs that operate in South Asia (Table 6.2), for which data are available.
Table 6.2: Air services liberalization indices of South Asian BASAs
Bilateral ASA ALI Standard ALI 5+ ALI O+ ALI D+ TypeSri Lanka-Pakistan 8 13.5 6.5 7 iSri Lanka-India 6 12 5 5.5 cBangladesh-India 10 15.5 8.5 13 eBangladesh-Nepal 6 12 5 5.5 cPakistan-Nepal 6 12 5 5.5 c
Notes: i = incomplete data; c = 3rd, 4th and 5th freedom rights, double approval of tariffs, single designation, substantial ownership and effective control, pre-determination of capacity; e = 3rd, 4th and 5th freedom rights, double approval of tariffs, multiple designation, substantial ownership and effective control, pre-determination of capacity.Source: WTO Air Services Liberalization Analytical Tool, www.wto.org
The maximum ALI score that is possible is 50, and this applies to all four different scoring schemes in the above table. From this perspective, it appears that South Asian ASAs are very restrictive, with the highest ALI (standard) being 10. However, as mentioned earlier, most ASAs that operate globally remain somewhat restrictive, and therefore, one fi nds that even the most liberal of the ASAs do not score very high (Ta-ble 6.3).
Table 6.3: Weighted Air Services Liberalization Index (WALI) of high-traffi c BASAs
ASAs concerned WALITop 67 ASAs 16.6Top 100 ASAs 16.1Top 200 ASAs 15.4All QUASAR ASAs (1970) 14.0
Source: www.wto.org
Nonetheless, it is clear that South Asian ASAs are even more restric-tive than average ASAs that operate globally. South Asian countries are relatively more liberal in terms of BASAs with third parties than within the region (Table 6.4).

112
Table 6.4: ASAs between South Asian and select extra-regional countries6
Country Singapore Japan UKSt 5+ O+ D+ St 5+ O+ D+ St 5+ O+ D+
Sri Lanka 14 19 12 16.5 10 15.5 8.5 13 14 12 12 16.5India 10 15.5 8.5 13 12 17 10 14.5 10 15.5 8.5 13Pakistan 14 19 12 16.5 - - - - 14 12 12 16.5Nepal 17 21.5 14.5 15.5 10 15.5 8.5 13 8 7 7 11Bangladesh 10 15.5 8.5 9 6 12 5 5.5 - - - -
Source: WTO Air Services Liberalization Analytical Tool, www.wto.org
Thus, the restrictiveness of BASAs in South Asia could potentially be an important determinant of limited connectivity in the region. We now examine the extent to which the region is connected by air.
5. Extent of air connectivity in South Asia
Currently, there are three routes that are considered “commercial routes” in South Asia (more than double daily fl ights). They are Colom-bo–Chennai, Delhi–Kathmandu and Dhaka–Kolkata. Mumbai–Kath-mandu and Mumbai–Dhaka are considered “well-serviced routes” with double daily fl ights. Three other routes, Dhaka–Karachi, Dhaka–Delhi and Dhaka–Kathmandu, are considered “adequately serviced routes” with more than 10 fl ights a week. Figure 6.2 shows all the existing air connectivity within the region.
It is evident that India is the most connected country in the region while Pakistan is the least connected. There is no direct fl ight between Sri Lanka and Nepal; therefore, air travel between the two countries takes place via Delhi, Bangkok, Singapore, or the Middle East. In a re-cent development, the Sri Lankan budget carrier, Mihin Airlines, has started a Colombo–Dhaka direct fl ight, which fl ies three times a week.
As Table 6.5 illustrates, the extent of country-to-country air con-nectivity in South Asia is disappointing. The situation is even worse if capital-to-capital connectivity is considered. For example, Colombo is not connected directly to Kathmandu or Islamabad; and Kathmandu and Islamabad are also not directly connected.
It needs to be seen whether such poor air connectivity in South Asia is a result of excessive regulations or whether other factors are at work. To supplement the quantitative fi ndings pertaining to the restrictive-ness of ASAs with qualitative research, we collected perspectives of rep-resentatives of airlines operating in the region, and of aviation offi cials. The next section discusses the fi ndings of this exercise.
Air services liberalization in South Asia

Regional Economic Integration Challenges for South Asia during turbulent times
113
6. Stakeholders’ views
Interviews were conducted with key airlines and governments in the region, which included Sri Lankan Airlines, Jet Air, Kingfi sher Airlines, Civil Aviation Authority of Sri Lanka and the Ministry of Tourism and Civil Aviation in Nepal. It was not possible to interview representatives of Pakistan International Airways and Bangladeshi Airlines. A summa-ry of the fi ndings of these interviews is presented below.
Route Frequency per week
Colombo–Chennai 52Colombo–Bangalore 7Colombo–Delhi 7/8Colombo–Karachi 2/3Colombo–Mumbai 7/8Colombo–Tiruchirapalli 8/9Colombo–Trivandrum 2/5/8Colombo–Varanasi 6Delhi–Dhaka 11Delhi–Kathmandu 56Dhaka–Karachi 10Dhaka–Kathmandu 12Dhaka–Kolkata 28Karachi–Kathmandu 2Karachi–Delhi 2Karachi–Mumbai 2Kolkata–Kathmandu 4Lahore–Delhi 2Mumbai–Dhaka 14Mumbai–Kathmandu 14Varanasi–Kathmandu 4
Figure 6.2: Air connectivity in South Asia
Source: South Asian airlines’ websites.
Table 6.5: Connectivity in South Asia (fl ights per week)
India Pakistan Sri Lanka Bangladesh NepalIndia - 6 120 53 78Pakistan 6 - 3 10 1Sri Lanka 120 3 - 3 0Bangladesh 53 10 3 - 12Nepal 78 2 0 12 -
Source: South Asian Airlines’ websites

114
6.1 Commercial viability
A unanimous perception of stakeholders was that air services in South Asia were not commercially viable. It is because the region remains rela-tively poor with low per capita incomes, and so the demand for air trav-el in most countries other than India is sub-optimal. This is particularly true for intra-regional travel. The demand for fl ights for tourism and commercial purposes within the region is very low. Such low demand for fl ights is one factor that makes more frequent scheduled fl ights be-tween these countries less commercially viable.
Sri Lankan industry players noted that India has moved forward a little in granting more rights (on capacity) to metro airports, and grant-ing even more rights to operate into secondary airports. They noted that commercial potential is limited in these secondary airports, and so open-ing up more capacity rights to metro airports will be key to expanding air services to India. An example cited by one of the interviewees was that instead of offering more capacity on the Colombo–Mumbai route, which is seeing greater traffi c potential, India offered more capacity on a new Colombo–Pune route as an alternative. This is of little use as pas-senger traffi c to Mumbai would not prefer travelling to Pune as a con-necting destination instead. However, it is important to bear in mind that commercial viability (as determined by demand for air travel) infl u-ences, and is also infl uenced by, economic integration, which is low in the region at present.
6.2 Code sharing
Stakeholders noted that there are certain aspects of regulation that could provide a marginal boost to intra-regional connectivity, and code sharing is one such factor. Civil aviation regulatory bodies in the region place restrictions on code sharing in some cases. Stakeholders who were interviewed stated that both Pakistan and Bangladesh do not allow code sharing between two third-party airlines, and expect all agreements to take place with their national carriers. One of the interviewees was of the opinion that one of the biggest barriers to travel from Sri Lanka to Bangladesh is the restriction on code sharing. He pointed out that only 10–15 passengers per fl ight travel from Sri Lanka to India with the in-tention of disembarking in Bangladesh. Therefore, allowing Sri Lanka to share code with a third-party airline will reduce costs and inconve-nience to passengers.
At present, divergence in quality and safety records deter certain airlines from code sharing with other national carriers in the region.
Air services liberalization in South Asia

Regional Economic Integration Challenges for South Asia during turbulent times
115
For example, Sri Lankan Airlines is reluctant to share code with Ban-gladesh’s Biman Airways and Nepal Airlines. However, Sri Lankan Airlines, for instance, could access the Bangladeshi market via a code sharing arrangement with a third-party airline that fl ies from, say, In-dia to Bangladesh. At present, most BASAs place restrictions on code sharing, for instance, by allowing code sharing only with the national carrier of that country, and not allowing code sharing with a third-party airline.7 By completely liberalizing restrictions on code sharing in ASAs, or at least allowing unrestricted code sharing on a priority basis on key routes where code sharing could have a positive impact, it would be possible to create more convenient routes connecting passengers travel-ling within South Asia. Such liberalization will result in greater compe-tition for national carriers, especially on commercially lucrative routes.
6.3 Operational costs
Another factor that could affect the commercial viability of routes is the magnitude of operational costs. The commercial viability of a route is contingent on the potential revenue and the cost of operating the route. Therefore, a reduction in the latter could, to an extent, mitigate short-falls in the former. In South Asia, high operational costs are prevalent in many cases in ground handling, airport charges and a number of other expenses. Some of these could be addressed by policy changes such as revisiting monopoly rights accorded to ground handling, for example, in the case of Sri Lankan Airlines in Sri Lanka. In other cases, it is impor-tant to continuously emphasize enhancing ground handling effi ciency and other airport operations across the region.
Low-cost carriers are particularly conscious of high operating costs at airports, especially high airport taxes/charges, as their profi t margins over budget air ticket prices are slim. Recently, Malaysia-based AirAsia has remarked that airport taxes in certain Indian airports are crippling, noting that as much as half of the ticket price (on an average US$100 fare) goes towards paying airport taxes (Aviation Week 2011). Newer airports have tended to be particularly hawkish in charging high taxes. For example, the new Hyderabad Airport has begun charging a “user development fee”, a move that may prompt other new airports or new terminals to follow suit.
6.4 Visa bottlenecks
Another problem identifi ed by stakeholders is that in some cases, im-migration laws and visa processes undermine smoother connectivity.

116
It was pointed out that the process of obtaining double-entry transit visa to India is cumbersome and this makes it diffi cult for passengers to transit via India while travelling through the region. The visa regime is relatively more liberal between India and Sri Lanka. This is one reason for the existence of a relatively better air connectivity between the two countries that has led to the spurring of tourism, thereby creating much required commercial demand for air connectivity within the region.
Given the present limitations in economic integration and interac-tion within South Asia (other than on a bilateral basis with India), busi-ness visitors alone will not be suffi cient to generate suffi cient air traffi c within the region. Therefore, increasing intra-regional tourism will play a central role, and fl exible visa regimes are an important determinant of this.
6.5 Geographic issues
Another prohibitive factor for greater regional air connectivity is the geography of the region. One interviewee illustrated the diffi culties in navigating through the mountainous terrain surrounding the Kathman-du airport and the requirement of a non-automated “visual landing”. He pointed out that airlines have to set aside additional funds to pay for specialist pilots who are licensed to land in mountainous terrain, particularly when visibility is sub-optimal (a frequent occurrence at Kathmandu airport due to geographical reasons) and after dark. It was noted that only one international airline operates a night fl ight owing to the requirement of specially trained pilots in landing at night at Kath-mandu airport.
6.6 Route-specifi c issues
Interviewees also pointed out factors infl uencing the lack of fl ights be-tween certain specifi c routes. They are discussed below.
Colombo–Kathmandu: As far as Kathmandu is concerned, the geo-graphic positioning of the airport makes night fl ights challenging. Sri Lankan Airlines’ representatives indicated that their entire schedule will need to be altered to accommodate this destination point.
Colombo–Dhaka: Since Bangladesh does not allow code sharing with third party airlines, and Sri Lankan Airlines is not willing to share codes with Biman, this route seems unviable.
It was also pointed out that with regard to routes such as Colombo –Kathmandu and Colombo–Dhaka, even if 5th freedom rights are
Air services liberalization in South Asia

Regional Economic Integration Challenges for South Asia during turbulent times
117
granted by neighbouring countries, air travel in these routes must be economically viable to utilize those rights. Commercial viability would require at least 100 passengers on a given fl ight to make the route fea-sible, which is not the case regarding these routes.
India–Pakistan: Being the two largest economies in the region, there is undoubtedly potential commercial viability in this route. However, the interviewees opined that the political relations between the two countries have compromised negotiations between airlines of the two countries. The negative spill-over of political tension has undermined connectivity between these two countries.
6.7 Challenges from liberalization
Stakeholders’ perceptions were also taken on the key challenges that might result from a more liberal environment in civil aviation regula-tions in South Asia. Their responses are briefl y discussed below.
6.7.1 Low-cost carriers
Deregulation will lower entry costs for low-cost carriers (LCCs) which will threaten national full service carriers (FSCs) in terms of commercial viability. Existing LCCs too will thrive and expand in an open aviation market. However, rather than creating a new market through low pric-ing, LCCs will tend to infi ltrate and erode the target market of FSCs. The end result is that new benchmark pricing would be created below the breakeven point of FSCs (at least in some routes).
However, while LCCs are always a challenge, LCCs and FSCs could thrive side-by-side as in other regions. The need for FSCs will not cease to exist just because of a greater advent of LCCs. The moot point will be the distribution of gains and losses between countries in such a liberal-ized environment. It is likely that ineffi cient airlines, which could be national carriers in certain countries, would lose out to LCCs or even more competitive FSCs in a liberal environment. There will obviously be stringent opposition to liberalization through which such outcomes manifest. Measures to alleviate such distributional effects will need to be taken at the highest political levels, balancing overarching regional benefi ts against short-run national costs. Of course, the ultimate objec-tive would be to enhance effi ciency of all airlines in the region in order to meet the demands of a more competitive environment. However, it would be a mistake to wait for this to happen prior to embarking on steps to enhance liberalization in the region.

118
6.7.2 Infrastructure
While capacity is not signifi cantly affected by shortfalls in infrastructure at present, both in terms of airport capacity and airlines capacity, these problems need to be remedied in the long run in order to accommodate potential increased traffi c in a liberalized environment.
Tretheway (2010) shows that in several countries, investment in air-port infrastructure (along with investment in airlines capacity) provides strong rates of return, by increasing connectivity and contributing to increases in national GDP (Table 6.6).
6.7.3 Political economy factors
As noted in an earlier section, the benefi ciaries of air services liberaliza-tion are numerous and fragmented, and receive relatively small mar-ginal benefi ts, while the losers are large, usually politically infl uential industries such as entrenched domestic airline monopolies. Therefore, deregulation poses inherent political economy challenges. For example, deregulation of airline-related services at Sri Lanka’s main international airport, currently held in monopoly by the fully state-owned national fl ag carrier, is not considered an option.8 Much of the losses of the air-line’s direct operations have been more than offset by the monopoly profi ts earned from its ground handling and catering services provided to all airlines.
7. Policy road map for South Asia
The case for greater liberalization of air services in South Asia is strong. South Asian policy makers and stakeholders examining the issue need to take note of the substantial evidence from other research studies which demonstrate the economic benefi ts of air services liberalization in the region. They include reduced fares and some employment creation in the short run, and catalytic growth of direct and indirect employment, and enhanced trade, in the longer run.
While some efforts are made to formulate a more liberal South Asian air services connectivity framework, other related issues, for instance, introducing more competition in national air transport and support ser-vices markets and addressing infrastructure constraints, need to be si-multaneously addressed. A SAARC-led collaborative programme could give the necessary impetus for South Asian countries to begin address-ing these issues. It would be useful if such a programme is informed by an examination of other regions’ efforts at tackling similar issues.
Air services liberalization in South Asia

Regional Economic Integration Challenges for South Asia during turbulent times
119
Tabl
e 6.
6: In
vest
men
t in
air t
rans
port:
Dev
elop
ing-
coun
try ra
tes
of re
turn
Cou
ntry
Air
port
in
vest
men
t (U
S$ m
illio
n)
Air
craf
t in
vest
men
t (U
S$ m
illio
n)
Perc
ent i
ncre
ase
in c
onne
ctiv
ity
2000
–200
5
Perc
ent
incr
ease
in
natio
nal G
DP
Nat
iona
l GD
P in
200
0 (U
S$
mill
ion)
GD
P in
crea
se
(US$
mill
ion)
Ann
ual
rate
of
retu
rnC
ambo
dia
248
538
610.
323
31,0
8510
019
El S
alva
dor
256
546
430.
245
34,5
9285
16Jo
rdan
2633
476
0.38
526
,048
100
28Ja
mai
ca23
168
340.
199
13,1
2326
16K
enya
6134
885
0.41
750
,007
209
59
Sour
ce: T
reth
eway
(201
0).

120
Sector stakeholders need to be made aware of the process and measures adopted by these regions.
The section below outlines some key steps in enhancing the com-mercial viability of air services in the region; suggests some measures for a broader liberalization of air services under a phased approach; provides, as a case study, a brief overview of the India-Sri Lanka bilat-eral effort to liberalize air services; and highlights the emphasis placed on connectivity within the SAARC agenda which provides the impetus to move aggressively towards air services liberalization in the region.
7.1 Enhancing commercial viability
Some policy-related measures could help enhance the viability of cer-tain routes. These include: Enabling code sharing with third-party airlines. Reducing operational costs in the region, for example, through lib-
eralizing ground handling by breaking monopolies and introducing competition in some cases.
Granting 5th freedom rights on certain routes, which will also be important to consider the “quality” of liberalization. For example, if 5th freedom rights are granted by a country, there is a need to ensure that allocated landing times are of a commercially viable nature.
Simplifying visa processes. Investing in airlines to enhance competitiveness, for which encour-
aging greater foreign equity in national airlines could be an option.These measures need to be supplemented by greater overall invest-
ment in airline-related infrastructure, particularly airport capacity and airline strength. To catalyse such infrastructure development, South Asian countries would need to place more emphasis on involvement of the private sector. India has already strongly embraced this, and is the forerunner in promoting public-private partnerships (PPPs) in airport development in the region.9
While these would address some of the key infrastructure bottle-necks, a signifi cant driver of increased connectivity would be greater demand for travel within the region, and this would require greater re-gional integration in general, on fronts such as commerce, tourism and people-to-people transactions. The case of Indo-Lanka air services liber-alization set out later in this section highlights the central role played by the relaxation of visa regulations by Sri Lanka in spurring demand for fl ights between the two countries.
In the current environment of limited demand for fl ights, it appears that the regulatory environment of the BASAs is not the only signifi cant
Air services liberalization in South Asia

Regional Economic Integration Challenges for South Asia during turbulent times
121
inhibitory factor. However, assuming that demand increases in the long run as economic integration and tourism increase, regulatory factors will pose greater constraints. Additionally, it must be borne in mind that as regional air services connectivity is further liberalized, this would have dynamic effects, which may, in turn, cause certain routes that are cur-rently commercially unviable to become viable. For instance, a current commercially unviable route connecting two South Asian capitals, as identifi ed in earlier sections of this article, may become viable due to the granting of 5th freedom rights in a country. Sri Lanka’s own experience of the initial attempts to move towards open skies via unilateral liberal-ization of air services with India highlights the positive spill-over effects of such liberalization—increased tourist arrivals and greater people-to-people connections, which stimulate investment and commerce.
7.2 Measures towards greater liberalization: A phased approach
It will be necessary for SAARC to move towards greater air services lib-eralization in a phased manner as was done by ASEAN and the EU. The ASEAN region, for instance, began by enabling foreign equity participa-tion in domestic airlines, which would help airlines face increased com-petition in times of downturn. The relatively easy and less contentious measures such as easing capacity controls and tariff restrictions could be implemented fi rst before moving on to more complicated areas. Such a staggered approach to liberalization will give airlines in the region time to adjust in terms of costs entailed in the process. The key challenge for policy makers in the region will be to balance regional interest with national interests of countries whose carriers are likely to struggle to survive in an increasingly competitive environment.
The following steps in liberalizing BASAs in South Asia could be taken as a tentative road map for air services liberalization in South Asia in the longer term.
Easing restrictions on withholding: Allowing foreign investment in air-lines can enhance the quality and magnitude of services. This is also important for enabling code sharing and ensuring an increase in fl ights since the current airline capacity in many South Asian countries is lim-ited, and for countries like Nepal, even viable routes cannot be serviced due to a lack of aircraft.
Easing restrictions on designation (double designation) and capacity (Ber-muda I): It is important to reduce limits on the number of destinations that airlines are allowed to fl y into and also the number of passengers permitted. This will benefi t the smaller countries in the region since they can tap into the Indian market better in the same way as Sri Lanka was

122
able to enter the Indian market as a result of increased fl ights allowed into Indian cities.10 Such a venture into the Indian market can help air-lines in the region increase their profi tability, which would facilitate a move to the rest of the region in the longer term.
It is also essential to fully liberalize capacity (free determination) for 3rd and 4th freedom rights for capital-to-capital fl ights in the region; allow multiple designations (i.e., multiple destination points); liberalize tariff and extend 5th freedom right across the region.
While the exact nature of the steps to be taken could change accord-ing to circumstances, the road map presented here is a starting point for further liberalization of air services in South Asia. It is important to see this initial road map as a precursor to a much more ambitious and proactive liberalization plan by SAARC, possibly even adopting the ASEAN plan, with suitable adaptations to suit SAARC’s context.
8. India-Sri Lanka bilateral air services liberalization experience
Liberalization of air services between India and Sri Lanka began from 2000. According to the Joint Study Group Report on India-Sri Lanka Comprehensive Economic Partnership Programme, “between 2000 and 2003 the number of Indian destinations to which Sri Lankan Airlines fl ies increased from 5 to 8, the number of fl ights from 29 to 44 per week and the number of seats from around 8,000 to nearly 9,500, representing a signifi cant increase in capacity.” In 2003, it was agreed between the two countries to eliminate the requirement of commercial agreements between the designated airlines of the two countries for asymmetrical operation. By around 2005, Sri Lanka had the most fl ights into India for any international carrier and was soon operating 110 fl ights a week be-fore the global economic crisis reduced the demand for travel.
Sri Lankan Airlines’ venture into the Indian market helped it stay afl oat after a debilitating terrorist attack on Sri Lanka’s international air-port in 2001 that resulted in reduction in travel to and from Sri Lanka. A key factor that infl uenced the increase in fl ights between the two coun-tries was the extension of visa on arrival by Sri Lanka to Indian visitors (which was later extended to 73 countries worldwide). This facilitated travel to a great extent and resulted in increased demand for Indian visi-tors to Sri Lanka. Unsurprisingly, India soon became Sri Lanka’s leading source of tourism. At the same time, movement of Sri Lankans to India was also increasing for educational, medical and business activities. The fact that the two countries had a very visible and effective bilateral FTA helped spur business travel between the two countries as bilateral trade and investment grew exponentially. At the same time, increase in capac-
Air services liberalization in South Asia
Regional Economic Integration Challenges for South Asia during turbulent times
123
ity allowance enabled Sri Lankan Airlines to position itself as a gateway to and from India, connecting India with Southeast Asia. After Sri Lank-an Airlines got direct fl ight access to numerous Indian cities, people, who did not necessarily want to fl y directly to the popular metros such as Delhi and Mumbai because of various problems, got the option to fl y to cities of their choice. Liberalization of regulations also enabled Sri Lankan Airlines to design its strategy in a more fl exible manner, keep-ing in mind long-term commercial viability.
The case of India and Sri Lanka shows that for air services to increase, there needs to be both a viable market for air services (and this was cre-ated by the relaxation of visa requirements and the increase in economic interaction and exchange between the two countries) and relaxation of the stringent BASA. The problem among many South Asian countries is that, other than in terms of bilateral relations with India, economic and tourism integration between them is still at a nascent stage. If one were to pin point the driver of increased air service operations between India and Sri Lanka, the relaxation of visa regulations by Sri Lanka would be a key candidate, with tourism being an important determinant. This is further illustrated by the fact that it was only in November 2010 that many Indian airlines began operations on the Colombo–Delhi route as demand increased following the end of war in Sri Lanka.
9. Conclusion
This article examined the nature of air services connectivity in South Asia and found that regulatory issues, as per the BASAs that operate within the region, are fairly restrictive, but there are several other re-lated issues that have caused the region to be characterized by limited air connectivity. According to stakeholders, the limited number of eco-nomically viable routes poses a key challenge to profi tably expanding air connectivity in the region.
With a forecast of stronger growth of passenger aviation and air cargo in Asia in general, and in South Asia in particular, it is important for South Asia to critically evaluate the various elements affecting the growth of its civil aviation industry. The nature of BASAs, the level of competition and contestability in domestic airport services markets, the level of investment in and competitiveness of airlines, and the level of supporting infrastructure need to be investigated and anomalies and barriers addressed on a SAARC-wide, collaborative basis.
South Asian policy makers need to note the signifi cant interdepen-dence between regional economic integration and transport connec-tivity. A signifi cant driver of increased connectivity would be greater

124
demand for travel within the region, and this would require greater re-gional integration in general, on fronts such as commerce, tourism and people-to-people transactions. In the longer run, South Asia needs to embark on a more ambitious framework of liberalization on a regional basis since restrictive air services regulations between countries stifl e air travel, trade, business interactions, and tourism, and in turn, economic growth and job creation.
Better and freer air services can spur a virtuous circle of increased dynamism in South Asia in terms of air transport markets, reduced fares, higher passenger fl ows within the region, and increased air cargo, all of which would complement the broader effort to improve multi-modal intra-regional connectivity in the SAARC region. It will also help lower transaction costs of doing business in the region, catalyse intra-regional trade, boost South Asian exports in global production networks, and enhance trade and tourism.
Research for this article was undertaken for an ADB-SACEPS study on “Lib-eralization of Air Services in South Asia”. Contributing authors to a previous version of this article include Deshal De Mel and Jithendra Seneviratne of the Institute of Policy Studies of Sri Lanka, Colombo.
Notes
1 As a matter of fact, most capitals in the region are not connected to more than three capitals of other South Asian countries by direct flights. Although Figure 6.2 provides connectivity map for five countries in the region, based on available information, it does not include Kabul (Afghanistan) and Male (the Maldives), which are least connected to regional capitals. However, Paro (Bhutan), which too is not included in the figure, is connected to three capi-tals, namely, Dhaka, Kathmandu and New Delhi.
2 As per the aviation connectivity index supplied by the International Air Transport Association.
3 An example cited in this study is the case of Poland where the connectiv-ity index increased by 27 percent with flights to the United Kingdom (UK) increasing from 58 per week to 250 (seats increasing from 7,000 to 40,000), which resulted in a cumulative increase in productivity of 0.19 percent, val-ued at approximately US$600 million. The UK too saw a rise in productivity, with the corresponding figure at US$45 million.
4 Adapted from Findlay and Goldstein (2004).5 The term “withholding clause” is used by the International Civil Aviation
Organization, but this clause is often referred to as “designation” or, more frequently, “ownership” clause, given that the “standard” requirement is that, to be designated by a Contracting State to utilize the rights granted in an ASA, an airline has to be “substantially owned and effectively controlled” by the nationals of that Contracting State.
6 Singapore, Japan and the UK are selected since data for these countries’ ASAs
Air services liberalization in South Asia

Regional Economic Integration Challenges for South Asia during turbulent times
125
with almost all the selected South Asian countries were available.7 Of the Indian carriers, Sri Lankan Airlines shares code only with the national
flag carrier, Air India.8 At a discussion in March 2011 on Sri Lanka’s civil aviation sector, respond-
ing to a question on the need to deregulate airline-related services to infuse competition and thereby reduce operating costs, the state-owned airports company (Airport and Aviation Services Limited) stated that “allowing a second ground handler is not seen as possible at this point”.
9 Several Indian airports have been developed under the PPP model since the Indian authorities opened the sector to private investment over 5 years ago, e.g., development of existing airports at Delhi and Mumbai, building “green-field” airports in Hyderabad and Bangalore, and calls for investment for pro-posed second airports in Chennai and Navi Mumbai.
10 However, an important parallel measure was extension of visa on arrival in Sri Lanka.
References
Aviation Week. 2011. “AirAsia says airport taxes too high in India”, 7 January. Available at http://www.aviationweek.com/aw/generic/story_channel.jsp?channel=comm&id=news/avd/2011/01/07/11.xml (accessed 11 May 2011).
Balaz, Vlado and Allan Williams. 2006. “Air travel de-regulation and local economies in Europe: Refl ections on the unintended conse-quences for productivity.” Available at www.cs.nott.ac.uk/~dap/network/.../working.doc (accessed 10 April 2010).
Findlay, Christopher and Andrea Goldstein. 2004. “Liberalization and foreign direct investment in Asia transport systems: The case of avi-ation.” Asian Development Review, Vol. 21, No. 1: 37–65.
Grancay, Martin. 2009 “The economic impacts of air transport liberal-ization.” Munich Personal RePEc Archive. Available at http://mpra.ub.uni-muenchen.de/16590/1/MPRA_paper_16590.pdf (accessed 15 April 2010).
Piermartini, Roberta and Linda Rousova. 2008. “Liberalization of air transport services and passenger traffi c.” Available at http://www.etsg.org/ETSG2008/Papers/Rousova.pdf (accessed 30 March 2010).
Tham, Siew Yeaw. 2008. “Open skies in ASEAN.” ADB Institute Work-ing Paper No. 119. Available at http://www.adbi.org/working paper/2008/11/04/2736.asean.open.skies.airport.development. strategy.malaysia/open.skies.in.asean/ (accessed 18 March 2010).
Tretheway, Michael. 2010. Economic impacts of aviation: Catalytic impacts. Paper presented at the ACED Conference, 20 September 2010.

.

1. Introduction
Surface transport network in South Asia continues to remain fragment-ed despite the existence of basic infrastructure and facilities. Due to lack of integration of the transport system, logistic costs in South Asia are very high and range between 13 percent and 14 percent of the commod-ity value compared to 8 percent in the United States (US). Intra-regional trade among members of the South Asian Association for Regional Co-operation (SAARC) has been around 5 percent for several years, which is much less compared to other regional groupings in the world. Had overland transport connectivity among SAARC countries been im-proved, intra-regional trade could have been enhanced.
At present, for bilateral trade between India and Bangladesh, Bangla-desh and Nepal, and Bhutan and Bangladesh, goods are transshipped at the border between trucks. Freight trains are not allowed to move across borders. For example, in the case of freight trains between India and Bangladesh, rail wagons are pulled by Indian locomotives up to Bangladesh’s border and Bangladesh Railway locomotives pull these to their destinations within Bangladesh.
Improving transport connectivity in South Asia
Chapter 7
M. Rahmatullah

128
Before 1947, goods from Northeast India used to pass through ter-ritories which now lie in Bangladesh. These territories were part of East Pakistan after India was divided into two countries in 1947. However, rail and inland water transport (IWT) transit traffi c movement across these territories continued until the war between India and Pakistan in 1965, and was suspended thereafter. After East Pakistan seceded from West Pakistan (now Pakistan) in 1971 to form Bangladesh, transit only by IWT was restored, but restrictions on movement of transit traffi c by road and rail continued. Currently, there is only limited bus transport movement between India and Bangladesh.
Northeast India is virtually a landlocked territory, and traffi c from Northeast India is required to travel 1,400 km–1,650 km to reach the port in Kolkata, which is the only port available to it. If Bangladesh would allow transit through its territory, goods from Northeast India would have to travel only 450 km–700 km to reach the Kolkata port.
Consequences of poor connectivity in South Asia are huge. Current-ly, a 20 ft. container takes at least 30 days to move between New Delhi and Dhaka through the maritime route (via Mumbai and Singapore/Colombo to Chittagong and then by rail to Dhaka), which costs around US$2,500. Direct rail connectivity between the two cities could reduce the time to 4–5 days and the cost to around US$850.
One of the earliest initiatives to establish regional connectivity in South Asia was taken by the United Nations Economic and Social Com-mission for Asia and the Pacifi c (UNESCAP) through two regional projects initiated in 1959 and 1960, respectively. Similarly, the SAARC Regional Multi-modal Transport Study, completed in 2006, was another major initiative to strengthen regional connectivity in South Asia. How-ever, a real breakthrough in this regard occurred with the signing of the Joint Communiqué by India and Bangladesh on 12 January 2010 follow-ing a historic India-Bangladesh Summit in New Delhi. The Joint Com-muniqué set the tone to achieve a long-lasting cooperation in transport connectivity in the northeastern sub-region of South Asia.
This article critically reviews the various initiatives taken to ensure transport connectivity in the region and identifi es issues that need to be addressed urgently to achieve concrete results on the ground.
2. Past initiatives to address connectivity
2.1 The UNESCAP initiative
UNESCAP undertook pioneering efforts to establish regional connectiv-ity in South Asia through two of its famous projects—the Asian High-
Improving transport connectivity in South Asia

Regional Economic Integration Challenges for South Asia during turbulent times
129
Map 7.1: Asian Highway
Map 7.2: Trans-Asian Railway
way (AH) and the Trans Asian Railway (TAR)—initiated in 1959 and 1960, respectively. The AH Agreement has already been signed by 28 countries out of 32 which would be crisscrossed by the proposed high-way, and entered into force on 4 July 2005. AH1 and AH2 are the two major routes which connect Southeast Asia and South Asia with Europe (Map 7.1).
The TAR network has also been identifi ed. The Southern corridor from Indonesia via India to Turkey, which is of direct interest to South Asia, covers a length of 35,200 km. Five gauges are involved in this net-work, and there are still several missing links, such as Thailand–Myan-mar, Myanmar–Yunan Province of China, Myanmar–India, Pakistan–Iran, etc. (Map 7.2).

130
In order to operationalize the TAR network, a separate agreement needs to be signed by the countries concerned, spelling out various de-tails, which is yet to take place.
2.2 SAARC initiatives
The 12th SAARC Summit held in Islamabad in 2004 decided to strength-en transport, transit and communications links among South Asian countries. This was followed by a SAARC Regional Multi-modal Trans-port Study (SRMTS), which was completed in June 2006. SRMTS iden-tifi ed 10 road corridors, 5 rail corridors, 2 IWT corridors, 10 maritime gateways and 16 aviation gateways for regional transport connectiv-ity. The 14th SAARC Summit held in 2007 in New Delhi approved the recommendations provided by SRMTS and urged Transport Ministers to oversee their implementation. The Summit also decided to extend SRMTS to include Afghanistan and directed the Inter-Governmental Group on Transport to identify and develop sub-regional and regional projects based on the prioritized recommendations of SRMTS.
At the 14th SAARC Summit, some sub-regional projects were also proposed by Bhutan, India and Sri Lanka, and their implementation was reviewed by a meeting of Transport Ministers held in Colombo in July 2009. Progress to that end, so far, has been marginal except that a transport agreement has been put in place. The Transport Ministers’ Meeting also agreed to run a demonstration container train from Paki-stan to Bangladesh through India and Nepal, which is still to be pursued by the SAARC Secretariat. Lately, a SAARC expert group has been set up which is reviewing the drafts of the Motor Vehicle Agreement and the Railway Agreement for fi nalization.
3. A recent initiative: India-Bangladesh Joint Communiqué
During Bangladesh’s Prime Minister Sheikh Hasina’s visit to India in January 2010, the two countries signed a Joint Communiqué covering several issues of bilateral as well as regional importance. Regarding transport connectivity, the Joint Communiqué included the following: Making available Mongla and Chittagong Sea Ports for use by Ne-
pal, Bhutan and India. Making available Rohanpur/Singabad–Katihar–Raxaul–Birgunj
broad gauge rail link for Nepal’s third-country trade through Mon-gla Sea Port, and for bilateral trade between Bangladesh and Nepal.
Constructing Akhaura–Agartala rail link. Designating Ashuganj as a new port of call and a transshipment port
Improving transport connectivity in South Asia

Regional Economic Integration Challenges for South Asia during turbulent times
131
for Indian transit traffi c by IWT and then for onward movement to Tripura by road transport.
Allowing goods between India and Bangladesh to be carried in con-tainers through rail and water transport routes.The Joint Communiqué, if implemented fully, will strengthen Ban-
gladesh’s connectivity with India, Bhutan and Nepal. India will also stand to gain considerably in terms of cost and time savings. Ban-gladesh could trade in transport services and earn foreign exchange through transport charges in the form of rail charges, port charges, road transport charges and water transport charges, depending on the routes being used. Bangladesh should be able to earn transit fees as well (a part of the cost savings that Indian transit traffi c would be gaining, besides huge time savings).
Besides easing trade between Nepal and Bangladesh, Bhutan and Bangladesh, and Northeast India and mainland India, such transport connectivity would also provide an opportunity to Bangladesh to es-tablish itself as the “transport hub” of the sub-region. Similarly, provid-ing port facilities to neighbouring countries is also expected to increase patronage for Bangladesh’s Deep Sea Port Project at Sonadia (south of Chittagong). Bangladesh has already invited India and the Yunnan Province of China (having capital at Kunming) to use the Deep Sea Port and join hands in its development. Meanwhile, Myanmar has also in-dicated its willingness to establish, through its territory, a road link be-tween Kunming and Chittagong.
4. Implementation of the Joint Communiqué
Bangladesh’s roads have been designed for 8.2 ton axle load and are only two-lane wide. Hence, these roads can be used only in a limited way, mainly to carry high-value commodities. Most goods have to be carried mostly by rail and IWT. Therefore, to facilitate movement of road traffi c across Bangladesh and access to the sea ports, a thorough assessment was made of the various initiatives undertaken and investments needed to implement each of the decisions included in the Joint Communiqué. Some of the major fi ndings of the assessment are discussed below.
4.1 Maximizing the use of Mongla and Chittagong Ports
According to the assessment made by the Government of Bangladesh (GOB), Mongla and Chittagong Ports currently have around 80 percent and 40 percent spare capacity. Therefore, to utilize the spare capacities, some investments have already been planned to modernize these ports.

132
GOB has already decided to operate the New Mooring Container Ter-minal through the private sector on a lease holding basis.
Furthermore, to facilitate effi cient use of the Chittagong Port, major projects that need to be implemented include: Recommissioning of Kulaura−Shahbazpur−Mahissasan (39 km),
plus a transshipment facility near Shahbazpur, to be fi nanced through GOB’s own resources.
Construction of Akhaura−Agartala rail link (approx. 10 km), to be fi nanced through an Indian grant outside the US$1 billion line of credit (LOC).
Construction of three major sections along the Dhaka−Chittagong route as double tracks, to be fi nanced by the World Bank, the Asian Development Bank (ADB) and the Japan International Cooperation Agency.1
Construction of second Bhairab Rail Bridge and second Titas Rail Bridge, to be fi nanced out of the US$1 billion LOC to be provided by India.
Construction of an inland container depot (ICD) at Dhirasram near Tongi, to be fi nanced by the World Bank.
Construction of a second rail bridge on Jamuna river, for which the ADB has already committed funds for a feasibility study.
Strengthening of several rail sections, modernization of signalling and acquisition of rolling stock, to be fi nanced through a number of sources.
4.2 Improving road transport
Since major roads in Bangladesh are only two-lane and they also suffer from structural weaknesses, loaded Indian trucks are not al-lowed to use Bangladesh’s roads. Therefore, to facilitate movement of both national and regional road traffi c, a number of road sec-tions, including Brahmanbaria−Mainamati, Sutarkandi−Sylhet and Benapole−Jessore−Khulna need upgradation.
Temporarily, and as an immediate solution, Bangladesh’s road transporters could provide transshipment facilities from one border to another border across Bangladesh to carry some of the Indian high-value commodities. Alternatively, a Joint Venture Trucking Company could be set up by Bangladesh’s road transporters with shareholders in India, Nepal and Bhutan, with double registration (e.g., vehicles registered both in Bangladesh and India) for the company’s multi-axle vehicles (truck trailers, covered vans, etc.). Double registration will al-low these vehicles to pick up containers from inside India, Nepal and
Improving transport connectivity in South Asia

Regional Economic Integration Challenges for South Asia during turbulent times
133
Bhutan and move across Bangladesh to deliver goods to destinations without any transshipment at the border. Such a system could reduce transportation costs appreciably. However, to set up such a company and ensure its smooth operationalization, strong political support of the governments of all four countries would be essential.
4.3 Operationalizing the Rohanpur−Katihar−Birgunj rail link
Currently, movement of goods between Nepal and Bangladesh is allowed only through the Kakarvitta (Nepal)−Phulbari (India)−Banglabandha (Bangladesh) route. The Joint Communiqué signed between India and Bangladesh has stated that the Rohanpur (Bangladesh)−Katihar (India)−Birgunj (Nepal) rail link will be made available to Nepal for its third-country trade via Mongla Port. This is an attractive alternative for Nepal; however, this route will face tough competition from the exist-ing Birgunj−Kolkata rail route since it is shorter (around 700 km) com-pared to the new route, which is 900 km (Map 7.3). Nevertheless, the new route can still be competitive if the dwell time in Mongla Port can be kept as low as possible, and transshipment facilities for containers at the Khulna Railway Station and the 44 km truck-trailer service between the Khulna Railway Station and Mongla Port are made effi cient. Still, once the Khulna−Mongla rail link and the bridge on Rupsa River are built, there could be a drastic change in the situation.
Since Kolkata Port is already facing congestion and siltation prob-lems, Mongla Port has a fair chance of surviving the competition, pro-vided that the port operations are modernized, adequate infrastructure facilities are ensured and port charges are kept comparatively lower. To this end, Mongla Port has initiated several projects to enhance its effi ciency. It is being modernized through installation of modern con-tainer handling equipment, undertaking dredging to increase draft of the main channel, introducing night navigation and dredging of outer bar. A major part of these investments is being fi nanced by the GOB through its own resources.
4.4 Constructing the Akhaura−Agartala rail link
At present, Northeast India’s connectivity with Bangladesh by railway is only through Shahbazpur/Mahissasan. A new link, Akhaura−Agartala (around 10 km), is going to be built soon through an Indian grant out-side the US$1 billion LOC. The alignment has been fi nalized by the India-Bangladesh Joint Technical Group, and the recommendation has been submitted to the respective governments for approval. Once ap-

134
Improving transport connectivity in South Asia
proved, a feasibility study will be undertaken and tenders called for construction.
The Akhaura−Agartala metre-gauge link will become a direct com-petitor to the existing Kulaura−Shahbazpur/Mahissasan link (Map 7.4).
Map 7.3: Rohanpur−Katihar−Birgunj rail link
Map 7.4: Rail link between Northeast India and Bangladesh

Regional Economic Integration Challenges for South Asia during turbulent times
135
4.5 Making Ashuganj a new transshipment port
A transshipment facility for containers is going to be developed in Ashuganj. This will facilitate the movement of containers between In-dia’s northeastern states and Kolkata. For the facility, Bangladesh is expected to make an investment of around Taka 2.5 billion out of the US$1 billion LOC to be provided by India. Development of this facility will provide India’s northeastern states a shorter IWT-cum-road trans-port link to Kolkata. As a result, India will gain considerably in terms of transport cost savings per ton of cargo moving across Bangladesh, besides substantial time savings. Bangladesh should also be able to earn IWT charges, road transport charges, transshipment charges as well as “transit fees” (a part of the savings in transport cost per ton when the transit cargo will be travelling through a shorter route across Bangla-desh versus the existing long route through the chicken’s neck).2 The amount of “transit fee” to be charged shall have to be decided based on discussion between India and Bangladesh to make it a win-win deal for both countries.
4.6 Ensuring container movement by rail and IWT
As stated earlier, there is no direct overland container movement be-tween India and Bangladesh. All containers move along rail-cum-sea route via Mumbai, Singapore and Chittagong. According to the Joint Communiqué, direct container movement by rail and IWT would now be allowed. In this context, it may be noted that the Jamuna Bridge in Bangladesh has no restriction for ISO container3 movement. But there is a limitation on the number of trains that can pass through the bridge in 24 hours, and the utilization rate has been almost fully saturated. There-fore, there is a need to allow more trains to cross the bridge in specifi c intervals. After crossing the Jamuna Bridge, containers can move up to Dhaka ICD through dual gauge. An IWT container terminal in the public sector is under construction at Pangaon, and some private sec-tor IWT container terminals are also under development. These IWT terminals, when developed, will facilitate direct container movement between Kolkata and Dhaka as well as between Dhaka and Chittagong, and Dhaka and Mongla.
5. Identifi cation of routes through Bangladesh
Based on a review of the major corridors identifi ed by SRMTS, 13 routes were selected for further investigation (Table 7.1). Assessments were

136
made of each route with regard to their suitability to serve as the most cost-effective and effi cient route for transit traffi c through Bangladesh—to reach the sea ports (for Nepal and Bhutan) as well as Kolkata (for India’s northeastern states).
Recently, the GOB set up a high-level core committee to look into transit issues among Bangladesh, India, Nepal and Bhutan. Five sub-committees were set up to work on the various aspects involved. The mandate of one of the sub-committees was to identify possible routes for transit traffi c. It is quite likely that many of the routes considered by the sub-committee and listed in Table 7.2 will receive priority attention for the movement of transit traffi c across Bangladesh.
Of the 17 routes (A, B1 and C) listed in Table 7.2, only a few can be operationalized immediately because the others suffer from acute in-frastructural defi ciencies. It might take about three to fi ve years to im-prove, modernize and fully operationalize all the identifi ed routes.
Improving transport connectivity in South Asia
Table 7.1: The 13 routes analysed by SRMTS
S. N. Selected routesA. Road routes (7)
1 Road route 1: Silchar−Sutarkandi−Paturia Ferry−Benapole/Petrapole−Kolkata
2 Road route 2: Agartala−Akhaura LCS−Paturia Ferry−Benapole/Petrapole−Kolkata
3 Road route 3: Guwahati−Dawki/Tamabil−Chittagong Port4 Road route 4: Silchar−Sutarkandi−Chittagong Port5 Road route 5: Agartala−Akhaura−Chittagong Port6 Road route 6: Kathmandu−Kakarvitta−Phulbari/Banglabandh−Mongla Port7 Road route 7: Thimphu−Phuentsholing/Jaigaon−Burimari−Mongla Port
B. Rail routes (5)
8 Rail route 1: Silchar−Mahisassan/Shahbazpur−Dhaka ICD−Darsana−Kolkata
9 Rail route 2: Silchar−Mahisassan/Shabazpur−Chittagong Port
10 Rail route 3: Agartala−Akhaura LCS−Dhaka ICD (Dhirasram)−Darsana/Gede−Kolkata
11 Rail route 4: Agartala−Akhaura−Chittagong Port12 Rail route 5: Birgunj−Katihar−Rohanpur−Khulna−by road to Mongla Port
C. IWT route (1)
13 IWT route: Kolkata−Raimongal−Mongla−Narayanganj−Ashuganj−by road to Agartala

Regional Economic Integration Challenges for South Asia during turbulent times
137
(Continued in next page)
Table 7.2: Details of the various routes considered by the sub-committee
A. Road routes
S.N. Route Beneficiaries
1 Kolkata−Petrapole/Benapole−Dhaka−Akhaura/Agartala Tripura and Mizoram
2 Agartala−Akhaura−Chittagong Tripura and Mizoram
3 Silchar−Sutarkandi−Chittagong Port Nagaland, Manipur and south-ern part of Assam
4 Silchar−Sutarkandi−Paturia Ferry−Benapole/Petrapole−Kolkata
Nagaland, Manipur and south-ern part of Assam
5 Samdrup Jonkhar (Bhutan)−Guwahati−Shillong−Tamabil−Sylhet−Chittagong
Eastern part of Bhutan, Guwa-hati, part of Assam and eastern part of Meghalaya
6Kathmandu−Kakarvitta/Phulbari−Banglabandh−Mongla/ Chittagong
Eastern and central regions of Nepal
7 Thimphu−Phuentsholing−Jaigaon/Burimari−Mongla/ Chittagong Capital region of Bhutan
B1. Rail routes
S.N. Route Beneficiaries
1Silchar−Mahisasan/Shahbazpur−Dhaka ICD (Dhirasram)−Bangabandhu Bridge−Darsana/Gede−Kolkata
Nagaland, Manipur, southern part of Assam
2 Silchar−Mahisasan/Shahbazpur−Chittagong Port
Nagaland, Manipur and south-ern part of Assam
3Agartala−Akhaura−Dhaka ICD (Dhirasram)−Bangabandhu Bridge Dar-sana/Gede−Kolkata
Tripura and Mizoram
4 Agartala−Akhaura−Chittagong Port Tripura and Mizoram
5 Kolkata−Petrapole/Benapole−Khulna−Mongla Port
West Bengal and parts of Bihar and Orissa
6 Birgunj/Raxual−Katihar−Singhabad/Rohanpur−Khulna−Mongla Port
Eastern and central regions of Nepal
7 Jogbani/Biratnagar−Radhikapur/Birol−Parbatipur−Khulna−Mongla Port Biratnagar region of Nepal

138
6. Benefi ts of cooperation
Cooperation in transport connectivity in South Asia would be benefi cial to user countries (India, Nepal and Bhutan) as well as the transit facility-providing country Bangladesh. These benefi ts are discussed below.
6.1 Benefi ts to India, Nepal and Bhutan
Benefi ts that will accrue to users of transit facilities may be categorized as static benefi ts such as transport effi ciency in terms of time and costs, as well as productivity gains, and dynamic benefi ts such as employment creation, poverty reduction and trade creation. Once regional transport connectivity through Bangladesh is established, users of transport ser-vices are expected to benefi t from lower transport costs due to establish-ment of shorter and direct routes through Bangladesh, and time savings due to reduction in travel time, mostly due to shorter routes.
India will also benefi t from earnings from transport charges (rail or road transport charges) for the segment of the route that belongs to India.
Improving transport connectivity in South Asia
B2. Potential rail routes for future development
S.N. Potential routes Beneficiaries
1 Agartala−Akhaura−Dhaka ICD (Dhirasram)−Padma Bridge−Benapole/Petrapole−Kolkata
Tripura and Miz-oram
2 Hashimara−Holdibari/Chilahati−Parbatipur−Khulna−Mongla Port
Northern part of West Bengal
C. IWT routes
S.N Route Beneficiaries
1Kolkata−Namkhana−Shiekhbaria−Mongla−Kawkhali−Barisal−Chandpur−Bhairabbazar/Ashuganj−Sherpur−Zakiganj−Karimganj
Tripura and Mizoram
2
Kolkata−Namkhana−Shiekhbaria−Mongla−Kawkhali−Barisal−Chandpur−Mawa−Paturia−Sirajganj−Chilmari−Daikhawa−Dhubri−Pandu−Silghat
Tripura and Mizoram
3Kolkata−Namkhana−Shiekbaria−Mongla−Kawkhali−Barisal−Chandpur−Ashuganj (by waterway) then Ashuganj−Akhaura (by road) as a multi-modal route
India-Bangla-desh-India(Proposed route)
Note: Tripura, Mizoram, Nagaland, Manipur, Assam and Meghalaya are India’s northeastern states, and Guwahati is the capital of Assam. West Bengal and Orissa are states in the eastern part of India.
(Continued from previous page)

Regional Economic Integration Challenges for South Asia during turbulent times
139
For example, if a truck trailer carries a container from Kolkata to Agar-tala, India will earn transport charges for the segments from Kolkata to Petropole and from Akhaura to Agartala, while Bangladesh would earn transport charges from Benapole to Akhaura. There will also be benefi ts through substantial transport cost savings for using shorter transit routes through Bangladesh. According to a study (SACEPS and CPD 2010), the percentage of savings per ton could be in the range of 12 percent to 76 percent of the existing transport costs. It shows that the highest savings (76 percent) could be along the Agartala−Akhaura−Chittagong port by rail versus the Agartala−Kolkata port via the chicken’s neck, and the lowest savings (12 percent) along the Guwahati−Tamabil−Chittagong port by road versus the Guwahati−Kolkata port via the chicken’s neck.
6.2 Benefi ts to Bangladesh
As a transit facility-providing country, Bangladesh could enjoy the fol-lowing benefi ts depending on the routes and facilities used: Transport charges earnings (rail freight, road transport and water
transport charges). Port charges earnings (for international traffi c using the sea ports). Border crossing charges earnings at land ports for transit traffi c. Toll charges earnings for using major bridges such as Jamuna bridge
and major road infrastructures, and ferry charges earnings. Transit fee earnings.4
6.3 Other benefi ts
Of the various studies undertaken to analyse the implications of hav-ing regional transit arrangements through Bangladesh, most of them have concluded that sizeable traffi c could get diverted to shorter routes through Bangladesh. There are estimates that up to 100 percent inter-state and international traffi c could get diverted from the Indian states of Manipur, Nagaland, Mizoram and Tripura. Similarly, partial diver-sion could occur from the southeastern part of Assam and the eastern part of Meghalaya. However, there are also fi ndings that such diversions might not take place. For example, Murshid (2010) states that there may be no diversion from Assam and Meghalaya. Nevertheless, a majority of studies claim that there will be sizeable diversion from Assam and Meghalaya. In the cases of Nepal and Bhutan also, most of the studies have revealed that 50 percent of freight traffi c to and from Nepal could potentially be diverted,5 while for Bhutan, 100 percent diversion along the Bangladeshi routes could be possible.

140
There will not just be diverted traffi c using the new routes through Bangladesh. There will also be sizeable “generated traffi c”. Although Northeast India is rich in natural resources, these have not been exploit-ed so far in the absence of access to sea ports. Now that Bangladesh has agreed to allow India to use its Chittagong and Mongla ports, natural resources of Northeast India could be exploited with the prospects of exporting them through Bangladeshi ports. Thus, the actual benefi t to Bangladesh and India from transit traffi c movement through the new routes would be much more than what has been estimated so far.
7. Investments needed to improve Bangladesh’s transport system
In 2008/09, Bangladesh prepared a draft Integrated Multi-modal Trans-port Policy (IMTP). Within the framework of the draft IMTP, sectoral master plans were prepared for roads, railways and inland water trans-port. Investment requirements to implement the master plans were pro-jected for a 20-year period, in four phases of fi ve years each.
Meanwhile, in order to meet the commitment made by Bangladesh as part of the Joint Communiqué signed between India and Bangladesh in January 2010, a number of projects are required to be implemented on a priority basis. At the same time, Bangladesh’s transport system needs to be improved to ensure continued national growth of more than 6 percent, and a sizeable investment is needed for this purpose. Estimates have put the fi gures for such investments over the next 10 years to be at least US$7 billion.
8. India’s fi nancial assistance
As part of the Joint Communiqué signed by India and Bangladesh in January 2010, the Government of India announced an LOC of US$1 billion for Bangladesh to implement a range of projects, including rail-way infrastructure, supply of broad gauge locomotives and passenger coaches, rehabilitation of Saidpur Railway Workshop, procurement of buses including articulated buses and dredgers, construction of some road links, and transshipment facility at Ashuganj inland port. It is to be noted that this is the largest loan that India has ever provided to any country in the world.
The loan carries 1.75 percent interest per annum, and is to be repaid over a period of 20 years, with a provision of 0.5 percent commitment fee per year on unused credit after 12 months from the date of contract approval.
Improving transport connectivity in South Asia

Regional Economic Integration Challenges for South Asia during turbulent times
141
By the end of 2010, 14 projects with estimated costs of around US$601 million were identifi ed to be implemented under this assistance. One of the 14 identifi ed projects includes the power gridline of 400 KV between Bheramara and the border that would cost US$150.86 million. But this project has been proposed to be fi nanced by the ADB. Therefore, effec-tively there are 13 projects that have been identifi ed to be implemented under India’s fi nancial assistance, and the tentative costs of their imple-mentation would be around US$450 million. Efforts are under way to identify other projects that could be implemented using the remaining US$550 million.
Out of 13 projects identifi ed, eight are of interest to both Bangla-desh and India, three are only of Bangladesh’s interest and two projects, namely transshipment port at Ashuganj and reconstruction of Sarail−Brahmanbaria−Sultanpur−Akhaura−Senarbadi road are directly related to the development of facilities for transit traffi c.
9. Conclusion
The political leaders of India and Bangladesh, through their New Delhi Summit that took place on 10–12 January 2010, set the tone for a long-lasting regional cooperation in South Asia, mainly in the area of connec-tivity, and other areas of concern covering water sharing, land bound-ary demarcation, resolving maritime boundary, removal of non-tariff barriers, etc. Most of the outstanding problems have been identifi ed by the Joint Communiqué and leaders have committed to solve them. Now the challenge before both the governments is to honour the commit-ments and take necessary actions to address the outstanding problems.
The GOB is seriously implementing the various understandings reached at New Delhi, mainly in relation to resolving transit-related problems and improving regional connectivity. Once the priority proj-ects identifi ed by Bangladesh are complete, transit traffi c from North-east India, Nepal and Bhutan would fi nd it attractive to transit through Bangladesh, and use its port facilities.
Also, once regional traffi c movement starts across Bangladesh, and Northeast India gets access to Chittagong Port, there would be enough incentives for the exploitation of untapped natural resources in North-east India, where Bangladesh would also get an opportunity to invest in joint venture projects. Such developments would give rise to large-scale “generated traffi c”. That would also generate additional employment opportunities and have several other types of multiplier effects. Thus, the ultimate benefi ts that would accrue from such regional connectivity would be much higher than what have been estimated so far.

142
Regarding modes of transport to be used for transit traffi c move-ment, railways and IWT will be the most important ones. To facilitate movement of high-value and perishable commodities across Bangla-desh, a network of expressways (toll roads) will have to be developed by involving the private sector on a build, operate and transfer basis. Since Bangladesh has 40-metre-wide right of ways along its National Highways, these could be used to build the expressways, without hav-ing to undertake major new land acquisition, which could create prob-lems and delays.
While part of the investments required to implement the identifi ed projects can be fi nanced through the LOC provided by India, Bangla-desh will have to mobilize the rest of the resources, of which some are already in the pipeline.
Notes1 Funds have already been committed for this project, but their release has
been tied to reforming the Bangladesh Railway, which is still pending.2 The chicken’s neck is a narrow stretch of land (21 km to 40 km) that connects
India’s northeastern states with the rest of India.3 ISO containers meet the specifications set by the International Organization
for Standardization (ISO) and are suitable for multiple transportation meth-ods such as truck and rail, or rail and ship.
4 There are evidences of collecting transit fees in the world, e.g., Egypt and Panama receive transit fees from the passage of shipping freight through the Suez and Panama Canals under their territories.
5 Partial diversion of Nepalese traffic is due to cost disadvantage of Birgunj−Rohanpur−Mongla Port rail corridor versus Birgunj−Kolkata Port, which is shorter by 200 km.
References
Murshid, K.A.S. 2010. “India, Bangladesh and the Northeast: Transit and transshipment–strategic considerations.” Working Paper No. 6. Dhaka: Bangladesh Institute of Development Studies.
SACEPS and CPD. 2010. Costs and benefi ts of cooperation in transport in SAARC region. Draft. Kathmandu and Dhaka: South Asia Centre for Policy Studies and Centre for Policy Dialogue.
Improving transport connectivity in South Asia

Regional Economic Integration Challenges for South Asia during turbulent times
143
1. Background
Trade facilitation is an important part of trade reform. Reducing trans-action costs, it enhances trade competitiveness. It reduces not only di-rect costs such as cost of preparing documents, cost of complying with regulations and cost of moving goods from the exporter to the importer, but also indirect costs such as opportunity costs associated with delays in moving goods from the seller to the buyer. These costs have been es-timated to account for about 80 percent of total transaction costs (ADB and UNESCAP 2009).
Besides cutting red tape, trade facilitation also reduces uncertainties and makes trade transactions predictable. It is even argued that Asia-Pacifi c economies have gained more from trade facilitation than from tariff liberalization (UNESCAP 2009). In view of the increasing impor-tance of trade facilitation in international trade, the World Trade Orga-nization (WTO) has also included trade facilitation in the negotiation agenda of the Doha Development Round, albeit with limited scope. The
Role of government regulations in trade facilitation: Case of Nepal
Chapter 8
Pushpa Raj Rajkarnikar
144
negotiation agenda concerns improving the relevant aspects of Article V (freedom of transit), Article VIII (fees and formalities) and Article X (publication and administration of trade regulations) of the General Agreement on Tariffs and Trade (GATT) 1994. The importance of trade facilitation for trade creation and expansion is not only a developed- or industrialized-country concern. It is paramount for growth and devel-opment of developing countries too (ITC 2005).
Trade facilitation cuts across a wide range of issues and sectors, in-cluding government regulations. It is crucial that trade-related govern-ment regulations be cost effective, transparent and as easy to comply with as possible in order for trading fi rms to remain competitive inter-nationally.
2. Defi nition of trade facilitation
There is no universal defi nition of trade facilitation. Various interna-tional and regional organizations have defi ned trade facilitation accord-ing to their mandates and objectives. For example, the United Nations Economic Commission for Europe (UNECE) defi nes trade facilitation as a comprehensive and integrated approach to reducing the complexity and cost of the trade transactions process, and ensuring that all these activities can take place in an effi cient, transparent and predictable manner, based on internationally accepted norms, standards, and best practices, while the Organisation for Economic Co-operation and Devel-opment (OECD) defi nes it as the simplifi cation and standardization of procedures and associated information fl ows required to move goods internationally from the seller to the buyer and to make payment in the other direction. The OECD also defi nes it broadly as all the steps that can be taken to smooth and facilitate the fl ow of trade, covering im-port and export procedures at the border (customs, licensing and quar-antine), transport formalities, payments, insurance and other fi nancial requirements. Similarly, according to the Asia-Pacifi c Economic Coop-eration (APEC), trade facilitation generally refers to the simplifi cation, harmonization, use of new technologies and other measures to address procedural and administrative impediments to trade.
The International Chamber of Commerce defi nes trade facilitation as that which focuses on improvements in the effi ciency of the pro-cesses associated with trading in goods across national borders (ICC 2009). This requires the adoption of a comprehensive and integrated approach to simplifying and reducing the cost of international trade transactions and ensuring that all relevant activities take place in an ef-fi cient, transparent and predictable manner, based on internationally
Role of government regulations in trade facilitation: Case of Nepal

Regional Economic Integration Challenges for South Asia during turbulent times
145
accepted norms, standards and best practices. Trade facilitation is not just a matter of improving customs procedures; it is also about targeting the growing range of controls being implemented at national borders by other authorities.
The World Bank defi nes trade facilitation as encompassing the domestic policies, institutions and infrastructure associated with the movement of goods across borders. The WTO defi nition, however, lim-its trade facilitation to the simplifi cation and harmonization of interna-tional trade procedures, including activities, practices and formalities involved in collecting, presenting, communicating and processing data required for the movement of goods in international trade. Thus, in a narrow sense, trade facilitation may be defi ned as the systematic ratio-nalization of customs procedures and documents. In a broader sense, it covers all the measures that affect the movement of goods between buyers and sellers along the entire international supply chain (ADB and UNESCAP 2009).
3. Trade transaction procedures
A large number of activities need to be performed to complete an inter-national trade transaction. Different procedures set by the governments of exporting and importing countries as well as transit countries are required to be followed in performing these activities as they are gov-erned by government regulations of the country concerned. The United Nations Centre for Trade Facilitation and Electronic Business (UN/CE-FACT) has developed an International Trade Transaction Model. Ac-cording to this model, to complete an international trade transaction, the following procedures have to be followed: Commercial procedures that establish business contract between
buyer and seller. These also include activities of packing, certifi ca-tion, accreditation and warehousing of goods in trade.
Transport procedures refer to the process of managing transport for moving goods from exporters to importers.
Regulatory procedures refer to compliance with trade control regu-lations.
Finance procedures refer to the process of payment settlement be-tween buyers and sellers and also the process of insuring goods
4. Improving trade procedures
Trade facilitation aims to improve trade procedures so as to make do-mestic fi rms more competitive in the international market and reap

146
the benefi ts of international trade. These procedures can be improved through better transport connectivity, better information and commu-nication connectivity, effi cient and automated customs, harmonization of standards, better government regulations, etc.
Transport services form the basis for trade effi ciency. Not only physical connectivity but also adequacy and effectiveness of transport services are critical for facilitating international trade. This is more so in the case of landlocked countries like Afghanistan, Bhutan and Ne-pal. Infrastructure quality and transportation costs are two of the major determinants of cross-country variations of trade fl ow. According to an estimation by Anderson and van Wincoop (2004), transport cost ac-counts for 21 percent of total trade cost in industrialized countries. This cost may be much higher in landlocked least-developed countries. A transport network requiring minimum transshipment helps traders to reduce their transaction cost.
An effi cient communication network links all related parties of in-ternational trade and provides a basis for them to share information in the easiest and fastest way through electronic means. Information technology has a signifi cant role in simplifying and harmonizing trade procedures that ultimately facilitate trade. Information and communi-cations technology (ICT) has been identifi ed as a key to trade facilitation by rapidly growing nations such as South Korea, Singapore and Ma-laysia, which are moving towards paperless trade from the traditional document-based trading system. Korea, for example, has adopted ICT in cargo clearance as a crucial component of its overall trade facilitation initiative (Yang 2009).
South Asian countries have also automated their customs in varying extent and scope. For example, Nepal started automation of its customs in 1996 with the introduction of the Automated System for Customs Data (ASYCUDA), a software developed by the United Nations Confer-ence on Trade and Development (UNCTAD). Sri Lanka has also adopt-ed ASYCUDA since 1992. Most South Asian countries are moving to-wards ICT-based single window system. Automation in customs makes customs clearance faster and reduces time and cost for traders. While the use of ICT also reduces the regulatory burden for traders, accep-tance of electronic lodgment of documents by customs reduces paper documents and also enhances the effi ciency of customs administration. A leading concern expressed in the private sector surveys of trade facili-tation conducted in Bangladesh, China, India and Nepal in 2006 was the irregular payments that had to be made for the clearance and release of goods (Alburo 2007). Automation reduces human interface and thereby reduces the opportunity for bribery.
Role of government regulations in trade facilitation: Case of Nepal

Regional Economic Integration Challenges for South Asia during turbulent times
147
Traders need to fulfi l product standards while performing an inter-national trade transaction. These standards are primarily set by govern-ment authorities to protect the life and health of human beings, animals and plants. For example, emissions standards are set for protection from air pollution. The implementation of standards involves time and costs, arising from the testing and certifi cation of the product to be traded. For traders in Asia and the Pacifi c, meeting such standards is found to be diffi cult and has become one of the most problematic issues of trade facilitation. For instance, a Nepalese exporter of vegetable ghee to India has to spend 10 to 15 days to get a certifi cate of test from Indian labo-ratories since Indian importers do not recognize certifi cates issued by Nepalese laboratories (Rajkarnikar 2010a).
Indian exporters have encountered standards-related problems in exporting, for example, peanuts, mango and pulses to countries of the European Union. Although imposed to protect public interest, stan-dards that are not based on international norms may restrain trade and limit market entry. It follows that the appropriateness of the regulatory requirements pertaining to standards needs to be ensured for trade fa-cilitation. Harmonization of standards through international standards-setting organizations such as the Food and Agriculture Organization of the United Nations (FAO) and the International Organization for Stan-dardization (ISO) may be an effective way to reduce diffi culties faced by traders in fulfi lling the standards. Standards should also be transpar-ent.
Trading activities need to take place in conformity with government regulations. Governments enforce trade-related regulations to improve trade effi ciency while protecting public interest. The primary goals of government regulations are to address market failures, protect consum-ers from anti-competitive behaviour of fi rms, and reconcile the interest of fi rms and wider social goals.
A right regulatory regime facilitates trade but governments often fail to realize the true objectives of improving regulations. Restrictive regulations open up opportunities for corruption, create unnecessary delays in trade transactions and thereby increase the cost of trading. Such regulations also increase uncertainty and risk for traders. Regula-tory reform is, therefore, important. Good regulations reduce complexi-ties in the trade process and also reduce trade costs while enhancing the competitive strength of fi rms. Trade potential can be optimally har-nessed only with a trade-friendly regulatory regime. However, having good regulations is not enough; they need to be implemented in the most effi cient way. Improving regulatory environment is one of the ba-sic elements of trade facilitation.

148
5. Government regulations
Governments enforce different regulations. Some of them are directly related to trade and are enforced to implement the trade policy of the country while some others may be indirectly related to trade. Trade reg-ulations refer to the acts, rules and regulations that govern the activities of trading across the border. They can be classifi ed broadly into:
Trade control regulations. Customs regulations. Technical regulations. Product-specifi c regulations. Sectoral regulations.
5.1 Trade control regulations
Trade control regulations are those regulations through which gov-ernments impose non-tariff barriers (NTBs) on exports and imports to achieve certain objectives like correction of balance of payments imbal-ance, protection of domestic industries and domestic supply manage-ment. Governments exercise trade controls through licensing, quantita-tive restrictions and canalization of imports or exports. In the wave of trade liberalization, the licensing system has been squeezed to a great extent in almost all countries. For example, in Nepal, no licence is re-quired for the import of goods other than a few prohibited and quanti-tatively restricted items.
Quantitative restrictions on the export or import of goods through quota allotment are yet another means of trade control. Quota allotment by India for the import of zinc, copper wire, acrylic yarn and vegetable ghee from Nepal is a case in point. Export or import is also controlled by designating a particular institution for the import and/or export of a particular product. For instance, the Government of Nepal designates the Salt Trading Corporation as the sole importer of salt in Nepal. Such controls reduce competition and thereby effi ciency in international trade.
5.2 Customs regulations
The primary tasks of a customs administration relate to the movement of goods across countries. These tasks include the enforcement of quantita-tive restrictions on the import or export of particular commodities; the detection and seizure of prohibited items; the enforcement of sanitary and phytosanitary restrictions and of rules relating to endangered spe-
Role of government regulations in trade facilitation: Case of Nepal

Regional Economic Integration Challenges for South Asia during turbulent times
149
cies, antiques, arms and ammunitions, and intellectual property rights; and collection of revenues from import tariff and charges on exports. The customs of developing countries are more revenue oriented.
The process of accomplishing the tasks of customs is established by customs regulations. Clearance and release of goods, valuation, tariff classifi cation, advance lodgment, advance ruling and appeal mecha-nism are the major aspects of the customs process in relation to the ex-port or import of goods. Inspection of cargo is the most time-consuming part of the customs process. Quick clearance and release of goods is very important as a trade facilitation measure because delays in move-ment may cause considerable loss to traders. A document-intensive and manual process of clearance takes a longer time to be completed. Hence, customs automation is one of the means to reduce clearance time.
Similarly, the introduction of a risk assessment system, which has been considered to be an important element of customs reform in many countries, reduces the need for physical inspection of cargo. In this sys-tem, physical examination of cargo is carried out only on a selective basis. The major benefi t to traders from the system of risk assessment is that for most traders, clearance of the bulk of the cargo will happen quickly without it being subject to physical examinations. In this system, the customs administration concentrates on high-risk transactions. The World Bank’s Doing Business 2011 shows that the introduction of a risk-based inspection system was one of the main factors behind Peru being able to signifi cantly improve its trading-across-borders performance in 2010. Although the foregoing discussion underscores the importance of the risk-assessment system in trade facilitation, it needs to be supported by audit-based controls, including post-clearance audit and post-clear-ance inspection, to control any misuse.
Customs valuation is one of the key areas of trade facilitation. Val-uation of goods is important since tariff and tax liabilities are usually calculated ad valorem. Recognizing the importance of an effi cient and transparent customs valuation process, WTO members have signed the Agreement on Customs Valuation (ACV), which requires the customs administration to accept the transaction value declared by the trader, unless the authenticity of the supporting invoice can be unequivocally disproved by the authorities. The basic purposes of the ACV are to re-quire countries to adopt a valuation system that is fair, neutral and uni-form, and protect traders from use of arbitrary or fi ctitious values by the authorities. Thus, the WTO method of valuation is trader friendly. But evasion of duty through undervaluation of imports is an acute problem for administrations in developing countries (Walsh 2003). Valuation fraud is serious particularly in developing countries having relatively
150
high rates of duties and other taxes on the import of goods. Therefore, customs regulations should be balanced and strong so that they can ef-fectively control undervaluation on the one hand, and make valuation fair, transparent and predictable on the other.
In order to avoid misunderstandings and confusions, the customs regulation on valuation should be clear and comprehensive with spe-cifi c provisions on matters like exchange rate, release of goods, and transportation and insurance costs. The price of imported goods is gen-erally expressed in foreign currency in the invoice. It should be clear in the regulation whether the exchange rate at the time of exportation or importation is to be applied while converting the foreign currency-quoted price into domestic currency. Similarly, the regulation must be clear on whether the goods can be released from customs control taking a guarantee in a situation where the fi nal determination of the value is delayed for certain reasons. The regulation also needs to determine whether transportation and insurance costs are to be included in the dutiable value of imported goods.
The tariff classifi cation of goods is essential to verify the accuracy of the assessment process. A large number of misclassifi cation is reported due to difference in interpretation of nomenclature; attempts by trad-ers to declare under tariff lines with lower rates; and attempts by cus-toms offi cials with large discretionary power to extract rents. Lack of effi ciency in classifi cation leads to considerable loss of revenue and to a distortion in tariff protection levels. Almost all countries now use the Harmonized Commodity Description and Coding System (HS). How-ever, there are instances of differences in interpretation of goods not only between customs and traders but also between customs and other government agencies as well as among customs. Such a situation pro-vides discretionary power to customs offi cials regarding decisions on tariff classifi cation of goods and creates a grey area of corruption in cus-toms administration. Therefore, a clear and comprehensive guideline for tariff classifi cation of goods based on the HS is essential.
Advance lodgment of customs declaration and supporting docu-ments prior to the arrival of goods can greatly facilitate the rapid release of goods because this enables customs authorities to process data in ad-vance and use them for risk assessment, and to reach a decision on the required action before the goods actually arrive in the customs territory. With this provision, traders will also know the amount of duty payable in advance. Many countries provide advance ruling facilities in various customs matters. China and India, for example, provide some binding rulings on valuation and classifi cation. Such a regulation makes trading across borders more predictable.
Role of government regulations in trade facilitation: Case of Nepal

Regional Economic Integration Challenges for South Asia during turbulent times
151
An appropriate mechanism of appeal for reviewing and correcting administrative decisions related to customs matters is essential for pro-viding justice to parties to international trade. The ACV of the WTO also requires that member countries provide for the right of appeal to the importer in relation to the determination of customs value. Avenues for appeal should be made available at different levels. A fair and inde-pendent review mechanism needs to be established within the customs administration in the fi rst instance, with the right to judicial authority in the second instance. Appeal procedures exist in most countries but the mere existence of appeal procedures does not help traders. Process in this regard should be simple, fast and inexpensive as, otherwise, it will be of no use. For example, the appeal rate is very low in Nepal as it is costly and time consuming.
Customs clearance is done by customs agents on behalf of traders. In some countries, it is mandatory that goods be cleared through licensed agents only. In such a situation, the role of customs agents or customs brokers becomes crucial for trade facilitation. Government regulations should set minimum standards for these agents to enhance their effi -ciency and thereby reduce delays in customs clearance of goods.
5.3 Technical regulations
Technical regulations are mainly related to manufactured goods, raw materials and agriculture products and they are issued to ensure the standards of products so as to protect the health and life of human be-ings, animals and plants, and also to protect the environment. These regulations not only lay down product characteristics but also deter-mine the process of conformity assessment and product certifi cation. Such standards and processes are product specifi c. WTO rules aim at ensuring that technical regulations do not constitute unnecessary bar-riers to trade. There are two WTO agreements in this area: the Agree-ment on Technical Barriers to Trade (TBT) and the Agreement on the Application of Sanitary and Phytosanitary Measures (SPS). Both agree-ments urge governments to use internationally agreed standards (e.g., ISO standards), where they exist, as a basis for their national standards. The TBT Agreement addresses the issues of product characteristics and related processes or production methods. The agreement also requires that technical regulations conform to the basic principles of transpar-ency and non-discrimination (Wilson 2002).
According to WTO rules, the norms and standards for industrial goods that are established by member countries should be normally ap-plicable to all imports, irrespective of their origin [the most-favoured-

152
nation (MFN) principle] and the size of the exporting enterprise. Under the SPS Agreement, application in respect of only one or a few countries is permitted, provided the measure does not arbitrarily or unjustifi ably discriminate between countries with identical or similar conditions. It should be noted that the fl exibility to deviate from the MFN principle is permitted only for SPS measures that aim at preventing the entry of plant- or animal-borne pests and diseases into a country from certain territories where unique condition prevails. SPS measures aiming at en-suring food safety would ordinarily have to be applied on an MFN basis (ITC 2001).
Governments are free to fi x their own product standards. But the WTO encourages members to adopt internationally recognized stan-dards. A member can apply stricter standards only when the govern-ment considers and justifi es that international standards are inappropri-ate. As developed countries are adopting rigorous standards, problems relating to the implementation of obligation under the TBT and SPS Agreements rank high among developing-country concerns.
5.4 Product-specifi c regulations
Governments may enforce special regulations in the trading of specifi c products. For example, the Government of Nepal has issued regulations requiring a distinct procedure to be followed for the import of pharma-ceuticals. Similarly, in addition to general trade regulations, exporters of handicrafts in Nepal have to obtain a certifi cate from the Department of Archaeology for the export of such items.
5.5 Sectoral regulations
Regulations of different sectors such as industry, transport, communica-tion and fi nance exert an impact on trading across the border. A busi-ness-friendly industrial regulation, for example, may be an attraction for foreign investment in different sectors of an economy, including trans-port and communication, which play a crucial role in trade facilitation. The economic case for regulations in any sector—goods or services—arises essentially from market failure attributable to natural monopoly or oligopoly, asymmetric information and externalities (Gamberale and Mattoo 2002).
A pro-competitive regulation in the transport and communication sectors may enhance trade facilitation, reducing transaction costs. Simi-lar is the case of banking regulations. Whether a trader has easy access to trade fi nance at reasonable cost depends on the quality of banking regu-
Role of government regulations in trade facilitation: Case of Nepal

Regional Economic Integration Challenges for South Asia during turbulent times
153
lations. Tighter regulations issued by the central bank put a constraint on the supply of trade fi nance and raise the cost of fi nance. Constraints on the supply of trade fi nance reduce the capacity of fi rms to trade and a high cost of fi nance reduces the competitive strength of traders. A 10 percent decline in trade fi nance could lead to a drop in total trade of US$129 billion in developing Asia, representing 3.6 percent of its total trade (Liu and Duval 2009). The issue of trade fi nance has become more prominent after the global economic crisis and the implementation of the Basel II charter1, which raised the required capital adequacy ratio of commercial banks, resulting in a rise in the cost of trade fi nance. Central banks of almost all countries have incorporated Basel II charter in their domestic banking regulations.
Banking regulations direct not only the lending process but also the process of payment settlements in international trade. The letter of cred-it is the most popular banking instrument used in settlement of pay-ments in international trade. Foreign exchange regulation is yet another regulation that has a direct impact on trade competitiveness. A realistic and fl exible foreign exchange regulation is an essential trade enabler in the dynamic market of international trade.
As there are several types of risks in moving goods from export-ers to importers, insurance is essential for trading across borders. Thus, domestic regulations creating a competitive insurance market have a positive impact on trade facilitation. International trade is thus affected by not only trade regulations but also various sectoral regulations.
5.6 Regulatory environment
Regulatory environment is considered as an indicator for measuring trade facilitation efforts. It constitutes regulations, and their implement-ing mechanisms and institutions. Trade regulations are issued and im-plemented by different agencies. All government agencies should work together to create an integrated regulatory environment. This avoids duplication of regulatory compliance, saves time and reduces cost. In order to facilitate trade, the cost and complexity of compliance with regulations should be reduced as far as possible.
Similarly, in order to reduce complexities, all regulations should be supported by clear guidelines. In order to encourage voluntary compli-ance, trader support services should be made accessible to all. Simplic-ity, transparency, consistency and cost effi ciency are the major charac-teristics of a good regulation. While good regulations are required to facilitate trade, even good regulations become ineffective if they are not supported by good institutions. For example, customs regulations can-

154
not be effectively implemented if customs offi ces are not effi cient for whatever reason.
Effi ciency of institutions largely depends on good governance and infrastructure. For example, corruption, lack of equipment, and conges-tion in customs yards have been sources of ineffi ciency in the customs of some South Asian countries. According to surveys conducted in Bangladesh, Nepal, India and China (Bhattacharya and Hossein 2006; Rajkarnikar et al. 2006; Chaturvedi 2006; Wenjing and Wei 2006), elimi-nation of bribery and other corrupt practices of offi cials involved in the clearance and release of imported goods ranks fi rst in priority ranking of trade facilitation measures by the private sector.
Similarly, in a more recent survey conducted among freight forward-ers and exporters in Nepal, 77 percent of the respondents reported that logistic facilities at customs points are not adequate (Rajkarnikar 2010b). All these evidences show that there is considerable scope to improve the regulatory environment in South Asian countries so as to make it trade friendly.
Trade performance is affected by not only the trade-related regu-latory environment but also the general business environment. Gener-ally applicable domestic business regulations may have an impact even greater than that of trade-specifi c regulatory barriers. The Asia Pacifi c Trade and Investment Report 2009 says that most countries in the Asia-Pacifi c region have scope to increase their trade competitiveness by tackling non-trade specifi c regulations affecting all domestic businesses (UNESCAP 2009). Non-trade specifi c regulations include regulations related to business registration, taxation, competition, bankruptcy, property rights, investment, etc. The Doing Business Indicators of the World Bank cover 10 business regulatory areas, namely, starting a busi-ness, dealing with construction permits, employing workers, register-ing property, getting credit, protecting investors, paying taxes, trading across borders, enforcing contracts, and closing a business.
A trade-friendly coherent trade and business regulatory environ-ment is warranted to facilitate trade. But the Business Regulatory Co-herence Index for 2007/08, despite recording an improvement over 2006/07, shows overall regulatory coherence in Asia Pacifi c, and South and Southwest Asia to be low (Duval and Utokthan 2009).
5.7 Access to regulations
Trade regulations are to be implemented by different government agen-cies and complied with by traders. Therefore, these regulations should be made easily available to all stakeholders on time through diversifi ed
Role of government regulations in trade facilitation: Case of Nepal

Regional Economic Integration Challenges for South Asia during turbulent times
155
but appropriate means of dissemination. Regulatory changes should be publicly notifi ed well in advance of implementation except for some sensitive provisions related to government revenue. If publication of regulations lags behind implementation, it means confusion and trouble for stakeholders, resulting in an adverse impact on trade performance. Such is the importance of timely availability of information on trade regulations that Article X of the GATT requires all WTO member coun-tries to publish all laws, regulations, judicial decisions and administra-tive rulings relevant to importing and exporting in a manner as to en-able government agencies and traders to become acquainted with them (ITC 2005).
The WTO, under its various agreements, has made provisions that require members to publish regulations. For example, the Agreement on Import Licensing Procedures requires members to publish the basis on which licences are granted. Similarly, the SPS Agreement requires member countries to publish all SPS measures and changes to them.
5.8 Regulations and stakeholder consultation
Although governments have the sole authority to formulate, enforce and amend regulations, it is better to consult with traders while formu-lating or amending them. Such consultations enhance public confi dence in regulations and generate support from the private sector in imple-menting them. The consultations also provide an opportunity for policy makers to improve regulatory quality and create a conducive regulatory environment for traders. Therefore, such consultations should not be on an ad hoc basis; they should be institutionalized.
For example, in Nepal, there are institutionalized consultative ar-rangements with traders at different levels and on different aspects. Trade Policy 2009 has incorporated a provision of constituting a Board of Trade at the central level, comprising representatives from the gov-ernment, the private sector and the academia, to facilitate trade, main-tain inter-agency coordination and help policy formulation. Similarly, there is a Trade Facilitation Committee in the Department of Customs, comprising representatives of both the government and the private sec-tor, to discuss and resolve customs-related problems.
6. Trade facilitation in South Asia
In the process of regional integration, the South Asian Association for Regional Cooperation (SAARC) has made attempts for gradual liberal-ization of intra-regional trade. It initiated the SAARC Preferential Trad-

156
Table 8.1: Doing business in South Asia (rank out of 183 countries)
Ease of doing business Trading across borders2010 2011 2010 2011
Afghanistan 165 167 183 183Bangladesh 111 107 110 112Bhutan 140 142 154 161India 135 134 93 100Maldives 96 85 125 138Nepal 112 116 161 164Pakistan 75 83 78 81Sri Lanka 102 102 66 72
Source: World Bank (2010).
ing Arrangement (SAPTA) and later replaced it with the Agreement on South Asian Free Trade Area (SAFTA). As in other regional trade agreements, several provisions have been made for trade facilitation in the SAFTA Agreement. For example, Article III of the Agreement states “SAFTA shall entail adoption of trade facilitation and other measures and the progressive harmonization of legislations by the contracting states in the relevant areas”.
Furthermore, Article VIII of the SAFTA Agreement has put for-ward 12 additional measures of trade facilitation, which include har-monization of standards, harmonization and simplifi cation of customs clearance procedures, customs cooperation, simplifi cation of banking procedures, and development of communication systems and trans-port infrastructure (SACEPS 2008). Realizing its importance, SAARC countries have taken several measures in the area of improving trade facilitation. However, South Asia ranks the last among all world regions in terms of road density, rail lines and mobile tele-density per capita. The regulatory constraints introduced at gateways and border crossings have been an important impediment to both regional and international trade (World Bank 2011).
By all indicators of trade facilitation—be it the Logistics Performance Index or the relevant indicators of the Global Competitiveness Index or the trading-across-borders indicator of the Doing Business Indicators—South Asia lags behind many other regions of the world. Doing Business 2011 shows a deterioration in the business environment in most SAARC countries (Table 8.1). Only Bangladesh, India and the Maldives have im-proved their overall environment of doing business. But in terms of the ease of trading across borders, the ranks of almost all South Asian coun-tries dipped, refl ecting a deterioration in their trade facilitation status.
Role of government regulations in trade facilitation: Case of Nepal

Regional Economic Integration Challenges for South Asia during turbulent times
157
7. Trade facilitation initiatives in Nepal
As part of overall economic reforms, Nepal initiated trade liberalization in 1985, which gained momentum in the early 1990s. In a continuous process to make its economy market oriented and integrated with inter-national markets, Nepal became a member of the WTO in 2004 through accession. In the process of accession, Nepal had made commitments to liberalize trade in goods and services, among others. Some of the com-mitments are directly related with trade facilitation. For example, Nepal had committed to implement the WTO Agreement on Customs Valua-tion. In view of the importance of trade facilitation and also in the con-text of commitments made at the WTO, Nepal has been implementing trade facilitation measures since the late 1990s. The major trade facilita-tion measures so far initiated in Nepal are discussed below.
7.1 Customs reform
Customs reform lies at the core of trade facilitation. To strengthen the ability of the Department of Customs to cope with an increasing de-mand for speeder clearance of imports and provide better services to the trading community, enhance effectiveness in revenue collection, and align the national customs system with the international standard, Nepal introduced ASYCUDA in 1996 and its use is being gradually ex-panded in different customs offi ces.
The Department of Customs designed and implemented a three-year customs reform action plan in fi scal year 2003/04. This programme accorded high priority to institutionalizing scientifi c customs valuation procedures, simplifying checking procedures, reducing documentary requirements, automation of customs processes, and selectivity check-ing based on risk analysis.
The new Customs Act and rules (2007) include many provisions in line with the Revised Kyoto Convention and other international agree-ments. The main features of the Act and rules are that they prescribe the number of documents required for clearance. The customs rules specify nine documents for import and four documents for export, but in prac-tice, the documentary requirement is much more than specifi ed in the customs rules. In the “Enabling Trade Index” of the World Economic Forum, Nepal ranks 117th out of 118 countries in effi ciency of customs administration. This means that there are certain shortcomings in cus-toms procedures. Taking all these into consideration, an Action Plan (2009–2013) has been launched with the objective of facilitating legiti-mate trade and industry, and thereby encouraging voluntary compli-

158
ance. The Action Plan has set the objective in line with international conventions and standards, which are to provide the basis for re-engi-neering all of the customs clearance procedures, including documenta-tion, data requirements, and procedures and use of risk management. The Customs Act 2007 has a provision for using a selective method un-der Clause 20.
The Customs Act 2007 has fully incorporated the WTO valuation rules, which recognize transaction value as the basis for customs valua-tion. There is also a provision for a Valuation Review Committee in line with WTO rules. The trader can challenge the valuation decision made by the customs offi ce.
7.2 Transportation
Nepal is a landlocked country and has to depend on India for transit facilities for third country trade. An effi cient transportation in transit is crucial to Nepal’s foreign trade. Establishment of inland clearance depots, also known as “dry ports”, play an important role in easing trading across borders for a landlocked country. The Government of Nepal established the Nepal Inter-modal Transport Development Board (NITDB) in 1997 with the objective of overseeing the economic and ef-fi cient management of ICDs for the facilitation of Nepal’s foreign trade. The main functions of the NITDB are to develop, manage and promote ICD terminals and prescribe criteria for determining service charges. This institution was also entrusted with concluding a railway operation agreement with the Indian Railways. Nepal also launched the Nepal Multi-modal Transit and Trade Facilitation Project in 1998 to construct rail-based and road-based ICDs in different parts of the country and to manage other legal and infrastructural requirements to operate these ICDs. The main objectives of the ICDs are to reduce transport costs, achieve competitiveness in imports and exports, and resolve transit hassles. Currently, three road-based and one rail-based ICDs are in op-eration.
7.3 Information and communication
The Ministry of Commerce and Supplies and the Department of Cus-toms have upgraded their webpages with additional trade-related infor-mation. In order to integrate Nepal into the global trade point network, two domestic trade points have been developed. A WTO reference centre has also been established under the Department of Commerce to enhance the fl ow of trade-related information among stakeholders.
Role of government regulations in trade facilitation: Case of Nepal

Regional Economic Integration Challenges for South Asia during turbulent times
159
Likewise, enquiry points have been established to respond to queries on SPS measures, TBT and services trade.
7.4 Special economic zone
The Trade Policy 1992 aimed to, among others, establish export pro-cessing zones. Accordingly, the government has initiated the process of setting up special economic zones and export processing zones in different places of the country. Such zones are expected to provide dif-ferent export incentives in the form of tax rebates, credit benefi ts and fl exible labour laws in order to reduce transaction costs and enhance the competitive strength of Nepalese exports. In the absence of the required laws, no special economic zone, however, has been established in the country so far. The Government of Nepal has prepared a draft Special Economic Zone Act, which is pending in the Parliament.
7.5 New trade policy
The government announced a new trade policy in 2009, replacing the one in place since 1992. The new policy has provisions related to recent developments in international trade such as TBT and SPS requirements. One of the main strategies of the policy is to reduce transaction costs through the strengthening of institutions and the simplifi cation of pro-cedures. According to the policy, trade facilitation-related policies, laws and procedures will be made internationally compatible.
7.6 Single window services
A “single window” is defi ned as a facility that allows parties involved in trade and transport to lodge standardized documentation and/or data with a single entry point to fulfi l import-, export- and transit-related regulatory requirements (UN/CEFACT Recommendation No. 33). The concept of a single window is at a very early stage in Nepalese customs. A study conducted by the Department of Customs in 2004 on “customs processing steps” in Birgunj (the biggest trading point for Nepal’s for-eign trade) found that the clearance process entails more than 19 steps. It recommended operating a “single customs window”. This was imple-mented in the Birgunj customs offi ce in 2006 on a trial basis for overseas cargo. Processing steps were redesigned and reduced. But these changes were not fully in compliance with the ideal single window in customs. The Customs Action Plan (2009–2013) in its objectives has included the development of a single window system and its operation.

160
8. State of trade facilitation in Nepal
According to the Doing Business reports for the years 2008 to 2011, the number of documents required in Nepal for export and import re-mained unchanged during these four years. The number of documents required remained 9 and 10 for export and import, respectively. Simi-larly, the number of days required for export continued to be 41 days for the years 2009–2011. It was 43 days in 2008. Thus, though a slight improvement was recorded in the fi rst year of the review period, no fur-ther improvement was recorded during the last three years. The num-ber of days required for imports, however, remained 35 days for all four years. But the cost of exporting showed a rising trend and amounted to US$1,960 per 20-foot container in 2011 as compared to US$1,600 in 2008. The cost of importing also increased every year except in 2010. The cost of importing in 2008 was US$1,725 per 20-foot container, which reached US$2,095 in 2011. These fi gures reveal that despite the implementation of several reform measures, the state of trade facilitation has not im-proved in Nepal (Table 8.2).
Table 8.2: State of trade facilitation in Nepal
2008 2009 2010 2011 Export Import Export Import Export Import Export ImportDocument (number) 9 10 9 10 9 10 9 10
Time (days) 43 35 41 35 41 35 41 35Cost per 20-foot con-tainer (US$)
1,600 1,725 1,764 1,900 1,764 1,825 1,960 2,095
Source: Doing Business reports, various issues.
9. Major problems of trade facilitation
There are several studies in the area of trade facilitation, identifying problems of trade facilitation at the country, regional and international levels. Figure 8.1 shows business fi rms’ perceptions on the obstacles to business in South Asia. Corruption appears to be the top-most obstacle to business for both large fi rms and small and medium enterprises in South Asia, followed by economic and regulatory policy uncertainty, customs and trade regulations, transportation, and telecommunica-tions.
Corruption not only increases transaction cost and reduces competi-tive strength, but also impedes movement of goods. Timely delivery is
Role of government regulations in trade facilitation: Case of Nepal

Regional Economic Integration Challenges for South Asia during turbulent times
161
much more important than price competitiveness in modern-day inter-national business. Therefore, corruption has been identifi ed as a serious bottleneck to trade facilitation. Even good regulations remain only on paper if implementing offi cials are corrupt.
Nevertheless, good regulations are essential to boost trade. Cumber-some and costly regulations reduce trading effi ciency of domestic fi rms in the international market. Similarly, frequent changes in policies or regulations exert additional cost of adjustment to businesses. Policy sta-bility or stability in regulations largely depends on political stability or government stability. In South Asia, Nepal is the most unstable country in this sense. As uncertainty makes business environment more risky, investors are discouraged to invest in such a situation.
Transport is very intimately connected to the fl ow of goods from the exporter to the importer. Telecommunications relate to the establish-ment and execution of business relations among different actors of in-ternational trade such as bankers, freight forwarders, regulators, export-ers and importers located in distant places. The trade impact of internet services in the modern world is expected to be very signifi cant. Thus, transport and telecommunications occupy a pivotal role in international trade. Transport improvement can reduce the time and cost of trading. For example, reforms made in the Greater Mekong Sub-region North-South Transport Corridor reduced the time to cross a 270 km section of dirt track along the corridor of Lao PDR between China and Thailand from three days to four hours. A restrictive transport and telecommu-nications sector deprives the trading community of effi cient transpor-tation and telecommunication services. The problem of transportation is more severe in landlocked countries. Landlocked developing coun-
SMEsLarge firms
806040200
Telecommunications
Transportation
Customs & trade regulations
Economic & regulatorypolicy uncertainty
Corruption
Figure 8.1: Major problems of trade facilitation in South Asia
Source: Li and Wilson (2009).

162
tries suffer from time-consuming procedures and additional costs in the transit country for both imports and exports. For instance, according to Doing Business 2010, a Nepalese exporter has to bear US$900 per 20-foot container of exports, while a Bangladeshi exporter has to bear only US$140 for the same purpose.
10. Regulatory reform: Some issues
Regulatory reform is required to make the regulatory environment trade friendly. In the process of reform, various issues are to be addressed. Some pertinent issues in this regard are discussed below.
10.1 Issue of coordination
Various government and private sector agencies issue trade-related reg-ulations. Coordination among these agencies is required to avoid dupli-cation and inconsistencies among regulations issued by different agen-cies. Contradictions among regulations create confusion and delays in trading processes. Therefore, the issue of coordination should be well addressed for smooth and easy fl ow of goods, related information and documents, and money. Coordination is required not only among regu-latory bodies within the country (behind the border) but also among related institutions beyond the border. Thus, coordination could be at national, bilateral, regional or international levels.
10.2 Issue of use of ICT
The use of ICT is rapidly increasing in different aspects of trade transac-tions not only in developed countries but also in developing countries. Using ICT, developed countries are moving towards a paperless trad-ing system. Market search is done through the internet, while business relations are established through email. Similarly, payments are done electronically and data are submitted to as well as interchanged among regulatory agencies electronically. All related information is shared among the parties to trade through a telecommunications network. Use of ICT in trade can save transaction costs signifi cantly. But it is essential that appropriate hardware and software be developed for optimal and effi cient use of ICT. This requires a large amount of money and knowl-edge.
It is also essential that people involved in different activities of trade are capable of adopting and using modern technologies of information and communications. In developing countries, the technical competence
Role of government regulations in trade facilitation: Case of Nepal

Regional Economic Integration Challenges for South Asia during turbulent times
163
of people to adopt and use ICT is generally low. The fast-changing ICT has made the global trading mechanism easier for capable people who keep pace with the changing technology, but more complex for people who do not. For example, Nepalese small and medium enterprises lack the capacity to absorb trade-related information supplied by different agencies through various means of telecommunications (Rajkarnikar et al. 2006).
For proper use of ICT, comprehensive cyber laws and regulations are required. In the absence of such laws and regulations, the risk of fraudulent activities emerges, which in turn makes trade diffi cult and costly. But being a new concept, the drafting and enforcement of cyber laws and regulations is a challenging task for developing countries. Fur-ther, its implementation demands a large amount of fi nancial resources and knowledge.
10.3 Issue of single window
A single window helps to simplify trade processes and procedures, and improve transparency and predictability in international trade transac-tions. The concept of a single window is gaining wider acceptance. Some countries have already adopted this system. A number of countries in the Asia-Pacifi c region are in the process of establishing a national sin-gle window. A single window can also be established at regional and international levels. But establishing a single window is a diffi cult and challenging task, in terms of capital, technology and human resources required. The UN/CEFACT has developed a step-by-step approach to establish an electronic single window and paperless trade environment (Figure 8.2).
Figure 8.2: Step-by-step approach to developing an electronic single window and paperless trade environment
e-single
Source: www.unece.org/cefact/
cross-border data
national data
documents simplification
process simplification
business process analysis

164
Accordingly, in the process of establishing a single window, the tasks of business process analysis, simplifi cation and harmonization of processes, simplifi cation and alignment of documents, harmonization of national data, and cross-border data harmonization and exchange are to be completed in a phase-wise manner prior to the establishment of a single window. These tasks can be performed only with the integrated efforts of all the parties concerned. A single window can be established and run only with the support of an appropriate legal and institutional framework. It also requires an adequate and effi cient IT infrastructure, both hardware and software. Thus, it demands a huge budget and this is one of the reasons for the failure of developing countries to catch up with developed countries in this process. Filling this gap is a serious is-sue in global trade.
10.4 Issue of regulation cost
Regulatory reform demands new laws, rules and regulations or amend-ments to existing laws, rules and regulations. Costs are involved in both the stages of formulation and enforcement of laws and regulations. There are dissemination costs too. New laws and regulations or amendments to existing laws and regulations may also require new institutions to be established or existing institutions to be dissolved or restructured—all of which entail cost. Similarly, regulatory reform may require new physical facilities. For example, changes in regulations recognizing elec-tronic submission of customs declaration require computers in customs. Cost is also involved in the training of personnel as required by the regulatory reform. Such trainings are needed not only for government regulatory offi cials or staff but also to the other relevant people belong-ing to the private sector such as freight forwarders, bankers, exporters and importers. Therefore, the cost factor has to be seriously considered while amending the regulations.
10.5 Issue of resistance to change
If changes are diffi cult to comply with and costly, even if they are ben-efi cial in the long run, people tend to resist change. Resistance to change generally comes from government or regulatory offi cials and staff as they are not the immediate benefi ciaries. Therefore, reform should be conducted in such a way that the parties concerned do not take it as a burden. Reform should be implemented in a fl exible way and enough time should be provided to the parties concerned for adjustment. Ad-justment has costs, and this is also a reason for resistance. So, to avoid
Role of government regulations in trade facilitation: Case of Nepal

Regional Economic Integration Challenges for South Asia during turbulent times
165
resistance, reform should be initiated in such a way that adjustment costs are minimized to the extent possible.
Frequent changes to regulations reduce predictability and hence are resisted by traders. Therefore, even for the sake of reform, frequent changes to regulations are not desirable. The stability factor also needs to be considered in the process of regulatory reform. Only a regulatory reform with farsighted vision will be stable and acceptable to the trad-ing community.
10.6 Issue of transit-country regulation
Landlocked countries also need to comply with the regulations of transit countries. Transit countries issue regulations unilaterally, often exerting serious adverse impacts on the traders of landlocked countries. Nepal has experienced such a situation several times despite bilateral treaties on transit and trade with India, the transit country. Transit-country regulations are often unpredictable. The difference in the regulations of the transit country and the trading country creates additional costs and delays in trade transactions of the landlocked country. These issues can be addressed to a great extent if the principles and good practices set by international organizations such as the WTO and the World Cus-toms Organization are strictly followed by the transit country in this regard. According to Article V of the GATT, which is related to freedom of transit with respect to regulations, transit traffi c should be treated no less favourably than domestic goods by the transit country. Similarly, relevant transit-related laws and regulations should be published and reviewed regularly.
11. Conclusion
The reduction of tariff and non-tariff barriers to trade has increased the importance of trade facilitation in boosting world trade. Countries are now giving priority to trade facilitation. According to the second Aid for Trade Global Review, many recipient countries of aid for trade put trade facilitation among their top three priorities (UNESCAP 2009).
The role of government regulations is crucial in trade facilitation. Regulations are enforced to achieve the twin objectives of facilitating trade and protecting the social interest of the people. Thus, government regulations should be business friendly on the one hand and effective to attain social objectives, on the other.
Regulatory reform is needed to make regulations transparent, pre-dictable, stable and business friendly, thereby reducing the cost and time

166
of transaction and enhancing effi ciency and competitiveness. Building competitive strength is vital to trading in today’s international market of keen competition. Regulations should be compatible with the de-velopments taking place in the international trading system. There are costs associated with complying with regulations. Excessive regulation impedes trade and increases costs unnecessarily, eroding competitive strength. The number of regulations should be as minimum as possible. But they should be prudent and effectively implemented.
Regulatory reform can be considered as a key component of trade facilitation. The state of trade facilitation in South Asia is still far be-low than that in other regions of the world. The burden of government regulation is still high in a majority of South Asian countries (Jayaratne 2010). A joint effort is essential towards improving such a situation. Regulatory harmonization may also make a remarkable contribution in this regard.
Countries are at different levels in terms of trade facilitation. Con-sidering their trade facilitation status, and resource and knowledge availability, more aid for trade and technical assistance should be direct-ed towards least-developed and landlocked countries so that they can develop both hardware and software components of trade facilitation. Nepal has to improve its trade facilitation status, including through reg-ulatory reform, massively, for which it needs a huge amount of fi nan-cial and technical resources for not only software components but also hardware components. Nepal is in dire need of physical facilities in the customs to improve its cross-border trade. Nepal is still in a very early stage of developing an e-trade system. Technical assistance is needed in different aspects, including regulation, for a speedy move towards it.
Notes
1 Basel II charter is a set of banking regulations put forth by the Basel Commit-tee on Bank Supervision, which regulates finance and banking internation-ally.
References
ADB and UNESCAP. 2009. Designing and implementing trade facilitation in Asia and the Pacifi c. Manila: Asian Development Bank (ADB).
Alburo, Florian A. 2007. “Prioritizing trade facilitation measures: A note.” In UNESCAP, Trade facilitation beyond the multilateral trade ne-gotiations, regional practices, customs valuation and other emerging is-
Role of government regulations in trade facilitation: Case of Nepal

Regional Economic Integration Challenges for South Asia during turbulent times
167
sues. Bangkok: United Nations Economic and Social Commission for Asia and the Pacifi c (UNESCAP) and United Nations Development Programme (UNDP).
Anderson, James E. and Eric van Wincoop. 2004. “Trade costs.” Journal of Economic Literature, Vol. 42, No. 3: 691–751.
Bhattacharya, Debapriya and Syed Saifuddin Hossain. 2006. “An evalu-ation of the need and cost of selected trade facilitation measures in Bangladesh: Implication for the WTO negotiations on trade facilita-tion.” ARTNeT Working Paper No. 9. Bangkok: UNESCAP.
Chaturvedi, Sachin. 2006. “Selected trade facilitation measures in India: Implications for the WTO negotiations.” ARTNeT Working Paper No. 4. Bangkok: UNESCAP.
Duval, Yann and Chorthip Utoktham. 2009. “Behind-the-border trade facilitation in Asia-Pacifi c: Cost of trade, credit information, contract enforcement and regulatory coherence.” UNESCAP TID Staff Work-ing Paper No. 02/09. Bangkok: UNESCAP.
Gamberale, Carlo and Aaditya Mattoo. 2002. “Domestic regulations and liberalization of trade in services.” In Bernard Hoekman, Aaditya Mattoo and Philip English (eds.), Development, trade and the WTO: A handbook. Washington, D.C.: The World Bank.
ICC (International Chamber of Commerce). 2009. “ICC calls on G20 to address impact of Basle II in trade fi nance”, Paris. Available at http://www.iccwbo.org/icccigde/index.htm/
ITC. 2001. WTO answer book. Geneva: International Trade Centre.ITC. 2005. Business and the WTO negotiation on trade facilitation. Geneva:
International Trade Centre.Jayaratne, Suwendrani. 2010. Trade facilitation issues in South Asia. Pa-
per presented in Round Table on SAFTA, 20–21 April, Kathmandu.Li, Yue and John Wilson. 2009. Trade facilitation and expanding the
benefi ts of trade: Evidence from fi rm level data. Paper presented at Regional Policy Forum on Trade Facilitation and SMEs in Times of Crisis, Beijing.
Liu, Wei and Yann Duval. 2009. “Trade fi nance in times of crisis and beyond.” ARTNeT Alerts on Emerging Policy Challenges, Issue 3, April. Bangkok: UNESCAP.
Rajkarnikar, Pushpa Raj, Nephil Matangi Maskey and Shiv Raj Adhikari. 2006. “The need for and cost of selected trade facilitation measures relevant to the WTO trade facilitation negotiation: A case study of Nepal.” ARTNeT Working Paper No. 8. Bangkok: UNESCAP.
Rajkarnikar, Pushpa Raj. 2010a. Improving regional trade procedures and processes: A business process analysis of export of vegetable ghee from Nepal to India and China and import of textile from India

168
to Nepal. Kathmandu: Institute for Policy Research and Develop-ment (IPRAD).
Rajkarnikar, Pushpa Raj. 2010b. “Adequacy and effectiveness of deliv-ery of logistic services: Implication for export performance of Ne-pal.” ARTNeT Working Paper Series No. 79. Bangkok: UNESCAP.
SACEPS (South Asia Centre for Policy Studies). 2008. “Assessing and reformulating SAARC road map.” SACEPS Paper No. 18. Kathman-du: SACEPS.
UNESCAP. 2009. Asia Pacifi c trade and investment report 2009. Bangkok: UNESCAP.
Walsh, T.J. 2003. “Customs valuation.” In Michael Keen (ed.), Changing customs challenges and strategies for the reform of customs administra-tion. Washington, D.C.: International Monetary Fund.
Wenjing, Chen and Li Wei. 2006. “An evaluation of the need and cost of selected trade facilitation measures in China: Implication for the WTO negotiations on trade facilitation.” ARTNeT Working Paper No. 5. Bangkok: UNESCAP.
Wilson, John S. 2002. “Standards, regulation and trade: WTO rules and developing country concerns.” In Bernard Hoekman, Aaditya Mat-too and Philip. English (eds.), Development, trade and the WTO: A handbook. Washington, D.C.: The World Bank.
World Bank. 2010. Doing business 2011. Washington, D.C.: The World Bank.
World Bank. 2011. Cooperation on trade facilitation in South Asia: Re-gional cooperation and integration. Available at www.worldbank.org
Yang, Junsok. 2009. “Small and medium enterprises adjustments to in-formation technology in trade facilitation: The South Korean experi-ence.” ARTNeT Working Paper Series No. 61. Bangkok: UNESCAP.
Role of government regulations in trade facilitation: Case of Nepal

Regional Economic Integration Challenges for South Asia during turbulent times
169
4PART
DEVELOPMENT ISSUES

.

1. Introduction
The fi nancial crisis that had its origins in the United States (US) in 2008 spread to Europe, and then to Japan. The effect of the crisis has been slow to manifest in the six Gulf Co-operation Council (GCC) countries.1 Their basic strengths—a public-funded banking sector and a huge trade surplus due to the export of oil, the price of which saw an unprecedent-ed increase in a span of six months in 2008—shielded the GCC econo-mies from the adverse impact during the initial days of the crisis. This, coupled with signifi cant inward foreign direct investment (FDI) fl ows to all GCC countries, except Kuwait, also had a benefi cial impact (ES-CWA 2008).
The GCC economies, however, began to feel the impact of the global crisis from the last quarter of 2008. The most signifi cant indicator was the slowdown in the gross domestic product (GDP) growth rate in 2008 and the negative growth rate in 2009 in some of these economies. In the fi nancial sector, the stock markets in all GCC countries recorded a
The fi nancial crisis in the Gulf and its impact on South Asian migration and remittances
Chapter 9
S. Irudaya Rajan and D. Narayana

172
decline, owing to the withdrawal of foreign institutional investors. A number of private-funded domestic and international projects in the Gulf region had reportedly been cancelled or abandoned, leading to a large number of layoffs or retrenchment of the workforce. Countries that are more exposed to global capital, investment and consumption demand face a greater risk of being affected by the crisis than others. For instance, Dubai in the United Arab Emirates (UAE), which depends heavily on international capital, tourism and real estate, seems to be more adversely affected than other countries. On the other hand, Saudi Arabia, which has only 25 percent foreign workers compared to much higher proportions in the other GCC economies, might be much less affected than others (Zachariah and Rajan 2009). The slowdown in the growth rates of GCC economies has particular signifi cance for South Asian expatriates, who are the main migrant labour in GCC countries.
In this context, this article focuses on the following questions: How did the crisis affect the demand for South Asian migrant work-
ers in the Gulf countries? What strategies did the emigrants adopt to cope with the situation at
their place of work (countries of destination) and what is the likely impact of the crisis on the home country in terms of decline in remit-tances, if any?
Did countries in South Asia see large-scale return emigration? Did they fi nd a decline in the outfl ow of emigrant labour to Gulf coun-tries, and inward remittances from them?
2. Approach and methodology
Following an assessment of the trends in expatriate workers and em-ployment structure in GCC countries based on published data, an at-tempt is made to map the trends and patterns of international migra-tion, preferred countries of destination and trends in remittances over a long period of time. In addition to the macro assessment of the situation, this article also draws on two surveys, concerning: i) return emigrants in the countries of origin who lost their jobs in the countries of destination due to the fi nancial crisis; and b) return emigrants who came back as per the migration terms of contract.
2.1 Survey of crisis-led return emigrants
This survey was conducted among the emigrants who lost their jobs and were forced to return home because of the fi nancial crisis in the Gulf. It was also aimed at examining their coping mechanism after their
The fi nancial crisis in the Gulf and its impact on South Asian migration and remittances

Regional Economic Integration Challenges for South Asia during turbulent times
173
return to their home country. The survey was canvassed among 50 re-turn emigrants each in four South Asian countries: Bangladesh, Nepal, Pakistan and Sri Lanka. In India, the survey was canvassed among 250 return emigrants in fi ve states of India, 50 each in Andhra Pradesh, Tamil Nadu, Kerala, Maharashtra and Punjab. Thus, the total number of return emigrants surveyed was 450 among the fi ve countries of origin in South Asia. However, we confess that it was diffi cult to locate the emi-grants who lost their jobs in the countries of destination and returned to the countries of origin. The return emigrant survey collected infor-mation on household characteristics, the profi le of return emigrants, household economic assets, employment, remittances and their utiliza-tion, household expenditure pattern, reasons for return, and adaptation and coping mechanisms.
2.2 Resurvey of regular return emigrants
Return migration from the Gulf is the normal process of contract mi-gration. Migrants from South Asia go on contract work to destination countries, and once the contract ends, they, in the normal course, re-turn to their countries of origin. As of now, we have no estimate of re-turn emigration from the Gulf to South Asia. However, the Centre for Development Studies (CDS) has completed four large-scale migration surveys (1998, 2003, 2007 and 2008) over the last decade. To assess both regular return emigrants and the crisis-led return emigrants from the Gulf, in 2009 we revisited emigrant households from the 15,000 house-holds of the 2008 Kerala migration survey. We estimated the extent of crisis-led return emigrants in Kerala after the revisit. In a later section of this article, we apply the same methodology to estimate the number of return emigrants from the Gulf to South Asia. In addition, the resurvey also estimated the number of emigrants who lost their jobs in the Gulf, but had chosen to remain there without returning to their countries of origin. This new information (“lost job, but have not returned”) is also generated for South Asia as a whole.
3. Financial crisis and growth in the Gulf2
The global crisis originating in the US, spreading to Europe and to Japan, has affected the Middle East through a large fall in price of oil, reversal of capital infl ows, depression of property and equity markets, and loss-es in sovereign wealth funds. The effect of the crisis varied across the countries depending upon country characteristics, such as high share of oil exports in total exports, large quantum of re-exports, and a sizeable
174
share of services in GDP, especially transportation, trade, hotel and res-taurants. In the region as a whole, growth declined from 5.1 percent in 2008 to 2.4 percent in 2009. Among oil-producing countries, the sharpest slowdown was in the UAE, where the exit of external funds contributed to a large contraction in liquidity, a sizeable fall in property and equity prices, and a substantial pressure in the banking system. At the other end of the spectrum is Qatar, which grew by about 9 percent in 2009.
Interestingly, a comparison of the growth forecast for 2009 and the re-alized growth shows some important patterns. For developed countries, the contractions forecast and realized hardly show much of a difference, but the recovery is expected to be quicker. For South Asian countries as a whole, the realized growth is much better than the forecast, and the re-covery is also rapid. The GCC countries show a mixed pattern: both the UAE and Kuwait witnessed contractions greater than the forecasts; the rest of the countries except Qatar reported growth rates higher than the forecasts; the growth recovery in 2010 and 2011 is on expected lines.
3.1 Gulf economies: Population and GDP growth
The population of GCC countries increased by 8.39 million between 2000 and 2008, an increase which is almost the size of the GCC exclud-ing Saudi Arabia in 2000. The large increase in the populations of al-most all the Gulf countries is accompanied by a high average growth of GDP between 2000 and 2009. Only Kuwait showed a large increase in population with a relatively low increase in GDP (Table 9.1). Along with population growth, the proportion of expatriates in the popula-tion has increased. In Qatar and the UAE, expatriates constitute over 80 percent of the total population, and in Kuwait they account for close to 70 percent of the total population. In Saudi Arabia and Oman, expatri-ates constitute slightly over a quarter of the population, while Bahrain has over 40 percent non-nationals in the total population. The propor-tion of expatriates in the labour force is linked to their proportion in the population. Over 60 percent of the expatriates are from South Asia and in some countries, such as Oman and Bahrain, they account for over 90 percent of the expatriates (Table 9.2). Overall, the fl ow of South Asian migrants to GCC countries is a function of GDP growth in the latter.
3.2 Employment structure in GCC countries
In GCC countries, over 50 percent of the workforce is employed in manufacturing, trade and construction. Kuwait and Saudi Arabia are the exceptions, where the share of public administration and defence is
The fi nancial crisis in the Gulf and its impact on South Asian migration and remittances

Regional Economic Integration Challenges for South Asia during turbulent times
175
Table 9.1: Growth of population and GDP in GCC countries
Country
Population (million)GDP growth2000–2008 (%)2000 2009 Change
2000–2009Change 2000–2009 (%)
Kuwait 2.217 3.443 1.226 55.30 6.68Qatar 0.606 1.098 0.492 81.19 11.17Saudi Arabia 20.474 24.897 4.423 21.60 3.91UAE 2.995 4.764 1.769 59.07 7.74Bahrain 0.670 0.779 0.109 16.27 6.29Oman 2.402 2.769 0.367 15.28 5.36Total 29.364 37.750 8.386 28.56 -
Source: International Monetary Fund, World Economic Outlook Database, April 2009.
Table 9.2: Profi le of expatriates in the Gulf, 2009
Country Population (’000)
% Expatri-ates in total population
% of South Asian expatriates in total expatriates
% of expatriates in the labour force
Kuwait 3,443 68.8 52.8 83.9Qatar 1,098 86.5 68.4 92.5Saudi Arabia 24,897 27.8 54.9 55.8United Arab Emirates 4,764 81.0 68.7 89.8
Bahrain 779 43.0 95.1 58.3Oman 2,769 28.4 89.0 64.3GCC 37,750 40.3 61.8 -
Source: Compiled from various sources such as Country Reports prepared by the CDS team, figures reported by the respective embassies in the Gulf, and United Nations (2009), Kapiszewski (2006), Taattolo (2006) and Shah (2009).
rather high (Table 9.3). The share of construction in total employment increased rapidly during 2001–2008 in some of the GCC countries. For instance, in the UAE, the share of construction sector employment in-creased by 5 percentage points during the period. In Saudi Arabia, the increase in employment in the construction sector during the period was about 300,000.
As construction is one of the major sectors attracting expatriate la-bour, it is important to analyse the effect of the crisis on this sector. Proj-ect fi nance and utilities have taken a severe beating along with fi nan-cial institutions in the crisis. A survey of projects (worth at least US$10 million) in mid-2009 reported 10 percent to 30 percent cancellations or

176
The fi nancial crisis in the Gulf and its impact on South Asian migration and remittances
Table 9.3: Share of employment (%) across economic activities in GCC countries, 2007
Activity Bahrain Oman Kuwait Qatar Saudi Arabia UAE
Agriculture, hunting and forestry 0.47 9.09 2.60 1.92 4.69 5.0
Fishing 0.01 0.44 0.08 0.43 * *Mining and quarrying 0.49 1.96 1.90 5.27 1.32 1.3Manufacturing 17.54 10.77 4.43 8.69 7.28 13.0Electricity, gas and water supply 0.13 0.33 0.01 0.66 0.96 1.2
Construction 29.86 34.68 14.23 37.14 10.22 20.6Wholesale, retail trade and car repairs 24.62 16.18 14.03 12.28 16.10 20.0
Hotels and restaurants 6.55 5.97 2.89 1.96 3.20 4.2Transport, storage and communication 4.20 1.30 3.85 4.33 4.42 6.2
Financial intermediaries 3.46 0.29 1.21 1.09 1.08 1.4Real estate and renting services 7.54 1.77 5.59 3.43 3.22 3.3
Public administration and defence 0.01 – 14.75 6.35 18.03 10.8
Education 1.24 0.76 5.23 3.16 11.96 **Health and social work 0.24 1.91 2.40 2.55 4.33 **Community and personal services 2.11 1.08 4.18 1.54 2.26 4.5
Domestic services 0.06 9.96 21.86 8.79 10.79 8.4Extra-territorial organizations and bodies 0.21 2.59 0.11 0.21 0.13 -
Not classified by economic activity 0.30 0.90 0.66 0.18 0.01 0.01
Total 100 100 100 100 100 100
*Fishing is included in agriculture, hunting and forestry.**Education and Health are included in Public Administration and Defence. Note: For Bahrain and UAE, figures show paid employment by economic activity. For Oman, figures show expatriate workers in the private sector. Kuwait figures are for 2005.Source: International Labour Organization, Labour Statistics; Ministry of National Economy, Oman, Statistical Year Book 2008. For Saudi Arabia and UAE, figures are taken from the country reports.
orders put on hold in GCC countries (Table 9.4). Dubai, which has about 60 percent of all projects in the GCC, has taken the largest hit, which in turn has affected the GCC as a whole. Interestingly, the crisis has affect-ed all sub-sectors—from commercial projects to residential properties—as the illustration from the UAE shows (Table 9.5).

Regional Economic Integration Challenges for South Asia during turbulent times
177
Table 9.4: Projects affected by the crisis in the GCC
Country Projects under construction
Projects cancelled/on hold
Total project worth (US$ billion)*
Cancella-tion (%)
Kuwait 90 18 114 17Qatar 124 7 42 -Saudi Arabia 442 106 387 19UAE 1,372 566 900 29Bahrain 148 54 36 27Oman 95 8 38 8
*All projects, including cancelled/on hold.Source: Proleads.
Table 9.5: Projects affected by sub-sectors, UAE
Sub-sector Projects under construction
Total number of projects
Projects cancelled and cancellation rate (%)
Commercial projects 340 487 147 (30)Hospitality business 288 406 118 (29)Residential properties 495 712 217 (30)Retail projects 249 333 84 (25)Total 1,372 1,938 566
Source: www.gulfbase.com/site/interface/NewsArchiveDetails.aspx?n=110724
While new project starts have come down in the UAE, there is con-tinuing high-level activity in ongoing projects that would be “the envy of many” elsewhere in the world. There is evidence of increased con-struction activity in Abu Dhabi, Sharjah and Ajman. Thus, while new starts have come down and those about to be started have been put on hold, a lot of activity is continuing in ongoing projects.
3.3 Gulf crisis and South Asian labour: The Links
The link between economic growth and labour fl ow is through the growth in manufacturing, trade and construction. Construction, in par-ticular, attracts large numbers of expatriate labour from South Asia. Any of the factors adversely affecting construction would affect labour. The quick rebound of oil prices by mid-2009 and the not-too-depressing cur-rent account and budget balances have made the governments of GCC countries bolder and induced them to continue major infrastructure in-vestments. The increase in government expenditures (as a percentage of GDP) was close to 10 percentage points in most of the countries (Table 9.6), except Bahrain and Qatar. Fiscal policy has played a crucial role in cushioning the impact of the global crisis on GCC countries.

178
Table 9.6: Government expenditure in GCC countries, 2006–2011 (% of GDP)
Country 2006 2007 2008 2009 2010 2011Kuwait 31.83 29.94 40.15 47.36 43.22 44.28Qatar 26.42 25.37 24.52 26.66 23.22 22.47Saudi Arabia 31.96 34.36 30.81 44.54 42.80 40.75UAE 18.39 18.98 21.22 32.11 28.34 23.07Bahrain 28.48 28.70 28.00 31.42 30.83 29.53Oman 34.44 35.33 29.42 38.73 37.38 37.02
Note: Figures for 2010 and 2011 are projected.Source: World Economic Outlook Database, October 2010.
Interventions in the banking sector have also been decisive. A fur-ther boost has been the healthy, albeit lower, GDP growth in the whole of South Asia in 2009 and the forecast of higher growth rates in 2010. South Asia and China have emerged as the major trading partners of GCC economies and the trade outlook does not look very depressing.
However, continuing adverse factors have been the depressed real estate and equity prices in GCC countries, particularly in Dubai. The re-covery will remain fragile as long as private investment does not stimu-late growth. FDI, which had played a major role in the high growth of the pre-crisis days, fell drastically in 2009 in almost all GCC coun-tries, except Oman, Qatar and Saudi Arabia. In the UAE, FDI fell from US$13.7 billion in 2008 to US$4 billion in 2009 (UNCTAD 2010).
4. Impact of the crisis on South Asian migrant workers
This section is devoted to an assessment of the impact of the crisis on South Asian migrant workers in terms of return emigration; fl ows of la-bour emigration from Asia to the Gulf; and inward remittances to South Asia. The assessment is based on the summary results of two surveys conducted to understand the coping mechanisms of individuals and families in times of crisis.
4.1 Return migration to South Asia from the Gulf, 2009
All agencies working on migration and remittances in South Asian countries and the Gulf region predicted an exodus of return emigrants from the Gulf to their countries of origin following the crisis. CDS, Ker-ala, which has undertaken four large-scale migration surveys in Kerala during the last 10 years to estimate the number of emigrants and return emigrants, and remittances, revisited the households of the 2008 survey (CDS 2008) in 20093 to arrive at reliable estimates of return emigrants.
The fi nancial crisis in the Gulf and its impact on South Asian migration and remittances

Regional Economic Integration Challenges for South Asia during turbulent times
179
All those in the original sample who had returned were asked to cite the reasons for returning to Kerala. The questionnaire provided 10 pos-sible reasons for the return, among which the following three could be attributed to recession: job loss and return due to fi nancial crisis, expiry of contract (renewal of contract did not take place as expected due to recession), and compulsory expatriation. Estimates of return migrants due to the crisis are provided in Table 9.7.
Table 9.7: Number of return emigrants in Kerala due to recession in 2009
Sample TotalTotal emigrants in 2008 based on 2008 Kerala Migration Survey 3,953 2,193,412
Return emigrants among emigrants of 2008 in Return Migration Survey in 2009 304 168,681
Return emigrants in Kerala due to financial crisis and recession 110 61,036
Source: Zachariah and Rajan (2009).
If we deduce that out of the stock of 2.19 million emigrants from Kerala, about 61,036 crisis-led migrants returned, then what could be the number of return emigrants from the Gulf to South Asia? According to data available from various formal and informal sources, there are about 9.5 million South Asian emigrants in the Gulf; and the number of projected return emigrants from the Gulf to South Asia is 263,660 (Table 9.8).4 The number of return emigrants from the Gulf to countries in South Asia can also be estimated. For instance, India had a stock of 1.7 million migrants settled in the UAE, and the projected number of Indian return emigrants from the UAE was 47,000.
Table 9.8: Estimates of return emigrants in South Asia from the Gulf due to fi nancial crisis, 2009
Country/state Stock of emigrants
Return emigrants due to crisis
Kerala 2,193,412 61,036India 5,050,000 140,526Pakistan 2,300,000 64,002Bangladesh 900,000 25,044Nepal 250,000 6,957Sri Lanka 975,000 27,131South Asia 9,475,000 263,660
Source: Survey (see text).

180
Why are these numbers so small compared to numerous predictions? We postulate two important features of Gulf migration from South Asia as responsible for this: i) the cost of migration to the Gulf; and ii) the peculiarities of the channel of migration.
South Asians incur huge costs to migrate to the Gulf. According to the Kerala Migration Survey 2008, the cost of migration to the Gulf var-ied between Indian rupees (INR) 53,951 for Kuwait and INR 74,606 for Saudi Arabia, that is, between US$1,200 and US$1,660 at an exchange rate of INR 45 per US$1 (Table 9.9). This applies to all South Asian coun-tries (also see United Nations 2009; Zachariah and Rajan 2009; Rajan and Prakash 2009). The high cost of migration to the Gulf caused many emigrants to borrow from various fi nancial sources. Under such condi-tions, even if the expatriates lost their jobs in the Gulf, they would prefer not to return home fearing inability to repay the debt already contracted there. They would rather accept any job at a lower wage and send home remittances to repay their loans even during a crisis in the destination country.
Another characteristic of South Asian migration to the Gulf is the part played by the social network, which consists of friends and rela-tives, who perform a major role in the channel of migration fl ows by arranging visas and other requirements for the emigration process. For instance, an all-India survey conducted by CDS for the International La-bour Organization and the Ministry of Overseas Indian Affairs revealed that close to 80 percent of Indian emigrants utilized their friends and relatives as an important channel for migration (Table 9.10). This also ensured that in the event of a job loss, they could rely on someone to provide them temporary support.
The fi nancial crisis in the Gulf and its impact on South Asian migration and remittances
Table 9.9: Average cost of emigration for different migration corridors from Kerala, 2008
Countries Average cost (INR)Kerala-Bahrain 57,172Kerala-Kuwait 53,951Kerala-Oman 56,840Kerala-Qatar 66,316Kerala-Saudi Arabia 74,606Kerala-UAE 61,308Kerala-UK 56,589Kerala-US 42,080
Source: Survey (see text).

Regional Economic Integration Challenges for South Asia during turbulent times
181
Table 9.10: Channels of migration by emigrants, 2007
Channel Male Female Total Male Female TotalGovernment agency 3 0 3 0.7 0.00 0.5Foreign employer 41 7 48 9.2 3.35 7.3Private recruitment agencies 71 17 88 16.01 8.1 13.5Total 445 209 654 100 100 100
Source: Rajan et al. (2009).
4.3 Outfl ow of workers from South Asia to the Gulf, 2009
As there were no offi cial data to show the extent of outfl ow of workers from South Asia to the Gulf, we estimated the possible trends using reasonably well-managed databases from these countries. All the coun-tries in South Asia, except Sri Lanka, have reported decline in the fl ow
4.2 Emigrants who lost jobs in the Gulf and have not returned
There are migrants who lost their jobs in the Gulf but have not returned home as they continue to look for jobs in sectors less/not affected by the crisis, at lower wages and in poorer working conditions. The Re-turn Emigrant Survey 2009 conducted in Kerala offered a unique op-portunity to estimate the number of those who lost their jobs in the Gulf countries due to the crisis there. According to the estimate made by the authors, of the 2.2 million stock of emigrants from Kerala, about 39,396 persons lost their jobs between 2008 and 2009 but have not returned to their country of origin (Zachariah and Rajan 2009). Applying the same methodology to estimate the number of South Asian migrants who lost their jobs in the Gulf yields the number 170,181 (Table 9.11).
Table 9.11. Estimates of emigrants who lost their jobs in the Gulf but have not returned, 2009
Country Stock of emigrants Number of emigrants who lost their jobs but have not returned
Kerala 2,193,412 39,396India 5,050,000 90,703Pakistan 2,300,000 41,310Bangladesh 900,000 16,165Nepal 250,000 4,490Sri Lanka 975,000 17,512South Asia 9,475,000 170,181
Source: Survey (see text).

182
of workers to the Gulf. The projected decline for India is huge—about 280,000—followed by Pakistan with just 12,000 (Table 9.12).
The fi nancial crisis in the Gulf and its impact on South Asian migration and remittances
Table 9.12: Outfl ow of migrant workers from South Asia to the Gulf, 2005–2009
India Pakistan Bangladesh Nepal Sri Lanka2005 454,628 127,810 207,089 88,230 192,0042006 618,286 172,837 307,620 128,306 170,0492007 770,510 278,631 483,757 182,870 188,3652008 818,315 419,842 643,424 169,510 215,7932009 538,090 407,077 n.a. 152,272 226,299
Source: Based on country papers for this study prepared by the respective country teams in the countries of origin.
As regards the destination, the decline was large for the UAE, which has been more severely affected by the crisis than the other countries in the Gulf. But this was more than compensated by the increase in the numbers who left for Saudi Arabia. This pattern holds for India, Paki-stan, Sri Lanka and Nepal. Thus, the crisis has changed the migration and demographic dynamics of South Asian workers in the Gulf region.
4.4 Inward remittances to South Asia, 2009
The money that migrants send home is important not only to their fami-lies, but also to their countries’ balance of payments. In many develop-ing countries, remittances represent a signifi cant proportion of GDP as well as foreign exchange receipts. Among South Asian countries, India ranked fi rst in terms of the volume of remittances, at US$52 billion (or 4.2 percent of GDP), in 2008. Bangladesh ranked eighth and Pakistan ranked 11th in terms of remittances. Nepal was one of the top 10 coun-tries in the world in terms of remittances as a percentage of GDP, at 22 percent. When the crisis hit in 2008, the World Bank stated that the outlook for remittances for the rest of 2008 and 2009–2010 remained as uncertain as the outlook for global growth, oil and non-oil commod-ity prices, and currency exchange rates. After several years of strong growth, remittance fl ows to developing countries began to slow down signifi cantly in the third quarter of 2008 in response to a deepening global fi nancial crisis.
Our estimates based on the simple average of remittances for the available months from the country reports prepared by the country teams suggest that all the countries of South Asia are resilient to the cri-sis in terms of remittances (Table 9.13). Our estimates put the growth in

Regional Economic Integration Challenges for South Asia during turbulent times
183
remittances to India at 3 percent, from US$51.6 billion in 2008 to US$53.2 billion in 2009.
Table 9.13: Inward remittances to South Asian countries from migrant workers, 2000–2009 (US$ million)
India Pakistan Bangladesh Nepal Sri Lanka2000 12,890 1,075 1,968 111 1,1662001 14,273 1,461 2,105 147 1,1852002 15,736 3,554 2,858 678 1,3092003 20,999 3,964 3,192 771 1,4382004 18,750 3,945 3,584 823 1,5902005 22,125 4,280 4,314 1,212 1,9912006 28,334 5,121 5,428 1,453 2,1852007 37,217 5,998 6,562 1,734 2,5272008 51,581 7,039 8,995 2,727 2,9472009* 47,000 8,619 10,431 3,010 2,8922009+ 53,227 8,856 10,525 2,812 3,308
% change2000–01 10.73 35.91 6.96 32.43 1.632001–02 10.25 143.26 35.77 361.22 10.462002–03 33.45 11.54 11.69 13.72 9.852003–04 -10.71 -0.48 12.28 6.74 10.572004–05 18.00 8.49 20.37 47.27 25.222005–06 28.06 19.65 25.82 19.88 9.742006–07 31.35 17.13 20.89 19.34 15.652007–08 38.60 17.36 37.08 57.27 16.622008–09* -8.88 22.45 15.96 10.38 -1.872008–09+ 3.19 25.81 17.01 3.12 12.25
* World Bank estimates; +Authors’ estimates.Source: World Bank and the country reports prepared by the research team.
Remittances did not decline in South Asia for the following six rea-
sons: i) the debts contracted to meet the high cost of migration kept the emigrants from returning to their home countries in spite of the lay-offs; ii) the predictions of a large exodus of emigrants from the Gulf did not come true; iii) though the outfl ow declined in the fi rst half of 2009, it did not signifi cantly affect the stock of South Asian migrants in the Gulf; iv) the appreciation of the US dollar vis-à-vis South Asian currencies; for instance, the current exchange rate of the Indian rupee to the US dollar is much higher than what it was during the crisis period; v) the continu-ous rise in oil prices generating more income in the Gulf; and vi) the “reverse migration” of the crisis-led return emigrants back to the Gulf.

184
5. Conclusion
The impact of the crisis on output and employment in the US had gener-ated an anticipation of large-scale retrenchment of expatriate labourers in the Gulf region. The anticipated misery and the need for rehabilita-tion had got some governments in South Asia thinking about plans for the returning migrants. We fi nd that the dimensions of the impact were not as large as was feared earlier. For a stock of approximately 9.5 mil-lion South Asian emigrants in the Gulf, the number who returned due to the crisis is estimated at 264,000 (just around 2.78 percent); and the number of workers who lost jobs but were continuing to stay in the Gulf was about 170,000 (1.8 percent). Overall, less than 5 percent of the South Asian emigrants had lost jobs owing to the crisis. The yearly fl ow of out-migrants from South Asia was also not adversely affected much.
As regards remittances (in US dollars), the annual percentage in-crease since 2004–05 has been over 20 percent for South Asian countries, except for Sri Lanka. The rate of increase has taken a hit all over South Asia, except Pakistan from where the outfl ow of migrants had been in-creasing at around 50 percent every year since 2005. But remittances have not fallen following the crisis; either it has remained stagnant or has shown a mild rise depending upon the estimates. As most of the South Asian currencies have depreciated against the US dollar (to which the GCC currencies are pegged) from late 2007, remittances in terms of domestic currencies have shown an increase. Surveys of migrant households in South Asia confi rmed these estimates as 94 percent of the households reported regular remittances during the crisis period also as in previous years, and no signifi cant change in the use of remittances was reported by these households.
Overall, less than 5 percent of the stock of South Asian migrants in the Gulf had lost jobs and had either returned or were struggling to continue staying in the Gulf. The fl ow of workers from South Asia to the Gulf had also not been affected in any signifi cant extent, but there were changes in the origin (in favour of Pakistan) and the destination (in fa-vour of Saudi Arabia) of the fl ow. The volume of remittances into South Asia had also not fallen to any signifi cant extent. In sum, the crisis of 2008–2009 was a blip on the radar of labour migration to GCC countries from South Asia. A few thousands lost jobs and had to return home, but the number migrating to the Gulf has hardly fallen.
This article is based on a study funded by the Asian Development Bank, Ministry of Overseas Indian Affairs, Government of India, and Department of Non-Resident Keralite Affairs, Government of Kerala.
The fi nancial crisis in the Gulf and its impact on South Asian migration and remittances

Regional Economic Integration Challenges for South Asia during turbulent times
185
Notes1 GCC countries are: the United Arab Emirates (UAE), Saudi Arabia, Qatar,
Bahrain, Kuwait and Oman.2 This section is based on the six country reports prepared by the research
team at the Centre for Development Studies (CDS). Most of the members of the research team visited the Gulf to assess the reality by talking to stake-holders, and additional research was done by the authors of this article.
3 Return Emigrant Survey 2009 was conducted by CDS and sponsored by the Department of Non-Resident Keralite Affairs, Government of Kerala (for more details of the survey report, see Zachariah and Rajan (2009)). The field work was carried out during 16 June–7 September 2009.
4 These could be underestimates as the composition of migrants from Kerala would have a lower proportion of unskilled workers.
References
Centre for Development Studies (CDS). 2008. Global fi nancial crisis and Kerala economy: Impact and mitigation measures. Report submitted to the Government of Kerala.
ESCWA (Economic and Social Commission for Western Asia). 2008. Foreign direct investment report, E/ESCWA/EDGD/2008/Techni-cal Paper 1, 3 September, United Nations, New York.
Kapiszewski, Andrzej. 2006. Arab versus Asian migrant workers in the GCC countries. UN Expert Group Meeting on International Migration and Development in the Arab Region, UN/POP/EGM/2006/02.
Rajan, Irudaya and B.A. Prakash. 2009. Migration and development linkages re-examined in the context of the global economic crisis. Invited paper for the Civil Society Days of the 3rd Global Forum on Migration and Development, 2–3 November, Athens.
Rajan, Irudaya, V. J. Varghese and M. S. Jayakumar. 2009. Overseas re-cruitment practices in India: A critical assessment. Report submitted to the International Labour Organization, Thailand and Ministry of Overseas Indian Affairs, Government of India, New Delhi.
Shah, Nasra M. 2009. Trends and policies for contract worker mobil-ity of Asian to the Gulf Cooperation Council Countries. Paper for presentation at the 2009 IUSSP Conference in Marrakech, Morocco, September 27–October 2, Session 603 on International Migration, or-ganized by Ayman Zohry.
Taattolo, Givonni. 2006. Arab labour migration to the GCC states. Proj-ect on Arab Labour Migration.
UNCTAD (United Nations Conference on Trade and Development). 2010. World investment report 2010. New York and Geneva: United Nations.

186
United Nations. 2009. International migration 2009. New York: Depart-ment of Economic and Social Affairs, Population Division.
Zachariah, K. C. and Irudaya Rajan, S. 2009. Migration and development: The Kerala experience. New Delhi: Daanish Publishers.
The fi nancial crisis in the Gulf and its impact on South Asian migration and remittances

Regional Economic Integration Challenges for South Asia during turbulent times
187
1. Introduction
It is natural that gains from any regional economic cooperation arrange-ment (RECA) are not likely to be shared equally by all the partner coun-tries of the arrangement. The asymmetric benefi ts within any RECA are a by-product of a large variation in the size of the economies of the member countries, their economic structures, institutional endowments and policy-intervention mechanisms in place (Razzaque 2007; Adhikari 2010). However, the sustainability of any RECA depends on the extent to which benefi ts are equitably shared by all the participating countries. RECA should be considered a public good in the sense that the benefi ts of such an arrangement transcend national boundaries. This is more so when there is a shared vision of regional prosperity and the ensuing peace dividend. Several RECAs, including the European Union (EU), Southern Cone Common Market (Mercosur) and Association of South-east Asian Nations (ASEAN) Free Trade Area (AFTA), which are guid-ed by the philosophical underpinning of “regional public good”, have made every possible attempt to ensure that the benefi ts of RECA are shared more or less equitably by all the participating members.
LDC Integration Fund in South Asia
Chapter 10
Ratnakar Adhikari

188
The Agreement on South Asian Free Trade Area (SAFTA), dubbed “too little, too late” by some commentators, is moving at a glacial pace in terms of enhancing trade within the region. This is evident from, inter alia, the share of regional trade in the total trade of the region, which has hovered around 5 percent for more than a decade now. Lower vol-ume and value of trade may not in itself be so much of a problem if the benefi ts from SAFTA are shared more or less equitably by all the mem-ber countries. However, what is disquieting is the fact that the benefi ts of regional integration are reaped by relatively better-off countries in the region while the least-developed countries (LDCs)1 continue to be marginalized from the mainstream of regional trade. Although SAFTA recognizes this asymmetry as well as the need to accord special and differential treatment to the LDCs in the region, provisions according such treatment have not moved beyond rhetoric and can be described as “best endeavour” clauses.
Against this backdrop, the objective of this article is to highlight the inherent asymmetry in trade benefi ts that accrue to various countries within the region and identify the reasons for such anomalies. One of the assumptive foundations of the article is that LDCs are being mar-ginalized from the regional trade mainstream, which is reminiscent of the discussions at the global level, due to their supply-side constraints. Therefore, the article provides the rationale for the establishment of a relatively large-sized LDC Integration Fund (LIF) in order to address the challenge. It also proposes the contours and modalities of the LIF.
2. Situation analysis
Among SAARC member countries, LDCs have a higher stake in re-gional economic cooperation because of their excessive dependence on regional trade. Figure 10.1 provides the share of regional trade in the total international trade of SAARC member countries. In 2008, while Bhutan’s dependence on regional trade was 82 percent, Nepal’s share was 63 percent and Afghanistan’s share was 41 percent. Although the dependence of Sri Lanka, a developing country, on regional trade (17 percent) is more than that of two LDCs—the Maldives (14 percent) and Bangladesh (12 percent)—India and Pakistan have a negligible depen-dence on regional trade.
What is even more worrying is LDCs’ dependence on the two larg-est economies of the region, namely India and Pakistan. Figures 10.2a and 10.2b provide the level of dependence of LDCs on these two coun-tries in terms of both exports and imports. Barring the Maldives, which is not dependent so much on India for its export trade within the region,
LDC Integration Fund in South Asia

Regional Economic Integration Challenges for South Asia during turbulent times
189
and which has a very limited dependence on Pakistan for its exports, all other LDCs in the region are dependent on these two countries for more than 90 percent of their regional exports. The dependence of all LDCs, including the Maldives, on the two largest economies in the region for their imports is even more glaring.
The Agreement on SAFTA, in effect since 2006, is not expected to transform the historically tardy process of regional economic coopera-tion in South Asia; however, fi ve years of implementation record of the agreement leaves much to be desired. It is even disappointing in the case of LDCs’ participation. Despite their excessive dependence on re-gional trade, LDCs, with the possible exception of Bhutan, are increas-ingly being marginalized under SAFTA in terms of exports. Their im-ports from the region are increasing more rapidly than their exports to the region, with the result that their shares in intraregional exports have been shrinking, causing widening trade defi cits.
A comparison of trade fi gures for 2000 and 2008 reveals that trade defi cits of LDCs vis-à-vis their regional trading partners have increased signifi cantly (Table 10.1). Trade defi cit at the bilateral level, or even at the regional level, may not be a cause for concern as long as the coun-tries with these defi cits have trade surpluses vis-à-vis countries outside
17
63
14
12
41
82
6
2
Figure 10.1: Dependence of South Asian countries on regional trade (as % of their global trade), 2008
Sri Lanka
Pakistan
India
Nepal
Maldives
Bhutan
Bangladesh
Afghanistan
Source: International Monetary Fund (IMF) Direction of Trade Statistics (DOTS) online (accessed 21 April 2010).

190
the region. While this is true, to some extent, in cases of LDCs such as Bangladesh and the Maldives, Bhutan and Nepal have not been as for-tunate. It is this asymmetry that needs to be corrected in order to help the LDCs in the region realize their development potentials.
One of the natural corollaries to the development discussed above is that the shares of LDCs in regional exports have decreased signifi cantly in 2008 compared to 2000, as can be seen from Figure 10.3.2 The shares of all LDCs in regional exports have reduced, whereas two developing countries, namely India and Pakistan, have seen their shares increase in
LDC Integration Fund in South Asia
Afghanistan
Bangladesh
Bhutan
Maldives
Nepal
Total LDCs
99%
95%
91%
91%
92%
10%
Figure 10.2a: LDCs’ dependence on India and Pakistan for their regional exports (percentage), 2008
Source: IMF DOTS online (accessed 21 April 2010).
Afghanistan*
Bangladesh
Bhutan
Maldives
Nepal*
Total LDCs
100%
97%
98%
71%
78%
100%
Figure 10.2b: LDCs’ dependence on India and Pakistan for their regional imports (percentage), 2008
*100% due to rounding up.Source: IMF DOTS online (accessed 21 April 2010).

Regional Economic Integration Challenges for South Asia during turbulent times
191
2008 as compared to 2000. The only exception among developing coun-tries is Sri Lanka, which has seen its share decline.
Several factors are responsible for such deterioration of regional ex-port performance of LDCs, one of them being market access barriers, which will be discussed below. It needs to be noted that some LDCs in the region, notably Bangladesh, have considerably increased their ex-ports to countries outside the region, which could have also resulted in reduction in the share of their intra-regional exports. Despite this, Table 10.1 and Figure 10.3 provide evidence in support of our central argu-
Table 10.1: Regional trade balance of South Asian countries, 2000 and 2008 (US$ million)
2000 2008
Exports Imports Trade balance Exports Imports Trade
balanceAfghanistan 60 169 -109 175 2,331 -2,157 Bangladesh 93 1,050 -957 431 3,916 -3,485 Bhutan - - - 164 171 -7 India 1,820 454 1,366 9,449 2,410 7,039 Maldives 14 90 -76 18 216 -198 Nepal 309 587 -278 881 2,110 -1,229 Pakistan 404 291 113 2,919 1,272 1,647 Sri Lanka 190 707 -517 725 3,213 -2,488
Note: Since data for Bhutan’s trade are not available, they are calculated based on the export and import data of Bhutan’s trading partners.Source: IMF DOTS online (accessed 21 April 2010).
Figure 10.3: Share of intra-regional exports of South Asian countries, 2000–2008
Afghanistan Bangladesh India Maldives Nepal Pakistan Sri Lanka
100% 1.18%3.21% 2.92%
62.97%
04.48%0.12%
10.70%5.97%
13.99%19.77%
6.57%4.91%
64.01%
2000 2008
Source: IMF DOTS online (accessed 21 April 2010).

192
ment that LDCs, in general, have not benefi tted much from the regional trade agreement in South Asia.
3. Barriers to effective participation of LDCs in SAFTA
Although there are a host of market access barriers impeding the pros-pects of South Asian LDCs to better integrate themselves into the re-gional trade mainstream, two stand out in the case of most LDCs: i) sensitive list as a tariff barrier; and ii) rules of origin (RoO) and stan-dard-related barriers as non-tariff barriers.3 While the signifi cance of sensitive list as a tariff barrier is on the wane in the case of India, due to the unilateral pruning of the list by India,4 Pakistan and Sri Lanka do not even provide a different sensitive list for LDCs as required by the SAFTA Agreement.
RoO remains a barrier for LDCs’ exports to developing-country mar-kets in the region largely due to the lack of backward integration within LDCs. This, in turn, owes much to the level of industrialization in LDCs. However, what is more pernicious as a trade barrier is the standard-re-lated trade barriers, whether in the name of promoting health and safety of plants and animals, or in the name of protecting the environment.
There is no denying that these measures may be necessary to protect the legitimate policy goals of developing countries. However, if they are imposed due to political economy factors and to afford disguised pro-tection to domestic enterprises, they are not justifi ed. There have been reported cases of arbitrary imposition of such barriers.5
Another issue that is important from the perspective of LDCs is that their efforts to diversify their trade beyond India (in the case of Ban-gladesh, Bhutan and Nepal) and Pakistan (in the case of Afghanistan) within the region is hampered by several geographical factors. Among them, the geographical situation of three LDCs (Afghanistan, Bhutan and Nepal) deserves special mention. Because of the landlocked status of these countries and frequent transit-related hassles being encountered by them, they are unable to diversify their trade with other developing countries as well as LDCs within the region.6
4. Supply-side constraints
LDCs in the region face severe supply-side constraints7 that limit their ability to export products for which market access barriers do not im-pose binding constraints. Although some of these constraints are due to natural handicaps, a majority of these owe to governance failure, implying the inability of the government to make optimal provision-
LDC Integration Fund in South Asia

Regional Economic Integration Challenges for South Asia during turbulent times
193
ing of public goods. These include defi ciencies in infrastructure, human capital and trade facilitation measures coupled with limited access to fi nance and technology.
These issues are often overlooked in mainstream literature as well as policy documents due to two main reasons. First, standard trade theory assumes that supply response is invariably automatic. It assumes that once market access is provided, resources will switch to export sectors, which will help enterprises exploit the opportunity. Second, policy makers, including trade negotiators, have their focus predominantly, if not exclusively, on the reduction of trade barriers while engaging in any trade negotiations.
Various studies conducted in the context of South Asian LDCs have identifi ed fi ve supply-side constraints as the most pressing ones: i) in-frastructure; ii) human capital; iii) trade facilitation; iv) access to fi nance; and v) access to technology.8
Adhikari (2011b), based on a survey conducted in Bangladesh and Nepal, fi nds the fi rst three as the most binding supply-side constraints faced by these countries.9 In order to gauge the severity of the prob-lem, comparisons between South Asian developing countries and LDCs have been made using various globally available indicators, of which two prominent ones are those in the Global Competitiveness Report and the Doing Business report. The precarious nature of supply-side con-straints faced by South Asian LDCs is refl ected in their rankings in the Global Competitiveness Report 2010–2011, which bases its analysis on 12 different components of competitiveness. While all the factors analysed by the report are necessary to measure the level of competitiveness of an economy, this article focuses on four factors, namely infrastructure, human capital (represented by health and primary education), access to fi nance (represented by ease of access to loan), and access and adapt-ability to technology (represented by technological readiness) that have been identifi ed as the major constraints by earlier studies discussed above (Table 10.2).
Table 10.2 shows that in terms of various competitiveness rankings, Nepal and Bangladesh fall below other South Asian countries on infra-structure, ease of access to loan, and technological readiness, although both of them have better indicators than Pakistan in the case of health and primary education. In terms of ease of access to loan, Sri Lanka is the country with the best indicator within the region, followed by India and Pakistan. However, Bangladesh and Nepal rank much lower in this indicator as well.
What is still missing is the indicator of trade facilitation, an area in which South Asian LDCs lag far behind developing countries in the re-

194
gion, as is evident from the trading-across-borders indicators included in the Doing Business report published by the World Bank (Table 10.3). Of particular note is the number of documents required for imports and exports, and the number of days taken for imports and exports. These are also refl ected in the cost to import and export in LDCs. In the case of Nepal and Bhutan, the costs to import and export are very high—almost three times higher that the least costly exporter (Sri Lanka) and importer (Pakistan) in the region. Although the landlocked status of these coun-tries is partly responsible for this, the lower quality of domestic infra-structure seems to have equally contributed to this.
While some constraints discussed above such as absence of requi-site human capital or fi nance are purely supply-side constraints, oth-ers such as lack of institutional apparatus to comply with the standards and regulatory requirements of the importing country or RoO can be considered as both market access barriers and supply-side constraints. Given the fact that these two barriers are considered major non-tariff barriers in the context of South Asia, we need to bring these issues un-der sharper focus. For example, the inability of a country to fulfi l the RoO requirement imposed by the importing country or under any re-gional trade agreement for the export of manufactured products is due to low level of industrialization of the exporting country in general and a lack of backward integration in particular. Similarly, the inability of an exporting country to meet, for example, the standard for pesticide resi-due in agriculture product prescribed by the importing country is also a supply-side issue. Therefore, time has come to view these problems as supply-side constraints rather than considering them as purely market access barriers.
LDC Integration Fund in South Asia
Table 10.2: Select competitiveness rankings and indices, 2010–2011
InfrastructureHealth and pri-mary education
Ease of access to loan
Technological readiness
Country/Economy Rank Index Rank Index Rank Index Rank Index
N = 139 (1 to 7) N = 139 (1 to 7) N = 139 (1 to 7) N = 139 (1 to 7)Bangladesh 133 2.1 106 5 79 2.6 126 2.7India 86 3.5 104 5.2 39 3.3 86 3.3Nepal 139 1.8 109 4.8 88 2.5 134 2.5Pakistan 110 2.8 123 4.3 40 3.3 109 2.9Sri Lanka 70 3.8 35 6.2 38 3.3 84 3.4
Source: World Economic Forum (2010).

Regional Economic Integration Challenges for South Asia during turbulent times
195
5. Addressing the constraints: Lessons from elsewhere
It is clear that LDCs are unable to overcome these challenges on their own. Adhikari (2011b) considers governance problems and resource constraints as two major impediments in this regard. While the issue of governance is important for LDCs to overcome the above-mentioned constraints, the focus of this article is on resource constraints. Although the Aid for Trade initiative, which was launched during the Hong Kong Ministerial Conference of the World Trade Organization, too intends to serve a similar purpose, this article focuses on a regional mechanism modelled on the time-tested mechanism of the EU, which is considered to be, by far, the most successful example of a RECA. It has followed what can be considered as “distributional sensitive” economic coopera-tion strategy, which is stated clearly in its Regional Policy document: “Regional policy is…the expression of the EU’s solidarity with less de-veloped countries and regions, concentrating funds on the areas and sectors where they can make the most difference. Regional policy aims to reduce the signifi cant economic, social and territorial disparities that still exist between Europe’s regions. Leaving these disparities in place would undermine some of the cornerstones of the EU, including its large single market…”10
Table 10.3: Trading-across-borders indicators for South Asian countries, 2010
IndicatorsSouth Asian LDCs South Asian DCsAF BD BT MV NP IN PK SL
Doing business—trading across borders (rank out of 183)
183 112 161 138 164 100 81 72
No. of documents re-quired for exports 12 6 8 8 9 8 9 8
No. of days process re-quired for exports 74 25 38 21 41 17 21 21
Cost to export (US$ per container) 3,865 985 1,210 1,550 1,960 1,055 611 715
No. of documents re-quired for imports 11 8 11 9 10 9 8 6
No. of days process re-quired for imports 77 31 38 22 35 20 18 19
Cost to import (US$ per container) 3,830 1,390 2,665 1,526 2,095 1,025 680 745
Note: AF = Afghanistan; BD = Bangladesh; BT = Bhutan; MV = Maldives; NP = Nepal; IN = India; PK = Pakistan; SL = Sri Lanka. Source: World Bank (2010).

196
This concern for collective prosperity that is underpinned by the phi-losophy which views pan-European economic cooperation as a “region-al public good” is the bedrock of the EU regional policy. As suggested by Winters (1997), in order to provide practical shape to the idea, the European Regional Development Fund was created, with the main ob-jective of assisting relatively poorer countries—Greece, Portugal, Spain and Ireland, the late entrants to the Union. Signifi cant transfers were made to these countries in order to help them address their supply-side constraints, build credible institutions and indeed catch up with the rest of the members of the Union. Similarly, according to Ismail (2008), who provides a historical account of European economic growth as well as economic integration trajectory, success of their integration effort is largely attributed to transfers made by the European Commission to the relatively poor countries and regions through a structural and cohesion fund. In keeping with this policy, the EU continues to provide such re-sources to the less developed regions within the Union.
The fact that 10 new countries from Eastern Europe joined the EU in May 2004 as relatively less developed countries compared to the rest of the Union seems to have redoubled the signifi cance of the Fund. For example, during the period 2007–2013, the EU is expected to invest a total of €347 billion in uplifi ting the status of various less developed regions within the Union.11 An indicative list of areas for which funding is provided includes: i) improving transport links to remote regions; ii) boosting small and medium-sized enterprises in disadvantaged areas; iii) improving education and skills; iv) encouraging innovation through investment in research and technological development; v) building information and communication capabilities; and vi) developing new products and production methods.12
6. LDC Integration Fund
Building on the above model, a policy paper prepared by Coalition for Action on South Asian Cooperation (CASAC), which offered its per-spective on the Report of the SAARC Group of Eminent Persons, had realized the constraints faced by LDCs in the early 2000s. It had made a plea for the “creation of a reasonably large sized fund” for the de-velopment of LDCs’ infrastructure, human resources, export produc-tion and diversifi cation of export capacity (CASAC 2001, 19). Despite its potential contribution to enhancing regional integration in general and helping LDCs in the region obtain equitable benefi ts from the integra-tion initiatives in particular, not much attention has been paid to this proposition. Therefore, this article recommends the revival of this idea
LDC Integration Fund in South Asia

Regional Economic Integration Challenges for South Asia during turbulent times
197
and the creation of an LDC Integration Fund (LIF), with the expectation that this would provide a much-needed shot in the arm for spurring regional economic integration in South Asia as well as for preventing marginalization of LDCs from the system.
6.1 Modality for fi nancing and operation of the LIF
When we discuss about mobilizing resources to fund the LIF, fi nancing immediately becomes a major challenge for SAARC, which is currently under-funded to implement several joint initiatives to give practical shape to the guidelines provided by various SAARC Summits. For the creation of the LIF, since a “reasonably large sized” fund is not defi ned, we need to fi rst determine the size of the Fund. Since it is diffi cult to quantify the size of the Fund without adequate needs assessment, we propose the creation of a Fund with an annual contribution of US$1.1 billion, calculated at 0.07 percent of the GDP of SAARC member coun-tries. This fi gure is 10 percent of what the United Nations has urged the Development Assistance Committee of the Organisation for Economic Co-operation and Development (OECD) to contribute in the form of Of-fi cial Development Assistance. The following modality is proposed for fi nancing the initiative:
Core contributions: There are three major types of core contribution that South Asian leaders could think of tapping into. First, SAARC member countries, including LDCs, would be required to contribute at least 50 percent of the resources based on the share of their regional trade. Second, SAARC observers should be urged to contribute 25 per-cent of the total requirement. Third, other multilateral donors and bi-lateral donors, which are not observers to the SAARC, can be urged to contribute 25 percent of the total requirement.
Project-based contributions: Since creating regional public goods such as cross-border road linkages, communication and trade facilitation aimed at promoting intra-regional as well as extra-regional trade are among the priority agenda of the multilateral Aid for Trade initiative, it would be possible to tap into these resources for project-based funding. Two successful examples of the Aid for Trade initiative are: i) a multi-donor North-South corridor initiative jointly implemented by three regional groupings in Southern Africa; and ii) an Asian Development Bank (ADB)-funded Greater Mekong Sub-regional project. Although the ADB has also been implementing a similar project in South Asia un-der the South Asian Sub-regional Economic Cooperation programme, it is yet to show tangible results. A similar model can be replicated in the case of South Asia as well.

198
Although the Second Meeting of the Sub-Group on Technical As-sistance to Least Developed Contracting States under Article 11 (d) of SAFTA has identifi ed 10 such areas and some of them can be count-ed as assistance for addressing supply-side constrains and enhanc-ing competitiveness of LDCs, there has been little movement, if any, on the delivery of actual assistance, let alone contributing to a certain level of desired outcomes.13 While the non-implemention has its root in the “best endeavour” nature of this provision, the areas identifi ed represent largely “software” component of trade-related assistance as opposed to “hardware” components such as creating infrastructure or upgrading testing facilities. Since bilateral technical assistance tends to be driven more by political and foreign policy objectives rather than by trade-promoting objective, this initiative should be regionalized and merged with the proposed LIF, with the developing member countries in a position to provide such assistance making direct contributions to the LIF, over and above their core contributions.
While the operational modality could be decided once the funding issue is settled, entrusting a professional management team with the responsibility to manage the Fund is a sine qua non for the successful implementation of the projects in the priority areas. The management modality could, therefore, be close to what is being currently followed in the case of the SAARC Development Fund.
The following represents an indicative non-exhaustive list of prior-ity areas, over and above what has already been identifi ed by the Sub-Group on Technical Assistance for LDCs: Development of transport corridors to improve regional connectiv-
ity. Construction of a regional grid to facilitate trade in electricity. Trade facilitation, particularly modernization of customs, to reduce
costs of trading across borders. Construction of laboratories and testing facilities to meet relevant
standards. Construction of warehouses and cold storages to facilitate trade in
agriculture products.
7. Conclusion
Despite LDCs constituting a majority of its membership, mechanisms under SAFTA are yet to adopt a “distribution sensitive” approach to trade integration and regional economic cooperation as followed by the EU. The idea of better integrating LDCs into the regional trade agree-ment and arresting their marginalization from the system is, therefore,
LDC Integration Fund in South Asia

Regional Economic Integration Challenges for South Asia during turbulent times
199
not being considered as a priority issue. This can be seen not only from their deteriorating export performance, but also from the absence of concrete initiatives to put the special and differential treatment provi-sions contained in the SAFTA Agreement into practice.
The article argues that while the major focus in mainstream discus-sions have been on the market access issue, the issue of supply-side con-straints, which need to be tackled upfront to enhance the general level of competitiveness of LDC exports, both within and outside the region, has not received the attention it deserves. This article recommends the creation of an LDC Integration Fund, modelled on the trajectory fol-lowed by the EU and based on a proposal developed by CASAC. It is envisaged that the Fund should be utilized to help these countries over-come binding constraints, particularly those related to hard infrastruc-ture, so as to help them reap the benefi ts of regional trade integration espoused by SAFTA. The article also provides the options available for the fi nancing of the Fund and proposes an operational modality as well as priorities to make it meaningful, operational and effective.
Notes1 At the time of writing, there were five LDCs in the region, namely Afghani-
stan, Bangladesh, Bhutan, the Maldives and Nepal. 2 Since baseline data for Bhutan are not available, the figure presents a com-
parative picture for seven South Asian countries (four LDCs and three devel-oping countries).
3 See Adhikari (2011a) for further details. 4 India’s initial sensitive list for LDCs consisted of 763 goods, which has been
unilaterally reduced twice and now brought down to 480. 5 See, for example, Raihan (2009) in the case of Bangladesh and MoCS (2010) in
the case of Nepal. 6 See Adhikari and Kharel (2011) for further details. 7 We define supply-side constraints as constraints on supply capacity that
limit the ability of a country to produce and supply goods and/or services to the international market in a competitive manner.
8 Razzaque (2005); Eusuf et al. (2007); SAWTEE and ActionAid Nepal (2007); Adhikari (2010).
9 One of the major limitations of the study is that it focuses only on two South Asian LDCs. However, given the fact that these two countries represent both coastal and landlocked countries with different development trajectories, they can be considered to be largely representative of South Asian LDCs as a whole.
10 http://ec.europa.eu/regional_policy/what/index_en.cfm (accessed 24 Jan-uary 2012).
11 European Commission (2006).12 http://ec.europa.eu/regional_policy/what/index_en.cfm (accessed 24 Jan-
uary 2012).13 See Adhikari (2011a) for further details.

200
References
Adhikari, Ratnakar. 2010. “LDC Integration Fund.” Trade Insight (Special brief), Vol. 6, No. 1.
Adhikari, Ratnakar. 2011a. Integration of least developed countries into South Asian Free Trade Agreement: A human development perspective. Bangkok: United Nations Development Programme Asia Pacifi c Re-gional Centre.
Adhikari, Ratnakar. 2011b. Political economy of Aid for Trade: An in-quiry into supply-side constraints facing South Asian least devel-oped countries. PhD Thesis. Coventry: University of Warwick.
Adhikari, Ratnakar and Paras Kharel. 2011. Nepal and SAFTA: Issues, prospects and challenges. Report submitted to Commonwealth Sec-retariat, London.
CASAC. 2001. “SAARC vision beyond the year 2000: The CASAC per-spective on the Report of the SAARC Group of Eminent Persons.” In K.K. Bhargava and Sridhar K. Khatri (eds.), South Asia 2010: Chal-lenges and opportunities. New Delhi: Konark Publishers Pvt. Ltd.
European Commission. 2006. “Regulation (EC) No 1080/2006 of the Eu-ropean Parliament and the Council of 5 July 2006 on the European Regional Development Fund and repealing Regulation (EC) No 1783/1999.” Offi cial Journal of the European Union, L 210.
Eusuf, Abu, Mahbub Alam, Mokammel K. Toufi que and Rabeya Khatoon. 2007. “Non-traditional exports: A brief review of some se-lected sector-specifi c and general constraints.” In Abdur Razzaque and Selim Raihan (eds.), Trade and industrial policy environment in Bangladesh: With special reference to some non-traditional export sectors. Dhaka: Pathak Shamabesh.
Ismail, Faizel. 2008. “Aid for trade: An essential component of the mul-tilateral trading system and the WTO Doha Development Agenda.” In Dominique Njinkeu and Hugo Cameron (eds.), Aid for Trade and Development. New York: Cambridge University Press.
MoCS, GoN. 2010. Nepal trade integration strategy 2010: Executive sum-mary and action matrix. Kathmandu: Ministry of Commerce and Sup-plies, Government of Nepal.
Raihan, Selim. 2009. “Non-tariff barriers facing Bangladesh in South Asia.” Trade Insight, Vol. 5, No. 3–4: 15–16.
Razzaque, Mohammed A. 2005. Sustaining RMG export growth after MFA phase-out: An analysis of relevant issues with reference to trade and human development. A study prepared for UNDP, Dha-ka, May.
Razzaque, Mohammad A. 2007. “SAFTA: Issues for weaker economies.”
LDC Integration Fund in South Asia

Regional Economic Integration Challenges for South Asia during turbulent times
201
Issue paper. Kathmandu: SAWTEE. SAWTEE and ActionAid Nepal. 2007. Trade and industrial policy environ-
ment in Nepal. Kathmandu: SAWTEE and ActionAid Nepal.Winters, Alan L. 1997. “What can European experience teach develop-
ing countries about integration.” The World Economy, Vol. 20, No. 7.World Bank. 2010. Doing business 2011. Washington, D.C.: The World
Bank.World Economic Forum. 2010. The Global Competitiveness Report 2010–
2011. Geneva: World Economic Forum.

.

5PART
DRIVERS OF REGIONAL COOPERATION

.

1. Introduction
There has been a considerable amount of scepticism, sarcasm and cyni-cism about the effectiveness of the South Asian Association for Regional Cooperation (SAARC). Some of the many critical comments about the Association are justifi ed and need to be frankly acknowledged and ad-dressed.
SAARC, established in 1985, is relatively a latecomer as a regional association compared to other such associations such as the European Union, Organization of African Unity and the Association of Southeast Asian Nations (ASEAN). As a former Sri Lankan Head of State once remarked, SAARC has grown like a large tree that has taken deep root, with many branches of activity, much foliage and verbiage, but not enough fruit. Yet, it is indispensible for South Asia, and its agreed goals need to be pursued with greater dedication, political commitment and coordinated action.
Roles of peoples’ representatives and non-state actors in strength-ening regional cooperation
Chapter 11
Nihal Rodrigo

206
2. People and politics in South Asia
In order for SAARC to deliver, it is important to secure the engagement of the people in the region. These include political representatives, par-ticularly those in the parliamentary processes, the political Executive, the Legislature and the Judiciary, and those representing the corporate sectors, professional organizations, academic groups and civil society. One such initiative was taken as early as in 2000 by S. M. Krishna, the then Chief Minister of Karnataka, when a business conference was or-ganized in the state bringing together politicians, corporate executives, representatives of chambers of commerce and industry, economists, academics and the SAARC Secretariat together. The conference empha-sized the need for all groups to work more closely together.
In respect of the impact of the current global situation on each South Asian country, and the complexity of the issues involved, individual national concerns as well as sectarian interests internally within each country do clash and are sometimes in open confl ict, even spawning acts of violence at local levels. This tends to render coordinated respons-es at the regional level much more complex. In this situation, careful interactions among all concerned groups, with support from the general public, are required to grapple with the issues concerned. This needs to be done, fi rst, at the national level before coordinated regional ap-proaches can be taken up.
Akmal Hussain, a Pakistani economist, once remarked that gov-ernments in South Asia are required, as the media reported, to “move out of a mind-set that regards an adversarial relationship with a neigh-bouring country as the emblem of patriotism; affl uence of the few at the expense of the many as the hallmark of development; individual greed as the basis of public action and mutual deionization as the basis of inter-state relations”. He later said that the media had erroneously reported his words since what he referred to was “demonization” and not “de-ionization”. However, given that “splitist”, divisive tendencies are often visible in the development processes, which involve so many diverse actors—although some of them are constrained to act like mere “extras” clashing sometimes even violently, and ineffectively with the more powerful political and corporate “lead” players—I feel that both words were appropriate.
Regrettably, some adversarial bilateral issues such as border dis-putes, which still remain as lingering legacies of the colonial period, in India and Pakistan for example, have even delayed, at times, the con-vening of SAARC Summits.
Roles of peoples’ representatives and non-state actors in strengthening regional cooperation

Regional Economic Integration Challenges for South Asia during turbulent times
207
3. Parliaments and democracy
Among the South Asian bodies offi cially accorded “recognition” by the SAARC is the Association of Speakers and Parliaments, which has had a number of meetings in various capitals in the region since its fi rst meet-ing in 1994 when it was known as the South Asian Parliamentarians’ Association. Democratically elected governments currently characterize the political scene in all SAARC member countries, although in some, the need to contend with certain complex issues is hampering smooth governance. In February 2009, the Conference of SAARC Ministers of Parliamentary Affairs bearing the theme, “Good Governance through Parliamentary Democracy”, evoked a comment from the SAARC Sec-retary General that “good governance was an ideal which is complex in its totality”, but that however, “the lack of it was felt at the people’s level quite intensely”.
In their Declaration adopted at the 16th SAARC Summit in Thim-phu in April 2010, Heads of State/Government, while “appreciating that all the Member States had evolved into multi-party democracies”, also “underlined the challenges faced by them in ensuring effective, effi cient, transparent and accountable governments, recognized the need to draw on the democratic and participatory tradition represented collectively by the Parliamentarians of South Asia for the progress of SAARC”. A draft Charter of Democracy already on the SAARC anvil is being shaped up for eventual adoption/ratifi cation and practical action by the governments in the region. It is expected to affi rm that broad-based participation of the people in the institutions and processes of governance would create a sense of ownership and responsibility, and thereby, could help in the promotion of greater interaction among dif-ferent sectors of each of the South Asian states.
The role of the South Asian Members of Parliament (MPs) and other people’s representatives in the collaborative regional process, built on the foundations of their respective national processes, is indeed com-plex. At the closing Session of the Fourth Conference of the Association of SAARC Speakers and Parliamentarians, the Deputy Speaker of the Indian Lok Sabha underlined the need for parliaments everywhere to de-vise mechanisms to ensure that the public good could always prevail over private interests.
There needs to be deeper and substantial interactions among Mem-bers of National, Provincial and other chambers, and the people and representative interest groups whose support and votes they seek and whose interests they are expected to represent and seriously promote

208
for specifi c action. In February 2009, the Conference of SAARC Minis-ters of Parliamentary Affairs decided that every endeavour should be made to make the people aware of the functioning of the government. It declared that measures should be introduced to ensure greater devolu-tion of powers at the grassroots level to ensure maximum participation of the people in the decision-making and implementation processes. Where this fails, public protests, resort to demonstrations, sometimes even of a violent disruptive nature, could be the result.
4. Engagement of the corporate sector, professional associations, civil society and literary/cultural associations
SAARC is primarily an inter-state organization. However, after much consideration, it has given formal “recognition” status to a number of region-wide associations, including Chambers of Commerce and Indus-try and other groups serving and promoting the corporate sector. It has also accorded recognition to professional and other associations with region-wide membership, for example, of accountants, architects, cre-ative artists and writers, the media, medical doctors, lawyers, etc. These groups have provided means for fruitful economic, professional, cul-tural and other regional interaction and cooperation. South Asian writ-ers and creative artists, who interact with each other across the region, project a regional identity and give voice to the many who suffer and endure in silence.
SAARC has formally accorded recognition to the Foundation of SAARC Writers and Literature, which organizes festivals promoting literary and cultural activity. It draws participants from even remote depressed regions in South Asia to participate in these festivals and project their myriad unique personalities and ways of life. Thus, while there have been some efforts to engage the corporate sector and other truly representative groups in the SAARC process, it is time that parlia-mentarians be in close consultation and cooperation with these groups to deal with the manifold issues relating to regional integration. Some of the major issues to contend with currently include climate change, food security and energy. These are issues that have direct bearings on the most vulnerable groups in every SAARC country.
MPs in every South Asian country are duty-bound to monitor and assess the views and concerns of the people they represent and articu-late them, where necessary. They should not only bring forward such views and concerns in parliaments and at public meetings, but also be-fore the eventual decision-making processes of governments to ensure their proper implementation.
Roles of peoples’ representatives and non-state actors in strengthening regional cooperation

Regional Economic Integration Challenges for South Asia during turbulent times
209
The role of MPs is essential in explaining to their own electorates what benefi ts would accrue to the country from national decisions once they are made. Therefore, beyond individual national contexts, closer interaction among MPs of SAARC countries would be essential to deal with economic issues which have a regional dimension. Shared bor-ders, which are in bilateral disputes—the historical legacies of colonial times—have often obstructed broader regional economic and political connectivity. Apart from exceptional circumstances, political issues of this nature should not interfere in, nor obstruct, regional economic col-laboration for the common benefi t of the people of South Asia.
5. Connectivity in SAARC
The importance of connectivity for regional integration is well docu-mented. It has also been reiterated time and again by SAARC leaders. For example, India’s Prime Minister Manmohan Singh once stated that connectivity is a vital factor in advancing South Asian economic devel-opment and cooperation. Similarly, Sri Lanka’s President Mahinda Ra-japaksa, at the 15th SAARC Summit in Colombo in 2008, while strongly acknowledging the importance of connectivity as an essential aspect of growth, also stressed the practical necessity of ensuring “continuity, consistency and coordination of initiatives, decisions and measures to sustain the momentum in regional economic integration” lest they lin-ger or remain confi ned to noble words in declarations. Here, I discuss connectivity not only in terms of transport connectivity, but in a broader context.
There are fi ve vital aspects of connectivity, summarized below, which could help or hinder, in certain contexts, economic cooperation and good relations among SAARC countries.
First, there is lack of connectivity, within individual SAARC mem-ber countries, between economic progress and success in certain areas and the continuing lack of economic development in others. It is urgent to ensure that economic successes also reach the poorest sections of ev-ery country in the region and for that, infrastructure development is essential. Also, politicians elected to serve in such areas need to work with greater practical dedication to improve living conditions as well as to shield the innocents from religious, gender, caste and other forms of vile discrimination rampant in some areas where these differentiations are even given some degree of implicit social acceptance.
Second, there must be connectivity and coordination between the organs of the State, parliaments and corporate sectors, and the bureau-cracy, which is the vital implementing arm of the State. The bureaucracy

210
must faithfully implement national/regional decisions taken, or boldly and clearly indicate, when necessary, if decisions are fl awed or bring no benefi t to the people. Bureaucrats have distinct roles and responsibili-ties in exercising their duties without merely surviving as servile “yes-men” and “yes-women” who accommodate corrupt and unscrupulous politicians seeking private gain over public good.
Third, there must not be any entanglement of contentious bilateral issues between member countries with the larger and more vital issues of regional cooperation. Bilateral issues need to be dealt with by the concerned countries outside the regional context without contaminat-ing the atmosphere for cooperation with other SAARC member coun-tries. SAARC meetings, particularly Ministerial Meetings and Summits, do provide opportunities for discrete, quiet engagement, at the high-est political levels—on the sidelines of formal meetings—to deal with and even resolve long-stagnant contentious bilateral issues. In the past, there have been some close encounters of this kind, including at the 11th SAARC Summit in Kathmandu and the preceding Ministerial Meeting in Nuwara Eliya, Sri Lanka. These have played a particularly important role in clearing bilateral controversial issues, which were then obstruct-ing progress on SAARC action.
Fourth, infrastructure connectivity, within the region and beyond, is also vital for SAARC’s economic development. From Sri Lanka’s per-spective, transport connectivity fi gures prominently. In 2009, Shyam Saran, then Special Advisor to the Indian Prime Minister, indicated that around 70 percent of maritime cargo in and out of Indian ports tran-sit through the port of Colombo. The port also provides facilities for break-bulk of Indian cargo before it is dispersed to multiple destina-tions. Hambantota, a port in the south of the island, which served as a point of connectivity for the ancient Silk Route of the Seas, is being cur-rently developed with China’s assistance to provide enhanced services for South Asian economic interaction as well as to provide connectivity beyond the region. Hambantota is situated virtually at the centre of the Indian Ocean and is an important transit point in South Asia, connect-ing eastwards to China, Japan, Korea and the ASEAN states; and west-wards to Africa, the Arab Middle East and thence to Europe. The port is situated a few miles north of what are assessed as the busiest sea-lanes in the world. Sri Lanka’s ongoing infrastructure development strategies cover aspects of naval connectivity as well.
The Sri Lanka Navy commemorated its 60th Anniversary in 2010. The then Navy Commander Vice Admiral Thisara Samarasinghe stated that the presence of representatives of South Asian and other navies on the occasion in the island provided an opportunity to discuss In-
Roles of peoples’ representatives and non-state actors in strengthening regional cooperation

Regional Economic Integration Challenges for South Asia during turbulent times
211
dian Ocean regional maritime security, which was being threatened by international criminal cartels involved in human traffi cking, arms smuggling, drug traffi cking, and more recently, by increasing piracy. These are affecting regional security and economic development as well as causing immense suffering to victims of unscrupulous human traf-fi ckers. At conferences on Indian Ocean security, some think tanks have made graphic power-point presentations in which the naval ports of Sitwe in Myanmar, Chittagong in Bangladesh, Hambantota in Sri Lanka and Gwadar in Pakistan are depicted as strategically yoked as “a neck-lace of pearls” strangling India. Shiv Shankar Menon, Security Adviser to the Indian Prime Minister, stated at a lecture at the Indian National Maritime Foundation that “for China, as for India and Japan, her energy security is intimately linked to keeping the sea lanes open in the Indian Ocean”. He also declared that there were no Chinese bases in the Indian Ocean. Speaking of energy security as distinct from military security, he said it was natural, for example, for Indian companies to operate oil tank farms in Trincomalee—another port in Sri Lanka having one of the deepest natural harbours in the world—for economic reasons.
Fifth, and fi nally, economic connectivity between SAARC member countries and nations now accepted as observers in the Association needs to be carefully developed for mutual benefi t. Following considerable reservations held in the past about the possibility of extra-regional inter-ference, functional cooperation is now being discussed and is gradually developing with the following observers in SAARC: Australia, China, Iran, Japan, Republic of Korea, Mauritius, Myanmar, the United States and the European Union. No region in today’s globalized world can thrive in isolation although entanglements in certain evil trends, such as human smuggling, do constitute non-traditional security threats that are increasing. Financial contributions from the observers to the SAARC Development Fund are now being accepted under certain understand-able conditions relating to their purpose, deployment and usage. Here too, attitudes and views expressed in the media and in politico-strategic circles come into play and need to be rationally analysed.
When discussing the role of peoples’ representatives in strengthen-ing the regional cooperation process in South Asia, there is no denying that with regard to national policies and approaches to regional coop-eration, foreign policy debates in parliaments need to dispassionately approach interrelated issues of regional development, security and ris-ing non-traditional security threats.

.

1. Introduction
The struggling United States (US) economy and the ongoing debt crisis in several European Union (EU) economies suggest that the global eco-nomic slowdown may not ease in the near future. There is also a high likelihood of short-term volatility in fi nancial as well as commodity mar-kets. Clearly, South Asian exports cannot be expected to grow rapidly if they continue to be directed primarily towards the developed world. On the other hand, the experience of Southeast Asia, where China as an emerging global export powerhouse exerted an enormous infl uence in a rapid growth of intra-regional trade, may offer a beacon of hope to South Asia where India can play a similar role aided by its vast domestic market as well as exports. This is, however, not to say that South Asian nations can do away altogether with trade with the US and other large economies in the West (see Athukorala and Yamashita 2009).
Amid calls for a rebalancing of the global economy in the wake of the global fi nancial and economic crises—which means that exports to
Private sector in South Asia: Stumbling blocks or building blocks to regional integration?
Chapter 12
Anura Ekanayake

214
the developed West must reduce and the East must import more—the case for strengthened intra-regional trade in South Asia has become even stronger than in the past. A commonsense argument here is to start with the neighbours and then move further eastwards.
In the following sections of this article, South Asia’s current trade fl ows will fi rst be briefl y examined in comparison to other regional trad-ing blocs of similar vintage. The case for free trade for development and the debate on stumbling blocks and building blocks will be taken up thereafter as a precursor to the specifi c context within which the “stumbling blocks and building blocks” terminology is used in this ar-ticle. This will lead us to an examination of the role of the private sector for the understanding and managing of stumbling blocks and building blocks. The ongoing debate on the Indo-Sri Lanka Comprehensive Eco-nomic Partnership Agreement (CEPA) will be taken up as an example. Finally, the potential role of the trade chambers in creating dynamic building blocks will be discussed.
2. Current trade fl ows in South Asia
Intra-regional trade in the South Asian Association for Regional Coop-eration (SAARC) is extremely low. About 5 percent of the global trade of SAARC countries is intra-regional trade, compared to about 24 per cent in the Association of Southeast Asian Nations (ASEAN) and about 62 percent in the EU.
The EU and the US are key export destinations for four of the SAARC countries, namely Bangladesh, Sri Lanka, Pakistan, India and the Mal-dives, in that order of priority. The exceptions are Nepal and Bhutan, two landlocked neighbours of India whose major trading partner is, un-derstandably, India.
Similarities in the trade profi les of SAARC countries, tariff barriers, non-tariff barriers and high trade costs have been identifi ed as among the reasons for the low volume of intra-regional trade. Among the trade costs are transportation costs, information costs, use of different curren-cies, lack of trade facilitation, language barriers and local distribution costs (Banik and Gilbert 2008). In addition, geopolitical tensions arising from, among others, ethnic concerns, border disputes, separatist move-ments, terrorism and subversive activities, communalism and religious confl icts (Bhatta 2004) have compounded the economic factors.
The issue in the context of the slow recovery of the US and the EU economies and the desired and perhaps inevitable global rebalancing is that the scope of increased exports to these destinations from South Asia will be limited. Further, to the extent exports can drive the growth of
Private sector in South Asia: Stumbling blocks or building blocks to regional integration?

Regional Economic Integration Challenges for South Asia during turbulent times
215
economies, particularly those of the smaller ones, there is a need to fi rst look for closer destinations and thereafter more eastwards for South Asian exports.
3. Stumbling blocks and building blocks
That open trade generally leads to higher levels of economic growth and employment is widely accepted today. At the same time, the reality that there are costs in moving towards freer trade and that those impacted by such costs lobby against trade liberalization and, therefore, their con-cerns must be addressed is also well accepted. The fi nal report of the Organisation for Economic Co-operation and Development (OECD), the International Labour Organization and the World Bank prepared for the G-20 Summit of November 2010 opens thus:
The message is clear: open markets can contribute to growth and better employment outcomes; this was true before the crisis and remains so today. In the near term, given pressures on governments, the fi nancial sector, and households to strengthen balance sheets, further trade open-ing can generate an additional stimulus that will create employment opportunities for the world as a whole. The benefi ts of trade generally outweigh the costs associated with the reallocation of labour and capi-tal to more effi cient uses. However, if support for open markets is to be sustained, those costs need to be recognized and policies put in place to assist workers and communities to adjust to a more competitive environ-ment (OECD 2010).
The last sentence of this quote with regard to costs of liberalization is of much relevance to the substance of this article and will be further elaborated later. In the meantime, the timing of the assertion that “open markets can contribute to growth and better employment outcomes” is of signifi cance since this statement was made in the immediate af-termath of the global fi nancial crisis during which there were fears of increasing restrictions on trade.
In general, liberalization is desired on the grounds that: Trade encourages fl ow of resources from low-productivity sectors to
high-productivity sectors leading to an overall increase in output. With unemployed resources, an increase in exports leads to an over-
all expansion in production and a fall in the unemployment rate. International trade allows for purchase of capital goods from foreign
countries and exposes an economy to the technological advances of industrialized countries.

216
In the so-called “stumbling block or building block” debate sparked off by a phrase of Jagdish Bhagwati in 1991, trading blocs are stumbling blocks if they prevent or slow multilateral tariff cutting, while they are building blocks if they accelerate or at least do not hinder multilateral-ism (see Panagariya 1999). The underlying premise is that trade liberal-ization is a necessary condition for development. In this article, the same “stumbling block or building block” phrase is applied in a somewhat different context where the actions/behaviour of the private sector are identifi ed as stumbling blocks if they hinder the promotion of regional-ism and as building blocks if they do not hinder such efforts.
A brief enquiry as to whether this application of the “stumbling block or building block” terminology is consistent with its original us-age is warranted. Emerging evidence that regionalism may in fact pro-mote multilateralism instead of thwarting it is the best defence we can offer in this regard.
Based on case studies of the Greater Mekong Sub Region (GMS) and the ASEAN Free Trade Area (AFTA), Menon (2005) found that the GMS programme is assisting its members to integrate more closely with ASE-AN and, through this, with the rest of the world. As a programme based on market rather than institutional integration, the GMS was observed to promote both regionalism and multilateralism. Thereafter, he exam-ined the relationship between regionalism and multilateralism and con-cluded that if members pursue open regionalism and offer their trade and other preferences to non-members on a non-discriminatory basis, this would be consistent with the principles and objectives of multilater-alism. Further, he observed that for the original ASEAN members, GSM has actually hastened the speed at which these countries have moved towards their goal of free and open trade because of the ambitious liber-alization programme that AFTA had committed them to.
Hill and Menon (2010) echo these sentiments, pointing out that most of the ASEAN region’s trade is extra-regional and that in order to minimize the potential costs of trade diversion, the original ASEAN members have been reducing their external tariffs in conjunction with reducing barriers to intra-ASEAN trade. Instead of jeopardizing multi-lateralism, AFTA has hastened the speed at which these countries have moved towards their goal of free and open trade.
4. The role of the private sector
As stated earlier, there are costs of trade liberalization, and those ad-versely affected tend to oppose them. The fact that potential benefi ts accrue over an extended period of time (long-term) and, therefore, may
Private sector in South Asia: Stumbling blocks or building blocks to regional integration?

Regional Economic Integration Challenges for South Asia during turbulent times
217
not be seen to be real or tangible beforehand while losses are more im-mediate (short-term) gives greater impetus to lobbying by those who are likely to suffer losses. Also, potential losers tend to invoke politically powerful nationalistic arguments and appeal to patriotism which ap-pears to have much effect in developing nations such as those of South Asia. It is, therefore, necessary to understand such issues as how the private sector/business community behaves and what drives its behav-iour before considering action to win it over towards trade liberalization and/or counter its arguments effectively.
In 2002, the International Trade Centre (ITC) undertook a study (ITC 2002) to identify and analyse the operational constraints that hin-der trade policy-related advocacy activities by developing-country and transition-economy industry associations and enterprises. It was based on the premise that industry associations, which frequently represent small and medium enterprises and large enterprises, have a strong in-terest in taking a proactive stand both at the national and international levels in respect of the preparation for multilateral trade negotiations. At the same, it was observed that developing-country business com-munities have not been very successful in assuming that role in the past. This study provides a simple and effective framework for understand-ing business advocacy in trade policy, the basis for differences in the be-haviour of the business community and the potential role of the private sector in trade policy negotiations. Much of what follows in this section will be based on the above study unless stated otherwise.
Business advocacy in trade policy as undertaken by business groups to infl uence government policymaking affecting international trade in-volves: Monitoring trade policymaking for a group interest. Building a case in favour of that interest. Presenting it to policy makers for their acceptance and support. Assisting the authorities in reaching the desired outcome in trade
negotiations. Controlling the advocacy process, evaluating the benefi ts obtained
and communicating the results to stakeholders.It is of interest here to note that the ITC identifi es the Ceylon Cham-
ber of Commerce, the premier trade chamber of Sri Lanka established way back in 1839, as an example out of three such entities involved in business advocacy in trade policy as described above.
Among the varying objectives of business groups are: Shelter: Desire for protection from foreign competitors through tar-
iffs, quotas and other protective measures which will give domestic producers a producer’s rent.

218
Special privileges: Obtaining special privileges such as landing rights for airlines, exclusive rights to conduct certain banking operations, or for privileged access to government procurement contracts.
Government support: To obtain special fi nancial privileges that pro-vide additional competitive edge such as subsidies and tax exemp-tions.
Improved competitive position in foreign markets: Improved access to foreign markets and regulations that improve their competitive po-sition such as protection of intellectual property rights and recogni-tion of national standards in international markets.
Limiting the pressure of other interest groups: Advocacy to neutralize the efforts of other pressure groups.Changes in the status quo towards a reduction in the level of protec-
tion meet with opposition from groups likely to lose from such trade liberalization. Business advocacy in trade policymaking often tends to be biased in favour of import-competing industries. The problem is that individual gains from reforms—while in the aggregate usually greater than costs—tend to be dispersed, while losses are concentrated. Con-sequently, those who face losses resulting from liberalization have a greater incentive to invest in lobbying than those that gain from it. This explains why trade liberalization is not an easy process in most nations and the fi rms that expect to gain from it should mobilize themselves to counterbalance the conservative pressures of import-competing indus-tries. Hence, in developing countries, trade policymaking is increasingly perceived as a process of negotiation involving compromises between main interest groups and government departments. In a changing trad-ing environment and faced with a variety of pressures previously de-scribed, industry leaders must be aware of the need to build relation-ships with strategic actors concerned with trade policy matters and the importance of lobbying to defend industry’s interests.
The long-drawn debate in Sri Lanka for and against a CEPA with India illustrates the diffi culties in the regional integration of South Asia. The role played by the private sector of Sri Lanka in this case may well be repeated in other countries in South Asia as well.
5. Debate on the Indo-Lanka CEPA
The India-Sri Lanka Free Trade Agreement (ISFTA) was signed in 1998 and came into effect in March 2000. This resulted in a rapid increase in bilateral trade, and India became the largest source of imports and the third largest export destination after the US and the EU for Sri Lanka. While Sri Lanka’s ranking as an export destination for India improved,
Private sector in South Asia: Stumbling blocks or building blocks to regional integration?

Regional Economic Integration Challenges for South Asia during turbulent times
219
it was of a relatively lower magnitude (from 18th position in 2000 to 13th position in 2005) given the size and scale of the Indian economy and its exports. Similarly, Sri Lanka’s rank as an import source for India improved from 60th position in 2000 to 31th position in 2005. Based on such success, the Joint Study Group of the two countries recommended in 2003 that the ISFTA be developed into a CEPA. The proposed CEPA was to cover—in addition to expanded coverage of trade in goods—trade in services, investment and economic cooperation.
While bilateral trade under the ISFTA has grown rapidly, the mar-gin of preference under the ISFTA has declined due to unilateral tariff reductions as a result of globalization; trade in products in the sensi-tive lists has also grown; and the highly differentiated external tariffs in some sectors have resulted in trade defl ection (Behera and Mukherji 2011). Accordingly, a movement towards a deeper cooperative arrange-ment, incorporating the lessons learned, such as a CEPA or a revamped ISFTA is recommended (ibid.).
The bilateral negotiations on CEPA commenced in 2005 and follow-ing 13 rounds of technical discussions, an agreement was ready to be signed by July 2008. The actual signing, however, did not take place due to the protests by some sections of the business community as well as some political parties. Since then, steps have been taken to resume a formal dialogue on the CEPA. However, a clear timeline in this regard with milestones is not available in the public domain.
The views expressed by the then Indian Finance Minister Pranab Mukherjee in November 2009 in Colombo may be taken as one of the best articulations of the Indian offi cial position on the CEPA:
It is with a view to take our economic engagement to a higher trajectory that the two countries fi nalized the CEPA (Comprehensive Economic Partnership Agreement) last year. Given the preponderant importance of services sector to the Sri Lankan economy, we are confi dent that Sri Lankan companies can leverage their access to the Indian markets and realize economies of scale through greater investments. To replace lost export demand, an ideal option is to expand investments. But when protectionist voices and mutual suspicion get juxtaposed against an eco-nomic downturn, there is bound to be some apprehension about how the CEPA will affect Sri Lanka. With lower growth and higher unemploy-ment, calls for protectionism are bound to increase. While we wait for you to develop a domestic consensus on this issue, I can assure you one thing—at a time when global players are investing in India to leverage their synergies with us, including in services, CEPA can only be a win-win situation for both India and Sri Lanka (Mukherjee 2009).

220
Since the aborted attempt to sign the CEPA agreement in July 2008, the debate for and against the CEPA has continued in the media. There have also been a few public seminars organized by those who oppose the CEPA, who acknowledge the merits of such an agreement, as well as those who are neutral. The Government of Sri Lanka, however, has not made its position public so far. The only indication has been that the government will not go ahead with signing the CEPA if some sections of the private sector oppose it. It appears as if the “ball is squarely in the court” of the private sector.
What is attempted below is a summary of the points made for and against the CEPA based on some of the articles which appeared in some English-language newspapers.1 The views against the CEPA2 can be broadly categorized as follows: “Negative” experiences under the ISFTA: The view that India benefi t-
ted more from the ISFTA with Indian exports to Sri Lanka increasing from US$500 million to US$1,820 million while Sri Lankan exports to India increased from US$45 million to US$322 million during the period 1999–2009; and the specifi c “bad” experiences in India of a handful of Sri Lankan businesspeople.
Concerns arising from India’s size and the range and scale of industries: The population difference of 1.2 billion versus 20 million; large-scale production capacity versus small-scale; the fi nancial strength of In-dian conglomerates compared to the very modest capacity of Sri Lankan businesses and the former’s ability to engage in price wars to the detriment of Sri Lankan businesses; the reach of Indian tele-vision channels into Sri Lanka directly and via satellite and the re-sulting brand communication/brand advertising advantage; strong Indian bureaucracy versus “weak” Sri Lankan bureaucracy in the administering of the “rules of the game” of the CEPA, etc.
Worry of a “big brother” approach by India: As alleged in the case of other neighbouring countries such as Nepal, Bhutan and Bangla-desh and the sending of an Indian Peacekeeping Force to Sri Lanka (Weerakoon 2010), and the fear that such interventions may increase with the CEPA.
Worries of the professional community of being swamped by Indian profes-sionals with services sector liberalization under the CEPA: The large In-dian labour force and the professional community implying a “one-way traffi c” fl ow of Indians, thereby depriving Sri Lankans of jobs.Views in favour of the CEPA, on the other hand, are as follows:
Successes of the ISFTA: While Indian exports to Sri Lanka increased fourfold, Sri Lankan exports to India increased sevenfold; there are several success stories of Sri Lankan ventures in India.
Private sector in South Asia: Stumbling blocks or building blocks to regional integration?

Regional Economic Integration Challenges for South Asia during turbulent times
221
Access to a large market: Allowing the realization of economies of scale, the ability to integrate into large value chains as well as access to investment.
Diversifi cation imperative: The need for diversifying Sri Lanka’s ex-port destinations from the stagnating West.
Stimulating growth: The potential of the proposed agreement to stim-ulate growth and reduce political friction.It is apparent that there is a high degree of misinformation, misinter-
pretation and baseless speculation among some of the positions taken in this debate. For example, the performance of the ISFTA is seen as positive for Sri Lanka by those who favour the CEPA and the same is seen as negative by those who are not in favour (see Samarajeeva 2010; Wijewardena 2011). This is the reason the same numbers are used by one group from an absolute sense and by the others in a relative sense. The conclusions are diametrically opposite.
The debate on the CEPA is still continuing. Authorities, by and large, are silent. Those against it are more vociferous and those in fa-vour of it are rather subdued. Those against it invoke more political and nationalistic arguments in support of their case and as the then Indian Finance Minister Pranab Mukherjee observed, “protectionist voices and mutual suspicion” appear to stand in the way of a domestic consensus. Somehow in the public arena, the bad news appears to resonate better with the prevailing fears and prejudices in the minds of the Sri Lankan public with regard to India.
6. Potential role of trade chambers
It is clear from the above that there is no consensus among the Sri Lank-an private sector with regard to the CEPA. Given that the private sector is not monolithic or homogeneous, such differences in views are not surprising. The question then is what should be the role of trade cham-bers in such a situation.
Three different basic positions have been observed in the Sri Lankan case with regard to the CEPA by different trade chambers and associa-tions:
Take a national interest-based position. Take a sector- or fi rm-based position. Take a national interest-based position but try to mitigate any
adverse effects/adjustment costs of specifi c sectors or fi rms.The Ceylon Chamber of Commerce (CCC) has been involved in the
CEPA negotiation process by representing various sector-wise interests and concerns as in the case of the negotiation of the ISFTA. The CCC

222
has a history of advocacy in trade policy, as noted earlier. Soon after the CEPA was put on hold due to the very vocal opposition to the CEPA which emerged on the eve of its planned signing, the CCC offered to the government its support in wider stakeholder consultations in order to:
Increase transparency and minimize misinterpretation and spec-ulation; and
Address genuine stakeholder concerns and mitigate them. This is, in fact, the third position listed above. Clearly, the fi rst posi-
tion is unrealistic since even the most benefi cial course of action for the nation can be stalled if there is heavy resistance from affected stakehold-ers. The second position is untenable, though not unlikely, on the part of a chamber or association, as experienced in Sri Lanka with regard to the CEPA.
Responsible trade chambers must then take the leadership in ex-plaining the pros and cons to the others in an intellectually coherent manner with a public interest perspective along with practical measures to mitigate adverse effects on those affected. The same prescription is valid for the government.
In brief, the role of trade chambers in making the private sector a “building block instead of a stumbling block” can be expressed as fol-lows:
Take a national interest-based position. Recognize that change creates winners as well as losers. Find ways to address/mitigate costs of change for the losers and
lobby accordingly. Look at the challenge as an opportunity and not as a threat. Educate the individual members/fi rms of the private sector. Engage with other chambers/associations with different views. Educate the general public. Be an active and constructive partner in the trade negotiation
process, not a mere observer and a destructive critic. Learn and be knowledgeable on trade negotiations/trade agree-
ments—ignorance sometimes can be the main reason for fear and resistance.
Build in-house expertise to conduct research to assess costs and benefi ts from a private sector perspective.
It has to be acknowledged, however, that addressing concerns aris-ing from geopolitical, security, ethnic and religious perspectives can be very diffi cult, if not impossible, for trade chambers. While developing in-house expertise and capability with regard to trade matters is feasible as seen in the case of the CCC, to do the same in the case of all other areas of expertise can be feasible, if at all, only for a university or a re-
Private sector in South Asia: Stumbling blocks or building blocks to regional integration?

Regional Economic Integration Challenges for South Asia during turbulent times
223
search institution. In the specifi c case of the India-Sri Lanka CEPA and in any future attempts at regional economic integration of South Asia, such issues may outweigh purely economic issues and dominate the debate. This is an area which requires inter-disciplinary research and concerted action.
Notes1 Daily Mirror, Financial Times, Sunday Times and Sunday Leader.2 See Waduge (2011); Weerakoon (2010).
References
Athukorala, Prema-Chandra and Nobuaki Yamashita. 2009. “Global production sharing and Sino-US trade relations.” China and World Economy, Vol. 17, No. 3: 39–56.
Banik, Nilanjan and John Gilbert. 2008. “Regional integration and trade costs in South Asia.” ADB Institute Working Paper No. 127.
Behera, Subarta Kumar and Indra Nath Mukherji. 2011. Indo Sri Lanka Free Trade Agreement: A decadal assessment. ADB RETA 6472: Strategic Partnership for Policy Development and Action to Foster Regional Cooperation in South Asia.
Bhatta, Chandra C. 2004. “Regional integration and peace in South Asia: An analysis.” Peace Confl ict and Development Journal, Issue 5, July.
Hill, Hal and Jayant Menon. 2010. “ASEAN economic integration: Driv-en by markets, bureaucrats or both?” Working Papers in Trade and Development, ANU Working Paper No. 2010/11.
ITC. 2002. Business advocacy and trade policy making. Geneva: Internation-al Trade Centre, UNCTAD/WTO.
Menon, J. 2005. “Building blocks or stumbling blocks? Regional coop-eration arrangements in South East Asia.” ADB Institute Discussion Paper No. 41.
Mukherjee, Pranab. 2009. “Fourth Kadirgamar memorial lecture.” Sunday Times, 15 November. Available at http://sundaytimes.lk/091115/News/nws_22.html
OECD. 2010. Seizing the benefi ts of trade for employment and growth. OECD, ILO, World Bank, WTO fi nal report. Prepared for submis-sion to the G-20 Summit meeting, 11–12 November.
Panagariya, Arvind. 1999. “The regionalism debate: An overview.” The World Economy, Vol. 22, No. 4: 455–76.
Samarajeewa, Rohan. 2010. “CEPA—Trade in services and ignorance.” Sunday Times, 30 May. Available at http://sundaytimes.lk/100530/

224
BusinessTimes/bt08.htmlWaduge, Shenali. 2011. “The business of India in Sri Lanka.” Daily Mirror,
9 August. Available at http://print.dailymirror.lk/business/127-local/52537.html
Weerakkoon, Gamini. 2010. “Why Sri Lankans fear CEPA agreement.” Sunday Leader, 17 October. Available at www.thesundayleader.lk/2010/10/17/why-sri-lankans-fear-cepa-agreement-2/
Wijewardena, W.A. 2011. “Reviving CEPA—Act swiftly and decisively.” Financial Times, 21 February. Available at www.ft.lk/2011/02/21/reviving-cepa-%E2%80%93-act-swiftly-and-decisively/
Private sector in South Asia: Stumbling blocks or building blocks to regional integration?

Regional Economic Integration Challenges for South Asia during turbulent times
225
6PART
CLIMATE CHANGE AND REGIONAL COOPERATION

.

1. Introduction
At the 16th Summit of the South Asian Association for Regional Coop-eration (SAARC) in April 2010, apart from the usual Summit declara-tion, SAARC countries also adopted the Thimphu Statement on Climate Change with a view to making South Asia a world leader in low-carbon technologies and renewable energy. Among other things, the Statement emphasized the promotion of climate resilience that would promote both development and poverty eradication in a sustainable manner. This is important as South Asia appears to be among the most vulner-able regions in terms of climate change impacts due to its social, eco-nomic and environmental conditions.
Climate change is expected to reduce access to drinking water, negatively affect the health of poor people, and pose a real threat to food security in many countries in Africa, Asia and Latin America.1 It is also likely to increase the frequency and magnitude of extreme weather events such as droughts, fl oods and storms. Hence, the impacts of cli-
Trade and climate change: South Asian agenda at the UNFCCC and the WTO
Chapter 13
Nitya Nanda

228
mate change are likely to be superimposed on existing vulnerabilities of developing and least-developed countries, including in South Asia, which have very limited institutional and fi nancial capacity to antici-pate and respond to the effects of climate change.
Climate change impacts are going to be varied. In seasonally dry and tropical regions, crop productivity is projected to decrease for even a small increase in temperature (IPCC 2007). Climate change is also expected to exacerbate current stresses on water resources, which, in turn, would result in decreased availability of water, thereby affecting hydropower potential as well as agriculture production, particularly in Asia where irrigation plays an important role. This will directly impact a huge population in developing and least-developed countries, includ-ing in South Asia, where a majority of people depend on climate-sensi-tive sectors such as agriculture and fi sheries for their livelihoods.
Another important concern regarding climate change is its impacts on health. Since most developing countries are in the tropical region, any increase in temperature is likely to increase the incidence of tropical diseases, which already is the cause of a large number of deaths in these countries. Also, arrival of new diseases cannot be ruled out as behaviour patterns of microbes might change due to climate change. This will im-pact not only on human health, but on animal and plant health as well, and hence have adverse effects on agriculture and allied activities.
For many developing countries, sectors such as agriculture and fi sheries are also the major sources of their exports. Therefore, besides affecting livelihood and food security in developing countries, climate change is also likely to adversely affect their macroeconomic and trade performance. As if that were not enough, developing countries now face the spectre of climate- or carbon-related tariff and non-tariff trade bar-riers, which developed countries intend to impose on products coming from developing countries to make adjustment for their own carbon re-duction measures. In fact, some private non-tariff trade barriers related to climate change are already in practice. Such adjustment measures can impose signifi cant economic costs on developing countries by affecting market access and reducing export revenues. This might, in turn, affect their ability to deal with the challenges of climate change mitigation and adaptation.
2. Climate change and the global initiative
Recognizing the threats posed by climate change, the global commu-nity, at the United Nations Conference on Environment and Develop-ment (also known as the Earth Summit) at Rio de Janeiro on 3–14 June
Trade and climate change: South Asian agenda at the UNFCCC and the WTO

Regional Economic Integration Challenges for South Asia during turbulent times
229
1992, adopted a new international instrument called the United Nations Framework Convention on Climate Change (UNFCCC). Parties to the UNFCCC are classifi ed into three groups: i) Annex I countries (indus-trialized countries and economies in transition); ii) Annex II countries (developed countries which pay for the costs of developing countries); and iii) developing countries.
An important process at the UNFCCC is the annual Conference of Parties (COP). The third COP (COP3), held at Kyoto in Japan in Decem-ber 1997, adopted the Kyoto Protocol. Under the Protocol, most indus-trialized nations and some central European economies in transition (all defi ned as Annex B countries in the Protocol) agreed to legally binding reductions in emissions of greenhouse gases (GHGs) in the range of 6–8 percent below 1990 levels between 2008 and 2012. The Protocol came into force in February 2005. The United States (US), which was to re-duce emissions by 7 percent, did not ratify, as the Bush administration rejected it in 2001. Like the COP at the UNFCCC, the Kyoto Protocol also agreed to have Meeting of Parties (MOP) which is normally held back-to-back with COP. COP11/MOP1 at Montreal in 2005 extended the life of the Kyoto Protocol beyond its 2012 expiration date and agreed to negotiate deeper cuts.
2.1 Recent developments at the UNFCCC
In 2007, Parties to the UNFCCC met at Bali for COP13/MOP3 and agreed to have a shared vision for long-term cooperative action. They also agreed to adopt measures on mitigation, adaptation, fi nance and technology transfer. Although no specifi c fi gure was quoted in the Bali Action Plan, there have been suggestions from several quarters to con-tain the temperature within 2°C from the pre-industrial level, and ac-cordingly a per capita emission of 2 ton per annum by 2050 and 1.5 ton by 2100.
With the above target in place, the emissions path from 2050 to 2100 appears to be more clearly defi ned, but there is much less clarity on the path up to 2050. What kinds of emissions paths developed and develop-ing countries will follow is also a contentious issue. A principle that has been accepted at the UNFCCC is “common but differentiated respon-sibilities (CBDR)”, but the principle is being interpreted differently by different countries. While developing countries are reluctant to accept any binding commitment on mitigation in the near future, developed countries are insisting that they do so.
Much of the focus in this regard has been on large nations like China, India and Indonesia. These countries do have high carbon emissions,

230
but their emissions per capita are far lower than those of many other developing countries whose per capita emissions are as high as those of developed countries, and in some cases, even higher. For example, Ma-laysia, South Africa and Brazil have per capita emissions comparable to many developed countries. South Korea has higher per capita emissions than Japan; but while the latter has emissions reduction targets, South Korea does not. In West Asia, in several countries such as the United Arab Emirates (UAE), Saudi Arabia, Qatar and Kuwait, per capita emis-sions are higher than those of the US. However, energy-producing countries are a different category since other countries import a signifi -cant part of the energy they produce. But to categorize some countries such as South Korea and Singapore as developing, which are actually developed countries for all practical purposes, and providing them con-cessions in terms of emissions reduction, might not be justifi able.
Countries with larger populations tend to have more GHG emis-sions in total. But it is not fair to only measure total emissions since they are largely based on population size. Thus, a useful comparison across countries would be to measure in terms of carbon dioxide emissions per person. Moreover, for climate change implications, it is important to look at the stock of GHGs in the atmosphere. Developed countries, of course, cannot take back their contribution to the stock of GHGs, but it is incumbent upon them to take the responsibility for mitigation and adaptation, even in developing countries. Although it is true that fl ow is linked to stock, the focus of the global discourse on climate change cur-rently is more on the fl ow of emissions rather than on the stock.
The Kyoto Protocol specifi ed targets and actions only until 2012. The process of determining an action plan for the post-2012 period was planned to take place at the COP15 held in Copenhagen in December 2009. It was expected that countries would agree to a long-term target for restraining temperature rise and for some framework and measures covering areas of mitigation, adaptation, technology transfer and fi -nance. However, they could not reach an agreement in Copenhagen.
Nevertheless, a few countries (mostly from the developed world and some large developing countries such as India and China) agreed on a Copenhagen Accord, which is a political agreement and is not legally binding. The Accord covered all the main elements of the Bali Action Plan, including long-term goal; mitigation; adaptation; issues related to fi nance, technology and forests; and measurement, reporting and verifi cation. Among other things, the Accord called for establishing a Copenhagen Green Climate Fund as one channel for delivering fi nance and setting up a high-level panel “to study the contribution of the po-tential sources of revenue” towards funding goals. The Accord has been
Trade and climate change: South Asian agenda at the UNFCCC and the WTO

Regional Economic Integration Challenges for South Asia during turbulent times
231
quite an issue of discord as many developing countries were opposed to it. In the COP16 held in Cancun from 29 November to 10 December 2010, however, countries agreed on a broad framework and extended the mandate of the Ad Hoc Working Group on Long-Term Cooperative Action (AWG-LCA) so that the outcome could be adopted at the next COP. The next COP (COP17) took place in Durban from 28 November 2010 to 9 December 2011 and adopted the outcome of the AWG-LCA.
2.2 Managing differential abilities at the UNFCCC
As stated above, one important principle in the UNFCCC is CBDR. But how it will be operationalized is a debated issue. The General Agree-ment on Tariffs and Trade (GATT)/the World Trade Organization (WTO) also follows a similar principle called “special and differential treatment (S&DT)” in that the WTO Agreements contain special pro-visions which give developing countries special rights and privileges. The two purposes of providing S&DT to developing countries under the GATT/WTO are: i) to help development, and ii) to help the internation-al system by easing the integration of developing countries into it (Page 2004). While the second purpose is equally valid in the case of climate change mitigation, the fi rst purpose may have a different connotation. Developed countries might not have had development concerns under the GATT/WTO, but in the context of climate change, even developed countries are yet to move into a sustainable low carbon path. Moreover, “to help development” will mean that developing countries should not be forced into obligations that might thwart their development efforts. However, CBDR has another important dimension, that is, developed countries have the historical responsibility to take the burden due to their past emissions. Interestingly, historical responsibility has also been a factor that led to the provision of S&DT for developing countries at the GATT as colonial relations in the past played their role in the origin and evolution of S&DT (Page 2004).
Some special provisions that were made to operationalize the prin-ciple of S&DT at the GATT/WTO include:
Longer time periods for implementing agreements and commit-ments.
Measures to increase trading opportunities for these countries. Provisions requiring all WTO members to safeguard trade inter-
ests of developing countries. Support to help developing countries build the infrastructure
for WTO work, handle disputes, and implement technical stan-dards.

232
Similar approaches can be followed in establishing a global archi-tecture in dealing with the challenges of climate change. In fact, the role of fi nance and technology transfer has already been recognized in this regard. However, the post-Uruguay Round2 experience showed that even though commitments made under various WTO Agreements were binding, the promised technical or fi nancial assistance did not reach the targeted countries, at least not to the extent expected. Hence, in the Doha Round of negotiations, the July 2004 Framework, which was cru-cial to revive the stalled WTO negotiations after the “failed” Ministerial Conference at Cancun in 2003 (equivalent to UNFCCC COP), compli-ance with new trade rules by developing countries (at least in one area, namely trade facilitation) were linked to technical assistance. But this is yet to be put into practice as the Doha Round is yet to be concluded. A similar approach can be taken in climate change negotiations.
3. Trade issues at the UNFCCC
Non-binding commitments of developing countries along with manda-tory emissions reduction commitments by developed countries in the Kyoto Protocol have been cited as the justifi cation for adopting border trade adjustment to ensure “level playing fi elds”. However, neither the UNFCCC nor the Kyoto Protocol provides for specifi c trade measures. In fact, Article 3.5 of the UNFCCC stipulates that measures taken to combat climate change, including unilateral ones, should not constitute a means of arbitrary or unjustifi able discrimination or a disguised restriction on international trade. This has been interpreted differently by different ex-perts. While some interpret this to mean that unilateral trade measures cannot be used (Dasgupta 2009), others argue that trade measures can be used provided that they are not disguised restrictions on trade or do not lead to arbitrary or unjustifi able discrimination (Howse and Eliason 2009). In any case, it is doubtful whether such measures would amount to subversion of the principle of CBDR as developing countries would be forced to share the burden of climate change mitigation in the name of avoiding carbon leakage and protecting competitiveness.
There is yet another view (Petsonk 1999), however, which argues that the Kyoto Protocol’s exclusion of developing countries in interna-tional emissions trading would amount to a violation of WTO’s non-discrimination principle if emission credits could be defi ned as either “goods” or “products” under the GATT or “services” under the General Agreement on Trade in Services (GATS). But this may not be tenable as developing countries can enjoy S&DT under the WTO. Also, this can be in line with the CBDR principle at the UNFCCC.
Trade and climate change: South Asian agenda at the UNFCCC and the WTO

Regional Economic Integration Challenges for South Asia during turbulent times
233
Amidst this controversy, developing countries, spearheaded by the Group of 77 countries (G77) and China, wanted that the UNFCCC reit-erate its position that developed countries shall not use climate change as a tool to introduce unilateral trade measures against developing country imports. India and China also made specifi c suggestions (Box 13.1) for the negotiating text in Copenhagen. Finally, in the Cancun Agreement (Para 90), which is essentially a refl ection of the UNFCCC provisions, the Parties reaffi rmed that they “should cooperate to pro-mote a supportive and open international economic system that would lead to sustainable economic growth and development in all Parties, particularly developing country Parties, thus enabling them better to address the problems of climate change; measures taken to combat cli-mate change, including unilateral ones, should not constitute a means of arbitrary or unjustifi able discrimination or a disguised restriction on international trade”.
Box 13.1: India’s and China’s proposed texts on unilateral trade measures
India“Developed country Parties shall not resort to any form of unilateral measures including countervailing border measures, against goods and services imported from developing countries on grounds of protection and stabilization of climate. Such unilateral measures would violate the principles and provisions of the Con-vention, including, in particular, those related to the principle of common but differentiated responsibilities (Article 3, Paragraph 1); trade and climate change (Article 3 paragraph 5); and the relationship between mitigation actions of devel-oping countries and provision of financial resources and technology by developed country Parties (Article 4, Paragraphs 3 and 7).”
China“Recalling Article 3, paragraph 1 and 5, and Article 4, paragraph 3 and 7 of the Convention, developed country Parties shall not resort to any form of unilateral measures including countervailing border measures, against goods and services imported from developing countries on grounds of protection and stabilization of climate.”
Source: UNFCCC (2009).
4. Climate change issues at the WTO
Whether trade measures can be used to combat climate change, or to be more specifi c, whether trade can be restricted on the basis of climate friendliness of production process, is still a contested territory. But this is not the only issue that the WTO might have to deal with in the con-text of climate change. The existing WTO agenda on trade and climate

234
change includes the issue of the relationship between trade agreements and multilateral environmental agreements. But there has hardly been any progress on this. The issue that has received much attention in this regard is the elimination or reduction of tariff and non-tariff barriers to trade in environmental goods and services (EGS).
The likely proliferation of carbon standards and labelling is another issue that might have to be dealt with in the WTO. This is also linked to the issue of border tax adjustment as carbon standards and label-ling can be used as trade measures in practice. The existing WTO provi-sions on standards and labelling are not suffi ciently elaborate to deal with carbon-based standards and labelling. Also, technology transfers and the impact of prevailing intellectual property right (IPR) regimes on such transfers have been highlighted at the UNFCCC and there are demands for reforms in the global IPR regime. However, it has not re-ceived the same level of attention at the WTO. Nevertheless, any reform in the global IPR regime is contingent upon reforms of the IPR regime under the WTO.
5. Climate change and trade performance
Climate change will affect trade performance of South Asian countries mainly through its impact on agriculture. Wheat yields in central India may drop by 2 percent in a pessimistic climate change scenario. As one study (Kumar and Parikh 2001) has estimated, even after accounting for farm-level adaptation, a 2°C rise in mean temperature and a 7 percent increase in mean precipitation will reduce farm-level net revenues by 8.4 percent. In Pakistan, cereal crops are already at the margin of stress and it has been estimated that wheat yields are predicted to decline by 6–9 percent in sub-humid, semi-arid, and arid areas with 1°C increase in temperature. For important cash crops like cotton, mango and sugar-cane, even a 0.3°C decadal rise could have a severe impact. In Sri Lanka, temperature rise by even just 0.5°C is predicted to reduce rice output by 6 percent, and increased dryness will adversely affect yields of key products like tea, rubber and coconut.
Climate change is likely to increase the frequency of droughts and extreme rainfall events leading to fl oods and events like cyclones. Ban-gladesh is already badly affected by such events on a regular basis. Many other South Asian countries are also affected in different ways from time to time.
Several studies have shown that fl uctuations in monsoon and tem-perature affect the productivity of several crops grown in the region. In the Himalayan nations of Nepal and Bhutan, it is expected that in-
Trade and climate change: South Asian agenda at the UNFCCC and the WTO

Regional Economic Integration Challenges for South Asia during turbulent times
235
creased severity and frequency of storms and fl ooding could aggravate the occurrence of landslides, which, in addition to the danger to life and property, would deposit sediments in agriculture lands or in irriga-tion canals and streams and contribute to deterioration in the quality of agriculture lands and hence in crop production (Kelkar and Bhadwal 2007).
Agriculture and allied activities, on average, constitute about 25 per-cent of Sri Lanka’s exports and about 20 percent of Pakistan’s exports. In the case of India, the share of agriculture goods in its export basket is much lower (less than 15 percent). However, for both India and Paki-stan, which export textile and textile products that are based primarily on cotton produced domestically, agriculture generates indirect exports. The share of agriculture goods in Bangladesh’s export basket too is not very high, but the country is a net food-importing country. The share of food items in its import basket is about 12 percent of its total imports. Similarly, the shares of agriculture products in Nepal’s total exports and total imports are about 25 percent and 20 percent, respectively, and Ne-pal is also a net food-importing country. Climate change might exacer-bate the already bad situation of both Bangladesh and Nepal in terms of food security.
6. Border tax adjustment
Developed countries have demanded that if they have to take emissions cuts, they must be allowed to put in place some border tax adjustment mechanism for imports coming from countries that do not undertake emissions cut commitments. However, it is not clear whether such uni-lateral measures would be compatible with WTO rules. The general ap-proach under WTO rules has been to acknowledge that some degree of trade restriction might be necessary to achieve certain policy objec-tives as long as a number of carefully crafted conditions are respected. The Appellate Body’s observations in the “Shrimp-Turtle case” indicate that there is a possibility of allowing trade measures based on environ-mental concerns (Box 13.2). However, the issue is still not very clear as emissions-related trade measures would be extremely diffi cult to imple-ment. It may, however, be noted that the recent academic literature in Europe has been more supportive of such trade measures which can have infl uence on any case at the WTO as and when they might come up (Dröge et al. 2004; Green 2005).
Carbon taxes have already been implemented by several countries such as Finland, Sweden and Denmark, but none of them have intro-duced border tax adjustment so far. However, in the US, the American

236
Clean Energy and Security Act (Waxman-Markey Bill), which was in-troduced and passed by the US House of Representatives in June 2009, proposes to put a cap on GHG emissions by requiring high-emitting industries to reduce their output to specifi c targets between now and 2050. The Bill also envisages putting in place measures to levy addi-tional charges on imports of carbon-intensive products from countries that do not adopt similar climate change mitigation measures as it does. In such cases, US importers of such products would have to buy car-bon allowances. There has been demand for similar measures in Europe as well. In particular, French President Nicolas Sarkozy is in favour of implementing a direct carbon tax on some industries along with bor-der tax adjustment. The EU is reportedly considering a possible carbon equalization mechanism to create a level playing fi eld for EU companies in energy-intensive sectors with signifi cant risks of carbon leakage.
The Waxman-Markey Bill proposed a cap-and-trade system with mandatory limits on emissions from 2012. The Bill proposed distribu-tion of emissions allowances through auctions. To address carbon leak-age and competitiveness concerns, the Bill has provisioned an output-based rebate (OBR) mechanism wherein rebates will be provided to eligible carbon-intensive manufacturers. Manufacturers are presumed eligible if they meet 5 percent energy intensity or GHG intensity thresh-old and 15 percent trade intensity. From 2020, imports of goods that are energy intensive or have high exposure to trade may require the sub-mission of emissions allowances, which represents a form of border tax. This requirement would take effect if there is no internationally binding
Trade and climate change: South Asian agenda at the UNFCCC and the WTO
Box 13.2: The shrimp-turtle case
The US government, by virtue of its enabling legislation (Sec. 609 of US Endan-gered Species Act) imposed a ban on the import of shrimps that were harvested without using Turtle Excluder Devices (TED) because this way of trawling killed endangered species of sea turtles. The affected parties regarded the action as a uni-lateral measure restricting the entry of their products into the domestic market of the US, contrary to GATT rules. Therefore, India, Pakistan, Malaysia and Thailand lodged complaints at the WTO in early 1997, claiming that Section 609 violated a number of WTO rules.
On 6 April 1998, a dispute settlement panel at the WTO ruled against the shrimp embargo. However, the Appellate Body reversed the stand of the Panel. In its report, the Appellate Body made clear that under WTO rules, countries have the right to take trade action to protect the environment (in particular, human, animal or plant life and health, and endangered species and exhaustible resources). The Appellate Body also observed that the ban was not imposed in a non-discriminato-ry manner. The US, therefore, won the case.
Source: http://www.wto.org/english/tratop_e/envir_e/edis08_e.htm

Regional Economic Integration Challenges for South Asia during turbulent times
237
agreement on emissions reduction by 2018 or if countries do not dem-onstrate comparable climate action in a sector that is covered under the US emissions reduction programme.
It would also not take effect in a given sector if at least 85 percent of the sector’s imports come from countries meeting one or more of the following criteria: i) the country is party to an international treaty and has agreed to emissions reduction at least as stringent as those in the US; ii) the country is party to an international sectoral agreement to which the US is a party; and iii) the country has an energy or GHG intensity in that sector no higher than that in the US. This requirement will also not apply to imports from least-developed countries (LDCs) or nations that account for less than 0.5 percent of global GHG emissions and less than 5 percent of US imports in a particular sector. The eligibility of sectors for OBR as well as border tax adjustment is based not only on carbon intensity of the sector but also on trade intensity, which may be diffi cult to justify under Article XX of the GATT even if border tax adjustment is allowed.
Another controversial issue is regarding the countries against which border tax adjustment will be used. Ostensibly, the Bill wants to target large developing countries such as China and India, and it has exempt-ed imports from LDCs or nations that account for less than 0.5 percent of global GHG emissions and less than 5 percent of US imports in a particular sector. However, according to the WTO’s “most favoured nation” principle, such discrimination may not be allowed. LDCs, of course, may be exempted due to their special status. In South Asia, there are three countries that are not LDCs. Hence, along with India, Pakistan and Sri Lanka may also be targeted. Even the Maldives, which has now graduated from LDC status and Bangladesh, which is likely to graduate from LDC status by 2020, could be targeted.
As far as the impact of such a measure in South Asian countries is concerned, except India and Pakistan, others do not have much energy-intensive products in their export baskets. Even for India and Pakistan, the share of such products (excluding petroleum products) in their ex-port basket is not very high. The combined share of goods such as steel, aluminum, cement, paper and chemicals remains less than 10 percent, in terms of both their global exports and exports to developed countries. However, as per the proposed law in the US, border tax adjustment may be applied not only for goods with high energy intensity but also in sec-tors with high trade intensity. Hence, even textile and clothing products could be targeted. If so, that would be to the detriment of Pakistan and Sri Lanka since textile and clothing products constitute more than 40 percent of their export basket.

238
Nevertheless, such a measure would be diffi cult to implement in a fair manner. Emissions would be different for different producers and they would also be diffi cult to measure. Thus, a single adjustment rate for all producers is likely to be discriminatory. Moreover, such a single rate would be a serious disincentive for producers adopting energy effi ciency measures on their own. Even otherwise, the case for border tax adjustment may not be very strong as a study (World Bank 2007) has shown that the overall impacts of domestic policies like carbon tax and energy effi ciency standards on competitiveness have not been very strong. While they have been negative in some sectors, in others the impacts have actually been positive due to subsidies and exemptions. A recent Pew Center analysis projected that most energy-intensive sec-tors face only a modest competitiveness impact—losing on average 1 percent of production to imports—at a price of carbon dioxide at US$15 per ton (Aldy and Pizer 2009).
Border tax adjustments do not fully counterbalance competitiveness issues since manufacturers in the tax imposing country would still be at a disadvantage in global markets. Moreover, the affected countries might adopt retaliatory measures which can vitiate the global atmo-sphere and endanger the spirit of cooperation that might be required to tackle the problem of climate change. Since most developing countries are operating well below their bound tariff rates in most product lines, they might resort to increasing their applied rates by remaining within WTO rules.
As Box 13.3 illustrates, the issue of border tax adjustment has been dealt with in the GATT/WTO framework where products were found to be eligible for border tax adjustment, provided that the inputs were detectable and physically incorporated (Howse and Eliason 2009). An
Trade and climate change: South Asian agenda at the UNFCCC and the WTO
Box 13.3: A case of border tax adjustment at the WTO
In the US-Superfund case, Canada, the European Economic Community (EEC) and Mexico jointly challenged the legality of US measures imposing discriminatory tax rates on imported and domestic petroleum as well as taxes imposed on certain im-ported substances that were allegedly not imposed on like domestic products. The US successfully defended the latter issue as a permissible case of border tax adjust-ment as envisaged under GATT Article II:2(a), which says “nothing in this Article shall prevent any contracting party from imposing at any time on the importation of any product a charge equivalent to an internal tax imposed consistently with the provisions of paragraph 2 of Article III in respect of the like domestic product or in respect of an article from which the imported product has been manufactured or produced in whole or in part.”
Source: WTO (1987).

Regional Economic Integration Challenges for South Asia during turbulent times
239
engineering approach, of course, may not consider energy consumed as physically incorporated. Moreover, emissions are not even an input but a by-product to produce energy consumed in the process of produc-tion. It is thus not clear if the US-Superfund case will have any valid-ity for border tax adjustment based on emissions. The OBR mechanism envisaged in the US Waxman-Markey Bill may be in confl ict with the provisions of the WTO Agreement on Subsidies and Countervailing Measures, which prohibits subsidies that are specifi c to an enterprise or industry. Free allowances to industrial units in energy-intensive sectors can very well be considered as subsidies.
7. Issues with environmental goods
WTO members have been discussing the liberalization of trade in EGS. A key challenge facing WTO members in this regard is that there is no universally agreed defi nition of what constitute EGS. The Committee on Trade and Environment (CTE) of the WTO has studied defi nitional issues at great length but could not reach any conclusion.
Some WTO members have put forward lists of what they regard as environmental goods (EGs). However, many developing countries, including India, have opposed such a list-based approach to liberaliz-ing trade in EGs. Alternatively, India has suggested a project-based ap-proach. India’s argument is that many products have multiple uses and they may not be used for environmental purposes once imported into a country. Hence, a list-based approach might not meet the objectives. But a project-based approach will ensure that the product(s) in question are used for environmental purposes. For example, pipes are used to transport petroleum products, but they are also used as sewer pipes. If a list-based approach is followed, even pipes used to transport petroleum products would be covered by the liberalization process, thus defeat-ing the objective of liberalizing trade in EGS, whereas if a project-based approach is followed, tariff and non-tariff barriers on pipes that would be used for sewage purposes only would be reduced/eliminated. How-ever, there have been too few takers of this approach. Countries such as Argentina, Brazil and China have proposed other approaches, including combinations of list-based and project-based ones, as well as request-and-offer approaches as in the case of services trade liberalization.
A study by the World Bank (World Bank 2007) has identifi ed a list of 43 goods that can be good for the climate and the list has been discussed at the WTO. The list is widely referred to as the World Bank list, though it has not been offi cially endorsed by the Bank. This list, however, seems to be ad hoc as it has not been prepared with any defi ned criteria.
240
There is another problem too with the list-based approach. As is known, technology is dynamic in character. Therefore, EGs, including climate-friendly goods, are always evolving. What may be construed to be an EG today may not be treated the same in the future as new prod-ucts with better environmental performance might enter the market. In fact, such a phenomenon has already been observed. For example, com-pact fl uorescent light (CFL) is considered as an environment- or climate-friendly good and many countries have argued for its liberalization. But another technology, light emitting diode (LED), came into commercial use not long after CFL was brought to commercial use. LED is much more energy effi cient than CFL. It also does not use mercury (which CFL does) that is environmentally hazardous. Therefore, if a list-based approach is followed, it could be that more environment- friendly prod-ucts would be discriminated against in favour of the not-so-friendly ones. And revising the list on a regular basis would also not be easy.
Therefore, even if a list-based approach is followed, it is important to have a “living list”. An option that has been suggested in that respect is to have two lists: one core and another complementary, which can be updated over time. Another option that has been suggested is to update the list between rounds of negotiations. Again, however, the problem is that negotiation rounds may not take place on a par with technological progress. Nor would it be easy to agree on an updated list.
Hence, a more practical option could be to allow member countries to include a new product in the place of a product included in the exist-ing list if it can be shown with scientifi c evidence that the new product has substantially better environmental performance compared to the one that is included in the existing list. But there could be problems in this approach too. Many countries could resort to dispute settlement due to arbitrary changes in the lists.
Other concerns related to the liberalization of EGS include the is-sue of infant industry protection raised by developing countries. Their argument is that free import of EGs might hinder the development of their like industries. If so, the objective of environment protection might be diffi cult to achieve because, without domestic capabilities in the pro-duction of EGs, their wide use might not be possible.
There is also no guarantee that energy-effi cient goods might be help-ful in meeting the emissions reduction objectives since increased energy effi ciency could increase the use of these products, a phenomenon re-ferred to as the Jevon’s Paradox. For example, if cars and air condition-ers become more energy effi cient, people might use them more. It is also doubtful that technology can be the only solution to climate change. Developed countries have good access to technologies and fi nancial re-
Trade and climate change: South Asian agenda at the UNFCCC and the WTO

Regional Economic Integration Challenges for South Asia during turbulent times
241
sources; yet the levels of emissions in these countries are 5 to 10 times higher than the acceptable levels. It is also noteworthy that North Amer-ica and Western Europe have similar levels of standards of living as well as similar access to technologies; yet the emissions level in North America is almost double that in Western Europe.
8. Technology, IPR and the WTO
Surprisingly, the issue of technology transfer has not received much at-tention in WTO discussions on trade and environment although it is an important component in the UNFCCC agenda. Nevertheless, the issue regarding access to environment-friendly technologies and the role of IPR has been raised by some countries in the CTE. Most notably, Cuba has demanded the shortening of patent protection period to facilitate transfer of clean technologies (WTO 2008).
The issue of IPR is also not explicitly mentioned in the Doha Agenda on trade and environment. Similarly, there has not been any remarkable development regarding this issue in the Working Group on Trade and Technology Transfer at the WTO.
Much of the discussion on technology transfer has been concerned with the issue of climate change mitigation. However, for developing countries, technology would probably be more important for adapta-tion. They are mainly in need of technology in agriculture that would help crops withstand the impacts of climate change. They are also in need of technology to deal with water stress as well as to deal with greater occurrence of existing diseases and arrival of new ones.
Technologies protected by IPRs need to be licensed, and the nature of IPR regime determines the terms of licensing. Therefore, there is likelihood of production and usage costs going much higher because of payments made in order to obtain these licences. In some cases, the owner may just refuse to grant a licence altogether as such technologies are used as barriers to entry (Aoki and Small 2004). Often, production of relevant goods that embody such technology is cheaper in develop-ing countries even after payments of royalties. Given this context, it has been suggested that the issuance of compulsory licences can be a tool for faster diffusion of climate-friendly technologies (Barton 2007; Khor 2008). Compulsory licences ensure competition, and hence make rel-evant goods and services cheaper (Box 13.4).
Contrary to popular belief, there are several grounds on which com-pulsory licences can be issued even within the WTO’s TRIPS framework. Rights of member countries to make use of compulsory licences in the interest of public health have been explicitly recognized in the Doha

242
Declaration on Public Health and the August 2003 Decision by WTO members regarding the implementation of the Declaration. Pursuant to these, the General Council of the WTO amended the TRIPS Agreement on 6 December 2005 to incorporate the decisions made in favour of the use of compulsory licences.
The effectiveness of the use of compulsory licensing to promote technology transfer, however, will depend on market conditions of rel-evant products and the technology market. It is important that there will be capable and willing fi rms to receive a compulsory licence. This will require that there will be a suffi cient number of fi rms operating in the same or similar products. Markets for climate-friendly products and technologies are unlikely to meet such conditions as they are highly concentrated. Such concentration is even higher in particular segments of the industry (Sawhney 2006). When a fi rm remains a virtual monopo-list for a suffi ciently long period of time, it becomes extremely diffi cult for any other fi rm to enter that industry.
The US is the world’s largest producer of environmental technolo-gies and enjoys about 33 percent share of the international market. Other major suppliers are the EU, particularly Germany and Japan. The Offi ce of Environmental Industries of the US proudly claims that developing
Trade and climate change: South Asian agenda at the UNFCCC and the WTO
Box 13.4: Compulsory licensing and the WTO
The term “compulsory licence” does not figure as such in the Agreement on Trade-Related Aspects of Intellectual Property Rights (TRIPS). However, it is incorporat-ed in Article 31: Other Use Without Authorization of the Right Holder. Exceptions to rights of patent holders and principles on measures for preventing the abuse of IPRs by right-holders, or the resort to practices which unreasonably restrain trade or adversely affect the international transfer of technology also provide reason-able flexibility for resorting to the provision of compulsory licence (Article 8 of TRIPS). Article 30 allows members to provide limited reasonable exceptions to the exclusive rights conferred by a patent, if it does not unreasonably prejudice the legitimate interests of the patent-owner and takes into account the legitimate inter-est of third parties.
Similarly, Article 31 (c) provides that a country can use such a measure “to remedy a practice determined after judicial or administrative process to be anti-competitive”. Hence, countries can invoke their competition law where “abuse of dominance” is included as one of the anti-competitive practices and the source of dominance is an IPR. However, Article 31 provides that the possibilities of obtain-ing a voluntary licence must be exhausted before a compulsory licence is sought. Also, Article 40 dealing with control of anti-competitive practices in contractual licences states, “Nothing in this Agreement shall prevent Members from specify-ing in their legislation licensing practices or conditions that may in particular cases constitute an abuse of intellectual property rights having an adverse effect on com-petition in the relevant market”. Hence, under-servicing the market and refusing to provide licence can be taken as an anti-competitive practice.
Regional Economic Integration Challenges for South Asia during turbulent times
243
nations simply do not have the technologies (Nanda 2008). It is very like-ly that the situation would be quite similar in case of technologies that relate to climate change mitigation. In a recent study based on patenting between 1978 and 2003, it was found that innovation in climate change technologies is highly concentrated in three countries, namely Japan, Germany and the US, and they collectively account for two thirds of to-tal climate innovations in 13 technologies (Dechezleprêtre et al. 2008). It is important to note that climate-friendly technologies and products are different from pharmaceutical products. Therefore, even an LDC like Bangladesh has capabilities to produce pharmaceutical products, but even a relatively advanced developing country like India does not have much capability in climate change mitigation technologies.
In such a situation, it would be diffi cult for developing countries to operationalize a compulsory licensing arrangement to promote access to technology. A requirement in TRIPS Article 31(f) is that production under compulsory licence has to be predominantly for the domestic market. This was a major concern for developing and least-developed countries, and therefore, at the Doha Ministerial Conference of the WTO, they raised this concern in the context of TRIPS and public health. Accordingly, an amendment was made, as per which countries with-out pharmaceutical manufacturing capability could issue compulsory licence to foreign fi rms as well. However, this exemption from Article 31(f) of TRIPS was provided only for public health needs, and the same cannot be used for climate-friendly goods and technologies.
Even if the fl exibility of using compulsory licence is extended to in-clude climate-friendly goods and services, it might not be too helpful for developing countries. They might fi nd it diffi cult to use the compulsory licence provision due to political pressure from the developed world, particularly the US (Wise 2006). In that case, a political statement by de-veloping countries at the global level will certainly strengthen their po-sition, and a public health type exemption to issue compulsory licence to foreign fi rms would certainly be a welcome move. However, it might be necessary to extend such facility to all developing countries, and not just LDCs (Nanda 2009).
9. Carbon standards and carbon labelling
Eco-labelling is a relatively new concept and practice adopted mainly by developed countries. It tries to ensure that exports from a country, on environmental grounds, are harmless for consumers and the envi-ronment of the importing country. In doing so, it looks at the entire life cycle of the product in question and analyses its production- and

244
process-related criteria. Eco-labelling has been a major issue for devel-oping countries and LDCs since they do not have the requisite capacity to fulfi l the set criteria. It has been observed that exports from develop-ing countries to developed countries, mainly the EU and the US, have already been considerably affected by the latter countries’ eco-labelling requirements.
Various governments and non-governmental organizations have been supporting eco-labelling programmes, which cover thousands of products in more than 20 countries. There have also been efforts to standardize environmental labelling schemes at the international level. Therefore, there are possibilities that carbon labelling, which is a part of eco-labelling, may emerge as signifi cant trade concerns in the years to come (Nanda and Ratna 2010); and that emissions norms will enter the eco-label criteria in greater measure (OECD 1997; UNESCAP 1997; CUTS 2005).
In the early 1990s, a private initiative was taken in the UK to forward a concept called “food miles”. The main feature of the concept is that through labelling, which is one way of carbon labelling, consumers are informed about the distance that a particular item has covered to reach the store so that consumers would use their informed judgement as to whether to buy that particular product. Campaigns are also organized to discourage consumers from purchasing products that have been im-ported from far-off places. The concept has now gained immense popu-larity and is now supported by a range of environmental, community and farmer groups, including the World Wildlife Fund and Soil Asso-ciation. It is also getting momentum in other European countries, the US and Australia.
When international architectures like the UNFCCC, the Intergovern-mental Panel on Climate Change (IPCC) and experts like Nicholas Stern favour the adoption of carbon labelling requirements, they might not have considered the impacts that such requirements can have on small producers and poor people of developing countries. Complying with carbon standards will require estimation of the carbon footprint of all suppliers. For many small producers, there may not be fi xed suppliers. They might source their supplies from the market without any knowl-edge of the original suppliers. This would mean that complying with standards or measuring carbon footprint will be extremely diffi cult.
Though standards, labelling and air miles are more prevalent in food items, they are likely to make ways into non-food items as well in the near future. For developing countries, adoption of carbon labelling even on a voluntary basis is a matter of concern. Much of the demand for carbon standard and labelling is fuelled by the fear that producers
Trade and climate change: South Asian agenda at the UNFCCC and the WTO

Regional Economic Integration Challenges for South Asia during turbulent times
245
in developed countries will lose competitiveness and outsource their production to developing countries.
It is very likely that most products coming from developing coun-tries will have lower emissions. A signifi cant portion of the export bas-ket of most developing countries constitutes small producers’ products, which are not energy intensive. Even in a country like India, which has a relatively diverse industrial structure in the developing world, the share of energy-intensive products in its exports is less than 10 percent. There-fore, developing countries will have diffi culties in meeting the carbon labelling requirements as the costs of compliance would be very high, particularly for small producers. A growing number of private stan-dards may also confuse consumers, thereby diminishing their intended effects. However, their effects on trade restriction will remain.
Prima facie, the idea of food miles appears to be justifi ed as transpor-tation is a highly energy-intensive activity. However, the issue is much more complex than it appears. It is perfectly possible for a product to remain less carbon-intensive even after it has been airlifted from Africa to a store in Europe compared to similar products grown in the neigh-bourhood if carbon intensities of the production processes in Europe are much higher than those in Africa.
The concept of food miles, however, raises important concerns. Not only that it can have adverse impacts on food exporters which can have economic, social and ethical dimensions, its reliability on the impact on climate change itself is suspect. Food miles indicate only a part of the carbon emitted in the life cycle of a product. The concept indicates car-bon emitted in the process of transportation only while ignoring carbon emitted in other phases in the life cycle of the product. There is already some evidence that food miles can be a misleading indicator of carbon emissions in the food supply chain. For example, a study found that cut roses grown in Kenya for the British market, based on a life-cycle analysis, are 5.8 times more carbon effi cient compared to Dutch green-house fl owers even after accounting for emissions caused by air freight (Appleton 2009).
It has often been argued that carbon labelling is a better alternative than promoting the concept of food miles to address the issue of car-bon emissions in international trade (Muller 2007). Countries such as Australia and New Zealand, which are developed countries and major exporters of agriculture goods, also subscribe to this view (Hogan and Thorpe 2009). But some concerns remain. Carbon labelling will involve signifi cant transaction costs along with the issue of quality assurance. Further, there is no guarantee that promotion of carbon labelling will automatically stop the promotion of food miles. It would also be almost

246
impossible to have a measure of carbon emissions of a product on a life-cycle basis. It may be possible to measure emissions of a product up to the factory gate. But emissions due to transportation from the factory gate to the consumer would be diffi cult to measure as they will vary not only from market to market but also on the mode of transport. Measur-ing emissions due to disposal would be even more diffi cult as nobody can have control over it.
Standard-setting and labelling activities come under the Agreement on Technical Barriers to Trade (TBT) of the WTO irrespective of whether they are mandatory and voluntary and though the applicable provisions are different. There is, however, no consensus on whether standards or technical regulations on non-product-related processes and production methods and private labelling schemes will fall within the purview of the Agreement. Hence, private standards and labelling schemes are pos-sibly taking advantage of some loopholes in the TBT Agreement and es-sentially defeating the very purpose of it. WTO members have already been discussing the issue of private standards and have recognized the need to deal with them so that they do not unnecessarily restrict trade (Box 13.5).
Trade and climate change: South Asian agenda at the UNFCCC and the WTO
Box 13.5: Carbon standards and the WTO
The TBT Agreement covers standards set by central government bodies, local gov-ernment bodies as well as non-governmental bodies. As was seen in the US Su-perfund case, if the processes and production methods (PPM) are detectable and embodied in the product itself, they may come under the agreement. However, carbon emissions are not detectable and measuring it is also a difficult task. In the US Shrimp-Turtle case, the import ban was examined under Articles XI and XX of the GATT, and hence does not shed any light on the applicability of TBT.
It is, however, debatable if activities of organizations and corporations like the Soil Association, Bio Suisse, Tesco, and Marks and Spencer should be considered as standardizing or simply marketing or strategic issues. Many WTO members are not in favour of standards based on non-product-related PPM, and hence, such standards have not been allowed to accede to the TBT Code. An interesting case is that of Forest Stewardship Council. It is widely recognized by many WTO mem-bers and its standards and labels are recognized globally. It is also listed by the World Standards Services Network as an international standardizing body.
Source: Appleton (2009).
10. Conclusion
In most developing countries, including in South Asia, per capita emis-sions are very low; in some cases even lower than two tons per capita, which some suggest to be the target for 2050. Also, since these countries

Regional Economic Integration Challenges for South Asia during turbulent times
247
already operate at a very low level of energy use, their mitigation ef-forts are not likely to contribute much to the possible global emissions reduction. It is also true that some degree of climate change is inevitable no matter what we do now. Developing countries thus need to have elaborate preparations for adaptation to climate change. They need to develop technical, institutional and human capabilities to face up to these adaptation challenges. They cannot, of course, ignore the issue of mitigation as that is linked to their energy security even if mitigation need not be a priority, particularly in countries where emissions are low. Moreover, since developing countries are relatively more vulnerable to the effects of climate change, they have signifi cant interest in mitigation efforts made by the global community as a whole.
It is in the interest of humanity that a global deal is achieved to curb emissions, but developing countries cannot be treated on a par with de-veloped countries in this regard. In the case of South Asia in particu-lar, since the region is home to the largest number of poor people on earth, countries in the region have to deal with many socio-economic problems. Hence, it is important that CBDR is implemented in its true spirit and South Asian countries do not have to accept undue obliga-tions. There have been some concerns that if suffi cient progress is not made in the UNFCCC and the WTO in resolving relevant issues, that might legitimize the potential unilateral trade measures adopted by de-veloped countries. This, however, is unlikely to make developing coun-tries rush towards multilateral settlement of such issues if they are not convinced that the results of negotiations will be in their interest. After all, trade measures, if at all adopted, are likely to impact only a segment of their economy, but commitments at the multilateral level will impact the whole economy.
However, trade measures like border tax adjustments are likely to be discriminatory and unlikely to serve any useful purpose. It is another matter that such measures would be extremely diffi cult to implement and might even be disallowed by the WTO. In South Asian countries, the export sector is not the major source of greenhouse gas emissions. Hence, trade measures are unlikely to be effective in forcing countries to adopt climate change mitigation measures. Competitiveness concerns are best addressed through international agreements rather than unilat-eral measures. Since an important item on the WTO trade and environ-ment agenda is the clarifi cation of the relationship between WTO agree-ments and multilateral environmental agreements, issues like border tax adjustment can also get addressed here. Developing countries are also likely to be forced to take some mitigation measures to maintain their trade performance as there is proliferation of private initiatives taking

248
place in developed countries that might restrict imports from develop-ing countries. It is not clear if there would be appropriate measures at the WTO or other forums to discipline such measures, some of which are arbitrary, particularly in case of food miles. Even if some rules are adopted in this regard, the question of whether they will be effective enough will remain.
The issue of climate change has already entered the WTO arena through its discussion on trade and environment, but the discussion is mainly focused on liberalization of trade in environmental or climate-friendly goods. Moreover, there has not been much progress in the discussions due to defi nitional problems. It is indeed diffi cult to defi ne environment-friendly or climate-friendly goods, and it is also not clear as to what extent liberalization of such goods would contribute to meet-ing the environmental or climate objective.
In reality, climate change is hardly a concern on the WTO agenda on trade and environment. It is more of a market access agenda, and the en-vironmental objective is expected to be achieved through liberalization of trade in EGS. It is oblivious of the fact that some of the existing WTO provisions like rules on subsidies and tariffs can thwart climate change mitigation efforts at national levels. If reforms are proposed at the WTO to promote climate-friendly technologies, South Asian countries might support such initiatives.
Climate change has not been discussed enough under TRIPS, which has major implications for access to technologies that are important for climate change mitigation and adaptation. Interestingly, some develop-ing countries have proposed a more liberal IPR regime, including re-laxation of compulsory licensing framework, but developed countries, particularly the US and the EU, have opposed it. It should also be noted that compulsory licensing alone may not do much and hence other mea-sures will also be required. Moreover, in the global discourse on trade and climate change, mitigation issues get the most focus whereas for developing countries, the issues of adaptation to climate change, effects of climate change on their trade performance and access to technology are much more important.
Notes
1 http://www.oecd.org/dataoecd/60/27/2502872.pdf2 The WTO was established after a number of rounds of negotiations. The last
and the longest of those rounds was the Uruguay Round, which established the WTO.
Trade and climate change: South Asian agenda at the UNFCCC and the WTO

Regional Economic Integration Challenges for South Asia during turbulent times
249
References
Aldy, Joseph E. and William A. Pizer. 2009. “The competitiveness im-pacts of climate change mitigation policies”, May. Arlington, VA: Pew Center on Global Climate Change.
Aoki, Reiko and John Small. 2004. “Compulsory licensing of technol-ogy and the essential facilities doctrine.” Information Economics and Policy, Vol. 16, No. 1: 13–29.
Appleton, Arthur E. 2009. “Private climate change standards and la-belling schemes under the WTO Agreement on Technical Barriers to Trade.” In Thomas Cottier, Olga Nartova and Sadeq Z. Bigdeli (eds.), International trade regulation and the mitigation of climate change. Cambridge: Cambridge University Press.
Barton, John H. 2007. “Intellectual property and access to clean energy technologies in developing countries: An analysis of solar photovol-taic, biofuel and wind technologies.” ICTSD Programme on Trade and Environment, Issue Paper No. 2. Geneva: International Centre for Trade and Sustainable Development (ICTSD).
CUTS. 2005. “Eco-labelling: Does (Should) one size fi t all?” Research Report No. 501. Jaipur: Consumer Unity and Trust Society (CUTS) International.
Dasgupta, C. 2009. “International trade and climate change.” GALT Up-date, Vol. 4, No. 1: 1–5. New Delhi: The Energy and Resources Insti-tute (TERI).
Dechezleprêtre, Antoine, Matthieu Glachant, Ivan Hascic, Nick John-stone and Yann Ménière. 2008. Invention and transfer of climate change mitigation technologies on a global scale: A study drawing on patent data. Available at http://www.cerna.ensmp.fr/index.php?option=com_content&task=view&id=192&Itemid=288 (ac-cessed 16 March 2009).
Dröge, Susanne, Harald Trabold, Frank Biermann, Frédéric Böhm and Rainer Brohm. 2004. “National climate change policies and WTO law: A case study of Germany’s new policies.” World Trade Review, Vol. 3, No. 2: 161–87.
Green, Andrew. 2005. “Climate change, regulatory policy and the WTO: How constraining are trade rules?” Journal of International Economic Law, Vol. 8, No. 1: 143–89.
Hogan, L. and S. Thorpe. 2009. “Issues in food miles and carbon label-ing.” ABARE Research Report 09.18, December.
Howse, Robert and Antonia L. Eliason. 2009. “Domestic and interna-tional strategies to address climate change: An overview of the WTO legal issues.” In T. Cottier, O. Nartova and S. Z. Bigdeli (eds.), In-

250
ternational trade regulation and the mitigation of climate change. Cam-bridge: Cambridge University Press.
IPCC. 2007. Fourth assessment report, summary for policymakers. Geneva: Intergovernmental Panel on Climate Change.
Kelkar, Ulka and Suruchi Bhadwal. 2007. “South Asian regional study on climate change impacts and adaptation: Implications for human development.” Occasional Paper. New York: UNDP Human Devel-opment Report Offi ce.
Khor, Martin. 2008. “Note on access to technology, IPR and climate change.” Briefi ng Paper 1, Climate Change Subsidiary Bodies’ Ses-sions, 2−13 June, Bonn. Available at http://unfccc.meta-fusion.com/kongresse/SB28/downl/080607_SB28_1_Martin%20Khor.pdf (accessed 15 February 2009).
Kumar, K., S. Kavi and Jyoti Parikh. 2001. “Indian agriculture and cli-mate sensitivity.” Global Environmental Change, Vol. 11, No. 2: 147–54.
Muller, B. 2007. “Food miles or poverty eradication? The moral duty to eat African strawberries at Christmas.” Oxford Institute for En-ergy Studies, Oxford Energy and Environment Comment, October. Available at www.oxfordclimatepolicy.org
Nanda, Nitya. 2008. Expanding frontiers of global trade rules: The political economy dynamics of the international trading system. London: Rout-ledge.
Nanda, Nitya. 2009. “Diffusion of climate friendly technologies: Can compulsory licensing help?” Journal of Intellectual Property Rights, Vol. 14, No. 3: 241–46.
Nanda, Nitya and Rajan S Ratna. 2010. “Carbon standards and carbon labelling: An emerging trade concern.” ARTNet Policy Brief, Issue No. 29, November. Bangkok: United Nations Economic and Social Commission for Asia and the Pacifi c (UNESCAP).
OECD. 1997. Eco-labelling: Actual effects of selected programmes. OECD Report Number OCDE/GD(97)105. Paris: Organisation for Economic Co-operation and Development (OECD).
Page, Sheila. 2004. The evolution of special and differential treatment in the multilateral trading system. London: Overseas Development Insti-tute.
Petsonk, Annie. 1999. “The Kyoto Protocol and the WTO: Integrating greenhouse gas emission allowance trading into the global market-place.” Duke Environmental Law and Policy Forum 10: 185–220.
Sawhney, Aparna. 2006. “Environmental services.” In Rupa Chanda (ed.), Trade in services & India: Prospects and strategies. New Delhi: Wiley-India.
Trade and climate change: South Asian agenda at the UNFCCC and the WTO

Regional Economic Integration Challenges for South Asia during turbulent times
251
UNESCAP. 1997. “Trade effects of eco-labels.” Studies in Trade and In-vestment 27. Bangkok: United Nations Economic and Social Com-mission for Asia and the Pacifi c (UNESCAP).
UNFCCC. 2009. Ad hoc Working Group on Long-term Cooperative Ac-tion under the Convention. Document No. FCCC/AWGLCA/2009/INF,1/Add.1.
Wise, Jacqui. 2006. “Access to AIDS medicines stumbles on trade rules.” Bulletin of the World Health Organization, Vol. 84, No. 5, May.
World Bank. 2007. “Warming up to trade: Harnessing international trade to support climate change objectives.” World Bank Report No. 40217. Washington, D.C.: The World Bank.
WTO. 1987. United States−Taxes on petroleum and certain imported substances. Report of the Panel adopted on 17 June 1987 (L/6175 – 34S/136).
WTO. 2008. Communication from Cuba, Committee on Trade and Envi-ronment (08-3299), Special Session (TN/TE/W/73), 9 July (Original: Spanish).

.

1. Introduction
The environmental issue has emerged as an important area of concern for policy makers in South Asian countries. These countries face mul-tiple problems in the areas of environment, ranging from air and water pollution to soil degradation and desertifi cation to depletion of forest and fi sh resources, loss of biodiversity and ecosystem, urbanization and congestion. South Asian countries are also vulnerable to the risk of cli-mate change, which is feared to lead to sea level rise with severe impacts on the lives and livelihoods of a large number of people in the region. At the same time, South Asian economies have been integrating into the global economy at a fast pace over the last decade. Their economic poli-cies have focused on trade liberalization to promote the growth of the export sector and stimulate overall economic growth.
In the context of higher intensity of environmental problems and increased economic interdependence among countries, trade and envi-ronmental policies need to be formulated in a manner which can ensure
WTO negotiations on environmental goods and services: South Asia’s interests
Chapter 14
Fahmida Khatun

254
sustainable economic growth. Recognizing the interface between trade and environment, the World Trade Organization (WTO) addresses the issue through various agreements, most of which contain exceptions from the trade liberalization rule in order to legitimize the efforts of its members to protect the environment (WTO 2001). Paragraph 31 (iii) of the Doha Ministerial Declaration mandated negotiations on “the reduc-tion or, as appropriate, elimination of tariff and non-tariff barriers to environmental goods and services” as part of the single undertaking.1 Since the launch of the Doha Round of the WTO in 2001, negotiations on the trade-environment issue have not gained suffi cient momentum. However, an outcome on trade and environment is expected to be part of a larger package of the agreements achieved when the Doha Round negotiations are completed.
Participation of South Asian countries in trade and environment negotiations has been limited. Given these countries’ environmental vulnerabilities and the importance of trade in their development ef-forts, it is important that South Asia examines the implications of these negotiations at the WTO. This article attempts to examine some of the specifi c issues with respect to negotiations on environmental goods and services (EGS) in South Asia and make recommendations for negotiat-ing positions. Based on secondary data, the article estimates the pattern of environmental goods (EGs) trade in South Asia, its share in global merchandise trade, and major EG exports and imports of South Asian countries. Data on environmental services (ES) related to South Asia are not available from published sources; hence, analysis in this area is constrained.
2. Overview of negotiations on EGS
2.1 Environmental goods
The defi nition and coverage of EGs has been a contentious issue at the WTO. Key issues that complicate defi ning EGs include: i) whether “en-vironmental goods” should include products with multiple end use; ii) the mechanisms of capturing goods by the Harmonized Commodity Description and Coding System (HS); and iii) how goods and services that correspond to local concerns can be identifi ed as EG in the global trade context (Jha 2008).
Defi nitions by the Organisation for Economic Co-operation and De-velopment (OECD) and the Asia-Pacifi c Economic Cooperation (APEC), which developed two separate lists of EGs, were starting points in the discussion of EGs in the context of the Doha Round. The OECD list was
WTO negotiations on environmental goods and services: South Asia’s interests

Regional Economic Integration Challenges for South Asia during turbulent times
255
developed in the context of an analytical work on the role of EGS in environmental policy and industrial competitiveness. The APEC list re-sulted from negotiations on trade liberalization among APEC countries. WTO members also proposed their own products in the context of the EG negotiations based on their perceived interests and comparative ad-vantage. In 2007, the “Friends of EGs” submitted a list of EGs compris-ing 153 items under 12 broad categories.
A number of suggestions have been made in the Committee on Trade and Environment Special Session (CTESS) for purposes of identi-fying EGs. These include focusing on the product’s “end use” or “direct use”, but concerns have been raised about the dual or multiple uses of these products. On the other hand, it has been stressed that distinc-tions based on processes and production methods should not be used as the basis for the identifi cation of EGs. Other considerations relate to the concept of environmentally preferred products, which, according to the United Nations Conference on Trade and Development (UNCTAD), are those goods whose production and sale contribute signifi cantly to the preservation of the environment (UNCTAD 2003). The debate lies in the fact that for most developing countries, their export interest lies in environmentally preferred products. It is in their interest, therefore, that these products be covered by the defi nition or approaches fi nally adopted in the EG negotiations at the WTO. Such products include, for instance, natural fi bres and colorants, other non-timber forest products and renewable energy products, including ethanol and biodiesel.
Developed countries are advocating a “list-based” approach to iden-tifying specifi c environmental goods while many developing countries support alternative approaches, particularly the liberalization of EGS associated with a specifi c environmental project. Under the list ap-proach, countries would identify specifi c EGs and then negotiate the elimination or reduction of bound tariffs and non-tariff barriers (NTBs) permanently on those goods, on a most-favoured-nation basis. Sugges-tions have been made for a “development list” to be developed by de-veloping and least-developed countries to identify EGs subject to lower tariff reductions based on the principle of less than full reciprocity. The list approach has been criticized on the ground that it may lead to the liberalization of goods that have both environmental and non-environ-mental end uses.
The project approach spearheaded by India would allow imports of goods and services at concessional terms for environmental projects approved by a designated national authority based on criteria devel-oped by the WTO Committee on Trade and Environment (CTE). This approach is said to recognize the diversity in environmental standards

256
and articulate the concept of common but differentiated responsibilities by developing countries, integrating environmental and development concerns in the approach to the negotiations. Developed countries have criticized the project approach, however, for failing to provide predict-able, binding and permanent trade concessions, and have questioned its consistency with WTO rules.
A third alternative is an integrated approach requiring the CTESS to multilaterally pre-identify the categories of environmental projects and EGs used in such projects that would benefi t from tariff and NTB con-cessions. Yet another approach is a “request-offer” approach whereby each country will identify products that contribute to the environment and seek tariff concessions on those products while also indicating the products in which it is prepared to undertake liberalization commit-ments as requested by other members.
2.2 Environmental services
Similar to the situation with EGs, there is no universally accepted defi -nition of ES. The General Agreement on Trade in Services’ (GATS) Sec-toral Classifi cation List (W/120) sorts ES as: i) sewage services; ii) re-fuse disposal services; iii) sanitation and similar services; and iv) other services (cleaning services of exhaust gases, noise abatement services, nature and landscape protection services, and other ES). The OECD ar-gues, however, that such classifi cation is too narrow. The OECD/Euro-stat classifi cation is wider: seven groups of ES are listed and under them there are 10 sub-categories (OECD 1999). The GATS Sectoral Classifi ca-tion List (W/120), which is based on the United Nations provisional Central Product Classifi cation (CPC), was revised as CPC version 2 in 2008. This classifi cation includes seven broad categories of ES under which there are sub-categories.
In the course of negotiations, WTO members have proposed to di-vide ES into a “core” group and a “cluster”. The “core” group would encompass services which can undisputedly be classifi ed as “purely” environmental, categorized according to environmental media such as water, noise, solid and hazardous waste, among others. In the “cluster” approach, conceptual services such as design, engineering, research and design, and consulting services can be considered as a special cluster since these have environmental end use. In fact, it is diffi cult to separate EGs and ES for purposes of trade analysis. EGs are often used to pro-vide a service. But a good is tangible whereas a service is not. There is a signifi cant overlap between the services segment and the equipment segment of environmental products.
WTO negotiations on environmental goods and services: South Asia’s interests

Regional Economic Integration Challenges for South Asia during turbulent times
257
3. EG trade by South Asian countries
South Asia’s share in EG trade is very little compared to South Asia’s share in global trade. The share of EG exports in total exports by South Asian countries was 2.97 percent and the share of EG imports in total imports by South Asian countries was 4.58 percent in 2007. India has emerged as a major exporter and importer of EGs in South Asia. With a share of 90 percent, the market for EGs is, however, dominated by de-veloped countries. Even among the developed countries, the European Union (EU), the United States (US) and Japan together account for 85 percent of the total market (OECD 2001). Based on data of the Trade Map of the International Trade Centre (ITC), the UN Comtrade and the World Integrated Trade Solution (WITS), it is estimated that total global exports and imports of EGs stood at US$783.2 billion and US$753.8 bil-lion, respectively, in 2007. Total exports and imports of EGs increased from US$323 billion and US$333.8 billion, respectively, in 2001. These EGs are those defi ned in the “WTO 153 list” categorized at the HS 6-dig-it level.
The share of South Asian countries in global trade of EGs is very small. In the absence of the latest data, this analysis is based on 2007 data. The share of South Asian EG exports in total global EG exports was 0.71 percent while the share of South Asian EG imports in total global EG imports was 1.75 percent (Table 14.1). Among South Asian countries, India’s share in both exports and imports was the highest, at almost 91 percent and 79 percent respectively. Bangladesh stood second with 6.34 percent share of total South Asian EG exports while Pakistan secured the second position in case of EG imports with 12.87 percent share in total South Asian EG imports. Afghanistan, Bhutan, Nepal and Sri Lanka had very little shares in EG trade.
Disaggregated data according to 12 broad categories under the WTO’s “153 list” reveal that in the case of both exports and imports, “renewable energy plant” and “waste water management and portable water treatment” have been the two most important items for South Asian countries (Table 14.2). The top 10 EG export products comprise 46.06 percent of all South Asia EG exports. The list includes the follow-ing items:
Parts for diesel and semi-diesel engines; Taps, cocks, valves and similar appliances; Static converters; Wind-powered generating equipment; Photosensitive semiconductor device, photovoltaic cells and
light emit diodes;

258
Jute and other textile fi bres, raw or retted; Articles, iron or steel; Towers and lattice masts, iron or steel; Parts of machines and mechanical appliances having individual
functions; and Sacks and bags for package of goods of jute or of other textile fi bres.
In the case of imports at HS 6-digit level, the top 10 EG imports com-prise 34.35 percent of the region’s EG imports. These are as follows:
Machines and mechanical appliances having individual func-tions;
Air or gas compressors, hoods; Static converters; Taps, cocks, valves and similar appliances; Parts of electric motors, generators, generating sets and rotary
converters; Articles, iron or steel; Measuring or checking instruments, appliances and machines; Parts for diesel and semi-diesel engines;
WTO negotiations on environmental goods and services: South Asia’s interests
Table 14.1: Total export and import of EGs (US$ million)
CountryTotal export Total import2001 2007 2001 2007
Afghanistan 0.00 1.71 4.76 156.15Bangladesh 137.29 351.10 297.31 488.00Bhutan 0.27 0.27 1.53 9.28India 940.39 5,022.09 1,807.96 10,360.44Maldives 0.10 0.00 24.06 68.76Nepal 0.00 29.95 0.01 50.17Pakistan* 40.13 88.65 523.69 1,696.17Sri Lanka 13.57 48.02 172.25 351.60Total South Asia 1,131.74 5,541.78 2,831.57 13,180.57Total trade of South Asia (all products) n.a. 186,706.62 n.a. 287,783.23
Total world trade of EGs 323,041.99 783,206.37 333,793.60 753,796.24Share of South Asian EG trade in total trade of South Asia
n.a. 2.97 n.a. 4.58
Share of South Asia in total world EG trade 0.35 0.71 0.85 1.75
Note: *For Pakistan, 2003 data instead of 2001 data.Source: UN Comtrade, Trade Map and WTO Trade Database.

Regional Economic Integration Challenges for South Asia during turbulent times
259
Parts of machines and mechanical appliances having individual functions; and
Gears and gearing, ball screws, gear boxes, speed changers/torque converters.
On the top fi ve EG imports by each South Asian country, the effec-tive applied tariff rates range from 0 percent to over 40 percent (Table 14.3). Parts of diesel and semi-diesel engines face the highest tariff, at 40.74 percent, and pumps face 35.83 percent in the Maldives. Static con-verter, which is among the top fi ve EG import items in Bangladesh, In-dia, Nepal and Sri Lanka, faces tariffs ranging from 3.8 percent to 15 per-cent. Even though tariffs on EGs in developed countries are very low, South Asian countries will benefi t from liberalization of EGs since their EG exports are also destined to a number of developing countries where they face high import tariffs for EGs. In developing countries such as China, Mexico, Syria and the United Arab Emirates, major EG exports from Bangladesh and Nepal face tariffs ranging from 4.7 percent to 30.3 percent.
Table 14.2: South Asia’s EG trade by broad product category, 2007 (US$ million)
Product categoryExport ImportSouth Asia World South Asia World
Air pollution control 546.72 75,596.15 1,889.88 74,586.29Management of solid and haz-ardous waste and recycling systems
628.44 130,729.82 2,157.42 120,349.17
Clean up for remediation of soil and water 65.30 5,904.99 111.29 5,469.29
Renewable energy plant 1,591.11 202,314.18 3,319.86 190,689.40Heat and energy management 73.19 13,399.67 202.17 12,493.87Waste water management and portable water treatment 1,415.59 198,215.95 2,879.80 193,121.96
Environmentally preferable products, based on end use or disposal characteristics
385.83 547.50 110.38 436.53
Cleaner or more resource-effi-cient technologies and products 11.99 8,251.71 71.44 9,741.66
Natural risk management 37.62 7,320.41 176.77 6,172.38Natural resources protection 29.46 861.25 10.47 654.34Noise and vibration abatement 570.32 56,677.40 538.57 57,615.68Environmental monitoring, anal-ysis and assessment equipment 204.93 87,046.71 1,783.35 86,023.91
Source: Author’s calculations based on UN Comtrade and Trade Map.

260
Table 14.3: Tariffs on top fi ve EG imports of South Asian countries, 2007
HS code Product description Applied tariff (%)Afghanistan
841581Incorporating a refrigerating unit and a valve for 5
Bangladesh
847989Machines & mechanical appliances having individual functions 1.67
850440 Static converters 7.33853710 For a voltage not exceeding 1,000 V 8.5841480 Air or gas compressors, hoods 9.13840999 Parts for diesel & semi-diesel engines 5Bhutan730820 Towers and lattice masts 20730690 Tubes, pipe & hollow profiles, iron or steel, welded 20842121 For filtering or purifying water 10853710 For a voltage not exceeding 1,000 V 20847420 Crushing or grinding machines 10India
847989Machines & mechanical appliances having individual functions 12.5
850440 Static converters 12.5848180 Taps, cocks, valves & similar appliances 12.5850300 Parts suitable for use solely or principally with 12.5841480 Air or gas compressors, hoods 12.5Maldives840999 Parts for diesel & semi-diesel engines 40.74848180 Taps, cocks, valves & similar appliances 19.82841381 Pumps 35.83730490 Tubes, pipe & hollow profiles, iron or steel, smls 25842121 For filtering or purifying water 19.3Nepal
530310Jute and other textile bast fibres, raw or retted 5
850720 Other lead acid accumulators 15847420 Crushing or grinding machines 5
854140Photosensitive semiconductor devices, including... 0
850440 Static converters 15Pakistan
841480 Air or gas compressors, hoods 14.87
847989Machines & mechanical appliances having individual functions 5
WTO negotiations on environmental goods and services: South Asia’s interests

Regional Economic Integration Challenges for South Asia during turbulent times
261
850239 Electric generating sets 5
841989Machinery, plant/laboratory equipment for treatment of... 20
847420 Crushing or grinding machines 5Sri Lanka841182 Of a power exceeding 5,000 Kw 2.5
730630Other, welded, of circular crosssection, of iron... 1.72
850440 Static converters 3.83848180 Air or gas compressors, hoods 2.22732690 Articles, iron or steel 8.48
Source: WITS database.
4. Issues and strategies for negotiation on EGS liberalization
Social, political and economic factors in their respective countries need to be considered by South Asian negotiators when they participate in discussions on what goods and services to liberalize, how to liberalize and what approaches to be adopted. Though the issue of export of EGS is in fact part of the overall market access issue from which South Asia may benefi t, opening up of domestic markets of South Asian countries for foreign products and companies is a sensitive issue.
South Asian countries have to participate effectively in international negotiations on EGS so that they can make an informed assessment of the opportunities and challenges associated with EGS liberalization. While the principal objective of such negotiations should be whether re-duction or elimination of tariffs and NTBs will protect the environment while expanding national trade, South Asia has to consider a number of aspects, discussed below, while adopting strategies for EGS negotia-tions.
4.1 Negotiations on EGs
The list approach does not emphasize the need for technology trans-fer adequately. On the other hand, the project approach stands to of-fer better opportunities for South Asia in terms of market access since this approach is supposed to enable technology transfer, which, in turn, can help improve South Asian countries’ compliance with technical and sanitary and phytosanitary (SPS) requirements. Many enterprises in South Asia are in the category of small and medium enterprises, which lack fi nancial and technological capability to comply with requirements set by the importers of developed countries.

262
Standards, certifi cation requirements and environmental regulations limit trade to a great extent. Products from developing countries and LDCs face diffi culties in entering foreign markets due to stringent stan-dards set by destination governments, often to protect domestic suppli-ers. Identifi cation, harmonization and elimination of NTBs for products identifi ed as EGs are needed in order to facilitate trade in such goods.
Developing and least-developed countries have demanded fl exibil-ity in the Agreement on Trade-Related Aspects of Intellectual Property Rights (TRIPS) in order to solve problems of patented climate-friendly technologies. For LDCs, it is important that Article 66.2 of TRIPS, which mandates developed-country members to take measures to encourage technology transfer to LDCs, is effectively implemented for climate technologies. South Asia should also be watchful of any attempts of dumping of old technologies by developed countries in the name of technology transfer.
In order to take full advantage of EG liberalization, technical and fi nancial assistance is essential. Such assistance is needed not only for buying clean technologies but also for addressing any probable nega-tive impact of liberalization on South Asian countries. Support can be sought from the WTO’s Aid for Trade initiative.
4.2 Negotiations on ES
The Doha Ministerial Declaration placed services negotiations in the overall timeframe of the Doha Round. It reaffi rmed the Guidelines and Procedures for the Negotiations adopted by the Council for Trade in Services on 28 March 2001 as the basis for continuing the negotiations, with a view to achieving the objectives of the GATS.
Analysis of South Asia’s interests in trade in ES is diffi cult since there are no data available on this. The main way to trade in ES is through Mode 3 and Mode 4 of the GATS. Under Mode 3, services are provided by a subsidiary or a branch in a host country through its commercial presence, and under Mode 4, services are provided by professionals temporarily working abroad. A number of issues stand in the way of better trade performance under both these Modes.
Provision of environmental infrastructural services in South Asia requires high levels of investment and expertise. South Asian countries may benefi t from such investments through commercial presence under Mode 3 in the area of increased access to safe water through treatment of polluted water or wastewater management. However, the issue of affordability of these essential environmental services is a concern for South Asian governments. Water is a public good and privatization of
WTO negotiations on environmental goods and services: South Asia’s interests

Regional Economic Integration Challenges for South Asia during turbulent times
263
such services would create confl ict of interest as the provision of this good would be on a profi t-making basis, ignoring the affordability of the poor in the face of weak regulatory capacity in South Asian coun-tries. Profi t-driven motivation behind the supply of essential goods like water creates the risk of exclusion of people who cannot afford such private services.
Liberalization may also act to undermine many traditional and lo-cal technologies and methods of ES in favour of advanced and modern techniques and tools imported from abroad. In the process, region-spe-cifi c, cheap, simple and cost-effective innovations may be encouraged instead of expensive, complex and sometimes out-dated technologies exclusively imported from abroad (Sugathan 2007).
The interplay between trade and environment is an evolving issue and subject to debates as the relationship can exhibit both positive and negative results on poverty and human development. Therefore, the op-portunities and challenges of liberalization of ES should be examined through in-depth cost-benefi t analyses on a case-by-case basis, that is, on a country-by-country and service-by-service basis. The objective of such an exercise is to explore mechanisms to ensure effi ciency and eq-uity if liberalization of ES trade takes place. In order to ensure accessibil-ity and affordability of essential products and services such as drinking water and sanitation, there should be regulations on prices and business practices of domestic and foreign companies. In South Asia, the mo-nopoly of the government in these sectors is justifi ed on equity grounds. Commercial presence of foreign enterprises under Mode 3 may contrib-ute to increased investment and capital formation, improvements in the coverage and quality of environmental services, transfer of technology and capacity building. However, without an understanding of the im-plications of liberalization of essential environmental infrastructural services such as water, South Asia should not make any commitments in this area.
Commercially meaningful liberalization of environmental infra-structural services requires market access in environmental support services such as construction, engineering, legal and consulting ser-vices, where Mode 4 is an increasingly relevant factor. Market access of services providers from South Asia to developed countries is con-strained by stringent immigration and recruitment policies of importing developed countries. Services providers are also affected by restrictions such as licensing requirements and prerequisites relating to qualifi ca-tion and work experience. Though export of ES by South Asia is not very signifi cant, some of these countries could reap economic benefi ts by exporting environment-related professional services in the form of

264
studies, assessments and consultancies. For example, countries which suffer from environment-related natural disasters such as fl ood, cyclone and drought are better equipped with the expertise for dealing with such catastrophes.
5. Issues for South Asian LDCs
There are four LDCs in South Asia—Afghanistan, Bangladesh, Bhu-tan and Nepal. LDCs have a number of special issues in the WTO with regard to market access, preference erosion and technology transfer, among others. Growth without domestic innovation and capacity build-ing through free trade would not be environmentally and economically sustainable for LDCs in the long run. LDCs should use liberalization as a tool to import foreign technologies at a lower cost to enhance their ca-pacity and profi ciency in utilizing their resources rather than have only foreign fi rms do the job.
The United Nations Framework Convention on Climate Change (UNFCCC) has mandated transfer of technology and know-how related to environmentally sound technologies. The Seventh Conference of the Parties to the UNFCCC held in Marrakesh in 2001 adopted a framework for technology transfer to enhance adoption of climate-friendly tech-nologies. The importance of transfer of energy-effi cient and low-carbon technologies to developing and least-developed countries has been em-phasized in the Stern Review as well (Stern 2006).
The issue of intellectual property rights (IPRs) and technology trans-fer has to be resolved for enabling technology transfer to LDCs. Though studies indicate that IPRs may act in both positive and negative ways (Park and Lippoldt 2008), appropriate technology and its effi cient utili-zation can contribute to the economic progress of countries around the world.
From the point of view of developed countries, a strict IPR regime is essential for protecting technologies. Developing countries, on the other hand, can benefi t from lax IPRs to access technologies and re-en-gineering processes. The reconciliation between protection of IPRs and dissemination of climate-friendly technologies is a challenge. LDCs de-mand fl exibility in the TRIPS Agreement in order to solve problems of patented climate-friendly technologies. Article 66.2 of TRIPS should be effectively implemented for climate technologies. Transfer of technol-ogy, one of the key elements of the Bali Road Map, is of vital impor-tance for all developing and least-developed countries for mitigation as well as adaptation. The IPR regime is a barrier to technology transfer to LDCs, and this needs to be reviewed.
WTO negotiations on environmental goods and services: South Asia’s interests

Regional Economic Integration Challenges for South Asia during turbulent times
265
Technology transfer through aid and technical assistance for envi-ronmental technologies has been mentioned both in the list and project approaches to EG negotiations submitted by developed and develop-ing countries, though at a less-than-adequate level by the former group. Though the IPR regime has not been very strict with respect to tech-nology transfer to LDCs, actual transfer has been slow due to various supply-side constraints such as lack of capacity and fi nancial resources. Hence, for LDCs to take full advantage of liberalization of EGS, techni-cal and fi nancial assistance is essential. Such assistance is needed not only for buying clean technologies but also for addressing any possible negative impact of liberalization on LDCs. In LDCs, small and medium enterprises dominate the industrial sector, which are not in a position to buy clean technologies to comply with domestic environmental regula-tions even if there is marginal reduction of prices of technologies due to tariff changes. LDCs should submit proposals to receive support from the WTO’s Aid for Trade initiative. WTO members should avoid dump-ing old technologies in the name of technology transfer, and should fa-cilitate technological innovation.
It is likely that many of the EGs will fall under various preferen-tial programmes offered to LDCs by developed countries. Therefore, if these products are listed as EGs, tariff will be reduced at a faster pace for these items which will erode LDCs’ preferences in those markets and reduce their competitiveness. South Asian LDCs should demand special and differential treatment for improved market access for their products which have less negative environmental impact and which are derived in an environment-friendly way.
6. Conclusions
The EG trade pattern of South Asian countries refl ects the fact that these countries require technologies for renewable energy plant, wastewater management and potable water treatment, management of solid and hazardous waste, recycling system and air pollution control. In order for these countries to access such technologies, import duties may be reduced in the importing countries. They should also be made available at a concessional price by developed countries.
With respect to preference erosion suffered by South Asian LDCs due to liberalization of EGS, the loss should be compensated by devel-oped countries and those developing countries in a position to do so by way of full duty-free and quota-free market access, simplifi ed rules of origin, technology transfer and fi nancial support through various mechanisms, including soft loans and aid for trade.

266
Liberalization of EGs through tariff reduction may not increase South Asian EG exports unless NTBs are removed. Though EG exports to developed countries face either zero or very low tariffs, they may still face various NTBs such as product standards, technical requirements, SPS measures and certifi cation. South Asia should participate actively in global standards-setting bodies in order to ensure that standards re-fl ect their priorities and are not discriminatory. They also require fi nan-cial and technical support to be able to certify environmental require-ments credibly.
For meaningful participation in ES trade, domestic regulatory frameworks should be in place prior to allowing foreign direct invest-ment in environmental services. The issue of affordability of essential environmental services such as water should be the priority for South Asian countries as the majority of their populations live in poverty. South Asian countries have a comparative advantage in exporting envi-ronmental services providers under Mode 4. This will require capacity building in these countries for ES providers and relaxation of various measures by importing countries that act as barriers to the cross-border movement of services providers.
Note1 WT/MIN/(01)/DEC/W/1, 2001.
References
Jha, Veena. 2008. “Environmental priorities and trade policy for envi-ronmental goods: A reality check.” ICTSD Programme on Trade and Environment Issue Paper No. 7, September.
OECD. 1999. The environmental goods and services industry: Manual for data collection and analysis. Paris: Organisation for Economic Co-operation and Development.
OECD. 2001. Environmental goods and services: The benefi ts of further trade liberalization. Paris: Organisation for Economic Co-operation and Development.
Park, Walter G. and Douglas C. Lippoldt. 2008. “Technology transfer and the economic implications of the strengthening of intellectual property rights in developing countries.” OECD Trade Policy Work-ing Paper No. 62. Available at www/oils.oecd/2007doc.nsf/Link-To/NT00005B06/$FILE/JT03239222.PDF
Stern, Nicholas. 2006. “Stern review on the economics of climate change.” HM Treasury, London. Available at www.hm-treasury.
WTO negotiations on environmental goods and services: South Asia’s interests

Regional Economic Integration Challenges for South Asia during turbulent times
267
gov.uk/sternreview_index.htmSugathan, Mahesh. 2007. “A way forward on WTO negotiations on en-
vironmental goods: Elements of a strategic response and options.” In ICTSD, Trade in Environmental Goods and Services and Sustainable Development. Policy Discussion Paper. Geneva: International Centre for Trade and Sustainable Development.
UNCTAD. 2003. Environmental goods and services in trade and sus-tainable development. TD/B/COM.1/EM.21/2.
WTO. 2001. Trading into the future. Geneva: World Trade Organization.

.

Anura EkanayakeFormer ChairmanCeylon Chamber of CommerceColombo
Anushka WijesinhaResearch Offi cerInstitute of Policy Studies of Sri Lanka (IPS)Colombo
Devjit Roy ChowdhuryResearch AssistantIndian Council for Research on International Economic Relations (ICRIER)New Delhi
Fahmida KhatunHead of ResearchCentre for Policy Dialogue (CPD)Dhaka
M. RahmatullahVisiting FellowCentre for Policy Dialogue (CPD)Dhaka
Mustafi zur RahmanExecutive DirectorCentre for Policy Dialogue (CPD)Dhaka
Neetika KaushalResearch AssistantIndian Council for Research on International Economic Relations (ICRIER)New Delhi
About the authors and editors
270
Nihal RodrigoFormer SAARC Secretary GeneralandFormer Foreign SecretaryGovernment of Sri Lanka
Nisha TanejaProfessorIndian Council for Research on International Economic Relations (ICRIER)New Delhi
Nitya NandaFellowThe Energy and Resources Institute (TERI)New Delhi
Paras KharelResearch CoordinatorSouth Asia Watch on Trade, Economics and Environment (SAWTEE)Kathmandu
Pushpa Raj RajkarnikarChairmanInstitute for Policy Research and Development (IPRAD)Kathmandu
Puspa SharmaResearch DirectorSouth Asia Watch on Trade, Economics and Environment (SAWTEE)Kathmandu
Rajan Sudesh RatnaJoint Director General of Foreign TradeDepartment of CommerceGovernment of India
About the authors and editors
Regional Economic Integration Challenges for South Asia during turbulent times
271
Ratnakar AdhikariChief Executive DirectorSouth Asia Watch on Trade, Economics and Environment (SAWTEE)Kathmandu
S. Irudaya RajanChair ProfessorMinistry of Overseas Indian AffairsResearch Unit on International MigrationCentre for Development Studies (CDS)Thiruvananthapuram, Kerala
D. NarayanaDirectorGulati Institute of Public Finance and TaxationKerala
Saman KelegamaExecutive DirectorInstitute of Policy Studies of Sri Lanka (IPS)ColomboandEditorSouth Asia Economic Journal
Saon RaySenior FellowIndian Council for Research on International Economic Relations (ICRIER)New Delhi

.

.

.

Copyright © 2022 FDOKUMEN