Enhancing Regional Trade Integration in Southeast Europe
162
THE WORLD BANK WORLD BANK WORKING PAPER NO. 185 Enhancing Regional Trade Integration in Southeast Europe Borko Handjiski Robert Lucas Philip Martin Selen Sarisoy Guerin Public Disclosure Authorized Public Disclosure Authorized Public Disclosure Authorized Public Disclosure Authorized Public Disclosure Authorized Public Disclosure Authorized Public Disclosure Authorized Public Disclosure Authorized
-
Upload
khangminh22 -
Category
Documents
-
view
2 -
download
0
Transcript of Enhancing Regional Trade Integration in Southeast Europe

THE WORLD BANK
W O R L D B A N K W O R K I N G P A P E R N O . 1 8 5
Enhancing Regional TradeIntegration in Southeast Europe
Borko HandjiskiRobert LucasPhilip MartinSelen Sarisoy Guerin
Pub
lic D
iscl
osur
e A
utho
rized
Pub
lic D
iscl
osur
e A
utho
rized
Pub
lic D
iscl
osur
e A
utho
rized
Pub
lic D
iscl
osur
e A
utho
rized
Pub
lic D
iscl
osur
e A
utho
rized
Pub
lic D
iscl
osur
e A
utho
rized
Pub
lic D
iscl
osur
e A
utho
rized
Pub
lic D
iscl
osur
e A
utho
rized
wb350881
Typewritten Text
53099

W O R L D B A N K W O R K I N G P A P E R N O . 1 8 5
Enhancing�Regional�Trade�Integration�in�Southeast�Europe�Borko�Handjiski�Robert�Lucas�Philip�Martin�Selen�Sarisoy�Guerin�����������������������
WP_185_web_1-11-10.pdf 1WP_185_web_1-11-10.pdf 1 1/11/2010 1:39:03 PM1/11/2010 1:39:03 PM

�
Copyright�©�2010�The�International�Bank�for�Reconstruction�and�Development�/�The�World�Bank�1818�H�Street,�N.W.�Washington,�D.C.�20433,�U.S.A.�All�rights�reserved�Manufactured�in�the�United�States�of�America�First�Printing:�January�2010��
�Printed�on�recycled�paper�
1�2�3�4�� � � 13�12�11�10���World� Bank� Working� Papers� are� published� to� communicate� the� results� of� the� Bank’s� work� to� the�development�community�with�the�least�possible�delay.�The�manuscript�of�this�paper�therefore�has�not�been�prepared� in�accordance�with� the�procedures�appropriate� to� formally�edited� texts.�Some�sources�cited�in�this�paper�may�be�informal�documents�that�are�not�readily�available.��
The�findings,�interpretations,�and�conclusions�expressed�herein�are�those�of�the�author(s)�and�do�not� necessarily� reflect� the� views� of� the� International� Bank� for� Reconstruction� and�Development/The�World�Bank�and�its�affiliated�organizations,�or�those�of�the�Executive�Directors�of�The�World�Bank�or�the�governments�they�represent.��
The� World� Bank� does� not� guarantee� the� accuracy� of� the� data� included� in� this� work.� The�boundaries,�colors,�denominations,�and�other�information�shown�on�any�map�in�this�work�do�not�imply�any�judgment�on�the�part�of�The�World�Bank�of�the�legal�status�of�any�territory�or�the�endorsement�or�acceptance�of�such�boundaries.�
The�material�in�this�publication�is�copyrighted.�Copying�and/or�transmitting�portions�or�all�of�this�work� without� permission� may� be� a� violation� of� applicable� law.� The� International� Bank� for�Reconstruction� and� Development/The� World� Bank� encourages� dissemination� of� its� work� and� will�normally�grant�permission�promptly�to�reproduce�portions�of�the�work.�
For�permission�to�photocopy�or�reprint�any�part�of�this�work,�please�send�a�request�with�complete�information� to� the�Copyright�Clearance�Center,� Inc.,�222�Rosewood�Drive,�Danvers,�MA�01923,�USA,�Tel:�978�750�8400,�Fax:�978�750�4470,�www.copyright.com.�
All�other�queries�on�rights�and� licenses,� including�subsidiary�rights,� should�be�addressed� to� the�Office�of�the�Publisher,�The�World�Bank,�1818�H�Street�NW,�Washington,�DC�20433,�USA,�Fax:�202�522�2422,�email:�[email protected].���ISBN:�978�0�8213�8259�2�eISBN:�978�0�8213�8266�0�ISSN:�1726�5878� DOI:�10.1596/978�0�8213�8259�2��Library�of�Congress�Cataloging�in�Publication�Data�has�been�requested.����
WP_185_web_1-11-10.pdf 2WP_185_web_1-11-10.pdf 2 1/11/2010 1:39:19 PM1/11/2010 1:39:19 PM

iii
Contents�
Acknowledgments�.................................................................................................................�vii�Foreword�.................................................................................................................................�viii�Acronyms�and�Abbreviations�.................................................................................................�x�Executive�Summary�.................................................................................................................�xii�
Part�I:�Evolution�of�Intra�regional�Trade�in�Southeast�Europe:�The�Role�of�CEFTA�for�Enhancing�Regional�Trade�Integration�...............................................�1�Abstract�.......................................................................................................................................�2�1.�Introduction�............................................................................................................................�3�2.�Trade�Patterns�in�the�SEE�Region�.......................................................................................�5�
Patterns�and�Structure�of�Trade�Flows�in�SEE�................................................................�7�Decomposition�of�Intra�regional�Trade�.........................................................................�11�Intra��versus�Inter�industry�Trade�..................................................................................�15�Quality�of�Foreign�Trade�Statistics�for�the�Region�.......................................................�18�
3.�The�Role�of�Trade�Regulations,�Trade�related�Business�Environment,�and�Rules�of�Origin�in�Trade�Expansion�and�Integration�................................................�22�Technical�Regulations�and�Standards�............................................................................�22�Trade�Related�Business�Environment�............................................................................�29�Cost�and�Quality�of�Trade�Logistics�...............................................................................�35�Rules�of�Origin�..................................................................................................................�38�
4.�How�Are�Firms�Reacting�to�Regional�Trade�Integration?�............................................�41�The�Case�of�Agrokor�.........................................................................................................�41�The�Case�of�ArcelorMittal�................................................................................................�42�
5.�Conclusions�and�Recommendations�................................................................................�44�Annexes�.....................................................................................................................................�46�
Annex�I.A.�Trade�Structure�by�HS�2�Product�Category�in�2007�.................................�46�Annex�I.B.�Trade�Structure�by�HS�2�Product�Category�in�2008�..................................�48�Annex�I.C.�Net�Exports�to�CEFTA,�the�Top�and�Bottom�Five�HS�2�digit�Products�in�
2008�..............................................................................................................................�50�Annex�I.D.�Description�of�2�digit�HS�Categories�..........................................................�51�
Part�II:�Labor�Mobility�in�Southeast�Europe.........................................................�53�Abstract�.....................................................................................................................................�54�6.�Introduction�..........................................................................................................................�55�7.�CEFTA:�The�Setting�............................................................................................................�56�
Population�and�Labor�Force�............................................................................................�56�Economic�Growth�and�Employment�..............................................................................�58�
WP_185_web_1-11-10.pdf 3WP_185_web_1-11-10.pdf 3 1/11/2010 1:39:19 PM1/11/2010 1:39:19 PM

iv Contents
Migration�Patterns�............................................................................................................�61�The�Diaspora�.....................................................................................................................�64�Migrants’�Education�Levels�.............................................................................................�64�Migrant�Stocks�in�the�CEFTA�Countries�........................................................................�66�Irregular�Migration�...........................................................................................................�68�Remittances�........................................................................................................................�69�
8.�Labor�Mobility�Provisions�in�Free�Trade�Agreements�.................................................�71�Asia�Pacific�Economic�Cooperation�(APEC)�.................................................................�71�ASEAN�Free�Trade�Area�(AFTA)�...................................................................................�72�Caribbean�Community�(CARICOM)..............................................................................�72�East�Africa�Community�(EAC)�........................................................................................�74�Mercado�Comun�del�Sur�(Mercosur)�.............................................................................�75�North�American�Free�Trade�Agreement�(NAFTA)�......................................................�76�European�Union�(EU)�.......................................................................................................�76�Lessons�from�Labor�Mobility�Provisions�of�FTAs�........................................................�79�
9.�The�Benefits�(and�Costs)�of�Labor�Mobility�Provisions�...............................................�83�Overall�Production�and�Productivity�.............................................................................�83�The�Distribution�of�Benefits�and�Costs�..........................................................................�84�The�Transition�to�EU�Requirements�...............................................................................�86�
10.�Implementing�Mobility�in�CEFTA�.................................................................................�87�Migration�Management:�Alignment�with�the�EU�.........................................................�87�Informal�Economies�and�Work�Permits�.........................................................................�89�Credential�Recognition,�Social�Security,�Other�Issues�.................................................�90�
11.�Conclusions�........................................................................................................................�92�
Part�III:�The�Impact�of�Establishing�a�Virtual�Customs�Union�between�Southeast�Europe�and�the�European�Union�..........................................................�95�Abstract�.....................................................................................................................................�96�12.�Introduction�........................................................................................................................�97�13.�Customs�Union�versus�a�Virtual�Customs�Union......................................................�101�14.�Tariff�Profile�of�Southeast�Europe�...............................................................................�106�
The�Level�of�Adjustment�................................................................................................�107�15.�Estimates�of�Trade�Diversion�and�Trade�Creation�Due�to�Adoption�of�EU’s�CET�....�117�
Breakdown�of�Trade�Diversion�and�Creation�among�Trade�Partners�.....................�121�16.�Summary�and�Policy�Recommendations�....................................................................�125�
Appendix:�Consumer�Surplus�by�Product�and�Country�..................................�129�
References�.................................................................................................................�135�� �
WP_185_web_1-11-10.pdf 4WP_185_web_1-11-10.pdf 4 1/11/2010 1:39:19 PM1/11/2010 1:39:19 PM

Contents v
Tables�Table�2.1.�Key�Economic�and�Trade�Indicators�for�SEE�(2008)�............................................�6�Table�2.2.�Quarterly�Imports�from�CEFTA�Parties,�in�€�Million�.........................................�6�Table�2.3.�Intra�Regional�Exports�in�2008,�in�€�Million�.........................................................�8�Table�2.4.�Intra�regional�imports�in�2008,�in�€�Million�.........................................................�8�Table2.5.�Top�Five�Export�Products�(4�digit�SITC�level),�Share�in�Total�..........................�13�Table�2.6.�SEE’s�Export�Structure�to�CEFTA�and�EU�Partners�in�2007�.............................�14�Table�2.7.�Share�of�Intra�industry�Trade�for�the�SEE�Countries�........................................�16�Table�2.8.�Industries�(at�2�Digit�Product�Level)�with�Largest�Share�of�Intra�
industry�Trade�in�SEE�.....................................................................................................�17�Table�2.9.�SEE�Mirror�Gap�Statistics:�Difference�between�Imports�and�Exports�(in�
Percent)�..............................................................................................................................�18�Table�2.10.�Difference�between�Imports�and�Exports�(in�Percent)�for�2000–06�
Period�for�Selected�Trade�Relationships�.......................................................................�19�Table�3.1.�Progress�in�Convergence�to�EU�Standards�.........................................................�24�Table�3.2.�Number�of�Firms�Using�ISO�Standards�at�the�End�of�2007�..............................�25�Table�3.3.�Doing�Business�2010�Rankings�in�the�Area�of�Trade�........................................�31�Table�3.4.�BEEPS�2008�Results�................................................................................................�34�Table�3.5.�Logistics�Performance�Index�................................................................................�36�Table�7.1.�CEFTA�Population�Indicators:�2008,�2025�..........................................................�56�Table�7.2.�CEFTA:�Economically�Active�Population,�2005–2020�(thousands)�.................�57�Table�7.3.�CEFTA�Labor�Force�by�Education,�2001�07�........................................................�58�Table�7.4.�Diaspora�of�the�CEFTA�Countries�in�2000�..........................................................�65�Table�7.5.�Expatriate�Adults�in�the�OECD�Countries�by�Education:�2000�.......................�65�Table�7.6.�Migrant�Stock�in�CEFTA�Countries:�2000�(Percent)�..........................................�67�Table�7.7.�CEFTA�Diaspora�in�CEFTA�Countries:�(2000–05)�.............................................�68�Table�7.8.�Remittances’�Share�of�GDP:�2006�(percent)�........................................................�69�Table�10.1.�Intra�SEE�Visa�Requirements�.............................................................................�87�Table�10.2.�Shadow�Economy,�2002–03�(Percent�of�GDP)�..................................................�89�Table�13.1.�Southeast�Europe�and�Stabilization�and�Association�Agreements�.............�105�Table�14.1.�Summary�of�MFN�Applied�Tariff�Profiles�of�the�Western�Balkans�and�
the�EU,�Non�agricultural�Goods�(Percent�of�Tariff�Lines),�2007�..............................�106�Table�14.2.�Pre�Reform�and�After�Reform�Average�and�Weighted�Tariffs�....................�108�Table�14.3.�Albania:�Adjustment�to�EU’s�CET�...................................................................�109�Table�14.4.�Bosnia�and�Herzegovina:�Adjustment�to�EU’s�CET�......................................�110�Table�14.5.�Croatia:�Adjustment�to�EU’s�CET�....................................................................�110�Table�14.6.�Macedonia:�Adjustment�to�EU’s�CET..............................................................�111�Table�14.7.�Montenegro:�Adjustment�to�EU’s�CET�...........................................................�111�Table�14.8.�Serbia:�Adjustment�to�EU’s�CET�......................................................................�112�Table�14.9.�Albania:�Tariffs�and�Imports�by�Product�Groups�..........................................�112�Table�14.20.�Bosnia�and�Herzegovina:�Tariffs�and�Imports�by�Product�Groups�..........�113�Table�14.21.�Croatia:�Tariffs�and�imports�by�Product�Groups�.........................................�113�Table�14.22.�FYR�Macedonia:�Tariffs�and�Imports�by�Product�Groups�..........................�114�Table�14.23.�Montenegro:�Tariffs�and�Imports�by�Product�Groups�................................�114�Table�14.24.�Serbia:�Tariffs�and�Imports�by�Product�Groups�...........................................�115�Table�14.25.�EU:�Tariffs�and�Imports�by�Product�Groups�................................................�116�
WP_185_web_1-11-10.pdf 5WP_185_web_1-11-10.pdf 5 1/11/2010 1:39:20 PM1/11/2010 1:39:20 PM

vi Contents
Table�15.1.�Summary�of�Simulation�Results�(US$�millions)�............................................�119�Table�15.2.�Tariff�Revenue�in�SEE�(LCU�million)�..............................................................�120�Table�15.3.�Top�Exporting�Countries�to�the�Region�(US$�millions)�................................�122�Table�15.4.�Trade�Creation�....................................................................................................�122�Table�15.5.�Trade�Diversion..................................................................................................�123�Table�15.6�Impact�of�EU�SEE�Customs�Union�on�Intra�regional�Exports�(US$�million)�....�123�Figures�Figure�2.1.�Exports�of�CEFTA�Members�to�Other�Members,�in�US$�Million�....................�7�Figure�2.2.�Intra�regional�Imports�by�HS�2�Digit�Product�Category�..................................�9�Figure�2.3.�Decomposition�of�Export�Growth�of�CEFTA�Countries:�2000–07�.................�11�Figure�2.4.�Decomposition�of�Export�Growth�in�SEE�by�Sub�period,�2000–04�(Top)�
and�2004–07�(Bottom)�......................................................................................................�12�Figure�2.5.�EU�10’s�IIT�Share�..................................................................................................�16�Figure�2.6.�Trade�between�Bosnia�and�Herzegovina�and�Croatia�.....................................�20�Figure�3.1.�Share�of�Agriculture�Exports�and�Imports�in�Total�to�CEFTA�in�2008�.........�27�Figure�3.2.�WEF’s�Enabling�Trade�Index�2009�.....................................................................�33�Figure�3.3.�Trade�Logistics�Performance,�SEE�and�EU�10�Countries�................................�36�Figure�3.4.Association�of�Trade�Logistics�Performance�and�Diversification�of�Exports�......�37�Figure�7.1:�GDP�Per�Capita�2007�(PPP�International�Dollars)�...........................................�58�Figure�7.2.�Indices�of�Total�Employment�(2003=100)�..........................................................�59�Figure�7.3.�Unemployment�Rates�2006�.................................................................................�60�Figure�7.4.�Unemployment�Rates�among�Males,�Females,�and�Youths�...........................�60�Figure�7.5.�Net�Migration�Rates�1950–2005�..........................................................................�61�Figure�7.6.�Refugee�Population�from�Bosnia�and�Herzegovina�........................................�62�Figure�7.7.�Migrant�Stock�as�Percent�of�Population�............................................................�66�Figure�7.8.�Gross�Remittance�Receipts�per�Capita�US$�......................................................�69�Figure�13.1.�Turkey’s�Exports�and�Imports�1986–2008�(US$�millions)�...........................�104�Boxes�Box�2.1.�The�“New”�CEFTA�.....................................................................................................�5�Box�2.2.�The�Impact�of�the�Crisis�on�Trade�Flows�in�SEE�...................................................�10�Box�2.3.�Inter�industry�and�Intra�industry�Trade�................................................................�15�Box�3.1.�How�Technical�Standards�and�Regulations�Can�Be�an�Obstacle�to�Trade�........�23�Box�3.2.�CEFTA�on�Technical�Barriers�to�Trade�..................................................................�26�Box�3.3.�Import�Restricting�Measures�between�Bosnia�and�Herzegovina,�Croatia,�and�
Serbia�..................................................................................................................................�29�Box�3.4.�Single�Customs�Window�in�FYR�Macedonia�........................................................�32�Box�3.5.�Logistics�Costs�in�Albania�........................................................................................�37�Box�3.6.�The�Benefits�of�Diagonal�Cumulation�....................................................................�38��
WP_185_web_1-11-10.pdf 6WP_185_web_1-11-10.pdf 6 1/11/2010 1:39:20 PM1/11/2010 1:39:20 PM

vii
Acknowledgments�
his� paper� consists� of� three� reports.� The� first� report,� “Evolution� of� Intra�regional�Trade� in� Southeast� Europe:� The� Role� of� CEFTA� for� Enhancing� Regional� Trade�
Integration,”�was�written�by�Borko�Handjiski�(World�Bank).�The�second�report,�“Labor�Mobility� in� Southeast� Europe,”� was� prepared� by� professors� Robert� Lucas� (Boston�University)�and�Philip�Martin�(UC�Davis).�The�last�report,�“The�Impact�of�Establishing�a�Virtual�Customs�Union� between� Southeast� Europe� and� the� European�Union,”�was�written� by� Selen� Sarisoy�Guerin� (Vrije�Universiteit� Brussel� and�Centre� for� European�Policy�Studies).�Peer�reviewers�for�the�first�report�were�Leopoldo�Rubinacci�(European�Commission,� DG� Trade),� Juan� Sebastaian� Saez� (World� Bank,� International� Trade�Department),�and�Renata�Vitez�(CEFTA�Secretariat).�Peer�reviewers�for�the�other�two�reports� were� Vladimir� Gligorov� (The� Vienna� Institute� for� International� Economic�Studies),� Juan�Sebastaian�Saez� (World�Bank),�and�Trpe�Stojanovski� (MARRI�Regional�Centre).�Their�comments�and�suggestions�are�gratefully�acknowledged.�The�paper�also�benefited� from� the� comments� of� World� Bank� staff� including� Bernard� Funck,� Vesna�Kostic,�Matija�Laco,�and�Sanja�Madzarevic�Sujster.�
The� work� on� the� last� two� reports� was� initiated� by� Sanjay� Kathuria� and� was�financed�by� the�governments�of�Finland,�Norway,�Sweden,�and� the�United�Kingdom�through�a�contribution�from�the�Multi�Donor�Trust�Fund�for�Trade�and�Development.�
����
T
WP_185_acknow_1-14-2010.pdf 1WP_185_acknow_1-14-2010.pdf 1 1/14/2010 5:43:19 PM1/14/2010 5:43:19 PM

viii
Foreword��
he� Southeast� Europe� (SEE)� region� comprises� a� group� of� countries� at� a� relatively�similar� stage� of� economic� development� and� with� a� common� objective,� and�
prospect,�of�becoming�members�of�the�European�Union�(EU).�To�achieve�the�goal�of�EU�membership,� the�countries�of� the�region�have�pursued�closer� integration�with�the�EU�as� well� as� with� each� other.� Numerous� regional� cooperation� initiatives� have� been�introduced�in�several�areas,� including�aviation,�energy,�and�railways,�but�the�greatest�progress�has�been�made�in�trade�integration.�In�December�2006,�the�SEE�countries�and�Moldova� signed� the� Central� European� Free� Trade� Agreement1� (CEFTA),� a�comprehensive� free� trade� agreement� (FTA)� that� aims� to� fully� liberalize� trade� in� the�region� as�well� as� to� achieve� greater� cooperation� in� a� number� of� trade�related� areas,�such�as�investment,�services,�public�procurement,�and�intellectual�property�rights.�
This�paper�is�part�of�the�World�Bank’s�efforts�to�understand�the�impact�of�CEFTA�on� regional� trade� flows,� as�well� as� to� put� forward� other,� complementary,� ideas� that�could�enhance�further�regional�trade�integration.�It�builds�on�previous�analytical�work�done� by� the�World� Bank� in� this� area,� and� in� particular� on� the� book� “Western� Balkan�Integration�and�the�EU:�Agenda�for�Trade�and�Growth”�(Kathuria,�2008).��
The�paper�includes�three�studies.�The�first�one�looks�at� intra�regional�trade�flows�and�the�remaining�nontariff�barriers�to�trade�in�the�region�(in�particular�in�those�areas�that�are� included�in�CEFTA).�The�other�two�studies� introduce�two�ideas� that�have�so�far�not�received�sufficient�attention�from�policy�makers�in�the�region:�(i)�to�allow�free�movement� [of� certain� categories]� of� skilled� labor�within� the� region,� and� (ii)� to� adopt�EU’s�Common�External�Tariff�as�a�measure�to�prevent�trade�diversion�and�to�prepare�for�EU�integration.�
We� believe� the� findings� merit� close� attention� and� provide� solid� arguments� for�policy�action.� Intra�regional� trade�has� increased�rapidly� in�recent�years;�however,� the�amount�and�content�of�trade�flows�do�not�signal�significant�trade�integration,�such�as�the�countries�of�Central�and�Eastern�Europe�achieved�in�the�past�decade.�Following�the�tariff� liberalization,� nontariff� barriers� have� become� the�main� obstacles� for� trade� and,�therefore,�the�focus�should�now�shift�to�eliminating�those�barriers.�Enhanced�regional�trade� integration� should�not� be� confined� only� to� free�movement� of� goods.� Increased�labor�mobility�(a�key�pillar�of�the�EU)�could�also�have�trade�creation�effects�and�could�help� create� a� regional�market� able� to� attract� greater� foreign� investment.�Last� but�not�least,� tariff� structures� in� many� countries� of� the� region� allow� some� scope� for� trade�diversion�in�favor�of�EU�and�CEFTA�countries�at�the�expense�of�the�rest�of�the�world.�Such�trade�diversion�could�be�reduced�by�adopting�the�EU’s�Common�External�Tariff�structure.�This�would�also�help�the�SEE�countries�to�prepare�for�EU�accession.�� �
T
WP_185_web_1-11-10.pdf 8WP_185_web_1-11-10.pdf 8 1/11/2010 1:39:20 PM1/11/2010 1:39:20 PM

Foreword ix
�
This�paper�comes�at�an�important�point�of� the�region’s�development,�and�should�guide�policy�makers� in�defining�policy� actions� that�will� help� their� countries� unleash�their�trade�potential�as�well�as�prepare�them�for�EU�membership.�
�Bernard�Funck,�
Sector�Manager,�Europe�and�Central�Asia�The�World�Bank�
Notes�1� Also� called� CEFTA� 2006� (to� differentiate� from� the� original� agreement� signed� by� the� Central�European�countries�in�the�early�1990s).�
WP_185_page_ix_with_sig_1-14-2010.pdf 1WP_185_page_ix_with_sig_1-14-2010.pdf 1 1/14/2010 3:09:48 PM1/14/2010 3:09:48 PM

x
Acronyms�and�Abbreviations�
ABTC� Apec�Business�Travel�Card�AFTA� Asean�Free�Trade�Area�APEC� Asia�Pacific�Economic�Cooperation�BEEPS� Business�Environment�and�Enterprise�Performance�Survey�BiH� Bosnia�and�Herzegovina�CARICOM� Caribbean�Community�CEFTA� Central�European�Free�Trade�Agreement�CIS� Commonwealth�of�Independent�States�COMESA� Common�Market�for�Eastern�and�Southern�Africa�CSME� Caricom�Single�Market�and�Economy�DCO� Diagonal�cumulation�of�origin�EAC� East�Africa�Community�ECA� Europe�and�Central�Asia�ECJ� European�Court�of�Justice�ECOWAS� Economic�Community�of�Western�African�States�EFTA� European�Free�Trade�Area�EN� European�Standard�EPL� Employment�Protection�Legislation�ETI� Enabling�Trade�Index�EU� European�Union�FDI� foreign�direct�investment�FTA� free�trade�agreement�FYR�� Former�Yugoslav�Republic�GDP� gross�domestic�product�ICMPD� International�Centre�for�Migration�Policy�Development�ICT� information�and�communication�technologies�IIT� Intra�Industry�Trade�ILO� International�Labour�Organization�IOM� International�Organization�for�Migration�MARRI� Migration,�Asylum,�Refugees,�Regional�Initiative�MERCOSUR� Mercado�Comun�del�Sur�MFN� most�favored�nation�MOI� Croatian�Ministry�of�Interior�NAFTA� North�American�Free�Trade�Agreement�NTB� nontariff�barriers�OECD� Organization�for�Economic�Cooperation�and�Development�SAA� Stabilization�and�Association�Agreements�SEE� Southeast�Europe�SITC� Standard�International�Trade�Classification�SMART� Software�for�Market�Analysis�and�Restrictions�on�Trade�SMEs� small�and�medium�sized�enterprises�
WP_185_web_1-11-10.pdf 10WP_185_web_1-11-10.pdf 10 1/11/2010 1:39:20 PM1/11/2010 1:39:20 PM

Acronyms and Abbreviations xi
�
SPS� sanitary�and�phytosanitary�TBT� technical�barriers�to�trade�UNCTAD� United�Nations�Conference�on�Trade�and�Development�UNHCR� United�Nations�High�Commissioner�for�Refugees�U.S.� United�States�VAT� value�added�tax�WEF� World�Economic�Forum�WTO� World�Trade�Organization� �
WP_185_web_1-11-10.pdf 11WP_185_web_1-11-10.pdf 11 1/11/2010 1:39:21 PM1/11/2010 1:39:21 PM

xii
Executive�Summary�
he� Southeast� Europe� (SEE)� region� comprises� a� group� of� countries� at� a� relatively�similar� stage� of� economic� development� and� with� a� common� objective,� and�
prospect,�of�becoming�members�of�the�European�Union�(EU).�To�achieve�the�goal�of�EU�membership,� the�countries�of� the�region�have�pursued�closer� integration�with�the�EU�as�well�as�with�each�other.�Regional�cooperation�has�been�focused�on�areas�that�aim�to�promote� greater� economic� ties� among� the� countries.� A� multilateral� free� trade�agreement,� CEFTA,� was� concluded� in� December� 2006� to� achieve� the� pursuit� of�economic� integration.� This� agreement� is� very� comprehensive� and� aims� to� enhance�collaboration� in� several� trade�related� areas.� In� addition� to� the� fulfilling� the�commitments�of�CEFTA,�the�SEE�countries�could�consider�additional�policies�to�foster�trade�integration.�
Intra-regional Trade Patterns and Constraints
As� discussed� in� Part� I� of� this� paper,� intra�regional� trade� performance� in� Southeast�Europe� has� improved� considerably� in� recent� years.� The� increased� trade� flows� have�been� a� result� of� formal� trade� liberalization� (first� through� bilateral� FTAs� and� later�through�CEFTA)�and�of�trade�facilitation�measures.�The�trade�expansion�in�this�decade�had�led�to�trade�deepening�with�one�fifth�of�the�trade�increase�coming�from�new�trade�relationships.� So� far,� trade� liberalization� has� been� by� and� large� confined� to�manufactures,�but�these�early�successes�should�embolden�CEFTA�members�to�expand�their�efforts�to�agriculture�and�services.�
Despite� the� significant� increase� in� trade,� its� structure� does� not� signal� significant�trade�integration.�Commodities�continue�to�dominate,�and�intra�industry�trade�remains�low�compared�to�intra�industry�trade�performance�in�the�EU�10�countries�(now�as�well�as�in�the�period�prior�to�joining�the�EU).�
Growth�in�trade�within�the�region�was�even�stronger�in�2008,�following�the�entry�of�CEFTA�into�force,�though�of�course�this�cannot�be�fully�attributed�to�the�Agreement.�As�a�matter�of�fact,�the�most�important�novelty�of�the�Agreement,�in�addition�to�the�full�liberalization� of� trade� in� manufactured� goods,� is� the� inclusion� of� other� areas� of�cooperation�such�as�technical�barriers�to�trade,�rules�of�origin,�competition�rules,�public�procurement,�intellectual�property�rights,�and�so�forth.�CEFTA�also�establishes�a�well�defined� dispute� resolution� mechanism� and� it� is� important� to� ensure� that� the�Agreement�is�well�implemented�or�that�possible�disputes�could�be�efficiently�resolved.�Otherwise,�disappointments�are�inevitable,�as�has�happened�under�the�bilateral�FTAs,�which�are�often�not�properly�implemented�for�a�number�of�reasons.�
The� report� assesses� the� progress� and� challenges� on� some� of� the�most� important�constraints�to�greater�trade�integration�in�the�region.�It�finds�that,�with�the�abolishment�of� tariffs�and�quotas,� technical� regulations,�and�standards�have�become�an� important�constraint� on� trade� and� greater� collaboration� is� required� to� reduce� these� barriers.� In�this� regard,� the� harmonization� and� international� recognition� of� the� quality� of�infrastructure�in�SEE�is�vital�for�further�promoting�regional�trade.�
T
WP_185_web_1-11-10.pdf 12WP_185_web_1-11-10.pdf 12 1/11/2010 1:39:21 PM1/11/2010 1:39:21 PM

Executive Summary xiii
�
The� trade�related� environment� continues� to� include� policy�induced� barriers� that�prevent� further� development� of� intra�regional� (and� broader)� trade.� The� report� finds�that� most� SEE� countries� have� made� significant� progress� on� the� trade� facilitation�agenda,�but�have�yet�to�fully�catch�up�with�the�more�advanced�European�reformers�on�number�of�trade�related�issues,�as�evidenced�by�global�or�regional�surveys�and�reports�such� as� the� Doing� Business� report,� the� Business� Environment� and� Enterprise�Performance� Survey� (BEEPS),� Enabling� Trade� Index,� and� the� Logistics� Performance�Indicators.�While�no�particular�area�can�be� identified�as�a�binding�constraint� to� trade�per� se,� addressing� these� constraints� could� reduce� the� overall� costs� of� trading� and�promote�export�growth.�The�case�studies�of�two�regional�firms�confirm�the�findings�of�the�global�surveys�and�report.�
In�this�context,�implementation�first,�then�deepening�of�the�CEFTA�agreement�will�help�the�SEE�countries’�EU�accession�prospects.�All�countries�in�the�region�are�strongly�committed�to�becoming�members�of�the�European�Union.�Even�though�the�timeframe�for�joining�the�EU�is�uncertain�and�probably�varies�among�the�countries,�once�the�SEE�countries� join,� their� economies� will� be� fully� integrated� into� the� EU’s� Single�Market.�Hence,�creating�a�more�unified�regional�economic�space�prior�to�becoming�part�of�the�EU�will�have�multiple�benefits:�(i)�firms�will�be�better�able�to�cope�with�the�competitive�pressures�within�the�Union;�(ii)�national�administrations�will�have�gained�experience�in�regional�cooperation,�which�is�essential�for�well�functioning�within�the�EU;�and�(iii)�by�converging� towards� EU� standards,� the� countries�will� sooner� achieve� alignment�with�the�EU�acquis�in�these�areas.�
The Benefits of Skilled Labor Mobility
Part�II�of�this�paper�is�motivated�by�World�Bank�recommendations�(Kathuria,�2008,�p.�22)� that� urge� CEFTA� member� states� to� “negotiate� an� agreement� on� preferential�liberalization�of�professional�services�that�focuses�on�the�movement�of�natural�persons�[beginning�with]�mutual� recognition�of�professional�qualifications� [and�extending]� to�all�labor,�skilled�or�unskilled…”�to�deepen�economic�integration.�
The� original� CEFTA� came� into� force� in� 1994,� but� all� states� that� were� members�before�2003�exited�CEFTA�upon�gaining�accession�to�the�EU.�There�are�currently�eight�CEFTA� members:� the� Republic� of� Albania,� Bosnia� and� Herzegovina,� Republic� of�Croatia,�Kosovo,� the�Former�Yugoslav�Republic�of�Macedonia,�Republic�of�Moldova,�Montenegro,�and�the�Republic�of�Serbia.�All�parties,�except�Moldova,�aspire�and�expect�to� join� the�EU.�Croatia�and�FYR�Macedonia�are�most�advanced� in� this�process,�while�the�others�are�considered�potential�EU�candidates�(Montenegro�and�Albania�submitted�membership�applications� in�2009).� In�2003,�EU� leaders�said� that�“the�Western�Balkan�countries� will� become� an� integral� part� of� the� EU,� once� they� meet� the� established�criteria.”�(Thessaloniki�European�Council,� June�19�20,�2003).� It� is� important�to�see�the�issue� of� labor� mobility� among� CEFTA� members� in� the� context� of� eventual� EU�membership�and�freedom�of�movement,�a�cornerstone�of�the�EU.1��
Many� FTAs,� including� with� the� EU,� allow� and� sometimes� encourage� labor�mobility� among� member� countries.� A� review� of� the� mobility� provisions� of� FTAs�indicates�a�number�of�common�features:�
WP_185_web_1-11-10.pdf 13WP_185_web_1-11-10.pdf 13 1/11/2010 1:39:21 PM1/11/2010 1:39:21 PM

xiv Executive Summary
�
� Labor�mobility�often�comes�into�force�with�considerable�time�lag,�often�several�years�after�free�trade�in�goods.�
� Implementation� of�mobility� provisions� is� generally� far� less� complete� among�the� developing� countries;� most� lack� institutions� to� which� individuals� who�believe�their�mobility�rights�were�violated�can�appeal.�
� Labor�mobility�agreements,�as�with�free�trade�agreements,�can�be�bilateral�or�multilateral.� Most� FTAs� are� regional,� involving� neighboring� countries.�Countries� that�are�members�of�more� than�one� free�trade�grouping�often� find�progress� toward� labor� mobility� more� complex.� In� any� event,� liberalizing�freedom�of�movement� between� two� countries� requires� consideration� of� so�called�“third�country�nationals.”�
� It�is�easier�to�negotiate�agreements�to�liberalize�skilled�labor�migration�because�the� numbers� are� relatively� small,� the� economic� and� public� finance� gains� to�receiving�countries�may�be�greater,�and�skilled�workers�may�generate�positive�externalities�such�as�innovation�where�they�live.�
� Some� FTAs� such� as�NAFTA� limit� free�movement� to� highly� skilled�workers,�while�others�encompass�a�wider� range�of� skill� categories.�Movement� toward�mutual� recognition� of� qualifications� is� important� for� mobility� of� skilled�workers.�
� The�distribution�of�economic�benefits� from�free� labor�mobility�provisions�are�not�equally�spread�across�member�countries�or�within�each�country.�
� Lack�of�portability�of�pensions�and�health�and�similar�benefits�may�discourage�workers� from�working�abroad�and�returning;�portability� is�an� issue� in�many�labor� mobility� negotiations.� Posted� workers� employed� by� a� home�country�employer� abroad� are� less� affected� by� portability� issues� because� they� remain�covered�by�home�country�benefit�systems.�
� There� is�sometimes� less�migration�than�anticipated�under� free� labor�mobility�provisions,�reflecting�issues�with�information�about�jobs,�language�differences,�credentials�recognition,�and�lack�of�access�to�public�sector�employment.�
All� CEFTA�member� countries� have� substantial� experience�with� labor�migration.�Most� have� diasporas� that� send� home� significant� remittances.� Estimates� of� migrant�stocks�and�flows�vary�considerably�reflecting�different�definitions,�extensive�irregular�migration,�and�widespread�dual�nationality.�Perhaps�up�to�a�third�of�the�diaspora�from�Bosnia�and�Herzegovina�is�residing�in�other�CEFTA�states.�The�size�of�the�diaspora�is�much�lower�and�its�distribution�is�different�for�the�other�CEFTA�states,�reflecting�more�migration� to� the� EU.� Moldova� remains� relatively� isolated� from� this� intra�CEFTA�mobility,� since� most� Moldovan� migrants� move� to� Commonwealth� of� Independent�States�(CIS)�and�EU�countries.�All�of�the�CEFTA�countries�except�FYR�Macedonia�and�Montenegro�require�Albanians�to�obtain�visas�for�visits.�
The� combined� population� of� the� eight� CEFTA�member� countries� is� less� than� 28�million,� slightly�more� than�Romania.�Enhancing� labor�mobility�within� the�region�can�exploit� scale�economies,� increasing�productivity�and�attracting� foreign� investment.� In�turn,�these�factors�can�enhance�the�region’s�competitiveness�in�international�trade.�
Most� of� the� CEFTA� countries� were� part� of� the� Socialist� Federal� Republic� of�Yugoslavia,� which� began� disintegrating� in� the� 1990s.� Achieving� freer� labor�mobility�
WP_185_web_1-11-10.pdf 14WP_185_web_1-11-10.pdf 14 1/11/2010 1:39:21 PM1/11/2010 1:39:21 PM

Executive Summary xv
�
among�the�ex�Yugoslav�republics�should�be�expedited�by�similarities�in�education�and�credential�systems�and�patterns�of�pre�independence�migration,�but�may�be�slowed�by�high� unemployment� and� under�employment� (Iara� and� Vidovic,� 2009;� Fetsi,� 2007),�lingering�hostilities� from�1990s�armed�conflicts,�and�newly�erected�migration�barriers�in�evolving�migration�systems�and�other�changes.�
Trying� to� formalize� low�skilled� irregular� migration� via� guest� worker� programs,�before� labor�markets� are�made�more� flexible� and� informal� economies� curbed,� could�reduce� labor� migration� and� reduce� some� of� the� flexibility� that� migrants� currently�provide.�
Professionals�and�skilled�workers�are�less�likely�to�migrate�to�neighboring�Balkan�countries� in� an� irregular� status,� justifying� government� efforts� to� foster� skilled� labor�mobility.�Specific�steps�to�promote�skilled�labor�migration�might�include:�
� encouraging� student� migration,� allowing� foreign� students� to� work� while�studying�and�graduates�to�seek�employment�with�minimal�bureaucracy,�as�in�the�EU�
� allowing�CEFTA�employers�to�offer�jobs�to�CEFTA�nationals�who�have�at�least�one�university�degree�without�a�labor�market�test,�as�in�NAFTA,�where�a�job�offer�and�proof�of�citizenship�and�credentials�allows�issuance�of�an�indefinitely�renewable�work�and�residence�visa�
� promoting�intra�company�transfers�by�allowing�firms�with�branches�in�several�CEFTA�countries�to�transfer�workers�between�them�with�minimal�formalities,�the�part�of�the�GATS�trade�in�services�negotiations�that�has�received�the�most�liberalizing�offers.2��
Over�time,�guest�worker�programs�may�then�be�created�and�expanded�that�allow�the�admission�of�CEFTA�workers�to�fill�seasonal� jobs� in�other�CEFTA�member�states,�extending�such�programs�to�encompass�a�wider�range�of�workers�and�jobs.�
EU� accession� will,� in� any� case,� eventually� require� development� of� such�mechanisms.�It�may�therefore�behoove�the�CEFTA�states�to�bring�their�migration�and�permit�systems�into�line�with�the�EU�standards,�implementing�these�among�themselves�initially,�either�on�a�multilateral�or�bilateral�basis.�
Reducing External Tariffs by Adopting EU’s Common External Tariff
Even� though� SEE’s� exports� have� been� increasing� steadily,� both� intra�� and� extra�regional�exports�remain�below�potential.�In�addition�to�this�they�remain�fragile�as�they�heavily�depend�on�a� few�items,�mainly�commodities.�The�aim�of� the� final�part�of� the�paper� is� to�establish� the�costs�and�benefits�of�adopting�EU’s�CET� in�order� to� identify�whether� this� can� be� the� right� policy� option� for� SEE� countries� in� order� to� encourage�export�led�growth.�
First,�the�tariff�structure�of�each�SEE�country�is�examined�in�detail�and�compared�to�that�of�EU.�After�such�a�reform,�the�region’s�simple�average�tariff�would�be�reduced�from�5.1�percent� to�2.3�percent�and� the� trade�weighted�average� tariff� from�4.7�percent� to�2.2�percent.�Among�the�SEE�countries,�Serbia�will�go�through�the�most�ambitious�adjustment�process� due� to� its� higher� average� tariffs� and� tariff� dispersions.� On� the� other� extreme,�Croatia�will�require�the�least�effort�to�adopt�EU’s�CET�thanks�to�its�advanced�status�as�an�EU�candidate�country.�
WP_185_web_1-11-10.pdf 15WP_185_web_1-11-10.pdf 15 1/11/2010 1:39:22 PM1/11/2010 1:39:22 PM

xvi Executive Summary
�
Second,�the�costs�and�benefits�of�adopting�EU’s�CET�are�quantitatively�estimated�by�making�use�of�traditional�concepts�of�trade�diversion�and�creation.�The�estimation�tools�used�include�a�partial�equilibrium�model�of�SMART�developed�by�UNCTAD�and�the� World� Bank.� The� results� indicate� that� the� impact� of� this� trade� reform� will� be�positive�with�net�trade�creation�in�the�magnitude�of�US$998.9�million�for�the�region,�an�increase� of� 4.3� percent� from� pre�reform� import� levels.� Even� though� imports� will�increase�significantly,�the�net�effect�of�adopting�the�EU’s�CET�will�result�in�revenue�loss�roughly� half� of� the� gains� from� trade� creation,� that� is,that� is,� US$459.7� million.� The�consumer�surplus,�which�will�result�from�reducing�the�deadweight�loss�from�tariffs,�is�a� modest� US$51.7� million.� The� overall� net� effect� of� CET� amounts� thus� to� US$590.9�million,�roughly�1�percent�of�SEE’s�combined�GDP.�
Another� observation� one� can� make� based� on� the� simulation� results� is� that� all�countries� will� be� able� to� diversify� their� trade� to� other� countries� outside� the� region.�Although�several�EU�member�states�are�among�the�top�10�export�partners,�China,�the�Russian� Federation,� the�United� States,� and�Turkey� are� set� to� gain� significant�market�share�in�the�SEE�market�as�a�results�of�trade�creation.�The�impact�of�adopting�CET�is�going�to�have�a�negative�effect�on�intra�regional�exports.�Nevertheless,�the�decrease�in�intra�regional�exports�(that�is,�trade�diversion)�is�a�re�adjustment�and�only�amounts�to�0.1�percent�of�GDP.�
If�the�SEE�countries�decide�to�proceed�with�adopting�the�EU’s�CET�unilaterally�and�individually,�political� resistance�may�arise� against� such�a�measure� in� those� countries�where� the� tariff� revenue� loss� is� the� highest.� A� committee� could� be� established� to�compensate� those� countries� that� are� most� dependent� on� customs� import� duties� as�revenue,� for�a� temporary�period�of�adjustment� (for� example,� five�years).�Although� it�may� be� difficult� for� the� SEE� countries� to� pool� their� sovereignty� over� ‘most’� of� their�trade� policy,� it� should� be� politically� easier� to� adopt� the� EU’s� CET,� an� external�benchmark.�As�all�countries�in�the�region�have�a�clear�EU�vocation,�adopting�the�EU’s�CET�would�bring�them�closer�to�EU�membership.��
Notes�1�Moldova�is�not�considered�for�EU�membership�and�has�limited�economic�inter�linkages�with�the�remaining�CEFTA�states,�and�will�be�excluded�from�explicit�discussion�in�the�remainder�of�this�report.��2� Under� GATS�Mode� 4,� intra�company� transfers� are� often� limited� to� managers,� workers� with�specialized�skills,�and�sometimes�trainees�who�have�been�employed�by�the�multinational�firm�at�least�a�year�(Martin,�Abella,�and�Kuptsch,�2005).�
WP_185_web_1-11-10.pdf 16WP_185_web_1-11-10.pdf 16 1/11/2010 1:39:22 PM1/11/2010 1:39:22 PM

1
���
�
Part�I�
Evolution�of�Intra�regional�Trade�in�Southeast�Europe:�The�Role�of�CEFTA�for�Enhancing�Regional�
Trade�Integration�
Borko�Handjiski,�World�Bank���
WP_185_web_1-11-10.pdf 17WP_185_web_1-11-10.pdf 17 1/11/2010 1:39:22 PM1/11/2010 1:39:22 PM

2
Abstract�
he�countries�of�Southeast�Europe,�and�Moldova,�signed�the�Central�European�Free�Trade� Agreement� (CEFTA)� in� 2006.� CEFTA� 2006� is� a� comprehensive� free� trade�
agreement�that�aims�to�fully�liberalize�trade�in�the�region�as�well�as�to�address�various�nontariff� barriers� to� trade.� It� also� promotes� cooperation� in� other� trade�related� areas,�such�as�investment,�services,�public�procurement,�and�intellectual�property�rights.�
This� study� aims� to� assess� the� impact� of�CEFTA�on� regional� trade� integration,� as�well�as�to�analyze�the�remaining,�nontariff,� impediments�to�trade�in�the�region.�Intra�regional� trade�performance� in�Southeast�Europe�has� improved�considerably� in�recent�years.� Growth� in� trade� was� particularly� strong� in� 2008,� though� this� is� a� result� of�numerous� factors� in� addition� to� the� entry� of� CEFTA� in� to� force,� such� as� trade�facilitation�measures.�The�trade�expansion�in�recent�years�had�led�to�trade�deepening.�However,� despite� the� significant� increase� in� trade,� its� structure� does� not� signal�significant� trade� integration.� Commodities� continue� to� dominate,� and� intra�industry�trade�remains�low.�
The� report� also� finds� that,� with� the� abolishment� of� tariffs� and� quotas,� technical�regulations,�and�standards�have�become�an�important�constraint�on�trade�and�greater�collaboration�is�required�to�reduce�these�barriers.�In�this�regard,�the�harmonization�and�international� recognition� of� the� quality� of� infrastructure� in� SEE� is� vital� for� further�promoting�regional� trade.�The�trade�related�environment�continues�to� include�policy�induced� barriers� that� prevent� further� development� of� intra�regional� (and� broader)�trade.�The�report�finds�that�most�SEE�countries�have�made�significant�progress�on�the�trade� facilitation� agenda,� but� are� yet� to� fully� catch� up� with� the� more� advanced�European� reformers� on� number� of� trade�related� issues.� The� case� studies� of� two�regional�firms�confirm�the�findings�of�the�global�surveys�and�report.�
�
T
WP_185_web_1-11-10.pdf 18WP_185_web_1-11-10.pdf 18 1/11/2010 1:39:22 PM1/11/2010 1:39:22 PM

3
CHAPTER �1 �
Introduction�
ountries� of� the� Southeast� Europe1� (SEE)� region� have� witnessed� significant�economic� improvement� since� the� beginning� of� their� transition� to� market�
economies�in�the�early�1990s.�Growth�has�been�particularly�strong�in�the�past�six�years,�but�still�lower�than�in�other�fast�growing�countries�in�the�East�Asia�and�Baltic�regions,�or� some� of� the� other� new� member� states� of� the� EU.� So� far,� trade� (exports)� have�contributed� little� to� the� growth� story,� and� for� small� countries� such� as� those� in� SEE,�sustainable�growth�should�be�export�led�as�small�countries�gain�more�than�larger�ones�from� trade�induced� expansion� in�market� size� (see� Kathuria,� 2008).� For� example,� the�Central� and� Eastern� Europe� countries,� and� other� countries� such� as� Chile,� have�successfully�followed�export�driven�growth�strategies.��
The� benefits� of� increased� trade� have� been� well� acknowledged� in� the� economic�literature.� The� fastest�growing� developing� countries� have� also� achieved� impressive�export�performances.�This�is�especially�the�case�for�small�economies,�which�are�able�to�take� advantage� of� the� economies� of� scale� from� accessing,� or� being� part� of,� larger�markets.� In� addition,� greater� trade� generates� gains� from� factor� reallocations,� reduces�macro�volatility,�and�stimulates�innovation�through�absorption�of�foreign�technologies�(see�Hallaky�and�Sivadasanz,� 2009).�A� study�by�Gorodnichenko,� Svejnar,� and�Terrell�(2009)� on� the� transition� economies� confirms� that� exporting� and� importing� induces�innovation,�which�in�turns�improves�productivity�and�competitiveness.�Fernandes�and�Paunov�(2009)�show�that�trade�can�also�benefit�the�non�exporting�sector;�they�find�that�import� competition� has� positive� effects� on� product� quality,� especially� for� non�exporting� producers.� Last� but� not� least,� trade� could� improve� consumer� welfare� by�allowing�for� lower�prices�of� imported�products�and� lower�firm�costs�by�reducing�the�prices�of�imported�inputs.�
Deepening� trade� among� the� SEE� economies� would� bring� both� economic� and�political� benefits� to� the� region.� The� region� comprises� seven� small� economies� (with� a�population� and� nominal� GDP� lower� than� that� of� neighboring� Romania)� that� could�benefit�from�creating�a�larger�economic�space�as�this�would�create�economies�and�scale�for� production� and� increase� their� attractiveness� for� foreign� investment.� The� region,�excluding�Albania,�was�a�single�country�for�almost�five�decades�and�some�of�the�legacy�from� this� economic� integration� remains� despite� the� negative� economic� and� political�shocks�of� the�mid�1990s.�Last�but�not� least,�all�countries� in� the�region�aim�to�become�part� of� the� EU� and� its� Single�Market� of� goods,� people,� capital,� and� services.� In� this�regard,� by� enhancing� regional� trade� integration� prior� to� EU� membership,� the�economies� would� be� better� prepared� to� face� the� competitive� pressures� of� the� EU’s�Single�Market.�
C
WP_185_web_1-11-10.pdf 19WP_185_web_1-11-10.pdf 19 1/11/2010 1:39:22 PM1/11/2010 1:39:22 PM

4 World Bank Working Paper
�
Enhancing� trade� performance� has� three� dimensions:� greater� presence� in� global�trade,�trade�integration�with�the�EU,�and�enhanced�regional�trade.�This�report�aims�to�focus� on� the� latter� dimension,� and� will� look� at� trade� performance� in� SEE� mostly�through�the�prism�of�the�CEFTA�2006�Agreement.2��
The�purpose�of�this�study�is�twofold:�(i)�to�present�recent�trends�in�intra�regional�trade�in�SEE,�in�particular�following�the�implementation�of�CEFTA;�and�(ii)�to�bring�the�attention�of�policy�makers� to� some�of� the� remaining� impediments� to�enhanced� intra�regional�trade.�
What� this� study� shows� is� that� intra�regional� trade� is� important� for� stimulating�export�led�growth,�and�that�greater�trade�integration�could�also�bring�indirect�benefits,�including�more� foreign� investment.� Trade� flows� have� been� increasing� at� a� fast� pace�since�the�signing�of�the�bilateral�free�trade�agreements�in�the�early�2000s.�The�increase�in� volume�has� been� accompanied� by� trade� deepening,�with� some� 20� percent� of� new�trade� coming� from� new� products.� However,� trade� is� largely� concentrated� (in�commodity�based�products)�and�the�share�of�inter�industry�trade,�which�is�an�indicator�of�economic�integration,�is�quite�low.�
Moreover,�with�tariffs�and�quotas�eliminated�under�CEFTA,�nontariff�barriers�such�as� technical� barriers� to� trade� (TBTs)� and� sanitary� and� phytosanitary� (SPS)�measures�become�more� prominent.� In� addition,� the� quality� and� efficiency� of� the� trade�related�environment�can�become�an�obstacle�to�trade�as�unjustified�costs�and�poor�quality�of�services� serve� add� an� implicit� tax� on� trade.� Hence,� eliminating� nontariff� barriers�(NTBs)�becomes�essential�for�boosting�trade�flows�and�regional�trade�integration.�
The� rest� of� the� study� is� organized� as� follows.�Chapter� 2� describes� intra�regional�trade� patterns,� both� prior� and� after� the� entry� of� CEFTA� into� force,� including� more�detailed� analysis� of� trade� structure.�Chapter� 3� emphasizes� the� role� of�NTBs,� such� as�technical�regulations�and�standards,�and�their�potential�impact�on�trade�enhancement,�as�well�as�the�importance�of�the�trade�related�environment�drawing�on�global�surveys�and�reports�(Doing�Business,�BEEPS,�Logistics�Performance�Indicator�and�the�Enabling�Trade�Index).�It�also�looks�at�rules�of�origin�and�their�role�in�trade�creation.�Chapter�4�aims�to�present�the�view�of�the�private�sector�on�CEFTA�and�on�trade�related�reforms�in� general� through� two� case� studies� of� regional� firms.� Chapter� 5� concludes� by�summarizing�the�key�recommendations�of�the�study.�
Notes�1� The� SEE� region,� also� referred� to� as� the� Western� Balkans,� comprises� Albania,� Bosnia� and�Herzegovina,� Croatia,� the� former� Yugoslav� Republic� of�Macedonia� (FYR�Macedonia),� Kosovo,�Montenegro,�and�Serbia.�2�The�original�CEFTA�was�signed� in�December�1992�by�Poland,�Hungary,� the�Slovak�Republic,�and� the� Czech� Republic.� In� December� 2006,� the� countries� of� SEE� (including� Bulgaria� and�Romania)�and�Moldova�signed�the�Agreement�on�amendment�and�accession�to�CEFTA,�or�the�so�called� CEFTA� 2006.� The�CEFTA� 2006�Agreement� consolidated� 32� previous� bilateral� free� trade�agreements� in� SEE� and� entered� into� force� on� 26� July� 2007� for� Albania,� Kosovo,� Montenegro,�Macedonia,� and�Moldova,� 22�August� for�Croatia,� 24�October� for� Serbia,� and� 22�November� for�Bosnia�and�Herzegovina.�Bulgaria�and�Romania,�signatory�parties�to�the�Agreement,�left�CEFTA�when�they�joined�the�EU�on�January�1,�2007.�
WP_185_web_1-11-10.pdf 20WP_185_web_1-11-10.pdf 20 1/11/2010 1:39:23 PM1/11/2010 1:39:23 PM

5
CHAPTER �2 �
Trade�Patterns�in�the�SEE�Region�
tarting�from�2000,�the�SEE�region�witnessed�significant�economic�growth,�up�to�the�beginning�of�the�global�financial�and�economic�crisis�in�2008.�Despite�the�improved�
economic� performance,� growth� rates� were� lower� compared� to� other� fast�growing�countries� such� as� East� Asia� and� many� of� the� EU�10� countries.� Domestic� demand,�stimulated�by�rise�in�credit,�wages,�and�remittances,�was�the�main�source�of�growth�for�most�of� the�SEE�economies.� In�contrast,�exports�have�not�played�a�compelling�role� in�the�region’s�growth�story,�and�have�in�fact�been�the�weak�link;�despite�the�preferential�trade�regimes�with�the�EU�and�within�the�region�(see�Kathuria,�2008).�To�sustain�and�increase� growth� rates,� the� region’s� export� performance� needs� to� be� boosted,� and�enhancing�intra�regional�trade�is�an�important�pillar�of�its�export�performance.���Box 2.1. The “New” CEFTA
The new CEFTA, signed in 2006, is a comprehensive preferential trade agreement covering a range of areas. The Agreement replaced the network of 32 bilateral FTAs in the region, and introduced fully liberalized trade of manufacturing products (with transition periods for few products) and largely free trade of agriculture products. The objectives of CEFTA are to expand trade (and transit) in goods and services, and foster investment, including foreign investment. It also seeks to provide fair conditions of competition and appropriate protection of intellectual property rights.
To achieve these objectives, the Agreement goes far beyond the standards issues covered under an FTA. It includes areas such as sanitary and phytosanitary standards, which are important, technical, nontariff barriers to trade. It also covers competition rules (including state aid), investment, government procurement, and intellectual property rights, which are important for promoting trade in services and investment. For some of these areas, concrete deadlines for action are specified in the Agreement, while for some of the most contentious issues only a commitment for collaboration is given without a specific timetable.
Last but not least, the Agreement stipulates a framework for collaboration and arbitration system for efficient resolution of disputes.
Source: Author.
�Intra�regional�trade�in�SEE�has�evolved�considerably�since�the�low�levels�of�the�late�
1990s.�However,�the�regional�trade�integration�varies�significantly�among�countries.�In�the�case�of�FYR�Macedonia,�exports� to�CEFTA�represent�14�percent�of�GDP,�while� in�Albania�and�Kosovo�this�ratio�is�about�2�percent.�Some�countries,�such�as�Montenegro,�have�developed�a�one�sided�trade�relationship�with�the�region;�imports�being�almost�8�times�larger�than�exports.�For�Albania’s�economy,�the�CEFTA�region�plays�a�marginal�role,�and�exports�almost�entirely�to�the�EU.�
S�
WP_185_web_1-11-10.pdf 21WP_185_web_1-11-10.pdf 21 1/11/2010 1:39:23 PM1/11/2010 1:39:23 PM

6 World Bank Working Paper
�
�Table 2.1. Key Economic and Trade Indicators for SEE (2008)
Population (in million)
Exports to
CEFTA (in € mn)
Imports from
CEFTA (in € mn)
GDP (in € mn)
CEFTA exports
per capita (in
€)
CEFTA imports
per capita (in
€)
CEFTA exports to GDP ratio (in
%)
Albania 3.2 125 298 8,364 39 93 1.5 Bosnia and Herzegovina 3.8 1,529 2,916 12,649 406 774 12.1 Croatia 4.4 2,253 1,051 47,165 509 237 4.8 Macedonia, FYR 2.0 922 511 6,477 452 250 14.2 Montenegro 0.6 159 1,227 3,393 247 1,911 4.7 Serbia 7.4 2,458 1,216 34,055 334 165 7.2 Kosovo 2.1 93 705 3,804 45 341 2.4
Source:�ECA�regional�tables,�national�authorities.��
Despite� the� differences� in� the� levels� of� trade� integration,� intra�regional� trade�picked� up� significantly� in� 2008,� following� the� entry� of� CEFTA� into� force,� across� the�region.� Total� intra�regional� trade,�measured� through� imports� (as� being�more� reliable�than�exports),�rose�from�€6.2�bn�in�2007�to�€7.9�bn�in�2008�(table�2.2).�The�regional�trade�growth�outperformed�the�export�growth�to�the�EU�by�a�wide�margin.�In�2008,�exports�to�the�EU�rose�by�some�6,�8,�10�and�12�percent�in�Croatia,�FYR�Macedonia,�Bosnia�and�Herzegovina,�and�Serbia,�respectively.�Bosnia�and�Herzegovina,�the�largest�importer�in�the� region,� and�Montenegro,� the� largest� importer� relative� to� the� size� of� its� economy,�accounted�for�70�percent�of�the�increase�in�imports.���Table 2.2. Quarterly Imports from CEFTA Parties, in € Million
2007 2008 2008/07
Q1 Q2 Q3 Q4 Q1 Q2 Q3 Q4 change
Albania 43 56 58 57 53 72 92 81 84 Bosnia and Herzegovina 351 525 571 563 514 646 701 1,055 906 Croatia 216 243 243 243 228 273 279 270 106 Macedonia 83 103 112 148 122 132 131 126 66 Montenegro 131 223 264 276 276 398 386 167 334 Serbia 214 279 291 318 281 326 321 541 368 Kosovo 123 129 163 155 136 181 208 179 136 Total 1,160 1,559 1,700 1,759 1,611 2,027 2,119 2,419 1,999
Source:�National�authorities.�
�� �
WP_185_web_1-11-10.pdf 22WP_185_web_1-11-10.pdf 22 1/11/2010 1:39:23 PM1/11/2010 1:39:23 PM

Enhancing Regional Trade Integration in Southeast Europe 7
�
Patterns and Structure of Trade Flows in SEE
World�trade,�and�investment,�flows�have�expanded�significantly�over�the�past�decade,�and�global�exports�and�imports�were�rising�continuously�for�over�three�decades�until�2009.� In� SEE,� in� contrast,� trade� flows� in� the� first� decade� of� transition� were� largely�constrained� by� political� factors� (including� embargoes)� and� conflicts� in� the� region.�While�the�political�and�developments�in�the�early�and�mid�1990s�had�a�negative�overall�effect�on�trade�performance,�intra�regional�trade�was�disproportionally�affected.�Prior�to�the�dissolution�of�SFR�Yugoslavia,�all�SEE�countries�except�Albania�traded�heavily�among�each�other�as�they�were�part�of�one�economy.�The�conflicts�which�followed�the�break�up�of�SFR�Yugoslavia�led�to�sharp�contraction�of�trade�flows�in�most�parts�of�the�region.�At�the�same�time,�SEE�countries�received�preferential�trade�treatment�from�the�European�Union�(EU)�which�shifted�trade�towards�the�EU�market.�
Intra�SEE�trade�began�to�rebound�in�this�decade�and�in�particular�after�2003.�The�recent�reversal�in�trade�patterns�could�be�explained�by�the�signing�of�bilateral�FTAs,�as�well� as� the� post�conflict� recovery� of� the� region.� Overall� trade� flows� have� steadily�grown�in�SEE,�and�total�trade�[at�least]�doubled�in�each�of�the�countries�between�2004�and�2008.�In�the�absence�of�available�data�on�trade�volumes,�rise�in�international�price�indexes�could�be�used�to�assess�the�real�vs.�nominal�increase�in�trade.�And�while�prices�of�certain�product�categories,�such�as�oil�and�food�rose�tremendously�in�the�first�years�of� the�decade� (followed�by�a�decline� in� recent�years),�prices�of�most� export�products�were�either�stable�or�witnessed�small�increases.��
Figure 2.1. Exports of CEFTA Members to Other Members, in US$ Million
�Source:�COMTRADE,�national�statistical�offices.��
Tables�2.3�and�2.4�show�intra�regional�trade�relationships�in�2008,�both�in�terms�of�exports�and�imports.�Over�90�percent�of�trade�flows�go�to�neighboring�countries,�and�the�largest�trade�flows�are�between�Bosnia�and�Herzegovina,�and�Croatia,�and�between�Serbia�and�Bosnia�and�Herzegovina.�
0
1,000
2,000
3,000
4,000
5,000
6,000
7,000
8,000
9,000
10,000
2000 2001 2002 2003 2004 2005 2006 2007 2008
US$
mill
ions
Year
Albania
BiH
Croatia
Macedonia, FYR
SaM/Serbia
SEE total
SEE total in EUR
WP_185_web_1-11-10.pdf 23WP_185_web_1-11-10.pdf 23 1/11/2010 1:39:23 PM1/11/2010 1:39:23 PM

8 World Bank Working Paper
�
Serbia� and�Croatia,� the� two� largest� economies,�were� the� largest� exporters� to� the�region.�In�contrast,�the�regional�market�seems�to�matter�the�least�for�Albania,�Kosovo,�and�Montenegro,� their�exports�account� for�some�5�percent�of� total�exports.�However,�Kosovo’s�export�base�is�very�low,�and�exports�to�CEFTA�account�for�almost�a�third�of�total� exports.� FYR� Macedonia’s� exports� are� substantial� relative� to� the� size� of� its�economy,�and�represent�36�percent�of�its�total�exports.���Table 2.3. Intra-Regional Exports in 2008, in € Million Source/Destination ALB BiH CRO MAC MON SER KOS MOL TotalAlbania 2 2 26 19 16 60 0 125BiH 10 730 41 97 602 51 0 1,529Croatia 31 1,468 97 126 529 n/a* 1 2,253Macedonia 70 69 152 25 606 n/a* 0 922Montenegro 6 22 7 1 108 16 0 159Serbia 52 907 294 334 866 n/a 4 2,458Kosovo 15 4 1 16 7 46 3 93Total 183 2,472 1,185 516 1,140 1,908 126 9 7,538 �Source:�National�authorities.�*�Kosovo�data�not�published.��
On�the�import�side,�Bosnia�and�Herzegovina�is�the�largest�importer,�and�the�bulk�of� its� imports� come� from� Croatia� (58� percent)� and� Serbia� (38� percent).� Kosovo� and�Montenegro�are�highly�dependent�on�imports�from�the�region.�Kosovo’s�imports�from�the�CEFTA� region� represent� 38� percent� of� its� total� imports� and� are� some� 50� percent�higher�compared�to�imports�from�the�EU.��Table 2.4. Intra-regional imports in 2008, in € Million Destination/Source ALB BiH CRO MAC MON SER KOS MOL TotalAlbania 10 36 79 6 145 21 0 298BiH 2 1,706 95 14 1,095 5 0 2,916Croatia 3 556 190 5 291 n/a* 6 1,051Macedonia 24 35 93 1 358 n/a* 3 514Montenegro 20 165 170 30 839 3 0 1,227Serbia 9 437 376 257 137 n/a 17 1,234Kosovo 53 39 49 343 14 208 0 705Total 111 1,242 2,429 993 177 2,936 30 27 7,945 �Source:�National�authorities.�*�Kosovo�data�not�published.��
Trade� among� the� region� is� relatively� concentrated� with� the� top� six� HS� 2�digit�product�categories1�representing�40�percent�of�total� imports�(figure�2.2).�Four�of�these�six�are�commodity�products:�mineral�fuels�(27),�iron�and�steel�(72),�steel�products�(73)�and� aluminum� (76).� The� other� two� are� beverages� (22)� and� electrical� machinery� and�equipment� (85).� Oil� imports� ranked� among� the� top� five� product� categories� in� each�country,�except�Montenegro,�and�iron�and�steel�is�among�the�top�five�both�import�and�export�products,�except�Croatia�(not�a�top�five�export).���
WP_185_web_1-11-10.pdf 24WP_185_web_1-11-10.pdf 24 1/11/2010 1:39:23 PM1/11/2010 1:39:23 PM

Enhancing Regional Trade Integration in Southeast Europe 9
�
Figure 2.2. Intra-regional Imports by HS 2-Digit Product Category
�Source:�National�authorities.��
Annexes� I.A�and� I.B�present� the� concentration�of� exports� and� imports� (the� top�5�HS�2� product� categories)� for� each� of� the� SEE� countries� in� 2007� and� 2008.� The�concentration� varies� among� the� countries.� For� example,� the� most� import� product�category�in�Albania,�Bosnia�and�Herzegovina,�and�Kosovo,�mineral�fuels,�have�a�high�share�in�their�intra�regional�imports.�But�apart�from�that,�and�maybe�the�second�largest�import�product,�the�concentration�seems�to�be�relatively�low.�In�the�case�of�Macedonia�and� Montenegro,� the� structure� of� imports� is� much� more� diversified,� and� most�imported�product�accounts�for�around�10�percent�of�total�imports.��
In� terms� of� the� export� structure,� Albania,� Croatia,� Kosovo,� Macedonia,� and�Montenegro� have� a� high� concentration� of� their� most�exported� product;� steel� for�Albania,�Kosovo,�and�Montenegro;�oil�for�Croatia;�and�both�in�the�case�of�Macedonia.�Bosnia�and�Herzegovina�and�even�more�so�Serbia,�in�contrast,�have�a�quite�diversified�export�structure.�The�concentration�of�trade�in�2008�is�very�similar�as�in�2007,�which�is�expected�as�trade�flows�do�not�change�dramatically�in�short�periods�of�time.�
Last�but�not�least,�annex�I.C�shows�the�top�five�HS�2�digit�product�categories�with�largest�trade�surplus�and�deficit�for�each�of�the�SEE�countries.�Croatia,�for�example,�has�a� large� intra�regional� trade� surplus� in� mineral� fuels� (oil),� and� significantly� smaller�surplus� in� other� products� (such� as�machinery).� Serbia� and�Macedonia� have�more� or�less�equal�surpluses� in�their� top�five�product�categories.�Bosnia�and�Herzegovina�has�only� two� products,� aluminum� and� wood,� with� substantial� trade� surplus.� Albania,�Kosovo,�and�Montenegro�have�almost�no�products�with�positive�net�exports,�and�are�on�the�other�hand,�significant�net�importers.�Annex�I.D�lists�the�2�digit�HS�categories.��
0�400�800�1,200�1,600�2,000�2,400�2,800�3,200�3,600�4,000�4,400�4,800�
27 72� 73 85 22 76 Other
HS
2-D
igit
prod
uct c
ateg
ory
WP_185_web_1-11-10.pdf 25WP_185_web_1-11-10.pdf 25 1/11/2010 1:39:24 PM1/11/2010 1:39:24 PM

10 World Bank Working Paper
�
Box 2.2. The Impact of the Crisis on Trade Flows in SEE
The global economic crisis, which began to unravel in 2008, has lead to significant disruptions in trade flows. According to the World Bank, the volume of world trade is expected to drop by 6 percent in 2009 after more than three decades of continued growth. Even though the crisis originated in the United States, Europe has been most hardly hit by the crisis, and this in turn has impacted the economies of SEE. While the transmission of the crisis through the financial markets has been so far limited in the region, the second transmission channel, through trade, is becoming more severe. The fall in demand from key European markets (Germany, Italy, Austria, and so forth) has harmed substantially SEE exports.
Overall exports and imports have sharply declined in 2009. The graph below shows the change in exports for the first four months of 2009, SEE’s exports have declined by between 10 (Croatia) and close to 50 percent (Macedonia and Kosovo). Declines in exports have been mostly consistent among various markets, except in the case of Albania where the fall of exports to CEFTA has been much greater than to other markets. Exports for manufactured goods declined much faster than agriculture exports, except in the case of Albania and Montenegro.
�
Note: Data for Albania, Montenegro, and Kosovo are for January-March period, and data for Bosnia and Herzegovina, Croatia, FYR Macedonia, and Serbia for January-April period. �The crisis has fueled political pressures to protect domestic producers from import competition throughout the world. A study by the World Bank (see Gamberoni and Newfarmer, 2009) revealed that between October 2008 and February 2009, 47 trade protection measures have been implemented, and many more have been proposed. These actions, taken by both developed and developing countries, take the form of increased import duties, import bans, subsidies and nontariff measures.
While measures taken by developed countries comprise mostly subsidies and other types of support to exporters, measures in developing countries take a range of forms, including nontariff measures. The nontariff measures vary from increased standards and regulations to adding costly bureaucratic procedures. For example, Argentina has introduced additional licensing requirements for a variety of products (for example, auto parts, TVs, and toys), and Indonesia now requires certain goods to be imported only at five ports and airports.
Within CEFTA, several trade protectionism cases have been brought up in recent clear, but it is not clear to what extend these measures were a result of economic crisis. Most of the underlying issues precede the start of the crisis, and refer to nontariff barriers of various sorts. The sections on TBTs and SPS include more information on trade protectionism and box 3.3, for example, describes recently introduced trade protection measures by Bosnia and Herzegovina and Croatia.
Source: Author.
�70.0��60.0��50.0��40.0��30.0��20.0��10.0�0.0�
Albania BiH Croatia� Macedonia,�FYR
Montenegro Serbia Kosovo�
Exports in 2009, y-o-y change in %
Exports�to�CEFTA Exports�to�EU Total�Exports
WP_185_web_1-11-10.pdf 26WP_185_web_1-11-10.pdf 26 1/11/2010 1:39:24 PM1/11/2010 1:39:24 PM

Enhancing Regional Trade Integration in Southeast Europe 11
�
Decomposition of Intra-regional Trade
The�marked�increase�in�trade�flows�since�2000�led�to�some�deepening�in�regional�trade�and� integration,� measured� through� the� diversification� of� products� exported� to� the�region.�As� shown� in� figure� 2.3,� 86� percent� of� the� exports’� growth� between� 2000� and�2007�came�from�increase�in�exports�of�existing�products�(to�existing�markets),�whereas�20�percent� came� from�exports�of�new�products.� So� in� terms�of� export�diversification,�the� SEE� region� compares� slightly� better� compared� to� global� trends,� but� worse�compared� to� the� ECA� region.� Brenton� and�Newfarmer� (2007)� find,� in� the� case� of� 99�export� countries,� that� increases� of� existing� products� to� existing�markets� account� for�over� 100� percent� of� total� export� growth,� and�new� exports� account� for� 19� percent.� In�ECA,�however,�the�share�of�new�exports�was�over�30�percent.�The�trade�diversification�in�SEE�could�actually�be�higher�as�the�above�comparison�is�based�on�slightly�different�methodologies.� Both� studies� use� the� same� sources,� COMTRADE� and� Standard�International� Trade� Classification� (SITC)� methodology;� however,� Brenton� and�Newfarmer�use�more�detailed�5�digit�data,�while� this� study�uses�more�aggregated�4�digit�data,�because�reliable�5�digit�data�were�not�available.��
Figure 2.3. Decomposition of Export Growth of CEFTA Countries: 2000–07
�
Source:�UN�COMTRADE�database.�Note:�The�decomposition�is�done�based�on�a�dataset�of�4�digit�level�products�exported�to�SEE,�based�on�the�Standard�International�Trade�Classification�Revision�3.�Data�for�Bosnia�and�Herzegovina�are�only�available�from�2003.�Montenegro�gained�independence�from�Serbia�and�Montenegro�in�2006,�but�to�allow�comparability�with�previous�years,�Serbia�and�Montenegro�are�considered�as�one�economy.��
A�more�detailed�analysis�of�the�export�growth�shows�that�new�trade�relationships�have� been� created� in� most� HS�2� product� categories.� However,� the� quantity� of� new�trade�flows�is�quite�concentrated:�the�top�5�and�top�10�product�categories�account�over�half� and� over� two� thirds� of� the� value� of� the� new� trade� relationships,� respectively.�Textiles,�chemicals,�and�milk�are�in�the�top�5�list,�followed�by�ceramic�products,�leather,�meat,�and�wool.�
–20
0
20
40
60
80
100
Extincion ofexports of existing
products
Fall in exports ofexisting products
Increase inexports of existing
products
New exports
Per
cent
Serbia andMontenegro
Macedonia,FYR
Croatia
Bosnia andHerzegovina
Albania
WP_185_web_1-11-10.pdf 27WP_185_web_1-11-10.pdf 27 1/11/2010 1:39:24 PM1/11/2010 1:39:24 PM

12 World Bank Working Paper
�
The�SEE�economies�diverge� in� terms�of� their�export�diversification.�For�example,�45�percent�of�the�increase�in�Albania’s�exports�to�the�region�came�from�new�products,�while�in�Croatia�the�share�was�only�10�percent.�However,�this�can�be�largely�explained�from� the� low� starting� point� of� Albania’s� exports,� and� the� relatively� large� Croatian�exports.�Albania�had�300�more�export�relationships2�with�the�region�in�2007�compared�to� 2000,� while� the� other� countries� of� the� region� managed� to� develop� between� 520�(Macedonia)�and�1,100�(Serbia�and�Montenegro)�new�export�relationships�in�the�same�period.�
Decomposition� of� exports� by� sub�period� shows� that� new� exports� had� a� higher�share�in�the�2000–04�period,�which�was�accompanied�with�a�fall�in�exports�of�existing�products�(figure�2.4).�During�2004–07,�the�share�of�new�exports�declined,�and�the�fall�of�exports� of� existing� products� was� reduced.� In� the� entire� period,� the� share� of� export�products�that�were�withdrawn�from�markets�was�negligible.����Figure 2.4. Decomposition of Export Growth in SEE by Sub-period, 2000–04 (Top) and 2004–07 (Bottom)
�
Source:�UN�COMTRADE�database.�
�
–30
–10
10
30
50
70
90
110
Per
cent
–30
–10
10
30
50
70
90
110
Per
cent
Serbia andMontenegro
Macedonia,FYR
Croatia
Bosnia andHerzegovina
Albania
Extincion ofexports of existing
products
Fall in exports ofexisting products
Increase inexports of existing
products
New exports
Extincion ofexports of existing
products
Fall in exports ofexisting products
Increase inexports of existing
products
New exports
WP_185_web_1-11-10.pdf 28WP_185_web_1-11-10.pdf 28 1/11/2010 1:39:24 PM1/11/2010 1:39:24 PM

Enhancing Regional Trade Integration in Southeast Europe 13
�
Table�2.5�shows� that� the�concentration�of�exports� in� the�region� is� relatively�high,�though�with�large�variation�among�the�economies.�For�example,�Albania,�which�is�the�smallest�exporter,�has�a�very�concentrated�trade�structure,�measured�by�the�share�of�the�top� five� export� products� at� 4�digit� product� level.� On� the� other� hand,� the� largest�exporters,�Croatia�and�Serbia3�have� relatively� low�concentration� ratios.� In�addition,�4�out�of�the�top�5�products�in�2000�disappeared�from�the�list�by�2007�in�the�case�of�Serbia.�The�export�decomposition�graphs�in�the�figure�above�show�that�Serbia�had�the�largest�fall�in�exports�of�existing�products.��Table2.5. Top Five Export Products (4-digit SITC level), Share in Total
2000 2007 Same “top 5
products” in both years
Albania 48.9 46.7 2 Bosnia and Herzegovina 33.6 31.8 3 Croatia 14.9 22.5 3 Macedonia, FYR 29.0 25.2 2 Serbia and Montenegro 14.2 17.6 1
Source:�COMTRADE.��
As�detailed�trade�statistics�per�commodity�are�not�yet�available�for�2008�and�2009,�it�is�not�possible�to�analyze�the�source�of�export�growth�after�the�entry�of�CEFTA�into�force� in� the� second� half� of� 2007.� However,� despite� the� lack� of� analysis,� significant�changes� in� trade�patterns�are�unlikely� to�occur� in�a� short�period�of� time.�A�study�by�Albornoz,�Pardo,�Corcos�and�Ornelas�(2009)�finds�that�exporters�usually�“start�small”�when� entering� new� markets� (by� selling� small� quantities� to� neighboring� countries).�After�this�initial�trial,�they�either�withdraw�or�their�exports�rocket.�The�implication�of�this� behavior� is� that� reduction� in� trade� barriers� has� delayed� effects� on� export� flows,�which�makes� it� difficult� to� assess� the� impact� of� trade� liberalization,� especially� in� the�context� of� regional� free� trade� areas.� In� any� case,� this� “sequential� exporting”� theory�suggests�that�large�shifts�in�trade�flows�should�not�be�expected�in�short�periods�of�time�following�trade�liberalization.�
Last�but�not�least,� the�study�compares�the�structure�of�exports�within�the�CEFTA�bloc�with�SEE’s�exports� to� the�EU,�which�accounts� for� the�bulk�of� their� total�exports.�Intra�regional�trade�patterns�are�slightly�different�compared�to�extra�CEFTA�(EU)�trade�patterns.� Differences� between� intra�� and� extra�regional� trade� are� common� in�developing� countries,� which� would� imply� that� regional� trade� integration� is�complementary�to,�as�well�as�an�important�pillar�of,�international�trade�integration.�In�the�case�of�SEE,�the�differences�in�the�composition�of�CEFTA�and�EU�exports�could�be�explained�by�the�different�trade�regimes�and�the�competitive�advantages�vis�à�vis�the�trading�partners�(table�2.6).�For�example,�food,�beverages,�and�tobacco�account�for�one�fifth�of� intra�SEE�exports�and� less� than�10�percent�of�SEE’s�exports� to� the�EU.�This� is�likely�due�to�the�tariff�and�quota�restrictions�on�agriculture�trade�with�the�EU,�but�even�more�so�from�the�strict�requirements�that�EU�puts�on�food�products�(such�as�sanitary�and� phytosanitary� standards).� On� the� other� hand,� SEE� countries� (in� particular� the�former� Yugoslav� republics)� have� a� long� history� in� food� trade� and� many� national�
WP_185_web_1-11-10.pdf 29WP_185_web_1-11-10.pdf 29 1/11/2010 1:39:24 PM1/11/2010 1:39:24 PM

14 World Bank Working Paper
�
brands� have� a� regional� recognition.� The� second� big� difference� is� in� trade� of�manufactured�products.�Miscellaneous�manufactured�parts�(SITC�category�8)�account�for�almost�a�quarter�of�exports�to�the�EU�compared�to�9�percent�of�CEFTA�exports,�and�this� is�derived� from� textile� exports�which� fall� in� this� category.�Textile� exports� are� 13�percent�of� total�exports� to� the�EU,�while� their�share� in� intra�CEFTA�exports� is�only�2�percent,�but�the�bulk�of�the�exports�to�the�EU�come�from�“inward�processing”�whereas�materials� are� imported� from� the� EU� for� further� processing� and� final� products� are�shipped� back� to� the� originating� country.� In� contrast,� the� textile� trade�within�CEFTA�mostly� involves� export� of� domestically� produced� products.� Last� but� not� least,� SEE�exporters� trade� much� more� high�value� products� such� as� machinery� and� transport�equipment�with�EU�firms.�The�share�of�machinery/transport�equipment�exports�to�the�EU�is�double�compared�to�intra�CEFTA�exports.��Table 2.6. SEE’s Export Structure to CEFTA and EU Partners in 2007
SITC Description CEFTA EU
0 Food & live animals 15.2 7.6 1 Beverages and tobacco 5.4 0.9 2 Crude materials except food/fuel 5.7 7.8 3 Mineral fuel/lubricants 15.3 3.6 4 Animal/veg oil/fat/wax 1.1 0.3 5 Chemicals/products n.e.s 10.1 6.3 6 Manufactured goods 26.7 28.2 7 Machinery/transport equipment 11.8 21.1 8 Miscellaneous man. arts 8.7 23.9 9 Commodities n.e.s. 0.0 0.1
Source:�UN�COMTRADE�database.�Note:�SITC�Revision�3,�EU�data�is�for�EU�25.��
Disaggregated� data� by� country� show� no� great� differences� among� the� countries,�with�one�or� two�exceptions.4�For�each�country,� food� (SITC�0�and�1)�and�mineral� fuel�(SITC� 3)� exports� have� a� larger� share� in�CEFTA� compared� to�EU� trade.�On� the� other�hand,�SITC�8�products,�which�include�textiles,�are�mostly�exported�to�the�EU.�Exports�in�this�category�account�for�over�60�percent�of�Albania’s�total�exports�to�the�EU,�while�their�share�in�exports�to�CEFTA�is�only�6�percent.�In�the�case�of�FYR�Macedonia,�these�products�account�for�37�percent�of�exports�to�the�EU,�and�only�5�percent�of�exports�to�CEFTA.� The� differences� are� greatest� in� the� manufactured� goods� (SITC� 6)� and�machinery/transport�equipment�(SITC�7).�Croatia’s�SITC�6�exports�have�an�equal�share,�of�17�percent,�in�both�CEFTA�and�EU�trade.�On�the�other�hand,�SITC�6�exports�in�the�other�countries�have�a�larger�share�in�total�exports:�44�percent�of�CEFTA�exports�and�28�percent�of�EU�exports�for�Bosnia�and�Herzegovina,�39�percent�of�CEFTA�exports�and�46�percent�of�EU�exports�for�FYR�Macedonia,�and�23�percent�of�CEFTA�exports�and�42�percent� of� EU� exports� in� the� case� of� Serbia.� In� contrast,� Croatia’s� machinery/transport�equipment�exports�have�a�larger�share�then�in�the�other�countries,�33�and�15�percent�of�EU�and�CEFTA� exports,� respectively.�Albania� and� FYR�Macedonia� have� a�modest� share� of�SITC�7�exports,�and�in�Serbia�they�account�for�13�percent�of�both�CEFTA�and�EU�exports.�
WP_185_web_1-11-10.pdf 30WP_185_web_1-11-10.pdf 30 1/11/2010 1:39:25 PM1/11/2010 1:39:25 PM

Enhancing Regional Trade Integration in Southeast Europe 15
�
Intra- versus Inter-industry Trade
The�following�section�looks�at� the�role�of� inter�industry�trade�for�regional� integration�and� export� performance.�While� traditional� trade� theory� (of� comparative� advantages)�was�based�on�trade�of�homogenous�products,�new�trade�theory�has�focused�on�intra�industry�trade.� Intra�industry�trade�(IIT),� that� is� trade�of�similar�products,�has�been�a�key�factor�in�trade�growth�in�recent�decades.�These�trends�have�mostly�been�attributed�to� the� fragmentation� of� production� (outsourcing� and� off�shoring)� as� a� result� of�globalization� and� new� technologies.� Empirical� research� on� intra�industry� trade� was�first� undertaken� on� the� countries� part� of� the� European�Economic�Community� in� the�early�1960s,�and�since� then� intra�industry� trade�continues� to�expand�not�only�among�developed�but�also�in�developing�countries.��
Box 2.3. Inter-industry and Intra-industry Trade
Inter-industry trade is defined as exchange of goods from different industries, for example, trading agricultural products for machinery and equipment. It is based on comparative advantages arising from different factor endowments and technology between countries.
Intra-industry trade is exchange of goods within the same industry, either similar products or products at different stages of production. IIT is explained largely by economies of scale, income levels, innovations, and demand for differentiated products, but also by comparative advantages (in the case of products along the value chain).
�Intra�industry� trade� brings� important� benefits� to� trading� partners.� First� of� all,� it�
allows� for� greater� product� variety,�which� is� of� benefit� to� both� firms� and� consumers.�Second,�firms�can�benefit�from�economies�of�scale,�and�in�case�of�vertical�specialization,�use� comparative� advantages.� From� a� macroeconomic� perspective,� IIT� stimulates�innovation,� and� tends� to� be� more� stable� and� less� prone� to� short�term� fluctuations.�Empirical� studies� show� that� intra�industry� trade� can� improve� export� performance.�Hoekman�and�Djankov�(1996)�find�a�strong�relationship�between�export�performance�and� growth� in� (vertical)� IIT� between� the� CEEC� and� the� EU.� In� the� early� 1990s,� the�Czech�and�Slovak�Republics�achieved�the�highest�export�growth�with�the�EU�(among�the�CEEC)�and�had�the�highest�level�and�rate�of�growth�in�IIT�with�the�EU.�
Export�performance�and�regional�integration�prospects�in�SEE�strongly�depend�on�the� structure� of� trade,� that� is,� whether� countries� engage� more� in� one�way� (inter�industry)� or� two�way� (intra�industry)� trade.� Neighboring� countries� which� are� at�similar� level� of� development� and� belong� to� a� free� trade� area� tend� to� have� more�intensive�intra�trade�relationships.5��
Unfortunately,� intra�industry� trade� in� SEE� is� surprisingly� low� by� any� standards�(table� 2.7).�Although� there� is� great� variation,� share� of� IIT� in� total� trade� among�SEE’s�economies�was�less�than�22�percent�in�2007.�Albania�and�Montenegro�are�the�outliers�in�the�group�with�ITT�accounting�for�less�than�10�percent�of�total�trade,�while�the�rest�of�the� region’s� IIT� share� ranges�between�22� and�25�percent.�On� the�other�hand,� IIT�has�increased� in� all� countries� between� 2000� and� 2007,� Croatia� making� the� largest� leap.�Nonetheless,�even�Croatia’s�share�is�about�half�of�the�IIT�share�for�the�EU�106�countries�(see� Kawecka�Wyrykowska,� 2009).� The� share� of� IIT� among� the� EU�15,� which� is�expectedly�higher,�stood�at�59�percent�in�2007.�
WP_185_web_1-11-10.pdf 31WP_185_web_1-11-10.pdf 31 1/11/2010 1:39:25 PM1/11/2010 1:39:25 PM

16 World Bank Working Paper
�
Table 2.7. Share of Intra-industry Trade for the SEE Countries
IIT with CEFTA IIT with EU-25
2000 2007 2000 2007
Albania 2.9 6.2 22.8 23.9 Bosnia and Herzegovina 14.2 23.6 n.a. 28.6 Croatia 11.6 25.0 37.5 36.0 Macedonia, FYR 18.1 24.6 8.3 10.7 Montenegro n.a. 9.5 n.a. n.a. Serbia (SaM in 2000) 17.8 21.9 22.7 24.6
Source:�UN�COMTRADE�database.�Note:�Author’s�own�calculations�based�on�SITC�Rev.�3�at�4�digit�product�level.�The�share�of�IIT�has�been�calculated�using�the�Gruber�Lloyd�index�(see�Gruber�et�al.,�1975).�The�index�is�sensitive�to�the�level�of�aggregation�of�the�data,�the�higher�the�grouping�of�products�the�larger�is�the�value�of�IIT.�For�SEE,�4�digit�disaggregation�level�is�used�(due�to�lack�of�reliable�data�at�more�disaggregated�levels),�while�studies�quoted�use�5�digit�level.��
Intra�industry� trade� is� also� low�between� SEE� and� the�EU.�Despite� the� free�trade�arrangements�with�the�EU,7�the�share�of�IIT�is�below�30�percent�for�each�country�apart�from�Croatia,�which� is� far� less�compared� to� the�share�of�EU�10�prior� to�accession� (40�percent�in�2002)�(figure�2.5).�It�is�important�to�note�that�intra�industry�trade�accelerated�for�the�EU�10�following�accession�in�2004�and�in�many�EU�10�countries�reached�above�50� percent,�which� is� higher� than� several� EU�15� countries� (Greece,� Portugal,� Finland,�and� so� forth).� The� above� results� confirm� earlier� findings� that� export� performance� in�SEE� has� been� largely� disappointing� as� these� economies� have� commodity�based�structure�and�have�not�been�successful� in� integrating� into�global�supplies�chains� (see�Kathuria,�2008).��Figure 2.5. EU-10’s IIT Share
�Source:�Kawecka�Wyrykowska�Elzbieta�(2009).�
�
3032343638404244464850
2000 2001 2002 2003 2004 2005 2006 2007
With EU-15 Among EU-10
WP_185_web_1-11-10.pdf 32WP_185_web_1-11-10.pdf 32 1/11/2010 1:39:25 PM1/11/2010 1:39:25 PM

Enhancing Regional Trade Integration in Southeast Europe 17
�
There� are� several� reasons�why� intra�industry� trade� should� be� higher� among� the�SEE� countries.� First� of� all,� all� countries� are� small� and� immediate� neighbors� which�should�lead�to�greater�integration�among�firms�and�production�processes.�Second,�even�prior� to�CEFTA,�all� countries�had� signed�bilateral� free�trade�agreements�among�each�other.� In� some� cases,� intra�industry� trade� has� developed� as� a� result� of� foreign�investment,� and� so� far� there� have� been� little� intra�regional� FDI� inflows� in� SEE,�particularly� in� the� tradable�sector.�However,�FDI�was�not� the�major� force�driving� the�growth�of�IIT� in�the�CEEC�in�the�early�1990s,�except�for�in�the�automotive�sector�(see�Hoekman� and� Djankov,� 1996).� The� preconditions� in� SEE� have� been� very� similar� to�those�in�the�“original”�CEFTA�group,�yet�regional�integration�has�not�occurred�at�the�pace�witnessed�in�CEEC.�
Intra�industry� trade� in� SEE� is� concentrated� in� few� heavy� industries� and� the�structure� is� very� similar� for� all� countries� of� the� region� (table� 2.8).� The� top� four�industries�account�for�over�a�third�of�total�IIT;�iron�and�steel�comes�first�in�all�countries�except�Croatia,�followed�by�metal�and�non�metal�manufactured�products�and�electrical�equipment.� Throughout� the� region,� these� industries� have� a� significant� share� in� total�industrial� output,� and� trade� in� these� products� had� been� largely� liberalized� prior� to�CEFTA.��Table 2.8. Industries (at 2-Digit Product Level) with Largest Share of Intra-industry Trade in SEE
Iron and steel (67) Metal manufactures (69)
Non-metal mineral manufactures (66)
Electrical equipment (77)
Albania 12.6 0.5 3.0 1.7BiH 5.4 4.9 2.6 2.3Croatia 4.2 4.2 2.0 1.8Macedonia, FYR 5.2 2.5 3.1 3.5MontenegroSerbia 2.2 2.9 3.2 3.4 �Source:�UN�COMTRADE�database.�
�Intra�industry�trade�in�agriculture�products,�on�the�other�hand,�is�marginal�despite�
the� strong� agricultural� and� food� processing� sector� in� each� of� these� countries.�Agricultural� output� accounts� for�over� 10�percent�of�GDP� in� each� country�apart� from�Croatia.�However,�only�two�agriculture�categories,�vegetables�and�fruits�(SITC�05)�and�beverages�(SITC�11)�are�in�(the�bottom�of)�the�top�10�categories�of�IIT.�The�low�IIT�share�in� agriculture� products� could� be� explained� by� the� remaining� tariff� and� nontariff�barriers�(sanitary�standards�and�border�crossings)�to�trade�in�agriculture�products.�
The�CEFTA�Agreement�could� facilitate�greater� intra�industry� trade�in� the�region.�In�addition�to�the�full�tariff�liberalization,�the�commitment�to�harmonize�standards�and�regulations�and�to�ensure�investment�and�intellectual�property�right�protection,�could�lead�to�more�regional�investment.�And�the�possibility�to�have�diagonal�cumulation�of�origin� (see� “Rules� of�Origin,”� chapter� 3)�with� the� EU,� as�well� as� EFTA� and� Turkey,�could�attract�foreign�investment�in�production�facilities�that�would�export�products�to�the�EU.�
WP_185_web_1-11-10.pdf 33WP_185_web_1-11-10.pdf 33 1/11/2010 1:39:25 PM1/11/2010 1:39:25 PM

18 World Bank Working Paper
�
Quality of Foreign Trade Statistics for the Region
Trade�statistics� in� the�SEE�region�reveal� significant�deficiencies� in� registering�exports�and� imports� by� customs� authorities,� which� is� a� serious� handicap� for� conducting�analysis�as�well�as� for�policy�making.�Mirror�statistics,� that� is,� statistics�derived� from�the� source� and� foreign� trading� partners,� point� to� significant� differences� between�imports�and�exports�in�each�of�the�countries�(see�table�2.9).�The�differences�could�come�from�the�fact�that�imports�are�recorded�based�on�product�origin�and�exports�based�on�the�source�country�from�which�the�goods�are�being�shipped,�but�could�also�imply�data�recording� issues�both�on� the�exporting�and� the� importing� side.�Unregistered� trade� is�quite�common�for�all�countries�and�the�efficiency�in�capturing�all�trade�largely�depends�on�the�quality�of�the�customs�authorities.�The�differences�in�mirror�statistics�among�the�SEE�countries�are�quite�significant�and�deserve�a�greater�attention�by�the�authorities.�
A�mismatch� in�mirror� statistics� can� be� found� for� all� SEE� countries�without� any�clear� pattern� as� to� which� countries� are� under� or� over�reporting� (table� 2.9).� Mirror�statistics�from�trading�country�should�not�completely�match,�this�would�imply�costless�transport�between�destinations�since�exports�are�reported�as�f.o.b.�(free�on�board)�and�imports�as�c.i.f.�(cost,�insurance,�freight).�Hence,�imports�of�country�A�from�country�B�should� be� slightly�higher� than� country�B’s� recorded� exports� to� country�A.�However,�trading� between� SEE� countries� shows� a� negative� import�export� ratio,� which� raises�serious� data� quality� concerns.� For� example,� Croatia’s� imports� from� Bosnia� and�Herzegovina� (recorded� c.i.f.� in� Croatian� statistics)� in� 2007� were� recorded� at� €536�million,�but�exports� to�Croatia� in�Bosnian�statistics� (recorded�f.o.b.),�which�should�be�lower� because� of� the� c.i.f.�f.o.b.� difference,� were� €557� million.� On� the� other� hand,�Albania’s�imports�from�Montenegro�were�€14.5�million,�while�Montenegro’s�exports�to�Albania�were�only�€9.5�million,�which�implies�unimaginably�high�freight�costs�of�over�50� percent� of� the� value� of� the� goods.� There� are� also� large� differences� between� other�pairs�of�countries,�actually,�half�of�the�“trading�relationships”�show�a�negative�import�to�export�ratio,�which�raises�suspicion�of�possible�duties�and�tax�evasion.���Table 2.9. SEE Mirror Gap Statistics: Difference between Imports and Exports (in Percent)
Exporter/importer Albania Bosnia and
Herzegovina Croatia Macedonia Montenegro Serbia Albania 20.7 417.8 3.2 46.4 1,262.4 Bosnia and Herzegovina 15.7 –3.8 1.4 28.7 –3.9 Croatia –5.0 –3.4 –5.8 8.1 –19.5 Macedonia 3.7 10.1 34.7 –5.8 –51.7 Montenegro 54.2 –28.8 –21.9 –14.2 –28.1 Serbia 30.1 –5.5 –0.9 2.6 –6.2
Source:�National�authorities.�Note:�Fields�in�italic�and�underline�denote�total�trade�volumes�below�€10�million.��
Historical�data�do�not�indicate�positive�trends�in�terms�of�improving�the�quality�of�statistics.� Table� 2.10� shows� import/export� ratios� for� several� country� pairs,� excluding�those�with�small�trade�values�as�well�trade�with�Serbia�and�Montenegro�as�the�data�on�SaM’s�exports�and� imports�do�not� include�Kosovo.�With� the�exception�of�one�or� two�country�pairs,� there� are�no�particular� trends� in� the�mirror�gaps�of� the� selected�pairs,�
WP_185_web_1-11-10.pdf 34WP_185_web_1-11-10.pdf 34 1/11/2010 1:39:26 PM1/11/2010 1:39:26 PM

Enhancing Regional Trade Integration in Southeast Europe 19
�
and� some� such� as� Bosnia� and� Herzegovina’s� exports� to� FYR� Macedonia� show�deterioration�in�quality.��Table 2.10. Difference between Imports and Exports (in Percent) for 2000–06 Period for Selected Trade Relationships
Exporter Importer 2000 2001 2002 2003 2004 2005 2006 2007
AL MK 27.7 –79.7 –77.3 29.4 –14.9 –12.0 –7.3 –20.0 MK AL 84.8 50.7 19.4 –68.6 0.7 16.2 20.3 11.9 BiH HR 11.0 5.9 –7.4 –6.3 –3.7 HR BiH –28.0 –21.8 –5.3 –1.4 –3.9 MK HR 15.0 7.8 13.3 12.7 45.4 78.4 44.9 35.3 HR MK –1.9 –11.6 –6.5 –9.8 –11.8 –7.6 –5.2 –6.1 MK BiH –43.0 –11.0 15.3 15.3 10.1 BiH MK 25.6 20.8 5.2 –2.5 1.4
Source:�UN�COMTRADE�database.��As� fully� comparable� data� on� mirror� exports� and� imports� (by� origin)� are� not�
available,�one�way� to�assess� the�possible�unregistered� trade� is� to�disaggregate�mirror�statistics�by�product�to�seek�possible�patterns.�Figure�2.6�shows�mirror�trade�statistics,�by�HS�2�category,�between�Bosnia�and�Herzegovina�and�Croatia,�for�the�20�categories�with� the� largest� mirror� gaps.� In� the� case� where� Croatia� is� the� source� and� Bosnia� and�Herzegovina�the�destination�(left�graph),�imports�as�expected�are�larger�than�exports�in�all�but� two�product�categories.�However,� for�some�product�categories,� such�as�10�or�86,� the�difference� is� too� large,� and� is� probably� unlikely� that� Bosnia� and�Herzegovina� imported�Croatian�products� in� these�categories� from�other�countries.� In�contrast,�Croatia’s� imports�from�Bosnia�and�Herzegovina�are�almost�uniformly�lower�than�Bosnia�and�Herzegovina’s�exports�to�Croatia,�which�deserves�some�greater�investigation.��
The� gap� in� mirror� statistics,� beyond� the� expected� c.i.f./f.o.b.� difference� and� the�differentiation� in� recording� based� on� the� origin� of� goods,� could� come� from� various�reasons:�smuggling�of�goods,�under�invoicing�and�misclassification�(to�categories�with�lower�duties/VAT),�but�also�from�exchange�rate�differences.�And�it�is�not�uncommon�to�have�trade�statistics�gaps�even�in�developed�countries.�For�example,� intra�OECD�exports�are�slightly�lower�(by�around�1�percent)�than�intra�imports,�according�to�UN�COMTRADE�database.� In�any�case,� the�gaps�bear� further� investigation�by�policy�makers� to�determine�whether�there�is�possible�misreporting,�and�if�yes�what�are�the�causes.��
Identifying�the�real�causes�would�then�allow�for�improving�the�efficiency�of�trade�reporting,�through�strengthening�the�customs�administrations�or�realigning�incentives�to� ensure� proper� recording� of� trade.� The� implications� of� the� misreporting� are� both�financial�and�intangible.�Under�reporting�of�imports�means�foregone�revenues�for�the�importing�authorities.�CEFTA�has�eliminated�customs�duties,�so�unregistered�imports�imply� uncollected� VAT� (which� is� the� largest� revenue� category� collected� by� customs�authorities).� This,� then,� leads� to� unfair� competition� between� illegally� imported� and�domestic� products.� Inadequate� statistics� quality� diminishes� the� perception� and�integrity� of� national� institutions,� which� among� other� things,� worsens� EU� prospects�(including�joining�the�Pan�Euro�Mediterranean�Area�of�diagonal�cumulation�of�origin).��
WP_185_web_1-11-10.pdf 35WP_185_web_1-11-10.pdf 35 1/11/2010 1:39:26 PM1/11/2010 1:39:26 PM

20 World Bank Working Paper
�
Figure 2.6. Trade between Bosnia and Herzegovina and Croatia
�Source:�national�authorities.��
Another,�but�much� less� relevant,� issue�concerning� trade�statistics� in� the�region� is�their� reporting� and�public� availability.�CEFTA� is� of� course� the� only�multilateral� free�trade�area�that�the�countries�are�members�of,�yet�trade�statistics�with�this�region�are�not�fully� publicly� available.� Statistical� offices� of� all� CEFTA� parties� publish� regular�(monthly)� trade� statistics,� by� product� and� trading� partners,� however,� Croatia� and�Kosovo�are�the�only�ones�which�report�trade�with�CEFTA�as�a�distinct�category.�Others�report�only�trade�with�top�trading�partners�and�in�most�cases�one�or�two�countries�are�missing� (for� example,�Moldova�and�Albania).8�The�Macedonian� statistics�office�has� a�category� “Western� Balkans,”� and� Bosnian� statistics� shows� all� CEFTA� parties� under�“European�countries�in�development.”�The�Serbian�statistics�office�shows�Serbia’s�trade�with�the�EU�and�13�other�economic�areas�(including�MERCOSUR�to�which�there�are�no�exports),�but�does�not� include�trade�with�CEFTA.�It�seems�that� trade�statistics�within�CEFTA�deserve�greater�attention�and�visibility�in�order�for�exporters�and�importers�to�assess�better�the�trade�potential�in�the�region.��
Last� but� not� least,� some� countries� continue� to� publish� trade� data� in�U.S.� dollars�(and�in�national�currency)�despite�the�fact�that�the�bulk�of�their�trade�is�conducted�in�euro.� In� addition,� monetary� (exchange�rate)� policy� in� all� of� these� countries� is� also�anchored�to�the�euro�with�de�facto�euro�pegs�in�some�countries�(and�euro�use�as�official�
–80–60–40–20
020406080
100
27 25 85 24 4 22 10 73 84 87 30 16 69 21 18 86 15 39 12 49
Difference between BiH's imports from Croatia and Croatia's exports to BiH
difference in % difference in EUR mn
–80–60–40–20
020406080
100
27 76 44 73 94 62 4 15 84 39 85 25 87 72 86 20 48 61 19 22
Difference between Croatia's imports from BiH and BiH's exports to Croatia
difference in % difference in EUR mn
Per
cent
Per
cent
WP_185_web_1-11-10.pdf 36WP_185_web_1-11-10.pdf 36 1/11/2010 1:39:26 PM1/11/2010 1:39:26 PM

Enhancing Regional Trade Integration in Southeast Europe 21
�
currency�in�Montenegro�and�Kosovo).�Hence,�trade�data�can�be�significantly�distorted�by�the�fluctuation�in�the�euro�dollar�exchange�rate,�which�has�been�extremely�volatile�in� recent� years.� In� this� regard,� euro�based� trade� statistics�would� be� of� clear� demand�both�among�policy�makers�and�analysts�as�well�as�among�businesses.�
Notes �1�List�of�all�HS�2�digit�product�categories�can�be�found�in�Annex�4.�2� Each� export� of� a� product� at� 4� digit� (SITC� Rev.� 3)� level� to� a� country� counts� as� an� export�relationship.�If�a�country�exports�100�products�at�4�digit�level�to�5�countries,�the�number�of�export�relationships�would�be�between�100�(each�product�is�exported�to�only�one�market)�and�500�(each�product�is�exported�to�each�market).�3�Serbia’s�exports�in�COMTRADE�for�2007�are�listed�as�Serbia�and�Montenegro.�4�Disaggregated�data�in�WITS�were�not�available�for�Kosovo�and�Montenegro.�5�See�Helpman�and�Krugman�(1985)�and�Helpman�(1987).�6� In�Kawecka�Wyrykowska’s�paper�EU�10� refers� to� the� 10� countries� that� joined� the�EU� in� 2004�(CEEC,�the�Baltics,�and�Cyprus�and�Malta)�7� In� accordance� with� the� EC’s� Autonomous� Trade� Preference� mechanism� and� later� the�Stabilization�and�Association�Agreements.�8�None�of�the�countries�publish�trade�statistics�with�Kosovo.�
WP_185_web_1-11-10.pdf 37WP_185_web_1-11-10.pdf 37 1/11/2010 1:39:26 PM1/11/2010 1:39:26 PM

22
CHAPTER �3 �
The�Role�of�Trade�Regulations,�Trade�related�Business�
Environment,�and��Rules�of�Origin�in�Trade�
Expansion�and�Integration�
Technical Regulations and Standards
As�the�impact�of�tariffs�and�quotas�diminishes�within�CEFTA,�the�impact�of�technical�barriers�to�trade1�(TBTs)�and�sanitary�and�phytosanitary�(SPS)�measures2�becomes�more�prominent.�TBTs�and�SPS,�by�their�very�nature,�may�result�in�restrictions�on�trade,�even�though� that� in�most� cases� is� not� the� purpose� of� their� existence.� They� put� additional�costs� on� exporters� to� adjust� their� products� to� comply� with� the� different� market�requirements� of� countries,� and� countries� may� use� them� as� an� excuse� to� protect�domestic� producers.� So,� as� trade� between� countries� expands� as� a� result� of�reduced/eliminated�tariff�barriers,�more�opportunities�for�disputes�on�the�TBT�and�SPS�issues�may�arise.��
Regulations�and�standards�on�industrial�and�agriculture�products�can�facilitate�or�impede� trade� depending� on� the� overall� institutional� setup.� The� empirical� literature�confirms� that� conforming� to� shared� standards� is� generally� considered� to� promote�trade.�To�prevent�technical�requirements�and�SPS�from�becoming�unnecessary�barriers�to� trade,� WTO� members� are� obliged� to� apply� the� SBS� and� TBT� Agreements.� The�CEFTA�countries,�while�not� all�WTO�members,3�have�agreed� to� apply�WTO�rules� in�their�trade,�including�the�SBS�and�TBTs�Agreements.�This�is�very�important�as�around�two� thirds� of� intra�CEFTA� trade� involves� non�WTO�members.� The� countries� in� the�region� could� take� further� steps� to� ensure� full� implementation� of� their� commitments�and� to� achieve� a� more� ambitious� progress� towards� minimizing� the� trade� distorting�effects�of�TBTs�and�SPS.�
Technical barriers to trade (TBTs)
TBTs�are�used�by�governments� to� regulate�markets,�protect� consumers,�and�preserve�natural� resources,� and� encompass� most� product� categories,� from� automobile� safety�standards�to�pharmaceutical�or�food�packaging�regulations.�TBTs,�by�their�very�nature,�
WP_185_web_1-11-10.pdf 38WP_185_web_1-11-10.pdf 38 1/11/2010 1:39:26 PM1/11/2010 1:39:26 PM

Enhancing Regional Trade Integration in Southeast Europe 23
�
may�result�in�restrictions�on�trade,�even�though�that�in�most�cases�is�not�the�purpose�of�their� existence.� As� a�matter� of� fact,� recent� empirical� evidence� shows� that� under� the�right� conditions� standards� and� technical� regulations� encourage� trade.� For� example,�strict� standards� and� regulations� can� increase� the� confidence� of� consumers� in� the�imported�products�(having�had�to�meet�these�standards).�Another�benefit�for�exporters�is�that�standards�and�regulations�convey�information�on�consumer�preferences�which�reduces� the�costs� for�gathering�such� information.�However,�TBTs�most�often�hamper�trade�through�the�diversity�of�standards�among�trading�partners�and� the� inadequate,�public�and�private,�infrastructure�for�standardization,�accreditation�and�metrology.�In�such�cases,� they�put�additional� costs�on� exporters� to�adjust� their�products� to� comply�with�the�different�market�requirements�of�countries,�and�countries�may�use�them�as�an�excuse� to� protect� domestic� production.� For� example,� empirical� research� shows� that�testing�procedures,�standards,�and�inspection�lower�developing�countries’�exports�by�9,�7,�and�3�percent,�respectively�(Taylor�and�Wilson,�2008).�In�addition,�over�80�percent�of�surveyed�firms�in�Eastern�Europe�have�stated�design,�testing,�and�certification�costs�as�a�reason�for�not�exporting.�
The� impact� of� technical� regulations� and� standards� on� trade� depends� on� the�existence�of�appropriate�national�quality�infrastructure�system�(box�3.1).4�This�includes�standardization,� accreditation,� metrology,� testing,� certification,� inspection,� and�supervision� services� to� ensure� that� products� meet� the� defined� requirements.� The�absence� of� such� well�functioning� system� is� damaging� to� both� exports� and� imports.�Exports� are� hampered� because� firms� cannot� meet� the� requirements� that� foreign�partners� have� set,� and� low� quality� imports� can� enter� the� market� because� of�inappropriate�quality�control�systems.��
Box 3.1. How Technical Standards and Regulations Can Be an Obstacle to Trade
Technical standards and regulations encompass a wide range of rules and procedures, and in many ways some of these can be used as a TBT. In the context of CEFTA, firms from most countries have raised complaints about TBT in some of the CEFTA markets, though it remains to be seen how many of these complaints are in fact TBTs as often TBTs are mixed up with other types of NTBs. There seems to be, for example, great dissatisfaction among trading firms with the lack of progress on mutual recognition of certifications. In some cases, exporters from a country which has adopted certain EU standards (for example, on labeling) are facing difficulties when exporting to CEFTA parties which have not yet adopted those EU standards. Then, firms in some countries object that market inspection bodies in some countries take an additional sample for inspection, in addition to the one already given to other inspection bodies, for example, sanitary. Last but not least, it is often heard that exporters do not have sufficient information about import requirements and procedures. Moreover, regulations are frequently changed without prior notification.
Source:�Author.��
The� national� quality� systems� in� SEE� are� still� at� a� development� stage,� and� this�hampers� trade�between� the�bloc�and�key�partners� such�as� the�EU�as�well�among� the�bloc� itself.� There� is� of� course� a� large� discrepancy� in� this� area�within� this� group,� but�nonetheless,� firms� in� the� region� are� unable� to� fully� penetrate� the� regional� market�created�with�the�CEFTA�agreement.�Anecdotal�evidence�confirm�that�standards�are�an�important�obstacle�to�trade�in�the�region;�exporting�firms�often�claim�that�standards�are�used�as�TBTs�to�prevent�trade,�and�domestic�firms�claim�that�insufficient�standards�(or�
WP_185_web_1-11-10.pdf 39WP_185_web_1-11-10.pdf 39 1/11/2010 1:39:27 PM1/11/2010 1:39:27 PM

24 World Bank Working Paper
�
implementation�of�quality�control)�allows�low�quality�products�to�enter�the�market�and�create�unfair�competition.�
All�countries�have�made�some�progress�on�improving�their�quality�infrastructure�systems�as�this�is�a�key�requirement�for�EU�accession.�Free�movement�of�goods,�which�includes�technical�regulations�and�standards,�is�one�of�the�four�freedoms�of�the�Single�Market,� and� all� countries�will� have� to� fully� adopt� EU’s� standards� before� joining� the�Union.� However,� the� systems� in� all� countries� in� the� region� were� outdated,�infrastructure� obsolete� and� standards� not� internationally� recognized,� so� substantial�institutional� and� legislative� reform� as� well� as� investment� is� necessary� to� bring� the�systems�to�EU�levels.��
The� fact� that�all� countries� in� the� region�are� adopting�European� standards�means�that�their�systems�are�converging�and�this�will�in�the�long�run�eliminate�TBTs�among�the� bloc.� Despite� the� substantive� progress� achieved� in� 2009,� most� countries� are� still�lagging� behind� in� transposing� the� EU� acquis� in� this� area,� so� full� alignment� (and�convergence)�requires�intensified�and�sustained�efforts�in�this�complex�area.�Croatia�is,�expectedly,�most� advanced� in� transforming� its� quality� infrastructure;� it� has� adopted�most� European� Standards� (ENs)� and� has� a� relatively� well� developed� infrastructure�with� over� 140� conformity� assessment� bodies.� Albania� and� Bosnia� and� Herzegovina�have� also� adopted� substantial� share� of� ENs� (mostly� by� endorsement);� however� the�number� of� bodies� remains� relatively� low� (table� 3.1).� According� to� the� European�Commission,�despite�the�various�degrees�of�progress,�all�countries�need�to�further�align�their�legislation�in�the�area�of�free�movement�of�goods�with�the�EU�acquis.�In�many�of�the�countries,�the�institutional�set�up�is�well�in�place,�but�administrative�capacities�need�to�be�strengthened�to�ensure�proper�implementation�and�enforcement.���Table 3.1. Progress in Convergence to EU Standards
European Standards (ENs) adopted Conformity assessment bodies
2008 2009 2008 2009
Albania 14,424 15,029 n/a 16 Bosnia and Herzegovina 8,000 9,653 32 35 Croatia 10,695 21,368 123 145 FYR Macedonia 3,674 6,011 20 36 Montenegro 500 1,530 n/a 0 Serbia 2,805 5,072 325 347 Kosovo 665 1,200 0 4
Source:�European�Commission�progress�reports�2008�and�2009.��
In� addition� to� mandatory� standards,� international� voluntary� standards� are� also�important�for�facilitating�trade.�Thousands�of�firms�choose�to�get�certification�for�ISO�developed� standards� because� they� perceive� an� added� value� in� showing� conformity�with� these� standards.�Clougherty� and�Grajek� (2006)� find� that� ISO�9000�diffusion�has�boosted� trade,� in� particular� in� developing� countries,� as� it� eases� the� costs� of� trade�through�the�quality�signal�it�sends�and�the�“common�language.”�The�authors�also�find�positive� links� to� FDI,� again�more� in�developing� countries,� as� international� standards�allow� for� easier� integration� of� production� processes.� The� perceived� value� of�
WP_185_web_1-11-10.pdf 40WP_185_web_1-11-10.pdf 40 1/11/2010 1:39:27 PM1/11/2010 1:39:27 PM

Enhancing Regional Trade Integration in Southeast Europe 25
�
international� certification� is�much�greater� for� firms� in�developing� countries,�whereas�firms� in� developed� countries� do� not� necessarily� feel� a� strong� need� for� international�recognition� of� their� systems.� That� is� why� for� example� Germany� has� less� ISO� 9001�certified�firms�per�population�than�Slovenia�and�twice�less�certified�firms�than�Italy.�
SEE� firms� have� not� engaged� very� strongly� in� adopting� international� standards.�According� to� ISO’s� latest� survey,� the�number�of� firms�which�have�adopted� ISO�9001,�that�covers�quality�management�systems,�is�extremely�low�in�Albania�and�Montenegro,�but� also� in� Macedonia� (table� 3.2).� Even� Serbia� and� Croatia� have� far� less� ISO� 9001�certified�firms�compared�to�some�of�the�neighboring�EU�10�countries.�The�situation�is�similar� concerning� the�diffusion�of� ISO�14001,� the� second�most�widely� implemented,�standard�that�covers�environmental�management�systems.�And�only�a�few�dozen�firms�in�the�entire�region�(most�of�which�in�Croatia)�have�introduced�the�ISO�16949�standard�for�quality�management�systems�for�automotive�production�and�relevant�service�part�organizations,�despite�the�willingness�and�potential�of�several�SEE�countries�to�develop�their�automotive�sector.�The�Slovak�Republic,�on�the�other�hand,�which�is�the�leader�in�the�automotive�industry�among�the�EU�10,�had�151�firms�implementing�this�standard.��Table 3.2. Number of Firms Using ISO Standards at the End of 2007
ISO 9001 ISO 14001 ISO 16949
Albania 23 0 0 Bosnia and Herzegovina 652 44 6 Croatia 2,073 258 20 FYR Macedonia 255 13 3 Montenegro 136 12 0 Serbia 1,987 149 6
Bulgaria 4,663 214 14 Slovak Republic 2,840 437 151 Slovenia 1,886 438 80
Source:�ISO�Survey�2007�(www.iso.org).��
The�chapter�on�TBTs�in�the�CEFTA�Agreement�states�that�parties�shall�identify�and�eliminate� unnecessary� TBTs� and� shall� not� introduce� new� such� barriers.� To� achieve�these� goals� the� parties� will� cooperate� within� the� CEFTA� institutional� framework� to�harmonize� technical� regulations,� standards,� and� conformity� assessment� procedures.�However,� the� legal� language� in� this�area� is�quite�weak�and�requires�only� that�parties�enter� into� negotiations� on� harmonization� and� mutual� recognition� before� the� end� of�2010.��
Harmonization�of�standards�and�mutual�recognition�of�conformity�assessment�can�be�a�long�process�which�requires�close�coordination�between�the�public�sector�and�the�industry,� including�negotiating� bodies,� standards� and� conformity� assessment� bodies,�and�the�regulatory�bodies.�For�example,�the�Asia�PacificPacific�Economic�Cooperation�(APEC)� Mutual� Recognition� Arrangement� for� Conformity� Assessment� of�Telecommunications�Equipment�(only),�in�which�18�countries�participate,�took�almost�three�years�to�negotiate�and�more�than�a�year�to�enter�into�effect.5��
WP_185_web_1-11-10.pdf 41WP_185_web_1-11-10.pdf 41 1/11/2010 1:39:27 PM1/11/2010 1:39:27 PM

26 World Bank Working Paper
�
It�is�difficult�to�estimate�the�foregone�trade�due�to�TBTs�arising�from�incompatible�standards,� high� certification� costs,� and� so� forth� It� is� to� be� expected� that� small� and�medium�sized� enterprises� (SMEs)� are� affected� disproportionately� more� by� the�certification�requirements�as�these�processes�involve�fixed�costs,�so�for�small�exporters�this�constitutes�a�significant�barrier�to�trade.�While�no�precise�data�on�the�structure�of�trading� firms�within�CEFTA� can� be� found� for� any� of� the� countries,� the�BEEPS� 20086�results� show�that� the�sharing�of�exporting�SMEs� is� significant,� especially� in� the� three�largest�SEE�economies.�In�Serbia,�41�percent�of�small�(1–19�employees)�and�58�percent�of�medium�sized�firms�(20–99�employees)�are�exporters.�The�respective�figures�are�24�and� 44� percent� for� Bosnia� and�Herzegovina,� and� 20� and� 34� percent� for�Croatia.� The�most� traded� products� within� CEFTA,� such� as� oil,� steel,� and� other� commodities,� are�exported�by� large� firms,�but�SMEs�probably�have�a�nontrivial� share� in�exporting�some�other�product�categories.��
In�preparation�of�implementation�of�CEFTA,�all�SEE�countries�prepared�reports�on�identifying�and�eliminating�NTBs.�The�assessment�of� these�reports,7�prepared�in�May�2007,� showed� that� SEE� countries� had�made� little� progress� in� addressing� NTBs.� The�assessment� found� there�was� insufficient� coordination� among� the� parties� and� under�emphasis� on� TBTs,� and� SPS,� issues� (and� over�emphasis� on� improving� border� and�customs�procedures).�To�improve�the�collaboration�and�progress�in�addressing�NTBs,�CEFTA� parties� have� established� a� subcommittee� on� NTBs,� which� has� met� on� few�occasions.�While� no�major� agreements� have� been�made� so� far,� an� expert� study8� has�been� commissioned� by� the� EC� that�would� assess� the� progress�made�with� regard� to�TBTs�and�provide�recommendations�(box�3.2).�Concerning�harmonization�of�standards�and�mutual�recognition�of�conformity�assessment,�the�study�urges�CEFTA�countries�to�achieve� full� European,� and� international,� recognition� of� their� national� quality�infrastructure.�At� the�same� time,� the�countries� should�establish�effective�mechanisms�for� regulatory� cooperation� and� implementation� of� CEFTA� clauses� on� transparency�with� regard� to� TBTs.� Technical� cooperation� on� the� progress�made� in� upgrading� the�quality�infrastructure�need�also�be�improved.��Box 3.2. CEFTA on Technical Barriers to Trade
TBTs are regulated in chapter IV of the Agreement, which obliges all parties to apply the WTO Agreement on TBTs. Article 13 requires that “the Parties undertake to identify and eliminate unnecessary existing technical barriers to trade within the meaning of the WTO Agreement on TBTs”. In addition, the Parties “undertake not to introduce new unnecessary technical barriers to trade” and “shall inform ... of any draft text for a new technical regulation or standard”.
Moreover, “the Parties are strongly encouraged ... to harmonize their technical regulations, standards and procedures for assessment of conformity with those in the European Community”. The Agreement specifies a concrete deadline for action on this issue: “the Parties undertake to enter into negotiations to conclude plurilateral agreements on harmonization of their technical regulations and standards, and the mutual recognition of conformity assessment procedures... before 31 December 2010.”
Source:�CEFTA.�
�The�small�size�of�their�economies�and�their�close�proximity�allow�for�much�greater�
cooperation�at�regional� level.�SEE�countries�could�benefit� from�economies�of�scale�by�
WP_185_web_1-11-10.pdf 42WP_185_web_1-11-10.pdf 42 1/11/2010 1:39:27 PM1/11/2010 1:39:27 PM

Enhancing Regional Trade Integration in Southeast Europe 27
�
sharing� their� quality� infrastructure,� since� the� number� of� potential� users� might� not�justify�having�every� service�provided� in� each�of� the� countries.� Furthermore,� some�of�the� small� countries� might� lack� the� necessary� specific� technical� expertise� and� the�financial� resources� to� offer� all� services� related� to� accreditation� and� metrology�domestically.��
Sanitary and Phytosanitary Standards
Sanitary� and� phytosanitary� standards� (SPS)� are� receiving� increasing� attention� in� the�international�trade�context.�The�use�of�food�safety,�animal�and�plant�health�rules�as�a�barrier�to�trade�has�increased�considerably�in�recent�years�throughout�the�world.�While�the� aim� of� these� rules� is� to� protect� the� health� of� domestic� consumers,� governments�frequently�use�SPS�to�shield�domestic�producers�of�agricultural�products�from�imports.�As�tariffs�and�quotas�on�agriculture�products�in�CEFTA�are�largely�abolished,�and�full�liberalization�is�likely�to�be�achieved�by�the�end�of�2009,�SPS�are�likely�to�become�more�common�barrier�to�trade.��
Agriculture� trade� features� prominently� in� intra�regional� trade,� hence� SPS� issues�are� of� great� relevance� for� improving� trade� potential.� Most� SEE� economies� have� a�significant�agriculture�sector,�and�agriculture�products�(HS�categories�1�to�24)�account�for�over�a�fifth�of� intra�regional�trade�(though�not�all�products�in�these�categories�are�subject� to� SPS� measures).� Agriculture� exports� account� for� over� a� quarter� of� total�exports�to�CEFTA�in�the�case�of�Kosovo,�Serbia,�and�Macedonia,�while�they�are�only�5�percent� for� Albania� (figure� 3.1).� Serbia� is� the� largest� next� exporter� of� agriculture�products,�followed�by�Croatia.�In�contrast,�Bosnia�and�Herzegovina,�Montenegro,�and�Kosovo�are�significant�net�importers.�Even�though�it�is�difficult�to�estimate�the�forgone�exports�arising�from�the�possible�use�of�SPS�measures�as�a�barrier� to� trade,�exporters�should�strongly�benefit�from�having�more�transparent�rules�of�the�game.���
Figure 3.1. Share of Agriculture Exports and Imports in Total to CEFTA in 2008
�Source:�National�Authorities.�Note:�Data�for�Montenegro�are�for�January�October�period.��
The� CEFTA� Agreement� and� the� EU� accession� process� should� help� reduce� the�distorting�effects�of�SPS�on�trade�within�the�region.�The�Agreement�obliges�all�parties�to�adhere�to�the�WTO�Agreement�on�SPS,�which�of�great�importance�as�over�80�percent�
0
5
10
15
20
25
30
35
Albania BiH Croatia Macedonia, FYR
Montenegro Serbia Kosovo
importsexports
Per
cent
WP_185_web_1-11-10.pdf 43WP_185_web_1-11-10.pdf 43 1/11/2010 1:39:27 PM1/11/2010 1:39:27 PM

28 World Bank Working Paper
�
of�agriculture�trade�in�CEFTA�goes�to�non�WTO�members.�In�addition,�all�parties�have�committed� to� cooperate� in� the� sanitary� and� phytosanitary� field� and� to� apply�regulations� in� a� nondiscriminatory� manner.� The� parties� also� envisage� concluding�agreements� on� harmonization� or� mutual� recognition� in� these� matters,� though,� the�Agreement�does�not�specify�any�deadlines�for�this.��
The� EU� accession� process� could� also� facilitate� the� convergence� of� sanitary� and�phytosanitary� measures� in� the� SEE� region.� As� the� countries� progress� on� their� EU�accession�path,�they�will�have�to�increasingly�comply�with�the�EU�rules�in�the�area�of�food�safety,�veterinary�and�phytosanitary�standards�(chapter�12�of�the�acquis).�So�in�the�long�run�each�of�the�countries�will�have�adopted�EU�comprehensive�set�of�standards�in�this� area,� and� exporters� will� not� have� to� meet� requirements� different� from� their�domestic� ones.� This� part� of� the� EU� acquis,� however,� is� among� the� most� difficult� to�comply� with,� so� the� convergence� process� will� be� a� long� one.� For� example,� Croatia,�which�is�by�far�most�advanced�in�the�negotiations�process,�has�yet�to�make�substantial�progress�in�the�area�of�food�safety�(European�Commission�progress�report�2008).�
It� is� important� to� note� that� when� it� comes� to� food� products,� large�retail/supermarket� chains� often� set� their� own� standards� (for� example,� fruits� to� be� of�same/similar�size�and�shape)�which�go�beyond�the�SPS�import�rules.�While�this�is�more�the� case� with� European� retailers,� retailers� in� the� region� are� likely� to� follow� similar�trends� (especially� if� they� are� bought� by� larger� global� retailers).� So,� agriculture�producers�will�increasingly�need�to�deal�with�these�market�imposed�standards�in�order�to�be�able�to�access�large�suppliers�(both�in�the�CEFTA�market�and�domestically).�
The�CEFTA�Agreement�introduces�several�novelties�that�aim�to�limit�the�use�of�SPS�measures�as�a�barrier�to�trade.�SPS�measures�are�regulated�in�the�chapter�on�agriculture�products� (III)� and� article� 12� of� the� Agreement� obliges� all� parties� to� apply� the�WTO�Agreement� on� the� application� of� SPS� measures.� The� same� article� requires� that� “the�Parties�shall�co�operate�in�the�field�of�sanitary�and�phytosanitary�measures,�including�veterinary� matters,� with� the� aim� of� applying� relevant� regulations� in� a� non�discriminatory�manner.”�In�addition,� it�obliges�parties� to�provide�information�on�SPS�measures� upon� request� of� another� party.�Moreover,� “The� Parties� shall� enter,� where�appropriate,� into� negotiations� to� conclude� agreements� on� harmonization� or� mutual�recognition�in�threes�matters....”�However,�a�deadline�for�such�action�is�not�specified.�
The� collaboration� on� these� matters� is� fostered� by� the� CEFTA� Subcommittee� on�NTBs.� However,� since� the� Agreement� entered� into� force,� firms� from� several� SEE�countries�have�voiced�complaints�about�cases�of�SPS�measures�being�used�as�a�barrier�to�trade.�Moreover,�several�countries�introduced�at�some�point�measures�(of�SPS�nature)�that� limit� or� prohibit� imports� from� other� CEFTA� parties.� Some� of� these� have� been�resolved�within�the�CEFTA�framework,�but�others�continue�to�be�applied.�For�example,�Croatia,�FYR�Macedonia,�and�Serbia�have�bans�on�import�of�some�meet�products�(some�of� these�bans�precede� the�CEFTA�Agreement).�The�business�community� in�Bosnia�and�Herzegovina�and�Montenegro�has�complained�that�excessive�inspection�procedures�and�sampling�of�certain�food�products�constitute�discriminatory�SPS�measures.��
Many�of�these�arise�from�the�non�acceptance�of�standards�and�certifications�of�the�exporting� party� (box� 3.3.).� Faster� progress� on� harmonization� or� mutual� recognition�should�significantly�reduce�the�complaints,�that�is,�barriers�to�trade�in�this�area.��
WP_185_web_1-11-10.pdf 44WP_185_web_1-11-10.pdf 44 1/11/2010 1:39:28 PM1/11/2010 1:39:28 PM

Enhancing Regional Trade Integration in Southeast Europe 29
�
Box 3.3. Import-Restricting Measures between Bosnia and Herzegovina, Croatia, and Serbia
Import-restricting measures between Bosnia and Herzegovina and Croatia for certain product groups, such as live bovine and milk, have existed for many years. For example, for some 9 years live bovine exports from Bosnia and Herzegovina to Croatia have been banned. In 2009, Bosnia and Herzegovina introduced a counter measures banning imports of live bovine from Croatia. Following this decision, Croatia introduced a ban on fish from Bosnia and Herzegovina. The escalation of trade protectionism measures on agriculture and food products finally led to negotiations between both sides at which most issues were resolved. Agreement had been reached to remove discriminatory measures for most products, for example, milk products (see http://www.dw-world.de/dw/article/0,4292323,00.html). Negotiations on removing bans on live bovine and fish remain to be finalized.
In June 2009, Bosnia and Herzegovina’s Parliament made a major precedent in the trade relationship by enacting a law on protection of domestic production (Official Gazette issue 49/09). This law introduced MFN duties for imports of some 900 products from Croatia and Serbia, and presented a direct breach of the CEFTA Agreement. Following the enactment, the constitutionality of the law was challenged and on July 3 2009, the Constitutional Court of Bosnia and Herzegovina brought a decision annulling the implementation of the law.
Sources: http://www.dw-world.de/dw/article/0,4292323,00.html; Official Gazette issue 49/09.
�The� national� reports� on� identifying� and� eliminating� NTBs,� as� well� as� their�
assessments,�included�also�SPS�issues.�The�recommendation�in�the�assessment�of�these�reports�was�to�improve�coordination�on�SPS�issues.�The�EC�has�commissioned�another�study9� which� would� provide� recommendations� on� harmonization� and/or� mutual�recognition�of�SPS�measures�under�CEFTA.�As�it�has�been�found�that�most�of�the�NTBs�actually� arise� from� SPS� measures,� it� would� be� essential� for� the� countries� to� assess�carefully�the�proposals�given�in�this�study,�and�to�make�swift�progress�towards�greater�collaboration�in�this�area.�
Trade-Related Business Environment
The� following� section� examines� the� trade�related� environment� in� SEE� through� the�prism�of�several�global�surveys�and�reports�(the�Doing�Business�report,�BEEPS,�and�the�Enabling�Trade� Index).� The� analysis� derived� from� these� reports� does� not� necessarily�relate� to� intra�regional� trade;� however,� the� findings� should� be� considered� valid� for�intra�regional�trade�as�it�captures�a�significant�share�of�total�trade.�In�addition,�several�pieces� of� country�specific� and� anecdotal� evidence� are� included� to� reflect� more�specifically� the� impact� of� the� trade�related� business� environment� on� intra�regional�trade.�
Tariffs� and� quotas� are� only� one� part� of� the� overall� costs� of� trade,� so� even�when�those�are�eliminated,�trade�performance�can�be�impeded�by�high�costs�to�transport�and�get� goods� across� borders.� The� literature� undoubtedly� shows� the� negative� correlation�between�trade�costs�and�trade�performance.�Other�aspects�of�the�business�environment,�such�as� regulatory�environment,� telecommunications�cost,�and� infrastructure�are�also�strong�determinants�of�trade�as�they�impact�the�costs�of�production�in�addition�to�the�trade�cost.10�Njinkeu,�Wilson,�and�Foss�(2008)�undertake�a�review�of�literature�on�trade�facilitation�and�find�that�improvements�in�the�customs�system,�regulatory�environment�(including� quality� of� institutions),� and� telecommunications� have� positive�improvements�on�trade.��
WP_185_web_1-11-10.pdf 45WP_185_web_1-11-10.pdf 45 1/11/2010 1:39:28 PM1/11/2010 1:39:28 PM

30 World Bank Working Paper
�
Hence,� improving� markets� by� establishing� friendly� business� and� trade�related�policies� is� complementary� to� the� formal� liberalization� of� trade� policy� via� FTAs.�Aminian,� Fung,� and� Ng� (2008)� compare� two� regions,� East� Asia� and� Latin� America,�which� have� followed� different� integration� paths;� integration� was� driven� by� market�conditions�in�East�Asia�and�by�trade�agreements�in�Latin�America.�The�study�finds�that�integration�via� the�markets�has�been�much�more� effective� and�East�Asian� economies�have�integrated�much�more�despite�the�absence�of�a�regional�trade�agreement�until�the�mid�1990s.11� For� example,� in� 2005� half� of� East� Asian� exports� went� to� the� region,�compared�to�only�13�percent�in�the�case�of�Latin�America�(even�though�Latin�American�economies� began� introducing� trade� treaties� in� the� 1960s).� The� conclusion� is� that� two�instruments� of� integration� are� complementary,� and� the� benefits� of� trade� can� be�maximized� by� improving� the� market� conditions� for� trade� in� addition� to� the� formal�trade�liberalization.�Structural�weaknesses�and�impediments�arising�from�the�business�environment�are�equally�important�for�unleashing�the�trade�and�growth�potential.�
To� understand� better� the� relative� importance� of� trade� costs,� Anderson� and� Van�Wincoop� (2004)� estimate� that� for� developed� countries� trade� costs,� including�distribution� costs,� are� roughly� about� 170� percent� of� the� production� costs.� Retail� and�wholesale� distribution� costs� account� for� the� bulk� of� total� trade� costs,� followed� by�border�related�costs�and� transport�costs.�Despite� the�obvious� large�variations� in�costs�across�countries�and�products,�the�importance�of�trade�costs�is�indisputably�large,�and�for� developing� countries� these� costs� are� probably� larger� as� they� often� face� higher�transport�and�border�costs�(due�to�poor�infrastructure�and�cumbersome�procedures).�
CEFTA�opens�up�the�potential�to�greater�intra�regional�trade�and�integration,�but�trade� liberalization� agreement� is� not� the� end� of� the� story.� Indeed,� the� SEE� countries�need�to�make�progress�on�trade�facilitation�to�ensure�that�they�benefit�to�the�maximum�possible� extent� from� their�multilateral� trade� liberalization.�Moving� forward� on� trade�facilitation�will�further�lower�trade�costs�and�promote�regional�trade�and�integration.��
Data�from�the�World�Bank’s�Doing�Business�database�show�that�the�overall�cost�of�exporting�and� importing� in�SEE� is�higher� than� in�OECD�and�well�performing�EU�10�countries.12�Last�year,�most�of�the�SEE�countries�made�progress�in�the�“Trading�Across�Borders”�area�of�the�Doing�Business�report,�however,�most�are�lagging�behind�the�top�performers� in� the� region.� The� cost� to� export� and� import� in� Kosovo� are� three� times�higher� than� in�Estonia,�and�Serbia� is�over�40�percent�more�expensive� than� the�Czech�Republic.� Unfortunately,� no� data� is� available� as� to� the� specific� costs� to� export� and�import�within�CEFTA.�However,� the� structure� of� these� costs� has� a� fixed� component�(related�to�licenses,�other�documentation,�crossing�the�border,�and�so�forth),�so�the�data�could�be�considered�representative� for� intra�regional� trade.�Moreover,� the�documents�and� time� for� export/import� are� more� or� less� the� same� irrespective� of� the� final�destination�of�the�products.�
The� procedures� for� exporting� and� importing� also� seem� to� be� unnecessary�burdensome,� according� to� the�Doing� Business� 2010� report� which� results� in� extended�time� and� cost� to� export� and� import� (table� 3.3).� Moreover,� policy�induced� measures�rather�than�infrastructure�capacity�and�quality�seem�to�be�large�contributors�to�the�time�and� cost� needed� to� cross� borders.� Exporters� and� importers� need� between� 6� and� 9�documents� to� move� their� product� across� the� border,� compared� to� 5� documents� in�OECD�countries�and�less�than�that�in�Estonia.�
WP_185_web_1-11-10.pdf 46WP_185_web_1-11-10.pdf 46 1/11/2010 1:39:28 PM1/11/2010 1:39:28 PM

Enhancing Regional Trade Integration in Southeast Europe 31
�
Table 3.3. Doing Business 2010 Rankings in the Area of Trade
Region or Economy
Documents for export
(number)
Time for export (days)
Cost to export (US$
per container)
Documents for import
(number)
Time for import (days)
Cost to import (US$
per container)
Albania 7 19 725 9 18 710 Bosnia and Herzegovina 6 16 1,125 7 16 1,090 Croatia 7 20 1,281 8 16 1,141 Macedonia, FYR 6 12 1,436 6 11 1,420 Montenegro 7 14 775 7 14 890 Serbia 6 12 1,398 6 14 1,559 Kosovo 8 17 2,270 8 16 2,330 SEE average 7 16 1,287 7 15 1,306 Bulgaria 5 23 1,551 7 21 1,666 Czech Republic* 4 17 985 7 20 1,087 Estonia 3 5 730 4 5 740 The Slovak Republic 6 20 1,445 8* 25* 1,445* ECA 7 27 1,582 8 28 1,773 EU 5 12 1,039 5 13 1,103
Source:�www.doingbusiness.org.�*�Doing�Business�2009�data���
The�time�to�export�and�import�in�the�region,�16�days�on�average,�is�longer�than�in�the�EU�countries,�but�less�than�in�many�of�the�EU�10.�And�while�the�costs�of�shipping�containers�depend�on�many� factors� beyond� customs� legislation,� the�procedures� (and�time)� for� crossing� borders� could� be� greatly� reduced� through� trade� facilitation�measures.� For� example,� Georgia� and� Estonia� have� succeeded� to� reduce� the� time� to�export�to�five�days.�In�addition,�maritime�shipping�costs�have�declined�significantly�in�the� past� several� decades,� so� SEE� firms� face� increased� competition� from� abroad,� so�reducing�unnecessary�trade�costs�could�help�maintain�the�advantage�of�short�distances�among�the�economies�in�the�region.�
These�long�times�to�export�and�import�can�be�a�major�obstacle�for�many�firms,�and�for�perishable�products,�such�as�fresh�fruits�and�vegetables,�are�simply�prohibitive.�The�array� among� the� countries� is� quite� large,� 12� days� to� export� in� FYR�Macedonia� and�Serbia,�and�20�days�in�Croatia,�which�also�causes�great�uncertainty�among�traders�and�hence� limits� trade� opportunities.� The� longer� time� to� move� goods� across� the� border�imply�not�only�higher�opportunity� costs�but�also�additional� expenditures� for� storage�and� wages� (truck� drivers).� For� example,� some� fruit� exporters� in� Serbia� have�complained� about� the� additional� costs� they� face� because� the� customs� authority� is�closed� on� Saturday� afternoon� and� Sunday.13�Djankov,� Freund,� and�Pham� (2006)� find�that� a�day�of�delay�at� the�border� is� equivalent� to� a� country�distancing� itself� from� its�trading�partner�by�additional�85�kilometers.�So,�using�this�rough�estimate,�an�eight�day�unnecessary�delay� at� borders� between�Croatia� and�Macedonia,� places� Skopje� further�than� Istanbul� in� terms�of� transport�costs� for�Croatian�exporters.� In�addition,� the� long�duration�and�high�uncertainty�force�firms�to�keep�higher�inventories�which�raise�their�operational� costs.� The� World� Bank’s� Country� Economic� Memorandum� for� Albania�
WP_185_web_1-11-10.pdf 47WP_185_web_1-11-10.pdf 47 1/11/2010 1:39:28 PM1/11/2010 1:39:28 PM

32 World Bank Working Paper
�
(forthcoming)� finds� the� cost� of� the� tied�up� capital� in� higher� inventories� to� be� quite�substantial�for�importers�but�also�significant�for�exporters.�
Most�of� the�SEE�countries�have�undertaken�deep�reforms� to�ease�doing� trade�by�streamlining� customs� procedures� and� have� achieved� huge� progress� in� recent� years.�Inspection�of�goods�at�borders�has�been�identified�as�one�of�the�biggest�causes�for�delay�in� transport� of� goods,� and� each� country� has� introduced� some� risk� management�techniques.�However,� the� approach� of� customs� authorities� remains� to� be� focused� on�trade�control� rather� than� trade� facilitation.� In�most�SEE�countries,�between�15�and�20�percent� of� shipments� are� physically� inspected� by� customs� officers,� compared� to� 5�percent� in� the�EU.� In�addition,�other� inspections,� such�as�market,�phytosanitary,� and�veterinary,�often�rely�on�100�percent�checking�of�all�goods.�Improving�the�efficiency�of�inspections,�as�well�as�removing�other�superfluous�procedures�could�greatly�reduce�the�waiting� times� for� goods� to� cross� borders� (box� 3.4).� The� World� Bank’s� Country�Economic� Memoranda� for� Albania,� Bosnia� and� Herzegovina,� and� FYR� Macedonia�(forthcoming),� and� its� Croatia’s� EU� Convergence� Report� (2009),� provide� more�information�on�the�remaining�constraints�to�export�in�these�countries.��
Box 3.4. Single Customs Window in FYR Macedonia
The Macedonian Customs Administration introduced in November 2008 an electronic “Single Window” for trade facilitation. The new system simplifies the process of exporting, importing, and transit of goods, and is a first step towards achieving a fully paperless trade system. The electronic single window allows for most of the certificates and licenses for export, transit, or import to be submitted electronically, which relieves traders, as well as the Customs Administration, from burdensome and time-consuming tasks.
The “single window”, once fully developed, would bring numerous benefits to trading firms and ultimately lowers the costs of imports and exports. For example, traders have now fast and efficient access to customs rules (for example, can get information online about all the customs requirements by tariff heading), information on requests submitted (for example, tracking of the current status of license applications online) and availability of tariff quotas. Some licenses are issued electronically and the system also provides information on the status of the license application, which takes away some of the uncertainty for traders. The new system also eliminates several procedures such as the obligation to submit evidence that the firm has been registered and that administrative fees for license application have been paid (fees can now be paid any time prior to receiving the license). Finally, the system is available 24/7 (www.exim.gov.mk), free of charge, hence the duration of the entire process is reduced.
The public authorities also greatly benefit from the new system which brings together 16 state institutions which are part of the trading process. The authorities now deal with electronic files which eliminates the time (and risk of errors) for entering data manually in the system. Also, they are able to monitor the payment of administrative fees as well as the distribution of quotas. The system allows for interlinking with other IT systems, so the access and flow of information is much more efficient.
Traders are increasingly showing interest in the new system. Almost 200 companies registered in the system by May 2009, and some 8,000 requests have been submitted electronically.
Source: Macedonian Customs Administration.
�The�Enabling�Trade� Index� (ETI)�prepared�by� the�World�Economic�Forum� (WEF)�
confirms� the� findings� of� the� Doing� Business� report.� The� ETI� measures� the� factors,�policies,�and�services�facilitating�international� trade�of�goods.�The�index14� is�based�on�
WP_185_web_1-11-10.pdf 48WP_185_web_1-11-10.pdf 48 1/11/2010 1:39:29 PM1/11/2010 1:39:29 PM

Enhancing Regional Trade Integration in Southeast Europe 33
�
hard�data� from�various� sources� and� survey�data� from� the�World� Economic� Forum’s�Executive� Opinion� Survey.� Croatia� stands� out� from� the� rest� of� the� region� (data� for�Serbia� and� Montenegro� are� not� available),� and� even� there� the� gap� with� well�performing�EU�10�countries�is�significant�in�areas�such�as�border�administration�(figure�3.2).�The�other�three�countries�of�the�region�rank�lower�than�Estonia�and�Slovenia�on�all�four� sub�indicators,� except�on�market�access�which� is�a� result�of�EU’s�common� trade�policy.� Between� 2008� and� 2009,� Albania,� Croatia,� and� FYR� Macedonia� had� made�progress� in� the� ranking,� while� Bosnia� and� Herzegovina’s� position� significantly�deteriorated� from� 89th� in� 2008� to� 102th� in� 2009.� Again,� the� index� relates� to� overall�trade,�but�most�of�the�indicators�used,�such�as�the�domestic�infrastructure,�the�border�administration,� and� the� business� environment,� are� same� for� all� trade� irrespective� of�destination.��
Figure 3.2. WEF’s Enabling Trade Index 2009
�Source:�WEF’s�Global�Enabling�Trade�Report�2009.��
The� BEEPS� 2008� depicts� a� less� harsh� trade�related� environment� as� perceived� by�firms� that� trade,� though� there� is� much� room� for� improvements� on� various� aspects�(table�3.4).�For�example,� this�survey�suggests� that� in�most�SEE�countries,� it� takes� less�time�to�clear�exports�and� imports� from�customs�than�in�some�of� the�EU�10�countries.�The� time� to� obtain� an� import� license,� in� contrast,� is� much� longer� in� SEE� (except�Montenegro)� than� in� the� better� performing� EU�10� countries.� The� perception� of� the�trade�related�environment� also�varies�among� the� countries,�only�5�percent�of� trading�firms� in� Montenegro� list� customs� and� trade� regulations� as� a� major� constraint,�compared� to� 18�percent� in� Serbia.�At� the� same� time,� however,�Montenegro�has� very�few� exporting� firms,� whereas� almost� half� of� the� interviewed� firms� in� Serbia� were�exporters.�
�
0
20
40
60
80
100
120
Overall Rank Market Access Border Administration Transport and communications
Infrastructure
Business Environement
Albania BiH Croatia
Macedonia, FYR Estonia Slovenia
Inde
x
WP_185_web_1-11-10.pdf 49WP_185_web_1-11-10.pdf 49 1/11/2010 1:39:29 PM1/11/2010 1:39:29 PM

34 World Bank Working Paper
�
Table 3.4. BEEPS 2008 Results
% of exporter
firms
% of firms that use material inputs and/or
supplies of foreign origin
% of Firms Expected to Give
Gifts to Get an Import License
Average time to
clear direct exports through customs
(days)
Average time to clear
imports from
customs (days)
Time to obtain import license (days)
Albania 21 94 6 1.9 2.6 27.5 Bosnia and Herzegovina 34 72 9 1.5 1.9 14.3 Croatia 28 81 1 1.5 1.6 13.4 Macedonia, FYR 38 80 4 2.5 3.7 18.8 Montenegro 9 75 0 2.6 2.7 4.4 Serbia 47 63 9 1.9 4.5 16.1 Kosovo 13 81 1 1.7 8.5 14.9 Bulgaria 17 50 8 4.2 5.4 24 Estonia 31 82 0 1.8 4.7 5.9 The Slovak Republic 20 57 30 2.5 4.8 2.5 Slovenia 58 88 7 2.9 3 7.3 ECA 22 62 16 4.5 8.8 15.2
Source:�www.enterprisesurveys.org.��
Other� indicators� that� capture� the� broader� trade�related� environment� (beyond�border�crossings)�confirm�the�constrains�to�trade�identified�by�the�Doing�Business�and�the�WEF.�SEE�firms�find�various�aspects�of�the�business�environment�to�be�much�less�favorable� than� in� the� advanced� EU�10� countries.� Also,� most� trading� firms� rely� on�foreign�supplies,�and�the�days�of�inventory�of�the�most�important�input�are�relatively�high�in�the�region:�over�30�days�in�each�country�except�Croatia�(53�days�in�Macedonia).�It�would�be�useful�to�have�information�on�the�use�of�foreign�supplies�from�SEE,�as�this�would�also�give�an�indication�of�the�use�of�production�networks�as�well�as�the�potential�for�cumulation�of�origin.�
Improving the trade-related environment within the CEFTA framework
Chapter� V� of� the� Agreement� refers� to� co�operation� in� customs� administration,� and�article� 14� stipulates� that� “the�Parties� shall� simplify� and� facilitate� customs�procedures�and�reduce,�as� far�as�possible,� the� formalities� imposed�on�trade”.�Article�15�prohibits�fiscal� discrimination:� “the� Parties� shall� refrain� from� any� measure� or� practice�establishing�...�discrimination�between�the�products�originating�in�the�Parties.”��
Several� articles� address� services,� which� has� both� direct� and� indirect� impact� on�trade� flows.�According� to�article�27,�“the�Parties�will�gradually�develop�and�broaden�their� co�operation�with� the� aim� of� achieving� a� progressive� liberalization� and�mutual�opening�of�their�service�markets,�in�the�context�of�European�integration....”�Action�on�these�matters�could�help�reduce�the�costs�of� trade�related�services� including�logistics,�transport,� and� so� forth.�The� following�article� stipulates� that� “the�Parties,� recognizing�that�the�use�of�electronic�means�increases�trade�opportunities�in�many�sectors,�agree�to�promote� the� development� of� electronic� commerce� between� them,� in� particular� by�
WP_185_web_1-11-10.pdf 50WP_185_web_1-11-10.pdf 50 1/11/2010 1:39:29 PM1/11/2010 1:39:29 PM

Enhancing Regional Trade Integration in Southeast Europe 35
�
cooperating� on� the� market� access� and� regulatory� issues.”� Last� but� not� least,� the�Agreement� commits�Parties� to�grant�and�ensure�adequate�and�effective�protection�of�intellectual�property�rights.�
Any�difficulties�arising�from�the�application�of� these�provisions�shall�be�resolved�in� accordance�with� the� dispute� resolution�mechanism� established� in�Article� 42.� This�article�establishes�a�Joint�Committee�(comprising�representatives�of�all�Parties)�as�a�first�mechanism�for�resolving�disputes�concerning�the�interpretation�and�application�of�the�Agreement.�The�consultations�in�the�Joint�Committee�could�be�done�in�the�presence�of�a�mediator.�If�a�dispute�is�not�resolved�through�consultations�in�the�Joint�Committee,�a�dispute�may�be�referred�to�arbitration.�
Cost and Quality of Trade Logistics
Cost� and�quality�of� trade�related� services�play�an� important� role� in� trade� expansion,�and� an� inefficient� logistics� environment� presents� an� implicit� tax� on� trading.� The�logistics�services�encompass�an�array�of�actions,�from�transportation,�consolidating�of�cargo,� warehousing,� and� border� clearance� to� in�country� distribution� and� payment�systems.� These� activities� require� solid� physical� infrastructure,� ICTs� and� most�importantly� well�developed� trade� legislation� (customs� rules� and� procedures).� High�logistics�costs�and�low�service�quality�can�be�a�barrier�to�both�exports�and�imports.��
The�performance�of� customs,� trade�related� infrastructure,� inland� transit,� logistics�services,� and� information� systems,�are�all� critical� to�whether�SEE�countries� can� trade�goods�and�services�on�time�and�at�low�cost,�within�the�region�and�with�the�rest�of�the�world.� SEE’s� logistics� performance� is� quite� diverse,� with� Croatia� being� the� best�performer�and�Albania�on�the�bottom�of�the� list,�but�at� the�same�time�relatively�poor�compared�to�other�European�countries�(table�3.5).�All�countries�in�the�region,�except�for�Croatia,�have�a�lower�score�than�the�ECA�average�of�2.6�(5�being�the�highest�score).�All�EU� countries� are� ranked� higher� than� the� region’s� best� performer� Croatia� (ranked� 63�globally).�Albania�on�the�other�hand�ranks�139th�out�of�150�countries;�its�score�is�well�below�the�average�for�low�income�countries.�As�with�the�previous�indicators,�these�are�based�on�overall� trade�performance,� but� again�most�of� them�are� equally� relevant� for�any�trade.�
Unnecessary� costs� and� time�delays� arising� from� the� logistics� environment�give� a�competitive� advantage� to� traders� from� countries� with� more� favorable� conditions.�Looking� at� figure� 3.3,�which� compares� trade� logistics� performance� between�SEE�and�the�EU�10�countries,�the�latter�outrank�the�SEE�group�on�all�aspects�of�trade�logistics,�apart�from�domestic�logistics�costs�(which�is�to�be�expected�as�the�average�price�levels�in� the�EU�10�are�higher� than� in�SEE).�This� implies� that�goods�can�be� imported� faster�and�cheaper�from�neighboring�EU�countries�than�from�CEFTA�countries.�The�biggest�gap�between�the�two�groups�is�in�the�timeliness�of�shipments�in�reaching�destination,�which�is�a�key�concern�for�traders,�as�well�as�in�the�ability�to�track�and�trace�shipments�(this�largely�depends�on�having�the�necessary�ICTs�in�place).�
�
WP_185_web_1-11-10.pdf 51WP_185_web_1-11-10.pdf 51 1/11/2010 1:39:29 PM1/11/2010 1:39:29 PM

36 World Bank Working Paper
�
Table 3.5. Logistics Performance Index
Country LPI Customs Infrastructure International shipments
Logistics competence
Tracking & tracing
Domestic logistics
costs Timeliness Croatia 2.71 2.4 2.5 2.7 2.8 2.5 3.1 3.5 Bosnia and Herzegovina 2.46 2.3 2.3 2.5 2.4 2.3 3.4 3.0
Macedonia, FYR 2.43 2.0 2.3 2.7 2.3 2.5 3.0 2.8 Serbia and Montenegro 2.28 2.3 2.2 2.3 2.3 2.1 3.1 2.5
Albania 2.08 2.0 2.3 2.3 2.0 1.7 2.8 2.1 The Slovak Republic 2.92 2.6 2.7 3.1 3.0 2.9 3.1 3.3 Romania 2.91 2.6 2.7 3.2 2.9 2.9 2.6 3.2 Bulgaria 2.87 2.5 2.5 2.8 2.9 3.1 2.9 3.6 ECA (average) 2.59 2.4 2.4 2.6 2.5 2.6 3.0 3.0 EU-10 (average) 3.0 2.7 2.8 3.0 3.0 3.0 3.1 3.5 SEE average 2.4 2.2 2.3 2.5 2.4 2.2 3.1 2.8
Source:�www.worldbank.org/lpi.�Note:�The�seven�areas�of�performance�are:�(1)�Efficiency�of�the�clearance�process�by�customs�and�other�border�agencies,�(2)�Quality�of�transport�and�information�technology�infrastructure�for�logistics,�(3)�Ease�and�affordability�of�arranging�international�shipments,�(4)�Competence�of�the�local�logistics�industry,�(5)�Ability�to�track�and�trace�international�shipments,�(6)�Domestic�logistics�costs,�and�(7)�Timeliness�of�shipments�in�reaching�destination.��
Figure 3.3. Trade Logistics Performance, SEE and EU-10 Countries
�Source:�www.worldbank.org/lpi.���
WP_185_web_1-11-10.pdf 52WP_185_web_1-11-10.pdf 52 1/11/2010 1:39:29 PM1/11/2010 1:39:29 PM

Enhancing Regional Trade Integration in Southeast Europe 37
�
Figure 3.4.Association of Trade Logistics Performance and Diversification of Exports
��Efficient� logistics� are� relevant� not� only� for� trade� expansion� but� also� for� trade�
diversification� and� integration.� The� global� production� networks� of� the� modern�economy�go�beyond�having�access�to�markets�and�put�a�premium�on�moving�goods�in�a� predictable,� timely,� and� cost�effective� way.� Logistics� performance� is� positively�correlated�with� the� diversification� of� exports� (figure� 3.4).� To� be� able� to� increase� and�diversify�its�export�structure�and�move�up�the�value�added�ladder,�the�region�ought�to�become�‘well�connected’.�By�becoming�logistically�friendly,�SEE�countries�could�gain�a�significant�competitive�and�cost�advantage�and�this�in�turn�would�lead�to�better�value�chain�integration�and�would�attract�export�oriented�FDI.�This�holds�in�particular�if�the�region� strives� to� attract� foreign� investment� in� sectors� which� look� at� the� region� as� a�single�market,� such� as� the� automotive� industry� or� ICT� sector� (see� the� OECD� (2008)�study�“Defining�and�Strengthening�Sector�Specific�Sources�of�Competitiveness� in� the�
Box 3.5. Logistics Costs in Albania
According to the World Bank’s Albania Country Economic Memorandum (forthcoming), Albania has among the highest logistics costs in Europe, which is also confirmed by its low ranking on the LPI regarding this component. In 2007, these costs were estimated around 22 percent of imports and 19 percent of exports; and these figures exclude unofficial payments to, for example, customs officers, road police, inspection services, and so forth.
Total logistics costs, including costs for domestic non-trade related logistics operations, in Albania were estimated at around $2 billion in 2007, or about a fifth of its GDP, a high figure both in a European and a worldwide comparison. For example, the equivalent costs in the EU-15 range between 10 and 16 percent of GDP, and in the EU-10 from 12 to 17 percent of GDP.
It should be noted though that the Albanian authorities have undertaken notable improvements related to the logistics environment in past three years, including major infrastructure investment, which has likely had a significant impact on logistics costs. The upcoming LPI 2009 index should shed more light on the impact of these reforms on logistics costs.
Source: Albania Country Economic Memorandum, World Bank (forthcoming).
WP_185_web_1-11-10.pdf 53WP_185_web_1-11-10.pdf 53 1/11/2010 1:39:30 PM1/11/2010 1:39:30 PM

38 World Bank Working Paper
�
Western� Balkans,”� which� identifies� these� sectors� as� most� attractive� for� regional�investment� approach).� One� way,� for� example,� to� improve� the� quality� and� cost� of�logistics� is�by�allowing� for� regional�distribution�activities� to� serve�neighboring�areas.�However,�to�achieve�this,�customs�clearance�procedures�would�need�to�be�streamlined�to�the�maximum.�
Rules of Origin
One�of�the�important�novelties�of�the�CEFTA�Agreement�is�that�it� introduces�rules�of�origin�identical�to�those�used�by�the�EU,�EFTA,�and�Turkey�(within�the�Pan�Euro�Med�area�of�diagonal�cumulation.�In�this�regards,�the�Agreement�brought�a�dual�benefit�for�SEE� firms:� (i)� it� introduced� intra�CEFTA� diagonal� cumulation� of� origin,� and� (ii)� it�created� an� opportunity� for� the� CEFTA� parties� to� become� a� part� of� a� wider� area� of�diagonal� cumulation� which� could� include� key� trading� partner� countries:� the� EU,�Turkey�and�EFTA.�
Several�empirical�studies�confirm�that�rules�of�origin�have�an�important�impact�on�trade�flows�and�that�diagonal�cumulation�of�rules�of�origin�can�facilitate�trade�(box�3.6).�Gasiorek� (2008)� shows� that� in� the� European� trade� context,� rules� of� origin� serve� to�restrict� trade� flows� with� non�cumulating� countries,� and� trade� with� those� countries�could� be� lower�by�up� to� 50�percent� (or� even� 70�percent� for� some� sectors).�Woolcock�(2007)� finds� that� “rules� of� origin� can� be� equivalent� to� a� 4� percent� tariff� and�incompatible� rules�of�origin�[that�prevent�diagonal�cumulation]� in�different�FTAs�are�the�antithesis�of�trade�facilitation”.�To�eliminate�these�trade�distortive�effects�of�rules�of�origin,�the�EU�in�1997�established�a�unified�system�of�diagonal�cumulation�comprising�EFTA,� the� then�CEFTA� countries� and� the� Baltics.� The� creation� of� this� Pan�European�system�of�cumulation�had�a�strong� impact�on�trade�flows�within� the�EU�10�countries�and�between�the�EU�10�and�the�EU�blocs�(see�Augier�et�al.,�2005).�Trade�growth�within�the�area�was�up�to�43�percent�higher�than�rise�in�trade�with�non�cumulating�countries�in�1997–99.��
Box 3.6. The Benefits of Diagonal Cumulation
The largest benefit of using identical rules of origin among three or more trading partners is the possibility to apply diagonal cumulation of origin. Bilateral cumulation of origin is allowed in any FTA, it allows one partner country to import intermediary products from the other partner, and export a final product to the other partner duty-free. For example, Montenegro would import raw materials from the EU, process them, and export them back to the EU duty-free. However, in the absence of diagonal cumulation, a Montenegrin product would not be allowed duty-free access to the EU if it uses significant amount of inputs from another country (for example, Albania) even if Albania also has duty-free access to the EU for that product. Allowing for diagonal cumulation overcomes this anomaly as it enables the use of inputs from all trading partners participating in the diagonal cumulation area, as long as they are linked by free trade agreements providing for diagonal cumulation.
Hence, diagonal cumulation promotes trade within the area of diagonal cumulation by encouraging sourcing and processing within that area. In case of a trade area which involves one major trading partner (in this case the EU) and several other smaller countries, diagonal cumulation could encourage trade within the smaller countries as firms could now get inputs from any of these countries instead of from the EU or domestic production as was previously.
Source: Author.
�
WP_185_web_1-11-10.pdf 54WP_185_web_1-11-10.pdf 54 1/11/2010 1:39:30 PM1/11/2010 1:39:30 PM

Enhancing Regional Trade Integration in Southeast Europe 39
�
Diagonal�cumulation�of�origin�within�CEFTA�became�automatically�possible�with�the� entry� into� force� CEFTA.� So,� a� Serbian� company� can� import� raw�materials� from�Albania,�process�them,�and�export�a�final�product�to�Croatia�at�a�zero�tariff�(assuming�trade� for� that� product� is� duty�free).� In� this� and� all� other� cases� of� within�CEFTA�diagonal�cumulation,�the�rules�of�origin�(and�the�accompanying�movement�certificate)�are� the� same,� which� greatly� reduces� the� administrative� burden� for� firms� to� prove�compliance�with� the� rules�of� origin.�The� actual� impact� of� the� intra�regional�diagonal�cumulation,� unfortunately,� cannot� be� assessed� as� data� on� the� use� of� diagonal�cumulation� is� not� available.� It� would� be� of� great� importance� for� CEFTA� parties� to�gather�such�data�in�order�to�analyze�the�trade�creation�impact�of�this�policy.�
The� second,� and� more� important,� benefit� of� the� CEFTA� rules� of� origin� is� the�possibility�to�engage�in�a�diagonal�cumulation�with�the�EU,�Turkey,�and�EFTA.�So,�for�example,�a�Montenegrin�product�with�Albanian� inputs�could�also�be�exported� to� the�EU.�Moreover,�the�CEFTA�countries�which�have�an�FTA�with�both�the�EU�and�Turkey�could�engage�in�a�diagonal�cumulation�of�origin�among�each�other.�For�example,�since�July�1�2009,�a�firm�in�FYR�Macedonia�can�import�fabric�and�other�raw�materials�from�Turkey,�process�them�and�then�export�final�textile�products�to�the�EU�market�at�a�zero�tariff� (assuming� trade� for� that�product� is�duty�free).� For� this� arrangement� to�become�operational,� FYR� Macedonia� and� its� trading� partners� (the� EU� and� Turkey)� had� to�modify�the�rules�of�origin�protocols�of�their�bilateral�FTAs.�The�same�needs�to�be�done�for�all�other�SEE�countries,�and�once�these�legal�requirements�are�fulfilled�(and�this�is�likely�to�happen�in�the�course�of�2009�for�most�SEE�countries),�the�diagonal�cumulation�possibility�would�become�reality.��
The� entry� into� the�Pan�Euro�Med� area� of� cumulation,� once� the� conditions� are� in�place,� should� be� expected� to� have� significant� trade� creation� effects.� Kejzar� (2009)�presents�the�possible�effects�of�allowing�diagonal�cumulation�with�the�EU,�EFTA,�and�Turkey,�and�finds�a�positive�effect� in�all�cases�on�trade�creation�and�trade�expansion.�The�same�study�also�shows� that� the�Mediterranean�countries�which�entered� the�Pan�Euro�Med�area�of�diagonal�cumulation�also�benefited�from�diagonal�cumulation,�and�non�participating� countries� have� lower� trade� with� the� EU� and� EFTA� by� up� to� 45�percent.��
The�full�use�of�diagonal�cumulation�for�achieving�free�trade�among�the�EU,�EFTA,�SEE,� and� Turkey� is,� however,� hampered� by� several� issues.� Firstly,� Turkey� does� not�have� free� trade� agreements� with� Serbia,� Montenegro,� and� Kosovo.� In� addition,� the�protocols�providing�for�diagonal�cumulation�have�yet�to�be�fully�concluded�in�the�case�of�the�existing�free�trade�agreements�with�some�of�the�other�countries�in�the�region.�So,�Croatian�imports�of�raw�materials�from�Turkey,�used�for�products�exported�to�the�EU,�would�still�be�subject�to�customs�duties.�Second,�the�inclusion�of�the�EFTA�countries�in�the�area�of�diagonal�cumulation�(EU�EFTA�Turkey�CEFTA)�remains�to�be�resolved�(as�it�might�require�modifications�of�protocols�with�the�Mediterranean�countries�as�well).�To�resolve�the�latter�issue,�it�is�planned�to�include�SEE�countries�in�the�Pan�Euro�Med�system�through�the�Regional�Convention�on�Pan�Euro�Med�preferential�rules�of�origin.�Lastly,�Kosovo�is�in�a�unique,�unenviable,�position�that�it�does�not�have�an�FTA�with�the�EU,�nor�with�Turkey�or�EFTA.�Until� this� is� remedied,�Kosovo�will�not�be�able� to�benefit�from�the�diagonal�cumulation,�apart�from�the�intra�CEFTA�cumulation.�
�
WP_185_web_1-11-10.pdf 55WP_185_web_1-11-10.pdf 55 1/11/2010 1:39:30 PM1/11/2010 1:39:30 PM

40 World Bank Working Paper
�
Notes �1� According� to� the� OECD,� technical� barriers� to� trade� (TBT)� refer� to� technical� regulations� and�voluntary� standards� that� set� out� specific� characteristics� of� a� product,� such� as� its� size,� shape,�design,�functions�and�performance,�or�the�way�a�product�is�labeled�or�packaged�before�it�enters�the�marketplace.�Included�in�this�set�of�measures�are�also�the�technical�procedures�which�confirm�that�products�fulfill�the�requirements�laid�down�in�regulations�and�standards�2� Sanitary� and� phytosanitary� (SPS)� measures� refer� to� any� of� the� laws,� rules,� standards,� and�procedures� that� governments� employ� to� protect� humans,� other� animals,� and� plants� from�diseases,�pests,�toxins,�and�other�contaminants.�3� Albania,� Croatia,� FYR� Macedonia,� and� Moldova� are� WTO� members,� and� Montenegro� is�expected�to�join�in�2009.�4�The�national�quality�infrastructure�comprises�a�set�of�public�and�private�institutions�that�enable�firms�to�demonstrate�that�they�are�complying�with�the�defined�standards.�This�includes:�testing�laboratories� and� inspection� bodies,� certification� bodies,� calibration� laboratories,� a� national�standards�body,�a�national�accreditation�body,�and�a�national�metrology�institute.�5� APEC’s� Telecommunications� MRA� was� concluded� at� a� gathering� of� Ministers� for�Telecommunications�and�Information�in�Singapore�on�May�8,�1998.�It�entered�into�effect�on�July�1,�1999.�6�www.enterprisesurveys.org�7� “Identifying� and� Eliminating� NTBs:� Annual� Reports� by� SEE� countries—An� Assessment,”�prepared�by�WTI�Advisors,�May�2007.�8�“Harmonization�of�Technical�Regulations�and�Standards�and�Mutual�Recognition�of�Conformity�Assessment�Procedures�under�CEFTA.”�9� “Identification� of� Potential� of� Harmonization� or� Mutual� Recognition� of� Sanitary� and�Phytosanitary�Measures�under�CEFTA.”�10�Trade�costs�encompass�all� costs� related� to� the� transfer�of�goods� to�a� final�user� (in�a�different�country),� other� than� the� costs� of� producing� the� goods.� Trade� costs� also� include� the� costs� of�compliance� with� standards� and� technical� regulations� in� foreign� markets� if� those� are� different�from�the�ones�in�the�domestic�market.�11�The�ASEAN�FTA�was�signed�in�1992�and�envisaged�setting�up�a�free�trade�area�within�15�years.�12�The�“Trading�Across�Borders”�component�of�Doing�Business�captures�the�total�official�cost�for�importing�or�exporting�a�standardized�cargo�of�goods,�excluding�ocean�transit�and�trade�policy�measures�such�as�tariffs.�13� See� B92� article� for� more� information:� http://www.b92.net/info/vesti/index.php?yyyy=2009&�mm=07&dd=23&nav_id=372878.��14�The� index�composes�10�pillars�grouped�in�four�sub�indexes:� (1)�Tariffs�and�nontariff�barriers,�(2)� Proclivity� to� trade,� (3)� Efficiency� of� customs� administration,� (4)� Efficiency� of� import�export�procedures,�(5)�Transparency�of�border�administration,�(6)�Availability�and�quality�of�transport,�infrastructure,�(7)�Availability�and�quality�of�transport�services,�(8)�Availability�and�use�of�ICTs,�(9)�Regulatory�environment,�(10)�Physical�security.�
WP_185_web_1-11-10.pdf 56WP_185_web_1-11-10.pdf 56 1/11/2010 1:39:30 PM1/11/2010 1:39:30 PM

41
CHAPTER �4 �
How�Are�Firms�Reacting�to�Regional�Trade�Integration?�
The Case of Agrokor
Agrokor�is�the�largest�private�Croatian�company,�with�revenue�of�some�€3.8�billion�in�2008.�Most�of�it�revenues�come�from�sales�in�Croatia,�SEE�and�some�of�its�EU�neighbors�(Slovenia,�Hungary,�and�so�forth).�It�is�also�one�of�the�biggest�companies�in�the�region.�At� the� same� time,� Agrokor� is� an� important� trader� in� the� region� with� around� €200�million� of� intra�regional� trade.� It� has� trade� relationships� with� each� country� in� the�region,� while�most� of� its� assets� (and� production)� are� located� in� Croatia,� Bosnia� and�Herzegovina,� and� Serbia.� The� company� employs� up� to� 38,000� employees,� most� in�Croatia,�but�also�some�2,400�in�Bosnia�and�Herzegovina�and�more�than�5,400�in�Serbia.�
As� a� truly� regional� company� with� production� sites,� suppliers� and� buyers�throughout� SEE,�Agrokor� sees� great� advantages� from� trade� integration� in� the� region�and� sees� CEFTA� as� a� major� step� forward� to� unleashing� the� potential� of� such�integration.� One� of� the� most� important� benefits� from� CEFTA� is� the�reduction/elimination� of� tariffs� (and� quotas)�within� the� region,� though� the� company�would� wish� to� see� trade� in� the� region� fully� liberalized� as� soon� as� possible.� Being�focused� mostly� on� food� products,� tariffs� and� import� bans� on� certain� products� (for�example,�pork,�beef,�and�so�forth.)�in�some�of�the�CEFTA�countries�continue�to�hamper�trade.� Recent� import�restricting� measures� in� some� of� the� countries� have� clearly�demonstrated�the�negative�effects�of�trade�protectionism.�
Another�important�benefit�for�Agrokor�is�the�introduction�of�unified�rules�of�origin�in�CEFTA�and� the�possibility� for�using�diagonal� cumulation�of� origin.�The� firm� sees�numerous�opportunities�from�implementing�diagonal�cumulation�in�the�region�and�the�EU.� It� would� enable� the� company� to� better� access� EU� markets� and� to� make� better�investment� decisions� (based� on� economic/cost� factors� rather� than� on� factors� such� as�borders).�Fully�implemented�DCO�is�very�much�needed�in�the�region,�and�would�have�great�impact�on�trade�creation.�
Nontariff� barriers� continue� to� be� a� constraint� to� trade� in� the� region� and� the�company� finds� that� technical� regulations� and� standards� are� used� as� trade�protectionism� measures.� For� example,� sometimes� trucks� with� food� products� (for�example,�meat)� spend� several� days� at� a� border� before� sanitary� inspection� clears� the�goods.� In� such� cases,� these� measures� prohibit� trade� of� perishable� goods.� Although�Agrokor� does� not� face� great� difficulties� in� meeting� technical� requirements� (for�example,�obtaining�certification,�and�so�forth)�for�the�products�its�trades,�the�variety�of�
WP_185_web_1-11-10.pdf 57WP_185_web_1-11-10.pdf 57 1/11/2010 1:39:31 PM1/11/2010 1:39:31 PM

42 World Bank Working Paper
�
regulations� poses� challenges� for� the� company.� For� example,� even� a� simple� product�such�as�bottled�water�(Jana�water� is�one�of�Agrokor’s�most�well�known�brands)�have�different�regulations�among�the�countries.�Harmonization�of�standards�would�facilitate�trade�and�reduce�costs�of�exporting�to�several�markets�in�the�region.��
Removing�the�remaining�nontariff�barriers�would�enhance�not�only�trade�but�also�investment�flows�to�the�region.�The�costly�and�timely�border�crossing�procedures�have�great�impact�on�investment�decisions�for�regional�and�foreign�companies.�Agrokor,�as�well�as�many�European�and�other�foreign�investors,�would�like�to�see�the�region�as�a�more�integrated�economic�space�where�investment�decisions�could�be�based�solely�on�economic�basis.�However,�this�is�not�the�case�yet�and�decisions�on�locating�production�and�distribution�sites�are�strongly�affected�by�these�border�crossing�issues.��
Concerning�other�aspects�of� the� trade�environment,�Agrokor�would�benefit� from�improvements� in� the� transport� infrastructure,� in� particular� rail.� Rail� transport� is�important� for� many� products,� especially� seasonal� products� such� as� wheat.� Yet,� rail�transport� is� for� many� reasons� limited� and� the� firm� relies� mostly� on� road� transport�which�at�this�stage�is�much�more�efficient.�In�terms�of�logistics,�due�to�its�size�Agrokor�manages� its� logistics� internally� (for� example,� has� its� own� distribution� channel)� and�does�not� find� them� to�be�a� constraint� to�doing�business.�Trade� finance� is� also�not�an�issue;�being�a�large�company,�it�has�access�to�banking�services�across�the�region,�and�it�helps�that�European�banks�are�present�in�practically�all�countries�in�the�region.�And�to�ensure�access�to�inputs,�Agrokor�sometimes�helps�its�own�suppliers�with�getting�access�to�finance.�
The Case of ArcelorMittal
ArcelorMittal,�previously�Mittal�Steel,�is�one�of�the�largest�steel�product�manufacturers�in� SEE� offering� various� steel� products� (for� example,� flat� products,� long� products,�automotive� grades,� and� so� forth).� It� operates� two� production� facilities� in� the� region,�one� in�Skopje� (FYR�Macedonia)�and�one� in�Zenica� (Bosnia�and�Herzegovina)�both�of�which� it�acquired� in�2004.�The�two�plants�sell� their�products� to� the�region�and�to� the�EU.�In�the�case�of�the�steel�plant�in�Skopje,�between�a�quarter�and�half�of�total�revenue�comes�from�the�CEFTA�region.�
In�terms�of�tariffs�and�quotas,�steel�trade�was�largely�liberalized�prior�to�CEFTA,�so�in� this� regard� the�Agreement�did�not�bring�any�additional�benefits� for� the� company.�However,�trade�flows�remain�to�be�hampered�by�some�nontariff�barriers.�The�company�faces�situations�when�technical�regulations�are�used�as�a�barrier�to�trade.�For�example,�when�exporting�to�Serbia,�goods�cannot�cross�the�border�before�the�company�provides�a�quality� certificate� (MTC)� to� the�Serbian�Customs�Administration.�This�often�delays�the� transport� and� the� Serbian�Customs�Administration� is� the� only� one� in� the� region�that�requests�the�quality�certificates�to�be�shown�prior�to�entry.�
One�of� the�most� important�challenges� that� the�company�is� facing� in�the�region� is�dealing� with� unfair� competition� offering� products� at� “dumping� prices.”� However,�these�low�priced�products�come�from�non�CEFTA�countries,�mostly�from�companies�in�the� CIS� region� and� from� Bulgaria� (mainly� hot� rolled� material).� In� this� regard,� the�provisions� in� CEFTA� on� state� aid� and� anti�dumping� are� perceived� as� important� for�ensuring�fair�competition�in�the�region.��
WP_185_web_1-11-10.pdf 58WP_185_web_1-11-10.pdf 58 1/11/2010 1:39:31 PM1/11/2010 1:39:31 PM

Enhancing Regional Trade Integration in Southeast Europe 43
�
More� efficient� border� crossings� should� be� one� of� the� top� priorities� for� trade�enhancement�as�seen�my�ArcelorMittal.�Unnecessary�delays�at�border�crossings�and�at�customs� terminals,� has� important� implications� on� the� total� transport� costs.� Opening�times�at�border�crossings�and�customs�terminals�are�short,�and�if�a�truck�is�not�cleared,�for� example,� by�Friday�afternoon,� it�has� to�wait�until�Monday� to� clear� customs.�This�results�in�unnecessary�increase�in�transport�costs.�
Infrastructure� availability� and� efficiency� is� also� one� of� the� most� important�determinants� of� transport� costs,� and� the� company� sees� a� lot� of� room� for� improving�infrastructure�throughout�the�region.�The�Skopje�plant�transports�some�40�percent�of�its�exports�by�rail,�however,�the�rail�infrastructure�is�quite�underdeveloped.�For�example,�the� Nis�Solun� track� is� one� rail� which� presents� a� major� bottleneck� for� larger� loads.�Moreover,�since�there�is�no�rail�connection�between�FYR�Macedonia�and�Bulgaria,�rail�cargo� to� Bulgaria� also� goes� via� Nis.� The� quality� of� the� transport� services� is� also� a�constraint� as� the� company� sometime� faces� insufficient� wagons� (in� particular� closed�wagons).� ArcelorMittal� also� sees� room� for� improvement� of� road� transport.� For�example,� exports� to� Albania� can� only� be� cleared� by� customs� in� Struga� (at� the� very�south�of�FYR�Macedonia)�which�extends�the�distance�for�trade�with�Albania.�
��
WP_185_web_1-11-10.pdf 59WP_185_web_1-11-10.pdf 59 1/11/2010 1:39:31 PM1/11/2010 1:39:31 PM

44
CHAPTER �5 �
Conclusions�and�Recommendations�
ntra�regional� trade�performance� in�SEE�has� improved�considerably� in�recent�years.�Formal� trade� liberalization� policies,� first� through� bilateral� FTAs� and� later� through�
CEFTA,�have�contributed�to�this�increase.�Nonetheless,�intra�regional�trade�integration�could�be�further�enhanced.�Despite�the�increase�in�trade�flows,�the�structure�of�does�not�signal� a� high� level� of� integration.� Commodities� continue� to� dominate,� and� intra�industry�trade�remains�low�compared�to�intra�industry�trade�performance�in�the�EU�10�countries.�Greater�trade�integration�could�be�an�important�driver�of�economic�growth�in� the� region,� and� a�number�of�policy� options� are� available� to� achieve� this.�Many�of�these� policy� options� are� specifically� addressed� in� the� CEFTA� Agreement,� hence,�include�a�clear�commitment�for�action.�
Achieving� complete� trade� liberalization� should� be� one� of� the� first� priorities.� The�visible� benefits� of� zero� tariffs� and� quotas� for� manufactured� goods� and� many�agriculture� products,� should� urge� the� authorities� to� complete� the� formal� trade�liberalization�agenda.�The�CEFTA�Agreement�itself�requires�countries�to�move�forward�on�this,�and�substantial�progress�has�been�made�within�the�CEFTA�framework�already.�Negotiations� on� agriculture� liberalization� have� been� initiated� and� it� is� likely� that� a�decision� could� be� taken� by� the� end� of� 2009.�At� the� same� time,� the� countries� should�refrain� from� introducing� protectionism� measures,� such� as� tariffs,� quotas� and� other�import�restrictions,� as� these� are� not� only� a� breach� of� the� Agreement,� but� also� have�negative�economic�consequences�in�the�long�term.�
With� tariffs� and� quotas� being� largely� eliminated� within� CEFTA,� the� impact� of�NTBs�on�trade�flows�becomes�more�prominent.�In�this�regard,�TBTs�and�SPS�measures�could�become�important�barriers�to�trade.�The�possibility�of�some�of�these�measures�to�act� as� a� barrier� to� trade� has� been�well� elaborated� in� the� trade� literature,� and� is� also�confirmed�by�the�reactions�from�the�SEE�business�community.�As�all�SEE�countries�aim�to� join� the� EU,� the� best� and� easiest� way� to� harmonize� technical,� sanitary� and�phytosanitary�standards�is�by�converging�to�EU�rules�(acquis)�in�these�areas.�At�present,�there�is�great�discrepancy�among�the�countries�in�the�level�of�transposition�of�the�EU�acquis.� Moreover,� enhanced� collaboration� on� these� matters� is� of� almost� equal�importance.�As�committed,�the�countries�should�co�operate�closely�in�the�fields�of�SPS�and� TBTs,� apply� regulations� in� non�discriminatory� manner,� and� refrain� from�introducing�new�barriers�to�trade.�
I�
WP_185_web_1-11-10.pdf 60WP_185_web_1-11-10.pdf 60 1/11/2010 1:39:31 PM1/11/2010 1:39:31 PM

Enhancing Regional Trade Integration in Southeast Europe 45
�
In� addition� to� the� trade� measures� that� are� part� of� CEFTA,� other� more� general�trade�facilitation� policies� could� also� enhance� intra�regional,� and� overall,� trade.� The�time�and�costs�to�export�and�import�in�some�of�the�SEE�countries�are�high�compared�to�well�performing�EU�10�countries.�At�the�same�time,�logistics�performance�is�weak.�The�transport� infrastructure� also� could� benefit� from� improvements.� These� findings� are�confirmed�by�the�two�case�study�firms,�which�would�like�to�see�more�efficient�customs�procedures� and� better� transport� infrastructure.� More� detailed� analysis� would� be�needed�to�determine�where�exactly�should�improvements�be�targeted�and�how�much�of� these� impediments� are� related� to� intra�regional� trade.� The� recent� World� Bank’s�Country�Economic�Memoranda�for�some�of�the�SEE�countries�contain�a�more�specific�diagnosis�on�these�issues.�
The� rules� of� origin,� and� the� possibility� to� apply� wider� diagonal� cumulation� of�origin,�are�another�potential�benefit�of�the�CEFTA�Agreement.�The�rules�allow�not�only�for� intra�CEFTA� cumulation� of� origin,� but� also� for� future� inclusion� in� the� Pan�Euro�Med�system�of� cumulation.�Allowing� for�diagonal� cumulation,� for�example,�with� the�EU�and�Turkey,�requires�changes�in�bilateral�trade�protocols,�and�not�all�countries�have�completed�this�process.�At�the�same�time,� the�authorities�would�need�to�engage�with�the�private�sector�and�to�promote�the�opportunities�offered�in�this�area.�
While�this�study�does�not�address�many�of�the�other�areas�that�are�included�in�the�Agreement,�some�of�them�are�of�great�importance�and�should�deserve�greater�attention�of�policy�makers.�For�example,�trade�in�services�could�be�greatly�enhanced�by�moving�forward� on� some� of� the� areas� in� the� Agreement,� such� as� public� procurement,�intellectual�property�rights,�competition�and�state�aid�rules,�and�so�forth.�The�countries�have�committed�to�collaborate�on�all�these�areas,�and�a�more�prompt�action�is�needed,�in� particular� on� those� for� which� the� Agreement� does� not� contain� any� deadlines� for�action.��
Last� but� not� least,� trade� statistics� deserve� greater� attention.� The� reasons� for� the�discrepancies� in�mirror� trade� statistics,� beyond� those� that� are� to� be� expected� due� to�recording�differences,� should�be� investigated� in�greater�detail.�Unrecorded� trade�has�fiscal� implications� and� distortive� effects� on�markets.�Moreover,� greater� transparency�and�availability�of�trade�statistics�would�be�valuable�for�policy�and�market�analysis.�
The� implementation� of� the� commitments� of� the�CEFTA� agreement�will� help� the�SEE� countries’� EU� accession� prospects.� External� trade� is� one� of� the� core,� and� sole,�Community� competencies� and�many� of� the� areas� of� co�operation� are� part� of� the� EU�acquis,� so� making� progress� on� these� will� require� harmonization� with� EU� standards.�Upon� joining� the�Union� SEE� economies�will� be� fully� integrated� into� the� EU’s� Single�Market.�Hence,�greater� trade�and�economic� integration�prior� to�becoming�part�of� the�EU�will�have�multiple�benefits:�(i)�firms�will�be�better�able�to�cope�with�the�competitive�pressures� within� the� Union;� and� (ii)� national� administrations� will� have� gained�experience� in� regional� cooperation,�which� is� essential� for�well�functioning�within� the�EU.���
WP_185_web_1-11-10.pdf 61WP_185_web_1-11-10.pdf 61 1/11/2010 1:39:31 PM1/11/2010 1:39:31 PM

46
�
Annexes�
Annex I.A. Trade Structure by HS-2 Product Category in 2007
�
0.0
10.0
20.0
30.0
40.0
50.0
60.0
70.0
80.0
90.0
44 73 10 72 27 Other
Albania imports from CEFTA in 2007
0
5
10
15
20
25
30
76 26 22 27 72 Other
Albania exports to CEFTA in 2007
��
0
200
400
600
800
1000
1200
1400
84 85 22 72 27 Other
BiH imports from CEFTA in 2007
0
50
100
150
200
250
300
350
400
450
500
73 44 72 76 27 Other
BiH exports to CEFTA in 2007
��
0.0
100.0
200.0
300.0
400.0
500.0
94 27 73 76 72 Other
Croatia imports from CEFTA in 2007
0
200
400
600
800
1000
1200
24 39 84 85 27 others
Croatia exports to CEFTA in 2007
��
WP_185_web_1-11-10.pdf 62WP_185_web_1-11-10.pdf 62 1/11/2010 1:39:32 PM1/11/2010 1:39:32 PM

Enhancing Regional Trade Integration in Southeast Europe 47
�
0.0
50.0
100.0
150.0
200.0
250.0
300.0
350.0
69 25 22 72 27 Other
Kosovo imports from CEFTA in 2007
0
5
10
15
20
25
30
07 85 11 41 72 others
Kosovo exports to CEFTA in 2007
��
0.0
50.0
100.0
150.0
200.0
250.0
300.0
350.0
11 85 39 72 27 Other
FYR Macedonia imports from CEFTA in 2007
0
50
100
150
200
250
300
350
30 22 73 27 72 Other
FYR Macedonia exports to CEFTA in 2007
��
0.0
100.0
200.0
300.0
400.0
500.0
600.0
700.0
73 85 87 27 84 others
Montenegro imports from CEFTA in 2007
0
5
10
15
20
25
30
35
40
45
50
30 44 24 22 72 Other
Montenegro exports to CEFTA in 2007
��
0.0
100.0
200.0
300.0
400.0
500.0
600.0
85 73 44 72 27 others
Serbia imports from CEFTA in 2007
0
200
400
600
800
1000
1200
1400
1600
39 22 84 27 72 others
Serbia exports to CEFTA in 2007
��
WP_185_web_1-11-10.pdf 63WP_185_web_1-11-10.pdf 63 1/11/2010 1:39:32 PM1/11/2010 1:39:32 PM

48 World Bank Working Paper
�
Annex I.B. Trade Structure by HS-2 Product Category in 2008
�
0.0
20.0
40.0
60.0
80.0
100.0
120.0
140.0
15 39 73 72 27 Other
Albania Imports from CEFTA 2008
0
10
20
30
40
50
60
26 76 25 27 72 Other
Albania exports to CEFTA in 2008
��
0
200
400
600
800
1000
1200
1400
1600
1800
85 72 22 73 27 Other
BiH Imports from CEFTA in 2008
0
100
200
300
400
500
600
700
44 73 76 72 27 Other
BiH exports to CEFTA in 2008
��
0
200
400
600
800
1000
1200
1400
25 39 84 85 27 others
Croatia exports to CEFTA in 2008
0.0
100.0
200.0
300.0
400.0
500.0
600.0
94 27 73 76 72 Other
Croatia imports from CEFTA in 2008
��
0.0
50.0
100.0
150.0
200.0
250.0
300.0
350.0
400.0
69 25 22 72 27 Other
Kosovo imports from CEFTA in 2008
0
5
10
15
20
25
20 07 73 22 72 others
Kosovo exports to CEFTA in 2008
��
WP_185_web_1-11-10.pdf 64WP_185_web_1-11-10.pdf 64 1/11/2010 1:39:32 PM1/11/2010 1:39:32 PM

Enhancing Regional Trade Integration in Southeast Europe 49
�
0
50
100
150
200
250
300
350
400
30 22 73 72 27 Other
FYR Macedonia exports to CEFTA in 2008
0.0
50.0
100.0
150.0
200.0
250.0
300.0
350.0
39 11 85 27 72 Other
FYR Macedonia imports from CEFTA in 2008
��
0
10
20
30
40
50
60
30 84 44 22 72 Other
Montenegro exports to CEFTA in 2008*
0
100
200
300
400
500
600
700
800
72 87 73 85 84 Other
Montenegro imports from CEFTA in 2008*
�*�Data�for�January�October�only.��
0.0
100.0
200.0
300.0
400.0
500.0
600.0
700.0
85 73 44 27 72 others
Serbia imports from CEFTA in 2008
0
200
400
600
800
1000
1200
1400
1600
1800
22 85 84 27 72 others
Serbia exports to CEFTA in 2008
������
WP_185_web_1-11-10.pdf 65WP_185_web_1-11-10.pdf 65 1/11/2010 1:39:33 PM1/11/2010 1:39:33 PM

50 World Bank Working Paper
�
Annex I.C. Net Exports to CEFTA, the Top and Bottom Five HS 2-digit Products in 2008
�60,000 �40,000 �20,000 0 20,000 40,000 60,000 80,000 100,000
27
44
7
70
8
11
87
85
22
84
Serbia
�80,000,000 �60,000,000 �40,000,000 �20,000,000 0 20,000,000
27
73
15
11
39
94
76
72
26
25
Albania
�400,000 �300,000 �200,000 �100,000 0 100,000 200,000
27
22
85
39
24
28
94
72
44
76
Bosnia�and�Herzegovina
�200,000 �150,000 �100,000 �50,000 0 50,000
27
72
22
69
25
71
79
47
78
41
Kosovo
�50,000 0 50,000 100,000 150,000
11
48
74
34
44
22
7
73
72
27
Macedonia,�FYR
�80,000 �60,000 �40,000 �20,000 0 20,000
84
85
73
87
27
97
88
47
41
Montenegro
�200,000 �100,000 0 100,000 200,000 300,000 400,000 500,000 600,000
72
76
73
29
94
24
39
84
85
27
Croatia
�Source:�National�authorities.�*�Data�are�for�first�three�quarters,�except�Croatia�(includes�October�data).�
WP_185_web_1-11-10.pdf 66WP_185_web_1-11-10.pdf 66 1/11/2010 1:39:33 PM1/11/2010 1:39:33 PM

Enhancing Regional Trade Integration in Southeast Europe 51
�
Annex I.D. Description of 2-digit HS Categories Code Description Code Description
1 Live animals 49 Printed books,newspapers,pictures;typescripts and plans2 Meat and edible meat offal 50 Silk3 Fish and crustaceans,molluscs & other aquatic invertebrates 51 Wool,fine or coarse animal hair;horsehair yarn and woven f4 Milk and products of milk;birds' eggs; natural honey 52 Cotton5 Products of animal origin not elsewhere included 53 Other vegetable textile fibres;paper yarn6 Live trees and other plants;roots and the like;cut flowers 54 Man-made filaments7 Edible vegetables and certain roots and tubers 55 Man-made staple fibres8 Edible fruit and nuts;peel of citrus fruits or melons 56 Wadding,felt and non-wovens;special yarns;twine,cordage9 Coffee,tea,mate and spices 57 Carpets and other textile floor coverings10 Cereals 58 Special woven fabrics;tufted textile fabrics;lace11 Products of the milling industry;malt;starches;inulin 59 Impregnated,coated,covered or laminated fabrics12 Oil,seeds and oleaginous fruits;miscellaneous grains, 60 Knitted or crocheted fabrics13 Lacs;gums,resins and other vegetable saps and extracts 61 Articles of apparel and clothing accessories,knitted14 Vegetable plaiting materials 62 Articles of apparel and clothing accessories,not knitted15 Animal or vegetable fats and oils;their cleavage products 63 Other made up textile articles;other16 Preparations of meat,of fish or of crustaceans,molluscus 64 Footwear,gaiters and the like;parts of such articles17 Sugars and sugar confectionery 65 Headgear and parts thereof18 Cocoa and cocoa preparations 66 Umbrellas,sun umbrellas,walking-sticks,seat-sticks,whips19 Preparations of cereals,flour,starch or milk; 67 Prepared feathers and down and articles made of feathers20 Preparations of vegetables,fruit,nuts 68 Articles of stone,plaster,cement,asbestos,mica or similar21 Miscellaneous edible preparations 69 Ceramic products22 Beverages, spirits and vinegar 70 Glass and glassware23 Waste from the food industries;prepared animal fodder 71 Natural or cultured pearls,precious or semi-precious stones24 Tobacco and manufactured tobacco substitutes 72 Iron and steel25 Salt;sulphur;earths & stone;plastering material,lime,cement 73 Articles of iron or steel26 Ores,slag and ash 74 Copper and articles thereof27 Mineral fuels,mineral oils and waxes;bituminous substances 75 Nickel and articles thereof28 Inorganic chemicals 76 Aluminium and articles thereof29 Organic chemicals 78 Lead and articles thereof30 Pharmaceutical products 79 Zinc and articles thereof31 Fertilizers 80 Tin and articles thereof32 Tanning or dyeing extracts;tannins and their derivates;dyes 81 Other base metals;cermets;articles thereof33 Essential oils and resinoids;perfumery,cosmetic preparations 82 Tools,implements,cutlery,spoons and forks,of base metal34 Soap,organic surface-active agents,washing preparations 83 Miscellaneous articles of base metal35 Albuminoidal substances;modified starches;glues;enzymes 84 Nuclear reactors,boilers,machinery and mechanical appliances36 Explosives;pyrotechnic products;matches;pyrophoric alloys 85 Electrical machinery and equipment and parts thereof37 Photographic or cinematographic goods 86 Railway or tramway locomotives,rolling-stock & parts thereof38 Miscellaneous chemical products 87 Vehicles other than railway or tramway rolling-stock,parts39 Plastics and articles thereof 88 Aircraft,spacecraft and parts thereof40 Rubber and articles thereof 89 Ships,boats and floating structures41 Raw hides and skins(other than furskins) and leather 90 Optical,photographic,cinematographic,measuring;parts thereof42 Articles of leather;saddlery and harness 91 Clocks and watches and parts thereof43 Furskins and artificial fur;manufactures thereof 92 Musical instruments;parts and accessories of such articles44 Wood and articles of wood;wood charcoal 93 Revolvers,pistols,shotguns&the like;cartridges&parts thereof45 Cork and articles of cork 94 Furniture;bedding,mattresses,mattress supports,cushions46 Manufactures of straw,of esparto,of other plaiting materials 95 Toys,games and sports requisites;parts thereof47 Pulp of wood or of other fibrous cellulosic material 96 Miscellaneous manufactured articles48 Paper and paperboard;articles of paper pulp 97 Works of art,collectors' pieces and antiques �
���
WP_185_web_1-11-10.pdf 67WP_185_web_1-11-10.pdf 67 1/11/2010 1:39:34 PM1/11/2010 1:39:34 PM

��
WP_185_web_1-11-10.pdf 68WP_185_web_1-11-10.pdf 68 1/11/2010 1:39:34 PM1/11/2010 1:39:34 PM

53
���
�
Part�II�
Labor�Mobility�in��Southeast�Europe�
Robert�Lucas�Philip�Martin���
WP_185_web_1-11-10.pdf 69WP_185_web_1-11-10.pdf 69 1/11/2010 1:39:34 PM1/11/2010 1:39:34 PM

54
Abstract�
he�eight�CEFTA�member�states�aim�to�join�the�European�Union,1�which�is�based�on�the�free�movement�of�goods,�capital,�services,�and�workers�over�national�borders.�
There�is� labor�migration�between�CEFTA�member�states,�but�few�formal�mechanisms�allow�and�encourage�the�freer�mobility�of�workers�that�could�allow�economies�of�scale�and�FDI�to�speed�up�economic�growth�and�job�creation.�
This�report�examines� the�mobility�provisions�of� free� trade�agreements� (FTAs);� its�purpose� is� to� show�how� to� implement� freer�migration�of� especially�professional� and�skilled�workers�between�CEFTA�member�states.�The�EU�experience�highlights�the�need�for� strong� leadership,� firm� time� lines,� and� institutions� that� can� provide� redress� to�individuals�whose�mobility� rights�were� impeded� and� set� precedents� that� encourage�freedom�of�movement.� The� examples� of� other� FTAs,� such� as�NAFTA�or�CARICOM,�may�provide�some�useful�lessons�as�to�how�to�approach�labor�mobility.�
The�benefits�of�more�skilled�worker�mobility�within�CEFTA�range�from�filling�skill�gaps�to�attracting�FDI,�promoting�cross�border�bids�for�infrastructure�projects�in�third�countries,� and� encouraging� investment� in� education.� CEFTA� member� states� could�begin� liberalizing�with� intra�company�transfers,�student�migration�that� includes�part�time�work�and�the�opportunity�to�seek�employment�after�graduation,�and�freedom�of�movement�for�those�with�university�degrees.
Note�1�The�countries�of�the�Western�Balkans,�unlike�Moldova,�have�been�offered�EU�membership�once�they�fully�meet�the�criteria�for�joining�the�EU.�
T
WP_185_web_1-11-10.pdf 70WP_185_web_1-11-10.pdf 70 1/11/2010 1:39:34 PM1/11/2010 1:39:34 PM

55
CHAPTER �6 �
Introduction�
abor�mobility�clauses�are�commonly�included�in�free�trade�agreements�(FTA).�The�purpose�of�this�report�is�to�review�the�labor�mobility�agreements�in�selected�FTAs�
and� their� applicability� to� members� of� the� Central� European� Free� Trade� Agreement�(CEFTA).�The�report�is�organized�in�five�main�sections:��
� The�first�section�provides�some�background�information�on�CEFTA,�including�a� brief� history,� population,� and� labor� force� profiles� of� the� various� member�countries,� economic� growth,� and� status� of� labor� markets� in� the� region,� and�prevailing�patterns�of�migration�and�remittances.�
� The� second� section�outlines� the� labor�mobility�provisions�of� other� free� trade�agreements�and�draws�lessons�for�CEFTA.�
� The�third�section�lays�out�some�of�the�potential�benefits�and�costs�of�enhanced�labor�mobility,�with�particular�reference�to�the�CEFTA�countries.�
� The� fourth� section� turns� to� the�existing�barriers� to� labor�mobility�among� the�CEFTA� member� countries,� including� visa� regulations,� work� permit�requirements,� social� barriers,� and� the� role� of� EU� member� states� as� a�destination�for�migrants.�
� The�fifth�section�draws�some�broad�conclusions.���
L
WP_185_web_1-11-10.pdf 71WP_185_web_1-11-10.pdf 71 1/11/2010 1:39:34 PM1/11/2010 1:39:34 PM

56
CHAPTER �7 �
CEFTA:�The�Setting�
he� new� CEFTA�Agreement� (also� called� CEFTA� 2006)� was� signed� by� all� CEFTA�parties�in�late�2007�and�entered�into�force�in�the�second�half�of�2008.��CEFTA�is�thus�a�very�young�association,�and�its�membership�may�again�change,�as�
Croatia� and� FYR� Macedonia� are� candidates� for� accession� to� the� EU� and� all� of� the�remaining�Western�Balkan�states1�are�considered�potential�candidates.2�The�fact�that�all�CEFTA�members� aim� to� join� the�EU� is� an� important� background� fact� in� considering�potential�labor�mobility�among�current�CEFTA�members,�since�freedom�of�movement�is�a�core�component�of� the�four�freedoms�on�which�the�EU�is�built,� freedom�to�move�goods,�capital,�services,�and�labor�among�EU�member�states.�
The� eight�members� of� CEFTA� differ� substantially� in� size� and� level� of� economic�development.�After�laying�out�basic�facts�on�the�population�and�the�labor�force�of�each�member�state,�we�review�economic�and�employment�growth�since�1990.�There�are�limited�migration�data,�but�those�available�are�reviewed�and�assessed�in�the�closing�section.�
Population and Labor Force
The� CEFTA�member� states� have� relatively� small� populations� and� geographic� areas,�making� foreign� direct� investment� (FDI),� trade,� and� migration� key� drivers� of� the�increased� competition,� larger� markets,� and� economies� of� scale� that� can� sustain�economic�growth�in�member�states�(table�7.1).�The�combined�population�of�the�CEFTA�member� states� is� about� 28� million,� and� most� members� have� stable� or� declining�populations,�except�for�Kosovo,�which�continues�to�have�a�high�rate�of�natural�increase�(of�1.4�percent�a�year).���Table 7.1. CEFTA Population Indicators: 2008, 2025
2008 2025 Population Change 2008-
2025 (%) Population (millions)
Natural Increase (%)
Total Fertility Rate (%)
Population (millions)
Albania 3.2 0.7 1.6 3.5 9 Bosnia and Herzegovina 3.8 0 1.2 3.7 –3 Croatia 4.4 –0.3 1.4 4.3 –2 Kosovo 2.2 1.4 2.5 2.7 19 FYR Macedonia 2 0.2 1.5 2 0 Montenegro 0.6 0.3 1.6 0.6 0 Serbia 7.4 –0.4 1.4 6.7 –10 Sum/Average 27.7 0.2 1.6 27.3 –1
Source:�Population�Reference�Bureau�(www.prb.org).��Note:�Data�for�2025�are�projections.�
T
WP_185_web_1-11-10.pdf 72WP_185_web_1-11-10.pdf 72 1/11/2010 1:39:34 PM1/11/2010 1:39:34 PM

Enhancing Regional Trade Integration in Southeast Europe 57
�
The�population�of�the�CEFTA�member�states�is�expected�to�shrink�slightly�by�2025,�with�the�sharpest�population�decline�expected�in�Serbia.�Despite�a�projected�10�percent�drop� in� population,� Serbia� is� still� expected� to� include� a� quarter� of�CEFTA� residents.�The�most�significant�population�increase�is�anticipated�for�Kosovo,�which�is�projected�to�have�four�times�more�residents�than�Montenegro�in�2025.�All�CEFTA�member�states�except� Albania� were� affected� directly� by� the� break�up� of� larger� entities.� As� a� result�there�was�migration�both�as�people�moved�over�borders�and�as�borders�moved�over�people� (with� the�dissolution�of� former�Yugoslavia).� In� the� latter� case,�people�became�“migrants”�without�moving�(Martin�and�Zuercher,�2008).�
ILO’s�most�recent�labor�force�projections�cover�all�CEFTA�members�except�Kosovo,�but�do�not�show�Montenegro�and�Serbia�separately�(table�7.2).�The�economically�active�population� of� the� CEFTA�member� states� (without� Kosovo)� is� projected� to� shrink� by�over�10�percent�between�2010�and�2020,�and�the�labor�force�aged�25–29,�the�age�group�that�includes�the�most�mobile�professional�workers,�is�projected�to�shrink�by�a�similar�10�percent.�The�labor�force�in�Croatia�is�projected�to�shrink�faster�than�the�labor�force�in�Serbia�and�Montenegro.��Table 7.2. CEFTA: Economically Active Population, 2005–2020 (thousands)
2005 2010 2015 2020 2010–2020
change
Albania 1,405 1,486 1,556 1,597 110 Age 25–29 166 186 220 211 25
Bosnia–Herzegovina 1,930 1,969 1,959 1,922 –47 Age 25–29 249 225 231 201 –24
Croatia 2,022 1,992 1,924 1,846 –146 Age 25–29 268 265 236 216 –49
FYR Macedonia 863 905 918 909 4 Age 25–29 117 122 117 112 –10
Serbia 4,760 4,840 4,830 4,786 –55 Age 25–29 591 604 583 528 –75
Subtotal 12,484 12,585 12,564 12,447 –137 Age 25–29 1,501 1,514 1,499 1,352 –162
Source:�ILO�Labor�Statistics,�Economically�Active�Population�Projections.�Note:�No�data�available�for�Kosovo;�Serbia�includes�Montenegro.��
Among� the� 1.3�million�CEFTA�nationals� in� Southeast� Europe� SEE)3� in� the� 25–29�age�group�(removing�an�assumed�200,000�in�this�age�group�in�Kosovo�and�Moldova),�how�many�would�qualify�for�freedom�of�movement�if�the�requirement�was�to�have�at�least�a�first�university�degree?�
The� ILO� database� includes� limited� information� on� educational� levels� of�economically�active�people,�and�some�of�the�data�may�be�suspect,�such�as�no�university�educated�workers�in�Bosnia�and�Herzegovina.�If�we�assume�that�15�percent�of�those�in�the�more�advanced�CEFTA�nations�of�Croatia�and�Serbia�have�at�least�a�first�university�degree,� and� 10� percent� of� those� in� Albania,� Bosnia� and� Herzegovina,� and� FYR�Macedonia�have�at� least� a� first�university�degree,� the�number�of� first�degree�persons�
WP_185_web_1-11-10.pdf 73WP_185_web_1-11-10.pdf 73 1/11/2010 1:39:35 PM1/11/2010 1:39:35 PM

58 World Bank Working Paper
�
who� would� enjoy� free�movement� rights� in� the� most� mobile� age� group� is� relatively�small� (table� 7.3).� For� example,� even� assuming� that� the� share� of� university�educated�persons� age� 25–29� is� 30� percent�means� that� only� 80,000� Croatians� in� this� age� group�would�qualify�for�freedom�of�movement�in�2010.4��Table 7.3. CEFTA Labor Force by Education, 2001-07
Year Labor Force
(millions) University degree
or more % share with
university degree
Albania 2001 1.4 107,339 8 Bosnia and Herzegovina 2007 1.2 100 0 Croatia 2007 1.8 324,000 18 Montenegro 2005 0.3 30,433 12
Source:�ILO�Labor�Statistics,�Total�and�Economically�Active�Population,�Table�1B.�Notes:�Year�is�year�of�most�recent�census.�University�degree�or�higher�corresponds�to�ISCED�levels�5–7.�No�data�are�available�for�Kosovo,�FYR�Macedonia,�and�Serbia.�
Economic Growth and Employment
GDP�per�capita�in�CEFTA�member�states�fell�sharply�in�the�early�1990s�in�the�transition�from� centrally� planned� to� market� systems.� Thereafter,� economic� recovery� has� been�sustained,� although� accelerated� growth� came� to� FYR�Macedonia� only� after� 2000� and�Albania’s�economy�shrank�after� the�collapse�of�pyramid� investment�schemes� in�1997.�By�2000�most�of�the�current�CEFTA�countries�had�re�achieved�or�surpassed�their�real�1990�income�levels.�
Most�of�the�SEE�countries�have�similar�GDP�per�capita�levels,�with�Croatia�being�outlier�together�with�Kosovo�though�in�the�latter�case�PPP�data�are�not�available�(see�figure�7.1).�The�sectoral�pattern�of�production�shifted�quite�dramatically�in�some�of�the�CEFTA� countries,� as� the� services� sector� expanded� with� rising� income� levels� and� a�transition�from�a�socialist�model,�while�both�agriculture�and�industry�shrank�as�a�share�of� GDP.� These� transformations� have� been� most� dramatic� in� Albania,� although� the�
Figure 7.1: GDP Per Capita 2007 (PPP International Dollars)
�
Source:�World�Bank�data.��
0 5 10 15 20
Albania
Serbia
Bosnia and Herzegovina
Macedonia
Montenegro
Croatia
US$ thousands
WP_185_web_1-11-10.pdf 74WP_185_web_1-11-10.pdf 74 1/11/2010 1:39:35 PM1/11/2010 1:39:35 PM

Enhancing Regional Trade Integration in Southeast Europe 59
�
declining� shares� of� agriculture� in� Bosnia� and� Herzegovina� and� of� industry� in� FYR�Macedonia�are�also�apparent.�
Despite� rising� GDP,� employment� has� not� recovered� in� some� of� the� CEFTA�members,� especially�FYR�Macedonia�and�Kosovo,�where�employment� stood�at�about�two� thirds� the� 1990� levels� as� late� as� 2007–08� (figure� 7.2).� In� Albania,� employment�stabilized�after�2000.�No�data�are�available�on�Bosnia�and�Herzegovina,�and�the�data�on�Serbia�and�Montenegro�are�very�incomplete,�but�the�substantial�loss�of�jobs�from�1995�through� 2003� is� apparent.� By� 2008� Croatia� had� regained� the� 1990� aggregate�employment�level,�and�the�dip�in�the�interim�was�generally�less�dramatic�than�in�some�of�the�other�member�states.��
Figure 7.2. Indices of Total Employment (2003=100)
�Sources:�International�Financial�Statistics.�Except�Serbia�&�Montenegro�from�ILO�at�http://laborsta.ilo.org/.��
The�restructuring�after�1990�was�accompanied�by�unemployment�(figure�7.3),5�but�the� persistence� of� the� very� high� rates� of� unemployment� points� to� inflexibility� in� the�labor�markets� of�CEFTA�member� states.�Micevska� (2004)� examined� the� labor�market�institutions�of�Southeastern�European�countries,�concluding�that� their�unemployment�insurance� schemes� were� less� generous� than� those� of� EU� member� states,� but� their�employment� protection� legislation� (EPL)� was� comparatively� strict,� especially� in� the�former�Yugoslav� states,�with� some� relaxation�of�EPL�after� 2000.�Micevska� concluded�that� EPL� was� not� a� major� contributor� to� overall� unemployment� but� its� strictness,�especially� with� respect� to� temporary� employment� and� collective� dismissals,�contributed� to� higher� unemployment� among� women� and� young� people� and�encouraging� an� underground� economy� that� generates� lower� official� labor� force�participation�rates.��
60
70
80
90
100
110
120
130
140
150
160
Inde
x
Albania
Croatia
Macedonia
Serb & Mont
WP_185_web_1-11-10.pdf 75WP_185_web_1-11-10.pdf 75 1/11/2010 1:39:35 PM1/11/2010 1:39:35 PM

60 World Bank Working Paper
�
Figure 7.3. Unemployment Rates 2006
�
Source:�Eurostat�Pocketbook�on�Candidate�and�Potential�Candidate�Countries,�2008�edition.�Except�Albania�=�Authors’�calculations�from�ILO�at�http://laborsta.ilo.org/��
The� unemployment� rates� of� females� are� generally� higher� than� among� males� in�CEFTA� member� states,� except� in� Serbia� (figure� 7.4).6� As� in� most� countries,�unemployment�rates�for�youth�are�higher�than�overall�rates,�but�the�absolute�levels�of�these�rates�in�CEFTA�member�states,�nearly�60�percent�in�FYR�Macedonia�and�Bosnia�and�Herzegovina�and�50�percent�in�Serbia,�are�a�major�concern.��
Figure 7.4. Unemployment Rates among Males, Females, and Youths
�Source:�Authors’�calculations.��
0
5
10
15
20
25
30
35
40
Croatia Albania Serbia Montenegro Bosnia Macedonia
Perc
ent
0
10
20
30
40
50
60
70
Albania Bosnia-Herz Croatia Macedonia Montenegro Serbia
Perc
ent
MalesFemalesYouths
WP_185_web_1-11-10.pdf 76WP_185_web_1-11-10.pdf 76 1/11/2010 1:39:35 PM1/11/2010 1:39:35 PM

Enhancing Regional Trade Integration in Southeast Europe 61
�
Migration Patterns
Migration� patterns� especially� in� the� ex�Yugoslav� CEFTA� member� states� were�influenced�by�the�dissolution�of� the�former�Soviet�Union�and�Yugoslavia,�subsequent�conflicts,� and� their� economic� aftermath.� To� place� these� changes� in� longer� run�perspective,� Figure� 7.5� shows� the�UN� estimates� of� net�migration� rates� (in�migration�minus� out�migration� per� thousand� population)� over� half� a� century,� from� 1950–55�through�2000–2005,� for� each�CEFTA�member.7�Although�each�of� the� states� exhibits� a�shift�in�migration�patterns�after�1990,�the�nature�of�these�changes�differs�significantly.���
Figure 7.5. Net Migration Rates 1950–2005
� �
� �
�
Source:�UN�Population�Division.��
�
-30
-20
-10
0
10
1955
1960
1965
1970
1975
1980
1985
1990
1995
2000
2005
Albania
-60
-40
-20
0
20
40
1955
1960
1965
1970
1975
1980
1985
1990
1995
2000
2005
Bosnia & Herzegovina
-20
-10
0
10
20
1955
1960
1965
1970
1975
1980
1985
1990
1995
2000
2005
Croatia
-20
-15
-10
-5
0
1955
1960
1965
1970
1975
1980
1985
1990
1995
2000
2005
FYR Macedonia
-4
-2
0
2
4
6
1955
1960
1965
1970
1975
1980
1985
1990
1995
2000
2005
Serbia & Montenegro
WP_185_web_1-11-10.pdf 77WP_185_web_1-11-10.pdf 77 1/11/2010 1:39:35 PM1/11/2010 1:39:35 PM

62 World Bank Working Paper
�
Bosnia and Herzegovina
Bosnia� and� Herzegovina� experienced� significant� net� out�migration� during� the� late�1950s� and� 1960s,� after�which� there�was� less� until� after� 1990.� By� 1992,� armed� conflict�resulted� in� a� massive� exodus� from� Bosnia� and� Herzegovina,� a� net� departure� of� 50�persons�per�1,000�residents�between�1990�and�1995,�according�to�the�UN�estimates.�At�the�peak�of�the�exodus�in�1996,�the�UNHCR�recognized�almost�a�million�refugees�from�Bosnia�and�Herzegovina,�including�25�percent�in�Serbia�Montenegro�and�16�percent�in�Croatia� (figure� 7.6).� Substantial� return� migration� in� the� second� half� of� the� 1990s�resulted�in�high�levels�of�net�in�migration,�reflected�in�Figure�6.�By�2007,�the�UNHCR�reported�that�there�were�60,000�refugees�from�Bosnia�and�Herzegovina,�with�about�half�each�in�Germany�and�Serbia�Montenegro.�In�working�toward�EU�membership,�Bosnia�and� Herzegovina� has� focused� largely� on� asylum,� border� management,� and� visa�management;� the� Law� on� the�Movement� and� Stay� of� Aliens� and�Asylum� came� into�force� in� May� 2008.� Interestingly,� the�Migration� and� Asylum� Action� Plan:� 2008–2011,�(Bosnia� and� Herzegovina,� 2008),� says� little� on� emigration� from� Bosnia� and�Herzegovina.��
Figure 7.6. Refugee Population from Bosnia and Herzegovina
�Source:�UNHCR�Statistical�Yearbook.��
Croatia
Many�Croatians�migrated�to�Western�Europe�as�guest�workers�in�the�1950s�and�1960s,�and� labor� migration� was� replaced� by� a� lower� level� of� family� unification� in� the� late�1970s� and� 1980s.� After� 1985� Croatia� became� a� net� immigration� area,� especially� as�people� fled� from� Bosnia� and� Herzegovina� into� Croatia.� After� 1995,� many� Serbs� in�Croatia� left,� and� 350,000� were� recognized� as� refugees� by� UNHCR;� most� moved� to�Serbia�and�Montenegro.�Since�then,�there�has�been�little�net�movement�either�in�or�out�of� Croatia,� although� some� reports� suggest� a� substantial� return� of� ethnic� Serbs� to�Croatia.��
0
200,000
400,000
600,000
800,000
1,000,000
1,200,000
Num
ber o
f ref
ugee
s
Elsewhere
Macedonia
Croatia
Serb+Mont
WP_185_web_1-11-10.pdf 78WP_185_web_1-11-10.pdf 78 1/11/2010 1:39:36 PM1/11/2010 1:39:36 PM
Enhancing Regional Trade Integration in Southeast Europe 63
�
Croatia� has� low� fertility� and� the� highest� per� capita� income� in� the� CEFTA� area,�prompting�the�prediction�that:�“In�view�of�demographic�decline�and�aging�population,�more�sustained� immigration� flows�will� increasingly�be�required� to�meet� the�needs�of�the�Croatian�labor�market.”8�The�Croatian�government�introduced�a�quota�system�for�the� recruitment� of� foreign� workers� to� meet� specific� perceived� shortages.� As� of�December� 2006,� the�Migration� Policy� Strategy� of� the� Republic� of� Croatia,� 2007� reported�almost�10,000�foreign�workers�in�Croatia,�85�percent�male,�and�mostly�less�skilled.9��
Serbia and Montenegro.
Migration�from�Serbia�and�Montenegro�also�fluctuated�considerably�over�time,�though�the�UN�estimates�suggest�low�rates�of�net�migration.�Between�1955�and�1975,�there�was�slight� net� out�migration,� followed� by� 15� years� of� little� net�movement� until� the� early�1990s,�when�Serbia�and�Montenegro�became�net�immigration�areas.�The�UN�estimated�this�net�inflow�at�less�than�four�per�thousand�per�year,�which�seems�low�in�light�of�the�refugee� inflows� reported� by� UNHCR.� Since� 1995,� the� UN� reports� modest� net�emigration,� while� the� International� Organization� for� Migration� (IOM,� 2008a,� 12)�reported�that�“Serbia�(and�Montenegro)�is�among�the�countries�in�the�region�that�has�evolved� from� a� net� emigration� country� to� a� net� immigration� one.� Moderately�increasing�immigration�flows�also�call�for�renewed�immigration�policies�and�enhanced�cooperation�with�third�countries�of�origin.”��
Serbia� seeks� to� maintain� active� contact� with� its� diaspora,� as� reflected� in� the�establishment�of�a�Ministry�of�Diaspora�and�the�Diaspora�Action�Plan�2005.10�Serbia�is�bringing� its�migration� policies� into� conformity�with� those� of� the� EU�via� the� Law�on�Identification� of� Documents,� the� Law� on� Travel� Documents,� and� the� Law� on�Conditions�for�Employment�of�Foreign�Nationals.�
Kosovo
There�was�a�mass�exodus�of�Kosovars�in�1998–99�amidst�conflict�between�ethnic�Serbs�and� Albanians,� and� significant� return� migration� since� the� conflict� ended.� However,�there�are�almost�no�data�on�migration�flows,�and�the�dominant�migration�policy�issue�is�the�reintegration�of�returning�Kosovars.��
FYR Macedonia.
FYR�Macedonia�has�had�net�emigration�for�the�past�half�century.�Net�departures�were�particularly�high�between�1955�and�1970�and�again�in�the�early�1980s�but,�unlike�most�other� CEFTA� countries,� FYR� Macedonia� has� not� had� especially� high� rates� of� net�emigration� since� 1990� despite� the� uprising� and� events� of� 2001,� according� to� UN�estimates.� The� Government� of� FYR�Macedonia� (2009)� apparently� disagrees�with� the�UN�data�noting� that� immigration� remains� low�and� that� emigration�has�been�high� in�recent�years�(reportedly�20�percent�of�those�born�in�FYR�Macedonia�are�abroad).��
Given� high� unemployment� rates,� high� emigration� rates� are� to� be� expected.� The�government�of�FYR�Macedonia�is�concerned�about�depopulation�and�the�brain�drain,�and� is� making� efforts� to� reach� out� to� the� diaspora� with� a� Coordinative� Emigration�Body.� In� 2009,� the� government� announced� that� “Temporary� stay� and� permanent�residence�of�foreigners�in�the�Republic�of�Macedonia�is�regulated�with�legislation�and�transparent�procedures�that�have�been�entirely�harmonized�with�those�of�the�European�Union.”11�
WP_185_web_1-11-10.pdf 79WP_185_web_1-11-10.pdf 79 1/11/2010 1:39:36 PM1/11/2010 1:39:36 PM

64 World Bank Working Paper
�
Albania
Albania�was�almost�closed�to�emigration�or�immigration�until�1990,�and�has�since�then�experienced� one� of� the� world’s� highest� rates� of� net� out�migration.� There� were� two�major�waves�of�emigrants:�in�1990�91�and�again�in�1997.�Since�then,�the�net�emigration�has�decreased.�
Much�of� the� emigration� from�Albania� is� temporary,� as�Albanians� leave� (often� in�irregular� status)� for� Greece� and� Italy� to� fill� jobs� in� agriculture,� construction,� and�domestic�services:�“Albania�has�been�particularly�targeted�on�different�occasions�by�the�European�Union�as�one�of�the�top�priority�third�countries�for�the�fight�against�irregular�migration.�The�management�of�migration�flows�has�therefore�become�an�integral�part�of� the� Stabilization� and� Association� Process”� (Albania,� 2004,� 3).� The� Albanian�government� deals�with� emigration�management� by� increasing� “the� protection� of� the�rights�of�Albanian�emigrants�abroad,�building�up�and� linking�Albanian�communities�abroad,� driving� remittances� of� emigrants� into� business� investments,� organizing� an�adequate� policy� for� labor� migration,� facilitating� the� travel� of� Albanian� citizens�confronted� with� short� term� visa� requirements� and� finally,� the� development� of� the�adequate�legal�and�institutional�framework”�(Albania,�2004,�4).�
The Diaspora
By�2000,� the�CEFTA�diaspora,� (people�born� in� the�CEFTA�countries� living� in�another�country),� were� about� 19� percent� of� those� still� in� CEFTA� countries.� The� size� of� the�diaspora�varied�from�nearly�a�third�of�those�born�in�Bosnia�and�Herzegovina,�a�quarter�of�Albanians,�and�13�percent�of�those�born�in�Croatia�and�FYR�Macedonia12�(table�2.4).�
Nearly�half�of�Albanians�abroad�are�in�Greece�and�another�fifth�in�Italy.�More�than�a� third� of� the� diaspora� of� Bosnia� and� Herzegovina� is� in� other� CEFTA� states,� and�another�quarter�is�in�Germany�and�Austria.�Similarly�40�percent�of�Croatia’s�diaspora�is�in�Germany�and�a�significant�share�is�in�North�America,�and�a�similar�pattern�holds�for� the� diaspora� of� Serbia� and�Montenegro.� Emigrants� from� FYR�Macedonia� are� in�Australia,�Switzerland,�Turkey,�North�America,�and�Italy.�
An� important� feature� of� the�diaspora�data� in� table� 7.4� is� that,� apart� from�Bosnia�and� Herzegovina,� the� other� CEFTA� countries� have� less� than� 10� percent� of� their�overseas� populations� in� other� CEFTA� countries.� Moldova,� in� particular,� has� been�essentially�isolated�from�migration�to�the�SEE�states.�
Migrants’ Education Levels
The� educational� profile� of� CEFTA� nationals� in� the� OECD� countries� was� roughly�comparable�in�2000�(table�7.5).�About�half�had�less�than�a�secondary�education,�while�close� to� a� fifth� had� some� form� of� tertiary� level� education.� The� data� for�Moldova� no�doubt�look�quite�different�in�large�part�because,�as�we�have�seen,�most�of�the�diaspora�is�not�in�the�OECD�countries�but�in�the�Commonwealth�of�Independent�States�(CIS).�
�
WP_185_web_1-11-10.pdf 80WP_185_web_1-11-10.pdf 80 1/11/2010 1:39:36 PM1/11/2010 1:39:36 PM

Enhancing Regional Trade Integration in Southeast Europe 65
�
Table 7.4. Diaspora of the CEFTA Countries in 2000
Albania Bosnia and
Herzegovina Croatia Serbia and
Montenegro FYR
Macedonia Percent of Home Population 26.2 32.4 13.4 16.0 12.7 Percent of diaspora in: 4.75 37.03 6.87 8.97 4.92 CEFTA 0.39 2.77 0.94 3.43 1.24 Other Eastern Europe 11.27 17.06 40.05 25.30 6.29 Germany 49.27 0.03 0.06 0.30 0.36 Greece 0.26 10.63 6.41 8.54 5.41 Austria 0.42 3.78 4.15 9.58 16.16 Switzerland 20.43 1.10 3.28 2.81 10.01 Italy 0.40 0.19 0.04 6.69 12.17 Turkey 0.07 4.26 0.94 4.47 1.15 Sweden 0.35 1.90 5.03 0.52 3.81 France 0.05 0.04 0.02 3.16 0.01 Netherlands 0.38 0.58 1.23 1.93 0.55 United Kingdom 0.10 2.94 2.74 2.84 2.37 Other Western Europe 0.81 0.87 0.84 0.84 0.85 CIS 1.43 1.46 1.41 2.79 3.94 MENA 5.63 9.98 13.44 10.84 10.19 North America 0.22 1.96 8.96 3.49 17.11 Australasia 3.76 3.43 3.59 3.51 3.47 Other 100.00 100.00 100.00 100.00 100.00 TOTAL
Source:�Winters,�Alan�L.,�Terrie�L.�Walmsley,�Ronald�Skeldon,�and�Christopher�R.�Parsons,�Global�Migrant�Origin�Database,�Updated�March�2007,�at�http://www.migrationdrc.org/research/�typesofmigration/global_migrant_origin_database.html.���Table 7.5. Expatriate Adults in the OECD Countries by Education: 2000
Education Level Albania Bosnia and Herzegovina Croatia
Serbia and Montenegro
FYR Macedonia
Education Levels of Expatriate Adults in OECD (%) Primary 46.2 44.4 54.2 44.9 52.2 Secondary 35.3 38.6 25.3 34.3 28.1 Tertiary 18.4 17.0 20.5 20.7 19.6 Total 100.0 100.0 100.0 100.0 100.0
Percent of Working Age Population in OECD Primary 9.3 14.4 14.6 7.9 18.2 Secondary 7.2 15.2 8.9 10.3 12.8 Tertiary 9.0 23.9 24.1 13.6 29.1
Tertiary Educated Adults in OECD by Region (%) Europe 53.6 51.2 39.6 60.4 57.4 North America 44.8 39.5 48.4 28.3 19.3 Asia and Oceania 1.7 9.3 12.0 11.2 23.3 Total 100.0 100.0 100.0 100.0 100.0
Source:�Docquier,�Frédéric�and�Abdeslam�Marfouk.�2006.�“International�Migration�by�Educational�Attainment,”�in�Schiff,�Maurice�and�Çaglar�Özden�(eds.),�International�Migration,�Remittances,�and�the�Brain�Drain,�Washington�DC:�World�Bank.��
WP_185_web_1-11-10.pdf 81WP_185_web_1-11-10.pdf 81 1/11/2010 1:39:36 PM1/11/2010 1:39:36 PM

66 World Bank Working Paper
�
One�brain�drain�indicator�is�the�fraction�of�college�educated�adults�abroad.�There�are�no�overall�measures�but�much�of�the�migration�from�the�CEFTA�countries�is�to�the�OECD�member� countries.� The�middle� panel� of� table� 7.5� shows� the� selection� rate� of�expatriates� in� the� OECD� from� each� education� level,� relative� to� the� working� age�population,� at� home� and� abroad,� with� that� level� of� education.� Tertiary� educated�migrants�from�Bosnia�and�Herzegovina,�Croatia,�and�FYR�Macedonia�in�OECD�countries�are�over�a�fifth�of�the�total�population�with�a�college�level�education.�The�rates�at�which�the�college�educated�leave�Serbia,�Montenegro,�and�Albania�were�lower�in�2000.�
Anecdotes� suggest� that� large� numbers� of� college�educated� nationals� leave.� For�example,�half�of�the�lecturers�and�research�staff�of�Albanian�universities�reportedly�left�the� country� between� 1991� and� 2001,� prompting� a� new� policy� to� allow� Albanian�universities� to� hire� foreigners� to� replace� them.13� Apparently� few� Albanian� students�return�from�study�abroad,�prompting�a�2005�Brain�Gain�initiative�to�tap�the�expertise�of�the� diaspora� to� stimulate� Albanian� development.14� It� appears� that� many� highly�qualified�Albanians�work�in�quite�low�skill�occupations�abroad.�
The�Government�of�FYR�Macedonia�(2009,�31)�asserted�that�“the�scale�of�the�brain�drain�problem�has�reached�alarming�proportions”�and�that�“The�solution�ought�to�be�found�in�a�well�conceived�policy�in�the�medium�and�long�term,�which�in�essence�should�be�aimed�at�…�creating�conditions�conducive�to�a�decrease�in�the�volume�of�highly�educated�emigrants�and�gradual�return�of�part�of�the�Macedonian�population�living�abroad.”�
The�European�OECD�member� countries� are� the�major�destination� for�highly� skilled�CEFTA�migrants,�as�may�be�seen�from�the�lower�panel�of�Table�6.�However,�the�brain�drain�to�North�America�has�been�very�significant�(as�well�as�to�Australasia�from�FYR�Macedonia).�
Migrant Stocks in the CEFTA Countries
Prior�to�1990,�none�of�the�CEFTA�countries�had�a�significant�stock�of�migrants,�defined�by�the�UN�as�foreign�born�persons�present�in�the�country�for�at�least�one�year�(figure�7.7).� Since� 1990,� immigration�has� increased,� especially� in�Croatia,�where� the�migrant�stock�is�estimated�to�have�reached�nearly�15�percent�of�the�population�in�2005.�For�the�other�CEFTA�countries�the�proportion�of�migrants�is�much�lower,�especially�in�Albania�and�Bosnia�and�Herzegovina.���
Figure 7.7. Migrant Stock as Percent of Population
�Source:�UN�Population�Division.�
02468
10121416
Albania Bosnia & Herz Croatia Serbia & Mont Macedonia
Perc
ent
196019701980199020002005
WP_185_web_1-11-10.pdf 82WP_185_web_1-11-10.pdf 82 1/11/2010 1:39:36 PM1/11/2010 1:39:36 PM

Enhancing Regional Trade Integration in Southeast Europe 67
�
Most�migrants�in�Bosnia�and�Herzegovina,�Croatia,�and�FYR�Macedonia�are�from�the�other�ex�Yugoslavia�states,�as�might�be�expected.�However,�a�third�of�migrants�in�Serbia�Montenegro�are�from�the�EU,�and�there�are�significant�groups�from�the�Middle�East�(Turkey�and�the�Maghreb),�Asia�(notably�South�Asia)�and�the�Americas�(including�a� significant�U.S.� presence).�Albania’s�migrants� in� 2000�were�mostly� from�CIS� states�(Winters�et�al.,�2007).�
Table� 7.6� examines� movements� from� one� CEFTA� country� to� another� in� greater�detail.� As� Winters� et� al� emphasize,� their� migrant� stock� estimates� are� based� on� the�country�of�birth�and�are�approximate.�There�are�discrepancies�between�the�Winters�et�al.�database�and�other�data,�in�part�reflecting�the�prevalence�of�dual�citizenship�status�and�ethnic�identity.�For�example,�the�larger�Serbian�diaspora�estimate�made�by�MARRI�probably� reflects� ethnic� identity,� but� the� 45,000� Serbs� reported� by� MARRI� in� FYR�Macedonia�are�about�the�same�as�were�reported�in�the�Macedonian�Census�for�2002.��Table 7.6. Migrant Stock in CEFTA Countries: 2000 (Percent)
Albania Bosnia and Herzegovina Croatia
Serbia and Montenegro FYR Macedonia
CEFTA 19.1 98.7 92.3 5.5 84.6 CIS 43.6 0.3 0.6 3.6 0.2 EU 26.8 0.4 6.2 34.9 0.6 Other Europe 6.2 0.0 0.2 8.7 13.4 MENA 0.8 0.1 0.0 15.6 0.6 Asia 1.7 0.2 0.1 12.1 0.3 Americas 1.3 0.2 0.3 10.1 0.2 Other 0.5 0.1 0.2 9.4 0.1 TOTAL 100.0 100.0 100.0 100.0 100.0 Number 12,188 95,998 600,115 625,996 32,995
Source:�Winters,�Alan�L.,�Terrie�L.�Walmsley,�Ronald�Skeldon�and�Christopher�R.�Parsons,�Global�Migrant�Origin�Database,�Updated�March�2007,�at�http://www.migrationdrc.org/research/�typesofmigration/global_migrant_origin_database.html.��
Table�7.7�shows� that� the� largest� intra�CEFTA�movements�have�been� from�Bosnia�and�Herzegovina�to�Croatia�(including�refugees�recognized�by�the�UNHCR)�and�from�Serbia�Montenegro�to�Bosnia�and�Herzegovina�and�to�Croatia.�FYR�Macedonia�appears�not� to� have� played� host� to� large� numbers� of� CEFTA�migrants� there� are� few�CEFTA�nationals� in� Albania,� although� there� are� estimated� to� be� large� numbers� of� Albanian�nationals�in�FYR�Macedonia.��
Thus�migration�among�the�CEFTA�states�has�been�dominated�by�the�consequences�of� the� break� up� Yugoslavia,� with� mass� movements� in� and� out� of� Bosnia� and�Herzegovina,� Serbia� and�Montenegro,� and� Croatia.� To� the� extent� that� networks� are�important�in�shaping�migration,�we�could�expect�these�patterns�to�persist.�� �
WP_185_web_1-11-10.pdf 83WP_185_web_1-11-10.pdf 83 1/11/2010 1:39:37 PM1/11/2010 1:39:37 PM
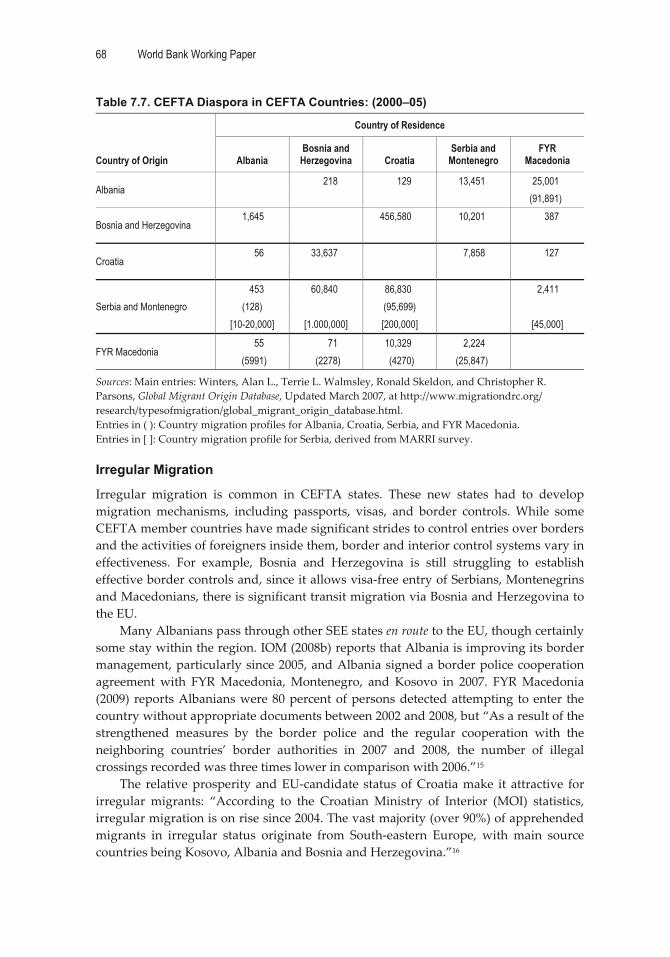
68 World Bank Working Paper
�
Table 7.7. CEFTA Diaspora in CEFTA Countries: (2000–05)
Country of Origin
Country of Residence
Albania Bosnia and Herzegovina Croatia
Serbia and Montenegro
FYR Macedonia
Albania 218 129 13,451 25,001 (91,891)
Bosnia and Herzegovina 1,645 456,580 10,201 387
Croatia 56 33,637 7,858 127
Serbia and Montenegro 453 60,840 86,830 2,411
(128) (95,699) [10-20,000] [1.000,000] [200,000] [45,000]
FYR Macedonia 55 71 10,329 2,224
(5991) (2278) (4270) (25,847)
Sources:�Main�entries:�Winters,�Alan�L.,�Terrie�L.�Walmsley,�Ronald�Skeldon,�and�Christopher�R.�Parsons,�Global�Migrant�Origin�Database,�Updated�March�2007,�at�http://www.migrationdrc.org/�research/typesofmigration/global_migrant_origin_database.html.�Entries�in�(�):�Country�migration�profiles�for�Albania,�Croatia,�Serbia,�and�FYR�Macedonia.�Entries�in�[�]:�Country�migration�profile�for�Serbia,�derived�from�MARRI�survey.�
Irregular Migration
Irregular� migration� is� common� in� CEFTA� states.� These� new� states� had� to� develop�migration�mechanisms,� including� passports,� visas,� and� border� controls.�While� some�CEFTA�member�countries�have�made�significant�strides�to�control�entries�over�borders�and�the�activities�of�foreigners�inside�them,�border�and�interior�control�systems�vary�in�effectiveness.� For� example,� Bosnia� and� Herzegovina� is� still� struggling� to� establish�effective�border�controls�and,�since�it�allows�visa�free�entry�of�Serbians,�Montenegrins�and�Macedonians,�there�is�significant�transit�migration�via�Bosnia�and�Herzegovina�to�the�EU.��
Many�Albanians�pass�through�other�SEE�states�en�route�to�the�EU,�though�certainly�some�stay�within�the�region.�IOM�(2008b)�reports�that�Albania�is�improving�its�border�management,�particularly�since�2005,�and�Albania�signed�a�border�police�cooperation�agreement�with� FYR�Macedonia,�Montenegro,� and� Kosovo� in� 2007.� FYR�Macedonia�(2009)� reports�Albanians�were�80�percent�of�persons�detected�attempting� to�enter� the�country�without�appropriate�documents�between�2002�and�2008,�but�“As�a�result�of�the�strengthened� measures� by� the� border� police� and� the� regular� cooperation� with� the�neighboring� countries’� border� authorities� in� 2007� and� 2008,� the� number� of� illegal�crossings�recorded�was�three�times�lower�in�comparison�with�2006.”15��
The� relative�prosperity� and�EU�candidate� status�of�Croatia�make� it� attractive� for�irregular� migrants:� “According� to� the� Croatian� Ministry� of� Interior� (MOI)� statistics,�irregular�migration�is�on�rise�since�2004.�The�vast�majority�(over�90%)�of�apprehended�migrants� in� irregular� status� originate� from� South�eastern� Europe,� with� main� source�countries�being�Kosovo,�Albania�and�Bosnia�and�Herzegovina.”16��
WP_185_web_1-11-10.pdf 84WP_185_web_1-11-10.pdf 84 1/11/2010 1:39:37 PM1/11/2010 1:39:37 PM

Enhancing Regional Trade Integration in Southeast Europe 69
�
Remittances
Rising�remittances�are�extremely�important�to�several�CEFTA�economies.�Table�7.8�and�figure� 7.8� show� gross� reported� remittance� receipts� per� capita� since� 1992.17� FYR�Macedonia�reported�the� lowest�remittance�receipts�per�capita,�US$131�in�2007,�versus�US$665� in� Bosnia� and� Herzegovina,� however,� this� is� partly� a� recording� issue�(remittances�are�considered�to�be�much�higher�than�that).�The�other�CEFTA�countries�received�US$400�to�US$470�in�remittances�per�capita.��Table 7.8. Remittances’ Share of GDP: 2006 (percent)
Albania 14.9
Bosnia and Herzegovina 17.6
Croatia 2.9
Serbia and Montenegro 13.6
FYR Macedonia 4.3
Source:�World�Bank�and�IMF�Data��
Figure 7.8. Gross Remittance Receipts per Capita US$
�Source:�World�Bank�and�IMF�data.��
The� World� Bank� reports� remittance�to�GDP� ratios� of� 174� countries.� With� the�exceptions�of�Croatia�and�Macedonia,� the�remaining�CEFTA�countries�are�among�the�top�20�recipients�on�this�list.18�Remittances�are�critical�both�to�the�families�that�receive�them� and� to� the� macro�economic� performance� of� the� CEFTA� countries.� It� must� be�remembered,� however,� that� in� thinking� about� intra�regional� migration,� remittance�inflows�to�one�country�also�imply�remittance�outflows�from�the�host.�
�
0
100
200
300
400
500
600
700
1992 1993 1994 1995 1996 1997 1998 1999 2000 2001 2002 2003 2004 2005 2006 2007
US$
Albania Bosnia & Herz Croatia Serb & Mont Macedonia
WP_185_web_1-11-10.pdf 85WP_185_web_1-11-10.pdf 85 1/11/2010 1:39:37 PM1/11/2010 1:39:37 PM

70 World Bank Working Paper
�
Notes �1�The�terms�“Western�Balkans”�and�“Southeast�Europe”�are�used�interchangeably�throughout�the�text.�2� All� CEFTA�member� states� except� Moldova� are� official� candidates� for� EU� accession� or� have�signed�Stabilization�and�Association�Agreements�(SAAs).�Kosovo�is�part�of�the�Stabilization�and�Association�Process�but�has�not�signed�an�SAA�or�a�trade�agreement�with�the�EU.��3� The� terms� Southeast� Europe� and�Western� Balkans� are� used� interchangeably� and� include� all�CEFTA�parties�except�Moldova.�4�There�are�projected�to�be�265,000�economically�active�Croatians�25–29�in�2010;�30�percent�of�this�number�is�79,500.�5�With� the�exception�of�Albania,� the�unemployment�measures� shown� in� figure�7.4� for�2006�are�drawn�from�Labor�Force�Surveys.�For�Albania,�the�implied�rate�of�unemployment�based�on�the�number� of� registered� unemployed� is� the� lower� figure� shown.�Albania’s� upper� unemployment�estimate� is� based� on� the� difference� between� the� official� rate� and� the� rate� according� to� the�Population�Census�in�2001.�The�rate�shown�for�Montenegro�is�for�2005.�6�Data�are� for�2007�except� for�Albania� (2001),�Montenegro� (2005)�and�the�youth�unemployment�rate� for� Serbia� (2006).� All� measures� are� calculated� from� ILO� data� drawn� from�http://laborsta.ilo.org/� except� the� youth� unemployment� rate� for� Serbia� which� is� reported� in�Eurostat� Pocketbook� on� Candidate� and� Potential� Candidate� Countries,� 2008� edition.� “Youth”�here�refers�to�persons�ages�15–24.�7�Separate�data�for�Serbia�and�Montenegro�are�not�available,�nor�are�data�for�Kosovo.�8�International�Organization�for�Migration�(2007),�p.24.�9�About�15�percent�of�the�10,000�had�a�university�degree,�half�had�a�high�school�diploma�and�over�a�quarter�apparently�had�less�than�high�school.�10�http://www.mzd.sr.gov.yu/_eng/docs/action_plan_mfd.doc.�11�Government�of�Macedonia�(2009)�p.29.�12�Figures�released�by�Bosnia�and�Herzegovina’s�Ministry�of�Foreign�Affairs,�in�April�2007,�show�1,343,805�citizens�currently�living�abroad.�More�broadly�defined�concepts�of�a�Diaspora�typically�depict�far�larger�numbers.�For�instance,�the�national�statistics�for�Croatia�indicate�that�there�are�at�least� 3.5� million� Croats� living� outside� of� Croatia,� which� is� around� 80� percent� of� the� home�population.�13�Centre�for�Economic�and�Social�Studies�(2006).�14�http://www.braingain.gov.al.�15�Government�of�Macedonia�(2009),�p.22.�16�IOM�(2008a),�p.20.��17�Remittances�include�workers’�remittances,�compensation�of�employees�and�migrant�transfers.�18�The�Macedonian�national�statistics�indicate�a�much�larger�role�for�remittances�at�more�than�ten�percent�of�GDP.��
WP_185_web_1-11-10.pdf 86WP_185_web_1-11-10.pdf 86 1/11/2010 1:39:37 PM1/11/2010 1:39:37 PM

71
CHAPTER �8 � �
Labor�Mobility�Provisions��in�Free�Trade�Agreements�
his� section� summarizes� the� labor� mobility� provisions� of� major� Free� Trade�Agreements� (FTAs).� The� purpose� of� FTAs� is� to� allow� the� free� flow� of� goods�
between�member�nations�by�reducing�tariff�and�nontariff�barriers�to�trade.�Many�FTAs�also�include�provisions�to�foster�cross�border�investment,�and�some�include�provisions�that�facilitate�the�cross�border�movement�of�at�least�some�types�of�workers,�including�investors,�business�visitors,�and�workers.�
The�EU,�which�CEFTA�members�want�to�join,�has�some�of�the�most�comprehensive�freedom�of�movement�provisions,�allowing�and�sometimes�encouraging�EU�nationals�to� move� from� one� EU� member� state� to� another.� Individuals� who� believe� that� their�freedom� of�movement� rights�were� abridged� can� appeal� to� institutions� for� remedies,�including�the�European�Court�of� Justice� (ECJ),�whose�decisions�have�generally�struck�down� national� attempts� to� limit� the� right� of� workers� to� move� freely� from� one� EU�member�state�to�another.1��
Mobility� provisions� in� the� other� FTAs� reviewed� below� provide� more� limited�freedom�of�movement�rights�and�often�lack�institutions�to�which�aggrieved�individuals�can� appeal.� In� some� cases� there� appears� to� be� a� trade�off� between�migrant� numbers�and� migrant� rights,� meaning� that� states� accepting� more� (especially� low�skilled)�migrants� tend� to� accord� them� fewer� rights� to� social� services� and� settlement� (Martin,�2008;�Ruhs�and�Martin,�2008).�
Asia-Pacific Economic Cooperation (APEC)
The� Asia�Pacific� Economic� Cooperation� (www.apec.org)� is� a� 21�member� forum�established�in�1989�to�promote�economic�growth�among�member�nations.2�APEC�bills�itself�as�the�only�international�intergovernmental�forum�that�aims�to�reduce�barriers�to�trade�and�investment�by�consensus,�that�is,�without�requiring�its�members�to�enter�into�legally� binding� obligations.� APEC’s� three� pillars� are� trade� and� investment�liberalization,�business�facilitation,�and�economic�and�technical�cooperation.�
A�major� accomplishment� of� the� business� facilitation� pillar� is� the�APEC�Business�Travel� Card� (ABTC)� program,� which� has� facilitated� the� cross�border� movement� of�business� visitors� since� 1997� and� included� 17� participating� countries� in� 2009�(www.businessmobility.org).�Nationals�of�participating�APEC�member�states�apply�to�their� home� governments� for� ABTC� cards,� which� transmit� information� on� approved�business�visitors�to�other�APEC�member�countries�to�obtain�their�approval�before�the�
T
WP_185_web_1-11-10.pdf 87WP_185_web_1-11-10.pdf 87 1/11/2010 1:39:38 PM1/11/2010 1:39:38 PM

72 World Bank Working Paper
�
ABTC� is� issued.3� ABTC�holders� receive� expedited� admission� via� special� lanes� at�participating�country�airports,�and�can�generally�stay� in�another�member�country� for�60�to�90�days.�ABTC�cards�do�not�allow�employment�for�wages�abroad.�
The�APEC�members�participating�in�the�ABTC�have�varying�visa�and�immigration�requirements.�Having�an�ABTC,�for�example,�does�not�exempt�an�Indonesian�from�the�need� to�obtain�a�visa� to�enter�Canada�or� the�United�States,�but�ABTC�holders�do�get�expedited�visa�application�interviews.4�
ASEAN Free Trade Area (AFTA)
The�ASEAN�FTA,� established� in� 1992,� aims� to� create� a� free�trade�area� encompassing�over�550�million�people�in�10�Southeast�Asian�nations.�Almost�half�of�these�people�are�in� Indonesia� (www.aseansec.org).5� The� goal� is� to� eliminate� all� tariffs� between� the�original�six�member�states�by�2010,�and�tariff�barriers�for�states�joining�later�by�2015.6�ASEAN� has� signed� free�trade� agreements� with� Australia� and� New� Zealand,� China,�Japan,�the�Republic�of�Korea,�and�India.�
The�original�ASEAN�Vision�2020,�endorsed�by�heads�of�government� in�1997,�did�not�mention�migration,�although�it�did�emphasize�a�“free�flow�of�goods,�services�and�investment�and�capital.”7�However,�in�1998,�the�Ha�Noi�Plan�of�Action�revised�Vision�2020� to� call� for� a� “freer� flow� of� skilled� labor� and� professionals� in� the� region”� and�ASEAN� Lanes� at� ports� of� entry� to� facilitate� the� intra�regional� travel� of� ASEAN�nationals.� In� 2006,� ASEAN� leaders� agreed� to� allow� nationals� of� ASEAN� member�nations�to�enter�other�ASEAN�states�without�visas�for�up�to�14�days.8�
There� is� significant� intra�ASEAN�migration,� including� from�Myanmar,� Lao� PDR�and�Cambodia� into� Thailand,� from� Indonesia� and�Vietnam� into�Malaysia,� and� from�Malaysia,� the� Philippines� and� other� ASEAN� nations� into� Singapore;� Brunei�Darussalam� also� attracts�migrant�workers.�Manning� and� Bhatnagar� (2004)� examined�patterns� of� labor� migration� within� ASEAN� and� recommended� that� liberalizing�freedom�of�movement�begin�with�the�occupations�that�already�have�the�highest�share�of�most�migrants,� including� seafarers,� business� executives,� construction�workers� and�domestic� helpers.� They� argued� that� ASEAN� could� aim� to� achieve� freedom� of�movement�for�professional,�business�and�skilled�workers�by�2020�(2004,�p.�v).�
ASEAN�leaders�signed� the�ASEAN�Declaration�on� the�Protection�and�Promotion�of� the�Rights�of�Migrant�Workers�on� January�13,� 2007.� It� commits� receiving� states� to�draw�up�charters�that�ensure�decent�working�conditions,�protection�from�all�forms�of�abuse,�and�a�minimum�wage�to�protect�ASEAN�nationals�employed�in�other�ASEAN�countries.�The�Declaration�calls�for�tougher�penalties�on�smugglers�and�traffickers,�but�is� not� legally� binding� and�does� not� require� governments� to� change� their� labor� laws;�advocates�hope�that�it�will�be�followed�by�a�legally�binding�convention.9�
Caribbean Community (CARICOM)
The� Caribbean� Community� (www.caricom.org)� is� an� organization� of� 15� Caribbean�nations� and� dependencies� created� by� the� 1973� Treaty� of� Chaguaramas� that� aims� to�promote� economic� integration,� including� freedom� of� movement,� between� member�states.10�The�population�of�CARICOM�was�about�6.5�million� in�2000.�Three� countries�
WP_185_web_1-11-10.pdf 88WP_185_web_1-11-10.pdf 88 1/11/2010 1:39:38 PM1/11/2010 1:39:38 PM

Enhancing Regional Trade Integration in Southeast Europe 73
�
included�almost� three�fourths�of�CARICOM’s� residents,�with�40�percent� in� Jamaica,11�20�percent�in�Trinidad�&�Tobago�and�12�percent�in�Guyana.��
There�are�two�components�to�freedom�of�movement:�(1)�facilitation�of�travel�with�common� travel�documents�and�national� treatment�at�ports�of�entry� (Article�46�of� the�CSME)�and�(2)�the�free�movement�of�skills�(Articles�32,�34d,�36,�and�37�of�the�CSME).�CARICOM�members�began�issuing�a�common�passport�in�2005.�
The� free� movement� of� skills� initiative� originated� in� the� 1989� Grand� Anse�Declaration.� Article� 45� of� the� revised� Treaty� of� Chaguaramas� says:� “Member� States�commit� themselves� to� the� goal� of� the� free� movement� of� their� nationals� within� the�Community.”�CARICOM�began� the� freedom�of�movement�process�with� five� types�of�workers:�graduates�of�approved�universities,12�media�workers,�musicians,�artists,�and�sports�persons�certified�by�national�professional�bodies.��
Freedom�of�movement� rights� for� these� occupations�within�CARICOM�went� into�effect� in� January� 1996;� extending� free� mobility� to� three� more� occupations��teachers,�nurses,�domestic�helpers—has�been�discussed�since�2007�(Girvan,�2007,�39).�During�the�30th�meeting�of�CARICOM�leaders�in�July�2009,�domestic�helpers�were�added�to�the�list�of� occupations� that� enjoy� freedom� of� movement� rights,� effective� January� 1,� 2010.�However,� Antigua,� Barbuda,� and� Belize� were� allowed� to� study� the� socio�economic�impacts�of�free�mobility�for�domestic�helpers�for�up�to�five�years�before�adding�them�to�the�freedom�of�movement�list.�
Those�wishing�to�move�between�CARICOM�member�states�first�obtain�a�Certificate�of� Recognition� of� CARICOM� Skills� Qualification,� usually� from� their� home� country�Ministry�of�Labor,�and�present�it�to�immigration�authorities�upon�arrival�to�receive�six�month� work�and�residence� permits� while� the� certificate� is� reviewed.� After� the�credentials� are�verified,� the�CARICOM�national� is� to� receive�an� indefinite�work�and�residence� permit.� CARICOM� recognized� the� importance� of� skills� certification� and�social� security� transferability� for� wage� earners,� and� created� a� register� of� the� self�employed,� although� progress� in� achieving� full� transferability� has� been� slower� than�expected.� CARICOM� governments� made� commitments� to� establish� mechanisms� for�certifying� and� establishing� the� equivalency� of� degrees� and� credentials� earned� in�member� states� and� to� harmonize� and� make� transferable� the� social� security� benefits�earned�in�various�CARICOM�members.�
The� CARICOM� Single� Market� and� Economy� (CSME)� treaty� went� into� effect�January�1,�2006,�with�Barbados,�Belize,� Jamaica,�Guyana,�Suriname�and�Trinidad�and�Tobago�as�the�first�full�members;�they�were�joined�by�Antigua�and�Barbuda,�Dominica,�Grenada,�St.�Kitts�and�Nevis,�St.�Lucia,�and�St.�Vincent�and�the�Grenadines�July�3,�2006.�The� Single� Market� component� includes� freedom� of� movement� of� goods,� services,�capital,�business�enterprise,13�and�skilled�labor�within�a�customs�union.��
Barbados,� with� about� 300,000� residents� and� a� per� capita� gross� national� income�(GNI)� of� US$16,000� (at� PPP),� is�much� richer� than� Guyana,� which� has� about� 750,000�residents� and� a� per� capita� GNI� of� US$2,900.� About� 120,000� Guyanese� arrived� in�Barbados� in� 2008,� and� some�overstayed� and�worked� illegally.�Barbados� in� June� 2009�began�a� six�month� legalization�program� for�CARICOM�nationals�who�arrived�before�December� 31,� 2005,� have� been� in� Barbados� at� least� eight� years,� and�who� undergo� a�criminal�background�check.14��
WP_185_web_1-11-10.pdf 89WP_185_web_1-11-10.pdf 89 1/11/2010 1:39:38 PM1/11/2010 1:39:38 PM

74 World Bank Working Paper
�
East Africa Community (EAC)
The�East�Africa�Community�(www.eac.int)�is�a�Customs�Union�that�includes�Burundi,�Kenya,�Rwanda,�Tanzania,�and�Uganda.�The�implementation�of�this�Union�in�Burundi�and� Rwanda� was� officially� launched� July� 6,� 2009,� though� the� initial� Treaty� for� its�establishment� was� signed� by� Kenya,� Tanzania,� and� Uganda� a� decade� earlier.�Negotiations� are� continuing� for� a� protocol� on� establishing� a�Common�Market.15� This�protocol� includes� annexes� “to� remove� restrictions� on� the� free� movement� of�workers�...�(and)�...�on� harmonization� and� mutual� recognition� of� academic� and�professional�qualifications.…”��
Assurances� have� been� issued� that� this� freedom�of�movement� protocol�will� be� in�place�by�2010,�but�the�EAC�has�missed�other�deadlines.�Fallon�(2008)�distinguishes�five�major�barriers�to�labor�mobility,�including�restrictions�among�the�original�three�Treaty�signatories�of�Kenya,�Tanzania�and�Uganda.��
1.� Distinct�systems�of�work�permits�are�maintained�in�each�country,�restricting�the�access�of�workers�from�other�member�countries�and�their�ability�to�change�jobs�after�entry.�Specifically,�to�obtain�a�permit,�migrant�workers�must�first�obtain�a�job�offer,�prove�their�qualifications,�and�show�that�their�presence�will�contribute�to� economic� growth.� The� wording� of� these� requirements� is� sufficiently� vague�that� it� is�relatively�simple�to� justify�rejection�of�a�permit�and�rejection�rates�are�high.�Delays� in�processing�the�permits�are�reported�to�be� long�and�the�costs�of�preparing�the�paper�work�are�quite�substantial.�Moreover�some�of�the�member�countries�require�that�a�national�understudy�be�employed�alongside�the�migrant�to�learn�and�eventually�take�over�the�job.�
2.� The� portability� of� social� security� entitlements,� pensions,� and� health� benefits� is�very� limited.� However,� Fallon� does� point� out� that� this� is� less� of� an� issue� for�workers�posted�by�home�state�employers�to�work�elsewhere�within�the�EAC.�
3.� Although�significant�progress�has�been�made�toward�harmonizing�standards�for�university�degrees�and�honoring�mutual�recognition�of�university�qualifications,�there� is� less�harmonization�and�mutual� recognition�of�vocational�and� technical�training.�
4.� Not� surprisingly,� obtaining� information� about� job� opportunities� in� the� other�member� states� limits� mobility,� though� a� few� multinational� firms� do� transfer�employees�between�branches�in�the�various�member�countries.�
5.� The� cost� of� remitting� funds� is� also� cited� as� a� barrier� to� mobility,� though�comparatively�little�is�known�about�intra�African�international�remittances.��
�Four�of� the� five�EAC�countries� (not�Tanzania)�are�also�members�of� the�Common�
Market� for� Eastern� and� Southern�Africa� (COMESA),� comprising� 19� countries�with� a�combined� population� of� over� 400� million� stretching� from� Libya� to� Swaziland� and�Mauritius.�COMESA�has�a�separate�protocol�with�respect�to�labor�mobility,�though�it�remains�un�ratified.�
The� 50+� African� states� have� thus� negotiated� several� agreements� aimed� at�facilitating� freedom� of� movement,� including� the� EAC� and� COMESA� as� well� as� the�Economic�Community�of�Western�African�States�(ECOWAS)�and�the�Southern�African�
WP_185_web_1-11-10.pdf 90WP_185_web_1-11-10.pdf 90 1/11/2010 1:39:38 PM1/11/2010 1:39:38 PM

Enhancing Regional Trade Integration in Southeast Europe 75
�
Development� Community� (SADC).� However,� the� migration� experience� under� these�agreements� reinforces� the� conclusion� that� “regional� agreements� among� developing�countries�have�made�little�progress�in�easing�constraints�on�migration,�compared�with�the�major�agreements�among�industrial�countries�(notably�the�European�Union�and�the�treaty�between�Australia�and�New�Zealand)”�(Ratha�and�Shaw,�2007,�p.�16).��
It�is�not�clear�how�important�formal�freedom�of�movement�agreements�are�in�the�African�context.�Given�the�arbitrary�drawing�of�borders�by�the�former�colonial�powers�in�Africa,�migration�patterns� transcending� those�borders�have� been� long� established.�Moreover,�most�African�states�do�not�have�the�resources�or�capacity�to�monitor�border�crossings� except� at�major�points� such�as� international� airports.� Irregular�migration� is�widespread� and� the� norm� within� the� region� (Lucas,� 2006),� so� that� implementing�freedom� of� movement� may� serve� largely� to� formalize� the� migration� that� is� already�occurring.�
Mercado Comun del Sur (Mercosur)
The�Treaty� of�Asuncin,� signed�March� 26,� 1991,� created� the�Mercado�Comun�del� Sur�between� Argentina,� Brazil,� Paraguay� and� Uruguay� (www.mercosur.int).� The� key� to�Mercosur’s� success� is� cooperation� between� traditional� competitors� Argentina� and�Brazil,�much�as�the�EU’s�success�hinges�on�cooperation�between�historic�rivals�France�and�Germany.�República�Bolivariana�de�Venezuela�applied�in�2006,�and�is�on�the�verge�of�full�membership�in�2009�after�national�parliaments�in�the�four�member�states�ratify�its�full�membership�status.�Bolivia,�Chile,�Colombia,�Ecuador,�and�Peru�have�associate�member�status�in�Mercosur.�
The�major� goal� of�Mercosur� is� economic� integration� between�member� countries,�including� freedom� of� movement.� The� Andean� Community� of� Nations� (Comunidad�Andina�or�CAN)�is�a�smaller�trade�bloc�that�includes�Bolivia,�Colombia,�Ecuador,�and�Peru;�República�Bolivariana�de�Venezuela�resigned�from�CAN�to�join�Mercosur.�While�a� member� of� CAN,� the� Andean� Instrument� on� Labor� Migration,� signed� in� October�1973,� is� credited� with� encouraging� República� Bolivariana� de� Venezuela� to� legalize�250,000�unauthorized�foreigners,�mostly�from�Colombia,�in�1981�(IOM,�2003,�p.�180).�
Mercosur�aims�for�eventual�freedom�of�movement.�In�theory,�Mercosur�nationals�may�currently�move�among�member�states,�although�the�right�to�work�is�regulated�by�host�governments.�Progress� in� liberalizing� labor�mobility�has�been�slow.�A�Mercosur�social� security� agreement� was� signed� in� 1997,� but� many� of� the� steps� aimed� at�facilitating�migration�within�Mercosur�take�far�longer�to�be�implemented�than�planned.��
Much� of� the� migration� that� occurs� in� the� Mercosur� region� is� outside� formal�channels.� In� the� 1990s,� IOM�estimated� there�were� 1.3�million�migrants� in� the� region,�including� 62� percent� who� moved� from� Bolivia,� Chile,� Paraguay,� and� Uruguay� to�Argentina� and� another� 16� percent� in� Brazil� (IOM,� 2003,� p188).� Some� migrants� left�Argentina�during�the�economic�crisis�of�2001.�
In� December� 2002,� Mercosur� leaders� signed� an� Agreement� on� Residency� for�Mercosur� Nationals� aimed� at� providing� them� “equal� civil,� social,� cultural� and�economic�rights�and�freedoms”�to�citizens�of�the�Mercosur�country�in�which�they�are�living,�“particularly�the�right�to�work�and�to�carry�out�any�legal�activity.”�The�related�Agreement� on� Regulating� the�Migration� of�Mercosur� Citizens� encouraged�Mercosur�
WP_185_web_1-11-10.pdf 91WP_185_web_1-11-10.pdf 91 1/11/2010 1:39:39 PM1/11/2010 1:39:39 PM

76 World Bank Working Paper
�
governments� to� legalize� unauthorized� nationals� of� Argentina,� Brazil,� Paraguay,� and�Uruguay�as�well�as�nationals�of�associate�Mercosur�members�(Cerruti,�17–20).��
North American Free Trade Agreement (NAFTA)
The�North�American�Free�Trade�Agreement�(NAFTA),�which�went�into�effect�January�1,�1994,�aims�to�free�up�trade�and�investment�between�Canada,�Mexico,�and�the�United�States.� A� Canada�U.S.� FTA�went� into� effect� January� 1,� 1989,� and�Mexican� President�Salinas� requested� an� FTA� with� the� United� States� in� 1990,� which� eventually� led� to�NAFTA�(Villarreal�and�Cid,�2008).�
NAFTA�has�22�chapters,�and�Chapter�16,�Temporary�Entry�for�Business�Purposes,�covers� four� types�of�business� travelers:�business�visitors,� traders�and� investors,� intra�company�transferees,�and�specified�professionals.16��
The�United� States� is� the�major� destination� for�NAFTA�related�migrants� (Martin,�2005).�Under�U.S.�immigration�law,�the�first�three�groups�of�NAFTA�migrants,�business�visitors,�traders�and�investors,�intra�company�transferees,�enter�with�visas�that�existed�before�NAFTA�went�into�effect,�for�example,�business�visitors�use�B�1�visas�to�enter�the�United�States,� treaty� traders� and� investors�use�E�1� and�E�2�visas,� and� intra�company�transferees�use�L�1�visas.�NAFTA�created�a�new�TN�visa�for�the�fourth�group�(TD�visas�for�their�dependents),�allowing�U.S.�employers�to�offer�jobs�that�require�college�degrees�to�Canadians�and�Mexicans�who�have�college�degrees.��
These�written� job�offers,�plus�proof�of�the�requisite�education�and�$50,�suffice�for�Canadians� and�Mexicans� to� have� indefinitely� renewable� employment� and� residence�visas�issued�at�U.S.�ports�of�entry.17�There�are�no�limits�on�the�number�of�TN�visas�that�can�be�issued,�U.S.�employers�do�not�have�to�try�to�recruit�U.S.�workers�before�hiring�Canadians� or� Mexicans,� and� there� is� no� requirement� that� TN�visa� holders� receive�prevailing�wages�while�working�in�the�United�States.�
The�number�of�Canadian�professionals�entering�the�United�States�with�NAFTA�TN�visas�almost�quadrupled�between�1995�and�2000,�but� fell�after� the� IT�bubble�burst� in�2000� to� less� than� 60,000� in� 2003� and� 2005.� Canadian� admissions� have� since� risen� to�almost�70,000�a�year,�but�are�still�well�below�the�almost�90,000�of�2000.�The�number�of�Mexican�entries�rose�even�faster,�but�from�a�very�low�base,�doubling�between�2006�and�2008�to�almost�20,000.�
The� NAFTA� experience� shows� that� a� liberal� free�mobility� provision� can� be�included�in�an�FTA�with�safeguards,�viz,�limiting�entries�to�those�with�at�least�college�degrees�in�specified�fields�and�for�10�years,�requiring�US�employers�to�show�that�U.S.�workers�were�not�available�before�extending�job�offers�to�Mexicans,�where�wages�were�significantly� lower.�Mexican� admissions,� and� the�Mexican� share� of� total� admissions,�have�risen�significantly�in�recent�years.�
European Union (EU)
Two�main�bodies�of� legislation�affect�migration�among�the�members�of�the�European�Union:� the� provisions� for� the� free� movement� of� workers� within� the� EU� and� the�Schengen� Agreement� on� borderless� travel� within� Schengen� member� countries.�Freedom�of�movement�is�included�in�Article�39�of�the�EU�treaty�and�implemented�via�
WP_185_web_1-11-10.pdf 92WP_185_web_1-11-10.pdf 92 1/11/2010 1:39:39 PM1/11/2010 1:39:39 PM

Enhancing Regional Trade Integration in Southeast Europe 77
�
Regulation�1612/68�on�freedom�of�movement�for�workers�and�Directive�2004/38/EC�on�the�right�to�reside.��
Freedom�of�movement�was�one�of� the� founding�principles�of� the� then�European�Communities� in� 1957:� freedom� to� move� goods,� capital,� and� services� were� the� other�three� fundamental� freedoms.�“Free�movement�of�workers�entitles�EU�citizens� to� look�for�a�job�in�another�country,�to�work�there�without�needing�a�work�permit,�to�live�there�for� that� purpose,� to� stay� there� even� after� the� employment� has� finished� and� to� enjoy�equal� treatment�with� nationals� in� access� to� employment,�working� conditions� and� all�other�social�and�tax�advantages�that�may�help�integrate�in�the�host�country….�Certain�rights� are� extended� to� family�members� of� the� worker.� They� have,� in� particular,� the�right�to�live�with�the�worker�in�the�host�Member�State�and�the�right�to�equal�treatment�as�regards�for�example�education�and�social�advantages.�Some�members�of�the�family�have� also� the� right� to� work� there.”18� EU� nationals� employed� at� least� five� years�continuously�in�another�state�automatically�acquire�the�right�to�permanent�residence�in�the�host�state.��
There�are�several�important�limitations�on�freedom�of�movement�in�the�EU.�First,�EU�member�states�may�restrict,� to�their�own�nationals,� those� jobs� in�the�public�sector�that� involve� the� exercise� of� national� sovereignty,� though� privatization� and� court�decisions�have�whittled�away�the�share�of�jobs�not�open�to�foreigners.�Second,�existing�EU�member� states�may� choose� to� restrict� freedom� of�movement� for� the� nationals� of�new� entrants.� For� example,� Italians� had� to�wait� 10� years� before� they� got� freedom�of�movement�rights�(until�1967),�and�Greeks,�Portuguese�and�Spaniards�had�to�wait�seven�years,�but� there�were�no� restrictions�on� freedom�of�movement� for�Britons,�Austrians,�Swedes�and�other�late�EU�entrants.��
For� the� ten�Eastern�European� countries� that� joined� in� 2004� and� 2007,� there�were�special� transition� rules� to� freedom� of�movement.� The� original� EU�15�member� states�were�allowed�to�restrict�the�freedom�of�movement�rights�of�Eastern�European�nationals�for�up�to�seven�years,�although�they�had�to�justify�to�the�European�Commission�their�reasons� for� restricting�mobility,� initially,� after� two�years,� and� after� three� years.�Only�Britain,� Ireland,� and� Sweden� allowed� immediate� freedom� of� movement� of� so�called�EU�8� nationals� in� 2004,� and� far� more� Poles� and� other� Eastern� Europeans� moved� to�Britain� and� Ireland� than� projected.� One� result� was� that� none� of� the� EU�15� member�states�allowed�Bulgarians�and�Romanians�freedom�of�movement�when�these�countries�joined� the� EU� in� 2007.� Yet� several� observers� in� the� UK� have� indicated� that� the� UK�gained�economically�from�this�influx,�that�it�had�relatively�little�impact�on�employment�or�wages�of�prior�UK�residents�while�contributing�positively�to�both�output�and�to�the�UK’s�fiscal�balance.19�
Under�the�EU’s�freedom�to�provide�services,�employers�based�in�one�EU�state�may�win�a�contract� in�another�and�send�employees�over�borders�to�“service�the�contract,”�which�often�means�constructing�or�refurbishing�a�building�or�working�in�a�factory�or�service�business.�The�European�Commission�in�2008�estimated�a�million�workers�were�“posted”� from� one� EU� member� state� to� another.20� To� avoid� “social� dumping,”� EU�governments�can�require�that�these�posted�workers�are�paid�at�least�the�local�minimum�wage,�if�there�is�one.�Since�Austria�enacted�a�national�minimum�wage�effective�January�2009,� 21�of� the�EU’s�27�members�have�national�minimum�wages.�Most�of� the�others,�including�Germany,�extend�negotiated�minimum�wages�to�an�entire�sector.�
WP_185_web_1-11-10.pdf 93WP_185_web_1-11-10.pdf 93 1/11/2010 1:39:39 PM1/11/2010 1:39:39 PM

78 World Bank Working Paper
�
In�several�cases,�the�European�Court�of�Justice�has�interpreted�freedom�to�provide�services�in�ways�that�encourage�more�migration�within�the�EU,�which�is�the�aim�of�the�European�Commission.�Wages�vary�within�the�EU,�and�especially�in�construction�there�is� widespread� use� of� subcontractors� from� lower�wage� countries� in� higher�wage�countries.��
Germany�has�no�national�minimum�wage,�but�the�1949�Collective�Bargaining�Act�allows�the�federal�government�to�“extend”�the�wages�negotiated�between�unions�and�employers� that� cover� at� least� 50�percent� of�workers� in� a� sector� to� all� employers� and�workers� in� a� sector.�After�workers� from� Ireland,� Portugal� and� other� lower�wage� EU�member�states�flooded�into�Germany�during�the�reunification�boom�of�the�mid�1990s,�the�1996�Employee�Posting�Act� (Arbeitnehmer�Entsendegesetz)�was�enacted� to�allow�the�German�government�to�require�employers�of�EU�nationals�“posted”�to�Germany�to�pay�at�least�the�minimum�wage�that�was�negotiated�in�the�German�construction�sector.�Germany’s� state� of� Lower� Saxony,� and� most� other� German� government� entities,�required� employers� bidding� on� public� projects� to� pay� all� workers� employed� on� the�project� at� least� this� negotiated� wage.� However,� a� contractor� building� a� prison� in�Goettingen�used�a�Polish�subcontractor�and�53�“posted”�Polish�workers�who�were�paid�less� than�half� of� the� local�union�wage.� In�April� 2008,� the�ECJ� ruled� that�EU�member�state�governments�could�require�posted�workers�to�receive�minimum�wages,�but�only�if�they�were�universal,�not�just�for�public�projects.21�
There�is�perception�within�the�European�Commission�that�there�is�too�little�intra�EU�labor�migration.�The�Commission�made�25�recommendations� in�February�2002�to�increase� intra�EU� labor� migration,� and� Social� Affairs� Commissioner� Anna�Diamantopoulou� highlighted� four� priorities� to� increase� labor� market� flexibility� and�mobility:� find� the� correct� link� between� the� education� system� and� labor� markets;�overcome� the� problem� of�mutual� recognition� of� qualifications� and�work� experience;�transfer�pension�rights�and�health�rights�more�easily;�and�speed�up�the�implementation�of� the� common� policy� on� immigration.� The� European� Commission� (2007,� 2)� cites� a�number�of�reasons�for�the�lack�of�greater�realized�mobility:�
Aside� from� an� uncertainty� over� the� advantages� of� being� mobile,�individuals� face� a� number� of� hurdles� to� their�movement.� These� can�range� from� legal� and� administrative� obstacles,� housing� costs� and�availability,� employment� of� spouses� and� partners,� portability� of�pensions,� linguistic� barriers,� and� issues� on� the� acceptance� of�qualifications�in�other�Member�States.�
In� 2000,� about� 225,000� EU� residents,� less� than� 0.1� percent� of� the� total� EU�population,�changed�their�official�residence�by�moving�between�two�EU�countries.�By�contrast,�about�2.5�percent�of�U.S.�residents�move�between�states�each�year.22�
The� second� major� agreement� affecting� mobility� within� the� EU� is� the� Schengen�Agreement,� originally� signed� by� five� members� of� the� then� 10�member� European�Community� in�Luxembourg� in� 1985.�Under� this� agreement,� border� controls� between�Schengen�member�states�were�eliminated�as�each�Schengen�state�maintains�and�agrees�to�strengthen�border�controls�with�non�member�states.��
The�scope�of� the� initial�Schengen�Agreement�was�considerably�widened�with�the�signing�of� the�Amsterdam�Treaty,�which�came�into�force� in�1999,�and�subsequent�EU�
WP_185_web_1-11-10.pdf 94WP_185_web_1-11-10.pdf 94 1/11/2010 1:39:40 PM1/11/2010 1:39:40 PM

Enhancing Regional Trade Integration in Southeast Europe 79
�
enlargement;� new� EU�member� states� are� required� to� join� Schengen,� which� involves�agreeing�to�common�visa�issuance�rules� for�Schengen�visas�and� joining�the�Schengen�Information�System�that�provides�a�common�lookout�database�and�EURODAC,�which,�inter� alia,� fingerprints� asylum� applicants� so� they� can� apply� in� only� one� EU�member�state.��
In�2009,�the�Schengen�Area�encompassed�25�European�countries,�including�all�EU�members� except� Ireland� and� the� UK,� which� opted� out,� and� Romania,� Cyprus,� and�Bulgaria,�which�hope�to� join.� Iceland,�Norway,�and�Switzerland�are�not�EU�members�but�part�of�the�Schengen�Area.�Thus,�the�Schengen�Area�is�not�conterminous�with�the�EU,� though� there� is� considerable� overlap� between� Schengen� and� EU� countries.�Moreover,�while�the�EU�is�effectively�a�Customs�Union�(maintaining�common�external�trade� policies),� the�member� states� of� the� Schengen�Area� retain� separate� control� over�entry�from�non�member�states.��
Lessons from Labor Mobility Provisions of FTAs
There�are�at�least�20�major�multilateral�FTAs,�and�an�even�longer�list�of�bilateral�FTAs.23�The�major�purpose�of�FTAs�is� to�free�up�trade�in�goods�and�flows�of� investment,�but�many�also�include�provisions�aimed�at�expediting�the�movement�of�business�investors,�service� providers,� and� sometimes� workers� employed� for� wages� in� an� FTA� partner�country.�Most�FTAs�include�contiguous�or�neighboring�countries,�and�some�aim�to�be�more�than�simply�free�trade�areas,�as�with�the�EU.�FTAs�are�normally�signed�between�neighboring� countries� because� of� political� opportunity� and� because� of� geography—distance�matters,�and�most�trade�and�migration�is�between�countries�that�are�close�to�each�other,�in�part�because�of�improved�information�flows�(Rauch,�1999).�
If�trade�and�migration�are�substitutes,�FTAs�may�reduce�labor�mobility�over�time�by�narrowing�wage�and�income�gaps�between�member�countries.�However,�it�should�be�emphasized�that�most�FTAs�are�between�countries�at�a�similar�level�of�development,�reducing� incentives� for� migration.� Trade� agreements� are� almost� always� struck� first,�with� the� implementation� of� clauses� promising� to� liberalize� or� coordinate� labor�movement�often�delayed�so�that�there�will�be�less�migration�(Martin,�1993).��
Trade� agreements� are� complex� and� difficult� to� negotiate,� particularly� if� they�involve�common�external�trade�barriers,�and�free�labor�movement�agreements�are�even�more�difficult� to�achieve.�Reasons� for� lack�of�progress� toward� freedom�of�movement�under�FTAs�include:��
1.� Immigration,� whether� within� a� free� trade� area� or� otherwise,� can� have� major�distributional� consequences,� as� some� parties� in� the� host� country� gain� while�others� are� hurt� economically� by� new� arrivals.� Moving� forward� can� require�considerable�political�will�and�capacity.�
2.� Although� the�motives� of� individuals� are� diverse,� the� net� effect� of�migration� is�movement� from� low� to� higher� income� countries.� If� FTAs� encompass� countries�with� different� income� levels,� there� is� likely� to� be� net�migration� to� the� higher�income�member�states.�
3.� It� is�easier�to�negotiate�agreements�to�liberalize�skilled�labor�migration�because�the� numbers� are� relatively� small,� the� economic� and� public� finance� gains� to�
WP_185_web_1-11-10.pdf 95WP_185_web_1-11-10.pdf 95 1/11/2010 1:39:40 PM1/11/2010 1:39:40 PM

80 World Bank Working Paper
�
receiving�countries�may�be�greater,�and�they�may�generate�positive�externalities�where�they�live.��
4.� Countries�include�both�nationals�and�foreigners,�so�that�liberalizing�freedom�of�movement� between� two� countries� requires� consideration� of� so�called� “third�country�nationals.”�In�most�FTAs,�only�nationals�of�member�states�are�covered.��
5.� A� distinction� is� sometimes�made� between� temporary�workers� and� permanent�immigrants.� It� is� well� known� that� temporary� workers� may� settle� and� that�permanent�immigrants�can�and�do�return�to�their�countries�of�origin.�Most�FTAs,�as�well� as�GATS�Mode�4�negotiations,� emphasize� the�movement� of� temporary�workers� over� borders� rather� than� immigrant� settlers,� helping� them� to� avoid�often�controversial�issues�that�range�from�access�to�the�social�safety�net�to�voting�rights.��
�The� experiences� of� some� of� the� FTAs� reviewed� here�may� offer� particularly� relevant�insights�in�moving�forward�toward�enhanced�labor�mobility�in�the�case�of�CEFTA.�
CARICOM� offers� some� interesting� comparisons� with� CEFTA,� both� being�composed�of�states�with�very�small�populations.�The�15�English�speaking�CARICOM�member�states�have�an�advantage�in�being�united�by�a�common�language,�which�aided�the� establishment� of� pooled� university� facilities� and� enhanced� the� mobility� of�graduates.�The�benefits�of�a�shared�language�extend�to�only�some�portions�of�CEFTA,�though�there�is�a�substantial�history�of�student�training�and�mobility,�at�least�across�the�sates� of� former� Yugoslavia.� The� mobility� of� graduates� in� CARICOM� has� probably�accelerated� economic� integration,� though� some� tensions� remain� over� guest�worker�programs�for�less�skilled�workers.�
Both�NAFTA�and�CARICOM�encompass�states�at�very�different�income�levels.�As�a�result,�the�pressures�for�labor�mobility�tend�to�be�in�one�direction.�Here�CEFTA�has�an� advantage� in� that� income� disparities� are� not� so� large� (with� the� exceptions� of�Moldova�at�one�end�and�Croatia�at�the�other).�Nonetheless,�NAFTA�has�come�to�terms�with�this�by�restricting�freedom�of�movement�to�those�with�at�least�a�university�degree�in� specified� occupations�who�have� a� job� offer� from�an� employer� in� another�member�state.� Moreover,� NAFTA� initially� imposed� extra� restrictions� on� the� lowest� wage�member,�Mexico.�
The�APEC�business�card�shows�that�having�the�home�country�government�issue�a�freedom�of�movement�document�with�the�approval�of�other�member�governments�can�ensure� that� there� are� fewer� difficulties� at� fast�track� entry� points.� This� may� be�particularly� important� for� companies�doing� business� in�more� than� one�CEFTA� state.�However,� it� should�be�noted� that� the�APEC�business� card�does�not� allow�holders� to�earn�wages�abroad.�
Perhaps� the�most� important� lesson�that�emerges,� though,� is� the�contrast�between�the�case�of�the�EU,�which�has�made�the�most�progress�toward�labor�market�integration,�in� contrast� with� some� of� the� developing� country� FTAs� that� have� made� little� real�progress� in� this� direction� despite� their� rhetoric.� A� weak� institutional� framework�underlying� some� of� the� latter� regional� agreements� serves� to� restrict� progress.� In�contrast,� the�experience�of� the�supranational� institutions� in� the�EU�context�played�an�important� role� in� general,� and� regarding� labor� freedom� in� particular.� The� CEFTA�
WP_185_web_1-11-10.pdf 96WP_185_web_1-11-10.pdf 96 1/11/2010 1:39:40 PM1/11/2010 1:39:40 PM

Enhancing Regional Trade Integration in Southeast Europe 81
�
member� states� may� be� able� to� take� advantage� of� the� EU� case� by� emulating� this�experience�and�specifically�by�aligning�their�migration�systems�with�those�of�the�EU.�
Notes�1�http://curia.europa.eu/jcms/jcms/Jo1_6308/.��2�The�21�member�nations�are:�Australia;�Brunei�Darussalam;�Canada;�Chile;�China;�Hong�Kong,�China;�Indonesia;�Japan;�Republic�of�Korea;�Malaysia;�Mexico;�New�Zealand;�Papua�New�Guinea;�Peru;�the�Philippines;�The�Russian�Federation;�Singapore;�Chinese�Taipei;�Thailand;�US;�and�Viet�Nam.��3�This�means�that�one�country’s�refusal�to�approve�an�individual�blocks�him�or�her�from�receiving�an�ABTC.�4� In� March� 2008,� there� were� 34,000� active� ABTC� cards;� 40� percent� were� held� by� Australians�(www.apec.org/apec/business_resources/apec_business_travel0.html,�accessed�6�2�09).��5�ASEAN�was�created�August�9,�1967,�and�the�ASEAN�Charter�of�December�15,�2008�calls�for�an�ASEAN�community�by�2015�(ISEASa,�2009).��6�Average�tariffs�were�reported�to�be�about�two�percent�in�2008,�down�from�4.4�percent�in�2000.�Surin� Pitsuwan,� Secretary�General� of�ASEAN,� Progress� in�ASEAN�Economic� Integration� since�the�Adoption�of�the�ASEAN�Charter,�June�29,�2009�(www.aseansec.org/93.htm).��7�www.aseansec.org/16572.htm.�8�www.aseansec.org/18570.htm.�9�The� Declaration� extends� protections� to� families� formed� by� migrants� after� legal� entry� and�employment.��10�The� treaty� establishing� the� Caribbean� Community� and� Common� Market� (signed� at�Chaguaramas,�Trinidad�and�Tobago,�July�4,�1973.�CARICOM�members�are�Antiuga�&�Barbuda,�Barbados,� Bermuda,� Bahamas,� Belize,� Dominica,� St.� Lucia,� St.� Vincent� &� the� Grenadines,�Grenada,�Trinidad�&�Tobago,�Jamaica,�and�Guyana.��11�Jamaica�has�a�very�high�emigration�rate—about�20,000�people�a�year,�almost�one�percent�of�the�2.6�million� residents,� are� accepted� as� immigrants� each� year;� 80� percent� by� the�US.� Short�term,�seasonal�movements�to�the�US�are�even�more�common�(Lucas�and�Chappell�2009).��12�The�University�of�West�Indies�began�as�an�external�college�of�the�University�of�London�in�1948,�and�became� fully� independent� in� 1962.�Today� it�has� about� 39,000� students�on� three� campuses:�Cave�Hill,�Barbados;�Mona,�Jamaica;�and�St.�Augustine,�Trinidad.�There�is�also�an�open�campus,�and�the�University�graduates�about�5,800�students�a�year.�13�CARICOM�nationals� have�had� since� January� 1,� 2006� the� right� to� establish� a� business� in� any�member�state�and�be�treated�as�a�national�of�that�state;�their�families�are�allowed�to�join�them.�14�Heppilena�Ferguson,�“Barbados�open�to�‘structured’�readmission�of�overstays,”�Stabroek�News,�July�2,�2009.�15�http://www.news.eac.int/index.php?option=com_content&view=article&id=85:progress�registered�in�negotiations�on�the�annexes�to�the�draft�eac�common�market�protocol�in�kigali&catid=48:eac�latest&Itemid=69.��16�www.worldtradelaw.net/nafta/index.htm.��17�http://travel.state.gov/visa/temp/types/types_1274.html.��18�European� Commission,� Employment,� Social� Affairs� and� Equal� Opportunities� at�http://ec.europa.eu/social/main.jsp?catId=458&langId=en.�19�See,�for�example,�Sriskandarajah�et�al.�(2005),�Coats�(2008),�Reed�and�Latorre�(2009).�20�EU:� Blue� Cards,� Minimum� Wages.� 2008.� Migration� News.� Volume� 14� Number� 2.� April.�http://migration.ucdavis.edu/mn/more.php?id=3347_0_4_0.��21�EU:� Blue� Cards,� Minimum� Wages.� 2008.� Migration� News.� Volume� 14� Number� 2.� April.�http://migration.ucdavis.edu/mn/more.php?id=3347_0_4_0.��
WP_185_web_1-11-10.pdf 97WP_185_web_1-11-10.pdf 97 1/11/2010 1:39:40 PM1/11/2010 1:39:40 PM

82 World Bank Working Paper
�
�22�EU:� Mobility,� Enlargement.� 2002.� Migration� News.� Volume� 8� Number� 4.� March.�http://migration.ucdavis.edu/mn/more.php?id=2578_0_4_0.��23�A� listing� of� operating� and� proposed� multilateral� FTAs� is� at:�http://en.wikipedia.org/wiki/List_of_free_trade_agreements.� A� listing� of� bilateral� FTAs� is� at:�http://en.wikipedia.org/wiki/List_of_bilateral_free_trade_agreements.��
WP_185_web_1-11-10.pdf 98WP_185_web_1-11-10.pdf 98 1/11/2010 1:39:41 PM1/11/2010 1:39:41 PM

83
CHAPTER �9 �
The�Benefits�(and�Costs)��of�Labor�Mobility�Provisions�
Overall Production and Productivity
There� is� considerable� potential� for� improving� overall� labor� productivity� within� the�region�by�relocating�workers� from�low�to�higher�productivity�settings.� In� the�CEFTA�context,� this� is� particularly� true� since� the� combined� population� of� the� eight� CEFTA�member� countries� is� less� than� 28� million.� To� exploit� the� advantages� of� any� scale�economies�in�production�will�require�access�to�more�labor�than�is�available�in�any�one�of�the�member�states.�
Since�1990,�production�in�each�of�the�CEFTA�states�has�come�to�be�dominated�by�service� activities.� Scale� economies� are� likely� to� be� more� important� in� the� industrial�sector� than� in�most�services.� Indeed,� the�decline�of� industry� in� the�region�may�partly�reflect� this� inability� to� exploit� scale� economies,� though� many� other� factors� have�contributed�also.�In�any�case,�if�manufacturing�is�to�be�revived�within�the�region,�then�access�to�sufficient�appropriate�labor�will�play�a�role.�
Competitiveness� in�professional�service�provision�does�not� typically�require�very�large�numbers�of�personnel�concentrated�in�any�one�location.�Nonetheless,�a�sufficient�pool� of� personnel� with� overlapping� professional� skills� is� normally� an� essential�ingredient.�Given�the�limited�number�of�highly�educated�adults�remaining�within�the�region,�achieving�such�pooling�again�raises�demands�for�the�mobility�of�workers.�
To� attract�more� direct� investment� into� the� region�will� probably� thus� require� the�ability�to�hire�workers�from�other�countries�within�the�region.�Moreover,�the�ability�to�transfer�workers�and�managerial�staff�among�branches�in�other�CEFTA�member�states�may�be�important�to�attract�some�forms�of�business.�
Enhancing� labor� mobility� within� the� region� can� thus� potentially� increase�productivity,�enable�exploitation�of�scale�economies,�and�attract�foreign�investment.�In�turn,� each� of� these�will� alter� the� region’s� competitiveness� in� international� trade.� But�what�ranges�of�skills�are�likely�to�prove�most�critical�to�these�possibilities?�
While� some� other� free� trade� agreements� have� been� extended� to� permit� freer�mobility� of� those� with� a� university� education� or� specific� profession� (such� as�CARICOM),�other�agreements�have�encompassed�a�much�wider�range�of�skills�(such�as�the�EU).�For�CEFTA,�much�will�depend�upon�the�proposed�development�strategy�and�the�kind�of�activities�that�will�become�the�focus�of�this.�
The�Serbian�National�Employment�Action�Plan�for�2006–2008�foresees�a� focus�on�new� technologies� in� agriculture� and� forestry,� tourism� and� services,� rather� than�
WP_185_web_1-11-10.pdf 99WP_185_web_1-11-10.pdf 99 1/11/2010 1:39:41 PM1/11/2010 1:39:41 PM

84 World Bank Working Paper
�
industry.� In� this� process� a� gap� persists� between� the� fields� of� emphasis� in� both�university� and� vocational� education� on� the� one� hand,� versus� perceived� labor� force�needs� on� the� other� hand.� The� Serbian� Plan� goes� on� to� mention� the� potential�contribution� of� migrant� workers� to� filling� some� of� these� gaps,� though� it� seems� the�intent� may� be� more� one� of� encouraging� the� return� of� Serbs� from� abroad.� Croatia’s�quota�scheme� is�designed� to�meet� their� labor�market�needs� in� the� face�of�a�declining�and�ageing�population.�This�scheme�provides�the�largest�numbers�of�work�permits�in�the� shipbuilding,� construction,� and� tourism� sectors;� the� construction� and� tourism�sectors�also�employ�significant�numbers�of�irregular,�seasonal�migrant�workers.�Of�the�documented� foreign� workers� in� Croatia� in� 2006� only� about� 15� percent� possessed� a�university�degree.�Together�these�indications�for�the�two�largest�countries�in�the�region�suggest�that�current�labor�market�demands�are�not�for�the�highly�educated�but�rather�for�skilled�workers�in�such�fields�as�construction�and�shipbuilding.�
There� is�always�a� temptation�for�states� to�consider� filling�perceived�skill�gaps�by�importing�migrant�workers.�This�can�indeed�be�a�productive�strategy�in�the�short�run.�However,� reliance� on�manpower� planning� techniques� to� forecast� future� shortages� is�generally� very� risky.� If� economies� prove� at� all� dynamic� then� the� patterns� of� future�demands�will�prove�volatile,�demanding�fluid�responses�on�behalf�of�skilled�workers.�Designing�current�migration�quotas�on�the�basis�of�immediate�needs,�and�then�proving�incapable� of� reallocating� these� workers� or� encouraging� their� onward� or� return�migration,�can�result�in�a�cumulative�problem.�
The Distribution of Benefits and Costs
Although�there�may�be�efficiency�gains�from�expanded�migration,�the�net�benefits�will�not�be�evenly�divided,�either�between�countries�or�across�households.�
Scale�economies�might�evoke�an� image�of�each�country�specializing� in�particular�activities,�with�migration�sorting�out�the�required�allocation�of�workers.�In�reality�the�higher� income� countries� within� the� free� labor� movement� agreement� will� no� doubt�experience� net� immigration� while� lower� income� signatories� will� serve� as� migrant�sources.�The� impacts�on�the� two�types�of�states�are,� to�some�extent,�mirror� images�of�each�other.�
For� competing,� indigenous�workers� in� countries� of� immigration,� wages� and� the�chances� employment� are� likely� to� diminish,� and� the� opposite� tends� to� be� true� in�countries�of�origin.�There�are,�however,�potentially�important�off�setting�effects.�First,�the� agglomeration� of� activities� in� the� migrant� host� countries� can� actually� serve� to�enhance� productivity� of� prior� inhabitants� to� the� extent� that� scale� economies� prove�important.� The� potential� attractions� for� direct� foreign� investment� can� then� actually�serve�to�expand�job�offerings,�rather�than�displacing�domestic�workers.�Second,�not�all�migrant�workers�compete�with�domestic�workers:�some�indeed�complement�domestic�labor.� For� instance,� access� to� foreign� skilled� workers� can� alleviate� production�bottlenecks,�expanding�opportunities�for�the�domestic�labor�force;�even�availability�of�low�skill�service�workers�can�free�the�time�of�local�professionals,�cheapening�the�cost�of�enjoying�the�services�provided.�
The�effects�of�expanded�migration�on�labor�in�countries�of�immigration�are,�thus,�quite�mixed.� The� effects� on� employers� and�migrants� are,� however,� clearer.� From� the�perspective� of� employers,� immigration� can� offer� a� source� of� relatively� cheap� labor,�
WP_185_web_1-11-10.pdf 100WP_185_web_1-11-10.pdf 100 1/11/2010 1:39:41 PM1/11/2010 1:39:41 PM

Enhancing Regional Trade Integration in Southeast Europe 85
�
possibly�keep�down�the�costs�of�domestic� labor,�and�provide�access� to�specific�skills.�Hence�it�is�typically�presumed�that�employers�and�the�migrants�themselves�are�the�big�winners�in�the�expansion�of�migration.�
From� the� perspective� of� the� countries� of� emigration,� particularly� in� the� face� of�significant�unemployment�of� low�skill�workers,� the�biggest�concern�is� frequently� that�of� intellectual� emigration;� the� so�called� brain�drain.� The� costs� imposed� by� the�emigration�of�highly�skilled�professionals�hinges�on�at�least�two�key�elements.�First�is�the�manner� in�which� their� education� has� been� financed.� Second� is� the� issue� of� how�effectively�professionals�are�deployed�if�they�remain�at�home.�If�highly�skilled�workers�remain�unemployed�at�home,�or�under�employed�in�activities�that�do�not�utilize�their�training,�or�are�employed�in�activities�offering�little�social�benefit,�then�their�departure�will�impose�minimal�cost.�
Vying�with�brain�drain�concerns�has�been�a�good�deal�of�recent�discussion�of�the�potential� for� brain�gain,�which� refers� to� the� advantages� of� having� a� highly� educated�diaspora.� At� least� four� types� of� benefit� have� been� discussed:� the� transfer� of�technologies�from�professional�citizens�abroad;�a�stimulus�to�trade�through�improved�information� about� trading� opportunities� with� the� home� country� and� easier� contract�enforcement�with�friends�and�relatives�at�home;�return�migration�with�freshly�acquired�skills;� and� the� inducement� for� those� remaining� at� home� to� extend� their� educational�experience�(Lucas,�2005).�
On�one�hand,�a�number�of�programs�exist� in� the�CEFTA�states� to� support� study�abroad,�which�frequently�accelerates�departure�of�the�highly�skilled,�while�nonetheless�providing� important� opportunities� for� nationals.� On� the� other� hand,� attempts� have�been�made� in�most� of� the�CEFTA� states� to� encourage� interaction�with� and� return�of�skilled�nationals�through�such�efforts�as�the�Temporary�Return�of�Qualified�Nationals�program�in�Kosovo�and�the�Brain�Gain�Program�in�Albania.1�Just�how�successful�such�programs� are,� in� promoting� return,� remains� unclear.� Moreover,� the� merits� of� such�programs�are�often�questionable�on�the�grounds�that�the�skills�acquired�abroad�are�of�limited�relevance�in�the�lower�technology�setting�of�countries�of�origin.�
There�are,�however,�at�least�three�studies�in�Southeast�Europe�that�indicate�a�gain�in�productivity�among�workers�who� return� from�abroad.�Each�of� these�contributions�adjusts� for� the� fact� that� those� emigrating� are� self�selected� and,� hence,� possibly�more�enterprising�than�non�migrants.�Co�et�al.�(2000)�find�that�Hungarian�women�who�have�worked�abroad�earn�a�premium� for�having�done� so,� though�men�do�not.�De�Coulon�and� Piracha� (2005)� compare� migrants� returned� to� Albania� with� those� who� never�migrated.�The�migrants�receive�higher�wages�as�a�result�of�their�experience.�However,�the� non�migrants�would�have� gained� even�more�had� they�migrated.�De�Coulon� and�Piracha� suggest� that� the� non�migrants� are� generally� more� highly� skilled� in� the� first�place:�to�emigrate�would�require�greater�adjustment�costs�for�them,�such�as�learning�a�foreign� language� to� access� skilled� jobs,� and� this� additional� cost� discourages� their�emigration.�Iara�(forthcoming)�looks�at�earnings�of�returned,�young,�male�migrants�in�thirteen�countries�of�Central�and�Eastern�Europe.�Her�results�demonstrate�a�substantial�gain� in� earnings� among� those� who� migrated� to� Western� Europe.� Iara� also� draws�attention�to�the�fact�that�these�migrants�to�Western�Europe�are�generally�from�better�off�households�in�the�first�place,�so�the�substantial�rewards�to�migrating�exacerbate�income�inequality�at�home.�
WP_185_web_1-11-10.pdf 101WP_185_web_1-11-10.pdf 101 1/11/2010 1:39:42 PM1/11/2010 1:39:42 PM

86 World Bank Working Paper
�
Albania,�Bosnia�and�Herzegovina,�Serbia,�and�most� likely�FYR�Macedonia�are�all�highly�dependent�on� remittances.�But�who�benefits� from�these� remittances�and�what�are� their� consequences?� The� migrants� from� Albania� have� been� drawn�disproportionately� from� poor,� rural� areas� and� the� ensuing� remittances� have�consequently� been� quite� critical� in� poverty� alleviation.� Remittances� appear� to� have�financed� significant�movement� out� of� rural� areas� and� into� Tirana,� and� also� to� have�spawned�start�up�small�scale�enterprises,� though�the�employment�generated�by�these�enterprises�has�been�largely�confined�to�family�members�(Konica�and�Filer,�2003).�On�the�other�hand,� in�Albania�the� infusion�of�remittances�may�have�propped�up�the�real�exchange�rate,�thus�limiting�export�expansion�and�hence�employment�creation�(Lucas,�1985).� In� the�context�of�Serbia,� Jovicic�and�Mitrovic� (2007)�note� that� remittances�have�moved� counter�cyclically� with� consumption,� suggesting� a� poverty� alleviating� role.�However,�this�study�also�notes�that�much�of�the�supported�consumption�has�resulted�in�additional�imports�of�consumer�goods,�limiting�any�multiplier�benefits.�
The Transition to EU Requirements
As� in� most� contexts,� a� good� deal� of� irregular� migration� is� occurring� amongst� the�CEFTA� states.� Formalizing� these� movements� should� offer� better� protection� to� the�migrants.�It�may�also�serve�to�reinforce�national�autonomy.�Yet�this�may�come�at�a�cost.�Granting� better� rights� to� migrants� often� comes� at� the� expense� of� reduced� numbers;�formalizing� existing� irregular�patterns�may�actually� restrict� the�prevailing�volume�of�migration� and� its� associated� benefits.� Moreover,� free� labor� mobility� provisions� will�induce� some� degree� of� dependence� upon� this� movement,� both� by� workers� and�employers.� Subsequent� attempts� to� restrict� these� movements,� such� as� imposing� EU�external�visa�requirements,�may�result�in�exacerbated,�irregular�migrations.�
Perhaps�most� importantly,�as�accession� to� the�EU� is�achieved�among� the�various�CEFTA�members,�the�labor�mobility�provisions�of�the�EU�will�come�into�force�(though�possibly�with� a� lag).� Implementing�mobility�within�CEFTA�will� therefore� take� place�against� this� background.� Reviewing� labor� mobility� provisions� within� CEFTA,�presumably�in�conformity�with�EU�requirements,�should�therefore�prove�beneficial�in�preparation�for�EU�entry.�
Note �1�http://www.braingain.gov.al/.�
WP_185_web_1-11-10.pdf 102WP_185_web_1-11-10.pdf 102 1/11/2010 1:39:42 PM1/11/2010 1:39:42 PM

87
CHAPTER �10 � �
Implementing�Mobility�in�CEFTA�
Migration Management: Alignment with the EU
Each� of� the� current� CEFTA� countries� has� aspirations� to� follow� their� predecessors� in�joining�the�EU,�which�means�they�must�bring�their�immigration�and�asylum�laws�into�conformity�with�the�EU�acquis.�CEFTA�countries�in�the�Balkans�are�developing�migration�laws�and�policies�with�the�help�of�EU�based�facilitators.�The�Vienna�based�ICMPD�outlined�the�migration� and� asylum� systems� in� the�CEFTA�countries,� and� summarized� them� in� a�publication�concluding�the�two�year�Aeneas�project�(Regional�Guidelines,�2008).�
The� Aeneas� project,� which� involved� seminars� that� allowed� migration�related�agencies�in�the�Balkans�to�learn�about�EU�migration�policies,�aimed�to�set�the�stage�for�increased�cooperation�between�migration�agencies�in�the�various�countries.�
Croatian�law�requires�visas�of�its�southern�Balkan�neighbors,�as�per�the�EU�acquis,�but� has� implemented� these� visa� requirements� only� for� Albanians.� After� EU� entry,�Croatia�will�have�to�implement�EU�visa�requirements,�and�they�may�exempt�nationals�of�some�non�EU�Balkan�states�from�obtaining�visas�for�tourist�visits.�For�example,�The�European� Commission� in� July� 2009� proposed� that� citizens� of�Macedonia� and� Serbia�and� Montenegro� have� visa�free� access� to� EU� member� nations� for� tourist� visits�beginning�January�1,�2010.�
Table� 10.1� sets� out� the� matrix� of� visa� requirements� among� the� remaining� SEE�states.�The�requirements�clearly�vary�both�by�host�and�by�country�of�origin,�though�all�countries�except�FYR�Macedonia�and�Montenegro�require�visas�of�Albanians.��Table 10.1. Intra-SEE Visa Requirements
Host Country
Source Country Albania Bosnia and Herzegovina Croatia
FYR Macedonia Montenegro Serbia
Albania Yes Yes No (1) No (1) Yes Bosnia and Herzegovina Yes No (1) No (1) No (1) No Croatia No (1) No (1) No (1) No (1) No FYR Macedonia No (1) No No (1) No (2) No Montenegro No (1) No Yes (3) No(2) No Serbia Yes No (4) Yes (3) No (2) No
Source:�MARRI:�Overview�of�the�Visa�Regimes�Among�and�Between�SEECP�Countries,�2008.�Notes:�1.�No�visa�required�for�entry�up�to�90�days;�2.�No�visa�required�for�entry�up�to�60�days;��3.�Temporary�suspension�of�the�visa�regime�until�31�December�2009.�Holders�of�national�passports,�temporarily�do�not�require�visas�to�enter�Croatia,�for�tourist�visits�up�to�90�days;�4.�Holders�of�UNMIK�Passports�need�a�visa.��
WP_185_web_1-11-10.pdf 103WP_185_web_1-11-10.pdf 103 1/11/2010 1:39:42 PM1/11/2010 1:39:42 PM

88 World Bank Working Paper
�
The�IOM�reported�(IOM,�2008b,�38)�that�Albania�was�developing�a�“centralized�IT�system� to� administer� visas.”� In� turn,� Albania� reached� a� Visa� Facilitation�Agreement�with� the� EU� in� 2008.� A� border� police� cooperation� agreement� was� signed� with� FYR�Macedonia,�Montenegro,�and�Kosovo�in�2007,�and�on�February�19,�2008,�Albania�and�FYR� Macedonia� eliminated� border�crossing� fees� for� nationals� of� the� two� countries.�Registered� suitcase� traders� from� one� country� may� enter� the� other� twice� a� month�(Regional�Guidelines,� 2008,� 70).�At� a�much� earlier� stage,� bilateral� labor� agreements� on�seasonal�employment�were�signed�with�Germany�(1991),�Greece�(1996),�and�Italy�(1997),�though�again�no�such�agreements�seem�to�have�been�reached�with�any�CEFTA�countries.�
In�FYR�Macedonia�“A�permanent�stay�permit� is� issued�to�a�foreign�national�who�has,�prior�to�applying�for�a�permanent�stay�permit�and�on�the�basis�of�a�temporary�stay�permit,� resided� in� the� territory� of� the� Republic� of�Macedonia� for� at� least� five� years�without� interruption….�According� to� the� situation� reported� on�October� 15,� 2008,� the�total�number�of�foreign�nationals�with�granted�temporary�and�permanent�residence�in�the�Republic�of�Macedonia�amounts�to�7,673�persons.�Out�of�them,�7,148�are�foreigners�with� temporary� stay,� while� 355� are� foreigners� with� granted� permanent� residence.”�(Government�of�FYR�Macedonia,�2009,�8–9).�The�report�goes�on�to�explain�that�some�58�percent� of� those� granted� temporary� residence� in� 2008� had� arrived� for�marriage� to� a�Macedonian� citizen� and� another� 15� percent�were� family�members� joining� foreigners�residing�in�FYR�Macedonia�to�work.�FYR�Macedonia�(2009,�9)�distinguishes�two�types�of�temporary� stay:� “Foreign� nationals� with� temporary� stay� are� persons� residing� in� the�country�from�3�to�12�months,�while�foreign�nationals�with�extended�temporary�stay�are�persons�residing�in�the�country�for�longer�than�12�months.”�During�2006�and�2007,�of�the�4,543�temporary�stays�granted�to�aliens,�58�percent�were�for�extended�temporary�stays.�
IOM�(2008a)�reports�no�bilateral� labor�agreements�in�place�for�Serbia,�though�on�going� negotiations� are� noted� with� Algeria,� Belarus,� Germany,� Hungary,� Libya,� and�Romania.�Meanwhile,�Serbia�is�revising�its�immigration�and�asylum�laws�to�bring�them�into� conformity�with� the�EU�acquis.�Many�of� these� laws�were� in�preparation� in�2008,�including�a�law�on�the�employment�of�foreigners�(Aeneas,�Serbia,�2008,�14);�the�goal�is�to�have�revised�migration�laws�reflect�the�EU�acquis.�
Perhaps�the�most�important�institutional�development�has�been�the�creation�of�the�Migration,� Asylum,� Refugees,� Regional� Initiative� (MARRI)� in� Skopje,� Macedonia� in�2003.� The� six� major� CEFTA� members� are� also� members� of� MARRI,� whose�responsibilities�include�promoting�regional�cooperation�on�migration�issues,�including�labor�migration.1�MARRI,�which�promotes�the�development�of�orderly�labor�migration�in�the�region,�held�a�workshop�on�labor�migration�in�Zagreb�in�February�2006.�
MARRI�staff�have�been�providing�advice�to�member�country�governments�on�how�to� develop�migration�management� systems.�However,�most� of� this� advice� is� general�rather� than� specific.� For� example,� Medved� (2007,� 5)� advises� governments� to�“synthesize�migration�policy�goals�with� the�economic� as�well� as�demographic�policy�goals� [and]� balance� between� the� interests� of� the� State,� business� and� individual�migrants.”� Medved� (2007,� 6–7)� goes� on� to� advise� governments� to� “work� towards�providing�a�single�application�procedure�leading�to�one�combined�title,�encompassing�both� residence� and� work� permit� within� one� administrative� act� and� improve� the�recognition�of�qualification�and�professional�skills�prior�and�after�admission�in�order�to�attract�high�skilled�migrants.”�
WP_185_web_1-11-10.pdf 104WP_185_web_1-11-10.pdf 104 1/11/2010 1:39:42 PM1/11/2010 1:39:42 PM

Enhancing Regional Trade Integration in Southeast Europe 89
�
Medved�(2007,�42)�summarized�the�status�of�MARRI�member�integration�with�the�EU�as�of�December�2006.�However,�many�MARRI�EU�discussions�center�on�issues�such�as� returns� and� re�admission,� not� the� benefits� of� increasing� labor�mobility�within� the�region.�
Specific� labor�agreements�among�the�SEE�states�thus�do�not�appear� to�have�been�established�to�date.�Nonetheless�bilateral�agreements�have�been�struck�on�a�wide�range�of� cross�border� issues.�Although� there� are,� thus,� signs�of�progress� in� terms�of� easing�movement� between� some� of� the� SEE� states,� extensive� visa� and� residence� permit�requirements� remain� in� place.� On� the� other� hand,� it� should� be� noted� that� many�nationals� of� SEE� countries� are� dual� nationals,� making� visa� requirements� less� of� a�barrier�to�mobility.��
Croatia� and� Serbia� made� liberal� provision� for� persons� outside� their� borders� to�acquire�nationality� if� they�wish.�Others,� such� as�Bosnia� and�Herzegovina�allow�dual�citizenship�only�on�a�bilateral�basis,� so� that,�under� the�Bosnia�and�Herzegovina�1997�citizenship� law,� refugees� who� acquire� another� citizenship� from� particular� states�automatically�lose�Bosnia�and�Herzegovina�citizenship.�Serbs�in�the�Republic�Srpska�part�of�Bosnia�and�Herzegovina�are�eligible� for�Serbian�citizenship,�helping� to�explain�why�many�young�people�from�Republic�Srpska�study�in�Serbia.2�Similarly,�many�of�the�Croats�in�the�Federation�part�of�Bosnia�and�Herzegovina�are�eligible�for�Croatian�citizenship.��
In� addition,� although� attempts� are� underway� to� tighten� enforcement� of� the�commensurate� border� controls� and,� in� particular,� to� bring� these� into� line� with� EU�standards,� it� is� clear� that� the� borders� remain� quite� porous.� Irregular� migration� is�extensive,� both� en� route� to� the� EU� and�with� the�more� prosperous� SEE� countries� as�targets�in�their�own�right.�
Informal Economies and Work Permits
Several�CEFTA�members�possess�substantial�shadow�economies,�offering�unregulated�employment� to� both� domestic� and� undocumented� alien� workers� in� “grey”� labor�markets.�In�Serbia,�for�instance,�“It� is�estimated�that�the�informal�economy�comprises�up�to�30�per�cent�of�GDP,�which�means�that�the�actual�number�of�working�persons�is�much�larger�than�the�official�number�of�employed�persons�...�[with]�the�highest�number�of� illegally� hired� foreign� workers� in� agricultural,� construction� and� catering� in�bordering�areas.”3�Schneider� (2006)�estimates� the�size�of�Serbia’s�shadow�economy�to�be� even� larger,� though� this� is� not� out� of� line� with� his� estimates� for� the� remaining�CEFTA�members4�(table�10.2).��Table 10.2. Shadow Economy, 2002–03 (Percent of GDP) Albania 35.3 Bosnia and Herzegovina 36.7 Croatia 35.4 FYR Macedonia 36.3 Serbia and Montenegro 39.1
Source:�Schneider�(2006).��
WP_185_web_1-11-10.pdf 105WP_185_web_1-11-10.pdf 105 1/11/2010 1:39:43 PM1/11/2010 1:39:43 PM

90 World Bank Working Paper
�
Access� to� formal� labor� markets� requires� work� permits� for� foreign� workers.� In�Croatia,�the�2003�Aliens�Act�exempted�23�categories�or�migrant�workers�from�the�work�permit� requirement,� including� permanent� foreign� residents,� foreign� spouses� of�Croatian� nationals,� key� staff� of� companies,� university� professors,� scientists� and�researchers,� athletes� and� artists.�Croatia� in� 2004� introduced� a� quota� system�allowing�foreign�workers�to�be�employed�in�shipbuilding,�construction,�tourism,�culture,�science�and�education,�transport�and�health�care,�but�only�half�of�the�permits�were�requested�in� the� first� three� years� of� operation:� “Low� utilization� of� quotas� shows� that�improvements�could�be�made�in�the�quota�system�which�should�be�more�flexible�and�able� to� promptly� respond� to� actual� labor�market� needs.”� (IOM,� 2007,� 32).� Instead� of�using�the�quota�system�to�obtain�work�permits,�employers�in�construction�and�tourism�appear�to�employ�substantial�numbers�of�irregular�foreign�workers.�In�addition�to�the�work�permit�scheme,�Croatia’s�Alien�Act�also�provides�for�business�permits�to�facilitate�foreign�investment�and�business�transactions.�
In�moving� toward�conformity�with�EU�policy,�FYR�Macedonia�also� introduced�a�quota�system�in�February�2008,� issuing�3,500�work�permits�in�the�course�of�2008.�The�Government�of�FYR�Macedonia�(2009,�10)�notes,�however,�that�“Most�of�the�employed�foreign� nationals� have� secondary� or� higher� education� and� fall� into� the� category� of�administration�staff.”� In�view�of� the�massive�unemployment�rates� in�FYR�Macedonia�this� is� not� surprising.� Unlike� Croatia,� FYR� Macedonia� still� issues� a� Business� Visa,�though�the�number�of�such�remains�tiny�(170�in�2008).�
Montenegro’s� Strategy� for� Migration,� (Government� of� Montenegro,� 2008),�envisages� three�categories�of�work�permits:�A�Personal�Work�Permit�would�render�a�foreigner,�holding�such�a�permit,�equal�to�a�Montenegrin�citizen�in�terms�of�labor�and�unemployment� rights;� an� Employment� Permit�would� permit� local� employers� to� hire�foreign�workers�to�fill�a�job�that�is�permanent�in�character�but�only�for�a�limited�period;�and�a�Work�Permit�which�would�encompass�temporary�jobs,�including�seasonal�work.�
The� Aeneas� Regional� Guidelines� advise� that� Serbia’s� national� migration� laws�should�distinguish�between�foreigners�arriving�to�work�for�wages�and�those�who�are�self� employed,� a� distinction� found� in� EU� law� (2008,� 36).�Moreover,� the� new� Serbian�legislation� is� to�permit�management�personnel�of� foreign�companies� to�enter�without�the�need�to�obtain�a�work�permit.�
Credential Recognition, Social Security, Other Issues
Besides� the� barriers� already� outlined� to� mobility� between� the� CEFTA� states,� some�additional�economic�and�non�economic�barriers�may�be�mentioned.�
First,� enhanced� mutual� recognition� of� credentials� obtained� in� other� CEFTA�countries�would�undoubtedly�ease� the�movement�of�skilled�workers.�This� is� true�not�only� at� a� professional� level� and�with� respect� to� college� qualifications,� but� also�with�respect� to� the� various� trades.�Moving� toward� such� recognition� is� not� simple,� in� part�because� skilled� groups� naturally� attempt� to� prevent� entry� of� competitors.� (The�American�Medical�Association� is� a� prime� example).� It� is�made�more� difficult� by� the�potential� to� recognize� qualifications� in� principle� but� not� in� practice,� requiring� some�process�of�arbitration.�
Second,�the�lack�of�portability�of�social�benefits�can�serve�to�limit�migration�in�both�directions.�First,� the�prospect�of�not�being�able�to�return�home�and�enjoy�the�benefits�
WP_185_web_1-11-10.pdf 106WP_185_web_1-11-10.pdf 106 1/11/2010 1:39:43 PM1/11/2010 1:39:43 PM

Enhancing Regional Trade Integration in Southeast Europe 91
�
accumulated�while�away�may�well�discourage�initial�movement.�Second,�for�those�who�do� migrate,� inability� to� transfer� benefits� to� the� home� country� will� deter� return�migration.� Portability� of� benefits� raises� some� complex� questions� that� have� not� been�entirely� resolved� within� the� EU.� The� SEE� countries� already� possess� a� number� of�bilateral�agreements�amongst�themselves�with�respect� to�social� insurance,�but�further�negotiations� on� these�may� need� to� address� the� issue� of� portability� of� benefits� more�explicitly.�
Third,�as�noted�in�the�course�of�discussing�EU�labor�mobility,�people�are�naturally�reluctant� to� relocate� in� unfamiliar� circumstances,� and� differences� in� ethnicity,�languages,� and� religions� commonly� contribute� to� this� reluctance,� even� among� the�Balkan� states.� Comparisons� of� opinion� surveys� for� 2006� and� 2008� indicate� that:� “All�countries� in� the� Western� Balkan� region� have� seen� a� decrease� in� their� residents’�willingness� to� leave.� This� reduction� is� especially� pronounced� in� the� countries� that�recently�proclaimed� independence:�Montenegro�and�Kosovo.�Here,� the�percentage�of�people�willing� to� leave�has�almost�halved….�Results� from�the�survey� further�suggest�that�migration�from�the�Western�Balkans�is�not�likely�to�be�of�a�permanent�nature:�of�respondents� that� mentioned� a� desire� to� migrate,� 60%� stated� that� they� intended� to�return�after�a�couple�of�years�at�the�most”�(Gallup,�2009,�3).�
Fourth,�in�all�free�trade�areas�enhancing�labor�mobility�meets�resistance�from�those�who�believe�they�will�be�hurt�economically�by�legal�admission.�One�might�suspect�that,�at�both�a�political�and�perhaps�personal�level,�the�history�of�conflict�among�some�of�the�CEFTA�member�states�make�acceptance�of�migration�even�more�difficult.�Interestingly,�however,�Gallup�(2009,�7)�reports�“Across�the�Western�Balkans,�people�are�convinced�that�the�free�circulation�of�people�and�goods�will�help�the�region�to�have�a�peaceful�and�prosperous� future.� Asked� what� is� needed� for� peace� and� development,� the� free�movement�of�people�and�free�trade�within�the�region�came�second�only�to�putting�an�end�to�corruption.�Unrestricted�travel�and�free�trade�between�countries�were�both�said�to�be�important�by�more�than�8�in�10�respondents�across�the�region.�The�desire�for�free�movement� of� people� between� countries� was� particularly� strong� in� Macedonia� and�Serbia,�where�more� than� 9� in� 10� respondents� thought� there�would� be� no� peace� and�development�without�it.”�
Notes �1�Marri�(www.marri�rc.org)�officially�opened�in�September�2004�and�was�recognized�as�an�inter�governmental�organization�a�year�later.�2�Interview�with�Alenka�Prvinsek,�ICMPD,�June�18,�2009.��3�IOM�(2008a)�p.49.��4�In�revising�GDP�data�in�January�2009,�Croatian�Statistics�estimated�a�much�smaller�role�for�their�informal�sector�at�an�average�rate�of�about�8.4�percent�of�GDP�from�1995�to�2005.�
WP_185_web_1-11-10.pdf 107WP_185_web_1-11-10.pdf 107 1/11/2010 1:39:43 PM1/11/2010 1:39:43 PM

92
CHAPTER �11 �
Conclusions�
his� report� examined� the� potential� gains� from� the� increased� mobility� of� skilled�workers� between� the� eight� members� of� the� Central� European� Free� Trade�
Agreement�(CEFTA).�All�CEFTA�member�countries�have�experience�with�the�“3�Rs”�of�recruitment,� remittances,� and� returns,� and� all� have� significant� diasporas� that� can�promote�trade�and�investment�and�development�in�their�countries�of�origin.�
The� purpose� of� this� report� is� to� review� policies� that� could� promote� especially�skilled�worker�migration�between�these�neighboring�SEE�countries�that�aim�to�join�the�EU.�The� fact� that� six�of� the� eight�CEFTA�countries�were�part� of� the�Socialist� Federal�Republic�of�Yugoslavia�and�thus�have�similar�education�and�credential�systems�should�facilitate�migration.�On� the� other� hand,� lingering� effects� from� 1990s� armed� conflicts,�persisting� high� unemployment,� and� new�migration� systems� that� in� some� cases� erect�barriers�to�labor�mobility,�justify�government�intervention�to�promote�labor�mobility.�
Moving�toward�freedom�of�movement�within�CEFTA�could�be�expedited�by:�
� Beginning� with� skilled� workers� and� agreeing� on� the� mutual� recognition� of�credentials� earned� in� CEFTA� member� states� throughout� CEFTA,� as� in�CARICOM,� to� recognize� that� small� countries� are� unable� to� each� support�specialized�universities�and�training�institutions�
� Promoting�intra�company�transfers�by�allowing�firms�with�branches�in�several�CEFTA�countries�to�transfer�workers�between�them�with�minimal�formalities,�the�part�of�the�GATS�trade�in�services�negotiations�that�has�received�the�most�liberalizing�offers.1�
� Allowing�CEFTA� employers� to� offer� jobs� that� normally� require� a� university�degree�to�CEFTA�nationals�with�at�least�one�university�degree�without�a�labor�market�test,�as�in�NAFTA,�where�such�a�job�offer�and�proof�of�citizenship�and�university�credentials�allows� issuance�of�an� indefinitely�renewable�work�and�residence�visa.��
� Encouraging� student� migration,� allowing� foreign� students� to� work� while�studying�and�graduates�to�seek�employment�with�minimal�bureaucracy,�as�in�the�EU�
� Speeding�up�the�adoption�and�incorporation�of�the�migration�provisions�of�the�EU�acquis� into�national�law.�Currently,�CEFTA�member�states�are�focused�on�facilitating�travel�to�the�EU,�which�normally�requires�signing�of�re�admission�agreements� that� oblige� countries� to� accept� the� return� of� apprehended�nationals2abroad�instead�of�preparing�for�EU�accession.��
T
WP_185_web_1-11-10.pdf 108WP_185_web_1-11-10.pdf 108 1/11/2010 1:39:43 PM1/11/2010 1:39:43 PM

Enhancing Regional Trade Integration in Southeast Europe 93
�
� Creating�and�expanding�guest�worker�programs� that�allow� the�admission�of�seasonal�CEFTA�workers�to�fill�seasonal� jobs�in�other�CEFTA�member�states,�and� expanding� such� programs� to� encompass� a�wider� range� of�workers� and�jobs�over�time�
� Recognizing� the�migration� that� is�already�occurring�as�dual�nationals�move,3�and�encouraging�more�bilateral�labor�migration�agreements.4��
Encouraging� more� labor� migration� within� the� CEFTA� region� may� not� be� easy.�Employment� rates� are� generally� low,� especially� for� women� and� older� workers,�unemployment� rates� are� high,� especially� for� women� and� youth,� and� there� is� a�significant� informal�economy� that�makes� it�difficult� to�accurately�assess� labor� supply�and� demand.� As� CEFTA� governments� formalize� their� labor� markets� and� raise�employment� and� lower� unemployment� rates,� labor� market� vacancies� are� likely� to�appear.� Indeed,� the� studies� in�Kathuria� (2008)� find� that�many�of� the� countries� in� the�region�face�skill�gaps�in�certain�sectors,�despite�the�high�overall�unemployment.�Filling�these�gaps�with�nationals�of�neighboring�CEFTA�countries�can�promote�both�economic�efficiency�and�economic�integration.�
EU� accession� will,� in� any� case,� eventually� require� development� of� such�mechanisms.� It� may� therefore� behoove� the� CEFTA� states� to� focus� on� bringing� their�migration� and� permit� systems� into� line� with� the� EU� standards,� implementing� these�among�themselves�initially,�either�on�a�multilateral�or�bilateral�basis.��
Notes �1� Under� GATS�Mode� 4,� intra�company� transfers� are� often� limited� to� managers,� workers� with�specialized�skills,�and�sometimes�trainees�who�have�been�employed�by�the�multinational�firm�at�least�a�year.��2� For� example,� the�EU�Serbia� agreement�was� signed�April� 29,� 2008� and� ratified�by� the� Serbian�Parliament�in�September�2008.��3�Up�to�10�percent�of�Balkan�residents�may�be�dual�nationals,�as�with�Kosovars�who�are�Serbs�as�well�as�Slovenes�or�Croats.�Interview�with�Alenka�Prvinsek,�ICMPD,�June�18,�2009.��4�For�example,�Montenegro�allowed�the�entry�of�up�to�40,000�migrant�workers�from�Serbia�and�Bosnia� and�Herzegovina� in� 2008� to� fill� jobs� in� agriculture� and� tourism.� Interview�with�Alenka�Prvinsek,�ICMPD,�June�18,�2009.�
WP_185_web_1-11-10.pdf 109WP_185_web_1-11-10.pdf 109 1/11/2010 1:39:44 PM1/11/2010 1:39:44 PM

���
WP_185_web_1-11-10.pdf 110WP_185_web_1-11-10.pdf 110 1/11/2010 1:39:44 PM1/11/2010 1:39:44 PM

95
��
��
�
Part�III�
The�Impact�of�Establishing�a�Virtual�Customs�Union�between�
Southeast�Europe�and�the�European�Union�
Selen�Sarisoy�Guerin*����
*�The� author� would� like� to� acknowledge� excellent� research� assistance� by� Emre� Tuncalp� and�Tilman�Anger.�
WP_185_web_1-11-10.pdf 111WP_185_web_1-11-10.pdf 111 1/11/2010 1:39:44 PM1/11/2010 1:39:44 PM

96
Abstract�
n� this� study� we� analyze� the� costs� and� benefits� of� implementing� EU’s� common�external�tariff� in�Southeast�Europe�(SEE).�A�detailed�examination�at�6�digit�product�
level�indicates�that�each�country�requires�a�different�level�of�adjustment.�Furthermore,�we� carried� out� a� partial� equilibrium� analysis� to� estimate� trade� diversion� and� trade�creation� effect.� The�overall� trade� creation� effect� is� positive� for� the� region,� as� imports�increase� by� 4.3� percent� after� reform.� There� is� a� negative� impact� on� intra�regional�exports;�however,�the�loss�in�exports�amounts�to�only�0.1�percent�of�GDP.�
I�
WP_185_web_1-11-10.pdf 112WP_185_web_1-11-10.pdf 112 1/11/2010 1:39:44 PM1/11/2010 1:39:44 PM

97
CHAPTER �12 �
Introduction�
he�aim�of�this�report� is� to�provide�an�in�depth�analysis�of� the�potential� impact�of�adopting� EU’s� common� external� tariff� (CET)� covering� industrial� goods� hence�
forming� a� virtual� customs� union� between� the� EU� and� the� CEFTA� region.1� Several�studies�indicated�that�although�exports�of�the�region�have�grown�steadily,�they�remain�below� potential� (World� Bank,� 2008a,� 2008b).� The� economic� integration� of� the� region�significantly� accelerated� as� all� countries� have� been� offered� Stabilization� and�Association�Agreements� (SAA)�with� the�EU.�Currently�all�have�duty�and�quotas� free�access�to�the�EU,�their�largest�trading�partner�due�to�the�autonomous�trade�preferences�granted� in�2000.2�The�Council�of� the�EU�have�granted�Southeast�Europe3�asymmetric�trade� liberalization� preceding� the� SAAs,� in� order� to� contribute� to� the� process� of�economic� and� political� stabilization� in� the� region.� In� this� sense,� “the� granting� of�autonomous�trade�preferences�is�linked�to�respect�for�fundamental�principles�of�democracy�and�human� rights� and� to� the� readiness� of� the� countries� concerned� to� develop� economic� relations�between� themselves”� (EC�no�2007/2000).�As�part�of� the�regional�dimension�of� the�SAA,�these� countries�have�also� signed�a� series�of�bilateral�FTAs�with�each�other�and� these�bilateral�agreements�have�been�brought�under�one�agreement,�CEFTA�that�entered�into�force�in�2007.�
So� far� the� impact� of� preferential� access� to� the� EU� has� not� produced� the� desired�effect� of�boosting� the� competitiveness�of� the� region� through� increased�exports� to� the�EU� nor� its� intra�regional� trade� that� is� much� needed� for� the� sustainable� growth� of�Southeast�Europe.� In�a� recent� report�Handjiski� (2009)�concludes� that�growth� in� intra�regional�trade�in�2008�has�been�significant�after�the�entry�into�force�of�CEFTA,�however�in� comparison� to� EU�10� the� intra�industry� trade� is� still� low� and� trade� is� largely�dependent�on�commodities.�In�terms�of�extra�regional�trade,�deepening�integration�for�the�region�revealed�itself�in�the�form�of�large�current�account�deficits:�all�five�countries�within�the�region�have�started�running�wide�current�account�deficits�that�are�concern�for� macroeconomic� stability.4� The� current� account� deficits� in� the� region� were� all� in�excess� of� 10� percent,� reaching� at� 40� percent� of� GDP� in� Montenegro,� 18� percent� in�Serbia,�and�15�percent�in�Bosnia�and�Herzegovina�(2008).�A�closer�examination�of�the�balance� of� payment� statistics� reveals� that� several� countries� in� the� region� have� trade�deficit� in� goods� and� services� (and� income)� larger� than� their� current� account� deficits.�The�large�trade�deficits�are�typically�characterized�by�large�imports�of�goods�and�low�exports,�whereas� they� tend� have� trade� surplus� in� services.� The� poor� performance� of�merchandise� exports� is� especially� disappointing� as� small� open� economies� depend�largely� on� trade� to� boost� growth.� In� a� recent� World� Bank� report� (2008),� the�sustainability� of� future� growth� in� Southeast� Europe� (SEE)�was� raised� as� an� issue� of�
T
WP_185_web_1-11-10.pdf 113WP_185_web_1-11-10.pdf 113 1/11/2010 1:39:44 PM1/11/2010 1:39:44 PM

98 World Bank Working Paper
�
concern� as� much� of� the� transition�driven� growth� has� already� been� achieved.� In� the�report,�it�is�suggested�that�in�order�to�reduce�their�still�high�poverty�rates�and�to�fulfill�their� EU� aspirations� the� SEE� countries� need� to� increase� their� growth� rate� through�increases�in�total�factor�productivity�(TFP).��
Classic� international� trade� theory� argues� that� trade� liberalization� help� countries�specialize� in� the� production� of� those� products� where� they� have� a� comparative�advantage,� as� a� result� of� which� the� country� benefits� from� static� productivity� gains.�Several� empirical� studies� test� the� relationship� between� trade� openness� and� growth�such�as�Sachs�and�Warner,�1995,�Frankel�and�Romer�1999�and�Dollar�and�Kraay�2004.�Even� though� empirical� results� are� inconclusive� about� the� relationship� between� trade�openness�and�growth,�theoretical�models�have�evolved�to�explain�how�trade�can�boost�growth.� According� to� endogenous� growth� models� and� new� trade� theories� the�interaction�between�trade�openness�and�growth�is�no�longer�static�and�the�gains�from�trade� liberalization� come� from� accumulation� and/or� transfer� of� technology� or� a�concentration� on� innovation.�Hence� new� trade� theories� foresee� the� gains� from� trade�liberalization� to� be�dynamic� as� countries� accumulate�more� technology� and� carry� out�more�innovation�which�is�the�key�to�long�term�growth.�Other�channels�through�which�trade� openness�might� improve� productivity� growth� are:� (i)� the� disciplining� effect� of�imports,� and� (ii)� the� increasing� variety� of� available� inputs.� An� inspection� of� the�evolution� of� total� factor� productivity� over� time� suggests� that,� during� periods� of� the�most� rapid�decline� in�protection� rates,�productivity�gains�are� largest.� In�an�empirical�analysis�of�the�impact�of�customs�union�on�Turkish�manufacturing�sector�productivity�Taymaz� and� Yilmaz� (2007)� find� that� the� gains� in� productivity� of� Turkish� firms� are�higher�if�they�are�import�competing.��
FDI� is� also� another� channel� through� which� new� technology� transfer� can� be�achieved,� hence� a� positive� impact� on�productivity.� For� example,� Blalock� and�Gertler�(2008)�find�theoretically�and�empirically�that�multinational�firms�in�emerging�markets�transfer� technology� to� local� suppliers� to� increase� their� productivity� and� lower� input�prices.5�They�argue�that�this�is�welfare�improving�not�only�for�those�sectors�that�attract�FDI�but�also�those�sectors�downstream�who�are�suppliers.��
The�main�motivation� of� this� study� is� to� identify� potential� sources� of� export�led�growth� for� the� region.� As� exports� have� not� yet� reached� their� full� potential,� they�represent� a� channel� to� growth� that� is� largely� untapped.� Forming� a� virtual� customs�union�will�have�three�significant�effects�on�the�SEEs:�(i)�reducing�tariff�dispersion,�that�is,� by� reducing� or� abolishing� tariff� peaks;� (ii)� reducing� the� trade� diverting� effects� of�existing�preferential�agreements,�such�as� the�SAAs�and�CEFTA�and�hence� improving�welfare;�and�(iii)�boosting�intra�regional�trade.�The�SEE�countries’�tariff�profiles�present�several�tariff�peaks�much�higher�and�more�frequent�than�the�EU’s�CET.�Although�there�are�some�tariff�peaks� in�EU’s�CET�as�well,�a�virtual�customs�union�would�amount� to�unilateral� trade� liberalization� for� the� countries� in� the� region.6� All� preferential�agreements,�for�example,�FTAs,�such�as�SAA’s�Interim�Agreement�on�trade�have�trade�diverting�effect�(as�well�as�trade�creation).�As�tariffs�are�fully�abolished�in�the�CEFTA�region,� goods� originating� within� the� EU� will� have� a� cost� advantage� over� other�countries�that�have�to�pay�the�full�tariff.�If�EU�is�a�less�efficient�producer�of�a�particular�good�and�due�to�its�preferential�access�to�CEFTA�region�it�may�replace�a�more�efficient�trade�partner,�hence�reducing�welfare.�As�trade�will�be�already�diverted�toward�the�EU�
WP_185_web_1-11-10.pdf 114WP_185_web_1-11-10.pdf 114 1/11/2010 1:39:44 PM1/11/2010 1:39:44 PM

Enhancing Regional Trade Integration in Southeast Europe 99
�
(when�tariff�liberalization�schedules�are�completed)�adopting�the�CET�will�reduce�trade�diversion� that� is� caused� by� the� SAAs.� In� addition,� the� implementation� of� CEFTA� is�another�source�of�trade�diversion,�as�trade�may�be�diverted�within�the�members:�When�an� FTA� is� created�parties� to� the� agreement� offer� each� other� tariff� free� access� to� each�other’s�market,�however,�they�continue�to�apply�their�previously�established�tariffs�to�third� countries.� If� one� partner� has� lower� tariffs� than� the� other,� then� extra�FTA� trade�will�be�diverted�towards�the�partner�with�lower�tariffs�as�once�the�good�enters�the�FTA�area�it�can�be�freely�shipped�to�the�higher�tariff�partner.�This�effect�of�an�FTA�does�not�exist�in�the�case�of�a�customs�union.�Finally,�as�EU’s�average�MFN�rates�are�lower�than�SEE� countries’� rates,� adopting� CET� will� amount� to� a� unilateral� tariff� reduction� in�relation�to�third�parties,�hence�it�will�also�have�trade�creating�effects.��
Our� results� indicate� that� after� such� a� reform,� the� region’s� simple� average� tariffs�would�be�reduced�from�5.1�percent�to�2.3�percent,�trade�weighted�average�tariff�would�be�reduced� from�4.7�percent� to�2.2�percent.�Among�the�SEE�countries,�Serbia� is� to�go�through� the�most� ambitious� adjustment�process�due� to� its�higher� average� tariffs� and�tariff�dispersions.�On�the�other�extreme,�Croatia�requires�the�least�effort�to�adopt�EU’s�CET�thanks� to� its�advanced�status�as�an�EU�candidate�country.� In� the�second�part�of�this�study,�we�estimate�quantitatively�the�costs�and�benefits�of�adopting�EU’s�CET�by�making�use�of�traditional�concepts�of�trade�diversion�and�creation.�As�our�estimation�tools�we� use� partial� equilibrium�model� of� SMART� developed� by�UNCTAD� and� the�World� Bank.� The� results� indicate� that� the� impact� of� this� trade� reform� is� going� to� be�positive�with�net�trade�creation�in�the�magnitude�of�US$998.9�million�for�the�region,�an�increase� of� 4.3� percent� from� pre�reform� import� levels.� Even� though� imports� will�increase� significantly,� the�net� effect� of� adopting�EU’s�CET�will� result� in� revenue� loss�roughly�half�of�the�gains�from�trade�creation,�that�is,�US$459.7�million.�The�consumer�surplus,�which�will�result�from�reducing�the�deadweight�loss�from�tariffs,�is�a�modest�US$51.7� million.� The� overall� net� effect� of� CET� amounts� thus� to� US$590.9� million,�roughly� 1� percent� of� SEE’s� combined�GDP.� The� impact� of� adopting�CET� is� going� to�have� a� negative� effect� on� intra�regional� exports.�Nevertheless,� the� decrease� in� intra�regional� exports� (that� is,� trade� diversion)� is� a� readjustment� and� only� amounts� to� 0.1�percent�of�GDP.�China�is�going�to�increase�its�exports�by�8�percent�to�the�region�and�is�going�to�be�the�main�extra�EU�beneficiary�of�this�trade�reform.�
In� chapter� 13�we� describe� in� detail� how� a� virtual� customs� union� differs� from� a�customs�union�and�also�present�theoretical�and�empirical�evidence�on�customs�union�literature.� In� chapter� 14,�we�present� the� tariff�profiles� for� the� region� and� the� level� of�adjustment�required�for�each�country:�Albania,�Bosnia�and�Herzegovina,�Croatia,�FYR�Macedonia,�Montenegro,�Serbia,�and�Kosovo.�In�chapter�15,�we�present�results�from�a�partial�equilibrium�analysis.�In�chapter�16,�we�conclude�with�policy�recommendations.��
Note �1� The� CEFTA� region� is� comprised� of� Albania,� Bosnia,� and� Herzegovina,� Croatia,� the� Former�Yugoslav�Republic�of�Macedonia�(FYR�Macedonia),�Montenegro,�Serbia,�and�Kosovo.�Moldova�is�excluded� as� it� is� not� interlinked�with� the� rest� of� countries� in� the� region,� nor� it� has� a� clear� EU�perspective.�2�With�some�exceptions�like�sugar,�wine,�baby�beef,�and�so�forth.��
WP_185_web_1-11-10.pdf 115WP_185_web_1-11-10.pdf 115 1/11/2010 1:39:45 PM1/11/2010 1:39:45 PM

100 World Bank Working Paper
�
�3�In�this�paper�we�will�use�the�terms�“CEFTA�region”�and�“Southeast�Europe”�interchangeably.��4�IMF�estimates,�WEO�April�2009.�5� Blalock,� G.� and� P.� Gertler� (2008),� “Welfare� Gains� from� FDI� through� Technology� Transfer� to�Local�Suppliers,”�Journal�of�International�Economics�(74).�6�See�Kaminski�(2008)�for�a�case�study�of�Albania.��
WP_185_web_1-11-10.pdf 116WP_185_web_1-11-10.pdf 116 1/11/2010 1:39:45 PM1/11/2010 1:39:45 PM

101
CHAPTER �13 �
Customs�Union�versus��a�Virtual�Customs�Union�
�customs�union�is�a�free�trade�area�where�parties�adopt�a�common�external�tariff�against� the� third�parties.�Since� the�coming� into� force�of�CEFTA�in�2007,� the�SEE�
countries� have� become� a� free� trade� area� where� common� rules� of� origin� is� the�most�important�instrument.�As�CEFTA�was�formed�from�a�network�of�32�bilateral�FTAs,�the�removal�of�the�quotas�and�customs�duties�that�existed�in�the�bilateral�FTAs�is�still�being�negotiated.1�If�the�seven�SEE�countries�adopt�EU’s�CET�the�countries�in�the�region�will�become�part�of�a�customs�union.�As�adopting�the�common�customs�tariff�of�the�EU�is�only� one� element� of� a� complete� customs�union�with� the�EU,� this� unilateral� action� is�envisaged�as�forming�a�“virtual”�customs�union.��
Indeed� joining�the�common�market�and�becoming�part�of�EU’s�common�customs�requires�much�more�than�adopting�the�CET.�All�candidate�states�that�joined�the�EU�had�to�adopt�the�part�of�the�acquis�communautaire,�namely�“Chapter�25:�Customs�Union.”�As�the�borders�of�the�candidate�states�become�the�new�borders�of�the�EC�it�is�important�to�assure�that�the�customs�aquis�is�implemented�in�a�harmonious�way�at�all�the�points�of�the� border� of� the� EU.�Hence� the� customs� acquis� includes� the�Community’s� Customs�Code� and� its� implementing� provisions,� the� Combined� Nomenclature,� the� Common�Customs� Tariff� with� preferences� tariff� quotas� and� tariff� suspensions,� and� other�customs�related� legislation�outside� the�scope�of� the�customs�code,�as� for�example� the�legislation� on� counterfeit� and� pirated� goods,� drug� precursors� and� export� of� cultural�goods� (EC,�DG�TAXUD).�Currently,� the� only�non�EU�members�who�have� a� customs�union�with� the�EU�are�Turkey,�Andorra,�and�San�Marino.�For�example,�as�part�of� its�customs�union,�Turkey�had�to�adopt�not�only�the�EU’s�CET�but�also�EU’s�preferential�tariffs� with� third� countries� by� signing� free� trade� agreements� (FTAs)� with� them.2�Turkey’s�approximation�of�other�laws�such�as�intellectual�property�rights,�competition,�and� taxation� are� still� not� fully� completed.� Turkey� also� has� to� implement� EU’s� trade�defense�instruments�such�as�any�anti�dumping�rulings�against�a�country.�
The� difference� between� a� customs� union� and� a� preferential� agreement� (for�example,�FTA)�is�that�the�movement�of�goods�within�customs�unions�is�not�based�on�their� originating� status� but� on� the� fact� that� they� comply� with� provisions� on� free�circulation.3� This�means� that� any� good� that� is�wholly� produced� or� imported� from� a�third� party� once� they� are� granted� free� circulation� can� move� freely� within� the�community� and/or� for� example,� Turkey,� Andorra� and� San� Marino.� As� goods� can�circulate� freely� within� the� customs� borders� of� the� EU� from� one� member� state� to�
A
WP_185_web_1-11-10.pdf 117WP_185_web_1-11-10.pdf 117 1/11/2010 1:39:45 PM1/11/2010 1:39:45 PM

102 World Bank Working Paper
�
another,�this�reduces�all�costs�related�to�obtaining�a�certificate�of�origin�once�the�goods�enter� a� customs� union.4� But� of� course,� administration� of� a� customs� union� requires�several� additional� measures� to� be� taken,� such� as� the� customs� administrations� must�guarantee� the�accurate�development�and� implementation�of�a� revenue�collection�and�management� strategy.� This� requires� the� candidate� countries� to� develop� policies,�systems,� procedures,� technologies,� and� instruments� compatible� with� the� EU�requirements�and�standards.�
The�theoretical�analysis�on�customs�union�dates�back�to�classical�analysis�of�Viner�(1950).� In�his� classical� analysis�of� the� impact�of� customs�union�on� the� trade�between�member�states,�he�utilized�two�competing�concepts:�trade�diversion�and�trade�creation.�Trade�creation�signifies� increase�of� imports� from�the�partner�due�to� tariff�elimination�that�were�previously�domestically�produced.� If� indeed� the� imports� replaces�domestic�produce� that� were� more� inefficiently� produced,� trade� creation� is� seen� as� a� positive�effect�as�it�allows�freeing�up�of�resources�that�were�previously�inefficiently�used�to�be�diverted�to�the�production�of�goods�where�home�country�has�a�comparative�advantage.�Trade�diversion,�however,� implies� lower� cost� trade� from�a� third� country�be�diverted�towards� a� higher�cost� producer� within� the� customs� union,� therefore� it� is� welfare�reducing.�The�subsequent�works�of�Meade�and�Lipsey�have�built�on�Viner’s�analysis�of�a� customs�union.�The�overall� impact� of� a� customs�union�depends�on�net� effect� from�trade�diversion�versus�trade�creation.�In�a�more�recent�study,�Kruger�(1997)�argues�that�basic� arguments� of� trade� creation�diversion� for� customs� unions� can� be� expanded� in�several� ways.� One� of� the� arguments� is� that� customs� unions�may� promote� increased�competition�and�this�may�stimulate�searches�for�static�and�dynamic�productivity�gains.�The� author� also� argues� that� a� customs� union� between� developing� and� developed�countries�are�likely�to�bring�more�welfare�gains�as�there�is�wide�divergences�between�the�comparative�advantage�of�one�compared�to�the�other.�
There�are�currently�in�force�14�customs�unions�around�the�world�that�are�notified�to� the�WTO.�The�oldest� customs�union� (CU)� is� the�one�established�between� the� then�nine�member� states� of� the� European�Community� (EC)� under� the� EC�Treaty� in� 1958.�Since�then�there�has�been�a�steady�increase�in�numbers�of�CU�where�the�majority�of�the�agreements�have� taken�place� in�Africa� (for�example,�East�African�Community� (2000);�Economic� Community� of� West� African� States� (1993);� West� African� Economic� and�Monetary�Union�(2000);�South�African�Customs�Union�(2004);�Economic�and�Monetary�Community� of� Central� Africa� (1999))� and� Central� and� Latin� America� (Andean�Community� (1988);� Central� American� Common� Market� (1961);� MERCOSUR� (1991);�CARICOM�(1973).�Besides�EC’s�customs�union�with�non�member�states�there�are�only�two� other� in� force:� Gulf� Cooperation� Countries� (2003)� and� Eurasian� Economic�Community�(1997)�established�among�CIS.�
There� are� several� empirical� studies� on� impact� of� a� customs� union� on� member�states.�Due�to�differences�in�methodology�used�it�is�difficult�to�reach�a�consensus�on�the�outcome�of�forming�a�customs�union.�Overall,�an�examination�of�the�literature�reveals�that�each�case�if�different�and�there�are�no�comparative�studies�available�to�the�best�of�our�knowledge.�For�the�main�motivation�of�this�study,�we�choose�to�concentrate�on�the�EU�Turkey� customs� union� and� Turkey’s� experience.� As� EU�Turkey� customs� union�covers� only� industrial� goods� and� has� been� in� force� since� 1996,� it� provides� a� perfect�comparator.5� Several� studies� find� that� EU�Turkey� customs� union� has� increased�
WP_185_web_1-11-10.pdf 118WP_185_web_1-11-10.pdf 118 1/11/2010 1:39:45 PM1/11/2010 1:39:45 PM

Enhancing Regional Trade Integration in Southeast Europe 103
�
considerably�import�penetration�in�manufacturing�while�not�significantly�affecting�the�share�of�EU�in�Turkey’s�trade�(Erzan�et�al.�2002).�Although�the�share�of�EU�in�Turkey’s�trade�have�remained�stable�before�and�after�the�customs�union�several�studies�indicate�that�there�has�been�significant�gains�in�the�manufacturing�sector�of�Turkey�in�terms�of�productivity� gains.� Taymaz� and� Yilmaz� (2007)� find� that� even� though� growth� in�productivity� of� manufacturing� sectors� slowed� down� substantially� after� 1996,�productivity�actually�increased�in�the�manufacturing�sectors�especially�in�those�sectors�with� increased� import� penetration� rates.� Akkoyunlu� et� al.� (2007)� also� find� that�manufacturing� imports� from�EU� countries� cause� total� factor� productivity� increase� in�Turkish� manufacturing� industry.� The� results� of� Lohrrman� (2001)� support� the�“catching�up”� hypothesis� not� the� “Hecksher�Ohlin� trap”� for� Turkey� because� the�Turkish�trade�pattern�has�shifted�towards�intra�industry�trade.�In�fact,�one�of�the�most�important� effects� of� the� customs� union� has� been� Turkey’s� increasing� intra�industry�with�the�EU.�Kocyigit�(2007)�show�that�growth�of�intra�industry�trade�between�Turkey�and�the�EU�indicates�that�Turkey’s�industrial�base�is�dramatically�changing�from�low�technology� products� group� to� high� technology� industries,� since� the� customs� union�agreement�with� the�EU�has�been�put� into�effect� in�1996.�This� in�return�has�a�positive�impact�on�Turkey’s�development�and�growth.��
Some�of�the�results�discussed�are�readily�observable�from�export�and�import�data�of�Turkey�(figure�13.1).�When�one�compares�Turkey’s�exports�to�the�EU�versus�the�rest�of�the�world,�one�can�see�that�they�have�been�increasing�in�unison�with�the�exception�of�the�impact�of�the�current�financial�crisis�in�2008.�This�is�in�line�with�finding�that�EU’s�share�in�Turkey’s�exports�to�the�world�has�remained�the�same�after�the�customs�union.�The� sharp� increase� in� both� exports� and� imports� come� much� later� in� 2002.6� It� is�interesting� to�note� that� after� 2003� imports� from� the� rest� of� the�world�have� increased�faster� than� imports� from� the� EU,� hence� the� larger� trade� deficit� with� the� rest� of� the�world.� This� can� be� partially� explained� by� the� fact� that� adjustment� to� EU’s� CET�was�only�completed�in�2006.�This�may�also�explain�the�concomitant�increase�in�exports.�
In�the�case�of�SEE�countries,�the�free�trade�area�is�already�in�place�and�the�Interim�Agreements� covering� trade� have� entered� into� force� for� all� countries� except� Kosovo�(table� 13.1).� As� Croatia� is� in� the� process� of� membership� negotiations,� it� is� the�most�advanced�in�terms�of�its�tariff�liberalization�with�the�EU.�Tariffs�were�fully�liberalized�on� industrial� goods� originating� within� the� EU� by� 2007.� Among� the� rest,� FYR�Macedonia�also�has�a�more�advanced�status�in�terms�of�implementation�of�its�Interim�Agreement:� tariff� liberalization� on� EU’s� industrial� goods�was� to� be� completed� in� 10�years,� that� is,� by� 2011.� On� the� other� hand,� Albania,� Bosnia� and� Herzegovina,� and�Montenegro�have�just�started�implementing�the�Interim�Agreement�on�trade�and�they�are� to�be� completed�over�5�years,� that� is,�by�2014� in�Albania�and�2013� in�Bosnia�and�Herzegovina�and�Montenegro.�Serbia�has�ratified�its�SAA�but�the�implementation�is�on�hold�due�to�political�reasons.��� �
WP_185_web_1-11-10.pdf 119WP_185_web_1-11-10.pdf 119 1/11/2010 1:39:46 PM1/11/2010 1:39:46 PM

104 World Bank Working Paper
�
Figure 13.1. Turkey’s Exports and Imports 1986–2008 (US$ millions)
����
�
Source:�UN�COMTRADE�database.�
Imports
0
20,000
40,000
60,000
80,000
100,000
120,000
140,000
1986
1987
1988
1989
1990
1991
1992
1993
1994
1995
1996
1997
1998
1999
2000
2001
2002
2003
2004
2005
2006
2007
2008
EU-Turkey Turkey-RoW
US
$ m
illion
s
Year
1986
1987
1988
1989
1990
1991
1992
1993
1994
1995
1996
1997
1998
1999
2000
2001
2002
2003
2004
2005
2006
2007
2008
EU-Turkey Turkey-RoW
Year
Exports
0
10,000
20,000
30,000
40,000
50,000
60,000
70,000
80,000
US
$ m
illion
s
WP_185_web_1-11-10.pdf 120WP_185_web_1-11-10.pdf 120 1/11/2010 1:39:46 PM1/11/2010 1:39:46 PM

Enhancing Regional Trade Integration in Southeast Europe 105
�
Table 13.1. Southeast Europe and Stabilization and Association Agreements
SAA Signature Interim Agreement on trade-date of entry into force
Albania June 12, 2006 December 1, 2006 Bosnia and Herzegovina June 16, 2008 July 1, 2008 Croatia October 29, 2001 February 1, 2005 FYR Macedonia April 9, 2001 June 1, 2001 Montenegro October 15, 2007 January 1, 2008 Serbia April 29, 2008 January 1, 2009 (ratified by Serbia, on hold in EU) Kosovo Not started —
Source:�European�Commission.�
When�all�tariff�liberalization�is�completed�in�the�region�with�the�EU,�and�with�the�removal�of�all�intra�regional�quotas�and�customs�duties,�adopting�the�CET�will�amount�to�forming�a�‘virtual’�customs�union�without�the�implementation�of�other�institutional�and�regulatory�requirements.�The�next�section�examines�tariff�profiles�of�SEE�in�detail�in�order�to�assess�the�adjustment�that�would�be�necessary�to�apply�the�CET.�
Notes �1�Center�for�European�Perspective,�2008�December.�2� Although� Turkey’s� MFN� tariff� rates� are� fully� in� line� with� EU’s� CET,� there� are� a� few�discrepancies� due� to� EU’s� preferential� rates.� So� far� Turkey� has� signed� FTAs� with� several� EU�bilateral� preferential� partners;� however,� this� falls� short� of� the� full� list� as� mostly� there� is� no�incentives� for� some� of� the� third� countries� to� sign� FTAs� with� Turkey.� This� is� at� times� a�controversial�issue.��3�Some�products,�such�as�agriculture,�coal�and�steel,�in�trade�with�the�countries�concerned�do�not�fall�within�the�scope�of�the�customs�union�but�remain�subject�to�a�preferential�treatment�based�on�origin.�4� According� to� the� responses� to� a� survey� (CEPS� and� CASE� report� for� DG� Trade)� on� Euro�Mediterranean�economic�integration,�the�Mediterranean�exporters�to�the�EU�reported�the�cost�of�obtaining�certificates�of�origin�to�be�negligible�but�the�process�to�be�very�complex,�bureaucratic,�and�time�consuming.��5� Although� Turkey� is� expected� to� align� with� the� acquis� in� several� supporting� aspects� of� the�customs�union�(for�example,�IPR�and�elimination�of�state�subsidies)�progress�lacks�behind�to�this�day.��6�This�may�be�explained�by�effect�of�the�stabilization�program�introduced�by�IMF�following�the�2001�financial�crisis.�
WP_185_web_1-11-10.pdf 121WP_185_web_1-11-10.pdf 121 1/11/2010 1:39:46 PM1/11/2010 1:39:46 PM

106
CHAPTER �14 �
Tariff�Profile�of��Southeast�Europe�
outheast�Europe�is�comprised�of�a�diverse�group�of�countries�not�only�in�terms�of�their� macroeconomic� performances� but� also� in� their� trade� policies.� Within� the�
region�Albania�(2000),�Croatia�(2000)�and�FYR�Macedonia�(2003)�are�already�members�of� the� WTO.� Bosnia� and� Herzegovina� started� negotiations� in� 1999� and� it� is� at� an�advanced�stage�whereas�Serbia�and�Montenegro�both�applied�in�2004.1��
Table�14.1�compares�EU’s�simple�average�and�trade�weighted�average�MFN�rates�for� non�agricultural� goods� to� those� of� SEE� in� the� upper� part� of� the� table.�As� can� be�clearly� seen� the� EU’s� simple� average� MFN� rate� of� 3.8� percent� and� trade�weighted�average� MFN� rate� of� 2.4� percent� are� considerably� lower� than� those� of� SEE.����Table 14.1. Summary of MFN Applied Tariff Profiles of the Western Balkans and the EU, Non-agricultural Goods (Percent of Tariff Lines), 2007
MFN applied on non-agricultural goods
Simple average MFN applied
Trade-weighted average
EU 3.8 2.4 Albania 5.0 6.1 Bosnia and Herzegovina 6.2 6.5 Croatia 4.0 3.7 FYR Macedonia 6.8 6.3 Montenegro 4.0 — Serbia 6.4 5.4
Frequency distribution Duty-free 0<=5 5<=10 10<=15 15<=25 >25
EU 31.0 36.6 24.7 6.7 0.9 0 Albania 30.7 33.7 19.8 15.9 0 0 Bosnia and Herzegovina 26.9 31.8 31.9 9.4 0 0 Croatia 52.4 15.7 20.6 11.0 0.3 0 FYR Macedonia 37.2 18.7 19.4 15.9 8.7 0 Montenegro 2.2 74.8 20.5 1.6 0.7 0.1 Serbia 1.2 61.1 23.9 4.5 8.9 0.4
Source:�WTO�tariff�profile�2008.���
S�
WP_185_web_1-11-10.pdf 122WP_185_web_1-11-10.pdf 122 1/11/2010 1:39:46 PM1/11/2010 1:39:46 PM

Enhancing Regional Trade Integration in Southeast Europe 107
�
Among�the�countries�in�the�region�only�Croatia�and�Montenegro�come�close�to�the�EU�average�MFN�rate�with�a� simple�average� rate�of�4�percent�each.�Albania,�Bosnia�and�Herzegovina,�FYR�Macedonia,�and�Serbia�have�both�simple�and�trade�weighted�rates�that�are� significantly�higher� than� that�of� the�EU.�Among�all,�FYR�Macedonia�has� the�highest�simple�and�trade�weighted�average�MFN�rates,�even�though�it�is�now�officially�a� candidate� country.� Although� simple� averages� are� informative,� a� more� detailed�examination�of�the�distribution�of�tariffs�over�tariff�lines�reveals�wider�differences�(the�second�part�of�table�14.1).�Table�14.1�presents�the�percent�of�tariff� lines�that�are�duty�free�in�the�first�column�followed�by�the�share�of�tariff�lines�in�increasing�range,�that�is,�0–5�percent,�5–10�percent,�10–15�percent,�and�15–25�percent.��
In�comparison�to� the�EU,�Croatia�and�FYR�Macedonia�have�more� tariff� lines� that�are�duty�free.�In�contrast,�Serbia�and�Montenegro�have�only�1.2�and�2.2�percent�of�tariff�lines�that�are�duty�free�respectively.�If�one�can�generalize,�EU’s�MFN�is�skewed�to�the�left�with� few�tariff�peaks.�For�example,� the�EU�has�only�6.7�percent� tariff� lines� in� the�tariff�range�of�10–15�percent�and�0.9�percent�in�15–25�range.�This�is�exactly�where�the�countries� within� the� region� begin� to� differ.� With� the� exception� of� Montenegro,� all�countries�have� larger�percent�of� tariff� lines� in� excess�of� 10�percent� tariffs.� Serbia� and�Montenegro�have�tariff�in�excess�of�25�percent�even�though�only�a�few�exist.�Although�this�table�shows�the�tariff�profiles�of�each�country�it�does�not�give�information�where�the� adjustment� has� to� take� place.� For� example,� one� can� see� that�Albania� has� similar�tariff�structure�for�the�range�below�5�percent�but�needs�to�reduce�the�percent�of�its�tariff�lines�that�fall�in�the�category�of�10–15�from�15.9�percent�to�6.7.�This�line�of�reasoning�is�misleading�as� the� table�below�does�not� indicate�whether�a� tariff� line�with�15�percent�tariff�has�to�be�reduced�to�below�10�percent�or�to�zero�percent.�Hence�in�the�section�we�will� examine� tariff� structure� of� each� country� and� its� distribution� among� different�products.�The�adjustment�is�to�be�more�severe�for�those�countries�which�have�a�higher�percent�of� tariff� lines� in� the�range�10�percent�and�more,�especially� if� they�differ� from�EU’s� sensitive�products.�The� following�section�gives�a�precise� idea�about� the� level�of�adjustment�required�in�the�tariff�profiles�of�SEE.��
The Level of Adjustment
In�this�section�we�analyze�in�detail�how�much�adjustment�would�be�required�for�each�country� in� the� region.� The� analysis� is� carried� out� at� 6�digit� product� level� using�UNCOMTRADE� TRAINS� database.� With� the� exception� of� Albania� and� Serbia,� all�countries� report� their� tariff� structure� according� to� HS07� classifications� as� the� EU.�Albania� and�Serbia�use�HS02�classification.�The�HS07�classification� renders�a� total�of�4330� products� and� tariffs� and� HS02� classification� has� more� product� categories� than�HS07�classification.� In�order�to�be�able�to�compare�EU’s�MFN�rate�at�HS�6�digit� level�we�only�used�the�products�that�matched�on�both�side�for�Albania�and�Serbia2.�Before�introducing�a�country�by�country�analysis�of�the�level�of�adjustment�required,�in�table�14.2� we� present� the� average� level� of� adjustment� required� to� adopt� the� CET� by�examining�pre��and�after�reform�simple�and�trade�weighted�average�tariffs.�
Among�the�six�countries,�Serbia�has�to�undertake�the�most�dramatic�change�to�its�tariff�structure�by�nature�of�its�high�protectionism.�Currently�in�Serbia�simple�average�tariffs�on�industrial� products� are� 8.8� percent,� with� a� trade�weighted� average� of� 8.0� percent.�
WP_185_web_1-11-10.pdf 123WP_185_web_1-11-10.pdf 123 1/11/2010 1:39:46 PM1/11/2010 1:39:46 PM

108 World Bank Working Paper
�
Table 14.2. Pre-Reform and After Reform Average and Weighted Tariffs
Old simple
average tariff New simple
average tariff Old weighted
tariff New weighted
tariff
SEE average 5.1 2.3 4.7 2.2 Albania 4.0 1.8 4.1 1.9 Bosnia and Herzegovina 6.4 2.8 5.9 2.7 Croatia 3.6 2.1 2.9 1.7 FYR Macedonia 5.9 2.7 5.7 2.7 Montenegro 2.0 0.7 1.4 0.5 Serbia 8.8 3.8 8.0 3.5
Source:�Author’s�calculations.�Note:�Average�tariffs�include�preferential�tariffs�as�well�as�MFN�tariffs.��After�the�adoption�of�EU’s�CET,�Serbia’s�simple�average�tariffs�will�be�reduced�to�3.8�percent� and� a� trade�weighted� average� of� 3.5� percent.� However,� even� after� the�adjustment�Serbia’s�average�tariffs�(both�simple�and�trade�weighted)�will�remain�to�be�the� highest� within� the� region.� This� is� simply� because� other� countries� have� a�considerably� higher� number� of� tariff� lines� that� are� duty�free,� hence� do� not� require�adjustment.�On�average�Bosnia�and�Herzegovina’s�simple�average� tariffs�will�decline�to� 2.8� percent� from� 6.4� percent� and� trade�weighted� tariffs� to� 2.7� percent� from� 5.9�percent.� In�order�of� the� level�of�adjustment�required�Bosnia�and�Herzegovina�will�be�followed�by�FYR�Macedonia,�Albania,�and�Croatia.�On�the�other�extreme,�Montenegro�has� the� lowest� average� tariffs� (2.0� percent� of� simple� average� and� 1.4� percent� trade�weighted� average)� and� will� further� achieve� even� lower� average� tariff� rates� that� are�close� to�one�percent.�The�after�reform�weighted� tariffs�will�be� lowest� in�Montenegro,�followed�by�Croatia,�Albania.�Bosnia�and�Herzegovina�and�FYR�Macedonia�will�have�an� after�reform� trade�weighted� average� tariff� similar� to� the� EU’s� MFN� rate,� while�Serbia’s�average�tariffs�will�remain�above�EU�average.�
In�the�remainder�of�this�section�a�detailed�analysis�of�the�level�of�adjustment�will�be� discussed� for� each� country� in� the� region.� Starting� with� Albania,� there� are� 4098�products�categories�that�matched�with�the�EU’s�tariff�profile.3�In�the�first�column�of�the�table� below,� to� give� an� idea� about� the� extent� of� adjustment� needed,� we� report� the�number�of�tariff�headings�that�have�be�zeroed�(that�is,�100�percent�reduction),�headings�where�tariffs�have�to�be�reduced�by�more�than�75�percent,�50–74�percent,�25–49�percent,�0–24�percent.�We�also�report�the�number�of�headings�that�require�no�change,�and�the�number�of� tariff�heading�where�EU’s�MFN�rates�are�higher� than� in� the�SEE�country.�Due� to� concern� on�WTO� compatibility,� especially� for� those� countries� that� are�WTO�members�(but�also�others�as�they�are�in�the�process�of�negotiation)�we�propose�that�the�tariff� headings� with� tariff� rates� lower� than� EU’s� MFN� rates� be� left� unchanged.�According� to� a�WTO� ruling� on� customs� union,� in� the� particular� case� of� Turkey,� the�appellate� body� concluded� that� any� customs� union,� to� be� WTO� compatible,� has� to�respect� GATT�Art.� XXIV� and� should� especially� ensure� that� it� is� not� erected� against�third�parties.�The�report�of�the�Appellate�body�stated:�“According�to�paragraph�4,�the�purpose�of� a� customs�union� is� “to� facilitate� trade”�between� the� constituent�members�and� “not� to� raise� barriers� to� the� trade”�with� third� countries.� This� objective�demands�that� a� balance� be� struck� by� the� constituent�members� of� a� customs�union.�A� customs�
WP_185_web_1-11-10.pdf 124WP_185_web_1-11-10.pdf 124 1/11/2010 1:39:47 PM1/11/2010 1:39:47 PM

Enhancing Regional Trade Integration in Southeast Europe 109
�
union�should�facilitate�trade�within�the�customs�union,�but�it�should�not�do�so�in�a�way�that�raises�barriers�to�trade�with�third�countries”�(WT/DS34/AB/R).��
Table� 14.3� summarizes� the� adjustment� requirement� of� Albania’s� tariff� structure.�Out� of�Albania’s� 4,098� tariff� headings,� 2,230� of� them�are� lower� than�EU’s�MFN� rate.�Since�there�is�very�little�overlap�between�Albania’s�and�EU’s�rate�(only�16�tariff�lines),�together� with� the� 2,230� tariff� headings� that� are� lower� than� EU’s� MFN� rate,� the�remaining�tariff�headings�that�require�some�level�of�adjustment�is�less�than�50�percent.�Among�those�tariff�headings�that�need�to�be�zeroed�(542�tariff�headings),�the�majority�(429)� of� them� are� already� in� the� low� tariff� bracket� ranging� between� non�zero� and� 5�percent.�On� the�other�hand,� there�are�60� tariff�headings� that�are� in� the� range�of�5–10�percent�and�53�in�the�range�of�10–15�that�need�to�be�brought�down�to�zero.�When�the�table� is� examined�by� columns,�one� can� see� that� there� are�more�numbers� of�headings�that� require� reduction� in� the� higher� tariff� categories.� For� example,� among� the� tariff�range�10–15�percent�(column�6),�53�heading�tariffs�need�to�be�abolished,�253�need�to�be�reduced�by�more�than�75�percent,�113�need�to�be�reduced�by�more�than�50�percent�(but�less�than�75�percent),�40�needs�to�be�reduced�by�more�than�25�percent�(but�less�than�50�percent),�and�180�need� to�be�reduced�by� less� than�25�percent.� In�summary,�Albania’s�external�tariff�structure�need�to�be�reduced�significantly,�as�761�tariff�headings�require�more�than�50�percent�reduction�fall�into�the�5+�percent�category.� Table 14.3. Albania: Adjustment to EU’s CET
Total tariff lines 0<=5 5<=10 10<=15 15<=25 >25
100 percent reduction 542 429 60 53 0 0 75–99 percent reduction 332 0 79 253 0 0 50–74 percent reduction 331 15 203 113 0 0 25–49 percent reduction 163 28 95 40 0 0 0–24 percent reduction 484 17 287 180 0 0 no reduction 16 14 2 0 0 0 No. heading where EU MFN is higher 2,230 Total 4,098
Source:�Own�calculations,�UN�COMTRADE�TRAINS.��
Bosnia�and�Herzegovina�uses�HS07�classification�as�the�EU,�hence�the�adjustment�will�cover�full�4330�tariff�headings.�There�are�1507�tariff�headings�that�do�not�require�adjustment� as� they� are� already� lower� than�EU’s�MFN� rates,� plus� the� 29� that� are� the�same�as�the�EU.�Unlike�in�Albania,�the�tariff�headings�in�the�range�10–15�require�less�of�an� adjustment:� only� 8� of� them� need� to� be� reduced� to� zero,� 41� of� them� need� to� be�reduced�by�more�than�75�percent,�43�need�to�be�reduced�by�more�than�50�percent,�but�the�majority�(almost�300)�need�to�be�reduced�by�less�than�50�percent�(table�14.4).�The�weight�of�adjustment�in�Bosnia�and�Herzegovina�will�largely�fall�on�the�tariff�heading�that� are� in� the� range� of� 5–10:�more� than� half� of� a� total� of� 1264� headings� have� to� be�reduced�by�more� than� 50�percent.�On� the�other�hand,� in� the� 0–5�percent� tariff� range�there�is�also�significant�reduction�within�the�range.��
WP_185_web_1-11-10.pdf 125WP_185_web_1-11-10.pdf 125 1/11/2010 1:39:47 PM1/11/2010 1:39:47 PM

110 World Bank Working Paper
�
Table 14.4. Bosnia and Herzegovina: Adjustment to EU’s CET Total tariff lines 0<=5 5<=10 10<=15 15<=25 >25
100 percent reduction 616 398 210 8 0 75–99 percent reduction 206 19 146 41 0 50–74 percent reduction 785 283 459 43 0 25–49 percent reduction 494 238 184 72 0 0–24 percent reduction 693 205 263 225 0 no reduction 29 27 2 0 0 No. heading where EU MFN is higher 1,507 Total 4,330
Source:�Own�calculations,�UN�COMTRADE�TRAINS.���
Croatia,� as� a� country� that� is� at� an� advanced� stage� of� negotiations� for� EU�membership,� needs� to� make� more� minor� adjustments� to� its� external� tariff� structure�(table�14.5).�First�of�all,�out�of�4330� tariff�headings,�2515�are� less� than�EU’s�MFN�rate�and� 407� are� exactly� the� same.� As� can� be� seen,� Croatia� has� already� been� making�preparations�for�membership�and�aligning�its�tariff�profile�towards�EU.�Among�the�407�tariff�heading�that�are�the�same�as�EU’s,�76�are�in�the�range�0–5,�310�are�in�the�range�5–10� and� 21� are� in� the� range� 10–15.� The� tariff� headings� that� need� to� be� abolished� are�mostly� in� the� category� 0–5� range,� however� there� are� still� 199� tariff� headings� in� the�range� 10–15� that� have� to� be� reduced� by�more� than� 50� percent.� But� in� summary� the�majority�of�the�adjustment�that�has�to�take�place�is�within�the�lower�tariff�ranges�and�by�about�25–75�percent.�� Table 14.5. Croatia: Adjustment to EU’s CET
Total tariff lines 0<=5 5<=10 10<=15 15<=25 >25 100 percent reduction 240 145 81 13 1 75–99 percent reduction 239 8 89 137 5 50–74 percent reduction 414 114 238 62 0 25–49 percent reduction 220 112 64 44 0 0–24 percent reduction 295 48 54 193 0 no reduction 407 76 310 21 0 No. heading where EU MFN is higher 2,515 Total 4,330 503 836 470 6
Source:�Own�calculations,�UN�COMTRADE�TRAINS.��
As�the�other�countries�in�the�region,�Macedonia�also�has�a�large�number�of�tariffs�that� are� less� than� EU’s� MFN� rate� (1969)� and� also� those� that� are� the� same� (56).� In�contrast�with� the�countries�examined�above,�Macedonia�has�a� large�number�of� tariffs�(376)�in�the�range�15–25�percent�(that�others�did�not�have)�that�all�have�to�be�reduced�(table� 14.6).� However,� the� heavy� weight� of� adjustment� will� fall� on� the� two� tariff�categories,� that� is,� 5–10� percent� with� 801� tariff� heading� and� 10–15� percent� with� 685�tariff�headings.�In�total,�there�are�316�tariffs�that�have�to�be�reduced�to�zero,�553�have�to�be� reduced� by� more� than� 75� percent� and� 699� have� to� be� reduced� by� more� than� 50�percent.�
WP_185_web_1-11-10.pdf 126WP_185_web_1-11-10.pdf 126 1/11/2010 1:39:47 PM1/11/2010 1:39:47 PM

Enhancing Regional Trade Integration in Southeast Europe 111
�
Table 14.6. Macedonia: Adjustment to EU’s CET
Total tariff lines 0<=5 5<=10 10<=15 15<=25 >25
100 percent reduction 316 93 115 98 10 – 75–99 percent reduction 553 4 88 394 67 50–74 percent reduction 699 100 207 123 269 25–49 percent reduction 290 130 79 52 29 0–24 percent reduction 447 159 269 18 1 no reduction 56 13 43 0 0 No. heading where EU MFN is higher 1,969 Total 4,330 499 801 685 376
Source:�Own�calculations,�UN�COMTRADE�TRAINS.�� Montenegro�in�general�has� lower� incidence�of� tariff�peaks�compared�to�Serbia�and�to�Macedonia.�There�are�only�30�tariff�headings�with�tariffs�in�the�range�of�15–25�percent,�out� of� which� 13� have� to� be� completely� abolished� and� the� remaining� 17� have� to� be�reduced� by� 75� percent.� This� indicates� that� those� tariffs� of�Montenegro�were� not� the�same�sensitive�products�as�EU’s.� In� fact,�Montenegro�has�only�98� tariff�headings� that�are�the�same�as�EU’s�and�29�of�them�are�in�the�range�0–5�range�and�67�are�in�5–10�range��(table�14.7).�Unlike�other�countries,�Montenegro�has� large�number�of� tariff�headings� that�have�to�be�reduced�to�zero:�out�of�1046�heading�that�have�to�be�reduced�to�zero,�890�fall�in�the� range�of� 0–5�percent,� 109� into� 5–10� range,� 34� in� 10–15� range� and�13� in� 15–25� range.�� Table 14.7. Montenegro: Adjustment to EU’s CET
Total tariff lines 0<=5 5<=10 10<=15 15<=25 >25
100 percent reduction 1,046 890 109 34 13 – 75–99 percent reduction 103 10 62 14 17 50–74 percent reduction 348 126 206 16 0 25–49 percent reduction 314 220 91 3 0 0–24 percent reduction 239 162 77 0 0 no reduction 98 29 67 0 0 No. heading where EU MFN is higher 2,182 Total 4,330 1437 612 67 30
Source:�Own�calculations,�UN�COMTRADE�TRAINS.���In�general� the�majority�of�adjustment� is�going� to� take�place� in� the�0–5�percent� range:�1,408� tariff� headings�have� to� be� reduced� at� various�degrees.�There� are� also� 545� tariff�headings� in� the� range� 5–10� percent� that� have� to� be� reduced� as� well.� The�weight� of�adjustment� in�Montenegro�will� fall� largely� on� these� two� tariff� categories,� that� is,� 0–5�and� 5–10� percent� and� they�will� have� to� be� reduced� by�more� than� 25� percent�mostly�(with�the�exception�of�999�headings�that�have�to�be�brought�down�to�zero).��
Serbia�uses�the�HS02�classification�for�its�tariff�headings�and�a�similar�adjustment�as�was� done� before� for�Albania� to�make� it� comparable� to� the� EU’s�CET� (table� 14.8).�Hence�we�ended�up�with�somewhat�less�than�4,330�headings�for�our�analysis�(that�is,�4,098).� Serbia� stands� out� among� the� SEE� countries� as� having� the� most� protectionist�tariff�structure:�it�has�in�total�529�tariff�headings�in�access�of�10�percent,�with�350�falling�
WP_185_web_1-11-10.pdf 127WP_185_web_1-11-10.pdf 127 1/11/2010 1:39:47 PM1/11/2010 1:39:47 PM

112 World Bank Working Paper
�
in� the� category�15–25�percent�and�13� in�excess�of� 25�percent.�Across� all� categories� in�Serbia,� 1,001� tariff� headings� will� have� to� be� abolished� to� adopt� EU’s� CET.� As� the�majority�of� tariff�headings�are� in� the�0–5�and�5–10�percent�range�there�are�significant�adjustment�required�in�the�lower�percentages�as�well.���Table 14.8. Serbia: Adjustment to EU’s CET
Total tariff lines 0<=5 5<=10 10<=15 15<=25 >25
100 percent reduction 1,001 783 172 31 15 0 75–99 percent reduction 239 7 119 54 47 12 50–74 percent reduction 560 114 346 50 49 1 25–49 percent reduction 500 159 66 42 233 0 0–24 percent reduction 505 214 271 14 6 0 no reduction 28 22 6 0 0 0 No. heading where EU MFN is higher 1,265 Total 4,098
Source:�Own�calculations,�UN�COMTRADE�TRAINS.���
Table� 14.9� shows� which� product� categories� are� more� protected� in� Albania.�Clothing,� leather,� footwear,� etc.� and� textiles�are� the�most�protected� sectors�where� for�example�the�average�MFN�rate�for�clothing�is�15�percent,�with�no�lines�that�are�duty–free.� Leather,� footwear,� etc.� and� textiles� have� average� MFN� applied� duties� of� 10.8�percent�and�7.8�percent�with�only�3.3�percent�and�0.3�percent�of�tariff� lines�duty�free,�respectively.�Petroleum�is�also�a�protected�sector�with�9.2�percent�average�MFN�(with�maximum�of�10�percent)�and�no�lines�duty�free.�Manufactures,�n.e.s.�and�minerals�and�metals� are� also� relatively� protected� sectors.� In� fact� one� can� see� that� all� product�categories�have�tariff�peaks�ranging�between�10�and�18�percent.�As�one�would�expect,�those�products�that�have�a�lower�average�MFN�tariff�constitute�a�larger�percent�of�total�imports:�chemicals,�non�electrical�and�electrical�machinery.�Minerals�and�metals�are�an�exception.���Table 14.9. Albania: Tariffs and Imports by Product Groups
Product groups
MFN applied duties
Max Imports
share in % Duty-free
in % AVG Duty-free
in % Minerals & metals 6.0 16.5 18 21.2 15.9 Petroleum 9.2 0 10 6.5 0 Chemicals 1.7 47.8 15 9.4 41.3 Wood, paper, etc. 0.3 95.4 15 4.2 98 Textiles 7.8 0.3 15 5.9 0.4 Clothing 15.0 0 15 5.6 0 Leather, footwear, etc. 10.8 3.3 15 4.1 0.1 Non-electrical machinery 1.6 32.7 10 10.2 31.2 Electrical machinery 3.6 39.9 10 7.4 32.8 Transport equipment 4.1 27.7 15 6.0 2.9 Manufactures, n.e.s. 7.0 34.7 15 3.4 52.0
Source:�WTO�tariff�profile�2008.��
WP_185_web_1-11-10.pdf 128WP_185_web_1-11-10.pdf 128 1/11/2010 1:39:47 PM1/11/2010 1:39:47 PM

Enhancing Regional Trade Integration in Southeast Europe 113
�
In�Bosnia�and�Herzegovina,�with�the�exception�of�petroleum�and�chemicals,�high�tariff� rates� are� pervasive� in� all� product� categories� (table� 14.20).� By� far� the� most�protected�products�are� textiles�and�clothing�as� in�Albania.�Besides� these� two�product�categories�average�MFN�rates�range�between�5�percent�in�minerals�and�metals�to�7.9�in�leather,�footwear,�etc.,�with�a�tariff�peak�of�105�percent�in�minerals�and�metals.���Table 14.20. Bosnia and Herzegovina: Tariffs and Imports by Product Groups
Product groups
MFN applied duties
Max Imports
Share in % Duty-free
in % AVG Duty-free
in % Minerals & metals 5.0 35.1 105 18.2 35.2 Petroleum 1.6 83.6 10 8.2 62.1 Chemicals 3.3 50.1 15 12.2 21.6 Wood, paper, etc. 5.6 27.9 15 5.0 19.4 Textiles 9.0 4.5 15 4.5 0.8 Clothing 15.0 0 15 2.1 0 Leather, footwear, etc. 7.9 19.2 15 4.0 3.1 Non-electrical machinery 6.0 12.9 15 11.8 6.3 Electrical machinery 6.7 21.6 15 5.8 10.4 Transport equipment 5.7 25.5 15 7.9 6.5 Manufactures, n.e.s. 6.4 21.6 15 4.2 43.8
Source:�WTO�tariff�profile�2008.��
Croatia�has�a�different� tariff�structure�when�compared� to� the�countries�discussed�above� (table� 14.21).� Although� it� has� tariff� peaks� reaching� as� high� as� 18� percent� (for�example,� in�minerals� and�metals� and�manufactures)� it� has� a� higher� percent� of� tariff�lines� that� are� duty�free� under� each� product� category.� As� Albania� and� Bosnia� and�Herzegovina,� the� most� protected� sector� in� Croatia� is� also� textiles� and� clothing.�Chemicals,� wood,� paper,� etc.,� non�electrical� and� electrical� machinery,� manufactures,�n.e.s.�and�minerals�and�metals�are�imported�mostly�in�duty�free�lines.���Table 14.21. Croatia: Tariffs and imports by Product Groups
Product groups
MFN applied duties
Max Imports
Share in % Duty-free
in % AVG Duty-free
in %
Minerals & metals 3.7 57.2 18 17.8 61.4 Petroleum 9.8 23.5 14 11.1 79.2 Chemicals 1.3 77.8 7 12.2 57.4 Wood, paper, etc. 1.4 74.4 12 5.7 54.9 Textiles 6.5 16.7 14 3.1 14.5 Clothing 13.2 1.4 14 2.2 1.2 Leather, footwear, etc. 4.6 43.4 15 2.7 37.4 Non-electrical machinery 3.0 61.5 15 12.7 64.5 Electrical machinery 3.6 61.2 15 4.8 62.4 Transport equipment 6.1 28.3 15 13.5 24.6 Manufactures, n.e.s. 3.2 63.8 18 5.1 76.0
Source:�WTO�tariff�profile�2008.�
WP_185_web_1-11-10.pdf 129WP_185_web_1-11-10.pdf 129 1/11/2010 1:39:48 PM1/11/2010 1:39:48 PM

114 World Bank Working Paper
�
Macedonia� has� higher� average�MFN� rates� in� all� product� categories� compared� to�other�WTO�members�Albania�and�Croatia�(14.22).�The�average�MFN�rate�in�clothing�is�25�percent�with�no� lines�duty�free.�Petroleum,� leather,� footwear,� etc.,� and� textiles�are�also�highly�protected.�The�only�product�categories�that�have�low�tariffs�on�average�are�chemicals�and�wood,�paper,�etc.,�minerals�and�metals�and�non�electrical�machinery.���Table 14.22. FYR Macedonia: Tariffs and Imports by Product Groups
Product groups
MFN applied duties
Max Imports
Share in % Duty-free
in % AVG Duty-free
in %
Minerals & metals 5.6 47.3 23 17.8 66.5 Petroleum 14.1 6.7 20 18.5 96.9 Chemicals 3.5 37.7 25 10.4 29.4 Wood, paper, etc. 2.9 75.7 18 3.5 67.3 Textiles 9.1 11.5 25 11.5 6.9 Clothing 25.0 0.0 25 1.8 0.0 Leather, footwear, etc. 10.4 22.6 25 2.6 7.4 Non-electrical machinery 5.4 44.5 16 8.4 53.9 Electrical machinery 8.0 33.9 25 2.4 23.8 Transport equipment 7.1 23.9 20 7.5 4.4 Manufactures, n.e.s. 7.1 31.6 25 4.0 65.4
Source:�WTO�tariff�profile�2008.� �
Montenegro�is�different�than�the�other�countries�discussed�so�far.�Its�average�MFN�rates� are� low;� however,� the� number� of� tariff� lines� that� are� duty�free� within� each�product�category�are�also�low�(table�14.23).�Simply�put�Montenegro�has�very�few�tariff�lines�that�are�duty�free�as�was�indicated�in�table�14.1.��
�Table 14.23. Montenegro: Tariffs and Imports by Product Groups
Product groups
MFN applied duties
Max Imports
Share in % Duty-free
in % AVG Duty-free
in %
Minerals & metals 4.2 2.9 20 No Petroleum 2.2 3.4 10 information Chemicals 1.3 2.3 3.7 available Wood, paper, etc. 4.4 1.2 15 Textiles 3.6 1.4 15 No Clothing 10.0 0 10 information Leather, footwear, etc. 6.3 0 15 available Non-electrical machinery 2.7 0.5 15 Electrical machinery 1.9 0.2 7 No Transport equipment 2.0 14.8 10 information Manufactures, n.e.s. 5.2 0.6 25 available
Source:�WTO�tariff�profile�2008.��
WP_185_web_1-11-10.pdf 130WP_185_web_1-11-10.pdf 130 1/11/2010 1:39:48 PM1/11/2010 1:39:48 PM

Enhancing Regional Trade Integration in Southeast Europe 115
�
Tariff� peaks� are� highest� in� manufactures,� n.e.s.� (25� percent)� and� petroleum� (20�percent)� but� on� average� only� 5.2� and� 4.2� percent� respectively.� Like� the� other� WB�countries,�clothing�is�the�most�protected�product�category,�and�leather,�footwear,�etc.�to�a� lesser� extent.� Unlike� others,� average� MFN� rates� for� textiles� are� only� 3.6� percent.�Average�MFN�rates�in�petroleum,�chemicals,�wood,�paper,�etc.,�textiles,�non�electrical,�electrical�machinery,�transport�equipment�are�all�below�5�percent.��
Serbia�as�well�as�others�has�clothing,�textiles�and�leather,�footwear,�etc.�as�its�most�protected� sectors� (table� 14.24).� Besides� these� three� product� categories,� average�MFN�rates� for� minerals� and� metals,� petroleum,� chemicals,� wood,� paper,� etc.� and� non�electrical�machinery�are�all�below�5�percent.�On�the�other�hand,�electrical�machinery,�transport� equipment� and� manufactures,� n.e.s.� have� tariff� above� 5� percent.� As� in�Montenegro,�Serbia�has�very�few�tariff�lines�that�are�tariff�free.��
UNMIK�Kosovo�has�adopted�its�Integrated�Tariff�(TARIK)�in�2005.�It�consists�of�a�Goods�Nomenclature�based�on�the�HS�of�the�World�Customs�Organization�and�on�the�Combined�Nomenclature�of�the�EC.�The�tariffs�for�each�tariff�line�are�either�zero�or�10�percent.�Average�MFN�applied�tariffs�on�industrial�products�are�8.2�percent,�which�is�higher�than�average�rate�for�agricultural�goods�(7.2�percent).�Average�tariffs�for�textiles�in�Kosovo�are�6.31�percent� (HS�code�11),� 9.74�percent� for� footwear� (HS�code�12)�and�9.54�percent�for�mineral�products�(HS�05).�Average�tariffs�are�lower�for�plastics,�rubber,�etc.� (HS�code�07),� raw�hides�and�skin,�etc.� (HS�code�08),�and�for�pulp�and�paper� (HS�code�10).�� Table 14.24. Serbia: Tariffs and Imports by Product Groups
Product groups
MFN applied duties
Max Imports
Share in % Duty-free
in % AVG Duty-free
in % Minerals & metals 4.9 2.7 30 23.1 1.0 Petroleum 2.1 4.7 10 12.7 2.3 Chemicals 3.3 1.0 30 13.4 2.5 Wood, paper, etc. 4.9 0 20 5.7 0 Textiles 9.2 1.9 30 3.6 1.0 Clothing 20.4 0 22 1.8 0 Leather, footwear, etc. 8.6 0 30 2.9 0 Non-electrical machinery 4.6 0 20 11.7 0 Electrical machinery 6.9 0.2 15 5.6 0 Transport equipment 5.3 5.6 20 8.1 0.1 Manufactures, n.e.s. 5.8 0.2 25 3.9 0
Source:�WTO�tariff�profile�2008.��
Finally,�examining�the�EU’s�tariff�profile,�one�can�see�that�clothing,�textiles,�footwear�are� also� sensitive� product� categories� (table� 14.25).� Although� average�MFN� for� transport�equipment�is�4.1,�there�is�a�tariff�peak�of�22�percent�in�this�sector,�and�only�15.7�percent�of�tariff�lines�are�tariff�free.�Albania�will�see�its�largest�adjustment�in�the�minerals�and�metals,�petroleum�and�manufactures�n.e.s.;�Bosnia�and�Herzegovina�in�all�except�in�petroleum�and�chemicals;�Croatia�in�all�except�in�chemicals,�textiles�and�footwear;�Macedonia�in�
WP_185_web_1-11-10.pdf 131WP_185_web_1-11-10.pdf 131 1/11/2010 1:39:48 PM1/11/2010 1:39:48 PM

116 World Bank Working Paper
�
almost�all�with�exceptionally�high�adjustment�in�petroleum,�clothing,�leather,�footwear,�etc.,�electrical�machinery,�transport�equipment�and�manufactures,�n.e.s.;�Montenegro�in�wood,� paper,� etc.,� leather,� footwear,� etc,� and� manufactures;� Serbia� in� all� except�chemicals.�Montenegro�is�the�only�country�in�SEE�to�have�a�lower�average�MFN�rate�in�clothing�and�textiles�compared�to�the�EU.���Table 14.25. EU: Tariffs and Imports by Product Groups
Product groups
MFN applied duties
Max Imports
share in % Duty-free
in % AVG Duty-free
in % Minerals & metals 2.0 49.6 12 17.4 70.8 Petroleum 2.0 50.0 5 21.7 96.4 Chemicals 4.6 20.0 7 9.6 60.5 Wood, paper, etc. 0.9 84.1 10 3.1 90.3 Textiles 6.5 3.4 12 2.4 1.9 Clothing 11.5 0 12 4.8 0 Leather, footwear, etc. 4.2 27.8 17 2.5 19.6 Non-electrical machinery 1.7 26.5 10 13.1 67.6 Electrical machinery 2.4 31.5 14 6.3 39.5 Transport equipment 4.1 15.7 22 6.1 22.9 Manufactures, n.e.s. 2.5 25.9 14 6.3 56.8
Source:�WTO�tariff�profile�2008.�
Notes�1�Montenegro�is�in�the�final�stage�of�becoming�a�member.�2�The�differences�in�HS07�and�HS02�tariff�headings�were�examined�carefully.�Usually,�those�tariff�headings�that�exist�for�Albania�or�Serbia�but�not�for�the�EU�were�the�ones�where�EU�trade�was�negligible.�For�simplicity�we�suggest�that�Albania�and�Serbia�adopt�CET�only�on�those�products�that�are�commonly�traded.�3�This�number�corresponds�to�the�number�of�tariff� lines�that�were�matched�in�different�product�classifications�as�mentioned�before.�
WP_185_web_1-11-10.pdf 132WP_185_web_1-11-10.pdf 132 1/11/2010 1:39:48 PM1/11/2010 1:39:48 PM

117
CHAPTER �15 �
Estimates�of�Trade�Diversion��and�Trade�Creation�Due�to�
Adoption�of�EU’s�CET�
n�this�section�we�will�present�simulation�results�quantifying�the�impact�of�adopting�the�EU’s�CET�for�each�country.�Using�partial�equilibrium�analysis�(that�is,�the�WITS�
SMART� model),� we� estimate� trade� diversion� and� creation,� welfare� and� revenue�changes� for� each� country� in� the� region.�As�will� be�presented� below� in� greater� detail�adopting�the�EU’s�CET�for�industrial�products�(HS�2�digit�codes�25–97)�and�applying�these� new� rates� against� all� countries� in� the�world� (with� the� exception� of� partners� of�SEE’s�preferential� agreements)� is� for� all� practical�purposes� a�unilateral� liberalization.�As� mentioned� above,� this� move� towards� trade� openness� will� have� two� significant�effects:�one�on�reducing�trade�diversion�from�preferential�trade�partners�of�the�region�to�more�efficient�producers�(countries),�and�a�second�effect�on�trade�creation�from�third�countries.��
The� choice� of� partial� equilibrium� model� of� SMART� is� manifold.� Recently�computable�general�equilibrium�(CGE)�models�have�become�popular�in�estimating�the�reaction�of�an�economy�to�changes�in�trade�policy.�Even�though�CGE�models�are�more�comprehensive�(since�they�factor�in�not�only�direct�effects�of�a�policy�change�but�also�secondary/indirect� effects� such� as� inter�industry� effects� and� macroeconomic�adjustment)�than�partial�equilibrium�models,�they�suffer�from�data�availability�as�they�are�more�data�demanding.�As�such�the�required�data�to�run�CGE�models�only�exist�for�Albania�and�Croatia�in�the�GTAP�database.�Although�CGE�models�estimate�impact�on�output,�employment,�as�well�as�exports�and�imports�at�a�sectoral�level,�they�have�been�heavily� criticized� on� theoretical� grounds.� On� the� other� hand,� partial� equilibrium�models�such�as�SMART�can�deliver�estimates�of�trade�diversion�and�creation,�as�well�as�change� in� revenue� and� consumer�welfare� at� a�highly�disaggregate� level� that�may�be�more�useful�for�policy�makers.��
The�partial�equilibrium�model�of�SMART�which�was�developed�by�UNCTAD�and�the� World� Bank� relies� on� several� assumptions.� First,� SMART� assumes� a� perfect�competition�model;�hence�a�tariff�cut�is�fully�reflected�in�the�price�paid�by�consumers.�The� simulations� are� then�based�on�estimates�of� supply� elasticity,� import� substitution�elasticity�and�import�demand�elasticity.�In�the�model,��
I�
WP_185_web_1-11-10.pdf 133WP_185_web_1-11-10.pdf 133 1/11/2010 1:39:48 PM1/11/2010 1:39:48 PM

118 World Bank Working Paper
�
� Supply�elasticities�are�assumed�to�be�infinite�(=99).�This�means�that�an�increase�in� demand� for� a� given� good�will� always� be�matched� by� the� producers� and�exporters� of� that� good� without� any� impact� on� the� price� of� the� good.� This�assumption� is�reasonable�when�the� importer� is�a�small�country,� for�example,�like�the�SEE�countries,�and�the�exporter�is�rest�of�the�world�(that�is,�large).�
� Import� substitution� elasticity� is� the� rate� of� substitution� between� two� of� the�same�good�from�different�origins.�The�Armington�assumption�is�incorporated�in� SMART,� meaning� that� similar� goods� from� different� countries� are�imperfectly� substitutable.� In� SMART� the� import� substitution� elasticity� is�considered� to� be� 1.5� for� each� good.� As� tastes� and� preferences� also� play� a�significant�role�in�international�trade�this�assumption�is�reasonable.�
� Import�demand�elasticity�measures�the�demand�response�to�a�shift� in�import�price.�In�SMART,�the�import�demand�elasticity�varies�at�the�HS�4�level�and�is�based�on�a�survey�by�Stern�in�“price�elasticities�in�international�trade.”��
As�indicated�above,�all�countries�in�the�SEE�region�were�offered�SAA�and�they�all�signed�and�started�implementing�the�Interim�Agreement�on�trade,�with�the�exception�of�Kosovo�and�Serbia.�As�Kosovo�is�not�yet�signed�its�SAA,�it�will�be�left�out�of�further�analysis.� Since� the� latest�data� available� on� tariffs� in�WITS� is� from�2008,1� for�Albania,�Bosnia�and�Herzegovina,�Montenegro�and�Serbia�the�tariffs�have�not�yet�been�adjusted�for� the� first� phase� of� tariff� reductions� with� the� EU.� Hence,� much� of� the� analysis�involves� not� only� the� impact� of� adopting� EU’s� CET� but� also� tariff� liberalization�towards�the�EU.�As�all�SEE�countries�in�the�region�have�signed�preferential�agreements�with� the� EU� and�within� the� region� (CEFTA),� this� indicates� that�most� of� the� trade� is�duty�free.� Hence� the� trade� creation� effects� of� EU’s� CET� can� be� expected� to� be� only�moderate,� whereas� some� trade� diversion� may� be� expected� away� from� preferential�trade�partners� to�more�efficient�producers� in� the�world.�Such�trade�diversion�may�be�considered�a�positive�outcome�as�consumers�can�access�the�same�goods�and�pay�less.�This� kind� of� trade� diversion� in� fact� corrects� for� the� negative� trade� diversion� that� is�usually�created�when�an�FTA�is�established.��
Table�15.1�summarizes�the�effects�of�adopting�EU’s�CET�on�the�region�and�for�each�of� the�countries� in� the� region�and�divides� them� into� its�effect�on� total� trade,� revenue�and�the�consumer�surplus.�The�total�trade�effect�is�the�net�effect�from�trade�diversion,�trade�creation�and�price�effect�(that�is,�terms�of�trade).�Trade�diversion�effect�refers�to�trade�diverted�towards�the�FTA�partners.�In�this�case,�as�the�adoption�of�EU’s�CET�is�applied� to� all� countries� in� the� world� (less� any� FTA� partners� of� the� region),� the�beneficiaries�of�this�unilateral�move�are�practically�all�countries�in�the�world�minus�the�EU�and�CEFTA�(for�them�the�new�tariffs�are�zero�for�all�industrial�goods).2�Hence�the�simulation�results�have�all�the�features�of�a�virtual�customs�union�with�the�EU,�as�they�include�the�impact�of�completion�of�tariff�liberalization�schedules�with�the�EU�plus�the�implementation� of� the�CET.3� Since� trade� liberalization�will� apply� to� all� countries� the�overall�trade�diversion�effects�cancels�out�as�there�are�some�losers�and�some�winners.�In�other�words,�when�Albania�reduces�its�tariffs�on�a�given�product�from�15�percent�to�1.7�percent�(EU’s�MFN),�Albania’s�preferential�partners�observe�a�preference�erosion�as�more�efficient�non�preferential�partners�gain�access� to�Albania.�Trade�creation� in� this�model�refers�to�trade�creation�for�both�the�SEE�countries�and�the�partners�(that� is,�all�
WP_185_web_1-11-10.pdf 134WP_185_web_1-11-10.pdf 134 1/11/2010 1:39:48 PM1/11/2010 1:39:48 PM

Enhancing Regional Trade Integration in Southeast Europe 119
�
countries).�The�price�effect�is�the�effect�of�the�change�in�term�of�trade�due�to�the�change�in�the�tariff�of�a�given�country.�In�this�simulation�the�price�effect�is�zero�since�we�use�export� supply� elasticity� equal� to� infinity.� This� translates� into� claiming� that� the� SEE�countries�are�price�takers,�or�in�other�words�too�small�to�have�any�impact�on�the�world�unit�price�of�a�product.4� In�summary� the� total� trade�effect� for�a�given�country� in� this�simulation� is� the� net� effect� of� trade� creation� and� trade� diversion� across� all� product�categories.���Table 15.1. Summary of Simulation Results (US$ millions)
Pre-reform Imports
Total Trade Creation
Change in Revenue
Consumer Surplus
Net effect of CET
SEE Total 23,442.7 998.9 –459.7 51.7 590.9 Albania 2,106.8 50.2 –26.2 0.9 24.9 Bosnia and Herzegovina 4,446.6 253.7 –120.8 12.7 145.6 Croatia 7,703.6 93.3 –46.4 2.7 49.6 FYR Macedonia 2,067.9 81.6 –67.0 3.6 18.2 Montenegro 694.9 10.2 –5.1 0.2 5.3 Serbia 6,422.9 509.9 –194.2 31.6 347.3
Source:�Various�country�sources,�WDI.��
The�above�table�shows�in�the�first�column�the�total�imports�of�SEE�from�the�world�before� the� implementation� of� the� EU’s�CET.5� The� second� column� of� the� table� shows�simulation� results� of� total� trade� effect� which� comes� from� trade� creation,� the� third�column�returns�the�total�reduction�in�revenue�from�trade�liberalization�and�the�fourth�column�gives�estimates�of� consumer�surplus�and� the� final� column� is� the�net�effect�of�CET� (that� is,� addition� of� total� trade� creation� plus� change� in� revenue� and� consumer�surplus).�Consumer�surplus� in�this�model�refers�to�the�change�in�deadweight� loss:�as�the�economy�looses� in�terms�of�welfare�by�imposing�a� tariff�on�the� imported�good,� it�incurs� a� deadweight� loss.�When� the� tariff� is� reduced� the� economy� as� a�whole� gains�from� additional� tariff� revenue� from� increased� imports� and/or� from� additional�consumer�surplus�by�increased�imports.�
As�can�be�seen�the�total�trade�creation�in�the�region�is�positive�and�it�represents�an�increase�of�US$998.9�million� in� imports� to� the� region,� and�an�average� increase�of� 4.2�percent�from�pre�reform�levels.�As�total�pre�reform�imports�into�the�region�constitutes�40� percent� of� the� region’s� GDP,� this� increase� is� rather� significant� and� represents� an�increase� of� 1.7� percent� of� GDP.6� Implementing� CET�will� increase� most� dramatically�imports� into� Serbia,� by�US$509.9�million,� an� increase� of� 7.9� percent� from�pre�reform�level.�Trade�creation�effect�is�also�high�for�Bosnia�and�Herzegovina,�with�an�increase�of�US$253.7�million,�a�5.7�percent�increase.�In�order�of�significance,� imports�into�Croatia�will�increase�by�US$93.3�million,�FYR�Macedonia�by�81.6�million,�Albania�by�US$50.2�million� and� by� US$10.2� million� to� Montenegro.� These� results� are� in� line� with�expectations�as�the�most�protectionist�country�in�the�region�will�benefit�the�most�from�trade�liberalization�(that�is,�Serbia)�and�the�least�protectionist�will�benefit�the�least�(that�is,�Montenegro).��
WP_185_web_1-11-10.pdf 135WP_185_web_1-11-10.pdf 135 1/11/2010 1:39:49 PM1/11/2010 1:39:49 PM

120 World Bank Working Paper
�
Naturally,� tariff� liberalization� is�going� to� reduce� revenue� from�customs�duties� in�the� region.� This� effect� amounts� to� a� decrease� of�US$459.7�million� SEE� countries� as� a�whole,� that� is,�53�percent�reduction�on�pre�reform�levels� (roughly�1�percent�of�GDP).�The� tariff� revenue� change� is� the� net� effect� from� two� opposite� effects:� (i)� the� tariff�revenue� lost� at� constant� import� value,� which� correspond� to� a� transfer� from� State� to�consumers�(ii)�a�tariff�revenue�gain�through�the�increase�in�imports�which�enlarges�the�tax�base.�As�the�model�assumes�an�import�demand�elasticity�that�implies�that�gains�are�less�than�losses�SMART�returns�negative�values�in�most�cases.�The�largest�revenue�loss,�as� can� be� expected,� will� be� in� Serbia� (US$194.2� million),� followed� by� Bosnia� and�Herzegovina� (US$120.8� million),� then� by� FYR� Macedonia� (US$67� million),� Croatia�(US$46.4� million),� Albania� (US$26.2� million)� and� Montenegro� (US$5.1� million).�However,� the�overall� fiscal� impact�of� the�revenue�loss�for�each�country�differs� in� line�with� the� level� of� dependency� on� customs� duties� for� revenue.� As� table� 15.2� shows,�Bosnia� and�Herzegovina�has� the�highest� rate� of� customs� and�other�duty� to� taxes� (18�percent),�followed�by�Albania�(10�percent),�Montenegro�(9.7�percent),�FYR�Macedonia�(9.2�percent),�Serbia�(6.5�percent)�and�Croatia�(2.7�percent).�Clearly,�Croatia�will�be�the�least�affected�country�in�the�region�as� its� tax�base� is�well�diversified�even�though�the�reduction� in� revenue�amounts� to�37�percent�of�pre�reform� levels.�On� the�other�hand,�both�Albania�and�Bosnia�and�Herzegovina�will�face�a�52�percent�reduction�in�revenue�and�therefore�these�two�countries�will�be�the�largest�hit�if�they�cannot�take�measures�to�diversify� their� tax�base.� FYR�Macedonia� and�Montenegro�are� also�going� to�be� facing�significant�losses�as�the�change�in�revenue�amounts�to�a�67�percent�cut�in�revenue�for�both.�Although�Serbia� is�going� to� lose� the� largest� amount� in�dollar� terms,� in� relative�terms� it� will� be� less� affected� when� compared� to� the� four� SEE� countries� mentioned.�These� results� are� based� on� observations� of� the� latest� years� data� are� available� for� a�breakdown�of�government�revenue,�and�hence�do�not�take�into�account�the�volatility�of�the� ratios.� For� example,�WDI�data� indicate� that� Serbia� has� generated� 11� percent� of� its�taxes�from�import�tariffs�in�2007,�as�opposed�to�6.5�percent�in�2008.�This�adds�uncertainty�into�our�analysis�and�hence�these�results�may�only�be�interpreted�with�caution.�� Table 15.2. Tariff Revenue in SEE (LCU million)
Country Revenues Taxes
Customs and other import
duties TR/Taxes (%)
Albania 13,871.7 10.0 Bosnia and Herzegovina 546.5 18.0 Croatia 120,036.7 69,572.7 1,900.9 2.7 Serbia (in billion RSD) 1,145.9 1,000.3 64.8 6.5 FYR Macedonia 144,705.0 80,639.0 7,420.0 9.2 Montenegro (€ million) a 774,718,974.0 690,880,722.1 67,151,545.3 9.7 Kosovo 1,033,145.0 805,030.0 604,196.0 75.1
Source:�various�country�sources,�WDI.��a.�figures�are�extrapolated�from�based�on�10�month�figures�to�annual�(2007).�Albania�and�Bosnia�and�Herzegovina�figures�are�from�2004,�others�are�from�2008.��
WP_185_web_1-11-10.pdf 136WP_185_web_1-11-10.pdf 136 1/11/2010 1:39:49 PM1/11/2010 1:39:49 PM

Enhancing Regional Trade Integration in Southeast Europe 121
�
Finally� the� total� consumer� surplus� that� will� be� generated� after� the� reform� will�amount�to�US$51.7�million,�equivalent�to�0.1�percent�of�GDP.�The�consumer�surplus�is�modest�indicating�that�for�several�of�the�main�trade�partners�of�SEE�countries�FTAs�are�already�in�place�and�hence�trade�is�conducted�duty�free.�Serbia�is�to�receive�the�largest�share� in� consumer� surplus,� 61� percent� of� the� total,� followed� by� Bosnia� and�Herzegovina� that�will� receive� 25�percent.� The� rest�will� gain� only� small� shares� of� the�total�consumer�surplus�in�the�region,�ranging�from�a�zero�percent�for�Montenegro�to�7�percent� for� FYR�Macedonia.� The� simulation� results� provide� a� 6�digit� breakdown� of�consumer�surplus�for�each�country.�Since�the�overall�effect�of�the�gains�from�consumer�surplus�is�low,�we�refer�the�reader�to�Appendix�1�for�details.��
The�net�effect�of�adopting�EU’s�CET�is� the�cumulative�effect� from�trade�creation,�revenue� change� and� consumer� surplus.� This� net� effect� amounts� to� US$590.9�million�(approximately�1�percent�of�GDP)�for�the�SEE�countries�as�a�region.�Individually,� the�net�effect�is�going�to�be�higher�for�Serbia�and�reach�2.8�percent�of�GDP.�The�overall�net�effect�of�the�customs�union�is�also�going�to�be�significant�for�Bosnia�and�Herzegovina,�and�will�amount�to�1.9�percent�of�GDP.�On�the�other�hand,�Croatia�is�going�to�gain�0.2�percent� of� GDP,� FYR� Macedonia,� and� Montenegro� 0.4� percent� of� GDP� each� and�Albania�is�going�to�gain�only�0.5�percent�of�GDP.��
Breakdown of Trade Diversion and Creation among Trade Partners
In�this�section�we�will�examine�in�detail�the�impact�of�adopting�EU’s�CET�on�exports�of�SEE� trade� partners.� As� discussed� above,� the� theoretical� implication� of� such� a� trade�reform�would�mean� that� some� trade�partners�will� export�more� to� SEE� (that� is,� trade�creation)�due� to� increased�market�accessibility,�while�some�trade�partners�will�export�less� due� to� preference� erosion.� Theoretically,� trade� creation� is� seen� as� a� positive�outcome�of� trade� liberalization�as�more�efficiently�produced�goods�gain�access� to� the�domestic� market.� Some� of� the� new� trade� created�may� replace� domestic� production.�This� can� also� be� seen� as� a� positive� aspect� of� the� preferential� agreement� as� domestic�resources�are�free�up�to�be�used�in�a�more�productive�way�(that�is,�efficiency�gains).�On�the�other�hand,�there�are�two�types�of�trade�diversion.�First�trade�may�be�diverted�in�favour� of� a� FTA� partner,� even� though� the� goods�may� be� produced�more� efficiently�somewhere� else.� The� second� type� of� trade� diversion� happens� when� the� trade� is�diverted�from�an�existing�FTA�partner�to�an�third�party�due�to�preference�erosion.�This�type�of�trade�diversion�is�considered�positive.�In�the�case�of�EU�SEE�customs�union,�we�may� expect� to� see� trade� creation� and� trade� diversion� that� is� positive.� As� the� SEE�countries�have�already�signed�FTA�with�the�EU,�and�with�other�parties,�adopting�CET�will� erode� these� countries’� privileged� access� to� the� SEE.� In� summary,� a� priori,� one�would� expect� all� preferential� trading� partners� to� lose� out� in� exports,� in� a�manner� of�correction/reduction�to�trade�diversion�caused�initially�due�to�the�FTAs�signed.��
Table�15.3� ranks� the� top�10� trading�partners�and� their� exports� to� the�SEE�region.�Italy�and�Germany�are�the�two�most�important�exporters�to�the�region�and�they�stand�to� gain� the�maximum� amount� in� export� revenues,� as� exports� increase� by� 13� and� 10�percent�respectively.�Other�EU�member�states,�such�as�Slovenia,�Austria,�Bulgaria,�and�the�Czech�Republic�are�among�the�top�10�beneficiaries.�However,�these�countries�gain�not�due�to�the�adoption�of�CET�but�rather�the�completion�of�the�implementation�of�the�SAA’s�interim� agreements� on� trade.� This� result� is� significant:� it� indicates� that� even�when� the�
WP_185_web_1-11-10.pdf 137WP_185_web_1-11-10.pdf 137 1/11/2010 1:39:49 PM1/11/2010 1:39:49 PM

122 World Bank Working Paper
�
SEE’s�common�external�tariffs�are�reduced�to�EU’s�MFN�rates,�the�gains�from�completing�the�FTAs�will�be�larger�and�hence�accrue�a�net�positive�effect�for�these�countries.��
�Table 15.3. Top Exporting Countries to the Region (US$ millions)
Pre-reform exports After reform exports Change
Italy 1,334.66 1,503.39 168.73 Germany 1,264.18 1,391.18 127.00 China 1,234.47 1,333.79 99.32 Slovenia 868.83 952.51 83.68 Russia 768.74 819.60 50.86 Austria 407.24 453.00 45.76 Turkey 334.14 363.40 29.26 United States 310.06 364.83 31.08 Bulgaria 278.35 228.26 34.03 Czech Republic 259.45 292.68 33.23
Source:�Various�country�sources,�WDI.��
On� the� other� hand,� there� are� also� a� few� extra�EU� countries� among� the� top� 10�trading� partners� of� the� SEE� that�will� benefit� from� increased� export� revenues.�China,�Russia,� the�United�States,�and�Turkey�may�expect� to�achieve�strong�export�growth�to�the� region� under� such� a� scenario.� China� already� ranks� number� three� among� the�region’s�export�partners,�as�its�export�reach�US$1.2�billion.�According�to�the�simulations�its�exports�to�the�region�are�to�be�expected�to�increase�by�8�percent.�The�United�States,�ranked�eigth�among�export�partner�is�to�increase�its�exports�by�10�percent,�Turkey�by�9�percent�and�Russia�by�7�percent.��
In�table�15.4�we�present�the�top�five�countries�that�benefit�from�an�increase�in�their�exports� to� each� SEE� country� following� the� adoption� of� CET.� In� this� table,� we� aim� to�separate�out� the� impact�of�CET� (from�the� final� implementation�of�EU�FTAs)�hence�we�concentrate�on�those�countries�that�are�extra�EU.�For�example,�Switzerland�is�the�number�one� beneficiary� in� Albania� and� Bosnia� and� Herzegovina.� Switzerland� also� gains�significant�increase�in�exports�revenues�in�Montenegro�and�Serbia.�As�seen�above,�China�is�the�overall�winner.�The�CET�can�be�said�to�induce�a�secondary�positive�impact�on�some�of�the�countries�in�the�region�as�new�export�partners�gain�market�share,�such�as�Korea�in�Bosnia�and�Herzegovina;�Taiwan,�China�and�Hong�Kong,�China�in�Croatia;�Pakistan�in�FYR�Macedonia;�and�Hong�Kong,�China�in�Montenegro.���Table 15.4. Trade Creation
Albania Bosnia and Herzegovina Croatia Macedonia Montenegro Serbia
Switzerland Switzerland China Russia China China China China United States China Switzerland United States Russia Korea, Rep. of Japan United States Turkey Ukraine Ukraine United States Taiwan, China Pakistan United States Turkey Turkey Russia Hong Kong, China Japan Hong Kong, China Switzerland
Source:�Author.��
WP_185_web_1-11-10.pdf 138WP_185_web_1-11-10.pdf 138 1/11/2010 1:39:49 PM1/11/2010 1:39:49 PM

Enhancing Regional Trade Integration in Southeast Europe 123
�
On� the�other�hand,� there� are� several� countries� that�will� experience� a�decrease� in�their� exports� to� the� SEE� countries.� Among� all� the� trade� partners� of� Albania,� Italy,�Serbia,� FYR�Macedonia,�Greece,� and�Spain�will�experience�the� largest�decrease� in� their�exports�(table�15.5).�In�line�with�expectation,�many�of�the�countries�that�will�experience�a�loss�of�revenue�due�to�reduced�exports�are�other�CEFTA�members�or�EU�member�states.�� Table 15.5. Trade Diversion
Albania Bosnia and Herzegovina Croatia Macedonia Montenegro Serbia
Italy Croatia Italy Serbia Serbia Croatia Serbia Serbia Germany Turkey Croatia Bosnia and Herzegovina FYR Macedonia Turkey Slovenia Croatia Macedonia Russia Greece FYR Macedonia Austria Albania Russia Macedonia Spain Hungary Switzerland Moldova
Source:�Author.��
Due�to�the�CET,�intra�regional�exports�are�also�expected�to�decrease.�According�to�simulation� results,� the� pre�reform� intra�regional� exports� of� US$2.9� billion� are� to� be�reduced�by�US$70.5�million,�that�is,�by�2.4�percent.�Among�the�SEE�countries,�Albania’s�exports� to� the� region� will� decrease� by� 3.8� percent,� followed� by� FYR� Macedonia’s�exports�by�3.0�percent,�Croatia’s�exports�by�2.9�percent,�Serbia�by�2.1�percent,�Bosnia�and�Herzegovina�by�1.5�percent�and�Montenegro�by�0.9�percent�(table�15.6).7���Table 15.6 Impact of EU-SEE Customs Union on Intra-regional Exports (US$ million)
Pre-reform
intra-region exports After reform
intra-region exports Change (%)
Total SEE 2,979.8 2,909.3 –70.5 –2.4 Albania 11.3 10.8 –0.4 –3.8 Bosnia and Herzegovina 521.8 513.9 –8.0 –1.5 Croatia 1,043.8 1,013.6 –30.2 –2.9 FYR Macedonia 238.1 230.9 –7.2 –3.0 Montenegro 7.2 7.1 –0.1 –0.9 Serbia 1,157.6 1,133.0 –24.6 –2.1
Source:�Author.�
It� is� important� to� remember� again� that� these� results� are� to� be� interpreted� with�caution.� As� mentioned� earlier,� partial� equilibrium� models� can� only� estimate� single�country� equations� and� hence� the� results� do� not� factor� in� secondary� interactions�between�countries�and�sectors.�
Notes �1� In�some�cases�WITS�uses�earlier�years�as�reference�hence�the�tariff�data�are�not�up�to�date.�In�such� a� case,� the� data� are� corrected� by� the� author� to� fully� incorporate� all� the� preferential�agreements�of�SEEs�as�of�today.�2�Most�countries�have�also�signed�FTA�with�Turkey�and�some�with�Russia.���
WP_185_web_1-11-10.pdf 139WP_185_web_1-11-10.pdf 139 1/11/2010 1:39:50 PM1/11/2010 1:39:50 PM

124 World Bank Working Paper
�
�3�In�the�case�of�tariffs�with�regards�to�the�EU27,�all�tariff�data�are�up�to�date�including�first�stages�of� reduction� in�Albania,�Montenegro,�and�Bosnia�and�Herzegovina.� In� the�simulations� the�new�tariffs� vis� a� vis� EU’s� industrial� products� are� taken� to� be� zero,� hence� a� scenario�which� has� the�impact�of�completion�of�SEE�tariff�liberalizations�schedules�with�the�EU.��4�This�is�a�standard�assumption�of�the�SMART�model.��5�These�trade�statistics�are�taken�from�UNCOMTRADE�database�and�are�the�latest�data�available,�usually�for�the�year�2008.�6�The�GDP�of�SEE�countries�as�a�region� is�calculated�by�using� the�World�Bank’s�WDI�database�and�is�the�total�of�average�GDPs�over�the�last�five�years.��7�The�low�level�of�decrease�in�Montenegro’s�exports�may�reflect�some�data�availability�problems.�For�some�reporting�countries�the�exports�from�Montenegro�were�not�available�in�WITS.��
WP_185_web_1-11-10.pdf 140WP_185_web_1-11-10.pdf 140 1/11/2010 1:39:50 PM1/11/2010 1:39:50 PM

125
CHAPTER �16 �
Summary�and�Policy�Recommendations�
y�now�SEE� countries’� low� export� potential� is�well� established� in� literature.� Even�though� exports� have� been� increasing� steadily,� both� intra�� and� extra�regional�
exports�remain�below�potential.�In�addition�to�this�they�remain�fragile�as�they�heavily�depend�on�a�few�items,�mainly�commodities.�The�aim�of�this�study�is�to�establish�the�costs�and�benefits�of�adopting�EU’s�CET� in�order� to� identify�whether� this� can�be� the�right�policy�option�for�SEE�countries�in�order�to�encourage�export�led�growth.��
In�the�first�part�of�the�study,�the�tariff�structure�of�each�SEE�country�was�examined�in�detail�and�compared�to�that�of�EU.�After�such�a�reform,�the�region’s�simple�average�tariffs�would�be�reduced�from�5.1�percent�to�2.3�percent,�trade�weighted�average�tariff�would�be�reduced�from�4.7�percent�to�2.2�percent.�Among�the�SEE�countries,�Serbia�is�to�go�through�the�most�ambitious�adjustment�process�due�to�its�higher�average�tariffs�and�tariff�dispersions.�On�the�other�extreme,�Croatia�requires�the�least�effort�to�adopt�EU’s�CET�thanks�to�its�advanced�status�as�an�EU�candidate�country.�Montenegro�is�a�unique�case:� its� simple�average� tariffs�are�much� lower� than� the� regional�average�and�EU’s� rates.� With� the� adoption� of� CET,� Montenegro’s� new� rates� will� be� less� than� 1�percent.� Despite� the� fact� FYR� Macedonia� is� a� WTO� member� and� an� EU� candidate�country,� it� require� considerable� amount� of� adjustment� in� its� tariff� structure.�Albania�and�Bosnia�and�Herzegovina�require�a�moderate�level�of�adjustment�compared�to�the�extreme�cases�mentioned.�In�terms�of�sensitive�sectors,�textiles,�clothing,�and�footwear�are�also�highly�protected� in�SEE�countries�as� in� the�EU.�Only� in�Montenegro,� textiles�MFN�tariffs�are�lower�than�EU�average.�Otherwise,�there�are�several�sensitive�products�and�sectors�in�each�country�and�it�is�hard�to�generalize.��
In�the�second�part�of�this�study,�we�estimate�quantitatively�the�costs�and�benefits�of� adopting� EU’s� CET� by�making� use� of� traditional� concepts� of� trade� diversion� and�creation.� As� our� estimation� tools� we� use� partial� equilibrium� model� of� SMART�developed�by�UNCTAD�and�the�World�Bank.�One�has�to�keep�in�mind�that�the�results�of�our�analysis�present�only�the�direct�effect�of�this�trade�reform�as�partial�equilibrium�models� cannot� take� into� account� additional� effects� from� inter�industry� and�macroeconomic� adjustments.� These� secondary� effects� can� be� better� modeled� by�computable� general� equilibrium� (CGE)� model.1� Despite� this� shortcoming,� partial�equilibrium�models�have�the�advantage�of�presenting�the�trade�diversion�and�creation�as�well�as�revenue�and�welfare�effects�of�a�trade�reform�on�a�highly�disaggregated�level�(that�is,�6�digit� in�this�study).�One�of�the�strengths�of�our�analysis�is� to�show�in�great�
B
WP_185_web_1-11-10.pdf 141WP_185_web_1-11-10.pdf 141 1/11/2010 1:39:50 PM1/11/2010 1:39:50 PM

126 World Bank Working Paper
�
detail� the� sectors� (products)� and� the� partner� countries� that� will� be� impacted� by� the�adoption� of� EU’s� CET.� Having� this� in� mind,� for� countries� in� the� region� that� have�already� liberalized� their� trade� against� the� EU,� this� measure� will� erode� EU� member�states� preference� with� the� SEE.� On� the� other� hand,� market� access� of� third� party�countries�(that�is,�extra�EU�and�non�CEFTA�countries)�will�improve�in�the�SEE�market.��
The�results�indicate�that�the�impact�of�this�trade�reform�is�going�to�be�positive�with�net� trade�creation�in�the�magnitude�of�US$998.9�million�for�the�region,�an�increase�of�4.3� percent� from� pre�reform� import� levels.� Even� though� imports� will� increase�significantly,� the�net� effect� of� adopting�EU’s�CET�will� result� in� revenue� loss� roughly�half�of�the�gains�from�trade�creation,�that�is,�US$459.7�million.�The�consumer�surplus,�which�will�result�from�reducing�the�deadweight�loss�from�tariffs,�is�a�modest�US$51.7�million.� The� overall� net� effect� of� CET� amounts� thus� to� US$590.9� million,� roughly� 1�percent�of�SEE’s�combined�GDP.��
Another� observation� one� can� make� based� on� the� simulation� results� is� that� all�countries� will� be� able� to� diversify� their� trade� to� other� countries� outside� the� region.�Although� several� EU� member� states� are� among� the� top� 10� export� partners,� China,�Russia,�the�United�States,�and�Turkey�are�set�to�gain�significant�market�share�in�the�SEE�market� as� a� results� of� trade� creation.� The� exports� from� China� to� the� region� are� to�increase�by�8�percent�and�reach�US$1.3�billion.�The�next�largest�beneficiary�of�this�trade�reform� is�Russia:� its�exports�are� to� increase�by�7�percent�and�reach�US$819.6�million.�Exports�from�the�United�States�and�Turkey�are�also�going�to�increase�by�10�percent�and�9� percent� respectively.� On� the� other� hand,� trade� diversion� is� going� reduce� exports�mostly� from�existing�preferential� trade�partners�as� expected.�The� impact�of� adopting�CET�is�going�to�have�a�negative�effect�on�intra�regional�exports.�Intra�regional�exports�will�be�reduced�by�US$70.5�million,�that�is,�by�2.4�percent.�Albania’s�exports�are�going�to�suffer�by�far� the�most.�Nevertheless,� the�decrease� in� intra�regional�exports� (that� is,�trade� diversion)� is� a� re�adjustment� and� hence� lessens� the� negative� effect� of� trade�diversion� that� was� caused� by� the� bilateral� FTAs� that� are� now� brought� under� the�CEFTA�umbrella.��
As� these�results�are�obtained�by�single�country�simulations� they�do�not� take� into�effect�indirect�(secondary)�results�and�interactions�between�regions�and�industries.�As�such�these�results�may�be�taken�as�a�conservative�minimum�impact.�For�example,�one�such� indirect� effect� of� adopting� the� EU’s� CET� is� increased� FDI� attractiveness� from�outside� the� region.� After� joining� the� EU,� the� 10� new� member� states� have� enjoyed�increased� FDI� inflows� from� outside,� such� as� Southeast� Asia� for� example.� This� is� an�additional� positive� effect� of� adopting� EU’s� CET.� Currently� different� tariff� structures�allow� for�divergences� in�prices� across� the� region.�Hence� it� brings� additional� costs� to�doing�business�in�an�economically�segmented�market.�If�the�SEE�adopt�EU’s�CET,�this�would�make�the�region�more�attractive�to�the�multinational�companies.��
If� the� SEE� countries�decide� to�proceed�with� adopting�EU’s�CET�unilaterally� and�individually,�political� resistance�may�arise� against� such�a�measure� in� those� countries�where�the�tariff�revenue�loss�is�the�highest.�Ideally�a�committee�should�be�established�to� compensate� those� countries� that� are�most�dependent�on� customs� import�duties� as�revenue,� for�a� temporary�period�of� adjustment� (for� example,� five�years).�Needless� to�say,�this�would�prove�difficult�in�practice�in�the�case�of�a�virtual�customs�union�with�no�harmonization�of�customs�regulation�within�the�SEE.�This�adjustment�period�should�be�
WP_185_web_1-11-10.pdf 142WP_185_web_1-11-10.pdf 142 1/11/2010 1:39:50 PM1/11/2010 1:39:50 PM

Enhancing Regional Trade Integration in Southeast Europe 127
�
fixed� for� all,� for� example,� to� be� achieved� over� five� years,� however,� with� country�specific� tariff� liberalization� schedules.� Each� country� should� be� allowed� to� decide� its�sensitive� sectors.� There� may� be� 2�speed� for� tariff� liberalization:� one� for� sensitive�products,�one�for�non�sensitive�products.��
Although�it�may�be�difficult�for�the�six�SEE�countries�to�pool�their�sovereignty�over�“most”� of� their� trade� policy,� it� should� be� politically� easier� to� adopt� EU’s� CET,� an�external�benchmark,�than�any�other�CET.�As�all�countries�in�the�region�have�a�clear�EU�vocation,�adopting�the�EU’s�CET�would�bring�them�closer�to�EU�membership.�
Note �1�However,�CGE�models�are�often�very�data�intensive�and�hence�it�is�not�possible�to�use�them�due�data�limitations.��
WP_185_web_1-11-10.pdf 143WP_185_web_1-11-10.pdf 143 1/11/2010 1:39:50 PM1/11/2010 1:39:50 PM

�
����
WP_185_web_1-11-10.pdf 144WP_185_web_1-11-10.pdf 144 1/11/2010 1:39:51 PM1/11/2010 1:39:51 PM

�
APPENDIX �
Consumer�Surplus�by��Product�and�Country�
Albania�
Tariff line
Imports before (US$
millions)
Imports, change in
(US$ millions) Product
Consumer surplus
(US$ million)
TOTAL 2,106.80 50.22 0.93 270112 18.17 4.79 Bituminous coal, whether or not pulverized, non-agglomerated 0.14
271019 366.83 5.22 Medium oils and preparations, of petroleum or bituminous minerals, n.e.s. 0.11
271600 309.00 19.89 Electrical energy 0.07
721420 100.39 2.94
Bars and rods, of iron or non-alloy steel, with indentations, ribs, groves or other deformations produced during the rolling process 0.04
690890 33.98 0.49
Glazed ceramic flags and paving, hearth or wall tiles (excl. of siliceous fossil meals or similar siliceous earths, refractory ceramic goods, tiles made into stands, ornamental articles and tiles specifically manufactured for stoves) 0.03
841510 11.69 0.54 Window or wall air conditioning machines, self-contained or “split-system” 0.03
691010 7.91 0.36
Ceramic sinks, washbasins, washbasin pedestals, baths, bidets, water closet pans, flushing cisterns, urinals and similar sanitary fixtures of porcelain or china (excl. soap dishes, sponge holders, tooth-brush holders, towel hooks and toilet paper holders) 0.03
252329 48.84 0.95 Portland cement (excl. white, whether or not artificially colored) 0.02
252390 31.87 0.73 Cement, whether or not colored (excl. aluminous cement and portland cement) 0.02
690810 33.68 0.29
Glazed ceramic tiles, cubes and similar articles, for mosaics, whether or not square or rectangular, the largest surface area of which is capable of being enclosed in a square of side of < 7 cm, whether or not on a backing 0.02
Source:�UN�COMTRADE�database.�� �
WP_185_web_1-11-10.pdf 145WP_185_web_1-11-10.pdf 145 1/11/2010 1:39:51 PM1/11/2010 1:39:51 PM

130 World Bank Working Paper
�
����������Bosnia�and�Herzegovina�
Tariff line
Imports before (US$
millions)
Imports, change in
(US$ millions) Product
Consumer surplus
(US$ million)
TOTAL 4,446.64 253.68 12.71
870332 119.55 16.81
Motor cars and other motor vehicles principally designed for the transport of persons, incl. station wagons and racing cars, with compression-ignition internal combustion piston engine “diesel or semi-diesel engine” of a cylinder capacity > 1.500 cm³ but <= 2.500 cm³ (excl. vehicles for the transport of persons on snow and other specially designed vehicles of subheading 8703.10) 1.73
640620 21.20 14.03 Outer soles and heels, of rubber or plastics 1.24
830241 16.29 8.31 Base metal mountings and fittings suitable for buildings (excl. locks with keys and hinges) 0.43
840310 13.39 10.76 Central heating boilers, non-electric (excl. vapor generating boilers and superheated water boilers of heading 8402) 0.35
611790 1.98 2.61 Parts of garments or clothing accessories, knitted or crocheted, n.e.s. 0.35
640699 60.81 4.75
Parts of footwear (excl. outer soles and heels of rubber or plastics, uppers and parts thereof, and general parts made of wood or asbestos) 0.31
570320 3.00 2.75 Carpets and other floor coverings, of nylon or other polyamides, tufted “needle punched”, whether or not made up 0.30
840991 15.42 3.32 Parts suitable for use solely or principally with spark-ignition internal combustion piston engine, n.e.s. 0.21
350691 7.71 3.68
Adhesives based on polymers of heading 3901 to 3913 or on rubber (excl. products suitable for use as glues or adhesives put up for retail sale as glues or adhesives, with a net weight of <= 1 kg) 0.20
722790 4.89 3.32
Bars and rods of alloy steel other than stainless, hot-rolled, in irregularly wound coils (excl. products of high-speed steel or silicon-electrical steel) 0.17
Source:�UN�COMTRADE�database.��� �
WP_185_web_1-11-10.pdf 146WP_185_web_1-11-10.pdf 146 1/11/2010 1:39:51 PM1/11/2010 1:39:51 PM

Enhancing Regional Trade Integration in Southeast Europe 131
�
Croatia�
Tariff line
Imports before (US$
millions)
Imports, change in
(US$ millions) Product
Consumer surplus
(US$ million)
TOTAL 7,703.57 93.32 2.67
271011 184.22 40.40
Light oils and preparations, of petroleum or bituminous minerals which >= 90% by volume “incl. losses” distil at 210°C “ASTM D 86 method” 1.22
271019 586.47 8.57 Medium oils and preparations, of petroleum or bituminous minerals, n.e.s. 0.11
640399 105.14 1.34
Footwear with outer soles of rubber, plastics or composition leather, with uppers of leather (excl. covering the ankle, incorporating a protective metal toecap, sports footwear, orthopedic footwear and toy footwear) 0.07
610910 71.19 0.60 T-shirts, singlets and other vests of cotton, knitted or crocheted 0.05
620342 38.07 0.49
Men’s or boys’ trousers, bib and brace overalls, breeches and shorts, of cotton (excl. knitted or crocheted, underpants and swimwear) 0.04
420222 10.83 0.42
Handbags, whether or not with shoulder straps, incl. those without handles, with outer surface of plastic sheeting or textile materials 0.03
620462 33.49 0.42
Women’s or girls’ trousers, bib and brace overalls, breeches and shorts of cotton (excl. knitted or crocheted, panties and swimwear) 0.03
711790 3.71 0.47 Imitation jewelry (excl. jewelry, of base metal, whether or not clad with silver, gold or platinum) 0.03
611020 39.58 0.35 Jerseys, pullovers, cardigans, waistcoats and similar articles, of cotton, knitted or crocheted (excl. wadded waistcoats) 0.03
640510 9.40 0.45
Footwear with uppers of leather or composition leather (excl. with outer soles of rubber, plastics, leather or composition leather and uppers of leather, orthopedic footwear and toy footwear) 0.02
Source:�UN�COMTRADE�database.��� �
WP_185_web_1-11-10.pdf 147WP_185_web_1-11-10.pdf 147 1/11/2010 1:39:51 PM1/11/2010 1:39:51 PM

132 World Bank Working Paper
�
FYR�Macedonia�
Tariff line
Imports before (US$
millions)
Imports, change in
(US$ millions) Product
Consumer surplus
(US$ million)
TOTAL 2,067.89 81.56 3.65
270900 570.28 36.67 Petroleum oils and oils obtained from bituminous minerals, crude 1.22
271019 37.26 7.16 Medium oils and preparations, of petroleum or bituminous minerals, n.e.s. 0.50
271011 3.15 3.44
Light oils and preparations, of petroleum or bituminous minerals which >= 90% by volume “incl. losses” distil at 210°C “ASTM D 86 method” 0.35
551339 3.81 1.30
Woven fabrics containing predominantly, but < 85% synthetic staple fibers by weight, mixed principally or solely with cotton and weighing <= 170 g/m², made of yarn of different colors (excl. plain woven fabrics of polyester staple fibers) 0.09
680293 3.99 1.85
Granite, in any form, polished, decorated or otherwise worked (excl. tiles, cubes and similar articles of subheading 6802.10, imitation jewelry, clocks, lamps and lighting fittings and parts thereof, original sculptures and statuary, setts, curbstones and flagstones) 0.09
410711 7.80 3.12
Full grains leather “incl. parchment-dressed leather”, unsplit, of the whole hides and skins of bovine “incl. buffalo” or equine animals, further prepared after tanning or crusting, without hair on (excl. chamois leather, patent leather and patent laminated leather, and metalized leather) 0.04
640399 4.47 0.36
Footwear with outer soles of rubber, plastics or composition leather, with uppers of leather (excl. covering the ankle, incorporating a protective metal toecap, sports footwear, orthopedic footwear and toy footwear) 0.04
730830 1.49 0.45 Doors, windows and their frames and thresholds for doors, of iron or steel 0.03
841510 9.79 0.58 Window or wall air conditioning machines, self-contained or “split-system” 0.03
640520 1.35 0.22
Footwear with uppers of textile materials (excl. with outer soles of rubber, plastics, leather or composition leather, orthopedic footwear and toy footwear) 0.03
Source:�UN�COMTRADE�database.��� �
WP_185_web_1-11-10.pdf 148WP_185_web_1-11-10.pdf 148 1/11/2010 1:39:51 PM1/11/2010 1:39:51 PM

Enhancing Regional Trade Integration in Southeast Europe 133
�
Montenegro�
Tariff line
Imports before (US$
millions)
Imports, change in
(US$ millions) Product
Consumer surplus
(US$ million)
TOTAL 694.89 10.22 0.22
680293 1.89 2.87
Granite, in any form, polished, decorated or otherwise worked (excl. tiles, cubes and similar articles of subheading 6802.10, imitation jewelry, clocks, lamps and lighting fittings and parts thereof, original sculptures and statuary, setts, curbstones and flagstones) 0.07
841810 2.99 0.50 Combined refrigerator-freezers, with separate external doors 0.02 842211 2.57 0.29 Dishwashing machines of the household type 0.01
851712 37.40 0.85 Telephones for cellular networks “mobile telephones” or for other wireless networks 0.01
441820 4.46 0.62 Doors and their frames and thresholds, of wood 0.01
841581 2.60 0.26
Air conditioning machines incorporating a refrigerating unit and a valve for reversal of the cooling-heat cycle “reversible heat pumps” (excl. of a kind used for persons in motor vehicles and self-contained or “split-system” window or wall air conditioning machines) 0.01
722820 0.18 0.15
Bars and rods of silico-manganese steel (excl. semi-finished products, flat-rolled products and hot-rolled bars and rods in irregularly wound coils) 0.01
481910 1.00 0.34 Cartons, boxes and cases, of corrugated paper or paperboard 0.01
340220 12.73 0.18
Surface-active preparations, washing preparations, auxiliary washing preparations and cleaning preparations put up for retail sale (excl. organic surface-active agents, soap and organic surface-active preparations in the form of bars, cakes, molded pieces or shapes, and products and preparations for washing the skin in the form of liquid or cream) 0.01
845011 6.71 0.11 Fully automatic household or laundry-type washing machines, of a dry linen capacity <= 6 kg 0.00
Source:�UN�COMTRADE�database.��� �
WP_185_web_1-11-10.pdf 149WP_185_web_1-11-10.pdf 149 1/11/2010 1:39:51 PM1/11/2010 1:39:51 PM

134 World Bank Working Paper
�
Serbia�
Tariff line
Imports before (US$
millions)
Imports, change in
(US$ millions) Product
Consumer surplus
(US$ million)
TOTAL 6,422.92 509.92 31.16
870332 127.73 49.36
Motor cars and other motor vehicles principally designed for the transport of persons, incl. station wagons and racing cars, with compression-ignition internal combustion piston engine “diesel or semi-diesel engine” of a cylinder capacity > 1.500 cm³ but <= 2.500 cm³ (excl. vehicles for the transport of persons on snow and other specially designed vehicles of subheading 8703.10) 5.48
840310 14.72 24.52 Central heating boilers, non-electric (excl. vapor generating boilers and superheated water boilers of heading 8402) 1.49
271119 49.114 56.3405
Gaseous hydrocarbons, liquefied, n.e.s. (excl. natural gas, propane, butane, ethylene, propylene, butylene and butadiene) 1.39184
732219 8.24 8.7668
Radiators for central heating, non-electrically heated, and parts thereof, of iron other than cast iron or steel (excl. parts, elsewhere specified or included, and central-heating boilers) 0.980716
611790 2.151 5.61168 Parts of garments or clothing accessories, knitted or crocheted, n.e.s. 0.841752
870210 36.574 6.31626
Motor vehicles for the transport of >= 10 persons, incl. driver, with compression-ignition internal combustion piston engine “diesel or semi-diesel engine” 0.699808
690890 21.853 5.92539
Glazed ceramic flags and paving, hearth or wall tiles (excl. of siliceous fossil meals or similar siliceous earths, refractory ceramic goods, tiles made into stands, ornamental articles and tiles specifically manufactured for stoves) 0.638261
870331 21.76 4.15173
Motor cars and other motor vehicles principally designed for the transport of persons, incl. station wagons and racing cars, with compression-ignition internal combustion piston engine “diesel or semi-diesel engine” of a cylinder capacity <= 1.500 cm³ (excl. vehicles for the transport of persons on snow and other specially designed vehicles of subheading 8703.10) 0.470428
481910 5.514 6.13527 Cartons, boxes and cases, of corrugated paper or paperboard 0.468768
830241 11.113 7.05982 Base metal mountings and fittings suitable for buildings (excl. locks with keys and hinges) 0.445636
Source:�UN�COMTRADE�database.��
WP_185_web_1-11-10.pdf 150WP_185_web_1-11-10.pdf 150 1/11/2010 1:39:51 PM1/11/2010 1:39:51 PM

135
�
References�
Aeneas.� 2008.� “Regional� Guidelines� for� Unified� Asylum,� Migration,� and� Visa�Management�in�the�Western�Balkans.”�ICMPD�(www.icmpd.org).�October.�
———.�2008.�“National�Reports�on�Strong�Institutions�and�a�Unified�Approach�in�the�Asylum,� Migration� and� Visa� management� in� the� Western� Balkans.”� ICMPD�(www.icmpd.org).�September.�
Akkoyunlu�Wigley,�A.,�and�S.�Mihci.�2006.�“The�Customs�Union�with� the�EU�and�Its�Impact� on� Turkey’s� Economic� Growth.”� Paper� presented� at� 8th� ETSG� Annual�Conference,�Vienna.�Albornoz,�Facundo,�Héctor�F.�Calvo�Pardo,�Gregory�Corcos�and�Emanuel�Ornelas.�2009.�“Sequential�Exporting”.�Preliminary�version�(forthcoming)�Aminian,� Nathalie,� K.C.� Fung,� and� Francis� Ng.� 2008.� “Integration� of� Markets� vs.�
Integration�by�Agreements.”�World�Bank�Policy�Research�Working�Paper�4546.�World�Bank,�Washington,�DC.�
Anderson,� James�E.,� and�Eric�Van�Wincoop.� 2004.� “Trade�Costs.”� Journal� of� Economic�Literature�42(3):�691–751.�
Arieti,� Samuel.� 2006.� “The� Role� of� MERCOSUR� as� a� Vehicle� for� Latin� American�Integration.”�Chicago�Journal�of�International�Law�6:�761–773a.�
Augier,�Patricia,�Michael�Gasiorek,�and�Charles�Lai�Tong.�2005.�“The�Impact�of�Rules�of�Origin�on�Trade�Flows.”�Economic�Policy�20(43):�567–624.�
Besic,�Milos.�2009.�“Student�Mobility� in�Western�Balkan�Countries.”�Research�Report.�January.�King�Baudouin�Foundation.�Available�at:�www.kbs�frb.be/publication.�aspx?id=243444&LangType=1033.�
Blalock,� G.,� and� P.� Gertler.� 2008.� “Welfare� Gains� from� FDI� through� Technology�Transfer� to� Local� Suppliers.”� Journal� of� International� Economics� 74.� Bosnia� and�Herzegovina.� 2008.�Migration� and� Asylum� Action� Plan:� 2008�2011.� Ministry� of�Security� in� Cooperation� with� the� International� Organization� for� Migration.�November.�
Brenton,� Paul� and� Richard� Newfarmer.� 2007.� “Watching�More� Than� The� Discovery�Channel:�Export�Cycles�and�Diversification�in�Development.”�World�Bank�Policy�Research�Working�Paper�4302,�Washington�DC�
CARICOM� Secretariat.� n.d.� “The� Free� Movement� of� Skills� and� Social� Security.”�Available� at:� the� www.caricom.org/jsp/single_market/free_movement.jsp?�menu=csme.�
Centre� for� Economic� and� Social� Studies.� 2006.� “From� Brain� Drain� to� Brain� Gain:�Mobilizing� Albania’s� Skilled� Diaspora.”� Development� Research� Centre� on�Migration,�Globalization�and�Poverty.�UNDP�Policy�Paper.�
WP_185_web_1-11-10.pdf 151WP_185_web_1-11-10.pdf 151 1/11/2010 1:39:51 PM1/11/2010 1:39:51 PM

136 World Bank Working Paper
�
Cerrutti,� Marcela.� 2009.� “Gender� and� Intra�Regional� Migration� in� South� America.”�HDR� Paper� 2009/12.� Available� at:� http://hdr.undp.org/en/reports/global/�hdr2009/papers/.�
Clougherty,�Joseph�A.,�and�Michal�Grajek.�2006.�“The�Impact�of�ISO�9000�Diffusion�on�Trade�and�FDI:�A�New�Institutional�Analysis.”�CERP�Discussion�Paper�No.�6026.�
Co,� Catherine� Y.,� Ira� N.� Gang,� and� Myeong�Su� Yun.� 2000.� “Returns� to� Returning.”�Journal�of�Population�Economics�13(1):�57–79.�
Coats,� David.� 2008.� “Migration� Myths:� Employment,� Wages� and� Labour� Market�Performance.”� London:� The� Work� Foundation.� www.theworkfoundation.com/�assets/docs/publications/33_migration%20myths.pdf.�
Commission�of� the�European�Communities.� 2007.� “Mobility,� an� Instrument� for�More�and� Better� Jobs:� The� European� Job� Mobility� Action� Plan� (2007�2010).”�Communication�from�the�Commission�to�the�Council,�the�European�Parliament,�the� European� Economic� and� Social� Committee� and� the� Committee� of� the�Regions,�COM(2007)�773�final,�Brussels,�6.12.2007.�
de�Coulon,�Augustin,�and�Matloob�Piracha.�2005.�“Self�selection�and�the�Performance�of� Return� Migrants:� The� Source� Country� Perspective.”� Journal� of� Population�Economics�18:�779–807.�
Djankov,� Simeon,�Caroline� L.� Freund,� and�Cong� S.� Pham.� 2006.� “Trading� on� Time.”�World�Bank�Policy�Research�Working�Paper�No.�3909.�World�Bank,�Washington,�DC.�
Dollar,�D.,�and�A.�Kraay.�2004.�“Trade,�Growth�and�Poverty.”�Economic� Journal,�Royal�Economic�Society�114�(493).�
Erzan,� R.� et� al.� 2002.� “Turkey’s� Customs� Union� with� the� EU:� A� Framework� for�Evaluating� the� Impact� of� Economic� Integration.”� MPRA� paper� no� 382.�University�Library�of�Munich,�Germany.�
European� Training� Foundation� (ETF).� 2009.�Country� Plans� and� Labor� Market� Reviews.�Available� at:� www.etf.europa.eu/web.nsf/pages/Publications_catalogue_EN?�OpenDocument.�
Fallon,�Peter�R.�2008.�“Barriers�to�Labor�Mobility�in�East�Africa.”�Report�prepared�for�the�World�Bank,�June.�World�Bank,�Washington,�DC.�
Fernandes,�Ana�M.,� and�Caroline�Paunov.� 2009.� “Does�Tougher� Import�Competition�Foster� Product� Quality� Upgrading?”� World� Bank� Policy� Research� Working�Paper�4894.�World�Bank,�Washington,�DC.�
Fetsi,� Anastasia,� ed.� 2007.� “Labour�Markets� in� the�Western� Balkans:� Challenges� for� the�Future.”� ETF.� Available� at:� www.etf.europa.eu/web.nsf/pages/EmbedPub_EN?�OpenDocument&emb=/pubmgmt.nsf/(WebPublications%20by%20yearR)/F624E6A60F073F75C125728F002FFCF0?OpenDocument.�
Frankel,� J.,� and� D.� Romer.� 1999.� “Does� Trade� Cause� Growth?”� American� Economic�Review�89(3):�379–399.��
Gallup.�2009.�“Focus�On:�The�Impact�of�Migration.”�Balkan�Monitor.�Gamberoni,� Elisa,� and� Richard� Newfarmer.� 2009.� “Trade� Protection:� Incipient� but�
Worrisome�Trends.”�World�Bank�Trade�Note�37.�World�Bank,�Washington,�DC.�Gasiorek,�Michael.�2008.�“The�Impact�of�the�Diagonal�Cumulation�of�Rules�of�Origin�in�
the� Context� of� Euro�Med� Integration.”� Research� n°FEM31�13.� CARIS,� United�Kingdom.�
WP_185_web_1-11-10.pdf 152WP_185_web_1-11-10.pdf 152 1/11/2010 1:39:51 PM1/11/2010 1:39:51 PM

Enhancing Regional Trade Integration in Southeast Europe 137
�
Girvan,� Norman.� 2007.� “Towards� a� Single� Development� Vision� and� the� Role� of� the�Single�Economy.”�Paper�approved�by�CARICOM�Heads�of�Government�July�1–4.�Barbados.�Available�at:�www.caricom.org�(accessed�June�29,�2009).�
Gligorov,� Vladimir� Anna� Iara,� Michael� Landesmann,� Robert� Stehrer,� and� Hermine�Vidovic.� 2008.� “Adjustment�Capacity� to�External� Shocks� of� EU�Candidate� and�Potential� EU� Candidate� Countries� of� the� Western� Balkans,� with� a� Focus� on�Labour�Markets.”�WiiW� (Vienna� Institute� for� International� Economic� Studies).�Report�352.�December.�
Gorodnichenko,� Yuriy,� Jan� Svejnar,� and� Katherine� Terrell.� 2009.� “Globalization� and�Innovation�in�Emerging�Markets”.�World�Bank�Policy�Research�Working�Paper�4808.�World�Bank,�Washington,�DC.�
Grecic,� Vladimir,� ed.� 2006.� Visa� Policy� and� the� Western� Balkans.� Balkan� Trust� for�Democracy.� Belgrade.� Institute� of� International� Politics� and� Economics.�Available�at:�www.diplomacy.bg.ac.yu/.�
Greene,� Edward.� 2005.� “Free� Movement� of� Persons:� The� Vision� and� the� Reality.”�CARICOM� Community� Secretariat.� March� 16�17.� Available� at:�www.caricom.org/jsp/single_market/free_movement.jsp?menu=csme.�
Grubel,� Herbert� G.,� and� Peter� J.� Lloyd.� 1975.� Intra�Industry� Trade:� The� Theory� and�Measurement�of�International�Trade�in�Differentiated�Products.�New�York:�Wiley.�
Government�of�Albania.�2004.�National�Migration�Strategy.�Government�of�the�FYR�Macedonia.�2009.�Republic�of�Macedonia:�Migration�Profile:�2008.�
January.�Government� of� Montenegro.� 2008.� Strategy� for� Integrated� Migration� Management� in�
Montenegro:�2008�2013.�Podgorica,�September.�Hallaky,� Juan� Carlos,� and� Jagadeesh� Sivadasanz.� 2009.� “Exporting� Behavior� under�
Quality�Constraints.”�Preliminary�version�(forthcoming).�NBER�Working�Paper�No.�14928.�
Hamilton,�Pamela�Coke.�2000.�“Protocol�II�on�Establishment,�Services,�and�Capital.”�In�Sherry� Stephenson,� ed.� Services� Trade� in� the� Western� Hemisphere.� Brookings�Institution�Press:�192–210.�
Helpman,� Elhanan.� 1987.� “Imperfect� Competition� and� International� Trade:� Evidence�from� Fourteen� Industrial� Countries.”� Journal� of� the� Japanese� and� International�Economies�1:�62–81.�
Helpman,� Elhanan,� and� Paul� Krugman.� 1985.� Market� Structure� and� Foreign� Trade.�Cambridge:�MIT�Press.�
Heston,�Alan,� Robert� Summers,� and� Bettina�Aten.� 2006.� “Penn�World� Table�Version�6.2.”�Center�for�International�Comparisons�of�Production,�Income�and�Prices�at�the�University�of�Pennsylvania,�September.�
Hoekman,�Bernard,�and�Simeon�Djankov.�1996.�“Intra�industry�Trade,�Foreign�Direct�Investment,� and� the� Reorientation� of� Eastern� European� Exports.”� Policy�Research�Working�Paper�Series�1652.�World�Bank,�Washington,�DC.�
Iara,�Anna.�“East�to�West�Europe:�Skill�Diffusion�by�Temporary�Migration?”�In�Robert�E.B.� Lucas,� Lyn� Squire,� and� T.N.� Srinivsan,� eds.,�Global� Exchanges� and� Poverty:�Trade,�Investment�and�Migration.�Edward�Elgar�Press,�forthcoming.�
WP_185_web_1-11-10.pdf 153WP_185_web_1-11-10.pdf 153 1/11/2010 1:39:52 PM1/11/2010 1:39:52 PM

138 World Bank Working Paper
�
Iara,� Anna,� and� Hermine� Vidovic.� 2009.� “Employment� and� Unemployment� in� the�Western� Balkans:� An� Assessment.”� Monthly� Report� No.� 4/2009.� Available� at:�http://publications.wiiw.ac.at/�?action=publ&id=details&publ=MR2009�04_1.�
International�Organization�for�Migration.�2003.�World�Migration�Report.�Geneva.�———.�2007.�The�Republic�of�Croatia�Migration�Profile,�Ministry�of�Interior,�Government�
of�Slovenia,�October.�———.�2008a.�Migration�in�Serbia:�A�Country�Profile.�———.�2008b.�Migration�in�Albania:�A�Country�Profile.�ISEAS.�2009a.�“ASEAN�Economic�Community�Blueprint.”�Institute�for�Southeast�Asian�
Studies.�Available�at:�http://bookshop.iseas.edu.sg/.�———.� 2009b.� “Global� Financial� Crisis:� Implications� for� ASEAN.”� Institute� for�
Southeast�Asian�Studies.�Available�at:�http://bookshop.iseas.edu.sg/.�———.�2009c.�“MERCOSUR�Economic�Integration:�Lessons�for�ASEAN.”�Institute�for�
Southeast�Asian�Studies.�Available�at:�http://bookshop.iseas.edu.sg/.�Jovicic,�Milena,�and�Radmila�Dragutinovic�Mitrovic.�2007.�“Macroeconomic�Analysis�of�
Causes�and�Effects�of�Remittances:�A�Panel�Model�of� the�SEE�Countries�and�a�Case�Study�of�Serbia.”�University�of�Belgrade.�Report�to�GDN.�
Kaminski,� B.� 2008.� “Multilateral� and�Regional� Tariff� Liberalization� in�Albania:�Gains�from�Harmonizing�MFN�Tariffs�on�Industrial�Products�with�the�EU.”�Mimeo.�
Kathuria,�Sanjay,� ed.� 2008.�Western�Balkan� Integration� and� the�EU:�An�Agenda� for�Trade�and�Growth.�Washington,�DC:�World�Bank.�
Katja� Zajc� Kejžar.� 2009.� “Ideas� for� EU� Extended� Support� for� Trade� Growth� in� the�Western� Balkan� Countries:� Diagonal� versus� Bilateral� Cumulation� of� Origin.”�Draft�version,�February�2009�
Kawecka�Wyrykowska� Elzbieta.� 2009.� “Evolving� Pattern� of� Intra�industry� Trade�Specialization� of� the� New�Member� States� (NMS)� of� the� EU:� The� Case� of� the�Automotive�Industry.”�Warsaw,�January�2009.�
Kocyigit,� A.,� and�A.� Sen.� 2007.� “The� Extent� of� Intra�industry� Trade� between� Turkey�and� the� EU:� The� Impact� of� Customs� Unions.”� Journal� of� Economic� and� Social�Research�9(2):�61–85.�
Konica,� Nevila,� and� Randall� K.� Filer.� 2003.� “Albanian� Emigration:� Causes� and�Consequences.”� CERGE�EI� Working� Paper� 181.� Prague:� Center� for� Economic�Research�and�Graduate�Education�of�Charles�University.��
Krueger,� A.� 1997.� “Free� Trade� Agreements� versus� Customs� Unions.”� Journal� of�Development�Economics�54:�169–187.�
Lipsey,� R.� 1957.� The� Theory� of� Customs� Union:� Trade� Diversion� and� Welfare.� Blackwell�Publishing,�The�London�School�of�Economics�and�Political�Science.��
Lohrman,�A.�2000.�“Development�Effects�of� the�Customs�Union�between�Turkey�and�the�EU.”�Russian�and�East�European�Finance�and�Trade�36(4):�26–44.�
Lucas,�Robert�E.B.�2005.�International�Migration�and�Economic�Development:�Lessons�from�Low�Income�Countries.�Northampton,�MA�and�Cheltenham,�UK:�Edward�Elgar.�
———.� 2006.� “Migration� and� Economic� Development� in� Africa:� A� Review� of�Evidence.”�Journal�of�African�Economies�15�(supplement�2)�December:�337–395.�
Lucas,� Robert� E.B.,� and�Laura�Chappell.� 2009.� “Measuring�Migration’s�Development�Impacts:� Preliminary� Evidence� from� Jamaica.”� Development� on� the� Move�
WP_185_web_1-11-10.pdf 154WP_185_web_1-11-10.pdf 154 1/11/2010 1:39:52 PM1/11/2010 1:39:52 PM

Enhancing Regional Trade Integration in Southeast Europe 139
�
Working�Paper�2,� Institute�for�Public�Policy�Research�and�Global�Development�Network,�February.�
Lundström,�Cecilia.�2009a.�Personal�communication.��———.� 2009b.� “Students� from� the� Western� Balkans.”� February� 12.� King� Baudouin�
Foundation.� Available� at:� www.kbs�frb.be/otheractivity.aspx?id=228446&�LangType=1033.�
Manning,� Chris,� and� Pradip� Bhatnagar.� 2004.� “Liberalizing� and� Facilitating� the�Movement�of�Individual�Service�Providers�under�AFAS:�Implications�for�Labour�and� Immigration� Policies� and� Procedures� in� ASEAN.”� REPSF� Project� 02/004.�March.�Available�at:�www.aseansec.org/16945.htm.�
Martin,�Philip�L.�1993.�Trade�and�Migration:�NAFTA�and�Agriculture.�Washington:�DC:�Institute�for�International�Economics,�October.�Available�at:�http://www.iie.com.�
———.� 2005.� “Mexico�US� Migration,”� in� Gary� Hufbauer� and� Jeffrey� Schott� (eds.),�NAFTA� Revisited:� Achievements� and� Challenges.� Institute� for� International�Economics:� 441�486.� Available� at:� http://bookstore.iie.com/merchant.mvc?�Screen=PROD&Product_Code=332.�
———.� 2007.� “Guest�Workers:�New�Solution�or�New�Problem.”�University� of�Chicago�Legal�Forum:�289�318.�
———.� 2008.� “Low�� and� Semi�Skilled�Workers� Abroad.”� In�World� Migration� Report.�Managing�Labour�Mobility�in�the�Evolving�Global�Economy,�IOM:�77�104.�Available�at:�www.iom.ch/jahia/Jahia/cache/offonce/�pid/1674?entryId=20275.�
———.�2009.�“Recession�and�Migration:�A�New�Era�for�Labor�Migration.”�International�Migration�Review.�43(3),�Fall:�671–691.�
Martin,�Philip�L.�and�Manolo�Abella.�2009.�“Migration�and�Development:�The�Elusive�Link�at�the�GFMD.”�International�Migration�Review.�43(2),�Summer:�431�439.�
Martin,�Philip,�Manolo�Abella,�and�Christiane�Kuptsch.�2006.�Managing�Labor�Migration�in� the� Twenty�First� Century.� Yale� University� Press.� Available� at:�http://yalepress.yale.edu/yupbooks/book.asp?isbn=0300109040.�
Martin,� Philip� L.,� and� Gottfried� Zuercher.� 2008.� “Managing� Migration:� The� Global�Challenge.”�Washington�D.C.�Population�Reference�Bureau�63(1),�March.�Available�at:�www.prb.org/Publications/PopulationBulletins/2008/managingmigration.aspx.�
Meade,�J.�1953.�Problems�of�Economic�Union.�Chicago:�University�Chicago�Press.�Medved,�Felicita.�2007.�Draft�MARRI�Paper.�April.�Mimeo.�Mendola,� Mariapia,� and� Gero� Carletto.� 2009.� “International� Migration� and� Gender�
Differentials� in� the� Home� Labor� Market:� Evidence� from� Albania.”� Policy�Research� Working� Paper� 4900,� Poverty� Team,� Development� Research� Group.�World�Bank,�Washington,�DC,�April.�
Micevska,� Maja.� 2004.� “Unemployment� and� Labour� Market� Rigidities� in� Southeast�Europe.”�Global�Development�Network�of�Southeast�Europe,�June.�
Njinkeu�Dominique,�John�S.�Wilson,�and�Bruno�Powo�Fosso.�2008.�“Expanding�Trade�within�Africa:� The� Impact� of� Trade� Facilitation.”�World� Bank� Policy� Research�Working�Paper�4790.�World�Bank,�Washington,�DC.�
Nowak�Lehmann,�F.,�et�al.�2007.�“The�Impact�of�a�Customs�Union�between�Turkey�and�the�EU�on�Turkey’s�Exports�to�the�EU.”�Journal�of�Common�Market�Studies�45(3):�71–743.�
WP_185_web_1-11-10.pdf 155WP_185_web_1-11-10.pdf 155 1/11/2010 1:39:52 PM1/11/2010 1:39:52 PM

140 World Bank Working Paper
�
OECD.�2008.�“Defining�and�Strengthening�Sector�Specific�Sources�of�Competitiveness�in�the�Western�Balkans—Recommendation�for�a�Regional�Investment�Strategy.”�Presented�in�Sarajevo�on�October�9,�2008.�
Ratha,� Dilip,� and� William� Shaw.� 2007.� “South�South� Migration� and� Remittances.”�World�Bank�Working�Paper�102.�World�Bank,�Washington,�DC.�
Rauch,� James.� 1999.� “Networks� versus� Markets� in� International� Trade.”� Journal� of�International�Economics�7(35).�
Reed,�Howard,�and�Maria�Latorre.�2009.�“The�Economic�Impacts�of�Migration�on� the�UK�Labour�Market.”�London:�Institute�for�Public�Policy�Research.�Economics�of�Migration�Working�Paper�3,�February.�
Ruhs,� Martin,� and� Philip� Martin.� 2008.� “Numbers� vs.� Rights:� Trade�offs� and� Guest�Worker�Programs.”�International�Migration�Review�42(1):�249–65.�
Sachs,�J.,�and�A.�Warner.�1995.�“Economic�Reform�and�Process�of�Global�Integration.”�Harvard�Institute�of�Economic�Research�Working�Papers�no�1733.�
Schneider,�Friedrich.�2006.�“Shadow�Economies�of�145�Countries�All�Over�the�World:�What� Do� We� Really� Know?”� Working� paper.� Available� at:� www3.brookings.�edu/metro/umi/events/20060904_schneider.pdf.��
Sriskandarajah,� Dhananjayan,� Laurence� Cooley,� and� Howard� Reed.� 2005.� “Paying�Their�Way:�The�Fiscal�Contribution�of�Immigrants�in�the�UK.”�London:�Institute�for�Public�Policy�Research.�Available�at:�www.ippr.org/publicationsandreports/�publication.asp?id=280.�
Taylor,� Benjamin� J.,� and� John� S.�Wilson.� 2008.� “Harmonized� International� Standards�Do�Matter�to�Developing�Country�Exports.”�World�Bank�Trade�Issue�Brief�July�2008.�World�Bank,�Washington,�DC.�
Taymaz,� E.,� and� K.� Yilmaz.� 2007.� “Productivity� and� Trade� Orientation:� Turkish�Manufacturing� Industry� Before� and� After� the� Customs� Union.”� The� Journal� of�International�Trade�and�Diplomacy�1(1):�127–154.��
Villarreal,�M.�Angeles,�and�Marisabel�Cid.�2008.�“NAFTA�and�the�Mexican�Economy.”�Congressional�Research�Service�RL34733.�November�4.�
Viner,�J.�1950.�“The�Customs�Union�Issue.”�Carnegie�Endowment�for�International�Peace,�New�York.�Available�at:�wiiw.ac.at/?action=publ&id=searchfulltext&step=2.�
Woolcock,�Stephen.�2007.� “European�Union�Policy� towards�Free�Trade�Agreements.”�ECIPE�Working�Paper�No.�03/2007.�
World� Bank.� 2008a.�Western� Balkan� Integration� and� the� EU:� An� Agenda� for� Trade� and�Growth.�Ed.�S.�Kathuria,�World�Bank,�Washington,�DC.�
———.�2008b.�“Macedonia:�Country�Report.”�World�Bank,�Washington,�DC.�———.�2009�(forthcoming).�“Albania�Country�Economic�Memorandum.”�World�Bank,�
Washington,�DC.�———.� 2009� (forthcoming).� “Bosnia� and� Herzegovina� Country� Economic�
Memorandum.”�World�Bank,�Washington,�DC.�———.� 2009� (forthcoming).� “Croatia’s� EU� Convergence� Report:� Reaching� and�
Sustaining�Higher�Rates�of�Economic�Growth.”�World�Bank,�Washington,�DC.�———.� 2009� (forthcoming).� “FYR� Macedonia� Country� Economic� Memorandum.”�
World�Bank�report�44170�MK.�World�Bank,�Washington,�DC.���
WP_185_web_1-11-10.pdf 156WP_185_web_1-11-10.pdf 156 1/11/2010 1:39:52 PM1/11/2010 1:39:52 PM

�
��� �
WP_185_web_1-11-10.pdf 157WP_185_web_1-11-10.pdf 157 1/11/2010 1:39:53 PM1/11/2010 1:39:53 PM

�
�
� �
WP_185_web_1-11-10.pdf 158WP_185_web_1-11-10.pdf 158 1/11/2010 1:39:53 PM1/11/2010 1:39:53 PM

�
�
� �
WP_185_web_1-11-10.pdf 159WP_185_web_1-11-10.pdf 159 1/11/2010 1:39:53 PM1/11/2010 1:39:53 PM

�
�
�����
Eco-Audit
Environmental Benefits Statement �The�World�Bank�is�committed�to�preserving�Endangered�Forests�and�natural�resources.�We�print�World�Bank�Working�Papers�and�Country�Studies�on�postconsumer�recycled�paper,� processed� chlorine� free.� The� World� Bank� has� formally� agreed� to� follow� the�recommended� standards� for� paper� usage� set� by� Green� Press� Initiative—a� nonprofit�program� supporting� publishers� in� using� fiber� that� is� not� sourced� from� Endangered�Forests.�For�more�information,�visit�www.greenpressinitiative.org.��In�2008,�the�printing�of�these�books�on�recycled�paper�saved�the�following:��
Trees*� Solid�Waste� Water� Net�Greenhouse�Gases�
Total�Energy�
289� 8,011� 131,944 27,396� 92�mil.�*40�feet�in��height�and��6–8�inches�in�diameter�
Pounds� Gallons�Pounds�CO2�Equivalent� BTUs�
�
������
�
WP_185_web_1-11-10.pdf 160WP_185_web_1-11-10.pdf 160 1/11/2010 1:39:53 PM1/11/2010 1:39:53 PM

THE WORLD BANK1818 H Street, NW
Washington, DC 20433 USA
Telephone: 202 473-1000
Internet: www.worldbank.org
E-mail: [email protected]
Enhancing Regional Trade Integration in Southeast Europe is
part of the World Bank Working Paper series. These papers
are published to communicate the results of the Bank’s
ongoing research and to stimulate public discussion.
The countries of the Southeast Europe region have the com-
mon objective of joining the European Union (EU). To
achieve this goal, these countries have pursued closer inte-
gration with the EU and with each other, including signing
the Central European Free Trade Agreement (CEFTA). CEFTA
aims to fully liberalize trade in the region and work toward
greater cooperation in a number of trade-related areas, such
as investment, services, public procurement, and intellectu-
al property rights. This paper aims to help policy makers in
Southeast Europe assess the impact of the recently intro-
duced trade policy measures, and proposes actions that
could complement these measures and help achieve greater
regional trade integration. The paper considers intra-region-
al trade flows and the remaining nontariff barriers to trade,
the benefits of allowing free movement of skilled labor in
the region, and how adopting the EU’s Common External
Tariff could prevent trade diversion.
World Bank Working Papers are available individually or on
standing order. This World Bank Working Paper series is also
available by subscription to the World Bank e-Library
(www.worldbank.org/newelibrary).
ISBN 978-0-8213-8259-2
SKU 18259