![48216 Baack Final Proof [FM]](https://static.fdokumen.com/doc/165x107/631bfe5b3e8acd997705b218/48216-baack-final-proof-fm.jpg)
ENHANCING THE FACILITIES MANAGEMENT (FM ...
419
ENHANCING THE FACILITIES MANAGEMENT (FM) SERVICE DELIVERY IN MALAYSIA: THE DEVELOPMENT OF PERFORMANCE MEASUREMENT FRAMEWORK (PERFM) NIK ELYNA MYEDA A thesis submitted in partial fulfilment of the requirements of University College London for the degree of Doctor of Philosophy UNIVERSITY COLLEGE LONDON JUNE 2013
-
Upload
khangminh22 -
Category
Documents
-
view
0 -
download
0
Transcript of ENHANCING THE FACILITIES MANAGEMENT (FM ...
ENHANCING THE FACILITIES MANAGEMENT (FM) SERVICE DELIVERY IN MALAYSIA: THE DEVELOPMENT OF
PERFORMANCE MEASUREMENT FRAMEWORK (PERFM)
NIK ELYNA MYEDA
A thesis submitted in partial fulfilment of the requirements of
University College London for the degree of Doctor of Philosophy
UNIVERSITY COLLEGE LONDON
JUNE 2013 !

!
I, Nik Elyna Myeda, confirm that the work presented in this thesis is my own. Where
information has been derived from other sources, I confirm that this has been
indicated in the thesis.
NIK ELYNA MYEDA
JUNE 2013
!!!
!!
3!
!
ABSTRACT
Facilities management (FM) is a practice that contributes added value to
organisations. An optimum FM service delivery can be achieved by giving more
emphasis to the performance measurement (PM) aspect. The significant functions
of PM in maximising the efficient productivity of organisations’ service delivery have
been acknowledged and proven globally. However, there is still a gap in the scope
of PM in FM, especially in Malaysia, whereby its concept is still not as well-
developed as it is in other industries. There is also a lack of an appropriate set of
performance measures that can be used by FM practitioners in the industry. The
literature review for this research has also shown that FM industry in Malaysia is still
immature and in need of a step forward to be as competitive as other FM industries
globally. This has driven this research to endeavour to discover and comprehend
the effective key PM elements in measuring FM service performance. This research
aimed to develop a framework that proposes appropriate FM performance
measures that can be used by organisations in Malaysia. The qualitative
methodology approach from the pilot study survey, case studies and interviews has
shown significant findings on three levels of analysis. First, there is a gap in the
literature about the FM industry in Malaysia, and a greater understanding of the FM
service delivery needs to be further addressed and developed. Second, by using a
comparison study, this research has demonstrated that the PM designs in the UK
are comprehensive, detailed and customer-driven, whereas PM designs in Malaysia
are simple and supplier driven, but not objective-oriented. Third, findings from the
interviews, which aimed to evaluate the proposed framework, have demonstrated
that the developed performance measurement framework (PERFM) in this research
embeds positive qualities of an effective PM framework and is suitable to be
implemented in FM practice in Malaysia. From the findings of this research, it is
strongly anticipated that PERFM would enable the FM practitioners to better
understand the FM service scopes and the performance specifications and targets
that should be achieved within their capacities. PERFM is also expected to offer
values and benefits and serve as a platform in bringing up the FM industry to a
whole new level.
!!
4!
!
ACKNOWLEDGEMENTS In the name of God, the Most Gracious, the Most Merciful. Praise be to Allah.
I would like to extend my deepest gratitude to the following people for the help and
support given throughout the production of this thesis:
Professor Michael Pitt, my supervisor and ‘guru’ for his support and guidance
throughout the whole process. You have given me a lot of opportunities for which I
will be forever in debt. Peter McLennan, for the encouragement and directions in my
research. Your support has enabled me to focus on my effort for this research.
FM companies and practitioners in Malaysia and UK, for the co-operation and
guidance in my data collection process. Your valuable input and feedback are highly
appreciated.
My husband Fikri for always being there for me and giving me faithful support. Your
understanding, patience, sacrifice and love have always restored my faith.
My dear parents, this is what I’ve promised you. Thank you for the prayers and love,
which have always been my pillars of strength. My family and friends, for all the
advice, help and support from my day one starting this research up until the finishing
line.
Last but not least, to my two-year-old son Nik Emir Qalif. Finally I can show you that
this is something that I’ve been working on when you always found me not being
able to give my full attention to you when you needed me. You have always been
my great motivation and I believe this sacrifice is for our greater good.
May we always be driven to be the best among all.
!!
5!
!
Table of Contents
Declaration………………………………………………………………………………... 2 Abstract .…...……………………………………………………………………………... 3 Acknowledgements ...…………………………………………………………………... 4 List of Tables …………………………………………………………………………..… 9 List of Figures .…………………………………………………………………………. 10
CHAPTER 1: INTRODUCTION ................................................................... 12 1.1 Overview of the Thesis ............................................................................. 12 1.2 The research problem ............................................................................... 12 1.3 Research questions .................................................................................. 14 1.4 Aim and objectives .................................................................................... 14 1.5 Research Approach .................................................................................. 15 1.6 Research Design ....................................................................................... 16 1.7 Proposed Research Structure .................................................................. 17 1.8 Proposed Research Schedule .................................................................. 20 1.9 Research Summary ................................................................................... 22
CHAPTER 2: INTRODUCTION TO FACILITIES MANAGEMENT (FM) ..... 23 2.1 Introduction ............................................................................................... 23 2.2 FM Growth and Development ................................................................... 26 2.3 Revolution in FM ....................................................................................... 27 2.4 FM in a Business Context ......................................................................... 28 2.5 Scope of FM Services ............................................................................... 30 2.6 The Evolution of FM .................................................................................. 34 2.7 Delivering FM strategically ....................................................................... 36 2.8 FM Contributions ....................................................................................... 40 2.9 Responsibilities of FM Managers ............................................................ 42 2.10 Innovation in FM Service Delivery ......................................................... 43 2.11 The FM Industry in Malaysia .................................................................. 44
2.11.1 Growth and Development ................................................................... 45 2.11.2 Practice ............................................................................................... 48 2.11.3 Profession ........................................................................................... 49 2.11.4 Problems and Challenges ................................................................... 50 2.11.5 Opportunities ....................................................................................... 51
2.12 Chapter Summary ................................................................................... 53 CHAPTER 3: PERFORMANCE MEASUREMENT (PM): KEY ELEMENTS AND SERVICE DELIVERY ........................................................................... 54
3.1 Introduction to PM ..................................................................................... 54 3.2 The Development of A PMS ...................................................................... 56 3.3 Problems in Developing and Implementing a PMS ................................ 59 3.4 Strategic PMS ............................................................................................ 61 3.5 Principles of An Effective PMS ................................................................ 62 3.6 Existing PMS .............................................................................................. 64 3.7 Identifying Performance Measures .......................................................... 67
3.7.1 Types of Performance Measures .......................................................... 68 3.7.2 Financial and Non-financial Performance Measures ............................ 71 3.7.3 Traditional Productivity Performance Measures ................................... 73
!!
6!
!
3.7.4 Time-based Productivity Performance Measures ................................. 74 3.8 Chapter Summary ..................................................................................... 75
CHAPTER 4: PERFORMANCE MEASUREMENT (PM) IN FACILITIES MANAGEMENT (FM) ................................................................................... 76
4.1 Introduction ............................................................................................... 76 4.2 PM Literature ............................................................................................. 78 4.3 Performance .............................................................................................. 79 4.4 Quality of Services Delivered ................................................................... 81 4.5 The Lack of PM practice in FM ................................................................. 82 4.6 The Rationale in Measuring FM Performance ........................................ 84 4.7 FM Performance must be measured ....................................................... 85 4.8 PM Models in FM ....................................................................................... 87
4.8.1 Performance Measures’ Studies ........................................................... 90 4.8.2 Performance Measures Used ............................................................... 95
4.9 Chapter Summary ................................................................................... 103 CHAPTER 5: DEVELOPMENT OF A PERFORMANCE MEASUREMENT (PM) FRAMEWORK ................................................................................... 104
5.1 The Rationale in Developing a Framework ........................................... 104 5.2 Multiple Dimensions of Performance .................................................... 105 5.3 Design Process ....................................................................................... 106
5.3.1 Literature ............................................................................................. 107 5.3.2 Fieldwork ............................................................................................. 108 5.3.3 Analysis ............................................................................................... 108
5.4 Developing A Theoretical Framework ................................................... 108 5.5 Validity of Performance Measures ......................................................... 112
5.5.1 Validity of Objective and Subjective Performance Measures .............. 113 5.6 The Process of Selecting Performance Measures ............................... 114 5.7 Criteria of A Successful PM Framework ............................................... 116 5.8 Performance Criteria ............................................................................... 117 5.9 Service Classification Parameters ......................................................... 122 5.10 Principles of Supply Chain Management in FM ................................. 124 5.11 Pilot Study Survey ................................................................................. 126
5.11.1 Questionnaire Design ........................................................................ 126 5.11.2 Structure of the Questionnaire .......................................................... 127 5.11.3 Attitude Rating Scales ....................................................................... 127 5.11.4 Reliability Test ................................................................................... 128 5.11.5 Respondents’ Background ................................................................ 129 5.11.6 FM Profession and Role .................................................................... 129 5.11.7 Strategic FM ...................................................................................... 131 5.11.8 FM and Client’s Corporate Objectives .............................................. 134 5.11.9 PM in FM ........................................................................................... 134 5.11.10 Barriers in Implementing PMS ........................................................ 136
5.12 Pilot Study Conclusion ......................................................................... 138 5.13 Chapter Summary ................................................................................. 140
CHAPTER 6: RESEARCH METHODOLOGY ........................................... 141 6.1 Literature .................................................................................................. 141
6.1.1 Paradigm ............................................................................................. 142 6.1.2 Debates of Paradigm .......................................................................... 147 6.1.3 Research Design ................................................................................. 148
6.2 Research Study Framework ................................................................... 152 6.2.1 Inductive Grounded Theory ................................................................. 153 6.2.2 Research Methods .............................................................................. 155 6.2.3 Ethical Consideration .......................................................................... 158

!!
7!
!
6.2.4 Data Analysis in Qualitative Research ................................................ 159 6.2.5 Reliability and Validity of Data ............................................................. 160 6.2.6 Data Collection Setting and Design .................................................... 161 6.2.7 Primary Data Collection Instruments ................................................... 162
6.3 Chapter Summary ................................................................................... 162 CHAPTER 7: CASE STUDIES DATA ANALYSIS .................................... 164
7.1 Introduction ............................................................................................. 164 7.2 Background of Case Studies ................................................................. 164
7.2.1 Malaysian Case Studies ...................................................................... 165 7.2.2 UK Case Studies ................................................................................. 173
7.3 The Scope of FM Services ...................................................................... 181 7.4 The Elements of Performance Measures .............................................. 183
7.4.1 Healthcare Organisations .................................................................... 184 7.4.2 Retail Organisations ............................................................................ 187 7.4.3 Finance Organisations ........................................................................ 189 7.4.4 Office Buildings’ Organisations ........................................................... 191
7.5 PM Structures .......................................................................................... 193 7.6 Comparison of PM Designs in Malaysia and the UK ........................... 196 7.7 Case Studies Data and Findings ............................................................ 197 7.8 Chapter Summary ................................................................................... 197
CHAPTER 8: INTRODUCTION OF PERFORMANCE MEASUREMENT FRAMEWORK (PERFM) ............................................................................ 198
8.1 Introduction ............................................................................................. 198 8.2 Theoretical Elements .............................................................................. 198 8.3 Structure of PERFM ................................................................................ 201 8.4 PERFM Categories .................................................................................. 202 8.5 Chapter Summary ................................................................................... 208
CHAPTER 9: INTERVIEWS DATA ANALYSIS ........................................ 209 9.1 Introduction ............................................................................................. 209 9.2 High-Level Thematic Analysis ............................................................... 210 9.3 Design of Framework .............................................................................. 210 9.4 Functionality ............................................................................................ 212 9.5 Implementation ........................................................................................ 215 9.6 Summary of PERFM Evaluation Themes .............................................. 218 9.7 Chapter Summary ................................................................................... 219
CHAPTER 10: CONCLUSIONS & RECOMMENDATIONS ...................... 220 10.1 Reflection on the Research Aim and Objectives ................................ 220 10.2 Summary of Conclusions ..................................................................... 221
10.2.1 Conclusion 1 ..................................................................................... 221 10.2.2 Conclusion 2 ..................................................................................... 224 10.2.3 Conclusion 3 ..................................................................................... 227 10.2.4 Conclusion 4 ..................................................................................... 229
10.3 Research Limitations ............................................................................ 230 10.4 Recommendations ................................................................................ 231 10.5 Contribution to Knowledge .................................................................. 232
10.5.1 Academic .......................................................................................... 232 10.5.2 Industry ............................................................................................. 233 10.5.3 New knowledge ................................................................................. 234
10.6 Research Summary ............................................................................... 235 References ……………………………………………………………………..……….236
Appendices ……………………………………………………………………..………257
!!
8!
!
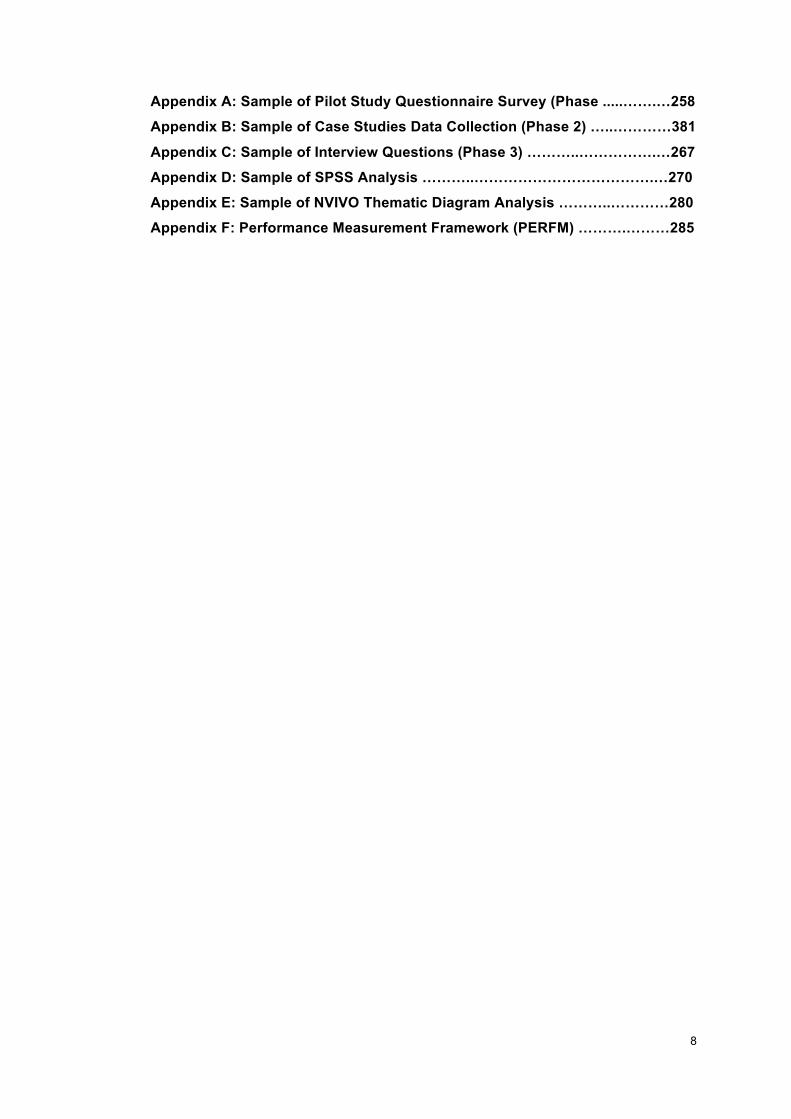
Appendix A: Sample of Pilot Study Questionnaire Survey (Phase .....…….…258
Appendix B: Sample of Case Studies Data Collection (Phase 2) …..…………381
Appendix C: Sample of Interview Questions (Phase 3) ………..…………….…267
Appendix D: Sample of SPSS Analysis ………..……………………………….…270
Appendix E: Sample of NVIVO Thematic Diagram Analysis ………..…………280
Appendix F: Performance Measurement Framework (PERFM) ……….………285
!!
9!
!
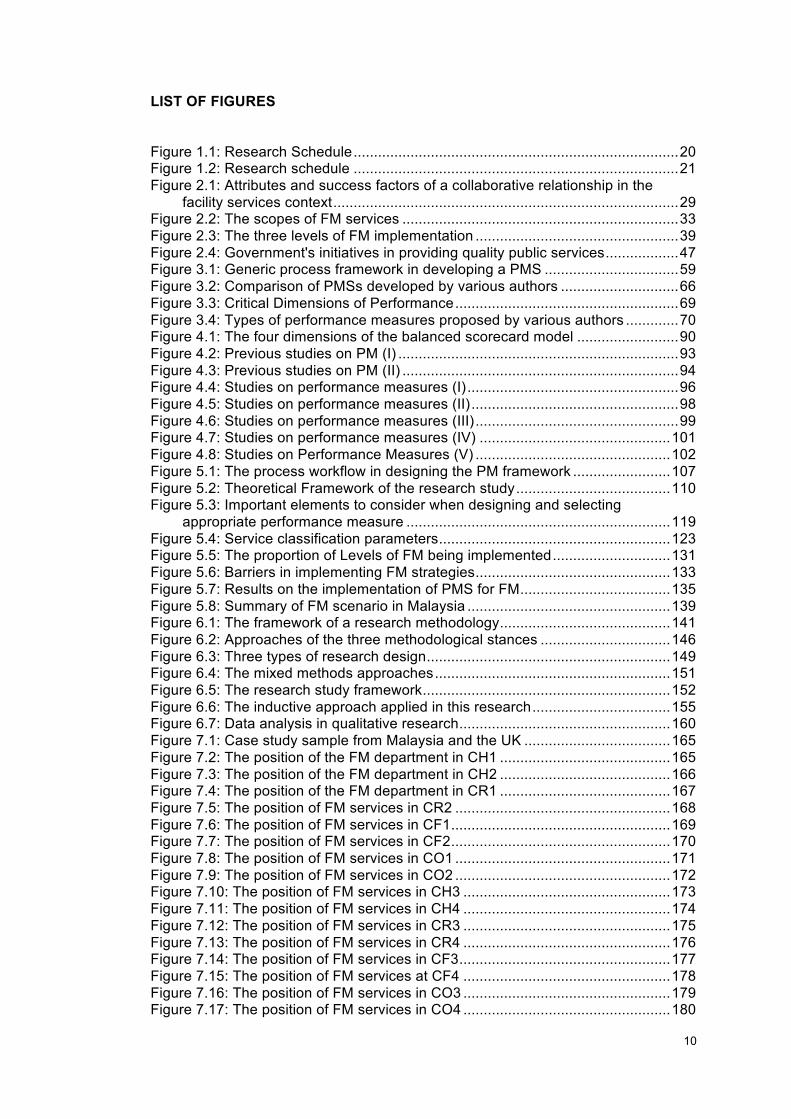
LIST OF TABLES
Table 1.1: Proposed research methods ................................................................... 17 Table 1.2: Outline of research chapters ................................................................... 19 Table 3.1: Barriers in implementing PMS ................................................................. 61 Table 4.1: Main changes and trends in the development of PMS ............................ 82 Table 5.1: The theoretical comparison of SCM service element with FM service
scopes ............................................................................................................ 125 Table 5.2: Structure of the questionnaire ............................................................... 127 Table 5.3: Likert scale used in the study ................................................................ 128 Table 5.4: Cronbach's Alpha value ......................................................................... 128 Table 5.5: Number of respondents according to job title ........................................ 129 Table 5.6: Percentage of respondents based on their period of involvement in the
FM industry ..................................................................................................... 129 Table 5.7: Results on FM profession and role variables ........................................ 130 Table 5.8: Results on variables tested for strategic FM ......................................... 131 Table 5.9: Results of the implementation of FM strategies .................................... 132 Table 5.10: The ranking of FM strategies influencing factors as rated by
respondents .................................................................................................... 132 Table 5.11: The highest level of agreements on the FM status and practice in client's
business ......................................................................................................... 134 Table 5.12: Respondent's response on the PMS implementation and improvement
........................................................................................................................ 135 Table 5.13: Problems or barriers in implementing PMS ......................................... 137
!!
10!
!
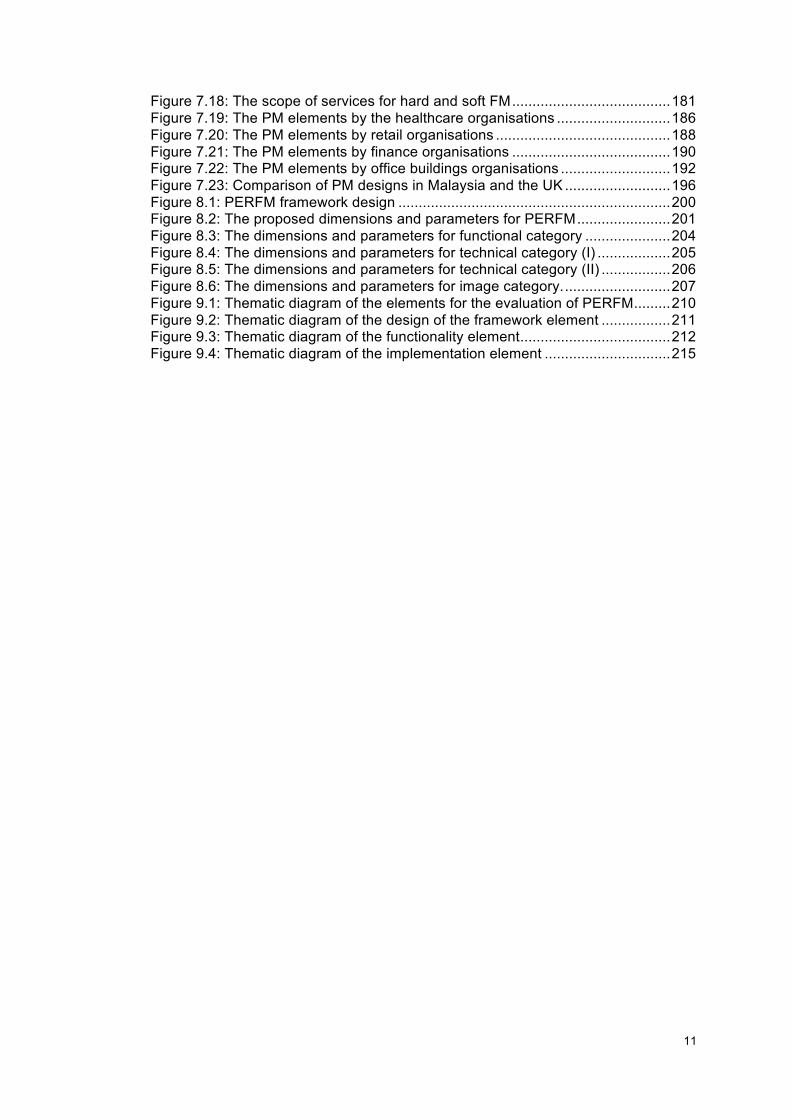
LIST OF FIGURES
Figure 1.1: Research Schedule ................................................................................ 20 Figure 1.2: Research schedule ................................................................................ 21 Figure 2.1: Attributes and success factors of a collaborative relationship in the
facility services context ..................................................................................... 29 Figure 2.2: The scopes of FM services .................................................................... 33 Figure 2.3: The three levels of FM implementation .................................................. 39 Figure 2.4: Government's initiatives in providing quality public services .................. 47 Figure 3.1: Generic process framework in developing a PMS ................................. 59 Figure 3.2: Comparison of PMSs developed by various authors ............................. 66 Figure 3.3: Critical Dimensions of Performance ....................................................... 69 Figure 3.4: Types of performance measures proposed by various authors ............. 70 Figure 4.1: The four dimensions of the balanced scorecard model ......................... 90 Figure 4.2: Previous studies on PM (I) ..................................................................... 93 Figure 4.3: Previous studies on PM (II) .................................................................... 94 Figure 4.4: Studies on performance measures (I) .................................................... 96 Figure 4.5: Studies on performance measures (II) ................................................... 98 Figure 4.6: Studies on performance measures (III) .................................................. 99 Figure 4.7: Studies on performance measures (IV) ............................................... 101 Figure 4.8: Studies on Performance Measures (V) ................................................ 102 Figure 5.1: The process workflow in designing the PM framework ........................ 107 Figure 5.2: Theoretical Framework of the research study ...................................... 110 Figure 5.3: Important elements to consider when designing and selecting
appropriate performance measure ................................................................. 119 Figure 5.4: Service classification parameters ......................................................... 123 Figure 5.5: The proportion of Levels of FM being implemented ............................. 131 Figure 5.6: Barriers in implementing FM strategies ................................................ 133 Figure 5.7: Results on the implementation of PMS for FM ..................................... 135 Figure 5.8: Summary of FM scenario in Malaysia .................................................. 139 Figure 6.1: The framework of a research methodology .......................................... 141 Figure 6.2: Approaches of the three methodological stances ................................ 146 Figure 6.3: Three types of research design ............................................................ 149 Figure 6.4: The mixed methods approaches .......................................................... 151 Figure 6.5: The research study framework ............................................................. 152 Figure 6.6: The inductive approach applied in this research .................................. 155 Figure 6.7: Data analysis in qualitative research .................................................... 160 Figure 7.1: Case study sample from Malaysia and the UK .................................... 165 Figure 7.2: The position of the FM department in CH1 .......................................... 165 Figure 7.3: The position of the FM department in CH2 .......................................... 166 Figure 7.4: The position of the FM department in CR1 .......................................... 167 Figure 7.5: The position of FM services in CR2 ..................................................... 168 Figure 7.6: The position of FM services in CF1 ...................................................... 169 Figure 7.7: The position of FM services in CF2 ...................................................... 170 Figure 7.8: The position of FM services in CO1 ..................................................... 171 Figure 7.9: The position of FM services in CO2 ..................................................... 172 Figure 7.10: The position of FM services in CH3 ................................................... 173 Figure 7.11: The position of FM services in CH4 ................................................... 174 Figure 7.12: The position of FM services in CR3 ................................................... 175 Figure 7.13: The position of FM services in CR4 ................................................... 176 Figure 7.14: The position of FM services in CF3 .................................................... 177 Figure 7.15: The position of FM services at CF4 ................................................... 178 Figure 7.16: The position of FM services in CO3 ................................................... 179 Figure 7.17: The position of FM services in CO4 ................................................... 180
!!
11!
!
Figure 7.18: The scope of services for hard and soft FM ....................................... 181 Figure 7.19: The PM elements by the healthcare organisations ............................ 186 Figure 7.20: The PM elements by retail organisations ........................................... 188 Figure 7.21: The PM elements by finance organisations ....................................... 190 Figure 7.22: The PM elements by office buildings organisations ........................... 192 Figure 7.23: Comparison of PM designs in Malaysia and the UK .......................... 196 Figure 8.1: PERFM framework design ................................................................... 200 Figure 8.2: The proposed dimensions and parameters for PERFM ....................... 201 Figure 8.3: The dimensions and parameters for functional category ..................... 204 Figure 8.4: The dimensions and parameters for technical category (I) .................. 205 Figure 8.5: The dimensions and parameters for technical category (II) ................. 206 Figure 8.6: The dimensions and parameters for image category. .......................... 207 Figure 9.1: Thematic diagram of the elements for the evaluation of PERFM ......... 210 Figure 9.2: Thematic diagram of the design of the framework element ................. 211 Figure 9.3: Thematic diagram of the functionality element ..................................... 212 Figure 9.4: Thematic diagram of the implementation element ............................... 215 !
!!
12!
!
CHAPTER 1: INTRODUCTION
1.1 Overview of the Thesis !This thesis presents a significant contribution to knowledge by exploring the
implementation of Performance Measurement (PM) in Facilities Management (FM).
It seeks to understand the key elements in measuring FM service performance and
to develop a framework that can be used by FM practitioners in Malaysia. This
chapter addresses the research scope and problem, research question, research
aims and objectives, significant contribution to knowledge, research design,
research structure and chapters, and, finally, the research schedule. This first
chapter explains how the research was carried based on the root problems to
achieve the underlying aim and objectives.
1.2 The research problem
!Much FM practice remains cost-focused, rooted in operations and concerned
primarily with maintaining the steady-state position of an organisation (Kaya et al.,
2004). There is a need for the FM practice to continuously be improved in order to
demonstrate the added value to the organisation’s directives. One essential
approach is determining that the service delivered by service providers is as per the
standard and should meet or exceed the clients’ expectations. Sarshar and Pitt
(2009) believe that there are areas that are more significant for client than for
supplier. Therefore, it is the client or organisation’s responsibility to understand the
service provided and select the appropriate measurement parameters or
performance measures by which to effectively measure the service performance.
Lack of a conceptual management framework is the reason why FM remains
misunderstood in the general business sector (McLennan, 2000). A PM framework
can bridge this gap, by proposing the imperative elements in service delivery, which
can contribute to the organisation’s short- and long-term business planning.
Most research in FM focuses on the role of the corporate real estate function,
outsourcing decisions or more general management issues (Kadefors, 2008).
Previous studies in performance have tended to measure profitability, economics
and environmental issues and, recently, issues on sustainability, but there is a lack
of studies that focus on performance purely from the FM perspective (Enoma and
!!
13!
!
Allen, 2007). Although the area of PM is not new, the constructs are neither well-
established nor standardised across and even within FM disciplines, giving an
abundant area for investigation. Amaratunga (2000) believes that researchers and
writers have yet to investigate the concepts of PM that are well-developed in other
fields, and that they currently do not take into account the complexities of PM at the
organisational level. In essence, Liyanage and Egbu (2008) also agree that there is
a need to develop the framework for all FM services using FM service level
agreements and other key performance indicators (KPIs). Most of the studies on
measuring FM service performance concentrate on the principles and general
indicators but there is a lack of specific parameters that look at both management
and operation.
At present, the lack of proper categorisation hampers frequent and widespread use
of performance metrics by the industry (Lavy et al., 2010). There are also only
limited KPIs that can be used in FM as most frameworks propose the performance
measures or indicators that are too general for FM service specification (Enoma and
Allen, 2007). This shows that there is a big gap in formulating an appropriate set of
performance measures that can be used by FM practitioners in the industry.
As for the Malaysian context, there has been little study of FM service performance.
The current situation in Malaysia confirms that practices vary from one organisation
to another, depending on the services provided or applied to the buildings. The slow
pace of regulating appropriate FM standards or regulations is another factor that
requires immediate response action (Mustaffa et al., 2008).
One major problem faced is the lack of FM service standards that can be used to
guide the practitioners to implement and measure FM strategically. As suggested by
Amaratunga (2000), there is a need to determine, verify and integrate the axioms of
the modern Performance Measurement System (PMS) in the context of FM.
Therefore, this research seeks to fill the gap in the Malaysian FM industry by
integrating the concept of PM theories and performance elements being practised in
the industry through the development of Performance Measurement Framework
(PERFM).
!!
14!
!
1.3 Research questions
Based on the apparent research problems identified from the initial literature review,
this study poses the following research questions:
What are the key elements in measuring FM service performance?
How can FM organisations in Malaysia measure their performance
strategically, using a practical framework?
1.4 Aim and objectives
Based on the apparent research problems and the research questions posed, this
research proposes the following aim:
To develop a PM framework that FM companies in Malaysia can use to
implement and enhance service delivery
Therefore, in its first stage it seeks to understand the current knowledge and
implementation of PM aspect by FM practitioners both in Malaysia and the UK, in
order to introduce a PM framework for FM practice in Malaysia to enhance existing
service delivery.
To systematically investigate this aim, four objectives have been derived:
(1) To understand the current thinking on FM and PM globally, with a specific
focus on the Malaysian context.
(2) To understand the elements of effective PM both in theory and practice,
looking at Malaysian and UK case studies.
(3) To develop PERFM to be used by Malaysian FM practitioners:
a. Identify the key components of PM, drawing on the key findings from
Objectives 1 and 2;
b. Use knowledge from Objective 2 to obtain the current position of both
Malaysian and UK organisations;
c. Produce PERFM based on findings from Objectives 3a and 3b.
(4) To evaluate PERFM’s ability to enable FM practitioners in Malaysia to
enhance their existing FM service delivery
!!
15!
!
1.5 Research Approach
In a Malaysian context, there is a lack of guidelines and framework of strategic FM
or performance guidelines to be followed by practitioners. This research aims to
overcome the challenges faced by the FM industry in Malaysia by looking at the
imperative elements in measuring FM service delivery and developing PERFM as a
powerful tool for practitioners to use as a guide to upgrading their practice from
operational to strategic FM.
Upon completion, this PERFM should be an integral part of measuring FM service
delivery. It is designed to incorporate the following aspects:
• Management- which consists of functional performance measures covering
the managerial aspect
• Operation- which consists of technical and image performance measures
focusing on operational elements namely hard and soft FM
The performance measures for both management and operation aspects focus on
the essential indicators aiming for potential efficiency gains and quality
improvement, particularly in the management, operation, customer-focus and
outsourcing elements.
The development of this framework will serve as guidance by which Malaysian FM
practitioners can strategically measure their FM service delivery based on the robust
performance measures proposed in PERFM. This new development being
implemented by the practitioners will open a new, challenging experience and lead
to a rapid growth of the FM industry in Malaysia.
The novelty of this research is proven by the lack of FM guidelines in Malaysia,
particularly for measurement purposes. This research is taking a step forward in
developing a master plan to change the FM sector in Malaysia. It is expected that
this research will create a lot of interest among academics and practitioners, as it
proposes a set of PM framework that has never been developed and researched
extensively.
!!
16!
!
1.6 Research Design
In order to achieve the aims and objectives, this research proposes to adapt the
qualitative approach. Three phases of data collection were conducted comprising of
pilot study survey, case studies and interviews.
The philosophical worldview adapted in this research is constructivism, where it
seeks to understand a specific context in which how the people work in order to
understand the work settings of the participants. Based on this worldview philosophy
and grounded theory approach, this research adapted the triangulation technique
comprises of pilot study survey, case studies and interviews.
The methodology of this research commenced with a pilot study survey, conducted
through the distribution of questionnaires to the key FM players in the Malaysian
context. The survey gave feedback and findings on the key items of FM and PM in
FM, which have been summarised from the literature review. Subsequently, the
qualitative approach was undertaken by conducting a series of case study on
selected FM organisations in Malaysia and the UK. In-depth study and analysis of
the case studies provided overview of the current performance measures being
used in Malaysian organisations in comparison to UK organisations, where the FM
industry is much more developed.
Further evaluation of the developed PERFM was based on the feedback from the
final interviews carried out with the selected FM practitioners from the case study
organisations in Malaysia. It is concluded that the objectives of this study were
successfully achieved by implementing the selected research methods and tools (as
shown in Table 1.1). The primary source of data collection of this study was based
on the qualitative approach from both case studies and interviews. The methodology
used has successfully achieved the aim of the constructivism approach, which is to
inductively generate a theory based on the study of the service settings both from
literature studies and data collection.
!!
17!
!
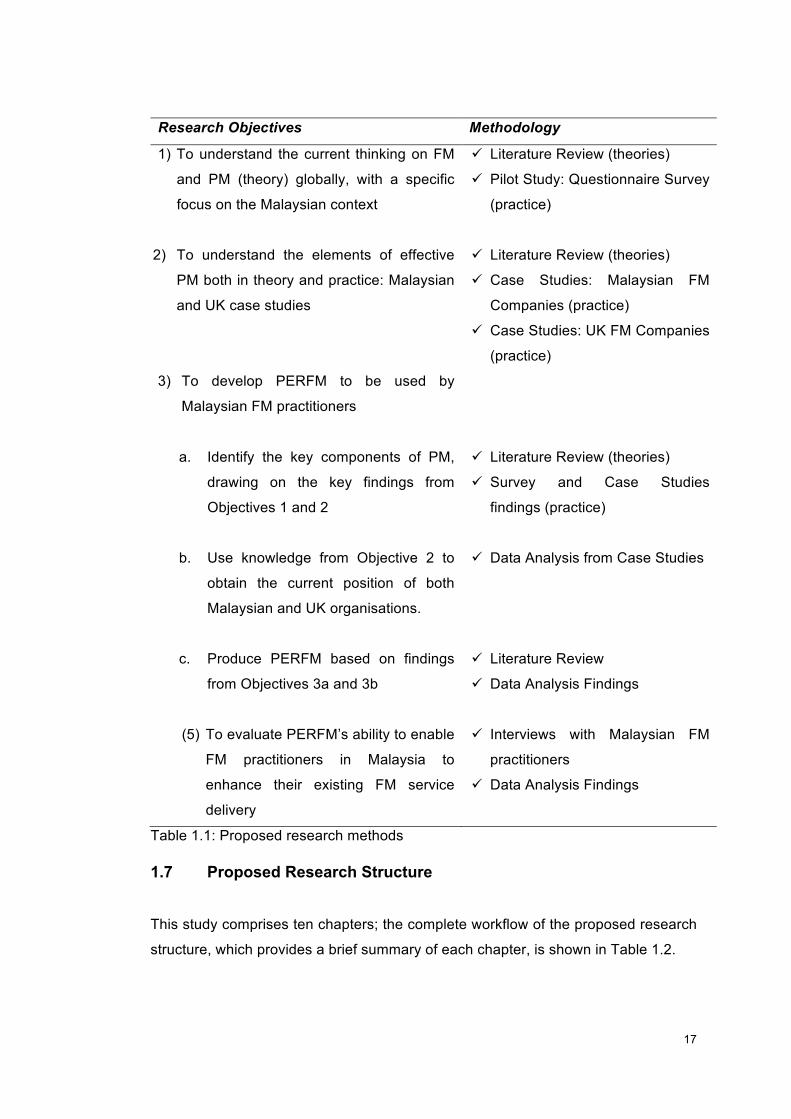
Research Objectives Methodology
1) To understand the current thinking on FM
and PM (theory) globally, with a specific
focus on the Malaysian context
! Literature Review (theories)
! Pilot Study: Questionnaire Survey
(practice)
2) To understand the elements of effective
PM both in theory and practice: Malaysian
and UK case studies
! Literature Review (theories)
! Case Studies: Malaysian FM
Companies (practice)
! Case Studies: UK FM Companies
(practice)
3) To develop PERFM to be used by
Malaysian FM practitioners
a. Identify the key components of PM,
drawing on the key findings from
Objectives 1 and 2
! Literature Review (theories)
! Survey and Case Studies
findings (practice)
b. Use knowledge from Objective 2 to
obtain the current position of both
Malaysian and UK organisations.
! Data Analysis from Case Studies
c. Produce PERFM based on findings
from Objectives 3a and 3b
! Literature Review
! Data Analysis Findings
(5) To evaluate PERFM’s ability to enable
FM practitioners in Malaysia to
enhance their existing FM service
delivery
! Interviews with Malaysian FM
practitioners
! Data Analysis Findings
Table 1.1: Proposed research methods !1.7 Proposed Research Structure
This study comprises ten chapters; the complete workflow of the proposed research
structure, which provides a brief summary of each chapter, is shown in Table 1.2.
!!
18!
!
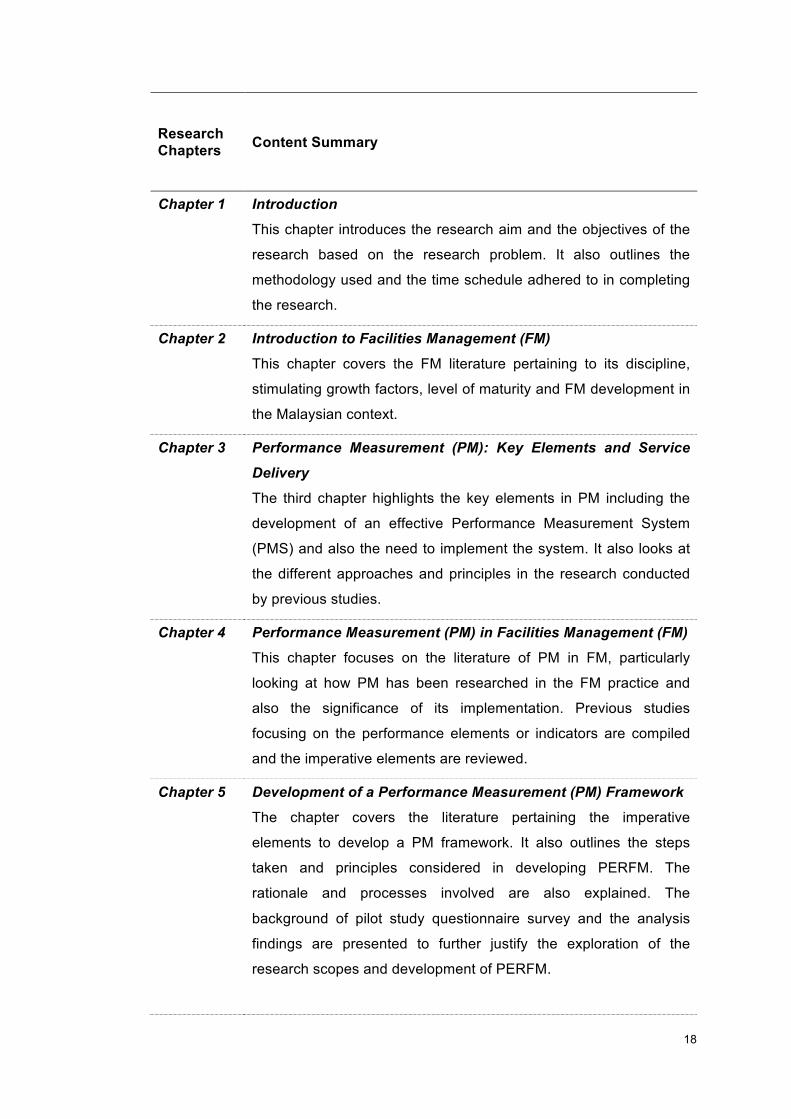
Research Chapters
Content Summary
Chapter 1
Introduction
This chapter introduces the research aim and the objectives of the
research based on the research problem. It also outlines the
methodology used and the time schedule adhered to in completing
the research.
Chapter 2 Introduction to Facilities Management (FM)
This chapter covers the FM literature pertaining to its discipline,
stimulating growth factors, level of maturity and FM development in
the Malaysian context.
Chapter 3 Performance Measurement (PM): Key Elements and Service
Delivery
The third chapter highlights the key elements in PM including the
development of an effective Performance Measurement System
(PMS) and also the need to implement the system. It also looks at
the different approaches and principles in the research conducted
by previous studies.
Chapter 4 Performance Measurement (PM) in Facilities Management (FM)
This chapter focuses on the literature of PM in FM, particularly
looking at how PM has been researched in the FM practice and
also the significance of its implementation. Previous studies
focusing on the performance elements or indicators are compiled
and the imperative elements are reviewed.
Chapter 5 Development of a Performance Measurement (PM) Framework
The chapter covers the literature pertaining the imperative
elements to develop a PM framework. It also outlines the steps
taken and principles considered in developing PERFM. The
rationale and processes involved are also explained. The
background of pilot study questionnaire survey and the analysis
findings are presented to further justify the exploration of the
research scopes and development of PERFM.
!!
19!
!
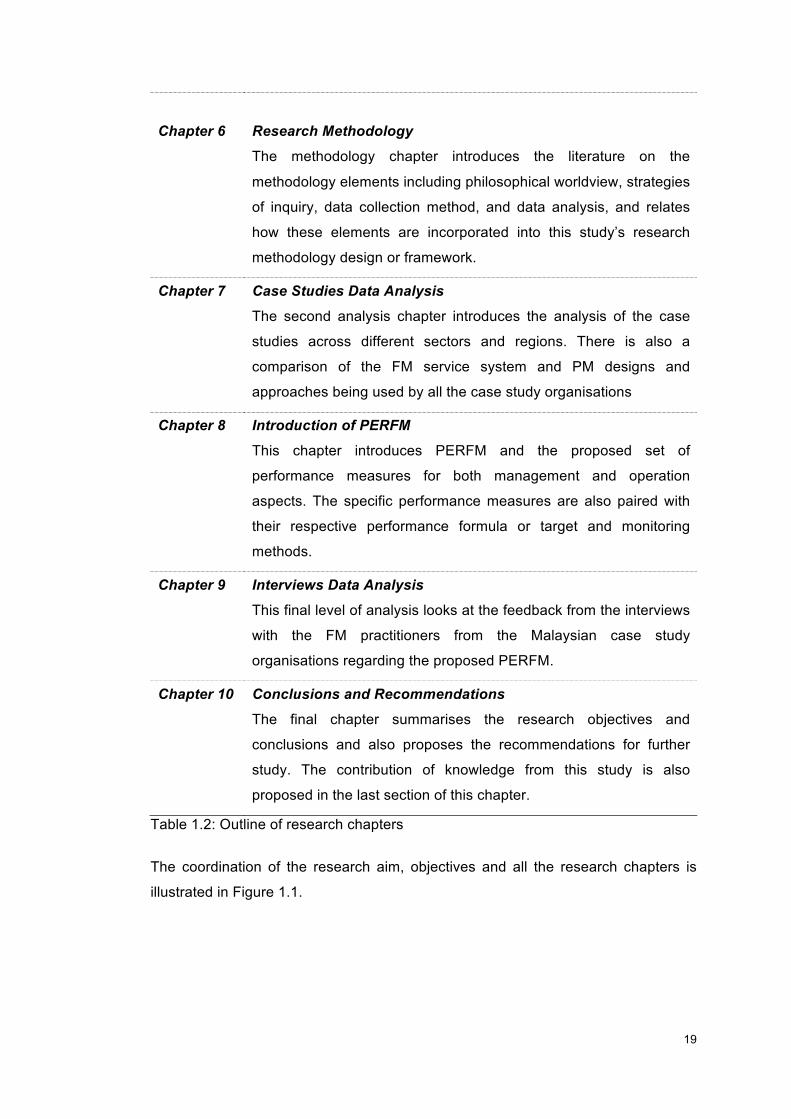
Chapter 6
Research Methodology
The methodology chapter introduces the literature on the
methodology elements including philosophical worldview, strategies
of inquiry, data collection method, and data analysis, and relates
how these elements are incorporated into this study’s research
methodology design or framework.
Chapter 7 Case Studies Data Analysis
The second analysis chapter introduces the analysis of the case
studies across different sectors and regions. There is also a
comparison of the FM service system and PM designs and
approaches being used by all the case study organisations
Chapter 8 Introduction of PERFM
This chapter introduces PERFM and the proposed set of
performance measures for both management and operation
aspects. The specific performance measures are also paired with
their respective performance formula or target and monitoring
methods.
Chapter 9 Interviews Data Analysis
This final level of analysis looks at the feedback from the interviews
with the FM practitioners from the Malaysian case study
organisations regarding the proposed PERFM.
Chapter 10 Conclusions and Recommendations
The final chapter summarises the research objectives and
conclusions and also proposes the recommendations for further
study. The contribution of knowledge from this study is also
proposed in the last section of this chapter.
Table 1.2: Outline of research chapters
The coordination of the research aim, objectives and all the research chapters is
illustrated in Figure 1.1.
!!
20!
!
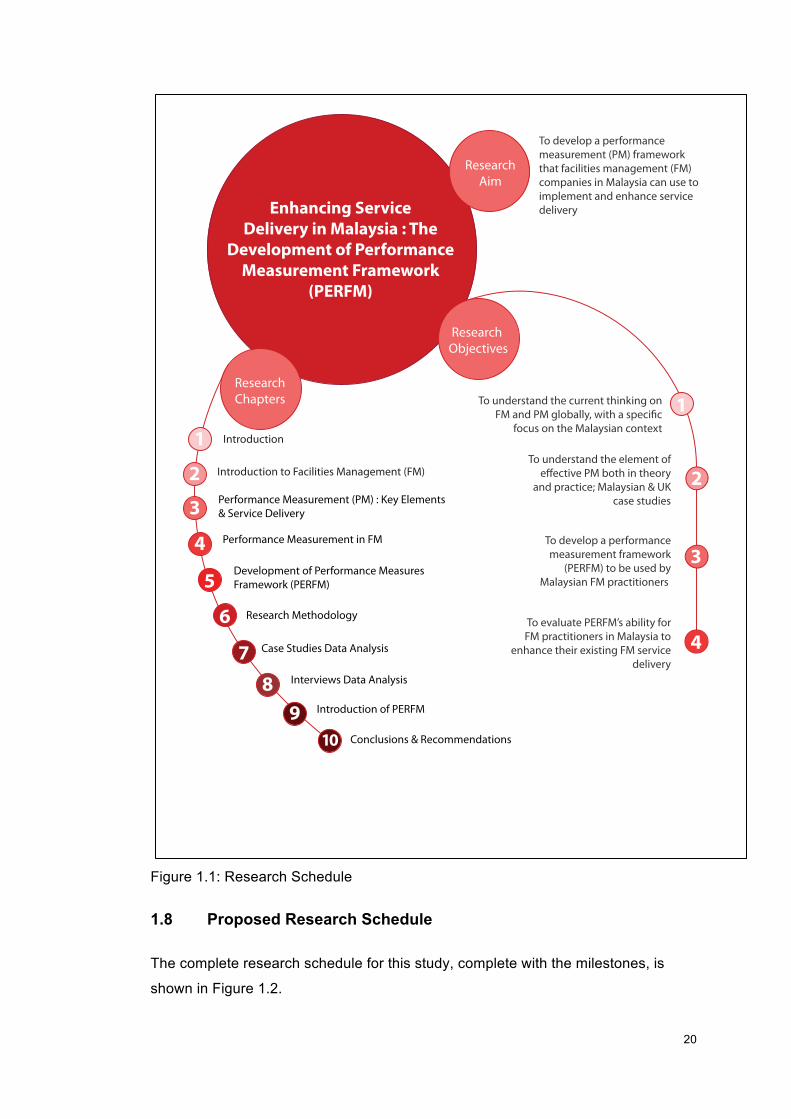
!Figure 1.1: Research Schedule
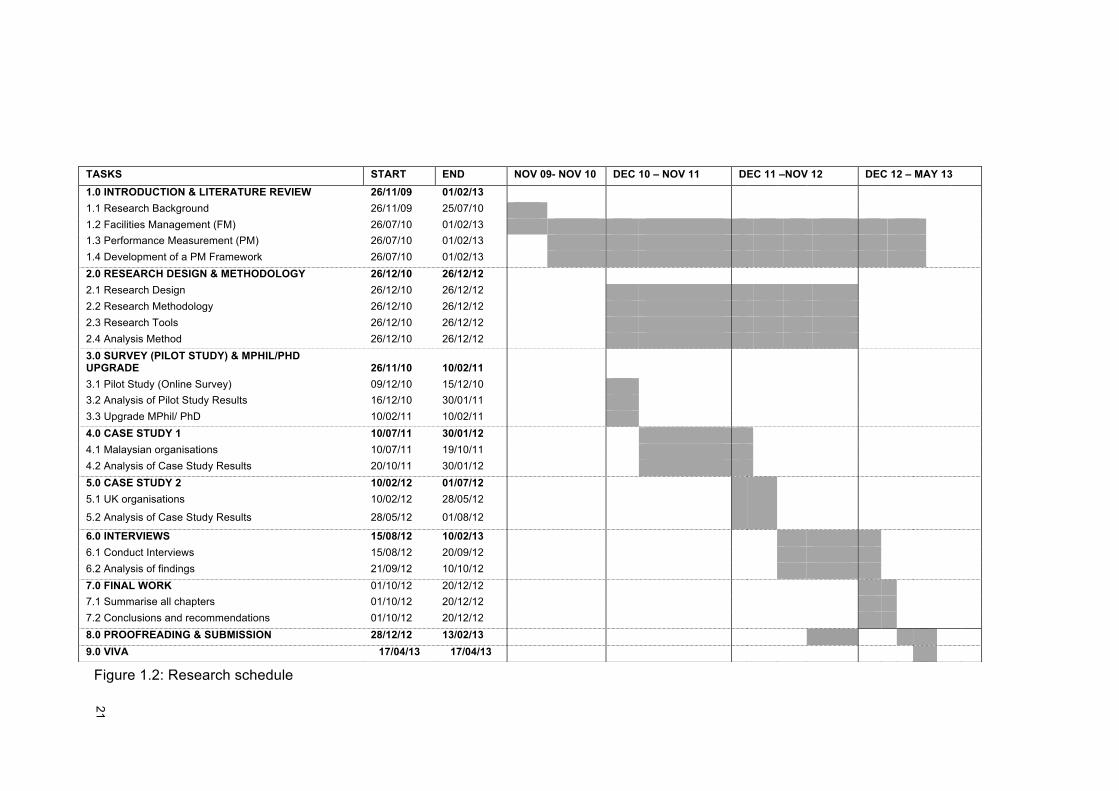
1.8 Proposed Research Schedule
The complete research schedule for this study, complete with the milestones, is
shown in Figure 1.2.
ResearchChapters
ResearchAim
Research Objectives
Enhancing Service Delivery in Malaysia : The
Development of Performance Measurement Framework
(PERFM)
To develop a performance measurement (PM) framework that facilities management (FM) companies in Malaysia can use to implement and enhance service delivery
To understand the current thinking on FM and PM globally, with a speci!c
focus on the Malaysian context
To understand the element of e"ective PM both in theory
and practice; Malaysian & UK case studies
To develop a performance measurement framework
(PERFM) to be used by Malaysian FM practitioners
To evaluate PERFM’s ability for FM practitioners in Malaysia to
enhance their existing FM service delivery
1
4
5
6
78
910
2
3
4
1
2
3
Introduction to Facilities Management (FM)
Performance Measurement (PM) : Key Elements & Service Delivery
Performance Measurement in FM
Development of Performance Measures Framework (PERFM)
Research Methodology
Case Studies Data Analysis
Interviews Data Analysis
Introduction of PERFM
Conclusions & Recommendations
Introduction
!!
21!
!
!!!!!!!!!!!!!!!
Figure 1.2: Research schedule
TASKS START END NOV 09- NOV 10 DEC 10 – NOV 11 DEC 11 –NOV 12 DEC 12 – MAY 13 1.0 INTRODUCTION & LITERATURE REVIEW 26/11/09 01/02/13 1.1 Research Background 26/11/09 25/07/10 1.2 Facilities Management (FM) 26/07/10 01/02/13 1.3 Performance Measurement (PM) 26/07/10 01/02/13 1.4 Development of a PM Framework 26/07/10 01/02/13 2.0 RESEARCH DESIGN & METHODOLOGY 26/12/10 26/12/12 2.1 Research Design 26/12/10 26/12/12 2.2 Research Methodology 26/12/10 26/12/12 2.3 Research Tools 26/12/10 26/12/12 2.4 Analysis Method 26/12/10 26/12/12 3.0 SURVEY (PILOT STUDY) & MPHIL/PHD UPGRADE 26/11/10 10/02/11
3.1 Pilot Study (Online Survey) 09/12/10 15/12/10 3.2 Analysis of Pilot Study Results 16/12/10 30/01/11 3.3 Upgrade MPhil/ PhD 10/02/11 10/02/11 4.0 CASE STUDY 1 10/07/11 30/01/12 4.1 Malaysian organisations 10/07/11 19/10/11 4.2 Analysis of Case Study Results 20/10/11 30/01/12 5.0 CASE STUDY 2 10/02/12 01/07/12 5.1 UK organisations 10/02/12 28/05/12
5.2 Analysis of Case Study Results 28/05/12 01/08/12
6.0 INTERVIEWS 15/08/12 10/02/13 6.1 Conduct Interviews 15/08/12 20/09/12 6.2 Analysis of findings 21/09/12 10/10/12 7.0 FINAL WORK 01/10/12 20/12/12 7.1 Summarise all chapters 01/10/12 20/12/12 7.2 Conclusions and recommendations 01/10/12 20/12/12 8.0 PROOFREADING & SUBMISSION 28/12/12 13/02/13 9.0 VIVA 17/04/13 17/04/13
!!
22!
!
1.9 Research Summary Based from the introduction of the overall research structure and design in chapter
1, a further exploration of the literature pertaining FM is covered in chapter 2. The
literature studies of FM in the next chapter will give an overview of the whole
concept of FM in general, and Malaysia in specific. This would give a good
understanding of the FM literature in order for this study to move forward in
investigating the philosophies and theories of the FM implementation and scope of
service delivery.
!!
23!
!
CHAPTER 2: INTRODUCTION TO FACILITIES MANAGEMENT (FM)
This chapter discusses how FM is being regarded as a business support role and
how it contributes to the overall organisation’s success. It also looks at many other
imperative elements of FM, namely, its evolution, strategic delivery, responsibilities
of FM managers, and also the scopes and level of FM services that have been
implemented in the industry. The development and growth of FM is also explained
to give an overview of how the FM practice has since progressed. This chapter also
focuses on the FM industry in Malaysia by looking at the factors and aspects that
contribute to its growth and development in that region, as well as the opportunities,
demands and challenges of the FM industry to progress further in that region.
2.1 Introduction
The main function and focus of FM is to manage the changes that are taking place
in the relationship between organisations, their employees and their facilities
(Grimshaw, 1999). As introduced by Barret (1995), based on its three levels of
operation (that is, strategic, tactical and operational), three main areas of FM are
premises’ services, office services and central services. These activities can vary
between advising and policy making on one side and managing and executing
operations on the other.
FM covers an extremely wide field of activity (Nutt, 1999). It includes the physical
issues of built space, services, technology, maintenance, modification and
adaptation; the human and business concerns of facility purpose, function and use,
security, safety, comfort, and environmental health; and financial issues of property
investment, asset value, and the costs and benefits of occupancy. Today, the scope
of FM has diversified and now also covers real estate management, financial
management, change management, human resources management, and health
and safety contract management. Most significantly, it covers the management
structures, operations and procedures that serve to integrate decisions across the
physical, human and financial areas of concern, all for the improved use,
performance and productivity of facilities in all sectors. Just over a decade ago,
Then (1999) described FM as a hybrid management discipline that combines
people, property and process management expertise to provide vital services in
support of the organisation. It has also been seen as a resource management at
!!
24!
!
strategic and operational levels of support (Nutt, 2000). However, it has also been
suggested that it should be considered from the strategic view instead of from an
operational view (Then, 1999).
Barret (2000) relates the role of FM in delivering a high level of operational support
to the core business and providing an improved strategic context so that
effectiveness as well as efficiency is achieved. He also claims that there is an
absence of process to link core business and FM strategies. According to Best et al.
(2003), FM is a dynamic and growing area. It is about empowering people through
provision of infrastructure that adds value to the processes that they support (Smith,
2003).
FM is also perceived to contribute significantly within the community context
(Roberts; 2004, Alexander and Brown, 2006). Atkins and Brooks (2005) also
positions FM in the strategic business discipline. More recently, the definition of FM
has been diversified, allowing it to be recognised and understood from various
perspectives. According to Atkin and Brooks (2006), there are two perspectives on
managing facilities: the short-term perspective, that is, to consider what must be
done to maintain current services; and the long-term perspective, which considers
the future potential changes of the organisation and how this will impact upon the
services required. The latter employs strategies in managing FM by integrating both
existing facilities’ provision and forecast requirements.
Pitt and Tucker (2008) define FM as the integration and alignment of the non-core
services - including those relating to premises - required to operate and maintain a
business in order to fully support the core objectives of the organisation. Instead of
focusing FM on traditional FM, that is, mainly on reactive maintenance, no
measurement and management of PM and not considering FM innovations, FM
should be applied from a strategic approach where the function is seen to be able to
add value to organisations by implementing all the strategic approaches and models
available. This is supported by Tucker and Pitt (2009), who argue that FM should be
viewed strategically, where the integration and alignment of non-core services
required to operate and maintain a business fully support its core objectives. An
example of another strategic approach is the position and priority given to the
people – in particular the customers and end users as the centre of a service
delivery in FM(Tucker and Pitt, 2010). Larsen (2011) signifies the role of FM in
!!
25!
!
cultivating creative working environments within a community. This has shown a
new dimension of FM perceptions among the practitioners and the society,
Two leading international professional bodies of FM, namely the International
Facility of Management Associations (IFMA) and the British Institute of Facilities
Management (BIFM), representing a well-developed FM in their respective
countries, have similar definitions of FM:
FM is a profession that encompasses multiple disciplines to ensure functionality of
the built environment by integrating people, place, process and technology (IFMA,
2012).
FM is the integration of processes within an organisation to maintain and develop
the agreed services, which support and improve the effectiveness of its primary
activities (BIFM, 2012).
The IFMA (2012) views FM as having an holistic nature regarding the various
disciplines and interdependence of multiple factors in its success, while the BIFM
(2012) promotes the development of FM as a critical, professional and strategic
business discipline. This suggests that FM is a profession that is comprised of
multiple areas and integration of people, place, process and technology to achieve
the agreed service needed to ensure the functionality and effectiveness of the
activities in the built environment.
Therefore, FM can be perceived as a fundamental aspect in business, which links
its strategic approach with the organisation’s objectives or missions. An effective
practice can be achieved through strategised processes in delivering values and
benefits for both short- and long-term targets and achievements. The processes
involved for each aspect within its scope of services must be prioritised and
measured accordingly to determine an outcome in a form of a good and healthy
working environment to the customers. The roles of FM is not limited to only
business and organisations, but also to offer values and harmony to the social
community and built environment.
!!
26!
!
2.2 FM Growth and Development
FM has established itself as a key service sector, with a diverse and highly
competitive market of FM contractors, in-house FM teams, FM vendors, FM
consultants and professional FM institutions (Nutt, 1999; Tay and Ooi, 2001). The
BIFM (2007) has suggested a number of factors that could stimulate the FM growth.
Global competition is one of them, where there is a need to maintain a healthy
competition in delivering quality services to the public. Another factor is the high cost
of space, which is caused by the rising cost of occupying, servicing and maintaining
space. This has also resulted in limitations and cost constraints in FM services. The
rising expectations from clients and building occupiers are also the driving force
behind FM in prioritising the service elements. FM also seeks to use the rapid
development in information technology in a variety of ways, e.g., to delegate service
tasks and to communicate with users. Most important of all, the relationship
between the clients, the users and the FM team is crucial in supporting the growth
and development of FM. The FM role in supporting an organisation’s core business
objectives must be shown, including how FM deals with the demand and supply
relationship and the various levels of possible interaction that FM can offer. It
encompasses multiple activities under various disciplines and combined resources,
which can contribute to the organisation’s success (Mohd-Noor and Pitt, 2009a).
One of the significant ways that FM can support the organisation’s direction is
through its role in creating value. Jensen (2010) also signifies the positive change of
FM direction towards creating added value. A number of models have been
developed to facilitate the process and concept of added values. The FM Value Map
by Jensen (2010) for example, aims to demonstrate the various different ways that
FM can offer the added values to the practitioners. It proposes how the resources
can benefit the stakeholders- society, customers, staff and owners through the
impacts or outcomes from both processes and provisions. The development of
various models in the value creation aspect signifies an impressive initiative in
creating innovative and advance tools for the practitioners. This way, the clients will
be able to comprehend the values that FM service can offer.
FM is also developing in giving more efforts to the community. FM is perceived in a
different perspective within the context of an urbanised FM (Roberts, 2004;
Alexander and Brown, 2006). This perspective looks into FM approach outside its
traditional practical and theoretical dominion focusing on business imperative,
!!
27!
!
organizational context, workplace setting and service delivery. In 2004, Roberts had
introduced the concept of urban FM towards the future of FM alignment particularly
looking at the opportunities between FM and the management of public
infrastructure and the related services. The opportunity for FM to develop is also
demonstrated by Roberts (2004) where he believed that the dominance of the
business imperative and shareholder value would be balanced in the future by the
realignment of FM with the public interest. Mohd-Tobi et al. (2013) also studied the
focus of urban FM in managing the community facilities within the context of FM,
where urban FM is seen as a platform for the future innovations in delivering
benefits and values to the community. The introduction of an urban FM approach
also has changed the traditional focus of FM towards the long-term presence of built
assets in a community (Alexander and brown, 2006).
2.3 Revolution in FM
FM is one of the main cost-cutting initiatives of the 1970s and 1980s when
organisations began to outsource their core services (BIFM, 2012; Mohd-Noor and
Pitt, 2009a). In the last three decades, FM has established itself as a key service
sector, with a diverse and highly competitive market of FM contractors, in-house FM
teams, FM vendors, FM consultants and professional FM institutions (Nutt, 1999;
Tay and Ooi, 2001). FM was traditionally viewed as the poor relation between the
real estate and construction professions, often conjuring images of maintenance
plants, caretaking and cleaning (Atkins and Brooks, 2000). Becker (1990) believes
that FM encompasses all areas of an organisation’s activities and can be seen as a
series of linked activities involving the co-ordination of all efforts relating to the
planning, designing and managing of an organisation’s physical resources. Then
(1990) contradicts Becker’s perception that FM mainly covers the physical
equipment of the building as he believes that the practice is concerned with the
delivery of an enabling workplace environment, the optimum functional space that
supports the business processes and human resources.
The success of FM at a corporate level can be seen in how it contributes to the
delivery of strategic and operational objectives on a day-to-day basis (Mohd-Noor
and Pitt, 2009a). Its scope of discipline covers all aspects of property, space,
environment control, health and safety, and support services (Alexander, 1999).
More often than not, the FM remit is interpreted as maintenance management,
space management and accommodation standards; project management for new-
!!
28!
!
build and alterations to the general premises; management of the building stock and
the administration of associated support services (Hinks and McNay, 1999). From
another perspective, FM is also seen as a management of cost-efficiency rather
than a method by which to achieve multi-dimensional enhancement of business
competitiveness. Many still view FM in collective terms, which lumps together all
building facilities and services within the organisation. It becomes a non-core
department, supporting services and, more importantly, the innovation that can be
brought about by improving the management of services (Pitt and Hinks, 2001).
However, FM is not just about delivering services in the most effective ways, it is
also about providing them in an ever-evolving world/industry (Mohd-Noor and Pitt,
2009b).
2.4 FM in a Business Context
In relating FM to the business context, McLennan (2000) believes that FM stands in
a potentially powerful position because it has the knowledge of physical facilities’
performance with the knowledge of business objectives, operations and support
services. A study by Sarshar and Pitt (2009) shows that the reviewed organisations
do not have FM strategies but they do have clear business directions. The key role
of FM is often overlooked in the organisation planning. Alexander (2003) believes
that FM fits very well into the overall business agenda as it identifies the influences
for change in the business environment and also develops facilities to accommodate
it. Myeda and Pitt (2013) promote the significance of FM in supporting a business
operation. FM is also a key function in managing facility resources, support services
and working environment to support the core business of the organisation in both
the long- and short-term (Chotipanich, 2004). For many organisations, the
effectiveness and behaviour patterns of the workforce and the effectiveness of their
information technology and communication systems are of considerable importance,
and the profession of FM continues to evolve to reflect this (Atkin and Brooks,
2005).
According to McLennan (2004), business sector is a key factor determining the
criticality of facilities to core operations. He also suggests that FM practice should
be tailored to meet the particular needs of the specific business sector. Hallam in
Kamaruzzaman and Zawawi (2010) declares that successful FM teams will be able
to embrace the language of the core organisations they serve by clarifying the
strategic contribution in terms of business-relevant outcomes. Kaya et al. (2004)
!!
29!
!
suggest that FM be reframed as business projects in order to involve the
participation of senior management.
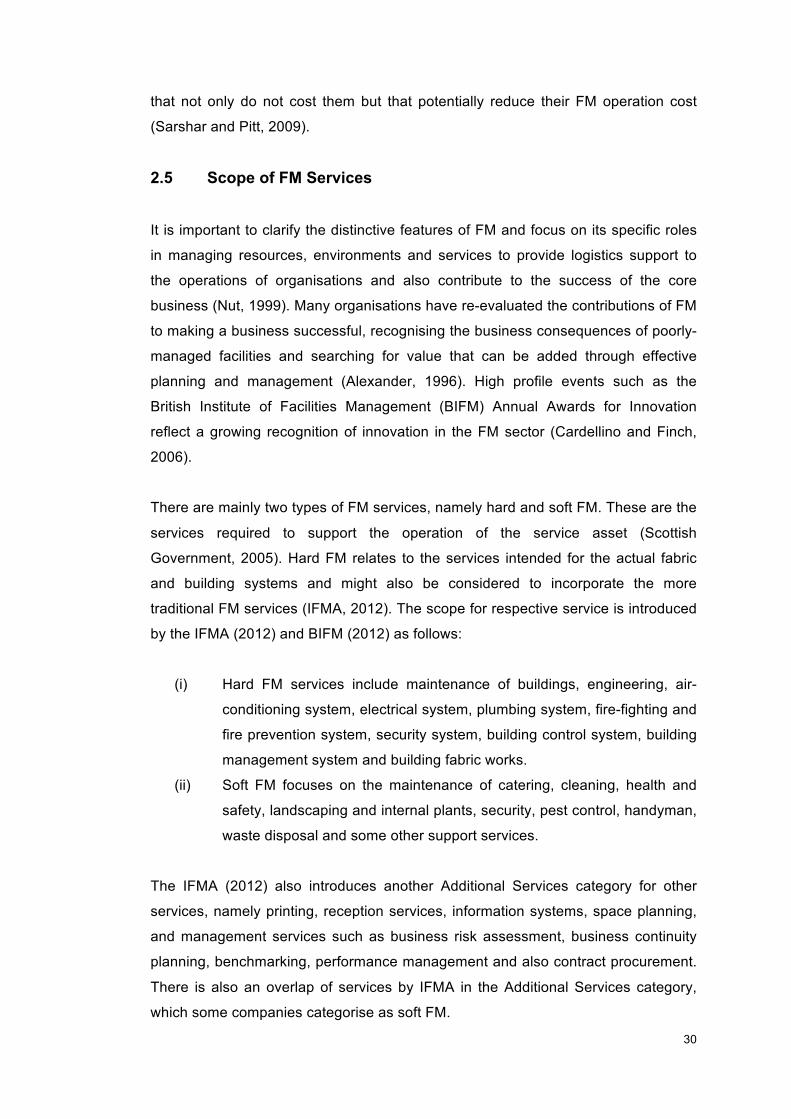
Lehtonen (2006) declares that, for most organisations, facility services are support
activities without significant strategic importance. Based on the findings of his study,
the success factors of collaborative relationship facilities services seem to be quite
similar to the success factors of more strategic models in other industries (refer to
Figure 2.1). A collaborative relationship in this context can be seen as a
collaborative effort from all departments or sectors involved in a business. All
identified attributes and success factors are mainly concerned with the teamwork
effort from different organisational levels having mutually agreed goals to sustain a
good performance and to incorporate all necessary involvement in the development
and planning phase.
Figure 2.1: Attributes and success factors of a collaborative relationship in the facility services context (Source: Lehtonen, 2006)
Recognising the importance of collaborative work among the business departments
also opens up the opportunity for the organisation to look into the perspective from
various angles, technical and operational, and also takes into account the
customers’ perspective. In the business organisation, senior management identify
their customers’ core values and set procurement strategies to respond to business
needs. Middle management design and streamline the operational processes, while
customers benefit from the service delivery. It is important for the service delivery
providers to engage with the customers at different levels of the organisation, in
order to capture a holistic set of customer requirements. Clients want innovations
Attributes Success factors
Commitment • Ability to meet performance expectations
• Continuous development • Clearly defined and mutually
agreed goals •
Involvement of different organisational levels
• Joint problem solving
Mutual trust • Mutual involvement in development and planning
Openness
• Two-way information sharing • Promise of mutual benefits
!!
30!
!
that not only do not cost them but that potentially reduce their FM operation cost
(Sarshar and Pitt, 2009).
2.5 Scope of FM Services
It is important to clarify the distinctive features of FM and focus on its specific roles
in managing resources, environments and services to provide logistics support to
the operations of organisations and also contribute to the success of the core
business (Nut, 1999). Many organisations have re-evaluated the contributions of FM
to making a business successful, recognising the business consequences of poorly-
managed facilities and searching for value that can be added through effective
planning and management (Alexander, 1996). High profile events such as the
British Institute of Facilities Management (BIFM) Annual Awards for Innovation
reflect a growing recognition of innovation in the FM sector (Cardellino and Finch,
2006).
There are mainly two types of FM services, namely hard and soft FM. These are the
services required to support the operation of the service asset (Scottish
Government, 2005). Hard FM relates to the services intended for the actual fabric
and building systems and might also be considered to incorporate the more
traditional FM services (IFMA, 2012). The scope for respective service is introduced
by the IFMA (2012) and BIFM (2012) as follows:
(i) Hard FM services include maintenance of buildings, engineering, air-
conditioning system, electrical system, plumbing system, fire-fighting and
fire prevention system, security system, building control system, building
management system and building fabric works.
(ii) Soft FM focuses on the maintenance of catering, cleaning, health and
safety, landscaping and internal plants, security, pest control, handyman,
waste disposal and some other support services.
The IFMA (2012) also introduces another Additional Services category for other
services, namely printing, reception services, information systems, space planning,
and management services such as business risk assessment, business continuity
planning, benchmarking, performance management and also contract procurement.
There is also an overlap of services by IFMA in the Additional Services category,
which some companies categorise as soft FM.
!!
31!
!
FM services are positioned differently in every organisation and sector. As FM
involves a number of disciplines and services, each organisation and body
categorises the service scopes of FM in different categories and elements. This
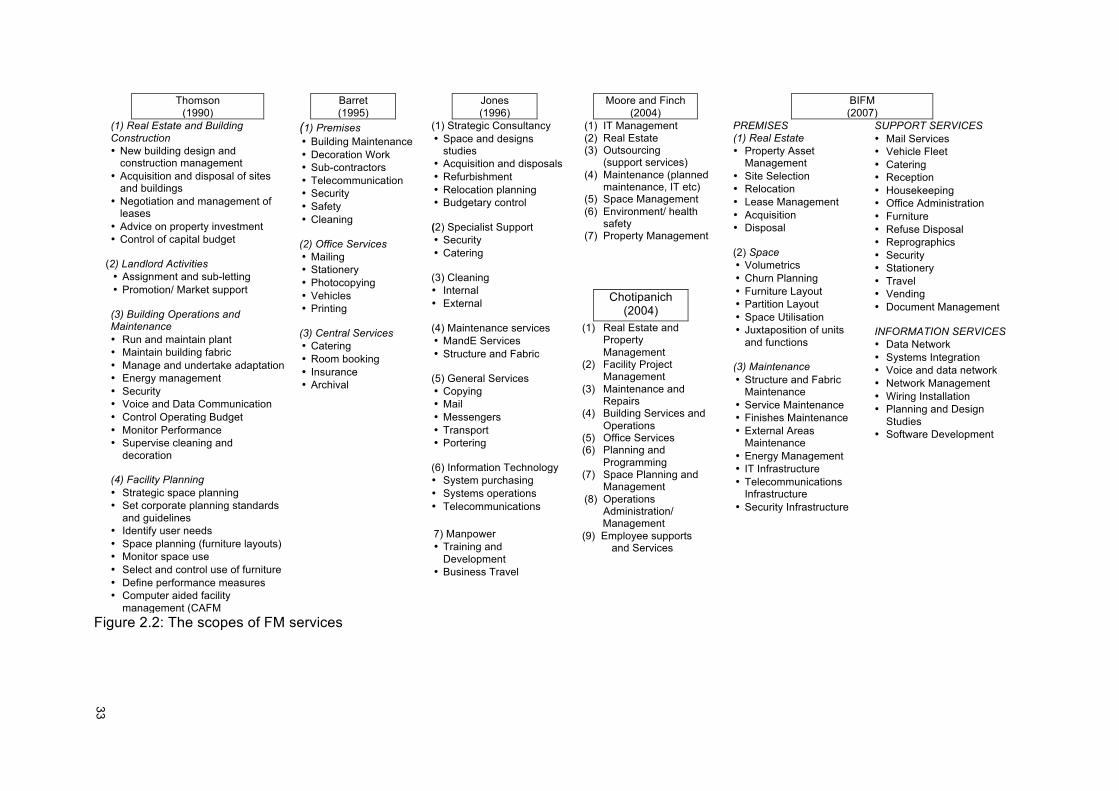
study also looks at six examples of how the FM service is categorised differently, as
shown in Figure 2.3.
For example, in 1990, Thomson introduced the four generic departments that he
believed constitute FM: real estate and building construction, landlord activities,
building operations and maintenance, and facility planning. The categories introduce
the different scope of FM services, distinctively ranging from works involving real
estate and construction, lettings, maintenance and also the strategic FM planning.
Barret (1995) has suggested that FM services are divided into three areas:
premises, office services and central services. Service scope that is dedicated for a
premise is both hard and soft FM; mailing, stationery and office works for office
services; and finally, catering, room booking, insurance and archival for central
services. Barret’s categorisation is targeted mainly at the hard and soft FM only and
not on any strategic approach such as management or corporate planning
standards. Jones (1996) also incorporates mainly the hard and soft FM service
elements in his definition of FM service scope. However, he also emphasises the
strategic consultancy elements as well as two services that were not mentioned by
the previous authors: information technology and manpower.
Similarly, Moore and Finch (2004) also include the information technology aspect in
their proposed FM departments. Although the sub-services for each department are
not specified, Moore and Finch’s (2004) list of departments is broader and includes
IT management, real estate, outsourcing, maintenance, space management,
environment or health safety, and property management. Another expansive
classification was also introduced by Chotipanich in 2004. The nine service scopes
included are real estate and property management, facility project management,
maintenance and repairs, building services and operations, office services, planning
and programming, space planning and management, operations administration or
management, and employee supports and services. The work of these authors
indicates that FM scopes have diversified and are getting broader.
The BIFM (2007) has also developed a set of FM scope of services based on
Alexander’s (1997) list of three FM components that are premises, support services
!!
32!
!
and information services. The categories are more comprehensive and the
proposed sub-services for respective components are precise. The BIFM’s
classification also gives a holistic view of how FM services support an organisation’s
business process. The diversity of service scopes indicates how FM service
objectives can fit into the overall business success and strategies and provide the
added value.
The BIFM (2007) further emphasises the function of FM in providing the support
essential to its core business operation through:
• Interaction between the core business, the support functions and the
facilities throughout all sections of industry, commerce and service.
• Property strategy, space management and communications infrastructure to
building maintenance, administration and contract management
• Business support services together with associated human resources and
buildings, e.g. systems, plant, IT, equipment, fittings and furniture
• Management support in primary activities of an organisation. This deals with
the demand and supply relationship and presents the different levels of
possible FM interaction
FM plays a supporting role in enhancing the performance of a firm and is applicable
to all organisations since it relates to the uses of space in a workplace. Tay and Ooi
(2001) believe that an integrated approach is required when employing FM
practices.!
It can be seen that the scopes of FM services perceived by the authors vary
differently. Most importantly, the scope has diversified, allowing various aspects and
elements to be considered in managing FM service. The scope is not only limited to
the daily operation elements but also the strategic aspects namely the planning,
consultancy and project management. In general, the scope of FM services focuses
on the functional, technical and image aspects that are from both management and
operations components. These components cover the aspects pertaining to people,
process and property to ensure that the services are addressed and delivered
accordingly. The key aspect of the FM service revolves around the total
management of the services in order to ascertain a quality service delivered to the
clients and customers.
!!
33!
!
Thomson (1990)
Barret (1995)
Jones (1996)
Moore and Finch (2004)
BIFM (2007)
(1) Real Estate and Building Construction • New building design and
construction management • Acquisition and disposal of sites
and buildings • Negotiation and management of
leases • Advice on property investment • Control of capital budget
(2) Landlord Activities • Assignment and sub-letting • Promotion/ Market support (3) Building Operations and Maintenance • Run and maintain plant • Maintain building fabric • Manage and undertake adaptation • Energy management • Security • Voice and Data Communication • Control Operating Budget • Monitor Performance • Supervise cleaning and
decoration (4) Facility Planning • Strategic space planning • Set corporate planning standards
and guidelines • Identify user needs • Space planning (furniture layouts) • Monitor space use • Select and control use of furniture • Define performance measures • Computer aided facility
management (CAFM
(1) Premises • Building Maintenance • Decoration Work • Sub-contractors • Telecommunication • Security • Safety • Cleaning (2) Office Services • Mailing • Stationery • Photocopying • Vehicles • Printing (3) Central Services • Catering • Room booking • Insurance • Archival
(1) Strategic Consultancy • Space and designs
studies • Acquisition and disposals • Refurbishment • Relocation planning • Budgetary control
(2) Specialist Support • Security • Catering
(3) Cleaning • Internal • External
(4) Maintenance services • MandE Services • Structure and Fabric (5) General Services • Copying • Mail • Messengers • Transport • Portering (6) Information Technology • System purchasing • Systems operations • Telecommunications 7) Manpower • Training and
Development • Business Travel
(1) IT Management (2) Real Estate (3) Outsourcing
(support services) (4) Maintenance (planned
maintenance, IT etc) (5) Space Management (6) Environment/ health
safety (7) Property Management
PREMISES (1) Real Estate • Property Asset
Management • Site Selection • Relocation • Lease Management • Acquisition • Disposal
(2) Space • Volumetrics • Churn Planning • Furniture Layout • Partition Layout • Space Utilisation • Juxtaposition of units
and functions
(3) Maintenance • Structure and Fabric
Maintenance • Service Maintenance • Finishes Maintenance • External Areas
Maintenance • Energy Management • IT Infrastructure • Telecommunications
Infrastructure • Security Infrastructure
SUPPORT SERVICES • Mail Services • Vehicle Fleet • Catering • Reception • Housekeeping • Office Administration • Furniture • Refuse Disposal • Reprographics • Security • Stationery • Travel • Vending • Document Management INFORMATION SERVICES • Data Network • Systems Integration • Voice and data network • Network Management • Wiring Installation • Planning and Design
Studies • Software Development
Chotipanich (2004)
(1) Real Estate and Property Management
(2) Facility Project Management
(3) Maintenance and Repairs
(4) Building Services and Operations
(5) Office Services (6) Planning and
Programming (7) Space Planning and
Management (8) Operations
Administration/ Management (9) Employee supports and Services
Figure 2.2: The scopes of FM services
!!
34!
!
2.6 The Evolution of FM
Alexander (2003) claims that FM emerged over the last couple of decades as a
response to the business environment and the recession in the 1980s and early
1990s. After reaching the UK in 1983 and Japan in 1985, FM went global during the
1990s, becoming more diverse as it did so (Price, 2002). FM is one of the fastest-
growing professions in the UK (Mohd-Noor and Pitt, 2009a). According to Best et al.
(2003), FM is emerging as a discipline in its own right and it embraces more than
operational concerns of plumbing and lighting, and even more than the provision
and maintenance of a productive and comfortable work environment. Increasingly,
the focus is more on the strategic management of facilities, with a broader range of
FM responsibilities and scope of work.
The FM field is highly developed and widely practised by property developers and
companies in the West. There is a stark contrast in FM practice between Western
countries and Asian countries (Mustaffa et al, 2008). However, some countries like
Japan, Australia, New Zealand, Hong Kong and Singapore have shown a positive
growth in the FM field. FM is recognised in these countries as an activity that can
achieve more effective management of the buildings, services and associated
workforce, in support of the strategic objectives of an organisation (Kamaruzzaman
and Zawawi, 2010). There is a significant difference between FM development in
Asian countries like Japan, Hong Kong, Taiwan, South Korea, Singapore and
Malaysia. Japan first embarked on introducing an integrated FM system by using
the automated mechanisation: Nippon Telegraph and Telephone Corporation.
Japan sees FM as an important area in business and the techniques of FM are
increasingly used. Hong Kong started implementing FM in 1994 and, to-date, the
industry has gone from strength to strength, gaining more professional members
and organising successful annual conferences.
The whole area of FM is quite well-developed, with the growth in the professional
FM sector being matched and complemented by research and education. The
growth is encouraged by the fact that Hong Kong has been a place where East
meets West and has a multi-cultural background. On the other hand, Taiwan shows
smaller growth than Japan and Hong Kong but is slowly improving, based on the
increasing number of IFMA memberships. FM in South Korea is developing at a
slower pace than some of its competitors in the region. This was indicated in a
survey in 2007 by the Ministry of Industry and Trade, which showed that only 2.7%
!!
35!
!
of the respondents were familiar with the concepts of FM. Despite this low number,
multi-national companies like Samsung, Hewlett Packard and IBM Korea have used
international FM consultants in their business organisations in South Korea
(Mustaffa et al., 2008). From an education perspective, the well-attended Asian FM
conferences signify a growing interest in FM among the Asian countries
The development of FM in Asian countries like Hong Kong, Malaysia and Singapore
is based on three areas, namely practice, research and education (Mustaffa et al.,
2008). A survey of these countries by Moore and Finch (2004) shows clear signs of
progress in Hong Kong and Singapore and mixed signals in Malaysia, concluded by
the little evidence of real tangible and visible progress in the field. The study shows
that a general lack of understanding and progress are the key drivers that hamper
the development of FM in Malaysia. It is also anticipated that the lack of attention
given to environmental issues in South-East Asia impedes organisations practising
FM from achieving efficiency.!
!!
36!
!
2.7 Delivering FM strategically
Over the last 10-15 years, FM in both the private and public sectors has been
evolving from a discipline historically focused on individual buildings to one focused
on the total performance of a portfolio of buildings in support of an organisation’s
overall mission (Cable and Davis, 2004). It is also seen as a management of cost-
efficiency rather than a method to achieve multi-dimensional enhancement of
business competitiveness. However, FM is not just about delivering services in the
most effective ways, it is also about providing them within an ever-evolving world
and industry (Mohd-Noor and Pitt, 2009a). FM has always been acknowledged for
facilitating organisation’s performance (Amaratunga and Baldry, 2000). High profile
events such as the British Institute of Facilities Management (BIFM) Annual Awards
for Innovation reflect a growing recognition of innovation in the FM sector
(Cardellino and Finch, 2006).
Strategic FM is the way forward for every organisation to add their service value
(Myeda, 2012). FM deals with the management of built assets and incorporates the
control of services necessary for an organisation’s successful business operations
(Lavy et al., 2010). It is concerned with the delivery of an enabling workplace
environment, the optimum functional space that supports the business processes
and human resources, and is not mainly concerned with the physical equipment of
the building (Then, 1999). More often than not, the FM remit is interpreted as
maintenance management, space management and accommodation standards,
project management for new-build and alterations of the general premises,
management of the building stock, and the administration of associated support
services (Hinks and McNay, 1999).
FM should be applied from a strategic approach where the function is seen to be
able to add value to the organisations by implementing all the strategic approaches
and models available. The contribution of FM can be seen in the integration and
alignment of non-core services required to operate and maintain a business, and
also to fully support its core objectives (Tucker and Pitt, 2009).
The delivery of an FM service is based on two levels of strategic objective (Nutt,
2000). At the national level, the strategic objective of FM is to provide better
infrastructure and logistic support to business and public endeavours of all kinds
and across all sectors. At the local level, its objective is the effective management of
!!
37!
!
facility resources and services to provide shells of support to us all: support to the
operations of organisations, their working groups, project teams and individuals.
According to Myeda (2012), the strategic approach of FM introduces the concept of
efficient management to support both corporate and public endeavours, which is
gaining re interest and recognition. Strategic FM roles include the formulation,
implementation, and evaluation of market-firm decisions on the sourcing of space,
services, funds and performance (Yiu, 2008). Yiu claims that the shift of more
studies from operational service towards strategic management also shows that one
of the strategic FM functions is to include the evaluation of asset and service
performance in gaining interest and recognition. Strategic FM emphasises the
formulation of strategies to meet business needs and the core value that they want
to deliver to the customers for the end users’ benefit. Clients also want cost-effective
innovations, which can reduce their FM operational cost (Sarshar and Pitt, 2009).
The strategic role of FM is also as a business enabler. It bridges the gap between
the physical environment of the workplace and the occupants. This is because FM is
the process by which an organisation delivers and sustains agreed levels of support
services in a quality environment at an appropriate cost to meet the business need
(BIFM, 2007).
BIFM (2007) also introduces two strategic objectives of FM:
(i) To provide an active management of FM functions, in a co-ordinated
manner and in accordance with corporate strategy that encapsulates FM.
(ii) To balance the demand with supply inside an organisation, reaching the
optimised mix between needs or service levels and capabilities,
constraints or costs.
The aim of FM should not be limited to simply reducing the operating expenses of a
built facility, but should focus on enhancing efficiency of the facility as well
(Amaratunga et al., 2000). Effective FM encompasses multiple activities under
various disciplines, combining resources, and is vital to the success of any
organisation (Mohd-Noor and Pitt, 2009a). In order for FM to be effective, both the
“hard” issues, such as financial regulation and the “soft” issues, such as managing
people, have to be considered (Atkin and Brooks, 2000). Both issues have to be
efficiently managed to ensure that FM can harmonise and provide a safe and
efficient working environment. To gauge the effectiveness of FM, it is necessary to

!!
38!
!
reach an understanding of the current conditions of the facility and to postulate
changes in FM practices in order to achieve the desired performance (Lavy et al.,
2010). Organisations need to recognise the need to make a big shift in
implementing FM strategically, from both the short- and long-term perspective
(Myeda, 2012).
There are three levels of FM implementation in an organisation. BIFM (2007)
introduces the scope of FM aims and objectives in the strategic, tactical and
operational level respectively, as shown in Figure 2.2. These three levels were
implemented based on different targets. Strategic FM aims to achieve the objectives
in the long term, whereas tactical FM targets for medium term, and operational FM
seeks for daily achievement.
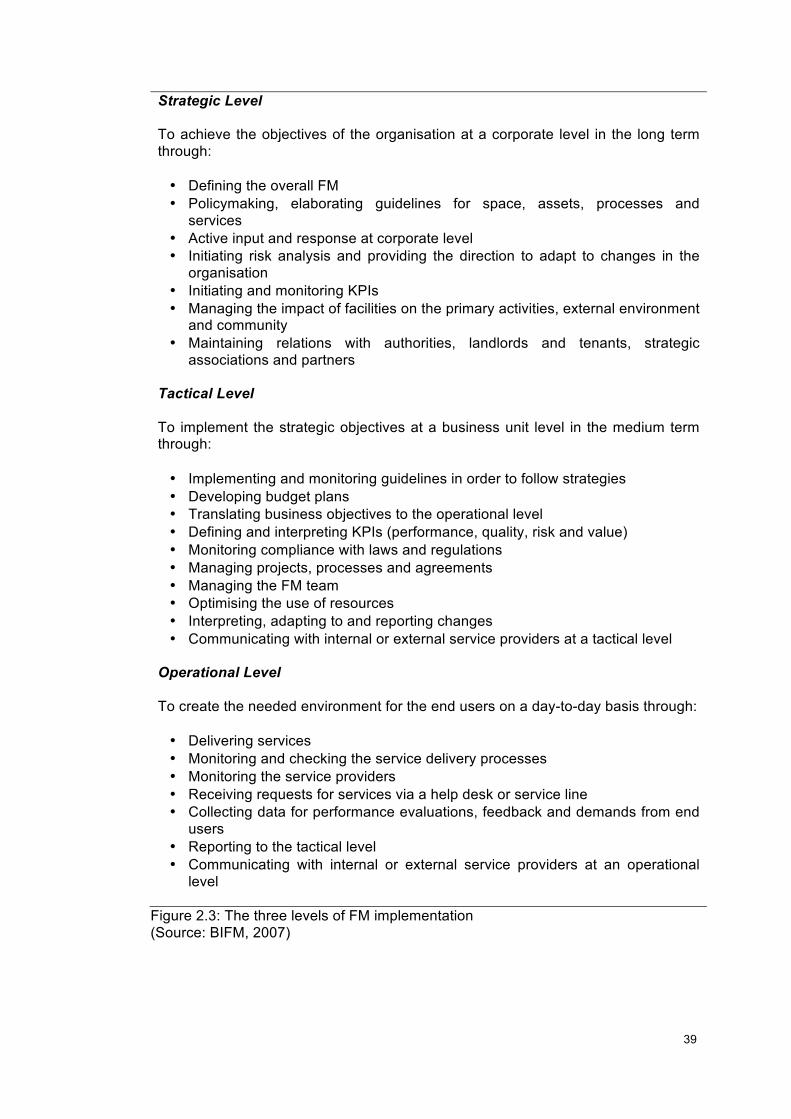
!!
39!
!
Figure 2.3: The three levels of FM implementation (Source: BIFM, 2007)
Strategic Level To achieve the objectives of the organisation at a corporate level in the long term through: • Defining the overall FM • Policymaking, elaborating guidelines for space, assets, processes and
services • Active input and response at corporate level • Initiating risk analysis and providing the direction to adapt to changes in the
organisation • Initiating and monitoring KPIs • Managing the impact of facilities on the primary activities, external environment
and community • Maintaining relations with authorities, landlords and tenants, strategic
associations and partners Tactical Level To implement the strategic objectives at a business unit level in the medium term through: • Implementing and monitoring guidelines in order to follow strategies • Developing budget plans • Translating business objectives to the operational level • Defining and interpreting KPIs (performance, quality, risk and value) • Monitoring compliance with laws and regulations • Managing projects, processes and agreements • Managing the FM team • Optimising the use of resources • Interpreting, adapting to and reporting changes • Communicating with internal or external service providers at a tactical level
Operational Level To create the needed environment for the end users on a day-to-day basis through: • Delivering services • Monitoring and checking the service delivery processes • Monitoring the service providers • Receiving requests for services via a help desk or service line • Collecting data for performance evaluations, feedback and demands from end
users • Reporting to the tactical level • Communicating with internal or external service providers at an operational
level
!!
40!
!
2.8 FM Contributions
In the service aspect, FM provides a clear and transparent method of
communication between the demand side and supply side by having an FM
manager or FM team to conduct the co-ordination and integration of all the required
support services. Myeda et al. (2011b) believe that the functions of FM should not
be limited to the technical aspect of the facilities, but also to enhance the efficiency
of the whole FM functions in supporting business. The requirement of having
Service Level Agreements (SLAs) for every service facilitates the management of
contracts through an objective approach to managing clients’ and vendors’
perceptions and expectations during the contractual period (Goyal, 2007). This also
provides a transparent knowledge and information base for each service scope,
which can be clearly formulated into FM strategies and can also be communicated
to the end users.
Based on strategic decision, FM also introduces a simple and manageable concept
of internal and external responsibilities for services, giving systematic procedures for
outsourcing or in-house management. This also reduces the conflicts between
internal and external service providers.
There are many business tools available to aid organisations’ efficiency in business
sectors, but FM offers a holistic and evolutionary approach to achieving optimum
business solutions. This is by taking account of business policies, procedures and
services, alongside procurement procedures, human resources management,
training and development, business relationships and statutory considerations. FM
can be strategic in managing business support functions and operational by
concentrating on the detailed operational activities of the organisation (Barret and
Baldry, 2004). In order to allow a business to compete and adapt to changes and
other possibilities, a high level of integration must be achieved and the innovation
process must be perceived as a knowledge supply chain (Goyal, 2007).
FM principles are integrated into the business scheme as an innovative way of
giving the organisation a modern image, reducing unnecessary costs in the
organisation’s administration system and creating a better working environment
(Mohd-Noor and Pitt, 2009a). Mohd-Noor and Pitt (2009b) also claim that the
integration of FM into a business will create differences between competitors in
terms of culture and strategy, and through quality of service with regard to the ability
!!
41!
!
to effectively respond to customers’ requirements. Through this, an organisation will
benefit more from the implementation of FM in its business process.
Many organisations have re-evaluated the contributions of FM in making a business
successful, recognising the business consequences of poorly-managed facilities
and searching for value that can be added through effective planning and
management (Alexander, 1996). Facilities have an influence on organisational
effectiveness and it is clear that the introduction of FM, as a response to the need
for more effective control and the promotion of effectiveness in the whole workplace,
sets new management challenges within organisations (Goyal, 2007).
The principle of FM takes into account the most effective use of synergies amongst
different services, which will help to improve the costs and performance of an
organisation. Therefore, an organisation needs to recognise the significant
contribution of FM in delivering business objectives and routine operation in order to
enable an organisation to adapt to the competitive market.
!!
42!
!
2.9 Responsibilities of FM Managers
FM managers play an important role in delivering a top quality service to the
facilities’ users. Two general areas of activity that fall under the responsibility of FM
managers are management and maintenance. Management refers to four main
components, namely the management of resources, planning, co-ordination and
knowledge of regulations according to the current legislation. Maintenance supports
the building operations (Myeda et al., 2011), and some areas of maintenance to be
covered are preventive maintenance and also hierarchism of systems and
emergency plan (Miro-Bedos and Girbal-Puig, 1991).
FM managers are responsible for integrating all factors of all the support roles that
provide a working environment for an organisation. They are also seen to be
responsible for co-ordinating and managing an extremely wide range of specialist
areas including property and estates, construction and refurbishment, space
management, maintenance and operations, IT, support services and, to an
increasing extent, human factors (Bell, 1992). In short, they are mostly responsible
for buildings and services that support businesses and organisations. This common
perception of FM managers, however, does not comprise the holistic FM
perspectives in the corporate world (Mohd-Noor and Pitt, 2009a). Due to an ever-
changing role, the differences of each individual at different points of responsibility
means that defining FM is becoming more complex (Lunn and Stephenson, 2000).
Important decisions regarding properties and facilities in large corporate
organisations are often being made by unqualified and untrained staff with a less
than satisfactory understanding of either property or FM issues, which is due to a
lack of balance between knowledge and expertise. This does not reflect a
professional management of the built environment. All these factors prohibit
management and users from getting the maximum efficiency and effectiveness from
the space.
FM managers are also responsible for ensuring a smooth relationship is established
between themselves and their customers. According to the BIFM (2007), customers
were unwilling to discuss confidential strategic business issues with FM managers
for fear of the information leaking out into the market. Property managers or FM
managers find it difficult to advise their many clients on the landlords’ side of the
fence without having regard to highly relevant, but privileged, information from the
!!
43!
!
tenants’ side. Occupiers are seldom being invited to play a high-level advisory role
within their organisation at an early stage in the property decision-making process.
This has resulted in occupiers being left behind and, subsequently, wrong priorities
being set. A lot of money and resources have been wasted as a result of too much
speculation and guesswork, and not enough understanding, forward planning and
communication, not to mention the knock-on effects in relation to the economy as a
whole.
Another scenario is where the occupiers or end users of a property are not
considered important to the landlords or their FM agents due to a conflict of
interests. This has become the driving factor in the need for FM to be a separate
management discipline. Landlords regard property as the main core business for
most of their clients, but this is not the case with end users or occupiers. The big
gap between the FM managers or landlords and occupiers or end users has led to
properties and facilities being both badly managed and maintained on a significant
scale. Customers or occupiers are also not getting the advice and support they
need.
2.10 Innovation in FM Service Delivery
Many organisations are concerned about implementing innovative strategies into
their FM sector. The need for an innovative approach to service provisions has
never been great as FM innovation acts as an enabler, adding value to the
organisation. The role of innovative management in FM is not about producing
innovative solutions, but rather the provision of a creative environment in which
solutions can be conceived, developed and applied (Goyal and Pitt, 2006).
The relevance and significance of innovations are not just limited to industrial
products and processes alone, but also extend to the environment and facilities,
organisational workers and employees, as well as to the buyers of products and
services (Alexander, 1999). FM interface, for example, is a strategic approach to
creating a cohesive workplace environment that is able to create an innovative
culture. More importantly, innovation in FM must be implemented at an initial stage
and matched with the organisation’s overall innovation strategies. This is to enable
holistic innovation values, belief and attitudes to be adopted at all levels within an
organisation (Mohd-Noor and Pitt, 2009a).
!!
44!
!
There is a clear link between innovation and high-performing workplaces, where
good managers inspire their employees and create a workplace culture in which
new ideas are encouraged and rewarded (DTI, 2003). It has been further
emphasised that an organisation’s failure to embrace innovation culture will hinder
the growth and sustainability of the establishment.
According to Amaratunga et al. (2000), FM can ensure that the mission and goals of
the organisations may be achieved at the best combination of efficiency, cost and
quality. FM is capable of contributing towards organisational success if it is given the
opportunity to exploit new ideas and perform innovative activities that are regularly
measured and integrated within the overall business goals and strategies of the key
suppliers. In this regard, innovation in FM should be firmly installed as an integral
part of the total management system and, if innovative ideas are perceived as a
culture at all levels within an organisation, then it can flourish as a whole.
Organisations that aim to be innovative need to be clearly and coherently managed
as a set of processes by creative people. One thing to remember: the role of
innovation in FM services is not just to produce innovative solutions, but also to
establish and develop a creative environment in which solutions can be conceived,
developed and implemented (Mohd-Noor and Pitt, 2009a).
2.11 The FM Industry in Malaysia
The Asia Pacific market in general shows an emphasis on the traditional function of
property management in FM, and awareness of the impact of FM on overall
business is also low (Ho et al., 2000). Similarly, the South-East Asia region shows
unimpressive progress in FM development whereby property managers and owners
are facing increasing competition and escalating maintenance costs. Instead of
simply managing and maintaining buildings, they should focus on the strategic role
of FM. This would then allow their respective organisations to maximise the value of
their property assets (Moore and Finch, 2004).
In Malaysia, FM is perceived as a new term (Mustaffa et al., 2008). According to
Moore and Finch (2004), the growth of FM in Malaysia is very slow and the field is
still in its infancy. The definition of FM is poorly understood, thus FM is not being
practised in an appropriate way. The traditional management methods are
dominantly applied rather than an integrated FM system, although the new
approach provides better strategic operations (Myeda and Pitt, 2013).
!!
45!
!
The lack of understanding of FM definitions and functions is possibly the root
problem of the passive development of FM in Malaysia. FM practice is not guided
and most often its importance is neglected in business strategies. Other than that,
the non-existence of a FM department in the government body to provide guidelines
and control on the quality level as well as to assess the performance of FM practice
is the reason why analysis or evaluation of this field is difficult (Myeda and Pitt,
2013).
There is also a lack of standards and requirements to measure and monitor the
efficiency of the FM services both for public and private sectors. The government is
yet to regulate any standardised framework or policy on this, and therefore the
consistency of the agreed level of FM services provided cannot be determined
accordingly. Although there are different sets of PM frameworks and indicators
proposed in the academic and in other industries globally, but there is yet an
appropriate PM framework to be implemented in Malaysia. FM in Malaysia is in
need of a comprehensive set of framework, which outlines the detailed PM
indicators focusing on the specific scope of FM services. The existing PM
frameworks are believed to be too generic for FM management and operation
aspects and not inclusive of the specifically defined attributes for each FM service.
Therefore, it is clear that a development of a new set of PM framework for FM would
serve as an innovative tool for Malaysian industry to improve the FM service sector
and FM service delivery in specific, through a provision of service standards and
indicators that can be regulated efficiently.
2.11.1 Growth and Development
FM in Malaysia has started from a focus on maintenance where, in 1974, the
Malaysian government circulated rules on the maintenance of public buildings,
public roads, sewerage systems of buildings, and the responsibilities of the Public
Works Department (PWD) or ‘Jabatan Kerja Raya’ (JKR). Following the
government’s launch of the Excellent Work Culture Movement in 1989 to promote
quality service in the public sector, an administrative directive entitled “Guidelines
for Strategies for Quality Improvement in the Public Service” was introduced in 1992
(Fei and Rainey, 2003). This set of guidelines is the first Total Quality Management
guideline ever introduced by the Malaysian government. In the same year, the
government also introduced the “Strategies for Quality Improvement in the Public
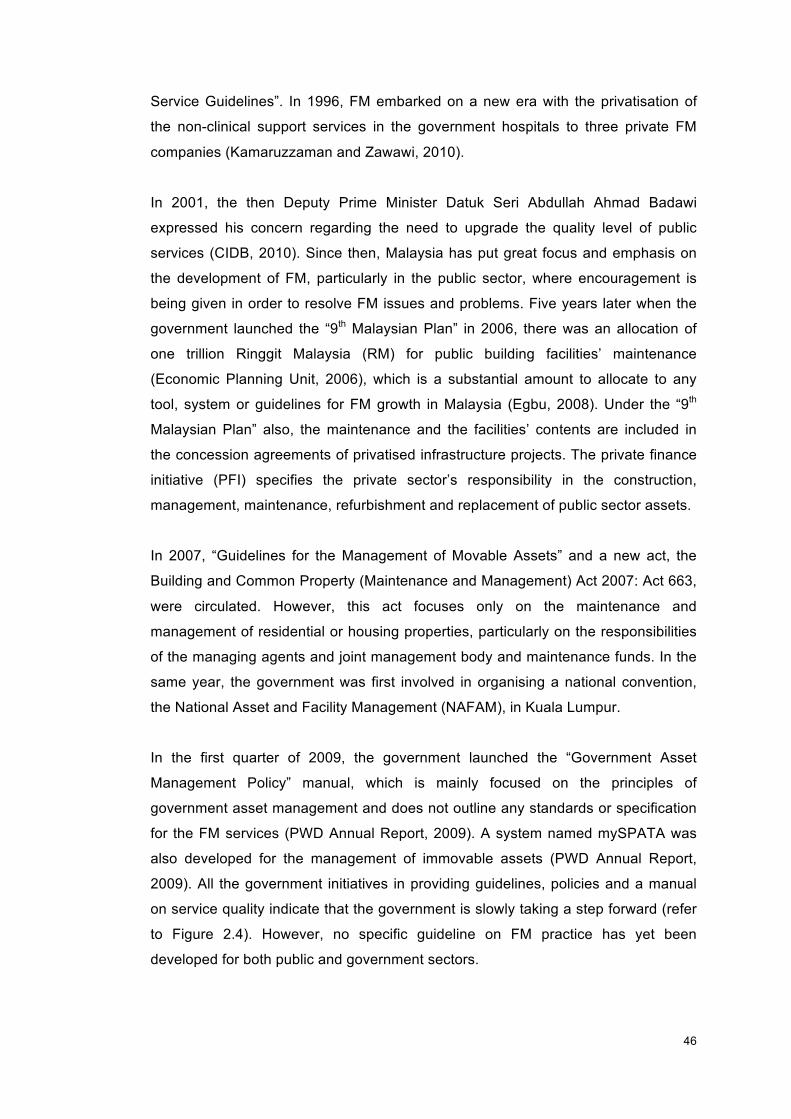
!!
46!
!
Service Guidelines”. In 1996, FM embarked on a new era with the privatisation of
the non-clinical support services in the government hospitals to three private FM
companies (Kamaruzzaman and Zawawi, 2010).
In 2001, the then Deputy Prime Minister Datuk Seri Abdullah Ahmad Badawi
expressed his concern regarding the need to upgrade the quality level of public
services (CIDB, 2010). Since then, Malaysia has put great focus and emphasis on
the development of FM, particularly in the public sector, where encouragement is
being given in order to resolve FM issues and problems. Five years later when the
government launched the “9th Malaysian Plan” in 2006, there was an allocation of
one trillion Ringgit Malaysia (RM) for public building facilities’ maintenance
(Economic Planning Unit, 2006), which is a substantial amount to allocate to any
tool, system or guidelines for FM growth in Malaysia (Egbu, 2008). Under the “9th
Malaysian Plan” also, the maintenance and the facilities’ contents are included in
the concession agreements of privatised infrastructure projects. The private finance
initiative (PFI) specifies the private sector’s responsibility in the construction,
management, maintenance, refurbishment and replacement of public sector assets.
In 2007, “Guidelines for the Management of Movable Assets” and a new act, the
Building and Common Property (Maintenance and Management) Act 2007: Act 663,
were circulated. However, this act focuses only on the maintenance and
management of residential or housing properties, particularly on the responsibilities
of the managing agents and joint management body and maintenance funds. In the
same year, the government was first involved in organising a national convention,
the National Asset and Facility Management (NAFAM), in Kuala Lumpur.
In the first quarter of 2009, the government launched the “Government Asset
Management Policy” manual, which is mainly focused on the principles of
government asset management and does not outline any standards or specification
for the FM services (PWD Annual Report, 2009). A system named mySPATA was
also developed for the management of immovable assets (PWD Annual Report,
2009). All the government initiatives in providing guidelines, policies and a manual
on service quality indicate that the government is slowly taking a step forward (refer
to Figure 2.4). However, no specific guideline on FM practice has yet been
developed for both public and government sectors.
!!
47!
!!
Figure 2.4: Government's initiatives in providing quality public services !Based on the figures generated from the 2009 PWD Annual Report, the Building
Facilities Maintenance Division has overspent a substantial amount of RM
1,416,039.84 million on top of the RM 3,618,109.53 million operational budget
allocated by the government. This indicates the need for control of the budget
allocation and expenditure, particularly in the public building services. On the
contrary, there was no development budget allocated to this division, which is
suspected to be the factor responsible for null development of any facilities system
or guidelines by the government.
!!
48!
!
There is also a lack of a maintenance and facilities culture in Malaysia. However,
the government’s current main agenda is to provide a holistic approach towards
integrating effort and collective responsibility for greater performance
(Kamaruzzaman and Zawawi, 2010).
2.11.2 Practice
At present, the role of managing buildings in general is undertaken by real estate
companies, as FM recognition is very poor. FM is widely adopted by only a single
sector: healthcare, by which FM was first brought into the Malaysian industry in
1997 (Kamaruzzaman and Zawawi, 2010). This was followed by the appointment of
a private company as a consultant to assess the performance of the concession
companies (Hamid, 2007). From that year forward, offices and hospitals appear to
have dominated the attention of the FM profession in Malaysia whilst other facilities
are seldom seriously considered. Formal practice of FM as a recognised discipline
is a new phenomenon and as such is vulnerable. Unfortunately, this area is hardly
recognised in Malaysia.
Record or data tracking is poorly or hardly compiled, resulting in a poor record of
data management, which contributes to negative future planning of maintenance
works and services management. In general, the service quality is low (Ariff, 2007),
possibly due to the low standard of maintenance set. This could possibly stem from
the lack of awareness of the high standard of service that needs to be delivered by
the provider to match the expectation of the users or customers. FM implementation
is not progressing, due to lack of guidance on the service standard and
performance. Hence, comparisons cannot be made as no specific structure can be
used to benchmark the performance of FM practice.
However, there are some improvements observed by Kamaruzzaman and Zawawi
(2010) where the Integrated Building Management Systems which require
integrated IT advancement and strategic management approach are widely used,
which can stimulate advancements in FM. A recent rise in studies on various related
topics also shows the initiatives taken in defining the importance of adopting FM in
Malaysia. A certain degree of synergy is demonstrated through research
collaborations between academic institutions and FM practitioners. Various
organisations have also started to promote the need of FM as part of the business
organisation, which also contributes to the increasing awareness of the role of FM.
!!
49!
!
2.11.3 Profession
Despite the initiatives taken, FM has not been readily adopted or encouraged by the
Malaysian government in any organised way. Contrary to other countries where the
IFMA, BIFM and Facility Management Association of Australia (FMA) have been
established in recognition of FM, the Malaysian Association of Facilities
Management (MAFM) is still not being made known to other professions or to the
public. The association was first formed in 2001 and yet, up to today, it has not
taken any remarkable outcome or major steps to promote the FM profession locally.
The other closely related professional bodies involved in managing property are The
Board of Valuers, Appraisers and Estate Agents (BoVAEA) and the Malaysian
Association of Professional Property Managers (MAPPM). Similarly, there is a
Building Management Association of Malaysia (BMAM) to represent and protect the
overall interests of the building management industry in Malaysia. More often, FM is
seen not as a profession on its own but rather as a part of property management
services. The users cannot distinguish the overlap and contradiction of the FM and
PM professions, as the FM profession cannot stand on its own identity and is often
being confused with the role of property managing agent.
FM is a multi-disciplinary function that involves many professionals in the decision-
making processes, but to date in Malaysia few are designated as ‘facility manager’
(Kamaruzzaman and Zawawi, 2010). The responsibilities of FM managers are often
being undertaken by various professionals, especially by the Mechanical and
Electrical Engineers and the Civil Engineers. These professions are not specifically
designed to cover the required skills and knowledge expected from FM managers.
Therefore, FM roles need to be addressed and established by the government, to
give FM an opportunity to be developed and to mature progressively. The lack of
efforts given to this has resulted in no strategic development being planned or
organised for the FM industry. An example of industry expertise should be taken
from the developed countries in the West where FM significantly contributes to the
success of business development and planning. This gap of development in
Malaysia has underutilised the capacity of the FM industry to shape the country’s
economic and development future. Non-existence of a specific organisation to
provide guidelines and control on the quality level as well as to assess the
performance of FM practice is the reason why analysis or evaluation of this field is
difficult.
!!
50!
!
2.11.4 Problems and Challenges
In general, FM challenges include lack of recognition, education and training needs,
professional status, career pathways, information standard, performance
benchmarking, cost value versus value in service procurement, and the corporate
and community contribution of FM (Ballesty, 2007). It is a clear challenge for FM
organisations to develop the managerial leadership that can build the organisational
competencies needed to balance knowledge and skill requirements and improve, as
well as maintain them within the increasingly competitive FM market (Ismail, 2007).
This leads to a lack of local expertise as well as to the disaggregated deployment of
specialists, which cannot meet the challenges in Malaysia at the present time.
Samad (2007) declares that the first and foremost issue in handling FM is to
determine the right department to be in charge of handling government buildings, as
this involves public assets and funds. The confusion of selecting the responsible
ministry or department to perform a full surveillance of FM practice in Malaysia
indicates that the sector is in need of strategic organisation and planning. The lack
of an FM government body also restricts the evaluation of FM industry development
in Malaysia. There is also a problem in outsourcing for local expertise to provide an
immediate response to any failure of service, as well as a lack of FM practitioners in
the local market who can provide advice or assistance in the implementation of FM.
The key issue faced by FM in Malaysia is the low service quality (Ruslan, 2007).
The implementation of FM is considered to be too late for some properties, as at
present there are many aging buildings with high levels of deterioration. FM may
help in standardising the future maintenance allocation required but this, however,
may not contribute to minimisation of maintenance costs if the building services are
in poor condition due to improper maintenance carried out in the past.
Despite the government’s commitment with the allocation of RM 1.079 million for
upgrading renovation, there is evident of shoddy work and buildings falling into
disrepair (Hassan, 2007). According to the Head of Maintenance Sector, the
standard of maintenance in government buildings is not up to expectations (Annies,
2007). The real challenge of FM lies in the lack of standards that can be used to
measure the quality level and performance of both traditional and integrated FM
applied by building or property management companies. The slow pace of
regulating appropriate FM standards or regulations is another factor that requires
!!
51!
!
immediate action. A good level of planning for FM may help in standardising the
future maintenance allocation required and planning for the strategic maintenance
approach.
Whilst Malaysia is making progress in the development of FM, there is an overall
mixed signal (Moore and Finch, 2004). There remains a general lack of
understanding and progress of the key drivers that continue to hamper the
successful development of FM. One of the drivers is that when there is no
recognition of the FM profession this leads to a lack of participation from the whole
organisation. The result is that the FM sector fails to demonstrate the added value
that FM can contribute to the organisation’s overall benefit.
Malaysia is still lagging behind in software development specific to FM. Assets in
Malaysia require good maintenance performance to extend their life capacity. In this
respect, Hussin (2007) suggests that the application of technology in the
management of assets leads to effective and efficient management of the
government’s assets and facilities. Adoption of integrated FM requires high initial
cost, unless the computerised programs can be developed locally in the market or
funding support is provided. The adoption of an integrated FM requires space
allocation in order to store the automation mechanism required to operate the
integrated service system. This may not be a problem for new developments but, as
earlier mentioned, there are lots of aging buildings and densely populated buildings
where space allocation might be an issue.
2.11.5 Opportunities
The changes in the services offered include integrated and computerised systems
like the Computerised Maintenance Management System (CMMS) or the Enterprise
Asset Management (EAM) System recently developed by the Construction Industrial
Board (CIDB), which open up opportunities for the FM sector to be developed
rapidly. Although the technological tools available are not sufficient to enhance the
service delivery (Zahri, 2007), the constant development of Information Technology
(IT) in Malaysia also opens up the enhancement of service delivery in FM. The
progressive changes in technology have seen more and new technologies being
made available in Malaysia and the adoption of these technologies often requires
advancement in the management and IT systems. Most of the modern technologies
are integrated systems, requiring IT technology in order to operate them. Generally,
!!
52!
!
the integrated computerised system is much preferred by potential tenants or
buyers, and this supports the development of FM.
For many leading participants in the outsourcing industry today, the well-understood
tools of performance-based or incentive contracting and improved techniques for
operational management are now taken for granted as the starting point for services
delivered. The top players on both the in-house and industry supply side are now
increasingly responsive to core business needs. They are addressing a more
strategic challenge using the concepts within the construction industry to construct
service agreements that free up core business capital tied up in facilities, and at the
same time reducing costs and increasing quality.
There is also the advantage of FM being regarded as a new subject for industry,
whereby there is flexibility for different techniques, and approach practices are
readily available to be implemented. The involvement of FM could also be
introduced during the early construction phase: planning and design, where design
failure can be avoided and good planning of the space and environment can be
delivered. Current rapid development of high-rise buildings in densely populated
cities calls for a good maintenance and strategic planning due to the rising cost in
both occupying and maintaining space (Myeda and Pitt, 2013). The maintenance
and services rates are becoming high in Malaysia and FM is seen as a substitute for
strategic planning, as it records all relevant data specific to the FM area. There is
also a change in the social perception in which a well-maintained building is much
more sought after by potential tenants or buyers. This has resulted in a need to plan
and to design a suitable management approach that may suit the needs of the
buyers/tenants.
2.11.5.1 Demands
The combination of outsourcing and privatisation is boosting demand for FM
services and driving revenue within the industry in Malaysia. As the commercial and
education sectors are heavily pushing third party FM, outsourcing to third party
players remains strong compared to typical in-house management. The
establishment of national conferences such as NAFAM signifies the government’s
attitude to the establishment of a systematic management of service delivery.
Intentions to improve the public delivery system aiming for a well-functioning
national asset and facilities will contribute to a more efficient and effective public
!!
53!
!
service. Hassan (2007) believes that the service delivery can be improved by
implementing performance measures to evaluate the maintenance projects and
project monitoring.
The greater complexity in today’s building facilities also demands a more
professional approach to managing and maintaining these physical assets, and the
FM profession has a great chance of implementing strategic techniques and
practice to improve the quality standard. This will subsequently lead to a growing
awareness of the social perceptions regarding buyers’ and users’ needs for well-
maintained buildings and environment. With the rapid changes in information
technology, clients now have a preference to upgrade from a traditional FM practice
to an advanced computerised system for the management of facilities.
Ariff (2007), Head of Maintenance Sector, Public Works Department, has voiced his
concern on the need for co-ordination in an organisation’s vision in order to integrate
the people, process and technology or systems. He further claims that a strategic
model is needed to overcome the challenges and issues faced in the Malaysian FM
sector.
2.12 Chapter Summary
It is clear that despite the less acceptance and acknowledgement of FM service
within the Malaysian context, there are demands and opportunities for FM industry
to progress further with strategic plans and actions by the government. The
emphasis of service delivery for instance is one fundamental aspect that needs to
be focused. Chapter 3 focuses on the literature of PM, including its potential in
offering more values and benefits the organisations and people involved, the
themes of performance measures or metrics that constitute a good performance
measurement system (PMS) and also factors that need to be considered in
selecting performance measures. It also introduces the previous studies on the PMS
models that have been developed in PM field.
!!
54!
!
CHAPTER 3: PERFORMANCE MEASUREMENT (PM): KEY ELEMENTS AND SERVICE DELIVERY
This chapter focuses on the literature pertaining to PM particularly in the key
elements and service delivery aspects. This includes the definition of a Performance
Measurement System (PMS), how it can be developed, and the potential problems
that can arise in developing it. Principles of an effective and strategic PMS are also
introduced to give an understanding of an ideal PMS. This chapter also elaborates
on the types of performance measures that can be incorporated into a PMS based
on previous literature studies.
3.1 Introduction to PM
PM may be defined as the process of quantifying action, where measurement is the
process of quantification and action correlates with performance (Neely et al., 1995;
Parida and Kumar, 2006). It may also be defined as the process by which a
company manages its performance. It should be in line with the company’s
corporate and functional strategies and objectives (Bititci et al., 1997). PM is also
perceived as the process of determining how successful organisations or individuals
have been in attaining their objectives and strategies (Kagioglou et al., 2001). This
is because it enables managers to make decisions based on facts rather than on
assumptions (Parker, 2000). An operational PMS also acts like an early-warning
system where it gives an indication for problems and areas for continuous
improvement; thus, it has been given a prominent place in most organisations
(Parida and Kumar, 2006; Martinez, 2005; Baldwin et al., 2001).
Measurement is an area that has been increasingly discussed over the past few
years with familiar adages like “you can’t manage what you cannot measure” and
“what gets measured gets done” (Amaratunga, 2000). Measurement is essential as
it provides feedback, builds understanding and encourages intrinsic motivation
rather than a tool for top-down management control (Meekings, 1995). Meekings
further added that the recognition of measurement in the world’s industries has
shown that the current focus is on systematic thinking, fundamental structural
change and organisational learning, instead of mindless target-setting, continual
fire-fighting or the rigorous allocation of blame. PM is often seen as an effective tool
for increasing the competitiveness and profitability of manufacturing companies
through the support and encouragement of productivity improvements. Neely et al.
!!
55!
!
(1995) also agree that performance should be defined as the efficiency and
effectiveness of action. According to Cain (2004), PM is used as the first stage of
any improvement process that benefits the end users with lower prices and the
organisation with higher profit margins and at the same time enhances the product
quality.
PMSs are compared in terms of how easily they are derived from strategic
objectives, how easy they are to understand and also whether they help to provide a
long-term view of performance (Tangen, 2003). In the past, PM has been criticised
for judging performance against the wrong framework of performance measures
and, recently, there is widespread support for the belief that performance measures
should be developed from strategies (Neely et al., 2003). However, there are
negative effects of PM that are based on complicated and excessive performance
measures (Martinez, 2005). This has caused problems with investment and the
commitment of people involved through the consumption of a lot of time and the
limiting of the freedom of managers due to its rigidity and inflexibility.
In literature, PM is a subject that is often discussed but rarely defined; however,
since the 1980s it has become a very popular research topic (Tangen, 2003). Since
then, it has received considerable attention and remarkable progress has been
made. The concept of PM was first introduced around the 1860s and 1870s
(Kaplan, 1984). It was first developed based on simple yet straightforward objectives
that were to monitor and maintain the organisational processes aiming to achieve
the goals and objectives of the organisations (Nani et al., 1990).
During the first introduction, PM was mostly concerned with the financial aspects of
an organisation (Kagioglou, 2001). From that point forward, Ladrum et al. (2000)
believe that the globalisation, diversification and technological innovations have
pushed the rapid development of PM within business organisations. At this point,
traditional performance measures were perceived as not suitable and unable to be
used as the sole criteria for assessing performance (Kennerly and Neely, 2002).
Neither industry nor academia has agreed on what new performance measures
should be used or on what criteria the selection of performance measures should be
based (Tangen, 2003).
!!
56!
!
Slack et al. (2001) introduced five types of performance objectives, namely cost,
flexibility, speed, dependability and quality. According to them, the effects these
performance objectives have on an operation are:
• High-quality operations do not waste time or effort having to re-do things, nor
are their internal customers inconvenienced by flawed service.
• Fast operations reduce the level of in-process inventory between micro
operations, as well as reducing administrative overheads. Products can also
be delivered earlier to the customer.
• Dependable operations can be relied on to deliver exactly as planned. This
eliminates wasteful disruption and allows the other micro operations to operate
efficiently.
• Flexible operations adapt to changing circumstances quickly and without
disrupting the rest of the operation. Flexible micro operations can also change
over between tasks quickly and without wasting time and capacity.
• Low cost operations allow the company to sell their products at a competitive
price, and increase profitability.
Proponents of any one particular form of measurement are keen to stress the
advantage of that measurement, but are much more reluctant to discuss its
disadvantages or to highlight situations under which it may not be appropriate. Even
though numerous theoretical frameworks for PM design can be found in the
management literature, the measurement practitioner in a company is offered little
practical guidance when trying to decide what performance measures are suitable
for the company’s specific situation (Tangen, 2003)
3.2 The Development of A PMS
A PMS may be defined as the set of metrics used to quantify the efficiency and
effectiveness of action (Neely et al., 1995). It is also seen as the comparison of
results against expectations, with the implied objective of learning to do better
(Rouse and Putterill, 2003). A PMS that incorporates the implementation of
framework or performance measures can focus on their specific performance
targets effectively. A PMS that comprises appropriate performance measures has
the potential to offer more values and benefits to the people involved. (Myeda and
Pitt, 2012).
!!
57!
!
Tangen (2002) proposed a few basic criteria necessary for performance measures
to be effective:
• The performance measures must be derived from strategic objectives to
ensure that employee behaviour is consistent with corporate goals
• The performance measures must provide timely, relevant and accurate
feedback, from both a long-term and short-term perspective
• The performance measures should be undertaken in ways that are easily
understood by those whose performance is being evaluated
• The measurement aspect should be accomplished by a limited number of
financial and non-financial performance measures
The development of a number of PM frameworks and approaches or processes
emerged to meet the need for companies to align their PMS with their strategic
goals (Hudson et al., 2001). The balanced scorecard (BSC) has acted as a catalyst
for further research into the characteristics of, and approaches for, developing
strategic PMSs (Bititci et al., 1997; Oliver and Palmer, 1998; Hudson et al., 2001),
although many of those companies implementing the BSC are not successful (Neely
et al., 2003). The change of emphasis to developing a strategic PMS represents a
revolution in the field of PM (Neely, 1999). While there has been increased attention
on PM per se, the current literature is inadequate in respect of the specific Small
Medium Enterprise (SME) context (Hudson et al., 2001).
Previous research has normally focused only on the content of strategic PMS for
other industries in general, but not specifically on FM (Myeda and Pitt, 2012). The
requirements identified for effective measurement of PMS are mostly suitable to
cater for manufacturing industries. There is a need to determine, verify and integrate
the axioms of modern PM in the context of FM (Amaratunga, 2000). Traditional
accounting-based performance measures have been characterised as being
financially based, internally focused, backward-looking and more concerned with
local departmental performance than with the overall health or performance of the
business (Bourne and Neely, 2003). Many researchers and practitioners realised
that, due to increased complexity of organisations and the markets in which they
compete, it was no longer appropriate to use financial measures as the sole criteria
for assessing success. Johnson and Kaplan (1987), for example, highlighted the
failure of financial performance measures to reflect changes in the competitive
circumstances and strategies of modern organisations. Kaplan and Norton (1992)
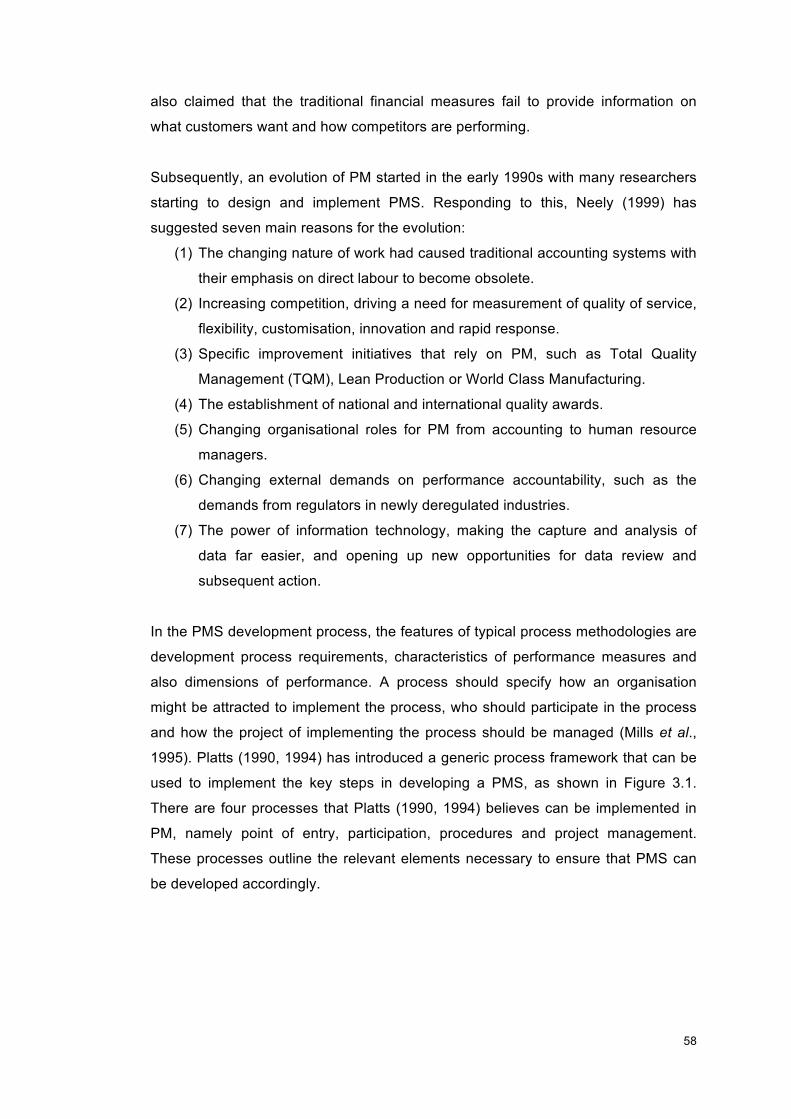
!!
58!
!
also claimed that the traditional financial measures fail to provide information on
what customers want and how competitors are performing.
Subsequently, an evolution of PM started in the early 1990s with many researchers
starting to design and implement PMS. Responding to this, Neely (1999) has
suggested seven main reasons for the evolution:
(1) The changing nature of work had caused traditional accounting systems with
their emphasis on direct labour to become obsolete.
(2) Increasing competition, driving a need for measurement of quality of service,
flexibility, customisation, innovation and rapid response.
(3) Specific improvement initiatives that rely on PM, such as Total Quality
Management (TQM), Lean Production or World Class Manufacturing.
(4) The establishment of national and international quality awards.
(5) Changing organisational roles for PM from accounting to human resource
managers.
(6) Changing external demands on performance accountability, such as the
demands from regulators in newly deregulated industries.
(7) The power of information technology, making the capture and analysis of
data far easier, and opening up new opportunities for data review and
subsequent action.
In the PMS development process, the features of typical process methodologies are
development process requirements, characteristics of performance measures and
also dimensions of performance. A process should specify how an organisation
might be attracted to implement the process, who should participate in the process
and how the project of implementing the process should be managed (Mills et al.,
1995). Platts (1990, 1994) has introduced a generic process framework that can be
used to implement the key steps in developing a PMS, as shown in Figure 3.1.
There are four processes that Platts (1990, 1994) believes can be implemented in
PM, namely point of entry, participation, procedures and project management.
These processes outline the relevant elements necessary to ensure that PMS can
be developed accordingly.
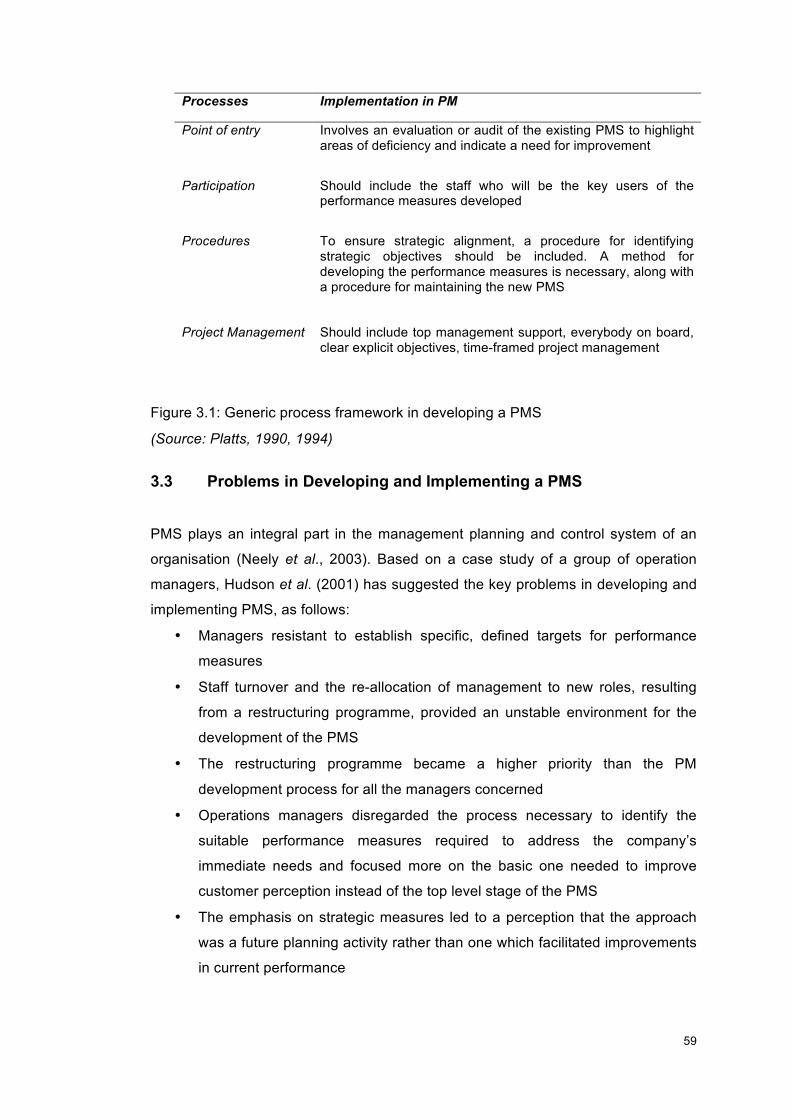
!!
59!
!
(Source: Platts, 1990, 1994)
3.3 Problems in Developing and Implementing a PMS
PMS plays an integral part in the management planning and control system of an
organisation (Neely et al., 2003). Based on a case study of a group of operation
managers, Hudson et al. (2001) has suggested the key problems in developing and
implementing PMS, as follows:
• Managers resistant to establish specific, defined targets for performance
measures
• Staff turnover and the re-allocation of management to new roles, resulting
from a restructuring programme, provided an unstable environment for the
development of the PMS
• The restructuring programme became a higher priority than the PM
development process for all the managers concerned
• Operations managers disregarded the process necessary to identify the
suitable performance measures required to address the company’s
immediate needs and focused more on the basic one needed to improve
customer perception instead of the top level stage of the PMS
• The emphasis on strategic measures led to a perception that the approach
was a future planning activity rather than one which facilitated improvements
in current performance
Processes Implementation in PM
Point of entry Involves an evaluation or audit of the existing PMS to highlight areas of deficiency and indicate a need for improvement
Participation Should include the staff who will be the key users of the performance measures developed
Procedures To ensure strategic alignment, a procedure for identifying strategic objectives should be included. A method for developing the performance measures is necessary, along with a procedure for maintaining the new PMS
Project Management Should include top management support, everybody on board, clear explicit objectives, time-framed project management
Figure 3.1: Generic process framework in developing a PMS
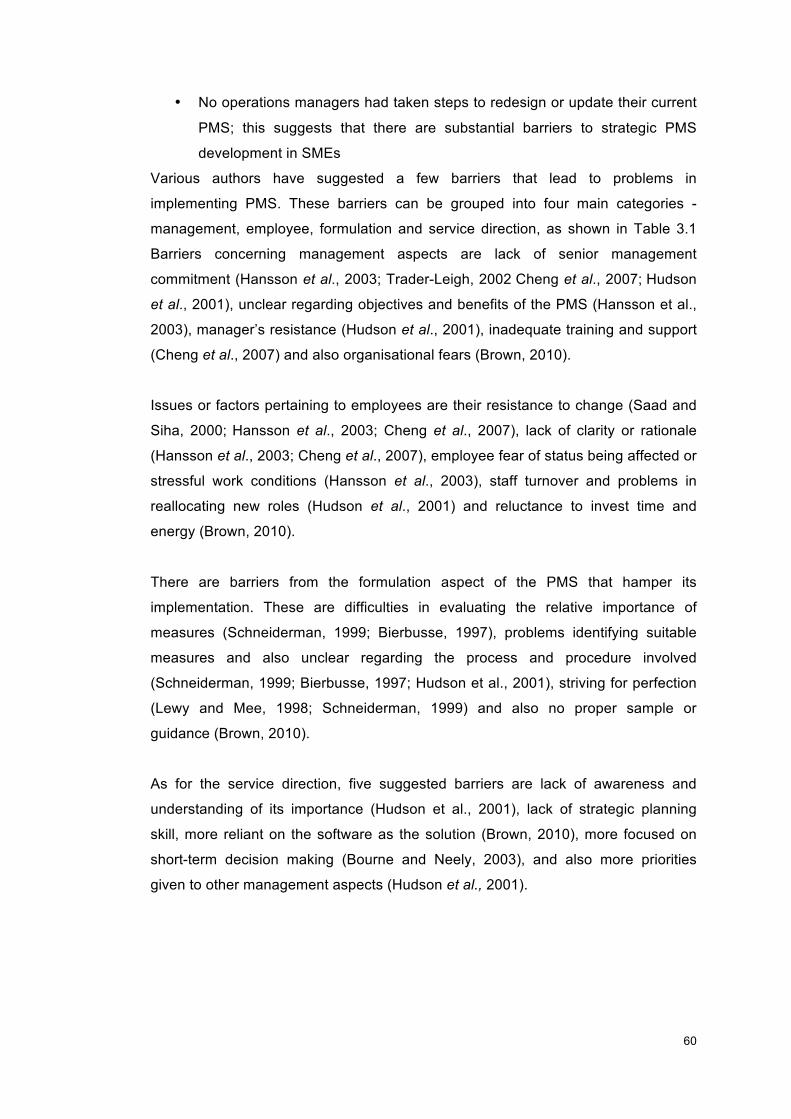
!!
60!
!
• No operations managers had taken steps to redesign or update their current
PMS; this suggests that there are substantial barriers to strategic PMS
development in SMEs
Various authors have suggested a few barriers that lead to problems in
implementing PMS. These barriers can be grouped into four main categories -
management, employee, formulation and service direction, as shown in Table 3.1
Barriers concerning management aspects are lack of senior management
commitment (Hansson et al., 2003; Trader-Leigh, 2002!Cheng et al., 2007;!Hudson
et al., 2001), unclear regarding objectives and benefits of the PMS (Hansson et al.,
2003), manager’s resistance (Hudson et al., 2001), inadequate training and support
(Cheng et al., 2007) and also organisational fears (Brown, 2010).
Issues or factors pertaining to employees are their resistance to change (Saad and
Siha, 2000;!Hansson et al., 2003; Cheng et al., 2007), lack of clarity or rationale
(Hansson et al., 2003; Cheng et al., 2007), employee fear of status being affected or
stressful work conditions (Hansson et al., 2003), staff turnover and problems in
reallocating new roles (Hudson et al., 2001) and reluctance to invest time and
energy (Brown, 2010).
There are barriers from the formulation aspect of the PMS that hamper its
implementation. These are difficulties in evaluating the relative importance of
measures (Schneiderman, 1999; Bierbusse, 1997), problems identifying suitable
measures and also unclear regarding the process and procedure involved
(Schneiderman, 1999; Bierbusse, 1997; Hudson et al., 2001), striving for perfection
(Lewy and Mee, 1998; Schneiderman, 1999) and also no proper sample or
guidance (Brown, 2010).
As for the service direction, five suggested barriers are lack of awareness and
understanding of its importance (Hudson et al., 2001), lack of strategic planning
skill, more reliant on the software as the solution (Brown, 2010), more focused on
short-term decision making (Bourne and Neely, 2003), and also more priorities
given to other management aspects (Hudson et al., 2001).
!!
61!
!
Management • Lack of senior management commitment • Unclear regarding objectives and benefits • Manager’s resistance • Inadequate training and support • Organisational fears (Hudson et al., 2001; Hansson et al., 2003; Trader-Leigh, 2002!Cheng et al., 2007;!Brown, 2010).!
Employee • Employee resistance to change • Lack of clarity/rationale • Employee fear of status being affected or stressful work conditions • Staff turnover and problems in reallocating new roles • Reluctant to invest in time and energy (Saad and Siha, 2000;!Hudson et al., 2001; Hansson et al., 2003; Cheng et al., 2007; Brown, 2010)
Formulation • Difficulties in evaluating the relative importance of measures • Problems identifying suitable measures • Unclear regarding the process and procedure involved • Striving for perfection • No proper sample or guidance (Lewy and Mee, 1998; Bierbusse, 1997; Schneiderman, 1999; Hudson et al., 2001; Brown, 2010)
Service Direction • Lack of awareness and understanding of its importance • Lack of strategic planning skill • Reliance on software as solution • More focused on short-term decision making • Priorities given to other management aspects (Hudson et al., 2001; Bourne and Neely, 2003; Brown, 2010)
Table 3.1: Barriers in implementing PMS 3.4 Strategic PMS
The concept of strategic PM was developed in response to the criticism that
traditional PMSs are financially driven and historically focused (Kaplan and Norton,
1993). Measurement needs to be related directly to the organisation’s mission and
objectives in order to reflect the company’s external competitive environment,
customer requirements and internal objectives (Kennerley and Neely, 2002). The
performance measurement needs to be aligned to organisational strategy (Kaplan,
1983; Eccles, 1991; Gregory, 1993; Kaplan and Norton, 2001; Murty et al., 2002;
Parida and Kumar, 2006). The measures should provide an explicit link back to
operations (Greatbanks and Boaden, 1998). A PMS that is designed based on
strategies would provide data that could input directly into the strategy formulation
!!
62!
!
process (Hudson et al., 2001). Research has shown that SMEs that link operations
to their business strategies outperform the competition (Argument et al., 1997).
Resource limitations associated with SMEs indicate that the dimensions of quality
and time are critical to ensure that waste levels are kept low and that a high level of
productivity performance is attained (Hudson et al., 2001). Hudson et al. also
proposed a set of characteristics of strategic PMS for SMEs:
• Personalises management, with little devolution of authority
• Severe resource limitations in terms of management and staffing levels as
well as finance
• Reliance on a small number of customers, and operating in limited markets
• Flat, flexible structures
• High innovatory potential
• Reactive, fire-fighting mentality
• Informal, dynamic strategies
Having a small number of customers suggests that, in order to remain competitive,
SMEs must ensure that customer satisfaction remains high and that they can be
flexible enough to respond rapidly to changes in the market (Hudson et al., 2001).
Meekings (1995) suggests that PMS has significant implications for the FM
business; for example, the role of maintenance may be changed from backward-
looking record keeping to forward-looking prediction and insight. The focus is also
on systematic thinking, fundamental structural change and organisational learning
instead of mindless target setting, continual fire-fighting or the rigorous allocation of
blame.
3.5 Principles of An Effective PMS
In designing the framework for PMS, one must consider the important aspects like
goals, design and management (Wordsworth, 2001). Such a framework is essential
for an organisation to align its PMS with the company goals by setting objectives
and defining key performance at each level. A good PMS should include subjective
performance measures as well as objective performance measures. Objective
performance measures are sought as they have the advantage of not being biased
by whoever is providing the opinion. Conversely, subjective performance measures
provide a wealth and variety that is not obtainable from objective performance
measures alone (White, 1996). Involvement of employees in the development of the
!!
63!
!
PMS is also needed to frame a good measurable PMS, as employees are the
individuals who operate the processes and who know the task best. Thus, getting
them involved will not only result in commitment towards efficient PMS but also
influence the actual performance (Sinclair and Zairi, 1996). Bourne et al. (2000) also
believe that PMS requiring regular reporting are best automated.
Another approach to include in developing a good PMS is the Total Quality
Management (TQM) philosophy along with associated Critical Success Factors
(CFSs), which has been proven to achieve dramatic improvements in the
implementation of PMS (Sharp et al., 1997). Dwight (1995) has suggested two other
approaches to PM: the system audit approach and the incident evaluation approach.
These approaches are based on the idea that definition of performance can be
stated in terms of the change in value or the probable future earnings of the system.
One favourable aspect of such systems might be that they capture the impacts of
any actions on future periods. He further proposed a set of properties of a good
PMS:
• An agreed standard exists, for which there is generally commitment from those
required to control it, or improve by it;
• There is a known cause and effect relationship between the performance
measures and a retained or improved business performance; and
• There is an understanding of the various influences on the performance
measures proposed
Similarly, Wordsworth (2001) presents the key design features of a quality PMS as
follows:
• Appropriateness of the performance measures in relation to the strategic
objectives of an organisation. Selection criteria: each performance measure
should have an organisational goal or objective to feedback
• Vertical alignment of performance measures to translate the strategic objectives
into different levels of hierarchy. Deployment criteria: recognition of different
hierarchies
• Balanced view of the maintenance system
• Integration of objective and subjective performance measures
• Employee involvement
• Cross-functional structure
!!
64!
!
PMS should become a framework for everyone to understand and align with top-
level objectives of the organisation and enable them to actively and enthusiastically
participate in continuous improvement (Meekings, 1995).
3.6 Existing PMS
Over the years, several frameworks have been developed for measuring
performance. Until 1980, PM was based mostly on financial measurements (Parida
and Kumar, 2006). According to Kaplan and Norton (1992), the approach at that
time was focusing more on four components: financial, customers, internal
processes, and innovation and learning. In the subsequent years, various
researchers have developed frameworks considering the use of non-financial
measurements and intangible assets on the achievement of competitive
advantages.
This study compiles a few types of PMSs that have been introduced since the early
phase of PM (refer to Figure 3.2). Kaplan and Norton (1992) have introduced the
principle of mixing financial and non-financial performance measures in the Balance
Scorecard. Although the system appeared to be balanced and new at that time, it
seemed to have a lack of mechanism to maintain it, which possibly created
problems in executing the strategies between the top level, strategic level and
operational level. Lynch and Cross (1991) have proposed the Performance Pyramid
system, which established how objectives from the top level are communicated to
the operational level and, subsequently, how the formulated measures are
conveyed back to the top level. Fitzegrald et al. (1991) have suggested both leading
and lagging performance measurements in the proposed Results & Determinants
Matrix. It gives an overview of what performance measures should look like and
provides a useful development process. However, this PMS does not include
customers in the performance dimensions. Similarly, Ghalayini et al. (1997) also do
not emphasise the human resources or customers in their proposed Integrated
Dynamic PM. Although it provides a process for ensuring fast feedback, the system
seems complicated as it has several different tools that might confuse the users.
The Integrated PM System proposed by Bititci et al. (1997) provides a useful
process in identifying the link between the performance measures and strategic
plans of the business. It also covers many of the criteria required for a
comprehensive PMS but fails to provide a structured process to specify objectives
and timescales for its development and implementation.
!!
65!
!
Neely et al. (1996, 2003) have suggested The Cambridge PM, which offers a very
structured process in identifying the suitable performance measures to suit business
objectives. However, the system focuses more on the business unit and suggests
that the development process for operational measures is optional. Oliver and
Palmer (1998), in the proposed Integrated Measurement Model, define the
performance dimensions and provide a mechanism for designing the measures, but
do not include any proposal regarding the development process. Flapper et al.
(1996), in the proposed Consistent PMS, introduce the performance indicators and
how to set values for them. This model also outlines the process for developing and
implementing PMS, despite not reaching an insight into the relationship between
performance objectives.
All the proposed and published PMSs have significant values in giving directions for
implementing PM into the business. However, few have proposed any performance
measures or indicators that emphasise the service delivery performance.
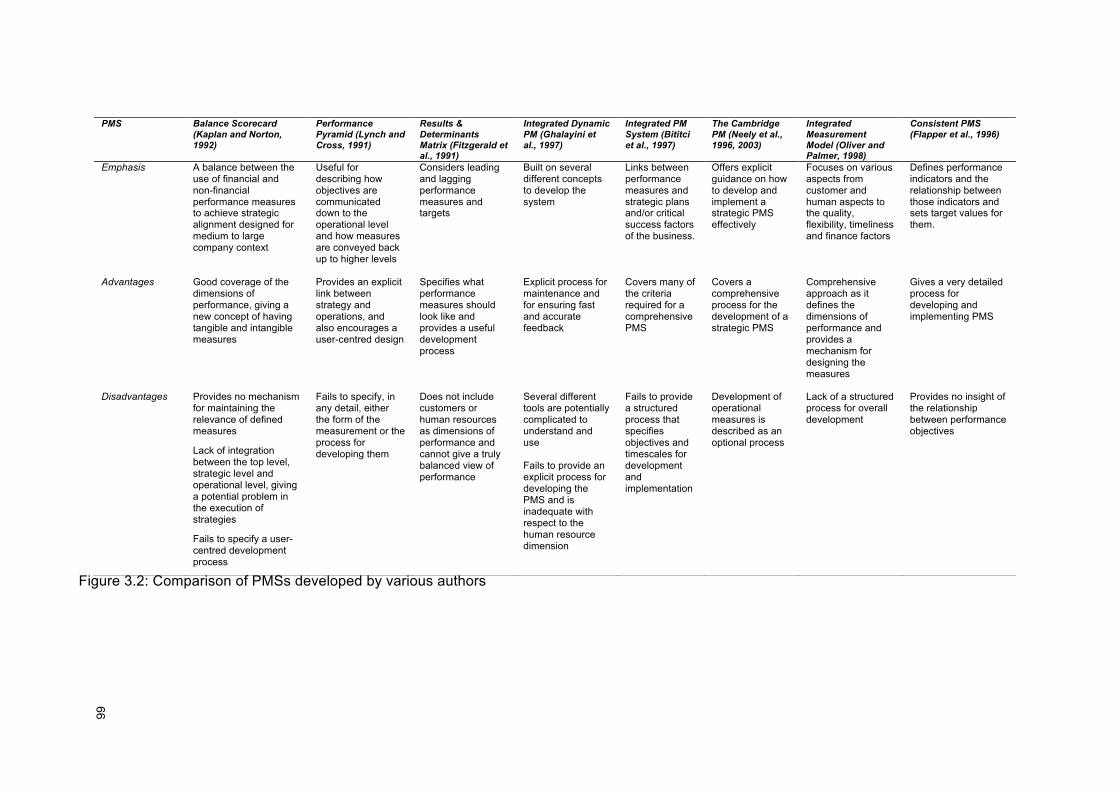
!!
66!
!
PMS Balance Scorecard (Kaplan and Norton, 1992)
Performance Pyramid (Lynch and Cross, 1991)
Results & Determinants Matrix (Fitzgerald et al., 1991)
Integrated Dynamic PM (Ghalayini et al., 1997)
Integrated PM System (Bititci et al., 1997)
The Cambridge PM (Neely et al., 1996, 2003)
Integrated Measurement Model (Oliver and Palmer, 1998)
Consistent PMS (Flapper et al., 1996)
Emphasis A balance between the use of financial and non-financial performance measures to achieve strategic alignment designed for medium to large company context
Useful for describing how objectives are communicated down to the operational level and how measures are conveyed back up to higher levels
Considers leading and lagging performance measures and targets
Built on several different concepts to develop the system
Links between performance measures and strategic plans and/or critical success factors of the business.
Offers explicit guidance on how to develop and implement a strategic PMS effectively
Focuses on various aspects from customer and human aspects to the quality, flexibility, timeliness and finance factors
Defines performance indicators and the relationship between those indicators and sets target values for them.
Advantages Good coverage of the dimensions of performance, giving a new concept of having tangible and intangible measures
Provides an explicit link between strategy and operations, and also encourages a user-centred design
Specifies what performance measures should look like and provides a useful development process
Explicit process for maintenance and for ensuring fast and accurate feedback
Covers many of the criteria required for a comprehensive PMS
Covers a comprehensive process for the development of a strategic PMS
Comprehensive approach as it defines the dimensions of performance and provides a mechanism for designing the measures
Gives a very detailed process for developing and implementing PMS
Disadvantages
Provides no mechanism for maintaining the relevance of defined measures
Lack of integration between the top level, strategic level and operational level, giving a potential problem in the execution of strategies
Fails to specify a user-centred development process
Fails to specify, in any detail, either the form of the measurement or the process for developing them
Does not include customers or human resources as dimensions of performance and cannot give a truly balanced view of performance
Several different tools are potentially complicated to understand and use Fails to provide an explicit process for developing the PMS and is inadequate with respect to the human resource dimension
Fails to provide a structured process that specifies objectives and timescales for development and implementation
Development of operational measures is described as an optional process
Lack of a structured process for overall development
Provides no insight of the relationship between performance objectives
Figure 3.2: Comparison of PMSs developed by various authors
!!
67!
!
3.7 Identifying Performance Measures
Performance measures should be clearly defined, have an explicit purpose, be
relevant, easy to maintain and simple to understand and use (Hudson et al., 2001).
Globerson (1985) believes that performance measures must be clearly defined with
an explicit purpose. Simplicity is also the key, with many authors suggesting that
performance measures have to be simple to understand and use, relevant and easy
to maintain and provide fast and accurate feedback (Maskell, 1989; Lynch and
Cross, 1991; Neely et al., 1996). Most importantly, they need to stimulate
continuous improvement. Performance measures are used to provide feedback,
build understanding and encourage intrinsic motivation rather than as a tool for top-
down management control (Meekings, 1995). It is important to conceptualise the
content of performance measures’ characteristics and appropriate dimensions of
performance. This is important because a development process needs both
structure and relevant content in order to effectively deliver value to business.
Developing a strategic PMs is necessarily long term and it explicitly requires the
resulting performance measures to be strategically focused.
Performance measure is a metric used to quantify the effectiveness level of an
action (Neely et al., 1995). Performance measures are often classified and
measured according to the performance objectives, cost measures, quality
measures, speed measures, dependability measures and flexibility measures (Slack
et al., 2001). Tangen (2003) proposes a few factors in selecting the appropriate type
of performance measures to suit the nature of the organisation:
(1) The purpose of the performance measures
(2) The level of detail required
(3) The time available for the measurement
(4) The existence of available predetermined data
(5) The cost of measurement
White (1996)!suggests that performance measures could be identified according to
the following aspects:
(1) Competitive priority: the characteristics of the performance measures that
are considered competitive, such as cost, quality, flexibility, delivery
reliability, or speed
!!
68!
!
(2) Source of data: the data can either be internal, where the sources of data
are within the organisation, or external, where the sources of data are from
outside the organisation
(3) Type of data: the data can be subjective, that is based on perception or
opinion; or objective, which is based on observable facts and does not
involve opinion
(4) Reference: whether the performance measures are benchmarked with other
organisations or self-referenced, which does not involve any comparison
with another organisation
(5) Orientation to process: to determine whether the performance measures are
the input or outcome of some process
Flapper et al. (1996) have suggested a new classification of performance measures
involving three intrinsic dimensions, that is, decision type, aggregation level, and
measurement unit. Decision type focuses on the kind of decision the performance
measure is meant to support like strategic, tactical or operational. Aggregation level
is to work out if the performance measure is of overall or partial nature.
Measurement unit relates to which unit the measure is expressed in, whether
monetary, physical or dimensionless.
3.7.1 Types of Performance Measures
PM is often referred to as the use of a multi-dimensional set of performance
measures (Neely et al., 2003). It is only relevant within a reference framework
against which the efficiency and effectiveness of action can be judged. Hudson et al.
(2001) propose six types of performance measures that can be seen to cover all
aspects of business: quality, time, flexibility, finance, customer satisfaction and
human resources, as shown Figure 3.3.
Time, quality and flexibility provide the financial results and the operating
performance. Customer satisfaction provides an insight into the way the company is
perceived externally, whilst the human resource dimension offers managers the
ability to evaluate the cultural aspects of the working environment. These
dimensions are not prescriptive, and they are intended to encourage the holistic
consideration of these areas when developing performance measures to support the
organisation’s strategies.
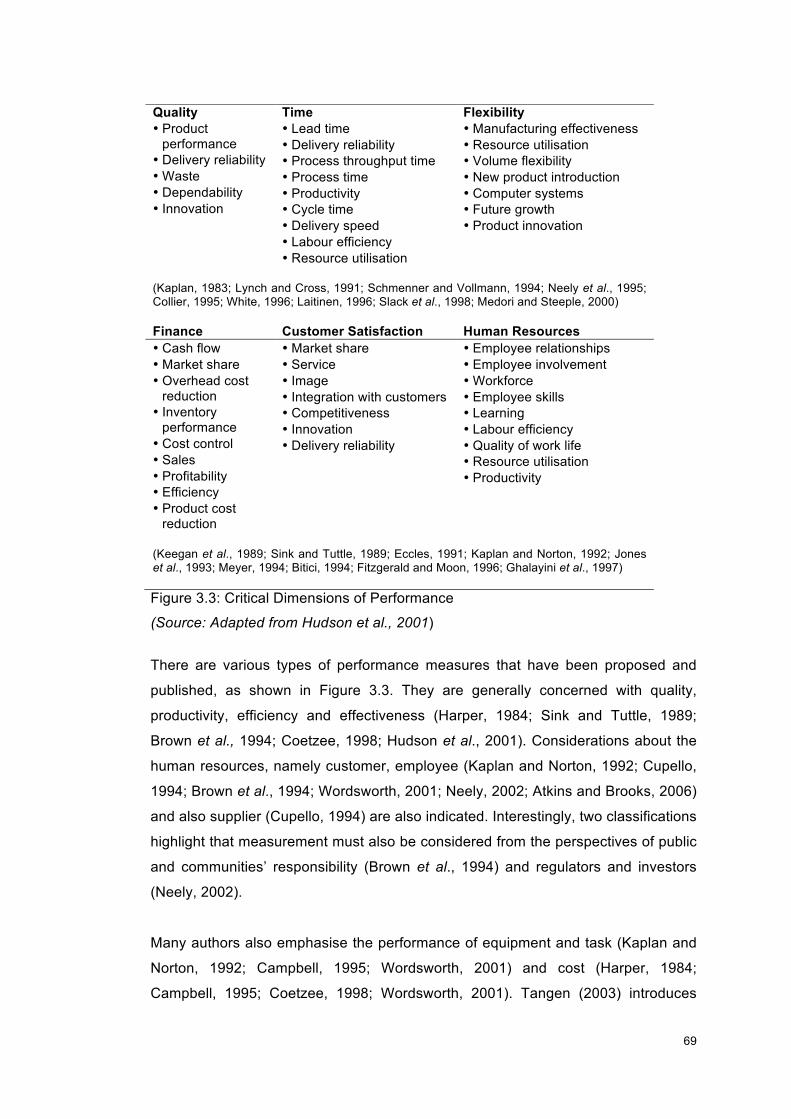
!!
69!
!
(Source: Adapted from Hudson et al., 2001)
There are various types of performance measures that have been proposed and
published, as shown in Figure 3.3. They are generally concerned with quality,
productivity, efficiency and effectiveness (Harper, 1984; Sink and Tuttle, 1989;
Brown et al., 1994; Coetzee, 1998; Hudson et al., 2001). Considerations about the
human resources, namely customer, employee (Kaplan and Norton, 1992; Cupello,
1994; Brown et al., 1994; Wordsworth, 2001; Neely, 2002; Atkins and Brooks, 2006)
and also supplier (Cupello, 1994) are also indicated. Interestingly, two classifications
highlight that measurement must also be considered from the perspectives of public
and communities’ responsibility (Brown et al., 1994) and regulators and investors
(Neely, 2002).
Many authors also emphasise the performance of equipment and task (Kaplan and
Norton, 1992; Campbell, 1995; Wordsworth, 2001) and cost (Harper, 1984;
Campbell, 1995; Coetzee, 1998; Wordsworth, 2001). Tangen (2003) introduces
Quality Time Flexibility • Product
performance • Delivery reliability • Waste • Dependability • Innovation
• Lead time • Delivery reliability • Process throughput time • Process time • Productivity • Cycle time • Delivery speed • Labour efficiency • Resource utilisation
• Manufacturing effectiveness • Resource utilisation • Volume flexibility • New product introduction • Computer systems • Future growth • Product innovation
(Kaplan, 1983; Lynch and Cross, 1991; Schmenner and Vollmann, 1994; Neely et al., 1995; Collier, 1995; White, 1996; Laitinen, 1996; Slack et al., 1998; Medori and Steeple, 2000)
Finance Customer Satisfaction Human Resources • Cash flow • Market share • Overhead cost
reduction • Inventory
performance • Cost control • Sales • Profitability • Efficiency • Product cost
reduction
• Market share • Service • Image • Integration with customers • Competitiveness • Innovation • Delivery reliability
• Employee relationships • Employee involvement • Workforce • Employee skills • Learning • Labour efficiency • Quality of work life • Resource utilisation • Productivity
(Keegan et al., 1989; Sink and Tuttle, 1989; Eccles, 1991; Kaplan and Norton, 1992; Jones et al., 1993; Meyer, 1994; Bitici, 1994; Fitzgerald and Moon, 1996; Ghalayini et al., 1997)
Figure 3.3: Critical Dimensions of Performance
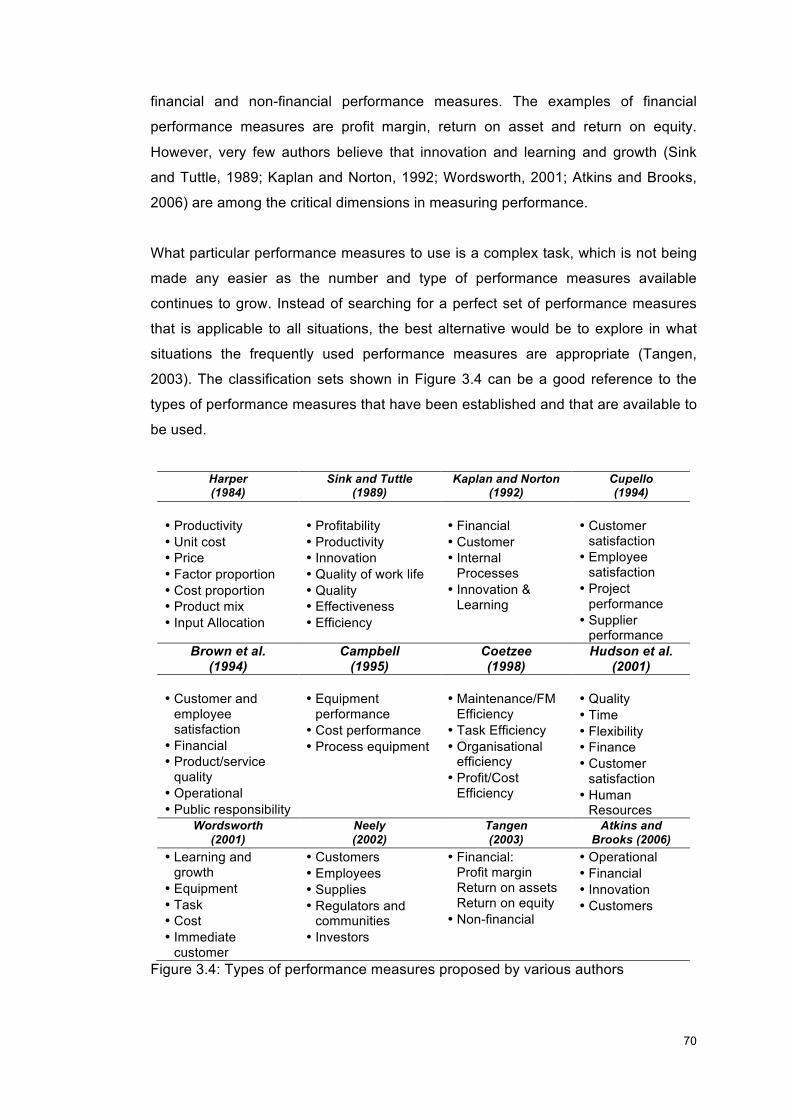
!!
70!
!
financial and non-financial performance measures. The examples of financial
performance measures are profit margin, return on asset and return on equity.
However, very few authors believe that innovation and learning and growth (Sink
and Tuttle, 1989; Kaplan and Norton, 1992; Wordsworth, 2001; Atkins and Brooks,
2006) are among the critical dimensions in measuring performance.
What particular performance measures to use is a complex task, which is not being
made any easier as the number and type of performance measures available
continues to grow. Instead of searching for a perfect set of performance measures
that is applicable to all situations, the best alternative would be to explore in what
situations the frequently used performance measures are appropriate (Tangen,
2003). The classification sets shown in Figure 3.4 can be a good reference to the
types of performance measures that have been established and that are available to
be used.
Harper (1984)
Sink and Tuttle (1989)
Kaplan and Norton (1992)
Cupello (1994)
• Productivity • Unit cost • Price • Factor proportion • Cost proportion • Product mix • Input Allocation
• Profitability • Productivity • Innovation • Quality of work life • Quality • Effectiveness • Efficiency
• Financial • Customer • Internal
Processes • Innovation &
Learning
• Customer
satisfaction • Employee
satisfaction • Project
performance • Supplier
performance Brown et al.
(1994) Campbell
(1995) Coetzee (1998)
Hudson et al. (2001)
• Customer and
employee satisfaction
• Financial • Product/service
quality • Operational • Public responsibility
• Equipment
performance • Cost performance • Process equipment
• Maintenance/FM
Efficiency • Task Efficiency • Organisational
efficiency • Profit/Cost
Efficiency
• Quality • Time • Flexibility • Finance • Customer
satisfaction • Human
Resources Wordsworth
(2001) Neely (2002)
Tangen (2003)
Atkins and Brooks (2006)
• Learning and growth
• Equipment • Task • Cost • Immediate
customer
• Customers • Employees • Supplies • Regulators and
communities • Investors
• Financial: Profit margin Return on assets Return on equity
• Non-financial
• Operational • Financial • Innovation • Customers
Figure 3.4: Types of performance measures proposed by various authors
!!
71!
!
A simple but effective approach, which is based on the Performance Value Model,
was introduced by Nutt and McLennan (2000). The model is derived from the Total
Quality Management (TQM) model, fused with the basic principles of project
management with the focus on three key elements of cost, time/use and quality. The
performance metric cost refers to the cost of the workplace facilities and building
services. Time/Use metrics refer to how efficiently the building space is being used
over time. These key metrics can be facilitated by analysing the space utilisation to
ensure space efficiency and allow the flexibility required in the organisation. The
Quality metric refers to how well the office meets its intended purpose, for instance,
to support work activities and enhance work performance. The authors also
suggested that all the three performance metrics could be benchmarked with other
buildings. The comparison will ascertain the performance level of an organisation in
offering the best value service.
3.7.2 Financial and Non-financial Performance Measures
Any measurement regime should be designed to meet specific needs and should be
built from a variety of measurement types that, together, offer the data that will be
useful in monitoring performance and taking appropriate action. Several frameworks
have been developed for measuring performance over the years. Parida and Kumar
(2006) claim that since 1980 until to-date, the practitioners have mostly
implemented financial performance measures. Traditional ways of measuring
performance with financial and productivity performance measures have a number
of shortcomings, principally the absence of a link to company strategy and the risk
of sub-optimisation. However, these performance measures should not be
automatically rejected as they also have a number of advantages. They are precise,
objective and can form the basis of a low-cost measurement regime. Their
limitations suggest that they should be used in combination with non-cost measures.
During the last decade, many researchers have focused on developing more
complex PMS, as the cost accounting system will not entirely solve the problem with
financial performance measures; other types of performance measures are needed
to gauge performance. PMSs that incorporate both cost and non-cost performance
objectives are signified to be more suitable for the business environment today
(Atkin and Brooks, 2006; Kaplan and Norton, 1992). To focus primarily on one type
of performance measures will often result in sub-optimisation. A varied set of
measures will give a more correct and certainly more balanced view of a company’s
!!
72!
!
performance (Tangen, 2003). Subsequently, various researchers have developed
frameworks considering non-financial measurements and intangible assets in order
to achieve competitive advantages (Kaplan and Norton, 1992).
There is no completely unambiguous way to know when a company is profitable,
since many business opportunities involve sacrificing current and future profits
(Ross et al., 1993). In the financial measure, Tangen (2003) has introduced three
common aspects: profit margin, return on asset and return on equity. Profit margin
or return sales measures how much a company earns relative to its sales. These
measures determine the company’s ability to withstand competition and adverse
rising costs, falling prices or declining sales in the future (Ross et al., 1993); while
return on assets (ROA), as developed by Dupont in 1919, is one of the most widely
used financial models for PM (Zairi, 1994). It determines the company’s ability to
utilise its assets, but it does not tell how well a company is performing for the
stockholder. Lastly, return on equity (ROE) measures how well the company is
doing for investors like the stockholders, since it tells how much income they are
getting for their investments.
Many researchers argue that there are significant limitations to financial
performance measures, since they are based on a simple cost accounting system
that was common in the early 1900s. Such a system focuses on controlling and
reducing direct labour costs and therefore cannot adapt to today’s competitive
environment. Cost accounting systems were designed for an environment of mass
production of a few standardised items, which makes them more or less inadequate
in a manufacturing environment that includes new philosophies such as lean
production, agile manufacturing or mass customisation. However, while the climate
for manufacturing companies has changed enormously, the techniques of
management accounting have changed very little.
As for the manufacturing industry, the financial performance measure has a
limitation where there is a lack of relevance to the control of production and it is not
directly related to manufacturing strategy (Maskell, 1991). Excessive use of return of
investment ROI also distorts strategy building (Hill, 1995). Traditional criteria such
as cost efficiency and utilisation may pressure managers and supervisors into
maximising short-term results, and therefore discourage improvements (Crawford
and Cox, 1990). Ghalayini et al. (1997) have suggested that many improvements
are difficult to quantify directly in monetary value, such as lead-time reduction. Most
!!
73!
!
financial performance measures also have a predetermined inflexible format that is
used across all departments, ignoring the fact that most departments have their own
unique characteristics and priorities (Maskell, 1991). This also makes them not
applicable to the new management techniques that give shop-floor operators a
responsibility and autonomy (Ghalayini et al., 1997). Bititci (1994) also believes that
this type of measure does not adequately identify the cost of quality. However, many
manufacturing companies are still primarily relying on traditional cost-related
performance measures focusing on the ROI, profit margin and cash flow in spite of
the limitations of financial measures (Tangen, 2003). Even an improved cost
accounting system will not entirely solve the problem with financial measures; other
measures than cost are needed to adequately gauge manufacturing performance
relative to a competitive strategy (White, 1996).
The use of non-cost performance measures has increased due to the pressure of an
increasingly global economy and a business environment characterised by
complexity, competition, change and uncertainty (Tangen, 2003). The non-cost
performance measures are the types of performance measures that are based on
performance objectives, namely perceptions or opinions, benchmarking with other
organisations, or input and outcome of some process (White, 1996).
3.7.3 Traditional Productivity Performance Measures
Tangen (2003) classifies partial productivity measures and total productivity
performance measures as the two types of index productivity performance
measures. Partial productivity performance measures concern the ratios of output to
one source of input, such as labour, capital, material or energy. One example of a
common performance measure is the labour productivity, i.e., output per working
hour or output per employee. This type of performance measure is simple to
understand and measure in reality. Therefore, it can detect improvements and the
reasons behind them more easily than can broader performance measures. The
needed data are usually easy to obtain and partial productivity indices are not
difficult to calculate (Sumanth, 1994). It also proves very useful in feedback of
performance to the workers since these data are easy to understand and workers
want to know how they are doing (Bernolak, 1997).
However, Suh (1990) argues that labour productivity is becoming a useless
performance measure in modern manufacturing operations since the total direct
!!
74!
!
labour cost is becoming a smaller fraction of the total manufacturing costs. It only
considers one production factor, which in turn is often decided on interplay with the
use of the other production factors like capital, energy and primary products. One
example of this problem is called capital-labour substitution, which means that the
labour productivity can be improved at the cost of capital, resulting in decreases in
the total productivity. This way, the partial productivity performance measures tend
to overstate the increase in productivity (Grossman, 1993). Sumanth (1994) also
believes that the performance measures do not have the ability to explain overall
cost increases, and can be very misleading if they are used alone. On the other
hand, the total productivity performance measure looks at the ratios of total output to
the sum of all input factors (Tangen, 2003). It provides a comparably good picture of
the overall productivity of a process or a company. However, it is more difficult to
understand than to measure, unless the production factors are weighed accordingly
(Grossman, 1993).
3.7.4 Time-based Productivity Performance Measures
Time is a common measure that is used for measurement as it can be used to
measure productivity (Arnold, 1991). Time-based productivity performance measure
is a ratio between value-adding time and total time (Jackson and Petersson, 1999).
The performance measure is claimed to be easy to determine and also easy to
understand. It also facilitates comparisons between countries where there are a
variety of currencies. As in operative manufacturing, there is approximately a linear
relationship between time and cost. According to Jackson and Petersson (1999),
time-based productivity element does not provide information about the consumed
resources in the production process. Therefore, it is questionable if a completely
time-based measure can be classified as a performance measure. PM cannot be
done in isolation and it has an impact on the environment in which it operates (Neely
et al., 2003). The measurement process, targets and results influence the individual
or groups within the organisation, and therefore the selection of suitable and
appropriate performance measures is important to ascertain an enhanced service in
a balanced environment.
!!!!!

!!
75!
!
3.8 Chapter Summary
This chapter has provided an overview of the elements that constitute a good PMS.
The study on a set of existing PMS has shown that there are both advantages and
disadvantages of the models respectively. It was also concluded although the
models are generally detailed and comprehensive, they were designed to meet the
objective and criteria of FM services. The overview of the principles of PM and PMS
in this section can be further linked with its implementation in FM in the next
chapter. In chapter 4, the principles and theories of PM are further explored within
the FM context. Focus on the previous PM models and frameworks for FM are also
presented to understand their scopes and approaches.
!!
76!
!
CHAPTER 4: PERFORMANCE MEASUREMENT (PM) IN FACILITIES MANAGEMENT (FM)
This chapter draws the link between PM and FM, the two scopes which have also
been covered in the earlier chapters. A few models from previous studies are
introduced, to give an overview of the PM models that have been established in FM
services. A variety of performance measures types and implementation is also
studied, so specific focuses on the FM management and operation services can be
achieved.
4.1 Introduction
In 1998, Cotts defined FM as a managerial practice that integrates the principles of
business administration, architecture, and the behavioural and engineering sciences
to ensure effectiveness of all these procedures. It exists to support the core
business that is the preliminary goal-seeking activity of the enterprise (Amaratunga,
2000). She further suggests that the role of FM in facilitating organisational
performance, and thereby in providing competitive advantage, is widely
acknowledged. FM is gaining increasing importance in the sector of business
process outsourcing. However, stemming from the practitioners’ experience, there is
a lack of a significant theoretical foundation based on empirical evidence about PM
(De Toni et al., 2007). FM encompasses a vast spectrum of perspectives about
people, organisations and change processes to enhance the value of any
organisation (Amaratunga and Baldry, 2000).
One essential aspect of FM other than the emphasis of the technical operation is its
performance (Myeda and Pitt, 2013). FM also requires a multi-skill approach and
functions to concentrate on the area of interface between physical workplace and
people (Barret, 1994). PM indicates where the organisation is heading; therefore, it
is also perceived as the language of process for an organisation (Rose, 1995). It
functions as a guide to whether the organisation is en route to achieving its goals.
Additionally, Kamaruzzaman et al. (2013) believe that, by measuring the service
performance, the FM managers would be able to comprehend the strengths,
weaknesses and also significance of the services provided, and also understand
both the tangible and intangible values of the buildings.
!!
77!
!
Clearly the basis of PM is that unless a score is kept it is difficult to know whether
the approach works or not (Hatry, 1978). Ahmad (2008) affirms that building
services’ assessment and condition monitoring needs to be carried out in order to
determine the status of services provided to the users. It is also seen as a key
management activity, which provides decision makers with information necessary
for decision-making, monitoring performance and effective allocation of resources
(Webster and Hung, 1994).
Performance relates to a building’s ability to contribute to fulfilling the functions of its
intended use (Williams, 1993). In order for PM to function effectively, the emphasis
must be given to the organisation, process and also job or performer itself (Rummler
and Brache, 1995). However, Pintelon and Van Puyvelde (1997) argue that for
service operation the performance will depend on the perspective applied; for
instance, accountants will think of maintenance in terms of costs, top management
often is only interested in budget performance, engineers will focus on techniques,
production will see performance in terms of equipment availability and support
responsiveness. Despite the different perspectives among the management
personnel and officers involved, it is observed that companies using an integrated
balanced PMS perform better than those that do not measure their performance
(Kennerly and Neely, 2003; Lingle and Schiemann, 1996). Amaratunga (2000)
claims that the step towards better management of facilities is set to continue as the
management of buildings by organisations continues to become more sophisticated.
FM is a complex area, bringing together services related to asset management,
building operations, maintenance and business support services (Kadefors, 2008).
Since the 1980s, FM has gradually gained a foothold as a discipline and profession
within the property and construction industry (Ventovuori et al., 2007). While some
FM literature suggests that FM should be a strategic function with a connection to
strategic objectives of core business (Bon et al., 1998; Barret, 2000), it is commonly
accepted that FM has a strong tendency to be technically oriented and reactive
(Barret, 2000). Grimshaw (1999) has proposed that FM is based on three
paradoxes. First, FM professes to be a strategic discipline when it is clear that most
of its practitioners are situated at an operational level in their respective
organisations. Second, FM professes to want to be at the heart of organisational
development when clearly many FM services are delivered either by external
consultants or in-house teams set up as internal consultants. Third, FM professes to
be proactive in managing change within organisations when quite clearly it is
!!
78!
!
reactive in most cases. FM profession has progressed from being a narrowly
defined set of functional tasks delivered in a mechanistic manner to meet a specific
requirement, to an integrated management approach (Pathirage et al., 2008). This
also signifies its role as a significant determinant of corporate goal achievement
(Pitt, 2005). The main focus of FM has for a long time been on cost reductions, but
in recent years there has been a significant change towards the need for FM to
create added value (Jensen, 2010). According to Jensen, adding value is seen as a
contrast to pure cost reductions, but the relationship between value and cost is
complex. The added value can be defined as the value of the product reduced by
the value of the resources used during the process. Reducing cost by increasing
efficiency leads to added exchange value. Meanwhile, use value relates to the
output and possibly the outcome of a process but does not concern the process as
such. For both exchange value and use value, he added that value is a relative
concept, which refers to a change over time.
FM can be strategic in managing business support functions and operational,
concentrating on the detailed operational activities of the organisation (Baharum and
Pitt, 2009). It also embraces every part of an organisation’s activities, and can be
seen as a series of inter-related activities involving the co-ordination of all efforts
relating to planning, designing and managing an organisation’s physical resources
(Becker, 1990). Facilities represent a substantial percentage of most organisations’
assets and their operating costs; thus it is hardly surprising that performance
appraisal in FM is becoming a formal and regular part of the FM process
(Amaratunga and Baldry, 2000). Much work has been done to measure FM
performance, but it often ignores the influences of erratic patterns of reinvestment in
building fabric and components which can add as much as 25 per cent to the cost of
running a building (Kincaid, 1994).
4.2 PM Literature
PM literature is deficient in addressing the properties of an effective PM
development process (Hudson et al., 2001). Although PM is often discussed, the
mechanisms of how PM happens in FM are unclear as researchers in the FM field
have yet to investigate the concepts of PM that are well developed in other fields,
nor do they take into account the complexities of PM at the FM organisational level
(Amaratunga, 2000). Amaratunga further suggests that, although the literature on
!!
79!
!
PM is vast, very little of it provides concrete evidence that the concepts are
operational in the real world, specifically in disciplines such as FM.
Also according to Amaratunga (2000), PM in FM is a less developed area in
literature and few data are available to assess how extensively the use of PM
techniques has been diffused, what factors have influenced their diffusion and how
the factors affect the overall organisational performance, as only a few authors put
forward such application. A review of FM literature over recent years also indicates
a trend towards PM, particularly for strategic development. Although a few authors
have used some measures to assess their performance for a long time, such
measures often fail to be integrated indicators in a fully-fledged measurement
process (De Toni et al., 2007). FM researchers do not use the concepts of PM, for
example, the business performance theories, in as rigorous a manner (Amaratunga,
2000). Most literature on PM suggests that an effective PMS should be able to
recognise different performance hierarchies and multiple dimensions of performance
measures, relate the measures to the relevant goals and link them to strategy,
address cross-functional issues, involve subjective measures as well as objective
ones, involve employees to ensure that it gets their support and, finally, present a
balanced view of the system (Myeda et al., 2011a)
Study of PM in the FM setting is superficial as researchers make no use of more
general discussions of performance measures, for example, the usefulness of
constructing a PM framework for FM, or to add PM into models of the FM process in
the same way that they implement the project management techniques
(Amaratunga, 2000). Amaratunga further suggests that there is only a limited
number of empirical studies available on this topic.
4.3 Performance
Performance in the instance of Key Performance Indicators (KPI) is categorised as
an explicit knowledge that is used as a tool for knowledge transfer which is related
to the FM strategic process (Fong and Dettwiler, 2009). According to Kadefors
(2008), KPIs are included in the FM contract awarded to the supplier. The need to
establish KPIs for FM has been well recognised for more than a decade (Hinks and
McNay, 1999). Measurement is still one of the critical aspects of today’s
management, as it has been in the past, being a key aspect of scientific
development since the seventeenth century. The concept of PM has been
!!
80!
!
embraced by FM managers and project managers, who increasingly use it as a
benchmark against which effectiveness can be measured, and a basis for which
improvement can be determined (Enoma and Allen, 2007).
PM is not an easy task, especially when relating it to FM functions. There is a need
to develop indicators for performance measures because FM functions are not
measurable. These indicators, for example, will help in assessing the performance
in the areas of safety and security (Enoma and Allen, 2007). Benchmarking is
essentially a cost reduction method and, according to McDougall and Hinks (2000),
its application in FM performance criteria is now apparent within large organisations.
They also state that the ease of acquiring and interpreting information appears to be
one of the characteristics of FM benchmarking which directly conflicts with the
academic push to widen the scope of benchmarking into concerns like customer
satisfaction and service standards. Benchmarking also provides a powerful
combination of tools that can allow any organisation to identify areas where
performance could be improved (Enoma and Allen, 2007). The need for continuous
improvement is the core development, which requires a very clear picture of how
things stand today. According to Kouzmin et al. (1999), due to the relative early
stages of the introduction of benchmarking into the public sector, its acceptance is
welcomed with scepticism, and experienced many anti-organisational change
elements within the workplace resisting every effort towards the benchmarking
process. They further suggest that managers can use benchmarking as a
management strategy to measure performance, and also to evaluate, budget,
motivate, control, learn, improve, promote and plan. Therefore, managers should
think about the managerial purposes to which PM relates and how they might be
used before selecting the measures with appropriate characteristics to help achieve
each purpose.
Benchmarking can also have its own drawback and, according to Synnestvedt
(2001), there are a few barriers in performance benchmarking, including the fact that
data or information exists in a number of guises; not all relevant information exists;
the language is often technical; there can be measurement problems; there are
statistical lags; the available information can often be hard to verify; and the format
of the information might make comparison very difficult.
PM in relation to the delivery of an effective service will involve delivery that is timely
and orderly to eliminate non-value adding activity in FM. The result of PM will
!!
81!
!
indicate how well the organisation is doing against predetermined goals, assess the
strengths and weakness of the organisation and help in establishing standards
(Enoma and Allen, 2007). When measurements are involved, a lot can be learnt
from operational services or cost centres, functional use of space, financial
performance and other performance. Performance indicators can help inform the
resource allocation decisions, when used to direct resources to the most successful
activities, thereby enhancing efficient use of resources (Enoma and Allen, 2007).
They can also provide means of improving programmes by learning from success
and improving the performance of the programme. Neely et al. (1995) suggest that
managers find it easy to decide on what to measure when looking at PM from the
dimensions of cost, quality and time. Once implemented, PM has to be applied both
inside and outside the organisation. Enoma and Allen (2007) signify that, to date,
PM has been used to monitor past performance and laggard indicators and to
stimulate future action.
4.4 Quality of Services Delivered
The standard at which an organisation believes it is delivering FM services can often
be distinctly different from the perceptions of the customers or users receiving the
services. In this context, performance specifications can allow services to be better
adapted to needs, and to require less work upfront for specifying processes in detail
(Kadefors, 2008).
Moss et al. (2007) propose that one of the key problems in measuring FM
performance is that some KPIs do not help to improve the services. Carder (1997)
suggests that as the FM discipline gains maturity it must take on greater
responsibility, particularly in leading business towards a greater understanding of
the contribution of non-core elements to an organisation’s overall success. He also
describes this as interface management with the underlying concept of
understanding and managing the interface between an organisation’s core business
and its physical working environment.
Jensen (2010) suggests that, if FM is going to survive as a discipline, it is important
to develop the field from not only being able to provide the same services as before
at a lower cost but also to deliver qualitatively better services to their clients,
customers and end users. Anderson and McAdam (2004) suggest that the focus of
!!
82!
!
PM has also changed where the traditional PMS has improved to innovative PMS,
as shown in Table 4.1.
(Source: Anderson and McAdam, 2004)
Functional performance of a property is believed to be the greatest influence on the
organisation’s core objectives, which accounts for 80 to 90 per cent of its total costs
(Loosemore and Hsin, 2001). PM helps managers and operators to determine those
issues that are crucially important to the overall organisation and its success, and
also issues pertaining to the successful delivery of the specific function or
operations concerned (Varcoe, 1996). The benefits of PM lie in their measurability
and the fact that the performance levels are derived from objectives. Carder (1997)
suggests that, if the workplace infrastructure like buildings, locations, IT and
transport are managed and measured effectively, they can contribute to the
organisation by improving operational capacity and cost effectiveness.
4.5 The Lack of PM practice in FM
Amaratunga (2000) points out that there is a lack of a systematic process for
determining appropriate measurements. An exploratory approach to the area of PM
in FM organisations was the preferred approach as the problem of lack of construct
validity is general rather than specific (Amaratunga, 2000). The non-existence of
such validation or feedback and evaluation mechanism within academic research
has been identified as the ‘fundamental missing link’ for researchers, research users
and funders (Lorch, 2000).
Traditional PMS
Innovative PMS
• Based on cost/efficiency
• Value based
• Trade-off between performances • Performance compatibility
• Profit-oriented • Customer oriented
• Short-term orientation • Long-term orientation
• Prevalence of individual measures • Prevalence of team measures
• Prevalence of functional measures • Prevalence of transversal measures
• Comparison with standard • Improvement monitoring
• Aim at evaluating • Aim at evaluating and involving
Table 4.1: Main changes and trends in the development of PMS
!!
83!
!
Amaratunga (2000) also believes that there is a need to determine, verify and
integrate the axioms of modern PM in the context of FM. There is also a need to
provide a better understanding of PM in FM. For example, although the area of PM
is not new, the constructs are neither well-established nor standardised across and
even within FM disciplines, giving an abundance of areas for investigation.
Specific research on the application of customer satisfaction indicators as a
strategic PM process within FM is also insufficiently documented (Tucker and Pitt,
2009). The significance of customer satisfaction responses is also seconded by
Myeda et al. (2012), where customers would give the most accurate results and
perceptions from the end users’ points of view. Increased customer satisfaction
generates positive reviews and brings in new customers to the firm.
Most research in FM focuses on the role of the corporate real estate function,
outsourcing decisions or more general management issues (Kadefors, 2008).
Previous studies in performance tend to measure profitability, economics and
environmental issues and, recently, issues on sustainability, but there is a lack of
studies that focus on performance purely from the FM perspective (Enoma and
Allen, 2007). There is a causal link between FM practices and performance,
prompting the evaluation researchers to question whether performance evaluation
does in fact add value and enhance organisational performance (Amaratunga and
Baldry, 2000).
There are very few studies that deal with what constitutes effectiveness in either the
facilities or FM. The well-documented shift towards customer satisfaction and quality
as organisational priorities is perhaps still unclear in its translation to the FM context.
Managers may need to take a wider look at the stakeholders of an organisation, and
their various priorities, for a richer understanding of these ambiguous concepts
(McDougall and Hinks, 2000).
There are also limited KPIs that can be used in FM; the frameworks tested based on
the measures from other indicators are too general for FM service specification
(Enoma and Allen, 2007). Little has been researched in the areas of PM in domestic
service in healthcare organisations, and there is evidence of a lack of common
understanding of what is meant by performance, or how performance could be
measured in FM practice (Liyanage and Egbu, 2008). In spite of the increasing
importance of PM in operations management, De Toni and Tonchia (2001) believe
!!
84!
!
that very few empirical studies concern models; and, in order to make the very best
of the system, they have proposed integration and formalisation with the
organisation’s system being emphasised, while at the same time creating greater
space for human resource considerations.
However, an absence of a robust PM approach could be the main reason for the
lack of a comprehensive set of performance indicators and measures in domestic
services. It is also understood that there is uncertainty over the meaning and
implications of PM in domestic services (Liyanage and Egbu, 2008). This signifies
the need to have a framework for demonstrating how performances are
operationalised within domestic services and in the FM service as a whole.
4.6 The Rationale in Measuring FM Performance
The growing acceptance of a need to measure FM performance is in contrast with a
lack of a systematic process for determining appropriate measures (Amaratunga,
2000). The need for measurement as a valid management tool is to enable good
planning and control; management of change; communications; continuous
improvement; resource allocation; motivation; and long-term focus (Sinclair and
Zairi, 1995). It also helps FM managers to understand where they are heading and
what their targets are in order to achieve an optimum FM service delivery (Rose,
1995). There is also a strong correlation between performance and satisfaction, and
a building must be allowed to be benchmarked against others so that its relative
performance can be assessed (Nutt et al., 2000). FM also focuses on constant
evaluation of performance to guide management decisions and indeed enhance
innovative quality delivery that is cost effective (Myeda and Pitt, 2013).
Kamaruzzaman et al. (2013) have signified the importance of PM in measuring the
FM services. They believe that maintenance managers tend to carry out reactive
maintenance works as opposed to preventive works and at times do not consider
the clients’ satisfaction and the service performance. There is a concern related to
unprofessional practice by the FM managers which can be overcome by
incorporating PM in their service.
According to Amaratunga (2000), PM in FM is perceived in two ways: as a critical
success factor in the strategic development process and as a learning process
within the FM organisation. In the learning process, the FM organisation aligns itself
with its environment by obtaining information, either from the marketplace or through
!!
85!
!
the generation of scientific knowledge and the subsequent applications of this in
organisational development process. This indicates that the measurement of FM will
help to exercise the strategic development process and enhance the learning
process in an organisation.
Atkinson et al. (1997) state that PM serves three basic functions, which are to co-
ordinate, to monitor and to diagnose a performance of a service. Through these
functions, PM if implemented and used properly can actually change the lives of
people and organisations. Similarly, Cupello (1994) looks at performance
hierarchies for different performance measures and provides four reasons why
organisations need to conduct measurement, which are for planning, screening,
control and diagnosing. Planning measures, which are the responsibility of top
management, are measures that address issues related to whether the organisation
is achieving its strategic plan. Screening measures, on the other hand, are targeted
at measuring whether the functional areas of the organisation are in support of the
organisation’s strategic plan. These measures are the responsibility of the middle
management. The performances of individual employees, machines, products,
services and processes are classified as control measures. The purpose of
diagnostic measures is to determine whether the organisation’s quality initiatives are
achieving the desired result. The types of performance measures that come under
this category are customer satisfaction measures, employee satisfaction measures,
project performance measures and supplier performance measures.
Owners and clients have started to forget the main reason why a supplier’s
performance shall be measured (Moss et al., 2007). The importance of gathering
service delivery data from the customer perspective is expressed by Tucker and
Smith (2008), where perceptions of the users about the initial input of the service
delivery process are important as they essentially determine the strategic and
operational objectives of the organisation.
4.7 FM Performance must be measured
Over the past few decades, the complex global business environment and
increasing business competitiveness have highlighted the importance of PM (Yang
et al., 2010). Performance methods have been widely adopted in many industries
and they have received more and more attention (Niven, 2002). People in industry
have started to recognise the benefits of PM in determining how successful the
!!
86!
!
organisations or individuals are in attaining their objectives Bititci et al. (1997). The
main purpose of PM is to measure and improve the efficiency and the quality of the
performance, and identify opportunities for progressive improvements in
performance (Wegelius-Lehtoneen, 2001). Pillai et al. (2002) believe that PM can
help evaluate the overall performance of a project at any point of time during its life
cycle. Luu et al. (2008) suggest that PM can help firms identify their strategies,
quantify their strategic performance, and improve their competitive advantage.
Amaratunga and Baldry (2002) propose that PM could generate results about what
had happened but not why and what to do about it.
Tucker and Pitt (2009) propose that the FM service delivery performance needs to
be measured to ensure added value is being achieved. Amaratunga and Baldry
(2003) have proposed that the added value of FM should be managed efficiently so
that the benefits can be maximised. Tolman and Parkkila (2009) believe that healthy
performance of facilities is essential for the occupants. ‘Healthy buildings’ in this
context refers to buildings with good indoor air quality. They further observe that the
aspects of healthy buildings have attracted interest over the past decades from
multidisciplinary scientific communities.
According to Tolman and Parkkila (2009), performance compliance to the
requirements during the whole post-occupancy period is also essential to the
provision of healthy spaces. They further state that, in order for any measurement
and evaluation to be truly meaningful, these should refer to explicit requirement
levels against which they can be judged. The performance of a building has some
physical factors that serve as principal indicators. For condition monitoring, for
instance, temperature and humidity are key indicators, and are also major factors for
performance evaluation. In the use phase, maintenance and energy consumption
are the main cost components and directly relate to user comfort and services. In
all, the way to quantify performance is to measure performance indicators.
Generally, a provision for PM framework in FM will benefit both client and the
business management, taking into account the participation of the organisation’s
related departments to form agreed goals and indicators to enhance the service
delivery. It is important to clarify the distinctive features of the FM and focus on the
specific roles of FM in managing resources, environment and services to provide
logistics support to the operations of organisations, and also contribute to the
success of the core business (Nutt, 1999).

!!
87!
!
All these principles in determining the success of FM service delivery must be linked
to the PM. FM performance must be considered in relation to the outcomes rather
than the outputs of core business success (Price, 2002). The definition of PM is
reflected in how the company manages its performance. Bititci et al. (1997) believe
that it should be in line with the organisation’s corporate and functional strategies
and objectives. The strategic approach of PM is by deriving the performance
measures from the corporate strategies (Neely et al., 2003). PM aims to assess the
performance in order to guide management decision-making and also to act as a
driver to enhance the innovation and quality of an organisation’s service delivery.
The key determinant in achieving effective PM is to view FM strategically, where FM
is aligned to support the core objectives of the organisation (Pitt and Tucker, 2008).
The selected performance measures must be appropriate in relation to the strategic
goals of the organisation (Wordsworth, 2001), and targeted to improve the service
delivery standard.
4.8 PM Models in FM
Tucker and Pitt (2009) have developed the Customer Performance Measurement
System (CPMS), which was designed by taking into account the significance of
customer perceptions in delivering quality services. The system comprises generic
satisfaction benchmarks for FM, which FM companies can implement when
measuring their performance. This study also looked at the efficiency and the
criticality levels of the FM services provided. This system is also similar to the GAPS
model, which emphasised the significance of end users’ expectations and
perceptions and the gaps that exist between the two elements (Parasuraman,
2004). Moss et al. (2007) have also developed a Quality Managed Facilities (QMF)
framework that was adopted from Alexander (2002). This model outlines the
business drivers necessary to produce both tangible and intangible FM outputs.
Liyanage and Egbu (2008) have proposed a Performance Management Framework
(PMF) that specifically focuses on the control of Healthcare Associated Infections
(HAI) in FM. It considers a set of predetermined indicators to assess the
performance of control of HAI in domestic services. The proposed PMF also
integrates the performance goals and indicators with other hierarchical levels,
namely departmental, hospital, trust/board and national level. This way, everyone
knows where FM is going as there is a clear focus on goals and priorities. This level
!!
88!
!
of clarity helps to correctly direct resources, which means there are fewer instances
of resource limitations. As the emphasis of a PMF is on meeting the set goals,
indicators and measures, it is easier to monitor the progress of the services and to
take appropriate corrective actions if and where necessary. Carder (1997) has
proposed a model that was developed on the basis of a process and holistic
systems approach, and which uses the PM concept of the balanced scorecard. The
model outlines the performance pyramid linking the input to the balanced business
outputs from the four aspects, namely financial, customer, internal and
organisational development. The rationale of the pyramid model is that it can plot
the business outputs against the inputs - which are the workplace factors that are
considered to have the greatest impact on the business value-chain.
Hinks and McNay (1999) have developed a set of KPIs for measuring the FM
function of a financial service company by a process called ‘management by
variance’, which is based on performance trend monitoring and analysis. However,
in their study there were no general performance indicators for FM function, and
there was the need to clarify and prioritise indicators that correlated the views of the
customers and goals of the study (Enoma and Allen, 2007). Behn (2003) suggests
that managers may find performance measures or KPIs helpful in achieving specific
managerial purposes. However, looking at the challenges of the functional
performance of the facility and the organisational objectives, Valins and Slater
(1996) express the difficulty that exists with measuring the impact of buildings upon
the emotions, attitudes, behaviour and both performance levels and satisfaction of
those who use them. KPIs in FM can be related to cost of operation, maintaining
and running a facility, revenue generated space usage and management,
environmental, and health and safety issues (Enoma and Allen, 2007). Financial
performance measures and indicators have been the main measure of corporate
performance over a number of years, possibly because they are widely accepted
and easy to use and understand. However, in FM the use of only financial indicators
is not only insufficient but it is also outdated and the emphasis on profit will not be
helpful, without a corresponding increase in efficiency and effectiveness in
employing the relevant resources to create very high levels of services for
customers (Enoma and Allen, 2007).
There are a few approaches that can be applied in identifying the right indicators, for
instance, Amaratunga and Baldry (2003) examine the practice of PM in FM by
looking into the advantages and disadvantages in the current PMSs in order to
!!
89!
!
develop a conceptual framework; while Brackerts and Kenley (2002) have applied a
holistic model to provide an appropriate measures of FM which included both
financial and non-financial performance indicators. Finch (2002) has explored the
significant value of effectiveness and how it can be derived from a network device in
relation to performance indicators.
PM should be a means to manage and improve performance and it has to prove the
FM contribution to an organisation’s core business by delivering quality, and cost-
effective and user-satisfied services (Moss et al., 2007). Therefore, a powerful FM
tool needs to be able to handle the collection of a massive amount of data and its
communication as information to the FM manager or other actors involved in
facilities’ use and maintenance (Tolman and Parkkila, 2009). The process of PM is
usually determined by the metric of a number of indicators, which include both
financial and non-financial performance indicators (Yang et al., 2010). A PM
framework is a complete set of performance measures and indicators derived in a
consistent manner according to a prior set of rules or guidelines (Brown and Devlin,
1997). The frameworks help to measure whether the functions and departments are
doing the right thing and whether they are doing them well (Lynch and Cross, 1991).
With the development of PM, the frameworks have become more and more
comprehensive and practicable (Yang et al., 2010). Haapasolo et al. (2006) argue
that one purpose for establishing frameworks is to check whether the strategy is
realistic overall and what kinds of goals should be used on a daily basis in order to
reach long-term goals. In this respect, the indicators can also be considered as one
of the ultimate goals.
Many frameworks are established to evaluate and compare the performance of
projects, organisations and stakeholders (Yang et al., 2010). All measurements
must relate physical, functional and financial attributes on the one hand and also
consider customer satisfaction, flexibility and productivity on the other (Enoma and
Allen, 2007). Varcoe (1993) has suggested that FM performance criteria must be
based on cost, quality and delivery. Punniyamoorthy and Murali (2008) have
improvised the Balanced Scorecard Model, which was first introduced by Kaplan
and Norton (1992), where performance from the internal process perspective has to
be derived from “What must we excel at”, as shown in Figure 4.1.
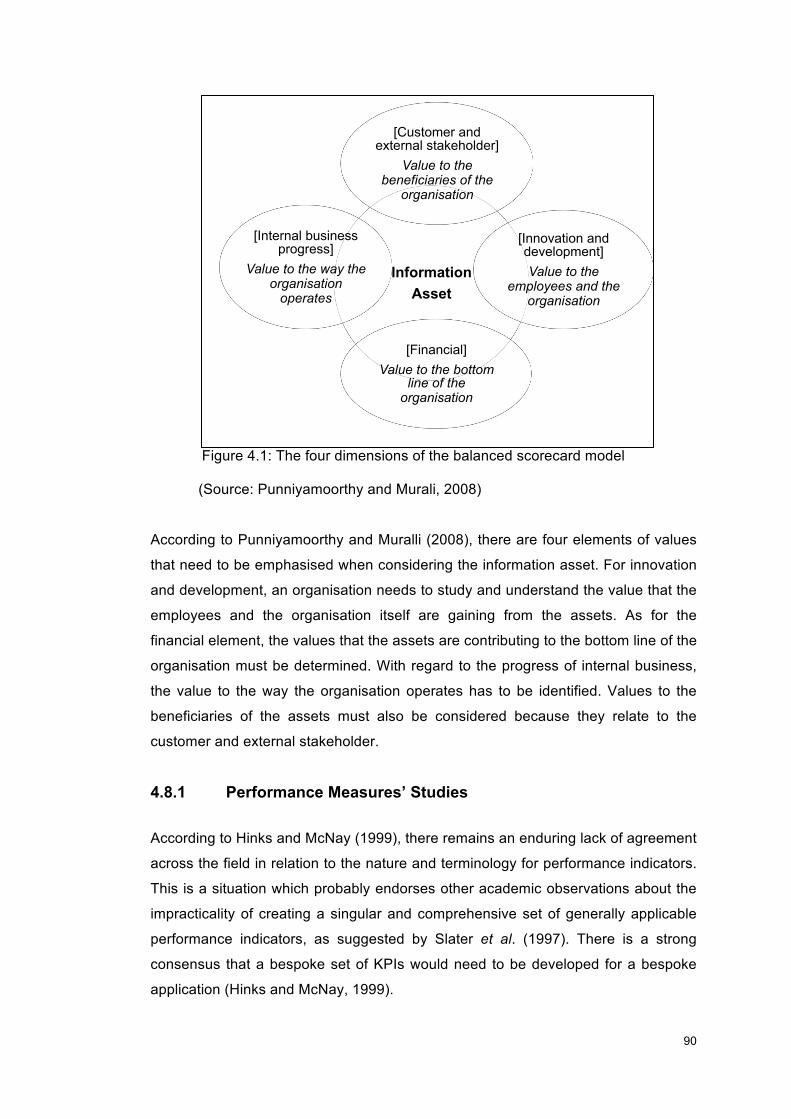
!!
90!
!
(Source: Punniyamoorthy and Murali, 2008)
According to Punniyamoorthy and Muralli (2008), there are four elements of values
that need to be emphasised when considering the information asset. For innovation
and development, an organisation needs to study and understand the value that the
employees and the organisation itself are gaining from the assets. As for the
financial element, the values that the assets are contributing to the bottom line of the
organisation must be determined. With regard to the progress of internal business,
the value to the way the organisation operates has to be identified. Values to the
beneficiaries of the assets must also be considered because they relate to the
customer and external stakeholder.
4.8.1 Performance Measures’ Studies
!According to Hinks and McNay (1999), there remains an enduring lack of agreement
across the field in relation to the nature and terminology for performance indicators.
This is a situation which probably endorses other academic observations about the
impracticality of creating a singular and comprehensive set of generally applicable
performance indicators, as suggested by Slater et al. (1997). There is a strong
consensus that a bespoke set of KPIs would need to be developed for a bespoke
application (Hinks and McNay, 1999).
Information Asset
[Customer and external stakeholder]
Value to the beneficiaries of the
organisation
[Innovation and development] Value to the
employees and the organisation
[Financial] Value to the bottom
line of the organisation
[Internal business progress]
Value to the way the organisation
operates
Figure 4.1: The four dimensions of the balanced scorecard model
!!
91!
!
Slater et al. (1997) also believe that a PM framework should be limited to between
seven and 12 performance measures. Varcoe (1993) accords that the ideal number
of performance indicators should be minimised, by suggesting between five or six
well-defined business objectives, each with four to six KPIs. Bititci et al. (1997)
believe that the performance measures must take into account the corporate and
functional strategies and objectives.
The study of the academic literature identified a body of research on PMS and
performance indicators developed by various authors, as shown in Figure 4.2 and
Figure 4.3.
Liyana and Egbu (2008) propose a framework for PM in healthcare FM services.
The objective of the framework is to provide plausible solutions for the control of
Healthcare Associated Infections (HAI) (refer to Figure 4.2). It introduces the
performance measures or indicators such as Control of HAI, Organisation and
Policy, Service Levels and Standards. Although the overall framework shows
appropriate measures, it only focuses on a specific service, that is, cleaning. Lavy et
al. (2010) have possibly introduced the most comprehensive PM framework of all,
by identifying the appropriate KPIs for specific FM services. In this approach, the
indicators are proposed together with the measurement units in order to provide a
holistic performance assessment. Enoma and Allen (2007) have introduced a set of
KPIs that they believe can potentially be used for airport security and safety. The
final output also specified the priorities, targets and measure of success for each
KPI.
Hinks and McNay (1999) were among the first to develop a PMS. Their proposed
PMS was based on the management-by-variance principle. They proposed the
seven main performance parameters, namely business benefits, equipment, space,
environment, change management, maintenance/services and general, with
respective indicators. The study also emphasised prioritising the indicators, which
correlated the views from customers and premises. Augenbroe and Park (2007)
have attempted to validate the applicability and usability of a benchmarking toolkit in
their case study sample of public offices. The focus of the study is on building
performance, particularly on energy, lighting, thermal comfort and maintenance. The
final output offers a set of normative and software tools for rapid deployment and
integration into the owner’s asset management process.

!!
92!
!
Loosemore and Hsin (2001) have explored the relationship between FM and core
objectives by examining the KPIs used (refer to Figure 4.3). Based on the customer-
focused KPI principle, they have proposed the KPI sets for five sectors: health,
education, hotels, defence, and government enterprise respectively. Attributes were
also introduced for some indicators in the hotel, education and government
enterprise sectors. In 2000, Ho et al. adopted the benchmarking approach in
identifying the metrics that are considered important in practice. The sample size
undertaken was the Asia Pacific companies who were also involved in ranking the
benchmarking parameters and indicators. The benchmarking metrics or parameters
evaluated were on the size and use of facilities, maintenance measurements,
refurbishment measurements, cleaning measurements and energy consumption.
In 1998, Massheder and Finch identified the metrics used by FM practitioners
among 25 UK companies. The focus was on the benchmarking practice in the FM
industry. The final output proposed five sets of performance dimensions, namely
business, building performance, portfolio, acquisition and disposal of, and indicators,
respectively. Meng and Minogue (2011) have conducted a survey of 73 companies
with the aim of identifying the most important performance indicators used by them.
Based on the Performance Model principle, the study suggests 10 important
performance indicators, namely client satisfaction, cost-effectiveness, response
time, service reliability, health, safety, environmental compliance, staff commitment,
client-service provider relationship and IT application. The performance measures or
indicators were formulated from the body of literature and results from the expert
interviews.
All the PM studies mentioned above focused on the implementation of PMS. In
general, they aimed to identify the most suitable and appropriate performance
measures or indicators for various different sectors. This shows the growing interest
in understanding the priorities and practical application of performance measures in
enhancing service delivery. Although various concepts and approaches were used
in these studies, the approach and concept of this research is different and unique.
This research aims to identify the performance measures used in managing the FM
services at the selected buildings of different types of services, namely healthcare,
retail, finance and office buildings. It aims to propose a set of performance
measures frameworks (PERFM) that outlines the suitable FM performance
measures that were derived from the body of literature and the case study
methodology.
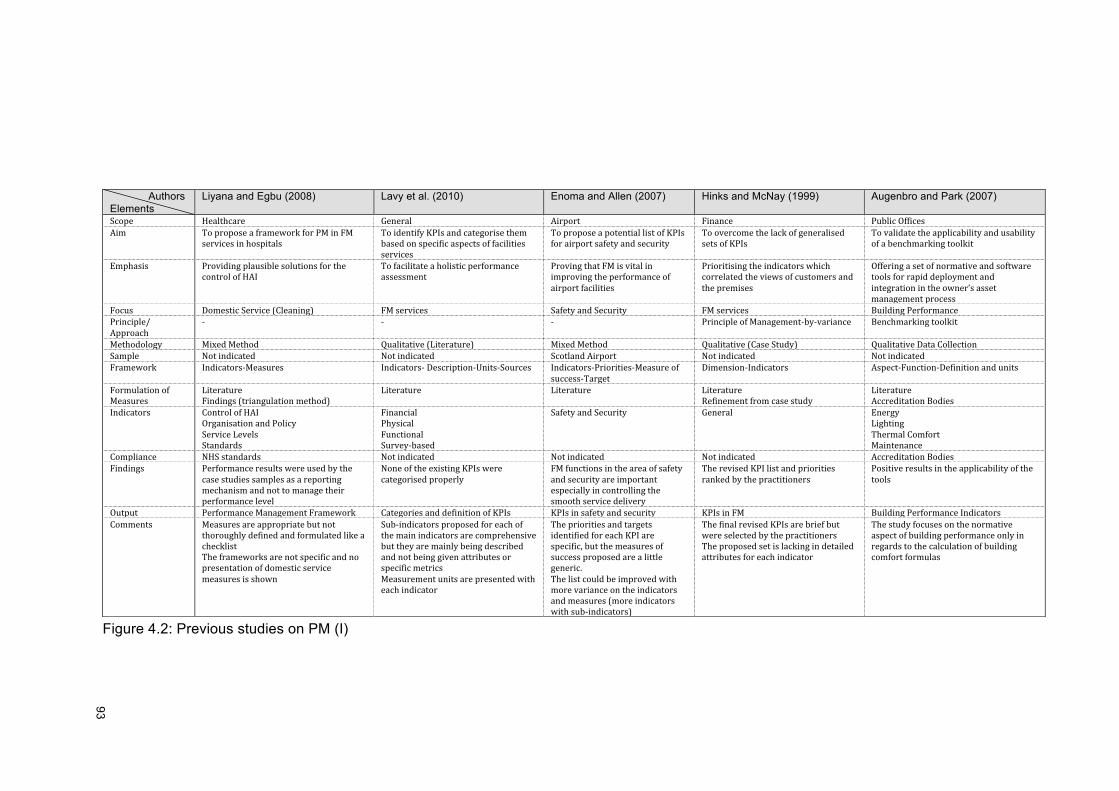
!!
93!
!
Figure 4.2: Previous studies on PM (I)
Authors Elements
Liyana and Egbu (2008) Lavy et al. (2010) Enoma and Allen (2007) Hinks and McNay (1999) Augenbro and Park (2007)
Scope! Healthcare! General! Airport! Finance! Public!Offices!Aim! To!propose!a!framework!for!PM!in!FM!
services!in!hospitals!!To!identify!KPIs!and!categorise!them!based!on!specific!aspects!of!facilities!services!
To!propose!a!potential!list!of!KPIs!for!airport!safety!and!security!
To!overcome!the!lack!of!generalised!sets!of!KPIs!
To!validate!the!applicability!and!usability!of!a!benchmarking!toolkit!
Emphasis! Providing!plausible!solutions!for!the!control!of!HAI!
To!facilitate!a!holistic!performance!assessment!
Proving!that!FM!is!vital!in!improving!the!performance!of!airport!facilities!
Prioritising!the!indicators!which!correlated!the!views!of!customers!and!the!premises!
Offering!a!set!of!normative!and!software!tools!for!rapid!deployment!and!integration!in!the!owner’s!asset!management!process!
Focus! Domestic!Service!(Cleaning)! FM!services! Safety!and!Security! FM!services! Building!Performance!Principle/!Approach!
K! K! K! Principle!of!ManagementKbyKvariance! Benchmarking!toolkit!
Methodology! Mixed!Method!! Qualitative!(Literature)! Mixed!Method! Qualitative!(Case!Study)! Qualitative!Data!Collection!Sample! Not!indicated! Not!indicated! Scotland!Airport! Not!indicated! Not!indicated!Framework! IndicatorsKMeasures! IndicatorsK!DescriptionKUnitsKSources! IndicatorsKPrioritiesKMeasure!of!
successKTarget!DimensionKIndicators! AspectKFunctionKDefinition!and!units!
Formulation!of!Measures!
Literature!Findings!(triangulation!method)!
Literature!!
Literature!!
Literature!Refinement!from!case!study!
Literature!Accreditation!Bodies!
Indicators! Control!of!HAI!Organisation!and!Policy!Service!Levels!Standards!
Financial!Physical!Functional!SurveyKbased!
Safety!and!Security! General!!
Energy!Lighting!Thermal!Comfort!Maintenance!
Compliance! NHS!standards! Not!indicated! Not!indicated! Not!indicated! Accreditation!Bodies!Findings! Performance!results!were!used!by!the!
case!studies!samples!as!a!reporting!mechanism!and!not!to!manage!their!performance!level!!
None!of!the!existing!KPIs!were!categorised!properly!!
FM!functions!in!the!area!of!safety!and!security!are!important!especially!in!controlling!the!smooth!service!delivery!!
The!revised!KPI!list!and!priorities!ranked!by!the!practitioners!
Positive!results!in!the!applicability!of!the!tools!
Output! Performance!Management!Framework! Categories!and!definition!of!KPIs! KPIs!in!safety!and!security! KPIs!in!FM! Building!Performance!Indicators!Comments! Measures!are!appropriate!but!not!
thoroughly!defined!and!formulated!like!a!checklist!!The!frameworks!are!not!specific!and!no!presentation!of!domestic!service!measures!is!shown!
SubKindicators!proposed!for!each!of!the!main!indicators!are!comprehensive!but!they!are!mainly!being!described!and!not!being!given!attributes!or!specific!metrics!Measurement!units!are!presented!with!each!indicator!!
The!priorities!and!targets!identified!for!each!KPI!are!specific,!but!the!measures!of!success!proposed!are!a!little!generic.!The!list!could!be!improved!with!more!variance!on!the!indicators!and!measures!(more!indicators!with!subKindicators)!
The!final!revised!KPIs!are!brief!but!were!selected!by!the!practitioners!The!proposed!set!is!lacking!in!detailed!attributes!for!each!indicator!
The!study!focuses!on!the!normative!aspect!of!building!performance!only!in!regards!to!the!calculation!of!building!comfort!formulas!
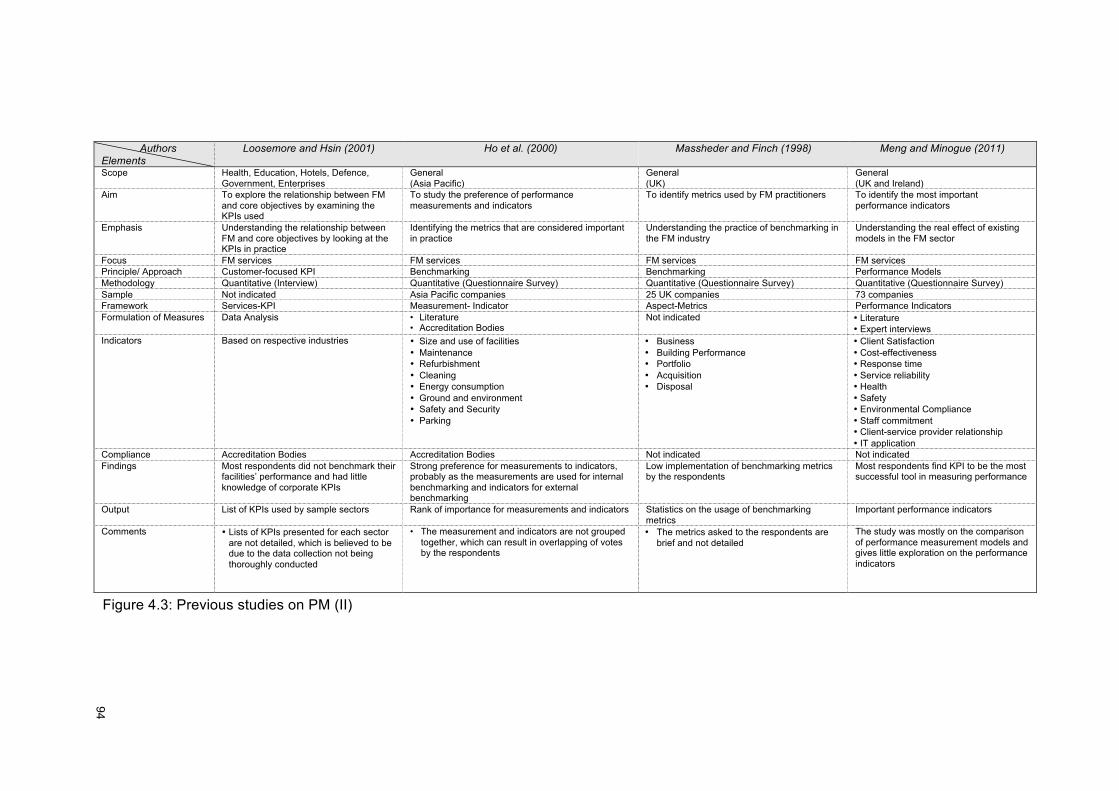
!!
94!
!
Authors Elements
Loosemore and Hsin (2001) Ho et al. (2000) Massheder and Finch (1998) Meng and Minogue (2011)
Scope Health, Education, Hotels, Defence, Government, Enterprises
General (Asia Pacific)
General (UK)
General (UK and Ireland)
Aim To explore the relationship between FM and core objectives by examining the KPIs used
To study the preference of performance measurements and indicators
To identify metrics used by FM practitioners To identify the most important performance indicators
Emphasis Understanding the relationship between FM and core objectives by looking at the KPIs in practice
Identifying the metrics that are considered important in practice
Understanding the practice of benchmarking in the FM industry
Understanding the real effect of existing models in the FM sector
Focus FM services FM services FM services FM services Principle/ Approach Customer-focused KPI Benchmarking Benchmarking Performance Models Methodology Quantitative (Interview) Quantitative (Questionnaire Survey) Quantitative (Questionnaire Survey) Quantitative (Questionnaire Survey) Sample Not indicated Asia Pacific companies 25 UK companies 73 companies Framework Services-KPI Measurement- Indicator Aspect-Metrics Performance Indicators Formulation of Measures Data Analysis • Literature
• Accreditation Bodies Not indicated • Literature
• Expert interviews Indicators Based on respective industries • Size and use of facilities
• Maintenance • Refurbishment • Cleaning • Energy consumption • Ground and environment • Safety and Security • Parking
• Business • Building Performance • Portfolio • Acquisition • Disposal
• Client Satisfaction • Cost-effectiveness • Response time • Service reliability • Health • Safety • Environmental Compliance • Staff commitment • Client-service provider relationship • IT application
Compliance Accreditation Bodies Accreditation Bodies Not indicated Not indicated Findings Most respondents did not benchmark their
facilities’ performance and had little knowledge of corporate KPIs
Strong preference for measurements to indicators, probably as the measurements are used for internal benchmarking and indicators for external benchmarking
Low implementation of benchmarking metrics by the respondents
Most respondents find KPI to be the most successful tool in measuring performance
Output List of KPIs used by sample sectors Rank of importance for measurements and indicators Statistics on the usage of benchmarking metrics
Important performance indicators
Comments • Lists of KPIs presented for each sector are not detailed, which is believed to be due to the data collection not being thoroughly conducted
• The measurement and indicators are not grouped together, which can result in overlapping of votes by the respondents
• The metrics asked to the respondents are brief and not detailed
The study was mostly on the comparison of performance measurement models and gives little exploration on the performance indicators
Figure 4.3: Previous studies on PM (II)
!!
95!
!
4.8.2 Performance Measures Used
Based on the nine studies on PM, the aggregation levels of performance measures
are performance parameters or metrics, indicators and attributes. Figure 4.4 shows
the specific performance metrics and respective indicators used in the studies by
Liyana and Egbu (2008), Lavy et al. (2010) and Enoma and Allen (2007). Liyana
and Egbu (2008) have proposed a PM framework that can be used for FM service in
the healthcare sector. The performance metrics proposed are control of HAI,
organisation policy, service levels and standards. In general, the performance
metrics and indicators aim to ensure that the effectiveness of work is achieved and
the importance of communication, particularly in the control of HAI and service
levels, is agreed. The indicators are also more focused on the quality control and
standard. Emphasis is on the management control of the proposed metrics,
specifically on the clarity, appropriateness, implementation control and also defined
roles and communication among the employees. Lavy et al. (2010) propose four
performance metrics, namely financial, functional, physical and survey-based, which
they believe are important in delivering a FM service. Fifteen indicators are
proposed for financial performance metric. The financial indicators range from utility
cost, operating cost, deferred maintenance and deferred maintenance backlog, and
also Facility Condition Index (FCI). Functional performance metric focuses on the
indicators pertaining to the productivity, parking, utilisation and adequacy of space,
employee or occupants, turnover rates, mission and vision, and Mission
Dependency Index (MDI). Physical metric has 10 indicators that are dedicated to the
physical and performance evaluation, including the specification of FM services
such as waste, security and others. Survey-based metric concerns the participation
in and satisfaction of the services from customer or building occupants, appearance,
and also making sure that the environment of the building is provided to suit the
learning and educational appropriateness. Enoma and Allen (2007) propose a set of
KPIs that they signify as important in measuring the performance of an airport’s
safety and security. The metrics are concerned with the breach of security,
evacuation in the case of emergency, hysteria control, managing the damage and
attacks on facilities by passengers, and destructive passengers’ behaviours at
airports. The respective indicators for all the performance metrics serve as a helpful
tool in managing the security at airports, which is of a very high level. This set of
indicators is very focused and is anticipated to enhance to enhance the safety and
security performance at airports specifically.
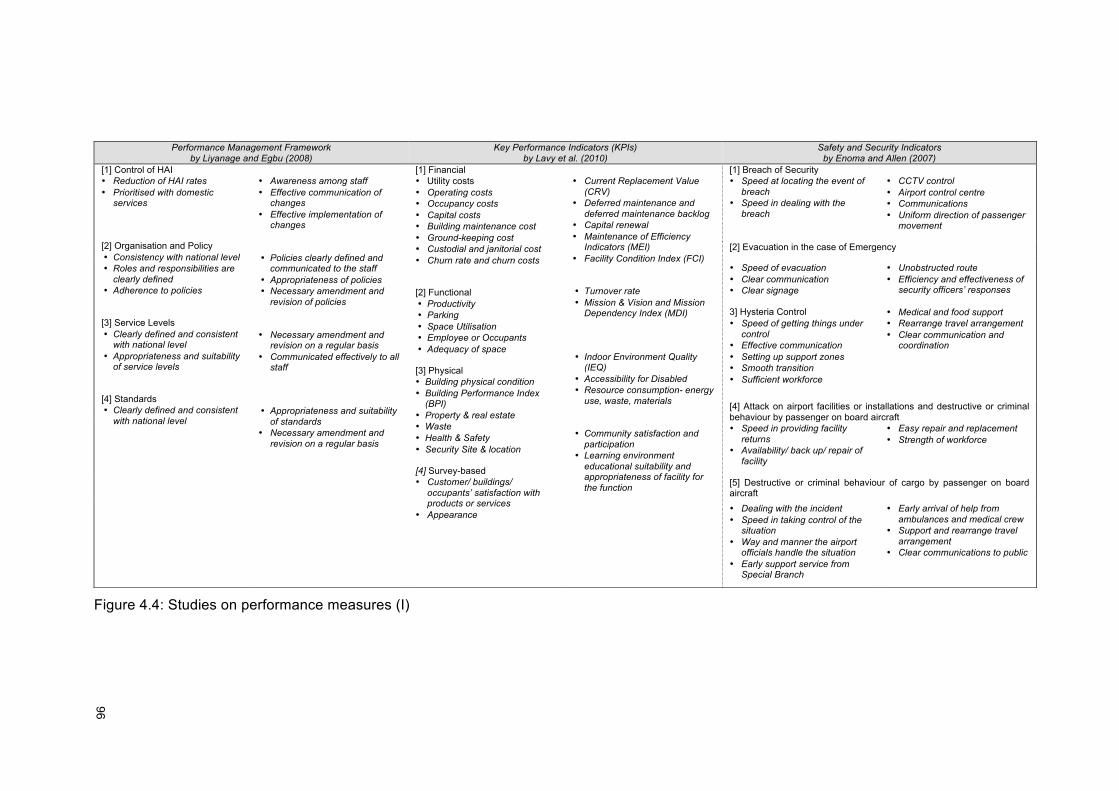
!!
96!
!
Performance Management Framework by Liyanage and Egbu (2008)
Key Performance Indicators (KPIs) by Lavy et al. (2010)
Safety and Security Indicators by Enoma and Allen (2007)
[1] Control of HAI • Reduction of HAI rates • Prioritised with domestic
services [2] Organisation and Policy • Consistency with national level • Roles and responsibilities are
clearly defined • Adherence to policies
[3] Service Levels • Clearly defined and consistent
with national level • Appropriateness and suitability
of service levels
[4] Standards • Clearly defined and consistent
with national level
• Awareness among staff • Effective communication of
changes • Effective implementation of
changes
• Policies clearly defined and
communicated to the staff • Appropriateness of policies • Necessary amendment and
revision of policies
• Necessary amendment and revision on a regular basis
• Communicated effectively to all staff
• Appropriateness and suitability
of standards • Necessary amendment and
revision on a regular basis
[1] Financial • Utility costs • Operating costs • Occupancy costs • Capital costs • Building maintenance cost • Ground-keeping cost • Custodial and janitorial cost • Churn rate and churn costs [2] Functional • Productivity • Parking • Space Utilisation • Employee or Occupants • Adequacy of space [3] Physical • Building physical condition • Building Performance Index
(BPI) • Property & real estate • Waste • Health & Safety • Security Site & location [4] Survey-based • Customer/ buildings/
occupants’ satisfaction with products or services
• Appearance
• Current Replacement Value
(CRV) • Deferred maintenance and
deferred maintenance backlog • Capital renewal • Maintenance of Efficiency
Indicators (MEI) • Facility Condition Index (FCI) • Turnover rate • Mission & Vision and Mission
Dependency Index (MDI)
• Indoor Environment Quality (IEQ)
• Accessibility for Disabled • Resource consumption- energy
use, waste, materials • Community satisfaction and
participation • Learning environment
educational suitability and appropriateness of facility for the function
[1] Breach of Security • Speed at locating the event of
breach • Speed in dealing with the
breach
• CCTV control • Airport control centre • Communications • Uniform direction of passenger
movement
[2] Evacuation in the case of Emergency
• Speed of evacuation • Clear communication • Clear signage 3] Hysteria Control • Speed of getting things under
control • Effective communication • Setting up support zones • Smooth transition • Sufficient workforce
• Unobstructed route • Efficiency and effectiveness of
security officers’ responses • Medical and food support • Rearrange travel arrangement • Clear communication and
coordination
[4] Attack on airport facilities or installations and destructive or criminal behaviour by passenger on board aircraft • Speed in providing facility
returns • Availability/ back up/ repair of
facility
• Easy repair and replacement • Strength of workforce
[5] Destructive or criminal behaviour of cargo by passenger on board aircraft • Dealing with the incident • Speed in taking control of the
situation • Way and manner the airport
officials handle the situation • Early support service from
Special Branch
• Early arrival of help from ambulances and medical crew
• Support and rearrange travel arrangement
• Clear communications to public
Figure 4.4: Studies on performance measures (I)
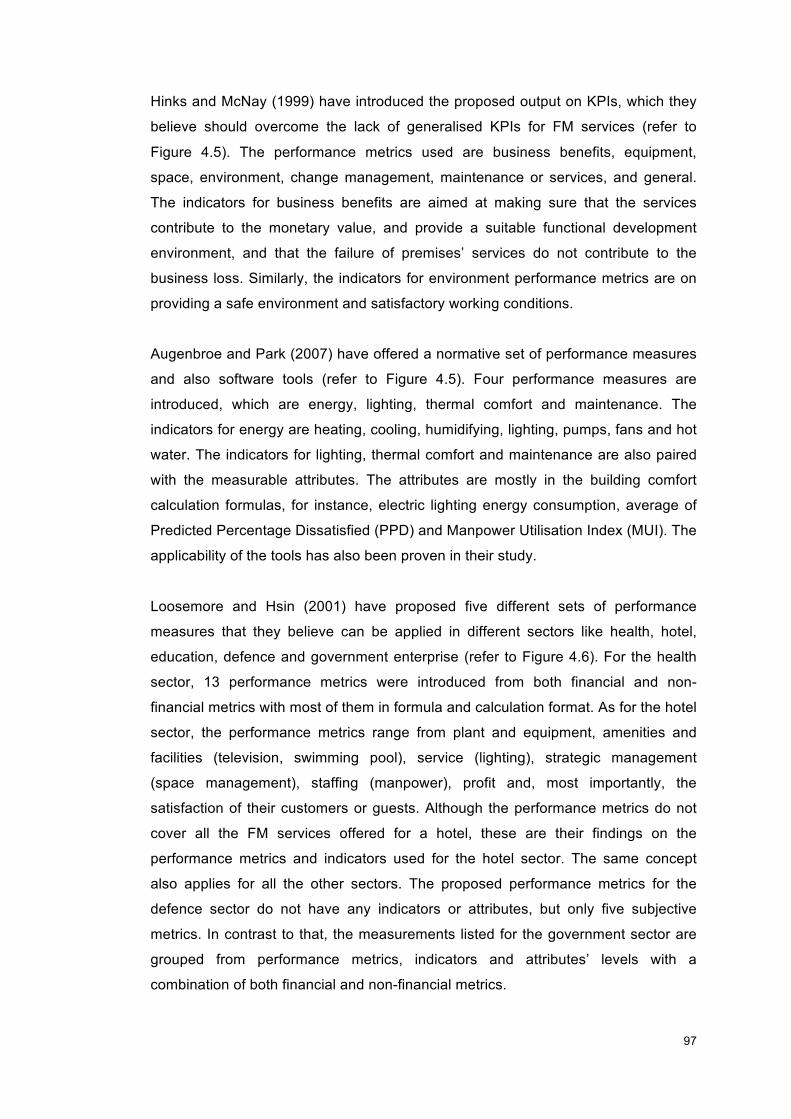
!!
97!
!
Hinks and McNay (1999) have introduced the proposed output on KPIs, which they
believe should overcome the lack of generalised KPIs for FM services (refer to
Figure 4.5). The performance metrics used are business benefits, equipment,
space, environment, change management, maintenance or services, and general.
The indicators for business benefits are aimed at making sure that the services
contribute to the monetary value, and provide a suitable functional development
environment, and that the failure of premises’ services do not contribute to the
business loss. Similarly, the indicators for environment performance metrics are on
providing a safe environment and satisfactory working conditions.
Augenbroe and Park (2007) have offered a normative set of performance measures
and also software tools (refer to Figure 4.5). Four performance measures are
introduced, which are energy, lighting, thermal comfort and maintenance. The
indicators for energy are heating, cooling, humidifying, lighting, pumps, fans and hot
water. The indicators for lighting, thermal comfort and maintenance are also paired
with the measurable attributes. The attributes are mostly in the building comfort
calculation formulas, for instance, electric lighting energy consumption, average of
Predicted Percentage Dissatisfied (PPD) and Manpower Utilisation Index (MUI). The
applicability of the tools has also been proven in their study.
Loosemore and Hsin (2001) have proposed five different sets of performance
measures that they believe can be applied in different sectors like health, hotel,
education, defence and government enterprise (refer to Figure 4.6). For the health
sector, 13 performance metrics were introduced from both financial and non-
financial metrics with most of them in formula and calculation format. As for the hotel
sector, the performance metrics range from plant and equipment, amenities and
facilities (television, swimming pool), service (lighting), strategic management
(space management), staffing (manpower), profit and, most importantly, the
satisfaction of their customers or guests. Although the performance metrics do not
cover all the FM services offered for a hotel, these are their findings on the
performance metrics and indicators used for the hotel sector. The same concept
also applies for all the other sectors. The proposed performance metrics for the
defence sector do not have any indicators or attributes, but only five subjective
metrics. In contrast to that, the measurements listed for the government sector are
grouped from performance metrics, indicators and attributes’ levels with a
combination of both financial and non-financial metrics.
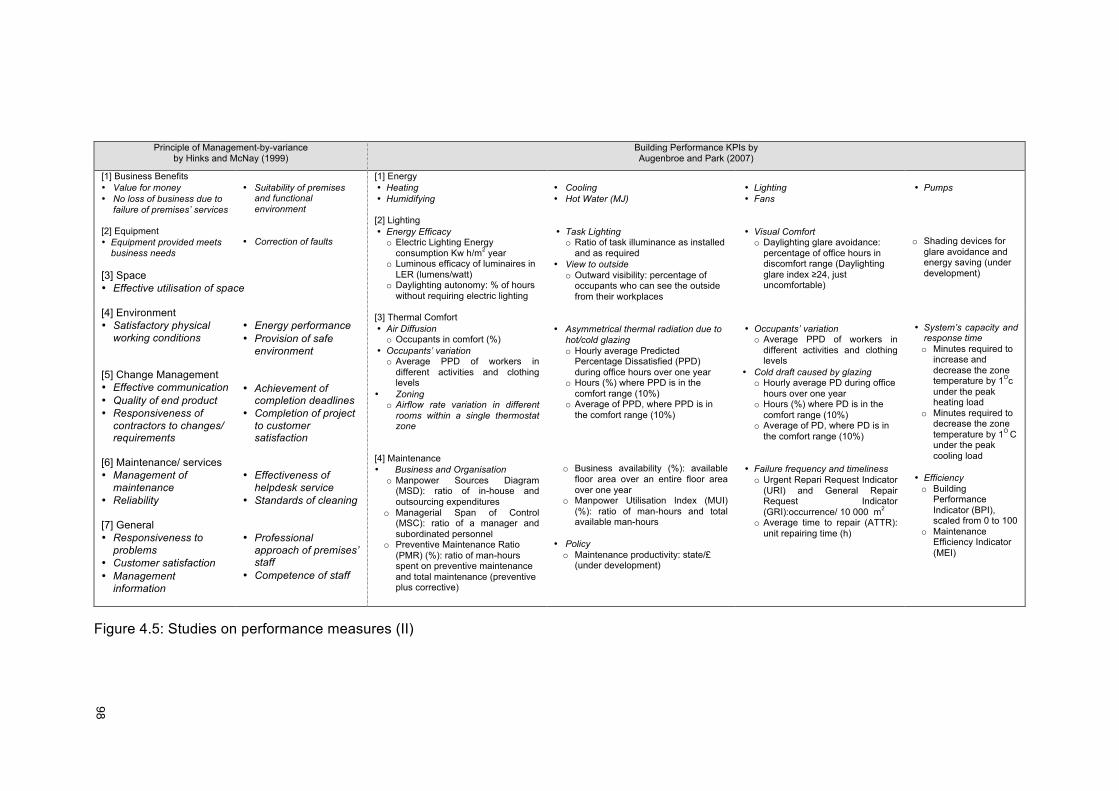
!!
98!
!
Principle of Management-by-variance
by Hinks and McNay (1999) Building Performance KPIs by Augenbroe and Park (2007)
[1] Business Benefits • Value for money • No loss of business due to
failure of premises’ services
[2] Equipment • Equipment provided meets
business needs
• Suitability of premises
and functional environment
• Correction of faults
[1] Energy • Heating • Humidifying [2] Lighting • Energy Efficacy o Electric Lighting Energy
consumption Kw h/m2 year o Luminous efficacy of luminaires in
LER (lumens/watt) o Daylighting autonomy: % of hours
without requiring electric lighting
[3] Thermal Comfort • Air Diffusion o Occupants in comfort (%)
• Occupants’ variation o Average PPD of workers in
different activities and clothing levels
• Zoning o Airflow rate variation in different
rooms within a single thermostat zone
[4] Maintenance • Business and Organisation
o Manpower Sources Diagram (MSD): ratio of in-house and outsourcing expenditures
o Managerial Span of Control (MSC): ratio of a manager and subordinated personnel
o Preventive Maintenance Ratio (PMR) (%): ratio of man-hours spent on preventive maintenance and total maintenance (preventive plus corrective)
• Cooling • Hot Water (MJ) • Task Lighting o Ratio of task illuminance as installed
and as required • View to outside
o Outward visibility: percentage of occupants who can see the outside from their workplaces
• Asymmetrical thermal radiation due to
hot/cold glazing o Hourly average Predicted
Percentage Dissatisfied (PPD) during office hours over one year
o Hours (%) where PPD is in the comfort range (10%)
o Average of PPD, where PPD is in the comfort range (10%)
o Business availability (%): available
floor area over an entire floor area over one year
o Manpower Utilisation Index (MUI) (%): ratio of man-hours and total available man-hours
• Policy o Maintenance productivity: state/£
(under development)
• Lighting • Fans • Visual Comfort o Daylighting glare avoidance:
percentage of office hours in discomfort range (Daylighting glare index ≥24, just uncomfortable)
• Occupants’ variation o Average PPD of workers in
different activities and clothing levels
• Cold draft caused by glazing o Hourly average PD during office
hours over one year o Hours (%) where PD is in the
comfort range (10%) o Average of PD, where PD is in
the comfort range (10%) • Failure frequency and timeliness o Urgent Repari Request Indicator
(URI) and General Repair Request Indicator (GRI):occurrence/ 10 000 m2
o Average time to repair (ATTR): unit repairing time (h)
• Pumps
o Shading devices for glare avoidance and energy saving (under development)
• System’s capacity and
response time o Minutes required to
increase and decrease the zone temperature by 1Oc under the peak heating load
o Minutes required to decrease the zone temperature by 1O C under the peak cooling load
• Efficiency o Building
Performance Indicator (BPI), scaled from 0 to 100
o Maintenance Efficiency Indicator (MEI)
[3] Space • Effective utilisation of space
[4] Environment • Satisfactory physical
working conditions [5] Change Management • Effective communication • Quality of end product • Responsiveness of
contractors to changes/ requirements
[6] Maintenance/ services • Management of
maintenance • Reliability
[7] General • Responsiveness to
problems • Customer satisfaction • Management
information
• Energy performance • Provision of safe
environment • Achievement of
completion deadlines • Completion of project
to customer satisfaction
• Effectiveness of
helpdesk service • Standards of cleaning
• Professional approach of premises’ staff
• Competence of staff
Figure 4.5: Studies on performance measures (II)
!!
99!
!
KPIs used in various sectors by Loosemore and Hsin (2001) [1] Health Sector • Average stay period • Patient mortality • Number of patient throughput
[2] Hotel Sector • Plant and equipment o Response time o Down time
• Number of occupants • Revenue generated
[3] Education Sector • Space management o Floor area efficiency (gross floor
area/ usable floor area) o Gross floor area per full-time student
load o Gross floor area per staff load
• Cleaning o Total cleaning expenditure/m2 o Total cleaning expenditure/m2 / full-
time student load o In-house staff costs/ total cleaning
costs [4] Defence Sector • Down time [5] Government Enterprise • Customer Satisfaction
o Delivery performance (consistent on time delivery)
o Cares about customers o Friendly service by knowledgeable
staff o Easy to use products and services o Value for money
• Cost per bed (capital, maintenance
and energy • Cost per occasion of service • Lighting
o Request for repairs o Quality of lighting o Lifetime of bulbs/strips
• Gross opening profit • Building maintenance
o Facility condition index (current asset conditions/ as-new condition)
o Facility functionality index o Total maintenance expenditure/m2 o Backlog expenditure/ backlog liability
• Security services o Security expenditure/ m2 o Security expenditure/ full-time student load o In-house staff costs/Security expenditure
• Non-performance • Financial
o Net profit o Revenue growth o Ordinary dividends o Return on average assets
• Non-financial o Number of letters o Standard letter rate o Productivity growth o Cumulative labour productivity o Mail volume growth o Human resources
• Mean time between failures • Down time • Cost of repairs
• Swimming pool o Temperature of water o Chemical balance of water o Cleanliness of water
• Guest satisfaction • Energy consumption
o Annual energy consumption/m2 o Annual energy consumption per m2
/ full-time student load o Annual energy cost/ m2 o Annual energy cost per m2 / full-
time student load • Water consumption o Water consumption/ m2 o Water consumption/ full-time
student load o Water cost/ total water consumption
• Defects • Retail-based
o Productivity analysis ! Cost to house as a percentage of
retail revenue ! Occupancy cost as a percentage of
retail revenue ! Cost to house per 100 customers ! Retail revenue per m2 ! Customers per day ! Retail revenue per customer
• Availability • Running costs • Life-cycle costs
• Space management o Floor area/ guest
• Manpower o Productivity/staff member
• Parking services o Number of parking spaces/
full-time staff o Number of parking spaces/
full-time student load • Building operating costs o Total operating costs/ m2 o Total operating costs/ full-
time student load o Total operating costs/
operating grant
• Delays
! Retail revenue per full-timeemployee
! Square metres per counter position
! Retail revenue per counter position
! Customers per counter position
! Customers per full-time employee
• Time of response to maintenance
requests • Ability to deliver stated requirements
• Television
o Quality of picture o Range of programmes o Timeliness of programmes o Number of complaints
• Ground maintenance
o Ground expenditure per ha • Refurbishment projects
o Refurbishment expenditure/ asset replacement value
o Refurbishment expenditure/m2 • Telephone services • Cost of telephone system/staff
member
• Response Time
o Occupancy analysis ! Rental costs per m2 ! Outgoing costs per m2 ! Occupancy costs per m2 ! Cleaning costs per m2 ! Energy costs per m2 ! Total accommodation costs per
m2 ! Depreciation costs per m2 ! Total costs to house per m2
Figure 4.6: Studies on performance measures (III)
!!
100!
!
Ho et al. (2000) have proposed a set of performance measures for eight scopes of
FM services, which are size and use of facilities, maintenance, refurbishment,
cleaning, energy consumption, ground and environment, safety and security, and
parking (refer to Figure 4.7). Each of the performance dimensions is introduced with
specific measurements, to which this research referred as performance metrics and
performance indicators for all the studies mentioned before. These two elements,
performance metrics and indicators, are implemented in different levels. According
to Ho et al. (2000), performance metrics are preferred more than indicators as they
are implemented for internal benchmarking, whereas the latter is used for external
benchmarking. The performance measures and indicators proposed by Ho et al.,
are both objective and subjective performance measures, and also financial and
non-financial performance measures.
In Figure 4.8, Massheder and Finch (1998) propose five benchmarking elements
that were being used by various organisations in the UK, namely business, building
performance, portfolio, acquisition and disposal. The business performance metric
focuses on two main components, which are occupancy: which relates to the
costing in relation to business unit; and location: which is concerned with the
locational analysis of the availability of key skills, and also locational optimisation.
Similarly, the building performance metric is also focused on the occupancy,
particularly on the calculations of occupancy per sq metre, person and also building
size. The other performance indicators for portfolio, acquisition and disposal are a
mixture of both objective and subjective performance measures. Meng and Minogue
(2011) have suggested 10 important performance measures that were being used
by the organisations in the UK and Ireland (refer to Figure 4.8). The performance
measures are focused on various key elements. For instance, in terms of quality the
research outlines the response time and service reliability. Emphasis is also given to
the compliance of important service elements like health, safety and environmental
compliance. It also considers the importance of the human factor; therefore,
indicators such as client satisfaction, staff commitment and client-service provider
relationship are also proposed. The other three metrics that are perceived in
delivering FM services are cost-effectiveness, staff commitment and IT application.
Each of the studies described above provides different findings and output on their
proposed set of frameworks, which they believe are appropriate and practical for FM
services. This study has referred to the proposed performance measures, indicators
and attributes in proposing a novel set of performance measures.
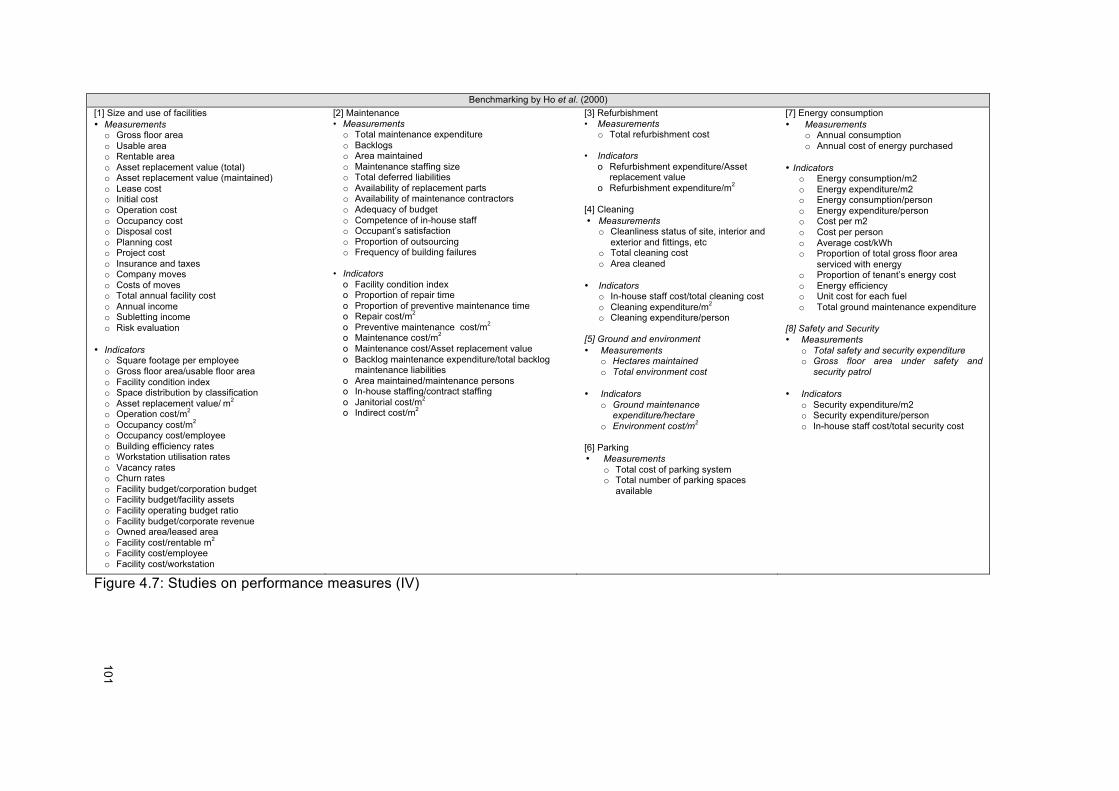
!!
101!
!
Benchmarking by Ho et al. (2000) [1] Size and use of facilities • Measurements o Gross floor area o Usable area o Rentable area o Asset replacement value (total) o Asset replacement value (maintained) o Lease cost o Initial cost o Operation cost o Occupancy cost o Disposal cost o Planning cost o Project cost o Insurance and taxes o Company moves o Costs of moves o Total annual facility cost o Annual income o Subletting income o Risk evaluation
• Indicators o Square footage per employee o Gross floor area/usable floor area o Facility condition index o Space distribution by classification o Asset replacement value/!m2 o Operation cost/m2 o Occupancy cost/m2 o Occupancy cost/employee o Building efficiency rates o Workstation utilisation rates o Vacancy rates o Churn rates o Facility budget/corporation budget o Facility budget/facility assets o Facility operating budget ratio o Facility budget/corporate revenue o Owned area/leased area o Facility cost/rentable m2 o Facility cost/employee o Facility cost/workstation
[2] Maintenance • Measurements o Total maintenance expenditure o Backlogs o Area maintained o Maintenance staffing size o Total deferred liabilities o Availability of replacement parts o Availability of maintenance contractors o Adequacy of budget o Competence of in-house staff o Occupant’s satisfaction o Proportion of outsourcing o Frequency of building failures
• Indicators
o Facility condition index o Proportion of repair time o Proportion of preventive maintenance time o Repair cost/m2 o Preventive maintenance cost/m2 o Maintenance cost/m2 o Maintenance cost/Asset replacement value o Backlog maintenance expenditure/total backlog
maintenance liabilities o Area maintained/maintenance persons o In-house staffing/contract staffing o Janitorial cost/m2 o Indirect cost/m2
[3] Refurbishment • Measurements
o Total refurbishment cost
• Indicators o Refurbishment expenditure/Asset
replacement value o Refurbishment expenditure/m2
[4] Cleaning • Measurements
o Cleanliness status of site, interior and exterior and fittings, etc
o Total cleaning cost o Area cleaned
• Indicators
o In-house staff cost/total cleaning cost o Cleaning expenditure/m2 o Cleaning expenditure/person
[5] Ground and environment • Measurements
o Hectares maintained o Total environment cost
• Indicators
o Ground maintenance expenditure/hectare
o Environment cost/m2 [6] Parking • Measurements
o Total cost of parking system o Total number of parking spaces
available
[7] Energy consumption • Measurements
o Annual consumption o Annual cost of energy purchased
• Indicators o Energy consumption/m2 o Energy expenditure/m2 o Energy consumption/person o Energy expenditure/person o Cost per m2 o Cost per person o Average cost/kWh o Proportion of total gross floor area
serviced with energy o Proportion of tenant’s energy cost o Energy efficiency o Unit cost for each fuel o Total ground maintenance expenditure
[8] Safety and Security • Measurements
o Total safety and security expenditure o Gross floor area under safety and
security patrol
• Indicators o Security expenditure/m2 o Security expenditure/person o In-house staff cost/total security cost
Figure 4.7: Studies on performance measures (IV)
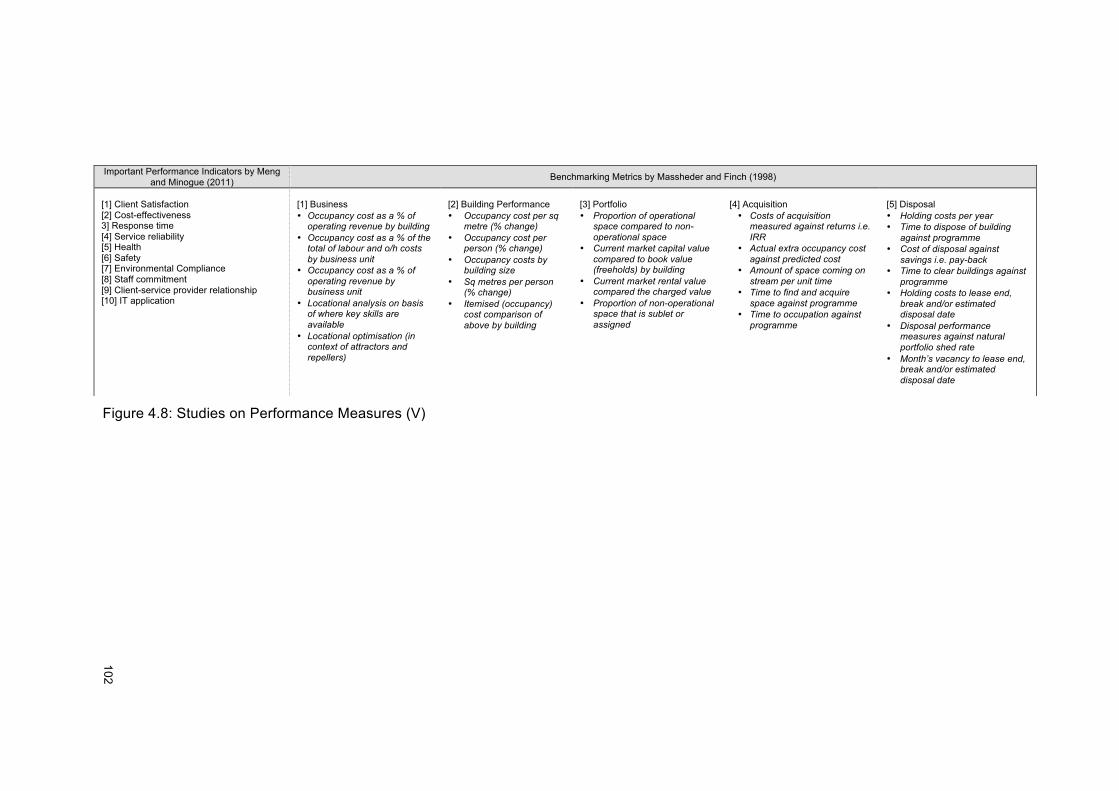
!!
102!
!
Important Performance Indicators by Meng and Minogue (2011) Benchmarking Metrics by Massheder and Finch (1998)
[1] Client Satisfaction [2] Cost-effectiveness 3] Response time [4] Service reliability [5] Health [6] Safety [7] Environmental Compliance [8] Staff commitment [9] Client-service provider relationship [10] IT application
[1] Business • Occupancy cost as a % of
operating revenue by building • Occupancy cost as a % of the
total of labour and o/h costs by business unit
• Occupancy cost as a % of operating revenue by business unit
• Locational analysis on basis of where key skills are available
• Locational optimisation (in context of attractors and repellers)
[2] Building Performance • Occupancy cost per sq
metre (% change) • Occupancy cost per
person (% change) • Occupancy costs by
building size • Sq metres per person
(% change) • Itemised (occupancy)
cost comparison of above by building
[3] Portfolio • Proportion of operational
space compared to non-operational space
• Current market capital value compared to book value (freeholds) by building
• Current market rental value compared the charged value
• Proportion of non-operational space that is sublet or assigned
[4] Acquisition • Costs of acquisition
measured against returns i.e. IRR
• Actual extra occupancy cost against predicted cost
• Amount of space coming on stream per unit time
• Time to find and acquire space against programme
• Time to occupation against programme
[5] Disposal • Holding costs per year • Time to dispose of building
against programme • Cost of disposal against
savings i.e. pay-back • Time to clear buildings against
programme • Holding costs to lease end,
break and/or estimated disposal date
• Disposal performance measures against natural portfolio shed rate
• Month’s vacancy to lease end, break and/or estimated disposal date
Figure 4.8: Studies on Performance Measures (V)
!!
103!
!
4.9 Chapter Summary
Based from the literature in this chapter, it can be concluded that the implementation
of PM approach in FM practice is highly valuable. It can contribute significantly to
the FM practice particularly by emphasising the measures needed to ensure a
quality service delivery. Studies on the previous PM models and measures have
shown that each model focuses on FM service scope differently. Despite some of
the PM models propose detailed performance measures, they are still lacking of
comprehensive coverage on all FM service scopes. Following the overview of
performance and PM of chapter 4, in chapter 5 the aspects pertaining the
development of a PM framework are covered. The next chapter looks into the
components of developing a PM framework leading to the workflow and theoretical
framework that have been considered in developing PERFM.
!!
104!
!
CHAPTER 5: DEVELOPMENT OF A PERFORMANCE MEASUREMENT (PM) FRAMEWORK
This chapter explains the rationale and processes in developing a PM framework,
and shows the important elements and processes that were referred to in
developing the Performance Measurement Framework (PERFM). The theoretical
framework of this study is also presented, which links the research objectives,
processes and outcomes. This chapter also discusses how the performance
measures for PERFM have been selected and how they contribute to a successful
framework. Sections on the pilot study survey and analysis are also presented
towards the end of the chapter. The objectives in conducting the pilot study survey
are to understand the general thinking and implementation of both PM and FM
among the practitioners and to demonstrate the findings which support the need of
the research scopes- PM and FM to be explored especially within Malaysian
context.
5.1 The Rationale in Developing a Framework
Performance is generally accepted to be a less complex concept in the private
sector than in the public sector because most stakeholders agree that strong
financial results are essential to business success. Despite increasing attention
being paid to public service performance, the persistent problem has been the
conceptualisation and measurement of performance (Andrews et al., 2006).
According to Neely et al. (1997), measurement provides a means of capturing
performance data, which can be used to inform decision-making. There is also no
clear consensus on the best approach for measuring organisational performance
(Pandey and Moynihan, 2006). One of the key weaknesses of the PMS used by
many firms is that they have traditionally adopted a narrow or uni-dimensional focus
(Neely et al., 2000), which can be overcome if a firm adopts a balanced set of
measures that aim to monitor the performance quality (Kaplan and Norton, 1992).
However, Neely et al. (2000) suggest that there is little guidance on how the
appropriate performance measures can be identified, introduced and ultimately used
to manage the business. In order for the framework to be of practical value, they
also further suggest that the process of populating the framework has to be
understood.
!!
105!
!
FM managers may have difficulties in selecting the appropriate performance
measures on which to rely for their services. Keegan et al. (1989), for instance, have
proposed a set of performance measures that integrate different classes of business
performance, namely financial and non-financial and also internal and external.
However, practitioners may have problems in identifying links between the four
different parameters. Fitzgerald et al. (1991) have suggested that any organisation
should consider performance measures that relate to results and also determinants
of results, but the performance measures are quite limited and brief. On the other
hand, Azzone et al. (1991) have created a model that is suitable for organisations
that want to specifically focus on the time-based competition. Despite an appropriate
set of performance measures linking the four elements of input, process, output and
outcome, Brown (1996) has proposed a set of performance measures that seem not
to be derived from a business or organisation’s objectives or strategies. However,
these performance measures probably seemed to fit well with the industry at that
time. On the other hand, Lynch and Cross (1991) have introduced a Performance
Pyramid that focuses on the horizontal flows of material and information within an
organisation. However, the sets of performance measures being introduced are very
open and can be interpreted in many ways, resulting in FM managers not achieving
the desired performance results.
These are a few examples of performance measures proposed by various authors
for FM managers’ reference. All of the above models are leaning on the general
approach of performance for an organisation. But none of them is actually geared
towards service delivery strategies. Some may have meeting customers’ satisfaction
as the targeted end result, but the processes towards the outcome do not
specifically explain the paramount elements grouped under quality or services.
Managers are still looking for off-the-shelf solutions, which require little time and
effort to develop. The day-to-day pressures of their jobs prevent them from to
spending time and effort thinking about FM, so they are forced to fall back on simple
pre-packaged solutions (Neely et al., 2000). Reflecting on this problem, this study
identifies the rationale behind the development of PM framework in FM.
5.2 Multiple Dimensions of Performance
Businesses choose to measure performance for various reasons, among which are:
to know where they are, to know how rapidly they are improving, to enable
comparison with other business, even to influence individuals’ behaviour (Neely et
!!
106!
!
al., 1997). Organisational performance is multifaceted (Boyne, 2003) as the public
organisations are required to address a range of goals, some of which may be
conflicting, and they are also obliged to focus attention on multiple dimensions of
performance (Andrews et al., 2006).
Boyne (2002) introduces a few conceptual categories of performance dimensions:
outputs, efficiency, responsiveness and democratic outcomes. These dimensions
have been adapted in various academic studies, governments and public
organisations (Andrews et al., 2006):
• Outputs - the quantity and quality of services
• Efficiency - concerned with the cost per unit of outputs
• Effectiveness - refers to the achievement of formal objectives
• Responsiveness - includes measures of satisfaction as judged by direct
service users, wider citizens and staff
• Democratic outcomes - concerned with accountability, probity and
participation
A few important aspects, namely functionality, quality, comfort and efficiency are
suggested by Trinius and Sjostrom (2005) as the main elements in technical
performance requirements which can help to ensure that the services provided are
operational. They further suggest that one component or building material provides
its functionality and performance to other components or materials on the same
system level, or to components, or to the building on a higher system level, due to
their integration in the same building. Therefore, a material or a component also
demands certain functionality from other items in its surroundings in order to reach
its performance. The viability of a firm now depends largely on how well it is capable
of responding to customer requirements while becoming lean (Gunasekaran et al.,
2001).
5.3 Design Process
The design of a performance measure is a fundamental process. Inputs, in the form
of requirements, are captured and an output, in the form of a performance measure,
is produced (Neely et al., 1997). Designing specific measures of performance is
essential (Neely et al., 1997) and the two requirements of the design phase are
identifying the key objectives to be measured and designing the measures (Bourne
et al., 2000). A theory by Trinius and Sjostrom (2005) suggests that the level of
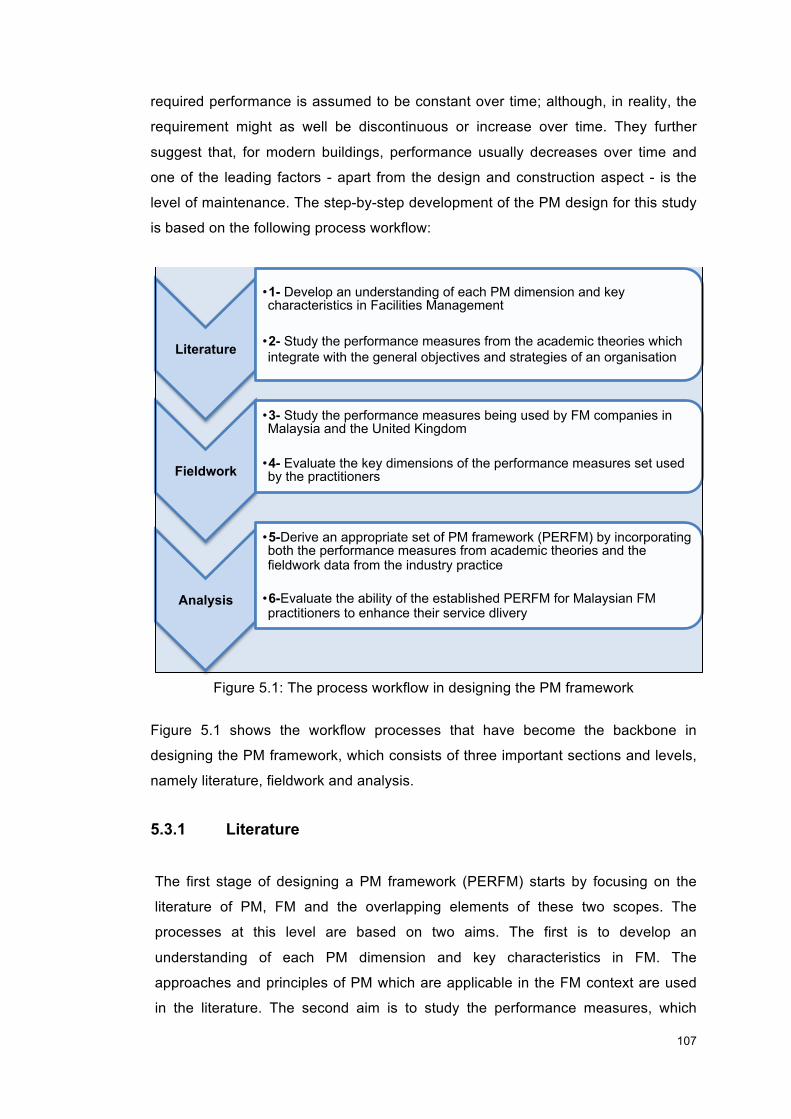
!!
107!
!
required performance is assumed to be constant over time; although, in reality, the
requirement might as well be discontinuous or increase over time. They further
suggest that, for modern buildings, performance usually decreases over time and
one of the leading factors - apart from the design and construction aspect - is the
level of maintenance. The step-by-step development of the PM design for this study
is based on the following process workflow:
!Figure 5.1: The process workflow in designing the PM framework
Figure 5.1 shows the workflow processes that have become the backbone in
designing the PM framework, which consists of three important sections and levels,
namely literature, fieldwork and analysis.
5.3.1 Literature
The first stage of designing a PM framework (PERFM) starts by focusing on the
literature of PM, FM and the overlapping elements of these two scopes. The
processes at this level are based on two aims. The first is to develop an
understanding of each PM dimension and key characteristics in FM. The
approaches and principles of PM which are applicable in the FM context are used
in the literature. The second aim is to study the performance measures, which
Literature
• 1- Develop an understanding of each PM dimension and key characteristics in Facilities Management
• 2- Study the performance measures from the academic theories which integrate with the general objectives and strategies of an organisation
Fieldwork
• 3- Study the performance measures being used by FM companies in Malaysia and the United Kingdom
• 4- Evaluate the key dimensions of the performance measures set used by the practitioners
Analysis
• 5-Derive an appropriate set of PM framework (PERFM) by incorporating both the performance measures from academic theories and the fieldwork data from the industry practice
• 6-Evaluate the ability of the established PERFM for Malaysian FM practitioners to enhance their service dlivery
!!
108!
!
based on the academic theories, integrates with the general objectives and
strategies of an organisation.
5.3.2 Fieldwork
In the fieldwork stage, this research studies the performance measures used by
organisations in two separate case study regions, that is, Malaysia and the UK.
Case studies conducted in organisations have given the research 16 different sets
of performance measures practised by these companies respectively. Based on
this, evaluation of the key dimensions used by these practitioners was conducted,
as each company has proven that they have differing preferences and perspectives
on the performance measures and criteria.
5.3.3 Analysis
During the analysis stage, this study seeks to derive an appropriate PM framework
by incorporating both the normative performance measures from academic theories
and the fieldwork data from the industry practice. Next, this study evaluates the
appropriateness of the established PERFM within the Malaysian industry so FM
practitioners in this region can enhance their service delivery.
5.4 Developing A Theoretical Framework
The theoretical framework of a piece of research must consider that the study
should benefit from previous scientific contributions. The starting point of the
empirical research is going to be an initial combination of factors and the empirical
research’s assumed relationship with the phenomenon studied, resulting in a wide
bibliographical revision (Nieto and Perez, 2000). According to Santos (1999, cited in
Amaratunga and Baldry, 2003), an explicit theoretical framework is the logical and
necessary steps used in making sense of integrating and re-arranging the ideas. It
is also impossible to codify existing knowledge in the field in a coherent manner
without using the logical and necessary steps. It has long been recognised that
inadequately designed performance measures can result in dysfunctional behaviour.
This is often because the method of calculating performance is the formula that
encourages individuals to pursue inappropriate courses of action (Neely et al.,
1997).
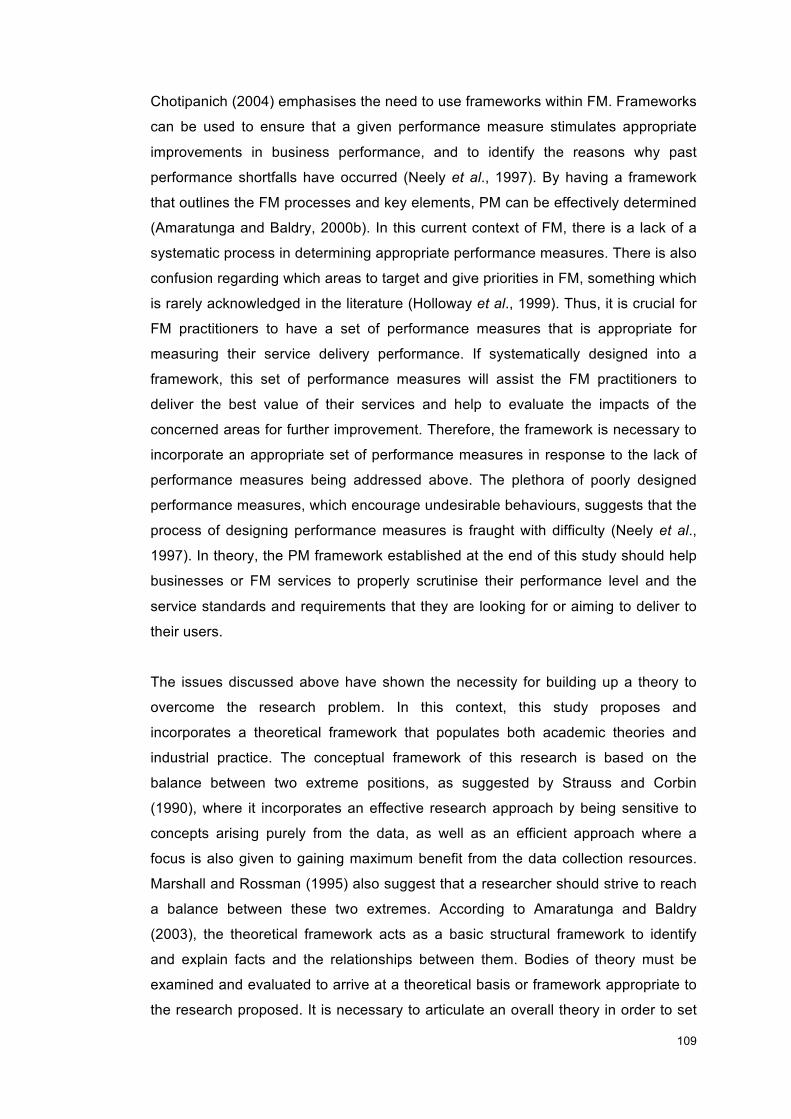
!!
109!
!
Chotipanich (2004) emphasises the need to use frameworks within FM. Frameworks
can be used to ensure that a given performance measure stimulates appropriate
improvements in business performance, and to identify the reasons why past
performance shortfalls have occurred (Neely et al., 1997). By having a framework
that outlines the FM processes and key elements, PM can be effectively determined
(Amaratunga and Baldry, 2000b). In this current context of FM, there is a lack of a
systematic process in determining appropriate performance measures. There is also
confusion regarding which areas to target and give priorities in FM, something which
is rarely acknowledged in the literature (Holloway et al., 1999). Thus, it is crucial for
FM practitioners to have a set of performance measures that is appropriate for
measuring their service delivery performance. If systematically designed into a
framework, this set of performance measures will assist the FM practitioners to
deliver the best value of their services and help to evaluate the impacts of the
concerned areas for further improvement. Therefore, the framework is necessary to
incorporate an appropriate set of performance measures in response to the lack of
performance measures being addressed above. The plethora of poorly designed
performance measures, which encourage undesirable behaviours, suggests that the
process of designing performance measures is fraught with difficulty (Neely et al.,
1997). In theory, the PM framework established at the end of this study should help
businesses or FM services to properly scrutinise their performance level and the
service standards and requirements that they are looking for or aiming to deliver to
their users.
The issues discussed above have shown the necessity for building up a theory to
overcome the research problem. In this context, this study proposes and
incorporates a theoretical framework that populates both academic theories and
industrial practice. The conceptual framework of this research is based on the
balance between two extreme positions, as suggested by Strauss and Corbin
(1990), where it incorporates an effective research approach by being sensitive to
concepts arising purely from the data, as well as an efficient approach where a
focus is also given to gaining maximum benefit from the data collection resources.
Marshall and Rossman (1995) also suggest that a researcher should strive to reach
a balance between these two extremes. According to Amaratunga and Baldry
(2003), the theoretical framework acts as a basic structural framework to identify
and explain facts and the relationships between them. Bodies of theory must be
examined and evaluated to arrive at a theoretical basis or framework appropriate to
the research proposed. It is necessary to articulate an overall theory in order to set
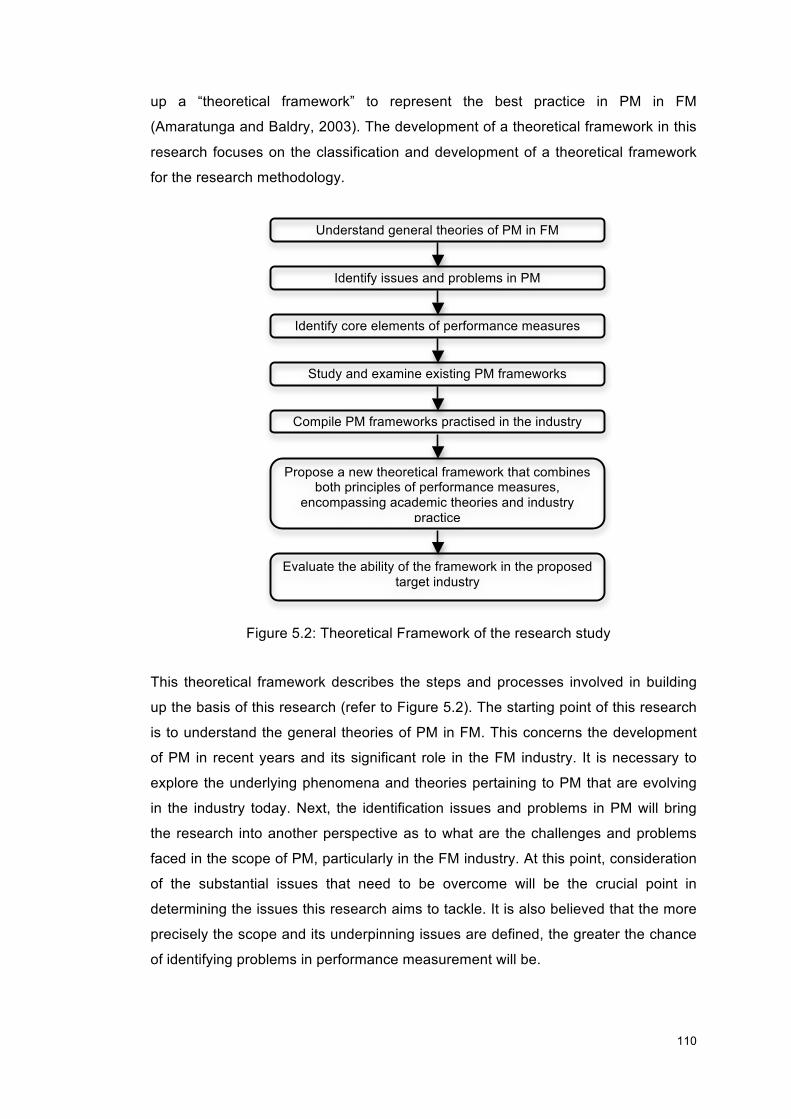
!!
110!
!
up a “theoretical framework” to represent the best practice in PM in FM
(Amaratunga and Baldry, 2003). The development of a theoretical framework in this
research focuses on the classification and development of a theoretical framework
for the research methodology.
This theoretical framework describes the steps and processes involved in building
up the basis of this research (refer to Figure 5.2). The starting point of this research
is to understand the general theories of PM in FM. This concerns the development
of PM in recent years and its significant role in the FM industry. It is necessary to
explore the underlying phenomena and theories pertaining to PM that are evolving
in the industry today. Next, the identification issues and problems in PM will bring
the research into another perspective as to what are the challenges and problems
faced in the scope of PM, particularly in the FM industry. At this point, consideration
of the substantial issues that need to be overcome will be the crucial point in
determining the issues this research aims to tackle. It is also believed that the more
precisely the scope and its underpinning issues are defined, the greater the chance
of identifying problems in performance measurement will be.
Understand general theories of PM in FM
Identify issues and problems in PM
Identify core elements of performance measures
Study and examine existing PM frameworks
Compile PM frameworks practised in the industry
Propose a new theoretical framework that combines both principles of performance measures,
encompassing academic theories and industry practice
Evaluate the ability of the framework in the proposed target industry
Figure 5.2: Theoretical Framework of the research study
!!
111!
!
This study then moves to narrowing the subject of the scope by focusing on the
performance measures element of the general PM. All suggested core elements are
compiled to get a consensus regarding what the academic theories on the
appropriate core elements to measure performance suggest. Various key elements
that are considered to be core to any FM service performance in the literature
survey are examined. As described by Bourne et al. (2000), two requirements of the
design phase are identifying the key objectives to be measured and designing the
measures. Alongside this, the PM framework was analysed and thoroughly
scrutinised with respect to their respective approaches, principles, performance
measures and overall designs. This research then adopts a fieldwork methodology
where case studies are conducted in order to compile the different types of PM
frameworks being practised in the FM industry. In this context, this study looks into
two different FM industries – one of which is in Malaysia where FM is considered
immature and the other in the UK where FM has shown progressive developments.
Frameworks from the mixed method analysis will be the main reference for the
outcome of the next phase. Then, new performance measures were be formulated,
taking into account the performance measures suggested in the academic theories
and the ones practised by the 16 case studies. Further evaluation was also
conducted to assess the ability of the framework in enhancing FM service delivery in
Malaysia.
This theoretical framework is believed to serve as a sound basis for this research as
it incorporates the core elements by Amaratunga and Baldry (2003) in developing a
theoretical framework, namely examining existing frameworks, studying practices,
looking for theoretical explanations, and also identifying potentially useful theories
and comparing them with practice. The development of a theoretical framework in
this research focuses on the classification and structuring of the core ideas
underpinning the current PM theories. This theoretical framework's phases of
research are useful as they allow the important scopes of this research to be
defined and analysed into split phases which require different approaches. The
phases also highlight the lack of coverage and literature on certain aspects, namely
on the development of a PM framework for FM services. The processes lead to the
classification of the important measures in PM and to a means of providing a
framework for the identification of the key measures of the subject.
!!
112!
!
5.5 Validity of Performance Measures
Performance measure is a means of tracking performance (Fry, 1995) and, as
suggested by Boyne et al. (2006), there are two types of data - perceptual or
‘subjective’ data and archival or ‘objective data - that are believed to be the best
source of performance. However, Andrews et al. (2006) state that, although
academics have debated for over three decades on the merits of subjective and
objective performance measures, both objective and subjective performance
measures of performance are still being used in studies of the determinants of
performance in public organisations but rarely in combination (Meier and O’Toole,
2003; Andrews et al., 2006), as they are both equally susceptible to problems of
validity.
Andrews et al. (2006) have proposed the following identities for both objective and
subjective performance measures:
(i) Objective performance measures:
• Objective performance measures have been viewed as the gold standard in
public management research
• They are typically regarded as the optimum indicators of public sector
performance because they are believed to reflect the ‘real’ world accurately
and ‘minimise discretion’ (Meier and Brudney, 2002)
• An objective indicator should therefore be impartial, independent, and
detached from the unit of analysis
• To reduce discretion and be objective, a measure of performance must
involve, first, the precise assessment of a dimension of performance and,
second, an external process to verify its accuracy - many measures meet
these criteria
• Examples: school exam results - they reflect an element of effectiveness of
schools, and students’ achievements are validated through the marking of
their work by external examiners.
(ii) Subjective performance measures:
• A subjective measure may be biased or prejudiced in some way and is not
distant from the unit of analysis.

!!
113!
!
• Like objective performance measures, subjective performance measures
must refer to a dimension of performance that is relevant to the organisation,
that is, subjective judgements may be made either by members of an
organisation, such that judgements of performance are internal, typically
obtained from surveys of managers; or they may be based on external
stakeholders such as consumers or inspectors employed by regulatory
agencies. While these measures are external, they typically have not been
subjected to independent scrutiny.
• Internal subjective performance measures - based on perceptions of
corporate and service managers, and users
• External subjective performance measures – e.g. derived from other
inspection reports for local services
5.5.1 Validity of Objective and Subjective Performance Measures
A number of validity issues exist in relation to all types of performance measures.
Validity is not a problem only for subjective performance measures - serious
questions have also been posed about the accuracy of objective performance
measures (Bohte and Meier, 2000). The solution is to combine both subjective and
objective performance measures to compensate for the deficiencies of using either
in isolation. However, when studies adopt both types of performance measures,
their limitations are not always systematically addressed and they are sometimes
seen as interchangeable. There are also positive and statistically significant
correlations between objective and subjective performance measures of overall
performance only when measures of the same dimensions of performance are used
(Guest et al., 2003; Voss and Voss, 2000). It has been suggested that the best
course of action for public management researchers and practitioners is to use both
objective and subjective performance measures to capture diverse interpretations of
organisational performance and to address the limitations of each type of
performance measure.
Criteria that balance both objective and subjective performance measures, in which,
if any of these conditions is not met then the relationship between subjective and
objective measures of performance will become weaker, can be defined as follows:
• The same criteria of performance are used
• The weights attached to the criteria are the same
!!
114!
!
• The same indicators are used to operationalise these criteria
• The information is regarded as equally credible by different groups
• Expectations of the level of achievement against the indicators are the same
Andrews et al., (2006) also signify the following aspects of objective vs. subjective
performance measures:
• Using objective performance measures can be most difficult when they are
paired with an extensive number of performance dimensions in the public
sector. When objective performance measures are not able to deal with the
complexity of performance in public organisations, serious attention must be
paid to the use of subjective performance measures.
• The use of subjective performance measures is often defended in the
literature because objective performance measures are simply not available,
or do not tap into all of the appropriate dimensions of performance.
• Subjective performance measures are seen to be limited because they suffer
from a number of flaws, of which common-method bias is believed to be the
most serious (Wall et al., 2004). Common-method bias is caused by
informants’ general predilection towards giving similar responses to separate
survey questions (using the higher or lower points on a response scale). This
causes problems when survey respondents make judgements on both
management and performance and these variables are then used in
statistical models.
• Reliance upon recall together with uncertainty about informants’ knowledge
of actual performance may also undermine the accuracy of subjective
performance measures (Golden, 1992).
• It cannot be concluded that subjective perceptions of performance are
‘wrong’ simply because they are weakly related to objective measures.
Except when either subjective or objective performance measures are
distorted by low reliability or deliberate error, neither is an inherently superior
estimate of organisational performance in the public sector.
5.6 The Process of Selecting Performance Measures
The lack of well-defined performance criteria through which performance of
individuals and the organisation may be evaluated, makes it hard to plan and control
(Globerson, 1985). Inappropriate performance measures lead to difficulties in
!!
115!
!
tackling productivity issues and problems (Neely et al., 1997). According to Gumbus
(2005), measures for performance are created by defining a comprehensive list of
measures used in the business and narrowing the list to the key performance
measures that truly assess business success. The larger list of performance
measures can be derived from current management measures used at executive
meetings, budgets, plans, and board reports - that is, by looking at key processes;
by assessing what individual departments are using to measure their own
performance; or by external benchmarks derived from seminars, articles, and books.
On the other hand, Gumbus (2005) also states that there a few criteria of
performance measures that cannot be used: measures that may not have an owner,
which means that there is no proper group for them; measures that may be
duplicated and trivial; measures that are impossible to capture any data; and most
importantly, those measures that do not contribute to the business.
There is still uncertainty over the best way to measure and operationalise the criteria
of performance, for instance, in the use of aggregated or broad and individual or
narrow measures of performance by which to judge the performance progress:
• Aggregated performance measures draw together performance data from a
number of sources to produce an overall score for an organisation. Results
are often presented in scorecard format (Weimer and Gormley, 1999).
• Individual performance measure typically focuses on one dimension of
performance in one service area and is reported as specific performance
indicator.
• Using aggregated performance measures may mask the contributions of
particular management practices, while using individual ones could result in
what educationalists call ‘teaching to the test’.
The question of what constitutes a well-designed PM framework is often not being
addressed despite the high level of academic and industrial interest in PM (Neely et
al., 1997). Brewer (2006) agrees that the reason that organisational performance is
widely practiced in the public sector is because organisational performance is a
socially-constructed concept and all measures of performance are subjective. In the
public sector, organisational performance is an elusive concept and in this context
the perceptual measures are appropriate. There is a challenge in creating perpetual
and subjective performance measures that satisfy three crucial criteria: validity,
reliability and sensitivity (Brewer, 2006).
!!
116!
!
5.7 Criteria of A Successful PM Framework
A successful PM framework must be driven from the top of the organisation and
business management. The success depends upon a well-developed organisational
structure, an understanding of the role of the customer, and ownership by top and
middle management (Kaplan and Norton, 1996b). This is also proven by the
introduction of a set of Balance Scorecards (BSC) by Gumbus (2002), in which the
initial mobilisation and momentum is required to launch the effort and sustain it over
time. There is also a need to have a continuous focus to track best practices,
flexibility for changing strategies and to continually monitor against targeted
outcomes. Performance measures also have a behavioural impact on systems,
especially systems involving humans, who respond to performance measures.
People modify their behaviours in an attempt to ensure a positive performance
outcome even if this means pursuing inappropriate courses of action (Hoopwood,
1984).
A PM framework must be complete, measurable and controllable. If any of these
important criteria are absent, the performance measures will not link to an
employee’s daily operations (Inamdar et al., 2000). The use of too many
performance measures can also lead to resistance from employees (Gumbus,
2005). The ideal PM situation is one in which there is widespread agreement about
what the organisation should be doing and that this goal can be accurately identified
through a limited number of performance measures. Unfortunately, this rarely exists
for public organisations (Pandey and Moynihan, 2006). The design of a PM
framework is principally a cognitive exercise, translating the views of customer and
other stakeholder needs into business objectives and appropriate performance
measures. There is now a growing body of literature on this specific topic which
suggests that this process is becoming understood (Bourne et al., 2000). If the
organisation fails to deliver the right products and cost-effective services to satisfy
customers’ needs in both the short- and long-term, the consequences are that
revenue will not be generated, and the business will wither and die (Amaratunga
and Baldry, 2003). A framework seeks to encapsulate the elements, which together
constitute good performance measures and can be used to ensure that the selected
measures will drive improvements in the company (Neely et al., 1997). FM
managers should have a clear idea of their customer and business segments, and
should select a set of core outcome measurements for those targeted segments.
These outcome measurements should represent the targets for an FM
!!
117!
!
organisation’s product and service development process (Amaratunga and Baldry,
2003).
Conventional PMS focus only on monitoring and improving cost, quality and time-
based measures of existing business processes. In contrast, there is a need for an
approach to measure performance, which enables demand for internal process
performance to be derived from the expectations of specific external constituencies.
Managers need to decide at which operations, processes, competencies and skills
their organisations must excel if customer demands are to be met adequately
(Amaratunga and Baldry, 2003).
5.8 Performance Criteria
The aim of the process design phase is to establish a practical PMS design process,
building on the best of academic theory and industrial practice, which could
subsequently be tested through live application (Neely et al., 2000). The key issue in
designing performance measures is that they have to be matched to the
organisational context (Neely et al., 1997). This can be achieved by selecting
appropriate performance measures, and this study proposes a set of performance
criteria in designing and selecting suitable performance measures based on
academic references, as shown in Figure 5.3.
This study proposes a set of elements that need to be considered when designing
performance measures. As measurement provides a means of capturing
performance data, which can be used to inform decision-making, the following
fundamentals must be considered seriously (Neely et al., 1997):
• Purposes must be related to business objectives and specified to enable the
monitoring of the rate of improvement, thereby driving down the total cost,
stimulating improvement in the delivery performance of suppliers, and ensuring
that the new product introduction lead-time is continually reduced.
• Objectives of any business are a function of the requirements of its owners and
customers. The levels of performance the business needs to achieve to satisfy
these objectives are dependent on how good its competitors are.
• The ways that assess whether performance is improving rapidly enough are by
having knowledge of how good the competition is and having an explicit target,
which specifies the level of performance to be achieved, and a time scale for
achieving it. This will also ascertain whether the business is able to compete in
!!
118!
!
the medium to long term.
• Typical targets are:
(i) 20 per cent improvement year on year
(ii) 15 per cent reduction during the next 12 months
(iii) Achieve 98 per cent delivery performance (on time, in full) by the end of
next year
• One of the golden rules of PM is that there is no point measuring someone or
something over which the companies have no control.
Unless the management loops are closed, there is no point in having the
measurement. It is possible to define in general the management process that will
be followed should performance appear to be either acceptable or unacceptable.

!!
119!
!
Elements Performance Criteria Source
Aims • Have an explicit purpose • Derived from company’s objectives • Directly related to firm’s strategy
Globerson, 1985; Maskell, 1989
Benchmarking • Comparison of the organisations in the same business Globerson, 1985
Purpose • Must be made explicit • Should reflect the business process • Rationale underlying the measure has to be specified
Globerson, 1985; Fortuin, 1988; Maskell, 1989; Lynch and Cross, 1991; Neely et al., 1997; Neely et al., 2000
Principles • Objective (not based on opinion) and simple to understand • Relevant and have visual impact • Focus on improvement rather than variance • Visible and clearly defined to all • Provide precise information • Consistent (maintain significance)
Hall, 1983; Globerson, 1985; Fortuin, 1988; Lea and Parker, 1989; Crawford and Cox, 1990; Azzone et al., 1991; House and Price, 1991; Lynch and Cross, 1991
Formulation
• Data collection and methods of calculating the performance criteria must be clearly defined • There is a link between strategies, action and measures • Geared to meet customers’ expectation and satisfaction • Relate to specific, stretching, but achievable goals/targets • Based on quantities that can be influenced or controlled by the users • Based on explicitly defined formula and source of data
Globerson, 1985; Lynch and Cross, 1991; Myeda et al., 2011
Weightage • Ratio based performance criteria are preferred to absolute numbers Globerson, 1985 Design • Integration of objective and subjective measures
• Cross-functional structure • Be focused on improvement rather than variance
Parker, 1989; Lynch and Cross, 1991; White, 1996; Lea and Parker, 1989; Hall et al., 1991; Atkinson and Brown, 2001; Wordsworth, 2001
Approach • Stimulate continuous improvement rather than simply monitor • System Audit approach • Incident Evaluation approach • Cause and effect relationship between the measures • Balanced view of the services system
Maskell 1989; Dwight, 1995; Wordsworth, 2001
Types • Adoption of non-financial measures • Consider objective or subjective measures or a combination of both
Andrews et al., 2006
Methods/Process • Discussions with the people involved (customers, employees, managers) Globerson, 1985; Sinclair and Zairi, 1996
Management • Under the control of the evaluated organisational unit • Part of a closed management loop
Globerson, 1985; Kaplan and Norton, 1992
Implementation • Flexible to changes in performance and circumstances • Simple and easy to use • Provide timely/fast and accurate feedback • Use data which are automatically collected as part of a process whenever possible
Globerson, 1985; Fortuin, 1988; Maskell, 1989; Dixon et al., 1990; McMann and Nanni, 1994;Bourne et al., 2000; Myeda et al., 2011
Report • Should be reported in a simple consistent format • Regular reporting
Maskell, 1989; Lynch and Cross, 1991
Figure 5.3: Important elements to consider when designing and selecting appropriate performance measure
!!
120!
!
As the performance measures are drafted based on the organisation’s objectives,
indirectly the framework also identifies the organisation’s core position and,
therefore, progress towards organisation-wide integration (Amaratunga and Baldry,
2003). A good PMS or PM framework should include subjective performance
measures as well as objective performance measures. The objective performance
measures are addressed in order to have the advantage of not being biased by
whoever is providing the opinion. Conversely, subjective performance measures
provide a wealth and variety that is not obtainable from objective performance
measures alone (White, 1996). Myeda et al. (2011) also suggest that the formulation
of performance measures must be geared to meet customers’ expectation and
satisfaction. Customers’ concerns tend to fall into four categories: time, quality,
performance and service (Kaplan and Norton, 1992), and consist of performance
measures relating to the most desired customer requirements (Amaratunga and
Baldry, 2003).
According to Neely et al. (1997), customer service is a multi-dimensional concept
and, like quality and flexibility, it can be affected by both tangible and intangible
factors. Customers may base their assessment of the level of service they receive
on factors such as the value of the product or service, their satisfaction with their
environment in which they receive their service, and the speed with which the
service is delivered. However, the essence of customer service will vary from one
organisation to the other. Hence, it is important to consider what are the
requirements and perceptions of customers to the service delivered. This will be one
of the pillars in selecting and constructing appropriate performance measures.
Performance measures also have a behavioural impact on how systems, especially
systems involving humans, how they actually respond to specified performance
measures. People modify their behaviours in an attempt to ensure a positive
performance outcome, even if this means pursuing inappropriate courses of action
(Hoopwood, 1984). Those organisations that can translate their PMS are far better
able to execute their strategy because they can communicate their objectives and
their targets (Amaratunga and Baldry, 2003). The ideal PM situation is one in which
there is widespread agreement about what the organisation should be doing and
that this goal can be accurately identified through a limited number of performance
measures. Unfortunately, this rarely exists for public organisations (Pandey and
Moynihan, 2006).
!!
121!
!
PM has already been described as a process of assessing the progress towards
achieving pre-determined goals, including information on the efficiency with which
resources are transformed into goods and services, the quality of those outputs and
outcomes, and the effectiveness of organisational operations in terms of their
specific contributions to organisational objectives (Amaratunga and Baldry, 20003).
Bititci et al. (2000) also suggest that the PMS needs to be dynamic by being able to:
cope with the changes to the external and internal environment of the organisation,
deploy significant changes to the internal objectives and priorities to critical parts of
the organisation, and ensure alignment at all times and that gains are achieved
throughout the improvement programmes.
Performance is closely related to end customer values. Obvious difficulties lie in
understanding and describing user values and in determining the conformity of the
delivered products with these values (Trinius and Sjostrom, 2005). A best practice
PM framework should represent the criteria that the FM organisation should fulfil in
order to be fully integrated with the rest of the organisation. FM tasks and services
indicate that they range from pure service tasks to more complex tasks (Haas,
2010). In this respect, facilities managers need to identify how FM could be
integrated with other departments within the core organisations (Amaratunga and
Baldry, 20003). On the other hand, from the micro perspective, an increasing
number of organisations are finding it profitable to adopt strategies that require the
development of closer partnership relationships with their major suppliers (Croom et
al., 2000).
Different stakeholders will have different expectations concerning building
performance. They normally express performance requirements from their sphere of
interest and are influenced by their priorities in aspects of building performance.
Five key stakeholders in the building sector are listed to indicate their differences in
perspective and expectations, namely the users, investors, regulators, product
manufacturers and designers (Trinius and Sjostrom, 2005). Therefore, Amaratunga
and Baldry (2003) have suggested the following:
• PM in FM should be based upon how useful FM is to the business
• The measurement of the whole of the FM function should be involved rather
than merely summing the parts
• The challenge of measuring what is really important and not continuing the
mistake of placing the emphasis on the importance of measurement.
!!
122!
!
As for the reporting of management aspects, the decision-makers must be enabled
to identify relevant performance requirements that reflect the current situations as
well as reflecting the requirements expressed on higher levels of concern (Trinius
and Sjostrom, 2005). The internal processes report on the efficiency of internal
organisational processes and procedures, and reflect the organisation’s core skills
and the critical technology involved in adding value to the business. They enable the
FM organisation to satisfy stakeholder expectations, including producing excellent
financial returns (Amaratunga and Baldry, 2003). The organisation’s internal
processes focus on the internal business results and lead to financial success and
the satisfaction of customers’ expectations (Olve et al., 1999). Measurement should
be focused on the internal processes that will have the greatest impact on customer
satisfaction and achieve the organisation’s financial objectives (Amaratunga and
Baldry, 2003).
There is a rising need for organisations to reassess their measurement systems, but
managers still do not complete their review of management systems. Reasons given
were lack of time and other business pressure (Neely et al., 2000). The lack of well-
defined performance criteria, through which performance of individuals and the
organisation may be evaluated, make it hard to plan and control (Globerson, 1985).
Responding to this, this study’s proposed framework can be a good reference as it
combines both academic theory and practised measures in the industry, which is
also the unique point of this research. It is believed that there are problems arising
during the design process, particularly at the discussion stage regarding selection of
appropriate performance measures, whereby there is resistance to measurement,
and also top management commitment is being distracted by other events (Bourne
et al., 2000)
5.9 Service Classification Parameters
The service characteristics above influence the way the FM function can manage
the service and the processes involved in delivering the service (Haas, 2010).
These more complex tasks also have interfaces with other internal organisation
departments as well as with external service providers, implying that the FM function
in this broad perspective spans professional skills and functions (Tay and Ooi,
2001). The service area of FM is where the greatest focus is on the outsourcing of
FM service processes (Haas, 2010) and is seen as the processes supporting the
core business processes, for example, IT, catering, reception and cleaning (Jensen,
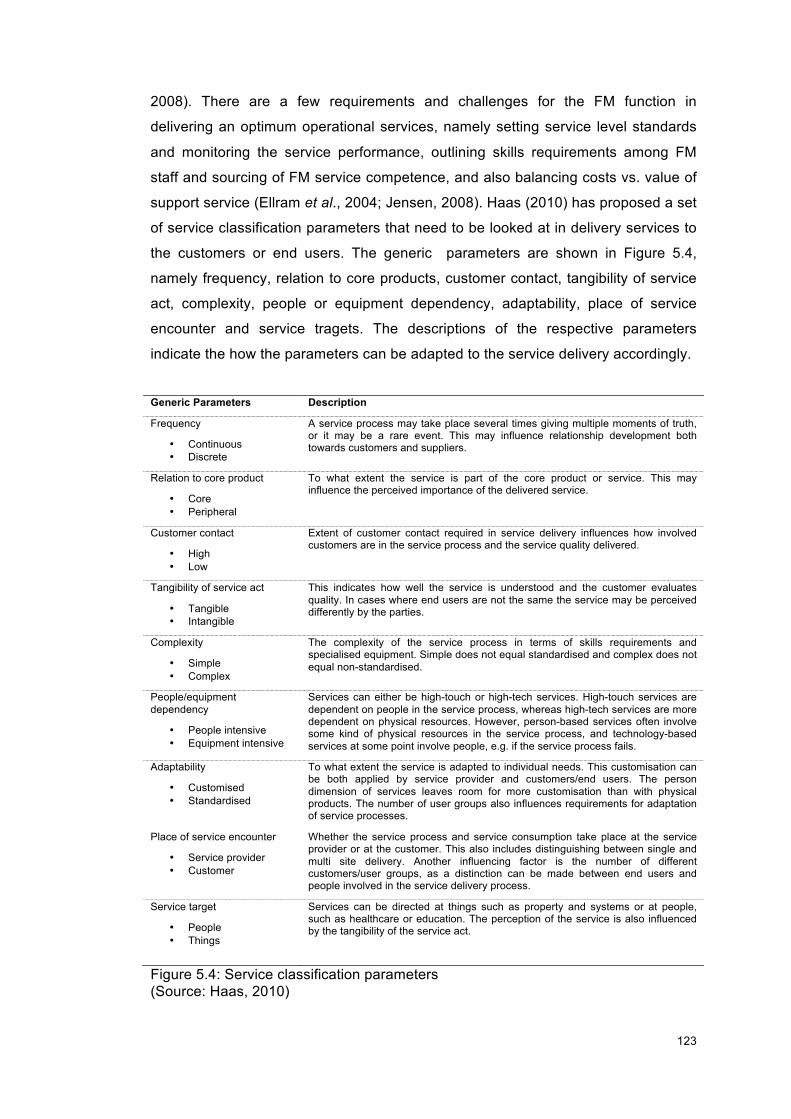
!!
123!
!
2008). There are a few requirements and challenges for the FM function in
delivering an optimum operational services, namely setting service level standards
and monitoring the service performance, outlining skills requirements among FM
staff and sourcing of FM service competence, and also balancing costs vs. value of
support service (Ellram et al., 2004; Jensen, 2008). Haas (2010) has proposed a set
of service classification parameters that need to be looked at in delivery services to
the customers or end users. The generic parameters are shown in Figure 5.4,
namely frequency, relation to core products, customer contact, tangibility of service
act, complexity, people or equipment dependency, adaptability, place of service
encounter and service tragets. The descriptions of the respective parameters
indicate the how the parameters can be adapted to the service delivery accordingly.
Generic Parameters Description
Frequency
• Continuous • Discrete
A service process may take place several times giving multiple moments of truth, or it may be a rare event. This may influence relationship development both towards customers and suppliers.
Relation to core product
• Core • Peripheral
To what extent the service is part of the core product or service. This may influence the perceived importance of the delivered service.
Customer contact
• High • Low
Extent of customer contact required in service delivery influences how involved customers are in the service process and the service quality delivered.
Tangibility of service act
• Tangible • Intangible
This indicates how well the service is understood and the customer evaluates quality. In cases where end users are not the same the service may be perceived differently by the parties.
Complexity
• Simple • Complex
The complexity of the service process in terms of skills requirements and specialised equipment. Simple does not equal standardised and complex does not equal non-standardised.
People/equipment dependency
• People intensive • Equipment intensive
Services can either be high-touch or high-tech services. High-touch services are dependent on people in the service process, whereas high-tech services are more dependent on physical resources. However, person-based services often involve some kind of physical resources in the service process, and technology-based services at some point involve people, e.g. if the service process fails.
Adaptability
• Customised • Standardised
To what extent the service is adapted to individual needs. This customisation can be both applied by service provider and customers/end users. The person dimension of services leaves room for more customisation than with physical products. The number of user groups also influences requirements for adaptation of service processes.
Place of service encounter
• Service provider • Customer
Whether the service process and service consumption take place at the service provider or at the customer. This also includes distinguishing between single and multi site delivery. Another influencing factor is the number of different customers/user groups, as a distinction can be made between end users and people involved in the service delivery process.
Service target
• People • Things
Services can be directed at things such as property and systems or at people, such as healthcare or education. The perception of the service is also influenced by the tangibility of the service act.
Figure 5.4: Service classification parameters (Source: Haas, 2010)
!!
124!
!
5.10 Principles of Supply Chain Management in FM
It is becoming increasingly more difficult and less economical for companies to
produce their needs on their own (Gunasekaran et al., 2001) and the solution to this
is by taking the outsourcing approach. Supply Chain Management (SCM) has the
same focus as FM, that is, to add value to the customer, and concerns on delivering
the best result to the end users. Mohd-Noor and Pitt (2009b) also suggest that SCM
principles can be applied to have a more effective organisational supply chain for
FM service delivery. There are areas where FM could gain advantages from SCM
and they have similarities in dealing with a non-physical product, that is, a service,
and are focused on customer demand, service levels and performance measures
(Haas, 2010).
An interesting theory has been proposed by Haas (2010), where the comparison of
SCM process and FM service scopes, namely space management, operational
services, and service, is carried out (refer to Table 5.1). There are opportunities for
FM in specifying PM requirements to align with SCM scopes and context, especially
as SCM is believed to have a more established identity than FM. This is supported
by McLennan (2004), who states that the lack of conceptual or theoretical
management framework is part of the reason why FM remains misunderstood in the
general business sector.
The theoretical comparison also indicates that performance metrics can be
specifically identified according to SCM service elements like information flow,
capacity and skills management, customer relationship management, supplier
relationship management, service delivery management, cash flow and demand
management.
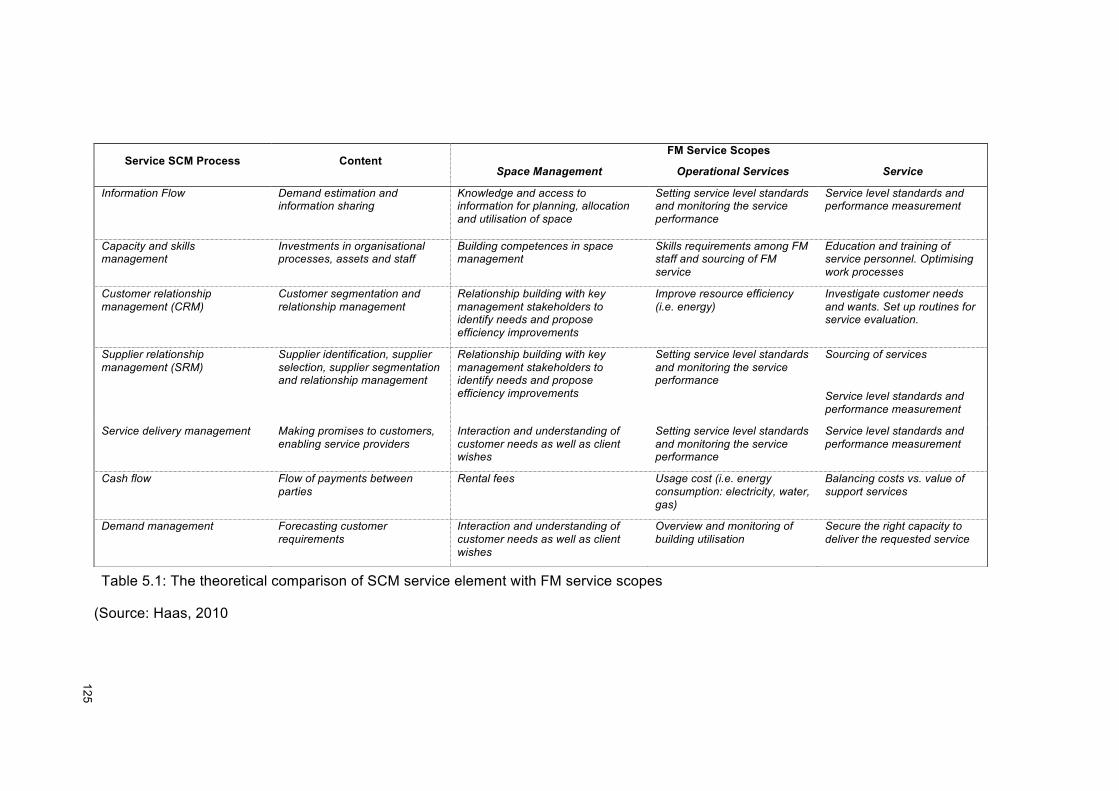
!!
125!
!
(Source: Haas, 2010
Service SCM Process Content FM Service Scopes
Space Management Operational Services Service
Information Flow Demand estimation and information sharing
Knowledge and access to information for planning, allocation and utilisation of space
Setting service level standards and monitoring the service performance
Service level standards and performance measurement
Capacity and skills management
Investments in organisational processes, assets and staff
Building competences in space management
Skills requirements among FM staff and sourcing of FM service
Education and training of service personnel. Optimising work processes
Customer relationship management (CRM)
Customer segmentation and relationship management
Relationship building with key management stakeholders to identify needs and propose efficiency improvements
Improve resource efficiency (i.e. energy)
Investigate customer needs and wants. Set up routines for service evaluation.
Supplier relationship management (SRM)
Supplier identification, supplier selection, supplier segmentation and relationship management
Relationship building with key management stakeholders to identify needs and propose efficiency improvements
Setting service level standards and monitoring the service performance
Sourcing of services
Service level standards and performance measurement
Service delivery management Making promises to customers, enabling service providers
Interaction and understanding of customer needs as well as client wishes
Setting service level standards and monitoring the service performance
Service level standards and performance measurement
Cash flow Flow of payments between parties
Rental fees Usage cost (i.e. energy consumption: electricity, water, gas)
Balancing costs vs. value of support services
Demand management Forecasting customer requirements
Interaction and understanding of customer needs as well as client wishes
Overview and monitoring of building utilisation
Secure the right capacity to deliver the requested service
Table 5.1: The theoretical comparison of SCM service element with FM service scopes
!! 126!
!
5.11 Pilot Study Survey
!This section presents the findings from pilot study survey and analysis. The
questionnaire design, scales used and also the analysis of the findings from each
survey section are presented. The objective of the Phase 1 pilot survey data
collection and analysis is to understand the current scenario of FM practice in
Malaysia. The findings give an overview of the responses from the FM practitioners
in relation to the FM knowledge and the implementation of PMS in their FM
services.
!
The survey serves as a preliminary study that helps to give an idea of the main
subjects of the research, which are FM and PM. The focus was to comprehend
respondents’ understanding of FM maturity and knowledge, strategic FM, and
client’s corporate objectives as well as the implementation of PMS in FM. The pilot
study survey was conducted within the research sample, that is, FM practitioners in
Malaysia, to gain an understanding of the elements of FM and PM in their practice.
The results also prove that there is an opportunity for further exploration on the
subject of FM and PM in Malaysia.
5.11.1 Questionnaire Design
A qualitative survey adopted at this level of data collection as it provides a
quantitative or numeric description of trends, attitudes, or opinions of a population
by studying a sample of that population. The questionnaire survey includes cross-
sectional and longitudinal studies using questionnaires for data collection, with the
intent of generalising from a sample to a population (Babbie, 1990). The survey was
chosen at the preliminary stage, as it is believed to give good statistics and
numerical results to perceive the viability of the research scope. The questionnaire
is a survey instrument used to elicit information from the respondents as it translates
the information needed into a set of specific questions that the respondents can and
will answer (Mahmud, 2008). This methodology is also the best approach to obtain
an explanation and understanding of the current FM industry in Malaysia. This
questionnaire is designed to be straightforward and simple. Ali (2009) believes this
design and approach is more likely to attract higher responses. This research was
conducted by using a qualitative survey approach aimed at FM practitioners in
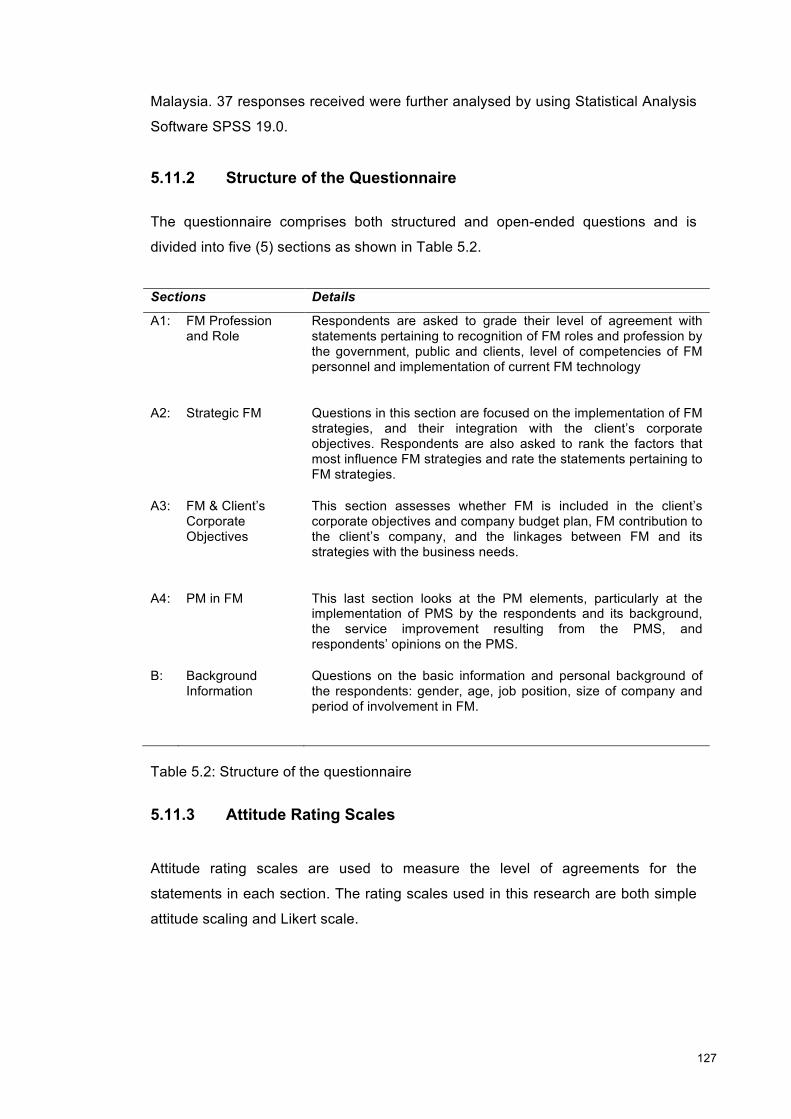
!! 127!
!
Malaysia. 37 responses received were further analysed by using Statistical Analysis
Software SPSS 19.0.
5.11.2 Structure of the Questionnaire
The questionnaire comprises both structured and open-ended questions and is
divided into five (5) sections as shown in Table 5.2.
Sections Details
A1:
FM Profession and Role
Respondents are asked to grade their level of agreement with statements pertaining to recognition of FM roles and profession by the government, public and clients, level of competencies of FM personnel and implementation of current FM technology
A2:
Strategic FM
Questions in this section are focused on the implementation of FM strategies, and their integration with the client’s corporate objectives. Respondents are also asked to rank the factors that most influence FM strategies and rate the statements pertaining to FM strategies.
A3:
FM & Client’s Corporate Objectives
This section assesses whether FM is included in the client’s corporate objectives and company budget plan, FM contribution to the client’s company, and the linkages between FM and its strategies with the business needs.
A4:
PM in FM
This last section looks at the PM elements, particularly at the implementation of PMS by the respondents and its background, the service improvement resulting from the PMS, and respondents’ opinions on the PMS.
B:
Background Information
Questions on the basic information and personal background of the respondents: gender, age, job position, size of company and period of involvement in FM.
Table 5.2: Structure of the questionnaire
5.11.3 Attitude Rating Scales
!Attitude rating scales are used to measure the level of agreements for the
statements in each section. The rating scales used in this research are both simple
attitude scaling and Likert scale.
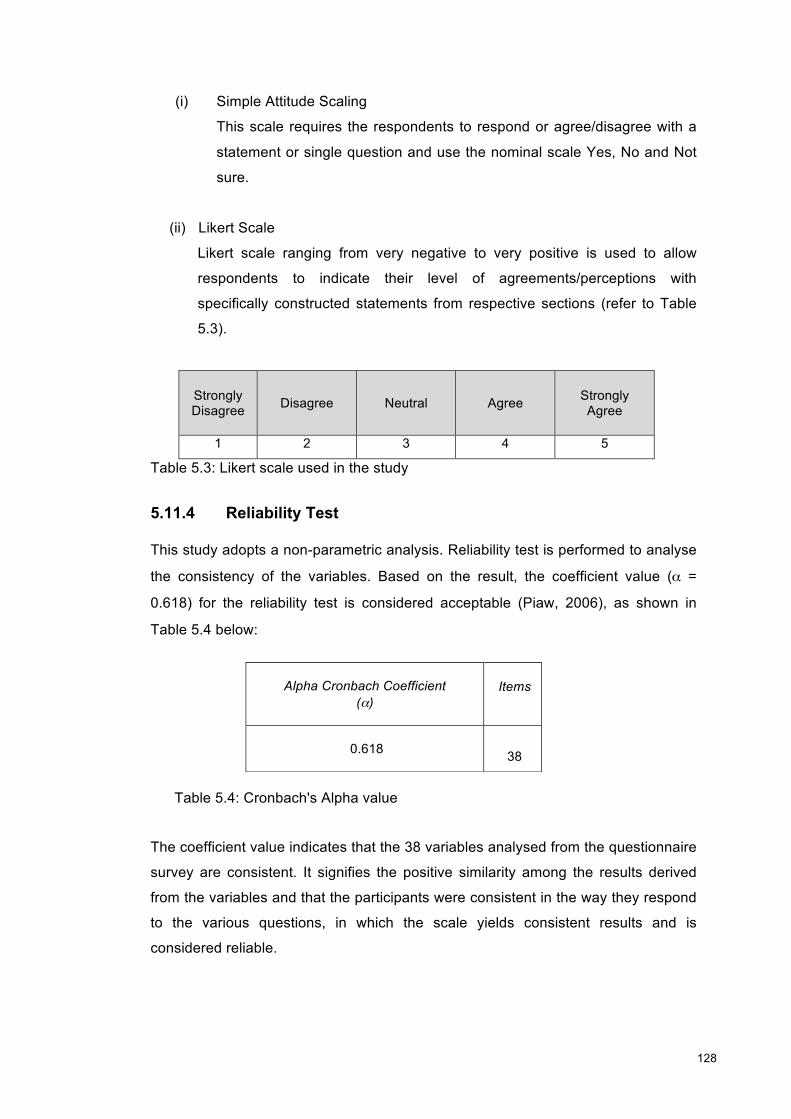
!! 128!
!
(i) Simple Attitude Scaling
This scale requires the respondents to respond or agree/disagree with a
statement or single question and use the nominal scale Yes, No and Not
sure.
(ii) Likert Scale
Likert scale ranging from very negative to very positive is used to allow
respondents to indicate their level of agreements/perceptions with
specifically constructed statements from respective sections (refer to Table
5.3).
Strongly Disagree Disagree Neutral Agree Strongly
Agree
1 2 3 4 5
Table 5.3: Likert scale used in the study 5.11.4 Reliability Test
This study adopts a non-parametric analysis. Reliability test is performed to analyse
the consistency of the variables. Based on the result, the coefficient value (α =
0.618) for the reliability test is considered acceptable (Piaw, 2006), as shown in
Table 5.4 below:
The coefficient value indicates that the 38 variables analysed from the questionnaire
survey are consistent. It signifies the positive similarity among the results derived
from the variables and that the participants were consistent in the way they respond
to the various questions, in which the scale yields consistent results and is
considered reliable.
Alpha Cronbach Coefficient
(α)
Items
0.618
38
Table 5.4: Cronbach's Alpha value
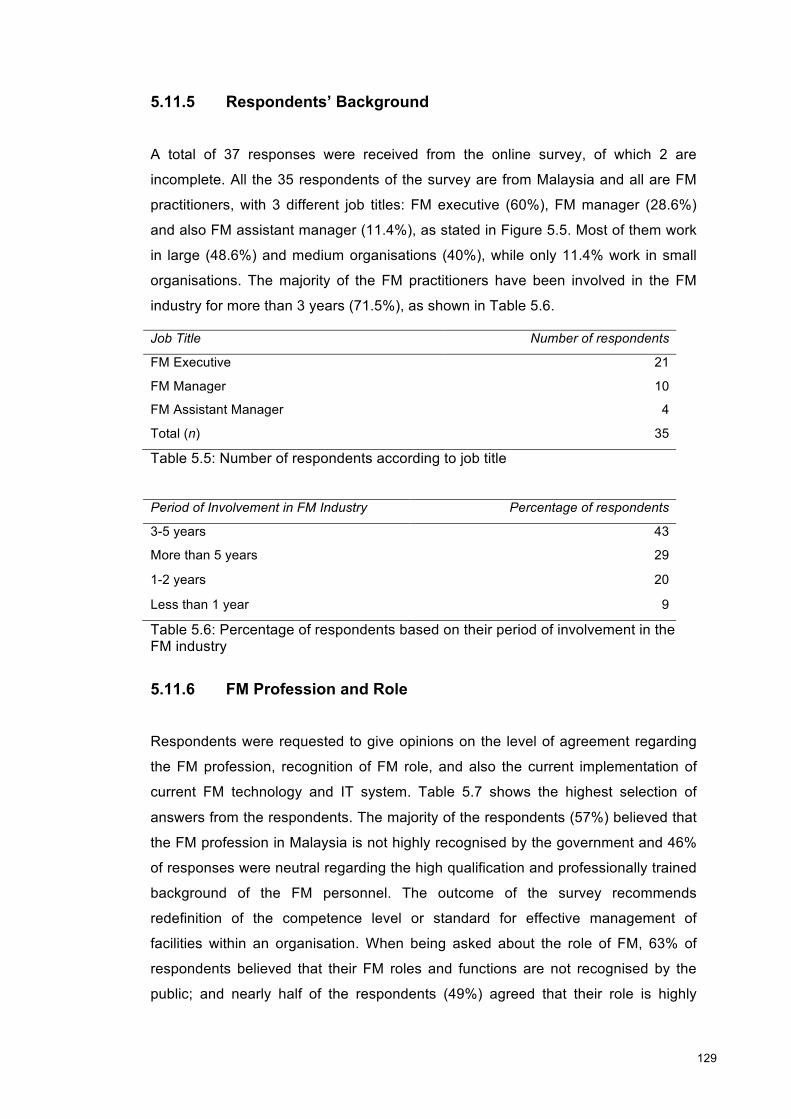
!! 129!
!
5.11.5 Respondents’ Background
A total of 37 responses were received from the online survey, of which 2 are
incomplete. All the 35 respondents of the survey are from Malaysia and all are FM
practitioners, with 3 different job titles: FM executive (60%), FM manager (28.6%)
and also FM assistant manager (11.4%), as stated in Figure 5.5. Most of them work
in large (48.6%) and medium organisations (40%), while only 11.4% work in small
organisations. The majority of the FM practitioners have been involved in the FM
industry for more than 3 years (71.5%), as shown in Table 5.6.
Job Title Number of respondents
FM Executive 21
FM Manager 10
FM Assistant Manager 4
Total (n) 35
Table 5.5: Number of respondents according to job title !
Period of Involvement in FM Industry Percentage of respondents
3-5 years 43
More than 5 years 29
1-2 years 20
Less than 1 year 9
Table 5.6: Percentage of respondents based on their period of involvement in the FM industry
5.11.6 FM Profession and Role
Respondents were requested to give opinions on the level of agreement regarding
the FM profession, recognition of FM role, and also the current implementation of
current FM technology and IT system. Table 5.7 shows the highest selection of
answers from the respondents. The majority of the respondents (57%) believed that
the FM profession in Malaysia is not highly recognised by the government and 46%
of responses were neutral regarding the high qualification and professionally trained
background of the FM personnel. The outcome of the survey recommends
redefinition of the competence level or standard for effective management of
facilities within an organisation. When being asked about the role of FM, 63% of
respondents believed that their FM roles and functions are not recognised by the
public; and nearly half of the respondents (49%) agreed that their role is highly
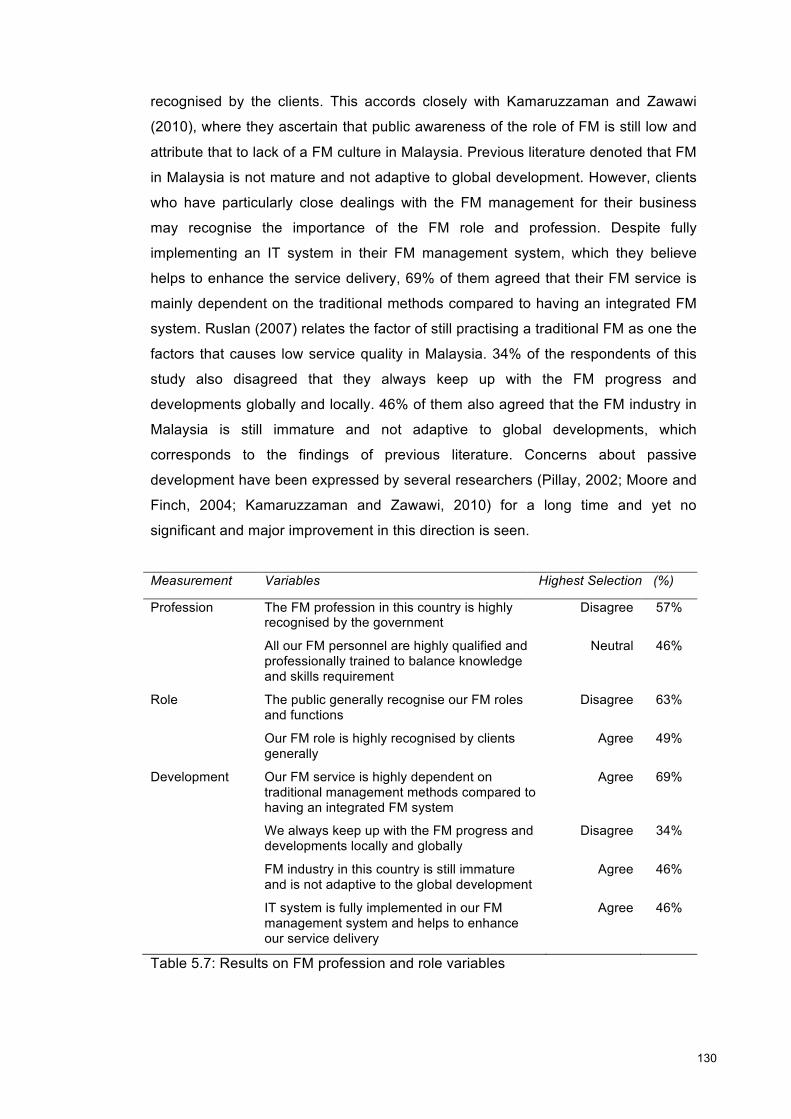
!! 130!
!
recognised by the clients. This accords closely with Kamaruzzaman and Zawawi
(2010), where they ascertain that public awareness of the role of FM is still low and
attribute that to lack of a FM culture in Malaysia. Previous literature denoted that FM
in Malaysia is not mature and not adaptive to global development. However, clients
who have particularly close dealings with the FM management for their business
may recognise the importance of the FM role and profession. Despite fully
implementing an IT system in their FM management system, which they believe
helps to enhance the service delivery, 69% of them agreed that their FM service is
mainly dependent on the traditional methods compared to having an integrated FM
system. Ruslan (2007) relates the factor of still practising a traditional FM as one the
factors that causes low service quality in Malaysia. 34% of the respondents of this
study also disagreed that they always keep up with the FM progress and
developments globally and locally. 46% of them also agreed that the FM industry in
Malaysia is still immature and not adaptive to global developments, which
corresponds to the findings of previous literature. Concerns about passive
development have been expressed by several researchers (Pillay, 2002; Moore and
Finch, 2004; Kamaruzzaman and Zawawi, 2010) for a long time and yet no
significant and major improvement in this direction is seen.
Measurement Variables Highest Selection (%)
Profession The FM profession in this country is highly recognised by the government
Disagree 57%
All our FM personnel are highly qualified and professionally trained to balance knowledge and skills requirement
Neutral 46%
Role The public generally recognise our FM roles and functions
Disagree 63%
Our FM role is highly recognised by clients generally
Agree 49%
Development Our FM service is highly dependent on traditional management methods compared to having an integrated FM system
Agree 69%
We always keep up with the FM progress and developments locally and globally
Disagree 34%
FM industry in this country is still immature and is not adaptive to the global development
Agree 46%
IT system is fully implemented in our FM management system and helps to enhance our service delivery
Agree 46%
Table 5.7: Results on FM profession and role variables
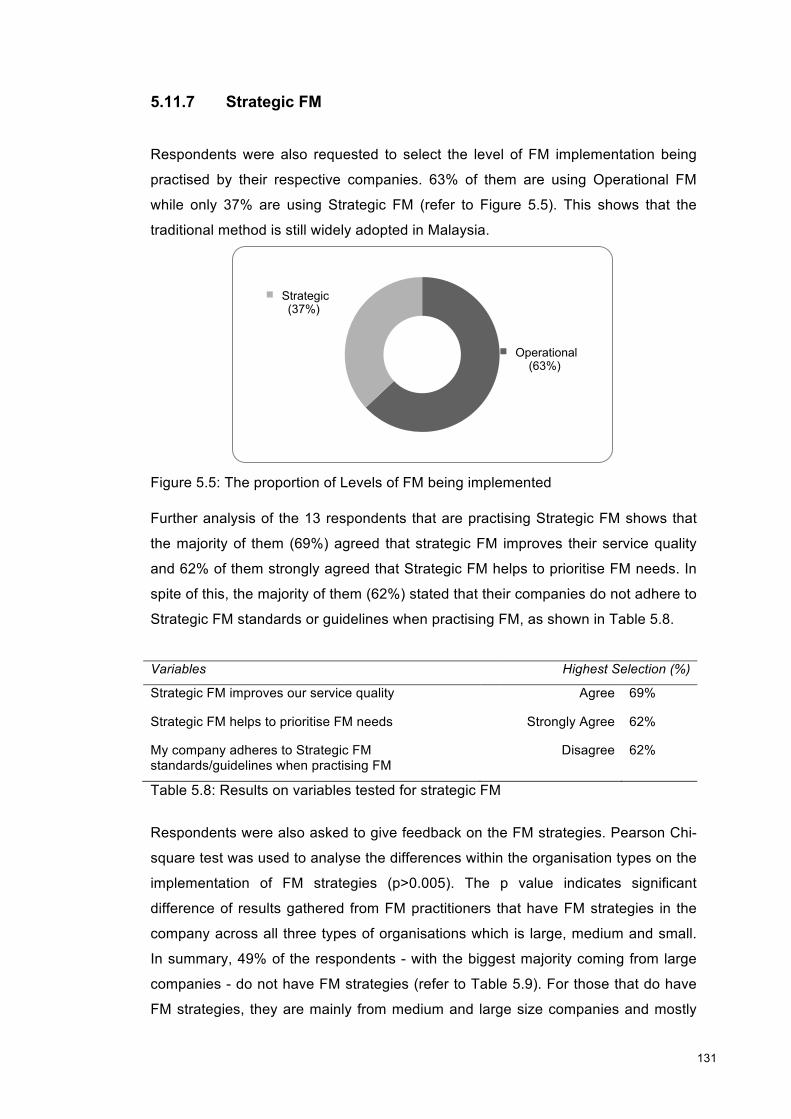
!! 131!
!
5.11.7 Strategic FM
Respondents were also requested to select the level of FM implementation being
practised by their respective companies. 63% of them are using Operational FM
while only 37% are using Strategic FM (refer to Figure 5.5). This shows that the
traditional method is still widely adopted in Malaysia.
!Figure 5.5: The proportion of Levels of FM being implemented !Further analysis of the 13 respondents that are practising Strategic FM shows that
the majority of them (69%) agreed that strategic FM improves their service quality
and 62% of them strongly agreed that Strategic FM helps to prioritise FM needs. In
spite of this, the majority of them (62%) stated that their companies do not adhere to
Strategic FM standards or guidelines when practising FM, as shown in Table 5.8.
Variables Highest Selection (%)
Strategic FM improves our service quality Agree 69%
Strategic FM helps to prioritise FM needs Strongly Agree 62%
My company adheres to Strategic FM standards/guidelines when practising FM
Disagree 62%
Table 5.8: Results on variables tested for strategic FM
Respondents were also asked to give feedback on the FM strategies. Pearson Chi-
square test was used to analyse the differences within the organisation types on the
implementation of FM strategies (p>0.005). The p value indicates significant
difference of results gathered from FM practitioners that have FM strategies in the
company across all three types of organisations which is large, medium and small.
In summary, 49% of the respondents - with the biggest majority coming from large
companies - do not have FM strategies (refer to Table 5.9). For those that do have
FM strategies, they are mainly from medium and large size companies and mostly
Operational (63%)
Strategic (37%)
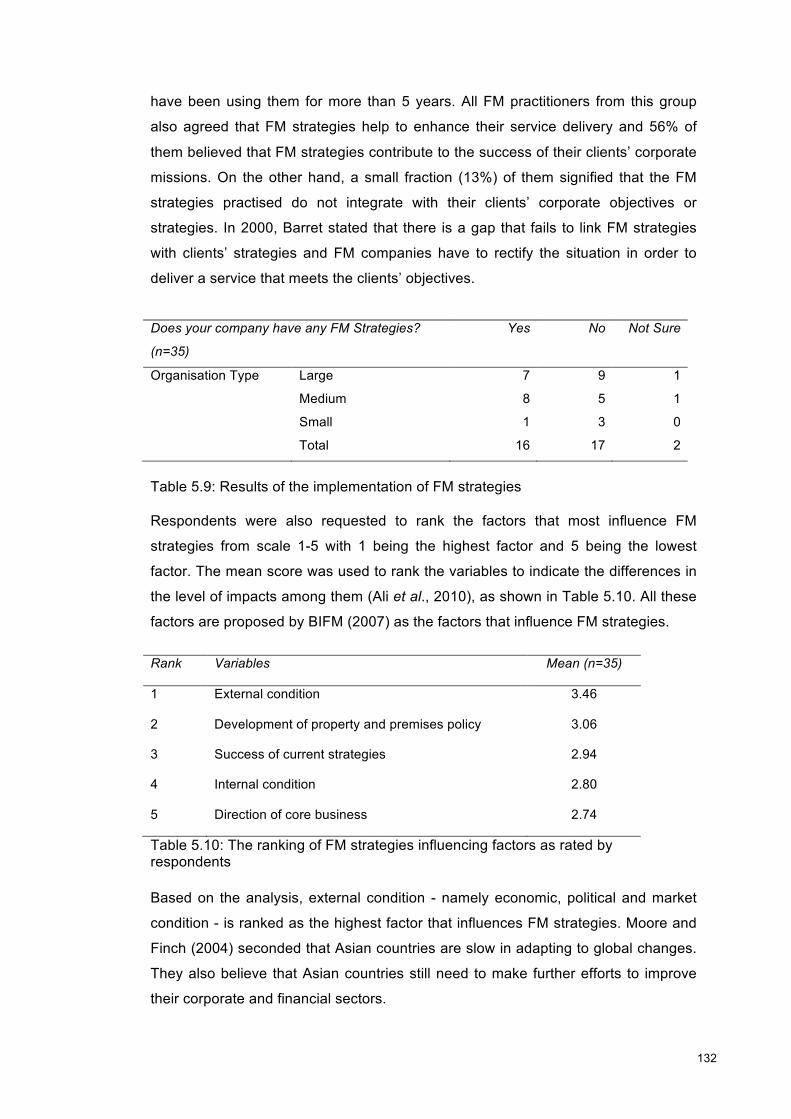
!! 132!
!
have been using them for more than 5 years. All FM practitioners from this group
also agreed that FM strategies help to enhance their service delivery and 56% of
them believed that FM strategies contribute to the success of their clients’ corporate
missions. On the other hand, a small fraction (13%) of them signified that the FM
strategies practised do not integrate with their clients’ corporate objectives or
strategies. In 2000, Barret stated that there is a gap that fails to link FM strategies
with clients’ strategies and FM companies have to rectify the situation in order to
deliver a service that meets the clients’ objectives.
Does your company have any FM Strategies?
(n=35)
Yes No Not Sure
Organisation Type Large 7 9 1
Medium 8 5 1
Small 1 3 0
Total 16 17 2
Table 5.9: Results of the implementation of FM strategies Respondents were also requested to rank the factors that most influence FM
strategies from scale 1-5 with 1 being the highest factor and 5 being the lowest
factor. The mean score was used to rank the variables to indicate the differences in
the level of impacts among them (Ali et al., 2010), as shown in Table 5.10. All these
factors are proposed by BIFM (2007) as the factors that influence FM strategies.
Rank Variables Mean (n=35)
1 External condition 3.46
2 Development of property and premises policy 3.06
3 Success of current strategies 2.94
4 Internal condition 2.80
5 Direction of core business 2.74
Table 5.10: The ranking of FM strategies influencing factors as rated by respondents !Based on the analysis, external condition - namely economic, political and market
condition - is ranked as the highest factor that influences FM strategies. Moore and
Finch (2004) seconded that Asian countries are slow in adapting to global changes.
They also believe that Asian countries still need to make further efforts to improve
their corporate and financial sectors.
!! 133!
!
Respondents also selected that the development of property and premises policy is
the second highest factor that influences FM strategies. They also perceived that
the success of current strategies is a moderate factor that determines FM strategies.
At the fourth rank, internal condition refers to the conditions of facilities or finance,
buildings and status of FM. Lastly, direction of core business is ranked as the lowest
factor that influences FM strategies.
In order to understand the practice of FM strategies, this survey requested the
respondents to select the factors that they believe are the barriers to the implication
of FM strategies. Seven variables were nominated as the barriers, as shown in
Figure 5.6 (BIFM, 2007). Lack of strategic planning in organisation and organisation
culture, beliefs and values are ranked as the two highest factors. As for other
factors, 2 respondents claimed that lack of budget and the difficulties in dealing with
council members about residential properties, which is similar to the sixth-ranked
factor - high stakeholders’ interest and involvement - are also obstacles in
implementing FM strategies.
!Figure 5.6: Barriers in implementing FM strategies
Other
Unacknowledged position of FM in
organisation
High stakeholders' interest and involvement
Senior management
resistance
Disorganised organisational
structure
Complicated decision making
process
Organisational culture, beliefs
and values
Lack of strategic planning in
organisation
!! 134!
!
5.11.8 FM and Client’s Corporate Objectives
The relationships between FM and client’s business were analysed based on the
practice of FM and its status or position in a client’s business. In Table 5.11, it can
be seen that 40% of the respondents agreed that FM is included in their client’s
corporate objectives. Nearly half of the respondents (40%) agreed that there is an
increasing recognition of FM’s contribution to the overall business performance.
Nevertheless, 31% of them signified neutral opinions when being asked whether
their clients understand the importance of FM strategies in reducing the overall cost.
Most of them (37%) also disagreed that FM is highly prioritised in their client’s
company budget. The respondents were also very positive that FM contribution to
the business largely depends on the position of FM in the organisation’s hierarchy.
This is reflected where 43% of them gave positive agreements on this statement.
Similarly, more than half of the respondents (57%) strongly agreed that FM should
be strategically planned and aligned to business needs.
Measurement Variables Highest Selection (%)
FM status/ position
FM is included in our client’s corporate objectives
Agree 40%
There is an increasing recognition of FM’s contribution to the overall business performance
Agree 40%
FM practice in client’s business
Our clients understand the importance of FM strategies in reducing the overall cost
Neutral 31%
FM is highly prioritised in the client’s company budget
Disagree 37%
FM contribution to the business largely depends on the position of FM in an organisation hierarchy
Agree 43%
FM should be strategically planned and aligned to business needs
Strongly Agree 57%
Table 5.11: The highest level of agreements on the FM status and practice in client's business
5.11.9 PM in FM
It was found that a large amount of respondents (60%) have no implementation of
PMS for their FM service delivery, as indicated in Figure 5.7. One survey participant
responded that the reason why PMS is not implemented is to avoid a strict key
performance indicator (KPI) in the service performance.
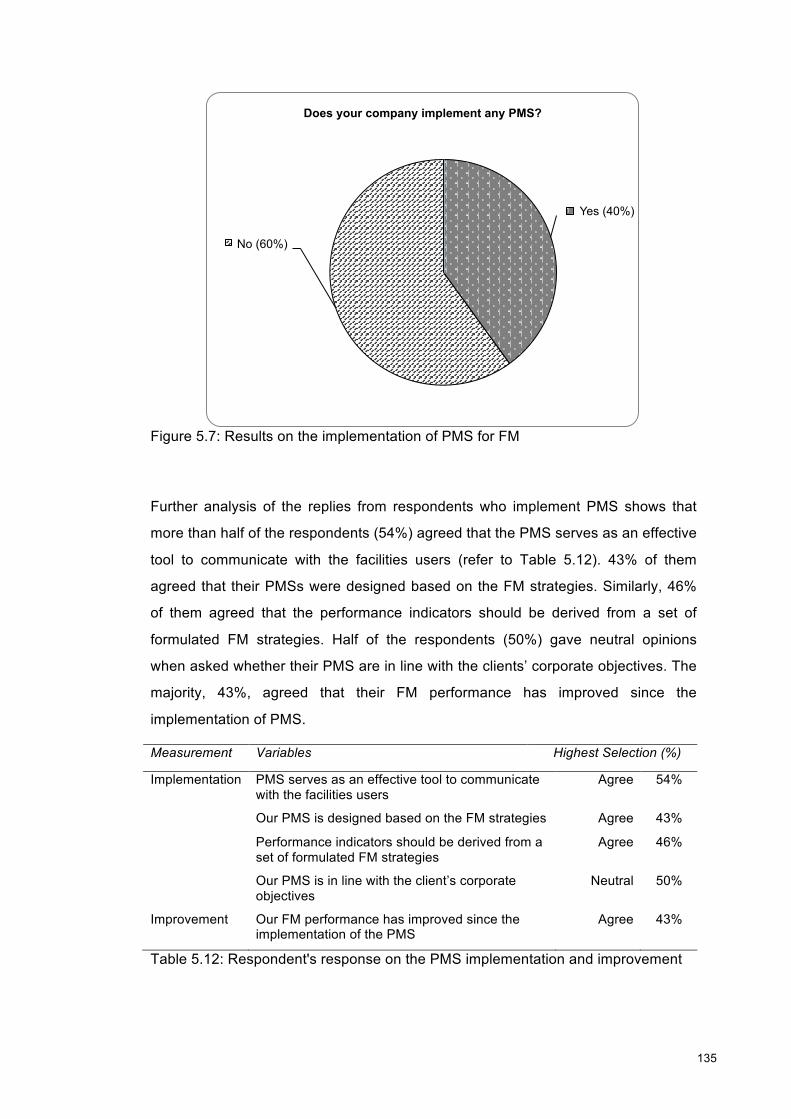
!! 135!
!
Figure 5.7: Results on the implementation of PMS for FM
Further analysis of the replies from respondents who implement PMS shows that
more than half of the respondents (54%) agreed that the PMS serves as an effective
tool to communicate with the facilities users (refer to Table 5.12). 43% of them
agreed that their PMSs were designed based on the FM strategies. Similarly, 46%
of them agreed that the performance indicators should be derived from a set of
formulated FM strategies. Half of the respondents (50%) gave neutral opinions
when asked whether their PMS are in line with the clients’ corporate objectives. The
majority, 43%, agreed that their FM performance has improved since the
implementation of PMS. Measurement Variables Highest Selection (%)
Implementation PMS serves as an effective tool to communicate with the facilities users
Agree 54%
Our PMS is designed based on the FM strategies Agree 43%
Performance indicators should be derived from a set of formulated FM strategies
Agree 46%
Our PMS is in line with the client’s corporate objectives
Neutral 50%
Improvement Our FM performance has improved since the implementation of the PMS
Agree 43%
Table 5.12: Respondent's response on the PMS implementation and improvement
Yes (40%)
No (60%)
Does your company implement any PMS?
!! 136!
!
5.11.10 Barriers in Implementing PMS
Respondents were also asked to select the problems that they faced in
implementing PMS or, for those who do not implement PMS, the barriers that they
perceived are potentially hindering the implementation of PMS in the FM service.
Table 5.13 shows the list of barriers or problems in implementing PMS based on the
ranks voted by the respondents. The proposed variables are derived from the
literature review and categorised into 4 elements, namely Management, Employee,
Formulation of Measures and Service Direction.
Results from Table 5.13 show that the top three problems identified in the
implementation of PMS are rooted in Service Direction where most of the
respondents are more focused on the short-term decision-making or goal only rather
than considering the long-term goal. They were also more reliant on the software
tool as the problem solution and most importantly they believed that lack of strategic
planning skill in planning for the performance monitoring and evaluation is also the
problem and barrier in implementing PMS. The respondents also provided some
problems that are not listed but which they believed are among the contributing
factors, for instance they believed that it is both time- and energy-consuming for
managers to focus on the implementation of PMS and also to train employees. They
also believed that they were much burdened with current workload and PMS is not
something that they would want to look into. They further believed that the top
management needs to give full support for the PMS implementation to ensure its
effectiveness.
As for the formulation of measures, they had no idea of where to start and how to
work on designing a PMS considering the lack of resources that they have. One of
their responses was also that they were not clear regarding the long-term goal of
PMS and the long-term benefits behind its implementation. In general, it can be
seen that the lack of strategic planning, service direction and management skills and
goals are the factors that hamper the implementation of PMS for FM in Malaysia.
The scenario fits with the slow progress of FM development in Malaysia, where
there is a lack of guidelines and procedures towards enhancing standard service
delivery. The implementation of PMS as a strategic step forward is considered new
and alien to the FM service sectors there, as the industry is still immature.
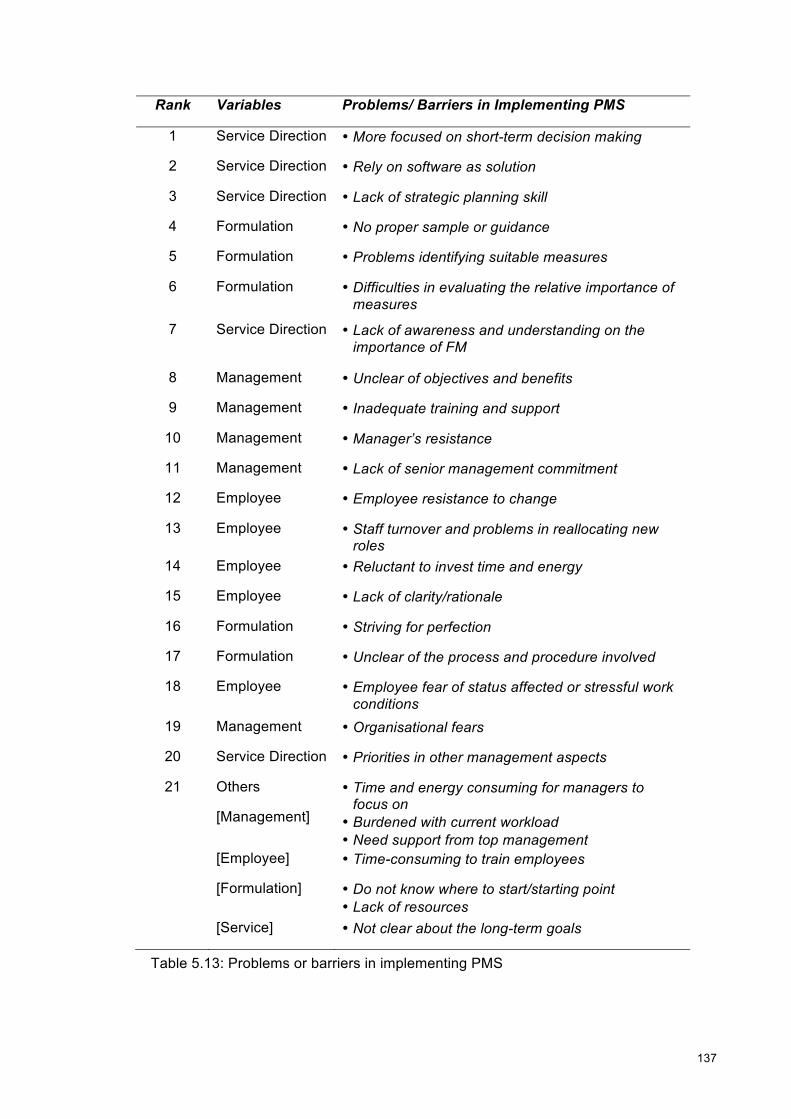
!! 137!
!
Rank Variables Problems/ Barriers in Implementing PMS
1 Service Direction • More focused on short-term decision making
2 Service Direction • Rely on software as solution
3 Service Direction • Lack of strategic planning skill
4 Formulation • No proper sample or guidance
5 Formulation • Problems identifying suitable measures
6 Formulation • Difficulties in evaluating the relative importance of measures
7 Service Direction • Lack of awareness and understanding on the importance of FM
8 Management • Unclear of objectives and benefits
9 Management • Inadequate training and support
10 Management • Manager’s resistance
11 Management • Lack of senior management commitment
12 Employee • Employee resistance to change
13 Employee • Staff turnover and problems in reallocating new roles
14 Employee • Reluctant to invest time and energy
15 Employee • Lack of clarity/rationale
16 Formulation • Striving for perfection
17 Formulation • Unclear of the process and procedure involved
18 Employee • Employee fear of status affected or stressful work conditions
19 Management • Organisational fears
20 Service Direction • Priorities in other management aspects
21 Others
[Management]
• Time and energy consuming for managers to focus on
• Burdened with current workload • Need support from top management
[Employee] • Time-consuming to train employees
[Formulation] • Do not know where to start/starting point • Lack of resources
[Service] • Not clear about the long-term goals
Table 5.13: Problems or barriers in implementing PMS
!! 138!
!
5.12 Pilot Study Conclusion
The overall survey findings show that the FM industry in Malaysia is still not fully
developed and is yet to be up to par with FM industries in other countries. With the
majority of FM practitioners still implementing operational FM and having no
performance measurement system in their practice, the future of this industry in
Malaysia is hard to predict. The industry appears to be passive, as it has seen little
development since the first statement in 2001 by the then Deputy Prime Minister of
Malaysia Datuk Seri Abdullah Badawi on the need for change in the provision of
good services and improvements in the upkeep of buildings.
This study proposes a summary of the FM scenario in Malaysia based on the
literature review and findings (refer to Figure 5.8). Generally, the overview of the FM
scenario in Malaysia can be classified into seven sectors namely: level of growth,
practice, service, profession, opportunities, demands and challenges. In summary,
the FM scenario in Malaysia is still lacking an FM culture, is passive and is in need
of radical changes in order to move forward. The implementation of traditional
management, lack of understanding, no FM guidelines and standards are among
the failures that continue to hamper the development of the FM industry in Malaysia.
However, since FM is still a new subject in Malaysia, there is flexibility for different
techniques and approaches for FM practice. There is also a strong outsourcing
demand for FM as a third party, especially since the recent combination of
outsourcing and privatisation by the government. As a final output of this research,
PERFM is anticipated to improve the current scenario of FM generally and to
improve the quality of service so the public will recognise the FM profession.
Although there is a limitation in the responses received for the preliminary study, the
results have shown that the FM profession in Malaysia needs to be further
addressed and studied. There is also a research gap in the literature about the FM
industry in Malaysia and this study proposes to conduct a further study and analysis
focusing on the FM profession and its service delivery.
The pilot study findings have shown that there is a need and opportunities for the
scopes of PM and FM to be further explored in FM industry in Malaysia. It also
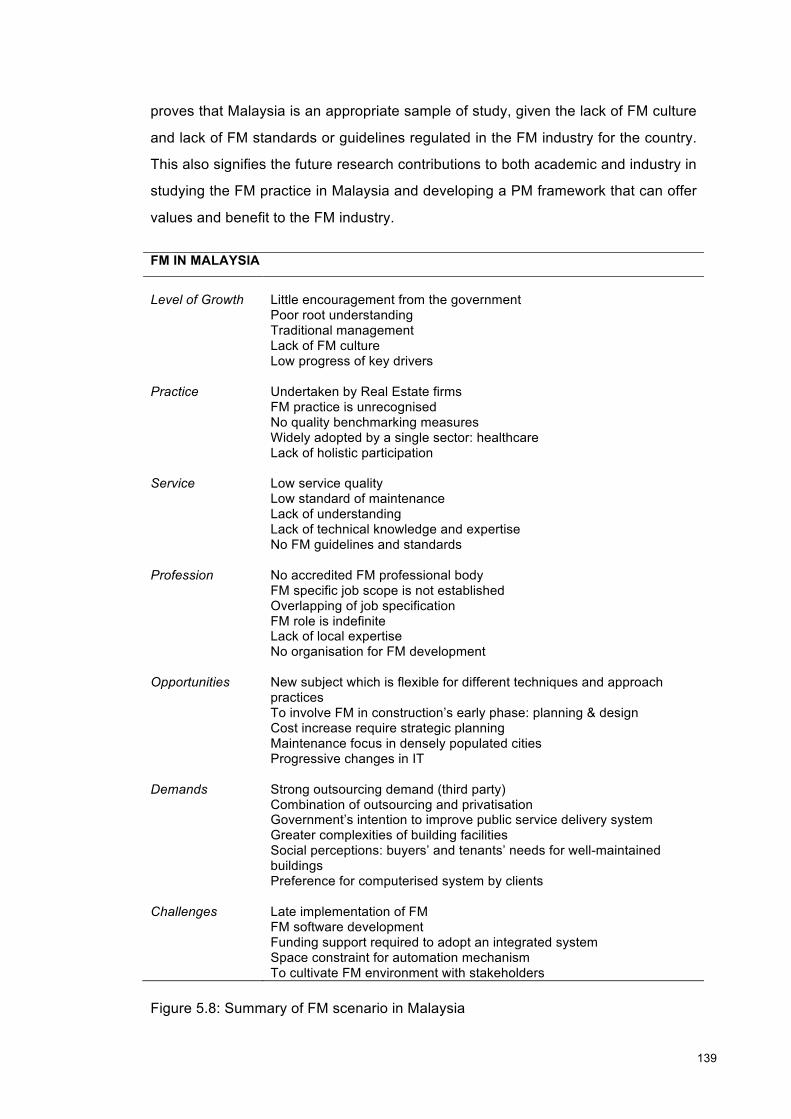
!! 139!
!
proves that Malaysia is an appropriate sample of study, given the lack of FM culture
and lack of FM standards or guidelines regulated in the FM industry for the country.
This also signifies the future research contributions to both academic and industry in
studying the FM practice in Malaysia and developing a PM framework that can offer
values and benefit to the FM industry.
FM IN MALAYSIA
Level of Growth
Little encouragement from the government Poor root understanding Traditional management Lack of FM culture Low progress of key drivers
Practice Undertaken by Real Estate firms FM practice is unrecognised No quality benchmarking measures Widely adopted by a single sector: healthcare Lack of holistic participation
Service Low service quality Low standard of maintenance Lack of understanding Lack of technical knowledge and expertise No FM guidelines and standards
Profession No accredited FM professional body FM specific job scope is not established Overlapping of job specification FM role is indefinite Lack of local expertise No organisation for FM development
Opportunities New subject which is flexible for different techniques and approach practices To involve FM in construction’s early phase: planning & design Cost increase require strategic planning Maintenance focus in densely populated cities Progressive changes in IT
Demands Strong outsourcing demand (third party) Combination of outsourcing and privatisation Government’s intention to improve public service delivery system Greater complexities of building facilities Social perceptions: buyers’ and tenants’ needs for well-maintained buildings Preference for computerised system by clients
Challenges Late implementation of FM FM software development Funding support required to adopt an integrated system Space constraint for automation mechanism To cultivate FM environment with stakeholders
!Figure 5.8: Summary of FM scenario in Malaysia
!! 140!
!
5.13 Chapter Summary
! Literature that has been covered in the earlier part of this chapter gives a good
understanding of a PM framework as to what needs to be focused and also the
steps in selecting appropriate performance measures. The latter part demonstrates
the pilot study survey conducted and findings derived from the analysis of the
questionnaire survey to the respondents. The qualitative survey findings have
contributed to the overall understanding of the PM and FM among the FM
practitioners in support of the literature review. The information and results gathered
from the survey analysis has also given a positive indication on a further exploration
of both PM and FM aspects particularly in Malaysian context. The preliminary
findings also denotes the demand of an innovate tool such as PERFM for the FM
practice and industry advancement in Malaysia.
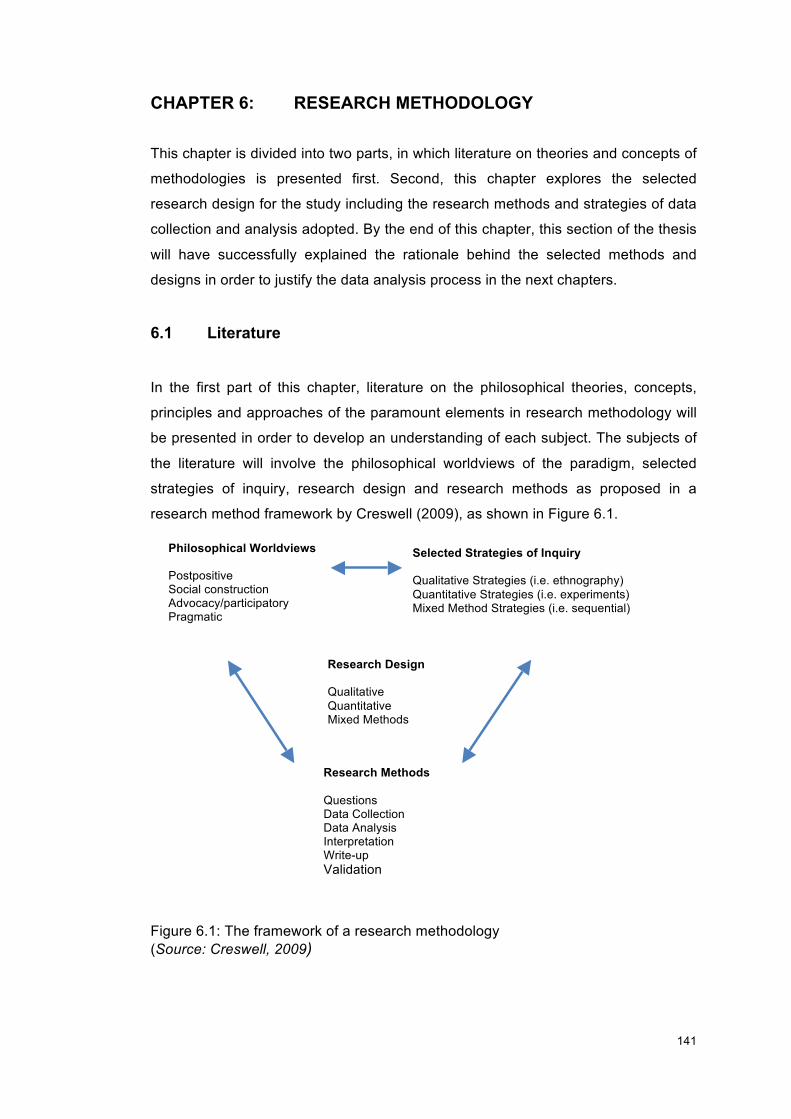
!!
141!
!
CHAPTER 6: RESEARCH METHODOLOGY This chapter is divided into two parts, in which literature on theories and concepts of
methodologies is presented first. Second, this chapter explores the selected
research design for the study including the research methods and strategies of data
collection and analysis adopted. By the end of this chapter, this section of the thesis
will have successfully explained the rationale behind the selected methods and
designs in order to justify the data analysis process in the next chapters.
6.1 Literature In the first part of this chapter, literature on the philosophical theories, concepts,
principles and approaches of the paramount elements in research methodology will
be presented in order to develop an understanding of each subject. The subjects of
the literature will involve the philosophical worldviews of the paradigm, selected
strategies of inquiry, research design and research methods as proposed in a
research method framework by Creswell (2009), as shown in Figure 6.1.
Philosophical Worldviews Postpositive Social construction Advocacy/participatory Pragmatic !
Selected Strategies of Inquiry Qualitative Strategies (i.e. ethnography) Quantitative Strategies (i.e. experiments) Mixed Method Strategies (i.e. sequential)
Research Design Qualitative Quantitative Mixed Methods!
Research Methods Questions Data Collection Data Analysis Interpretation Write-up Validation !
Figure 6.1: The framework of a research methodology (Source: Creswell, 2009) !
!!
142!
!
In the next part of this chapter, the framework or structure of the research
methodology will be outlined and justifications to support the selection will be
presented therein.
6.1.1 Paradigm Paradigms are worldviews and beliefs about the nature of reality, knowledge and
values (Schwandt, 1989) that guide researchers (Guba and Lincoln, 1994).
Paradigm is a special form of concept, which has gained importance not only in
social and related science but also in the philosophy of science, from where the
influence on contemporary empirical research stems (Bergman, 2010). Similarly,
Morgan (2007) sees paradigm as the consensual set of beliefs and practices that
guide a field in science studies. Paradigms are frameworks for thinking about
research design, measurement, analysis and personal involvement (Patton, 1982).
A paradigm is also an organising framework, which contains the concepts, theories,
assumptions, beliefs, values, and principles that inform a discipline on how to
interpret subject matter of concern. The paradigm also contains the research
methods considered best to generate knowledge and suggests that which is open
and not open to inquiry at the time (Powers and Knapp, 1990).
Onwuegbuzie and Leech (2005) believe that research can be viewed from a unified
perspective and Patton (1982) sees this in the value of making mind shifts back and
forth between the paradigms. However, Schwandt (1989) disagrees, as he is not
clear as to how such an astonishing feat is to be accomplished. Paradigm as a
worldview means that it is seen as the ways of experiencing and thinking about the
world, including beliefs on morals, values and aesthetics. It serves as a basic set of
assumptions that guide researchers’ actions and inquiries (Guba, 1990; Creswell,
1998; Creswell, 2009). This takes into account the personal view, experience,
preferences and cultures in conducting the studies and how to make them work.
Guba (1990) interprets worldview as a basic set of beliefs that guide actions. Others
have called the beliefs as paradigm (Lincoln & Guba, 2000; Mertens, 1998);
epistemologies and ontologies (Crotty, 1998), or broadly conceived research
methodologies (Neuman, 2000).
!!
143!
!
6.1.1.1 The Postpositivist Worldview
The postpositivist worldview represents the traditional form of research and is
sometimes called the ‘scientific method’ mainly because it is focused on qualitative
research rather than quantitative research. The meaning behind postpositivist
represents the thinking after positivism, challenging the traditional notion of the
absolute truth of knowledge (Creswell, 2009). It holds a deterministic philosophy in
which causes probably determine effects or outcomes. Thus, the problems studied
by postpositivists reflect the need to identify and assess the causes that influence
outcomes, such as are found in experiments (Creswell, 2009). It is also reductionist
in that the intent is to reduce the ideas into a small, discrete set of ideas to test,
such as the variables that comprise hypotheses and research questions. The
concept of this worldview underlies the developing numeric measures of careful
observations and studying the behaviour of individuals. This approach is based on
the theory verification principle, as the researcher begins with a theory, collects data
that either support or refute the theory, and then makes necessary revisions before
additional tests are conducted.
6.1.1.2 The Social Constructivist Worldview The social constructivist worldview is typically seen as an approach to qualitative
research. Social constructivists hold assumptions that individuals seek
understanding of the world in which they live and work. Individuals develop
subjective meanings of their experiences - meanings directed towards certain
objects or things. These meanings are varied and multiple, leading the researcher to
look for the complexity of views rather than narrowing meanings into a few
categories or ideas (Creswell, 2009).
The qualitative method can be seen in this approach, where the research questions
become broad and general so that the participants can construct the meaning of a
situation, typically forged in discussions or interactions with other person. This is
based on the intention to interpret the meanings others have about the world. The
more open-ended the questioning, the better, as the researcher listens carefully to
what people say or do in their life settings. Often the subjective meanings are
negotiated socially and historically. It is called social constructivism as the meanings
are not simply imprinted on individuals but are formed through interaction with
others, and through historical and cultural norms that operate in individuals’ lives.
!!
144!
!
Constructivist researchers often address the processes of interaction among
individuals. They also focus on the specific contexts in which people live and work,
in order to understand the historical and cultural settings of the participants. They
also recognise that their own backgrounds shape their interpretation, and they
position themselves in the research to acknowledge how their interpretation flows
from their personal, cultural and historical experiences. As opposed to starting with
a theory (as in postpositivism), inquirers generate or inductively develop a theory or
pattern of meaning, or in other words, a theory generation (Creswell, 2009).
6.1.1.3 The Advocacy and Participatory Worldview
The advocacy and participatory studies often begin with an important issue or
stance about the problems in society, such as the need for empowerment.
Empowerment, along with other subjects like inequality, oppression, domination,
suppression and alienation, is normally addressed as the focal point of the study.
This type of worldview is seen more in qualitative research than in quantitative
research. It typically begins by addressing any of the subjects of empowerment. The
focus of this worldview is on the needs of groups and individuals in our society that
may be marginalised or disenfranchised. It believes that research inquiry needs to
be intertwined with politics and a political agenda in the aim of creating a political
debate and discussion so that changes can be made. It also believes that what is at
fault in the postpositivist worldview is that the postpositivist assumptions imposed
structural laws and theories that did not fit marginalised individuals in our society or
issues of social justice that needed to be addressed.
The advocacy and participatory researchers also believe that they can help
individuals to free themselves from constraints found in the media, in language, in
work procedures, and in the relationships of power in educational settings (Creswell,
2009). This also differentiates this approach from the constructivist worldview,
whereby the constructivist stance did not go far enough in advocating for an action
agenda to help marginalised people. As the strength of this worldview is in the aim
of the researchers to bring change into practice, an agenda for further action is
normally advanced at the end of the research. Therefore, this type of study is seen
as practical and collaborative as it forwards action for change and also engages the
participants as active collaborators in the study.
!!
145!
!
6.1.1.4 The Pragmatic Worldview
The pragmatic worldview arises out of actions, situations, and consequences rather
than antecedent and conditions (as in postpositivism). Pragmatism is not committed
to any one system of philosophy and reality. This applies to mixed methods
research in that inquirers draw liberally from both quantitative and qualitative
assumptions when they engage in their research. As a philosophical underpinning
for mixed method studies, this type of worldview is important for focusing attention
on the research problem in social science and then using pluralistic approaches to
derive knowledge about the problem (Morgan, 2007).
Pragmatists agree that research always occurs in social, historical, political and
other contexts. In this way, mixed method studies may include a postmodern turn, or
a theoretical lens that is reflective of social justice and political aims. There is a
concern with applications pertaining to what works and what are the solutions to
problems (Patton, 1990). Instead of focusing on methods, researchers emphasise
the research problem and use all approaches available in order to understand the
problem (Rossman and Wilson, 1985).
Pragmatist researchers look to what are the scopes and subjects of research and
how to conduct the research, based on the intended consequences - where they
want to go with it. Mixed method researchers need to establish a purpose for their
mixing, a rationale for the reasons why quantitative and qualitative data need to be
mixed in the first place. Individual researchers have a freedom of choice.
Researchers are free to choose the methods, techniques, and procedures of
research that best meet their needs and purposes. In this respect, pragmatists do
not see the world as in absolute unity. In a similar way, mixed methods researchers
look to many approaches for collecting and analysing data rather than subscribing to
only one way - that is, either quantitative or qualitative. The investigators use both
qualitative and quantitative data because they work to provide the best
understanding of a research problem.
A pragmatic approach would place its emphasis on shared meanings and joint
action and also retains many of the virtues of the previous system (Morgan, 2007).
Therefore, it is reviewed as a specific justification for combining qualitative and
quantitative methods (Johnson and Onwuegbuzie, 2006). As for the mixed methods
researcher, pragmatism opens the door to multiple methods, different worldviews,
!!
146!
!
different assumptions, and different forms of data collection and analysis as well as
offering new opportunities.
Morgan (2007) proposed a summary of the pragmatic approach with the other two
important methodological stances in the social sciences: qualitative and quantitative
research (refer to Figure 6.2).
Research Elements
Qualitative Approach
Quantitative Approach
Pragmatic Approach
Connection of theory and data
Induction
Deduction
Abduction
Relationship to research process
Subjectivity Objectivity Intersubjectivity
Inference from data Context Generality Transferability
Figure 6.2: Approaches of the three methodological stances (Source: Morgan, 2007) The new insights of the pragmatic approach can be seen in the connection of theory
and data, relationship to research and process, and also the inference from data.
The pragmatic approach underlies the abductive reasoning that connects induction
and deduction by converting observations into theories and then assessing those
through action. As induction promotes the use of theories to account for
observations, in the pragmatic approach abduction assesses the conclusions
through actions. This benefits the researchers in mixed methods as the inductive
results from the qualitative approach serve as inputs to the deductive goals of the
quantitative approach, and vice versa.
Looking from the perspective of the relationship between the researcher and the
research process, the pragmatic approach promotes the intersubjective concept in
the idea that a piece of research may work back and forth between various frames
of references, and emphasises that knowledge can be created through lines of
action points to the joint actions that different researchers can pull together. The
pragmatic approach also supports the idea that research results are not specific to a
particular context or a set of generalised principles. This also gives the results a
position where the gained knowledge can be transferred to other settings.
Therefore, the pragmatic approach can be seen as an alternative approach that
offers new settings based on its concept on the abductive, intersubjective,
transferable aspects of a piece of research.
!!
147!
!
The pragmatic approach not only supports the kinds of research methods that this
study advocates but also provides a basis for reorienting the field of social science
research methodology in the appropriate direction. The great strength of this
approach to social research methodology is its emphasis on the connection
between epistemological concerns about the nature of the knowledge that we
produce and technical concerns about the methods that we use to generate that
knowledge (Morgan, 2007).
6.1.2 Debates of Paradigm
There was a debate between the two paradigms which was sometimes called the
qualitative-quantitative debate (Reichardt and Rallis, 1994). Several conceptual
issues were raised in the debate, namely the nature of reality or the possibility of
causal linkages, and no discipline in social and behavioural sciences has avoided
manifestations of these paradigm wars (Tashakkori and Teddlie, 2008). There were
debates on the strength of the positivist paradigm focusing on the quantitative
methods and constructivist underlying qualitative methods. According to Tashakkori
and Teddlie (2008), numerous attempts were made in the social and behavioural
sciences to find the solutions and consensus between these two major paradigmatic
principles.
The term ‘mixed-up models’ was yet to be fully articulated back in 1994; however,
Datta (1994) suggested that it was derived from the lack of worldview, paradigm, or
theory for mixed-model studies. He further argued that the preceding methodologies
way before the paradigm wars were proved to have been used years before that
and also have influenced policy and been supported by a lot of funding agencies.
Pragmatism is the new paradigm being put forward, which has the elements of both
quantitative and qualitative approaches or is also simply referred to as the mixed
methods approach (Patton, 1990). The shift of previous paradigms to a pragmatic
approach also promoted the thinking of how research in social sciences is
conducted (Morgan, 2007). The positive outcome of the revolution of the paradigm
battle or wars is that most researchers at present ensure that they adopt one
specific method for their research.
!!
148!
!
6.1.3 Research Design
Research design shapes the direction of the research by looking at how to conduct
the research, weighing the intersection of philosophy and also selecting the
strategies of inquiry. The research question drives the methodological approaches
or choices (Tashakkori & Teddlie, 2003). In planning a study, the researcher needs
to think through the philosophical worldview assumptions that they bring to the
study, the strategy of inquiry that is related to this worldview, and the specific
methods or procedures of research that translate the approach into practice
(Creswell, 2009). Newman and Benz (1998) also signify the importance of selecting
the appropriate research method for a piece of research.
There are three types of research designs from which researchers can choose
accordingly: quantitative approach, qualitative approach or mixed methods
approach. The first approach, qualitative, was introduced in around the 19th century.
Research paradigms like ontological, epistemological, axiological, rhetorical and
methodological assumptions and principles (Leech and Onwuegbuzie, 2009) also
emerged at this time. Secondly, the quantitative paradigm was adopted between
1900 and 1950 by many researchers who were interested in the quantitative
approach (Denzin and Lincoln, 2000). Shortly after that, in the 1960s, the concept of
mixing the two said approaches was introduced and since then the mixed method
became popular among the researchers (Rocco et al., 2003).
From that point forward, the mixed methods approach was used in various and
numerous research works, including social science studies. It started gaining
recognition despite the fact that there were some debates on the practicality of the
approach (Tashakkori and Teddlie, 2003). A brief summary of the three different
approaches was outlined by Tashakkori and Teddlie (2009), as shown in Figure 6.3.
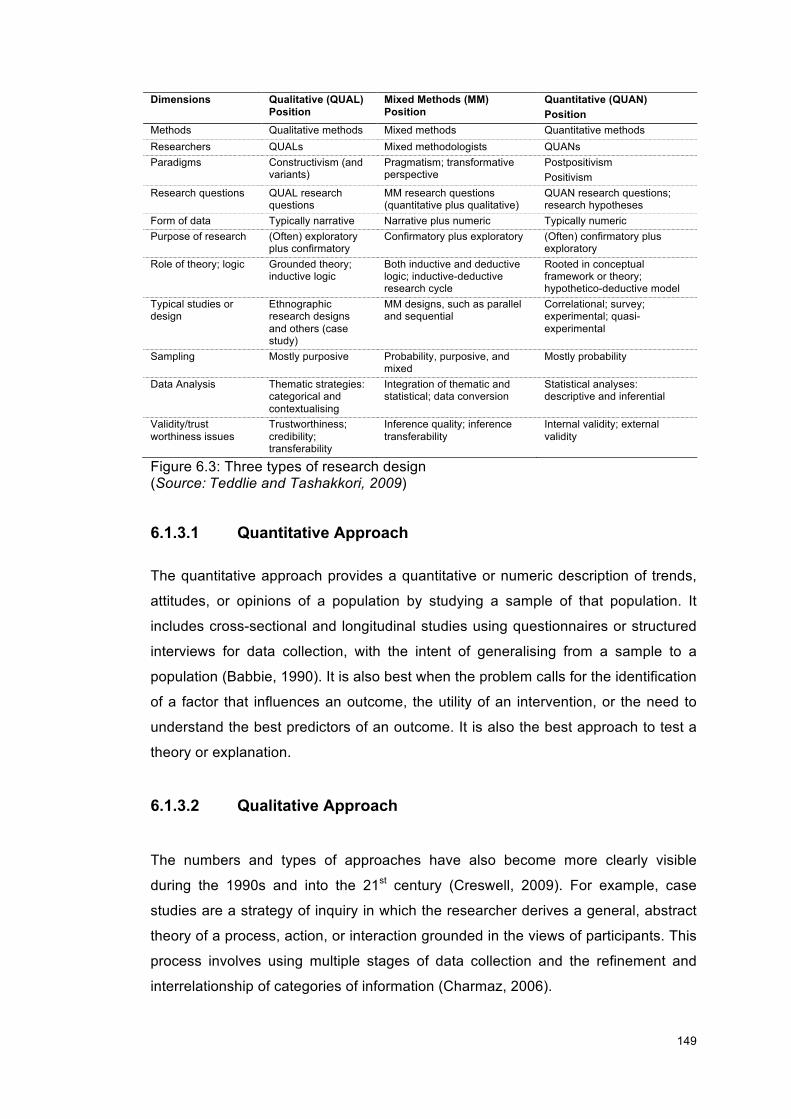
!!
149!
!
Dimensions Qualitative (QUAL) Position
Mixed Methods (MM) Position
Quantitative (QUAN) Position
Methods Qualitative methods Mixed methods Quantitative methods Researchers QUALs Mixed methodologists QUANs Paradigms Constructivism (and
variants) Pragmatism; transformative perspective
Postpositivism Positivism
Research questions QUAL research questions
MM research questions (quantitative plus qualitative)
QUAN research questions; research hypotheses
Form of data Typically narrative Narrative plus numeric Typically numeric Purpose of research (Often) exploratory
plus confirmatory Confirmatory plus exploratory (Often) confirmatory plus
exploratory Role of theory; logic Grounded theory;
inductive logic Both inductive and deductive logic; inductive-deductive research cycle
Rooted in conceptual framework or theory; hypothetico-deductive model
Typical studies or design
Ethnographic research designs and others (case study)
MM designs, such as parallel and sequential
Correlational; survey; experimental; quasi-experimental
Sampling Mostly purposive Probability, purposive, and mixed
Mostly probability
Data Analysis Thematic strategies: categorical and contextualising
Integration of thematic and statistical; data conversion
Statistical analyses: descriptive and inferential
Validity/trust worthiness issues
Trustworthiness; credibility; transferability
Inference quality; inference transferability
Internal validity; external validity
Figure 6.3: Three types of research design (Source:!Teddlie and Tashakkori, 2009)
6.1.3.1 Quantitative Approach
The quantitative approach provides a quantitative or numeric description of trends,
attitudes, or opinions of a population by studying a sample of that population. It
includes cross-sectional and longitudinal studies using questionnaires or structured
interviews for data collection, with the intent of generalising from a sample to a
population (Babbie, 1990). It is also best when the problem calls for the identification
of a factor that influences an outcome, the utility of an intervention, or the need to
understand the best predictors of an outcome. It is also the best approach to test a
theory or explanation.
6.1.3.2 Qualitative Approach
The numbers and types of approaches have also become more clearly visible
during the 1990s and into the 21st century (Creswell, 2009). For example, case
studies are a strategy of inquiry in which the researcher derives a general, abstract
theory of a process, action, or interaction grounded in the views of participants. This
process involves using multiple stages of data collection and the refinement and
interrelationship of categories of information (Charmaz, 2006).
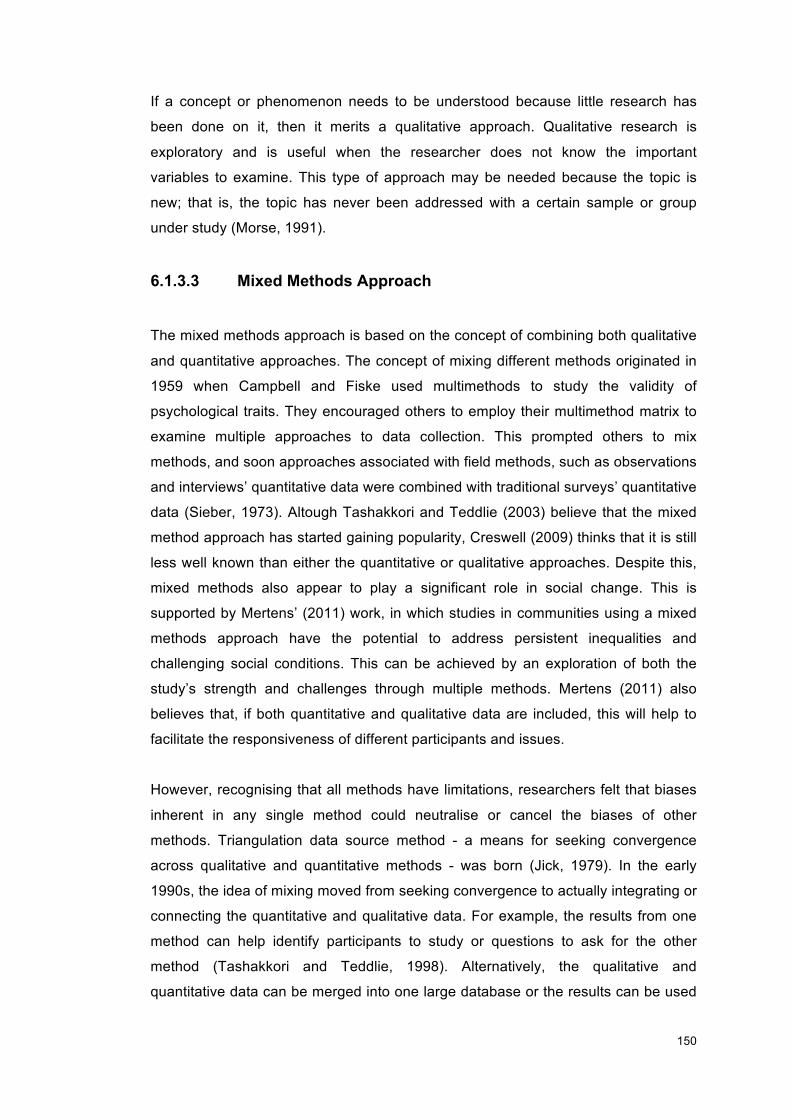
!!
150!
!
If a concept or phenomenon needs to be understood because little research has
been done on it, then it merits a qualitative approach. Qualitative research is
exploratory and is useful when the researcher does not know the important
variables to examine. This type of approach may be needed because the topic is
new; that is, the topic has never been addressed with a certain sample or group
under study (Morse, 1991).
6.1.3.3 Mixed Methods Approach
The mixed methods approach is based on the concept of combining both qualitative
and quantitative approaches. The concept of mixing different methods originated in
1959 when Campbell and Fiske used multimethods to study the validity of
psychological traits. They encouraged others to employ their multimethod matrix to
examine multiple approaches to data collection. This prompted others to mix
methods, and soon approaches associated with field methods, such as observations
and interviews’ quantitative data were combined with traditional surveys’ quantitative
data (Sieber, 1973). Altough Tashakkori and Teddlie (2003) believe that the mixed
method approach has started gaining popularity, Creswell (2009) thinks that it is still
less well known than either the quantitative or qualitative approaches. Despite this,
mixed methods also appear to play a significant role in social change. This is
supported by Mertens’ (2011) work, in which studies in communities using a mixed
methods approach have the potential to address persistent inequalities and
challenging social conditions. This can be achieved by an exploration of both the
study’s strength and challenges through multiple methods. Mertens (2011) also
believes that, if both quantitative and qualitative data are included, this will help to
facilitate the responsiveness of different participants and issues.
However, recognising that all methods have limitations, researchers felt that biases
inherent in any single method could neutralise or cancel the biases of other
methods. Triangulation data source method - a means for seeking convergence
across qualitative and quantitative methods - was born (Jick, 1979). In the early
1990s, the idea of mixing moved from seeking convergence to actually integrating or
connecting the quantitative and qualitative data. For example, the results from one
method can help identify participants to study or questions to ask for the other
method (Tashakkori and Teddlie, 1998). Alternatively, the qualitative and
quantitative data can be merged into one large database or the results can be used
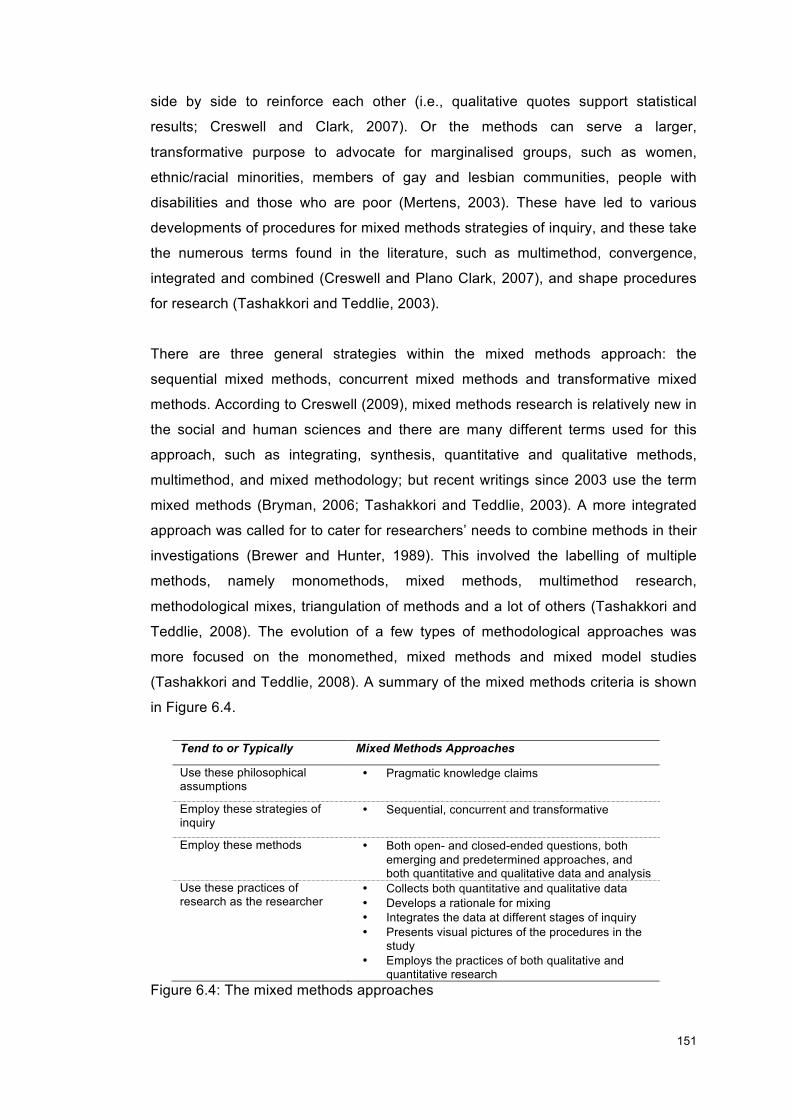
!!
151!
!
side by side to reinforce each other (i.e., qualitative quotes support statistical
results; Creswell and Clark, 2007). Or the methods can serve a larger,
transformative purpose to advocate for marginalised groups, such as women,
ethnic/racial minorities, members of gay and lesbian communities, people with
disabilities and those who are poor (Mertens, 2003). These have led to various
developments of procedures for mixed methods strategies of inquiry, and these take
the numerous terms found in the literature, such as multimethod, convergence,
integrated and combined (Creswell and Plano Clark, 2007), and shape procedures
for research (Tashakkori and Teddlie, 2003).
There are three general strategies within the mixed methods approach: the
sequential mixed methods, concurrent mixed methods and transformative mixed
methods. According to Creswell (2009), mixed methods research is relatively new in
the social and human sciences and there are many different terms used for this
approach, such as integrating, synthesis, quantitative and qualitative methods,
multimethod, and mixed methodology; but recent writings since 2003 use the term
mixed methods (Bryman, 2006; Tashakkori and Teddlie, 2003). A more integrated
approach was called for to cater for researchers’ needs to combine methods in their
investigations (Brewer and Hunter, 1989). This involved the labelling of multiple
methods, namely monomethods, mixed methods, multimethod research,
methodological mixes, triangulation of methods and a lot of others (Tashakkori and
Teddlie, 2008). The evolution of a few types of methodological approaches was
more focused on the monomethed, mixed methods and mixed model studies
(Tashakkori and Teddlie, 2008). A summary of the mixed methods criteria is shown
in Figure 6.4.
Tend to or Typically Mixed Methods Approaches
Use these philosophical assumptions
• Pragmatic knowledge claims
Employ these strategies of inquiry
• Sequential, concurrent and transformative
Employ these methods • Both open- and closed-ended questions, both emerging and predetermined approaches, and both quantitative and qualitative data and analysis
Use these practices of research as the researcher
• Collects both quantitative and qualitative data • Develops a rationale for mixing • Integrates the data at different stages of inquiry • Presents visual pictures of the procedures in the
study • Employs the practices of both qualitative and
quantitative research Figure 6.4: The mixed methods approaches
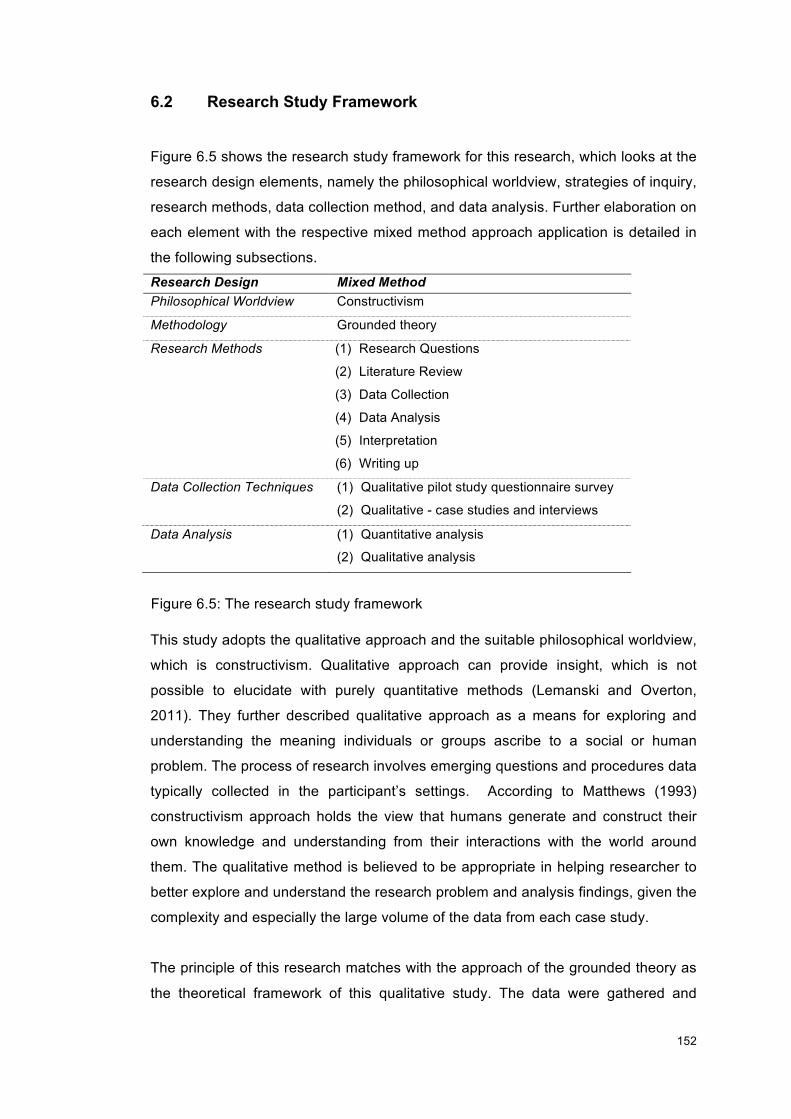
!!
152!
!
6.2 Research Study Framework
Figure 6.5 shows the research study framework for this research, which looks at the
research design elements, namely the philosophical worldview, strategies of inquiry,
research methods, data collection method, and data analysis. Further elaboration on
each element with the respective mixed method approach application is detailed in
the following subsections.
Research Design Mixed Method Philosophical Worldview Constructivism
Methodology Grounded theory!Research Methods (1) Research Questions
(2) Literature Review
(3) Data Collection
(4) Data Analysis
(5) Interpretation
(6) Writing up
Data Collection Techniques (1) Qualitative pilot study questionnaire survey
(2) Qualitative - case studies and interviews
Data Analysis (1) Quantitative analysis
(2) Qualitative analysis
!
!This study adopts the qualitative approach and the suitable philosophical worldview,
which is constructivism. Qualitative approach can provide insight, which is not
possible to elucidate with purely quantitative methods (Lemanski and Overton,
2011). They further described qualitative approach as a means for exploring and
understanding the meaning individuals or groups ascribe to a social or human
problem. The process of research involves emerging questions and procedures data
typically collected in the participant’s settings. According to Matthews (1993)
constructivism approach holds the view that humans generate and construct their
own knowledge and understanding from their interactions with the world around
them. The qualitative method is believed to be appropriate in helping researcher to
better explore and understand the research problem and analysis findings, given the
complexity and especially the large volume of the data from each case study.
The principle of this research matches with the approach of the grounded theory as
the theoretical framework of this qualitative study. The data were gathered and
Figure 6.5: The research study framework
!!
153!
!
analysed and the theory derives from the data. The concept is in contrast to
frameworks that put together a theory from a series of observations or concepts and
then gather data to test theory (Lemanski and Overton, 2011). Flick et al. (2004) that
grounded theory develops theories that are closer to reality.
The data collection techniques carried out for the research were staged into three
phases: Phase 1 qualitative questionnaire survey for the pilot study, Phase 2 case
studies and Phase 3 interviews. The principle of this research is an inductive
qualitative research method. It started with collecting data in the field and lets the
theory emerge or emanate from the data. Dunican (2005) believes that the theory is
actually grounded in the data. Dunican further signifies that the net outcome of
grounded theory research is a theory that containes a central phenomenon, its
causal conditions, its intervening conditions and its consequences. The grounded
theory constructivist approach in building theory from collecting data is
demonstrated in the qualitative data collection techniques, where the findings of the
Phase 1 quantitative analysis are aimed to help in shaping a detailed view of
performance measures collected in Phase 2 of the study. At first, the exploration in
Phase 1 was to understand the targeted population or sample and to learn what
variables in FM to study, which is PM and their measures, and then proceed to the
study of those variables in Phase 2 with a large and focused targeted case study. In
these situations, collecting both closed-ended and open-ended qualitative data
proves advantageous. Phase 3 interviews were conducted as an evaluation of the
PERFM developed from the summary of literature and data collected in Phase 2.
The final evaluation provides feedback on the developed PERFM, which includes
the theory that has been built from the data collected.
6.2.1 Inductive Grounded Theory
A theory is an interrelated set of constructs or variables formed into propositions, or
hypotheses, which specify the relationship between variables. A theory might
appear in a research study as an argument, a discussion, or a rationale, and it helps
to explain or predict phenomena that occur in the world. The theories help to form
the framework or structure for the study to better understand the research problem
and also serve as the bridge among the variables. In inductive theory, the end
theories or some other broad explanation becomes the end point. This approach is
distinct from the theoretical orientation. It is an inductive process of building from the
!!
154!
!
data to broad themes to a generalised model or theory. It also applied the principle
of theoretical lens or perspective, where the orientation of gender, class, race and
experiences are considered in the data collection.
The objective of Phase 1 of the qualitative data collection in this study is to have an
understanding of the FM industry in Malaysia; and the implementation of the
questionnaire survey was aimed at looking at the knowledge of FM among the FM
practitioners and also to test the variables from the literature in obtaining a better
understanding of the FM industry in that region. Based on Creswell’s (2009)
proposed structure, this theory becomes a framework for the first objective, an
organising model for the research questions or hypotheses and for the data
collection procedure. The researcher began by gathering detailed information to
compile a set of literature and variables of the scopes of study and then formed this
information into categories or themes. The variables were then tested on the
participants through Phase 1 qualitative questionnaire survey and Phase 2 case
studies (refer to Figure 6.6). Data collected were then analysed quantitatively to
form themes or categories. The findings were used to help the researcher in
developing themes into broad patterns, theories, or generalisations that were then
compared with personal experiences or with existing literature on the topic. Phase 3
interviews were conducted to evaluate the values of the final output that was
constructed based on the findings from Phase 1 and 2. The development of themes
and categories into patterns, theories, or generalisations suggests varied end points
for qualitative studies (Stake, 1995). By interpreting the findings, the theories from
both literature and data analysis are proposed as the novel point of the research.
The inductive qualitative approach is demonstrated in the systematic approach for
analysing qualitative data where the analysis is guided by specific objectives. The
underlying used of a general inductive approach is therefore proved,
According to Schwandt (1993), all qualitative studies must begin with pure
observation, and prior conceptual structure composed of theory and method
provides a starting point for all observations. Some qualitative studies do not employ
any explicit theory, but Creswell (2009) contended that, in this case, the inquirer
needs to construct a rich and detailed description of a central phenomenon. This is
reflected in the literature study pertaining PM, FM and PM in FM with a specific
focus given to Malaysian context.
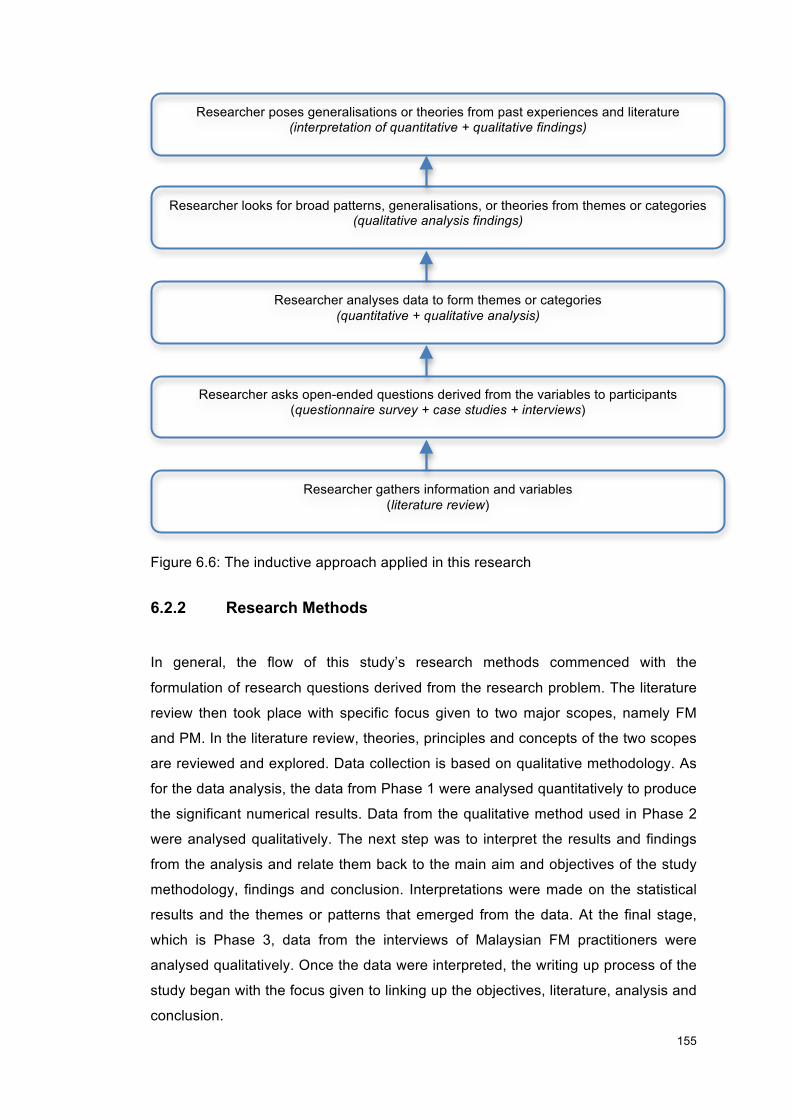
!!
155!
!
6.2.2 Research Methods
In general, the flow of this study’s research methods commenced with the
formulation of research questions derived from the research problem. The literature
review then took place with specific focus given to two major scopes, namely FM
and PM. In the literature review, theories, principles and concepts of the two scopes
are reviewed and explored. Data collection is based on qualitative methodology. As
for the data analysis, the data from Phase 1 were analysed quantitatively to produce
the significant numerical results. Data from the qualitative method used in Phase 2
were analysed qualitatively. The next step was to interpret the results and findings
from the analysis and relate them back to the main aim and objectives of the study
methodology, findings and conclusion. Interpretations were made on the statistical
results and the themes or patterns that emerged from the data. At the final stage,
which is Phase 3, data from the interviews of Malaysian FM practitioners were
analysed qualitatively. Once the data were interpreted, the writing up process of the
study began with the focus given to linking up the objectives, literature, analysis and
conclusion.
Figure 6.6: The inductive approach applied in this research
Researcher analyses data to form themes or categories (quantitative + qualitative analysis)
Researcher poses generalisations or theories from past experiences and literature (interpretation of quantitative + qualitative findings)
Researcher looks for broad patterns, generalisations, or theories from themes or categories (qualitative analysis findings)
Researcher asks open-ended questions derived from the variables to participants (questionnaire survey + case studies + interviews)
Researcher gathers information and variables (literature review)
!!
156!
!
6.2.2.1 Questionnaire Survey
A survey design provides a quantitative or numeric description of trends, attitudes,
or opinions of a population by studying a sample of that population. The purpose of
survey research is to generalise from a sample to a population so that inferences
can be made about some characteristics, attitude or behaviour of this population
(Babbie, 1990). A survey also gives advantages in identifying attributes of a large
population from a small group of individuals (Fowler, 2002) and also provides a
rapid turnaround in data collection. The survey design of the study was based on a
longitudinal approach where the data was collected over time.
The questionnaire survey begins with the identification of sample size for the FM
practitioners in Malaysia. This was conducted by approaching the Construction
Industry Development Board (CIDB) Malaysia, an organisation that is in charge of
the registered companies and organisations pertaining construction and
maintenance. An approach was also made to the Malaysian Association of FM
(MAFM) with the same objective that is to get a full registered list of companies and
organisations that registered for the provision of FM services. Unfortunately, there is
no complete registered list of FM service providers being held and compiled by them
that can be used for the sampling calculation and justification purposes. A list of
random organisations that implement maintenance and FM services were provided
only by the CIDB to the researcher, which was used as the master list for the
researcher to approach the participants for both questionnaire survey and case
studies data collections.
The researcher has approached the 142 companies that were compiled in the list
and only 37 responses received, with only 35 responses valid for analysis.
Considering the lack of awareness and recognition of FM practice in Malaysia, the
responses received from the participants are believed to be significant in leading
this research to move forward. Retrospectively, the lack of compilation of the
registered FM practice in Malaysia and the number of responses received confirm
the low progress and awareness of FM in Malaysia.
!!
157!
!
6.2.2.2 Case Studies
The data analyses were conducted in three phases based on guidelines suggested
by Miles and Huberman (1994):
(i) Phase 1: Documenting and Coding the Data
Relevant information was extracted from all the documents and archival
records and coded accordingly
(ii) Phase 2: Data Display
The data analysis displayed the data in an easy to understand form and
comparison tables were also established. Charts were also produced to
highlight the result trends.
(iii) Phase 3: Conclusion Drawing
The conclusions were then drawn based on the objectives and findings of
the research
The case studies data collection technique as it draws the qualitative research
paradigm aiming to understand the complex systems being used by the FM
organisations both in UK and Malaysia. Case studies method is believed to be the
most appropriate technique in emphasising the detailed contextual analysis of all the
FM services provided, principles and approaches of the PM designs and the
performance measures being used. This method is used to examine the significant
differences of the mentioned aspects between two groups of FM organisations from
both UK and Malaysia.
Case studies method was conducted following the objective derived from the
research problem and research questions. It seeks to understand the various
approaches adopted by the selected FM organisations. The selection of FM
organisations was made randomly by approaching the FM organisations in Klang
Valley as listed by the CIDB. Based from the invitation to participate distributed to
the organisations, only 8 FM organisations agreed to participate with 2
representatives each from four different categories- healthcare, retail, finance and
office buildings. Then, the same number of 8 case studies was also determined for
the UK case studies to ensure that equal comparison can be made accordingly.
!!
158!
!
6.2.2.3 Interviews !Interviews is another qualitative data collection technique or method used in Phase
3. The aim of the interviews is to get feedbacks from FM practitioners of the
participating organisations in Phase 2 case studies pertaining the developed
PERFM. The semi-structured questions developed for the interviews were focused
and clear to encourage open-ended responses. This group interviews is conducted
based on the key questions that help to define the evaluation of PERFM that this
research seeks to explore. The nature of interviews allows both interviewer and
interviewee to diverge in order to pursue an idea or response in more detail. The
semi-structured interviews is flexible as it allows the discovery or elaboration of
information that is important to participants but may not have been previously been
thought of as pertinent by the research team (Gill et al., 2008).
The purpose of the interviews was to explore the views on the specific aspects of
the PERM, based on their beliefs, motivations and experiences especially in the FM
industry. The detailed insights obtained from the interviews are imperative in the
assessing the usability and flexibility of the PERM if implemented in the FM industry
in Malaysia. The selection of the participants was based on the key players that
have involved in the earlier phase of data collection. This facilitates the conduct of
the interviews, as the interviewees were well informed of the purpose of this
research and the process that had been undertaken in the earlier stages. They also
understood the key elements that this research were exploring and has successfully
provided the feedbacks needed to improve the developed PERFM.
6.2.3 Ethical Consideration
6.2.3.1 Data Collection Techniques
The data collections in Phase 2 and 3 comprised interviews, documentation and
observation. Kvael (2007) signifies that interview in the qualitative approach is seen
as a moral inquiry. Therefore, this study considers the following elements: how the
interview will improve the human situation as well as enhance scientific knowledge,
how a sensitive interview interaction may be stressful for the participants, whether
participants have a say in how their statements are interpreted, and how critically
the interviewees might be questioned and what might be the consequences of the
interview for the interviewees and the groups to which they belong. In this respect,
!!
159!
!
the interviewer would also conduct the interview sessions as per participants’
preference including whether they agree to be audio-recorded or otherwise.
6.2.3.2 Data Analysis and Interpretation
Another critical issue that needs ethical consideration is one of data analysis and
interpretation. The researcher has ensured that all data are kept in a password-
protected device, which can only be accessed by the researcher and the research
supervisor. As agreed by the participants, once the data has been analysed, it
needs to be kept for five years. Sieber (1998) suggested that a reasonable period of
time would be between five and ten years. The researcher would then discard the
data so that it does not fall into the hands of other researchers who might
misappropriate it.
6.2.4 Data Analysis in Qualitative Research
Creswell (2009) has suggested a linear set of data analysis methods comprised of
various interrelated stages, which became the framework in analysing the qualitative
data in this study. In this research, the raw data collected in the form of field notes
were gathered together and sorted according to the respective case studies (refer to
figure 6.7). In organising and preparing data for analysis, all the field notes and
documents provided by the case studies’ participants were typed up and arranged
accordingly. Next, all the data were read through to obtain the general sense of the
information and to reflect on their overall meaning. This helped in acquiring the
impression of the overall use of the information for the next stage. Detailed analysis
of the data then started with the coding process. This involves coding the data on
the computer by naming the data into variables, labelling categories and also
assembling the data material belonging to each category in order to perform the
analysis. Description of the data - for instance, the information of the case studies
and participant settings together with themes - were identified. When the data are
grouped under several categories that will provide major findings, it is also an
indication that the themes have been identified properly. The next stage is the
interrelating of themes and descriptions identified across all the samples. Detailed
discussions on the descriptions and themes were presented before they were
interpreted accordingly. During the interpretation process, the meanings of the data

!!
160!
!
were processed, taking into account the understanding of the literature and the
findings, in order to deliver an in-depth analysis of the cases.
6.2.5 Reliability and Validity of Data
Validity is one of the strengths of the qualitative approach and Yin (2003) feels that
qualitative case study results can be generalised to some broader theory. The
qualitative approach focuses on the process that is occurring as well as the product
or outcome (Miller, 1991). The cycle of the same flow and process shows that
validation occurs throughout the steps in the process of this research. Creswell
(2009) suggested that qualitative validity means that the researcher checks for the
accuracy of the findings by employing certain procedures. On the other hand,
qualitative reliability indicates that the researcher’s approach is consistent across
different researchers and different projects (Gibbs, 2007). This can be done by
Validating the Accuracy of the
information
Reading through All Data
Organising and Preparing Data for Analysis
Raw Data (Interview data, documents, observations)
)
Interpreting the Meaning of Themes/Descriptions
Interrelating Themes/Description (Case Study + Interviews)
Coding the Data (Computer)
Themes Description
Figure 6.7: Data analysis in qualitative research (Source: Adopted form Creswell, 2009)
!
!!
161!
!
making sure that there is no shift in the meaning of codes during the process of
coding, which can be achieved by constantly checking on the data and codes during
the process. Yin (2003) also suggested that systematic documenting of the case
studies procedures and setting up the detailed case study protocol and database
were important in shaping reliable and consistent approaches. The validation for
qualitative data also adopts the triangulation principle where the data come from
various sources: interview data, documents and also observations. This
triangulation examines evidence from the sources and uses it to build a coherent
justification for themes. As themes are established based on converging several
sources of data or perspectives from participants, then this process can be claimed
as adding to the validity of the study (Creswell, 2009).
As the data are also analysed quantitatively, then the validity and reliability tests
carried out in the analysis process determine the significance of the two factors
respectively. It is anticipated that the triangulation or multiple data collection and
analysis used in the study also strengthens the reliability as well as internal validity
(Merriam, 1988) of the research. This study also uses a detailed and good
description to convey findings. This is to ensure that the understanding of the
setting, themes and discussions is delivered appropriately. Therefore, the findings
and results become clearer and more realistic and add value to the validity of the
findings. The researcher also made sure that there was no bias in interpreting the
data and results from the cases.
6.2.6 Data Collection Setting and Design
The qualitative case studies in Phase 2 were divided into two groups. The first group
was of eight organisations in Malaysia and second group was of eight organisations
in the UK. As for Phase 3, the interview participants were all from Malaysia, and
therefore can be put under the same group. The sampling design of all phases is
cluster sampling. Cluster sampling is ideal when it is impossible or impractical to
compile a list of the elements comprising the population (Babbie, 2007). In the
clustering procedure of Phase 1, an online survey link was randomly distributed to
the FM practitioners in Malaysia. Then, for Phase 2, the researcher first identified
clusters of the FM companies in those regions, Malaysia and the UK, and then
selected the case studies randomly within those clusters and then took samples
!!
162!
!
from within them. In Phase 3, the interview participants were selected from the
Malaysian case study organisations, which was conducted in Phase 2.
6.2.7 Primary Data Collection Instruments
!Case studies method is the primary source of data collection of this research as it
explores the main element of the research objectives, which is to understand the
performance measures being used in the industry by the FM organisations in the UK
and Malaysia. The case studies method compiles the PM approaches and
elements adopted by all the organisations particularly the purposes, principles,
formulation of measurement, measurement, implementation, quality assessment
and report. These elements were compared across all four categories- healthcare,
retail, finance and office buildings.
The scope of this case studies method was also on the PM structure of both
management and operations services. The case study organisations were
compared in term of their respective implementations of performance measures-
whether they comprise of all aggregative levels such as parameters, metrics,
indicators and attributes as well as the performance formula or targets. The
compiled performance measures were used as a ground in understanding the
differences of key elements in the FM services practised between the FM
practitioners in UK and Malaysia. The approaches adopted by FM organisations in
the UK demonstrate a group of comprehensive and detailed set of performance
measures, which this research used in developing the PERFM. The practised
performance measures in the UK industry were compiled along with the principles
and approaches form the literature review, creating a solid base in proposing the
appropriate set of performance measures in the PERFM.
6.3 Chapter Summary
In this chapter, this research concludes that the qualitative research methods that
have been adopted throughout the whole process of this study. It explains further on
the justification of each data collection technique comprising of qualitative
questionnaire survey, case studies and interviews throughout all three phases of
data collection. It has also been emphasised that the constructivist grounded theory
approach matches with the aim and objective of this research, and this is
demonstrated with the building up of theory from the literature review and data

!!
163!
!
collection process. In the next chapter, a further overview of the case study
organisations and also the findings derived from the case studies analysis are
presented.
!!
164!
!
CHAPTER 7: CASE STUDIES DATA ANALYSIS
This chapter focuses on the analysis of the case study data from the Phase 2 data
collection. The chapter starts by introducing the background of both case studies
from Malaysia and the UK. Then, it narrows down to the study of the FM scope of
services across all the case study organisations. Focuses are also given to the
elements of PM indicators, PM structures and the comparison of PM designs
between both Malaysian and UK organisations. This chapter aims to present the
data from both groups of case studies, Malaysia and the UK, in regard to their
approaches in FM and PM respectively.
7.1 Introduction
In this chapter, the distinctive elements of FM and PM are analysed and discussed
within the context of case study organisations:
(i) FM service scope – the provision of a range of FM services by different
categories: healthcare, retail, finance and office buildings
(ii) The elements of PM, PM structure and design - the differences and
uniqueness of approaches and methods adopted in respective
organisations
Yin (2003) signifies that an embedded case study design contains multiple units of
analysis. Data collection in this research was guided by a case study protocol
involving in-depth study of the PM implementation by analysing the archival records,
documentation process and service level agreements (SLAs), and through an
interview process with the FM managers. The researcher also worked hand-in-hand
with the FM teams to gather the best understanding in compiling robust and valid
data consistently across all the case studies. Follow up works were undertaken to
clarify some uncertainties in the acquired knowledge of the data.
7.2 Background of Case Studies
The study samples are collected from two different regions, Malaysia and the UK.
The units of analysis are eight organisations each from these two regions. Two
cases represent each region across the four categories respectively: healthcare,
retail, and finance and office buildings. This gives a total of 16 case studies for the
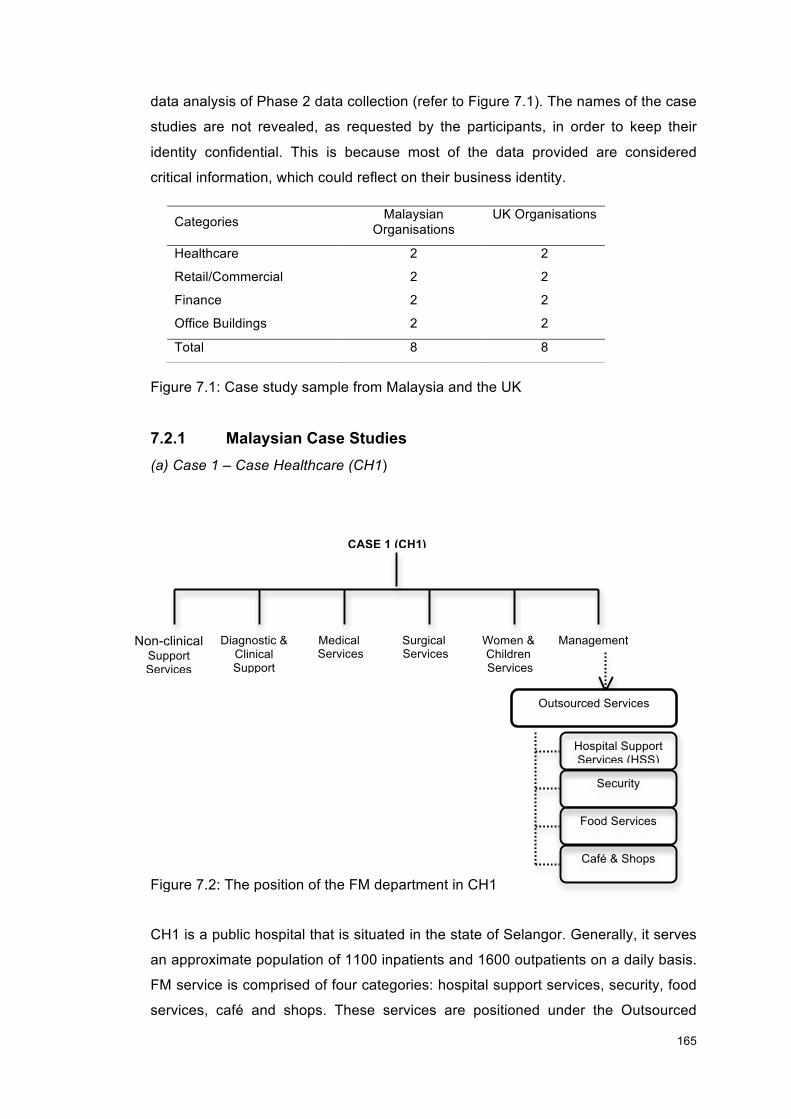
!!
165!
!
data analysis of Phase 2 data collection (refer to Figure 7.1). The names of the case
studies are not revealed, as requested by the participants, in order to keep their
identity confidential. This is because most of the data provided are considered
critical information, which could reflect on their business identity.
Figure 7.1: Case study sample from Malaysia and the UK 7.2.1 Malaysian Case Studies (a) Case 1 – Case Healthcare (CH1)
CH1 is a public hospital that is situated in the state of Selangor. Generally, it serves
an approximate population of 1100 inpatients and 1600 outpatients on a daily basis.
FM service is comprised of four categories: hospital support services, security, food
services, café and shops. These services are positioned under the Outsourced
Categories Malaysian Organisations
UK Organisations
Healthcare 2 2
Retail/Commercial 2 2
Finance 2 2
Office Buildings 2 2
Total 8 8
Non-clinical Support Services
Diagnostic & Clinical Support Services
Medical Services
Surgical Services
Women & Children Services
Management
CASE 1 (CH1)
Outsourced Services
Hospital Support Services (HSS)
Security
Food Services
Café & Shops
Figure 7.2: The position of the FM department in CH1
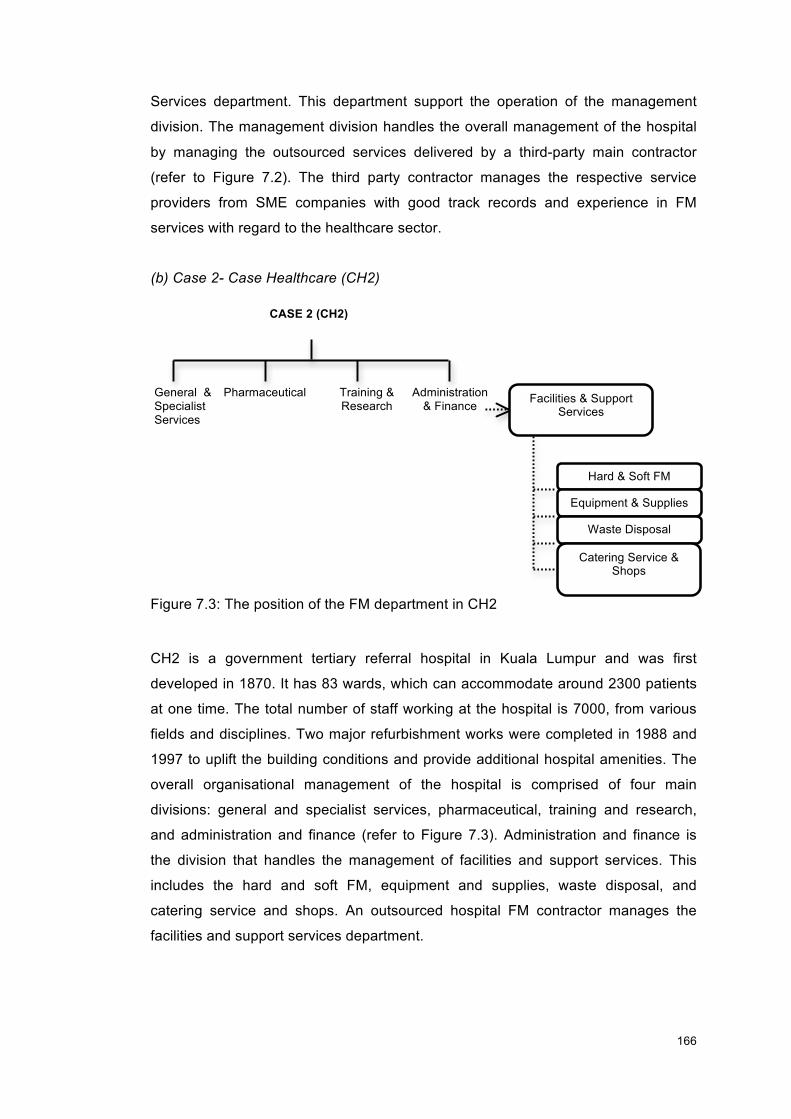
!!
166!
!
Services department. This department support the operation of the management
division. The management division handles the overall management of the hospital
by managing the outsourced services delivered by a third-party main contractor
(refer to Figure 7.2). The third party contractor manages the respective service
providers from SME companies with good track records and experience in FM
services with regard to the healthcare sector.
(b) Case 2- Case Healthcare (CH2)
CH2 is a government tertiary referral hospital in Kuala Lumpur and was first
developed in 1870. It has 83 wards, which can accommodate around 2300 patients
at one time. The total number of staff working at the hospital is 7000, from various
fields and disciplines. Two major refurbishment works were completed in 1988 and
1997 to uplift the building conditions and provide additional hospital amenities. The
overall organisational management of the hospital is comprised of four main
divisions: general and specialist services, pharmaceutical, training and research,
and administration and finance (refer to Figure 7.3). Administration and finance is
the division that handles the management of facilities and support services. This
includes the hard and soft FM, equipment and supplies, waste disposal, and
catering service and shops. An outsourced hospital FM contractor manages the
facilities and support services department.
CASE 2 (CH2)
Pharmaceutical Training & Research
General & Specialist Services
Administration & Finance Facilities & Support
Services
Hard & Soft FM
Equipment & Supplies
Waste Disposal
Catering Service & Shops
Figure 7.3: The position of the FM department in CH2

!!
167!
!
(c) Case 3- Case Retail (CR1)
CR1 is one of Malaysia’s famous landmarks and has a large spread of three-storey
floors of retail area. This large complex has 60 high-end retail outlets under its roof
and some public amenities such as a prayer room, food court and exhibition rooms.
It is managed by the client sub-company, which focuses only on the real estate
department. The real estate company handles the marketing, operations and lease
services, as shown in Figure 7.4. The FM service has a dedicated department
named FM Support, which is put under the operations division. The in-house FM
team is responsible for monitoring the service performance delivered by the
outsourced service providers and ensuring that all relevant requirements and
standards are adhered to. The outsourcing started when the building was first
operated in 1990. The FM Support department is also in charge of two main areas,
which are contract administration, and maintenance & operations. The in-house FM
employees from the contract administration division are responsible for handling the
management works such as procurement, contractual arrangement, statutory and
compliance matters, as well as payment matters; while the in-house FM employees
from maintenance & operations oversee the conduct of operations, monitoring of
contractors and any service matters which occur.
CASE 3 (CR1)
Real Estate
Marketing Lease Operations FM Support
Contract Administration
Maintenance & Operations
Figure 7.4: The position of the FM department in CR1
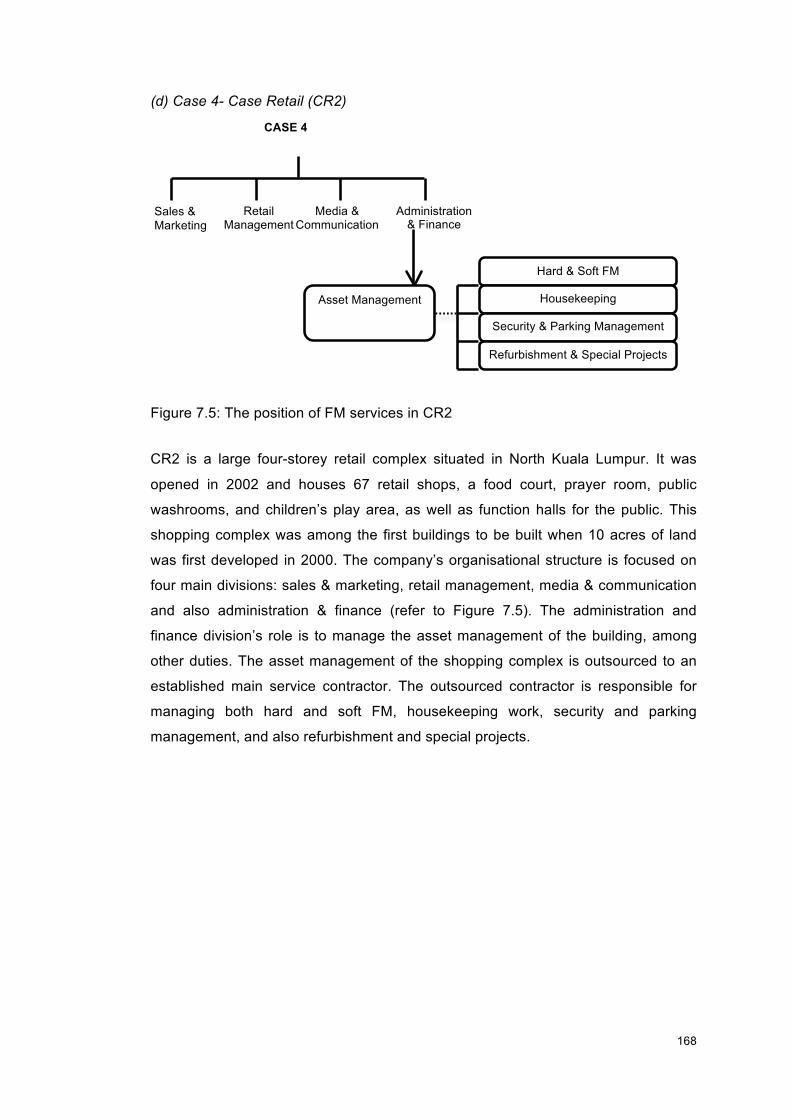
!!
168!
!
(d) Case 4- Case Retail (CR2)
CR2 is a large four-storey retail complex situated in North Kuala Lumpur. It was
opened in 2002 and houses 67 retail shops, a food court, prayer room, public
washrooms, and children’s play area, as well as function halls for the public. This
shopping complex was among the first buildings to be built when 10 acres of land
was first developed in 2000. The company’s organisational structure is focused on
four main divisions: sales & marketing, retail management, media & communication
and also administration & finance (refer to Figure 7.5). The administration and
finance division’s role is to manage the asset management of the building, among
other duties. The asset management of the shopping complex is outsourced to an
established main service contractor. The outsourced contractor is responsible for
managing both hard and soft FM, housekeeping work, security and parking
management, and also refurbishment and special projects.
Retail Management
Media & Communication
Administration & Finance
CASE 4 (CR2)
Sales & Marketing
Asset Management
Hard & Soft FM
Housekeeping
Security & Parking Management
Refurbishment & Special Projects
Figure 7.5: The position of FM services in CR2
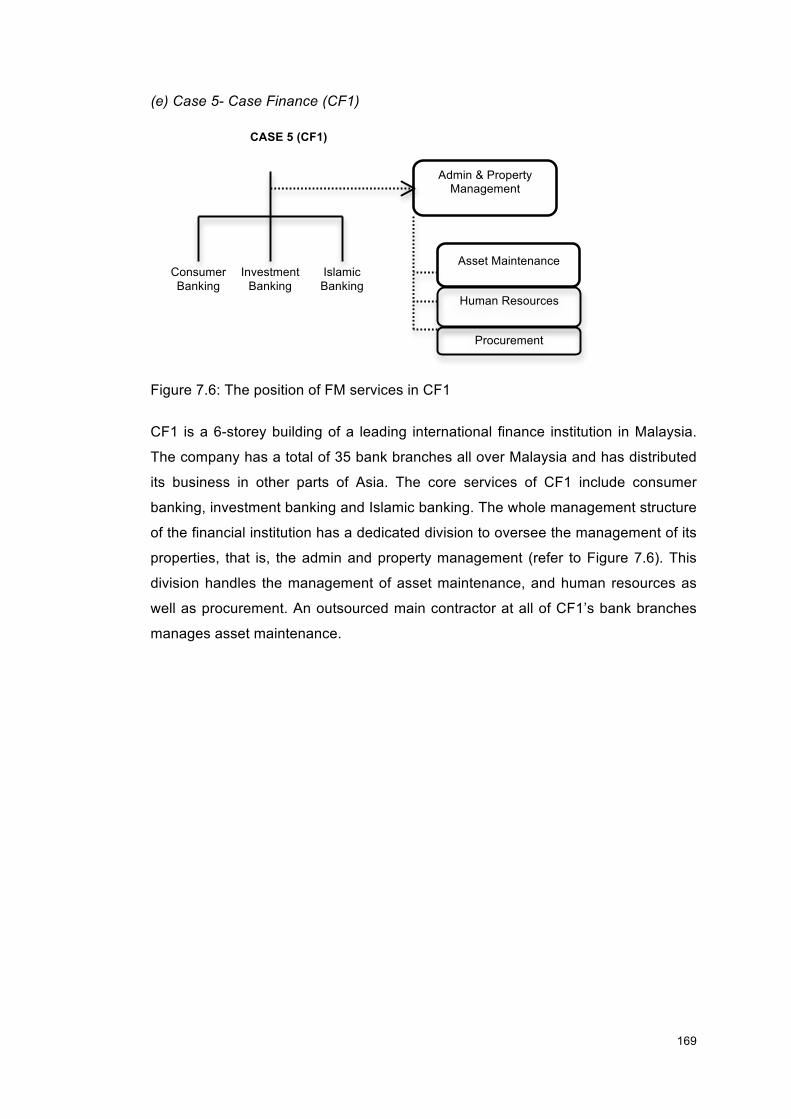
!!
169!
!
(e) Case 5- Case Finance (CF1)
CF1 is a 6-storey building of a leading international finance institution in Malaysia.
The company has a total of 35 bank branches all over Malaysia and has distributed
its business in other parts of Asia. The core services of CF1 include consumer
banking, investment banking and Islamic banking. The whole management structure
of the financial institution has a dedicated division to oversee the management of its
properties, that is, the admin and property management (refer to Figure 7.6). This
division handles the management of asset maintenance, and human resources as
well as procurement. An outsourced main contractor at all of CF1’s bank branches
manages asset maintenance.
Consumer Banking
Investment Banking
Islamic Banking
CASE 5 (CF1)
Admin & Property Management
Procurement
Human Resources
Asset Maintenance
Figure 7.6: The position of FM services in CF1
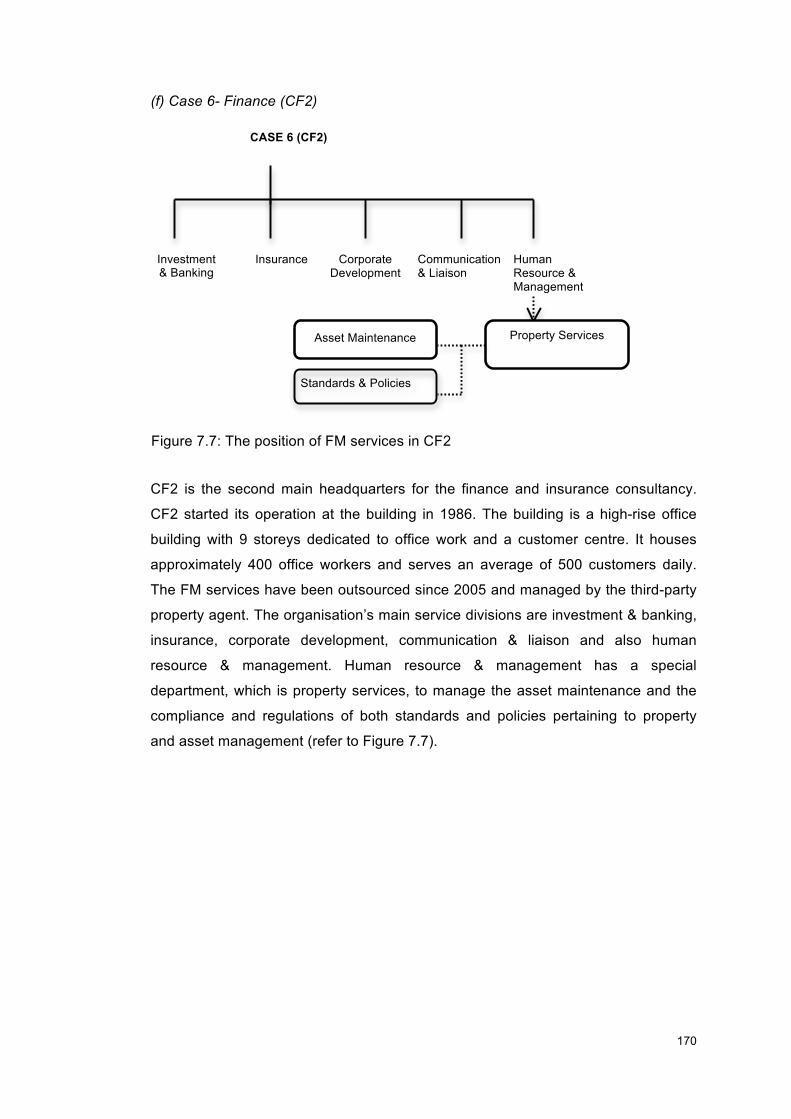
!!
170!
!
(f) Case 6- Finance (CF2)
CF2 is the second main headquarters for the finance and insurance consultancy.
CF2 started its operation at the building in 1986. The building is a high-rise office
building with 9 storeys dedicated to office work and a customer centre. It houses
approximately 400 office workers and serves an average of 500 customers daily.
The FM services have been outsourced since 2005 and managed by the third-party
property agent. The organisation’s main service divisions are investment & banking,
insurance, corporate development, communication & liaison and also human
resource & management. Human resource & management has a special
department, which is property services, to manage the asset maintenance and the
compliance and regulations of both standards and policies pertaining to property
and asset management (refer to Figure 7.7).
Human Resource & Management
Investment & Banking
Insurance Corporate Development
CASE 6 (CF2)
Communication & Liaison
Property Services
Standards & Policies
Asset Maintenance
Figure 7.7: The position of FM services in CF2
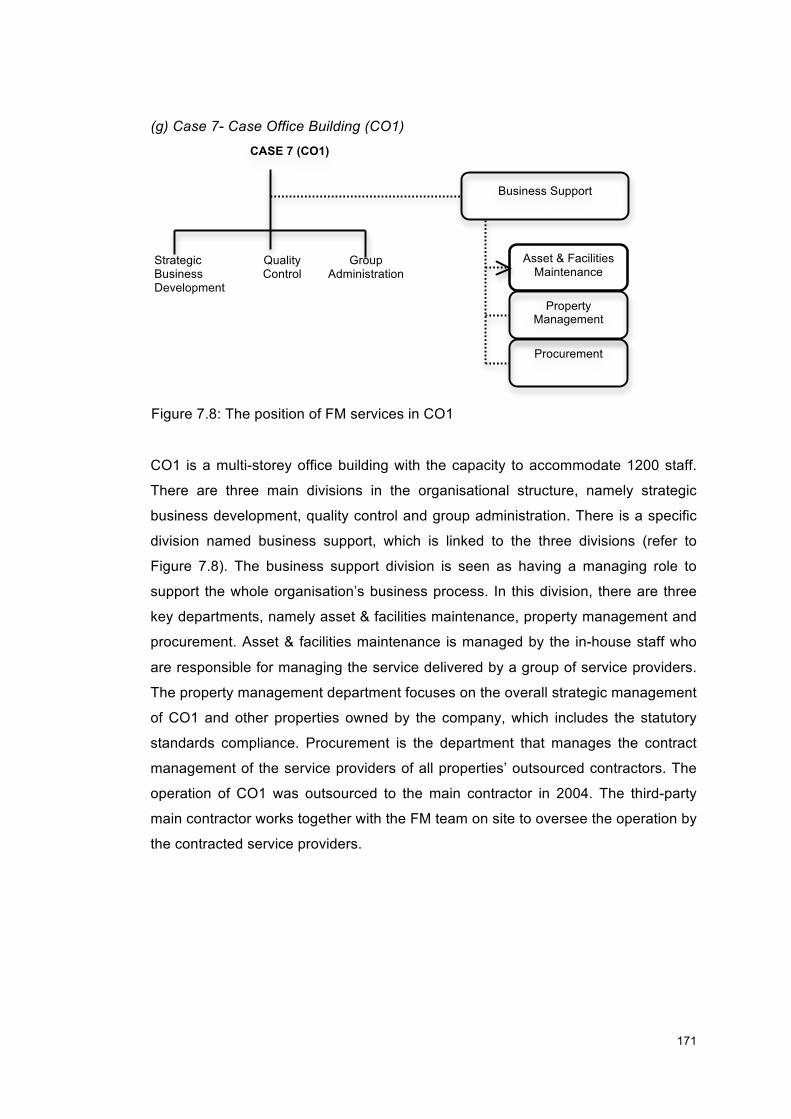
!!
171!
!
(g) Case 7- Case Office Building (CO1)
CO1 is a multi-storey office building with the capacity to accommodate 1200 staff.
There are three main divisions in the organisational structure, namely strategic
business development, quality control and group administration. There is a specific
division named business support, which is linked to the three divisions (refer to
Figure 7.8). The business support division is seen as having a managing role to
support the whole organisation’s business process. In this division, there are three
key departments, namely asset & facilities maintenance, property management and
procurement. Asset & facilities maintenance is managed by the in-house staff who
are responsible for managing the service delivered by a group of service providers.
The property management department focuses on the overall strategic management
of CO1 and other properties owned by the company, which includes the statutory
standards compliance. Procurement is the department that manages the contract
management of the service providers of all properties’ outsourced contractors. The
operation of CO1 was outsourced to the main contractor in 2004. The third-party
main contractor works together with the FM team on site to oversee the operation by
the contracted service providers.
Business Support
Asset & Facilities Maintenance
Property Management
Procurement
Strategic Business Development
Quality Control
Group Administration
CASE 7 (CO1)
Figure 7.8: The position of FM services in CO1
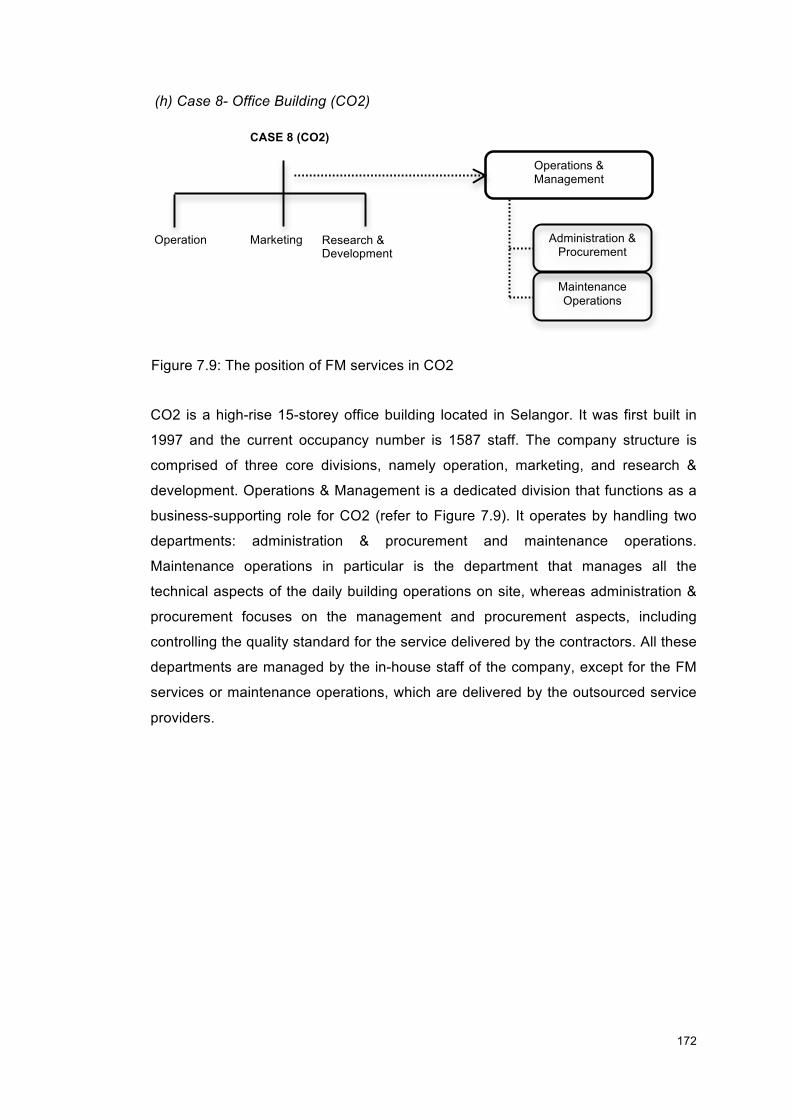
!!
172!
!
(h) Case 8- Office Building (CO2)
CO2 is a high-rise 15-storey office building located in Selangor. It was first built in
1997 and the current occupancy number is 1587 staff. The company structure is
comprised of three core divisions, namely operation, marketing, and research &
development. Operations & Management is a dedicated division that functions as a
business-supporting role for CO2 (refer to Figure 7.9). It operates by handling two
departments: administration & procurement and maintenance operations.
Maintenance operations in particular is the department that manages all the
technical aspects of the daily building operations on site, whereas administration &
procurement focuses on the management and procurement aspects, including
controlling the quality standard for the service delivered by the contractors. All these
departments are managed by the in-house staff of the company, except for the FM
services or maintenance operations, which are delivered by the outsourced service
providers.
CASE 8 (CO2)
Operation Marketing Research & Development
Operations & Management
Administration & Procurement
Maintenance Operations
Figure 7.9: The position of FM services in CO2
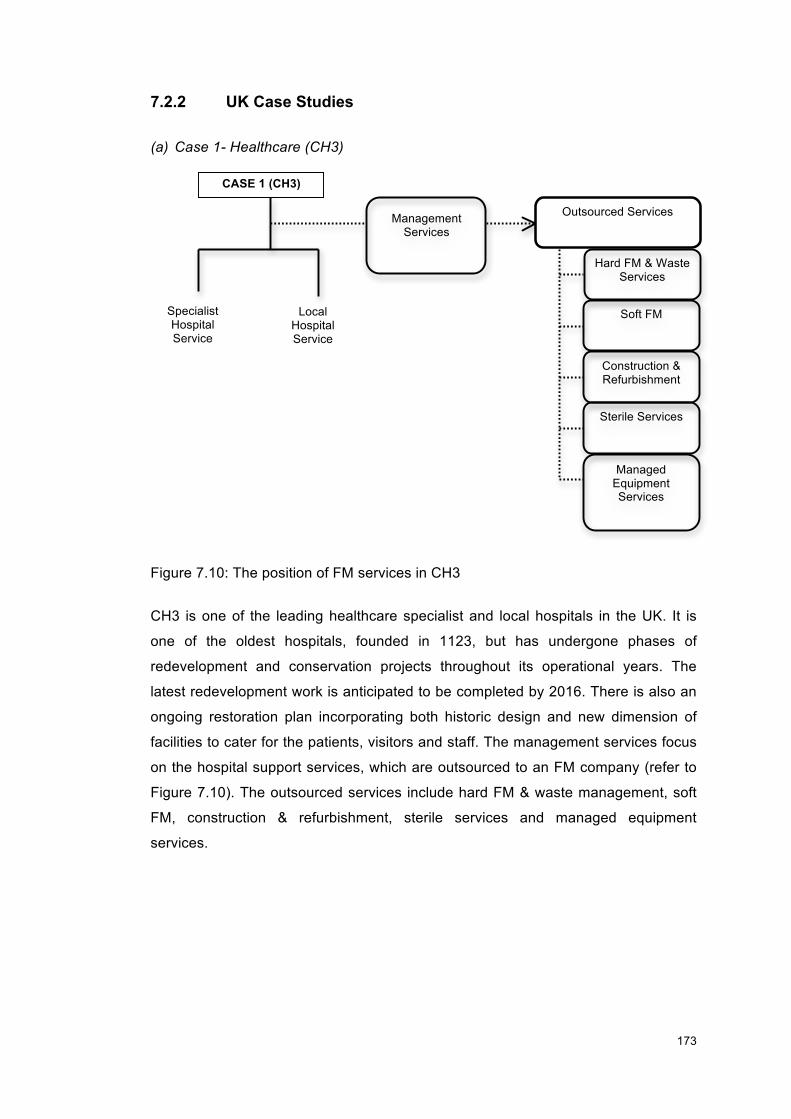
!!
173!
!
7.2.2 UK Case Studies
(a) Case 1- Healthcare (CH3)
CH3 is one of the leading healthcare specialist and local hospitals in the UK. It is
one of the oldest hospitals, founded in 1123, but has undergone phases of
redevelopment and conservation projects throughout its operational years. The
latest redevelopment work is anticipated to be completed by 2016. There is also an
ongoing restoration plan incorporating both historic design and new dimension of
facilities to cater for the patients, visitors and staff. The management services focus
on the hospital support services, which are outsourced to an FM company (refer to
Figure 7.10). The outsourced services include hard FM & waste management, soft
FM, construction & refurbishment, sterile services and managed equipment
services.
Specialist Hospital Service
Local Hospital Service
CASE 1 (CH3)
Management Services
Outsourced Services
Hard FM & Waste Services
Construction & Refurbishment
Managed Equipment Services
Sterile Services
Soft FM
Figure 7.10: The position of FM services in CH3
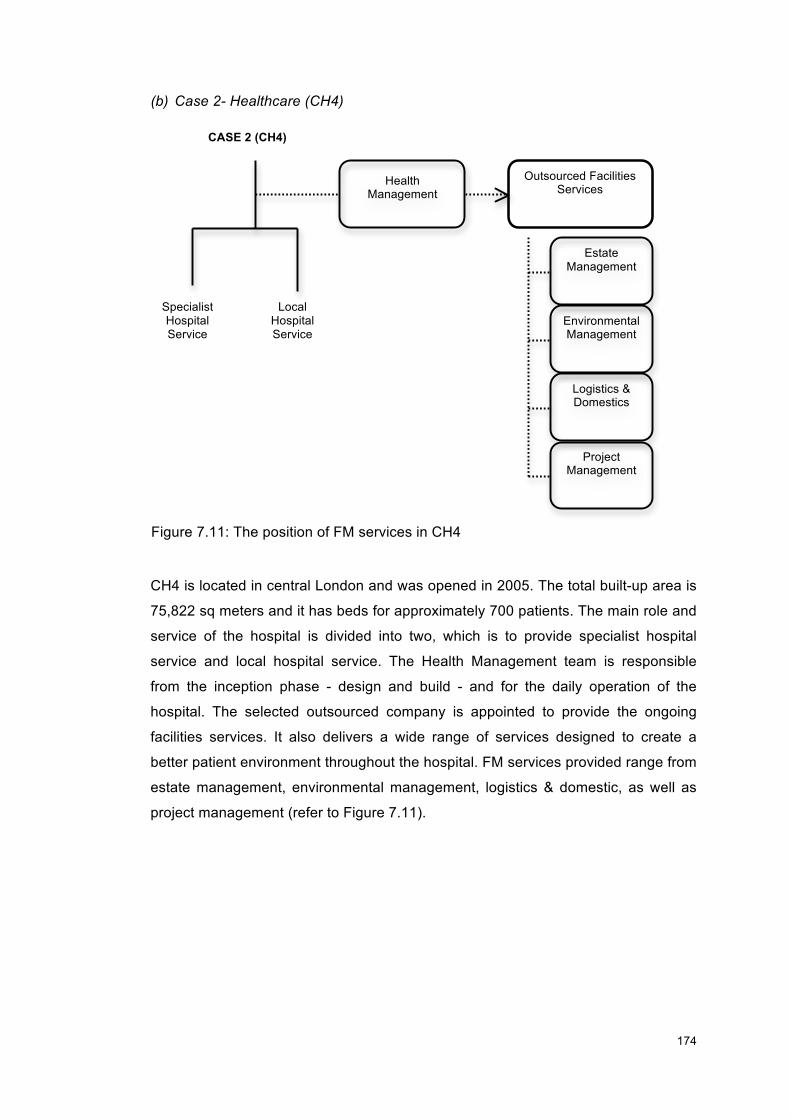
!!
174!
!
(b) Case 2- Healthcare (CH4)
CH4 is located in central London and was opened in 2005. The total built-up area is
75,822 sq meters and it has beds for approximately 700 patients. The main role and
service of the hospital is divided into two, which is to provide specialist hospital
service and local hospital service. The Health Management team is responsible
from the inception phase - design and build - and for the daily operation of the
hospital. The selected outsourced company is appointed to provide the ongoing
facilities services. It also delivers a wide range of services designed to create a
better patient environment throughout the hospital. FM services provided range from
estate management, environmental management, logistics & domestic, as well as
project management (refer to Figure 7.11).
Outsourced Facilities Services
Estate Management
Environmental Management
Logistics & Domestics
Project Management
Specialist Hospital Service
Local Hospital Service
CASE 2 (CH4)
Health Management
Figure 7.11: The position of FM services in CH4
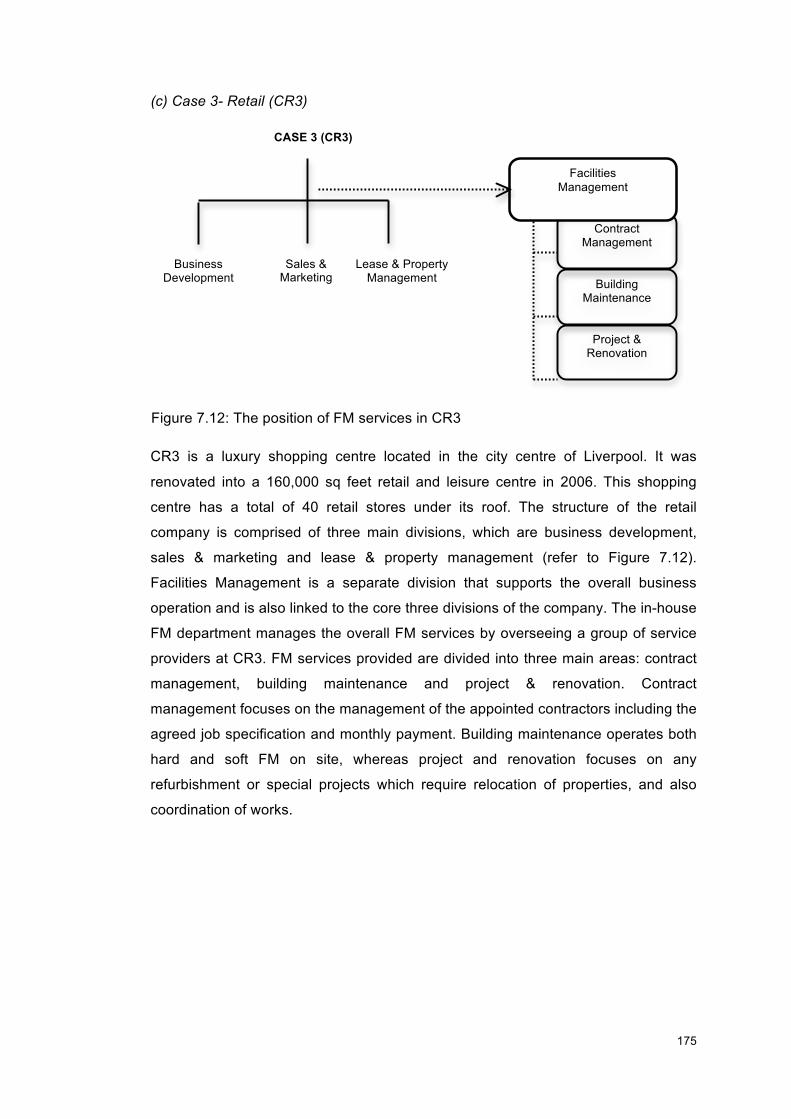
!!
175!
!
(c) Case 3- Retail (CR3)
CR3 is a luxury shopping centre located in the city centre of Liverpool. It was
renovated into a 160,000 sq feet retail and leisure centre in 2006. This shopping
centre has a total of 40 retail stores under its roof. The structure of the retail
company is comprised of three main divisions, which are business development,
sales & marketing and lease & property management (refer to Figure 7.12).
Facilities Management is a separate division that supports the overall business
operation and is also linked to the core three divisions of the company. The in-house
FM department manages the overall FM services by overseeing a group of service
providers at CR3. FM services provided are divided into three main areas: contract
management, building maintenance and project & renovation. Contract
management focuses on the management of the appointed contractors including the
agreed job specification and monthly payment. Building maintenance operates both
hard and soft FM on site, whereas project and renovation focuses on any
refurbishment or special projects which require relocation of properties, and also
coordination of works.
Contract Management
Project & Renovation
Building Maintenance
CASE 3 (CR3)
Business Development
Sales & Marketing
Lease & Property Management
Facilities Management
Figure 7.12: The position of FM services in CR3
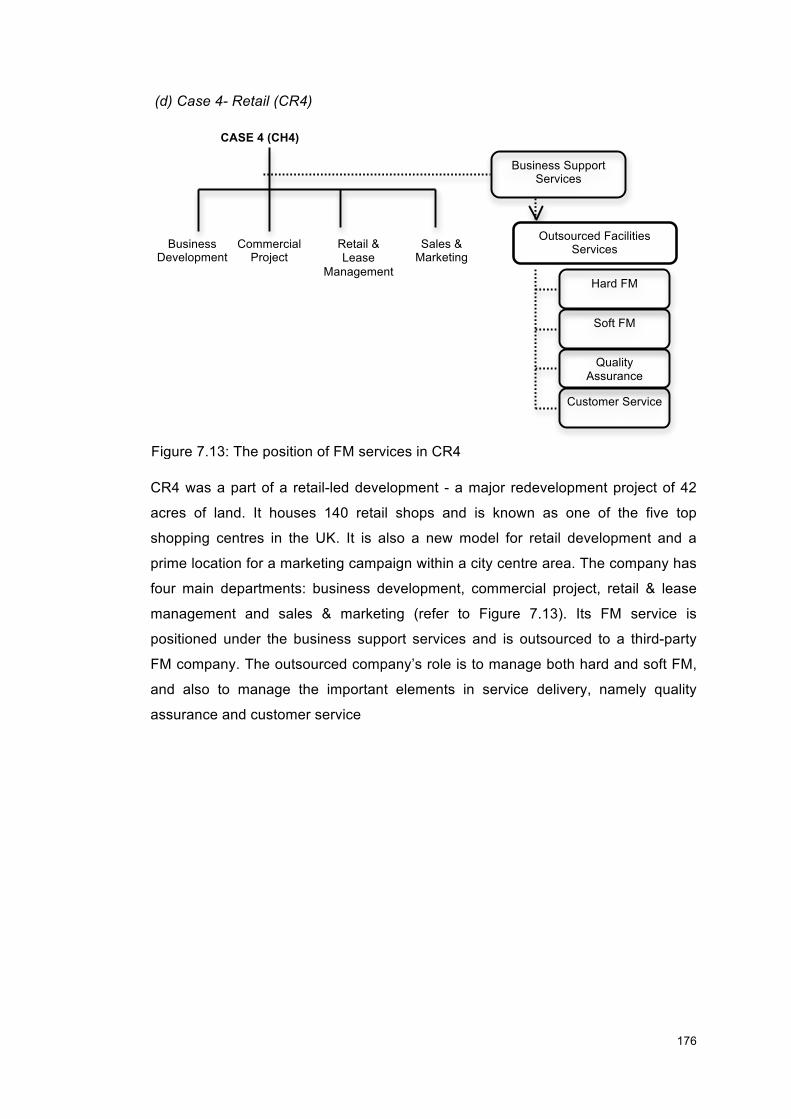
!!
176!
!
(d) Case 4- Retail (CR4)
CR4 was a part of a retail-led development - a major redevelopment project of 42
acres of land. It houses 140 retail shops and is known as one of the five top
shopping centres in the UK. It is also a new model for retail development and a
prime location for a marketing campaign within a city centre area. The company has
four main departments: business development, commercial project, retail & lease
management and sales & marketing (refer to Figure 7.13). Its FM service is
positioned under the business support services and is outsourced to a third-party
FM company. The outsourced company’s role is to manage both hard and soft FM,
and also to manage the important elements in service delivery, namely quality
assurance and customer service
Hard FM
Soft FM
Quality Assurance
Customer Service
Business Support Services
Outsourced Facilities Services
CASE 4 (CH4)
Commercial Project
Retail & Lease
Management
Sales & Marketing
Business Development
Figure 7.13: The position of FM services in CR4
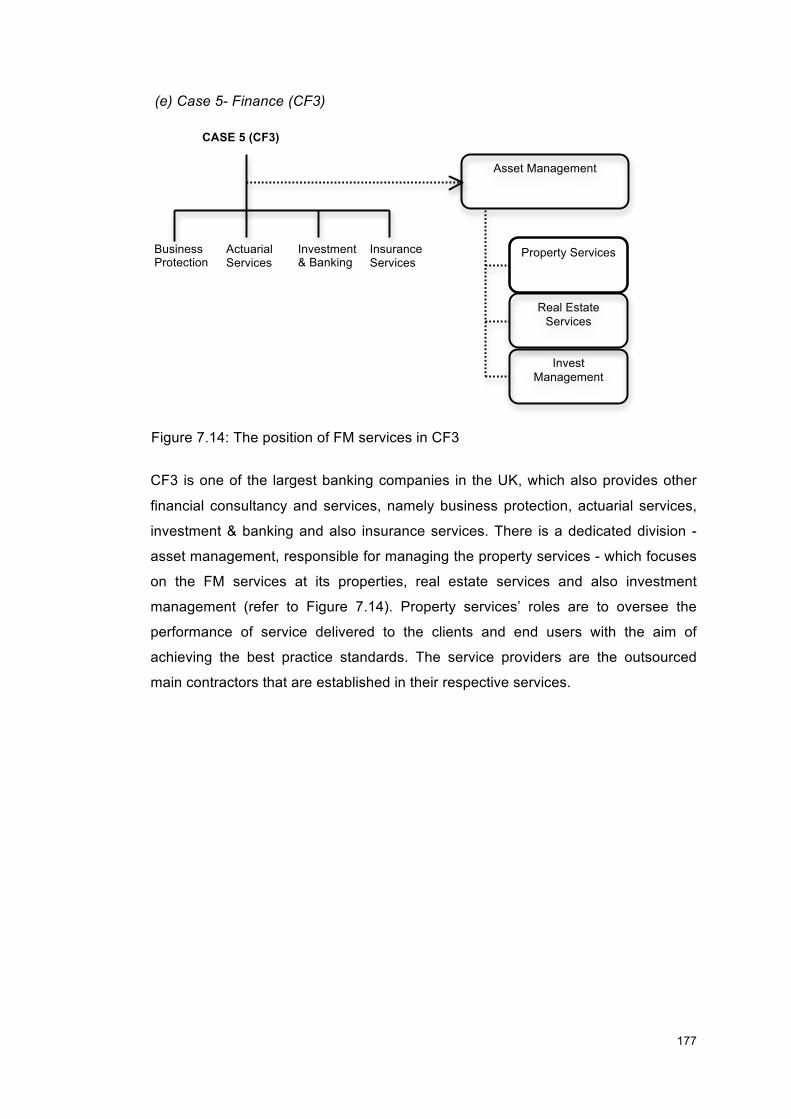
!!
177!
!
(e) Case 5- Finance (CF3)
CF3 is one of the largest banking companies in the UK, which also provides other
financial consultancy and services, namely business protection, actuarial services,
investment & banking and also insurance services. There is a dedicated division -
asset management, responsible for managing the property services - which focuses
on the FM services at its properties, real estate services and also investment
management (refer to Figure 7.14). Property services’ roles are to oversee the
performance of service delivered to the clients and end users with the aim of
achieving the best practice standards. The service providers are the outsourced
main contractors that are established in their respective services.
CASE 5 (CF3)
Business Protection
Actuarial Services
Insurance Services
Investment & Banking
Asset Management
Property Services
Real Estate Services
Invest Management
Figure 7.14: The position of FM services in CF3
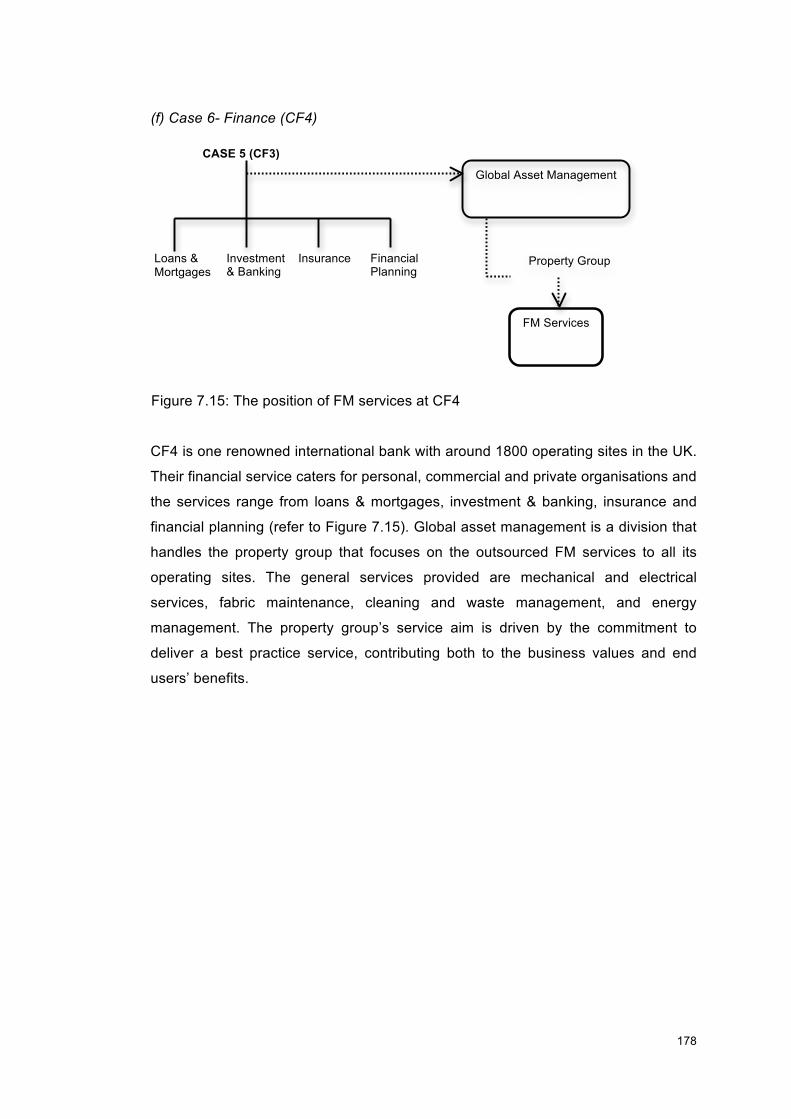
!!
178!
!
(f) Case 6- Finance (CF4)
CF4 is one renowned international bank with around 1800 operating sites in the UK.
Their financial service caters for personal, commercial and private organisations and
the services range from loans & mortgages, investment & banking, insurance and
financial planning (refer to Figure 7.15). Global asset management is a division that
handles the property group that focuses on the outsourced FM services to all its
operating sites. The general services provided are mechanical and electrical
services, fabric maintenance, cleaning and waste management, and energy
management. The property group’s service aim is driven by the commitment to
deliver a best practice service, contributing both to the business values and end
users’ benefits.
FM Services
CASE 5 (CF3)
Loans & Mortgages
Investment & Banking
Financial Planning
Insurance
Global Asset Management
Property Group
Figure 7.15: The position of FM services at CF4
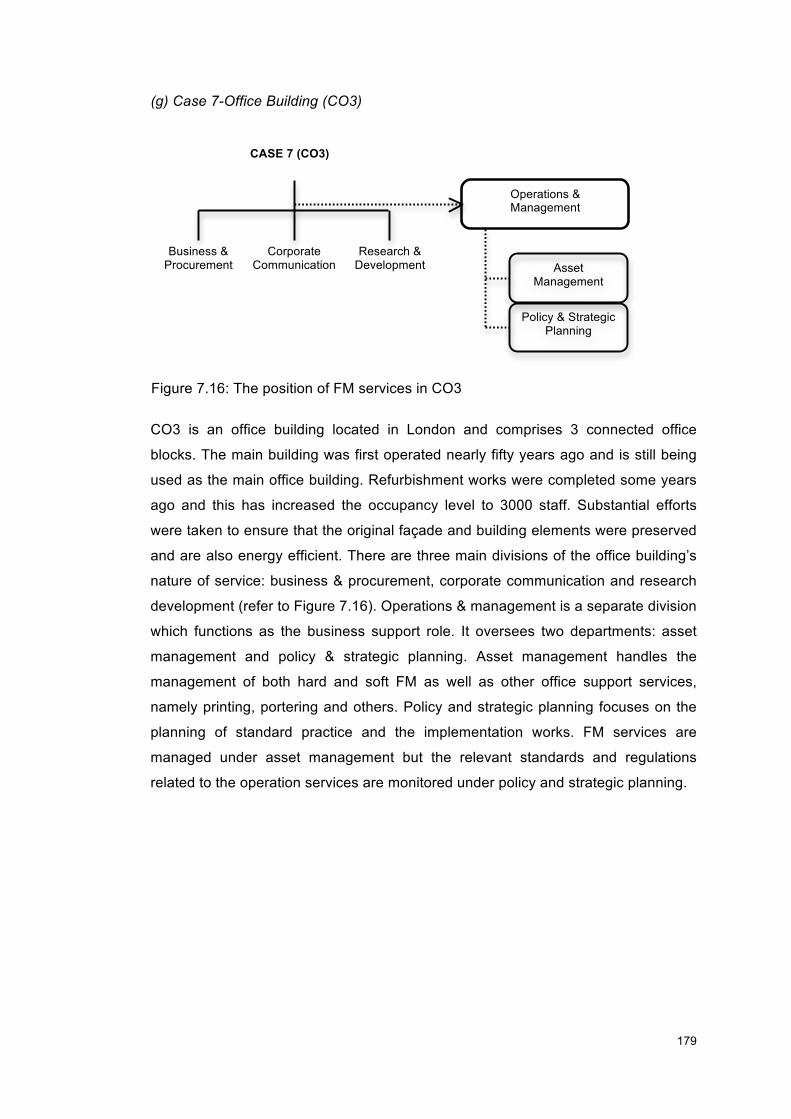
!!
179!
!
(g) Case 7-Office Building (CO3)
CO3 is an office building located in London and comprises 3 connected office
blocks. The main building was first operated nearly fifty years ago and is still being
used as the main office building. Refurbishment works were completed some years
ago and this has increased the occupancy level to 3000 staff. Substantial efforts
were taken to ensure that the original façade and building elements were preserved
and are also energy efficient. There are three main divisions of the office building’s
nature of service: business & procurement, corporate communication and research
development (refer to Figure 7.16). Operations & management is a separate division
which functions as the business support role. It oversees two departments: asset
management and policy & strategic planning. Asset management handles the
management of both hard and soft FM as well as other office support services,
namely printing, portering and others. Policy and strategic planning focuses on the
planning of standard practice and the implementation works. FM services are
managed under asset management but the relevant standards and regulations
related to the operation services are monitored under policy and strategic planning.
Operations & Management
Asset Management
Policy & Strategic Planning
CASE 7 (CO3)
Business & Procurement
Corporate Communication
Research & Development
Figure 7.16: The position of FM services in CO3
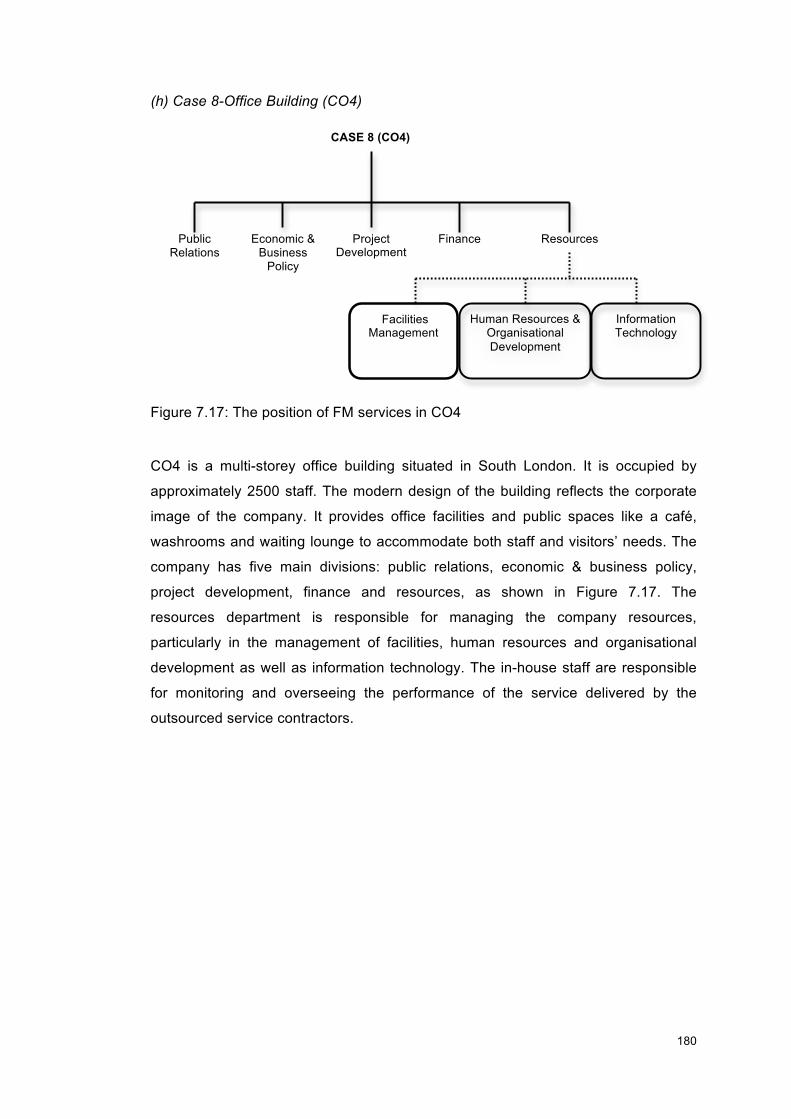
!!
180!
!
(h) Case 8-Office Building (CO4)
CO4 is a multi-storey office building situated in South London. It is occupied by
approximately 2500 staff. The modern design of the building reflects the corporate
image of the company. It provides office facilities and public spaces like a café,
washrooms and waiting lounge to accommodate both staff and visitors’ needs. The
company has five main divisions: public relations, economic & business policy,
project development, finance and resources, as shown in Figure 7.17. The
resources department is responsible for managing the company resources,
particularly in the management of facilities, human resources and organisational
development as well as information technology. The in-house staff are responsible
for monitoring and overseeing the performance of the service delivered by the
outsourced service contractors.
Human Resources & Organisational Development
Facilities Management
Information Technology
CASE 8 (CO4)
Public Relations
Economic & Business
Policy
Project Development
Finance Resources
Figure 7.17: The position of FM services in CO4
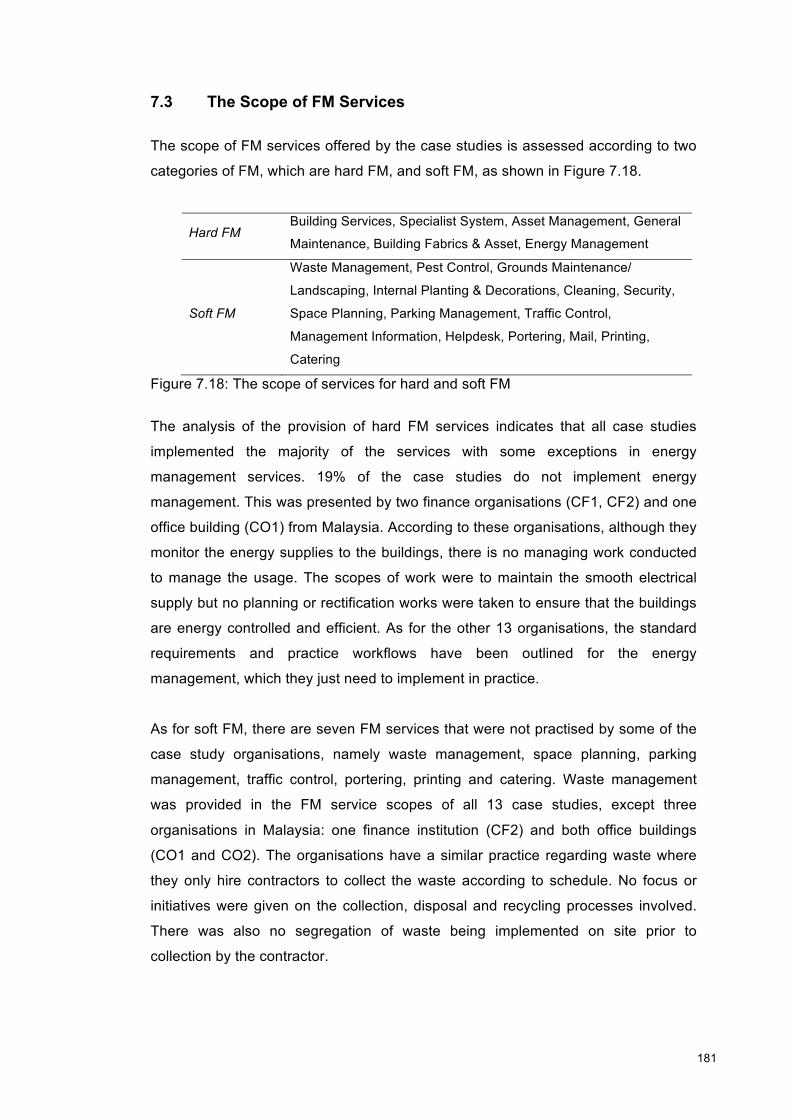
! 181!
7.3 The Scope of FM Services
The scope of FM services offered by the case studies is assessed according to two
categories of FM, which are hard FM, and soft FM, as shown in Figure 7.18.
Hard FM Building Services, Specialist System, Asset Management, General
Maintenance, Building Fabrics & Asset, Energy Management
Soft FM
Waste Management, Pest Control, Grounds Maintenance/
Landscaping, Internal Planting & Decorations, Cleaning, Security,
Space Planning, Parking Management, Traffic Control,
Management Information, Helpdesk, Portering, Mail, Printing,
Catering
Figure 7.18: The scope of services for hard and soft FM
The analysis of the provision of hard FM services indicates that all case studies
implemented the majority of the services with some exceptions in energy
management services. 19% of the case studies do not implement energy
management. This was presented by two finance organisations (CF1, CF2) and one
office building (CO1) from Malaysia. According to these organisations, although they
monitor the energy supplies to the buildings, there is no managing work conducted
to manage the usage. The scopes of work were to maintain the smooth electrical
supply but no planning or rectification works were taken to ensure that the buildings
are energy controlled and efficient. As for the other 13 organisations, the standard
requirements and practice workflows have been outlined for the energy
management, which they just need to implement in practice.
As for soft FM, there are seven FM services that were not practised by some of the
case study organisations, namely waste management, space planning, parking
management, traffic control, portering, printing and catering. Waste management
was provided in the FM service scopes of all 13 case studies, except three
organisations in Malaysia: one finance institution (CF2) and both office buildings
(CO1 and CO2). The organisations have a similar practice regarding waste where
they only hire contractors to collect the waste according to schedule. No focus or
initiatives were given on the collection, disposal and recycling processes involved.
There was also no segregation of waste being implemented on site prior to
collection by the contractor.
! 182!
Both of the office buildings in Malaysia (CO1 and CO2) claimed that, although they
understand that space planning is one of the FM service scopes, they had never
given any focus to this service element. Although space planning is something very
imperative in office buildings’ management, they had never been involved in any
space planning or arrangement when any relocation or refurbishment work took
place. The higher management would normally hire a consultant and designer to
work on the new planning design for the works, and an FM contractor was only
instructed to oversee the relocation and movement of properties during the process.
As for both parking management and traffic control, all the case study organisations
claimed to have scope for these services in their FM services. The only organisation
that does not offer this service is CR3 in the UK. This is because there is no parking
facility provided at the case study building. The rest of the case study organisations
stated that their management of parking and also traffic control includes the
issuance and payment of parking tickets, and maintenance and surveillance of
parking areas, as well as the traffic control for the access and exits of the parking
space, lobby and waiting areas.
The other scope of FM services that was not being implemented by several case
study organisations is portering. Both retail organisations in Malaysia and one in the
UK (CR1, CR2, and CR3) and also one financial institution in Malaysia (CF1)
claimed that they do not offer portering services.
!!
183!
!
7.4 The Elements of Performance Measures
An analysis was made of the elements of the performance measures being used by
all the case study organisations according to the respective category and region.
The aggregative levels of performance measures can range from performance
parameters, metrics, indicators and attributes. The aggregative levels show the
heading or grouping of the performance measures as well as how detailed they are
being designed by the participating case study organisations. The study aims to
understand the various approaches implemented for the imperative elements of
performance measures. The term of measurement here refers to the total approach
taken for the measurement designs of respective organisations, which include the
performance measures and whether any other related performance elements
namely performance formula or targets and monitoring methods. This includes
whether the purposes of the measurement process are fully communicated among
the higher management level and FM team members and also, what are the core
principles of the PM approach. The design and methods chosen to formulate the
whole measurement approach including the performance measures were also
considered, to reflect whether the organisation’s mission and strategies were also
emphasised therein. The types of performance measures, namely subjective or
objective, and the balance of the emphasis given to the management and operation
scope of FM services were also covered. Another element that was given attention
was the implementation of the performance measures - whether they are easy or
complicated to implement, and also whether both management and operation
scopes are implemented concurrently. Quality assessment signifies the steps taken
to assess the quality level of both service performance and the performance
measures themselves. They could be any exercise of a consistent audit or
benchmarking of the performance measures or dimensions or other means of
assessment, namely client satisfaction survey. The last element is report, which
refers to how the compliance of each PM indicator is reported, and the frequency of
each report being exercised by the service providers to the FM team or by the FM
team to the higher management. These elements are the core fundamentals that
were suggested in the literature to lead to a clear and better understanding of the
PM indicators used by the selected organisations. Further analysis of what is being
represented by each category - healthcare, retail, finance and office building from
Malaysia and the UK respectively - is presented in the next part of the analysis.
!!
184!
!
7.4.1 Healthcare Organisations A comparison is made between healthcare organisations in Malaysia (CH1 and
CH2) and the UK (CH3 and CH4), as shown in Figure 7.19. Both cases claimed that
their staff understood their measurement purposes. Generally, their purpose is to
understand their performance level in providing the best hospital care to the patients
and building users. The purpose also reflects the organisation’s process and
mission. When asked what is their principle of measurement, the healthcare
organisations in Malaysia claimed that theirs is to improve their service delivery and
ensure that the agreed service level is delivered; whereas the UK organisations
stated that their focus was on improvement and to provide precise information of
their service level. They also intended to stimulate continuous improvement rather
than just simply monitor their service performance. They also made sure that the
performance measures represent a balanced view of the service system and that
the cause and effect relationship between the performance measures and results
are established. As for the formulation of PM indicators, CH1 and CH2 from
Malaysia claimed that their performance measures were formulated and proposed
by their consultants to cater the FM services for hospitals. The performance
measures were designed to meet the expectations of both the board directors and
patients.
On the contrary, the performance measures for both CH3 and CH4 in the UK were
derived from a mutual consensus arising from a discussion among the trust boards,
professional practitioners and also the FM department. The sets of performance
measures were formulated by considering both patients’ and building users’ points
of view. They were also geared to achieve a balanced and cost-efficient operation
with achievable targets. Although all organisations adopted both financial and non-
financial measurements, their types of performance measures are different.
Malaysian healthcare organisations use subjective performance measures to
measure the management services, but set brief performance measures for
operation services, where more detailed specifications must be referred to the
contractors’ Service Level Agreements (SLAs).
Therefore, more focus is given to measure the management performance measures
as opposed to the technical requirements for operation services. On the contrary,
the UK healthcare organisations provide a set of subjective and objective
performance measures for both management and operation services that service
!!
185!
!
contractors need to achieve. The indicators are outlined based on the service
processes involved for each service and they also define unit of analysis and
performance tolerance. This has resulted in more consistency of the management
service indicators being implemented by CH1 and CH2, in comparison to the
operation performance measures that had to be referred to SLAs. This also shows
that the performance measures for both the healthcare organisations in Malaysia
are separated and the specifications for technical operations were not given much
emphasis. The performance measures for the UK healthcare organisations appear
to be more comprehensive and easy to be measured and the data were
automatically collected from the completed service processes. All organisations also
claimed that external audits were conducted to compare their performance
measures with other healthcare organisations within the regions. Similarly, their
reporting methods were linked to the appraisal report and penalty scheme and
regulated on a monthly basis.
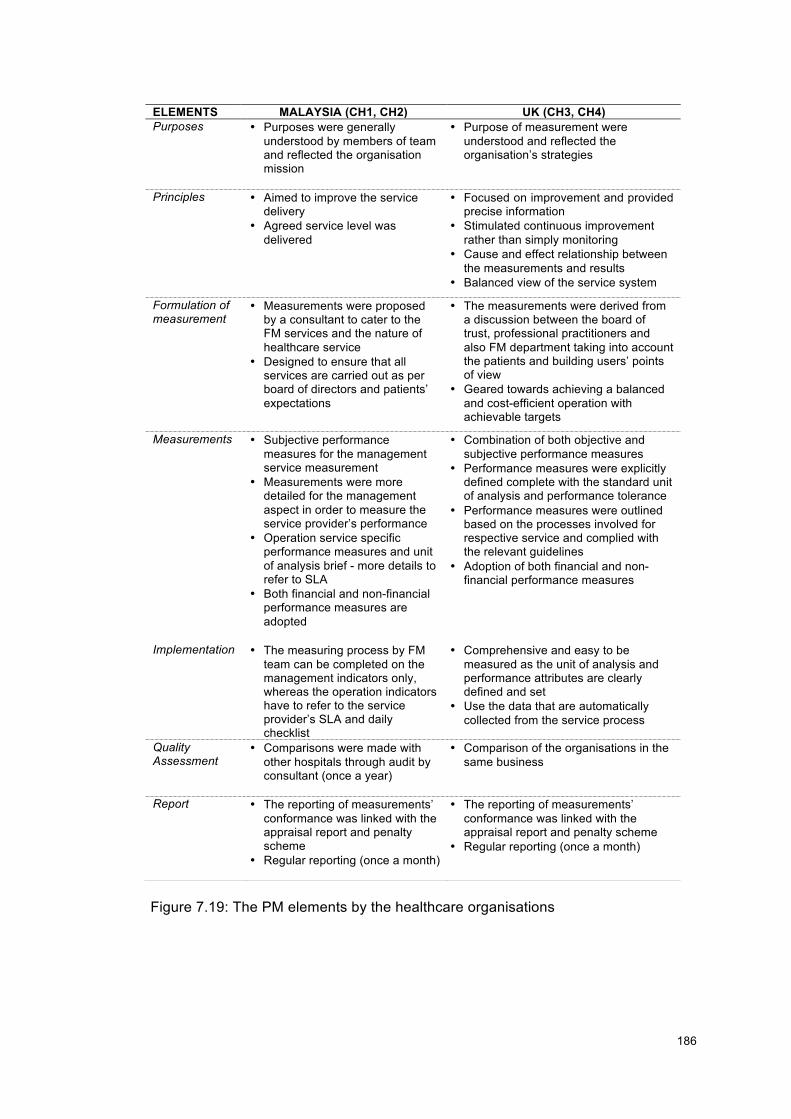
!!
186!
!
Figure 7.19: The PM elements by the healthcare organisations
ELEMENTS MALAYSIA (CH1, CH2) UK (CH3, CH4) Purposes • Purposes were generally
understood by members of team and reflected the organisation mission
• Purpose of measurement were understood and reflected the organisation’s strategies
Principles • Aimed to improve the service delivery
• Agreed service level was delivered
• Focused on improvement and provided precise information
• Stimulated continuous improvement rather than simply monitoring
• Cause and effect relationship between the measurements and results
• Balanced view of the service system
Formulation of measurement
• Measurements were proposed by a consultant to cater to the FM services and the nature of healthcare service
• Designed to ensure that all services are carried out as per board of directors and patients’ expectations
• The measurements were derived from a discussion between the board of trust, professional practitioners and also FM department taking into account the patients and building users’ points of view
• Geared towards achieving a balanced and cost-efficient operation with achievable targets
Measurements • Subjective performance measures for the management service measurement
• Measurements were more detailed for the management aspect in order to measure the service provider’s performance
• Operation service specific performance measures and unit of analysis brief - more details to refer to SLA
• Both financial and non-financial performance measures are adopted
• Combination of both objective and subjective performance measures
• Performance measures were explicitly defined complete with the standard unit of analysis and performance tolerance
• Performance measures were outlined based on the processes involved for respective service and complied with the relevant guidelines
• Adoption of both financial and non-financial performance measures
Implementation • The measuring process by FM team can be completed on the management indicators only, whereas the operation indicators have to refer to the service provider’s SLA and daily checklist
• Comprehensive and easy to be measured as the unit of analysis and performance attributes are clearly defined and set
• Use the data that are automatically collected from the service process
Quality Assessment
• Comparisons were made with other hospitals through audit by consultant (once a year)
• Comparison of the organisations in the same business
Report • The reporting of measurements’ conformance was linked with the appraisal report and penalty scheme
• Regular reporting (once a month)
• The reporting of measurements’ conformance was linked with the appraisal report and penalty scheme
• Regular reporting (once a month)
!!
187!
!
7.4.2 Retail Organisations The Malaysian retail organisations (CR1 and CR2) claimed that their measuring
purposes were well understood by the stakeholders and FM staff (refer to Figure
7.20). Similarly, the UK retail organisations (CR3 and CR4) also claimed that their
measurement purposes were well understood and linked with the organisation’s
mission and vision. CR1 and CR2’s principles were aimed to meet the customers’
expectations and enable the evaluation of service providers’ performance. Similarly,
CR3 and CR4’S principles were more to achieve improvements and quality
enhancement, and to achieve the required service standard. The approaches taken
by the UK and Malaysian retail organisations in formulating the measurement are
quite similar. CR1 and CR2 signified that their performance measures were
designed to meet the daily capacity and service providers’ scope of work and were
formulated by the FM team and approved by the stakeholders or clients. CR3 and
CR4 also formulated their performance measures based on the consensus among
the stakeholders and managerial level. The performance measures were designed
with emphasis given to the customers’ prioritised elements. Clearly, CR3 and CR4
were able to highlight the core elements in meeting the customers’ satisfaction. CR1
and CR2’s selection of performance measures were on subjective and non-financial
performance measures, and this only applied to the management service aspect.
Operation service performance measures were not compiled together with the
management performance measures, as they were mainly listed briefly in the daily
checklist and can be further referred to the SLAs. CR3 and CR4 had a different
approach, where they adopted both financial and non-financial performance
measures and subjective and objective performance measures. This also signifies
that the performance measures were paired with the relevant units of analysis and
also monitoring methods. They also claimed that their sets of performance
measures were easy to monitor and provided fast and accurate feedback. UK retail
organisations believed that having a structured set of performance measures and
attributes with measurable units of analysis had enabled them to be more
knowledgeable and also flexible to any changes. CR1 and CR2 also depended on
the tenants’ satisfaction survey to assess their service and to improvise on the
selection of PM indicators. CR3 and CR4 seemed to have taken more initiatives,
which were by conducting surveys to both tenants and customers and had also
undertaken continuous assessment of the facilities’ improvement. Although all the
organisations’ measurement compliances were connected to the penalty schemes,
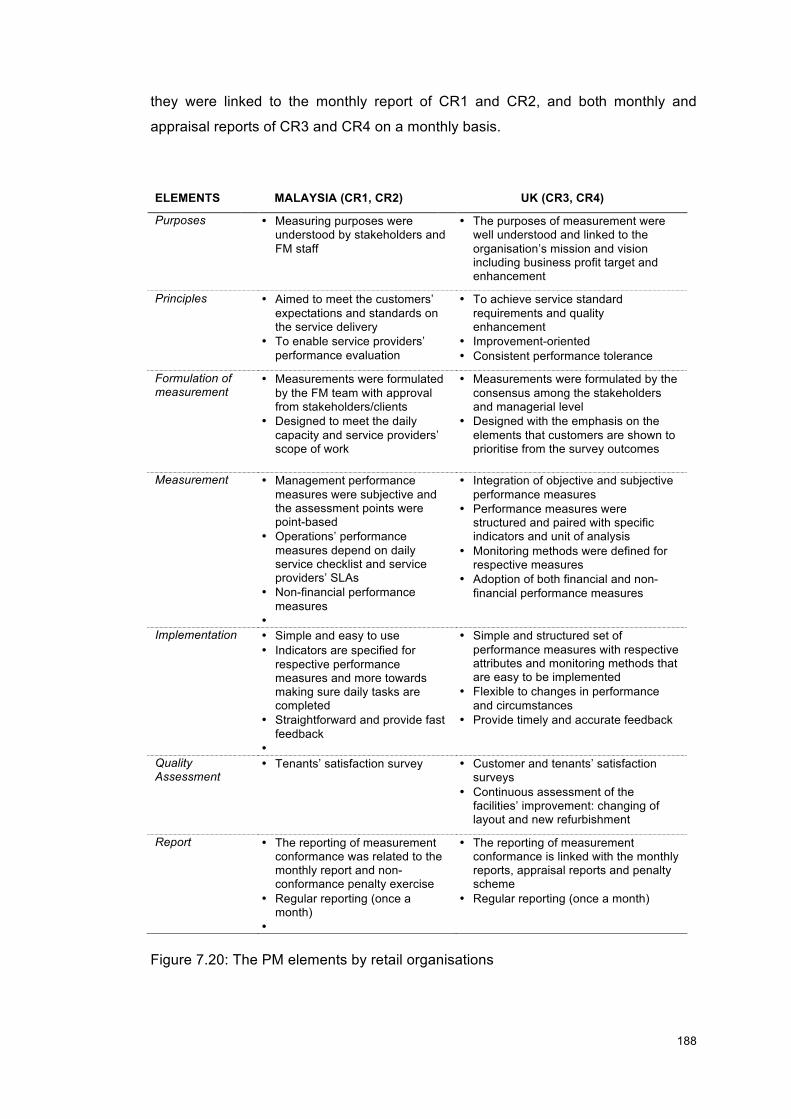
!!
188!
!
they were linked to the monthly report of CR1 and CR2, and both monthly and
appraisal reports of CR3 and CR4 on a monthly basis.
Figure 7.20: The PM elements by retail organisations
ELEMENTS MALAYSIA (CR1, CR2) UK (CR3, CR4)
Purposes • Measuring purposes were understood by stakeholders and FM staff
• The purposes of measurement were well understood and linked to the organisation’s mission and vision including business profit target and enhancement
Principles • Aimed to meet the customers’ expectations and standards on the service delivery
• To enable service providers’ performance evaluation
• To achieve service standard requirements and quality enhancement
• Improvement-oriented • Consistent performance tolerance
Formulation of measurement
• Measurements were formulated by the FM team with approval from stakeholders/clients
• Designed to meet the daily capacity and service providers’ scope of work
• Measurements were formulated by the consensus among the stakeholders and managerial level
• Designed with the emphasis on the elements that customers are shown to prioritise from the survey outcomes
Measurement • Management performance measures were subjective and the assessment points were point-based
• Operations’ performance measures depend on daily service checklist and service providers’ SLAs
• Non-financial performance measures
•
• Integration of objective and subjective performance measures
• Performance measures were structured and paired with specific indicators and unit of analysis
• Monitoring methods were defined for respective measures
• Adoption of both financial and non-financial performance measures
Implementation • Simple and easy to use • Indicators are specified for
respective performance measures and more towards making sure daily tasks are completed
• Straightforward and provide fast feedback
•
• Simple and structured set of performance measures with respective attributes and monitoring methods that are easy to be implemented
• Flexible to changes in performance and circumstances
• Provide timely and accurate feedback
Quality Assessment
• Tenants’ satisfaction survey • Customer and tenants’ satisfaction surveys
• Continuous assessment of the facilities’ improvement: changing of layout and new refurbishment
Report • The reporting of measurement conformance was related to the monthly report and non-conformance penalty exercise
• Regular reporting (once a month)
•
• The reporting of measurement conformance is linked with the monthly reports, appraisal reports and penalty scheme
• Regular reporting (once a month)
!!
189!
!
7.4.3 Finance Organisations All finance organisations claimed that their measurement purposes were clear and
linked with the corporate objectives and strategies (refer to Figure 7.21). In addition,
UK finance organisations (CF3 and CF4) believed that their purposes were
communicated to the corporate level to ensure that the corporate objectives and
strategies were achieved. The principles applied by CF1 and CF2 were to deliver an
agreed service quality to improve the service performance and customers’
satisfaction. Similarly, CF3 and CF4’s applied principles were very simple and
focused – the objective was to deliver a quality service delivery strategically. They
also emphasised a continuous service enhancement. Both groups of finance
organisations from Malaysia and the UK had their performance measures
formulated by the FM team, and approved by the stakeholders and clients. While
CF1 and CF2’s sets of measurements were designed to produce routine results,
CF3 and CF4 ensured that their measurements incorporated short- and long-term
strategic planning objectives and linked strategies, actions and performance
measures. The approaches taken by both Malaysian and UK finance organisations
in structuring the PM indicators are different. CF1 and CF2 had only subjective and
non-financial performance measures for management and operation services. The
performance measures for operation services were simple and more details have to
be referred to the contractors’ SLAs. Meanwhile, CF3 and CF4 incorporated both
objective and subjective performance measures, and financial and non-financial
performance measures. Performance tolerance and formula were also specified
therein. CF1 and CF2 implemented the performance monitoring process when
finalising the monthly report and non-conformance fines for the monthly payments,
and not as a scheduled monitoring process. CF3 and CF4 believed that their sets of
performance measures are easy to implement and monitor, in which they also
produced timely and accurate feedback that led to accurate results. Both the UK
finance organisations also ensured that their sets of performance measures were
flexible to any circumstance changes. As for the quality assessment, CF1 and CF2
mainly depend on any complaint report feedback. On the other hand, CF3 and CF4
had taken imperative actions where, apart from customer satisfaction surveys and
complaint assessments, they also conducted an external benchmarking with other
finance organisations once every three to five years. The four finance organisations’
reporting methods were quite similar: monthly reporting and as part of the monthly
service report. However, the UK finance organisations also required the service
contractors to provide major non-compliance reports as and when needed.
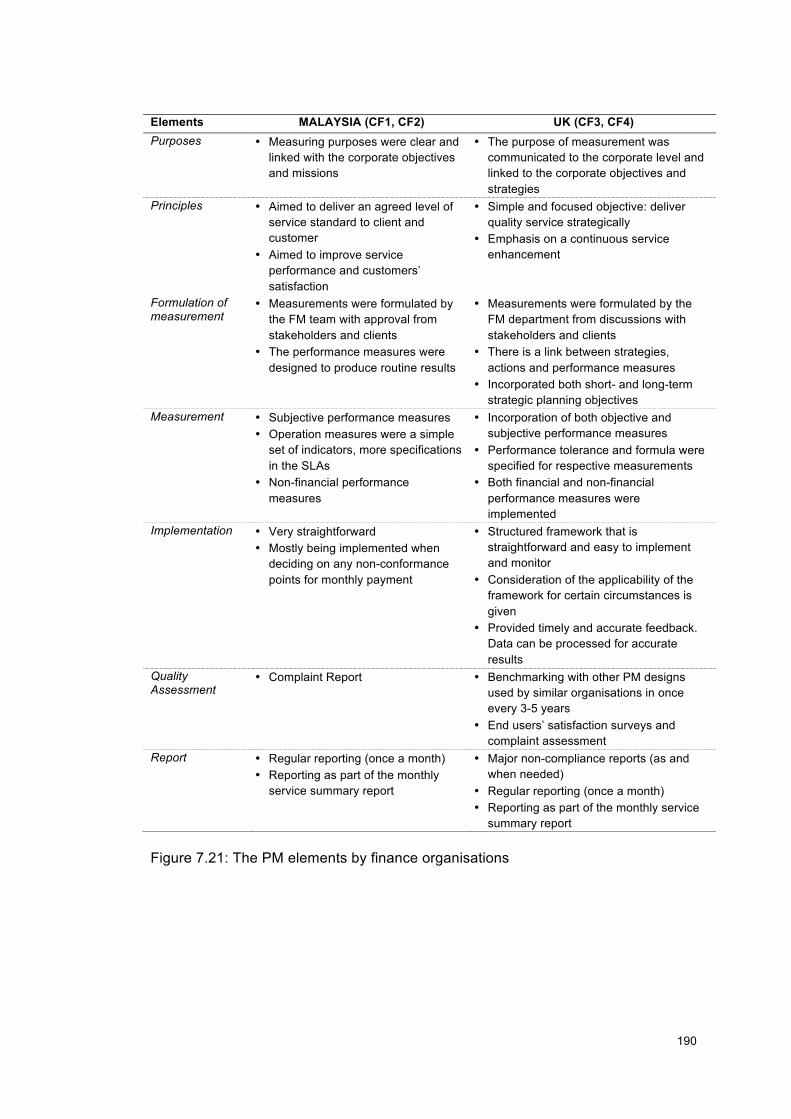
!!
190!
!
Figure 7.21: The PM elements by finance organisations
Elements MALAYSIA (CF1, CF2) UK (CF3, CF4) Purposes • Measuring purposes were clear and
linked with the corporate objectives and missions
• The purpose of measurement was communicated to the corporate level and linked to the corporate objectives and strategies
Principles • Aimed to deliver an agreed level of service standard to client and customer
• Aimed to improve service performance and customers’ satisfaction
• Simple and focused objective: deliver quality service strategically
• Emphasis on a continuous service enhancement
Formulation of measurement
• Measurements were formulated by the FM team with approval from stakeholders and clients
• The performance measures were designed to produce routine results
• Measurements were formulated by the FM department from discussions with stakeholders and clients
• There is a link between strategies, actions and performance measures
• Incorporated both short- and long-term strategic planning objectives
Measurement • Subjective performance measures • Operation measures were a simple
set of indicators, more specifications in the SLAs
• Non-financial performance measures
• Incorporation of both objective and subjective performance measures
• Performance tolerance and formula were specified for respective measurements
• Both financial and non-financial performance measures were implemented
Implementation • Very straightforward • Mostly being implemented when
deciding on any non-conformance points for monthly payment
• Structured framework that is straightforward and easy to implement and monitor
• Consideration of the applicability of the framework for certain circumstances is given
• Provided timely and accurate feedback. Data can be processed for accurate results
Quality Assessment
• Complaint Report • Benchmarking with other PM designs used by similar organisations in once every 3-5 years
• End users’ satisfaction surveys and complaint assessment
Report • Regular reporting (once a month) • Reporting as part of the monthly
service summary report
• Major non-compliance reports (as and when needed)
• Regular reporting (once a month) • Reporting as part of the monthly service
summary report
!!
191!
!
7.4.4 Office Buildings’ Organisations
Both Malaysian (CO1 and CO2) and UK (CO3 and CO4) office buildings’
organisations claimed that their purposes of measurements were communicated to
the corporate levels (refer to Figure 7.22). However, CO1 and CO2’s sets of PM
indicators focused on the service contractors’ services and did not encompass any
corporate enhancement elements. Meanwhile, CO3 and CO4 claimed that their sets
of performance measures were driven from the corporate objectives and strategies.
The principles used by CO1 and CO2 were simple and brief - to ease the monitoring
process of service providers’ performance and customers’ satisfaction. A strategic
principle was adopted by CO3 and CO4, where they aimed for strategic service
delivery. All performance measures and attributes were clearly defined to all the
parties involved. The formulation of measurements by all the organisations was
different. CO1 and CO2 adopted subjective and non-financial measurements with
only short-term objectives to produce routine results. Both management and
operation measurements were based on simple guidelines designed by the FM
team and approved by the stakeholders, clients and service providers. CO3 and
CO4’s responsible party to formulate the measurements was also the FM team, with
approval from the stakeholders and clients. They adopted subjective, objective,
financial and non-financial performance measures to achieve both short- and long-
term strategic planning objectives. This is also to link strategies, actions and
measurements. They also specified performance formula, calculation, and
performance tolerance for the performance measures. The performance evaluation
process conducted by both CO1 and CO2 was very simple and straightforward,
where the data were processed from service checklists and reviewed during the
non-conformance assessment for monthly payments. On the contrary, CO3 and
CO4’s set of performance measures were used for continuous evaluation and
produced accurate results. The Malaysian organisations relied on the audits by the
clients’ quality control department to assess the FM team quality service, and also
service providers’ audit results to better understand the FM service deliveries.
Meanwhile, the UK organisations used internal and external benchmarking
exercises to evaluate their performance measures in comparison to other
departments and organisations. They also used the helpdesk feedback and end
users’ and employee satisfaction survey results to improve their PM. CO1 and CO2
used the monthly performance report to clarify the non-conformance penalties by
the service providers. CO3 and CO4 also adopted the same reporting method with
the addition of a performance audit report to the corporate level on a monthly basis.
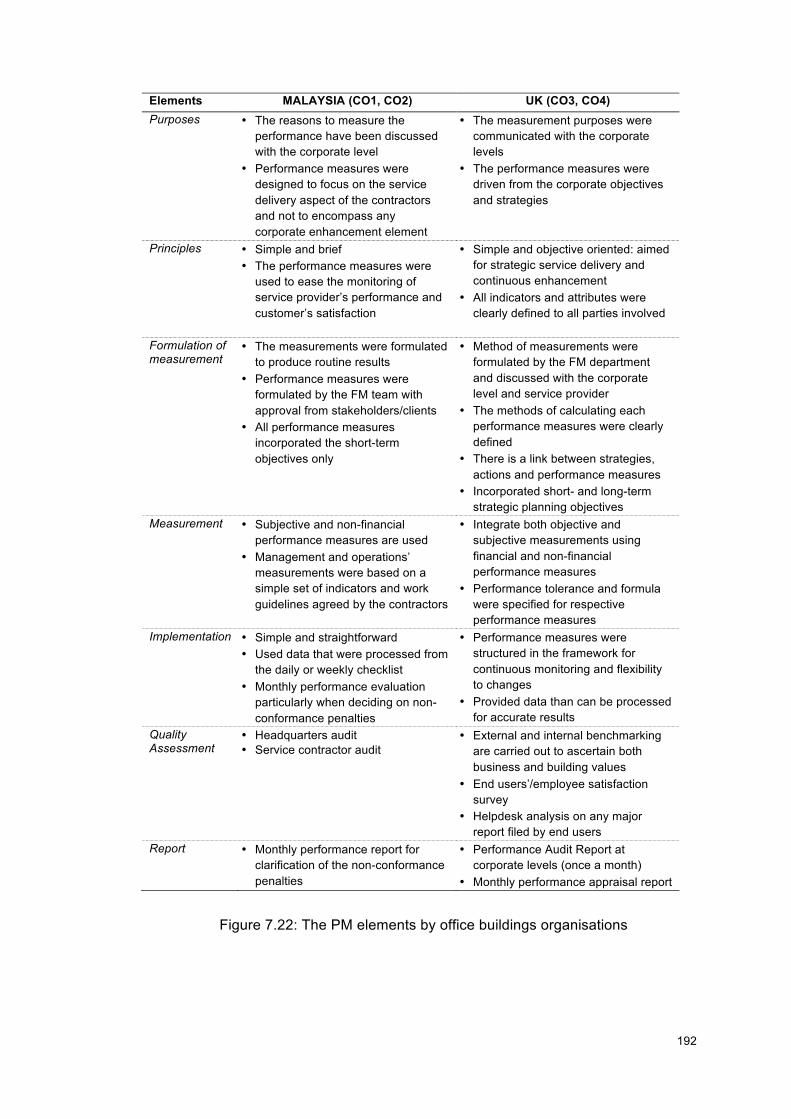
!!
192!
!
Figure 7.22: The PM elements by office buildings organisations
Elements MALAYSIA (CO1, CO2) UK (CO3, CO4) Purposes • The reasons to measure the
performance have been discussed with the corporate level
• Performance measures were designed to focus on the service delivery aspect of the contractors and not to encompass any corporate enhancement element
• The measurement purposes were communicated with the corporate levels
• The performance measures were driven from the corporate objectives and strategies
Principles • Simple and brief • The performance measures were
used to ease the monitoring of service provider’s performance and customer’s satisfaction
• Simple and objective oriented: aimed for strategic service delivery and continuous enhancement
• All indicators and attributes were clearly defined to all parties involved
Formulation of measurement
• The measurements were formulated to produce routine results
• Performance measures were formulated by the FM team with approval from stakeholders/clients
• All performance measures incorporated the short-term objectives only
• Method of measurements were formulated by the FM department and discussed with the corporate level and service provider
• The methods of calculating each performance measures were clearly defined
• There is a link between strategies, actions and performance measures
• Incorporated short- and long-term strategic planning objectives
Measurement • Subjective and non-financial performance measures are used
• Management and operations’ measurements were based on a simple set of indicators and work guidelines agreed by the contractors
• Integrate both objective and subjective measurements using financial and non-financial performance measures
• Performance tolerance and formula were specified for respective performance measures
Implementation • Simple and straightforward • Used data that were processed from
the daily or weekly checklist • Monthly performance evaluation
particularly when deciding on non-conformance penalties
• Performance measures were structured in the framework for continuous monitoring and flexibility to changes
• Provided data than can be processed for accurate results
Quality Assessment
• Headquarters audit • Service contractor audit
• External and internal benchmarking are carried out to ascertain both business and building values
• End users’/employee satisfaction survey
• Helpdesk analysis on any major report filed by end users
Report • Monthly performance report for clarification of the non-conformance penalties
• Performance Audit Report at corporate levels (once a month)
• Monthly performance appraisal report
!!
193!
!
7.5 PM Structures
All the case studies were also analysed with regard to their PM structures and
designs. Several elements were looked into, namely the performance measures
aggregative levels and also the overall structure and design. The aggregative levels
refer to the extension of performance measures namely performance parameters,
metrics, indicators and attributes. The structure focuses on the inclusion of
performance formula or targets as well as monitoring methods by the respective
case study organisations. The design element looks into the combination of both
management and operation service measurements of the overall PM practised.
Figure 7.23 shows the comparison of PM structure for management services
adopted by all the 16 case study organisations. In general, it can be seen that the
Malaysian healthcare organisations are the only case studies in Malaysia that
incorporate the performance metrics, indicators, attributes, performance formula or
targets and monitoring methods. Malaysia’s retail and office buildings organisations
did not specify the performance formula or targets and monitoring methods for their
management measurements. Both finance organisations in Malaysia (CF1 and CF2)
outlined the performance formula or targets but not the monitoring methods. In
contrast, the structures of all healthcare, retail, finance and office buildings
organisations in the UK adopted similar comprehensive PM. They designed their
PM structure to incorporate all the aggregated elements of measurement:
parameters, metrics, indicators, attributes; performance formula or targets and
monitoring methods.
As for the operation services, all case study organisations had a simple aggregated
level of measurement, that is, metrics and indicators, with some exception by CR2
and CO1, which only had indicators (refer to Figure 7.24). Healthcare organisations
in Malaysia had a brief performance formula and targets, where more specifications
had to be referred to the SLAs. The retail organisations had no specific
measurement for both performance formula and target, unless referred to SLAs as
and when needed. Both finance organisations (CF1 and CF2) and one office
building organisation (CO1) had no monitoring methods specified in their PM
structure. All UK organisations had otherwise shown a contrasting result. Although
some of the organisations (CF3 and CR4) had less aggregated measurements, all
eight case studies emphasised the performance formula or targets and monitoring
methods in their PM structure. In summary, this has indicated that the UK
!!
194!
!
organisations had a more structured, elaborated and comprehensive PM designs in
comparison to Malaysian organisations. The only Malaysian organisations that had
a more structured set of management service measurements are the healthcare
organisations, where all elements are incorporated. This is anticipated, as the FM
service is more progressive in the healthcare sector compared to other sectors in
Malaysia.

!!
195!
!
Figure 7.23: The PM structure for the management services
Figure 7.24: The PM structure for the operation services
Sector Healthcare Retail Finance Office Buildings Region Malaysia UK Malaysia UK Malaysia UK Malaysia UK PM Structure CH1 CH2 CH3 CH4 CR1 CR2 CR3 CR4 CF1 CF2 CF3 CF4 CO1 CO2 CO3 CO4 Management Services Performance Measures Aggregative Levels Parameters
! √!
√!
! √!
√!
√!
!
! √!
√!
!
! √!
√!
Metrics √! √! √! √! √! √! √! √! √! √! √! √! √! √! √! √!Indicators √! √! √! √! √! √! √! √! √! √! √! √! √! √! √! √!Attributes √! √! √! √! √! √! √! √! ! ! √! √! ! √! √! √! Performance Formula/Targets √! √! √! √! ! ! √! √! √! √! √! √! ! ! √! √!Monitoring Methods √! √! √! √! ! ! √! √! ! ! √! √! ! ! √! √!
Sector Healthcare Retail Finance Office Buildings Region Malaysia UK Malaysia UK Malaysia UK Malaysia UK PM Structure CH1 CH2 CH3 CH4 CR1 CR2 CR3 CR4 CF1 CF2 CF3 CF4 CO1 CO2 CO3 CO4 Operation Services Performance Measures Aggregative Levels Parameters
! √!
√!
!
! √!
!
!
!
! √!
!
! √!
√!
Metrics √! √! √! √! √! ! √! √! √! √! √! √! ! √! √! √!Indicators √! √! √! √! √! √! √! √! √! √! √! √! √! √! √! √!Attributes ! √! √! √! ! ! √! √! ! ! √! ! ! ! √! √! Performance Formula/Targets Brief + Refer
SLAs!√! √!
Refer SLAs √! √! √! √! √! √! √! √! √! √!
Monitoring Methods √! √! √! √! ! ! √! √! ! √! √! √!
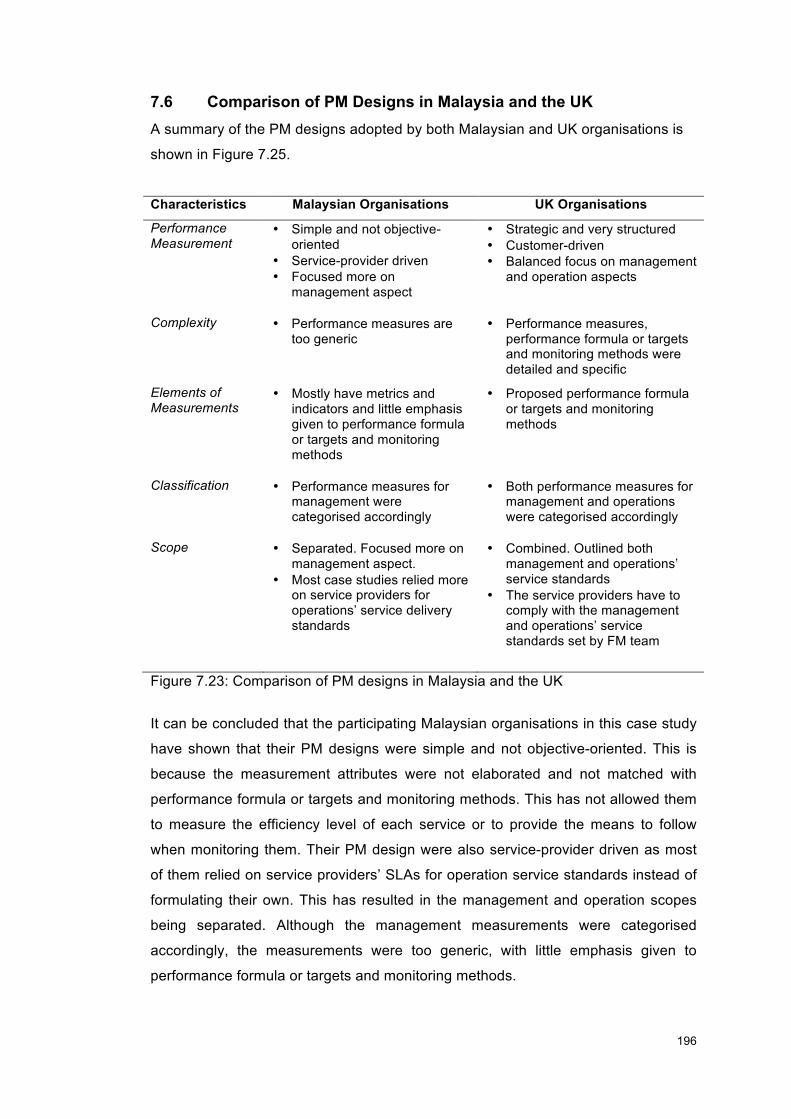
!!
196!
!
7.6 Comparison of PM Designs in Malaysia and the UK A summary of the PM designs adopted by both Malaysian and UK organisations is
shown in Figure 7.25.
Characteristics Malaysian Organisations UK Organisations
Performance Measurement
• Simple and not objective-oriented
• Service-provider driven • Focused more on
management aspect
• Strategic and very structured • Customer-driven • Balanced focus on management
and operation aspects
Complexity • Performance measures are too generic
• Performance measures, performance formula or targets and monitoring methods were detailed and specific
Elements of Measurements
• Mostly have metrics and indicators and little emphasis given to performance formula or targets and monitoring methods
• Proposed performance formula or targets and monitoring methods
Classification • Performance measures for management were categorised accordingly
• Both performance measures for management and operations were categorised accordingly
Scope • Separated. Focused more on management aspect.
• Most case studies relied more on service providers for operations’ service delivery standards
• Combined. Outlined both management and operations’ service standards
• The service providers have to comply with the management and operations’ service standards set by FM team
Figure 7.23: Comparison of PM designs in Malaysia and the UK
It can be concluded that the participating Malaysian organisations in this case study
have shown that their PM designs were simple and not objective-oriented. This is
because the measurement attributes were not elaborated and not matched with
performance formula or targets and monitoring methods. This has not allowed them
to measure the efficiency level of each service or to provide the means to follow
when monitoring them. Their PM design were also service-provider driven as most
of them relied on service providers’ SLAs for operation service standards instead of
formulating their own. This has resulted in the management and operation scopes
being separated. Although the management measurements were categorised
accordingly, the measurements were too generic, with little emphasis given to
performance formula or targets and monitoring methods.
!!
197!
!
On the contrary, the UK organisations have indicated that their PM designs were
structured and strategically designed. They were also customer-driven where, in the
formulation of the performance measures, the FM team made sure that they took
into account the feedback from the clients and customers. An equal focus was also
given to both management and operation service measurements, resulting in having
them properly categorised and proposed with an aggregated level of
measurements, performance formula or targets and monitoring methods. They also
demonstrated that their PM approaches are holistic and the service providers have
to conform to the outlined performance level standards set by the FM team.
7.7 Case Studies Data and Findings
The case studies data and findings gathered from the Phase 2 data collection were
then used towards developing the PERFM. The findings on the performance
measures of the UK organisations in particular, were used along with the literature
studies in constructing a set of comprehensive performance measures based on the
four aggregative levels- parameters, metrics, indicators and attributes; and together
with the respective performance formula or targets. The data from the FM
organisations in the UK are the primary data used to develop PERFM. They are
believed to be significant as the performance measures used are regularly
benchmarked against other competiting organisations.
7.8 Chapter Summary
In overall, the findings of the case studies analysis have signified the significant
differences of the FM practice and PM approaches in FM practice between the FM
organisations and in the UK and Malaysia. The progresses shown by the FM
industry of both regions further confirm the differences and gap of FM practice in the
UK where FM is mature and has long been recognised as opposed to Malaysian FM
industry, which is still lagging behind. In the next chapter, PERFM specifically the
theories and key elements are introduced. In this chapter- chapter 8, further
explanation of the elements of performance measures adopted from Phase 2 are
presented.
!!
198!
!
CHAPTER 8: INTRODUCTION OF PERFORMANCE MEASUREMENT FRAMEWORK (PERFM)
8.1 Introduction PERFM is designed as a tool that can be used by FM practitioners in Malaysia to
enhance their service delivery. PERFM emphasises a measurable set of
performance measures to measure FM performance. It should serve as a good
base for the FM managers to assess the performance standard for both in-house
and outsourced service providers.
PERFM emerges because there is a need for a holistic approach of PMS for more
effective practices. The developed framework is clear and cohesive and can be well
understood by all levels of managers and staff. It is well supported by the
aggregative levels of performance measures ranging from performance metrics,
indicators, attributes, to a balanced control of both performance target or formula
and monitoring methods. The framework was developed as an iterative process that
can enhance continuous improvement in FM services through effective
measurement of service performance, staff training and development, and also
through effective feedback. This framework offers valuable insights into the
dimensions to be explored and scrutinised at each service delivery process. It
incorporates both tangible and intangible aspects, which also allows sufficient
flexibility in the process to perform against outcomes detailed in the Service Level
Agreements (SLAs).
8.2 Theoretical Elements
The underlying theoretical elements of PERFM are people, process and property.
Each dimension represents different justifications in structuring PERFM, as follows:
(i) People
• Focuses on the values for the business stakeholders, clients and
customers.
• The involvement of people in various levels of service, i.e. decision-
making process to the delivery of service. This refers to the decision
maker (higher management), managing works (FM manager) and
manpower supply (service workers)
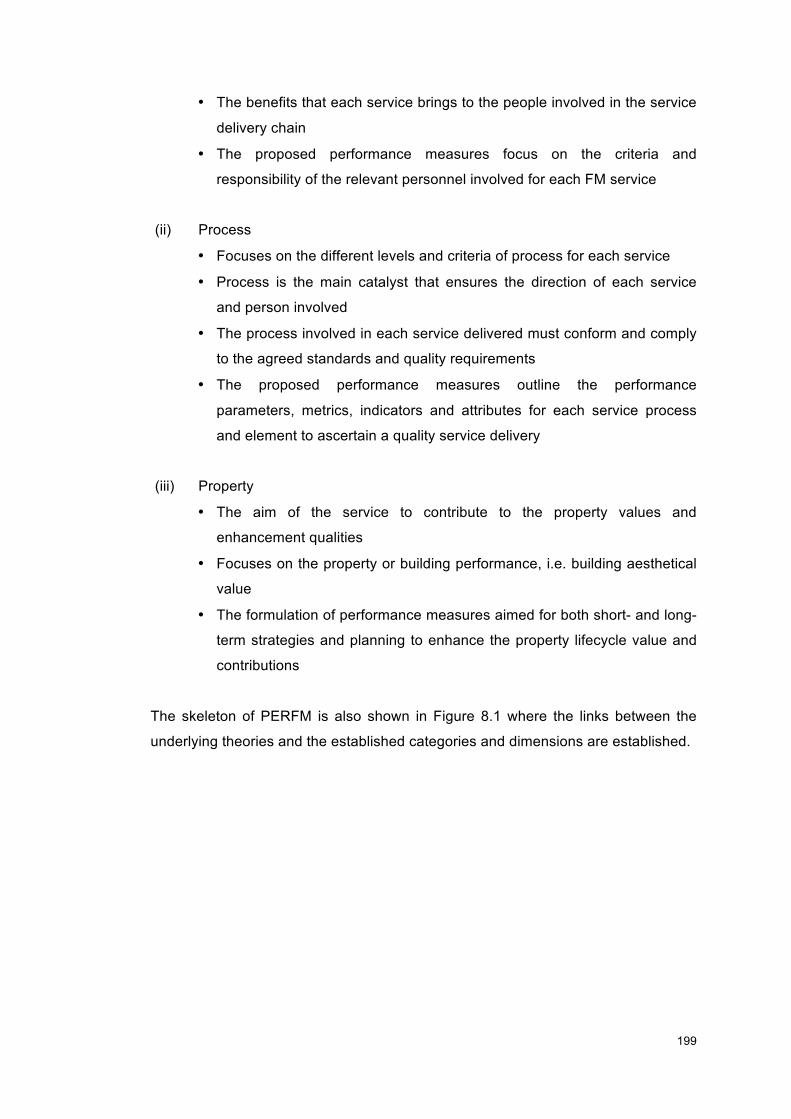
!!
199!
!
• The benefits that each service brings to the people involved in the service
delivery chain
• The proposed performance measures focus on the criteria and
responsibility of the relevant personnel involved for each FM service
(ii) Process
• Focuses on the different levels and criteria of process for each service
• Process is the main catalyst that ensures the direction of each service
and person involved
• The process involved in each service delivered must conform and comply
to the agreed standards and quality requirements
• The proposed performance measures outline the performance
parameters, metrics, indicators and attributes for each service process
and element to ascertain a quality service delivery
(iii) Property
• The aim of the service to contribute to the property values and
enhancement qualities
• Focuses on the property or building performance, i.e. building aesthetical
value
• The formulation of performance measures aimed for both short- and long-
term strategies and planning to enhance the property lifecycle value and
contributions
The skeleton of PERFM is also shown in Figure 8.1 where the links between the
underlying theories and the established categories and dimensions are established.
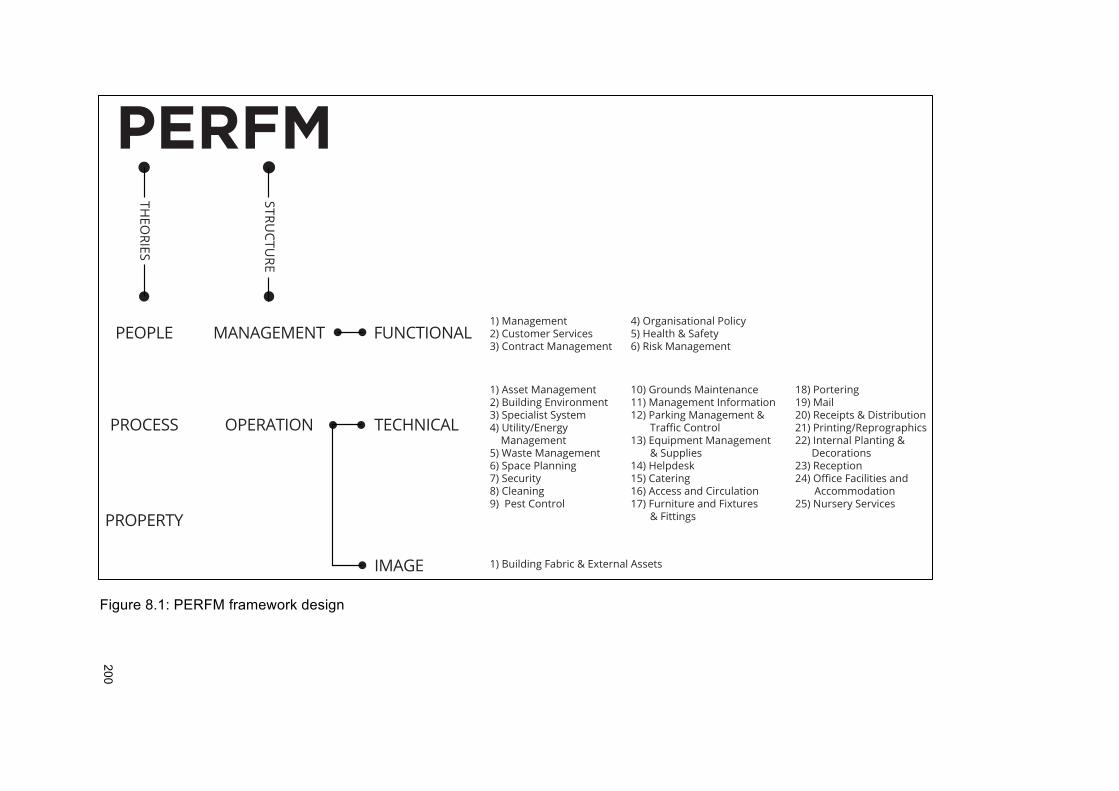
!!
200!
!
PERFM
PEOPLE MANAGEMENT FUNCTIONAL
PROCESS OPERATION TECHNICAL
IMAGE
PROPERTY
TH
EO
RIE
S
ST
RU
CT
UR
E
1) Management2) Customer Services3) Contract Management
1) Building Fabric & External Assets
4) Organisational Policy5) Health & Safety6) Risk Management
1) Asset Management2) Building Environment3) Specialist System4) Utility/Energy Management5) Waste Management6) Space Planning7) Security8) Cleaning9) Pest Control
10) Grounds Maintenance11) Management Information12) Parking Management & Traffic Control
13) Equipment Management & Supplies14) Helpdesk15) Catering16) Access and Circulation17) Furniture and Fixtures & Fittings
18) Portering19) Mail20) Receipts & Distribution21) Printing/Reprographics22) Internal Planting & Decorations23) Reception24) Office Facilities and
Accommodation25) Nursery Services
Figure 8.1: PERFM framework design
!!
201!
!
8.3 Structure of PERFM
PERFM is divided into three main sections each headed by a different dimension
namely functional, technical and image (refer to Figure 8.2).
SECTION 1
Category
Functional
Dimension (1) Management (2) Customer Service (3) Contract Management
(4) Organisational Policy (5) Health and Safety (H&S) (6) Risk Management!
SECTION 2
Category
Technical
Dimension (1) Asset Management (2) Building Environment (3) Specialist System (4) Utility/ Energy
Management (5) Waste Management (6) Space Planning (7) Security (8) Cleaning (9) Pest Control (10) Grounds Maintenance (11) Management
Information (12) Parking Management &
Traffic Control (13) Equipment
Management & Supplies
(14) Helpdesk (15) Catering (16) Access and Circulation (17) Furniture and Fixtures &
Fittings (18) Portering (19) Mail (20) Receipts & Distribution (21) Printing/Reprographics (22) Internal Planting &
Decorations (23) Reception (24) Office Facilities and
Accommodation (25) Nursery Services
SECTION 3
Category
Image
Dimension (1) Building Fabric and External Assets
Figure 8.2: The proposed dimensions and parameters for PERFM
!!
202!
!
Functional category focuses on the dimension concerned in the management
service delivery aspect. The identified dimension help to streamline the
management structure and procedures involved in managing the whole service
structure of FM services. Technical category proposes the set of dimensions that
back up the operational services of FM such as the asset and building maintenance
as well as other support services. These dimensions are considered the backbone
in making sure all services are run smoothly and comply with the relevant standards
and requirements. Image category focuses on the image of the property or building
and the proposed dimensions can be used to ensure that optimal service efficiency
is achieved in maintaining the image. The proposed set of dimensions for the
respective categories is shown in Figure 8.2.
Each of performance dimension is matched with appropriate parameters, metrics
and indicators which are also linked to the attributes which specify the performance
measurement standard; formula or performance target which gives an indication of
the performance target or calculation in ensuring the success of the attributes; and
also monitoring method specified in monitoring the performance for each parameter.
PERFM gives a good guide for FM managers to assess each of the performance
parameters outlined for each FM service delivered to the customers or end users.
8.4 PERFM Categories
In the section 1, the functional category of PERFM focuses on the management
aspect. The dimensions outlined for this section are management, health and safety
(H&S), customer service, risk management, contract management and
organisational policy. Generally the metrics and indicators outlined are concerned
with the management aspects relating to the up keeping of administration system
and control, staffing, H&S security compliance, customer service delivery,
satisfaction assessment, contract management administration and the control
assurance of organizational policy. Details on the metrics grouped for each
functional dimension is shown in Figure 8.3.
In section 2, the technical category emphasises on the technical aspect of the FM
service scope. It concerns on the 25 service operations dimensions- which
parameters, indicators and attributes cover on the specific service specification in
ensuring a smooth and satisfaction service delivered to the customers. The
technical category is the main category that is dedicated to focus on the scheduled

!!
203!
!
maintenance and operation works and the three theoretical elements of people,
process and property are embedded therein. The parameters for the respective
dimensions in the technical category are illustrated in both Figures 8.4 and 8.5.
Section 3 of PERFM explores the image category with one dedicated dimension that
is building fabric and external assets as shown in Figure 8.6. This dimension
specifically outlines the parameters relating to building fabric and external assets
and also maintenance of building elements. Specified attributes concerning the
process and people involved are proposed accordingly to measure the property
performance.
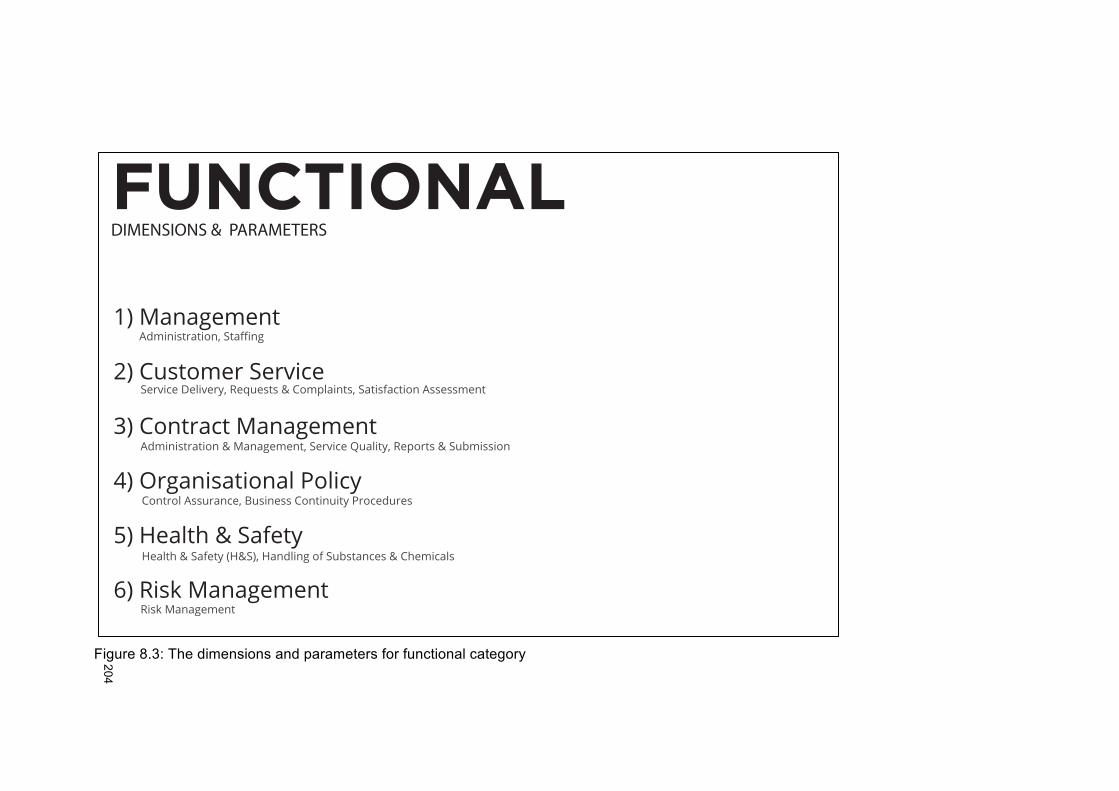
!!
204!
!
Figure 8.3: The dimensions and parameters for functional category
FUNCTIONAL
1) Management
2) Customer Service
3) Contract Management
4) Organisational Policy
5) Health & Safety
6) Risk Management
Administration,Staffing
Administration & Management, Service Quality, Reports & Submission
Control Assurance, Business Continuity Procedures
Health & Safety (H&S), Handling of Substances & Chemicals
Risk Management
Service Delivery, Requests & Complaints, Satisfaction Assessment
DIMENSIONS & PARAMETERS
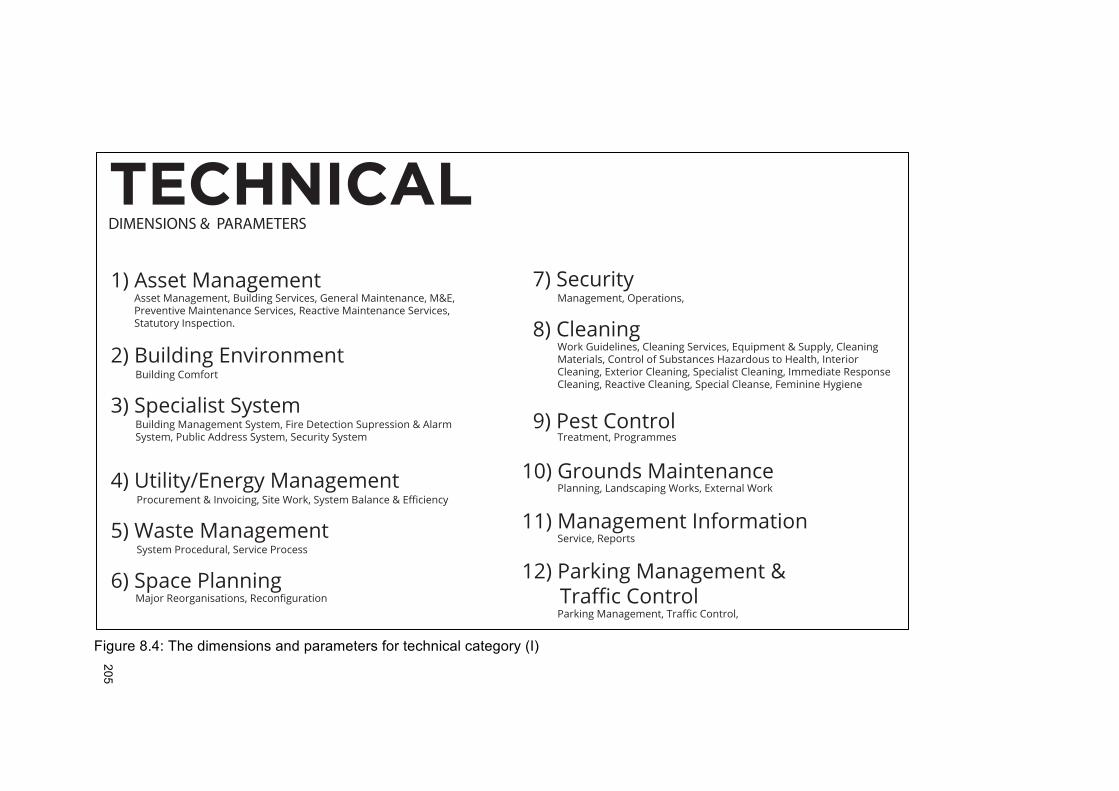
!!
205!
!
Figure 8.4: The dimensions and parameters for technical category (I)
TECHNICAL1) Asset Management
2) Building Environment
3) Specialist System
4) Utility/Energy Management
5) Waste Management
6) Space Planning
7) Security
8) Cleaning
9) Pest Control
10) Grounds Maintenance
11) Management Information
12) Parking Management & Traffic Control
Asset Management, Building Services, General Maintenance, M&E, Preventive Maintenance Services, Reactive Maintenance Services, Statutory Inspection.
Management, Operations,
Work Guidelines, Cleaning Services, Equipment & Supply, Cleaning Materials, Control of Substances Hazardous to Health, Interior Cleaning, Exterior Cleaning, Specialist Cleaning, Immediate Response Cleaning, Reactive Cleaning, Special Cleanse, Feminine Hygiene
Treatment, Programmes
Planning, Landscaping Works, External Work
Service, Reports
Parking Management, Traffic Control,
Building Management System, Fire Detection Supression & Alarm System, Public Address System, Security System
Procurement & Invoicing, Site Work, System Balance & Efficiency
System Procedural, Service Process
Major Reorganisations, Reconfiguration
Building Comfort
DIMENSIONS & PARAMETERS
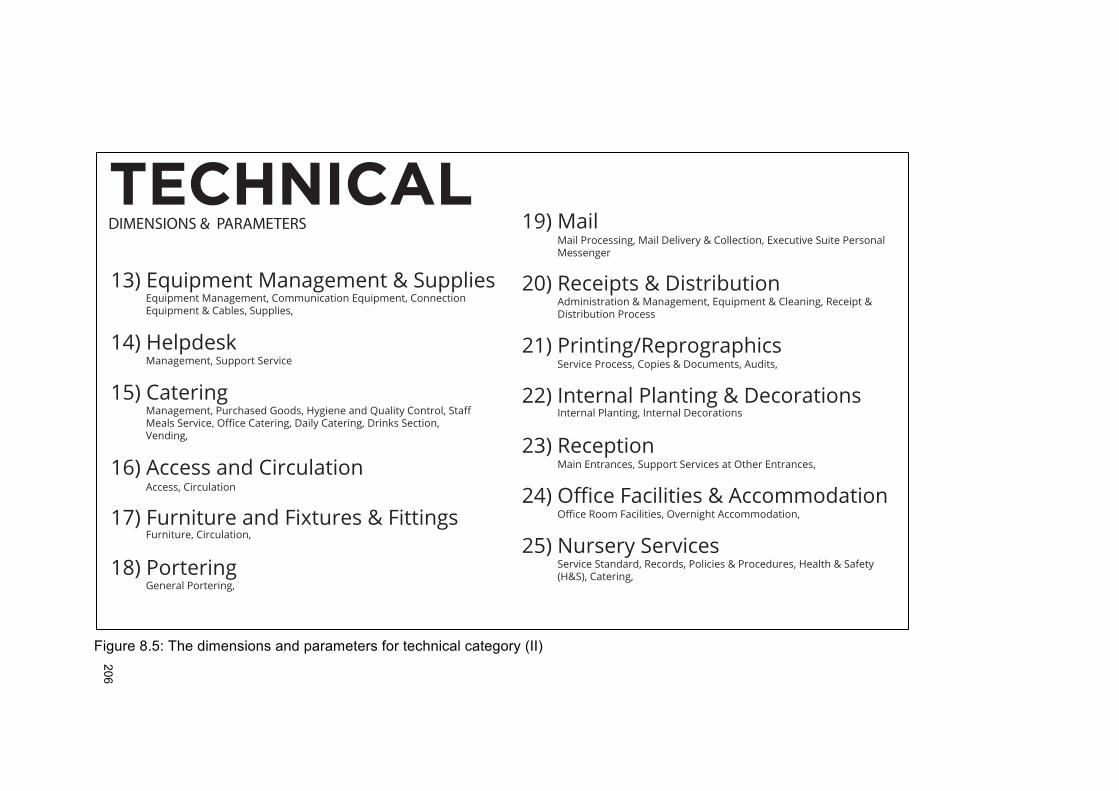
!!
206!
!
Figure 8.5: The dimensions and parameters for technical category (II)
TECHNICAL13) Equipment Management & Supplies
14) Helpdesk
15) Catering
16) Access and Circulation
17) Furniture and Fixtures & Fittings
18) Portering
19) Mail
20) Receipts & Distribution
21) Printing/Reprographics
22) Internal Planting & Decorations
23) Reception
24) Office Facilities & Accommodation
25) Nursery Services
Equipment Management, Communication Equipment, ConnectionEquipment & Cables, Supplies,
Management, Support Service
Management, Purchased Goods, Hygiene and Quality Control, Staff Meals Service, Office Catering, Daily Catering, Drinks Section, Vending,
Access, Circulation
Furniture, Circulation,
General Portering,
Mail Processing, Mail Delivery & Collection, Executive Suite Personal Messenger
Administration & Management, Equipment & Cleaning, Receipt & Distribution Process
Service Process, Copies & Documents, Audits,
Internal Planting, Internal Decorations
Main Entrances, Support Services at Other Entrances,
Office Room Facilities, Overnight Accommodation,
Service Standard, Records, Policies & Procedures, Health & Safety (H&S), Catering,
DIMENSIONS & PARAMETERS

!!
207!
!
Figure!8.6:!The!dimensions!and!parameters!for!image!category.!
IMAGE1) Building Fabric & External Assets
Building Fabric & External Assets, Maintenance of Building Elements
DIMENSIONS & PARAMETERS
!!
208!
!
8.5 Chapter Summary
This chapter has presented an introduction of the developed PERFM, in specific the
underlying theories embedded throughout the three categories of functional,
technical and image. The performance measures are categorised based on the set
of aggregative levels- dimension, parameter, indicator and attribute are matched
with the relevant performance target or formula and also monitoring methods. The
comprehensive list of the PERFM can be further referred to Appendix F.
Following the proposed PERFM, this research presents the analysis and findings
gathered from the Phase 3 interviews. Therefore, the overview of PERFM explained
in chapter 8 can be further understood and explored based on the evaluation made
on the key elements that can determine the ability of PERFM to enhance the
existing FM services in Malaysia.
!!
209!
!
CHAPTER 9: INTERVIEWS DATA ANALYSIS In this chapter, the findings from the data analysis of Phase 3 are established. The
evaluations of the elements that constitute PERFM are presented. Feedback
received from the interviewed FM managers has been analysed to evaluate the
design of framework, functionality and implementation of PERFM. A summary of
feedback is also presented at the end of this chapter.
9.1 Introduction
The aim of interview conduction at Phase 3 was to evaluate the ability of PERFM to
enhance the existing FM services in Malaysia. Semi-structured interviews were
conducted with the 8 FM managers who participated in the Phase 2 case studies.
Three major elements were looked at in the evaluation studies, as follows:
(i) Design of Framework
These PERFM design factors are reflected: structure and layout, content
elaboration, principles and scopes.
(ii) Functionality
Evaluation of the functionality factors, namely flexibility, productivity,
quality, delivery, and cost control.
(iii) Implementation
Interviewees were asked to provide feedback on four elements: project
management, demands, challenges and also recommendations.
Thematic analysis was conducted using NVivo, where the co-ordination of three
types of three nodes was established, i.e. high-level themes, mid-level themes and
low-level themes. They were illustrated in thematic diagrams for better
understanding.
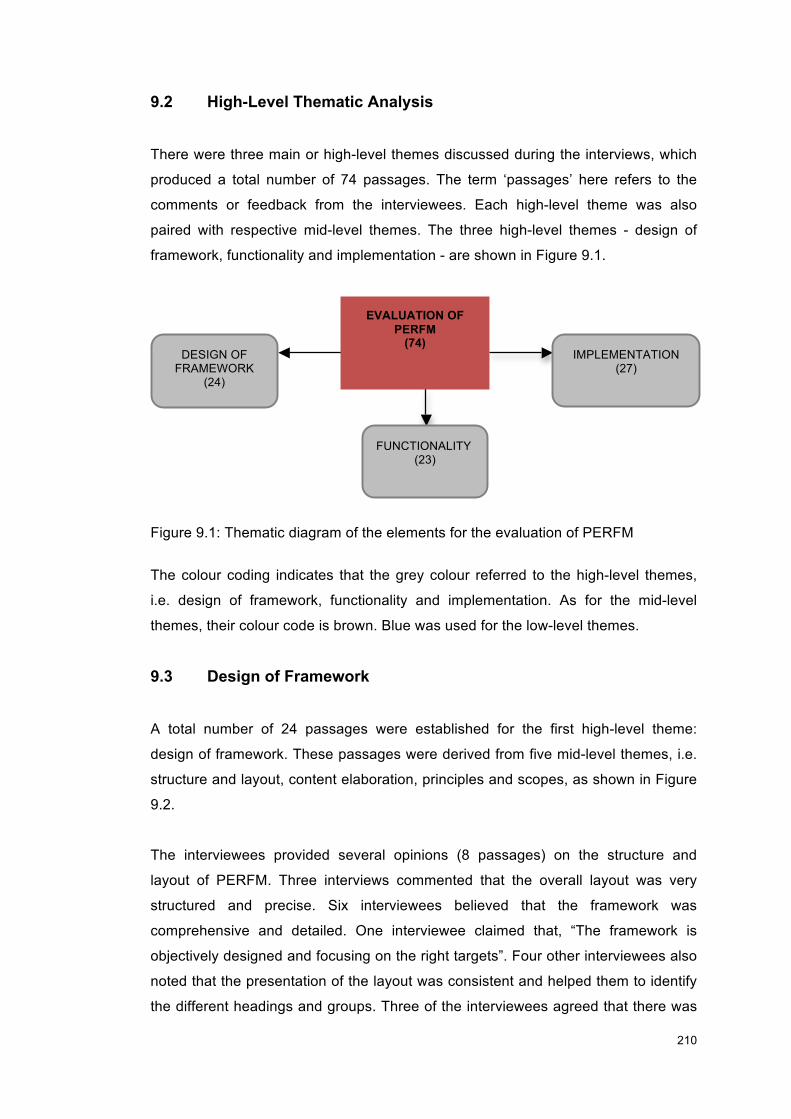
!!
210!
!
9.2 High-Level Thematic Analysis
There were three main or high-level themes discussed during the interviews, which
produced a total number of 74 passages. The term ‘passages’ here refers to the
comments or feedback from the interviewees. Each high-level theme was also
paired with respective mid-level themes. The three high-level themes - design of
framework, functionality and implementation - are shown in Figure 9.1.
Figure 9.1: Thematic diagram of the elements for the evaluation of PERFM
The colour coding indicates that the grey colour referred to the high-level themes,
i.e. design of framework, functionality and implementation. As for the mid-level
themes, their colour code is brown. Blue was used for the low-level themes.
9.3 Design of Framework
A total number of 24 passages were established for the first high-level theme:
design of framework. These passages were derived from five mid-level themes, i.e.
structure and layout, content elaboration, principles and scopes, as shown in Figure
9.2.
The interviewees provided several opinions (8 passages) on the structure and
layout of PERFM. Three interviews commented that the overall layout was very
structured and precise. Six interviewees believed that the framework was
comprehensive and detailed. One interviewee claimed that, “The framework is
objectively designed and focusing on the right targets”. Four other interviewees also
noted that the presentation of the layout was consistent and helped them to identify
the different headings and groups. Three of the interviewees agreed that there was
DESIGN OF FRAMEWORK
(24) !
FUNCTIONALITY (23) !
IMPLEMENTATION (27) !
EVALUATION OF PERFM
(74)
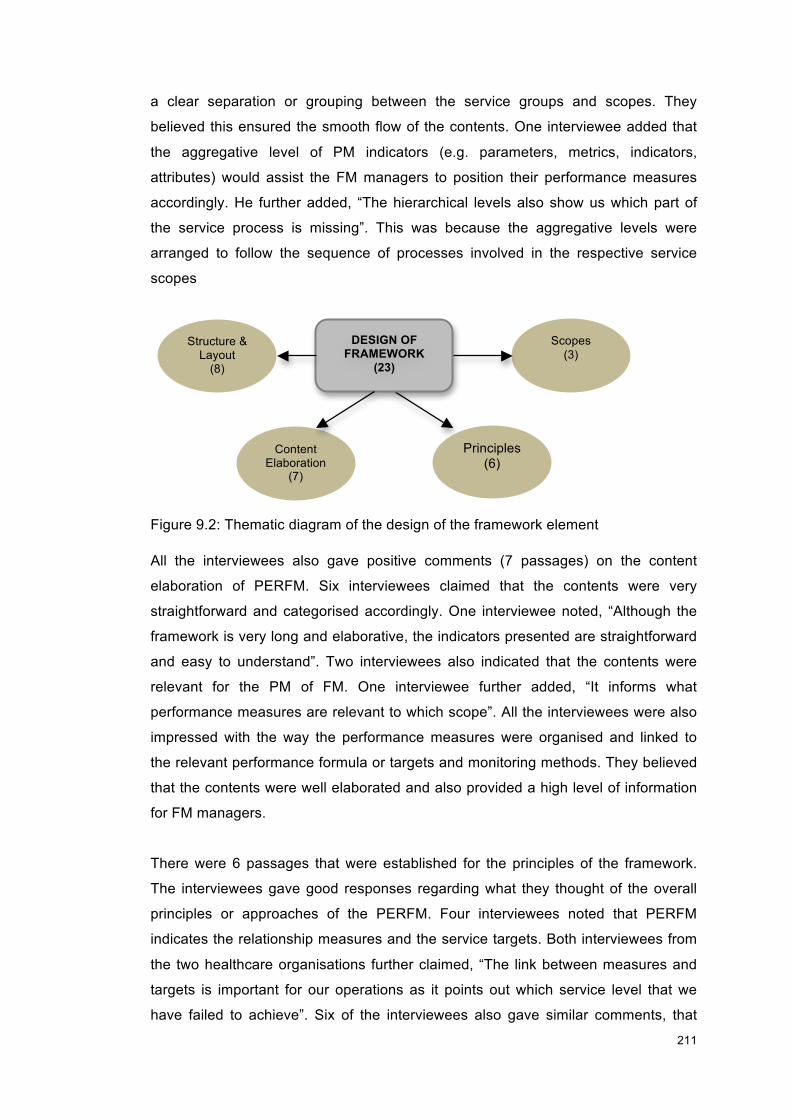
!!
211!
!
a clear separation or grouping between the service groups and scopes. They
believed this ensured the smooth flow of the contents. One interviewee added that
the aggregative level of PM indicators (e.g. parameters, metrics, indicators,
attributes) would assist the FM managers to position their performance measures
accordingly. He further added, “The hierarchical levels also show us which part of
the service process is missing”. This was because the aggregative levels were
arranged to follow the sequence of processes involved in the respective service
scopes
Figure 9.2: Thematic diagram of the design of the framework element !All the interviewees also gave positive comments (7 passages) on the content
elaboration of PERFM. Six interviewees claimed that the contents were very
straightforward and categorised accordingly. One interviewee noted, “Although the
framework is very long and elaborative, the indicators presented are straightforward
and easy to understand”. Two interviewees also indicated that the contents were
relevant for the PM of FM. One interviewee further added, “It informs what
performance measures are relevant to which scope”. All the interviewees were also
impressed with the way the performance measures were organised and linked to
the relevant performance formula or targets and monitoring methods. They believed
that the contents were well elaborated and also provided a high level of information
for FM managers.
There were 6 passages that were established for the principles of the framework.
The interviewees gave good responses regarding what they thought of the overall
principles or approaches of the PERFM. Four interviewees noted that PERFM
indicates the relationship measures and the service targets. Both interviewees from
the two healthcare organisations further claimed, “The link between measures and
targets is important for our operations as it points out which service level that we
have failed to achieve”. Six of the interviewees also gave similar comments, that
Principles (6)
DESIGN OF FRAMEWORK
(23) !
Structure & Layout
(8)
Content Elaboration
(7)
Scopes (3)
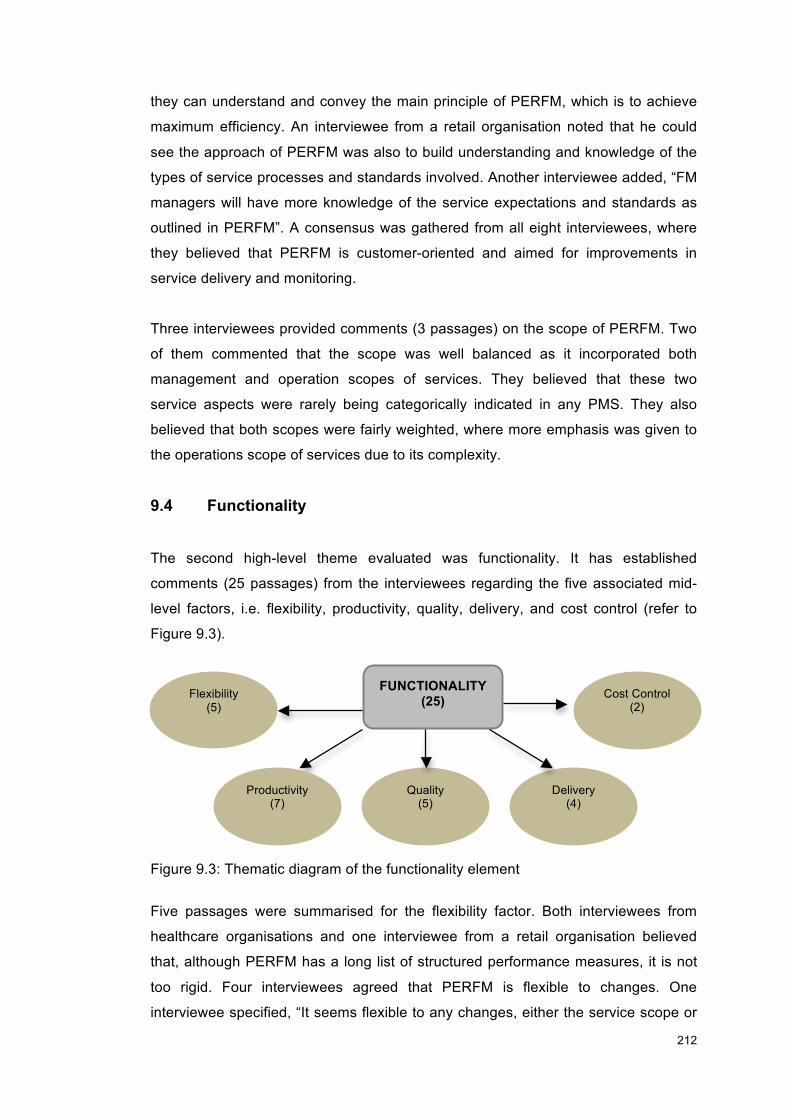
!!
212!
!
they can understand and convey the main principle of PERFM, which is to achieve
maximum efficiency. An interviewee from a retail organisation noted that he could
see the approach of PERFM was also to build understanding and knowledge of the
types of service processes and standards involved. Another interviewee added, “FM
managers will have more knowledge of the service expectations and standards as
outlined in PERFM”. A consensus was gathered from all eight interviewees, where
they believed that PERFM is customer-oriented and aimed for improvements in
service delivery and monitoring.
Three interviewees provided comments (3 passages) on the scope of PERFM. Two
of them commented that the scope was well balanced as it incorporated both
management and operation scopes of services. They believed that these two
service aspects were rarely being categorically indicated in any PMS. They also
believed that both scopes were fairly weighted, where more emphasis was given to
the operations scope of services due to its complexity.
9.4 Functionality
The second high-level theme evaluated was functionality. It has established
comments (25 passages) from the interviewees regarding the five associated mid-
level factors, i.e. flexibility, productivity, quality, delivery, and cost control (refer to
Figure 9.3).
Figure 9.3: Thematic diagram of the functionality element
Five passages were summarised for the flexibility factor. Both interviewees from
healthcare organisations and one interviewee from a retail organisation believed
that, although PERFM has a long list of structured performance measures, it is not
too rigid. Four interviewees agreed that PERFM is flexible to changes. One
interviewee specified, “It seems flexible to any changes, either the service scope or
Quality (5)
FUNCTIONALITY (25) !
Flexibility (5)
Productivity (7)
Delivery (4)
Cost Control (2)
!!
213!
!
other circumstances, be it urgent or not”. Two interviewees also commented that
they believed that, with the structured and specified performance measures
elements, FM managers could adapt to the changes with less disruption. One
interviewee also signified the flexibility factor, where he believed that, with the
comprehensive framework ready to hand, FM managers could have a smooth
transaction of handing over new management to a newly appointed outsourcing
companies. Two other interviewees also noted that PERFM comprises the standard
service levels and regulatory compliance, and therefore it can be easily linked to a
general company’s mission and objectives.
All the interviewees were also asked about the productivity of PERFM, i.e. how they
believed PERFM could contribute to their productivity level, and seven passages
were established. Three interviewees agreed that PERFM could provide a good
management of sources, with one interviewee stating, “PERFM can help us to
manage our labour, money and time”. One interviewee from an office building
organisation signified that it could also assist and improve the decision-making
process. All interviewees also believed that PERFM provided both short- and long-
term views of the overall strategic performance objectives to be emphasised in FM
service. This would help them to strategise their FM objectives and aims. All of the
interviewees also shared the same consensus in two other aspects. First, they
believed that PERFM would increase their efficiency level. Second, they agreed that
their productivity level would be enhanced as the maximum potential of resources
could be utilised.
As previously explained in the literature, quality is one of the fundamental elements
in delivering services. Five passages were established for this mid-level theme. All
eight interviewees believed that PERFM could help to enhance the service quality,
particularly through five different approaches (5 passages). One interviewee
believed that the specific performance indicators and targets would help them to
understand and focus on the targeted deliverables. Three interviewees - the two
from retail organisations and one from an office building organisation - signified that
the performance measures would be useful in helping FM managers to formulate
and implement quality strategies. Three interviewees also noted that the
management process would also be more organised, with one of them claiming,
“This would help us to strive for quality, now that we have a more organised
management process”. One interviewee noted that PERFM would assist FM
managers in setting priorities for their quality targets. She further added, “Quality
!!
214!
!
service is all about delivering the right service to the customers. Setting priorities
would ensure that we are doing the right thing at the right time”. Another interviewee
also emphasised that, by having a predetermined set of performance formula,
targets and monitoring method, the quality of audit or assessment could be
enhanced accordingly. His claim was, “FM managers now can improve their audit or
assessment, because the performance formula and monitoring process are
specified. The outcomes can be easily measured and monitored every month”.
Interviewees were also asked about how they believed their delivery process could
be enhanced with the implementation of PERFM. Four positive passages were
concluded. Interestingly, more than half of the interviewees (5 interviewees) agreed
that having all the performance measures in place would help to increase the speed
of service delivery, with two interviewees from finance organisations mentioning the
word ‘product’. In general, the services were also regarded as a product, the same
as the outcome of a process. One interviewee further added that, “In fact the
product can actually be delivered earlier to the customers”. An interviewee from the
retail organisation noted that the service promptness could also be improved. Two
interviewees also commented about positive improvement in the delivery process, in
which one of them said, “As the performance measures cover the relevant
processes for each service scope, a FM manager would find it easier to focus on
each level of the delivery process”. She further gave an example of the waste
management service where a FM manager could focus on each process level from
segregation to collection, and improve them accordingly. Two other interviewees
also noted that having a set of performance attributes and respective delivery
targets should help the FM managers in setting the delivery targets that service
providers aim to achieve for each service.
Four interviewees were optimistic about how PERFM can contribute to the cost
control of FM services. Two passages were established, where one of them was
that PERFM eliminated non-value added activities. Two interviewees agreed about
this, believing that the performance measures give a transparent evaluation of the
significance of each process or element. Two other interviewees also claimed that
the measurable elements play a significant role in ensuring that the delivered
services are cost-efficient.
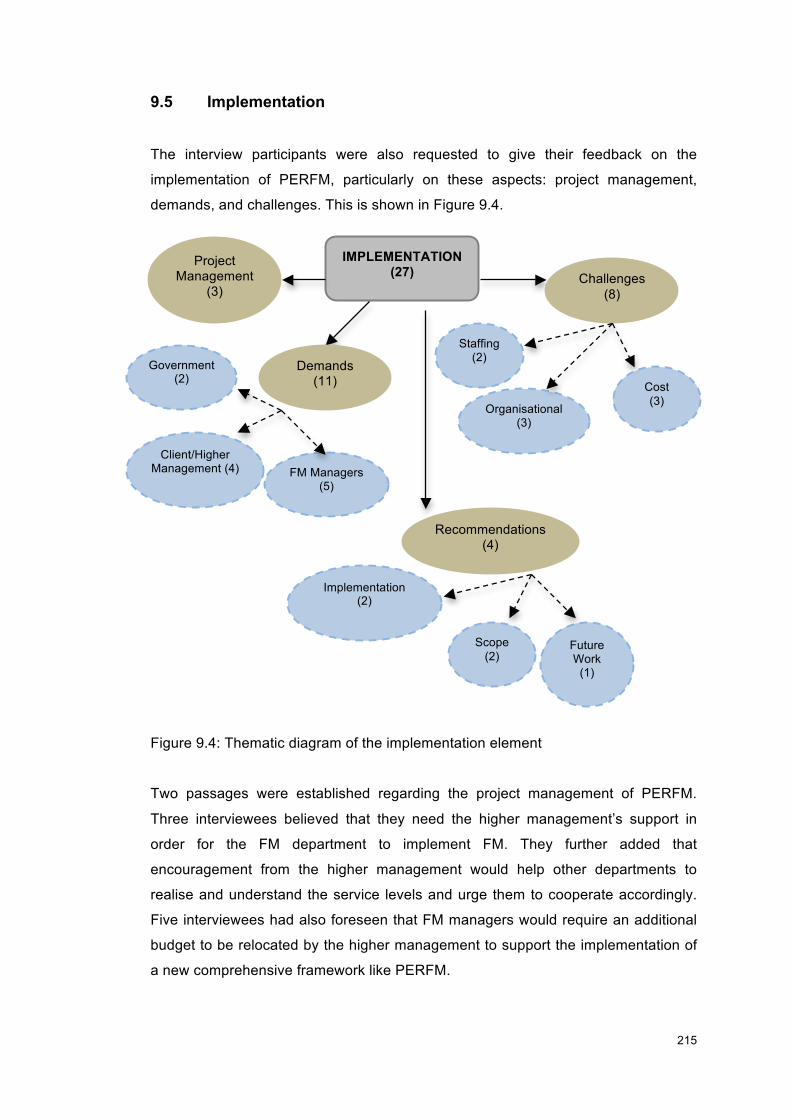
!!
215!
!
9.5 Implementation
The interview participants were also requested to give their feedback on the
implementation of PERFM, particularly on these aspects: project management,
demands, and challenges. This is shown in Figure 9.4.
Two passages were established regarding the project management of PERFM.
Three interviewees believed that they need the higher management’s support in
order for the FM department to implement FM. They further added that
encouragement from the higher management would help other departments to
realise and understand the service levels and urge them to cooperate accordingly.
Five interviewees had also foreseen that FM managers would require an additional
budget to be relocated by the higher management to support the implementation of
a new comprehensive framework like PERFM.
IMPLEMENTATION (27) !
Project Management
(3)
Demands (11)
Government (2)
Client/Higher Management (4)
FM Managers (5)
Recommendations (4)
Future Work
(1)
Scope (2)
Implementation (2)
Challenges (8)
Organisational (3)
Staffing (2)
Cost (3)
Figure 9.4: Thematic diagram of the implementation element
!!
216!
!
The interview participants also gave positive comments (11 passages) for the
demand factors. Generally, the comments or demands can be categorised into three
low-level themed categories: government, client/higher management and FM
managers.
Seven interviewees mentioned the two demands (2 passages) that might be
acquired by the Malaysian government. Four of them believed that there was a
demand by the government to have the PERFM as a standard guideline to
standardise all the FM service level practice in Malaysia. This could be related to the
lack of initiatives taken on FM practice, particularly on the service and measurement
process at present. Three other interviewees also believed that the government
would additionally demand the implementation of PERFM to ease the monitoring
process of all FM services to the public and at the public offices.
The interviewees also related four comments (4 passages) on how there might be
some demands from the client or an organisation’s higher management. Three
interviewees believed that the client/higher management would demand PERFM in
order to increase an organisation’s overall productivity. Two interviewees agreed
that they would require the framework to have a better control of all the resources.
Five of the interviewees claimed that there would also be a demand for an efficient
budget or financial control, to which PERFM would be able to contribute
significantly. Two interviewees also noted that the client/higher management would
see PERFM as a tool for them to ensure that both internal, i.e. the organisation’s
requirement, and external standards, i.e. regulatory standards, are complied with by
the FM department.
The interview participants also shared some consensus (5 passages) on the
potential demands from the FM managers. Four interviewees believed that FM
companies in Malaysia would see PERFM as an enhancement tool to implement a
strategic FM practice. One of them claimed, “It is time for us to practise strategic
FM, and PERFM would be a great tool to help us start measuring our service
performance efficiently”. All eight of the interviewees also anticipated that there
would be a high demand from FM managers to use PERFM to have a better control
of both FM services and the service providers. Five interviewees also noted that FM
managers would realise that PERFM can serve as a means to enhance their
existing service. Two of them believed that FM managers would also demand
PERFM to help them in prioritising the scope of services.
!!
217!
!
The interviewees were also asked to give some opinions on what challenges they
would anticipate in implementing PERFM. Seven responses (8 passages) were
received, which concerned these factors: staffing, cost, and organisational. Five
interviewees expressed their concerns on the staffing factor. Two of them noted that
there might be a problem in relation to staff turnover. New staff would require some
time to understand the whole process and become familiar with all the performance
measures, and a high turnover of staff would demand a high dedication of time and
expertise from other staff. Three interviewees further anticipated that any party, i.e.
the Malaysian government, an organisation’s higher management and FM
managers, might find some challenges in reallocating new roles and resources and
setting new limitations in adapting the newly improved measurement practice.
All of the interviewees also expected some challenges (3 passages) with regard to
the cost factor. Five of them expected that the implementation of PERFM would
require a new allocation of investment budget. All of the interviewees also believed
that a higher budget needed to be allocated to the FM department. This is because
additional sources, e.g. equipment, provision of new space, storage and
administration tools, were required to enhance their services. Two interviewees
expected that there would also be a higher cost of outsourcing services quoted or
charged by the service providers due to the change of service scope and
arrangement. All these claims were foreseen to be the challenges in adapting
PERFM.
The interviewees also provided some insights (3 passages) regarding the expected
organisational challenges. Three interviewees agreed that it might be challenging to
acquire a commitment of time and energy by the staff involved. Five interviewees
signified that the implementation of PERFM would bring FM services to a new level
in the organisation. The higher management was expected to provide more
diversified FM roles, and it was felt that FM services might face some challenges in
carrying out the new responsibilities and functions. One interviewee also claimed
that there would be a new demand from both internal (clients on site) and external
management (headquarters).
The final question of the interview was to request the interviewees to provide any
suggestions or recommendations for PERFM. A total number of four comments (4
passages) were summarised from three related mid-level themes: scope,
!!
218!
!
implementation and future work. Two interviewees suggested that the scopes of
monitoring method should be further elaborated. They believed that FM managers
would have a systematic way of managing monitoring methods (e.g. inspection,
quality audits) if more elaboration and focus were given to this aspect. One
interviewee suggested that additional content focusing on the roles and
responsibilities of the key parties involved in all the outlined performance measures
process is needed. He believed that this would help to identify who are responsible
at which stage, and what are the expected roles and responsibilities. Two other
interviewees believed that a support service is needed when first implementing the
PERFM. The conduction of training would be a good preparation exercise prior to
implementing the new measurement approach. One interviewee also gave a future
work suggestion, in which he claimed, “Perhaps the future work should evaluate the
effectiveness of PERFM, so it can be further revised”.
9.6 Summary of PERFM Evaluation Themes
The analysis has indicated that all the interviewed FM managers in Malaysia
positively evaluated the PERFM. Overall, positive comments were given on the
design of the framework, its functionality factor and also the potential
implementation factors. The interviewees believed that the PERFM was
appropriately designed by incorporating the relevant elements for the measurement
exercise. The overall structure and layout was also well received, and PERFM
contents were appropriately elaborated. The interviewees also managed to
acknowledge the underlying principles of PERFM and all of them were aware of its
customer-oriented and improvement-monitoring approaches.
Interestingly, the interviewees also provided positive feedback on how PERFM’s
functionality could enhance their existing service. Based on the comments, it was
evident that PERFM was regarded as flexible to changes and having the potential to
increase the FM service productivity level. It was also anticipated to improve both
the service quality and delivery of the process outcome. It was also noted that the
interviewees were aware of the potential contributions of PERFM to cost control.
Based on the feedback of the implementation of PERFM, it was noted that the
interviewees had some concerns on the project management process, e.g. a higher
management support and new allocation of roles. The interviewees were also very
positive in anticipating the demands from three related parties: government, client
!!
219!
!
and FM managers. However, a few challenges from staffing, cost and organisational
aspects were anticipated. Finally, they also gave some recommendations to
improve the scope of PERFM contents and implementation method, as well as
recommending work to be carried out in the future. A summary of Nvivo thematic
analysis diagram can be referred to Appendix E.
9.7 Chapter Summary In summary, this chapter has presented the findings from the evaluation studies of
PERFM based on the design of framework, functionality and implementation. The
findings also demonstrate that the potentials of PERFM were positively
acknowledged by the FM players participated in the interviews. These findings and
feedback complete the whole process of evaluating the performance measures
proposed in PERFM.
Next, the conclusions and the recommendations of this research are presented in
the final chapter that is chapter 10. In chapter 10, the research aim and objectives
were revisited where summaries of the conclusions achieved are elaborated
accordingly. This chapter also explains further on the proposed recommendations,
research limitations faced as well as the contributions of knowledge as a conclusion
of this study.
!!
220!
!
CHAPTER 10: CONCLUSIONS & RECOMMENDATIONS
In this chapter, the key conclusions that are reflected throughout the thesis are
presented. The conclusions are linked back to the research aim and objectives, and
the findings that have been derived from the literature review and all the three
phases of data collection and analysis. The research limitations are also explained,
to give an overview of the constraints faced in conducting this research. A set of
recommendations and the research summary are presented to conclude this
chapter.
10.1 Reflection on the Research Aim and Objectives
Based on the research problem, this thesis proposed two research questions:
(i) What are the key elements in measuring FM service performance?
(ii) How can FM organisations in Malaysia measure their performance
strategically, using a practical framework?
Therefore, this research proposed the following aim to answer the research
questions:
(i) To develop a PM framework that FM organisations in Malaysia can use to
implement and enhance service delivery
To systematically investigate this aim, four objectives were derived:
(i) To understand the current thinking on FM and PM globally, with a specific
focus on the Malaysian context.
(ii) To understand the elements of effective PM both in theory and practice,
looking at Malaysian and UK case studies.
(iii) To develop a PERFM to be used by Malaysian FM practitioners:
a. Identify the key components of PM, drawing on the key findings from
Objectives 1 and 2;
b. Use knowledge from Objective 2 to obtain the current position of both
Malaysian and UK organisations;
c. Produce PERFM based on findings from Objectives 3a and 3b.
(iv) To evaluate PERFM’s ability to enable FM practitioners in Malaysia to
enhance their existing FM service delivery
!!
221!
!
10.2 Summary of Conclusions
Four sets of conclusions have been established, which were derived from the
research aim and objectives. The conclusions were devised based on the adopted
mixed methods research design and the incorporation of the literature studies and
findings from all phases of data collection. Based on the empirical findings, this
study proposes the following propositions:
10.2.1 Conclusion 1
A literature review of both FM and PM has shown that both subjects have been
established on their own, and the integration of PM elements in FM is essential in
exercising the strategic development process and practice of FM. A study of both
literature and data analysis findings has also indicated that the FM industry in
Malaysia is still lacking in innovation, and the implementation of strategic PM in FM
is still low.
Based on the literature review, FM can be said to have established itself as a key
service sector and started to emerge as a response to the business environment. It
fits well into the overall business agenda as it identifies the influences required for
change in the business environment and develops facilities to accommodate it. FM
provides an improved strategic context of services, where both effectiveness and
efficiency are achieved. Generally, clients understand the contribution of FM in
reducing unnecessary costs and creating a better working environment. However, in
order to deliver a business enhancement progress, a collaborative relationship
among clients, users and FM teams must be established. This way, the growth and
development of FM can be supported, and FM can continuously support core
business in both the short- and the long-term. It was also emphasised in the
literature that FM should be applied from a strategic approach, where the function is
seen to be able to add value to the organisations. This can be achieved by
embedding the concept of PM into the service delivery and implementing all the
strategic approaches and models available.
PM identifies opportunities for progressive improvement in performance and
ensures that added value is achieved. Although there is a trend towards reviewing
FM practice in PM, PM in FM is a less developed area in the literature. The
performance constructs are neither well established nor standardised. The growing
!!
222!
!
need to measure performance is in contrast with a lack of systematic process for
determining an appropriate measurement.
The concept of PM has been embraced by FM managers, who use it as a
benchmark against which effectiveness can be measured and as a basis by which
improvement can be implemented. Measurement is essentially a cost reduction
method and its application is much needed in large companies in order to enhance
efficient use of resources. Previous studies have also demonstrated that there is an
absence of an evaluation mechanism and a robust PM approach within academic
research. This could be the main reason for the lack of a comprehensive set of
performance indicators and measures for FM. The established knowledge and
understanding from the literature and pilot study (Phase 1 data collection) findings
indicated that there is a huge opportunity for the exploration of both PM and FM
scopes. FM functions are not measurable, thus there is a need to develop
performance indicators. The measurement of FM will help to exercise the strategic
development process and enhance the learning process in the organisation.
It can be summarised from the literature review that FM in western countries is
much more progressive than in eastern countries. Some Asian countries like Japan,
Hong Kong, Singapore and South Korea have shown positive developments in FM.
However, the growth of FM in Malaysia is slow and still in its infancy. It was noted
that the scope of PM in FM is not well developed. FM in Malaysia is still lagging
behind other Asian and western countries. There are several factors that can be
considered in understanding the FM industry in Malaysia, namely level of growth,
practice, service, profession, opportunities, demands and challenges. Both the
literature review and findings from the Phase 1 data collection suggested that there
are a few factors that hamper the development of FM in Malaysia. A few examples
of these factors are that the current practice is more focused on short-term decision
making, more reliant on software as a solution, lacks a strategic planning skill, and
has no proper sample or guidance of measurement, problems identifying suitable
measures, difficulties in evaluating the relative importance of measures, as well as
lack of awareness and understanding of the importance of PM in FM. Previous
literature studies have also suggested that the general lack of understanding and
progress are among the contributing factors for the slow development of FM in
Malaysia.
!!
223!
!
Despite government initiatives in building up the profession, public awareness is still
low and the practice of FM in Malaysia is not yet up to par with FM industries in
other countries. It was observed that the steps taken by the Malaysian government
were slow and were not being fully enforced. The lack of recognition by the
government in establishing FM professions in the government bodies has indicated
that it is not yet fully accepting FM. It can be seen that Malaysia has underutilised
FM’s capacity to improve the country’s economic and development future.
It was also noted that there are opportunities and demands for the FM industry to
progress successfully in Malaysia. There is a growing concern among the building
owners to maintain the performance and life cycle of their properties. There is also a
demand for a strategic model to measure their performance and this could
overcome the challenges and issues faced in the Malaysian FM sector. There is
also a strong outsourcing demand for FM as a third party, especially since the
recent combination of outsourcing and privatisation by the government.
In summary, the FM scenario in Malaysia is still lacking an FM culture, is passive,
and is in need of radical changes to move forward. Proper planning to cultivate the
awareness and understanding of FM is greatly required to improve the low service
quality in Malaysia and to enable the FM industry to progress in the competitive
business environment.
!!
224!
!
10.2.2 Conclusion 2
An understanding of elements for effective PM in theory and practice are derived
from three categories, namely aims, development and implementation. By analysing
some established trends of PM practice by FM industries in Malaysia and the UK, it
was evident that the FM companies in the UK adopt a customer-oriented PM, in
contrast with the service-provider PM approach adopted by FM companies in
Malaysia.
Studies of both theory and practical reviews have suggested that there are three
elements that need to be emphasised for effective PM: aim, development, and
implementation. PM functions as a process of determining how successful
organisations or individuals have been in attaining their objectives and strategies. It
is able to indicate problems and areas for continuous improvement. The aim should
be in line with the organisation’s corporate and functional strategies and objectives.
This way, PM will provide a good feedback and also build understanding among the
people involved with the measurement. Organisations need to be clear about the
goals when measuring performance, so that they can monitor and maintain the
organisational processes aimed at achieving their goals and objectives.
Once the aim of measuring performance is set and well understood by the staff
involved, the development process needs to be given a focus. In the development
process, organisations need to make sure that their PM frameworks incorporate a
multi-dimensional set of performance measures. The performance measures must
be balanced between financial and non-financial, and also objective and subjective
measures, which focus on management and technical scopes of service. These
performance measures must provide a timely, relevant and accurate feedback from
both short- and long-term perspectives. The set of PM frameworks should emerge
as a tool for companies to align their performance with strategic goals. The
development process of the PM framework should include the participation of
corporate or top management and FM staff in making sure that all the cause and
effect relationships between the performance measures are developed and the
business performance is established.
The implementation of PM would require a high level of support from the top
management and commitment from the staff involved in the PM framework process.
The key staff involved need to understand the orientation to process, i.e. whether
!!
225!
!
PM is the input or outcome of some processes. The key staff need to explore in
what situations are the frequently used performance measures appropriate and able
to be efficiently implemented.
Case study evidence strongly suggests that there are clear, significant differences in
PM implementation by the UK and Malaysian companies. The UK organisations
have a more structured and comprehensive set of performance measures, with
more emphasis given to the conformity of the agreed service standard and
regulatory standard. The approach adopted is customer-driven and it directly
influences the emphasis of service contributions to meet the customer’s
expectations. An effective development process is also involved, including good
communication and involvement from both FM staff and service providers, who also
gave a full commitment throughout the implementation process. It was also
observed that the reduction in service cost was not the main pressure but that there
is a growing and continuous need of the FM organisations to differentiate
themselves from their competitors in terms of service quality, i.e. the conduction of
external benchmarking. The organisations also considered the complexity of service
offerings, and therefore adopted a comprehensive set of PM indicators that also
comprise the performance outcomes, delivery characteristics and monitoring
actions. Their set of PM indicators defined the specification of service concept and
performance targets in their attempts to adopt a high degree PM in FM practice.
They were confident that they could offer precise service targets based on a clear
identification of service performance standards. They also believed that this could
lead to a better utilisation of resources and a tighter cost control. These companies
believed that they are able to show their strategic FM role by improving the service
performance. Their feedback on PM outcomes also demonstrated that the service
performance indicators were contingent upon the overall service delivery success. It
was also observed that the companies have claimed to be able to meet both their
corporate and functional strategies; this was delivered through a holistic set of PM
indicators. In general, the study summarised that the UK companies measured the
success of their delivery not only in terms of financial performance but also in
relation to other performance criteria such as competitive performance and quality.
Analysis of the Malaysian case studies has demonstrated that most of the
organisations have developed policies and regulations regarding H&S in their
workplace but lack the abilities to demonstrate in the performance indicators that
these regulations are adhered to. The organisations also adopted a set of
!!
226!
!
performance indicators that focus on the management aspect, and the range of
performance indicators according to service process and compliance was limited
and highly dependent on the service provider’s SLAs. It was found that the
organisations also failed to translate their service targets into explicit service
specifications on the basis of which the service delivery system may be designed.
There was also no specification of service technical parameters being defined in
their set of performance indicators, with the exception of healthcare companies, who
proposed a brief set of performance indicators that need to be further referred to
SLAs. The Malaysian case study organisations also exercised no discretion over the
compliance of each FM service, because they were confident that the service
providers would adhere to the statutory requirements due to the service providers’
reputable image. This showed that the compliance process was loosely controlled
and the organisations were reliant on the service providers’ judgement with regard
to the conformance with statutory requirements. They also claimed that it was more
difficult to automate process tasks because of the complexity of the activities
performed and the definite performance targets and tolerance not being set. This
has indicated that the performance indicators are largely pre-determined by the
service providers, which gives FM managers less control of the services performed
by the service providers.
It was also observed that the company culture has an impact on the implementation
of PM in FM. The top management of the Malaysian case study organisations are
not very involved in the FM service and therefore both they and their clients have no
clear understanding of the impact and benefits of PM when embedded into the FM
services. The nature of service delivery, which was more on a reactive and
corrective basis than on a proactive one, also affected the awareness of service
performance in FM.
Findings from both Malaysian and UK healthcare organisations have suggested that
the FM service in healthcare and retail sectors with heterogeneous and
sophisticated or specified customer and client requirements requires complex
measures typified by multiple configurable parameters as well as a high level, very
involved, relationship with top level management or client and also service
providers.
It can be summarised that the greater the PM is customised, the more the service
delivery systems are discretionary, subjective and uniquely designed. Although a
!!
227!
!
simple set of PM elements may seem doable, it would actually constrain
performance capacity. It can also be concluded that PM indicators in the UK are
customer-driven, whereas the PM indicators in Malaysia are service-provider-driven.
The elements of PM in FM service in the UK organisations are much more
advanced and holistic compared to the case study organisations in Malaysia. It is
believed that the mature FM industry with various sources of FM quality standards
has enabled the UK organisations to precisely specify and to tightly define task and
activities’ requirements. Therefore, the implementation of PM indicators or
frameworks by the UK organisations is exemplary and could be used to develop the
PERFM.
10.2.3 Conclusion 3
PERFM, a performance measurement framework, was developed by integrating
both the elements of PM from literature reviews and case study analysis. The
underlying theory of PERFM is to assimilate the elements of people, process and
property. PERFM comprises measurable performance measures (i.e. parameters,
metrics, indicators, attributes), performance target or formula and monitoring
methods. This structured framework is designed as a tool for FM practitioners in
Malaysia to enhance their existing service delivery.
Findings from the Phase 2 analysis have demonstrated that the performance
measures used by the UK case study organisations are far more comprehensive
and structured than the ones practised by case study organisations in Malaysia. The
performance measures proposed in PERFM were incorporated from the best
measurement practised from the data analysis and also within the literature studies.
PERFM was developed based on a theoretical framework consisting of three
elements: people, process and property. It focuses on the values that can be
provided for the people, i.e. clients and customers, and also the incorporation of
various key parties in different levels of the service delivery process, that is, from
decision-making to the implementation of PERFM. The principle of PERFM is to
emphasise the performance measures involved in the FM processes. The conduct
of FM processes will determine the quality of the service or end product being
delivered to users. The objective of PERFM is also to contribute to the property
added values and enhancement qualities for both short- and long-term performance.
The unified theory is essential in supporting PERFM’s role as a holistic framework
!!
228!
!
that can offer valuable insights into the service dimensions to be explored and
scrutinised at each service delivery process.
PERFM is a flexible tool that can be adapted to changes as it includes both tangible
and intangible aspects. As suggested in the literature study, both management and
technical aspects of FM were given emphasis. There are three main sections of
PERFM, which are functional - which focuses on the management aspect - and also
the technical and image aspects- which constitute the technical facet of FM
services. A good management reporting is essential in streamlining the
management structure and procedures in managing FM. Technical measurement
would be useful in making sure the operational side of FM services is run smoothly.
Image focuses on achieving an optimal efficiency of managing the property’s
performance.
PERFM was developed in response to the demand for a greater accountability of
PM framework. It is clear, cohesive and can be well understood by all levels of FM
managers and staff. It is well supported by the imperative elements of PM and
allows a sufficient flexibility for service providers to perform in relation to the
outcomes detailed in the SLAs. PERFM’s aim is not only to provide a satisfactory
working environment but also to foster service offerings, which can optimise the
building service values.
PERFM seeks to foster the thinking of FM managers by helping them to
conceptualise the PM principles embedded in PERFM. It is anticipated that PERFM
can contribute significantly by comprehensively calibrating the effectiveness of
services. Its comprehensive set of performance measures shows a wider
applicability for a holistic assessment of a wide range of facilities. This framework
can serve as a baseline for a comparison in order to measure the performance in
terms of achievements and improvements. It was evident from the literature review
that the practical uses of performance indicators are normally as industry-specific or
organisation-specific indicators. It is suggested that PERFM can be used for both in
government or private sectors, and has incorporated the relevant elements to cater
for the FM services in a few organisational categories, namely healthcare, retail,
finance and office buildings.
!!
229!
!
10.2.4 Conclusion 4
Evaluation findings have demonstrated that PERFM embeds positive qualities of an
effective PM framework. Positive feedback was received on the overall design of the
framework, its functionality, and the potential implementation of PERFM within an
organisation. It is envisaged that PERFM has the ability to enhance the FM service
delivery in Malaysia, which can contribute to a better FM practice.
Analysis from the Phase 3 evaluation study has indicated positive comments
regarding the design of framework, functionality and implementation aspects. The
overall structure and layout was well received, and the contents were perceived to
be well elaborated, providing a high level of information. It was also claimed that the
incorporation of management and technical aspects appeared to be balanced, when
more emphasis had been expected for the technical aspect of FM services.
The feedback also indicated that PERFM is not rigid but is flexible to changes. It
was seen as an appropriate tool to enhance levels of speed of delivery, quality and
productivity. PERFM’s introduction of a good management of sources could also
contribute to the cost control aspect.
In the implementation factor, constructive feedback was given on the project
management aspect. It was evident that strong support from higher management
was required to fully implement PERFM. A few responses regarding the potential
demands of PERFM were received, which were expected to be from the
government, clients and FM managers. It was predicted that the government would
demand PERFM as a tool to standardise the FM practice, which would also ease
the monitoring process of FM services. Clients were also potentially expected to
demand PERFM to increase the organisation’s overall productivity and manage their
financial control strategically. As for FM managers, there was a high anticipation that
they would need PERFM as an enhancement tool for implementing strategic FM
and taking full control of the service providers’ performance.
A few challenges were also foreseen in respect to the staffing, cost and
organisational aspects. It was suggested that there might be challenges in the
issues of staff turnover and reallocating of new roles. There were also expectations
about a new allocation of investment budget and higher outsourcing services within
the organisations. There were also concerns regarding the challenges that might
!!
230!
!
arise from the high commitment of time and energy that is greatly required from the
key people involved in the implementation process, and also in carrying out the new
roles and responsibilities.
Several recommendations were also suggested, for example, more focus should be
given to the monitoring methods and key people involved in all the processes and
levels outlined in PERFM. It was also suggested that conducting training would
suffice as preparation prior to commencing PERFM. A suggestion of future work to
evaluate the effectiveness of PERFM was also noted.
In summary, the positive responses of PERFM indicate that it has been well
accepted and evaluated. As a final output of this research, PERFM is anticipated to
improve the current scenario of FM generally and to improve the quality of service
so that the public will recognise the importance of the FM profession.
10.3 Research Limitations
One limitation in conducting the research was addressed, as follows:
(i) Constraints in getting the responses from the pilot study questionnaire survey–
due to a lack of co-operation and awareness in FM. A considerable amount of
time was taken to conduct the survey because some potential respondents
were reluctant to participate when approached by the researcher. It was
suspected that the awareness of the FM practice in Malaysia is still low due to
the fact that the industry is still not as fully developed as in other countries,
e.g. the UK and USA.
(ii) There is no repository of a registered list of FM organisations that can facilitate
the sampling and settings of data collection. This is reflected in the number of
participants especially in Phase 1 questionnaire survey and Phase 2 case
studies, which limits the scope of findings.
!!
231!
!
10.4 Recommendations
A summary of recommendations is proposed:
(i) FM Practice
• FM can be involved during the initial phase of building planning and
design, where input from FM managers can help mitigate the risk of
failure in design.
• FM employees need to have a thorough understanding of the service
offerings, market and industry to ensure that they are able to comprehend
detailed customer requirements, and translate these requirements into
performance measurements
(ii) Organisational
• Higher organisational awareness of the needs of FM in the property
industry is essential for FM development.
• Joint or collaborative involvement of the government plays an important
role in instilling FM culture and awareness through the imposition of
guidelines and research works, and providing assistance in complying
with the requirements.
• Allocation of the monitoring units may need some adjustments and
reshuffling of the existing services due to strategic roles and focus.
(iii) Industry
• The public and professional bodies should be exposed to the importance
of FM as a strategic component in service delivery. To achieve this, better
participation from the government is needed in enforcing standards and
regulations. The clients themselves should be responsible for embedding
the importance of FM into their strategic endeavours through conducting
training and by adopting a PM framework.
• A change in the mindset is needed against the conservative and
protective industry practice. Therefore, more proactive campaigns are
needed to change the perception of the professionals involved in the
construction and property markets.
!!
232!
!
(iv) Working Culture
• A paradigm shift is needed in leadership to cultivate a culture of positive
and beneficial interaction between customers and staff.
(v) Development of Tools
• New innovative tool such as software application to measure performance
can be developed to aid the measuring process by the FM team. The
PERFM can serve as a ground in developing this innovative software
application.
(vi) Research Studies
• Further research studies can be conducted in expanding the scopes of
this research. There are opportunities in exploring various scopes of
studies such as the concept of PM in other FM industries globally;
performance measures for specific nature of business or category i.e
education, manufacturing; the concept of PM in urban FM and also the
productivity analysis based on the outcomes of the measured services.
• There is also an opportunity to conduct a specific study focusing on the
testing of the developed PERFM. Further analysis and studies would be
beneficial in positioning the tested PERFM in the academic and the
Malaysian FM industry.
10.5 Contribution to Knowledge
10.5.1 Academic
• This research opens up new possibilities for academic research. Although
the scope of PM is widely studied by researchers, the focus of PM in
relation to FM service performance is still lacking in interest and coverage.
The existing frameworks are mostly concerned with the general indicators
of FM with less focus given to the performance formula or targets. It is fair
to say that this study is a new knowledge discovery, where a review of the
relevant literature has not found any evidence of the specific approach
that this study takes.
!!
233!
!
• It also promotes future subject exploration where new research
approaches, methods and concepts can be further developed based on
the design of this study. Future researchers could adopt this research’s
approaches and concepts in constructing models or frameworks for FM
service, which could also be in other specialisations, for instance
sustainability approach, strategic FM organisation and other FM topics
and focuses.
• The new underlying theories of PERFM also validate its suitability within
the performance indicators, values and concepts. This research also
draws together the existing concepts by investigating two different FM
industries and shows the feasibility of comparison between these two
concepts in developing PERFM. These theories and concept approaches
are good examples of future subject exploration that can be embarked
upon by researchers.
• This study also highlights an in-depth understanding of performance
criteria that need to be emphasised in both research and practice. It gives
a solid overview of the PM subject and approaches in FM practice, which
serves as a good reference for other researchers.
10.5.2 Industry
• The development of PERFM proposes a set of performance measures
that can be used on a daily basis to measure the FM service
performance. It is anticipated to fill the gap of the non-existence of a
framework or guidelines for FM practitioners in Malaysia. This PERFM
would enable the FM practitioners to understand the FM service scopes
better and the performance specifications and targets that should be
achieved within their capacities. The concise set of performance
indicators would be a good reference of what are being currently used by
the more developed FM industries and suggested in the literature.
• PERFM is also anticipated to serve as a platform in bringing up the FM
industry to a whole new level. In Malaysia, quality and performance have
always been compromised in the FM service and the future of the FM

!!
234!
!
profession has been consistently underrated. The emergence of PERFM,
assisted by government support, should be able to upgrade the level of
quality and performance that should be aimed for in the industry. Previous
cases of severe public building deteriorations are the evidence of the lack
of emphasis in ensuring the quality level of the FM service for the public
buildings in Malaysia.
• PERFM is a robust framework that has been developed by adopting
appropriate concept and methodologies, which exhibit wide applicability
and valid FM performance categorisations. This new contribution to the
industry has demonstrated that this research has taken into account the
current phenomena of the FM industry in Malaysia and has developed a
solution based on established techniques and methods but with a different
focus to suit the originality of the research objectives.
10.5.3 New knowledge
• It can be concluded that this research poses evidences that it has
demonstrated a new theoretical concept of FM service in PERFM, which
has never been established in the FM field, especially focusing on the
Malaysian context. A set of publications based on this research is also the
supporting evidence where the knowledge of this research has been
affirmed in academia. The unique concept, techniques, methodologies
and analyses also demonstrate how this research significantly contributes
to the knowledge and also is original.
!!!!!!!!!
!
!!
235!
!
10.6 Research Summary
In conclusion, the research aim and objectives of this research have been
successfully achieved through the series of research methods from the formulation
of research questions, literature review, data collection, data analysis, interpretation
and up to the writing up process. The adoption of qualitative method shapes the
data collection techniques of all the three phases; qualitative questionnaire survey,
case studies and interviews. The first pilot study questionnaire survey provides
significant findings in understanding the current thinking of PM and FM in Malaysian
context as well as to further support the need to focus on the PM approach in
Malaysia due to the lack of FM culture and awareness in Malaysia. The case studies
findings provide primary data of the performance measures being practised, and
these were then matched with the key principles and elements from the literature
review to be compiled in the PERFM. Further evaluation of PERFM in the form of
interviews also proves that the FM key players believe that PERFM is able to
enhance the FM service delivery in Malaysia. This is as PERFM is able to fill the gap
of Malaysian industry in specific, where there is a lack of tool to measure the FM
performance. This research has proven beneficial in providing a new dimension in
seeing how PM can contribute to strategic FM delivery in Malaysia. PERFM can be
a catalyst to a new paradigm of what is currently a traditional and conservative
practice to a modern and measureable approach. It is highly suggested that the
Malaysian FM industry can adopt the framework in their strategic FM practice. The
uniqueness of PERFM in comparison to other PM models is that PERFM offers a
holistic framework, which consists the imperative elements that constitute the
management and operation of FM services. It is developed based on the study of
the performance measures developed in the academic and practised in the industry.
The aggregative levels of its performance measures signify the details being given
on this, and the performance formula or target identify the established target or
achievement level. Monitoring methods are proposed in order to facilitate the
tracking of the measurement process. It is envisaged that PERFM will be able to
contribute significantly by offering the value and benefits in aiding the measuring
process to both in-house staff or outsourced service providers. This research also
opens up opportunities for ample research areas in the future. Future research
could focus on the strategic FM in Malaysia, strategic principles of PM, post-
evaluation of PERFM practice, and customers’ response to the services improved
based on PERFM, among other topics.
!!
236!
!
REFERENCES Ahmad, R., 2008. Role and Approach of Building Surveying in Facilities &
Maintenance Management. In: National Seminar on Facilities & Maintenance Management In the 21st Century: The Demands & Needs for Growth In Malaysian Building Industry. Kuala Lumpur, 12 August 2008.
Alexander, K. 1996. Facilities Management: Theory and Practice. London: E & FN
Spon. Alexander, K. 1997. Facilities Management. London: E & FN Spon. Alexander, K. 1999. Facilities Management. 2nd ed. London: E & FN Spon. Alexander, K. 2002. Facilities Management: creating the platform for business
value, unpublished paper. Alexander, K. 2003. A strategy for facilities management. Facilities, 21(11/12), pp.
269-274. Alexander , K. and Brown, M. 2006. Community-based facilities management.
Facilities, 24(7/8), pp. 250-268. Ali, A.S. 2009. Cost decision making in building maintenance practice in Malaysia.
Journal of Facilities Management, 7(4), pp.298-306. Ali, A.S., Kamaruzzaman, S.N., Sulaiman, R. and Peng, Y.C. 2010. Factors
affecting housing maintenance cost in Malaysia. Journal of Facilities Management, 8(4), pp. 285-298.
Amaratunga, D. 2000. Assessment of Facilities Management Performance. Property
Management, 18(4), pp. 258-266. Amaratunga, D., Baldry, D. and Sarshar, M. 2000. Assessment of facilities
management performance - what next? Facilities, 18(1), pp.65-75. Amaratunga, D. and Baldry, D. 2000. Assessment of facilities management
performance in higher education properties. Facilities, 18(7/8), pp. 293-301. Amaratunga, D. and Baldry, D. 2002. Moving from performance measurement to
performance management. Facilities, 20(5/6), pp. 217-223. Amaratunga, D. and Baldry, D. 2003. A conceptual framework to measure facilities
management performance. Property Management, 21(2), pp.171-189. Anderson, K. and McAdam, R. 2004. A critique of benchmarking and performance
measurement: lead or lag? Benchmarking: An International Journal, 11(5), pp. 465-483.
Andrews, R., Boyne, G. A., & Walker, R. M. 2006. Subjective and objective
measures of organizational performance: An empirical exploration. In Boyne, G.A., Meier, K.J., O’Toole, L.J., and Walker, R.M., (Eds.). Public service
!!
237!
!
performance: Perspectives on measurement and management. Cambridge: Cambridge University Press, pp.14 -34.
Annies, A. 2007. Current issues and challenges in managing government’s assets
and facilities. In: National Asset & Facilities Management (NAFAM) Convention. Kuala Lumpur, 13 August 2007.
Argument, L., Harrison, D. and Wainwright, C. 1997. Manufacturing strategy within
the SME sector. In: 13th National Conference of Manufacturing. Glasgow: Glasgow Caledonian University, pp. 6-10.
Ariff, A.M. 2007. Current issues and challenges in managing government’s assets
and facilities. In: National Asset and Facilities Management (NAFAM) Convention. Kuala Lumpur, 13 August 2007.
Arnold, J. 1991. Introduction to Materials Management. Englewood Cliffs, NJ:
Prentice-Hall. Atkin, B. and Brooks, A. 2000. Total Facilities Management. Oxford: Blackwell
Science Ltd. Atkin, B. and Brooks, A. 2005. Total Facilities Management. 2nd ed. Oxford:
Blackwell Publishing. Atkin, B. and Brooks, A. 2006. Total Facilities Management. 3rd ed. Oxford:
Blackwell Publishing. Atkinson, A.A., Waterhouse, J.H., Wells, R.B. 1997. A Stakeholder Approach to
Strategic Performance Measurement. Sloan Management Review, 38(3), pp.25-37.
Atkinson, H. and Brown, J.B. 2001. Rethinking performance measures: assessing
progress in UK hotels. International Journal of Contemporary Hospitality Management, 13(3), pp. 128-135.
Augenbroe, G. and Park, C. 2005. Quantification methods of technical building
performance. Building Research and Information, 33(2), pp. 159-172 Azzone, G., Masella, C. and Bartele, U. 1991. Design of performance measures for
time-based companies. International Journal of Operations & Production Management. 11(3), pp.77-85.
Babbie, E. 1990. Survey Research Methods. Belmont, CA: Wadsworth Publishing. Babbie, E. 2007. The Practice of Social Research.11th ed. Belmont, CA: Wadsworth
Publishing. Baharum, M.R. and Pitt, M. 2009. Determining a conceptual framework for green
FM intellectual capital. Journal of Facilities Management, 7(4), pp. 267-282. Baldwin, A., McCaffer, R. and Osman, I. 2001. Project performance in a contracting
organisation: Analysis, evaluation and development. In: CIB World Congress. Willington, New Zealand, April 2001.
!!
238!
!
Ballesty, S. 2007. Best practices and success stories in asset and facility management. In: National Asset & Facilities Management (NAFAM) Convention. Kuala Lumpur, Malaysia, 13 August 2007.
Barret, P.S. 1995. Facilities Management: Towards Best Practice. Oxford: Blackwell
Science. Barret, P. 2000. Achieving strategic facilities management through strong
relationships. Facilities, 18 (10/11/12), pp.421-426. Barret, P. and Baldry, D. 2004. Facilities Management: towards best practice.
London: Blackwell Publishing. Becker, F. 1990. The Total Workplace. New York: Van Nostrand Reinhold. Behn, R. D. 2003. Why Measure Performance? Different Purposes Require Different
Measures. Public Administration Review, 63(5), pp. 586–606 Bell, J. 1992. Facilities management and changing professional boundaries.
Facilities, 10(10), pp.161-173. Bergman, M.M. 2010. On Concepts and Paradigms in Mixed Methods Research.
Journal of Mixed Methods Research, 4(3), pp. 171-175. Bernolak, I. 1997. Effective measurement and successful elements of company
productivity: the basis of competitiveness and world prosperity. International Journal of Production Economic, 52 (1/2), pp. 203-213.
Best, R., Langston, C. and De Valence. 2003. Continuous Improvement. In: Best, R.
Langston, C. and De Valence, G., (Eds.), Workplace Strategies and Facilities Managements. 1st ed. Burlington: Butterworth-Heinemann Publications, pp. 1-7.
Bierbusse, P. and Siesfeld, T. 1997. Measures that matter. Journal of Strategic
Performance Measurement, 1(2), pp. 6-11. Bititci, U.S. 1994. Measuring your way to profit. Management Decision, 32(6), pp.16-
24. Bititci, U., Carrie, A. and McDevitt, L. 1997. Integrated performance measurement
systems: a development guide. International Journal of Operations & Management. (17(5), pp. 522-534.
Bohte, J. and Meier, K.J. 2000. Goal displacement: assessing the motivation for
organisational cheating. Public Administration Review, 60(2), pp. 173-182. Boyne, G.A., Meier, K.J., O’Toole, L.J. and Walker, R.M. (Eds.), 2006. Public
service performance: Perspectives on measurement and management. Cambridge, UK: Cambridge University Press, pp. 1-12.
Bon, R., McMahan, J.F. and Carder, P. 1998. Property performance measurement:
from theory to management practice. Facilities, 16(7/8), pp. 208-214.
!!
239!
!
Bourne, M., Mills, J., Wilcox, M., Neely, A.D. 2000. Designing, Implementing and Updating Performance Measurement Systems. International Journal of Operations & Productions Management, 20(7), pp. 754-771.
Bourne, M., Neely, A.D. 2003. Implementing Performance Measurement Systems: a
literature review. International Journal of Business Performance Management, 5(1), pp.1-24.
Boyne, G.A. 2002. Concepts and indicators of local authority performance: An
evaluation of the statutory framework in England and Wales. Public Money and Management, 22(4), pp. 17-24.
Boyne, G.A. 2003. What is public service improvement? Public Administration,
81(2), pp. 221-228. Brackerts, N. and Kenley, R. 2002. Evaluating community facilities in local
government: managing for service enablement. Journal of Facility Management, 1(3), pp. 283-299.
Brewer, G. 2006. All Measures of Performance are Subjective: More Evidence on
US Federal Agencies. In Boyne, G.A., Meier, K.J., O’Toole, L.J. and Walker, R.M. (Eds.) Public Service Performance: Perspectives on Measurement and Management. Cambridge, UK: Cambridge University Press, PP.35-54.
Brewer, J. and Hunter, A. 1989. Multimethod research: A Synthesis of Styles.
Newbury Park CA: Sage Publications. British Institute of Facilities Management (BIFM). 2007. Workbook 3: FM and FM
Strategy. West Midlands: BPP Learning Media. British Institute of Facilities Management (BIFM). 2012. Facilities Management
Introduction [online]. Available at: <http://www.bifm.org.uk/bifm/about/facilities [Accessed on 12 April 2012.]
Brown, J. and Devlin, J. 1997. Performance Measurement – The ENAPS Approach.
The International Journal of Business Transformation, 1(2), pp 73-84. Brown, M.G, Hitchcock, D.E. and Willard M.L. 1994. Why TQM Fails? Burr Ridge,
Illinois: Irwin Publishing. Brown, M. 1996. Keeping Score: Using the Right Metrics to Drive World Class
Performance. New York, NY: Quality Resources. Bryman, A. 2006. Integrating Quantitative and Qualitative Research: how is it done?
Qualitative Research, 6(1), pp.97-114. Cable, J.H. and Davis, J.S. 2004. Key Performance Indicators for Federal Facilities
Portfolios. Federal Facilities Council Technical Report 147. Washington, DC: National Academic Press.
Cain, C. T. 2004. Performance Measurement for Construction Profitability, Oxford,
UK: Blackwell Publishing Ltd. Campbell, J.D. 1995. Uptime: Strategies for Excellence in Maintenance
Management. Cambridge, UK: Productivity Press.
!!
240!
!
Campbell, D.T., and Fiske, D.W. 1959. Convergent and discriminant validation by the multitrait-multimethod matrix. Psychological Bulletin, 56(2), pp.81-105.
Cardellino, P. and Finch, E. 2006. Evidence of systematic approaches to innovation
in facilities management. Journal of Facilities Management, 4(3), pp.150-66. Carder, P. 1997. Interface management: a fictional case study. Facilities, 15(5/6),
pp. 142-149. Charmaz, K. ed. 2006. Constructing Grounded Theory: A Practical Guide Through
Qualitative Analysis-Introducing Qualitative Methods. London: Sage Publications.
Cheng, M.-I., Dainty, A. and Moore, D. 2007. Implementing a new performance
management system within a project-based organization. International Journal of Productivity and Performance Management, 56(1), pp. 60-75.
Chotipanich, S. 2004. Positioning facility management. Facilities, 22(13/14), pp.364-
372. Consruction Industrial Development Board (CIDB) 2010. Newsletter [online],
Malaysia: CIDB. Available at: <http://www.cidb.gov.my/v6/?q=en/content/533> [Accessed on 10 December 2010.]
Coetzee,J. L. 1998. Maintenance. Republic of South Africa: Maintenance
Publishers. Collier, P. 1995. Improving business success through accurate performance
measurement. Worcester: Worcester College of Higher Education. Cotts, D.G. 1998. The Facility Management Handbook. 2nd ed. New York, NY:
Amacom Press. Crawford, K. and Cox, J. 1990. Designing performance measurement systems for
just in time operations. International Journal of Production Research, 28(11), pp. 2025-2036.
Creswell, J. W. 1994. Research Design: Qualitative and Quantitative Approaches.
Thousand Oaks, CA: Sage Publications. Creswell, J. 1998. Qualitative inquiry and research design: Choosing among five
traditions. Thousand Oaks, CA: Sage Publications. Creswell, J.W. and Clark, P. 2007. Designing and conducting mixed method
research. Thousand Oaks, CA: Sage Publications. Creswell, J.W. 2009. Research Design: Qualitative, Quantitative, and Mixed Method
Approaches. 3rd ed. London: Sage Publications. Croom, S., Romano, P. and Giannakis, M. 2000. Supply chain management: an
analytical framework for critical literature review. European Journal of Purchasing & Supply Management, 6(1), pp. 67-83
Crotty, M. 1998. The Foundations of Social Research: Meaning and Perspective in
the Research Process. London: Sage Publications.
!!
241!
!
Cupello, J.M. 1994. A new paradigm for measuring TQM progress. Quality Progress, 27(5), pp. 79-82.
Datta, L. 1994. Paradigm wars: A basis for peaceful coexistence and beyond. In
Reichardt, C.S. & Rallis, S.F. (Eds.) The qualitative-quantitative debate: New perspectives. San Francisco: Jossey-Bass.
Denzin, N.K., Lincoln, Y.S. 2000. Introduction: The Discipline and Practice of
Qualitative Research. In Denzin, N.K. and Lincoln, Y.S. (Eds.) Handbook of Qualitative Research. 2nd ed. Thousand Oaks, CA: Sage Publications, pp. 1-28.
Department of Trade Industry (DTI). 2003. Competing in the global economy: the
innovation challenge. Economic Paper No.7. London: DTI. De Toni, A. and Tonchia, S. 2001. Performance measurement systems.
International Journal of Operations & Production Management, 21(1/2), pp. 46-70.
De Toni, A., Fornasier, A. Montagner, M. and Nonino, F. 2007. A performance
measurement system for facility management: the case study of a medical service authority. International Journal of Productivity and Performance Management, 56(5/6), pp. 417-435.
Dixon, J.R., Nani, A.J., and Vollman, T.E. 1990. The New Performance Challenge:
Measuring Operations for World Class Competition. Homewood, IL: Dow-Jones Irwin.
Dunican, E. 2005. A framework for evaluating qualitative research methods in
computer programming education. In: 17th Workshop of the Psychology of Programming Interest Group. Sussex University, June 2005.
Dwight, R.A. 1995. Concepts of Measuring Maintenance Performance, New
Developments in Maintenance. Utrecht: Moret Ernst & Young Management Consultants, pp. 109-125.
Eccles, R. 1991. The performance measurement manifesto, Harvard Business
Review, 69 (January-February), pp. 131-137. Economic Planning Unit, 2006. 9th Malaysian Plan [pdf] Available at:
<www.parlimen.gov.my/news/eng-ucapan_rmk9.pdf> [Accessed on 20 June 2011.]
Egbu, C. 2008. Sustainability in Building Facilities & Maintenance: Skills, Knowledge
and Personal Qualities for Managing Refurbishment Project. In: National Seminar on Facilities & Maintenance Management In the 21st Century: The Demands & Needs for Growth In Malaysian Building Industry. Kuala Lumpur, 12 August 2008.
Ellram, L.M. and Tate, W.L. and Billington, C. 2004. Understanding Service Supply
Chain Management. The Journal of Supply Chain Management, 40(4), pp.17-32.

!!
242!
!
Enoma, A. and Allen, S. 2007. Developing key performance indicators for airport safety and security. Facilities, 25(7), pp. 296-315.
Fei, T.L.K. and Rainey, H.G. 2003. Total Quality Management in Malaysian
Government Agencies Conditions for Successful Implementation of Organisational Change. International Public Management Journal, 6(2), pp. 145-172.
Finch, E. 2002. Automated information capture in performance measurement,
Journal of Facilities Management, 1(2), pp. 188-95. Fitzgerald, L., Johnson, R., Brignall, S., Silvestro, R. and Voss, C. 1991.
Performance Measurement in Service Businesses. London: CIMA. Fitzgerald, L. and Moon, P. 1996. Performance Measurement in the Service
Industries: Making it Work. London: CIMA. Flapper, S., Fortuin, L. and Stoop, P. 1996. Towards consistent performance
management systems. International Journal of Operations & Production Management, 16(7), pp. 27-37.
Fong, P.S.W. and Dettwiler, P. 2009. Entrepreneurial firms and their knowledge
creation: a study of real estate management. Facilities, 27(7/8), pp. 267-276. Fortuin, L. 1988. Performance indicators – why, where and how? European Journal
of Operational Research, 34(1), pp. 1-9. Fowler, F.J. 2002. Survey Research Methods: Applied Social Research Methods
Series. 3rd ed. California: Sage Publications. Fry, T.D. 1995. Japanese manufacturing performance criteria. International Journal
of Production Research, 33(4), pp. 933-954. Ghalayini, A.M., Noble, J.S. and Crowe, T.C. 1997. An integrated dynamic
performance measurement system for improving manufacturing competitiveness. International Journal of Production Economics, 48(3), pp. 207-225.
Gibbs, G. 2007. Analyzing qualitative data- Book 6 of The Sage Qualitative
Research Kit. London: Sage Publications. Globerson, S. 1985. Performance criteria and incentive system. International
Journal of Production Research, 23(4), pp. 639-46.
Golden, B.R. 1992. Is the past the past - or is it? The use of retrospective account as indicators of past strategies. Academy of Management Journal, 35(4), pp. 848-860.
Goyal, S. and Pitt, M. 2006. Determining the role of innovation management in
facilities management.In: School of Built Environment (SOBE) Postgraduate Conference. Liverpool John Moores University, Liverpool.
!!
243!
!
Goyal, S. 2007. Determining the role of innovation management and measurement in strategic facilities management: ensuring optimisation and continuity. PhD. Liverpool John Moores University.
Greatbanks, R. and Boaden, R. 1998. Can SMMEs afford to measure performance?
Performance Measurement-Theory and practice. In: Conference Proceedings, Vol.1, Cambridge, UK: Cambridge University, pp 117-124.
Gregory, M. 1993. Integrated performance measurement: a review of current practice and emerging trends. International Journal of Production Economics, 30(31), pp.281-296.
Grimshaw, B. 1999. Facilities management: the wider implications of managing
change. Facilities, 17(1/2), pp. 24-30. Grossman, E. 1993. How to measure company productivity: Handbook for
Productivity Measurement and Improvement. Cambridge, MA: Productivity Press.
Guba, E. G. 1990. The paradigm dialog. Beverly Hills, CA: Sage Publications. Guba, E. G. and Lincoln, Y. S. 1994. Competing paradigms in qualitative research.
In N. K. Denzin & Y. S. Lincoln (Eds.). Handbook of qualitative research. London: Sage Publications, pp. 105-117.
Guest, D.E., Michie, J., Conway, N. and Sheehan, M. 2003. Human resource
management and corporate performance in the UK. British Journal of Industrial Relations. 41(2), pp. 291-314.
Gumbus, A. and Lyons, B. 2002. The balanced scorecard at Phillips Electronics.
Strategic Finance, 84(5), pp.45-49. Gumbus, A. 2005. Introducing the Balance Scorecard: Creating Metrics to Measure
Performance. Journal of Management Education, 29(4), pp. 617-630 Gunasekaran, A., Patel, C. and Tirtiroglu, E. 2001. Performance measures and
metrics in a supply chain environment. International Journal of Operations & Production Management, 21(1/2), pp. 71-87.
Haas, d. H., Hansen, A.P. 2010. Facilities Management In A Service Supply Chain
Perspective. In: Arlbjørn, J.S. (Ed.) Logistics and Supply Chain Management in a Globalised Economy. Proceedings of the 22nd Annual NOFOMA Conference, University of Southern Denmark, 10-11 June 2010.
Hall, R.W. 1983) Zero Inventories. Dow-Jones Irwin, Homewood, IL: Dow-Jones
Irwin. Hall, R.W., Johnson, H.T. and Turney, P.B.B. 1991. Measuring Up - Charting
Pathways to Excellence. Homewood, IL: Business One Irwin. Hallam, S. 2000. In: Kamaruzzaman, S.N and Zawawi, E.M.A. 2010. Development
of facilities management in Malaysia. Journal of Facilities Management, 8(1), pp.75-81
Haapasalo, H., Ingalsuo, K. and Lenkkeri, T. 2006. Linking strategy into operational
management. Benchmarking: An International Journal, 13(6), pp. 701-717.
!!
244!
!
Hamid, A. 2007. Clinical Engineering in Malaysia - A Case Study. In: IFMBE Proceedings MEDICON 2007:11th Mediterranean Conference on Medical and Biological Engineering and Computing. Ljubljana, 26-30 June 2007.
Hansson, J., Backlund, F., Lycke, L. 2003. Managing commitment: Increasing the
odds for successful implementation of TQM, TPM or RCM. International Journal of Quality & Reliability Management, 20(9), pp. 993-1008.
Harper, J. 1984. Measuring Business Performance. Institute of Manpower Studies:
Gower Publishing. Hassan, S. 2007. National asset and facility management development. In: National
Asset & Facilities Management (NAFAM) Convention. Kuala Lumpur, Malaysia, 13 August 2007.
Hatry, H.P. 1978. The status of productivity measurement in the public sector. Public
Administration Review, 38(1), pp. 28-33. Hill, T. 1995. Manufacturing Strategy: The Strategic Management of the
Manufacturing Function. 2nd ed. London: Open University, Macmillan. Hinks, J. and McNay, P.1999. The creation of a management-by-variance tool for
facilities management performance assessment. Facilities, 17(1/2), pp. 31-53. Ho, D.C.W., Chan, E.H.W., Wong, N.Y. and Chan, M-W. 2000. Significant metrics
for facilities management: benchmarking in the Asia-Pacific region. Facilities, Vol.18 no. 13/14, pp.545-556.
Hopwood, A.G. 1984. Accounting and human behaviour. Englewood Cliffs, NJ:
Prentice-Hall. House, C.H. and Price, R.L. 1991.The return map: tracking product teams. Harvard
Business Review, (January-February), pp. 92-100. Howe, K. 1988. Against the Quantitative-qualitative Incompatibility Thesis or
Dogmas die Hard. Educational Researcher, 17(8), pp.10-16. Hudson, M., Smart, A. and Bourne, M. 2001. Theory and practice in SME
performance measurement systems. International Journal of Operations & Production Management, 21(8), pp. 1096-1115.
Husin, J.M. 2007. Technology utilization in managing government assets and
facilties. In: National Asset & Facilities Management (NAFAM) Convention. Kuala Lumpur, Malaysia, 13 August 2007.
Inamdar, S.N., Kaplan, R.S., Helfrich, J.M.L. and Menitoff, R. 2000. The balanced
scorecard: A strategic management system for multi-sector collaboration and strategy implementation. Quality Management in Health Care, 8(4), pp.21-39.
International Facility Management Association (IFMA). 2012. What is FM [online]. Available at: <http://www.ifma.org/what_is_fm/index.cfm>. [Accessed on 1 May 2012.]
Ismail, M. 2007. Developing a core competency-based career and development framework for facilities and asset managers. In: National Asset & Facilities Management (NAFAM) Convention. Kuala Lumpur, Malaysia, 13 August 2007.

!!
245!
!
Jackson, M. and Petersson, P. 1999. Productivity - an overall measure of competitiveness. In: 2nd Workshop on Intelligent Manufacturing Systems. Leuven, Belgium, 22-24 September 2009.
Jensen, P.A. 2008. The origin and constitution of facilities management as an
integrated corporate function. Facilities, 26(13/14), pp. 490-500. Jensen, P.A. 2010. The Facilities Management Value Map: a conceptual framework.
Facilities, 28(3/4), pp. 175-188. Jick, T.D. 1979. Mixing qualitative and quantitative methods: Triangulation in action.
Administrative Science Quarterly, 24(4), pp.602-611. Johnson, H.T. and Kaplan, R.S. 1987. Relevance Lost: The Rise and Fall of
Management Accounting. Boston Massachusetts: Harvard Business School. Johnson, B., and Onwuegbuzie, A. 2006. Mixed method research: A research
paradigm whose time has come. Educational Researcher, 33(7), pp. 14-26. Jones, S., Buerkle, M., Hall, A., Rupp, L. and Matt, G. 1993. Work group
performance measurement and feedback. Group and Organisation Management Journal, 18(3), pp. 269-91.
Jones, C.R. 1996. Customer satisfaction assessment for internal suppliers.
Managing Service Quality, 6(1), pp.45-48. Kadefors, A. 2008. Contracting in FM: collaboration, coordination and control.
Journal of Facilities Management, 6(3), pp. 178-188. Kagioglou, M., Cooper, R. and Aouad, G. 2001. Performance management in
construction: a conceptual framework. Construction Management & Economics, 19(1), 85- 95.
Kamaruzzaman, S.N and Zawawi, E.M.A. 2010. Development of facilities
management in Malaysia. Journal of Facilities Management, 8(1), pp.75-81. Kamaruzzaman, S.N., Myeda, N.E. and Pitt, M. 2013. Performance levels of high-
rise private office buildings maintenance management in Malaysia. Eksploatacja i Niezawodnosc – Maintenance and Reliability, 16(2), pp. 110-115.
Kaplan, R.S. 1983. Measuring manufacturing performance: a new challenge for
managerial accounting research. The Accounting Review, 18(4), pp. 686-705. Kaplan, R.S. 1984. The evolution of management accounting. The Accounting
Review, 59(3), pp. 390-418. Kaplan, R.S. and Norton, D.P. 1992. The Balanced Scorecard – Measures that drive
Performance. Harvard Business Review, 70(1), pp. 71-79. Kaplan, R. and Norton, D.P. 1993. Putting the balanced scorecard to work. Harvard
Business Review, (September-October), pp. 34-147.
!!
246!
!
Kaplan, R.S. and Norton, D.P. 2001. Transforming The Balanced Scorecard From Performance Measurement To Strategic Management: Part I, Accounting Horizons, Vol. 15 No. 1.
Kaplan, R.S. and Norton, D.P. 2001. A CFO Interview: On Balance. CFO, (Feb), pp.
73-78. Kaya, S., Heywood, C.A, Arge, K., Brawn, G. and Alexander, K. 2004. Raising
facilities management’s profile in organisations: developing a world-class framework. Journal of Facilities Management. 3(1), pp. 65-82.
Keegan, D.P., Eiler, R.G. and Jones, C.R. 1989. Are your performance measures
obsolete? Management Accounting, 70(12), pp. 45-50. Kennerley, M. and Neely, A. 2002. A framework of the factors affecting the evolution
of Performance measurement systems. International Journal of Operations and Production Management, 22(11), pp.1222-1245.
Kennerley, M. and Neely, A. 2003. Measuring Performance in A Changing Business
Environment. International Journal of Operation & Production Management, 23(2), pp. 213-229.
Kincaid, D. 1994. Measuring performance in facilities management. Facilities, 12(6),
pp.17-20. Kouzmin, A., Loffler, E., Klages, H. and Korac-Kakabadse, N. 1999. Benchmarking
and performance measurement in public sectors. International Journal of Public Sector Management, 12(2), pp. 121-144.
Kvale, S. 2007. Doing interviews. London: Sage Publications Ladrum, N.E., Howell, J.P. and Pari, L. 2000. Leadership for strategic change.
Leadership and Organisation Development Journal, 21(3), pp.150- 156. Laitinen, E.K. 1996. Framework for Small Business Performance Measurement –
Towards Integrated PM Systems, Proceedings of the University of Vaasa. University of Vaasa, Vaasa, Finland, Research Series 210, 82 p.
Larsen, J.L., Elle, M., Hoffmann, B, and Munthe-Kaas, P. 2011. Urbanising facilities
management: the challenges in a creative age. Facilities, 29(1/2), pp. 80-92. Lavy, S., Garcia, J.A. and Dixit, M.K. 2010. Establishment of KPIs for facility
performance measurement: review of literature. Facilities, 28(9/10), pp. 440-464.
Lea, R. and Parker, B. 1989. The JIT spiral of continuous improvement. IMDS, 4,
pp. 10-13. Leech, N.L. and Onwuegbuzie, A.J. 2009. A Typology of Mixed Methods Research
Designs. Quality and Quantitative, 43(2), pp. 265-275. Lehtonen, T. 2006. Collaborative relationships in facility services. Leadership &
Organization, 27(6), pp.449-464.
!!
247!
!
Lemanski, T. and Overton, T. 2011, [online], An introduction to qualitative research. The Higher Education Academy- UK Physical Sciences Centre,”. Available at: <http://www.heacademy.ac.uk/assets/ps/documents/primers/primers/qualitative_research.pdf>. [Accessed on 01 May 2013].
Lewy, C. P., and A. F. Mée. 1998. Balanced Scorecard: Implementing the Ten Commandments." KPMG Consulting, Londres.
Lincoln, Y. S., and Guba, E., G. 2000. Paradigmatic controversies, contradictions
and emerging confluences. In: N. K. Denzin & Y. S. Lincoln. (Eds.) Handbook of Qualitative Research. 2nd ed. Thousand Oaks, CA: Sage Publications, Inc, pp. 163-188.
Lingle, J. H. and Schiemann, W. A. 1996. From balanced scorecard to strategy
gauge. Is measurement worth it? Management Review, 85(3), pp. 56-62. Liyanage, C. and Egbu, C. 2008. A performance management framework for
healthcare facilities management. Journal of Facilities Management, 6(1), pp. 23-36.
Loosemore, M. and Hsin, Y.Y. 2001. Customer focused benchmarking for facilities
management. Facilities, 19(13/14), pp. 464-475. Lorch, R. 2000. Improving the communication of academic research to the
construction industry. Construction research and innovation strategy panel CRISP. Available at: <http://ncrisp.steel-sci.org/Publications/9916frLo.pdf, [Accessed on: 18 May 2011.]
Lunn, S.D and Stephenson, P. 2000. The impact of tactical and strategic FM
automation. Facilities, 18(7/8), pp.20-31. Luu, T.V., Kim, S.Y., Cao, H.L. and Park, Y.M. 2008. Performance measurement of
construction firms in developing countries. Construction Management and economics, 26(4), pp. 373-386.
Lynch, C. 1991. Measure Up! – Yardsticks for Continuous Improvement. Oxford:
Wiley. Lynch, R.L. and Cross K.F. 1991. Measure Up - the Essential Guide to Measuring
Business Performance. London: Mandarin. Mahmud, Z. 2008. Handbook of Research Methodology: A Simplified Version. Shah
Alam: University Publication Centre (UPENA). Malaysian Association of Facilities Management. 2012. MAFAM [online]. Available
at: <http://www.mafm.org.my/index.php?option=com_content&task=view&id=15&Itemid=27> [Accessed on 18 July 2012.]
Marshall, C. and Rossman, G.B. 1995. Designing Qualitative Research. Thousand
Oaks, CA: Sage Publications. Martinez, V. 2005. Performance measurement systems: mix effects, [online].
Available at: <http://euram2005.wi.tum.de> [Accessed on 18 May 2011.]
!!
248!
!
Maskell, B. 1989. Performance measures for world-class manufacturing. Management Accounting, May, pp. 32-33.
Maskell, B. 1991. Performance Measurement for World Class Manufacturing: A
Model for American Companies. Cambridge, MA: Productivity Press. Massheder, K. and Finch, E. 1998. Benchmarking metrics used in UK facilities
management. Facilities, 16(5/6), pp. 123-127. McDougall, G. and Hinks, J. 2000). Identifying priority issues in facilities
management benchmarking. Facilities, 18(10/11/12), pp. 427-434. McLennan, P. 2000. Intellectual capital: future competitive advantage for facility
management. Facilities, 18(3/4), pp.168-71. McLennan, P. 2004. Service Operations Management As A Conceptual Framework
for Facility Management. Facilities, 22(13/14), pp. 344-348. McMann, P. and Nanni, A.J. 1994. Is your company really measuring performance?
Management Accounting, 76(5), pp. 55-58. Medori, D. and Steeple, D. 2000). A framework for auditing and enhancing
performance measurement systems. International Journal of Operations & Production Management, 20(5), pp. 520-533.
Meekings, A. 1995. Unlocking the potential of performance measurement: a
practical implementation guide. Public Money and Management, 15(4), pp. 5-12.
Meier, K.J. and Brudney, J.L. 2002. Applied statistics for public administration.
Orlando: Haincourt College. Meier, K.J. and O’Toole, L.J. 2003. Public management and educational
performance: the impact of managerial networking. Public Administration Review, Vol. 63(6), pp. 689-699.
Meng, X., and Minogue, M. 2011. Performance measurement models in facility
management: a comparative study. Facilities, 29(11/12), pp. 472-484 Merriam, S. B. 1988. Case study research in education: A qualitative approach. San
Francisco, CA: Jossey-Bass. Mertens, D.M. 1998. Research methods in education and psychology: Integrating
diversity with quantitative and qualitative approaches. Thousand Oaks, CA: Sage Publications.
Mertens, D.M. 2003. Mixed methods and the politics of human research: The
transformative-emancipatory perspective. In A. Tashakkori & C. Teddlie. (Eds.) Handbook of mixed methods in social and behavioral research. Thousand Oaks, CA: Sage Publications, pp. 135-164.
Mertens, D.M. 2011. Mixed Methods as Tools for Social Change. Journal of Mixed
Methods Research, 5(3), pp. 195-197. Meyer, C. 1994. How the right measures help teams excel. Harvard Business
Review, 72(3), pp. 95-103.
!!
249!
!
Miles, M.B. & Huberman, A.M. 1994. Qualitative Data Analysis. 2nd ed. Thousand
Oaks, CA: Sage Publications. Miller D.C. 1991. Handbook of research design and social measurement. 5th ed.
Newbury Park, CA: Sage Publications. Miller, W.L. and Crabtree, B.F. 1994. Clinical Research. In: Denzin, N.K. and
Lincoln, Y.S. (Eds.) Handbook of Qualitative Research. Thousand Oaks, CA: Sage Publications, pp. 340-35.
Mills, J., Platts, K. and Gregory, M. 1995. A framework for the design of
manufacturing strategy processes. International Journal of Operations & Production Management, 15(4), pp. 17-49.
Miro-Bedos, J. and Girbal-Puig, A. 1991. Management of an intelligent building: the
facilities manager and the building director. Facilities, 9(4), pp.13-18. Mohd-Noor, M.N. and Pitt, M. 2009a. A Critical Review on Innovation in Facilities
Management Service Delivery. Facilities, 27(5/6), pp. 211-228. Mohd-Noor, M.N. and Pitt, M. 2009b. The Application of Supply Chain Management
and Collaborative Innovation In The Delivery of Facilities Management. Journal of Facilities Management, 7(4), pp. 283-297.
Mohd-Tobi, S. U., Amaratunga, D. and Mohd-Noor, M.N. 2013. Social enterprise
applications in an urban facilities management setting. Facilities, 31(5/6), pp. 238-254.
Moore, M. and Finch, E. 2004. Facilities Management in South East Asia. Facilities,
22(9/10), pp.259-270. Morgan, D.L. 2007. Paradigms Lost and Pragmatism Regained. Journal of Mixed
Method Research, 1(1), pp. 48-76 Morse, J. 1991. On the evaluation of qualitative proposals. Qualitative Health
Research, 1(2), pp. 147-151. Moss, Q. Z., Alho, J. and Alexander, K. 2007. Performance measurement action
research. Journal of Facilities Management, 5(4), pp. 290-300. Murthy, D.N.P., Atrens, A. and Eccleston, J.A. 2002. Strategic maintenance
management. Journal of Quality in Maintenance Engineering, 8(4), pp. 287-305.
Mustaffa, S.A.H., Adnan, H. and Jusoff, K. 2008. Facilities management challenges
and opportunity in the Malaysian property sector. Journal of Sustainable Development, 1(2), pp.79-85.
Myeda, N.E., Kamaruzzaman, S.N., Samad, Z. A. and Zawawi, E.M.A. 2009.
Establishing the Key Factors in Measuring Maintenance Management Performance. In: 1st Regional Symposium on Sustainable Construction Material & Building Systems (SUCOMBS), Kuala Lumpur. Malaysia, 12 October 2009.
!!
250!
!
Myeda, N.E., Kamaruzzaman, S.N. and Pitt, M. 2011a. Measuring the performance of office buildings maintenance management in Malaysia. Journal of Facilities Management, 9(3), pp.181 – 199.
Myeda, N.E.., Kamaruzzaman, S.N. and Pitt, M. 2011b. Assessing The Maintenance
Aspect of Facilities Management through A Performance Measurement System: A Malaysian Case Study. Elsevier Procedia Engineering: 2nd International Building Control Conference, Vol. 20, pp. 329-338.
Myeda, N.E. 2012. The sphere of performance measurement in strategic facilities
management. Journal of Facilities Management, 10(3). Myeda, N.E. and Pitt, M. 2012. Understanding the performance measurement
system for facilities management industry in Malaysia. In: Performance Manegement (PMA) 2012 Conference: From Strategy to Delivery. Cambridge, 11-13 July 2012.
Myeda, N.E. and Pitt, M. 2012. Facilities Management in Malaysia: Understanding
the Development and Practice. Facilities (forthcoming). Nani, A.J., Dixon, J.R. and Vollmann, T.E. 1990. Strategic control and performance
measurement. Journal of Cost Management, 4(2) pp. 33-42. Neely, A., Gregory, M. and Platts, K. 1995. Performance measurement system
design: a literature review and research agenda. International Journal of Operations & Production Management, 15(4), pp.80-116.
Neely, A., Mills, J., Gregory, M., Richards, H., Platts, K. and Bourne, M. 1996.
Getting the Measure of Your Business. Works Management, Cambridge. Neely, A., Richards, H., Mills, J., Platts, K. and Bourne, M. 1997. Designing
performance measures: a structured approach. International Journal of Operations & Production Management, 17(11), pp.1131 – 1152.
Neely, A. 1999. The performance measurement revolution: why now and what
next?. International Journal of Operations & Production Management, 19(2), pp. 205-228.
Neely, A. 2002. Business Performance Management Theory and Practice.
Cambridge, UK: Cambridge University Press, Neely, A., Mills, J., Platts, K., Richards, H., Gregory, M., Bourne, M. and Kennerly,
M. 2000. Performance measurement system design: developing and testing a process-based approach. International Journal of Operations & Production Management, 20(10), pp. 1119-1145.
Neely, A., Adams, C. and Kenerley, M. 2002. The performance prism: the scorecard
for measuring and managing business success. London: Financial Times- Prentice Hall.
Neely, A., Marr, B., Roos, G., Pike, S., & Gupta, O. 2003. Towards the third generation of performance measurement. Controlling, 15(3/4), pp.129-135.
Neuman, W.L. 2000. Social Research Methods: Qualitative and quantitative
approaches. 4th ed. Boston: Allyn & Bacon.
!!
251!
!
Newman, I. and Benz, C.R. 1998. Qualitative-quantitative research methodology: Exploring the interactive continuum. Carbondale: Southern Illinois University Press.
Nieto, M. and Perez, W. 2000. The development of the theories from the analysis of
the organization: case studies by the patterns of behaviour. Management Decision, 38(10), pp.723-733.
Niven, P.R. 2002. Balanced Scorecard Step-By-Step. New York: Wiley. Nutt, B. 1999. Linking FM practice and research. Facilities, 17(1/2), pp.11-17. Nutt, B. 2000. Four competing futures for facility management. Facilities, 18(3/4),
pp. 124-132. Nutt, B. and McLennan, P. 2000. Facility Management Risks and Opportunities.
Oxford: Blackwell Science Ltd. Nutt, P.C., Backoff, R.W. and Hogan, M.F. 2000. Managing the paradoxes of
strategic change. Journal of Applied Management Studies, 9(1), 5-31. Oliver, L. and Palmer, E. 1998. An integrated model for infrastructural
implementation of performance measurement. In: Performance Measurement-Theory and Practice. (Vol.2) Cambridge: Cambridge University, pp 695-702.
Olve, N., Roy, J. and Wetter, M. 1999. Performance Drivers: A Practical Guide to
Using the Balanced Scorecard. Chichester: John Wiley & Sons. Onwuegbuzie, A.J. and Leech, N.L. 2005. On becoming a Pragmatic Researcher:
The Importance of combining quantitative and qualitative research methodologies. International Journal of Social Research Methodology: Theory and Practice, 8, pp. 375-387.
Pandey, S. K. and Moynihan, D. P. 2006. Bureaucratic Red Tape and
Organizational Performance: testing the Moderating Role of Culture and Political Support. In Boyne, G.A., Meier, K.J., O’Toole, L.J. Jr., and Walker, R.M. (Eds.). Public service performance: Perspectives on measurement and management. Cambridge, UK: Cambridge University Press, pp.130 -151
!Parasuraman, A. 2004. Assessing and improving service performance for maximum
impact: insights from a two-decade-long research journey. Performance Measurement & Metrics, 5(2), pp. 45-52.
Parida, A. and Kumar, U. 2006. Maintenance Performance Measurement (MPM):
Issues and Challenges. Journal of Quality in Maintenance, 12(3) pp.239-251. Parker, C. 2000. Performance Measurement. Work study, 49(2), pp.63-66. Pathirage C., Haigh, R., Amaratunga, D. and Baldry, D. 2008. Knowledge
management practices in facilities organisations: a case study. Journal of Facilities Management, 6(1), pp.5-22.
Patton, J. 1982. Practical evaluation. Beverly Hills, CA: Sage Publications.
!!
252!
!
Patton, M. Q. 1990. Qualitative Evaluation and Research Methods. 2nd ed. Newbury Park, CA: Sage Publications.
Piaw, C.Y. 2006. Asas Statistik Penyelidikan. Malaysia: McGraw Hill Companies Pillai, A.S., Joshi, A. and Rao, K.S. 2002. Performance measurement of R&D
projects in a multi-project, concurrent engineering environment. International Journal of Project Management, 20(2), pp. 165-177.
Pillay, M.S. 2002. Privatization of Hospital Support Services. Berlin: Springer. Pintelon, L. and Van Puyvelde, F. 1997. Maintenance performance reporting
systems: some experiences. Journal of Quality in Maintenance Engineering, 3(1), pp. 4 – 15.
Pitt, M. and Hinks, J. 2001. Barriers to the operations of the facilities management.
Facilities, 19 (7/8), pp. 304-347. Pitt, M. 2005. Trends in shopping centre waste management. Facilities, 23(11/12),
pp. 522-533. Pitt, M. and Tucker, M. 2008. Performance measurement in facilities management:
driving innovation? Property Management, 26(4), pp. 241-254. Platts, K. 1990. Manufacturing audit in the process of strategy formulation. PhD.
University of Cambridge. Platts, K. 1994. Characteristics of methodologies for manufacturing strategy
formulation. Computer Integrated Manufacturing Systems, 7(2), pp. 93-99. !Powers B.A. & Knapp T.R. 1990. A Dictionary of Nursing Theory and Research.
Newbury Park: Sage Publications. Price, I. 2002. Can FM evolve? If not, what future? Journal of Facilities
Management, 1(1), pp. 56-69. Price, I. 2003. Facilities management as an emerging discipline. In: Best, R.
Langston, C. and De Valence, G. (Eds.) Workplace Strategies and Facilities Managements. 1st ed. Burlington: Butterworth-Heinemann Publications, pp. 30-48.
Public Works Department Annual Report. 2000. [online], Malaysia, PWD. Available
at: <www.jkr.gov.my/jkr4/index.php?r=page/view&id=161>. [Accessed on 19 August 2010.]
Punniyamoorthy, M. and Murali, R. 2008. Balanced score for the balanced
scorecard: a benchmarking tool. Benchmarking: An International Journal, Vol. 15(4), pp. 420-443.
Reichardt, C.S. and Rallis, S.F. 1994. The Qualitative-Quantitative Debate: New
Perspectives. New Directions for Program Evaluation (No. 61). San Francisco: Jossey-Bas.
Roberts, P. 2004. FM: new urban and community alignments. Facilities, 22(13/14),
pp. 349-352.
!!
253!
!
Rocco, T. S., Bliss, L. A. Gallagher, S., and Pérez-Prado, A. 2003. Taking the Next Step: Mixed Methods Taking the Next Step: Mixed Methods Research in Organizational Systems Research in Organizational Systems. Information Technology, Learning, and Performance Journal, 21(1), pp.19-29.
Rose, K.H. 1995. A performance measurement model. Quality Progress, 28(2), pp.
63-66. Ross, S.A., Chambers, S. and Johnston, R. 1993. Corporate Finance. 3rd ed. Burr
Ridge, IL: Irwin. Rossman, G.B. and Wilson, B.L. 1985. Numbers and words: Combining qualitative
and quantitative methods in a single large scale evaluation. Evaluation Review, 9(5), pp. 627-643.
Rouse, P. and Putterill, M. 2003. An integral framework for performance
measurement. Management Decision, 41(8), pp. 791-805. Rummler, G.A. and Brache, A.P. 1995. Improving Performance: How to Manage the
White Space on the Organisation Chart. San Francisco: Jossey-Bass Publishers.
Ruslan, N. 2007. Campus facilities management experience. In: National Asset &
Facilities Management (NAFAM) Convention. Kuala Lumpur, Malaysia, 13 August 2007.
Saad, G. H., and Siha, S. 2000. Managing quality: critical links and a contingency
model. International Journal of Operations & Production Management, 20(10), pp. 1146-1164
Samad, S.A. 2007. Critical issues in managing government’s assets & facilities in
Malaysia. In: National Asset & Facilities Management (NAFAM) Convention. Kuala Lumpur, Malaysia, 13 August 2007.
Santos, A. 1999. in Amaratunga, D. and Baldry, D. 2003. A conceptual framework to
measure facilities management performance. Property Management, 21(2), pp.171-189.
Sarshar, M. and Pitt, M. 2009. Adding value to clients: learning from four case-
studies. Facilities, 27(9/10), pp.399-412. Schneiderman, M.A. 1998. Measurement, the Bridge Between the Hard and Soft
Sides. Journal of Strategic Performance Measurement, April/May, pp.14-21 Schmenner, R. and Vollmann, T. 1994. Performance measures: gaps, false alarms
and the usual suspects. International Journal of Operations & Production Management, 14(12), pp.58-69.
Schwandt, T. 1989. Solutions to the paradigm controversy: Coping with uncertainty.
Journal of Contemporary Ethnography, 17(4), pp. 379-407. Schwandt, T. 1994. Constructivist, interpretivist approaches to human inquiry. In: N.
K. Denzin, N.K. and Lincoln, Y. S. Lincoln (Eds.). Handbook of qualitative research. Thousand Oaks, CA: Sage Publications, pp. 118-137.
!!
254!
!
Scottish Government. 2005. Initial research report on the performance of Public Private Partnerships in Scotland. Scottish Government. Available at: <http://www.scotland.gov.uk/Publications/2005/05/05153704/37067>. [Accessed on 14 March 2011.]
Sharp, J.M., Irani, Z., Wyant, T. and Firth, N. 1997. TQM in maintenance to improve
manufacturing performance. In: Portlamd International Conference on Management of Engineering Technology (PICMET) Conference, Portland, OH, 27-31 July 1997.
Sieber, S. D. 1973. The integration of fieldwork and survey methods. American
Journal of Sociology, 78(6), pp.1335-1359. Sieber, J.E. 1998. Planning Ethically Responsible Research: A Guide for Students.
Science and Engineering Ethics, 4(1), pp.7-23. Sinclair, D. and Zairi, M. 1995. Effective process management through performance
measurement. Business Process Re-engineering and Management Journal, 19(1), pp.75-88.
Sinclair, D. and Zairi, M. 1996. Assessing the Effectiveness of Performance
Measurement Systems: A Case Study. Total Quality Management, 7(4), pp. 367-78.
Sink, S. and Tuttle, T. 1989. Planning and Measurement in your organisation of the
future. Norcross, GA: Industrial Engineering & Management Press. Slack, N., Chambers, S., Harland, C., Harrison, A. and Johnston, R. 1998.
Operations Management. London: Pitman Publishing. Slack N., Chambers, S. and Johnston, R. 2001. Operations Management. 3rd ed.
London: Pearson Education. Slater, S.F., Olson, E.M. and Reddy, V.K. 1997. Strategy based performance
measurement. Business Horizons, 40(4), pp. 37-44. Smith, S. 2003. Defining Facilities. In Best, R. Langston, C. and De Valence, G.
(Eds.) Workplace Strategies and Facilities Managements. 1st ed. Burlington: Butterworth-Heinemann Publications, pp. 11-27.
Smith, A. 1993. Reliability-Centered Maintenance. New York, NY: McGraw-Hill. Stake, R. 1995. The art of case research. Thousand Oaks, CA: Sage Publications. Strauss, A. and Corbin, J. 1990. Basics of Qualitative Research-Grounded Theory
Procedures and Techniques. Newbury Park, CA: Sage Publications. Suh, N. 1990. The Principles of Design, Oxford Series on Advanced Manufacturing.
New York, NY: Oxford University Press. Sumanth, D. 1994. Productivity Engineering and Management. Maidenhead:
McGraw-Hill. Synnestvedt, T. 2001. Debates over environmental information to stakeholders as a
policy instrument. Eco-Management and Auditing, 8(3), pp. 165-178.
!!
255!
!
Tangen, S. 2002. A theoretical foundation for productivity measurement and improvement of automatic assembly systems. Licentiate thesis, The Royal Institute of Technology, Stockholm.
Tangen, S. 2003. An Overview of Frequently used Performance Measures. Work
Study, 52(7), pp. 347-354. Tashakkori, A. and Teddlie, C. 1998. Mixed Methodology: Combining qualitative and
quantitative approaches. Thousand Oaks, CA: Sage Publications. Tashakkori, A. & Teddlie, C. 2003. Handbook of Mixed Methods in Social &.
Behavioral Research. Thousand Oaks, CA: Sage Publications. Tashakkori, A. and Teddlie, C. 2008. Introduction to Mixed Method and Mixed Model
Studies in the Social and Behavioural Sciences. Thousand Oaks, CA: Sage Publications.
Tay, L. and Ooi, J.T. 2001. Facilities management: a jack of all trades? Facilities,
19(10), pp. 357-362. Teddlie, C. and Tashakkori, A. 2009. Foundations of Mixed Method Research.
Thousand Oaks, CA: Sage Publications. Then, D.S.S. 1999. An integrated resource management view of facilities
management. Facilities, 17(12/13), pp.462-469. Thomson, T. 1990. The essence of facilities management. Facilities, 8(8), pp. 8-12. Tolman, A. and Parkkila T. 2009. FM Tools to ensure healthy performance based
buildings. Facilities, 27(11/12), pp. 469-479. Trader-Leigh, K. E. 2002. Case study: Identifying resistance in managing change. Journal of Organizational Change Management, 15(2), pp.138-155 Trinius, W. and Sjostrom, C. 2005. Service life planning and performance
requirements. Building Research & Information, 33(2), pp. 173-181. Tucker, M. and Smith, A. 2008. User perceptions in workplace productivity and
strategic FM delivery. Facilities, 26(5/6), pp. 196-212. Tucker, M. and Pitt, M. 2009a. Customer performance measurement in facilities
management: a strategic approach. International Journal of Productivity and Performance Management, 58(5/6), pp. 407-422.
Tucker, M. and Pitt, M. 2009b. National standards of customer satisfaction in
facilities management. Facilities, 27(13/14), pp. 497-514. Tucker, M. and Pitt, M. 2010. Improving service provision through better
management and measurement of customer satisfaction in facilities management. Journal of Corporate Real Estate, 12(4), pp. 220-233.
Valins, M.S. and Slater, D. 1996. Future Care: New Directions in Planning Health
and Care Environments. Oxford: Blackwell Science.
!!
256!
!
Varcoe, B.J. 1993. Facilities performance: achieving value-for-money through performance measurement and benchmarking. Property Management, 11(4), pp. 301 – 307.
Varcoe, B.J. 1996. Facilities performance measurement. Facilities, 14(10/11), pp.
46-51. Ventovuori, T., Lehtonen, T., Salonen, A. and Nenonen, S. 2007. A review and
classification of academic research in facilities management. Facilities, 25(5/6), pp.227-237.
Voss, G.B. and Voss, Z.G. 2000. Strategic orientation and firm performance in an
artistic environment. Journal of Marketing, 64(1), pp. 67-83. Wall, T.B., Michie, J., Patterson, M., Wood, S.J., Sheehan, M., Clegg, C.W. and
West, M. 2004. On the validity of subjective measures of company performance. Personnel Psychology, 57(1), pp. 95-118.
Webster, C. and Hung, L. 1994. Measuring Service Quality and Promoting
Decentring. The TQM Magazine, 6(5), pp. 50-55. Webster, E. 2007. Property Performance Measurement [online]. Available at
:<http://www.ogc.gov.uk/high_performing_property_property_performance_measurement.asp>. [Accessed on 10 Jan 2009.]
Wegelius-Lehtonen, T. 2001. Performance measurement in construction logistics,
International Journal of Production Economics, 69(1), pp. 107-116. Weimer, D.L. and Gormley, W.T. 1999. Organisational report cards. Cambridge,
MA: Harvard University Press. White, G. 1996. A survey and taxonomy of strategy-related performance measures
for manufacturing. International Journal of Operations & Production Management, 16(3), pp. 42-61.
Williams, B. 1993. What a performance! Property Management, 11(3), pp. 190-199. Wordsworth, P. 2001. Lee's building maintenance management. 4th ed. Oxford:
Blackwell Science Ltd. Yang, H., Yeung, J.F.Y., Chan, A.P.C., Chiang, Y.H. and Chan, D.W.M. 2010. A
critical review of performance measurement in construction. Journal of Facilities Management, 8(4), pp. 269-284.
Yin, R. K. 2003. Case study research, design and methods. 3rd ed. Newbury Park:
Sage Publications. Yiu C.Y. 2008. A conceptual link among facilities management, strategic
management and project management. Facilities, 26(13/114), pp. 501-511. Zahri, N.A.M. 2007. Utilisation of technologies in managing government’s assets
and facilities. In: National Asset & Facilities Management (NAFAM) Convention. Kuala Lumpur, Malaysia, 13 August 200
!!
257!
!
APPENDICES APPENDIX A: SAMPLE OF PILOT STUDY QUESTIONNAIRE SURVEY (PHASE 1)
APPENDIX B: SAMPLE OF CASE STUDIES DATA COLLECTION (PHASE 2)
APPENDIX C: SAMPLE OF INTERVIEWS QUESTIONS (PHASE 3)
APPENDIX D: SAMPLE OF SPSS ANALYSIS
APPENDIX E: SAMPLE OF NVIVO THEMATIC DIAGRAM ANALYSIS
APPENDIX F: PERFORMANCE MEASUREMENT FRAMEWORK (PERFM)
!!
258!
!
APPENDIX A:
SAMPLE OF PILOT STUDY QUESTIONNAIRE SURVEY (PHASE 1)
!!
259!
!
QUESTIONNAIRE SURVEY: PARITICIPANT INFORMATION SHEET
Project Title: Understanding Facilities Management (FM) Industry in Malaysia You are invited to join with UCL in taking part in this research study.
This research is being conducted as part of a PhD programme in Facilities Management (FM) at UCL.
This research aims to develop a Performance Measurement (PM) framework that FM companies and
other organisations can practically use in order to enhance their service delivery. The research is
specifically designed to provide an understanding of your role, opinions and experience in the FM
industry and also some information on your level of understanding of the FM and the implementation of
PM in the FM services provided by your company.
This research survey is considered as voluntary based. This questionnaire survey contains a set of questions
pertaining your involvement background in Facilities Management (FM) industry and also some
information on your level of understanding in FM, FM services provided also the elements of
Performance Measurement (PM) in the FM service delivery by your company. Therefore you will be asked
to answer all the questions accordingly. Then, your answers will be interpreted by using the statistical software in
this regard.
To complete this questionnaire survey, it will take approximately 20-25 minutes of your time. The duration for this
survey is about 2 months. Thus, you have a time to complete this survey at your convenience within the duration
stated.
There are no risks to you in taking part in the questionnaires. There are no risks involved with this research,
because all information received from you will be kept confidentially in a protect storage device. In addition, your
answers are of the general opinions and do not involve any of your organisation’s business confidentialities.
However, you will get the benefits from the summary of the recommendations from the findings that will
be provided on a request basis.
Thank you for your time and co-operation.
Contact Details of Researcher
If you wish to receive a summary of the research findings once the study is complete or if you require
any further information please contact the following:
Ms Nik Elyna Myeda Nik Mat
Email:
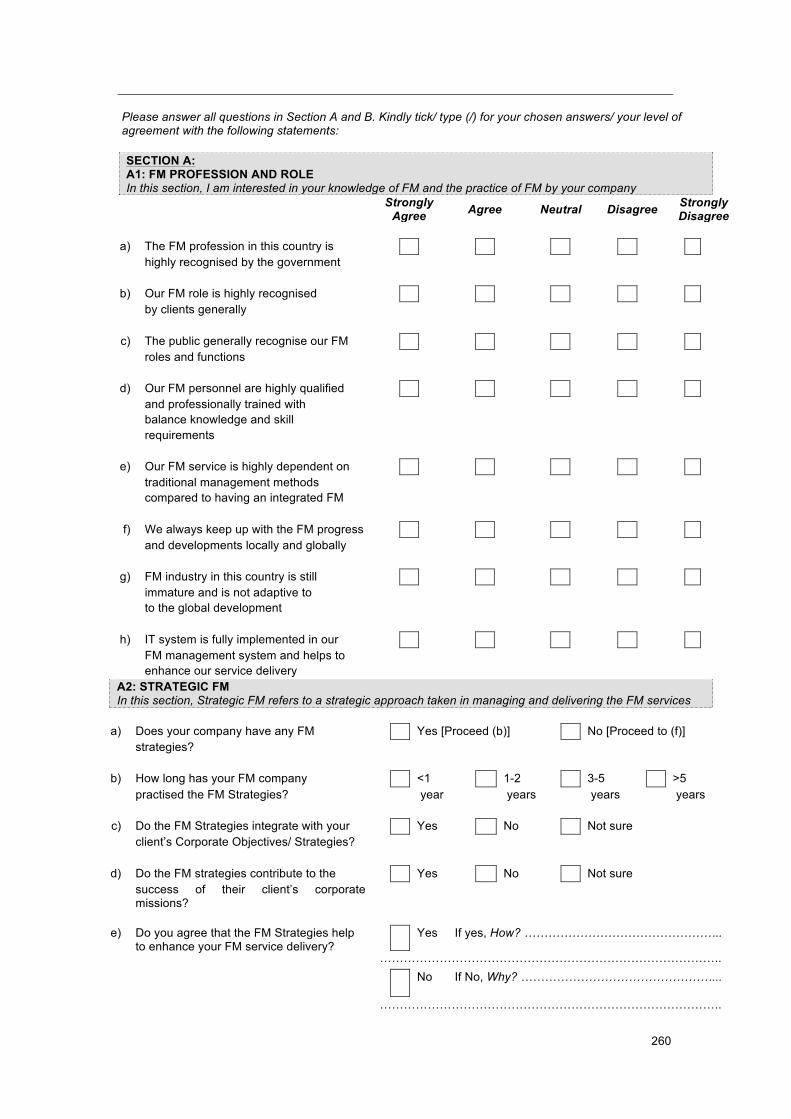
!!
260!
!
Please answer all questions in Section A and B. Kindly tick/ type (/) for your chosen answers/ your level of agreement with the following statements:
SECTION A: A1: FM PROFESSION AND ROLE In this section, I am interested in your knowledge of FM and the practice of FM by your company
Strongly Agree Agree Neutral Disagree Strongly
Disagree
a) The FM profession in this country is highly recognised by the government
b) Our FM role is highly recognised by clients generally
c) The public generally recognise our FM roles and functions
d) Our FM personnel are highly qualified and professionally trained with balance knowledge and skill requirements
e) Our FM service is highly dependent on traditional management methods compared to having an integrated FM
f) We always keep up with the FM progress and developments locally and globally
g) FM industry in this country is still immature and is not adaptive to to the global development
h) IT system is fully implemented in our FM management system and helps to enhance our service delivery
A2: STRATEGIC FM In this section, Strategic FM refers to a strategic approach taken in managing and delivering the FM services
a) Does your company have any FM Yes [Proceed (b)] No [Proceed to (f)]
strategies?
b) How long has your FM company <1 1-2 3-5 >5 practised the FM Strategies? year years years years
c) Do the FM Strategies integrate with your Yes No Not sure client’s Corporate Objectives/ Strategies?
d) Do the FM strategies contribute to the Yes No Not sure success of their client’s corporate
missions?
e) Do you agree that the FM Strategies help
to enhance your FM service delivery? Yes If yes, How? …………………………………………..
………………………………………………………………………….. No If No, Why? …………………………………………...
…………………………………………………………………………..
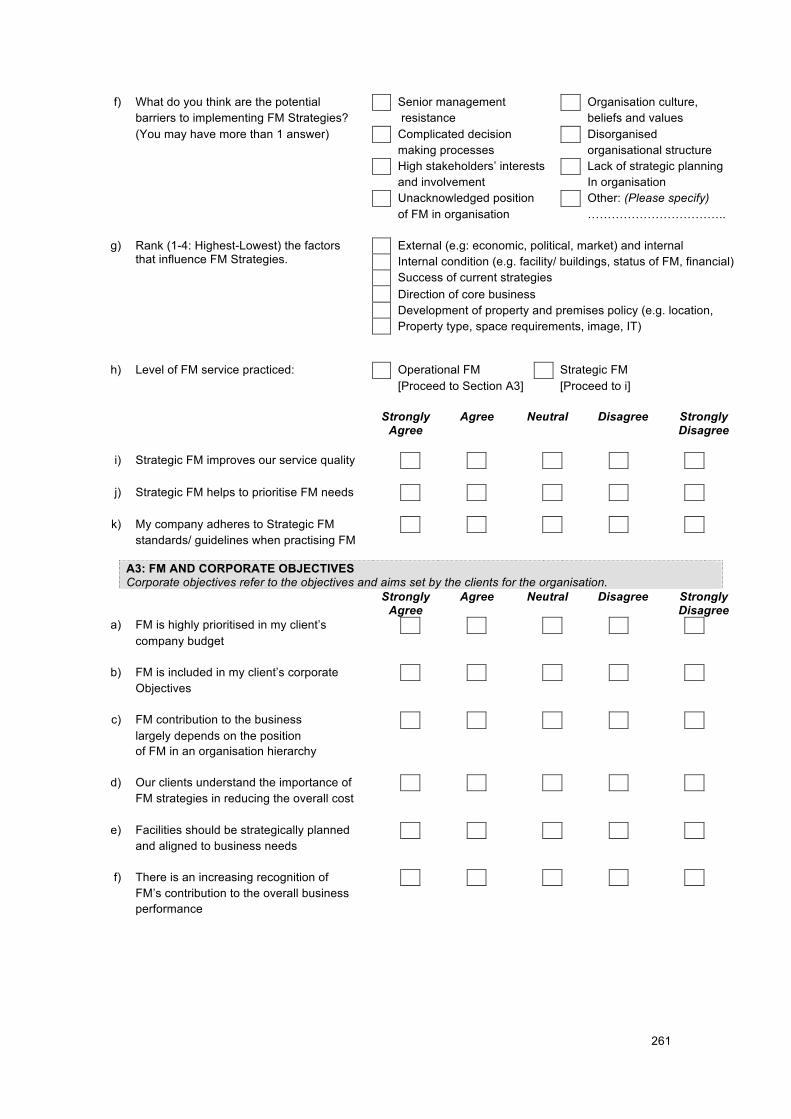
!!
261!
!
f) What do you think are the potential Senior management Organisation culture, barriers to implementing FM Strategies? resistance beliefs and values (You may have more than 1 answer) Complicated decision Disorganised making processes organisational structure High stakeholders’ interests Lack of strategic planning and involvement In organisation Unacknowledged position Other: (Please specify) of FM in organisation ……………………………..
g) Rank (1-4: Highest-Lowest) the factors that influence FM Strategies.
External (e.g: economic, political, market) and internal Internal condition (e.g. facility/ buildings, status of FM, financial) Success of current strategies Direction of core business Development of property and premises policy (e.g. location, Property type, space requirements, image, IT)
h) Level of FM service practiced: Operational FM Strategic FM
[Proceed to Section A3] [Proceed to i]
Strongly Agree
Agree Neutral Disagree Strongly Disagree
i) Strategic FM improves our service quality
j) Strategic FM helps to prioritise FM needs
k) My company adheres to Strategic FM
standards/ guidelines when practising FM
A3: FM AND CORPORATE OBJECTIVES Corporate objectives refer to the objectives and aims set by the clients for the organisation.
Strongly Agree
Agree Neutral Disagree Strongly Disagree
a) FM is highly prioritised in my client’s company budget
b) FM is included in my client’s corporate Objectives
c) FM contribution to the business largely depends on the position of FM in an organisation hierarchy
d) Our clients understand the importance of FM strategies in reducing the overall cost
e) Facilities should be strategically planned and aligned to business needs
f) There is an increasing recognition of FM’s contribution to the overall business performance
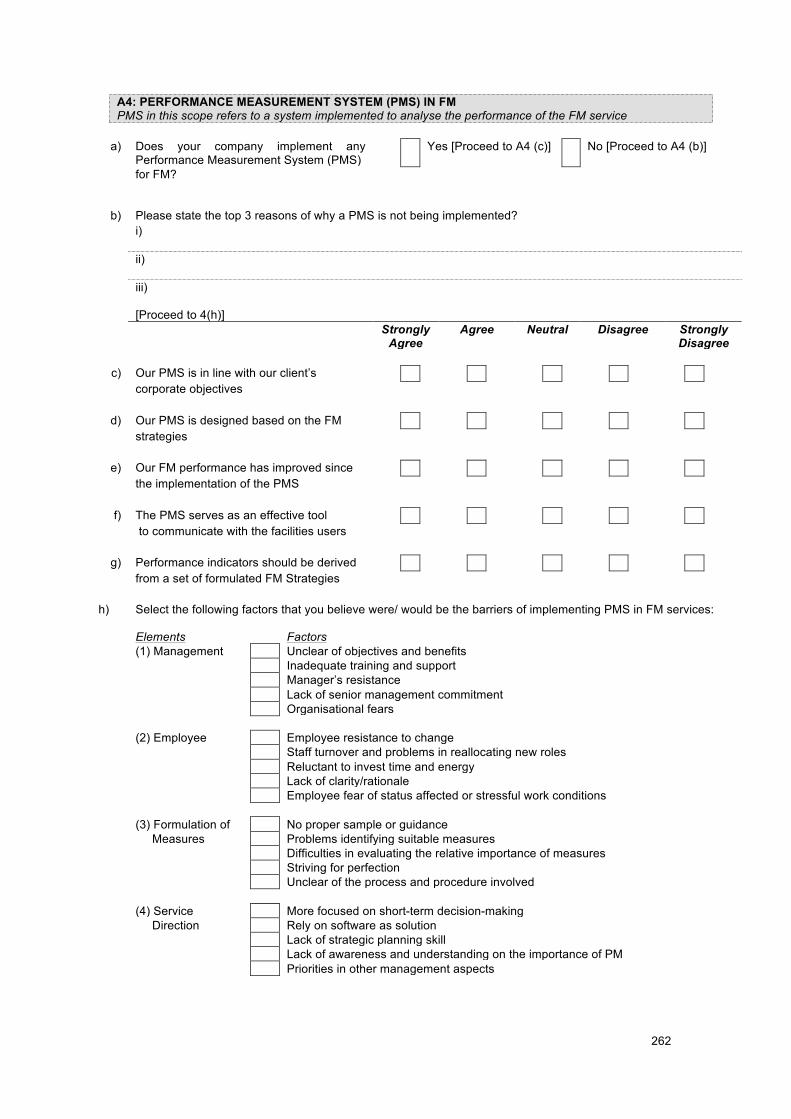
!!
262!
!
A4: PERFORMANCE MEASUREMENT SYSTEM (PMS) IN FM PMS in this scope refers to a system implemented to analyse the performance of the FM service
a) Does your company implement any
Performance Measurement System (PMS) Yes [Proceed to A4 (c)] No [Proceed to A4 (b)]
for FM?
b) Please state the top 3 reasons of why a PMS is not being implemented? i)
ii)
iii)
[Proceed to 4(h)]
Strongly Agree
Agree Neutral Disagree Strongly Disagree
c) Our PMS is in line with our client’s
corporate objectives
d) Our PMS is designed based on the FM strategies
e) Our FM performance has improved since the implementation of the PMS
f) The PMS serves as an effective tool to communicate with the facilities users
g) Performance indicators should be derived from a set of formulated FM Strategies
h) Select the following factors that you believe were/ would be the barriers of implementing PMS in FM services: Elements Factors (1) Management Unclear of objectives and benefits Inadequate training and support Manager’s resistance Lack of senior management commitment Organisational fears (2) Employee Employee resistance to change Staff turnover and problems in reallocating new roles Reluctant to invest time and energy Lack of clarity/rationale Employee fear of status affected or stressful work conditions (3) Formulation of No proper sample or guidance Measures Problems identifying suitable measures Difficulties in evaluating the relative importance of measures Striving for perfection Unclear of the process and procedure involved (4) Service More focused on short-term decision-making Direction Rely on software as solution Lack of strategic planning skill Lack of awareness and understanding on the importance of PM Priorities in other management aspects
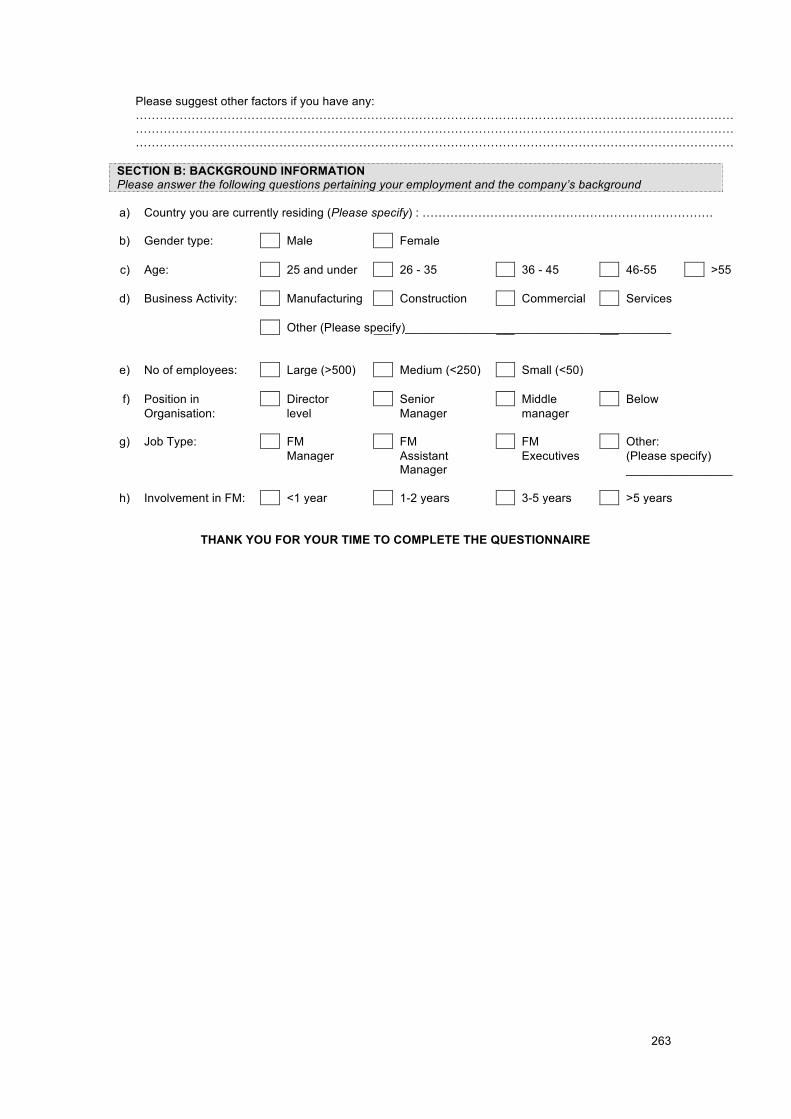
!!
263!
!
Please suggest other factors if you have any: ………………………………………………………………………………………………………………………………………………………………………………………………………………………………………………………………………………………………………………………………………………………………………………………………………………
SECTION B: BACKGROUND INFORMATION
Please answer the following questions pertaining your employment and the company’s background
a) Country you are currently residing (Please specify) : ……………………………………………………………….
b) Gender type: Male Female
c) Age: 25 and under 26 - 35 36 - 45 46-55 >55
d) Business Activity: Manufacturing Construction Commercial Services
Other (Please specify)________________________________________
e) No of employees: Large (>500) Medium (<250) Small (<50)
f) Position in Director Senior Middle Below Organisation: level Manager manager
g) Job Type: FM FM FM Other: Manager Assistant Executives (Please specify) Manager ________________
h) Involvement in FM: <1 year 1-2 years 3-5 years >5 years
THANK YOU FOR YOUR TIME TO COMPLETE THE QUESTIONNAIRE

!!
264!
!
APPENDIX B: SAMPLE OF CASE STUDIES DATA COLLECTION (PHASE 2)
!!
265!
!
CASE STUDIES DATA COLLECTION: PARTICIPANT INFORMATION SHEET Project Title: The Development Of A Performance Measurement Framework to enhance FM Service Delivery in Malaysia
Your company is invited to take part in the above mentioned research study. However, before you decide it is
important that you understand why the research is being undertaken and what it involves. Please take time to read
the following information. You are free to ask if there is anything unclear or if you would like more information.
Please consider whether your company would like to take part in this research.
This research is being conducted by me (Mrs Nik Elyna Myeda Nik Mat) as part of my dissertation for
the award of PhD in Facilities Management at University College London (UCL). This research aim is to
develop a Performance Measurement (PM) framework that FM companies in Malaysia can practically
use in order to enhance their existing service delivery. In order to achieve the aim, the objectives are:
• To understand the elements of effective PM both in theory and practice, looking at Malaysian
and UK case studies.
• To develop a PM framework to be used by Malaysian FM practitioners
• To evaluate the framework ability to enable FM practitioners in Malaysia to enhance their
existing FM service delivery
The methodology that will be adopted at this phase is case study method. This approach would require your co-
operation in providing information pertaining the background of the FM service provided, PM approach adopted,
performance indicators used to monitor the performance of FM service delivery to both in-house FM team or
service providers, formulation of performance indicators, monitoring method and also the quality assessment
approach adopted. The structure of the case study data required is attached.
This duration of the data collection would be 3-4 weeks and can be arranged at your convenient time. The methods of
data collection would include interview with FM manager, observation, access to documents pertaining the subject
area and also a follow-up towards the end of the data collection phase.
There are no risks to your company in taking part in this case study and it does not involve any of your
organisation’s business confidentialities. You may also request for a summary of the research study
involving your company data for clarification purposes.
Thank you for your time and co-operation.
Contact Details of Researcher
If you wish to receive a summary of the research findings once the study is complete or if you require
any further information please contact the following:
Ms Nik Elyna Myeda Nik Mat
Email:
!!
266!
!
STRUCTURE OF CASE STUDIES DATA COLLECTION ---------------------------------------------------------------------------
Section A
------------------------------------------------------------------------------------------------------------------------------------------
1. Background of the organisation
2. Procurement method
3. Position of FM in the corporate organisation
4. FM service scopes- management and operation service aspects
Section B
-----------------------------------------------------------------------------------------------------------------------------------------
1. PM approach
2. PMS system
3. Performance indicators used
4. Elements of PM indicators:
! Purposes
! Principles
! Formulation of measurement
! Implementation
! Performance target
! Performance formula
! Performance tolerance
5. Monitoring methods
6. Linked to organisation/ corporate objectives or mission
7. Quality assessment
8. Reporting method
The proposed methods to obtain the above data are by studying both FM and PM systems implemented
through the provision of documents, reports, archival records, interview and observation.
A follow-up is anticipated towards the completion of data collection.

!!
267!
!
APPENDIX C: SAMPLE OF INTERVIEW QUESTIONS (PHASE 3)
!!
268!
!
INTERVIEWS: PARTICIPANT INFORMATION SHEET Project Title: The Development Of A Performance Measurement Framework to enhance FM Service Delivery in Malaysia
You are invited to take part in the above mentioned research study. However, before you decide it is important that
you understand why the research is being undertaken and what it involves. Please take time to read the following
information. You are free to ask if there is anything unclear or if you would like more information. Please consider
whether your company would like to take part in this research.
As you were previously involved in the earlier phase of data collection and are familiar with this research study, I
would appreciate if you could give feedback to the proposed Performance Measurement Framework (PERFM). At
this level, the aim is to evaluate the PERFM’s ability to enable FM practitioners in Malaysia to enhance their existing
FM service delivery.The evaluation will be based on a few elements namely design of framework, functionality, and
implementation.
This duration of this interview would be around 50-60 minutes and can be arranged at your convenient time.
There are no risks to you in taking part in the interview. There are no risks involved with this research,
because all information received from you will be kept confidentially in a protect storage device. In addition, your
answers are of the general opinions and do not involve any of your organisation’s business confidentialities.
However, you will get the benefits from the summary of the recommendations from the findings that will
be provided on a request basis.
Thank you for your time and co-operation.
Contact Details of Researcher
If you wish to receive a summary of the research findings once the study is complete or if you require
any further information please contact the following:
Ms Nik Elyna Myeda Nik Mat
Bartlett School of Graduate Studies
University College London
1 – 19 Torrington Place
London WC1E 7HB
Email: [email protected]!
!!
269!
!
LEVEL 3 DATA COLLECTION
INTERVIEW QUESTIONS FOR FM MANAGERS
1. What do you think of the overall structure and layout of PERFM?
2. What do you think of the content elaboration of PERFM?
3. What do you think of the underlying principles and approach of PERFM? What
principles/approaches do you see?
4. What do you think of the scope of PERFM?
5. Can you suggest how do you perceive PERFM’s functionality by giving comments on the following
aspects:
(a) Flexibility
(b) Productivity
(c) Quality
(d) Delivery
(e) Cost Control
6. In terms of the implementation of PERFM, do you have any comment on the project management of
this framework?
7. Do you believe that there is a potential demand of PERFM in Malaysian FM industry?
8. Do you anticipate any potential challenges in implementing PERFM? Could you please suggest
them?
9. Do you have any suggestions or recommendations for PERFM?
10. Are there any other comment you would like to add?

!!
270!
!
APPENDIX D: SAMPLE OF SPSS ANALYSIS
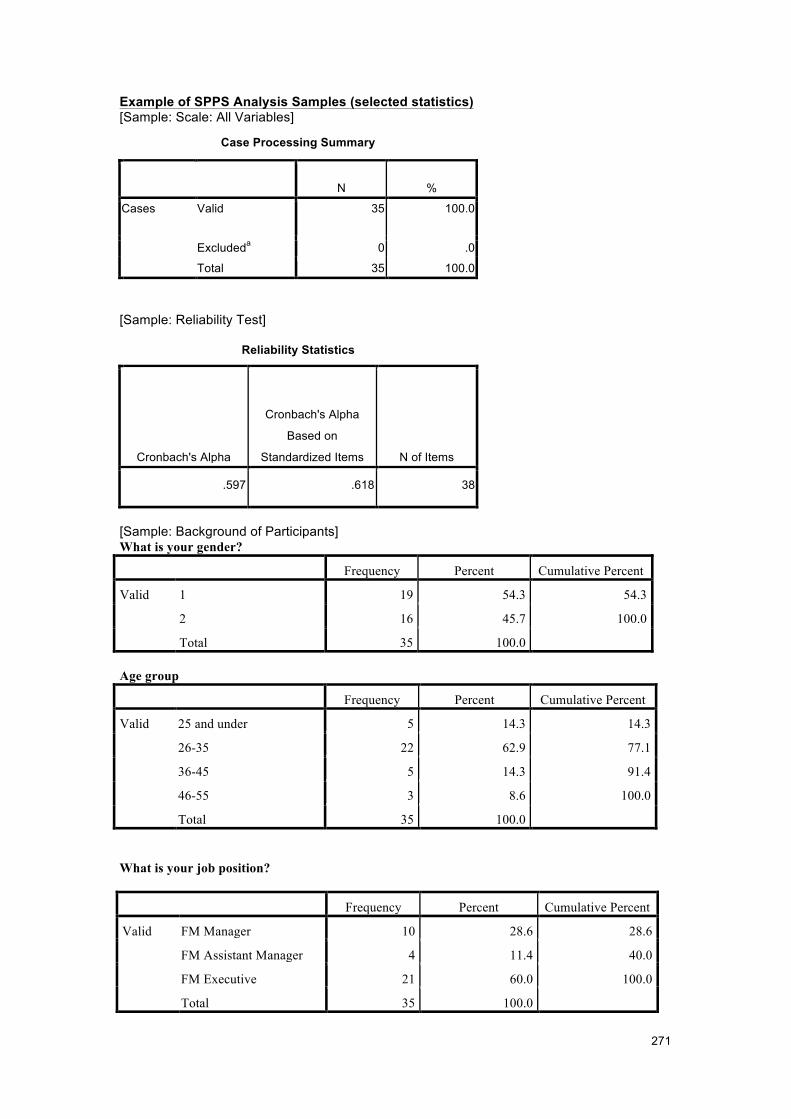
!!
271!
!
Example of SPPS Analysis Samples (selected statistics) [Sample: Scale: All Variables]
Case Processing Summary
N %
Cases Valid 35 100.0
Excludeda 0 .0
Total 35 100.0
[Sample: Reliability Test]
Reliability Statistics
Cronbach's Alpha
Cronbach's Alpha
Based on
Standardized Items N of Items
.597 .618 38
[Sample: Background of Participants] What is your gender?
Frequency Percent Cumulative Percent
Valid 1 19 54.3 54.3
2 16 45.7 100.0
Total 35 100.0
Age group
Frequency Percent Cumulative Percent
Valid 25 and under 5 14.3 14.3
26-35 22 62.9 77.1
36-45 5 14.3 91.4
46-55 3 8.6 100.0
Total 35 100.0
What is your job position?
Frequency Percent Cumulative Percent
Valid FM Manager 10 28.6 28.6
FM Assistant Manager 4 11.4 40.0
FM Executive 21 60.0 100.0
Total 35 100.0
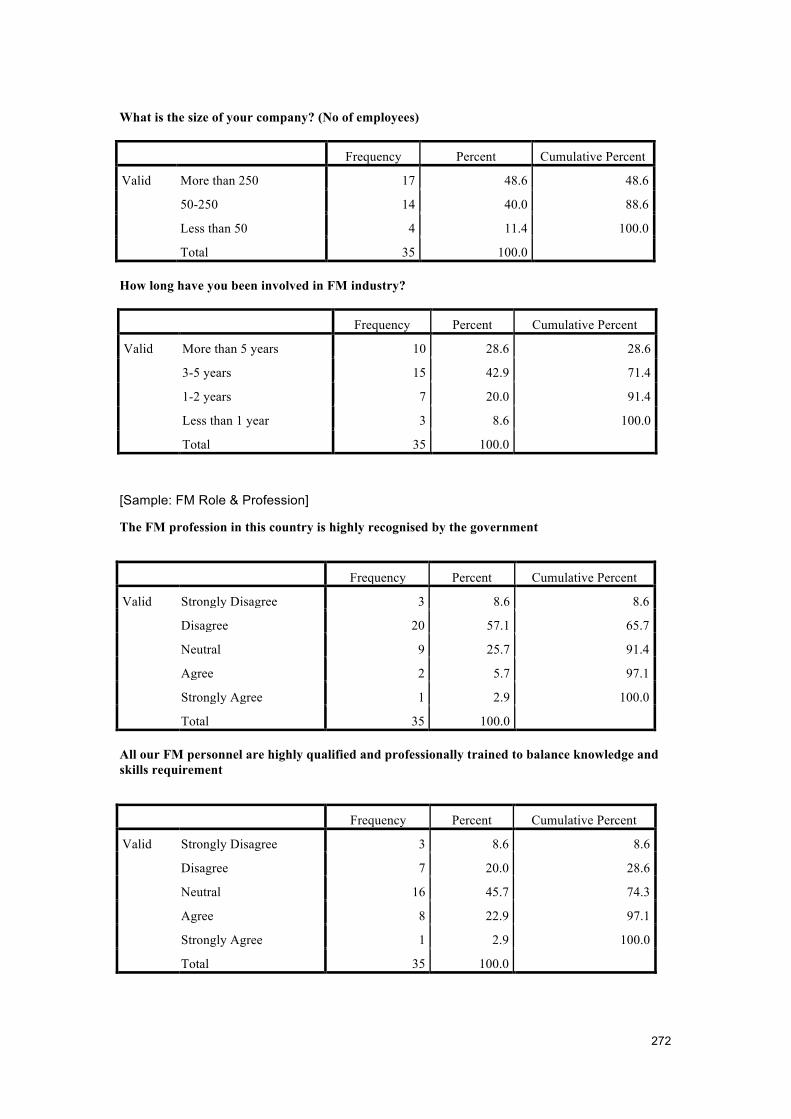
!!
272!
!
What is the size of your company? (No of employees)
Frequency Percent Cumulative Percent
Valid More than 250 17 48.6 48.6
50-250 14 40.0 88.6
Less than 50 4 11.4 100.0
Total 35 100.0
How long have you been involved in FM industry?
Frequency Percent Cumulative Percent
Valid More than 5 years 10 28.6 28.6
3-5 years 15 42.9 71.4
1-2 years 7 20.0 91.4
Less than 1 year 3 8.6 100.0
Total 35 100.0
[Sample: FM Role & Profession]
The FM profession in this country is highly recognised by the government
Frequency Percent Cumulative Percent
Valid Strongly Disagree 3 8.6 8.6
Disagree 20 57.1 65.7
Neutral 9 25.7 91.4
Agree 2 5.7 97.1
Strongly Agree 1 2.9 100.0
Total 35 100.0
All our FM personnel are highly qualified and professionally trained to balance knowledge and skills requirement
! Frequency Percent Cumulative Percent
Valid Strongly Disagree 3 8.6 8.6
Disagree 7 20.0 28.6
Neutral 16 45.7 74.3
Agree 8 22.9 97.1
Strongly Agree 1 2.9 100.0
Total 35 100.0
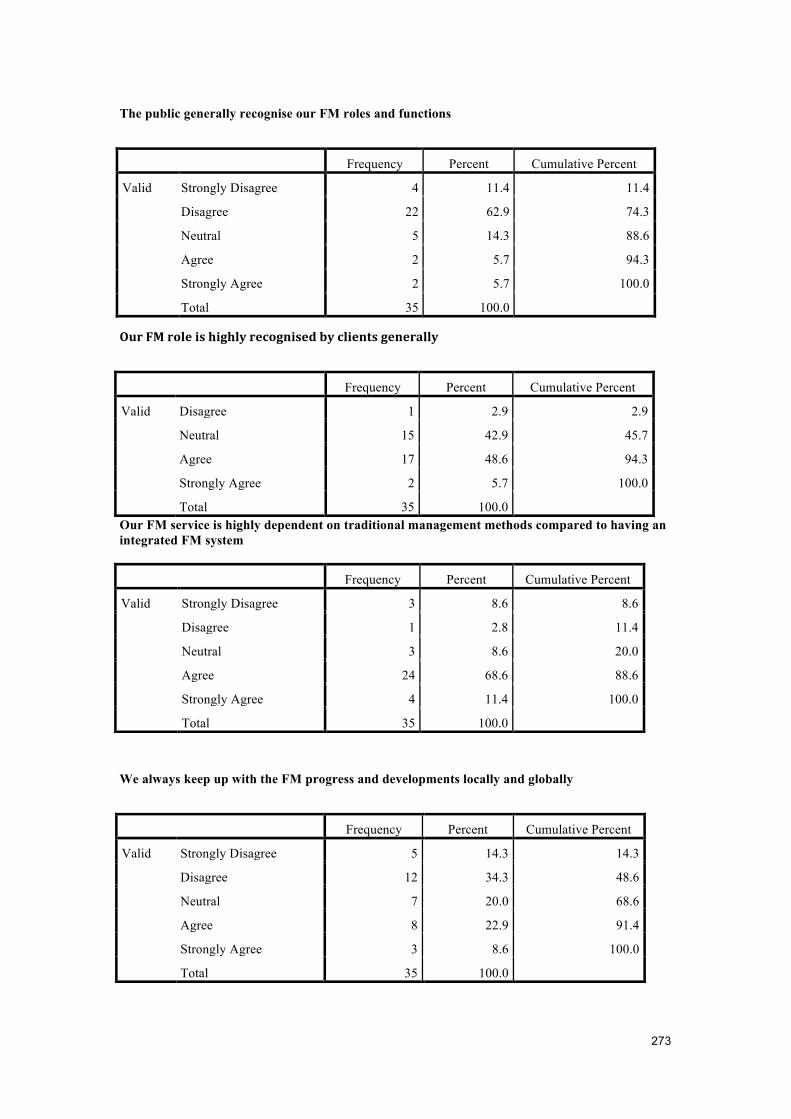
!!
273!
!
The public generally recognise our FM roles and functions
Frequency Percent Cumulative Percent
Valid Strongly Disagree 4 11.4 11.4
Disagree 22 62.9 74.3
Neutral 5 14.3 88.6
Agree 2 5.7 94.3
Strongly Agree 2 5.7 100.0
Total 35 100.0
Our$FM$role$is$highly$recognised$by$clients$generally$
! Frequency Percent Cumulative Percent
Valid Disagree 1 2.9 2.9
Neutral 15 42.9 45.7
Agree 17 48.6 94.3
Strongly Agree 2 5.7 100.0
Total 35 100.0
Our FM service is highly dependent on traditional management methods compared to having an integrated FM system
Frequency Percent Cumulative Percent
Valid Strongly Disagree 3 8.6 8.6
Disagree 1 2.8 11.4
Neutral 3 8.6 20.0
Agree 24 68.6 88.6
Strongly Agree 4 11.4 100.0
Total 35 100.0
We always keep up with the FM progress and developments locally and globally
Frequency Percent Cumulative Percent
Valid Strongly Disagree 5 14.3 14.3
Disagree 12 34.3 48.6
Neutral 7 20.0 68.6
Agree 8 22.9 91.4
Strongly Agree 3 8.6 100.0
Total 35 100.0
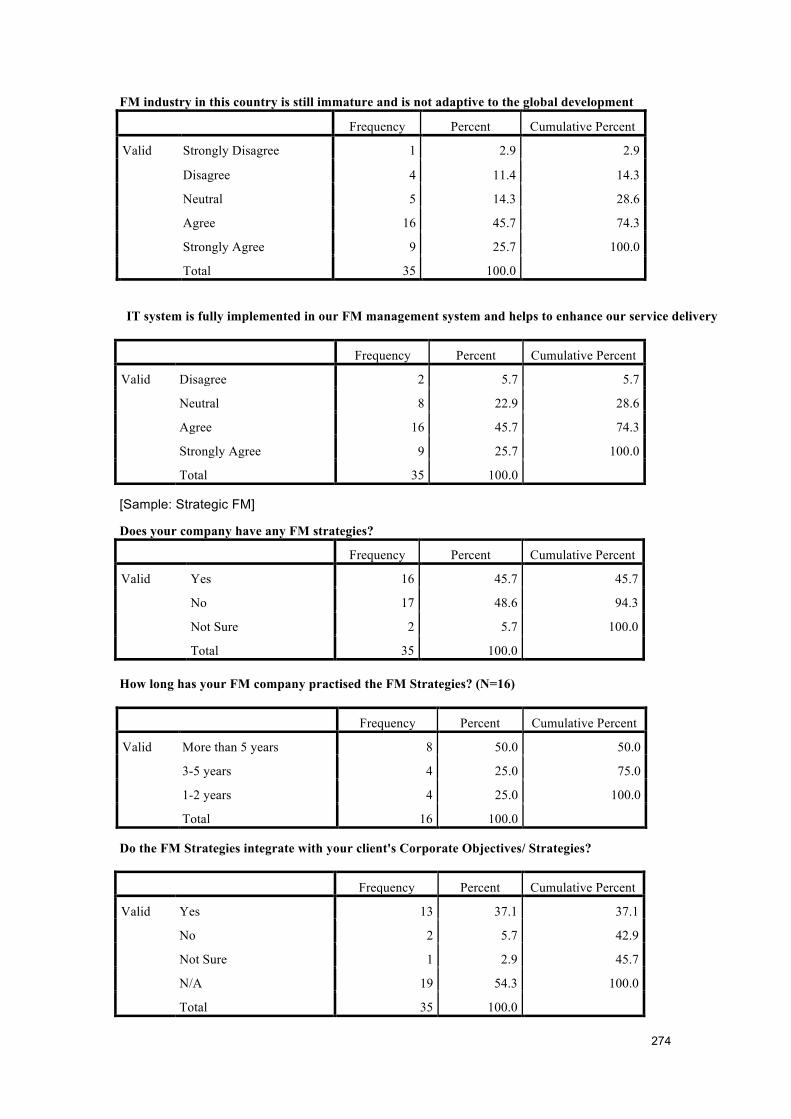
!!
274!
!
FM industry in this country is still immature and is not adaptive to the global development Frequency Percent Cumulative Percent
Valid Strongly Disagree 1 2.9 2.9
Disagree 4 11.4 14.3
Neutral 5 14.3 28.6
Agree 16 45.7 74.3
Strongly Agree 9 25.7 100.0
Total 35 100.0
IT system is fully implemented in our FM management system and helps to enhance our service delivery
Frequency Percent Cumulative Percent
Valid Disagree 2 5.7 5.7
Neutral 8 22.9 28.6
Agree 16 45.7 74.3
Strongly Agree 9 25.7 100.0
Total 35 100.0
[Sample: Strategic FM]
Does your company have any FM strategies? Frequency Percent Cumulative Percent
Valid Yes 16 45.7 45.7
No 17 48.6 94.3
Not Sure 2 5.7 100.0
Total 35 100.0
How long has your FM company practised the FM Strategies? (N=16)
Frequency Percent Cumulative Percent
Valid More than 5 years 8 50.0 50.0
3-5 years 4 25.0 75.0
1-2 years 4 25.0 100.0
Total 16 100.0
Do the FM Strategies integrate with your client's Corporate Objectives/ Strategies?
Frequency Percent Cumulative Percent
Valid Yes 13 37.1 37.1
No 2 5.7 42.9
Not Sure 1 2.9 45.7
N/A 19 54.3 100.0
Total 35 100.0
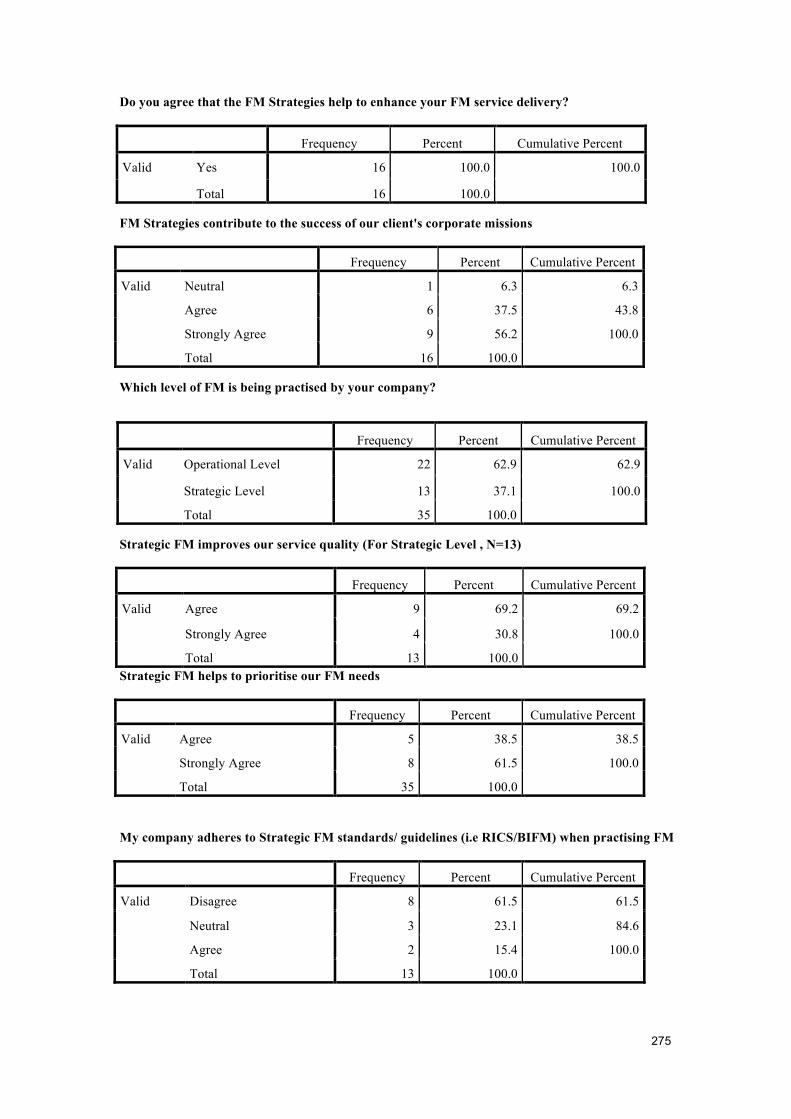
!!
275!
!
Do you agree that the FM Strategies help to enhance your FM service delivery?
Frequency Percent Cumulative Percent
Valid Yes 16 100.0 100.0
Total 16 100.0
FM Strategies contribute to the success of our client's corporate missions
Frequency Percent Cumulative Percent
Valid Neutral 1 6.3 6.3
Agree 6 37.5 43.8
Strongly Agree 9 56.2 100.0
Total 16 100.0
Which level of FM is being practised by your company?
Frequency Percent Cumulative Percent
Valid Operational Level 22 62.9 62.9
Strategic Level 13 37.1 100.0
Total 35 100.0
Strategic FM improves our service quality (For Strategic Level , N=13)
Frequency Percent Cumulative Percent
Valid Agree 9 69.2 69.2
Strongly Agree 4 30.8 100.0
Total 13 100.0 Strategic FM helps to prioritise our FM needs
Frequency Percent Cumulative Percent
Valid Agree 5 38.5 38.5
Strongly Agree 8 61.5 100.0
Total 35 100.0
My company adheres to Strategic FM standards/ guidelines (i.e RICS/BIFM) when practising FM
Frequency Percent Cumulative Percent
Valid Disagree 8 61.5 61.5
Neutral 3 23.1 84.6
Agree 2 15.4 100.0
Total 13 100.0
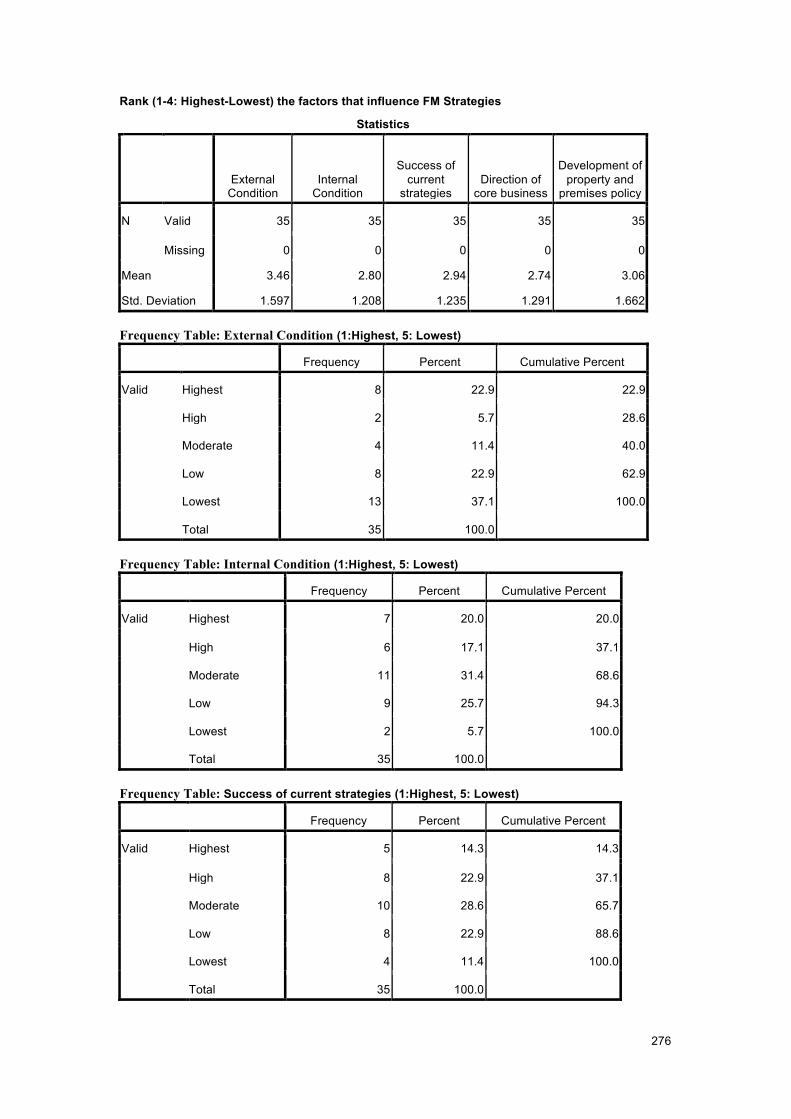
!!
276!
!
Rank (1-4: Highest-Lowest) the factors that influence FM Strategies
Statistics
External Condition
Internal Condition
Success of current
strategies Direction of
core business
Development of property and
premises policy
N Valid 35 35 35 35 35
Missing 0 0 0 0 0
Mean 3.46 2.80 2.94 2.74 3.06
Std. Deviation 1.597 1.208 1.235 1.291 1.662
Frequency Table: External Condition (1:Highest, 5: Lowest)
Frequency Percent Cumulative Percent
Valid Highest 8 22.9 22.9
High 2 5.7 28.6
Moderate 4 11.4 40.0
Low 8 22.9 62.9
Lowest 13 37.1 100.0
Total 35 100.0 Frequency Table: Internal Condition (1:Highest, 5: Lowest)
Frequency Percent Cumulative Percent
Valid Highest 7 20.0 20.0
High 6 17.1 37.1
Moderate 11 31.4 68.6
Low 9 25.7 94.3
Lowest 2 5.7 100.0
Total 35 100.0 Frequency Table: Success of current strategies (1:Highest, 5: Lowest)
Frequency Percent Cumulative Percent
Valid Highest 5 14.3 14.3
High 8 22.9 37.1
Moderate 10 28.6 65.7
Low 8 22.9 88.6
Lowest 4 11.4 100.0
Total 35 100.0
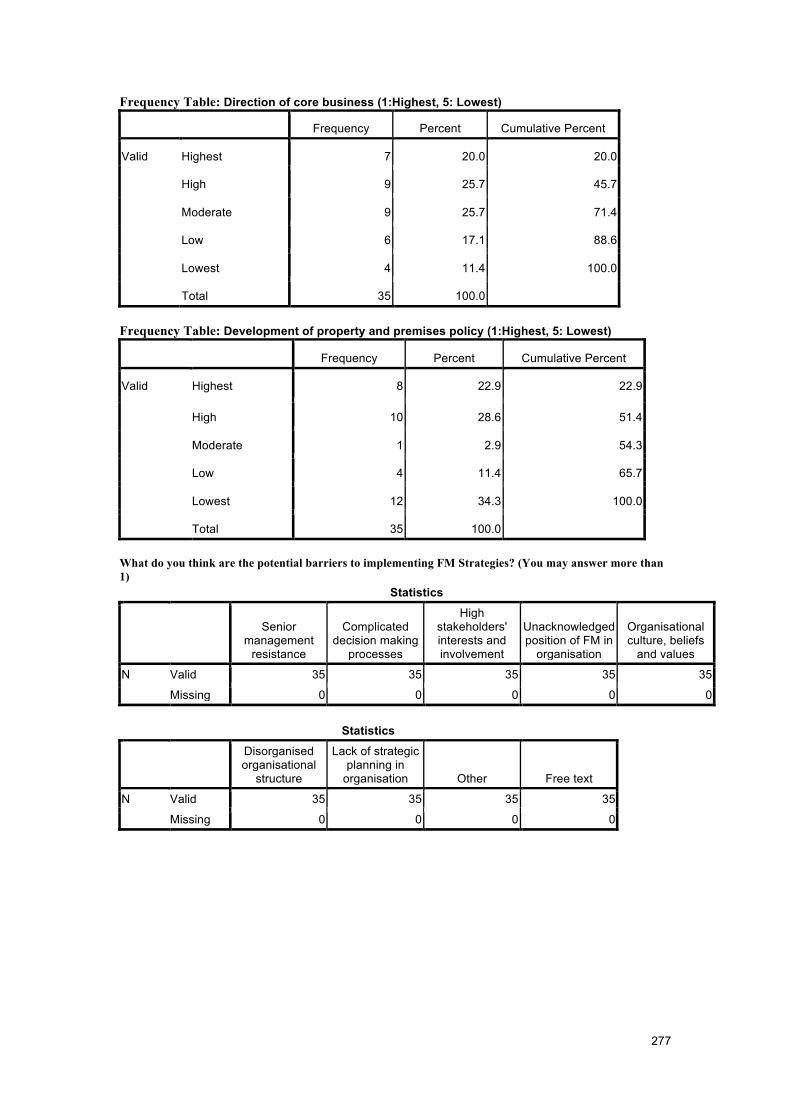
!!
277!
!
Frequency Table: Direction of core business (1:Highest, 5: Lowest)
Frequency Percent Cumulative Percent
Valid Highest 7 20.0 20.0
High 9 25.7 45.7
Moderate 9 25.7 71.4
Low 6 17.1 88.6
Lowest 4 11.4 100.0
Total 35 100.0 Frequency Table: Development of property and premises policy (1:Highest, 5: Lowest)
Frequency Percent Cumulative Percent
Valid Highest 8 22.9 22.9
High 10 28.6 51.4
Moderate 1 2.9 54.3
Low 4 11.4 65.7
Lowest 12 34.3 100.0
Total 35 100.0 What do you think are the potential barriers to implementing FM Strategies? (You may answer more than 1)
Statistics
Senior
management resistance
Complicated decision making
processes
High stakeholders' interests and involvement
Unacknowledgedposition of FM in
organisation
Organisational culture, beliefs
and values
N Valid 35 35 35 35 35
Missing 0 0 0 0 0
Statistics
Disorganised organisational
structure
Lack of strategic planning in
organisation Other Free text
N Valid 35 35 35 35
Missing 0 0 0 0
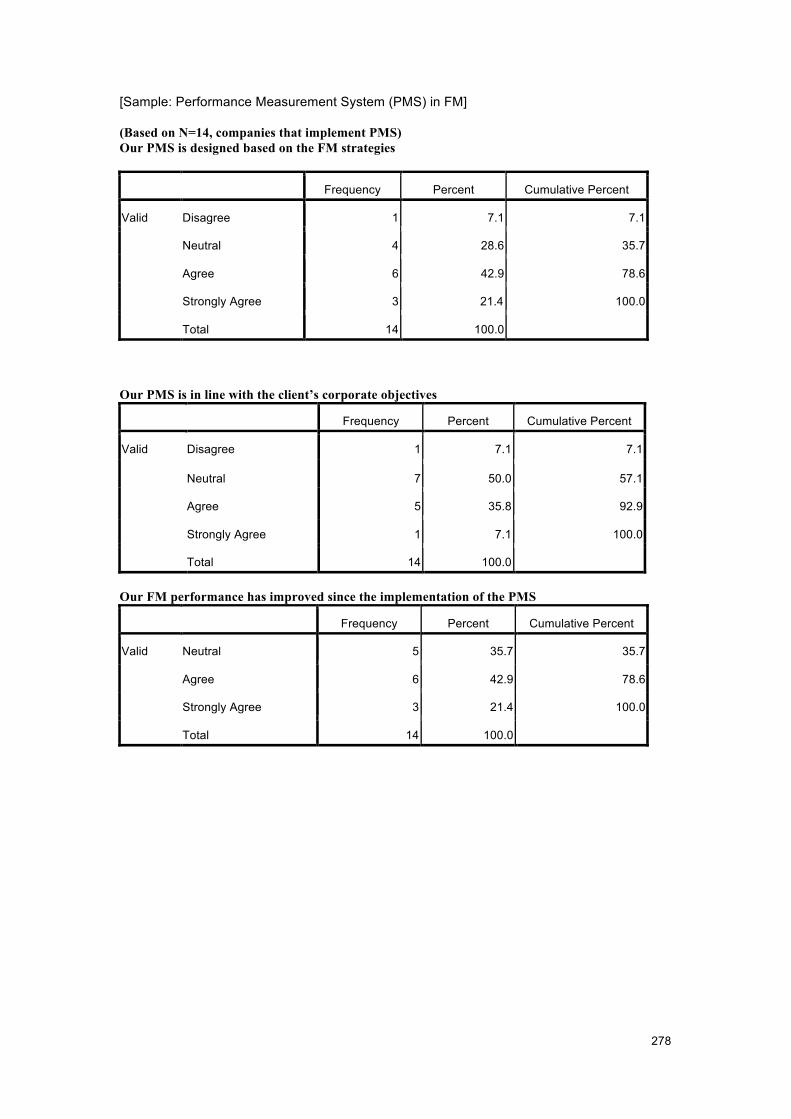
!!
278!
!
[Sample: Performance Measurement System (PMS) in FM] (Based on N=14, companies that implement PMS) Our PMS is designed based on the FM strategies
Frequency Percent Cumulative Percent
Valid Disagree 1 7.1 7.1
Neutral 4 28.6 35.7
Agree 6 42.9 78.6
Strongly Agree 3 21.4 100.0
Total 14 100.0 Our PMS is in line with the client’s corporate objectives
Frequency Percent Cumulative Percent
Valid Disagree 1 7.1 7.1
Neutral 7 50.0 57.1
Agree 5 35.8 92.9
Strongly Agree 1 7.1 100.0
Total 14 100.0 Our FM performance has improved since the implementation of the PMS
Frequency Percent Cumulative Percent
Valid Neutral 5 35.7 35.7
Agree 6 42.9 78.6
Strongly Agree 3 21.4 100.0
Total 14 100.0
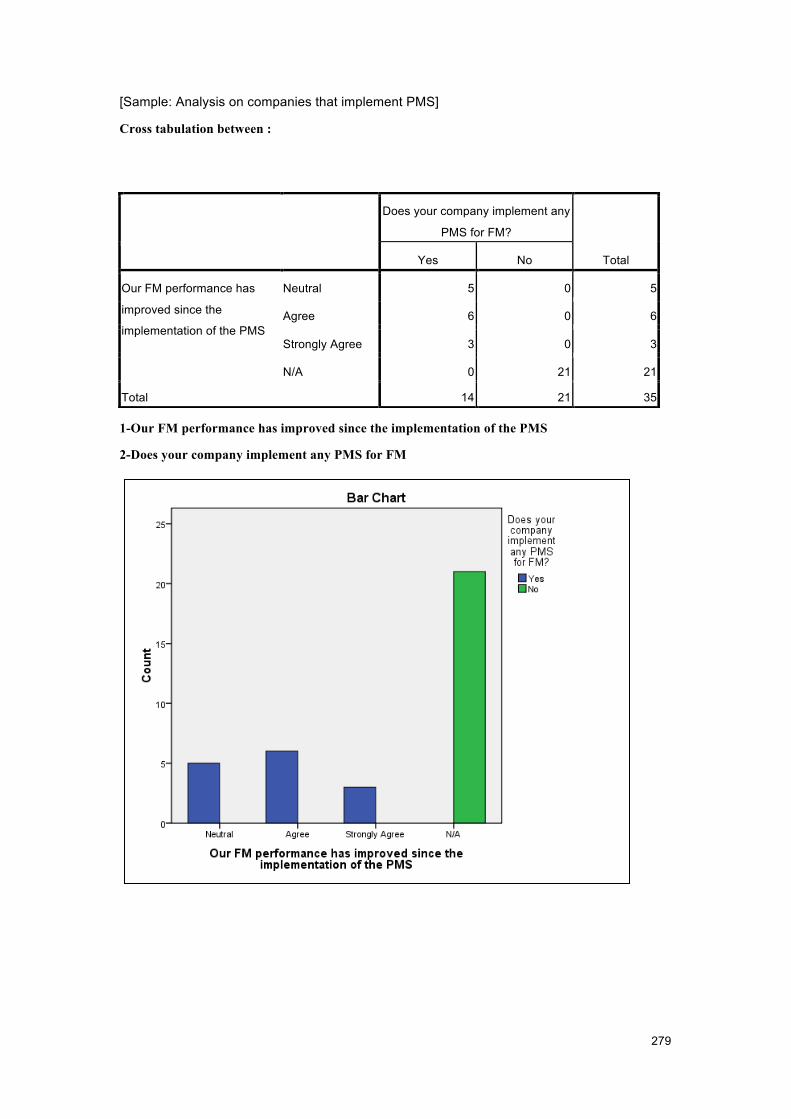
!!
279!
!
[Sample: Analysis on companies that implement PMS]
Cross tabulation between :
1-Our FM performance has improved since the implementation of the PMS
2-Does your company implement any PMS for FM
Does your company implement any
PMS for FM?
Total Yes No
Our FM performance has
improved since the
implementation of the PMS
Neutral 5 0 5
Agree 6 0 6
Strongly Agree 3 0 3
N/A 0 21 21
Total 14 21 35

!!
280!
!
APPENDIX E: SAMPLE OF NVIVO THEMATIC ANALYSIS DIAGRAM
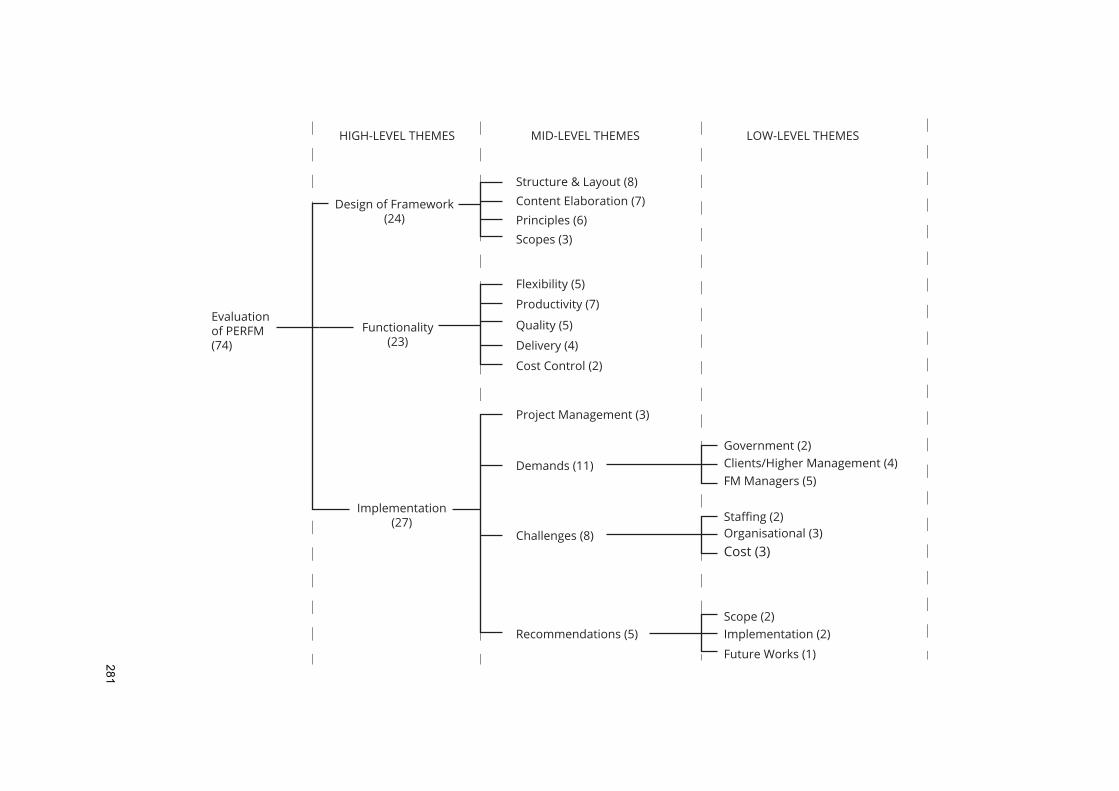
!!
281!
!
Evaluation of PERFM(74)
Design of Framework(24)
Project Management (3)
Government (2)
Staffing(2)
Implementation (2)
Functionality(23)
Implementation(27)
Structure & Layout (8)Content Elaboration (7)Principles (6)Scopes (3)
Flexibility (5)
Productivity (7)
Quality (5)
Delivery (4)
Cost Control (2)
Demands (11)
Challenges (8)
Recommendations (5)
Clients/Higher Management (4)FM Managers (5)
Organisational (3)Cost (3)
Scope (2)
Future Works (1)
HIGH-LEVEL THEMES MID-LEVEL THEMES LOW-LEVEL THEMES
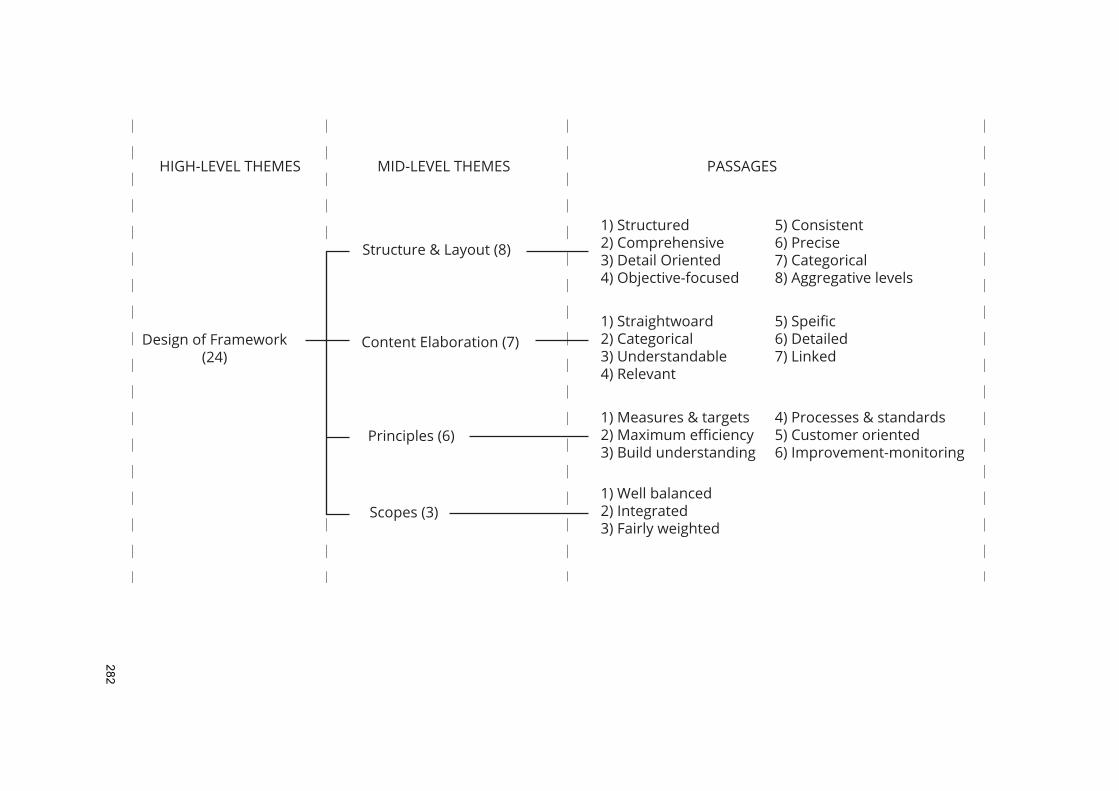
!!
282!
!
Design of Framework(24)
Structure & Layout (8)
Content Elaboration (7)
Principles (6)
Scopes (3)
HIGH-LEVEL THEMES MID-LEVEL THEMES PASSAGES
1) Structured2) Comprehensive3) Detail Oriented4) Objective-focused
5) Consistent 6) Precise7) Categorical8) Aggregative levels
1) Straightwoard2) Categorical3) Understandable4) Relevant
5)Speific6) Detailed7) Linked
1) Measures & targets2)Maximumefficiency3) Build understanding
4) Processes & standards5) Customer oriented6) Improvement-monitoring
1) Well balanced2) Integrated3) Fairly weighted
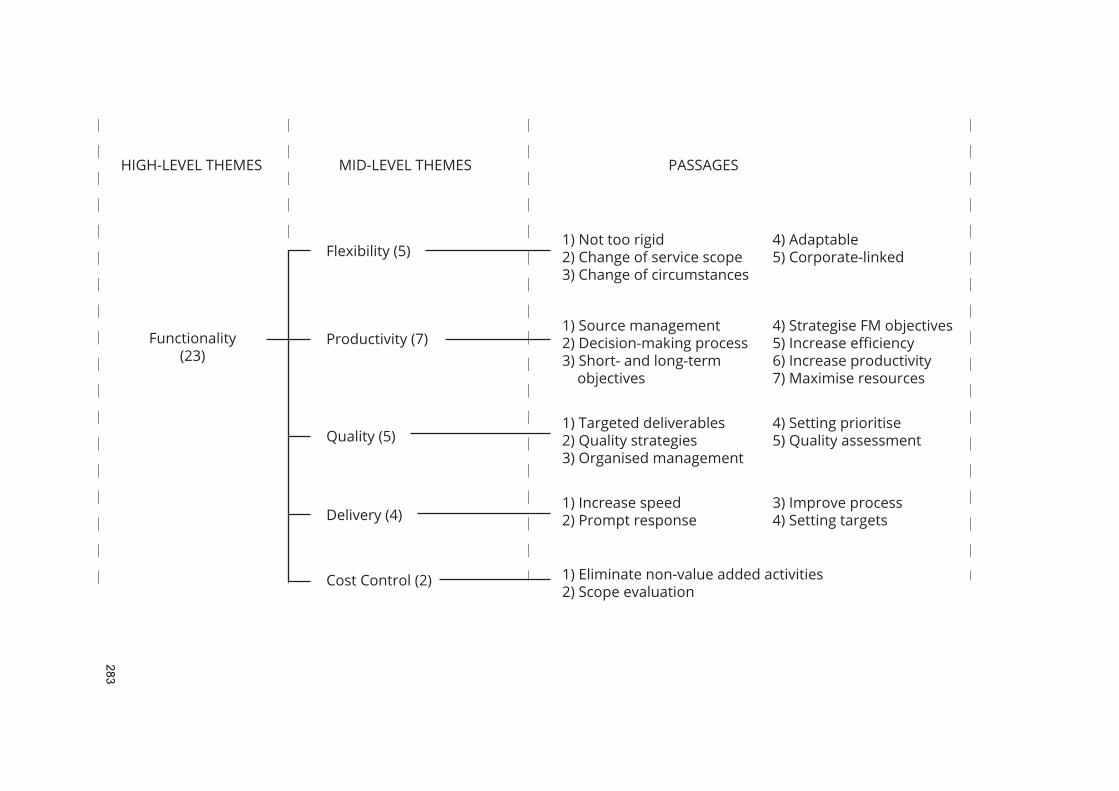
!!
283!
!
HIGH-LEVEL THEMES MID-LEVEL THEMES PASSAGES
Functionality(23)
Flexibility (5)
Productivity (7)
Quality (5)
Delivery (4)
Cost Control (2)
1) Not too rigid2) Change of service scope3) Change of circumstances
4) Adaptable5) Corporate-linked
1) Source management2) Decision-making process3) Short- and long-term objectives
4) Strategise FM objectives5)Increaseefficiency6) Increase productivity7) Maximise resources
1) Targeted deliverables2) Quality strategies3) Organised management
4) Setting prioritise5) Quality assessment
1) Increase speed2) Prompt response
3) Improve process4) Setting targets
1) Eliminate non-value added activities2) Scope evaluation
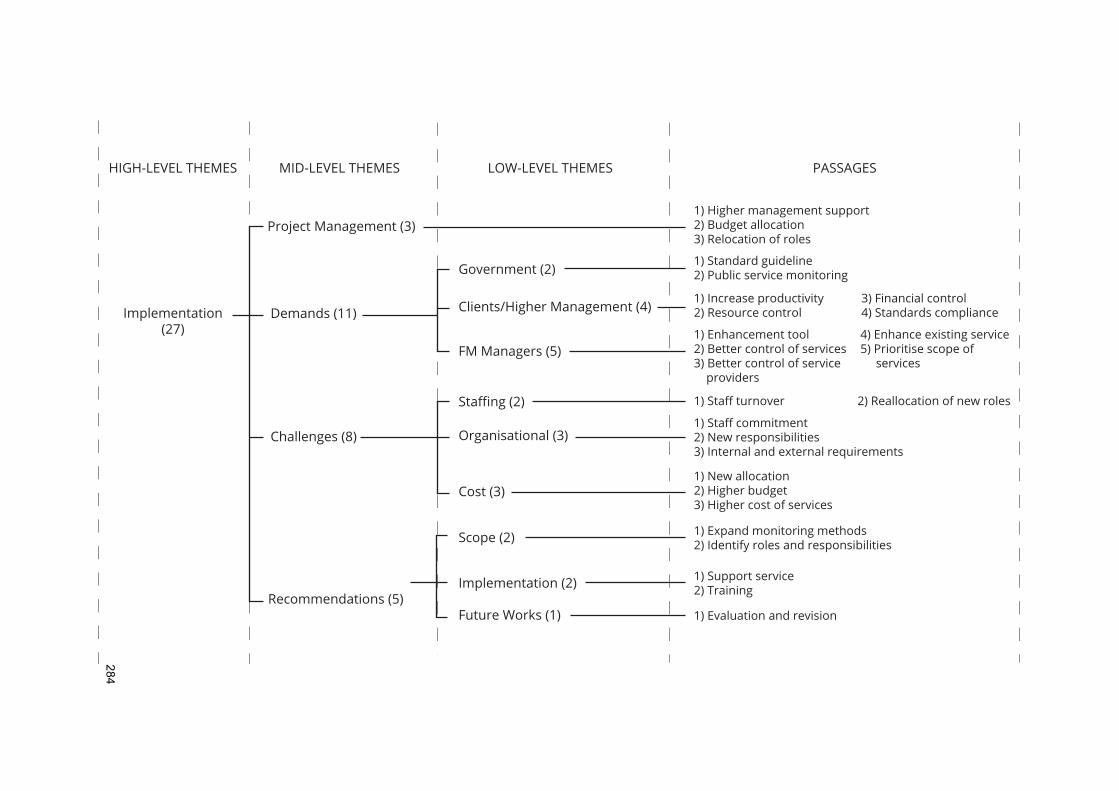
!!
284!
!
HIGH-LEVEL THEMES MID-LEVEL THEMES LOW-LEVEL THEMES PASSAGES
Implementation(27)
Project Management (3)
Demands (11)
Challenges (8)
Recommendations (5)
1) Higher management support2) Budget allocation3) Relocation of roles
Government (2)
Clients/Higher Management (4)
FM Managers (5)
1) Standard guideline2) Public service monitoring
1) Increase productivity2) Resource control
3) Financial control4) Standards compliance
1) Enhancement tool2) Better control of services3) Better control of service providers
4) Enhance existing service5) Prioritise scope of services
Staffing(2)
Organisational (3)
Cost (3)
1)Staffturnover 2) Reallocation of new roles
1)Staffcommitment2) New responsibilities3) Internal and external requirements
1) New allocation2) Higher budget3) Higher cost of services
Implementation (2)
Scope (2)
Future Works (1)
1) Expand monitoring methods2) Identify roles and responsibilities
1) Support service2) Training
1) Evaluation and revision
!!
285!
!
APPENDIX F:
PERFORMANCE MEASUREMENT FRAMEWORK (PERFM)
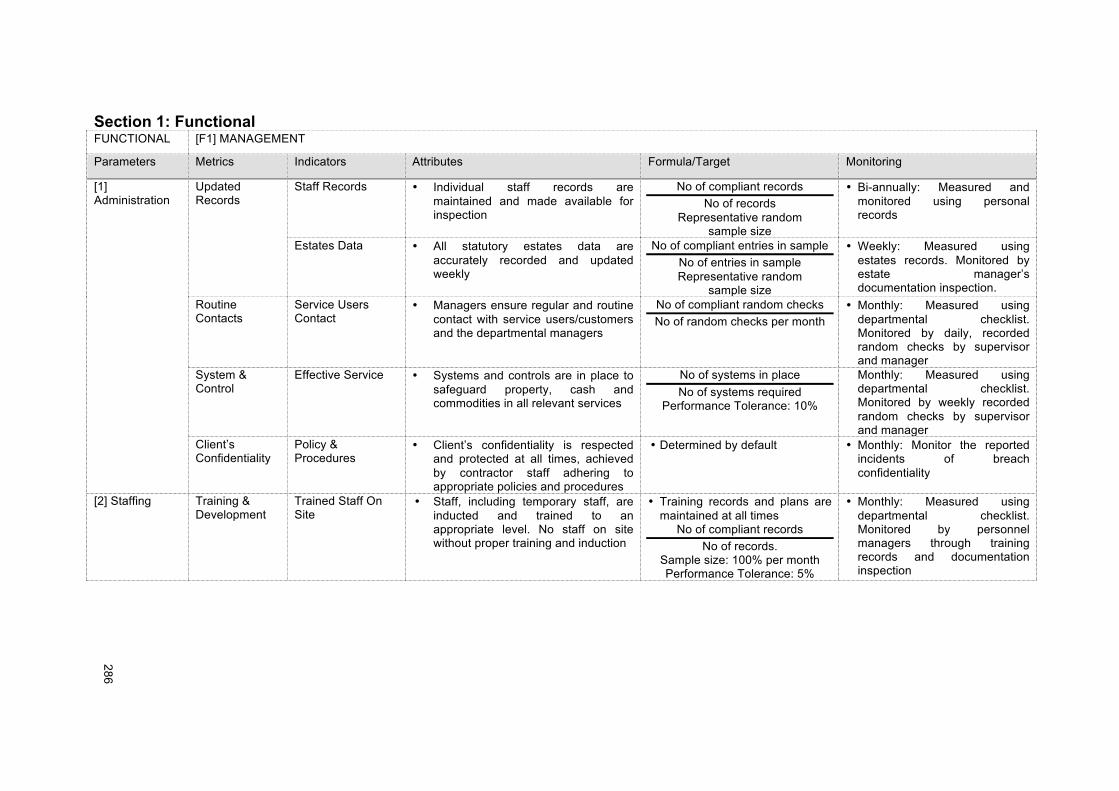
!!
286!
!
Section 1: Functional FUNCTIONAL [F1] MANAGEMENT
Parameters Metrics Indicators Attributes Formula/Target Monitoring
[1] Administration
Updated Records
Staff Records • Individual staff records are maintained and made available for inspection
No of compliant records No of records
Representative random sample size
• Bi-annually: Measured and monitored using personal records
Estates Data • All statutory estates data are
accurately recorded and updated weekly
No of compliant entries in sample No of entries in sample Representative random
sample size
• Weekly: Measured using estates records. Monitored by estate manager’s documentation inspection.
Routine Contacts
Service Users Contact
• Managers ensure regular and routine contact with service users/customers and the departmental managers
No of compliant random checks No of random checks per month
• Monthly: Measured using departmental checklist. Monitored by daily, recorded random checks by supervisor and manager
System & Control
Effective Service • Systems and controls are in place to safeguard property, cash and commodities in all relevant services
No of systems in place No of systems required
Performance Tolerance: 10%
Monthly: Measured using departmental checklist. Monitored by weekly recorded random checks by supervisor and manager
Client’s Confidentiality
Policy & Procedures
• Client’s confidentiality is respected and protected at all times, achieved by contractor staff adhering to appropriate policies and procedures
• Determined by default • Monthly: Monitor the reported incidents of breach confidentiality
[2] Staffing Training & Development
Trained Staff On Site
• Staff, including temporary staff, are inducted and trained to an appropriate level. No staff on site without proper training and induction
• Training records and plans are maintained at all times
No of compliant records No of records.
Sample size: 100% per month Performance Tolerance: 5%
• Monthly: Measured using departmental checklist. Monitored by personnel managers through training records and documentation inspection
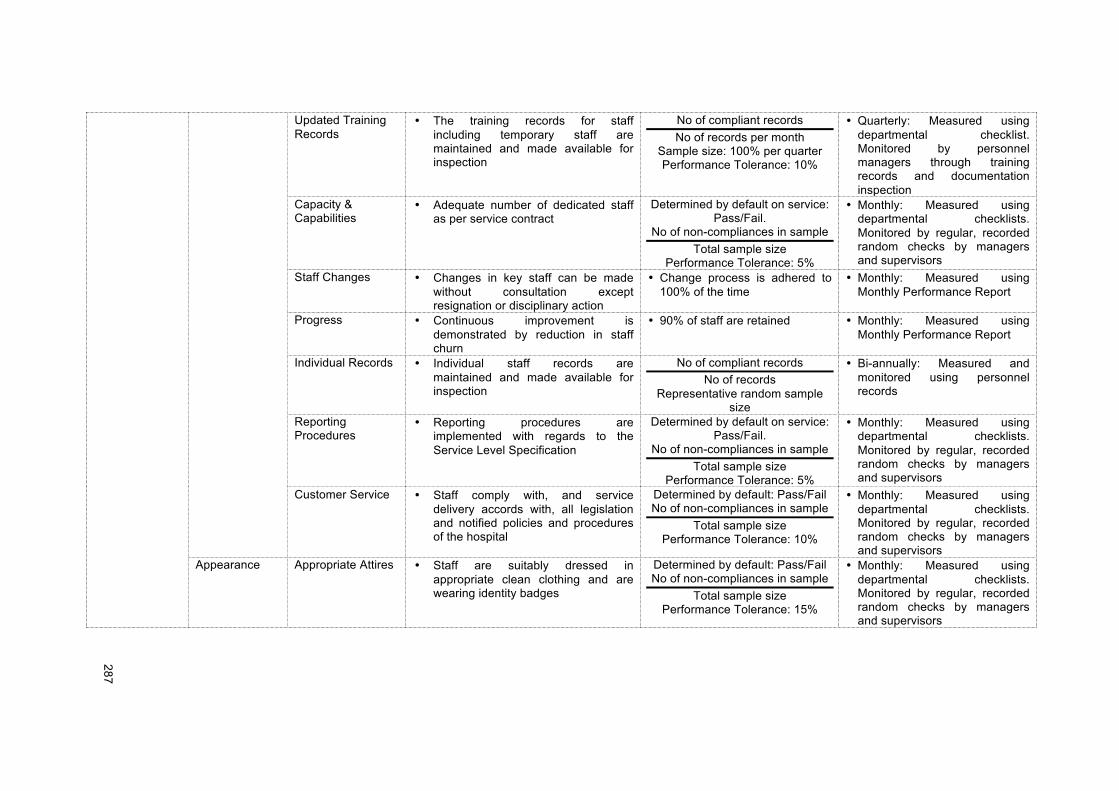
!!
287!
!
Updated Training Records
• The training records for staff including temporary staff are maintained and made available for inspection
No of compliant records No of records per month
Sample size: 100% per quarter Performance Tolerance: 10%
• Quarterly: Measured using departmental checklist. Monitored by personnel managers through training records and documentation inspection
Capacity & Capabilities
• Adequate number of dedicated staff as per service contract
Determined by default on service: Pass/Fail.
No of non-compliances in sample Total sample size
Performance Tolerance: 5%
• Monthly: Measured using departmental checklists. Monitored by regular, recorded random checks by managers and supervisors
Staff Changes • Changes in key staff can be made without consultation except resignation or disciplinary action
• Change process is adhered to 100% of the time
• Monthly: Measured using Monthly Performance Report
Progress • Continuous improvement is demonstrated by reduction in staff churn
• 90% of staff are retained • Monthly: Measured using Monthly Performance Report
Individual Records • Individual staff records are maintained and made available for inspection
No of compliant records No of records
Representative random sample size
• Bi-annually: Measured and monitored using personnel records
Reporting Procedures
• Reporting procedures are implemented with regards to the Service Level Specification
Determined by default on service: Pass/Fail.
No of non-compliances in sample Total sample size
Performance Tolerance: 5%
• Monthly: Measured using departmental checklists. Monitored by regular, recorded random checks by managers and supervisors
Customer Service • Staff comply with, and service delivery accords with, all legislation and notified policies and procedures of the hospital
Determined by default: Pass/Fail No of non-compliances in sample
Total sample size Performance Tolerance: 10%
• Monthly: Measured using departmental checklists. Monitored by regular, recorded random checks by managers and supervisors
Appearance Appropriate Attires • Staff are suitably dressed in appropriate clean clothing and are wearing identity badges
Determined by default: Pass/Fail No of non-compliances in sample
Total sample size Performance Tolerance: 15%
• Monthly: Measured using departmental checklists. Monitored by regular, recorded random checks by managers and supervisors
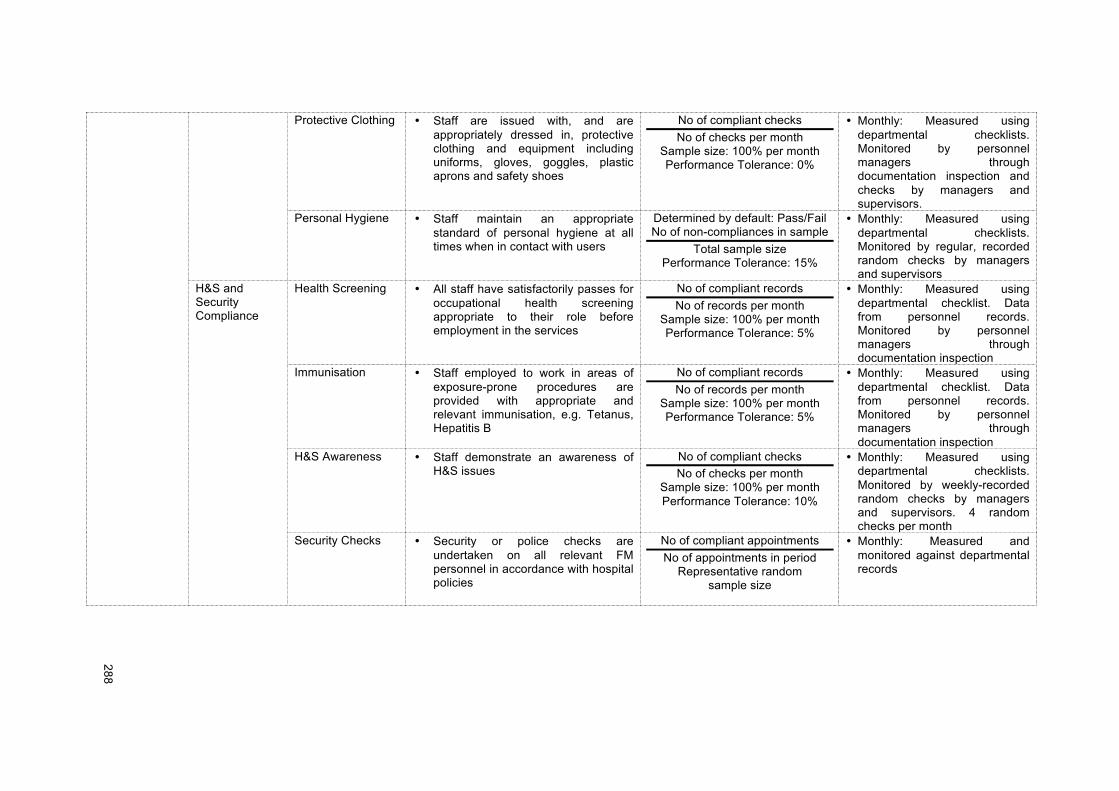
!!
288!
!
Protective Clothing • Staff are issued with, and are appropriately dressed in, protective clothing and equipment including uniforms, gloves, goggles, plastic aprons and safety shoes
No of compliant checks No of checks per month
Sample size: 100% per month Performance Tolerance: 0%
• Monthly: Measured using departmental checklists. Monitored by personnel managers through documentation inspection and checks by managers and supervisors.
Personal Hygiene • Staff maintain an appropriate standard of personal hygiene at all times when in contact with users
Determined by default: Pass/Fail No of non-compliances in sample
Total sample size Performance Tolerance: 15%
• Monthly: Measured using departmental checklists. Monitored by regular, recorded random checks by managers and supervisors
H&S and Security Compliance
Health Screening • All staff have satisfactorily passes for occupational health screening appropriate to their role before employment in the services
No of compliant records No of records per month
Sample size: 100% per month Performance Tolerance: 5%
• Monthly: Measured using departmental checklist. Data from personnel records. Monitored by personnel managers through documentation inspection
Immunisation • Staff employed to work in areas of exposure-prone procedures are provided with appropriate and relevant immunisation, e.g. Tetanus, Hepatitis B
No of compliant records No of records per month
Sample size: 100% per month Performance Tolerance: 5%
• Monthly: Measured using departmental checklist. Data from personnel records. Monitored by personnel managers through documentation inspection
H&S Awareness • Staff demonstrate an awareness of H&S issues
No of compliant checks No of checks per month
Sample size: 100% per month Performance Tolerance: 10%
• Monthly: Measured using departmental checklists. Monitored by weekly-recorded random checks by managers and supervisors. 4 random checks per month
Security Checks • Security or police checks are undertaken on all relevant FM personnel in accordance with hospital policies
No of compliant appointments No of appointments in period
Representative random sample size
• Monthly: Measured and monitored against departmental records
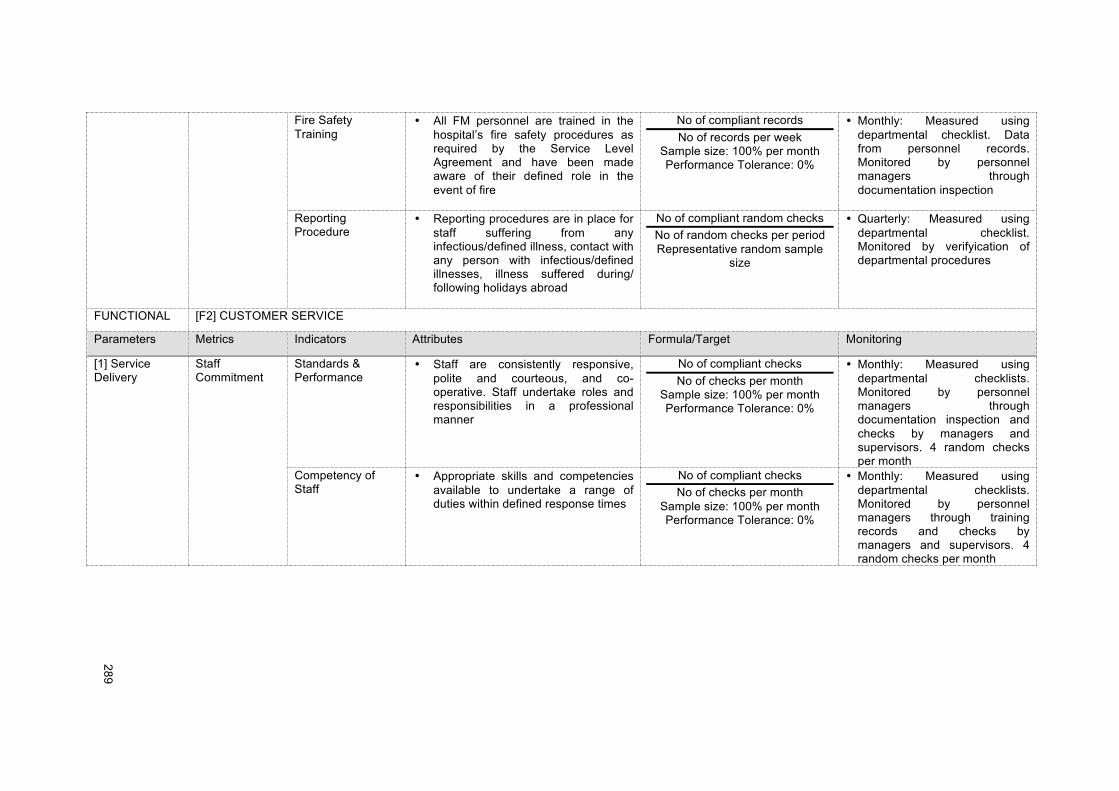
!!
289!
!
Fire Safety Training
• All FM personnel are trained in the hospital’s fire safety procedures as required by the Service Level Agreement and have been made aware of their defined role in the event of fire
No of compliant records No of records per week
Sample size: 100% per month Performance Tolerance: 0%
• Monthly: Measured using departmental checklist. Data from personnel records. Monitored by personnel managers through documentation inspection
Reporting Procedure
• Reporting procedures are in place for staff suffering from any infectious/defined illness, contact with any person with infectious/defined illnesses, illness suffered during/ following holidays abroad
No of compliant random checks No of random checks per period Representative random sample
size
• Quarterly: Measured using departmental checklist. Monitored by verifyication of departmental procedures
FUNCTIONAL [F2] CUSTOMER SERVICE
Parameters Metrics Indicators Attributes Formula/Target Monitoring
[1] Service Delivery
Staff Commitment
Standards & Performance
• Staff are consistently responsive, polite and courteous, and co-operative. Staff undertake roles and responsibilities in a professional manner
No of compliant checks No of checks per month
Sample size: 100% per month Performance Tolerance: 0%
• Monthly: Measured using departmental checklists. Monitored by personnel managers through documentation inspection and checks by managers and supervisors. 4 random checks per month
Competency of Staff
• Appropriate skills and competencies available to undertake a range of duties within defined response times
No of compliant checks No of checks per month
Sample size: 100% per month Performance Tolerance: 0%
• Monthly: Measured using departmental checklists. Monitored by personnel managers through training records and checks by managers and supervisors. 4 random checks per month
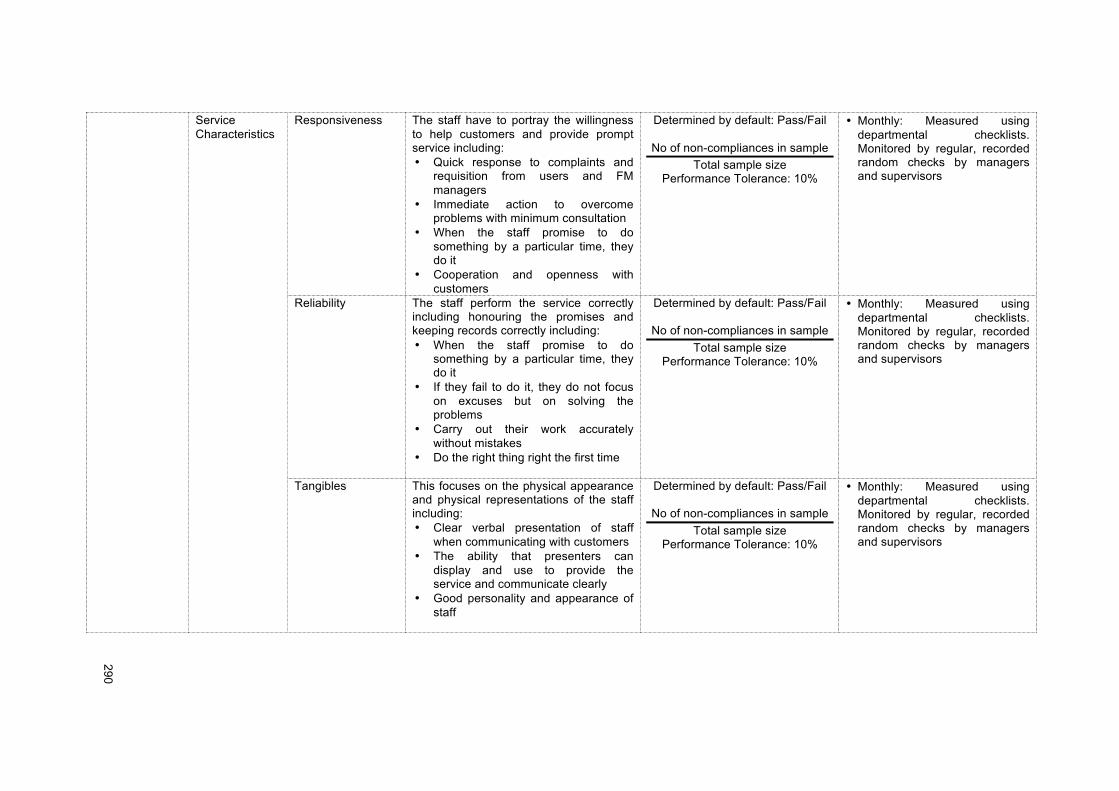
!!
290!
!
Service Characteristics
Responsiveness The staff have to portray the willingness to help customers and provide prompt service including: • Quick response to complaints and
requisition from users and FM managers
• Immediate action to overcome problems with minimum consultation
• When the staff promise to do something by a particular time, they do it
• Cooperation and openness with customers
Determined by default: Pass/Fail
No of non-compliances in sample Total sample size
Performance Tolerance: 10%
• Monthly: Measured using departmental checklists. Monitored by regular, recorded random checks by managers and supervisors
Reliability The staff perform the service correctly including honouring the promises and keeping records correctly including: • When the staff promise to do
something by a particular time, they do it
• If they fail to do it, they do not focus on excuses but on solving the problems
• Carry out their work accurately without mistakes
• Do the right thing right the first time
Determined by default: Pass/Fail
No of non-compliances in sample Total sample size
Performance Tolerance: 10%
• Monthly: Measured using departmental checklists. Monitored by regular, recorded random checks by managers and supervisors
Tangibles This focuses on the physical appearance and physical representations of the staff including: • Clear verbal presentation of staff
when communicating with customers • The ability that presenters can
display and use to provide the service and communicate clearly
• Good personality and appearance of staff
Determined by default: Pass/Fail
No of non-compliances in sample Total sample size
Performance Tolerance: 10%
• Monthly: Measured using departmental checklists. Monitored by regular, recorded random checks by managers and supervisors
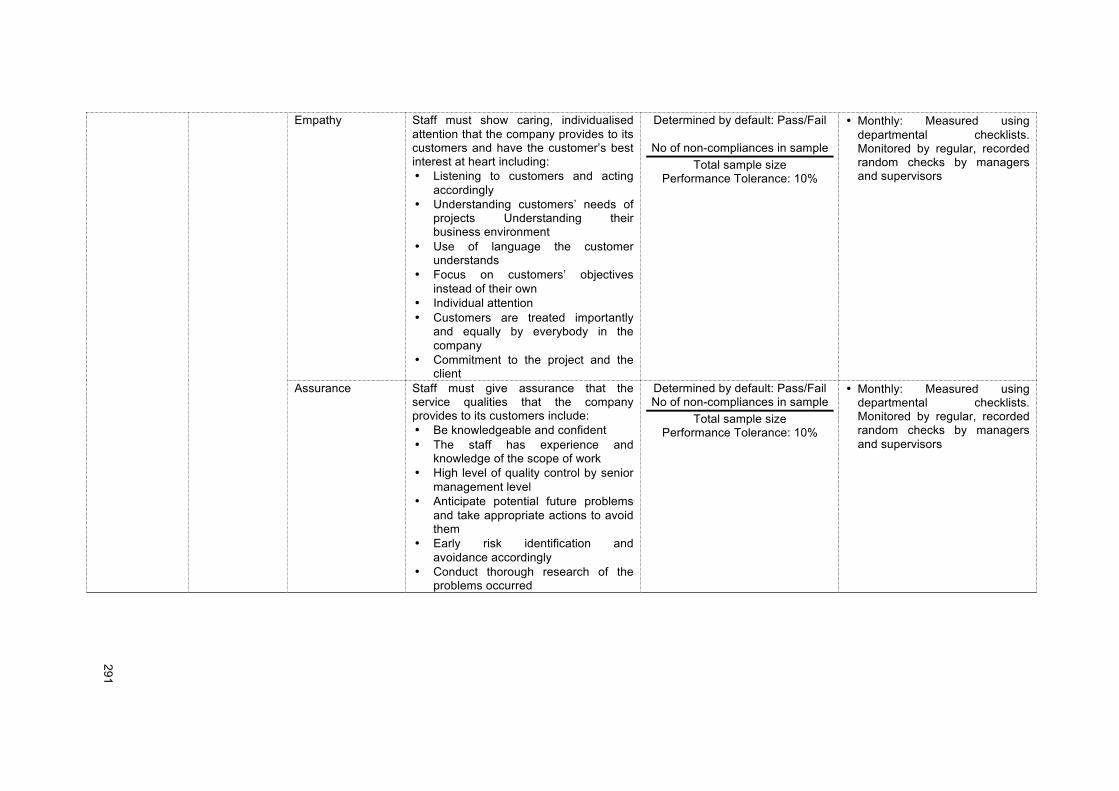
!!
291!
!
Empathy Staff must show caring, individualised attention that the company provides to its customers and have the customer’s best interest at heart including: • Listening to customers and acting
accordingly • Understanding customers’ needs of
projects Understanding their business environment
• Use of language the customer understands
• Focus on customers’ objectives instead of their own
• Individual attention • Customers are treated importantly
and equally by everybody in the company
• Commitment to the project and the client
Determined by default: Pass/Fail
No of non-compliances in sample Total sample size
Performance Tolerance: 10%
• Monthly: Measured using departmental checklists. Monitored by regular, recorded random checks by managers and supervisors
Assurance Staff must give assurance that the service qualities that the company provides to its customers include: • Be knowledgeable and confident • The staff has experience and
knowledge of the scope of work • High level of quality control by senior
management level • Anticipate potential future problems
and take appropriate actions to avoid them
• Early risk identification and avoidance accordingly
• Conduct thorough research of the problems occurred
Determined by default: Pass/Fail No of non-compliances in sample
Total sample size Performance Tolerance: 10%
• Monthly: Measured using departmental checklists. Monitored by regular, recorded random checks by managers and supervisors
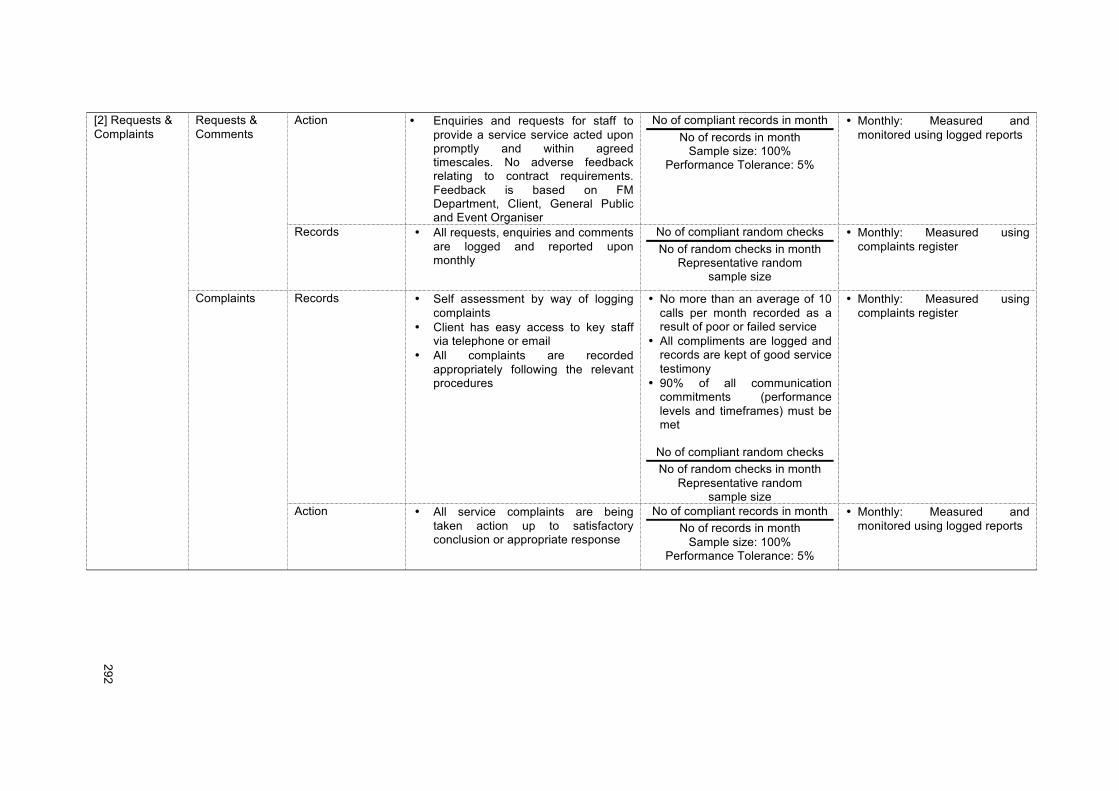
!!
292!
!
[2] Requests & Complaints
Requests & Comments
Action • Enquiries and requests for staff to provide a service service acted upon promptly and within agreed timescales. No adverse feedback relating to contract requirements. Feedback is based on FM Department, Client, General Public and Event Organiser
No of compliant records in month No of records in month
Sample size: 100% Performance Tolerance: 5%
• Monthly: Measured and monitored using logged reports
Records • All requests, enquiries and comments are logged and reported upon monthly
No of compliant random checks No of random checks in month
Representative random sample size
• Monthly: Measured using complaints register
Complaints Records • Self assessment by way of logging complaints
• Client has easy access to key staff via telephone or email
• All complaints are recorded appropriately following the relevant procedures
• No more than an average of 10 calls per month recorded as a result of poor or failed service
• All compliments are logged and records are kept of good service testimony
• 90% of all communication commitments (performance levels and timeframes) must be met
No of compliant random checks No of random checks in month
Representative random sample size
• Monthly: Measured using complaints register
Action • All service complaints are being taken action up to satisfactory conclusion or appropriate response
No of compliant records in month No of records in month
Sample size: 100% Performance Tolerance: 5%
• Monthly: Measured and monitored using logged reports
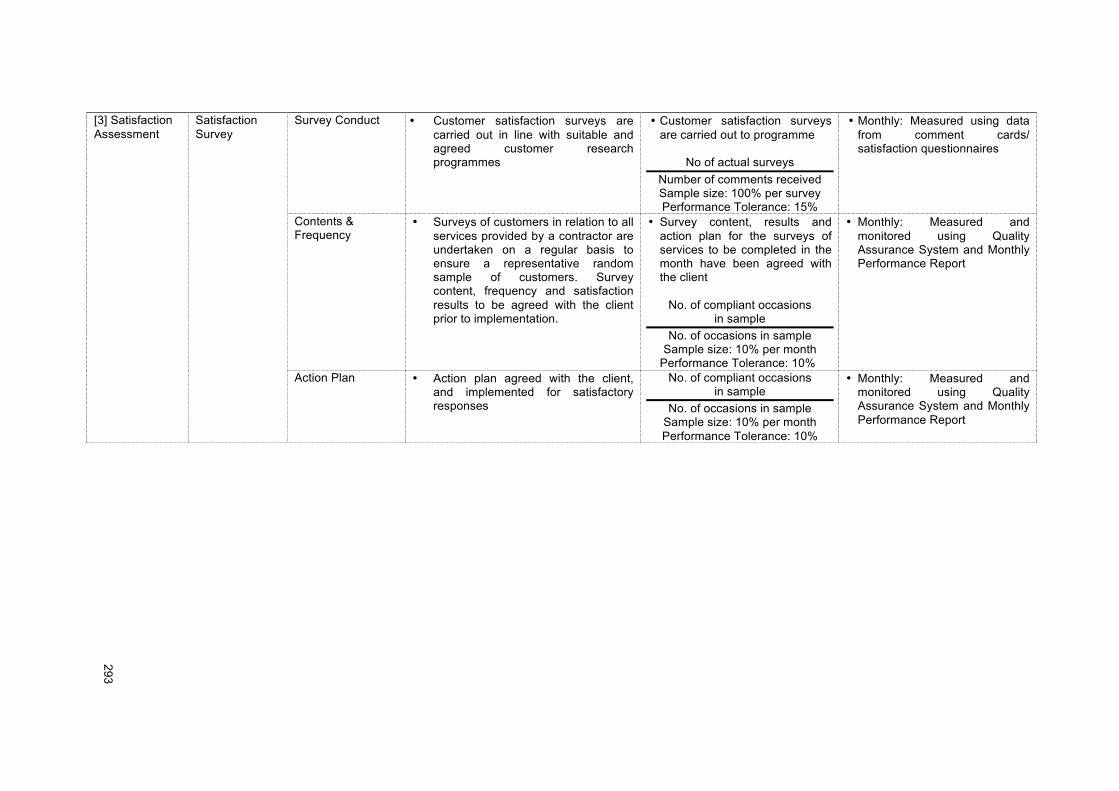
!!
293!
!
[3] Satisfaction Assessment
Satisfaction Survey
Survey Conduct • Customer satisfaction surveys are carried out in line with suitable and agreed customer research programmes
• Customer satisfaction surveys are carried out to programme
No of actual surveys Number of comments received Sample size: 100% per survey Performance Tolerance: 15%
• Monthly: Measured using data from comment cards/ satisfaction questionnaires
Contents & Frequency
• Surveys of customers in relation to all services provided by a contractor are undertaken on a regular basis to ensure a representative random sample of customers. Survey content, frequency and satisfaction results to be agreed with the client prior to implementation.
• Survey content, results and action plan for the surveys of services to be completed in the month have been agreed with the client
No. of compliant occasions in sample
No. of occasions in sample Sample size: 10% per month
Performance Tolerance: 10%
• Monthly: Measured and monitored using Quality Assurance System and Monthly Performance Report
Action Plan • Action plan agreed with the client, and implemented for satisfactory responses
No. of compliant occasions in sample
No. of occasions in sample Sample size: 10% per month Performance Tolerance: 10%
• Monthly: Measured and monitored using Quality Assurance System and Monthly Performance Report

!!
294!
!
FUNCTIONAL [F3] CONTRACT MANAGEMENT
Parameters Metrics Indicators Attributes Formula/Target Monitoring
[1] Administration & Management
Staff Working Permit • Permit to work system is complied with
No of compliant records in month No of records in month
Sample size: 100% Performance Tolerance: 0%
• Bi-annually: Measured and monitored using personal records
Qualified • Suitably qualified person cover is
maintained all the time No of compliant records in month
No of records in month Sample size: 100%
Performance Tolerance: 0%
• Monthly: Measured and monitored against departmental records
Supervision • Daily management and supervision of the services is provided by a team of staff at an appropriate level
• Percentage of compliant days per month.
• Performance Tolerance: 5%
• Monthly: Measured using departmental checklist. Data from duty records. Monitored by the supplier general managers through documentation inspection
Materials/ Equipment
Safety • All service provider materials, chemicals and equipments are stored and used in safe conditions appropriate to ensure no impact to any activities
No. of compliant occasions in sample
No. of occasions in sample Sample size: 10% per month Performance Tolerance: 0%
• Monthly: Measured and monitored using Quality Assurance System and Monthly Performance Report
[2] Service Quality
Quality Delivery Issues • No significant operational issues raised by clients
• No written formal complaint escalated to client as a result of failure to resolve at local level
No of compliant records in month No of records in month
Sample size 100% Performance Tolerance: 5%
• Monthly: Measured and monitored using logged reports and Monthly Performance Report

!!
295!
!
Request • Ad hoc requests for information are processed within agreed time frames
• Requests for information are provided within 5 days
No. of compliant occasions in sample
No. of occasions in sample Sample size: 10% per month Performance Tolerance: 0%
• Monthly: Measured and monitored using logged reports and Monthly Performance Report
Complaints • All complaints received by the supplier are recorded and forwarded to the FM Department nominated officers as identified in the FM Compliant Procedure
No of compliant records in month No of records in month
Sample size: 100% Performance Tolerance: 5%
• Monthly: Measured and monitored using logged reports and Monthly Performance Report
Audit Completion • Audit programmes are completed • 90% of audits completed on time
No of compliant records in month
No of records in month Sample size: 100%
Performance Tolerance: 5%
• Monthly: Measured and monitored against departmental records and monthly performance report
Compliance Procurement Process
• Complete compliance with the agreed procurement process
• 100% compliance with procurement process
No. of compliant occasions
in sample No. of occasions in sample
Sample size: 10% per month Performance Tolerance: 10%
• Monthly: Measured and monitored using Quality Assurance System and Monthly Performance Report
Financial Approval • Complete compliance with the agreed financial approval process and timescales
• 100% compliance with agreed approval process
No. of compliant occasions in sample
No. of occasions in sample Sample size: 10% per month
Performance Tolerance: 10%
• Monthly: Measured and monitored using Quality Assurance System and Monthly Performance Report
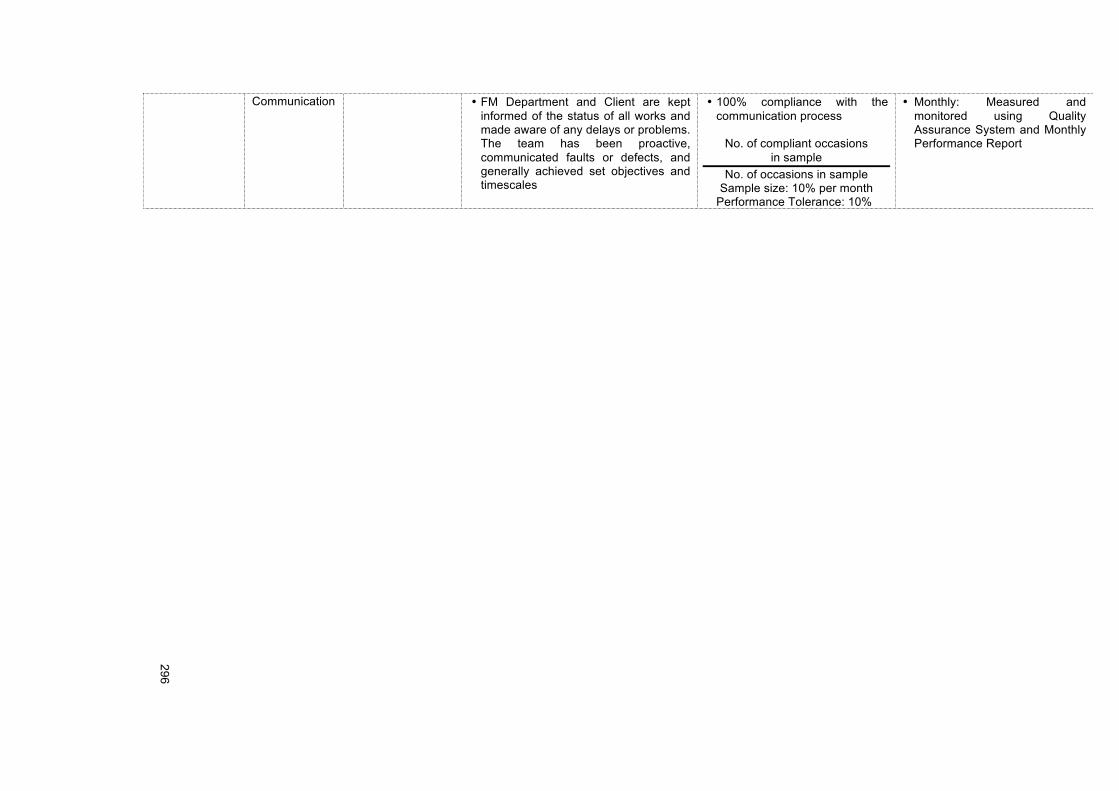
!!
296!
!
Communication • FM Department and Client are kept informed of the status of all works and made aware of any delays or problems. The team has been proactive, communicated faults or defects, and generally achieved set objectives and timescales
• 100% compliance with the communication process
No. of compliant occasions
in sample No. of occasions in sample
Sample size: 10% per month Performance Tolerance: 10%
• Monthly: Measured and monitored using Quality Assurance System and Monthly Performance Report
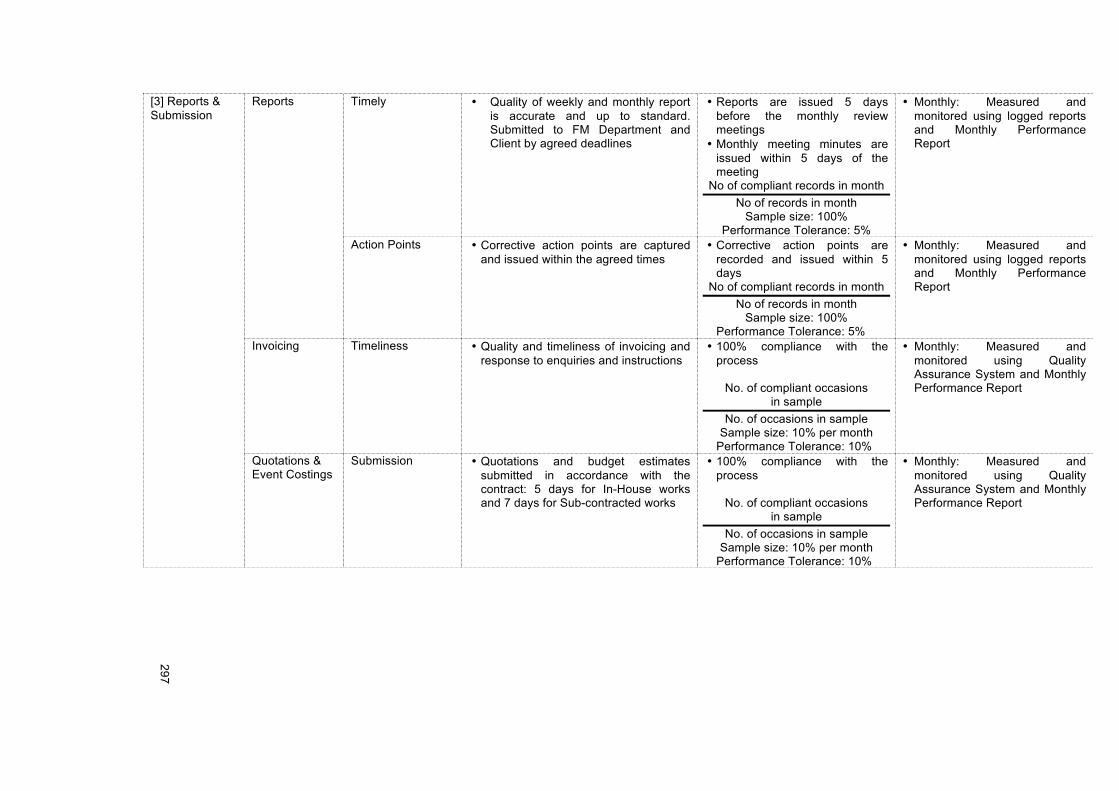
!!
297!
!
[3] Reports & Submission
Reports Timely • Quality of weekly and monthly report is accurate and up to standard. Submitted to FM Department and Client by agreed deadlines
• Reports are issued 5 days before the monthly review meetings
• Monthly meeting minutes are issued within 5 days of the meeting
No of compliant records in month No of records in month
Sample size: 100% Performance Tolerance: 5%
• Monthly: Measured and monitored using logged reports and Monthly Performance Report
Action Points • Corrective action points are captured and issued within the agreed times
• Corrective action points are recorded and issued within 5 days
No of compliant records in month No of records in month
Sample size: 100% Performance Tolerance: 5%
• Monthly: Measured and monitored using logged reports and Monthly Performance Report
Invoicing Timeliness • Quality and timeliness of invoicing and response to enquiries and instructions
• 100% compliance with the process
No. of compliant occasions
in sample No. of occasions in sample
Sample size: 10% per month Performance Tolerance: 10%
• Monthly: Measured and monitored using Quality Assurance System and Monthly Performance Report
Quotations & Event Costings
Submission • Quotations and budget estimates submitted in accordance with the contract: 5 days for In-House works and 7 days for Sub-contracted works
• 100% compliance with the process
No. of compliant occasions
in sample No. of occasions in sample
Sample size: 10% per month Performance Tolerance: 10%
• Monthly: Measured and monitored using Quality Assurance System and Monthly Performance Report
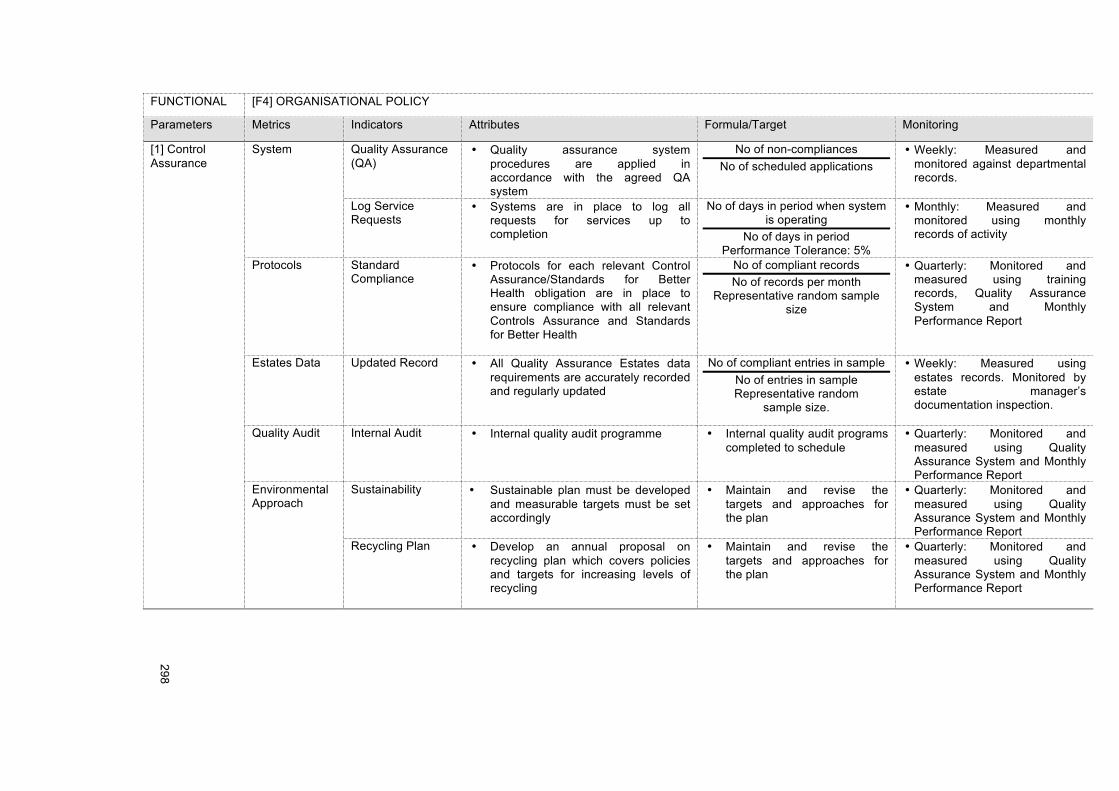
!!
298!
!
FUNCTIONAL [F4] ORGANISATIONAL POLICY
Parameters Metrics Indicators Attributes Formula/Target Monitoring
[1] Control Assurance
System Quality Assurance (QA)
• Quality assurance system procedures are applied in accordance with the agreed QA system
No of non-compliances No of scheduled applications
• Weekly: Measured and monitored against departmental records.
Log Service Requests
• Systems are in place to log all requests for services up to completion
No of days in period when system is operating
No of days in period Performance Tolerance: 5%
• Monthly: Measured and monitored using monthly records of activity
Protocols Standard Compliance
• Protocols for each relevant Control Assurance/Standards for Better Health obligation are in place to ensure compliance with all relevant Controls Assurance and Standards for Better Health
No of compliant records No of records per month
Representative random sample size
• Quarterly: Monitored and measured using training records, Quality Assurance System and Monthly Performance Report
Estates Data Updated Record • All Quality Assurance Estates data requirements are accurately recorded and regularly updated
No of compliant entries in sample No of entries in sample Representative random
sample size.
• Weekly: Measured using estates records. Monitored by estate manager’s documentation inspection.
Quality Audit Internal Audit • Internal quality audit programme • Internal quality audit programs
completed to schedule • Quarterly: Monitored and
measured using Quality Assurance System and Monthly Performance Report
Environmental Approach
Sustainability • Sustainable plan must be developed and measurable targets must be set accordingly
• Maintain and revise the targets and approaches for the plan
• Quarterly: Monitored and measured using Quality Assurance System and Monthly Performance Report
Recycling Plan • Develop an annual proposal on recycling plan which covers policies and targets for increasing levels of recycling
• Maintain and revise the targets and approaches for the plan
• Quarterly: Monitored and measured using Quality Assurance System and Monthly Performance Report
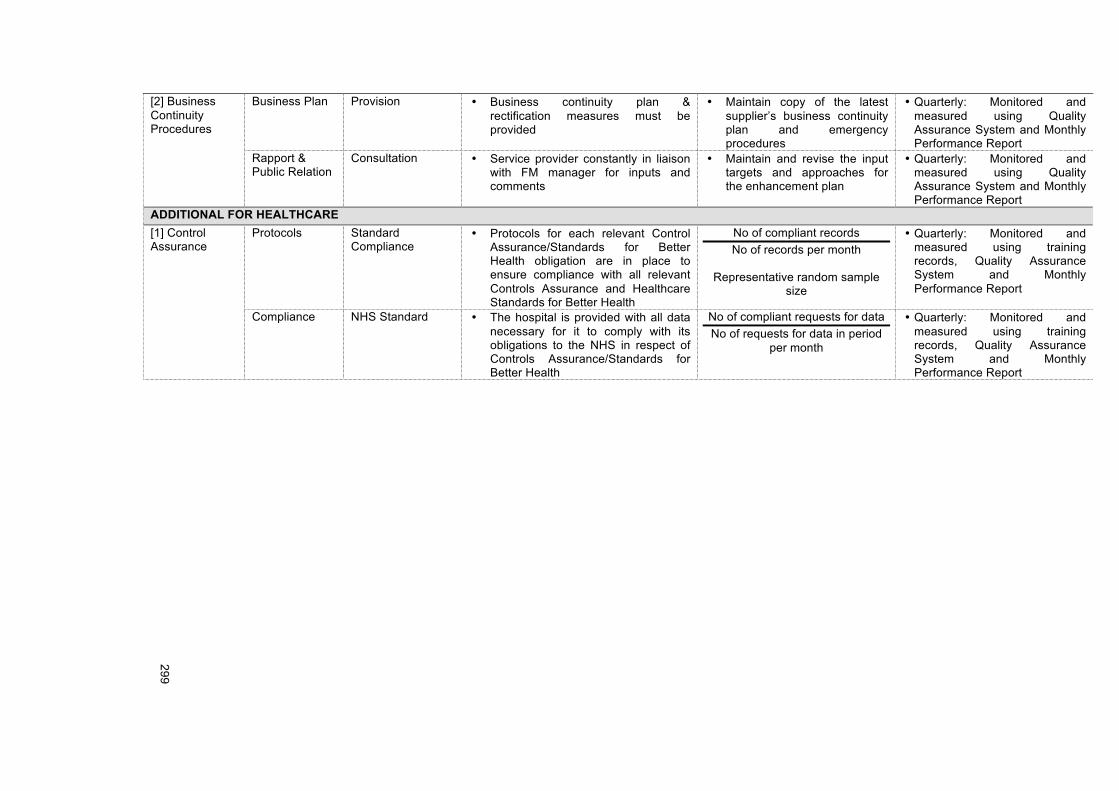
!!
299!
!
[2] Business Continuity Procedures
Business Plan Provision • Business continuity plan & rectification measures must be provided
• Maintain copy of the latest supplier’s business continuity plan and emergency procedures
• Quarterly: Monitored and measured using Quality Assurance System and Monthly Performance Report
Rapport & Public Relation
Consultation • Service provider constantly in liaison with FM manager for inputs and comments
• Maintain and revise the input targets and approaches for the enhancement plan
• Quarterly: Monitored and measured using Quality Assurance System and Monthly Performance Report
ADDITIONAL FOR HEALTHCARE [1] Control Assurance
Protocols Standard Compliance
• Protocols for each relevant Control Assurance/Standards for Better Health obligation are in place to ensure compliance with all relevant Controls Assurance and Healthcare Standards for Better Health
No of compliant records No of records per month
Representative random sample
size
• Quarterly: Monitored and measured using training records, Quality Assurance System and Monthly Performance Report
Compliance NHS Standard • The hospital is provided with all data necessary for it to comply with its obligations to the NHS in respect of Controls Assurance/Standards for Better Health
No of compliant requests for data No of requests for data in period
per month
• Quarterly: Monitored and measured using training records, Quality Assurance System and Monthly Performance Report
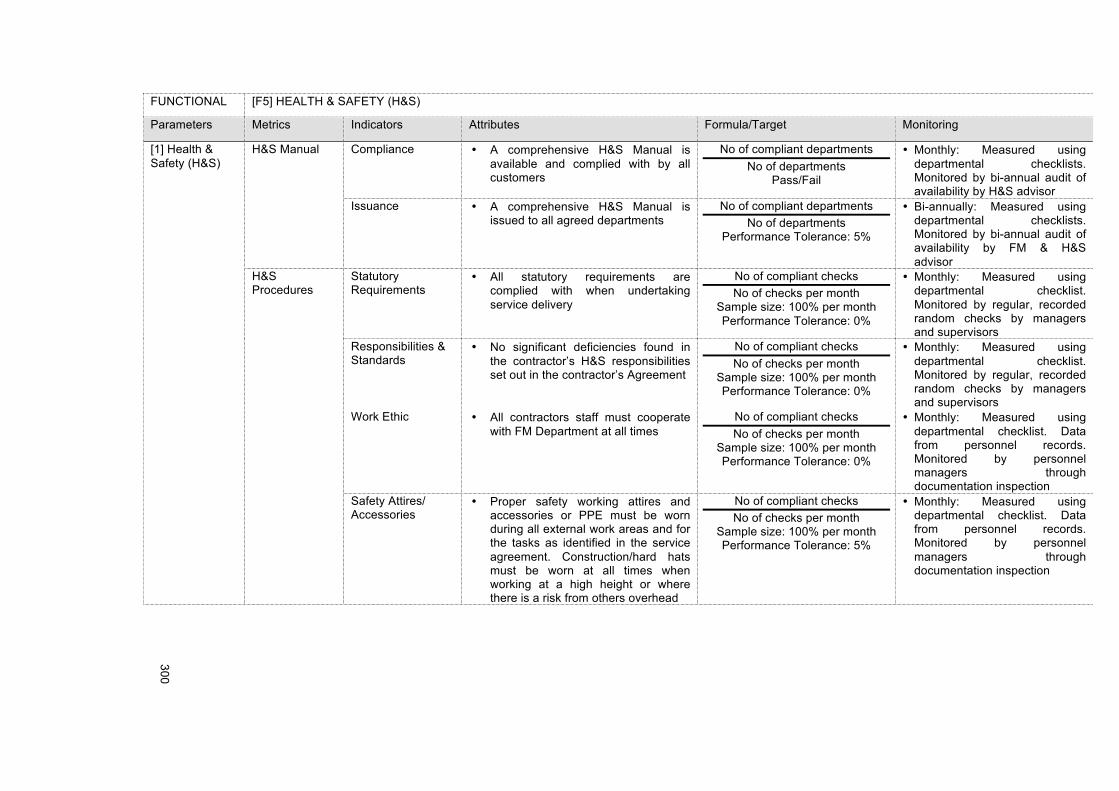
!!
300!
!
FUNCTIONAL [F5] HEALTH & SAFETY (H&S)
Parameters Metrics Indicators Attributes Formula/Target Monitoring
[1] Health & Safety (H&S)
H&S Manual Compliance • A comprehensive H&S Manual is available and complied with by all customers
No of compliant departments No of departments
Pass/Fail
• Monthly: Measured using departmental checklists. Monitored by bi-annual audit of availability by H&S advisor
Issuance • A comprehensive H&S Manual is issued to all agreed departments
No of compliant departments No of departments
Performance Tolerance: 5%
• Bi-annually: Measured using departmental checklists. Monitored by bi-annual audit of availability by FM & H&S advisor
H&S Procedures
Statutory Requirements
• All statutory requirements are complied with when undertaking service delivery
No of compliant checks No of checks per month
Sample size: 100% per month Performance Tolerance: 0%
• Monthly: Measured using departmental checklist. Monitored by regular, recorded random checks by managers and supervisors
Responsibilities & Standards
• No significant deficiencies found in the contractor’s H&S responsibilities set out in the contractor’s Agreement
No of compliant checks No of checks per month
Sample size: 100% per month Performance Tolerance: 0%
• Monthly: Measured using departmental checklist. Monitored by regular, recorded random checks by managers and supervisors
Work Ethic • All contractors staff must cooperate with FM Department at all times
No of compliant checks No of checks per month
Sample size: 100% per month Performance Tolerance: 0%
• Monthly: Measured using departmental checklist. Data from personnel records. Monitored by personnel managers through documentation inspection
Safety Attires/ Accessories
• Proper safety working attires and accessories or PPE must be worn during all external work areas and for the tasks as identified in the service agreement. Construction/hard hats must be worn at all times when working at a high height or where there is a risk from others overhead
No of compliant checks No of checks per month
Sample size: 100% per month Performance Tolerance: 5%
• Monthly: Measured using departmental checklist. Data from personnel records. Monitored by personnel managers through documentation inspection

!!
301!
!
Safety Rules • All staff should not try or breach any safety rules which will result in suspension or termination
No of compliant checks No of checks per month
Sample size: 100% per month Performance Tolerance: 0%
• Monthly: Measured using departmental checklist. Data from personnel records. Monitored by personnel managers through documentation inspection
Proof of Work • Contractors must be able to provide proof of qualification/certificates pertaining to special works, i.e. calibration, servicing of electrical equipment
No of compliant checks No of checks per month
Sample size: 100% per month Performance Tolerance: 0%
• Monthly: Measured using departmental checklist. Data from personnel records. Monitored by personnel managers through documentation inspection
Emergency & Evacuation Procedures
• Contractors must be aware and fully informed of the Emergency and Evacuation procedures
No of compliant checks No of checks per month
Sample size: 100% per month Performance Tolerance: 0%
• Monthly: Measured using departmental checklist. Data from personnel records. Monitored by personnel managers through documentation inspection
Incident Record • All incidents must be recorded and reported accordingly to the FM Department
Number of incidents actioned Total number of incidents per
week
• Monthly: Measured and monitored using incident report book
Provision of Signages
• All information and signages pertaining to the Emergency and Evacuation Procedures must be put in the designated areas or routes
No of compliant checks No of checks per month
Sample size: 100% per month Performance Tolerance: 0%
• Monthly: Measured using departmental checklist. Data from personnel records. Monitored by personnel managers through documentation inspection
First Aid Facilities • First aid equipment must be available at all times
No of compliant checks No of checks per month
Sample size: 100% per month Performance Tolerance: 0%
• Monthly: Measured using departmental checklist. Data from personnel records. Monitored by personnel managers through documentation inspection
H&S Training Training Records • All suppliers facilities staff are trained and trainings are recorded up-to-date
No of compliant checks No of checks per month
Sample size: 100% per month Performance Tolerance: 5%
• Monthly: Measured using departmental checklist. Data from personnel records. Monitored by personnel managers through documentation inspection
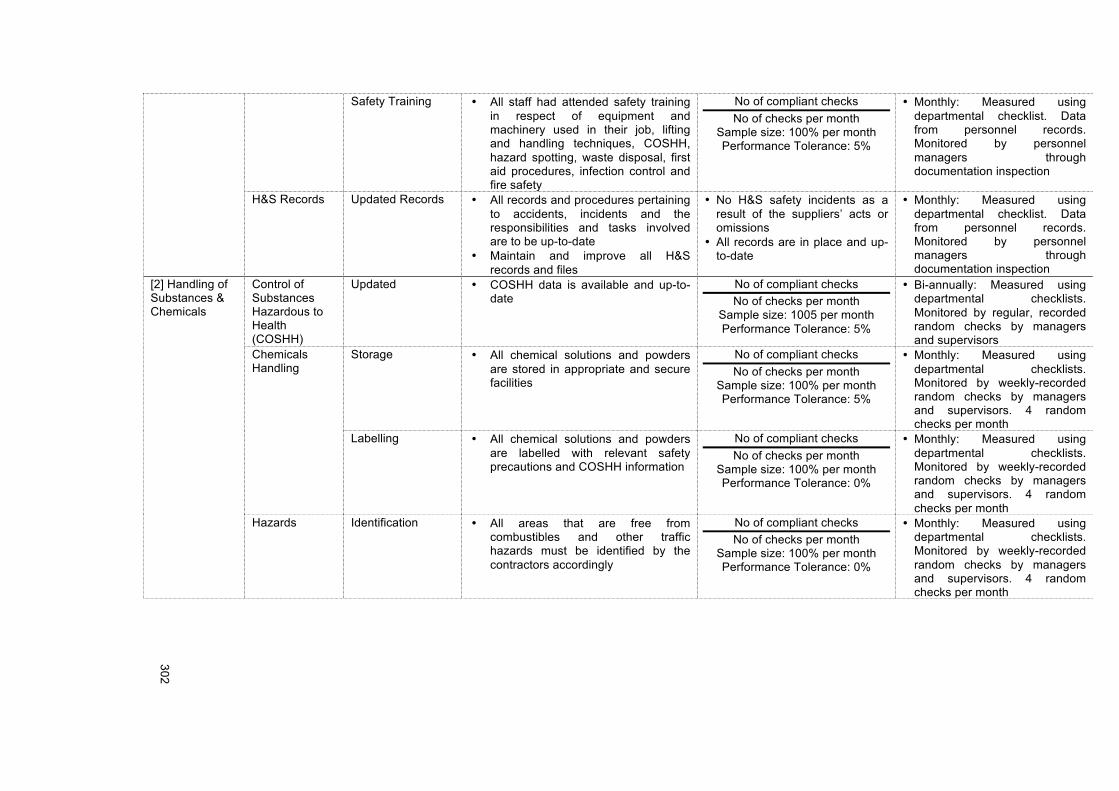
!!
302!
!
Safety Training • All staff had attended safety training in respect of equipment and machinery used in their job, lifting and handling techniques, COSHH, hazard spotting, waste disposal, first aid procedures, infection control and fire safety
No of compliant checks No of checks per month
Sample size: 100% per month Performance Tolerance: 5%
• Monthly: Measured using departmental checklist. Data from personnel records. Monitored by personnel managers through documentation inspection
H&S Records Updated Records • All records and procedures pertaining to accidents, incidents and the responsibilities and tasks involved are to be up-to-date
• Maintain and improve all H&S records and files
• No H&S safety incidents as a result of the suppliers’ acts or omissions
• All records are in place and up-to-date
• Monthly: Measured using departmental checklist. Data from personnel records. Monitored by personnel managers through documentation inspection
[2] Handling of Substances & Chemicals
Control of Substances Hazardous to Health (COSHH)
Updated • COSHH data is available and up-to-date
No of compliant checks No of checks per month
Sample size: 1005 per month Performance Tolerance: 5%
• Bi-annually: Measured using departmental checklists. Monitored by regular, recorded random checks by managers and supervisors
Chemicals Handling
Storage • All chemical solutions and powders are stored in appropriate and secure facilities
No of compliant checks No of checks per month
Sample size: 100% per month Performance Tolerance: 5%
• Monthly: Measured using departmental checklists. Monitored by weekly-recorded random checks by managers and supervisors. 4 random checks per month
Labelling • All chemical solutions and powders are labelled with relevant safety precautions and COSHH information
No of compliant checks No of checks per month
Sample size: 100% per month Performance Tolerance: 0%
• Monthly: Measured using departmental checklists. Monitored by weekly-recorded random checks by managers and supervisors. 4 random checks per month
Hazards Identification • All areas that are free from combustibles and other traffic hazards must be identified by the contractors accordingly
No of compliant checks No of checks per month
Sample size: 100% per month Performance Tolerance: 0%
• Monthly: Measured using departmental checklists. Monitored by weekly-recorded random checks by managers and supervisors. 4 random checks per month
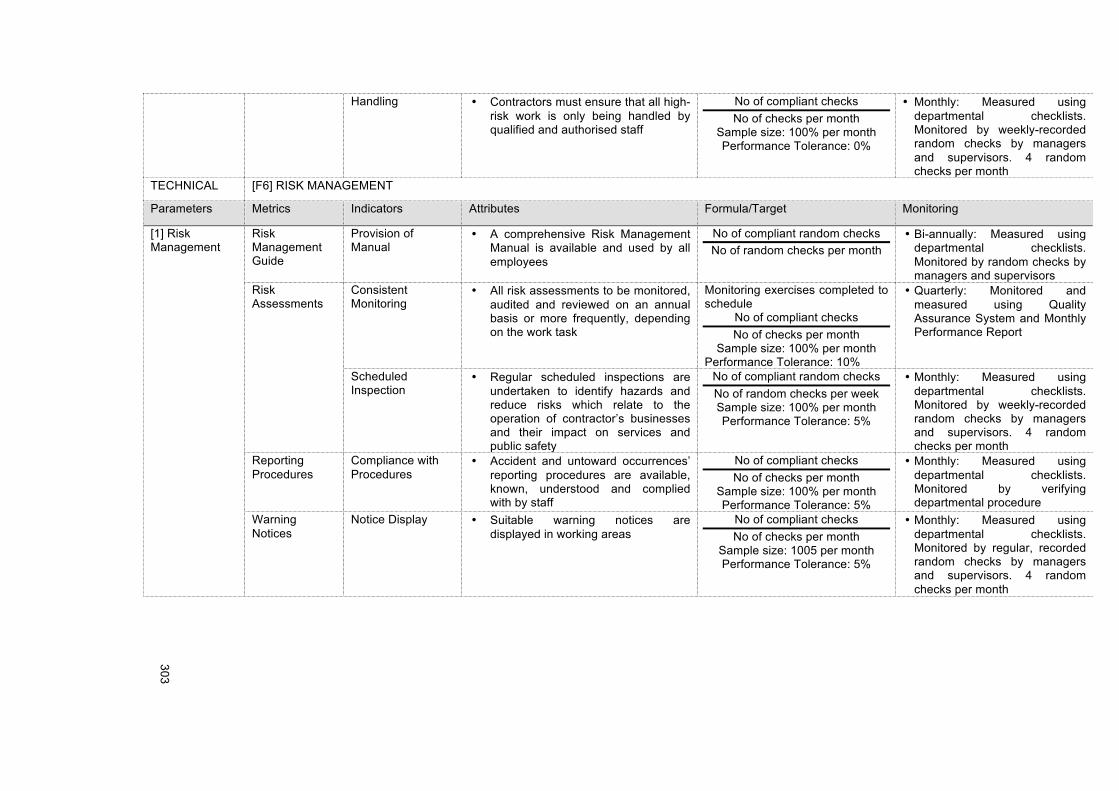
!!
303!
!
Handling • Contractors must ensure that all high-risk work is only being handled by qualified and authorised staff
No of compliant checks No of checks per month
Sample size: 100% per month Performance Tolerance: 0%
• Monthly: Measured using departmental checklists. Monitored by weekly-recorded random checks by managers and supervisors. 4 random checks per month
TECHNICAL [F6] RISK MANAGEMENT
Parameters Metrics Indicators Attributes Formula/Target Monitoring
[1] Risk Management
Risk Management Guide
Provision of Manual
• A comprehensive Risk Management Manual is available and used by all employees
No of compliant random checks No of random checks per month
• Bi-annually: Measured using departmental checklists. Monitored by random checks by managers and supervisors
Risk Assessments
Consistent Monitoring
• All risk assessments to be monitored, audited and reviewed on an annual basis or more frequently, depending on the work task
Monitoring exercises completed to schedule
No of compliant checks No of checks per month
Sample size: 100% per month Performance Tolerance: 10%
• Quarterly: Monitored and measured using Quality Assurance System and Monthly Performance Report
Scheduled Inspection
• Regular scheduled inspections are undertaken to identify hazards and reduce risks which relate to the operation of contractor’s businesses and their impact on services and public safety
No of compliant random checks No of random checks per week Sample size: 100% per month Performance Tolerance: 5%
• Monthly: Measured using departmental checklists. Monitored by weekly-recorded random checks by managers and supervisors. 4 random checks per month
Reporting Procedures
Compliance with Procedures
• Accident and untoward occurrences’ reporting procedures are available, known, understood and complied with by staff
No of compliant checks No of checks per month
Sample size: 100% per month Performance Tolerance: 5%
• Monthly: Measured using departmental checklists. Monitored by verifying departmental procedure
Warning Notices
Notice Display • Suitable warning notices are displayed in working areas
No of compliant checks No of checks per month
Sample size: 1005 per month Performance Tolerance: 5%
• Monthly: Measured using departmental checklists. Monitored by regular, recorded random checks by managers and supervisors. 4 random checks per month
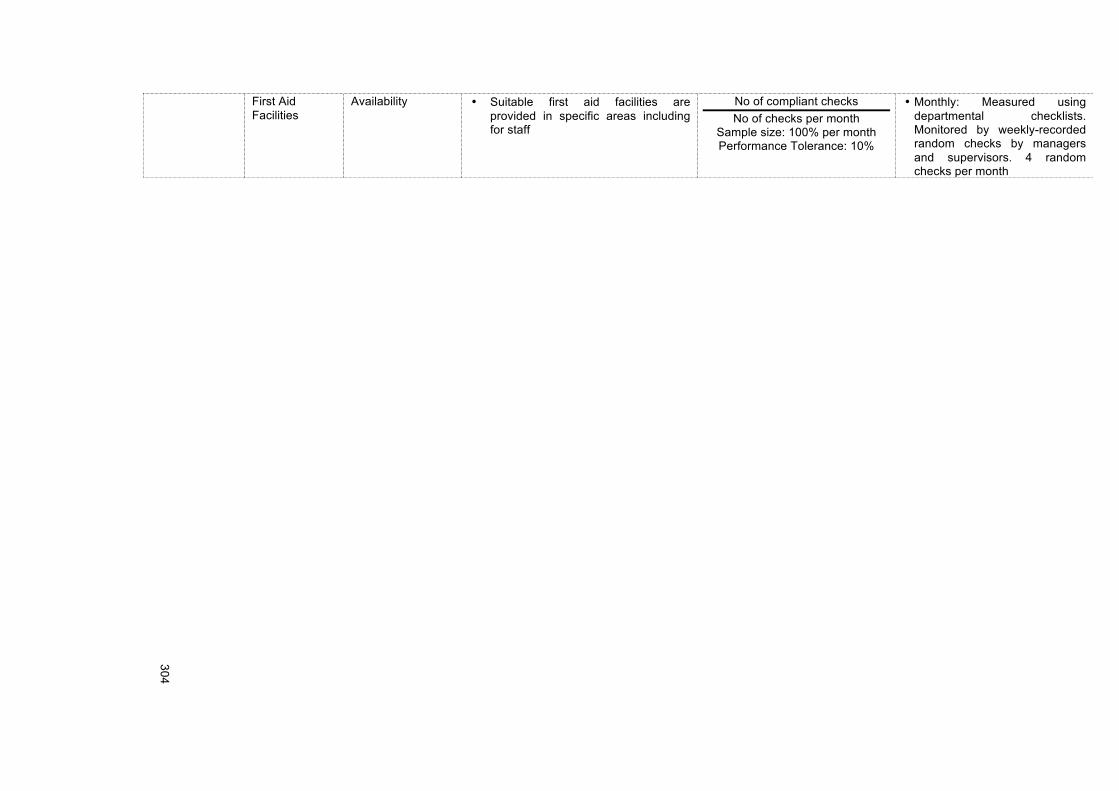
!!
304!
!
First Aid Facilities
Availability • Suitable first aid facilities are provided in specific areas including for staff
No of compliant checks No of checks per month
Sample size: 100% per month Performance Tolerance: 10%
• Monthly: Measured using departmental checklists. Monitored by weekly-recorded random checks by managers and supervisors. 4 random checks per month
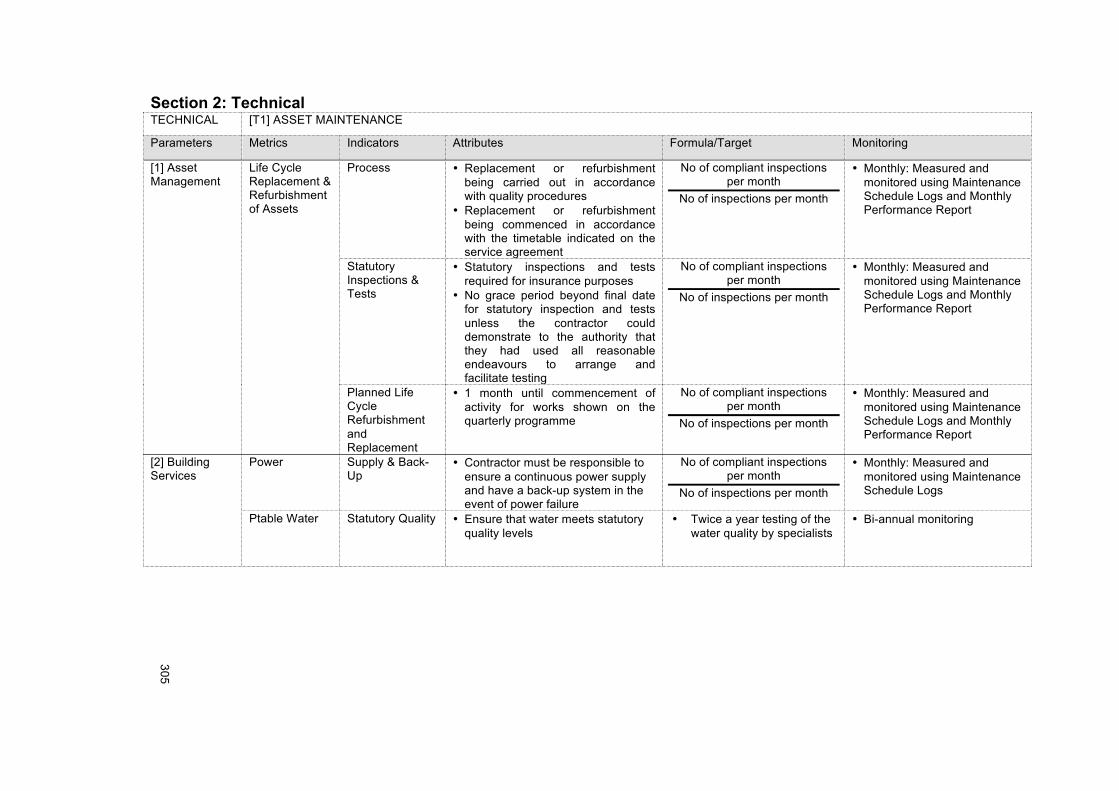
!!
305!
!
Section 2: Technical TECHNICAL [T1] ASSET MAINTENANCE
Parameters Metrics Indicators Attributes Formula/Target Monitoring
[1] Asset Management
Life Cycle Replacement & Refurbishment of Assets
Process • Replacement or refurbishment being carried out in accordance with quality procedures
• Replacement or refurbishment being commenced in accordance with the timetable indicated on the service agreement
No of compliant inspections per month
No of inspections per month
• Monthly: Measured and monitored using Maintenance Schedule Logs and Monthly Performance Report
Statutory Inspections & Tests
• Statutory inspections and tests required for insurance purposes
• No grace period beyond final date for statutory inspection and tests unless the contractor could demonstrate to the authority that they had used all reasonable endeavours to arrange and facilitate testing
No of compliant inspections per month
No of inspections per month
• Monthly: Measured and monitored using Maintenance Schedule Logs and Monthly Performance Report
Planned Life Cycle Refurbishment and Replacement
• 1 month until commencement of activity for works shown on the quarterly programme
No of compliant inspections per month
No of inspections per month
• Monthly: Measured and monitored using Maintenance Schedule Logs and Monthly Performance Report
[2] Building Services
Power Supply & Back- Up
• Contractor must be responsible to ensure a continuous power supply and have a back-up system in the event of power failure
No of compliant inspections per month
No of inspections per month
• Monthly: Measured and monitored using Maintenance Schedule Logs
Ptable Water Statutory Quality • Ensure that water meets statutory quality levels
• Twice a year testing of the water quality by specialists
• Bi-annual monitoring
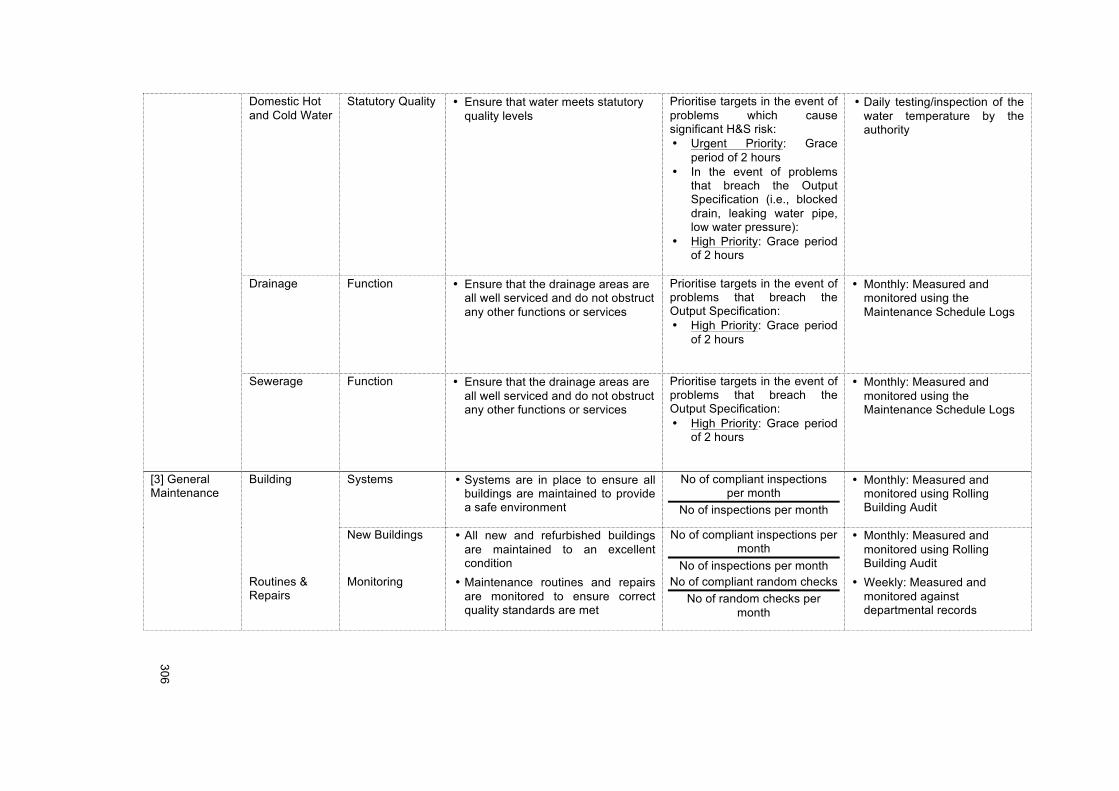
!!
306!
!
Domestic Hot and Cold Water
Statutory Quality • Ensure that water meets statutory quality levels
Prioritise targets in the event of problems which cause significant H&S risk: • Urgent Priority: Grace
period of 2 hours • In the event of problems
that breach the Output Specification (i.e., blocked drain, leaking water pipe, low water pressure):
• High Priority: Grace period of 2 hours
• Daily testing/inspection of the water temperature by the authority
Drainage Function • Ensure that the drainage areas are all well serviced and do not obstruct any other functions or services
Prioritise targets in the event of problems that breach the Output Specification: • High Priority: Grace period
of 2 hours
• Monthly: Measured and monitored using the Maintenance Schedule Logs
Sewerage Function • Ensure that the drainage areas are all well serviced and do not obstruct any other functions or services
Prioritise targets in the event of problems that breach the Output Specification: • High Priority: Grace period
of 2 hours
• Monthly: Measured and monitored using the Maintenance Schedule Logs
[3] General Maintenance
Building Systems • Systems are in place to ensure all buildings are maintained to provide a safe environment
No of compliant inspections per month
No of inspections per month
• Monthly: Measured and monitored using Rolling Building Audit
New Buildings • All new and refurbished buildings are maintained to an excellent condition
No of compliant inspections per month
No of inspections per month
• Monthly: Measured and monitored using Rolling Building Audit
Routines & Repairs
Monitoring • Maintenance routines and repairs are monitored to ensure correct quality standards are met
No of compliant random checks No of random checks per
month
• Weekly: Measured and monitored against departmental records
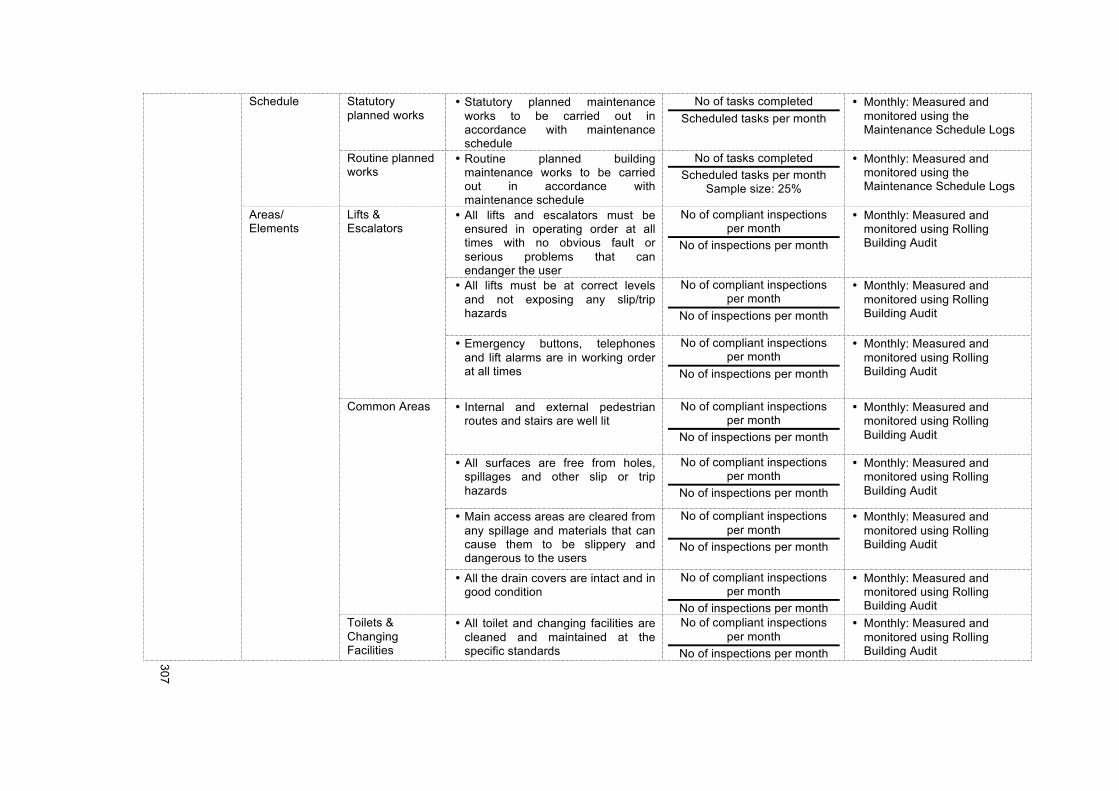
!!
307!
!
Schedule Statutory planned works
• Statutory planned maintenance works to be carried out in accordance with maintenance schedule
No of tasks completed Scheduled tasks per month
• Monthly: Measured and monitored using the Maintenance Schedule Logs
Routine planned works
• Routine planned building maintenance works to be carried out in accordance with maintenance schedule
No of tasks completed Scheduled tasks per month
Sample size: 25%
• Monthly: Measured and monitored using the Maintenance Schedule Logs
Areas/ Elements
Lifts & Escalators
• All lifts and escalators must be ensured in operating order at all times with no obvious fault or serious problems that can endanger the user
No of compliant inspections per month
No of inspections per month
• Monthly: Measured and monitored using Rolling Building Audit
• All lifts must be at correct levels and not exposing any slip/trip hazards
No of compliant inspections per month
No of inspections per month
• Monthly: Measured and monitored using Rolling Building Audit
• Emergency buttons, telephones and lift alarms are in working order at all times
No of compliant inspections per month
No of inspections per month
• Monthly: Measured and monitored using Rolling Building Audit
Common Areas • Internal and external pedestrian routes and stairs are well lit
No of compliant inspections per month
No of inspections per month
• Monthly: Measured and monitored using Rolling Building Audit
• All surfaces are free from holes, spillages and other slip or trip hazards
No of compliant inspections per month
No of inspections per month
• Monthly: Measured and monitored using Rolling Building Audit
• Main access areas are cleared from any spillage and materials that can cause them to be slippery and dangerous to the users
No of compliant inspections per month
No of inspections per month
• Monthly: Measured and monitored using Rolling Building Audit
• All the drain covers are intact and in good condition
No of compliant inspections per month
No of inspections per month
• Monthly: Measured and monitored using Rolling Building Audit
Toilets & Changing Facilities
• All toilet and changing facilities are cleaned and maintained at the specific standards
No of compliant inspections per month
No of inspections per month
• Monthly: Measured and monitored using Rolling Building Audit
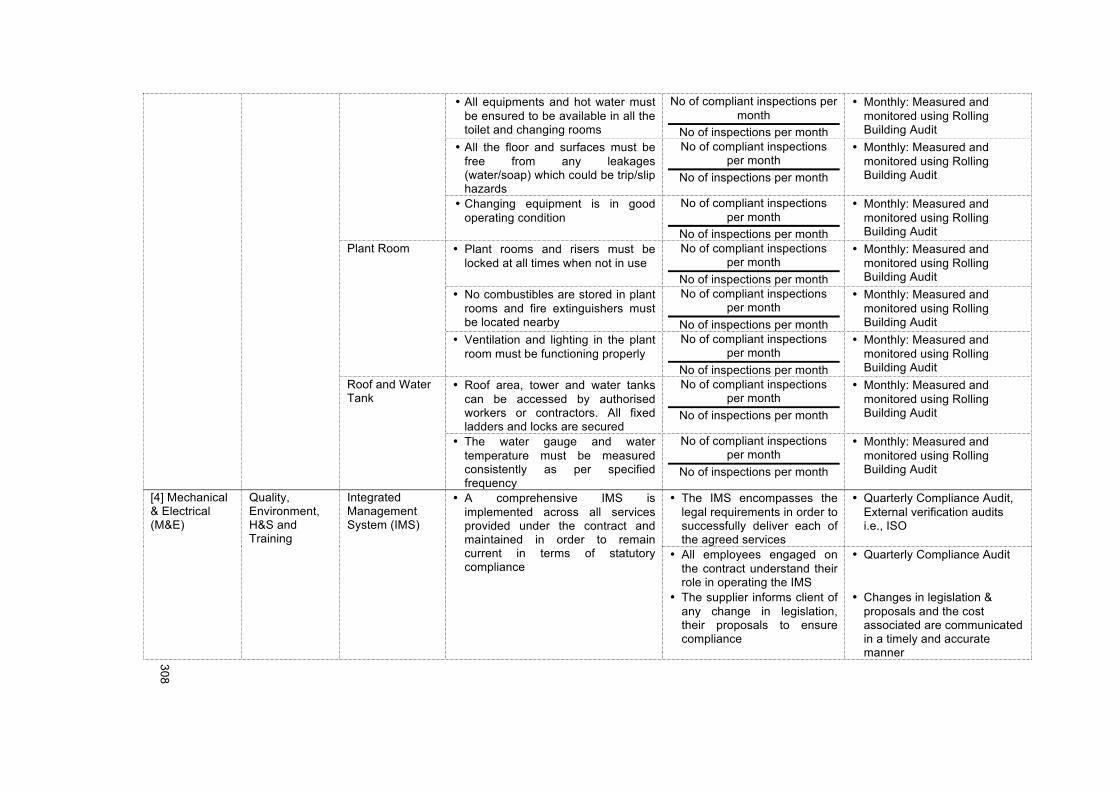
!!
308!
!
• All equipments and hot water must be ensured to be available in all the toilet and changing rooms
No of compliant inspections per month
No of inspections per month
• Monthly: Measured and monitored using Rolling Building Audit
• All the floor and surfaces must be free from any leakages (water/soap) which could be trip/slip hazards
No of compliant inspections per month
No of inspections per month
• Monthly: Measured and monitored using Rolling Building Audit
• Changing equipment is in good operating condition
No of compliant inspections per month
No of inspections per month
• Monthly: Measured and monitored using Rolling Building Audit
Plant Room • Plant rooms and risers must be locked at all times when not in use
No of compliant inspections per month
No of inspections per month
• Monthly: Measured and monitored using Rolling Building Audit
• No combustibles are stored in plant rooms and fire extinguishers must be located nearby
No of compliant inspections per month
No of inspections per month
• Monthly: Measured and monitored using Rolling Building Audit
• Ventilation and lighting in the plant room must be functioning properly
No of compliant inspections per month
No of inspections per month
• Monthly: Measured and monitored using Rolling Building Audit
Roof and Water Tank
• Roof area, tower and water tanks can be accessed by authorised workers or contractors. All fixed ladders and locks are secured
No of compliant inspections per month
No of inspections per month
• Monthly: Measured and monitored using Rolling Building Audit
• The water gauge and water temperature must be measured consistently as per specified frequency
No of compliant inspections per month
No of inspections per month
• Monthly: Measured and monitored using Rolling Building Audit
[4] Mechanical & Electrical (M&E)
Quality, Environment, H&S and Training
Integrated Management System (IMS)
• A comprehensive IMS is implemented across all services provided under the contract and maintained in order to remain current in terms of statutory compliance
• The IMS encompasses the legal requirements in order to successfully deliver each of the agreed services
• Quarterly Compliance Audit, External verification audits i.e., ISO
• All employees engaged on the contract understand their role in operating the IMS
• Quarterly Compliance Audit
• The supplier informs client of any change in legislation, their proposals to ensure compliance
• Changes in legislation & proposals and the cost associated are communicated in a timely and accurate manner
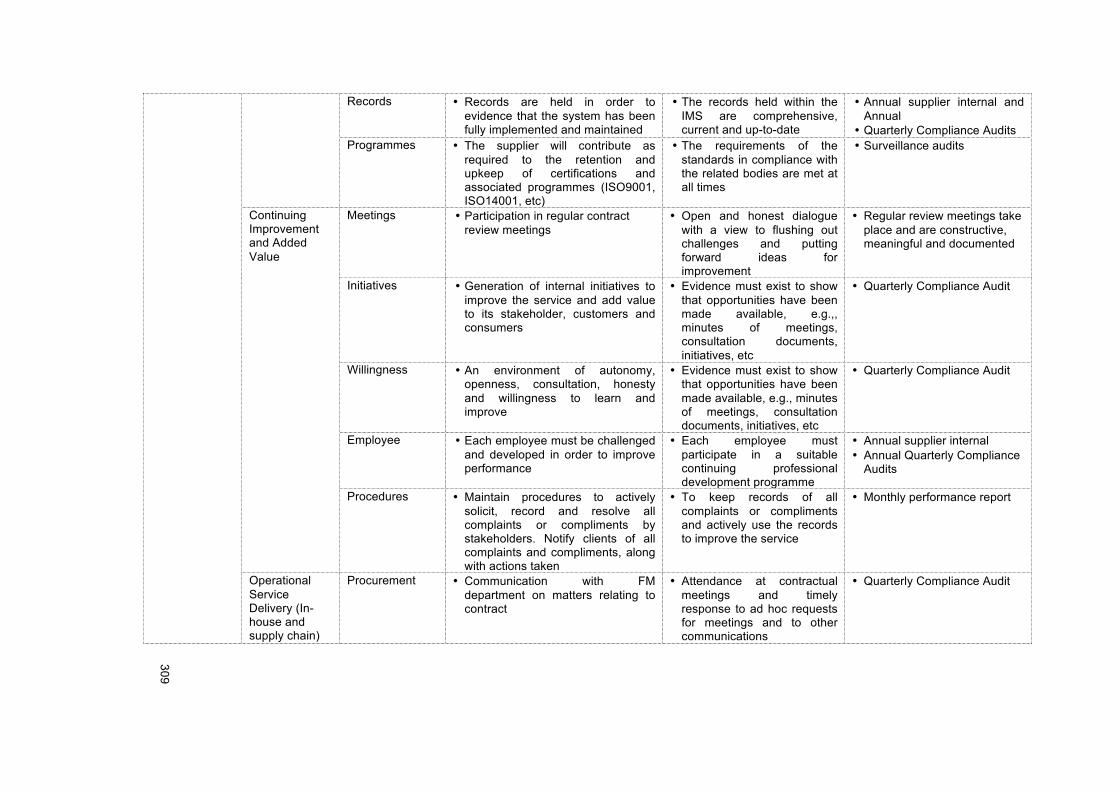
!!
309!
!
Records • Records are held in order to evidence that the system has been fully implemented and maintained
• The records held within the IMS are comprehensive, current and up-to-date
• Annual supplier internal and Annual
• Quarterly Compliance Audits Programmes • The supplier will contribute as
required to the retention and upkeep of certifications and associated programmes (ISO9001, ISO14001, etc)
• The requirements of the standards in compliance with the related bodies are met at all times
• Surveillance audits
Continuing Improvement and Added Value
Meetings • Participation in regular contract review meetings
• Open and honest dialogue with a view to flushing out challenges and putting forward ideas for improvement
• Regular review meetings take place and are constructive, meaningful and documented
Initiatives • Generation of internal initiatives to improve the service and add value to its stakeholder, customers and consumers
• Evidence must exist to show that opportunities have been made available, e.g.,, minutes of meetings, consultation documents, initiatives, etc
• Quarterly Compliance Audit
Willingness • An environment of autonomy, openness, consultation, honesty and willingness to learn and improve
• Evidence must exist to show that opportunities have been made available, e.g., minutes of meetings, consultation documents, initiatives, etc
• Quarterly Compliance Audit
Employee • Each employee must be challenged and developed in order to improve performance
• Each employee must participate in a suitable continuing professional development programme
• Annual supplier internal • Annual Quarterly Compliance
Audits
Procedures • Maintain procedures to actively solicit, record and resolve all complaints or compliments by stakeholders. Notify clients of all complaints and compliments, along with actions taken
• To keep records of all complaints or compliments and actively use the records to improve the service
• Monthly performance report
Operational Service Delivery (In-house and supply chain)
Procurement • Communication with FM department on matters relating to contract
• Attendance at contractual meetings and timely response to ad hoc requests for meetings and to other communications
• Quarterly Compliance Audit
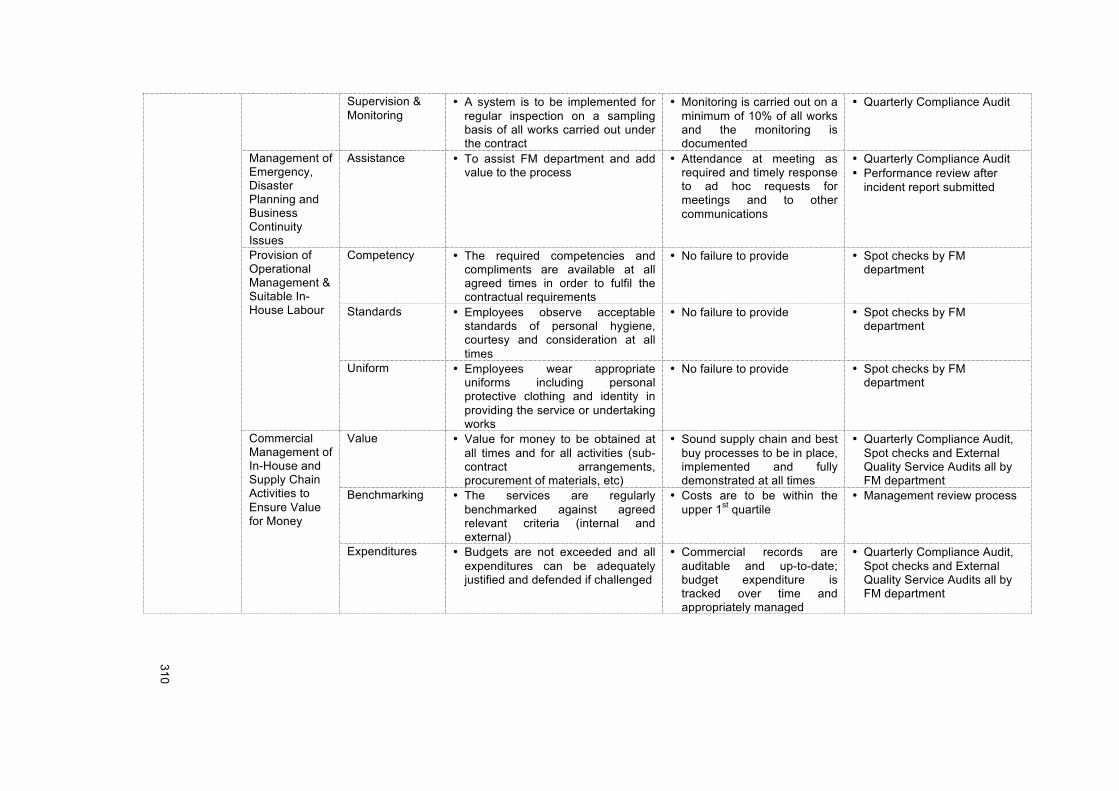
!!
310!
!
Supervision & Monitoring
• A system is to be implemented for regular inspection on a sampling basis of all works carried out under the contract
• Monitoring is carried out on a minimum of 10% of all works and the monitoring is documented
• Quarterly Compliance Audit
Management of Emergency, Disaster Planning and Business Continuity Issues
Assistance • To assist FM department and add value to the process
• Attendance at meeting as required and timely response to ad hoc requests for meetings and to other communications
• Quarterly Compliance Audit • Performance review after
incident report submitted
Provision of Operational Management & Suitable In-House Labour
Competency • The required competencies and compliments are available at all agreed times in order to fulfil the contractual requirements
• No failure to provide • Spot checks by FM department
Standards • Employees observe acceptable standards of personal hygiene, courtesy and consideration at all times
• No failure to provide • Spot checks by FM department
Uniform • Employees wear appropriate uniforms including personal protective clothing and identity in providing the service or undertaking works
• No failure to provide • Spot checks by FM department
Commercial Management of In-House and Supply Chain Activities to Ensure Value for Money
Value • Value for money to be obtained at all times and for all activities (sub-contract arrangements, procurement of materials, etc)
• Sound supply chain and best buy processes to be in place, implemented and fully demonstrated at all times
• Quarterly Compliance Audit, Spot checks and External Quality Service Audits all by FM department
Benchmarking • The services are regularly benchmarked against agreed relevant criteria (internal and external)
• Costs are to be within the upper 1st quartile
• Management review process
Expenditures • Budgets are not exceeded and all expenditures can be adequately justified and defended if challenged
• Commercial records are auditable and up-to-date; budget expenditure is tracked over time and appropriately managed
• Quarterly Compliance Audit, Spot checks and External Quality Service Audits all by FM department
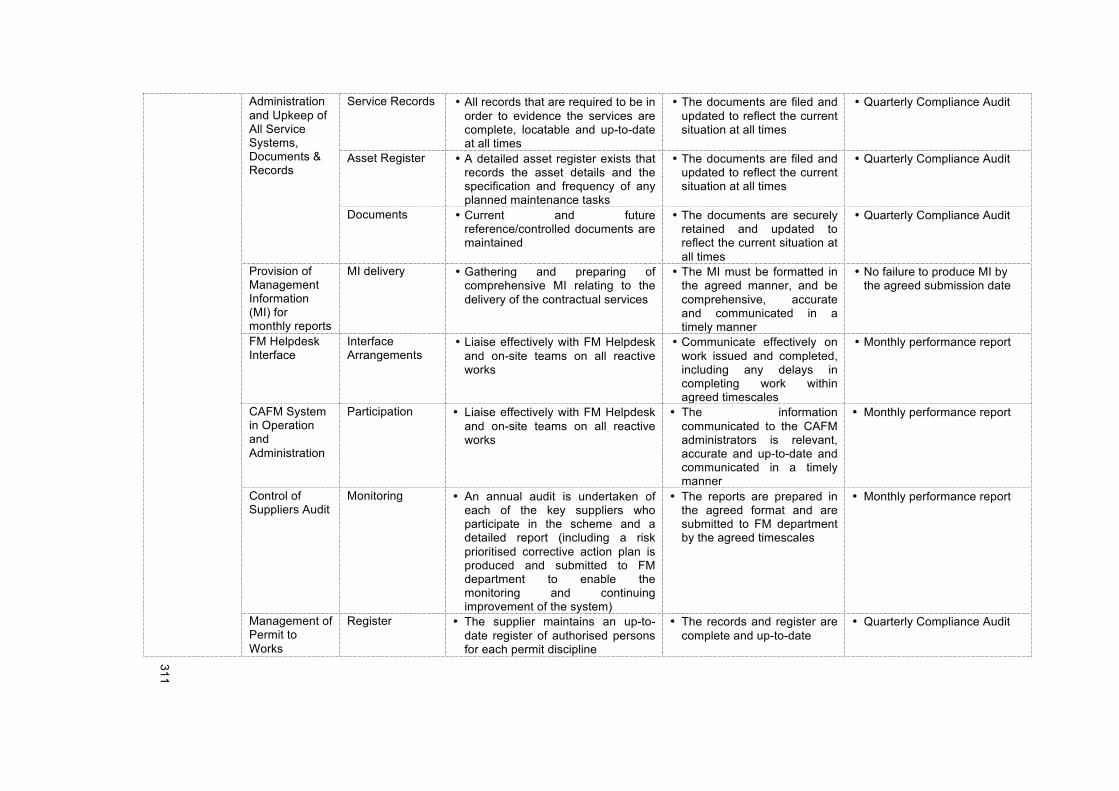
!!
311!
!
Administration and Upkeep of All Service Systems, Documents & Records
Service Records • All records that are required to be in order to evidence the services are complete, locatable and up-to-date at all times
• The documents are filed and updated to reflect the current situation at all times
• Quarterly Compliance Audit
Asset Register • A detailed asset register exists that records the asset details and the specification and frequency of any planned maintenance tasks
• The documents are filed and updated to reflect the current situation at all times
• Quarterly Compliance Audit
Documents • Current and future reference/controlled documents are maintained
• The documents are securely retained and updated to reflect the current situation at all times
• Quarterly Compliance Audit
Provision of Management Information (MI) for monthly reports
MI delivery • Gathering and preparing of comprehensive MI relating to the delivery of the contractual services
• The MI must be formatted in the agreed manner, and be comprehensive, accurate and communicated in a timely manner
• No failure to produce MI by the agreed submission date
FM Helpdesk Interface
Interface Arrangements
• Liaise effectively with FM Helpdesk and on-site teams on all reactive works
• Communicate effectively on work issued and completed, including any delays in completing work within agreed timescales
• Monthly performance report
CAFM System in Operation and Administration
Participation • Liaise effectively with FM Helpdesk and on-site teams on all reactive works
• The information communicated to the CAFM administrators is relevant, accurate and up-to-date and communicated in a timely manner
• Monthly performance report
Control of Suppliers Audit
Monitoring • An annual audit is undertaken of each of the key suppliers who participate in the scheme and a detailed report (including a risk prioritised corrective action plan is produced and submitted to FM department to enable the monitoring and continuing improvement of the system)
• The reports are prepared in the agreed format and are submitted to FM department by the agreed timescales
• Monthly performance report
Management of Permit to Works
Register • The supplier maintains an up-to-date register of authorised persons for each permit discipline
• The records and register are complete and up-to-date
• Quarterly Compliance Audit!
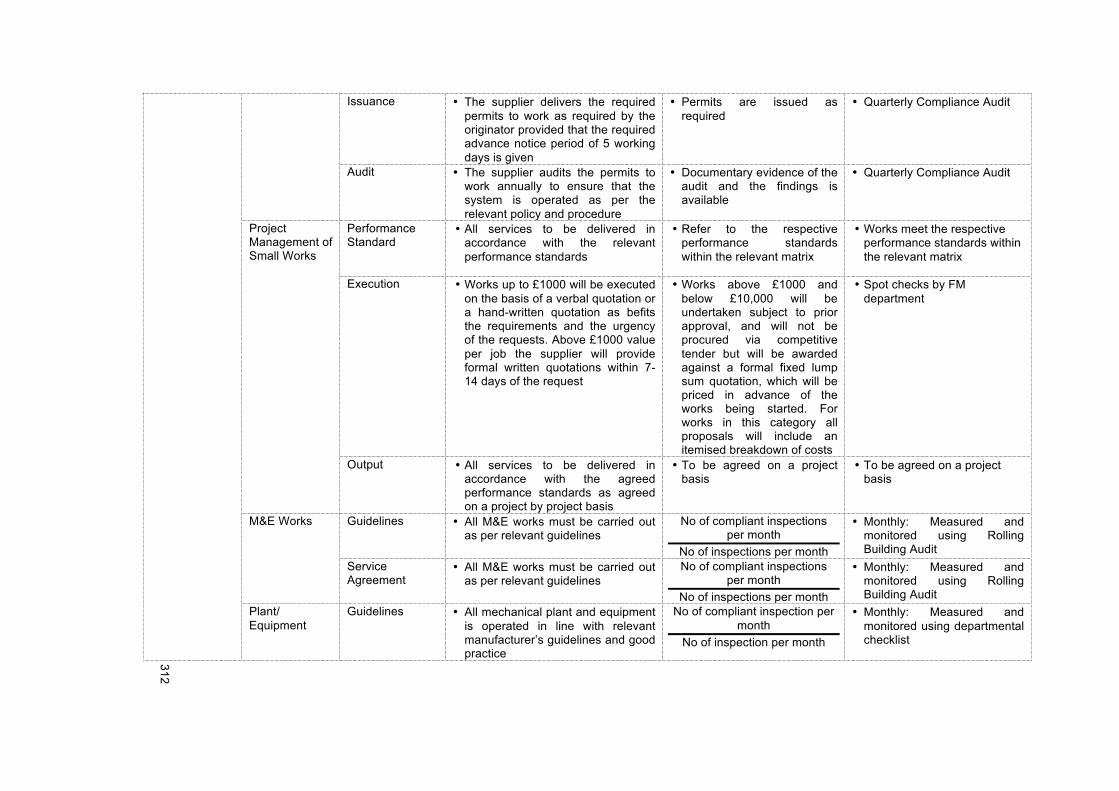
!!
312!
!
Issuance • The supplier delivers the required permits to work as required by the originator provided that the required advance notice period of 5 working days is given
• Permits are issued as required
• Quarterly Compliance Audit!
Audit • The supplier audits the permits to work annually to ensure that the system is operated as per the relevant policy and procedure
• Documentary evidence of the audit and the findings is available
• Quarterly Compliance Audit!
Project Management of Small Works
Performance Standard
• All services to be delivered in accordance with the relevant performance standards
• Refer to the respective performance standards within the relevant matrix
• Works meet the respective performance standards within the relevant matrix
Execution • Works up to £1000 will be executed on the basis of a verbal quotation or a hand-written quotation as befits the requirements and the urgency of the requests. Above £1000 value per job the supplier will provide formal written quotations within 7-14 days of the request
• Works above £1000 and below £10,000 will be undertaken subject to prior approval, and will not be procured via competitive tender but will be awarded against a formal fixed lump sum quotation, which will be priced in advance of the works being started. For works in this category all proposals will include an itemised breakdown of costs
• Spot checks by FM department
Output • All services to be delivered in accordance with the agreed performance standards as agreed on a project by project basis
• To be agreed on a project basis
• To be agreed on a project basis
M&E Works Guidelines • All M&E works must be carried out as per relevant guidelines
No of compliant inspections per month
No of inspections per month
• Monthly: Measured and monitored using Rolling Building Audit
Service Agreement
• All M&E works must be carried out as per relevant guidelines
No of compliant inspections per month
No of inspections per month
• Monthly: Measured and monitored using Rolling Building Audit
Plant/ Equipment
Guidelines • All mechanical plant and equipment is operated in line with relevant manufacturer’s guidelines and good practice
No of compliant inspection per month
No of inspection per month
• Monthly: Measured and monitored using departmental checklist
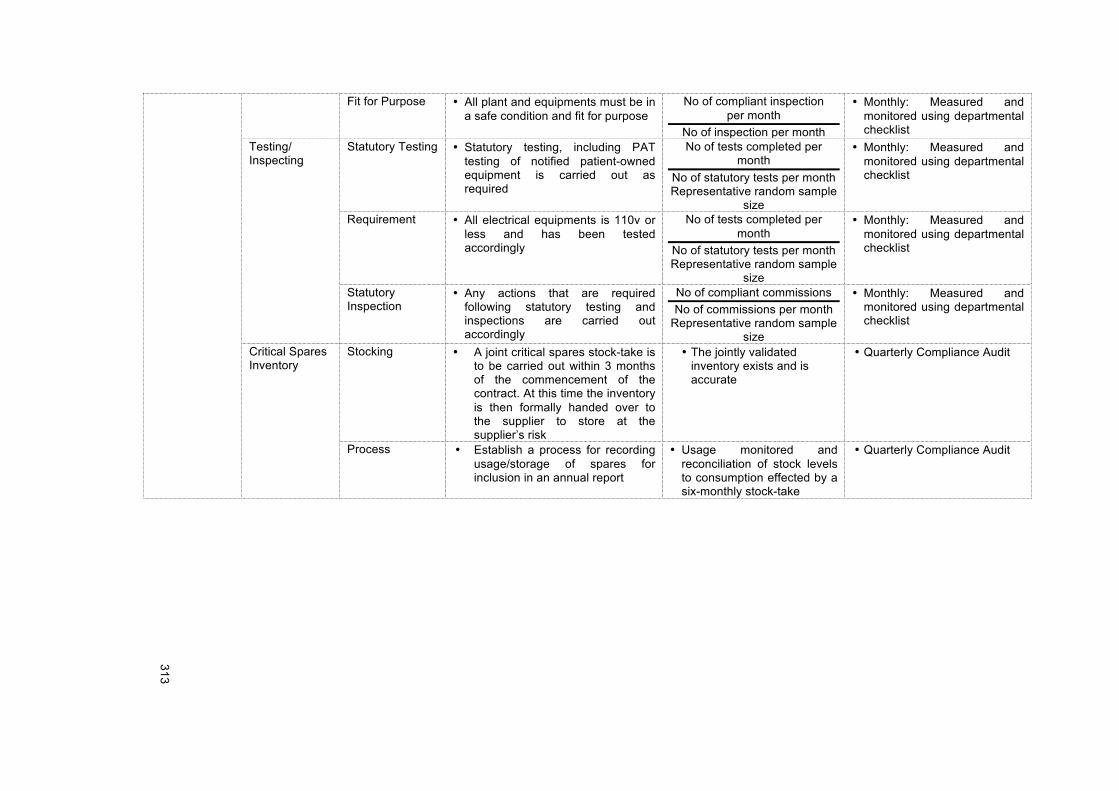
!!
313!
!
Fit for Purpose • All plant and equipments must be in a safe condition and fit for purpose
No of compliant inspection per month
No of inspection per month
• Monthly: Measured and monitored using departmental checklist
Testing/ Inspecting
Statutory Testing • Statutory testing, including PAT testing of notified patient-owned equipment is carried out as required
No of tests completed per month
No of statutory tests per month Representative random sample
size
• Monthly: Measured and monitored using departmental checklist
Requirement • All electrical equipments is 110v or less and has been tested accordingly
No of tests completed per month
No of statutory tests per month Representative random sample
size
• Monthly: Measured and monitored using departmental checklist
Statutory Inspection
• Any actions that are required following statutory testing and inspections are carried out accordingly
No of compliant commissions No of commissions per month
Representative random sample size
• Monthly: Measured and monitored using departmental checklist
Critical Spares Inventory
Stocking • A joint critical spares stock-take is to be carried out within 3 months of the commencement of the contract. At this time the inventory is then formally handed over to the supplier to store at the supplier’s risk
• The jointly validated inventory exists and is accurate
• Quarterly Compliance Audit
Process • Establish a process for recording usage/storage of spares for inclusion in an annual report
• Usage monitored and reconciliation of stock levels to consumption effected by a six-monthly stock-take
• Quarterly Compliance Audit
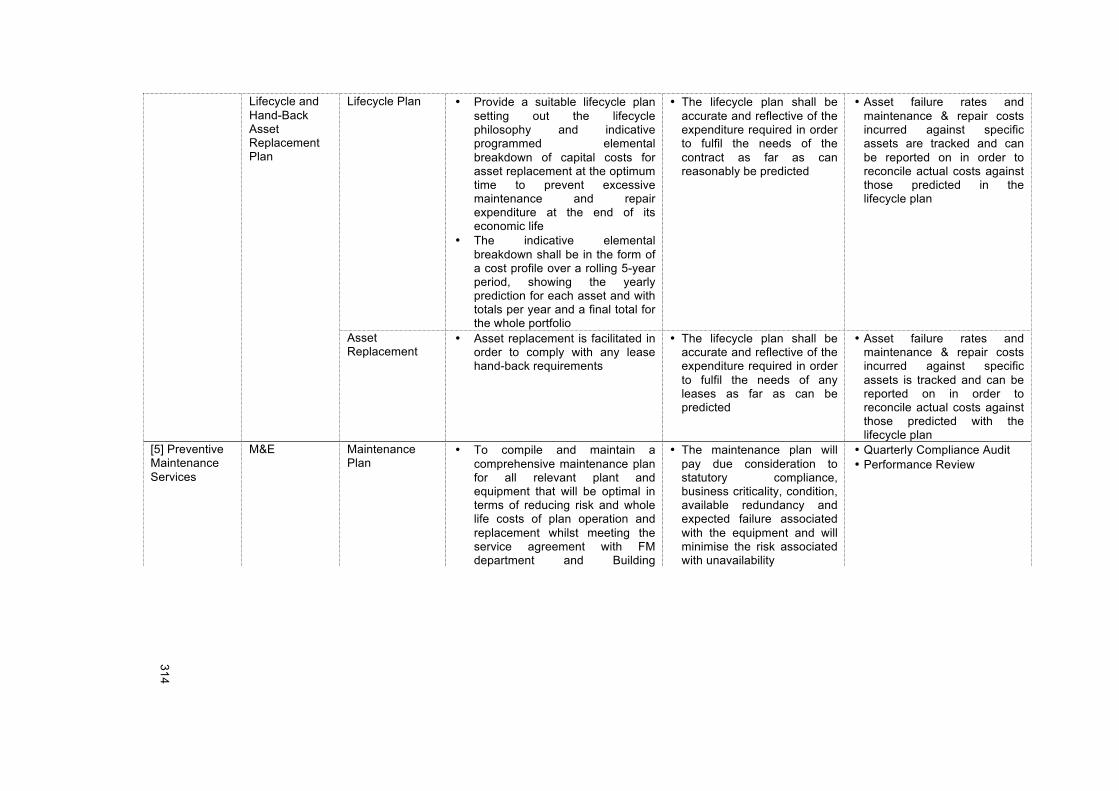
!!
314!
!
Lifecycle and Hand-Back Asset Replacement Plan
Lifecycle Plan • Provide a suitable lifecycle plan setting out the lifecycle philosophy and indicative programmed elemental breakdown of capital costs for asset replacement at the optimum time to prevent excessive maintenance and repair expenditure at the end of its economic life
• The indicative elemental breakdown shall be in the form of a cost profile over a rolling 5-year period, showing the yearly prediction for each asset and with totals per year and a final total for the whole portfolio
• The lifecycle plan shall be accurate and reflective of the expenditure required in order to fulfil the needs of the contract as far as can reasonably be predicted
• Asset failure rates and maintenance & repair costs incurred against specific assets are tracked and can be reported on in order to reconcile actual costs against those predicted in the lifecycle plan
Asset Replacement
• Asset replacement is facilitated in order to comply with any lease hand-back requirements
• The lifecycle plan shall be accurate and reflective of the expenditure required in order to fulfil the needs of any leases as far as can be predicted
• Asset failure rates and maintenance & repair costs incurred against specific assets is tracked and can be reported on in order to reconcile actual costs against those predicted with the lifecycle plan
[5] Preventive Maintenance Services
M&E Maintenance Plan
• To compile and maintain a comprehensive maintenance plan for all relevant plant and equipment that will be optimal in terms of reducing risk and whole life costs of plan operation and replacement whilst meeting the service agreement with FM department and Building
• The maintenance plan will pay due consideration to statutory compliance, business criticality, condition, available redundancy and expected failure associated with the equipment and will minimise the risk associated with unavailability
• Quarterly Compliance Audit • Performance Review
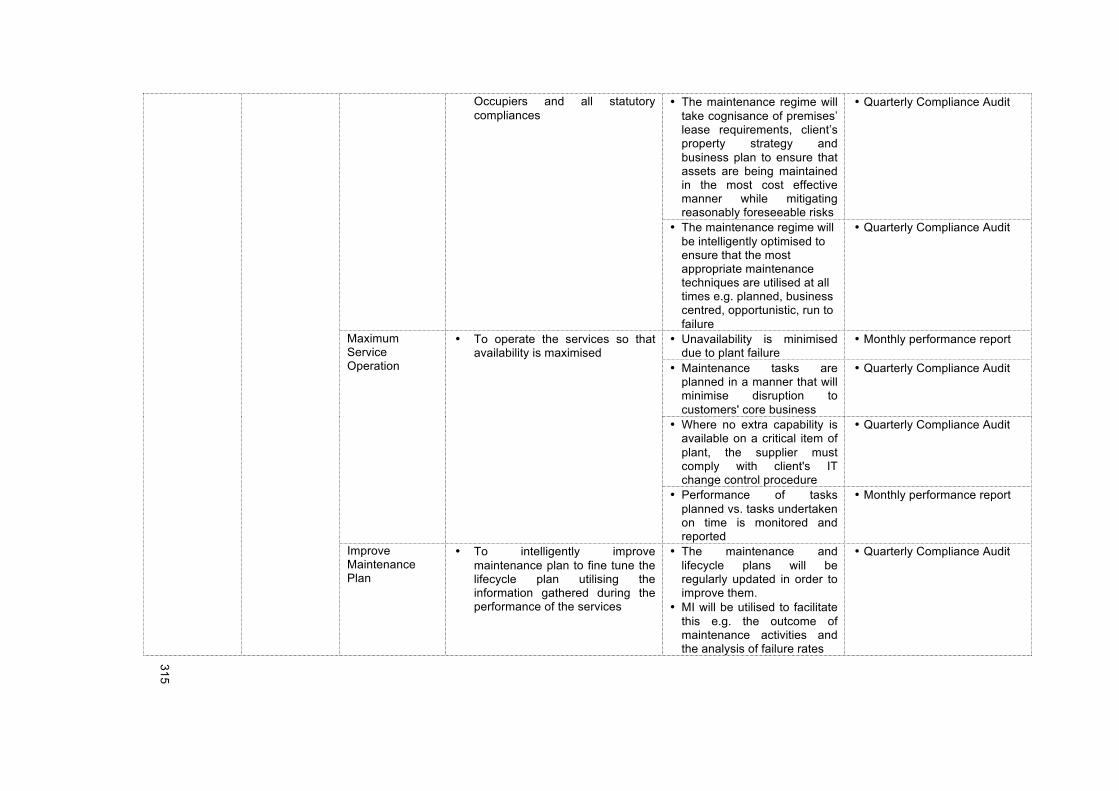
!!
315!
!
Occupiers and all statutory compliances
• The maintenance regime will take cognisance of premises’ lease requirements, client’s property strategy and business plan to ensure that assets are being maintained in the most cost effective manner while mitigating reasonably foreseeable risks
• Quarterly Compliance Audit
• The maintenance regime will be intelligently optimised to ensure that the most appropriate maintenance techniques are utilised at all times e.g. planned, business centred, opportunistic, run to failure
• Quarterly Compliance Audit
Maximum Service Operation
• To operate the services so that availability is maximised
• Unavailability is minimised due to plant failure
• Monthly performance report
• Maintenance tasks are planned in a manner that will minimise disruption to customers' core business
• Quarterly Compliance Audit
• Where no extra capability is available on a critical item of plant, the supplier must comply with client's IT change control procedure
• Quarterly Compliance Audit
• Performance of tasks planned vs. tasks undertaken on time is monitored and reported
• Monthly performance report
Improve Maintenance Plan
• To intelligently improve maintenance plan to fine tune the lifecycle plan utilising the information gathered during the performance of the services
• The maintenance and lifecycle plans will be regularly updated in order to improve them.
• MI will be utilised to facilitate this e.g. the outcome of maintenance activities and the analysis of failure rates
• Quarterly Compliance Audit
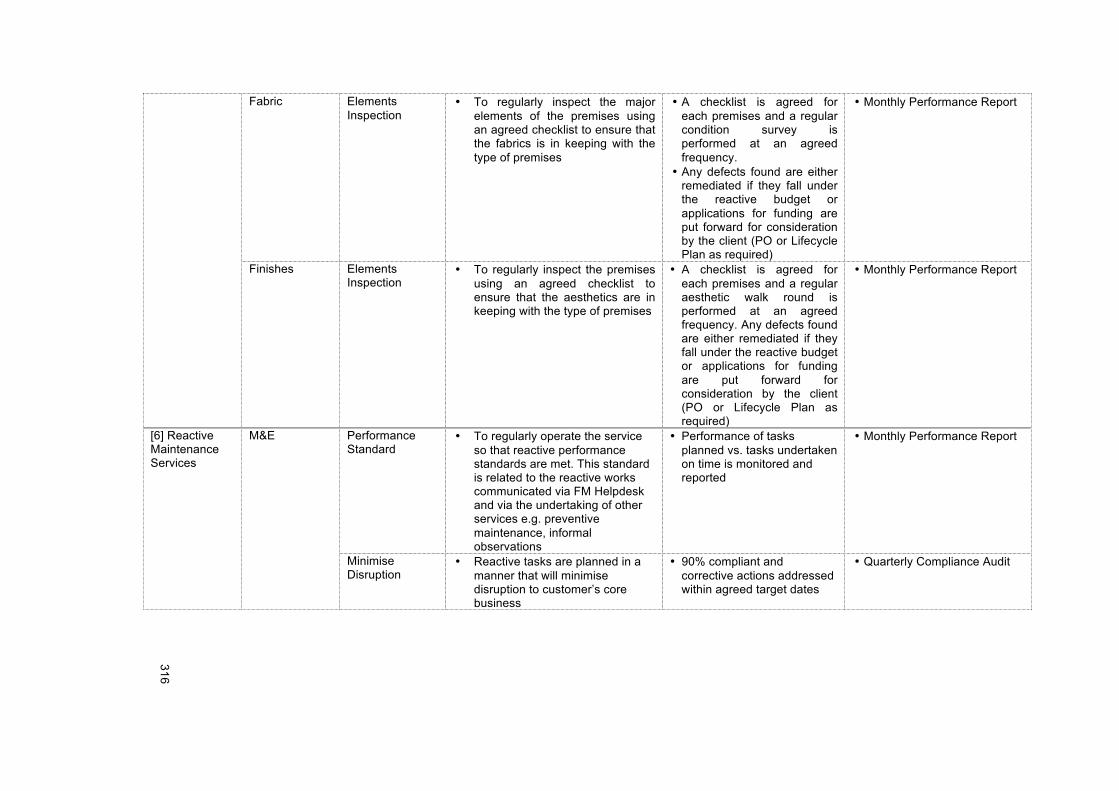
!!
316!
!
Fabric Elements Inspection
• To regularly inspect the major elements of the premises using an agreed checklist to ensure that the fabrics is in keeping with the type of premises
• A checklist is agreed for each premises and a regular condition survey is performed at an agreed frequency.
• Any defects found are either remediated if they fall under the reactive budget or applications for funding are put forward for consideration by the client (PO or Lifecycle Plan as required)
• Monthly Performance Report
Finishes Elements Inspection
• To regularly inspect the premises using an agreed checklist to ensure that the aesthetics are in keeping with the type of premises
• A checklist is agreed for each premises and a regular aesthetic walk round is performed at an agreed frequency. Any defects found are either remediated if they fall under the reactive budget or applications for funding are put forward for consideration by the client (PO or Lifecycle Plan as required)
• Monthly Performance Report
[6] Reactive Maintenance Services
M&E Performance Standard
• To regularly operate the service so that reactive performance standards are met. This standard is related to the reactive works communicated via FM Helpdesk and via the undertaking of other services e.g. preventive maintenance, informal observations
• Performance of tasks planned vs. tasks undertaken on time is monitored and reported
• Monthly Performance Report!
Minimise Disruption
• Reactive tasks are planned in a manner that will minimise disruption to customer’s core business
• 90% compliant and corrective actions addressed within agreed target dates
• Quarterly Compliance Audit
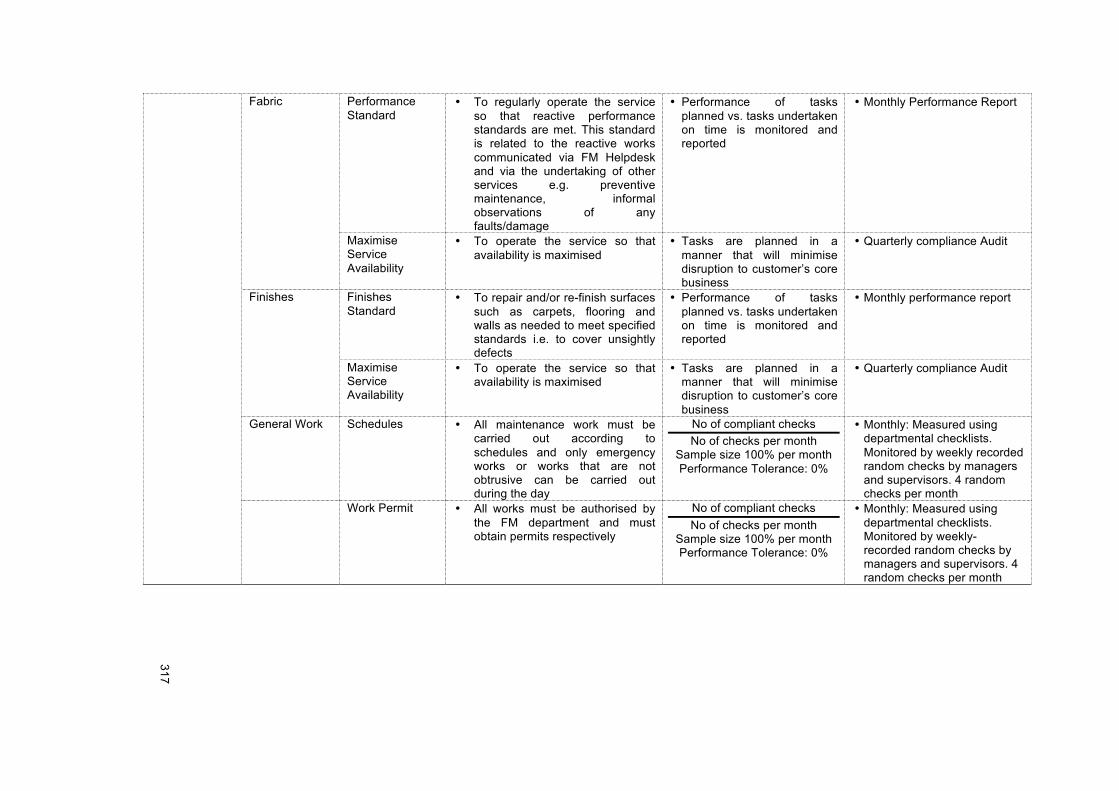
!!
317!
!
Fabric Performance Standard
• To regularly operate the service so that reactive performance standards are met. This standard is related to the reactive works communicated via FM Helpdesk and via the undertaking of other services e.g. preventive maintenance, informal observations of any faults/damage
• Performance of tasks planned vs. tasks undertaken on time is monitored and reported
• Monthly Performance Report!
Maximise Service Availability
• To operate the service so that availability is maximised
• Tasks are planned in a manner that will minimise disruption to customer’s core business
• Quarterly compliance Audit
Finishes Finishes Standard
• To repair and/or re-finish surfaces such as carpets, flooring and walls as needed to meet specified standards i.e. to cover unsightly defects
• Performance of tasks planned vs. tasks undertaken on time is monitored and reported
• Monthly performance report
Maximise Service Availability
• To operate the service so that availability is maximised
• Tasks are planned in a manner that will minimise disruption to customer’s core business
• Quarterly compliance Audit
General Work Schedules • All maintenance work must be carried out according to schedules and only emergency works or works that are not obtrusive can be carried out during the day
No of compliant checks No of checks per month
Sample size 100% per month Performance Tolerance: 0%
• Monthly: Measured using departmental checklists. Monitored by weekly recorded random checks by managers and supervisors. 4 random checks per month
Work Permit • All works must be authorised by the FM department and must obtain permits respectively
No of compliant checks No of checks per month
Sample size 100% per month Performance Tolerance: 0%
• Monthly: Measured using departmental checklists. Monitored by weekly-recorded random checks by managers and supervisors. 4 random checks per month
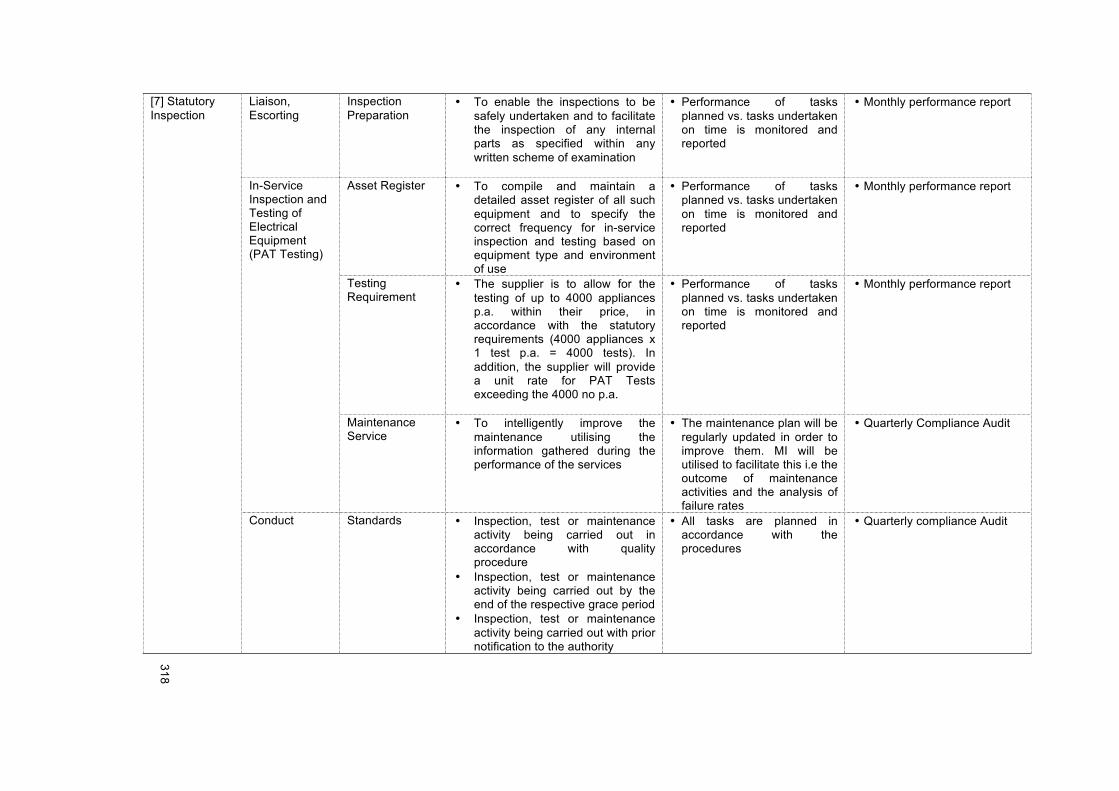
!!
318!
!
[7] Statutory Inspection
Liaison, Escorting
Inspection Preparation
• To enable the inspections to be safely undertaken and to facilitate the inspection of any internal parts as specified within any written scheme of examination
• Performance of tasks planned vs. tasks undertaken on time is monitored and reported
• Monthly performance report
In-Service Inspection and Testing of Electrical Equipment (PAT Testing)
Asset Register • To compile and maintain a detailed asset register of all such equipment and to specify the correct frequency for in-service inspection and testing based on equipment type and environment of use
• Performance of tasks planned vs. tasks undertaken on time is monitored and reported
• Monthly performance report
Testing Requirement
• The supplier is to allow for the testing of up to 4000 appliances p.a. within their price, in accordance with the statutory requirements (4000 appliances x 1 test p.a. = 4000 tests). In addition, the supplier will provide a unit rate for PAT Tests exceeding the 4000 no p.a.
• Performance of tasks planned vs. tasks undertaken on time is monitored and reported
• Monthly performance report
Maintenance Service
• To intelligently improve the maintenance utilising the information gathered during the performance of the services
• The maintenance plan will be regularly updated in order to improve them. MI will be utilised to facilitate this i.e the outcome of maintenance activities and the analysis of failure rates
• Quarterly Compliance Audit
Conduct Standards • Inspection, test or maintenance activity being carried out in accordance with quality procedure
• Inspection, test or maintenance activity being carried out by the end of the respective grace period
• Inspection, test or maintenance activity being carried out with prior notification to the authority
• All tasks are planned in accordance with the procedures
• Quarterly compliance Audit
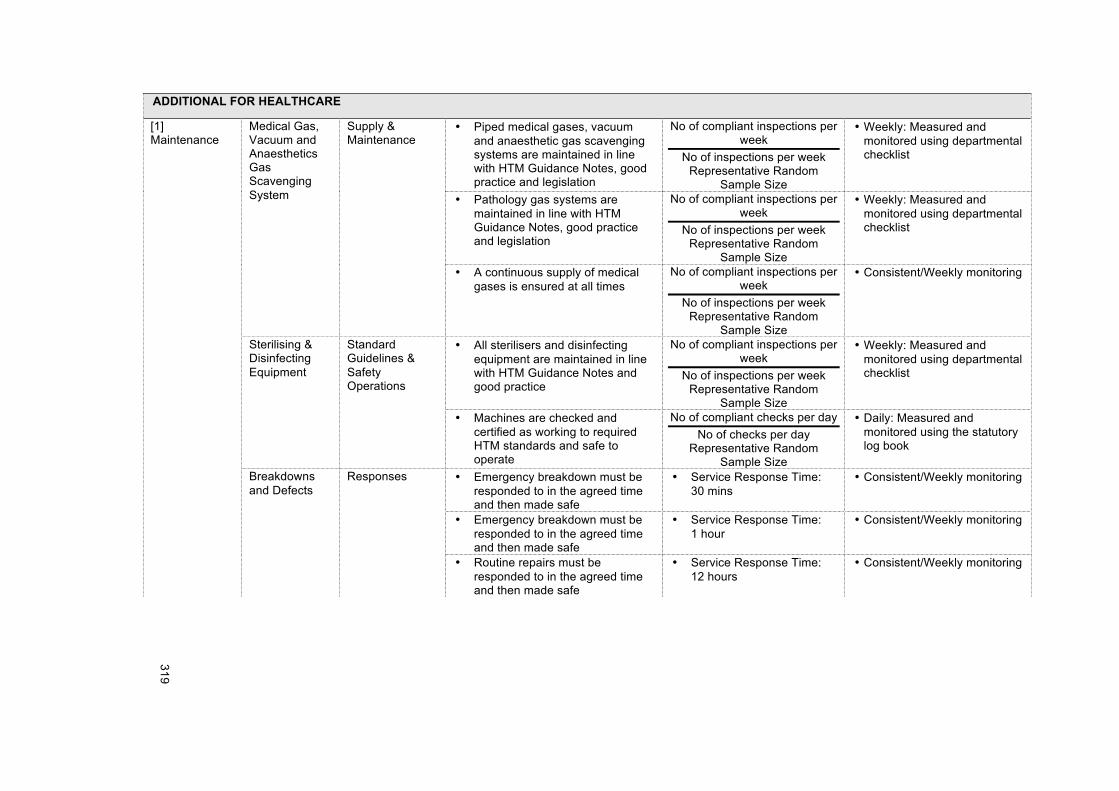
!!
319!
!
ADDITIONAL FOR HEALTHCARE
[1] Maintenance
Medical Gas, Vacuum and Anaesthetics Gas Scavenging System
Supply & Maintenance
• Piped medical gases, vacuum and anaesthetic gas scavenging systems are maintained in line with HTM Guidance Notes, good practice and legislation
No of compliant inspections per week
No of inspections per week Representative Random
Sample Size
• Weekly: Measured and monitored using departmental checklist
• Pathology gas systems are maintained in line with HTM Guidance Notes, good practice and legislation
No of compliant inspections per week
No of inspections per week Representative Random
Sample Size
• Weekly: Measured and monitored using departmental checklist
• A continuous supply of medical gases is ensured at all times
No of compliant inspections per week
No of inspections per week Representative Random
Sample Size
• Consistent/Weekly monitoring
Sterilising & Disinfecting Equipment
Standard Guidelines & Safety Operations
• All sterilisers and disinfecting equipment are maintained in line with HTM Guidance Notes and good practice
No of compliant inspections per week
No of inspections per week Representative Random
Sample Size
• Weekly: Measured and monitored using departmental checklist
• Machines are checked and certified as working to required HTM standards and safe to operate
No of compliant checks per day No of checks per day
Representative Random Sample Size
• Daily: Measured and monitored using the statutory log book
Breakdowns and Defects
Responses • Emergency breakdown must be responded to in the agreed time and then made safe
• Service Response Time: 30 mins
• Consistent/Weekly monitoring
• Emergency breakdown must be responded to in the agreed time and then made safe
• Service Response Time: 1 hour
• Consistent/Weekly monitoring
• Routine repairs must be responded to in the agreed time and then made safe
• Service Response Time: 12 hours
• Consistent/Weekly monitoring
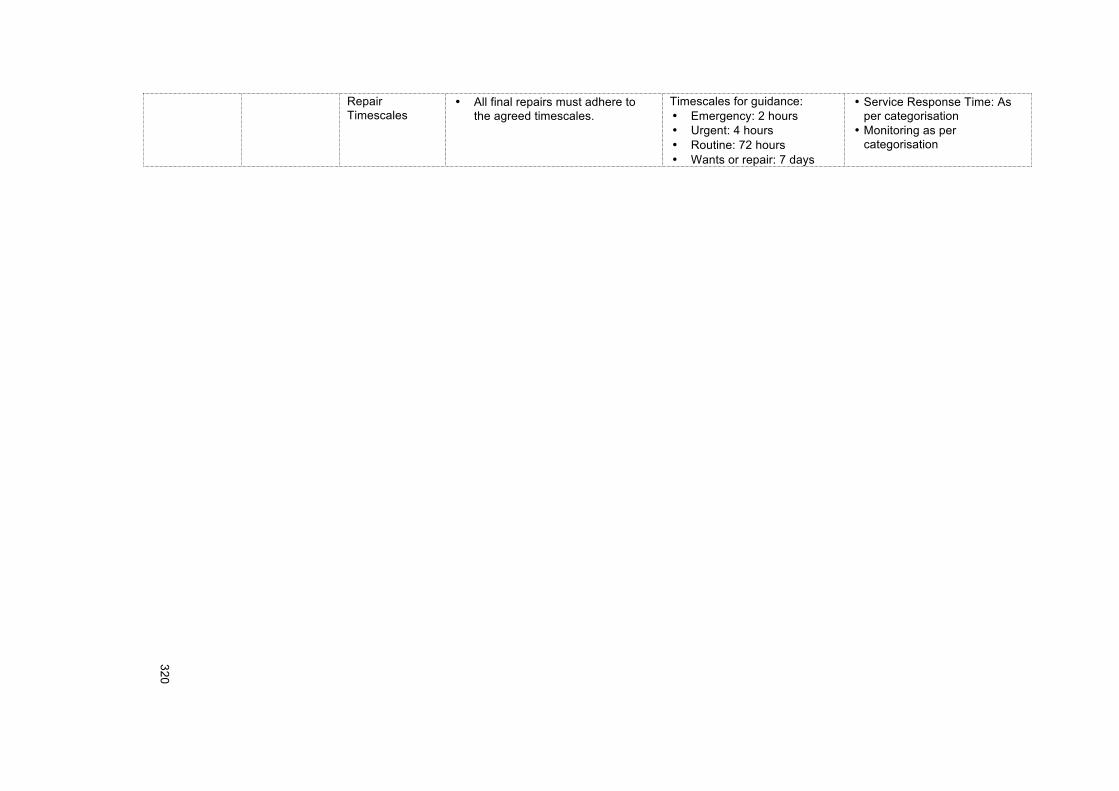
!!
320!
!
Repair Timescales
• All final repairs must adhere to the agreed timescales.
Timescales for guidance: • Emergency: 2 hours • Urgent: 4 hours • Routine: 72 hours • Wants or repair: 7 days
• Service Response Time: As per categorisation
• Monitoring as per categorisation
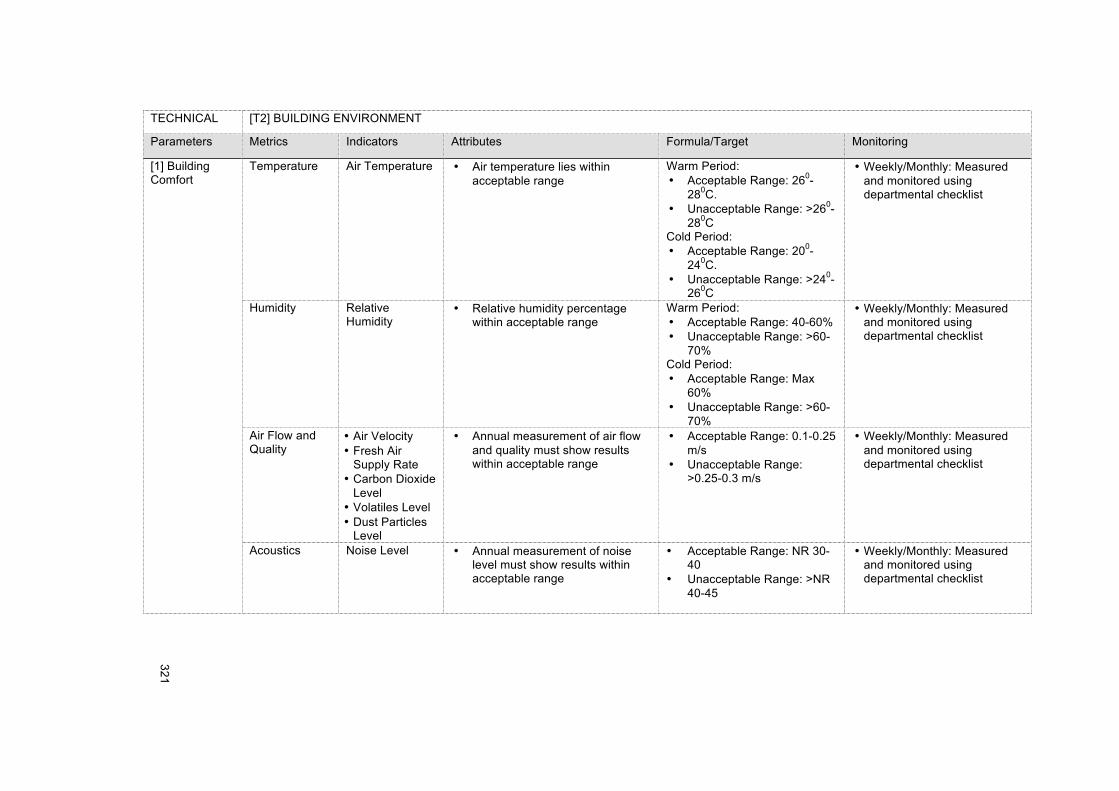
!!
321!
!
TECHNICAL [T2] BUILDING ENVIRONMENT
Parameters Metrics Indicators Attributes Formula/Target Monitoring
[1] Building Comfort
Temperature Air Temperature • Air temperature lies within acceptable range
Warm Period: • Acceptable Range: 260-
280C. • Unacceptable Range: >260-
280C Cold Period: • Acceptable Range: 200-
240C. • Unacceptable Range: >240-
260C
• Weekly/Monthly: Measured and monitored using departmental checklist
Humidity Relative Humidity
• Relative humidity percentage within acceptable range
Warm Period: • Acceptable Range: 40-60% • Unacceptable Range: >60-
70% Cold Period: • Acceptable Range: Max
60% • Unacceptable Range: >60-
70%
• Weekly/Monthly: Measured and monitored using departmental checklist
Air Flow and Quality
• Air Velocity • Fresh Air
Supply Rate • Carbon Dioxide
Level • Volatiles Level • Dust Particles
Level
• Annual measurement of air flow and quality must show results within acceptable range
• Acceptable Range: 0.1-0.25 m/s
• Unacceptable Range: >0.25-0.3 m/s
• Weekly/Monthly: Measured and monitored using departmental checklist
Acoustics Noise Level • Annual measurement of noise level must show results within acceptable range
• Acceptable Range: NR 30-40
• Unacceptable Range: >NR 40-45
• Weekly/Monthly: Measured and monitored using departmental checklist
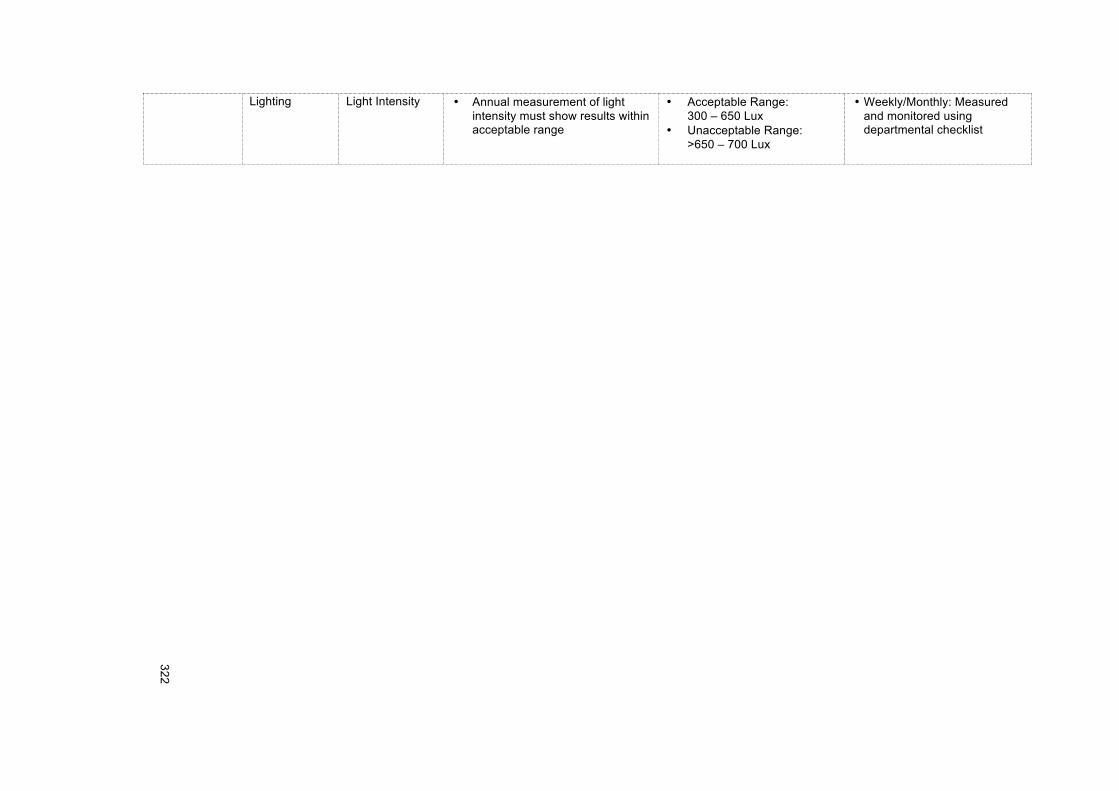
!!
322!
!
Lighting Light Intensity • Annual measurement of light intensity must show results within acceptable range
• Acceptable Range: 300 – 650 Lux
• Unacceptable Range: >650 – 700 Lux
• Weekly/Monthly: Measured and monitored using departmental checklist
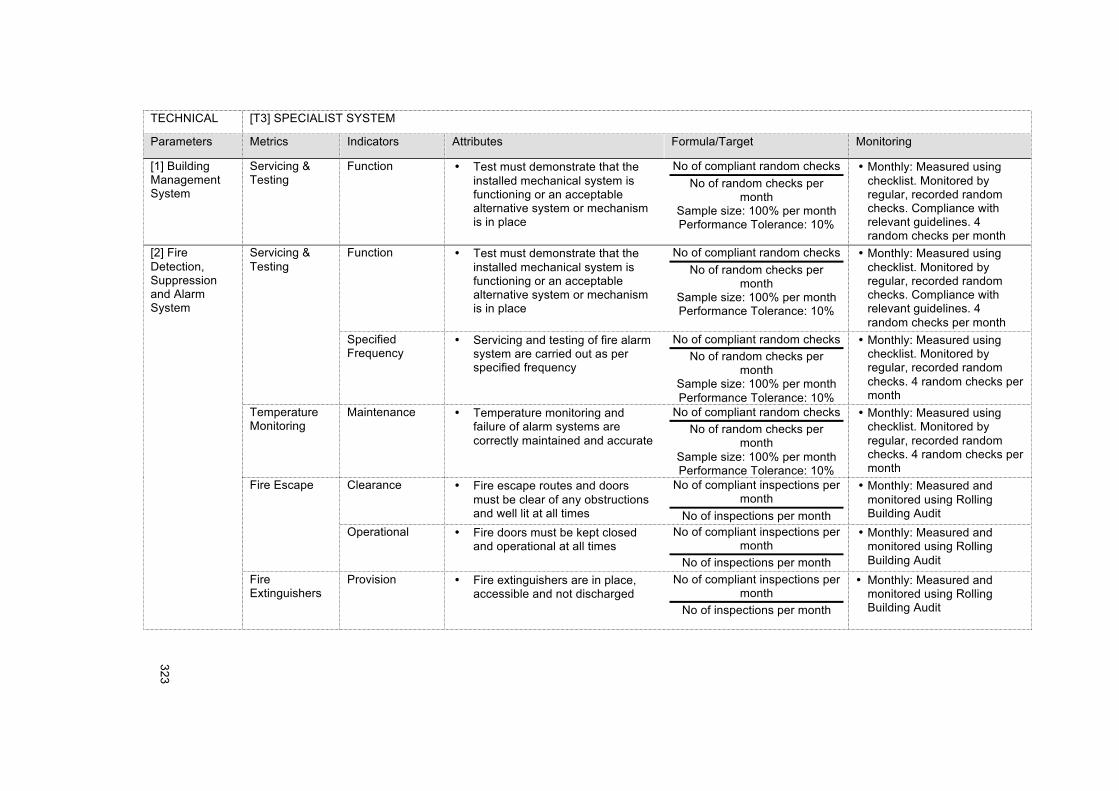
!!
323!
!
TECHNICAL [T3] SPECIALIST SYSTEM
Parameters Metrics Indicators Attributes Formula/Target Monitoring
[1] Building Management System
Servicing & Testing
Function • Test must demonstrate that the installed mechanical system is functioning or an acceptable alternative system or mechanism is in place
No of compliant random checks No of random checks per
month Sample size: 100% per month Performance Tolerance: 10%
• Monthly: Measured using checklist. Monitored by regular, recorded random checks. Compliance with relevant guidelines. 4 random checks per month
[2] Fire Detection, Suppression and Alarm System
Servicing & Testing
Function • Test must demonstrate that the installed mechanical system is functioning or an acceptable alternative system or mechanism is in place
No of compliant random checks No of random checks per
month Sample size: 100% per month Performance Tolerance: 10%
• Monthly: Measured using checklist. Monitored by regular, recorded random checks. Compliance with relevant guidelines. 4 random checks per month
Specified Frequency
• Servicing and testing of fire alarm system are carried out as per specified frequency
No of compliant random checks No of random checks per
month Sample size: 100% per month Performance Tolerance: 10%
• Monthly: Measured using checklist. Monitored by regular, recorded random checks. 4 random checks per month
Temperature Monitoring
Maintenance • Temperature monitoring and failure of alarm systems are correctly maintained and accurate
No of compliant random checks No of random checks per
month Sample size: 100% per month Performance Tolerance: 10%
• Monthly: Measured using checklist. Monitored by regular, recorded random checks. 4 random checks per month
Fire Escape Clearance • Fire escape routes and doors must be clear of any obstructions and well lit at all times
No of compliant inspections per month
No of inspections per month
• Monthly: Measured and monitored using Rolling Building Audit
Operational • Fire doors must be kept closed and operational at all times
No of compliant inspections per month
No of inspections per month
• Monthly: Measured and monitored using Rolling Building Audit
Fire Extinguishers
Provision • Fire extinguishers are in place, accessible and not discharged
No of compliant inspections per month
No of inspections per month
• Monthly: Measured and monitored using Rolling Building Audit
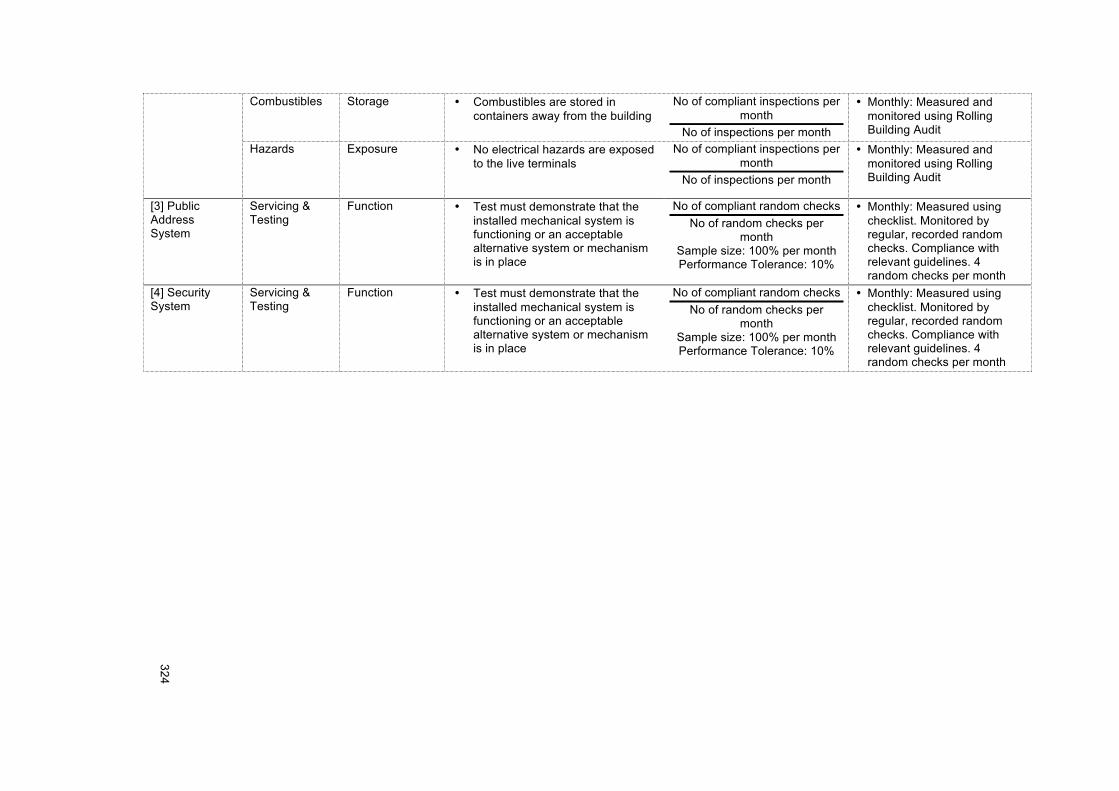
!!
324!
!
Combustibles Storage • Combustibles are stored in containers away from the building
No of compliant inspections per month
No of inspections per month
• Monthly: Measured and monitored using Rolling Building Audit
Hazards Exposure • No electrical hazards are exposed to the live terminals
No of compliant inspections per month
No of inspections per month
• Monthly: Measured and monitored using Rolling Building Audit
[3] Public Address System
Servicing & Testing
Function • Test must demonstrate that the installed mechanical system is functioning or an acceptable alternative system or mechanism is in place
No of compliant random checks No of random checks per
month Sample size: 100% per month Performance Tolerance: 10%
• Monthly: Measured using checklist. Monitored by regular, recorded random checks. Compliance with relevant guidelines. 4 random checks per month
[4] Security System
Servicing & Testing
Function • Test must demonstrate that the installed mechanical system is functioning or an acceptable alternative system or mechanism is in place
No of compliant random checks No of random checks per
month Sample size: 100% per month Performance Tolerance: 10%
• Monthly: Measured using checklist. Monitored by regular, recorded random checks. Compliance with relevant guidelines. 4 random checks per month
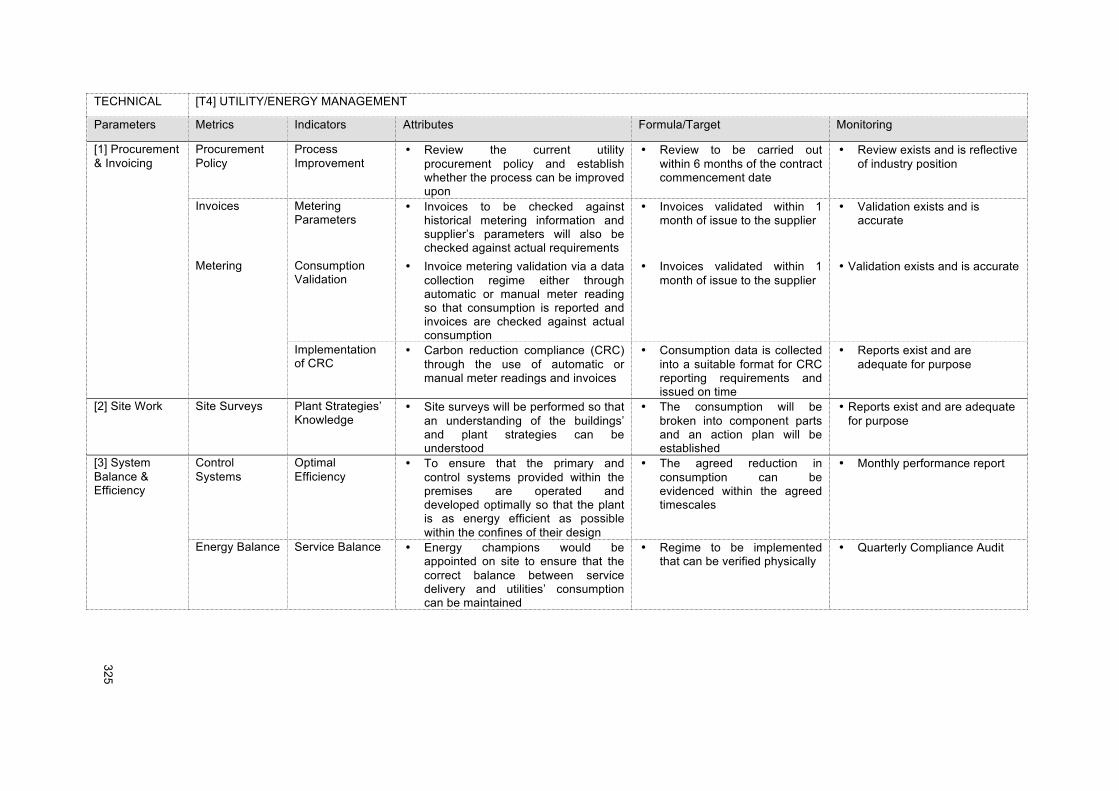
!!
325!
!
TECHNICAL [T4] UTILITY/ENERGY MANAGEMENT
Parameters Metrics Indicators Attributes Formula/Target Monitoring
[1] Procurement & Invoicing
Procurement Policy
Process Improvement
• Review the current utility procurement policy and establish whether the process can be improved upon
• Review to be carried out within 6 months of the contract commencement date
• Review exists and is reflective of industry position
Invoices Metering Parameters
• Invoices to be checked against historical metering information and supplier’s parameters will also be checked against actual requirements
• Invoices validated within 1 month of issue to the supplier
• Validation exists and is accurate
Metering Consumption Validation
• Invoice metering validation via a data collection regime either through automatic or manual meter reading so that consumption is reported and invoices are checked against actual consumption
• Invoices validated within 1 month of issue to the supplier
• Validation exists and is accurate
Implementation of CRC
• Carbon reduction compliance (CRC) through the use of automatic or manual meter readings and invoices
• Consumption data is collected into a suitable format for CRC reporting requirements and issued on time
• Reports exist and are adequate for purpose
[2] Site Work Site Surveys Plant Strategies’ Knowledge
• Site surveys will be performed so that an understanding of the buildings’ and plant strategies can be understood
• The consumption will be broken into component parts and an action plan will be established
• Reports exist and are adequate for purpose
[3] System Balance & Efficiency
Control Systems
Optimal Efficiency
• To ensure that the primary and control systems provided within the premises are operated and developed optimally so that the plant is as energy efficient as possible within the confines of their design
• The agreed reduction in consumption can be evidenced within the agreed timescales
• Monthly performance report
Energy Balance Service Balance • Energy champions would be appointed on site to ensure that the correct balance between service delivery and utilities’ consumption can be maintained
• Regime to be implemented that can be verified physically
• Quarterly Compliance Audit
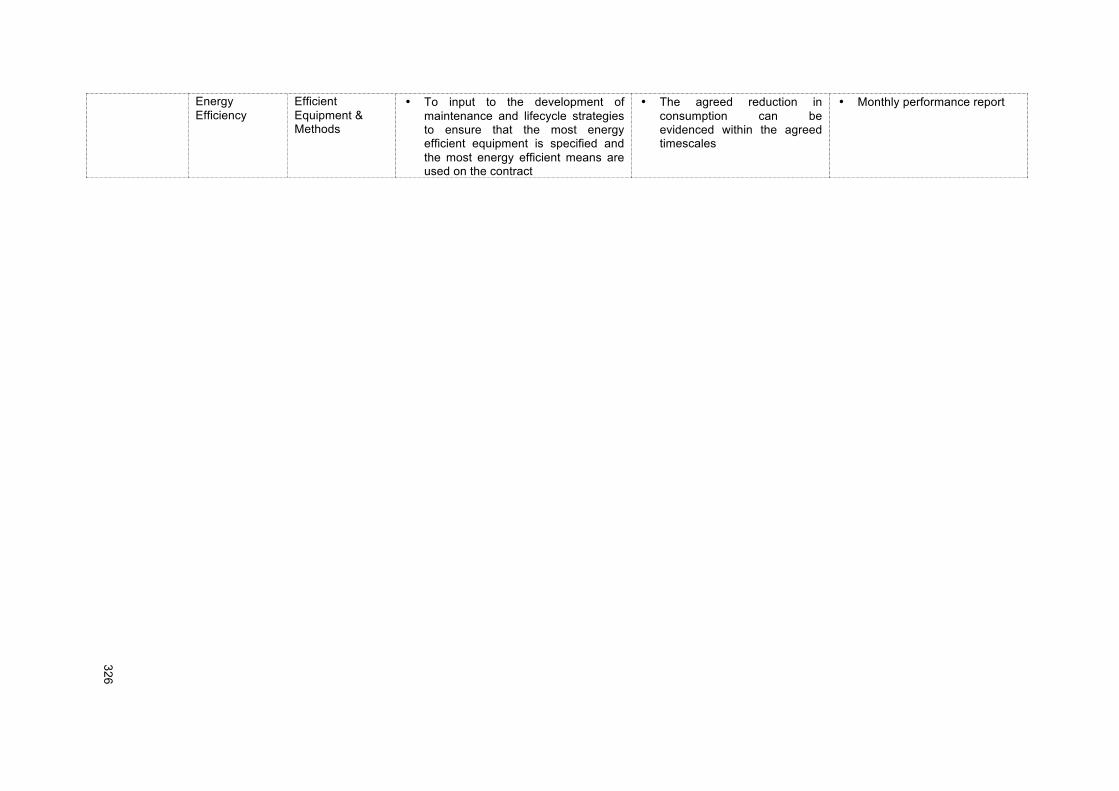
!!
326!
!
Energy Efficiency
Efficient Equipment & Methods
• To input to the development of maintenance and lifecycle strategies to ensure that the most energy efficient equipment is specified and the most energy efficient means are used on the contract
• The agreed reduction in consumption can be evidenced within the agreed timescales
• Monthly performance report
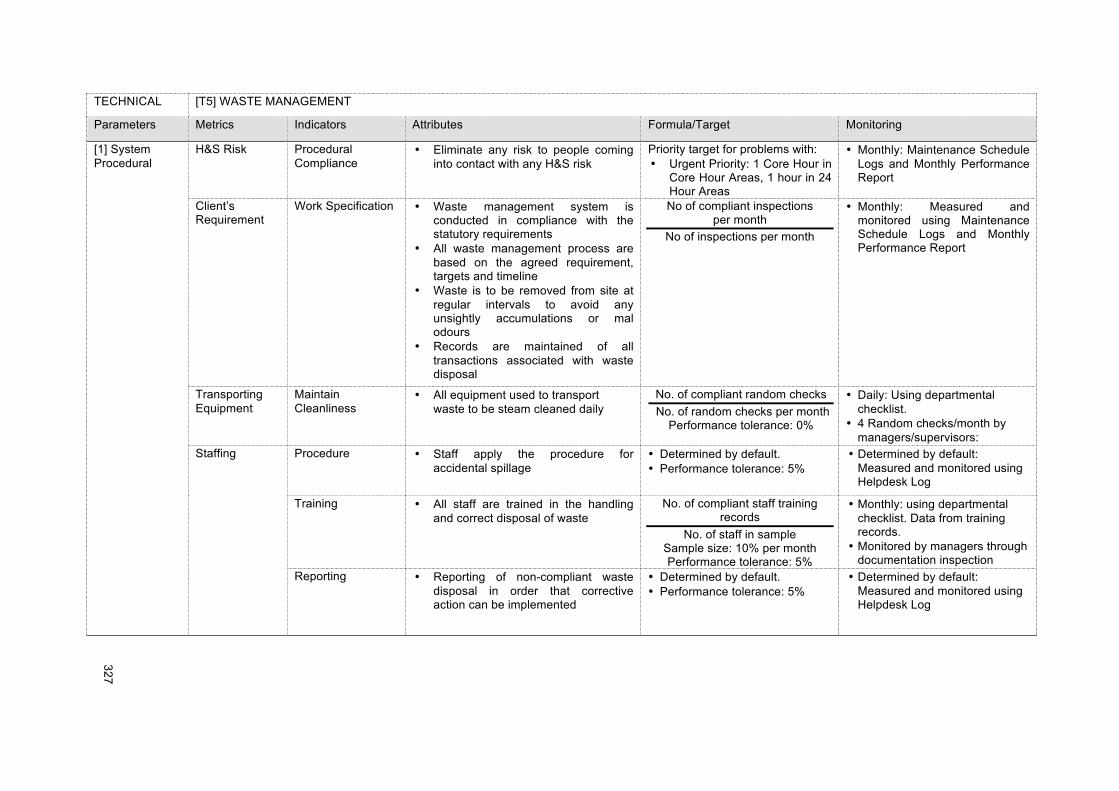
!!
327!
!
TECHNICAL [T5] WASTE MANAGEMENT
Parameters Metrics Indicators Attributes Formula/Target Monitoring
[1] System Procedural
H&S Risk Procedural Compliance
• Eliminate any risk to people coming into contact with any H&S risk
Priority target for problems with: • Urgent Priority: 1 Core Hour in
Core Hour Areas, 1 hour in 24 Hour Areas
• Monthly: Maintenance Schedule Logs and Monthly Performance Report
Client’s Requirement
Work Specification • Waste management system is conducted in compliance with the statutory requirements
• All waste management process are based on the agreed requirement, targets and timeline
• Waste is to be removed from site at regular intervals to avoid any unsightly accumulations or mal odours
• Records are maintained of all transactions associated with waste disposal
No of compliant inspections per month
No of inspections per month
• Monthly: Measured and monitored using Maintenance Schedule Logs and Monthly Performance Report
Transporting Equipment
Maintain Cleanliness
• All equipment used to transport waste to be steam cleaned daily
No. of compliant random checks No. of random checks per month
Performance tolerance: 0%
• Daily: Using departmental checklist.
• 4 Random checks/month by managers/supervisors:
Staffing Procedure • Staff apply the procedure for accidental spillage
• Determined by default. • Performance tolerance: 5%
• Determined by default: Measured and monitored using Helpdesk Log
Training • All staff are trained in the handling and correct disposal of waste
No. of compliant staff training records
No. of staff in sample Sample size: 10% per month Performance tolerance: 5%
• Monthly: using departmental checklist. Data from training records.
• Monitored by managers through documentation inspection
Reporting • Reporting of non-compliant waste disposal in order that corrective action can be implemented
• Determined by default. • Performance tolerance: 5%
• Determined by default: Measured and monitored using Helpdesk Log
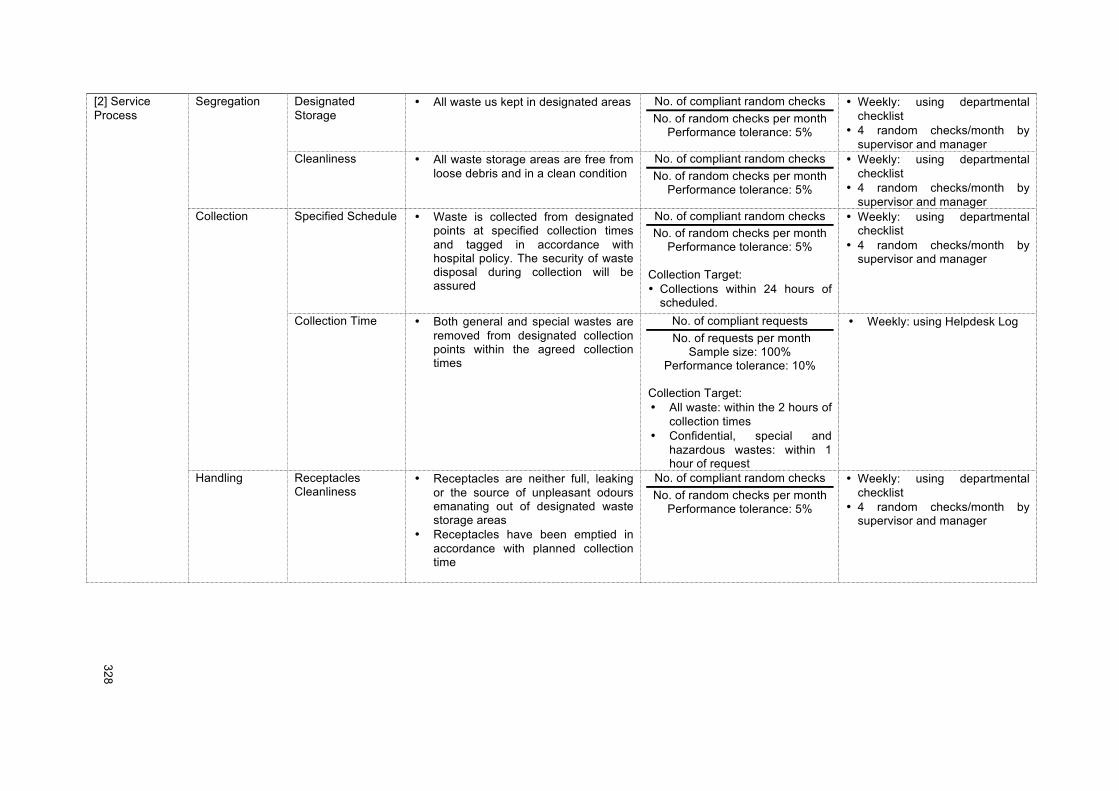
!!
328!
!
[2] Service Process
Segregation Designated Storage
• All waste us kept in designated areas No. of compliant random checks No. of random checks per month
Performance tolerance: 5%
• Weekly: using departmental checklist
• 4 random checks/month by supervisor and manager
Cleanliness • All waste storage areas are free from loose debris and in a clean condition
No. of compliant random checks No. of random checks per month
Performance tolerance: 5%
• Weekly: using departmental checklist
• 4 random checks/month by supervisor and manager
Collection Specified Schedule • Waste is collected from designated points at specified collection times and tagged in accordance with hospital policy. The security of waste disposal during collection will be assured
No. of compliant random checks No. of random checks per month
Performance tolerance: 5% Collection Target: • Collections within 24 hours of
scheduled.
• Weekly: using departmental checklist
• 4 random checks/month by supervisor and manager
Collection Time • Both general and special wastes are removed from designated collection points within the agreed collection times
No. of compliant requests No. of requests per month
Sample size: 100% Performance tolerance: 10%
Collection Target: • All waste: within the 2 hours of
collection times • Confidential, special and
hazardous wastes: within 1 hour of request
• Weekly: using Helpdesk Log
Handling Receptacles Cleanliness
• Receptacles are neither full, leaking or the source of unpleasant odours emanating out of designated waste storage areas
• Receptacles have been emptied in accordance with planned collection time
No. of compliant random checks No. of random checks per month
Performance tolerance: 5%
• Weekly: using departmental checklist
• 4 random checks/month by supervisor and manager
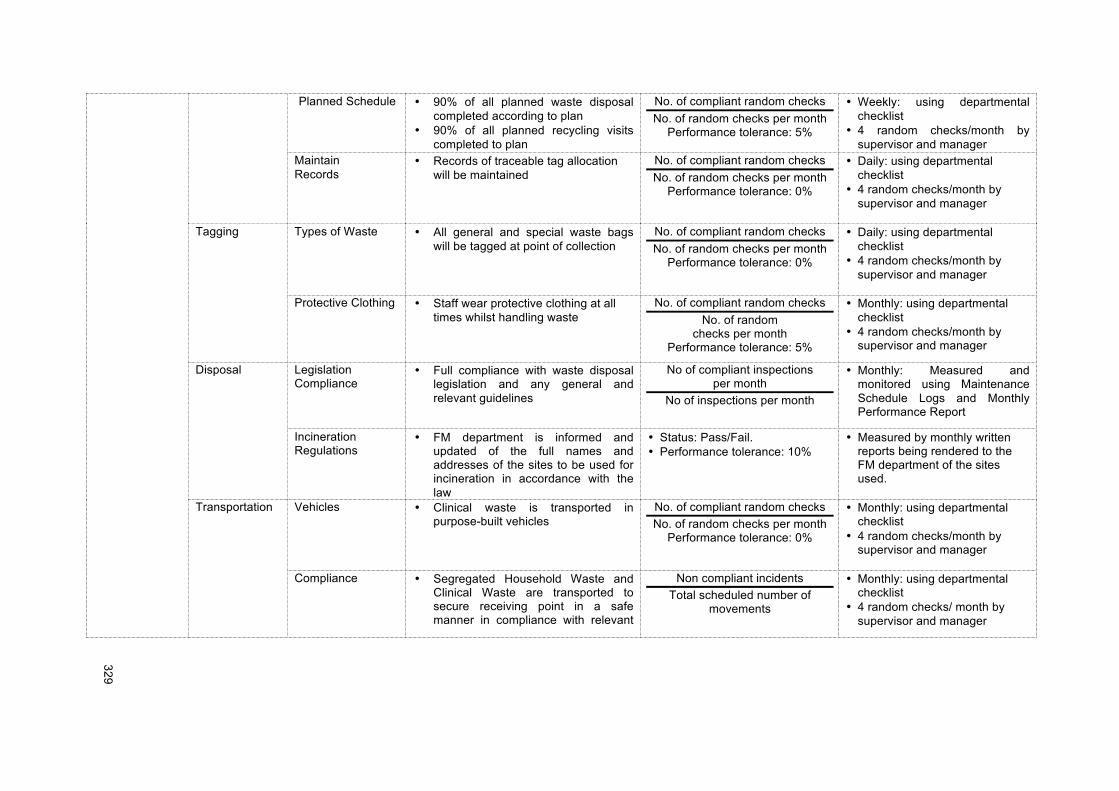
!!
329!
!
Planned Schedule • 90% of all planned waste disposal completed according to plan
• 90% of all planned recycling visits completed to plan
No. of compliant random checks No. of random checks per month
Performance tolerance: 5%
• Weekly: using departmental checklist
• 4 random checks/month by supervisor and manager
Maintain Records
• Records of traceable tag allocation will be maintained
No. of compliant random checks No. of random checks per month
Performance tolerance: 0%
• Daily: using departmental checklist
• 4 random checks/month by supervisor and manager
Tagging Types of Waste • All general and special waste bags will be tagged at point of collection
No. of compliant random checks No. of random checks per month
Performance tolerance: 0%
• Daily: using departmental checklist
• 4 random checks/month by supervisor and manager
Protective Clothing • Staff wear protective clothing at all times whilst handling waste
No. of compliant random checks No. of random
checks per month Performance tolerance: 5%
• Monthly: using departmental checklist
• 4 random checks/month by supervisor and manager
Disposal Legislation Compliance
• Full compliance with waste disposal legislation and any general and relevant guidelines
No of compliant inspections per month
No of inspections per month
• Monthly: Measured and monitored using Maintenance Schedule Logs and Monthly Performance Report
Incineration Regulations
• FM department is informed and updated of the full names and addresses of the sites to be used for incineration in accordance with the law
• Status: Pass/Fail. • Performance tolerance: 10%
• Measured by monthly written reports being rendered to the FM department of the sites used.
Transportation Vehicles • Clinical waste is transported in purpose-built vehicles
No. of compliant random checks No. of random checks per month
Performance tolerance: 0%
• Monthly: using departmental checklist
• 4 random checks/month by supervisor and manager
Compliance • Segregated Household Waste and Clinical Waste are transported to secure receiving point in a safe manner in compliance with relevant
Non compliant incidents Total scheduled number of
movements
• Monthly: using departmental checklist
• 4 random checks/ month by supervisor and manager
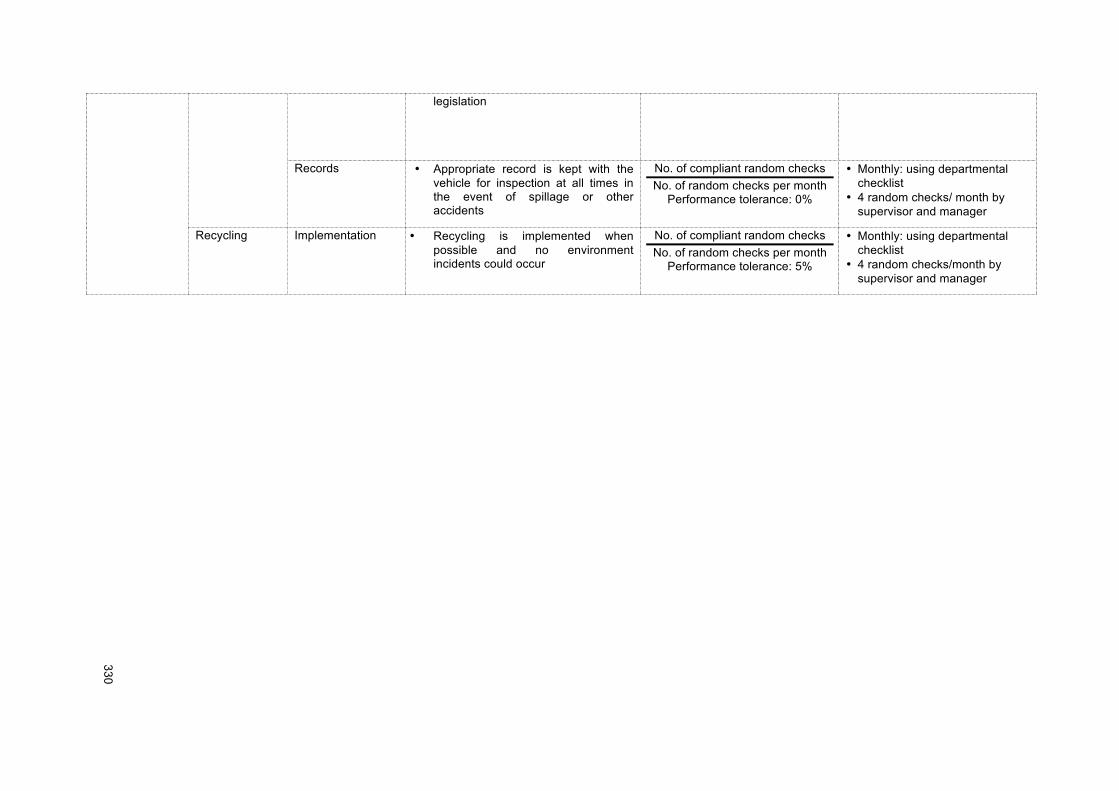
!!
330!
!
legislation
Records • Appropriate record is kept with the vehicle for inspection at all times in the event of spillage or other accidents
No. of compliant random checks No. of random checks per month
Performance tolerance: 0%
• Monthly: using departmental checklist
• 4 random checks/ month by supervisor and manager
Recycling Implementation • Recycling is implemented when possible and no environment incidents could occur
No. of compliant random checks No. of random checks per month
Performance tolerance: 5%
• Monthly: using departmental checklist
• 4 random checks/month by supervisor and manager
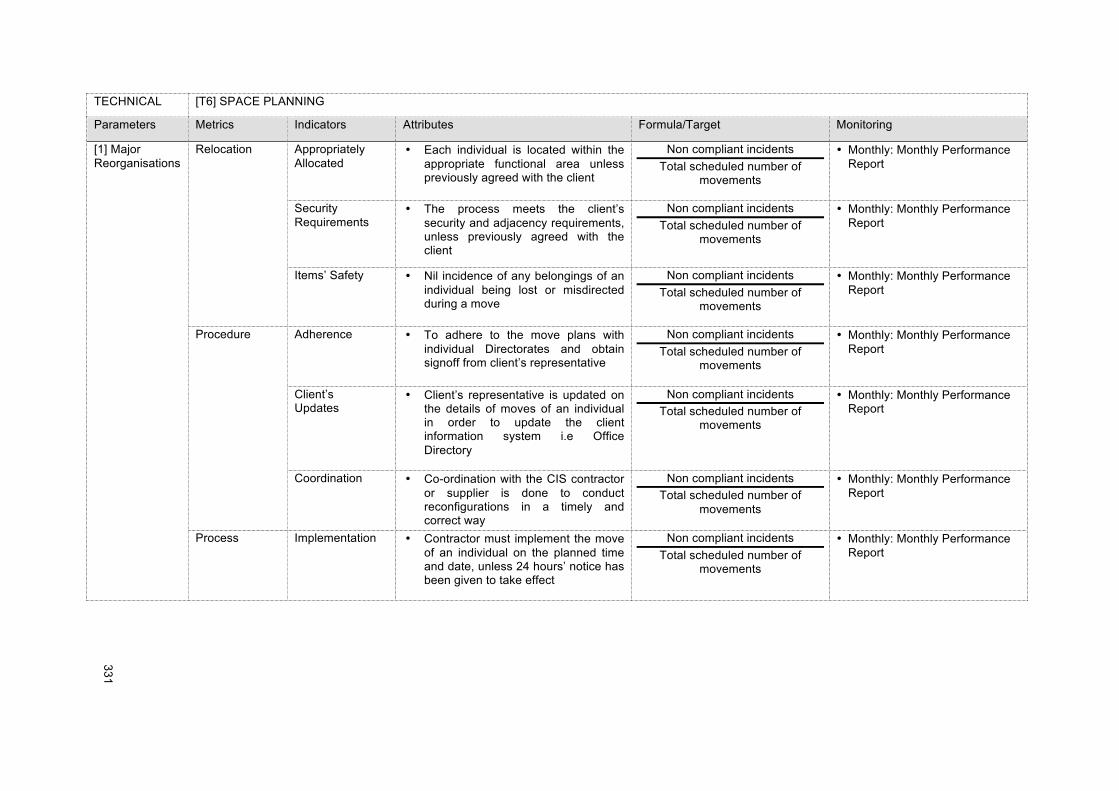
!!
331!
!
TECHNICAL [T6] SPACE PLANNING
Parameters Metrics Indicators Attributes Formula/Target Monitoring
[1] Major Reorganisations
Relocation
Appropriately Allocated
• Each individual is located within the appropriate functional area unless previously agreed with the client
Non compliant incidents Total scheduled number of
movements
• Monthly: Monthly Performance Report
Security Requirements
• The process meets the client’s security and adjacency requirements, unless previously agreed with the client
Non compliant incidents Total scheduled number of
movements
• Monthly: Monthly Performance Report
Items’ Safety • Nil incidence of any belongings of an individual being lost or misdirected during a move
Non compliant incidents Total scheduled number of
movements
• Monthly: Monthly Performance Report
Procedure Adherence • To adhere to the move plans with individual Directorates and obtain signoff from client’s representative
Non compliant incidents Total scheduled number of
movements
• Monthly: Monthly Performance Report
Client’s Updates
• Client’s representative is updated on the details of moves of an individual in order to update the client information system i.e Office Directory
Non compliant incidents Total scheduled number of
movements
• Monthly: Monthly Performance Report
Coordination • Co-ordination with the CIS contractor or supplier is done to conduct reconfigurations in a timely and correct way
Non compliant incidents Total scheduled number of
movements
• Monthly: Monthly Performance Report
Process Implementation • Contractor must implement the move of an individual on the planned time and date, unless 24 hours’ notice has been given to take effect
Non compliant incidents Total scheduled number of
movements
• Monthly: Monthly Performance Report
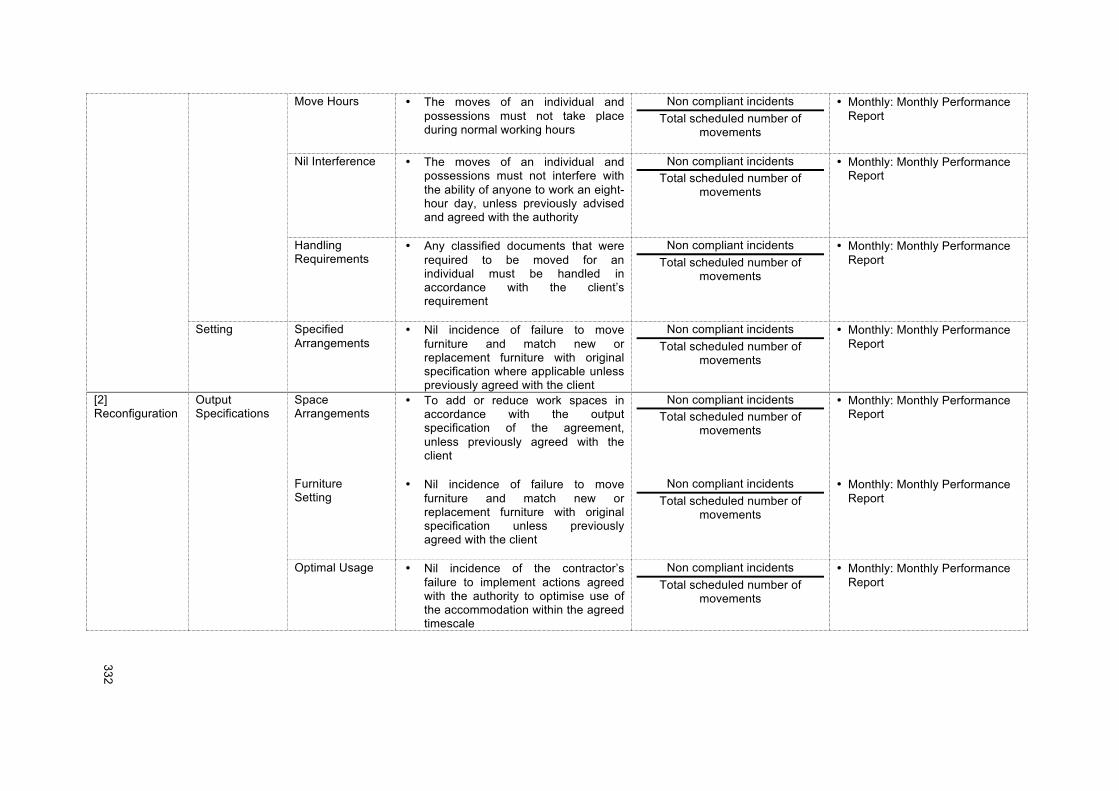
!!
332!
!
Move Hours • The moves of an individual and possessions must not take place during normal working hours
Non compliant incidents Total scheduled number of
movements
• Monthly: Monthly Performance Report
Nil Interference • The moves of an individual and possessions must not interfere with the ability of anyone to work an eight-hour day, unless previously advised and agreed with the authority
Non compliant incidents Total scheduled number of
movements
• Monthly: Monthly Performance Report
Handling Requirements
• Any classified documents that were required to be moved for an individual must be handled in accordance with the client’s requirement
Non compliant incidents Total scheduled number of
movements
• Monthly: Monthly Performance Report
Setting Specified Arrangements
• Nil incidence of failure to move furniture and match new or replacement furniture with original specification where applicable unless previously agreed with the client
Non compliant incidents Total scheduled number of
movements
• Monthly: Monthly Performance Report
[2] Reconfiguration
Output Specifications
Space Arrangements
• To add or reduce work spaces in accordance with the output specification of the agreement, unless previously agreed with the client
Non compliant incidents Total scheduled number of
movements
• Monthly: Monthly Performance Report
Furniture Setting
• Nil incidence of failure to move furniture and match new or replacement furniture with original specification unless previously agreed with the client
Non compliant incidents Total scheduled number of
movements
• Monthly: Monthly Performance Report
Optimal Usage • Nil incidence of the contractor’s failure to implement actions agreed with the authority to optimise use of the accommodation within the agreed timescale
Non compliant incidents Total scheduled number of
movements
• Monthly: Monthly Performance Report
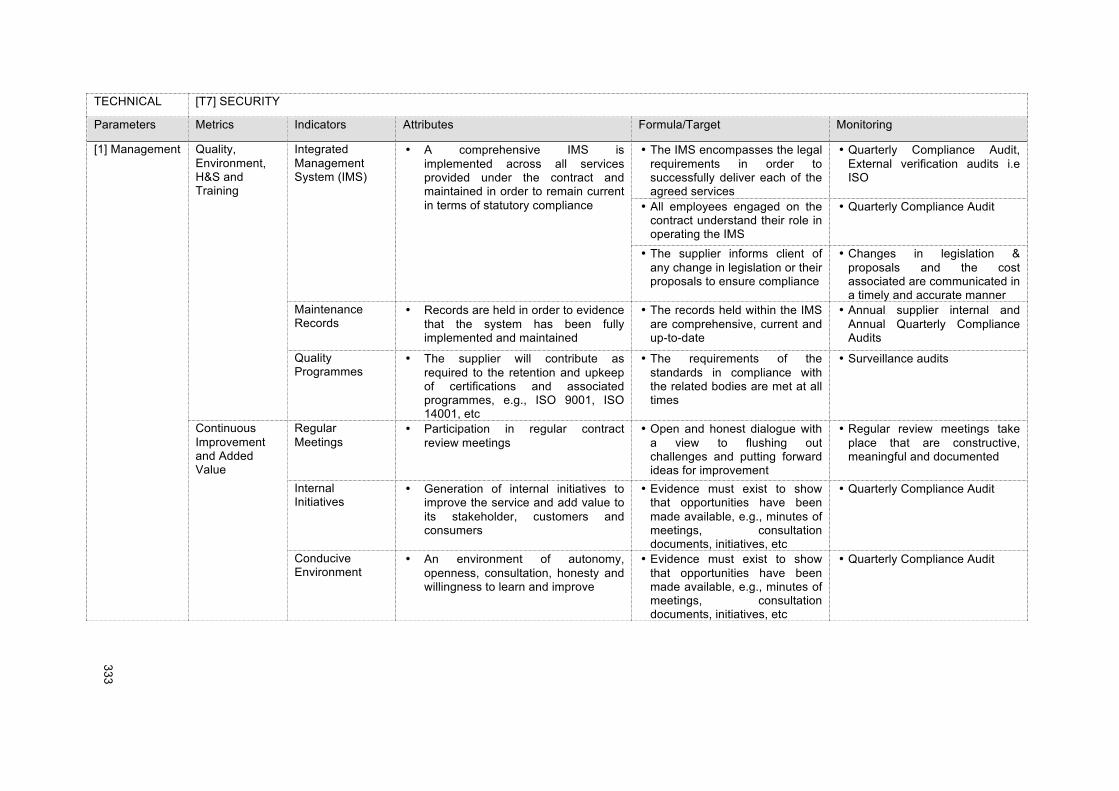
!!
333!
!
TECHNICAL [T7] SECURITY
Parameters Metrics Indicators Attributes Formula/Target Monitoring
[1] Management Quality, Environment, H&S and Training
Integrated Management System (IMS)
• A comprehensive IMS is implemented across all services provided under the contract and maintained in order to remain current in terms of statutory compliance
• The IMS encompasses the legal requirements in order to successfully deliver each of the agreed services
• Quarterly Compliance Audit, External verification audits i.e ISO
• All employees engaged on the contract understand their role in operating the IMS
• Quarterly Compliance Audit
• The supplier informs client of any change in legislation or their proposals to ensure compliance
• Changes in legislation & proposals and the cost associated are communicated in a timely and accurate manner
Maintenance Records
• Records are held in order to evidence that the system has been fully implemented and maintained
• The records held within the IMS are comprehensive, current and up-to-date
• Annual supplier internal and Annual Quarterly Compliance Audits
Quality Programmes
• The supplier will contribute as required to the retention and upkeep of certifications and associated programmes, e.g., ISO 9001, ISO 14001, etc
• The requirements of the standards in compliance with the related bodies are met at all times
• Surveillance audits
Continuous Improvement and Added Value
Regular Meetings
• Participation in regular contract review meetings
• Open and honest dialogue with a view to flushing out challenges and putting forward ideas for improvement
• Regular review meetings take place that are constructive, meaningful and documented
Internal Initiatives
• Generation of internal initiatives to improve the service and add value to its stakeholder, customers and consumers
• Evidence must exist to show that opportunities have been made available, e.g., minutes of meetings, consultation documents, initiatives, etc
• Quarterly Compliance Audit
Conducive Environment
• An environment of autonomy, openness, consultation, honesty and willingness to learn and improve
• Evidence must exist to show that opportunities have been made available, e.g., minutes of meetings, consultation documents, initiatives, etc
• Quarterly Compliance Audit
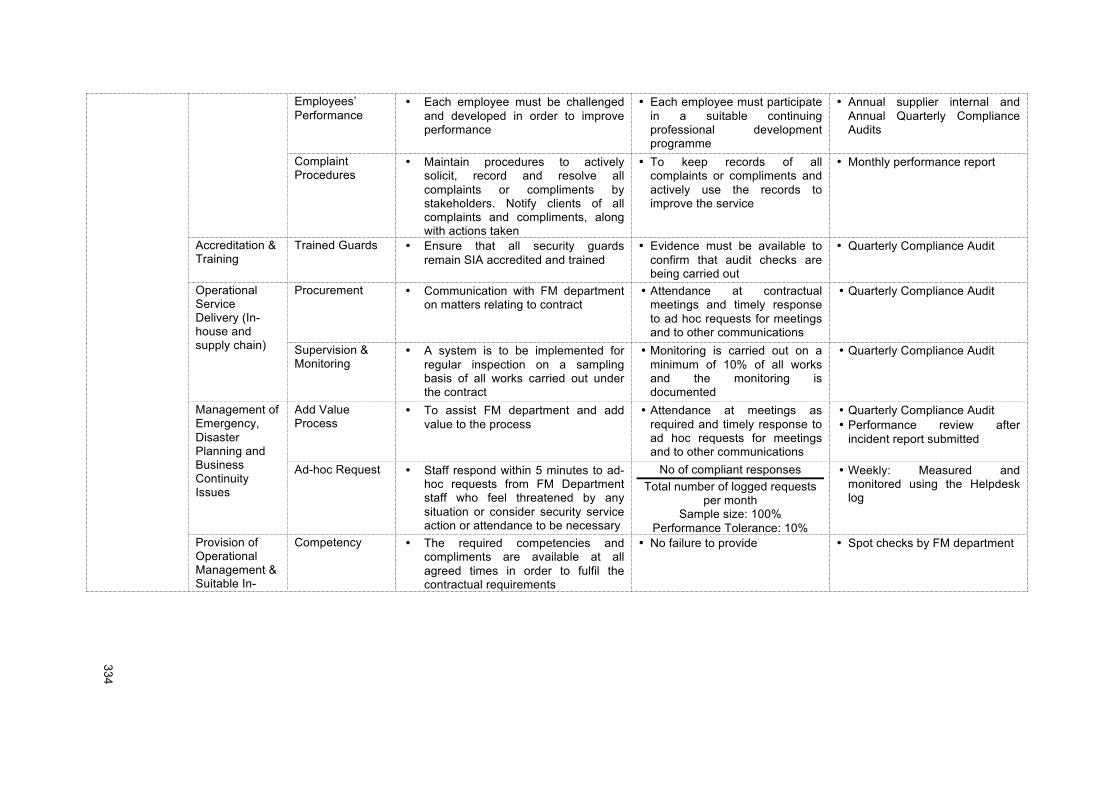
!!
334!
!
Employees’ Performance
• Each employee must be challenged and developed in order to improve performance
• Each employee must participate in a suitable continuing professional development programme
• Annual supplier internal and Annual Quarterly Compliance Audits
Complaint Procedures
• Maintain procedures to actively solicit, record and resolve all complaints or compliments by stakeholders. Notify clients of all complaints and compliments, along with actions taken
• To keep records of all complaints or compliments and actively use the records to improve the service
• Monthly performance report
Accreditation & Training
Trained Guards • Ensure that all security guards remain SIA accredited and trained
• Evidence must be available to confirm that audit checks are being carried out
• Quarterly Compliance Audit
Operational Service Delivery (In-house and supply chain)
Procurement • Communication with FM department on matters relating to contract
• Attendance at contractual meetings and timely response to ad hoc requests for meetings and to other communications
• Quarterly Compliance Audit
Supervision & Monitoring
• A system is to be implemented for regular inspection on a sampling basis of all works carried out under the contract
• Monitoring is carried out on a minimum of 10% of all works and the monitoring is documented
• Quarterly Compliance Audit
Management of Emergency, Disaster Planning and Business Continuity Issues
Add Value Process
• To assist FM department and add value to the process
• Attendance at meetings as required and timely response to ad hoc requests for meetings and to other communications
• Quarterly Compliance Audit • Performance review after
incident report submitted
Ad-hoc Request • Staff respond within 5 minutes to ad- hoc requests from FM Department staff who feel threatened by any situation or consider security service action or attendance to be necessary
No of compliant responses Total number of logged requests
per month Sample size: 100%
Performance Tolerance: 10%
• Weekly: Measured and monitored using the Helpdesk log
Provision of Operational Management & Suitable In-
Competency • The required competencies and compliments are available at all agreed times in order to fulfil the contractual requirements
• No failure to provide • Spot checks by FM department
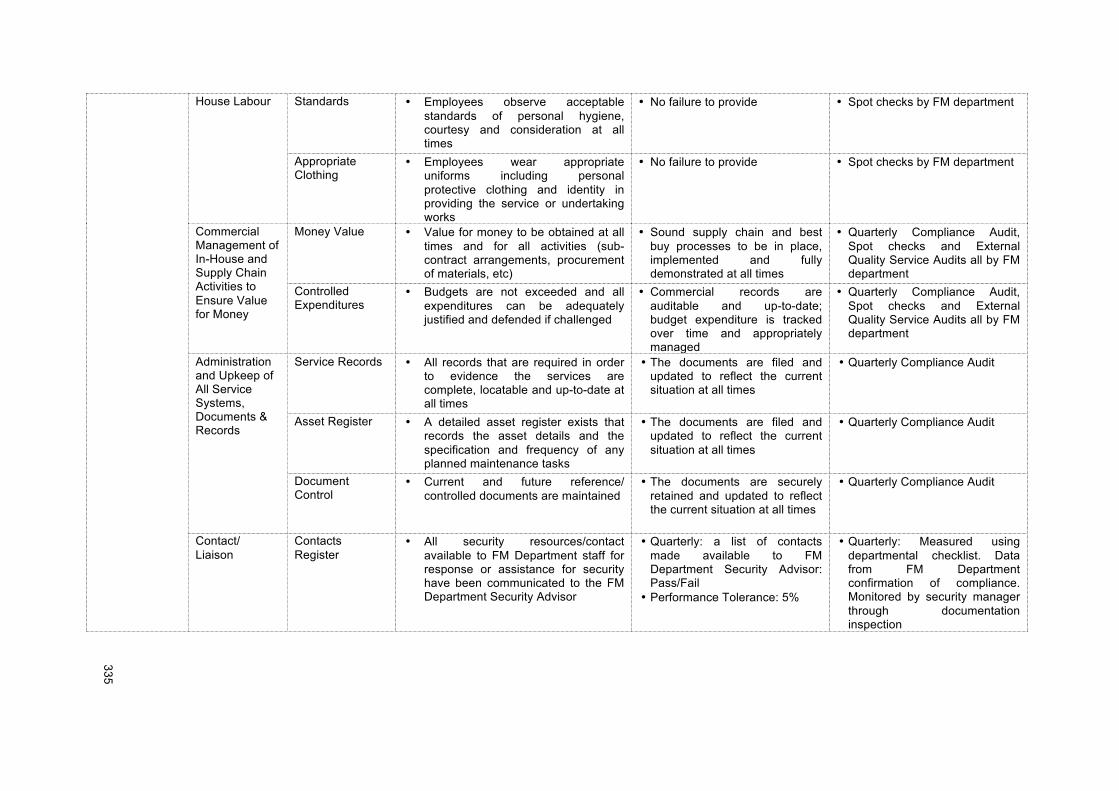
!!
335!
!
House Labour Standards • Employees observe acceptable standards of personal hygiene, courtesy and consideration at all times
• No failure to provide • Spot checks by FM department
Appropriate Clothing
• Employees wear appropriate uniforms including personal protective clothing and identity in providing the service or undertaking works
• No failure to provide • Spot checks by FM department
Commercial Management of In-House and Supply Chain Activities to Ensure Value for Money
Money Value • Value for money to be obtained at all times and for all activities (sub-contract arrangements, procurement of materials, etc)
• Sound supply chain and best buy processes to be in place, implemented and fully demonstrated at all times
• Quarterly Compliance Audit, Spot checks and External Quality Service Audits all by FM department
Controlled Expenditures
• Budgets are not exceeded and all expenditures can be adequately justified and defended if challenged
• Commercial records are auditable and up-to-date; budget expenditure is tracked over time and appropriately managed
• Quarterly Compliance Audit, Spot checks and External Quality Service Audits all by FM department
Administration and Upkeep of All Service Systems, Documents & Records
Service Records • All records that are required in order to evidence the services are complete, locatable and up-to-date at all times
• The documents are filed and updated to reflect the current situation at all times
• Quarterly Compliance Audit
Asset Register • A detailed asset register exists that records the asset details and the specification and frequency of any planned maintenance tasks
• The documents are filed and updated to reflect the current situation at all times
• Quarterly Compliance Audit
Document Control
• Current and future reference/ controlled documents are maintained
• The documents are securely retained and updated to reflect the current situation at all times
• Quarterly Compliance Audit
Contact/ Liaison
Contacts Register
• All security resources/contact available to FM Department staff for response or assistance for security have been communicated to the FM Department Security Advisor
• Quarterly: a list of contacts made available to FM Department Security Advisor: Pass/Fail
• Performance Tolerance: 5%
• Quarterly: Measured using departmental checklist. Data from FM Department confirmation of compliance. Monitored by security manager through documentation inspection
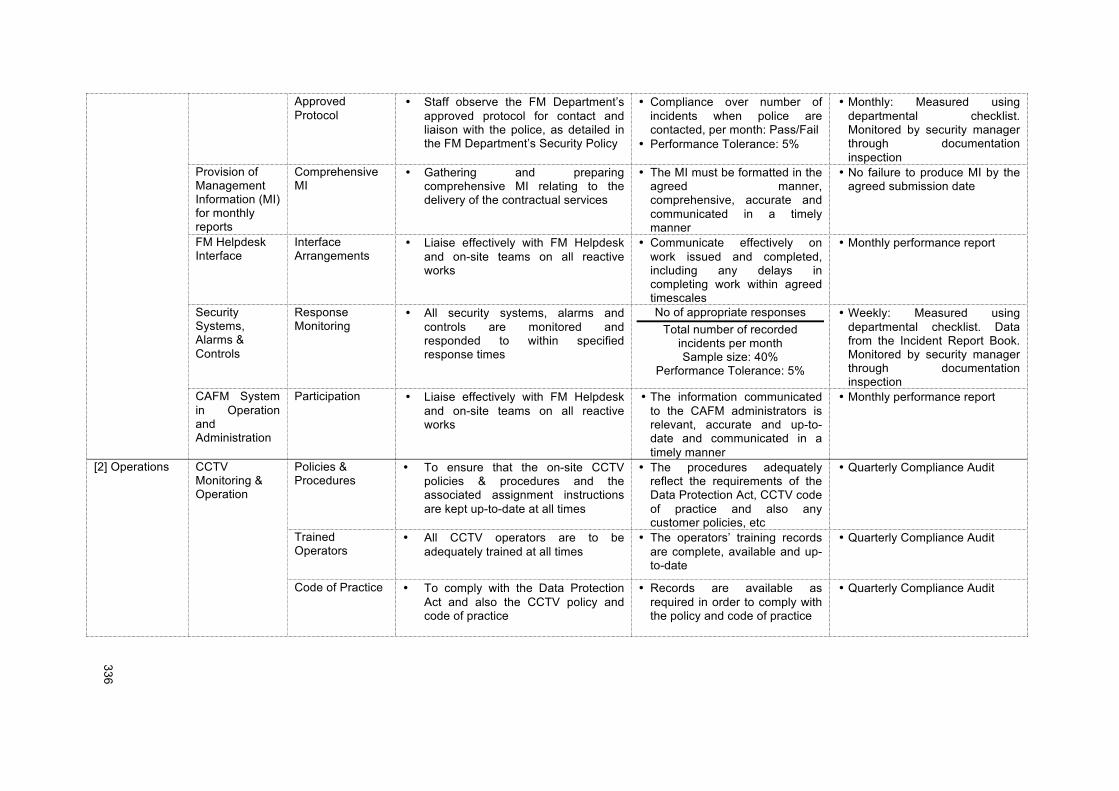
!!
336!
!
Approved Protocol
• Staff observe the FM Department’s approved protocol for contact and liaison with the police, as detailed in the FM Department’s Security Policy
• Compliance over number of incidents when police are contacted, per month: Pass/Fail
• Performance Tolerance: 5%
• Monthly: Measured using departmental checklist. Monitored by security manager through documentation inspection
Provision of Management Information (MI) for monthly reports
Comprehensive MI
• Gathering and preparing comprehensive MI relating to the delivery of the contractual services
• The MI must be formatted in the agreed manner, comprehensive, accurate and communicated in a timely manner
• No failure to produce MI by the agreed submission date
FM Helpdesk Interface
Interface Arrangements
• Liaise effectively with FM Helpdesk and on-site teams on all reactive works
• Communicate effectively on work issued and completed, including any delays in completing work within agreed timescales
• Monthly performance report
Security Systems, Alarms & Controls
Response Monitoring
• All security systems, alarms and controls are monitored and responded to within specified response times
No of appropriate responses Total number of recorded
incidents per month Sample size: 40%
Performance Tolerance: 5%
• Weekly: Measured using departmental checklist. Data from the Incident Report Book. Monitored by security manager through documentation inspection
CAFM System in Operation and Administration
Participation • Liaise effectively with FM Helpdesk and on-site teams on all reactive works
• The information communicated to the CAFM administrators is relevant, accurate and up-to-date and communicated in a timely manner
• Monthly performance report
[2] Operations CCTV Monitoring & Operation
Policies & Procedures
• To ensure that the on-site CCTV policies & procedures and the associated assignment instructions are kept up-to-date at all times
• The procedures adequately reflect the requirements of the Data Protection Act, CCTV code of practice and also any customer policies, etc
• Quarterly Compliance Audit
Trained Operators
• All CCTV operators are to be adequately trained at all times
• The operators’ training records are complete, available and up-to-date
• Quarterly Compliance Audit
Code of Practice • To comply with the Data Protection Act and also the CCTV policy and code of practice
• Records are available as required in order to comply with the policy and code of practice
• Quarterly Compliance Audit
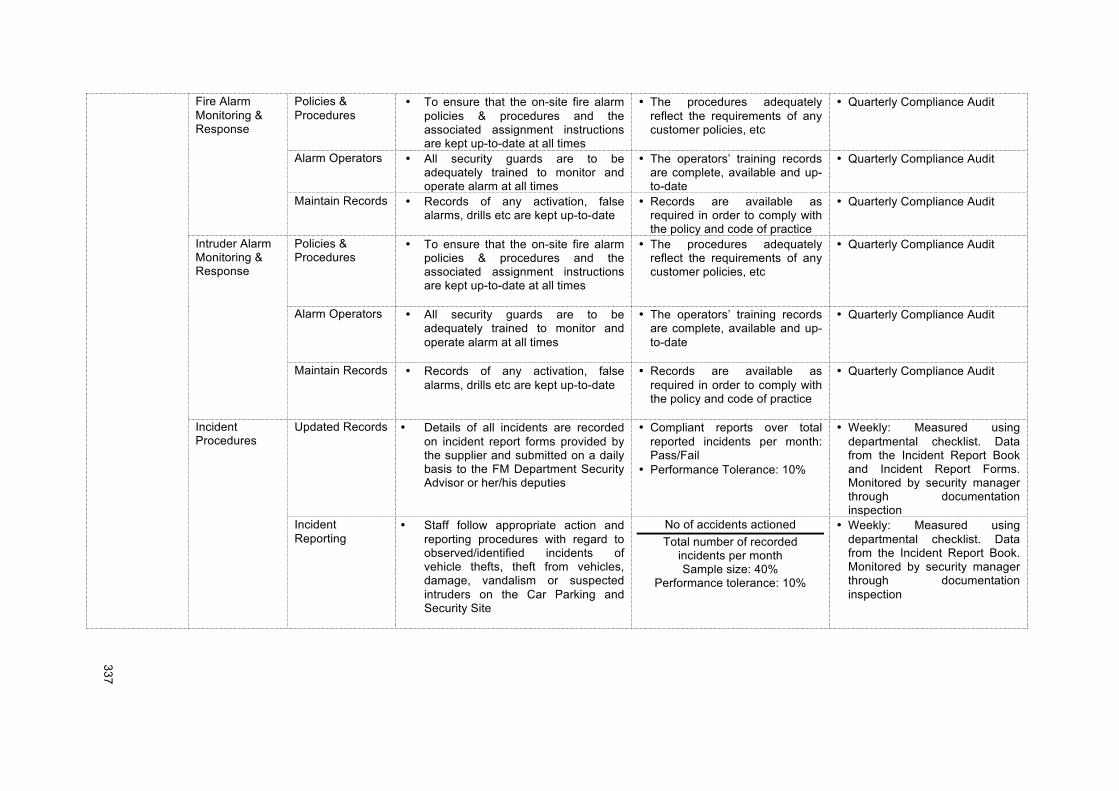
!!
337!
!
Fire Alarm Monitoring & Response
Policies & Procedures
• To ensure that the on-site fire alarm policies & procedures and the associated assignment instructions are kept up-to-date at all times
• The procedures adequately reflect the requirements of any customer policies, etc
• Quarterly Compliance Audit
Alarm Operators • All security guards are to be adequately trained to monitor and operate alarm at all times
• The operators’ training records are complete, available and up-to-date
• Quarterly Compliance Audit
Maintain Records • Records of any activation, false alarms, drills etc are kept up-to-date
• Records are available as required in order to comply with the policy and code of practice
• Quarterly Compliance Audit
Intruder Alarm Monitoring & Response
Policies & Procedures
• To ensure that the on-site fire alarm policies & procedures and the associated assignment instructions are kept up-to-date at all times
• The procedures adequately reflect the requirements of any customer policies, etc
• Quarterly Compliance Audit
Alarm Operators • All security guards are to be adequately trained to monitor and operate alarm at all times
• The operators’ training records are complete, available and up-to-date
• Quarterly Compliance Audit
Maintain Records • Records of any activation, false alarms, drills etc are kept up-to-date
• Records are available as required in order to comply with the policy and code of practice
• Quarterly Compliance Audit
Incident Procedures
Updated Records • Details of all incidents are recorded on incident report forms provided by the supplier and submitted on a daily basis to the FM Department Security Advisor or her/his deputies
• Compliant reports over total reported incidents per month: Pass/Fail
• Performance Tolerance: 10%
• Weekly: Measured using departmental checklist. Data from the Incident Report Book and Incident Report Forms. Monitored by security manager through documentation inspection
Incident Reporting
• Staff follow appropriate action and reporting procedures with regard to observed/identified incidents of vehicle thefts, theft from vehicles, damage, vandalism or suspected intruders on the Car Parking and Security Site
No of accidents actioned Total number of recorded
incidents per month Sample size: 40%
Performance tolerance: 10%
• Weekly: Measured using departmental checklist. Data from the Incident Report Book. Monitored by security manager through documentation inspection
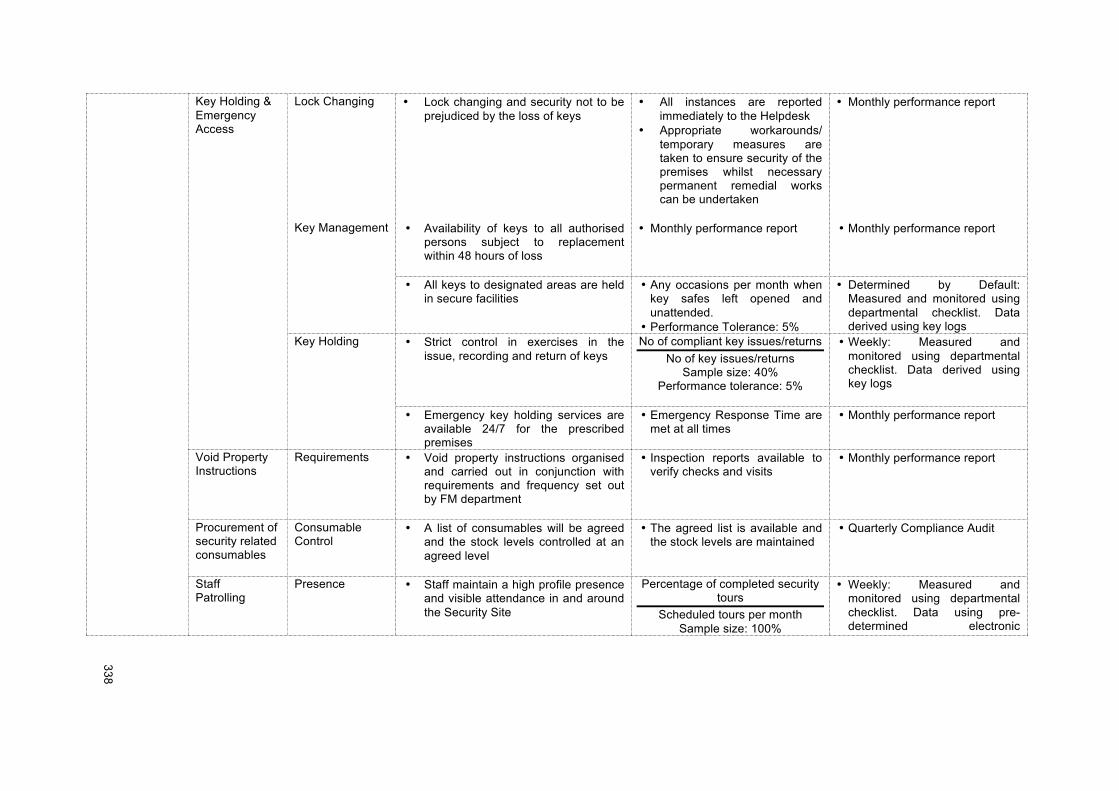
!!
338!
!
Key Holding & Emergency Access
Lock Changing • Lock changing and security not to be prejudiced by the loss of keys
• All instances are reported immediately to the Helpdesk
• Appropriate workarounds/ temporary measures are taken to ensure security of the premises whilst necessary permanent remedial works can be undertaken
• Monthly performance report
Key Management • Availability of keys to all authorised persons subject to replacement within 48 hours of loss
• Monthly performance report • Monthly performance report
• All keys to designated areas are held in secure facilities
• Any occasions per month when key safes left opened and unattended.
• Performance Tolerance: 5%
• Determined by Default: Measured and monitored using departmental checklist. Data derived using key logs
Key Holding • Strict control in exercises in the issue, recording and return of keys
No of compliant key issues/returns No of key issues/returns
Sample size: 40% Performance tolerance: 5%
• Weekly: Measured and monitored using departmental checklist. Data derived using key logs
• Emergency key holding services are available 24/7 for the prescribed premises
• Emergency Response Time are met at all times
• Monthly performance report
Void Property Instructions
Requirements • Void property instructions organised and carried out in conjunction with requirements and frequency set out by FM department
• Inspection reports available to verify checks and visits
• Monthly performance report
Procurement of security related consumables
Consumable Control
• A list of consumables will be agreed and the stock levels controlled at an agreed level
• The agreed list is available and the stock levels are maintained
• Quarterly Compliance Audit
Staff Patrolling
Presence • Staff maintain a high profile presence and visible attendance in and around the Security Site
Percentage of completed security tours
Scheduled tours per month Sample size: 100%
• Weekly: Measured and monitored using departmental checklist. Data using pre-determined electronic
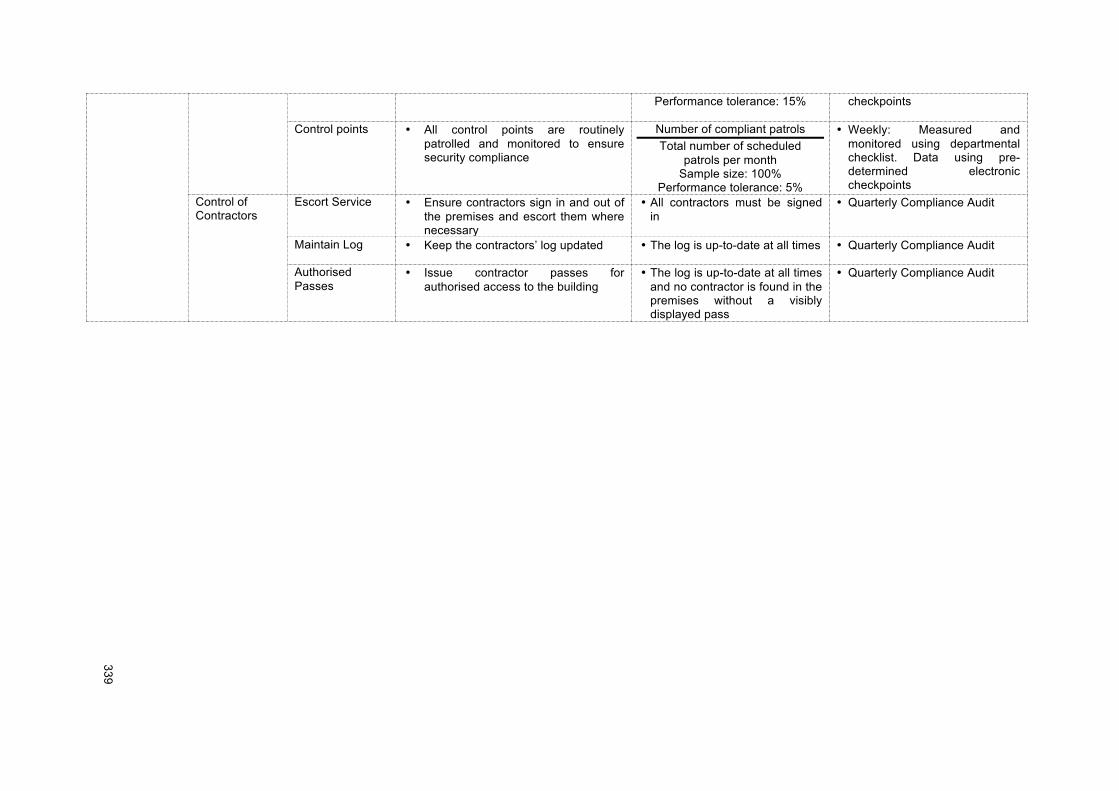
!!
339!
!
Performance tolerance: 15% checkpoints
Control points • All control points are routinely patrolled and monitored to ensure security compliance
Number of compliant patrols Total number of scheduled
patrols per month Sample size: 100%
Performance tolerance: 5%
• Weekly: Measured and monitored using departmental checklist. Data using pre-determined electronic checkpoints
Control of Contractors
Escort Service • Ensure contractors sign in and out of the premises and escort them where necessary
• All contractors must be signed in
• Quarterly Compliance Audit!
Maintain Log • Keep the contractors’ log updated • The log is up-to-date at all times • Quarterly Compliance Audit!
Authorised Passes
• Issue contractor passes for authorised access to the building
• The log is up-to-date at all times and no contractor is found in the premises without a visibly displayed pass
• Quarterly Compliance Audit!
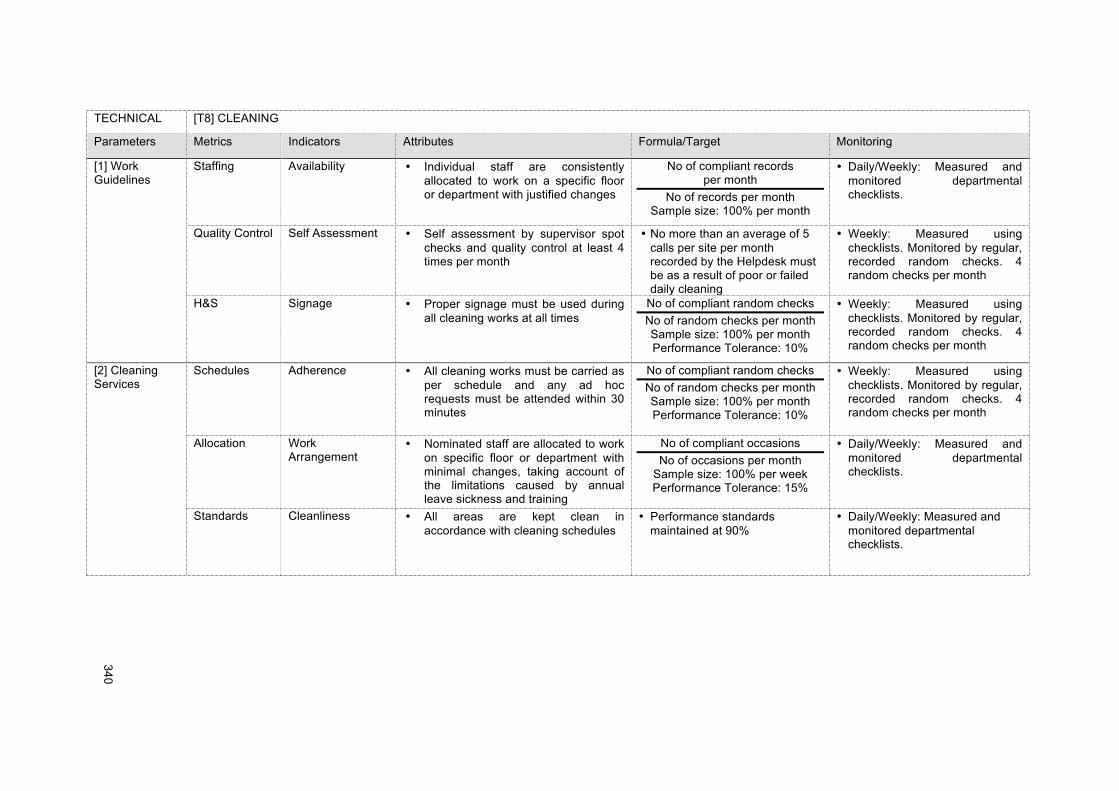
!!
340!
!
TECHNICAL [T8] CLEANING
Parameters Metrics Indicators Attributes Formula/Target Monitoring
[1] Work Guidelines
Staffing Availability • Individual staff are consistently allocated to work on a specific floor or department with justified changes
No of compliant records per month
No of records per month Sample size: 100% per month
• Daily/Weekly: Measured and monitored departmental checklists.
Quality Control Self Assessment • Self assessment by supervisor spot checks and quality control at least 4 times per month
• No more than an average of 5 calls per site per month recorded by the Helpdesk must be as a result of poor or failed daily cleaning
• Weekly: Measured using checklists. Monitored by regular, recorded random checks. 4 random checks per month
H&S Signage • Proper signage must be used during all cleaning works at all times
No of compliant random checks No of random checks per month Sample size: 100% per month Performance Tolerance: 10%
• Weekly: Measured using checklists. Monitored by regular, recorded random checks. 4 random checks per month
[2] Cleaning Services
Schedules Adherence • All cleaning works must be carried as per schedule and any ad hoc requests must be attended within 30 minutes
No of compliant random checks No of random checks per month Sample size: 100% per month Performance Tolerance: 10%
• Weekly: Measured using checklists. Monitored by regular, recorded random checks. 4 random checks per month
Allocation Work Arrangement
• Nominated staff are allocated to work on specific floor or department with minimal changes, taking account of the limitations caused by annual leave sickness and training
No of compliant occasions No of occasions per month
Sample size: 100% per week Performance Tolerance: 15%
• Daily/Weekly: Measured and monitored departmental checklists.
Standards Cleanliness • All areas are kept clean in accordance with cleaning schedules
• Performance standards maintained at 90%
• Daily/Weekly: Measured and monitored departmental checklists.
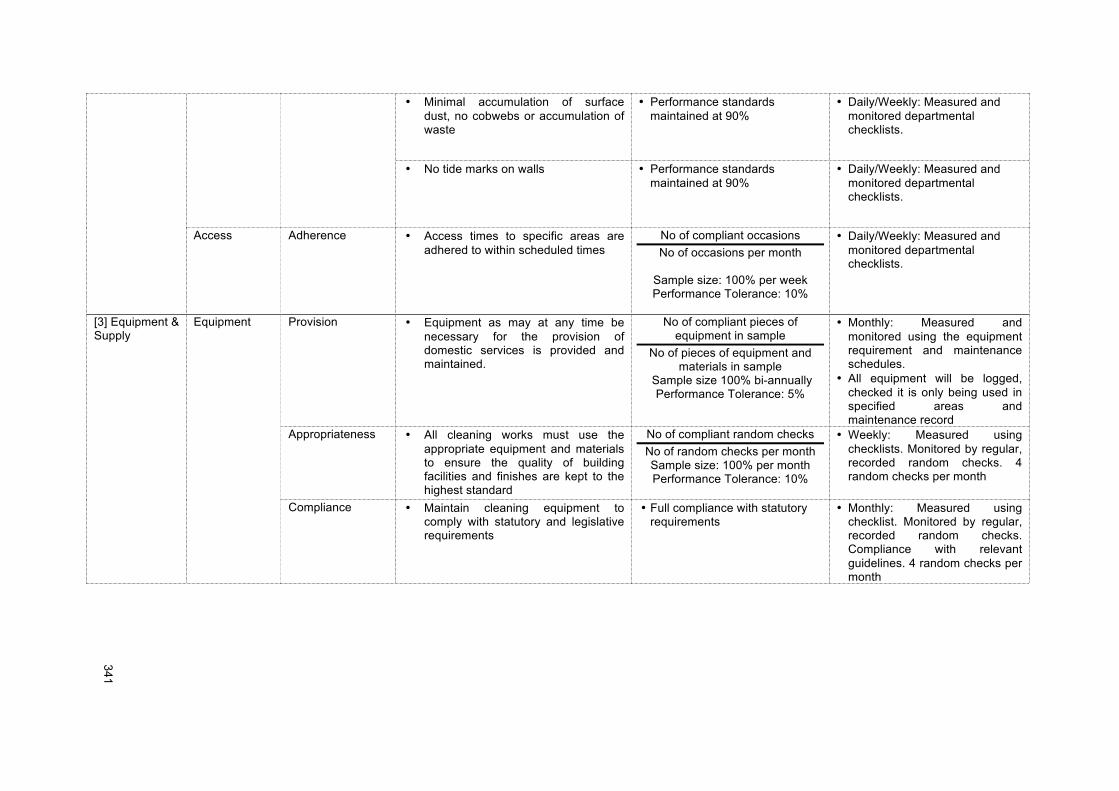
!!
341!
!
• Minimal accumulation of surface dust, no cobwebs or accumulation of waste
• Performance standards maintained at 90%
• Daily/Weekly: Measured and monitored departmental checklists.
• No tide marks on walls • Performance standards maintained at 90%
• Daily/Weekly: Measured and monitored departmental checklists.
Access Adherence • Access times to specific areas are adhered to within scheduled times
No of compliant occasions No of occasions per month
Sample size: 100% per week Performance Tolerance: 10%
• Daily/Weekly: Measured and monitored departmental checklists.
[3] Equipment & Supply
Equipment Provision • Equipment as may at any time be necessary for the provision of domestic services is provided and maintained.
No of compliant pieces of equipment in sample
No of pieces of equipment and materials in sample
Sample size 100% bi-annually Performance Tolerance: 5%
• Monthly: Measured and monitored using the equipment requirement and maintenance schedules.
• All equipment will be logged, checked it is only being used in specified areas and maintenance record
Appropriateness • All cleaning works must use the appropriate equipment and materials to ensure the quality of building facilities and finishes are kept to the highest standard
No of compliant random checks No of random checks per month Sample size: 100% per month Performance Tolerance: 10%
• Weekly: Measured using checklists. Monitored by regular, recorded random checks. 4 random checks per month
Compliance • Maintain cleaning equipment to comply with statutory and legislative requirements
• Full compliance with statutory requirements
• Monthly: Measured using checklist. Monitored by regular, recorded random checks. Compliance with relevant guidelines. 4 random checks per month
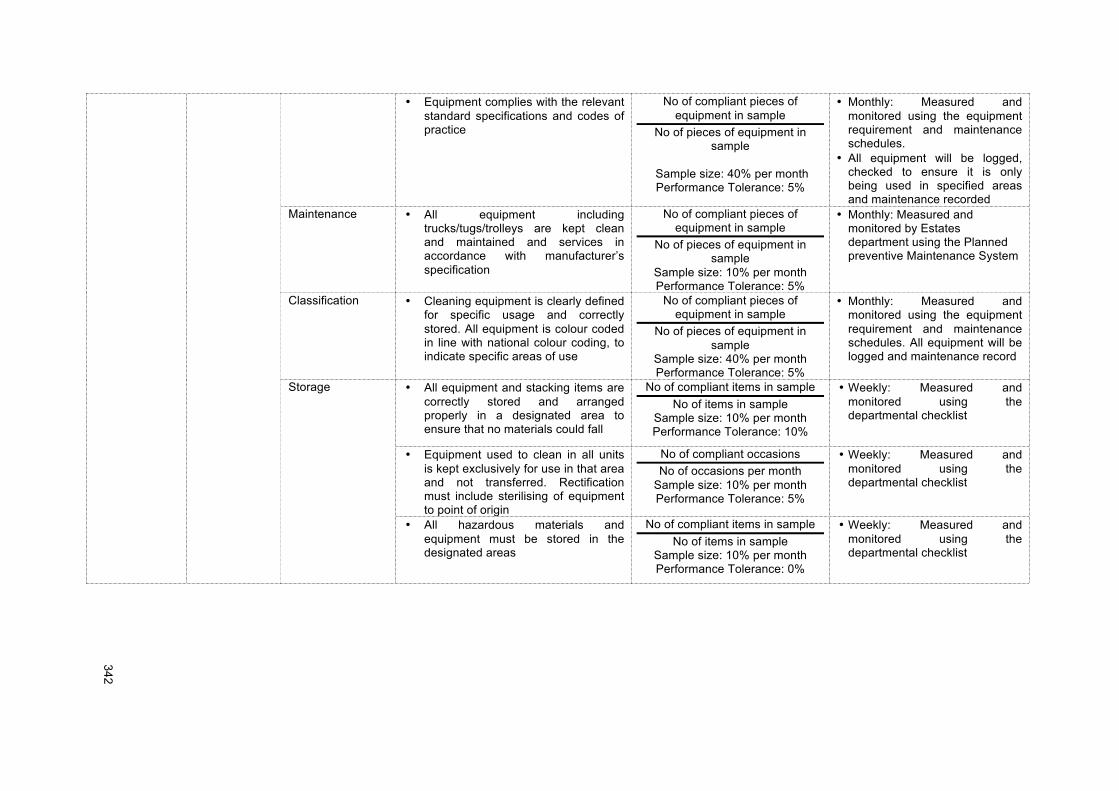
!!
342!
!
• Equipment complies with the relevant standard specifications and codes of practice
No of compliant pieces of equipment in sample
No of pieces of equipment in sample
Sample size: 40% per month Performance Tolerance: 5%
• Monthly: Measured and monitored using the equipment requirement and maintenance schedules.
• All equipment will be logged, checked to ensure it is only being used in specified areas and maintenance recorded
Maintenance • All equipment including trucks/tugs/trolleys are kept clean and maintained and services in accordance with manufacturer’s specification
No of compliant pieces of equipment in sample
No of pieces of equipment in sample
Sample size: 10% per month Performance Tolerance: 5%
• Monthly: Measured and monitored by Estates department using the Planned preventive Maintenance System
Classification • Cleaning equipment is clearly defined for specific usage and correctly stored. All equipment is colour coded in line with national colour coding, to indicate specific areas of use
No of compliant pieces of equipment in sample
No of pieces of equipment in sample
Sample size: 40% per month Performance Tolerance: 5%
• Monthly: Measured and monitored using the equipment requirement and maintenance schedules. All equipment will be logged and maintenance record
Storage • All equipment and stacking items are correctly stored and arranged properly in a designated area to ensure that no materials could fall
No of compliant items in sample No of items in sample
Sample size: 10% per month Performance Tolerance: 10%
• Weekly: Measured and monitored using the departmental checklist!
• Equipment used to clean in all units is kept exclusively for use in that area and not transferred. Rectification must include sterilising of equipment to point of origin
No of compliant occasions No of occasions per month
Sample size: 10% per month Performance Tolerance: 5%
• Weekly: Measured and monitored using the departmental checklist!
• All hazardous materials and equipment must be stored in the designated areas
No of compliant items in sample No of items in sample
Sample size: 10% per month Performance Tolerance: 0%
• Weekly: Measured and monitored using the departmental checklist!
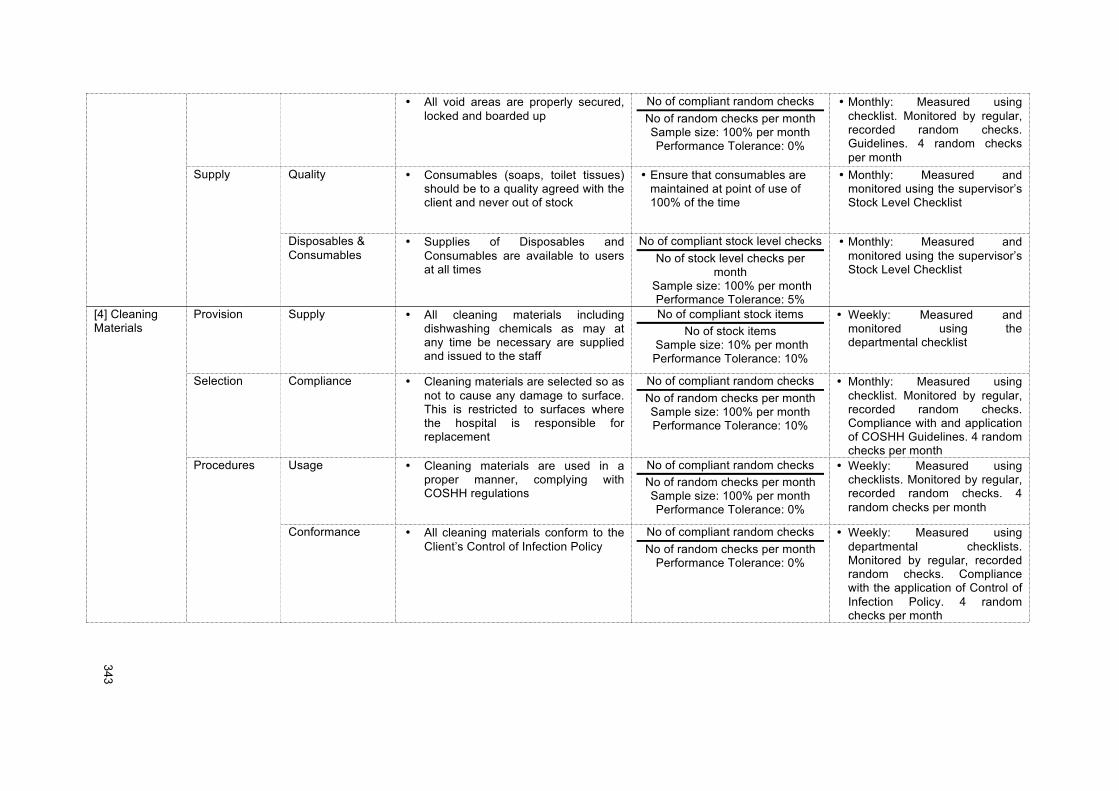
!!
343!
!
• All void areas are properly secured, locked and boarded up
No of compliant random checks No of random checks per month Sample size: 100% per month Performance Tolerance: 0%
• Monthly: Measured using checklist. Monitored by regular, recorded random checks. Guidelines. 4 random checks per month
Supply Quality • Consumables (soaps, toilet tissues) should be to a quality agreed with the client and never out of stock
• Ensure that consumables are maintained at point of use of 100% of the time
• Monthly: Measured and monitored using the supervisor’s Stock Level Checklist
Disposables & Consumables
• Supplies of Disposables and Consumables are available to users at all times
No of compliant stock level checks No of stock level checks per
month Sample size: 100% per month
Performance Tolerance: 5%
• Monthly: Measured and monitored using the supervisor’s Stock Level Checklist
[4] Cleaning Materials
Provision Supply • All cleaning materials including dishwashing chemicals as may at any time be necessary are supplied and issued to the staff
No of compliant stock items No of stock items
Sample size: 10% per month Performance Tolerance: 10%
• Weekly: Measured and monitored using the departmental checklist
Selection Compliance • Cleaning materials are selected so as not to cause any damage to surface. This is restricted to surfaces where the hospital is responsible for replacement
No of compliant random checks No of random checks per month Sample size: 100% per month Performance Tolerance: 10%
• Monthly: Measured using checklist. Monitored by regular, recorded random checks. Compliance with and application of COSHH Guidelines. 4 random checks per month
Procedures Usage • Cleaning materials are used in a proper manner, complying with COSHH regulations
No of compliant random checks No of random checks per month Sample size: 100% per month Performance Tolerance: 0%
• Weekly: Measured using checklists. Monitored by regular, recorded random checks. 4 random checks per month
Conformance • All cleaning materials conform to the Client’s Control of Infection Policy
No of compliant random checks No of random checks per month
Performance Tolerance: 0%
• Weekly: Measured using departmental checklists. Monitored by regular, recorded random checks. Compliance with the application of Control of Infection Policy. 4 random checks per month
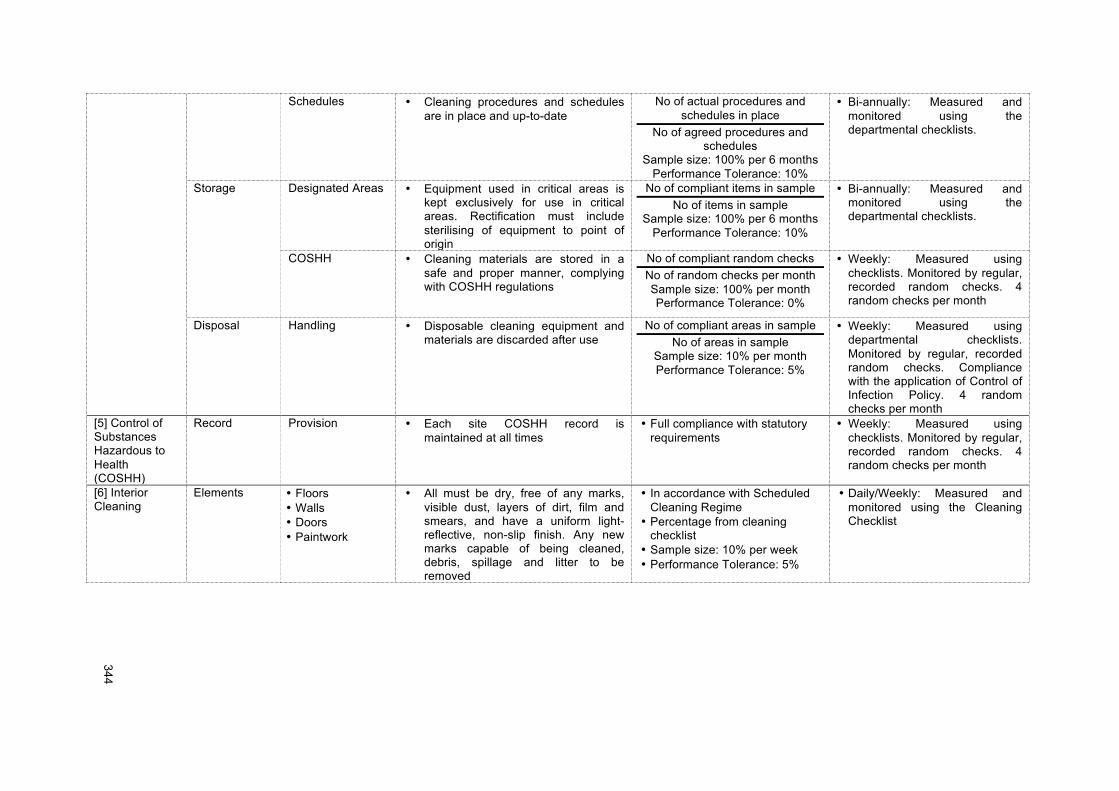
!!
344!
!
Schedules • Cleaning procedures and schedules are in place and up-to-date
No of actual procedures and schedules in place
No of agreed procedures and schedules
Sample size: 100% per 6 months Performance Tolerance: 10%
• Bi-annually: Measured and monitored using the departmental checklists.
Storage Designated Areas • Equipment used in critical areas is kept exclusively for use in critical areas. Rectification must include sterilising of equipment to point of origin
No of compliant items in sample No of items in sample
Sample size: 100% per 6 months Performance Tolerance: 10%
• Bi-annually: Measured and monitored using the departmental checklists.
COSHH • Cleaning materials are stored in a safe and proper manner, complying with COSHH regulations
No of compliant random checks No of random checks per month Sample size: 100% per month Performance Tolerance: 0%
• Weekly: Measured using checklists. Monitored by regular, recorded random checks. 4 random checks per month
Disposal Handling • Disposable cleaning equipment and materials are discarded after use
No of compliant areas in sample No of areas in sample
Sample size: 10% per month Performance Tolerance: 5%
• Weekly: Measured using departmental checklists. Monitored by regular, recorded random checks. Compliance with the application of Control of Infection Policy. 4 random checks per month
[5] Control of Substances Hazardous to Health (COSHH)
Record Provision • Each site COSHH record is maintained at all times
• Full compliance with statutory requirements
• Weekly: Measured using checklists. Monitored by regular, recorded random checks. 4 random checks per month
[6] Interior Cleaning
Elements • Floors • Walls • Doors • Paintwork
• All must be dry, free of any marks, visible dust, layers of dirt, film and smears, and have a uniform light-reflective, non-slip finish. Any new marks capable of being cleaned, debris, spillage and litter to be removed
• In accordance with Scheduled Cleaning Regime
• Percentage from cleaning checklist
• Sample size: 10% per week • Performance Tolerance: 5%
• Daily/Weekly: Measured and monitored using the Cleaning Checklist
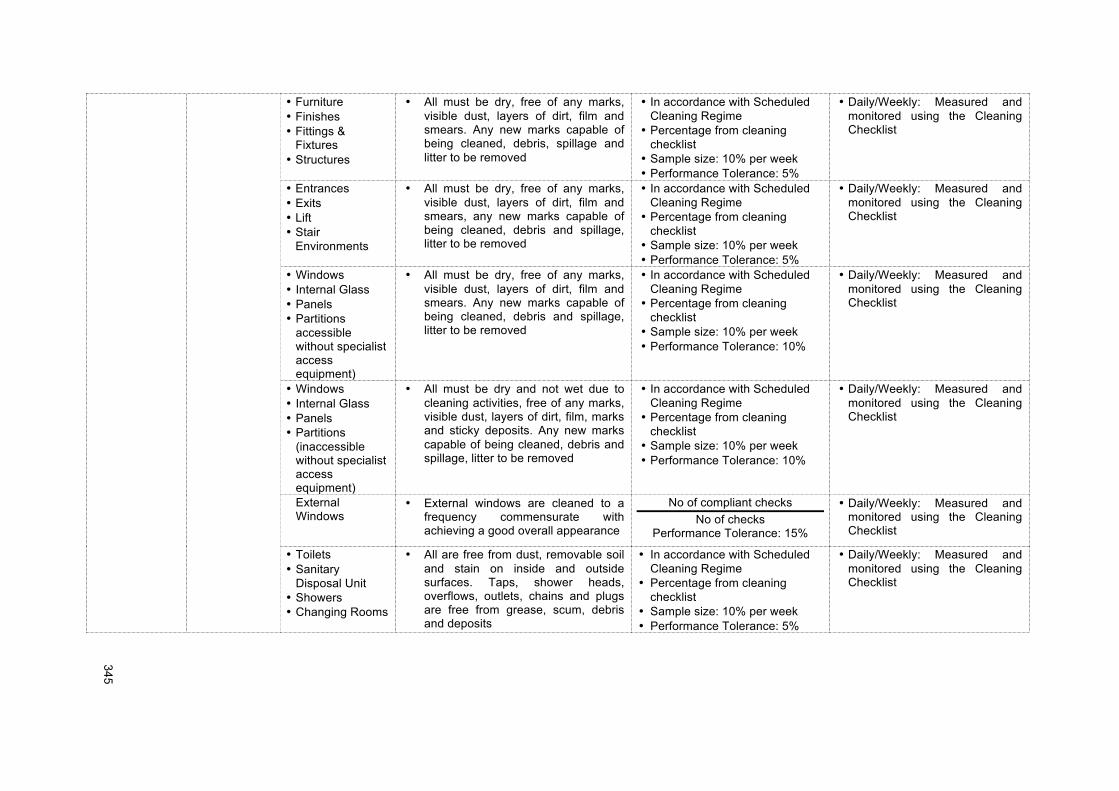
!!
345!
!
• Furniture • Finishes • Fittings &
Fixtures • Structures
• All must be dry, free of any marks, visible dust, layers of dirt, film and smears. Any new marks capable of being cleaned, debris, spillage and litter to be removed
• In accordance with Scheduled Cleaning Regime
• Percentage from cleaning checklist
• Sample size: 10% per week • Performance Tolerance: 5%
• Daily/Weekly: Measured and monitored using the Cleaning Checklist
• Entrances • Exits • Lift • Stair
Environments
• All must be dry, free of any marks, visible dust, layers of dirt, film and smears, any new marks capable of being cleaned, debris and spillage, litter to be removed
• In accordance with Scheduled Cleaning Regime
• Percentage from cleaning checklist
• Sample size: 10% per week • Performance Tolerance: 5%
• Daily/Weekly: Measured and monitored using the Cleaning Checklist
• Windows • Internal Glass • Panels • Partitions
accessible without specialist access equipment)
• All must be dry, free of any marks, visible dust, layers of dirt, film and smears. Any new marks capable of being cleaned, debris and spillage, litter to be removed
• In accordance with Scheduled Cleaning Regime
• Percentage from cleaning checklist
• Sample size: 10% per week • Performance Tolerance: 10%
• Daily/Weekly: Measured and monitored using the Cleaning Checklist
• Windows • Internal Glass • Panels • Partitions
(inaccessible without specialist access equipment)
• All must be dry and not wet due to cleaning activities, free of any marks, visible dust, layers of dirt, film, marks and sticky deposits. Any new marks capable of being cleaned, debris and spillage, litter to be removed
• In accordance with Scheduled Cleaning Regime
• Percentage from cleaning checklist
• Sample size: 10% per week • Performance Tolerance: 10%
• Daily/Weekly: Measured and monitored using the Cleaning Checklist
External Windows
• External windows are cleaned to a frequency commensurate with achieving a good overall appearance
No of compliant checks No of checks
Performance Tolerance: 15%
• Daily/Weekly: Measured and monitored using the Cleaning Checklist
• Toilets • Sanitary
Disposal Unit • Showers • Changing Rooms
• All are free from dust, removable soil and stain on inside and outside surfaces. Taps, shower heads, overflows, outlets, chains and plugs are free from grease, scum, debris and deposits
• In accordance with Scheduled Cleaning Regime
• Percentage from cleaning checklist
• Sample size: 10% per week • Performance Tolerance: 5%
• Daily/Weekly: Measured and monitored using the Cleaning Checklist
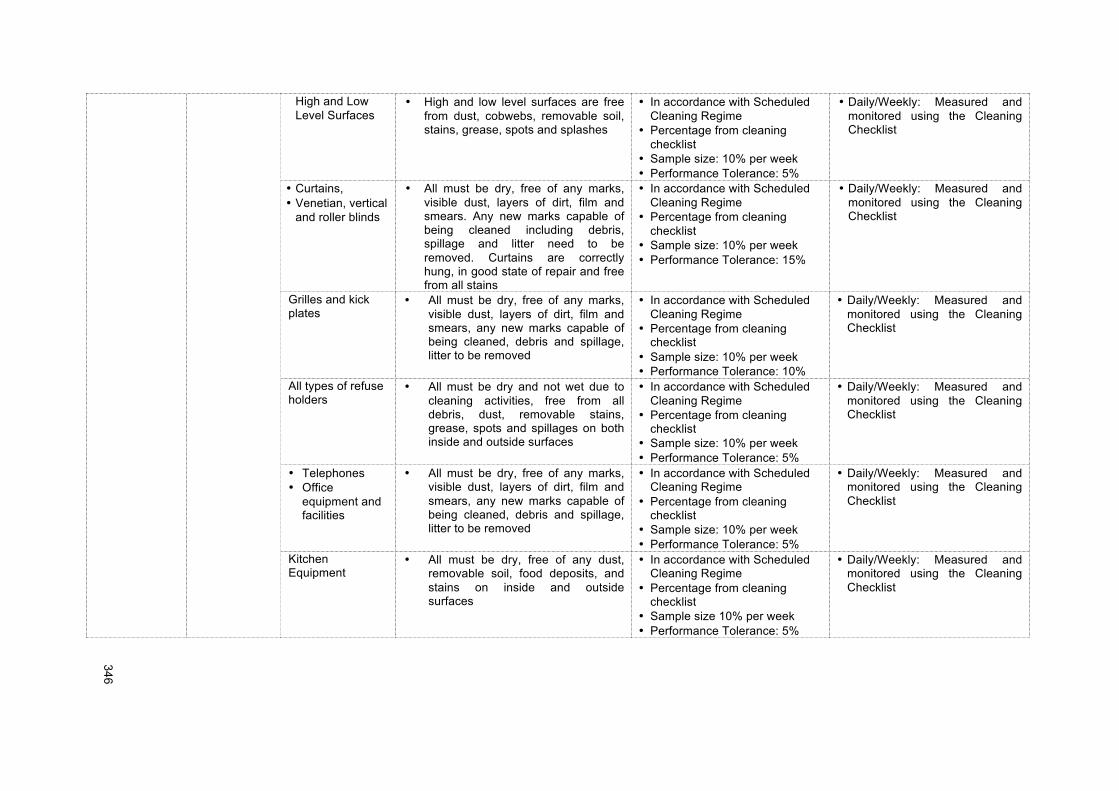
!!
346!
!
High and Low Level Surfaces
• High and low level surfaces are free from dust, cobwebs, removable soil, stains, grease, spots and splashes
• In accordance with Scheduled Cleaning Regime
• Percentage from cleaning checklist
• Sample size: 10% per week • Performance Tolerance: 5%
• Daily/Weekly: Measured and monitored using the Cleaning Checklist
• Curtains, • Venetian, vertical
and roller blinds
• All must be dry, free of any marks, visible dust, layers of dirt, film and smears. Any new marks capable of being cleaned including debris, spillage and litter need to be removed. Curtains are correctly hung, in good state of repair and free from all stains
• In accordance with Scheduled Cleaning Regime
• Percentage from cleaning checklist
• Sample size: 10% per week • Performance Tolerance: 15%
• Daily/Weekly: Measured and monitored using the Cleaning Checklist
Grilles and kick plates
• All must be dry, free of any marks, visible dust, layers of dirt, film and smears, any new marks capable of being cleaned, debris and spillage, litter to be removed
• In accordance with Scheduled Cleaning Regime
• Percentage from cleaning checklist
• Sample size: 10% per week • Performance Tolerance: 10%
• Daily/Weekly: Measured and monitored using the Cleaning Checklist
All types of refuse holders
• All must be dry and not wet due to cleaning activities, free from all debris, dust, removable stains, grease, spots and spillages on both inside and outside surfaces
• In accordance with Scheduled Cleaning Regime
• Percentage from cleaning checklist
• Sample size: 10% per week • Performance Tolerance: 5%
• Daily/Weekly: Measured and monitored using the Cleaning Checklist
• Telephones • Office
equipment and facilities
• All must be dry, free of any marks, visible dust, layers of dirt, film and smears, any new marks capable of being cleaned, debris and spillage, litter to be removed
• In accordance with Scheduled Cleaning Regime
• Percentage from cleaning checklist
• Sample size: 10% per week • Performance Tolerance: 5%
• Daily/Weekly: Measured and monitored using the Cleaning Checklist
Kitchen Equipment
• All must be dry, free of any dust, removable soil, food deposits, and stains on inside and outside surfaces
• In accordance with Scheduled Cleaning Regime
• Percentage from cleaning checklist
• Sample size 10% per week • Performance Tolerance: 5%
• Daily/Weekly: Measured and monitored using the Cleaning Checklist
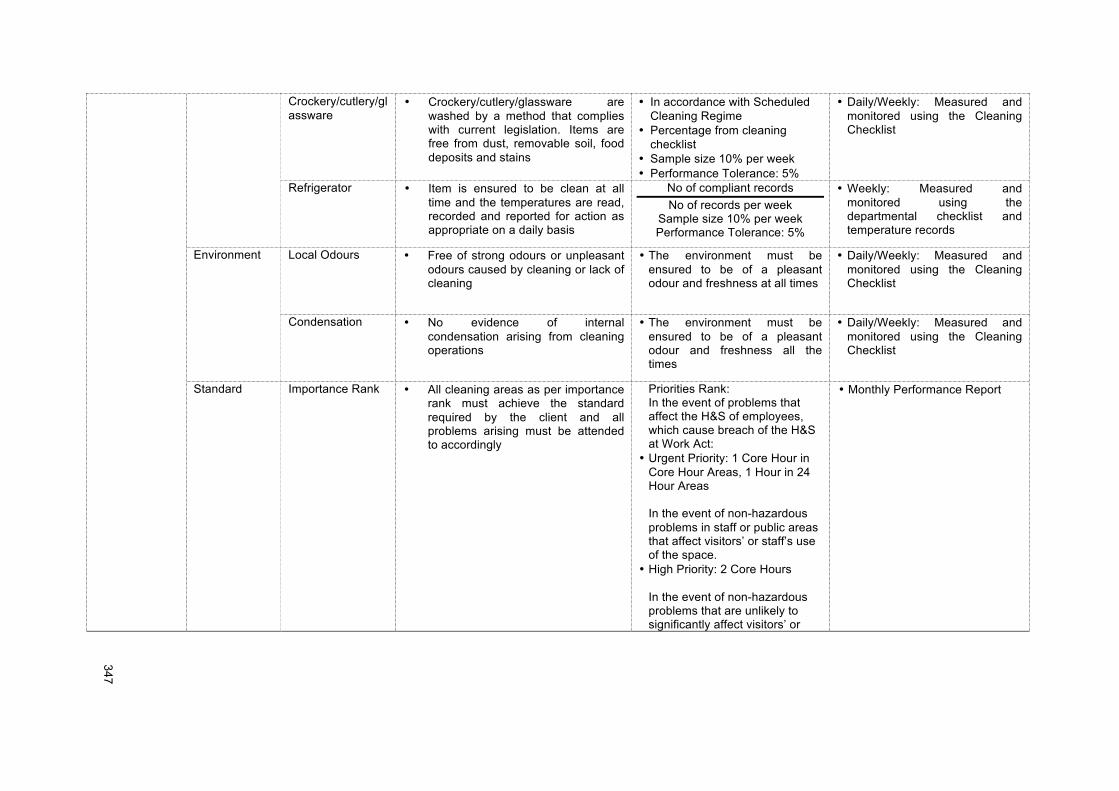
!!
347!
!
Crockery/cutlery/glassware
• Crockery/cutlery/glassware are washed by a method that complies with current legislation. Items are free from dust, removable soil, food deposits and stains
• In accordance with Scheduled Cleaning Regime
• Percentage from cleaning checklist
• Sample size 10% per week • Performance Tolerance: 5%
• Daily/Weekly: Measured and monitored using the Cleaning Checklist
Refrigerator • Item is ensured to be clean at all time and the temperatures are read, recorded and reported for action as appropriate on a daily basis
No of compliant records No of records per week
Sample size 10% per week Performance Tolerance: 5%
• Weekly: Measured and monitored using the departmental checklist and temperature records
Environment Local Odours • Free of strong odours or unpleasant odours caused by cleaning or lack of cleaning
• The environment must be ensured to be of a pleasant odour and freshness at all times
• Daily/Weekly: Measured and monitored using the Cleaning Checklist
Condensation • No evidence of internal condensation arising from cleaning operations
• The environment must be ensured to be of a pleasant odour and freshness all the times
• Daily/Weekly: Measured and monitored using the Cleaning Checklist
Standard Importance Rank • All cleaning areas as per importance rank must achieve the standard required by the client and all problems arising must be attended to accordingly
Priorities Rank: In the event of problems that affect the H&S of employees, which cause breach of the H&S at Work Act:
• Urgent Priority: 1 Core Hour in Core Hour Areas, 1 Hour in 24 Hour Areas In the event of non-hazardous problems in staff or public areas that affect visitors’ or staff’s use of the space.
• High Priority: 2 Core Hours
In the event of non-hazardous problems that are unlikely to significantly affect visitors’ or
• Monthly Performance Report!
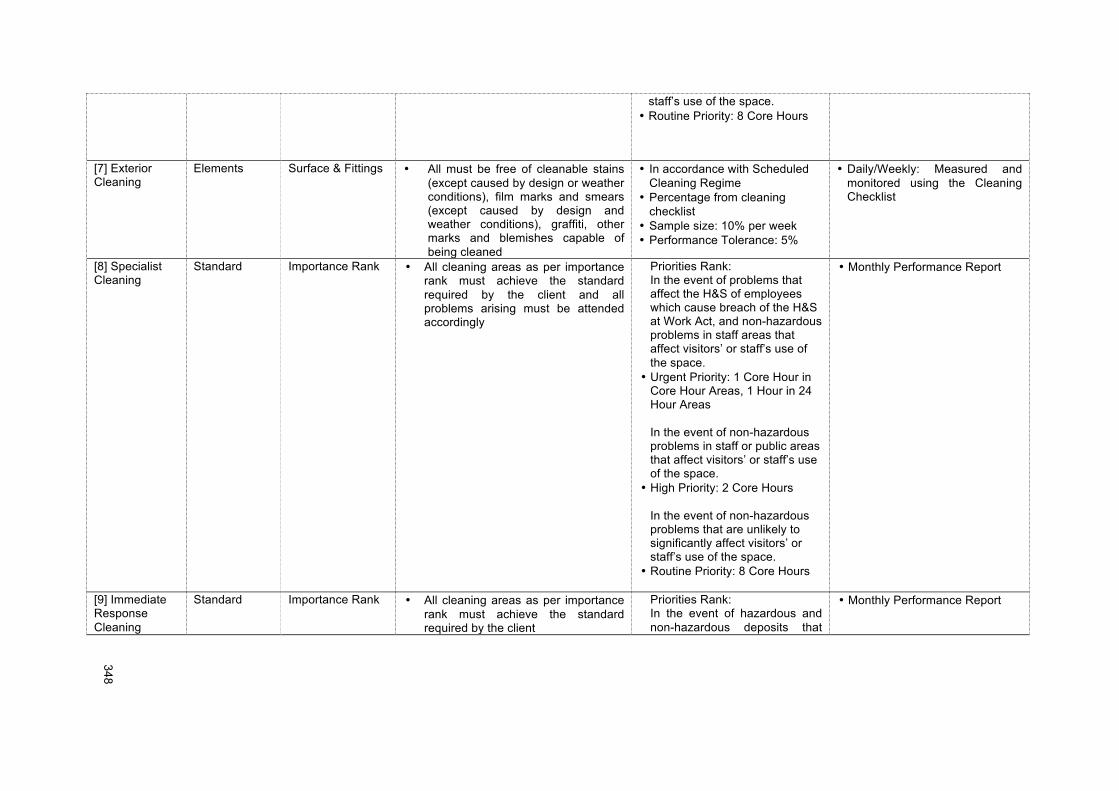
!!
348!
!
staff’s use of the space. • Routine Priority: 8 Core Hours
[7] Exterior Cleaning
Elements Surface & Fittings • All must be free of cleanable stains (except caused by design or weather conditions), film marks and smears (except caused by design and weather conditions), graffiti, other marks and blemishes capable of being cleaned
• In accordance with Scheduled Cleaning Regime
• Percentage from cleaning checklist
• Sample size: 10% per week • Performance Tolerance: 5%
• Daily/Weekly: Measured and monitored using the Cleaning Checklist
[8] Specialist Cleaning
Standard Importance Rank • All cleaning areas as per importance rank must achieve the standard required by the client and all problems arising must be attended accordingly
Priorities Rank: In the event of problems that affect the H&S of employees which cause breach of the H&S at Work Act, and non-hazardous problems in staff areas that affect visitors’ or staff’s use of the space.
• Urgent Priority: 1 Core Hour in Core Hour Areas, 1 Hour in 24 Hour Areas
In the event of non-hazardous problems in staff or public areas that affect visitors’ or staff’s use of the space.
• High Priority: 2 Core Hours
In the event of non-hazardous problems that are unlikely to significantly affect visitors’ or staff’s use of the space.
• Routine Priority: 8 Core Hours
• Monthly Performance Report!
[9] Immediate Response Cleaning
Standard Importance Rank • All cleaning areas as per importance rank must achieve the standard required by the client
Priorities Rank: In the event of hazardous and non-hazardous deposits that
• Monthly Performance Report!
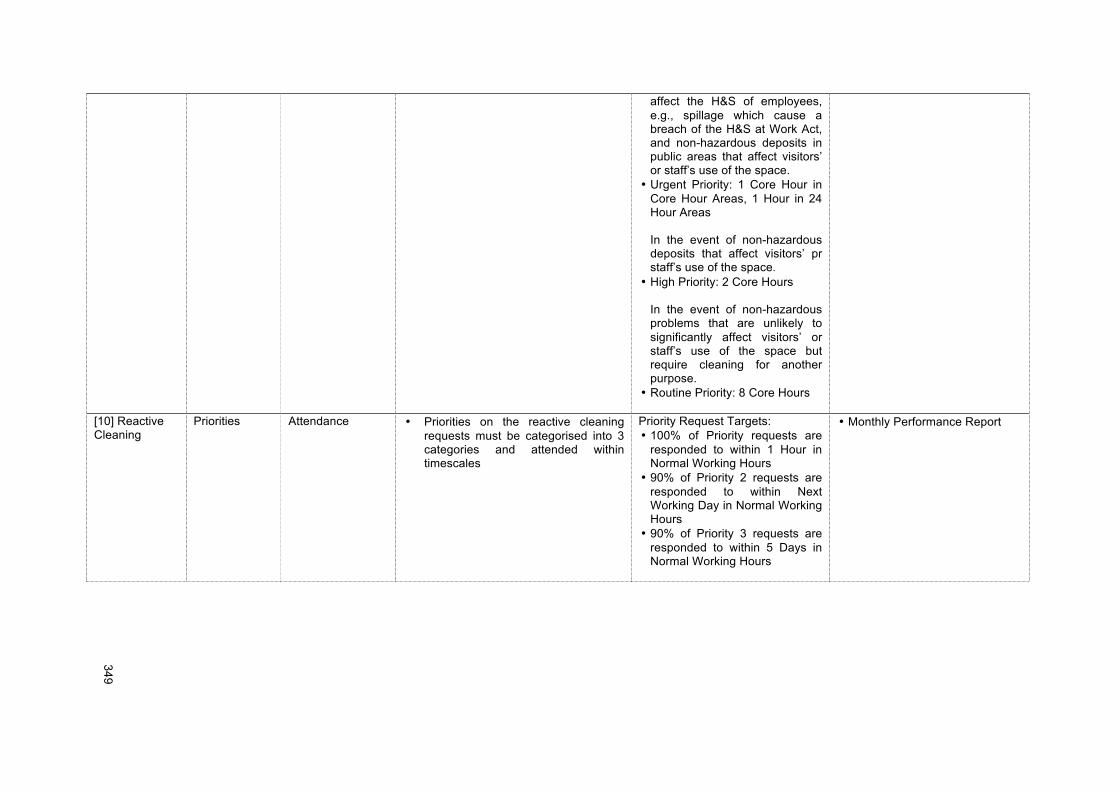
!!
349!
!
affect the H&S of employees, e.g., spillage which cause a breach of the H&S at Work Act, and non-hazardous deposits in public areas that affect visitors’ or staff’s use of the space.
• Urgent Priority: 1 Core Hour in Core Hour Areas, 1 Hour in 24 Hour Areas
In the event of non-hazardous deposits that affect visitors’ pr staff’s use of the space.
• High Priority: 2 Core Hours
In the event of non-hazardous problems that are unlikely to significantly affect visitors’ or staff’s use of the space but require cleaning for another purpose.
• Routine Priority: 8 Core Hours
[10] Reactive Cleaning
Priorities Attendance • Priorities on the reactive cleaning requests must be categorised into 3 categories and attended within timescales
Priority Request Targets: • 100% of Priority requests are
responded to within 1 Hour in Normal Working Hours
• 90% of Priority 2 requests are responded to within Next Working Day in Normal Working Hours
• 90% of Priority 3 requests are responded to within 5 Days in Normal Working Hours
• Monthly Performance Report!
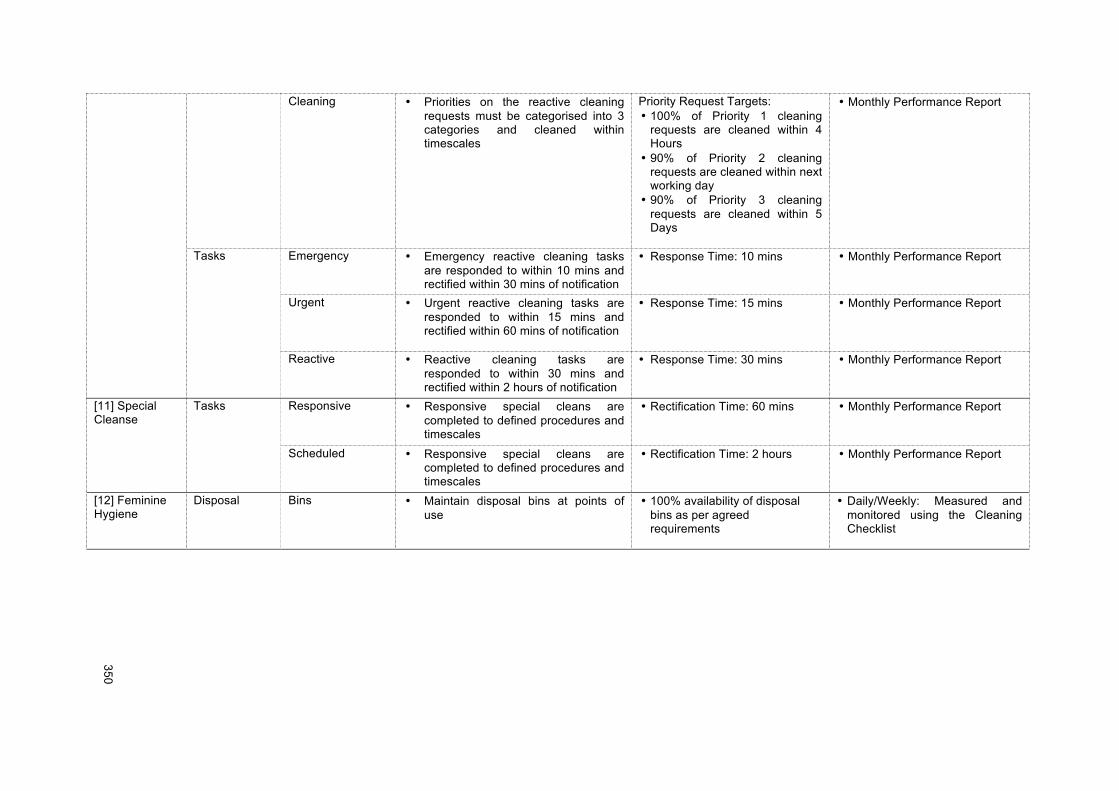
!!
350!
!
Cleaning • Priorities on the reactive cleaning requests must be categorised into 3 categories and cleaned within timescales
Priority Request Targets: • 100% of Priority 1 cleaning
requests are cleaned within 4 Hours
• 90% of Priority 2 cleaning requests are cleaned within next working day
• 90% of Priority 3 cleaning requests are cleaned within 5 Days
• Monthly Performance Report!
Tasks Emergency • Emergency reactive cleaning tasks are responded to within 10 mins and rectified within 30 mins of notification
• Response Time: 10 mins • Monthly Performance Report!
Urgent • Urgent reactive cleaning tasks are responded to within 15 mins and rectified within 60 mins of notification
• Response Time: 15 mins • Monthly Performance Report!
Reactive • Reactive cleaning tasks are responded to within 30 mins and rectified within 2 hours of notification
• Response Time: 30 mins • Monthly Performance Report!
[11] Special Cleanse
Tasks Responsive • Responsive special cleans are completed to defined procedures and timescales
• Rectification Time: 60 mins • Monthly Performance Report!
Scheduled • Responsive special cleans are completed to defined procedures and timescales
• Rectification Time: 2 hours • Monthly Performance Report!
[12] Feminine Hygiene
Disposal Bins • Maintain disposal bins at points of use
• 100% availability of disposal bins as per agreed requirements
• Daily/Weekly: Measured and monitored using the Cleaning Checklist
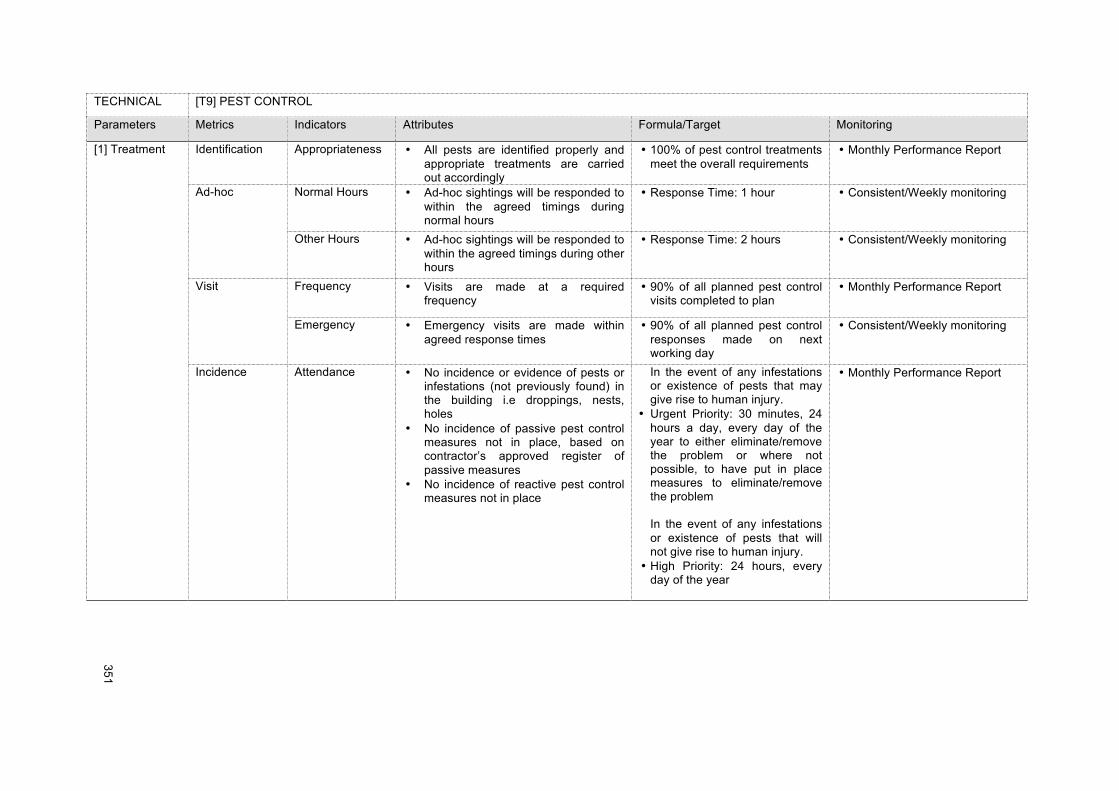
!!
351!
!
TECHNICAL [T9] PEST CONTROL
Parameters Metrics Indicators Attributes Formula/Target Monitoring
[1] Treatment Identification Appropriateness • All pests are identified properly and appropriate treatments are carried out accordingly
• 100% of pest control treatments meet the overall requirements
• Monthly Performance Report!
Ad-hoc Normal Hours • Ad-hoc sightings will be responded to within the agreed timings during normal hours
• Response Time: 1 hour • Consistent/Weekly monitoring
Other Hours • Ad-hoc sightings will be responded to within the agreed timings during other hours
• Response Time: 2 hours • Consistent/Weekly monitoring
Visit Frequency • Visits are made at a required frequency
• 90% of all planned pest control visits completed to plan
• Monthly Performance Report!
Emergency • Emergency visits are made within agreed response times
• 90% of all planned pest control responses made on next working day
• Consistent/Weekly monitoring
Incidence Attendance • No incidence or evidence of pests or infestations (not previously found) in the building i.e droppings, nests, holes
• No incidence of passive pest control measures not in place, based on contractor’s approved register of passive measures
• No incidence of reactive pest control measures not in place
In the event of any infestations or existence of pests that may give rise to human injury.
• Urgent Priority: 30 minutes, 24 hours a day, every day of the year to either eliminate/remove the problem or where not possible, to have put in place measures to eliminate/remove the problem
In the event of any infestations or existence of pests that will not give rise to human injury.
• High Priority: 24 hours, every day of the year
• Monthly Performance Report!
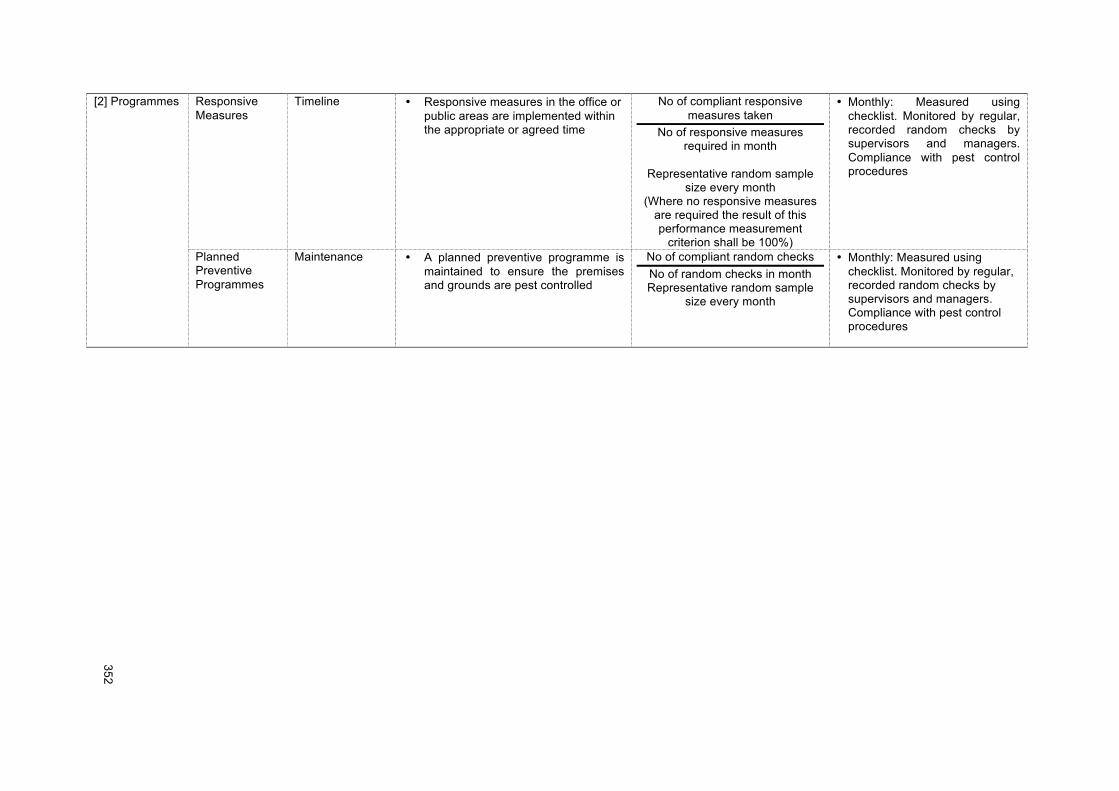
!!
352!
!
[2] Programmes Responsive Measures
Timeline • Responsive measures in the office or public areas are implemented within the appropriate or agreed time
No of compliant responsive measures taken
No of responsive measures required in month
Representative random sample
size every month (Where no responsive measures
are required the result of this performance measurement
criterion shall be 100%)
• Monthly: Measured using checklist. Monitored by regular, recorded random checks by supervisors and managers. Compliance with pest control procedures
Planned Preventive Programmes
Maintenance • A planned preventive programme is maintained to ensure the premises and grounds are pest controlled
No of compliant random checks No of random checks in month Representative random sample
size every month
• Monthly: Measured using checklist. Monitored by regular, recorded random checks by supervisors and managers. Compliance with pest control procedures
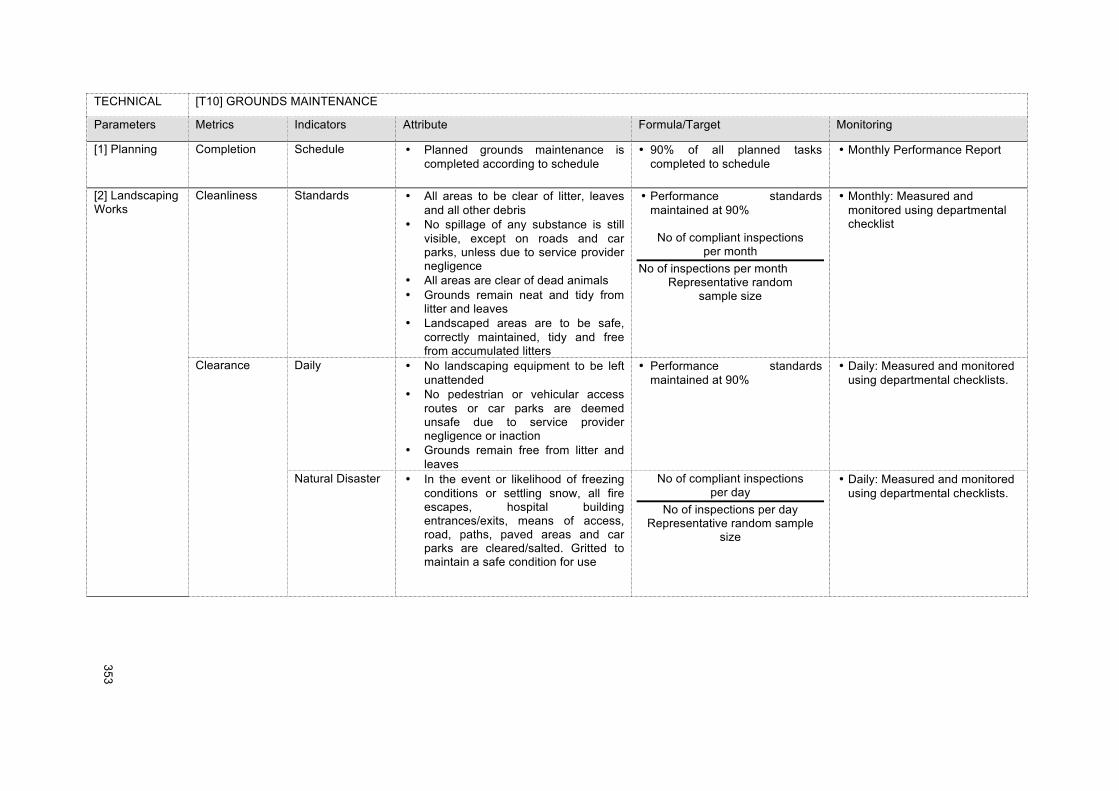
!!
353!
!
TECHNICAL [T10] GROUNDS MAINTENANCE
Parameters Metrics Indicators Attribute Formula/Target Monitoring
[1] Planning Completion
Schedule • Planned grounds maintenance is completed according to schedule
• 90% of all planned tasks completed to schedule
• Monthly Performance Report!
[2] Landscaping Works
Cleanliness Standards • All areas to be clear of litter, leaves and all other debris
• No spillage of any substance is still visible, except on roads and car parks, unless due to service provider negligence
• All areas are clear of dead animals • Grounds remain neat and tidy from
litter and leaves • Landscaped areas are to be safe,
correctly maintained, tidy and free from accumulated litters
• Performance standards maintained at 90%
No of compliant inspections
per month No of inspections per month
Representative random sample size
• Monthly: Measured and monitored using departmental checklist
Clearance Daily • No landscaping equipment to be left unattended
• No pedestrian or vehicular access routes or car parks are deemed unsafe due to service provider negligence or inaction
• Grounds remain free from litter and leaves
• Performance standards maintained at 90%
• Daily: Measured and monitored using departmental checklists.
Natural Disaster • In the event or likelihood of freezing conditions or settling snow, all fire escapes, hospital building entrances/exits, means of access, road, paths, paved areas and car parks are cleared/salted. Gritted to maintain a safe condition for use
No of compliant inspections per day
No of inspections per day Representative random sample
size
• Daily: Measured and monitored using departmental checklists.
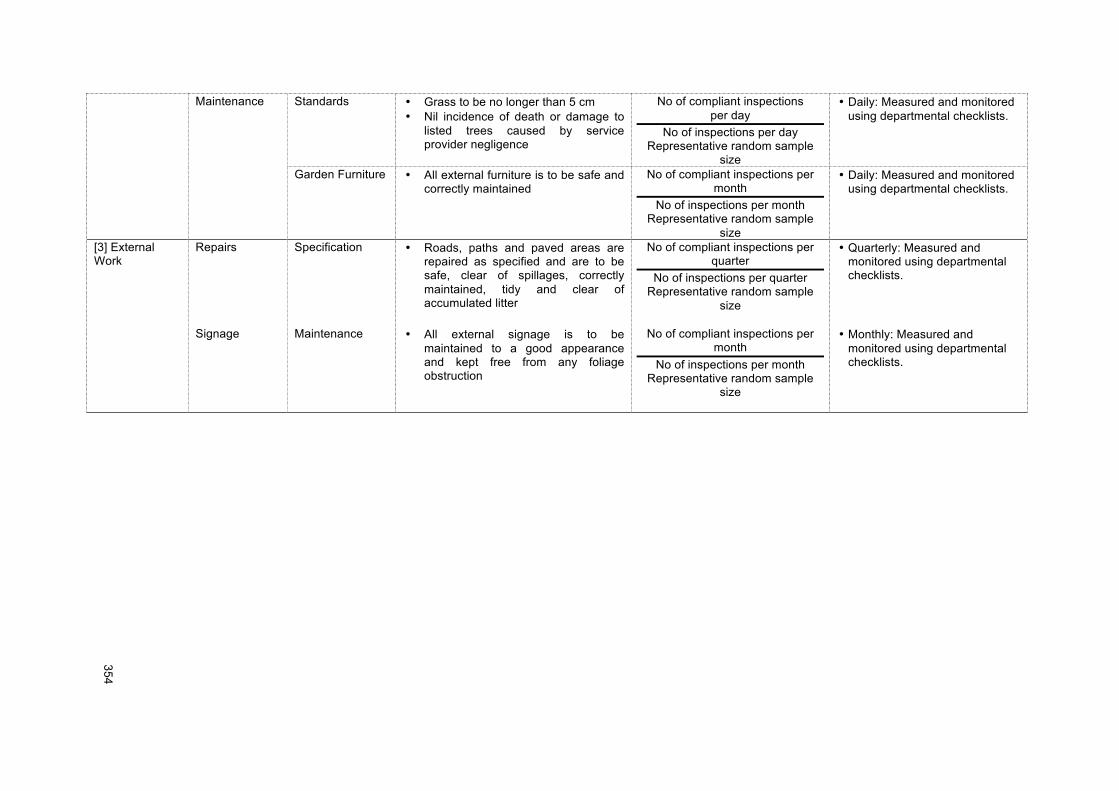
!!
354!
!
Maintenance Standards • Grass to be no longer than 5 cm • Nil incidence of death or damage to
listed trees caused by service provider negligence
No of compliant inspections per day
No of inspections per day Representative random sample
size
• Daily: Measured and monitored using departmental checklists.
Garden Furniture • All external furniture is to be safe and correctly maintained
No of compliant inspections per month
No of inspections per month Representative random sample
size
• Daily: Measured and monitored using departmental checklists.
[3] External Work
Repairs Specification • Roads, paths and paved areas are repaired as specified and are to be safe, clear of spillages, correctly maintained, tidy and clear of accumulated litter
No of compliant inspections per quarter
No of inspections per quarter Representative random sample
size
• Quarterly: Measured and monitored using departmental checklists.
Signage Maintenance • All external signage is to be maintained to a good appearance and kept free from any foliage obstruction
No of compliant inspections per month
No of inspections per month Representative random sample
size
• Monthly: Measured and monitored using departmental checklists.

!!
355!
!
TECHNICAL [T11] MANAGEMENT INFORMATION
Parameters Metrics Indicators Attributes Formula/Target Monitoring
[1] Service Customer Satisfaction
Monitoring System
• Provision of Management Information including open book accounting and system for monitoring customer satisfaction
No of compliant responses Total number of logged requests
per month Sample size: 100%
Performance Tolerance: 10%
• Weekly: Measured and monitored using the Helpdesk log
[2] Reports
Quality Delivery Timeliness
• Reports are submitted within time scale as agreed
• Any records, financial or accounting information must be available to the Authority for inspection within 1 Working Day of request
Non compliant random checks No. of random checks per month
Delivery Targets: • Daily report must be delivered
not later than 0900 on the following working day
• Weekly report must be delivered not later than 1 working day after the end of the week to which it refers
• Monthly: Monthly Performance Report
Report Accuracy • Records must be reported as accurately as they were recorded
No. of compliant random checks No. of random checks per month
Performance tolerance: 0%
• Monthly: using departmental checklist
• 4 random checks/month by supervisor and manager
Complete Records
• Report or record complete and as specified and required respectively
No. of compliant random checks No. of random checks per month
Performance tolerance: 0%
• Monthly: using departmental checklist
• 4 random checks/month by supervisor and manager
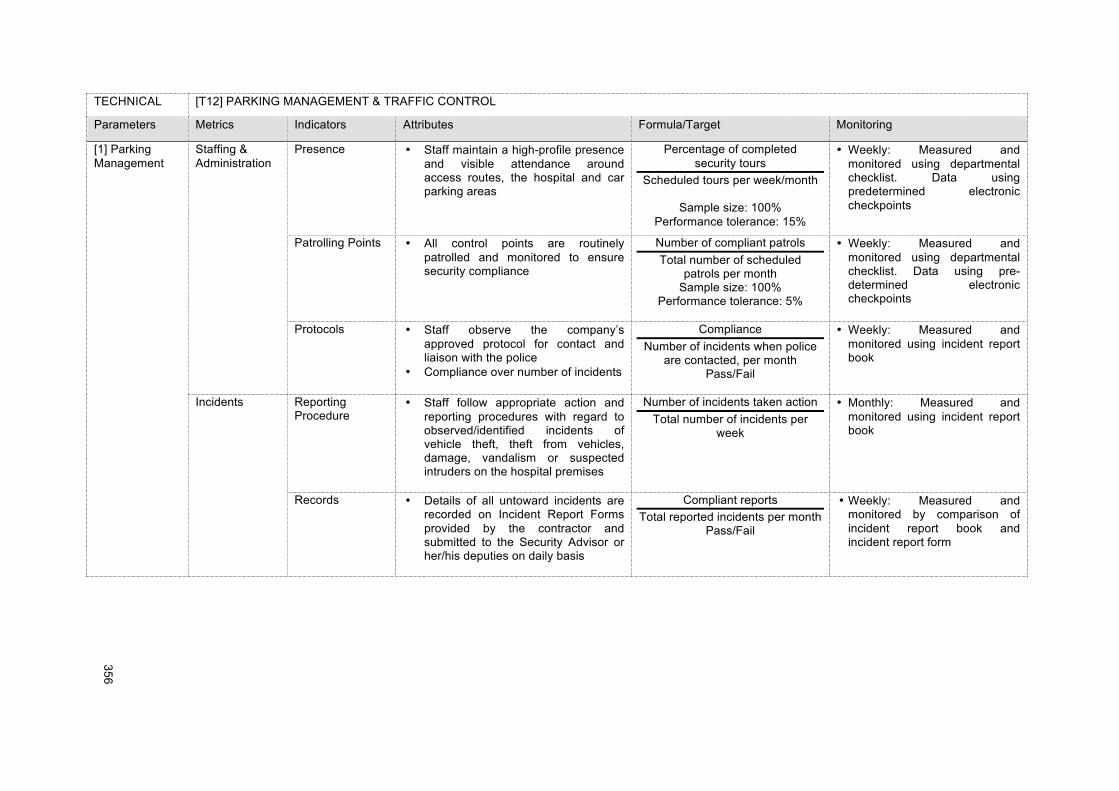
!!
356!
!
TECHNICAL [T12] PARKING MANAGEMENT & TRAFFIC CONTROL
Parameters Metrics Indicators Attributes Formula/Target Monitoring
[1] Parking Management
Staffing & Administration
Presence • Staff maintain a high-profile presence and visible attendance around access routes, the hospital and car parking areas
Percentage of completed security tours
Scheduled tours per week/month
Sample size: 100% Performance tolerance: 15%
• Weekly: Measured and monitored using departmental checklist. Data using predetermined electronic checkpoints
Patrolling Points • All control points are routinely patrolled and monitored to ensure security compliance
Number of compliant patrols Total number of scheduled
patrols per month Sample size: 100%
Performance tolerance: 5%
• Weekly: Measured and monitored using departmental checklist. Data using pre-determined electronic checkpoints
Protocols • Staff observe the company’s approved protocol for contact and liaison with the police
• Compliance over number of incidents
Compliance Number of incidents when police
are contacted, per month Pass/Fail
• Weekly: Measured and monitored using incident report book
Incidents Reporting Procedure
• Staff follow appropriate action and reporting procedures with regard to observed/identified incidents of vehicle theft, theft from vehicles, damage, vandalism or suspected intruders on the hospital premises
Number of incidents taken action Total number of incidents per
week
• Monthly: Measured and monitored using incident report book
Records • Details of all untoward incidents are recorded on Incident Report Forms provided by the contractor and submitted to the Security Advisor or her/his deputies on daily basis
Compliant reports Total reported incidents per month
Pass/Fail
• Weekly: Measured and monitored by comparison of incident report book and incident report form
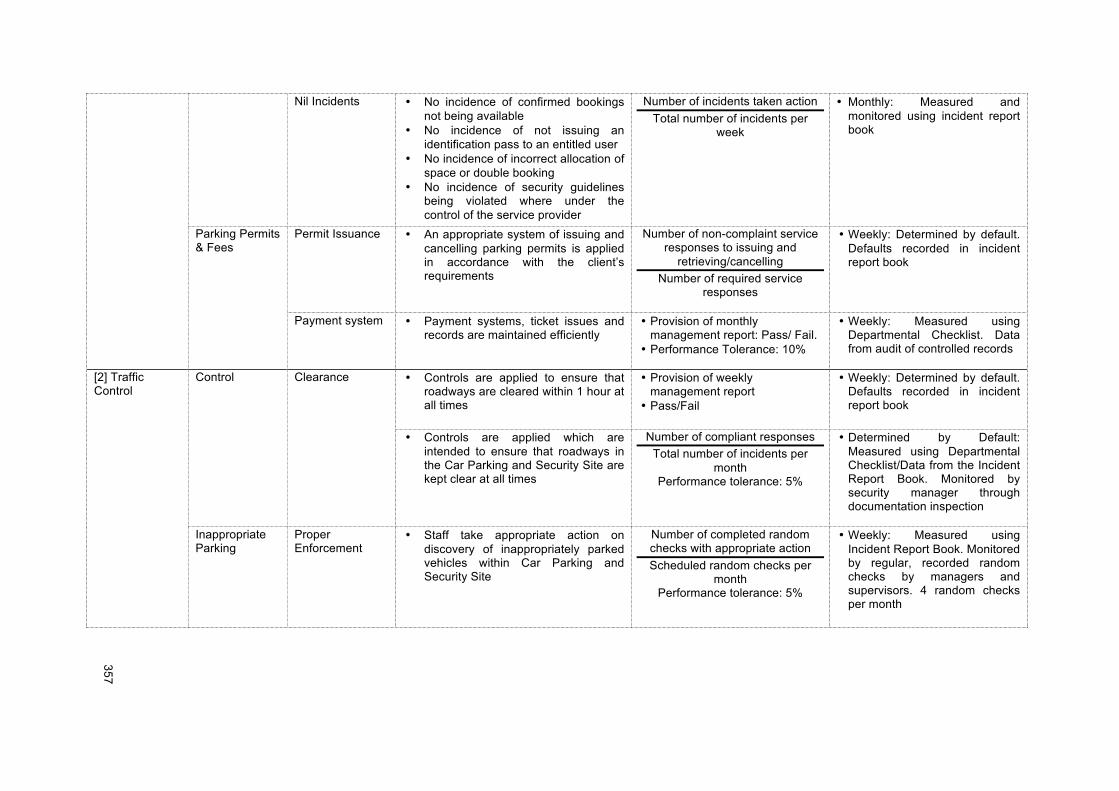
!!
357!
!
Nil Incidents • No incidence of confirmed bookings not being available
• No incidence of not issuing an identification pass to an entitled user
• No incidence of incorrect allocation of space or double booking
• No incidence of security guidelines being violated where under the control of the service provider
Number of incidents taken action Total number of incidents per
week
• Monthly: Measured and monitored using incident report book
Parking Permits & Fees
Permit Issuance • An appropriate system of issuing and cancelling parking permits is applied in accordance with the client’s requirements
Number of non-complaint service responses to issuing and
retrieving/cancelling Number of required service
responses
• Weekly: Determined by default. Defaults recorded in incident report book
Payment system • Payment systems, ticket issues and records are maintained efficiently
• Provision of monthly management report: Pass/ Fail.
• Performance Tolerance: 10%
• Weekly: Measured using Departmental Checklist. Data from audit of controlled records
[2] Traffic Control
Control Clearance • Controls are applied to ensure that roadways are cleared within 1 hour at all times
• Provision of weekly management report
• Pass/Fail
• Weekly: Determined by default. Defaults recorded in incident report book
• Controls are applied which are
intended to ensure that roadways in the Car Parking and Security Site are kept clear at all times
Number of compliant responses Total number of incidents per
month Performance tolerance: 5%
• Determined by Default: Measured using Departmental Checklist/Data from the Incident Report Book. Monitored by security manager through documentation inspection
Inappropriate Parking
Proper Enforcement
• Staff take appropriate action on discovery of inappropriately parked vehicles within Car Parking and Security Site
Number of completed random checks with appropriate action Scheduled random checks per
month Performance tolerance: 5%
• Weekly: Measured using Incident Report Book. Monitored by regular, recorded random checks by managers and supervisors. 4 random checks per month
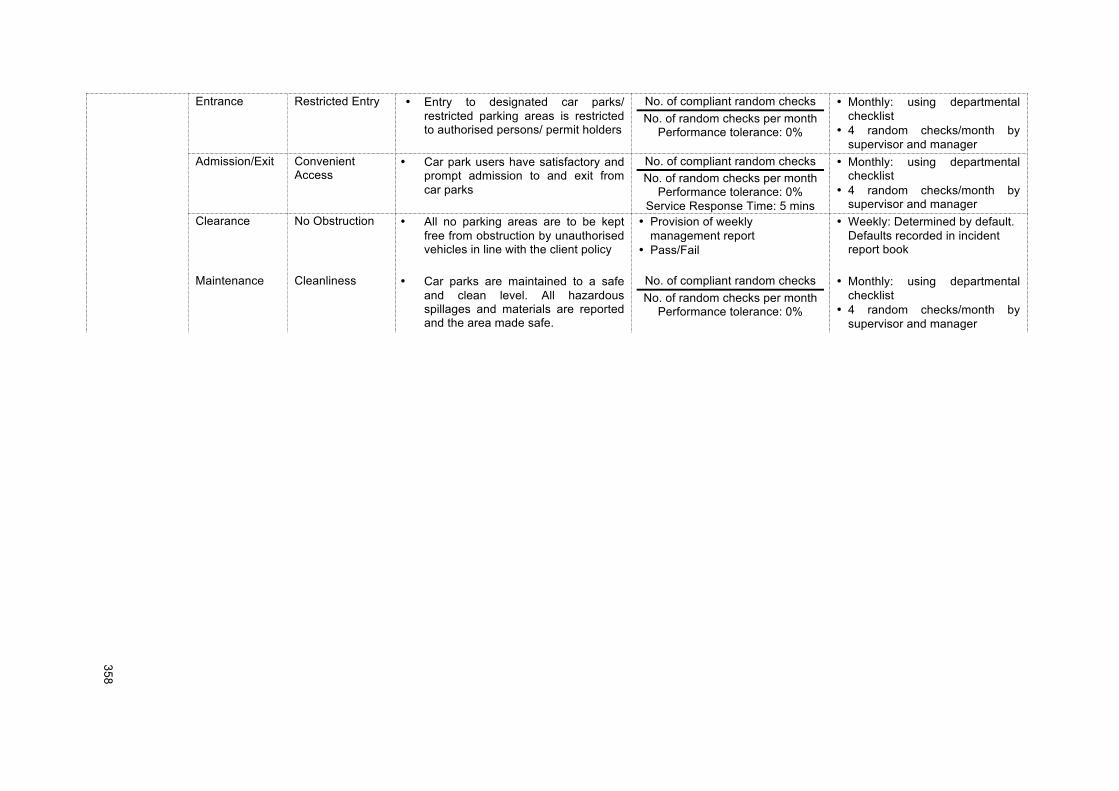
!!
358!
!
Entrance Restricted Entry • Entry to designated car parks/ restricted parking areas is restricted to authorised persons/ permit holders
No. of compliant random checks No. of random checks per month
Performance tolerance: 0%
• Monthly: using departmental checklist
• 4 random checks/month by supervisor and manager
Admission/Exit Convenient Access
• Car park users have satisfactory and prompt admission to and exit from car parks
No. of compliant random checks No. of random checks per month
Performance tolerance: 0% Service Response Time: 5 mins
• Monthly: using departmental checklist
• 4 random checks/month by supervisor and manager
Clearance No Obstruction • All no parking areas are to be kept free from obstruction by unauthorised vehicles in line with the client policy
• Provision of weekly management report
• Pass/Fail
• Weekly: Determined by default. Defaults recorded in incident report book
Maintenance Cleanliness • Car parks are maintained to a safe
and clean level. All hazardous spillages and materials are reported and the area made safe.
No. of compliant random checks No. of random checks per month
Performance tolerance: 0%
• Monthly: using departmental checklist
• 4 random checks/month by supervisor and manager
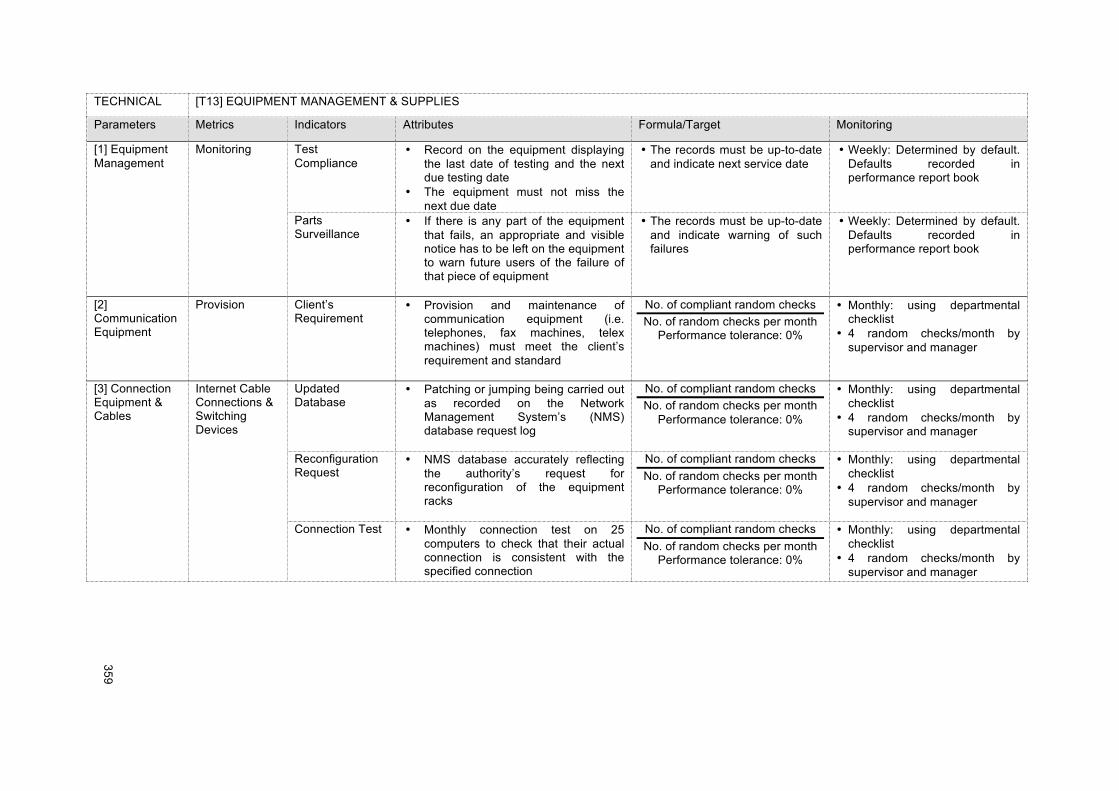
!!
359!
!
TECHNICAL [T13] EQUIPMENT MANAGEMENT & SUPPLIES
Parameters Metrics Indicators Attributes Formula/Target Monitoring
[1] Equipment Management
Monitoring Test Compliance
• Record on the equipment displaying the last date of testing and the next due testing date
• The equipment must not miss the next due date
• The records must be up-to-date and indicate next service date
• Weekly: Determined by default. Defaults recorded in performance report book
Parts Surveillance
• If there is any part of the equipment that fails, an appropriate and visible notice has to be left on the equipment to warn future users of the failure of that piece of equipment
• The records must be up-to-date and indicate warning of such failures
• Weekly: Determined by default. Defaults recorded in performance report book
[2] Communication Equipment
Provision Client’s Requirement
• Provision and maintenance of communication equipment (i.e. telephones, fax machines, telex machines) must meet the client’s requirement and standard
No. of compliant random checks No. of random checks per month
Performance tolerance: 0%
• Monthly: using departmental checklist
• 4 random checks/month by supervisor and manager
[3] Connection Equipment & Cables
Internet Cable Connections & Switching Devices
Updated Database
• Patching or jumping being carried out as recorded on the Network Management System’s (NMS) database request log
No. of compliant random checks No. of random checks per month
Performance tolerance: 0%
• Monthly: using departmental checklist
• 4 random checks/month by supervisor and manager
Reconfiguration Request
• NMS database accurately reflecting the authority’s request for reconfiguration of the equipment racks
No. of compliant random checks No. of random checks per month
Performance tolerance: 0%
• Monthly: using departmental checklist
• 4 random checks/month by supervisor and manager
Connection Test • Monthly connection test on 25 computers to check that their actual connection is consistent with the specified connection
No. of compliant random checks No. of random checks per month
Performance tolerance: 0%
• Monthly: using departmental checklist
• 4 random checks/month by supervisor and manager
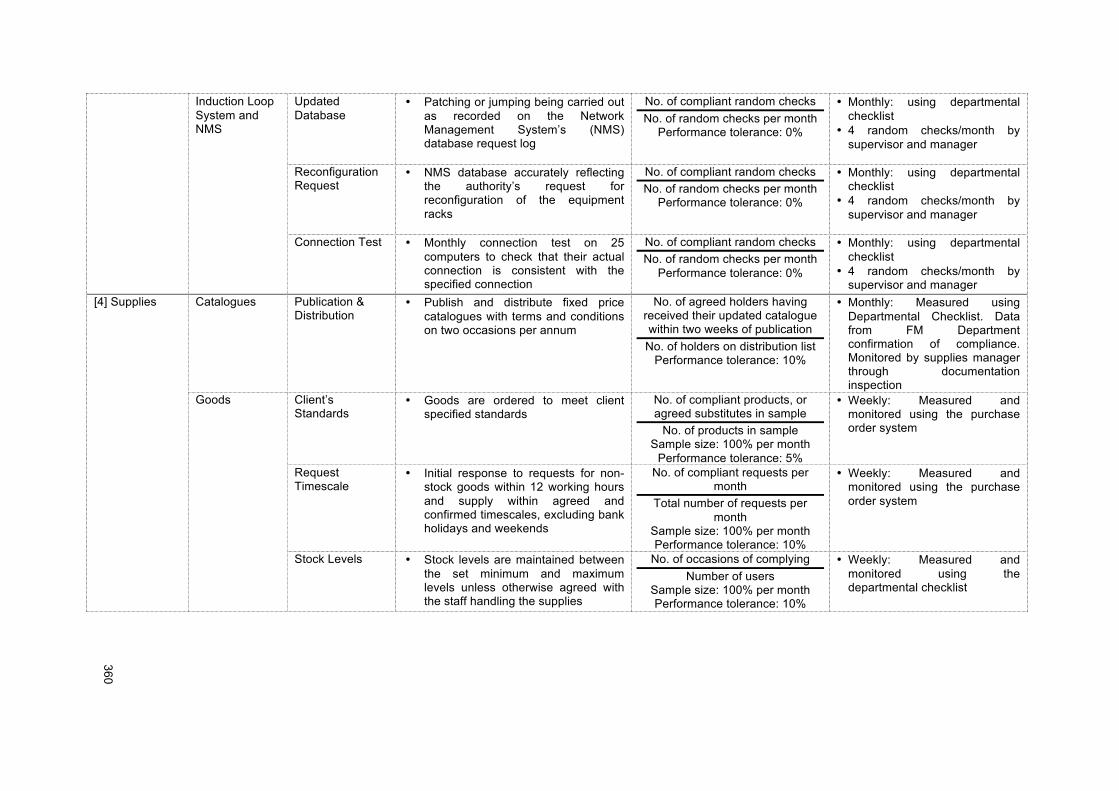
!!
360!
!
Induction Loop System and NMS
Updated Database
• Patching or jumping being carried out as recorded on the Network Management System’s (NMS) database request log
No. of compliant random checks No. of random checks per month
Performance tolerance: 0%
• Monthly: using departmental checklist
• 4 random checks/month by supervisor and manager
Reconfiguration Request
• NMS database accurately reflecting the authority’s request for reconfiguration of the equipment racks
No. of compliant random checks No. of random checks per month
Performance tolerance: 0%
• Monthly: using departmental checklist
• 4 random checks/month by supervisor and manager
Connection Test • Monthly connection test on 25 computers to check that their actual connection is consistent with the specified connection
No. of compliant random checks No. of random checks per month
Performance tolerance: 0%
• Monthly: using departmental checklist
• 4 random checks/month by supervisor and manager
[4] Supplies Catalogues Publication & Distribution
• Publish and distribute fixed price catalogues with terms and conditions on two occasions per annum
No. of agreed holders having received their updated catalogue within two weeks of publication
No. of holders on distribution list Performance tolerance: 10%
• Monthly: Measured using Departmental Checklist. Data from FM Department confirmation of compliance. Monitored by supplies manager through documentation inspection
Goods Client’s Standards
• Goods are ordered to meet client specified standards
No. of compliant products, or agreed substitutes in sample
No. of products in sample Sample size: 100% per month
Performance tolerance: 5%
• Weekly: Measured and monitored using the purchase order system
Request Timescale
• Initial response to requests for non-stock goods within 12 working hours and supply within agreed and confirmed timescales, excluding bank holidays and weekends
No. of compliant requests per month
Total number of requests per month
Sample size: 100% per month Performance tolerance: 10%
• Weekly: Measured and monitored using the purchase order system
Stock Levels • Stock levels are maintained between the set minimum and maximum levels unless otherwise agreed with the staff handling the supplies
No. of occasions of complying Number of users
Sample size: 100% per month Performance tolerance: 10%
• Weekly: Measured and monitored using the departmental checklist
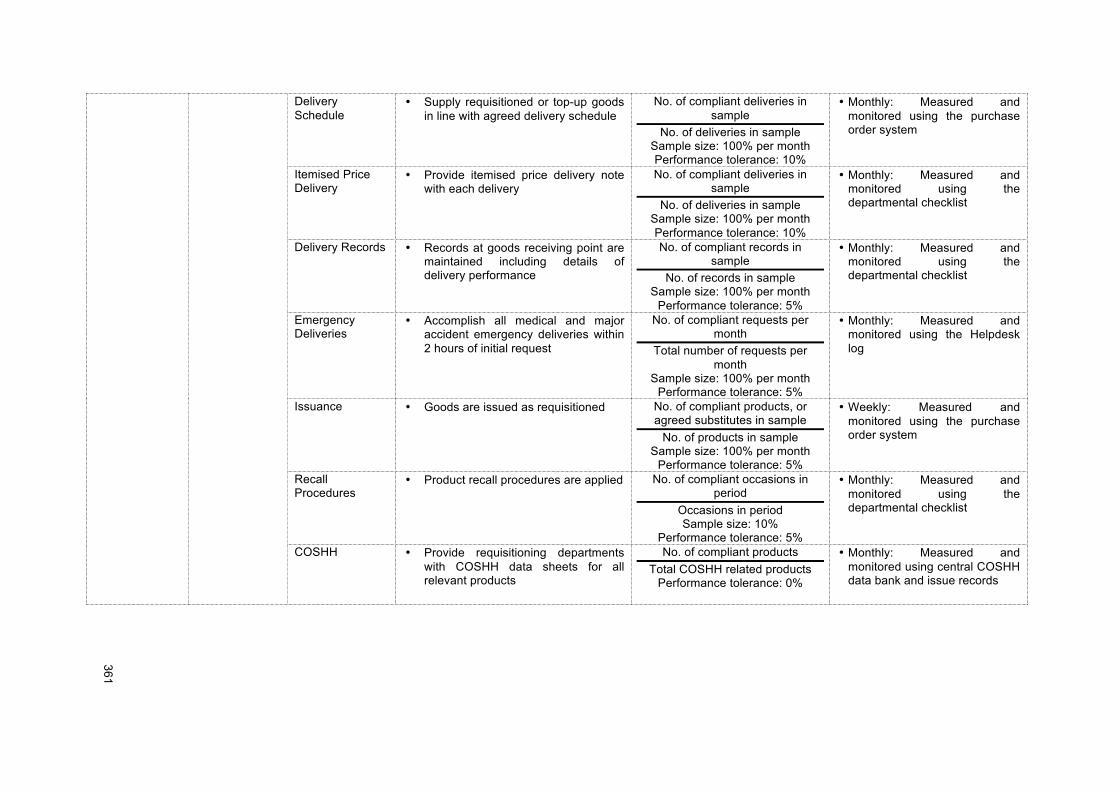
!!
361!
!
Delivery Schedule
• Supply requisitioned or top-up goods in line with agreed delivery schedule
No. of compliant deliveries in sample
No. of deliveries in sample Sample size: 100% per month Performance tolerance: 10%
• Monthly: Measured and monitored using the purchase order system
Itemised Price Delivery
• Provide itemised price delivery note with each delivery
No. of compliant deliveries in sample
No. of deliveries in sample Sample size: 100% per month Performance tolerance: 10%
• Monthly: Measured and monitored using the departmental checklist
Delivery Records • Records at goods receiving point are maintained including details of delivery performance
No. of compliant records in sample
No. of records in sample Sample size: 100% per month
Performance tolerance: 5%
• Monthly: Measured and monitored using the departmental checklist
Emergency Deliveries
• Accomplish all medical and major accident emergency deliveries within 2 hours of initial request
No. of compliant requests per month
Total number of requests per month
Sample size: 100% per month Performance tolerance: 5%
• Monthly: Measured and monitored using the Helpdesk log
Issuance • Goods are issued as requisitioned No. of compliant products, or agreed substitutes in sample
No. of products in sample Sample size: 100% per month
Performance tolerance: 5%
• Weekly: Measured and monitored using the purchase order system
Recall Procedures
• Product recall procedures are applied No. of compliant occasions in period
Occasions in period Sample size: 10%
Performance tolerance: 5%
• Monthly: Measured and monitored using the departmental checklist
COSHH • Provide requisitioning departments with COSHH data sheets for all relevant products
No. of compliant products Total COSHH related products
Performance tolerance: 0%
• Monthly: Measured and monitored using central COSHH data bank and issue records
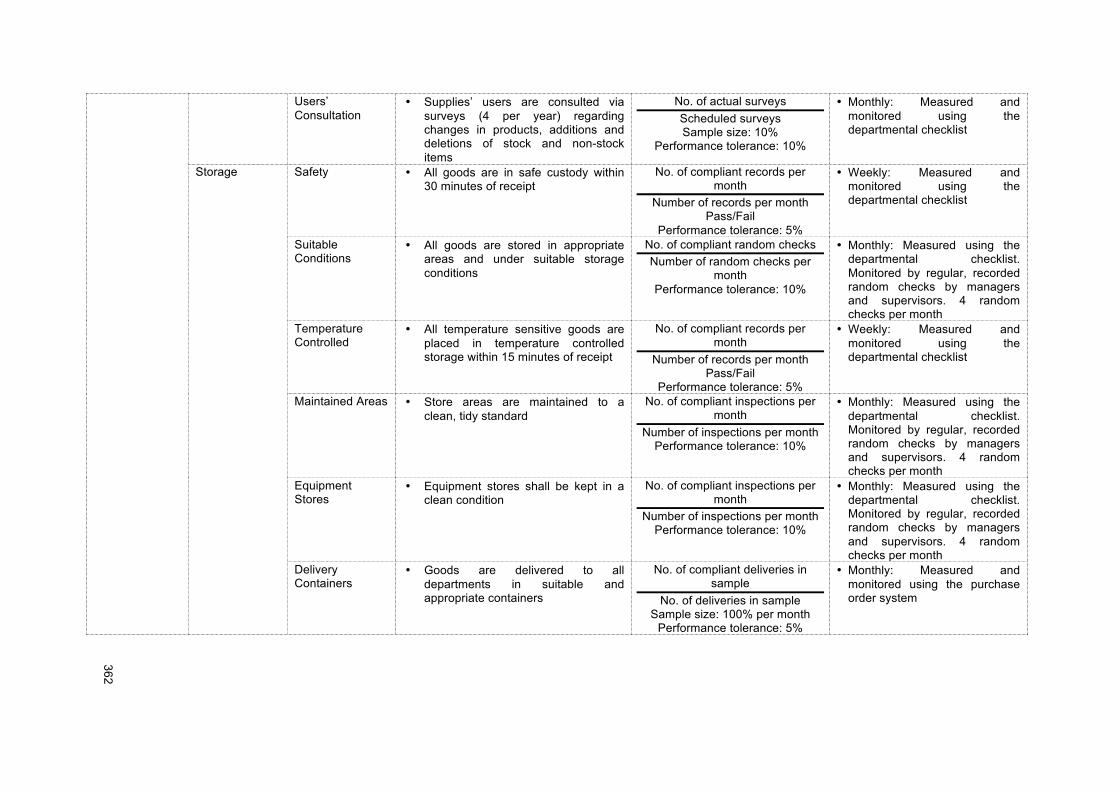
!!
362!
!
Users’ Consultation
• Supplies’ users are consulted via surveys (4 per year) regarding changes in products, additions and deletions of stock and non-stock items
No. of actual surveys Scheduled surveys Sample size: 10%
Performance tolerance: 10%
• Monthly: Measured and monitored using the departmental checklist
Storage Safety • All goods are in safe custody within 30 minutes of receipt
No. of compliant records per month
Number of records per month Pass/Fail
Performance tolerance: 5%
• Weekly: Measured and monitored using the departmental checklist
Suitable Conditions
• All goods are stored in appropriate areas and under suitable storage conditions
No. of compliant random checks Number of random checks per
month Performance tolerance: 10%
• Monthly: Measured using the departmental checklist. Monitored by regular, recorded random checks by managers and supervisors. 4 random checks per month
Temperature Controlled
• All temperature sensitive goods are placed in temperature controlled storage within 15 minutes of receipt
No. of compliant records per month
Number of records per month Pass/Fail
Performance tolerance: 5%
• Weekly: Measured and monitored using the departmental checklist
Maintained Areas • Store areas are maintained to a clean, tidy standard
No. of compliant inspections per month
Number of inspections per month Performance tolerance: 10%
• Monthly: Measured using the departmental checklist. Monitored by regular, recorded random checks by managers and supervisors. 4 random checks per month
Equipment Stores
• Equipment stores shall be kept in a clean condition
No. of compliant inspections per month
Number of inspections per month Performance tolerance: 10%
• Monthly: Measured using the departmental checklist. Monitored by regular, recorded random checks by managers and supervisors. 4 random checks per month
Delivery Containers
• Goods are delivered to all departments in suitable and appropriate containers
No. of compliant deliveries in sample
No. of deliveries in sample Sample size: 100% per month
Performance tolerance: 5%
• Monthly: Measured and monitored using the purchase order system
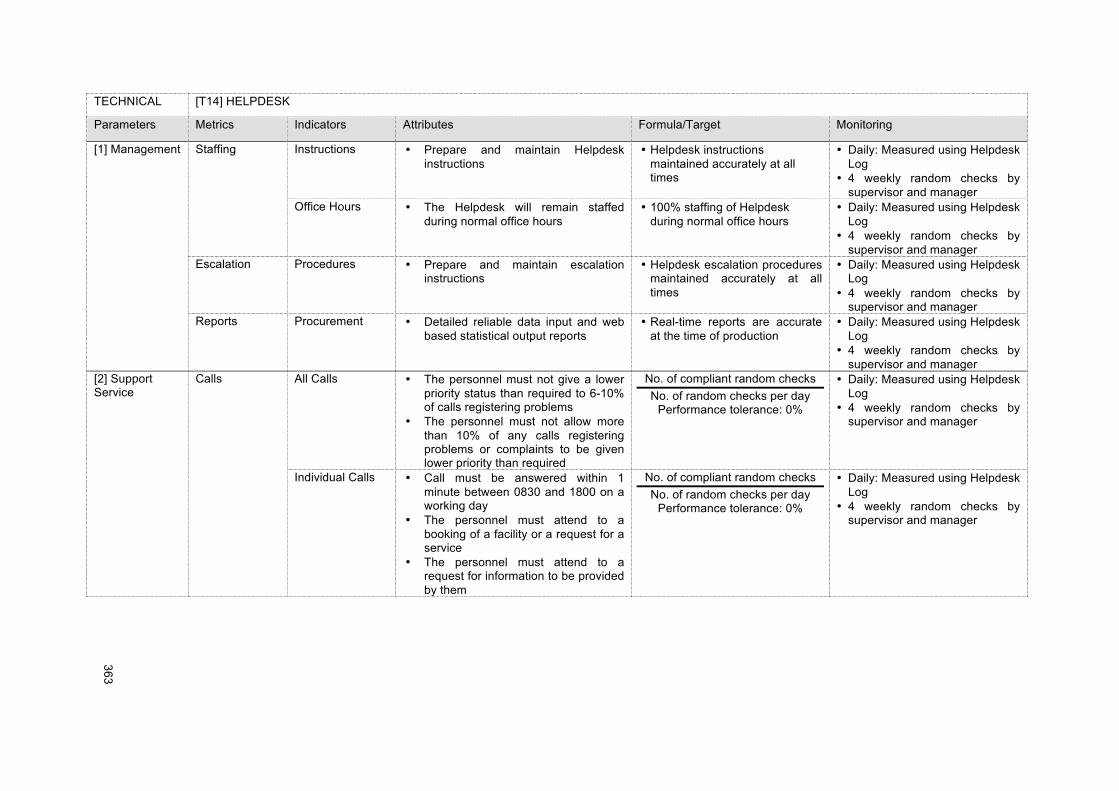
!!
363!
!
TECHNICAL [T14] HELPDESK
Parameters Metrics Indicators Attributes Formula/Target Monitoring
[1] Management Staffing Instructions • Prepare and maintain Helpdesk instructions
• Helpdesk instructions maintained accurately at all times
• Daily: Measured using Helpdesk Log
• 4 weekly random checks by supervisor and manager
Office Hours • The Helpdesk will remain staffed during normal office hours
• 100% staffing of Helpdesk during normal office hours
• Daily: Measured using Helpdesk Log
• 4 weekly random checks by supervisor and manager
Escalation Procedures • Prepare and maintain escalation instructions
• Helpdesk escalation procedures maintained accurately at all times
• Daily: Measured using Helpdesk Log
• 4 weekly random checks by supervisor and manager
Reports Procurement • Detailed reliable data input and web based statistical output reports
• Real-time reports are accurate at the time of production
• Daily: Measured using Helpdesk Log
• 4 weekly random checks by supervisor and manager
[2] Support Service
Calls All Calls • The personnel must not give a lower priority status than required to 6-10% of calls registering problems
• The personnel must not allow more than 10% of any calls registering problems or complaints to be given lower priority than required
No. of compliant random checks No. of random checks per day
Performance tolerance: 0%
• Daily: Measured using Helpdesk Log
• 4 weekly random checks by supervisor and manager
Individual Calls • Call must be answered within 1 minute between 0830 and 1800 on a working day
• The personnel must attend to a booking of a facility or a request for a service
• The personnel must attend to a request for information to be provided by them
No. of compliant random checks No. of random checks per day
Performance tolerance: 0%
• Daily: Measured using Helpdesk Log
• 4 weekly random checks by supervisor and manager
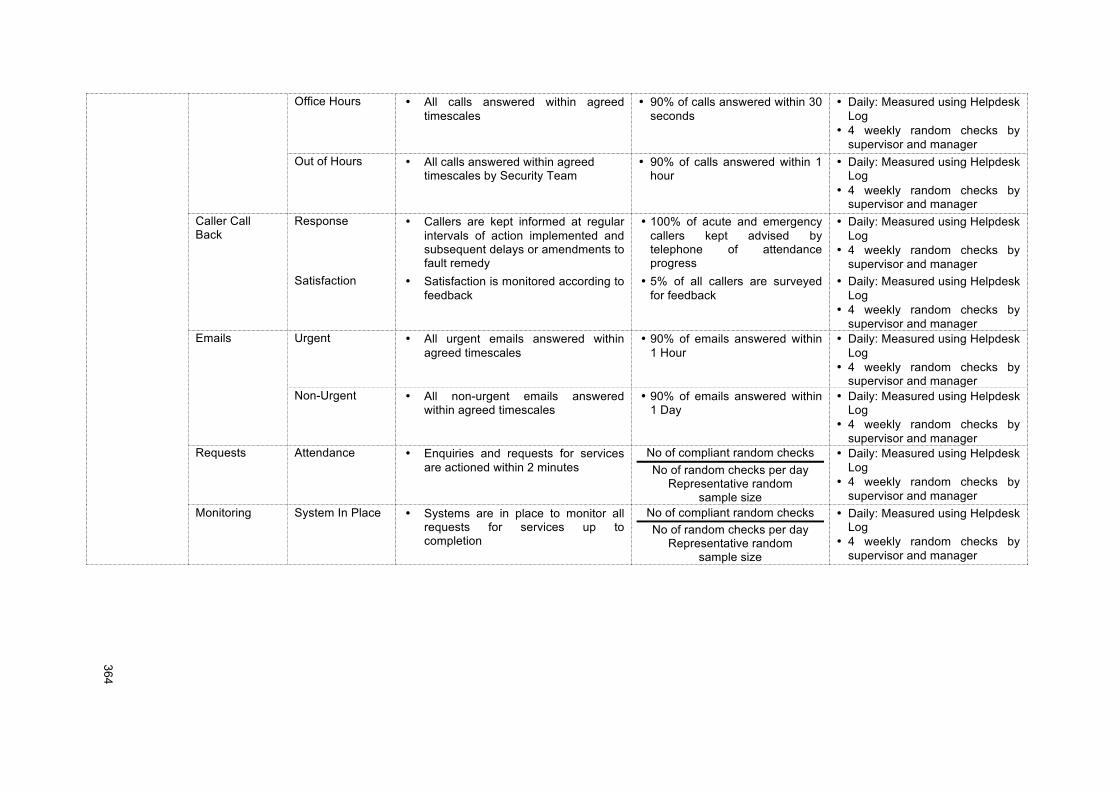
!!
364!
!
Office Hours • All calls answered within agreed timescales
• 90% of calls answered within 30 seconds
• Daily: Measured using Helpdesk Log
• 4 weekly random checks by supervisor and manager
Out of Hours • All calls answered within agreed timescales by Security Team
• 90% of calls answered within 1 hour
• Daily: Measured using Helpdesk Log
• 4 weekly random checks by supervisor and manager
Caller Call Back
Response • Callers are kept informed at regular intervals of action implemented and subsequent delays or amendments to fault remedy
• 100% of acute and emergency callers kept advised by telephone of attendance progress
• Daily: Measured using Helpdesk Log
• 4 weekly random checks by supervisor and manager
Satisfaction • Satisfaction is monitored according to feedback
• 5% of all callers are surveyed for feedback
• Daily: Measured using Helpdesk Log
• 4 weekly random checks by supervisor and manager
Emails Urgent • All urgent emails answered within agreed timescales
• 90% of emails answered within 1 Hour
• Daily: Measured using Helpdesk Log
• 4 weekly random checks by supervisor and manager
Non-Urgent • All non-urgent emails answered within agreed timescales
• 90% of emails answered within 1 Day
• Daily: Measured using Helpdesk Log
• 4 weekly random checks by supervisor and manager
Requests Attendance • Enquiries and requests for services are actioned within 2 minutes
No of compliant random checks No of random checks per day
Representative random sample size
• Daily: Measured using Helpdesk Log
• 4 weekly random checks by supervisor and manager
Monitoring System In Place • Systems are in place to monitor all requests for services up to completion
No of compliant random checks No of random checks per day
Representative random sample size
• Daily: Measured using Helpdesk Log
• 4 weekly random checks by supervisor and manager
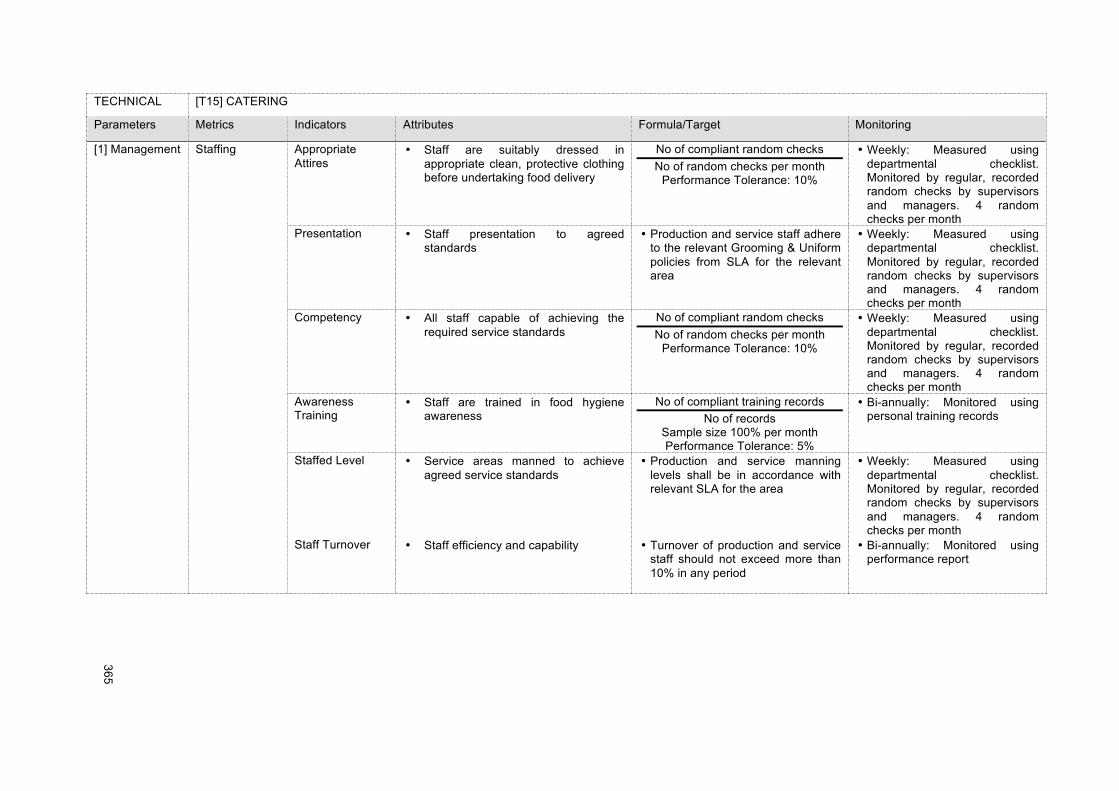
!!
365!
!
TECHNICAL [T15] CATERING
Parameters Metrics Indicators Attributes Formula/Target Monitoring
[1] Management Staffing Appropriate Attires
• Staff are suitably dressed in appropriate clean, protective clothing before undertaking food delivery
No of compliant random checks No of random checks per month
Performance Tolerance: 10%
• Weekly: Measured using departmental checklist. Monitored by regular, recorded random checks by supervisors and managers. 4 random checks per month
Presentation • Staff presentation to agreed standards
• Production and service staff adhere to the relevant Grooming & Uniform policies from SLA for the relevant area
• Weekly: Measured using departmental checklist. Monitored by regular, recorded random checks by supervisors and managers. 4 random checks per month
Competency • All staff capable of achieving the required service standards
No of compliant random checks No of random checks per month
Performance Tolerance: 10%
• Weekly: Measured using departmental checklist. Monitored by regular, recorded random checks by supervisors and managers. 4 random checks per month
Awareness Training
• Staff are trained in food hygiene awareness
No of compliant training records No of records
Sample size 100% per month Performance Tolerance: 5%
• Bi-annually: Monitored using personal training records!
Staffed Level • Service areas manned to achieve agreed service standards
• Production and service manning levels shall be in accordance with relevant SLA for the area
• Weekly: Measured using departmental checklist. Monitored by regular, recorded random checks by supervisors and managers. 4 random checks per month
Staff Turnover • Staff efficiency and capability • Turnover of production and service staff should not exceed more than 10% in any period
• Bi-annually: Monitored using performance report!
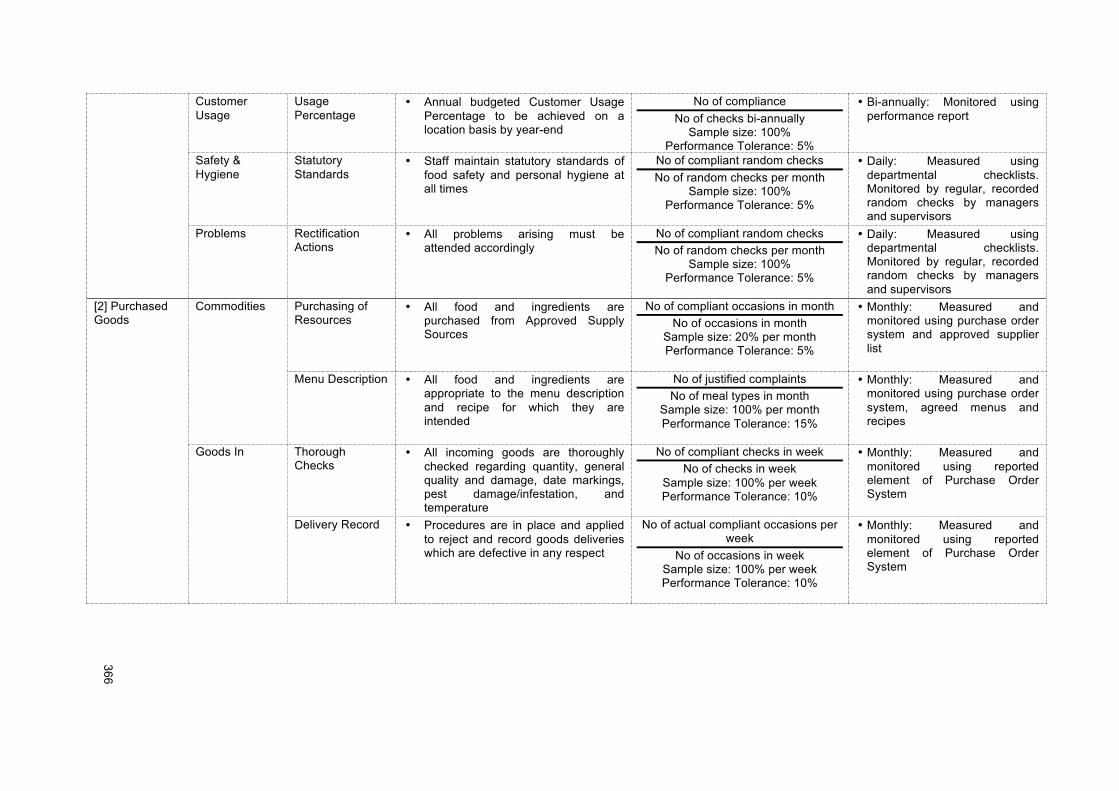
!!
366!
!
Customer Usage
Usage Percentage
• Annual budgeted Customer Usage Percentage to be achieved on a location basis by year-end
No of compliance No of checks bi-annually
Sample size: 100% Performance Tolerance: 5%
• Bi-annually: Monitored using performance report!
Safety & Hygiene
Statutory Standards
• Staff maintain statutory standards of food safety and personal hygiene at all times
No of compliant random checks No of random checks per month
Sample size: 100% Performance Tolerance: 5%
• Daily: Measured using departmental checklists. Monitored by regular, recorded random checks by managers and supervisors
Problems Rectification Actions
• All problems arising must be attended accordingly
No of compliant random checks No of random checks per month
Sample size: 100% Performance Tolerance: 5%
• Daily: Measured using departmental checklists. Monitored by regular, recorded random checks by managers and supervisors
[2] Purchased Goods
Commodities Purchasing of Resources
• All food and ingredients are purchased from Approved Supply Sources
No of compliant occasions in month No of occasions in month
Sample size: 20% per month Performance Tolerance: 5%
• Monthly: Measured and monitored using purchase order system and approved supplier list
Menu Description • All food and ingredients are appropriate to the menu description and recipe for which they are intended
No of justified complaints No of meal types in month
Sample size: 100% per month Performance Tolerance: 15%
• Monthly: Measured and monitored using purchase order system, agreed menus and recipes
Goods In Thorough Checks
• All incoming goods are thoroughly checked regarding quantity, general quality and damage, date markings, pest damage/infestation, and temperature
No of compliant checks in week No of checks in week
Sample size: 100% per week Performance Tolerance: 10%
• Monthly: Measured and monitored using reported element of Purchase Order System
Delivery Record • Procedures are in place and applied to reject and record goods deliveries which are defective in any respect
No of actual compliant occasions per week
No of occasions in week Sample size: 100% per week Performance Tolerance: 10%
• Monthly: Measured and monitored using reported element of Purchase Order System
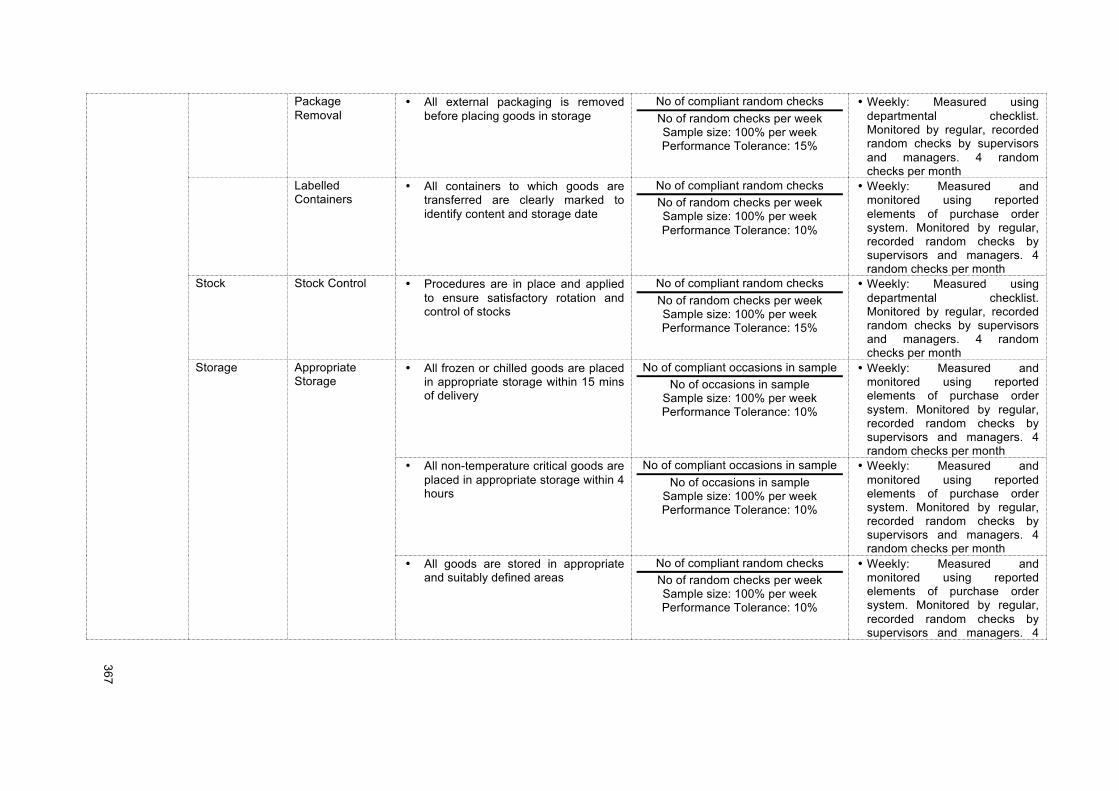
!!
367!
!
Package Removal
• All external packaging is removed before placing goods in storage
No of compliant random checks No of random checks per week Sample size: 100% per week Performance Tolerance: 15%
• Weekly: Measured using departmental checklist. Monitored by regular, recorded random checks by supervisors and managers. 4 random checks per month
Labelled Containers
• All containers to which goods are transferred are clearly marked to identify content and storage date
No of compliant random checks No of random checks per week Sample size: 100% per week Performance Tolerance: 10%
• Weekly: Measured and monitored using reported elements of purchase order system. Monitored by regular, recorded random checks by supervisors and managers. 4 random checks per month
Stock Stock Control • Procedures are in place and applied to ensure satisfactory rotation and control of stocks
No of compliant random checks No of random checks per week Sample size: 100% per week Performance Tolerance: 15%
• Weekly: Measured using departmental checklist. Monitored by regular, recorded random checks by supervisors and managers. 4 random checks per month
Storage Appropriate Storage
• All frozen or chilled goods are placed in appropriate storage within 15 mins of delivery
No of compliant occasions in sample No of occasions in sample
Sample size: 100% per week Performance Tolerance: 10%
• Weekly: Measured and monitored using reported elements of purchase order system. Monitored by regular, recorded random checks by supervisors and managers. 4 random checks per month
• All non-temperature critical goods are placed in appropriate storage within 4 hours
No of compliant occasions in sample No of occasions in sample
Sample size: 100% per week Performance Tolerance: 10%
• Weekly: Measured and monitored using reported elements of purchase order system. Monitored by regular, recorded random checks by supervisors and managers. 4 random checks per month
• All goods are stored in appropriate and suitably defined areas
No of compliant random checks No of random checks per week Sample size: 100% per week Performance Tolerance: 10%
• Weekly: Measured and monitored using reported elements of purchase order system. Monitored by regular, recorded random checks by supervisors and managers. 4
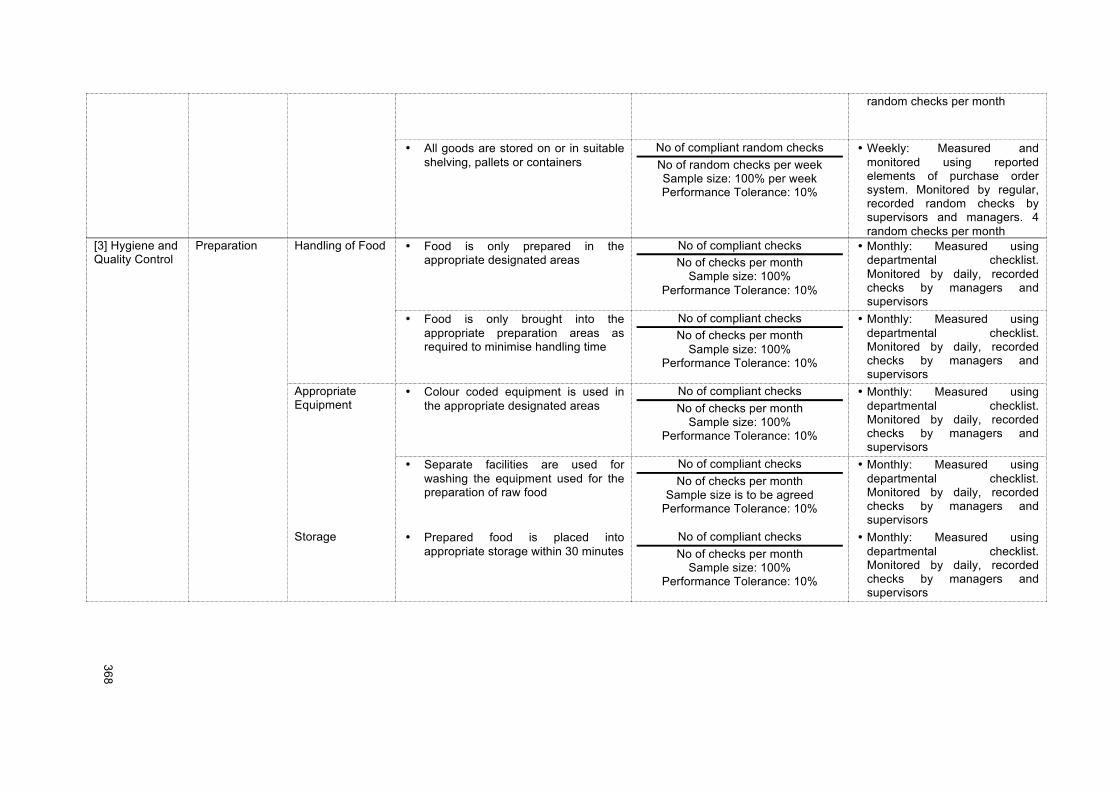
!!
368!
!
random checks per month
• All goods are stored on or in suitable shelving, pallets or containers
No of compliant random checks No of random checks per week Sample size: 100% per week Performance Tolerance: 10%
• Weekly: Measured and monitored using reported elements of purchase order system. Monitored by regular, recorded random checks by supervisors and managers. 4 random checks per month
[3] Hygiene and Quality Control
Preparation Handling of Food • Food is only prepared in the appropriate designated areas
No of compliant checks No of checks per month
Sample size: 100% Performance Tolerance: 10%
• Monthly: Measured using departmental checklist. Monitored by daily, recorded checks by managers and supervisors
• Food is only brought into the appropriate preparation areas as required to minimise handling time
No of compliant checks No of checks per month
Sample size: 100% Performance Tolerance: 10%
• Monthly: Measured using departmental checklist. Monitored by daily, recorded checks by managers and supervisors
Appropriate Equipment
• Colour coded equipment is used in the appropriate designated areas
No of compliant checks No of checks per month
Sample size: 100% Performance Tolerance: 10%
• Monthly: Measured using departmental checklist. Monitored by daily, recorded checks by managers and supervisors
• Separate facilities are used for washing the equipment used for the preparation of raw food
No of compliant checks No of checks per month
Sample size is to be agreed Performance Tolerance: 10%
• Monthly: Measured using departmental checklist. Monitored by daily, recorded checks by managers and supervisors
Storage • Prepared food is placed into appropriate storage within 30 minutes
No of compliant checks No of checks per month
Sample size: 100% Performance Tolerance: 10%
• Monthly: Measured using departmental checklist. Monitored by daily, recorded checks by managers and supervisors
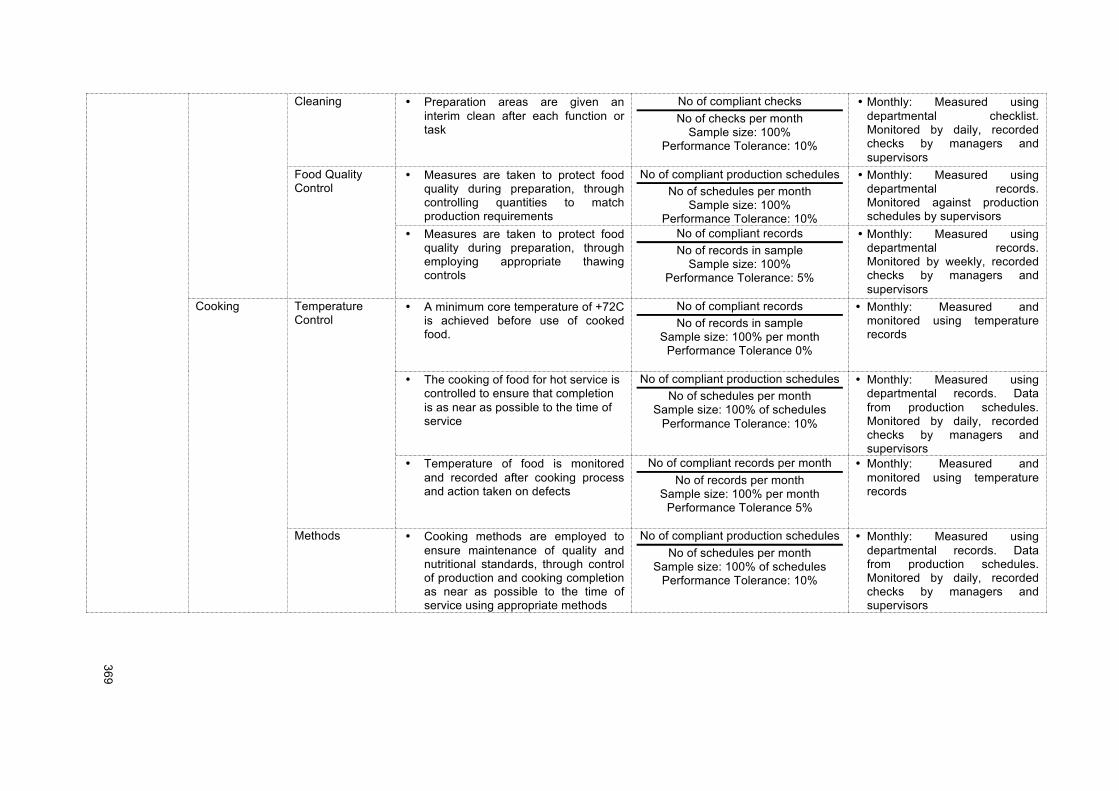
!!
369!
!
Cleaning • Preparation areas are given an interim clean after each function or task
No of compliant checks No of checks per month
Sample size: 100% Performance Tolerance: 10%
• Monthly: Measured using departmental checklist. Monitored by daily, recorded checks by managers and supervisors
Food Quality Control
• Measures are taken to protect food quality during preparation, through controlling quantities to match production requirements
No of compliant production schedules No of schedules per month
Sample size: 100% Performance Tolerance: 10%
• Monthly: Measured using departmental records. Monitored against production schedules by supervisors
• Measures are taken to protect food quality during preparation, through employing appropriate thawing controls
No of compliant records No of records in sample
Sample size: 100% Performance Tolerance: 5%
• Monthly: Measured using departmental records. Monitored by weekly, recorded checks by managers and supervisors
Cooking Temperature Control
• A minimum core temperature of +72C is achieved before use of cooked food.
No of compliant records No of records in sample
Sample size: 100% per month Performance Tolerance 0%
• Monthly: Measured and monitored using temperature records
• The cooking of food for hot service is controlled to ensure that completion is as near as possible to the time of service
No of compliant production schedules No of schedules per month
Sample size: 100% of schedules Performance Tolerance: 10%
• Monthly: Measured using departmental records. Data from production schedules. Monitored by daily, recorded checks by managers and supervisors
• Temperature of food is monitored and recorded after cooking process and action taken on defects
No of compliant records per month No of records per month
Sample size: 100% per month Performance Tolerance 5%
• Monthly: Measured and monitored using temperature records
Methods • Cooking methods are employed to ensure maintenance of quality and nutritional standards, through control of production and cooking completion as near as possible to the time of service using appropriate methods
No of compliant production schedules No of schedules per month
Sample size: 100% of schedules Performance Tolerance: 10%
• Monthly: Measured using departmental records. Data from production schedules. Monitored by daily, recorded checks by managers and supervisors
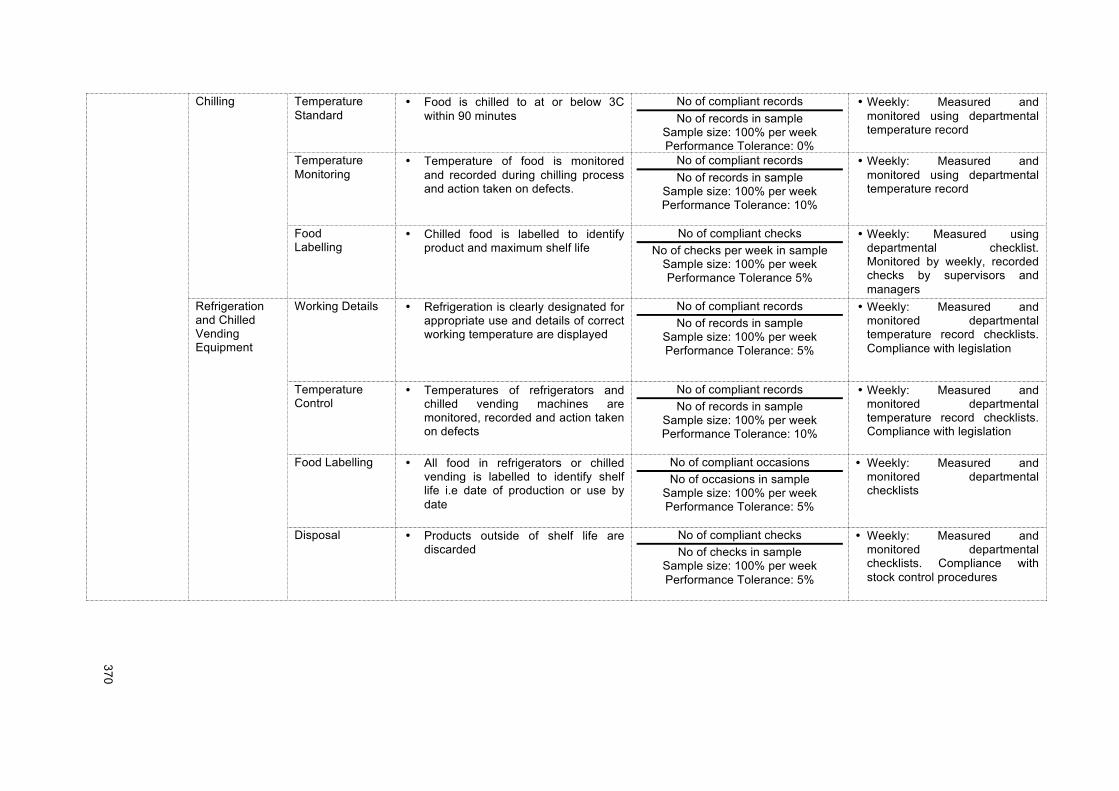
!!
370!
!
Chilling Temperature Standard
• Food is chilled to at or below 3C within 90 minutes
No of compliant records No of records in sample
Sample size: 100% per week Performance Tolerance: 0%
• Weekly: Measured and monitored using departmental temperature record
Temperature Monitoring
• Temperature of food is monitored and recorded during chilling process and action taken on defects.
No of compliant records No of records in sample
Sample size: 100% per week Performance Tolerance: 10%
• Weekly: Measured and monitored using departmental temperature record
Food Labelling
• Chilled food is labelled to identify product and maximum shelf life
No of compliant checks No of checks per week in sample
Sample size: 100% per week Performance Tolerance 5%
• Weekly: Measured using departmental checklist. Monitored by weekly, recorded checks by supervisors and managers
Refrigeration and Chilled Vending Equipment
Working Details
• Refrigeration is clearly designated for appropriate use and details of correct working temperature are displayed
No of compliant records No of records in sample
Sample size: 100% per week Performance Tolerance: 5%
• Weekly: Measured and monitored departmental temperature record checklists. Compliance with legislation
Temperature Control
• Temperatures of refrigerators and chilled vending machines are monitored, recorded and action taken on defects
No of compliant records No of records in sample
Sample size: 100% per week Performance Tolerance: 10%
• Weekly: Measured and monitored departmental temperature record checklists. Compliance with legislation
Food Labelling • All food in refrigerators or chilled vending is labelled to identify shelf life i.e date of production or use by date
No of compliant occasions No of occasions in sample
Sample size: 100% per week Performance Tolerance: 5%
• Weekly: Measured and monitored departmental checklists
Disposal • Products outside of shelf life are discarded
No of compliant checks No of checks in sample
Sample size: 100% per week Performance Tolerance: 5%
• Weekly: Measured and monitored departmental checklists. Compliance with stock control procedures
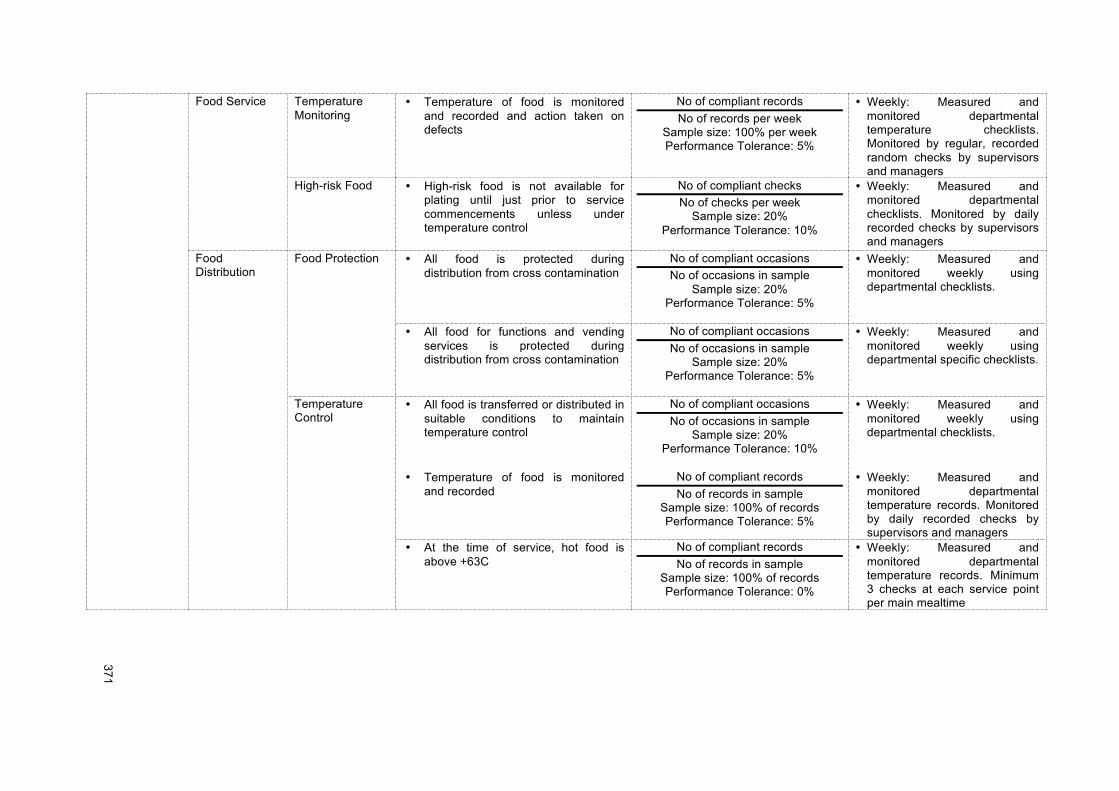
!!
371!
!
Food Service Temperature Monitoring
• Temperature of food is monitored and recorded and action taken on defects
No of compliant records No of records per week
Sample size: 100% per week Performance Tolerance: 5%
• Weekly: Measured and monitored departmental temperature checklists. Monitored by regular, recorded random checks by supervisors and managers
High-risk Food • High-risk food is not available for plating until just prior to service commencements unless under temperature control
No of compliant checks No of checks per week
Sample size: 20% Performance Tolerance: 10%
• Weekly: Measured and monitored departmental checklists. Monitored by daily recorded checks by supervisors and managers
Food Distribution
Food Protection • All food is protected during distribution from cross contamination
No of compliant occasions No of occasions in sample
Sample size: 20% Performance Tolerance: 5%
• Weekly: Measured and monitored weekly using departmental checklists.
• All food for functions and vending services is protected during distribution from cross contamination
No of compliant occasions No of occasions in sample
Sample size: 20% Performance Tolerance: 5%
• Weekly: Measured and monitored weekly using departmental specific checklists.
Temperature Control
• All food is transferred or distributed in suitable conditions to maintain temperature control
No of compliant occasions No of occasions in sample
Sample size: 20% Performance Tolerance: 10%
• Weekly: Measured and monitored weekly using departmental checklists.
• Temperature of food is monitored and recorded
No of compliant records No of records in sample
Sample size: 100% of records Performance Tolerance: 5%
• Weekly: Measured and monitored departmental temperature records. Monitored by daily recorded checks by supervisors and managers
• At the time of service, hot food is above +63C
No of compliant records No of records in sample
Sample size: 100% of records Performance Tolerance: 0%
• Weekly: Measured and monitored departmental temperature records. Minimum 3 checks at each service point per main mealtime
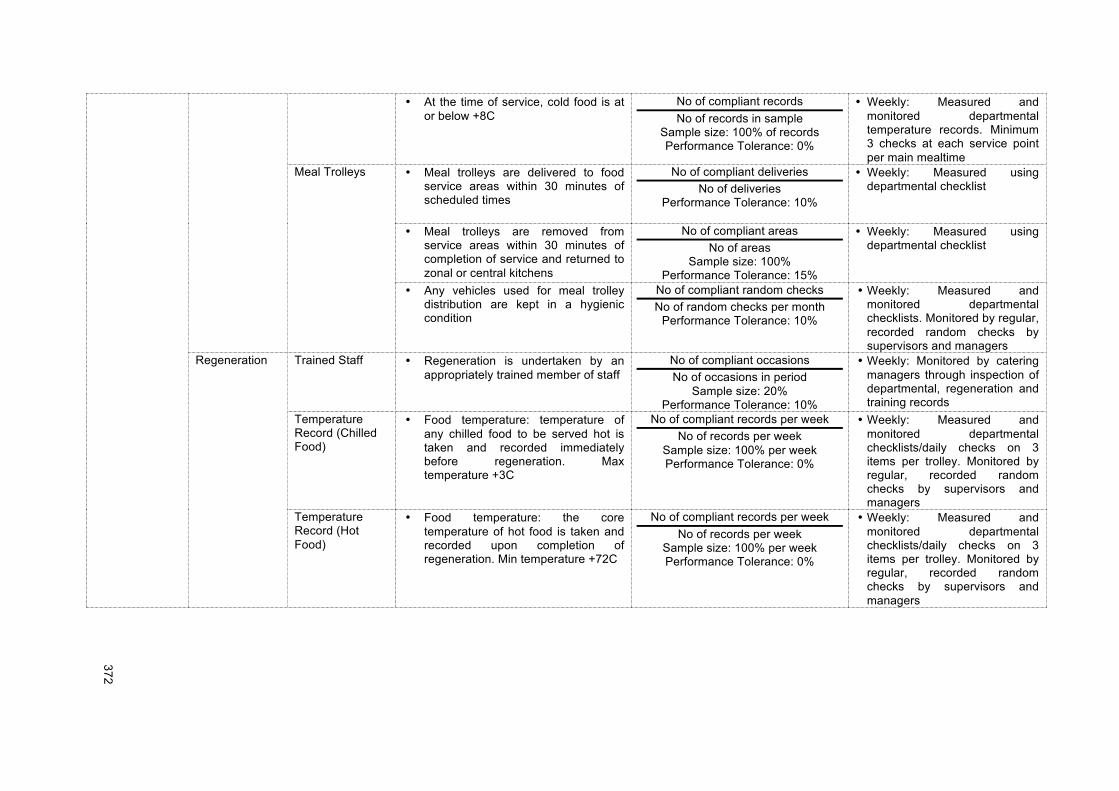
!!
372!
!
• At the time of service, cold food is at or below +8C
No of compliant records No of records in sample
Sample size: 100% of records Performance Tolerance: 0%
• Weekly: Measured and monitored departmental temperature records. Minimum 3 checks at each service point per main mealtime
Meal Trolleys • Meal trolleys are delivered to food service areas within 30 minutes of scheduled times
No of compliant deliveries No of deliveries
Performance Tolerance: 10%
• Weekly: Measured using departmental checklist
• Meal trolleys are removed from service areas within 30 minutes of completion of service and returned to zonal or central kitchens
No of compliant areas No of areas
Sample size: 100% Performance Tolerance: 15%
• Weekly: Measured using departmental checklist
• Any vehicles used for meal trolley distribution are kept in a hygienic condition
No of compliant random checks No of random checks per month
Performance Tolerance: 10%
• Weekly: Measured and monitored departmental checklists. Monitored by regular, recorded random checks by supervisors and managers
Regeneration Trained Staff • Regeneration is undertaken by an appropriately trained member of staff
No of compliant occasions No of occasions in period
Sample size: 20% Performance Tolerance: 10%
• Weekly: Monitored by catering managers through inspection of departmental, regeneration and training records
Temperature Record (Chilled Food)
• Food temperature: temperature of any chilled food to be served hot is taken and recorded immediately before regeneration. Max temperature +3C
No of compliant records per week No of records per week
Sample size: 100% per week Performance Tolerance: 0%
• Weekly: Measured and monitored departmental checklists/daily checks on 3 items per trolley. Monitored by regular, recorded random checks by supervisors and managers
Temperature Record (Hot Food)
• Food temperature: the core temperature of hot food is taken and recorded upon completion of regeneration. Min temperature +72C
No of compliant records per week No of records per week
Sample size: 100% per week Performance Tolerance: 0%
• Weekly: Measured and monitored departmental checklists/daily checks on 3 items per trolley. Monitored by regular, recorded random checks by supervisors and managers
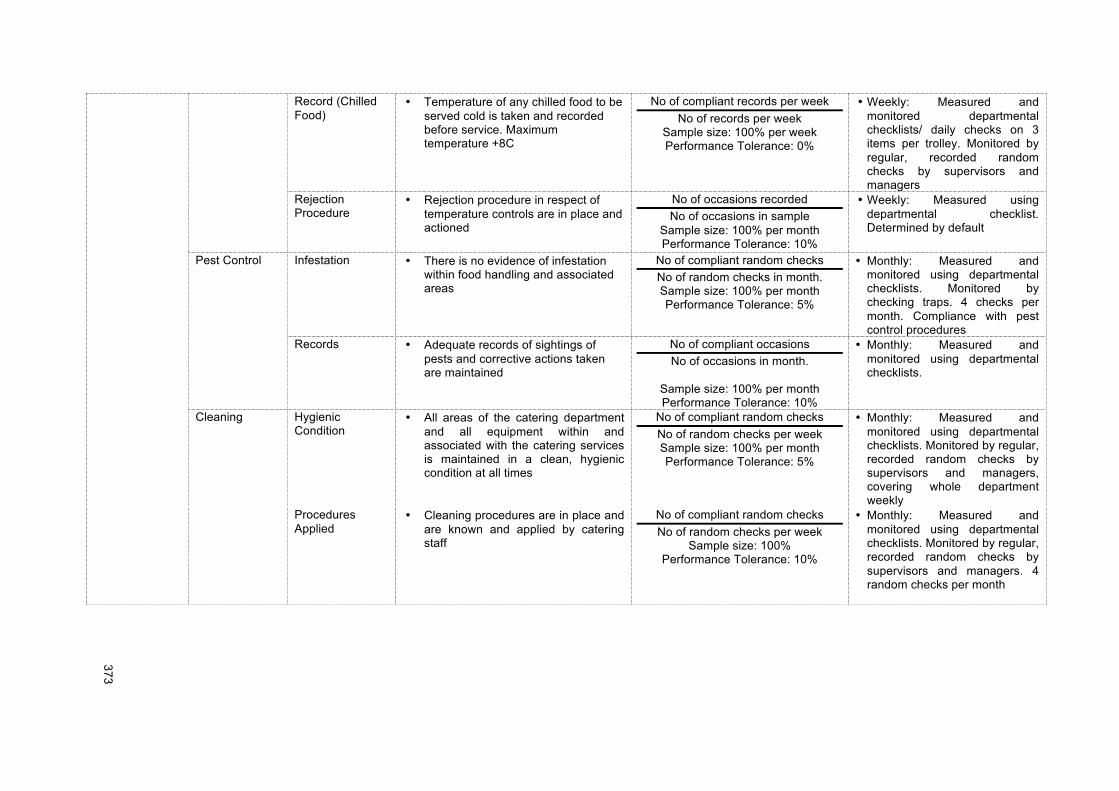
!!
373!
!
Record (Chilled Food)
• Temperature of any chilled food to be served cold is taken and recorded before service. Maximum temperature +8C
No of compliant records per week No of records per week
Sample size: 100% per week Performance Tolerance: 0%
• Weekly: Measured and monitored departmental checklists/ daily checks on 3 items per trolley. Monitored by regular, recorded random checks by supervisors and managers
Rejection Procedure
• Rejection procedure in respect of temperature controls are in place and actioned
No of occasions recorded No of occasions in sample
Sample size: 100% per month Performance Tolerance: 10%
• Weekly: Measured using departmental checklist. Determined by default
Pest Control Infestation • There is no evidence of infestation within food handling and associated areas
No of compliant random checks No of random checks in month. Sample size: 100% per month Performance Tolerance: 5%
• Monthly: Measured and monitored using departmental checklists. Monitored by checking traps. 4 checks per month. Compliance with pest control procedures
Records • Adequate records of sightings of pests and corrective actions taken are maintained
No of compliant occasions No of occasions in month.
Sample size: 100% per month Performance Tolerance: 10%
• Monthly: Measured and monitored using departmental checklists.
Cleaning Hygienic Condition
• All areas of the catering department and all equipment within and associated with the catering services is maintained in a clean, hygienic condition at all times
No of compliant random checks No of random checks per week Sample size: 100% per month Performance Tolerance: 5%
• Monthly: Measured and monitored using departmental checklists. Monitored by regular, recorded random checks by supervisors and managers, covering whole department weekly
Procedures Applied
• Cleaning procedures are in place and are known and applied by catering staff
No of compliant random checks No of random checks per week
Sample size: 100% Performance Tolerance: 10%
• Monthly: Measured and monitored using departmental checklists. Monitored by regular, recorded random checks by supervisors and managers. 4 random checks per month
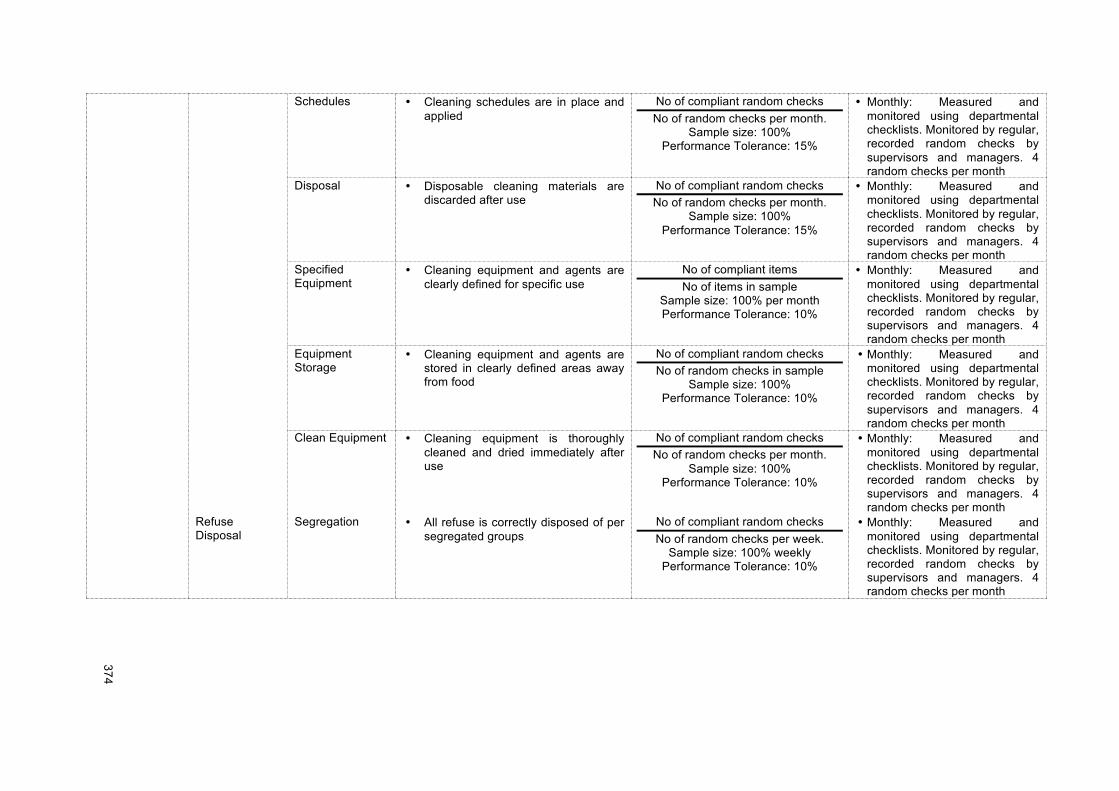
!!
374!
!
Schedules • Cleaning schedules are in place and applied
No of compliant random checks No of random checks per month.
Sample size: 100% Performance Tolerance: 15%
• Monthly: Measured and monitored using departmental checklists. Monitored by regular, recorded random checks by supervisors and managers. 4 random checks per month
Disposal • Disposable cleaning materials are discarded after use
No of compliant random checks No of random checks per month.
Sample size: 100% Performance Tolerance: 15%
• Monthly: Measured and monitored using departmental checklists. Monitored by regular, recorded random checks by supervisors and managers. 4 random checks per month
Specified Equipment
• Cleaning equipment and agents are clearly defined for specific use
No of compliant items No of items in sample
Sample size: 100% per month Performance Tolerance: 10%
• Monthly: Measured and monitored using departmental checklists. Monitored by regular, recorded random checks by supervisors and managers. 4 random checks per month
Equipment Storage
• Cleaning equipment and agents are stored in clearly defined areas away from food
No of compliant random checks No of random checks in sample
Sample size: 100% Performance Tolerance: 10%
• Monthly: Measured and monitored using departmental checklists. Monitored by regular, recorded random checks by supervisors and managers. 4 random checks per month
Clean Equipment • Cleaning equipment is thoroughly cleaned and dried immediately after use
No of compliant random checks No of random checks per month.
Sample size: 100% Performance Tolerance: 10%
• Monthly: Measured and monitored using departmental checklists. Monitored by regular, recorded random checks by supervisors and managers. 4 random checks per month
Refuse Disposal
Segregation • All refuse is correctly disposed of per segregated groups
No of compliant random checks No of random checks per week.
Sample size: 100% weekly Performance Tolerance: 10%
• Monthly: Measured and monitored using departmental checklists. Monitored by regular, recorded random checks by supervisors and managers. 4 random checks per month
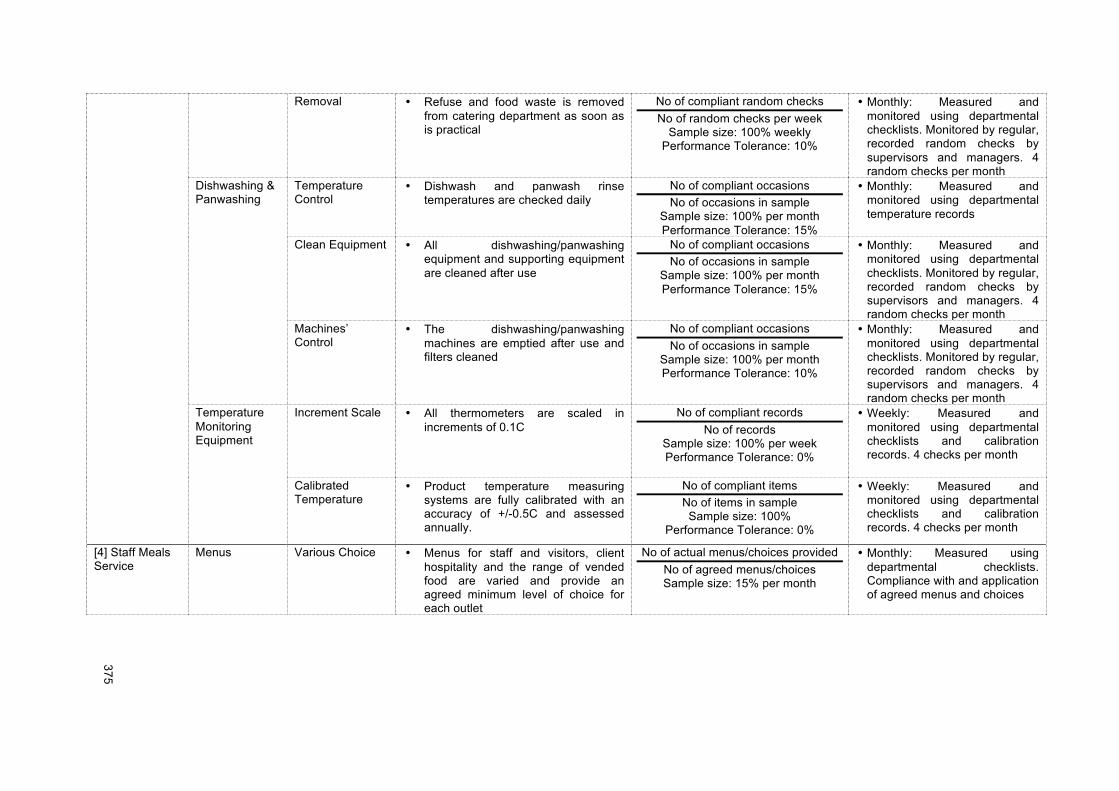
!!
375!
!
Removal • Refuse and food waste is removed from catering department as soon as is practical
No of compliant random checks No of random checks per week
Sample size: 100% weekly Performance Tolerance: 10%
• Monthly: Measured and monitored using departmental checklists. Monitored by regular, recorded random checks by supervisors and managers. 4 random checks per month
Dishwashing & Panwashing
Temperature Control
• Dishwash and panwash rinse temperatures are checked daily
No of compliant occasions No of occasions in sample
Sample size: 100% per month Performance Tolerance: 15%
• Monthly: Measured and monitored using departmental temperature records
Clean Equipment • All dishwashing/panwashing equipment and supporting equipment are cleaned after use
No of compliant occasions No of occasions in sample
Sample size: 100% per month Performance Tolerance: 15%
• Monthly: Measured and monitored using departmental checklists. Monitored by regular, recorded random checks by supervisors and managers. 4 random checks per month
Machines’ Control
• The dishwashing/panwashing machines are emptied after use and filters cleaned
No of compliant occasions No of occasions in sample
Sample size: 100% per month Performance Tolerance: 10%
• Monthly: Measured and monitored using departmental checklists. Monitored by regular, recorded random checks by supervisors and managers. 4 random checks per month
Temperature Monitoring Equipment
Increment Scale • All thermometers are scaled in increments of 0.1C
No of compliant records No of records
Sample size: 100% per week Performance Tolerance: 0%
• Weekly: Measured and monitored using departmental checklists and calibration records. 4 checks per month
Calibrated Temperature
• Product temperature measuring systems are fully calibrated with an accuracy of +/-0.5C and assessed annually.
No of compliant items No of items in sample Sample size: 100%
Performance Tolerance: 0%
• Weekly: Measured and monitored using departmental checklists and calibration records. 4 checks per month
[4] Staff Meals Service
Menus Various Choice • Menus for staff and visitors, client hospitality and the range of vended food are varied and provide an agreed minimum level of choice for each outlet
No of actual menus/choices provided No of agreed menus/choices Sample size: 15% per month
• Monthly: Measured using departmental checklists. Compliance with and application of agreed menus and choices
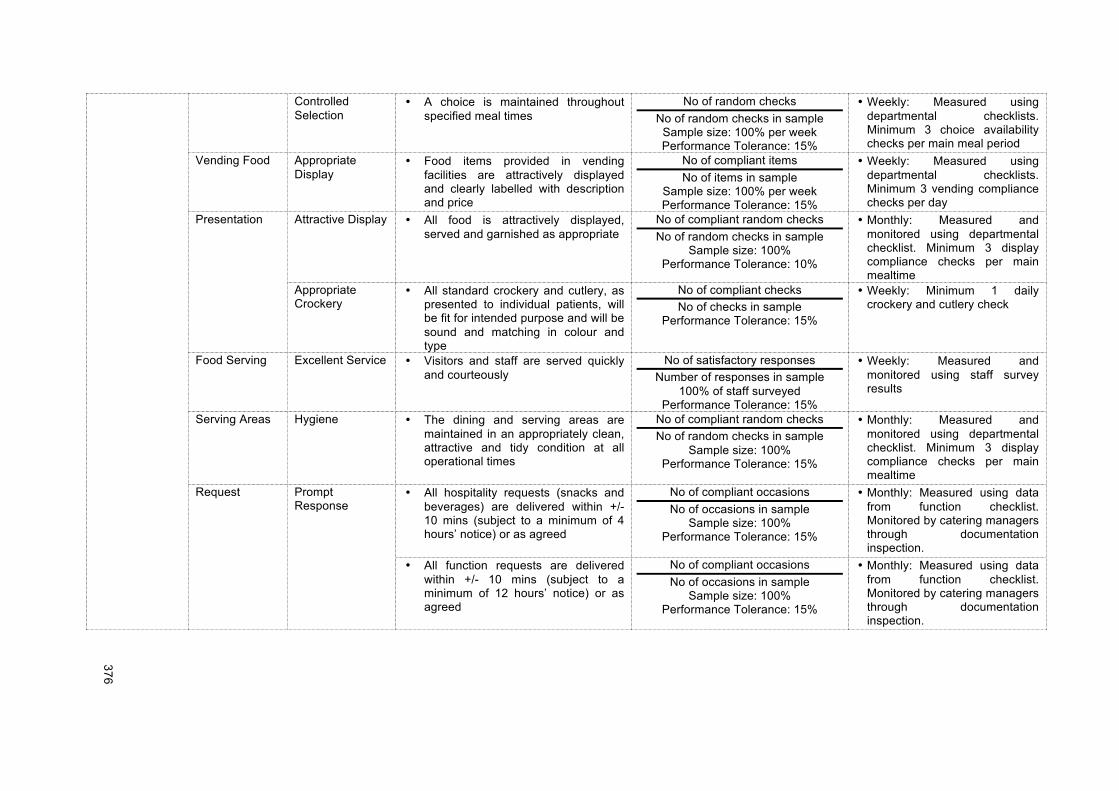
!!
376!
!
Controlled Selection
• A choice is maintained throughout specified meal times
No of random checks No of random checks in sample
Sample size: 100% per week Performance Tolerance: 15%
• Weekly: Measured using departmental checklists. Minimum 3 choice availability checks per main meal period
Vending Food Appropriate Display
• Food items provided in vending facilities are attractively displayed and clearly labelled with description and price
No of compliant items No of items in sample
Sample size: 100% per week Performance Tolerance: 15%
• Weekly: Measured using departmental checklists. Minimum 3 vending compliance checks per day
Presentation Attractive Display • All food is attractively displayed, served and garnished as appropriate
No of compliant random checks No of random checks in sample
Sample size: 100% Performance Tolerance: 10%
• Monthly: Measured and monitored using departmental checklist. Minimum 3 display compliance checks per main mealtime
Appropriate Crockery
• All standard crockery and cutlery, as presented to individual patients, will be fit for intended purpose and will be sound and matching in colour and type
No of compliant checks No of checks in sample
Performance Tolerance: 15%
• Weekly: Minimum 1 daily crockery and cutlery check
Food Serving Excellent Service • Visitors and staff are served quickly and courteously
No of satisfactory responses Number of responses in sample
100% of staff surveyed Performance Tolerance: 15%
• Weekly: Measured and monitored using staff survey results
Serving Areas Hygiene • The dining and serving areas are maintained in an appropriately clean, attractive and tidy condition at all operational times
No of compliant random checks No of random checks in sample
Sample size: 100% Performance Tolerance: 15%
• Monthly: Measured and monitored using departmental checklist. Minimum 3 display compliance checks per main mealtime
Request Prompt Response
• All hospitality requests (snacks and beverages) are delivered within +/- 10 mins (subject to a minimum of 4 hours’ notice) or as agreed
No of compliant occasions No of occasions in sample
Sample size: 100% Performance Tolerance: 15%
• Monthly: Measured using data from function checklist. Monitored by catering managers through documentation inspection.
• All function requests are delivered within +/- 10 mins (subject to a minimum of 12 hours’ notice) or as agreed
No of compliant occasions No of occasions in sample
Sample size: 100% Performance Tolerance: 15%
• Monthly: Measured using data from function checklist. Monitored by catering managers through documentation inspection.
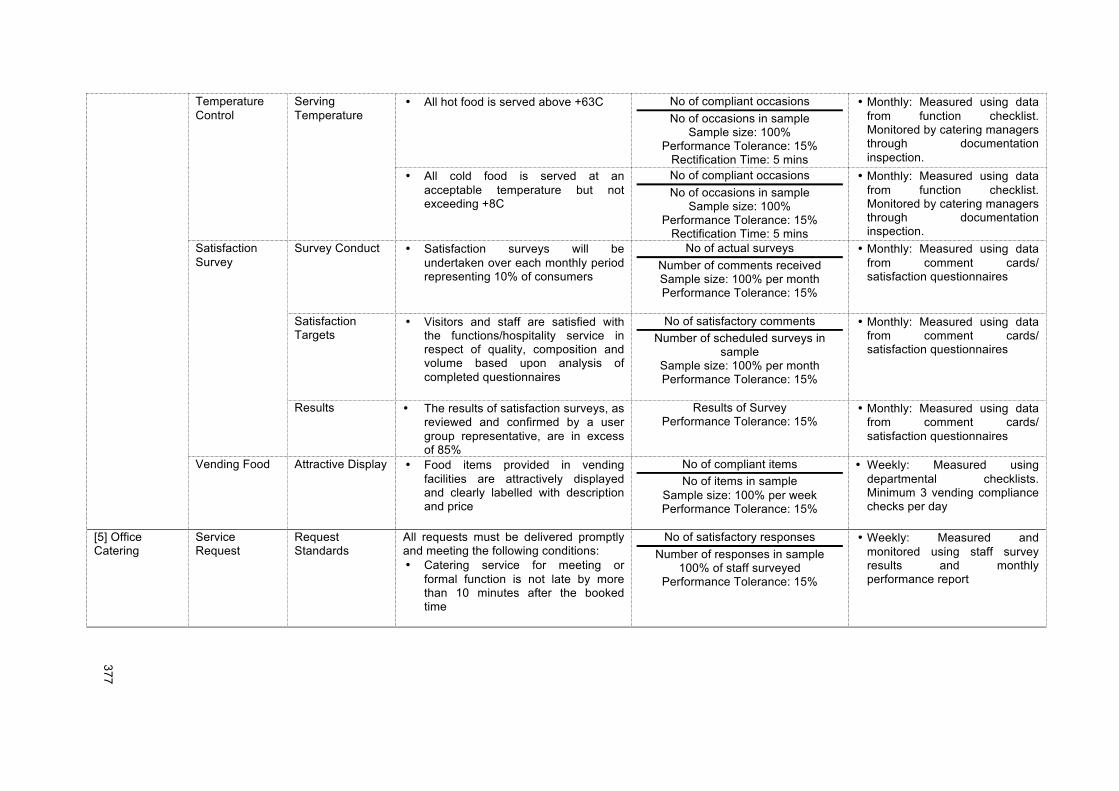
!!
377!
!
Temperature Control
Serving Temperature
• All hot food is served above +63C No of compliant occasions No of occasions in sample
Sample size: 100% Performance Tolerance: 15%
Rectification Time: 5 mins
• Monthly: Measured using data from function checklist. Monitored by catering managers through documentation inspection.
• All cold food is served at an acceptable temperature but not exceeding +8C
No of compliant occasions No of occasions in sample
Sample size: 100% Performance Tolerance: 15%
Rectification Time: 5 mins
• Monthly: Measured using data from function checklist. Monitored by catering managers through documentation inspection.
Satisfaction Survey
Survey Conduct • Satisfaction surveys will be undertaken over each monthly period representing 10% of consumers
No of actual surveys Number of comments received Sample size: 100% per month Performance Tolerance: 15%
• Monthly: Measured using data from comment cards/ satisfaction questionnaires
Satisfaction Targets
• Visitors and staff are satisfied with the functions/hospitality service in respect of quality, composition and volume based upon analysis of completed questionnaires
No of satisfactory comments Number of scheduled surveys in
sample Sample size: 100% per month Performance Tolerance: 15%
• Monthly: Measured using data from comment cards/ satisfaction questionnaires
Results • The results of satisfaction surveys, as reviewed and confirmed by a user group representative, are in excess of 85%
Results of Survey Performance Tolerance: 15%
• Monthly: Measured using data from comment cards/ satisfaction questionnaires
Vending Food Attractive Display • Food items provided in vending facilities are attractively displayed and clearly labelled with description and price
No of compliant items No of items in sample
Sample size: 100% per week Performance Tolerance: 15%
• Weekly: Measured using departmental checklists. Minimum 3 vending compliance checks per day
[5] Office Catering
Service Request
Request Standards
All requests must be delivered promptly and meeting the following conditions: • Catering service for meeting or
formal function is not late by more than 10 minutes after the booked time
No of satisfactory responses Number of responses in sample
100% of staff surveyed Performance Tolerance: 15%
• Weekly: Measured and monitored using staff survey results and monthly performance report
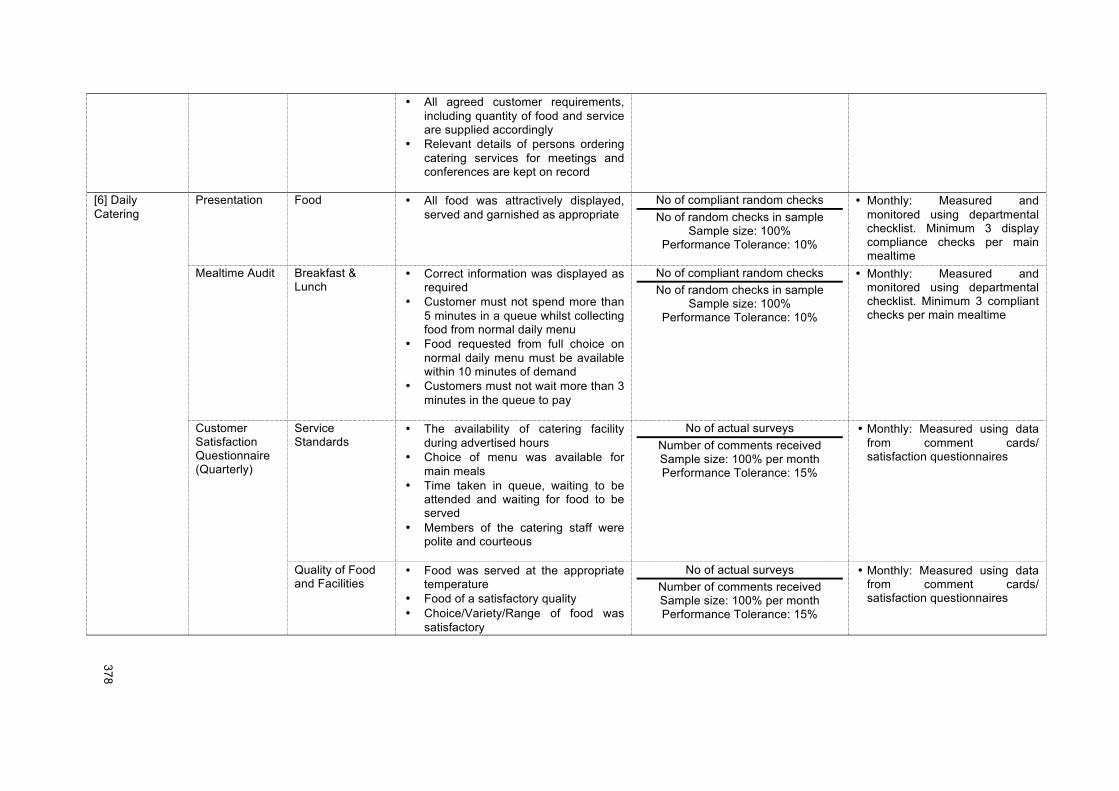
!!
378!
!
• All agreed customer requirements, including quantity of food and service are supplied accordingly
• Relevant details of persons ordering catering services for meetings and conferences are kept on record
[6] Daily Catering
Presentation Food • All food was attractively displayed, served and garnished as appropriate
No of compliant random checks No of random checks in sample
Sample size: 100% Performance Tolerance: 10%
• Monthly: Measured and monitored using departmental checklist. Minimum 3 display compliance checks per main mealtime
Mealtime Audit Breakfast & Lunch
• Correct information was displayed as required
• Customer must not spend more than 5 minutes in a queue whilst collecting food from normal daily menu
• Food requested from full choice on normal daily menu must be available within 10 minutes of demand
• Customers must not wait more than 3 minutes in the queue to pay
No of compliant random checks No of random checks in sample
Sample size: 100% Performance Tolerance: 10%
• Monthly: Measured and monitored using departmental checklist. Minimum 3 compliant checks per main mealtime
Customer Satisfaction Questionnaire (Quarterly)
Service Standards
• The availability of catering facility during advertised hours
• Choice of menu was available for main meals
• Time taken in queue, waiting to be attended and waiting for food to be served
• Members of the catering staff were polite and courteous
No of actual surveys Number of comments received Sample size: 100% per month Performance Tolerance: 15%
• Monthly: Measured using data from comment cards/ satisfaction questionnaires
Quality of Food and Facilities
• Food was served at the appropriate temperature
• Food of a satisfactory quality • Choice/Variety/Range of food was
satisfactory
No of actual surveys Number of comments received Sample size: 100% per month Performance Tolerance: 15%
• Monthly: Measured using data from comment cards/ satisfaction questionnaires
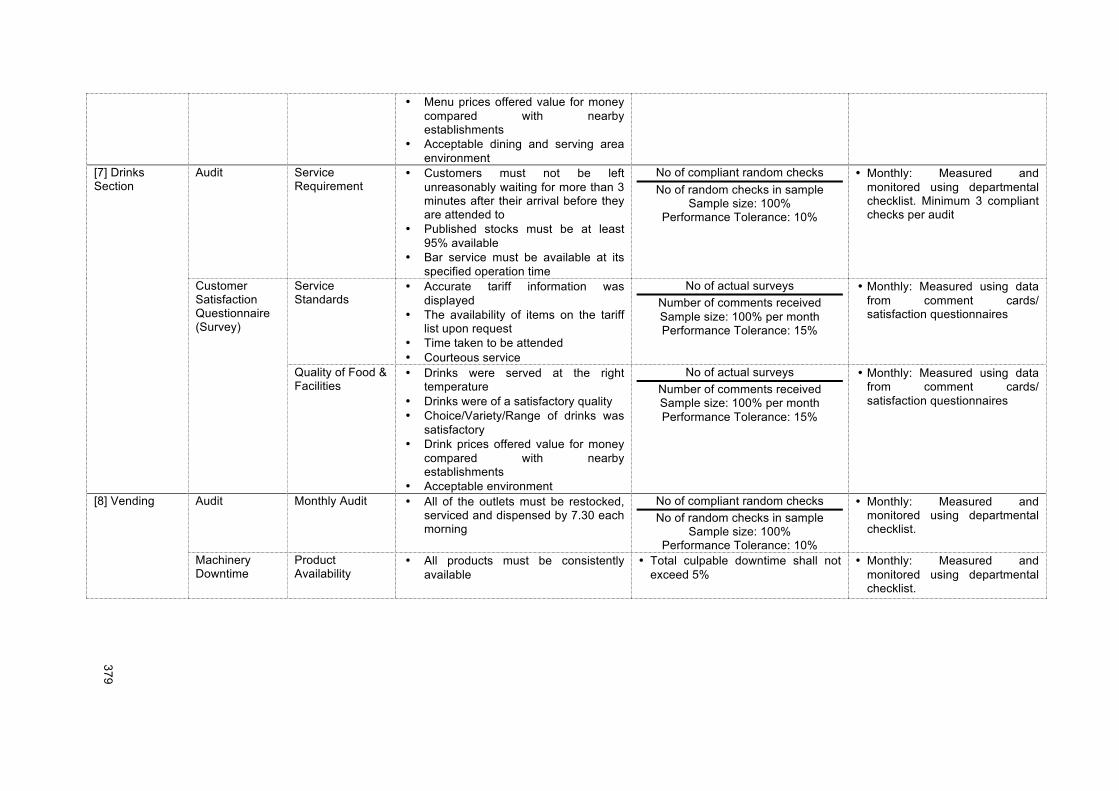
!!
379!
!
• Menu prices offered value for money compared with nearby establishments
• Acceptable dining and serving area environment
[7] Drinks Section
Audit Service Requirement
• Customers must not be left unreasonably waiting for more than 3 minutes after their arrival before they are attended to
• Published stocks must be at least 95% available
• Bar service must be available at its specified operation time
No of compliant random checks No of random checks in sample
Sample size: 100% Performance Tolerance: 10%
• Monthly: Measured and monitored using departmental checklist. Minimum 3 compliant checks per audit
Customer Satisfaction Questionnaire (Survey)
Service Standards
• Accurate tariff information was displayed
• The availability of items on the tariff list upon request
• Time taken to be attended • Courteous service
No of actual surveys Number of comments received Sample size: 100% per month Performance Tolerance: 15%
• Monthly: Measured using data from comment cards/ satisfaction questionnaires
Quality of Food & Facilities
• Drinks were served at the right temperature
• Drinks were of a satisfactory quality • Choice/Variety/Range of drinks was
satisfactory • Drink prices offered value for money
compared with nearby establishments
• Acceptable environment
No of actual surveys Number of comments received Sample size: 100% per month Performance Tolerance: 15%
• Monthly: Measured using data from comment cards/ satisfaction questionnaires
[8] Vending Audit Monthly Audit • All of the outlets must be restocked, serviced and dispensed by 7.30 each morning
No of compliant random checks No of random checks in sample
Sample size: 100% Performance Tolerance: 10%
• Monthly: Measured and monitored using departmental checklist.
Machinery Downtime
Product Availability
• All products must be consistently available
• Total culpable downtime shall not exceed 5%
• Monthly: Measured and monitored using departmental checklist.

!!
380!
!
Customer Satisfaction Questionnaire (Survey)
Service Standards
• Accurate tariff information was displayed
• The availability or unavailability of items on the tariff board were indicated accordingly
• The vending machine was working or otherwise is clearly indicates as being out of order
No of actual surveys Number of comments received Sample size: 100% per month Performance Tolerance: 15%
• Monthly: Measured using data from comment cards/ satisfaction questionnaires
Quality of Food & Facilities
• Food and drinks are received at the right temperature
• Provisions were of a satisfactory quality
• Choice/Variety/Range of drinks were satisfactory
• Prices offered value for money compared with nearby establishments
No of actual surveys Number of comments received Sample size: 100% per month Performance Tolerance: 15%
• Monthly: Measured using data from comment cards/ satisfaction questionnaires
ADDITIONAL FOR HEALTHCARE
[1] Management Safety & Hygiene
Statutory Standards
• Staff maintain statutory standards of food safety and personal hygiene at all times
No of compliant random checks No of random checks per month
Sample size: 100% Performance Tolerance: 5%
• Daily: Measured using departmental checklists. Monitored by regular, recorded random checks by managers and supervisors
[2] Purchased Goods
Commodities Purchasing of Resources
• All food and ingredients are purchased from Approved Supply Sources except where specifically requested by the client/hospital
No of compliant occasions in month No of occasions in month
Sample size: 20% per month Performance Tolerance: 5%
• Monthly: Measured and monitored using purchase order system and approved supplier list
Menu Description • All food and ingredients are appropriate to the menu description and recipe for which they are intended
No of justified complaints No of meal types in month
Sample size: 100% per month Performance Tolerance: 15%
• Monthly: Measured and monitored using purchase order system, agreed menus and recipes
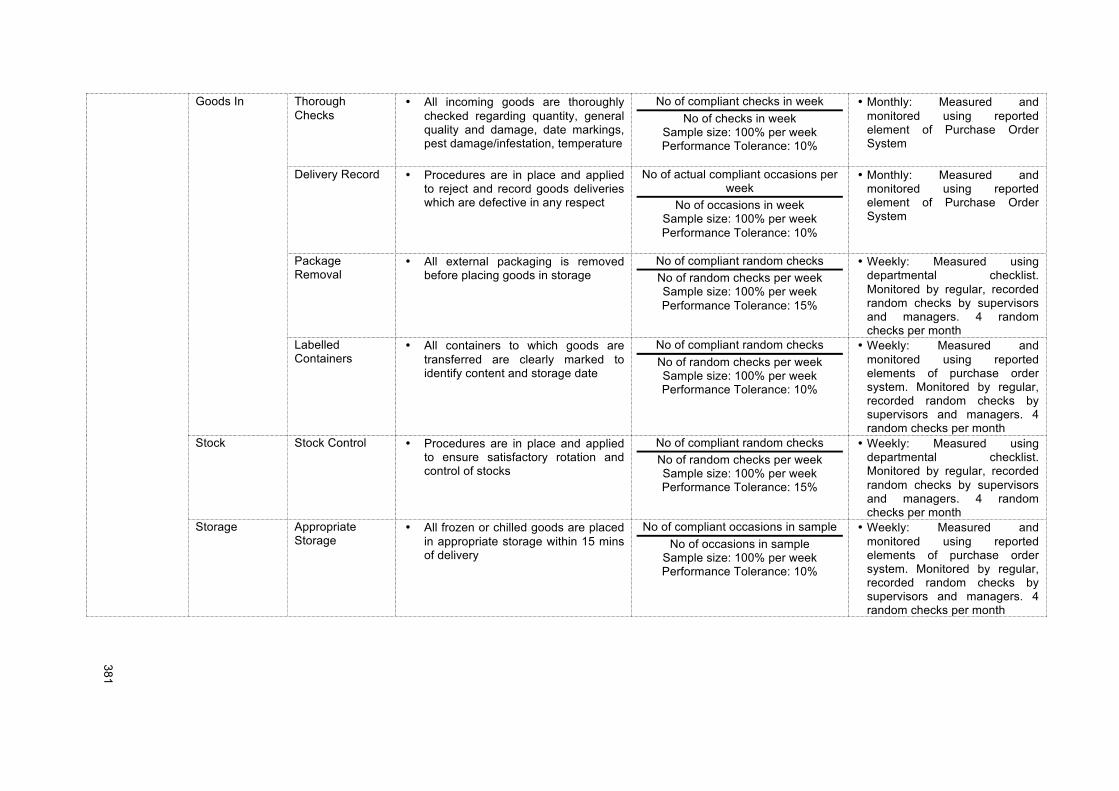
!!
381!
!
Goods In Thorough Checks
• All incoming goods are thoroughly checked regarding quantity, general quality and damage, date markings, pest damage/infestation, temperature
No of compliant checks in week No of checks in week
Sample size: 100% per week Performance Tolerance: 10%
• Monthly: Measured and monitored using reported element of Purchase Order System
Delivery Record • Procedures are in place and applied to reject and record goods deliveries which are defective in any respect
No of actual compliant occasions per week
No of occasions in week Sample size: 100% per week Performance Tolerance: 10%
• Monthly: Measured and monitored using reported element of Purchase Order System
Package Removal
• All external packaging is removed before placing goods in storage
No of compliant random checks No of random checks per week Sample size: 100% per week Performance Tolerance: 15%
• Weekly: Measured using departmental checklist. Monitored by regular, recorded random checks by supervisors and managers. 4 random checks per month
Labelled Containers
• All containers to which goods are transferred are clearly marked to identify content and storage date
No of compliant random checks No of random checks per week Sample size: 100% per week Performance Tolerance: 10%
• Weekly: Measured and monitored using reported elements of purchase order system. Monitored by regular, recorded random checks by supervisors and managers. 4 random checks per month
Stock Stock Control • Procedures are in place and applied to ensure satisfactory rotation and control of stocks
No of compliant random checks No of random checks per week Sample size: 100% per week Performance Tolerance: 15%
• Weekly: Measured using departmental checklist. Monitored by regular, recorded random checks by supervisors and managers. 4 random checks per month
Storage Appropriate Storage
• All frozen or chilled goods are placed in appropriate storage within 15 mins of delivery
No of compliant occasions in sample No of occasions in sample
Sample size: 100% per week Performance Tolerance: 10%
• Weekly: Measured and monitored using reported elements of purchase order system. Monitored by regular, recorded random checks by supervisors and managers. 4 random checks per month
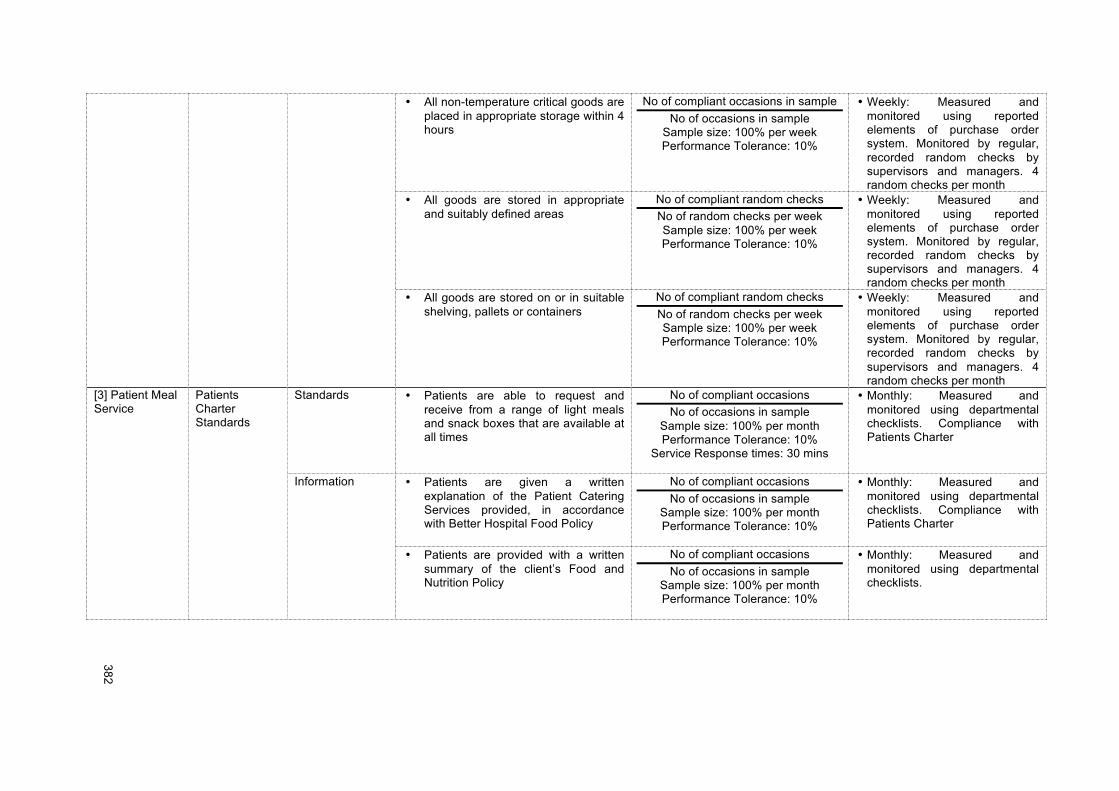
!!
382!
!
• All non-temperature critical goods are placed in appropriate storage within 4 hours
No of compliant occasions in sample No of occasions in sample
Sample size: 100% per week Performance Tolerance: 10%
• Weekly: Measured and monitored using reported elements of purchase order system. Monitored by regular, recorded random checks by supervisors and managers. 4 random checks per month
• All goods are stored in appropriate and suitably defined areas
No of compliant random checks No of random checks per week Sample size: 100% per week Performance Tolerance: 10%
• Weekly: Measured and monitored using reported elements of purchase order system. Monitored by regular, recorded random checks by supervisors and managers. 4 random checks per month
• All goods are stored on or in suitable shelving, pallets or containers
No of compliant random checks No of random checks per week Sample size: 100% per week Performance Tolerance: 10%
• Weekly: Measured and monitored using reported elements of purchase order system. Monitored by regular, recorded random checks by supervisors and managers. 4 random checks per month
[3] Patient Meal Service
Patients Charter Standards
Standards • Patients are able to request and receive from a range of light meals and snack boxes that are available at all times
No of compliant occasions No of occasions in sample
Sample size: 100% per month Performance Tolerance: 10%
Service Response times: 30 mins
• Monthly: Measured and monitored using departmental checklists. Compliance with Patients Charter
Information • Patients are given a written explanation of the Patient Catering Services provided, in accordance with Better Hospital Food Policy
No of compliant occasions No of occasions in sample
Sample size: 100% per month Performance Tolerance: 10%
• Monthly: Measured and monitored using departmental checklists. Compliance with Patients Charter
• Patients are provided with a written summary of the client’s Food and Nutrition Policy
No of compliant occasions No of occasions in sample
Sample size: 100% per month Performance Tolerance: 10%
• Monthly: Measured and monitored using departmental checklists.
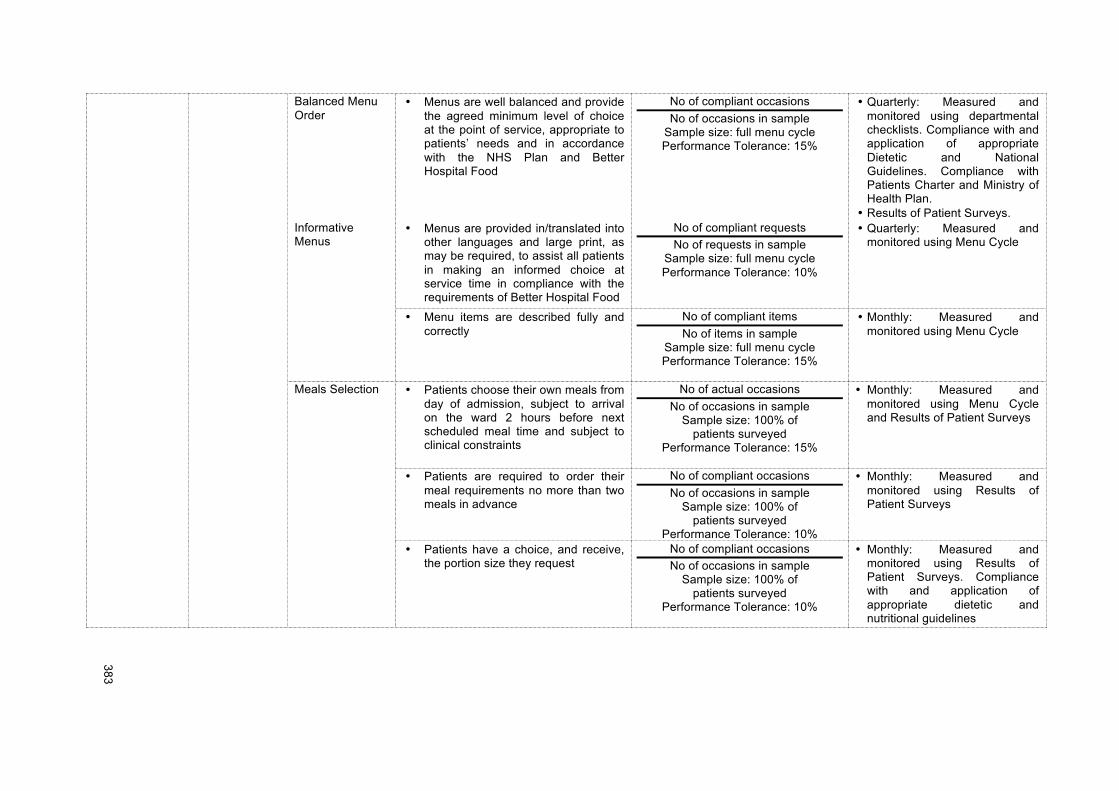
!!
383!
!
Balanced Menu Order
• Menus are well balanced and provide the agreed minimum level of choice at the point of service, appropriate to patients’ needs and in accordance with the NHS Plan and Better Hospital Food
No of compliant occasions No of occasions in sample
Sample size: full menu cycle Performance Tolerance: 15%
• Quarterly: Measured and monitored using departmental checklists. Compliance with and application of appropriate Dietetic and National Guidelines. Compliance with Patients Charter and Ministry of Health Plan.
• Results of Patient Surveys. Informative Menus
• Menus are provided in/translated into other languages and large print, as may be required, to assist all patients in making an informed choice at service time in compliance with the requirements of Better Hospital Food
No of compliant requests No of requests in sample
Sample size: full menu cycle Performance Tolerance: 10%
• Quarterly: Measured and monitored using Menu Cycle
• Menu items are described fully and correctly
No of compliant items No of items in sample
Sample size: full menu cycle Performance Tolerance: 15%
• Monthly: Measured and monitored using Menu Cycle
Meals Selection • Patients choose their own meals from day of admission, subject to arrival on the ward 2 hours before next scheduled meal time and subject to clinical constraints
No of actual occasions No of occasions in sample
Sample size: 100% of patients surveyed
Performance Tolerance: 15%
• Monthly: Measured and monitored using Menu Cycle and Results of Patient Surveys
• Patients are required to order their meal requirements no more than two meals in advance
No of compliant occasions No of occasions in sample
Sample size: 100% of patients surveyed
Performance Tolerance: 10%
• Monthly: Measured and monitored using Results of Patient Surveys
• Patients have a choice, and receive, the portion size they request
No of compliant occasions No of occasions in sample
Sample size: 100% of patients surveyed
Performance Tolerance: 10%
• Monthly: Measured and monitored using Results of Patient Surveys. Compliance with and application of appropriate dietetic and nutritional guidelines
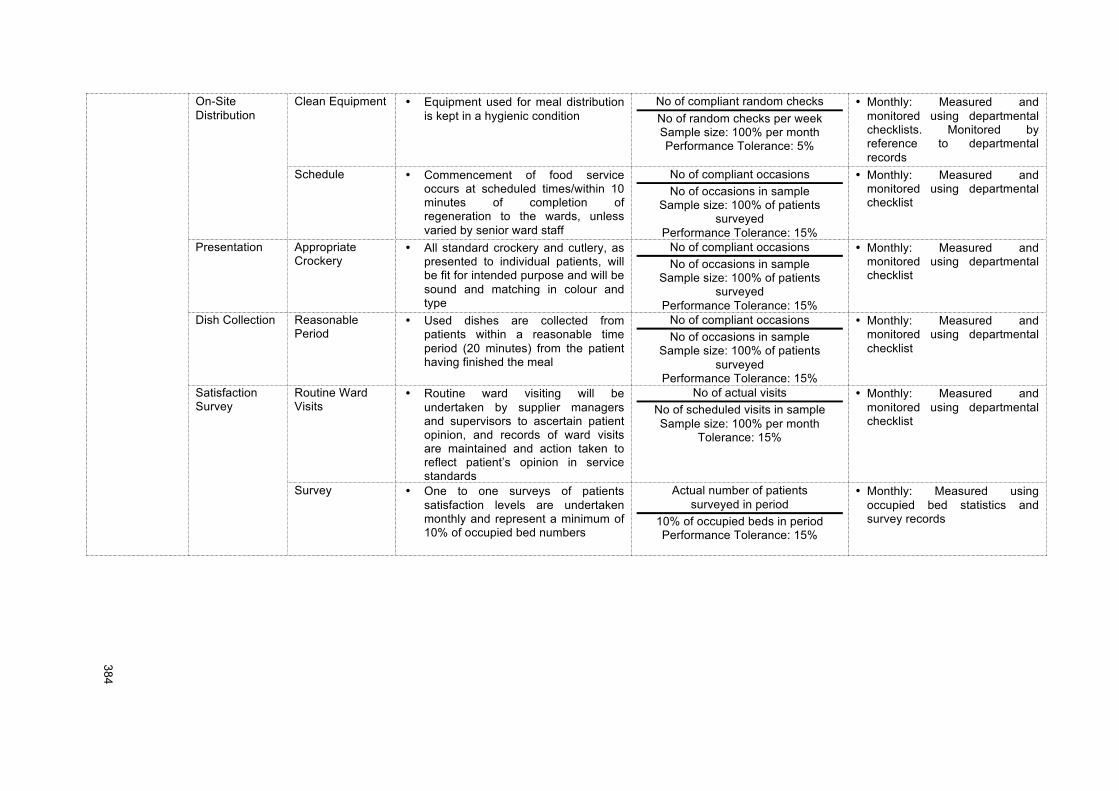
!!
384!
!
On-Site Distribution
Clean Equipment • Equipment used for meal distribution is kept in a hygienic condition
No of compliant random checks No of random checks per week Sample size: 100% per month Performance Tolerance: 5%
• Monthly: Measured and monitored using departmental checklists. Monitored by reference to departmental records
Schedule • Commencement of food service occurs at scheduled times/within 10 minutes of completion of regeneration to the wards, unless varied by senior ward staff
No of compliant occasions No of occasions in sample
Sample size: 100% of patients surveyed
Performance Tolerance: 15%
• Monthly: Measured and monitored using departmental checklist
Presentation Appropriate Crockery
• All standard crockery and cutlery, as presented to individual patients, will be fit for intended purpose and will be sound and matching in colour and type
No of compliant occasions No of occasions in sample
Sample size: 100% of patients surveyed
Performance Tolerance: 15%
• Monthly: Measured and monitored using departmental checklist
Dish Collection Reasonable Period
• Used dishes are collected from patients within a reasonable time period (20 minutes) from the patient having finished the meal
No of compliant occasions No of occasions in sample
Sample size: 100% of patients surveyed
Performance Tolerance: 15%
• Monthly: Measured and monitored using departmental checklist
Satisfaction Survey
Routine Ward Visits
• Routine ward visiting will be undertaken by supplier managers and supervisors to ascertain patient opinion, and records of ward visits are maintained and action taken to reflect patient’s opinion in service standards
No of actual visits No of scheduled visits in sample Sample size: 100% per month
Tolerance: 15%
• Monthly: Measured and monitored using departmental checklist
Survey • One to one surveys of patients satisfaction levels are undertaken monthly and represent a minimum of 10% of occupied bed numbers
Actual number of patients surveyed in period
10% of occupied beds in period Performance Tolerance: 15%
• Monthly: Measured using occupied bed statistics and survey records

!!
385!
!
TECHNICAL [T16] ACCESS & CIRCULATION
Parameters Metrics Indicators Attributes Formula/Target Monitoring
[1] Access Lifts Time to Arrive • The average waiting time for a lift i.e. any lift at that lift location, to respond to a manual call button request is less than TBA.
• Response time < TBA • 3 measurements taken within a
10 minute period
• Weekly/Monthly: Measured and monitored using departmental checklist
Alignment • A lift stops no more than 40 mm from horizontal floor level
In the event of problems which cause a significant H&S risk, or security risk (i.e. people trapped in lift) • Urgent Priority: Grace Period is
2 Core Hours in Core Hour Areas, 2 Hours in 24 Hour Areas, except 45 minutes at any time for entrapment in a lift
In the event of any other problems. • High Priority: Grace Period is 2
Working Days in Core Hour Areas, 24 Hours in 24 Hour Areas
• Weekly/Monthly: Measured and monitored using departmental checklist
2) Escalators Speed • The speed of the handrail shall not deviate from the speed of the steps by more than 2%
In the event of problems which cause a significant H&S risk, or security risk (i.e. people trapped in lift) • Urgent Priority: Grace Period is
2 Core Hours in Core Hour Areas, 2 Hours in 24 Hour Areas, except 45 minutes at any time for entrapment in a lift
In the event of any other problems. • High Priority: Grace Period is 2
• Weekly/Monthly: Measured and monitored using departmental checklist
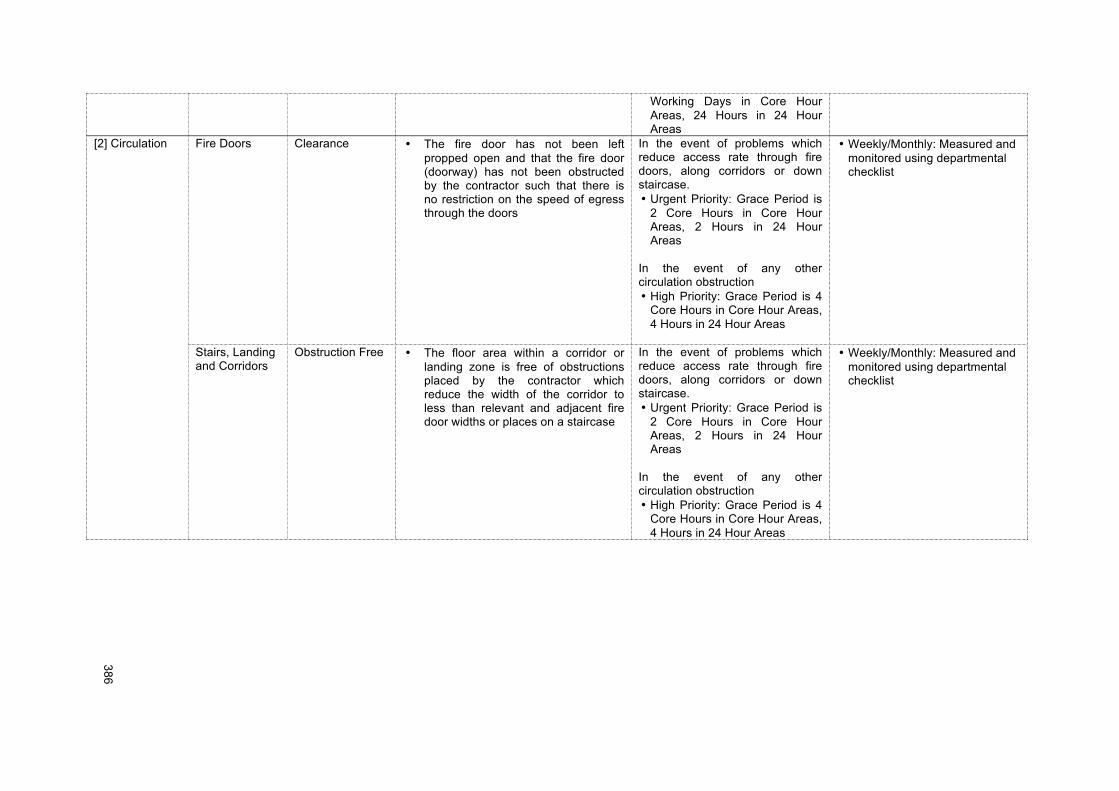
!!
386!
!
Working Days in Core Hour Areas, 24 Hours in 24 Hour Areas
[2] Circulation Fire Doors Clearance • The fire door has not been left propped open and that the fire door (doorway) has not been obstructed by the contractor such that there is no restriction on the speed of egress through the doors
In the event of problems which reduce access rate through fire doors, along corridors or down staircase. • Urgent Priority: Grace Period is
2 Core Hours in Core Hour Areas, 2 Hours in 24 Hour Areas
In the event of any other circulation obstruction • High Priority: Grace Period is 4
Core Hours in Core Hour Areas, 4 Hours in 24 Hour Areas
• Weekly/Monthly: Measured and monitored using departmental checklist
Stairs, Landing and Corridors
Obstruction Free • The floor area within a corridor or landing zone is free of obstructions placed by the contractor which reduce the width of the corridor to less than relevant and adjacent fire door widths or places on a staircase
In the event of problems which reduce access rate through fire doors, along corridors or down staircase. • Urgent Priority: Grace Period is
2 Core Hours in Core Hour Areas, 2 Hours in 24 Hour Areas
In the event of any other circulation obstruction • High Priority: Grace Period is 4
Core Hours in Core Hour Areas, 4 Hours in 24 Hour Areas
• Weekly/Monthly: Measured and monitored using departmental checklist
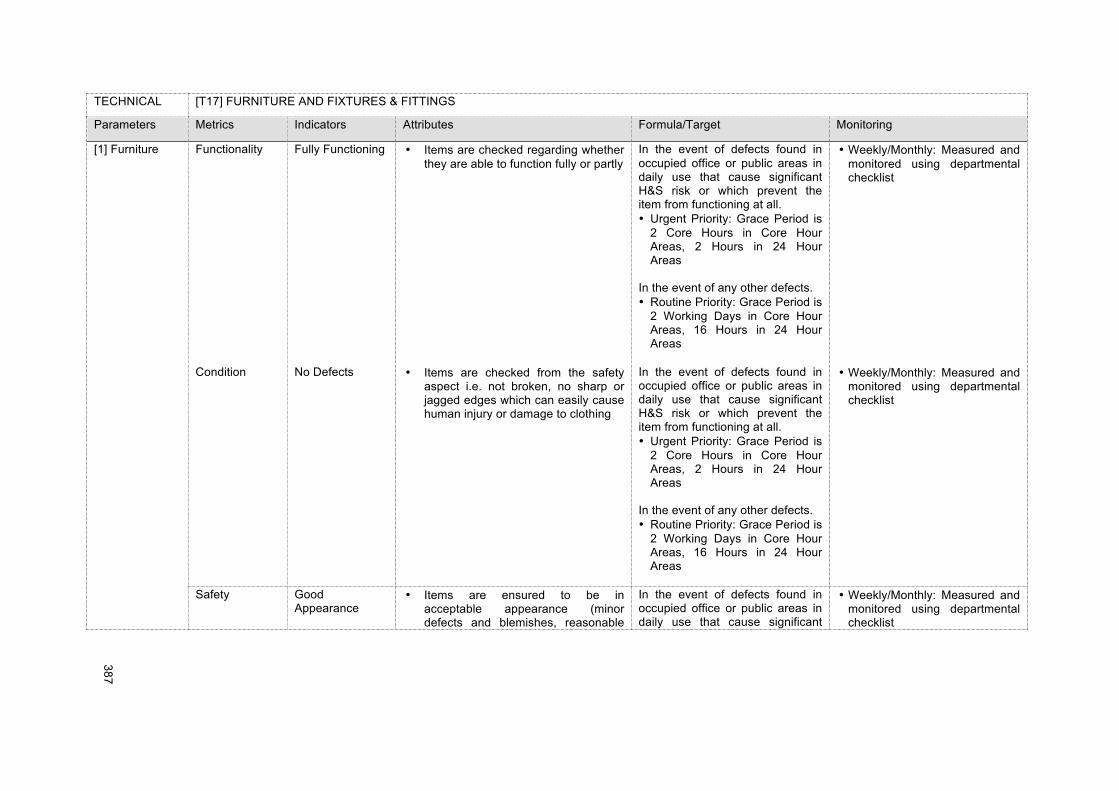
!!
387!
!
TECHNICAL [T17] FURNITURE AND FIXTURES & FITTINGS
Parameters Metrics Indicators Attributes Formula/Target Monitoring
[1] Furniture Functionality Fully Functioning • Items are checked regarding whether they are able to function fully or partly
In the event of defects found in occupied office or public areas in daily use that cause significant H&S risk or which prevent the item from functioning at all. • Urgent Priority: Grace Period is
2 Core Hours in Core Hour Areas, 2 Hours in 24 Hour Areas
In the event of any other defects. • Routine Priority: Grace Period is
2 Working Days in Core Hour Areas, 16 Hours in 24 Hour Areas
• Weekly/Monthly: Measured and monitored using departmental checklist
Condition No Defects • Items are checked from the safety aspect i.e. not broken, no sharp or jagged edges which can easily cause human injury or damage to clothing
In the event of defects found in occupied office or public areas in daily use that cause significant H&S risk or which prevent the item from functioning at all. • Urgent Priority: Grace Period is
2 Core Hours in Core Hour Areas, 2 Hours in 24 Hour Areas
In the event of any other defects. • Routine Priority: Grace Period is
2 Working Days in Core Hour Areas, 16 Hours in 24 Hour Areas
• Weekly/Monthly: Measured and monitored using departmental checklist
Safety Good Appearance
• Items are ensured to be in acceptable appearance (minor defects and blemishes, reasonable
In the event of defects found in occupied office or public areas in daily use that cause significant
• Weekly/Monthly: Measured and monitored using departmental checklist
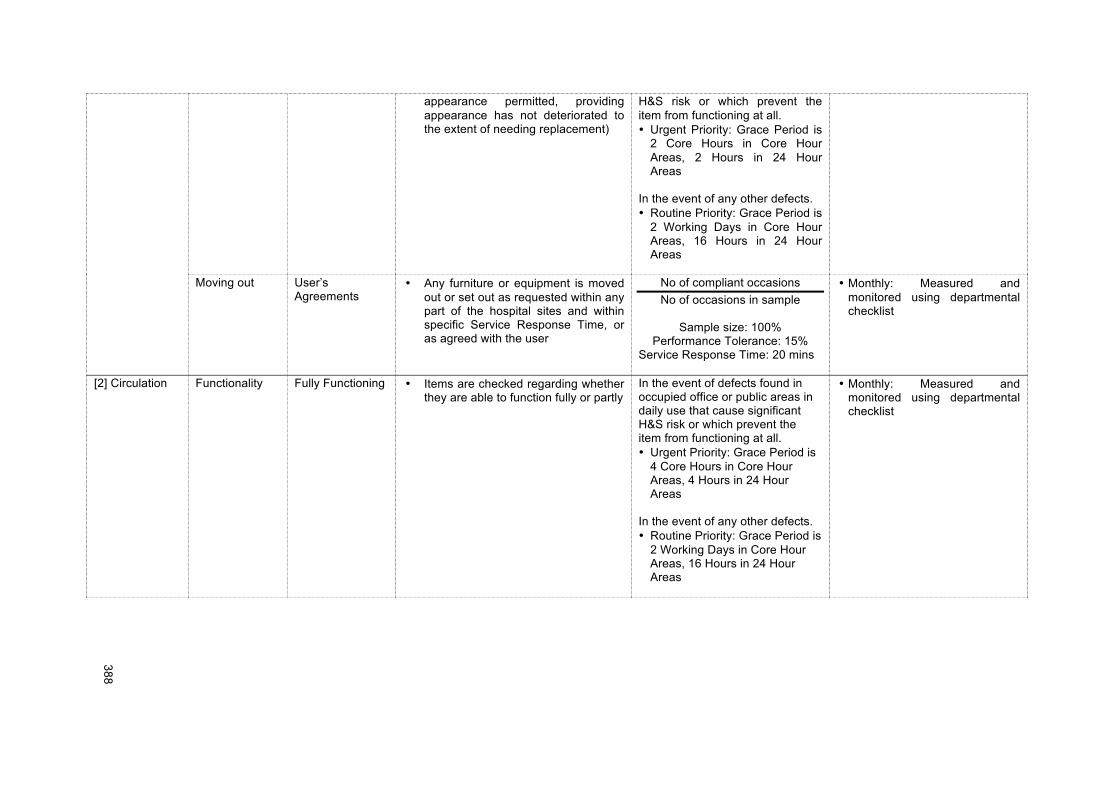
!!
388!
!
appearance permitted, providing appearance has not deteriorated to the extent of needing replacement)
H&S risk or which prevent the item from functioning at all. • Urgent Priority: Grace Period is
2 Core Hours in Core Hour Areas, 2 Hours in 24 Hour Areas
In the event of any other defects. • Routine Priority: Grace Period is
2 Working Days in Core Hour Areas, 16 Hours in 24 Hour Areas
Moving out User’s
Agreements • Any furniture or equipment is moved
out or set out as requested within any part of the hospital sites and within specific Service Response Time, or as agreed with the user
No of compliant occasions No of occasions in sample
Sample size: 100%
Performance Tolerance: 15% Service Response Time: 20 mins
• Monthly: Measured and monitored using departmental checklist
[2] Circulation Functionality Fully Functioning • Items are checked regarding whether they are able to function fully or partly
In the event of defects found in occupied office or public areas in daily use that cause significant H&S risk or which prevent the item from functioning at all. • Urgent Priority: Grace Period is
4 Core Hours in Core Hour Areas, 4 Hours in 24 Hour Areas
In the event of any other defects. • Routine Priority: Grace Period is
2 Working Days in Core Hour Areas, 16 Hours in 24 Hour Areas
• Monthly: Measured and monitored using departmental checklist
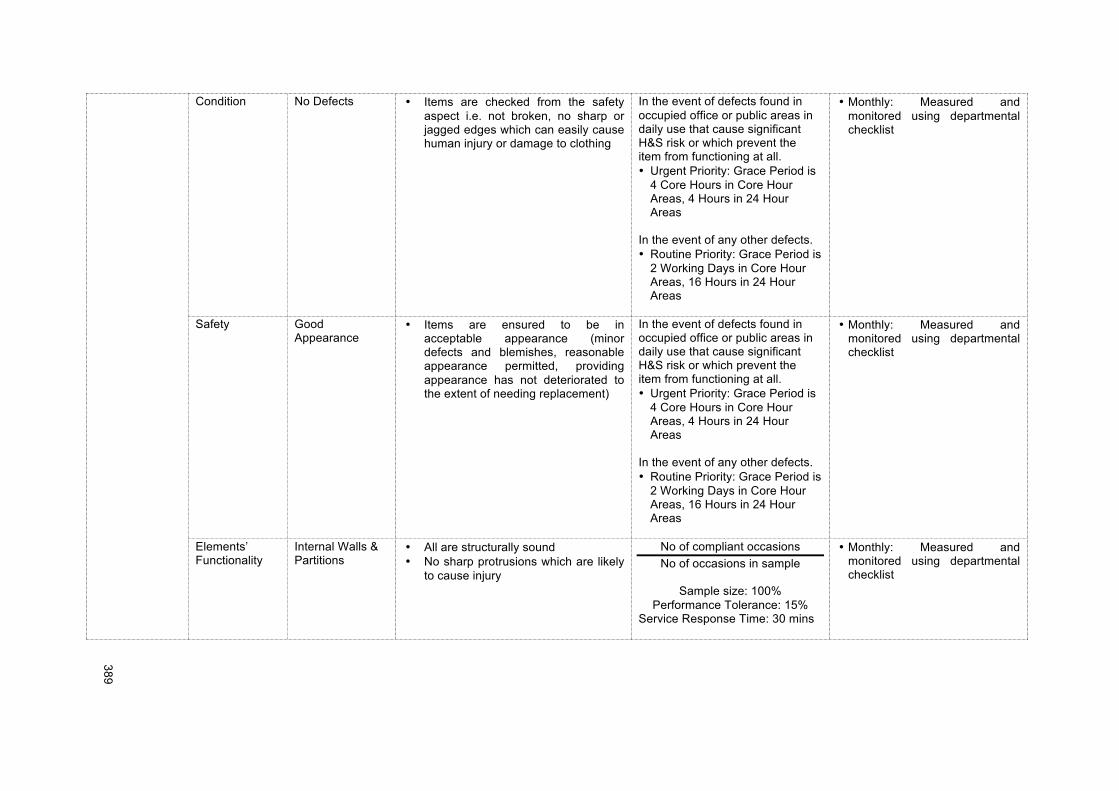
!!
389!
!
Condition No Defects • Items are checked from the safety aspect i.e. not broken, no sharp or jagged edges which can easily cause human injury or damage to clothing
In the event of defects found in occupied office or public areas in daily use that cause significant H&S risk or which prevent the item from functioning at all. • Urgent Priority: Grace Period is
4 Core Hours in Core Hour Areas, 4 Hours in 24 Hour Areas
In the event of any other defects. • Routine Priority: Grace Period is
2 Working Days in Core Hour Areas, 16 Hours in 24 Hour Areas
• Monthly: Measured and monitored using departmental checklist
Safety Good Appearance
• Items are ensured to be in acceptable appearance (minor defects and blemishes, reasonable appearance permitted, providing appearance has not deteriorated to the extent of needing replacement)
In the event of defects found in occupied office or public areas in daily use that cause significant H&S risk or which prevent the item from functioning at all. • Urgent Priority: Grace Period is
4 Core Hours in Core Hour Areas, 4 Hours in 24 Hour Areas
In the event of any other defects. • Routine Priority: Grace Period is
2 Working Days in Core Hour Areas, 16 Hours in 24 Hour Areas
• Monthly: Measured and monitored using departmental checklist
Elements’ Functionality
Internal Walls & Partitions
• All are structurally sound • No sharp protrusions which are likely
to cause injury
No of compliant occasions No of occasions in sample
Sample size: 100%
Performance Tolerance: 15% Service Response Time: 30 mins
• Monthly: Measured and monitored using departmental checklist
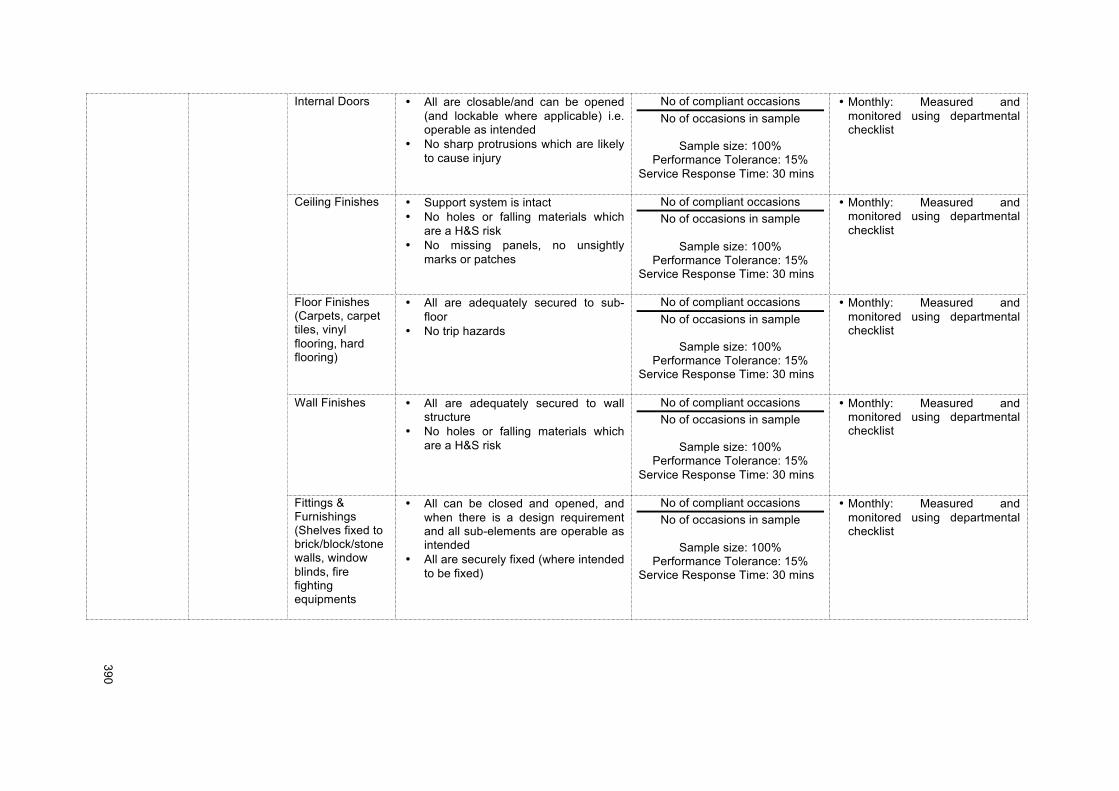
!!
390!
!
Internal Doors • All are closable/and can be opened (and lockable where applicable) i.e. operable as intended
• No sharp protrusions which are likely to cause injury
No of compliant occasions No of occasions in sample
Sample size: 100%
Performance Tolerance: 15% Service Response Time: 30 mins
• Monthly: Measured and monitored using departmental checklist
Ceiling Finishes • Support system is intact • No holes or falling materials which
are a H&S risk • No missing panels, no unsightly
marks or patches
No of compliant occasions No of occasions in sample
Sample size: 100%
Performance Tolerance: 15% Service Response Time: 30 mins
• Monthly: Measured and monitored using departmental checklist
Floor Finishes (Carpets, carpet tiles, vinyl flooring, hard flooring)
• All are adequately secured to sub-floor
• No trip hazards
No of compliant occasions No of occasions in sample
Sample size: 100%
Performance Tolerance: 15% Service Response Time: 30 mins
• Monthly: Measured and monitored using departmental checklist
Wall Finishes • All are adequately secured to wall structure
• No holes or falling materials which are a H&S risk
No of compliant occasions No of occasions in sample
Sample size: 100%
Performance Tolerance: 15% Service Response Time: 30 mins
• Monthly: Measured and monitored using departmental checklist
Fittings & Furnishings (Shelves fixed to brick/block/stone walls, window blinds, fire fighting equipments
• All can be closed and opened, and when there is a design requirement and all sub-elements are operable as intended
• All are securely fixed (where intended to be fixed)
No of compliant occasions No of occasions in sample
Sample size: 100%
Performance Tolerance: 15% Service Response Time: 30 mins
• Monthly: Measured and monitored using departmental checklist
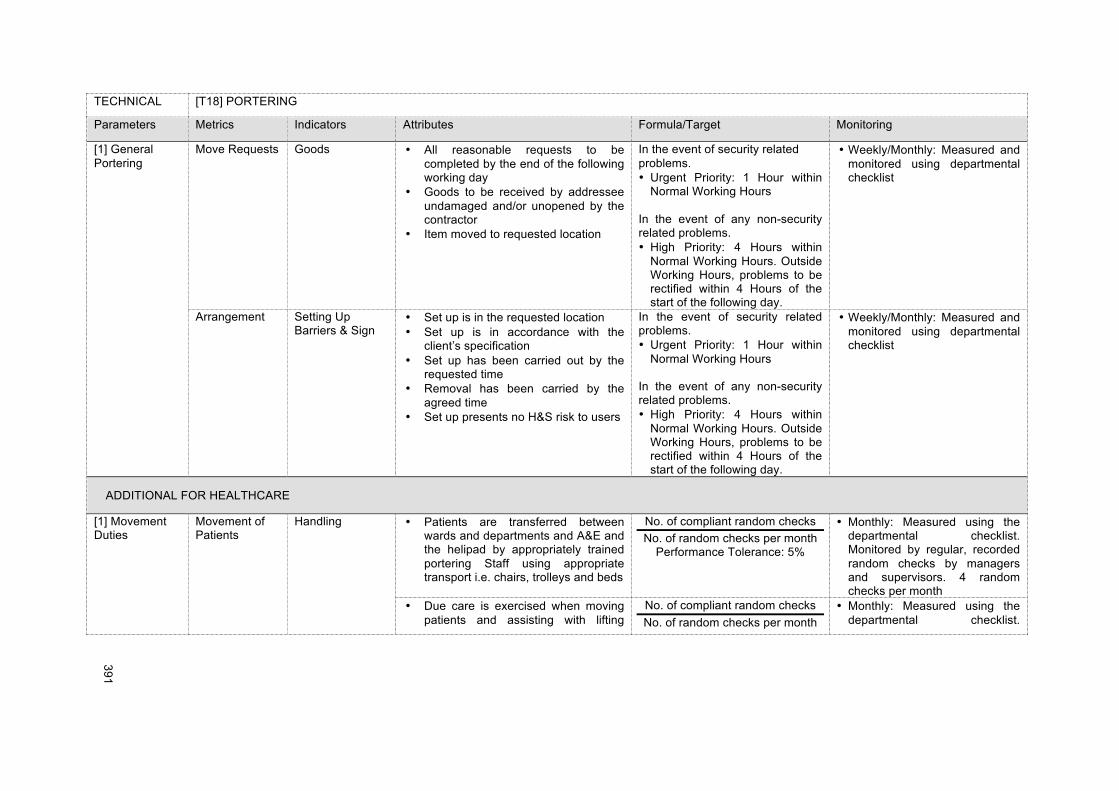
!!
391!
!
TECHNICAL [T18] PORTERING
Parameters Metrics Indicators Attributes Formula/Target Monitoring
[1] General Portering
Move Requests Goods • All reasonable requests to be completed by the end of the following working day
• Goods to be received by addressee undamaged and/or unopened by the contractor
• Item moved to requested location
In the event of security related problems. • Urgent Priority: 1 Hour within
Normal Working Hours In the event of any non-security related problems. • High Priority: 4 Hours within
Normal Working Hours. Outside Working Hours, problems to be rectified within 4 Hours of the start of the following day.
• Weekly/Monthly: Measured and monitored using departmental checklist
Arrangement Setting Up Barriers & Sign
• Set up is in the requested location • Set up is in accordance with the
client’s specification • Set up has been carried out by the
requested time • Removal has been carried by the
agreed time • Set up presents no H&S risk to users
In the event of security related problems. • Urgent Priority: 1 Hour within
Normal Working Hours In the event of any non-security related problems. • High Priority: 4 Hours within
Normal Working Hours. Outside Working Hours, problems to be rectified within 4 Hours of the start of the following day.
• Weekly/Monthly: Measured and monitored using departmental checklist
ADDITIONAL FOR HEALTHCARE
[1] Movement Duties
Movement of Patients
Handling • Patients are transferred between wards and departments and A&E and the helipad by appropriately trained portering Staff using appropriate transport i.e. chairs, trolleys and beds
No. of compliant random checks No. of random checks per month
Performance Tolerance: 5%
• Monthly: Measured using the departmental checklist. Monitored by regular, recorded random checks by managers and supervisors. 4 random checks per month
• Due care is exercised when moving patients and assisting with lifting
No. of compliant random checks No. of random checks per month
• Monthly: Measured using the departmental checklist.
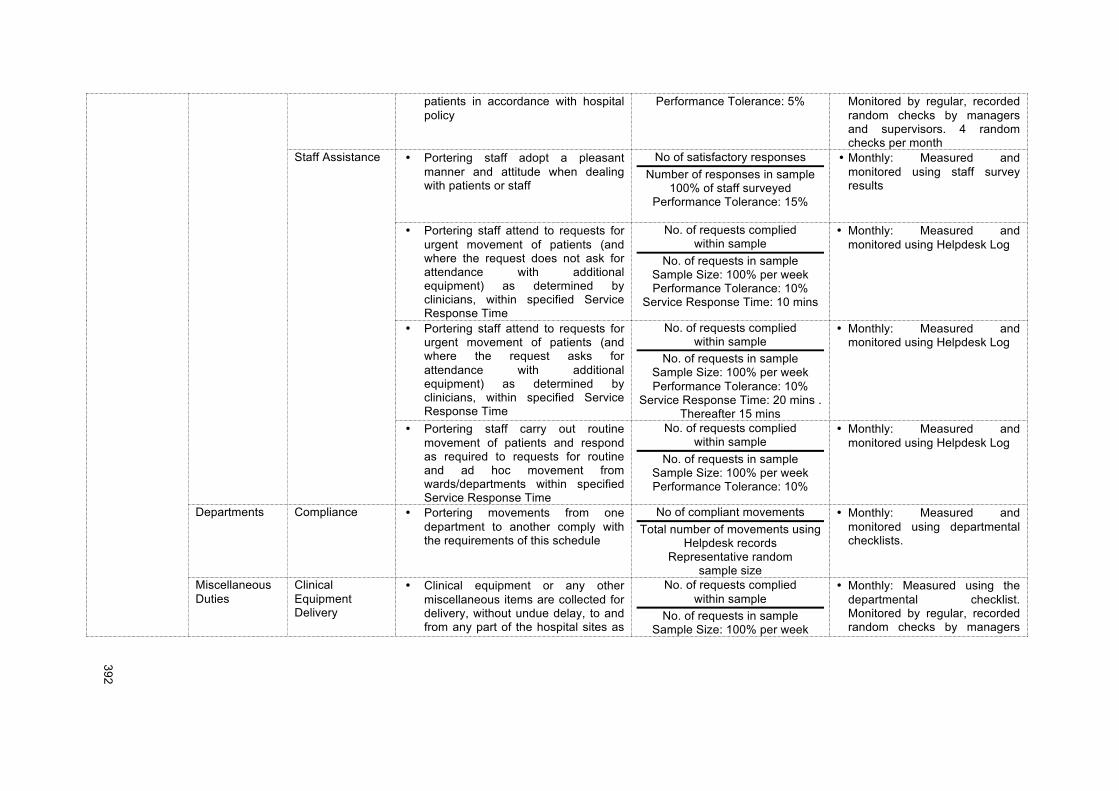
!!
392!
!
patients in accordance with hospital policy
Performance Tolerance: 5% Monitored by regular, recorded random checks by managers and supervisors. 4 random checks per month
Staff Assistance • Portering staff adopt a pleasant manner and attitude when dealing with patients or staff
No of satisfactory responses Number of responses in sample
100% of staff surveyed Performance Tolerance: 15%
• Monthly: Measured and monitored using staff survey results
• Portering staff attend to requests for urgent movement of patients (and where the request does not ask for attendance with additional equipment) as determined by clinicians, within specified Service Response Time
No. of requests complied within sample
No. of requests in sample Sample Size: 100% per week Performance Tolerance: 10%
Service Response Time: 10 mins
• Monthly: Measured and monitored using Helpdesk Log
• Portering staff attend to requests for urgent movement of patients (and where the request asks for attendance with additional equipment) as determined by clinicians, within specified Service Response Time
No. of requests complied within sample
No. of requests in sample Sample Size: 100% per week Performance Tolerance: 10%
Service Response Time: 20 mins . Thereafter 15 mins
• Monthly: Measured and monitored using Helpdesk Log
• Portering staff carry out routine movement of patients and respond as required to requests for routine and ad hoc movement from wards/departments within specified Service Response Time
No. of requests complied within sample
No. of requests in sample Sample Size: 100% per week Performance Tolerance: 10%
• Monthly: Measured and monitored using Helpdesk Log
Departments Compliance • Portering movements from one department to another comply with the requirements of this schedule
No of compliant movements Total number of movements using
Helpdesk records Representative random
sample size
• Monthly: Measured and monitored using departmental checklists.
Miscellaneous Duties
Clinical Equipment Delivery
• Clinical equipment or any other miscellaneous items are collected for delivery, without undue delay, to and from any part of the hospital sites as
No. of requests complied within sample
No. of requests in sample Sample Size: 100% per week
• Monthly: Measured using the departmental checklist. Monitored by regular, recorded random checks by managers
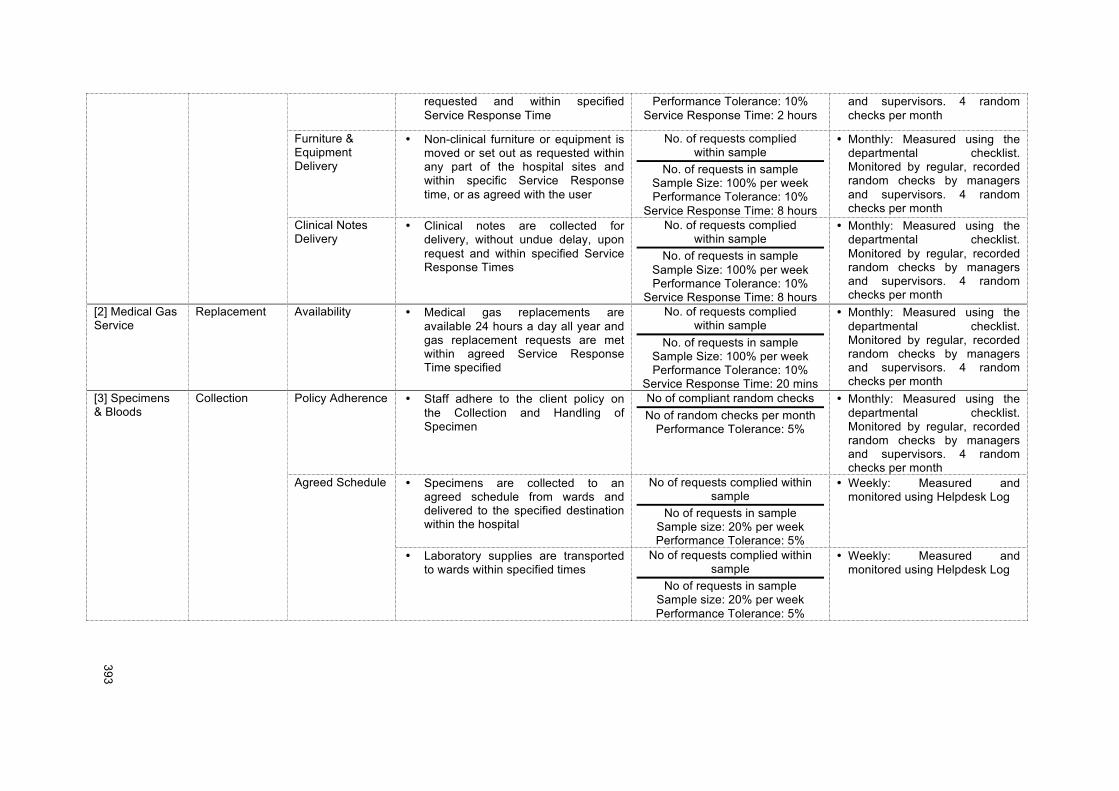
!!
393!
!
requested and within specified Service Response Time
Performance Tolerance: 10% Service Response Time: 2 hours
and supervisors. 4 random checks per month
Furniture & Equipment Delivery
• Non-clinical furniture or equipment is moved or set out as requested within any part of the hospital sites and within specific Service Response time, or as agreed with the user
No. of requests complied within sample
No. of requests in sample Sample Size: 100% per week Performance Tolerance: 10%
Service Response Time: 8 hours
• Monthly: Measured using the departmental checklist. Monitored by regular, recorded random checks by managers and supervisors. 4 random checks per month
Clinical Notes Delivery
• Clinical notes are collected for delivery, without undue delay, upon request and within specified Service Response Times
No. of requests complied within sample
No. of requests in sample Sample Size: 100% per week Performance Tolerance: 10%
Service Response Time: 8 hours
• Monthly: Measured using the departmental checklist. Monitored by regular, recorded random checks by managers and supervisors. 4 random checks per month
[2] Medical Gas Service
Replacement Availability • Medical gas replacements are available 24 hours a day all year and gas replacement requests are met within agreed Service Response Time specified
No. of requests complied within sample
No. of requests in sample Sample Size: 100% per week Performance Tolerance: 10%
Service Response Time: 20 mins
• Monthly: Measured using the departmental checklist. Monitored by regular, recorded random checks by managers and supervisors. 4 random checks per month
[3] Specimens & Bloods
Collection Policy Adherence • Staff adhere to the client policy on the Collection and Handling of Specimen
No of compliant random checks No of random checks per month
Performance Tolerance: 5%
• Monthly: Measured using the departmental checklist. Monitored by regular, recorded random checks by managers and supervisors. 4 random checks per month
Agreed Schedule • Specimens are collected to an agreed schedule from wards and delivered to the specified destination within the hospital
No of requests complied within sample
No of requests in sample Sample size: 20% per week Performance Tolerance: 5%
• Weekly: Measured and monitored using Helpdesk Log
• Laboratory supplies are transported to wards within specified times
No of requests complied within sample
No of requests in sample Sample size: 20% per week Performance Tolerance: 5%
• Weekly: Measured and monitored using Helpdesk Log
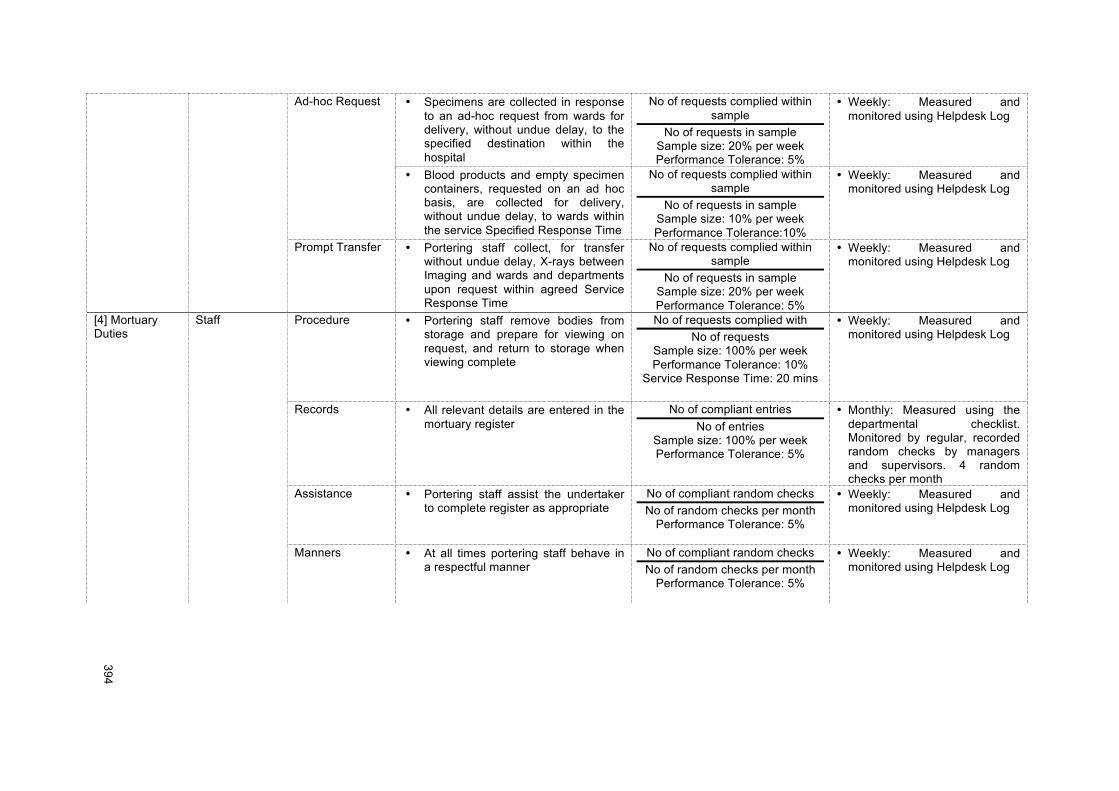
!!
394!
!
Ad-hoc Request • Specimens are collected in response to an ad-hoc request from wards for delivery, without undue delay, to the specified destination within the hospital
No of requests complied within sample
No of requests in sample Sample size: 20% per week Performance Tolerance: 5%
• Weekly: Measured and monitored using Helpdesk Log
• Blood products and empty specimen containers, requested on an ad hoc basis, are collected for delivery, without undue delay, to wards within the service Specified Response Time
No of requests complied within sample
No of requests in sample Sample size: 10% per week Performance Tolerance:10%
• Weekly: Measured and monitored using Helpdesk Log
Prompt Transfer • Portering staff collect, for transfer without undue delay, X-rays between Imaging and wards and departments upon request within agreed Service Response Time
No of requests complied within sample
No of requests in sample Sample size: 20% per week Performance Tolerance: 5%
• Weekly: Measured and monitored using Helpdesk Log
[4] Mortuary Duties
Staff Procedure • Portering staff remove bodies from storage and prepare for viewing on request, and return to storage when viewing complete
No of requests complied with No of requests
Sample size: 100% per week Performance Tolerance: 10%
Service Response Time: 20 mins
• Weekly: Measured and monitored using Helpdesk Log
Records • All relevant details are entered in the mortuary register
No of compliant entries No of entries
Sample size: 100% per week Performance Tolerance: 5%
• Monthly: Measured using the departmental checklist. Monitored by regular, recorded random checks by managers and supervisors. 4 random checks per month
Assistance • Portering staff assist the undertaker to complete register as appropriate
No of compliant random checks No of random checks per month
Performance Tolerance: 5%
• Weekly: Measured and monitored using Helpdesk Log
Manners • At all times portering staff behave in a respectful manner
No of compliant random checks No of random checks per month
Performance Tolerance: 5%
• Weekly: Measured and monitored using Helpdesk Log
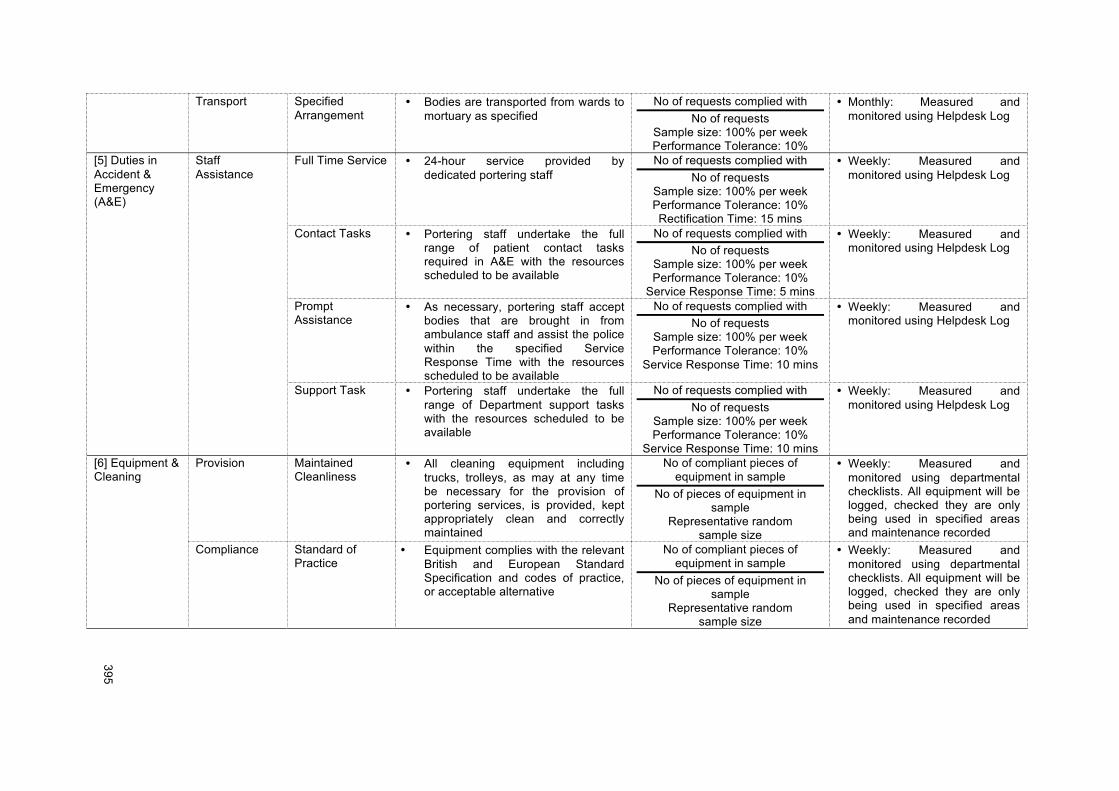
!!
395!
!
Transport Specified Arrangement
• Bodies are transported from wards to mortuary as specified
No of requests complied with No of requests
Sample size: 100% per week Performance Tolerance: 10%
• Monthly: Measured and monitored using Helpdesk Log
[5] Duties in Accident & Emergency (A&E)
Staff Assistance
Full Time Service • 24-hour service provided by dedicated portering staff
No of requests complied with No of requests
Sample size: 100% per week Performance Tolerance: 10% Rectification Time: 15 mins
• Weekly: Measured and monitored using Helpdesk Log
Contact Tasks • Portering staff undertake the full range of patient contact tasks required in A&E with the resources scheduled to be available
No of requests complied with No of requests
Sample size: 100% per week Performance Tolerance: 10%
Service Response Time: 5 mins
• Weekly: Measured and monitored using Helpdesk Log
Prompt Assistance
• As necessary, portering staff accept bodies that are brought in from ambulance staff and assist the police within the specified Service Response Time with the resources scheduled to be available
No of requests complied with No of requests
Sample size: 100% per week Performance Tolerance: 10%
Service Response Time: 10 mins
• Weekly: Measured and monitored using Helpdesk Log
Support Task • Portering staff undertake the full range of Department support tasks with the resources scheduled to be available
No of requests complied with No of requests
Sample size: 100% per week Performance Tolerance: 10%
Service Response Time: 10 mins
• Weekly: Measured and monitored using Helpdesk Log
[6] Equipment & Cleaning
Provision Maintained Cleanliness
• All cleaning equipment including trucks, trolleys, as may at any time be necessary for the provision of portering services, is provided, kept appropriately clean and correctly maintained
No of compliant pieces of equipment in sample
No of pieces of equipment in sample
Representative random sample size
• Weekly: Measured and monitored using departmental checklists. All equipment will be logged, checked they are only being used in specified areas and maintenance recorded
Compliance Standard of Practice
• Equipment complies with the relevant British and European Standard Specification and codes of practice, or acceptable alternative
No of compliant pieces of equipment in sample
No of pieces of equipment in sample
Representative random sample size
• Weekly: Measured and monitored using departmental checklists. All equipment will be logged, checked they are only being used in specified areas and maintenance recorded
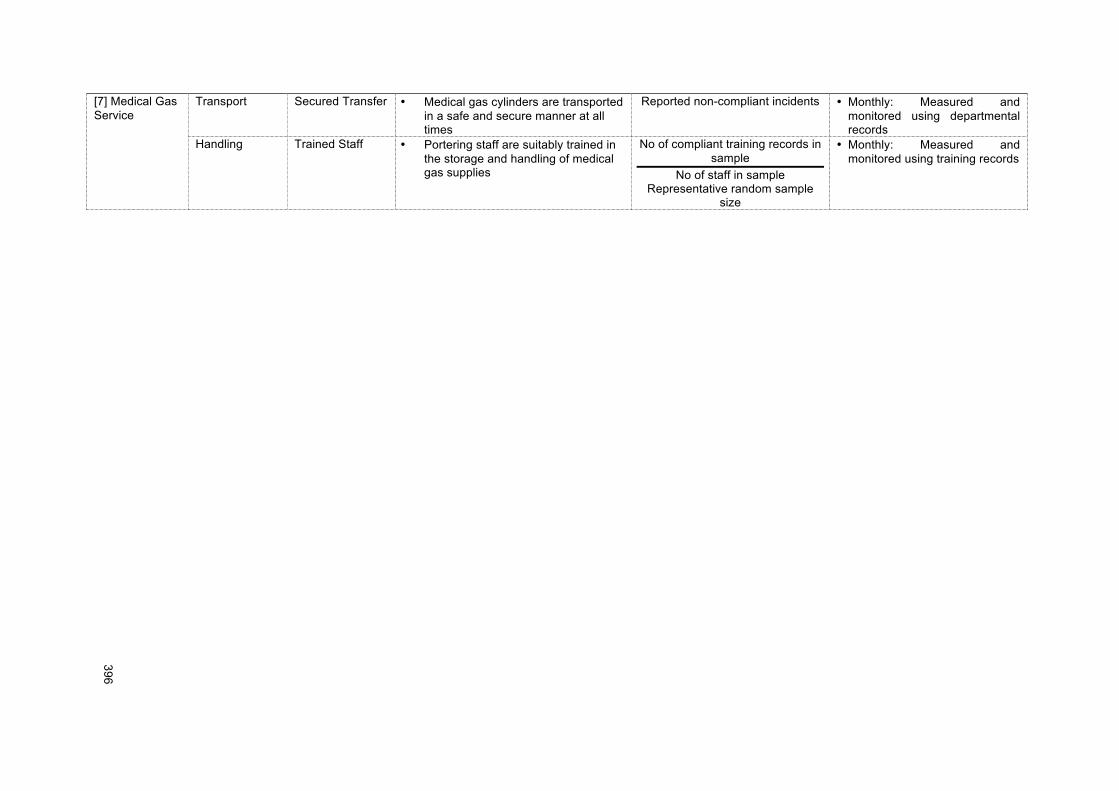
!!
396!
!
[7] Medical Gas Service
Transport Secured Transfer • Medical gas cylinders are transported in a safe and secure manner at all times
Reported non-compliant incidents • Monthly: Measured and monitored using departmental records
Handling Trained Staff • Portering staff are suitably trained in the storage and handling of medical gas supplies
No of compliant training records in sample
No of staff in sample Representative random sample
size
• Monthly: Measured and monitored using training records
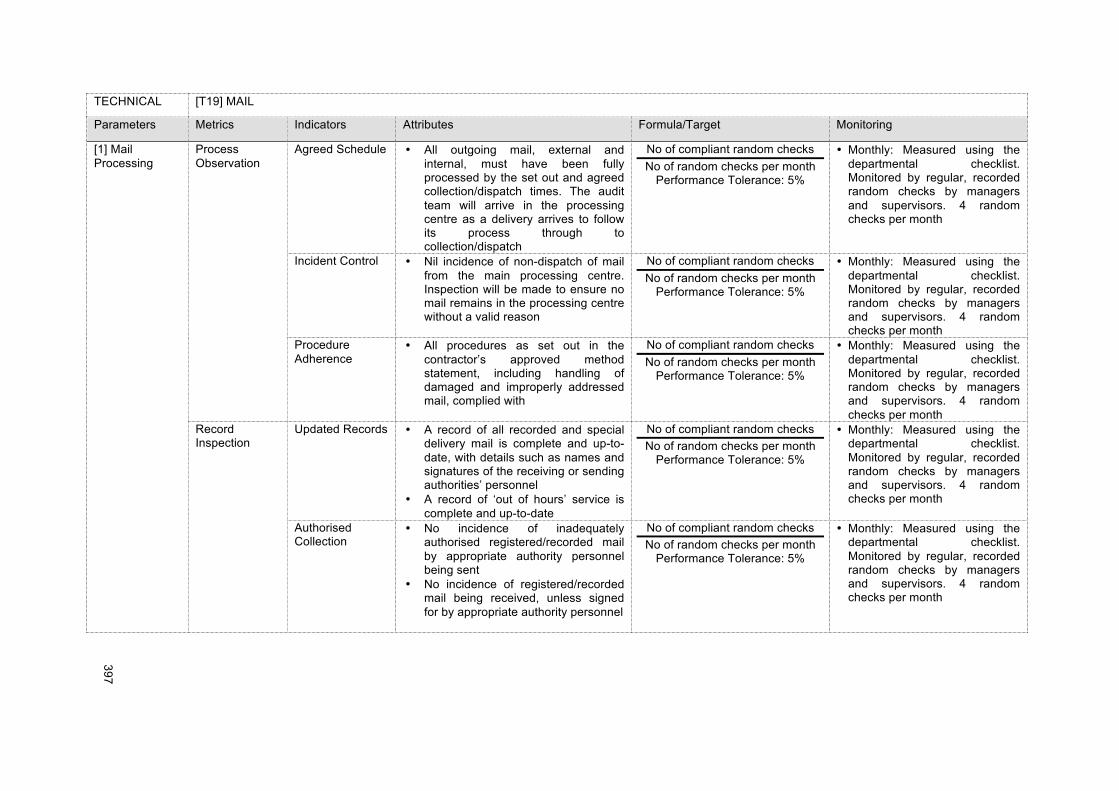
!!
397!
!
TECHNICAL [T19] MAIL
Parameters Metrics Indicators Attributes Formula/Target Monitoring
[1] Mail Processing
Process Observation
Agreed Schedule • All outgoing mail, external and internal, must have been fully processed by the set out and agreed collection/dispatch times. The audit team will arrive in the processing centre as a delivery arrives to follow its process through to collection/dispatch
No of compliant random checks No of random checks per month
Performance Tolerance: 5%
• Monthly: Measured using the departmental checklist. Monitored by regular, recorded random checks by managers and supervisors. 4 random checks per month
Incident Control • Nil incidence of non-dispatch of mail from the main processing centre. Inspection will be made to ensure no mail remains in the processing centre without a valid reason
No of compliant random checks No of random checks per month
Performance Tolerance: 5%
• Monthly: Measured using the departmental checklist. Monitored by regular, recorded random checks by managers and supervisors. 4 random checks per month
Procedure Adherence
• All procedures as set out in the contractor’s approved method statement, including handling of damaged and improperly addressed mail, complied with
No of compliant random checks No of random checks per month
Performance Tolerance: 5%
• Monthly: Measured using the departmental checklist. Monitored by regular, recorded random checks by managers and supervisors. 4 random checks per month
Record Inspection
Updated Records • A record of all recorded and special delivery mail is complete and up-to-date, with details such as names and signatures of the receiving or sending authorities’ personnel
• A record of ‘out of hours’ service is complete and up-to-date
No of compliant random checks No of random checks per month
Performance Tolerance: 5%
• Monthly: Measured using the departmental checklist. Monitored by regular, recorded random checks by managers and supervisors. 4 random checks per month
Authorised Collection
• No incidence of inadequately authorised registered/recorded mail by appropriate authority personnel being sent
• No incidence of registered/recorded mail being received, unless signed for by appropriate authority personnel
No of compliant random checks No of random checks per month
Performance Tolerance: 5%
• Monthly: Measured using the departmental checklist. Monitored by regular, recorded random checks by managers and supervisors. 4 random checks per month
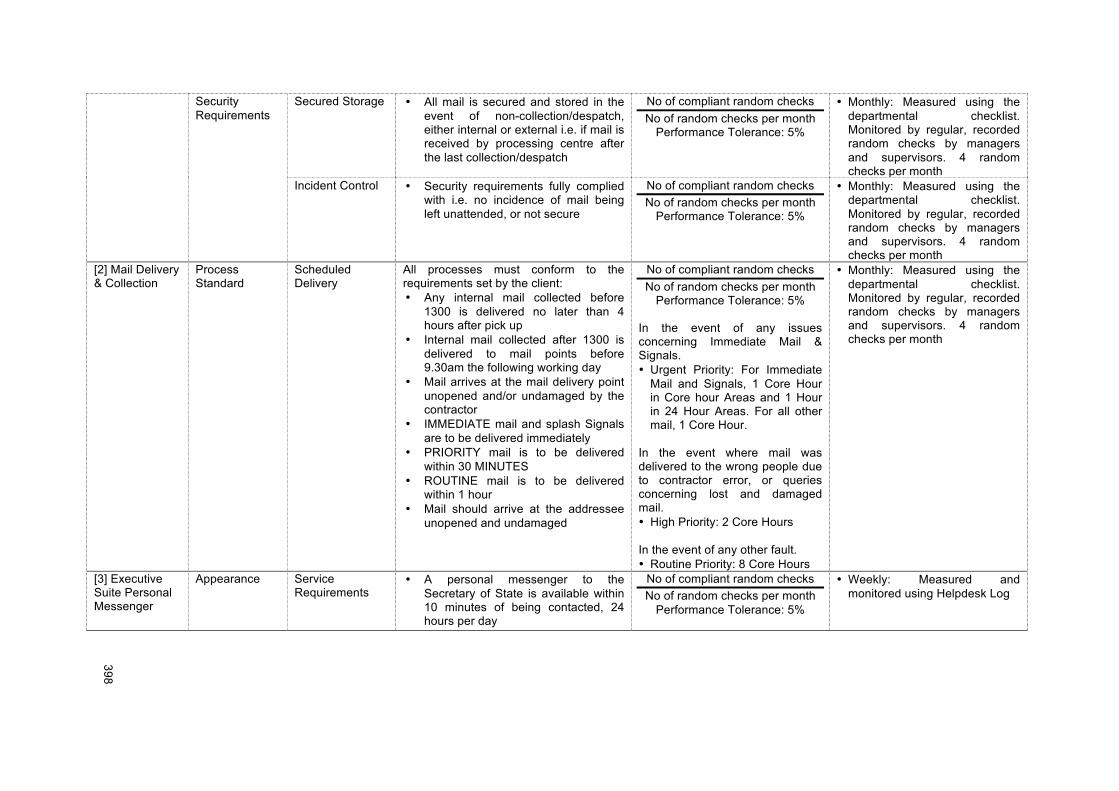
!!
398!
!
Security Requirements
Secured Storage • All mail is secured and stored in the event of non-collection/despatch, either internal or external i.e. if mail is received by processing centre after the last collection/despatch
No of compliant random checks No of random checks per month
Performance Tolerance: 5%
• Monthly: Measured using the departmental checklist. Monitored by regular, recorded random checks by managers and supervisors. 4 random checks per month
Incident Control • Security requirements fully complied with i.e. no incidence of mail being left unattended, or not secure
No of compliant random checks No of random checks per month
Performance Tolerance: 5%
• Monthly: Measured using the departmental checklist. Monitored by regular, recorded random checks by managers and supervisors. 4 random checks per month
[2] Mail Delivery & Collection
Process Standard
Scheduled Delivery
All processes must conform to the requirements set by the client: • Any internal mail collected before
1300 is delivered no later than 4 hours after pick up
• Internal mail collected after 1300 is delivered to mail points before 9.30am the following working day
• Mail arrives at the mail delivery point unopened and/or undamaged by the contractor
• IMMEDIATE mail and splash Signals are to be delivered immediately
• PRIORITY mail is to be delivered within 30 MINUTES
• ROUTINE mail is to be delivered within 1 hour
• Mail should arrive at the addressee unopened and undamaged
No of compliant random checks No of random checks per month
Performance Tolerance: 5%
In the event of any issues concerning Immediate Mail & Signals. • Urgent Priority: For Immediate
Mail and Signals, 1 Core Hour in Core hour Areas and 1 Hour in 24 Hour Areas. For all other mail, 1 Core Hour.
In the event where mail was delivered to the wrong people due to contractor error, or queries concerning lost and damaged mail. • High Priority: 2 Core Hours In the event of any other fault. • Routine Priority: 8 Core Hours
• Monthly: Measured using the departmental checklist. Monitored by regular, recorded random checks by managers and supervisors. 4 random checks per month
[3] Executive Suite Personal Messenger
Appearance Service Requirements
• A personal messenger to the Secretary of State is available within 10 minutes of being contacted, 24 hours per day
No of compliant random checks No of random checks per month
Performance Tolerance: 5%
• Weekly: Measured and monitored using Helpdesk Log
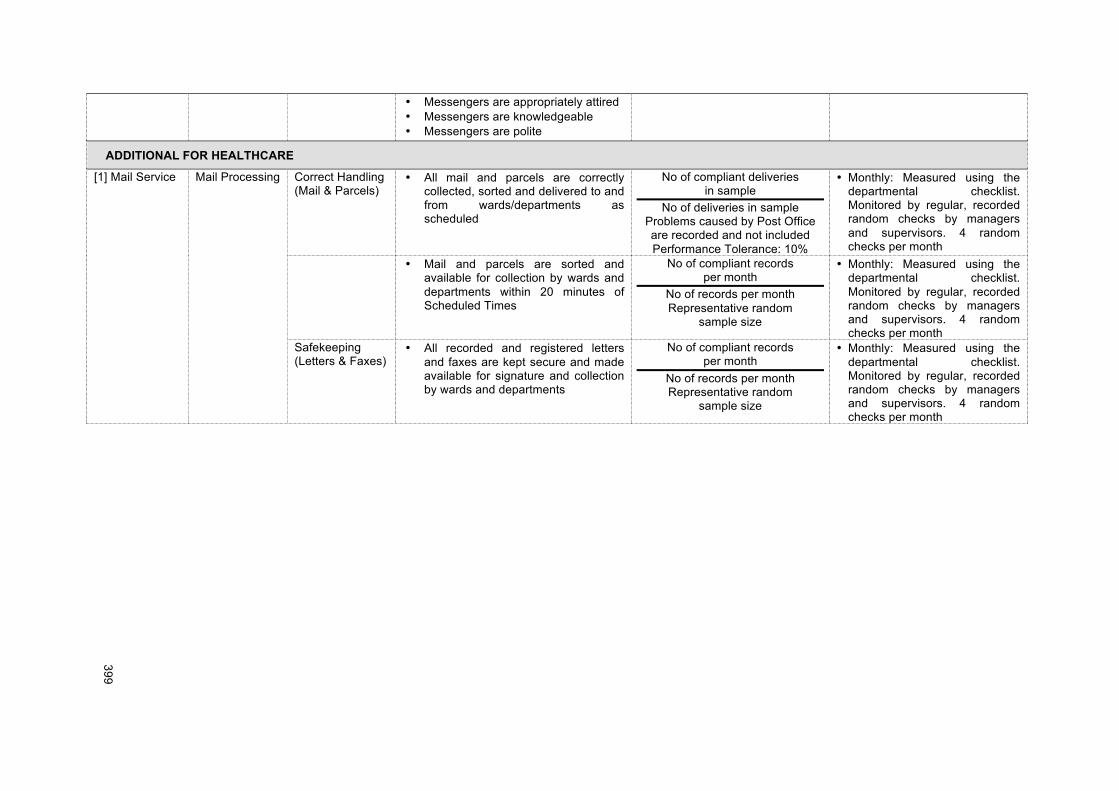
!!
399!
!
• Messengers are appropriately attired • Messengers are knowledgeable • Messengers are polite
ADDITIONAL FOR HEALTHCARE
[1] Mail Service Mail Processing Correct Handling (Mail & Parcels)
• All mail and parcels are correctly collected, sorted and delivered to and from wards/departments as scheduled
No of compliant deliveries in sample
No of deliveries in sample Problems caused by Post Office are recorded and not included Performance Tolerance: 10%
• Monthly: Measured using the departmental checklist. Monitored by regular, recorded random checks by managers and supervisors. 4 random checks per month
• Mail and parcels are sorted and available for collection by wards and departments within 20 minutes of Scheduled Times
No of compliant records per month
No of records per month Representative random
sample size
• Monthly: Measured using the departmental checklist. Monitored by regular, recorded random checks by managers and supervisors. 4 random checks per month
Safekeeping (Letters & Faxes)
• All recorded and registered letters and faxes are kept secure and made available for signature and collection by wards and departments
No of compliant records per month
No of records per month Representative random
sample size
• Monthly: Measured using the departmental checklist. Monitored by regular, recorded random checks by managers and supervisors. 4 random checks per month
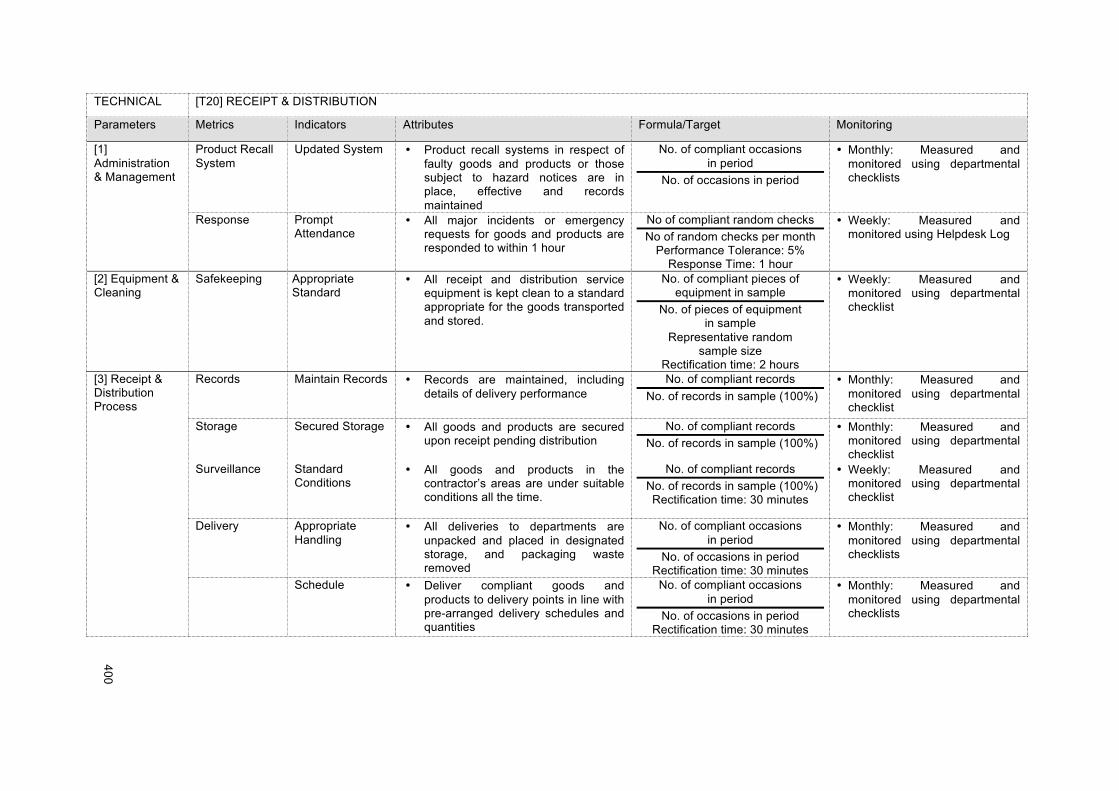
!!
400!
!
TECHNICAL [T20] RECEIPT & DISTRIBUTION
Parameters Metrics Indicators Attributes Formula/Target Monitoring
[1] Administration & Management
Product Recall System
Updated System • Product recall systems in respect of faulty goods and products or those subject to hazard notices are in place, effective and records maintained
No. of compliant occasions in period
No. of occasions in period
• Monthly: Measured and monitored using departmental checklists
Response Prompt Attendance
• All major incidents or emergency requests for goods and products are responded to within 1 hour
No of compliant random checks No of random checks per month
Performance Tolerance: 5% Response Time: 1 hour
• Weekly: Measured and monitored using Helpdesk Log
[2] Equipment & Cleaning
Safekeeping Appropriate Standard
• All receipt and distribution service equipment is kept clean to a standard appropriate for the goods transported and stored.
No. of compliant pieces of equipment in sample
No. of pieces of equipment in sample
Representative random sample size
Rectification time: 2 hours
• Weekly: Measured and monitored using departmental checklist
[3] Receipt & Distribution Process
Records
Maintain Records • Records are maintained, including details of delivery performance
No. of compliant records No. of records in sample (100%)
• Monthly: Measured and monitored using departmental checklist
Storage Secured Storage • All goods and products are secured upon receipt pending distribution
No. of compliant records No. of records in sample (100%)
• Monthly: Measured and monitored using departmental checklist
Surveillance Standard Conditions
• All goods and products in the contractor’s areas are under suitable conditions all the time.
No. of compliant records No. of records in sample (100%)
Rectification time: 30 minutes
• Weekly: Measured and monitored using departmental checklist
Delivery Appropriate Handling
• All deliveries to departments are unpacked and placed in designated storage, and packaging waste removed
No. of compliant occasions in period
No. of occasions in period Rectification time: 30 minutes
• Monthly: Measured and monitored using departmental checklists
Schedule • Deliver compliant goods and products to delivery points in line with pre-arranged delivery schedules and quantities
No. of compliant occasions in period
No. of occasions in period Rectification time: 30 minutes
• Monthly: Measured and monitored using departmental checklists
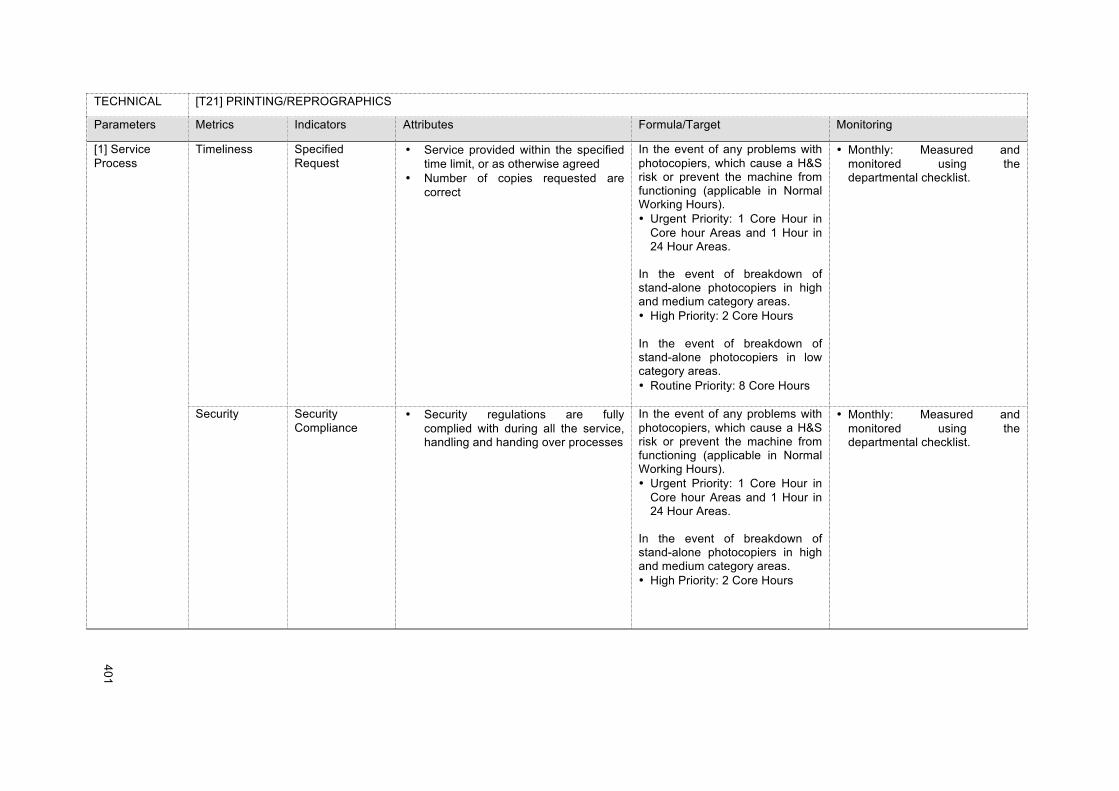
!!
401!
!
TECHNICAL [T21] PRINTING/REPROGRAPHICS
Parameters Metrics Indicators Attributes Formula/Target Monitoring
[1] Service Process
Timeliness Specified Request
• Service provided within the specified time limit, or as otherwise agreed
• Number of copies requested are correct
In the event of any problems with photocopiers, which cause a H&S risk or prevent the machine from functioning (applicable in Normal Working Hours). • Urgent Priority: 1 Core Hour in
Core hour Areas and 1 Hour in 24 Hour Areas.
In the event of breakdown of stand-alone photocopiers in high and medium category areas. • High Priority: 2 Core Hours
In the event of breakdown of stand-alone photocopiers in low category areas. • Routine Priority: 8 Core Hours
• Monthly: Measured and monitored using the departmental checklist.
Security Security Compliance
• Security regulations are fully complied with during all the service, handling and handing over processes
In the event of any problems with photocopiers, which cause a H&S risk or prevent the machine from functioning (applicable in Normal Working Hours). • Urgent Priority: 1 Core Hour in
Core hour Areas and 1 Hour in 24 Hour Areas.
In the event of breakdown of stand-alone photocopiers in high and medium category areas. • High Priority: 2 Core Hours
• Monthly: Measured and monitored using the departmental checklist.

!!
402!
!
In the event of breakdown of stand-alone photocopiers in low category areas. • Routine Priority: 8 Core Hours
[2] Copies & Documents
Quality Requirements
Finished Standard
• Documents provided with correct finishes to enable effective use of them i.e. document bound if binding was requested
• Documents provided with almost correct finishes to enable effective use of them i.e. with some additional work they can be used i.e. stapling omitted
• Format correct i.e. paper size, colour, single/double sided
• Pages assembled in correct sequence and orientation, as per the original
• Detail and difference in tone not of a poorer quality than the original
In the event of any problems with photocopiers, which cause a H&S risk or prevent the machine from functioning (applicable in Normal Working Hours). • Urgent Priority: 1 Core Hour in
Core hour Areas and 1 Hour in 24 Hour Areas.
In the event of breakdown of stand-alone photocopiers in high and medium category areas. • High Priority: 2 Core Hours In the event of breakdown of stand-alone photocopiers in low category areas. • Routine Priority: 8 Core Hours •
• Monthly: Measured and monitored using the departmental checklist.
[3] Audits Standard Requirements • Quality of copies not noticeably different from originals (test pattern to be used for this purpose)
• Copy rate complies with the contractor’s proposal
• Copies and original documents are fed through the photocopier without sheets sticking together, being damaged or becoming jammed
• Spare paper available and there is a record available indicating the time and quality of the last re-stocking, in accordance with timings and proposals set out in the technical
In the event of any problems with photocopiers which cause a H&S risk or prevent the machine from functioning (applicable in Normal Working Hours). • Urgent Priority: 1 Core Hour in
Core hour Areas and 1 Hour in 24 Hour Areas.
In the event of breakdown of stand-alone photocopiers in high and medium category areas. • High Priority: 2 Core Hours
• Monthly: Measured and monitored using the departmental checklist.
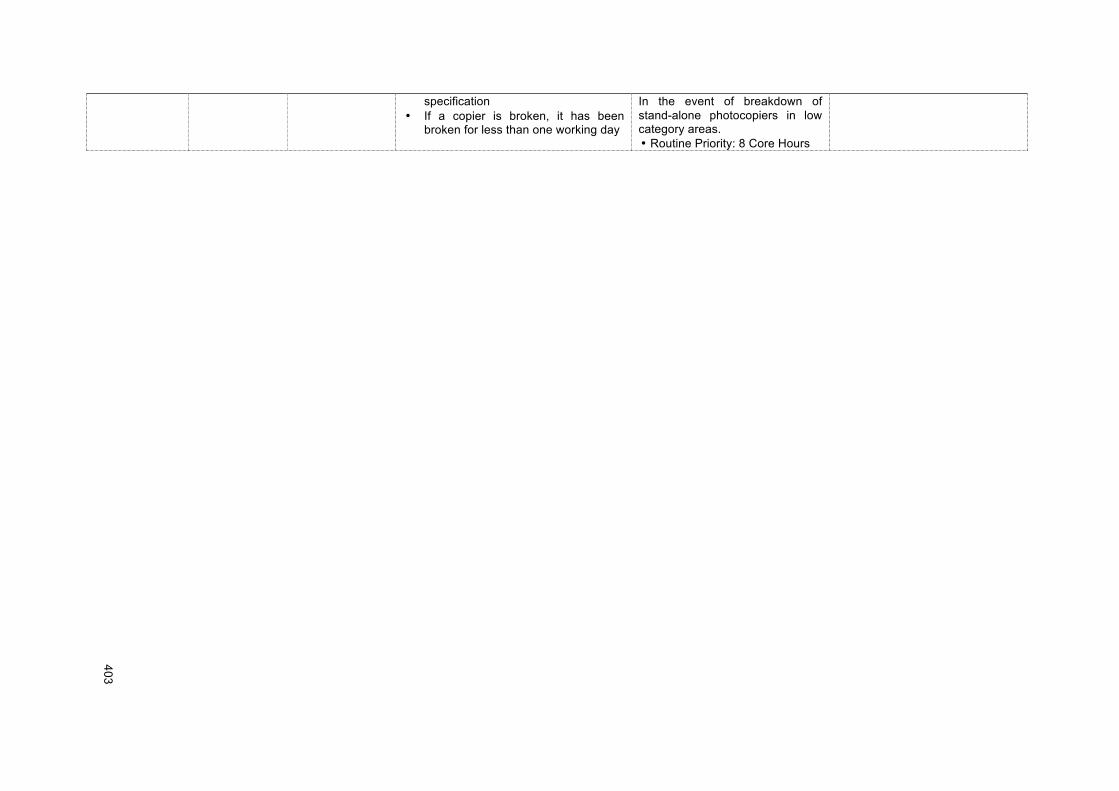
!!
403!
!
specification • If a copier is broken, it has been
broken for less than one working day
In the event of breakdown of stand-alone photocopiers in low category areas. • Routine Priority: 8 Core Hours
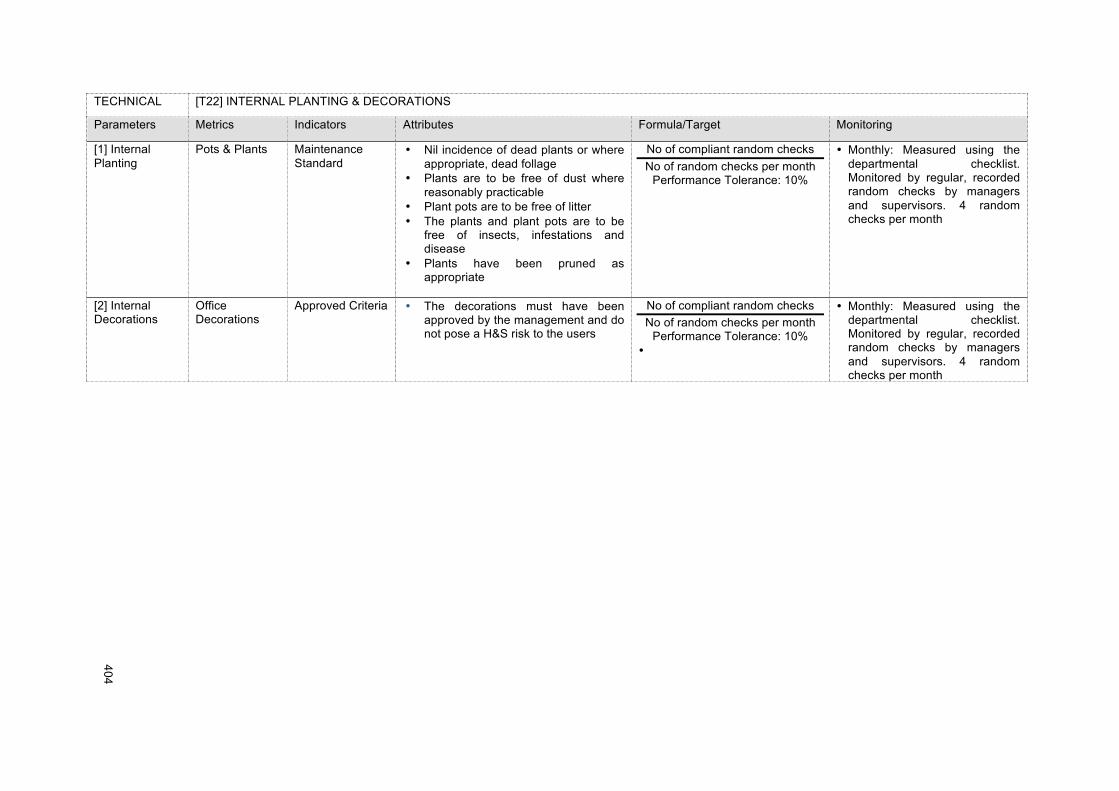
!!
404!
!
TECHNICAL [T22] INTERNAL PLANTING & DECORATIONS
Parameters Metrics Indicators Attributes Formula/Target Monitoring
[1] Internal Planting
Pots & Plants Maintenance Standard
• Nil incidence of dead plants or where appropriate, dead follage
• Plants are to be free of dust where reasonably practicable
• Plant pots are to be free of litter • The plants and plant pots are to be
free of insects, infestations and disease
• Plants have been pruned as appropriate
No of compliant random checks No of random checks per month
Performance Tolerance: 10%
• Monthly: Measured using the departmental checklist. Monitored by regular, recorded random checks by managers and supervisors. 4 random checks per month
[2] Internal Decorations
Office Decorations
Approved Criteria • The decorations must have been approved by the management and do not pose a H&S risk to the users
No of compliant random checks No of random checks per month
Performance Tolerance: 10% •
• Monthly: Measured using the departmental checklist. Monitored by regular, recorded random checks by managers and supervisors. 4 random checks per month
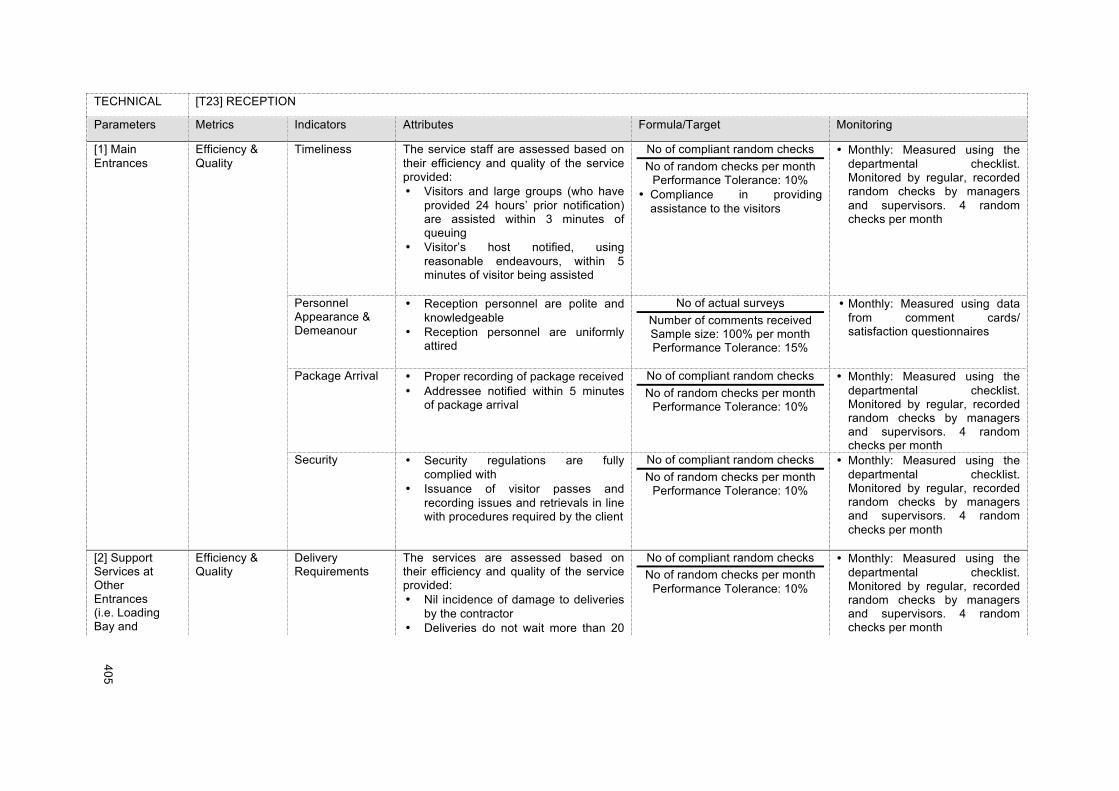
!!
405!
!
TECHNICAL [T23] RECEPTION
Parameters Metrics Indicators Attributes Formula/Target Monitoring
[1] Main Entrances
Efficiency & Quality
Timeliness The service staff are assessed based on their efficiency and quality of the service provided: • Visitors and large groups (who have
provided 24 hours’ prior notification) are assisted within 3 minutes of queuing
• Visitor’s host notified, using reasonable endeavours, within 5 minutes of visitor being assisted
No of compliant random checks No of random checks per month
Performance Tolerance: 10% • Compliance in providing
assistance to the visitors
• Monthly: Measured using the departmental checklist. Monitored by regular, recorded random checks by managers and supervisors. 4 random checks per month
Personnel Appearance & Demeanour
• Reception personnel are polite and knowledgeable
• Reception personnel are uniformly attired
No of actual surveys Number of comments received Sample size: 100% per month Performance Tolerance: 15%
• Monthly: Measured using data from comment cards/ satisfaction questionnaires
Package Arrival • Proper recording of package received • Addressee notified within 5 minutes
of package arrival
No of compliant random checks No of random checks per month
Performance Tolerance: 10%
• Monthly: Measured using the departmental checklist. Monitored by regular, recorded random checks by managers and supervisors. 4 random checks per month
Security • Security regulations are fully complied with
• Issuance of visitor passes and recording issues and retrievals in line with procedures required by the client
No of compliant random checks No of random checks per month
Performance Tolerance: 10%
• Monthly: Measured using the departmental checklist. Monitored by regular, recorded random checks by managers and supervisors. 4 random checks per month
[2] Support Services at Other Entrances (i.e. Loading Bay and
Efficiency & Quality
Delivery Requirements
The services are assessed based on their efficiency and quality of the service provided: • Nil incidence of damage to deliveries
by the contractor • Deliveries do not wait more than 20
No of compliant random checks No of random checks per month
Performance Tolerance: 10%
• Monthly: Measured using the departmental checklist. Monitored by regular, recorded random checks by managers and supervisors. 4 random checks per month
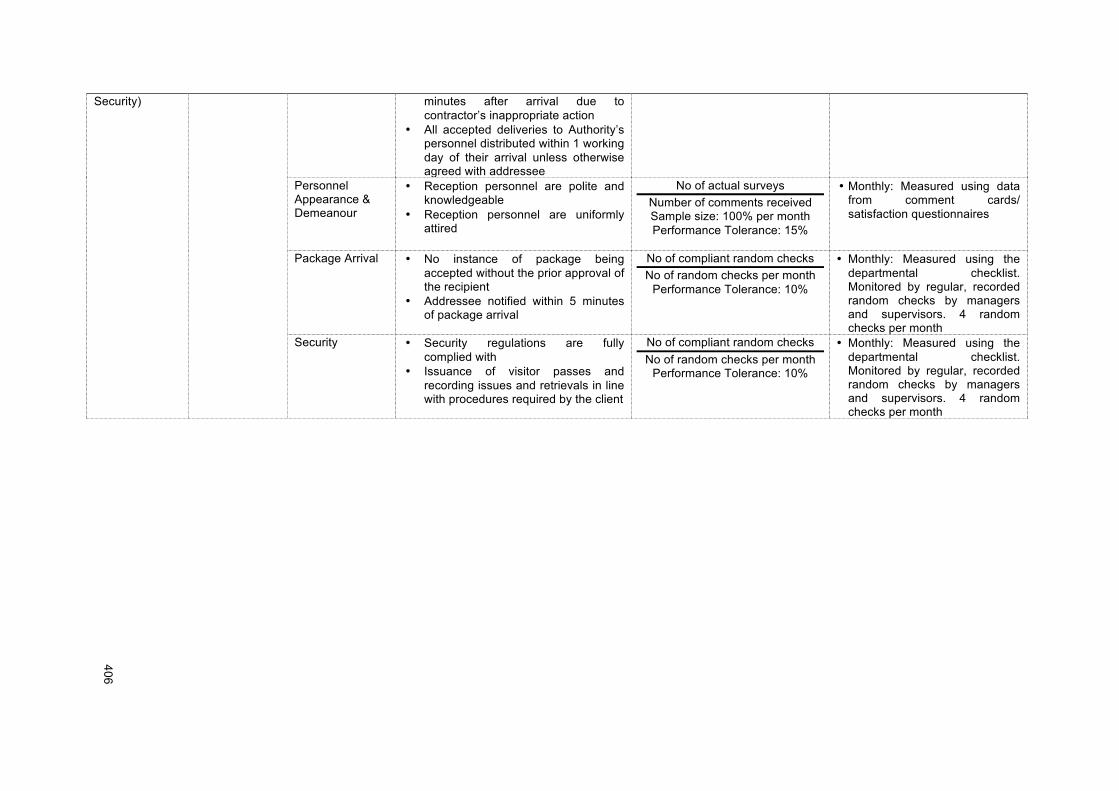
!!
406!
!
Security) minutes after arrival due to contractor’s inappropriate action
• All accepted deliveries to Authority’s personnel distributed within 1 working day of their arrival unless otherwise agreed with addressee
Personnel Appearance & Demeanour
• Reception personnel are polite and knowledgeable
• Reception personnel are uniformly attired
No of actual surveys Number of comments received Sample size: 100% per month Performance Tolerance: 15%
• Monthly: Measured using data from comment cards/ satisfaction questionnaires
Package Arrival • No instance of package being accepted without the prior approval of the recipient
• Addressee notified within 5 minutes of package arrival
No of compliant random checks No of random checks per month
Performance Tolerance: 10%
• Monthly: Measured using the departmental checklist. Monitored by regular, recorded random checks by managers and supervisors. 4 random checks per month
Security • Security regulations are fully complied with
• Issuance of visitor passes and recording issues and retrievals in line with procedures required by the client
No of compliant random checks No of random checks per month
Performance Tolerance: 10%
• Monthly: Measured using the departmental checklist. Monitored by regular, recorded random checks by managers and supervisors. 4 random checks per month

!!
407!
!
TECHNICAL [T24] OFFICE FACILITIES AND ACCOMODATION SERVICES
Parameters Metrics Indicators Attributes Formula/Target Monitoring
[1] Office Room Facilities
Internal & External Workspace Facilities
Booking Requirements
• Booking details confirmed back to event organiser
• Size, time and location of facility as booked
• IT and presentation equipment and other booked services provided as requested
• Facilities are clean and tidy
In the event of any fault that means a meeting or conference (internal or external) cannot continue. • Urgent Priority: 15 minutes,
during any time for which the facilities can be used
In the event of any fault that disrupts a conference or meeting (internal or external) or the use of business suite. • High Priority: 30 minutes, within
Normal Working Hours. Outside Working Hours fault to be rectified within 30 minutes of the start of normal working hours on the following working day.
In the event of any fault that disrupts the use of workspaces. • Routine Priority: 1 Hour within
Normal Working Hours. Outside Working Hours fault to be rectified within 1 Hour of the start of Normal Working Hours on the following working day.
• Monthly: Measured using the departmental checklist. Monitored by regular, recorded random checks by managers and supervisors. 4 random checks per month
Exhibitions & Displays
Booking Requirements
• Booking facility available • Exhibition space and services
requested are available and provided as booked
• Support services such as portering, set up, presentation planning and display production are available and
In the event of any fault which prevents the exhibition. • Urgent Priority: 30 minutes,
throughout all the time that the exhibition runs.
In the event of any fault that
• Monthly: Measured using the departmental checklist. Monitored by regular, recorded random checks by managers and supervisors. 4 random checks per month

!!
408!
!
as booked disrupts a manned exhibition. • High Priority: 2 Hours, during
Normal Working hours. Outside Working Hours fault to be rectified within 2 Hours of the start of Normal Working Hours on the following working day.
In the event of any fault that disrupts an unmanned exhibition. • High Priority: 4 Hours, during
Normal Working hours. Outside Working Hours fault to be rectified within 4 Hours of the start of Normal Working Hours on the following working day.
Security Control • Security regulations are fully
complied with • Issuance of visitor passes and
recording issues and retrievals in line with procedures required by the client
No of compliant random checks No of random checks per month
Performance Tolerance: 10%
• Monthly: Measured using the departmental checklist. Monitored by regular, recorded random checks by managers and supervisors. 4 random checks per month
[2] Overnight Accommodation
Asset Register Complete Inventories
• The inventory of soft furnishings is complete for duty cabin and resident clerk’s accommodation and inventory of crockery is complete for resident clerk’s accommodation only
No of compliant random checks No of random checks per month
Performance Tolerance: 10%
• Monthly: Measured using the departmental checklist. Monitored by regular, recorded random checks by managers and supervisors. 4 random checks per month
Service Quality Residents’ Satisfaction
• Residents are satisfied with the overall condition of the rooms and facilities provided
No of actual surveys Number of comments received Sample size 100% per month Performance Tolerance: 15%
• Monthly: Measured using data from comment cards/ satisfaction questionnaires
Incident Control • No incidence of accommodation preparation outside core working hours
• No incidence of duty staff not having
In the event of any H&S risk. • Urgent Priority: 1 Hour, 24
Hours a day, 365 days a year
• Monthly: Measured using the departmental checklist. Monitored by regular, recorded random checks by managers
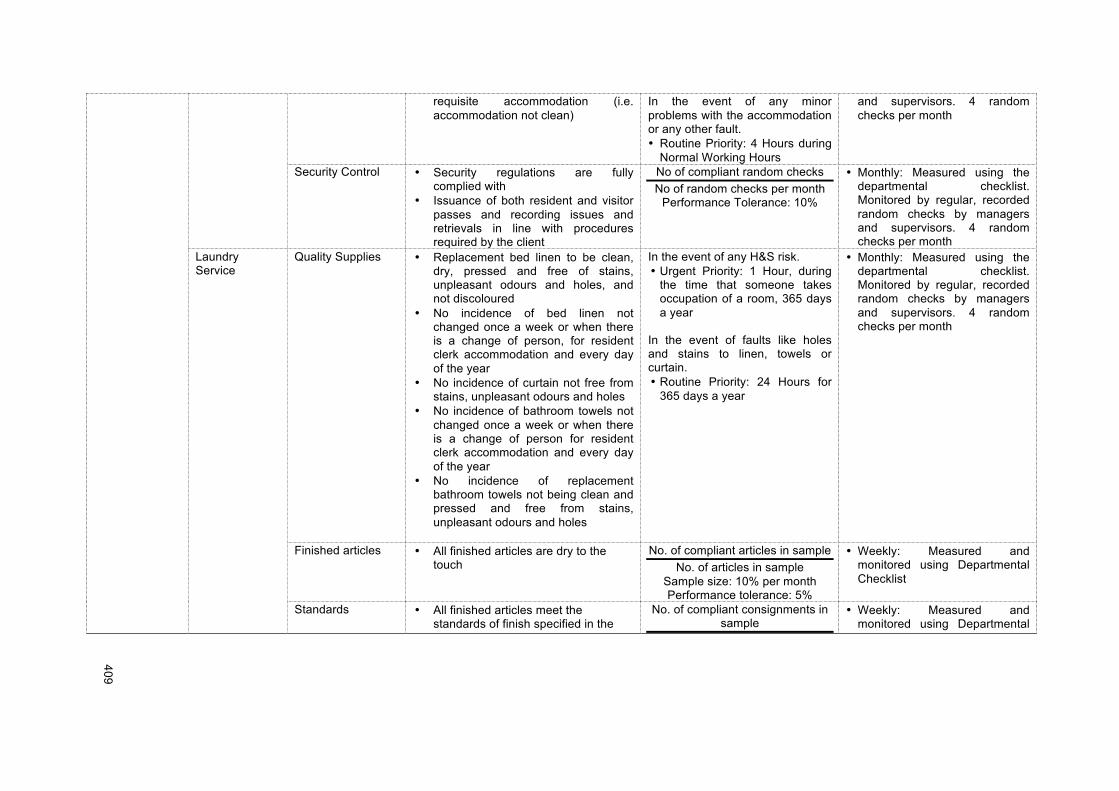
!!
409!
!
requisite accommodation (i.e. accommodation not clean)
In the event of any minor problems with the accommodation or any other fault. • Routine Priority: 4 Hours during
Normal Working Hours
and supervisors. 4 random checks per month
Security Control • Security regulations are fully complied with
• Issuance of both resident and visitor passes and recording issues and retrievals in line with procedures required by the client
No of compliant random checks No of random checks per month
Performance Tolerance: 10%
• Monthly: Measured using the departmental checklist. Monitored by regular, recorded random checks by managers and supervisors. 4 random checks per month
Laundry Service
Quality Supplies • Replacement bed linen to be clean, dry, pressed and free of stains, unpleasant odours and holes, and not discoloured
• No incidence of bed linen not changed once a week or when there is a change of person, for resident clerk accommodation and every day of the year
• No incidence of curtain not free from stains, unpleasant odours and holes
• No incidence of bathroom towels not changed once a week or when there is a change of person for resident clerk accommodation and every day of the year
• No incidence of replacement bathroom towels not being clean and pressed and free from stains, unpleasant odours and holes
In the event of any H&S risk. • Urgent Priority: 1 Hour, during
the time that someone takes occupation of a room, 365 days a year
In the event of faults like holes and stains to linen, towels or curtain. • Routine Priority: 24 Hours for
365 days a year
• Monthly: Measured using the departmental checklist. Monitored by regular, recorded random checks by managers and supervisors. 4 random checks per month
Finished articles • All finished articles are dry to the touch
No. of compliant articles in sample No. of articles in sample
Sample size: 10% per month Performance tolerance: 5%
• Weekly: Measured and monitored using Departmental Checklist
Standards • All finished articles meet the standards of finish specified in the
No. of compliant consignments in sample
• Weekly: Measured and monitored using Departmental
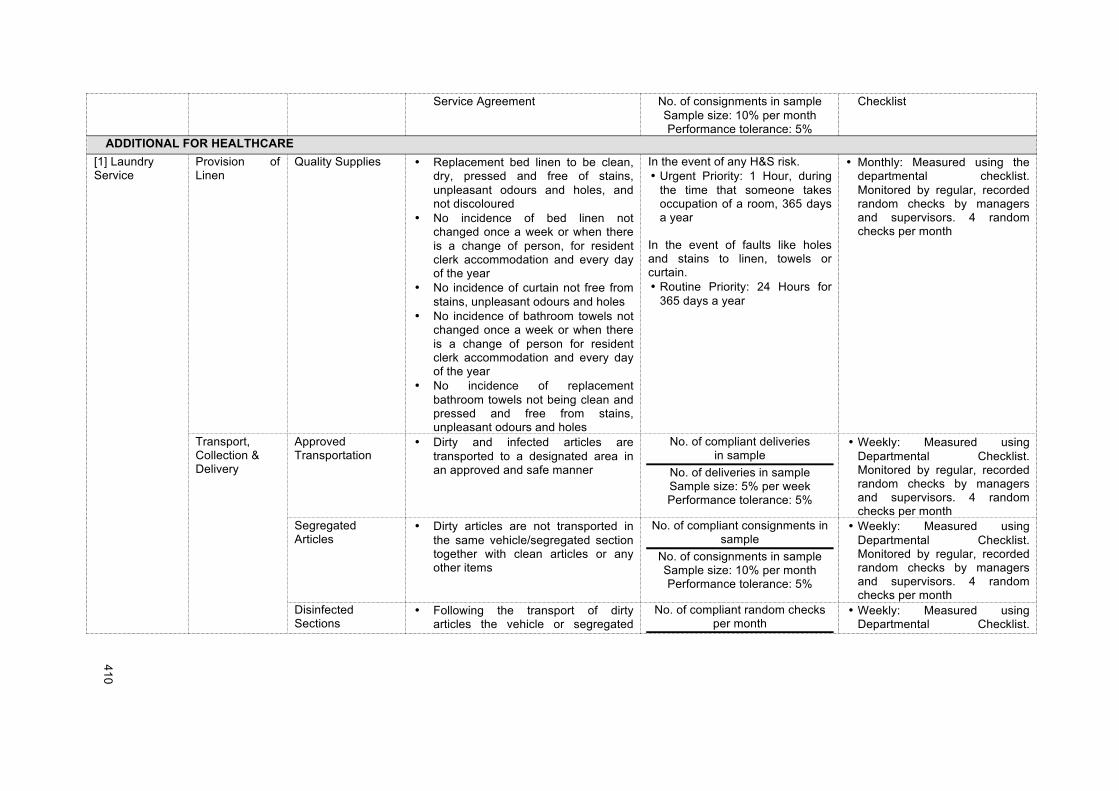
!!
410!
!
Service Agreement No. of consignments in sample Sample size: 10% per month Performance tolerance: 5%
Checklist
ADDITIONAL FOR HEALTHCARE [1] Laundry Service
Provision of Linen
Quality Supplies • Replacement bed linen to be clean, dry, pressed and free of stains, unpleasant odours and holes, and not discoloured
• No incidence of bed linen not changed once a week or when there is a change of person, for resident clerk accommodation and every day of the year
• No incidence of curtain not free from stains, unpleasant odours and holes
• No incidence of bathroom towels not changed once a week or when there is a change of person for resident clerk accommodation and every day of the year
• No incidence of replacement bathroom towels not being clean and pressed and free from stains, unpleasant odours and holes
In the event of any H&S risk. • Urgent Priority: 1 Hour, during
the time that someone takes occupation of a room, 365 days a year
In the event of faults like holes and stains to linen, towels or curtain. • Routine Priority: 24 Hours for
365 days a year
• Monthly: Measured using the departmental checklist. Monitored by regular, recorded random checks by managers and supervisors. 4 random checks per month
Transport, Collection & Delivery
Approved Transportation
• Dirty and infected articles are transported to a designated area in an approved and safe manner
No. of compliant deliveries in sample
No. of deliveries in sample Sample size: 5% per week Performance tolerance: 5%
• Weekly: Measured using Departmental Checklist. Monitored by regular, recorded random checks by managers and supervisors. 4 random checks per month
Segregated Articles
• Dirty articles are not transported in the same vehicle/segregated section together with clean articles or any other items
No. of compliant consignments in sample
No. of consignments in sample Sample size: 10% per month Performance tolerance: 5%
• Weekly: Measured using Departmental Checklist. Monitored by regular, recorded random checks by managers and supervisors. 4 random checks per month
Disinfected Sections
• Following the transport of dirty articles the vehicle or segregated
No. of compliant random checks per month
• Weekly: Measured using Departmental Checklist.
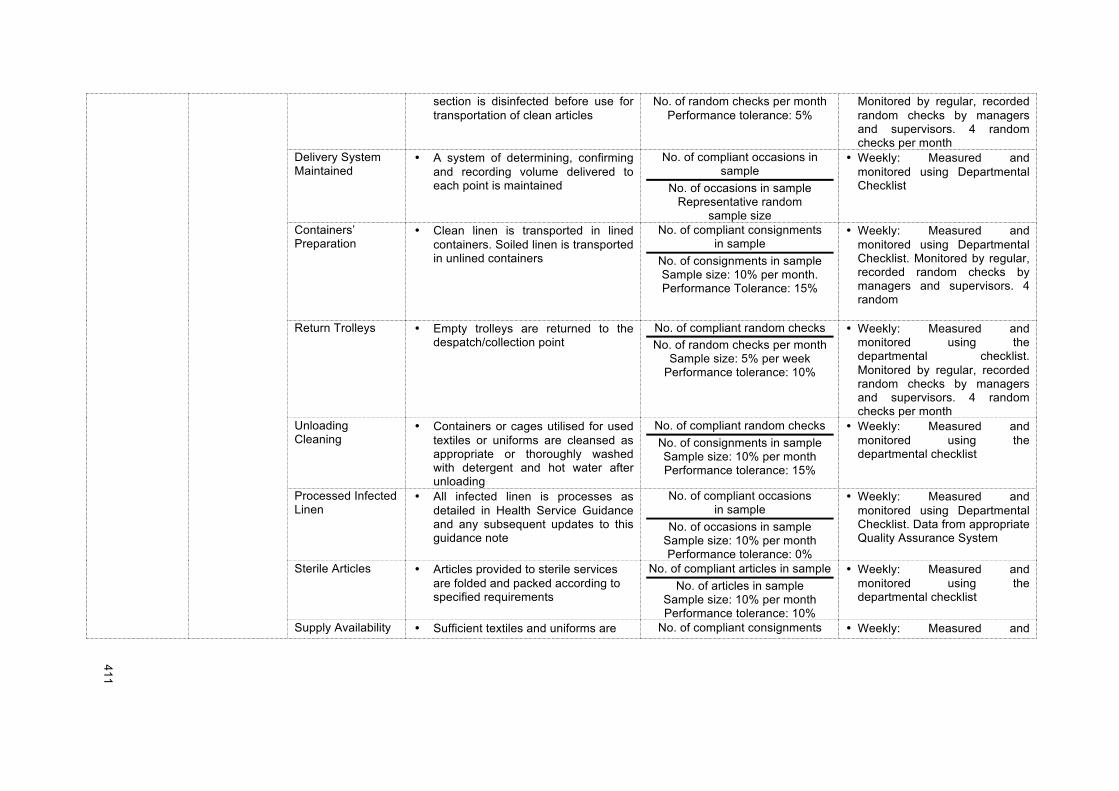
!!
411!
!
section is disinfected before use for transportation of clean articles
No. of random checks per month Performance tolerance: 5%
Monitored by regular, recorded random checks by managers and supervisors. 4 random checks per month
Delivery System Maintained
• A system of determining, confirming and recording volume delivered to each point is maintained
No. of compliant occasions in sample
No. of occasions in sample Representative random
sample size
• Weekly: Measured and monitored using Departmental Checklist
Containers’ Preparation
• Clean linen is transported in lined containers. Soiled linen is transported in unlined containers
No. of compliant consignments in sample
No. of consignments in sample Sample size: 10% per month. Performance Tolerance: 15%
• Weekly: Measured and monitored using Departmental Checklist. Monitored by regular, recorded random checks by managers and supervisors. 4 random
Return Trolleys • Empty trolleys are returned to the
despatch/collection point No. of compliant random checks No. of random checks per month
Sample size: 5% per week Performance tolerance: 10%
• Weekly: Measured and monitored using the departmental checklist. Monitored by regular, recorded random checks by managers and supervisors. 4 random checks per month
Unloading Cleaning
• Containers or cages utilised for used textiles or uniforms are cleansed as appropriate or thoroughly washed with detergent and hot water after unloading
No. of compliant random checks No. of consignments in sample Sample size: 10% per month Performance tolerance: 15%
• Weekly: Measured and monitored using the departmental checklist
Processed Infected Linen
• All infected linen is processes as detailed in Health Service Guidance and any subsequent updates to this guidance note
No. of compliant occasions in sample
No. of occasions in sample Sample size: 10% per month Performance tolerance: 0%
• Weekly: Measured and monitored using Departmental Checklist. Data from appropriate Quality Assurance System
Sterile Articles • Articles provided to sterile services are folded and packed according to specified requirements
No. of compliant articles in sample No. of articles in sample
Sample size: 10% per month Performance tolerance: 10%
• Weekly: Measured and monitored using the departmental checklist
Supply Availability • Sufficient textiles and uniforms are No. of compliant consignments • Weekly: Measured and
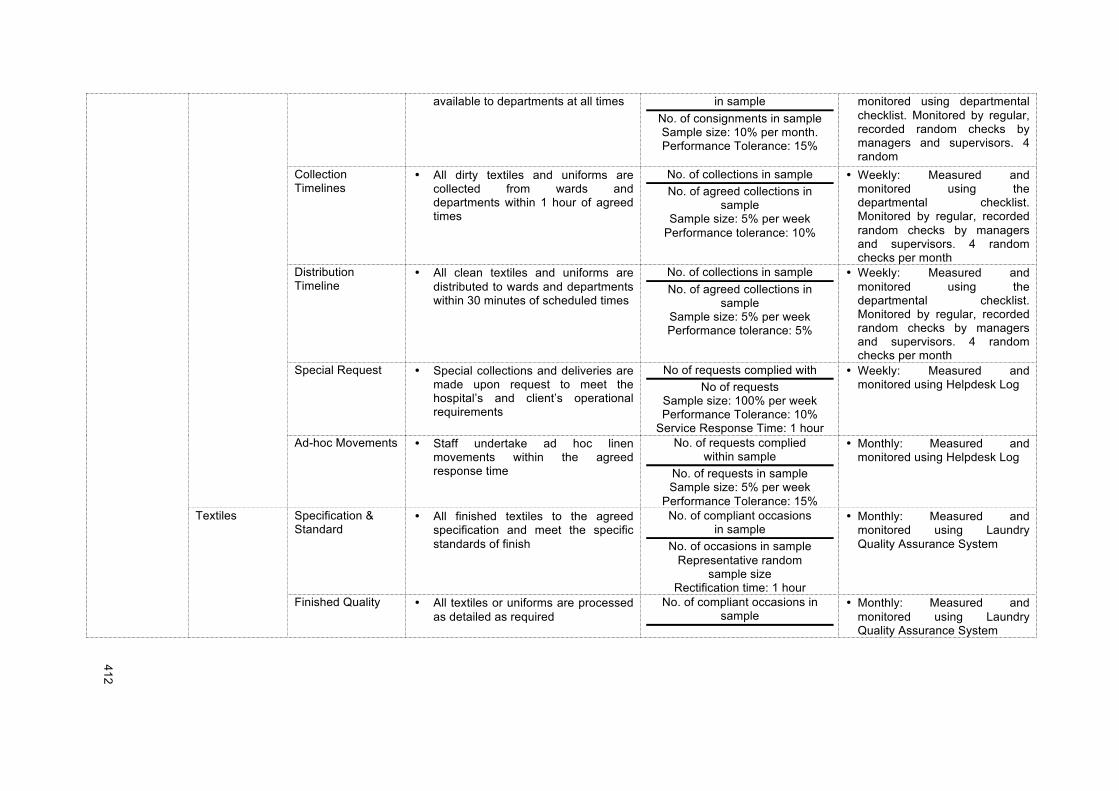
!!
412!
!
available to departments at all times in sample No. of consignments in sample Sample size: 10% per month. Performance Tolerance: 15%
monitored using departmental checklist. Monitored by regular, recorded random checks by managers and supervisors. 4 random
Collection Timelines
• All dirty textiles and uniforms are collected from wards and departments within 1 hour of agreed times
No. of collections in sample No. of agreed collections in
sample Sample size: 5% per week
Performance tolerance: 10%
• Weekly: Measured and monitored using the departmental checklist. Monitored by regular, recorded random checks by managers and supervisors. 4 random checks per month
Distribution Timeline
• All clean textiles and uniforms are distributed to wards and departments within 30 minutes of scheduled times
No. of collections in sample No. of agreed collections in
sample Sample size: 5% per week Performance tolerance: 5%
• Weekly: Measured and monitored using the departmental checklist. Monitored by regular, recorded random checks by managers and supervisors. 4 random checks per month
Special Request • Special collections and deliveries are made upon request to meet the hospital’s and client’s operational requirements
No of requests complied with No of requests
Sample size: 100% per week Performance Tolerance: 10%
Service Response Time: 1 hour
• Weekly: Measured and monitored using Helpdesk Log
Ad-hoc Movements • Staff undertake ad hoc linen movements within the agreed response time
No. of requests complied within sample
No. of requests in sample Sample size: 5% per week
Performance Tolerance: 15%
• Monthly: Measured and monitored using Helpdesk Log
Textiles Specification & Standard
• All finished textiles to the agreed specification and meet the specific standards of finish
No. of compliant occasions in sample
No. of occasions in sample Representative random
sample size Rectification time: 1 hour
• Monthly: Measured and monitored using Laundry Quality Assurance System
Finished Quality • All textiles or uniforms are processed as detailed as required
No. of compliant occasions in sample
• Monthly: Measured and monitored using Laundry Quality Assurance System
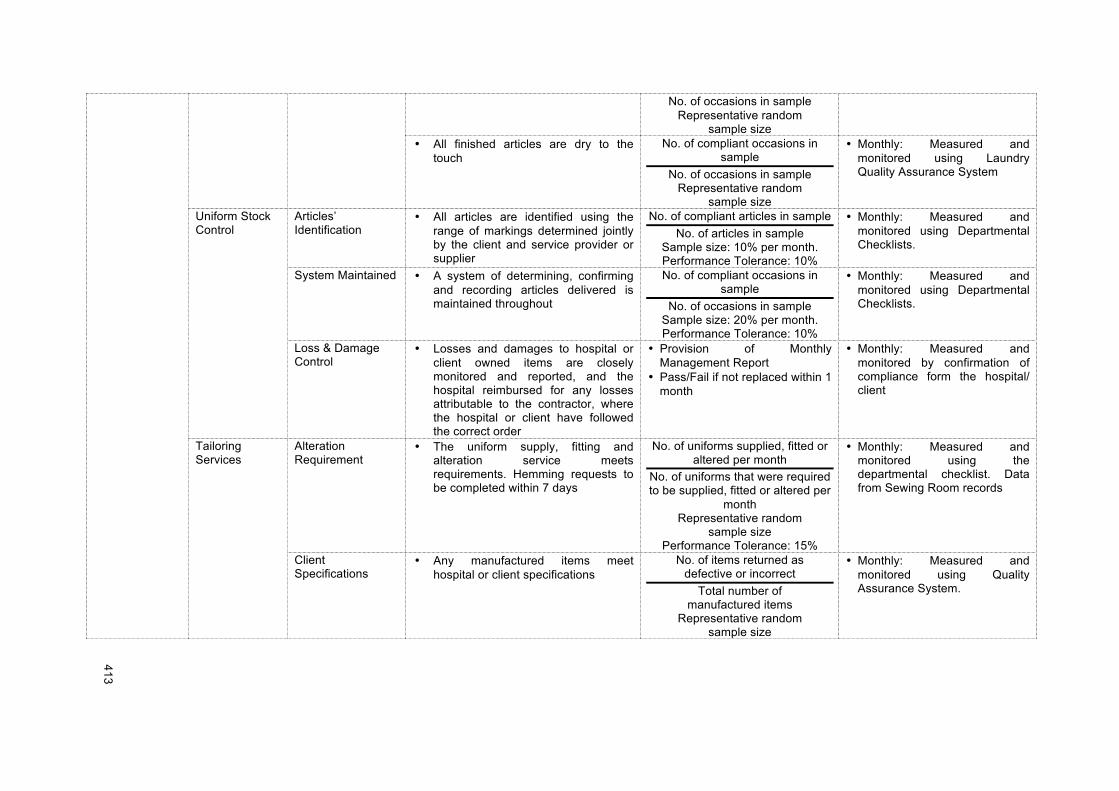
!!
413!
!
No. of occasions in sample Representative random
sample size • All finished articles are dry to the
touch No. of compliant occasions in
sample No. of occasions in sample
Representative random sample size
• Monthly: Measured and monitored using Laundry Quality Assurance System
Uniform Stock Control
Articles’ Identification
• All articles are identified using the range of markings determined jointly by the client and service provider or supplier
No. of compliant articles in sample No. of articles in sample
Sample size: 10% per month. Performance Tolerance: 10%
• Monthly: Measured and monitored using Departmental Checklists.
System Maintained • A system of determining, confirming and recording articles delivered is maintained throughout
No. of compliant occasions in sample
No. of occasions in sample Sample size: 20% per month. Performance Tolerance: 10%
• Monthly: Measured and monitored using Departmental Checklists.
Loss & Damage Control
• Losses and damages to hospital or client owned items are closely monitored and reported, and the hospital reimbursed for any losses attributable to the contractor, where the hospital or client have followed the correct order
• Provision of Monthly Management Report
• Pass/Fail if not replaced within 1 month
• Monthly: Measured and monitored by confirmation of compliance form the hospital/ client
Tailoring Services
Alteration Requirement
• The uniform supply, fitting and alteration service meets requirements. Hemming requests to be completed within 7 days
No. of uniforms supplied, fitted or altered per month
No. of uniforms that were required to be supplied, fitted or altered per
month Representative random
sample size Performance Tolerance: 15%
• Monthly: Measured and monitored using the departmental checklist. Data from Sewing Room records
Client Specifications
• Any manufactured items meet hospital or client specifications
No. of items returned as defective or incorrect
Total number of manufactured items
Representative random sample size
• Monthly: Measured and monitored using Quality Assurance System.
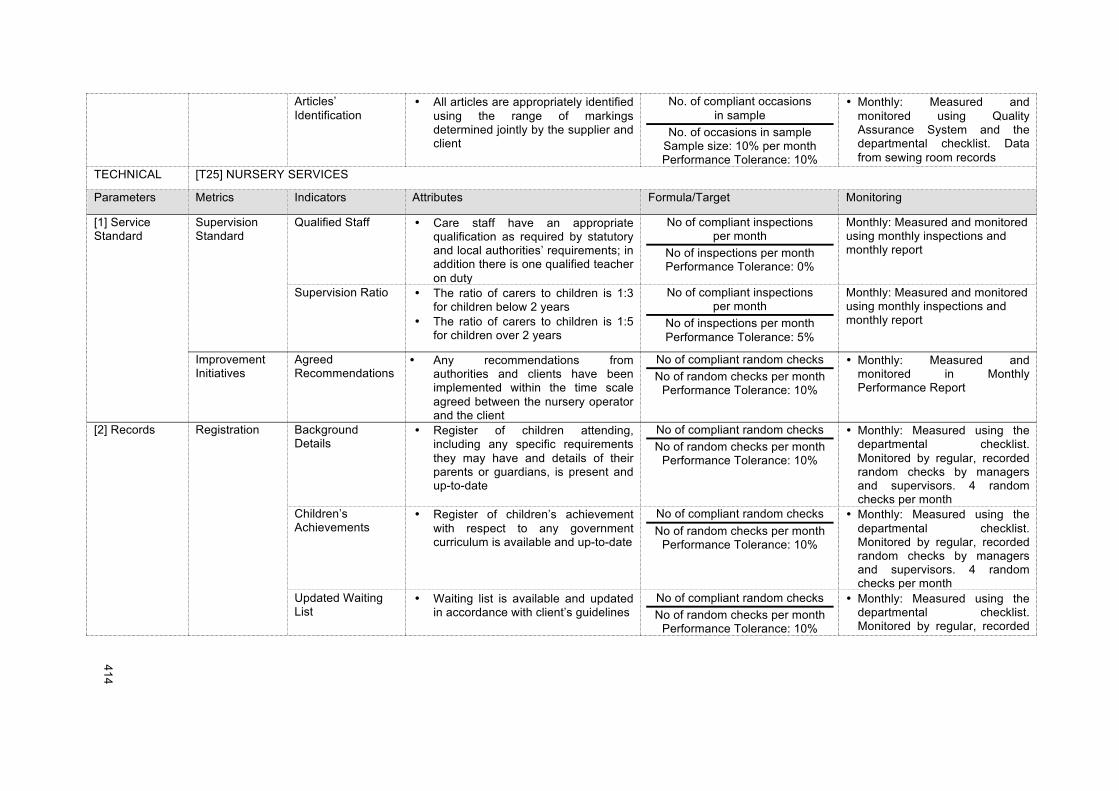
!!
414!
!
Articles’ Identification
• All articles are appropriately identified using the range of markings determined jointly by the supplier and client
No. of compliant occasions in sample
No. of occasions in sample Sample size: 10% per month Performance Tolerance: 10%
• Monthly: Measured and monitored using Quality Assurance System and the departmental checklist. Data from sewing room records
TECHNICAL [T25] NURSERY SERVICES
Parameters Metrics Indicators Attributes Formula/Target Monitoring
[1] Service Standard
Supervision Standard
Qualified Staff • Care staff have an appropriate qualification as required by statutory and local authorities’ requirements; in addition there is one qualified teacher on duty
No of compliant inspections per month
No of inspections per month Performance Tolerance: 0%
Monthly: Measured and monitored using monthly inspections and monthly report
Supervision Ratio • The ratio of carers to children is 1:3 for children below 2 years
• The ratio of carers to children is 1:5 for children over 2 years
No of compliant inspections per month
No of inspections per month Performance Tolerance: 5%
Monthly: Measured and monitored using monthly inspections and monthly report
Improvement Initiatives
Agreed Recommendations
• Any recommendations from authorities and clients have been implemented within the time scale agreed between the nursery operator and the client
No of compliant random checks No of random checks per month
Performance Tolerance: 10%
• Monthly: Measured and monitored in Monthly Performance Report
[2] Records Registration Background Details
• Register of children attending, including any specific requirements they may have and details of their parents or guardians, is present and up-to-date
No of compliant random checks No of random checks per month
Performance Tolerance: 10%
• Monthly: Measured using the departmental checklist. Monitored by regular, recorded random checks by managers and supervisors. 4 random checks per month
Children’s Achievements
• Register of children’s achievement with respect to any government curriculum is available and up-to-date
No of compliant random checks No of random checks per month
Performance Tolerance: 10%
• Monthly: Measured using the departmental checklist. Monitored by regular, recorded random checks by managers and supervisors. 4 random checks per month
Updated Waiting List
• Waiting list is available and updated in accordance with client’s guidelines
No of compliant random checks No of random checks per month
Performance Tolerance: 10%
• Monthly: Measured using the departmental checklist. Monitored by regular, recorded
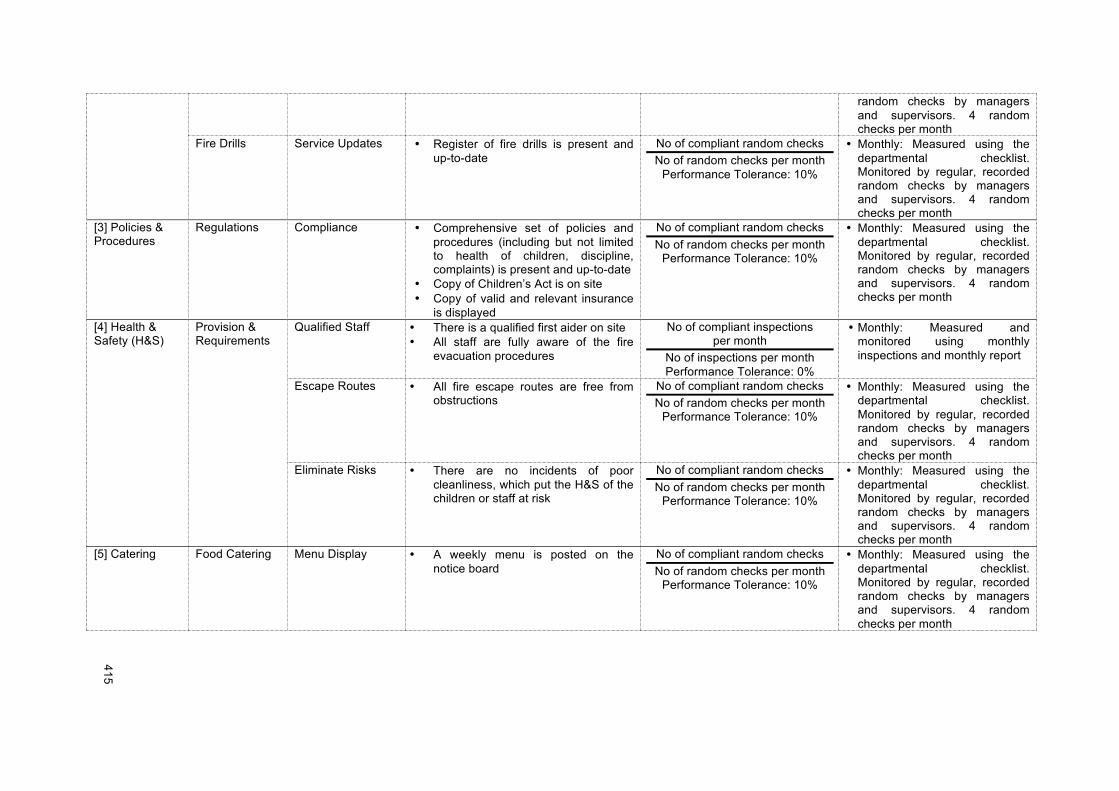
!!
415!
!
random checks by managers and supervisors. 4 random checks per month
Fire Drills Service Updates • Register of fire drills is present and up-to-date
No of compliant random checks No of random checks per month
Performance Tolerance: 10%
• Monthly: Measured using the departmental checklist. Monitored by regular, recorded random checks by managers and supervisors. 4 random checks per month
[3] Policies & Procedures
Regulations Compliance • Comprehensive set of policies and procedures (including but not limited to health of children, discipline, complaints) is present and up-to-date
• Copy of Children’s Act is on site • Copy of valid and relevant insurance
is displayed
No of compliant random checks No of random checks per month
Performance Tolerance: 10%
• Monthly: Measured using the departmental checklist. Monitored by regular, recorded random checks by managers and supervisors. 4 random checks per month
[4] Health & Safety (H&S)
Provision & Requirements
Qualified Staff • There is a qualified first aider on site • All staff are fully aware of the fire
evacuation procedures
No of compliant inspections per month
No of inspections per month Performance Tolerance: 0%
• Monthly: Measured and monitored using monthly inspections and monthly report
Escape Routes • All fire escape routes are free from obstructions
No of compliant random checks No of random checks per month
Performance Tolerance: 10%
• Monthly: Measured using the departmental checklist. Monitored by regular, recorded random checks by managers and supervisors. 4 random checks per month
Eliminate Risks • There are no incidents of poor cleanliness, which put the H&S of the children or staff at risk
No of compliant random checks No of random checks per month
Performance Tolerance: 10%
• Monthly: Measured using the departmental checklist. Monitored by regular, recorded random checks by managers and supervisors. 4 random checks per month
[5] Catering Food Catering Menu Display • A weekly menu is posted on the notice board
No of compliant random checks No of random checks per month
Performance Tolerance: 10%
• Monthly: Measured using the departmental checklist. Monitored by regular, recorded random checks by managers and supervisors. 4 random checks per month
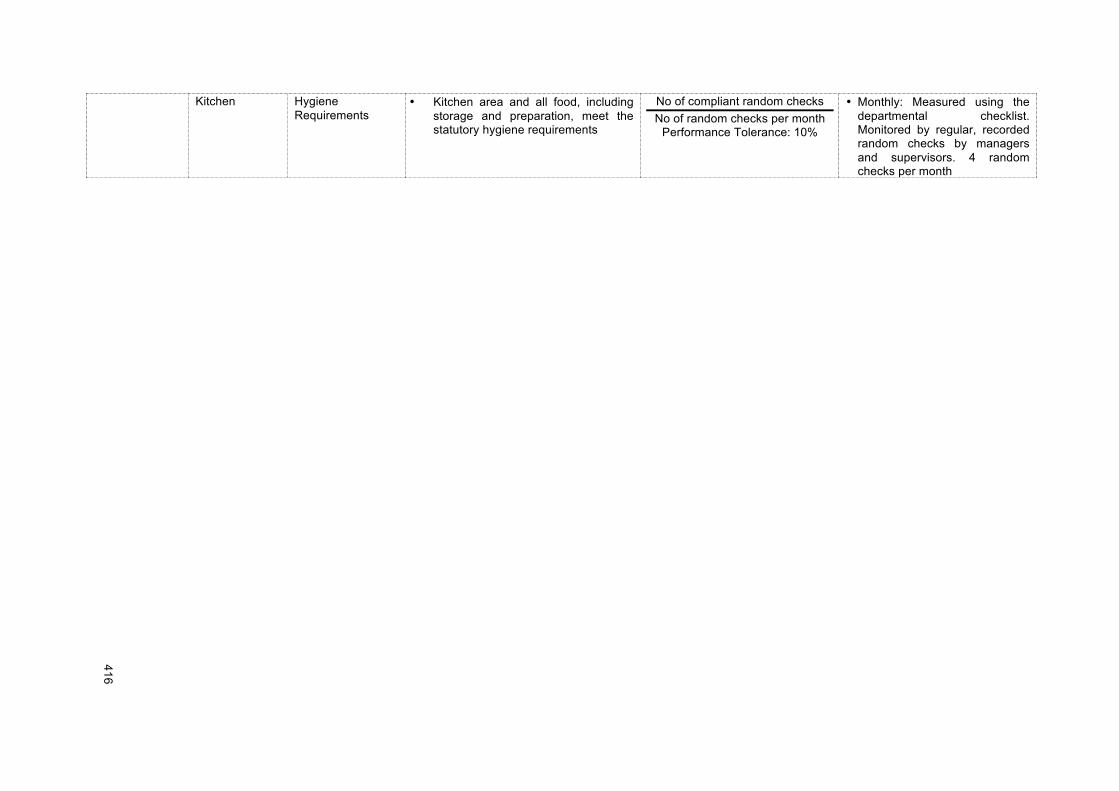
!!
416!
!
Kitchen Hygiene Requirements
• Kitchen area and all food, including storage and preparation, meet the statutory hygiene requirements
No of compliant random checks No of random checks per month
Performance Tolerance: 10%
• Monthly: Measured using the departmental checklist. Monitored by regular, recorded random checks by managers and supervisors. 4 random checks per month
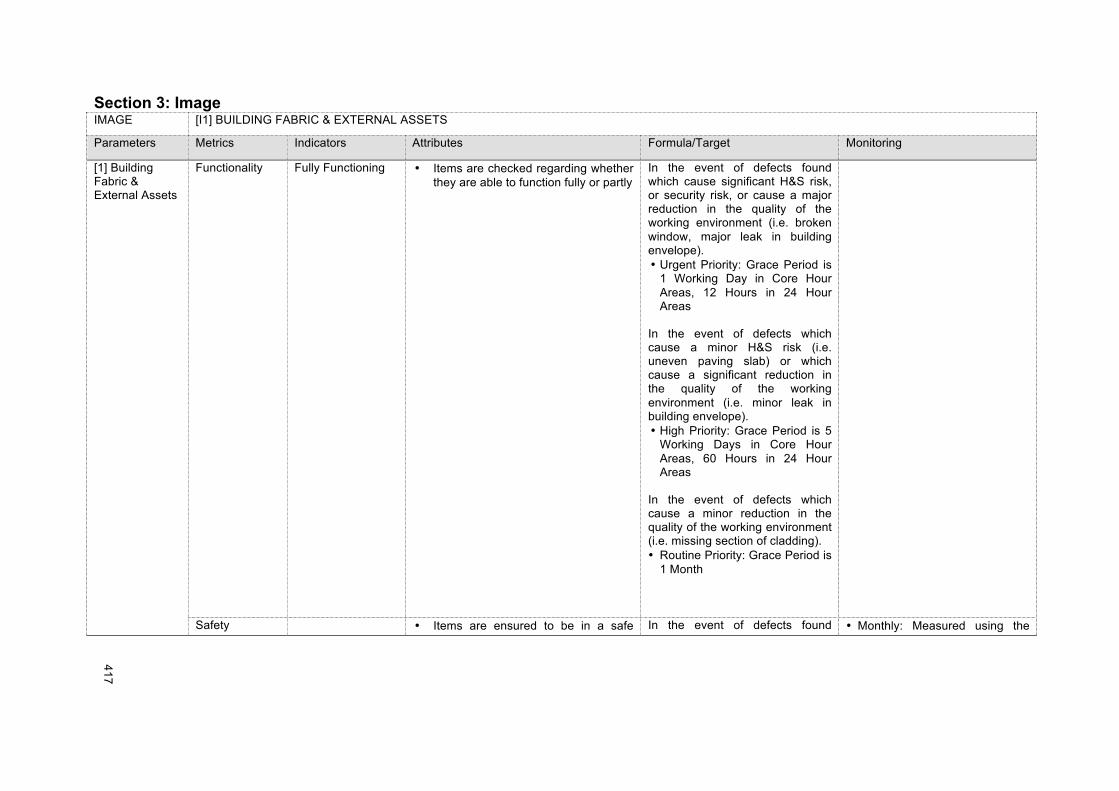
!!
417!
!
Section 3: Image IMAGE [I1] BUILDING FABRIC & EXTERNAL ASSETS
Parameters Metrics Indicators Attributes Formula/Target Monitoring
[1] Building Fabric & External Assets
Functionality
Fully Functioning • Items are checked regarding whether they are able to function fully or partly
In the event of defects found which cause significant H&S risk, or security risk, or cause a major reduction in the quality of the working environment (i.e. broken window, major leak in building envelope). • Urgent Priority: Grace Period is
1 Working Day in Core Hour Areas, 12 Hours in 24 Hour Areas
In the event of defects which cause a minor H&S risk (i.e. uneven paving slab) or which cause a significant reduction in the quality of the working environment (i.e. minor leak in building envelope). • High Priority: Grace Period is 5
Working Days in Core Hour Areas, 60 Hours in 24 Hour Areas
In the event of defects which cause a minor reduction in the quality of the working environment (i.e. missing section of cladding). • Routine Priority: Grace Period is
1 Month
Safety • Items are ensured to be in a safe In the event of defects found • Monthly: Measured using the
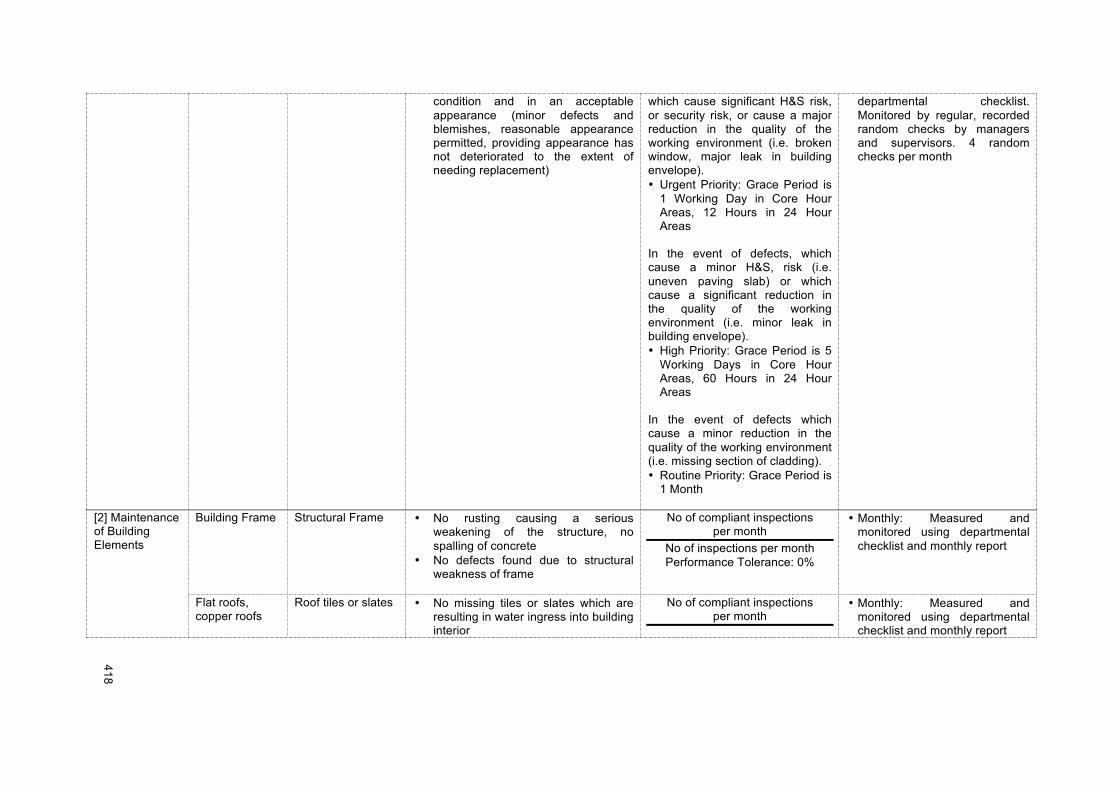
!!
418!
!
condition and in an acceptable appearance (minor defects and blemishes, reasonable appearance permitted, providing appearance has not deteriorated to the extent of needing replacement)
which cause significant H&S risk, or security risk, or cause a major reduction in the quality of the working environment (i.e. broken window, major leak in building envelope). • Urgent Priority: Grace Period is
1 Working Day in Core Hour Areas, 12 Hours in 24 Hour Areas
In the event of defects, which cause a minor H&S, risk (i.e. uneven paving slab) or which cause a significant reduction in the quality of the working environment (i.e. minor leak in building envelope). • High Priority: Grace Period is 5
Working Days in Core Hour Areas, 60 Hours in 24 Hour Areas
In the event of defects which cause a minor reduction in the quality of the working environment (i.e. missing section of cladding). • Routine Priority: Grace Period is
1 Month
departmental checklist. Monitored by regular, recorded random checks by managers and supervisors. 4 random checks per month
[2] Maintenance of Building Elements
Building Frame Structural Frame • No rusting causing a serious weakening of the structure, no spalling of concrete
• No defects found due to structural weakness of frame
No of compliant inspections per month
No of inspections per month Performance Tolerance: 0%
• Monthly: Measured and monitored using departmental checklist and monthly report
Flat roofs, copper roofs
Roof tiles or slates • No missing tiles or slates which are resulting in water ingress into building interior
No of compliant inspections per month
• Monthly: Measured and monitored using departmental checklist and monthly report
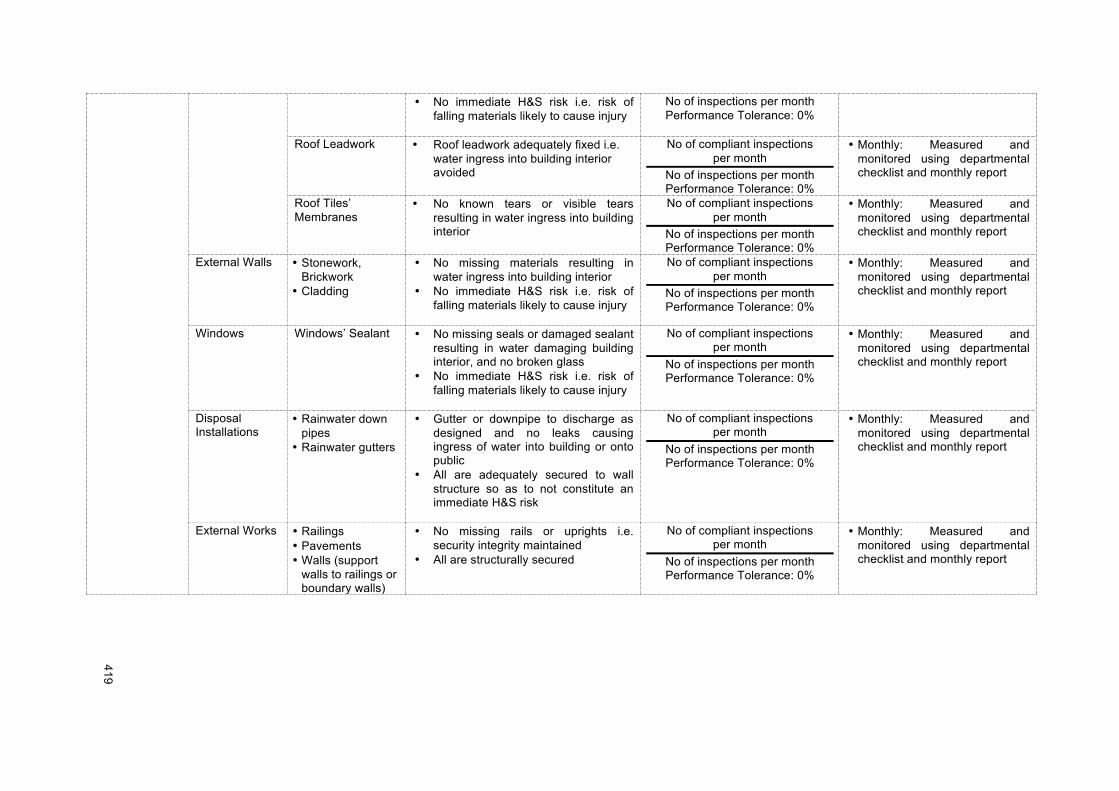
!!
419!
!
• No immediate H&S risk i.e. risk of falling materials likely to cause injury
No of inspections per month Performance Tolerance: 0%
Roof Leadwork • Roof leadwork adequately fixed i.e. water ingress into building interior avoided
No of compliant inspections per month
No of inspections per month Performance Tolerance: 0%
• Monthly: Measured and monitored using departmental checklist and monthly report
Roof Tiles’ Membranes
• No known tears or visible tears resulting in water ingress into building interior
No of compliant inspections per month
No of inspections per month Performance Tolerance: 0%
• Monthly: Measured and monitored using departmental checklist and monthly report
External Walls • Stonework, Brickwork
• Cladding
• No missing materials resulting in water ingress into building interior
• No immediate H&S risk i.e. risk of falling materials likely to cause injury
No of compliant inspections per month
No of inspections per month Performance Tolerance: 0%
• Monthly: Measured and monitored using departmental checklist and monthly report
Windows Windows’ Sealant • No missing seals or damaged sealant resulting in water damaging building interior, and no broken glass
• No immediate H&S risk i.e. risk of falling materials likely to cause injury
No of compliant inspections per month
No of inspections per month Performance Tolerance: 0%
• Monthly: Measured and monitored using departmental checklist and monthly report
Disposal Installations
• Rainwater down pipes
• Rainwater gutters
• Gutter or downpipe to discharge as designed and no leaks causing ingress of water into building or onto public
• All are adequately secured to wall structure so as to not constitute an immediate H&S risk
No of compliant inspections per month
No of inspections per month Performance Tolerance: 0%
• Monthly: Measured and monitored using departmental checklist and monthly report
External Works • Railings • Pavements • Walls (support
walls to railings or boundary walls)
• No missing rails or uprights i.e. security integrity maintained
• All are structurally secured
No of compliant inspections per month
No of inspections per month Performance Tolerance: 0%
• Monthly: Measured and monitored using departmental checklist and monthly report