Carbon Black Supported FM-NC (FM=Fe, Co, Ni) Single-Atom ...
36
Supporting Information Carbon Black Supported FM-N-C (FM=Fe, Co, Ni) Single-Atom Catalysts Synthesized by Self-Catalysis of Oxygen Coordinated Ferrous Metal Atoms Lina Wang, ‡ a Junwei Zhang, ‡ b,c Lirong Zheng, d Jiarui Yang, a Yongcheng Li, a XinWan, a Xiaofang Liu, a Xixiang Zhang, c Ronghai Yu a and Jianglan Shui *, a a School of Materials science and engineering, Beihang University, No. 37 Xueyuan Road, Beijing 100083, China. b Key Laboratory for Magnetism and Magnetic Materials of the Ministry of Education, Lanzhou University, No. 222 Tianshui Road, Lanzhou 730000, China. c Physical Science and Engineering Division (PSE), King Abdullah University of Science and Technology (KAUST), Thuwal 23955–6900, Saudi Arabia. d Beijing Synchrotron Radiation Facility, Institute of High Energy Physics, Chinese Academy of Sciences, No. 19 Yuquan Road, Beijing 100049, China. *Corresponding author E-mail address: [email protected] ‡ These authors contributed equally to the work. Electronic Supplementary Material (ESI) for Journal of Materials Chemistry A. This journal is © The Royal Society of Chemistry 2020
-
Upload
khangminh22 -
Category
Documents
-
view
0 -
download
0
Transcript of Carbon Black Supported FM-NC (FM=Fe, Co, Ni) Single-Atom ...

Supporting Information
Carbon Black Supported FM-N-C (FM=Fe, Co, Ni)
Single-Atom Catalysts Synthesized by Self-Catalysis of
Oxygen Coordinated Ferrous Metal Atoms
Lina Wang,‡ a Junwei Zhang,‡ b,c Lirong Zheng,d Jiarui Yang,a Yongcheng Li,a XinWan,a
Xiaofang Liu,a Xixiang Zhang,c Ronghai Yu a and Jianglan Shui *, a
a School of Materials science and engineering, Beihang University,
No. 37 Xueyuan Road, Beijing 100083, China.
b Key Laboratory for Magnetism and Magnetic Materials of the Ministry of Education,
Lanzhou University,
No. 222 Tianshui Road, Lanzhou 730000, China.
c Physical Science and Engineering Division (PSE), King Abdullah University of
Science and Technology (KAUST),
Thuwal 23955–6900, Saudi Arabia.
d Beijing Synchrotron Radiation Facility, Institute of High Energy Physics, Chinese
Academy of Sciences,
No. 19 Yuquan Road, Beijing 100049, China.
*Corresponding author E-mail address: [email protected]
‡ These authors contributed equally to the work.
Electronic Supplementary Material (ESI) for Journal of Materials Chemistry A.This journal is © The Royal Society of Chemistry 2020

Experimental
Chemicals
Black Pearls 2000 (BP) was purchased from Cabot Corporation. Sulfuric acid
(98%), nitric acid (70%), ethanol, potassium thiocyanate and potassium hydroxide were
obtained from Beijing Chemical Works. Perchloric acid (70%) was obtained from
Sinopharm Chemical Reagent Co., Ltd. Ferrous acetate (Fe(Ac)2) was purchased from
Aladdin Industrial Corporation. Cobalt (Ⅱ) acetate terahydrate (Co(Ac)2·4H2O) and
nickel (Ⅱ) acetate terahydrate (Ni(Ac)2·4H2O) were purchased from Guangdong
Chemical Reagent Engineering-technological Research and Development Centre.
Ultrapure water with the specific resistance of 18.23 MΩ cm was obtained by reversed
osmosis followed by ion exchange and filtration. 20 wt% Pt/C catalyst was purchased
from Johnson Matthey. Potassium bicarbonate was purchased from Shanghai Macklin
biochemical Co., Ltd. All reagents were of analytical grade and used as received
without further purification.
Catalyst preparation
500 mg Black Pearls 2000 (BP) were refluxed in a 80 ml 1:1 v/v solution of sulfuric
acid (98%) and nitric acid (70%) at 60 ℃ for 1 h and continuously stirred at 10 ℃ for
40 h to introduce surface oxygenic functional groups. The treated BP was repeatedly
washed with water during vacuum filtration and dried at 60 ℃ in vacuum.
Subsequently, 100 mg preoxidized BP was dispersed in 50 ml ethanol solution
containing 0.02 mmol bivalent metal acetate (Fe(Ac)2, Co(Ac)2·4H2O, or
Ni(Ac)2·4H2O) by sonifier cell disrupter for 10 min, and then stirred for 24 h to allow
for adequate absorption of the bivalent metal ions (Fe2+, Co2+ and Ni2+). The mixture
was collected by vacuum filtration and dried at 60 ℃ in vacuum, and followed by a
heating at 600 ℃ for 3h under NH3 flow.
Materials characterization
The morphology and microstructure of samples were investigated by field-
emission scanning electron microscopy (FESEM, JSM-7500, JEOL, Japan) and high

resolution transmission electron microscopy (HRTEM, JEM 2100F, 200 kV). X-ray
diffraction (XRD) patterns were obtained using an X-ray diffractometer (Rigaku
D/Max 2500) equipped with a Cu Kα irradiation. Atomic resolution structures of the
samples were observed using a high-angle annular dark-field scanning transmission
electron microscopy (HAADF-STEM, Titan Cubed Themis G2 300) operated at 200
kV. The X-ray photoelectron spectroscopy (XPS) analysis was performed on
ESCALAB 250Xi using monochromatic Al Kα radiation. Inductively coupled plasma
optical emission spectrometry (ICP-OES) was carried out on Optima-7000DV. N2
sorption isotherms were measured by the AS-6B system (Quantachrome Instruments)
at 77.3 K and the porosity parameters were calculated using the software QuadraWin
(version 6.0). The specific surface area was obtained using the Brunauer–Emmett–
Teller(BET)method. The pore size distribution was determined using quenched
solid density functional theory model. The external surface area is defined as
nonmicropore area, which was obtained by subtracting the micropore surface area
(calculated through t-plot method) from the Brunauer–Emmett–Teller surface area.
Fourier transform infrared spectroscopy (FTIR) was performed on a Nicolet IS10 FTIR
spectrophotometer on KBr pellets. Laser Confocal Raman Microspectroscopy were
measured by the Renishaw inVia. X-ray absorption spectroscopy (XAS) was performed
at room temperature on the 1W1B beamline at BSRF (Beijing Synchrotron Radiation
Facility). Fluorescence-mode Fe (Co and Ni) K-edge XAFS data of Fe-N/BP (Co-N/BP
and Ni-N/BP) and Fe-O/BP (Co-O/BP and Ni-O/BP) were collected, where a 100% Ar
filled Lytle ion-chamber detector with Mn (Fe and Co) X-ray filters and soller slits were
used. The absorption spectra of reference Fe2O3 (Co3O4 and NiO), FePc (CoPc and
NiPc) were collected in transmission mode. The monochromator energy was calibrated
using a Fe (Co and Ni) foil. The XAFS data were analyzed using IFEFFIT.
Electrochemical Testing
ECSA was estimated from the electrochemical double-layer capacitance of the
catalytic surface. To measure double-layer charging via CV, a potential range in which
no apparent Faradaic processes occur was determined from static CV. Here, the

potential range of 0.92-0.94 V was selected. All measured current in this non-Faradaic
potential region is assumed to be due to double-layer charging. The ECSA can be
estimated using the equation:
𝐸𝐶𝑆𝐴 =𝑖
𝑣 ∗ 𝑚 ∗ 𝐶𝑔𝑐
where i is the current, m is the electrode mass, v is the scan rate and Cgc is the double
layer capacitance (F m−2) of the glassy carbon electrode surface, for which the typical
value of 0.2 F m-2 was used.
ORR Electrochemical experiments were performed with a bipotentiostat (CHI 760E,
CH Instruments) and rotator (AFMSRCE, Pine Research Instrumentation) at 25 ℃
using a three-electrode electrochemical cell. Saturated calomel electrode (SCE) and
Hg/HgO electrode were respectively used for reference electrodes in acidic and alkaline
electrolytes, and graphite rod was used as the counter electrode. The acidic and alkaline
electrolytes were 0.5 M H2SO4 (or 0.1 M HClO4 for Pt/C) and 0.1 M KOH, respectively.
The potentials obtained in 0.5 M H2SO4, 0.1 M HClO4 and 0.1 M KOH were converted
to the reversible hydrogen electrode (RHE) scale by a shift value of 0.273 V, 0.303 V
and 0.865 V, respectively. A rotating ring-disk electrode (RRDE, 5.61 mm of disk outer
diameter, Pine Research Instrumentation) was used as the working electrode. Prior to
every measurement, the RRDE was polished with 300 nm alumina powders and then
with 50 nm alumina powders to afford a mirror finish. To prepare the catalyst ink, 1.5
mg of the catalyst or 1 mg Pt/C catalyst was mixed with 43.00 uL deionized water,
54.75 uL isopropanol, and 2.15 uL Nafion® alcohol solution (5 wt%, Aldrich), and the
resulting slurry was ultrasonicated for 15 min. The 10 μL catalyst ink was pipetted with
a micropipette onto the glassy carbon disk and dried in the air, resulting in a catalyst
loading of ca. 600 μg cm-2. A Pt/C (20 wt%) catalyst with a loading of 40 μg Pt cm-2
was used as a reference. Before ORR electrochemical tests, the electrolyte was
saturated with Ar or O2 and the gas flow was maintained during the experiments. The
resultant current was obtained by subtracting the background current measured in the
Ar-saturated electrolyte from the original linear sweep voltammetry (LSV) measured
in the O2-saturated electrolyte. LSV was conducted between 0.2 and 1.2 V vs. RHE for

ORR at 1600 rpm with a sweep rate of 10 mV s-1. The ring voltage for RRDE
measurement is set at 1.25 V vs RHE. The peroxide yields were calculated from the
ring current (Ir) and the disk current (Id) by using the equation:
𝐻2𝑂2(%) = 200 ×𝐼𝑟
𝐼𝑟 + 0.37𝐼𝑑
The electron transfer number in acid was computed by the equation:
𝑛 =4𝐼𝑑
𝐼𝑑 +𝐼𝑟
0.37
where
: ring current𝐼𝑟
: disk current𝐼𝑑
The collection efficiency was 37%.
The CO2 reduction experiments were performed in a gastight H-type glass cell with
two-compartments separated by Nafion 211 membrane (DuPont). Each compartment
contained 25 ml 0.5 M KHCO3 electrolyte with approximately 25 ml headspace. A flow
of CO2 (20 sccm, 99.99%), monitored by a mass flow controller (S500, Horiba Metron),
was purged into the cathodic compartment during the measurement to remove residual
air and ensure continuous CO2 saturation in a three-electrode system at an
electrochemical workstation. The Pt wire and Ag/AgCl electrodes (with saturated KCl
solution) served as the counter electrode and the reference electrodes, respectively. In
a typical synthesis of the working electrode, a catalyst ink was prepared by dispersing
1 mg of catalyst into 950 uL ethanol and 50 μL Nafion solution (5 wt%, Aldrich) with
10 min sonication. The catalyst ink (200 uL) was loaded and dried into the 1×1 cm2
carbon paper. For the stability test, 500 uL of the ink was loaded onto a carbon fiber
paper toward a mass loading of 0.5 mg cm-2. All potentials measured against a saturated
Ag/AgCl electrode were converted to the RHE scale in this work using E (vs. RHE) =
E (vs. Ag/AgCl) + 0.1989 V + 0.0591×pH, where pH values of electrolytes were
determined by a pH Meter (PHS-3C, Shanghai Yueping Instrument). The gas products
were sampled and detected by gas chromatograph (GC-2030, Shimadzu) after a

continuous electrolysis of 20 min under each potential. The liquid product was
characterized by 1H NMR on Bruker AVANCE III 600.
The current for gas production is calculated at a given potential as follows:
𝐼𝑝𝑟𝑜𝑑𝑢𝑐𝑡 =𝑁 × 𝐹 × 𝑉 × 𝑣𝑝𝑟𝑜𝑑𝑢𝑐𝑡 × (1 × 10 ‒ 6 𝑚3 𝑚𝑙 ‒ 1) × 𝑃
𝑅 × 𝑇 × (60 𝑠 𝑚𝑖𝑛 ‒ 1)
: partial current for certain product, A.𝐼𝑝𝑟𝑜𝑑𝑢𝑐𝑡
: the number of electron transferred for product formation, which is 2 for CO and H2.𝑁
: Faradaric constant, 96485 C mol-1.𝐹
: gas flow rate measured by a flow meter at the exit of the cell at room temperature 𝑉
and under ambient pressure, ml min-1.
: volume concentration of product in the exhaust gas from the cell (GC data), 𝑣𝑝𝑟𝑜𝑑𝑢𝑐𝑡
vol %.
: ambient pressure, 1.013×10⁵ Pa.𝑃
: molar gas constant, 8.314 J mol-1 K-1.𝑅
: room temperature, 298.15 K.𝑇
The Faradaric efficiency for gas production is calculated at a given potential as
follows:
𝐹𝐸 =𝐼𝑝𝑟𝑜𝑑𝑢𝑐𝑡
𝐼𝑡𝑜𝑡𝑎𝑙× 100 %
: Faradaric efficiency for production.𝐹𝐸
: steady-state cell current, A.𝐼𝑡𝑜𝑡𝑎𝑙
The TOF value for gas product was calculated as follows:
𝑇𝑂𝐹 =𝐼𝑝𝑟𝑜𝑑𝑢𝑐𝑡/𝑁𝐹
𝑚𝑐𝑎𝑡 × 𝑤/𝑀× 3600
: turnover frequency, h-1.𝑇𝑂𝐹
: catalyst mass in the electrode, g.𝑚𝑐𝑎𝑡
: metal loading in the catalyst.𝑤
: atomic mass of metal, g mol-1.𝑀

MEA Preparation and PEM Fuel Cell Tests
The catalyst Fe-N/BP and Nafion ionomer (weight ratio of 1/1) were mixed in
isopropanol/water (volume ratio of 1/1) to form a uniform catalyst ink by sonication
and stirring. Afterwards, the homogeneous ink was brushed onto a piece of 5 cm2
carbon paper (gas diffusion layer, GDL) and dried at 80 °C for 2 h under vacuum. The
cathode catalyst loading was 3 mg cm-2 for Fe-N/BP. Anode was Pt/C(20%) with a
catalyst loading of 0.5 mgPt cm-2. A couple of anode and cathode were hot-pressed onto
a piece of Nafion 211 membrane (DuPont®) at 130 °C for 2 min under 300 pounds cm-2
pressure to obtain the MEA. Finally, PEM fuel cell test was performed on a fuel cell
test station (Scribner 850e) with UHP grade H2 and O2. The gas and cell temperatures
were 80 °C. The flow rate of 100% humidified H2 and O2 was 300 and 400 mL min-1,
respectively.
Computational methods
The density functional theory (DFT) calculation was performed within a
generalized gradient approximation (GGA) designed by Perdew-Burke-Ernzerhof
(PBE), as implemented in the Vienna ab initio simulation package (VASP). The
projector augmented wave (PAW) method is used to describe the ionic potentials. The
cutoff energy for the plane-wave expansion was set to 400 eV. The K-point sampling
of the Brillouin zone was obtained using a 2×2×1 grid generating meshes with their
origin centered at the gamma (Γ) point. All calculations were spin polarized and the
force convergence criterion for atomic relaxation was 0.01 eV/Å in the optimization of
structure. The likely transition state (TS) structures produced by the NEB method were
further refined until the forces on the atoms were less than 0.05 eV/Å. The unit box was
built with a volume of 12 Å × 12 Å × 20 Å for all calculations. All the atoms in slab

structure including adsorbates were allowed to relax in three dimensions during the
optimization.
The adsorption energies for NH3 adsorption on the surface of the catalyst 𝐸𝑎𝑑𝑠
precursors was calculated according to the formula:
𝐸𝑎𝑏𝑠 = 𝐸𝑁𝐻3 ‒ 𝑠𝑢𝑏𝑠𝑡𝑟𝑎𝑡𝑒 ‒ (𝐸𝑁𝐻3+ 𝐸𝑠𝑢𝑏𝑠𝑡𝑟𝑎𝑡𝑒)
where , and represent the energy of free NH3 molecule, 𝐸𝑁𝐻3 𝐸𝑠𝑢𝑏𝑠𝑡𝑟𝑎𝑡𝑒
𝐸𝑁𝐻3 ‒ 𝑠𝑢𝑏𝑠𝑡𝑟𝑎𝑡𝑒
the surface of catalyst precursors and NH3 adsorbed on the surface of catalyst
precursors, respectively.
The stability of various FM-O/BP and FM-N/BP models is evaluated by
calculating their formation energies ( ) according to the formula:𝐸𝑓
𝐸𝑓 = 𝐸𝐷 ‒ (𝐸𝑃 ‒ Δ𝑛𝐶𝜇𝐶) ‒ Δ𝑛𝑂/𝑁𝜇𝑂/𝑁 ‒ Δ𝑛𝐹𝑀𝜇𝐹𝑀
where and are the energies of doped and pristine graphene sheets, 𝐸𝐷 𝐸𝑃
respectively, is the chemical potential of atomic species i (i = C, O/N, and FM), and 𝑢𝑖
is the difference of atomic species i in doped and pristine graphene. Here , , Δ𝑛𝑖 𝜇𝐶 𝜇𝑂/𝑁
and are referred to the energy of the C atom in graphene, half of the energy of an 𝜇𝐹𝑀
O2/N2 molecule, and the energy of the FM atom, respectively.

Supplementary Figures and Tables
Figure S1. Synthetic procedure of FM-N/BP SACs.
Figure S2. Raman spectra of BP and O/BP.

Figure S3. XPS spectra of O/BP. a) survey, b) C1s, and c) O1s spectra.
Figure S4. TEM images of a) Fe-O/BP, b) Co-O/BP and c) Ni-O/BP (Insets: high-resolution images).

Figure S5. TEM images of a) Fe-O/BP, b) Co-O/BP and c) Ni-O/BP thermally heated at 300 ℃ under NH3 atmosphere (Insets: high-resolution images).
Figure S6. FTIR spectra of the Fe-O/BP (blue line), the heat-treated samples at 300 ℃ in NH3 (red line) and the final catalyst Fe-N/BP (green line).

Figure S7. SEM images of BP and Fe-N/BP.
Figure S8. TEM images of a) Co-N/BP and b) Ni-N/BP (Insets: HR-TEM images).
Figure S9. XRD patterns of Fe-N/BP, Co-N/BP, Ni-N/BP and BP.

Figure S10. STEM images and corresponding elemental mappings of a) Co-N/BP and b) Ni-N/BP.
Figure S11. a) TEM and b) HR-TEM images of Fe-N/BP heated at 700 ℃, showing metal nanoparticles.

Figure S12. XPS surveys of Fe-N/BP (green line), Co-N/BP (blue line), Ni-N/BP (red line) and N/BP (black line).
Figure S13. XPS C 1s spectra of a) N-BP, b) Fe-N/BP, c) Co-N/BP and d) Ni-N/BP.

Figure S14. XPS spectra of a) Fe 2p of Fe-N/BP, b) Co 2p of Co-N/BP and c) Ni 2p of Ni-N/BP.
Figure S15. XPS N 1s spectra of a) N/BP, b) Fe-N/BP, c) Co-N/BP and d) Ni-N/BP.

Figure S16. a) Relative content of various N species in the catalysts of N/BP, Fe-N/BP, Co-N/BP and Ni-N/BP. b)The metal-nitrogen percentage (ωM-N%), metal percentage (ωM%) and their ratios (ωM-N%/ωM%) of Fe-N/BP, Co-N/BP and Ni-N/BP.
Figure S17. (a1-c1) Normalized XANES spectra at FM (Fe, Co, Ni) K-edge and (a2-c2) FT-EXAFS spectra of indicated samples and the R-space fitting for Fe-O/BP, Co-O/BP and Ni-O/BP. The fitting results in (a2-c2) show the FM atom is possibly coordinated by four oxygen atoms.

Figure S18. Wavelet transforms for the Co k3-weighted EXAFS signals of (a) Co foil, (b) Co-O/BP, (c) Co-N/BP and Ni k3-weighted EXAFS signals of (d) Ni foil, (e) Ni-O/BP, (f) Ni-N/BP with optimum resolutions at 2.0 Å.

Figure S19. Geometric structures of a) O/BP, b) Fe/BP and c) Fe-O/BP with adsorption of NH3. The gray, pink, brown, blue and white represent C, O, Fe, N and H atoms, respectively.
Figure S20. Geometric structures of (a) Co-O/BP and (b) Ni-O/BP with adsorption of NH3. Density of states of (c) Co-O/BP and (d) Ni-O/BP with adsorption of NH3. The gray, pink, magenta, green, blue and white represent C, O, Co, Ni, N and H atoms, respectively.

Figure S21. The configurations, formation energies, FM-O/FM-N bond lengths of (a) Fe-O/BP, (b) Co-O/BP, (c) Ni-O/BP, (d) Fe-N/BP, (e) Co-N/BP and (f) Ni-N/BP. The gray, pink, blue, brown, magenta and green represent C, O, N, Fe, Co and Ni atoms, respectively.
Figure S22. The ECSA estimation. (a) Cyclic voltammetry data of Fe-N/BP, Co-N/BP and Ni-N/BP at various scan rates. (b) Plots of current densities (taken at 0.930 V vs. RHE) as a function of scan rates. All the CV curves were obtained in nitrogen-saturated 0.5 M H2SO4.

Figure S23. LSV curves of Fe-N/BP catalysts in O2-saturated 0.1 M KOH. The catalysts was treated at the indicated heat-treatment temperatures.
Figure S24. The electron transfer numbers and H2O2 yields of Fe-N/BP, Co-N/BP and Pt/C in 0.1 M KOH electrolytes.
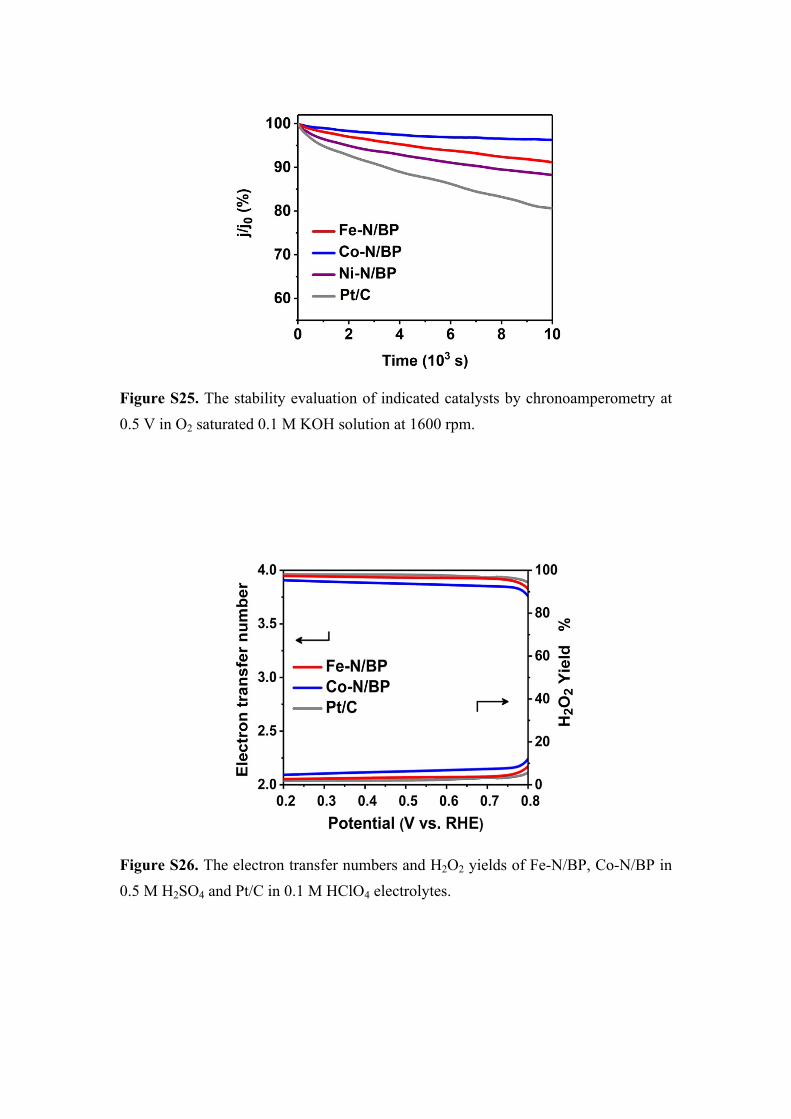
Figure S25. The stability evaluation of indicated catalysts by chronoamperometry at 0.5 V in O2 saturated 0.1 M KOH solution at 1600 rpm.
Figure S26. The electron transfer numbers and H2O2 yields of Fe-N/BP, Co-N/BP in 0.5 M H2SO4 and Pt/C in 0.1 M HClO4 electrolytes.

Figure S27. LSV curves of a) Fe-N/BP, b) Co-N/BP, c) Ni-N/BP before and after addition of 0.05 M KSCN in 0.5 M H2SO4.
Figure S28. The stability evaluation of indicated catalysts by chronoamperometry at
0.5 V for 10,000 s. Test conditions: O2-saturated 0.5 M H2SO4 (0.1 M HClO4 for Pt/C),
1600 rpm.

Figure S29. The methanol tolerance evaluation by chronoamperometry at 0.5 V in O2 saturated 0.5 M H2SO4 (0.1 M HClO4 for Pt/C) at 1600 rpm (injecting 1M methanol at 400 s).
Figure S30. HAADF-STEM images of (a) Fe-N/BP, (b) Co-N/BP and (c) Ni-N/BP
after the durability tests, showing the well maintained atomically dispersed FM atoms
on BP2000 support as highlighted by color circles.

Figure S31. LSV curves of N/BP, Fe(N)/BP and Fe-N/BP in 0.5 M H2SO4.
Figure S32. H2, CO and total steady-state current densities of Fe-N/BP in CO2-saturated 0.5 M KHCO3. The catalyst mass loading is 0.2 mg cm-2.

Figure S33. Representative NMR spectra of the electrolyte after CO2 reduction electrolysis 3h at -0.9 V versus RHE for the Ni-N/BP and Fe-N/BP.
Figure S34. (a) Faradaic efficiencies of H2 and CO and (b) TOF of Fe-N/BP in an H-cell test. The catalyst mass loading is 0.2 mg cm-2.

Figure S35. Chrono-Amperometry results for Fe-N/BP and Ni-N/BP at the potentials of -0.47 V vs. RHE and -0.73 vs. RHE, respectively. The catalyst mass loading is 0.5 mg cm-2.

Table S1. Specific surface areas and pore size distributions of as-prepared materials.
Catalysts Specific surface
area / m2 g-1
Micropore
area / m2 g-1
Micropore
volume / cm3 g-1
External surface
area / m2 g-1
BP 1215 876 0.39 330Fe-N/BP 938 605 0.28 278

Table S2. Single-atom metal loadings of the FM-N/BP and some previously reported
carbon supported SACs synthesized by the high temperature pyrolysis.
SampleMetal
loading
Measurement
methodT (℃) Reference
Ni-NCB 0.27 wt% ICP 800 1
Pt1-N/BP 0.4 wt% ICP 750 2
ZnNx/BP 0.3 wt% ICP 900 3
Fe/NG-750 ~0.6 wt% ICP 750 4
Pt1.1/BPdefect 1.1 wt% ICP 900 5
Co-N/CNT ~ 0.1 at% XPS 900 6
Ni-SAC@graphene
oxide0.44 at% XPS 900 7
Fe-SACs 1.85 wt% ICP 600 8
Fe-N/BP1.6 wt% /
0.41 at%ICP/XPS 600
Co-N/BP2.1 wt% /
0.6 at%ICP/XPS 600
Ni-N/BP2.0 wt% /
0.55 at%ICP/XPS 600
This work

Table S3. Surface elemental compositions of O/BP, N/BP and FM-N/BP determined
by XPS.
Sample C atom% O atom% N atom% M atom%
O/BP 83.57 16.43 - -
N/BP 91.27 2.54 6.19 -
Fe-N/BP 86.11 2.30 11.04 0.41
Co-N/BP 85.20 2.67 11.52 0.60
Ni-N/BP 86.37 2.29 10.79 0.55
Table S4. The contents of N in different chemical states for N/BP and FM-N/BP
catalysts obtained from N 1s XPS results.
Sample Pyridinic N
%
M-coordinated
N %
Pyrrolic N
%
Graphitic
N %
Oxidized
N %
N/BP 39.52 - 20.26 17.71 22.51
Fe-N/BP 32.73 18.92 14.74 16.15 17.46
Co-N/BP 23.14 19.41 15.93 19.79 21.73
Ni-N/BP 29.07 23.79 20.06 17.01 10.05

Table S5. Fitting results of EXAFS for FM-O/BP by the IFEFFIT code.
Sample path N R (Å) σ2(*10-3 Å2) ΔE0 (eV) R factor (%)
Fe-O/BP Fe-O 3.8 2.00 1.09 0.76 0.11
Co-O/BP Co-O 3.8 1.93 0.59 4.43 0.06
Ni-O/BP Ni-O 4.2 1.98 0.58 2.66 0.06
N : coordination numbers; R : bond distance; σ2 : Debye-Waller factors; ΔE0: the inner
potential correction; R factor: goodness of fit. Error bounds (accuracies) that
characterize the structural parameters obtained by EXAFS spectroscopy were estimated
as N ± 20%; R ± 1%; σ2 ± 20%; ΔE0 ± 20%. Ѕ02 = 0.98 was fixed to all the samples.

Table S6. Fitting results of EXAFS for FM-N/BP by the IFEFFIT code.
Sample path N R (Å) σ2(*10-3 Å2) ΔE0
(eV)
R factor
(%)
Fe-N/BP Fe-N 4.1 2.03 2.80 1.12 0.60
Co-N/BP Co-N 4.0 1.86 7.99 -7.52 0.18
Ni-N/BP Ni-N 3.9 1.75 6.67 -8.98 0.14
N : coordination numbers; R: bond distance; σ2 : Debye-Waller factors; ΔE0: the inner
potential correction; R factor: goodness of fit. Error bounds (accuracies) that
characterize the structural parameters obtained by EXAFS spectroscopy were estimated
as N ± 20%; R ± 1%; σ2 ± 20%; ΔE0 ± 20%. Ѕ02 was fixed to 0.98 as determined from
Fe foil (Co foil or Ni foil) fitting.

Table S7. Comparison of ORR activities of various Fe-N-C catalysts in the alkaline
medium.
Sample Electrolytes E1/2 (V) Reference
Fe-N-SCCFs 0.1 M KOH 0.883 9
3D MPC 0.1 M KOH 0.88 10
FePx/Fe–N–C/NPC 0.1 M KOH 0.86 11
FeN2/NOMC-3 0.1 M KOH 0.863 12
CAN-Pc(Fe) 0.1 M KOH 0.74 13
Fe-NPC 0.1 M KOH 0.885 14
Fe-N-C HNSs 0.1 M KOH 0.87 15
FeSA-N-C 0.1 M KOH 0.891 16
Fe-N-C-900 0.1 M KOH 0.89 17
Fe-N/BP 0.1 M KOH 0.90 This work

Table S8. Comparison of ORR activities of various Fe-N-C catalysts in acid media.
Sample Electrolytes E1/2 (V) Reference
Fe-N/CNT-2 0.1 M HClO4 0.77 18
Fe1-N-C 0.5 M H2SO4 0.715
Fe2-N-C 0.5 M H2SO4 0.78
Fe3-N-C 0.5 M H2SO4 0.762
19
Fe-N-C-950 0.1 M HClO4 0.78 20
FeSA-N-C 0.1 M HClO4 0.776 16
Fe-NC SAC 0.1 M HClO4 0.68 21
Fe-N-DSC 0.5 M H2SO4 0.65 22
C-AFC©ZIF-8 0.1 M HClO4 0.75 23
(CM+PANI)-Fe-C 0.5 M H2SO4 0.80 24
p-Fe–NCNF 0.1 M HClO4 0.74 25
Fe-N/BP 0.5 M H2SO4 0.78 This work

Table S9. Performance comparison for electrocatalytic CO2 reduction to CO in KHCO3
for Ni-N-C catalysts.
SampleElectrolytes
(KHCO3)
Onset potential
(V vs. RHE)
Highest
faradaic
efficiency (%)
Reference
Ni-NC
SACs0.5 M ~ -0.2 89 21
Ni-N-C 0.1 M ~ -0.42 85 26
Ni-N-C 0.1 M ~ -0.6 90 7
Ni-NCB 0.5 M -0.41 ~99 1
Ni SAs/N-C 0.5 M ~ -0.5 72 27
Ni-N/BP 0.5 M -0.42 88 This work
Reference
1. T. Zheng; K. Jiang; N. Ta; Y. Hu; J. Zeng; J. Liu; H. Wang, Joule 2019, 3, 265-
278.
2. J. Liu; M. Jiao; L. Lu; H. M. Barkholtz; Y. Li; Y. Wang; L. Jiang; Z. Wu; D. J. Liu;
L. Zhuang; C. Ma; J. Zeng; B. Zhang; D. Su; P. Song; W. Xing; W. Xu; Y. Wang; Z.
Jiang; G. Sun, Nat. Commun. 2017, 8, 15938.
3. P. Song; M. Luo; X. Liu; W. Xing; W. Xu; Z. Jiang; L. Gu, Adv. Funct. Mater.
2017, 27, 1700802.
4. C. Zhang; S. Yang; J. Wu; M. Liu; S. Yazdi; M. Ren; J. Sha; J. Zhong; K. Nie;
A.-S. Jalilov; Z. Li; H. Li; B.-I. Yakobson; Q. Wu; E. Ringe; H. Xu; P.-M. Ajayan; J.-
M. Tour, Adv. Energy Mater. 2018, 8, 1703487.
5. J. Liu; M. Jiao; B. Mei; Y. Tong; Y. Li; M. Ruan; P. Song; G. Sun; L. Jiang; Y.
Wang; Z. Jiang; L. Gu; Z. Zhou; W. Xu, Angew. Chem. Int. Ed. 2019, 58, 1163-1167.
6. Y. Liu; F. Chen; W. Ye; M. Zeng; N. Han; F. Zhao; X. Wang; Y. Li, Adv. Funct.
Mater. 2017, 27, 1606034.

7. T. Möller; W. Ju; A. Bagger; X. Wang; F. Luo; T. Ngo Thanh; A. S. Varela; J.
Rossmeisl; P. Strasser, Energ. Environ. Sci. 2019, 12, 640-647.
8. H. Yang; L. Shang; Q. Zhang; R. Shi; G. I. N. Waterhouse; L. Gu; T. Zhang, Nat.
Commun. 2019, 10, 4585.
9. B. Wang; X. Wang; J. Zou; Y. Yan; S. Xie; G. Hu; Y. Li; A. Dong, Nano Lett.
2017, 17, 2003-2009.
10. W. Wang; W. Chen; P. Miao; J. Luo; Z. Wei; S. Chen, ACS Catal. 2017, 7, 6144-
6149.
11. Q. Qin; H. Jang; P. Li; B. Yuan; X. Liu; J. Cho, Adv. Energy Mater. 2019, 9,
1803312.
12. H. Shen; E. Gracia-Espino; J. Ma; H. Tang; X. Mamat; T. Wagberg; G. Hu; S.
Guo, Nano Energy 2017, 35, 9-16.
13. S. Yang; Y. Yu; M. Dou; Z. Zhang; L. Dai; F. Wang, Angew. Chem. Int. Ed. 2019,
58, 14724-14730.
14. Y. Li; B. Chen; X. Duan; S. Chen; D. Liu; K. Zang; R. Si; F. Lou; X. Wang; M.
Rønning; L. Song; J. Luo; D. Chen, Appl. Catal. B: Environ. 2019, 249, 306-315.
15. Y. Chen; Z. Li; Y. Zhu; D. Sun; X. Liu; L. Xu; Y. Tang, Adv. Mater. 2019, 31,
e1806312.
16. L. Jiao; G. Wan; R. Zhang; H. Zhou; S. H. Yu; H. L. Jiang, Angew. Chem. Int. Ed.
2018, 57, 8525-8529.
17. C. Zhu; Q. Shi; B. Z. Xu; S. Fu; G. Wan; C. Yang; S. Yao; J. Song; H. Zhou; D.
Du; S. P. Beckman; D. Su; Y. Lin, Adv. Energy Mater. 2018, 8, 1801956.
18. D. Xia; X. Yang; L. Xie; Y. Wei; W. Jiang; M. Dou; X. Li; J. Li; L. Gan; F. Kang,
Adv. Funct. Mater. 2019, 29, 1906174.
19. W. Ye; S. Chen; Y. Lin; L. Yang; S. Chen; X. Zheng; Z. Qi; C. Wang; R. Long;
M. Chen; J. Zhu; P. Gao; L. Song; J. Jiang; Y. Xiong, Chem 2019, 5, 2865-2878.
20. M. Xiao; J. Zhu; L. Ma; Z. Jin; J. Ge; X. Deng; Y. Hou; Q. He; J. Li; Q. Jia; S.
Mukerjee; R. Yang; Z. Jiang; D. Su; C. Liu; W. Xing, ACS Catal. 2018, 8, 2824-2832.
21. L. Zhao; Y. Zhang; L.-B. Huang; X.-Z. Liu; Q.-H. Zhang; C. He; Z.-Y. Wu; L.-J.
Zhang; J. Wu; W. Yang; L. Gu; J.-S. Hu; L.-J. Wan, Nat. Commun. 2019, 10, 1278.

22. Z. Huang; H. Pan; W. Yang; H. Zhou; N. Gao; C. Fu; S. Li; H. Li; Y. Kuang, ACS
Nano 2018, 12, 208-216.
23. Y. Ye; F. Cai; H. Li; H. Wu; G. Wang; Y. Li; S. Miao; S. Xie; R. Si; J. Wang; X.
Bao, Nano Energy 2017, 38, 281-289.
24. H.-T. Chung; D.-A. Cullen; D. Higgins; B.-T. Sneed; E.-F. Holby; K.-L. More; P.
Zelenay, Science 2017, 357, 479-484.
25. B.-C. Hu; Z.-Y. Wu; S.-Q. Chu; H.-W. Zhu; H.-W. Liang; J. Zhang; S.-H. Yu,
Energ. Environ. Sci. 2018, 11, 2208-2215.
26. W. Ju; A. Bagger; G.-P. Hao; A.-S. Varela; I. Sinev; V. Bon; B. Roldan-Cuenya;
S. Kaskel; J. Rossmeisl; P. Strasser, Nat. Commun. 2017, 8, 944.
27. C. Zhao; X. Dai; T. Yao; W. Chen; X. Wang; J. Wang; J. Yang; S. Wei; Y. Wu;
Y. Li, J. Am. Chem. Soc. 2017, 139, 8078-8081.