Regional Economic Integration in ASEAN How Far Will It Go?
24
5HJLRQDO (FRQRPLF ,QWHJUDWLRQ LQ $6($1 +RZ )DU :LOO ,W *R" Shahriar Kabir, Ruhul A. Salim Journal of Southeast Asian Economies (JSEAE), Volume 31, Number 2, August 2014, pp. 313-335 (Article) 3XEOLVKHG E\ ,QVWLWXWH RI 6RXWKHDVW $VLDQ 6WXGLHV DOI: 10.1353/ase.2014.0027 For additional information about this article Access provided by Curtin University of Technology (25 Aug 2014 05:10 GMT) http://muse.jhu.edu/journals/ase/summary/v031/31.2.kabir.html
Transcript of Regional Economic Integration in ASEAN How Far Will It Go?

R n l n nt r t n n N: H F r llt Shahriar Kabir, Ruhul A. Salim
Journal of Southeast Asian Economies (JSEAE), Volume 31, Number2, August 2014, pp. 313-335 (Article)
P bl h d b n t t t f th t n t dDOI: 10.1353/ase.2014.0027
For additional information about this article
Access provided by Curtin University of Technology (25 Aug 2014 05:10 GMT)
http://muse.jhu.edu/journals/ase/summary/v031/31.2.kabir.html

Journa l o f Southeas t As ian Economies 313 Vo l . 31 , No . 2 , Augus t 2014
Journal of Southeast Asian Economies Vol. 31, No. 2 (2014), pp. 313–35 ISSN2339-5095print/ISSN2339-5206electronic
©2014JSEAE
DOI:10.1355/ae31-2j
Regional Economic Integration in ASEAN
How Far Will It Go?
Shahriar Kabir and Ruhul A. Salim
The Association of South East Asian Nations (ASEAN) is among several regional blocs that have received praise from economists for making significant progress towards developing intra- and extra-regional economic relationships. However, opinions differ over the extent of ASEAN’s potential for integration. This paper reviews the performance of and prospects for the group’s intra- and extra-regional integration. It also reviews the performance of individual members in order to assess whether ASEAN integration could potentially lead to a monetary union in the future. We provide an overview of trade performance and a comparison of three macroeconomic variables: inflation; interest; and exchange rates. We observe that ASEAN members are in a favourable position to form a strong economic zone in the near future, but adopting a common monetary policy is less plausible.
Keywords:ASEAN,economicintegration,MaastrichtCriteria,trade,economicconvergence.
I. Introduction
Regionalization, regional economic cooperation,andfreetradeagreementsarerecent“catchphrases”in international economics. Regional economiccooperation, free trade agreements and othertrading arrangements have been helped alongby globalization, which may even promote theadoption of a common currency by regionalgroupings.
The existing literature suggests that economicregionalism leads to substantial improvements inregional trade, but the empirical findings are mixed and inconclusive. This claim has more weight inthecontextofEastandSoutheastAsiancountries,
particularly after the 1997–98 Asian FinancialCrisis (AFC). But opinions are divided even inthisregard.BayoumiandEichengreen(1997)andMcKinnon(2004)havepraisedEastandSoutheastAsia’s role in the world economy because of theregions’ intra- and extra-regional economic andtradeintegration.Ontheotherhand,SallyandSen(2011)have“accused”someASEANmembersofadopting discriminatory bilateral trade policies.Richardson (2005), however, is of the view thatASEANmembersareattractivetradepartnersduetotheirgradualincreaseinstability,prosperityandeconomic integration with other significant Asian economies. This paper engages this debate by
10.indd 313 7/7/14 8:34:53 AM

Journa l o f Southeas t As ian Economies 314 Vo l . 31 , No . 2 , Augus t 2014
discussingtwoimportantissues.First,weevaluatethe impact of the ongoing ASEAN integrationprocesswithregardtoitsintra-andextra-regionaltrade. Secondly, we assess the potential for thisintegration process to adopt a common monetarypolicyandformacurrencyunion.
Severino (2011), among others, discussesASEAN’s economic cooperation from a politicalperspective. To this growing political-economyliterature on ASEAN members, we add astatistics-oriented analysis from a trade andeconomics perspective. In a similar study, Chia(2011) investigates some developments in andchallenges toASEAN economic integration. Ourpaper enriches the literature by exploring theregional grouping’s and its individual members’performances with a view towards assessingthe possibilities for ASEAN countries to forma currency union. Regional performance isevaluatedbasedon regional integration and tradeperformance inrecentyears. Individualmembers’performances are ranked against the “MaastrichtCriteria”,establishedbymembersoftheEuropeanUnion (EU) prior to their monetary integration.AlthoughtheMaastrichtCriteriahasrecentlybeencriticizedbypolicy-makers, it isaneffective toolto measure the early stage integration prospectsforASEAN countries. To our knowledge, such acomparisonhasnotyetbeenmadeforthisregion.
The outcome of our analysis is fairlystraightforward. Despite being political andeconomically heterogeneous, ASEAN has madesubstantial progress in intra- and extra-regionaltrade through its ongoing regional cooperationactivities.As a result,ASEAN countries conduct25percentoftheirtotaltradewithintheregion.Inaddition, their extra-regional trade is two-fifths of totalEUtrade.1Individually,ASEANmembersarefarfromadoptingacommonmonetarypolicy.Yet,this study shows that the region is at least at theveryearlystagesofextra-regionalintegration.Thesustainabilityofcurrenttradegrowthissubjecttocareful observation and proper policy reforms byASEANpolicy-makers.
The remainder of this paper is organized asfollows: section II discusses the initial objectivesofASEAN. Section III presents a brief overview
of the group’s regional economic and tradeperformance; followed by an investigation ofindividual members’ performance in section IV.Section V provides a discussion of some policyimplications, while section VI concludes withrecommendationsforadetailedstudyofcurrencyunionsandthetradeintegrationprocess.
II. ASEAN: An Overview
The Association of Southeast Asian Nations(ASEAN) was formed on 8 August 1967 and,in 2012, ASEAN comprised a total area of 4.44million square kilometres with a population ofabout 617 million (ASEAN Secretariat 2014c).The ASEAN population makes up 9 per cent oftheworld’s totalpopulationand1.2 times thatoftheeurozone,eventhoughtheregion’sgeographicsize is almost equal to that of the eurozone. In2010,ASEAN’s GDP was about US$2.3 trillion,approximately3percentofworldGDPandone-seventh of the eurozone’s GDP. Total ASEANtradein2012wasaboutUS$2.5trillion,i.e.,morethan6percentofworld tradeandalmosthalfoftotalEUtrade.
ASEAN was initially formed to accelerateregionaleconomic,socialandculturaldevelopmentamongitsmembers.Establishingpeaceandstabilitywas another important objective. Accordingly,the ASEAN Declaration contains five aims and purposes:(i)thepromotionofactivecollaborationand mutual assistance in the economic, social,cultural, technical and administrative fields; (ii) theprovisionofassistancetofellowmembersin the educational, professional, technical andadministrativesectors;(iii)effectivecollaborationto promote greater resource utilization, such asin agriculture and industries, tradeexpansionandtransportation and communication development;(iv) the promotion of Southeast Asian studies;and (v) to cooperate in existing international andregional affairs and explore new avenues forcloser cooperation (ASEAN Secretariat 2014b).To fulfil these aims and purposes, ASEAN leaders have adopted some fundamental principles andkey regional economic indicators. These basicindicatorsincludeland,population,GDPandtrade.
10.indd 314 7/7/14 8:34:53 AM
Journa l o f Southeas t As ian Economies 315 Vo l . 31 , No . 2 , Augus t 2014
StatisticsfortheseindicatorsareprovidedinTable1 of the Appendix. Inflation, exchange rates and employment rates are deemed “intermediate”indicators(ASEANSecretariat2014c).
II.1 Fundamental Principles and Economic Vision of ASEAN
In1997,ASEANmembersintroducedtheASEANVision 2020 for adopting regional economicintegration: through trade and investmentliberalization; the free flow of goods, services, investments and capital; balanced economicprogress;andreducedpovertyandsocio-economicdifferences.ThecreationoftheASEANTransportAction Plan 2005–2010 and other transportinitiatives, are important steps towards ASEANeconomic integration.The evolving infrastructuregridincludesmajorhighways,waterwaysandrailnetworks.Vision2020alsoaimsforeconomicandsocial development to ensure outward-looking,peaceful, stable and prosperous lives within theregion(ASEANSecretariat2014a).
The commitment to establish an ASEANcommunity by 2015 is another commendablestep taken by the ASEAN leaders towardsregional integration. According to the ASEANSecretariat (2014b), the development of theASEAN community will progress along threethemes, namely, the: ASEAN Political-SecurityCommunity; ASEAN Economic Community;and ASEAN Socio-Cultural Community. Theimplementationof thesethreethemesarealreadyunderway along with the Initiative for ASEANIntegration (IAI) and the IAI Work Plan (phaseII). In 2009, “revisions” were made, via the“Roadmap forASEAN Community 2009–2015”,tohelpaidprogress towards forminganASEANCommunity. However, we will have to waittwo more years to observe the outcomes of theroadmap(ASEANSecretariat2014b).Finally,theASEANCharter,adoptedin2008,providesalegalandorganisationalframeworkforthecommunity-buildingprocess(ASEANSecretariat2014b).
ASEAN has made significant progress in developing intra-regional economic relationships.The ASEAN Free Trade Area (AFTA) was
introducedwith theobjective todevelop regionalcompetitive advantages including the economicefficiency and productivity of its member nations. The AFTA has removed most tariff and non-tariff barriers within the region. Regionalism hasdecreased the average real trade cost for the tenASEAN members from 10.3 per cent in 1990to 3.9 per cent in 2007, and the amount of costreductionfortheASEAN-5ismorethan50percent(Pomfret and Sourdin 2009). Besides the AFTA,ASEANmembershavedevelopedsomefreetradeareasoutside the region.Theseareas include the:ASEAN-AustraliaNewZealandFreeTradeArea;ASEAN-China Free Trade Area; ASEAN-IndiaFreeTradeArea;ASEAN-Japan FreeTradeAreaand;ASEAN-RepublicofKoreaFreeTradeArea.In addition, the region has developed dialoguerelationswithCanada,theEU,Russia,theUnitedStates and Pakistan. In 2014, Kazakhstan joinedthe aforementioned countries in showing interestindevelopingtraderelationswithASEAN.
ASEAN members have initiated monetaryand financial cooperation not only within their regional grouping but also in East Asia.Such cooperation comprises the exchange ofinformation, surveillance processes and resourceprovision mechanisms. Specific initiatives include the:ASEANSurveillanceProcess(October1998);ASEAN+3 Surveillance Process (November1999); Monitoring Capital Flows (April 2000);ASEAN+3 Early Warning Systems (May 2001);and the Chiang Mai Initiative of the ASEAN+3FinanceMinisters(May2001).Alltheseeffortsatfinancial cooperation have gradually culminated in theASEAN SwapArrangement (ASA), BilateralSwaps and RepurchaseAgreements (BSA) and aRegional Financing Facility among ASEAN+3members(Rana2002).
Clearly, ASEAN has achieved substantialprogress,consistentwiththeirprinciplesandaims,atdifferentstagesoftheirintra-andextra-regionalintegration process. However, such progressnotwithstanding, two important policy questionsarise with regard to integration (Madhur 2002).First, what would be the impact of the ongoingprocess of regional integration and cooperationwithinASEAN on its members’ intra- and extra-
10.indd 315 7/7/14 8:34:53 AM

Journa l o f Southeas t As ian Economies 316 Vo l . 31 , No . 2 , Augus t 2014
regionaltrade?Second,canthisintegrationprocessreach the ultimate goal of forming a commonmonetary policy and currency union? This latterquestion arises because the promulgation of freetradeagreementsisoftenconsideredthebeginningofregionaleconomiccoordination,whichtypicallyends with the adoption of a common currency(for example, see Madhur 2002). Bayoumi andEichengreen (1997) also suggest that ASEAN isthe next prospective region to adopt a commoncurrency after the EU. ASEAN leaders havesuccessfully handled the initial stages of theirregionalintegrationprocess.Weattempttoanswerthe aforementioned questions affecting the next stageofintegrationinthefollowingsections.
III. The Impact of ASEAN Regional Integration on Trade
Aneweraofeconomiccoordinationandregionaleconomic development commenced after theformationoftheEUandtheadoptionoftheeuro.ASEAN is assessing the benefits of economic coordinationofasimilarkind.AftertheAFC,mostASEANcountriesrecoveredquickly,withregionalGDP growth standing at 5.7 per cent in 2012(ASEANSecretariat2014c)andmembercountrieslike Singapore and Brunei achieving a per capitaGDPofUS$50,000orhigher(ASEANSecretariat2014c).The region’s total international tradewasUS$2.47 trillion in 2012 with a nominal growthof 3.6 per cent (ASEAN Secretariat 2014c).Thissection aims to explore the current trade impactof the ongoingASEAN intra- and extra-regionalintegration process by observing trade flows.
In Figure 1, ASEAN trade includes bothexports and imports from each ASEAN memberto the world. Singapore had the highest trade inthe region from 2007 through 2012, althoughtheir trade levelsdippedin2008and2009.Othermembers’ trade levels were equal to or greaterthan Singapore’s in 2008 but their trade levelsdropped in 2009. Thailand and Indonesia’s tradesubstantially increased in 2008. Thai trade evenexceeded Malaysian trade that year. For mostmembers, trade moved upwards during 2010to 2012, indicating a quick recovery from the
downturntriggeredbytheGlobalFinancialCrisis(GFC).
Like total trade,ASEAN exports increased in2008 for all its members except for Singaporeand the Philippines, and declined in 2009. In2007 through 2012, Singapore’s exports andimportswere thehighest in the region.Malaysiaand Thailand stood in second place, followedby Indonesia. Thailand appeared to be moredependent than Malaysia on imports, which wasthe third largest importing nation in the regionduringthisperiod,whileIndonesia’simportswerealso substantial. From 2010, ASEAN membersshowed remarkable improvement inbothexportsand imports, indicating a successful recoveryfrom the economic downturn after the GFC. SeeFigure2.
Overall, trade substantially increased forIndonesia, Vietnam, Thailand and Myanmar in2008. Singapore showed negative growth forexports, imports and trademorebroadly in2008.This phenomenon reflects Singapore’s high trade dependencyontheworldeconomy.Thisgraphicaldisplay shows ASEAN members’ gradualimprovementintradeperformanceaftertheGFC.Mostofthesecountrieswereabletomanageafastand smooth recovery, indicated by high growthin 2010. All members maintained positive tradegrowthatmoderatelevelsin2011andatrelativelylowerlevelsin2012.However,Indonesianexportssubstantially dropped in 2012, but this was anexception.
Next, we investigate ASEAN trade, exportsand imports for 2012 by placing them into twocategories: intra- and extra-ASEAN (Figure 3).2Extra-ASEAN trade, exports and imports weremuchhigherthanintra-ASEANtrade,exportsandimports, indicatingthatASEANtradedependedagreatdealontheconsumptionandproductionneedsoftherestoftheworld.Themostsubstantialgapsappeared for Singapore, followed by Indonesia,Malaysia,Thailand andVietnam. However, someexceptions were Brunei Darussalam, Laos andMyanmar, whose trade was substantially lowcomparedtotheothermembers.
Naturally ASEAN’s negotiation powerstrengthens as a region rather than as individual
10.indd 316 7/7/14 8:34:54 AM

Journa l o f Southeas t As ian Economies 317 Vo l . 31 , No . 2 , Augus t 2014
FIGURE1ASEANTrade(millionUS$)from2007to2012
(a)Totaltrade
(b)Exports
(c)Imports
Source:Authors’calculations;datacollectedfromtheASEANSecretariatWebsite(Table17:ASEANTrade<http://www.asean.org/resources/>)andtheWorldDevelopmentIndicators.
0.00
200,000.00
400,000.00
600,000.00
800,000.00
1,000,000.00
1,200,000.00
2007
2008
2009
2010
2011
2012
0.00100,000.00200,000.00300,000.00400,000.00500,000.00600,000.00700,000.00800,000.00900,000.00
2007
2008
2009
2010
2011
2012
0.00
100,000.00
200,000.00
300,000.00
400,000.00
500,000.00
600,000.00
2007
2008
2009
2010
2011
2012
10.indd 317 7/7/14 8:34:55 AM

Journa l o f Southeas t As ian Economies 318 Vo l . 31 , No . 2 , Augus t 2014
-40
-20
0
20
40
60
80
Exports
Imports
Total trade
0.0%
5.0%
10.0%
15.0%
20.0%
25.0%
30.0%
35.0%
Exports
Imports
Total trade
-10.0%
-5.0%
0.0%
5.0%
10.0%
15.0%
20.0%
25.0%
30.0%
Exports
Imports
Total trade
-40
-30
-20
-10
0
10
20
30
40
50
60
Exports
Imports
Total trade
FIGURE2Year-on-YearChangeofASEANTrade(percentage):2007–12
(a)2007to2008 (d)2010to2011
(b)2008to2009 (e)2011to2012
(c)2009to2010Source:Authors’calculations;datacollectedfromtheASEANSecretariatWebsite(Table17:ASEANTrade(collectedfordifferentyearsduring2009to2013)<http://www.asean.org/resources/>)andtheWorldDevelopmentIndicators.
0.0%
20.0%
40.0%
60.0%
80.0%
100.0%
120.0%
Exports
Imports
Total trade
10.indd 318 7/7/14 8:34:57 AM

Journa l o f Southeas t As ian Economies 319 Vo l . 31 , No . 2 , Augus t 2014
FIGURE3Intra-andextra-ASEANTrade(millionUS$)in2012
(a)Totaltrade
(b)Exports
(c)Imports
Source: Authors’ calculations; data collected from the ASEAN Secretariat Website (Table 18: Intra- and extra-ASEAN trade (collected fordifferentyearsduring2009 to2013)<http://www.asean.org/resources/) and theWorldDevelopmentIndicators.
0.00
100,000.00
200,000.00
300,000.00
400,000.00
500,000.00
600,000.00
700,000.00
Intra-ASEAN trade
Extra-ASEAN trade
-
50,000.0
100,000.0
150,000.0
200,000.0
250,000.0
300,000.0
Brun
ei D
arus
sala
m
Cam
bodi
a
Indo
nesi
a
Laos
Mal
aysi
a
Mya
nmar
The
Phili
ppin
es
Sing
apor
e
Thai
land
Viet
nam
Intra-ASEAN exports
Extra-ASEAN exports
0.00
50,000.00
100,000.00
150,000.00
200,000.00
250,000.00
300,000.00
350,000.00
Brun
ei D
arus
sala
m
Cam
bodi
a
Indo
nesi
a
Laos
Mal
aysi
a
Mya
nmar
The
Phili
ppin
es
Sing
apor
e
Thai
land
Viet
nam
Intra-ASEAN imports
Extra-ASEAN imports
10.indd 319 7/7/14 8:34:59 AM

Journa l o f Southeas t As ian Economies 320 Vo l . 31 , No . 2 , Augus t 2014
membercountries.Hence,theregionalintegrationandcooperationprocessplaysanimportantroleinimproving extra-regional trade relations and theoveralltradeprospectsforASEANmembers.
Figure4showsASEAN’smajortradepartnersin2012. ASEAN, as a whole, was a significant trade partner for its members in terms of both exportsandimports,capturingalmost25percentoftheirtrade. China, Japan, the United States and theEU were also influential exporting and importing partners.TheRepublicofKorea,Australia, India,the United Arab Emirates (UAE), Hong Kongand Saudi Arabia were also among the top ten.Therefore,ASEANisanimportanttradingpartnerfor Asia, and a significant exporter to Europe and theUnitedStates.
III.1 Trade Intensity
Next, we explore trade patterns (in Figure 5) interms of exports intensity, imports intensity andnetexportsintensity.TheobservationincludessixASEANcountries(ASEAN-5andVietnam).3
The exports intensity indicates how manyexports are transacted every year against eachdollar of GDP. This ratio reflects the popularity of domesticproductsintheworld.Ofthesixobservedmembers,Singapore,VietnamandThailandshowupwardmovementsofexportsintensity.Singaporehas consistently exported US$2 or more againsteverydollarofGDPsince2002.
Withregardtotheothercountries, thevalueofexportsintensitywasaboutUS$1orless.Indonesiamaintained a steady but low value of US$0.25of exports against every dollar of their GDPthroughout the observation period. The exportsintensity values for Malaysia and the Philippinesdipped in the years leading up to 2009 and wererevived in 2010. Unsurprisingly, all countriesshowed a slight decline in exports intensity in2011and2012,yetanothereffectoftheGFC.
Imports intensity values indicate how manyimports are transacted every year against eachdollar of GDP. This ratio reflects the openness of the ASEAN members with reference to tradewith the world. Movements in imports intensityare similar to movements in exports intensity.
Singapore, Vietnam and Thailand’s opennessmoved upwards, while Malaysia and thePhilippineshaveexperienceddownward trends inrecentyears.Onceagain,asagroup,allmembersexperiencedupwardtrendsin2010,followedbyareversalduring2011and2012.
The net exports intensity reflects actual trade gains forASEAN members. Of the six observedmembers, Singapore, Indonesia, Malaysia andThailand enjoyed trade surpluses, while Vietnamand the Philippines suffered from trade deficit. SingaporeandMalaysia’snetexportsurplusvariesfrom10 cents to30 cents against everydollar oftheir GDP, while the surplus for Thailand andIndonesia is below 10 cents. For the Philippines,the net export deficit varies within 10 cents against every dollar of their GDP through theobservationperiod.Vietnam’sexperiencematchedthe Philippines’ till about 2006; however, thecountry’s net export deficit increased to 15 cents in2007–08.
During the AFC, the net exports of all sixcountriesdeclined.TheimpactwasimmediateforSingapore,Indonesia,thePhilippinesandThailand,while Malaysia and Vietnam felt the impacts ofthe shocks about a year later. Similarly, duringtheGFC,saveforMalaysiaandVietnam,thefourother countries saw their net exports intensitycurve downwards. On the contrary, Malaysiaand Vietnam experienced upward trends duringthis period. In 2010, net exports intensity valueseither continued to decline or remained flat for all members except for Singapore. During 2011–12,Vietnam had a substantial improvement in netexports intensity with a trade surplus in 2012.Other members suffered declining net exportsintensity over these two years, with Indonesiaentering a trade deficit in 2012 — a lagged effect oftheGFContheASEANeconomy.
In summary, the above data show that theintegration process appears to have created sometrade gains forASEAN members; however, theirtrade is more integrated with the world economythan with their regional grouping. Intra-regionalASEAN trade relations have yet to be sufficiently consolidated to overcome the effects of extra-regional shocks, whilst bearing in mind that
10.indd 320 7/7/14 8:34:59 AM

Journa l o f Southeas t As ian Economies 321 Vo l . 31 , No . 2 , Augus t 2014
FIGURE4TopTenASEANTradingPartners,2012
(a)Totaltrade
(b)Exports
(c)Imports
Source:Authors’calculations;datacollectedfromtheASEANSecretariatWebsite(Table20:ToptenASEANtradepartnercountries/regions,2012andTable21:Top tenexportmarketsand importorigins,2012<http://www.asean.org/resources/>.
24.3
12.9
10.6
9.8
8.1
5.3
3.9
3.8
2.9
2.8 ASEAN
China
Japan
EU-28
US
Republic of Korea
Taiwan
Hong Kong
India
Australia
25.8
11.3
10.1
10.0
8.6
6.4
4.4
3.73.5 2.8 ASEAN
China
Japan
EU-28
USA
Hong Kong
Republic of Korea
Australia
India
Taiwan
22.7
14.5
11.2
9.7
7.5
6.2
5.03.2
3.1
2.3
ASEAN
China
Japan
EU-28
USA
Republic of Korea
Taiwan
United Arab Emirates
Saudi Arabia
India
10.indd 321 7/7/14 8:35:01 AM

Journa l o f Southeas t As ian Economies 322 Vo l . 31 , No . 2 , Augus t 2014
FIGURE5ASEANTradeIntensity
(a)ExportsIntensity
(b)ImportsIntensity
(c)NetExportsIntensity
Source:Authors’calculations;datacollectedfromtheWorldDevelopmentIndicators.
0
0.5
1
1.5
2
2.5
1994 1996 1998 2000 2002 2004 2006 2008 2010 2012
Indonesia
Malaysia
Philippines
Singapore
Thailand
Vietnam
0
0.5
1
1.5
2
2.5
1994 1996 1998 2000 2002 2004 2006 2008 2010 2012
Indonesia
Malaysia
Philippines
Singapore
Thailand
Vietnam
-0.2
-0.1
0
0.1
0.2
0.3
0.4
1994 1996 1998 2000 2002 2004 2006 2008 2010 2012
Indonesia
Malaysia
Philippines
Singapore
Thailand
Vietnam
10.indd 322 7/7/14 8:35:02 AM

Journa l o f Southeas t As ian Economies 323 Vo l . 31 , No . 2 , Augus t 2014
the exposure to extra-regional shocks may notcompletely diminish as a significant portion of ASEANtradeistiedtoextra-regionaleconomies.
The trade dependency of ASEAN economiescan be explained from a different perspective bycomparing the trade intensity of the ASEAN-5withthatoftheEU(Figure9).Bothregionsshowan upward trend of trade intensity from 2000onwards (except for 2011 and 2012). However,trade intensity is much higher in ASEAN (morethan US$1.20 against every dollar of GDP) thanin theEU(less than80cents).Evidently, trade ismuch more dominant inASEAN economies thaninEUeconomies(seealsoKabirandSalim2011).This isunderstandablebecauseASEANcountriesare developing as trade-based economies. Theirtrade is not limited to the final stage of production, but also involves trade in intermediate goods. Infact, ASEAN countries are an important part of
the East Asian international production network(IPN); making manufacturing and trade muchmoreimportantfortheireconomythanagriculture(seeAthukorala2011).
The above discussion shows that all ASEANeconomies are more or less trade-focussed — both intra-regionally and extra-regionally. Singaporeis the country with the highest levels of tradeand ishighly integratedwith theworldeconomy.Malaysia,Thailandand Indonesiaalsoparticipatein a substantial amount of trade, exportingconsiderably large amounts of goods outsidethe region. At the same time, ASEAN membersare highly dependent on imports from the worldfor their domestic consumption. Therefore,even as ASEAN trade is largely dependent onextra-regional demand and supply, the groupingitself is the highest exporter and importer for itsmember countries followed by China and Japan.
FIGURE6ComparisonofTradeIntensitybetweentheASEAN-5andtheEU
Source:Authors’calculations;datacollectedfromtheWorldDevelopmentIndicators.
0
0.2
0.4
0.6
0.8
1
1.2
1.4
1.6
1.8
220
00
2001
2002
2003
2004
2005
2006
2007
2008
2009
2010
2011
2012
European Union
ASEAN 5
Linear (European Union)
Linear (ASEAN 5)
10.indd 323 7/7/14 8:35:02 AM

Journa l o f Southeas t As ian Economies 324 Vo l . 31 , No . 2 , Augus t 2014
This indicates the importance and consolidationof both intra- and extra-regional trade by andamongASEANcountries. In thenextsection,weinvestigatetheindividualperformanceofASEANmembers with respect to the ongoing regionaleconomic integration process taking place withinASEANusingselectmacroeconomicindicators.
IV. Individual Performances of ASEAN Members: Signs for a Prospective Common Monetary Zone?
Theinitialexperienceoftheeurohelpedencouragethe concept of a regional currency union forenhancing the benefits of regional cooperation (see Mundell2003).Inthiscontext,ASEANcountrieshave often been considered highly crediblecandidates for a currency union (McKinnon2004; Bayoumi and Eichengreen 1997), althougheconomistsdifferonthequestionofwhichanchorcurrency to select (Alesina and Barro 2002;McKinnon 2003; Plummer and Wignaraja 2007).Recent literature even calls for sub-groupingswithin a currency union of East Asian countries(Sato and Zhang 2006; Sato, Zhang and Allen2009;Nguyen2010).Controversy also surroundstheselectionofanappropriatecurrencyblockforthisregion.SomeeconomistsviewAsiaasadollarblock (McKinnon, 2005; McKinnon and Schnabl2004),whileothersareoftheviewthatthisregionisayenblock(Karras2005;Kwon2001).Asimilardifferenceexistswithrespecttointroducinganewregional currency (Jeon andZhang2007;LarraínandTavares2003) andtheadoptionofacurrencybasket (Williamson 2005). Nobel prize-winningeconomist and major contributor to OptimumCurrency Area (OCA) theory, Robert Mundell(2003) suggests that there is prospect for a largecurrency area in Asia. Accordingly, this sectionassesses whetherASEAN members exhibit signsto support a prospective common monetary zoneintheregion.
Buiter (2010) and Faris (2010) apply severalcriteria while assessing the potential for GulfCooperation Council (GCC) members to movetowards a currency union. Drawing from theirwork, we explore the individual performance
of ASEAN members with respect to regionalintegration. Unlike the GCC, ASEAN currentlyconcentrates on different economic, social andculturalcooperationwithinandoutsidetheregionin the process of formally institutionalizing theintegration process. However, regional policy-makers have specified any criteria for the measure theyplantoundertake.Tofacilitatetheirwork,weapply the Maastricht Criteria as a benchmark tocompareeachindividualmember’smacroeconomicintegrationperformance.Thesecriteriaweresetforpolicy harmonization in the European monetaryunionprocess(formoredetails,seePlummerandWignaraja 2007).Although recently criticized bysome policy-makers, the Maastricht Criteria isthe only clearly stated threshold for a commoncurrency.
The Maastricht Criteria focuses on somemacroeconomic variables such as inflation, interestrate,exchangerateandpublicdebt,allofwhich influence a country’s monetary policy. The idea is to bring each of these variables within athreshold of deviation for all members, so thattheir individual monetary policy can be replacedbyacommonpolicy(seeAfxentiou2000).Inthispaper we assess ASEAN members using similarvariables. We look at inflation and exchange rates because these two variables are consideredby ASEAN to be key macroeconomic variables(ASEAN Secretariat 2014c). We include interestratesinthisstudybecauseASEANinvestmentandfinancial cooperation is a priority area for ASEAN leaders (for details, see Schulze 1988 and Rajan2000).
IV.1 Inflation
The adoption of a common monetary policyrequires inflation among members to fall within the rangeofminimumdeviationfromthebasecountry.According to the Maastricht Criteria, the twelve-month average inflation of member countries shouldbewithin1.5percentoftheaverageofthethree countries with the lowest inflation rates. The individual inflation experiences of the ASEAN members from 1981 to 2010 is shown in Table1. From 1981 to 1990, Laos suffered from the
10.indd 324 7/7/14 8:35:03 AM

Journa l o f Southeas t As ian Economies 325 Vo l . 31 , No . 2 , Augus t 2014
TAB
LE1
Infla
tion
Crit
eria
of E
cono
mic
Con
verg
ence
(in
perc
enta
ges)
Peri
od
Brun
ei
Cam
bodi
a In
done
sia
Laos
M
alay
sia
Mya
nmar
Ph
ilipp
ines
Si
ngap
ore
Thai
land
Vi
etna
m
D
arus
sala
m19
81–1
990
Mea
n2.
98
8
.61
48.4
93.
25
11.7
914
.33
2.28
4.
43M
edia
n1.
96
8
.66
48.4
92.
72
8.0
710
.41
1.94
3.
77St
anda
rdD
evia
tion
2.67
2.5
018
.17
2.86
9
.12
13.9
62.
59
3.32
1991
–200
0M
ean
2.00
5.
39
14.1
434
.10
3.55
25
.11
8.1
31.
73
4.53
3.
71M
edia
n1.
66
5.58
8
.97
16.5
23.
52
24.6
57
.20
1.86
5.
34
4.12
Stan
dard
Dev
iatio
n1.
94
5.95
16
.15
41.4
31.
09
13.2
73
.97
1.18
2.
27
3.40
2001
–201
2M
ean
0.64
5.
39
7.9
67
.36
2.24
18
.85
5.0
12.
17
2.75
8.
76M
edia
n0.
71
3.96
6
.50
7.3
71.
76
14.6
94
.23
1.34
2.
89
8.02
Stan
dard
Dev
iatio
n1.
12
6.71
3
.15
3.8
21.
35
17.3
72
.14
2.18
1.
78
6.40
Sou
rc
e:A
utho
rs’c
alcu
latio
ns;d
ata
colle
cted
from
the
Wor
dD
evel
opm
entI
ndic
ator
s.
10.indd 325 7/7/14 8:35:03 AM

Journa l o f Southeas t As ian Economies 326 Vo l . 31 , No . 2 , Augus t 2014
highest average inflation of about 48 per cent with notably high deviation from the range set by theMaastrichtCriteria.Myanmarand thePhilippinesalso suffered from an average of above 10 percent inflation with high deviation. Indonesia’s average inflation then was also above 8 per cent (thestandarddeviationwas2.38percent).Brunei,Malaysia, Singapore and Thailand were able tomaintain fairly low and steady inflation rates.
During 1991 to 2000, Laos had high andunstable inflation, followed by Indonesia and Myanmar. The Philippines also suffered fromquite high inflation, although it was comparatively stable. Other members maintained comparativelylower and stable inflation rates. Brunei, Malaysia, SingaporeandVietnamfellwithintherequirementsoftheMaastrichtCriteria.
From2001to2012,evenastheGFCunfolded,inflation was controlled well by the ASEAN members except for Myanmar (although, as was
mentionedabove,onlyBrunei,Malaysia,SingaporeandThailandmettheMaastrichtCriteria).
Figure 7 presents a clearer view of inflation convergence. With a few exceptions (Laos,Myanmar and Indonesia), most members’ inflation rates were within the 10 per cent range. Thisrangeisstill toohighaccordingto theMaastrichtCriteria, however, inflation rates over recent years have shown some signs of convergence, whichmaybeexpeditedthoughproperpolicyreforms.
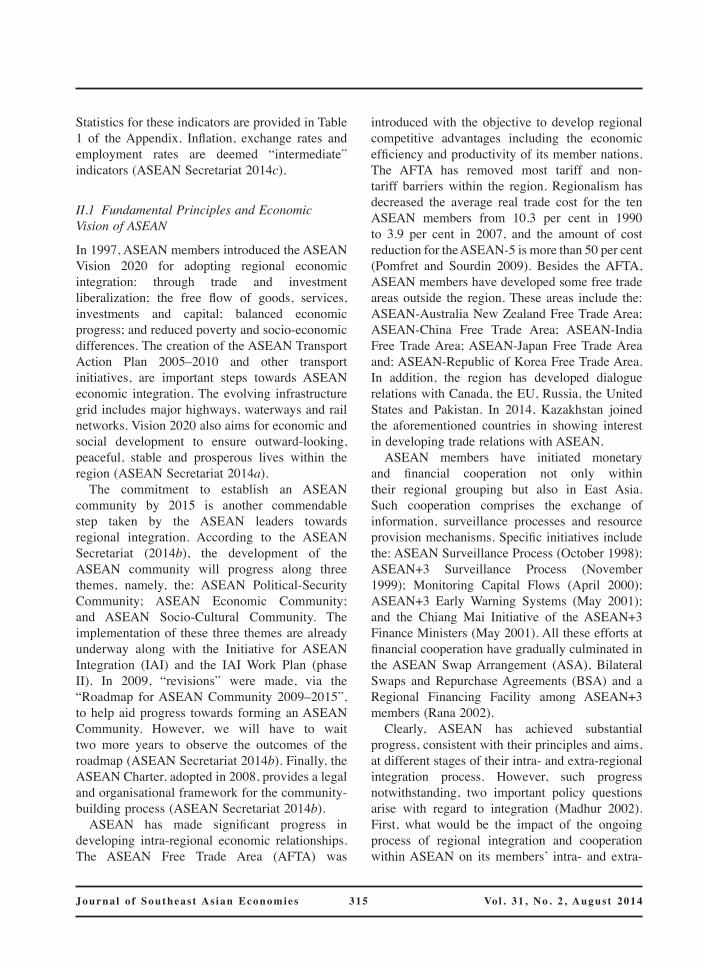
IV.2 Interest Rates
As with inflation rates, the Maastricht Criteria suggeststhatthetwelve-monthaverageinterestrateof long-termbondsshouldbewithin1.5percentoftheaverageofthelowestthreecountries.Table2 explores the interest rate performance of eightASEANmembers (substantial data is unavailablefor other members) by analysing their lending
FIGURE7Average Annual Inflation (1981 to 2011)
Source:WDI,WorldBankDatabase.
-20.00
0.00
20.00
40.00
60.00
80.00
100.00
120.00
140.00
1981
1984
1987
1990
1993
1996
1999
2002
2005
2008
2011
Brunei Darussalam
Cambodia
Indonesia
Laos
Malaysia
Myanmar
Philippines
Singapore
Thailand
Vietnam
10.indd 326 7/7/14 8:35:03 AM
Journa l o f Southeas t As ian Economies 327 Vo l . 31 , No . 2 , Augus t 2014
TAB
LE2
Inte
rest
Rat
eC
riter
iao
fEco
nom
icC
onve
rgen
ce
Peri
od
Indo
nesi
a La
os
Mal
aysi
a M
yanm
ar
Phili
ppin
es
Sing
apor
e Th
aila
nd
Viet
nam
1981
–199
0M
ean
21.5
6
9.34
8
.00
19.9
78.
32
14.5
4M
edia
n21
.67
9.
10
8.0
018
.68
7.71
14
.82
Stan
dard
Dev
iatio
n0
.46
0.
72
0.0
05
.29
2.42
2
.24
1991
–200
0M
ean
22.6
124
.73
9.60
12
.19
15.7
66.
28
12.1
213
.04
Med
ian
21.2
126
.00
9.65
16
.32
14.9
56.
11
12.7
113
.55
Stan
dard
Dev
iatio
n4
.69
9.1
21.
27
6.9
33
.52
0.71
2
.40
10.4
620
01–2
012
Mea
n15
.38
27.2
06.
10
15.9
19
.47
5.37
6
.47
11.0
1M
edia
n14
.31
27.6
76.
19
15.5
49
.31
5.34
6
.42
10.5
5St
anda
rdD
evia
tion
2.2
92
.74
0.76
1
.24
1.7
40.
09
0.6
72
.60
Sou
rc
e:A
utho
rs’c
alcu
latio
ns;d
ata
colle
cted
from
the
Wor
ldD
evel
opm
entI
ndic
ator
s.
10.indd 327 7/7/14 8:35:04 AM

Journa l o f Southeas t As ian Economies 328 Vo l . 31 , No . 2 , Augus t 2014
interest rates. During 1981 to 1990, the averageinterest rate was above 15 per cent in IndonesiaandMyanmar,andabout15percentinThailand.Forothermembers,theinterestratewaslessthan10 per cent. For most members, the variation ininterestrateswaslessthan2.5percent.
During 1991 to 2000, interest rates amongthe ASEAN members were high and wereaccompanied by relatively high volatility. Thehighest average interest rate isobserved forLaos(24percent),followedbyIndonesia(above20percent). For Laos, the standard deviation was alsomore than8 per cent throughout this period.Thelowest average interest rate (6.28 per cent) wasobserved for Singapore with a substantially lowstandarddeviation(about0.67percent).
During2001to2012, theaverageinterestratesinMalaysia,SingaporeandThailandwerearound5 per cent. The standard deviation also variedwithin a 0.8 per cent range. On the other hand,
Laos, Indonesia and Myanmar’s average interestrate for this period was still above 15 per cent,thoughthedeviationwasquitecontrolled.
ASEANmembersfailedtomeettheMaastrichtCriteria for interest rates throughout theobservationperiod,however,signsofconvergencestarted to appear during 2001 through 2010(Figure 8). Except for Indonesia, the otherASEAN-5 members, in particular, have movedtowards a trend of convergence. In recent years,evenIndonesiaappearstohavejoinedthistrend.
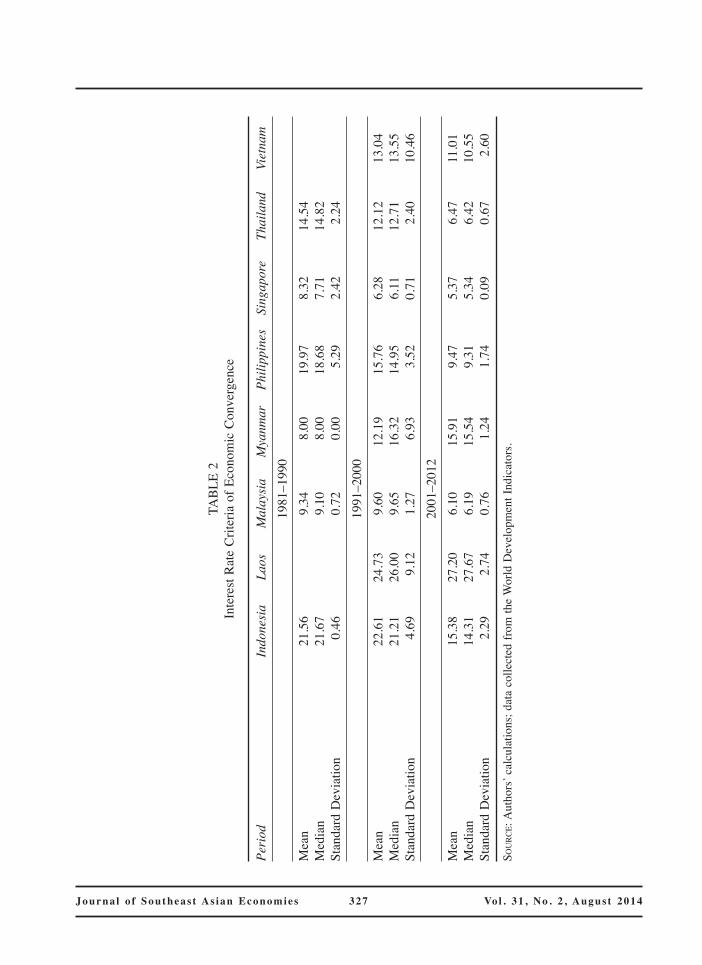
IV.3 Exchange Rate
Kawai (2008) has constructed a useful scenarioto explain the currency management policies ofASEAN economies. Except for Brunei, all othereconomieshave adopted intermediate regimesofa managed float, mostly anchoring their currency to the U.S. dollar. Singapore has a managed
FIGURE8AverageAnnualInterestRateVariation
Source:Authors’calculations;datacollectedfromtheWorldDevelopmentIndicators.
0
5
10
15
20
25
30
35
1981
1983
1985
1987
1989
1991
1993
1995
1997
1999
2001
2003
2005
2007
2009
2011
Indonesia
Laos
Malaysia
Myanmar
Philippines
Singapore
Thailand
Vietnam
10.indd 328 7/7/14 8:35:04 AM
Journa l o f Southeas t As ian Economies 329 Vo l . 31 , No . 2 , Augus t 2014
FIGURE9AverageMonthlyExchangeRateofASEANMembers’Currencies
(LocalCurrencyvalueperUS$)
(a)Weakercurrencies
(b)Strongercurrencies
Source:Authors’calculations;datacollectedfromtheWordDevelopmentIndicators
0
5000
10000
15000
20000
25000
Cambodia
Indonesia
Laos
Vietnam
0
10
20
30
40
50
60
1990
1992
1994
1996
1998
2000
2002
2004
2006
2008
2010
2012
Brunei Darussalam
Malaysia
Myanmar
Philippines
Singapore
Thailand
10.indd 329 7/7/14 8:35:05 AM

Journa l o f Southeas t As ian Economies 330 Vo l . 31 , No . 2 , Augus t 2014
float with a currency basket system. Indonesia, Cambodia and Laos have a managed float with relatively large exchange rate fluctuation, while the Philippines, Thailand and Vietnam have amanaged float with relatively smaller exchange rate fluctuation.
TheMaastrichtCriteriaprohibitstherealignmentofindividualexchangeratestwoyearspriortothemonetaryunion.ASEANiscurrentlyfarremovedfrom meeting this criteria, although some of thecountries are attempting to keep their exchangeratesstable.Fromthisstandpoint, thereappear tobetwogroupswithinASEAN,separatedbytrendsinthevalueoftheircurrencies:aweakercurrencygroup (value climbs above 100 units per U.S.dollar)anda strongercurrencygroup (values fallbelow 100 units per U.S. dollar) (see Figures 9aandb;localcurrencyvalueagainsttheU.S.dollar).The upward trend of the line signifies a decline in the local currency value, and the downwardtrend of the line signifies an increase in the local currencyvalue.
Among the weaker currencies, the Cambodianriel has been fairly stable against the U.S. dollarexcept for a sharp rise during the AFC. Sincethat financial crisis, the Indonesian rupiah has continuously fluctuated. From 1994 to 2005, the Laos kip was found to be quite stable except forsome sharp increases in 1998, 1999 and 2005.After a steep rise in 2005, the kip has beenslowly converging with its previous value. TheVietnamesedonghasanupwardtrajectoryonthecurve,whichsignalsthecontinuousweakeningofthatcurrency.
Among the stronger currencies, the BruneidollarandtheSingaporedollarappeartohavebeenstable throughout the observation period, a resultoftheirdollarpegging.TheMalaysianringgitwasalsostableexceptforaslightriseduringtheAFC.In contrast, the Filipino peso and the Thai bahtremainedvolatileduringtheAFC.Infact,thebahtwas the first currency to collapse in 1997, thus triggering theAFC. However, it has been gettingstronger and comparatively more stable in recentyears. The new currency management systemadopted in Myanmar in 2012 led to a rise in thevalueofthekyatto950kyatsperU.S.dollar.
In short, Brunei, Cambodia, Laos, Malaysia,Myanmar and Singapore were able to managetheircurrencieswell.Properpolicyreformswouldresult in them successfully adopting specific criteriatofacilitatethedevelopmentofanASEANcurrencyexchangepolicy.
IV.5 Overall Comparison
This subsection explores the ASEAN members’individual integration performance and comparesthe level of convergence among members. From2001 onwards, Brunei, Malaysia, Thailandand Singapore maintained less than 3 per centof average inflation with less than 2 per cent deviation. Brunei maintained average inflation of less than 1 per cent.All of the otherASEANmembers, except for Myanmar, were able tomaintain either an average inflation rate of about 8 per cent or an inflation deviation rate of about 3 per cent or both.The region may still be stepsaway from the recommended inflation convergence indicatorssetoutbytheMaastrichtCriteria,buttheaforementioned percentages are a good indicatorofconvergencewithintheregionnonetheless.
AsimilarlevelofdeviationfromtheMaastrichtCriteriaexistswithregardtointerestandexchangerates,althoughselectASEANmembershavebeenabletomeetthecriteriaforinterestratesoverthelast decade. More specifically, Malaysia, Singapore andThailandhavemaintainedthreeof the lowestdeviationlevels(interestrates)intheregion;theiraverageis0.5percent.ThecriteriastatesthattheotherASEANmembersshouldkeeptheir interestrates’deviationlevelswithin2percent.
MyanmarandthePhilippineshavemanagedtomaintain deviation at the 2 per cent level but fortheothers,deviationstandsatabout2to3percent.ASEAN countries show strong signs of convergebuthalfofitsmembers(i.e.,thecountriesthatdonot comprise the ASEAN-5) are still well awayfrom meeting the Maastricht Criteria for interestrates.
The same applies to the criteria for exchangerates.TheSingaporedollar, theBruneidollarandtheMalaysianringgithavebeensubstantiallystableovertheyears,whiletheircounterpartshavefailed
10.indd 330 7/7/14 8:35:05 AM
Journa l o f Southeas t As ian Economies 331 Vo l . 31 , No . 2 , Augus t 2014
toconsistentlymaintainstability.Itisworthnotingthat all three of the above-mentioned currenciesare also dollar pegged, making their currencystability questionable in real terms. Therefore, itcannotbesaidthattheASEANmembers’currencymanagementsystemshavemettherequirementsoftheMaastrichtCriteria.EvenifASEANisabletoadoptacommoncurrencyinthefuture,wewouldsupport Mundell’s (2003) suggestion of selectingthe U.S. dollar as an external anchor currency,instead of choosing an internal anchor currency.This is because our analysis shows that none oftheASEANcurrencieshavethestrengthtoactasananchorcurrency.Moreover,thestableonesarepeggedtotheU.S.dollar.
ItisthereforequiteclearthatASEANmembershave a long way to go before achieving thedesired convergence level that would allow themto introduce a common monetary policy. Properpolicyreformswould lead the integrationprocesstowardscreatinganenvironmentforadoptingsucha policy; however, the cost of macroeconomiccorrection could become an equally formidablehurdle.Alternatively,concentratingmoreonintra-and extra-regional trade integration would be abetterpolicystrategytohelpfurtherstrengthentheintegrationprocess.
V. Policy Implications
Going by the initial success of the EuropeanMonetary Union, economists and policy-makersaround the world had increasingly considereddesigning similar policies for other regionaleconomic integrations andmonetaryunions (EastAsia,ASEAN,theGulfCooperationCouncil,andsoon).ASEANcountries,inparticular,haveshowncommendable progress in economic and tradeintegration.Furthermore, inrecentyears,ASEANleadershaveexpressedtheircommitmentstowardsstrongerASEANintegrationviatheestablishmentof the three ASEAN communities. The ASEANEconomicCommunity (AEC) is alsoaneffectivesteptowardsincreasingASEAN’scompetitivenessintheworld(Petri,PlummerandZhai2012).TheASEAN leaders’ increasing commitment towardsregional integration provides the context to raise
the question about the possible destination ofthe ASEAN regional integration process. Thissectionoutlinesaframeworkfordeliveringpolicyimplicationsinthisregard.
Three important policy issues are worthdiscussing.First,sinceitscreationin1976,ASEANhasachievedremarkablesuccessinintegratingitsmembers.However,muchofthiswastheresultofinformal processes.A formal integration process,on the other hand, has only been established inrecent years, particularly after the AFC. A moreformalizedprocessrequiresstrongpoliticalwillonthepartofallASEANcountriestogobeyondtheAECBlueprintandothersuchinitiatives.
The regional integration process has played animportant role in improving ASEAN members’trade performance both within and outsidethe region. However, ASEAN members aresimultaneously involved in regional,bilateral andmultilateraltradeagreements.Forexample,besidesthe AFTA, Malaysia, Singapore and Thailandhave individually initiated free trade agreementswith Australia. Without proper trade policiesand guidelines, these multiple, overlapping tradeagreements may clash in the future and distortASEAN’s successful intra- and extra-regionaltrade integration. Strong political commitment isessential to avoid this kind of complication. Inaddition,itisnotalwaysevidentwhetherASEANasawhole,oronlyafewofitsmajoreconomies,areactiveparticipantsintheEastAsianintegrationprocess together with China, Japan and Korea.ASEAN leaders need to clearly outline their rolein East Asia, and the depth of their engagementwithEastAsiancountries,toavoidcompromising“ASEANcentrality”.
Finally,aswehaveshown,reachingtheultimateformofregionalintegrationbyformingamonetaryunion is still a big challenge for ASEAN. Withregard to inflation, interest rate and exchange rate management, ASEAN members show signs ofconvergencebutalsohighlevelsofdiversity.Thishas also been observed by Lee and Koh (2012)andSato,ZhangandAllen(2009).
Yet, these signs of convergence suggest thatdevelopingacommonmonetarypolicyisatleastpossiblewiththerightpolicydirectionsandwith
10.indd 331 7/7/14 8:35:06 AM

Journa l o f Southeas t As ian Economies 332 Vo l . 31 , No . 2 , Augus t 2014
theunderstandingthatmacroeconomiccorrection(to correct heterogeneity) will come at a highcost. In the interim, and also considering thatthe recent GFC and the euro crisis have raisedquestionsabout thevalueofmonetaryunions, itmay be worth focusing the regional integrationprocess on deeper trade, economic and socialties.
VI. Conclusion
This paper provided anoverviewofASEAN andits efforts at regional integration. Against thebackdrop of stronger commitment by ASEANleaderstofosterdeeperregionalcooperation(withthe announcement of the AEC, for example) weexaminedthepossibilitiesforintegratingtheregioninto a monetary union. The graphical discussionabove shows that ASEAN has strong economicstanding,fastgrowth,andexperiencedarelativelyquickrecoveryfromtheGFC.
The above indicators are testament to theview that ASEAN is a strong prospectivecandidate for formal regional integration and forforming a currency union.Three of its members,Singapore, Malaysia andThailand, are already inan economically strong position, while Vietnam,Cambodia and Laos are on fast growth tracks.Brunei and Indonesia also have considerableeconomic strength. In addition, Singapore,Malaysia,ThailandandIndonesiahaveconsolidatedstrong trade relations within and outside theregion.Except for2009(due to theeffectsof theGFC), ASEAN members’ trade increased everyyear during the period of observation. By 2011,trade grew by an impressive 10 to 30 per centfor almost allmembers.Besides, tradedominates
mostoftheASEANmembers’domesticeconomy.TheirexportsandimportsrangefromUS$0.50toUS$1.50againsteverydollaroftheirGDP.
However, we also noted that correcting theexistingmonetaryheterogeneityamongitsmembersraises important cost-benefit questions about the value of adopting a common monetary policy.ASEAN members have not shown substantialsigns of convergence for inflation, interest rates or currency management. Brunei, Malaysia,SingaporeandThailandmeet thestandardsetoutby theMaastrichtCriteria but theothermembershavefailedtoshowanynotableconvergence.Wedid note, however, that ASEAN members, morebroadly, have shown better control over inflation andinterestratesinrecentyears.
The more important question about monetarypolicy integration and the adoptionof a commonregional currency is: can this move provideASEAN with additional gains in trade? Rose(2000) identifies that trade gains were an important benefit for the EU with the adoption of the euro. ASEAN is already on track to reap high tradegains,whichmayormaynotbefurtherenhancedwith a common currency. We recommend thatfuture research conduct a cost-benefit analysis of doing so, using the information provided in thispaper,whichhasattemptedtooutlinewhereeachASEANmemberstandsontheroadtointegration.Our recommendation based on our findings in thispaperareforASEANpolicy-makers tofocusmore on achieving gains in trade through theirongoing regional integration process, instead ofattempting to form anASEAN monetary zone inthe near future. Therefore, at present, Mundell’s(2003)claimforacurrencyareainAsiadoesnotyetseemfeasibleforASEANcountries.
10.indd 332 7/7/14 8:35:06 AM

Journa l o f Southeas t As ian Economies 333 Vo l . 31 , No . 2 , Augus t 2014
Appendix
APPENDIxTABLE1KeyIndicatorsSelectedbyASEANLeaders
Indicators Unit 2010 2011 2012Totallandarea km2 4,435,670 4,435,674 4,435,623Totalpopulation thousand 600,291 608,383 616,632Grossdomesticproductatcurrentprices US$million 1,884,068 2,184,845 2,312,788GDPgrowth percent 7.82580849 4.73172518 5.68792325Grossdomesticproductpercapitaat currentprices US$ 3,139 3,591 3,751Internationalmerchandisetrade US$million 2,045,731 2,388,592 2,474,674Export US$million 1,070,941 1,242,286 1,254,004Import US$million 974,790 1,146,306 1,220,671Foreign direct investments inflow US$ million 98,873 108,096 108,214Visitorarrivals thousand 73,753 81,229 85,464
SourceS:ASEANstats,ASEANSecretariat.
NOTES
We express our gratitude to Professor Harry Block for his valuable feedback. We also thank to two anonymousrefereesfortheirusefulcomments.1. CalculationsfortheworldandtheEUarebasedondataprovidedbytheCIAWorldFactbook(2014).2. BasedonlatestdataprovidedbytheASEANSecretariat.3. Brunei,Laos,CambodiaandMyanmarareexcludedfromtheanalysisontradeintensityduetoinconsistencies
inthedataseriesfor theperiodofobservation.Note:Unlessotherwisestated,ASEANeconomiesrefers toallmembers.However,andashasbeenmentioned, theanalysison trade intensity focusesonlyon theASEAN-5andVietnam.Theanalysison interest ratecriteriaexcludesBruneiandCambodiadue to theunavailabilityofdata.
REFERENCES
Afxentiou, P.C. “Convergence, the Maastricht Criteria, and Their Benefits”. Brown Journal of World Affairs7,no.1(2000):245–54.
Alesina,A.andR.J.Barro.“CurrencyUnions”.Quarterly Journal of Economics117,no.2(2002):409–36.Athukorala, P. “Production Networks and Trade Patterns in East Asia: Regionalization or Globalization?”. Asian
Economic Papers10,no.1(2011):65–95.ASEANSecretariat.ASEAN Secretariat 2014a<http://www.asean.org/asean/asean-secretariat>.ASEANSecretariat.Overview 2014b<http://www.asean.org/asean/about-asean/overview>.ASEANSecretariat.Selected Key Indicators 2014c<http://www.asean.org/news/item/selected-key-indicators>.Bayoumi,T.andB.Eichengreen.“EverClosetoHeaven?AnOptimum-Currency-AreaIndexforEuropeanCountries”.
European Economic Review41,no.3–5(1997):761–70.Buiter,W.H.“Economic,PoliticalandInstitutionalPrerequisitesforMonetaryUnionamongtheMembersoftheGulf
Cooperation Council”. In Currency Union and Exchange Rate Issues: Lessons for the Gulf States, edited byR.MacDonaldandA.A.Faris.Northampton:EdwardElgar,2010.
10.indd 333 7/7/14 8:35:06 AM

Journa l o f Southeas t As ian Economies 334 Vo l . 31 , No . 2 , Augus t 2014
Chia, S.Y. “Association of SoutheastAsian Nations Economic Integration: Developments and Challenges”. Asian Economic Policy Review 6(2011):43–63.
CIA. World Factbook. Central Intelligence Agency, n.d. <https://www.cia.gov/library/publications/the-world-factbook/>.
Faris,A.A. “Currency Union in the GCC Countries: History, Prerequisites and Implications”. In Currency Union and Exchange Rate Issues: Lessons for the Gulf States,editedbyR.MacDonaldandA.A.Faris.Northampton:EdwardElgar,2010.
Jeon,B.N.andH.f.Zhang.“ACurrencyUnionoranExchangeRateUnion:EvidencefromNortheastAsia”.Journal of Economic Integration22,no.2(2007):256–87.
Kabir,S.andR.A.Salim.“ParallelIntegrationandASEAN-EUTradePotential:anEmpiricalAnalysis”.Journal of Economic Integration26,no.4(2011):601–23.
Karras, G. “Is There a Yen Optimum Currency Area? Evidence from 18 Asian and Pacific Economies”. Japan and the World Economy17,no.4(2005):456–69.
Kawai,M. “Toward aRegionalExchangeRateRegime inEastAsia”.Pacific Economic Review 13, no. 1 (2008):83–103.
Kwon,C.H.Yen Bloc: Toward Economic Integration in Asia.Washington,D.C.:BrookingsInstitutionPress,2001.Larraín, F. and J.Tavares. “Regional Currencies versus Dollarization: Options forAsia and theAmericas”. Policy
Reform6,no.1(2003):35–49.Lee, G.H.Y. and S.G.M. Koh. “The Prospect of a Monetary Union in EastAsia”. Economic Modeling 29, no. 2
(2012):96–102.Madhur, S. “Cost and Benefit of a Common Currency for ASEAN”. ERD Working Paper 12. Manila: Asian
DevelopmentBank,2002.McKinnon,R.I.“TheEastAsianDollarStandard,LifeafterDeath?”.Economic Notes29,no.1(2003):31–82.———. “Optimum Currency Areas and Key Currencies Mundell I versus Mundell II”. Journal of Common Market
Studies42,no.4(2004):689–715.———. Exchange rates under the East Asian dollar standard.Cambridge,MA:MITPress,2005.——— and G. Schnabl. “The East Asian dollar standard, fear of floating, and original sin”. Review of Development
Economics8,no.3(2004):331–60.Mundell,R.“ProspectsforanAsianCurrencyArea”.Journal of Asian Economics14,no.1(2003):1–10.Nguyen, T. “An analysis of East Asian currency area: Bayesian dynamic factor model approach”. International
Review of Applied Economics24,no.1(2010):103–17.Petri, P.A., M.G. Plummer and F. Zhai. “ASEAN Economic Community:A General EquilibriumAnalysis”. Asian
Economic Journal26,no.2(2012):93–118.Plummer, M.G., and G. Wignaraja. “The Post-Crisis Sequencing of Economic Integration in Asia: Trade as a
Complement to a Monetary Future”. Working Paper Series on Regional Economic Integration 9. Office of RegionalEconomicIntegration,AsianDevelopmentBank,2007.
Pomfret,R.andP.Sourdin.“HaveAsianTradeAgreementsReducedTradeCosts?”.Journal of Asian Economics20(2009):255–68.
Rajan,R.S.“FinancialandMacroeconomicCooperationinASEAN:IssuesandPolicyInitiatives”.InASEAN Beyond the Regional Crisis: Challenges and Initiatives, edited by MyaThan. Singapore: Institute of SoutheastAsianStudies,2000.
Rana, P.B. “Monetary and financial cooperation in East Asia: the Chiang Mai Initiative and beyond”. ERD Working PaperNo.6.Manila:AsianDevelopmentBank,2002.
Richardson,M.“Australia-SoutheastAsiaRelationsandtheEastAsianSummit”.Australian Journal of International Affairs59,no.3(2005):351–65.
Rose,A.K. “OneMoney,OneMarket:TheEffect ofCommonCurrencies onTrade”.Economic Policy 15, no. 30(2000):9–45.
Sally,R.,andR.Sen.2011.“TradepoliciesinSoutheastAsiainthewiderAsianPerspective”.World Economy34,no.4:568–601.
Sato, K. and Z. Zhang. “Real Output Co-movements in EastAsia:Any Evidence for a Monetary union?”. World Economy29,no.12(2006):1671–89.
———, Z. Zhang and D. Allen. “The Suitability of a Monetary Union in East Asia: What Does the Cointegration ApproachTell?”.Mathematics and Computers in Simulation79,no.9(2009):2927–37.
Schulze,D.L.“TheASEANFinanceCorporation”.ASEAN Economic Bulletin5,no.1(1988):71–80.Severino,R.C.“PoliticsofAssociationofSoutheastAsianNationsEconomicCooperation”.Asian Economic Policy
Review 6(2011):22–38.
10.indd 334 7/7/14 8:35:06 AM

Journa l o f Southeas t As ian Economies 335 Vo l . 31 , No . 2 , Augus t 2014
Takagi, S. and I. Kozuru. “Output and Price Linkages in Asia’s Post-Crisis Macroeconomic Interdependence”.Singapore Economic Review55,no.1(2010):59–81.
WorldBank.World Development Indicators<http://data.worldbank.org/data-catalog/world-development-indicators>.Williamson, J. “A Currency Basket for East Asia, Not Just China”. Institute for International Economics Policy
Briefs,August2005.Zhang,Y.andM.Shen. “EmergenceofASEAN,Chinaand Indiaand theRegionalArchitecture”.China & World
Economy20,no.4(2012):92–107.
Shahriar Kabir is aLecturer at theDepartmentofEconomics,SchoolofBusiness,MonashUniversityMalaysia,JalanLagoonSelatan,46150,BandarSunway,SelangorDarulEhsan,Malaysia;email:[email protected].
Ruhul A. SalimisanAssociateProfessorattheSchoolofEconomicsandFinance,CurtinBusinessSchool,CurtinUniversity,Room617,Bldg.402CurtinBusSchool,BentleyCampus,WesternAustralia;email:[email protected].
10.indd 335 7/7/14 8:35:07 AM