We go far - EUROWAG
234
We go far Annual Report and Accounts for the year ended 31 December 2021 W.A.G payment solutions plc Company Number: 13544823
-
Upload
khangminh22 -
Category
Documents
-
view
1 -
download
0
Transcript of We go far - EUROWAG

We go far
Annual Report and Accounts for the year ended 31 December 2021
W.A.G payment solutions plc Company Number: 13544823

Eurowag is a leading pan-European integrated payments and mobility platform focused on the commercial road transportation (“CRT”) industry.
We make the CRT industry life simpler, by connecting business owners, drivers, dispatchers and accountants with merchants in the energy network, toll chargers and other roadside and mobility service providers. We do this by creating a comprehensive suite of services across payment and mobility solutions.
OUR VISION
To democratise commercial road transportation through a technological revolution.
OUR PURPOSE
To create sustainable financial and technological solutions for the benefit of our industry, society and the environment.
OUR MISSION
To become the ultimate on-road mobility platform, creating better business opportunities across the industry.
Catch up with all of our latest news at https://www.eurowag.comhttps://investors.eurowag.com

We operate in
30
countries
Serving
15,020active payment solutions customers
Operating
82,640
active payment solutions trucks
We provide access to approximately
17,000 fuel stations
We have over
25
years of innovation and dynamic growth
In 2021, we processed approximately
32.5m
payment solutions transactions
Each year, we donate
1%
of EBIT to charitable causes
There are more than
1,000employees in 18 sales offices across Europe
And over
360,000charging points across Europe
Our payments customers consume
2.83products on average
In 2021, we listed on the London Stock Exchange and raised
€200mof equity capital
Net revenue retention
>110%
CONTENTS
Strategic reportEurowag at a glance 01Q&A with Eurowag’s CEO 02Why Invest in us? 04Group Highlights 05Chairman’s Statement 06Growing with a positive impact 08Marketplace 10Our Business Model 16Case Study- How we acquire andgrow our customers 24Our end-to-end ecosystem 26Our purpose, values,strategy and culture 32Our Key Performance Indicators 34Chief Executive Officers Statement 36Financial Review 40Risk Management 48Viability Statement 56Our Engagement with Stakeholders 59Responsibility and Sustainability 64Non-Financial Reporting Statement 92
GovernanceBoard of Directors 96Corporate Governance Report 100Nomination Committee Report 109Audit and Risk Committee Report 112Remuneration Report 120Directors’ Report 142
Financial StatementsIndependent Auditors’ Report 150Consolidated Statement of Comprehensive Income 160Consolidated Statement of Financial Position 161Consolidated Statement of Changes In Shareholders’ Equity 162Consolidated Statement of Cash Flows 163Notes to the Financial Statements 164Company Statement of Financial Position 223Company Statement of Changes in Shareholders’ Equity 224Notes to the Financial Statements 225Company information 231
01
Annual Report and Accounts EUROWAG
STRATEGIC REPORT
Eurowag at a Glance

Q Q
A ACommercial road transportation (“CRT”) is a fragmented market, dominated by family-owned small and medium-sized enterprise (“SME”) fleet operators that historically have had low access to capital and largely analogue operations. Significant in-journey costs are incurred remotely, by a lone employee, with multiple merchants and often in more than one currency. This is complex to track and vulnerable to fraud. Working capital is also a major challenge, as operators need to finance the cost of transporting their loads before they are paid for, doing so up to 90 days after delivery. I am an entrepreneur by nature and so I founded Eurowag to address these pain points, initially by providing essential payment services, which acted as an entry point to a platform of technology enabled services.
Through technology, I wanted to democratise CRT and help our customers compete and grow in a low-carbon, digital economy. At the heart of our purpose is the desire to create sustainable financial and technological solutions for the benefit of our industry, society and the environment. Ever since people have been able to use computers and mobile phones to authorise transactions, we have been innovating through technology and data to transform the CRT industry to help our customers and partners grow. Now we have listed on the London Stock Exchange, a great market for technology stocks. This is an important demonstration of our commitment to governance, as well as our confidence in our exciting growth plan. Our story has always been about long-term sustainable growth, and our listing starts the next chapter.
Our fuel cards created a business-critical partnership between Eurowag and our customers, which remains a key pillar of our business. Our fuel cards have evolved into a closed loop payment card covering all significant in-journey costs including toll payments, secure parking, truck wash and repair shops. This enables the operator to receive a comprehensive, real-time record of the diverse payments made across a freight trip. With our services deeply tied into the operations of SMEs across the CRT industry through our fuel cards, we were well placed to expand our offering with data-based services. The Eurowag of today is a data led technology enabler, providing SME fleet operators with the benefits of digitalisation through our mobile apps and vehicle telematics.
Our products and services now help simplify back-office performance for fleet operators by automating data exchange and analytics and enabling connectivity by reducing the friction between systems. Our technology helps our customers improve financial record keeping, reduce fraud and increase reliability of job execution. Our on-board payment and telematics device enables the digitalisation of the operator’s entire fleet, providing real time data – truck by truck, driver by driver. This provides access to a broad platform of digital solutions, which boosts fleet efficiency and reliability through route optimisation, expense tracking/analysis, monitoring/improving driver decision making and behaviour.
As the founder and CEO of Eurowag, what did you set out to achieve?
Eurowag began as a fuel card company – are you now a tech company?
Martin VohánkaChief Executive Officer
02
EUROWAG Annual Report and Accounts for the year ended 31 December 2021
STRATEGIC REPORT
Q&A with Eurowag’s CEO

Q Q Q
A A AWe are deeply embedded in the operations of our customers, enabling visibility of pain points and opportunities across the industry. Thanks to our data-driven insights, we can develop or acquire the optimal products and services, and integrate them on our scalable business platform. Through enabling digitalisation for our customers, we are able to continue to expand our platform of connected systems and products with new offerings. In addition, our listing raises the profile of our business and helps attract the talented people we need for growth. It also prepares us for acquisition opportunities, which is one of the pillars of our strategy. All in all, Eurowag is a growing, profitable, cash-generative business, with a well capitalised balance sheet, and quite apart from our growth to date, we are well positioned for further growth.
The industry we serve still uses vehicles that run on fossil fuels, operated by human drivers, to deliver goods that people need. However, the world is changing fast. The pandemic has accelerated society’s transition from cash to card and from card to virtual payments, to our benefit. With our stake in Drivitty, we’re giving new meaning to mobile and contactless payments. Regulatory initiatives such as open banking will help us disrupt the way people pay even faster. In addition, eMobility and autonomous vehicles are distinct global megatrends. Our business model is energy agnostic and is positioned to support our customers through industry change, providing data-led services to navigate disruption. Uberisation – that is, commoditisation of services through new digital platforms – will help shippers and carriers connect faster. This helps us reduce performance risk through real-time data. Through acquiring a stake in Last Mile Solutions, we are able to accelerate our focus on sustainable transportation by providing industry-leading eMobility services, helping us to expand into the middle and last mile. Vehicle manufacturers are becoming an important sales channel for our products, as well as a potential consumer of our services, so we have further expanded our Automotive business unit. Yes, the world is changing fast, and we play a key role in the new world, which is where our growth will come from.
Yes, it’s not just technology that is changing, people’s expectations of businesses are changing too, and we recognise our responsibility to the world we all live in. There is much we already do, and more we can do, to help protect the environment and combat climate change. We use our position to enable faster energy transition and to diversify energy sales to a wide range of sources, such as LNG, CNG, electricity and future fuels such as hydrogen. We understood the potential of digitalisation early, as drivers turned from maps to navigation systems, so we acquired a stake in Sygic, which in turn built technology talent and development resources through Road Lords. Our real-time traffic data makes transport more efficient by optimising routes and preventing service disruptions, and safer by managing traffic and improving driving styles. Through our telematics systems, we help enforce regulations and monitor vehicle status. Our technology also helps tackle social issues such as driver loneliness and poor working facilities and conditions. Improving standards across the industry can help operators employ and retain people. Our aim is for our success to benefit all our stakeholders, and that is something we work hard at every day.
What has allowed Eurowag to enjoy such impressive growth?
What gives you the confidence in this future growth?
Talking of the wider world, what role can you play in improving environmental and social impacts?
STRATEGIC REPORT
Annual Report and Accounts EUROWAG
03
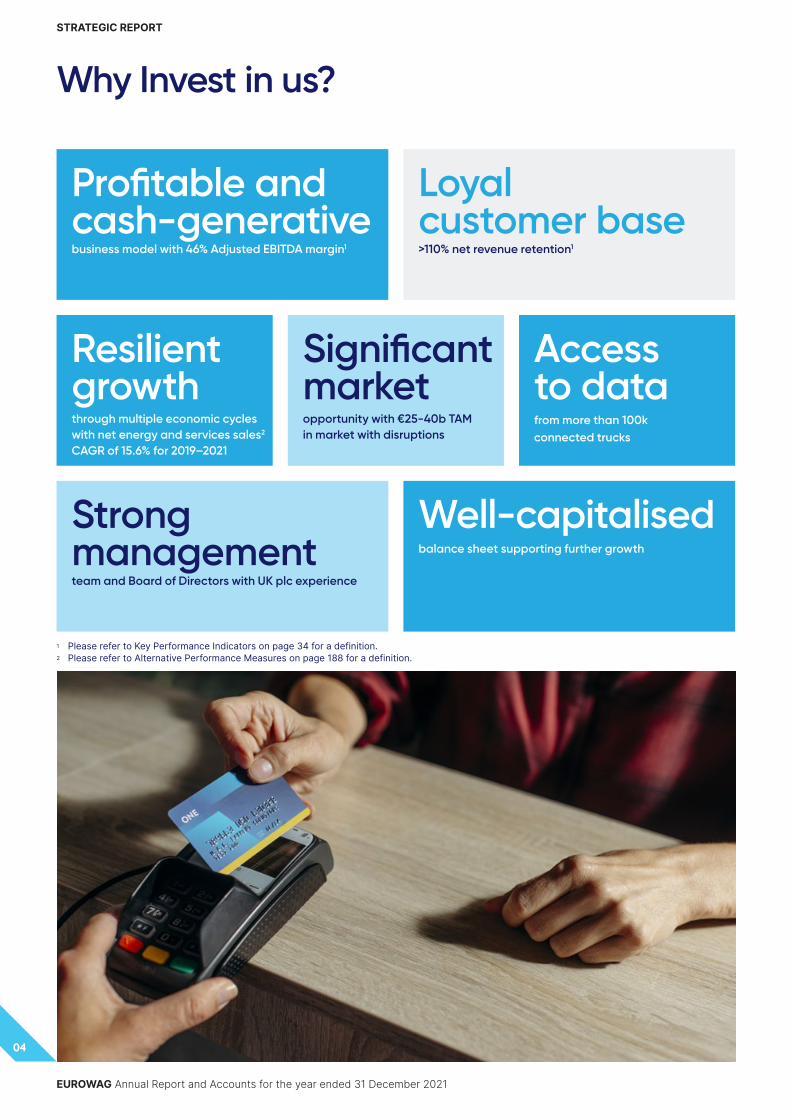
Resilient growth through multiple economic cycles with net energy and services sales2 CAGR of 15.6% for 2019–2021
Well-capitalised balance sheet supporting further growth
Access to data from more than 100k connected trucks
Strong management team and Board of Directors with UK plc experience
Loyal customer base>110% net revenue retention1
Profitable and cash-generativebusiness model with 46% Adjusted EBITDA margin1
Significant market opportunity with €25-40b TAM in market with disruptions
1 Please refer to Key Performance Indicators on page 34 for a definition.2 Please refer to Alternative Performance Measures on page 188 for a definition.
EUROWAG Annual Report and Accounts for the year ended 31 December 2021
04
STRATEGIC REPORT
Why Invest in us?

STRATEGIC
INITIAL PUBLIC OFFERINGIn October 2021 Eurowag listed on the London Stock Exchange. Our shares are trading under the symbol WPS.
We strengthened our balance sheet by raising €200mn in equity capital to support further growth.
GOVERNANCEWe expanded our management team and established a new Board of Directors with UK PLC experience.
MERGERS & ACQUISITIONSWe completed the acquisition of ADS and started integrating the customer portfolio, providing easy access to the full suite of products and services offered by the Group.
We acquired minority stakes in KomTeS, Drivitty and Last Mile Solutions, positioning for future growth especially in digital payments and e-Mobility.
We announced the intended acquisition of WebEye, to increase the penetration in our key markets, expand cross-sell and up-sell opportunities, and acquire more data from the connected vehicles.
EXPANDING DIGITAL PLATFORMIntroduced specialized modes for Dispatchers and Drivers on the Road Lords platform, and launched the Eurowag mobile application for easy access to products and services.
Activated access to the new electronic tolling systems in Austria, Belgium and Poland, followed by the EETS pilot in Germany in 2022.
21 15,020
19 11,919
20 13,180
18 9,114
21 82,640
19 66,592
20 72,884
18 50,113
21 32.5m
19 26.6m
20 29.1m
18 18.4m
21 153.1
19 114.6
20 128.6
18 73.7
NET ENERGY AND SERVICES SALES2 (€m)
21 45.5
19 41.1
20 45.6
18 35.1
ADJUSTED EBITDA MARGIN2 (%)
21 69.7
19 47.1
20 58.6
18 25.9
ADJUSTED EBITDA2 (€m)
21 5.77
20 4.83
ADJUSTED BASIC EARNINGS PER SHARE2 (cents)
21 (0.89)
20 0.91
NET LEVERAGE3
CUSTOMERSThe average number of payment solutions active customers1 rose from 13,180 to 15,020, representing 14% year-on-year growth.
TRUCKSThe average number of payment solutions active trucks1 rose from 72,884 to 82,640, representing 13% year-on-year growth.
TRANSACTIONSThe number of payment solutions transactions1 rose from 29.1m to approximately 32.5m, representing 12% year-on-year growth.
FOCUS ON CROSS SELL AND UP SELLOur ability to cross-sell and up-sell has produced net revenue retention1 for 2017-2021 over 110%.
OPERATIONAL
FINANCIAL
2 Please refer to Alternative Performance Measures on page 188 for a definition.3 Please refer to Key Performance Indicators on page 34 for a definition.21 1.54
20 3.76
BASIC EARNINGS PER SHARE (cents)
21 17.7
20 28.8
PROFIT BEFORE TAX (€m)
1 Please refer to Key Performance Indicators on page 34 for a definition.
STRATEGIC REPORT
Annual Report and Accounts EUROWAG
05
Group Highlights

The Group is in a good position to continue to broaden its technological foundations and capabilities and make selected strategic acquisitions to expand its market offering.”
DEAR FELLOW SHAREHOLDERS,I am pleased to be introducing Eurowag’s first Annual Report as a Company listed on the London Stock Exchange. It has been a momentous year in Eurowag’s 26-year history. In the years since 1995, the Group has transformed into one of Europe’s leading providers of solutions to the commercial road transport (“CRT”) industry through its integrated digital payments and mobility platform – all part of its vision for every company in the sector, however small, to have access to the benefits of digitisation at scale.
I was honoured to be invited to be the Chairman of W.A.G payment solutions plc as the Group moves into this new chapter of its history. I am assisted by a strong Board, which is embodied with a comprehensive skill set and diverse background. I have been encouraged by the unity of the Executive and Non-Executive Board members, with mutual learning and appreciation clearly evident as the boardroom dynamics begin to materialise.
LISTINGOn 13 October 2021, W.A.G payment solutions plc was admitted to trading on the London Stock Exchange. I want to thank all those within the business that helped in this achievement through their extraordinary effort and dedication in difficult market conditions.
Trading in our shares has been constrained by low liquidity and by volatility in the global financial markets. However, the fact that Martin Vohánka, and the other Shareholders, chose to list in London underlines the Group’s ambition and emphasis on good corporate governance.
Following the listing, Eurowag is now in a good position to continue to broaden its technological foundations and capabilities and make selected strategic acquisitions to expand its market offering. With its accelerated growth plans, Eurowag can play an integral role in the digitalisation of the CRT industry.
Paul ManducaChairman
I am pleased to be introducing Eurowag’s first annual report as a company listed on the London Stock Exchange.
INTRODUCTION
EUROWAG Annual Report and Accounts for the year ended 31 December 2021
06
STRATEGIC REPORT
Chairman’s Statement

STRATEGYThroughout the IPO process, the Group made clear its objectives to become the ultimate on-road mobility platform, creating better business opportunities across the industry.
The Board was disappointed with decision of the Ministry of Interior in Hungary not to approve the proposed acquisition of WebEye in its current form, however we will continue to assess options and remain committed to the strategy set out at the IPO and to further expanding our payments and mobility platform.
Eurowag continues to aim for sustainable growth for the future with integrated services that reduce the impact of our industry on the environment, by reducing the ratio of trips with empty loads and improving road safety.
2021 PERFORMANCEThe Group has performed well in 2021 against a difficult macro-economic background. Many industries have been affected by the uncertainty surrounding COVID-19, and the stop-start recovery has only exacerbated the difficulties faced by the CRT industry. The Board will continue to monitor the humanitarian tragedy in Ukraine and our thoughts are with the Ukrainian people at this time.
I am pleased to see that the business performed in line with historical trends and the medium-term guidance. The
top and bottom lines grew around 19%, delivering Net revenue of EUR 153.1 million and adjusted EBITDA of EUR 69.7 million for the year.
Key performance indicators also continue to provide a solid base for further growth. Eurowag is a strong business, supported by its strong track record of achieving profitability and growth.
OUR EMPLOYEES AND CULTUREWe are of course dependent on the loyalty and dedication of our personnel. Our Group consists of more than 1,000 special individuals spread around Europe, representing more than 30 different nationalities, in 18 countries.
A number of the Non-Executive Directors and I met many of our colleagues in Prague after our listing, and the entire Board is very much looking forward to our site visits later this year. One thing is clear from our engagement, our people are fundamental to the creation of sustainable, financial and technology solutions for the benefit of our industry, society and the environment.
SUSTAINABILITYESG was among the first items on the agenda at the Board’s inaugural meeting following the IPO. Through collaboration between Board and Management, Eurowag has developed a new sustainability (ESG)
strategy to support our purpose, business strategy and future growth opportunities.
This strategy was formed following stakeholder feedback and was developed specifically to address the material governance, risk, social and environmental challenges facing Eurowag and the industries we operate in.
I invite Shareholders to read more in our Responsibility and Sustainability section, which includes our reporting against TCFD targets, from page 64 of this report.
LOOKING TO THE FUTUREDespite the volatile geopolitical situation, which may have a negative impact on the European economy, Eurowag remains a fast growing, profitable, cash-generative business. I want to thank Shareholders for their investment in Eurowag. The year ahead promises opportunity for the Group. The Board looks forward to making strong strategic and operational progress in 2022. I again want to thank all of our colleagues who helped make 2021 a success.
Paul Manduca Chairman
STRATEGIC REPORT
Annual Report and Accounts EUROWAG
07

The growth of our business is• profitable;• cash generative; and• resilient.
We continue to build the business on the following strategic pillars:Accelerate digitalisation in the commercial road transportation (“CRT”) industry, bringing new partners onto our platform to cross-sell and up-sell to our existing customers.
Continue to build scale by growing our customer base.
Geographic expansion, exploring opportunities for new regions and further market penetration.
Unlock liquidity in the CRT industry and build a platform for third-party providers to integrate their offerings.
Use data available on the platform to facilitate interactions between participants in the CRT industry and create an integrated end-to-end marketplace.
Growing in a responsible and sustainable manner is at the heart of our values. We consider a broad range of stakeholders and share in our success by:• helping customers grow
their fleets and expand their business by improving their efficiency;
• helping partners grow revenues through our payment solutions;
• helping employees grow their skills and succeed in their career; and
• growing the value of our business for investors.
GROWTH FROM EXISTING CUSTOMERS
GEOGRAPHIC EXPANSION AND MARKET PENETRATION
DIGITAL PLATFORM DEVELOPMENT
Focus on cross-selling and up-selling to existing customersWe focus on retaining and expanding our existing customer relationships, and this is reflected in our high NPS scores and the longevity of the relationships. Our proven ability to cross-sell and up-sell has created an attractive average net revenue retention rate of over 110% and average customer tenure of approximately 7.4 years.
We expect to support and improve these figures by introducing new products and services, such as eWallet and Mobile Payment Management Services, by expanding our European Electronic Toll Service (“EETS”) capabilities, and by expanding our platform to further automate processes and create an even more seamless experience for customers, thus retaining them on our platform.
We also aim to advance our mobile applications, enabling social interactions that further deepens the relationship with its customers.
Examples from 2021 and plans for 2022:• High net revenue retention >110%• New toll access in Poland, Austria,
Belgium and Germany• Deploying on-board unit integrating
toll and telematics, with anti-fraud protection for payments
• Expanded the acceptance network for roadside service payments
• Launched Eurowag mobile application for easy access to customer accounts
Explore opportunities for geographic expansion and further market penetrationUse highly effective go-to-market strategy for new customer acquisition
We acquire new customers through a marketing strategy based on geographic clusters, that uses three primary sales channels to enable a decentralised sales organisation for our products.
We plan to further expand our extensive European payment network and increase our market share within existing markets, as well as expand into new regions in Europe. Increased geographical penetration will enable us to better provide full coverage to customers.
Examples from 2021:• Completed ADS acquisition and
started integrating customers to strengthen position in Iberia
• Rolled out digital sales channels in western Europe to expand geographic footprint
• Number of payment solutions active customers rose from 13,180 to 15,020 representing 14% year-on-year growth
• Number of payment solutions active trucks rose from 72,884 to approximately 82,640, representing 13% year-on-year growth
Digital platform expansionContinued digitisation of the CRT industry is a clear trend, and one we are already at the forefront of. We will continue to consolidate our leadership by evolving towards an integrated, end-to-end digital platform.
We aim to be a conduit for intermediating payments and data exchange between all parties, including, but not limited to, shippers, carriers, merchants and other partners. This will allow us to serve our existing customers better and expand our client base to include shippers and freight forwarders.
Examples from 2021:• Rolled out Road Lords application for
use in the office and on the road• Enabled payments for charging
stations on the Sygic application• Launched digital customer onboarding • Introduced automated scoring of
customer credit risk• Offered supply-chain financing
solutions from third parties to customers via EW Cash
EUROWAG Annual Report and Accounts for the year ended 31 December 2021
08
STRATEGIC REPORT
Growing with a Positive Impact

ACCRETIVE M&A
ENVIRONMENTAL, SOCIAL AND GOVERNANCE
Pursue value-enhancing acquisition opportunitiesWe have a proven record of acquisitions and a history of successful integration. We see acquisitions as a helpful tool for building our platform and bringing the next phase of efficient revenue and profit growth.
Our key considerations for evaluating acquisition opportunities include:• enlarging our total addressable market
through new geographic regions• broadening our total addressable
market through adjacent products and services
• strengthening our market position in existing markets
• accelerating the pace of our strategy by acquiring the necessary technologies for an integrated end-to-end digital platform
• increasing customer life-time value and retention
Our mergers and acquisitions team constantly monitors the market with the aim of making acquisitions consistent with our strategy and financial discipline. When evaluating an acquisition opportunity, we always consider its potential impact on our goals for sustainability and an inclusive culture.
Examples from 2021:• Increased capital available for M&A by
primary issue in IPO• Expanded M&A team• Appointed Chief Performance
Officer responsible for post-merger integrations
• Invested in Drivitty to enhance mobile-payment capabilities, and Last Mile Solutions to enable energy transition
• Completed ADS acquisition as an example of post-merger integration
• Announced potential WebEye acquisition
We have a methodical approach to ESG and reflect our values in everything we doGrowing in a sustainable manner is at the heart of our values, and we aim to create sustainable financial and technological solutions for the benefit of the CRT industry, society and the environment. As such, our ESG strategy places an ongoing and strong emphasis on operating responsibly, on being a leader in the industry by exceeding best practice and by helping transform the industry and broader society. In practice, we focus on: initiatives aimed at reducing GHG emissions to help foster the transition to clean mobility; addressing the inefficiencies in the transport industry; and improving the business results and wellbeing of our CRT customers.
Examples from 2021:ENVIRONMENTAL• Set a target to reduce emissions from
our own operations by 50% by 2030 (Scope 1 and Scope 2) and published Scope 3 baseline 2019 data
• Initiated a climate-risk assessment to understand risks and opportunities and report in line with TCFD
• Began renewable-energy purchasing and investments across the Group
• Continued expansion of our alternative and e-mobility solution offering in Europe
SOCIAL• Refreshed and published policies
to support DEI, as well as human rights including employees, including equal opportunities, anti-bullying and anti-harassment, health and safety policy, and grievance policy and severance principles and the Modern Slavery and Anti-Trafficking policy
• Improving customers’ wellbeing (connecting truck drivers via Road Lords app, enabling access to clean and safe facilities)
• Making roads safer (helping enforce regulations, aiding driving style, monitoring vehicle status)
• Promoting diversity, equity and inclusion (>30 different nationalities, 80% senior managers are international, established target to reach 40% female representation in leadership roles by 2025 and achieved a retention rate of 80.3% as of 31 December 2021)
GOVERNANCE• Formalised a new ESG strategy
including commitments that focus on helping our customers compete and grow in a low-carbon, digital future
• Established a sustainability function and strengthened ESG governance, including the appointment of Susan Hooper as the Board-level ESG champion
• Expanded the scope of ESG performance metrics publicly reported
The intensive data processing requires strong dedication to meet the regulatory requirements in the area of personal data protection (e.g. GDPR), and data security as a whole. We relentlessly work on improvements in both of these areas to be in line with the business standards, with the aim to exceed them.
DATA PROTECTION
STRATEGIC REPORT
Annual Report and Accounts EUROWAG
09

The commercial road transport market overviewWe operate in the large and growing European commercial road transport (“CRT”) industry and offer companies a comprehensive suite of payments and mobility solutions to help them to operate more efficiently. We focus on the fleets of both international and domestic small and medium-sized enterprises (“SMEs”).
The industry is an essential pillar of the economy, yet the current market is still an under-served industry where companies face multiple challenges and needs in their day-to-day operations. Industry annual turnover in Europe is approximately more than €350 bn and accounts for 75% of total European overall freight transport by volume (figures Eurostat).
MARKET CHARACTERISTICS INCLUDE:
According to market data, approximately 96% of the industry’s SMEs have fewer than 50 employees, with limited opportunities to scale their businesses. This results in lower bargaining power and provides opportunities for service providers to differentiate through superior products and services.
HIGHLY FRAGMENTED INDUSTRY
The digital adoption rate for logistics service providers is at 13%, substantially lower than in most industries. Therefore, long-term digital convergence is a substantial opportunity for our market.
LOW ADOPTION OF DIGITAL SOLUTIONS
Customers tend to be overburdened by having to often perform equally complex and manual workload, when also truck drivers cope with non-driving activities, which creates even more challenges to the already highly complex and time-constrained job. The small size of a typical operator hampers their ability to digitise, as this requires investment.
LIMITED ABILITY TO OPTIMISE OPERATIONS
Our customers and partners are looking to streamline their operations by seeking greater convenience, and hence prefer integrated solutions through a single platform with end-to-end integration.
DEMAND FOR A COMPREHENSIVE INTEGRATED ONE-STOP OFFERING
SMEs in the commercial road transport sector have fewer and costlier opportunities to obtain capital from the primary finance providers, this is usually due to the limited size, lack of established credit history, lack of assets for collaterals and unstable working capital resulting in negative cash flow. Due to this hurdle, many opportunities still exist to create efficiencies through technology.
CONSTANT FOCUS ON OPTIMISING WORKING CAPITAL
Carriers must comply with sustainability and safety initiatives, as well as local tax rules.
A HIGHLY REGULATED MARKET BOTH LOCALLY AND EUROPE-WIDE
EUROWAG Annual Report and Accounts for the year ended 31 December 2021
10
STRATEGIC REPORT
Marketplace

9.1 million commercial road transport trucks in 2020
Circa
€10.1bnin net revenue (2020) across fuel-card payments, toll, tax and other CRT market solutions
Responsible for
75%of European freight transportation movements and constituting 5% of European GDP
The market is expected to grow with a CAGR of
5%until 2025
We estimate that the addressable market has the potential to reach
€25–40bn with the introduction of digitised and integrated additional payment and mobility solutions
The size of the European commercial road transport marketRoad remains the dominant mode of transportation in Europe. In 2020, there were approximately 9.1 million commercial road transport (“CRT”) trucks in Europe (estimates IHS Markit and Eurostat), 26% of them based in Central and Eastern Europe.
In 2020, companies in the CRT sector spent €10.1 billion in net revenues, pooled across fuel-card payments, toll, tax and similar market solutions. This expenditure is expected to increase to €12.7 billion by 2025, representing a compound annual growth rate (CAGR) of approximately 5%.
INDUSTRY TRENDSThe services we provide to our addressable market in payments and mobility solutions have the potential to expand significantly and reach an overall size in the range of €25–€40 billion. This expansion is primarily due to trends in the digital optimisation of transportation processes, the need for improved access to liquidity, and an increase in demand for improved efficiency, reduced emissions and regulatory compliance.
We believe we can capitalise on these developments by developing an integrated digital platform that connects participants in the commercial road transportation industry. Using products and services available on the platform will help our customers make their operations more cost efficient and help them access opportunities to expand revenues, ultimately accelerating the growth of their businesses.
Annual Report and Accounts EUROWAG
11
STRATEGIC REPORT

We believe digital disruption is poised to create a substantial additional serviceable market opportunity and expect it to result in:
Trend Description How do we address these trends?
Emergence of digital freight forwarding (“DFF”) and digital freight exchanges
The market is experiencing a digitalisation of the freight allocation process. Through this, intermediary platforms can connect shippers and hauliers in real time. One of the primary benefits of this trend is the ability for hauliers to better manage empty loads by participating in a spot market for freight.
• We are exploring options to connect shippers with carriers on our integrated digital platform. Matching jobs with available capacity would further improve efficiency in the commercial road transport industry and help protect the environment by reducing empty miles.
A rise in digital payments
Digitalisation and growth in DFF are also expected to accelerate digital payment solutions and so increase the penetration of alternative payment methods like our fuel and toll cards, to the point where these could make 60%–80% of all payments
• We are working on introducing digital payments across our merchant partners, targeting primary energy payments.
• Introducing enhanced, predictive and mainly real-time security measures, e.g. geo-corridoring or remote refuelling, preventing fraudulent behaviour, and so saving unnecessary costs.
• Real-time processing provides an instant overview of spending, allowing our clients better planning and financial operations management.
• Automating the overall environment allows users to focus on what is important and improve their business performance, with limited engagement.
Financial services at scale
A rise in digital payments enables the ability for providers to offer short-term financing or tailored working capital.
• Digitalisation of the overall financial industry allows CRT players access to alternative sources of liquidity.
• Different types of liquidity suit different products. We are ready to provide credit-based, asset-based or other hybrid financing products.
• While a complex offering, it is simple on the user interface, with embedded financing allowing for effective resolution of different user requirements, and it can provide financing for customers with limited credit history.
Direct vehicle sale by OEMs
As original equipment manufacturers (“OEMs”) begin working directly with platform providers, they may use them as a sales channel for their new premium vehicles. This may create the potential for a new profit pool of the commission on sales, with estimates of as much as 10% of a vehicle’s value for a sale on the platform.
• We are developing strategic partnerships with major CRT OEM’s as we see the automotive OEM’s as essential partners to sell, extend, and complement our own products and services, improving CRT customers’ efficiency and user experience.
European electronic toll service (“EETS”)
More recently, the EU increased the push on European member states to comply with the European Electronic Tolling Service, aiming to create a harmonised EU-wide toll system to simplify the administrative burden and reduce the associated costs.
• We have taken the opportunity to build a proprietary EETS toll payment solution, which from the outset integrates with our other services, such as telematics along with fuel payment securitisation and fraud prevention. This creates a growing market opportunity, with barriers to entry for competitors, and expansion potential both on the tolling network and through cross-sales to our other services.
• Solves complexity by simplifying the job for truckers with one product.
Lower carbon mobility
As the number of electric vehicles (“EV”) and alternative fuel vehicles rises, the structural demand dynamics between traditional fuel and lower carbon substitutes changes.
• Digital solutions support greater energy efficiency. • Eurowag promotes sustainability and enables the green transition of
the industry.• We continue to expand our alternative energy and e-mobility
offerings. • We ensure sufficient infrastructure, large acceptance network with
wide geographical coverage. We create industry partnerships to advance the development of alternative fuels and e-mobility in the sector.
• We focus on integrating data on charging points and electric vehicles, to facilitate an e-mobility transition worldwide. This covers how to lower charging and range anxiety and enhance the driving experience.
EUROWAG Annual Report and Accounts for the year ended 31 December 2021
12
STRATEGIC REPORT
Marketplace CONTINUED

GEOGRAPHIC PRESENCEWe are a pan-European Company with origins in central and eastern Europe, an area that represents an under-served and rapidly growing part of the European market. From these origins, we have built a pan-European payment network for commercial road transport (“CRT”) customers and merchants.
We split Europe into three geographic clusters, covered by 18 sales offices – the Central Cluster (Czech Republic, Estonia, Latvia, Lithuania, Poland, Slovakia, and Ukraine), the Southern Cluster (Bulgaria, Hungary, Italy, Macedonia, Romania, Serbia, and Turkey) and the Western Cluster (Austria, France, Germany, Portugal and Spain). We plan to further expand our market share in existing markets, and enter new regions within Europe. We are also growing our sales office in Germany, with the intention of creating a DACH Cluster.
HOW WE SERVE OUR CUSTOMERSWe provide energy payments to our customers through our bunkering network (owned/rented truck parks and supply partnership sites) and through a network of acceptance partners at approximately 17,000 outlets in 30 countries. These sites are located on major transportation routes and along Trans European Network Transport corridors.
We provide our customers with payment solutions for traditional fuels (diesel, gasoline, adBlue) as well as alternative fuels such as LNG, CNG, biofuels. Additionally, with our closed loop card, clients can pay for a wide range of road services. In 2021, our clients had access to 230 parking locations, 890 washing and cleaning locations and 390 truck-repair shops within our sites and through partner cooperation. In 2022, we plan to extend our offer further by adding both locations and partners.
COMPETITIVE LANDSCAPEWe face competition from many companies, including international oil companies, single-product providers of fuel cards and other mobility services, including, telematics and fleet-management providers, car manufacturers, logistics brokers and domestic freight-forwarding operators. Except few bigger players with complex offer and European footprint, majority of these service providers is focused on specific single product or region, whereas we offer an end-to-end integrated solution across all products and countries.
Our competitive advantage is in our technological platform we have built, which is able to combine products in the best way for customer benefit. High technological investment together with time needed for build are a barrier for other players to compete with us directly.
Market with disruptions2020 2025
10
13
25–40~3x increase
c.3x
Sources: Company and Company estimates based on data as of May 2021; Allied Market Research (2020); BearingPoint (2015); BIS Research (2020); Mordor Intelligence (2017); Fitch/BMI; Industry report.
Notes: Converted from USD to EUR at a fixed rate of USD:EUR 0.8250; (1) Management estimates.
TOTAL ADDRESSABLE MARKET AND SERVICEABLE ADDRESSABLE MARKET (€BN) Growing serviceable addressable market driven by CRT digitalisationServiceable addressable market(1) (Net Revenue in €bn)
HOW WE SERVE OUR CUSTOMERS
13
Annual Report and Accounts EUROWAG
STRATEGIC REPORT

EUROPEAN ENERGY PAYMENTS MARKETThe European close loop card market is experiencing strong growth as a result of the need for better transport management, an increasing demand for payments and financing for fuel-saving products and services, and the higher acceptance of fuel cards and other new products that improve security. Using close loop energy payment cards brings many benefits, such as preventing unauthorised purchases, reducing energy costs, payment for other services such as toll, parking, washing, repairs etc., within closed merchant network, low cost of payment processing, short-term financing and tracking non-fuel purchases and fleet spending limits. The total European fuel-card market, including passenger fleets, which were heavily affected by the pandemic in that year, was approximately €156 billion of processed volume in 2020 and is expected to grow to approximately to a volume of €361 billion by 2027, a CAGR of approximately 13% (Allied Market Research).
EUROPEAN TOLL PAYMENTS MARKETThe European toll market is also expected to grow significantly due to planned investment in infrastructure and the deployment of efficient traffic-management solutions and pollution charges. It is expected to reach €33 billion by 2027, a CAGR 2020–2027 of approximately 7%.
Heavy goods vehicles (“HGVs”) accounted for approximately 88% of overall toll collections in Europe and are expected to account for approximately €29 billion by 2027. European Electronic Toll Service (“EETS”)-related toll services are expected to account for approximately €12 billion by 2030.
With our focus on heavy goods vehicles and medium commercial vehicles (“MCVs”) across Europe, rather than passenger fleets, we are well positioned to benefit from these trends. In addition, we are one of the few registered providers of European Electronic Toll Services in our markets. The aim of European Electronic Toll Services is to simplify tolling by granting private companies the permission to pay tolls through one device and through one customer contract, reducing the costs and administration.
EMBEDDED FINANCINGIn addition, we can use our sector knowledge and data to target the large outstanding working-capital needs of the trucking industry. We provide credit limits to eligible customers, with financing built into the end-user pricing. We also provide access to third-party financing solutions e.g. receivables factoring via EW Cash in the Czech Republic, Latvia, Lithuania, Poland and Slovakia.
The market segments we address
Payment solutions
EUROWAG Annual Report and Accounts for the year ended 31 December 2021
14
STRATEGIC REPORT
Our Marketplace CONTINUED

EUROPEAN TAX REFUND MARKETTax refund services: The tax refund market is mainly directed by European Union (“EU”) and local legislation, with varying value-added tax (“VAT”) rates across EU countries, ranging currently from 8% to 27%, with different treatment for rebates and excise duty (“ED”). These disparities cause increasing complexity for cross-border trucking, especially in the event of changes in VAT rates to support government policies such as seen recently in Germany and Poland. The size of the market depends largely on the volumes of international truckers, fuel-price movements, the toll-payments market and volumes of submitted tax-refund requests, which may now include components for electric vehicles and charging. The market is also influenced to a lesser extent by other VAT-bearing items such as oil, Ad-blue, parking, ferries and electricity. In recent years, the market for tax-refund services has been consolidating, with larger more-efficient players acquiring smaller ones, and also with VAT rates consolidating in EU member states. Another EU trend is the digitalisation of tax using mostly e-invoicing, and using AI for extraction of the data. We expect these trends to continue, and are currently well positioned as number three in the EU market.
EUROPEAN TELEMATICS MARKETTelematics: Road transport plays an essential role in the European economy through commercial vehicles, medium and heavy trucks, buses, coaches, light commercial vehicles and company cars. Berg Insight believes the European fleet management market has entered a growth period that will last for several years and the number of fleet management systems in use is forecast to grow at a compound annual growth rate of 14%, from 11.5 million units at the end of 2020, to 22.5 million by 2025. The growing demand for enhanced efficiency, safety features, sustainability initiatives and control will serve as a catalyst for market growth, further reinforced by government regulations.
Smart routing and location-based services: Working with system integrators, original equipment manufacturers (“OEMs”) and insurance companies, our offering spans a number of different industries. A key tool is to highlight our Road Lords navigation app, which links to the rest of our payment and mobility offering.
The overall commercial road transport market across payments and mobility solutions is supported by:
• the growth of cross-border e-commerce generally, which is growing at twice the rate of domestic e-commerce and is increasing demand for commercial road transport services
• deeper penetration of products in core services, such as increased use of fuel cards
• the growth of fleet-management services and digitalisation of both logistics and the overall supply chain
• development of new technologies and business models based on large datasets and analytics
• declining connectivity cost• increasing awareness of ESG
and industry-wide energy transformation, influencing the use of solutions to aid in the transition to green energy. We intend to be ready to support any type of energy and our applications help optimise journeys and use of assets, so reducing emissions and congestion
• the expanding economy, growing trade and the growth in the underlying commercial road transport market
• the expected stable share of road freight as a proportion of the total European land freight transport volume
Mobility solutions
STRATEGIC REPORT
Annual Report and Accounts EUROWAG
15

Eurowag connects its customers – owners, drivers, dispatchers and accountants – with partners, who are merchants in the energy network, toll chargers and other roadside and mobility service providers. We do this by creating a comprehensive suite of services across payment and mobility solutions. This integrated solution contributes to a smooth customer experience.This experience, in turn, draws the customer in through our core payment solutions and, in time, adding more of our mobility solutions products, which results in further efficiencies and enhancements in our customers’ operations.This creates a strong network effect, forming a virtuous cycle where each new participant strengthens the whole. It also provides us with deep and detailed customer data, creating further sales opportunities, increasing the lifetime value of each customer and bringing economies of scale.
HOW STAKEHOLDERS BENEFIT FROM OUR MODEL
BUSINESS OWNERSWe help low-margin businesses get the best price for energy, optimised routing, and value-for-money services for their drivers. To ease cash flow, we provide credit on toll expenses and tax liabilities, as well as other financing solutions. We provide further insights to help them make better business decisions.
TRUCK DRIVERSWe offer the peace of mind that drivers won’t be out of pocket, plus an extended network of fuel stations and road services, and up-to-date details of toll services. We provide accurate maps and navigation tools, and help them anticipate or find solutions to unpredictable events on the road.We help restore the enjoyment of life on the road.
FLEET DISPATCHERSWe provide easy and relevant places for the trucks to refuel, and affordable solutions to meet drivers’ needs. We offer detailed visibility of trip and truck travel costs, data to make better decisions, and the ability to calculate optimal routes and get an accurate estimated time arrival (“ETA”), as well as manage the entire fleet from a single tool.
How we create value
Payments Mobility
PAYMENT SOLUTIONS • Payment services enable
access to essential products and services like energy and toll
• Our services allow customers to transact efficiently and at a strong price point
• The Payments and Mobility Solutions integrate in our platform, which provides our customers insights into their expected payment needs (e.g. trip toll calculations) and improves overall ease of use
KEY SOLUTIONS• Energy payments• Toll payments
INTEGRATED PAYMENT AND MOBILITY NETWORK• Creating lasting customer
relationships and deeply
CU
STO
MER
DATA
16
STRATEGIC REPORT
EUROWAG Annual Report and Accounts for the year ended 31 December 2021
Our Business Model

KEY DIFFERENTIATING FACTORS BOLSTERING OUR COMPETITIVE POSITION
Prominent position due to high share of a walletServicing more than 50% share
Comprehensive payment network focused on CRTSmall number of market participants due to high barriers of entry
Proprietary technology and product suite designed to generate unique market dataEVA, Road Lords, Vector, EETS
Integration makes the differenceNew products improve unit economics and extend customer life-time value
Well positioned for a sustainable futureEnergy agnostic with growing alternative fuels network and strong e-mobility presence
ADMINISTRATIVE STAFFWe provide accountants with detailed visibility of trip and truck travel operations, costs, data and receipts, and take care of tax refund formalities, including complex foreign currency and regulations processes.
MERCHANTS AND PARTNERSWe make it easy to find and process customers for energy product providers, trucker services providers and financial services providers. For toll chargers, we integrate seamlessly with their systems. We provide the data for those who need maps such as OEMs, apps and freight forwarders.
Payments Mobility
MOBILITY SOLUTIONS • Mobility services provide
enrichment to and increase the relevancy of the payments solutions
• Integrated FMS improve trucker’s economics (through better efficiency) and enhance trucker experience (through better planning and connectivity)
• High ratings of Road Lords, even in its early development, indicate the product’s relevance for customer retention
KEY SOLUTIONS• Tax refund• Vehicle information• Smart navigation• Adjacent services
entrenching Eurowag into our trucker’s daily life
• Providing a platform for growing Eurowag share of wallet
CU
STO
MER
DATA
STRATEGIC REPORT
17
Annual Report and Accounts EUROWAG

Our integrated product offering Operational efficiency: optimisation of consumption and wear out; managing working capital requirements; cost reporting; smart routing; and removing the overall administrative burden for truckers.
Cost savings: cost control; fraud prevention; improved purchasing conditions; smart routing, FX management; enhancing driving style; and financing.
Convenience: cashless payments; automatic payments; optimum route suggestions; relevant network of acceptance points for energy payments; driver recommendations for best facilities, best supplies and provisions; and points of interest on route; fewer on-board units (“OBU”).
Safety and social: driver community; safe parking; driving assessment and education; driver social media for meetings; and traffic recommendations.
PLAN THE ROUTEFleet dispatchers can plan the optimal route for heavy trucks and deploy directions to the navigation system inside the cabin for drivers to follow.CALCULATE EXPECTED COSTSFleet dispatchers can calculate indicative costs, compare alternatives and select the optimal route. They can also book ferries through our partner, Move Expert.
SECURE ADEQUATE FINANCINGBusiness owners can use one credit line for all vehicles in the fleet, across multiple products, on parallel jobs, improving working capital efficiency.
INSURE THE TRIPBusiness owners can insure various risks more efficiently.
PAY FOR ENERGY Business owners can provide the means of payment for truck drivers to refuel or recharge on the road.
PAY FOR TOLLSFleet operators can equip vehicles with integrated on-board units, enabling drivers to pay for highway tolls and tunnels seamlessly across Europe.
NAVIGATE SAFELYTruck drivers can focus on the road and use the navigation system with directions optimised for vehicle parameters, offline maps and traffic updates. Business owners can enforce regulations (e.g. tachograph) and monitor driver behaviour (e.g. speed limits) and driving style (e.g. aggressive accelerating/frequent braking), across the fleet.
MANAGE FLEETS ON THE MOVEBusiness owners can optimise operations, fleet dispatchers can plan capacity, truck drivers can communicate with operators, back-office workers can monitor live vehicle information. Our integrated suite of products and services creates efficiency on the go.
COVER INCIDENTAL SPENDBusiness owners can equip truck drivers with a credit card to cover incidental spend on the road.
PROCESS TAX REFUNDSBusinesses can process and collect eligible excise duty and VAT refunds. They can also pre-finance eligible refunds through net invoicing or advance payments.SIMPLIFY ACCOUNTING AND PAYMENTSBusinesses can combine spending for different products and services on a single itemised invoice. They can also change the settlement currency on outstanding invoices to further optimise cash flow.
EUROWAG CASHBusinesses can finance eligible receivables through our partner Factris.
REGULATORY SERVICESFleet operators can post drivers and fulfil the regulatory obligations in various countries through our partner, Move Expert.
The Group’s focus is on making customers’ lives easier, more efficient and more profitable, whether before setting out, on the road, or after delivery.
BEFORE A JOURNEY AFTER DELIVERYON THE ROAD
EUROWAG Annual Report and Accounts for the year ended 31 December 2021
18
STRATEGIC REPORT
Our Business Model CONTINUED

Business owners Truck drivers Fleet dispatchers Backoffice Merchants and partners
Energy We offer the best fuel price for the least effort
We provide an extended network of fuel stations and peace of mind they won’t be out of pocket when they refuel
We provide easy and relevant places for trucks to refuel
We provide automatic and detailed visibility of trip and truck travel operations
We drive traffic to partner locations and help energy product providers sell higher volumes
Toll We offer credit on toll expenses
We provide up-to-date toll services and hardware
We automatically provide detailed visibility of trip and truck travel costs
We provide detailed visibility of trip and truck travel operations including cash out and receipts
For toll chargers, we integrate seamlessly with their systems
Tax refund
We provide peace of mind by taking care of tax refunds and factoring liabilities on foreign tax services
– – We provide peace of mind by taking care of tax refund formalities
–
Financial services
We provide the financial means to manage both the expected and the unexpected expenses
We offer peace of mind that they won’t be out of pocket
We simplify or automate finance-related tasks
We make it simple to control the flow of information and cash
For financial services companies, we make it easy to find and process customers
Smart routing
We provide maps with accurate data to calculate routes
We provide accurate maps through apps and navigation tools
We help them calculate optimal routes quickly and get an accurate ETA
– For OEM, apps and freight forwarders who need maps, we provide the data they need
Vehicle information (Telematics)
We provide the information to make better business decisions
We help them find the quick solutions to unpredictable events – ETA change, payment issues, tyre repair, wrong address, navigation, alerting shippers
We provide proactive data to help make better and easier trip and truck decisions
We provide automatic and detailed visibility of trip and truck travel operations
For fleet managers, we make it easy to access and interpret multiple data sets to make better decisions
Adjacent services
We offer value for money on the services they buy for their drivers
We provide an extended network of road services, and peace of mind they will find what they need when they need it
We provide access to reliable and affordable solutions to meet drivers’ needs
We provide detailed visibility of trip and truck travel operations
For third-party product and service providers, we make it easy to find and process customers
Road Lords
We provide the information to make better business decisions
Our digital community helps them anticipate issues
We help them manage the entire fleet from a single tool, and make smart, real-time decisions
– –
STRATEGIC REPORT
Annual Report and Accounts EUROWAG
19
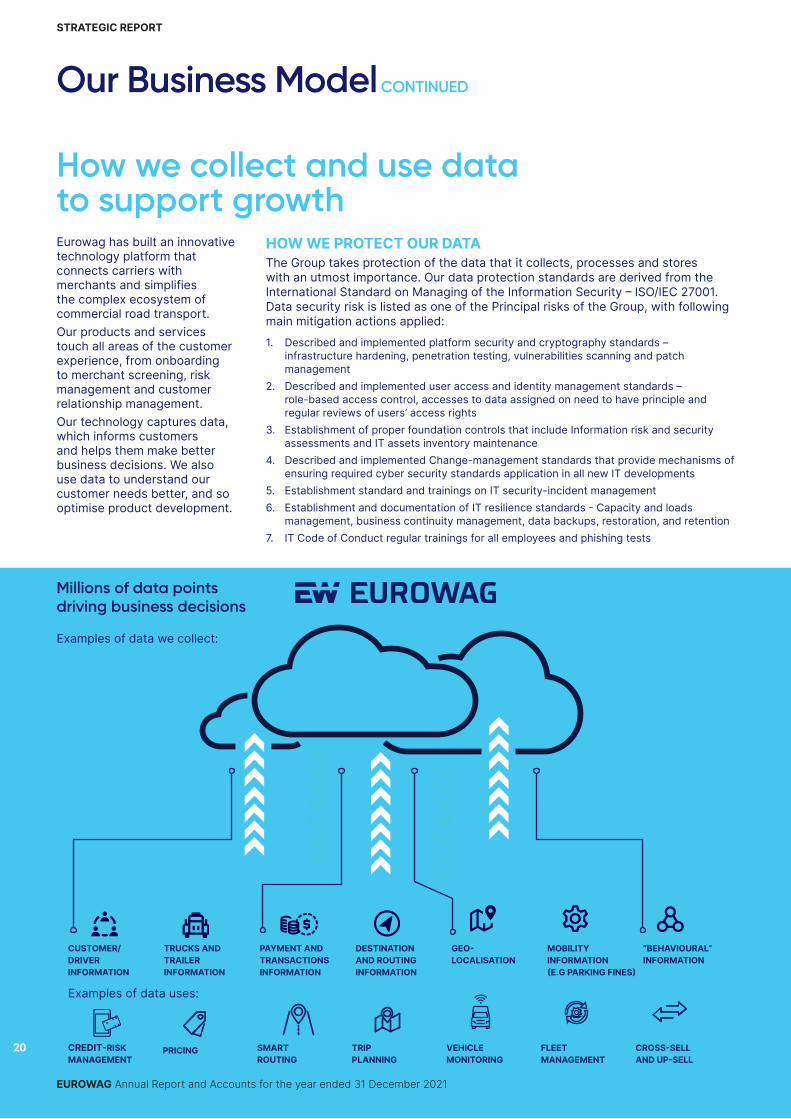
Eurowag has built an innovative technology platform that connects carriers with merchants and simplifies the complex ecosystem of commercial road transport.Our products and services touch all areas of the customer experience, from onboarding to merchant screening, risk management and customer relationship management.Our technology captures data, which informs customers and helps them make better business decisions. We also use data to understand our customer needs better, and so optimise product development.
How we collect and use data to support growth
Millions of data points driving business decisions
DATAExamples of data we collect:
HOW WE PROTECT OUR DATAThe Group takes protection of the data that it collects, processes and stores with an utmost importance. Our data protection standards are derived from the International Standard on Managing of the Information Security – ISO/IEC 27001. Data security risk is listed as one of the Principal risks of the Group, with following main mitigation actions applied:1. Described and implemented platform security and cryptography standards –
infrastructure hardening, penetration testing, vulnerabilities scanning and patch management
2. Described and implemented user access and identity management standards – role-based access control, accesses to data assigned on need to have principle and regular reviews of users’ access rights
3. Establishment of proper foundation controls that include Information risk and security assessments and IT assets inventory maintenance
4. Described and implemented Change-management standards that provide mechanisms of ensuring required cyber security standards application in all new IT developments
5. Establishment standard and trainings on IT security-incident management6. Establishment and documentation of IT resilience standards - Capacity and loads
management, business continuity management, data backups, restoration, and retention7. IT Code of Conduct regular trainings for all employees and phishing tests
Examples of data uses:
CREDIT-RISK MANAGEMENT
PRICING SMART ROUTING
TRIP PLANNING
VEHICLE MONITORING
FLEET MANAGEMENT
CROSS-SELL AND UP-SELL
CUSTOMER/ DRIVER INFORMATION
TRUCKS AND TRAILER INFORMATION
PAYMENT AND TRANSACTIONS INFORMATION
DESTINATION AND ROUTING INFORMATION
GEO- LOCALISATION
MOBILITY INFORMATION (E.G PARKING FINES)
“BEHAVIOURAL” INFORMATION
EUROWAG Annual Report and Accounts for the year ended 31 December 2021
20
STRATEGIC REPORT
Our Business Model CONTINUED

We see mergers and acquisitions as a useful strategy for building our integrated payment ecosystem, and creating growth and synergies. The acquisitions and equity investments shown here have helped us to:
expand our total addressable marketincrease market share in existing markets and enter new marketssupport innovation through access to customers, talent and technologybuild capabilities to develop our platformincrease customer life-time value and retention
The history of our key acquisitions is as follows:• In 2014, the launch of our tax
services product line followed from the Group’s acquisition of 100% stake in ČESKÁ LOGISTICKÁ a.s., a small Czech tax services company, which we renamed Reamon Tax in 2015. This acquisition added
essential skills for processing tax refunds across Europe, reducing our dependence on external providers for these services.
• In 2017, the launch of our telematics product line followed from the acquisition of 100% stake in Princip a.s. and expanded in 2018 with the acquisitions of 100% stake both in Aldobec Technologies, s.r.o. and Hi Software Development s.r.o. Each expanded our product, research and development capabilities and added new telematics software crucial customer know-how. This helped us develop a unique on-board unit that became the basis for our EVA and EETS offering.
• In 2019, we acquired 70% stake in Sygic, a navigation software company, allowing us to develop our navigation services and software, to create an integrated digital sales channel. Through this acquisition, we were able to develop our eMobility offerings.
• Also during 2019, we acquired a 75% stake in ADS, a group of companies operating in Iberia on a similar business model to ours, further expanding our market presence, growing our fuel card acceptance network and accelerating our market entry plans into Spain and Portugal.
• In 2021, we made three strategic equity growth investments:
1. a strategic partnership (via a 27.75% minority investment) with Dutch-based company, Last Mile Solutions, one of the fastest growing eMobility platforms in Europe
2. a 20% minority investment in Lithuanian-based company Drivitty, a mobile payment solutions integration provider to the CRT industry
3. a 51% majority investment in Czech-based company KomTeS, a value-added reseller of our telematics products
Reamon TaxTax Refund (2014)
Expanded capabilities and added essential customer competencies
ADSGeographic Expansion (2019)
Market entry into Iberia
Last Mile SolutionseMobility (2021)
Reinforced industry-leading eMobility services
PrincipTelematics (2017)
Expanded customer base and enabled Eurowag to develop
hardware necessary for OBUs
SygicNavigation (2019)
Expanded capabilities and gained new technology and tools
DrivittyPayments (2021)
Enhanced payment capabilities (cashless and cardless services)
Aldobec Technologies and Hi Software Development
Fleet Management System (2018)Expanded customer portfolio,
telematics know-how and customer data
KomTeSValue Added Reseller (2021)
Unification of direct sales channel
WebEyeFleet Management System (2022)1
Expanded customer portfolio and access to data
Expand our TAM
Strengthen our market position
Support our innovation
Build our capabilities as an end-to-end digital ecosystem
Proven M&A track record and integration capabilities
Product expansion Customer-base acquistion Both product expansion and customer-base acquisition
How we use M&A to enhance our digital platform
SYGIC SDK BRINGS THE TALENT AND TECHNOLOGY FOR DESIGNING, DEVELOPING, MARKETING AND MONETISING MOBILE APPS. THE BEST EXAMPLES ARE THE EUROWAG APP AND ROAD LORDS, WHICH SERVE AS DIGITAL MARKETING TOOLS CUSTOMISED TO TARGET DIFFERENT AUDIENCES.
1 Transaction announced in 2021, not completed as of date of publication. See Subsequent Events on page 218 for details.
STRATEGIC REPORT
Annual Report and Accounts EUROWAG
21

Many providers to the CRT industry focus on one aspect of customer needs, such as fuel card or fleet management system, with the main focus just on trucking companies. To fulfil many different, but related, customer needs we provide an integrated product offering or a one-stop shop approach that eases the complexities and fragmentation found in the CRT industry with ultimate focus on truckers, which is differentiating us from the competition. We support this with our proven cross-selling strategy that seeks to achieve lifetime customer relationships.
Typically, we initiate the relationship with customers through our energy payment solutions, but ultimately aim to expand on this with the addition of financing, toll payment solutions, tax refund, telematics, smart routing and other adjacent services.
We aim to further increase our share of their spending as we introduce new products and services. Through new services and continuous high quality customer care we are building long-term relationships with our customers, which is further increasing potential for future growth of our share of wallet.
Our comprehensive suite of payments and mobility technology solutions focuses on the fleets of both international and domestic SMEs, helping them operate more efficiently. A typical customer might have seven employees, consume 40,000 litres of fuel a year to cover 130,000 kilometres, have six OBUs in operation and have approximately 200 payment transactions per month.
Our customer base includes 15,020 active payment solutions customers and 82,640 active payment solutions
trucks in 2021. Over time, repeat customers use more of the Group services. For example, the average customer with a one-year relationship uses from two to three products for customers that are with us more than five years.
We are able to provide a highly customised offering and also a retention strategy based on our access to millions of data points, including frequency of usage, company size and origin, location, customer price sensitivity, customer behaviour, transactional data and tenure. Our digital customer on-boarding system provides a competitive advantage as it facilitates a centralised platform for creating customer awareness and marketing campaigns, as well as digital administration.
How we serve our customers
EUROWAG Annual Report and Accounts for the year ended 31 December 2021
22
STRATEGIC REPORT
Our Business Model CONTINUED

GO TO MARKET STRATEGY AND MARKETINGOur diversified sales channels include field sales, telesales, direct marketing, point-of-sale marketing, word of mouth and the internet. Our decentralised sales model supports customer proximity with a sales force of 354 full time employees in 18 sales offices across our three geographic clusters: Central, Southern and Western. Our multi-channel sales and marketing strategy is focused on three main elements:
Direct sales and marketing – The sales team uses industry expertise and country-specific databases of newly registered trucks. Country sales managers manage sales operations for an entire country in target, area sales managers meet potential customers, and remote telesales representatives identify potential customers through a calling strategy. They are supported by local customer care teams, specialists for individual products and also by local credit specialists to ensure the most efficient operation and minimise risk. The area sales force are generally industry experts, many of them former employees in the CRT industry, and they explain to customers how we are reducing the complexity of international and domestic transport.
We then monitor the customer’s use of the product and services selected to identify and pursue opportunities to cross-sell or up-sell. All this is supported by advanced data analytics, which is providing all necessary information on a daily basis.
Digital strategy and marketing – We apply an integrated digital marketing approach including brand awareness building, engagement, acquisition, onboarding, up-sell and cross-sell activities where all key digital channels (paid advertising, SEO, social media, content marketing etc.) work in alignment to maximise efficiency. There are different digital touchpoints (our public web, product landing pages, online onboarding channel, mobile application, and client selfcare portal) that each serve a specific purpose in the customer journey. Our newly updated website is turned from a static Company page into an active lead generation tool where interested customers can be fully onboarded online. The role of the sales representatives is evolving into personalised consultation and assistance. As with the direct sales, we then monitor the customer’s use of the product and services selected to identify and pursue opportunities to cross-sell or up-sell. Integrating marketing with our digital products gives us an opportunity to personalise
the sales proposition. For example, we can deliver offers to navigation system users such as energy payments or insurance when customers behaviour indicates that these products would enhance their experience.
Indirect sales and marketing Based on our unique breadth of services and focus on the CRT Industry, we also partner with Automotive and larger customers through indirect sales and mobility solutions. We provide our own core services bundled with our customers’ services to enable them to offer an extended offer to their customers based on our own backend systems and organisation. An example of this is our partnership with Volvo Financial services where Volvo offers our fuel, toll and tax refund bundled with their own maintenance services on one co-branded card to their own customers. We are also building a position in the CRT industry primarily through Navigation where we sell directly to the Automotive OEMs allowing them to benefit from our leading Mobility solutions and allowing other services to be enabled directly from the dashboard.
STRATEGIC REPORT
Annual Report and Accounts EUROWAG
23

CUSTOMERMERCHANT
ONBOARDING BUILDING A RELATIONSHIP BECOMING A TRUSTED PARTNER
Daniel responded to one of our digital campaigns. Our local area sales manager, with detailed knowledge of the industry, followed up the lead and worked with Daniel to tailor an offer based upon the specific needs of their business.
Over time, we were able to use data analytics to build a richer picture of Daniel’s transactional activity. During this period, we noticed significant international refuelling. This enabled us to propose both toll services and tax refund services to simplify their payments and improve their cash flow. Daniel took up our toll services as a second service, three months after becoming a customer. Tax refund services followed shortly after, and our services were quickly bringing lower energy costs, improved cash flow and greater convenience.
Our sales team have a deep understanding of carriers’ needs and tailor the products in the best possible bundle to target these needs.
Daniel has a more efficient business with Eurowag as a partner. Regular sales team contact, combined with the digital apps Daniel is now using, such as Road Lords app, allow multiple opportunities to both support, up-sell and cross-sell further services to Daniel as our relationship evolves. Daniel will be able to benefit from further efficiencies from route planning, financing, alternative fuels and insurance.
How we acquire and grow our customers
24
EUROWAG Annual Report and Accounts for the year ended 31 December 2021
STRATEGIC REPORT
Case Study
Our step-by-step approach to onboarding and building loyalty with our customers.Meet Daniel. They’ve been operating a fleet of seven vehicles for seven years. Their business is based in Hungary and their contracts regularly take their fleet across six borders within the EU.

BECOMING A TRUSTED PARTNER
Thanks to our partnership with Eurowag, our business can compete with larger fleet operations and we can grow our business with confidence.”
25
Annual Report and Accounts EUROWAG
STRATEGIC REPORT

The Group’s business is divided into the payment solutions segment (comprising energy payments and toll payments) and the mobility solutions (comprising tax refund services, including telematics, smart navigation and other adjacent services).
PAYMENT SOLUTIONS MOBILITY SOLUTIONS
Re-occurring transaction-based revenue streams
Re-occurring transaction, recurring and other fee-based revenue streams
Energy payments
Number of transactions
(x)average units
per transaction(x)
fee per unit(1)
Tax Refund
Processed volume
(x)% take rate
Smart routing
• Subscription based and lifetime license fees
Toll payment
Processed volume
(x)% take rate
Vehicle information (Inc. telematics)
• Subscription based
Other adjacent services
• Various
Contributions of the Group’s two business segments to the Group’s net revenues
26.8%
73.2%
26.1%
73.9%
20202021
Payment Solutions & Mobility Solutions
Payment Solutions Mobility Solutions
1 Units: e.g. litres of fuel, kilo of LNG /CNG, kWh for EV.
EUROWAG Annual Report and Accounts for the year ended 31 December 2021
26
STRATEGIC REPORT
End-to-End Ecosystem

Payments are the major part of our ecosystem and are comprised of economically efficient and secure means of energy payments through pre-pay or post-pay fuel cards and toll payments (by on-board units). They often serve as the introduction to our services for customers.
We have expanded into new payment methods such as mobile payments or alternative authorisation methods such as bring your own device and more. These latest technologies will allow for further integration of our own, or third-party, tools, further enhancing our closed-loop network within our contracted merchant network, which continues to grow. Through our investment in Drivitty, a leader in mobile fuel payments, we expect to gain additional energy stations and benefit from Drivitty’s existing platform including integration with mobile-ready merchant partners and marketing incentive programmes.
73.9%of the Group’s net revenues
In addition to our closed-loop payment means (fuel cards), we also encourage customers to use our open-loop Eurowag Mastercard card. This allows us to provide liquidity solutions tailor-made for each customer.• Serving 82,640 active payment
solutions trucks• Processing approximately
32.5 million payment solutions transactions
ENERGY PAYMENT SOLUTIONSOur energy payment solutions generate mainly recurring transactional revenue through our network of acceptance points and bunkering sites located on major transportation routes. These offer customers a more efficient way to purchase and finance their energy needs while on the road, offering competitive prices for their energy at accessible locations across Europe, through pre-pay or post-pay fuel cards.
We are able to use our scale to receive competitive energy prices for our customers, who can find out the prices they may encounter in advance. We may also offer discounts to the displayed prices.
Fuel cards offer customers a cashless means of payment for buying energy on our network, thus offering anti-fraud protection, security and transparency to our customers. At the end of the invoicing period, customers receive a single invoice for all of their energy charges, including comprehensive usage and management information.
In line with our ESG commitment to facilitate and support the green energy transition in the CRT sector, we are committed to:• Expand our alternative energy
acceptance points to reach sufficiently large coverage across the EU
• Increase the share of active trucks using alternative energy and drive customer adoption of transitional and cleaner fuels
• Introduce data insights and advisory solutions to help our customers transition to lower carbon vehicles and fuels, reduce emissions and improve efficiency
• Reduce the carbon intensity of the fuels we sell
We aim to harness our mobility and payments platform services to accelerate the transition to a low carbon future in the CRT sector. ACCEPTANCE POINTSWe provide payment solutions for energy sales through fuel cards and apps that customers use at an acceptance point. Acceptance points sell various grades of diesel, AdBlue, gasoline, bio products and alternative fuels like LNG and CNG. We secure contracts with fuel stations who become acceptance partners in the network. This allows for a substantial network of providers, so we can provide full geographical coverage to customers.
For energy we sell this way, we process the transaction and add a margin for each unit of energy sold based on various formulas, which differ based on the mode of sale. With a pre-pay card we use customer funds to settle; with a post-pay card, we are providing short-term credit to the customer.
PAYMENT SOLUTIONS
STRATEGIC REPORT
Annual Report and Accounts EUROWAG
27

BUNKERING SITESEnergy payment solutions also sells energy directly to customers through supply partnerships and fully owned or rented truck parks.
We own or rent, and operate our truck parks, 18 of which are unmanned and fully automated. All are strategically located in key logistics hubs and truck traffic zones close to key intra-EU borders and offer large serving capacities designed to achieve high throughput, with fast and efficient refuelling. They operate at low cost and afford us full control of service and product quality.
We also supply the energy to the supply partnership stations where we pay a throughput fee to the station owner. These sites offer the opportunity for branding without ownership responsibilities, lowering of prices for customers and the achievement of a good balance between flexibility and control.
EMOBILITY PAYMENT SOLUTIONS Through our minority investment in Last Mile Solutions, we provide industry-leading eMobility services, including payment solutions. Last Mile Solutions offers a scalable, white-label billing transaction and charging-management platform to eMobility service providers and charge-point operators. Customers pay Last Mile Solutions a monthly subscription fee for the platform as well as a margin on the price of kWh purchased. Last Mile Solutions:• provides access to more
than 67,000 connected charging points
• has over 437,000 active charge-payment cards
• has users in 22 countries• processed more than
12 million transactions in 2021
We also provide charge payment options for eMobility customers through Sygic GPS Navigation for consumers. Through its GPS Navigation app, we offer EV mode with search of charging points, electric and plug-in hybrid vehicles onbording, and routing for more than 360,000 charging points across Europe with online data and payment possibilities (via in-app or RFID card) at approximately 225,000 of these.
TOLL PAYMENT SOLUTIONSEach European country has its own tolling system and regulations, making over 135 toll chargers across Europe. Cross-border drivers often need a variety of on-board units (“OBUs”) and payment solutions. Our toll payment solutions business, similar to energy payment solutions, allows customers to pre-pay or post-pay for their toll payments on European tolled road networks. • Approximately 60% of
customers use both energy and toll payment solutions
• Operating in 23 European countries and five tunnels
• Cooperating with over 80 partners
EUROPEAN ELECTRONIC TOLLING SERVICEMore recently, the EU has increased the requirements for European member states to comply with the European Electronic Tolling Service (“EETS”), aiming to create a harmonised EU-wide toll system to simplify the administrative burden and reduce the associated costs.
We have taken the opportunity to build a proprietary EETS toll payment solution, that from the outset integrates with our other services, such as telematics, fraud prevention and fuel payment. This creates a growing market opportunity, with barriers to entry for competitors, and expansion potential both on the tolling network and through cross-sales to our other services. This is in the form of an on-board unit, a small hardware device. This is usually associated with a specific national toll domain that helps record the tolled drives and supports enforcement by national authorities. In the past, international trucks had to use a variety of OBU devices in a single trip.
PAYMENT SOLUTIONS CONTINUED
EUROWAG Annual Report and Accounts for the year ended 31 December 2021
28
STRATEGIC REPORT
End-to-End Ecosystem CONTINUED

The EETS scheme enables a single OBU to be used across different countries – with one contract, one device and one invoice.The market opportunityFor the carrier, toll payments are mandatory – the choice is what service or services to choose. Our toll payment solutions generate recurring transactional revenue from commission on carrier toll payments as well as a transaction-based remuneration received from the national toll chargers. Our EETS OBU can significantly reduce the number of OBUs carriers need to use to pay for tolls. In certain countries, we can also secure discounted toll fees for customers.
The expected total transaction value of the market is predicted to have a CAGR of 7% from 2020 to 2027. We anticipate nation states will strive to earn revenue by increasing tolling, whether through increased toll rates, additional vehicle classes, or growth of the tolled road network. We are among the top five EETS providers in Europe, and aim to maintain this position by offering an increasing EETS coverage on our proprietary technology and through partners, some of whom might be competitors in certain markets. We also build on our extensive experience in cooperating with toll chargers where our fuel card has been used in the past.Barriers to market entryEETS providers must go through a very demanding and technical certification process in each country. EETS is a set of standards and not unified across regions, so the broader the coverage, the more difficult it is to comply, and new domains may cause recertifications in the existing coverage. Currently we see a large number of players in early stages of their EETS activities and we
closely monitor the competition. With our top-five position1 in the current market, we expect to remain one of the leaders in the market. A key for success will be the ability to be among the first providers in new toll domains. The concentration of countries yet to join the EETS scheme is especially high in our core markets, providing an attractive starting point as we have the technical skill, proprietary technology, a strong existing customer base, and an existing relationship with toll chargers.Cross-selling and up-sellingWe typically acquire the customer through energy payments, and through this, learn their routes. This enables the cross-selling of toll payments. Toll then becomes the next retention tool, along with financing customers’ credit, thus increasing customer loyalty and share of customer spend. In addition, our proprietary EETS solution integrates toll payment functions with other value-added services, bringing greater differentiation to the competition in the market and supporting customer retention. This solution also generates the real-time data essential for our platform business.Expanding our networkWe focus on the main transport corridors in our core markets of Central and Eastern Europe and aim at offering all available EETS domains through our own solution by the end of 2023. These two major transport corridors connect the Baltic region with the ports of Belgium and the Netherlands, and connect Turkey with the freight harbours in and around Germany. We seek to complete the service offering on those routes whenever available.
In this respect, we will serve Western Europe in the immediate future through partners, as these countries are secondary extensions of the main corridors we focus on. A fully-owned pan-European coverage is our long-term plan.
We continue to pursue acceptance of our OBUs in countries that have not yet adopted the EETS standard by providing the best customer experience in the region and using our data and knowledge of the customer.PartnershipsOn top of our proprietary EETS solution, we provide payment means or act as resellers for 17 toll chargers and toll service providers, and as an agent for four others, receiving a percentage of the collected toll volume from the provider as well as from the customer. In this set up, we can provide to our customers a full coverage according to their needs as the EETS standard has not yet been adopted in all relevant countriesAchievements in 2021Our EETS core system received successful certifications in Austria and Belgium, and is compatible with the tolling systems in Hungary and Poland. We also received clearance for trial operations in Germany. To provide full coverage in our market we also use partners and local integrators and through this we were able to offer options for our customers in Italy.
1 Source: https://www.aetis-europe.eu/about-eets/. Company analysis based on available data
STRATEGIC REPORT
Annual Report and Accounts EUROWAG
29

MOBILITY SOLUTIONS
Through our mobility solutions segment, we offer customers tax refund services, telematics products, smart routing and other adjacent services. The segment provides a mix of recurring transactional revenue, recurring subscription and other fee-based revenue streams.
TAX REFUND SERVICESWe offer tax refund services on standard VAT, ED partial refund, pre-financed VAT, and advanced payment of excise duty (“APED”). For each of these, we retain a percentage of the total value processed and also charge fees. We have also introduced various financing options for customers. The tax refund business works for customers in the 27 EU member states, as well as in the UK, Norway, Turkey, Serbia and North Macedonia, though refund of ED is for EU-based customers only. Customers grant us with a power of attorney for one year to act on their behalf for tax refunds, and the administrative burden to change this creates good customer retention.
By using these services, customers can avoid waiting for refund payments which, depending on the country, can be anything from a few weeks to three years. These services offer customers significant cash-flow improvements and an efficient process to recover their taxes. We digitise all documents, and now use AI to extract data from documents the customer provides to speed up the refunds process. Customers can use our online platform to track the status of their refunds.
26.1%of the Group’s net revenues
TELEMATICSCombining advanced electronic software and engineering solutions, our telematics products allow customers to track various fleet operating metrics in real time. Using an OBU that collects data we process and report on, customers can track fuel consumption, truck idle time, driving time and carriage load, among other metrics, to optimise planning efficiency and increase cost-effectiveness. Customers pay fees for an OBU for stand-alone telematics services, and a subscription fee for our fleet management software for tracking and monitoring.
• We are one of the leaders in Central Europe
Source: Berg Insight Report on Fleet Management in Europe, November 2021
EFLEET MANAGEMENTCustomers can benefit from using a single telematics solution with fleets that combine standard diesel/gas engines, battery-electric vehicles, and plug-in hybrids. With an eMobility licence subscription, the OBU can read additional metrics such as state of charge, driving range, or battery state of health. With this data available, the dispatcher can plan a trip for the electric vehicle, manage home/company charging, or assess the charging behaviour of a plug-in hybrid vehicle user.EVAEVA is our proprietary tolling OBU, which combines our telematics, toll payment and energy payment anti-fraud protection capabilities in one device. EVA provides three scalable tiered fleet-management solutions modules:
• EVA Start is the self-installed version powered by the cigarette-lighter, providing real-time position, daily fuel price and estimated time of arrival to compare actual and planned routes.
• EVA Plus is connected to vehicle CANbus providing additional information such as mileage, idling information and fuel consumption.
• EVA Ultra is connected also to a chronotachograph providing additional features such as legal driver’s time, remote chronotachograph download and driver behaviour.
DRIVER SCORING AND PERFECT DRIVEOur products aimed at reducing CRT emissions and improving driver wellbeing and safety.
Driver Scoring seeks to promote commercial vehicle driver safety through fleet management as well as for regular drivers. By combining information from GPS, accelerometer, pedometer, gyroscope and an underlying map, fleet managers are able to recognise signs of distracted driving and measure various aspects of a driver’s driving style. Fleet managers can then create a customisable driver scoring system, and educate drivers with in-app coaching, and motivate their drivers to drive more safely and reduce energy consumption and insurance claims.
Customers can use Perfect Drive to evaluate the driving style of commercial vehicle drivers. Fleet managers can use this information with their drivers to address the negative effects of driving style on fuel consumption and vehicle wear and tear, for road safety and to identify the need for further training for drivers as needed. The data provided can also contribute to reduced insurance costs.
EUROWAG Annual Report and Accounts for the year ended 31 December 2021
30
STRATEGIC REPORT
End-to-End Ecosystem CONTINUED

LOCATION-BASED PRODUCTS AND SERVICESWe offer smart navigation products and location-based services through our brand Sygic.SYGIC PROFESSIONAL NAVIGATION FOR TRUCKS AND FLEETSProvides commercial routing with premium-quality maps for individual truck drivers, as well as for fleets as a part of integrated automotive, telematics and fleet management solutions. Dispatchers can navigate their drivers remotely to a single destination, a series of stops or on an exact route. Dispatchers can set the vehicle’s dimensions and road attributes to plan routes in advance and alter an existing itinerary at any time, remotely. Drivers can see the entire route with estimated time of arrivals for each stop. Sygic Professional Navigation offers various business models to suit the needs of its indirect resellers network.
• Has been installed on more than 3.2 million Android devices
SYGIC GPS NAVIGATION APPProvides subscription-based GPS navigation for millions of non-CRT users worldwide, with high-quality 3-D maps, up-to-date information on energy prices and stations, speed limit and speed-camera warnings, real-time traffic information, voice navigation and lane guidance. Customers can also buy add-on features. It offers the first-ever real-time traffic-light countdown to be commercially available, which was awarded a CES 2020 Innovation Award.
• Has been installed on more than 100 million Android devices
SYGIC GPS EMOBILITY We also provide charge payment options for eMobility customers through Sygic GPS Navigation for consumers. Through its GPS Navigation app, we offer EV mode with search of charging points, electric and plug-in hybrid vehicles onboarding, and routing for more than 360,000 charging points across Europe with online data and payment possibilities (via in-app or RFID card) at approximately 225,000 of these.ROAD LORDS Road Lords is our free-of-charge community-based trucking ecosystem. It includes a portal for dispatchers and truck navigation GPS app for Android users, providing specialised routes for trucks and other large vehicles, as well as a social platform. Advanced features include energy station and parking data, including what services and supplies are available at any given site. Users can enter the attributes of their trucks and receive customised route recommendations. The social platform enables drivers to find transport information from other drivers.
• Has been installed on more than 2.5 million Android devices
OTHER ADJACENT SERVICESWe also offer a variety of solutions to address customer needs at every point in their operations, charging fees or receiving commission, including the following:
• Our pre-paid or post-paid payment card issued by a 3rd party. Customers can use it for non-energy-related transactions such as tyres, towing and fines. Our revenue is based on the monthly payments and difference between retention/service fee and additional costs connected with processing.
• Roadside Assistance – 24-hour roadside assistance.
• ClientFX – Our cross-border currency exchange services, for customers to pay for their invoices in the currency of their choice.
• Insurance – Through brokerage partnerships, we connect customers to tailor-made local insurance plans by country.
• Factoring – Through brokerage partnerships, we provide a factoring solution or financial restructuring.
• Parking – We offer a network of 230 parking sites across Europe that are easy to find. Customers can pay using our fuel cards.
• Washing – We offer washing and tank-cleaning services at our truck park in the Czech Republic and at acceptance network or partner cooperation, altogether at 890 sites across Europe. Customers can pay using our fuel cards.
• Truck repairs – We have offered truck-repair services since December 2021 at 390 sites across Europe via partner cooperation.
• Administrative support and freight ferry booking – We provide these through brokerage partnerships.
STRATEGIC REPORT
Annual Report and Accounts EUROWAG
31

Eurowag Values
Fundamental beliefs that underpin everything we do ethically, enabling better decisions every day
At Eurowag, performance is driven by passion and purpose rather than controls. Therefore, we refer to our values as to our superpowers and guiding principles for everything we do.
Our values inspire us to achieve success and happiness in our work and private lives.
EUROWAG VALUES DELIVER YOUR BEST BE A TRUE
COLLEAGUE EMBRACE
CHANGE BE A GOOD
PERSON
To democratise commercialroad transportation througha technological revolution.
For more information on our culture and values please refer to page 83 XX
OUR VISION
OU
R PURPO
SE
O
UR AM
BITI
ON
To become the ultimate on-road mobility platform
creating better business opportunities
across the industry.
To create sustainable financial and technological solutions for the benefit of
our industry, society and the environment.
EUROWAG Annual Report and Accounts for the year ended 31 December 2021
32
STRATEGIC REPORT
Our Purpose, Values, Strategy and Culture

Working in a dynamic and change-driven industry, we are all faced with new challenges on a daily basis. Therefore, we use our values and leadership principles as a guiding tool to choose the best way forward.”
Kristi AnsbergChief People Officer
STRATEGIC REPORT
Annual Report and Accounts EUROWAG
33

FINANCIAL AND NON-FINANCIAL
Net energy and services sales represents revenues from contracts with customers less cost of energy resold to customers. The Group believes this measure is relevant to an understanding of the Group’s financial performance on the basis that it adjusts for the volatility in underlying energy prices. This metric also supports comparability of the Group’s performance with other companies who have concluded that they act as an agent in the sale of energy and, therefore, report revenues net of energy sold. Net energy and services are referred to as the Group’s “net revenues” throughout this document.
Adjusted EBITDA margin represents Adjusted EBITDA for the period, divided by Net energy and services sales.
The ratio of total net (cash)/debt to adjusted EBITDA.
21 153.1
19 114.6
20 128.6
18 73.7
21 45.5
19 41.1
20 45.6
18 35.1
21 (0.89)
20 0.91
Net energy and services sales1 (€m)
€153.1m
Adjusted EBITDA margin3 (%)
45.5%
Adjusted basic EPS is calculated by dividing adjusted earnings attributable to ordinary equity holders of the parent entity by the weighted average number of ordinary shares outstanding during the period.
21 5.77
20 4.83
Adjusted basic earnings per share2 (cents/share)
5.77
21 1.54
20 3.76
Basic earnings per share (cents/share)
1.54
Net leverage4
(0.89)
Average net revenue retention represents, for Eurowag only (i.e., excluding ADS and Sygic) the average retained proportion of the Group’s net revenues derived from its payment solutions and tax refund customers during the entirety of the previous years. This is presented as the average of this figure over a five-year period.
21 111.5
20 110.0
Average net revenue retention (%)
111.5%
21 17.7
20 28.8
Profit before tax (€m)
€17.7m
1 This is an APM, a reconciliation to IFRS measures is on p.160.2 This is an APM, a reconciliation to IFRS measures is on p.213.3 This is an APM, Adjusted EBITDA reconciliation to IFRS measures is on p.190 and Net energy and services sales on p.160.4 This is an APM, net (cash)/debt is based on statutory balance sheet (p.161) and Adjusted EBITDA reconciliation to IFRS measures is on p.190.
EUROWAG Annual Report and Accounts for the year ended 31 December 2021
34
STRATEGIC REPORT
Our Key Performance Indicators

Number of payment solutions active trucks represents the number of customer vehicles that have used the Group’s payment solutions services in a given period, calculated as the average of the number of active customer vehicles for each month in the period. A customer vehicle is considered an “active truck” if it uses the Group’s payment solutions products at least once in a given month.
21 82,640
19 66,592
20 72,884
18 50,113
Number of payment solutions active trucks
82.6k
Number of payment solutions active customers represents the number of customers who have used the Group’s payment solutions services in a given period, calculated as the average of the number of active customers for each month in the period. A customer is considered an “active customer” if it uses the Group’s payment solutions products at least once in a given month.
21 15,020
19 11,919
20 13,180
18 9,114
Number of payment solutions active customers
15.0k
Number of payment solutions transactions represents the number of payment solutions transactions (fuel and toll transactions) processed by the Group for customers in that period. A fuel transaction is defined as one completed (i.e. not cancelled or otherwise terminated) fuelling transaction. AdBlue transactions are not counted as standalone fuel transaction. A toll transaction is defined as one truck passing through a given toll gateway per day and per merchant country (meaning multiple passages by the same truck through any toll gateway in one merchant country in a given day is still counted as one transaction).
21 32.5
19 26.6
20 29.1
18 18.4
Number of payment solutions transactions (m)
32.5m
Diversity, equity and inclusion
Target: 40%Reach 40% female representation in leadership roles by 2025.
Directors, Employees, Senior Managers and People Leaders gender split. The percentage of male or female in each category as of 31 December of each reporting year. People leaders are defined as everyone having at least one direct report. It includes the Senior Leadership Team (Executive Committee and Vice Presidents) and the CEO and CFO.
Carbon emissions from own operations
Target: 50%50% reduction of emissions from our operations by 2030, on a 2019 baseline.
Total operational emissions (both location-based and market-based). Total Scope 1 and 2 for market-based emissions.
Quality and availability of job opportunities
Target: 25%Reach the top 25% in Employee Engagement Score in EU Tech companies by 2025.
The engagement score is calculated based on the answers to five questions (scale 1–5), that will be deployed to all employees. The unit is % of employees and they will be surveyed twice a year. The survey tool and source will be the Company’s Culture Amp Survey and be benchmarked against their database of European technology companies.
STRATEGIC REPORT
Annual Report and Accounts EUROWAG
35

Martin VohánkaChief Executive Officer
At the beginning of 2022, we are in a strong position with a loyal and growing customer base, confirmingsolid revenue retention trends.”
DEAR FELLOW SHAREHOLDERS,We are delighted to have achieved very strong results this year, in line with guidance we presented during our IPO on the London Stock Exchange in October 2021. We delivered strong revenue and profits growth from our two segments of payment and mobility solutions. Operating in an economic environment that is still dealing with the headwinds of the pandemic and supply-chain disruptions, this demonstrates the resilience of our business model, and the mission-critical nature of our customer value proposition. Throughout the year, we have also continued to invest in our future by building the skills within our organisation, and through strategic investments such as accelerating the development of our digital platform through Road Lords and Eurowag applications, and completing the acquisition of ADS and executing new M&A transactions.
True to our purpose, we continued to innovate the road transportation industry and enable energy transition in Europe, by introducing mobile payments and enabling payments for charging stations on the Sygic GPS Navigation. To build-out the
integrated nature of our offering, we deployed new telematics features for fleet management on our on-board unit for toll payments and improved anti-fraud protection for fuel card payments through geolocation. To further expand our platform, we added payments for roadside services to the acceptance network, enabled hybrid financing of tax refunds and introduced a new solution for supply chain financing via third parties.
From a geographic perspective, core markets in our Central Cluster continue to account for nearly 50% of net energy and services sales. The Southern Cluster grew the fastest in 2021, now accounting for 30% of net energy and services sales, driven predominanty by successful market penetration in Romania. We continue to see opportunity for growth in the Western Cluster, especially in cross-sell and up-sell to ADS customers during the integration phase, supported by investment into direct, indirect and digital sales channels. To accelerate customer onboarding and complete their digital journey, we launched a pilot of the Automated Credit Approval System for small exposures in France.
The IPO was a significant milestone in the Company’s development enabling us to take advantage of
We are delighted to have achieved very strong results this year, in line with guidance we presented during our IPO on the London Stock Exchange in October 2021.
INTRODUCTION
EUROWAG Annual Report and Accounts for the year ended 31 December 2021
36
STRATEGIC REPORT
Chief Executive Officers Statement

GROWTH FROM EXISTING CUSTOMERS.Through further innovation in core payment services, and integration and cross-selling with mobility services, we can retain and expand our existing customer relationships by continuing to solve their evolving needs.
GEOGRAPHIC EXPANSION AND PENETRATION.We apply our scalable business model to new markets serving both existing and new customers, thus expanding market share.
GO-TO-MARKET CHANNEL EXPANSION.We continue to acquire new customers through a marketing strategy based on geographic clusters and three sales channels – digital, telesales and field - with an increasing focus on digital sales.
DIGITAL PLATFORM DEVELOPMENT.We continue to develop our end-to-end platform to be a conduit for intermediating payments and data exchange between all parties, thereby connecting digital services and physical assets. This allows us to expand our client base to include shippers and freight forwarders, and to integrate third-party providers and financiers seamlessly into our platform, thereby facilitating frictionless interactions among industry participants to create a fully connected marketplace.
ACCRETIVE M&A.We continue to seek acquisition targets that will create cross-sell and up-sell opportunities, generate cost and revenue synergies, and develop our product and technology capabilities.
the benefits of listing in a number of ways. First, the capital raise will enable us to accelerate the execution of our strategic objectives. Second, our status as a publicly listed Company provides a clear signal of our ambitions and confidence in our prospects. And third, it will help us attract the talented people we need to maintain our growth trajectory.
Sustainability, which was already at the heart of how we run our business, has also benefited. Strengthening our governance credentials means even greater transparency and rigour in our reporting and controls. We have further formalised our ESG strategy and made sure it involves all relevant stakeholders, collected baseline data for more detailed reporting and have set ourselves specific targets within areas where we can produce the greatest potential impact. The ESG-related KPIs commit us to a 50% reduction of Scope 1 and Scope 2 emissions from our operations by 2030, on a 2019 baseline. We have also set a target to achieve 40% female representation in leadership roles by 2025, and reach the top 25% of European technology companies for employee engagement in the same timeframe.
We can now state three distinctive ambitions for our business each benefiting broader society. The first is to help predominantly small and medium commercial road transport companies prosper and improve the wellbeing of their people. The second is to contribute to making our industry cleaner by promoting decarbonisation and enabling efficiency gains, such as truck utilisation, better routing and driver performance. The third is to grow the value of our business for investors, while helping our employees develop as professionals with fulfilling roles, ensuring both groups benefit from a productive journey with Eurowag.
The Culture Manifesto we presented in 2020 contains four fundamental values that inspire us to achieve success, happiness and personal growth in our work and private lives. We encourage employees at every step of their journey with us, from the interview process through to day-to-day operations. We are also investing to ensure our culture becomes
OUR STRATEGY REMAINS FOCUSED ON FIVE KEY AREAS:
the “tone from the top”, and have appointed a new Board of Directors and strengthened the Executive Committee. We have introduced programmes to make Eurowag a great place to work and have accordingly been able to recruit very talented people.
We are set up to succeed by supporting many current industry trends and aligning to new regulations. The most notable of these is the transition to clean mobility, promoted by the Renewables Energy Directive II and Alternative-Fuels Infrastructure Regulation among others. This stimulates better industry cooperation with greater potential for alliances and partnerships, with substantial funding being channelled into new low-carbon powertrain solutions
and the related infrastructure. The accelerating digitalisation of payments is extending the transformation from cash-to-card to card-to-virtual and increasing the penetration of alternative payment methods. Implementation of the European Electronic Toll Service also progressed with pilot launches in Austria and Belgium in 2021, and Germany launching in 2022. Finally, we are expanding and developing our relationships with vehicle manufacturers as they shift their business models towards the concept of Transportation as a Service.
STRATEGIC REPORT
Annual Report and Accounts EUROWAG
37

At the outset of 2021, we acquired the remaining minority stake in ADS, allowing for the full migration of the ADS portfolio onto our platform. This means ADS customers now have access to our broader portfolio of services. We have also strengthened our critical skillset by acquiring a minority stake in the Lithuanian firm, Drivitty. This brings in-house expertise of digital payments, allowing customers to execute transactions using mobile devices and on board units and accelerates our progress towards providing fully integrated payments and mobility solutions. With Last Mile Solutions, the rapidly growing leader in e-mobility, we are expanding our platform by offering EV charging and smart energy management services for e-mobility businesses in Europe. We also announced the intended acquisition of WebEye, a leading provider of fleet management solutions in Hungary and Romania. Although the transaction was not approved by the Hungarian Ministry of Interior in March 2022, we are looking for ways to facilitate the acquisition to expand our customer base, generate cross-sell and up-sell opportunities, and obtain data from the connected trucks, which will provide more insights for optimising the development of new and improved solutions.
The shocking act of unprovoked and unjustified aggression from the Russian Federation against Ukraine is unfolding as we finalise this report. Following the invasion the Group took immediate steps to comply with sanctions and suspend all services we provided in Russia. Our response to the humanitarian aspect of this crisis benefited from strong support of all our employees. We offered help to colleagues with origins or family members from the affected regions and have created a Ukraine
Aid fund on their behalf. The Group is matching charitable donations made by our employees, over and above our ongoing commitment to distribute 1% of EBIT each year to charitable causes. We are also providing fuelling for humanitarian convoys.
Although the Group has limited exposure to Russia and Ukraine, which together account for less than 0.1% of Group net revenue, the economic outlook in our key regions is uncertain and we continue to monitor and evaluate the potential impacts as the situation evolves. Should the conflict escalate and materially affect European economies, we may observe lower demand for our products and services. The impacts of recent events on global supply chain disruptions are not yet over, and the Group could be affected by energy-supply shortages in the region hindering industrial production and mobility. Additional risks to the business include a potential shortage of drivers and regulatory measures such as retail fuel price caps that may have an impact on margins.
We, therefore, continue to diligently monitor the areas we can control and mitigate. Primarily, this is by further diversifying energy-supply partnerships, while acknowledging the dependency on Russian-originated sources across central and eastern Europe and the Balkan region. To mitigate the impacts of a potential economic downturn, we can apply cost-saving measures and implement actions to stimulate revenue growth learnt and used during the last two global economic crises. These include actions to promote customer loyalty, readiness of our customers to pay a premium for mission-critical products and services, and increased interest of our customers in efficiency gains and cost-saving solutions, which the Group provides.
At the beginning of 2022, we are in a strong position with a loyal and growing customer base, confirming solid revenue retention trends. We have developed new sales channels that have started producing visible results, and we continue to deliver product innovations that help our customers grow their businesses. Our teams expand with new talents that joined Eurowag in 2021 ready to deliver on our objectives. All of this, together with a proven strategy and a well-capitalised balance sheet, underpins our confidence to keep delivering strong performance while navigating external volatility.
Martin Vohánka Chief Executive Officer
EUROWAG Annual Report and Accounts for the year ended 31 December 2021
38
STRATEGIC REPORT
Chief Executive Officers Statement CONTINUED

Annual Report and Accounts EUROWAG
39
STRATEGIC REPORT

In 2021 we delivered a strong performance with all key financial metrics in line with our mid-term financial guidance.”
Magdalena BartośChief Financial Officer
The Group achieved key financial objectives on its medium-term financial guidance.
• Net energy and services sales1 up by 19.1% at €153.1 million, with organic growth1 of 17.1% year-on-year
• Payment solutions segment up by 20.2% at €113.1 million and mobility solutions segment up by 15.9% at €40.0 million
• Adjusted EBITDA1 up by 18.9% at €69.7 million resulting in adjusted EBITDA margin at 45.5%
• Strong progress on transformational capital expenditure1 plan with €23.3 million spent
• Net cash1 position of €61.7 million as at 31 December 2021 providing for significant leverage headroom to take advantage of strategic opportunities
Growing scale and network within a high quality payments-oriented business model and highly diversified revenue base underpinned strong net energy and services sales growth.
• Average active payment solutions customers up by 13.9% at 15,020
• Average active payment solutions trucks up by 13.4% at 82,640
• Payment solutions transactions up by 11.7% at €32.5 million
• Net revenue retention for 2017-2021 over 110%
FINANCIAL HIGHLIGHTS
Key statutory financials 2021 2020 YoY%Revenue from contracts with customers (€m) 1 646.1 1 253.0 31.4%
Profit for the year (€m) 17.7 28.8 (38.5%)
Basic EPS (cents/share) 1.54 3.76 (59.0%)
Alternative performance measures1 2021 2020 YoY%Net energy and services sales (€m) 153.1 128.6 19.1%
Adjusted EBITDA (€m) 69.7 58.6 18.9%
Adjusted basic EPS (cents/share) 5.77 4.83 19.5%
1 Please refer to Alternative Performance Measures on page 188 for a definition.
EUROWAG Annual Report and Accounts for the year ended 31 December 2021
40
STRATEGIC REPORT
Financial Review

1 Presented measure excludes telematics and includes post-paid as a separate service2 Calculated as impairment losses of financial assets to total revenue increased by toll payment solutions turnover
FINANCIAL REVIEWIt has been a year of rapid growth and change for Eurowag. We are proud of the way the business has dealt with the challenges arising from continued COVID-19 pandemic restrictions and its agility in responding to the opportunities presented. We have delivered a strong set of results in a truly exceptional year, listed the Group on the London Stock Exchange, completed several business acquisitions and are delivering on our technology transformation plans.
Throughout the year, the business executed at pace against the strategy that we set out at the time of the IPO. We delivered strong performance with all key financial metrics on a positive trajectory, reflecting the resilience and strength of our business. Group net energy and services sales growth of 19.1% year-on-year, was delivered through further expanding our customer base in the payment solutions segment (average number of customers up by 13.9%), enhanced by effective cross selling of our mobility solutions. Resilience and strength of our business is supported by average number of services per customer of 2.83 (2020: 2.82)1. Our growth through these turbulent times is a testimony to the essential nature of the CRT industry, the efficiencies that our products and services deliver to our customers, the strength of our
revenue retention and the geographic and product revenue diversity of our business enhanced by strong customer relationships.
Adjusted EBITDA increased 18.9% year-on-year to €69.7 million (2020: €58.6 million). Adjusted EBITDA margin was unchanged year-on-year at 45.5% (2020: 45.6%) in line with our mid-term guidance. Adjusted EBITDA performance reflects strong operating leverage inherent in the business, while we continue to invest in the organisation focusing on priority hires, upskilling the organisation and technology-related spend. Adjusted basic EPS increased 19.5% year-on-year to 5.77 (2020: 4.83) cents per share in line with adjusted EBITDA growth.
On a statutory basis, profit before tax decreased by 38.5% to €17.7 million (2020: €28.8 million) and basic EPS decreased by 59.0% to 1.54 (2020: 3.76) cents per share due to a significant amount of adjusting items including non-recurring IPO-related expenses, pre-IPO share-based compensation schemes and strategic transformation costs. Basic EPS has reduced more than profit before tax due to a higher effective tax rate in 2021 which is further discussed in Taxation section.
Supported by our underlying highly cash generative business model and equity raise at IPO, our overall
financial position has significantly strengthened, and we closed the year with a net cash position of €61.7 million. Our absolute focus on credit risk management and cash collection contributed to improvement in credit losses ratio from 0.2% to 0.1%2. Against the backdrop of business performance and strong cash generation we continued to invest into our digital transformation (with transformational capital expenditure reaching €23.3 million) and inorganic growth (with investments in subsidiaries and associates reaching €38.9 million).
As we embark on the next year of implementing the Group’s strategy, our robust financial position and disciplined approach to capital allocation will ensure that the business is well positioned to leverage the benefits of industry digital disruption and many opportunities that lie ahead. We have strong conviction around our purpose to create sustainable financial and technological solutions for the benefit of our industry, society and the environment.
PERFORMANCE REVIEWOn the following page is a summary of the segmental performance and explanatory notes related to items including corporate expenses, alternative performance measures, taxation, interest, investment and free cash flow generation.
STRATEGIC REPORT
Annual Report and Accounts EUROWAG
41

SEGMENTS2021 (€m) 2020 (€m) YoY (€m) YoY %
Segment revenue total 1 646.1 1 253.0 393.1 31.4%Payment solutions 1 606.1 1 218.5 387.6 31.8%Mobility solutions 40.0 34.5 5.5 15.9%
Net energy and services sales total 153.1 128.6 24.5 19.1%Payment solutions 113.1 94.1 19.0 20.2%Mobility solutions 40.0 34.5 5.5 15.9%Expenses included in Contribution (24.6) (23.8) (0.8) 3.4%
Contribution total1 128.5 104.8 23.7 22.6%Payment solutions 99.6 79.8 19.8 24.8%Mobility solutions 28.9 25.0 3.9 15.6%
Contribution margin1 total 84% 81% 2.5 pp N/APayment solutions 88% 85% 3.3 pp N/AMobility solutions 72% 73% (0.3 pp) N/A
Corporate overhead and indirect costs before adjusting items (58.8) (46.2) (12.6) 27.3%Adjusted EBITDA 69.7 58.6 11.1 18.9%Adjusting items affecting Adjusted EBITDA (22.8) (3.2) (19.6) 612.5%EBITDA1 46.9 55.4 (8.5) (15.3%)Depreciation and amortisation (21.9) (18.2) (3.7) 20.3%Operating profit 25.1 37.2 (12.1) (32.5%)
The Group’s total revenues increased by 31.4% year-on-year to €1,646.1 million driven by growing scale of our payment solutions complemented by higher energy prices (a corresponding growth was reported for costs of energy sold).
The Group delivered double-digit net energy and services sales growth and strong contribution margins in both segments. Growth in organic1 net energy and services sales was 17.1%, and overall net energy and services sales were up by 19.1%.
Payment solutions net energy and services sales grew by 20.2% year-on-year, driven by strong new customer and truck acquisitions complemented by net revenue retention.
The Group saw growth in new customer acquisition across all geographic clusters, as the strength of the Group’s payments network and effectiveness of the go-to-market strategy enabled us to increase market penetration. The Group also expanded into new sales channels including digital and enabled fully online customers onboarding.
Mobility solutions net energy and services sales grew by 15.9% year-on-year, driven by effective cross sell supported by inorganic growth of telematics net energy and services sales.
On 1 January 2021, the Group acquired 51% of the share capital in KomTeS, a value-added reseller of the Group’s telematics solutions. The transaction will ensure the highest level of support, service, and value to the Group and KomTeS customers in the Czech Republic and Slovakia.
CORPORATE EXPENSES2021 (€m) 2020 (€m) YoY (€m) YoY %
Expenses included in Contribution (24.6) (23.8) (0.8) 3.4%Corporate overhead and indirect costs before adjusting items (58.8) (46.2) (12.6) 27.3%Adjusting items affecting Adjusted EBITDA (22.8) (3.2) (19.6) 612.5%Depreciation and amortisation (21.9) (18.2) (3.7) 20.3%Total (128.1) (91.4) (36.7) 40.2%
The above table is relevant for segmental review while below table summarises corporate expenses based on statutory financials categories:
1 Please refer to Alternative Performance Measures on page 188 for a definition.
EUROWAG Annual Report and Accounts for the year ended 31 December 2021
42
STRATEGIC REPORT
Financial Review CONTINUED

2021 (€m) 2020 (€m) YoY (€m) YoY %Employee expenses (55.7) (41.4) (14.3) 34.5%Impairment losses of financial assets (3.1) (4.1) 1.0 (24.4%)Technology expenses (6.8) (4.0) (2.8) 70.0%Other operating income 0.7 0.9 (0.2) (22.2%)Other operating expenses (41.3) (24.6) (16.7) 67.9%Depreciation and amortisation (21.9) (18.2) (3.7) 20.3%Total (128.1) (91.4) (36.7) 40.2%
Employee expenses increased by 34.5% to €55.7 million as the Group focused on priority hires, talent retention, strengthening the structure and remuneration schemes appropriate for a listed Company. Adjusting items included in employee expenses amounted to €8.6 million in 2021.
Impairment losses of financial assets decreased by 24.4% to €3.1 million thanks to a focus on credit risk management and cash collection.
Technology expenses increased by 70.0% to €6.8 million as a consequence of the Group’s focus on cloud transition and expenses related to the new generation ERP system. Adjusting items included in technology expenses amounted to €0.6 million in 2021.
Other operating expenses increased by 67.9% to €41.3 million mainly due to non-recurring IPO costs.
Depreciation and amortisation increased by 20.3% to €21.9 million primarily as a result of increased transformational technology being put into production. Adjusting items included in depreciation and amortisation amounted to €7.1 million in 2021.
NET FINANCE EXPENSENet finance expense in 2021 was €6.7 million (2020: €8.3 million). The decrease in 2021 reflects the lower interest charge on Senior Facilities Agreement (weighted average interest rate in
2021 was 2.4% compared to 3.3% in 2020) and improved result on revaluation of derivatives partially offset by higher factoring fees related to higher average factoring limits utilisation throughout the year.
TAXATIONThe Group tax charge of €8.0 million (2020: €5.9 million) represents an effective tax rate of 45.4% in 2021 (2020: 20.4%). Corporate income tax for companies in the Czech Republic and United Kingdom for the years 2020 and 2021 was 19%, corporate income tax in Spain for the years 2020 and 2021 was 24%. They represent the major tax regimes in which the Group operates.
The Group’s effective tax rate is impacted by the tax impact of Adjusting items. It is, therefore, helpful to consider the underlying and adjusting items affecting tax rates separately:
• The effective tax rate on Adjusted earnings before tax1 for the year increased to 24.8% (2020: 20.2%) largely due to the fact that 2020 effective tax rate was influenced by newly recognized deferred tax assets in the year.
• The effective tax rate for Adjusting items1 was 12.7% (2020: 20.4%) and was driven mainly by non-deductible IPO-related expenses and share-based payments.
We adopt a prudent approach to our tax affairs, aligned to business transactions and economic activity. We have a constructive and good working relationship with the tax authorities in the countries in which we operate and there are no outstanding tax audits except for France.
EPSBasic EPS for 2021 was 1.54 cents per share (a decrease of 59.0% relative to 2020) due to a significant amount of Adjusting items including non-recurring IPO-related expenses and pre-IPO share-based compensations.
Adjusted basic EPS1 for 2021 was 5.77 cents per share (an increase of 19.5% relative to 2020) based on the weighted average number of ordinary shares in issue during the year of 595,582,785. After accounting for the impact of PSP, adjusted diluted earnings per share was 5.76 cents per share. Adjusting items are as described previously.
INVESTMENTS IN ASSOCIATESIn 2021, the Group acquired 28% interest in Threeforce BV (Last Mile Solutions) and 20% interest in UAB, Tankita (Drivitty).
Last Mile Solutions is a fast growing eMobility platform in Europe and the investment supports the Group’s position in the eMobility market and confirms our focus on sustainable transportation solutions. Key financials for 2021 were as follows:
Threeforce B.V. (Last Mile Solutions) 2021 (€m)Net assets 11.3Revenue 29.6Total comprehensive income (2.2)Impact on Group profit for the year (0.6)
1 Please refer to Alternative Performance Measures on page 188 for a definition.
STRATEGIC REPORT
Annual Report and Accounts EUROWAG
43

Drivitty is a mobile services integration leader in the commercial transportation market. With this strategic partnership the Group aims to accelerate its path towards providing fully seamless mobile payments experience to its customers. Drivitty financials are currently immaterial to the Group.
BALANCE SHEETNet assets of the Group increased by 344.2% to €284.7 million mainly reflecting the IPO proceeds of €196.1 million, retained earnings increase of €12.3 million, other comprehensive income increase of €5.1 million and exercised share options impact of €3.8 million.
Intangible assets of the Group excluding goodwill increased by €20.7 million to €88.3 million in 2021, predominantly due to investments into the strategic IT transformation.
Goodwill comprises mainly CGU Energy of €40.2 million, CGU Navigation of €34.6 million and CGU Telematics of €26.0 million. Goodwill is tested for impairment on an annual basis, no impairment loss was identified in 2021.
Trade and other receivables increased by €64.2 million to €300.6 million mainly due to changes to phasing of tax refund receivables collection (year-on-year impact of €29.9 million), higher volume of transactions and increased energy prices in 2021.
Trade and other payables increased by €8.6 million to €314.5 million mainly due to higher volume of transactions and increased energy prices in 2021.
CASH PERFORMANCE2021 (€m) 2020 (€m) YoY (€m) YoY %
Net cash (used in)/generated from operating activities (9.6) 86.7 (96.3) (111.1%)Net cash used in investing activities (43.1) (23.2) (19.9) 85.8%Net cash generated from financing activities 187.8 5.4 182.4 3377.8%Net increase in cash and cash equivalents 135.1 68.9 66.2 96.1%Effect of exchange rate changes on cash and cash equivalents 0.1 (0.2) 0.3 (150.0%)Cash and cash equivalents at beginning of period 89.0 20.3 68.7 338.4%Cash and cash equivalents at end of period (presented in statement of cash flows) 224.2 89.0 135.2 151.9%Bank overdrafts 0 29.1 (29.1) (100.0%)Cash and cash equivalents at end of period (presented in statement of financial position) 224.2 118.1 106.1 89.8%Interest-bearing loans and borrowings 162.5 171.2 (8.7) (5.1%)
Net debt1/cash 61.7 (53.1) 114.8 (216.2%)
At 31 December 2021, the Group had net cash of €61.7 million compared to net debt of €53.1 million as of 31 December 2020.
The increase in the level of cash is due to the proceeds from new shares issued and strong Adjusted Operating Cash Flow Conversion (a ratio of Adjusted EBITDA less ordinary capital expenditure to Adjusted EBITDA) during 2021 at 85.2% offset by IPO-related expenses, acquisition of subsidiaries and associates and transformational capital expenditure.
Net cash flows from operating activities decreased from €86.7 million in 2020 to (€9.6) million primarily due to adverse working capital movements related to phasing of tax refund receivables collection (€29.9) million and overall higher volume of transactions and increased fuel prices affecting 2021 receivables, there was further impact of €15.4 million related to Adjusting items in 2021.
Interest paid decreased to €4.5 million reflecting lower cost of debt.Tax paid increased by €2.9 million due to higher tax advances paid.
Net cash used in investing activities increased by €19.9 million in 2021 to €43.1 million largely due to the outflows in connection with capital expenditure related to investment in the development of technology (increase of €6.3 million) and outflows related to investments in subsidiaries and associates (increase of €11.9 million).
Net cash from financing activities amounted to an inflow of €187.8 million in 2021 (2020: €5.4 million), largely driven by the proceeds from new shares issued and the net movement in borrowings offset by an outflow related to the acquisition of the remaining minority interest of ADS (€27.0 million).
The cash impact of Adjusting items was €7.6 million for IPO-related expenses, €0.8 million for M&A-related expenses and €2.7 million for strategic transformation expenses. 1 Please refer to Alternative Performance Measures on page 188 for a definition.
EUROWAG Annual Report and Accounts for the year ended 31 December 2021
44
STRATEGIC REPORT
Financial Review CONTINUED

ALTERNATIVE PERFORMANCE MEASURESThe Group has identified certain Alternative Performance Measures (“APMs”) that it believes provide additional useful information to the readers of Consolidated Financial Statements and enhance the understanding of the Group’s performance. These APMs are not defined within IFRS and are not considered to be a substitute for, or superior to, IFRS measures. These APMs may not be necessarily comparable to similarly titled measures used by other companies. Directors and management use these APMs alongside IFRS measures when budgeting and planning, and when reviewing business performance. Executive management bonus targets include an adjusted EBITDA measure and long-term incentive plans include an adjusted basic EPS measure.
2021 (€m) 2020 (€m) YoY (€m) YoY %Profit before tax 17.7 28.8 (11.1) (38.5%)
Net finance expense and share of net loss of associates 7.3 8.4 (1.1) (13.1%)
Depreciation and amortisation 21.9 18.2 3.7 20.3%
EBITDA 46.9 55.4 (8.5) (15.3%)
M&A-related expenses 0.8 0.4 0.4 100.0%
Non-recurring IPO-related expenses 12.9 0.3 12.6 4200.0%
Strategic transformation expenses 2.7 1.2 1.5 125.0%
Share-based compensations 6.4 1.2 5.2 433.3%
Adjusting items 22.8 3.2 19.6 612.5%
Adjusted EBITDA 69.7 58.6 11.1 18.9%
2021 (€m) 2020 (€m) YoY (€m) YoY %Profit for the year 9.7 23.0 (13.3) (57.8%)
Amortisation of acquired intangibles 5.4 5.5 (0.1) (1.8%)
Amortisation due to transformational useful life changes 1.7 0.2 1.5 750.0%
Adjusting items affecting Adjusted EBITDA 22.8 3.2 19.6 612.5%
Tax effect (3.8) (1.8) (2.0) (111.1%)
Adjusted earnings (net profit) 35.8 30.1 5.7 18.9%
2021 2020 YoY YoY %Adjusted net profit attributable to equity holders (€m) 34.4 27.3 7.1 26.0%
Basic weighted average number of shares 595,582,785 564,857,081 30,725,704 5.4%
Adjusted basic EPS (cents/share) 5.77 4.83 0.94 19.5%
Costs arising in connection with the IPO have been separately identified in recognition of the nature, infrequency and materiality of this capital markets transaction. IPO had very limited impact on expenses in 2020 and will not have any impact on expenses in 2022.
M&A-related expenses are fees and other costs relating to the Group’s acquisitions activity. M&A-related expenses differ every year based on acquisition activity of the Group. Exclusion of these costs allow better result comparability.
Strategic transformation expenses are costs relating to broadening the skill bases of the Group’s employees (including executive search and recruiting costs) as well as costs related to transformation of key IT systems. As previously announced, the strategic transformation is expected to complete in 2023.
In addition, adjustment has been made for the compensations provided to the Group’s management before IPO. Further details of these awards are set out in Note 13 to the Consolidated Financial Statements. These legacy incentives comprise a combination of cash and share-based payments and those that have not yet vested will vest across each of the subsequent financial years ending 31 December 2024. The Group believes that it is appropriate to treat these costs as an adjusting item as they relate to a one-off award, designed and implemented while the Group was under private ownership (and are reasonably typical of that market and appropriate in that context).
STRATEGIC REPORT
Annual Report and Accounts EUROWAG
45

The Group now operates in a new environment and the Remuneration Committee will apply the Remuneration Policy in a listed company context, hence similar awards are not expected in future. For clarity, where share-based payment charges arise as a consequence of the operation of the Group’s post-IPO Remuneration Policy, these are not treated as adjusting items as they represent non-cash element of annual remuneration package. This includes costs of €0.4 million in 2021 relating to a grant in connection with the 2024 PSP.
Amortisation of acquired intangibles represents amortisation of assets recognized at the time of an acquisition (primarily ADS and Sygic). The item is prone to volatility from period to period depending on the level of M&A.
Amortisation due to transformational useful life changes represents accelerated amortisation of assets being replaced by strategic transformation of the Group. The Group expects this adjustment to be relevant until 2024.
CAPITAL EXPENDITURECapital expenditure in the year amounted to €33.8 million compared with €22.0 million for the year ended 31 December 2020. The marked increase reflects the transformational investment into our technology platform.
The Group’s transformational investment programme totaling €23.3 million (2020: €16.4 million) continued to focus on expanding the customer and products capabilities for the Group, including the digital customer journey, new generation ERP, EETS Toll and OBU, Telematics and the integrated offering.
The Group’s ordinary capital expenditure in 2021 was €10.4 million (2020: €5.1 million) representing reinvestment into the platform and assets base and amounted to 6.8% of net energy and services sales compared to 4.0% in the previous year.
CAPITAL ALLOCATIONOur priority will continue to be organic and inorganic investment to drive long-term sustainable growth. As previously advised, the Group will incur aggregated transformational capital expenditures of €50 million during 2022 and 2023 to develop our integrated end-to-end digital platform and invest in the quality of our integrated product and service offering. Our transformational capex is firmly on track to complete in 2023, by which point we will have the most modern, complete and modular tech stack and product offering in the industry. We will continue to consider value-accretive M&A opportunities in our current and adjacent markets and in product and technology areas that will accelerate growth. We will only look to make acquisitions where the acquisition is complementary to our strategy and in line with our acquisition criteria. We will also maintain a robust balance sheet. As set out in our financial guidance the Group does not intend to pay dividends as we continue to prioritise investment in growth.
TREASURY MANAGEMENTThe Group manages credit risk, its exposures to movements in interest rates and foreign exchange rates, financial debt and liquidity profile through a centralised Treasury department. The activities are carried out in accordance with Board approved policies. The Group uses financial derivatives to hedge interest rate and foreign currency risks.
In determining the credit risk of its customers, the Group performs financial and business analyses using data from internal and external sources. Scoring parameters include financial reports, debt registers, credit agencies, history of payment discipline and onboarding questionnaires for sole traders. The Group’s risk model uses country-specific scorecards, probabilities of default derived for each customer, expected loss versus expected net revenues of customers and formulated behavioural probabilities of customer default, when calculating expected losses.
The Group’s credit risk department conducts ongoing credit exposure monitoring, adjusting credit limits in regular intervals and upon utilisation of available limits, and updating collateral from customers as needed. The ageing of receivables is regularly monitored to assess credit risk, based on expected loss calculations which evaluate probability of default, exposure at default and loss given default. The process takes place through weekly calls at country level and bi-weekly calls at Group level.
To mitigate the risk of default from customers on eligible trade and other receivables the Group uses credit insurance subject to first-loss policies on both individual and aggregate bases. To offset the credit risk exposure the Group accepts cash deposits and advance payments from customers. The Group also accepts other types of security such as pledges of receivables and physical assets, promissory notes and bank guarantees.
In 2021 the Group introduced an Automated Credit Approval System to enhance the digital journey in customer onboarding. The system returns credit decisions for individual limits up to €5,000 enabling a faster processing of credit applications and supporting geographical expansion and market penetration.
The Group maintains a disciplined approach to its financing and is committed to maintain a net debt to EBITDA leverage ratio of 1.5-2.5 times over the medium term.
The Group holds financial debt under the Senior Multicurrency Term and Revolving Facilities Agreement (“Syndicated Facilities Agreement”), which consists of the following tranches:
• Amortising EUR term loan facility for a maximum amount of €47.5 million
• Non-amortising EUR term loan facility for a maximum amount of €47.5 million
• Amortising EUR term loan facility for a maximum amount of €95.0 million (Acquisition/CAPEX)
EUROWAG Annual Report and Accounts for the year ended 31 December 2021
46
STRATEGIC REPORT
Financial Review CONTINUED

• Multicurrency revolving credit facility for a maximum amount of €120.0 million, split as
− €45.0 million Revolving Credit Facility
− €15.0 million Multicurrency Overdraft Facility
− €60.0 million Bank Guarantee Facilities
Subject to certain conditions, the Group can request to raise additional debt under the Syndicated Facilities Agreement up to an amount of €100.0 million, of which up to €50.0 million can be used to finance certain acquisitions which are specifically permitted under the Syndicated Facilities Agreement and the remaining €50.0 million can be used to finance or refinance working capital of companies, businesses or undertakings acquired as a result of such permitted acquisition or utilised by way of a guarantee, documentary or stand-by letter of credit. As of 31 December 2021, €29 million has been drawn to establish limits for Bank Guarantees, with the remainder of €21 million to be drawn in Q1 2022 for the same purpose. The Incremental Facility is not committed.The Syndicated Facilities Agreement contains financial covenants at the level of W.A.G. payment solutions, a.s., some of which were amended at IPO:• Interest Cover (the ratio of Adjusted
EBITDA to finance charges), which replaced the previous cashflow cover (the ratio of cashflow to debt service), is not less than 5.00:1 for each 12-month period ending on the last day of each financial quarter. As at 31 December 2021, Interest Cover was at 11.81.
• Net Leverage (measured quarterly on the basis of Total Net Debt on the measurement date and rolling 12 months Adjusted EBITDA) does not exceed 3.75:1 for each 12-month period ending on the last day of each financial quarter in 2021. As at 31 December 2021, Net Leverage was at 2.12.
• Adjusted Net Leverage (measured quarterly on the basis of Adjusted Total Net Debt on the measurement date and rolling 12 months Adjusted EBITDA) does not exceed 6.50:1 for each 12-month period ending on the last day of each financial quarter. As at 31 December 2021, Adjusted Net Leverage was at 3.49.
• Borrowing Base (the ratio of the sum of outstanding amount of revolving facility less cash and cash equivalents, to trade receivables), which was amended to exclude the outstanding bank guarantees and must not exceed 1:1 in relation to any three-month period ending on the last day of each financial quarter. As at 31 December 2021, Borrowing Base was at 0.46.
During 2021, the Group repaid €18.4 million of the Syndicated Facilities Agreement borrowings and drew down €39.5 million to finance acquisitions and capital expenditures resulting in a notional debt of €165 million outstanding under the SFA as of 31 December 2021.
The Group concentrates cash on bank accounts held with financial institutions that participate in the Syndicated Facilities Agreement. Balances may be held on bank accounts with other financial institutions to fund outgoing payments especially in countries outside of the Economic and Monetary Union.
OUTLOOKIn 2021, we delivered a strong performance with all key financial metrics in line with our mid-term financial guidance.
As we move into 2022, we expect to continue to increase penetration in our existing markets supported by effective go-to-market strategies, which will be enhanced by our digital sales channel. Early in the current financial year the Group has continued to deliver growth in line with management expectations and focused on executing our
strategy investing into technology transformation.
Like many, we are shocked and saddened by events in Ukraine. The Group has had limited energy payments acceptance network in Russia and Ukraine. While we discontinued our payments network in Russia, we continue our operations in Ukraine to the extent supplies are available. Direct impact of discontinued or disrupted operations is immaterial to Group’s revenues.
Since the outbreak of the war, we have been constantly reviewing updates to the sanctions regime to ensure adherence.
While currently we have seen no material impact on trading, we will continue to monitor the situation to assess any indirect impact on fuel availability, fuel price and sales regulations, availability of drivers, supply chains, and general levels of business activity and confidence. We have identified the principal risks in the Risk Management section of the Annual Report and Accounts. We are actively monitoring them and, to the extent possible, have drawn up plans for mitigating actions.
Our expectations for the year are currently unchanged and we anticipate delivering results in line with our mid-term financial guidance. However, it is too early to determine the potential impact of the Russian invasion of Ukraine on the out-turn for the full year.
The combination of our strong market positions, continued investment behind innovation and our solid balance sheet underpin our confidence to keep delivering a strong performance, while navigating external volatility.
Magdalena BartośChief Financial Officer
STRATEGIC REPORT
Annual Report and Accounts EUROWAG
47

Managing risk plays an important role in pursuing the Group´s strategic objectives and in adding sustainable value to all our activities. OVERVIEWRisk management is a never-ending process. As with all businesses, our risks evolve constantly, along with the environment we operate in. To pursue our strategic objectives, we have established a risk-management framework that allows us to identify, evaluate, address, monitor and report the risks we face effectively, and helps achieve a balance between risks and opportunities.
RISK MANAGEMENT FRAMEWORKWe established our risk-management framework on the accepted system of three lines of defence and in accordance with the FRC guidance on risk management, internal control and related financial and business reporting. In this, the first line manages and “owns” the risk; the second defines a uniform management framework for each risk category; and the third provides independent confirmation of the effectiveness of the risk management process. The Group currently outsources the third line of defense function to KPMG Česká republika, s.r.o.
The Board has overall responsibility for managing risks. In an ongoing manner, it is responsible for identifying the principal risks that might prevent the Group from achieving its strategic objectives, and is also responsible for determining the extent and severity of risks we are willing to undertake – our risk appetite. The Audit and Risk Committee act on behalf of the Board and are responsible for supervising the risk-management framework design and its activities.
In addition, we have a Business Assurance Committee comprised of members of the second line of defence and selected members of the Executive team. This committee is responsible for more hands-on, systematic risk management activities, including reviewing governance, approving risk assessments, monitoring risk exposure and managing incidents. It escalates matters of importance to the Audit and Risk Committee.
AUDIT AND RISK COMMITTEE
1ST LINE OF DEFENCE 2ND LINE OF DEFENCE 3RD LINE OF DEFENCE
OPERATIONS MANAGEMENT
INTERNAL CONTROLS
CONTROL FUNCTIONS INTERNAL AUDIT EXTERNAL AUDIT
RISK OWNERSHIP RISK CONTROL RISK ASSURANCE
RISK APPETITEThe goal of risk management is for the Group to be exposed only to certain types and severity of risk. This is defined as risk appetite. Risk appetite determines what risks the Group wants to take, what to reduce and what to avoid, in pursuing our strategic and operational objectives. Over the last year, we reviewed and modified the process of defining our risk appetite – setting a clear scale across our principal risks and wider financial and non-financial risk management. The Group recognises following categories of the risk appetite:
Low appetite – we are not willing to be exposed to the respective risks and thus all the risks need to be mitigated to the highest possible extent. The appetite corresponds to low risk rating.
Medium appetite – we are willing to be exposed to some of the risks falling in the category, in a limited extent. The full mitigation of these risks needs to be considered in the cost and business perspectives. The appetite corresponds to medium risk rating.
High appetite – we are willing to be exposed to the respective risks. The risks are monitored, however, their mitigation is done opportunistically. The appetite corresponds to high risk rating.
EUROWAG Annual Report and Accounts for the year ended 31 December 2021
48
STRATEGIC REPORT
Risk Management

Like
lihoo
d
Impact
Alm
ost c
erta
inRa
re
Insignificant Catastrophic
10
8
97
6
4
32
1
5
ENTERPRISE RISKS1 Product demand decline risk
2 Growth strategy implementation risk
3 Competitors
OPERATIONAL RISKS4 External parties dependency risk
5 Technology security and resilience risk
6 Personnel dependency risk
7 Climate change risk
8 Physical security risk
LEGAL AND COMPLIANCE RISKS9 Regulatory and licensing risk
FINANCIAL RISKS10 Clients default risk
PRINCIPAL RISKS HEAT MAP The heat map below shows the outcome of the processes for principal risks assessment. This shows the relative likelihood and impact of the principal risks identified. Risks rated as high and critical are devoted a significant focus on their further mitigation and monitoring.
The Board has ultimate responsibility for defining risk appetite, but the initial proposal comes from the Executive team – they use a bottom-up approach for financial and non-financial risk categories and a top-down approach for principal risks. The Board ultimately reviews and approves this and evaluates whether the mitigation measures assigned to principal risks are adequate. Further, the Board reviews whether the internal controls are adequate and effective. The reviews take place twice a year and take into account changes in our business environment, internal initiatives and developments in our exposure to principal risks.
EMERGING RISKSThe Group continues to monitor and assess emerging risks. This is done through both bottom-up and top-down discussions, held across the businesses with an aim to identify new risks and changes in the existing ones.
Russian invasion of Ukraine represents the most current emerging risks of geopolitical and macroeconomic uncertainty in the Central and Eastern Europe region. The Group recognises impacts of the invasion in changing trends of the Principal risks and in the risk of fuel supplies disruptions and potential truck parks dry outs, which are most significant in the Central and Eastern Europe region.
PRINCIPAL RISKSThe principal risks are the Group-wide key risks that pose the highest threat to our business and strategic objectives. They are proposed by the Group Executives and selected subject-matter experts, with the Board ultimately responsible for defining and approving them. The process is as follows:
1. Identify the Group’s key principal risks.
2. Identify the current mitigation measures.
3. Evaluate the identified risks – estimating their impacts and probability of happening.
4. Determine the current trends in risk-evaluation criteria.
5. Identify forward-looking measures.
The Audit and Risk Committee discusses and reviews the principal risks quarterly.
STRATEGIC REPORT
Annual Report and Accounts EUROWAG
49

KEY
Increased Decreased Stable
PRINCIPAL RISKS REGISTERThe list below provides further details on our identified principal risks, trends of their exposure and the mitigation measures implemented.
1 Risk of a decline in product demand
MITIGATION MEASURES TREND
Our operating results are materially affected by general conditions in the economy. The volume of customer payment transactions we process, and customer demand for the products and services we provide, correlates with general economic conditions. Economic downturns are generally characterised by reduced commercial activity and trade, resulting in red uced demand and use of our products and services by customers. Decline in general economic conditions thus could result in a decline in demand for fuel and toll payments, tax refund services, telematics, or other adjacent services we provide. Decline in demand would adversely affect the Group’s business, financial condition, results of operation and prospects.
The Group considers the trend of the risk as increasing due to consequences of Russian invasion of Ukraine, which among others are energy prices increasing, closing of the markets, supply cuts, shortage of drivers, complications and limitations in logistics and currencies volatility.
• Reducing dependency on a single economy• Reducing dependency on non-EUR currency• Diversification of products and services offering• Geographical expansion – EU and non-EU
countries• Subscription-based revenues
2 Risk in implementing growth strategy
MITIGATION MEASURES TREND
Our growth strategy is to build an integrated end-to-end digital platform around the needs of our customers in the CRT industry. Its implementation relies significantly on technology development and increased power to analyse and utilise data. Inability to successfully achieve the necessary technology developments, or not completing strategic acquisition targets (as a result of unavailability of targets or insufficient funding), would expose the Group to an inability to achieve its growth objectives. This would result in a decline in revenue and a more difficult position to recover from.
The Group considers the trend of the risk as increasing due to challenging commitments made on delivery of integrated end-to-end digital platform.
• Continual diversification of products and services
• Geographic expansion and expansion of sales channels
• Beginning activities to introduce financing platform
• Beginning activities to introduce digital freight-forwarding platform
• Establishment and regular reviews of the M&A strategy
EUROWAG Annual Report and Accounts for the year ended 31 December 2021
50
STRATEGIC REPORT
Risk Management CONTINUED

3 Risk from competition
MITIGATION MEASURES TREND
The Group faces competition in each of its product lines from many companies offering similar capabilities and services, including international oil companies, single-product providers of fuel cards, and other services. In addition, markets where we operate are characterised as oligopolistic or monopolistic, and are burdened by heavy regulation and restrictions for entering or expanding. These factors could cause an adverse impact on revenues and prospects if we cannot compete or expand our business activities effectively.
The Group considers the trend of the risk as stable due to not recorded significant failures in the expansion of Group’s business as a result of inability to compete.
• Reducing dependency on a single economy, single market or single revenue stream
• Geographical diversification and products or services offering diversification
• Fast inorganic growth through M&A activities
4 Risk of dependency on external parties
MITIGATION MEASURES TREND
The Group’s business is dependent on several key strategic relationships with third parties, the loss of which could adversely affect our results. Key partners mainly fall into the following categories – fuel suppliers, acceptance network, toll chargers, authorisation centres and technology service providers. Furthermore, the Group has also initialised an internalisation of the authorisation centre of its fuel cards transactions that is currently being provided by an external transactions authorisation centre – AEVI. The project is significantly dependent on the current external provider of the authorisation centre and an inability to complete the internalisation, in an expected quality and time-frame, would expose Group to additional costs and potential business disruptions.
The Group considers the trend of the risk as increasing due to the ongoing project on the internalisation of authorisation centre, which is heavily dependent on the cooperation of external party.
• IT vendors management policy – setting the standards for vendors selection, contracts reviews and signature and vendors monitoring
• Centralised procurement team for energy supplies and logistics
• Centralised development and maintenance role for acceptance network
• Contract management rules and attestation rules
• Centralised legal counsel – aids in the contracts elaboration and reviews
• Project on the internalisation of the authorisation centre in execution
STRATEGIC REPORT
Annual Report and Accounts EUROWAG
51
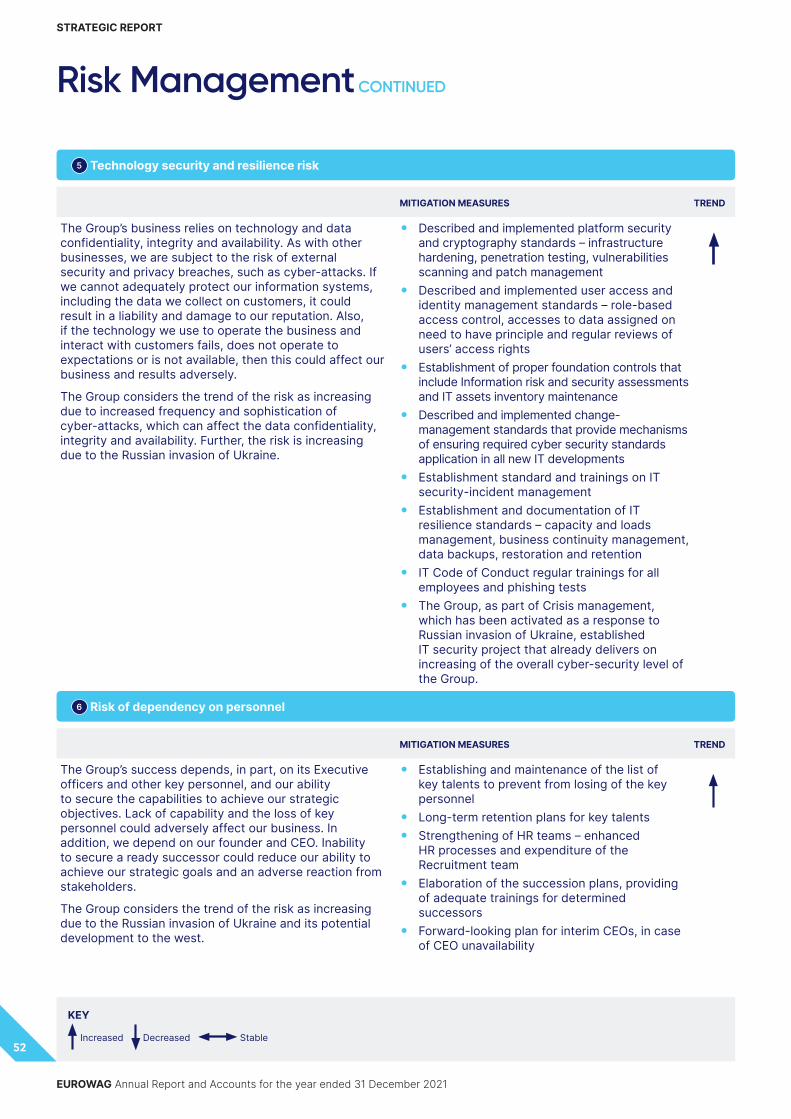
KEY
Increased Decreased Stable
5 Technology security and resilience risk
MITIGATION MEASURES TREND
The Group’s business relies on technology and data confidentiality, integrity and availability. As with other businesses, we are subject to the risk of external security and privacy breaches, such as cyber-attacks. If we cannot adequately protect our information systems, including the data we collect on customers, it could result in a liability and damage to our reputation. Also, if the technology we use to operate the business and interact with customers fails, does not operate to expectations or is not available, then this could affect our business and results adversely.
The Group considers the trend of the risk as increasing due to increased frequency and sophistication of cyber-attacks, which can affect the data confidentiality, integrity and availability. Further, the risk is increasing due to the Russian invasion of Ukraine.
• Described and implemented platform security and cryptography standards – infrastructure hardening, penetration testing, vulnerabilities scanning and patch management
• Described and implemented user access and identity management standards – role-based access control, accesses to data assigned on need to have principle and regular reviews of users’ access rights
• Establishment of proper foundation controls that include Information risk and security assessments and IT assets inventory maintenance
• Described and implemented change-management standards that provide mechanisms of ensuring required cyber security standards application in all new IT developments
• Establishment standard and trainings on IT security-incident management
• Establishment and documentation of IT resilience standards – capacity and loads management, business continuity management, data backups, restoration and retention
• IT Code of Conduct regular trainings for all employees and phishing tests
• The Group, as part of Crisis management, which has been activated as a response to Russian invasion of Ukraine, established IT security project that already delivers on increasing of the overall cyber-security level of the Group.
6 Risk of dependency on personnel
MITIGATION MEASURES TREND
The Group’s success depends, in part, on its Executive officers and other key personnel, and our ability to secure the capabilities to achieve our strategic objectives. Lack of capability and the loss of key personnel could adversely affect our business. In addition, we depend on our founder and CEO. Inability to secure a ready successor could reduce our ability to achieve our strategic goals and an adverse reaction from stakeholders.
The Group considers the trend of the risk as increasing due to the Russian invasion of Ukraine and its potential development to the west.
• Establishing and maintenance of the list of key talents to prevent from losing of the key personnel
• Long-term retention plans for key talents• Strengthening of HR teams – enhanced
HR processes and expenditure of the Recruitment team
• Elaboration of the succession plans, providing of adequate trainings for determined successors
• Forward-looking plan for interim CEOs, in case of CEO unavailability
EUROWAG Annual Report and Accounts for the year ended 31 December 2021
52
STRATEGIC REPORT
Risk Management CONTINUED

7 Risk of climate change
MITIGATION MEASURES TREND
Climate change and the energy transition represent both a risk and opportunity for the Group. Our reputation, operating and compliance costs, and diversification of revenue, may be influenced by our pace of action, the pace of the energy transition in the CRT sector and by our customers in the short, medium and long term. We currently derive a significant portion of our revenues from fees for fossil fuels transactions. We note that changes in road-transport policy and regulations, the cost of carbon, carbon taxation, changes in market demand for alternative fuel and clean mobility solutions, and pace of adoption of low-carbon powertrains by our customers, can all influence the level of risk and opportunity for the business. We also recognise that extreme weather events could pose a risk to business continuity for our physical assets, as well as the health, safety and wellbeing of our workforce and customers. In addition, we recognise we are responsible for reducing our own carbon footprint, as well as for contributing to solutions to help customers make the transition to a low-carbon future.
The Group considers the trend of the risk as increasing due to science predictions and upcoming actions of regulators, countries and community leaders.
• Investing in a portfolio of alternative fuels and technologies, including eMobility, to support the transition to a low-carbon future in the CRT sector
• Investing in eMobility solutions, including in Last Mile Solutions, to provide industry-leading eMobility services to customers throughout Europe
• Investing in digitalisation and technologies to help our customers improve efficiency in CRT and reduce energy intensity
• Formalising our ESG strategy, including carbon reduction targets for our operations as well as develop targets for, and means of, reducing Scope 3 emissions across our value chain
• Reviewing business-continuity plans to take into account the potential impacts of extreme weather events caused by climate change, and the impact on people and physical assets
• Increased transparency of carbon emissions and related efforts to reduce them
• Formal, structured scenario analysis to assess the physical and transition risks for the business and its assets, and to inform ongoing risk-assessment and mitigation measures, as well as to report in line with TCFD
8 Physical security risk
MITIGATION MEASURES TREND
The Group operates a number of truck parks and these are exposed to security threats. A security threat materialising as a result of insufficient protection would result in danger to the health of our employees and customers, and significant business disruptions.
The Group considers the trend of the risk as increasing due to the Russian invasion of Ukraine and its potential development to the west.
• Implementation of the Health and safety plans on the Group’s truck parks to avoid security threats materialisation
• Having in place emergency plans and staff trained on the acting in the emergency situations
• Petrol stations security and operating rules and their regular control and revision
STRATEGIC REPORT
Annual Report and Accounts EUROWAG
53

9 Regulatory and licensing risk
MITIGATION MEASURES TREND
The Group relies on numerous licences for the provision of its on-road mobility products, these include wholesale and retail permits required for the provision of fuel products, as well as fuel station operating licences for its truck parks, EETS licence and EETS certifications in a number of countries, Electronic money institution licence required for the provision of financial services and insurance distribution licences. As a consequence of holding the licences and certifications, the Group is subject to strict regulatory requirements (Governance, Products, IT security and Operational) of regulatory bodies in respective jurisdictions. Non-compliance with these can result in fines, suspension of business or loss of licences. Key regulatory requirements are operationalised by governance and compliance with UK plc listing rules, anti-money laundering (“AML”) and sanction laws, personal-data-protection laws, Czech national bank regulation, fuel-reselling legislation and EETS regulation. In addition, changes in laws, regulations and enforcement activities may adversely affect our products, services and markets.
The Group considers the trend of the risk as increasing due to upcoming legislative changes and further expansion of Group´s business activities to highly regulated markets.
• Legal and compliance counsels for all business units, with regulation watch implied
• Continuously implementing risk management control framework
• Involving legal and compliance counsels in new-markets entry process
• Implementing Group-wide AML policy, partner-screening directive and detailed AML directive
• Regular AML re-screening of customers who use regulated financial services
• Two-level monitoring of sanctions – one conducted by Attorney office, one by automated update notifications (EU, UK and USA updates)
• Implementing Group-wide personal-data-protection policy and detailed GDPR directive
• Project to ensure continuous compliance with GDPR directive requirements
10 Risk of clients defaulting
MITIGATION MEASURES TREND
The Group is subject to the credit risk of its customers, many of whom are small and mid-sized CRT businesses. We are exposed to customer credit risk for particular customers in our payment solutions segment who we finance through post-payment of their energy consumption and toll balances and also for customers with invoices on 30-day payment terms. If we fail to assess and monitor adequately the credit risks posed by counterparties, we could experience an increase in credit losses and other adverse effects.
The Group considers the trend of the risk as stable due to proven credibility and efficiency of the Group´s credit risk management.
• Credit assessment at onboarding (scoring) – in determining the credit risk of its customers, the Group performs a credit assessment, which consists of a financial analysis of recent results and development as well as a business analysis and verification using available databases.
• The Group’s credit risk department conducts ongoing credit exposure monitoring, revising credit limits at regular intervals and upon utilisation of available limits, and updating collateral from customers as needed.
• The ageing of receivables is regularly monitored by the Group management to assess credit risk, based on expected loss calculations, which evaluate probability of default, exposure at default and loss given default.
• The Group has credit insurance subject to first-loss policies on both individual and aggregate bases to ensure against the risk of default from customers on its trade and other receivables.
• Collateral (guarantees, pledge of receivables, pledge of physical assets) – The Group accepts cash deposits and advance payments from customers to secure credit exposure. The Group also accepts other types of security (such as pledges of assets or promissory notes) to mitigate credit risk.
KEY
Increased Decreased Stable
EUROWAG Annual Report and Accounts for the year ended 31 December 2021
54
STRATEGIC REPORT
Risk Management CONTINUED

STRATEGIC REPORT
Annual Report and Accounts EUROWAG
55

EUROWAG Annual Report and Accounts for the year ended 31 December 2021
56
STRATEGIC REPORT
Viability Statement
In accordance with provision 31 of the 2018 UK Corporate Governance Code, the Board of Directors have assessed the Company and the Group’s prospects and viability taking into account the business model, the Group’s current position and principal risks over a period longer than the 12 months as required by the Viability and Going Concern statement.
VIABILITY TIMEFRAMEThe Board of Directors have determined a three-year period to 31 December 2024 is the appropriate timeframe to assess viability. Selection of this timeframe is based on the following rationale:
• This period is reviewed by the Board in the annual planning and budgeting process, this allows financial modelling to be supported by the budget and growth factors in business plan approved by the Board;
• This time horizon is captured as the relevant period for evaluation and stress testing of principal risks (primarily those of an operational nature), which are typically occurring within this timeframe;
• The innovative nature of the Group and expected disruption of the market by innovations make it difficult to predict with sufficient confidence how competition and other risks will impact beyond a three-year timeframe; and
• Considering continuous changes of macroeconomic and political environment period longer than three-year timeframe would bring greater uncertainty into a forecasted period.
While the Board of Directors have no reason to believe that the Company and the Group will not be viable over the long-term period, they consider the three financial years to be an appropriate planning time horizon to assess viability and to determine the probability and impact principal risks.
ASSESSMENT OF BUDGET AND FINANCIAL FORECASTThe Company’s and the Group’s financial forecast is assessed primarily through the financial planning process (annual operating budget) and the strategic planning (long-term strategic plan). This process is managed by the Chief Executive Officer, Chief Financial Officer, Chief Performance Officer, Chief Strategy Officer and Chief Operating Officer in cooperation with division and functional management teams.
The Board of Directors participate fully in the annual process to review, challenge and approve the annual operating budget for the new financial year. The output of the annual budget process provides a clear explanation and overview of key assumptions and risks to be considered when agreeing the annual operating budget as a detailed set of one-year financial forecasts.
The Group also has a long-term strategy in place, in the form of a long-term strategic plan. The strategy is reviewed and updated on a periodic basis and is based on detailed financial forecasts.
The long-term financial forecasts are prepared with the first year of financial forecasts based on the Group’s annual operating budget and for subsequent years forecast financials based on the strategic plan.
Both the annual operating budget and the strategic plan are further updated through a rolling forecast process. The annual operating budget is updated on a quarterly basis and the strategic plan is reviewed on an annual basis. In case of any risk occurrence mitigating actions are taken whether identified through actual trading performance or through the rolling forecast process.
The latest annual operating budget for the year ending 31 December 2022 was reviewed and approved by the Board of Directors in February 2022, and this budget is based on the Company and the Group’s current position and its prospects over the forthcoming year and in line with the Group’s stated strategy.
ASSUMPTIONS USED IN FINANCIAL FORECASTThe key assumptions within the Company’s and the Group’s financial forecasts are as follows:
• Organic net revenue development expected to be driven by both payment solutions and mobility solutions to grow on average at a similar pace over the projected period:
− Organic net revenue growth, of both payment and mobility solutions, is primarily driven by increasing number of customers, which is positively influenced by (i) launch of new sales channels (digital and telesales); (ii) penetration of the markets where the Group has an already established position; (iii) new markets entry; and (iv) considering the development of upsell/cross sell activities of our products into the customer base, we assume to keep net revenue retention (“NRR”) at least at a level of 110%.
− Mobility solutions are positively supported by continuous up-sell and cross-sell of the products, due to:
− Additional cross-sell of tax refund services into the payment solutions customer base;
− Strong expansion of our telematics solution;
− Continuous growth in financial services supported by the launch of new factoring services; and
− Development of smart navigation products and mobile applications (Road Lords and Eurowag App) and continuous growth in Original Equipment Manufacturers (“OEM”) cooperation.
• Assumptions driven by energy prices development.
• Credit losses reflect an increase of turnover, there is no change in credit risk assumed.

STRATEGIC REPORT
Annual Report and Accounts EUROWAG
57
Application of presented risks in above mentioned scenarios were examined via four different effects on Company’s business, overview of these effects and their application for particular risk and scenario is outlined in the table below:
Risk application Downside senario # Effect 1 Effect 2 Effect 3 Effect 4
Principal risk
Market decline
Data breaches/ cyber attack
Loss of business
Technological disruption
Product demand decline risk 1,2,3 – –
Technology security and resilience risk 1,2,3 –
External parties dependency risk 1,2,3 – – –
Physical security risk 2,3 – –
Climate change risk 1,2,3 – –
• Operational costs (“OpEx”) in both budgeted and forecasted period is based on following assumptions:
− To keep the costs under control, OpEx in the budgeted period is based on 2021 run rates increased by additional costs related to (i) being a publicly listed company; (ii) implementation of next generation ERP; (iii) ESG activities; (iv) annual salary reviews and changes in the bonus schemes; and (v) upskilling of the organisation specifically with technology talent.
• M&A investments: Both budget and financial plan assume all committed transactions.
• External financing: Both budget and financial plan assume maintaining current financing structure.
• Capital expenditure (“CapEx”): (i) ordinary CapEx of high single digit % of net revenues for period 2022–2024; and (ii) transformational CapEx expected at level of €50 million cumulatively for the years ending 31 December 2022 and 2023, there is no transformational CapEx planned for 2024.
ASSESSMENT OF VIABILITYThe key assumptions within the projections were stress tested with reference to risks set out in the Risk Management section on pages 48 to 54 of this Annual Report.
This year the Board of Directors considered application of the following risks:
• Impact of ongoing COVID-19 pandemic. Principal risk: Product demand decline risk
• Impact of any form of geo-political risk. Principal risk: Product demand decline risk
• Deteriorating economic and market conditions, which could result in lower sales volume and higher fuel prices. Principal risk: Product demand decline risk
• Impact of potential cyber-attacks may appear annually, which may result in increased operational technology costs. Principal risk: Technology security and resilience risk
• Impact of potential problems with data availability, which may cause increased operational technology costs and a potential downturn of net sales. Principal risk: Technology security and resilience risk
• Impact of potential project failure, which may result in an increase of technology costs from FY23 onwards. Principal risk: External parties dependency risk
• Given the geographical location of the Spanish subsidiary we considered the potential security risk, which may cause 50% decrease of all operations of Spanish subsidiary. Principal risk: Physical security risk
• Impact of climate changes which could result in increase of (i) operational cost, we could expect increases in people costs, consultancy costs, marketing and PR, technology costs, engineering cost and costs related to truck park management; and (ii) increases of CapEx – additional investments into technology projects related to climate change. Principal risk: Climate change risk
Applied risks and their effect were stress tested via three types of downside scenarios. First Scenario focuses on (i) product demand decline risk; (ii) technology and resilience risk; (iii) external parties dependency risk; and (iv) climate change risk. Second Scenario focuses on (i) product demand decline risk; (ii) technology and resilience risk; (iii) external parties dependency risk; (iv) physical security risk; and (v) climate change risk. Third Scenario focuses on (i) product demand decline risk; (ii) technology and resilience risk; (iii) external parties dependency risk; and (iv) climate change risk. The Directors also considered the potential mitigating actions that the Group could take to preserve liquidity and ensure compliance with the Group’s financial covenants. In doing so, judgement has been applied in determining whether such actions would be reasonably possible to execute as well as the financial impact of taking such actions. In terms of mitigating actions, the Directors are confident that they would be able to take similar actions to those taken during previous economic downturns.

EUROWAG Annual Report and Accounts for the year ended 31 December 2021
58
STRATEGIC REPORT
Applied risks were estimated to create severe but plausible downside scenarios covered in the first and the second scenario and took into account the development of net revenues, level of OpEx and levels of CapEx. The scenarios were also modelled to test potential occurrence of any liquidity issue of the Group, both first and second scenarios have proven that the Group operates with sufficient level of liquidity headroom and ability to meet financial covenants.
Along with this analysis, the Directors have considered a reverse stress tests scenario (third scenario) in order to further assess the Company’s and the Group’s viability. In the reverse stress test, there are assumed, as described in detail above, primarily impacts of (i) long-term and severe macro-economic crisis (market downturn by 30-60%) along with; and (ii) severe impact of climate changes. This reverse test scenario considered the negative changes required from these factors and as mentioned above, the Directors also considered the potential mitigating actions that the Group could take to preserve liquidity and ensure compliance with the Group’s financial covenants.
Considering the level of stress test scenario, the Directors have no reason to believe that the Company and the Group will no be viable over the long-term period.
VIABILITY STATEMENTBased on the above described assessment of the principal risks facing the Company and the Group, stress testing and reverse stress testing undertaken to assess the Company’s and the Group’s prospects, the Board of Directors have a reasonable expectation that the Company and the Group will be able to continue in operation and retain sufficient available cash to meet its liabilities as they fall due over the period to 31 December 2024 and consequently, the Group proved it will remain relevant and solvent in the medium to long-term considering technological, social and environmental changes expected to happen in the medium to long-term period.
GOING CONCERNThe Board of Directors have considered the financial prospects of the Company and the Group for the foreseeable future, which is at least the next 12 months and made
an assessment of the Company’s and the Group’s ability to continue as a going concern. The Directors’ assessment included consideration of the availability of the Company’s and the Group’s credit facilities, cash flow forecasts and stress scenarios. Stress test scenarios applied in the Going concern statement are in line with scenarios covered in the Viability statement, except application of climate changes risk. Climate changes risk was stress tested only for Viability statement, this risk is modelled with an effect on Company’s business from the beginning of financial year 2024, this period is beyond tested period applicable for Going concern statement. The Board of Directors are satisfied that the Company and the Group has the resources to continue business for the foreseeable future, in particular given the level of cash balances available following the IPO, and furthermore are not aware of any material uncertainties that may cast significant doubt upon the Company’s and the Group’s ability to continue as a going concern and the Board of Directors considers it is appropriate to adopt the going concern basis of accounting in preparing the annual financial statements.
Viability Statement CONTINUED

In accordance with section 414CZA of the Companies Act, the Directors provide the following statement that describes how they have had regard to the matters set out in section 172(1)(a) to (f) when performing their duty under section 172. It outlines how the Board of Directors promote the success of the Company for the benefit of its members as a whole, by engaging with key stakeholders to better inform their decision making.
Eurowag puts stakeholder considerations and sustainable business practises at the heart of its purpose: to create sustainable financial and technological solutions for the benefit of the commercial road transport industry, society and the environment.
The Non-Executive Directors of the Board were formally appointed in September 2021. The Board as a whole delegates certain engagement responsibilities to individual Non-Executive Directors, the Executive team, including the Group Chief Executive, Chief Financial Officer and relevant Executive Committee members, as well as senior management. These individuals provide the Board with updates on stakeholder developments and interests and this feedback helps inform the Board as it takes principal decisions, including the development of business strategy. The Board recognises that proactive and two-way dialogue with stakeholders is a critical part of the Company’s long-term success. Thus, the Board will continue to take stakeholder interests and concerns into account as part of its decision making process.
The following outlines the Board and Executive team’s approach for listening to and engaging with specific stakeholder groups.
SECTION 172 STATEMENT
STRATEGIC REPORT
Annual Report and Accounts EUROWAG
59
Our Engagement with Stakeholders

INVESTORS INITIAL PUBLIC OFFERING REGULATORS AND GOVERNMENT
Eurowag monitors policy and regulatory developments across Europe, as well as in our priority markets. Our business lines are affected by complex and changing requirements in the countries where we operate, covering a wide range of topics from carbon reduction in transport to VAT legislation and GDPR. The legal and compliance functions are responsible for overseeing these developments and report regularly to the Executive Committee. In 2022, the Board will also receive relevant and material developments that present both risks and opportunities for the industry, Eurowag and our customers. We participate in a number of trade bodies including the International Road Transport Union, FCE, UPEI (an industry body representing independent fuel suppliers in Europe), CHARIN, AETIS (the Association of Electronic Toll and Interoperable Service) and ČAPPO (Czech Association of Petroleum Industry and Trade), to monitor and engage with stakeholders in the regulatory and policy arenas. Key topics of interest and concern during 2021 included: • policies relating to energy
transition, including the EU Mobility Package and alternative-energy directives
• consultations and further engagement with the FCA in the lead up to the Company’s IPO on the London Stock Exchange
• evolving policy and legislation relating to energy efficiency and carbon reduction, and reporting requirements in Europe and key markets
• policy on new toll payment solutions for EETS and national tolls
• changes in VAT legislation in Europe and the OECD’s new international tax framework
• payment services legislation interpretation and updates
• engaging with regulators in Hungary on the acquisition of WebEye
The Investor Relations function facilitates communication with existing and prospective Shareholders. The Head of Investor Relations supports the CFO and the CEO in briefings to the Board and provides feedback from investors, analysts and brokers on the Company’s performance and general shareholder sentiment on priorities such as ESG and remuneration.In the period between IPO and the financial year end, the team held more than 30 meetings with investors and analysts. Due to the ongoing pandemic, all meetings were virtual. Key topics of interest in 2021 included: • listing on the London Stock
Exchange and performance after the IPO
• growth strategy and technological investment
• M&A strategy and recent transactions
• use of proceeds from the IPO• industry trends, especially the
potential impacts of energy transition
The Board was established ahead of the IPO on the London Stock Exchange and has been involved in advising and supporting the process for listing. The Executive Committee and Board recognised that the IPO would be instrumental to the future success and sustainability of the business. A successful listing would enable the Company to accelerate its growth and achieve its vision to ensure that businesses in the CRT sector can access and benefit from digitisation before, during and after every journey. Throughout the process, the Head of Investor Relations, the CEO and CFO, alongside advisors, provided the Board with regular updates about the concerns and interests from prospective investors and feedback from other stakeholders, including sponsors and advisors. In preparation for the IPO, the Board and Executive Committee implemented a strong governance framework, which reflects the Company’s desire to maintain a reputation for high standards of business conduct. The topics of most interest included: • competitive position of Eurowag• strategy for growing the
business, including geographic expansion
• risks and opportunities to the business
• technological transformation of the industry, digital trends and impacts of energy transition
• changes in governance• environmental and social
impacts• M&A strategy and investment in
technology
Ahead of the IPO, the Group undertook 38 individual meetings, more than 30 group meetings and 300 calls to potential investors from banks representing Eurowag. These calls included participation from the Executive Directors. Following the IPO, the investor relations team continues to engage with investors and provide regular updates to the Board.
EUROWAG Annual Report and Accounts for the year ended 31 December 2021
60
STRATEGIC REPORT
Our Engagement with Stakeholders CONTINUED

CUSTOMERS
Customer engagement is led by the Chief Commercial Officer who oversees the go-to-market strategy based on three geographic clusters (Central, Southern and Western Europe) and the Group Marketing team. The Chief Commercial Officer is a member of the Executive Committee and responsible for providing updates to the Board on customer insights. The mechanisms for engaging with customers include direct sales through area sales managers, supported by a telesales team; and indirect sales through leads generated by third-party relationships, focusing on verticals and co-branded solutions. Both models are supported by digital sales, which in itself became an independent channel in 2021. The Group’s technology platform is designed to offer a seamless customer experience from on-boarding to screening, risk management as well as ongoing customer relationship management (“CRM”). In 2021, we allowed for fully digital customer acquisition and onboarding, which is aimed at smaller fleets. In addition, the marketing and customer teams engage with customers through surveys that provide formal, quantitative insight into customer needs and interests. The teams also secure unique insight into the needs of truckers through the Road Lords app, a truck navigation
GPS app for Android users. In addition to providing specialised routes for trucks and other large vehicles, it serves as a social platform, linking drivers to other drivers. We also monitor the level and type of customer complaints so we can address customer concerns. A key measure for assessing the quality of our engagement with, and support to, customers is our customer Net Promoter Score (“NPS”). Our NPS allows us to effectively gauge the customer experience and track how well we are developing our relationship with our customers. This factor was a key consideration for the Remuneration Committee in ensuring remuneration is aligned with our customer-centric strategy. Therefore, in 2022, this measure will be a leading KPI that informs an element of annual bonus targets and remuneration. In 2021, key topics of interests to Eurowag customers included: • availability of the workforce
including drivers• availability of parking • costs and administrative burdens
associated with changes to regulation in home markets and across borders
• health and safety on the road • e-tolling changes in Poland• rising price of fuel • competitiveness and small
margins
STRATEGIC REPORT
Annual Report and Accounts EUROWAG
61

EMPLOYEES PURPOSE, CULTURE AND VALUES
The Chief People Officer has primary responsibility for ensuring that workforce-related issues are tabled at the Executive Committee and with the Board. The Chief People Officer is a member of the Executive Committee and is responsible for the Company’s culture and values framework as well as the diversity, equity and inclusion strategy. In addition, Susan Hooper, has been appointed as the Non-Executive Director responsible for workforce engagement issues. The HR function regularly engages with the workforce through several channels, including through the onboarding process, annual engagement survey and Pulse surveys. In early 2022, the Chairman and other Board members visited the Prague headquarters to meet leaders and employees. In addition, these visits will include engaging with employees to hear the topics of interest and concern to the workforce. The Board will look to insights and trends from employee pulse and employee Net
Promoter Scores (“eNPS”). These tools allow the Board to understand the sentiment of our employees and how they feel about working for us. This in turn provides the Board with the opportunity to develop relationships and focus on what matters to the workforce. It is vital we align the interests of our employees with our strategy so, in 2022, eNPS will also inform an element of annual bonus targets and remuneration alongside NPS as a KPI. Our Culture Amp tool provides the means for employee engagement surveys as well as benchmarking against technology peers across Europe. Employee engagement and employee net promoter scores are another key measure the Board will use to understand the quality of workforce engagement.
In October, the Board held a session on the purpose and values of the Group. The discussion included an overview of Eurowag’s Culture Manifesto, which sets out the framework for maintaining a strong, ethical and responsible culture. By setting and developing the Eurowag purpose and values in an attempt to achieve the desired culture, the Board, through management, are establishing practices that allow us to maintain our high standards of business conduct. Furthermore, the Board is ensuring we continue to build strong relationships with our customers through nurturing and promoting a culture within the organisation that sets high standards for the way we interact with them.
Crucially, the discussions also included the practical role that our purpose and values plays in the recruitment, management, development and retention of the Group’s workforce and overall culture.
For more information on Eurowag’s purpose and values, please refer to page 104
EUROWAG Annual Report and Accounts for the year ended 31 December 2021
62
STRATEGIC REPORT
Our Engagement with Stakeholders CONTINUED

SOCIETY AND THE ENVIRONMENT GROUP RISK FRAMEWORK
During the year, the Board considered and approved the Risk Management section. This is built on a “three lines of defence” model and includes a Risk Management code, Risk Assessment directive, Risk Monitoring and Reporting directive as well as an Incidents Management directive. Since Q4 2021, Group risk updates have been provided to the Audit and Risk Committee quarterly. The foundation of the entire risk process considers interfaces and risks covering all stakeholders, including customers, suppliers, employees, shareholders, regulators, the environment and society at large. Our ability to manage these risks has a direct impact on the preservation of relationships with all stakeholders.
For more information on the Risk Framework and Governance, please refer to page 48
In 2021, Eurowag established a sustainability function to oversee our strategy for covering a wide range of environment, social and governance (“ESG”) topics. This includes responsibility for providing the Board and Executive Committee with news of external developments and trends, as well as applicable policy developments covering sustainability issues. The function will also be responsible for engaging with opinion formers, non-profit and charitable organisations working on environmental and social issues. Further, the Board appointed Susan Hooper as the Company’s designated Non-Executive ESG Representative for the Company and on the Group’s ESG Executive Committee, with effect from 1 January 2022. During the financial year the Board undertook alternative arrangements for workforce engagement in accordance with provision 5 of the UK Corporate Governance Code. Since her appointment to the Board, Susan has been involved in developing and formalising the Group ESG strategy. In her capacity as ESG Director, Susan will ensure the Board considers sustainability and stakeholder views in their discussions and decisions. In October, the Board considered and approved Eurowag’s new sustainability strategy. Developed in early 2021, this strategy includes commitments covering material topics in the environmental, social and governance arenas.
The strategy has been informed by a formal materiality analysis, conducted during 2021. This exercise examined the ESG issues of greatest interest and concern to the Company and industry stakeholders. The initial materiality analysis examined and prioritised 14 social, environmental and ethical issues including climate change, data protection, diversity, equity and inclusion, employee engagement, workplace wellbeing, supporting our customers in the energy transition, and on efficiency as well as wellbeing and financial sustainability.Key issues of interest and under discussion at the Executive Committee and Board during the year included • developing and implementing
Eurowag’s ESG Sustainability Strategy
• impacts, opportunities and implications of ESG developments, including climate change and the energy transition
• non-financial reporting and disclosure requirements
For more information on Eurowag’s sustainability strategy and the materiality analysis, please refer to pages 68 to 70
The following outlines the strategic topics and principal decisions considered by the Board along with their consideration of stakeholder interest and concerns.
STRATEGIC REPORT
Annual Report and Accounts EUROWAG
63
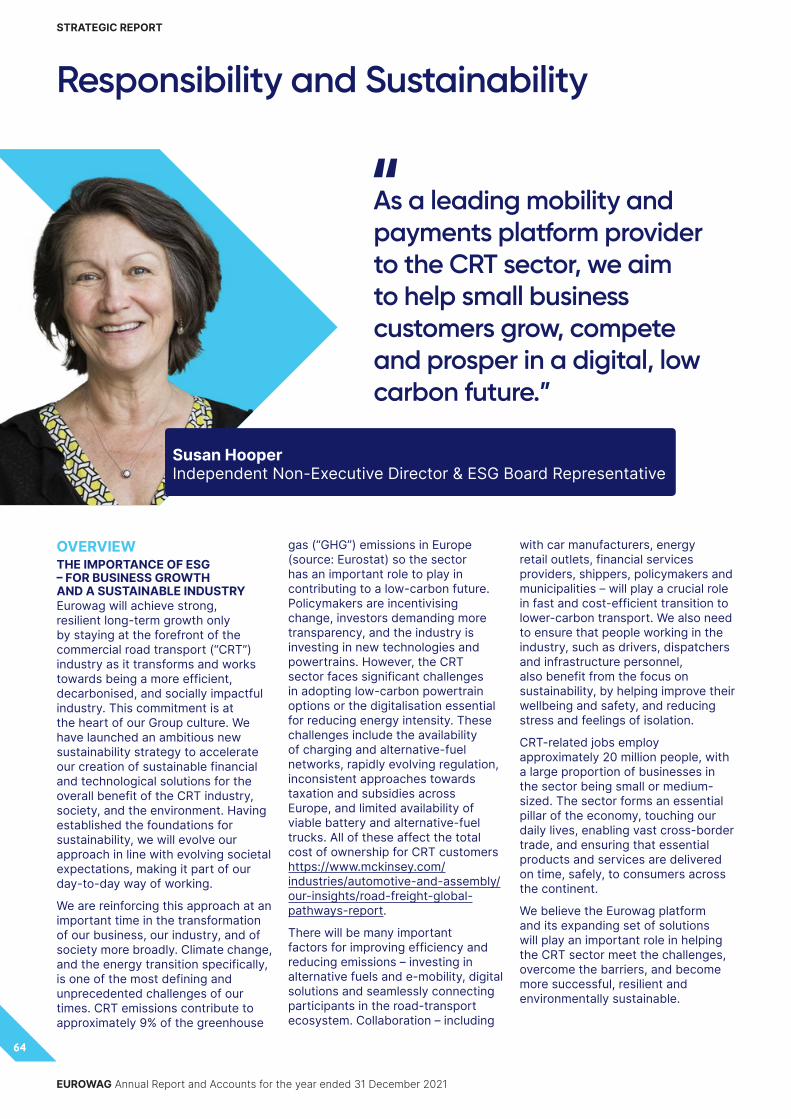
OVERVIEWTHE IMPORTANCE OF ESG – FOR BUSINESS GROWTH AND A SUSTAINABLE INDUSTRYEurowag will achieve strong, resilient long-term growth only by staying at the forefront of the commercial road transport (“CRT”) industry as it transforms and works towards being a more efficient, decarbonised, and socially impactful industry. This commitment is at the heart of our Group culture. We have launched an ambitious new sustainability strategy to accelerate our creation of sustainable financial and technological solutions for the overall benefit of the CRT industry, society, and the environment. Having established the foundations for sustainability, we will evolve our approach in line with evolving societal expectations, making it part of our day-to-day way of working.
We are reinforcing this approach at an important time in the transformation of our business, our industry, and of society more broadly. Climate change, and the energy transition specifically, is one of the most defining and unprecedented challenges of our times. CRT emissions contribute to approximately 9% of the greenhouse
gas (“GHG”) emissions in Europe (source: Eurostat) so the sector has an important role to play in contributing to a low-carbon future. Policymakers are incentivising change, investors demanding more transparency, and the industry is investing in new technologies and powertrains. However, the CRT sector faces significant challenges in adopting low-carbon powertrain options or the digitalisation essential for reducing energy intensity. These challenges include the availability of charging and alternative-fuel networks, rapidly evolving regulation, inconsistent approaches towards taxation and subsidies across Europe, and limited availability of viable battery and alternative-fuel trucks. All of these affect the total cost of ownership for CRT customers https://www.mckinsey.com/industries/automotive-and-assembly/our-insights/road-freight-global-pathways-report.
There will be many important factors for improving efficiency and reducing emissions – investing in alternative fuels and e-mobility, digital solutions and seamlessly connecting participants in the road-transport ecosystem. Collaboration – including
with car manufacturers, energy retail outlets, financial services providers, shippers, policymakers and municipalities – will play a crucial role in fast and cost-efficient transition to lower-carbon transport. We also need to ensure that people working in the industry, such as drivers, dispatchers and infrastructure personnel, also benefit from the focus on sustainability, by helping improve their wellbeing and safety, and reducing stress and feelings of isolation.
CRT-related jobs employ approximately 20 million people, with a large proportion of businesses in the sector being small or medium-sized. The sector forms an essential pillar of the economy, touching our daily lives, enabling vast cross-border trade, and ensuring that essential products and services are delivered on time, safely, to consumers across the continent.
We believe the Eurowag platform and its expanding set of solutions will play an important role in helping the CRT sector meet the challenges, overcome the barriers, and become more successful, resilient and environmentally sustainable.
As a leading mobility and payments platform provider to the CRT sector, we aim to help small business customers grow, compete and prosper in a digital, low carbon future.”
Susan HooperIndependent Non-Executive Director & ESG Board Representative
EUROWAG Annual Report and Accounts for the year ended 31 December 2021
64
STRATEGIC REPORT
Responsibility and Sustainability

OUR APPROACH Eurowag is driving the transformation of the commercial road transport industry to create a successful, resilient, sustainable future for our customers, communities and company.
We have always believed that we succeed and grow as a company when our customers, communities and colleagues succeed and grow. With the decarbonisation imperative growing in urgency, we are intensifying our efforts to make life more fair, secure and sustainable for the people at the heart of the CRT industry.
In 2021, we worked with ESG experts to examine our material impact on the world. We used these insights to shape our new sustainability strategy and targets. Our approach focusses on three areas:
OUR INDUSTRY.We are committed to creating structural solutions to power the CRT industry’s transition into a low carbon future. Our priorities are to build a better-connected industry, increase access to lower carbon mobility solutions and reduce emissions across the CRT value chain.
OUR CUSTOMERS.We are determined to help SME customers transition into a low-carbon future and prosper as business owners. Our priorities are to help customers improve operational efficiency and reduce emissions, to help improve customer wellbeing and safety, and to support SME business success through financing and advice.
OUR COMPANY, COLLEAGUES AND COMMUNITIES.We are working to achieve the highest responsible business standards in a thriving inclusive culture. Our priorities are to reduce our direct emissions, develop an ambitious DEI strategy, and make a positive impact on our communities through our employee-driven charitable giving and volunteering programme.
HELPING OUR CUSTOMERS AND INDUSTRY TRANSITION TO A LOW CARBON FUTUREDecarbonisation is the defining issue of the decade for every sector of society – including the road transport industry.
For Eurowag’s largest customer base – small carrier businesses with limited capital – rising to this imperative is a significant challenge. Carriers face limited availability of charging and alternative fuel networks, limited availability of battery and alternative fuel trucks, and inconsistent regulations, subsidies, and taxation programmes across Europe.
Given that Eurowag’s services are deeply embedded in our carriers’ everyday operations, we have a unique opportunity to help and inspire small business to tackle these challenges and succeed and grow.
We have outlined our sustainability commitments and targets under three pillars: operating responsibly, leading the sector and transforming the industry and wider society.
In addition to setting out a formalized strategy and commitments, key areas of progress during the year include:
• Establishing a sustainability function and strengthened ESG governance
• Setting new ESG targets including: − A carbon reduction target to reduce emissions
from our direct operations (Scope 1 and Scope 2) by 50% by 2030 on a 2019 baseline.
− A DEI target to have 40% female representation in leadership roles by 2025 on a 2021 baseline.
− Achievement of a top 25% of employee engagement score as compared to EU Tech companies benchmark by 2025.
• Expanding the scope of ESG performance metrics publicly reported including reporting in line with TCFD requirements.
Whilst we have formalized our approach in 2021, we recognize there is much more to be done. We are committed to accelerate progress against our commitments and ultimately:
• help our customers prosper • make road transport cleaner, more efficient and safer• help our employees and communities thrive in a
healthy environment
In the following sections, you will find an overview of
• Governance and oversight of sustainability in Eurowag• Material issues of interest to our business and society • Our commitments under the 3 pillars • Data and progress covering environment (including
our TCFD statement), social and governance topics.
STRATEGIC REPORT
Annual Report and Accounts EUROWAG
65

ESG GOVERNANCE This year, we established a governance structure to agree and monitor implementation of our ESG strategy. The Board of Directors is ultimately responsible for ESG, but delegates accountability to the ESG Executive Committee, from where it receives regular updates, as well as periodic presentations. The Committee is facilitated by the VP of Sustainability and comprises one independent Non-Executive Director, Susan Hooper, the CEO, Martin Vohánka, and senior executives from legal, human resources, communications, commercial and investor relations, as well as an environmental subject matter expert. It sets the strategic direction and tracks progress of the ESG strategy, related policies and reporting, as well as monitors ESG risks and opportunities. It meets every two months.
We also have an operational monthly ESG Operational Committee, where representatives from around the business coordinate the day-to-day running of the strategy. During the year, we also established a sustainability function to facilitate this, and to ensure ESG is part of our decision making processes. We have also introduced a formal ESG policy that codifies and sets out our governance and approach for integrating sustainability into our business, as well as monitoring and reporting on its progress.
ESG GOVERNANCE AND ACCOUNTABILITY
BOARD OF DIRECTORS OVERSEES THE STRATEGY
ESG EXECUTIVE COMMITTEE LEADERSHIP AND STRATEGY
SUSTAINABILITY FUNCTION FUNCTIONAL LEADERSHIP AND SUPPORT
ESG OPERATIONAL COMMITTEE COORDINATION AND MANAGEMENT
FUNCTIONAL LEADERS
BUSINESS UNITS
COUNTRY OPERATIONS
(offices and truck parks)IMPLEMENTATION
EUROWAG Annual Report and Accounts for the year ended 31 December 2021
66
STRATEGIC REPORT
Responsibility and Sustainability CONTINUED

STRATEGIC REPORT
Annual Report and Accounts EUROWAG
67

WHAT ISSUES ARE MATERIAL TO OUR STAKEHOLDERS?In developing our ESG strategy, we ran an extensive materiality analysis to identify our most material ESG topics. This helped us prioritise the issues that concern our stakeholders, and understand their level of importance and how we can respond effectively to them. As well as interviewing Board members and
senior management, we surveyed a cross section of stakeholders such as investors, employees, suppliers, customers as well as drivers. The process was as follows:• We defined a long list of important
industry topics.• We shortened the list to relevant
topics.• We conducted our survey with key
stakeholders.
• We drafted our initial materiality matrix.
• We fine-tuned based on selective peer review and expert input.
We asked those surveyed to prioritise issues according to relevance and importance. We reviewed the results in the context of ESG topics relevant to the mobility and payments sectors, peers and competitors, as well as to adjacent sectors with overlapping
Prevention of anti-competitive practices
Employee health and wellbeing
Non-discrimination Socioeconomic tax compliance
Employee development and retention
Corporate management and business continuity
Not abusing dominant position
toward stakeholders
Product material sustainability
Truck park notice and light pollution
Improving EW water usage
Waste management and prevention of accidents
with environmental impact
Improving life time of trucks
Here we outline the issues our stakeholders consider important and which could have an impact on the business.
IMPO
RTA
NC
E TO
STA
KEH
OLD
ERS
MA
JOR
SIG
NIF
ICA
NT
MO
DER
ATE
MODERATE
EUROWAG Annual Report and Accounts for the year ended 31 December 2021
68
STRATEGIC REPORT
Responsibility and Sustainability CONTINUED

stakeholder interests. The exercise highlighted 14 material topics, which we categorised into three pillars of commitments that map to our strategy:
• Transform: those where we can make a game-changing difference to the CRT industry
• Lead: those where we have an ambition to be at the forefront in having a positive impact
• Operate responsibly: those where we must uphold best-in-class industry standards
Here we outline the issues our stakeholders consider important and which could have an impact on the business.
We will review the materiality analysis annually to identify any significant developments and continue to monitor emerging issues
as their materiality increases. We will supplement this by monitoring developments in the mobility and payments sector and the wider business landscape, as well as changes to mobility and climate change policies and regulation in Europe. We will also conduct further stakeholder dialogue to this end.
Customer privacy and data security Reducing CRT emissions
Preventing violation of human rights
Anti-corruption and anti-bribery
Ethical business conduct
Reducing emissions directly attributed to EW
Energy transition
DEI: Inclusive recruiting and employment
Transparency and financial regulatoty
compliance
Risk management and business continuity
Creating high-quality local job opportunities Selling practices
Product safety and quality
Supply chain sustainability and
responsible procurement
Helping small truckers be more successful
Sustainable operations
Engagement with charities and community
organisations
Improving trucker’s wellbeing and safety
Environmental compliance
MAJORSIGNIFICANT
IMPACT ON BUSINESS/IMPACT OF BUSINESS
KeyEnvironment Social Governance
STRATEGIC REPORT
Annual Report and Accounts EUROWAG
69

OUR ESG STRATEGY Our ambition is underpinned by commitments and targets under three pillars: operating responsibly, leading the industry and transforming industry and wider society
OUR ESG COMMITMENTS IN DEPTH1. Transform the CRT industryAt the heart of our strategy is a focus on helping our customers compete and grow in a low-carbon, digital future. Our commitments under this pillar:
• Enabling the clean-energy transition – As the world continues to decarbonise transport, we will support our customers by developing our acceptance and retail network to offer cleaner mobility solutions, including alternative fuels. We will also further develop modern technological solutions and services to help our customers electrify their fleet.
• Reducing customer CRT emissions through efficiency – We offer data insights and solutions through our telematics and navigation businesses, to help improve the efficiency of loads, as well as navigation solutions to optimise routes. We aim to decrease CRT emissions in our customer fleet by 2030.
• Ensuring customers’ success – We are working with small transport businesses who may be struggling to compete due to their size and access to financing, offering benefits and services at attractive terms, and helping them expand into new segments. In 2021, we began to survey our customers to create a baseline understanding of their beliefs. Through our first customers’ survey in Q4 2021, of those surveyed, 65% of respondents felt we were supporting their success. We are aiming to increase this proportion year-on-year.
• Improving customer wellbeing and safety – Carriers, and truckers specifically, face significant challenges on the road, from loneliness to physical safety. To that end, the safety and wellbeing of our customers is one of our top priorities. Through our services, such as Road Lords, we intend to create a stronger community, as well as improve the quality of customer experience at our truck parks and across our entire network. In Q4 2021, we surveyed our customers to better understand how they feel about this, and how we can improve and create a baseline figure we can use to monitor how we are doing. Of customers surveyed and asked about their views on how Eurowag is supporting wellbeing and safety, 73% said that they believed we are supporting their wellbeing.
ESG is at the heart of our purpose: To create sustainable financial and technological solutions for the benefit of our industry, society and the environment.
OUR AMBITION AND FOCUS
We are committed to fulfilling industry and regulatory standards, upholding responsible and ethical business conduct, and making a positive impact in the communities where we operate. These include the following areas • Supply-chain sustainability and responsible
procurement• Engagement with CSR activities• Customer privacy and data security• Transparency and financial regulatory
compliance• Anti-corruption and anti-bribery• Ethical business conduct• Responsible sales practices
We are committed to lead the industry by exceeding best practice
• Reducing our direct emissions
• Promoting diversity, equity and inclusion
• Creating high-quality local job opportunities
We help transform our industry and wider society
• Enabling the energy transition
• Reducing CRT emissions
• Helping small truckers be more successful
• Improving truckers’ wellbeing and safety
OPERATE RESPONSIBLY LEAD TRANSFORM
EUROWAG Annual Report and Accounts for the year ended 31 December 2021
70
STRATEGIC REPORT
Responsibility and Sustainability CONTINUED
2. Lead our industryOur second pillar is to lead our sector in three key areas:
• Reduce our direct emissions – We have set a 2030 target to reduce our Scope 1 and 2 emissions by 50% from a 2019 baseline year. We will do this through a range of initiatives, including decreasing consumption and investing in renewable energy. As Eurowag recognises that Scope 3 emissions make up the majority of our total emissions, we have also initiated specific workstreams to reduce those emissions in our material categories
• Promote diversity, equity and inclusion in our recruitment and employment – We have set a target to increase representation of females in leadership roles to 40% by 2025, using a 2021 baseline. In 2021, we began to develop our diversity, equity, and inclusion strategy. For more information, please see page 86.
• Create high-quality local job opportunities – We want to be a preferred employer in the markets where we operate, by providing an inclusive, open culture with high-quality professional development opportunities as well as competitive benefits. We have set a target of reaching the top 25% of employee engagement scores in EU Tech companies by 2025. We will use our Culture AMP platform to measure this through our employee net promoter scores and pulse surveys, and benchmark against EU tech companies. For more on how we are supporting the development of our workforce, please see page 84.
3. Operate responsiblyThe third pillar of our strategy is to uphold the highest ethical and responsible business and industry standards. This covers the following commitments.
• Promote sustainable supply-chain practices and responsible procurement – We are committed to identify and mitigate supply-chain risks, and ensure we follow responsible and sustainable practices when purchasing goods and services. This includes understanding and managing risk from environmental, compliance and social issues within our supply chain, including ensuring we uphold human rights and combat modern slavery. In 2021, we began to measure our Scope 3 emissions using a 2019 baseline. During the course of 2022, we will develop a 2030 emissions target as well as measure material categories of Scope 3 emissions for 2021. We will also begin to engage with our suppliers on how best to use our portfolio to help them reduce emissions from trucks carrying fuel to our stations and network.
• Create a positive impact in the communities where we operate, through employee-led philanthropy – Our charity and volunteering programme is well established, and we will continue to donate 1% of consolidated earnings before interest and tax annually to charitable causes. Our community investment programme includes both employee giving and volunteering.
• Operate ethically and with integrity, including anti-corruption – We aim to create the environment of trust, transparency, accountability and business integrity necessary to achieve sustainable long-term success. Our code of conduct sets out our principles, expectations, and rules, and includes our commitment to comply with anti-corruption laws. For this, our compliance team oversee our policies and programme of training.
• Promote transparency and financial regulatory compliance, including anti-money-laundering – The Company implements a structured programme to ensure compliance with anti-money-laundering and financial regulatory requirements. We continuously strengthen our compliance programme including policies, training, risk assessment and monitoring. In addition, we have taken steps to further improve efficiency and effectiveness through automation and digitisation of our tools and programming.
• Customer privacy and data security – We make it a priority to safeguard the data of our customers and employees, and to comply with GDPR and industry standards. We have policies, training, risk assessments and a GDPR programme in place, which we work continuously to strengthen.
• Uphold responsible selling practices – We will ensure our sales and commercial teams act responsibly and ethically when selling our products and services. We will assess our performance with regular reviews of complaints, insights from our customer experience team and feedback from customer surveys.
STRATEGIC PROGRESS AND PERFORMANCE IN 2021: • Conducted a materiality exercise
to define our key areas of focus.• Formalised the sustainability
governance and function. • Published our commitments under
three pillars • Developed a methodology for
quantitative and qualitative KPIs.• Collected baseline data and,
where possible, comparative data, for key metrics. Expanding the scope of ESG performance metrics publicly disclosed.
STRATEGIC REPORT
Annual Report and Accounts EUROWAG
71

NON-FINANCIAL METRICS AND ESG REPORTINGAs part of formalising our ESG strategy, in 2021, we set both quantitative and qualitative KPIs to measure progress towards our targets, alongside some other KPIs in the early stages of development. We also began collecting baseline data for the KPIs. In this report, we include ESG data for the metrics we have finalised, and where data is available for the baseline and current year. We will report with reference to GRI and SASB. For more information, please see our Investor Relations website https://investors.eurowag.com. In 2022, we will further develop the quality and scope of our non-financial metrics and targets and include these in future reports.
Human Capital Development and Diversity, Equity and Inclusion Performance data is on page 86
Performance data for Governance, Compliance, and Ethical matters is on page 88
ENVIRONMENTPROGRESS AND HIGHLIGHTS:• Set carbon reduction targets for
our direct operations• Initiated a climate-related risk
assessment to understand risks and opportunities.
• Published baseline and current-year carbon data
• Began renewable energy purchasing and investments across the Group
• Continued expansion of our alternative and e-mobility solution offering in Europe
Climate change is a defining issue for our generation. This year’s historic COP26 climate change conference highlighted the urgency of the challenge as well as the need for the corporate sector to work closely with governments, the public and private financial sector, local communities and NGOs to tackle it.
As part of our strategy, we have started to measure our carbon emissions as well as set a carbon reduction target for our operations. We are also setting targets for reducing emissions in our supply chain, and are developing mobility
solutions to help our customers improve efficiency and the transition to a low-carbon future. At an operational level, our energy business unit plays an instrumental role in overseeing environmental management at site and operational levels, working with retail network, country and office management. We have made a commitment to reduce emissions from our direct operations (Scope 1 and 2) by 50% from 2019 to 2030. For the purposes of our annual ESG reporting, we define direct operations as operations in which the Group has a 50% or more ownership . Within this boundary, we account for 100% of the GHG emissions from owned assets and leased assets that are treated as wholly owned assets in financial accounting and are recorded as such on the balance sheet. We will achieve this through a combination of shifting to renewable energy for our offices and retail operations, using LED lighting to improve energy efficiency in our buildings, installing electric vehicle chargers in the headquarters garage, and using electric cars in our fleet. After exploring a wide range of mitigation measures, we will also define our approach for purchasing carbon offsets.
The table below show three years of emissions data, including our 2019 baseline data for Scope 1 and 2.
2019 2020 2021Total Energy Consumption (kWh) 6,388,280 6,339,958 6,979,760
Scope 1 emissions (Tonnes CO2e) 1,070 1,225 1,316
Scope 2 emissions (Tonnes CO2e) – Location-based 1,360 1,227 1,221
Total Scope 1+2 GHGs emissions (Tonnes CO2e) – Location-based 2,430 2,452 2,537
Scope 2 emissions (Tonnes CO2e) – Market-based 1,534 1,387 1,351
Total Scope 1+2 GHGs emissions (Tonnes CO2e) – Market-based 2,604 2,612 2,667
GHG Intensity Petrol stations (Tonnes CO2e/refuelling point) – Location-based – 5.93 6.10
GHG Intensity Offices (Tonnes CO2e/ thousand sqm) – Location-based – 36.41 34.52
GHG Intensity Petrol stations (Tonnes CO2e/refuelling point) – Market-based – 6.52 6.68
GHG Intensity Offices (Tonnes CO2e/thousand sqm) – Market-based – 39.52 36.51
In 2021, we have seen a 4.4% increase in our total Scope 1 and 2 GHGs emissions (location-based) compared to our 2019 baseline. We have also recorded a 3.5% increase in our total Scope 1 and 2 GHGs emissions (location-based) in 2021 compared to 2020, which was due to an increase in activity post COVID-19 2020 and the addition of new assets to the business, which have led to a 10.1% increase in total energy consumption. We have also split our emissions between offices and petrol stations to calculate relevant
GHG intensity measures for each. For petrol stations we have calculated our GHG intensity per refuelling point whereas for offices we have used surface area as our denominator. In 2019, we have mapped our Scope 3 emissions against all 15 categories of the Greenhouse Gases Protocol and calculated our emissions in all relevant categories. In 2019, our total Scope 3 emissions amounted to 4,546,185 tonnes of CO2e, of which 78.9% are from the Greenhouse Gas Protocol Category 11 (Use of sold products), 20.9%
EUROWAG Annual Report and Accounts for the year ended 31 December 2021
72
STRATEGIC REPORT
Responsibility and Sustainability CONTINUED

CASE STUDY
Sygic – recognised for its contribution to sustainabilityIn 2020, Sygic, part of the Eurowag Group, became the first navigation system worldwide with a mode for electric and plug-in hybrid vehicles (EV mode), and an integrated payment system for charging. It has successfully grown its user base and set of features during 2021. By introducing the EV driver mode, available for free, Sygic aims to help solve the charging and range anxiety connected with electric vehicles. In September 2021, Sygic was recognised for this contribution to sustainable mobility by Emerging Europe.
from Category 1 (Purchased Goods and Services), and 0.2% from all other relevant categories, which includes categories 2, 3, 4, 5, 6, 7 and 9. In 2022, we intend to publish our Scope 3 emissions targets using a 2019 baseline as well as the 2021 calculations for the material categories of scope 3. We also intend to participate in CDP’s climate change questionnaire for the first time in 2022 and align our targets and strategy with the latest climate science.
During 2021, we began a series of initiatives to reduce our environmental footprint. They included working with suppliers on climate change and carbon reduction commitments, changing to renewable energy for offices and other real estate, and refreshing our corporate car policy to incentivise uptake of hybrid and fully electric cars. In 2021, we also began to include environmental criteria in our tender process for providers of transport services for telematics hardware and logistics services in our Czech office. We are also growing the network’s acceptance of transitional fuels and clean-mobility solutions.TCFD STATEMENT Climate risk and TCFD statementThe Financial Conduct Authority issued a Policy Statement in late 2020 requiring commercial companies with a UK premium listing to include a statement in their annual financial report covering the period starting on 1 January 2021. As a newly established FTSE-listed Company and in line with the UK’s Task Force on Climate-related Financial Disclosures (“TCFD”), we are including our first statement this year.
The disclosures made below are consistent with the TCFD recommendations and recommended disclosures, and therefore, adheres to the FCA’s Listing Rule 9.8.6R(8).
In the following statement, we outline our compliance with all the elements of the TCFD, except for three areas of the TCFD disclosures, being: 1) the quantification and measurement of risks; 2) 2021 (current year) Scope 3 emissions; and 3) Scope 3 targets (interim and long term). For these elements of the TCFD disclosure and requirements, we have explained our future plans and timeline for complying with the relevant areas of the TCFD requirements.
This statement outlines the Company’s approach to identifying and mitigating climate risk and is based on a robust assessment of our climate-related risks and opportunities.
We also aim to continually improve our understanding and management of climate risk to further strengthen our approach and future plans for the Eurowag Group.
In 2021, during the process of developing the Group’s new ESG strategy, we began to identify climate risks as part of our materiality assessment. In addition, we included climate risk as part of the identification of ESG risks and as part of the Group’s overall risk process and governance framework. Climate change and the energy transition represent both a risk and an opportunity for the Group. Our reputation, operating and compliance costs, and diversification of revenue, may be influenced by our pace of action, the pace of
the energy transition in the CRT sector and by our customers in the short, medium, and long term. We currently derive a significant portion of our revenues from fees for fossil fuels transactions. We note that changes in road transport policy and regulations, the cost of carbon, carbon taxation, changes in market demand for alternative fuel and clean mobility solutions, and pace of adoption of low-carbon powertrains by our customers, can all influence the level of risk and opportunity for the business. We also recognise that extreme weather events could pose a risk to business continuity for our physical assets and the need to monitor the impact of such events on the health, safety and wellbeing of our workforce and customers. In addition, we have made a commitment to reduce our own carbon footprint, as well as to contribute to solutions to help customers make the transition to a low-carbon future.
In 2022, we will continue to expand the level and scope of our climate-related risk assessment, how we quantify those risks and how we integrate them into both our strategic and financial considerations.
Here we outline our progress and approach, as well as plans for 2022.
The TCFD framework consists of four core elements: governance, strategy, risk management, and metrics and targets. A summary of Eurowag’s current approach against the four core elements and plans for the near future is provided in the next table, including signposts to more information.
73
Annual Report and Accounts EUROWAG
STRATEGIC REPORT

TCFD TABLE: TCFD disclosure
Current approach
Future plans
Additional reference and information
Governancea) Describe the Board’s oversight of climate-related risks and opportunities.
Within Eurowag, the full Board oversees climate-related risk and opportunities as part of its overall consideration of our ESG strategy. It oversees climate risk in two ways. Firstly, through the Audit and Risk Committee, which reviews principal risks. Secondly, in January 2022, the Board has appointed Susan Hooper as its ESG Director. Part of her role is to be responsible for reporting and advising the Board on climate risks and opportunities, as part of discussions on the ESG strategy.
The Board will review the effectiveness of the current governance structure during the course of 2022 and discuss any changes to Board Governance related to climate change and ESG during the course of 2022.
See section on ESG governance on page 66
See section on corporate governance on page 156
b) Describe management’s role in assessing and managing climate-related risks and opportunities.
At a management level, the ESG Executive Committee is responsible for identifying and reviewing climate risks and escalating to the Group Risk Officer on a monthly basis to ensure climate risks are factored into the Group Risk process.
Currently transition risks are part of the in control framework for the Group. Climate-related regulatory, compliance and policy risks are captured as part of the risk process.
We will track and monitor our performance and progress towards meeting our GHG target. This will be monitored by the ESG Executive Committee and will be part of internal management reporting as well as non-financial disclosures and annual reporting.
In 2022, we will work to enhance the quality and detail related to specific climate-related risks.
Going forward, we will review the climate risks associated M&A activity as well as country level activities that could create climate-related risks or opportunities for the Group
The Sustainability and Risk functions are in the process of working with the countries, business units, CFO and other functions to identify, review, mitigate and quantify physical and transitional climate risks.
EUROWAG Annual Report and Accounts for the year ended 31 December 2021
74
STRATEGIC REPORT
Responsibility and Sustainability CONTINUED

TCFD disclosure
Current approach
Future plans
Additional reference and information
Strategya) Describe the climate-related risks and opportunities the organisation has identified over the short, medium, and long term.
The heart of our ESG strategy is helping our customers compete and grow in a low-carbon future. We have also made commitments to reducing our carbon footprint in our operations and supply chain. The strategy is informed by our materiality assessment. We will further adapt our climate strategy following the outcomes of a risk assessment started in Q4 2021.
We have identified short, medium and long-term climate-related physical and transitional risks and opportunities through a series of workshops with business units and functional leaders. The timeframe for these risks are as follows: less than 5 years for short term; 5-10 years for medium-term; and 10+ years for long term, as compared with 2021.
During the workshops, we assessed the resilience of our strategy in three plausible future climate scenarios (1.5C, 2C and 3C) through four lenses: Assets and employees; Business model; Supply chain; and Customers. These workshops were delivered in January 2022.
In 2022, we will continue to refine and consolidate the risks and opportunities identified during these workshops by piloting new tools to better understand and identify climate risks associated with our current physical portfolio and supply.
See section on ESG governance on page 66
See section on corporate governance on page 156
b) Describe the impact of climate-related risks and opportunities on the organisation’s businesses, strategy, and financial planning.
We have started the work to identify the potential impact of the climate-related risks and opportunities we have identified during our workshops. Climate has been considered as part of the preparation of the Viability statement as well as the financial statements for 2021.
The Group’s reputation, operating and compliance costs, and diversification of revenue may be influenced by our pace of action as well as the pace of the energy transition within broader CRT enabling ecosystem and by customers in the short, medium and long term. The energy transition poses unique challenges for our small and medium sized customers, including the availability of sufficient charging and alternative fuel networks, rapidly evolving and yet unstable regulation raising significantly business risk, uneven approach on taxation and subsidy programs across Europe as well as limited availability of viable battery and alternative fuel trucks for commercial road transport in the near term. All of which affect transition risks and the total cost of ownership (“TCO”) as a key drivers for mass adoption of sustainable alternatives. We also recognise that extreme weather events could pose a risk to business continuity for our physical assets as well as the health and wellbeing of our workforce. The Group also recognises that it is imperative to take responsibility to reduce its own carbon footprint as well as contribute to solutions to help its customers make the transition to a low carbon future.
To address these risk and opportunities, we are
• Investing in acceptance network to support uptake of alternative fuels (e.g. LNG) and technologies
• Investing in eMobility solutions including a growth investment in Last Mile Solutions to provide industry-leading eMobility services to customers throughout Europe
• Investment in digitation and technologies to improve efficiency within CRT road transport ecosystem and thus decrease energy and asset intensity per tonne of transported good
• Eurowag will also explore how carbon reduction for its operations as well as investment in products and services to support customers with efficiency and emissions reductions will be a factor in capex investment decisions
In 2022, the Sustainability function will continue to work with the Finance and Group Risk function as well as the relevant business units to assess the impact of our climate-related risks and related mitigation measures.
This aim is to better understand likelihood and impact (and timeframes) of those climate- related risks and opportunities to ensure we have a robust prioritisation process.
During the first half of 2022, the Group will initiate work to quantify climate risks and impacts to enhance consideration as part of strategy and financial planning.
See section on ESG governance on page 66
See section on corporate governance on page 156
c) Describe the resilience of the organisation’s strategy, taking into consideration different climate-related scenarios, including a 2°C or lower scenario.
We have identified various climate-related risks and opportunities following the series of workshops completed in January 2022.
The Company utilised three scenarios to identify physical and transitional climate risks. This included a 1.5-degree scenario. In this world action taken around the world has achieved the aims set out in the 2015 Paris Agreement – global temperatures have been limited to 1.5°C compared to pre-industrial levels. But that does not mean everything is the same as today. There have been some physical changes and achieving this goal has required a substantial shift in policy and behaviour. We also explored a second scenario of a 2-degree world. In this scenario, change ebbs and flows in the consciousness of leaders and the general public alike. Some action has been taken, but it’s very much business as usual. It is a bit better but global temperatures continue to climb, albeit slowly. And the impacts are clear to see. Finally, we considered a 3-degree scenario. In this scenario, Economies around the world have continued to be powered by fossil fuels and promises made by global leaders have been largely ignored. Life has continued much the same. As a result, the planet is in crisis and well past the point of no return by 2030. Global warming has accelerated. This is not doomsday, but the changes in climate are all around, tangible and in some cases catastrophic.
Please see page 56 for the Company’s Viability statement and more detail on the resilience of Eurowag’s business strategy.
As we are at the beginning of our journey, we will be continuing this work in 2022, ensuring that our business strategy and management approach is resilient when considering those different plausible futures.
The Risk and Sustainability functions will review the business continuity plans for assets in order to ensure that considerations from the climate scenarios are taken into account in the plans.
See Viability statement on page 56
STRATEGIC REPORT
Annual Report and Accounts EUROWAG
75

TCFD disclosure
Current approach
Future plans
Additional reference and information
Risk Managementa) Describe the organisation’s processes for identifying and assessing climate-related risks.
The full Board is responsible for overseeing climate-related risks and opportunities.
During the course of 2021, the Group initiated a materiality analysis to identify material ESG issues for Eurowag. This included the identification of climate risks and opportunities. In addition, the Sustainability function initiated a series of workshops with the business units and functions to identify and assess climate-related risks; using scenario analysis to identify those risks.
As part of the overall risk process, climate risks are escalated to the risk function which then prepares the risk update to the Audit and Risk Committee. This Committee reviews the climate-related risks and opportunities as climate is a principal risk.
During the course of 2022, the Group will fine tune its processes for regularly identifying and assessing climate-related risks as part of the overall risk process.
This will include a regular review to update the climate risks in the short, medium and long term. This will also take into account review of climate risks when exploring M&A opportunities and post acquisition integration.
See Principal risk on page 53
b) Describe the organisation’s processes for managing climate-related risks.
Following the identification of climate-related risk and opportunities as part of the materiality analysis in early 2021, Eurowag outlined a number of initiatives to reduce its operational and supply chain emissions as well as developing products/services to help its CRT customers reduce their emissions. This process included review and development of opportunities with individual business units. The Business units have included prioritised plans for climate mitigation in their annual plan. This process will continue and be refined during 2022, as the Group reviews its emissions data across Scope 1, 2 and 3 as well as conduct further analysis of climate scenarios.
Now that we have identified our climate-related risks and opportunities, we will be working on quantifying these impacts on our business and take appropriate steps to establish processes to manage those risks.
See Principal risk on page 53
c) Describe how processes for identifying, assessing, and managing climate-related risks are integrated into the organi sation’s overall risk management.
Climate-related risk is a principal risk. The process for identifying, assessing and managing climate-related risks as part of the overall risk management is as follows:
As part of the overall risk process, climate risks are escalated to the risk function, which then prepares the risk update to the Audit and Risk Committee. This Committee reviews the climate-related risks and opportunities as climate is a principal risk.
Each quarter the Chief Risk Officer prepares the principal risk register for review by the Audit and Risk Committee of the Board. The source of the information comes from risk focal points in individual business units and functions, including the sustainability function. The nature of climate-related issues raised via the individual BUs typically falls under the transitional risk bucket and risks vary depending on the specific relevance of the climate to the business.
Climate risk is treated like other risks (e.g. people, technology, etc).
During the course of 2022, the Group will further enhance the detail of specific climate risks, the processes as well as training to support the business to identify and mitigate climate risk.
Crucially, the Group will initiate a project to measure and then quantify climate risks as part of the overall risk management process during the first half of 2022.
See Principal risk on page 53
Metrics and targetsa) Disclose the metrics used by the organisation to assess climate-related risks and opportunities in line with its strategy and risk management process.
For 2021, the Group discloses the following metrics related to climate risks and opportunities:
Risk: The Company discloses the absolute and intensity of carbon emissions from Scope 1 and 2, the company has also disclosed the absolute emissions from Scope 3 for 2019.
Opportunities: Eurowag discloses the volumes and transactions of alternative fuels and alternative fuelling points across its network.
In 2022, we will expand the metrics used by the Company to assess climate risks and opportunities. This includes a quantitative assessment of the impact of each of the material climate-related risks and opportunities identified.
See Environmental section on page 72
b) Disclose Scope 1, Scope 2, and, if appropriate, Scope 3 greenhouse gas (“GHG”) emissions, and the related risks.
We have disclosed our Scope 1 and 2 (both location and market-based) GHG emissions for the last three years.
We are also reporting our baseline 2019 Scope 3 GHG emissions. Scope 3 emissions for material categories (1,3,4 and 11), will be calculated and reported as part of the Company’s submission to CDP for 2022 as well as in the 2022 Annual Report.
These calculations can be found on page 72.
In 2022, we will be measuring and disclosing our 2021 Scope 3 emissions. This will be part of the CDP submission for 2022 and 2022 Annual Report.
See section on non-financial metrics on page 72
c) Describe the targets used by the organisation to manage climate-related risks and opportunities and performance against targets.
We have set a target to reduce our absolute Scope 1 and 2 emissions by 50% by 2030. We have published Scope 3 baseline (2019 data) and are conducting the analysis to develop a target and roadmap for Scope 3.
Additional work is in progress to set targets for our commitments related to the energy transition and reducing CRT emissions. These measures will cover our activities related to fuel sold, our network as well as technology and services.
We are also measuring specific metrics related to volumes of alternative fuel as well as the growth and uptake of e-mobility services.
During the course of 2022, the Group plans to set and publish a supply chain (Scope 3) target as well as a carbon intensity target
The ESG Executive Committee will review progress towards our Scope 1 and 2 target and report annually through the Annual Report.
We will define metrics for commitments across the energy transition and help CRT customers improve efficiency.
See section on non-financial metrics on page 72
EUROWAG Annual Report and Accounts for the year ended 31 December 2021
76
STRATEGIC REPORT
Responsibility and Sustainability CONTINUED

Scenario AnalysisTo comply with recommended disclosure (c) under the Strategy element, Eurowag has carried out climate scenario analysis. Through three workshops involving 25 participants from key business units and functions, the Group aimed to identify the resilience of its strategy under three possible climate futures; identify physical and transition risks and opportunities; and identify actions to mitigate risks and capture opportunities.
With the support of external experts, three scenarios were created. The three scenarios were built based on publicly available scenarios from the Intergovernmental Panel on Climate Change (“IPCC”) Representative Concentration Pathways (“RCPs”) and Shared Socioeconomic Pathways (“SSPs”); International Energy Agency (“IEA”); and Principles for Responsible Investment Inevitable Policy Response (“PRI IPR”). The three scenarios are summarised in the section below.
Our scenarios describe the pathway towards different temperature outcomes by 2100. Because scenarios are models rather than
precise predictions of the future, they describe changes on a decadal level. They use a mix of qualitative and quantitative information and were applied through four lenses: Assets and employees; Business model; Supply chain; and Customers. We used a number of sources, which contribute insights on different elements of climate change. The IPCC RCP scenarios are about physical changes; the SSPs are focused on wider societal changes and the IEA scenarios provide specific insights on electrification of transport. To that end, the different scenarios help inform different parts of our analysis.
Eurowag scenarios
A Better World (1.5°C) An Uncertain and Volatile World (2°C) An Irreversible World (3°C)
Summary Action taken around the world has achieved the aims set out in the 2015 Paris Agreement – global temperatures have been limited to 1.5°C compared to pre-industrial levels. But that does not mean everything is the same as today. There have been some physical changes and achieving this goal has required an unprecedented shift in policy and behaviour.
Not much has changed from today. Climate Change ebbs and flows in the consciousness of leaders and the general public alike. Actions have been taken to meet current and expected pledges made by global leaders. Global temperatures continue to climb, albeit slowly, reaching 2°C by 2100. The impacts become clear to see for many over the next 10–20 years.
Economies around the world have continued to be powered by fossil fuels and promises made by global leaders have been largely ignored. Life has continued much the same. As a result, the planet is in crisis and well past the point of no return by 2030. Global warming has accelerated. The changes in climate are all around, tangible and in some cases catastrophic. They continue to worsen and become more pervasive as temperatures climb above 2°C by the 2040s.
External scenarios
IPCC Scenarios RCP2.6/SSP1 RCP4.5/SSP2 RCP6.0/SSP5
IEA Scenarios Global EV Outlook: Sustainable Development Scenario (“SDS”)
Global EV Outlook: Stated & Expected Policies Scenario (“STEPS”) and SDS
Other Scenarios PRI IPR: 1.5C Required Policy Scenario
Other data sources Climate Analytics, Climate Impact Explorer; Climate Central, Surging Seas: Sea Level Rise Analysis; Climate Interactive; and EN-ROADS Climate Change Solutions Simulator.
STRATEGIC REPORT
Annual Report and Accounts EUROWAG
77
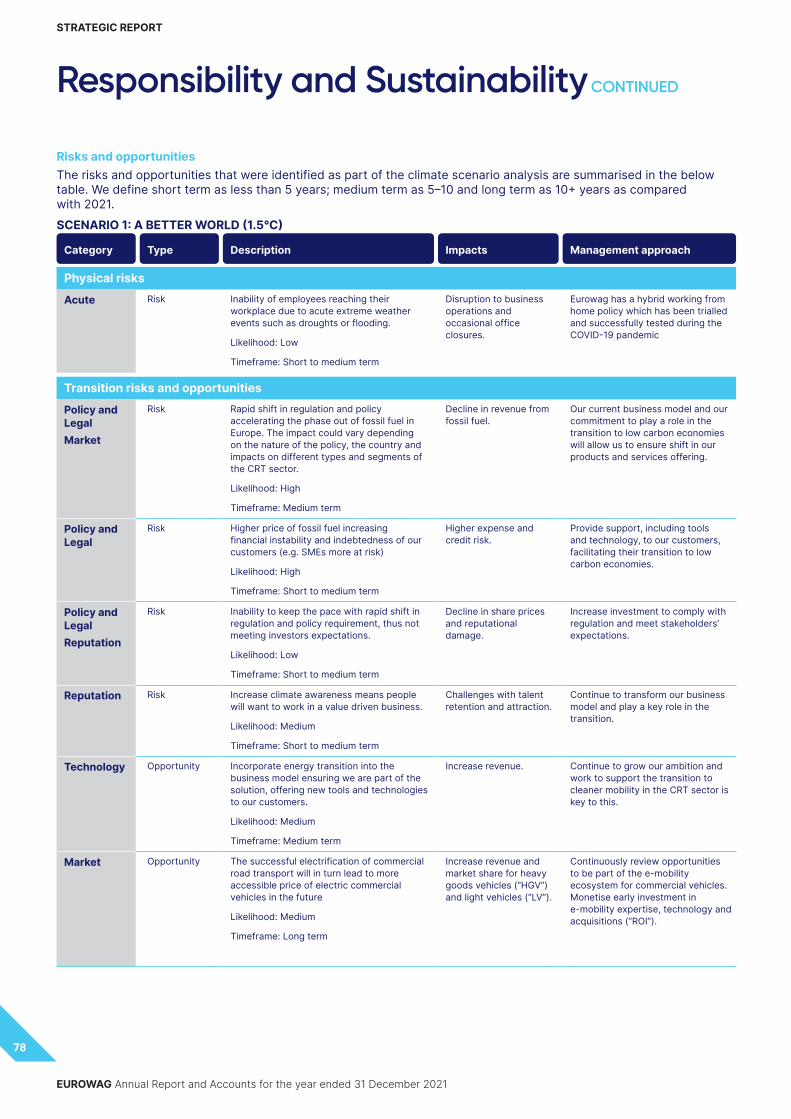
Risks and opportunitiesThe risks and opportunities that were identified as part of the climate scenario analysis are summarised in the below table. We define short term as less than 5 years; medium term as 5–10 and long term as 10+ years as compared with 2021. SCENARIO 1: A BETTER WORLD (1.5°C)
Category Type Description Impacts Management approach
Physical risks
Acute Risk Inability of employees reaching their workplace due to acute extreme weather events such as droughts or flooding.
Likelihood: Low
Timeframe: Short to medium term
Disruption to business operations and occasional office closures.
Eurowag has a hybrid working from home policy which has been trialled and successfully tested during the COVID-19 pandemic
Transition risks and opportunities
Policy and LegalMarket
Risk Rapid shift in regulation and policy accelerating the phase out of fossil fuel in Europe. The impact could vary depending on the nature of the policy, the country and impacts on different types and segments of the CRT sector.
Likelihood: High
Timeframe: Medium term
Decline in revenue from fossil fuel.
Our current business model and our commitment to play a role in the transition to low carbon economies will allow us to ensure shift in our products and services offering.
Policy and Legal
Risk Higher price of fossil fuel increasing financial instability and indebtedness of our customers (e.g. SMEs more at risk)
Likelihood: High
Timeframe: Short to medium term
Higher expense and credit risk.
Provide support, including tools and technology, to our customers, facilitating their transition to low carbon economies.
Policy and LegalReputation
Risk Inability to keep the pace with rapid shift in regulation and policy requirement, thus not meeting investors expectations.
Likelihood: Low
Timeframe: Short to medium term
Decline in share prices and reputational damage.
Increase investment to comply with regulation and meet stakeholders’ expectations.
Reputation Risk Increase climate awareness means people will want to work in a value driven business.
Likelihood: Medium
Timeframe: Short to medium term
Challenges with talent retention and attraction.
Continue to transform our business model and play a key role in the transition.
Technology Opportunity Incorporate energy transition into the business model ensuring we are part of the solution, offering new tools and technologies to our customers.
Likelihood: Medium
Timeframe: Medium term
Increase revenue. Continue to grow our ambition and work to support the transition to cleaner mobility in the CRT sector is key to this.
Market Opportunity The successful electrification of commercial road transport will in turn lead to more accessible price of electric commercial vehicles in the future
Likelihood: Medium
Timeframe: Long term
Increase revenue and market share for heavy goods vehicles (“HGV”) and light vehicles (“LV”).
Continuously review opportunities to be part of the e-mobility ecosystem for commercial vehicles. Monetise early investment in e-mobility expertise, technology and acquisitions (“ROI”).
EUROWAG Annual Report and Accounts for the year ended 31 December 2021
78
STRATEGIC REPORT
Responsibility and Sustainability CONTINUED

SCENARIO 2: AN UNCERTAIN AND VOLATILE WORLD (2°C)
Category Type Description Impacts Management approach
Physical risks
Acute Risk Extreme weather events such as sea level rise, flooding, fires or droughts compromising the usability of routes, thus leading to business disruption. For example, the closure of petrol stations.
Likelihood: Low
Timeframe: Short to medium term
Inability for the Group to operate during those events.
Conduct regular reviews of our business continuity plans to factor in potential impacts of extreme weather events.
Chronic Risk Increased droughts in Southern Europe and increased flooding events in Northern Europe leading to shortage of supply and potential assets becoming inoperable (e.g. dried out petrol stations).
Likelihood: Low
Timeframe: Medium term
Disruption to operations. Conduct regular assessment of climate risks associated with our current physical portfolio and supply to ensure we monitor the physical climate-related risks.
Transition risks and opportunities
Policy and LegalMarket
Risk Eurowag’s current transition plan not at a fast enough pace to follow the shift in regulation and policy accelerating the phase out of fossil fuel in Europe.
Likelihood: High
Timeframe: Short to medium term
Decline in revenue from fossil fuel.
We continuously monitor the pace of change and aim to be a key leader in the transition for the CRT sector thus ensuring we keep at pace.
Market Risk Customer viability due to increase price of fossil fuel.
Likelihood: Medium
Timeframe: Medium to long term
Higher expense and credit risk.
Provide mobility and payment solutions and related tools and advisory services to support customers in their transition to low carbon economies.
Policy and LegalReputation
Risk Inability to keep the pace with rapid shift in regulation and policy requirement, thus not meeting investors’ expectations
Likelihood: Low
Timeframe: Short to medium term
Decline in share prices and reputational damage.
Increase investment to comply with regulation and meet stakeholders’ expectations.
Policy and Legal
Risk The establishment of policies is disjointed with individual countries in Europe taking different approaches, with new policies and legislation on GHG emissions, electric vehicles, pollution, taxes and levies. All of this leading to a complex and challenging system of compliance, increasing the challenges of operating in the region.
Likelihood: High
Timeframe: Medium term
Disruption operations.
Increase in costs for the Group and its customers.
Establish ongoing, constructive engagement and advocacy with policymakers to promote a unified and consistent approach to public policy measures. This includes active participation within trade bodies as well as with other like-minded stakeholders in the CRT sector.
Market Opportunity With our commitment to support the CRT’s sector to low carbon economy, Eurowag has the opportunity to lead that transition, in turn increasing our attractiveness compared to other peers.
Likelihood: Medium
Timeframe: Medium to long term
Reputational gain and increase in market share.
Invest in new tools and technologies, support our consumers and work in partnership to facilitate that transition.
STRATEGIC REPORT
Annual Report and Accounts EUROWAG
79

SCENARIO 3: AN IRREVERSIBLE WORLD (3°C)
Category Type Description Impacts Management approach
Physical risks
Acute Risk Increase in frequency and intensity of flooding events, higher temperatures, and other extreme weather events.
Likelihood: High
Timeframe: Short to medium term
Temporary closure and/or disruption of key assets.
Disruption of our supply chain.
Impact on employees’ health and ability to travel to work.
Damages to infrastructure.
Periodically review business continuity plans to ensure risks are factored into planning in the short and medium term.
This includes utilisation of climate tools to assess risk on assets and supply chain.
Chronic Risk Extreme weather events and sea level rise would lead to high investment required to keep vulnerable assets operational. This can include wind, flooding, and drought.
Likelihood: Medium
Timeframe: Long term
Higher capital investment.
Write off of assets.
Disruption to operations.
Better understand the scale of the impact via regular climate-related physical risk assessment for both current and new assets and include future investment into financial planning.
This includes utilisation of climate tools to assess risk on assets and supply chain.
Chronic Risk Extreme weather could lead to social unrest and migration of upwards of million people to Western and Northern Europe.
Likelihood: High
Timeframe: Long term
Migration of employees.
Challenges with talent retention and attraction.
Regular review and assessment of strategic and people agenda.
Transition risks and opportunities
Market Risk Competitive disadvantage if no ROI in low carbon solutions due to a slow transition, with economic growth still powered by fossil fuels.
Likelihood: Low
Timeframe: Short term
We will see no positive return from our current business model to transition if the transition has been slow.
Monitor external developments, stay agile and adapt our business model if need be.
Policy and Legal
Risk Social and political shift. Ideological and political perspectives change. Risk that world becomes more polarised and irrational policy decisions are taken.
Likelihood: High
Timeframe: Medium to long term
Disruption to operations. Monitor external developments and ensure the business is equipped to meet changing regulatory requirements.
Technology Risk Increase criminal activities and cyber-crime impacting platforms and technology sector.
Likelihood: Medium
Timeframe: Medium to long term
Loss of revenue. Strengthen cyber security in all our platform and manage the risk.
EUROWAG Annual Report and Accounts for the year ended 31 December 2021
80
STRATEGIC REPORT
Responsibility and Sustainability CONTINUED

SUPPORTING THE TRANSITION TO CLEANER MOBILITY IN THE CRT SECTORIn line with our commitment to facilitate and support the energy transition in the CRT sector, we are committed to • Expand our alternative energy
acceptance points to reach sufficiently large coverage across the EU.
• Increase the share of active trucks using alternative energy and drive customer adoption of transitional and cleaner fuels.
• Introduce data insights and advisory solutions to help our customers transition to lower carbon vehicles and fuels, reduce emissions and improve efficiency.
• Reduce the carbon intensity of the fuels we sell.
We aim to harness our mobility and payments platform services to accelerate the transition to a low carbon future in the CRT sector. We continue to expand our alternative energy and e-mobility offerings, while also investing in the acceptance network, our infrastructure and industry partnerships, to advance the development of alternative fuels and electric mobility in the sector. We were one of the first businesses in Europe to introduce payment solutions for AdBlue, the pollution-reducing additive for diesel engines, as well as high-grade biofuels. Our eMobility and Alternative Fuels Advisory teams guide and advise customers on adopting clean fuels and related products.
In early 2021, we acquired a 28% interest in Last Mile Solutions (“LMS”), one of Europe’s leading e-mobility platforms and service providers, which will contribute to our being able to enhance convenience for customers with electric vehicles. Our eMobility team is working closely with LMS, Sygic and other Eurowag teams to improve and expand provision of e-mobility services across Europe. Over the coming year, the combined team will be launching a comprehensive white-label public-charging solution for our partners. In addition, we have expanded our product portfolio for OEMs to include EV capability.
Since May 2020, our navigation division, Sygic, has been offering EV mode to help customers find charging points easily, plan their routes to the closest charging station and pay for charging directly within the app. In addition, Sygic is working with a number of companies across European markets – such as Elec2Go, Plugsurfing, Greenway, eJoin, Polyfazer, Unicorn and TomTom – to ensure drivers have the best coverage of the Europe’s EV charging network. With the EV mode, drivers also have access to detailed information about stations, availability of chargers and notifications of charging level.
Our eFleet Management offering also plays an important role in supporting the low-carbon transport solutions. Our telematics products can be adapted for fleet management of EVs. Using an installed unit EV customers can subscribe to different packages to provide insight such as battery state or range.
eFleet Management users can receive information on charging costs for all nearby locations, see EV locations on a real-time map according to individual charging preferences, and manage the performance of their plug-in hybrid vehicles (“PHEVs”), including a tool to see whether they are charged regularly. Fleet managers and drivers can also monitor and manage their EV fleets through a mobile app, a solution we used successfully in the Czech market and are preparing for European roll-out.
We focus on integrating data on charging points and electric vehicles, to facilitate an e-mobility transition across Europe. This covers how to lower charging and range anxiety, and how enhance the driving experience. One of our focus points is navigation, developing new functionality that will help plan routes automatically and more effectively. Taking into account the specifics of model, range and level of battery charge, it will automatically offer a route with optimal charging points. Users will see the current status of the car battery on the app screen and get alerts when the battery is critically low. In addition, if the recommended charging point is occupied, it offers the nearest alternative.
We are investing in pilots to ensure we are ready for the adoption of eTrucks.
STRATEGIC REPORT
Annual Report and Accounts EUROWAG
81

A summary of e-mobility service statistics at the end of 2021:
• LMS provides access to more than 67,000 connected charging points.
• The Network coverage increased to more than more than 360,000 charging points (with the following partners: Plugsurfing, TomTom, Polyfazer, Unicorn/ChargeUp, eJoin and GreenWay)
• Charge point coverage with payments in Europe ~225,000
• Our telematics services are compatible with 90% of vehicles on the market, 64 models of BEV and PHEVs (including 90% of all LCVs on the market)
For more information on EW’s approach to e-mobility, please refer to https://www.eurowag.com/en/products/automotive-and-emobility.
HELPING DRIVERS IMPROVE EFFICIENCY, WELLBEING AND SAFETYDriver Score and Perfect Drive are two of our products aimed at reducing CRT emissions and improving driver wellbeing and safety, by providing customers with solutions that measure various aspects of driving style.
The Driver Score app is a solution for insurance and road safety. By combining information from GPS, accelerometer, pedometer, gyroscope and an underlying map, fleet managers can recognise signs of distracted driving, and measure aspects of driving style such as acceleration, speeding, braking, cornering and pothole detection. It allows them to create a customisable driver-scoring system, and to train drivers through in-app coaching that provides warning notifications.
Through this combination, fleet managers can motivate their drivers to drive more safely, and reduce energy consumption and insurance claims.
Perfect Drive allows customers to monitor and evaluate the driving style of commercial-vehicle drivers. It monitors parameters such as the engine and vehicle speed, brake use, driver foresight, coasting, cruise control and use of the accelerator. It evaluates a trucker’s driving style in a report for fleet managers, as well as producing fleet reports. Fleet managers can then address with their drivers the negative effects of driving style on fuel consumption, wear and tear and road safety, and identify the need for further training.
CASE STUDY
Testing our telematics solution for mixed fleets – including e-trucksIn 2021, Eurowag and DHL began a pilot to test our telematics solution in support of DHL’s efforts to establish a low-carbon fleet and improve the analysis of its mixed fleet, including its e-trucks. DHL will have access to a wide range of data points to monitor this, including time to full charge, actual charge, live range monitoring and the amount of energy charged during charging sessions. We will provide training and support for the telematics solution with an evaluation at the end of the three-month pilot in 2022.
EUROWAG Annual Report and Accounts for the year ended 31 December 2021
82
STRATEGIC REPORT
Responsibility and Sustainability CONTINUED

SOCIALPROGRESS AND HIGHLIGHTS• Selected and communicated
our first Culture Champions for each value.
• Initiated development of a Diversity, Equity and Inclusion Strategy.
• Refreshed and published policies to support our employees, including equal opportunities, anti-bullying and anti-harassment, health and safety policy, and grievance policy and severance principles.
• Approved Modern Slavery and Anti-Trafficking policy.
• Launched a new virtual learning and development programme for employees.
• Continued to provide health and wellbeing programmes for employees, including psychological support through available therapists sessions.
OUR CULTURE AND VALUES Our culture and values are the guiding principles for everything we do, from bringing in a new team member to making commercial and people decisions.
In 2020, we launched a new culture manifesto, defining our culture. Our employees can use it to guide their decisions, and to align with all across the organisation as we grow.
We are establishing our culture within the organisation in a number of ways. In 2021, we launched a new leadership development programme as well as talks that explain our values and values-based behaviour. We also launched our Culture Champion awards to recognise those in our workforce who exhibit the best of our values.
At Eurowag, our success is based on the success of our people and their teamwork. We nurture a culture that values feedback, embraces flexible ways of working – including remote work and job sharing – and aims to create a respectful and inclusive workplace where positive teamwork is key. It is important our employees feel fulfilled, satisfied with their work environment, and proud to work for Eurowag. We also aim to increase diversity in the workplace through our hiring and promotion practices. We are also creating a learning environment, where employees have access to a wide range of opportunities to develop personal and professional skills.
CASE STUDY
Supporting the financial wellbeing of customers and their employeesIn the Czech Republic, over 700,000 people are affected by indebtedness and financial distress, including businesses and employees in the trucking sector (https://www.institut-predluzeni.cz/mapy-a-statistiky/exekuce/) - Exekutorská komora ČR (centrální evidence exekucí) – Enforcement Chamber of the Czech Republic (central record of indebtness).
Recognising this challenge, the Tax Refund business is working with the Institute of Prevention and Treatment of Over Indebtedness to raise awareness with our business customers and promote financial wellbeing services for their employees. The Institute’s services available include professional legal support, advice on debt relief, and financial education. In 2021, we contacted over 6,000 customers and now work with a small, but growing, number of them to support their employees. We launched a special site on our customer portal where customers can find further information. We are working with the Institute to explore the potential for expanding this programme outside the Czech Republic.
STRATEGIC REPORT
Annual Report and Accounts EUROWAG
83

HUMAN CAPITAL DEVELOPMENTSupporting the development and growth of our people An important part of our culture and commitment to our people is providing leadership and growth opportunities. The pandemic prompted us to move quickly from providing induction and development programmes in person, to running a virtual programme we call Journey2GROW. This features four pillars and is available to all employees.
We launched the Leadership pillar in 2021 for our leaders of people, with the aim of imparting the most relevant leadership fundamentals. It started at a particularly critical time given the impacts of the pandemic, as it is designed to help leaders thrive in today’s uncertain and dynamic environment. The workshops and coaching sessions include our values, leadership principles and strategic ways of working.
During the year, we also launched inspiring talks called Journey Ahead, to support personal growth, better work-life balance and improved capabilities. We also offer employees eLearning and online language tutoring through easily accessible learning platforms, as well as self-study opportunities on Coursea – a self-study module platform.
When people join, we provide extensive induction training called Welcome @EW, designed to ensure we bring newcomers on board smoothly, with sessions hosted by business leaders on people, functions, processes and the EW story. In a unique element of the programme, Eurowag founder and CEO, Martin Vohánka, hosts sessions introducing the EW history and vision. Our compliance training, also deployed through eLearning, covers GDPR, safety and fire protection, road safety and self-study on our policies. The Sales team has also rolled out an extensive learning programme to equip sales teams with knowledge and skills related to product and sales. This programme is provided on the intranet site, Newton, supplemented with webinars and other forums.
JOURNEY TO GROW
EW CULTURE CHAMPION AWARDS
EXCELLENCE CHAMPION
LEADER OF THE YEAR
TEAMWORK CHAMPION
FOUNDER’S AWARD
DELIVER YOUR BEST
LEADERSHIP PRINCIPLES
BE A TRUE COLLEAGUE
GROWTH CHAMPION
COMMUNITY CHAMPION
EMBRACE CHANGE BE A GOOD PERSON
Supporting workplace wellbeingRunning wellbeing programmes to support employees has been a priority throughout the pandemic. Our wellbeing programme has two main components: educational broadcasts and psychological consultancy. It runs on a platform called Mojra. This platform offers all employees the opportunity to book personal online sessions with a psychologist, available in seven different languages. Employees can choose a range of sessions online. It also offers a series of educational sessions, where guest speakers from the Board and senior management provide tips and advice on topics such as mindfulness, resilience, and stress management.
LEADERSHIP WELLBEING
PROFESSIONAL SELF-STUDY EW INTERNAL
EUROWAG Annual Report and Accounts for the year ended 31 December 2021
84
STRATEGIC REPORT
Responsibility and Sustainability CONTINUED

Engaging our workforce We make listening to, and engaging with, our employees a key priority. We want to be an employer of choice in the markets where we operate, where we have set a specific goal to create high-quality local jobs. We want to be in the top 25% in EU Tech companies for employee engagement by 2025. Throughout the year, we measure the level of employee engagement through an annual survey as well as pulse surveys. These formal survey tools help us understand the concerns and issues that are top of employees’ minds and enable us to quickly respond as part of enhancing the employee experience - including through internal communication, professional and leadership development and employee benefits.
We engage with our colleagues through a number of channels covering a wide range of topics. In 2021, we launched a newsletter called ‘Are we There Yet’ , which is a weekly newsletter to keep our colleagues updated important corporate main source of the important information and updates for all employees. In addition, our intranet contains all the necessary information employee might need. These channels are used to keep employees up to date on the company’s performance, annual performance and evaluation process, remuneration policy as well as bonus schemes for the year. Colleagues are encouraged to contact the Chief People Officer and/or a designated HR colleague in order to ask questions and/or provide feedback on these topics.
We have digitised employee processes to improve the employee experience, through a new system called Bob, which serves as the central self-service information system. A unique element of the system is that it offers employees
the ability to recognise good work from colleagues, through Kudos. We have also introduced an application called Culture AMP, which serves as a performance and development management system that also enables 360 degree feedback processes.
We aim to build a collaborative environment where employees can thrive. We utilise a number of formal survey tools to better understand how we can continuously improve the employee experience and address issues of concern to our workforce. As with previous years, we have used an employee engagement survey reflected in an employee Net Promoter score (“eNPS”). eNPS is designed to help employers measure employee satisfaction based on how likely they are to recommend their employer as a place of work. In 2020, Eurowag had an eNPS score of 16.1 and will conduct the next annual survey in 2022. We also conduct pulse surveys twice a year to assess top of mind concerns and issues to our employees during the year. In 2021, we piloted a new methodology and tool for this purpose. The outcome of this pulse survey was a 75% engagement score. Going forward, we will use the 2021 pulse survey data as a baseline to monitor and improve our performance with the goal of being in the top 25% amongst EU Technology companies for employee engagement by 2025 https://www.cultureamp.com/science/insights/new-tech. As a result of the 2020 survey, we’ve been focusing on improvements related to recognition of employees, improving information sharing and change communications, supporting delegation skills and strengthening post merger integration processes and related communications.
Another data point that we assess is turnover and retention. During the year, total turnover increased by 2 percentage points in the year ended 31 December 2021 compared to the previous year (from 17.7% in 2020 to 19.7% in 2021.) Voluntary turnover was 15.3% by the end of 2021. Our retention rate was 80.3% as of 31 December 2021.DIVERSITY, EQUITY AND INCLUSION (“DEI”)As we develop our culture, we’re keen to ensure we access a broader and more diverse pool of talent. We employ people from more than 30 different nationalities, aged from 20 to 70, and have flexible working options to enhance employees’ work-life balance. Most of our employees fall between the ages of 20 and 50. We have also focused on building a diverse leadership team to help bring together this broader range of experience and thinking in business, and have formalised our target to increase female representation at leadership levels.
To strengthen and enhance our approach to DEI, we began to develop a new strategy that we will evolve further in 2022. As part of this, we will focus on promoting gender diversity among our leadership teams, support more female representation in technology generally, promote cultural diversity and equip our leaders with the support to be equity and inclusion role models in the workplace, and tackle unconscious bias. In 2021, we introduced a new Equal Opportunities, Anti-Bullying and Anti-Harassment policy, which further codifies our commitments to DEI and sets out an employee’s right to be treated with equality, dignity and respect, and our duty to promote a positive and harmonious working environment. During the year, the Executive Committee received an introduction to the strategy, which the HR function has overall responsibility for.
We also piloted unconscious bias training for the talent acquisition team, and will expand training in 2022.
2021
New Leadership
Academy
Professional Psychology
(Mojra)
Professional Self Study –
Coursera
Professional Self Study –
Preply
Professional Self Study –
EW new hires orienteering
program
Employees who completed training 100 15 400 201 301
STRATEGIC REPORT
Annual Report and Accounts EUROWAG
85

As part of our Group Equal Opportunities, Anti-Bullying and Anti-Harassment Policy, we explicitly prohibit discrimination of people with disabilities and outline guidance for managers as well as colleagues who may have a disability. Our policy covers direct and indirect discrimination, unjustified, less favourable treatment because of the effects of a disability, and failure to make reasonable adjustments to alleviate disadvantages caused by a disability. In addition, in the Czech Republic and Slovakia, we are proudly partnering with suppliers who employ more that 50% of their workforce with people who have disabilities.
DEI Performance Data At year end 2021, the Group’s gender breakdown was 59% male and 41% female, with 86% of the senior managers identifying as male and 14% female. As of the date of this document, 67% of the Group’s Board members identified as female. The definition of senior manager population is Executive Committee and Vice Presidents (excluding CEO and CFO).
As part of the ESG strategy, we have set out a target to increase female representation to 40% by 2025 on a 2021 baseline amongst a wider group of leaders defined as all people leaders. This population includes the senior leadership team including the CEO and CFO as well as all people leaders with at least one direct report. The following numbers provide an overview of the baseline numbers for the purpose of this target. In 2021, the total of the population in scope was a total 208 people. Of this population, 59 identified as female (28.3 %).
As we further develop our DEI strategy, we will explore additional metrics to understand, evaluate and drive our performance.
The following provides an overview of additional 2021 data points.
2021Number of employees 1047% male (Total employee number) 59%% female employee (Total employee number) 41%Number of senior managers 21% male (Senior management)* 86%% female (Senior management)* 14%Number of directors 8% male (Board level) 38%% female (Board Level) 62%
* Senior Management defined as Senior Leadership Team (“SLT”) except CFO and CEO.
Workforce relationsWe respect the right of our people to participate in collective bargaining agreements, and support their fundamental right to organise. Currently, with the exception of certain employees in Italy and Spain, who are part of standard industry arrangements, none of our employees are subject to collective bargaining agreements.
RESPECTING HUMAN RIGHTS AND COMBATTING MODERN SLAVERYWe respect human rights in our operations and create a work environment where we treat everyone with dignity and respect, and ensure they are free from harassment, bullying and discriminatory or intimidating behaviour of any kind. Our policy aligns to the UN Guiding Principles on Business and Human Rights, and the International Bill of Human Rights, which consists of the Universal Declaration of Human Rights, the International Covenant on Civil and Political Rights and the International Covenant on Economic, Social and Cultural Rights.
We state this commitment in our code of conduct, Group modern slavery and human trafficking policy as well as our equal opportunities, anti-bullying and anti-harassment policies. Our modern slavery and anti-trafficking Policy , approved in 2021, explicitly states how we uphold human rights and tackle modern slavery throughout our supply chains.
Our contracting processes with third parites includes specific prohibitions of the use of forced, compulsory or trafficked labour, or of anyone held in slavery or servitude, whether adults or children. We expect our suppliers to hold their suppliers to the same high standards.
The Board is accountable for ensuring the policy complies with our legal and ethical obligations, and that those under our control comply with it. The Compliance department implements the policy, monitors its use and effectiveness, and deals with any queries about it, including auditing relevant internal control systems and procedures to ensure they are effective. Management is responsible for ensuring everyone understands and complies with this policy, and is given adequate and regular training on it.
We maintain an employee grievance policy and whistleblowing policy, and a related speak-up channel, which enables anyone to raise concerns about human and labour rights.
In 2022, we will review our human-rights and modern-slavery risks, as well as publish an updated annual report statement on modern slavery.
PROMOTING HEALTH, SAFETY AND WELLBEING We take the health and wellbeing of our employees seriously, and monitor and respond to the ongoing developments of the pandemic related to our operations. We have moved to a hybrid-working model and published a policy to outline our approach. We also continue to run a series of initiatives such as remote-working webinars, to help employees adjust to working from home in line with government restrictions. We maintain strict procedures to provide a safe working environment, as well as monitor developments and rules from governments, ensuring compliance across our offices.
In 2021, the Group approved a Group Health and Safety policy that outlines our approach to safeguarding our people and promoting a healthy workplace. The HR function, country managers and truck park managers are responsible for implementing the policy, and ensuring compliance with the relevant statutory frameworks. There is an additional health and safety policy for the retail network.
EUROWAG Annual Report and Accounts for the year ended 31 December 2021
86
STRATEGIC REPORT
Responsibility and Sustainability CONTINUED

In 2021, we delivered a range of health and safety training modules for our employees, alongside a range of wellbeing programmes, including workshops and access to mental-health support. We have reported no work-related incidence in 2021 and 2020. The following provides an overview of the modules and attendee numbers for the training sessions.
Employees who completed training
Health and safety training 2020 2021Driving in the Czech Republic 132 166Fire Protection for Managers 13 23Fire Protection 256 409Occupational Safety for Managers 16 17Occupational Safety 259 425Fire protection, Health and Safety and Driving 676 1040
You can find more information on our wellbeing programmes on page 84.
MAKING A POSITIVE SOCIAL IMPACT We aim to make a positive social impact in the communities where we operate. Our charitable giving and volunteering programme has three elements: • Philanthropy and You – Our
charitable giving programme. Every year, employees receive an equal amount of money to donate to a charity of their choice.
• BeBetter Days – Our employee volunteering programme. Each year, we offer Czech-based employees the opportunity to volunteer their working time and skills for a non-profit organisation. This is a well-established programme in the Czech Republic and we are exploring expansion in other markets starting in 2022.
• Support for Truck HELP Foundation – As a leading payments and mobility platform Company, we recognise the importance of road safety. Through the Truck HELP Foundation we support families who have lost loved ones during their work as professional drivers.
Each year, we donate 1% of annual EBIT to charitable causes around in Europe through these programmes, as well as encourage our employees to give their time, skills and financial support to charitable organisations and causes. We maintain a policy and guidelines governing the process for donations and volunteering.
Philanthropy and YouWe run this through a partnership with Foundation Via. The Foundation has an online giving platform that enables employees to choose and request donations to charitable causes important to them. In 2021, we expanded our programme to our Arrai, Trofa and Salamanca offices. Much of this year’s employee support was for children and families affected by illness. All in all, the programme involved:
• 663 employees • 246 projects• 238,680 euros
donated • 215 organisations• 14 countries.
BeBetter DaysIn 2021, we sponsored nine BeBetter days with 74 employees giving over 450 hours of their time to support eight non-profit organisations. Employees joined forces to support organisations working in the social services, the Jewish community in Prague, environmental organisations, national parks and other important cultural organisations.
2020 2021Philanthropy and You – % employee participation 76.4% 80.7%Philanthropy and You – No. of projects supported 190 246Philanthropy and You – Total amount allocated (k EUR) 93.6 238.7Philanthropy and You – No. of countries 13 14
STRATEGIC REPORT
Annual Report and Accounts EUROWAG
87

Truck HELP Foundation We continued to support Truck HELP Foundation in their mission to help children who have lost a family member – a truck or bus driver who died in a work accident. The Foundation offers financial support, motivational support to help children to study, psychological support, as well as conducting road safety programmes. In 2021, we donated 150,000 CZK (6,033 EUR) to support the Foundation’s programmes, which included a summer camp. In 2021, the Foundation supported 41 children.
GOVERNANCEPROGRESS AND HIGHLIGHTS:• Established ESG governance
structure.• Published new and refreshed
corporate compliance policies. • Deployed refreshed compliance
training.
In 2021, we formalised our ESG governance structure and function, which supplements the existing legal, compliance and assurance governing customer privacy and data security, anti-corruption and anti-bribery, ethical business conduct, transparency and financial regulatory compliance and selling practises. We maintain a comprehensive compliance framework aligned with globally recognised standards and consistent with international sanctions regimes. We have adopted
a number of key policies, including a code of conduct, anti-money laundering and countering the financing of terrorism, anti-bribery and anti-corruption, conflicts of interests, whistleblowing and discrimination and harassment. In 2021, we issued new and updated corporate policies including:• Anti-harassment, Anti-Bullying• Modern Slavery and Anti-
Trafficking policy• Personal data Protection policy • Gifts and Anti-bribery policy • Anti-money laundering policy• Conflicts of interest policy
Our code of ethics outlines our standards, and guides the way we do business across our operations.
CASE STUDY
Supporting the next generation of female tech talent in SlovakiaSince 2020, Sygic has partnered with You in IT, a nonprofit organisation dedicated to increase the number of females in the technology sector and expand accessibility for female talent to enter into the sector in Slovakia. Through their community and practical workshops, the organisation is delivering a wide range of programming to support women in technology in Slovakia – from programming to mentoring. Sygic is collaborating with You in IT to deliver workshops aimed at helping young women prepare for a career in IT. The workshops are designed to help with interview preparations as well as the development and refinement of CVs. The Company’s support will continue into 2022 with the aim of supporting the next generation of young women to secure professional opportunities in the technology sector.
EUROWAG Annual Report and Accounts for the year ended 31 December 2021
88
STRATEGIC REPORT
Responsibility and Sustainability CONTINUED

STRATEGIC REPORT
Annual Report and Accounts EUROWAG
89

COMPLIANCE TRAININGEach year, the Compliance function runs mandatory training for employees across Europe. In 2022, Eurowag will continue to strengthen its training programme by expanding the scope and quality as well as uptake and completion rates for the training courses. To achieve this, the courses will be translated into five languages including Czech, Polish, Romanian, Spanish and Hungarian. In addition, the training programme will include additional reminders and an escalation process for those who have been assigned, but have not completed their training within the time frame allocated. In 2022, the Group plans to deploy a suite of new compliance training modules, covering the following topics: enhanced AML training, business ethics, anti-harassment, whistleblowing as well as human rights and modern slavery.
The following table provides an overview of the number of employees completing mandatory compliance training modules in 2021
STAKEHOLDER AND POLICY ENGAGEMENTWe work with a wide range of external stakeholders at EU level, as well as in the countries where we operate. We believe constructive collaboration is key to helping us learn and innovate.
Both before and since our listing on the London Stock Exchange in October 2021, the investor relations team, CFO and CEO have led our engagement with prospective and current investors.
Our Sales and Marketing teams lead our engagement with customers. To better understand and respond to their needs, the marketing and customer teams engage with customers through surveys that provide formal, quantitative insight into customer needs and interests. The teams also secure unique insight into the needs of truckers through the Road Lords app, a truck navigation GPS app for Android users. In addition to providing specialised routes for trucks and other large vehicles, it serves as a social platform, linking drivers to other drivers. We also monitor the level and type of customer complaints so we can address customer concerns.
We also engage peers in related and influential industries, such as OEMs through our Automotive division.
We work both with industry peers and policymakers through our membership and participation in a number of trade bodies. This helps us understand and monitor regulatory developments as well as the impact of current and future policy and regulations at EU and member-state level.
We engage extensively with our workforce through a range of formal and informal channels, such as our intranet site, our Leaders Talks (short video presentations from our leaders), and virtual “town hall” meetings with our executive management. In addition, we organise an annual roadshow to engage with employees on the summary of the year. The Executive Committee visits the local offices to engage with employees as part of the roadshow. We ask our workforce about the issues most important to them through a range of surveys, and we host an idea board, for colleagues’ suggestions. For more information on how we are engaging and supporting our workforce, please see page 84.
For more information about how our Board and executive management take into account stakeholder concerns, please see page 59 for our section 172 statement. QUALITY ASSURANCEWe have a well-established quality assurance function, led by the Chief of Staff, which is responsible for our quality processes covering product, services and processes. The function oversees the quality management system (“QMS”). The Company is certified ISO 14001:2015, which defines the minimum operating standards for our Czech fuel stations and car washes. We are in the process of securing certification in other countries, including Poland.SUSTAINABLE SUPPLY CHAIN AND RESPONSIBLE PROCUREMENTAs mentioned in the human rights section, we engage with our supply chain to promote sustainable and responsible business practices. When onboarding suppliers, the procurement teams conduct due diligence, checks and can escalate cases to Compliance, if necessary. In addition, the Group has begun to engage with suppliers on climate, compliance and human rights, to better understand and mitigate risks in the procurement process. In addition, the Group is exploring opportunities to work with suppliers, particularly fuel suppliers, to meet our carbon reduction goals. In 2021, we began to procure green energy for our operations, and included environmental criteria into our tender process for logistics services for offices and telematics in the Czech republic. In 2021, we measured our Scope 3 emissions for 2019 in order to understand the source of our supply chain emissions, develop an action plan to reduce emissions in the supply chain as well as conduct the analysis to develop a Scope 3 emissions reduction target.
2021Anti-Bribery & Corruption and conflict
of interestInsider trading
Anti money laundering
GDPR – Personal
data protection
Information and Cyber
Security
Employees who completed training 583 601 33 600 899
EUROWAG Annual Report and Accounts for the year ended 31 December 2021
90
STRATEGIC REPORT
Responsibility and Sustainability CONTINUED

CASE STUDY
Ewerest: Sustainable supply chain in actionIn 2021, our HQ restaurant, Ewerest, agreed to sustainable and local sourcing, as well as sustainable practises. It selected a portfolio of local suppliers and is working with eight local farmers for supplies, as well as offering employees a range of local options for trout, turkey, eggs and rabbit. Employees can also order farm delicacies and other quality food for delivery to the restaurant. It also offers reusable take- out boxes for soup and main meals and no longer uses disposable plastic. During the year, the restaurant also upgraded its vegetarian menu.
DATA PROTECTION AND INFORMATION SECURITY Safeguarding data and privacy is important for building and maintaining trust with our employees, customers, regulators and business partners. Our Compliance team oversees our data protection programme, reporting to the Audit and Risk Committee on the Board level and Business Assurance Committee on the executive/operating level. In 2021, we approved a new data protection policy that outlines our processes for complying with GDPR. In 2022, the team will continue to implement training, refresh risk assessments and ensure GDPR and privacy-by-design principles are part of both legacy and new systems.
For more information on data protection, please refer to page 20.
SPEAK UP (WHISTLEBLOWING)We ensure current and former employees, as well as third parties, have a confidential and easily accessible mechanism for raising concerns about unlawful or unethical conduct, and ensure we can identify and tackle any problems quickly. We have set up a channel for stakeholders to raise concerns confidentially to the compliance department through various routes such as e-mail, phone lines, physical mailbox, etc. We also established an alternative route directly to the Chair of the Audit and Risk Committee. The Audit Committee Chair acts as an external escalation point for any items, which employees may not feel comfortable raising directly with management. No items had been notified to the Committee Chair prior to this report.
During 2021, we had 18 issues raised through this channel, compared to 14 issues raised in the previous year. The compliance and legal team investigated the cases with 10 of the 18 issues further investigated and addressed.
For more information on Corporate Governance, please refer to page 156.
STRATEGIC REPORT
Annual Report and Accounts EUROWAG
91

The table below constitutes the Eurowag Non-Financial Reporting Statement, produced in compliance with the non-financial reporting requirements set out in Sections 414CA and 414CB of the Companies Act 2006. Information relating to each section of the non-financial reporting requirements have been incorporated via cross reference.
Reporting Requirement Policies and Standards Additional information related to our policies and standards
(a) ESG governance ESG policy Responsibility and Sustainability – pages 64 to 88
(b) Environmental Matters Environmental policy
ESG strategy
ESG policy
Environment – page 66
Responsibility and Sustainability – pages 64 to 88
ESG Governance and Accountability in EW – page 66
TCFD Statement – pages 73 to 77
Main activities undertaken during the financial year – page 103
(c) Employees Eurowag values
Code of conduct
Whistleblowing policy
Health and safety policy
Grievance policy
Anti-harassment and anti-bullying policy
S172 Statement – pages 59 to 63
Main activities undertaken during the financial year – page 103
Engagement with the workforce – page 62
Developing our culture – page 104
Diversity, Equity and Inclusion – page 85
(d) Social Matters Modern slavery and human trafficking policy
Responsibility and Sustainability – pages 64 to 66
Diversity, Equity and Inclusion – page 85
(e) Human Rights Modern slavery and human trafficking policy
Anti-bullying and anti-harassment policy
Personal data protection policy
Personal data directive
Respecting human rights and combatting modern slavery – page 86
(f) Anti-Corruption and Anti-Bribery Matters
Anti-bribery and corruption policy
Anti-money laundering policy
(AML) System of internal principles
Partner screening directive
Conflicts of interest policy
Market Abuse Regulation procedures manual
Related Parties Transactions policy
Significant Transactions policy
ESG Governance and Accountability in EW – page 66
EUROWAG Annual Report and Accounts for the year ended 31 December 2021
92
STRATEGIC REPORT
Non-Financial Reporting Statement

Reporting Requirement Policies and Standards Additional information related to our policies and standards
Principal risks relating to requirements (a)–(e)
N/A Risk Management – pages 48 to 54
Business Model N/A Business model – pages 16 to 23
Non-Financial KPI’s N/A Key Performance Indicators – pages 34 to 35
This Strategic report was approved by and signed on its behalf by:
David Orr on behalf of Computershare Company Secretarial Services Limited.
Company Secretary
24 March 2022
STRATEGIC REPORT
Annual Report and Accounts EUROWAG
93

GovernanceReport
Board of Directors 96Corporate governance report 100Nomination Committee report 109Audit Committee report 112Remuneration report 120Directors’ report 142
CONTENTS

GovernanceReport

APPOINTED7 September 2021
NATIONALITY British/Maltese
OTHER COMMITMENTSPaul is the Chair of St James’s Place plc and Templeton Emerging Markets Investment Trust plc.
SKILLS AND EXPERIENCEPaul has over 40 years’ experience in executive and non-executive roles in the financial and business services sectors, including serving as Chairman of a number of FTSE 100 companies.
From 2012 to 2020, Paul was Chairman of Prudential plc, having previously been appointed to the board as Senior Independent Director in 2010. Other prominent positions include roles as Non-Executive Director of WM Morrison Supermarkets plc from 2005 until 2011, during which he served as chair of the Audit Committee and the Remuneration Committee. Prior to this, he was appointed global Chief Executive Officer of Rothschild Asset Management in 1999 and European Chief Executive Officer of Deutsche Asset Management from 2002 to 2005. Earlier in his career, Paul served as Chair of the Association of Investment Companies, as Chair of The City UK’s Leadership Council and as founding CEO of Threadneedle Asset Management Limited.
Other previous appointments include, Chairman of Aon UK Limited from 2008 to 2012, having served as a Non-Executive Director since 2006, JPM European Smaller Companies Investment Trust plc and Bridgewell Group plc and as a Director of Henderson Smaller Companies Investment Trust plc, Eagle Star Insurance Company and Allied Dunbar.
Paul holds an MA in Modern Languages from the University of Oxford, where he is also an Honorary Fellow of Hertford College. In 2018, Paul was awarded a Maltese Order of Merit.
APPOINTED3 August 2021
NATIONALITY Czech
OTHER COMMITMENTSIn his personal life, Martin is a devoted philanthropist, passionate about the development of civil society. In 2016, he co-founded the Nadační fond nezávislé žurnalistiky (Independent Journalism Foundation) and the Nadace BLÍŽKSOBĚ (Closer Together Foundation), a non-profit organisation that aims to support people in need.
Martin is a Director of Couverina Business s.r.o.
SKILLS AND EXPERIENCEMartin Vohánka founded Eurowag Group in 1995, shortly after graduating from high school. Over the years, Martin has successfully developed and scaled the business from an energy payments solution to an integrated payments and mobility platform for the commercial road transportation (“CRT”) industry, that includes toll payments, on-board telematics, route optimisation and much more.
Martin is devoted to providing every CRT company with the benefits of digitalisation at scale. He has grown up with these businesses, spending time in their vehicles and with the families that own and operate them, to understand what they need in order to improve efficiencies. His vision is to build a seamless integrated digital ecosystem to revolutionise what is known as the middle mile, to benefit customers, partners and the environment.
Martin holds an MBA from the University of Pittsburgh and also lectures at the University of Economics, Prague.
N
Martin VohánkaChief Executive Officer
Paul ManducaIndependent Non-Executive Director and Chairman
The directors of the company who were in office during the year and up to the date of signing the financial statements were:
EUROWAG Annual Report and Accounts for the year ended 31 December 2021
96
GOVERNANCE
Board of Directors

APPOINTED3 August 2021
NATIONALITY Polish
OTHER COMMITMENTSN/A
SKILLS AND EXPERIENCEMagdalena has a proven record as a successful CFO, responsible for strategic growth and financial performance, and with vast experience in M&A.
Before joining Eurowag in September 2019, Magdalena led finance functions at renowned businesses in the energy, fuels, and manufacturing industries, including as CFO and member of the board at Paged SA, MD-Economic and Financial Affairs at PGE Group SA, Chief Financial Officer and Finance Director at Zelmer SA, and Finance Director of NIKE Poland.
Magdalena holds a postgraduate degree in Business (Africa Business and Beyond) from SWPS University in Warsaw, and a master’s degree in Management, Capital Investments and Corporate Financial Strategies from the University of Economics and Business in Poznań.
APPOINTED7 September 2021
NATIONALITY Swiss
OTHER COMMITMENTSMirjana is a member of the Board and the Audit Committee of Orell Füssli Ltd, EWE Ltd, and Eniso Partners Ltd, Chief Financial Officer of Synhelion Ltd, Vice-Chair of the Board and Chair of the Audit Committee at IWB Industrielle Werke Basel Ltd, and Secretary of the Board of Qnective Ltd. SKILLS AND EXPERIENCE Mirjana has more than 20 years’ experience in the areas of corporate finance, structuring of companies and management of complex corporate transactions. She was appointed to the Eurowag supervisory board in December 2020 to provide vision and expertise to guide Eurowag on its mission to become the leading on-road mobility platform.
Mirjana held the role of Chief Financial Officer at Qnective Ltd until 2018 and, earlier in her career, was Chief Executive and Financial Officer of Edisun Power Europe Ltd, Chief Financial Officer of MediService Ltd and Chief Financial Officer for Novartis Oncology Switzerland.
Mirjana holds an undergraduate degree from the University of Applied Sciences Zurich and an MBA from the University of St Gallen.
A R N
Mirjana BlumeSenior Independent Non-Executive Director
Magdalena BartośChief Financial Officer
KEY
Chair A Audit & Risk Committee R Remuneration Committee N Nomination Committee
Annual Report and Accounts EUROWAG
97
GOVERNANCE

APPOINTED7 September 2021
NATIONALITY British
OTHER COMMITMENTSSharon is currently Chair of the Board of AIM-listed Restore plc. Sharon is an independent technology consultant and Chair of both DriveWorks Ltd, an independent design automation company, and Foundation SP Ltd.
SKILLS AND EXPERIENCESharon has had a successful career in technology, media and digital companies, and has extensive corporate governance experience.
Sharon is a former Non-Executive Director of Ted Baker plc and served as acting Chair from December 2019 until July 2020. She has previously held roles as Marketing Director and main Board Director of the BBC, and spent 16 years at Microsoft, where she was a Board Director of Microsoft UK and Regional General Manager of MSN International. Until March 2022, Sharon was Non-Executive Director of Hyve Group plc and Non-executive Chair at Unique X Ltd.
Sharon holds a graduate Diploma in Marketing from the Chartered Institute of Marketing, is a Fellow of the Chartered Institute of Marketing, as well as a Member of Women in Advertising and Communications Leadership.
APPOINTED7 September 2021
NATIONALITY British/Irish
OTHER COMMITMENTSCaroline is a Non-Executive Director of London-listed IP Group plc, where she Chairs the Audit and Risk Committee, Georgia Capital plc and Luceco plc. She is also a Non-Executive Director of NYSE-listed Rockley Photonics Holdings Limited and is an external member of the global Partnership Council of Clifford Chance.
SKILLS AND EXPERIENCECaroline has extensive executive and non-executive experience across the technology, financial services and industrials sectors. She has over 20 years’ experience sitting on the boards of listed companies, and has chaired audit committees of listed companies for the past 18 years.
Her early career was spent in corporate finance with Merrill Lynch (New York), UBS and HSBC.
Caroline holds a first-class degree and PhD in Natural Sciences from the University of Cambridge, an MBA and MA from the City Business School, University of London. She is a Fellow of the Chartered Institute of Management Accountants and qualified as a Chartered Financial Analyst and a Chartered Director.
Caroline BrownIndependent Non-Executive Director
Sharon Baylay-BellIndependent Non-Executive Director
A R N A R N
EUROWAG Annual Report and Accounts for the year ended 31 December 2021
98
GOVERNANCE
Board of Directors CONTINUED

APPOINTED7 September 2021
NATIONALITY British
OTHER COMMITMENTSSusan is a Non-Executive Director of Moonpig Group plc and was appointed Chair of the Remuneration Committee, ESG lead, and designated representative for workforce engagement. Susan is also a Non-Executive at Uber UK, The Rank Group plc, where she is Chair of the ESG and Safer Gambling Committee, and Affinity Water Limited where she is also Chair of the Remuneration Committee. Susan was appointed Chair of the Board of Tangle Teezer Limited in January 2022. She is a founding Director of ChapterZero.org.uk, an organisation dedicated to helping board directors and chairs get knowledge and insight on climate change for use in board discussions.
SKILLS AND EXPERIENCESusan has extensive experience within a broad range of large consumer-facing businesses, both in executive and non-executive roles.
Until June 2020, Susan was a Non-Executive Director of Wizz Air plc, and, until March 2020, she was a Non-Executive Director for the Department for Exiting the European Union. She further held senior roles at Royal Caribbean International, Avis Europe, PepsiCo International, McKinsey & Co, and Saatchi & Saatchi.
Susan holds bachelor’s and master’s degrees in International Politics and Economics from the Johns Hopkins University and the Johns Hopkins University’s School of Advanced International Studies (“SAIS”).
APPOINTED7 September 2021
NATIONALITY American
OTHER COMMITMENTSMorgan is Managing Director at TA Associates and co-head of its European Technology Group. Morgan currently sits on the following boards as a representative of TA Associates: The Access Group, Adcubum, Auction Technology Group, Flashtalking, ITRS, Netrisk Group, Sovos, thinkproject and Unit4.
SKILLS AND EXPERIENCEMorgan has over 16 years of private-equity experience and has led investments in software, financial technology, online and e-commerce, and semiconductor companies. He is deeply involved in creating both organic growth and complementary acquisitions for all his portfolio companies.
Prior to joining TA Associates in 2002, Morgan worked for Morgan Stanley and Raymond James.
Morgan holds an MBA from the Stanford Graduate School of Business and a bachelor’s degree in Economics from Yale University.
Joseph Morgan SeiglerNon-Executive Director
Susan HooperIndependent Non-Executive Director
A R N
KEY
Chair A Audit & Risk Committee R Remuneration Committee N Nomination Committee
Annual Report and Accounts EUROWAG
99
GOVERNANCE

The Board has sought to establish a strong corporate governance framework, with the alignment of purpose, strategy and culture at the forefront of our considerations.”
Eurowag’s admission to the London Stock Exchange is a significant milestone, in what I am certain is going to be a long and successful future as we meet our commitments to Shareholders and the wider stakeholder groups.
The Board is committed to the highest levels of corporate governance. In the short time between listing and the Group’s first financial year end as a publicly traded company, the Board has sought to establish a strong corporate governance framework, with the alignment of purpose, strategy and culture at the forefront of our considerations. Given the limited time frame, we prioritised certain aspects of the UK Corporate Governance Code (the “Code”) for practical reasons and you can find more details of the Group’s compliance with the Code on a comply or explain basis on page 102.
Looking forward to the Group’s first full year as a listed company in 2022, the Board is committed to further integrating the principles and provisions of the Code and guiding management through the cultural transition from being a private company.
BOARD DYNAMICSI have been very pleased to be joined on the Board by a group of Directors that bring a wealth of experience and diverse perspectives on matters facing the Company.
We were fortunate that Mirjana Blume and Morgan Seigler agreed to serve as Non-Executive Directors of the listed Company, having previously served on the W.A.G. payment solutions, a.s. Supervisory Board. Their collective knowledge and familiarity with the Company, its people and the industry is an asset to fellow Board members and provides historical context to key decisions.
My fellow Committee Chairs, Sharon Baylay-Bell and Caroline Brown lead by example in ensuring that the appropriate Remuneration and Audit and Risk structures are enshrined within the business, and guide management through the transition into a standard of corporate governance required of a listed company.
Finally, Susan Hooper has been appointed as the ESG Board Representative, a role that includes being the designated workforce
Paul ManducaChairman
It has been a privilege to lead the Eurowag Board through the Company’s Initial Public Offering and I am pleased to present the first Corporate Governance Report for the Group.
INTRODUCTION
EUROWAG Annual Report and Accounts for the year ended 31 December 2021
100
GOVERNANCE
Corporate Governance Report

representative, as outlined by Provision 5 of the Code. Susan sits on the Company’s ESG Committee and will provide regular updates to the Board on ESG matters.
The Board and the wider business place emphasis on diversity and inclusivity at all levels. I am very pleased that the Board has exceeded the Hampton-Alexander target, with 67% female representation on the Board. As part of the new ESG commitments, we have set out a target to increase female representation to 40% amongst our leadership population beyond the Board. This illustrates our ambition and commitment to promote and support gender diversity across our business. As part of our Diversity, Equality, and Inclusion strategy, we are also committed to promoting and supporting candidates drawn from diverse, cultural backgrounds. We will continue to review the dynamics of the Board and the Executive pipeline, giving prominence to individuals from diverse backgrounds and who can demonstrate diversity of thought.
PURPOSE AND CULTUREOne of our primary roles as Directors is to set the tone and culture of the Group, in a way that reinforces and evokes the purpose and strategic direction of the Company. We want to create sustainable, financial and technological solutions for the
benefit of our industry, society and the environment, and can only do so by promoting the Eurowag values. The Board will continue to monitor the alignment of the Company’s culture and values with its purpose and strategy, and will take corrective action should divergences become apparent.
ENGAGEMENT WITH THE WORKFORCEOne way the Board will satisfy itself that the desired culture is rooted within business is by being on the ground and getting to know our colleagues. COVID-19 travel restrictions, together with the timing of the IPO, have made face-to-face engagement difficult in 2021. I am, however, grateful for the opportunity I had earlier this year to engage with our people in Prague. I know I speak for the Board when I say that getting to meet more of our colleagues and learn from them is a high priority for 2022.
STAKEHOLDERSIt is also important that we expand our stakeholder engagement programme. I was grateful for the input received by the Board from the various engagements of management with stakeholder groups and through advisors. This played an integral part in the principal decisions taken by the Board in 2021. Further details can be found in our s172 statement on pages
59 to 63, including the considerations the Board gave as part of its decision making process. I look forward to more direct engagement with our stakeholders in 2022.
In particular, we hope to have the opportunity to engage with our Shareholders more in the early part of 2022 and in the build-up to our Annual General Meeting (“AGM”). Our first AGM as a Public Limited Company is scheduled to be held on 26 May 2022 at 2:00 pm at our registered office, Third Floor (East), Albemarle House, 1 Albemarle Street, London W1.
CONCLUSIONThis year has been eventful. I am so pleased to be a part of this Company as it embarks on the next chapter of its incredible voyage. But I am cognisant that 2021 has been, for many, an extremely difficult year as we all endure in our battle against COVID-19. However, there is room for optimism, and I look forward to another exciting year, full of opportunity, for the Company and the Board as the world continues its recovery.
Paul Manduca Chairman
Annual Report and Accounts EUROWAG
101
GOVERNANCE

Governance overviewImplementation of the 2018 UK Corporate Governance CodeW.A.G payment solutions plc was admitted to the FCA’s Official List and to trading on the London Stock Exchange’s Main Market on 13 October 2021, and on this date, the Group adopted the UK Corporate Governance Code (the “Code”). Since admission, the Group has complied with the provisions of the Code, except in the following aspects:
PROVISION 21 AND PROVISION 22An annual evaluation of the performance of the Board has not yet taken place given the short period of time between admission and the financial year end, and the fact that the foundations of the Board dynamics were still being established. The Board is committed to holding
an annual Board evaluation of its own performance, that of its committees and individual directors. The Board will report on the first formal evaluation in the 2022 Annual Report.
PROVISION 23Initial discussion on the Group’s policy on diversity and inclusion, its objectives and linkage to Company strategy were held in 2021. The Board is scheduled to review the final policy with the view to approving its implementation in March 2022.
PROVISION 25 AND PROVISION 29An annual evaluation of the effectiveness of the external audit process and the company’s risk management and internal control
systems has not yet taken place, given this was the first reporting year as a listed entity and it would not be appropriate given the short time frame in which they were active. An evaluation of the effectiveness of the external audit and the Company’s risk management and internal controls system for the 2021 and 2022 financial years will take place during 2022 and will be reported on in the 2022 Annual Report.
Further information on the Company’s application of the principles and provisions of the Code can be found in the Corporate Governance Report on pages 100 to 108. The Code is publicly available at https://www.frc.org.uk/.
EUROWAG Annual Report and Accounts for the year ended 31 December 2021
102
GOVERNANCE
Corporate Governance Report CONTINUED

Board leadership and Company purpose Main activities undertaken during the financial year Topic
Key activities and discussion in FY21
Key achievements
Key priorities for FY22
Strategy and management
• The Company IPO process • Merger and acquisition
opportunities • Review of Company branding • Continued investment in organic
and inorganic growth opportunities and to fund the technological transformation
• The Company’s successful admission onto the London Stock Exchange
• Approval of the intention to acquire WebEye, a leading fleet-management solution provider
• Creation of the Executive Committee
• Review of further M&A opportunities for the business
• Further embedding of culture conducive to the strategic direction of the Company
• Supporting in the establishment of practises and procedures expected of management and the workforce, as the Company embarks on its first full year as a listed entity
• Continued realisation of the commitments made to Shareholders as part of the capital raise, with priority to organic and inorganic growth, the further development of an end-to-end digital platform and technology transformation
Stakeholder engagement
• Discussion of the Company’s purpose and culture
• Review of Culture Manifesto• S.172 Director training
• Approval of the Company’s Purpose Statement.
• Initial Shareholder meetings with key Shareholders
• Further Shareholder engagement• Investor-relations meetings • Support management with initiatives
to further improve Net Promoter Score and Employee Net Promoter Score
Risk management and internal controls
• Review of the Company’s Risk Appetite
• Review of the Company’s Principal Risk and Uncertainties
• Review of the Risk Management Framework and internal control systems
• Review of the Company’s Risk Register
• Review and approval of the internal audit plan
• Provisional approval of Company’s Risk Appetite
• Provisional approval of the Company’s Principal Risk and Uncertainties
• Establishment of internal audit function
• Review of the performance of Internal Auditor
• Continued implementation of the new generation Enterprise Resource Planning, focused on general ledger accounting, treasury management system and Group reporting to support the Company’s objectives and long-term growth
• Continuous review of the Company’s Risk Appetite and Risk Register
• Review of Company’s climate risks
Financial reporting and controls
• Review of the external audit workplan
• Appointment of External Auditor • Review of the performance of External Auditor
• Finalising the Company’s commitment, targets and implementation of KPIs reporting
Environmental, social and governance
• Discussion of the Company’s ESG strategy for 2022
• Discussion of the Company’s Vision Statement and ambition, purpose and values
• Review of ESG Strategy and considerations for Climate Change and TCFD Reporting
• Approval of the Company’s Vision Statement and oversight of Group culture
• Development and approval of the Company’s ESG Strategy
• Assessment of the Company’s positions against TCFD recommendations
• The creation of Non-Executive ESG Board representative
• Implementation of the Company’s ESG strategy
• Continued evolution of the Company’s Culture Manifesto
Board composition and effectiveness
• The appointment of the Board of Directors as part of the IPO process
• Review of the Board’s composition, including skills’ matrix
• Appointments of Independent Non-Executive Directors and Chair as part of the Company’s IPO process
• Appointment of Susan Hooper as the Non-Executive ESG Board representative with effect from 1 January 2022
• Board evaluation to be undertaken in 2022
• Succession Planning Policy• Board Diversity Policy
Annual Report and Accounts EUROWAG
103
GOVERNANCE

Developing our culture DEFINING PURPOSE AND VALUESThe Board has ultimate responsibility for establishing the purpose, values and strategy of the Group. Our purpose is to create sustainable financial and technological solutions for the benefit of our industry, society and the environment. This is underpinned by our four values, which guide our workforce: (1) deliver your best; (2) embrace change; (3) be a true colleague; and (4) be a good person.
EMPLOYEE ENGAGEMENT ON CULTURE The Group’s leadership has built a collaborative environment where its employees thrive, as evidenced by the Group’s high employee engagement. The strength of our employee engagement is reflected in our 2020 Employee Net Promotion Score (“eNPS”) and we will conduct the next annual survey in 2022. eNPS is designed to help employers measure employee satisfaction based on how likely they are to recommend their employer as a place of work.
We have also set out an ambition to be in the top 25% amongst EU Technology companies for employee engagement by 2025. In addition, as of 31 December, employee retention rate was 80.3%. Engagement with our employees is a priority and leads to a work environment where everyone can be working to their true potential.
As the only Company listed in October 2021, there has not been sufficient time to have any formal workforce engagement by the newly established Board. Susan Hooper has been appointed as the Board’s designated representative for workforce engagement in January 2022. Following her appointment to the role, Susan is planning to undertake several site visits during 2022 to discuss a variety of topics, including culture.
Members of the Group leadership team regularly present to the Board on specific areas of the Group to ensure the Board has a thorough understanding of the key operations of the business.
ALIGNING PURPOSE, VALUES, STRATEGY AND CULTURE Performance comes from passion and purpose. Our values are our guiding principles for everything we do. Our values inspire us to achieve success and happiness in our work and private lives. Ultimately, this leads to achieving our strategy effectively; our purpose is clearly defined and our values are established throughout our workforce to create alignment between Company, team and individual goals, and interests.
We ensure that whoever we recruit, promote and reward demonstrates these values, and we retain those who share our values. This safeguards and perpetuates the culture we have built, which in turn enables us to keep achieving our strategy year-on-year.
EUROWAG Annual Report and Accounts for the year ended 31 December 2021
104
GOVERNANCE
Corporate Governance Report CONTINUED

Division of responsibilities DECISIONS AND MATTERS RESERVED FOR THE BOARDThere is a formal schedule of matters reserved for the Board, as well as a delegated authority matrix, which assists the Board’s planning and provides clarity as to where responsibility for decision making lies.
The formal schedule of matters reserved for the Board’s decision is available on the Company’s website and covers areas including: STRATEGY AND MANAGEMENTThe Board is responsible for managing and overseeing the Group’s operations, ensuring: competent, prudent and effective management; sound planning; an adequate system of internal control; adequate accounting and other records; and compliance with statutory and regulatory obligations.
The Board considers and reviews the Group’s strategic aims and business plan, and reviews the Group’s performance in light of these aims. The Board determines the Company’s purpose and values and the Group’s aims, long-term objectives and commercial strategy.
Extension of the Group’s activities into new business or geographic areas, the decision to cease all or any material part of the Group’s business, or the restructuring or reorganisation of the Group shall be decided by the Board. BOARD COMPOSITION AND EFFECTIVENESSThe Board is committed to holding an annual Board evaluation of its own performance, that of its committees and individual Directors. The independence and appropriateness of the skills, experience, knowledge and commitment of the Directors will be assessed annually during the evaluation process.REMUNERATIONThe Board oversees the Remuneration Committee, which is responsible for determining the policy for Executive Director remuneration and setting remuneration for the Chairman, Non-Executive Directors and senior management.
The Board is responsible for considering and approving the remuneration policy for the Directors and other senior executives, and determines the remuneration of the Non-Executive Directors within the limits set in the Articles.
For further details of the Company’s approach to remuneration, see page 120.FINANCIAL AND ANNUAL REPORTINGThe Board is responsible for approving the Group’s Annual Report and Accounts, the Interim Accounts and Half-Yearly Report, trading statements and the preliminary announcement of the final results following recommendation from the Audit and Risk Committee.CAPITAL EXPENDITURE AND FINANCING The Board is responsible for approving investments and capital projects exceeding £8 million, and overseeing the project’s completion. Any borrowings by the Group in excess of £5 million shall be approved by the Board.
The Board shall approve entering into of any indemnities or guarantees where the maximum amounts payable could exceed £5 million, other than indemnities and guarantees given in respect of the Company’s products or services or any banking facilities (including any indemnities, guarantees or facilities in substitution for or renewal of existing arrangements).
The Board shall approve the creation of any mortgage, charge (fixed or floating), pledge, hypothecation or other encumbrance of a similar nature over all or any part of the undertaking, property and assets (both present and future) and uncalled capital of the Company. Additionally, the Board shall approve an issue by any member of the Group of any debt instruments for amounts in excess of £5 million, including bond issues, debenture issues and loan stock instruments (but excluding intragroup debt instruments).
ENGAGEMENT WITH SHAREHOLDERS AND WIDER STAKEHOLDER GROUPSThe Board ensures effective engagement with, and encouragement of participation from, the Group’s Shareholders and stakeholders, including the workforce. It will undertake regular review of engagement mechanisms in place to ensure they remain effective. The Company has developed an engagement strategy based on those issues that are most important to its long-term success.
Further information on how the Company engages with Shareholders and wider stakeholder groups can be found on pages 59 to 63. ENVIRONMENTAL, SOCIAL AND GOVERNANCEThe Board considers the impact of the Group’s operations on the community and the environment and reviews and recommends amendments to the Group’s Environmental, Social and Governance (“ESG”) strategy.
Susan Hooper was appointed as the designated ESG Director for the Company, with effect from 1 January 2022. Susan is planning to undertake several site visits during 2022 to meet the workforce and discuss a variety of topics.
For further details of the Company’s approach to ESG, see page 65.INTERNAL CONTROLThe Board is responsible for maintaining and reviewing the effectiveness of risk management and internal control systems, and for determining the aggregate level and types of risks the Group is willing to take in achieving its strategic objectives.
The Company’s internal audit function provides independent assurance to the CEO, the Audit and Risk Committee and Board as to whether the Group’s system of internal control is adequately designed and operating effectively to respond appropriately to risks significant to the Company.
Further information on the Company’s internal controls framework can be found on pages 48 to 54.
Annual Report and Accounts EUROWAG
105
GOVERNANCE

BOARD INDEPENDENCEAll Directors are expected to exercise independent judgment in their duty to promote the success of the Company for the benefit of its members as a whole. Directors should exercise their judgment to this end free from material interference, and must disclose any and all business or other relationships to the Board.
It is an essential aspect of good governance that the Independent Non-Executive Directors (“INEDs”) constructively challenge the CEO and the leadership team at Board meetings, while providing support and guidance to promote meaningful discussion and, ultimately, informed and effective decision making. The CEO welcomes and encourages INEDs to test proposals and provide strategic guidance in light of their wider experience outside the Company, particularly in listed environments.
Morgan Seigler is a Non-Independent Non-Executive Director, nominated to the Board by major Shareholder Bock Capital EU Luxembourg WAG SARL. Morgan is expected to exercise the same duties as fellow Board members, in exercising independent judgement and avoiding conflicts of interest. Shareholding agreements, relationship agreements and appropriate processes and procedures ensure safeguard against undue influence affecting Board decision making. Measures have been introduced to ensure that confidentiality is maintained, in particular on price-sensitive matters.
The balance between Executive Directors, Non-Executive Directors and Independent Non-Executive Directors ensures that no one individual or small group of individuals dominates the Board’s decision making.
The Board reviews the independence of its NEDs at each meeting, as advised by the Company Secretary, and takes action to identify and manage conflicts of interests to ensure that third-party influence does not override or compromise independent judgement.
Directors are required to provide requisite information to allow the Board, aided by the Nomination Committee, to evaluate their independence at appointment and throughout their engagement with the Company. The Board is satisfied that there are no matters that give rise to conflict of interests which could compromise the independence of the INEDs.
BOARD GOVERNANCE FRAMEWORK
SHAREHOLDERS
BOARD
BOARD COMMITTEES
REMUNERATION COMMITTEE
NOMINATION COMMITEE
AUDIT & RISK COMMITTEE
EXECUTIVE COMMITTEECHIEF EXECUTIVE OFFICER
CHAIRMAN
SENIOR INDEPENDENT DIRECTOR
INDEPENDENT NON EXECUTIVE DIRECTOR
INDEPENDENT NON EXECUTIVE DIRECTOR
CHIEF EXECUTIVE OFFICER
CHIEF FINANCIAL OFFICER
NON EXECUTIVE DIRECTOR
INDEPENDENT NON EXECUTIVE DIRECTOR
CHIEF FINANCIAL
OFFICER
CHIEF OPERATING
OFFICER
CHIEF STRATEGY
OFFICER
CHIEF COMMERCIAL
OFFICER
CHIEF PEOPLE OFFICER
CHIEF PERFORMANCE
OFFICER
CHIEF OF
STAFF
SENIOR VICE PRESIDENT ENERGY BU
EUROWAG Annual Report and Accounts for the year ended 31 December 2021
106
GOVERNANCE
Corporate Governance Report CONTINUED

TIME COMMITMENTThe Chairman, Independent Non-Executive Directors and Non-Independent Non-Executive Director each have letters of appointment. They are not employed in an Executive capacity by the Group. These letters set out the main terms of their appointments to the Board and cover an initial term of three years. However, in line with the UK Corporate Governance Code 2018, all Directors are put forward for initial election and annual re-election thereafter by Shareholders.
The letters contain information in relation to the time commitment expected of each Director in their role. Independent Non-Executive Directors can expect a typical time
commitment of 26 days a year on average, whilst Morgan Seigler, being a Non-Independent Non-Executive Director is expected to commit, on average, 16 days per year. Given the nature of the role of Chairman, the expected time commitment of Paul Manduca is circa one day per week. While the time commitments outlined are guidance, not targets, the time required of Directors can fluctuate and all Directors are expected to devote sufficient time to discharge their responsibilities effectively, particularly at times of high activity or demand on the business.
Directors’ external time commitment is regularly reviewed to ensure Directors can allocate the necessary time and effort to Eurowag. This
process is continually managed by the Company Secretary and the Chair and takes into consideration outside appointments and commitments, including relevant factors such as complexity of company and industry, in particular highly regulated sectors, and issues affecting these other companies.
The Board has concluded that, notwithstanding Directors’ other appointments, they are each able to dedicate sufficient time to fulfil their duties and obligation to the Company.
Annual Report and Accounts EUROWAG
107
GOVERNANCE
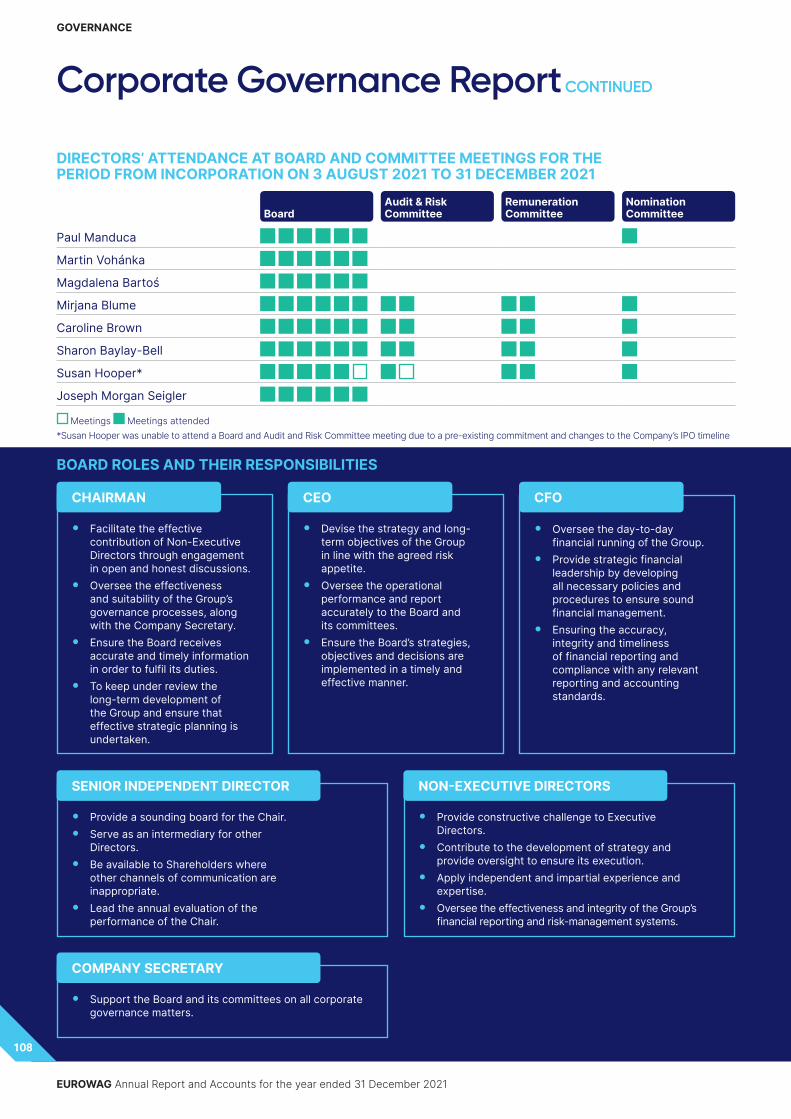
DIRECTORS’ ATTENDANCE AT BOARD AND COMMITTEE MEETINGS FOR THE PERIOD FROM INCORPORATION ON 3 AUGUST 2021 TO 31 DECEMBER 2021
Board
Audit & Risk Committee
Remuneration Committee
Nomination Committee
Paul Manduca Martin Vohánka Magdalena Bartoś Mirjana Blume Caroline Brown Sharon Baylay-Bell Susan Hooper* Joseph Morgan Seigler
Meetings Meetings attended *Susan Hooper was unable to attend a Board and Audit and Risk Committee meeting due to a pre-existing commitment and changes to the Company’s IPO timeline
• Facilitate the effective contribution of Non-Executive Directors through engagement in open and honest discussions.
• Oversee the effectiveness and suitability of the Group’s governance processes, along with the Company Secretary.
• Ensure the Board receives accurate and timely information in order to fulfil its duties.
• To keep under review the long-term development of the Group and ensure that effective strategic planning is undertaken.
• Provide a sounding board for the Chair.• Serve as an intermediary for other
Directors.• Be available to Shareholders where
other channels of communication are inappropriate.
• Lead the annual evaluation of the performance of the Chair.
• Support the Board and its committees on all corporate governance matters.
• Devise the strategy and long-term objectives of the Group in line with the agreed risk appetite.
• Oversee the operational performance and report accurately to the Board and its committees.
• Ensure the Board’s strategies, objectives and decisions are implemented in a timely and effective manner.
• Provide constructive challenge to Executive Directors.
• Contribute to the development of strategy and provide oversight to ensure its execution.
• Apply independent and impartial experience and expertise.
• Oversee the effectiveness and integrity of the Group’s financial reporting and risk-management systems.
• Oversee the day-to-day financial running of the Group.
• Provide strategic financial leadership by developing all necessary policies and procedures to ensure sound financial management.
• Ensuring the accuracy, integrity and timeliness of financial reporting and compliance with any relevant reporting and accounting standards.
BOARD ROLES AND THEIR RESPONSIBILITIES
CHAIRMAN
SENIOR INDEPENDENT DIRECTOR
COMPANY SECRETARY
CEO
NON-EXECUTIVE DIRECTORS
CFO
EUROWAG Annual Report and Accounts for the year ended 31 December 2021
108
GOVERNANCE
Corporate Governance Report CONTINUED

COMMITTEE OVERVIEW• Comprises the Chairman of the
Board and four independent Non-Executive Directors.
• All members have relevant experience.
• The Committee’s first meeting following admission was held in December 2021.
• Meetings are attended by the CEO and other relevant attendees, by invitation of the Chair.
PROGRESS SINCE INCORPORATION • The Board’s composition has
complied with the Code since admission.
• The Board has met the Hampton-Alexander target for 33% female Board representation.
• The Board has committed to meet the Parker Review target of at least one person from a non-white ethnic group by 2024.
FOCUS AREAS FOR FY22• Succession planning for the Board
and the Senior Leadership Team. • Perform the first annual evaluation
of the Board, it’s committees, the Chair and the individual Directors.
• Ensure adequate induction and training programmes are in place.
• Continued focus on diversity in all aspects within the Group.
KEY RESPONSIBILITIES • Monitor the governance
framework, including the structure, size and composition of the Board and its committees, to ensure a balance of skills, knowledge, experience and diversity.
• Lead a rigorous and transparent process for identifying and selecting candidates to serve as Directors on the Board and its committees, and making recommendations to the Board for their appointment.
• Develop and implement effective succession plans for the Board,
its committees and the senior leadership team, having regard to the skills and expertise needed to ensure the long-term sustainable success of the Company.
• Oversee the development of a diverse talent pipeline and monitor the Company’s diversity policies and initiatives and their effectiveness.
• Review the external directorships and commitments of the Non-Executive Directors.
• Assist the Chairman in ensuring there is a rigorous annual evaluation of the performance of the Board, its Committees, the Chairman and individual Directors.
• Ensure that appropriate procedures are in place for training and developing Directors.
The Committee’s Terms of Reference, which are reviewed and approved annually, are available on the Company’s website at https://investors.eurowag.com.
Paul ManducaNomination Committee Chairman
MEMBERSHIPCommittee member Meetings attendedPaul Manduca Non-Executive Chairman of the Board and Chair of the Committee 1/1Sharon Baylay-Bell Non-Executive Director 1/1Caroline Brown Non-Executive Director 1/1Mirjana Blume Senior Independent Non-Executive Director 1/1Susan Hooper Non-Executive Director 1/1
The Committee recognises the benefits of diversity of thought and when considering Board appointments and hiring or promoting to senior leadership positions, the Group will continue to take account of diversity, while seeking to ensure that each role is offered on merit, against objective criteria.”
Annual Report and Accounts EUROWAG
109
GOVERNANCE
Nomination Committee Report

CHAIR’S INTRODUCTION Dear Shareholders, I am pleased to present the first Nomination Committee Report, covering the period from admission on 13 October 2021 until 31 December 2021.
The Nomination Committee comprises four independent Non-Executive Directors: Sharon Baylay-Bell, Caroline Brown, Mirjana Blume and Susan Hooper and myself (Independent Non-executive Chair of the Board and of the Committee). The biographies of each member of the Committee are set out on pages 96 to 99.
The Committee met once in 2021, during which we undertook an initial Board composition review, discussed and approved the Directors induction plan and the continuing training regime for existing Directors, succession planning, and we formally recommended to the Board that Susan Hooper be appointed as ESG Representative for the Board.
My role as Committee Chair is to lead my fellow committee members in assessing the Board’s effectiveness, taking into account the Company’s strategic priorities, and planning accordingly to ensure the right balance of skills, experience and challenge are present in the boardroom.
DIVERSITY POLICYInitial discussion on the Group’s policy on diversity and inclusion, its objectives and linkage to Company strategy were held in 2021. The Board reviewed final policy and approved for implementation in March 2022.
The Company is committed to ensuring diversity in all forms, and inclusion. The Committee recognises the benefits of diversity of thought and when considering Board appointments and hiring or promoting to senior leadership positions, the Group will continue to take account of diversity, while seeking to ensure that each role is offered on merit, against objective criteria, to the best available candidate.
During the period, the Committee reviewed the composition of the Board and its committees and is pleased that the current gender composition of the Board exceeds the target set in the Hampton-Alexander review.
DIRECTOR APPOINTMENT PROCESSMartin Vohánka and Magdalena Bartoś were retained in their roles as Chief Executive Officer and Chief Financial Officer respectively, having held those positions for W.A.G. payment solutions a.s., prior to the IPO.
In advance of listing, Paul Manduca was identified as Chairman-designate following a strict selection process to identify a respected individual with experience of leading large UK-listed companies to help guide the Board as the Company embarked on its next chapter. Ten individuals were considered for the role, with valuable insight on appropriate selection criteria provided by sponsors, Shareholders and advisors.
Pedersen & Partners were engaged to lead a detailed and systematic search for candidates for the Non-Executive Director positions, with due regard to diversity and technology and fintech experience. A pool of over 360 candidates was identified, with fewer than 13 shortlisted, those having demonstrated the required skill set, experience and personal traits conducive of a well-rounded Board, with an array of technical experience and entrepreneurial drive.
Following a comprehensive multi-stage interview process to identify the most appropriate candidates, including interviews with the Chairman-designate, CEO and CFO, as well as meetings with leading Shareholders, four new Independent Non-Executives were identified. In addition, Mirjana Blume was asked to undertake the role of Senior Independent Director, having previously served as a Supervisory Board member for W.A.G. payment solutions a.s. Her experience and knowledge of the Company’s
operations and culture were considered an invaluable asset to the new Board.
Morgan Seigler was appointed to the Board by TA Associates (UK) LLP. Under the Relationship Agreement, TA Associates has a right to nominate for appointment one Non-Executive Director (the Nominee Director) to the Board, while it and its associates’ shareholding in the Company is greater than or equal to 10%.
Pedersen & Partners was considered independent, free from any connections with the new Independent Non-Executive Directors.
BOARD COMPOSITION STATISTICS1 INDEPENDENCE
62.5%25.0%
12.5%
Independent Non-Executive Directors
Executive Directors
Non-Executive Directors
GENDER
37.5%
62.5%
Male
Female
1 The composition of the Board is shown as at 31 December 2021. There have been no changes to the composition of the Board since the year end.
SKILLS MATRIXThe following skills matrix details some of the key skills and experience the Nomination Committee has identified as valuable to the effective oversight of the Group and execution of the Company’s strategy.
EUROWAG Annual Report and Accounts for the year ended 31 December 2021
110
GOVERNANCE
Nomination Committee Report CONTINUED

CapabilitiesDIRECTOR
Paul Manduca
Martin Vohánka
Magdalena Bartoś
Mirjana Blume
Sharon Baylay-Bell
Caroline Brown
Susan Hooper
Joseph Morgan Seigler
Payment Solutions
Transport and Logistics
Financial/ Audit and Risk
UK-Listed PLC and Governance
ESG
Capital Markets
Tech and Digital
All directors were appointed on the basis of having extensive Strategic, Leadership and People experience.
SUCCESSION PLANNING During the period, the Committee has reviewed the appointment profile of each Director and considered succession planning from the three time horizons; contingency planning, medium-term planning and long-term planning. The Committee is committed to developing and implementing effective succession plans for the Board and its committees, having regard to the skills and expertise needed to ensure the long-term sustainable success of the Company. The Committee and Board will continue to have regard for matters such as time commitment and the benefits of diversity of gender, social and ethnic backgrounds, cognitive and personal strengths.
The Committee has considered the skills and expertise of the Board and concluded that the existing composition is appropriate to meet the current leadership needs of the business.
The Committee oversees the succession and development of the Company’s senior leadership team and talent pipeline. During the period, the Committee has reviewed the Executive “bench strength” and successors’ readiness for key senior roles, and has identified key roles that will form part of the Company’s succession planning focus for 2022.
TRAINING AND ONGOING DEVELOPMENT OF SKILLSPrior to admission, the Company’s external lawyers provided all Directors with training for their legal, regulatory and governance duties, responsibilities and obligations as a Director of a listed company.
The Committee has since established a formal Director induction programme for future Director appointments, as well as a continued induction plan to further integrate the recently appointed Directors into the business with the objective of further enhancing their understanding of the Company, its culture and the industry it operates in. A schedule of one-to-one briefing sessions with relevant members of the senior leadership team will be provided for the Directors during their first year of appointment, relevant to their specific role on the Board.
A number of training and “deep dive” sessions have also been scheduled for the Board and its committees during the course of 2022, on topics including, but not limited to, digital transformation; s172 duties and reporting requirements; and ESG-related topics such as TCFD reporting, climate change, diversity and boardroom dynamics.
BOARD EVALUATIONIn view of the short period of time between admission and the financial year end, it was not deemed practical to hold a formal evaluation in 2021.
The foundations of the boardroom dynamics were still being established and it was not appropriate to analyse the performance of the Board, its committees and individual Directors on a limited sample of interactions. Objectives and strategic direction of the Board have not had time to sufficiently materialise and evaluation of these would yield little benefit at this stage.
The Board is committed to holding an annual Board evaluation of its own performance, that of its committees and individual Directors. The Board will report on the first formal evaluation in the 2022 Annual Report.
ELECTION OF DIRECTORS In accordance with the Code, all Directors will offer themselves for election by Shareholders at the 2022 AGM. Both the Committee and the Board are satisfied that all Directors continue to be effective in, and demonstrate commitment to, their respective roles on the Board. The Committee believes each Director makes a valuable contribution to the leadership of the Company. The Board, therefore, recommends that Shareholders approve the resolutions to be proposed at the 2022 AGM relating to the election of the Directors.
Paul ManducaChair of the Nomination Committee
24 March 2022
Annual Report and Accounts EUROWAG
111
GOVERNANCE

The Committee has supported and challenged management, ensuring that a rigorous financial reporting and governance framework is established to enable the Company to be well positioned for continued growth in the future.”
COMMITTEE OVERVIEW• Comprises four independent Non-
Executive Directors.• Caroline Brown and Mirjana
Blume are considered by the Board to have recent and relevant accounting experience. All members have relevant commercial and operating experience.
• Two meetings have been held between admission and 31 December 2021.
• Meetings are attended by the Chair of the Board and CFO, other members of management, the Internal Auditor and the External Auditor, by invitation of the Chair.
PROGRESS SINCE INCORPORATION • Approved the appointment of
PwC LLP as External Auditors and KPMG Česká republika, s.r.o. as externally sourced Internal Auditors.
• Approved the external audit plan and fee for the year ended 31 December 2021.
• Approved a formal policy on procuring non-audit services.
• Approved the inaugural internal audit plan.
FOCUS AREAS FOR FY22• Review and scrutinise the
preparation of the Annual Report and Accounts for the year ended 31 December 2021, including significant financial reporting issues and judgements.
• Monitor the implementation of financial position and prospects procedures.
• Assist the Board in its review of the effectiveness of the Group’s systems of internal control and risk-management methodology.
• Review and advise the Board on the effectiveness of the Group’s whistleblowing procedures.
• Review the performance of the External Auditors and the Internal Auditors.
• Undertake a review of the Committee’s performance, composition and terms of reference.
KEY RESPONSIBILITIES The Committee’s main responsibilities, as outlined in its terms of reference, are: • Recommending the half and full-
year financial results to the Board.• Maintaining the integrity of
all financial and non-financial reporting, including review of significant judgments and estimates.
• Monitoring the Group’s internal financial controls and risk-management systems.
• Overseeing the relationship with the External Auditor and reporting the findings and recommendations of the Auditor to the Board.
The Committee’s Terms of Reference, which are reviewed and approved annually, are available on the Company’s website at https://investors.eurowag.com.
MEMBERSHIPCommittee member Meetings attendedCaroline Brown Non-Executive Director
and Committee Chair 2/2Sharon Baylay-Bell Non-Executive Director 2/2Mirjana Blume Senior Independent
Non-Executive Director 2/2Susan Hooper Non-Executive Director 1/2
Dr Caroline BrownAudit and Risk Committee Chair
EUROWAG Annual Report and Accounts for the year ended 31 December 2021
112
GOVERNANCE
Audit and Risk Committee Report
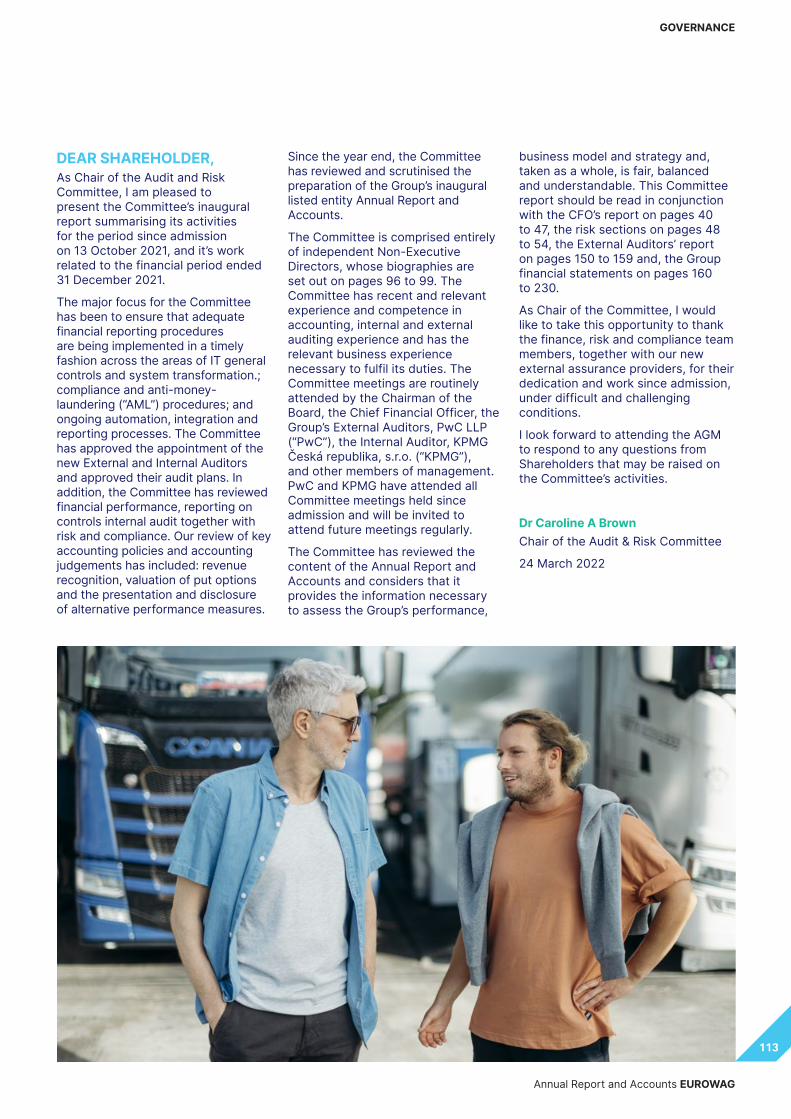
DEAR SHAREHOLDER,As Chair of the Audit and Risk Committee, I am pleased to present the Committee’s inaugural report summarising its activities for the period since admission on 13 October 2021, and it’s work related to the financial period ended 31 December 2021.
The major focus for the Committee has been to ensure that adequate financial reporting procedures are being implemented in a timely fashion across the areas of IT general controls and system transformation.; compliance and anti-money-laundering (“AML”) procedures; and ongoing automation, integration and reporting processes. The Committee has approved the appointment of the new External and Internal Auditors and approved their audit plans. In addition, the Committee has reviewed financial performance, reporting on controls internal audit together with risk and compliance. Our review of key accounting policies and accounting judgements has included: revenue recognition, valuation of put options and the presentation and disclosure of alternative performance measures.
Since the year end, the Committee has reviewed and scrutinised the preparation of the Group’s inaugural listed entity Annual Report and Accounts.
The Committee is comprised entirely of independent Non-Executive Directors, whose biographies are set out on pages 96 to 99. The Committee has recent and relevant experience and competence in accounting, internal and external auditing experience and has the relevant business experience necessary to fulfil its duties. The Committee meetings are routinely attended by the Chairman of the Board, the Chief Financial Officer, the Group’s External Auditors, PwC LLP (“PwC”), the Internal Auditor, KPMG Česká republika, s.r.o. (“KPMG”), and other members of management. PwC and KPMG have attended all Committee meetings held since admission and will be invited to attend future meetings regularly.
The Committee has reviewed the content of the Annual Report and Accounts and considers that it provides the information necessary to assess the Group’s performance,
business model and strategy and, taken as a whole, is fair, balanced and understandable. This Committee report should be read in conjunction with the CFO’s report on pages 40 to 47, the risk sections on pages 48 to 54, the External Auditors’ report on pages 150 to 159 and, the Group financial statements on pages 160 to 230.
As Chair of the Committee, I would like to take this opportunity to thank the finance, risk and compliance team members, together with our new external assurance providers, for their dedication and work since admission, under difficult and challenging conditions.
I look forward to attending the AGM to respond to any questions from Shareholders that may be raised on the Committee’s activities.
Dr Caroline A BrownChair of the Audit & Risk Committee
24 March 2022
Annual Report and Accounts EUROWAG
113
GOVERNANCE

ACTIVITIES OF THE COMMITTEEThe Committee has had an extensive number of items on the agenda focusing on the audit, assurance, and risk processes within the business. The Committee has worked closely with the senior management, the Internal Auditor, the External Auditor and the financial reporting team to
ensure appropriate control framework was in place and to publish the inaugural Annual Report of the Company.
The Committee’s role is to ensure that management’s disclosures reflect the supporting detail provided to the Committee or challenge them to explain and justify their interpretation and, if necessary,
re-present the information. The Committee reports its findings and makes recommendations to the Board accordingly. There were two meetings of the Committee held during the year. Items of business considered by the Committee, including as part of the Annual Report and Accounts process, are set out below:
Actions Outcomes Cross-reference
Annual reporting
Review of outstanding items from the Financial Position and Prospects Procedures (“FPPP”) report
The Committee reviewed and monitored the progress of outstanding items from the FPPP following the IPO of the Company at every meeting in the period.
N/A
External audit planning and key accounting matters
The Committee received and approved the external audit plan and audit fee proposal for PwC in December.
150 to 159 and 119
Review of significant financial reporting issues and key judgements
The Committee received and approved management’s accounting paper in March 2022.
116
Review of Going Concern and Viability statements
The Committee received and approved management’s paper on Going Concern and Viability in March 2022.
117
Review of inaugural Annual Report The Committee recommended the Annual Report and Accounts to the Board in March 2022
N/A
EUROWAG Annual Report and Accounts for the year ended 31 December 2021
114
GOVERNANCE
Audit and Risk Committee Report CONTINUED

Actions Outcomes Cross-reference
Risk management and internal control
Risk Management Framework and Risk Registers
The Committee reviewed the 2021 Risk Management Framework and requested an independent review of its design and operating effectiveness in October.
117
Review of principal and emerging risks
The Committee and the Board undertook a robust assessment of the Company’s emerging and principal risks, including a a description of its principal risks, the procedures in place to identify emerging risks, and an explanation of how these are being managed and mitigated. Details of the risks approved by the Board can be found in the Risk Section of this report.
117
Review of internal controls The Committee reviewed the internal control reporting for 2021 and reviewed Compliance updates in December.
117
Approved internal audit plan The Committee approved the internal audit plan for 2022 in December.
119
Governance
Internal Auditor appointment Following a competitive tender, KPMG were appointed as internal audit co-source partner for the Company. KPMG have a direct reporting line into the Audit and Risk Committee.
119
External Auditor appointment Following an audit tender in 2019, PwC was appointed as External Auditor for W.A.G. payment solutions a.s., the Parent Company of the Group prior to the Group’s listing, and has subsequently been appointed as Auditor of the Company.
The Committee recognises the importance of continuity of knowledge of the accounting and internal infrastructure of the Company, whilst maintaining independence as Auditor.
117
Non-Audit Services Policy The Committee adopted the Non-Audit Services Policy for the Company.
119
Committee Terms of Reference The Committee reviewed and agreed the Terms of Reference for the Committee.
https://investors.eurowag.com
Financial Reporting Procedures The Committee reviewed financial reporting procedure and controls.
113
IT General Controls & System Transformation
The Committee reviewed and, where appropriate, challenged the IT controls and system transformation plan.
117
Annual Report and Accounts EUROWAG
115
GOVERNANCE

KEY ACCOUNTING ISSUES AND SIGNIFICANT JUDGEMENTSIn the preparation of the Group’s 2021 financial statements, the Committee assessed the accounting principles and policies adopted, and whether management had made appropriate estimates and judgements. In doing so, the Committee discussed management reports and enquired into judgements made and discussed key matters with the External Auditors.
The significant issues considered by the Committee in relation to the financial statements include:
Significant issue: Summary:
Revenue recognition The Group acts as principal in the acceptance business as it is the primary obligor in respect of delivery of energy and related services to its customers. In addition, the Group has discretion in establishing the price for the specified fuel.
Valuation of put options Significant judgement:
The Group concluded that it does not, in substance, acquire present access to economic benefits of acquired subsidiaries. The put option redemption liability will be settled with a transfer of the non-controlling interest’s shares for a price that is deemed to approximate their fair value. Therefore, the Non-controlling Shareholders have retained the risks and rewards associated with ownership until the options are exercised.
Significant estimate:
The put option redemption liability measurement requires significant estimates and assumptions at each reporting date, including forecasted future revenues and profits of the acquired business and discount rates. Higher forecasted revenues and profits result in higher put option redemption liability, which is recognised within financial liabilities with a corresponding charge directly to equity. The charge to equity is recognised separately as business combinations equity adjustment.
Presentation of adjusting items (and new policy on adjusting items)
In determining whether an item should be presented as an adjusting item to IFRS measures, the Group considers items which must initially meet at least one of the following criteria:• It is a significant item, which may cross more than one accounting period. • It has been directly incurred as a result of either an acquisition, capital restructuring
or relates to the Group’s strategic transformation programme as these are not part of the Group’s underlying trading activity.
• It is unusual in nature, e.g. outside the normal course of business.
If an item meets at least one of the criteria, the Board, through the Audit and Risk Committee, then exercises judgement as to whether the item should be classified as an adjusting item to IFRS performance measures. Refer to Note 11 for a list of these items including definitions and exclusion justifications.
The Committee reviewed presentation and disclosure of adjusting items including new accounting policy and concluded that they are appropriate.
Further information is available within the Auditor’s report on pages 150 to 158
Our disclosures against the Code are reviewed by an external specialist and then reported to the Committee. Our disclosures against the Code are reviewed by the internal audit team and reported to the Committee.
EUROWAG Annual Report and Accounts for the year ended 31 December 2021
116
GOVERNANCE
Audit and Risk Committee Report CONTINUED

FAIR, BALANCED AND UNDERSTANDABLEThe Committee carried out a thorough review of the Group’s Annual Report and Accounts. The Committee gave particular consideration to whether the Annual Report and Accounts, taken as a whole, was fair, balanced and understandable, concluding it was.
To make this assessment, the Committee received copies of the Annual Report and financial statements to review during the drafting process, to ensure that the key messages being followed aligned with the Company’s position, performance and strategy being pursued and that the narrative sections of the Annual Report were consistent with the financial statements. After consideration of all of this information, we are satisfied that, when taken as a whole, the 2021 Annual Report and Accounts is fair, balanced and understandable, and provides the information necessary for Shareholders to assess the Group’s performance, business model and strategy.
GOING CONCERN AND VIABILITY REVIEWThe Committee reviewed management’s approach to the Going Concern and Viability statement prior to the year end and agreed that a three-year horizon was appropriate for viability reporting. After the year end, the Committee reviewed management’s reports setting out its view of the Group’s viability including a description of the factors considered in forming an assessment of the Group’s prospects. The viability review was based on the Group’s three-year strategic plan and an analysis of the impact of the principal risks relating to product demand decline risk, technology security and resilience risk, external parties dependency risk, physical security risk and climate change risk.
Having considered management’s assessment, the Committee approved the Going Concern statement set out on page 58 and the Viability statement set out on pages 56 to 58.
RISK AND INTERNAL CONTROLSThe key elements of the Group’s internal-control framework and procedures are set out on pages 48 to 54. The principal risks the Group faces are set out on pages 49 to 54. The Committee devoted part of each meeting to items concerning risk and its management.
The Executive Committee has established a sub-committee, the Business Assurance Committee. The sub-committee reports to the Executive Committee and also has a separate reporting line directly to the Audit and Risk Committee where the Chair of the Business Assurance Committee presents updates.
The executive sub-committee coordinates the governance, risk and controls at the Group before reporting to the Committee and the Board. During late 2021 and early 2022, the Committee reviewed risk registers and management’s updated risk appetite statements ahead of Board discussions to approve the Group’s final risk appetite statements. The Committee requested an independent review into the design and operating effectiveness of the risk management framework to be conducted in 2022.
COMPLIANCEPrior to year end, the Committee reviewed its assurance arrangements covering legal, financial, tax, risk, IT and cyber, and employment policies, identified areas where additional assurance on Group compliance with these policies and procedures was required and agreed actions with management to obtain the desired level of assurance.
EFFECTIVENESS OF EXTERNAL AUDIT The Committee, on behalf of the Board, is responsible for the relationship with the Auditor, and part of that role is to examine the effectiveness of the statutory audit process. Audit quality is regarded by the Committee as the principal requirement of the annual audit process.
The effectiveness of the external audit process depends on appropriate risk identification. In December, the Committee discussed the Auditor’s plan for the 2021 audit. This included a summary of the proposed audit
scope and a summary of what the Auditor considered to be the most significant financial reporting risks facing the Group, together with the Auditor’s proposed audit approach to these significant risks. In March, the Auditor reported against their audit scope, providing an opportunity for the Committee to monitor progress and raise questions, and challenge both the Auditor and management.
The auditor meets management at regular intervals during the annual audit process.
The Committee will formally review the effectiveness of the 2021 external audit during the first half of 2022.
AUDITOR INDEPENDENCE The Committee keeps under review the cost-effectiveness, independence and objectivity of the External Auditor. The Committee has put in place a policy on the engagement of the External Auditor to supply non-audit services and a review of the effectiveness of the External Auditor.
In assessing the independence of the Auditor from the Group, the Committee takes into account the information and assurances provided by the Auditor, confirming that all its partners and staff involved with the audit are independent of any links to the Group. PwC confirmed that all its partners and staff complied with their ethics and independence policies and procedures, which are fully consistent with the FRC’s Ethical Standard, including that none of its employees working on the audit hold any shares in W.A.G payment solutions plc.
PwC has audited the Group since 2019 and the lead audit partner rotates every five years to assure independence. PwC, Deloitte and former external auditor EY took part in 2019 audit tender process. PwC and EY were shortlisted and PwC was later selected as an external auditor for the Group. Mr Mark Skedgel became lead partner in late 2021, responsible for the Group’s statutory audit for the 2021 year end onwards. The Committee has no current plans to re-tender the audit.
The Committee is satisfied that PwC continues to be independent, and free from any conflicting interest with the Group.
Annual Report and Accounts EUROWAG
117
GOVERNANCE

Board Committees
RemunerationCommittee
NominationCommittee
Audit & RiskCommittee
Executive Sub- Committee
Business Assurance Committee
• Legal and Compliance• Risk
• Internal Audit (+KMPG)• Security
Board
CHAIRMAN CHIEF EXECUTIVE OFFICER
SENIOR INDEPENDENT NON EXECUTIVE DIRECTOR CHIEF FINANCIAL OFFICER
INDEPENDENT NON EXECUTIVE DIRECTOR INDEPENDENT NON EXECUTIVE DIRECTOR
INDEPENDENT NON EXECUTIVE DIRECTOR NON EXECUTIVE DIRECTOR
Senior Leadership TeamExecutive Committee
CEO
CHIEFFINANCIAL OFFICER
CHIEFOPERATING
OFFICER
CHIEFSTRATEGY
OFFICER
CHIEFCOMMERCIAL
OFFICER
CHIEFPEOPLEOFFICER
CHIEFPERFORMANCE
OFFICER
CHIEF OF
STAFF
SVP ENERGY
BU
Internal AuditVP Legal &
Compliance(General Counsel)
Security ProcessExcellence Head of Risk
Head ofCompliance IT Risk
EUROWAG Annual Report and Accounts for the year ended 31 December 2021
118
GOVERNANCE
Audit and Risk Committee Report CONTINUED

NON-AUDIT SERVICES POLICYThe External Auditors are primarily engaged to carry out statutory audit work. There may be other services where the External Auditors are considered to be the most suitable supplier by reference to their skills and experience. A policy is in place for the provision of non-audit services by the External Auditors, to ensure that the provision of these services does not impair the External Auditors’ independence or objectivity, in accordance with the FRC Ethical and Auditing Standards.
Service Policy
AUDIT-RELATED SERVICES May include the provision of services subject to approval by the Audit & Risk Committee, including capital markets services, review of interim financial statements, compliance certificates and reports to regulators.
The half-year review, an assurance-related non-audit service, is approved as part of the Audit and Risk Committee approval of the external audit plan.
All permitted non-audit services require approval in advance by the Audit and Risk Chair or Audit and Risk Committee, subject to the cap of 70% of the fees paid for the audit in the last three consecutive financial years (the cap does not apply until 3 years of audit fees have been accumulated).
PERMISSIBLE SERVICES Permissible services are detailed in the FRC’s white-list of Permitted Audit-Related and Non-Audit Services. Any audit-related service or non-audit-related service, which is not on the list, cannot be provided by the External Auditor.
Permissible in accordance with the FRC Revised Ethical Standard 2019.
NON-AUDIT SERVICES Fees for non-audit services paid to PwC in 2021 include the cost of reporting accountant work related to the IPO and consultancy services in respect of product development. Reporting accountant work is based on listing requirements and is often performed by the existing audit firm due to the nature of the work and the continuity of knowledge. Consultancy services were terminated within three months after Admission to ensure audit independence and enable work on the first audit as a public company to commence.
INTERNAL AUDITThe Committee reviewed the internal audit reports for 2021. Following a strict tender process, KPMG was selected as the preferred external internal audit partner for the Group and the Committee approved their appointment in October. The Committee also approved the internal audit plan for 2022 in December.
The Committee will formally review the effectiveness of the internal audit function during 2022.
AUDIT FEES FOR 2021Fees paid to the external auditor for the year were €4.17m, of which 76.81% (€3.20m) was for non-audit and other assurance services and €0.97m was for the audit. The audit to non-audit fee ratio was 1:3.3.
The audit committee is satisfied that this level of fee is appropriate in respect of the audit services provided, given the transition from a private company to listed company within the financial year with the majority of the non-audit fees resulting from IPO Reporting Accountancy (€2.46m). Reporting accountant work is based on listing requirements and as such is exempted from non-audited services cap. Excluding IPO Reporting Accountancy, non-audit services represented 43.34% of fees paid to the External Auditor in the year.
All non-audit work that was required to stop within 3 months of the IPO was indeed ceased within that time frame. The Committee will continue to review the non-audit fee ratio.
PRIORITIES FOR 2022During the forthcoming year, the Committee will continue to support and challenge management through the evolution of the Group’s internal-controls framework in the light of changes expected in the UK regulatory framework. The Committee will consider how to bring increased rigour to the review of the Group’s risks and risk appetite.
Finally, the Committee will continue to focus on the risks associated with climate change and the impacts of those risks on the Group’s financial statements.
GOVERNANCEWHISTLEBLOWINGThe Committee discussed the Company’s whistleblowing procedure and agreed that the committee chair would act as external escalation for any items which employees did not feel comfortable raising directly with management. No items had been notified to the committee chair prior to this report. Further information on the Company whistleblowing arrangements is available on pages 90 to 91.TERMS OF REFERENCEThe Committee has reviewed and adopted the Terms of Reference, which are available on the Company’s website. The Committee will, at least annually, review its Terms of Reference to ensure they remain appropriate and robust. COMMITTEE EFFECTIVENESS REVIEW Due to the short period since admission, the Committee has not undertaken an effectiveness review. The Committee intends to do this during 2022 once it is more established.CONTINUING EDUCATION AND TRAINING The entire Board has received training on the current UK Corporate Governance Code, and regularly receives information and regulatory updates that could affect the work of the Committee.
Annual Report and Accounts EUROWAG
119
GOVERNANCE

The Remuneration Policy proposed is considered to underpin the Group’s strategy, reflects best practice, and ensures the focus of the leaders is on the continued long-term, sustainable success of the business.”Sharon Baylay-Bell
Remuneration Committee Chair
DEAR SHAREHOLDER, I was appointed to the Board and as Chair of the Remuneration Committee on 7 September 2021 and this report covers the period from Incorporation on 3 August 2021 to 31 December 2021.
The Directors’ Remuneration Report comprises the following three sections:
• This Annual Statement, where I summarise the work of the Committee and our approach to Directors’ remuneration;
• The Directors’ Remuneration Policy (the “Policy”), which builds on the work undertaken prior to Admission and provides the framework under which directors will be paid over the next three years; and
• The Annual Report on Remuneration, which explains in more detail how directors have been paid since Incorporation and how we intend to pay directors in 2022 under the new Policy.
REMUNERATION COMMITTEE COMPOSITIONThe Remuneration Committee was established shortly prior to Admission. I am joined on the Committee by fellow Independent Non-Executive Directors, Caroline Brown, Mirjana Blume and Susan Hooper. I am pleased to confirm that the Committee has been constructed to comply with the recommendations of the UK Corporate Governance Code in relation to independence, composition and experience. The Committee’s terms of reference can be found on the Company’s corporate website.
REVIEW OF REMUNERATION2021 was an extraordinary year for Eurowag and it marked an exciting step in its journey as we listed the business on the London Stock Exchange. In preparation for the IPO, amongst the numerous and significant concurrent workstreams, the business undertook a thorough review of its pay arrangements and made certain changes to ensure that, going forward, pay is aligned with market expectations expected of a FTSE 250 business, that good governance features apply and that there is an appropriate balance between fixed and variable pay. This included the introduction of a market
INTRODUCTIONI am pleased to present Eurowag’s first Directors’ Remuneration Report since our Admission to the London Stock Exchange on 13 October 2021.
EUROWAG Annual Report and Accounts for the year ended 31 December 2021
120
GOVERNANCE
Remuneration Report

standard annual bonus scheme (with deferral) and awards of shares under a Performance Share Plan (“PSP”), with both schemes designed to incentivise sustainable growth over the medium to long term.
I joined Eurowag as a Director towards the end of the review process and take comfort that the pay arrangements for the senior team have been well thought through, they are fit for purpose and that there is an appropriate cascade through the business.
DIRECTORS’ REMUNERATION POLICYAt the Company’s first AGM in May 2022, the Directors’ Remuneration Policy will be submitted to a binding Shareholder vote. The Policy is set out on pages 125 to 134 and the key features of the Policy are summarised below.
• Base salaries will be reviewed annually and take into account the individual’s experience, performance, level of responsibility, the scope and nature of the role. Unlike most FTSE CEO’s, Martin Vohánka’s position is fairly atypical given he founded the business and continues to retain a significant shareholding in the Company. The Committee considered carefully how to position his base salary and in agreement with Martin, his salary has been set at €300,000, which is below market levels compared to CEO’s of similar sized businesses on the UK market. The Company’s CFO, Magdalena Bartoś’ base salary has been set at €390,000 and will next be reviewed in January 2023.
• Pension – the Executive Directors do not receive any company contributions towards pension arrangements and, if introduced, these will be no more generous than the workforce contribution rate.
• Annual bonus – Executive Directors have the opportunity to earn 150% of their base salary if stretching targets are achieved. In 2022, the CFO’s bonus opportunity has been set at 125% of salary and one-third of any bonus earned will be deferred in shares for a period of three years. The CEO will not participate in the 2022 annual bonus.
• Long-term incentives – Executive Directors and certain senior executives will participate in the Performance Share Plan, under which the first award of performance shares was granted at Admission. A two-year post vesting holding period applies to awards granted to Executive Directors. The maximum grant level under the PSP is 150% of salary and awards will be granted annually with the CFO’s 2022 award to be granted later than usual, after the interim results, reflecting the receipt of her first award in October 2021. The CEO did not receive an award at Admission and will not participate in the 2022 PSP cycle.
• Governance features – in addition to bonus deferral and pension alignment, robust malus and clawback provisions apply to the incentive schemes, performance share awards granted to Executive Directors will have a two-year holding period and Executive Directors are subject to shareholding guidelines (during and post-employment).
IPO ALL EMPLOYEE BONUS AND LEGACY ARRANGEMENTSTo celebrate Admission, the Company awarded approximately 900 of its employees (excluding Senior Management and a number of other senior employees) with cash bonuses of €500 per employee, subject to having been with the Group for a short period of qualifying service.
As disclosed in the prospectus, in recognition of legacy entitlements due to the CFO, she received an additional “one-off” performance share award (granted at the same time as her normal performance share award noted previously). These awards vest in April 2023 subject to the achievement of adjusted EBITDA per share targets for the financial year ending 31 December 2022.
FY21 PERFORMANCE AND PAY OUTCOMESShareholders will be aware that we are operating in an economic environment that is still dealing with the headwinds of the pandemic and
supply-chain disruptions. Against this backdrop, we are pleased to have achieved a strong set of results, in line with guidance we presented during our IPO on the London Stock Exchange in October 2021. It explicitly proves the resilience of our business model, and the mission-critical nature of our customer value proposition.
We delivered strong net revenue growth of 19.1% (EUR 153.1 million) and Adjusted EBITDA of EUR 69.7 million for the year. Key performance indicators also continue to provide a solid base for further growth. Furthermore, we have also continued to invest in our future, completed several business acquisitions and delivered on our technology transformation plans.
The single figure of total remuneration payable for the period ended 31 December 2021, shown in this report, is based on the period from Incorporation on 3 August 2021 to 31 December 2021. The base salary, pension and benefits are the amounts paid over this period. The CEO did not participate in the annual bonus and the bonus value assigned to the CFO is the pro rata amount of the full year bonus, which was based on annual targets.
The CFO’s bonus measures were based 80% on adjusted EBITDA and 20% on non-diesel revenues and were based on very stretching targets.
The business achieved 19.0% growth in adjusted EBITDA over the prior year and this element of the bonus paid out at 40.6% of maximum. Non-diesel revenues grew by 20.3% and this resulted in a payout of 34.2% of maximum. The CFO’s overall bonus outcome was 39.3% of maximum. The Remuneration Committee believes this outcome is appropriate reflecting the strong financial delivery of the business in the context of demanding targets. The Committee has not applied any discretion to adjust the formulaic bonus outcomes. Full disclosure of the targets and achievement is provided in the Annual Report on Remuneration.
The first PSP award was granted at Admission and this is based on earnings performance for the year ending 31 December 2023. The CFO’s one-off legacy award is based
Annual Report and Accounts EUROWAG
121
GOVERNANCE

on performance for the year ending 31 December 2022 and details of both awards can be found in the Annual Report on Remuneration.
As disclosed in the Prospectus, the CFO and other senior management also received shares in recognition of services provided in connection with the Global Offering. These shares were awarded on Admission. Recipients were able to sell sufficient shares to settle any tax liability and related subscription cost and the net of tax number of shares have a holding period of one year. This was a one-off award that was agreed prior to Admission and does not form part of our ongoing post-IPO Policy.
OUR PEOPLEAlongside the review of senior executive pay arrangements, the Company has also reviewed the remuneration of employees at the end of 2021, which resulted in the average pay increase of 4.6% and 500 employees receiving the pay rise on 1 January 2022. When identifying the eligibility for the pay rise, the Company is using external benchmarks, as well as key talent review outcomes. The Company has also put into place the policy for the ‘Employee Share Plan’, which enables the Company to award key talent and experts with a long-term incentive plan in order to retain them in the organisation. The first awards under this scheme are expected to be granted by April 2022 after the performance and talent reviews are completed.
The Employee Engagement Survey conducted at the end of 2020 indicated a good level of engagement and the pulse survey undertaken in Q3 2021 indicated that 77% of employees feel engaged. During 2022, the Company has set up an ambitious target to be amongst the top 25% of technology companies in Europe for employee engagement, which would require the overall level of engagement to be over 80% and eNPS close to 30 points. The next engagement survey will be conducted in April 2022, and Group eNPS features in the bonus scheme for senior managers in 2022.
OPERATION OF THE POLICY IN 2022Subject to approval of the Directors’ Remuneration Policy at the 2022 Annual General Meeting, the Committee intends to operate the policy as follows for the current financial year.
• Fixed pay – there will be no change to fixed pay arrangements. As set out in the Prospectus, the CEO’s base salary is €300,000 p.a. and the CFO’s salary is €390,000 p.a. and neither Director will receive an increase in 2022 or a Company contribution towards pension.
• Annual bonus – the CFO’s bonus will remain at 125% of salary, below the proposed 150% of salary policy limit. This will be based on adjusted EBITDA targets (70%), on-road technology enabled solutions revenue (20%) and customer and employee net promoter scores (10%). This provides an appropriate balance between profit delivery, focusing the business on ‘green’ revenues and two of our key stakeholders, the customer and our colleagues.
• Long-term incentives – it is anticipated that the CFO will receive an award of performance shares with a face value of 150% of base salary. As she was granted an award at the time of Admission, the 2022 award will be granted later in the financial year, likely to be after the announcement of interim results. The awards will vest after three years subject to continued employment and the satisfaction of adjusted earnings per share targets (60%) and relative total shareholder return (40%), measured against the FTSE 250 excluding investment trusts. Both conditions will be measured over three financial years commencing 1 January 2022. Eurowag’s base share price for relative TSR measurement purposes will be the IPO offer price of 150 pence.
The Committee is aware of calls to incorporate ESG metrics into incentive schemes and intends to undertake further work over the course of the year on how best to do this.
CONCLUDING REMARKSConsiderable work was undertaken prior to and directly after the IPO to ensure the senior executive remuneration arrangements are aligned with good practice in the UK, while also taking into account the various jurisdictions within which we operate and our employees are based.
The Policy proposed for Shareholder approval is considered to underpin the Group’s strategy, reflect the market environment, and provide a strong support for ensuring the focus of the leaders is on the continued long-term, sustainable success of the business.
We look forward to engaging with Shareholders and other stakeholders on an ongoing basis and I would welcome any feedback or comments on the Directors’ Remuneration Report more generally.
Sharon Baylay-Bell Chair of the Remuneration Committee
24 March 2022
EUROWAG Annual Report and Accounts for the year ended 31 December 2021
122
GOVERNANCE
Remuneration Report CONTINUED

DIRECTORS’ REMUNERATION POLICYThis section sets out the Company’s first Directors’ Remuneration Policy, which has been prepared in accordance with the Large and Medium-sized Companies and Groups (Accounts and Reports) Regulations. This Policy will be subject to a binding Shareholder vote at the 2022 Annual General Meeting (“AGM”). The Policy applied immediately following Admission to the London Stock Exchange and, subject to Shareholder approval, it is intended to apply for three years from the date of its approval.
In anticipation of Admission, the Company undertook a review of the Group’s remuneration policy for senior employees, including the Executive Directors, to ensure that it is appropriate for the listed company environment, taking into account good practice in the UK and recognising the various jurisdictions in which the Company’s senior executives and employees work and reside. In undertaking this review, the Remuneration Committee sought independent, specialist advice. The members of the Committee bring their experience to bear and had the opportunity to discuss proposals without management present to ensure that decisions are reached objectively and without inappropriate influence. No person participates in decision relating to their personal remuneration.
The main features of the Directors’ Remuneration Policy were set out in the Prospectus and the full Policy is set out below. OBJECTIVES OF THE POLICYThe Directors’ Remuneration Policy has been designed with the following objectives in mind:
• to attract, retain and motivate the Executive Directors and senior employees, incorporating incentives that align with and support the Group's business strategy as it evolves, and which align Executives to the creation of long-term shareholder value;
• to continue to support the Group’s growth ambitions, with a significant proportion of potential total remuneration to be performance-related and delivered in awards over the Company’s shares;
• to ensure that pay is competitive in the various markets in which the Group operates;
• to ensure an appropriate and fair transition from current remuneration arrangements (salaries and existing incentive arrangements) to post-IPO remuneration packages, while taking into account the cost impact of any changes to pay;
• to encourage wider employee share ownership across the business; and
• to take into account good practice requirements in the UK, incorporating the necessary structural features to ensure a strong alignment to performance and delivery of strategic goals.
Annual Report and Accounts EUROWAG
123
GOVERNANCE

The Remuneration Committee has considered the six factors listed in Provision 40 of the UK Corporate Governance Code.
Clarity Simplicity Risk
The Policy is designed to be simple and support long-term, sustainable performance.
The Policy is in line with standard UK-listed company practice and is well understood by participants.
The Policy clearly sets out the limits in terms of quantum, an overview of the performance measures that can be used and discretions that could be applied if appropriate.
The Group’s arrangements are simple and include a market standard annual bonus and a single long-term incentive plan.
There are no complex or artificial structures required to deliver the Policy.
Appropriate individual limits and caps are set with appropriate weighting on long-term performance to discourage any inappropriate risk taking.
The Committee retains discretions to override formulaic outturns.
When considering performance measures and target ranges, the Committee will take account of the associated risks and liaise with the Audit and Risk Committee as necessary.
The long-term nature of a large proportion of pay (through annual bonus deferral, post-vesting holding periods and post-cessation shareholding requirements) encourages a long-term, sustainable mindset.
Clawback and malus provisions are in place across all incentive plans.
Predictability Proportionality Alignment to culture
The Policy contains appropriate caps for each component of pay.
The potential reward outcomes are easily quantifiable and are set out in the illustrations provided in the Policy.
Performance can be reviewed at regular intervals to ensure there are no surprises in outcomes at the end of the performance period.
Incentive outcomes are contingent on successfully meeting stretching performance targets, which are aligned to the delivery of the Company’s strategy.
The Committee retains discretions to override formulaic outturns.
The Policy encourages performance delivery, which is aligned to the culture within the business. However, this performance focus is always considered within an acceptable risk profile.
The measures used in the variable incentive plans reflect business priorities and are aligned across the Group.
EUROWAG Annual Report and Accounts for the year ended 31 December 2021
124
GOVERNANCE
Remuneration Report CONTINUED

Remuneration policy for Executive DirectorsThe following table summarises each element of the remuneration policy for the Executive Directors, explaining how each element operates and links to the corporate strategy.
BASE SALARY
PURPOSE OPERATION MAXIMUM POTENTIAL VALUE
PERFORMANCE METRICS
• To provide a base level of pay that helps us recruit, retain and engage high-calibre Executive Directors.
• Recognises the knowledge, skills and experience of the individual and reflects the scope and size of the role.
• Salaries are normally reviewed, but not necessarily increased, annually with any changes usually effective from 1 January. An out of cycle review may be conducted if the Committee determines it is appropriate.
• When setting base salaries, the Committee takes into account a number of factors, including (but not limited to), the skills and experience of the individual, the size and scope of the role, salary increases across the Group, business performance as well as salary levels for comparable roles in other similarly sized UK and comparable companies.
• There is no maximum salary level.
• However, salary increases are normally considered in relation to the wider salary increases across the Group.
• Above workforce increases may be necessary in certain circumstances such as when there has been a change in role or responsibility or where an Executive Director has been appointed to the Board on an initial salary which is lower than the desired market positioning.
• Individual performance, as well as the performance of the Group is taken into consideration as part of the annual review process.
PENSION
PURPOSE OPERATION MAXIMUM POTENTIAL VALUE
PERFORMANCE METRICS
• To provide cost-effective retirement benefits.
• The Executive Directors may receive a pension contribution to a company pension scheme or in the form of a cash allowance in lieu of pension.
• Pension allowances are normally paid monthly and are not bonusable.
• Pension provision is no more generous than any applicable local arrangements implemented for other employees.
• Where provided, pension contributions for Executive Directors are capped at that of the wider local workforce (which, for UK employees, is 7% of salary).
• Not applicable.
Annual Report and Accounts EUROWAG
125
GOVERNANCE

BENEFITS
PURPOSE OPERATION MAXIMUM POTENTIAL VALUE
PERFORMANCE METRICS
• To provide competitive, cost-effective benefits, which helps to recruit and retain Executive Directors.
• Benefits may include insurances such as life and accident insurance, private medical and dental cover, mobile telephone, use of a company car or a car allowance, fuel card, travel allowances and other market standard benefits provided across the Group from time to time.
• Other benefits, such as residency allowances, air travel where located away from home, tax return preparation costs, relocation expenses, tax equalisation, expatriate arrangements or support in meeting specific related costs incurred may be provided as necessary.
• Reasonable business-related expenses (including any tax thereon if determined to be a taxable benefit) will be reimbursed.
• There is no specific maximum, although it is not expected to exceed a normal market level.
• The value of benefits will vary based on the cost to the Company of providing the benefits.
• Not applicable.
EUROWAG Annual Report and Accounts for the year ended 31 December 2021
126
GOVERNANCE
Remuneration Report CONTINUED

ANNUAL BONUS
PURPOSE OPERATION MAXIMUM POTENTIAL VALUE
PERFORMANCE METRICS
• To incentivise and reward for the delivery of annual corporate targets aligned to the business strategy.
• To align with Shareholders’ and wider stakeholders’ interests.
• The Annual Bonus is subject to performance measures and objectives set by the Committee for the financial year.
• At the end of the performance period, the Committee assesses the extent to which the performance targets have been achieved and approves the final outcome.
• In respect of any bonus earned for performance in 2022 and thereafter, one-third of any bonus earned will be deferred in shares, normally for three years under the Deferred Bonus Share Plan (“DBSP”) in respect of which, dividend equivalents may apply to the extent such deferred awards vest.
• Malus and clawback provisions apply as set out on page 131.
• Bonus awards are payable at the Committee’s discretion.
• The annual bonus policy maximum is 150% of base salary.
• The target annual bonus opportunity is normally set at 50% of the maximum.
• The amount payable for achieving threshold performance is up to 25% of the maximum. If the threshold level is not achieved, no payment will arise for the portion of bonus against that metric.
• The Committee will determine the relevant measures and targets each year taking into account the key strategic objectives at that time.
• Performance measures may include financial, strategic, operational, ESG and/or personal objectives.
• The majority of the performance measures will be based on financial performance.
• The Committee sets targets that are challenging, yet realistic in the context of the business environment at the time and by reference to internal business plans and external consensus. Targets are set to ensure there is appropriate level of stretch associated with achieving the top end of the range but without encouraging inappropriate risk taking.
• The Remuneration Committee has the discretion to adjust formulaic outcomes if the Committee believes that such outcome is not a fair reflection of business and/or individual performance, including consideration of Shareholder and broader stakeholder views.
Annual Report and Accounts EUROWAG
127
GOVERNANCE

LONG-TERM INCENTIVES
PURPOSE OPERATION MAXIMUM POTENTIAL VALUE
PERFORMANCE METRICS
• To incentivise and reward for the delivery of long-term performance and sustainable shareholder value creation.
• To align with Shareholders’ interests and to foster a long-term ownership mindset.
• An annual award of performance shares under the Performance Share Plan (“PSP”), which normally vest after a period of not less than three years, and subject to continued employment and the achievement of performance conditions.
• Vested awards are subject to a further holding period applying at least until the fifth anniversary of grant, during which they may not ordinarily be sold (other than to pay relevant tax liabilities due).
• Dividend equivalents may accrue over the period from grant until the later of vesting and the expiry of any holding period.
• Malus and clawback provisions apply as set out on page 131.
• The maximum annual award is 150% of salary.
• The proportion of the award, which may vest for threshold performance, will be no more than 25% of the maximum award. If the threshold level is not achieved, no vesting will arise against that metric.
• Performance conditions, weightings and target ranges will be determined prior to grant each year to align with the Company’s longer-term strategic priorities at that time.
• The measures, which may be considered include financial and Shareholder value metrics, as well as strategic, non-financial measures. In normal circumstances, financial or Shareholder value measures will make up the majority of the long-term incentive.
• The Remuneration Committee has discretion under the PSP, in line with the UK Corporate Governance Code, to adjust the level of vesting that would otherwise result (for example, that would otherwise result by reference to formulaic outcomes alone). This discretion would only be used in exceptional circumstances and may take into account corporate and personal performance.
EUROWAG Annual Report and Accounts for the year ended 31 December 2021
128
GOVERNANCE
Remuneration Report CONTINUED

ALL EMPLOYEE SHARE PLANS
PURPOSE OPERATION MAXIMUM POTENTIAL VALUE
PERFORMANCE METRICS
• To encourage wider share ownership across all employees, including the Executive Directors.
• To align with Shareholders’ interests and to foster a long-term mindset.
• Executive Directors may participate in all employee schemes on the same basis as other eligible employees.
• While no scheme is currently in place, the Policy permits participation in a Share Incentive Plan, a Save As You Earn (“SAYE”) scheme or any other all-employee share scheme if introduced during the life of this Policy.
• Limits are in line with those set by HMRC.
• Not applicable.
SHAREHOLDING REQUIREMENTS
PURPOSE OPERATION MAXIMUM POTENTIAL VALUE
PERFORMANCE METRICS
• To align with Shareholders’ interests and to foster a long-term mindset.
• Executive Directors will normally be expected to retain shares, net of sales to settle tax, until they have met the required shareholding.
• Progress towards the guideline will be reviewed by the Committee on an annual basis.
• The shareholding requirement will continue to apply for a period of two years after termination of employment, with the obligation being to retain the lower of the shareholding requirement or those shares held towards the shareholding requirement at the date of termination. The shareholding requirement will halve upon the commencement of the second year following termination.
• The shareholding requirement for Executive Directors is 200% of base salary.
• The equivalent net value of unvested Ordinary Shares subject to any awards held by an Executive Director to which only time-based vesting or a holding period applies will count towards the shareholding requirement.
• Not applicable.
Annual Report and Accounts EUROWAG
129
GOVERNANCE

FEES POLICY FOR CHAIR AND NON-EXECUTIVE DIRECTORS The following table summarises the fees policy for the Chair and the Non-Executive Directors (“NEDs”).
FEES
PURPOSE OPERATION MAXIMUM POTENTIAL VALUE
PERFORMANCE METRICS
• To provide a competitive fee to attract NEDs who have the requisite skills and experience to oversee the implementation of the Company’s strategy.
• Fees for the Chairman are set by the Committee.
• Fees for the other NEDs are set by the Board, excluding the NEDs.
• Fees are reviewed, but not necessarily increased, annually. Fee increases are normally effective from 1 January.
• Fee levels are determined based on an estimate of the expected time commitments of each role and by reference to comparable fee levels in other companies of a similar size and complexity.
• Additional fees are payable to the Senior Independent Director and Chairman of the Audit and Risk and Remuneration Committees (or any other Committee operated by the Board), to reflect their additional responsibilities and a fee is payable for acting as a member of one or more of such Committees. Additional fees may be payable for ESG-related responsibilities and being the NED designated for engagement with the workforce for the purposes of the UK Corporate Governance Code.
• Higher fees may be paid to a NED should they be required to assume executive duties on a temporary basis.
• The NEDs and the Chairman are not eligible to receive benefits and do not participate in pension or incentive plans. Business expenses incurred in respect of their duties including international travel and accommodation for meetings (including any tax thereon) are reimbursed.
• There is no maximum fee level.
• Not applicable.
EUROWAG Annual Report and Accounts for the year ended 31 December 2021
130
GOVERNANCE
Remuneration Report CONTINUED

NOTES TO THE POLICY TABLEDIFFERENCES BETWEEN DIRECTORS’ REMUNERATION AND EMPLOYEES’ PAYThe key difference between senior executives’ pay and that of the workforce is participation in variable pay schemes. Senior executive remuneration arrangements are more aligned to Company performance due to the level of their business influence, with high focus on business performance and Shareholder alignment. For our employees, a significant factor in determining remuneration is the individual’s performance with appropriate retention initiatives focusing on high and key performers.
Over half of our employees participate in an annual bonus arrangement. Participation in the new share-based schemes (PSP and ESP) is limited to the most senior people and those with greater influence on Group performance outcomes and the share price. The value of each element of the package that an employee may receive will vary according to the employee’s seniority and level of responsibility.SELECTION OF PERFORMANCE MEASURES AND TARGETSThe Remuneration Committee determines the performance measures applying to the Annual Bonus and PSP based on the strategic priorities of the Group at the time. The measures and their weightings may change from year to year to reflect the needs of the business.
Measures used may include financial (such as net revenue, Adjusted EBITDA and Adjusted EPS), operational, strategic, ESG or sustainability goals, total shareholder return, and personal or individual objectives. The use of such measures is intended to ensure performance is assessed on a rounded basis and is appropriately aligned to the Group’s KPIs.
The targets for both the Annual Bonus and PSP are set after considering internal business plans, economic forecasts and, to the extent it exists, external analyst consensus. The target range is calibrated so that it is realistic yet requires stretching outperformance to achieve the top end.
RECOUPMENT (MALUS AND CLAWBACK)The incentive pay awards made by the Company are subject to provisions that allow it to recover any value delivered (or which would otherwise be delivered) in connection with any variable award including Annual Bonus, DBSP and PSP awards in exceptional circumstances, and where it believes that the value of those variable pay awards is no longer appropriate.
The malus and clawback provisions can be used in the following circumstances:
• A material misstatement;• An error of calculation (including
on account of inaccurate or misleading information);
• An action or conduct that amounts to serious misconduct;
• An instance of corporate failure (e.g. administration or liquidation); and
• A significantly adverse impact on the Group’s reputation.
Clawback may be affected in the period of three years following the determination of a bonus or the vesting of a DBSP or PSP award.
DISCRETIONS RETAINED BY THE COMMITTEE IN OPERATING THE INCENTIVE PLANS The Committee operates the Group’s incentive plans according to their respective rules and in accordance with HMRC and Listing rules where relevant. To ensure the efficient operation and administration of these plans, the Committee may apply certain discretions.
These include (but are not limited to) the following:
• Determining the participants in the plans.
• Determining the timing of grants and/or payments.
• Determining the size of grants and/or payments (within the limits set out in the policy table).
• Determining the appropriate choice of measures, weightings and targets for the incentive plans from year to year including any use of discretion to amend the
outcome, as appropriate.• Determining ‘good leaver’
status and the extent of vesting and or payment under the incentive plans.
• Determining the extent of vesting of awards under share-based plans in the event of a change of control.
• Making any appropriate adjustments required in certain circumstances (e.g. rights issues, corporate restructuring events, variation of capital and special dividends).
While performance conditions will generally remain unchanged once set, the Remuneration Committee may vary the performance conditions applying to any award after it is granted if an event occurs, which causes the Remuneration Committee to consider that it would be appropriate to amend the performance conditions, provided the Remuneration Committee acts fairly and reasonably in making the alteration and, in the case of awards to the Company’s Executive Directors, the amended performance conditions are not materially more or less challenging than the original conditions would have been but for the event in question.
LEGACY ARRANGEMENTSAs set out in the Prospectus, the Company has various legacy share and cash arrangements, some of which remain subject to time vesting and/ or performance conditions post-IPO. For the current CFO this included a one-off award under the PSP in recognition of legacy entitlements foregone. The CFO also received an award of bonus shares in recognition of her contribution to the Global Offering. These are summarised further in the Annual Report on Remuneration.
This Policy gives authority to the Company to honour any commitments entered into with current directors prior to the Company’s Admission or to internally promoted future directors prior to their appointment. Details of any payments under the legacy arrangements will be set out in future Directors’ Remuneration Reports as they arise.
Annual Report and Accounts EUROWAG
131
GOVERNANCE

STATEMENT OF CONSIDERATION OF SHAREHOLDER VIEWSIn considering the operation of the Policy, the Committee takes into account the published remuneration guidelines and specific views of Shareholders and proxy voting agencies. The Committee will consider Shareholder feedback received in relation to the AGM each year and the reports from Shareholder representative bodies more generally. The Committee will consult with the Company’s larger Shareholders, where considered appropriate, regarding changes to the operation of the Policy and when the Policy is being reviewed and brought to Shareholders for approval. Furthermore, the Committee will consider specific concerns or matters raised at any time by Shareholders on remuneration.
STATEMENT OF CONSIDERATION OF EMPLOYMENT CONDITIONS ELSEWHERE IN THE GROUPThe Committee will be provided with an update, at least annually, of pay and employment conditions throughout the Group. This will include details of base salary increases, bonus award levels, share scheme participation across the Group workforce as well as more information on the salaries and proposed increases for the Executive Committee and Senior Leadership Team. The Committee will review and agree all grants of share awards.
Although the Committee has not, to date, formally consulted with employees on matters of remuneration policy, the Committee will ensure there is appropriate liaison with the designated NED for workforce engagement on remuneration matters. Employee engagement scores and other internal surveys will be considered as appropriate.
RECRUITMENT OF EXECUTIVE DIRECTORS – APPROACH TO REMUNERATIONThe ongoing remuneration package for any new Executive Director will
be set in accordance with the terms of the Policy in place at the time of appointment. The principles, which will be applied, are set out below:
• Base salary – will be set at an appropriate level taking into account the skills and experience of the individual, the criticality and nature of the role and the geography in which the role competes or is recruited from. If the base salary is set below market on appointment to reflect experience, there will be an expectation that subsequent increases may be above those of the wider workforce to bring this into line with the desired level as the individual develops in the role. In some cases, it may be necessary to set a new recruit’s salary above his or her predecessor’s salary. The Committee is mindful that the Company should avoid paying more than is necessary to recruit the desired candidate.
• Benefits – will be in line with those offered to other employees in the same location and take account of any local market norms. In addition, the Committee recognises that it may need to meet certain relocation expenses, expatriate benefits, temporary accommodation and travel expenses, as appropriate.
• Pension – will be in line with that offered to local or wider workforce norms.
• Annual Bonus – will be operated in line with the terms set out in the Policy table and will be pro-rated in the year of joining to reflect the period of service rendered during the financial year. Depending on the timing of the appointment, it may be necessary for the Committee to use alternative performance measures for the remainder of the initial performance period.
• PSP – will be operated in line with the terms set out in the Policy table. An award may be made shortly after appointment (assuming not in a closed period).
• Buy-out awards – the Committee may consider offering additional
cash and/or share-based elements to replace remuneration forfeited by an individual on leaving their previous employment when it considers these to be necessary to facilitate the appointment and in the best interests of the Company and its Shareholders. Any buy-out arrangements will be made under the existing incentive plans or the relevant provision of the UKLA Listing Rules and would, as far as possible, be delivered on a like-for-like basis taking account of the nature, time horizons and any performance requirements attached to the awards forfeited.
For an internal appointment, any variable pay element or benefit awarded in respect of the prior role may be allowed to continue on its original terms. For the avoidance of doubt, this includes any remuneration arrangements in place prior to the Company’s Admission.
On appointment of a new Chairman of the Board or NED, the fees will be set taking into account the experience and calibre of the individual and the prevailing rates of other Non-Executives in similar sized companies at the time.
EXECUTIVE DIRECTORS’ SERVICE CONTRACTSThe CEO’s and CFO’s service contracts are terminable by either party on six months’ notice and any contracts for newly appointed Executive Directors will provide for equal notice in the future and a maximum of 12 months. The date of each service contract is noted in the table below:
Date of service contract
CEO – Martin Vohánka
7 September 2021
CFO – Magdalena Bartoś
7 September 2021
* CEO and CFO were appointed as Directors of W.A.G payment solutions plc on 3 August 2021
Executive Directors’ service agreements are kept available for inspection at the Company’s Single Alternative Inspection Location.
EUROWAG Annual Report and Accounts for the year ended 31 December 2021
132
GOVERNANCE
Remuneration Report CONTINUED

EXECUTIVE DIRECTORS’ EXTERNAL APPOINTMENTSExecutive Directors may accept external appointments as Non-Executive Directors of other companies with the specific approval of the Board in each case. Any fees payable will be retained by the Executive Directors.
NON-EXECUTIVE DIRECTORS’ TERMS OF APPOINTMENTThe NEDs do not have service contracts with the Company but instead have letters of appointment.
The appointments of each of the Independent Non-Executive Directors are for an initial term of three years from the date of appointment, unless terminated earlier until the conclusion of the Company’s Annual General Meeting occurring approximately three years from that date. The appointment of each Independent Non-Executive Director is also subject to annual re-election at the General Meeting of the Company.
The date of appointment for each NED is shown in the table below.
Date of appointment
Paul Manduca 7 September 2021
Joseph Morgan Seigler
7 September 2021
Mirjana Blume 7 September 2021
Caroline Brown 7 September 2021
Sharon Baylay-Bell
7 September 2021
Susan Hooper 7 September 2021
The Chair’s appointment is terminable on six months’ notice or, at the Company’s sole and absolute discretion, the appointment can be
terminated with immediate effect in return for a payment in lieu of notice. The Company has the ability to terminate the Chair’s appointment with immediate effect without paying compensation. The Non-Executive Directors’ appointment is terminable on one month’s notice or, at the Company’s sole and absolute discretion, the appointment can be terminated with immediate effect in return for a payment in lieu of notice. The Company has the ability to terminate a Non-Executive Director’s appointment with immediate effect without paying compensation.
POLICY ON PAYMENT FOR DEPARTURE FROM OFFICEOn termination of an Executive Director’s service contract, the Committee will take into account the departing Director’s duty to mitigate their loss when determining the amount of compensation. The Committee’s policy is described below and will be implemented, taking into account the contractual entitlements, the specific circumstances for the departure and the interests of Shareholders:
• Base salary, benefits and pension – If notice is served by either party, the Executive Director can continue to receive base salary, benefits and pension for the duration of their notice period. The Executive Director may be asked to perform their normal duties during their notice period, or they may be put on garden leave. The Company may, at its sole discretion, terminate the contract immediately, at any time after notice is served, by making a payment in lieu of notice equivalent to base salary only, with any such payments being paid in monthly instalments over the remaining notice period. The Executive Director will normally have a duty to seek alternative employment and any outstanding payments will be subject to offset against earnings from any new role.
• Annual bonus – if an Executive Director ceases to be employed or is under notice of termination for any reason prior to the date that a bonus is due to be paid, no bonus shall be payable. In certain good leaver circumstances (death, injury or disability, redundancy, retirement, their office or employment being in a company which ceases to be a Group member or for any other reason if the Committee so decides), the Committee may determine that a bonus shall continue to be paid at the normal time and the bonus will typically be subject to a time pro rata reduction. Any DBSP awards will lapse upon cessation, except in good leaver situations as set out above. In such cases, awards will normally vest on their normal vesting dates but the Committee may decide to vest awards upon cessation of employment. The Committee may apply a pro-rata reduction if it decides it is appropriate to do so.
• PSP awards – unvested performance share awards will lapse upon cessation. In certain good leaver situations, performance shares will normally be retained by the individual for the remainder of the vesting period and remain subject to the relevant performance conditions and ordinarily subject to a pro rata reduction for time. The Committee will retain discretion to assess performance and allow awards to vest at an earlier date if considered appropriate.
Any outstanding SIP and/or SAYE awards will be treated in line with HMRC regulations.
Disbursements, such as legal costs and outplacement fees, may be payable as appropriate.
The Committee retains the authority to settle any legal claims against the Company, if considered to be in the best interests of Shareholders.
Annual Report and Accounts EUROWAG
133
GOVERNANCE

ILLUSTRATION OF THE POLICYThe chart below sets out the potential values of the remuneration package of the Executive Directors for FY22 under various performance scenarios.
€2,000
€1,750
€1,500
€1,250
€1,000
€750
€500
€250
€0
€314
100% 100% 100% 100%100% 51%
30%
18%
28% 23%
33% 27%
39% 33%
17%
(00
0s)
Minimum On-target Maximum Max withgrowth
Minimum On-target Maximum Max withgrowth
€314 €314 €314€414
€804
€1,486
€1,779
CEO CFO
n Share price growth n Long-term incentive n Annual bonus n Fixed
The chart is based on the following assumptionsMINIMUMComprises the value of salary, benefits and pension and assumes no payout under incentive schemes. The CEO does not participate in the annual bonus or PSP.
Salary represents annual salary as at 1 January 2022. The benefits values have been estimated based on 2021 benefit costs annualised.
Executive Directors currently do not participate in a pension scheme. ON-TARGETTarget performance comprises an annual bonus payout of 50% of maximum and PSP vesting at 25% of maximum with no share price appreciation. MAXIMUMMaximum performance comprises annual bonus awarded at maximum level (125% of salary for the CFO) and full PSP vesting (150% of salary for the CFO).MAX WITH GROWTHAs per the Maximum scenario, but with an assumed increase of 50% in the value of the PSP award to take account of potential share price appreciation.
EUROWAG Annual Report and Accounts for the year ended 31 December 2021
134
GOVERNANCE
Remuneration Report CONTINUED

Annual Report on RemunerationThis section of the Directors’ Remuneration Report describes the operation of the Remuneration Policy.
REMUNERATION COMMITTEE ROLES AND RESPONSIBILITIESThe Remuneration Committee assists the Board in determining its responsibilities in relation to remuneration and workforce engagement, including making recommendations to the Board on the Company’s policy on executive remuneration, setting the over-arching principles, parameters and governance framework of the Company’s Remuneration Policy and determining the individual remuneration and benefits package of each of the Company’s Executive Directors and senior management.
Remuneration Committee members and meetings
The Remuneration Committee was established shortly prior to Admission. The Committee currently comprises the four Independent Non-Executive Directors.
• Sharon Baylay-Bell (Chair)• Caroline Brown• Mirjana Blume • Susan Hooper
The Chairman, the Chief Executive Officer, the Chief Financial Officer and the Chief People Officer are invited to attend meetings by invitation to provide valuable input. However, no Director plays any part in determining their remuneration.
The Remuneration Committee is required to meet at least three times a year. The terms of reference of the Remuneration Committee covers such issues as membership and the frequency of meetings, as mentioned above, together with requirements for the quorum for and the right to attend meetings, reporting responsibilities and the authority of the Remuneration Committee to carry out its duties. Further details on the roles and responsibilities of the Committee are disclosed in the terms of reference, which can be found on the Company’s corporate website.KEY ACTIVITIES DURING THE YEARThe Committee held one meeting during the period from Admission to 31 December 2021 and all members of the Remuneration Committee were present. The members of the Remuneration Committee also met on a number of occasions prior to Admission.
The Remuneration Committee had undertaken the following activities in this period:
• Approved the new Remuneration Policy and certain elements of its operation, which became effective from Admission, such as base salary levels;
• Received an update from advisors on market practice and governance developments;
• Received an interim update on the likely outcome of the 2021 annual bonus plan; and
• An initial consideration of performance measures to apply to the 2022 incentive schemes.
EXTERNAL ADVISERThe Company received advice from FIT Remuneration Consultants LLP (“FIT”) prior to Admission following a tender process and FIT were retained by the Remuneration Committee following Admission. FIT assisted the Remuneration Committee in the development of the Directors’ Remuneration Policy and on implementation related matters. FIT is a signatory to the Remuneration Consultants’ Code of Conduct and has confirmed to the Committee that it adheres in all respects to the terms of the Code. The fees for the advice provided for the period to 31 December 2021 were £35,572 (on a time and materials basis). FIT provided share plan technical services to the Company during the year but provides no other services to the Company and the Committee is satisfied that it receives independent and objective advice.
Annual Report and Accounts EUROWAG
135
GOVERNANCE

SINGLE TOTAL FIGURE OF REMUNERATION (AUDITED)The disclosures only cover the period from Incorporation. However, amounts below include the annual bonus as it related to a period including the period from Incorporation to the end of the financial year.
EURMartin
Vohánka 1, 5Magdalena
Bartoś 1, 5Paul
Manduca 7
Sharon Baylay-
Bell 7Caroline Brown 7
Mirjana Blume 7
Joseph Morgan
Seigler 6Susan
Hooper 7
Fixed Pay
Salary/Fees 125,635 147,087 121,508 28,051 29,921 28,424 – 24,311Benefits 2 8,218 13,562 – – – – – –
Variable Pay
Annual Bonus 3 – 79,319 – – – – – –LTIPs – – – – – – – –Other 4, 8 – 547,335 – – – – – –
Total Remuneration 133,853 787,303 121,508 28,051 29,921 28,424 – 24,311Total Fixed 133,853 160,649 121,508 28,051 29,921 28,424 – 24,311Total Variable – 626,654 – – – – – –1 Base salaries were reviewed at the time of Admission. The CEO’s salary was unchanged at €300,000 p.a. The CFO’s salary was set at €390,000 from
the date of her new service agreement, 7 September 20212 Benefits consisted of life insurance, private medical and dental insurance, residency allowance, air travel, reimbursement of tax return preparation
costs, use of company car, fuel card and travel allowances 3 The annual bonus is the bonus earned from the period of Incorporation to 31 December 2021 and was based on the salary in place upon Admission.
The bonus targets and their achievement are shown later in the next section of this report4 As disclosed in the Prospectus and agree prior to Listing, on Admission, the CFO was awarded 226,667 ordinary shares (with a value of €400,000)
in recognition of services provided in connection with the Global Offering. The net of tax number of ordinary shares (133,970) is subject to a holding period of one year
5 The current Executive Directors have not participated in a private pension arrangement during the period under review 6 Joseph Morgan Seigler has been appointed to the Board by TA Associates. He does not receive a fee for his services
7 The Non-Executive Directors’ fees represent the period from their appointment on 7 September 2021 to the end of the financial year. Chairman Paul Manduca provided consultancy services to the Group in the period from incorporation to appointment on 7 September 2021 amounting to €13,045, which were included in the fixed pay for the period
8 On 10 September 2021 the CFO purchased 37,822 shares of W.A.G. payment solutions, a.s. at a 50% discount, which were exchanged for 190,181 shares of the Company on 7 October 2021. The reported amount of €147,335 represents the market value of the discount
2021 ANNUAL BONUS OUTCOME (AUDITED)The CEO does not participate in the annual bonus. For the CFO the maximum opportunity for 2021 was 125% of salary.
The annual bonus was based on the achievement of Group financial targets split between adjusted EBITDA (80% weighting) and non-diesel revenues (20% weighting).
Performance measure WeightingThreshold
(10% Payable)Max
(100% Payable)Actual FY21
achievement
Bonus outcome (% of
total bonus)Adjusted ebitda 80% €67.39m €74.24m €69.72m 40.61%Non-diesel revenue 20% €59.62m €68.49m €62.00m 34.15%
The Committee considered the formulaic outturn in the context of wider Company and individual performance and felt that the result was warranted. Therefore, no discretion was used to alter the outturn.
The resulting bonus represented 39.3% of the maximum opportunity for the CFO (49.15% of post Admission salary). The bonus arrangements were agreed and put in place prior to Admission and at the time it was agreed that payment of this bonus will be made in cash. However, from 2022, in line with the proposed Directors’ Remuneration Policy, one-third of any bonus earned will be deferred into shares for three years.
EUROWAG Annual Report and Accounts for the year ended 31 December 2021
136
GOVERNANCE
Remuneration Report CONTINUED

PERFORMANCE SHARE PLAN AWARDS GRANTED IN FY21 (AUDITED) The CEO does not participate in the PSP. At Admission, PSP awards were granted to the CFO and other senior executives. Details of the CFO’s award are set out in the table below.
Date of grant
No. of shares
granted
Share price on date of
grantFace value
of awardAward as %
salary Vesting dateMagdalena Bartos (CFO) – normal PSP 13 October 2021 333,333 £1.50 £500,0001 150%1 13 October 20241 Based on salary of €390,000 converted at an exchange rate of £1:€1.17
These PSP awards were granted as nominal cost options and will ordinarily vest on the third anniversary of their grant date, subject to continued service and the Remuneration Committee’s assessment of the extent to which the award’s performance conditions are satisfied. A post vesting holding period applies to the awards granted to the CFO during which vested shares (net of any sales to pay for tax liabilities) must ordinarily be retained until the second anniversary of the vesting of her award.
This PSP award is subject to sliding scale adjusted EBITDA performance targets, which were disclosed in the Prospectus and have since been re-expressed as adjusted EBITDA per share for the financial year ending 31 December 2023. The targets set out below require significant growth on 2020 adjusted EBITDA.
Normal award performance shares vesting (% of awards)
Adjusted EBITDA/share equivalent for FY ending 31 December 2023
0% < 13.79 cents25% 13.79 cents100% ≥ 15.39 cents
Vesting will be determined on a straight-line basis for performance between 13.79 cents and 15.39 cents.
ONE-OFF PSP AWARD IN LIEU OF LEGACY ENTITLEMENTS (AUDITED)As explained in the Committee Chair’s statement, in recognition of various legacy entitlements pre-IPO, the CFO was granted at Admission one off, not to be repeated, PSP awards, which do not form part of the ongoing Remuneration Policy. The award was over shares with a face value of €1,200,000.
Date of grantno. of awards
grantedShare price on
date of grantFace value of
award Vesting dateCFO – additional PSP 13 October 2021 683,760 £1.50 £1,025,6401 April 20231 Converted at an exchange rate of £1:€1.17
This PSP award is subject to sliding scale adjusted EBITDA performance targets, which have been re-expressed as adjusted EBITDA per share for the financial year ending 31 December 2022. The targets set out below require significant growth on 2020 EBITDA.
One off performance shares vesting (% of awards)Adjusted EBITDA/share equivalent for FY
ending 31 December 20220% < 11.61 cents25% 11.61 cents100% ≥ 12.34 cents
Vesting will be determined on a straight-line basis for performance between 11.61 cents and 12.34 cents.
Annual Report and Accounts EUROWAG
137
GOVERNANCE

SHARE INTERESTS AND INCENTIVES (AUDITED PARTS HIGHLIGHTED)Audited
Shares owned
outright as at 31 December
2021
Subject to a holding
period
Awards unvested and
subject to performance
conditions
Options unvested and not subject to performance
conditions
Options vested but
not exercised
Shareholding as a
percentage of salary
Shareholding requirement
met (200% salary)
Executive DirectorsMartin Vohánka 1 325,061,688 – – – – 116,931% YESMagdalena Bartoś 2 190,181 133,970 1,017,093 – – 90% NONon-Executive DirectorsPaul Manduca 100,000 – – – – – –Joseph Morgan Seigler – – – – – – –Mirjana Blume 13,913 – – – – – –Caroline Brown – – – – – – –Sharon Baylay-Bell 35,000 – – – – – –Susan Hooper – – – – – – –1 Comprises 135,775,918 shares held by Martin Vohánka and 189,285,770 shares held by Couverina Business, s.r.o, a vehicle wholly owned by Martin
Vohánka
2 Comprises 190,181 pre-IPO shares subscribed by Magdalena Bartoś prior to listing and 133,970 pre-IPO bonus shares awarded on 13 October 2021, which are subject to a 12-month holding period
The shareholding as a percentage of salary is based on shares owned outright and the net of tax number of other awards which are not subject to ongoing performance conditions.
The middle market share price at the close of business on 31 December 2021 was £0.917 and the range of the middle market price during the period since Admission until 31 December 2021 was £1.537 to £0.900.
Since the year end there have been no changes in the shareholdings shown in the table above.
PERFORMANCE GRAPH AGAINST FTSE250The chart below shows the value of £100 invested in the Company on IPO compared with the value of £100 invested in the FTSE 250 Index at the same date and the movement in value until 31 December 2021. We have chosen the FTSE 250 Index as it provides the most appropriate and widely recognised index for benchmarking the Company’s corporate performance since IPO.
TOTAL SHAREHOLDER RETURNSource: Datastream (a Refinitiv product)
140
120
100
80
60
40
20
0
12/10/2021 12/10/2021 12/10/2021 12/10/2021 12/10/2021 12/10/2021 12/10/2021 12/10/2021 12/10/2021 12/10/2021 12/10/2021 12/10/2021
W A G Payments FTSE 250 Index
TS
R –
Val
ue o
f a
100
uni
t in
vest
men
t m
ade
at A
dm
issi
on
EUROWAG Annual Report and Accounts for the year ended 31 December 2021
138
GOVERNANCE
Remuneration Report CONTINUED

CEO single figure history FY21Total remuneration €133,853Annual bonus as % of max N/APSP shares vesting as % of max N/A
The CEO does not participate in the annual bonus nor any share incentive plans. His total remuneration for 2021 is based on fixed pay received between Incorporation and 31 December 2021.
CEO PAY RATIOThe Company does not have 250 UK employees and, therefore, has no statutory requirement to publish a CEO pay ratio. The Committee will continue to review the appropriateness of publishing pay ratios in the future.
RELATIVE IMPORTANCE OF SPEND ON PAYIn view of the fact that the Company only listed in October 2021, there are no distributions or buy-backs in the current year, nor any comparable year-on-year change to disclose. Full disclosure will be presented in the Annual Report on Remuneration for 2022.
PERCENTAGE CHANGE IN DIRECTORS’ REMUNERATION AND EMPLOYEE PAYIn view of the fact that the Company only listed in October 2021, there is no comparable year-on-year change to disclose. Full disclosure will be presented in the Annual Report on Remuneration for 2022.
PAYMENTS FOR LOSS OF OFFICE AND/OR PAYMENTS TO FORMER DIRECTORS (AUDITED)No payments for loss of office, nor payments to former Directors were made during 2021.
STATEMENT OF SHAREHOLDING VOTINGThis is the first Policy and Directors’ Remuneration Report submitted to Shareholders. Disclosure of the voting results at the 2022 AGM will be presented in the Annual Report on Remuneration for 2022.
Annual Report and Accounts EUROWAG
139
GOVERNANCE

IMPLEMENTATION OF POLICY FOR FY22
COMPONENT OF PAY IMPLEMENTATION FOR FY22
Base Salaries CEO: €300,000
CFO: €390,000
The base salaries for Executive Directors were set at IPO and there will be no increase for 2022. Across the Group the average pay increase for 2022 is 4.6%
Benefits and pension The current Executive Directors do not receive any pension contributions or allowance
No changes to benefit provisions.
Annual Bonus The CEO does not participate in the annual bonus. The maximum bonus opportunity for the CFO is 125% of salary (against a policy maximum of 150%), with one-third of any bonus deferred into shares for three years.
Subject to the following performance conditions:
• Group adjusted EBITDA – 70% weighting• On Road Technology Enabled Solutions revenue – 20% weighting• Customer and employee net promoter scores (EPS/ eNPS) – 10% weighting
The target ranges are not disclosed prospectively as they are commercially sensitive, but will be reported next year following the performance year.
LTIP The CEO will not participate in any share incentives. The CFO will be granted an award of 150% of salary, which vests in three years (followed by a two-year holding period). As the CFO was granted an award at Admission, her 2022 award will be granted after the interim results and this will be subject to the following performance conditions measured over three financial years commencing on 1 January 2022:
• Adjusted basic Earnings Per Share – 60% weighting – targets relating to the 2024 financial year. None of this part of the award will vest for adjusted basic EPS of less than 8.62 cents in 2024; 25% will vest for achieving 8.62 cents increasing on a straight-line basis to full vesting for 11.5 cents or higher.
• Relative TSR vs FTSE 250 Index – 40% weighting – median ranking (25% vesting), rising on a straight-line basis to upper quartile ranking (100% vesting). Reflecting the lower share price at the start of the performance period relative to the offer price, for the purposes of this award, Eurowag’s base share price will be the IPO offer price of 150 pence. Therefore, significant recovery of the share price will be required for this part of the award to have value.
NED fees The Chair and NED fees remain unchanged for FY22:
• Chairman fee: £290,000• Non-Executive Director base fee: £60,000• Senior Independent Director fee: £11,000• Audit and Risk Committee Chair fee: £15,000• Remuneration Committee Chair fee: £10,000• Designated ESG Director additional fee: £10,000• Member of Audit, Nomination or Remuneration Committees: £5,000
On behalf of the Board
Sharon Baylay-BellChair of the Remuneration Committee
24 March 2022
EUROWAG Annual Report and Accounts for the year ended 31 December 2021
140
GOVERNANCE
Remuneration Report CONTINUED

Annual Report and Accounts EUROWAG
141
GOVERNANCE

The Directors present the Annual Report, together with the audited consolidated financial statements for the year ended 31 December 2021.
The Directors’ Report, together with the Strategic Report on pages 01 to 93, represent the management report for the purposes of compliance with The Disclosure Guidance and Transparency Rules 4.1.R.
CORPORATE GOVERNANCE STATEMENTThe information that fulfils the requirements of the corporate governance statement for the purposes of the FCA’s Disclosure Guidance and Transparency Rules can be found in the corporate governance information on pages 102 to 108 (all of which forms part of this Directors’ Report) and in this Directors’ Report.
ARTICLES OF ASSOCIATION AND POWERS OF THE DIRECTORSThe Company’s Articles of Association (the “Articles”) contain the rules relating to the powers of the Company’s Directors and their appointment and replacement mechanisms. The Articles may only be amended by special resolution at a General Meeting of the Shareholders. The Articles provide that the business of the Company shall be managed by the Board, which may exercise all the powers of the Company, subject to the Statutes, these articles and any special resolutions of the Company. The Articles of Association can be found at: https://investors.eurowag.com/investors/ipo-information.
DIRECTORSAs at the date of this report, the Board is comprised of two Executive Directors, five Independent Non-Executive Directors and one Non-Independent Non-Executive Director (the Nominee Director; further information is provided on page 144 of this report). There have been no Director changes since Admission. Further details on each of the Directors can be found on pages 96 to 99 of this report.
An assessment of the independence of the Chair and each of the Non-Executive Directors (excluding the Nominee Director) was carried out during the IPO process following the relevant independence parameters provided for within the Code. As at Admission, and as published within the prospectus, with the exception of the Nominee Director, the Company considers all Non-Executive Directors to be independent upon appointment and free from any business or other relationship that could materially interfere with the exercise of their independent judgement. The independence of the Directors will continue to be assessed annually during the Board evaluation process.
The Code further recommends that one of the Independent Non-Executive Directors be appointed as the Senior Independent Director for the purposes of acting as a sounding board for the Chair, an intermediary for the other Non-Executive Directors and should lead the annual evaluation of the Chair. At Admission, it was agreed that Mirjana Blume would act as Senior Independent Director.
GREENHOUSE-GAS EMISSIONSThe information relevant to climate disclosures, including the Company’s TCFD statement, 2030 climate target and emissions data is outlined on pages 64 to 80. This includes information about the Company’s total energy consumption in our operations, scope 1 and scope 2 emissions as well as GHG intensity figures covering 2019–2021. The Company has also disclosed its 2019 baseline scope 3 emissions as well as information on the material categories for scope 3 emissions based on 2019 data. Information on climate risks is included in both the Principal Risk section as well as the TCFD disclosures.
DISCLOSURE OF INFORMATION TO AUDITORS The Directors confirm that, so far as they are each aware, there is no relevant audit information of which the Company’s Auditors are unaware. Each Director has taken all the steps that they ought to have taken as a Director to make themselves aware of any relevant audit information and to establish that the Company’s Auditors are aware of that information.
DIRECTORS’ INDEMNITIES In pursuing their duties, the Directors have the benefit of indemnity provisions contained within the Company’s Articles of Association. The Company has additionally purchased and maintained Directors’ and Officers’ liability insurance to provide further protections for the Directors.
The Directors are able to obtain legal or other relevant advice at the expense of the Company in their capacity as Directors. The Company provided a qualifying third-party indemnity to each Director as permitted by Section 234 of the Companies Act 2006 and by the Articles for the full financial year and which remain in force at the date of this report.
CONFLICTS OF INTERESTS The Directors have declared any conflict or potential conflict of interest to the Board, which has the authority to approve such situations. A register of the matters so approved is maintained and reviewed at each meeting of the Board. The Directors advise the Board as soon as they become aware of any conflict of interest. In the event that a Director has a relevant conflict of interest, they would not be party to discussions or decisions on the matter on which they are conflicted. The Board can confirm that it has not been necessary to exclude any Director from the consideration of Board or Committee matters on such a basis at any time during the period.
EUROWAG Annual Report and Accounts for the year ended 31 December 2021
142
GOVERNANCE
Directors’ Report

POLITICAL AND CHARITY DONATIONSThe Company’s policy is that it does not, directly or through any subsidiary, make what are commonly regarded as donations to any political party. However, the Act defines political donations very broadly and so it is possible that normal business activities, such as sponsorship, subscriptions, payment of expenses, paid leave for employees fulfilling certain public duties and support for bodies representing the business community in policy review or reform, which might not be thought of as
political expenditure in the usual sense, could be captured. Activities of this nature would not be thought of as political donations in the ordinary sense of those words. The resolution to be proposed at the 2022 AGM, authorising political donations and expenditure, is to ensure that the Group does not commit any technical breach of the Act.
At a General Meeting of the Company held on 7 October 2021, Shareholders voted to allow the Company to incur political expenditure up to a maximum aggregate amount of £100,000 in line with market practice.
That authority is due to expire at the Annual General Meeting due to be held on 26 May 2022 and, therefore, the Company will seek to renew the authority in line with the above considerations.
MAJOR SHAREHOLDERSAs at 31 December 2021, and in accordance with Rule 5 of the FCA’s Disclosure and Transparency rules, the following table sets out the major shareholdings notified to the Company by holders of notifiable interests.
As at 31 December 2021 and the date of this report
Name of ShareholderNumber of
ordinary shares
Percentage of issued
ordinary sharesCouverina Business, s.r.o(2) 189,285,770 27.48%Bock Capital EULuxembourg WAG S.à.r.l.(1) 179,505,764 26.06%Martin Vohánka 135,775,918 19.71%FIL InvestmentsInternational(3) 32,073,333 4.66%Funds and accounts under the management of SelectEquity Group, L.P(3) 26,633,333 3.87%
(1) A vehicle affiliated with TA Associates (UK), LLP (“TA Associates”) (2) A vehicle wholly owned by Martin Vohánka. (3) Includes Cornerstone Commitments
As at the date of this report, the Company has not been made aware of any further changes to the above shareholdings.
Annual Report and Accounts EUROWAG
143
GOVERNANCE

SHARE CAPITAL STRUCTUREOn 14 December 2021, a court order approved the cancellation of the Company’s sole B share. Companies House was unable to register the cancellation of the B share until after the financial year end. Therefore, at the financial year end, the Company has in issue 688,911,333 ordinary shares of £0.01 each (21.27% of the issued nominal value) and a single B share with a nominal value of £25,500,000 per share (78.73% of the issued nominal value). A total issued share capital of 688,911,334 amounts to an aggregate nominal value of £32,389,113.33. As at 8 January 2022 and the date of this report, the issued share capital of the Company comprised 688,911,333 ordinary shares of £0.01 each admitted to the London Stock Exchange. The ordinary shares have attached to them full voting, dividend and capital distribution (including winding up) rights. The class B shares have no voting or rights to distributions or rights to the return of capital on winding up.
AUTHORITY TO PURCHASE OWN SHARESAt a general meeting held on 7 October 2021, Shareholders passed a resolution allowing the Company to make market purchases of ordinary shares of £0.01 each in the capital of the Company up to a maximum aggregate amount of 10% of the Company’s issued share capital immediately following Admission. No shares have been purchased under this authority as at the date of this report. This authority is due to expire at the AGM to be held on 26 May 2022.
PRINCIPAL SHAREHOLDER AND RELATIONSHIP AGREEMENTIn connection with, and effective from, Admission, relationship agreements were entered into with Martin Vohánka, Couverina Business, s.r.o (“Couverina”) and TA Associates to ensure that, following Admission, the Company was able to operate independently of the aforementioned parties for the purposes of the Listing Rules.
RELATIONSHIP AGREEMENT WITH MARTIN VOHÁNKA AND COUVERINA Under the relationship agreement, Martin Vohánka and Couverina have made undertakings to (i) conduct all transactions and arrangements with any member of the Company and the Group at arm’s length and on normal commercial terms; (ii) not take any action which would have the effect of preventing the Company from complying with its obligations under the Listing Rules; and (iii) not propose or procure the proposal of any Shareholder resolution which is intended or appears to be intended to circumvent the proper application of the Listing Rules.
Subject to below, Martin Vohánka and Couverina have the right (i) to nominate for appointment up to two Non-Executive Directors to the Board, while together with their associates’ shareholding in the Company are greater than or equal to 25% of the votes available to be cast at General Meetings of the Company; and (ii) to nominate for appointment one Non-Executive Director to the Board, while together with their associates’ shareholding in the Company are greater than or equal to 10%. Martin Vohánka and Couverina opted not to appoint any Nominee Directors at Admission and currently have expressed that they do not intend to exercise these rights while Martin Vohánka is CEO.
Martin Vohánka shall not be considered as a Nominee Director for so long as he is an Executive Director of the Company, but that for so long as he is an Executive Director of the Company, the right of Martin Vohánka and Couverina to appoint Nominee Directors shall be reduced by one, to reflect Martin Vohánka’s appointment as a Director of the Company.
The relationship agreement additionally governs information flow between the Company and Martin Vohánka and Couverina.
For so long as Martin Vohánka (or its concert parties (as defined in the City Code on Takeovers and Mergers (the “City Code”)) holds in aggregate an interest in 30% or more of the aggregate voting rights in the Company and subject, where necessary, to the prior consent of the Panel, the Company has undertaken to procure that at the first Annual General Meeting of the Company and thereafter once in every calendar year, to propose to its Independent Shareholders a resolutions to waive, in accordance with Appendix 1 to the City Code, all obligations of the relevant Shareholder (or its concert parties) to make a general offer for the ordinary shares of the Company in accordance with Rule 9 of the City Code that may otherwise arise as result of the Company purchasing or effecting any other transactions in relation to the ordinary shares or related securities.RELATIONSHIP AGREEMENT WITH TA ASSOCIATESThe TA Relationship Agreement contains substantially the same terms as the relationship agreement with Martin Vohánka and Couverina as described above, other than the appointment rights, which provides Bock Capital EU Luxembourg WAG S.à.r.l. (“Bock”) with the right to appoint one Non-Executive Director to the Board, while together with its associates’ shareholding in the Company are greater than or equal to 10% of the votes available to be cast at General Meetings of the Company. Morgan Seigler was appointed to the Board, as Nominee Director, at Admission.
Morgan Seigler additionally has the ability to share confidential information with Bock in accordance with the terms of the relationship agreement, subject to prior clearance from the rest of the Board.
EUROWAG Annual Report and Accounts for the year ended 31 December 2021
144
GOVERNANCE
Directors’ Report CONTINUED
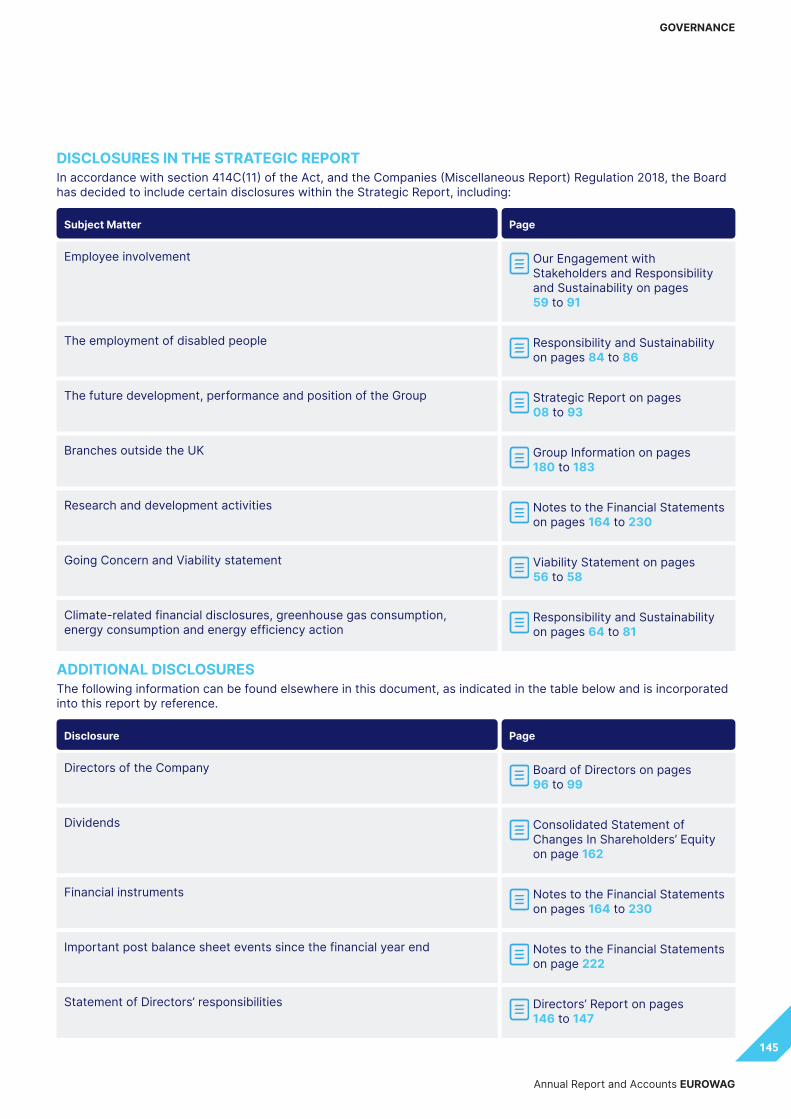
DISCLOSURES IN THE STRATEGIC REPORTIn accordance with section 414C(11) of the Act, and the Companies (Miscellaneous Report) Regulation 2018, the Board has decided to include certain disclosures within the Strategic Report, including:
Subject Matter Page
Employee involvement Our Engagement with Stakeholders and Responsibility and Sustainability on pages 59 to 91
The employment of disabled people Responsibility and Sustainability on pages 84 to 86
The future development, performance and position of the Group Strategic Report on pages 08 to 93
Branches outside the UK Group Information on pages 180 to 183
Research and development activities Notes to the Financial Statements on pages 164 to 230
Going Concern and Viability statement Viability Statement on pages 56 to 58
Climate-related financial disclosures, greenhouse gas consumption, energy consumption and energy efficiency action
Responsibility and Sustainability on pages 64 to 81
ADDITIONAL DISCLOSURES The following information can be found elsewhere in this document, as indicated in the table below and is incorporated into this report by reference.
Disclosure Page
Directors of the Company Board of Directors on pages 96 to 99
Dividends Consolidated Statement of Changes In Shareholders’ Equity on page 162
Financial instruments Notes to the Financial Statements on pages 164 to 230
Important post balance sheet events since the financial year end Notes to the Financial Statements on page 222
Statement of Directors’ responsibilities Directors’ Report on pages 146 to 147
Annual Report and Accounts EUROWAG
145
GOVERNANCE

Information required to be included in the Annual Report and Accounts by LR 9.8.4 can be found in this document as indicated in the table below:
Disclosure Page
Long-Term Incentive Plans Directors’ Remuneration Report on pages 120 to 140
Confirmations regarding entering into a relationship agreement with a Controlling Shareholder and compliance with independence provisions
Principal Shareholder and relationship agreement section on page 144
Agreements with a Controlling Shareholder Principal Shareholder and relationship agreement section on page 144
STATEMENT OF DIRECTORS’ RESPONSIBILITIES IN RESPECT OF THE FINANCIAL STATEMENTSThe Directors are responsible for preparing the Annual Report and the financial statements in accordance with applicable law and regulation.Company law requires the Directors to prepare financial statements for each financial year. Under that law the Directors have prepared the group financial statements in accordance with UK-adopted international accounting standards and the company financial statements in accordance with United Kingdom Generally Accepted Accounting Practice (United Kingdom Accounting Standards, comprising FRS 101 Reduced Disclosure Framework, and applicable law).Under company law, Directors must not approve the financial statements unless they are satisfied that they give a true and fair view of the state of affairs of the group and company and of the profit or loss of the Group for that period. In preparing the financial statements, the Directors are required to:• select suitable accounting policies
and then apply them consistently• state whether applicable UK-
adopted international accounting standards have been followed for the Group financial statements and United Kingdom Accounting Standards, comprising FRS
101 have been followed for the Company financial statements, subject to any material departures disclosed and explained in the financial statements
• make judgements and accounting estimates that are reasonable and prudent
• prepare the financial statements on the Going Concern basis unless it is inappropriate to presume that the Group and Company will continue in business
The Directors are responsible for safeguarding the assets of the Group and Company and hence for taking reasonable steps for the prevention and detection of fraud and other irregularities.
The Directors are also responsible for keeping adequate accounting records that are sufficient to show and explain the Group’s and Company’s transactions and disclose with reasonable accuracy at any time the financial position of the Group and Company and enable them to ensure that the financial statements and the Directors’ Remuneration Report comply with the Companies Act 2006.
The Directors are responsible for the maintenance and integrity of the Company’s website. Legislation in the United Kingdom governing the preparation and dissemination of financial statements may differ from legislation in other jurisdictions.
DIRECTORS’ CONFIRMATIONSThe Directors consider that the Annual Report and Accounts, taken as a whole, is fair, balanced and understandable and provides the information necessary for Shareholders to assess the Group’s and Company’s position and performance, business model and strategy.
Each of the Directors, whose names and functions are listed in Board of Directors on pages 96 to 99 confirm that, to the best of their knowledge:• the Group financial statements,
which have been prepared in accordance with UK-adopted international accounting standards, give a true and fair view of the assets, liabilities, financial position and profit of the Group;
• the Company financial statements, which have been prepared in accordance with United Kingdom Accounting Standards, comprising FRS 101, give a true and fair view of the assets, liabilities and financial position of the Company; and
• the Strategic section of this report includes a fair review of the development and performance of the business and the position of the Group and Company, together with a description of the principal risks and uncertainties that it faces.
EUROWAG Annual Report and Accounts for the year ended 31 December 2021
146
GOVERNANCE
Directors’ Report CONTINUED

In the case of each Director in office at the date the Directors’ Report is approved:• so far as the Director is aware,
there is no relevant audit information of which the Group’s and Company’s Auditors are unaware; and
• they have taken all the steps that they ought to have taken as a Director in order to make themselves aware of any relevant audit information and to establish that the Group’s and Company’s Auditors are aware of that information.
GOING CONCERN In accordance with Provision 30 of the Code, the Directors consider it appropriate to continue to adopt the going concern basis of accounting in preparing the financial statements. The Directors, having made appropriate enquiries, are satisfied that the Company and Group as a whole has adequate resources to continue operations for a period of at least 12 months from the date of this report.
The full Going Concern statement is set out on page 58
VIABILITY STATEMENT In accordance with Provision 31 of the Code, the Directors are required to provide a Viability statement that states whether the Company and Group will be able to continue in operation and meet its liabilities, taking into account its current position and the principal risks it faces. The Directors must also specify the period covered by, and the appropriateness of, this statement.
The Directors’ assessment of the viability of the Company is set out on pages 56 to 58
FAIR, BALANCED AND UNDERSTANDABLE The Board considers the annual report and financial statements, taken as a whole, is fair, balanced and understandable and provides the information necessary for Shareholders to assess the Company’s position and performance, business model and strategy.
This responsibility statement was approved by the Board of Directors and is signed on its behalf by:
David Orr on behalf of Computershare Company Secretarial Services Limited.
Company Secretary
24 March 2022
Annual Report and Accounts EUROWAG
147
GOVERNANCE

FinancialStatements
Independent Auditor’s Report 150Consolidated Statement of Comprehensive Income 160Consolidated Statement of Financial Position 161Consolidated Statement of Changes In Shareholders’ Equity 162Consolidated Statement of Cash Flows 163Notes to the Financial Statements 164Company Statement of Financial Position 223Company Statement of Changes in Shareholders’ Equity 224Notes to the Financial Statements 225Company information 231
CONTENTS

FinancialStatements

Report on the audit of the financial statementsOPINIONIn our opinion:
• W.A.G payment solutions plc’s group financial statements and company financial statements (the “financial statements”) give a true and fair view of the state of the group’s and of the company’s affairs as at 31 December 2021 and of the group’s profit and the group’s cash flows for the year then ended;
• the group financial statements have been properly prepared in accordance with UK-adopted international accounting standards;
• the company financial statements have been properly prepared in accordance with United Kingdom Generally Accepted Accounting Practice (United Kingdom Accounting Standards, comprising FRS 101 “Reduced Disclosure Framework”, and applicable law); and
• the financial statements have been prepared in accordance with the requirements of the Companies Act 2006.
We have audited the financial statements, included within the Annual Report and Accounts (the “Annual Report”), which comprise: Consolidated and Company Statement of Financial Position as at 31 December 2021; the Consolidated Statement of Comprehensive Income, the Consolidated Statement of Cash Flows, the Consolidated and Company Statement of Changes in Shareholders’ Equity for the year then ended; and the notes to the financial statements, which include a description of the significant accounting policies.
Our opinion is consistent with our reporting to the Audit & Risk Committee.
BASIS FOR OPINIONWe conducted our audit in accordance with International Standards on Auditing (UK) (“ISAs (UK)”) and applicable law. Our responsibilities under ISAs (UK) are further described in the Auditors’ responsibilities for the audit of the financial statements section of our report. We believe that the audit evidence we have obtained is sufficient and appropriate to provide a basis for our opinion.INDEPENDENCEWe remained independent of the group in accordance with the ethical requirements that are relevant to our audit of the financial statements in the UK, which includes the FRC’s Ethical Standard, as applicable to listed public interest entities, and we have fulfilled our other ethical responsibilities in accordance with these requirements.
To the best of our knowledge and belief, we declare that non-audit services prohibited by the FRC’s Ethical Standard were not provided.
Other than those disclosed in note 2 to the Group Financial Statements, we have provided no non-audit services to the company or its controlled undertakings in the period under audit.
OUR AUDIT APPROACHCONTEXTW.A.G payment solutions plc (the Company) is a public limited company incorporated and domiciled in the United Kingdom. The ordinary shares of the Company were admitted to the premium listing segment of the Official List of the UK Financial Conduct Authority and have traded on the London Stock Exchange plc’s main market for listed securities since 13 October 2021. Prior to the Initial Public Offering (“IPO”), W.A.G. payment solutions, a.s. was the parent company of the Group for which consolidated financial statements were produced. On 7 October 2021 the shareholders of W.A.G. payment solutions, a.s. transferred all of their shares in W.A.G. payment solutions, a.s. to W.A.G payment solutions plc in exchange for ordinary shares of equal value in W.A.G payment solutions plc. This resulted in W.A.G payment solutions plc becoming the new parent company of the Group. On 8 October 2021 the IPO was completed, with 13 October 2021 being the date of admission to the London Stock Exchange. The financial information for the year ended 31 December 2021 (and comparative information for the year ended 31 December 2020) is presented as a continuation of W.A.G. payment solutions, a.s. 2021 is our first year as independent auditors of the Group. The new listed entity appointed PwC UK as its auditors in December 2021.OVERVIEWAudit scope• PwC component audit teams were engaged to perform a full scope audit in the Czech Republic and Spain.
Other components within the Group were requested to perform specified procedures over certain balances and transactions. The Group audit team carried out audit procedures over the consolidation and the company.
EUROWAG Annual Report and Accounts for the year ended 31 December 2021
150
FINANCIAL STATEMENTS
Independent Auditors’ ReportTO THE MEMBERS OF W.A.G PAYMENT SOLUTIONS PLC

Key audit matters• Presentation of adjusting items (group)• Valuation of put options (group)• Accounting for IPO restructuring (parent)Materiality• Overall group materiality: 8,200,000 EUR (In Words: Eight million two hundred thousand euros) based on 0.5% of
gross revenues.• Overall company materiality: 3,100,000 EUR (In Words: Three million one hundred thousand euros) based on 1% of
total assets.• Performance materiality: 6,150,000 EUR (In Words: Six million one hundred and fifty thousand euros) (group) and
2,325,000 EUR (In Words: Two million three hundred and twenty five thousand euros) (company).THE SCOPE OF OUR AUDITAs part of designing our audit, we determined materiality and assessed the risks of material misstatement in the financial statements.KEY AUDIT MATTERSKey audit matters are those matters that, in the auditors’ professional judgement, were of most significance in the audit of the financial statements of the current period and include the most significant assessed risks of material misstatement (whether or not due to fraud) identified by the auditors, including those which had the greatest effect on: the overall audit strategy; the allocation of resources in the audit; and directing the efforts of the engagement team. These matters, and any comments we make on the results of our procedures thereon, were addressed in the context of our audit of the financial statements as a whole, and in forming our opinion thereon, and we do not provide a separate opinion on these matters.
This is not a complete list of all risks identified by our audit.
Key audit matter How our audit addressed the key audit matter
Presentation of adjusting items (group)
As at 31 December 2021, costs of €22.8m have been classified as adjusting items impacting adjusted EBITDA and net costs of €3.3m have been classified as adjusting items impacting adjusted earnings (net profit) for the year.
The adjusting items impacting adjusted EBITDA relate to: M&A related expenses – €0.8m (2020: €0.4m); non-recurring IPO related expenses – €12.9m (2020: €0.3m); strategic transformation expenses – €2.7m (2020: €1.2m); and share based compensation – €6.4m (2020: €1.2m).
The adjusting items impacting adjusted earnings (net profit) relate to: amortisation of business combination adjustments of €5.4m (2020: €5.6m); amortisation due to transformational useful life changes – €1.7m (2020: €0.3m); offset by tax effect of adjusting items – €3.8m (2020: €1.8m).
We evaluated and understood the rationale behind each adjusting item and audited each category of adjusting item to €1.7m materiality, such that the untested balance was well below group performance materiality. This involved agreeing the sampled items to underlying supporting documentation.
We have considered the appropriateness of the presentation of adjusting items in light of the Group’s accounting policy for adjusting items and with reference to FRC guidance on Alternative Performance Measures. We challenged management and considered whether the items disclosed as adjusting items were consistent with the accounting policy, with the approach taken in previous reporting and with the FRC’s guidance, to determine whether items were appropriately treated and disclosed. We performed sample testing across all balances and verified those samples to supporting invoices, agreements or other evidence. For amortisation of business combination adjustments and amortisation due to transformational useful life changes, we have agreed the book value to the accounting records and recalculated management estimates. We have considered other one-off or notable credits/charges recognised in earnings before adjusting items to ensure consistent treatment with adjusting items. We challenged the disclosures included in note 11 to assess whether they were clear and balanced.
Annual Report and Accounts EUROWAG
151
FINANCIAL STATEMENTS

Key audit matter How our audit addressed the key audit matter
We focused on this area as there is no definition of an adjusting item within IFRS and so judgement is required by the directors in determining whether items classified as adjusting are consistent with the group’s accounting policy. We also focussed on this area given the potential fraud risk attached to the presentation of these items in meeting market consensus and profit-based personal incentive targets. Consistency in identifying and disclosing items as adjusting is important to maintain comparability of the results year on year. See the significant accounting judgements, estimates and assumptions for management’s disclosure of this significant judgement. Also see the Key accounting issues and significant judgements section in the Audit & Risk Committee report.
Based on the evidence obtained, the presentation and disclosure of adjusting items is appropriate.
Valuation of put options (group)
When making acquisitions, the Group has historically included put options as part of the acquisition structure as a mechanism to acquire further equity interests. The Group has existing put options which may require it to purchase additional shares, including in Sygic, and Last Mile Solutions (LMS). The put option of Sygic is accounted for as a put option redemption liability, as the Group controls and consolidates this company, and is valued at €13.0m at 31 December 2021 (2020: €19.0m).
We used valuation experts to assess the methodology and assumptions, including volatility and EBITDA multiplier, used to value the LMS put option by the independent experts.
We agreed the LMS put option to the underlying sale and purchase agreement documentation.
On the Sygic put/call option we obtained the updated agreement setting out changes to the valuation methodology. We agreed the forecast sales and cash EBITDA to Board-approved forecasts. We recalculated the valuation of the redemption liability to assess whether it was consistent with that set out in the updated agreement. We agreed the revised sales and cash EBITDA to approved forecasts and recalculated the liability.
Under the terms of these options, the put option redemption liability will be settled through transfer of the sellers’ shares to the Group, for a price agreed at the time the options are exercised. Therefore, the non-controlling shareholders have retained the risks and rewards associated with ownership until the options are exercised, as a result of which the Group recognises changes to the value of these put option liabilities through equity rather than through comprehensive income.
On 16 February 2021, the Group acquired a 28% non-controlling interest in Dutch-based Threeforce B.V., operating under the brand name Last Mile Solutions (“LMS”), a fast-growing eMobility platform in Europe. The remaining shares are subject to a put option, which may require the Group to acquire all shares of LMS. The put option is measured as a derivative instrument as the Group does not control the business and therefore does not currently consolidate the investment.
The put option for LMS was valued by an independent expert using a monte carlo simulation and has a value of €0.1m at 31 December 2021.
EUROWAG Annual Report and Accounts for the year ended 31 December 2021
152
FINANCIAL STATEMENTS
Independent Auditors’ Report CONTINUEDTO THE MEMBERS OF W.A.G PAYMENT SOLUTIONS PLC

Key audit matter How our audit addressed the key audit matter
The Sygic put/call option was renegotiated in 2021. An updated agreement was signed by both parties in 2021. The revised forecast sales and cash EBITDA in 2023 has revised the multiples used to derive the valuation at exercise date in early 2024.
We assessed the appropriateness of the related disclosures.
Based on the evidence we obtained, the accounting for and disclosure of put options is appropriate.
We focused on this area as the valuation of put options includes both estimation and judgement. See the significant accounting judgements, estimates and assumptions for management’s disclosure of this significant judgement (note 6). Also see the Key accounting issues and significant judgements section in the Audit & Risk Committee report.
Accounting for IPO restructuring (parent)
In preparation for the IPO, and subsequent to it, a number of steps have been taken to change the capital structure of the Group. These include the insertion of W.A.G payment solutions plc as the new holding company for the group by way of a share for share exchange, followed by the issue of bonus shares and a capital reduction to create distributable reserves.
We reviewed the accounting paper prepared by management, detailing the proposed accounting for the IPO transactions, to assess whether the financial statements accurately reflect the transactions around the IPO. We tested the transactions record to corresponding statutory and legal documents.
We viewed statutory filings to confirm that the capital reduction was effective in January 2022.
We assessed whether there are any impairment indicators in the carrying value of investments as a result of the restructuring.
We assessed the disclosures in the financial statements, including the related equity disclosures.
Based on the evidence obtained, the accounting for and disclosure of the IPO restructuring in the company is appropriate.
The creation of the new holding company is treated as a capital restructuring event and hence, although the separate company financial statements will be for a five-month period from the date of incorporation, the consolidated financial statements will apply predecessor accounting principles. This will show a full year consolidation with comparatives, as if the new Plc entity had always been the holding company.
This brings a level of complexity to the accounting in the parent company financial statements.
Annual Report and Accounts EUROWAG
153
FINANCIAL STATEMENTS

HOW WE TAILORED THE AUDIT SCOPEWe tailored the scope of our audit to ensure that we performed enough work to be able to give an opinion on the financial statements as a whole, taking into account the structure of the group and the company, the accounting processes and controls, and the industry in which they operate.
The group financial statements are a consolidation of multiple reporting units across Europe, comprising the group’s operating businesses and centralised functions. These reporting units maintain their own accounting records and controls and report to the head office finance team in the Czech Republic for consolidation purposes. In establishing the overall approach to the Group audit, we identified three reporting units, which, in our view, required an audit of their complete financial information both due to their size and risk characteristics: W.A.G payment solutions plc (the Company), W.A.G payment solutions, a.s. incorporated in the Czech Republic and Arraia Oil, S.L incorporated in Spain. The Group engagement team audited W.A.G payment solutions plc (the company) and W.A.G payment solutions, a.s. and Arraia Oil, S.L were considered individually significant components and were audited by PwC Czech Republic and PwC Spain respectively. We also added six components to our scope to perform specified procedures to ensure sufficient coverage of certain balances within the group consolidation. Where work was performed by component auditors, we determined the appropriate level of involvement we needed to have in that audit work to ensure that we could conclude that sufficient appropriate audit evidence had been obtained for the Group Financial Statements as a whole. In addition to instructing and reviewing the reporting from our component audit teams, we conducted file reviews and participated in key meetings with local management. Due to Covid-19, most of these meetings took place remotely but we were able to make two site visits to the Czech Republic in person. We also had regular dialogue with component teams throughout the audit. The Group consolidation and financial statement disclosures included in Group audit scope were audited by the Group audit team. In planning our audit, we considered the potential impacts of climate change on the group’s business and its financial statements. We made enquiries of management to understand management’s process for assessing climate-related risks and opportunities, the extent of potential impact of climate change risk on the Group’s financial statements and the Group’s preparedness for this. The ESG report describes and explains how climate change could have an impact on the group’s business. Using our knowledge of the business we considered whether the risks identified by management are materially complete and have been appropriately estimated and disclosed. We have assessed how the group has considered the impact of climate change risk on the impairment assessment over non-current assets and in the Groups’ viability assessment. Based on the detailed audit work performed across the Group, we obtained coverage of 97% of gross revenue and 98% of net energy and services sales.MATERIALITYThe scope of our audit was influenced by our application of materiality. We set certain quantitative thresholds for materiality. These, together with qualitative considerations, helped us to determine the scope of our audit and the nature, timing and extent of our audit procedures on the individual financial statement line items and disclosures and in evaluating the effect of misstatements, both individually and in aggregate on the financial statements as a whole.
Based on our professional judgement, we determined materiality for the financial statements as a whole as follows:
Financial statements – group Financial statements – company
Overall materiality
8,200,000 EUR (In Words: Eight million two hundred thousand euros).
3,100,000 EUR (In Words: Three million one hundred thousand euros).
How we determined it
0.5% of gross revenues 1% of total assets
Rationale for benchmark applied
The Group is focused on increasing the number of customers, or the number of services used by each customer, both of which drives gross revenues. Gross revenues is a generally accepted auditing benchmark.
Based on the nature of the Plc company, it is a newly formed holding entity and trading is not the entity’s main function. The Plc company has transactions that are there to support the group in its trading and so total assets is considered appropriate and is a generally accepted auditing benchmark.
For each component in the scope of our group audit, we allocated a materiality that is less than our overall group materiality. The range of materiality allocated across components was between €5 million to €7.4 million. Certain components were audited to a local statutory audit materiality that was also less than our overall group materiality.
EUROWAG Annual Report and Accounts for the year ended 31 December 2021
154
FINANCIAL STATEMENTS
Independent Auditors’ Report CONTINUEDTO THE MEMBERS OF W.A.G PAYMENT SOLUTIONS PLC

We use performance materiality to reduce to an appropriately low level the probability that the aggregate of uncorrected and undetected misstatements exceeds overall materiality. Specifically, we use performance materiality in determining the scope of our audit and the nature and extent of our testing of account balances, classes of transactions and disclosures, for example in determining sample sizes. Our performance materiality was 75% of overall materiality, amounting to 6,150,000 EUR (In Words: Six million one hundred and fifty thousand euros) for the group financial statements and 2,325,000 EUR (In Words: Two million three hundred and twenty five thousand euros) for the company financial statements.
In determining the performance materiality, we considered a number of factors - the history of misstatements, risk assessment and aggregation risk and the effectiveness of controls - and concluded that an amount at the upper end of our normal range was appropriate.
We agreed with the Audit & Risk Committee that we would report to them misstatements identified during our audit above €400,000 (group audit) and €155,000 (company audit) as well as misstatements below those amounts that, in our view, warranted reporting for qualitative reasons.
CONCLUSIONS RELATING TO GOING CONCERNOur evaluation of the directors’ assessment of the group’s and the company’s ability to continue to adopt the going concern basis of accounting included:
• Obtaining and agreeing management’s going concern assessment to the business’s board approved plan and ensuring that the base case scenario, representing the business to 30 September 2023 indicates that the business generates sufficient cash flows to meets its long and short term obligations while complying with covenant arrangements;
• Assessment of the historical accuracy and reasonableness of management’s forecasting;• Analysing the cash flows in the forecast models to identify unexpected trends and relationships and ensuring the
mathematical accuracy of management’s models;• Evaluating management’s downside scenarios of a similar extent of disruptions as seen in previous economic
downturns and ensuring this is appropriately modelled through the cash flows;• Assessing whether climate change is expected to have a significant impact during the period of the going concern
assessment;• Review of the related disclosures in the Annual Report and Accounts.
Based on the work we have performed, we have not identified any material uncertainties relating to events or conditions that, individually or collectively, may cast significant doubt on the group’s and the company’s ability to continue as a going concern for a period of at least twelve months from when the financial statements are authorised for issue.
In auditing the financial statements, we have concluded that the directors’ use of the going concern basis of accounting in the preparation of the financial statements is appropriate.
However, because not all future events or conditions can be predicted, this conclusion is not a guarantee as to the group’s and the company’s ability to continue as a going concern.
In relation to the directors’ reporting on how they have applied the UK Corporate Governance Code, we have nothing material to add or draw attention to in relation to the directors’ statement in the financial statements about whether the directors considered it appropriate to adopt the going concern basis of accounting.
Our responsibilities and the responsibilities of the directors with respect to going concern are described in the relevant sections of this report.
Annual Report and Accounts EUROWAG
155
FINANCIAL STATEMENTS

REPORTING ON OTHER INFORMATIONThe other information comprises all of the information in the Annual Report other than the financial statements and our auditors’ report thereon. The directors are responsible for the other information, which includes reporting based on the Task Force on Climate-related Financial Disclosures (TCFD) recommendations. Our opinion on the financial statements does not cover the other information and, accordingly, we do not express an audit opinion or, except to the extent otherwise explicitly stated in this report, any form of assurance thereon.
In connection with our audit of the financial statements, our responsibility is to read the other information and, in doing so, consider whether the other information is materially inconsistent with the financial statements or our knowledge obtained in the audit, or otherwise appears to be materially misstated. If we identify an apparent material inconsistency or material misstatement, we are required to perform procedures to conclude whether there is a material misstatement of the financial statements or a material misstatement of the other information. If, based on the work we have performed, we conclude that there is a material misstatement of this other information, we are required to report that fact. We have nothing to report based on these responsibilities.
With respect to the Strategic report and Directors’ report, we also considered whether the disclosures required by the UK Companies Act 2006 have been included.
Based on our work undertaken in the course of the audit, the Companies Act 2006 requires us also to report certain opinions and matters as described below.STRATEGIC REPORT AND DIRECTORS’ REPORTIn our opinion, based on the work undertaken in the course of the audit, the information given in the Strategic report and Directors’ report for the year ended 31 December 2021 is consistent with the financial statements and has been prepared in accordance with applicable legal requirements.
In light of the knowledge and understanding of the group and company and their environment obtained in the course of the audit, we did not identify any material misstatements in the Strategic report and Directors’ report.DIRECTORS’ REMUNERATIONIn our opinion, the part of the Annual Report on Remuneration to be audited has been properly prepared in accordance with the Companies Act 2006.
CORPORATE GOVERNANCE STATEMENTThe Listing Rules require us to review the directors’ statements in relation to going concern, viability and that part of the corporate governance statement relating to the company’s compliance with the provisions of the UK Corporate Governance Code specified for our review. Our additional responsibilities with respect to the corporate governance statement as other information are described in the Reporting on other information section of this report.
Based on the work undertaken as part of our audit, we have concluded that each of the following elements of the corporate governance statement is materially consistent with the financial statements and our knowledge obtained during the audit, and we have nothing material to add or draw attention to in relation to:
• The directors’ confirmation that they have carried out a robust assessment of the emerging and principal risks;• The disclosures in the Annual Report that describe those principal risks, what procedures are in place to identify
emerging risks and an explanation of how these are being managed or mitigated;• The directors’ statement in the financial statements about whether they considered it appropriate to adopt the going
concern basis of accounting in preparing them, and their identification of any material uncertainties to the group’s and company’s ability to continue to do so over a period of at least twelve months from the date of approval of the financial statements;
• The directors’ explanation as to their assessment of the group’s and company’s prospects, the period this assessment covers and why the period is appropriate; and
• The directors’ statement as to whether they have a reasonable expectation that the company will be able to continue in operation and meet its liabilities as they fall due over the period of its assessment, including any related disclosures drawing attention to any necessary qualifications or assumptions.
EUROWAG Annual Report and Accounts for the year ended 31 December 2021
156
FINANCIAL STATEMENTS
Independent Auditors’ Report CONTINUEDTO THE MEMBERS OF W.A.G PAYMENT SOLUTIONS PLC

Our review of the directors’ statement regarding the viability of the group was substantially less in scope than an audit and only consisted of making inquiries and considering the directors’ process supporting their statement; checking that the statement is in alignment with the relevant provisions of the UK Corporate Governance Code; and considering whether the statement is consistent with the financial statements and our knowledge and understanding of the group and company and their environment obtained in the course of the audit.
In addition, based on the work undertaken as part of our audit, we have concluded that each of the following elements of the corporate governance statement is materially consistent with the financial statements and our knowledge obtained during the audit:
• The directors’ statement that they consider the Annual Report, taken as a whole, is fair, balanced and understandable, and provides the information necessary for the members to assess the group’s and company’s position, performance, business model and strategy;
• The section of the Annual Report that describes the review of effectiveness of risk management and internal control systems; and
• The section of the Annual Report describing the work of the Audit & Risk Committee.
We have nothing to report in respect of our responsibility to report when the directors’ statement relating to the company’s compliance with the Code does not properly disclose a departure from a relevant provision of the Code specified under the Listing Rules for review by the auditors.
RESPONSIBILITIES FOR THE FINANCIAL STATEMENTS AND THE AUDITRESPONSIBILITIES OF THE DIRECTORS FOR THE FINANCIAL STATEMENTSAs explained more fully in the Statement of directors’ responsibilities in respect of the financial statements, the directors are responsible for the preparation of the financial statements in accordance with the applicable framework and for being satisfied that they give a true and fair view. The directors are also responsible for such internal control as they determine is necessary to enable the preparation of financial statements that are free from material misstatement, whether due to fraud or error.
In preparing the financial statements, the directors are responsible for assessing the group’s and the company’s ability to continue as a going concern, disclosing, as applicable, matters related to going concern and using the going concern basis of accounting unless the directors either intend to liquidate the group or the company or to cease operations, or have no realistic alternative but to do so.AUDITORS’ RESPONSIBILITIES FOR THE AUDIT OF THE FINANCIAL STATEMENTSOur objectives are to obtain reasonable assurance about whether the financial statements as a whole are free from material misstatement, whether due to fraud or error, and to issue an auditors’ report that includes our opinion. Reasonable assurance is a high level of assurance, but is not a guarantee that an audit conducted in accordance with ISAs (UK) will always detect a material misstatement when it exists. Misstatements can arise from fraud or error and are considered material if, individually or in the aggregate, they could reasonably be expected to influence the economic decisions of users taken on the basis of these financial statements.
Irregularities, including fraud, are instances of non-compliance with laws and regulations. We design procedures in line with our responsibilities, outlined above, to detect material misstatements in respect of irregularities, including fraud. The extent to which our procedures are capable of detecting irregularities, including fraud, is detailed below.
Annual Report and Accounts EUROWAG
157
FINANCIAL STATEMENTS
Based on our understanding of the group and industry, we identified that the principal risks of non-compliance with laws and regulations related to the FCA Listing Rules, taxation, employment laws and health and safety, and we considered the extent to which non-compliance might have a material effect on the financial statements. We also considered those laws and regulations that have a direct impact on the financial statements such as the Companies Act 2006. We evaluated management’s incentives and opportunities for fraudulent manipulation of the financial statements (including the risk of override of controls), and determined that the principal risks were related to posting inappropriate journal entries that credit revenue or EBITDA. The group engagement team shared this risk assessment with the component auditors so that they could include appropriate audit procedures in response to such risks in their work. Audit procedures performed by the group engagement team and/or component auditors included:
• Discussions among the engagement personnel covering the potential for material misstatements due to error or fraud, the risks associated with related parties and emphasis on the need to maintain professional scepticism throughout the engagement;
• Inquiries of management and others within the entity, including those outside of finance, as to their knowledge, awareness and concerns regarding fraud;
• Identification and testing of journal entries that hit our risk criteria, in particular any journal entries posted with unusual account combinations which resulted in an impact on revenue/EBITDA and incorporating an element of unpredictability in the nature, timing and extent of audit procedures performed;
• Assessment of matters reported on the Group’s whistleblowing helpline and the results of management’s investigation of such matters;
• Testing accounting estimates made by management;• Reading the minutes of the Board meetings to identify any inconsistencies with other information provided by
management;• Reviewing component teams’ key working papers for all in-scope components with a particular focus on the areas
involving judgement and estimates;• Reviewing internal audit reports in so far as they related to the financial statements;• Reviewing legal expense accounts to identify significant legal spend which may be indicative of serious breaches of
laws and regulations.
There are inherent limitations in the audit procedures described above. We are less likely to become aware of instances of non-compliance with laws and regulations that are not closely related to events and transactions reflected in the financial statements. Also, the risk of not detecting a material misstatement due to fraud is higher than the risk of not detecting one resulting from error, as fraud may involve deliberate concealment by, for example, forgery or intentional misrepresentations, or through collusion.
Our audit testing might include testing complete populations of certain transactions and balances, possibly using data auditing techniques. However, it typically involves selecting a limited number of items for testing, rather than testing complete populations. We will often seek to target particular items for testing based on their size or risk characteristics. In other cases, we will use audit sampling to enable us to draw a conclusion about the population from which the sample is selected.
A further description of our responsibilities for the audit of the financial statements is located on the FRC’s website at: https://www.frc.org.uk/auditorsresponsibilities. This description forms part of our auditors’ report.USE OF THIS REPORTThis report, including the opinions, has been prepared for and only for the company’s members as a body in accordance with Chapter 3 of Part 16 of the Companies Act 2006 and for no other purpose. We do not, in giving these opinions, accept or assume responsibility for any other purpose or to any other person to whom this report is shown or into whose hands it may come save where expressly agreed by our prior consent in writing.
EUROWAG Annual Report and Accounts for the year ended 31 December 2021
158
FINANCIAL STATEMENTS
Independent Auditors’ Report CONTINUEDTO THE MEMBERS OF W.A.G PAYMENT SOLUTIONS PLC

Other required reportingCOMPANIES ACT 2006 EXCEPTION REPORTINGUnder the Companies Act 2006 we are required to report to you if, in our opinion:
• we have not obtained all the information and explanations we require for our audit; or• adequate accounting records have not been kept by the company, or returns adequate for our audit have not been
received from branches not visited by us; or• certain disclosures of directors’ remuneration specified by law are not made; or• the company financial statements and the part of the Annual Report on Remuneration to be audited are not in
agreement with the accounting records and returns.
We have no exceptions to report arising from this responsibility.
APPOINTMENTFollowing the recommendation of the Audit & Risk Committee, we were appointed by the directors on 2 December 2021 to audit the financial statements for the year ended 31 December 2021 and subsequent financial periods. This is therefore our first year of uninterrupted engagement.
Other mattersThe financial statements for the year ended 31 December 2020, forming the corresponding figures of the financial statements for the year ended 31 December 2021, are unaudited.
In due course, as required by the Financial Conduct Authority Disclosure Guidance and Transparency Rule 4.1.14R, these financial statements will form part of the ESEF-prepared annual financial report filed on the National Storage Mechanism of the Financial Conduct Authority in accordance with the ESEF Regulatory Technical Standard (‘ESEF RTS’). This auditors’ report provides no assurance over whether the annual financial report will be prepared using the single electronic format specified in the ESEF RTS.
Mark Skedgel (Senior Statutory Auditor)for and on behalf of PricewaterhouseCoopers LLPChartered Accountants and Statutory AuditorsBirmingham24 March 2022
Annual Report and Accounts EUROWAG
159
FINANCIAL STATEMENTS

Notes
For the year ended 31 December
2021 2020
Revenue from contracts with customers 10 1,646,102 1,252,954Costs of energy sold (1,492,970) (1,124,348)Net energy and services sales 11 153,132 128,606
Other operating income 655 942Employee expenses 12 (55,665) (41,407)Impairment losses of financial assets 21 (3,116) (4,061)Technology expenses (6,797) (4,049)Other operating expenses (41,282) (24,600)Operating profit before depreciation and amortisation (EBITDA) 46,927 55,431Analysed as:Adjusting items 11 22,793 3,168Adjusted EBITDA 11 69,720 58,599
Depreciation and amortisation 11 (21,867) (18,246)Operating profit 25,060 37,185Finance income 2,234 141Finance costs 14 (8,943) (8,488)Share of net loss of associates (682) –Profit before tax 17,669 28,838Income tax expense 15 (8,019) (5,886)PROFIT FOR THE YEAR 9,650 22,952
OTHER COMPREHENSIVE INCOMEOther comprehensive income to be reclassified to profit or loss in subsequent periods Change in fair value of cash flow hedge recognised in equity 3,683 (4,002)Exchange differences on translation of foreign operations 1,458 (835)Deferred tax related to other comprehensive income – 46Total other comprehensive income 5,141 (4,791)TOTAL COMPREHENSIVE INCOME FOR THE YEAR 14,791 18,161
Total profit for the financial year attributable to equity holders of the Company 9,148 21,239Total profit for the financial year attributable to non-controlling interests 502 1,713Total comprehensive income for the financial year attributable to equity holders of the Company 14,259 16,468Total comprehensive income for the financial year attributable to non-controlling interests 532 1,693
Earnings per share (in cents per share): 25Basic earnings per share 1.54 3.76Diluted earnings per share 1.53 3.73
EUROWAG Annual Report and Accounts for the year ended 31 December 2021
160
FINANCIAL STATEMENTS
Consolidated Statement of Comprehensive Income(EUR ‘000)

NotesAs at 31 December
2021 2020ASSETSNon-current assetsIntangible assets 16 193,453 171,364Property, plant and equipment 17 34,763 32,975Right-of-use assets 18 8,112 8,644Investments in associates 19 12,934 –Financial assets 37 258Deferred tax assets 15 7,642 7,057Derivative assets 9, 22 252 –Other non-current assets 3,554 4,395Total non-current assets 260,747 224,693Current assets Inventories 20 9,557 5,289Trade and other receivables 21 300,601 236,432Income tax receivables 5,095 1,212Derivative assets 9, 22 2,694 526Cash and cash equivalents 23 224,164 118,105Total current assets 542,111 361,564TOTAL ASSETS 802,858 586,257SHAREHOLDERS’ EQUITY AND LIABILITIESShare capital 24 38,113 4,158Share premium 24 194,763 2,927Merger reserve 24 (25,963) –Other reserves 24 1,465 (3,263)Business combinations equity adjustment 24 (17,046) (46,009)Retained earnings 24 84,526 72,177Equity attributable to equity holders of the Company 275,858 29,990Non-controlling interests 24 8,889 34,115Total equity 284,747 64,105Non-current liabilities Interest-bearing loans and borrowings 26 143,579 128,965Lease liabilities 18 5,973 7,155Deferred tax liabilities 15 5,495 3,858Derivative liabilities 9, 22 657 2,691Other non-current liabilities 28 20,281 22,273Total non-current liabilities 175,985 164,942Current liabilities Trade and other payables 28 314,522 305,957Interest-bearing loans and borrowings 26 18,894 42,274Lease liabilities 18 2,601 2,208Provisions 1,545 1,380Income tax liabilities 4,208 4,332Derivative liabilities 9, 22 356 1,059Total current liabilities 342,126 357,210TOTAL EQUITY AND LIABILITIES 802,858 586,257
The accompanying notes form an integral part of these financial statements.The consolidated financial statements were approved by the Board of Directors and authorised for issue on 24 March 2022. They were signed on its behalf by:
Magdalena Bartoś, Chief Financial OfficerCompany No. 13544823
Annual Report and Accounts EUROWAG
161
FINANCIAL STATEMENTS
Consolidated Statement of Financial Position(EUR ‘000)

NotesShare
capitalShare
premiumOther
reservesMerger reserve
Business combinations
equity adjustment
Retained earnings
Total equity attributable
to equity holders of the parent
Non-controlling
interestsTotal
equity
At 31 December 2019 4,158 2,927 1,499 – (41,745) 50,258 17,097 32,487 49,584Profit for the year – – – – – 21,239 21,239 1,713 22,952Other comprehensive income – – (4,771) – – – (4,771) (20) (4,791)Total comprehensive income – – (4,771) – – 21,239 16,468 1,693 18,161
Dividends paid – – – – – – – (65) (65)Share-based payments – – – – – 689 689 – 689Contribution to reserve fund – – 9 – – (9) – – –Put options held by non-controlling interests – – – – (4,264) – (4,264) – (4,264)At 31 December 2020 4,158 2,927 (3,263) – (46,009) 72,177 29,990 34,115 64,105Profit for the year – – – – – 9,148 9,148 502 9,650Other comprehensive income – – 5,111 – – – 5,111 30 5,141Total comprehensive income – – 5,111 – – 9,148 14,259 532 14,791
Share options exercised 24 84 3,698 – – – – 3,782 – 3,782Transactions with own shares – – – – – (10) (10) – (10)Group reorganisation 24 2,582 (6,625) – 4,043 – – – – –Pre-IPO bonus (share-based payments) 24 7 – – – – – 7 – 7Primary proceeds (net of expenses) 24 1,334 194,763 – – – – 196,097 – 196,097Cancellation of shares 24 (58) – – – – 58 – – –Allotment of class B share 24 30,006 – – (30,006) – – – – –Dividends paid – – – – – – – (1,980) (1,980)Transfer of reserves – – (383) – – 383 – – –Share-based payments – – – – – 3,736 3,736 – 3,736Acquisition of subsidiaries 8 – – – – – – – 2,259 2,259Acquisition of non-controlling interests 24 – – – – 27,003 (966) 26,037 (26,037) –Put options held by non-controlling interests – – – – 1,960 – 1,960 – 1,960At 31 December 2021 38,113 194,763 1,465 (25,963) (17,046) 84,526 275,858 8,889 284,747
EUROWAG Annual Report and Accounts for the year ended 31 December 2021
162
FINANCIAL STATEMENTS
Consolidated Statement of Changes In Shareholders’ Equity (EUR ‘000)

Notes
For the year ended 31 December
2021 2020
Cash flows from operating activitiesProfit before tax for the period 17,669 28,838Non-cash adjustments:Depreciation and amortisation 11 21,867 18,246Gain on disposal of non-current assets (29) (48)Interest income (44) (50)Interest expense 4,913 5,469Movements in provisions 153 1,883Impairment losses of financial assets 21 3,116 4,061Movements in allowances for inventories (64) 89Foreign currency exchange rate differences (784) 1,372Fair value revaluation of derivatives (1,472) (1,057)Share-based payments 3,736 689Other non-cash items 792 (124)Working capital adjustments:(Increase)/decrease in trade and other receivables and prepayments (69,445) (7,279)(Increase)/decrease in inventories (4,108) 1,855Increase in trade and other payables 28,774 45,024
Interest received 44 50Interest paid (4,498) (5,086)Income tax paid (10,193) (7,273)Net cash flows (used in)/generated from operating activities (9,573) 86,659
Cash flows from investing activitiesProceeds from sale of property, plant and equipment 225 89Purchase of property, plant and equipment (5,221) (3,221)Purchase of intangible assets (26,230) (19,954)Purchase of financial instruments – (127)Payments for acquisition of subsidiaries, net of cash acquired (1,166) –Investment in associates (10,685) –Net cash used in investing activities (43,077) (23,213)
Cash flows from financing activitiesPayment of principal elements of lease liabilities (2,382) (2,145)Proceeds from borrowings 39,519 12,147Repayment of borrowings (18,773) (4,494)Acquisition of non-controlling interests (27,003) –Dividend payments (3,480) (65)Proceeds from issued share capital (net of expenses) 199,879 –Proceeds from sale of own shares 20 –Net cash generated from financing activities 187,780 5,443
Net increase in cash and cash equivalents 135,130 68,889Effect of exchange rate changes on cash and cash equivalents 63 (217)Cash and cash equivalents at beginning of period 88,961 20,289Cash and cash equivalents at end of period 23 224,154 88,961
Annual Report and Accounts EUROWAG
163
FINANCIAL STATEMENTS
Consolidated Statement of Cash Flows(EUR ‘000)

1. CORPORATE INFORMATIONW.A.G payment solutions plc (the “Company” or the “Parent”) is a public limited company incorporated and domiciled in the United Kingdom and registered under the laws of England & Wales under company number 13544823 with its registered address at Third Floor (East), Albemarle House, 1 Albemarle Street, London W1S 4HA. The ordinary shares of the Company are admitted to the premium listing segment of the Official List of the UK Financial Conduct Authority and trade on the London Stock Exchange plc’s main market for listed securities on 13 October 2021.
The Parent and its subsidiaries (together the “Group”) are principally engaged in:
• Providing payment solutions for fleets of professional transport and forwarding companies, as well as running a network of petrol stations for commercial road transportation;
• Providing unified way of electronic toll payments on a number of European road networks for fleets of professional transport and forwarding companies;
• Recovery of VAT refunds and excise duty from European countries; • Creating an automated journey book and optimising traffic with the use of integrated digital maps; • Combine advanced solutions in the field of electronics, software engineering and applied mathematics; • Sale of navigation licenses; and • Other services.
A list of subsidiaries is included in Note 7.
Prior to the Initial Public Offering (“IPO”), W.A.G payment solutions, a.s was the parent company of the Group for which consolidated financial statements were produced. On 7 October 2021, the Shareholders of W.A.G payment solutions, a.s transferred all of their shares in W.A.G payment solutions, a.s to W.A.G payment solutions plc in exchange for ordinary shares of equal value in W.A.G payment solutions plc (“Group reorganisation”). This resulted in W.A.G payment solutions plc becoming the new Parent Company of the Group. On 8 October 2021, the IPO was completed, with 13 October 2021 representing admission to trading on the London Stock Exchange (“Admission”).
The financial information for the year ended 31 December 2021 (and comparative information for the year ended 31 December 2020) is presented as a continuation of W.A.G. payment solutions, a.s.
2. BASIS OF PREPARATIONThe consolidated financial statements of the Group have been prepared in accordance with UK adopted international accounting standards (“IFRS”) in conformity with the requirements of the Companies Act 2006.
As there was no change in control with the Group reorganisation (see Note 1) involving the Company becoming the new holding company of the Group in a share for share exchange, the financial information for the year ended 31 December 2021 (and comparative information for the year ended 31 December 2020) is presented as a continuation of W.A.G. payment solutions, a.s. A movement in share capital, share premium and merger reserve is reflected in the statement of changes in equity at the date of Group reorganisation.
The consolidated financial statements have been prepared on a historical cost basis, except for derivative financial instruments that have been measured at fair value. The consolidated financial statements are presented in EUR and all values are rounded to the nearest thousand (EUR ’000), except where otherwise indicated.
The Board of Directors have considered the financial prospects of the Company and the Group for the foreseeable future, which is at least the next 12 months and made an assessment of the Company’s and the Group’s ability to continue as a going concern. The Directors’ assessment included consideration of the availability of the Company’s and the Group’s credit facilities, cash flow forecasts and stress scenarios. Stress test scenarios applied in the Going Concern statement are in line with scenarios covered in the Viability statement. The Board of Directors are satisfied that the Company and the Group has the resources to continue business for the foreseeable future, in particular given the level of cash balances available following the IPO, and furthermore are not aware of any material uncertainties that may cast significant doubt upon the Company’s and the Group’s ability to continue as a going concern and the Board of Directors considers it is appropriate to adopt the going concern basis of accounting in preparing the annual financial statements.
The Group’s fiscal year begins on 1 January and ends on 31 December.
EUROWAG Annual Report and Accounts for the year ended 31 December 2021
164
FINANCIAL STATEMENTS
Notes to the Financial Statements

2. BASIS OF PREPARATION CONTINUED Information on Independent AuditorThe below fees represent amounts paid to PwC.
EUR ‘000
For the year ended 31 December2021 2020
The statutory audit of consolidated and Company’s financial statements 685 69Audit of the financial statements of the Company’s subsidiaries 281 232Total audit fees 966 301Other assurance services 2,461 –Consultancy services related to product development 739 676Total non-audit fees 3,200 676Total 4,166 977
Other assurance services relate to initial public offering, including work as a reporting accountant.
The consolidated financial statements of W.A.G. payment solutions, a.s. for 2020 were audited by PricewaterhouseCoopers Audit, s.r.o.
3. BASIS OF CONSOLIDATIONThe consolidated financial statements comprise the financial statements of the Company and its subsidiaries. Control is achieved when the Group is exposed, or has rights, to variable returns from its involvement with the investee and has the ability to affect those returns through its power over the investee. Specifically, the Group controls an investee if, and only if, the Group has:
• Power over the investee (i.e. existing rights that give it the current ability to direct the relevant activities of the investee);
• Exposure, or rights, to variable returns from its involvement with the investee; and• The ability to use its power over the investee to affect its returns.
Generally, there is a presumption that a majority of voting rights results in control. To support this presumption and when the Group has less than a majority of the voting or similar rights of an investee, the Group considers all relevant facts and circumstances in assessing whether it has power over an investee, including:
• The contractual arrangement with the other vote holders of the investee;• Rights arising from other contractual arrangements; and• The Group’s voting rights and potential voting rights.
The Group reassesses whether or not it controls an investee if facts and circumstances indicate that there are changes to one or more of the three elements of control. Consolidation of a subsidiary begins when the Group obtains control over the subsidiary and ceases when the Group loses control of the subsidiary. Assets, liabilities, income, and expenses of a subsidiary acquired or disposed of during the year are included in the consolidated financial statements from the date the Group gains control until the date the Group ceases to control the subsidiary.
Profit or loss and each component of other comprehensive income (“OCI”) are attributed to the equity holders of the Company and to the non-controlling interests, even if this results in the non-controlling interests having a negative balance. When necessary, adjustments are made to the financial statements of subsidiaries to bring their accounting policies into line with the Group’s accounting policies. All intra-group assets and liabilities, equity, income, expenses, and cash flows relating to transactions between members of the Group are eliminated in full on consolidation.
A change in the ownership interest of a subsidiary, without loss of control, is accounted for as an equity transaction.
If the Group loses control over a subsidiary, it derecognises the related assets (including goodwill), liabilities, non-controlling interest, and other components of equity, while any resultant gain or loss is recognised in profit or loss. Any investment retained is recognised at fair value.
Annual Report and Accounts EUROWAG
165
FINANCIAL STATEMENTS

4. SUMMARY OF SIGNIFICANT ACCOUNTING POLICIESThe accounting policies used in preparing the consolidated financial statements are set out below. These accounting policies have been consistently applied in all material respects to all periods presented.4.1 BUSINESS COMBINATIONS AND GOODWILLBusiness combinations are accounted for using the acquisition method. The cost of an acquisition is measured as the aggregate of the consideration transferred, measured at the acquisition date fair value and the amount of any non-controlling interest in the acquiree. For each business combination, the Group elects whether to measure the non-controlling interest in the acquiree at fair value or at the proportionate share of the acquiree’s identifiable net assets. Acquisition-related costs are expensed as incurred and included in other operating expenses.
When the Group acquires a business, it assesses the financial assets and liabilities assumed for appropriate classification and designation in accordance with the contractual terms, economic circumstances, and pertinent conditions as at the acquisition date. This includes the separation of embedded derivatives in host contracts by the acquiree.
If the business combination is achieved in stages, the previously held equity interest is remeasured at its acquisition date fair value and any resulting gain or loss is recognised in profit or loss.
Any contingent consideration to be transferred by the acquirer will be recognised at fair value at the acquisition date. Contingent consideration classified as an asset or liability that is a financial instrument and within the scope of IFRS 9 Financial Instruments: Recognition and Measurement, is measured at fair value with changes in fair value recognised in profit or loss. If the contingent consideration is not within the scope of IFRS 9, it is measured in accordance with the appropriate IFRS. Contingent consideration that is classified as equity is not remeasured and subsequent settlement is accounted for within equity.
There can also be a situation that the holder of non-controlling interest in the acquiree are granted put options that convey to those Shareholders the right to sell their shares in that acquiree for an exercise price specified in the option agreement. From the perspective of the Group, such written put options meet the definition of a financial liability in IAS 32 if the Group has an obligation to settle in cash or in another financial asset if the Non-controlling Shareholders exercise the option. If the terms affecting the exercisability of the option are genuine, then a liability for the put option exercise price is recognised. This is the case even if the put option is exercisable only on the occurrence of uncertain future events that are outside of control of both parties to the contract.
The amount that may become payable under the option on exercise is initially recognised at the present value of the redemption amount within financial liabilities with a corresponding charge directly to equity. The charge to equity is recognised separately as business combinations equity adjustment.
Any subsequent adjustments to the redemption liability are recorded in equity as business combination equity adjustment. In the event that the option expires unexercised, the liability is derecognised with a corresponding adjustment to equity. Once the put option is exercised, the amount previously recorded in equity as business combination equity adjustment is transferred into retained earnings.
Goodwill is initially measured at cost, being the excess of the aggregate of the consideration transferred and the amount recognised for non-controlling interests, and any previous interest held, over the net identifiable assets acquired and liabilities assumed. If the fair value of the net assets acquired is in excess of the aggregate consideration transferred, the Group reassesses whether it has correctly identified all of the assets acquired and all of the liabilities assumed and reviews the procedures used to measure the amounts to be recognised at the acquisition date. If the reassessment still results in an excess of the fair value of net assets acquired over the aggregate consideration transferred, then the gain is recognised in profit or loss.
After initial recognition, goodwill is measured at cost less any accumulated impairment losses. For the purpose of impairment testing, goodwill acquired in a business combination is, from the acquisition date, allocated to each of the Group’s cash-generating units (“CGU”) that are expected to benefit from the combination, irrespective of whether other assets or liabilities of the acquiree are assigned to those units.
Where goodwill has been allocated to a CGU and part of the operation within that unit is disposed of, the goodwill associated with the disposed operation is included in the carrying amount of the operation when determining the gain or loss on disposal. Goodwill disposed in these circumstances is measured based on the relative values of the disposed operation and the portion of the CGU retained.
EUROWAG Annual Report and Accounts for the year ended 31 December 2021
166
FINANCIAL STATEMENTS
Notes to the Financial Statements CONTINUED

4. SUMMARY OF SIGNIFICANT ACCOUNTING POLICIES CONTINUED4.2 FAIR VALUE MEASUREMENT The Group measures financial instruments such as derivatives at fair value at each balance sheet date. Fair value related disclosures for financial instruments and non-financial assets that are measured at fair value or where fair values are disclosed, are summarised in the following notes:
• Disclosures for valuation methods, significant estimates, and assumptions (Note 9);• Quantitative disclosures of fair value measurement hierarchy (Note 9); and• Financial instruments carried at fair value (Note 22).
Fair value is the price that would be received to sell an asset or paid to transfer a liability in an orderly transaction between market participants at the measurement date. The fair value measurement is based on the presumption that the transaction to sell the asset or transfer the liability takes place either:
• In the principal market for the asset or liability; or• In the absence of a principal market, in the most advantageous market for the asset or liability.
The principal or the most advantageous market must be accessible by the Group.
The fair value of an asset or a liability is measured using the assumptions that market participants would use when pricing the asset or liability, assuming that market participants act in their economic best interest.
A fair value measurement of a non-financial asset takes into account a market participant’s ability to generate economic benefits by using the asset in its highest and best use or by selling it to another market participant that would use the asset in its highest and best use.
The Group uses valuation techniques that are appropriate in the circumstances and for which sufficient data are available to measure fair value, maximising the use of relevant observable inputs and minimising the use of unobservable inputs.
All assets and liabilities for which fair value is measured in the financial statements are categorised within the fair value hierarchy, described as follows, based on the lowest level input that is significant to the fair value measurement as a whole:
• Level 1 – Quoted (unadjusted) market prices in active markets for identical assets or liabilities.• Level 2 – Valuation techniques for which the lowest level input that is significant to the fair value measurement is
directly or indirectly observable.• Level 3 – Valuation techniques for which the lowest level input that is significant to the fair value measurement is
unobservable.
For assets and liabilities that are recognised in the financial statements on a recurring basis, the Group determines whether transfers have occurred between levels in the hierarchy by reassessing categorisation (based on the lowest level input that is significant to the fair value measurement as a whole) at the end of each reporting period.
For the purpose of fair value disclosures, the Group has determined classes of assets and liabilities on the basis of the nature, characteristics and risks of the asset or liability and the level of the fair value hierarchy as explained above.
Annual Report and Accounts EUROWAG
167
FINANCIAL STATEMENTS

4. SUMMARY OF SIGNIFICANT ACCOUNTING POLICIES CONTINUED4.3 REVENUE FROM CONTRACTS WITH CUSTOMERSRevenues are recognised when the Group has satisfied a performance obligation and the amount of revenue can be reliably measured. The Group will recognise revenue at an amount that reflects the consideration to which the Group expects to be entitled (after reduction for expected discounts) in exchange for transferring goods or services to a customer.Sale of energyEnergy means any source that makes a vehicle move (diesel, petrol, e-mobility, bio fuel additives and alternative fuel, such as LNG/CNG).
The Group operates two business models for the sale of energy to fleets of professional transport and forwarding companies:
• the acceptance business model – sale through acceptance partner locations (petrol stations); customers may access any petrol station, which is accepting Group’s payment solutions, for price that is independent from the prices of petrol stations under pre-agreed terms; and
• the bunkering business model – owned/rented petrol stations (truck parks) and supply partnership sites (Group supplies energy to bunkering sites located at partner sites); energy inventory is in ownership of the Group until it is purchased by the Group’s customers.
The Group is acting as a principal in all business models with significant judgement made in respect of the acceptance model (see Note 6 under Principal versus agent consideration).
The revenue from the sale of energy is recognised when the Group satisfies a performance obligation (transfers control over the energy), usually on delivery of the energy. The Group recognises revenue at an amount that reflects the consideration to which the entity expects to be entitled (after reduction for expected discounts and volume rebates) in exchange for transferring goods or services to a customer. Sales are recognised net of value added tax.Arranging payments of tollThe revenues from commission for arranging payments of toll is recognised over time in the period in which the performance obligation is satisfied and the service is rendered. The amount of consideration depends on the number of trucks entering a toll gate within a particular month. The Group is acting as an agent as the Group’s responsibility is limited to arranging the provision of toll services.Revenues from tax refundThe revenues from commission fee for the tax refund is recognised over time as the customer simultaneously receives and consumes the benefits provided by the Group’s performance as the Group performs. Revenue is recognised based on assumption, how much time is needed for preparation and submission of a request for refund and other activities needed till reimbursed tax receipt.
Provision of tax refund services without “net invoicing” (pre-financing) is performed on behalf of a customer and no receivable is recognised in Trade and other receivables (Note 21).
In cases where the Group’s customer uses a “net invoicing” service provided by the Group, the client receives its tax refund almost immediately. This method, also known as a “financed refund”, ranks as one of the fastest ways to reclaiming VAT and Excise Duty paid to clients in the moment of the purchase of energy, other services or arranging payments of toll associated with passenger transport or freight haulage. The revenue from provision of credit in the amount of refund tax for the period of reimbursement is recognised over the average reimbursement period for each country in which the Group operates. TelematicsThe revenues from the sale of telematics units and recurring fees for software services are recognised in the period in which the performance obligation is satisfied, and the services are rendered. Telematics software allows companies the effective administration of their vehicle fleet and 24/7 monitor the activity of the whole fleet.
EUROWAG Annual Report and Accounts for the year ended 31 December 2021
168
FINANCIAL STATEMENTS
Notes to the Financial Statements CONTINUED

4. SUMMARY OF SIGNIFICANT ACCOUNTING POLICIES CONTINUEDNavigationNavigation revenue is generated through licensing of navigation software and digital map content to B2B and B2C customers. License of navigation software is granted as a “right to use an intellectual property” while the license of digital map content (including traffic) is granted as a “right to access to an intellectual property”. Right to access provides the customer the right to access, over a certain period of time, map data that is regularly updated during the contract period. Right-to-use licenses are those that only provide the customer the right to use navigation software as it exists at the moment the control passes to the customer. This does not give the customer the right to receive future updates or upgrades other than those that can be considered as minor enhancements or bug fixing.
Revenue for “right-to-use” licenses is recognised at the moment the control passes to the customer. Revenue from “right-to-access” licenses is recognised over the (estimated) period during which the Group is obliged to provide access to the customers, based on third-party content costs plus an appropriate margin. The period for B2C lifetime “right-to-access” licenses is estimated at three years, for B2B lifetime customers, five years.Other servicesOther services include services that are immaterial from Group perspective:
• 24hr assistance services – revenue recognised over period for which service is activated;• Legal services – revenue recognised at the moment service is rendered;• Insurance – the Group is acting as a broker offering clients different insurance products on behalf of some insurance
companies. Revenue is a commission from insurance companies recognised at the moment when a contract is signed;
• Factoring services – revenue recognised at the moment service is rendered; and• Other services.4.4 TAXESCurrent income taxCurrent income tax assets and liabilities for an accounting period are measured at the amount expected to be recovered from or paid to the taxation authorities. The tax rates and tax laws used to compute the amount are those that are enacted or substantively enacted at the reporting date in the countries where the Group operates and generates taxable income.
Current income tax relating to items recognised directly in equity is recognised in equity and not in the statement of profit or loss. Management periodically evaluates positions taken in the tax returns with respect to situations in which applicable tax regulations are subject to interpretation and establishes provisions where appropriate. No tax provisions were established as at 31 December 2021 and 2020.Deferred taxDeferred tax is calculated separately for each company of the Group, using the liability method on temporary differences between the tax bases of assets and liabilities and their carrying amounts for financial reporting purposes at the reporting date.
Deferred tax liabilities are recognised for all temporary differences, except:
• When the deferred tax liability arises from the initial recognition of goodwill or of an asset or liability in a transaction that is not a business combination and, at the time of the transaction, affects neither the accounting profit nor taxable profit or loss.
• In respect of taxable temporary differences associated with investments in subsidiaries, associates, when the timing of the reversal of the temporary differences can be controlled and it is probable that the temporary differences will not reverse in the foreseeable future.
Annual Report and Accounts EUROWAG
169
FINANCIAL STATEMENTS

4. SUMMARY OF SIGNIFICANT ACCOUNTING POLICIES CONTINUED
Deferred tax assets are recognised for all deductible temporary differences, the carry forwards of unused tax credits and unused tax losses, to the extent that it is probable that taxable profit will be available, against which the deductible temporary differences, and the carry forward of unused tax credits and unused tax losses, can be utilised, except:
• When the deferred tax asset relating to the deductible temporary difference arises from the initial recognition of an asset or liability in a transaction that is not a business combination and, at the time of the transaction, affects neither the accounting profit nor taxable profit or loss.
• In respect of deductible temporary differences associated with investments in subsidiaries, associates, deferred tax assets are recognised only to the extent that it is probable that the temporary differences will reverse in the foreseeable future and taxable profit will be available, against which the temporary differences can be utilised.
The carrying amount of deferred tax assets is reviewed at each reporting date and reduced to the extent that it is no longer probable that sufficient taxable profit will be available to allow all or part of the deferred tax asset to be utilised. Unrecognised deferred tax assets are reassessed at each reporting date and are recognised to the extent that it has become probable that future taxable profits will allow the deferred tax asset to be recovered.
Deferred tax assets and liabilities are measured at the tax rates that are expected to apply in the year when the asset is realised or the liability is settled, based on tax rates (and tax laws) that have been enacted or substantively enacted at the reporting date.
Deferred tax relating to items recognised outside profit or loss is recognised outside profit or loss. Deferred tax items are recognised in correlation to the underlying transaction either in other comprehensive income or directly in equity.
Deferred tax assets and deferred tax liabilities are offset if a legally enforceable right exists to set off current tax assets against current income tax liabilities and the deferred taxes relate to the same taxable entity and the same taxation authority.
Tax benefits acquired as part of a business combination, but not satisfying the criteria for separate recognition at that date, are recognised subsequently if new information about facts and circumstances change. The adjustment is either treated as a reduction in goodwill (as long as it does not exceed goodwill) if it was incurred during the measurement period or recognised in profit or loss.4.5 FOREIGN CURRENCY TRANSACTIONSThe Group’s consolidated financial statements are presented in EUR. Each entity in the Group determines its own functional currency, and items included in the financial statements of each entity are measured using that functional currency.
Transactions in foreign currencies are initially recorded by the Group entities at their respective functional currency rates prevailing at the date of the transaction.
Monetary assets and liabilities denominated in foreign currencies are translated at the functional currency spot rate of exchange valid at the reporting date.
Differences arising on settlement or translation of monetary items are recognised in profit or loss as finance income and expenses. Non-monetary items that are measured in terms of historical cost in a foreign currency are translated using the exchange rates at the dates of the initial transactions. Non-monetary items measured at fair value in a foreign currency are translated using the exchange rates at the date when the fair value is determined. The gain or loss arising on translation of non-monetary items measured at fair value is treated in line with the recognition of the gain or loss on the change in fair value of the item.
On consolidation, the assets and liabilities of foreign operations are translated into EUR at the exchange rates prevailing at the reporting date and their statements of profit or loss are translated at the average exchange rate for the relevant year. The exchange differences arising on translation for consolidation are recognised in OCI. On disposal of a foreign operation, the component of OCI relating to that particular foreign operation is recognised in profit or loss.
Any goodwill arising on the acquisition of a foreign operation and any fair value adjustments to the carrying amounts of assets and liabilities arising on the acquisition are treated as assets and liabilities of the foreign operation and translated at the spot rate of exchange at the reporting date.4.6 CASH DIVIDEND TO EQUITY HOLDERS OF THE COMPANYThe Company recognises a liability to make cash distributions to equity holders of the Company when the distribution is authorised, and the distribution is no longer at the discretion of the Company. As per the corporate laws of the United Kingdom, a distribution is authorised when it is approved by the Shareholders. A corresponding amount is recognised directly in equity.
EUROWAG Annual Report and Accounts for the year ended 31 December 2021
170
FINANCIAL STATEMENTS
Notes to the Financial Statements CONTINUED

4. SUMMARY OF SIGNIFICANT ACCOUNTING POLICIES CONTINUED4.7 INTANGIBLE ASSETSIntangible assets acquired separately are measured on initial recognition at cost. The cost of intangible assets acquired in a business combination is their fair value at the date of acquisition. Following initial recognition, intangible assets are carried at cost less any accumulated amortisation and accumulated impairment losses. Internally generated intangibles, excluding capitalised development costs, are not capitalised and the related expenditure is reflected in profit or loss in the period in which the expenditure is incurred. Directly attributable costs that are capitalised as part of the software include employee costs and an appropriate portion of relevant overheads. Capitalised development costs are recorded as intangible assets and amortised from the point at which the asset is ready for use.
The useful life of intangible assets is assessed as either finite or indefinite.
Intangible assets with finite life are amortised over the useful economic life and assessed for impairment whenever there is an indication that the intangible asset may be impaired. The amortisation period and the amortisation method for an intangible asset with a finite useful life are reviewed at least at the end of each reporting period. Changes in the expected useful life or the expected pattern of consumption of future economic benefits embodied in the asset are considered to modify the amortisation period or method, as appropriate, and are treated as changes in accounting estimates.
Amortisation of intangible assets with finite life is recorded on a straight-line basis over their estimated useful life as follows:
Years
Clients’ relationships 2–10Internal software developments 3–10Patents and rights 3–20External software 2–10Other intangible assets 2–3
Intangible assets in progress are not amortised.
Gains or losses arising from derecognition of an intangible asset are measured as the difference between the net disposal proceeds and the carrying amount of the asset and are recognised in the statement of profit or loss when the asset is derecognised.Clients’ relationshipsClients’ relationships were acquired as part of a business combination (Note 8, 16). They are recognised at their fair value at the date of acquisition and are subsequently amortised on a straight-line based on the timing of projected cash flows of the contracts over their estimated useful life.Internal software developmentResearch costs are expensed as incurred. Development expenditures on an individual project are recognised as an intangible asset when the Group can demonstrate:
• The technical feasibility of completing the intangible asset so that the asset will be available for use or sale;• Its intention to complete and its ability and intention to use or sell the asset;• How the asset will generate future economic benefits;• The availability of resources to complete the asset; and• The ability to measure reliably the expenditure during development.
Following initial recognition of the development expenditure as an asset, the asset is carried at cost less any accumulated amortisation and accumulated impairment losses. Amortisation of the asset begins when development is complete, and the asset is available for use. It is amortised over the period of expected future benefit.
Development includes the programming relating to internal development of externally purchased software, development of software-based solutions provided to the Group’s customers and development of new telematics products and services, which include telematics and toll units.Patents and rights, external softwareSeparately acquired patents and rights, and software are shown at historical cost. Patents and rights, and software acquired in a business combination are recognised at fair value at the acquisition date. They have a finite useful life and are subsequently carried at cost less accumulated amortisation and impairment losses.
Annual Report and Accounts EUROWAG
171
FINANCIAL STATEMENTS

4. SUMMARY OF SIGNIFICANT ACCOUNTING POLICIES CONTINUED4.8 PROPERTY, PLANT AND EQUIPMENTProperty, plant and equipment are stated at cost, net of accumulated depreciation and accumulated impairment losses, if any. Cost comprises the aggregate amount paid, and the fair value of any other consideration given to acquire the asset and includes costs directly attributable to making the asset capable of operating as intended.
When significant parts of property, plant and equipment are required to be replaced at intervals, the Group depreciates them separately, based on their specific useful life. Likewise, when a major inspection is performed, its cost is recognised in the carrying amount of the property, plant, and equipment as a replacement if the recognition criteria are satisfied. All other repair and maintenance costs are recognised in profit or loss as incurred.
Depreciation is recorded on a straight-line basis over the estimated useful life of an asset as follows:
Years
Buildings 8–35Leasehold improvements 4–15Machinery and equipment 3–20Vehicles 3–5Fixtures and fittings 5–10
Land and tangible assets in progress are not depreciated.
An item of property, plant and equipment and any significant part initially recognised is derecognised upon disposal or when no future economic benefits are expected from its use or disposal. Any gain or loss arising on derecognition of the asset (calculated as the difference between the net disposal proceeds and the carrying amount of the asset) is included in the income statement when the asset is derecognised.
The residual values, useful life, and methods of depreciation of property, plant and equipment are reviewed at each financial year end and adjusted prospectively, if appropriate.4.9 LEASESIdentification of the Subject of a Lease – Lease Agreement A lease is a contract, or part of a contract, that conveys the right to use an identifiable asset for a period of time in exchange for consideration. At the inception of the contract, the Group assesses whether the contract is a lease or contains a lease. The Group reassesses whether the contract is a lease or contains a lease only when the contractual terms are amended.
The Group assesses whether a contract transfers the right to control the use of an identifiable asset over a period of time based on:
• The Group has the right to obtain a substantial economic benefit from the asset for the period of its use;• The lease is agreed for the lease of a specific asset, and the lessor does not have the right to exchange it or to profit
financially from the exchange;• The Group has the right to control the use of an identifiable asset;• The lease is longer than 12 months (short-term lease exemption allowed under IFRS 16); and• The value of the new asset exceeds EUR 4,500 (low value exemption allowed under IFRS16).
The Group assesses whether the contract contains a lease separately for each potential lease component.
The Group does not have any external subleases outside of the Group nor any contract, where the Group is a lessor.Lease liabilityAt the commencement date, a lessee shall measure the lease liability at the present value of the lease payments that are not paid at that date. Lease payments are payments by the lessee to the lessor for the right to use an underlying asset for the duration of the lease. These payments include:
• fixed payments (lowered by any lease incentives);• variable lease payments that are indexed or fixed to a rate;• call option to purchase where there is sufficient certainty that the lessee will make use of the option; and• payment of penalties for termination of the lease where the lease period corresponds to the lessee making use of
the option to terminate the lease.
EUROWAG Annual Report and Accounts for the year ended 31 December 2021
172
FINANCIAL STATEMENTS
Notes to the Financial Statements CONTINUED
4. SUMMARY OF SIGNIFICANT ACCOUNTING POLICIES CONTINUED
After commencement date, variable lease payments not included in the measurement of the lease liability are recognised in profit or loss in the period in which the event or condition that triggers those payment occurs. Interest from the lease obligation is the Group’s finance costs.Right to use an assetThe Group measures the right to use an asset on the date the lease commences on the basis of a lease agreement. These are based on:
• the value of the lease liability increased by the lease payment that the Group has paid before the day the lease commences (reduced by lease incentives – discounts);
• the initial direct costs of the lease paid by the Group;• the estimated value of the costs for dismantling and removing an identified asset or the reclamation of the site
where the asset was located; and• an increase by the asset’s modification and renovation costs required in the lease agreement, namely by the creation
of a reserve in compliance with IAS 37 Provisions, Contingent Liabilities and Contingent Assets.
Right-of-use assets are generally depreciated over the shorter of the asset’s useful life and the lease term on a straight-line basis.4.10 INVESTMENT IN ASSOCIATESAssociates are all entities over which the Group has significant influence, but not control or joint control. This is generally the case where the Group holds between 20% and 50% of the voting rights. Investments in associates are accounted for using the equity method of accounting, after initially being recognised at cost.
Under the equity method of accounting, the investments are initially recognised at cost and adjusted thereafter to recognise the Group’s share of the post-acquisition profits or losses of the investee in profit or loss, and the Group’s share of movements in other comprehensive income of the investee in other comprehensive income. Dividends received or receivable from associates are recognised as a reduction in the carrying amount of the investment.
The carrying amount of equity-accounted investments is tested for impairment in accordance with the policy described in Note 4.14.4.11 BORROWING COSTSBorrowing costs directly attributable to the acquisition, construction or production of an asset that necessarily takes a substantial period of time to get ready for its intended use or sale are capitalised as part of the cost of an asset. All other borrowing costs are expensed in the period in which they occur. Borrowing costs consist of interest and other costs that the Group incurs in connection with the borrowing of funds.4.12 FINANCIAL INSTRUMENTS – IFRS 9A financial instrument is any contract that gives rise to a financial asset of one entity and a financial liability or equity instrument of another entity.Financial assetsClassification and measurementFinancial assets are classified based on the business model of the Group and characteristic of contractual cash flows. Under IFRS 9, the financial assets are classified into the following categories: financial assets subsequently measured at amortised cost (“AC”), financial assets at fair value through other comprehensive income (“FVOCI”) and financial assets at fair value through profit or loss (“FVTPL”)
The Group classifies financial assets into following categories:
(A) Financial assets subsequently measured at amortised cost – classified if both of the following conditions are met:
• the financial asset is held within a business model whose objective is to hold financial assets in order to collect contractual cash flows; and
• the contractual terms of the financial asset give rise on specified dates to cash flows that are solely payments of principal and interest on the principal amount outstanding (referred to as SPPI test).
Expected credit losses, foreign exchange rate differences, and interest revenues are recognised in the income statement. On derecognition, losses/gains are recognised in the income statement.
Annual Report and Accounts EUROWAG
173
FINANCIAL STATEMENTS

4. SUMMARY OF SIGNIFICANT ACCOUNTING POLICIES CONTINUED
(B) Financial assets at fair value through other comprehensive income
• Assets that are held for collection of contractual cash flows and for selling the financial assets, where the assets’ cash flows represent solely payments of principal and interest, are measured at FVTOCI. Movements in the carrying amount are taken through OCI, except for the recognition of impairment gains or losses, interest income and foreign exchange gains and losses, which are recognised in profit or loss. When the financial asset is derecognised, the cumulative gain or loss previously recognised in OCI is reclassified from equity to profit or loss and recognised in finance income/(costs). Interest income from these financial assets is included in finance income using the effective interest rate method. Foreign exchange gains and losses are presented in finance income/(costs), and impairment expenses are presented as separate line item in the statement of profit or loss.
(C) Financial assets at fair value through profit or loss
• This category includes the financial assets held with strategy of active trading with financial assets. Contractual cash flow collection is not the primary objective of the business model.
• Expected credit losses are not calculated and recognised. Changes in the fair value and foreign exchange rate differences are recognised in the income statement. Changes in the fair values are included in finance costs or finance income.
Trade and other receivables that do not contain a significant financing component, or for which the Group has applied the practical expedient, are measured at the transaction price determined under IFRS 15.
The Group’s financial assets include cash, trade and other receivables with no significant financing component meeting criteria for classification as AC and derivatives meeting criteria for classification as FVTPL and FVTOCI. Trade and other receivablesTrade and other receivables are carried at original invoice amount less an allowance for impairment of these receivables.
See next section for a description of Group’s impairment policies and Note 21 for further information on Trade and other receivables.Impairment of financial assets carried at amortised costAs the Group financial statements include financial assets representing trade and other receivables, only which do not include a significant financing component, the Group applies a simplified approach in calculating expected credit loss (“ECL”). Therefore, the Group does not track changes in credit risk, but instead recognises a loss allowance based on lifetime ECLs at each reporting date. The carrying amount of the asset is reduced either directly or through use of an allowance account. The amount of the loss is recognised in the income statement.
Simplified approach adopted by the Group is using elements from general approach, the main difference is that no staging of financial assets is being used.
ECL measurement is based on three components used by the Group: Probability of Default (“PD”), Exposure at Default (“EAD”) and Loss Given Default (“LGD”):
• PD is an estimate of the likelihood of default to occur over a given time period. It is calculated from combination of customers’ financial position and performance, transactional data, volumes, and payment performance. Set of variables differs according to scorecards applied to customers, which is determined by their resident country.
• EAD is an estimate of exposure at a future default date, taking into account expected changes in the exposure after the reporting period, including repayments of principal and interest, and expected drawdowns on committed credit limits.
• LGD is an estimate of the loss arising on default. It is based on the difference between the contractual cash flows due and those that the lender would expect to receive, including from any collateral. It is usually expressed as a percentage of the EAD.
Impaired debts are derecognised when they are assessed as uncollectible.
EUROWAG Annual Report and Accounts for the year ended 31 December 2021
174
FINANCIAL STATEMENTS
Notes to the Financial Statements CONTINUED

4. SUMMARY OF SIGNIFICANT ACCOUNTING POLICIES CONTINUEDRecognition and derecognitionRegular way purchases and sales of financial assets are recognised on trade date, being the date on which the Group commits to purchase or sell the asset.
A financial asset (or, where applicable, a part of a financial asset or part of a group of similar financial assets) is primarily derecognised (i.e. removed from the Group’s consolidated statement of financial position) when:
• The rights to receive cash flows from the asset have expired; or• The Group has transferred its rights to receive cash flows from the asset or has assumed an obligation to pay the
received cash flows in full without material delay to a third party under a “pass-through” arrangement; and either (a) the Group has transferred substantially all the risks and rewards of the asset, or (b) the Group has neither transferred nor retained substantially all the risks and rewards of the asset, but has transferred control of the asset.
When the Group has transferred its rights to receive cash flows from an asset or has entered into a passthrough arrangement, it evaluates if, and to what extent, it has retained the risks and rewards of ownership. When it has neither transferred nor retained substantially all of the risks and rewards of the asset, nor transferred control of the asset, the Group continues to recognise the transferred asset to the extent of its continuing involvement. In that case, the Group also recognises an associated liability. The transferred asset and the associated liability are measured on a basis that reflects the rights and obligations that the Group has retained.
Continuing involvement that takes the form of a guarantee over the transferred asset is measured at the lower of the original carrying amount of the asset and the maximum amount of consideration that the Group could be required to repay.Financial liabilitiesFinancial liabilities are classified into two main categories (a) at amortised cost and (b) at fair value through profit or loss.
All financial liabilities are recognised initially at fair value and, in the case of loans and borrowings and payables, net of directly attributable transaction costs.
The Group’s financial liabilities include trade and other payables, loans and borrowings including bank overdrafts and derivative financial instruments. Loans and borrowings After initial recognition, interest-bearing loans and borrowings are subsequently measured at amortised cost using the effective interest rate (“EIR”) method. Gains and losses are recognised in profit or loss when the liabilities are derecognised, as well as through the EIR amortisation process.
Amortised cost is calculated by taking into account any discount or premium on acquisition and fees or costs that are an integral part of the EIR. The EIR amortisation is included as finance costs in the statement of profit or loss.
This category generally applies to interest-bearing loans and borrowings. For more information, refer to Note 26.Trade and other payablesTrade payables are recognised at their nominal value, which is deemed to be materially the same as the fair value.Derecognition A financial liability is derecognised when the obligation under the liability is discharged or cancelled or expires. When an existing financial liability is replaced by another from the same lender on substantially different terms, or the terms of an existing liability are substantially modified, such an exchange or modification is treated as the derecognition of the original liability and the recognition of a new liability. The difference in the respective carrying amounts is recognised in the statement of profit or loss.Derivative financial instruments and hedge accountingThe Group uses derivative financial instruments, such as forward currency contracts and interest rate swaps, to hedge its foreign currency risks and interest rate risks. Such derivative financial instruments are initially recognised at fair value on the date on which a derivative contract is entered into and are subsequently remeasured at fair value. Derivatives are carried as financial assets when the fair value is positive and as financial liabilities when the fair value is negative.
Any gains or losses arising from changes in the fair value of derivatives are taken directly to profit or loss, except for the effective portion of cash flow hedges, which is recognised in OCI and later reclassified to profit or loss when the hedged item affects profit or loss.
Annual Report and Accounts EUROWAG
175
FINANCIAL STATEMENTS

4. SUMMARY OF SIGNIFICANT ACCOUNTING POLICIES CONTINUED
Derivatives embedded in financial liabilities are separated from the host contract and accounted for separately if the economic characteristics and risks of the host contract and the embedded derivative are not closely related, a separate instrument with the same terms as the embedded derivative would meet the definition of a derivative, and the combined instrument is not measured at fair value through profit or loss.
The embedded derivatives are separately valued upon inception and at each balance sheet date using an appropriate valuation model, with the changes in fair value recognised in profit or loss. For the purpose of hedge accounting, hedges, still in accordance with IAS39, are classified as:• Cash flow hedges when hedging the exposure to variability in cash flows that is either attributable to a particular
risk associated with a recognised asset or liability or a highly probable forecast transaction or the foreign currency risk in an unrecognised firm commitment; and
• Hedges of a net investment in a foreign operation.
At the inception of a hedge relationship, the Group formally designates and documents the hedge relationship to which it wishes to apply hedge accounting and the risk management objective and strategy for undertaking the hedge. The documentation includes identification of the hedging instrument, the hedged item or transaction, the nature of the risk being hedged and how the Group will assess the effectiveness of changes in the hedging instrument’s fair value in offsetting the exposure to changes in the hedged item’s fair value or cash flows attributable to the hedged risk. Such hedges are expected to be highly effective in achieving offsetting changes in fair value or cash flows and are assessed on an ongoing basis to determine that they actually have been highly effective throughout the financial reporting periods for which they were designated.
Hedges that meet the strict criteria for hedge accounting are accounted for as cash flow hedges or net investment hedges.Cash flow hedgesThe effective portion of the gain or loss on the hedging instrument is recognised in OCI in the cash flow hedge reserve, while any ineffective portion is recognised immediately in the statement of profit or loss.
The Group uses forward currency contracts as hedges of its exposure to foreign currency risk in forecast transactions and firm commitments. The ineffective portion relating to foreign currency contracts is recognised in finance costs. Ineffectiveness of forward currency contracts may arise if the timing of the forecast transaction changes from what was originally estimated, or if there are changes in the credit risk of the Group or the derivative counterparty.
Hedge ineffectiveness for interest rate swaps may occur due to the credit value/debit value adjustment on the interest rate swaps which is not matched by the loan or due to differences in critical terms between the interest rate swaps and loans.
Amounts recognised as OCI are transferred to profit or loss when the hedged transaction affects profit or loss, such as when the hedged financial income or financial expense is recognised or when a forecast sale occurs.
When the hedged item is the cost of a non-financial asset or non-financial liability, the amounts recognised as OCI are transferred to the initial carrying amount of the non-financial asset or liability.
If the hedging instrument expires or is sold, terminated or exercised without replacement or rollover (as part of the hedging strategy), or if its designation as a hedge is revoked, or when the hedge no longer meets the criteria for hedge accounting, any cumulative gain or loss previously recognised in OCI remains separately in equity until the forecast transaction occurs or the foreign currency firm commitment is met.Net investment hedges Hedges of net investments in foreign operations are accounted for similarly to cash flow hedges. Any gain or loss on the hedging instrument relating to the effective portion of the hedge is recognised in OCI in the foreign currency translation reserve. The gain or loss relating to the ineffective portion is recognised immediately in profit or loss within finance income/(costs). Gains and losses accumulated in equity are reclassified to profit or loss when the foreign operation is partially disposed of or sold.
EUROWAG Annual Report and Accounts for the year ended 31 December 2021
176
FINANCIAL STATEMENTS
Notes to the Financial Statements CONTINUED

4. SUMMARY OF SIGNIFICANT ACCOUNTING POLICIES CONTINUED4.13 INVENTORIES Inventories are valued at the lower of cost and net realisable value.
Costs are assigned to individual items on the basis of “first in, first out” (“FIFO”) method (the initial price in the measurement of inventory additions is used as the initial price in the measurement of inventory disposals). Costs of purchased inventory include acquisition-related costs (freight, customs, commission, etc.).
Net realisable value is the estimated selling price in the ordinary course of business, less estimated costs of completion and the estimated costs necessary to make the sale.4.14 IMPAIRMENT OF NON-FINANCIAL ASSETSThe Group assesses at each reporting date whether there is an indication that an asset may be impaired. If any indication exists, or when annual impairment testing for an asset is required, the Group estimates the asset’s recoverable amount. An asset’s recoverable amount is the higher of an assets or CGU’s fair value less costs of disposal and its value in use. The recoverable amount is determined for an individual asset, unless the asset does not generate cash inflows that are largely independent of those from other assets or groups of assets. When the carrying amount of an asset or CGU exceeds its recoverable amount, the asset is considered impaired and is written down to its recoverable amount.
In assessing value in use, the estimated future cash flows are discounted to their present value using a pre-tax discount rate that reflects current market assessments of the time value of money and the risks specific to the asset. In determining fair value less costs of disposal, recent market transactions are taken into account, if available. If no such transactions can be identified, an appropriate valuation model is used. These calculations are corroborated by valuation multiples, quoted share prices for publicly traded companies or other available fair value indicators.
The Group bases its impairment calculation on detailed budgets and forecast calculations, which are prepared separately for each of the Group’s CGUs, to which the individual assets are allocated. These budgets and forecast calculations generally cover a period of five years. A long-term growth rate is estimated and applied to project future cash flows after the fifth year.
Impairment losses of continuing operations are recognised in the statement of profit or loss.
For assets excluding goodwill, an assessment is made at each reporting date as to whether there is any indication that previously recognised impairment losses may no longer exist or may have decreased. If such indication exists, the Group estimates the assets or CGU’s recoverable amount. A previously recognised impairment loss is reversed only if there has been a change in the assumptions used to determine the assets recoverable amount since the last impairment loss was recognised. The reversal is limited so that the carrying amount of the asset does not exceed its recoverable amount, nor exceed the carrying amount that would have been determined, net of depreciation, had no impairment loss been recognised for the asset in prior years. Such reversal is recognised in the income statement.
Intangible assets with indefinite useful life are tested for impairment annually as at 31 December, either individually or at the cash-generating unit level, as appropriate and when circumstances indicate that the carrying value may be impaired. Impairment is determined for goodwill by assessing the recoverable amount of each CGU (or group of CGUs) to which the goodwill relates. When the recoverable amount of the CGU is less than its carrying amount, an impairment loss is recognised. Impairment losses relating to goodwill cannot be reversed in future periods.4.15 CASH AND CASH EQUIVALENTSCash and short-term deposits in the statement of financial position comprise cash in hand and cash at banks.
For the purpose of the consolidated statement of cash flows, cash and cash equivalents consist of cash and short-term deposits as defined above, net of outstanding bank overdrafts as they are considered an integral part of the Group’s cash management.4.16 SHARE-BASED PAYMENTSEmployees of the Group receive remuneration in the form of share-based payment transactions whereby employees render service as consideration for equity instruments or cash. Information relating to these transactions is set out in Note 13.Equity-settled transactionsThe fair value of options granted is recognised as employee expense, with a corresponding increase in equity. The total amount to be expensed is determined by reference to the fair value of options granted, using the Black-Scholes model. The total amount is recognised over the vesting period, which is the period over which all of the specified vesting conditions are to be satisfied. At the end of each period, the Group revises its estimates of the number of options that are expected to vest. It recognises the impact of the revision to original estimates, if any, in profit or loss, with a corresponding adjustment to equity.
Annual Report and Accounts EUROWAG
177
FINANCIAL STATEMENTS

4. SUMMARY OF SIGNIFICANT ACCOUNTING POLICIES CONTINUED
When the options are exercised, the Company issues the appropriate number of shares to the employee. The proceeds received, net of any directly attributable transaction costs, are credited directly to equity.Cash-settled transactionsLiabilities for cash-settled share-based payments are recognised as employee expense over the relevant service period. The liabilities are remeasured to fair value at each reporting date and are presented as employee-related liabilities in the balance sheet.4.17 ADJUSTING ITEMSAdjusting items are items of income and expense which the Group believes should be separately presented and disclosed to provide additional information to investors and to enhance their understanding of the underlying business performance of the Group. The items were determined based on the rules disclosed under Significant judgements. Adjusting items are separately disclosed on the face of the Consolidated Statement of Comprehensive Income and in Note 11. Examples of such items include costs related to acquisitions, amortisation of acquired intangibles, IPO-related costs, pre-IPO share-based payments and expenses related to strategic transformation of the Group.4.18 PROVISIONSProvisions are recognised when the Group has a present obligation (legal or constructive) as a result of a past event, it is probable that an outflow of resources embodying economic benefits will be required to settle the obligation and a reliable estimate can be made of the amount of the obligation. The expense relating to a provision is presented in the statement of profit or loss.
If the effect of the time value of money is material, provisions are discounted using a current pre-tax rate that reflects, when appropriate, the risks specific to the liability. When discounting is used, the increase in the provision due to the passage of time is recognised as a finance cost.
5. CHANGES IN ACCOUNTING POLICIES AND DISCLOSURES, ADOPTION OF NEW AND REVISED STANDARDS
5.1 APPLICATION OF NEW IFRS – STANDARDS AND INTERPRETATIONS EFFECTIVE IN THE REPORTING PERIODThe Group has applied the following standards and amendments for the first time for their annual reporting period commencing 1 January 2021:
• COVID-19 Related rent concessions – amendments to IFRS 16• Amendments to IFRS 4 – deferral of IFRS 9• Interest rate benchmark (“IBOR”) reform – Phase 2 amendments to IFRS 9, IAS 39, IFRS 7, IFRS 4 and IFRS 16
These Amendments did not have a significant impact on the Group’s consolidated financial statements. The Group has borrowings and derivatives for hedging purposes linked to interest rate benchmarks. The Group expects to transition to market standard reference rates or an equivalent mechanism when legacy benchmarks are discontinued and expects to recognise interest expense at a level similar to the current benchmarks. 5.2 NEW IFRSs AND IFRICs PUBLISHED BY THE IASB THAT ARE NOT YET EFFECTIVE The Group is currently assessing the potential impacts of the new and revised standards and interpretations that are expected to be effective from 1 January 2022 or later.
• IFRS 14 Regulatory deferral accounts• Sale or Contribution of Assets between an Investor and its Associate or Joint Venture – amendments to IFRS 10
and IAS 28• IFRS 17 “Insurance Contracts”• Classification of liabilities as current or non-current – Amendments to IAS 1• Proceeds before intended use, Onerous contracts – cost of fulfilling a contract, Reference to the Conceptual
Framework – narrow scope amendments to IAS 16, IAS 37 and IFRS 3• Annual Improvements to IFRSs 2018–2022 – amendments to IFRS 1, IFRS 9, IFRS 16 and IAS 41• Amendments to IFRS 17 and an amendment to IFRS 4• Amendments to IAS 1 and IFRS Practice Statement 2 – Disclosure of Accounting policies• Amendments to IAS 8 – Definition of Accounting Estimates• Deferred tax related to assets and liabilities arising from a single transaction – Amendments to IAS 12
These new standards and amendments are not expected to have any significant impacts on the Group’s consolidated financial statements.
EUROWAG Annual Report and Accounts for the year ended 31 December 2021
178
FINANCIAL STATEMENTS
Notes to the Financial Statements CONTINUED

6. SIGNIFICANT ACCOUNTING JUDGMENTS, ESTIMATES AND ASSUMPTIONS6.1 SIGNIFICANT JUDGEMENTSIn the process of applying the Group’s accounting policies, management has made the following judgments, which have the most significant effect on the amounts recognised in the consolidated financial statements:Principal versus agent considerationThe Group has considered whether it acts as a principal or an agent in the acceptance business model (see explanation of the business models used in sales of energy in Note 4.3) in sale of energy. The Group is not selling just the energy but an integrated web-based solution comprising advice on where to buy energy, offering discounted energy prices that are independent of pricing of the Group’s suppliers, use of payment cards, extended payment terms and administration of the energy sales transaction. The Group sells energy to its customers under one contract covering sales transactions realised under the two business models used by the Group and described in Note 4.3. In the case of the acceptance business model, the principal versus agent assessment involves significant judgement. In applying the judgment, management concluded that the Group is the principal mainly because it is the primary obligor in respect of delivery of energy and related services to its customers. Management also considered the following additional control indicators:
1. The Group has discretion in establishing the price for the specified energy independent from the prices of petrol stations under the acceptance model.
2. The Group has the right to choose its suppliers.3. The Group is responsible for damages caused by the product quality.Put options granted to non-controlling interestsThe Group concluded that it does not, in substance, acquire present access to economic benefits of acquired subsidiaries. The put option redemption liability will be settled with a transfer of the non-controlling interest’s shares for a price that is deemed to approximate their fair value. Therefore, the Non-controlling Shareholders have retained the risks and rewards associated with ownership until the options are exercised and a non-controlling interest is recognised in equity until then. Adjusting itemsIn determining whether an item should be presented as an adjusting item to IFRS measures, the Group considers items that must initially meet at least one of the following criteria:
• It is a significant item, which may cross more than one accounting period. • It has been directly incurred as a result of either an acquisition, capital restructuring or relates to Group’s strategic
transformation programme as these are not part of the Group’s underlying trading activity.• It is unusual in nature, e.g. outside the normal course of business.
If an item meets at least one of the criteria, the Board, through the Audit and Risk Committee, then exercises judgement as to whether the item should be classified as an adjusting item to IFRS performance measures. Refer to Note 11 for list of these items including definitions and exclusion justifications. 6.2 SIGNIFICANT ESTIMATES The preparation of consolidated financial statements requires the use of estimates and assumptions that affect the reported amount of revenues, expenses, assets and liabilities, and the accompanying disclosures, and the disclosure of contingent liabilities at the date of the financial statements. Uncertainty about these assumptions and estimates could result in outcomes that require a material adjustment to the carrying amount of assets or liabilities affected in future periods.
The key assumptions concerning the future and other key sources of estimation uncertainty at the reporting date, that have a significant risk of causing a material adjustment to the carrying amounts of assets and liabilities within the next financial year, are described in the following paragraph. The Group based its assumptions and estimates on parameters available when the consolidated financial statements were prepared. Existing circumstances and assumptions about future developments, however, may change due to market changes or circumstances arising that are beyond the control of the Group. Such changes are reflected in the assumptions when they occur.Put options granted to non-controlling interestsThe put option redemption liability measurement requires significant estimates and assumptions at each reporting date, including forecasted future revenues and profits of the acquired business and discount rates. Higher forecasted revenues and profits result in higher put option redemption liability, which is recognised within financial liabilities with a corresponding charge directly to equity. The charge to equity is recognised separately as business combinations equity adjustment.
Annual Report and Accounts EUROWAG
179
FINANCIAL STATEMENTS

7. GROUP INFORMATIONThe Group is organised in two operating segments:
• Payment solutions represent core of Group’s revenues, which are based on recurring and frequent transactional payments. The segment includes Energy and Toll payments, which are typical first choice of a new customer.
• Mobility solutions represent a number of services, which are subsequently sold to customers using Payment solutions products. The segment includes Tax refund, Telematics, Navigation, and other service offerings.
The consolidated financial statements of the Group include:
NamePrincipal activities
Country of incorporation Registered address
Effective economic interest2021 2020
W.A.G payment solutions plc Holding company
United Kingdom
Third Floor (East), Albemarle House, 1 Albemarle Street, London W1S 4HA
Company –
W.A.G. payment solutions UK LIMITED
Payment solutions
United Kingdom
Horton House, Exchange Flags, Liverpool, Merseyside L2 3PF, United Kingdom
100% 100%
W.A.G. payment solutions AT GmbH
Payment solutions
Austria Kammer 44, 4981 Reichersberg, Austria
100% 100%
W.A.G. AT GmbH Payment solutions
Austria Kammer 44, 4981 Reichersberg, Austria
100% 100%
W.A.G. payment solutions BE BVBA
Payment solutions
Belgium Marcel Broodthaersplein 8, 1060 Sint-Gillis, Brussel, Belgium
100% 100%
W.A.G. payment solutions BG EOOD
Payment solutions
Bulgaria 18 Todor Aleksandrov blvd. 1000 Sofia, Bulgaria
100% 100%
W.A.G. payment solutions HR d.o.o.
Payment solutions
Croatia Grand Centar, Hektorovićeva ulica 2, 10000 Zagreb, Croatia
100% 100%
W.A.G. payment solutions, a.s. Payment and mobility solutions
Czech Republic
Na Vítězné pláni 1719/4, 14000 Prague 4, Czech Republic
100% –
W.A.G. Issuing Services, a.s. Payment solutions
Czech Republic
Na Vítězné pláni 1719/4, 14000 Prague 4, Czech Republic
100% 100%
W.A.G. payment solutions CZ, s.r.o.
Payment solutions
Czech Republic
Na Vítězné pláni 1719/4, 14000 Prague 4, Czech Republic
100% 100%
Reamon Tax, a.s. Mobility solutions
Czech Republic
Göthova 149, Dačice I, 38001 Dačice, Czech Republic
100% 100%
HI Software Development s.r.o. (in liquidation)
Mobility solutions
Czech Republic
Ladova 389/10, Hejčín, 77900 Olomouc, Czech Republic
100% 100%
Princip a.s. Mobility solutions
Czech Republic
Hvězdova 1689/2a, 14000 Prague 4, Czech Republic
100% 100%
W.A.G. payment solutions DK ApS
Payment solutions
Denmark Frederiksborggade 15, 2nd and 3rd floor, 1360 Copenhagen, Denmark
100% 100%
W.A.G. payment solutions EE OÜ Payment solutions
Estonia Akadeemia tee 21/4-301, 12618 Tallinn Harjumaa, Estonia
100% 100%
W.A.G. payment solutions FI Oy Payment solutions
Finland Aalto University Campus, Metallimiehenkuja 10, 02150 Espoo, Finland
100% 100%
W.A.G. payment solutions FR SARL
Payment solutions
France Montpellier Optimum, 450 Rue Baden Powell, 34000 Montpellier. France
100% 100%
EUROWAG Annual Report and Accounts for the year ended 31 December 2021
180
FINANCIAL STATEMENTS
Notes to the Financial Statements CONTINUED

NamePrincipal activities
Country of incorporation Registered address
Effective economic interest2021 2020
W.A.G. payment solutions DE GmbH
Payment solutions
Germany Torgauer Strasse 231-233, Leipzig, 04347, Germany
100% 100%
W.A.G. payment solutions EL SP LTD
Payment solutions
Greece 12A Eleftheriou Venizelou Str., GR - 151 27 Melissia, Athens, Greece
100% 100%
W.A.G. payment solutions HU, Kft.
Payment solutions
Hungary 1138 Budapest, Népfürdő utca 22. B. ép. 13. em., Hungary
100% 100%
W.A.G. HU, Kft. Payment solutions
Hungary 1138 Budapest, Népfürdő utca 22. B. ép. 13. em., Hungary
100% 100%
W.A.G. payment solutions IE LIMITED
Payment solutions
Ireland 6th Floor, 2 Grand Canal Square, D02 A342 Dublin 2, Ireland
100% 100%
CONSORZIO EUROWAG S.C. A R.L
Payment solutions
Italy Via Giovanni Giolitti 55, 10123 Torino, Italy
100% 100%
W.A.G. payment solutions IT S.R.L. UNIPERSONALE
Payment solutions
Italy Via Savonarola 217, 35137 Padova, Italy
100% 100%
SIA W.A.G. payment solutions LV Payment solutions
Latvia Bauskas street 58A, Riga, LV-1004, Latvia
100% 100%
W.A.G. payment solutions LT, UAB
Payment solutions
Lithuania Lvovo str. 25, 16 floor, LT-09320 Vilnius, Lithuania
100% 100%
W.A.G. payment solutions LU S.à r.l.
Payment solutions
Luxembourg 19, rue de Bitbourg, L-1273 Luxembourg
100% 100%
W.A.G. payment solutions NL B.V. Payment solutions
The Netherlands
Cuserstraat 93, 1081 CN Amsterdam. The Netherlands
100% 100%
W.A.G. payment solutions NO AS Payment solutions
Norway Postboks 1964 Vika, 0125 Oslo, Norway
100% 100%
W.A.G. payment solutions PL, Sp. zoo
Payment solutions
Poland ul. Prosta 69, 00-838 Warsaw, Poland
100% 100%
Liserteco LDA Mobility solutions
Portugal Rua das Industrias, n˚ 236, 1˚, Sala 104, Trofa, 4785 – 625, Portugal
100% 75%
W.A.G. payment solutions PT Unnipessoal, LDA
Payment solutions
Portugal Torre de Monsanto, Rua Afonso Praça, Algés, 1495-061 Lisbon, Portugal
100% 100%
W.A.G. payment solutions RO, s.r.l.
Payment solutions
Romania Strada Intrarea Nestorei nr. 1, complex River Plaza, Corp B, et. 6, sector 4, Bucuresti, Romania
100% 100%
Eurowag d.o.o. Beograd-Stari Grad
Payment solutions
Serbia Maksima Gorkog No 8, 1st floor, 26000 Pančevo. Serbia
100% 100%
Aldobec technologies, s.r.o. Mobility solutions
Slovakia Twin City C, Mlynské Nivy 16, 82109 Bratislava - mestská časť Ružinov, Slovakia
100% 100%
Klub Investorov T&G SK, s.r.o. Payment solutions
Slovakia Hlavná 18, 90066 Vysoká pri Morave, Slovakia
100% 100%
W.A.G. payment solutions SK, s.r.o.
Payment solutions
Slovakia Kukučínova 38/A, 83103 Bratislava, Slovakia
100% 100%
W.A.G., plačilne rešitve SI, d.o.o. Payment solutions
Slovenia Trg. Republike 3, 1000 Ljubljana, Slovenia
100% 100%
7. GROUP INFORMATION CONTINUED
Annual Report and Accounts EUROWAG
181
FINANCIAL STATEMENTS

NamePrincipal activities
Country of incorporation Registered address
Effective economic interest2021 2020
W.A.G. payment solutions Spain SLU.
Payment solutions
Spain C/ Albeniz, 6, Polígono Industrial de Asparrena, San Román de San Millán, San Millán 01207 Araba/Álava, Spain
100% 100%
W.A.G. mobility solutions Iberia SL
Payment solutions
Spain C/ Albeniz, 6, Polígono Industrial de Asparrena, San Román de San Millán, San Millán 01207 Araba/Álava, Spain
100% 100%
Arraia-Oil, S.L. Payment solutions
Spain C/ Albeniz, 6, Polígono Industrial de Asparrena, San Román de San Millán, San Millán 01207 Araba/Álava, Spain
100% 75%
Arraia Autopistas, SL Payment solutions
Spain C/ Deida 6, San Román San Millán Industrial Poligon, 01250 Araia Asparrena 01 Araba/Álava, Spain
100% 75%
Liserteco 24 Horas, SL Mobility solutions
Spain C/ Deida 6, San Román San Millán Industrial Poligon, 01250 Araia Asparrena 01 Araba/Álava, Spain
100% 75%
Reivalsa Gestion, S.L. Mobility solutions
Spain C/ Deida 6, San Román San Millán Industrial Poligon, 01250 Araia Asparrena 01 Araba/Álava, Spain
100% 75%
Tax Refund Consulting SL Mobility solutions
Spain C/ Andres Mellado 6, Exterior 1 Izquierda, Madrid 28, Spain
100% 75%
Trofa Gestion, S.L. Mobility solutions
Spain C/ Olaguibel 8, 4 Izquierda, Vitoria 01 Araba/Álava, Spain
100% 75%
W.A.G. payment solutions CH AG Payment solutions
Switzerland Flurstrasse 55, 8048 Zürich, Switzerland
100% 100%
W.A.G. payment solutions Sweden AB
Payment solutions
Sweden Östermalmstorg 1, 114 42 Stockholm, Sweden
100% 100%
WAG Payment Solutions Turkey Ödeme Sistemleri Ticaret Limited Şirketi
Payment solutions
Turkey FSM Mah. Poligon Cad. No: 8B Buyaka2 Sitesi, Kule 2 Kat 6, Daire: 25, 34771 Tepeüstü- Ümraniye- İstanbul, Turkey
100% 100%
Sygic, a.s. Mobility solutions
Slovakia Twin City C, Mlynské Nivy 16, 82109 Bratislava - mestská časť Ružinov, Slovakia
70% 70%
Tripomatic s.r.o. Mobility solutions
Czech Republic
Za Parkem 631/14, Medlánky, 62100 Brno, Czech Republic
35.7% 35.7%
Sygic Czech Republic s.r.o. Mobility solutions
Czech Republic
Běchovická 701/26, 10000 Prague 10, Czech Republic
70% 70%
Sygic Ltd. (in liquidation) Mobility solutions
United Kingdom
Suite 1, 3rd Floor 11-12 St. James’s Square, SW1Y 4LB London, United Kingdom
70% 70%
7. GROUP INFORMATION CONTINUED
EUROWAG Annual Report and Accounts for the year ended 31 December 2021
182
Notes to the Financial Statements CONTINUED
FINANCIAL STATEMENTS

NamePrincipal activities
Country of incorporation Registered address
Effective economic interest2021 2020
KomTeS Chrudim s.r.o. Mobility solutions
Czech Republic
Malecká 273, Chrudim IV, 53705 Chrudim, Czech Republic
51% –
KomTeS CZ s.r.o. Mobility solutions
Czech Republic
Malecká 273, Chrudim IV, 53705 Chrudim, Czech Republic
51% –
KomTeS SK s.r.o. Mobility solutions
Slovakia Dopravná 7, 92101 Piešťany, Slovakia
51% –
Threeforce BV Mobility solutions
The Netherlands
Zeemansstraat 11, 3016 CN in Rotterdam, The Netherlands
27.75% –
UAB “Tankita” Payment solutions
Lithuania Žalgirio str. 96-103, Vilnius, Lithuania
20% –
The Company’s directly held subsidiary is W.A.G. payment solutions, a.s. All other subsidiaries are indirectly held.
The Company, through its subsidiary W.A.G. payment solutions, a.s., has the same percentage voting rights as effective economic interest, directly or indirectly, in all listed above subsidiaries except for Tripomatic s.r.o. W.A.G. payment solutions, a.s. possess 70% of shares in Sygic a.s., which is controlling Tripomatic s.r.o. by having 51% of voting rights.
W.A.G. payment solutions, a.s. has the following branches:
• W.A.G. payment solutions – Branch Bulgaria,• W.A.G. payment solutions, a.s. Spółka Akcyjna Oddział w Polsce,• W.A.G. payment solutions a.s Merkezi Çek Cumhuriyeti İstanbul Merkez Şubesi,• W.A.G. payment solutions, a.s. organizacná zložka.
7. GROUP INFORMATION CONTINUED
Annual Report and Accounts EUROWAG
183
FINANCIAL STATEMENTS

8. BUSINESS COMBINATIONThe following acquisitions took place in 2021:Acquisition of 51% share in KomTeSOn 1 January 2021, the Group acquired 51% of the share capital in KomTeS, a value-added reseller of the Group’s Webdispečink product (Telematics). The transaction will ensure the highest level of support, service, and value to Group and KomTeS customers in both the Czech Republic and Slovakia.
The remaining 49% non-controlling interest is subject to put/call option rights of the parties, where the Group is entitled to exercise the call option at any time after 1 January 2022 and the minority Shareholders are entitled to exercise the put option at any time after 18 December 2023 (if the call option has not been exercised).
The fair values of identifiable assets and liabilities of KomTeS as at the date of acquisition were:
EUR ‘000
Fair value recognised on acquisition
KomTeS Group
AssetsProperty, plant and equipment 109Identifiable intangible assets 4,981Trade receivables 772Cash and cash equivalents 1,610Inventories 96Accruals 10Total Assets 7,578
Trade payables 1,989Deferred tax 946Accruals 29Total Liabilities 2,964Total identifiable net assets at fair value 4,614Non-controlling interest measured at fair value 2,259Goodwill arising on acquisition –
The gross contractual receivables acquired amounted to EUR 772 thousand. At acquisition date, there were no contractual cash flows not expected to be collected. Associate investment in Last Mile SolutionsOn 16 February 2021, the Group acquired 28% non-controlling interest in Dutch-based Threeforce B.V., operating under brand Last Mile Solutions, a fast growing eMobility platform in Europe. The deal supports the Group’s position in the eMobility market and confirms its focus on sustainable transportation solutions. Through this partnership, both companies will combine efforts to provide industry-leading eMobility services to their customers throughout Europe.
Additional 62% shares are subject to a put option, which may require the Group to acquire shares of Last Mile Solutions. The put option is measured as a derivative instrument.
Further details are disclosed in Note 19.Associate investment in DrivittyOn 1 April 2021, the Group acquired a 20% non-controlling interest in the Lithuanian company Tankita UAB, operating under the brand Drivitty, a mobile services integration leader in the commercial transportation market. With this strategic partnership the Group aims to accelerate its path towards providing fully seamless mobile payments for its customers.
Although the Group has a call option to acquire the remaining shares of Drivitty, it concluded that the call option does not provide control over the entity.
EUROWAG Annual Report and Accounts for the year ended 31 December 2021
184
Notes to the Financial Statements CONTINUED
FINANCIAL STATEMENTS

8. BUSINESS COMBINATION CONTINUEDAcquisition of 25% non-controlling interest in ADS GroupOn 4 March 2021, the Group acquired the remaining 25% of shares of ADS companies, a top commercial road transport services provider in Spain and Portugal. The transaction is a key part of the Group’s long-term strategy to strengthen its presence in the Iberian Peninsula and Western Europe.
As the remaining 25% non-controlling interest was subject to put/call option rights of the parties, the Group recognised a financial liability at the present value of the amount payable on exercise of the NCI put in accordance with IFRS 9 at 31 December 2020 (Note 28). The impact of the acquisition on equity is described in Note 24.Pay-out of deferred acquisition considerationOn 24 November 2021, the Group paid first deferred acquisition consideration of EUR 421 thousand related to acquisition of Aldobec technologies, s.r.o.
There were no acquisitions in 2020.
Net outflows of cash to acquire subsidiaries were as follows:
EUR ‘00031 December
202131 December
2020
Cash consideration paid 2,776 –Cash acquired (1,610) –Net outflow of cash – investing activities 1,166 –
Cost of acquisition of subsidiaries recognised in other operating expense:
EUR ‘000
For the year ended 31 December2021 2020
Acquisition costs 789 376
9. FAIR VALUE MEASUREMENTThe following table provides the fair value measurement hierarchy of the Group’s assets and liabilities.
Fair value measurement hierarchy for assets and liabilities as at 31 December 2021:
EUR ‘000 Date of valuation
Fair value measurement usingQuoted
prices in active markets (Level 1)
Significant observable
inputs (Level 2)
Significant unobservable
inputs (Level 3) Total
Assets measured at fair value Derivative financial assets
Foreign currency forwards 31 December 2021 – 2,694 – 2,694Foreign currency swaps 31 December 2021 – 252 – 252
Liabilities measured at fair valueDerivative financial liabilities
Foreign currency forwards 31 December 2021 – 356 – 356Put options 31 December 2021 – – 130 130Interest rate swaps 31 December 2021 – 527 – 527
There have been no transfers between Level 1, Level 2 and Level 3 during the year ended 31 December 2021.
Annual Report and Accounts EUROWAG
185
FINANCIAL STATEMENTS

9. FAIR VALUE MEASUREMENT CONTINUED
Fair value measurement hierarchy for assets and liabilities as at 31 December 2020:
EUR ‘000 Date of valuation
Fair value measurement usingQuoted
prices in active markets (Level 1)
Significant observable
inputs (Level 2)
Significant unobservable inputs (Level
3) Total
Assets measured at fair value Derivative financial assets
Foreign currency forwards 31 December 2020 – 297 – 297Foreign currency swaps 31 December 2020 – 229 – 229
Liabilities measured at fair valueDerivative financial liabilities
Foreign currency forwards 31 December 2020 – 1,059 – 1,059Interest rate swaps 31 December 2020 – 2,691 – 2,691
There have been no transfers between Level 1, Level 2 and Level 3 during the year ended 31 December 2020.
Management assessed that the fair values of cash and cash equivalents, trade and other receivables and trade and other payables approximates their carrying amounts largely due to the short-term maturities of these instruments. Interest-bearing loans and borrowings are at floating rates with margin corresponding to market margins.
The fair value of the financial assets and liabilities is included at the amount at which the instrument could be exchanged in a current transaction between willing parties, other than in a forced or liquidation sale.
10. SEGMENTAL ANALYSISOperating segments are reported in a manner consistent with the internal reporting provided to the Chief Operating Decision Maker (“CODM”). The Group considers the Executive Committee to be the CODM effective from July 2021. The Board of Directors was considered as CODM prior to that date. The CODM reviews net energy and services sales and contribution to evaluate segment performance and allocate resources to the overall business.
For management purposes and based on internal reporting information, the Group is organised in two operating segments; Payment solutions and Mobility solutions. Payment solutions represent the core of the Group’s revenues, which are based on recurring and frequent transactional payments. The segment includes Energy and Toll payments, which are a typical first choice of a new customer. Mobility solutions represent a number of services, which are subsequently sold to customers using Payment solutions products. The segment includes Tax refund, Telematics, Navigation, and other service offerings.
Net energy and services sales, contribution, EBITDA, and Adjusted EBITDA are non-GAAP measures, see Note 11.
The CODM does not review assets and liabilities at segment level.
Year ended 31 December 2021 (EUR ’000)Payment solutions
Mobility solutions Total
Segment revenue 1,606,051 40,051 1,646,102Net energy and services sales 113,081 40,051 153,132
Contribution 99,594 28,926 128,520Contribution margin 88% 72% 84%Corporate overhead and indirect costs before adjusting items (58,800)Adjusting items affecting Adjusted EBITDA (22,793)Depreciation and amortisation (21,867)Net finance cost and share of net loss of associates (7,391)Profit before tax 17,669
EUROWAG Annual Report and Accounts for the year ended 31 December 2021
186
Notes to the Financial Statements CONTINUED
FINANCIAL STATEMENTS
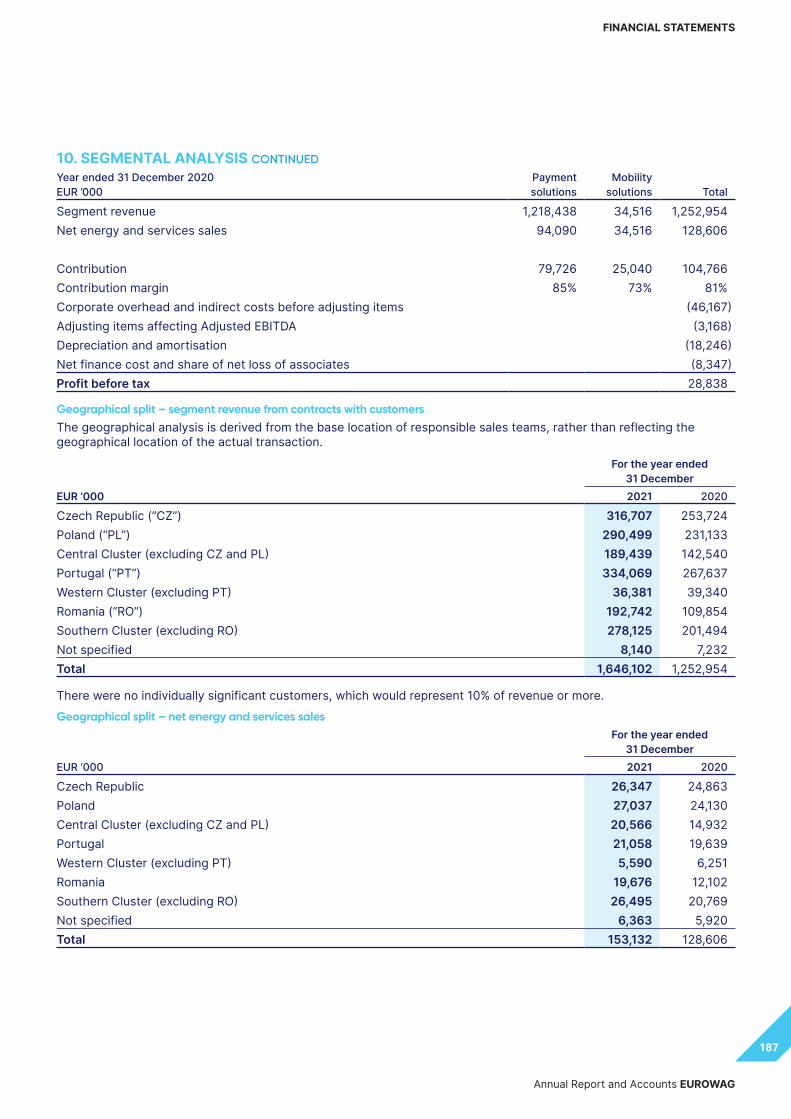
10. SEGMENTAL ANALYSIS CONTINUEDYear ended 31 December 2020EUR ’000
Payment solutions
Mobility solutions Total
Segment revenue 1,218,438 34,516 1,252,954Net energy and services sales 94,090 34,516 128,606
Contribution 79,726 25,040 104,766Contribution margin 85% 73% 81%Corporate overhead and indirect costs before adjusting items (46,167)Adjusting items affecting Adjusted EBITDA (3,168)Depreciation and amortisation (18,246)Net finance cost and share of net loss of associates (8,347)Profit before tax 28,838
Geographical split – segment revenue from contracts with customersThe geographical analysis is derived from the base location of responsible sales teams, rather than reflecting the geographical location of the actual transaction.
EUR ‘000
For the year ended 31 December2021 2020
Czech Republic (“CZ”) 316,707 253,724Poland (“PL”) 290,499 231,133Central Cluster (excluding CZ and PL) 189,439 142,540Portugal (“PT”) 334,069 267,637Western Cluster (excluding PT) 36,381 39,340Romania (“RO”) 192,742 109,854Southern Cluster (excluding RO) 278,125 201,494Not specified 8,140 7,232Total 1,646,102 1,252,954
There were no individually significant customers, which would represent 10% of revenue or more.Geographical split – net energy and services sales
EUR ‘000
For the year ended 31 December2021 2020
Czech Republic 26,347 24,863Poland 27,037 24,130Central Cluster (excluding CZ and PL) 20,566 14,932Portugal 21,058 19,639Western Cluster (excluding PT) 5,590 6,251Romania 19,676 12,102Southern Cluster (excluding RO) 26,495 20,769Not specified 6,363 5,920Total 153,132 128,606
Annual Report and Accounts EUROWAG
187
FINANCIAL STATEMENTS
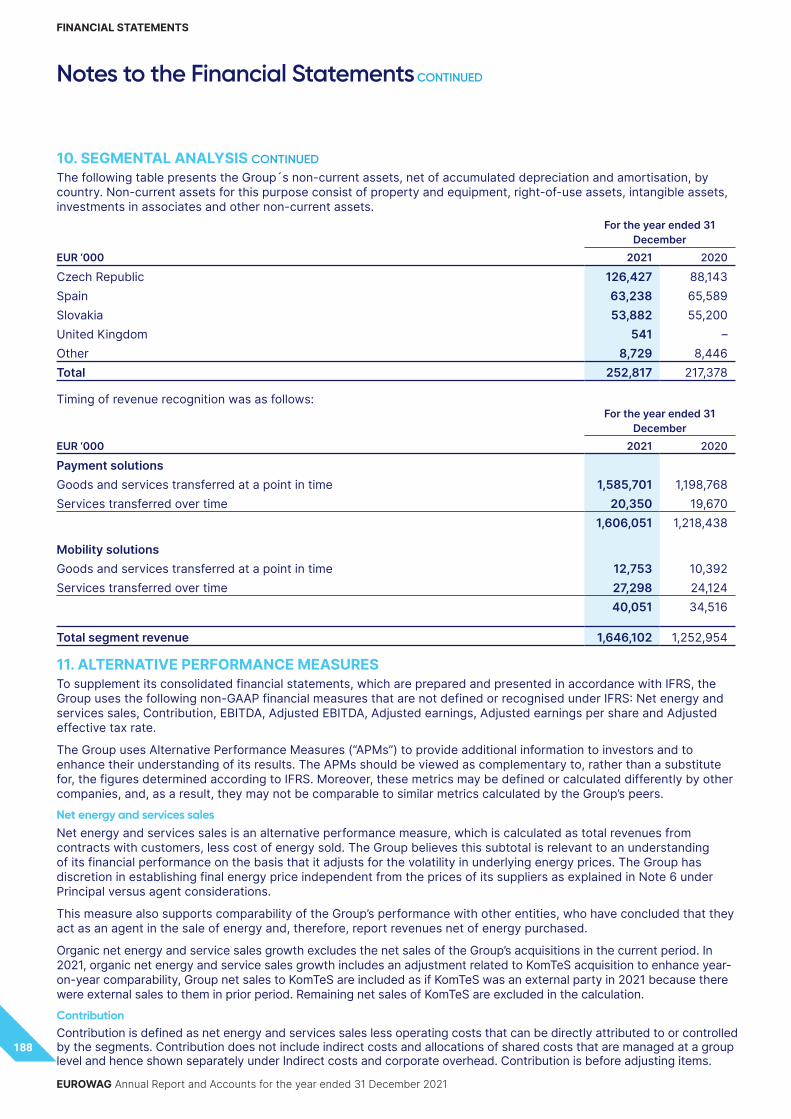
10. SEGMENTAL ANALYSIS CONTINUED
The following table presents the Group´s non-current assets, net of accumulated depreciation and amortisation, by country. Non-current assets for this purpose consist of property and equipment, right-of-use assets, intangible assets, investments in associates and other non-current assets.
EUR ‘000
For the year ended 31 December
2021 2020
Czech Republic 126,427 88,143Spain 63,238 65,589Slovakia 53,882 55,200United Kingdom 541 –Other 8,729 8,446Total 252,817 217,378
Timing of revenue recognition was as follows:
EUR ‘000
For the year ended 31 December
2021 2020
Payment solutionsGoods and services transferred at a point in time 1,585,701 1,198,768Services transferred over time 20,350 19,670
1,606,051 1,218,438
Mobility solutionsGoods and services transferred at a point in time 12,753 10,392Services transferred over time 27,298 24,124
40,051 34,516
Total segment revenue 1,646,102 1,252,954
11. ALTERNATIVE PERFORMANCE MEASURESTo supplement its consolidated financial statements, which are prepared and presented in accordance with IFRS, the Group uses the following non-GAAP financial measures that are not defined or recognised under IFRS: Net energy and services sales, Contribution, EBITDA, Adjusted EBITDA, Adjusted earnings, Adjusted earnings per share and Adjusted effective tax rate.
The Group uses Alternative Performance Measures (“APMs”) to provide additional information to investors and to enhance their understanding of its results. The APMs should be viewed as complementary to, rather than a substitute for, the figures determined according to IFRS. Moreover, these metrics may be defined or calculated differently by other companies, and, as a result, they may not be comparable to similar metrics calculated by the Group’s peers.Net energy and services salesNet energy and services sales is an alternative performance measure, which is calculated as total revenues from contracts with customers, less cost of energy sold. The Group believes this subtotal is relevant to an understanding of its financial performance on the basis that it adjusts for the volatility in underlying energy prices. The Group has discretion in establishing final energy price independent from the prices of its suppliers as explained in Note 6 under Principal versus agent considerations.
This measure also supports comparability of the Group’s performance with other entities, who have concluded that they act as an agent in the sale of energy and, therefore, report revenues net of energy purchased.
Organic net energy and service sales growth excludes the net sales of the Group’s acquisitions in the current period. In 2021, organic net energy and service sales growth includes an adjustment related to KomTeS acquisition to enhance year-on-year comparability, Group net sales to KomTeS are included as if KomTeS was an external party in 2021 because there were external sales to them in prior period. Remaining net sales of KomTeS are excluded in the calculation.ContributionContribution is defined as net energy and services sales less operating costs that can be directly attributed to or controlled by the segments. Contribution does not include indirect costs and allocations of shared costs that are managed at a group level and hence shown separately under Indirect costs and corporate overhead. Contribution is before adjusting items.
EUROWAG Annual Report and Accounts for the year ended 31 December 2021
188
Notes to the Financial Statements CONTINUED
FINANCIAL STATEMENTS

11. ALTERNATIVE PERFORMANCE MEASURES CONTINUEDThe CODM reviews net energy and services sales and contribution to evaluate segment performance and allocate resources to the overall business (Note 10).
Contribution margin represents, for each of the Group’s two operating segments, that segment’s contribution as a proportion of that segment’s Net energy and services sales.
EBITDAEBITDA is calculated as profit before tax, finance income and costs, depreciation and amortisation.
The Group presents EBITDA because it is widely used by securities analysts, investors, and other interested parties to evaluate the profitability of companies. EBITDA eliminates potential differences in performance caused by variations in capital structures (affecting net finance costs), tax positions (such as the availability of net operating losses, against which to relieve taxable profits), the cost and age of tangible assets (affecting relative depreciation expense) and the extent to which intangible assets are identifiable (affecting relative amortisation expense).Adjusted EBITDAAdjusted EBITDA is defined as EBITDA before adjusting items:
Adjusting item Definition Exclusion justification
M&A-related expenses Fees and other costs relating to the Group’s acquisitions activity
M&A-related expenses differ every year based on acquisition activity of the Group. Exclusion of these costs allow better result comparability.
Non-recurring IPO-related expenses
Non-recurring advisory and other expenses relating to the Admission
IPO costs are related to a one-off event, which has significant impact on 2021 profitability. IPO had very limited impact on expenses in 2020 and will not have any impact on expenses in 2022.
Strategic transformation expenses
Costs relating to broadening the skill bases of the Group’s employees (including in respect of executive search and recruiting costs), as well as costs related to transformation of key IT systems
Broadening the skill baseIPO and IT strategic transformation requires different skill base of the Group’s employees. Expenses related to these strategic events were excluded as otherwise they would not be incurred. The expenses are expected to end in 2022.
Transformation of key IT systemsTransformational expenditure represents investments intended to create a new product or service, or significantly enhance an existing one, in order to increase the Group’s revenue potential. This also includes systems and processes improvements to improve services provided to customers. Transformational expenditures, which cannot be capitalised as they are mainly related to research, were excluded as the Group is executing its strategic transformation programme, which is expected to end in 2023 and due to the fact that annual investments compared to Group’s Net sales are significantly higher than regular investments of a technology company.
Share-based compensation
Equity-settled and cash-settled compensation provided to the Group’s management before IPO
Share options and cash-settled compensation have been provided to management and certain employees in connection with the IPO. Total share-based payment charge to be excluded in period 2021–2024 amounts to EUR 21.9 million, from which EUR 1.3 million is a one-off and EUR 20.6 million is amortised over three years. Although these costs will be amortised over the next three years based on accounting policies, they were excluded as they relate to a one-off event. Anticipated expense adjustment amounts to EUR 6.9 million in 2022, EUR 6.1 million in 2023 and EUR 2.6 million in 2024.
Share awards provided post-IPO (Performance share plan in Note 13) were not excluded as they represent non-cash element of annual remuneration package.
Management believes that Adjusted EBITDA is a useful measure for investors because it is a measure closely tracked by management to evaluate the Group’s operating performance and to make financial, strategic, and operating decisions. It may help investors to understand and evaluate, in the same manner as management, the underlying trends in the Group’s operational performance on a comparable basis, period on period.
Annual Report and Accounts EUROWAG
189
FINANCIAL STATEMENTS

11. ALTERNATIVE PERFORMANCE MEASURES CONTINUEDAdjusted EBITDA reconciliation
EUR ‘000
For the year ended 31 December
2021 2020
Intangible assets amortisation (Note 16) 15,303 12,005Tangible assets depreciation (Note 17) 4,129 4,134Right of use depreciation (Note 18) 2,435 2,107Depreciation and amortisation 21,867 18,246Net finance cost and share of net loss of associates 7,391 8,347Profit before tax 17,669 28,838EBITDA 46,927 55,431
M&A-related expenses (Note 8) 789 376Non-recurring IPO-related expenses 12,943 330Strategic transformation expenses 2,688 1,238Share-based compensation (Note 13) 6,373 1,224Adjusting items 22,793 3,168
Adjusted EBITDA 69,720 58,599
Adjusted earnings (net profit)Adjusted earnings are defined as profit after tax before adjusting items:
Adjusting item Definition Exclusion justification
Amortisation of acquired intangibles
Amortisation of assets recognised at the time of an acquisition (primarily ADS and Sygic)
The Group acquired a number of companies in the past and plans further acquisitions in the future. The item is prone to volatility from period to period depending on the level of M&A.
Amortisation due to transformational useful life changes
Accelerated amortisation of assets being replaced by strategic transformation of the Group
Strategic IT transformation programme of the Group is replacing selected softwares before their originally estimated useful life. This may also include early fixed asset write-offs. Amortisation of such assets has been accelerated and abnormally high difference between original and accelerated depreciation was excluded to allow period on period result comparability.
Total expected amortisation charge to be excluded in period 2020–2022 amounts to EUR 4.1 million, from which EUR 2.1 million is expected to be excluded in 2022. The amount represents assets replaced by strategic IT transformation at the end of 2021, however, decisions may be taken as the Group continues with its strategic IT transformation in 2022 and 2023, which may lead to new assets being replaced and either accelerated or written-off. The Group expects this adjustment to be relevant until 2024.
Adjusting items affecting Adjusted EBITDA
Items recognised in the preceding table, which reconciles EBITDA to Adjusted EBITDA
Justifications for each item are listed in the preceding table.
Tax effect Decrease in tax expense as a result of above adjustments
Tax effect of above adjustments is excluded to adjust the impact on after tax profit.
The Group believes this measure is relevant to an understanding of its financial performance absent the impact of abnormally high levels of amortisation resulting from acquisitions and from technology transformation programmes.
EUROWAG Annual Report and Accounts for the year ended 31 December 2021
190
Notes to the Financial Statements CONTINUED
FINANCIAL STATEMENTS

11. ALTERNATIVE PERFORMANCE MEASURES CONTINUEDAdjusted earnings reconciliation
EUR ‘000
For the year ended 31 December
2021 2020
Profit for the year 9,650 22,952Amortisation of acquired intangibles 5,419 5,577Amortisation due to transformational useful life changes 1,717 261Adjusting items affecting Adjusted EBITDA 22,793 3,168Tax effect (3,801) (1,838)Adjusted earnings (net profit) 35,778 30,120
Adjusted earnings per shareAdjusted earnings per share is calculated by dividing the adjusted net profit for the period attributable to equity holders by the weighted average number of ordinary shares outstanding during the period. See Note 25 for further information.Adjusted effective tax rateAdjusted effective tax rate is calculated by dividing the adjusted tax expense by the adjusted profit before tax. The adjustments represent adjusting items affecting adjusted earnings. See Note 15 for further information.Net debt/cashNet debt/cash is calculated as cash and cash equivalents less interest-bearing loans and borrowings.Transformational capital expenditureTransformational capital expenditure represents investments intended to create a new product or service, or significantly enhance an existing one, in order to increase the Group’s revenue potential. This also includes systems and processes improvements to improve services provided to customers.
12. EMPLOYEE EXPENSESEmployee expenses for the respective periods consist of the following:
EUR ‘000
For the year ended 31 December2021 2020
Total personnel
Key management*
Total personnel
Key management*
Wages and salaries 42,077 2,822 33,319 1,787Social security and health insurance 12,347 389 8,780 302Social cost 1,375 – 1,188 1Option plans (Note 13) 6,746 5,327 1,224 1,224Other personnel cost (unused vacation) 126 – 601 143Own work capitalised (7,006) – (3,705) –Total employee expense 55,665 8,538 41,407 3,457
* Until 30 June 2021, included Chief Officers (Board of Directors) and Non-Executive Directors (Supervisory Board) of W.A.G. payment solutions, a.s. From 1 July 2021 includes the Board and Executive Committee of W.A.G payment solutions plc.
In 2021, the Group focused on key priority hires, talent retention, strengthening the structure and remuneration schemes for the public company standards. Adjusting items comprised in employee expenses amounted to EUR 8,609 thousand in 2021 (2020: EUR 1,967 thousand).
Information regarding the highest paid director is included in the Directors Remuneration Report on pages 120 to 140.
Annual Report and Accounts EUROWAG
191
FINANCIAL STATEMENTS
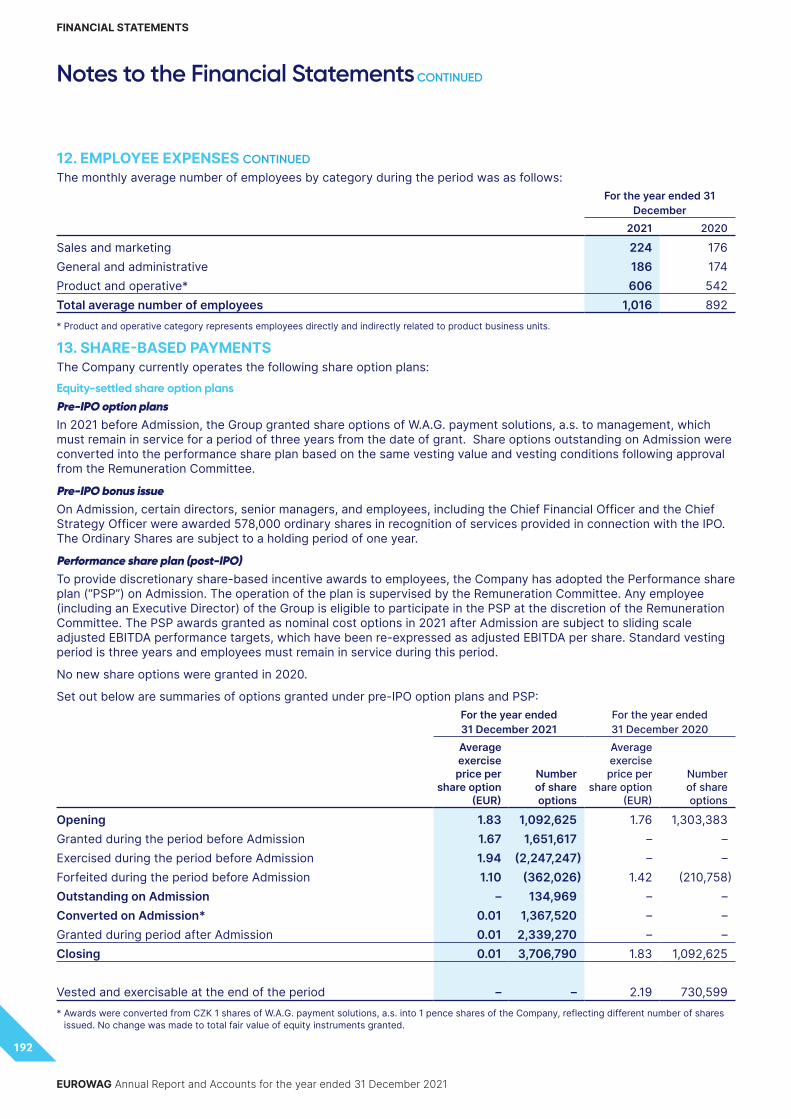
12. EMPLOYEE EXPENSES CONTINUED
The monthly average number of employees by category during the period was as follows:For the year ended 31
December2021 2020
Sales and marketing 224 176General and administrative 186 174Product and operative* 606 542Total average number of employees 1,016 892* Product and operative category represents employees directly and indirectly related to product business units.
13. SHARE-BASED PAYMENTSThe Company currently operates the following share option plans:Equity-settled share option plans Pre-IPO option plansIn 2021 before Admission, the Group granted share options of W.A.G. payment solutions, a.s. to management, which must remain in service for a period of three years from the date of grant. Share options outstanding on Admission were converted into the performance share plan based on the same vesting value and vesting conditions following approval from the Remuneration Committee.
Pre-IPO bonus issueOn Admission, certain directors, senior managers, and employees, including the Chief Financial Officer and the Chief Strategy Officer were awarded 578,000 ordinary shares in recognition of services provided in connection with the IPO. The Ordinary Shares are subject to a holding period of one year.
Performance share plan (post-IPO)To provide discretionary share-based incentive awards to employees, the Company has adopted the Performance share plan (“PSP”) on Admission. The operation of the plan is supervised by the Remuneration Committee. Any employee (including an Executive Director) of the Group is eligible to participate in the PSP at the discretion of the Remuneration Committee. The PSP awards granted as nominal cost options in 2021 after Admission are subject to sliding scale adjusted EBITDA performance targets, which have been re-expressed as adjusted EBITDA per share. Standard vesting period is three years and employees must remain in service during this period.
No new share options were granted in 2020.
Set out below are summaries of options granted under pre-IPO option plans and PSP:For the year ended 31 December 2021
For the year ended 31 December 2020
Average exercise price per
share option (EUR)
Number of share options
Average exercise price per
share option (EUR)
Number of share options
Opening 1.83 1,092,625 1.76 1,303,383Granted during the period before Admission 1.67 1,651,617 – –Exercised during the period before Admission 1.94 (2,247,247) – –Forfeited during the period before Admission 1.10 (362,026) 1.42 (210,758)Outstanding on Admission – 134,969 – –Converted on Admission* 0.01 1,367,520 – –Granted during period after Admission 0.01 2,339,270 – –Closing 0.01 3,706,790 1.83 1,092,625
Vested and exercisable at the end of the period – – 2.19 730,599* Awards were converted from CZK 1 shares of W.A.G. payment solutions, a.s. into 1 pence shares of the Company, reflecting different number of shares
issued. No change was made to total fair value of equity instruments granted.
EUROWAG Annual Report and Accounts for the year ended 31 December 2021
192
Notes to the Financial Statements CONTINUED
FINANCIAL STATEMENTS

13. SHARE-BASED PAYMENTS CONTINUED
Share options outstanding at the end of the period have the following expiry dates and exercise prices:
Exercise price(EUR)
31 December 2021 31 December 2020
Numbers of shares
outstanding
Weighted average
remaining life (years)
Numbers of shares
outstanding
Weighted average
remaining life (years)
2.17 – – 368,573 0.082.21 – – 362,026 0.671.10 – – 362,026 1.670.01 3,706,790 2.32 – –Total 3,706,790 – 1,092,625 –
Fair value of options granted was determined using the Black-Scholes model that takes into account the exercise price, the term of the option, the share price at grant date, expected price volatility of the underlying share and the risk-free interest rate for the term of the option.
The model inputs for options granted in 2021 included:
31 December 2021After Admission Before Admission
Share price at grant date 1.5 GBP 11.49 CZKExercise price 0.01 defined by option contractsExpected price volatility of Company’s shares 50% 50%Risk-free interest rate 1.04% 1.67%
Cash-settled share option plans (pre-IPO)Until 2020, the Group, at its discretion, granted share options of the W.A.G. payment solutions, a.s. to management, once the management has completed six months of service. Management must remain in service for a period of three years from the date of grant. The fair value of share options granted is estimated at each reporting date on the basis of estimated and realised EBITDA growth during service period. The liability is settled after satisfaction of the service condition.
In 2021, shadow shares plan was introduced to provide long-term incentives for certain managers to deliver long-term shareholder returns. Shadow shares are granted under the plan for no consideration and carry no voting rights. Participants in the plan are entitled to equivalent dividend in case dividends are approved by Shareholders of the Company. The fair value of shadow share options granted is estimated at the date of grant on the basis of estimated EBITDA growth in the next three years and remeasured at each reporting date.
Both option plans are cash-settled, and the Group recognised liability:
EUR ‘00031 December
202131 December
2020
Cash-settled plans liability 2,342 1,254
Annual Report and Accounts EUROWAG
193
FINANCIAL STATEMENTS

13. SHARE-BASED PAYMENTS CONTINUEDExpenses arising from share-based payment transactions
EUR ‘000
For the year ended 31 December2021 2020
Equity-settled plans (pre-IPO option plans) 2,238 689Equity-settled plans (pre-IPO bonus issue) 1,125 –Paid social security and health insurance on equity-settled plans (pre-IPO) 1,255 –Cash-settled plans (pre-IPO) 1,755 535Total pre-IPO expenses (Note 11) 6,373 1,224Equity-settled plans (PSP) 373 –Total (Note 12) 6,746 1,224
14. FINANCE COSTSFinance costs for the respective periods were as follows:
EUR ‘000
For the year ended 31 December2021 2020
Bank guarantees fee 616 518Interest expense 5,188 6,217Factoring fee 698 366Loss from the revaluation of derivatives – 878Foreign exchange loss 2,380 289Other 61 220Total 8,943 8,488
Net loss from the revaluation of derivatives relates to contracts that did not qualify for hedge accounting.
In 2021, foreign exchange loss is mostly compensated by EUR 2,122 thousand gain from the revaluation of derivatives, which is presented under finance income.
15. INCOME TAXCorporate income tax for companies in the Czech Republic and United Kingdom for the years 2020 and 2021 was 19%.
WAG Iberia, together with all the Alava tax resident companies of ADS sub-group (Reivalsa, Trofa, Arraia Oil, Arraia Autopistas and Liserteco 24h), formed a consolidation tax group for CIT purposes beginning on 1 April 2019. Spanish corporate income tax is 24%.
Structure of the income tax for the respective periods is as follows:
EUR ‘000
For the year ended 31 December2021 2020
Current income tax charge 7,679 7,383Adjustments in respect of current income tax of prior years 112 873Deferred tax 228 (2,370)Total 8,019 5,886
EUROWAG Annual Report and Accounts for the year ended 31 December 2021
194
Notes to the Financial Statements CONTINUED
FINANCIAL STATEMENTS

15. INCOME TAX CONTINUED
Reconciliation of tax expense and the accounting profit multiplied by the Company domestic tax rate for the below periods:
EUR ‘000
For the year ended 31 December2021 2020
Accounting profit before tax 17,669 28,838At UK’s statutory income tax rate of 19% 3,357 5,479Adjustments in respect of current income tax of prior years 112 873Effect of certain income subject to a special tax rate – (1)Effect of different tax rates in other countries of the Group 507 127Change in unrecognised deferred tax assets – (503)Non-deductible expenses (non-IPO) 1,398 1,153Non-deductible expenses (IPO related) 1,368 –Share-based payments 700 131Net investment hedge 468 (263)Tax credits – (432)Effect of accumulated tax loss claimed in the current period (36) (133)Effect of non-taxable income – (675)Effect of unrecognised deferred tax assets relating to tax losses of current period 145 130At the effective income tax rate of 45.38% 20.41%Income tax expense reported in the statement of profit or loss 8,019 5,886
Adjusted effective tax rate is as follows:
EUR ‘000
For the year ended 31 December2021 2020
Accounting profit before tax 17,669 28,838Adjusting items affecting adjusted EBITDA 22,793 3,618Amortisation of acquired intangibles 5,419 5,577Amortisation due to transformational useful life changes 1,717 261Adjusted profit before tax (A) 47,598 38,294
Accounting tax expense 8,019 5,886Tax effect of above adjustments 3,801 1,838Adjusted tax expense (B) 11,820 7,724
Adjusted earnings (A–B) 35,778 30,570Adjusted effective tax rate (B/A) 24.83% 20.17%
Annual Report and Accounts EUROWAG
195
FINANCIAL STATEMENTS

15. INCOME TAX CONTINUED
Unused tax losses, for which no deferred tax asset has been recognised were as follows:
EUR ‘00031 December
202131 December
2020
Unrecognised tax losses expiring by the end of: 31 December 2021 – 113 31 December 2022 210 195 31 December 2023 279 283 31 December 2024 and after 813 852 No expiry date 942 239Total unrecognised tax losses 2,244 1,682Potential tax benefit 426 320
The unused tax losses were incurred by dormant subsidiaries that are not likely to generate taxable income in the foreseeable future.
Deferred tax balances and movements:
EUR ‘0001 January
2021Business
combinations
(Charged) credited to
profit or lossCharged to
equityTranslation differences
31 December 2021
Difference between net book value of fixed assets for accounting and tax purposes (6,499) (946) (63) – (14) (7,522)Allowances to receivables 1,994 – (443) – 87 1,638Provisions for liabilities and charges 1,276 – 119 – 59 1,454Tax losses 157 – (15) – 6 148Tax benefit from pre-acquisition reserves 6,995 – (572) – – 6,423Other (724) – 746 – (16) 6Net deferred tax asset/(liability) 3,199 (946) (228) – 122 2,147Recognised deferred tax asset 7,057 – 463 – 122 7,642Recognised deferred tax liability (3,858) (946) (691) – – (5,495)
EUR ‘0001 January
2020Business
combinations
(Charged) credited to
profit or lossCharged to
equityTranslation differences
31 December 2020
Difference between net book value of fixed assets for accounting and tax purposes (6,967) – 464 – 4 (6,499)Allowances to receivables 593 – 1,419 – (18) 1,994Provisions for liabilities and charges – – 1,298 – (22) 1,276Accruals tax deductible in different period 331 – (322) – 5 14Tax losses – – 155 – 2 157Tax benefit from pre-acquisition reserves 6,995 – – – – 6,995Other (154) – (626) 46 (4) (738)Net deferred tax asset/(liability) 798 – 2,388 46 (33) 3,199Recognised deferred tax asset 5,636 – 1,408 46 (33) 7,057Recognised deferred tax liability (4,838) – 980 – – (3,858)
EUROWAG Annual Report and Accounts for the year ended 31 December 2021
196
Notes to the Financial Statements CONTINUED
FINANCIAL STATEMENTS

15. INCOME TAX CONTINUED
The Group offsets tax assets and liabilities if and only if it has a legally enforceable right to set off current tax assets and current tax liabilities and the deferred tax assets and deferred tax liabilities relate to income taxes levied by the same tax authority.
Direct subsidiary of the Company W.A.G. payment solutions, a.s. and its subsidiaries have undistributed earnings of EUR 154,840 thousand (2020: EUR 138,635 thousand) which, if paid out as dividends to the Company, would be subject to 5% withholding tax. An assessable temporary difference exists, but no deferred tax liability has been recognised as the Group is able to control the timing of distributions from this subsidiary and is not expected to distribute these profits in the foreseeable future.
16. INTANGIBLE ASSETSCost of intangible assets subject to amortisation:
EUR ‘000 GoodwillClient
relationships
Internal software
developmentPatents
and rightsExternal
software
Other intangible
assets
Internal assets in progress
External assets in progress Total
1 January 2020 104,654 23,657 22,437 5,460 20,488 155 10,765 933 188,549Additions – 510 18,120 2 52 – 365 409 19,458Transfer – – – – 119 (119) – – –Disposals – – – – (8) – – – (8)Translation differences (866) – (704) (2) (39) (5) (342) (4) (1,962)31 December 2020 103,788 24,167 39,853 5,460 20,612 31 10,788 1,338 206,037Additions – 113 18,738 – 2,077 – 7,647 – 28,575Acquisition of a subsidiary – 4,965 – – 77 – – – 5,042Transfer – – – – 915 – – (915) –Disposals – – – – (155) – (124) – (279)Translation differences 1,410 – 2,298 5 719 – 747 36 5,21531 December 2021 105,198 29,245 60,889 5,465 24,245 31 19,058 459 244,590
Accumulated amortisation and impairment of intangible assets subject to amortisation:
EUR ‘000 GoodwillClient
relationships
Internal software
developmentPatents
and rightsExternal
software
Other intangible
assetsAssets in progress Total
1 January 2020 – (7,675) (8,207) (1,511) (5,641) (41) – (23,075)Amortisation – (1,236) (5,791) (1,221) (3,757) – – (12,005)Transfer – – – – (14) 14 – –Disposals – – – – 6 – – 6Translation differences – 74 258 3 63 3 – 40131 December 2020 – (8,837) (13,740) (2,729) (9,343) (24) – (34,673)Amortisation – (2,850) (9,246) (5) (3,200) (2) – (15,303)Acquisition of a subsidiary – – – – (61) – – (61)Disposals – – – – 155 – – 155Translation differences – – (981) (3) (271) – – (1,255)31 December 2021 – (11,687) (23,967) (2,737) (12,720) (26) – (51,137)
Annual Report and Accounts EUROWAG
197
FINANCIAL STATEMENTS

16. INTANGIBLE ASSETS CONTINUED
Net book value:
EUR ‘000 GoodwillClient
relationships
Internal software
developmentPatents
and rightsExternal
software
Other intangible
assetsAssets in progress Total
Net book value at31 December 2020 103,788 15,330 26,113 2,731 11,269 7 12,126 171,364Net book value at 31 December 2021 105,198 17,558 36,922 2,728 11,525 5 19,517 193,453
Internal assets in progress consist of assets where the development phase has not yet been completed.
The Group capitalised employee expenses (Note 12) and cost of materials and services used or consumed in generating the intangible asset.
Research and development costs that were not capitalised and are, therefore, recognised expenses are as follows:
EUR ‘000
For the year ended 31 December2021 2020
Expensed research and development costs 5,024 5,003
Impairment testingImpairment exists when the carrying value of an asset or cash-generating unit (“CGU”) exceeds its recoverable amount, which is the higher of its fair value less costs of disposal and its value in use. The fair value less costs of disposal calculation is based on available data from binding sales transactions, conducted at arm’s length, for similar assets or observable market prices, less incremental costs for disposing of the asset. The value-in-use calculation is based on a DCF model. The cash flows are derived from the budget for the next five years and do not include restructuring activities that the Group is not yet committed to or significant future investments that will enhance the asset’s performance of the CGU being tested. Climate change impact on recoverable amounts and useful life of non-financial assets is not considered to be significant in the next five years. The recoverable amount is sensitive to the discount rate used for the DCF model, as well as the expected future cash-inflows and the growth rate used for extrapolation purposes. These estimates are most relevant to goodwill. The key assumptions used to determine the recoverable amount for the different CGUs are disclosed and further explained below.
Goodwill acquired through business combinations is allocated to the respective CGUs for impairment testing.
Carrying amount of the goodwill allocated to each of the CGUs:
EUR ‘00031 December
202131 December
2020
Energy 40,180 40,180Navigation 34,579 34,527Telematics 25,996 24,673Tax refund 2,382 2,347Toll 2,061 2,061Total 105,198 103,788
The recoverable amount of CGUs has been determined based on a value-in-use calculation using cash flow projections from financial budgets approved by senior management covering a five-year period, which shows growth in revenues.
EUROWAG Annual Report and Accounts for the year ended 31 December 2021
198
Notes to the Financial Statements CONTINUED
FINANCIAL STATEMENTS

16. INTANGIBLE ASSETS CONTINUEDKey assumptions used for impairment testingDiscounted cash flow model is based on the following key assumptions:
• Discount rate• Net energy and services sales for Energy CGU; revenues for Navigation and Telematics CGUs• Revenue growth
Net energy and services sales and revenue growth were determined by management separately for each CGU. They are based on the knowledge of each particular market, taking into account the historical development of revenues, estimated macroeconomic developments in individual regions and the Group’s plans regarding new products development, growth opportunities and market share expansion. Estimated net energy and services sales and revenue growth represent the best possible assumption of the Group’s management considering the future development as at the end of the period.
Discount rate reflects specific risks relating to the industry in which the Group operates. Used discount rate is based on the weighted average cost of capital (“WACC”) of the Group as presumed by Capital Asset Pricing Model.
The table below shows key assumptions used in the value-in-use calculations for material CGUs:
31 December 2021
31 December 2020
Energy CGUPre-tax discount rate 10.0% 10.5%Long-term growth rate 1.8% 1.8%
Navigation CGUPre-tax discount rate 12.0% 12.0%Long-term growth rate 2.0% 2.0%
Telematics CGUPre-tax discount rate 11.0% 11.0%Long-term growth rate 2.0% 2.0%
Tax refund and Toll CGUs were not significant.
The Group has considered the potential impact of climate change in impairment tests. Additional sensitivities of discounted cash-flows were modelled to determine break-even increase in operating and capital expenses and a combination of revenue decrease and expense increase. Reasonably possible change in operating and capital expenses does not lead to any impairment.EnergyThe recoverable amount is estimated to exceed the carrying amount of the CGU at 31 December 2021 by EUR 39,162 thousand.
Discount rate used in the value-in-use calculation would have to increase to 15.56% for the recoverable amount to be equal to its carrying amount.
Net energy and services sales used in the value-in-use calculation would have to decrease by 34.74% for the recoverable amount to be equal to its carrying amount.
Reasonably possible change in long-term revenue growth rate of 1.80% does not lead to any impairment.
Reasonably possible change in operating and capital expenses does not lead to any impairment.
Reasonably possible change in revenue decrease and expenses increase does not lead to any impairment.
Annual Report and Accounts EUROWAG
199
FINANCIAL STATEMENTS

16. INTANGIBLE ASSETS CONTINUEDNavigationThe recoverable amount is estimated to exceed the carrying amount of the CGU at 31 December 2021 by EUR 44,375 thousand.
Discount rate used in the value-in-use calculation would have to increase to 19.88% for the recoverable amount to be equal to its carrying amount.
Revenue used in the value-in-use calculation would have to decrease by 23.43% for the recoverable amount to be equal to its carrying amount.
Reasonably possible change in long-term revenue growth rate of 2.00% does not lead to any impairment.
Reasonably possible change in operating and capital expenses does not lead to any impairment.
Reasonably possible change in revenue decrease and expenses increase does not lead to any impairment.TelematicsThe recoverable amount is estimated to exceed the carrying amount of the CGU at 31 December 2021 by EUR 36,504 thousand.
Discount rate used in the value-in-use calculation would have to increase to 19.32% for the recoverable amount to be equal to its carrying amount.
Revenue used in the value-in-use calculation would have to decrease by 16.74% for the recoverable amount to be equal to its carrying amount.
Reasonably possible change in long-term revenue growth rate of 2.00% does not lead to any impairment.
Reasonably possible change in operating and capital expenses does not lead to any impairment.
Reasonably possible change in revenue decrease and expenses increase does not lead to any impairment.
17. PROPERTY, PLANT AND EQUIPMENTCost of property, plant and equipment:
EUR ‘000Lands and
BuildingsLeasehold
improvements
Machinery and
equipment
Vehicles, Furniture
and fixturesTangibles
in progress Total
1 January 2020 23,178 3,207 18,575 5,798 3,713 54,471Additions – – 493 9 2,049 2,551Transfer 1,499 457 1,373 483 (3,812) –Disposals – – (476) (340) (268) (1,084)Translation differences (685) (63) (455) (204) (127) (1,534)31 December 2020 23,992 3,601 19,510 5,746 1,555 54,404Additions 1,768 432 2,762 213 5 5,180Acquisition of a subsidiary – – – 557 – 557Disposals – (41) (119) (1,212) (10) (1,382)Translation differences 631 173 705 291 23 1,82331 December 2021 26,391 4,165 22,858 5,595 1,573 60,582
EUROWAG Annual Report and Accounts for the year ended 31 December 2021
200
Notes to the Financial Statements CONTINUED
FINANCIAL STATEMENTS

17. PROPERTY, PLANT AND EQUIPMENT CONTINUED
Accumulated depreciation and impairment of property, plant and equipment:
EUR ‘000Lands and
BuildingsLeasehold
improvements
Machinery and
equipment
Vehicles, Furniture
and fixturesTangibles
in progress Total
1 January 2020 (3,885) (1,009) (10,668) (3,020) – (18,582)Depreciation charge (514) (435) (2,247) (938) – (4,134)Disposals – – 433 350 – 783Translation differences 117 27 267 93 – 50431 December 2020 (4,282) (1,417) (12,215) (3,515) – (21,429)Depreciation charge (569) (590) (2,126) (844) – (4,129)Acquisition of a subsidiary – – – (448) – (448)Disposals – 10 113 1,056 – 1,179Translation differences (181) (108) (447) (256) – (992)31 December 2021 (5,032) (2,105) (14,675) (4,007) – (25,819)
Net book value of property, plant and equipment:
EUR ‘000Lands and
BuildingsLeasehold
improvements
Machinery and
equipment
Vehicles, Furniture
and fixturesTangibles
in progress Total
Net book valueat 31 December 2020 19,710 2,184 7,295 2,231 1,555 32,975Net book valueat 31 December 2021 21,359 2,060 8,183 1,588 1,573 34,763
Land, buildings and machinery and equipment are subject to pledge in respect of bank loans:
EUR ‘00031 December
202131 December
2020
Pledged property, plant and equipment 34,544 24,440
Increase in pledged assets is mainly driven by fully pledged shares of W.A.G. payment solutions, a.s. after the Admission and Group reorganisation.
18. LEASES (GROUP AS A LEASEE)The Group leases assets including buildings, land and motor vehicles. The average lease term is four years. Leases comprise a larger number of various diversified lease contracts in different locations.Right-of-use assets
EUR ‘00031 December
202131 December
2020
Buildings 7,005 8,002Lands 486 513Vehicles and machinery 621 129Total 8,112 8,644
Additions to the right-of-use assets 1,509 498
Annual Report and Accounts EUROWAG
201
FINANCIAL STATEMENTS

18. LEASES (GROUP AS A LEASEE) CONTINUEDDepreciation charge of right-of-use assets
EUR ‘000
For the year ended 31 December2021 2020
Buildings (2,244) (2,021)Lands (53) (52)Vehicles and machinery (138) (34)Total (2,435) (2,107)
Lease liabilities
EUR ‘00031 December
202131 December
2020
Long-term lease liabilities 5,973 7,155Short-term lease liabilities 2,601 2,208Total lease liabilities 8,574 9,363
EUR ‘00031 December
202131 December
2020
Within one year 2,601 2,208After one year but not more than five years 4,289 5,369More than five years 1,684 1,786Total lease liabilities 8,574 9,363
Discount rate used was in the range 1.10%–3.25%.Leases in the Income statementLeases are shown as follows in the income statement:
EUR ‘000
For the year ended 31 December2021 2020
Other operating expenseShort-term lease expenses 547 981Low-value lease expenses 53 27Other lease expenses (additional costs) 38 34Depreciation and impairment lossesDepreciation of right-of-use assets 2,435 2,107Net finance costs Interest expense on lease liabilities 229 229Currency translation (gains)/losses on lease liabilities (107) 5
19. INVESTMENT IN ASSOCIATESSet out below are the associates of the Group acquired in 2021 (Note 8):
Name Measurement method Registered officeEffective economic interest
2021 2020
Threeforce BV (Last Mile Solutions) Equity method The Netherlands 27.75% –UAB “Tankita” (Drivitty) Equity method Lithuania 20% –
Both associates are private entities; no quoted prices are available. Drivitty is immaterial to the Group.
EUROWAG Annual Report and Accounts for the year ended 31 December 2021
202
Notes to the Financial Statements CONTINUED
FINANCIAL STATEMENTS
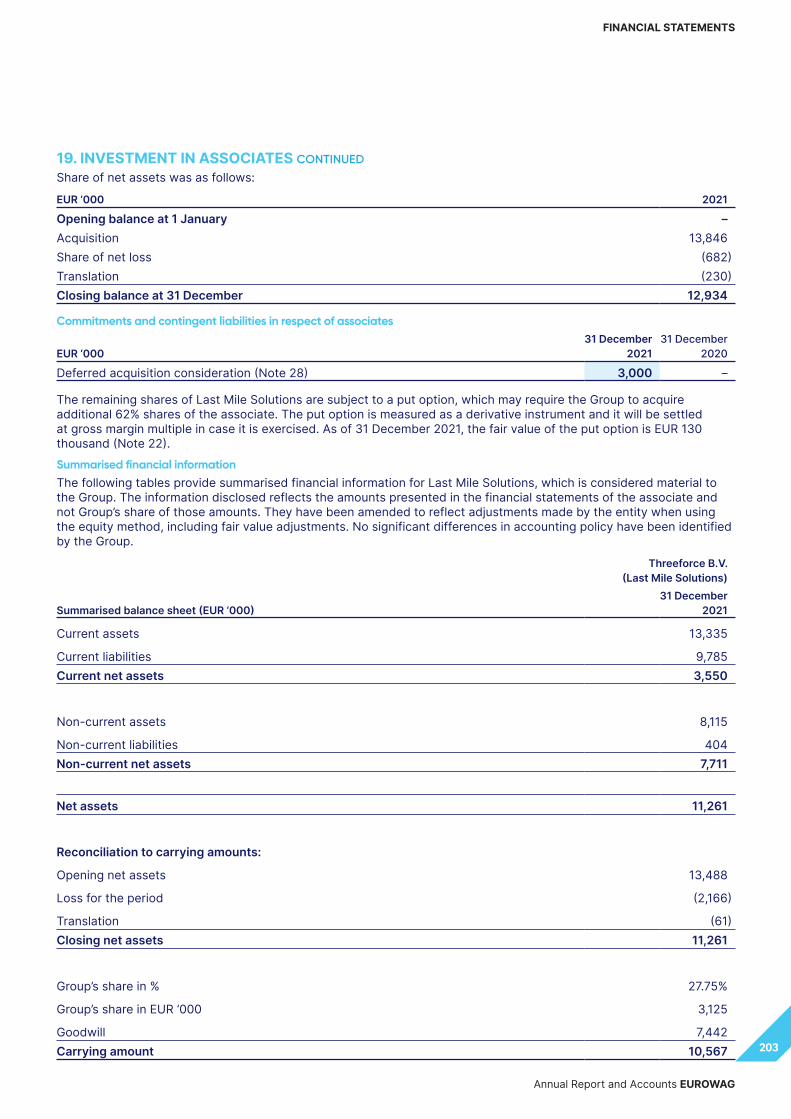
19. INVESTMENT IN ASSOCIATES CONTINUED
Share of net assets was as follows:
EUR ‘000 2021
Opening balance at 1 January –Acquisition 13,846Share of net loss (682)Translation (230)Closing balance at 31 December 12,934
Commitments and contingent liabilities in respect of associates
EUR ‘00031 December
202131 December
2020
Deferred acquisition consideration (Note 28) 3,000 –
The remaining shares of Last Mile Solutions are subject to a put option, which may require the Group to acquire additional 62% shares of the associate. The put option is measured as a derivative instrument and it will be settled at gross margin multiple in case it is exercised. As of 31 December 2021, the fair value of the put option is EUR 130 thousand (Note 22).Summarised financial informationThe following tables provide summarised financial information for Last Mile Solutions, which is considered material to the Group. The information disclosed reflects the amounts presented in the financial statements of the associate and not Group’s share of those amounts. They have been amended to reflect adjustments made by the entity when using the equity method, including fair value adjustments. No significant differences in accounting policy have been identified by the Group.
Summarised balance sheet (EUR ‘000)
Threeforce B.V. (Last Mile Solutions)
31 December 2021
Current assets 13,335
Current liabilities 9,785Current net assets 3,550
Non-current assets 8,115
Non-current liabilities 404Non-current net assets 7,711
Net assets 11,261
Reconciliation to carrying amounts:
Opening net assets 13,488
Loss for the period (2,166)
Translation (61)Closing net assets 11,261
Group’s share in % 27.75%
Group’s share in EUR ‘000 3,125
Goodwill 7,442Carrying amount 10,567
Annual Report and Accounts EUROWAG
203
FINANCIAL STATEMENTS

19. INVESTMENT IN ASSOCIATES CONTINUED
Summarised statement of comprehensive income (EUR ‘000)
Threeforce B.V. (Last Mile Solutions)
For the year ended
31 December 2021
Revenue 29,628
Loss for the period (2,166)
Total comprehensive income (2,166)
20. INVENTORIES
EUR ‘00031 December
202131 December
2020
Raw materials 136 246Goods (excluding on-board units) 6,470 4,082Finished products 3 20On-board units 2,948 941Total 9,557 5,289
Write-downs of inventories to net realisable value were as follows:
EUR ‘000
For the year ended 31 December2021 2020
Write-downs of inventories to net realisable value – 89
Write-downs of inventories were recognised as an expense and were included in cost of energy sold in the statement of profit or loss.
Goods recognised as an expense are presented in full under cost of energy sold.
Raw materials consumed were as follows:
EUR ‘000
For the year ended 31 December2021 2020
Raw materials consumed (in other operating expense) 308 813
21. TRADE AND OTHER RECEIVABLES
EUR ‘00031 December
202131 December
2020
Trade receivables 201,924 162,395Receivables from tax authorities 11,729 16,780Advances granted 10,948 7,231Unbilled revenue 5,533 9,966Miscellaneous receivables 4,000 3,713Tax refund receivables 60,945 31,000Prepaid expenses and accrued income 3,038 2,752Contract assets 2,484 2,595Total 300,601 236,432
EUROWAG Annual Report and Accounts for the year ended 31 December 2021
204
Notes to the Financial Statements CONTINUED
FINANCIAL STATEMENTS

21. TRADE AND OTHER RECEIVABLES CONTINUED
Pledged receivables are subject to security of bank loans including trade and other receivables subject to pledge on ADS shares:
EUR ‘00031 December
202131 December
2020
Pledged receivables 235,439 175,423Total 235,439 175,423
Trade receivables are non-interest bearing and are generally payable on terms below 30 days. Trade and other receivables are non-derivative financial assets carried at amortised cost.
Tax refund receivables include receivables from foreign tax authorities and from financing of tax refunds to customers until processing of the application for tax refund by tax authorities.
The Group applies the IFRS 9 simplified approach to measuring expected credit losses, which uses a lifetime expected loss allowance for all trade receivables and contract assets. Simplified approach adopted by the Group in 2020 is using elements from the general approach, the main difference is that no staging of financial assets is being used.
The ageing analysis of trade and other receivables overdue but without any expected credit loss was as follows:
EUR ‘000Past due
1–90 days
Past due more than
90 days
Past due more than
180 days
Past due more than 365 days Total
As at 31 December 2021 – – – 209 209As at 31 December 2020 – – – 2,438 2,438
The carrying value of trade and other receivables approximates their fair value due to their short-term maturities.
On the basis described previously, the loss allowance was as follows:
31 December 2021
EUR ‘000 CurrentPast due
1–90 days
Past due more than
90 days Total
Gross value of receivables * 237,145 34,314 20,773 292,232Expected credit loss 523 2,623 16,684 19,830 31 December 2020
EUR ‘000 CurrentPast due
1–90 days
Past due more than
90 days Total
Gross value of receivables * 179,115 27,071 21,739 227,925Expected credit loss 361 1,907 18,583 20,851
* Gross value of receivables excludes receivables from tax authorities, advances granted, prepaid expense and accrued income, and contract assets as these are non-financial assets.
Annual Report and Accounts EUROWAG
205
FINANCIAL STATEMENTS

21. TRADE AND OTHER RECEIVABLES CONTINUED
Allowances against outstanding receivables that are considered doubtful were charged to income statement based on the analysis of their collectability.
EUR ‘000 Amount
Allowances at 1 January 2020 16,745Charged 4,311Utilised (45)Unused amounts reversed (250)FX differences 90Allowances at 31 December 2020 20,851Charged 3,480Utilised (5,118)Unused amounts reversed (364)FX differences 981Allowances at 31 December 2021 19,830
Trade receivables and contract assets are written off where there is no reasonable expectation of recovery. Indicators that there is no reasonable expectation of recovery include, amongst others, the failure of a customer to engage in a repayment plan with the Group, when the customer has been placed under liquidation or has entered into bankruptcy proceedings.
22. DERIVATIVES
EUR ‘00031 December
202131 December
2020
Derivative assetsForeign currency forwards – held for trading 2,694 162Foreign currency swaps – held for trading – 229Foreign currency forwards – cash flow hedges – 135Interest rate swaps – cash flow hedges 252 –Total derivative assets at fair value 2,946 526Current 2,694 526Non-current 252 – Derivative liabilities Foreign currency forwards – held for trading 356 125Put options related to associates 130 –Foreign currency forwards – cash flow hedges – 934Interest rate swaps – cash flow hedges 527 2,691Total derivative liabilities at fair value 1,013 3,750Current 356 1,059Non-current 657 2,691
Derivatives not designated as hedging instruments reflect positive or negative change in fair value of those foreign currency forwards, foreign currency swap contracts and interest rate swap contracts that are not designated in hedge relationships, but are, nevertheless, intended to reduce the level of foreign currency risk on expected sales and purchases or interest rate risk.
Put options redemption liability related to non-controlling interests is described in Note 28. Put option related to an associate, which is measured as a derivative instrument and its fair value is EUR 130 thousand as of 31 December 2021, is described in Note 19.
EUROWAG Annual Report and Accounts for the year ended 31 December 2021
206
Notes to the Financial Statements CONTINUED
FINANCIAL STATEMENTS

22. DERIVATIVES CONTINUEDCash flow hedgesForeign currency riskForeign exchange forward contracts measured at fair value through OCI are designated as hedging instruments in cash flow hedges for forecasted sales in EUR.
While the Group also enters into other foreign exchange forward contracts with the intention of reducing the foreign exchange risk of expected sales and purchases, these other contracts are not designated in hedge relationships and are measured at fair value through profit or loss. The foreign exchange forward contract balances vary with the level of expected foreign currency sales and purchases and changes in foreign exchange forward rates.
The terms of the foreign currency forward contracts match the terms of the expected highly probable forecast transactions. As a result, there is no hedge ineffectiveness to be recognised in the statement of profit or loss.
The Group hedges cash flows from highly probable future sales of energy and financing of tolls and tax refunds. The Group contracted FX forwards as hedging instruments. The hedge effectiveness is measured by comparing the changes in hedged cash flow in CZK (foreign currency turnover in EUR translated into CZK) and the changes in the fair value of the hedging instruments (known as a “hypothetical derivative”).
Hedging parameters
• The sum of the nominal values of hedging foreign currency loans and the notional amount of derivatives and the expected amount of sales are identical, or sales in EUR are always higher;
• The hedged item and the hedging instruments are denominated in EUR, i.e. the same currencies;• Expected maturity of hedging instruments, respectively their impact on profit or loss and the timing of the impact of
cash flows on hedged sales are identical; and• Derivatives are negotiated at market price (i.e. without premium payment), the change in fair value corresponds to
the change in cash flow from changes in the exchange rate.
Hedging of future cash flows:
Balance as at 31 December 2021 Within 1 year 1–5 years Total
Currency risk exposureHedging of future cash flows – future receivables – – –Hedging of future cash flows – future liabilities – – –Total – – –
Balance as at 31 December 2020 Within 1 year 1–5 years Total
Currency risk exposureHedging of future cash flows – future receivables 135 – 135Hedging of future cash flows – future liabilities (934) – (934)Total (799) – (799)
Hedging is planned as 100% effective because the amount of effect from hedging items in EUR will be equal to the amount of revenues in EUR (hedged items).
Annual Report and Accounts EUROWAG
207
FINANCIAL STATEMENTS

22. DERIVATIVES CONTINUED
Interest rate riskThe Group obtained club financing facilities (Note 26) with floating interest rate denominated in EUR. The interest rate risk management strategy of the Group requires minimisation of its exposure to changes in cash flow interest rate risk.
The Group concluded interest rate swaps, where the Group pays interest based on a fixed interest rate and receives interest based on a floating interest rate (based on 3M EURIBOR) derived from principal amount in EUR. This instrument allows the Group to reduce its interest rate risk.
EUR ‘00031 December
202131 December
2020
Carrying amount (current and non-current asset) 252 –Carrying amount (current and non-current liabilities) (527) (2,691)Nominal amount 190,000 190,000Maturity date 2024
and 20252024
and 2025Change in fair value of outstanding hedging instruments since 1 January 2,416 (1,833)Change in value of hedged item used to determine hedge effectiveness (2,416) 1,833Weighted average hedged rate for the year 0.26% 0.26%
Hedging itemsThe Group used the following hedging instruments with nominal value:
EUR ‘00031 December
202131 December
2020
Foreign exchange forwards – 52,500Interest rate swaps 190,000 190,000Total 190,000 242,500
Hedging effects to statement of profit and loss in the respective periods were the following:
EUR ‘00031 December
202131 December
2020
Foreign exchange forwards 323 (916)Interest rate swaps (176) (242)Loan 10 million EUR – 124Total 147 (1,034)
Net investment hedgeThe investments of the Group are held by W.A.G. payment solutions, a.s. Based on this fact, one of the Group’s objectives in the area of currency risk management is to minimise the exposure of W.A.G. payment solutions, a.s., whose functional currency is CZK, to changes in the value of its investments arising from fluctuations in exchange rates. A foreign currency exposure arises from net investments in entities whose functional currency differs from CZK. To minimise its exposure to currency risk, W.A.G. payment solutions, a.s. uses loans denominated in EUR to finance acquisitions of its foreign investments.
EUR ‘00031 December
202131 December
2020
Carrying amount (non-current borrowings) 45,112 45,112Change in carrying amount of bank loan as a result of foreign currency movements since 1 January, recognised in OCI (2,447) 1,424Change in value of hedged item used to determine hedge effectiveness 2,462 (1,466)Weighted average hedged rate for the year 25.647 CZK
= 1 EUR26.452 CZK
= 1 EUR
EUROWAG Annual Report and Accounts for the year ended 31 December 2021
208
Notes to the Financial Statements CONTINUED
FINANCIAL STATEMENTS

23. CASH AND CASH EQUIVALENTSFor the purpose of the statement of cash flows, cash and cash equivalents comprise the following:
EUR ‘00031 December
202131 December
2020
Cash at banks 224,141 118,073Cash on hand 23 32Cash and cash equivalents presented in the statement of financial position 224,164 118,105Bank overdrafts (10) (29,144)Cash and cash equivalents presented in the statement of cash flows 224,154 88,961
Pledged cash at bank subject to security of bank loans:
EUR ‘00031 December
202131 December
2020
Cash at banks pledged 128,965 109,285
The fair value of cash and cash equivalents approximates their carrying value due to their short-term maturities.
Credit quality of cash at banks and short-term deposits:
EUR ‘000 External rating scale
31 December 2021
31 December 2020
Aa 704 –A 16,519 20,877Baa 161,643 77,434Ba 41,579 9,014B 654 641Caa 2,654 9,761Unrated 388 346Total 224,141 118,073
Annual Report and Accounts EUROWAG
209
FINANCIAL STATEMENTS

24. EQUITYShares authorised, issued and fully paid:
Number of
sharesShare capital
EUR ‘000Number of
sharesShare capital
EUR ‘000
Share premiumEUR ‘000
Merger reserve
EUR ‘000Ordinary shares1 Class B share
At 1 January 20201 2,412,532 4,158 – – 2,927 –Issuance of share capital – – – – – –At 31 December 2020 2,412,532 4,158 – – 2,927 –Issuance of share capital (share options exercised)2 2,141,868 84 – – 3,698 –Share capital immediately prior to IPO 4,554,400 4,242 – – 6,625 –Converted at IPO3 575,050,000 4,242 – – 6,625 –Group reorganisation4 – 2,582 – – (6,625) 4,043Pre-IPO bonus (share-based payments)3 578,000 7 – – – –Primary proceeds (net of expenses)5 113,333,333 1,334 – – 194,763 –Capital reduction6 (50,000) (58) – – – –Allotment of class B share7 – – 1 30,006 – (30,006)At 31 December 2021 688,911,333 8,107 1 30,006 194,763 (25,963)
1. Share capital at 1 January 2020 of W.A.G. payment solutions, a.s. represented 2,412,457 ordinary shares, 45 priority shares and 30 shares with special rights. There were four classes of ordinary shares – 108 shares with nominal value of CZK 1,000,000, 1 share with nominal value of CZK 296,000, 30 shares with nominal value of CZK 50,000 and 2,412,318 shares with nominal value of CZK 1
2. Ordinary shares were issued with nominal value of CZK 1. See Note 13 for further information on share-based payments3. The Company listed its shares on the London Stock Exchange on 8 October 2021 and was admitted to trading on 13 October 2021 (“Admission”). As
part of the IPO, holders of equity instruments in W.A.G. payment solutions, a.s. received 575,000,000 shares in the Company. In addition, 113,333,333 new shares were issued, and 578,000 shares were awarded to certain directors, senior managers and employees in recognition of services provided in connection with the listing, bringing the total amount of shares outstanding on Admission to 688,911,333. Initial share capital was cancelled 1 day before Admission (footnote 7 below)
4. EUR 2.6 million was reclassified to share capital and EUR 6.6 million from share premium into merger reserve to reflect the nominal value of 1 pence per 575,000,000 shares and of GBP 1 per 50,000 initial share capital shares
5. The increase in share capital and share premium of EUR 200.0 million represents the gross proceeds from the IPO, stabilisation profit of EUR 1.7 million less direct share issue expenses of EUR 5.7 million
Under stabilisation arrangement in connection with the IPO, the Company made an agreement that any profit or loss from the stabilisation phase belong to the Company. The profit is directly linked to the IPO process; therefore, it was treated in the same way as proceeds from the IPO and was recognized against share premium
6. The Company was established on 3 August 2021 with initial share capital of GBP 50,000 (EUR 58,000). The initial capital was cancelled on 12 October 2021
7. On 13 December 2021, the Company alloted from merger reserve 1 Class B share with no voting rights or rights to distributions or rights to the return of capital on winding up. The share has nominal value of GBP 25,500 thousand (EUR 30,006 thousand). On 14 December 2021, the High Court of Justice in England and Wales made an order confirming the reduction of the share premium account by GBP 163 million (EUR 191.8 million) and the cancellation of the Class B share. However, the capital reduction was only registered by Companies House on 8 January 2022, which is the effective date for financial reporting. The Company will be able to apply the distributable reserves arising from the capital reduction and the Class B share cancellation in 2022
Share-based paymentsThe Group has a share option scheme under which options to subscribe for the Group’s shares have been granted to management.
Refer to Note 13 for further details on these plans.Changes in Shareholders’ equity of W.A.G. payment solutions, a.s.Upon the decision of the regular General Meeting of Shareholders held on 30 June 2021, the Shareholders decided not to distribute profit to the Shareholders and keep all profit as the retained earnings.
Upon the decision of the regular General Meeting of Shareholders held on 17 September 2020, the Shareholders decided not to distribute profit to the Shareholders and keep all profit as the retained earnings.
EUROWAG Annual Report and Accounts for the year ended 31 December 2021
210
Notes to the Financial Statements CONTINUED
FINANCIAL STATEMENTS

24. EQUITY CONTINUEDOther reserves
EUR ‘00031 December
202131 December
2020
Foreign currency translation reserve 1,683 255Reserve funds 54 437Cash-flow hedge reserve (272) (3,955)Total 1,465 (3,263)
Until 2013, W.A.G. payment solutions, a.s. was obliged to contribute to legal reserve fund from current year profits. Since 2014, it is no longer obliged to keep this fund by law or statutes. Management is not restricted to decide on potential distribution. In December 2021, reserve fund of W.A.G. payment solutions, a.s. amounting to EUR 383 thousand was transferred to retained earnings.
Minor balances of reserve funds relate to selected subsidiaries, where the Group is obliged to make annual contributions from local profits.Business combinations equity adjustmentThe reserve reflects corresponding charge related to present value of put options redemption amount (Note 28). Once the put option is exercised and the liability is settled the equivalent amount is transferred from the Business combinations equity adjustment reserve to Retained earnings. Refer to Non-controlling interests section for ADS acquisition.Non-controlling interestsIn 2021, the Group acquired KomTes Group (Note 8). As of 31 December 2021, non-controlling interests related to KomTes Group amounts to EUR 2,707 thousand.
Set out below is summarised financial information for each subsidiary that has non-controlling interests that are material to the Group.
Summarised balance sheet (EUR ‘000)
ADS Group Sygic Group31 December
202131 December
202031 December
202131 December
2020
Current assets – 77,823 8,074 11,267Current liabilities – 39,133 4,035 4,735Current net assets – 38,690 4,039 6,532
Non-current assets – 69,554 51,777 53,099Non-current liabilities – 2,686 4,298 5,625Non-current net assets – 66,868 47,479 47,474
Net assets – 105,558 51,518 54,006
Accumulated NCI – 27,063 6,182 7,053
Annual Report and Accounts EUROWAG
211
FINANCIAL STATEMENTS

24. EQUITY CONTINUED
Summarised statement of comprehensive income (EUR ‘000)
ADS Group Sygic Group31 December
202131 December
202031 December
202131 December
2020
Revenues – 268,717 13,917 13,285Profit/(loss) for the period – 7,116 (194) (857)Other comprehensive income – 68 46 (20)Total comprehensive income – 7,184 (148) (877)
Profit allocated to NCI – 1,933 54 (220)
Dividends paid to NCI 1,025 – 955 65
Summarised cash flows (EUR ‘000)
ADS Group Sygic Group31 December
202131 December
202031 December
202131 December
2020
Cash flows from operating activities – 20,423 2,765 3,987Cash flows from investing activities – (1,892) (2,162) (785)Cash flows from financing activities – (101) (3,486) (500)Net increase/(decrease) in cash and cash equivalents – 18,430 (2,883) 2,702
On 4 March 2021, the Group acquired the remaining 25% of shares of ADS companies (Note 8). The parties agreed that acquisition price was determined based on balances as at 31 December 2020, therefore, no NCI was allocated in 2021.
The effect on the equity attributable to the owners of the Group is summarised as follows:
EUR ‘00031 December
202131 December
2020
Carrying amount of non-controlling interests acquired 26,037 –Consideration paid to non-controlling interests (27,003) –Excess of consideration paid recognised within retained earnings (966) –
25. EARNINGS PER SHAREAll ordinary shares have the same rights. Class B share was excluded from earnings per share (“EPS”) calculation as it has no voting rights, rights to distributions or rights to the return of capital on winding up.
Basic EPS is calculated by dividing the net profit for the period attributable to equity holders of the Group by the weighted average number of ordinary shares outstanding during the year.
Diluted EPS is calculated by dividing the net profit for the period attributable to equity holders of the Group by the weighted average number of ordinary shares outstanding during the period, plus the weighted average number of shares that would be issued if all dilutive potential ordinary shares were converted into ordinary shares.
Adjusted EPS is calculated by dividing the Adjusted earnings (net profit) for the period attributable to equity holders by the weighted average number of ordinary shares outstanding during the period.
EUROWAG Annual Report and Accounts for the year ended 31 December 2021
212
Notes to the Financial Statements CONTINUED
FINANCIAL STATEMENTS

25. EARNINGS PER SHARE CONTINUED
The following reflects the income and share data used in calculating EPS:
For the year ended 31 December
2021 2020
Net profit attributable to equity holders (EUR ‘000) 9,148 21,239Basic weighted average number of shares 595,582,785 564,857,081Effects of dilution from share options 1,483,248 4,852,427Total number of shares used in computing dilutive earnings per share 597,066,033 569,709,508Basic earnings per share (cents/share) 1.54 3.76Diluted earnings per share (cents/share) 1.53 3.73
The weighted average number of shares for the year ended 31 December 2020 of 564,857,081 has been determined based on the number of shares of W.A.G. payment solutions, a.s. multiplied by the ratio at which these shares were exchanged for shares in the Company on 7 October 2021.
Adjusted earnings per share measures:
For the year ended 31 December2021 2020
Net profit attributable to equity holders (EUR ‘000) 9,148 21,239Adjusting items affecting Adjusted EBITDA (Note 11) 22,793 3,168Amortisation of acquired intangibles 4,297 4,107Amortisation due to transformational useful life changes 1,717 261Tax impact of above adjustments* (3,573) (1,514)Adjusted net profit attributable to equity holders (EUR ‘000) 34,382 27,261Basic weighted average number of shares 595,582,785 564,857,081Adjusted basic earnings per share (cents/share) 5.77 4.83Diluted weighted average number of shares 597,066,033 569,709,508Adjusted dilutive earnings per share (cents/share) 5.76 4.79
* non-controlling interests impact was excludedOptionsOptions granted to employees under Share-based Option Plans are considered to be potential ordinary shares. They have been included in the determination of diluted earnings per share if the required performance criteria would have been met based on the Group’s performance up to the reporting date, and to the extent to which they are dilutive. The options have not been included in the determination of basic earnings per share. Details relating to the options are set out in Note 13.
Annual Report and Accounts EUROWAG
213
FINANCIAL STATEMENTS

26. INTEREST BEARING LOANS AND BORROWINGS 31 December 2021 31 December 2020
Currency MaturityInterest
rate
Total limit in
currency
Amount in original currency
Amount in EUR’000
Total limit in
currency
Amount in original currency
Amount in EUR’000
Bank loans Senior multicurrency term and revolving facilities agreement* EUR 2025/05
3M EURIBOR + margin 47,500 30,898 30,898 47,500 38,815 38,815
Senior multicurrency term and revolving facilities agreement* EUR 2025/05
3M EURIBOR + margin 47,500 46,843 46,843 47,500 46,702 46,702
Senior multicurrency term and revolving facilities agreement* EUR 2025/05
3M EURIBOR + margin 95,000 84,510 84,510 95,000 55,967 55,967
Other loans CZK fixed rate 5,277 5,277 212 16,037 16,037 611
Revolving facilities and overdrafts 10 10 29,144 29,144
Total EUR 162,473 171,239
Current EUR 18,894 42,274
Non-current EUR 143,579 128,965
* On 27 May 2019, the Group signed senior multicurrency term and revolving facilities agreements (“club financing facilities”) with following banks:
a. BNP Paribas S.A. acting through its branch BNP Paribas S.A., pobočka Česká republika, b. Citibank Europe plc acting through its branch Citibank Europe plc, organizační složka, c. Česká spořitelna, a.s., d. Československá obchodní banka, a. s., e. HSBC Bank plc acting through its branch HSBC Bank plc – pobočka Praha,f. Komerční banka, a.s.,g. Raiffeisenbank a.s.,h. UniCredit Bank Czech Republic and Slovakia, a.s.
Under this club financing, up to EUR 60 million is available for the Group for revolving facilities and overdraft accounts, and up to EUR 92 million for bank guarantees.
The Group has not drawn any loans from a non-bank entity.
The interest expense relating to bank loans and borrowings is presented in Note 14.
Interest bearing loans and borrowings are non-derivative financial liabilities carried at amortised cost.
As at 31 December 2021 and 31 December 2020, the following pledges have been made as a security for aforementioned loans:
• pledge of shares (W.A.G. payment solutions, a.s. shares were fully pledged after Admission);• pledge of receivables (Note 21);• pledge of bank accounts (Note 23);• pledge of real estate (Note 17);• pledge of movable assets (Note 17); and• pledge of trademarks.
EUROWAG Annual Report and Accounts for the year ended 31 December 2021
214
Notes to the Financial Statements CONTINUED
FINANCIAL STATEMENTS

26. INTEREST BEARING LOANS AND BORROWINGS CONTINUED
Under the old terms of the club financing facilities (until 27 August 2021), the Group was required to comply with the following financial covenants:
• cashflow cover (the ratio of cashflow to debt service) shall not be less than 1.10;• net leverage (the ratio of total net debt to Adjusted EBITDA) shall not exceed 4.25;• the borrowing base covenant (the ratio of the sum of outstanding amount of revolving facility, outstanding bank
guarantees less cash and cash equivalents, to trade receivables) shall not exceed 0.90; and• adjusted net leverage (the ratio of the adjusted total net debt to Adjusted EBITDA) shall not exceed 6.50.
The Group complied with all financial covenants under the Senior Facilities Agreement as of 31 December 2021 and 31 December 2020, and forecasts compliance for the going concern period. The Group did not comply with the cashflow cover covenant as of 31 March 2020 and 30 June 2020 due to adverse changes in working capital related to lockdown restrictions during the COVID-19 pandemic. The Group received waivers from the banks on both covenant breaches and complied with all financial covenants as of 30 September 2020 and 31 December 2020. The Group replaced the cashflow cover covenant with a less sensitive interest cover covenant in an amendment to the Senior Facilities Agreement dated 27 August 2021.
After 27 August 2021, new financial covenant terms of the club financing facilities were as follows:
Covenant Calculation Target
Actual 31 December
2021
Interest cover the ratio of adjusted EBITDA to interest payable Min 5.00 11.81Net leverage the ratio of total net debt to adjusted EBITDA Max 3.75* 2.12Borrowing base covenant the ratio of the sum of outstanding amount of revolving facility,
outstanding bank guarantees less cash and cash equivalents, to trade receivables Max 1.00 0.46
Adjusted net leverage the ratio of the adjusted total net debt to adjusted EBITDA Max 6.50 3.49
* the covenant shall not exceed 3.5 in 2022, 3.25 in 2023 and 3.00 from 2024 onwards
Annual Report and Accounts EUROWAG
215
FINANCIAL STATEMENTS

27. RECONCILIATION OF LIABILITIES ARISING FROM FINANCING ACTIVITIESThe table below sets out an analysis of liabilities from financing activities and the movements in the Group’s liabilities from financing activities for each of the periods presented. The items of these liabilities are those that are reported as financing in the statement of cash flows:
Liabilities from financing activities
EUR ‘000 BorrowingsLease
liabilities Total
Liabilities from financing activities at 1 January 2020 134,335 11,297 145,632
Cash inflows 12,147 – 12,147Cash outflows (4,494) (2,145) (6,639)New leases – 498 498Foreign exchange adjustments (160) (292) (452)Other movements* 267 5 272Liabilities from financing activities at 31 December 2020 142,095 9,363 151,458
Cash inflows 39,519 – 39,519Cash outflows (18,773) (2,382) (21,155)New leases – 1,509 1,509Foreign exchange adjustments 115 92 207Other movements* (493) (8) (501)Liabilities from financing activities at 31 December 2021 162,463 8,574 171,037
* The “Other movements” in Borrowings represent effective interest rate adjustment from transaction costs. The Group classifies interest paid as cash flows from operating activities. The “Other movements” in Lease liabilities represent cancellation of lease liability in connection with premature termination of a lease
EUROWAG Annual Report and Accounts for the year ended 31 December 2021
216
Notes to the Financial Statements CONTINUED
FINANCIAL STATEMENTS

28. TRADE AND OTHER PAYABLES, OTHER LIABILITIES
EUR ‘00031 December
202131 December
2020
CurrentTrade payables 260,530 237,122Employee related liabilities 10,656 8,109Advances received 13,464 11,772Miscellaneous payables 10,941 8,872Payables to tax authorities 9,728 7,083Contract liabilities 3,151 3,334Refund liabilities 3,052 2,238Put option redemption liability – 27,004Deferred acquisition consideration 3,000 423Total Trade and other payables 314,522 305,957Non-current Put option redemption liability 17,046 19,006Contract liabilities 1,742 1,801Employee related liabilities 747 669Other liabilities 746 797Total Other non-current liabilities 20,281 22,273
Trade payables are non-interest bearing and are normally settled on 30-day terms.
Miscellaneous payables include mainly payables in respect of sold receivables to factoring companies, representing cash collected from customers on behalf of factoring companies.
For explanations on the Group’s liquidity risk management processes, refer to Note 30.
Employee-related liabilities include liabilities from social security and health insurance, liabilities payable to employees for salaries and accrued employee vacation to be taken or compensated for in the following accounting period.
Put option redemption liability related to non-controlling interests represents present value of expected future settlement.
Trade and other payables are non-derivative financial liabilities carried at amortised cost. The fair value of current trade and other payables approximates their carrying value due to their short-term maturities.
Contract liabilities predominantly represent revenue deferred in line with Navigation revenue recognition policy (Note 4.3). The movements of contract deferred revenue during the years are as follows:
EUR ‘000 2021 2020
Opening balance 5,135 5,123Additions 3,093 2,798Release (3,335) (2,786)Closing balance 4,893 5,135Short term 3,151 3,334Long term 1,742 1,801Total 4,893 5,135
Annual Report and Accounts EUROWAG
217
FINANCIAL STATEMENTS

28. TRADE AND OTHER PAYABLES, OTHER LIABILITIES CONTINUED
The total amount of deferred revenue is expected to be released in the income statement with the following pattern:
Release to income statement 1 year 2 years 3–5 years Total
31 December 2021 3,151 1,144 598 4,89331 December 2020 3,334 1,215 586 5,135
29. CONTINGENT ASSETS AND LIABILITIESOff-balance sheet commitments are following:
EUR ‘00031 December
202131 December
2020
Unfunded customer credit limits 342,668 308,407Credit limits are further described in credit risk section of Note 30.
30. FINANCIAL RISK MANAGEMENTThe Group’s classes of financial instruments correspond with the line items presented in the Consolidated Statement of Financial Position.
The Group’s principal financial liabilities, other than derivatives, comprise loans and borrowings, leases and trade and other payables. The main purpose of these financial liabilities is to finance the Group’s operations and investments. The Group’s principal financial assets include trade and other receivables, cash and cash equivalents that derive directly from its operations. The Group also enters into derivative transactions.
The Group is exposed to market risk, credit risk and liquidity risk. The management of the Group identifies the financial risks that may have adverse impact on the business objectives and through active risk management reduces these risks to an acceptable level.Market riskMarket risk is the risk that the fair value of future cash flows of a financial instrument will fluctuate because of changes in market prices. Market risk comprises two types of risk: interest rate risk and currency risk.
The sensitivity analyses in the following sections relate to the position as at 31 December 2021 and 31 December 2020.
The sensitivity analyses have been prepared on the basis that the amount of net debt, the ratio of fixed to floating interest rates of the debt and derivatives and the proportion of financial instruments in foreign currencies are all constant.
The analyses exclude the impact of movements in market variables on: provisions, and the non-financial assets and liabilities of foreign operations.
The following assumptions have been made in calculating the sensitivity analyses:
• The sensitivity of the relevant statement of profit or loss item is the effect of the assumed changes in respective market risks. This is based on the financial assets and financial liabilities held at 31 December 2021 and 31 December 2020.
Interest rate riskInterest rate risk is the risk that the fair value or future cash flows of a financial instrument will fluctuate because of changes in market interest rates. The Group’s exposure to the risk of changes in market interest rates relates primarily to the Group’s bank loans and borrowings with floating interest rates.
The Group manages its interest rate risk by entering into interest rate swaps, in which it agrees to exchange, at specified intervals, the difference between fixed and variable rate interest amounts calculated by reference to an agreed-upon notional principal amount. At 31 December 2021 and 31 December 2020, after taking into account the effect of interest rate swaps, total amount of Group’s borrowings is at a fixed rate of interest.
EUROWAG Annual Report and Accounts for the year ended 31 December 2021
218
Notes to the Financial Statements CONTINUED
FINANCIAL STATEMENTS

30. FINANCIAL RISK MANAGEMENT CONTINUED
The following table demonstrates the sensitivity to a reasonably possible change in interest rates on that portion of loans and borrowings affected. With all other variables held constant, the Group’s profit before tax is affected through the impact on floating rate borrowings, as follows:
EUR´00031 December
202131 December
2020
Increase by 50 basis points – –Decrease by 50 basis points – –
Foreign currency riskForeign currency risk is the risk that the fair value or future cash flows of an exposure will fluctuate because of changes in foreign exchange rates. The Group’s exposure to the risk of changes in foreign exchange rates relates primarily to the Group’s operating activities (when revenue or expense is denominated in a foreign currency).
The Group invoices mainly in EUR. However, there are transactional currency exposures that arise from sales and purchases also in other currencies, in particular CZK and PLN.
Financial assets and liabilities include cash and cash equivalents, trade and other receivables and interest-bearing loans and borrowings and trade and other payables. All remaining assets and liabilities in foreign currencies are immaterial or not subject to exchange rate exposure (such as property, plant and equipment).
The table below presents the sensitivity of the profit before tax to a hypothetical change in EUR, CZK, PLN, and other currencies and the impact on financial assets and liabilities of the Group. The sensitivity analysis is prepared under the assumption that the other variables are constant.
Effect of the change in exchange rates between functional currency of each entity and EUR, CZK, PLN and other currencies on profit before tax:
EUR ´000% change in
rate31 December
202131 December
2020
EUR +/- 10% +/- 4,680 +/- 83PLN +/- 10% +/- 131 +/- 141CZK +/- 10% +/- 310 +/- 178Others +/- 10% +/- 870 +/- 270
The Group manages its foreign currency risk by using foreign currency forwards and swaps, impact of which is as disclosed in Note 14. Above effect on profit before tax is not adjusted for the impact of derivatives.Credit riskCredit risk is the risk that a counterparty will not meet its obligations under a financial instrument or customer contract, leading to a financial loss. The Group is exposed to credit risk from its operating activities (primarily trade receivables). The risk is managed on a Group basis and individual customer credit risk limits are set based on internal ratings. Refer to Note 29 for unfunded customer credit limits.
The outstanding balances of trade receivables and compliance with credit limits are monitored on a regular basis. The aim of the Group management is to minimise exposure of credit risk to single counterparty or group of similar counterparties. As at 31 December 2021 and 31 December 2020, there is no significant concentration of credit risk as there were no individually significant customers.
The Group insures eligible receivables and accepts bank guarantees and collateral pledges to mitigate credit risk.
The Group does not use credit derivatives to mitigate credit risk.
The ageing of receivables is regularly monitored by the Group management.
Refer to Note 21 for further details.
Annual Report and Accounts EUROWAG
219
FINANCIAL STATEMENTS

30. FINANCIAL RISK MANAGEMENT CONTINUEDLiquidity riskThe Group performs regular monitoring of its liquidity position to keep sufficient financial resources to settle its liabilities and commitments.
The Group’s current ratio (current assets divided by current liabilities) was:
31 December
202131 December
2020
Current ratio 1.58 1.01
The table below summarises the maturity profile of the Group’s financial liabilities based on contractual undiscounted payments (EUR ’000):
31 December 2021 On demandLess than 3
months3 to 12
months1 to 5 years
More than 5 years Total
Interest-bearing loans and borrowings – 5,802 17,142 151,019 – 173,963Lease liabilities – 705 2,067 4,605 1,911 9,288Trade and other payables* – 287,914 265 18,539 – 306,718Total – 294,421 19,474 174,163 1,911 489,969
31 December 2020 On demandLess than 3
months3 to 12
months1 to 5 years
More than 5 years Total
Interest-bearing loans and borrowings – 31,946 13,834 140,106 – 185,886Lease liabilities – 572 1,637 6,206 1,786 10,201Trade and other payables* – 281,027 2,311 20,902 – 304,240Total – 313,545 17,782 167,214 1,786 500,327
* Trade and other payables exclude tax payables, advances received and contract liabilities as these are non-financial liabilities
31. CAPITAL MANAGEMENTFor the purpose of the Group’s capital management, capital includes issued capital and all other equity reserves attributable to the equity holders of the Company. The primary objective of the Group’s capital management is to maximise the Shareholder value.
The Group manages its capital structure and makes adjustments in light of changes in economic conditions and the requirements of the financial covenants. To maintain or adjust the capital structure, the Group may adjust the dividend payment to Shareholders, return capital to Shareholders or issue new shares. The Group monitors capital using the equity/total assets ratio:
EUR ‘00031 December
202131 December
2020
Total equity 284,747 64,105Total assets 802,858 586,257Equity ratio (Equity/TA) 35.47% 10.93%
In order to achieve this overall objective, the Group’s capital management, amongst other things, aims to ensure that it meets financial covenants attached to the interest-bearing loans and borrowings that define capital structure requirements. Breaches in meeting the financial covenants would permit the bank to immediately call loans and borrowings. Further details are disclosed in Note 26.
No changes were made in the objectives, policies or processes for managing capital during the above period.
EUROWAG Annual Report and Accounts for the year ended 31 December 2021
220
Notes to the Financial Statements CONTINUED
FINANCIAL STATEMENTS

32. RELATED PARTY DISCLOSURESCompanyThe Company controlling the Group is disclosed in Note 1.SubsidiariesInterests in subsidiaries are set out in Note 7.Key management personnel compensationKey management personnel compensation is disclosed in Note 12.Paid dividendsPaid dividends are disclosed in Consolidated Statement of Changes in Shareholders’ Equity.Transactions with other related parties
EUR ‘000
For the year ended 31 December
2021 2020
Sale of goods to entities controlled by key management personnel – 3Sale of goods to key management personnel 1 –Purchases of various goods and services from key management personnel 42 –Purchases of various goods and services from entities controlled by the Company’s Shareholders 1 1Purchases of various goods and services from entities controlled by key management personnel* 19 188Purchases of various goods and services from associates 8 –Sale of W.A.G. payment solutions, a.s. shares to key management personnel 20 –Paid deferred acquisition consideration (Note 8) 421 –
* The Group acquired the following goods and services from entities that are controlled by members of the Group’s key management personnel: marketing research, consultancy, taxi services
Outstanding balances arising from sales/purchases of goods and services
EUR ‘00031 December
202131 December
2020
Trade payables to entities controlled by key management personnel – 10
As at 31 December 2021 and 2020, the Group had no outstanding loans, credit, security or other benefits in either monetary or in-kind form to persons who are the governing body or to members of governing or other management and supervisory bodies, including former officers and members of those bodies.
Two loans were provided during the year to key management personnel of EUR 800 thousand each. The first loan contract was signed on 27 July 2021 and the second contract on 31 August 2021. They were both repaid on 13 October 2021.
Selected employees benefit from the private use of the Group cars.Terms and conditionsTransactions relating to dividends were on the same terms and conditions that applied to other Shareholders. Goods were sold during the year based on the price lists in force and terms that would be available to third parties. All other transactions were made on normal commercial terms and conditions and at market rates.
Annual Report and Accounts EUROWAG
221
FINANCIAL STATEMENTS

33. SUBSEQUENT EVENTSCapital reductionAs disclosed in Note 24, capital reduction of the Company was registered by Companies House on 8 January 2022, which is the effective date for financial reporting.
Pro-forma share capital, share premium and retained earnings as of 8 January 2022 are as follows:
Share
capitalShare
premiumRetained earnings Total
At 31 December 2021 38,113 194,763 84,526 317,402Capital reduction (30,006) (191,805) 221,811 -At 8 January 2022 8,107 2,958 306,337 317,402
WebEye acquisitionOn 15 November 2021, the Group through its subsidiary W.A.G. payment solutions, a.s., entered into an agreement to acquire 100% of the share capital of WebEye Telematics Zrt. (“WebEye”), a leading Fleet Management Solution provider in Central and Eastern Europe. Closing of the agreement was subject to regulatory approvals in Hungary and Romania.
Upon closing, the Group would pay a cash consideration of EUR 38.5 million taking into account adjustments for net debt and normalised working capital. The Group would also pay a deferred settlement component within three years from closing, a part of which is subject to the fulfilment of certain KPIs. The maximum consideration, including the deferred settlement component, was capped at EUR 55.9 million.
The Group announced on 11 March 2022 that it has not received the approval from the Ministry of Interior in Hungary to complete the transaction. The Group is now assessing options to facilitate the acquisition.UkraineThe shocking act of unprovoked and unjustified aggression from the Russian Federation against Ukraine is unfolding as we publish this report. Following the invasion the Group took immediate steps to comply with sanctions and suspend all services we provided in Russia. Our response to the humanitarian aspect of this crisis benefited from strong support of all our employees. We offered help to colleagues with origins or family members from the affected regions and have created a Ukraine Aid fund on their behalf. The Group is matching charitable donations made by our employees, over and above our ongoing commitment to distribute 1% of EBIT each year to charitable causes. We are also providing fuelling for humanitarian convoys.
Although the Group has limited exposure to Russia and Ukraine, which together account for less than 0.1% of Group net revenue, the economic outlook in our key regions is uncertain and we continue to monitor and evaluate the potential impacts as the situation evolves. Should the conflict escalate and materially affect European economies, we may observe lower demand for our products and services. The impacts of recent events on global supply chain disruptions are not yet over, and the Group could be affected by energy-supply shortages in the region hindering industrial production and mobility. Additional risks to the business include a potential shortage of drivers and regulatory measures such as retail fuel price caps that may have an impact on margins.
We therefore continue to diligently monitor the areas we can control and mitigate. Primarily, this is by further diversifying energy-supply partnerships, while acknowledging the dependency on Russian-originated sources across central and Eastern Europe and the Balkan region. To mitigate the impacts of a potential economic downturn, we can apply cost-saving measures and implement actions to stimulate revenue growth learnt and used during the last two global economic crises. These include actions to promote customer loyalty, readiness of our customers to pay a premium for mission-critical products and services, and increased interest of our customers in efficiency gains and cost-saving solutions which the Group provides.
EUROWAG Annual Report and Accounts for the year ended 31 December 2021
222
Notes to the Financial Statements CONTINUED
FINANCIAL STATEMENTS

Notes
As at31 December
2021
ASSETSNon-current assetsInvestments in subsidiaries 6 79,398Other non-current assets 599Total non-current assets 79,997Current assetsTrade and other receivables 8 139,363Cash and cash equivalents 9 89,901Total current assets 229,264TOTAL ASSETS 309,261
SHAREHOLDERS’ EQUITY AND LIABILITIESShare capital 10 38,113Share premium 10 194,763Merger reserve 10 42,035Retained earnings (1,398)Total equity 273,513Current liabilitiesTrade and other payables 11 35,748Total current liabilities 35,748TOTAL EQUITY AND LIABILITIES 309,261
As permitted by section 408 of Companies Act 2006, a separate Statement of Comprehensive Income for W.A.G payment solutions plc has not been included in these financial statements. Total comprehensive loss for the period amounted to EUR 2.0 million.
The notes on pages 225 to 230 are an integral part of these financial statements.
The financial statements on pages 223 to 224 were approved by the Board of Directors and authorised for issue on 24 March 2022. They were signed on its behalf by:
Paul Manduca Magdalena Bartoś Chairman Chief Financial Officer
Company No. 13544823
Annual Report and Accounts EUROWAG
223
FINANCIAL STATEMENTS
Company Statement of Financial Position(EUR’000)

Notes Share capitalShare
premiumMerger
reservesRetained earnings Total equity
At 3 August 2021 10 58 – – – 58
Loss for the period – – – (2,047) (2,047)
Total comprehensive income – – – (2,047) (2,047)Transactions with owners in their capacity as owners:
Group reorganisation 10 6,766 – 72,041 – 78,807
Pre-IPO bonus (share-based payments) 10 7 – – – 7
Primary proceeds (net of expenses) 10 1,334 194,763 – – 196,097
Cancellation of shares 10 (58) – – 58 –
Allotment of class B share 10 30,006 – (30,006) – –
Share-based payments – – – 591 591
At 31 December 2021 38,113 194,763 42,035 (1,398) 273,513
EUROWAG Annual Report and Accounts for the year ended 31 December 2021
224
FINANCIAL STATEMENTS
Company Statement of Changes in Shareholders’ Equity (EUR ‘000)

1. CORPORATE INFORMATIONW.A.G payment solutions plc (the ”Company”) is a public limited company incorporated and domiciled in the United Kingdom and registered under the laws of England & Wales under company number 13544823 with its registered address at Third Floor (East), Albemarle House, 1 Albemarle Street, London W1S 4HA. The ordinary shares of the Company are admitted to the premium listing segment of the Official List of the UK Financial Conduct Authority and trade on the London Stock Exchange plc’s main market for listed securities on 13 October 2021.
The Company was incorporated on 3 August 2021 and its first financial period ends on 31 December 2021.
2. BASIS OF PREPARATIONThe financial statements of the Company have been prepared in accordance with Financial Reporting Standard 101, ‘Reduced Disclosure Framework’ (FRS 101). The financial statements have been prepared under the historical cost convention and in accordance with the Companies Act 2006. The financial statements are presented in EUR and all values are rounded to the nearest thousand (EUR’ 000), except where otherwise indicated. The Company has presented a period from incorporation on 3 August 2021 to 31 December 2021.
The preparation of financial statements in conformity with FRS 101 requires the use of certain critical accounting estimates. It also requires management to exercise its judgement in the process of applying the Company’s accounting policies. The areas involving a higher degree of judgement or complexity, or areas where assumptions and estimates are significant to the financial statements, are disclosed in Note 5.
The following exemptions from the requirements of IFRS have been applied in the preparation of these financial statements, in accordance with FRS 101:
• Paragraphs 45(b) and 46 to 52 of IFRS 2, ‘Share-based payment’ (details of the number and weighted average exercise prices of share options, and how the fair value of goods or services received was determined).
• IFRS 7, ‘Financial instruments: Disclosures’. • Paragraphs 91 to 99 of IFRS 13, ‘Fair value measurement’ (disclosure of valuation techniques and inputs used for fair
value measurement of assets and liabilities). • The following paragraphs of IAS 1, ‘Presentation of financial statements’:
− 10(d) (statement of cash flows); − 16 (statement of compliance with all IFRS); − 38A (requirement for minimum of two primary statements, including cash flow statements); − 38B-D (additional comparative information); − 111 (statement of cash flows information); and − 134-136 (capital management disclosures).
• IAS 7, ‘Statement of cash flows’. • Paragraphs 30 and 31 of IAS 8, ‘Accounting policies, changes in accounting estimates and errors’ (requirement
for the disclosure of information when an entity has not applied a new IFRS that has been issued but is not yet effective).
• Paragraph 17 of IAS 24, ‘Related party disclosures’ (key management compensation). • The requirements in IAS 24, ‘Related party disclosures’, to disclose related party transactions entered into between
two or more members of a group.Going concernThe Board of Directors have considered the financial prospects of the Company and the Group for the foreseeable future, which is at least the next 12 months and made an assessment of the Company’s and the Group’s ability to continue as a going concern. The Directors’ assessment included consideration of the availability of the Company’s and the Group’s credit facilities, cash flow forecasts and stress scenarios. Stress test scenarios applied in the Going Concern statement are in line with scenarios covered in the Viability statement. The Board of Directors are satisfied that the Company and the Group has the resources to continue business for the foreseeable future, in particular given the level of cash balances available following the IPO, and furthermore are not aware of any material uncertainties that may cast significant doubt upon the Company’s and the Group’s ability to continue as a going concern and the Board of Directors considers it is appropriate to adopt the going concern basis of accounting in preparing the annual financial statements.
Annual Report and Accounts EUROWAG
225
FINANCIAL STATEMENTS
Notes to the Financial Statements

3. SUMMARY OF SIGNIFICANT ACCOUNTING POLICIESThe accounting policies used in preparing the Company financial statements are set out below. These accounting policies have been consistently applied in all material respects to all periods presented.3.1 INVESTMENT IN SUBSIDIARIESInvestments in subsidiaries are recorded at cost, which is the fair value of the consideration paid. Refer to Note 3.6 Share for share exchange accounting policy used in determining the value of the investment to be recognised as a result of the share for share exchange in the shares of W.A.G. payment solutions, a.s. on 7 October 2021.
The cost related to the subsidiaries’ employees service is treated as investment value in subsidiaries. The awards represent capital contribution to the subsidiaries as no payment is expected for the equity-settled share-based payment awarded to their employees.
Investments are tested for impairment whenever events or changes in circumstances indicate that the carrying amount may not be recoverable. An impairment loss is recognised for the amount by which the asset’s carrying amount exceeds its recoverable amount. The recoverable amount is the higher of an asset’s fair value less costs of disposal and value in use. For the purposes of assessing impairment, assets are grouped at the lowest levels for which there are separately identifiable cash inflows that are largely independent of the cash inflows from other assets or groups of assets (cash-generating units). Investments that suffered an impairment are reviewed for possible reversal of the impairment at the end of each reporting period.3.2 SHARE-BASED PAYMENTSThe Company operates an equity-settled share-based compensation plan (“PSP”), under which subsidiaries receive services from employees as consideration for equity instruments (options) of the Company. The cost related to the subsidiaries’ employees service is treated as investment value in subsidiaries. The awards represent capital contribution to the subsidiaries as no payment (except nominal value of ordinary shares) is expected for the equity-settled share-based payment awarded to their employees.3.3 FINANCIAL INSTRUMENTSA financial instrument is any contract that gives rise to a financial asset of one entity and a financial liability or equity instrument of another entity.Trade and other receivablesTrade and other receivables are carried at original invoice amount less an allowance for impairment of these receivables.
The Company applies a simplified approach in calculating expected credit loss (“ECL”). Therefore, the Company does not track changes in credit risk, but instead recognises a loss allowance based on lifetime ECLs at each reporting date. Simplified approach adopted by the Company is using elements from the general approach, the main difference is that no staging of financial assets is being used.Trade and other payablesTrade payables are recognised at their nominal value, which is deemed to be materially the same as the fair value.3.4 CASH AND CASH EQUIVALENTSCash and cash equivalents in the statement of financial position comprise cash at banks.3.5 FOREIGN CURRENCY TRANSACTIONSThe functional currency of the Company is EUR.
Transactions in foreign currencies are initially recorded by the Company at its functional currency rate prevailing at the date of the transaction. Monetary assets and liabilities denominated in foreign currencies are translated at the functional currency spot rate of exchange valid at the reporting date.
Differences arising on settlement or translation of monetary items are recognised in the profit or loss account as finance income and expenses. Non-monetary items that are measured in terms of historical cost in a foreign currency are translated using the exchange rates at the dates of the initial transactions. Non-monetary items measured at fair value in a foreign currency are translated using the exchange rates at the date when the fair value is determined.
EUROWAG Annual Report and Accounts for the year ended 31 December 2021
226
FINANCIAL STATEMENTS
Notes to the Financial Statements CONTINUED

3. SUMMARY OF SIGNIFICANT ACCOUNTING POLICIES CONTINUED3.6 SHARE FOR SHARE EXCHANGEThe Company was incorporated on 3 August 2021 and became the parent entity of the Group on 7 October 2021, when the share for share exchange between W.A.G. payment solutions, a.s. and the Company was completed. Management treated this as a capital reorganisation.
IAS 27.13 specifies additional requirements to measure investments in subsidiaries in cases of reorganisations. When a parent reorganises the structure of its group by establishing a new entity as its parent in a manner that satisfies the following criteria:
• the new parent obtains control of the original parent by issuing equity instruments in exchange for existing equity instruments of the original parent;
• the assets and liabilities of the new group and the original group are the same immediately before and after the reorganisation; and
• the owners of the original parent before the reorganisation have the same absolute and relative interests in the net assets of the original group and the new group immediately before and after the reorganisation, and the new parent accounts for its investment in the original parent at cost in its separate financial statements, the new parent shall measure cost at the carrying amount of its share of the equity items shown in the separate financial statements of the original parent at the date of the reorganisation.
Management believes all of the criteria above was satisfied and, therefore, investment in W.A.G. payment solutions, a.s. was measured at the equity carrying amount of W.A.G. payment solutions, a.s. as at 7 October 2021.
4. CHANGES IN ACCOUNTING POLICIES AND DISCLOSURES, ADOPTION OF NEW AND REVISED STANDARDS
4.1 APPLICATION OF NEW IFRS – STANDARDS AND INTERPRETATIONS EFFECTIVE IN THE REPORTING PERIODThe Company has applied the following standards and amendments for the first time for their annual reporting period commencing 1 January 2021:
• COVID-19 Related rent concessions – amendments to IFRS 16• Amendments to IFRS 4 – deferral of IFRS 9• Interest rate benchmark (IBOR) reform – phase 2 amendments to IFRS 9, IAS 39, IFRS 7, IFRS 4 and IFRS 16
These Amendments did not have significant impact on the Company’s financial statements.4.2 NEW IFRSs AND IFRICs PUBLISHED BY THE IASB THAT ARE NOT YET EFFECTIVE The Company is currently assessing the potential impacts of the new and revised standards and interpretations that are expected to be effective from 1 January 2022 or later.
• IFRS 14 Regulatory deferral accounts• Sale or Contribution of Assets between an Investor and its Associate or Joint Venture – amendments to IFRS 10
and IAS 28• IFRS 17 ’Insurance Contracts’• Classification of liabilities as current or non-current – Amendments to IAS 1• Proceeds before intended use, Onerous contracts – cost of fulfilling a contract, Reference to the Conceptual
Framework – narrow scope amendments to IAS 16, IAS 37 and IFRS 3• Annual Improvements to IFRSs 2018–2022 – amendments to IFRS 1, IFRS 9, IFRS 16 and IAS 41• Amendments to IFRS 17 and an amendment to IFRS 4• Amendments to IAS 1 and IFRS Practice Statement 2 – Disclosure of Accounting policies• Amendments to IAS 8 – Definition of Accounting Estimates• Deferred tax related to assets and liabilities arising from a single transaction – Amendments to IAS 12
These new standards and amendments are not expected to have any significant impacts on the Company’s financial statements.
Annual Report and Accounts EUROWAG
227
FINANCIAL STATEMENTS

5. SIGNIFICANT ACCOUNTING JUDGMENTS, ESTIMATES AND ASSUMPTIONSThere are no significant accounting judgments or estimates applicable to Company’s financial statements.
6. INVESTMENT IN SUBSIDIARIESEUR ‘000 2021
As at 3 August –Share for share exchange with W.A.G. payment solutions, a.s. 78,807Share-based payments 591As at 31 December 79,398
On 7 October 2021, the Company acquired 100% of the issued share capital of W.A.G. payment solutions, a.s. through a share for share exchange agreement. The value of the investment at the transaction date represents the carrying value at that date.
The capital contribution relating to share-based payments relates to share-based payments issued to employees of subsidiary undertakings in the Group. For full details of the Group’s share-based payments, refer to Note 13 to the consolidated financial statements. The amount reflects share-based payment expense of outstanding awards since the Admission.
7. SHARE-BASED PAYMENTSCertain Group employees have been granted options over the shares in the Company. Refer to the accounting of the investment for details on the awards granted and the related accounting (Note 3).
Share options outstanding at the end of the year are the same as per the consolidated financial statements. Therefore, we refer to the disclosure in the consolidated financial statements (Note 13).
8. TRADE AND OTHER RECEIVABLES
EUR ‘00031 December
2021
Intercompany receivables 139,266Prepaid expenses 97Total 139,363
As of 3 December 2021, the Company entered into loan agreement with W.A.G. payment solutions, a.s. Under the agreement, the Company provided loan facility up to EUR 190 million repayable on demand, but no later than 30 November 2026. Interest rate is 1.02 % p.a.
Trade and other receivables are non-derivative financial assets carried at amortised cost. The carrying value of trade and other receivables approximates their fair value due to their short-term maturities.
9. CASH AND CASH EQUIVALENTS
EUR ‘00031 December
2021
Cash at banks 89,901Cash and cash equivalents 89,901
The fair value of cash and cash equivalents approximates their carrying value due to their short-term maturities.
EUROWAG Annual Report and Accounts for the year ended 31 December 2021
228
Notes to the Financial Statements CONTINUED
FINANCIAL STATEMENTS

10. EQUITYShares authorised, issued and fully paid:
Number of
sharesShare capital
EUR ‘000Number of
sharesShare capital
EUR ‘000
Share premiumEUR ‘000
Merger reserve
EUR ‘000Ordinary shares Class B share
As at 3 August 2021 50,000 58 – – – –Group re-organisation1 575,000,000 6,766 – – – 72,041Pre-IPO bonus (share-based payments)1 578,000 7 – – – –Primary proceeds (net of expenses)2 113,333,333 1,334 – – 194,763 –Capital reduction3 (50,000) (58) – – – –Allotment of class B share4 – – 1 30,006 – (30,006)At 31 December 2021 688,911,333 8,107 1 30,006 194,763 42,035
1. The Company listed its shares on the London Stock Exchange on 8 October 2021 and was admitted to trading on 13 October 2021 (“Admission”). As part of the IPO, holders of equity instruments in W.A.G. payment solutions, a.s. received 575,000,000 shares in the Company. In addition, 113,333,333 new shares were issued and 578,000 shares were awarded to certain directors, senior managers and employees in recognition of services provided in connection with the listing, bringing the total amount of shares outstanding on Admission to 688,911,333. Initial share capital was cancelled one day before Admission (footnote 3 below)
2. The increase in share capital and share premium of EUR 200.0 million represents the gross proceeds from the IPO, stabilisation profit of EUR 1.7 million less direct share issue expenses of EUR 5.7 million
Under the stabilisation arrangement in connection with the IPO, the Company made an agreement that any profit or loss from the stabilisation phase would belong to the Company. The profit is directly linked to the IPO process, therefore, it was treated in the same way as proceeds from the IPO and was recognised against share premium
3. The Company was established on 3 August 2021 with initial share capital of GBP 50,000 (EUR 58,000). The initial capital was cancelled on 12 October 2021
4. On 13 December 2021, the Company alloted from merger reserve 1 Class B share with no voting rights or rights to distributions or rights to the return of capital on winding up. The share has nominal value of GBP 25,500 thousand (EUR 30,006 thousand). On 14 December 2021, the High Court of Justice in England and Wales made an order confirming the reduction of the share premium account by GBP 163 million (EUR 191.8 million) and the cancellation of the Class B share. However, the capital reduction was only registered by Companies House on 8 January 2022, which is the effective date for financial reporting. The Company will be able to apply the distributable reserves arising from the capital reduction and the Class B share cancellation in 2022
11. TRADE AND OTHER PAYABLES
EUR ‘00031 December
2021
Trade payables 2,557Employee related liabilities 27Intercompany payable 33,164Total 35,748
Trade payables are non-interest bearing and are normally settled on 30-day terms. As at 31 December 2021, trade payables were mostly IPO related.
Intercompany payable was repaid on 12 January 2022.
Trade and other payables are non-derivative financial liabilities carried at amortised cost. The fair value of current trade and other payables approximates their carrying value due to their short-term maturities.
Annual Report and Accounts EUROWAG
229
FINANCIAL STATEMENTS

12. EMPLOYEE EXPENSESEmployee expenses of the Company consist of the following:
EUR ‘000
For the period ended
31 December 2021
Wages and salaries 331Social security and health insurance 37Other personnel cost (unused vacation) 3Total employee expense 371
The monthly average number of employees by category during the period was as follows:
For the period ended 31
December 2021
General and administrative 9Total average number of employees 9
13. CONTINGENT LIABILITIESThe Company has guaranteed WebEye acquisition disclosed in Note 33 to the consolidated financial statements. The Company has assessed the probability of loss under this guarantee as remote.
14. INFORMATION INCLUDED IN THE NOTES TO CONSOLIDATED FINANCIAL STATEMENTSSome of the information included in the Notes to the Consolidated Financial Statements is directly relevant to the financial statements of the Company.
Please refer to the following:
• Note 2 – Auditors’ remuneration • Note 7 – Subsidiaries• Note 12 – Key management personnel• Note 13 – Share-based payments • Note 32 – Related parties• Note 33 – Subsequent events
EUROWAG Annual Report and Accounts for the year ended 31 December 2021
230
Notes to the Financial Statements CONTINUED
FINANCIAL STATEMENTS

Annual Report and Accounts EUROWAG
231
FINANCIAL STATEMENTS
REGISTERED OFFICEThird Floor (East), Albemarle House, 1 Albemarle Street, London W1S 4HA
Tel: +420 233 555 111 https://www.eurowag.com/en
Registered in England and Wales No. 13544823
REGISTRARComputershare Investor Services plc The Pavilions Bridgwater Road Bristol Avon BS13 8AE United Kingdom
COMPANY SECRETARYComputershare Governance Services (UK) Limited The Pavilions Bridgwater Road Bristol Avon BS13 8AE United Kingdom
INTERNAL AUDITORKPMG Česká republika, s.r.o. Pobřežní 648/1a 186 00 Praha 8 Česká republika
+420 222 123 111 http://www.kpmg.cz/
EXTERNAL AUDITORPricewaterhouseCoopers LLP One Chamberlain Square Birmingham B3 3AX United Kingdom
+44 (0)121 265 5000 https://www.pwc.co.uk/
JOINT CORPORATE BROKERJefferies International Limited 100 Bishopsgate London EC2N 4JL United Kingdom
Morgan Stanley & Co. International plc 25 Cabot Square London E14 4QA United Kingdom
KEY DATES
2022 Financial Calendar Dates
Annual General Meeting 26 May 2022
Trading Update 5 May 2022
Half-Year Results 6 September 2022
Trading Update 3 November 2022
Company information

https://www.eurowag.com