
Go/No-Go Decision Model for Owners Using Exhaustive ...
24
sustainability Article Go/No-Go Decision Model for Owners Using Exhaustive CHAID and QUEST Decision Tree Algorithms Murat Gunduz 1, * and Hamza M. A. Lutfi 2 Citation: Gunduz, M.; Lutfi, H.M.A. Go/No-Go Decision Model for Owners Using Exhaustive CHAID and QUEST Decision Tree Algorithms. Sustainability 2021, 13, 815. https://doi.org/10.3390/ su13020815 Received: 26 December 2020 Accepted: 12 January 2021 Published: 15 January 2021 Publisher’s Note: MDPI stays neu- tral with regard to jurisdictional clai- ms in published maps and institutio- nal affiliations. Copyright: © 2021 by the authors. Li- censee MDPI, Basel, Switzerland. This article is an open access article distributed under the terms and con- ditions of the Creative Commons At- tribution (CC BY) license (https:// creativecommons.org/licenses/by/ 4.0/). 1 Department of Civil and Architectural Engineering, Qatar University, Doha P.O. Box 2713, Qatar 2 College of Engineering, Qatar University, Doha P.O. Box 2713, Qatar; [email protected] * Correspondence: [email protected] Abstract: Go/no-go execution decisions are one of the most important strategic decisions for owners during the early stages of construction projects. Restructuring the process of decision-making during these early stages may have sustainable results in the long run. The purpose of this paper is to establish proper go/no-go decision-tree models for owners. The decision-tree models were developed using Exhaustive Chi-square Automatic Interaction Detector (Exhaustive CHAID) and Quick, Unbiased, Efficient Statistical Tree (QUEST) algorithms. Twenty-three go/no-go key factors were collected through an extensive literature review. These factors were divided into four main risk categories: organizational, project/technical, legal, and financial/economic. In a questionnaire distributed among the construction professionals, the go/no-go variables were asked to be ranked according to their perceived significance. Split-sample validation was applied for testing and measuring the accuracy of the Exhaustive CHAID and QUEST models. Moreover, Spearman’s rank correlation and analysis of variance (ANOVA) tests were employed to identify the statistical features of the 100 responses received. The result of this study benchmarks the current assessment models and develops a simple and user-friendly decision model for owners. The model is expected to evaluate anticipated risk factors in the project and reduce the level of uncertainty. The Exhaustive CHAID and QUEST models are validated by a case study. This paper contributes to the current body of knowledge by identifying the factors that have the biggest effect on an owner’s decision and introducing Exhaustive CHAID and QUEST decision-tree models for go/no-go decisions for the first time, to the best of the authors’ knowledge. From the “sustainability” viewpoint, this study is significant since the decisions of the owner, based on a rigorous model, will yield sustainable and efficient projects. Keywords: decision tree; decision-making; risk management; risk assessment; critical project success factors; key performance indicators; sustainability; project planning; construction project manage- ment; knowledge management 1. Introduction The nature of each construction project is unique and dynamic as it involves numerous operations with multiple intricacies and various techniques that are used throughout one single project. Construction projects encompass various risks, and it is essential to evaluate and manage those risks to guarantee the success of a project or firm [1]. Ref [2] stated that the construction industry has a poor reputation in risk classification and analysis compared to other industries. Many variables and complex relationships that exist in construction projects make the execution of a decision complicated. Efficient and effective go/no-go decisions will provide benefits for owners or investors for future business development. There are several kinds of risk decisions in construction projects, starting with the concept phase, continuing with the planning and execution phases, and ending with the completion phase. In each phase, various stakeholders (owners, CMs (construction management firms), contractors, consultants, suppliers) are involved in the uncertain and complex Sustainability 2021, 13, 815. https://doi.org/10.3390/su13020815 https://www.mdpi.com/journal/sustainability
-
Upload
khangminh22 -
Category
Documents
-
view
2 -
download
0
Transcript of Go/No-Go Decision Model for Owners Using Exhaustive ...

sustainability
Article
Go/No-Go Decision Model for Owners Using ExhaustiveCHAID and QUEST Decision Tree Algorithms
Murat Gunduz 1,* and Hamza M. A. Lutfi 2
�����������������
Citation: Gunduz, M.; Lutfi, H.M.A.
Go/No-Go Decision Model for
Owners Using Exhaustive CHAID
and QUEST Decision Tree
Algorithms. Sustainability 2021, 13,
815. https://doi.org/10.3390/
su13020815
Received: 26 December 2020
Accepted: 12 January 2021
Published: 15 January 2021
Publisher’s Note: MDPI stays neu-
tral with regard to jurisdictional clai-
ms in published maps and institutio-
nal affiliations.
Copyright: © 2021 by the authors. Li-
censee MDPI, Basel, Switzerland.
This article is an open access article
distributed under the terms and con-
ditions of the Creative Commons At-
tribution (CC BY) license (https://
creativecommons.org/licenses/by/
4.0/).
1 Department of Civil and Architectural Engineering, Qatar University, Doha P.O. Box 2713, Qatar2 College of Engineering, Qatar University, Doha P.O. Box 2713, Qatar; [email protected]* Correspondence: [email protected]
Abstract: Go/no-go execution decisions are one of the most important strategic decisions for ownersduring the early stages of construction projects. Restructuring the process of decision-makingduring these early stages may have sustainable results in the long run. The purpose of this paperis to establish proper go/no-go decision-tree models for owners. The decision-tree models weredeveloped using Exhaustive Chi-square Automatic Interaction Detector (Exhaustive CHAID) andQuick, Unbiased, Efficient Statistical Tree (QUEST) algorithms. Twenty-three go/no-go key factorswere collected through an extensive literature review. These factors were divided into four mainrisk categories: organizational, project/technical, legal, and financial/economic. In a questionnairedistributed among the construction professionals, the go/no-go variables were asked to be rankedaccording to their perceived significance. Split-sample validation was applied for testing andmeasuring the accuracy of the Exhaustive CHAID and QUEST models. Moreover, Spearman’s rankcorrelation and analysis of variance (ANOVA) tests were employed to identify the statistical featuresof the 100 responses received. The result of this study benchmarks the current assessment modelsand develops a simple and user-friendly decision model for owners. The model is expected toevaluate anticipated risk factors in the project and reduce the level of uncertainty. The ExhaustiveCHAID and QUEST models are validated by a case study. This paper contributes to the currentbody of knowledge by identifying the factors that have the biggest effect on an owner’s decisionand introducing Exhaustive CHAID and QUEST decision-tree models for go/no-go decisions for thefirst time, to the best of the authors’ knowledge. From the “sustainability” viewpoint, this study issignificant since the decisions of the owner, based on a rigorous model, will yield sustainable andefficient projects.
Keywords: decision tree; decision-making; risk management; risk assessment; critical project successfactors; key performance indicators; sustainability; project planning; construction project manage-ment; knowledge management
1. Introduction
The nature of each construction project is unique and dynamic as it involves numerousoperations with multiple intricacies and various techniques that are used throughout onesingle project. Construction projects encompass various risks, and it is essential to evaluateand manage those risks to guarantee the success of a project or firm [1]. Ref [2] stated thatthe construction industry has a poor reputation in risk classification and analysis comparedto other industries. Many variables and complex relationships that exist in constructionprojects make the execution of a decision complicated. Efficient and effective go/no-godecisions will provide benefits for owners or investors for future business development.There are several kinds of risk decisions in construction projects, starting with the conceptphase, continuing with the planning and execution phases, and ending with the completionphase. In each phase, various stakeholders (owners, CMs (construction managementfirms), contractors, consultants, suppliers) are involved in the uncertain and complex
Sustainability 2021, 13, 815. https://doi.org/10.3390/su13020815 https://www.mdpi.com/journal/sustainability

Sustainability 2021, 13, 815 2 of 24
decision-making process in order to attain the greatest value of project objectives. Projectdecision management is a repetitive process, which is advantageous when implemented ina systematic manner throughout the lifecycle of a project, especially before the executionphase, at which the owner decides to go or not to go with the execution of a decision. Thispaper introduces, using QUEST (Quick, Unbiased, Efficient Statistical Tree) and exhaustiveCHAID (Exhaustive Chi-square Automatic Interaction Detector) decision tree algorithms,the development of go/no-go models for owners/CMs. The model is supported by theattitude of the owner in relation to his/her competence, as well as by the risk attached tothe project, as the owner must evaluate possible risks and his/her capability in the planningphase before the execution of a project. The proposed model is expected to identify certainstrategies that will meet the financial targets of an owner based on four main go/no-gorisk groups (organizational, project/technical, legal, and financial/economic) that include23 go/no-go factors. Before applying the go/no-go decision tree models, owners shouldassess the risk level of each go/no-go group by calculating the average risk of all relatedfactors of each group. Therefore, the decision tree of go/no-go models should be ableto predict the feasible decision in the planning phase so that the owner can move on tothe execution phase. The contribution of this study to the existing body of knowledgeis through its recognition of the most influential factors affecting the go/no-go decision(invest/don’t-invest) of the owner, as well as the introduction, for the first time, to thebest knowledge of the authors, of an exhaustive CHAID and QUEST decision tree modelfor go/no-go decisions. This study is important from the “sustainability” perspectivebecause the owner’s decisions based on a robust model would yield sustainable andsuccessful projects.
2. Literature Review
A number of previous studies investigated the decision-making process in the con-struction sector [3–7]. Additionally, go/no-go decision models for decision-making con-cerning different sectors are also available [8–14]. It can be concluded from previousstudies that a considerable amount of literature has been published on contractor deci-sions, while little literature has been published on decisions of owners or constructionmanagement firms. Moreover, certain models require complicated inputs and an advancedunderstanding of mathematics and require software to run the suggested model, which arenot practical for the owner. Additionally, some models do not address the importance ofrisk assessment in the early stages of the project and focus on the bidding stage, althoughearly-stage decision-making is much more critical. Moreover, some previous feasibilitymodels exclude some factors affecting the owner’s decision and focused mainly on finan-cial factors. A combination of all expected factors will result in a better decision strategyfor owners. Thus, developing a practical, easy, and fast model that supports the owner’sdecisions in the early stages of a project is a significant need.
Numerous researchers and studies have contributed to defining go-decision attributesin the construction industry. The literature on go/no-go decision factors was studiedto identify the key factors that influence decision-makers’ judgments. Extensive studiesby [3,15–41] identified the most influencing factors affecting go/no-go decisions. In thisstudy, a draft questionnaire with 23 key risk factors was prepared based on the existingliterature and divided into four main groups (organizational, project/technical, legal, andfinancial/economic). Table 1 demonstrates the twenty-three go/no-go decision attributes,with their corresponding literature references.

Sustainability 2021, 13, 815 3 of 24
Table 1. List of 23 risk factors with their corresponding literature references.
Organizational Risk Factors1. Financial stability of the owner [15–20]
2. Consultants’ and suppliers’ reliability and experience in construction [17,18,21–23]3. Design errors and omissions (Rush design) [18,23–28]
4. Qualification of designers and planners [18,23,29,30]5. Availability of skilled and unskilled workers/laborers [18,23,26,28,30,31]
6. Availability of reliable and experienced contractors [18,20,21,30–32]Project/Technical Risk Factors
1. Availability of materials and equipment [20,21,26,33,34]2. Erroneous geological condition study [24,35,36]
3. Availability of construction technologies and skills [15,18,20]4. Size and location of the project [25,28,37]
5. Required safety level [18,22,28]6. Clarity or complexity of the design and scope [15,18,22]
7. Site space constraints [17,28,36]8. Tight schedule [16,22,25,27,30,38]
Legal Risk Factors1. Excessive approval procedures in administrative
government departments [16,30,34,36]
2. Country specifications and level of standards in regulations and permits [15,17,36]3. Lack of legality and standard dispute settlement procedure [15,25,36,42]
Financial and Economic Risk Factors1. Underestimated budgeting [16,30,39]
2. Inflation and deflation [18,19,24,35]3. Price escalation of raw materials [18,19,22,42]
4. Expected return level/project profitability [39–41]5. High overhead cost [3,39]
6. Forecast about market demand/potential level of competition [35,39]
3. Research Methodology
This part presents the research methodology that was used in this study to achieve theresearch objectives. A questionnaire was designed to rank the 23 go/no-go decision factorscollected through the literature review. The questionnaire was structured in such a way thatit would determine the most significant risk factor based on the practitioners’ observationsas well as the relative significance of each risk group. Each respondent was requested torank each risk factor on a scale from 1 to 5 by considering its importance, 1 signifyingthe lowest degree of importance; 100 responses were collected from construction industryprofessionals. The collected data were analyzed using Spearman’s rank correlation andTukey’s test to extract the important features of the respondents’ responses. Spearman’srank correlation captures the statistical differences among categories, whereas the Tukeytest covers the differences among factors. In the second section of the questionnaire, therespondents were requested to indicate how often their company takes go decisions in theearly stages, after the initial design is completed, for different scenarios of the four afore-mentioned categories (organizational, project/technical, legal, and financial/economic).Then, 80 scenarios were thereby developed and distributed into two forms (40 scenariosper questionnaire).
Following that, a decision tree based on exhaustive CHAID and QUEST was intro-duced for a go/no-go decision model for owners in the construction sector. The decisiontree displays the soft and hot spots between independent and dependent variables, whichleads to better decision-making. Decision tree models display the result effectively in visualterms so that it becomes easier to understand and apply. To the best of our knowledge,this is the first study in the literature to introduce an Exhaustive CHAID and QUESTdecision tree model for go/no-go decisions to owners. Figure 1 below shows the steps ofthe methodology used in this study.

Sustainability 2021, 13, 815 4 of 24
Sustainability 2021, 13, x FOR PEER REVIEW 4 of 25
this is the first study in the literature to introduce an Exhaustive CHAID and QUEST de-
cision tree model for go/no-go decisions to owners. Figure 1 below shows the steps of the
methodology used in this study.
Figure 1. Research methodology steps.
3.1. Decision Trees
Decision trees have been identified as the most influential and useful classification
technique that is utilized in the field of data mining. A decision tree is considered to be an
instrumental tool that supports the decision-making process as it translates inputs into a
tree-like model with their different outcomes, which include “utility, costs of resources,
and chance-event outcomes” [43]. Decision trees are useful in managing two types of data
sets: categorical data and numerical data [44]. It is considered the easiest and least com-
plex technique because it provides result interpretation capabilities to the parties in-
volved.
According to [45], a decision tree is a model that has the shape of a tree with different
branch nodes. The tree starts with the root node at the top, with branch nodes underneath
it, where the data are presented by different branches, using some section measures. Each
branch node is responsible for representing a choice among alternatives based on the
number of substitutes available. The leaf node in the model is responsible for representing
a categorical or numerical decision [45]. The complexity of the tree can be measured by
either counting the total number of leaves or nodes or by the depth of the tree used. The
construction of a decision tree can be explained as follows; firstly, the attribute selection
is placed in the root node, and then two or more branches are created for each option
value, which is followed by the split process to form subsets for every value of the attrib-
ute. This process is repeated till the node has the same classification value. Ref. [46]
pointed out that the main differences among the various decision-tree-building algo-
rithms are identified by the attribution that produces the best split in the data. Each deci-
sion tree algorithm has its own measures to select the attributes at each step while growing
the tree.
The benefits of decision trees may be explained as follows: Decision trees are known
to be flexible and adaptable as they are made compact in order to become more under-
standable. In simple terms, decision trees can be understood by nonprofessional users too
because the model is straightforward and easy to understand. Furthermore, they utilize
sets of rules, making them clearer and more coherent. Decision trees are useful in classi-
fying knowledge into trees, and, thus, they facilitate the decision-making process.
According to [47], the Exhaustive CHAID algorithm was found to be a good and sig-
nificant predictor. Additionally, Ref. [43] examined four prediction algorithms in terms of
Identify objectives of
research
Literature Review
Data Collection
Data Analysis & Modeling
•Decision Tree Algorithms
•QUEST & Exhaustive CHAID algorithms
Model Evalution
Figure 1. Research methodology steps.
3.1. Decision Trees
Decision trees have been identified as the most influential and useful classificationtechnique that is utilized in the field of data mining. A decision tree is considered to bean instrumental tool that supports the decision-making process as it translates inputs intoa tree-like model with their different outcomes, which include “utility, costs of resources,and chance-event outcomes” [43]. Decision trees are useful in managing two types of datasets: categorical data and numerical data [44]. It is considered the easiest and least complextechnique because it provides result interpretation capabilities to the parties involved.
According to [45], a decision tree is a model that has the shape of a tree with differentbranch nodes. The tree starts with the root node at the top, with branch nodes underneathit, where the data are presented by different branches, using some section measures. Eachbranch node is responsible for representing a choice among alternatives based on thenumber of substitutes available. The leaf node in the model is responsible for representinga categorical or numerical decision [45]. The complexity of the tree can be measured byeither counting the total number of leaves or nodes or by the depth of the tree used. Theconstruction of a decision tree can be explained as follows; firstly, the attribute selection isplaced in the root node, and then two or more branches are created for each option value,which is followed by the split process to form subsets for every value of the attribute. Thisprocess is repeated till the node has the same classification value. Ref. [46] pointed out thatthe main differences among the various decision-tree-building algorithms are identified bythe attribution that produces the best split in the data. Each decision tree algorithm has itsown measures to select the attributes at each step while growing the tree.
The benefits of decision trees may be explained as follows: Decision trees are knownto be flexible and adaptable as they are made compact in order to become more under-standable. In simple terms, decision trees can be understood by nonprofessional userstoo because the model is straightforward and easy to understand. Furthermore, theyutilize sets of rules, making them clearer and more coherent. Decision trees are useful inclassifying knowledge into trees, and, thus, they facilitate the decision-making process.
According to [47], the Exhaustive CHAID algorithm was found to be a good andsignificant predictor. Additionally, Ref. [43] examined four prediction algorithms in termsof accuracy and concluded that Exhaustive CHAID and QUEST techniques proved to bemore efficient and accurate than other prediction techniques. Thus, this study appliesthe most appropriate combination of Exhaustive CHAID and QUEST models to forecastthe potential risks of a proposed project at an early stage and to compare the predictionperformance in terms of accuracy and efficiency.

Sustainability 2021, 13, 815 5 of 24
The tree models were generated using a training sample and tested on a selectedsample. The training sample was a percentage of the total sample size, and the remainingportion was used for the test sample; 80% of the collected data were used for developing thego/no-go decision tree models, and the remaining information was used for the test sample.
3.1.1. Exhaustive CHAID
CHAID stands for Chi-squared Automatic Interaction Detector. The ExhaustiveCHAID algorithm is a modified version of the CHAID decision-tree algorithm, which wasdeveloped by [48] to overcome some of the weaknesses of the latter. The main difference ofExhaustive CHAID is that it examines all possible splits on each node, and it does not stopthe splitting process even if the optimal split is reached. It keeps merging the categories ofthe predictor variable till only two subcategories are left. It has three core steps: merging,splitting, and stopping [49]. In a decision tree, these steps are repeated on each node,initiating from the root node.
1. Merging: The method used to calculate the p-value depends on the measurementlevel of Y. The F-test will be used if Y is continuous; the two-way cross tabulationtest will be used if Y is nominal; the likelihood-ratio test will be used if Y is ordinal.The pairs that have the greatest p-value will be combined to develop the compoundcategory. The previous step will be repeated till two categories are present. The set ofcategories having the smallest p (index) will be located.
2. Splitting: The independent variables with the least p-value will be used as a nodeseparator. If this p-value is lower than or equal to the α split identified by the user,the node will be subjected to splitting with the given predictor.
3. Stopping: The stopping process is dependent on four factors: split, depth of thedecision tree, the least number of parent nodes available, and the least number ofchild nodes available.
3.1.2. QUEST
QUEST is the decision tree algorithm that is responsible for the classification of data.It has a splitting rule, which assumes that the targeted variable is continuous or uniform.In terms of calculation speed, it is efficient and fast compared to some other methods. Italso can neglect the bias that is prevalent in other decision tree algorithms. It is generallybelieved that this algorithm is more appropriate for multiple-category variables. However,it can be used to process binary data only.
QUEST stands for Quick, Unbiased, Efficient statistical tree, which is based on thebinary split decision tree algorithm. It is used for data classification and mining. It can beused in a variety of combinations. These include linear or univariate combination splits.The unique aspect of QUEST is that the bias in its attribute selection method is negligible.The construction process of a QUEST tree comprises split predictor selection, split pointselection for the split predictor, and stopping.
Loh [50] asserts that QUEST has two steps that are based on the “significance teststo split each node”. During the first test, the association of each X with Y is tested. Thevariable selection is based on the level of significance. The highest significant variable isselected. If each X is independent of Y, then each X has the same selection chance. As aresult, selection bias is not present in this approach. QUEST uses different tests based onthe nature of the variables [50]. For categorical variables, it utilizes chi-squared tests. Forordered variables, analysis of variance tests are utilized.
For categorical prediction, the chi-square test result for Y and X independence needsto be calculated. The p-value is determined by means of the chi-square test. The leastp-value predictor that is located and represented as X is chosen as the split predictor forthe node.
Quadratic discriminant analysis (QDA) is used to find the best split point. QUEST isconsidered as a binary tree, which has a maximum of two splits from each node. However,if there are problems with more than two classifications and clustering, a two-means

Sustainability 2021, 13, 815 6 of 24
clustering method will be applied to group them into two superclasses by calculating themean vector for all classifications. The splitting will form Group A, where the mean of allclassifications is identical, while the rest will form Group B.
The QDA estimates the distribution of the two formed groups (A,B) by calculatingthe means and standard deviations from the samples and determines the split point as thepoint of intersection of the two Gaussian curves, being a root of the equation:
P(A|N)1√
2π SAe−
(x−XA)22SA = P(B|N)
1√2π SB
e−(x−XB)2
2SB (1)
where N is the node being split; XA, XB are the means; SA, SB are standard deviationsof groups (A,B). Thus, a quadratic equation can result from the previous equation, asfollowing:
ax2 + bx + c = 0 (2)
wherea = SA
2 − SB2 (3)
b = 2(
XASB2 − XBSA
2)
(4)
c = (XBSA)2 − (XASB)
2+ 2S2
AS2B log
nASBnBSA
(5)
For QUEST, the following stopping rules have been identified: for a node that is pure,the cases are grouped in the category of the same dependent variable within that node. Inthis case, the node will not be subjected to splitting. Additionally, if the predictor valuesare identical in the node, the node will not be subjected to splitting. Moreover, the nodewill not be subjected to splitting if the depth is prespecified and reaches its limit.
3.2. Population and Sample Size
In this study, beta-probability distribution was chosen to estimate sample size N ofthe selected respondent (the participants’ years of experience will be used to determine thesample size). According to Chisala [51] and Wanous [52], the following equation is used tocalculate sample size N:
N =
[Z2σ2
ε2
]For 30 ≤ N ≤ 500 (6)
- N is the required sample size, Z is the z-value for 99% confidence interval, and ε isthe margin of error.
- The standard deviation of normal distribution σ can be estimated as follows:
σ =
[max.years−min.years
6
](7)
For this study, maximum years of experience is assumed to be 45 years, 5 years ofexperience is the minimum number, and the margin of error is assumed to be 2 years;σ = 6.66; Z = 2.58, and ε = 2.0, hence, N = 74. The response rate of 30% was expectedto be reached by the respondents. Thus, 200 questionnaires were distributed randomlyamong construction professionals; 100 out of 200 questionnaires were replied to by therespondents. The actual response rate was higher than the expected response (50%). Thenumber of collected responses (100 participants) was more than the required sample size(74 participants). Therefore, the sample size of this study is valid.
3.3. Relative Importance Index (RII) Technique
To identify the importance of each risk factor that affects the owner’s decision, respon-dents were asked to rate each factor from 1 to 5 for go/no-go decisions. This scale was latertransformed to a relative importance index (RII) for all factors. A relative importance index(RII) can be defined as a method that is used to analyze the relative importance of each

Sustainability 2021, 13, 815 7 of 24
factor that affects certain phenomena in the data collected by means of the questionnaire.Each risk factor is calculated by multiplying its impact by its frequencies based on therespondents’ view. [53] used the formula below to calculate RII as follows:
RII = ∑ WAxN
(8)
whereW: the weight given to each factor by the respondents (ranges 1 to 5);A: the highest-ranking factor available, which is 5;N: the total number of respondents that have answered the questionnaire.
3.4. Spearman’s Correlation
Spearman’s correlation can be defined as a statistical measure of the strength ofa relationship between paired data. The value of the correlation coefficient rs range isconstrained between −1 < rs < 1. The closer the value to −1 or +1, the stronger therelationship, while 0 indicates no relationship between the variables [54]. A comparisonbetween all go/no-go categories (organizational-related factors, project-related factors,legal factors, financial factors) and the total level of importance is performed to determinethe type of relationship between the two groups. According to [29], Spearman’s correlationrs is calculated by the following equation:
rs = 1− 6 ∑ d2i
n(n2 − 1)(9)
whered: the difference between ranks assigned to variables for each factor;n: the number of rank pairs (which is equal to the number of go/no-go factors, which
is 23).
3.5. One-Way ANOVA Test
An analysis of variance (ANOVA) is identified as a statistical method that focuseson the comparison of the means of different samples. The purpose of ANOVA is to findwhether a significant difference can be found between the class means of two or moreindependent groups [55]. It is primarily utilized to analyze variances when the data issubjected to division in order to form different groups or classes by a single factor [55].
3.6. Tukey’s Method
Tukey’s method is used for comparing the means of pairs. Since this research usesANOVA, the difference found in the significance values of the groups needs to be comparedin order to identify all possible pairs to determine the mean that is significantly different [56].Tukey’s method compares pairs as this technique increases the efficiency of significantdifferences in pairs.
4. Descriptive Statistics of the Respondents
The targeted respondents for this study were the experienced professionals in theconstruction sector. The data was collected from construction industry professionalsworldwide. According to the respondent demographics, respondents with over 5 yearsof experience in construction made the largest portion of respondents, with 58%; 15%of the respondents had between 6–10 years of experience in construction; additionally,15% and 12% of the respondents had between 16 to 20 and over 21 years experience inconstruction, respectively; 53% of the respondents represented private company owners,whereas 47% of the respondents represented public owners. In terms of company size,it is found that approximately two-thirds of the participants (65%) worked in companieswith more than 500 employees. The majority of the respondents (57%) worked in projects

Sustainability 2021, 13, 815 8 of 24
worth $101–500 million. Finally, the participants were asked when to apply the proposeddecision model. Almost half of the participants believed that the go/no-go model shouldbe performed at the end of the conceptual design stage.
5. Ranks of the Factors Affecting the Go/No-Go Decision in the Early Stage of a Project
In order to observe the feedback of construction professionals, a questionnaire, asshown in the Appendices A–C, was structured as a form that is necessary to build thedecision tree model. The questionnaire was accompanied by a cover letter. The cover letterindicated the research objective and explained to the respondent that the proposed modelwill improve the owners’ ability to analyze and estimate risks and strengthen his decisionbased on the identified data.
The survey is composed of three parts, as following:
1. Basic personal and organization profiles (e.g., years of experience, company size,work volume) in order to have different groups of respondents for comparison and todevelop the go/no-go decision model.
2. Risk factors affecting go/no-go decisions after the project definition and planningstage of construction projects. The questionnaire is structured to examine the mostsignificant risk factor based on the practitioners’ observations and to determine therelative significance of each risk group. A quantitative weighting approach is adoptedin this study to calculate the relative significance of project risks.
3. A scenario of a go/no-go decision. In this section, the respondents were requested toindicate how often their company takes go-decisions in the early stages after initialdesign is completed for different scenarios of the four categories (organizational,project/technical, legal, and financial/economic); 80 scenarios were developed anddistributed into two forms (40 scenarios per questionnaire).
Table 2 below shows the relative importance index (RII) values and the ranking of keygo/no-go factors. The respondents were requested to rate the level of importance of the23 factors that influence the go/no-go decision in the early stage of a project. Likert scale1 to 5 were defined as follows: 1 = very low importance, 2 = low importance, 3 = mediumimportance, 4 = high importance, and 5 = very high importance.
The top-three ranked factors in the organizational category were
(1) Financial stability of the owner;(2) Consultants’ and suppliers’ reliability and experience in construction;(3) Qualifications of designers and planners.
The 3 top-ranked factors in the project/technical category were
(1) Availability of materials and equipment;(2) Tight schedule;(3) Safety level required.
The top-ranked factor in the legal category was “excessive approval procedures inadministrative government departments”.
The last category was the financial/economic category and the top-3 ranked factors inthis category were as follows:
(1) Underestimated budgeting;(2) High overhead cost;(3) Expected return level/project profitability.
The second part of the analysis is calculating the average RII value per category. TheRII values for each category were quite close to each other; however, the organizationalcategory had the highest importance value, which was equal to 0.756. The legal categorywas marked as the fourth category as it had the lowest RII value, which was 0.705.

Sustainability 2021, 13, 815 9 of 24
Table 2. Factors influencing the go/no-go decisions of the owner in the early stage of the project.
Code Factors 1 2 3 4 5 W RII * Factor Group Rank * Overall Rank Group Rank
Organizational Risk Factors 0.756 1
OF1 Financial Stability of Owner 2 0 13 29 56 437 0.874 1 1
OF2 Consultants’ and suppliers’ reliability and experience in construction 1 3 35 40 21 377 0.754 2 5
OF3 Design errors and omissions (Rush design) 2 7 34 29 28 374 0.748 4 9
OF4 Qualification of designers and planners 2 8 28 36 26 376 0.752 3 7
OF5 Availability of skilled and unskilled workers/laborers 5 10 37 36 12 340 0.68 6 21
OF6 Availability of reliable and experience contractors 2 7 28 50 13 365 0.73 5 11
Project/Technical Risk Factors 0.71 3
PF7 Availability (materials and equipment) 1 4 30 44 21 380 0.76 1 4
PF8 Erroneous geological condition study 3 14 34 30 19 348 0.696 5 17
PF9 Availability of construction technologies/and skills 1 10 42 41 6 341 0.682 6 20
PF10 Size and location of project 7 14 32 28 19 338 0.676 7 22
PF11 Safety level required 6 16 15 32 31 366 0.732 3 10
PF12 Clarity or complexity of the design and scope 3 11 27 40 19 361 0.722 4 12
PF13 Site space constraints 4 19 33 30 14 331 0.662 8 23
PF14 Tight schedule 3 10 23 38 26 374 0.748 2 8
Legal Risk Factors 0.705 4
LF15 Excessive approval procedures in administrative government departments 2 12 36 26 24 358 0.716 1 13
LF16 Country specifications and level of standards in regulations and permits 3 10 34 35 18 355 0.71 2 16
LF17 Lack of legality and standard dispute settlement procedures 2 13 40 29 16 344 0.688 3 19
Financial and Economic Risk Factors 0.747 2
EF18 Underestimated budgeting 0 5 19 32 44 415 0.83 1 2
EF19 Inflation and deflation 2 14 34 35 15 347 0.694 6 18
EF20 Price escalation of raw materials 2 11 31 39 17 358 0.716 5 15
EF21 Expected return level/project profitability 2 8 25 41 24 377 0.754 3 6
EF22 High overhead cost. 0 6 27 42 25 386 0.772 2 3
EF23 Forecast about market demand/potential level of competition 1 10 32 44 13 358 0.716 4 14

Sustainability 2021, 13, 815 10 of 24
6. Ranking Comparison amongst Go/No-Go Category Factors
An inferential statistical test (Spearman’s correlation) was conducted between allgo/no-go categories (organizational-related factors, project/technical-related factors, legal-related factors, financial- and economic-related factors) and the total level of importanceto test the strength of the relationship between the categories and then to find out whichcategory has the strongest correlation. The Spearman correlation test results are shown inTable 3.
Table 3. Ranking comparison amongst go/no-go category factors.
Project/Technical Risk Legal Risk Financial and Economic Risk Total Risk
Organizational RiskCorrelationCoefficient 0.572 0.368 0.278 0.749
p-value <0.01 <0.01 <0.01 <0.01
Project/Technical RiskCorrelationCoefficient 0.696 0.317 0.886
p-value <0.01 <0.01 <0.01
Legal RiskCorrelationCoefficient 0.284 0.727
p-value <0.01 <0.01
Financial and Economic RiskCorrelationCoefficient 0.585
p-value <0.01
Table 3 indicates a strong positive correlation between project factors and legal factors.Overall, the Spearman’s correlation coefficient is higher than 0 and positive for the entirecomparison, and the p-value is smaller than 0.01 for all comparisons. It means that apositive relationship exists between each and every pair. The correlation between thefinancial/economic category and the organizational category is the smallest, with a valueequal to 0.268. The table also shows that there is a strong and positive relationship (r = 0.886,p-value < 0.01) between project/technical factors and the total level of importance, whichis the strongest relationship in the whole comparison. There is also a strong and positivecorrelation (r = 0.749, p-value < 0.01) between organizational factors and the total levelof importance.
7. One-Way ANOVA Test Results
The primary target of applying the one-way ANOVA technique was to examine thepotential differences and the degree of disagreement among the respondents based on theircompany sector, company size, project size, and years of experience.
As can be seen in Table 4, p-values among the groups of company size, company sector,and years of experience are higher than the threshold of 0.05. This indicates that there areno differences between the groups of company size and company sector on the importancelevel of the go/no-go factors. However, based on size, the p-value between the groupsconcerning the legal risk category is smaller than 0.05. Additionally, the p-value of financialand economic factors (p-value = 0.012) is smaller than 0.05, which means that there aredifferences concerning the opinions of experienced respondents on the importance level ofthe go/no-go factors for the financial and economic risk category.
Based on the significant p-value for the legal risk category, multiple comparisons weremade to determine the disagreements among size categories using Tukey for the legalfactors and the project size; they are given in Table 5. Table 4 lists the results of the one-wayANOVA test.
There is a significant difference between the opinions of respondents who work insmall companies and those who work for medium companies (project size = $1–5 million)regarding the level of importance of some legal go/no-go related factors. Additionally,the mean difference between respondents who were working on small projects and thosewho were working on very large ones was extremely high compared to other groups. Thisindicates that the level of importance of legal-related factors (at least one factor or more) in

Sustainability 2021, 13, 815 11 of 24
the early-stage process significantly differs regarding project size. Lastly, significant legalfactors for the significant p-values after running Tukey tests (see Table 5) are presented inTable 6.
Table 4. Result of the one-way ANOVA test amongst respondents.
ANOVA Number of Years of Experience Company Size Company Sector Project Size
Category Go/No-go Factors p-value p-value p-value p-value
Organizational Risk Between Groups 0.494 0.294 0.56 0.093
Project/Technical Risk Between Groups 0.811 0.234 0.38 0.188
Legal Risk Between Groups 0.842 0.130 0.587 0.014
Financial and Economic Risk Between Groups 0.012 0.505 0.54 0.734
Table 5. Multiple comparisons using the Tukey test for project factors based on project size.
Dependent Variable Mean Difference p-Value
Legal Risk
$1–5 million
$6–50 million −1.5714 0.030
$51–100 million −1.3333 0.076
$101–500 million −1.6111 0.008
More than $500 million −1.5906 0.006
$6–50 million
$1–5 million 1.5714 0.030
$51–100 million 0.23809 0.972
$101–500 million −0.0396 1.000
More than $500 million −0.0192 1.000
$51–100 million
$1–5 million 1.3333 0.076
$6–50 million −0.2380 0.972
$101–500 million −0.2777 0.885
More than $500 million −0.2573 0.882
$101–500 million
$1–5 million 1.6111 0.008
$6–50 million 0.0396 1.000
$51–100 million 0.2777 0.885
More than $500 million 0.0204 1.000
More than $500 million
$1–5 million 1.5906 0.006
$6–50 million 0.0192 1.000
$51–100 million 0.2573 0.882
$101–500 million −0.0204 1.000
It is obvious that the factor of lack of legality and standard dispute settlement proce-dure is the main reason behind the differences in opinions of people who are working onmega projects and those working on small projects in the legal category. This result can betranslated as small projects being rarely prone to legal disputes because of their nature. Onthe other hand, it is logical that mega projects are more prone to legal disputes betweenthe parties involved. Additionally, the standards and codes followed in mega projects areextensively complicated compared to simple projects.
Similarly, significant financial and economic risk factors for the significant p-valueslisted in Table 5 are presented in Table 7 after running Tukey tests.

Sustainability 2021, 13, 815 12 of 24
Table 6. Posthoc tests—multiple comparisons using Tukey’s test for project size.
Code Attribute—Project Size p-Value
Small project ($1–5 million) vs. Mega project (more than $500 million)
LF17 Lack of legality and standard dispute settlement procedure 0.009
Small project ($1–5 million) vs. Very Large project ($101–500 million)
LF17 Lack of legality and standard dispute settlement procedure 0.007
Table 7. Posthoc tests—multiple comparisons using Tukey’s test for years of experience.
Code Attribute—Years of Experience p-Value
Senior level (11–15 years) vs. Managerial level (16–20 years)
EF18 Underestimated budgeting 0.017
Beginner level (1–5 years) vs. Managerial level (16–20 years)
EF19 Inflation and deflation 0.025
Director level (more than 20 years) vs. Managerial level (16–20 years)
EF19 Inflation and deflation 0.018
8. Decision Tree Model for the Owner8.1. Using the Exhaustive CHAID Method for the Owner
The visually structured model of the Exhaustive CHAID tree-based algorithm usedfor the prediction of go/no-go decisions is presented in Figure 2.
Sustainability 2021, 13, x FOR PEER REVIEW 15 of 25
Figure 2. Go/no-go decision tree model for the owner (Exhaustive CHAID method).
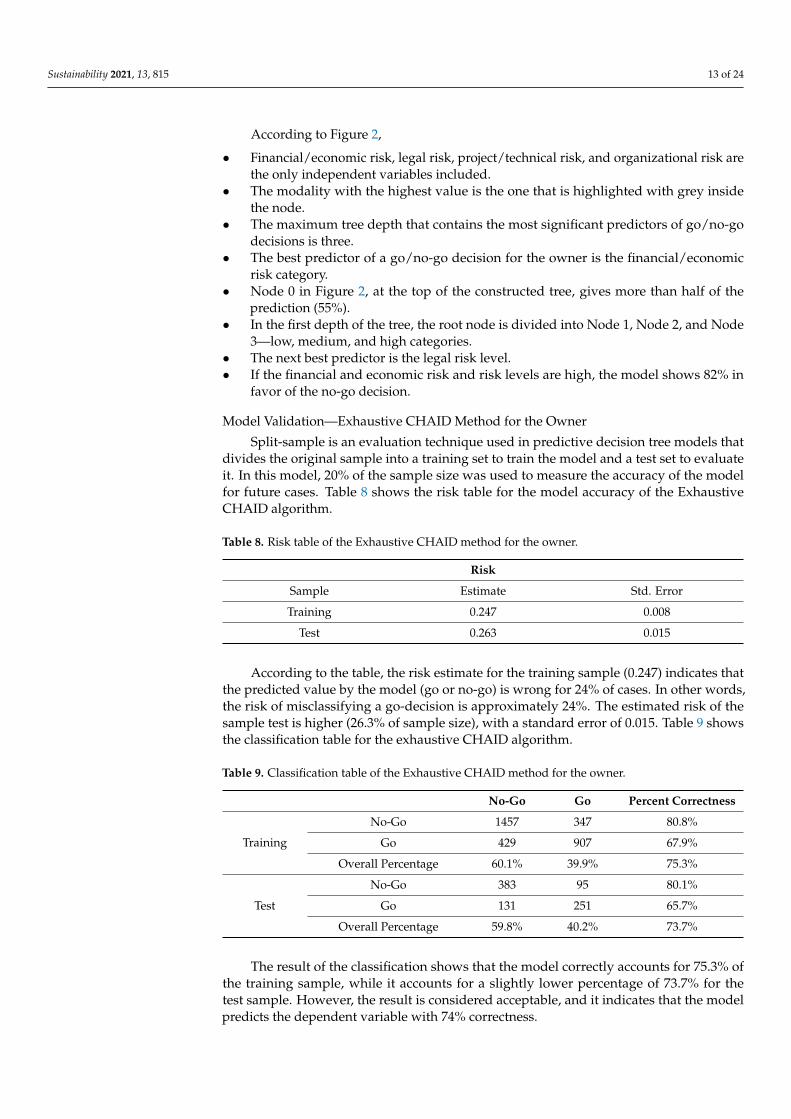
According to Figure 2,
Financial/economic risk, legal risk, project/technical risk, and organizational risk are
the only independent variables included.
The modality with the highest value is the one that is highlighted with grey inside
the node.
The maximum tree depth that contains the most significant predictors of go/no-go
decisions is three.
The best predictor of a go/no-go decision for the owner is the financial/economic risk
category.
Node 0 in Figure 2, at the top of the constructed tree, gives more than half of the
prediction (55%).
In the first depth of the tree, the root node is divided into Node 1, Node 2, and Node
3—low, medium, and high categories.
The next best predictor is the legal risk level.
If the financial and economic risk and risk levels are high, the model shows 82% in
favor of the no-go decision.
Model Validation—Exhaustive CHAID Method for the Owner
Split-sample is an evaluation technique used in predictive decision tree models that
divides the original sample into a training set to train the model and a test set to evaluate
it. In this model, 20% of the sample size was used to measure the accuracy of the model
for future cases. Table 8 shows the risk table for the model accuracy of the Exhaustive
CHAID algorithm.
Figure 2. Go/no-go decision tree model for the owner (Exhaustive CHAID method).
Sustainability 2021, 13, 815 13 of 24
According to Figure 2,
• Financial/economic risk, legal risk, project/technical risk, and organizational risk arethe only independent variables included.
• The modality with the highest value is the one that is highlighted with grey insidethe node.
• The maximum tree depth that contains the most significant predictors of go/no-godecisions is three.
• The best predictor of a go/no-go decision for the owner is the financial/economicrisk category.
• Node 0 in Figure 2, at the top of the constructed tree, gives more than half of theprediction (55%).
• In the first depth of the tree, the root node is divided into Node 1, Node 2, and Node3—low, medium, and high categories.
• The next best predictor is the legal risk level.• If the financial and economic risk and risk levels are high, the model shows 82% in
favor of the no-go decision.
Model Validation—Exhaustive CHAID Method for the Owner
Split-sample is an evaluation technique used in predictive decision tree models thatdivides the original sample into a training set to train the model and a test set to evaluateit. In this model, 20% of the sample size was used to measure the accuracy of the modelfor future cases. Table 8 shows the risk table for the model accuracy of the ExhaustiveCHAID algorithm.
Table 8. Risk table of the Exhaustive CHAID method for the owner.
Risk
Sample Estimate Std. Error
Training 0.247 0.008
Test 0.263 0.015
According to the table, the risk estimate for the training sample (0.247) indicates thatthe predicted value by the model (go or no-go) is wrong for 24% of cases. In other words,the risk of misclassifying a go-decision is approximately 24%. The estimated risk of thesample test is higher (26.3% of sample size), with a standard error of 0.015. Table 9 showsthe classification table for the exhaustive CHAID algorithm.
Table 9. Classification table of the Exhaustive CHAID method for the owner.
No-Go Go Percent Correctness
Training
No-Go 1457 347 80.8%
Go 429 907 67.9%
Overall Percentage 60.1% 39.9% 75.3%
Test
No-Go 383 95 80.1%
Go 131 251 65.7%
Overall Percentage 59.8% 40.2% 73.7%
The result of the classification shows that the model correctly accounts for 75.3% ofthe training sample, while it accounts for a slightly lower percentage of 73.7% for thetest sample. However, the result is considered acceptable, and it indicates that the modelpredicts the dependent variable with 74% correctness.

Sustainability 2021, 13, 815 14 of 24
8.2. Using the QUEST Method for Owners
The QUEST algorithm deals with several sequences of rules in the evaluation of nodesbased on a significant test, unlike the Exhaustive CHAID method. The visually structuredmodel of the QUEST tree-based algorithm used for the prediction of go/no-go decisions ispresented in Figure 3.
Sustainability 2021, 13, x FOR PEER REVIEW 17 of 25
bottom nodes.
Figure 3. Go/no-go decision tree model for the owner (QUEST method).
Model Validation—the QUEST method for the owner
Likewise, as with the Exhaustive CHAID method, a similar analysis (Table 10) shows
the risk table for the model accuracy of the QUEST algorithm.
Table 10. Risk table of the QUEST method for the owner.
Risk
Sample Estimate Std. Error
Training 0.248 0.015
Test 0.249 0.008
According to Table 10, the risk estimate for the training sample (0.248) indicates that
the predicted value by the model (go/no-go) is wrong for 25% of cases. In other words, the
risk of misclassifying a go-decision is approximately 25%. The estimated risk of the sample
test is higher (24.9% of sample size) with a standard error of 0.008. Table 11 shows the classi-
fication table for the QUEST algorithm.
Figure 3. Go/no-go decision tree model for the owner (QUEST method).
According to Figure 3,
• Financial/economic risk, legal risk, project/technical risk, and organizational risk arethe only independent variables included.
• The modality with the highest value is the one that is highlighted with grey insidethe node.
• The maximum tree depth, which contains the most significant predictors of go/no-godecisions, is four.
• The best predictor of go/no-go decisions for the owner is the financial and economicrisk variable (similar to the result in Exhaustive CHAID).
• Node 0 at the top of the constructed tree gives more than half of the prediction (57%)to not go ahead with the project.
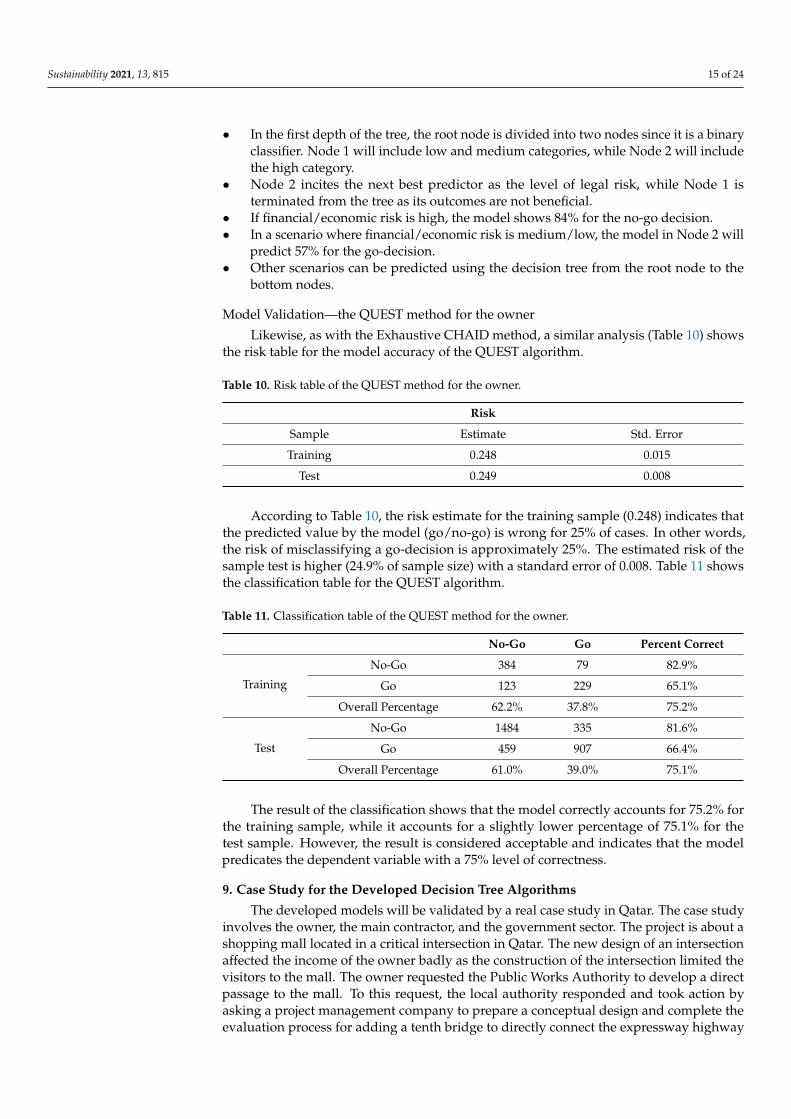
Sustainability 2021, 13, 815 15 of 24
• In the first depth of the tree, the root node is divided into two nodes since it is a binaryclassifier. Node 1 will include low and medium categories, while Node 2 will includethe high category.
• Node 2 incites the next best predictor as the level of legal risk, while Node 1 isterminated from the tree as its outcomes are not beneficial.
• If financial/economic risk is high, the model shows 84% for the no-go decision.• In a scenario where financial/economic risk is medium/low, the model in Node 2 will
predict 57% for the go-decision.• Other scenarios can be predicted using the decision tree from the root node to the
bottom nodes.
Model Validation—the QUEST method for the owner
Likewise, as with the Exhaustive CHAID method, a similar analysis (Table 10) showsthe risk table for the model accuracy of the QUEST algorithm.
Table 10. Risk table of the QUEST method for the owner.
Risk
Sample Estimate Std. Error
Training 0.248 0.015
Test 0.249 0.008
According to Table 10, the risk estimate for the training sample (0.248) indicates thatthe predicted value by the model (go/no-go) is wrong for 25% of cases. In other words,the risk of misclassifying a go-decision is approximately 25%. The estimated risk of thesample test is higher (24.9% of sample size) with a standard error of 0.008. Table 11 showsthe classification table for the QUEST algorithm.
Table 11. Classification table of the QUEST method for the owner.
No-Go Go Percent Correct
Training
No-Go 384 79 82.9%
Go 123 229 65.1%
Overall Percentage 62.2% 37.8% 75.2%
Test
No-Go 1484 335 81.6%
Go 459 907 66.4%
Overall Percentage 61.0% 39.0% 75.1%
The result of the classification shows that the model correctly accounts for 75.2% forthe training sample, while it accounts for a slightly lower percentage of 75.1% for thetest sample. However, the result is considered acceptable and indicates that the modelpredicates the dependent variable with a 75% level of correctness.
9. Case Study for the Developed Decision Tree Algorithms
The developed models will be validated by a real case study in Qatar. The case studyinvolves the owner, the main contractor, and the government sector. The project is about ashopping mall located in a critical intersection in Qatar. The new design of an intersectionaffected the income of the owner badly as the construction of the intersection limited thevisitors to the mall. The owner requested the Public Works Authority to develop a directpassage to the mall. To this request, the local authority responded and took action byasking a project management company to prepare a conceptual design and complete theevaluation process for adding a tenth bridge to directly connect the expressway highway
Sustainability 2021, 13, 815 16 of 24
to the mall to increase the number of mall visitors, as was in the past. The construction ofthe intersection is ongoing to develop a free-stopping intersection by building nine bridgesfor smooth traffic flow. The proposed bridge will be the extra bridge, which is considered achallenge due to its complex design. The main critical factors that drive the project are theneed for the project, the budget for the extra work, the size and complexity of the project,and the risks associated with the additional work.
9.1. Project Description
The project includes grade-separated interchanges, with crossroads, frontage roads,overpass and underpass structures, retaining walls, and other related infrastructure. Theintersection is considered the most complex intersection in Qatar, which includes ninebridges in one area for easy traffic flow. The proposed additional bridge will only serve themall; thus, the cost will be on the owner of the mall, as discussed with local authorities.The overall total area required to construct the additional bridge is around 1350 m2. Theadditional bridge will result in the removal of six existing residential buildings. Theproposed contract is design-build, assigned to the same main contractor that is workingon this intersection, subjected to advanced approval from the mall owner. The contractorprovided a conceptual design for the additional bridge, with a total cost of USD 30 millionto the mall owner. The proposed time is extremely tight as the additional bridge should notimpact the completion day of the ongoing project. The local authorities have denied anypostponement of the opening day as it will have a high impact on the neighborhood andlocal society. As stated previously, the site is already busy with the ongoing project, and,moreover, additional work is required. A relatively high level of logistics and planning isneeded to achieve the target without delaying the works of the remaining bridges. Fromthe mall owner’s perspective, the market is classified as highly competitive as there aretwo other malls located at the same intersection. The proposed conceptual design consistsof a single lane bridge, including MSE (mechanically stabilized earth) walls, six piers,and a retaining wall. A conceptual design has been prepared for a clear overview ofconstructability. The designer had already designed the previous nine bridges, and heaggregated the tenth one into the same intersection. The proposed construction workwill be assigned to the same main contractor working in the intersection as the contractoris already experienced with the sequence of the work and the requirements. This willminimize the risks and control problems.
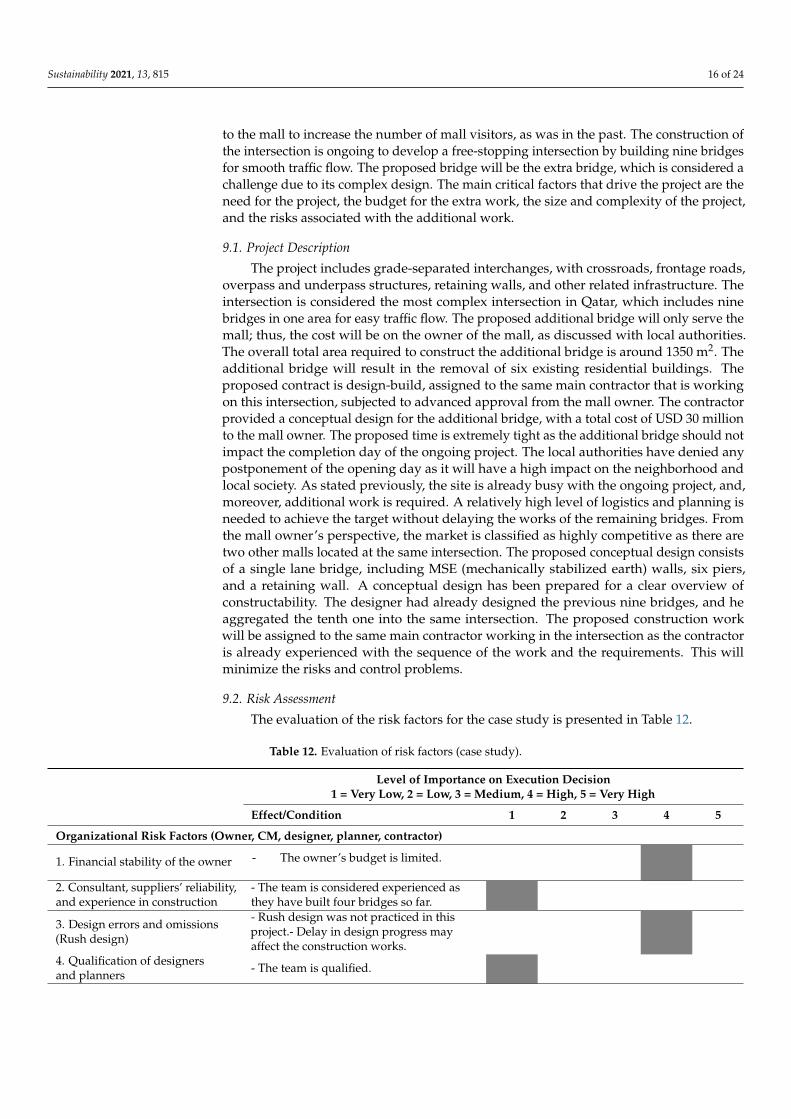
9.2. Risk Assessment
The evaluation of the risk factors for the case study is presented in Table 12.
Table 12. Evaluation of risk factors (case study).
Level of Importance on Execution Decision1 = Very Low, 2 = Low, 3 = Medium, 4 = High, 5 = Very High
Effect/Condition 1 2 3 4 5
Organizational Risk Factors (Owner, CM, designer, planner, contractor)
1. Financial stability of the owner - The owner’s budget is limited.
2. Consultant, suppliers’ reliability,and experience in construction
- The team is considered experienced asthey have built four bridges so far.
3. Design errors and omissions(Rush design)
- Rush design was not practiced in thisproject.- Delay in design progress mayaffect the construction works.
4. Qualification of designersand planners - The team is qualified.

Sustainability 2021, 13, 815 17 of 24
Table 12. Cont.
Level of Importance on Execution Decision1 = Very Low, 2 = Low, 3 = Medium, 4 = High, 5 = Very High
Effect/Condition 1 2 3 4 5
Organizational Risk Factors (Owner, CM, designer, planner, contractor)5. Availability ofskilled employees
- Skilled employees are available, withsome challenges.
6. Availability of reliable andexperienced contractors
- The main contractor who is assigned forthis intersection has a good internationalreputation.- Communications betweenparties are satisfactory.
Project/Technical Risk Factors
hline 1. Availability of resources(materials and equipment)
- Most of the materials and equipment willbe purchased from local suppliers, with fewitems that will be ordered from outside.
2. Geological conditions of theconstruction site
- Geological investigation was conducted,and the site was found suitable for theproposed construction.
3. Availability of constructiontechnologies and/or skills
- Up-to-date technologies will be used inthe management and execution ofthe project.
4. Size and location of project- The project may be affected by working invicinity of Al Shamal Road, over live traffic(safety hazard) or on the road itself.
5. Safety level required- The project may be affected by Al Shamal(busy main road), over live traffic (safetyhazard) or on the road itself.
6. Complexity of the designand scope
- The design is considered complex becausethe additional bridges were not in theoriginal plan and an extensive designprocedure is needed in order to find a wayfor the tenth bridge to be included withoutchanging the ongoing main scope.
7. Site space constraints
- The project is constrained by residentialbuildings that surround the intersection aswell as the live traffic on the expressway inthe heart of the city.- Site access is limitedbecause of the live traffic flow.
8. Tight schedule
- The proposed project should not affect thecompletion day of the main scope; thus, itshould be finished within one year, asinstructed by local authorities.
Legal Risk Factors
1. Excessive approval proceduresin administrative departments
- Expected delays in approvals from localauthorities on the proposed design.-Expected delay in Civil Defence approvals.-Expected delay in approval from TrafficDepartment.
2. Specifications and standardsrequired
- The team members are aware of thestandards since they have already usedthem in the construction of the previous 9bridges.

Sustainability 2021, 13, 815 18 of 24
Table 12. Cont.
Level of Importance on Execution Decision1 = Very Low, 2 = Low, 3 = Medium, 4 = High, 5 = Very High
Effect/Condition 1 2 3 4 5
Organizational Risk Factors (Owner, CM, designer, planner, contractor)
3. Dispute settlement procedure- Some difficulties would be experienced inthe settlement procedure among authoritiesand stakeholders.
Financial and Economic Risk Factors
1. Underestimated budgetingThe assessor is experienced, but unforeseenactivities may arise during constructionbecause of the complexity of the project.
2. Inflation and deflation Prices of materials are subject to increase asit is a fast-track project.
3. Price of raw materialsThe material is to be purchasedimmediately; high prices are expected dueto the tight schedule.
4. Expected return level/project profitability
The owner expects to compensate his losswith the new design, so the expectation isconsidered to be medium
5. High overhead costs Expected to be high
6. Forecast on marketdemand/potential levelof competition
Potential level of competition is consideredhigh because of the two other malls locatedat the same intersection. Hence, the needfor this project is high.
Note: Bold color bars in the table represents evaluation of the risk scores.
After the assessment of 23 go/no-go factors, an analysis was made to determine thecategories’ risk level; the following result was found:
• Organizational risk factors (Owner, CM, designer, planner, contractor) are consideredlow risk.
• Project/technical risk factors are considered high risk.• Legal risk factors are considered high risk.• Financial and economic risk factors are considered high risk.
9.3. Go/No-Go Decision Using Exhaustive CHAID
The Exhaustive CHAID tree model in Figure 2 should be tracked from the top “rootnode” to the bottom “child node” by the decision-maker. The present case study scenariois as follows: financial and economic risk is high (82.2% for no-go), legal risk is high (68.5%for no-go), project/technical risk is high (59.3% for no-go), and the organizational riskfactors are low (74.1% for no-go). Although the last category has a low level of risk, the“no-go” decision is recommended according to the model.
9.4. Go/No-Go Decision Using QUEST
The QUEST decision tree model in Figure 3 should be tracked from the top “root node”to the bottom “child node” by the decision-maker. According to the QUEST algorithm,financial and economic risk is high (84.2% for no-go), legal risk is high (65.7% for no-go),and project/technical risk is high (82.4% for no-go). No further nodes are required becausethe no-go decision is recommended; thus, the evaluation process should stop at this point.
10. Discussion
Twenty-three key go/no-go factors were identified from past research, categorizedinto four main groups, and ranked based on the relative importance index. The top fivego/no-go factors are (1) financial stability of the owner, (2) underestimated budgeting, (3)high overhead cost, (4) availability of materials and equipment, and (5) consultants’ and

Sustainability 2021, 13, 815 19 of 24
suppliers’ reliability and experience in construction. Following that, Spearman’s correlationtest was applied to investigate the relationship between the paired groups. Consequently,an ANOVA test analysis was performed amongst different groups of respondents, includingsuch variables as company size, company sector, project size, and the respondents’ numberof years of experience. It can be concluded that the majority of the comparisons did nothave a statistical difference between the go/no-go groups. A slight difference was foundbetween the respondents working on mega projects and those working on small projects inthe legal category.
In this research, two decision tree algorithms (Exhaustive CHAID and QUEST) werestructured to aid the owner in making the right decision during the early stage of a project.The primary goal of using two algorithms was to study the prediction accuracy of eachalgorithm and the percentage of error. The best predictor of the go/no-go decision forthe owner is the financial and economic risk. The structure of the Exhaustive CHAID treeconsists of 28 nodes, including 17 terminal nodes and a maximum of three depth levels.The second algorithm is QUEST, which consists of 15 nodes, including 8 terminal nodesand a maximum tree depth equal to four levels. The best predictor of the go/no-go decisionfor the owner is the financial and economic risk in this algorithm as well. The split-samplevalidation technique was applied to the decision tree models to check the accuracy of thego/no-go Exhaustive CHAID and QUEST models. All the charts indicate that the proposedmodels are good models; however, the QUEST technique has proved to be more efficientand accurate than the Exhaustive CHAID technique.
For an in-depth evaluation of the proposed models, a construction case study wasimplemented to test the results of the models. The case is interesting as it involves theowner, the main contractor, and the government sector. The findings obtained from thecase study tested the proposed decision models’ ability in go/no-go decisions during theearly stage, after conceptual design. Both models resulted in the same conclusion—a no-godecision. The conclusion assists the owner’s decision and prevents him from unwantedlosses. The result strengthens the evaluation provided to the mall owner and the difficultiesexpected over the risk factors.
11. Conclusions
The goal of this study was to identify and categorize the most relevant risk factorsinfluencing an owner’s go/no-go decision through a systematic literature review. Thego/no-go variables were rated in a questionnaire by construction professionals accordingto their perceived importance. After that, using QUEST and Exhaustive CHAID algorithms,a decision tree model was developed. The outcome of this research benchmarks the existingevaluation models and provides a clear and user-friendly decision model for owners. It isexpected that the model will determine anticipated risk factors in the project and decreasethe degree of uncertainty. A case study validated the Exhaustive CHAID and QUESTdesigns. This paper adds to the existing body of information by defining the variablesthat have the greatest influence on the decision of an owner as well as applying the bestknowledge of authors for the first time to the Exhaustive CHAID and QUEST decision treemodels for go/no-go decisions.
12. Limitations and Future Research
This research can be updated periodically to capture the latest market conditions andrisk factors. Additionally, several data-mining techniques, such as CRUSE and MARSalgorithms, can be examined and compared to the proposed models in this paper. Finally,software algorithms based on QUEST and Exhaustive CHAID growing algorithms can bedeveloped for the proposed go/no-go decision models in this study.

Sustainability 2021, 13, 815 20 of 24
Author Contributions: Conceptualization, M.G. and H.M.A.L.; Methodology, M.G. and H.M.A.L.;Software, H.M.A.L.; Validation, M.G. and H.M.A.L.; Formal analysis, M.G. and H.M.A.L.; Investi-gation, M.G. and H.M.A.L.; Resources, H.M.A.L.; Data curation, H.M.A.L.; Writing—original draftpreparation, M.G. and H.M.A.L.; Writing—review and editing, M.G. and H.M.A.L.; Visualization,H.M.A.L.; Supervision, M.G.; Project administration, M.G. All authors have read and agreed to thepublished version of the manuscript
Funding: This research received no external funding.
Institutional Review Board Statement: Not applicable.
Informed Consent Statement: Not applicable.
Data Availability Statement: All data, models, and code generated or used during the study areavailable from the corresponding author by request.
Conflicts of Interest: The authors declare no conflict of interest.
Appendix A. Basic Personal and Company Information
1. How many years have you worked in the construction sector?
Sustainability 2021, 13, x FOR PEER REVIEW 22 of 25
variables that have the greatest influence on the decision of an owner as well as applying
the best knowledge of authors for the first time to the Exhaustive CHAID and QUEST
decision tree models for go/no-go decisions.
12. Limitations and Future Research
This research can be updated periodically to capture the latest market conditions and
risk factors. Additionally, several data-mining techniques, such as CRUSE and MARS al-
gorithms, can be examined and compared to the proposed models in this paper. Finally,
software algorithms based on QUEST and Exhaustive CHAID growing algorithms can be
developed for the proposed go/no-go decision models in this study.
Author Contributions: Conceptualization, M.G. and H.M.A.L.; Methodology, M.G. and H.M.A.L.;
Software, H.M.A.L.; Validation, M.G. and H.M.A.L.; Formal analysis, M.G. and H.M.A.L.; Investi-
gation, M.G. and H.M.A.L.; Resources, H.M.A.L.; Data curation, H.M.A.L.; Writing—original draft
preparation, M.G. and H.M.A.L.; Writing—review and editing, M.G. and H.M.A.L.; Visualization,
H.M.A.L.; Supervision, M.G.; Project administration, M.G. All authors have read and agreed to the
published version of the manuscript
Funding: This research received no external funding.
Institutional Review Board Statement: Not applicable.
Informed Consent Statement: Not applicable.
Data Availability Statement: All data, models, and code generated or used during the study are
available from the corresponding author by request.
Conflicts of Interest: The authors declare no conflict of interest.
Appendix A. Basic Personal and Company Information
1. How many years have you worked in the construction sector?
1–5 11–15 >21
6–10 16–20
2. Which of the following describes your company sector?
Private Owner Public Owner
3. Which of the following describes your company size (number of employees)?
1–50 50–100
101–500 More than 500
4. Which of the following describes your company’s work volume in the last 5
years (USD)?
$1–5 million $6–50 million $51–100 million
$101–500 million More than $500 million
5. At which stage of the project lifecycle do you believe the final go/no-go de-
cision should be performed?
At the end of Conceptual Design
At the end of Preliminary Engineering
At the end of Final Design
1–5
Sustainability 2021, 13, x FOR PEER REVIEW 22 of 25
variables that have the greatest influence on the decision of an owner as well as applying
the best knowledge of authors for the first time to the Exhaustive CHAID and QUEST
decision tree models for go/no-go decisions.
12. Limitations and Future Research
This research can be updated periodically to capture the latest market conditions and
risk factors. Additionally, several data-mining techniques, such as CRUSE and MARS al-
gorithms, can be examined and compared to the proposed models in this paper. Finally,
software algorithms based on QUEST and Exhaustive CHAID growing algorithms can be
developed for the proposed go/no-go decision models in this study.
Author Contributions: Conceptualization, M.G. and H.M.A.L.; Methodology, M.G. and H.M.A.L.;
Software, H.M.A.L.; Validation, M.G. and H.M.A.L.; Formal analysis, M.G. and H.M.A.L.; Investi-
gation, M.G. and H.M.A.L.; Resources, H.M.A.L.; Data curation, H.M.A.L.; Writing—original draft
preparation, M.G. and H.M.A.L.; Writing—review and editing, M.G. and H.M.A.L.; Visualization,
H.M.A.L.; Supervision, M.G.; Project administration, M.G. All authors have read and agreed to the
published version of the manuscript
Funding: This research received no external funding.
Institutional Review Board Statement: Not applicable.
Informed Consent Statement: Not applicable.
Data Availability Statement: All data, models, and code generated or used during the study are
available from the corresponding author by request.
Conflicts of Interest: The authors declare no conflict of interest.
Appendix A. Basic Personal and Company Information
1. How many years have you worked in the construction sector?
1–5 11–15 >21
6–10 16–20
2. Which of the following describes your company sector?
Private Owner Public Owner
3. Which of the following describes your company size (number of employees)?
1–50 50–100
101–500 More than 500
4. Which of the following describes your company’s work volume in the last 5
years (USD)?
$1–5 million $6–50 million $51–100 million
$101–500 million More than $500 million
5. At which stage of the project lifecycle do you believe the final go/no-go de-
cision should be performed?
At the end of Conceptual Design
At the end of Preliminary Engineering
At the end of Final Design
11–15
Sustainability 2021, 13, x FOR PEER REVIEW 22 of 25
variables that have the greatest influence on the decision of an owner as well as applying
the best knowledge of authors for the first time to the Exhaustive CHAID and QUEST
decision tree models for go/no-go decisions.
12. Limitations and Future Research
This research can be updated periodically to capture the latest market conditions and
risk factors. Additionally, several data-mining techniques, such as CRUSE and MARS al-
gorithms, can be examined and compared to the proposed models in this paper. Finally,
software algorithms based on QUEST and Exhaustive CHAID growing algorithms can be
developed for the proposed go/no-go decision models in this study.
Author Contributions: Conceptualization, M.G. and H.M.A.L.; Methodology, M.G. and H.M.A.L.;
Software, H.M.A.L.; Validation, M.G. and H.M.A.L.; Formal analysis, M.G. and H.M.A.L.; Investi-
gation, M.G. and H.M.A.L.; Resources, H.M.A.L.; Data curation, H.M.A.L.; Writing—original draft
preparation, M.G. and H.M.A.L.; Writing—review and editing, M.G. and H.M.A.L.; Visualization,
H.M.A.L.; Supervision, M.G.; Project administration, M.G. All authors have read and agreed to the
published version of the manuscript
Funding: This research received no external funding.
Institutional Review Board Statement: Not applicable.
Informed Consent Statement: Not applicable.
Data Availability Statement: All data, models, and code generated or used during the study are
available from the corresponding author by request.
Conflicts of Interest: The authors declare no conflict of interest.
Appendix A. Basic Personal and Company Information
1. How many years have you worked in the construction sector?
1–5 11–15 >21
6–10 16–20
2. Which of the following describes your company sector?
Private Owner Public Owner
3. Which of the following describes your company size (number of employees)?
1–50 50–100
101–500 More than 500
4. Which of the following describes your company’s work volume in the last 5
years (USD)?
$1–5 million $6–50 million $51–100 million
$101–500 million More than $500 million
5. At which stage of the project lifecycle do you believe the final go/no-go de-
cision should be performed?
At the end of Conceptual Design
At the end of Preliminary Engineering
At the end of Final Design
>21
Sustainability 2021, 13, x FOR PEER REVIEW 22 of 25
variables that have the greatest influence on the decision of an owner as well as applying
the best knowledge of authors for the first time to the Exhaustive CHAID and QUEST
decision tree models for go/no-go decisions.
12. Limitations and Future Research
This research can be updated periodically to capture the latest market conditions and
risk factors. Additionally, several data-mining techniques, such as CRUSE and MARS al-
gorithms, can be examined and compared to the proposed models in this paper. Finally,
software algorithms based on QUEST and Exhaustive CHAID growing algorithms can be
developed for the proposed go/no-go decision models in this study.
Author Contributions: Conceptualization, M.G. and H.M.A.L.; Methodology, M.G. and H.M.A.L.;
Software, H.M.A.L.; Validation, M.G. and H.M.A.L.; Formal analysis, M.G. and H.M.A.L.; Investi-
gation, M.G. and H.M.A.L.; Resources, H.M.A.L.; Data curation, H.M.A.L.; Writing—original draft
preparation, M.G. and H.M.A.L.; Writing—review and editing, M.G. and H.M.A.L.; Visualization,
H.M.A.L.; Supervision, M.G.; Project administration, M.G. All authors have read and agreed to the
published version of the manuscript
Funding: This research received no external funding.
Institutional Review Board Statement: Not applicable.
Informed Consent Statement: Not applicable.
Data Availability Statement: All data, models, and code generated or used during the study are
available from the corresponding author by request.
Conflicts of Interest: The authors declare no conflict of interest.
Appendix A. Basic Personal and Company Information
1. How many years have you worked in the construction sector?
1–5 11–15 >21
6–10 16–20
2. Which of the following describes your company sector?
Private Owner Public Owner
3. Which of the following describes your company size (number of employees)?
1–50 50–100
101–500 More than 500
4. Which of the following describes your company’s work volume in the last 5
years (USD)?
$1–5 million $6–50 million $51–100 million
$101–500 million More than $500 million
5. At which stage of the project lifecycle do you believe the final go/no-go de-
cision should be performed?
At the end of Conceptual Design
At the end of Preliminary Engineering
At the end of Final Design
6–10
Sustainability 2021, 13, x FOR PEER REVIEW 22 of 25
variables that have the greatest influence on the decision of an owner as well as applying
the best knowledge of authors for the first time to the Exhaustive CHAID and QUEST
decision tree models for go/no-go decisions.
12. Limitations and Future Research
This research can be updated periodically to capture the latest market conditions and
risk factors. Additionally, several data-mining techniques, such as CRUSE and MARS al-
gorithms, can be examined and compared to the proposed models in this paper. Finally,
software algorithms based on QUEST and Exhaustive CHAID growing algorithms can be
developed for the proposed go/no-go decision models in this study.
Author Contributions: Conceptualization, M.G. and H.M.A.L.; Methodology, M.G. and H.M.A.L.;
Software, H.M.A.L.; Validation, M.G. and H.M.A.L.; Formal analysis, M.G. and H.M.A.L.; Investi-
gation, M.G. and H.M.A.L.; Resources, H.M.A.L.; Data curation, H.M.A.L.; Writing—original draft
preparation, M.G. and H.M.A.L.; Writing—review and editing, M.G. and H.M.A.L.; Visualization,
H.M.A.L.; Supervision, M.G.; Project administration, M.G. All authors have read and agreed to the
published version of the manuscript
Funding: This research received no external funding.
Institutional Review Board Statement: Not applicable.
Informed Consent Statement: Not applicable.
Data Availability Statement: All data, models, and code generated or used during the study are
available from the corresponding author by request.
Conflicts of Interest: The authors declare no conflict of interest.
Appendix A. Basic Personal and Company Information
1. How many years have you worked in the construction sector?
1–5 11–15 >21
6–10 16–20
2. Which of the following describes your company sector?
Private Owner Public Owner
3. Which of the following describes your company size (number of employees)?
1–50 50–100
101–500 More than 500
4. Which of the following describes your company’s work volume in the last 5
years (USD)?
$1–5 million $6–50 million $51–100 million
$101–500 million More than $500 million
5. At which stage of the project lifecycle do you believe the final go/no-go de-
cision should be performed?
At the end of Conceptual Design
At the end of Preliminary Engineering
At the end of Final Design
16–20
2. Which of the following describes your company sector?
Sustainability 2021, 13, x FOR PEER REVIEW 22 of 25
variables that have the greatest influence on the decision of an owner as well as applying
the best knowledge of authors for the first time to the Exhaustive CHAID and QUEST
decision tree models for go/no-go decisions.
12. Limitations and Future Research
This research can be updated periodically to capture the latest market conditions and
risk factors. Additionally, several data-mining techniques, such as CRUSE and MARS al-
gorithms, can be examined and compared to the proposed models in this paper. Finally,
software algorithms based on QUEST and Exhaustive CHAID growing algorithms can be
developed for the proposed go/no-go decision models in this study.
Author Contributions: Conceptualization, M.G. and H.M.A.L.; Methodology, M.G. and H.M.A.L.;
Software, H.M.A.L.; Validation, M.G. and H.M.A.L.; Formal analysis, M.G. and H.M.A.L.; Investi-
gation, M.G. and H.M.A.L.; Resources, H.M.A.L.; Data curation, H.M.A.L.; Writing—original draft
preparation, M.G. and H.M.A.L.; Writing—review and editing, M.G. and H.M.A.L.; Visualization,
H.M.A.L.; Supervision, M.G.; Project administration, M.G. All authors have read and agreed to the
published version of the manuscript
Funding: This research received no external funding.
Institutional Review Board Statement: Not applicable.
Informed Consent Statement: Not applicable.
Data Availability Statement: All data, models, and code generated or used during the study are
available from the corresponding author by request.
Conflicts of Interest: The authors declare no conflict of interest.
Appendix A. Basic Personal and Company Information
1. How many years have you worked in the construction sector?
1–5 11–15 >21
6–10 16–20
2. Which of the following describes your company sector?
Private Owner Public Owner
3. Which of the following describes your company size (number of employees)?
1–50 50–100
101–500 More than 500
4. Which of the following describes your company’s work volume in the last 5
years (USD)?
$1–5 million $6–50 million $51–100 million
$101–500 million More than $500 million
5. At which stage of the project lifecycle do you believe the final go/no-go de-
cision should be performed?
At the end of Conceptual Design
At the end of Preliminary Engineering
At the end of Final Design
Private Owner
Sustainability 2021, 13, x FOR PEER REVIEW 22 of 25
variables that have the greatest influence on the decision of an owner as well as applying
the best knowledge of authors for the first time to the Exhaustive CHAID and QUEST
decision tree models for go/no-go decisions.
12. Limitations and Future Research
This research can be updated periodically to capture the latest market conditions and
risk factors. Additionally, several data-mining techniques, such as CRUSE and MARS al-
gorithms, can be examined and compared to the proposed models in this paper. Finally,
software algorithms based on QUEST and Exhaustive CHAID growing algorithms can be
developed for the proposed go/no-go decision models in this study.
Author Contributions: Conceptualization, M.G. and H.M.A.L.; Methodology, M.G. and H.M.A.L.;
Software, H.M.A.L.; Validation, M.G. and H.M.A.L.; Formal analysis, M.G. and H.M.A.L.; Investi-
gation, M.G. and H.M.A.L.; Resources, H.M.A.L.; Data curation, H.M.A.L.; Writing—original draft
preparation, M.G. and H.M.A.L.; Writing—review and editing, M.G. and H.M.A.L.; Visualization,
H.M.A.L.; Supervision, M.G.; Project administration, M.G. All authors have read and agreed to the
published version of the manuscript
Funding: This research received no external funding.
Institutional Review Board Statement: Not applicable.
Informed Consent Statement: Not applicable.
Data Availability Statement: All data, models, and code generated or used during the study are
available from the corresponding author by request.
Conflicts of Interest: The authors declare no conflict of interest.
Appendix A. Basic Personal and Company Information
1. How many years have you worked in the construction sector?
1–5 11–15 >21
6–10 16–20
2. Which of the following describes your company sector?
Private Owner Public Owner
3. Which of the following describes your company size (number of employees)?
1–50 50–100
101–500 More than 500
4. Which of the following describes your company’s work volume in the last 5
years (USD)?
$1–5 million $6–50 million $51–100 million
$101–500 million More than $500 million
5. At which stage of the project lifecycle do you believe the final go/no-go de-
cision should be performed?
At the end of Conceptual Design
At the end of Preliminary Engineering
At the end of Final Design
Public Owner
3. Which of the following describes your company size (number of employees)?
Sustainability 2021, 13, x FOR PEER REVIEW 22 of 25
variables that have the greatest influence on the decision of an owner as well as applying
the best knowledge of authors for the first time to the Exhaustive CHAID and QUEST
decision tree models for go/no-go decisions.
12. Limitations and Future Research
This research can be updated periodically to capture the latest market conditions and
risk factors. Additionally, several data-mining techniques, such as CRUSE and MARS al-
gorithms, can be examined and compared to the proposed models in this paper. Finally,
software algorithms based on QUEST and Exhaustive CHAID growing algorithms can be
developed for the proposed go/no-go decision models in this study.
Author Contributions: Conceptualization, M.G. and H.M.A.L.; Methodology, M.G. and H.M.A.L.;
Software, H.M.A.L.; Validation, M.G. and H.M.A.L.; Formal analysis, M.G. and H.M.A.L.; Investi-
gation, M.G. and H.M.A.L.; Resources, H.M.A.L.; Data curation, H.M.A.L.; Writing—original draft
preparation, M.G. and H.M.A.L.; Writing—review and editing, M.G. and H.M.A.L.; Visualization,
H.M.A.L.; Supervision, M.G.; Project administration, M.G. All authors have read and agreed to the
published version of the manuscript
Funding: This research received no external funding.
Institutional Review Board Statement: Not applicable.
Informed Consent Statement: Not applicable.
Data Availability Statement: All data, models, and code generated or used during the study are
available from the corresponding author by request.
Conflicts of Interest: The authors declare no conflict of interest.
Appendix A. Basic Personal and Company Information
1. How many years have you worked in the construction sector?
1–5 11–15 >21
6–10 16–20
2. Which of the following describes your company sector?
Private Owner Public Owner
3. Which of the following describes your company size (number of employees)?
1–50 50–100
101–500 More than 500
4. Which of the following describes your company’s work volume in the last 5
years (USD)?
$1–5 million $6–50 million $51–100 million
$101–500 million More than $500 million
5. At which stage of the project lifecycle do you believe the final go/no-go de-
cision should be performed?
At the end of Conceptual Design
At the end of Preliminary Engineering
At the end of Final Design
1–50
Sustainability 2021, 13, x FOR PEER REVIEW 22 of 25
variables that have the greatest influence on the decision of an owner as well as applying
the best knowledge of authors for the first time to the Exhaustive CHAID and QUEST
decision tree models for go/no-go decisions.
12. Limitations and Future Research
This research can be updated periodically to capture the latest market conditions and
risk factors. Additionally, several data-mining techniques, such as CRUSE and MARS al-
gorithms, can be examined and compared to the proposed models in this paper. Finally,
software algorithms based on QUEST and Exhaustive CHAID growing algorithms can be
developed for the proposed go/no-go decision models in this study.
Author Contributions: Conceptualization, M.G. and H.M.A.L.; Methodology, M.G. and H.M.A.L.;
Software, H.M.A.L.; Validation, M.G. and H.M.A.L.; Formal analysis, M.G. and H.M.A.L.; Investi-
gation, M.G. and H.M.A.L.; Resources, H.M.A.L.; Data curation, H.M.A.L.; Writing—original draft
preparation, M.G. and H.M.A.L.; Writing—review and editing, M.G. and H.M.A.L.; Visualization,
H.M.A.L.; Supervision, M.G.; Project administration, M.G. All authors have read and agreed to the
published version of the manuscript
Funding: This research received no external funding.
Institutional Review Board Statement: Not applicable.
Informed Consent Statement: Not applicable.
Data Availability Statement: All data, models, and code generated or used during the study are
available from the corresponding author by request.
Conflicts of Interest: The authors declare no conflict of interest.
Appendix A. Basic Personal and Company Information
1. How many years have you worked in the construction sector?
1–5 11–15 >21
6–10 16–20
2. Which of the following describes your company sector?
Private Owner Public Owner
3. Which of the following describes your company size (number of employees)?
1–50 50–100
101–500 More than 500
4. Which of the following describes your company’s work volume in the last 5
years (USD)?
$1–5 million $6–50 million $51–100 million
$101–500 million More than $500 million
5. At which stage of the project lifecycle do you believe the final go/no-go de-
cision should be performed?
At the end of Conceptual Design
At the end of Preliminary Engineering
At the end of Final Design
50–100
Sustainability 2021, 13, x FOR PEER REVIEW 22 of 25
variables that have the greatest influence on the decision of an owner as well as applying
the best knowledge of authors for the first time to the Exhaustive CHAID and QUEST
decision tree models for go/no-go decisions.
12. Limitations and Future Research
This research can be updated periodically to capture the latest market conditions and
risk factors. Additionally, several data-mining techniques, such as CRUSE and MARS al-
gorithms, can be examined and compared to the proposed models in this paper. Finally,
software algorithms based on QUEST and Exhaustive CHAID growing algorithms can be
developed for the proposed go/no-go decision models in this study.
Author Contributions: Conceptualization, M.G. and H.M.A.L.; Methodology, M.G. and H.M.A.L.;
Software, H.M.A.L.; Validation, M.G. and H.M.A.L.; Formal analysis, M.G. and H.M.A.L.; Investi-
gation, M.G. and H.M.A.L.; Resources, H.M.A.L.; Data curation, H.M.A.L.; Writing—original draft
preparation, M.G. and H.M.A.L.; Writing—review and editing, M.G. and H.M.A.L.; Visualization,
H.M.A.L.; Supervision, M.G.; Project administration, M.G. All authors have read and agreed to the
published version of the manuscript
Funding: This research received no external funding.
Institutional Review Board Statement: Not applicable.
Informed Consent Statement: Not applicable.
Data Availability Statement: All data, models, and code generated or used during the study are
available from the corresponding author by request.
Conflicts of Interest: The authors declare no conflict of interest.
Appendix A. Basic Personal and Company Information
1. How many years have you worked in the construction sector?
1–5 11–15 >21
6–10 16–20
2. Which of the following describes your company sector?
Private Owner Public Owner
3. Which of the following describes your company size (number of employees)?
1–50 50–100
101–500 More than 500
4. Which of the following describes your company’s work volume in the last 5
years (USD)?
$1–5 million $6–50 million $51–100 million
$101–500 million More than $500 million
5. At which stage of the project lifecycle do you believe the final go/no-go de-
cision should be performed?
At the end of Conceptual Design
At the end of Preliminary Engineering
At the end of Final Design
101–500
Sustainability 2021, 13, x FOR PEER REVIEW 22 of 25
variables that have the greatest influence on the decision of an owner as well as applying
the best knowledge of authors for the first time to the Exhaustive CHAID and QUEST
decision tree models for go/no-go decisions.
12. Limitations and Future Research
This research can be updated periodically to capture the latest market conditions and
risk factors. Additionally, several data-mining techniques, such as CRUSE and MARS al-
gorithms, can be examined and compared to the proposed models in this paper. Finally,
software algorithms based on QUEST and Exhaustive CHAID growing algorithms can be
developed for the proposed go/no-go decision models in this study.
Author Contributions: Conceptualization, M.G. and H.M.A.L.; Methodology, M.G. and H.M.A.L.;
Software, H.M.A.L.; Validation, M.G. and H.M.A.L.; Formal analysis, M.G. and H.M.A.L.; Investi-
gation, M.G. and H.M.A.L.; Resources, H.M.A.L.; Data curation, H.M.A.L.; Writing—original draft
preparation, M.G. and H.M.A.L.; Writing—review and editing, M.G. and H.M.A.L.; Visualization,
H.M.A.L.; Supervision, M.G.; Project administration, M.G. All authors have read and agreed to the
published version of the manuscript
Funding: This research received no external funding.
Institutional Review Board Statement: Not applicable.
Informed Consent Statement: Not applicable.
Data Availability Statement: All data, models, and code generated or used during the study are
available from the corresponding author by request.
Conflicts of Interest: The authors declare no conflict of interest.
Appendix A. Basic Personal and Company Information
1. How many years have you worked in the construction sector?
1–5 11–15 >21
6–10 16–20
2. Which of the following describes your company sector?
Private Owner Public Owner
3. Which of the following describes your company size (number of employees)?
1–50 50–100
101–500 More than 500
4. Which of the following describes your company’s work volume in the last 5
years (USD)?
$1–5 million $6–50 million $51–100 million
$101–500 million More than $500 million
5. At which stage of the project lifecycle do you believe the final go/no-go de-
cision should be performed?
At the end of Conceptual Design
At the end of Preliminary Engineering
At the end of Final Design
More than 500
4. Which of the following describes your company’s work volume in the last 5 years (USD)?
Sustainability 2021, 13, x FOR PEER REVIEW 22 of 25
variables that have the greatest influence on the decision of an owner as well as applying
the best knowledge of authors for the first time to the Exhaustive CHAID and QUEST
decision tree models for go/no-go decisions.
12. Limitations and Future Research
This research can be updated periodically to capture the latest market conditions and
risk factors. Additionally, several data-mining techniques, such as CRUSE and MARS al-
gorithms, can be examined and compared to the proposed models in this paper. Finally,
software algorithms based on QUEST and Exhaustive CHAID growing algorithms can be
developed for the proposed go/no-go decision models in this study.
Author Contributions: Conceptualization, M.G. and H.M.A.L.; Methodology, M.G. and H.M.A.L.;
Software, H.M.A.L.; Validation, M.G. and H.M.A.L.; Formal analysis, M.G. and H.M.A.L.; Investi-
gation, M.G. and H.M.A.L.; Resources, H.M.A.L.; Data curation, H.M.A.L.; Writing—original draft
preparation, M.G. and H.M.A.L.; Writing—review and editing, M.G. and H.M.A.L.; Visualization,
H.M.A.L.; Supervision, M.G.; Project administration, M.G. All authors have read and agreed to the
published version of the manuscript
Funding: This research received no external funding.
Institutional Review Board Statement: Not applicable.
Informed Consent Statement: Not applicable.
Data Availability Statement: All data, models, and code generated or used during the study are
available from the corresponding author by request.
Conflicts of Interest: The authors declare no conflict of interest.
Appendix A. Basic Personal and Company Information
1. How many years have you worked in the construction sector?
1–5 11–15 >21
6–10 16–20
2. Which of the following describes your company sector?
Private Owner Public Owner
3. Which of the following describes your company size (number of employees)?
1–50 50–100
101–500 More than 500
4. Which of the following describes your company’s work volume in the last 5
years (USD)?
$1–5 million $6–50 million $51–100 million
$101–500 million More than $500 million
5. At which stage of the project lifecycle do you believe the final go/no-go de-
cision should be performed?
At the end of Conceptual Design
At the end of Preliminary Engineering
At the end of Final Design
$1–5 million
Sustainability 2021, 13, x FOR PEER REVIEW 22 of 25
variables that have the greatest influence on the decision of an owner as well as applying
the best knowledge of authors for the first time to the Exhaustive CHAID and QUEST
decision tree models for go/no-go decisions.
12. Limitations and Future Research
This research can be updated periodically to capture the latest market conditions and
risk factors. Additionally, several data-mining techniques, such as CRUSE and MARS al-
gorithms, can be examined and compared to the proposed models in this paper. Finally,
software algorithms based on QUEST and Exhaustive CHAID growing algorithms can be
developed for the proposed go/no-go decision models in this study.
Author Contributions: Conceptualization, M.G. and H.M.A.L.; Methodology, M.G. and H.M.A.L.;
Software, H.M.A.L.; Validation, M.G. and H.M.A.L.; Formal analysis, M.G. and H.M.A.L.; Investi-
gation, M.G. and H.M.A.L.; Resources, H.M.A.L.; Data curation, H.M.A.L.; Writing—original draft
preparation, M.G. and H.M.A.L.; Writing—review and editing, M.G. and H.M.A.L.; Visualization,
H.M.A.L.; Supervision, M.G.; Project administration, M.G. All authors have read and agreed to the
published version of the manuscript
Funding: This research received no external funding.
Institutional Review Board Statement: Not applicable.
Informed Consent Statement: Not applicable.
Data Availability Statement: All data, models, and code generated or used during the study are
available from the corresponding author by request.
Conflicts of Interest: The authors declare no conflict of interest.
Appendix A. Basic Personal and Company Information
1. How many years have you worked in the construction sector?
1–5 11–15 >21
6–10 16–20
2. Which of the following describes your company sector?
Private Owner Public Owner
3. Which of the following describes your company size (number of employees)?
1–50 50–100
101–500 More than 500
4. Which of the following describes your company’s work volume in the last 5
years (USD)?
$1–5 million $6–50 million $51–100 million
$101–500 million More than $500 million
5. At which stage of the project lifecycle do you believe the final go/no-go de-
cision should be performed?
At the end of Conceptual Design
At the end of Preliminary Engineering
At the end of Final Design
$6–50 million
Sustainability 2021, 13, x FOR PEER REVIEW 22 of 25
variables that have the greatest influence on the decision of an owner as well as applying
the best knowledge of authors for the first time to the Exhaustive CHAID and QUEST
decision tree models for go/no-go decisions.
12. Limitations and Future Research
This research can be updated periodically to capture the latest market conditions and
risk factors. Additionally, several data-mining techniques, such as CRUSE and MARS al-
gorithms, can be examined and compared to the proposed models in this paper. Finally,
software algorithms based on QUEST and Exhaustive CHAID growing algorithms can be
developed for the proposed go/no-go decision models in this study.
Author Contributions: Conceptualization, M.G. and H.M.A.L.; Methodology, M.G. and H.M.A.L.;
Software, H.M.A.L.; Validation, M.G. and H.M.A.L.; Formal analysis, M.G. and H.M.A.L.; Investi-
gation, M.G. and H.M.A.L.; Resources, H.M.A.L.; Data curation, H.M.A.L.; Writing—original draft
preparation, M.G. and H.M.A.L.; Writing—review and editing, M.G. and H.M.A.L.; Visualization,
H.M.A.L.; Supervision, M.G.; Project administration, M.G. All authors have read and agreed to the
published version of the manuscript
Funding: This research received no external funding.
Institutional Review Board Statement: Not applicable.
Informed Consent Statement: Not applicable.
Data Availability Statement: All data, models, and code generated or used during the study are
available from the corresponding author by request.
Conflicts of Interest: The authors declare no conflict of interest.
Appendix A. Basic Personal and Company Information
1. How many years have you worked in the construction sector?
1–5 11–15 >21
6–10 16–20
2. Which of the following describes your company sector?
Private Owner Public Owner
3. Which of the following describes your company size (number of employees)?
1–50 50–100
101–500 More than 500
4. Which of the following describes your company’s work volume in the last 5
years (USD)?
$1–5 million $6–50 million $51–100 million
$101–500 million More than $500 million
5. At which stage of the project lifecycle do you believe the final go/no-go de-
cision should be performed?
At the end of Conceptual Design
At the end of Preliminary Engineering
At the end of Final Design
$51–100 million
Sustainability 2021, 13, x FOR PEER REVIEW 22 of 25
variables that have the greatest influence on the decision of an owner as well as applying
the best knowledge of authors for the first time to the Exhaustive CHAID and QUEST
decision tree models for go/no-go decisions.
12. Limitations and Future Research
This research can be updated periodically to capture the latest market conditions and
risk factors. Additionally, several data-mining techniques, such as CRUSE and MARS al-
gorithms, can be examined and compared to the proposed models in this paper. Finally,
software algorithms based on QUEST and Exhaustive CHAID growing algorithms can be
developed for the proposed go/no-go decision models in this study.
Author Contributions: Conceptualization, M.G. and H.M.A.L.; Methodology, M.G. and H.M.A.L.;
Software, H.M.A.L.; Validation, M.G. and H.M.A.L.; Formal analysis, M.G. and H.M.A.L.; Investi-
gation, M.G. and H.M.A.L.; Resources, H.M.A.L.; Data curation, H.M.A.L.; Writing—original draft
preparation, M.G. and H.M.A.L.; Writing—review and editing, M.G. and H.M.A.L.; Visualization,
H.M.A.L.; Supervision, M.G.; Project administration, M.G. All authors have read and agreed to the
published version of the manuscript
Funding: This research received no external funding.
Institutional Review Board Statement: Not applicable.
Informed Consent Statement: Not applicable.
Data Availability Statement: All data, models, and code generated or used during the study are
available from the corresponding author by request.
Conflicts of Interest: The authors declare no conflict of interest.
Appendix A. Basic Personal and Company Information
1. How many years have you worked in the construction sector?
1–5 11–15 >21
6–10 16–20
2. Which of the following describes your company sector?
Private Owner Public Owner
3. Which of the following describes your company size (number of employees)?
1–50 50–100
101–500 More than 500
4. Which of the following describes your company’s work volume in the last 5
years (USD)?
$1–5 million $6–50 million $51–100 million
$101–500 million More than $500 million
5. At which stage of the project lifecycle do you believe the final go/no-go de-
cision should be performed?
At the end of Conceptual Design
At the end of Preliminary Engineering
At the end of Final Design
$101–500 million
Sustainability 2021, 13, x FOR PEER REVIEW 22 of 25
variables that have the greatest influence on the decision of an owner as well as applying
the best knowledge of authors for the first time to the Exhaustive CHAID and QUEST
decision tree models for go/no-go decisions.
12. Limitations and Future Research
This research can be updated periodically to capture the latest market conditions and
risk factors. Additionally, several data-mining techniques, such as CRUSE and MARS al-
gorithms, can be examined and compared to the proposed models in this paper. Finally,
software algorithms based on QUEST and Exhaustive CHAID growing algorithms can be
developed for the proposed go/no-go decision models in this study.
Author Contributions: Conceptualization, M.G. and H.M.A.L.; Methodology, M.G. and H.M.A.L.;
Software, H.M.A.L.; Validation, M.G. and H.M.A.L.; Formal analysis, M.G. and H.M.A.L.; Investi-
gation, M.G. and H.M.A.L.; Resources, H.M.A.L.; Data curation, H.M.A.L.; Writing—original draft
preparation, M.G. and H.M.A.L.; Writing—review and editing, M.G. and H.M.A.L.; Visualization,
H.M.A.L.; Supervision, M.G.; Project administration, M.G. All authors have read and agreed to the
published version of the manuscript
Funding: This research received no external funding.
Institutional Review Board Statement: Not applicable.
Informed Consent Statement: Not applicable.
Data Availability Statement: All data, models, and code generated or used during the study are
available from the corresponding author by request.
Conflicts of Interest: The authors declare no conflict of interest.
Appendix A. Basic Personal and Company Information
1. How many years have you worked in the construction sector?
1–5 11–15 >21
6–10 16–20
2. Which of the following describes your company sector?
Private Owner Public Owner
3. Which of the following describes your company size (number of employees)?
1–50 50–100
101–500 More than 500
4. Which of the following describes your company’s work volume in the last 5
years (USD)?
$1–5 million $6–50 million $51–100 million
$101–500 million More than $500 million
5. At which stage of the project lifecycle do you believe the final go/no-go de-
cision should be performed?
At the end of Conceptual Design
At the end of Preliminary Engineering
At the end of Final Design
More than $500 million
5. At which stage of the project lifecycle do you believe the final go/no-go decisionshould be performed?
Sustainability 2021, 13, x FOR PEER REVIEW 22 of 25
variables that have the greatest influence on the decision of an owner as well as applying
the best knowledge of authors for the first time to the Exhaustive CHAID and QUEST
decision tree models for go/no-go decisions.
12. Limitations and Future Research
This research can be updated periodically to capture the latest market conditions and
risk factors. Additionally, several data-mining techniques, such as CRUSE and MARS al-
gorithms, can be examined and compared to the proposed models in this paper. Finally,
software algorithms based on QUEST and Exhaustive CHAID growing algorithms can be
developed for the proposed go/no-go decision models in this study.
Author Contributions: Conceptualization, M.G. and H.M.A.L.; Methodology, M.G. and H.M.A.L.;
Software, H.M.A.L.; Validation, M.G. and H.M.A.L.; Formal analysis, M.G. and H.M.A.L.; Investi-
gation, M.G. and H.M.A.L.; Resources, H.M.A.L.; Data curation, H.M.A.L.; Writing—original draft
preparation, M.G. and H.M.A.L.; Writing—review and editing, M.G. and H.M.A.L.; Visualization,
H.M.A.L.; Supervision, M.G.; Project administration, M.G. All authors have read and agreed to the
published version of the manuscript
Funding: This research received no external funding.
Institutional Review Board Statement: Not applicable.
Informed Consent Statement: Not applicable.
Data Availability Statement: All data, models, and code generated or used during the study are
available from the corresponding author by request.
Conflicts of Interest: The authors declare no conflict of interest.
Appendix A. Basic Personal and Company Information
1. How many years have you worked in the construction sector?
1–5 11–15 >21
6–10 16–20
2. Which of the following describes your company sector?
Private Owner Public Owner
3. Which of the following describes your company size (number of employees)?
1–50 50–100
101–500 More than 500
4. Which of the following describes your company’s work volume in the last 5
years (USD)?
$1–5 million $6–50 million $51–100 million
$101–500 million More than $500 million
5. At which stage of the project lifecycle do you believe the final go/no-go de-
cision should be performed?
At the end of Conceptual Design
At the end of Preliminary Engineering
At the end of Final Design
At the end of Conceptual Design
Sustainability 2021, 13, x FOR PEER REVIEW 22 of 25
variables that have the greatest influence on the decision of an owner as well as applying
the best knowledge of authors for the first time to the Exhaustive CHAID and QUEST
decision tree models for go/no-go decisions.
12. Limitations and Future Research
This research can be updated periodically to capture the latest market conditions and
risk factors. Additionally, several data-mining techniques, such as CRUSE and MARS al-
gorithms, can be examined and compared to the proposed models in this paper. Finally,
software algorithms based on QUEST and Exhaustive CHAID growing algorithms can be
developed for the proposed go/no-go decision models in this study.
Author Contributions: Conceptualization, M.G. and H.M.A.L.; Methodology, M.G. and H.M.A.L.;
Software, H.M.A.L.; Validation, M.G. and H.M.A.L.; Formal analysis, M.G. and H.M.A.L.; Investi-
gation, M.G. and H.M.A.L.; Resources, H.M.A.L.; Data curation, H.M.A.L.; Writing—original draft
preparation, M.G. and H.M.A.L.; Writing—review and editing, M.G. and H.M.A.L.; Visualization,
H.M.A.L.; Supervision, M.G.; Project administration, M.G. All authors have read and agreed to the
published version of the manuscript
Funding: This research received no external funding.
Institutional Review Board Statement: Not applicable.
Informed Consent Statement: Not applicable.
Data Availability Statement: All data, models, and code generated or used during the study are
available from the corresponding author by request.
Conflicts of Interest: The authors declare no conflict of interest.
Appendix A. Basic Personal and Company Information
1. How many years have you worked in the construction sector?
1–5 11–15 >21
6–10 16–20
2. Which of the following describes your company sector?
Private Owner Public Owner
3. Which of the following describes your company size (number of employees)?
1–50 50–100
101–500 More than 500
4. Which of the following describes your company’s work volume in the last 5
years (USD)?
$1–5 million $6–50 million $51–100 million
$101–500 million More than $500 million
5. At which stage of the project lifecycle do you believe the final go/no-go de-
cision should be performed?
At the end of Conceptual Design
At the end of Preliminary Engineering
At the end of Final Design
At the end of Preliminary Engineering
Sustainability 2021, 13, x FOR PEER REVIEW 22 of 25
variables that have the greatest influence on the decision of an owner as well as applying
the best knowledge of authors for the first time to the Exhaustive CHAID and QUEST
decision tree models for go/no-go decisions.
12. Limitations and Future Research
This research can be updated periodically to capture the latest market conditions and
risk factors. Additionally, several data-mining techniques, such as CRUSE and MARS al-
gorithms, can be examined and compared to the proposed models in this paper. Finally,
software algorithms based on QUEST and Exhaustive CHAID growing algorithms can be
developed for the proposed go/no-go decision models in this study.
Author Contributions: Conceptualization, M.G. and H.M.A.L.; Methodology, M.G. and H.M.A.L.;
Software, H.M.A.L.; Validation, M.G. and H.M.A.L.; Formal analysis, M.G. and H.M.A.L.; Investi-
gation, M.G. and H.M.A.L.; Resources, H.M.A.L.; Data curation, H.M.A.L.; Writing—original draft
preparation, M.G. and H.M.A.L.; Writing—review and editing, M.G. and H.M.A.L.; Visualization,
H.M.A.L.; Supervision, M.G.; Project administration, M.G. All authors have read and agreed to the
published version of the manuscript
Funding: This research received no external funding.
Institutional Review Board Statement: Not applicable.
Informed Consent Statement: Not applicable.
Data Availability Statement: All data, models, and code generated or used during the study are
available from the corresponding author by request.
Conflicts of Interest: The authors declare no conflict of interest.
Appendix A. Basic Personal and Company Information
1. How many years have you worked in the construction sector?
1–5 11–15 >21
6–10 16–20
2. Which of the following describes your company sector?
Private Owner Public Owner
3. Which of the following describes your company size (number of employees)?
1–50 50–100
101–500 More than 500
4. Which of the following describes your company’s work volume in the last 5
years (USD)?
$1–5 million $6–50 million $51–100 million
$101–500 million More than $500 million
5. At which stage of the project lifecycle do you believe the final go/no-go de-
cision should be performed?
At the end of Conceptual Design
At the end of Preliminary Engineering
At the end of Final Design
At the end of Final Design
Appendix B. Risk Factors Affecting Go/No-Go Decisions in the Early Stages of theProject, before Execution
How important do you think the following risk factors affect go/no-go decisions in the early stage of the project, beforeexecution? (Please mark only one answer per row).
GNG Risk FactorsLevel of Importance on execution decision 1 = Very Low,
2 = Low, 3 = Medium, 4 = High, 5 = Very High
1 2 3 4 5
Organizational Risk Factors (Owner, CM, designer,planner, contractor)
1. Financial stability of the owner2. Consultants’ and suppliers’ reliability and experiencein construction
Sustainability 2021, 13, 815 21 of 24
How important do you think the following risk factors affect go/no-go decisions in the early stage of the project, beforeexecution? (Please mark only one answer per row).
3. Design errors and omissions (Rush design)4. Qualification of designers and planners5. Availability of skilled labor6. Availability of reliable and experienced contractors
Project/Technical Risk Factors
1. Availability of resources (materials and equipment)2. Geological conditions of the construction site3. Availability of construction technologies and/or skills4. Size and location of the project5. Safety level required6. Complexity of the design and scope7. Site space constraints8. Tight schedule
Legal Risk Factors
1. Excessive approval procedures in administrative departments2. Specifications and standards required3. Dispute settlement procedure
Financial and Economic Risk Factors
1. Underestimated budgeting2. Inflation and deflation3. Price of raw materials4. Expected return level/Project profitability5. High overhead costs.6. Forecast about market demand/Potential level of competition
Appendix C. Scenario of Go/No-Go Decision
How does your company/organization take go-decisions in the early stages, beforeexecution, in different scenarios. Please click on the go-decision (go/no-go) below fordifferent scenarios.
Form (A)
Scenario Organizational Risk Project/Technical Risk Legal Risk Financial/Economic RiskGo Decision
GO /NO-GO1 Low High Medium Medium2 High Low Low High3 Medium Medium Medium Low4 High Medium Medium Medium5 High Low Medium Medium6 Low Medium High Medium7 Low Low High Medium8 Low Medium High Low9 Low Medium Low Medium
10 High High Medium Low11 High High Medium Medium12 Medium High Medium Low13 Low Medium High High14 High Low Medium High15 Medium Low High Low
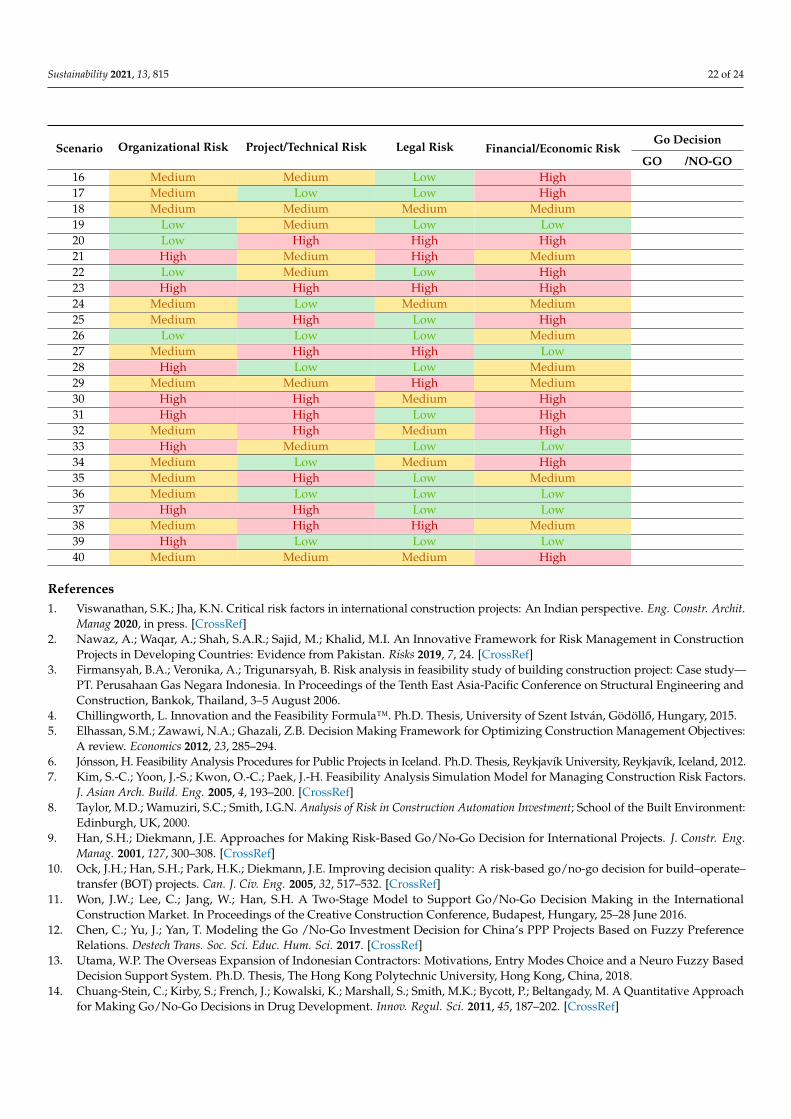
Sustainability 2021, 13, 815 22 of 24
Scenario Organizational Risk Project/Technical Risk Legal Risk Financial/Economic RiskGo Decision
GO /NO-GO16 Medium Medium Low High17 Medium Low Low High18 Medium Medium Medium Medium19 Low Medium Low Low20 Low High High High21 High Medium High Medium22 Low Medium Low High23 High High High High24 Medium Low Medium Medium25 Medium High Low High26 Low Low Low Medium27 Medium High High Low28 High Low Low Medium29 Medium Medium High Medium30 High High Medium High31 High High Low High32 Medium High Medium High33 High Medium Low Low34 Medium Low Medium High35 Medium High Low Medium36 Medium Low Low Low37 High High Low Low38 Medium High High Medium39 High Low Low Low40 Medium Medium Medium High
References1. Viswanathan, S.K.; Jha, K.N. Critical risk factors in international construction projects: An Indian perspective. Eng. Constr. Archit.
Manag 2020, in press. [CrossRef]2. Nawaz, A.; Waqar, A.; Shah, S.A.R.; Sajid, M.; Khalid, M.I. An Innovative Framework for Risk Management in Construction
Projects in Developing Countries: Evidence from Pakistan. Risks 2019, 7, 24. [CrossRef]3. Firmansyah, B.A.; Veronika, A.; Trigunarsyah, B. Risk analysis in feasibility study of building construction project: Case study—
PT. Perusahaan Gas Negara Indonesia. In Proceedings of the Tenth East Asia-Pacific Conference on Structural Engineering andConstruction, Bankok, Thailand, 3–5 August 2006.
4. Chillingworth, L. Innovation and the Feasibility Formula™. Ph.D. Thesis, University of Szent István, Gödöllo, Hungary, 2015.5. Elhassan, S.M.; Zawawi, N.A.; Ghazali, Z.B. Decision Making Framework for Optimizing Construction Management Objectives:
A review. Economics 2012, 23, 285–294.6. Jónsson, H. Feasibility Analysis Procedures for Public Projects in Iceland. Ph.D. Thesis, Reykjavík University, Reykjavík, Iceland, 2012.7. Kim, S.-C.; Yoon, J.-S.; Kwon, O.-C.; Paek, J.-H. Feasibility Analysis Simulation Model for Managing Construction Risk Factors.
J. Asian Arch. Build. Eng. 2005, 4, 193–200. [CrossRef]8. Taylor, M.D.; Wamuziri, S.C.; Smith, I.G.N. Analysis of Risk in Construction Automation Investment; School of the Built Environment:
Edinburgh, UK, 2000.9. Han, S.H.; Diekmann, J.E. Approaches for Making Risk-Based Go/No-Go Decision for International Projects. J. Constr. Eng.
Manag. 2001, 127, 300–308. [CrossRef]10. Ock, J.H.; Han, S.H.; Park, H.K.; Diekmann, J.E. Improving decision quality: A risk-based go/no-go decision for build–operate–
transfer (BOT) projects. Can. J. Civ. Eng. 2005, 32, 517–532. [CrossRef]11. Won, J.W.; Lee, C.; Jang, W.; Han, S.H. A Two-Stage Model to Support Go/No-Go Decision Making in the International
Construction Market. In Proceedings of the Creative Construction Conference, Budapest, Hungary, 25–28 June 2016.12. Chen, C.; Yu, J.; Yan, T. Modeling the Go /No-Go Investment Decision for China’s PPP Projects Based on Fuzzy Preference
Relations. Destech Trans. Soc. Sci. Educ. Hum. Sci. 2017. [CrossRef]13. Utama, W.P. The Overseas Expansion of Indonesian Contractors: Motivations, Entry Modes Choice and a Neuro Fuzzy Based
Decision Support System. Ph.D. Thesis, The Hong Kong Polytechnic University, Hong Kong, China, 2018.14. Chuang-Stein, C.; Kirby, S.; French, J.; Kowalski, K.; Marshall, S.; Smith, M.K.; Bycott, P.; Beltangady, M. A Quantitative Approach
for Making Go/No-Go Decisions in Drug Development. Innov. Regul. Sci. 2011, 45, 187–202. [CrossRef]

Sustainability 2021, 13, 815 23 of 24
15. Bahamid, R.A.; Doh, S.I.; Al-Sharaf, M.A. Risk factors affecting the construction projects in the developing countries. IOP Conf.Ser. Earth Environ. Sci. 2019, 244, 012040. [CrossRef]
16. Abd-Eltawab, A.I.; Kandil, K.A.; Hussein, G.; Badawy, M. Modelling Risks of Road Construction in Real Estate Projects. Int. Res.J. Eng. Technol. 2018, 5, 1025–1031.
17. El-Karim, M.S.B.A.; El Nawawy, O.A.M.; Abdel-Alim, A.M. Identification and assessment of risk factors affecting constructionprojects. HBRC J. 2017, 13, 202–216. [CrossRef]
18. Yucelgazi, F.; Yitmen, I. Risk Assessment for Large-Scale Transport Infrastructure Projects. In Proceedings of the 3rd WorldMultidisciplinary Civil Engineering, Architecture, Urban Planning Symposium (WMCAUS 2018), Prague, Czech Republic, 18–22June 2018; Institute of Physics (IOP): London, UK, 2019; Volume 471, pp. 1–10.
19. Amoatey, C.T.; Ameyaw, Y.; Adaku, E.; Famiyeh, S. Analysing delay causes and effects in Ghanaian state housing constructionprojects. Int. J. Manag. Proj. Bus. 2015, 8, 198–214. [CrossRef]
20. Bagaya, O.; Song, J. Empirical study of factors influencing schedule delays of public construction projects in Burkina Faso.J. Manag. Eng. 2016, 32, 05016014. [CrossRef]
21. Sharaf, M.M.M.; Abdelwahab, H.T. Analysis of Risk Factors for Highway Construction Projects in Egypt. J. Civ. Eng. Arch. 2015,9, 526–533.
22. Issa, U.H.; Farag, M.A.; Abdelhafez, L.M.; Ahmed, S.A. A Risk Allocation Model for Construction Projects in Yemen. Civ. Environ.Res. 2015, 7, 78–89.
23. Zidane, Y.J.-T.; Andersen, B. The top 10 universal delay factors in construction projects. Int. J. Manag. Proj. Bus. 2018,11, 650–672. [CrossRef]
24. Kishan, P. A Study of Risk Factors Affecting Building Construction Projects. Int. J. Eng. Res. Technol. 2014, 3, 831–835.25. Asadi, S.S.; Rao, V. An Integrated Approach to a Critical Analysis of Risk Management in Construction Projects. Int. J. Civ. Eng.
Technol. 2018, 9, 20–28.26. Singh, M.K.; Deep, S.; Banerjee, R. Risk management in construction projects as per Indian scenario. Int. J. Civ. Eng. Technol. 2017,
8, 127–136.27. Al-Hazim, N.; Abu Salem, Z.; Ahmad, H. Delay and Cost Overrun in Infrastructure Projects in Jordan. Procedia Eng. 2017,
182, 18–24. [CrossRef]28. Sharafi, P.; Rashidi, M.; Samali, B.; Ronagh, H.; Mortazavi, M. Identification of Factors and Decision Analysis of the Level of
Modularization in Building Construction. J. Arch. Eng. 2018, 24, 04018010. [CrossRef]29. Jarkas, A.M.; Mubarak, S.A.; Kadri, C.Y. Critical Factors Determining Bid/No Bid Decisions of Contractors in Qatar. J. Manag.
Eng. 2014, 30, 05014007. [CrossRef]30. Zou, P.X.; Zhang, G.; Wang, J.Y. Identifying Key Risks in Construction Projects: Life Cycle and Stakeholder Perspectives. Int. J.
Constr. Manag. 2014, 9. [CrossRef]31. Kadry, M.; Osman, H.; Georgy, M. Causes of Construction Delays in Countries with High Geopolitical Risks. J. Constr. Eng.
Manag. 2017, 143, 04016095. [CrossRef]32. Horine, G. Absolute Beginner’s Guide to Project Management, 2nd ed.; Que Publishing: Indianapolis, IN, USA, 2009.33. Diab, M.F.; Varma, A.; Nassar, K. Using risk assessment to improve highway construction project performance. In Proceedings of
the 48th ASC Annual International Conference, Birmingham, UK, 11–14 April 2012.34. Gavit, S.; Pitroda, J.; Makwana, A.H. Risk Management in High Rise Construction Projects in Surat City. Constr. Manag. Approach
2019, 5, 160–167.35. Sakthiganesh, R.; Suchithra, S.; Saravanakumar, S. A Study on Critical Risk Factors involved Life Cycle of construction Projects.
Int. J. Eng. Technol. Manag. Appl. Sci. 2017, 5, 32–36. Available online: http://www.ijetmas.com/admin/resources/project/paper/f201703071488864063.pdf (accessed on 14 January 2021).
36. Gondia, A.; Siam, A.; El-Dakhakhni, W.; Nassar, A.H. Machine Learning Algorithms for Construction Projects Delay RiskPrediction. J. Constr. Eng. Manag. 2020, 146, 04019085. [CrossRef]
37. Jang, W.; Lee, J.K.; Lee, J.; Han, S.H. Naive Bayesian Classifier for Selecting Good / Bad Projects during the Early Stage ofInternational Construction Bidding Decisions. Math. Probl. Eng. 2015, 2015. [CrossRef]
38. Wu, Z.; Nisar, T.M.; Kapletia, D.; Prabhakar, G.P. Risk factors for project success in the Chinese construction industry. J. Manuf.Technol. Manag. 2017, 28, 850–866. [CrossRef]
39. Mishra, A.K.; Mallik, K. Factors and Impact of Risk Management Practice on Success of Construction Projects of HousingDevelopers, Kathmandu, Nepal. Int. J. Sci. Basic Appl. Res. 2017, 36, 206–232.
40. Hastak, M.; Shaked, A. ICRAM-1: Model for International Construction Risk Assessment. J. Manag. Eng. 2000, 16, 59–69. [CrossRef]41. Chua, D.K.H.; Wang, Y.; Tan, W.T. Impacts of Obstacles in East Asian Cross-Border Construction. J. Constr. Eng. Manag. 2003,
129, 131–141. [CrossRef]42. Liu, J.; Zhao, X.; Yan, P. Risk Paths in International Construction Projects: Case Study from Chinese Contractors. J. Constr. Eng.
Manag. 2016, 142, 05016002. [CrossRef]43. Leka, S.; Caushi, E. Statistical Methods for Identification, Analysis and Prediction of Customer Attrition. Ph.D. Thesis, Catholic
University, Albania, 2019.44. Rajalakshmi, R.; Uma, M.; Thangadurai, K.; Punithavalli, M. Impact of Datamining Techniques in Forecasting Plant Disease. Int.
J. Adv. Res. Comput. Sci. 2012, 3, 187–190.

Sustainability 2021, 13, 815 24 of 24
45. Magesh, N.; Thangaraj, P.; Sivagobika, S.; Praba, S.; Priya Mohana, R. Evaluating The Performance of an Employee Using DecisionTree Algorithm. Int. J. Eng. Res. Technol. 2013, 2, 2814–2830.
46. Vandamme, J.-P.; Meskens, N.; Superby, J.-F. Predicting Academic Performance by Data Mining Methods. Educ. Econ. 2007,15, 405–419. [CrossRef]
47. Ali, M.; Eyduran, E.; Tariq, M.M.; Tirink, C.; Abbas, F.; Bajwa, M.A.; Baloch, M.H.; Nizamani, A.H.; Waheed, W.A.; Awan, M.A.;et al. Comparison of Artificial Neural Network and Decision Tree Algorithms used for Predicting Live Weight at Post WeaningPeriod from Some Biometrical Characteristics in Harnai Sheep. Pak. J. Zool. 2015, 47, 1579–1585.
48. Biggs, D.; De Ville, B.; Suen, E. A Method of choosing multiway partitions for classification and decision trees. J. Appl. Stat. 1991,18, 49–62. [CrossRef]
49. Novita, R.; Sabariah, M.K.; Effendy, V. Identifying factors that influence student failure rate using Exhaustive CHAID (Chi-squareautomatic interaction detection). In Proceedings of the 2015 3rd International Conference on Information and CommunicationTechnology (ICoICT), Nusa Dua, Bali, 27–29 May 2015.
50. Loh, W.-Y. Classification and regression trees. Wiley Interdiscip. Rev. Data Min. Knowl. Discov. 2011, 1, 14–23. [CrossRef]51. Chisala, M.L. Quantitative Bid or No-Bid Decision-Support Model for Contractors. J. Constr. Eng. Manag. 2017, 143, 04017088. [CrossRef]52. Wanous, M.; Boussabaine, A.H.; Lewis, J. Tendering factors considered by Syrian contractors. In Proceedings of the 14th annual
ARCOM conference, Reading, UK, 9–11 September 1998; pp. 535–543.53. Gunduz, M.; Nielsen, Y.; Ozdemir, M. Quantification of Delay Factors Using the Relative Importance Index Method for
Construction Projects in Turkey. J. Manag. Eng. 2013, 29, 133–139. [CrossRef]54. Faridi, A.S.; El-Sayegh, S.M. Significant factors causing delay in the UAE construction industry. Constr. Manag. Econ. 2006,
24, 1167–1176.55. Ostertagová, E.; Ostertag, O.; Kovác, J. Methodology and application of the Kruskal-Wallis test. In Applied Mechanics and Materials;
Trans Tech Publications: Zurich, Switzerland, 2014; Volume 611, pp. 115–120.56. Abdi, H.; Williams, L.J. Newman-Keuls test and Tukey test. In Encyclopedia of Research Design; Sage: Thousand Oaks, CA, USA,
2010; pp. 1–11.