Quantitative analysis of structural disorder in intervertebral ...
Upload
independentCategory
view
0download
0

Quantitative Chemical Analysis
[“The Experiment” by Sempe © C. Charillon, Paris.]
Quantitative ChemicalAnalysis
SEVENTH EDITION
Daniel C. HarrisMichelson LaboratoryChina Lake, California
W. H. Freeman and CompanyNew York

Publisher: Craig BleyerSenior Acquisitions Editor: Jessica FiorilloMarketing Manager: Anthony PalmiottoMedia Editor: Victoria AndersonAssociate Editor: Amy ThornePhoto Editors: Cecilia Varas/Donna RanieriDesign Manager: Diana BlumeCover Designer: Trina DoniniText Designer: Rae GrantText Layout: Jerry WilkeSenior Project Editor: Mary Louise ByrdIllustrations: Fine Line IllustrationsIllustration Coordinators: Shawn Churchman/Susan Timmins Production Coordinator: Paul W. RohloffComposition: TechBooks/GTS Companies, York, PAPrinting and Binding: RR Donnelley
Library of Congress Control Number: 2006922923
ISBN: 0-7167-7041-5EAN: 9780716770411
© 2007 by W. H. Freeman and Company
Printed in the United States of America
First printing
0 The Analytical Process 1
1 Measurements 9
2 Tools of the Trade 20
3 Experimental Error 39
4 Statistics 53
5 Quality Assurance and Calibration Methods 78
6 Chemical Equilibrium 96
7 Let the Titrations Begin 121
8 Activity and the Systematic Treatment of Equilibrium 140
9 Monoprotic Acid-Base Equilibria 158
10 Polyprotic Acid-Base Equilibria 180
11 Acid-Base Titrations 199
12 EDTA Titrations 228
13 Advanced Topics in Equilibrium 250
14 Fundamentalsof Electrochemistry 270
15 Electrodes and Potentiometry 298
16 Redox Titrations 327
17 Electroanalytical Techniques 348
18 Fundamentalsof Spectrophotometry 378
19 Applicationsof Spectrophotometry 402
20 Spectrophotometers 424
21 Atomic Spectroscopy 453
22 Mass Spectrometry 474
23 Introduction to Analytical Separations 501
24 Gas Chromatography 528
25 High-Performance Liquid Chromatography 556
26 Chromatographic Methods and Capillary Electrophoresis 588
27 Gravimetric and Combustion Analysis 628
28 Sample Preparation 644
Notes and References NR1
Glossary GL1
Appendixes AP1
Solutions to Exercises S1
Answers to Problems AN1
Index I1
Brief Contents

This page intentionally left blank
Preface xiii
0 The Analytical Process 1A Biosensor for Arsenic in the Environment
0-1 The Analytical Chemist’s Job 20-2 General Steps in a Chemical Analysis 7
Box 0-1 Constructing a Representative Sample 7
1 Measurements 9Ultrasensitive Measurement of Atoms
in a Vapor1-1 SI Units 91-2 Chemical Concentrations 121-3 Preparing Solutions 141-4 Stoichiometry Calculations 16
2 Tools of the Trade 20The Smallest Balances
2-1 Safe, Ethical Handling of Chemicals and Waste 20Box 2-1 Disposal of Chemical Waste 21
2-2 The Lab Notebook 222-3 Analytical Balance 222-4 Burets 252-5 Volumetric Flasks 262-6 Pipets and Syringes 272-7 Filtration 292-8 Drying 302-9 Calibration of Volumetric Glassware 31
2-10 Introduction to Microsoft Excel 332-11 Graphing with Microsoft Excel 35
3 Experimental Error 39Experimental Error
3-1 Significant Figures 393-2 Significant Figures in Arithmetic 403-3 Types of Error 42
Box 3-1 Standard Reference Materials 433-4 Propagation of Uncertainty from Random Error 44
Box 3-2 Propagation of Uncertainty in the Product x � x 48
3-5 Propagation of Uncertainty: Systematic Error 49
4 Statistics 53Is My Red Blood Cell Count High Today?
4-1 Gaussian Distribution 53
4-2 Confidence Intervals 574-3 Comparison of Means with Student’s t 59
Box 4-1 Analytical Chemistry and the Law 634-4 Comparison of Standard Deviations
with the F Test 634-5 t Tests with a Spreadsheet 644-6 Q Test for Bad Data 654-7 The Method of Least Squares 654-8 Calibration Curves 69
Box 4-2 Using a Nonlinear Calibration Curve 714-9 A Spreadsheet for Least Squares 71
5 Quality Assurance and Calibration Methods 78The Need for Quality Assurance
5-1 Basics of Quality Assurance 79Box 5-1 Control Charts 81
5-2 Method Validation 82Box 5-2 The Horwitz Trumpet: Variation
in Interlaboratory Precision 855-3 Standard Addition 875-4 Internal Standards 90
6 Chemical Equilibrium 96Chemical Equilibrium in the Environment
6-1 The Equilibrium Constant 976-2 Equilibrium and Thermodynamics 986-3 Solubility Product 100
Box 6-1 Solubility Is Governed by More Than the Solubility Product 101
Demonstration 6-1 Common Ion Effect 1026-4 Complex Formation 102
Box 6-2 Notation for Formation Constants 1046-5 Protic Acids and Bases 1056-6 pH 1076-7 Strengths of Acids and Bases 108
Demonstration 6-2 The HCl Fountain 109Box 6-3 The Strange Behavior
of Hydrofluoric Acid 110Box 6-4 Carbonic Acid 113
6-8 Solving Equilibrium Problems with a Concentration Table and a Spreadsheet 114
7 Let the Titrations Begin 121Evolution of the Buret
7-1 Titrations 121
vii
Contents

Box 7-1 Reagent Chemicals and Primary Standards 123
7-2 Titration Calculations 1237-3 Spectrophotometric Titrations 1267-4 The Precipitation Titration Curve 1277-5 Titration of a Mixture 1317-6 Calculating Titration Curves with
a Spreadsheet 1327-7 End-Point Detection 133
Demonstration 7-1 Fajans Titration 1347-8 Efficiency in Experimental Design 134
8 Activity and the Systematic Treatment of Equilibrium 140Hydrated Ions
8-1 The Effect of Ionic Strength on Solubility of Salts 141
Demonstration 8-1 Effect of Ionic Strength on Ion Dissociation 141
Box 8-1 Salts with Ions of Charge �|2|Do Not Fully Dissociate 143
8-2 Activity Coefficients 1438-3 pH Revisited 1478-4 Systematic Treatment of Equilibrium 147
Box 8-2 Calcium Carbonate Mass Balance in Rivers 150
8-5 Applying the Systematic Treatment of Equilibrium 150
9 Monoprotic Acid-Base Equilibria 158Measuring pH Inside Cellular
Compartments9-1 Strong Acids and Bases 159
Box 9-1 Concentrated HNO3 Is Only Slightly Dissociated 159
9-2 Weak Acids and Bases 1619-3 Weak-Acid Equilibria 162
Box 9-2 Dyeing Fabrics and the Fraction of Dissociation 164
Demonstration 9-1 Conductivity of Weak Electrolytes 165
9-4 Weak-Base Equilibria 1669-5 Buffers 167
Box 9-3 Strong Plus Weak Reacts Completely 170Demonstration 9-2 How Buffers Work 171
10 Polyprotic Acid-Base Equilibria 180Proteins Are Polyprotic Acids and Bases
10-1 Diprotic Acids and Bases 181Box 10-1 Successive Approximations 186
10-2 Diprotic Buffers 18710-3 Polyprotic Acids and Bases 188
10-4 Which Is the Principal Species? 19010-5 Fractional Composition Equations 19110-6 Isoelectric and Isoionic pH 193
Box 10-2 Isoelectric Focusing 194
11 Acid-Base Titrations 199Acid-Base Titration of a Protein
11-1 Titration of Strong Base with Strong Acid 20011-2 Titration of Weak Acid with Strong Base 20211-3 Titration of Weak Base with Strong Acid 20511-4 Titrations in Diprotic Systems 20611-5 Finding the End Point with a pH Electrode 208
Box 11-1 Alkalinity and Acidity 20911-6 Finding the End Point with Indicators 212
Demonstration 11-1 Indicators and the Acidity of CO2 214
Box 11-2 What Does a Negative pH Mean? 214Box 11-3 World Record Small Titration 216
11-7 Practical Notes 21611-8 The Leveling Effect 21611-9 Calculating Titration Curves with Spreadsheets 218
12 EDTA Titrations 228Ion Channels in Cell Membranes
12-1 Metal-Chelate Complexes 22912-2 EDTA 231
Box 12-1 Chelation Therapy and Thalassemia 23212-3 EDTA Titration Curves 23512-4 Do It with a Spreadsheet 23712-5 Auxiliary Complexing Agents 238
Box 12-2 Metal Ion Hydrolysis Decreases the Effective Formation Constant for EDTA Complexes 240
12-6 Metal Ion Indicators 241Demonstration 12-1 Metal Ion Indicator
Color Changes 24112-7 EDTA Titration Techniques 244
Box 12-3 Water Hardness 245
13 Advanced Topics in Equilibrium 250Acid Rain
13-1 General Approach to Acid-Base Systems 25113-2 Activity Coefficients 25413-3 Dependence of Solubility on pH 25713-4 Analyzing Acid-Base Titrations with
Difference Plots 263
14 Fundamentalsof Electrochemistry 270Electricity from the Ocean Floor
14-1 Basic Concepts 270
viii Contents

Box 14-1 Molecular Wire 27314-2 Galvanic Cells 274
Demonstration 14-1 The Human Salt Bridge 27714-3 Standard Potentials 27714-4 Nernst Equation 279
Box 14-2 E° and the Cell Voltage Do Not Depend on How You Write the Cell Reaction 280
Box 14-3 Latimer Diagrams: How to Find E° for a New Half-Reaction 282
14-5 E° and the Equilibrium Constant 283Box 14-4 Concentrations in the
Operating Cell 28414-6 Cells as Chemical Probes 28514-7 Biochemists Use E°� 288
15 Electrodes and Potentiometry 298A Heparin Sensor
15-1 Reference Electrodes 29915-2 Indicator Electrodes 301
Demonstration 15-1 Potentiometrywith an Oscillating Reaction 302
15-3 What Is a Junction Potential? 30315-4 How Ion-Selective Electrodes Work 30315-5 pH Measurement with a Glass Electrode 306
Box 15-1 Systematic Error in Rainwater pH Measurement: The Effect ofJunction Potential 310
15-6 Ion-Selective Electrodes 31115-7 Using Ion-Selective Electrodes 31715-8 Solid-State Chemical Sensors 318
16 Redox Titrations 327Chemical Analysis of High-Temperature
Superconductors16-1 The Shape of a Redox Titration Curve 328
Demonstration 16-1 PotentiometricTitration of Fe2� with MnO4
– 33216-2 Finding the End Point 33216-3 Adjustment of Analyte Oxidation State 33516-4 Oxidation with Potassium Permanganate 33616-5 Oxidation with Ce4� 337
Box 16-1 Environmental Carbon Analysis and Oxygen Demand 338
16-6 Oxidation with Potassium Dichromate 33916-7 Methods Involving Iodine 340
Box 16-2 Iodometric Analysis of High-Temperature Superconductors 342
17 Electroanalytical Techniques 348How Sweet It Is!
17-1 Fundamentals of Electrolysis 349Demonstration 17-1 Electrochemical
Writing 350
17-2 Electrogravimetric Analysis 35317-3 Coulometry 35517-4 Amperometry 357
Box 17-l Oxygen Sensors 358Box 17-2 What Is an “Electronic Nose”? 360
17-5 Voltammetry 362Box 17-3 The Electric Double Layer 365
17-6 Karl Fischer Titration of H2O 370Demonstration 17-2 The Karl Fischer
Jacks of a pH Meter 371
18 Fundamentals of Spectrophotometry 378The Ozone Hole
18-1 Properties of Light 37918-2 Absorption of Light 380
Box 18-1 Why Is There a Logarithmic Relation Between Transmittance and Concentration? 382
18-3 Measuring Absorbance 383Demonstration 18-1 Absorption Spectra 383
18-4 Beer’s Law in Chemical Analysis 38518-5 What Happens When a Molecule
Absorbs Light? 387Box 18-2 Fluorescence All Around Us 391
18-6 Luminescence 392Box 18-3 Instability of the Earth’s Climate 395
19 Applications of Spectrophotometry 402Fluorescence Resonance Energy
Transfer Biosensor19-1 Analysis of a Mixture 40219-2 Measuring an Equilibrium Constant:
The Scatchard Plot 40719-3 The Method of Continuous Variation 40819-4 Flow Injection Analysis 41019-5 Immunoassays and Aptamers 41119-6 Sensors Based on Luminescence Quenching 414
Box 19-1 Converting Light into Electricity 414
20 Spectrophotometers 424Cavity Ring-Down Spectroscopy: Do You Have an Ulcer?
20-1 Lamps and Lasers: Sources of Light 426Box 20-1 Blackbody Radiation and the
Greenhouse Effect 42620-2 Monochromators 42920-3 Detectors 433
Box 20-2 The Most Important Photoreceptor 43520-4 Optical Sensors 43720-5 Fourier Transform Infrared Spectroscopy 44220-6 Dealing with Noise 448
ixContents

21 Atomic Spectroscopy 453An Anthropology Puzzle
21-1 An Overview 454Box 21-1 Mercury Analysis by Cold Vapor
Atomic Fluorescence 45621-2 Atomization: Flames, Furnaces, and Plasmas 45621-3 How Temperature Affects Atomic
Spectroscopy 46121-4 Instrumentation 46221-5 Interference 46621-6 Inductively Coupled Plasma–
Mass Spectrometry 468
22 Mass Spectrometry 474Droplet Electrospray
22-1 What Is Mass Spectrometry? 474Box 22-1 Molecular Mass and Nominal Mass 476Box 22-2 How Ions of Different Masses
Are Separated by a Magnetic Field 47622-2 Oh, Mass Spectrum, Speak to Me! 478
Box 22-3 Isotope Ratio Mass Spectrometry 48222-3 Types of Mass Spectrometers 48422-4 Chromatography–Mass Spectrometry 488
Box 22-4 Matrix-Assisted Laser Desorption/Ionization 494
23 Introduction to Analytical Separations 501Measuring Silicones Leaking from
Breast Implants23-1 Solvent Extraction 502
Demonstration 23-1 Extraction with Dithizone 504
Box 23-1 Crown Ethers 50623-2 What Is Chromatography? 50623-3 A Plumber’s View of Chromatography 50823-4 Efficiency of Separation 51123-5 Why Bands Spread 516
Box 23-2 Microscopic Description of Chromatography 522
24 Gas Chromatography 528What Did They Eat in the Year 1000?
24-1 The Separation Process in Gas Chromatography 528
Box 24-1 Chiral Phases for Separating Optical Isomers 533
24-2 Sample Injection 53824-3 Detectors 54124-4 Sample Preparation 54724-5 Method Development in Gas Chromatography 549
25 High-Performance Liquid Chromatography 556In Vivo Microdialysis for Measuring
Drug Metabolism25-1 The Chromatographic Process 557
Box 25-1 Monolithic Silica Columns 562Box 25-2 “Green” Technology:
Supercritical Fluid Chromatography 56825-2 Injection and Detection in HPLC 57025-3 Method Development for Reversed-Phase
Separations 57525-4 Gradient Separations 580
Box 25-3 Choosing Gradient Conditions and Scaling Gradients 582
26 Chromatographic Methods and Capillary Electrophoresis 588Capillary Electrochromatography
26-1 Ion-Exchange Chromatography 58926-2 Ion Chromatography 594
Box 26-1 Surfactants and Micelles 59826-3 Molecular Exclusion Chromatography 59926-4 Affinity Chromatography 602
Box 26-2 Molecular Imprinting 60326-5 Principles of Capillary Electrophoresis 60326-6 Conducting Capillary Electrophoresis 61026-7 Lab on a Chip 620
27 Gravimetric and Combustion Analysis 628The Geologic Time Scale and
Gravimetric Analysis27-1 An Example of Gravimetric Analysis 62927-2 Precipitation 630
Demonstration 27-1 Colloids and Dialysis 63227-3 Examples of Gravimetric Calculations 63427-4 Combustion Analysis 637
28 Sample Preparation 644Extraction Membranes
28-1 Statistics of Sampling 64628-2 Dissolving Samples for Analysis 65028-3 Sample Preparation Techniques 655
ExperimentsExperiments are found at the Web sitewww.whfreeman.com/qca7e
1. Calibration of Volumetric Glassware2. Gravimetric Determination of Calcium as
CaC2O4 � H2O
x Contents

3. Gravimetric Determination of Iron as Fe2O3
4. Penny Statistics5. Statistical Evaluation of Acid-Base Indicators6. Preparing Standard Acid and Base7. Using a pH Electrode for an Acid-Base Titration8. Analysis of a Mixture of Carbonate and Bicarbonate9. Analysis of an Acid-Base Titration Curve:
The Gran Plot10. Kjeldahl Nitrogen Analysis11. EDTA Titration of Ca2� and Mg2� in Natural Waters12. Synthesis and Analysis of Ammonium Decavanadate13. Iodimetric Titration of Vitamin C14. Preparation and Iodometric Analysis
of High-Temperature Superconductor15. Potentiometric Halide Titration with Ag�
16. Electrogravimetric Analysis of Copper17. Polarographic Measurement of an Equilibrium
Constant18. Coulometric Titration of Cyclohexene with Bromine19. Spectrophotometric Determination of Iron in
Vitamin Tablets20. Microscale Spectrophotometric Measurement of Iron
in Foods by Standard Addition21. Spectrophotometric Measurement of an Equilibrium
Constant22. Spectrophotometric Analysis of a Mixture: Caffeine
and Benzoic Acid in a Soft Drink23. Mn2� Standardization by EDTA Titration24. Measuring Manganese in Steel by Spectrophotometry
with Standard Addition25. Measuring Manganese in Steel by Atomic Absorption
Using a Calibration Curve26. Properties of an Ion-Exchange Resin27. Analysis of Sulfur in Coal by Ion Chromatography28. Measuring Carbon Monoxide in Automobile Exhaust
by Gas Chromatography29. Amino Acid Analysis by Capillary Electrophoresis30. DNA Composition by High-Performance Liquid
Chromatography31. Analysis of Analgesic Tablets by High-Performance
Liquid Chromatography32. Anion Content of Drinking Water by Capillary
Electrophoresis
Spreadsheet Topics2-10 Introduction to Microsoft Excel 332-11 Graphing with Microsoft Excel 35Problem 3-8 Controlling the appearance of a graph 514-1 Average, standard deviation, normal distribution 554-5 t-Test 64
4-7 Equation of a straight line 674-9 Spreadsheet for least squares 71
Problem 4-25 Adding error bars to a graph 765-2 Square of the correlation coefficient (R2) 83
Problem 5-14 Using TRENDLINE 936-8 Solving equations with Excel GOAL SEEK 1157-6 Precipitation titration curves 1327-8 Multiple linear regression and
experimental design 1348-5 Using GOAL SEEK in equilibrium problems 153
Problem 8-27 Circular reference 1569-5 Excel GOAL SEEK and naming cells 176
11-9 Acid-base titration curves 21812-4 EDTA titrations 237Problem 12-18 Auxiliary complexing agents in
EDTA titrations 247Problem 12-20 Complex formation 24813-1 Using Excel SOLVER 25313-2 Activity coefficients with the Davies equation 25613-4 Fitting nonlinear curves by least squares 26413-4 Using Excel SOLVER for more than one unknown 26519-1 Solving simultaneous equations with
Excel SOLVER 40519-1 Solving simultaneous equations by matrix
inversion 406Problem 24-29 Binomial distribution function
for isotope patterns 555
Notes and References NR1Glossary GL1Appendixes AP1A. Logarithms and Exponents AP1B. Graphs of Straight Lines AP2C. Propagation of Uncertainty AP3D. Oxidation Numbers and Balancing Redox
Equations AP5E. Normality AP8F. Solubility Products AP9G. Acid Dissociation Constants AP11H. Standard Reduction Potentials AP20I. Formation Constants AP28J. Logarithm of the Formation Constant
for the Reaction M(aq) � L(aq) ML(aq) AP-31K. Analytical Standards AP-32
Solutions to Exercises S1Answers to Problems AN1Index I1
T
xiContents

Felicia Abraham
Arthur
My grandchildren assure methat the future is bright.

One of our most pressing problems is the need for sources of energy to replace oil.The chart at the right shows that world production of oil per capita has probablyalready peaked. Oil will play a decreasing role as an energy source and should bemore valuable as a raw material than as a fuel. There is also strong pressure to mini-mize the burning of fuels that produce carbon dioxide, which could be alteringEarth’s climate.
It is my hope that some of you reading this book will become scientists, engi-neers, and enlightened policy makers who will find efficient, sustainable ways to har-ness energy from sunlight, wind, waves, biomass, and nuclear fission and fusion.Nuclear fission is far less polluting than burning oil, but difficult problems of wastecontainment are unsolved. Much coal remains, but coal creates carbon dioxide andmore air pollution than any major energy source. There is a public misconceptionthat hydrogen is a source of energy. Hydrogen requires energy to make and is only ameans of storing energy. There are also serious questions about whether ethanol pro-vides more energy than is required for its production. More efficient use of energywill play a major role in reducing demand. No source of energy is sufficient if ourpopulation continues to grow.
Goals of This BookMy goals are to provide a sound physical understanding of the principles of analytical chem-istry and to show how these principles are applied in chemistry and related disciplines—especially in life sciences and environmental science. I have attempted to present the subjectin a rigorous, readable, and interesting manner that will appeal to students whether or nottheir primary interest is chemistry. I intend the material to be lucidenough for nonchemistry majors yet to contain the depth required byadvanced undergraduates. This book grew out of an introductoryanalytical chemistry course that I taught mainly for nonmajors at theUniversity of California at Davis and from a course for third-yearchemistry students at Franklin and Marshall College in Lancaster,Pennsylvania.
What’s New?In the seventh edition, quality assurance was moved from the back ofthe book into Chapter 5 to emphasize the increasing importanceattached to this subject and to link it closely to statistics and calibration.Two chapters on activity coefficients and the systematic treatment ofequilibrium from the sixth edition were condensed into Chapter 8. Anew, advanced treatment of equilibrium appears in Chapter 13. Thischapter, which requires spreadsheets, is going to be skipped in intro-ductory courses but should be of value for advanced undergraduate orgraduate work. New topics in the rest of this book include the acidity ofmetal ions in Chapter 6, a revised discussion of ion sizes and an exam-ple of experimental design in Chapter 8, pH of zero charge for colloids
xiiiPreface
Preface
*Oil production data can be found at http://bp.com/worldenergy. See also D. Goodstein, Out of Gas(New York: W. W. Norton, 2004); K. S. Deffeyes, Beyond Oil: The View from Hubbert’s Peak (New York:Farrar, Straus and Giroux, 2005); and R. C. Duncan, “World Energy Production, Population Growth, and theRoad to the Olduvai Gorge,” Population and Environment 2001, 22, 503 (or HubbertPeak.com/Duncan/Olduvai2000.htm).
Wor
ld o
il pr
oduc
tion
(L/d
ay/p
erso
n)
2.5
2.0
1.5
1.0
0.5
0.020001920 1940 1960
Year
1980
Per capita production of oil peaked in the1970s and is expected to decrease in comingdecades.*
Quality assurance applies concepts fromstatistics.
Detection limit
s s
3s
Signal amplitude
Probabilitydistributionfor blank
Probabilitydistributionfor sample
50% of area ofsample lies to leftof detection limit
~ 1% of area ofblank lies to right ofdetection limit
yblank ysample
in Chapter 10, monoclonal antibodies in Chapter 12, more on microelectrodes and the KarlFischer titration in Chapter 17, self-absorption in fluorescence in Chapter 18, surface plas-mon resonance and intracellular oxygen sensing in Chapter 20, ion mobility spectrometry forairport explosive sniffers in Chapter 22, a microscopic description of chromatography inChapter 23, illustrations of the effects of column parameters on separations in gas chro-matography in Chapter 24, advances in liquid chromatography stationary phases and moredetail on gradient separations in Chapter 25, automation of ion chromatography in Chapter 26,and sample concentration by sweeping in electrophoresis in Chapter 26. Updates to manyexisting topics are found throughout the book. Chapter 27 on gravimetric analysis nowincludes an example taken from the Ph.D. thesis of Marie Curie from 1903 and a descriptionof how 20-year-old Arthur Holmes measured the geologic time scale in 1910.
ApplicationsA basic tenet of this book is to introduce and illustrate topics with concrete, interestingexamples. In addition to their pedagogic value, Chapter Openers, Boxes, Demonstrations,and Color Plates are intended to help lighten the load of a very dense subject. I hope youwill find these features interesting and informative. Chapter Openers show the relevanceof analytical chemistry to the real world and to other disciplines of science. I can’t come toyour classroom to present Chemical Demonstrations, but I can tell you about some of myfavorites and show you color photos of how they look. Color Plates are located near thecenter of the book. Boxes discuss interesting topics related to what you are studying or theyamplify points in the text.
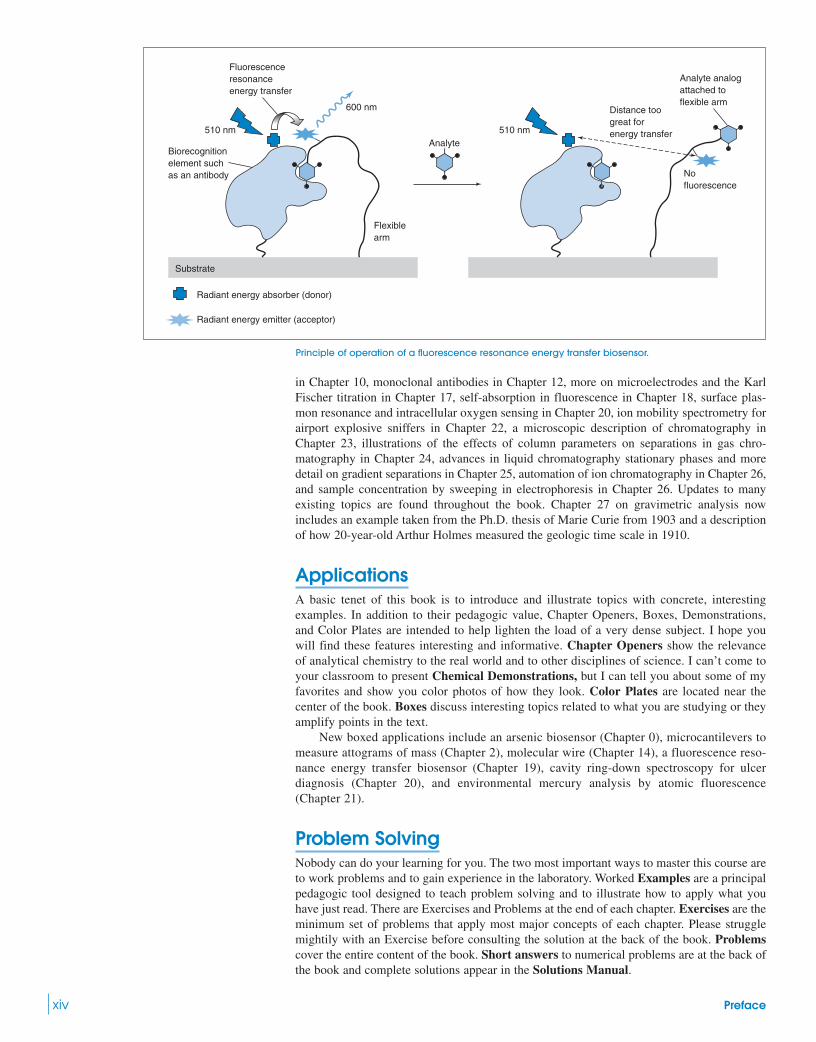
New boxed applications include an arsenic biosensor (Chapter 0), microcantilevers tomeasure attograms of mass (Chapter 2), molecular wire (Chapter 14), a fluorescence reso-nance energy transfer biosensor (Chapter 19), cavity ring-down spectroscopy for ulcerdiagnosis (Chapter 20), and environmental mercury analysis by atomic fluorescence(Chapter 21).
Problem SolvingNobody can do your learning for you. The two most important ways to master this course areto work problems and to gain experience in the laboratory. Worked Examples are a principalpedagogic tool designed to teach problem solving and to illustrate how to apply what youhave just read. There are Exercises and Problems at the end of each chapter. Exercises are theminimum set of problems that apply most major concepts of each chapter. Please strugglemightily with an Exercise before consulting the solution at the back of the book. Problemscover the entire content of the book. Short answers to numerical problems are at the back ofthe book and complete solutions appear in the Solutions Manual.
xiv Preface
Biorecognitionelement such as an antibody
Distance toogreat forenergy transfer
Fluorescenceresonanceenergy transfer
Nofluorescence
Analyte analogattached toflexible arm600 nm
510 nm510 nmAnalyte
Flexiblearm
Radiant energy absorber (donor)
Radiant energy emitter (acceptor)
Substrate
Principle of operation of a fluorescence resonance energy transfer biosensor.

Spreadsheets are indispensable tools for science and engi-neering. You can cover this book without using spreadsheets, butyou will never regret taking the time to learn to use them. The textexplains how to use spreadsheets and some problems ask you toapply them. If you are comfortable with spreadsheets, you will usethem even when the problem does not ask you to. A few of thepowerful built-in features of Microsoft Excel are described as theyare needed. These features include graphing in Chapter 2, statisticalfunctions and regression in Chapter 4, multiple regression forexperimental design in Chapter 7, solving equations with GOAL
SEEK in Chapters 6, 8, and 9, SOLVER in Chapters 13 and 19, andmatrix operations in Chapter 19.
Other Features of This BookTerms to Understand Essential vocabulary, highlighted in boldface in the text or, some-times, in color in the margin, is collected at the end of the chapter. Other unfamiliar or newterms are italic in the text, but are not listed at the end of the chapter.
Glossary All boldface vocabulary terms and many of the italic terms are defined in theglossary at the back of the book.
Appendixes Tables of solubility products, acid dissociation constants (updated to 2001values), redox potentials, and formation constants appear at the back of the book. You willalso find discussions of logarithms and exponents, equations of a straight line, propagation oferror, balancing redox equations, normality, and analytical standards.
Notes and References Citations in the chapters appear at the end of the book.
Inside Cover Here are your trusty periodic table, physical constants, and other usefulinformation.
SupplementsNEW! eBookThis online version of Quantitative Chemical Analysis, Seventh Edition combines the textand all existing student media resources, along with additional eBook features. The eBookincludes
• Intuitive navigation to any section or subsection, as well as any printed book page number.• In-text links to all glossary term definitions.• Bookmarking, Highlighting, and Notes features, with all activity automatically saved,
allow students or instructors to add notes to any page.• A full glossary and index and full-text search.
For instructors, the eBook offers unparalleled flexibility and customization options, including
• Custom chapter selection: students will access only chapters the instructor selects.• Instructor notes: Instructors can incorporate notes used for their course into the eBook.
Students will automatically get the customized version. Notes can include text, Web links,and even images.
The Solutions Manual for Quantitative Chemical Analysis contains complete solutions toall problems.
The Student Web Site, www.whfreeman.com/qca7e, has directions for experiments that maybe reproduced for your use. At this Web site, you will also find lists of experiments from theJournal of Chemical Education, a few downloadable Excel spreadsheets, and a few LivingGraph Java applets that allow students to manipulate graphs by altering data points andvariables. Supplementary topics at the Web site include spreadsheets for precipitation titra-tions, microequilibrium constants, spreadsheets for redox titration curves, and analysis ofvariance.
The Instructors’ Web Site, www.whfreeman.com/qca7e, has all illustrations and tables fromthe book in preformatted PowerPoint slides.
xvPreface
A B C D E F G
1 x y Output from LINEST
2 1 2 Slope Intercept
3 3 3 Parameter 0.61538 1.34615
4 4 4 Std Dev 0.05439 0.21414
5 6 5 R^2 0.98462 0.19612 Std Dev (y)
6
7 Highlight cells E3:F5
8 Type �� LINEST(B2:B5,A2:A5,TRUE,TRUE)"
9 Press CTRL � SHIFT � ENTER (on PC)
10 Press COMMAND � RETURN (on Mac)
Spreadsheets are indispensable tools.

The PeopleA book of this size and complexity is the work of many people. At W. H. Freeman and Com-pany, Jessica Fiorillo provided guidance and feedback and was especially helpful in ferretingout the opinions of instructors. Mary Louise Byrd shepherded the manuscript through pro-duction with her magic wand and is most responsible for creating the physical appearance ofthis book. Patty Zimmerman edited the copy with great care. The design was created byDiana Blume. Pages were laid out by Jerry Wilke and proofread by Karen Osborne. Photoediting and research was done by Cecilia Varas and Donna Ranieri. Paul Rohloff had overallresponsibility for production.
Julian Roberts of the University of Redlands twisted my arm until I created the new Chap-ter 13, and he provided considerable content and critique. My consultants at Michelson Labora-tory, Mike Seltzer and Eric Erickson, were helpful, as always. Solutions to problems and exer-cises were checked by Samantha Hawkins at Michelson Lab and Teh Yun Ling in Singapore.
My wife, Sally, worked on every aspect of this book and the Solutions Manual. She con-tributes mightily to whatever clarity and accuracy we have achieved.
In ClosingThis book is dedicated to the students who use it, who occasionally smile when they read it,who gain new insight, and who feel satisfaction after struggling to solve a problem. I havebeen successful if this book helps you develop critical, independent reasoning that you canapply to new problems. I truly relish your comments, criticisms, suggestions, and correc-tions. Please address correspondence to me at the Chemistry Division (Mail Stop 6303),Research Department, Michelson Laboratory, China Lake, CA 93555.
Dan Harris
AcknowledgmentsI am indebted to users of the sixth edition who offered corrections and suggestions and to themany people who reviewed parts of the current manuscript. John Haberman at NASA pro-vided a great deal of help in creating the back cover of this book. Bill Schinzer (Pfizer, Inc.)offered comments and information about the Karl Fischer titration. Athula Attygalle (StevensInstitute of Technology) pointed out my misinterpretation of Kielland’s “ion sizes,” whichled to a revision of Chapter 8. Krishnan Rajeshwar (University of Texas, Arlington) hadmany helpful suggestions, especially for electrochemistry. Carl E. Moore (Emeritus Profes-sor, Loyola University, Chicago) educated me on the history of the pH electrode and the pHmeter. Herb Hill (Washington State University) and G. A. Eiceman (New Mexico State Uni-versity) were most gracious in providing comments and information on ion mobility spec-trometry. Nebojsa Avdalovic (Dionex Corporation) provided key information on automationof ion chromatography. Shigeru Terabe (University of Hyogo, Japan) and Robert Weinbergerhelped with electrophoresis. Other corrections, suggestions, and helpful comments were pro-vided by James Gordon (Central Methodist University, Fayette, Missouri), Dick Zare (Stan-ford University), D. Bax (Utrecht University, The Netherlands), Keith Kuwata (MacalesterCollege), David Green (Albion College), Joe Foley (Drexel University), Frank Dalton (PineInstrument Company), David Riese (Purdue School of Pharmacy), Igor Kaltashov (Universityof Massachusetts, Amherst), Suzanne Pearce (Kwantlen University College, British Columbia),Patrick Burton (Socorro, New Mexico), Bing Xu (Hong Kong), and Stuart Larsen (New Zealand).
People who reviewed parts of the seventh-edition manuscript or who reviewed the sixthedition to make suggestions for the seventh edition included David E. Alonso (Andrews Uni-versity), Dean Atkinson (Portland State University), James Boiani (State University of NewYork, Geneseo), Mark Bryant, (Manchester College), Houston Byrd (University of Monte-vallo), Donald Castillo (Wofford College), Nikolay Dimitrov (State University of New York,Binghamton), John Ejnik (Northern Michigan University), Facundo Fernandez (GeorgiaInstitute of Technology), Augustus Fountain (U.S. Military Academy), Andreas Gebauer(California State University, Bakersfield), Jennifer Ropp Goodnough (University of Min-nesota, Morris), David W. Green (Albion College), C. Alton Hassell (Baylor University),Dale Hawley (Kansas State University), John Hedstrom (Luther College, Decorah, Iowa),Dan Heglund (South Dakota School of Mines and Technology), David Henderson (TrinityCollege, Hartford), Kenneth Hess (Franklin and Marshall College), Shauna Hiley (Missouri
xvi Preface

Western State University), Elizabeth Jensen (Aquinas College, Grand Rapids), MarkKrahling (University of Southern Indiana), Barbara Kramer (Truman State University), BrianLamp (Truman State University), Lisa B. Lewis (Albion College), Sharon McCarthy(Chicago State University), David McCurdy (Truman State University), Mysore Mohan(Texas A&M University), Kenneth Mopper (Old Dominion University), Richard Peterson(Northern State University, Aberdeen, South Dakota), David Rahni (Pace University, Pleas-antville/Briarcliff), Gary Rayson (New Mexico State University), Steve Reid (University ofSaskatchewan), Tracey Simmons-Willis (Texas Southern University), Julianne Smist(Springfield College, Massachusetts), Touradj Solouki (University of Maine), Thomas M.Spudich (Mercyhurst College), Craig Taylor (Oakland University), Sheryl A. Tucker (Univer-sity of Missouri, Columbia), Amy Witter (Dickinson College), and Kris Varazo (Francis-Marion University).
xviiPreface

This page intentionally left blank

1
In Bangladesh, 15–25% of the population is exposed to unsafe levels of arsenic in drinkingwater from aquifers in contact with arsenic-containing minerals. The analytical problem isto reliably and cheaply identify wells in which arsenic is above 50 parts per billion (ppb).Arsenic at this level causes vascular and skin diseases and cancer.
Panel (a) shows 8 test strips impregnated with genetically engineered E. coli bacteriawhose genes are turned on by arsenite . When the strips are exposed to drinkingwater, a blue spot develops whose size increases with the concentration of arsenite in thewater. By comparing the spot with a set of standards, we can estimate whether arsenic isabove or below 50 ppb. We call the test strip a biosensor, because it uses biological compo-nents in its operation.
Panel (b) shows how the assay works. Genetically engineered DNA in E. coli contains thegene arsR, which encodes the regulatory protein ArsR, and the gene lacZ, which encodes theprotein -galactosidase. ArsR binds to regulatory sites on the gene to prevent DNA transcrip-tion. Arsenite causes ArsR to dissociate from the gene and the cell proceeds to manufacture bothArsR and -galactosidase. Then -galactosidase transforms a synthetic, colorless substancecalled X-Gal in the test strip into a blue product. The more arsenite, the more intense the color.
��
�
(HAsO32�)
A BIOSENSOR FOR ARSENIC IN THE ENVIRONMENT1,2
The Analytical Process0
���� ����
���� ����
Makesβ-galactosidase
X-Gal(colorless)
DNAstrand
ArsR protein bound tooperator site preventsgene expression
Operator sitecontrols geneexpression
Arsenite (binds toArsR protein andremoves it fromoperator site)
Genes
Blueproduct
Makes ArsRprotein
Operator sitenow allows geneexpression
(a) Test strips exposed to different levels of arsenite. [Courtesy J. R. van der Meer, Université de Lausanne, Switzerland.](b) How the genetically engineered DNA works.
(b)
78
62
47
31
16
8
4
0
Arsenic(ppb)(a)

2 CHAPTER 0 The Analytical Process
Theobromine CaffeineA diuretic, smooth muscle relaxant, A central nervous system stimulantcardiac stimulant, and vasodilator
Too much caffeine is harmful for many people, and even small amounts cannot be toleratedby some unlucky individuals. How much caffeine is in a chocolate bar? How does that amountcompare with the quantity in coffee or soft drinks? At Bates College in Maine, Professor TomWenzel teaches his students chemical problem solving through questions such as these.4
But, how do you measure the caffeine content of a chocolate bar?
0-1 The Analytical Chemist’s JobTwo students, Denby and Scott, began their quest at the library with a computer search foranalytical methods. Searching with the key words “caffeine” and “chocolate,” they uncoverednumerous articles in chemistry journals. Reports titled “High Pressure Liquid Chromato-graphic Determination of Theobromine and Caffeine in Cocoa and Chocolate Products”5
described a procedure suitable for the equipment in their laboratory.6
SamplingThe first step in any chemical analysis is procuring a representative sample to measure—aprocess called sampling. Is all chocolate the same? Of course not. Denby and Scott boughtone chocolate bar in the neighborhood store and analyzed pieces of it. If you wanted to makebroad statements about “caffeine in chocolate,” you would need to analyze a variety ofchocolates from different manufacturers. You would also need to measure multiple samplesof each type to determine the range of caffeine in each kind of chocolate.
A pure chocolate bar is fairly homogeneous, which means that its composition is thesame everywhere. It might be safe to assume that a piece from one end has the same caffeinecontent as a piece from the other end. Chocolate with a macadamia nut in the middle is anexample of a heterogeneous material—one whose composition differs from place to place.The nut is different from the chocolate. To sample a heterogeneous material, you need to usea strategy different from that used to sample a homogeneous material. You would need toknow the average mass of chocolate and the average mass of nuts in many candies. Youwould need to know the average caffeine content of the chocolate and of the macadamia nut(if it has any caffeine). Only then could you make a statement about the average caffeinecontent of macadamia chocolate.
Sample PreparationThe first step in the procedure calls for weighing out some chocolate and extracting fat fromit by dissolving the fat in a hydrocarbon solvent. Fat needs to be removed because it wouldinterfere with chromatography later in the analysis. Unfortunately, if you just shake a chunkof chocolate with solvent, extraction is not very effective, because the solvent has no accessto the inside of the chocolate. So, our resourceful students sliced the chocolate into small bitsand placed the pieces into a mortar and pestle (Figure 0-1), thinking they would grind thesolid into small particles.
Imagine trying to grind chocolate! The solid is too soft to be ground. So Denby andScott froze the mortar and pestle with its load of sliced chocolate. Once the chocolate
O
N
CHN
CC
C CNO
CH3
H3C N
CH3O
N
N
CHHN
CC
C CNO
CH3
CH3
Pestle
Mortar
A diuretic makes you urinate.A vasodilator enlarges blood vessels.
Notes and references are listed at the back ofthe book.
Chemical Abstracts is the most comprehensivesource for locating articles published inchemistry journals. Scifinder is software thataccesses Chemical Abstracts.
Bold terms should be learned. They are listedat the end of the chapter and in the Glossaryat the back of the book. Italicized words areless important, but many of their definitionsare also found in the Glossary.
Homogeneous: same throughout
Heterogeneous: differs from region to region
Figure 0-1 Ceramic mortar and pestleused to grind solids into fine powders.
Chocolate is great to eat, but not so easy toanalyze. [W. H. Freeman photo by K. Bendo.]
C hocolate3 has been the savior of many a student on the long night before a major assignmentwas due. My favorite chocolate bar, jammed with 33% fat and 47% sugar, propels me overmountains in California’s Sierra Nevada. In addition to its high energy content, chocolate packsan extra punch with the stimulant caffeine and its biochemical precursor, theobromine.

0-1 The Analytical Chemist’s Job 3
was cold, it was brittle enough to grind. Then small pieces were placed in a preweighed15-milliliter (mL) centrifuge tube, and their mass was noted.
Figure 0-2 shows the next part of the procedure. A 10-mL portion of the solvent, petro-leum ether, was added to the tube, and the top was capped with a stopper. The tube wasshaken vigorously to dissolve fat from the solid chocolate into the solvent. Caffeine andtheobromine are insoluble in this solvent. The mixture of liquid and fine particles was thenspun in a centrifuge to pack the chocolate at the bottom of the tube. The clear liquid, con-taining dissolved fat, could now be decanted (poured off) and discarded. Extraction withfresh portions of solvent was repeated twice more to ensure complete removal of fat from thechocolate. Residual solvent in the chocolate was finally removed by heating the centrifugetube in a beaker of boiling water. The mass of chocolate residue could be calculated byweighing the centrifuge tube plus its content of defatted chocolate residue and subtracting theknown mass of the empty tube.
Substances being measured—caffeine and theobromine in this case—are called analytes.The next step in the sample preparation procedure was to make a quantitative transfer(a complete transfer) of the fat-free chocolate residue to an Erlenmeyer flask and to dissolvethe analytes in water for the chemical analysis. If any residue were not transferred from thetube to the flask, then the final analysis would be in error because not all of the analyte wouldbe present. To perform the quantitative transfer, Denby and Scott added a few milliliters ofpure water to the centrifuge tube and used stirring and heating to dissolve or suspend as muchof the chocolate as possible. Then they poured the slurry (a suspension of solid in a liquid)into a 50-mL flask. They repeated the procedure several times with fresh portions of water toensure that every bit of chocolate was transferred from the centrifuge tube to the flask.
To complete the dissolution of analytes, Denby and Scott added water to bring the vol-ume up to about 30 mL. They heated the flask in a boiling water bath to extract all the caf-feine and theobromine from the chocolate into the water. To compute the quantity of analytelater, the total mass of solvent (water) must be accurately known. Denby and Scott knewthe mass of chocolate residue in the centrifuge tube and they knew the mass of the emptyErlenmeyer flask. So they put the flask on a balance and added water drop by drop until therewere exactly 33.3 g of water in the flask. Later, they would compare known solutions of pureanalyte in water with the unknown solution containing 33.3 g of water.
Before Denby and Scott could inject the unknown solution into a chromatograph for thechemical analysis, they had to clean up the unknown even further (Figure 0-3). The slurry ofchocolate residue in water contained tiny solid particles that would surely clog their expensivechromatography column and ruin it. So they transferred a portion of the slurry to a centrifugetube and centrifuged the mixture to pack as much of the solid as possible at the bottom ofthe tube. The cloudy, tan supernatant liquid (liquid above the packed solid) was then filteredin a further attempt to remove tiny particles of solid from the liquid.
It is critical to avoid injecting solids into a chromatography column, but the tan liquidstill looked cloudy. So Denby and Scott took turns between classes to repeat the centrifuga-tion and filtration five times. After each cycle in which the supernatant liquid was filteredand centrifuged, it became a little cleaner. But the liquid was never completely clear. Givenenough time, more solid always seemed to precipitate from the filtered solution.
The tedious procedure described so far is called sample preparation—transforming asample into a state that is suitable for analysis. In this case, fat had to be removed from the
Solvent(petroleumether)
Finelygroundchocolate
Decantliquid
Defattedresidue
Supernatantliquid containingdissolved fat
Centrifuge
Solid residuepacked atbottom of tube
Shakewell
Suspensionof solid insolvent
Figure 0-2 Extracting fat from chocolate toleave defatted solid residue for analysis.
A solution of anything in water is called anaqueous solution.
Real-life samples rarely cooperate with you!

4 CHAPTER 0 The Analytical Process
chocolate, analytes had to be extracted into water, and residual solid had to be separated fromthe water.
The Chemical Analysis (At Last!)Denby and Scott finally decided that the solution of analytes was as clean as they could makeit in the time available. The next step was to inject solution into a chromatography column,which would separate the analytes and measure the quantity of each. The column inFigure 0-4a is packed with tiny particles of silica to which are attached long hydrocarbonmolecules. Twenty microliters of the chocolate extract were injectedinto the column and washed through with a solvent made by mixing 79 mL of pure water,20 mL of methanol, and 1 mL of acetic acid. Caffeine is more soluble than theobromine inthe hydrocarbon on the silica surface. Therefore, caffeine “sticks” to the coated silica parti-cles in the column more strongly than theobromine does. When both analytes are flushedthrough the column by solvent, theobromine reaches the outlet before caffeine (Figure 0-4b).
(20.0 10�6 liters)(SiO2)
Chromatography solvent is selected by asystematic trial-and-error process described inChapter 25. The function of the acetic acid isto react with negatively charged oxygenatoms that lie on the silica surface and, whennot neutralized, tightly bind a small fraction ofcaffeine and theobromine.
silica-O� ---------S silica-OHDoes not bind
analytes stronglyBinds analytes
very tightly
acetic acid
Inject analytesolution
Solventout
Solventin Solution containing
both analytes
Caffeine
Theobromine
Time
1 2 3 4
Detector
Ultravioletlamp
Chromatographycolumn packed withSiO2 particles
Hydrocarbon moleculechemically bound toSiO2 particle
To waste
Output tocomputer
SiO2
Figure 0-4 Principle of liquidchromatography. (a) Chromatographyapparatus with an ultraviolet absorbancemonitor to detect analytes at the columnoutlet. (b) Separation of caffeine andtheobromine by chromatography. Caffeineis more soluble than theobromine in thehydrocarbon layer on the particles in thecolumn. Therefore, caffeine is retained morestrongly and moves through the column moreslowly than theobromine. (a) (b)
Figure 0-3 Centrifugation and filtration areused to separate undesired solid residue fromthe aqueous solution of analytes.
Centrifuge
Transfer some ofthe suspension tocentrifuge tube
Suspension ofsolid in water
Insolublechocolateresidue
Supernatantliquid containingdissolved analytesand tiny particles
0.45-micrometerfilter
Withdraw supernatantliquid into a syringe andfilter it into a freshcentrifuge tube
Filtered solutioncontaining dissolvedanalytes for injectioninto chromatograph
Suspension ofchocolate residuein boiling water

0-1 The Analytical Chemist’s Job 5
Analytes are detected at the outlet by their ability to absorb ultraviolet radiation from thelamp in Figure 0-4a. The graph of detector response versus time in Figure 0-5 is called achromatogram. Theobromine and caffeine are the major peaks in the chromatogram. Smallpeaks arise from other substances extracted from the chocolate.
The chromatogram alone does not tell us what compounds are present. One way to iden-tify individual peaks is to measure spectral characteristics of each one as it emerges from thecolumn. Another way is to add an authentic sample of either caffeine or theobromine to theunknown and see whether one of the peaks grows in magnitude.
Identifying what is in an unknown is called qualitative analysis. Identifying how muchis present is called quantitative analysis. The vast majority of this book deals with quantita-tive analysis.
In Figure 0-5, the area under each peak is proportional to the quantity of compoundpassing through the detector. The best way to measure area is with a computer that receivesoutput from the chromatography detector. Denby and Scott did not have a computer linked totheir chromatograph, so they measured the height of each peak instead.
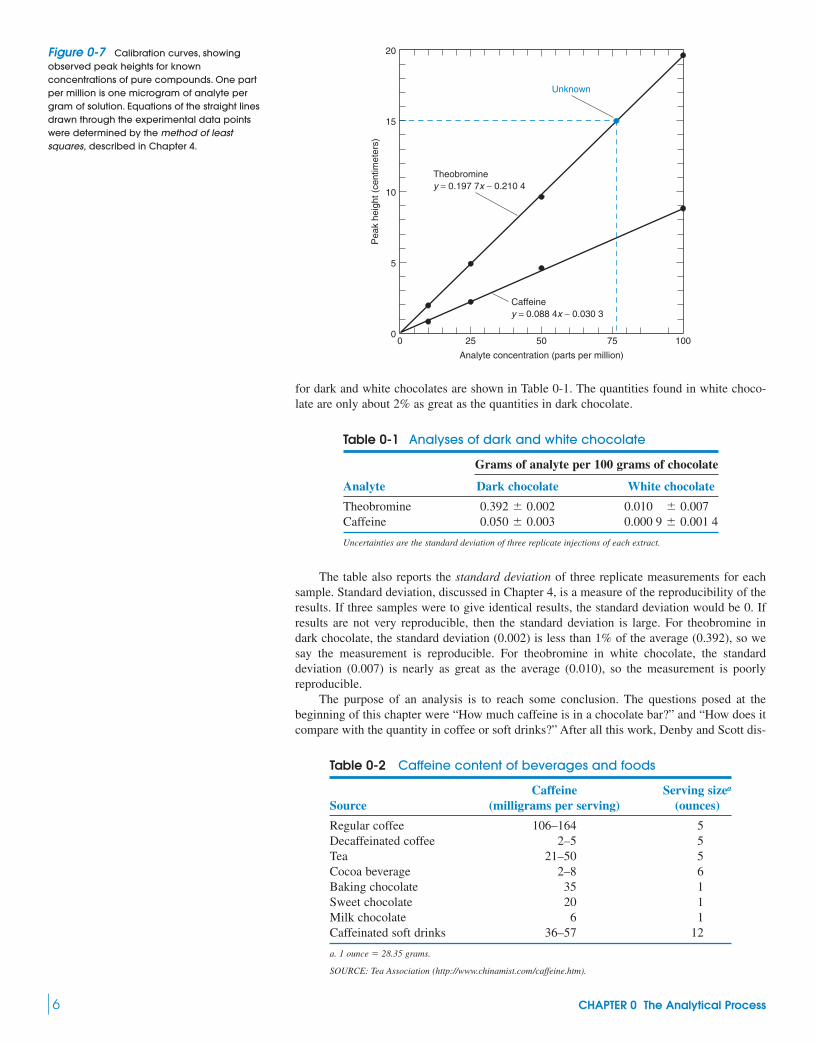
Calibration CurvesIn general, analytes with equal concentrations give different detector responses. Therefore,the response must be measured for known concentrations of each analyte. A graph of detec-tor response as a function of analyte concentration is called a calibration curve or a stan-dard curve. To construct such a curve, standard solutions containing known concentrationsof pure theobromine or caffeine were prepared and injected into the column, and the result-ing peak heights were measured. Figure 0-6 is a chromatogram of one of the standardsolutions, and Figure 0-7 shows calibration curves made by injecting solutions containing10.0, 25.0, 50.0, or 100.0 micrograms of each analyte per gram of solution.
Straight lines drawn through the calibration points could then be used to find the concen-trations of theobromine and caffeine in an unknown. From the equation of the theobromineline in Figure 0-7, we can say that if the observed peak height of theobromine from anunknown solution is 15.0 cm, then the concentration is 76.9 micrograms per gram of solution.
Interpreting the ResultsKnowing how much analyte is in the aqueous extract of the chocolate, Denby and Scottcould calculate how much theobromine and caffeine were in the original chocolate. Results U
ltrav
iole
t abs
orba
nce
at a
wav
elen
gth
of 2
54 n
anom
eter
s
0 2 4 6 8 10
Theobromine
Caffeine
Time (minutes)
Theobromine
Caffeine
Time (minutes)0 2 4 6 8
Ultr
avio
let a
bsor
banc
e at
a w
avel
engt
h of
254
nan
omet
ers
Figure 0-6 Chromatogram of 20.0microliters of a standard solution containing50.0 micrograms of theobromine and 50.0micrograms of caffeine per gram of solution.
Figure 0-5 Chromatogram of 20.0 micro-liters of dark chocolate extract. A 4.6-mm-diameter 150-mm-long column, packed with5-micrometer particles of Hypersil ODS, waseluted (washed) with water:methanol:aceticacid (79:20:1 by volume) at a rate of 1.0 mL per minute.
Only substances that absorb ultravioletradiation at a wavelength of 254 nanometersare observed in Figure 0-5. By far, the majorcomponents in the aqueous extract aresugars, but they are not detected in thisexperiment.
6 CHAPTER 0 The Analytical Process
for dark and white chocolates are shown in Table 0-1. The quantities found in white choco-late are only about 2% as great as the quantities in dark chocolate.
Table 0-1 Analyses of dark and white chocolate
Grams of analyte per 100 grams of chocolate
Analyte Dark chocolate White chocolate
TheobromineCaffeine
Uncertainties are the standard deviation of three replicate injections of each extract.
0.000 9 0.001 40.050 0.0030.010 0.0070.392 0.002
Table 0-2 Caffeine content of beverages and foods
Caffeine Serving sizea
Source (milligrams per serving) (ounces)
Regular coffee 106–164 5Decaffeinated coffee 2–5 5Tea 21–50 5Cocoa beverage 2–8 6Baking chocolate 35 1Sweet chocolate 20 1Milk chocolate 6 1Caffeinated soft drinks 36–57 12
a. 1 ounce � 28.35 grams.
SOURCE: Tea Association (http://www.chinamist.com/caffeine.htm).
0 25
Theobrominey = 0.197 7x − 0.210 4
Caffeiney = 0.088 4x − 0.030 3
Unknown
50
Analyte concentration (parts per million)
75 100
5
10
0
15
20
Pea
k he
ight
(ce
ntim
eter
s)
Figure 0-7 Calibration curves, showingobserved peak heights for knownconcentrations of pure compounds. One partper million is one microgram of analyte pergram of solution. Equations of the straight linesdrawn through the experimental data pointswere determined by the method of leastsquares, described in Chapter 4.
The table also reports the standard deviation of three replicate measurements for eachsample. Standard deviation, discussed in Chapter 4, is a measure of the reproducibility of theresults. If three samples were to give identical results, the standard deviation would be 0. Ifresults are not very reproducible, then the standard deviation is large. For theobromine indark chocolate, the standard deviation (0.002) is less than 1% of the average (0.392), so wesay the measurement is reproducible. For theobromine in white chocolate, the standarddeviation (0.007) is nearly as great as the average (0.010), so the measurement is poorlyreproducible.
The purpose of an analysis is to reach some conclusion. The questions posed at thebeginning of this chapter were “How much caffeine is in a chocolate bar?” and “How does itcompare with the quantity in coffee or soft drinks?” After all this work, Denby and Scott dis-

0-2 General Steps in a Chemical Analysis 7
covered how much caffeine is in the one particular chocolate bar that they analyzed. It wouldtake a great deal more work to sample many chocolate bars of the same type and many dif-ferent types of chocolate to gain a more universal view. Table 0-2 compares results fromanalyses of different sources of caffeine. A can of soft drink or a cup of tea contains less thanone-half of the caffeine in a small cup of coffee. Chocolate contains even less caffeine, but ahungry backpacker eating enough baking chocolate can get a pretty good jolt!
0-2 General Steps in a Chemical AnalysisThe analytical process often begins with a question that is not phrased in terms of a chemicalanalysis. The question could be “Is this water safe to drink?” or “Does emission testing ofautomobiles reduce air pollution?” A scientist translates such questions into the need for par-ticular measurements. An analytical chemist then chooses or invents a procedure to carry outthose measurements.
When the analysis is complete, the analyst must translate the results into terms that canbe understood by others—preferably by the general public. A most important feature of anyresult is its limitations. What is the statistical uncertainty in reported results? If you tooksamples in a different manner, would you obtain the same results? Is a tiny amount (a trace)of analyte found in a sample really there or is it contamination? Only after we understand theresults and their limitations can we draw conclusions.
We can now summarize general steps in the analytical process:
Formulating Translate general questions into specific questions to be answered the question through chemical measurements.
Selecting analytical Search the chemical literature to find appropriate procedures or, procedures if necessary, devise new procedures to make the required
measurements.
Sampling Sampling is the process of selecting representative material toanalyze. Box 0-1 provides some ideas on how to do so. If youbegin with a poorly chosen sample or if the sample changesbetween the time it is collected and the time it is analyzed, theresults are meaningless. “Garbage in, garbage out!”
Box 0-1 Constructing a Representative Sample
In a random heterogeneous material, differences in compositionoccur randomly and on a fine scale. When you collect a portion ofthe material for analysis, you obtain some of each of the differentcompositions. To construct a representative sample from a hetero-geneous material, you can first visually divide the materialinto segments. A random sample is collected by taking portionsfrom the desired number of segments chosen at random. If youwant to measure the magnesium content of the grass in the
field in panel (a), you could divide the fieldinto 20 000 small patches that are 10 centimeters on a side. Afterassigning a number to each small patch, you could use a computerprogram to pick 100 numbers at random from 1 to 20 000. Then
10-meter 20-meter
harvest and combine the grass from each of these 100 patches toconstruct a representative bulk sample for analysis.
For a segregated heterogeneous material (in which largeregions have obviously different compositions), a representativecomposite sample must be constructed. For example, the field inpanel (b) has three different types of grass segregated into regionsA, B, and C. You could draw a map of the field on graph paperand measure the area in each region. In this case, 66% of the arealies in region A, 14% lies in region B, and 20% lies in region C.To construct a representative bulk sample from this segregatedmaterial, take 66 of the small patches from region A, 14 fromregion B, and 20 from region C. You could do so by drawing ran-dom numbers from 1 to 20 000 to select patches until you have thedesired number from each region.
10 cm ×10 cm patcheschosenat random
10 m
eter
s
20 meters
Random heterogeneous material
(a)
20 meters
A 66%
C 20%
B 14%
Segregated heterogeneous material
10 m
eter
s
(b)

8 CHAPTER 0 The Analytical Process
standard solutionsupernatant liquidProblems
0-1. What is the difference between qualitative and quantitativeanalysis?
0-2. List the steps in a chemical analysis.
0-3. What does it mean to mask an interfering species?
0-4. What is the purpose of a calibration curve?
0-5. (a) What is the difference between a homogeneous materialand a heterogeneous material?
Complete solutions to Problems can be found in the SolutionsManual. Short answers to numerical problems are at the backof the book.
Problems
Terms to Understand
aliquotanalyteaqueouscalibration curvecomposite sampledecant
Terms are introduced in bold type in the chapter and are also defined in the Glossary.
(b) After reading Box 0-1, state the difference between a segregatedheterogeneous material and a random heterogeneous material.(c) How would you construct a representative sample from eachtype of material?
0-6. The iodide content of a commercial mineral water wasmeasured by two methods that produced wildy different results.7
Method A found 0.23 milligrams of per liter (mg/L) and method Bfound 0.009 mg/L. When was added to the water, the con-tent found by method A increased each time more was added,but results from method B were unchanged. Which of the Terms toUnderstand describes what is occurring in these measurements?
Mn2�
I�Mn2�
I�
(I�)
heterogeneoushomogeneousinterferencemaskingqualitative analysisquantitative analysis
quantitative transferrandom heterogeneous
materialrandom samplesample preparationsampling
segregated heterogeneous material
slurryspeciesstandard solution supernatant liquid
Sample preparation Sample preparation is the process of converting a representativesample into a form suitable for chemical analysis, which usuallymeans dissolving the sample. Samples with a low concentrationof analyte may need to be concentrated prior to analysis. It maybe necessary to remove or mask species that interfere with thechemical analysis. For a chocolate bar, sample preparationconsisted of removing fat and dissolving the desired analytes.The reason for removing fat was that it would interfere withchromatography.
Analysis Measure the concentration of analyte in several identical aliquots(portions). The purpose of replicate measurements (repeatedmeasurements) is to assess the variability (uncertainty) in theanalysis and to guard against a gross error in the analysis of asingle aliquot. The uncertainty of a measurement is as importantas the measurement itself, because it tells us how reliable themeasurement is. If necessary, use different analytical methods onsimilar samples to make sure that all methods give the same resultand that the choice of analytical method is not biasing the result.You may also wish to construct and analyze several different bulksamples to see what variations arise from your sampling procedure.
Reporting and Deliver a clearly written, complete report of your results, highlightinginterpretation any limitations that you attach to them. Your report might be
written to be read only by a specialist (such as your instructor) or itmight be written for a general audience (perhaps your mother). Besure the report is appropriate for its intended audience.
Drawing conclusions Once a report is written, the analyst might not be involved in whatis done with the information, such as modifying the raw materialsupply for a factory or creating new laws to regulate foodadditives. The more clearly a report is written, the less likely it isto be misinterpreted by those who use it.
Most of this book deals with measuring chemical concentrations in homogeneousaliquots of an unknown. The analysis is meaningless unless you have collected the sampleproperly, you have taken measures to ensure the reliability of the analytical method, and youcommunicate your results clearly and completely. The chemical analysis is only the middleportion of a process that begins with a question and ends with a conclusion.
Chemists use the term species to refer to anychemical of interest. Species is both singularand plural. Interference occurs when aspecies other than analyte increases ordecreases the response of the analyticalmethod and makes it appear that there ismore or less analyte than is actually present.Masking is the transformation of an interferingspecies into a form that is not detected. Forexample, in lake water can be measuredwith a reagent called EDTA. interferes withthis analysis, because it also reacts with EDTA.
can be masked by treating the samplewith excess to form , which does notreact with EDTA.
AlF3�6F�
Al3�
Al3�
Ca2�

1-1 SI Units 9
One of the ways we will learn to express quantities in Chapter 1 is by using prefixes suchas mega for million micro for one-millionth and atto for The illustra-tion shows a signal due to light absorption by just 60 atoms of rubidium in the cross-sectional area of a laser beam. There are atoms in a mole, so 60 atoms amountto moles. With prefixes from Table 1-3, we will express this number as 100yoctomoles (ymol) or 0.1 zeptomole (zmol). The prefix yocto stands for and zeptostands for . As chemists learn to measure fewer and fewer atoms or molecules, thesestrange-sounding prefixes become more and more common in the chemical literature.
10�21l0�24
1.0 10�226.02 1023
10�18.(l0�6),(106),
ULTRASENSITIVE MEASUREMENT OF ATOMS IN A VAPOR
Measurements1
Primed by an overview of the analytical process in Chapter 0, we are ready to discuss sub-jects required to get started in the lab. Topics include units of measurement, chemicalconcentrations, preparation of solutions, and the stoichiometry of chemical reactions.
1-1 SI UnitsSI units of measurement, used by scientists around the world, derive their name from theFrench Système International d’Unités. Fundamental units (base units) from which all othersare derived are defined in Table 1-1. Standards of length, mass, and time are the meter (m),kilogram (kg), and second (s), respectively. Temperature is measured in kelvins (K), amountof substance in moles (mol), and electric current in amperes (A).
Table 1-1 Fundamental SI units
Quantity Unit (symbol) Definition
Length meter (m) One meter is the distance light travels in a vacuum during of a second.Mass kilogram (kg) One kilogram is the mass of the prototype kilogram kept at Sèvres, France.Time second (s) One second is the duration of 9 192 631 770 periods of the radiation corresponding to a
certain atomic transition of 133Cs.Electric current ampere (A) One ampere of current produces a force of 2 10�7 newtons per meter of length when
maintained in two straight, parallel conductors of infinite length and negligible cross section, separated by 1 meter in a vacuum.
Temperature kelvin (K) Temperature is defined such that the triple point of water (at which solid, liquid, and gaseous water are in equilibrium) is 273.16 K, and the temperature of absolute zero is 0 K.
Luminous intensity candela (cd) Candela is a measure of luminous intensity visible to the human eye.Amount of substance mole (mol) One mole is the number of particles equal to the number of atoms in exactly 0.012 kg of
12C (approximately 6.022 141 5 1023).Plane angle radian (rad) There are 2� radians in a circle.Solid angle steradian (sr) There are 4� steradians in a sphere.
1299 792 458
Det
ecto
r cu
rren
t
240 250
Time (s)
260
Atomic absorption signal from 60 gaseousrubidium atoms observed by laser wavemixing. A 10-microliter (10 � 10�6 L) samplecontaining 1 attogram (1 � 10�18 g) of Rb� wasinjected into a graphite furnace to create theatomic vapor. We will study atomic absorptionspectroscopy in Chapter 21. [F. K. Mickadeit,S. Berniolles, H. R. Kemp, and W. G. Tong, Anal. Chem.2004, 76, 1788.]
For readability, we insert a space after everythird digit on either side of the decimal point.Commas are not used because in some partsof the world a comma has the same meaningas a decimal point. Two examples:
speed of light: 299 792 458 m/sAvogadro’s number: 6.022 141 5 1023 mol�1

10 CHAPTER 1 Measurements
Table 1-2 lists some quantities that are defined in terms of the fundamental quantities.For example, force is measured in newtons (N), pressure is measured in pascals (Pa), andenergy is measured in joules (J), each of which can be expressed in terms of the more funda-mental units of length, time, and mass.
Using Prefixes as MultipliersRather than using exponential notation, we often use prefixes from Table 1-3 to express largeor small quantities. As an example, consider the pressure of ozone in the upper atmo-sphere (Figure 1-1). Ozone is important because it absorbs ultraviolet radiation from the sunthat damages many organisms and causes skin cancer. Each spring, a great deal of ozone dis-appears from the Antarctic stratosphere, thereby creating what is called an ozone “hole.” Theopening of Chapter 18 discusses the chemistry behind this process.
At an altitude of meters above the earth’s surface, the pressure of ozone overAntarctica reaches a peak of 0.019 Pa. Let’s express these numbers with prefixes from Table 1-3.We customarily use prefixes for every third power of ten (and so on). The number m is more than m and less than m, so we use amultiple of
The number 0.019 Pa is more than Pa and less than Pa, so we use a multiple of
Figure 1-1 is labeled with km on the y-axis and mPa on the x-axis. The y-axis of any graph iscalled the ordinate and the x-axis is called the abscissa.
It is a fabulous idea to write units beside each number in a calculation and to cancelidentical units in the numerator and denominator. This practice ensures that you know the
0.019 Pa 1 mPa
10�3 Pa� 1.9 101 mPa � 19 mPa
10�3 Pa (� millipascals, mPa):10010�3
1.7 104 m 1 km
103 m� 1.7 101 km � 17 km
103 m (� kilometers, km):1061031.7 l04
10�9, 10�6, 10�3, 103, 106, 109,
1.7 104
(O3)
Table 1-2 SI-derived units with special names
Expression in Expression interms of terms of
Quantity Unit Symbol other units SI base units
Frequency hertz Hz l/sForce newton NPressure pascal PaEnergy, work, quantity of heat joule JPower, radiant flux watt W J/sQuantity of electricity, electric charge coulomb CElectric potential, potential difference, electromotive force volt V W/AElectric resistance ohm V/AElectric capacitance farad F C/V s4 � A2/(m2 � kg)
m2 � kg/(s3 � A2)�m2 � kg/(s3 � A)s � Am2 � kg/s3m2 � kg/s2N � mkg/(m � s2)N/m2m � kg/s2
Table 1-3 Prefixes
Prefix Symbol Factor Prefix Symbol Factor
yotta Y deci dzetta Z centi cexa E milli mpeta P microtera T nano ngiga G pico pmega M femto fkilo k atto ahecto h zepto zdeca da yocto y 10�24101
10�2110210�1810310�1510610�1210910�9101210�6 101510�3101810�2102110�11024
0 5 10 15 200
5
10
15
20
25
30
Ozone partial pressure (mPa)
Alti
tude
(km
)
Ozone hole
Normalstratosphericozone
Aug. 199512 Oct. 19935 Oct. 1995
Figure 1-1 An ozone “hole” forms eachyear in the stratosphere over the South Pole atthe beginning of spring in October. The graphcompares ozone pressure in August, whenthere is no hole, with the pressure in October,when the hole is deepest. Less severe ozoneloss is observed at the North Pole. [Data from
National Oceanic and Atmospheric Administration.]
Pressure is force per unit area:The pressure of the
atmosphere is approximately 100 000 Pa.1 N/m2.1 pascal (Pa) �
Of course you recall that 100 � 1.

1-1 SI Units 11
units for your answer. If you intend to calculate pressure and your answer comes out withunits other than pascals (or some other unit of pressure), then you know you have made amistake.
Converting Between UnitsAlthough SI is the internationally accepted system of measurement in science, other units areencountered. Useful conversion factors are found in Table 1-4. For example, common non-SIunits for energy are the calorie (cal) and the Calorie (with a capital C, which stands for 1 000calories, or 1 kcal). Table 1-4 states that 1 cal is exactly 4.184 J ( joules).
Your basal metabolism requires approximately 46 Calories per hour (h) per 100 pounds(lb) of body mass to carry out basic functions required for life, apart from doing any kindof exercise. A person walking at 2 miles per hour on a level path requires approximately45 Calories per hour per 100 pounds of body mass beyond basal metabolism. The same per-son swimming at 2 miles per hour consumes 360 Calories per hour per 100 pounds beyondbasal metabolism.
Example Unit Conversions
Express the rate of energy used by a person walking 2 miles per hour Calories per hour per 100 pounds of body mass) in kilojoules per hour per kilogram ofbody mass.
Solution We will convert each non-SI unit separately. First, note that 91 Caloriesequals 91 kcal. Table 1-4 states that so and
Table 1-4 also says that 1 lb is 0.453 6 kg; so The rate of energyconsumption is therefore
We could have written this as one long calculation:
Rate �91 kcal/h
100 lb 4.184
kJ
kcal
1 lb
0.453 6 kg� 8.4
kJ/h
kg
91 kcal/h
100 lb�
3.8 102 kJ/h
45.36 kg� 8.4
kJ/h
kg
100 lb � 45.36 kg.
91 kcal 4.184kJ
kcal� 3.8 l02 kJ
1 kcal � 4.184 kJ,1 cal � 4.184 J;
(46 � 45 � 91
Table 1-4 Conversion factors
Quantity Unit Symbol SI equivalenta
Volume liter Lmilliliter mL
Length angstrom Åinch in. *0.025 4 m
Mass pound lb *0.453 592 37 kgmetric ton *1 000 kg
Force dyne dynPressure bar bar
atmosphere atm *101 325 Patorr Torr 133.322 Papound/in.2 psi 6 894.76 Pa
Energy erg ergelectron volt eVcalorie, thermochemical cal *4.184 JCalorie (with a capital C) CalBritish thermal unit Btu 1 055.06 J
Power horsepower 745.700 WTemperature
Fahrenheit
a . An asterisk (*) indicates that the conversion is exact (by definition).
*1.8(K � 273.15) � 32°F*K � 273.15°Ccentigrade (� Celsius)
*1 000 cal � 4.184 kJ
1.602 176 53 10�19 J*10�7 J
(� 1 mm Hg)
*105 Pa*10�5 N
*10�10 m*10�6 m3*10�3 m3
One calorie is the energy required to heat1 gram of water from to .
One joule is the energy expended when aforce of 1 newton acts over a distance of1 meter. This much energy can raise 102 g(about pound) by 1 meter.
l cal � 4.184 J
14
15.5°C14.5°
Write the units: In 1999, the $125 millionMars Climate Orbiter spacecraft was lostwhen it entered the Martian atmosphere100 km lower than planned. The navigationerror would have been avoided if peoplehad labeled their units of measurement.Engineers who built the spacecraftcalculated thrust in the English unit, poundsof force. Jet Propulsion Laboratoryengineers thought they were receiving theinformation in the metric unit, newtons.Nobody caught the error.
The symbol is read “is approximately equal to.”
�
1 mile � 1.609 km
1 pound (mass) � 0.453 6 kg
Significant figures are discussed in Chapter 3.For multiplication and division, the number withthe fewest digits determines how many digitsshould be in the answer. The number 91 kcal atthe beginning of this problem limits the answerto 2 digits.

12 CHAPTER 1 Measurements
1-2 Chemical ConcentrationsA solution is a homogeneous mixture of two or more substances. A minor species in a solu-tion is called solute and the major species is the solvent. In this book, most discussions con-cern aqueous solutions, in which the solvent is water. Concentration states how much soluteis contained in a given volume or mass of solution or solvent.
Molarity and MolalityA mole (mol) is Avogadro’s number of particles (atoms, molecules, ions, or anything else).Molarity (M) is the number of moles of a substance per liter of solution. A liter (L) is thevolume of a cube that is 10 cm on each edge. Because
Chemical concentrations, denoted with square brackets, are usually expressed inmoles per liter (M). Thus “[H�]” means “the concentration of H�.”
The atomic mass of an element is the number of grams containing Avogadro’s numberof atoms.1 The molecular mass of a compound is the sum of atomic masses of the atoms inthe molecule. It is the number of grams containing Avogadro’s number of molecules.
Example Molarity of Salts in the Sea
(a) Typical seawater contains 2.7 g of salt (sodium chloride, NaCl) per What is the molarity of NaCl in the ocean? (b) has a concentration of
0.054 M in the ocean. How many grams of are present in 25 mL of seawater?
Solution (a) The molecular mass of NaCl is 22.99 The moles of salt in 2.7 g are so
the molarity is
(b) The molecular mass of is The number of grams in 25 mL is
An electrolyte is a substance that dissociates into ions in solution. In general, electrolytesare more dissociated in water than in other solvents. We refer to a compound that is mostlydissociated into ions as a strong electrolyte. One that is partially dissociated is called a weakelectrolyte.
Magnesium chloride is a strong electrolyte. In 0.44 M solution, 70% of the mag-nesium is free and 30% is 2 The concentration of molecules is closeto 0. Sometimes the molarity of a strong electrolyte is called the formal concentration (F),to emphasize that the substance is really converted into other species in solution. When wesay that the “concentration” of is 0.054 M in seawater, we are really referring to itsformal concentration (0.054 F). The “molecular mass” of a strong electrolyte is called theformula mass (FM), because it is the sum of atomic masses of atoms in the formula, eventhough there are very few molecules with that formula. We are going to use the abbreviationFM for both formula mass and molecular mass.
For a weak electrolyte such as acetic acid, some of the molecules dissociateinto ions in solution:
Molality (m) is concentration expressed as moles of substance per kilogram of solvent(not total solution). Molality is independent of temperature. Molarity changes with tempera-ture because the volume of a solution usually increases when it is heated.
Formal Percentconcentration dissociated
0.10 F 1.3%
0.010 F 4.1%
0.001 0 F 12%
O
CH3
COH
O
CH3
CO�
� H�
Aceticacid
Acetateion
CH3CO2H,
MgCl2
MgCl2MgCl�.Mg2�
MgCl2
Grams of MgCl2 � a0.054mol
Lb a95.20
g
molb(25 10�3 L) � 0.13 g
95.20 g/mol.24.30 g/mol (Mg) � 2 35.45 g/mol (Cl) �MgCl2
Molarity of NaCl �mol NaCl
L of seawater�
0.046 mol
100 10�3 L� 0.46 M
(2.7 g)�(58.44 g/mol) � 0.046 mol,58.44 g/mol.(Na) � 35.45 g/mol (Cl) �g/mol
MgCl2
MgCl210�3 L).100 mL (� 100
10�3 m3.10 cm � 0.1 m, 1 L � (0.1 m)3 �
Homogeneous means that the mixture has thesame composition everywhere. When sugardissolves in water, the mixture is homogeneous.A mixture that is not the same everywhere(such as orange juice, which has suspendedsolids) is heterogeneous.
Molarity (M) �moles of soluteliters of solution
number of atoms in 12 g of 12CAvogadro’s number �
Atomic masses are shown in the periodictable inside the cover of this book. Physicalconstants such as Avogadro’s number arealso listed inside the cover.
Strong electrolyte: mostly dissociated into ionsin solution
Weak electrolyte: partially dissociated intoions in solution
Confusing abbreviations:
m � molality �mol solutekg solvent
M � molarity �mol soluteL solution
mol � moles
1-2 Chemical Concentrations 13
Percent CompositionThe percentage of a component in a mixture or solution is usually expressed as a weightpercent (wt%):
(1-1)
A common form of ethanol is 95 wt%; this expression means 95 g of ethanolper 100 g of total solution. The remainder is water. Volume percent (vol%) is defined as
(1-2)
Although units of mass or volume should always be expressed to avoid ambiguity, mass isusually implied when units are absent.
Example Converting Weight Percent into Molarity and Molality
Find the molarity and molality of 37.0 wt% HCl. The density of a substance is the massper unit volume. The table inside the back cover of this book tells us that the density ofthe reagent is 1.19 g/mL.
Solution For molarity, we need to find the moles of HCl per liter of solution. The mass ofa liter of solution is The mass of HCl in a liter is
1442443This is what
37.0 wt% means
The molecular mass of HCl is 36.46 g/mol, so the molarity is
For molality, we need to find the moles of HCl per kilogram of solvent (which is ). The solution is 37.0 wt% HCl, so we know that 100.0 g of solution contains 37.0 g
of HCl and But 37.0 g of HCl containsThe molality is therefore
Figure 1-2 illustrates a weight percent measurement in the application of analyticalchemistry to archaeology. Gold and silver are found together in nature. Dots in Figure 1-2show the weight percent of gold in more than 1 300 silver coins minted over a 500-yearperiod. Prior to A.D. 500, it was rare for the gold content to be below 0.3 wt%. By A.D. 600,people had developed techniques for removing more gold from the silver, so some coins hadas little as 0.02 wt% gold. Colored squares in Figure 1-2 represent known, modern forgeriesmade from silver whose gold content is always less than the prevailing gold content in theyears A.D. 200 to 500. Chemical analysis makes it easy to detect the forgeries.
Parts per Million and Parts per BillionSometimes composition is expressed as parts per million (ppm) or parts per billion (ppb),which mean grams of substance per million or billion grams of total solution or mixture.Because the density of a dilute aqueous solution is close to 1.00 g/mL, we frequently equate1 g of water with 1 mL of water, although this equivalence is only approximate. Therefore,1 ppm corresponds to and 1 ppb is For gases,ppm usually refers to volume rather than mass. Atmospheric has a concentration near380 ppm, which means per liter of air. It is best to label units to avoid confusion.380 L CO2
CO2
1 ng/mL (� 1 g/L).1 g/mL (� 1 mg/L)
Molality �mol HCl
kg of solvent�
1.01 mol HCl
0.063 0 kg H2O� 16.1 m
37.0 g/(36.46 g/mol) � 1.01 mol.100.0 � 37.0 � 63.0 g of H2O (� 0.063 0 kg).
H2O
Molarity �mol HCl
L solution�
4.40 102 g HCl/L
36.46 g HCl/mol� 12.1
mol
L� 12.1 M
Mass of HCl per liter � a1.19 103g solution
Lba0.370
g HCl
g solutionb� 4.40 102
g HCl
L
(1.19 g/mL)(l 000 mL) � 1.19 103 g.
Volume percent �volume of solute
volume of total solution 100
(CH3CH2OH)
Weight percent �mass of solute
mass of total solution or mixture 100
A closely related dimensionless quantity is
Because the density of water at is veryclose to 1 g/mL, specific gravity is nearly thesame as density.
4°C
Specific gravity �density of a substancedensity of water at 4°C
Density �mass
volume�
g
mL
If you divide 1.01/0.063 0, you get 16.0. Dangot 16.1 because he kept all the digits in hiscalculator and did not round off until theend. The number 1.01 was really 1.014 8 and(1.014 8)�(0.063 0) � 16.1.
Question What does one part per thousandmean?
ppb �mass of substance
mass of sample 109
ppm �mass of substance
mass of sample 106

14 CHAPTER 1 Measurements
Example Converting Parts per Billion into Molarity
Normal alkanes are hydrocarbons with the formula . Plants selectively synthesizealkanes with an odd number of carbon atoms. The concentration of in summerrainwater collected in Hannover, Germany, is 34 ppb. Find the molarity of andexpress the answer with a prefix from Table 1-3.
Solution A concentration of 34 ppb means there are 34 ng of per gram of rainwater,a value that we equate to 34 ng/mL. Multiplying nanograms and milliliters by 1 000 gives
of per liter of rainwater. Because the molecular mass of is408.8 g/mol, the molarity is
An appropriate prefix from Table 1-3 would be nano (n), which is a multiple of :
1-3 Preparing SolutionsTo prepare a solution with a desired molarity from a pure solid or liquid, we weigh outthe correct mass of reagent and dissolve it in the desired volume in a volumetric flask(Figure 1-3).
Example Preparing a Solution with a Desired Molarity
Copper(II) sulfate pentahydrate, , has 5 moles of for each mole of in the solid crystal. The formula mass of is 249.69 g/mol.(Copper(II) sulfate without water in the crystal has the formula and is said to beanhydrous.) How many grams of should be dissolved in a volume of500.0 mL to make 8.00 mM ?
Solution An 8.00 mM solution contains . We need
The mass of reagent is (4.00 10�3 mol) a249.69g
molb � 0.999 g.
8.00 10�3mol
L 0.500 0 L � 4.00 10�3 mol CuSO4 � 5H2O
8.00 10�3 mol/L
Cu2�
CuSO4 � 5H2OCuSO4
CuSO4 � 5H2O (� CuSO9H10)CuSO4H2OCuSO4 � 5H2O
8.3 10�8 M a 1 nM
10�9 Mb � 83 nM
10�9
Molarity of C29H60 in rainwater �34 10�6 g/L
408.8 g/mol� 8.3 10�8 M
C29H60C29H6034 g
C29H60
C29H60
C29H60
CnH2n�2
Figure 1-2 Weight percent of gold impurityin silver coins from Persia. Colored squares areknown, modern forgeries. Note that theordinate scale is logarithmic. [A. A. Gordus and
J. P. Gordus, Archaeological Chemistry, Adv. Chem.
No. 138, American Chemical Society, Washington, DC,
1974, pp. 124–147.]
0.02
0.04
0.06
0.1
0.01200 300
Date (A.D.)400 500 600
0.2
0.4
0.6
1.0
2.0
Wei
ght p
erce
nt A
u im
purit
y in
silv
er
Figure 1-3 A volumetric flask contains aspecified volume when the liquid level isadjusted to the middle of the mark in the thinneck of the flask. Use of this flask is describedin Section 2-5.
500-mL mark
500 mLTC
20° C

1-3 Preparing Solutions 15
Using a volumetric flask: The procedure is to place 0.999 g of solid into a 500-mL volumetric flask, add about 400 mL of distilled water, and swirl to dissolvethe reagent. Then dilute with distilled water up to the 500-mL mark and invert the flaskseveral times to ensure complete mixing.
DilutionDilute solutions can be prepared from concentrated solutions. A volume of the concentratedsolution is transferred to a fresh vessel and diluted to the desired final volume. Thenumber of moles of reagent in V liters containing M moles per liter is the product
so we equate the number of moles in the concentrated (conc) anddilute (dil) solutions:
(1-3)14243 14243Moles taken from Moles placed in
concentrated solution dilute solution
Example Preparing 0.100 M HCl
The molarity of “concentrated” HCl purchased for laboratory use is approximately 12.1 M.How many milliliters of this reagent should be diluted to 1.000 L to make 0.100 M HCl?
Solution The dilution formula handles this problem directly:
To make 0.100 M HCl, we would dilute 8.26 mL of concentrated HCl up to 1.000 L.The concentration will not be exactly 0.100 M, because the reagent is not exactly 12.1 M.A table inside the cover of this book gives volumes of common reagents required tomake 1.0 M solutions.
Example A More Complicated Dilution Calculation
A solution of ammonia in water is called “ammonium hydroxide” because of theequilibrium
(1-4)Ammonia Ammonium Hydroxide
The density of concentrated ammonium hydroxide, which contains 28.0 wt% is What volume of this reagent should be diluted to 500.0 mL to make0.250 M ?
Solution To use Equation 1-3, we need to know the molarity of the concentrated reagent.The solution contains 0.899 g of solution per milliliter and there is 0.280 g of pergram of solution (28.0 wt%), so we can write
Now we find the volume of 14.8 M required to prepare 500.0 mL of 0.250 M :
The procedure is to place 8.45 mL of concentrated reagent in a 500-mL volumetric flask,add about 400 mL of water, and swirl to mix. Then dilute to exactly 500 mL with waterand invert the flask many times to mix well.
14.8 M Vconc � 0.250 M 500.0 mL 1 Vconc � 8.45 mL
M˛conc � Vconc � M˛dil � Vdil
NH3NH3
Molarity of NH3 �
899g solution
L 0.280
g NH3
g solution
17.03g NH3
mol NH3
� 14.8 M
NH3
NH3
0.899 g/mL.NH3,
NH3 � H2O ∆ NH�4 � OH�
(12.1 M) � (x mL) � (0.100 M) � (1 000 mL) 1 x � 8.26 mL
M˛conc � Vconc � M˛dil � Vdil
Mconc � Vconc � Mdil � VdilDilution formula:
M � V � mol/L � L,
CuSO4 � 5H2O
You may use any units for concentration andvolume in this equation, as long as you use thesame units on both sides. We frequently use mLfor volume.
The symbol is read “implies that.”1
In a chemical reaction, species on the left sideare called reactants and species on the rightare called products. NH3 is a reactant and
is a product in Reaction 1-4.NH4�

16 CHAPTER 1 Measurements
1-4 Stoichiometry CalculationsLet’s apply concepts from preceding sections to a chemical analysis. Iron from a dietary sup-plement tablet can be measured by dissolving it and then converting the iron into solid From the mass of , we can calculate the mass of iron in the original tablet. Chemicalanalysis based on weighing a final product is called gravimetric analysis.
Here are the steps in the procedure:
Step 1 Tablets containing iron(II) fumarate and inert binder are mixedwith 150 mL of 0.100 M HCl to dissolve the . The solution is filtered toremove insoluble binder.
Step 2 Iron(II) in the clear liquid is oxidized to iron(III) with excess hydrogen peroxide:
(1-5)Iron(II) Hydrogen peroxide Iron(III)
(ferrous ion) FM 34.01 (ferric ion)
Step 3 Ammonium hydroxide is added to precipitate hydrous iron(III) oxide, which is agel. The gel is filtered and heated in a furnace to convert it into pure solid .
(1-6)Hydroxide Hydrous iron(III) oxide Iron(III) oxide
FM 159.69
We now work through some practical laboratory calculations for this analysis.
Example How Many Tablets Should We Analyze?
In a gravimetric analysis, we need enough product to weigh accurately. Each tablet provides�15 mg of iron. How many tablets should we analyze to provide 0.25 g of product?
Solution We can answer the question if we know how many grams of iron are in 0.25 gof The formula mass of is 159.69 g mol, so 0.25 g is equal to
Each mol of has 2 mol of Fe, so 0.25 g of contains
The mass of Fe is
If each tablet contains 15 mg Fe, the number of tablets required is
Example How Much H2O2 Is Required?
What mass of 3.0 wt% solution is required to provide a 50% excess of reagent forReaction 1-5 with 12 dietary iron tablets?
Solution Twelve tablets provide , or. Reaction 1-5 requires
1 mol of for every 2 mol of . Therefore mol requires . A 50% excess means
that we want to use 1.50 times the stoichiometric quantity: The formula mass of is 34.01 g/mol, so the required mass of
pure is But hydrogen peroxide isavailable as a 3.0 wt% solution, so the required mass of solution is
Mass of H2O2 solution �0.082 g H2O2
0.030 g H2O2/g solution� 2.7 g solution
(2.4 10�3 mol)(34.01 g/mol) � 0.082 g.H2O2
H2O22.4 10�3 mol H2O2.(1.50)(1.6 10�3 mol H2O2) �
10�3 mol Fe 2�)(1 mol H2O2/2 mol Fe2�) � 1.6 10�3 mol H2O2
(3.2 Fe2�3.2 10�3Fe2�H2O2
(0.18 g Fe2�) / (55.845 g Fe2�/mol Fe2�) � 3.2 10�3 mol Fe2�
12 tablets (0.015 g/ tablet) � 0.18 g of Fe2�
H2O2
Number of tablets �0.18 g Fe
0.015 g Fe/tablet� 12 tablets
3.2 10�3 mol Fe 55.845 g Fe
mol Fe� 0.18 g Fe
1.6 10�3 mol Fe2O3 2 mol Fe
1 mol Fe2O3� 3.2 10�3 mol Fe
Fe2O3Fe2O3
mol Fe2O3 �0.25 g
159.69 g/mol� 1.6 10�3 mol
/Fe2O3Fe2O3.
Fe2O3
Fe3� � 3OH� � (x � 1)H2O S FeOOH � xH2O(s) ¡900°C
Fe2O3(s)
Fe2O3
2Fe2� � H2O2 � 2H� S 2Fe3� � 2H2O
Fe2�
(Fe2�C4H2O2�4 )
Fe2O3
Fe2O3.Stoichiometry is the calculation of quantities ofsubstances involved in a chemical reaction. Itis derived from the Greek stoicheion (simplestcomponent) and metiri (to measure).
�O2C
CO2�
C
H
C
HFumarate anion, C4H2O4
2�
The units of formula mass (FM) are g/mol.
The symbol � is read “approximately.”
mol �grams
grams per mol�
grams
formula mass
The atomic mass of Fe, 55.845 g/mol, is in theperiodic table inside the cover.
You should be able to use this relationship inyour sleep.
Moles �grams
formula mass�
g
g/mol

Problems 17
Example The Gravimetric Calculation
The final mass of isolated at the end of the experiment was 0.277 g. What is theaverage mass of iron per dietary tablet?
Solution The moles of isolated are There are 2 mol Fe per formula unit, so the moles of Fe in the product are
The mass of Fe is . Each of the12 tablets therefore contains an average of (0.194 g Fe)/12 � 0.016 1 g � 16.1 mg.
(3.47 10�3 mol Fe)(55.845 g Fe/mol Fe) � 0.194 g Fe
(1.73 10�3 mol Fe2O3)a 2 mol Fe
1 mol Fe2O3b � 3.47 10�3 mol Fe
(0.277 g)�(159.69 g/mol) � 1.73 10�3 mol.Fe2O3
Fe2O3
Terms are introduced in bold type in the chapter and are also defined in the Glossary.
abscissaanhydrousatomic massconcentrationdensityelectrolyte
formal concentrationformula masslitermolalitymolaritymole
molecular massordinateppb (parts per billion)ppm (parts per million)productreactant
SI unitssolutesolventvolume percentweight percent
Summary
(formula units per liter), percent composition, and parts per million.To calculate quantities of reagents needed to prepare solutions, therelation is useful because it equates themoles of reagent removed from a stock solution to the moles deliv-ered into a new solution. You should be able to use stoichiometryrelations to calculate required masses or volumes of reagents forchemical reactions. From the mass of the product of a reaction, youshould be able to compute how much reactant was consumed.
Mconc � Vconc � Mdil � Vdil
Terms to Understand
SI base units include the meter (m), kilogram (kg), second (s),ampere (A), kelvin (K), and mole (mol). Derived quantities such asforce (newton, N), pressure (pascal, Pa), and energy ( joule, J) canbe expressed in terms of base units. In calculations, units should becarried along with the numbers. Prefixes such as kilo- and milli- areused to denote multiples of units. Common expressions of concen-tration are molarity (moles of solute per liter of solution), molality(moles of solute per kilogram of solvent), formal concentration
1-A. A solution with a final volume of 500.0 mL was prepared by dis-solving 25.00 mL of methanol inchloroform.(a) Calculate the molarity of methanol in the solution.(b) The solution has a density of 1.454 g/mL. Find the molality ofmethanol.
0.791 4 g/mL)(CH3OH, density �
1-B. A 48.0 wt% solution of HBr in water has a density of 1.50 g/mL.(a) Find the formal concentration of HBr.(b) What mass of solution contains 36.0 g of HBr?(c) What volume of solution contains 233 mmol of HBr?(d) How much solution is required to prepare 0.250 L of 0.160 MHBr?
1-C. A solution contains 12.6 ppm of dissolved (whichdissociates into ). Find the concentration of inparts per million.
NO3�Ca2� � 2NO�
3
Ca(NO3)2
The difference between Exercises and Problems is that completesolutions to Exercises are provided at the back of the book,whereas only numerical answers to Problems are provided.Complete solutions to Problems are in the Solutions Manual.Exercises usually cover most of the major ideas in each chapterin the minimum number of questions.
Exercises
Units and Conversions
1-1. (a) List the SI units of length, mass, time, electric current, tem-perature, and amount of substance; write the abbreviation for each.(b) Write the units and symbols for frequency, force, pressure,energy, and power.
1-2. Write the names and abbreviations for each of the prefixesfrom to . Which abbreviations are capitalized?102410�24
1-3. Write the name and number represented by each symbol. Forexample, for kW you should write (a) mW (e) TJ(b) pm (f) ns(c) (g) fg(d) (h) dPa F
k�
kW � kilowatt � 103 watts.
Problems
Retain all the digits in your calculator during aseries of calculations. The product isnot 3.47; but, with the extra digits in thecalculator, the correct answer is 3.47 because1.73 was really 1.734 6.
1.73 2
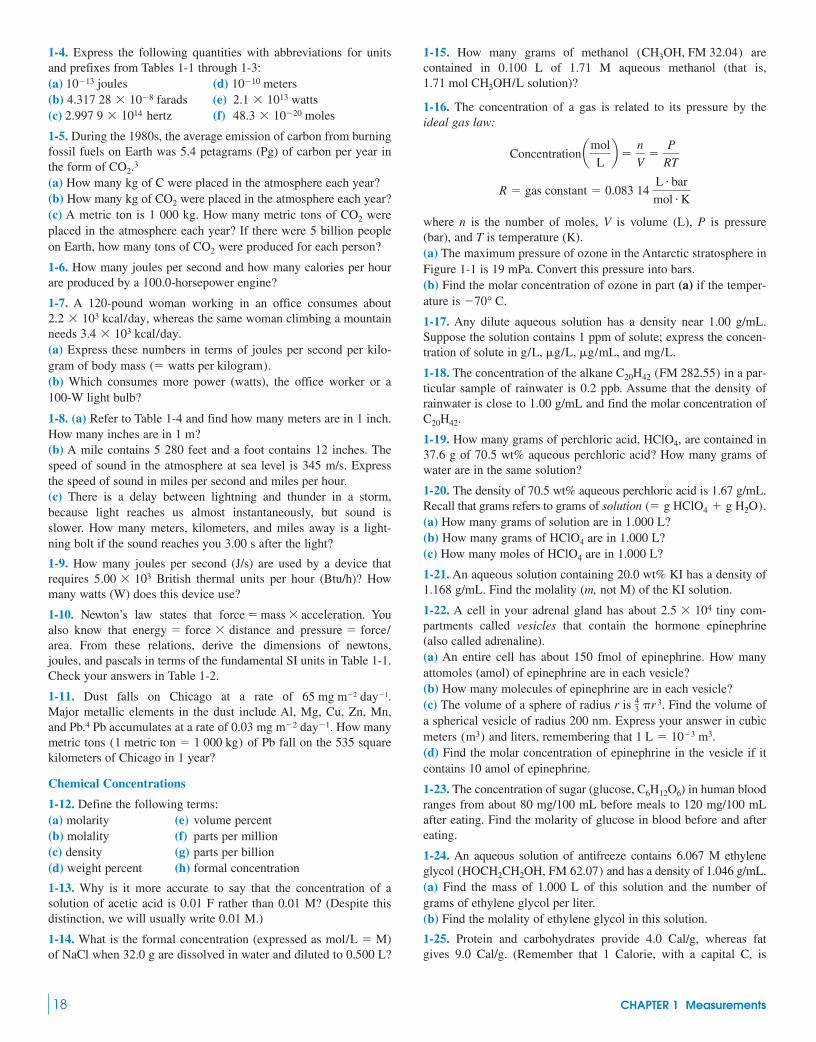
18 CHAPTER 1 Measurements
1-15. How many grams of methanol arecontained in 0.100 L of 1.71 M aqueous methanol (that is,
solution)?
1-16. The concentration of a gas is related to its pressure by theideal gas law:
where n is the number of moles, V is volume (L), P is pressure(bar), and T is temperature (K).(a) The maximum pressure of ozone in the Antarctic stratosphere inFigure 1-1 is 19 mPa. Convert this pressure into bars.(b) Find the molar concentration of ozone in part (a) if the temper-ature is .
1-17. Any dilute aqueous solution has a density near 1.00 g/mL.Suppose the solution contains 1 ppm of solute; express the concen-tration of solute in .
1-18. The concentration of the alkane in a par-ticular sample of rainwater is 0.2 ppb. Assume that the density ofrainwater is close to 1.00 g/mL and find the molar concentration of
.
1-19. How many grams of perchloric acid, , are contained in37.6 g of 70.5 wt% aqueous perchloric acid? How many grams ofwater are in the same solution?
1-20. The density of 70.5 wt% aqueous perchloric acid is 1.67 g/mL.Recall that grams refers to grams of solution(a) How many grams of solution are in 1.000 L?(b) How many grams of are in 1.000 L?(c) How many moles of are in 1.000 L?
1-21. An aqueous solution containing 20.0 wt% KI has a density of1.168 g/mL. Find the molality (m, not M) of the KI solution.
1-22. A cell in your adrenal gland has about tiny com-partments called vesicles that contain the hormone epinephrine(also called adrenaline).(a) An entire cell has about 150 fmol of epinephrine. How manyattomoles (amol) of epinephrine are in each vesicle?(b) How many molecules of epinephrine are in each vesicle?(c) The volume of a sphere of radius r is Find the volume ofa spherical vesicle of radius 200 nm. Express your answer in cubicmeters and liters, remembering that .(d) Find the molar concentration of epinephrine in the vesicle if itcontains 10 amol of epinephrine.
1-23. The concentration of sugar (glucose, ) in human bloodranges from about 80 mg/100 mL before meals to 120 mg/100 mLafter eating. Find the molarity of glucose in blood before and aftereating.
1-24. An aqueous solution of antifreeze contains 6.067 M ethyleneglycol and has a density of 1.046 g/mL.(a) Find the mass of 1.000 L of this solution and the number ofgrams of ethylene glycol per liter.(b) Find the molality of ethylene glycol in this solution.
1-25. Protein and carbohydrates provide 4.0 Cal/g, whereas fatgives 9.0 Cal/g. (Remember that 1 Calorie, with a capital C, is
(HOCH2CH2OH, FM 62.07)
C6H12O6
1 L � 10�3 m3(m3)
43 �r 3.
2.5 104
HClO4
HClO4
(� g HClO4 � g H2O).
HClO4
C20H42
C20H42 (FM 282.55)
g/L, g/L, g/mL, and mg/L
�70° C
R � gas constant � 0.083 14 L � bar
mol � K
Concentrationamol
Lb �
n
V�
P
RT
1.71 mol CH3OH/L
(CH3OH, FM 32.04)1-4. Express the following quantities with abbreviations for unitsand prefixes from Tables 1-1 through 1-3:(a) (d)(b) (e)(c) (f)
1-5. During the 1980s, the average emission of carbon from burningfossil fuels on Earth was 5.4 petagrams (Pg) of carbon per year inthe form of CO2.3
(a) How many kg of C were placed in the atmosphere each year?(b) How many kg of CO2 were placed in the atmosphere each year?(c) A metric ton is 1 000 kg. How many metric tons of CO2 wereplaced in the atmosphere each year? If there were 5 billion peopleon Earth, how many tons of CO2 were produced for each person?
1-6. How many joules per second and how many calories per hourare produced by a 100.0-horsepower engine?
1-7. A 120-pound woman working in an office consumes about, whereas the same woman climbing a mountain
needs .(a) Express these numbers in terms of joules per second per kilo-gram of body mass .(b) Which consumes more power (watts), the office worker or a100-W light bulb?
1-8. (a) Refer to Table 1-4 and find how many meters are in 1 inch.How many inches are in 1 m?(b) A mile contains 5 280 feet and a foot contains 12 inches. Thespeed of sound in the atmosphere at sea level is 345 m/s. Expressthe speed of sound in miles per second and miles per hour.(c) There is a delay between lightning and thunder in a storm,because light reaches us almost instantaneously, but sound isslower. How many meters, kilometers, and miles away is a light-ning bolt if the sound reaches you 3.00 s after the light?
1-9. How many joules per second (J/s) are used by a device thatrequires British thermal units per hour (Btu/h)? Howmany watts (W) does this device use?
1-10. Newton’s law states that Youalso know that and
From these relations, derive the dimensions of newtons,joules, and pascals in terms of the fundamental SI units in Table 1-1.Check your answers in Table 1-2.
1-11. Dust falls on Chicago at a rate of .Major metallic elements in the dust include Al, Mg, Cu, Zn, Mn,and Pb.4 Pb accumulates at a rate of . How manymetric tons of Pb fall on the 535 squarekilometers of Chicago in 1 year?
Chemical Concentrations
1-12. Define the following terms:(a) molarity (e) volume percent(b) molality (f) parts per million(c) density (g) parts per billion(d) weight percent (h) formal concentration
1-13. Why is it more accurate to say that the concentration of asolution of acetic acid is 0.01 F rather than 0.01 M? (Despite thisdistinction, we will usually write 0.01 M.)
1-14. What is the formal concentration (expressed as )of NaCl when 32.0 g are dissolved in water and diluted to 0.500 L?
mol/L � M
(1 metric ton � 1 000 kg)0.03 mg m�2 day�1
65 mg m�2 day�1
area.pressure � force/energy � force distance
force � mass acceleration.
5.00 103
(� watts per kilogram)
3.4 103 kcal/day2.2 103 kcal/day
48.3 10�20 moles2.997 9 1014 hertz2.1 1013 watts4.317 28 10�8 farads10�10 meters10�13 joules

Problems 19
really 1 kcal.) The weight percents of these components in somefoods are
Wt% Wt% Wt%Food protein carbohydrate fat
Shredded wheat 9.9 79.9 —Doughnut 4.6 51.4 18.6Hamburger (cooked) 24.2 — 20.3Apple — 12.0 —
Calculate the number of calories per gram and calories per ounce ineach of these foods. (Use Table 1-4 to convert grams into ounces,remembering that there are 16 ounces in 1 pound.)
1-26. It is recommended that drinking water contain 1.6 ppm fluo-ride for prevention of tooth decay. Consider a reservoir with adiameter of and a depth of 10.0 m. (The volume is
where r is the radius and h is the height.) How many grams ofshould be added to give 1.6 ppm? How many grams of sodium
fluoride, NaF, contain this much fluoride?
1-27. Noble gases (Group 18 in the periodic table) have the follow-ing volume concentrations in dry air: He, 5.24 ppm; Ne, 18.2 ppm;Ar, 0.934%; Kr, 1.14 ppm; Xe, 87 ppb.(a) A concentration of 5.24 ppm He means of He per literof air. Using the ideal gas law in Problem 1-16, find how manymoles of He are contained in at (298.15 K) and1.000 bar. This number is the molarity of He in the air.(b) Find the molar concentrations of Ar, Kr, and Xe in air at and 1 bar.
25°C
25.00°C5.24 L
5.24 L
F�
�r2h,4.50 102 m
(F�)
Preparing Solutions
1-28. How many grams of boric acid, shouldbe used to make 2.00 L of 0.050 0 M solution? What kind of flaskis used to prepare this solution?
1-29. Describe how you would prepare approximately 2 L of 0.050 0 m boric acid,
1-30. What is the maximum volume of 0.25 M sodium hypochloritesolution (NaOCl, laundry bleach) that can be prepared by dilutionof 1.00 L of 0.80 M NaOCl?
1-31. How many grams of 50 wt% NaOH (FM 40.00) should bediluted to 1.00 L to make 0.10 M NaOH? (Answer with two digits.)
1-32. A bottle of concentrated aqueous sulfuric acid, labeled 98.0 wt% , has a concentration of 18.0 M.(a) How many milliliters of reagent should be diluted to l.000 L togive 1.00 M ?(b) Calculate the density of 98.0 wt% .
1-33. What is the density of 53.4 wt% aqueous NaOH (FM 40.00) if16.7 mL of the solution diluted to 2.00 L gives 0.169 M NaOH?
Stoichiometry Calculations
1-34. How many milliliters of 3.00 M are required to reactwith 4.35 g of solid containing 23.2 wt% if the reactionis ?
1-35. How many grams of 0.491 wt% aqueous HF are required toprovide a 50% excess to react with 25.0 mL of 0.023 6 M bythe reaction ?Th4� � 4F� S ThF4(s)
Th4�
Ba2� � SO2�4 S BaSO4(s)
Ba(NO3)2
H2SO4
H2SO4
H2SO4
H2SO4
B(OH)3.
B(OH)3 (FM 61.83),

A nalytical chemistry extends from simple “wet” chemical procedures to elaborate instru-mental methods. This chapter describes basic laboratory apparatus and manipulations associ-ated with chemical measurements. We also introduce spreadsheets, which have becomeessential to everyone who manipulates quantitative data.
2-1 Safe, Ethical Handling of Chemicals and Waste
Chemical experimentation, like driving a car or operating a household, creates hazards. Theprimary safety rule is to familiarize yourself with the hazards and then to do nothing that you
20 CHAPTER 2 Tools of the Trade
Scientists can fabricate microelectromechanical devices such as the cantilever above, whichis a beam of silicon anchored at one end. The beam has a resonant vibrational frequencynear hertz (13 MHz) when stimulated with a piezoelectric vibrator. (A piezoelec-tric crystal, such as quartz, is one whose dimensions change in response to an electricfield.) When 93 attograms of an organic compound bind to the golddot near the end of the cantilever, the vibrational frequency decreases by 3.5 kHz becauseof the extra mass on the beam. The minimum mass that can be detected is estimated as0.4 attogram.
Microcantilevers can be coated with DNA or antibodies to respond to biological mole-cules or even a single virus.1,2,3 Bound material can be detected by the change in resonantfrequency, as above, or by measuring nanometer-scale static bending, shown at the left,caused by stress on the surface of the cantilever when molecules bind.
(93 10�18 g)
13 l06
THE SMALLEST BALANCES
Tools of the Trade2
AuAu
AuAu
Au
HS
R
HS
R
HS
R
AuAu
AuAu
Au
S
R
S
R
S
R
(b)(a) (c)
No thiol
Thiol
Frequency (MHz)
Opt
ical
det
ecto
r ou
tput
13.35 13.36
Antibody bound to onesurface of cantilever
Cantilever bends whenprotein binds to antibody
Protein
(a) Silicon cantilever with gold dot deposited on the surface, (b) Organic compound with thiol ( SH) group at the end binds to gold surface. (c) Resonant vibrational frequency ofcantilever changes when thiol compound binds to gold dot. [B. Ilic, H. G. Craighead, S. Krylov, W. Senaratne,C. Ober, and P. Neuzil, “Attogram Detection Using Nanoelectromechanical Oscillators,” J. Appl. Phys. 2004, 95, 3694.]
ß
Binding of molecules to one side createssurface stress that bends the cantilever.
Au dot
2 µm

2-1 Safe, Ethical Handling of Chemicals and Waste 21
(or your instructor or supervisor) consider to be dangerous. If you believe that an operationis hazardous, discuss it first and do not proceed until sensible precautions are in place.
Preservation of a habitable planet demands that we minimize waste production andresponsibly dispose of waste that is generated (Box 2-1). Recycling of chemicals is practicedin industry for economic as well as ethical reasons; it should be an important component ofpollution control in your lab.
Before working, familiarize yourself with safety features of your laboratory. You shouldwear goggles or safety glasses with side shields (Figure 2-1) at all times in the lab to protectyour eyes from liquids and glass, which fly around when least expected. Contact lenses arenot recommended in the lab, because vapors can be trapped between the lens and your eye.You can protect your skin from spills and flames by wearing a flame-resistant lab coat. Userubber gloves when pouring concentrated acids. Do not eat or drink in the lab.
Organic solvents, concentrated acids, and concentrated ammonia should be handled in afume hood. Air flowing into the hood keeps fumes out of the lab and dilutes the fumes beforeexpelling them from the roof. Never generate large quantities of toxic fumes that are allowedto escape through the hood. Wear a respirator when handling fine powders, which could pro-duce a cloud of dust that might be inhaled.
Box 2-1 Disposal of Chemical Waste
If carelessly discarded, many laboratory and household chemicalsand products are harmful to plants, animals, and people.4 For eachexperiment, your instructor should establish procedures for wastedisposal. Options include (1) pouring solutions down the drainand diluting with tap water, (2) saving the waste for disposal in anapproved landfill, (3) treating waste to decrease the hazard andthen pouring it down the drain or saving it for a landfill, and(4) recycling. Chemically incompatible wastes should never bemixed with each other, and each waste container must be labeledto indicate the quantity and identity of its contents. Waste contain-ers must indicate whether the contents are flammable, toxic, cor-rosive, or reactive, or have other dangerous properties.
A few examples illustrate different approaches to managinglab waste.5 Dichromate is reduced to with sodiumhydrogen sulfite treated with hydroxide to makeinsoluble and evaporated to dryness for disposal in alandfill. Waste acid is mixed with waste base until nearly neutral(as determined with pH paper) and then poured down the drain.Waste iodate is reduced to with neutralizedwith base, and poured down the drain. Waste solution istreated with sodium metasilicate solution to precipitateinsoluble that can be packaged for a landfill. Waste silver or gold is treated to recover the metal.6 Toxic gases used in afume hood are bubbled through a chemical trap or burned to pre-vent escape from the hood.
PbSiO3
(Na2SiO3)Pb2�
NaHSO3,I�(IO�3 )
Cr(OH)3,(NaHSO3),
Cr3�(Cr2O2�7 )
W
FIRE HAZARD (RED)
4. DANGER: Flammable gas or extremely flammable liquid.
3. WARNING: Flammableliquid. Flash pointbelow 100˚F.
2. CAUTION: Combustible liquid.Flash point of 100˚ F to 200˚ F.
1. Combustible ifheated.0. Not combustible.
RED
WHITE
YELLOWBLUE
(BLUE)HEALTHHAZARD
4. DANGER: May befatal on short exposure.Specialized protectiveequipment required.
3. WARNING: Corrosive or toxic:Avoid skincontactor inhalation.
2. WARNING:May be harmfulif inhaled orabsorbed.
1. CAUTION: Maycauseirritation.
0. No unusualhazard.
(YELLOW)INSTABILITY
HAZARD
4. DANGER: Explosivematerial at room
temperature.
3. DANGER: May be explosive if shocked,
heated, under confinement,
or mixed with water.
2. WARNING:Unstable,
or may reactif mixed with
water.
1. CAUTION: May react ifheated, or mixed
with water.
0. Stable.Not
reactive whenmixed with
water.
Avoid useof water
RadiationACID – Acid
ALK – AlkaliCOR. – Corrosive
OXY – Oxidizing Chemicals
Chemical Name Chemical Abstracts Service No. or MSDS No.
Cas. No. Cas. No.
Cas. No. Cas. No.
0
3 0
ACID
Label on37 wt% HCl
Healthhazard:Corrosiveor toxic
Instabilityrating:Stable
Fire hazard rating:Not combustible
Figure 2-2 Chemical hazards label used bythe National Fire Protection Association.
Limitations of gloves: In 1997, popularDartmouth College chemistry professorKaren Wetterhahn, age 48, died from adrop of dimethylmercury absorbed throughthe latex rubber gloves she was wearing.Many organic compounds readily pene-trate rubber. Wetterhahn was an expert inthe biochemistry of metals and the firstfemale professor of chemistry at Dartmouth.She was a mother of two children andplayed a major role in bringing morewomen into science and engineering.
Figure 2-1 Goggles or safety glasses withside shields should be worn at all times inevery lab. [Stockdisk.]
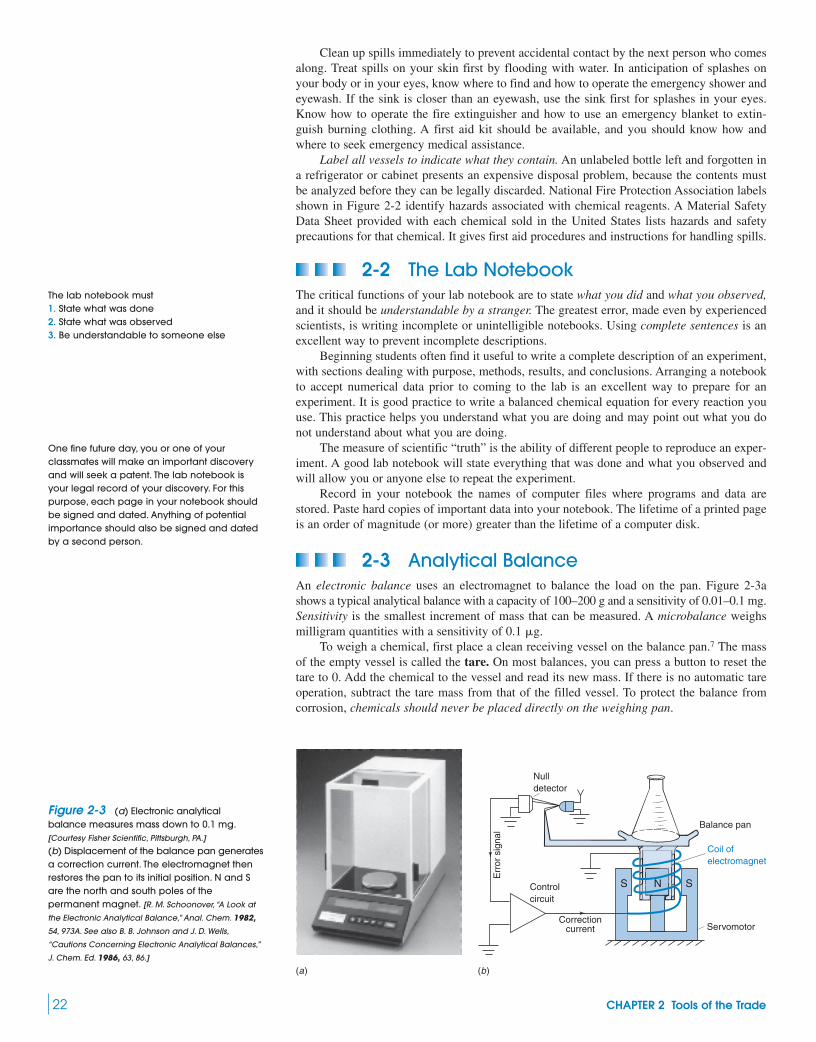
22 CHAPTER 2 Tools of the Trade
Clean up spills immediately to prevent accidental contact by the next person who comesalong. Treat spills on your skin first by flooding with water. In anticipation of splashes onyour body or in your eyes, know where to find and how to operate the emergency shower andeyewash. If the sink is closer than an eyewash, use the sink first for splashes in your eyes.Know how to operate the fire extinguisher and how to use an emergency blanket to extin-guish burning clothing. A first aid kit should be available, and you should know how andwhere to seek emergency medical assistance.
Label all vessels to indicate what they contain. An unlabeled bottle left and forgotten ina refrigerator or cabinet presents an expensive disposal problem, because the contents mustbe analyzed before they can be legally discarded. National Fire Protection Association labelsshown in Figure 2-2 identify hazards associated with chemical reagents. A Material SafetyData Sheet provided with each chemical sold in the United States lists hazards and safetyprecautions for that chemical. It gives first aid procedures and instructions for handling spills.
2-2 The Lab NotebookThe critical functions of your lab notebook are to state what you did and what you observed,and it should be understandable by a stranger. The greatest error, made even by experiencedscientists, is writing incomplete or unintelligible notebooks. Using complete sentences is anexcellent way to prevent incomplete descriptions.
Beginning students often find it useful to write a complete description of an experiment,with sections dealing with purpose, methods, results, and conclusions. Arranging a notebookto accept numerical data prior to coming to the lab is an excellent way to prepare for anexperiment. It is good practice to write a balanced chemical equation for every reaction youuse. This practice helps you understand what you are doing and may point out what you donot understand about what you are doing.
The measure of scientific “truth” is the ability of different people to reproduce an exper-iment. A good lab notebook will state everything that was done and what you observed andwill allow you or anyone else to repeat the experiment.
Record in your notebook the names of computer files where programs and data arestored. Paste hard copies of important data into your notebook. The lifetime of a printed pageis an order of magnitude (or more) greater than the lifetime of a computer disk.
2-3 Analytical BalanceAn electronic balance uses an electromagnet to balance the load on the pan. Figure 2-3ashows a typical analytical balance with a capacity of 100–200 g and a sensitivity of 0.01–0.1 mg.Sensitivity is the smallest increment of mass that can be measured. A microbalance weighsmilligram quantities with a sensitivity of 0.1 g.
To weigh a chemical, first place a clean receiving vessel on the balance pan.7 The massof the empty vessel is called the tare. On most balances, you can press a button to reset thetare to 0. Add the chemical to the vessel and read its new mass. If there is no automatic tareoperation, subtract the tare mass from that of the filled vessel. To protect the balance fromcorrosion, chemicals should never be placed directly on the weighing pan.
The lab notebook must1. State what was done2. State what was observed3. Be understandable to someone else
One fine future day, you or one of yourclassmates will make an important discoveryand will seek a patent. The lab notebook isyour legal record of your discovery. For thispurpose, each page in your notebook shouldbe signed and dated. Anything of potentialimportance should also be signed and datedby a second person.
Nulldetector
Balance pan
Coil of electromagnet
Servomotor
Controlcircuit
SNS
Err
or s
igna
l
Correctioncurrent
(b)(a)
Figure 2-3 (a) Electronic analyticalbalance measures mass down to 0.1 mg.[Courtesy Fisher Scientific, Pittsburgh, PA.]
(b) Displacement of the balance pan generatesa correction current. The electromagnet thenrestores the pan to its initial position. N and Sare the north and south poles of thepermanent magnet. [R. M. Schoonover, “A Look at
the Electronic Analytical Balance,” Anal. Chem. 1982,
54, 973A. See also B. B. Johnson and J. D. Wells,
“Cautions Concerning Electronic Analytical Balances,”
J. Chem. Ed. 1986, 63, 86.]

2-3 Analytical Balance 23
An alternate procedure, called “weighing by difference,” is necessary for hygroscopicreagents, which rapidly absorb moisture from the air. First weigh a capped bottle containingdry reagent. Then quickly pour some reagent from that weighing bottle into a receiver. Capthe weighing bottle and weigh it again. The difference is the mass of reagent delivered fromthe weighing bottle. With an electronic balance, set the initial mass of the weighing bottle tozero with the tare button. Then deliver reagent from the bottle and reweigh the bottle. Thenegative reading on the balance is the mass of reagent delivered from the bottle.8
Principle of OperationAn object placed on the pan of the balance in Figure 2-3b pushes the pan down with a forceequal to where m is the mass of the object and g is the acceleration of gravity. Thenull detector senses the displacement and sends an error signal to the circuit that generates acorrection current. This current flows through the coil beneath the pan, thereby creating amagnetic field that is repelled by a permanent magnet under the pan. As the deflectiondecreases, the output of the null detector decreases. The current required to restore the pan toits initial position is proportional to the mass on the pan.
The older single-pan mechanical balance shown in Figure 2-4 uses standard masses anda balance beam suspended on a sharp knife edge to measure the mass of the object on the bal-ance pan. The mass of the pan hanging from the balance point (another knife edge) at the leftis balanced by a counterweight at the right. An object placed on the pan pushes it down. Werotate knobs to remove weights from a bar that is above the pan and hidden inside the bal-ance. The balance beam is restored almost to its original position when the masses removedare nearly equal to the mass of the object on the pan. The slight difference from the originalposition is shown on an optical scale, whose reading is added to that of the knobs.
A mechanical balance should be in its arrested position when you load or unload thepan and in the half-arrested position when you are dialing weights. This practice minimizeswear on the knife edges, which degrades sensitivity.
Preventing Weighing ErrorsUse a paper towel or tissue to handle the vessel you are weighing, because fingerprints willchange its mass. Samples should be at ambient temperature (the temperature of the sur-roundings) to prevent errors due to air currents. A sample that has been dried in an oven takesabout 30 min to cool to room temperature. Place the sample in a desiccator during cooling toprevent accumulation of moisture. Close the glass doors of the balance in Figure 2-3a to pre-vent drafts from affecting the reading. Many top-loading balances have a plastic fence aroundthe pan to protect it from drafts. Sensitive balances should be located on a heavy table, suchas a marble slab, to minimize vibrations. The balance has adjustable feet and a bubble meterthat allow you to keep it level. Avoid spilling chemicals into the gap between the coil and thepermanent magnet of the servomotor.
Analytical balances calibrate themselves automatically by placing a standard mass onthe load-bearing structure and measuring the current required to balance the weight. Lessexpensive electronic balances are calibrated at the factory, where the force of gravity may notbe the same as the force of gravity in your lab. (Gravitational acceleration varies by �0.l%among different locations in the United States.) Magnetic materials or electromagnetic fields
m g,
Balance point
Removable weights
Balance beam
Optical scale
Counterweight
Fulcrum(knife edge)
Balancepan
Figure 2-4 Single-pan mechanical balance. To weighan object on the pan, we use mechanical knobs to detachremovable weights until the balance beam is restored asnear as possible to its original position. The remaining smalldeflection is read on the optical scale.
Weighing by difference

24 CHAPTER 2 Tools of the Trade
from neighboring instruments can affect the balance reading. Periodically check your bal-ance by weighing a standard mass. Tolerances (allowable deviations) for standard masses arelisted in Table 2-1.
BuoyancyYour weight when swimming is nearly zero, which is why people can float. Buoyancy is theupward force exerted on an object in a liquid or gaseous fluid.9 An object weighed in airappears lighter than its actual mass by an amount equal to the mass of air that it displaces.True mass is the mass measured in vacuum. A standard mass in a balance is also affected bybuoyancy, so it weighs less in air than in vacuum. A buoyancy error occurs whenever the den-sity of the object being weighed is not equal to the density of the standard mass.
If mass is read from a balance, the true mass m of the object weighed in vacuum isgiven by10
Buoyancy equation: (2-1)
where is the density of air (0.001 2 g/mL near 1 bar and 11 dw is the density of thecalibration weights (typically 8.0 g/mL), and d is the density of the object being weighed.
Example Buoyancy Correction
A pure compound called “tris” is used as a primary standard to measure concentrationsof acids. The volume of acid required to react with a known mass of tris tells us theconcentration of the acid. Find the true mass of tris if the apparentmass weighed in air is 100.00 g.
Solution Assuming that the balance weights have a density of 8.0 g/mL and the densityof air is 0.001 2 g/mL, we find the true mass by using Equation 2-1:
Unless we correct for buoyancy, we would think that the mass of tris is 0.08% less thanthe actual mass and we would think that the molarity of acid reacting with the tris is0.08% less than the actual molarity.
Figure 2-5 shows buoyancy corrections for several substances. When you weigh waterwith a density of 1.00 g/mL, the true mass is 1.001 1 g when the balance reads 1.000 0 g. The
m �
100.00 ga1 �0.001 2 g/mL
8.0 g/mLb
1 �0.001 2 g/mL
1.33 g/mL
� 100.08 g
(density � 1.33 g/mL)
25°C),da
m �
m¿a1 �da
dwb
a1 �da
db
m¿
Table 2-1 Tolerances for laboratory balance weightsa
Denomination Tolerance (mg) Denomination Tolerance (mg)
Grams Class 1 Class 2 Milligrams Class 1 Class 2
500 1.2 2.5 500 0.010 0.025200 0.50 1.0 200 0.010 0.025100 0.25 0.50 100 0.010 0.02550 0.12 0.25 50 0.010 0.01420 0.074 0.10 20 0.010 0.01410 0.050 0.074 10 0.010 0.0145 0.034 0.054 5 0.010 0.0142 0.034 0.054 2 0.010 0.0141 0.034 0.054 1 0.010 0.014
a. Tolerances are defined in ASTM (American Society for Testing and Materials) Standard E 617. Classes 1 and 2 are themost accurate. Larger tolerances exist for Classes 3–6, which are not given in this table.

2-4 Burets 25
error is 0.11%. For NaCl with a density of 2.16 g/mL, the error is 0.04%; and for with a density of 4.45 g/mL, the error is only 0.01%.
2-4 BuretsThe buret in Figure 2-6a is a precisely manufactured glass tube with graduations enablingyou to measure the volume of liquid delivered through the stopcock (the valve) at the bottom.The 0-mL mark is near the top. If the initial liquid level is 0.83 mL and the final level is27.16 mL, then you have delivered Class A burets (the mostaccurate grade) are certified to meet the tolerances in Table 2-2. If the reading of a 50-mLburet is 27.16 mL, the true volume can be anywhere in the range 27.21 to 27.11 mL and stillbe within the tolerance of 0.05 mL.
When reading the liquid level in a buret, your eye should be at the same height as the topof the liquid. If your eye is too high, the liquid seems to be higher than it really is. If your eyeis too low, the liquid appears too low. The error that occurs when your eye is not at the sameheight as the liquid is called parallax.
The surface of most liquids forms a concave meniscus like that shown in Figure 2-7.12 Itis helpful to use black tape on a white card as a background for locating the precise positionof the meniscus. Move the black strip up the buret to approach the meniscus. The bottom ofthe meniscus turns dark as the black strip approaches, thus making the meniscus more easily
27.16 � 0.83 � 26.33 mL.
AgNO3
Figure 2-5 Buoyancy correction, assumingda 0.001 2 g/mL and dw 8.0 g/mL. Theapparent mass measured in air (1.000 0 g) ismultiplied by the buoyancy correction to findthe true mass.
��
Figure 2-6 (a) Glass buret. [Courtesy A. H. Thomas Co.,
Philadelphia, PA.] (b) Digital titrator with plastic cartridge containingreagent solution is used for analyses in the field. [Courtesy Hach
Co., Loveland, CO.] (c) Battery-operated electronic buret withdigital readout delivers 0.01-mL increments from a reagent bottle.This device can be used for accurate titrations in the field.[Courtesy Cole-Parmer Co., Niles, IL.]
Table 2-2 Tolerances of Class Aburets
Buret Smallestvolume graduation Tolerance(mL) (mL) (mL)
5 0.01 0.0110 0.05 or 0.02 0.0225 0.1 0.0350 0.1 0.05
100 0.2 0.10
9
10
11
Level of meniscus
Figure 2-7 Buret with the meniscus at9.68 mL. Estimate the reading of any scale tothe nearest tenth of a division. This buret has0.1-mL divisions, so we estimate the reading tothe nearest 0.01 mL.
Deliveryknob
Digital counter
Reagentcartridge
Deliverytube
Stopcock
45
46
47
48
49
50
0
1
2
3
140SEC
ml
(b)(a) (c)

26 CHAPTER 2 Tools of the Trade
readable. Highly colored solutions may appear to have two meniscuses; either one may beused. Because volumes are determined by subtracting one reading from another, the impor-tant point is to read the position of the meniscus reproducibly. Always estimate the reading tothe nearest tenth of a division between marks.
The thickness of the markings on a 50-mL buret corresponds to about 0.02 mL. For bestaccuracy, select one portion of the marking to be called zero. For example, you can say thatthe liquid level is at the mark when the bottom of the meniscus just touches the top of themark. When the meniscus is at the bottom of the same mark, the reading is 0.02 mL greater.
For precise location of the end of a titration, we deliver less than one drop at a time fromthe buret near the end point. (A drop from a 50-mL buret is about 0.05 mL.) To deliver a frac-tion of a drop, carefully open the stopcock until part of a drop is hanging from the buret tip.(Some people prefer to rotate the stopcock rapidly through the open position to expel part ofa drop.) Then touch the inside glass wall of the receiving flask to the buret tip to transfer thedroplet to the wall of the flask. Carefully tip the flask so that the main body of liquid washesover the newly added droplet. Swirl the flask to mix the contents. Near the end of a titration,tip and rotate the flask often to ensure that droplets on the wall containing unreacted analytecontact the bulk solution.
Liquid should drain evenly down the wall of a buret. The tendency of liquid to stick toglass is reduced by draining the buret slowly (�20 mL/min). If many droplets stick to thewall, then clean the buret with detergent and a buret brush. If this cleaning is insufficient,soak the buret in peroxydisulfate–sulfuric acid cleaning solution,13 which eats clothing andpeople, as well as grease in the buret. Never soak volumetric glassware in alkaline solu-tions, which attack glass. A 5 wt% NaOH solution at dissolves Pyrex glass at a rate of9 m/h.
Error can be caused by failure to expel the bubble of air often found directly beneath thestopcock (Figure 2-8). If the bubble becomes filled with liquid during the titration, then somevolume that drained from the graduated portion of the buret did not reach the titration vessel.The bubble can be dislodged by draining the buret for a second or two with the stopcockwide open. You can expel a tenacious bubble by abruptly shaking the buret while draining itinto a sink.
When you fill a buret with fresh solution, it is a wonderful idea to rinse the buret severaltimes with small portions of the new solution, discarding each wash. It is not necessary to fillthe buret with wash solution. Simply tilt the buret to allow all surfaces to contact the washliquid. This same technique should be used with any vessel (such as a spectrophotometercuvet or a pipet) that is reused without drying.
The digital titrator in Figure 2-6b is convenient for use in the field where samples arecollected. The counter tells how much reagent has been dispensed. The precision of 1% is10 times poorer than that of a glass buret, but many measurements do not require higher pre-cision. The battery-operated electronic buret in Figure 2-6c fits on a reagent bottle and deliv-ers up to 99.99 mL in 0.01-mL increments. For titrations requiring the very highest precision,measure the mass of reagent, instead of the volume, delivered from a buret or syringe.14 Masscan be measured more precisely than can volume.
Microscale Titrations“Microscale” student experiments reduce costs by decreasing consumption of reagents andgeneration of waste. An inexpensive student buret can be constructed from a 2-mL pipetgraduated in 0.01-mL intervals.15 Volume can be read to 0.001 mL and titrations can be car-ried out with a precision of 1%.
2-5 Volumetric FlasksA volumetric flask is calibrated to contain a particular volume of solution at whenthe bottom of the meniscus is adjusted to the center of the mark on the neck of the flask(Figure 2-9, Table 2-3). Most flasks bear the label “ ” which means to contain at
(Pipets and burets are calibrated to deliver, “TD,” their indicated volume.) The temper-ature of the container is relevant because both liquid and glass expand when heated.
To use a volumetric flask, dissolve the desired mass of reagent in the flask by swirlingwith less than the final volume of liquid. Then add more liquid and swirl the solution again.Adjust the final volume with as much well-mixed liquid in the flask as possible. (When twodifferent liquids are mixed, there is generally a small volume change. The total volume is not
20°C.TC 20°C,
20°C
95°CAirbubble
Liquid
Liquid
Stopcock
Figure 2-8 An air bubble trapped beneaththe stopcock should be expelled before youuse the buret.
Operating a buret:• Wash buret with new solution• Eliminate air bubble before use• Drain liquid slowly• Deliver fraction of a drop near end point• Read bottom of concave meniscus• Estimate reading to 1/10 of a division• Avoid parallax• Account for graduation thickness in readings
Precision refers to the reproducibility of replicate deliveries.
Accuracy refers to the difference between thestated volume and the actual volumedelivered.
Thermal expansion of water and glass isdiscussed in Section 2-9. In contrast to oldertypes of glass, volumetric glassware made ofPyrex, Kimax, or other low-expansion glass canbe safely dried in an oven heated to at least320�C without harm,16 although there is rarelyreason to go above 150�C.

2-6 Pipets and Syringes 27
the sum of the two volumes that were mixed. By swirling the liquid in a nearly full volumet-ric flask before the liquid reaches the thin neck, you minimize the change in volume whenthe last liquid is added.) For good control, add the final drops of liquid with a pipet, not asquirt bottle. After adjusting the liquid to the correct level, hold the cap firmly in place andinvert the flask several times to complete mixing. Before the liquid is homogeneous, weobserve streaks (called schliera) arising from regions that refract light differently. After theschliera are gone, invert the flask a few more times to ensure complete mixing.
Figure 2-10 shows how liquid appears when it is at the center of the mark of a volumet-ric flask or a pipet. Adjust the liquid level while viewing the flask from above or below thelevel of the mark. The front and back of the mark describe an ellipse with the meniscus at thecenter.
Glass is notorious for adsorbing traces of chemicals—especially cations. Adsorption isthe process in which a substance sticks to a surface. (In contrast, absorption is the process inwhich a substance is taken inside another, as water is taken into a sponge.) For critical work,you should acid wash glassware to replace low concentrations of cations on the surface withH�. To do this, soak already thoroughly cleaned glassware in 3–6 M HCl (in a fume hood)for �1 h. Then rinse it well with distilled water and, finally, soak it in distilled water. Acidcan be reused many times, as long as it is only used for clean glassware. Acid washing isespecially appropriate for new glassware, which you should always assume is not clean. Thepolypropylene plastic volumetric flask in Figure 2-9b is designed for trace analysis (parts perbillion concentrations) in which analyte might be lost by adsorption on the walls of a glassflask.
2-6 Pipets and SyringesPipets deliver known volumes of liquid. The transfer pipet in Figure 2-11a is calibrated todeliver one fixed volume. The last drop does not drain out of the pipet and should not beblown out. The measuring pipet in Figure 2-11b is calibrated like a buret. It is used to delivera variable volume, such as 5.6 mL, by starting delivery at the 1.0-mL mark and terminatingat the 6.6-mL mark. The transfer pipet is more accurate, with tolerances listed in Table 2-4.
19K
USA
500-mLmark
A
$ KIMAX 500ml19 USA TC20°C
Figure 2-9 (a) Class A glass volumetric flask. [Courtesy A. H. Thomas Co., Philadelphia, PA.] (b) Class Bpolypropylene plastic volumetric flask for trace analysis. [Courtesy Fisher Scientific, Pittsburgh, PA.] Class Aflasks meet tolerances of Table 2-3. Class B tolerances are twice as big as Class A tolerances. (c) Short-form volumetric flask with Teflon-lined screw cap fits in the analytical balance in Figure 2-3a. Teflonprotects the cap from chemical attack.
Table 2-3 Tolerances of Class Avolumetric flasks
Flaskcapacity Tolerance(mL) (mL)
1 0.022 0.025 0.02
10 0.0225 0.0350 0.05
100 0.08200 0.10250 0.12500 0.20
1 000 0.302 000 0.50
(b)(a) (c)
Back ofmark
Meniscus
Front ofmark
Figure 2-10 Proper position of themeniscus—at the center of the ellipse formedby the front and back of the calibration markwhen viewed from above or below. Volumetricflasks and transfer pipets are calibrated tothis position.
Calibrationmark
(a)
(b)
Figure 2-11 (a) Transfer pipet and (b) measuring (Mohr) pipet. [Courtesy A. H. Thomas Co., Philadelphia, PA.]
(b)
(a)
Table 2-4 Tolerances of Class Atransfer pipets
Volume Tolerance(mL) (mL)
0.5 0.0061 0.0062 0.0063 0.014 0.015 0.01
10 0.0215 0.0320 0.0325 0.0350 0.05
100 0.08

28 CHAPTER 2 Tools of the Trade
Using a Transfer PipetUsing a rubber bulb or other pipet suction device, not your mouth, suck liquid up past the cal-ibration mark. Discard one or two pipet volumes of liquid to rinse traces of previous reagentsfrom the pipet. After taking up a third volume past the calibration mark, quickly replace thebulb with your index finger at the end of the pipet. Gently pressing the pipet against the bot-tom of the vessel while removing the rubber bulb helps prevent liquid from draining belowthe mark while you put your finger in place. (Alternatively, you can use an automatic suctiondevice that remains attached to the pipet.) Wipe the excess liquid off the outside of the pipetwith a clean tissue. Touch the tip of the pipet to the side of a beaker and drain the liquid untilthe bottom of the meniscus just reaches the center of the mark, as shown in Figure 2-10.Touching the beaker draws liquid from the pipet without leaving part of a drop hanging whenthe liquid reaches the calibration mark.
Transfer the pipet to a receiving vessel and drain it by gravity while holding the tipagainst the wall of the vessel. After the liquid stops, hold the pipet to the wall for a few moreseconds to complete draining. Do not blow out the last drop. The pipet should be nearly ver-tical at the end of delivery. When you finish with a pipet, you should rinse it with distilledwater or soak it until you are ready to clean it. Solutions should never be allowed to dryinside a pipet because removing internal deposits is very difficult.
MicropipetsMicropipets (Figure 2-12) deliver volumes of 1 to 1 000 L Liquid is con-tained in the disposable polypropylene tip, which is stable to most aqueous solutions andmany organic solvents except chloroform (CHCl3). The tip is not resistant to concentratednitric or sulfuric acids. To prevent aerosols from entering the pipet shaft, tips are availablewith polyethylene filters. Aerosols can corrode mechanical parts of the pipet or cross-contaminate biological experiments.
To use a micropipet, place a fresh tip tightly on the barrel. Keep tips in their package ordispenser so you do not contaminate the tips with your fingers. Set the desired volume withthe knob at the top of the pipet. Depress the plunger to the first stop, which corresponds tothe selected volume. Hold the pipet vertically, dip it 3–5 mm into the reagent solution, and
(1 L � 10�6 L).
Figure 2-12 (a) Microliter pipet withdisposable plastic tip (b) Enlarged view ofdisposable tip containing polyethylene filter toprevent aerosol from contaminating the shaftof the pipet. (c) Volume selection dial set to150 L. [Courtesy Rainin Instrument Co., Emeryville, CA.]
Do not blow the last drop out of a transferpipet.
(a)
Piston
Shaft
Filter
Aerosol
Disposablepolypropylene
tip
(b) (c)

2-7 Filtration 29
slowly release the plunger to suck up liquid. The volume of liquid taken into the tip dependson the angle at which the pipet is held and how far beneath the liquid surface the tip is heldduring uptake. Withdraw the tip from the liquid by sliding it along the wall of the vessel toremove liquid from the outside of the tip. To dispense liquid, touch the tip to the wall of thereceiver and gently depress the plunger to the first stop. Wait a few seconds to allow liquid todrain down the tip, and then depress the plunger further to squirt out the last liquid. Cleanand wet a fresh tip by taking up and discarding two or three squirts of reagent. The tip can bediscarded or rinsed well with a squirt bottle and reused. A tip with a filter (Figure 2-12b) can-not be cleaned for reuse.
Table 2-5 lists tolerances for micropipets from one manufacturer. As internal parts wearout, both precision and accuracy can decline by an order of magnitude. In a study17 of54 micropipets in use at a biomedical lab, 12 were accurate and precise to �1%. Five of 54had errors �10%. When 54 quality control technicians at four pharmaceutical companiesused a properly functioning micropipet, 10 people were accurate and precise to �1%. Sixwere inaccurate by �10%. Micropipets require periodic calibration and maintenance (clean-ing, seal replacement, and lubrication) and operators require certification.18
SyringesMicroliter syringes, such as that in Figure 2-13, come in sizes from 1 to 500 L and have anaccuracy and precision near 1%. When using a syringe, take up and discard several volumesof liquid to wash the glass walls and to remove air bubbles from the barrel. The steel needleis attacked by strong acid and will contaminate strongly acidic solutions with iron.
Table 2-5 Manufacturer’s tolerances for micropipets
At 10% of pipet volume At 100% of pipet volumePipet volume(�L) Accuracy (%) Precision (%) Accuracy (%) Precision (%)
Adjustable Pipets0.2–2 8 4 1.2 0.61–10 2.5 1.2 0.8 0.42.5–25 4.5 1.5 0.8 0.210–100 1.8 0.7 0.6 0.1530–300 1.2 0.4 0.4 0.15100–1 000 1.6 0.5 0.3 0.12
Fixed Pipets10 0.8 0.425 0.8 0.3
100 0.5 0.2500 0.4 0.18
1 000 0.3 0.12
SOURCE: Data from Hamilton Co., Reno. NV.
Barrel PlungerNeedle
1 00 2 0 3 0 40 1 0 5 0 6 0 7 0 8 0 9
Figure 2-13 Hamilton syringe with a volume of 1 L and divisions of 0.02 L on the glass barrel.[Courtesy Hamilton Co., Reno, NV.]
2-7 FiltrationIn gravimetric analysis, the mass of product from a reaction is measured to determine howmuch unknown was present. Precipitates from gravimetric analyses are collected by filtra-tion, washed, and then dried. Most precipitates are collected in a fritted-glass funnel (also

30 CHAPTER 2 Tools of the Trade
called a Gooch filter crucible) with suction applied to speed filtration (Figure 2-14). Theporous glass plate in the funnel allows liquid to pass but retains solids. The empty funnel isfirst dried at and weighed. After collecting solid and drying again, the funnel and itscontents are weighed a second time to determine the mass of collected solid. Liquid fromwhich a substance precipitates or crystallizes is called the mother liquor. Liquid that passesthrough the filter is called filtrate.
In some gravimetric procedures, ignition (heating at high temperature over a burner orin a furnace) is used to convert a precipitate into a known, constant composition. For exam-ple, precipitates as hydrous ferric oxide, with variable composition.Ignition converts it into pure prior to weighing. When a precipitate is to be ignited, itis collected in ashless filter paper, which leaves little residue when burned.
To use filter paper with a conical glass funnel, fold the paper into quarters, tear off onecorner (to allow a firm fit into the funnel), and place the paper in the funnel (Figure 2-15).The filter paper should fit snugly and be seated with some distilled water. When liquid ispoured in, an unbroken stream of liquid should fill the stem of the funnel (Figure 2-16). Theweight of liquid in the stem helps speed filtration.
For filtration, pour the slurry of precipitate down a glass rod to prevent splattering(Figure 2-16). (A slurry is a suspension of solid in liquid.) Particles adhering to the beaker orrod can be dislodged with a rubber policeman, which is a flattened piece of rubber at the endof a glass rod. Use a jet of appropriate wash liquid from a squirt bottle to transfer particlesfrom the rubber and glassware to the filter. If the precipitate is going to be ignited, particlesremaining in the beaker should be wiped onto a small piece of moist filter paper. Add thatpaper to the filter to be ignited.
2-8 DryingReagents, precipitates, and glassware are conveniently dried in an oven at (Somechemicals require other temperatures.) Anything that you put in the oven should be labeled.Use a beaker and watchglass (Figure 2-17) to minimize contamination by dust during drying.It is good practice to cover all vessels on the benchtop to prevent dust contamination.
The mass of a gravimetric precipitate is measured by weighing a dry, empty filter cru-cible before the procedure and reweighing the same crucible filled with dry product after theprocedure. To weigh the empty crucible, first bring it to “constant mass” by drying it in the
110°C.
Fe2O3
FeOOH � xH2O,Fe3�
110°C
Gooch filter crucible
Rubber adaptor
Glassfunnel
To air
To house vacuum or aspirator
Suction flask Trap
Porous glass
Goochfiltercrucible
Figure 2-14 Filtration with a Goochcrucible that has a porous (fritted) glass diskthrough which liquid can pass. Suction can beapplied by the house vacuum system or by anaspirator that uses flowing water to createvacuum. The trap prevents backup of tapwater from the aspirator into the suction flask.Alternatively, the trap prevents liquid in yoursuction flask from being accidentally suckedinto the house vacuum system. Using a trap isalways a good idea, no matter what yoursource of vacuum.
Dust is a source of contamination in allexperiments, so . . .
Cover all vessels whenever possible.
(a) (b) (c) (d )
Glass rod
Beaker withprecipitateand motherliquor
Receivingbeaker
Conical funnel
Filter paper
Unbroken liquid stream if filterpaper is properly seated
Figure 2-16 Filtering a precipitate. Theconical funnel is supported by a metal ringattached to a ring stand, neither of which isshown.
Figure 2-15 Folding filter paper for aconical funnel, (a) Fold the paper in half.(b) Then fold it in half again. (c) Tear off acorner to allow better seating of the paper inthe funnel. (d ) Open the side that was not tornwhen fitting the paper in the funnel.

2-9 Calibration of Volumetric Glassware 31
2-9 Calibration of Volumetric GlasswareEach instrument that we use has a scale of some sort to measure a quantity such as mass,volume, force, or electric current. Manufacturers usually certify that the indicated quantitylies within a certain tolerance from the true quantity. For example, a Class A transfer pipet iscertified to deliver 10.00 0.02 mL when you use it properly. Your individual pipet mightalways deliver 10.016 0.004 mL in a series of trials. That is, your pipet delivers an averageof 0.016 mL more than the indicated volume in repeated trials. Calibration is the process ofmeasuring the actual quantity of mass, volume, force, electric current, and so on, that corre-sponds to an indicated quantity on the scale of an instrument.
Watchglass Bent glass hooks
Weighing bottlewith cap ajar
ReagentBeaker
Figure 2-17 Use a watchglass as a dustcover while drying reagents or crucibles in theoven.
(a) (b)
Figure 2-18 (a) Ordinary desiccator. (b) Vacuum desiccator that can be evacuated through theside arm at the top and then sealed by rotating the joint containing the side arm. Drying is moreefficient at low pressure. [Courtesy A. H. Thomas Co., Philadelphia, PA.]
Table 2-6 Efficiencies of drying agents
Water left inatmosphere
Agent Formula (�g H2O/L)a
Magnesium perchlorate, anhydrous 0.2“Anhydrone” 1.5Barium oxide BaO 2.8Alumina 2.9Phosphorus pentoxide 3.6Calcium sulfate (Drierite)b 67Silica gel 70
a. Moist nitrogen was passed over each desiccant, and the water remaining in the gas was condensed and weighed. [A. I.Vogel, A Textbook of Quantitative Inorganic Analysis, 3rd ed. (New York: Wiley. 1961), p. 178.] For drying gases, the gas canbe passed through a 60-cm-long Nafion tube. At 25 �C, the residual moisture is 10 �g/L. If the drier is held at 0 �C, theresidual moisture is 0.8 �g/L. [K. J. Leckrone and J. M. Hayes. “Efficiency and Temperature Dependence of Water Removalby Membrane Dryers.” Anal. Chem. 1997, 69, 911.]
b. Used Drierite can be regenerated by irradiating 1.5-kg batches in a 100 190 mm Pyrex crystallizing dish in amicrowave oven for 15 min. Stir the solid, heat a second time for 15 min. and place the hot, dry material back in its originalcontainer. Use small glass spacers between the crystallizing dish and the glass tray of the oven to protect the tray. [J. A.Green and R. W. Goetz, “Recycling Drierite,” J. Chem. Ed. 1991, 68, 429.]
SiO2
CaSO4
P4O10
Al2O3
Mg(ClO4)2 � 1–1.5H2OMg(ClO4)2
oven for 1 h or longer and then cooling it for 30 min in a desiccator. Weigh the crucible andthen heat it again for about 30 min. Cool it and reweigh it. When successive weighings agreeto 0.3 mg, the filter has reached “constant mass.” You can use a microwave oven instead ofan electric oven for drying reagents and crucibles. Try an initial heating time of 4 min, withsubsequent 2-min heatings. Use a 15-min cooldown before weighing.
A desiccator (Figure 2-18) is a closed chamber containing a drying agent called a des-iccant (Table 2-6). The lid is greased to make an airtight seal and desiccant is placed in thebottom beneath the perforated disk. Another useful desiccant that is not in the table is 98%sulfuric acid. After placing a hot object in the desiccator, leave the lid cracked open for aminute until the object has cooled slightly. This practice prevents the lid from popping openwhen the air inside warms up. To open a desiccator, slide the lid sideways rather than tryingto pull it straight up.

32 CHAPTER 2 Tools of the Trade
For greatest accuracy, we calibrate volumetric glassware to measure the volume actuallycontained in or delivered by a particular piece of equipment. We do this by measuring themass of water contained or delivered by the vessel and using the density of water to convertmass into volume.
In the most careful work, it is necessary to account for thermal expansion of solutionsand glassware with changing temperature. For this purpose, you should know the lab temper-ature when a solution was prepared and when it is used. Table 2-7 shows that water expands0.02% per degree near Because the concentration of a solution is proportional to itsdensity, we can write
Correction for thermal expansion: (2-2)
where and are the concentration and density at temperature and c and d apply at tem-perature T.
Example Effect of Temperature on Solution Concentration
A 0.031 46 M aqueous solution was prepared in winter when the lab temperature wasWhat is the molarity of the solution on a warm day when the temperature is
Solution We assume that the thermal expansion of a dilute solution is equal to thethermal expansion of pure water. Then, using Equation 2-2 and densities from Table 2-7,we write
The concentration has decreased by 0.16% on the warm day.
c¿ at 25°
0.997 05 g/mL�
0.031 46 M
0.998 78 g/mL1 c¿ � 0.031 41 M
25°C?17°C.
T¿,d¿c¿
c¿d¿
�c
d
20°C.
Table 2-7 Density of water
Volume of 1 g of water (mL)
Temperature Density At temperature Corrected(�C) (g/mL) showna to 20�Cb
10 0.999 702 6 1.001 4 1.001 511 0.999 608 4 1.001 5 1.001 612 0.999 500 4 1.001 6 1.001 713 0.999 380 1 1.001 7 1.001 814 0.999 247 4 1.001 8 1.001 915 0.999 102 6 1.002 0 1.002 0
16 0.998 946 0 1.002 1 1.002 117 0.998 777 9 1.002 3 1.002 318 0.998 598 6 1.002 5 1.002 519 0.998 408 2 1.002 7 1.002 720 0.998 207 1 1.002 9 1.002 9
21 0.997 995 5 1.003 1 1.003 122 0.997 773 5 1.003 3 1.003 323 0.997 541 5 1.003 5 1.003 524 0.997 299 5 1.003 8 1.003 825 0.997 047 9 1.004 0 1.004 0
26 0.996 786 7 1.004 3 1.004 227 0.996 516 2 1.004 6 1.004 528 0.996 236 5 1.004 8 1.004 729 0.995 947 8 1.005 1 1.005 030 0.995 650 2 1.005 4 1.005 3
a. Corrected for buoyancy with Equation 2-1.
b. Corrected for buoyancy and expansion of borosilicate glass (0.001 0% K�1).
Page 38 gives a detailed procedure forcalibrating a buret.
The concentration of the solution decreaseswhen the temperature increases.

2-10 Introduction to Microsoft Excel 33
Pyrex and other borosilicate glasses expand by 0.001 0% per degree near room temper-ature. If the temperature increases by the volume of a piece of glassware increases by
For most work, this expansion is insignificant.To calibrate a 25-mL transfer pipet, you should first weigh an empty weighing bottle
like the one in Figure 2-17. Then fill the pipet to the mark with distilled water, drain it intothe weighing bottle, and cap the bottle to prevent evaporation. Weigh the bottle again to findthe mass of water delivered from the pipet. Finally, use Equation 2-3 to convert mass intovolume.
(2-3)
Example Calibration of a Pipet
An empty weighing bottle had a mass of 10.313 g. After the addition of water from a25-mL pipet, the mass was 35.225 g. If the lab temperature was find the volume ofwater delivered by the pipet.
Solution The mass of water is From Equation 2-3 and thenext-to-last column of Table 2-7, the volume of water is
at The last column in Table 2-7 tells us what the volume would be if thepipet were at This pipet would deliver at
2-10 Introduction to Microsoft ExcelIf you already use a spreadsheet, you can skip this section. The computer spreadsheet is anessential tool for manipulating quantitative information. In analytical chemistry, spreadsheetscan help us with calibration curves, statistical analysis, titration curves, and equilibriumproblems. Spreadsheets allow us to conduct “what if” experiments such as investigating theeffect of a stronger acid or a different ionic strength on a titration curve. We use MicrosoftExcel in this book as a tool for solving problems in analytical chemistry. Although you canskip over spreadsheets with no loss of continuity, spreadsheets will enrich your understand-ing of chemistry and provide a valuable tool for use outside this course.
This section introduces a few basic features of Excel 2000 for a PC computer. Other ver-sions of Excel and other spreadsheets are not very different from what we describe. Excellentbooks are available if you want to learn much more about this software.19
Getting Started: Calculating the Density of WaterLet’s prepare a spreadsheet to compute the density of water from the equation
(2-4)
where T is temperature and and
The blank spreadsheet in Figure 2-19a has columns labeled A, B, C and rows numbered1, 2, 3, . . . , 12. The box in column B, row 4 is called cell B4.
Begin each spreadsheet with a title to help make the spreadsheet more readable. InFigure 2-19b, we click in cell A1 and type “Calculating Density of H2O with Equation 2-4”.Then we click in cell A2 and write “(from the delightful book by Dan Harris)”. The computerautomatically spreads the text into adjoining cells.
We adopt a convention in this book in which constants are collected in column A. Type“Constants:” in cell A4. Then select cell A5 and type “ ”. Now select cell A6 and type thenumber 0.99989 (without extra spaces). In cells A7 to A12, enter the remaining constants.Powers of 10 are written, for example, as E-5 for Your spreadsheet should now looklike Figure 2-19b.
In cell B4, write the heading “Temp ”. Then enter temperatures from 5 through 40in cells B5 through B12. This is our input to the spreadsheet. The output will be computedvalues of density in column C.
(°C)
10�5.
a0�
a3 � 3.671 9 10�8.a0 � 0.999 89, a1 � 5.332 2 10�5, a2 � �7.589 9 10�6,(°C)
Density(g/mL) � a0 � a1*T � a2*T2 � a3*T3
20°C.(24.912 g)(1.004 5 mL/g) � 25.024 mL20°C.
27°C.25.027 mL(24.912 g)(1.004 6 mL/g) �
35.225 � 10.313 � 24.912 g.
27°C,
True volume � (grams of water) (volume of 1 g of H2O in Table 2-7)
(10)(0.001 0%) � 0.010%.10°C,
Small or odd-shaped vessels can becalibrated with Hg, which is easier than waterto pour out of glass and is 13.6 times denserthan water. This procedure is for researchers,not students.
The pipet delivers less volume at 20�C than at27�C because glass contracts slightly as thetemperature is lowered. Volumetric glassware isusually calibrated at 20�C.
This equation is accurate to five decimalplaces over the range 4� to 40�C.
Oops! I forgot one little trick. If you need moreroom in a column for the number of digits, youcan grab the vertical line at the top of thecolumn with your mouse and resize thecolumn.

34 CHAPTER 2 Tools of the Trade
Figure 2-19 Evolution of a spreadsheet for computingthe density of water.
A B C
1
2
3
4 cell B4
5
6
7
8
9
10
11
12
Columns644444474444448
Ro
ws
64
44
44
74
44
44
8 A B C
1 Calculating Density of H2O with Equation 2-4
2 (from the delightful book by Dan Harris)
3
4 Constants:
5 a0 �
6 0.99989
7 a1 �
8 5.3322E-05
9 a2 �
10 -7.5899E-06
11 a3 �
12 3.6719E-08
A B C
1 Calculating Density of H2O with Equation 2-4
2 (from the delightful book by Dan Harris)
3
4 Constants: Temp (°C) Density (g/mL)
5 a0 � 5 0.99997
6 0.99989 10 0.99970
7 a1 � 15 0.99911
8 5.3322E-05 20 0.99821
9 a2 � 25 0.99705
10 -7.5899E-06 30 0.99565
11 a3 � 35 0.99403
12 3.6719E-08 40 0.99223
13
14 Formula:
15 C5 � $A$6�$A$8*B5�$A$10*B5^2�$A$12*B5^3
(a) (b)
(c)
(d )
A B C
1 Calculating Density of H2O with Equation 2-4
2 (from the delightful book by Dan Harris)
3
4 Constants: Temp (°C) Density (g/mL)
5 a0 � 5 0.99997
6 0.99989 10
7 a1 � 15
8 5.3322E-05 20
9 a2 � 25
10 -7.5899E-06 30
11 a3 � 35
12 3.6719E-08 40
In cell C4, enter the heading “Density (g/mL)”. Cell C5 is the most important one in thetable. In this one, you will write the formula
(It doesn’t matter whether or not you use spaces around the arithmetic operators.) When youhit RETURN, the number 0.99997 appears in cell C5. The formula above is the spreadsheettranslation of Equation 2-4. $A$6 refers to the constant in cell A6. (We will explain the dol-lar signs shortly.) B5 refers to the temperature in cell B5. The times sign is * and the expo-nentiation sign is ^. For example, the term “$A$12*B5^3” means “(contents of cell A12) (contents of cell B5)3.”
Now comes the most magical property of a spreadsheet. Highlight cell C5 and the emptycells below it from C6 to C12. Then select the FILL DOWN command from the EDIT menu.This procedure copies the formula from C5 into the cells below it and evaluates the numbersin each of the selected cells. The density of water at each temperature now appears in columnC in Figure 2-19d.
In this example, we made three types of entries. Labels such as “ ” were typed in astext. An entry that does not begin with a digit or an equal sign is treated as text. Numbers,such as 25, were typed in some cells. The spreadsheet treats a number differently from text.In cell C5, we entered a formula that necessarily begins with an equal sign.
Arithmetic Operations and FunctionsAddition, subtraction, multiplication, division, and exponentiation have the symbols �, �, *, �,and ^. Functions such as Exp(�) can be typed by you or can be selected from the INSERT
menu by choosing FUNCTION. Exp(�) raises e to the power in parentheses. Other functions
a0�
� $A$6 � $A$8*B5 � $A$10*B5^2 � $A$12*B5^3
Three kinds of entries:labelnumberformula � $A$8*B5
4.4E-05A3 �
Formulas begin with an equal sign. Arithmeticoperations in a spreadsheet are� addition� subtraction* multiplication� division^ exponentiation

2-11 Graphing with Microsoft Excel 35
such as Ln(�), Log(�), Sin(�), and Cos(�) are also available. In some spreadsheets, functionsare written in all capital letters.
The order of arithmetic operations in formulas is negation first, followed by ^, followedby * and � (evaluated in order from left to right as they appear), finally followed by � and �(also evaluated from left to right). Make liberal use of parentheses to be sure that the com-puter does what you intend. The contents of parentheses are evaluated first, before carryingout operations outside the parentheses. Here are some examples:
When in doubt about how an expression will be evaluated, use parentheses to force what youintend.
Documentation and ReadabilityThe first important documentation in the spreadsheet is the name of the file. A name such as“Expt 9 Gran Plot” is much more meaningful than “Dan’s Lab”. The next important feature is atitle at the top of the spreadsheet, which tells its purpose. To remind ourselves what formulaswere used in the spreadsheet, we added text (labels) at the bottom. In cell A14, write “Formula:”and in cell A15 write “ ”. This docu-mentation tells us how numbers in column C were calculated.
For additional readability in Figure 2-19, column C was set to display just five decimalplaces, even though the computer retains many more for its calculations. It does not throwaway the digits that are not displayed. You can control the way numbers are displayed in acell by going to the FORMAT menu, selecting CELLS, and going to the Number tab.
Absolute and Relative ReferencesThe formula “ ” refers to cells A8 and B5 in different manners. $A$8 is anabsolute reference to the contents of cell A8. No matter where cell $A$8 is called from in thespreadsheet, the computer goes to cell A8 to look for a number. “B5” is a relative referencein the formula in cell C5. When called from cell C5, the computer goes to cell B5 to find anumber. When called from cell C6, the computer goes to cell B6 to look for a number. Ifcalled from cell C19, the computer would look in cell B19. This is why the cell written with-out dollar signs is called a relative reference. If you want the computer to always look only incell B5, then you should write “$B$5”.
2-11 Graphing with Microsoft ExcelGraphs are critical to understanding quantitative relations. Depending on which version ofExcel you have, there may be some variation from what is described here.
To make a graph from the spreadsheet in Figure 2-19d, go to the INSERT menu and selectCHART. A window appears with a variety of options. The one you will almost always want isXY (Scatter). Highlight XY (Scatter) and several options appear. Select the one that showsdata points connected by a smooth curve. Click Next to move to the next window.
Now you are asked which cells contain the data to be plotted. Identify the x data by writ-ing B5:B12 next to Data Range. Then write a comma and identify the y data by writingC5:C12. The input for Data Range now looks like B5:B12,C5:C12. Click the button to showthat data are in columns, not rows. Click Next.
Now a small graph of your data appears. If it does not look as expected, make sure youselected the correct data, with x before y. The new window asks you for axis labels and anoptional title for the graph. For the title, write “Density of Water” (without quotation marks).For the x-axis, enter “Temperature ” and for the y-axis write “Density (g/mL)”. Click Next.
Now you are given the option of drawing the graph on a new sheet or on the same sheetthat is already open. For this case, select “As object in Sheet 1”. Click Finish and the chart
(°C)
� $A$8*B5
C5 � $A$6�$A$8*B5�$A$10*B5^2�$A$12*B5^3
�2^2 � 4 but �(2^2) � �4
9/5^2�32 � 9/(5^2)�32 � (9/25)�32 � (0.36)�32 � 32.36
9�5*100/32 � 9�(5*100)/32 � 9�(500)/32 � 9�(500/32) � 9�(15.625) � 24.625
9/5*(100�32) � 9/5*(132) � (1.8)*(132) � 237.6
9/5*100�32 � (9/5)*100�32 � (1.8)*100�32 � (1.8*100)�32 � (180)�32 � 212
Documentation means labeling. If yourspreadsheet cannot be read by anotherperson without your help, it needs betterdocumentation. (The same is true of your labnotebook!)
Absolute reference: $A$8Relative reference: B5
Save your files frequently while you areworking and make a backup file of any-thing that you don’t want to lose.
Order of operations:1. Negation (a minus sign before a term)2. Exponentiation3. Multiplication and division (in order from left
to right)4. Addition and subtraction (in order from left
to right)
Operations within parentheses are evaluatedfirst, from the innermost set.

36 CHAPTER 2 Tools of the Trade
will appear on your spreadsheet. Grab the chart with your mouse and move it to the right ofthe data in your spreadsheet, as shown in Figure 2-20.
You have just drawn your first graph! Excel gives us many options for changing featuresof the graph. Here are a few, but you should experiment with the graph to discover otherformatting options. Double click on the y-axis and a window appears. Select the Patterns tab.Change Minor tic mark type from None to Outside and click OK. You will see new tic marksappear on the y-axis. Double click on the y-axis again and select the Number tab. Change thedecimal places to 3 and click OK. Double click on the y-axis again and select the Scale tab.Set the minimum to 0.992 and the maximum to 1.000 and click OK.
Double click on the x-axis and select Patterns. Change the Minor tic mark type fromNone to Outside. Select Scale and set the maximum to 40, the major unit to 10, the minorunit to 5, and click OK.
Double click on the gray area of the graph and a window called Patterns appears. SelectAutomatic for the Border and None for the Area. This removes the gray background andgives a solid line around the graph. To add vertical lines at the major tic marks, select thegraph with the mouse. Then go to the CHART menu and select CHART OPTIONS. In the windowthat appears, select Gridlines. For the Value (X) axis, check Major gridlines. Then select thetab for Legend and remove the check mark from Show Legend. The legend will disappear.Click OK. You should be getting the idea that you can format virtually any part of the chart.
Click on the outer border of the chart and handles appear. Grab the one on the right andresize the chart so it does not extend past column F of the spreadsheet. Grab the handle at thebottom and resize the chart so it does not extend below row 15. When you resized the chart,letters and numbers shrank. Double click on each set of numbers and change the font to8 points. Double click on the labels and change the letters to 9 points. Your chart should nowlook like the one in Figure 2-21.
If you want to write on the chart, go to the VIEW menu and select TOOLBARS andDRAWING. Select the Text Box tool from the Drawing toolbar, click inside your chart, andyou can begin typing words. You can move the words around and change their format. Youcan draw arrows on the chart with the Arrow tool. If you double click on a data point on thechart, a box appears that allows you to change the plotting symbols.
1.00100
A
Calculating Density of H2O with Equation 2-4
(from the delightful book by Dan Harris)
Constants: Temp (°C) Density (g/mL)
a0 =
0.99989
a1 =
5.3322E-05
a2 =
-7.5899E-06
a3 =
3.6719E-08
5
10
15
20
25
30
35
40
0.99997
0.99970
0.99911
0.99821
0.99705
0.99565
0.99403
0.99223
Formula:
C5 = $A$6+$A$8*B5+$A$10*B5^2+$A$12*B5^3
1
2
3
4
5
6
7
8
9
10
11
12
13
14
15
16
17
B C D E F G H
Density of Water
Series1
Temperature (°C)
Den
sity
(g
/mL
)
0.993000.992000.99100
40 600 20
0.994000.995000.996000.997000.998000.999001.00000
Figure 2-20 Initial density chart drawn by Excel.
1.000Density of Water
Temperature (°C)
Den
sity
(g
/mL
)
0.992
400 10 20 30
0.994
0.996
0.998
Figure 2-21 Density chart after reformatting.
Terms to Understandabsorptionacid washadsorptionashless filter paperbuoyancy
buretcalibrationdesiccantdesiccatorfiltrate
hygroscopicignitionmeniscusmother liquorparallax
pipetslurrytarevolumetric flask
Problems 37
SummarySafety requires you to think in advance about what you will do;never do anything that seems dangerous. Know how to use safetyequipment such as goggles, fume hood, lab coat, gloves, emergencyshower, eyewash, and fire extinguisher. Chemicals should be storedand used in a manner that minimizes contact of solids, liquids, andvapors with people. Environmentally acceptable disposal proce-dures should be established in advance for every chemical that youuse. Your lab notebook tells what you did and what you observed; itshould be understandable to other people. It also should allow youto repeat an experiment in the same manner in the future. Youshould understand the principles of operation of electronic andmechanical balances and treat them as delicate equipment. Buoy-ancy corrections are required in accurate work. Burets should beread in a reproducible manner and drained slowly for best results.Always interpolate between markings to obtain accuracy one deci-
mal place beyond the graduations. Volumetric flasks are used toprepare solutions with known volume. Transfer pipets deliver fixedvolumes; less accurate measuring pipets deliver variable volumes.Do not be lulled into complacency by the nice digital reading on amicropipet. Unless your pipet has been calibrated recently and yourpersonal technique tested, micropipets can have gross errors. Filtra-tion and collection of precipitates require careful technique, as doesthe drying of reagents, precipitates, and glassware in ovens anddesiccators. Volumetric glassware is calibrated by weighing watercontained in or delivered by the vessel. In the most careful work,solution concentrations and volumes of vessels should be correctedfor changes in temperature.
If you plan to use spreadsheets in this course, you should knowhow to enter formulas in a spreadsheet and how to draw a graph ofdata in a spreadsheet.
Exercises2-A. What is the true mass of water if the measured mass in theatmosphere is 5.397 4 g? When you look up the density of water,assume that the lab temperature is (a) and (b) Take thedensity of air to be 0.001 2 g/mL and the density of balance weightsto be 8.0 g/mL.
2-B. A sample of ferric oxide obtained from ignition of a gravimetric precipitate weighed 0.296 1 gin the atmosphere. What is the true mass in vacuum?
2-C. A solution of potassium permanganate was found(KMnO4)
(Fe2O3, density � 5.24 g/mL)
25°C.15°C
by titration to be 0.051 38 M at What was the molarity whenthe lab temperature dropped to
2-D. Water was drained from a buret between the 0.12- and 15.78-mLmarks. The apparent volume delivered was
Measured in the air at the mass of water deliveredwas 15.569 g. What was the true volume?
2-E. To familiarize yourself with your spreadsheet andgraphing software, reproduce the spreadsheet in Figure 2-19 and thegraph in Figure 2-21.
22°C,15.66 mL.15.78 � 0.12 �
16°C?24°C.
ProblemsSafety and Lab Notebook
2-1. What is the primary safety rule and what is your impliedresponsibility to make it work?
2-2. After the safety features and procedures in your laboratoryhave been explained to you, make a list of them.
2-3. In Box 2-1, why is converted into before disposalin an approved landfill?
2-4. Explain what each of the three numbered hazard ratings meansfor 37 wt% HC1 in Figure 2-2.
2-5. State three essential attributes of a lab notebook.
Analytical Balance
2-6. Explain the principles of operation of electronic and mechani-cal balances.
2-7. Why is the buoyancy correction equal to 1 in Figure 2-5 whenthe density of the object being weighed is 8.0 g/mL?
2-8. Pentane is a liquid with a density of 0.626 g/mL nearUse Equation 2-1 to find the true mass of pentane when the
mass weighed in air is 14.82 g. Assume that the air density is0.001 2 g/mL and the balance weight density is 8.0 g/mL.
2-9. The densities (g/mL) of several substances are: acetic acid,1.05; CCl4, 1.59; sulfur, 2.07; lithium, 0.53; mercury, 13.5;
lead, 11.4; iridium, 22.5. From Figure 2-5, predict which sub-stance will have the smallest percentage of buoyancy correction andwhich will have the greatest.
2-10. Potassium hydrogen phthalate is a primary standard used tomeasure the concentration of NaOH solutions. Find the true massof potassium hydrogen phthalate if the(density � 1.636 g/mL)
9.4;PbO2,
25°C.(C5H12)
PbSiO3Pb2�
apparent mass weighed in air is 4.236 6 g. If you did not correct themass for buoyancy, would the calculated molarity of NaOH be toohigh or too low? By what percentage?
2-11. (a) Use the ideal gas law (Problem 1-16) to calculate the den-sity (g/mL) of helium at and 1.00 bar.(b) Find the true mass of sodium metal weighed in a glove box with a helium atmosphere, if the apparentmass was 0.823 g and the balance weight density is 8.0 g/mL.
2-12. (a) What is the vapor pressure of water in the air at if therelative humidity is 42%? The vapor pressure of water at atequilibrium is 2 330 Pa. (Relative humidity is the percentage of theequilibrium water vapor pressure in the air.)(b) Use note 11 for Chapter 2 at the end of the book to find the airdensity (g/mL, not g/L) under the conditions of part (a) if the baro-metric pressure is 94.0 kPa.(c) What is the true mass of water in part (b) if the balance indicatesthat 1.000 0 g is present (balance weight
2-13. Effect of altitude on electronic balance. If an object weighs grams at distance from the center of the earth, it will weigh
when raised to An object weighs 100.000 0 g onthe 1st floor of a building at How much will itweigh on the 10th floor, which is 30 m higher?
Glassware and Thermal Expansion
2-14. What do the symbols “TD” and “TC” mean on volumetricglassware?
2-15. Describe how to prepare 250.0 mL of 0.150 0 M witha volumetric flask.
2-16. When is it preferable to use a plastic volumetric flask insteadof a more accurate glass flask?
K2SO4
ra � 6 370 km.rb.mb � ma(r 2
a/r 2b)
ra
ma
density � 8.0 g/mL)?
20°C20°C
(density � 0.97 g/mL)20°C

38 CHAPTER 2 Tools of the Trade
2-17. Describe how to deliver 5.00 mL of liquid by using a transferpipet.
2-18. Which is more accurate, a transfer pipet or a measuring pipet?
2-19. What is the purpose of the trap in Figure 2-14 and the watch-glass in Figure 2-17?
2-20. Which drying agent is more efficient, Drierite or phosphoruspentoxide?
2-21. An empty 10-mL volumetric flask weighs 10.263 4 g. Whenthe flask is filled to the mark with distilled water and weighed againin the air at the mass is 20.214 4 g. What is the true volumeof the flask at
2-22. By what percentage does a dilute aqueous solution expandwhen heated from to If a 0.500 0 M solution is preparedat what would its molarity be at
2-23. The true volume of a 50-mL volumetric flask is 50.037 mL atWhat mass of water measured (a) in vacuum and (b) in air atwould be contained in the flask?
2-24.You want to prepare 500.0 mL of at but thelab (and water) temperature is at the time of preparation. How24°C
20°C,1.000 M KNO3
20°C20°C.
25°C?15°C,25°C?15°
20°C?20°C,
many grams of solid should be dis-solved in a volume of 500.0 mL at to give a concentration of 1.000M at What apparent mass of weighed in air is required?
2-25. Glass is a notorious source of metal ion contamination. Threeglass bottles were crushed and sieved to collect 1-mm pieces.20 Tosee how much could be extracted, 200 mL of a 0.05 M solu-tion of the metal-binding compound EDTA was stirred with 0.50 gof �l-mm glass particles in a polyethylene flask. The Al content ofthe solution after 2 months was 5.2 M. The total Al content of theglass, measured after completely dissolving some glass in 48 wt%HF with microwave heating, was 0.80 wt%. What fraction of the Alwas extracted from glass by EDTA?
2-26. The efficiency of a gas chromatography column ismeasured by a parameter called plate height (H, mm), which isrelated to the gas flow rate (u, mL/min) by the van Deemter equa-tion: where A, B, and C are constants. Preparea spreadsheet with a graph showing values of H as a function of uforUse the values and 0.023 6 mm � min/mL.
C �B � 25.8 mm � mL/min,A � 1.65 mm,u � 4, 6, 8, 10, 20, 30, 40, 50, 60, 70, 80, 90, and 100 mL/min.
H � A � B/u � Cu,
Al3�
KNO320°C?24°C
(density � 2.109 g/mL)KNO3
Reference Procedure: Calibrating a 50-mL BuretThis procedure tells how to construct a graph such as Figure 3-3 toconvert the measured volume delivered by a buret to the true vol-ume delivered at
1. Fill the buret with distilled water and force any air bubbles outthe tip. See whether the buret drains without leaving drops onthe walls. If drops are left, clean the buret with soap and wateror soak it with cleaning solution.13 Adjust the meniscus to be ator slightly below 0.00 mL, and touch the buret tip to a beakerto remove the suspended drop of water. Allow the buret tostand for 5 min while you weigh a 125-mL flask fitted with arubber stopper. (Hold the flask with a tissue or paper towel, notwith your hands, to prevent fingerprint residue from changingits mass.) If the level of the liquid in the buret has changed,tighten the stopcock and repeat the procedure. Record the levelof the liquid.
2. Drain approximately 10 mL of water at a rate � 20 mL/mininto the weighed flask, and cap it tightly to preventevaporation. Allow about 30 s for the film of liquid on thewalls to descend before you read the buret. Estimate allreadings to the nearest 0.01 mL. Weigh the flask again todetermine the mass of water delivered.
3. Now drain the buret from 10 to 20 mL, and measure themass of water delivered. Repeat the procedure for 30, 40, and50 mL. Then do the entire procedure (10, 20, 30, 40, 50 mL)a second time.
4. Use Table 2-7 to convert the mass of water into the volumedelivered. Repeat any set of duplicate buret corrections that do notagree to within 0.04 mL. Prepare a calibration graph like that inFigure 3-3, showing the correction factor at each 10-mL interval.
Example Buret Calibration
When draining the buret at you observe the followingvalues:
24°C,
20°C.
Final reading 10.01 10.08 mLInitial reading 0.03 0.04
Difference 9.98 10.04 mLMass 9.984 10.056 gActual volume delivered 10.02 10.09 mLCorrection �0.04 �0.05 mLAverage correction �0.045 mL
To calculate the actual volume delivered when 9.984 g ofwater is delivered at look at the column of Table 2-7headed “Corrected to ” In the row for you find that1.000 0 g of water occupies 1.003 8 mL. Therefore, 9.984 goccupies The averagecorrection for both sets of data is
To obtain the correction for a volume greater than 10 mL,add successive masses of water collected in the flask. Supposethat the following masses were measured:
Volume interval (mL) Mass delivered (g)
0.03–10.01 9.98410.01–19.90 9.83519.90–30.06 10.071
Sum 30.03 mL 29.890 g
The total volume of water delivered is Because the indicated volume is 30.03 mL, the
buret correction at 30 mL is �0.03 mL.
What does this mean? Suppose that Figure 3-3 applies to yourburet. If you begin a titration at 0.04 mL and end at 29.00 mL, youwould deliver 28.96 mL if the buret were perfect. Figure 3-3 tellsyou that the buret delivers 0.03 mL less than the indicated amount,so only 28.93 mL were actually delivered. To use the calibrationcurve, either begin all titrations near 0.00 mL or correct both theinitial and the final readings. Use the calibration curve wheneveryou use your buret.
30.00 mL.(29.890 g)(1.003 8 mL/g) �
�0.045 mL.(9.984 g)(1.003 8 mL/g) � 10.02 mL.
24°C,20°C.24°C,
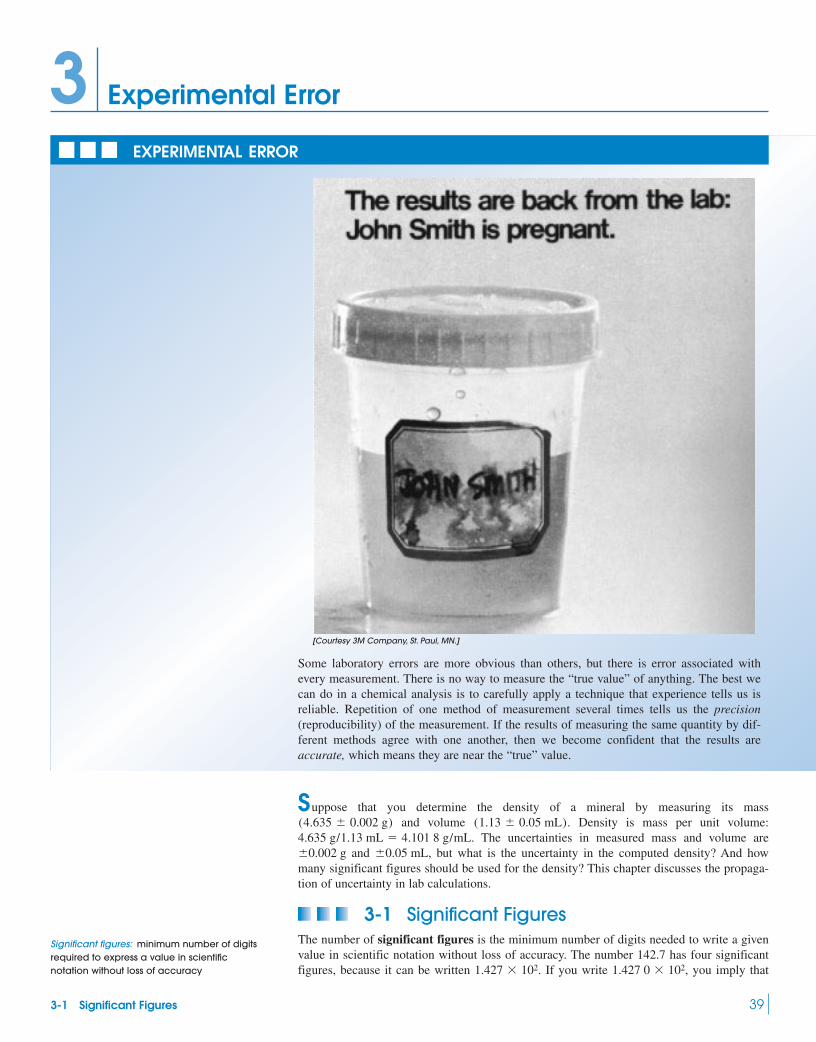
3-1 Significant Figures 39
EXPERIMENTAL ERROR
Experimental Error3
Some laboratory errors are more obvious than others, but there is error associated withevery measurement. There is no way to measure the “true value” of anything. The best wecan do in a chemical analysis is to carefully apply a technique that experience tells us isreliable. Repetition of one method of measurement several times tells us the precision(reproducibility) of the measurement. If the results of measuring the same quantity by dif-ferent methods agree with one another, then we become confident that the results areaccurate, which means they are near the “true” value.
Suppose that you determine the density of a mineral by measuring its massand volume Density is mass per unit volume:
The uncertainties in measured mass and volume areand but what is the uncertainty in the computed density? And how
many significant figures should be used for the density? This chapter discusses the propaga-tion of uncertainty in lab calculations.
3-1 Significant FiguresThe number of significant figures is the minimum number of digits needed to write a givenvalue in scientific notation without loss of accuracy. The number 142.7 has four significantfigures, because it can be written If you write you imply that1.427 0 102,1.427 102.
0.05 mL,0.002 g4.635 g/1.13 mL � 4.101 8 g/mL.
(1.13 0.05 mL).(4.635 0.002 g)
Significant figures: minimum number of digitsrequired to express a value in scientificnotation without loss of accuracy
[Courtesy 3M Company, St. Paul, MN.]

40 CHAPTER 3 Experimental Error
you know the value of the digit after 7, which is not the case for the number 142.7. The num-ber has five significant figures.
The number has four significant figures, because all four digits are neces-sary. You could write the same number as 0.000 006 302, which also has just four significantfigures. The zeros to the left of the 6 are merely holding decimal places. The number 92 500is ambiguous. It could mean any of the following:
3 significant figures
4 significant figures
5 significant figures
You should write one of the three numbers above, instead of 92 500, to indicate how manyfigures are actually known.
Zeros are significant when they occur (1) in the middle of a number or (2) at the end ofa number on the right-hand side of a decimal point.
The last significant digit (farthest to the right) in a measured quantity always has someassociated uncertainty. The minimum uncertainty is in the last digit. The scale of a Spec-tronic 20 spectrophotometer is drawn in Figure 3-1. The needle in the figure appears to be atan absorbance value of 0.234. We say that this number has three significant figures becausethe numbers 2 and 3 are completely certain and the number 4 is an estimate. The value mightbe read 0.233 or 0.235 by other people. The percent transmittance is near 58.3. Because thetransmittance scale is smaller than the absorbance scale at this point, there is more uncer-tainty in the last digit of transmittance. A reasonable estimate of uncertainty might be
There are three significant figures in the number 58.3.When reading the scale of any apparatus, try to estimate to the nearest tenth of a divi-
sion. On a 50-mL buret, which is graduated to 0.1 mL, read the level to the nearest 0.01 mL.For a ruler calibrated in millimeters, estimate distances to the nearest 0.1 mm.
There is uncertainty in any measured quantity, even if the measuring instrument has adigital readout that does not fluctuate. When a digital pH meter indicates a pH of 3.51, thereis uncertainty in the digit 1 (and maybe even in the digit 5). By contrast, some numbers areexact—with an infinite number of unwritten significant digits. To calculate the averageheight of four people, you would divide the sum of heights (which is a measured quantitywith some uncertainty) by the integer 4. There are exactly 4 people, not people!
3-2 Significant Figures in ArithmeticWe now consider how many digits to retain in the answer after you have performed arith-metic operations with your data. Rounding should only be done on the final answer (notintermediate results), to avoid accumulating round-off errors.
Addition and SubtractionIf the numbers to be added or subtracted have equal numbers of digits, the answer goes to thesame decimal place as in any of the individual numbers:
The number of significant figures in the answer may exceed or be less than that in theoriginal data.
1.362 10�4
� 3.111 10�4
4.473 10�4
4.000 0.002
58.3 0.2.
1
9.250 0 104
9.250 104
9.25 104
6.302 10�61.427 0 102
0 10 20 30 40 50
Percent transmittance
Absorbance
60 70 80 90 100
2∞ 1.0 0.20.30.40.5 0.1 0.05 0
Figure 3-1 Scale of a Bausch and LombSpectronic 20 spectrophotometer. Percenttransmittance is a linear scale andabsorbance is a logarithmic scale.
Significant zeros below are bold:106 0.010 6 0.106 0.106 0
Interpolation: Estimate all readings to thenearest tenth of the distance between scaledivisions.

123
If the numbers being added do not have the same number of significant figures, we arelimited by the least-certain one. For example, the molecular mass of is known only tothe third decimal place, because we only know the atomic mass of Kr to three decimalplaces:
Not significant
The number 121.794 806 4 should be rounded to 121.795 as the final answer.When rounding off, look at all the digits beyond the last place desired. In the preceding
example, the digits 806 4 lie beyond the last significant decimal place. Because this numberis more than halfway to the next higher digit, we round the 4 up to 5 (that is, we round up to121.795 instead of down to 121.794). If the insignificant figures were less than halfway, wewould round down. For example, 121.794 3 is rounded to 121.794.
In the special case where the number is exactly halfway, round to the nearest even digit.Thus, 43.55 is rounded to 43.6, if we can only have three significant figures. If we are retain-ing only three figures, becomes The number would become because 501 is more than halfway to the next digit. The ration-ale for rounding to an even digit is to avoid systematically increasing or decreasing resultsthrough successive round-off errors. Half the round-offs will be up and half down.
In the addition or subtraction of numbers expressed in scientific notation, all numbersshould first be expressed with the same exponent:
The sum is rounded to because the number limitsus to two decimal places when all numbers are expressed as multiples of
Multiplication and DivisionIn multiplication and division, we are normally limited to the number of digits contained inthe number with the fewest significant figures:
The power of 10 has no influence on the number of figures that should be retained.
Logarithms and AntilogarithmsThe base 10 logarithm of n is the number a, whose value is such that :
Logarithm of n: (3-1)
For example, 2 is the logarithm of 100 because The logarithm of 0.001 is because To find the logarithm of a number with your calculator, enter thenumber and press the log function.
In Equation 3-1, the number n is said to be the antilogarithm of a. That is, the antilog-arithm of 2 is 100 because and the antilogarithm of is 0.001 because
Your calculator has either a key or an antilog key. To find the antiloga-rithm of a number, enter it in your calculator and press (or antilog).10x
10x10�3 � 0.001.�3102 � 100,
0.001 � 10�3.�3100 � 102.
n � 10a means that log n � a
n � 10a
34.60
� 2.462 87
14.05
4.317 9 1012
3.6 10�19
1.6 10�6
3.26 10�5
1.78
5.80 10�5
105.9.84 10511.51 10511.513 07 105
1.632 105
� 4.107 103
� 0.984 106
S
1.632 105
� 0.041 07 105
� 9.84 105
11.51 105
1.43 10�9,1.425 01 10�91.42 10�9.1.425 10�9
18.998 403 2 (F)
� 18.998 403 2 (F)
� 83.798 (Kr)
121.794 806 4
KrF2
˛7.26 1014
� 6.69 1014
˛0.57 1014
˛5.345
� 6.728
12.073
3-2 Significant Figures in Arithmetic 41
Inspect the legend of the periodic table insidethe cover of this book. Be sure you caninterpret uncertainties in atomic masses. For Fand Kr, the atomic masses are
Kr: 83.798 0.002F: 18.998 403 2 0.000 000 5
Rules for rounding off numbers
Addition and subtraction: Express all numberswith the same exponent and align all numberswith respect to the decimal point. Round offthe answer according to the number ofdecimal places in the number with the fewestdecimal places.
10�3 �1
103�
11 000
� 0.001
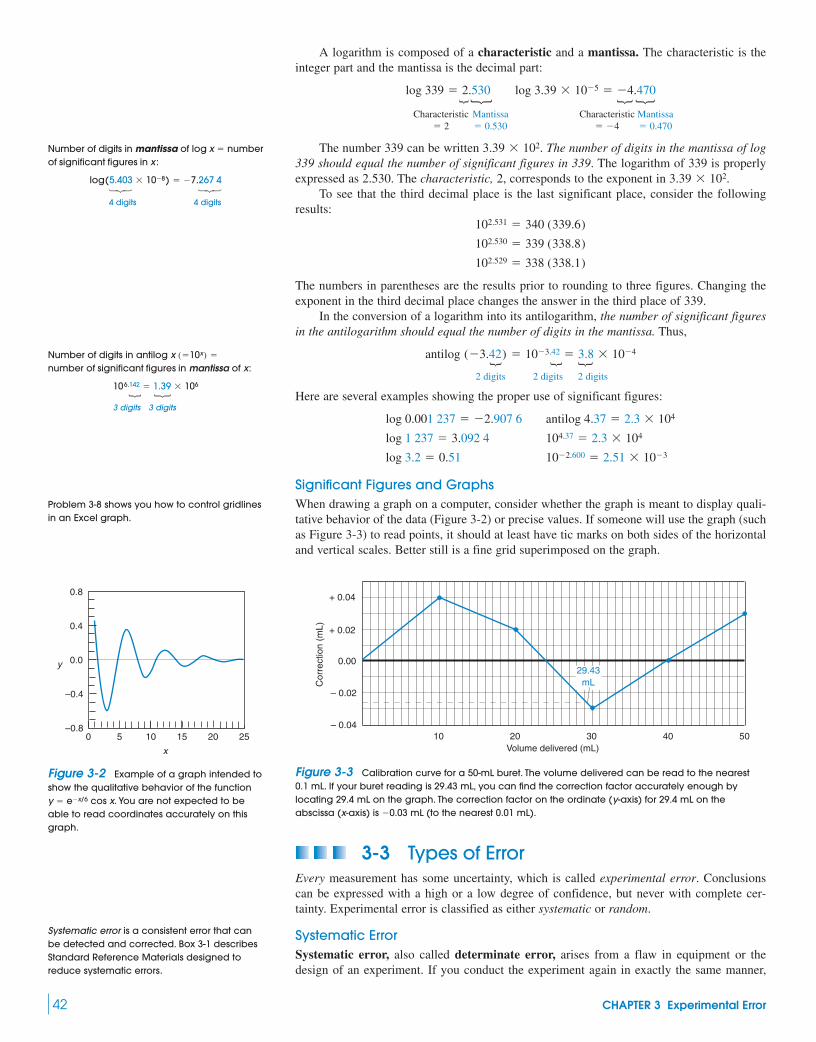
A logarithm is composed of a characteristic and a mantissa. The characteristic is theinteger part and the mantissa is the decimal part:
{{ { {Characteristic Mantissa Characteristic Mantissa
� 2 � 0.530 � �4 � 0.470
The number 339 can be written The number of digits in the mantissa of log339 should equal the number of significant figures in 339. The logarithm of 339 is properlyexpressed as 2.530. The characteristic, 2, corresponds to the exponent in
To see that the third decimal place is the last significant place, consider the followingresults:
The numbers in parentheses are the results prior to rounding to three figures. Changing theexponent in the third decimal place changes the answer in the third place of 339.
In the conversion of a logarithm into its antilogarithm, the number of significant figuresin the antilogarithm should equal the number of digits in the mantissa. Thus,
{ { {2 digits 2 digits 2 digits
Here are several examples showing the proper use of significant figures:
Significant Figures and GraphsWhen drawing a graph on a computer, consider whether the graph is meant to display quali-tative behavior of the data (Figure 3-2) or precise values. If someone will use the graph (suchas Figure 3-3) to read points, it should at least have tic marks on both sides of the horizontaland vertical scales. Better still is a fine grid superimposed on the graph.
10�2.600 � 2.51 10�3log 3.2 � 0.51
104.37 � 2.3 104log 1 237 � 3.092 4
antilog 4.37 � 2.3 104log 0.001 237 � �2.907 6
antilog (�3.42) � 10�3.42 � 3.8 10�4
102.529 � 338 (338.1)
102.530 � 339 (338.8)
102.531 � 340 (339.6)
3.39 102.
3.39 102.
log 3.39 10�5 � �4.470log 339 � 2.530
42 CHAPTER 3 Experimental Error
0.8
0.4
0.0
–0.4
–0.80 5 10 15 20
x
y
25– 0.04
– 0.02
0.00
+ 0.02
+ 0.04
10 20 30 40 50Volume delivered (mL)
Cor
rect
ion
(mL)
29.43mL
Number of digits in mantissa of
123 123
4 digits 4 digits
log(5.403 10�8) � �7.267 4
of significant figures in x :log x � number
Number of digits in antilog number mantissa of x:
{ {
3 digits 3 digits
106.142 � 1.39 106
of significant figures inx (�10x) �
Figure 3-2 Example of a graph intended toshow the qualitative behavior of the functiony e�x/6 cos x. You are not expected to beable to read coordinates accurately on thisgraph.
�
Figure 3-3 Calibration curve for a 50-mL buret. The volume delivered can be read to the nearest0.1 mL. If your buret reading is 29.43 mL, you can find the correction factor accurately enough bylocating 29.4 mL on the graph. The correction factor on the ordinate (y-axis) for 29.4 mL on theabscissa (x-axis) is �0.03 mL (to the nearest 0.01 mL).
Problem 3-8 shows you how to control gridlinesin an Excel graph.
Systematic error is a consistent error that canbe detected and corrected. Box 3-1 describesStandard Reference Materials designed toreduce systematic errors.
3-3 Types of ErrorEvery measurement has some uncertainty, which is called experimental error. Conclusionscan be expressed with a high or a low degree of confidence, but never with complete cer-tainty. Experimental error is classified as either systematic or random.
Systematic ErrorSystematic error, also called determinate error, arises from a flaw in equipment or thedesign of an experiment. If you conduct the experiment again in exactly the same manner,

the error is reproducible. In principle, systematic error can be discovered and corrected,although this may not be easy.
For example, a pH meter that has been standardized incorrectly produces a systematicerror. Suppose you think that the pH of the buffer used to standardize the meter is 7.00, but itis really 7.08. Then all your pH readings will be 0.08 pH unit too low. When you read a pHof 5.60, the actual pH of the sample is 5.68. This systematic error could be discovered byusing a second buffer of known pH to test the meter.
Another systematic error arises from an uncalibrated buret. The manufacturer’s toler-ance for a Class A 50-mL buret is When you think you have delivered 29.43 mL,the real volume could be anywhere from 29.38 to 29.48 mL and still be within tolerance. Oneway to correct for an error of this type is to construct a calibration curve, such as that in Fig-ure 3-3, by the procedure on page 38. To do this, deliver distilled water from the buret into aflask and weigh it. Determine the volume of water from its mass by using Table 2-7. Figure3-3 tells us to apply a correction factor of to the measured value of 29.43 mL. Theactual volume delivered is
A key feature of systematic error is that it is reproducible. For the buret just discussed,the error is always when the buret reading is 29.43 mL. Systematic error mayalways be positive in some regions and always negative in others. With care and cleverness,you can detect and correct a systematic error.
Random ErrorRandom error, also called indeterminate error, arises from the effects of uncontrolled (andmaybe uncontrollable) variables in the measurement. Random error has an equal chance ofbeing positive or negative. It is always present and cannot be corrected. There is randomerror associated with reading a scale. Different people reading the scale in Figure 3-1 reporta range of values representing their subjective interpolation between the markings. One per-son reading the same instrument several times might report several different readings.Another random error results from electrical noise in an instrument. Positive and negativefluctuations occur with approximately equal frequency and cannot be completely eliminated.
Precision and AccuracyPrecision describes the reproducibility of a result. If you measure a quantity several timesand the values agree closely with one another, your measurement is precise. If the valuesvary widely, your measurement is not precise. Accuracy describes how close a measuredvalue is to the “true” value. If a known standard is available (such as a Standard ReferenceMaterial described in Box 3-1), accuracy is how close your value is to the known value.
�0.03 mL
29.43 � 0.03 � 29.40 mL.�0.03 mL
0.05 mL.
3-3 Types of Error 43
Box 3-1 Standard Reference Materials
Inaccurate laboratory measurements can mean wrong medicaldiagnosis and treatment, lost production time, wasted energy andmaterials, manufacturing rejects, and product liability. The U.S.National Institute of Standards and Technology and nationalstandards laboratories around the world distribute Standard Refer-ence Materials, such as metals, chemicals, rubber, plastics,engineering materials, radioactive substances, and environmentaland clinical standards that can be used to test the accuracy ofanalytical procedures.1
For example, in treating patients with epilepsy, physiciansdepend on laboratory tests to measure concentrations of anticon-vulsant drugs in blood serum. Drug levels that are too low lead toseizures; high levels are toxic. Because tests of identical serumspecimens at different laboratories were giving an unacceptablywide range of results, the National Institute of Standards andTechnology developed a Standard Reference Material containingknown levels of antiepilepsy drugs in serum. The reference mate-rial now enables different laboratories to detect and correct errorsin their assay procedures.
Before the introduction of this reference material, five labo-ratories analyzing identical samples reported a range of resultswith relative errors of 40% to 110% of the expected value. Afterdistribution of the reference material, the error was reduced to20% to 40%.
Phenytoin
Err
or (
% o
f tar
get v
alue
)
0
20
40
60
80
100
120
Phenobarbital Primidone(Mysoline)
Ethosuximide(Zarontin)
Before
After
Ways to detect systematic error:1. Analyze a known sample, such as a
Standard Reference Material. Your methodshould reproduce the known answer. (SeeBox 15-1 for an example.)
2. Analyze “blank” samples containing none ofthe analyte being sought. If you observe anonzero result, your method responds tomore than you intend. Section 5-1 discussesdifferent kinds of blanks.
3. Use different analytical methods to measurethe same quantity. If results do not agree,there is error in one (or more) of the methods.
4. Round robin experiment: Different peoplein several laboratories analyze identicalsamples by the same or different methods.Disagreement beyond the estimatedrandom error is systematic error.
Random error cannot be eliminated, but itmight be reduced by a better experiment.
Precision: reproducibilityAccuracy: nearness to the “truth”

A measurement might be reproducible, but wrong. If you made a mistake preparing asolution for a titration, you might do a series of reproducible titrations but report an incorrectresult because the concentration of the titrating solution was not what you intended. In thiscase, the precision is good but the accuracy is poor. Conversely, it is possible to make poorlyreproducible measurements clustered around the correct value. In this case, the precision ispoor but the accuracy is good. An ideal procedure is both precise and accurate.
Accuracy is defined as nearness to the “true” value. The word true is in quotes becausesomebody must measure the “true” value, and there is error associated with every measure-ment. The “true” value is best obtained by an experienced person using a well-tested proce-dure. It is desirable to test the result by using different procedures, because, even though eachmethod might be precise, systematic error could lead to poor agreement between methods.Good agreement among several methods affords us confidence, but never proof, that resultsare accurate.
Absolute and Relative UncertaintyAbsolute uncertainty expresses the margin of uncertainty associated with a measurement. Ifthe estimated uncertainty in reading a calibrated buret is we say that isthe absolute uncertainty associated with the reading.
Relative uncertainty compares the size of the absolute uncertainty with the size of itsassociated measurement. The relative uncertainty of a buret reading of is adimensionless quotient:
(3-2)
The percent relative uncertainty is simply
(3-3)
If the absolute uncertainty in reading a buret is constant at the percent relativeuncertainty is 0.2% for a volume of 10 mL and 0.1% for a volume of 20 mL.
3-4 Propagation of Uncertaintyfrom Random Error
We can usually estimate or measure the random error associated with a measurement, such asthe length of an object or the temperature of a solution. The uncertainty might be based onhow well we can read an instrument or on our experience with a particular method. If possi-ble, uncertainty is expressed as the standard deviation or as a confidence interval, which arediscussed in Chapter 4. This section applies only to random error. We assume that systematicerror has been detected and corrected.
For most experiments, we need to perform arithmetic operations on several numbers,each of which has a random error. The most likely uncertainty in the result is not simply thesum of the individual errors, because some of them are likely to be positive and some nega-tive. We expect some cancellation of errors.
Addition and SubtractionSuppose you wish to perform the following arithmetic, in which the experimental uncertain-ties, designated are given in parentheses.
(3-4)
The arithmetic answer is 3.06. But what is the uncertainty associated with this result?
1.76 (0.03) d e1
� 1.89 (0.02) d e2
� 0.59 (0.02) d e3
3.06 (e4)
e1, e2, and e3,
0.02 mL,
� 100 0.002 � 0.2%
Percent relative uncertainty � 100 relative uncertaintyPercent relativeuncertainty:
�0.02 mL
12.35 mL� 0.002
Relative uncertainty �absolute uncertainty
magnitude of measurement
Relativeuncertainty:
12.35 0.02 mL
0.02 mL0.02 mL,
44 CHAPTER 3 Experimental Error
An uncertainty of means that, when thereading is 13.33, the true value could beanywhere in the range 13.31 to 13.35.
0.02
If you use a 50-mL buret, design your titration torequire 20–40 mL of reagent to produce asmall relative uncertainty of 0.1–0.05%.
In a gravimetric analysis, plan to haveenough precipitate for a low relativeuncertainty. If weighing precision is mg, a100-mg precipitate has a relative weighingerror of 0.3% and a 300-mg precipitate has anuncertainty of 0.1%.
0.3
By far, most propagation of uncertaintycomputations that you will encounter deal withrandom error, not systematic error. Our goal isalways to eliminate systematic error.

For addition and subtraction, the uncertainty in the answer is obtained from the absoluteuncertainties of the individual terms as follows:
(3-5)
For the sum in Equation 3-4, we can write
The absolute uncertainty is and we express the answer as Althoughthere is only one significant figure in the uncertainty, we wrote it initially as with thefirst insignificant figure subscripted. We retain one or more insignificant figures to avoidintroducing round-off errors into later calculations through the number The insignifi-cant figure was subscripted to remind us where the last significant figure should be at theconclusion of the calculations.
To find the percent relative uncertainty in the sum of Equation 3-4, we write
The uncertainty, is of the result, 3.06. The subscript 3 in is not significant.It is sensible to drop the insignificant figures now and express the final result as
Example Uncertainty in a Buret Reading
The volume delivered by a buret is the difference between final and initial readings. If theuncertainty in each reading is what is the uncertainty in the volume delivered?
Solution Suppose that the initial reading is and the final reading is17.88 The volume delivered is the difference:
Regardless of the initial and final readings, if the uncertainty in each one is the uncertainty in volume delivered is
Multiplication and DivisionFor multiplication and division, first convert all uncertainties into percent relative uncertain-ties. Then calculate the error of the product or quotient as follows:
(3-6)
For example, consider the following operations:
First convert absolute uncertainties into percent relative uncertainties.
Then find the percent relative uncertainty of the answer by using Equation 3-6.
The answer is To convert relative uncertainty into absolute uncertainty, find of the answer.
4.0% 5.64 � 0.040 5.64 � 0.23
4.0%5.64 (4.0%).
%e4 � 2(1.7)2 � (1.1)2 � (3.4)2 � 4.0%
1.76 (1.7%) 1.89 (1.1%)
0.59 (3.4%)� 5.64 e4
1.76 (0.03) 1.89 (0.02)
0.59 (0.02)� 5.64 e4
%e4 � 2(%e1)2 � (%e2)2 � (%e3)2Uncertainty in multiplicationand division:
0.03 mL.0.02 mL,
17.88 (0.02)
� 0.05 (0.02)
17.83 (e) e � 20.022 � 0.022 � 0.028 � 0.03
(0.02) mL.0.05 (0.02) mL
0.02 mL,
3.06 (1%) (relative uncertainty)
3.06 (0.04) (absolute uncertainty)
1.3%1.3%0.041,
Percent relative uncertainty �0.041
3.06 100 � 1.3%
0.041.
0.041,3.06 0.04.0.04,e4
e4 � 2(0.03)2 � (0.02)2 � (0.02)2 � 0.041
e4 � 2e21 � e2
2 � e23
Uncertainty in additionand subtraction:
3-4 Propagation of Uncertainty from Random Error 45
For addition and subtraction, use absoluteuncertainty.
For addition and subtraction, use absoluteuncertainty. Relative uncertainty can be foundat the end of the calculation.
For multiplication and division, use percentrelative uncertainty.
Advice Retain one or more extra insignificantfigures until you have finished your entirecalculation. Then round to the correct numberof digits. When storing intermediate results in acalculator, keep all digits without rounding.

The answer is Finally, drop the insignificant digits.
The denominator of the original problem, 0.59, limits the answer to two digits.
Mixed OperationsNow consider a computation containing subtraction and division:
First work out the difference in the numerator, using absolute uncertainties. Thus,
becauseThen convert into percent relative uncertainties. Thus,
becauseThe percent relative uncertainty is so the absolute uncertainty is
The final answer can be written as
Because the uncertainty begins in the 0.01 decimal place, it is reasonable to round the resultto the 0.01 decimal place:
The Real Rule for Significant FiguresThe first digit of the absolute uncertainty is the last significant digit in the answer. Forexample, in the quotient
the uncertainty occurs in the fourth decimal place. Therefore, the answer 0.094 6is properly expressed with three significant figures, even though the original data have fourfigures. The first uncertain figure of the answer is the last significant figure. The quotient
is expressed with four significant figures because the uncertainty occurs in the fourth place.The quotient
is expressed with four figures even though the dividend and divisor each have three figures.Now you can appreciate why it is all right to keep one extra digit when an answer lies
between 1 and 2. The quotient 82/80 is better written as 1.02 than 1.0. If I write 1.0, you cansurmise that the uncertainty is at least The actual uncertainty lies in thesecond decimal place, not the first decimal place.
Example Significant Figures in Laboratory Work
You prepared a 0.250 M solution by diluting of wt%[ ] up to Find the uncertainty in
0.250 M. The molecular mass of 17.030 5 g/mol, has negligible uncertainty relativeto other uncertainties in this problem.
NH3,500.0 (0.2) mL.density � 0.899 (0.003) g/mLNH3
28.0 (0.5)8.45 (0.04) mLNH3
1.0 0.1 � 10%.
0.821 (0.002)
0.803 (0.002)� 1.022 (0.004)
0.002 664 (0.000 003)
0.025 00 (0.000 05)� 0.106 6 (0.000 2)
(0.000 2)
0.002 364 (0.000 003)
0.025 00(0.000 05)� 0.094 6 (0.000 2)
0.62 (3%) (relative uncertainty)
0.62 (0.02) (absolute uncertainty)
0.619 (3.3%) (relative uncertainty)
0.619 (0.020) (absolute uncertainty)
0.020.0.033 0.6190 �3.3%,
2(3.1%)2 � (1.1%)2 � 3.3%.
1.17 (0.036)
1.89 (0.02)�
1.17 (3.1%)
1.89 (1.1%)� 0.6190 (3.3%)
2(0.03)2 � (0.02)2 � 0.036.
1.76 (0.03) � 0.59 (0.02) � 1.17 (0.036)
[1.76 (0.03) � 0.59 (0.02)]
1.89 (0.02)� 0.6190 ?
5.6 (4%) (relative uncertainty)
5.6 (0.2) (absolute uncertainty)
5.64 (0.23).
46 CHAPTER 3 Experimental Error
For multiplication and division, use percentrelative uncertainty. Absolute uncertainty canbe found at the end of the calculation.
The result of a calculation ought to be writtenin a manner consistent with its uncertainty.
The real rule: The first uncertain figure is the lastsignificant figure.
It is all right to keep one extra digit when ananswer lies between 1 and 2.

Solution To find the uncertainty in molarity, we need to find the uncertainty in molesdelivered to the 500-mL flask. The concentrated reagent contains ofsolution per milliliter. Weight percent tells us that the reagent contains of per gram of solution. In our calculations, we retain extra insignificant digits andround off only at the end.
becauseNext, we find the moles of ammonia contained in of concentrated
reagent. The relative uncertainty in volume is
becauseThis much ammonia was diluted to The relative uncertainty in
the final volume is The molarity is
because The absolute uncertainty is 1.88% ofThe uncertainty in molarity is in the third decimal place, so our
final, rounded answer is
Exponents and LogarithmsFor the function , the percent relative uncertainty in is equal to a times thepercent relative uncertainty in
(3-7)
For example, if a 2% uncertainty in x will yield a uncertaintyin y. If a 3% uncertainty in x leads to a uncertainty in y (Box 3-2).
If y is the base 10 logarithm of x, then the absolute uncertainty in is proportionalto the relative uncertainty in x, which is ex /x:
(3-8)
You should not work with percent relative uncertainty [ ] in calculations withlogs and antilogs, because one side of Equation 3-8 has relative uncertainty and the other hasabsolute uncertainty.
The natural logarithm (ln) of x is the number y, whose value is such that whereis called the base of the natural logarithm. The absolute uncertainty in y
is equal to the relative uncertainty in x.
(3-9)
Now consider which is the same as saying In this case, the rela-tive uncertainty in y is proportional to the absolute uncertainty in x.
y � 10 x.y � antilog x,
y � ln x 1 ey �ex
x
Uncertainty fornatural logarithm:
e (� 2.718 28 . . .)x � e y,
100 (ex/x)
y � log x 1 ey �1
ln 10
ex
x� 0.434 29
ex
xUncertainty forlogarithm:
y (ey)(2)(3%) � 6%y � x2,
1122(2%) � 1%y � 1x � x1�2,
y � xa 1 %ey � a(%ex)Uncertainty forpowers and roots:
x (%ex):y (%ey)y � xa
[NH3] � 0.250 (0.005) M
0.249 8 M � 0.004 7 M.2(1.88%)2 � (0.04%)2 � 1.88%.
� 0.249 8 (1.88%) M
mol NH3
L�
0.124 9 (1.88%) mol
0.500 0 (0.04%) L
0.000 2/0.500 0 � 0.04%.0.500 0 (0.000 2) L.
2(1.82%)2 � (0.473%)2 � (0%)2 � 1.88%.
� 0.124 9 (1.88%) mol
mol NH3 �
0.251 7 (1.82%) g NH3
mL 8.45 (0.473%) mL
17.030 5 (0%) g NH3
mol
0.04/8.45 � 0.473%.8.45 (0.04) mL
2(0.334%)2 � (1.79%)2 � 1.82%.
� 0.251 7 (1.82%) g NH3
mL
� 0.899 (0.334%) g solution
mL 0.280 (1.79%)
g NH3
g solution
� 0.899 (0.003) g solution
mL 0.280 (0.005)
g NH3
g solution
Grams of NH3 permL in concentratedreagent
NH3
0.280 (0.005) g0.899 (0.003) g
3-4 Propagation of Uncertainty from Random Error 47
Convert absolute uncertainty into percentrelative uncertainty for multiplication.
To calculate a power or root on yourcalculator, use the yx button. For example, tofind a cube root (y1/3), raise y to the
power with the yx button.0.333 333 333 . . .
Use relative uncertainty (ex/x), not percentrelative uncertainty [100 (ex/x)], incalculations involving log x, ln x, 10x, and ex.
The rationale for finding the uncertainty inthe molecular mass of is explained inSection 3-5:
N: 14.006 7 0.000 2�3H: �3(1.007 94 0.000 07)
N: 14.006 7 0.000 2�3H: �3.023 82 0.000 21NH3: 17.030 52 20.000 22 � 0.000 212
� 17.030 52 0.000 29
� 17.030 5 0.000 3
NH3

(3-10)
If the relative uncertainty in y equals the absolute uncertainty in x.
(3-11)
Table 3-1 summarizes rules for propagation of uncertainty. You need not memorize the rulesfor exponents, logs, and antilogs, but you should be able to use them.
Example Uncertainty in H� Concentration
Consider the function where is the molarity of For find and its uncertainty.
Solution First solve the equation for : Whenever thenIf then and But
We therefore need to find the uncertainty in the equation
In Table 3-1, the relevant function is in which and For the table tells us that
(3-12)
The relative uncertainty in y (� ey/y) is 0.069 1. Inserting the value into Equation 3-12 gives the answer:
The concentration of is Anuncertainty of 0.03 in pH gives an uncertainty of 7% in Notice that extra digitswere retained in the intermediate results and were not rounded off until the final answer.
[H�].6.17 (0.426) 10�6 � 6.2 (0.4) l0�6 M.H�
ey
y�
ey
6.17 10�6� 0.069 1 1 ey � 4.26 10�7
10�6y � 10�5.21 � 6.17
ey
y� 2.302 6 ex � (2.302 6)(0.03) � 0.069 1
ey/y � 2.302 6 ex.y � 10x,x � �(5.21 0.03).y � [H�]y � 10x,
[H�] � 10�pH � 10�(5.210.03)
10log [H�] � [H�].10log [H�] � 10�pH.log[H�] � �pHpH � �log [H�],10a � 10b.
a � b,[H�]pH � �log[H�]
[H�]5.21 0.03,pH �H�.[H�]pH � �log [H�],
y � ex 1 ey
y� ex
Uncertaintyfor ex:
y � ex,
y � 10x 1 ey
y� (ln 10)ex � 2.302 6 ex
Uncertaintyfor 10x:
48 CHAPTER 3 Experimental Error
Box 3-2 Propagation of Uncertainty in the Product x � x
Table 3-1 says that the uncertainty in the function If A 3% uncer-
tainty in x leads to a uncertainty in y.But what if we just apply the multiplication formula 3-6 to
the product ?
Which uncertainty is correct, 6% from Table 3-1 or fromEquation 3-6?
Table 3-1 (6%) is correct. In the formula the error ina measured value of x is always positive or always negative. If thetrue value of x is 1.00 and the measured value is 1.01, the com-puted value of That is, if the measured x ishigh by 1%, the computed value of is high by 2% because weare multiplying the high value by the high value.
Equation 3-6 presumes that the uncertainty in each factor ofthe product is random and independent of the other. In theproduct the measured value of x could be high sometimesand the measured value of z could be low sometimes. In the
x � z,x � z
x2x2 is (1.01)2 � 1.02.
y � x2,
4.2%
%e3 � 2(%e1)2 � (%e2)2 � 2(3%)2 � (3%)2 � 4.2%
x(e1) � x(e2) � x2(e3)
x � x
(2)(3%) � 6%y � x2, then a � 2 and %ey � 2(%ex).a(%ex).
y � xa is %ey � majority of cases, the uncertainty in the product is not asgreat as the uncertainty in
Example. The distance traveled by a falling object in timewhere g is the acceleration of gravity. If t has an uncer-
tainty of 1%, the uncertainty in Theuncertainty in distance computed from will also be 2%. If you(incorrectly) used Equation 3-6, you would compute an uncer-tainty in distance of 21%2 � 1%2 � 1.4%.
12gt2
t2 is 2(%et) � 2(1%) � 2%.t is 12gt2,
x2.x � z
Relativeuncertaintyin x
Relativeuncertaintyin z
Relativeuncertaintyin x · z
Relativeuncertaintyin x 2
Appendix C gives a general rule forpropagation of random uncertainty for anyfunction.

3-5 Propagation of Uncertainty: Systematic Error
Systematic error occurs in some common situations and is treated differently from randomerror in arithmetic operations.
Uncertainty in Molecular MassWhat is the uncertainty in the molecular mass of ? On the inside cover of this book, wefind that the atomic mass of oxygen is The uncertainty is notmainly from random error in measuring the atomic mass. The uncertainty is predominantlyfrom isotopic variation in samples of oxygen from different sources. That is, oxygen fromone source could have a mean atomic mass of 15.999 1 and oxygen from another sourcecould have an atomic mass of 15.999 7. The atomic mass of oxygen in a particular lot ofreagent has a systematic uncertainty. It could be relatively constant at 15.999 7 or 15.999 1,or any value in between, with only a small random variation around the mean value.
If the true mass were 15.999 7, then the mass of If the true mass is 15.999 1, then the mass of Themass of is somewhere in the range The uncertainty of the mass of natoms is The uncertainty isnot For systematic uncertainty, we add the uncertain-ties of each term in a sum or difference.
Now let’s find the molecular mass of :
(3-13)
For the uncertainty in the sum of the masses of we use Equation 3-5, whichapplies to random error, because the uncertainties in the masses of C and H are independentof each other. One might be positive and one might be negative. So the molecular mass of
is
Multiple Deliveries from One PipetA 25-mL Class A volumetric pipet is certified by the manufacturer to deliver
The volume delivered by a given pipet is reproducible, but can be any-where in the range 24.97 to 25.03 mL. The difference between 25.00 mL and the actual vol-ume delivered by a particular pipet is a systematic error. It is always the same, within a smallrandom error. You could calibrate a pipet by weighing the water it delivers, as in Section 2-9.
25.00 0.03 mL.
28.053 0.002 g/mol
28.053 16 0.001 6
28.053 16 20.001 62 � 0.000 282
C2H4
2C � 4H,
2C: 2(12.010 7 0.000 8) � 24.021 4 0.001 6 d 2 0.000 8
4H: 4(1.007 94 0.000 07) � 4.031 76 0.000 28 d 4 0.000 07
28.053 16 ?
C2H4
20.000 32 � 0.000 32 � 0.000 42.n (uncertainty of one atom) � 2 (0.000 3) � 0.000 6.
31.998 8 0.000 6.O2
O2 is 2 15.999 1 � 31.998 2 g/mol.O2 is 2 15.999 7 � 31.999 4 g/mol.
15.999 4 0.000 3 g/mol.O2
3-5 Propagation of Uncertainty: Systematic Error 49
Table 3-1 Summary of rules for propagation of uncertainty
Function Uncertainty Functiona Uncertaintyb
a . x represents a variable and a represents a constant that has no uncertainty,
b. ex /x is the relative error in x and %ex is 100 ex/x.
ey
y� exy � e x
ey
y� (ln 10)ex � 2.302 6 exy � 10x%ey � 2%ex1
2 � %ex2
2y �x1
x2
ey �ex
xy � ln x%ey � 2%ex1
2 � %ex2
2y � x1 � x2
ey �1
ln 10
ex
x� 0.434 29
ex
xy � log xey � 2ex1
2 � ex2
2y � x1 � x2
%ey � a%exy � xaey � 2ex1
2 � ex2
2y � x1 � x2
Propagation of systematic uncertainty:Uncertainty in mass of n identical atoms
n (uncertainty in atomic mass).
�
We choose to use the rule for propagation ofrandom uncertainty for the sum of atomicmasses of different elements.

50 CHAPTER 3 Experimental Error
SummaryThe number of significant digits in a number is the minimumrequired to write the number in scientific notation. The first uncer-tain digit is the last significant figure. In addition and subtraction,the last significant figure is determined by the number with thefewest decimal places (when all exponents are equal). In multiplica-tion and division, the number of figures is usually limited by the fac-tor with the smallest number of digits. The number of figures in themantissa of the logarithm of a quantity should equal the number ofsignificant figures in the quantity. Random (indeterminate) erroraffects the precision (reproducibility) of a result, whereas systematic(determinate) error affects the accuracy (nearness to the “true”
value). Systematic error can be discovered and eliminated by aclever person, but some random error is always present. For ran-dom errors, propagation of uncertainty in addition and subtrac-tion requires absolute uncertainties whereasmultiplication and division utilize relative uncertainties
Other rules for propagation of random errorare found in Table 3-1. Always retain more digits than necessaryduring a calculation and round off to the appropriate number of dig-its at the end. Systematic error in atomic mass or the volume of apipet leads to larger uncertainty than we get from random error. Wealways strive to eliminate systematic errors.
(%e3 � 2%e12 � e2
2).
(e3 � 2e12 � e2
2),
Exercises3-A. Write each answer with a reasonable number of figures. Findthe absolute and percent relative uncertainty for each answer.(a)(b)(c)(d)(e)(f)(g)
3-B. (a) You have a bottle labeled “” How many milliliters of
will you need to prepare 2.000 L of 0.169 M NaOH?(b) If the uncertainty in delivering NaOH is calculatethe absolute uncertainty in the molarity (0.169 M). Assume there isnegligible uncertainty in the formula mass of NaOH and in the finalvolume (2.000 L).
0.01 mL,NaOH
53.4 wt%density � 1.52 (0.01) g/mL.53.4 (0.4) wt% NaOH—
103.240.08 � ?log(3.24 0.08) � ?(3.24 0.08)4 � ?23.24 0.08 � ?6.843 (0.008) 104 � [2.09 (0.04) � 1.63 (0.01) ] � ?[3.26 (0.10) 8.47 (0.05)] � 0.18 (0.06) � ?[12.41 (0.09) � 4.16 (0.01)] 7.068 2 (0.000 4) � ?
3-C. We have a solution with a density ofTo deliver 0.050 0 mol of HCl requires 4.18 mL
of solution. If the uncertainty that can be tolerated in 0.050 0 mol ishow big can the absolute uncertainty in 4.18 mL be?
(Caution: In this problem, you have to work backward. You wouldnormally compute the uncertainty in mol HCl from the uncertaintyin volume:
But, in this case, we know the uncertainty in mol HCl (2%) and weneed to find what uncertainty in mL solution leads to that 2% uncer-tainty. The arithmetic has the form
If we know we can findby subtraction: )%e2
b � %e2a � %e2
c � %e2d.%eb
%ea, %ec, and %ed,%e2b � %e2
c � %e2d.
a � b c d, for which %e2a �
mol HCl �
mL solution g solution
mL solution
g HCl
g solutiong HCl
mol HCl
2%,
1.18 (0.01) g/mL.37.0 (0.5) wt% HCl
Problems
Significant Figures3-1. How many significant figures are there in the followingnumbers?(a) 1.903 0 (b) 0.039 10 (c)
3-2. Round each number as indicated:(a) 1.236 7 to 4 significant figures(b) 1.238 4 to 4 significant figures
1.40 104
(c) 0.135 2 to 3 significant figures(d) 2.051 to 2 significant figures(e) 2.005 0 to 3 significant figures
3-3. Round each number to three significant figures:(a) 0.216 74(b) 0.216 5(c) 0.216 500 3
Terms to Understandabsolute uncertaintyaccuracyantilogarithmcharacteristic
determinate errorindeterminate errorlogarithmmantissa
natural logarithmprecisionrandom errorrelative uncertainty
significant figuresystematic error
Calibration eliminates systematic error, because we would know that the pipet always deliv-ers, say, The remaining uncertainty is random error.
If you use an uncalibrated 25-mL Class A volumetric pipet four times to deliver a total of100 mL, what is the uncertainty in 100 mL? Because the uncertainty is a systematic error, theuncertainty in four pipet volumes is like the uncertainty in the mass of 4 moles of oxy-gen: The uncertainty is
Calibration improves accuracy. Suppose that a calibrated pipet delivers a mean volumeof 24.991 mL with a standard deviation (a random variation) of If you deliverfour aliquots from this pipet, the volume delivered is and theuncertainty is 20.0062 � 0.0062 � 0.0062 � 0.0062 � 0.012 mL.
4 24.991 � 99.964 mL0.006 mL.
0.06 mL.4 0.03 � 0.12 mL, not 20.032 � 0.032 � 0.032 � 0.032 �
(0.006 mL)25.991 0.006 mL.
In this example, calibration reduces theuncertainty from to 0.012 mL.0.12 mL

Problems 51
0 1 2 3 4 5
0 1 2 3 4 5
0 1 2 3 4 5
0 1 2 3 4 5 6 7 8 9 0
0 1 2 3 4 5 6 7 8 9 0
0 1 2 3 4 5 6 7 8 9 0
Reading(1.46 mm)
Digit 6 on lower scale aligned with marking on upper scale
(a)
(b)
(c)
Figure for Problem 3-4.
3-4. Vernier scale. The figure above shows a scale found on instru-ments such as a micrometer caliper used for accurately measuringdimensions of objects. The lower scale slides along the upper scaleand is used to interpolate between the markings on the upper scale. In (a), the reading (at the left-hand 0 of the lower scale) is between1.4 and 1.5 on the upper scale. To find the exact reading, observewhich mark on the lower scale is aligned with a mark on the upperscale. Because the 6 on the lower scale is aligned with the upperscale, the correct reading is 1.46. Write the correct readings in(b) and (c) and indicate how many significant figures are in eachreading.
3-5. Write each answer with the correct number of digits.(a)(b)(c)(d)(e)(f)(g)
3-6. Write the formula mass of (a) and (b) with a rea-sonable number of digits. Use the periodic table inside the cover ofthis book to find atomic masses.
3-7. Write each answer with the correct number of significant figures.(a)(b)(c)(d)(e)(f)(g)(h)
3-8. Controlling the appearance of a graph in Excel.Figure 3-3 requires gridlines to read the graph for buret corrections.The purpose of this exercise is to format a graph so it looks likeFigure 3-3. Follow the procedure in Section 2-11 to make a graph ofthe data in the following table. The Chart Type is xy Scatter show-ing data points connected by straight lines. Double click on thex-axis and select the Scale tab.
Select the Number tab andhighlight Number. Set In a similar manner, setthe ordinate to run from with a major unit of 0.02and a minor unit of 0.01, as in Figure 3-3. The spreadsheet may
�0.04 to �0.05Decimal places � 0.
Major unit � 10, and Minor unit � 1.Set Minimum � 0, Maximum � 50,
10�6.31 � 4.897 79 10�7
log(3.98 104) � 4.599 9(26.14/3.38) � 4.2 � 11.933 7(26.14/(37.62 108)) (4.38 10�2) � 3.043 413 10�10
(26.14/37.62) 4.38 � 3.043 413107.868 � (2.113 102) � (5.623 103) � 5 519.568106.9 � 31.4 � 75.500 01.0 � 2.1 � 3.4 � 5.8 � 12.300 0
C6H4O4BaF2
102.384 � ?antilog(�3.22) � ?log(4.218 1012) � ?0.060 2 � (2.113 104) � 2.849 03 10�6
4.34 9.2 � 39.92812.3 � 1.63 � 10.671.021 � 2.69 � 3.711
overrule you several times. Continue to reset the limits as you wantthem and click OK each time until the graph looks the way youintend. To add gridlines, click in the graph, go to the CHART menuand select CHART OPTIONS. Select the Gridlines tab and check bothsets of Major gridlines and Minor gridlines and click OK. In theCHART OPTIONS menu, select the Legend tab and deselect Showlegend. Move the x-axis numbers from the middle of the chart to thebottom as follows: Double click the y-axis (not the x-axis) andselect the Scale tab. Set “Value (x) axis crosses at” to ClickOK and the volume labels move beneath the graph. Your graphshould look the same as Figure 3-3.
Volume (mL) Correction (mL)
0.03 0.0010.04 0.0420.03 0.0229.98 �0.0340.00 0.0049.97 0.03
Types of Error
3-9. Why do we use quotation marks around the word true in thestatement that accuracy refers to how close a measured value is tothe “true” value?
3-10. Explain the difference between systematic and random errors.
3-11. Suppose that in a gravimetric analysis, you forget to dry thefilter crucibles before collecting precipitate. After filtering the prod-uct, you dry the product and crucible thoroughly before weighingthem. Is the mass of product always high or always low? Is theerror in mass systematic or random?
3-12. State whether the errors in parts (a)–(d) are random orsystematic:(a) A 25-mL transfer pipet consistently delivers (b) A 10-mL buret consistently delivers whendrained from exactly 0 to exactly 2 mL and consistently delivers
when drained from 2 to 4 mL.(c) A 10-mL buret delivered 1.983 9 g of water when drained fromexactly 0.00 to 2.00 mL. The next time I delivered water from the0.00- to the 2.00-mL mark, the delivered mass was 1.990 0 g.(d) Four consecutive injections of a solution into a chro-matograph were made and the area of a particular peak was 4 383,4 410, 4 401, and 4 390 units.
20.0- L
2.03 mL 0.02 mL
1.98 0.01 mL25.031 0.009 mL.
�0.04.

52 CHAPTER 3 Experimental Error
Cheryl Cynthia Carmen Chastity
Figure for Problem 3-13.
3-13. Cheryl, Cynthia, Carmen, and Chastity shot the targets aboveat Girl Scout camp. Match each target with the proper description.(a) accurate and precise(b) accurate but not precise(c) precise but not accurate(d) neither precise nor accurate
3-14. Rewrite the number in the forms(a) number and (b) number ( percent rel-ative uncertainty) with an appropriate number of digits.
Propagation of Uncertainty
3-15. Find the absolute and percent relative uncertainty and expresseach answer with a reasonable number of significant figures.(a)(b)(c)(d)
3-16. Find the absolute and percent relative uncertainty and expresseach answer with a reasonable number of significant figures.(a)(b)(c)(d)(e)
(f)(g)
3-17. Verify the following calculations:(a)(b)(c)(d)
(e)
3-18. Express the molecular mass of withthe correct number of significant figures.
3-19. (a) Show that the formula mass of NaCl is (0.002) g/mol.
58.443
C9H9O6N3(uncertainty)
loga 20.104 (0.006)
0.051 1 (0.000 9)b � 0.800 (0.015)
ln[3.141 5 (0.001 1)] � 1.144 70(0.000 35)antilog[3.141 5 (0.001 1)] � 1.3852(0.0035) 103log[3.141 5 (0.001 1)] � 0.497 14 (0.000 15)23.141 5 (0.001 1) � 1.772 43 (0.000 31)
log[3.14 (0.05)] � ?[3.14 (0.05) ]1/3 � ?4.61 (0.01) 101 � ?2.016 4 (0.000 8) 103 � 1.233 (0.002) 102 �2.016 4 (0.000 8) � 1.233 (0.002) � 4.61 (0.01) � ?[4.97 (0.05) � 1.86 (0.01) ] /21.1 (0.2) � ?91.3 (1.0) 40.3 (0.2) /21.1 (0.2) � ?9.23 (0.03) � 4.21 (0.02) � 3.26 (0.06) � ?
9.43 (0.05) 5[6.2 (0.2) 10�3] � [4.1 (0.1) 10�3]6� ?[6.2 (0.2) � 4.1 (0.1) ] � 9.43 (0.05) � ?9.43 (0.05) 0.016 (0.001) � ?6.2 (0.2) � 4.1 (0.1) � ?
(absolute uncertainty)3.123 56 (0.167 89%)
(b) To prepare a solution of NaCl, you weigh out and dissolve it in a volumetric flask whose volume is
Express the molarity of the solution, alongwith its uncertainty, with an appropriate number of digits.
3-20. What is the true mass of water weighed at in the air ifthe apparent mass is ? The density of air is
and the density of balance weights isThe uncertainty in the density of water in Table 2-7
is negligible in comparison to the uncertainty in the density of air.
3-21. Twelve dietary iron tablets were analyzed by the gravimetricprocedure in Section 1-4 and the final mass of was Find the average mass of Fe per tablet.(Relative uncertainties in atomic masses are small compared withrelative uncertainty in the mass of Neglect uncertainties inatomic masses in this problem.)
3-22. We can measure the concentration of HCl solution (a proce-dure called standardizing the solution) by reaction with puresodium carbonate: A vol-ume of of HCl solution was required forcomplete reaction with of
Find the molarity of the HCl and itsabsolute uncertainty.
3-23. Avogadro’s number can be computed from the followingmeasured properties of pure crystalline silicon:2 (1) atomic mass(obtained from the mass and abundance of each isotope), (2) den-sity of the crystal, (3) size of the unit cell (the smallest repeatingunit in the crystal), and (4) number of atoms in the unit cell. For sil-icon, the mass is where 35 is thestandard deviation in the last two digits. The density is
the size of the cubic unit cell is and there are 8 atoms per unit cell.
Avogadro’s number is computed from the equation
From the measured properties and their uncertainties (standarddeviations), compute Avogadro’s number and its uncertainty. Tofind the uncertainty of use the function in Table 3-1.y � xac0
3,
NA �mSi
(ρc03) /8
5.431 020 36 (33) 10�8 cm,c0 �2.329 031 9 (18) g/cm3,ρ �
mSi � 28.085 384 2 (35) g/mol,
0.001).(FM 105.988 Na2CO30.967 4 0.000 9 g
27.35 0.04 mL2H� � Na2CO3 S 2Na� � H2O � CO2.
Fe2O3.
0.2774 0.0018 g.Fe2O3 (FM 159.688)
8.0 0.5 g/mL.0.001 2 0.000 1 g/mL
1.034 6 0.000 2 g24°C
100.00 (0.08) mL.
2.634 (0.002) g

4-1 Gaussian Distribution 53
IS MY RED BLOOD CELL COUNT HIGH TODAY?
Statistics4
All measurements contain experimental error, so it is never possible to be completely cer-tain of a result. Nevertheless, we often seek the answers to questions such as “Is my redblood cell count today higher than usual?” If today’s count is twice as high as usual, it isprobably truly higher than normal. But what if the “high” count is not excessively above“normal” counts?
Count on “normal” days Today’s count
The number 5.6 is higher than the five normal values, but the random variation in normalvalues might lead us to expect that 5.6 will be observed on some “normal” days.
The study of statistics allows us to say that today’s value is expected to be observed on1 out of 20 normal days. It is still up to you to decide what to do with this information.
5.6 106 cells/ L
5.1
5.3
4.8
5.4
5.2
u 106 cells/ L
Experimental measurements always contain some variability, so no conclusion can bedrawn with certainty. Statistics gives us tools to accept conclusions that have a high proba-bility of being correct and to reject conclusions that do not.1,2
4-1 Gaussian DistributionIf an experiment is repeated a great many times and if the errors are purely random, then theresults tend to cluster symmetrically about the average value (Figure 4-1). The more timesthe experiment is repeated, the more closely the results approach an ideal smooth curvecalled the Gaussian distribution. In general, we cannot make so many measurements in alab experiment. We are more likely to repeat an experiment 3 to 5 times than 2 000 times.However, from the small set of results, we can estimate the statistical parameters that des-cribe the large set. We can then make estimates of statistical behavior from the small numberof measurements.
Red blood cells (erythrocytes, Er) tangled in fibrin threads (Fi) in a blood clot. Stacks of erythrocytes ina clot are called a rouleaux formation (Ro). [From R. H. Kardon, Tissues and Organs (San Francisco: W. H. Freeman, 1978), p. 39.]
We say that the variation in experimentaldata is normally distributed when replicate measurements exhibit the bell-shapeddistribution in Figure 4-1. It is equally probablethat a measurement will be higher or lowerthan the mean. The probability of observingany value decreases as its distance from themean increases.
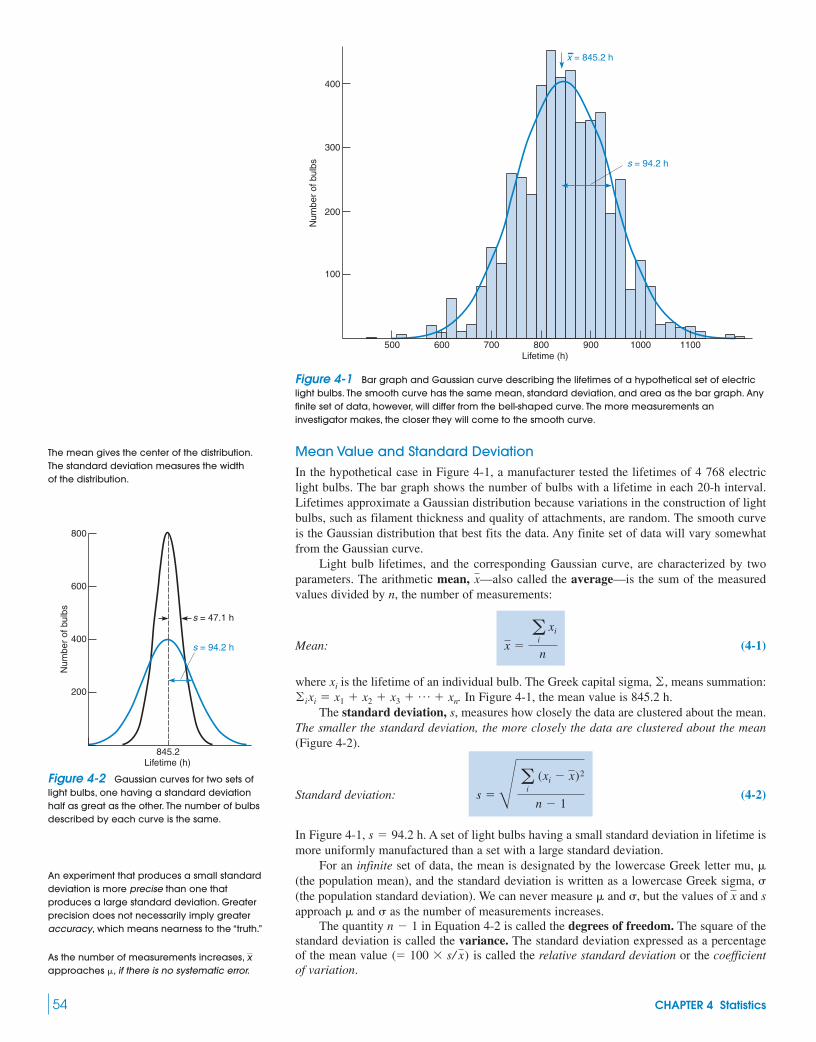
54 CHAPTER 4 Statistics
Mean Value and Standard DeviationIn the hypothetical case in Figure 4-1, a manufacturer tested the lifetimes of 4 768 electriclight bulbs. The bar graph shows the number of bulbs with a lifetime in each 20-h interval.Lifetimes approximate a Gaussian distribution because variations in the construction of lightbulbs, such as filament thickness and quality of attachments, are random. The smooth curveis the Gaussian distribution that best fits the data. Any finite set of data will vary somewhatfrom the Gaussian curve.
Light bulb lifetimes, and the corresponding Gaussian curve, are characterized by twoparameters. The arithmetic mean, —also called the average—is the sum of the measuredvalues divided by n, the number of measurements:
Mean: (4-1)
where is the lifetime of an individual bulb. The Greek capital sigma, means summation:In Figure 4-1, the mean value is 845.2 h.
The standard deviation, s, measures how closely the data are clustered about the mean.The smaller the standard deviation, the more closely the data are clustered about the mean(Figure 4-2).
Standard deviation: (4-2)
In Figure 4-1, A set of light bulbs having a small standard deviation in lifetime ismore uniformly manufactured than a set with a large standard deviation.
For an infinite set of data, the mean is designated by the lowercase Greek letter mu, (the population mean), and the standard deviation is written as a lowercase Greek sigma, (the population standard deviation). We can never measure and but the values of and sapproach and as the number of measurements increases.
The quantity in Equation 4-2 is called the degrees of freedom. The square of thestandard deviation is called the variance. The standard deviation expressed as a percentageof the mean value is called the relative standard deviation or the coefficientof variation.
(� 100 s/ x)
n � 1�
x�, �
s � 94.2 h.
s �R ai
(xi � x)2
n � 1
�ixi � x1 � x2 � x3 � p � xn.�,xi
x �a
ixi
n
x
s = 94.2 h
400
500
Num
ber
of b
ulbs
Lifetime (h)
300
200
100
1100600 700 800 900 1000
x = 845.2 h
Figure 4-1 Bar graph and Gaussian curve describing the lifetimes of a hypothetical set of electriclight bulbs. The smooth curve has the same mean, standard deviation, and area as the bar graph. Anyfinite set of data, however, will differ from the bell-shaped curve. The more measurements aninvestigator makes, the closer they will come to the smooth curve.
s = 94.2 h
200
845.2
Num
ber
of b
ulbs
Lifetime (h)
800
600
400
s = 47.1 h
The mean gives the center of the distribution.The standard deviation measures the widthof the distribution.
An experiment that produces a small standarddeviation is more precise than one thatproduces a large standard deviation. Greaterprecision does not necessarily imply greateraccuracy, which means nearness to the “truth.”
As the number of measurements increases,approaches , if there is no systematic error.
x
Figure 4-2 Gaussian curves for two sets oflight bulbs, one having a standard deviationhalf as great as the other. The number of bulbsdescribed by each curve is the same.

4-1 Gaussian Distribution 55
Example Mean and Standard Deviation
Find the average and the standard deviation for 821, 783, 834, and 855.
Solution The average is
To avoid accumulating round-off errors, retain one more digit for the average and thestandard deviation than was present in the original data. The standard deviation is
The average and the standard deviation should both end at the same decimal place. Forwe will write
Spreadsheets have built-in functions for the average and standard deviation. Inthe spreadsheet in the margin, data points are entered in cells B1 through B4. The averagein cell B5 is computed with the statement “ AVERAGE(B1:B4)”. B1:B4 means cells B1,B2, B3, and B4. The standard deviation in cell B6 is computed with “ STDEV(B1:B4)”.
For ease of reading, cells B5 and B6 were set to display 3 decimal places by use ofthe CELLS command in the FORMAT menu. A heavy line was placed beneath cell B4 bysetting border with the CELLS command of the FORMAT menu.
Significant Figures in Mean and Standard DeviationWe commonly express experimental results in the form: mean standard deviationIt is sensible to write the results of the preceding example as or even
to indicate that the mean has just two significant figures. The expressionsand are not suitable for continued calculations in which and s
are intermediate results. We will retain one or more insignificant digits to avoid introducinground-off errors into subsequent work. Try not to go into cardiac arrest over significant figureswhen you see as the answer to a problem in this book.
Standard Deviation and ProbabilityThe formula for a Gaussian curve is
Gaussian curve: (4-3)
where e is the base of the natural logarithm. For a finite set of data, weapproximate by and by s. A graph of Equation 4-3 is shown in Figure 4-3, in which thevalues and are used for simplicity. The maximum value of y is at andthe curve is symmetric about
It is useful to express deviations from the mean value in multiples, z, of the standarddeviation. That is, we transform x into z, given by
(4-4)
The probability of measuring z in a certain range is equal to the area of that range. For exam-ple, the probability of observing z between and is 0.136. This probability correspondsto the shaded area in Figure 4-3. The area under each portion of the Gaussian curve is givenin Table 4-1. Because the sum of the probabilities of all the measurements must be unity, thearea under the whole curve from to must be unity. The number in Equation 4-3 is called the normalization factor. It guarantees that the area under the entirecurve is unity. A Gaussian curve with unit area is called a normal error curve.
Example Area Under a Gaussian Curve
Suppose the manufacturer of the bulbs used for Figure 4-1 offers to replace free of chargeany bulb that burns out in less than 600 hours. If she plans to sell a million bulbs, howmany extra bulbs should she keep available as replacements?
1/(�22�)z � ��z � ��
�1�2
z �x �
��
x � xs
x � .x � , � 0� � 1
�x (� 2.718 28 . . .)
y �1
�22� e�(x� )2/2�2
823.2 30.3
x8.2 (0.3) 102823 308.2 (0.3) 102
823 30� x s.
��
s � 30.3.x � 823.2,
s � B (821 � 823.2)2 � (783 � 823.2)2 � (834 � 823.2)2 � (855 � 823.2)2
(4 � 1)� 30.3
x �821 � 783 � 834 � 855
4� 823.2
Learn to use the standard deviation functionon your calculator and see that you get
Do not round off during acalculation. Retain all the extra digits in yourcalculator.
s � 30.269 6 . . . .
A B
1 821
2 783
3 834
4 855
5 Average � 823.250
6 Std dev � 30.270
0.1
3
y
x210–1–2–3
0.4
0.2
0.3
Figure 4-3 A Gaussian curve in which and A Gaussian curve whose area isunity is called a normal error curve. In thiscase, the abscissa, x, is equal to z, defined asz � (x � )/�.
� � 1. � 0
When x is one standard deviationabove the mean. When x is twostandard deviations below the mean.
z � �2,z � �1,

Solution We need to express the desired interval in multiples of the standard deviationand then find the area of the interval in Table 4-1. Because and
The area under the curve between the mean value andis 0.495 3 in Table 4-1. The entire area from to the mean value is 0.500 0,
so the area from to must be 0.500 0 � 0.495 3 � 0.004 7. The area to the leftof 600 hours in Figure 4-1 is only 0.47% of the entire area under the curve. Only 0.47%of the bulbs are expected to fail in fewer than 600 h. If the manufacturer sells 1 millionbulbs a year, she should make 4 700 extra bulbs to meet the replacement demand.
Example Using a Spreadsheet to Find Area Beneath a Gaussian Curve
What fraction of bulbs is expected to have a lifetime between 900 and 1 000 h?
Solution We need to find the fraction of the area of the Gaussian curve betweenand The function NORMDIST in Excel gives the area of the curve
from up to a specified point, x. Here is the strategy: We will find the area from to900 h, which is the shaded area to the left of 900 h in Figure 4-4. Then we will find thearea from to 1 000 h, which is all the shaded area to the left of 1 000 h in Figure 4-4.The difference between the two is the area from 900 to 1 000 h:
(4-5)
In a spreadsheet, enter the mean in cell A2 and the standard deviation in cell B2. Tofind the area under the Gaussian curve from to 900 h in cell C4, we select cell C4and go to the INSERT menu and choose FUNCTION. In the window that appears, selectthe Statistical functions and find NORMDIST from the list of possibilities. Double clickon NORMDIST and another window appears asking for four values that will be usedby NORMDIST. (If you click on help, you will find a cryptic explanation of how to useNORMDIST.)
Values provided to the function NORMDIST(x,mean,standard_dev,cumulative) arecalled arguments of the function. The first argument is x, which is 900. The second argumentis the mean, which is 845.2. You can either enter 845.2 for the mean or you can type “A2”,which is the cell containing 845.2. The third argument is the standard deviation, for whichwe enter the value 94.2 or the cell B2. The last argument is called “cumulative.” When ithas the value TRUE, NORMDIST gives the area under the Gaussian curve. When cumulativeis FALSE, NORMDIST gives the ordinate (the y-value) of the Gaussian curve. We wantarea, so enter TRUE. The formula “ NORMDIST(900,$A$2,$B$2,TRUE)” in cell C4�
��
Area from 900 to 1 000 � (area from �� to 1 000) � (area from �� to 900)
��
����x � 1 000 h.x � 900
�2.60����z � �2.60
z � (600 � 845.2) /94.2 � �2.60.s � 94.2,x � 845.2
56 CHAPTER 4 Statistics
Table 4–1 Ordinate and area for the normal (Gaussian) error curve,
y Areab y Area y Area
0.0 0.398 9 0.000 0 1.4 0.149 7 0.419 2 2.8 0.007 9 0.497 40.1 0.397 0 0.039 8 1.5 0.129 5 0.433 2 2.9 0.006 0 0.498 10.2 0.391 0 0.079 3 1.6 0.110 9 0.445 2 3.0 0.004 4 0.498 6500.3 0.381 4 0.117 9 1.7 0.094 1 0.455 4 3.1 0.003 3 0.499 0320.4 0.368 3 0.155 4 1.8 0.079 0 0.464 1 3.2 0.002 4 0.499 3130.5 0.352 1 0.191 5 1.9 0.065 6 0.471 3 3.3 0.001 7 0.499 5170.6 0.333 2 0.225 8 2.0 0.054 0 0.477 3 3.4 0.001 2 0.499 6630.7 0.312 3 0.258 0 2.1 0.044 0 0.482 1 3.5 0.000 9 0.499 7670.8 0.289 7 0.288 1 2.2 0.035 5 0.486 1 3.6 0.000 6 0.499 8410.9 0.266 1 0.315 9 2.3 0.028 3 0.489 3 3.7 0.000 4 0.499 9041.0 0.242 0 0.341 3 2.4 0.022 4 0.491 8 3.8 0.000 3 0.499 9281.1 0.217 9 0.364 3 2.5 0.017 5 0.493 8 3.9 0.000 2 0.499 9521.2 0.194 2 0.384 9 2.6 0.013 6 0.495 3 4.0 0.000 1 0.499 9681.3 0.171 4 0.403 2 2.7 0.010 4 0.496 5 0 0.5
a.
b. The area refers to the area between z 0 and z the value in the table. Thus the area from z 0 to z 1.4 is 0.419 2.The area from z 0.7 to z 0 is the same as from z 0 to z 0.7. The area from z 0.5 to z 0.3 is (0.191 50.117 9) 0.309 4. The total area between z and z is unity.� ��� ���
�� �� ����� �
����
z � (x � ) /�.
�
0 z 00 z 00 z 0 ay �
122�e�z2/2
1100
Num
ber
of b
ulbs
Lifetime (h)600 1000900800700
Area from– ∞ to 900= 0.719 6
Area from– ∞ to 1000= 0.949 8
Figure 4-4 Use of the Gaussian curve tofind the fraction of bulbs with a lifetimebetween 900 and 1 000 h. We find the areabetween and 1 000 h and subtract thearea between and 900 h.�q
�q

4-2 Confidence Intervals 57
A B C
1 Mean � Std dev �
2 845.2 94.2
3
4 Area from �� to 900 � 0.7196
5 Area from �� to 1000 � 0.9498
6 Area from 900 to 1000 0.2302
7
8 C4 � NORMDIST(900,A2,B2,TRUE)
9 C5 � NORMDIST(1000,A2,B2,TRUE)
10 C6 � C5-C4
returns the value 0.719 6. This is the area under the Gaussian curve from to 900 h.To get the area from to 1 000 h, write “ NORMDIST(1000,$A$2,$B$2,TRUE)” incell C5. The value returned is 0.949 8. Following Equation 4-5, subtract the areas
to obtain 0.230 2, which is the area from 900 to 1 000. That is, 23.02% ofthe area lies in the range 900 to 1 000 h. We expect 23% of the bulbs to have a lifetime of900 to 1 000 h.
The standard deviation measures the width of the Gaussian curve. The larger the valueof the broader the curve. In any Gaussian curve, 68.3% of the area is in the range from
to That is, more than two-thirds of the measurements are expected to liewithin one standard deviation of the mean. Also, 95.5% of the area lies within and99.7% of the area lies within Suppose that you use two different techniques tomeasure sulfur in coal: Method A has a standard deviation of 0.4%, and method B has a stan-dard deviation of 1.1%. You can expect that approximately two-thirds of measurements frommethod A will lie within 0.4% of the mean. For method B, two-thirds will lie within 1.1% ofthe mean.
The more times you measure a quantity, the more confident you can be that the averagevalue of your measurements is close to the true population mean, Uncertainty decreases inproportion to where n is the number of measurements. You can decrease the uncer-tainty of the mean by a factor of 2 by making 4 times as many measurements andby a factor of 3.16 by making 10 times as many measurements.
4-2 Confidence IntervalsStudent’s t is a statistical tool used most frequently to express confidence intervals and tocompare results from different experiments. It is the tool you could use to evaluate the prob-ability that your red blood cell count will be found in a certain range on “normal” days.
Calculating Confidence Intervals
From a limited number of measurements, we cannot find the true population mean, or thetrue standard deviation, What we can determine are and s, the sample mean and the sam-ple standard deviation. The confidence interval is an expression stating that the true mean, is likely to lie within a certain distance from the measured mean, The confidence intervalof is given by
Confidence interval: (4-6)
where s is the measured standard deviation, n is the number of observations, and t is Stu-dent’s t, taken from Table 4-2.
Example Calculating Confidence Intervals
The carbohydrate content of a glycoprotein (a protein with sugars attached to it) isdetermined to be 12.6, 11.9, 13.0, 12.7, and 12.5 g of carbohydrate per 100 g of proteinin replicate analyses. Find the 50% and 90% confidence intervals for the carbohydratecontent.
� x ts2n
x.
,x�.
,
(� 210)(� 24)
1/2n, .
3�. 2�,
� 1�. � 1��,
(C5 � C4)
�����
Percentage ofRange measurements
68.395.599.7 3�
2�
1�
To decrease uncertainty by requires10 measurements. Instruments with rapiddata acquisition allow us to average manyexperiments in a short time to increase theaccuracy of a result.
1/210
“Student” was the pseudonym of W. S. Gosset,whose employer, the Guinness breweries ofIreland, restricted publications for proprietaryreasons. Because of the importance of Gosset’swork, he was allowed to publish it (Biometrika1908, 6, 1), but under an assumed name.
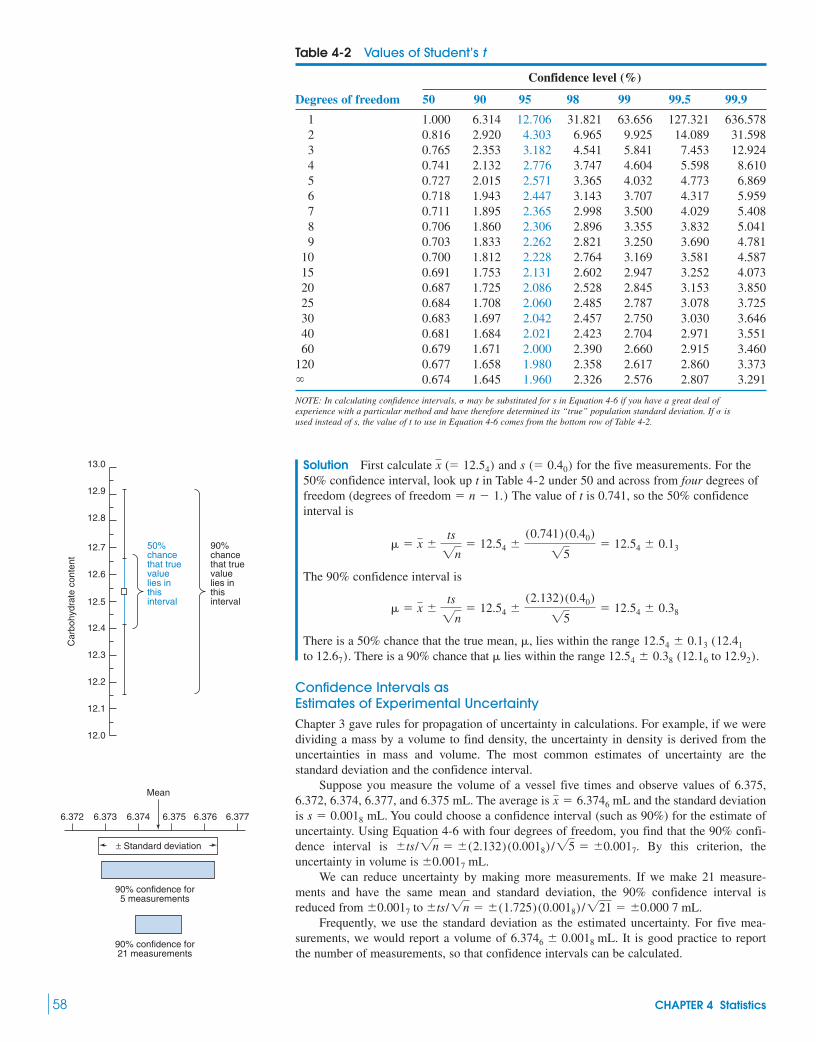
Solution First calculate and s for the five measurements. For the50% confidence interval, look up t in Table 4-2 under 50 and across from four degrees offreedom (degrees of freedom The value of t is 0.741, so the 50% confidenceinterval is
The 90% confidence interval is
There is a 50% chance that the true mean, lies within the range to There is a 90% chance that lies within the range
Confidence Intervals as Estimates of Experimental UncertaintyChapter 3 gave rules for propagation of uncertainty in calculations. For example, if we weredividing a mass by a volume to find density, the uncertainty in density is derived from theuncertainties in mass and volume. The most common estimates of uncertainty are thestandard deviation and the confidence interval.
Suppose you measure the volume of a vessel five times and observe values of 6.375,6.372, 6.374, 6.377, and 6.375 mL. The average is mL and the standard deviationis mL. You could choose a confidence interval (such as 90%) for the estimate ofuncertainty. Using Equation 4-6 with four degrees of freedom, you find that the 90% confi-dence interval is By this criterion, theuncertainty in volume is
We can reduce uncertainty by making more measurements. If we make 21 measure-ments and have the same mean and standard deviation, the 90% confidence interval isreduced from
Frequently, we use the standard deviation as the estimated uncertainty. For five mea-surements, we would report a volume of It is good practice to reportthe number of measurements, so that confidence intervals can be calculated.
6.3746 0.0018 mL.
0.0017 to ts/2n � (1.725)(0.0018) /221 � 0.000 7 mL.
0.0017 mL.ts/2n � (2.132)(0.0018) /25 � 0.0017.
s � 0.0018
x � 6.3746
(12.16 to 12.92).12.54 0.38 12.67).12.54 0.13 (12.41 ,
� x ts2n
� 12.54 (2.132)(0.40)25
� 12.54 0.38
� x ts2n
� 12.54 (0.741)(0.40)25
� 12.54 0.13
� n � 1.)
(� 0.40)x (� 12.54)
58 CHAPTER 4 Statistics
Table 4-2 Values of Student’s t
Confidence level (%)
Degrees of freedom 50 90 95 98 99 99.5 99.9
1 1.000 6.314 12.706 31.821 63.656 127.321 636.5782 0.816 2.920 4.303 6.965 9.925 14.089 31.5983 0.765 2.353 3.182 4.541 5.841 7.453 12.9244 0.741 2.132 2.776 3.747 4.604 5.598 8.6105 0.727 2.015 2.571 3.365 4.032 4.773 6.8696 0.718 1.943 2.447 3.143 3.707 4.317 5.9597 0.711 1.895 2.365 2.998 3.500 4.029 5.4088 0.706 1.860 2.306 2.896 3.355 3.832 5.0419 0.703 1.833 2.262 2.821 3.250 3.690 4.781
10 0.700 1.812 2.228 2.764 3.169 3.581 4.58715 0.691 1.753 2.131 2.602 2.947 3.252 4.07320 0.687 1.725 2.086 2.528 2.845 3.153 3.85025 0.684 1.708 2.060 2.485 2.787 3.078 3.72530 0.683 1.697 2.042 2.457 2.750 3.030 3.64640 0.681 1.684 2.021 2.423 2.704 2.971 3.55160 0.679 1.671 2.000 2.390 2.660 2.915 3.460
120 0.677 1.658 1.980 2.358 2.617 2.860 3.3730.674 1.645 1.960 2.326 2.576 2.807 3.291
NOTE: In calculating confidence intervals, may be substituted for s in Equation 4-6 if you have a great deal ofexperience with a particular method and have therefore determined its “true” population standard deviation. If isused instead of s, the value of t to use in Equation 4-6 comes from the bottom row of Table 4-2.
�
�
�
6.372 6.373 6.374 6.375
Mean
± Standard deviation
90% confidence for5 measurements
90% confidence for21 measurements
6.376 6.377
12.0
12.1
12.2
12.3
12.4
12.5
12.6
50%chancethat truevaluelies inthisinterval
90%chancethat truevaluelies inthisinterval
12.7
12.8
12.9
13.0
Car
bohy
drat
e co
nten
t

4-3 Comparison of Means with Student’s t 59
70000 20 40 60
50% Confidence intervals
Trial number(a)80 100
8000
9000
10000
Mea
n of
4 v
alue
s
11000
12000
13000
70000 20 40 60
90% Confidence intervals
Trial number80 100
8000
9000
10000
Mea
n of
4 v
alue
s
11000
12000
13000
(b)
The Meaning of a Confidence IntervalFigure 4-5 illustrates the meaning of confidence intervals. A computer chose numbers at ran-dom from a Gaussian population with a population mean of 10 000 and a populationstandard deviation of 1 000 in Equation 4-3. In trial 1, four numbers were chosen, andtheir mean and standard deviation were calculated with Equations 4-1 and 4-2. The 50% con-fidence interval was then calculated with Equation 4-6, using from Table 4-2 (50%confidence, 3 degrees of freedom). This trial is plotted as the first point at the left in Figure4-5a; the square is centered at the mean value of 9 526, and the error bar extends from thelower limit to the upper limit of the 50% confidence interval The experiment wasrepeated 100 times to produce the points in Figure 4-5a.
The 50% confidence interval is defined such that, if we repeated this experiment aninfinite number of times, 50% of the error bars in Figure 4-5a would include the true popu-lation mean of 10 000. In fact, I did the experiment 100 times, and 45 of the error bars inFigure 4-5a pass through the horizontal line at 10 000.
Figure 4-5b shows the same experiment with the same set of random numbers, but thistime the 90% confidence interval was calculated. For an infinite number of experiments, wewould expect 90% of the confidence intervals to include the population mean of 10 000. InFigure 4-5b, 89 of the 100 error bars cross the horizontal line at 10 000.
4-3 Comparison of Means with Student’s tWe use a t test to compare one set of measurements with another to decide whether or notthey are “the same.” Statisticians say we are testing the null hypothesis, which states that themean values from two sets of measurements are not different. Because of inevitable randomerrors, we do not expect the mean values to be exactly the same, even if we are measuring thesame physical quantity. Statistics gives us a probability that the observed difference betweentwo means can arise from purely random measurement error. We customarily reject the nullhypothesis if there is less than a 5% chance that the observed difference arises from random
(290).
t � 0.765
(�)( )
Figure 4-5 50% and 90% confidence intervals for the same set of random data. Filled squares arethe data points whose confidence interval does not include the true population mean of 10 000.
Confidence limits and the t test (and, later inthis chapter, the Q test) assume that datafollow a Gaussian distribution. If they do not,different formulas would be required.
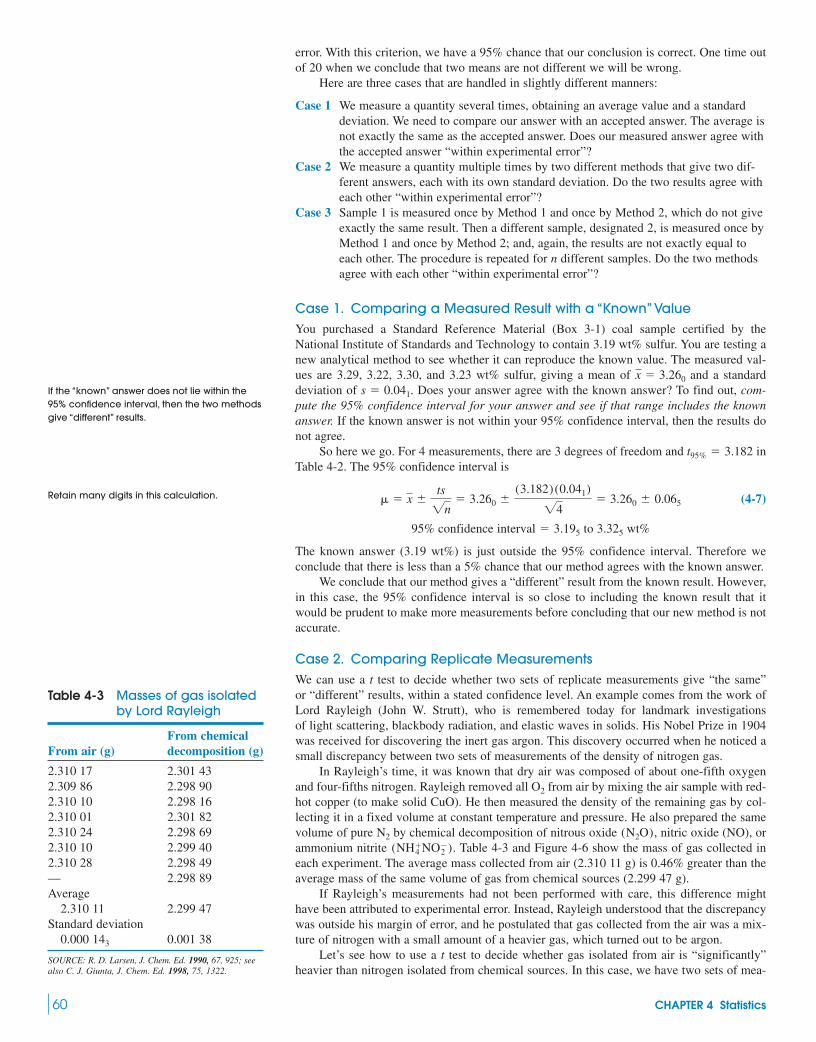
error. With this criterion, we have a 95% chance that our conclusion is correct. One time outof 20 when we conclude that two means are not different we will be wrong.
Here are three cases that are handled in slightly different manners:
Case 1 We measure a quantity several times, obtaining an average value and a standarddeviation. We need to compare our answer with an accepted answer. The average isnot exactly the same as the accepted answer. Does our measured answer agree withthe accepted answer “within experimental error”?
Case 2 We measure a quantity multiple times by two different methods that give two dif-ferent answers, each with its own standard deviation. Do the two results agree witheach other “within experimental error”?
Case 3 Sample 1 is measured once by Method 1 and once by Method 2, which do not giveexactly the same result. Then a different sample, designated 2, is measured once byMethod 1 and once by Method 2; and, again, the results are not exactly equal toeach other. The procedure is repeated for n different samples. Do the two methodsagree with each other “within experimental error”?
Case 1. Comparing a Measured Result with a “Known”ValueYou purchased a Standard Reference Material (Box 3-1) coal sample certified by theNational Institute of Standards and Technology to contain 3.19 wt% sulfur. You are testing anew analytical method to see whether it can reproduce the known value. The measured val-ues are 3.29, 3.22, 3.30, and 3.23 wt% sulfur, giving a mean of and a standarddeviation of Does your answer agree with the known answer? To find out, com-pute the 95% confidence interval for your answer and see if that range includes the knownanswer. If the known answer is not within your 95% confidence interval, then the results donot agree.
So here we go. For 4 measurements, there are 3 degrees of freedom and inTable 4-2. The 95% confidence interval is
(4-7)
95% confidence interval to wt%
The known answer (3.19 wt%) is just outside the 95% confidence interval. Therefore weconclude that there is less than a 5% chance that our method agrees with the known answer.
We conclude that our method gives a “different” result from the known result. However,in this case, the 95% confidence interval is so close to including the known result that itwould be prudent to make more measurements before concluding that our new method is notaccurate.
Case 2. Comparing Replicate MeasurementsWe can use a t test to decide whether two sets of replicate measurements give “the same”or “different” results, within a stated confidence level. An example comes from the work ofLord Rayleigh (John W. Strutt), who is remembered today for landmark investigationsof light scattering, blackbody radiation, and elastic waves in solids. His Nobel Prize in 1904was received for discovering the inert gas argon. This discovery occurred when he noticed asmall discrepancy between two sets of measurements of the density of nitrogen gas.
In Rayleigh’s time, it was known that dry air was composed of about one-fifth oxygenand four-fifths nitrogen. Rayleigh removed all from air by mixing the air sample with red-hot copper (to make solid CuO). He then measured the density of the remaining gas by col-lecting it in a fixed volume at constant temperature and pressure. He also prepared the samevolume of pure by chemical decomposition of nitrous oxide nitric oxide (NO), orammonium nitrite Table 4-3 and Figure 4-6 show the mass of gas collected ineach experiment. The average mass collected from air (2.310 11 g) is 0.46% greater than theaverage mass of the same volume of gas from chemical sources (2.299 47 g).
If Rayleigh’s measurements had not been performed with care, this difference mighthave been attributed to experimental error. Instead, Rayleigh understood that the discrepancywas outside his margin of error, and he postulated that gas collected from the air was a mix-ture of nitrogen with a small amount of a heavier gas, which turned out to be argon.
Let’s see how to use a t test to decide whether gas isolated from air is “significantly”heavier than nitrogen isolated from chemical sources. In this case, we have two sets of mea-
(NH�4 NO�
2 ).(N2O),N2
O2
3.325� 3.195
� x ts2n
� 3.260 (3.182)(0.041)24
� 3.260 0.065
t95% � 3.182
s � 0.041.x � 3.260
60 CHAPTER 4 Statistics
Retain many digits in this calculation.
If the “known” answer does not lie within the95% confidence interval, then the two methodsgive “different” results.
Table 4-3 Masses of gas isolatedby Lord Rayleigh
From chemicalFrom air (g) decomposition (g)
2.310 17 2.301 432.309 86 2.298 902.310 10 2.298 162.310 01 2.301 822.310 24 2.298 692.310 10 2.299 402.310 28 2.298 49— 2.298 89Average
2.310 11 2.299 47Standard deviation
0.000 0.001 38
SOURCE: R. D. Larsen, J. Chem. Ed. 1990, 67, 925; seealso C. J. Giunta, J. Chem. Ed. 1998, 75, 1322.
143
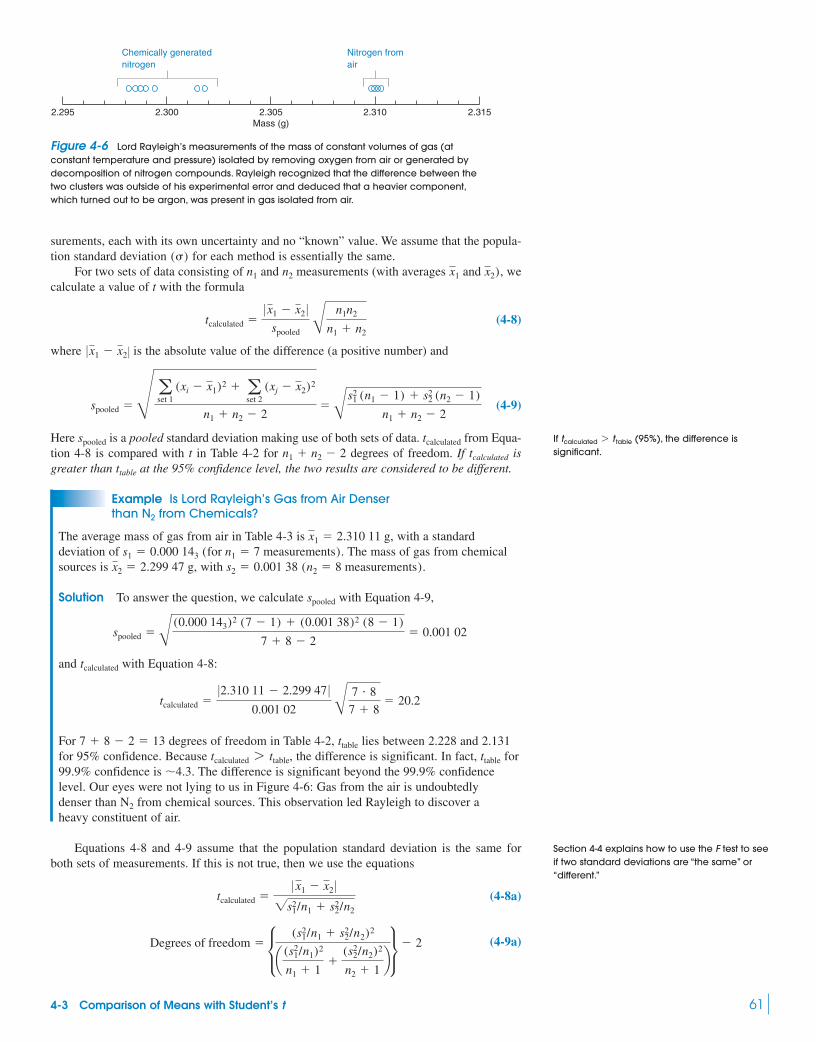
4-3 Comparison of Means with Student’s t 61
surements, each with its own uncertainty and no “known” value. We assume that the popula-tion standard deviation for each method is essentially the same.
For two sets of data consisting of and measurements (with averages and wecalculate a value of t with the formula
(4-8)
where is the absolute value of the difference (a positive number) and
(4-9)
Here is a pooled standard deviation making use of both sets of data. from Equa-tion 4-8 is compared with t in Table 4-2 for degrees of freedom. If isgreater than at the 95% confidence level, the two results are considered to be different.
Example Is Lord Rayleigh’s Gas from Air Denser than N2 from Chemicals?
The average mass of gas from air in Table 4-3 is with a standarddeviation of The mass of gas from chemicalsources is with
Solution To answer the question, we calculate with Equation 4-9,
and with Equation 4-8:
For degrees of freedom in Table 4-2, lies between 2.228 and 2.131for 95% confidence. Because the difference is significant. In fact, for99.9% confidence is The difference is significant beyond the 99.9% confidencelevel. Our eyes were not lying to us in Figure 4-6: Gas from the air is undoubtedlydenser than from chemical sources. This observation led Rayleigh to discover a heavy constituent of air.
Equations 4-8 and 4-9 assume that the population standard deviation is the same forboth sets of measurements. If this is not true, then we use the equations
(4-8a)
(4-9a)Degrees of freedom � c (s12/n1 � s2
2/n˛2)2
a (s12/n1)2
n1 � 1�
(s22/n2)2
n2 � 1bs � 2
tcalculated �0 x1 � x2 02s12/n1 � s2
2/n2
N2
�4.3.ttabletcalculated 7 ttable,
ttable7 � 8 � 2 � 13
tcalculated �02.310 11 � 2.299 47 0
0.001 02 B 7 � 8
7 � 8� 20.2
tcalculated
spooled � B (0.000 143)2 (7 � 1) � (0.001 38)2 (8 � 1)
7 � 8 � 2� 0.001 02
spooled
s2 � 0.001 38 (n2 � 8 measurements).x2 � 2.299 47 g,s1 � 0.000 143 (for n1 � 7 measurements).
x1 � 2.310 11 g,
ttable
tcalculatedn1 � n2 � 2tcalculatedspooled
spooled �R aset 1
(xi � x1)2 � aset 2
(xj � x2)2
n1 � n2 � 2� B s1
2 (n1 � 1) � s22 (n2 � 1)
n1 � n2 � 2
0 x1 � x2 �
tcalculated �0 x1 � x2 0
spooled B n1n2
n1 � n2
x2),x1n2n1
(�)
2.295 2.3152.3102.3052.300
Chemically generatednitrogen
Nitrogen fromair
Mass (g)
Figure 4-6 Lord Rayleigh’s measurements of the mass of constant volumes of gas (atconstant temperature and pressure) isolated by removing oxygen from air or generated bydecomposition of nitrogen compounds. Rayleigh recognized that the difference between thetwo clusters was outside of his experimental error and deduced that a heavier component,which turned out to be argon, was present in gas isolated from air.
If (95%), the difference issignificant.
tcalculated 7 t table
Section 4-4 explains how to use the F test to seeif two standard deviations are “the same” or“different.”
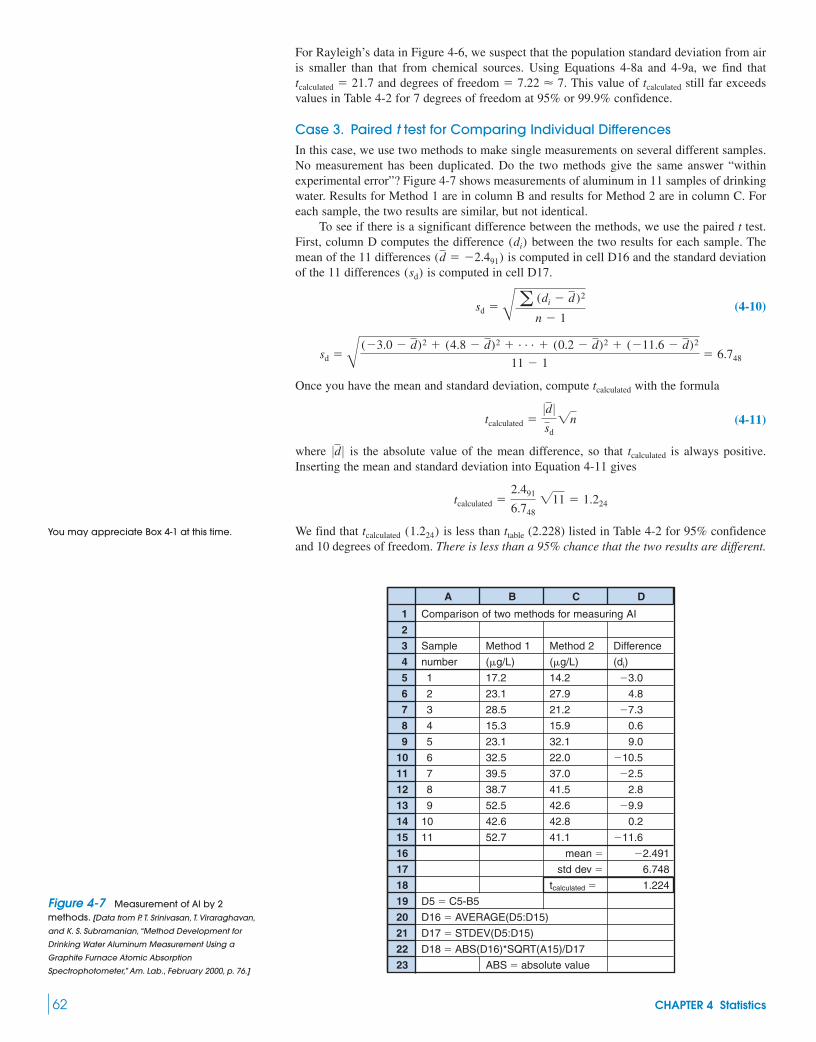
For Rayleigh’s data in Figure 4-6, we suspect that the population standard deviation from airis smaller than that from chemical sources. Using Equations 4-8a and 4-9a, we find that
and degrees of freedom This value of still far exceedsvalues in Table 4-2 for 7 degrees of freedom at 95% or 99.9% confidence.
Case 3. Paired t test for Comparing Individual DifferencesIn this case, we use two methods to make single measurements on several different samples.No measurement has been duplicated. Do the two methods give the same answer “withinexperimental error”? Figure 4-7 shows measurements of aluminum in 11 samples of drinkingwater. Results for Method 1 are in column B and results for Method 2 are in column C. Foreach sample, the two results are similar, but not identical.
To see if there is a significant difference between the methods, we use the paired t test.First, column D computes the difference between the two results for each sample. Themean of the 11 differences is computed in cell D16 and the standard deviationof the 11 differences is computed in cell D17.
(4-10)
Once you have the mean and standard deviation, compute with the formula
(4-11)
where is the absolute value of the mean difference, so that is always positive.Inserting the mean and standard deviation into Equation 4-11 gives
We find that is less than (2.228) listed in Table 4-2 for 95% confidenceand 10 degrees of freedom. There is less than a 95% chance that the two results are different.
ttable(1.224)tcalculated
tcalculated �2.491
6.748211 � 1.224
tcalculated0d 0tcalculated �
0d 0sd2n
tcalculated
sd � B (�3.0 � d)2 � (4.8 � d)2 � . . . � (0.2 � d)2 � (�11.6 � d)2
11 � 1� 6.748
sd � B a (di � d )2
n � 1
(sd)(d � �2.491)
(di)
tcalculated� 7.22 � 7.tcalculated � 21.7
62 CHAPTER 4 Statistics
A B C D
1 Comparison of two methods for measuring AI
2
3 Sample Method 1 Method 2 Difference
4 number ( g/L) ( g/L) (di)
5 1 17.2 14.2 �3.0
6 2 23.1 27.9 4.8
7 3 28.5 21.2 �7.3
8 4 15.3 15.9 0.6
9 5 23.1 32.1 9.0
10 6 32.5 22.0 �10.5
11 7 39.5 37.0 �2.5
12 8 38.7 41.5 2.8
13 9 52.5 42.6 �9.9
14 10 42.6 42.8 0.2
15 11 52.7 41.1 �11.6
16 mean � �2.491
17 std dev � 6.748
18 tcalculated � 1.224
19 D5 � C5-B5
20 D16 � AVERAGE(D5:D15)
21 D17 � STDEV(D5:D15)
22 D18 � ABS(D16)*SQRT(A15)/D17
23 ABS � absolute value
Figure 4-7 Measurement of Al by 2methods. [Data from P. T. Srinivasan, T. Viraraghavan,
and K. S. Subramanian, “Method Development for
Drinking Water Aluminum Measurement Using a
Graphite Furnace Atomic Absorption
Spectrophotometer,” Am. Lab., February 2000, p. 76.]
You may appreciate Box 4-1 at this time.
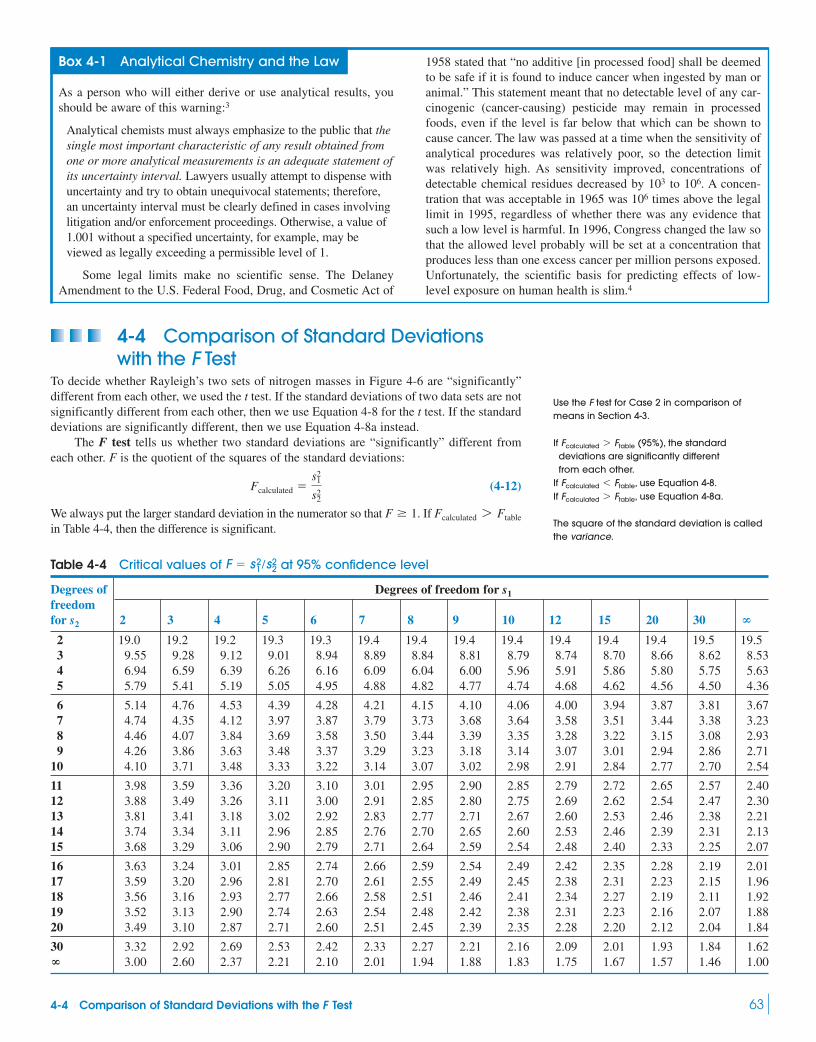
4-4 Comparison of Standard Deviations with the F Test 63
Box 4-1 Analytical Chemistry and the Law
As a person who will either derive or use analytical results, youshould be aware of this warning:3
Analytical chemists must always emphasize to the public that thesingle most important characteristic of any result obtained fromone or more analytical measurements is an adequate statement ofits uncertainty interval. Lawyers usually attempt to dispense withuncertainty and try to obtain unequivocal statements; therefore,an uncertainty interval must be clearly defined in cases involvinglitigation and/or enforcement proceedings. Otherwise, a value of1.001 without a specified uncertainty, for example, may beviewed as legally exceeding a permissible level of 1.
Some legal limits make no scientific sense. The DelaneyAmendment to the U.S. Federal Food, Drug, and Cosmetic Act of
1958 stated that “no additive [in processed food] shall be deemedto be safe if it is found to induce cancer when ingested by man oranimal.” This statement meant that no detectable level of any car-cinogenic (cancer-causing) pesticide may remain in processedfoods, even if the level is far below that which can be shown tocause cancer. The law was passed at a time when the sensitivity ofanalytical procedures was relatively poor, so the detection limitwas relatively high. As sensitivity improved, concentrations ofdetectable chemical residues decreased by to A concen-tration that was acceptable in 1965 was times above the legallimit in 1995, regardless of whether there was any evidence thatsuch a low level is harmful. In 1996, Congress changed the law sothat the allowed level probably will be set at a concentration thatproduces less than one excess cancer per million persons exposed.Unfortunately, the scientific basis for predicting effects of low-level exposure on human health is slim.4
106106.103
4-4 Comparison of Standard Deviationswith the F Test
To decide whether Rayleigh’s two sets of nitrogen masses in Figure 4-6 are “significantly”different from each other, we used the t test. If the standard deviations of two data sets are notsignificantly different from each other, then we use Equation 4-8 for the t test. If the standarddeviations are significantly different, then we use Equation 4-8a instead.
The F test tells us whether two standard deviations are “significantly” different fromeach other. F is the quotient of the squares of the standard deviations:
(4-12)
We always put the larger standard deviation in the numerator so that If in Table 4-4, then the difference is significant.
Fcalculated 7 FtableF � 1.
Fcalculated �s1
2
s22
Table 4-4 Critical values of at 95% confidence level
Degrees of Degrees of freedom for s1
freedom for s2 2 3 4 5 6 7 8 9 10 12 15 20 30 �
2 19.0 19.2 19.2 19.3 19.3 19.4 19.4 19.4 19.4 19.4 19.4 19.4 19.5 19.53 9.55 9.28 9.12 9.01 8.94 8.89 8.84 8.81 8.79 8.74 8.70 8.66 8.62 8.534 6.94 6.59 6.39 6.26 6.16 6.09 6.04 6.00 5.96 5.91 5.86 5.80 5.75 5.635 5.79 5.41 5.19 5.05 4.95 4.88 4.82 4.77 4.74 4.68 4.62 4.56 4.50 4.36
6 5.14 4.76 4.53 4.39 4.28 4.21 4.15 4.10 4.06 4.00 3.94 3.87 3.81 3.677 4.74 4.35 4.12 3.97 3.87 3.79 3.73 3.68 3.64 3.58 3.51 3.44 3.38 3.238 4.46 4.07 3.84 3.69 3.58 3.50 3.44 3.39 3.35 3.28 3.22 3.15 3.08 2.939 4.26 3.86 3.63 3.48 3.37 3.29 3.23 3.18 3.14 3.07 3.01 2.94 2.86 2.71
10 4.10 3.71 3.48 3.33 3.22 3.14 3.07 3.02 2.98 2.91 2.84 2.77 2.70 2.54
11 3.98 3.59 3.36 3.20 3.10 3.01 2.95 2.90 2.85 2.79 2.72 2.65 2.57 2.4012 3.88 3.49 3.26 3.11 3.00 2.91 2.85 2.80 2.75 2.69 2.62 2.54 2.47 2.3013 3.81 3.41 3.18 3.02 2.92 2.83 2.77 2.71 2.67 2.60 2.53 2.46 2.38 2.2114 3.74 3.34 3.11 2.96 2.85 2.76 2.70 2.65 2.60 2.53 2.46 2.39 2.31 2.1315 3.68 3.29 3.06 2.90 2.79 2.71 2.64 2.59 2.54 2.48 2.40 2.33 2.25 2.07
16 3.63 3.24 3.01 2.85 2.74 2.66 2.59 2.54 2.49 2.42 2.35 2.28 2.19 2.0117 3.59 3.20 2.96 2.81 2.70 2.61 2.55 2.49 2.45 2.38 2.31 2.23 2.15 1.9618 3.56 3.16 2.93 2.77 2.66 2.58 2.51 2.46 2.41 2.34 2.27 2.19 2.11 1.9219 3.52 3.13 2.90 2.74 2.63 2.54 2.48 2.42 2.38 2.31 2.23 2.16 2.07 1.8820 3.49 3.10 2.87 2.71 2.60 2.51 2.45 2.39 2.35 2.28 2.20 2.12 2.04 1.84
30 3.32 2.92 2.69 2.53 2.42 2.33 2.27 2.21 2.16 2.09 2.01 1.93 1.84 1.62� 3.00 2.60 2.37 2.21 2.10 2.01 1.94 1.88 1.83 1.75 1.67 1.57 1.46 1.00
F � s21 /s2
2
If (95%), the standarddeviations are significantly differentfrom each other.
Fcalculated 7 Ftable
If , use Equation 4-8.Fcalculated 6 Ftable
If , use Equation 4-8a.Fcalculated 7 Ftable
The square of the standard deviation is calledthe variance.
Use the F test for Case 2 in comparison ofmeans in Section 4-3.
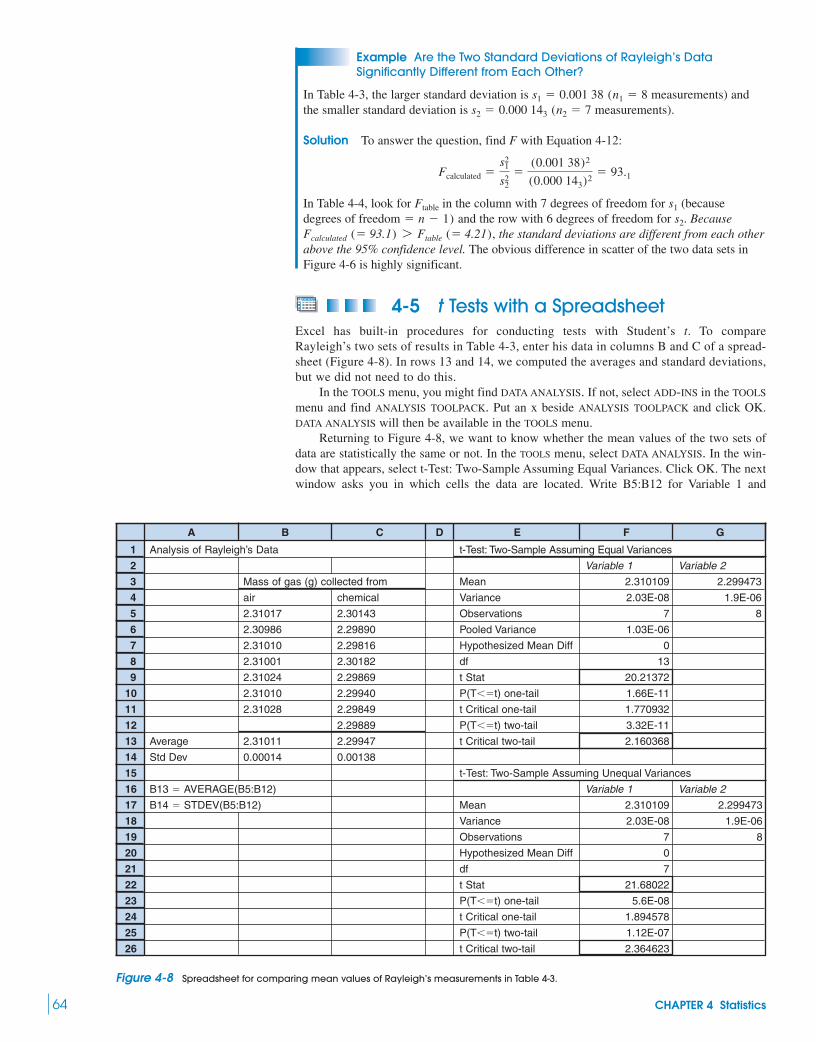
64 CHAPTER 4 Statistics
Example Are the Two Standard Deviations of Rayleigh’s DataSignificantly Different from Each Other?
In Table 4-3, the larger standard deviation is measurements) andthe smaller standard deviation is measurements).
Solution To answer the question, find F with Equation 4-12:
In Table 4-4, look for in the column with 7 degrees of freedom for (becausedegrees of freedom and the row with 6 degrees of freedom for Because
the standard deviations are different from each otherabove the 95% confidence level. The obvious difference in scatter of the two data sets inFigure 4-6 is highly significant.
4-5 t Tests with a SpreadsheetExcel has built-in procedures for conducting tests with Student’s t. To compareRayleigh’s two sets of results in Table 4-3, enter his data in columns B and C of a spread-sheet (Figure 4-8). In rows 13 and 14, we computed the averages and standard deviations,but we did not need to do this.
In the TOOLS menu, you might find DATA ANALYSIS. If not, select ADD-INS in the TOOLS
menu and find ANALYSIS TOOLPACK. Put an x beside ANALYSIS TOOLPACK and click OK.DATA ANALYSIS will then be available in the TOOLS menu.
Returning to Figure 4-8, we want to know whether the mean values of the two sets ofdata are statistically the same or not. In the TOOLS menu, select DATA ANALYSIS. In the win-dow that appears, select t-Test: Two-Sample Assuming Equal Variances. Click OK. The nextwindow asks you in which cells the data are located. Write B5:B12 for Variable 1 and
(� 4.21),(� 93.1) 7 FtableFcalculated
s2.� n � 1)s1Ftable
Fcalculated �s1
2
s22
�(0.001 38)2
(0.000 143)2� 93.1
(n2 � 7s2 � 0.000 143
(n1 � 8s1 � 0.001 38
A B C D E F G
1 Analysis of Rayleigh’s Data t-Test: Two-Sample Assuming Equal Variances
2 Variable 1 Variable 2
3 Mass of gas (g) collected from Mean 2.310109 2.299473
4 air chemical Variance 2.03E-08 1.9E-06
5 2.31017 2.30143 Observations 7 8
6 2.30986 2.29890 Pooled Variance 1.03E-06
7 2.31010 2.29816 Hypothesized Mean Diff 0
8 2.31001 2.30182 df 13
9 2.31024 2.29869 t Stat 20.21372
10 2.31010 2.29940 P(T��t) one-tail 1.66E-11
11 2.31028 2.29849 t Critical one-tail 1.770932
12 2.29889 P(T��t) two-tail 3.32E-11
13 Average 2.31011 2.29947 t Critical two-tail 2.160368
14 Std Dev 0.00014 0.00138
15 t-Test: Two-Sample Assuming Unequal Variances
16 B13 � AVERAGE(B5:B12) Variable 1 Variable 2
17 B14 � STDEV(B5:B12) Mean 2.310109 2.299473
18 Variance 2.03E-08 1.9E-06
19 Observations 7 8
20 Hypothesized Mean Diff 0
21 df 7
22 t Stat 21.68022
23 P(T��t) one-tail 5.6E-08
24 t Critical one-tail 1.894578
25 P(T��t) two-tail 1.12E-07
26 t Critical two-tail 2.364623
Figure 4-8 Spreadsheet for comparing mean values of Rayleigh’s measurements in Table 4-3.

C5:C12 for Variable 2. The routine ignores the blank space in cell B12. For the HypothesizedMean Difference enter 0 and for Alpha enter 0.05. Alpha is the level of probability to whichwe are testing the difference in the means. With Alpha we are at the 95% confidencelevel. For Output Range, select cell E1 and click OK.
Excel now goes to work and prints results in cells E1 to G13 of Figure 4-8. Mean valuesare in cells F3 and G3. Cells F4 and G4 give variance, which is the square of the standarddeviation. Cell F6 gives pooled variance computed with Equation 4-9. That equation waspainful to use by hand. Cell F8 shows degrees of freedom and from Equation 4-8 appears in cell F9.
At this point in Section 4-3, we consulted Table 4-2 to find that lies between 2.228and 2.131 for 95% confidence and 13 degrees of freedom. Excel gives us the critical value oft (2.160) in cell F13 of Figure 4-8. Because we con-clude that the two means are not the same. The difference is significant. Cell F12 states thatthe probability of observing these two mean values and standard deviations by randomchance if the mean values were really the same is The difference is highly sig-nificant. For any value of in cell F12, we would reject the null hypothesis and con-clude that the means are not the same.
The F test in Equation 4-12 told us that the standard deviations of Rayleigh’s two exper-iments are different. Therefore, we can select the other t test found in the TOOLS menu in theDATA ANALYSIS choices. Select t-Test: Two-Sample Assuming Unequal Variances and fill inthe blanks exactly as before. Results based on Equations 4-8a and 4-9a are displayed in cellsE15 to G26 of Figure 4-8. Just as we found in Section 4-3, the degrees of freedom are (cell F21) and (cell F22). Because is greater than the critical value oft (2.36 in cell F26), we reject the null hypothesis and conclude that the two means are signif-icantly different.
4-6 Q Test for Bad DataSometimes one datum is inconsistent with the remaining data. You can use the Q test to helpdecide whether to retain or discard a questionable datum. Consider the five results 12.53,12.56, 12.47, 12.67, and 12.48. Is 12.67 a “bad point”? To apply the Q test, arrange the datain order of increasing value and calculate Q, defined as
(4-13)
12.47 12.48 12.53 12.56 12.67
The range is the total spread of the data. The gap is the difference between the questionablepoint and the nearest value.
If the questionable point should be discarded. In the preceding exam-ple, In Table 4-5, we find Because
the questionable point should be retained. There is more than a 10% chance that thevalue 12.67 is a member of the same population as the other four numbers.
Some people would argue that you should never discard a datum unless you know thatthere was an error in the procedure that led to that particular measurement. Others wouldrepeat the questionable measurement several more times to gain higher confidence that onemeasurement is really out of line (or not). The decision is yours and it is subjective.
4-7 The Method of Least SquaresFor most chemical analyses, the response of the procedure must be evaluated for knownquantities of analyte (called standards) so that the response to an unknown quantity can beinterpreted. For this purpose, we commonly prepare a calibration curve, such as the one forcaffeine in Figure 0-7. Most often, we work in a region where the calibration curve is astraight line.
We use the method of least squares to draw the “best” straight line through experimen-tal data points that have some scatter and do not lie perfectly on a straight line.6 The best linewill be such that some of the points lie above and some lie below the line. We will learn to
Qtable,Qcalculated 6Qtable � 0.64.Qcalculated � 0.11/0.20 � 0.55.
Qcalculated 7 Qtable,
Range � 0.20
Questionablevalue
(too high?)
Gap � 0.11
Qcalculated �gap
range
tcalculatedtcalculated � 21.7df � 7
P � 0.053.32 10�11.
(� 20.2) 7 ttable (� 2.160),tcalculated
ttable
tcalculated � 20.2(df � 13)
� 0.05,
4-7 The Method of Least Squares 65
Note 5 for this chapter (in the Notes andReferences section of the book) explains whatis meant by 1-tail and 2-tail in the Excel outputin Figure 4-8. We use the 2-tailed test in thisbook.
Table 4-5 is based on 90% confidence. Ifdiscard the questionable
point.Qcalculated 7 Q table,
Table 4-5 Values of Q forrejection of data
Q Number of(90% confidence)a observations
0.76 40.64 50.56 60.51 70.47 80.44 90.41 10
a. Q gap/range. If the value inquestion can be rejected with 90% confidence.
SOURCE: R. B. Dean and W. J. Dixon, Anal. Chem. 1951, 23,636; see also D. R. Rorabacher, Anal. Chem. 1991, 63, 139.
Qcalculated 7 Qtable,�

estimate the uncertainty in a chemical analysis from the uncertainties in the calibration curveand in the measured response to replicate samples of unknown.
Finding the Equation of the LineThe procedure we use assumes that the errors in the y values are substantially greater than theerrors in the x values.7 This condition is usually true in a calibration curve in which theexperimental response (y values) is less certain than the quantity of analyte (x values). A sec-ond assumption is that uncertainties (standard deviations) in all the y values are similar.
Suppose we seek to draw the best straight line through the points in Figure 4-9 by mini-mizing the vertical deviations between the points and the line. We minimize only the verticaldeviations because we assume that uncertainties in y values are much greater than uncertain-ties in x values.
Let the equation of the line be
Equation of straight line: (4-14)
in which m is the slope and b is the y-intercept. The vertical deviation for the point inFigure 4-9 is where y is the ordinate of the straight line when
(4-15)
Some of the deviations are positive and some are negative. Because we wish to mini-mize the magnitude of the deviations irrespective of their signs, we square all the deviationsso that we are dealing only with positive numbers:
Because we minimize the squares of the deviations, this is called the method of least squares.It can be shown that minimizing the squares of the deviations (rather than simply their mag-nitudes) corresponds to assuming that the set of y values is the most probable set.
Finding values of m and b that minimize the sum of the squares of the vertical devia-tions involves some calculus, which we omit. We will express the final solution for slopeand intercept in terms of determinants, which summarize certain arithmetic operations. The
determinant represents the value So, for example,
`6 5
4 3` � (6 3) � (5 4) � �2
eh � fg.` e f
g h`
d2i � (yi � y)2 � (yi � mxi � b)2
Vertical deviation � di � yi � y � yi � (mxi � b)
x � xi.yi � y,(xi, yi)
y � mx � b
66 CHAPTER 4 Statistics
5
6
y
x54321
4
3
2
1 Intercept = b
y = mx + b
Slope = = m∆y∆x
∆y
∆x
(xi, yi)
σy
Verticaldeviation
= yi – y
Figure 4-9 Least-squares curve fitting. The points (1,2) and (6,5) do not fall exactly on the solid line,but they are too close to the line to show their deviations. The Gaussian curve drawn over the point(3,3) is a schematic indication of the fact that each value of yi is normally distributed about the straightline. That is, the most probable value of y will fall on the line, but there is a finite probability ofmeasuring y some distance from the line.
Equation for a straight line:
Slope (m)
y-Intercept (b) crossing point on y-axis�
��y�x
�y2 � y1
x2 � x1
y � mx � b
y
b
(x1, y1)∆y = y2 – y1
(x2, y2)
∆x = x2 – x1
x
To evaluate the determinant, multiply thediagonal elements and then subtractthe product of the other diagonal elements
e——f
g——h
�
�
�
f g.
e h

The slope and the intercept of the “best” straight line are found to be
Slope: (4-16)
Intercept: (4-17)
where D is
(4-18)
and n is the number of points.Let’s use these equations to find the slope and intercept of the best straight line through
the four points in Figure 4-9. The work is set out in Table 4-6. Noting that and puttingthe various sums into the determinants in Equations 4-16, 4-17, and 4-18 gives
The equation of the best straight line through the points in Figure 4-9 is therefore
We tackle the question of significant figures for m and b in the next section.
Example Finding Slope and Intercept with a Spreadsheet
Your scientific calculator has a procedure for computing the slope and intercept of a setof data, and you should learn how to use that procedure. Alternatively, Excel hasfunctions called SLOPE and INTERCEPT whose use is illustrated here:
The slope in cell D3 is computed with the formula “ ”, whereB2:B5 is the range containing the y values and A2:A5 is the range containing x values.
How Reliable Are Least-Squares Parameters?To estimate the uncertainties (expressed as standard deviations) in the slope and intercept, anuncertainty analysis must be performed on Equations 4-16 and 4-17. Because the uncertain-ties in m and b are related to the uncertainty in measuring each value of y, we first estimatethe standard deviation that describes the population of y values. This standard deviation, characterizes the little Gaussian curve inscribed in Figure 4-9.
We estimate the population standard deviation of all y values, by calculating thestandard deviation, for the four measured values of The deviation of each value of fromyiy.
sy,�y,
�y,
� SLOPE(B2:B5,A2:A5)
(x,y)
y � 0.615 38x � 1.346 15
b � `62 57
14 14` � `62 14
14 4` �
(62 14) � (57 14)
(62 4) � (14 14)�
70
52� 1.346 15
m � `57 14
14 4` � `62 14
14 4` �
(57 4) � (14 14)
(62 4) � (14 14)�
32
52� 0.615 38
n � 4
D � `� (x2i ) �xi
�xi n`
b � `� (x2i ) �(xiyi)
�xi �yi` � D
m � `� (xiyi) �xi
�yi n` � D
4-7 The Method of Least Squares 67
dLeast-squares“best” line
A B C D E F
1 x y Formulas:
2 1 2 slope �
3 3 3 0.61538 D3 � SLOPE(B2:B5,A2:A5)
4 4 4 intercept �
5 6 5 1.34615 D5 � INTERCEPT(B2:B5,A2:A5)
Table 4-6 Calculations for least-squares analysis
xi yi xi yi x2i
1 2 2 1 0.038 46 0.001 479 33 3 9 9 �0.192 31 0.036 9824 4 16 16 0.192 31 0.036 9826 5 30 36 �0.038 46 0.001 479 3
� (d2i ) � 0.076 923�(x˛
2i ) � 62�(xiyi) � 57�yi � 14�xi � 14
d2idi(� yi � mxi � b)
Translation of least-squares equations:
b ��(x2
i )�yi � (�xiyi )�xi
n�(x2i ) � (�xi )2
m �n�(xiyi) � �xi�yi
n�(x2i ) � (�xi)2
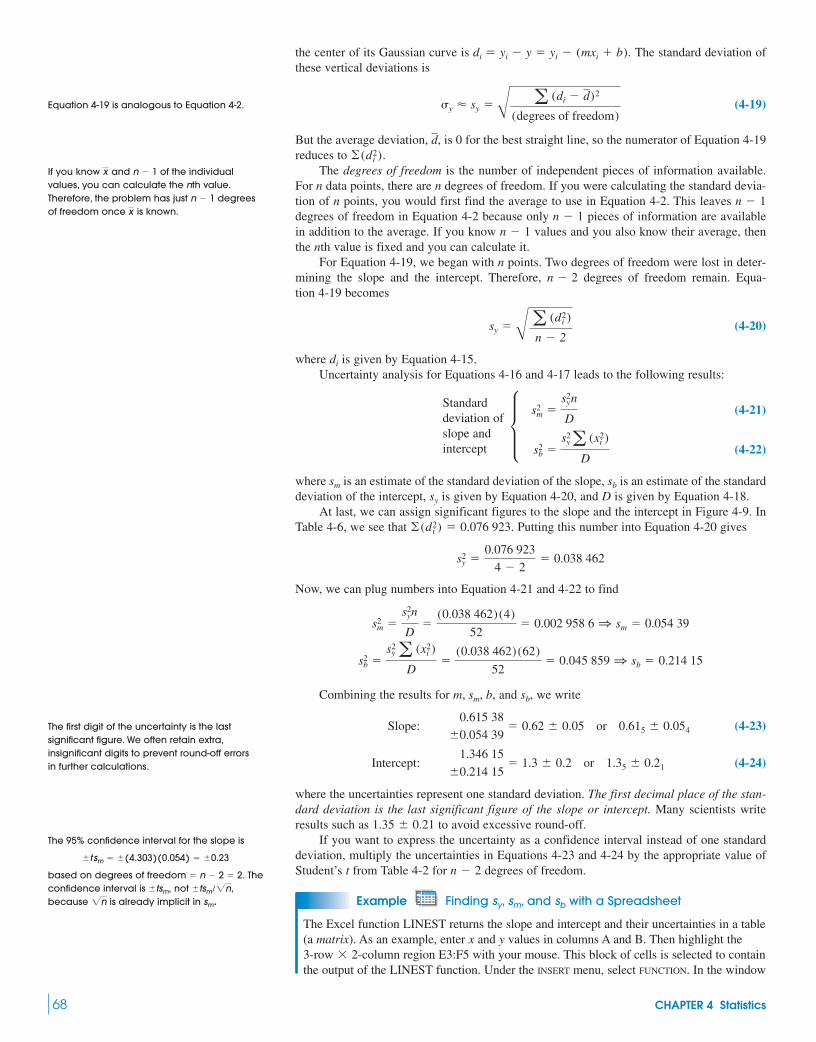
the center of its Gaussian curve is The standard deviation ofthese vertical deviations is
(4-19)
But the average deviation, is 0 for the best straight line, so the numerator of Equation 4-19reduces to
The degrees of freedom is the number of independent pieces of information available.For n data points, there are n degrees of freedom. If you were calculating the standard devia-tion of n points, you would first find the average to use in Equation 4-2. This leaves degrees of freedom in Equation 4-2 because only pieces of information are availablein addition to the average. If you know values and you also know their average, thenthe nth value is fixed and you can calculate it.
For Equation 4-19, we began with n points. Two degrees of freedom were lost in deter-mining the slope and the intercept. Therefore, degrees of freedom remain. Equa-tion 4-19 becomes
(4-20)
where is given by Equation 4-15.Uncertainty analysis for Equations 4-16 and 4-17 leads to the following results:
(4-21)
(4-22)
where is an estimate of the standard deviation of the slope, is an estimate of the standarddeviation of the intercept, is given by Equation 4-20, and D is given by Equation 4-18.
At last, we can assign significant figures to the slope and the intercept in Figure 4-9. InTable 4-6, we see that Putting this number into Equation 4-20 gives
Now, we can plug numbers into Equation 4-21 and 4-22 to find
Combining the results for and we write
(4-23)
(4-24)
where the uncertainties represent one standard deviation. The first decimal place of the stan-dard deviation is the last significant figure of the slope or intercept. Many scientists writeresults such as to avoid excessive round-off.
If you want to express the uncertainty as a confidence interval instead of one standarddeviation, multiply the uncertainties in Equations 4-23 and 4-24 by the appropriate value ofStudent’s t from Table 4-2 for degrees of freedom.
Example Finding sy, sm, and sb with a Spreadsheet
The Excel function LINEST returns the slope and intercept and their uncertainties in a table(a matrix). As an example, enter x and y values in columns A and B. Then highlight the
region E3:F5 with your mouse. This block of cells is selected to containthe output of the LINEST function. Under the INSERT menu, select FUNCTION. In the window3-row 2-column
n � 2
1.35 0.21
Intercept: 1.346 15
0.214 15� 1.3 0.2 or 1.35 0.21
Slope: 0.615 38
0.054 39� 0.62 0.05 or 0.615 0.054
sb,m, sm, b,
s2b �
s2ya (x2
i )
D�
(0.038 462)(62)
52� 0.045 859 1 sb � 0.214 15
s2m �
s2yn
D�
(0.038 462)(4)
52� 0.002 958 6 1 sm � 0.054 39
s2y �
0.076 923
4 � 2� 0.038 462
�(d2i ) � 0.076 923.
sy
sbsm
s2b �
s2ya (x2
i )
D
s2m �
s2yn
D
di
sy � B a (d2i )
n � 2
n � 2
n � 1n � 1
n � 1
� (d2i ).
d,
�y � sy � B a (di � d)2
(degrees of freedom)
di � yi � y � yi � (mxi � b).
68 CHAPTER 4 Statistics
dStandarddeviation ofslope andintercept
Equation 4-19 is analogous to Equation 4-2.
If you know and of the individualvalues, you can calculate the nth value.Therefore, the problem has just degreesof freedom once is known.x
n � 1
n � 1x
The first digit of the uncertainty is the lastsignificant figure. We often retain extra,insignificant digits to prevent round-off errorsin further calculations.
The 95% confidence interval for the slope is
based on degrees of freedom Theconfidence interval is not because is already implicit in sm.2n
tsm/2n,tsm,� n � 2 � 2.
tsm � (4.303)(0.054) � 0.23

4-8 Calibration Curves 69
A B C D E F G
1 x y Output from LINEST
2 1 2 Slope Intercept
3 3 3 Parameter 0.61538 1.34615
4 4 4 Std Dev 0.05439 0.21414
5 6 5 R^2 0.98462 0.19612 Std Dev (y)
6
7 Highlight cells E3:F5
8 Type "� LINEST(B2:B5,A2:A5,TRUE,TRUE)"
9 Press CTRL�SHIFT�ENTER (on PC)
10 Press COMMAND�RETURN (on Mac)
that appears, go to Statistical and double click on LINEST. The new window asks for fourinputs to the function. For y values, enter B2:B5. Then enter A2:A5 for x values. The nexttwo entries are both “TRUE”. The first TRUE tells Excel that we want to compute they-intercept of the least-squares line and not force the intercept to be 0. The second TRUEtells Excel to print out the standard deviations as well as the slope and intercept. Theformula you have just entered is Click OKand the slope appears in cell E3.
The output of LINEST should be a matrix, not a single number. What went wrong?To tell the computer that you want a matrix, go back and highlight cells E3:F5.
appears once again in the formula line. Nowpress on a PC or (�) on a Mac.Excel dutifully prints out a matrix in cells E3:F5. Write labels around the block to indicatewhat is in each cell. The slope and intercept are on the top line. The second line contains
and Cell F5 contains and cell E5 contains a quantity called which is defined inEquation 5-2 and is a measure of the goodness of fit of the data to the line. The closer is to unity, the better the fit.
4-8 Calibration CurvesA calibration curve shows the response of an analytical method to known quantities of ana-lyte.8 Table 4-7 gives real data from a protein analysis that produces a colored product. Aspectrophotometer measures the absorbance of light, which is proportional to the quantity ofprotein analyzed. Solutions containing known concentrations of analyte are called standardsolutions. Solutions containing all the reagents and solvents used in the analysis, but nodeliberately added analyte, are called blank solutions. Blanks measure the response of theanalytical procedure to impurities or interfering species in the reagents.
When we scan across the three absorbance values in each row of Table 4-7, the number0.392 seems out of line: It is inconsistent with the other values for and the range ofvalues for the samples is much bigger than the range for the other samples. The lin-ear relation between the average values of absorbance up to the sample also indi-cates that the value 0.392 is in error (Figure 4-10). We choose to omit 0.392 from subsequentcalculations.
It is reasonable to ask whether all three absorbances for the samples are low forsome unknown reason, because this point falls below the straight line in Figure 4-10. Repeti-tion of this analysis shows that the point is consistently below the straight line andthere is nothing “wrong” with the data in Table 4-7.
25.0- g
25.0- g
20.0- g15.0- g
15.0 g,
R2R2,sysb.sm
�RETURNCOMMANDCONTROL�SHIFT�ENTER“� LINEST(B2:B5,A2:A5,TRUE,TRUE)”
“� LINEST(B2:B5,A2:A5,TRUE,TRUE)”.
Table 4-7 Spectrophotometer data used to construct calibration curve
Amount of Absorbance ofprotein (�g) independent samples Range Corrected absorbance
0 0.099 0.099 0.100 0.001 �0.0033 �0.0033 0.0007
5.0 0.185 0.187 0.188 0.003 0.0857 0.0877 0.0887
10.0 0.282 0.272 0.272 0.010 0.1827 0.1727 0.1727
15.0 0.345 0.347 (0.392) 0.047 0.2457 0.2477 —20.0 0.425 0.425 0.430 0.005 0.3257 0.3257 0.3307
25.0 0.483 0.488 0.496 0.013 0.3837 0.3887 0.3967
0.400
25
Abs
orba
nce
Protein analyzed (µg)5 10 15 20
0.300
0.200
0.100
Average withquestionable
point
Questionabledata point
Average withoutquestionable point
Figure 4-10 Average absorbance values inTable 4-7 versus micrograms of proteinanalyzed. Averages for 0 to of protein lieon a straight line if the questionable datum0.392 at is omitted.15 m
20 g
Sections 18-1 and 18-2 discuss absorption oflight and define the term absorbance. Wewill use concepts from these two sectionsthroughout this book. You may want to readthese sections for background.

Constructing a Calibration CurveWe adopt the following procedure for constructing a calibration curve:
Step 1 Prepare known samples of analyte covering a range of concentrations expected forunknowns. Measure the response of the analytical procedure to these standards togenerate data like the left half of Table 4-7.
Step 2 Subtract the average absorbance of the blank samples from each measuredabsorbance to obtain corrected absorbance. The blank measures the response ofthe procedure when no protein is present.
Step 3 Make a graph of corrected absorbance versus quantity of protein analyzed(Figure 4-11). Use the least-squares procedure to find the best straight line throughthe linear portion of the data, up to and including of protein (14 points,including the 3 corrected blanks, in the shaded portion of Table 4-7). Find the slopeand intercept and uncertainties with Equations 4-16, 4-17, 4-20, 4-21, and 4-22.The results are
The equation of the linear calibration line is
14243 1442443y x
(4-25)
where y is the corrected absorbance Step 4 If you analyze an unknown solution at a future time, run a blank at the same time.
Subtract the new blank absorbance from the unknown absorbance to obtain thecorrected absorbance.
Example Using a Linear Calibration Curve
An unknown protein sample gave an absorbance of 0.406, and a blank had an absorbanceof 0.104. How many micrograms of protein are in the unknown?
Solution The corrected absorbance is which lies on the linearportion of the calibration curve in Figure 4-11. Equation 4-25 therefore becomes
(4-26)
We prefer calibration procedures with a linear response, in which the corrected analyt-ical signal is proportional to the quantity ofanalyte. Although we try to work in the linear range, you can obtain valid results beyond the
(� signal from sample � signal from blank)
g of protein �absorbance � 0.0047
0.016 30�
0.302 � 0.0047
0.016 30� 18.24 g
0.406 � 0.104 � 0.302,
(� observed absorbance � blank absorbance).
� (0.016 30)( g of protein) � 0.0047
absorbance � m ( g of protein) � b
b � 0.0047 sb � 0.0026
m � 0.016 30 sm � 0.000 22 sy � 0.0059
20.0 g
(0.0993)
70 CHAPTER 4 Statistics
0.40
25
Cor
rect
ed a
bsor
banc
e
Amount of protein (µg)2015105
0.35
0.30
0.25
0.20
0.15
0.10
0.05
0.00
–0.050
Quadraticcalibrationcurve
Unknown in linear region
Unknown beyond linear region
Linearcalibrationcurve
Figure 4-11 Calibration curve for proteinanalysis in Table 4-7. The equation of the solidstraight line fitting the 14 data points (opencircles) from 0 to derived by the methodof least squares, is
The standard deviation of y isThe equation of the dashed
quadratic curve that fits all 17 data points from0 to determined by a nonlinear least-squares procedure6 is
with sy � 0.0046.0.000 7 (0.001 0),� 0.018 58 (0.000 46)x �10�4 x2
y � �1.17 (0.21)
25 g,
sy � 0.0059.0.0047 (0.0026).
y � 0.016 30 (0.000 22)x �
20 g,
Absorbance of the blank can arise fromthe color of starting reagents, reactions ofimpurities, and reactions of interferingspecies. Blank values can vary from one setof reagents to another, but correctedabsorbance should not.
Equation of calibration line:
y (sy) � [m (sm) ]x � [b (sb) ]
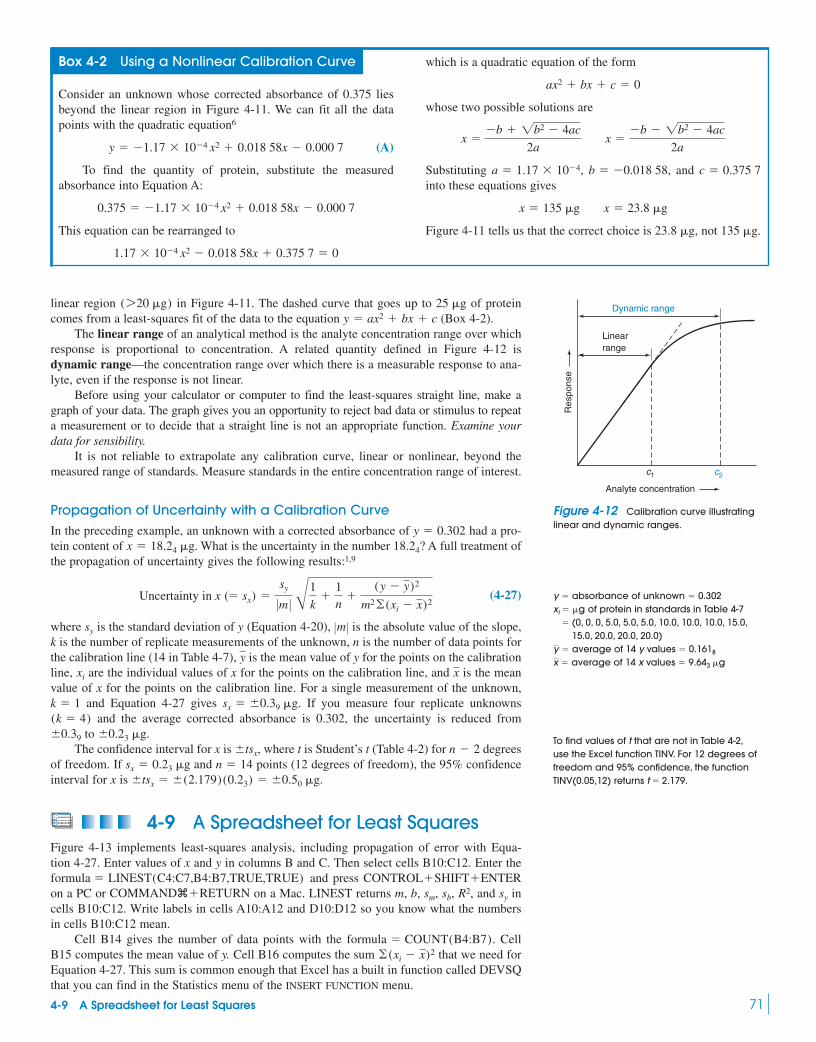
linear region in Figure 4-11. The dashed curve that goes up to of proteincomes from a least-squares fit of the data to the equation (Box 4-2).
The linear range of an analytical method is the analyte concentration range over whichresponse is proportional to concentration. A related quantity defined in Figure 4-12 isdynamic range—the concentration range over which there is a measurable response to ana-lyte, even if the response is not linear.
Before using your calculator or computer to find the least-squares straight line, make agraph of your data. The graph gives you an opportunity to reject bad data or stimulus to repeata measurement or to decide that a straight line is not an appropriate function. Examine yourdata for sensibility.
It is not reliable to extrapolate any calibration curve, linear or nonlinear, beyond themeasured range of standards. Measure standards in the entire concentration range of interest.
Propagation of Uncertainty with a Calibration CurveIn the preceding example, an unknown with a corrected absorbance of had a pro-tein content of What is the uncertainty in the number A full treatment ofthe propagation of uncertainty gives the following results:1,9
(4-27)
where is the standard deviation of y (Equation 4-20), is the absolute value of the slope,k is the number of replicate measurements of the unknown, n is the number of data points forthe calibration line (14 in Table 4-7), is the mean value of y for the points on the calibrationline, are the individual values of x for the points on the calibration line, and is the meanvalue of x for the points on the calibration line. For a single measurement of the unknown,
and Equation 4-27 gives If you measure four replicate unknownsand the average corrected absorbance is 0.302, the uncertainty is reduced from
toThe confidence interval for x is where t is Student’s t (Table 4-2) for degrees
of freedom. If and points (12 degrees of freedom), the 95% confidenceinterval for x is
4-9 A Spreadsheet for Least SquaresFigure 4-13 implements least-squares analysis, including propagation of error with Equa-tion 4-27. Enter values of x and y in columns B and C. Then select cells B10:C12. Enter theformula and press on a PC or � on a Mac. LINEST returns m, b, and incells B10:C12. Write labels in cells A10:A12 and D10:D12 so you know what the numbersin cells B10:C12 mean.
Cell B14 gives the number of data points with the formula CellB15 computes the mean value of y. Cell B16 computes the sum that we need forEquation 4-27. This sum is common enough that Excel has a built in function called DEVSQthat you can find in the Statistics menu of the INSERT FUNCTION menu.
� (xi � x)2� COUNT(B4:B7).
syR2,sb,sm,�RETURNCOMMANDCONTROL�SHIFT�ENTER� LINEST(C4:C7,B4:B7,TRUE,TRUE)
tsx � (2.179)(0.23) � 0.50 g.n � 14sx � 0.23 g
n � 2tsx,0.23 g.0.39
(k � 4)sx � 0.39 g.k � 1
xxi
y
�m �sy
Uncertainty in x (� sx) �sy
0m 0 B1
k�
1n
�(y � y)2
m2 � (xi � x)2
18.24?x � 18.24 g.y � 0.302
y � ax2 � bx � c25 g( 720 g)
4-9 A Spreadsheet for Least Squares 71
Box 4-2 Using a Nonlinear Calibration Curve
Consider an unknown whose corrected absorbance of 0.375 liesbeyond the linear region in Figure 4-11. We can fit all the datapoints with the quadratic equation6
(A)
To find the quantity of protein, substitute the measuredabsorbance into Equation A:
This equation can be rearranged to
1.17 10�4 x2 � 0.018 58x � 0.375 7 � 0
0.375 � �1.17 10�4 x2 � 0.018 58x � 0.000 7
y � �1.17 10�4 x2 � 0.018 58x � 0.000 7
which is a quadratic equation of the form
whose two possible solutions are
Substituting and into these equations gives
Figure 4-11 tells us that the correct choice is not 135 g.23.8 g,
x � 135 g x � 23.8 g
c � 0.375 7b � �0.018 58,a � 1.17 10�4,
x ��b � 2b2 � 4ac
2a x �
�b � 2b2 � 4ac
2a
ax2 � bx � c � 0
Res
pons
e
Analyte concentration
Linearrange
Dynamic range
c2c1
Figure 4-12 Calibration curve illustratinglinear and dynamic ranges.
of unknownof protein in standards in Table 4-7
� (0, 0, 0, 5.0, 5.0, 5.0, 10.0, 10.0, 10.0, 15.0,15.0, 20.0, 20.0, 20.0)
of 14 y valuesof 14 x values � 9.643 gx � average
� 0.1618y � average
xi � g� 0.302y � absorbance
To find values of t that are not in Table 4-2,use the Excel function TINV. For 12 degrees offreedom and 95% confidence, the functionTINV(0.05,12) returns t � 2.179.

Enter the measured mean value of y for replicate measurements of the unknown in cellB18. In cell B19, enter the number of replicate measurements of the unknown. Cell B20computes the value of x corresponding to the measured mean value of y. Cell B21 uses Equa-tion 4-27 to find the uncertainty (the standard deviation) in the value of x for the unknown. Ifyou want a confidence interval for x, multiply times Student’s t from Table 4-2 for degrees of freedom and the desired confidence level.
We always want a graph to see if the calibration points lie on a straight line. Follow theinstructions in Section 2-11 to plot the calibration data. To add a straight line, click on one datapoint and they will all be highlighted. Go to the CHART menu and select ADD TRENDLINE. Insome versions of Excel there is no CHART menu. In this case, go to the INSERT menu and selectTRENDLINE. In the window that appears, select Linear. Go to Options in the TRENDLINE boxand select Display Equation on Chart. When you click OK, the least-squares straight line andits equation appear on the graph. Double click on the line and you can adjust its thicknessand appearance. Double clicking on the equation allows you to modify its format. Doubleclick on the straight line and select Options. In the Forecast box, you can extend the trendlineForward and Backward as far as you like.
n � 2sx
72 CHAPTER 4 Statistics
Figure 4-13 Spreadsheet for linear least-squares analysis.
ALeast-Squares Spreadsheet
Highlight cells B10:C12Type "= LINEST(C4:C7,
B4:B7,TRUE,TRUE)For PC, press
CTRL+SHIFT+ENTER
COMMAND+RETURNFor Mac, press
x y
346
LINEST output:0.61540.05440.9846
m
n =Mean y =
Σ(xi – mean x)2 =
43.513
B14 = COUNT(B4:B7)B15 = AVERAGE(C4:C7)B16 = DEVSQ(B4:B7)
Input
Input
Measured y =
k = Number of replicatemeasurements of y =
Derived x =sx =
B20 = (B18-C10)/B10B21 = (C12/B10)*SQRT((1/B19)+(1/B14)+((B18-B15)^2)/(B10^2*B16))
2.72
1
2.23250.3735
sm
R2
bsb
sy
31 2
45
1.34620.21410.1961
123456789101112131415161718
19
2021
B C D E F G H I
x
y
00
1
2
3
4
5
6
1 2 3 4 5 6
y = 0.6154x + 1.3462
95% confidence interval for x in Figure 4-13:
(degrees of freedom � n � 2 � 2)
� 2.2 1.6x tsx � 2.232 5 (4.303)(0.373 5)
Terms to Understandaverageblank solutioncalibration curveconfidence intervaldegrees of freedomdeterminant
dynamic rangeF testGaussian distributioninterceptlinear rangelinear response
meanmethod of least squaresQ testslopestandard deviationstandard solution
Student’s tt testvariance
SummaryThe results of many measurements of an experimental quantity fol-low a Gaussian distribution. The measured mean, approaches thetrue mean, as the number of measurements becomes very large.The broader the distribution, the greater is the standard devia-tion. For n measurements, an estimate of the standard deviation isgiven by About two-thirds of allmeasurements lie within and 95% lie within The proba-bility of observing a value within a certain interval is proportionalto the area of that interval, given in Table 4-1.
2�.1�,s � 2[�(xi � x)2] / (n � 1).
�, ,
x,After you select a confidence level, Student’s t is used to find
confidence intervals and to compare mean val-ues measured by different methods. The F test is used to decidewhether two standard deviations are significantly different fromeach other. The Q test helps you to decide whether or not a ques-tionable datum should be discarded. It is best to repeat the measure-ment several times to increase the probability that your decision iscorrect.
( � x ts/2n)

Exercises 73
A calibration curve shows the response of a chemical analysisto known quantities (standard solutions) of analyte. When there is alinear response, the corrected analytical signal
is proportional to the quantity of ana-lyte. Blank solutions are prepared from the same reagents and sol-vents used to prepare standards and unknowns, but blanks have nointentionally added analyte. The blank tells us the response of theprocedure to impurities or interfering species in the reagents. Theblank value is subtracted from measured values of standards prior
sample � signal from blank)(� signal from
to constructing the calibration curve. The blank value is subtractedfrom the response of an unknown prior to computing the quantity ofanalyte in the unknown.
The method of least squares is used to determine the equationof the “best” straight line through experimental data points. Equa-tions 4-16 to 4-18 and 4-20 to 4-22 provide the least-squares slopeand intercept and their standard deviations. Equation 4-27 estimatesthe uncertainty in x from a measured value of y with a calibrationcurve. A spreadsheet greatly simplifies least-squares calculations.
Exercises4-A. For the numbers 116.0, 97.9, 114.2, 106.8, and 108.3, find themean, standard deviation, range, and 90% confidence interval forthe mean. Using the Q test, decide whether the number 97.9 shouldbe discarded.
4-B. Spreadsheet for standard deviation. Let’s create aspreadsheet to compute the mean and standard deviation of a col-umn of numbers in two different ways. The spreadsheet below is atemplate for this exercise.(a) Reproduce the template on your spreadsheet. Cells B4 to B8contain the data (x values) whose mean and standard deviation wewill compute.(b) Write a formula in cell B9 to compute the sum of numbers in B4to B8.(c) Write a formula in cell B10 to compute the mean value.(d) Write a formula in cell C4 to compute (x � mean), where x is incell B4 and the mean is in cell B10. Use the FILL DOWN com-mand to compute values in cells C5 to C8.(e) Write a formula in cell D4 to compute the square of the value incell C4. Use the FILL DOWN command to compute values in cellsD5 to D8.(f) Write a formula in cell D9 to compute the sum of the numbers incells D4 to D8.
(g) Write a formula in cell B11 to compute the standard deviation.(h) Use cells B13 to B18 to document your formulas.(i) Now we are going to simplify life by using formulas built into thespreadsheet. In cell B21 type “ SUM(B4:B8)”, which means findthe sum of numbers in cells B4 to B8. Cell B21 should display thesame number as cell B9. In general, you will not know what func-tions are available and how to write them. Find the FUNCTION menu(under the INSERT menu in Excel) and find SUM in this menu.(j) Select cell B22. Go to the FUNCTION menu and find AVERAGE.When you type “ AVERAGE(B4:B8)” in cell B22, its valueshould be the same as B10.(k) For cell B23, find the standard deviation function (“ STDEV(B4:B8)”) and see that the value agrees with cell B11.
4-C. Use Table 4-1 for this exercise. Suppose that the mileage atwhich 10 000 sets of automobile brakes had been 80% wornthrough was recorded. The average was 62 700, and the standarddeviation was 10 400 miles.(a) What fraction of brakes is expected to be 80% worn in less than40 860 miles?(b) What fraction is expected to be 80% worn at a mileage between57 500 and 71 020 miles?
4-D. Use the NORMDIST spreadsheet function to answerthese questions about the brakes described in Exercise 4-C:(a) What fraction of brakes is expected to be 80% worn in less than45 800 miles?(b) What fraction is expected to be 80% worn at a mileage between60 000 and 70 000 miles?
4-E. A reliable assay shows that the ATP (adenosine triphosphate)content of a certain cell type is You developed anew assay, which gave the following values for replicate analyses:117, 119, 111, 115, (average Can yoube 95% confident that your result differs from the “known” value?
4-F. Traces of toxic, man-made hexachlorohexanes in North Seasediments were extracted by a known process and by two new pro-cedures, and measured by chromatography.10
Concentration Standard Number ofMethod found (pg/g) deviation (pg/g) replications
Conventional 34.4 3.6 6Procedure A 42.9 1.2 6Procedure B 51.1 4.6 6
(a) Are the concentrations parts per million, parts per billion, orsomething else?(b) Is the standard deviation for procedure B significantly differentfrom that of the conventional procedure?
� 116.4).120 mol/100 mL
111 mol/100 mL.
�
�
�
A B C D
1 Computing standard deviation
2
3 Data � x x-mean (x-mean)^2
4 17.4
5 18.1
6 18.2
7 17.9
8 17.6
9 sum �
10 mean �
11 std dev �
12
13 Formulas: B9 �
14 B10 �
15 B11 �
16 C4 �
17 D4 �
18 D9 �
19
20 Calculations using built-in functions:
21 sum �
22 mean �
23 std dev �
Spreadsheet for Exercise 4-B.
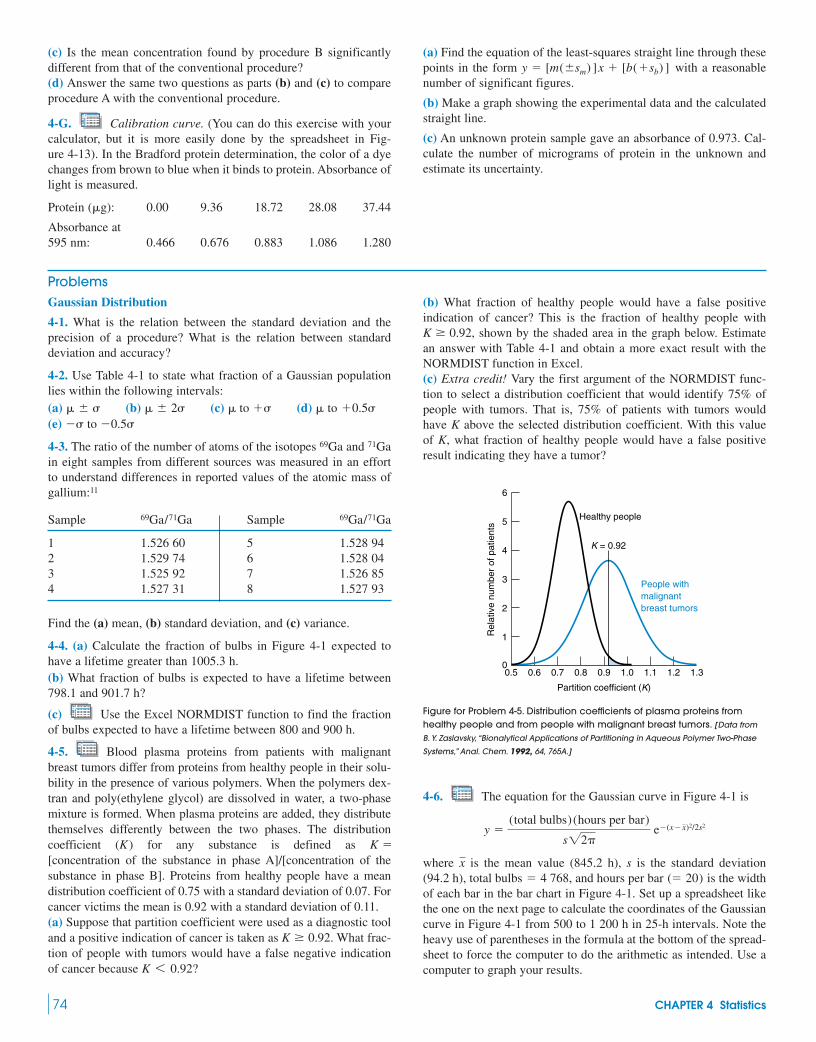
(c) Is the mean concentration found by procedure B significantlydifferent from that of the conventional procedure?(d) Answer the same two questions as parts (b) and (c) to compareprocedure A with the conventional procedure.
4-G. Calibration curve. (You can do this exercise with yourcalculator, but it is more easily done by the spreadsheet in Fig-ure 4-13). In the Bradford protein determination, the color of a dyechanges from brown to blue when it binds to protein. Absorbance oflight is measured.
Protein ( g): 0.00 9.36 18.72 28.08 37.44
Absorbance at595 nm: 0.466 0.676 0.883 1.086 1.280
(a) Find the equation of the least-squares straight line through thesepoints in the form with a reasonablenumber of significant figures.
(b) Make a graph showing the experimental data and the calculatedstraight line.
(c) An unknown protein sample gave an absorbance of 0.973. Cal-culate the number of micrograms of protein in the unknown andestimate its uncertainty.
y � [m(sm) ]x � [b(�sb) ]
74 CHAPTER 4 Statistics
ProblemsGaussian Distribution
4-1. What is the relation between the standard deviation and theprecision of a procedure? What is the relation between standarddeviation and accuracy?
4-2. Use Table 4-1 to state what fraction of a Gaussian populationlies within the following intervals:(a) (b) (c) (d) to(e) to
4-3. The ratio of the number of atoms of the isotopes and in eight samples from different sources was measured in an effortto understand differences in reported values of the atomic mass ofgallium:11
Sample 69Ga/71Ga Sample 69Ga/71Ga
1 1.526 60 5 1.528 942 1.529 74 6 1.528 043 1.525 92 7 1.526 854 1.527 31 8 1.527 93
Find the (a) mean, (b) standard deviation, and (c) variance.
4-4. (a) Calculate the fraction of bulbs in Figure 4-1 expected tohave a lifetime greater than 1005.3 h.(b) What fraction of bulbs is expected to have a lifetime between798.1 and 901.7 h?
(c) Use the Excel NORMDIST function to find the fractionof bulbs expected to have a lifetime between 800 and 900 h.
4-5. Blood plasma proteins from patients with malignantbreast tumors differ from proteins from healthy people in their solu-bility in the presence of various polymers. When the polymers dex-tran and poly(ethylene glycol) are dissolved in water, a two-phasemixture is formed. When plasma proteins are added, they distributethemselves differently between the two phases. The distributioncoefficient (K) for any substance is defined as [concentration of the substance in phase A]/[concentration of thesubstance in phase B]. Proteins from healthy people have a meandistribution coefficient of 0.75 with a standard deviation of 0.07. Forcancer victims the mean is 0.92 with a standard deviation of 0.11.(a) Suppose that partition coefficient were used as a diagnostic tooland a positive indication of cancer is taken as What frac-tion of people with tumors would have a false negative indicationof cancer because K 6 0.92?
K � 0.92.
K �
71Ga69Ga
�0.5���
�0.5� to �� 2� �
(b) What fraction of healthy people would have a false positiveindication of cancer? This is the fraction of healthy people with
shown by the shaded area in the graph below. Estimatean answer with Table 4-1 and obtain a more exact result with theNORMDIST function in Excel.(c) Extra credit! Vary the first argument of the NORMDIST func-tion to select a distribution coefficient that would identify 75% ofpeople with tumors. That is, 75% of patients with tumors wouldhave K above the selected distribution coefficient. With this valueof K, what fraction of healthy people would have a false positiveresult indicating they have a tumor?
Figure for Problem 4-5. Distribution coefficients of plasma proteins fromhealthy people and from people with malignant breast tumors. [Data from
B. Y. Zaslavsky, “Bionalytical Applications of Partitioning in Aqueous Polymer Two-Phase
Systems,” Anal. Chem. 1992, 64, 765A.]
4-6. The equation for the Gaussian curve in Figure 4-1 is
where is the mean value (845.2 h), s is the standard deviation(94.2 h), and hours per bar is the widthof each bar in the bar chart in Figure 4-1. Set up a spreadsheet likethe one on the next page to calculate the coordinates of the Gaussiancurve in Figure 4-1 from 500 to 1 200 h in 25-h intervals. Note theheavy use of parentheses in the formula at the bottom of the spread-sheet to force the computer to do the arithmetic as intended. Use acomputer to graph your results.
(� 20)total bulbs � 4 768,x
y �(total bulbs)(hours per bar)
s22�e�(x�x)2/2s2
1.30.5 0.6 0.7 0.8 0.9
Partition coefficient (K)
1.0 1.1 1.2
6
5 Healthy people
K = 0.92
People withmalignantbreast tumors
4
3
2
1
0
Rel
ativ
e nu
mbe
r of
pat
ient
s
K � 0.92,

4-15. Now we use a built-in routine in Excel for the paired ttest to see if the two methods in Problem 4-14 produce significantlydifferent results. Enter the data for Methods 1 and 2 into two columnsof a spreadsheet. Under the TOOLS menu, select DATA ANALYSIS. IfDATA ANALYSIS does not appear, select ADD-INS. Select ANALYSIS
TOOLPACK, click OK, and DATA ANALYSIS will be loaded into theTOOLS menu. In the DATA ANALYSIS window, select t-Test: PairedTwo Sample for Means. Follow the instructions of Section 4-5 andthe routine will print out a variety of information including (which is labeled t Stat) and (which is labeled t Critical two-tail). You should reproduce the results of Problem 4-14.
4-16. Lithium isotope ratios are important to medicine, geol-ogy, astrophysics, and nuclear chemistry. Measurements of the
ratio in a Standard Reference Material are given here.12 Dothe two methods give statistically equivalent results?
Method 1 Method 2
0.082 601 0.081 830.082 621 0.081 860.082 589 0.082 050.082 617 0.082 060.082 598 0.082 15
0.082 08
4-17. If you measure a quantity four times and the standard devia-tion is 1.0% of the average, can you be 90% confident that the truevalue is within 1.2% of the measured average?
4-18. Students measured the concentration of HCl in a solution bytitrating with different indicators to find the end point.13
Mean HClconcentration (M) Number of
Indicator ( standard deviation) measurements
1. Bromothymol blue 0.095 65 0.002 25 282. Methyl red 0.086 86 0.000 98 183. Bromocresol green 0.086 41 0.001 13 29
Is the difference between indicators 1 and 2 significant at the 95%confidence level? Answer the same question for indicators 2 and 3.
4-19. Hydrocarbons in the cab of an automobile were measuredduring trips on the New Jersey Turnpike and trips through the Lin-coln Tunnel connecting New York and New Jersey.14 The total con-centrations standard deviations) of m- and p-xylene were
Turnpike: (32 measurements)
Tunnel: (32 measurements)
Do these results differ at the 95% confidence level? At the 99%confidence level?
4-20. A Standard Reference Material is certified to contain 94.6ppm of an organic contaminant in soil. Your analysis gives valuesof 98.6, 98.4, 97.2, 94.6, and 96.2 ppm. Do your results differfrom the expected result at the 95% confidence level? If you madeone more measurement and found 94.5, would your conclusionchange?
4-21. Nitrite was measured by two methods in rainwaterand unchlorinated drinking water.15 The results standard deviation(number of samples) are given in the following table.
(NO�
2 )
52.9 29.8 g/m3
31.4 30.0 g/m3
(
6Li/7Li
ttable
tcalculated
Problems 75
A B C
1 Gaussian curve for light bulbs (Fig 4-1)
2
3 mean � x (hours) y (bulbs)
4 845.2 500 0.49
5 std dev � 525 1.25
6 94.2 550 2.98
7 total bulbs � 600 13.64
8 4768 700 123.11
9 hours per bar � 800 359.94
10 20 845.2 403.85
11 sqrt(2 pi) � 900 340.99
12 2.506628 1000 104.67
13 1100 10.41
14 1200 0.34
15 Formula for cell C4 �
16 ($A$8*$A$10/($A$6*$A$12))*
17 EXP(-((B4-$A$4)^2)/(2*$A$6^2))
Spreadsheet for Problem 4-6.
4-7. Repeat Problem 4-6 but use the values 50, 100, and 150 forthe standard deviation. Superimpose all three curves on a single graph.
Confidence Intervals, t Test, F test, and Q Test
4-8. What is the meaning of a confidence interval?
4-9. What fraction of the vertical bars in Figure 4-5a is expected toinclude the population mean (10 000) if many experiments are car-ried out? Why are the 90% confidence interval bars longer than the50% bars in Figure 4-5?
4-10. List the three different cases that we studied for comparisonof means, and write the equations used in each case.
4-11. The percentage of an additive in gasoline was measured six timeswith the following results: 0.13, 0.12, 0.16, 0.17, 0.20, 0.11%. Find the90% and 99% confidence intervals for the percentage of the additive.
4-12. Sample 8 of Problem 4-3 was analyzed seven times, withand Find the 99% confidence interval
for sample 8.
4-13. A trainee in a medical lab will be released to work on her ownwhen her results agree with those of an experienced worker at the95% confidence level. Results for a blood urea nitrogen analysis areshown below.
Trainee:
Experiencedworker:
(a) What does the abbreviation dL stand for?(b) Should the trainee be released to work alone?
4-14. The Ti content (wt%) of five different ore samples (each witha different Ti content) was measured by each of two methods. Dothe two analytical techniques give results that are significantly dif-ferent at the 95% confidence level?
Sample Method 1 Method 2
A 0.013 4 0.013 5B 0.014 4 0.015 6C 0.012 6 0.013 7D 0.012 5 0.013 7E 0.013 7 0.013 6
n � 5 sampless � 0.42 mg/dLx � 13.95 mg/dL
n � 6 sampless � 0.53 mg/dLx � 14.57 mg/dL
s � 0.000 07.x � 1.527 93
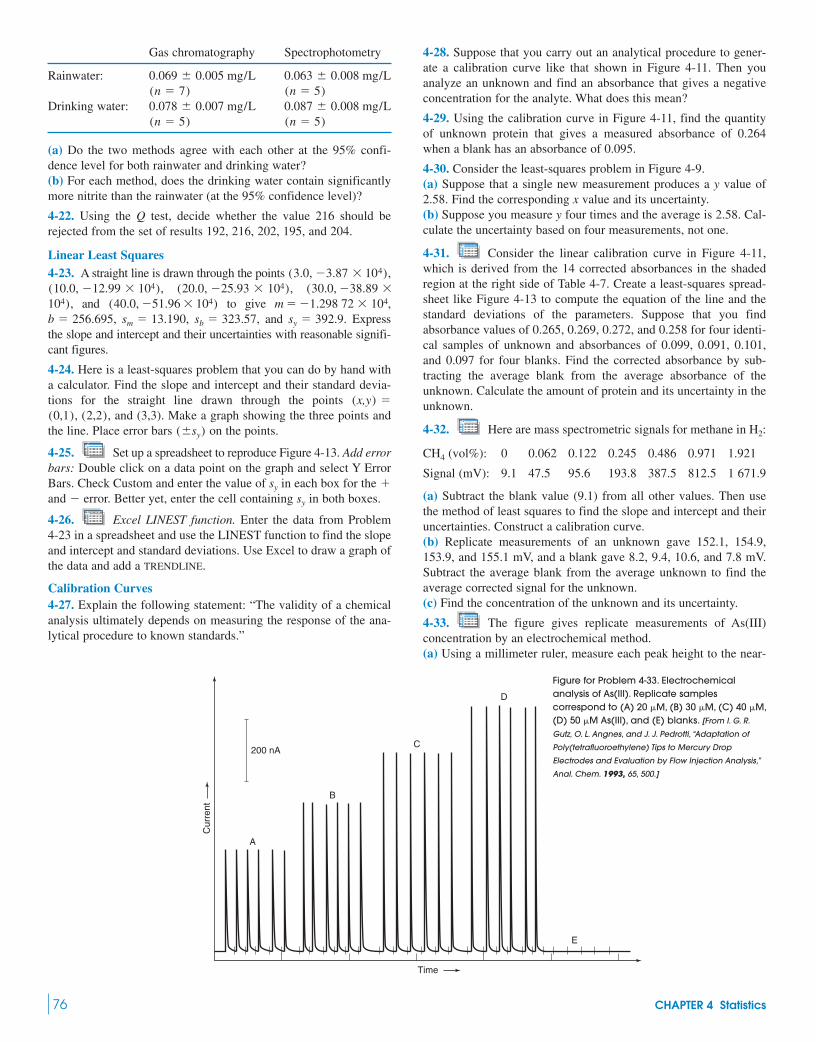
Gas chromatography Spectrophotometry
Rainwater:
Drinking water:
(a) Do the two methods agree with each other at the 95% confi-dence level for both rainwater and drinking water?(b) For each method, does the drinking water contain significantlymore nitrite than the rainwater (at the 95% confidence level)?
4-22. Using the Q test, decide whether the value 216 should berejected from the set of results 192, 216, 202, 195, and 204.
Linear Least Squares4-23. A straight line is drawn through the points
and to give and Express
the slope and intercept and their uncertainties with reasonable signifi-cant figures.
4-24. Here is a least-squares problem that you can do by hand witha calculator. Find the slope and intercept and their standard devia-tions for the straight line drawn through the points
and (3,3). Make a graph showing the three points andthe line. Place error bars on the points.
4-25. Set up a spreadsheet to reproduce Figure 4-13. Add errorbars: Double click on a data point on the graph and select Y ErrorBars. Check Custom and enter the value of in each box for the and error. Better yet, enter the cell containing in both boxes.
4-26. Excel LINEST function. Enter the data from Problem4-23 in a spreadsheet and use the LINEST function to find the slopeand intercept and standard deviations. Use Excel to draw a graph ofthe data and add a TRENDLINE.
Calibration Curves4-27. Explain the following statement: “The validity of a chemicalanalysis ultimately depends on measuring the response of the ana-lytical procedure to known standards.”
sy��sy
(sy)(0,1), (2,2),
(x,y) �
sy � 392.9.sb � 323.57,sm � 13.190,b � 256.695,104,m � �1.298 72 (40.0, �51.96 104)104),
�38.89 (30.0,(20.0, �25.93 104),(10.0, �12.99 104),10˛
4),(3.0, �3.87
(n � 5)(n � 5)0.087 0.008 mg/L0.078 0.007 mg/L(n � 5)(n � 7)0.063 0.008 mg/L0.069 0.005 mg/L
4-28. Suppose that you carry out an analytical procedure to gener-ate a calibration curve like that shown in Figure 4-11. Then youanalyze an unknown and find an absorbance that gives a negativeconcentration for the analyte. What does this mean?
4-29. Using the calibration curve in Figure 4-11, find the quantityof unknown protein that gives a measured absorbance of 0.264when a blank has an absorbance of 0.095.
4-30. Consider the least-squares problem in Figure 4-9.(a) Suppose that a single new measurement produces a y value of2.58. Find the corresponding x value and its uncertainty.(b) Suppose you measure y four times and the average is 2.58. Cal-culate the uncertainty based on four measurements, not one.
4-31. Consider the linear calibration curve in Figure 4-11,which is derived from the 14 corrected absorbances in the shadedregion at the right side of Table 4-7. Create a least-squares spread-sheet like Figure 4-13 to compute the equation of the line and thestandard deviations of the parameters. Suppose that you findabsorbance values of 0.265, 0.269, 0.272, and 0.258 for four identi-cal samples of unknown and absorbances of 0.099, 0.091, 0.101,and 0.097 for four blanks. Find the corrected absorbance by sub-tracting the average blank from the average absorbance of theunknown. Calculate the amount of protein and its uncertainty in theunknown.
4-32. Here are mass spectrometric signals for methane in
CH4 (vol%): 0 0.062 0.122 0.245 0.486 0.971 1.921
Signal (mV): 9.1 47.5 95.6 193.8 387.5 812.5 1 671.9
(a) Subtract the blank value (9.1) from all other values. Then usethe method of least squares to find the slope and intercept and theiruncertainties. Construct a calibration curve.(b) Replicate measurements of an unknown gave 152.1, 154.9,153.9, and 155.1 mV, and a blank gave 8.2, 9.4, 10.6, and 7.8 mV.Subtract the average blank from the average unknown to find theaverage corrected signal for the unknown.(c) Find the concentration of the unknown and its uncertainty.
4-33. The figure gives replicate measurements of As(III)concentration by an electrochemical method.(a) Using a millimeter ruler, measure each peak height to the near-
H2:
76 CHAPTER 4 Statistics
Cur
rent
200 nA
A
B
C
D
E
Time
Figure for Problem 4-33. Electrochemicalanalysis of As(III). Replicate samplescorrespond to (A) 20 M, (B) 30 M, (C) 40 M,(D) 50 M As(III), and (E) blanks. [From I. G. R.
Gutz, O. L. Angnes, and J. J. Pedrotti, “Adaptation of
Poly(tetrafluoroethylene) Tips to Mercury Drop
Electrodes and Evaluation by Flow Injection Analysis,”
Anal. Chem. 1993, 65, 500.]

est 0.1 mm. Noting the length that corresponds to 200 nA in thefigure, make a table showing the observed current (nA) for eachconcentration of As(III). The blanks appear to be near 0, sowe will disregard them in this problem.(b) Construct a calibration curve with 24 points (A–D) and find theslope and intercept and their uncertainties, using the method of leastsquares.(c) Calculate the concentration (and its uncertainty) of As(III) in anunknown that gave a mean current of 501 nA from six measure-ments.
4-34. Nonlinear calibration curve. Following the procedure inBox 4-2, find how many micrograms of protein are containedin a sample with a corrected absorbance of 0.350 in Figure 4-11.
4-35. Logarithmic calibration curve. Calibration data spanning fiveorders of magnitude for an electrochemical determination of p-nitrophenol are given in the table below. (The blank has alreadybeen subtracted from the measured current.) If you try to plot thesedata on a linear graph extending from 0 to and from 0to 5 260 nA, most of the points will be bunched up near the origin.To handle data with such a large range, a logarithmic plot is helpful.
p-Nitrophenol Current p-Nitrophenol Current( g/mL) (nA) ( g/mL) (nA)
0.010 0 0.215 3.00 66.70.029 9 0.846 10.4 2240.117 2.65 31.2 6210.311 7.41 107 2 0201.02 20.8 310 5 260
Data from Figure 4 of L. R. Taylor, Am. Lab., February 1993, p. 44.
310 g/mL
( g)
( M)
Problems 77
(a) Make a graph of log(current) versus log(concentration). Overwhat range is the log-log calibration linear?(b) Find the equation of the line in the form
(c) Find the concentration of p-nitrophenol corresponding to a sig-nal of 99.9 nA.
4-36. Confidence interval for calibration curve. To use a calibrationcurve based on n points, we measure a new value of y and calculatethe corresponding value of x. The one-standard-deviation uncer-tainty in x, is given by Equation 4-27. We express a confidenceinterval for x, using Student’s t:
where t is taken from Table 4-2 for degrees of freedom.A calibration curve based on known points was used to
measure the protein in an unknown. The results were protein where Find the 90% and 99% con-
fidence intervals for protein in the unknown.sx � 0.46 g.15.22(0.46) g,
�n � 10
n � 2
Confidence interval � x tsx
sx,
m log (concentration) � b.log(current) �
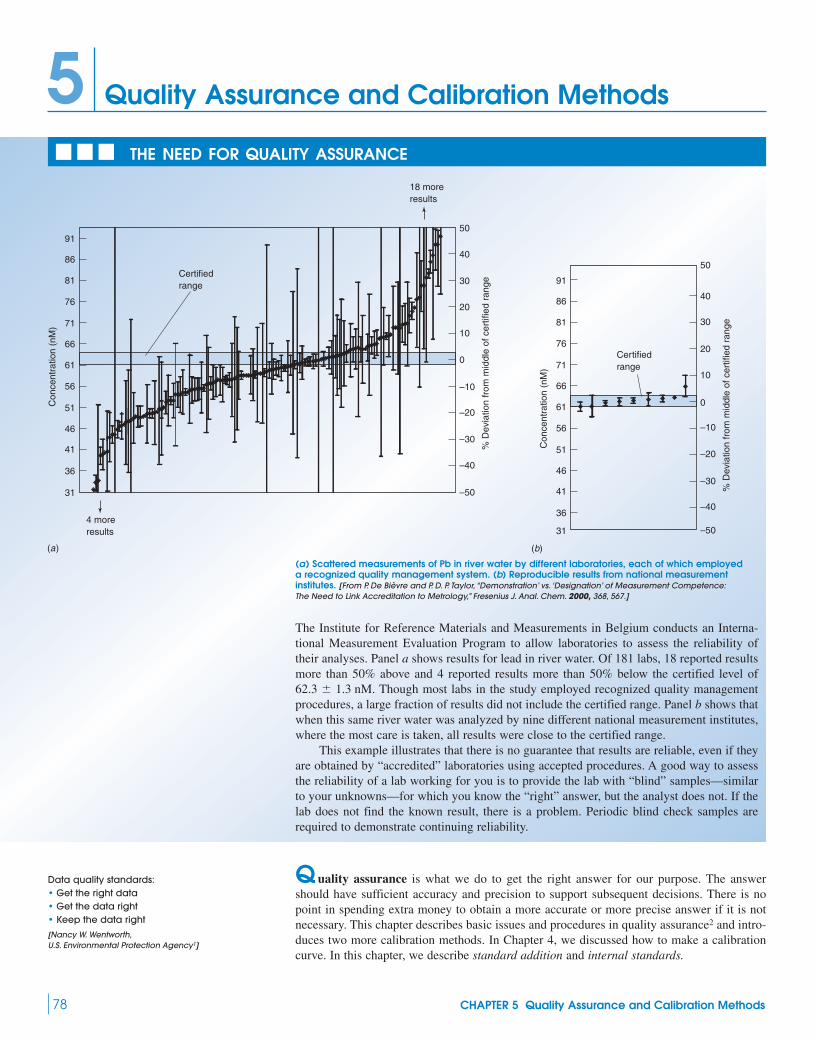
78 CHAPTER 5 Quality Assurance and Calibration Methods
The Institute for Reference Materials and Measurements in Belgium conducts an Interna-tional Measurement Evaluation Program to allow laboratories to assess the reliability oftheir analyses. Panel a shows results for lead in river water. Of 181 labs, 18 reported resultsmore than 50% above and 4 reported results more than 50% below the certified level of
Though most labs in the study employed recognized quality managementprocedures, a large fraction of results did not include the certified range. Panel b shows thatwhen this same river water was analyzed by nine different national measurement institutes,where the most care is taken, all results were close to the certified range.
This example illustrates that there is no guarantee that results are reliable, even if theyare obtained by “accredited” laboratories using accepted procedures. A good way to assessthe reliability of a lab working for you is to provide the lab with “blind” samples—similarto your unknowns—for which you know the “right” answer, but the analyst does not. If thelab does not find the known result, there is a problem. Periodic blind check samples arerequired to demonstrate continuing reliability.
62.3 1.3 nM.
THE NEED FOR QUALITY ASSURANCE
Quality Assurance and Calibration Methods5C
once
ntra
tion
(nM
)
91
86
81
76
71
66
61
56
51
46
41
36
31
50
40
30
20
10
0
–10
–20
–30
–40
–50%
Dev
iatio
n fr
om m
iddl
e of
cer
tifie
d ra
nge
18 moreresults
4 moreresults
Certifiedrange
Con
cent
ratio
n (n
M)
91
86
81
76
71
66
61
56
51
46
41
36
31
50
40
30
20
10
0
–10
–20
–30
–40
–50
% D
evia
tion
from
mid
dle
of c
ertif
ied
rang
e
Certifiedrange
Q uality assurance is what we do to get the right answer for our purpose. The answershould have sufficient accuracy and precision to support subsequent decisions. There is nopoint in spending extra money to obtain a more accurate or more precise answer if it is notnecessary. This chapter describes basic issues and procedures in quality assurance2 and intro-duces two more calibration methods. In Chapter 4, we discussed how to make a calibrationcurve. In this chapter, we describe standard addition and internal standards.
(a) Scattered measurements of Pb in river water by different laboratories, each of which employeda recognized quality management system. (b) Reproducible results from national measurementinstitutes. [From P. De Bièvre and P. D. P. Taylor, “Demonstration’ vs. ‘Designation’ of Measurement Competence:The Need to Link Accreditation to Metrology,” Fresenius J. Anal. Chem. 2000, 368, 567.]
Data quality standards:• Get the right data• Get the data right• Keep the data right
[Nancy W. Wentworth,U.S. Environmental Protection Agency1]
(a) (b)

5-1 Basics of Quality Assurance“Suppose you are cooking for some friends. While making spaghetti sauce, you taste it, sea-son it, taste it some more. Each tasting is a sampling event with a quality control test. Youcan taste the whole batch because there is only one batch. Now suppose you run a spaghettisauce plant that makes 1 000 jars a day. You can’t taste each one, so you decide to taste threea day, one each at 11 A.M., 2 P.M., and 5 P.M. If the three jars all taste OK, you conclude all1 000 are OK. Unfortunately, that may not be true, but the relative risk—that a jar has toomuch or too little seasoning—is not very important because you agree to refund the moneyof any customer who is dissatisfied. If the number of refunds is small, say, 100 a year, thereis no apparent benefit in tasting 4 jars a day.” There would be 365 additional tests to avoidrefunds on 100 jars, giving a net loss of 265 jars worth of profit.
In analytical chemistry, the product is not spaghetti sauce, but, rather, raw data, treateddata, and results. Raw data are individual values of a measured quantity, such as peak areasfrom a chromatogram or volumes from a buret. Treated data are concentrations or amountsfound by applying a calibration procedure to the raw data. Results are what we ultimatelyreport, such as the mean, standard deviation, and confidence interval, after applying statisticsto treated data.
Use ObjectivesIf you manufacture a drug whose therapeutic dose is just a little less than the lethal dose, youshould be more careful than if you make spaghetti sauce. The kind of data that you collectand the way in which you collect them depend on how you plan to use those data. An impor-tant goal of quality assurance is making sure that results meet the customer’s needs. A bath-room scale does not have to measure mass to the nearest milligram, but a drug tablet requiredto contain 2 mg of active ingredient probably cannot contain Writing clear, conciseuse objectives for data and results is a critical step in quality assurance and helps preventmisuse of data and results.
Here is an example of a use objective. Drinking water is usually disinfected with chlo-rine, which kills microorganisms. Unfortunately, chlorine also reacts with organic matter inwater to produce “disinfection by-products”—compounds that might harm humans. A disin-fection facility was planning to introduce a new chlorination process and wrote the followinganalytical use objective:
Analytical data and results shall be used to determine whether the modified chlorinationprocess results in at least a 10% reduction of formation of selected disinfectionby-products.
The new process was expected to decrease the disinfection by-products. The use objectivesays that uncertainty in the analysis must be small enough so that a 10% decrease in selectedby-products is clearly distinguishable from experimental error. In other words, is an observeddecrease of 10% real?
SpecificationsOnce you have use objectives, you are ready to write specifications stating how good thenumbers need to be and what precautions are required in the analytical procedure. How shallsamples be taken and how many are needed? Are special precautions required to protectsamples and ensure that they are not degraded? Within practical restraints, such as cost, time,and limited amounts of material available for analysis, what level of accuracy and precisionwill satisfy the use objectives? What rate of false positives or false negatives is acceptable?These questions need to be answered in detailed specifications.
Quality assurance begins with sampling. We must collect representative samples andanalyte must be preserved after sample is collected. If our sample is not representative or ifanalyte is lost after collection, then even the most accurate analysis is meaningless.
What do we mean by false positives and false negatives? Suppose you must certify thata contaminant in drinking water is below a legal limit. A false positive says that the concen-tration exceeds the legal limit when, in fact, the concentration is below the limit. A false neg-ative says that the concentration is below the limit when it is actually above the limit. Evenwell-executed procedures produce some false conclusions because of the statistical natureof sampling and measurement. More-stringent procedures are required to obtain lower rates offalse conclusions. For drinking water, it is likely to be more important to have a low rate
2 1 mg.
5-1 Basics of Quality Assurance 79
Quotation from Ed Urbansky. Section 5-1is adapted from a description writtenby Ed Urbansky.
Current: Taste 3 jars each 1 095 jars/yearReturn 100 jars/year tounhappy customers
Proposed: Taste 4 jars each 1 460 jars/yearReturn 0 jars/year because ofbetter quality control
Difference: 1 460 � 1 195 � 265 jars/year
�day
�day
Raw data: individual measurementsTreated data: concentrations derived from raw
data by use of calibration methodResults: quantities reported after statistical
analysis of treated data
Use objective: states purpose for which resultswill be used
Specifications might include:• sampling requirements• accuracy and precision• rate of false results• selectivity• sensitivity• acceptable blank values• recovery of fortification• calibration checks• quality control samples

of false negatives than a low rate of false positives. It would be worse to certify that contam-inated water is safe than to certify that safe water is contaminated.
In choosing a method, we also consider selectivity and sensitivity. Selectivity (alsocalled specificity) means being able to distinguish analyte from other species in the sample(avoiding interference). Sensitivity is the capability of responding reliably and measurablyto changes in analyte concentration. A method must have a detection limit (discussed in Sec-tion 5-2) lower than the concentrations to be measured.
Specifications could include required accuracy and precision, reagent purity, tolerancesfor apparatus, the use of Standard Reference Materials, and acceptable values for blanks.Standard Reference Materials (Box 3-1) contain certified levels of analyte in realistic mate-rials that you might be analyzing, such as blood or coal or metal alloys. Your analyticalmethod should produce an answer acceptably close to the certified level or there is somethingwrong with the accuracy of your method.
Blanks account for interference by other species in the sample and for traces of analytefound in reagents used for sample preservation, preparation, and analysis. Frequent measure-ments of blanks detect whether analyte from previous samples is carried into subsequentanalyses by adhering to vessels or instruments.
A method blank is a sample containing all components except analyte, and it is takenthrough all steps of the analytical procedure. We subtract the response of the method blankfrom the response of a real sample prior to calculating the quantity of analyte in the sample.A reagent blank is similar to a method blank, but it has not been subjected to all samplepreparation procedures. The method blank is a more complete estimate of the blank contri-bution to the analytical response.
A field blank is similar to a method blank, but it has been exposed to the site of sam-pling. For example, to analyze particulates in air, a certain volume of air could be suckedthrough a filter, which is then dissolved and analyzed. A field blank would be a filter carriedto the collection site in the same package with the collection filters. The filter for the blankwould be taken out of its package in the field and placed in the same kind of sealed containerused for collection filters. The difference between the blank and the collection filters is thatair was not sucked through the blank filter. Volatile organic compounds encountered duringtransportation or in the field are conceivable contaminants of a field blank.
Another performance requirement often specified is spike recovery. Sometimes,response to analyte is affected by something else in the sample. We use the word matrix torefer to everything else in the sample other than analyte. A spike, also called a fortification,is a known quantity of analyte added to a sample to test whether the response to a sample isthe same as that expected from a calibration curve. Spiked samples are analyzed in the samemanner as unknowns. For example, if drinking water is found to contain ofnitrate, a spike of could be added. Ideally, the concentration in the spiked portionfound by analysis will be If a number other than is found, then thematrix could be interfering with the analysis.
Example Spike Recovery
Let C stand for concentration. One definition of spike recovery is
(5-1)
An unknown was found to contain of analyte per liter. A spike of was added to a replicate portion of unknown. Analysis of the spiked sample gave aconcentration of Find the percent recovery of the spike.
Solution The percent of the spike found by analysis is
If the acceptable recovery is specified to be in the range from 96% to 104%, then 92%is unacceptable. Something in your method or techniques needs improvement.
When dealing with large numbers of samples and replicates, we perform periodic cali-bration checks to make sure that our instrument continues to work properly and the calibra-
% recovery �14.6 g/L � 10.0 g/L
5.0 g/L 100 � 92%
14.6 g/L.
5.0 g/L10.0 g
% recovery �Cspiked sample � Cunspiked sample
Cadded
15.0 g/L15.0 g/L.5.0 g/L
10.0 g/L
80 CHAPTER 5 Quality Assurance and Calibration Methods
Sensitivity
�change in signal
change in analyte concentration
� slope of calibration curve
Add a small volume of concentrated standardto avoid changing the volume of the samplesignificantly. For example, add of
standard to 5.00 mL of sample toincrease analyte by 5.00 g/L.500 g/L
50.5 L

tion remains valid. In a calibration check, we analyze solutions formulated to containknown concentrations of analyte. A specification might, for example, call for one calibrationcheck for every 10 samples. Solutions for calibration checks should be different from theones used to prepare the original calibration curve. This practice helps to verify that the ini-tial calibration standards were made properly.
Performance test samples (also called quality control samples or blind samples) are aquality control measure to help eliminate bias introduced by the analyst knowing the concen-tration of the calibration check sample. These samples of known composition are provided tothe analyst as unknowns. Results are then compared with the known values, usually by aquality assurance manager.
Together, raw data and results from calibration checks, spike recoveries, quality controlsamples, and blanks are used to gauge accuracy. Analytical performance on replicate samplesand replicate portions of the same sample measures precision. Fortification also helps ensurethat qualitative identification of analyte is correct. If you spike the unknown in Figure 0-5with extra caffeine and the area of a chromatographic peak not thought to be caffeineincreases, then you have misidentified the caffeine peak.
Standard operating procedures stating what steps will be taken and how they willbe carried out are the bulwark of quality assurance. For example, if a reagent has “gonebad” for some reason, control experiments built into your normal procedures should detectthat something is wrong and your results should not be reported. It is implicit that everyonefollows the standard operating procedures. Adhering to these procedures guards against thenormal human desire to take shortcuts based on assumptions that could be false.
A meaningful analysis requires a meaningful sample that represents what is to beanalyzed. It must be stored in containers and under conditions so that relevant chemical char-acteristics do not change. Protection might be needed to prevent oxidation, photodecomposi-tion, or growth of organisms. The chain of custody is the trail followed by a sample from thetime it is collected to the time it is analyzed and, possibly, archived. Documents are signedeach time the material changes hands to indicate who is responsible for the sample. Each per-son in the chain of custody follows a written procedure telling how the sample is to be han-dled and stored. Each person receiving a sample should inspect it to see that it is in theexpected condition in an appropriate container. If the original sample was a homogeneous
5-1 Basics of Quality Assurance 81
To gauge accuracy:• calibration checks• fortification recoveries• quality control samples• blanksTo gauge precision:• replicate samples• replicate portions of same sample
Box 5-1 Control Charts
A control chart is a visual representation of confidence intervalsfor a Gaussian distribution. The chart warns us when a monitoredproperty strays dangerously far from an intended target value.
Consider a manufacturer making vitamin C tablets intendedto have a target value of milligrams of vitamin C per tablet.Many analyses over a long time tell us the population standarddeviation, associated with the manufacturing process.
For quality control, 25 tablets are removed at random from themanufacturing line each hour and analyzed. The mean value of vita-min C in the 25 tablets is shown by a data point on the control chart.
�,
For a Gaussian distribution, 95.5% of all observations arewithin from the mean and 99.7% are within where n is the number of tablets that are averaged eachhour. The limits are warning lines and the lim-its are action lines. We expect �4.5% of measurements to be out-side the warning lines and �0.3% to be outside the action lines. Itis unlikely that we would observe two consecutive measurementsat the warning line
The following conditions are considered to be so unlikely thatif they occur the process should be shut down for troubleshooting:
• 1 observation outside the action lines• 2 out of 3 consecutive measurements between the warning and
action lines• 7 consecutive measurements all above or all below the center line• 6 consecutive measurements all increasing or all decreasing,
wherever they are located• 14 consecutive points alternating up and down, regardless of
where they are located• an obvious nonrandom pattern
For quality assessment of an analytical process, a controlchart could show the relative deviation of measured values of cal-ibration check samples or quality control samples from theirknown values. Another control chart could display the precision ofreplicate analyses of unknowns or standards as a function of time.
(probability � 0.045 0.045 � 0.002 0).
3�/1n2�/1n(� 25)
3�/1n,2�/1n
µ + 3σ n
µ + 2σ n
µ
µ − 2σ n
µ − 3σ n
Time
Upper action line
Target value
Lower warning line
Lower action line
Upper warning line
√
√
√
√

liquid, but it contains a precipitate when you receive it, the standard operating procedure maydictate that you reject that sample.
Standard operating procedures specify how instruments are to be maintained andcalibrated to ensure their reliability. Many labs have their own standard practices, such asrecording temperatures of refrigerators, calibrating balances, conducting routine instrumentmaintenance, or replacing reagents. These practices are part of the overall quality manage-ment plan. The rationale behind standard practices is that some equipment is used by manypeople for different analyses. We save money by having one program to ensure that themost rigorous needs are met.
AssessmentAssessment is the process of (1) collecting data to show that analytical procedures are oper-ating within specified limits and (2) verifying that final results meet use objectives.
Documentation is critical for assessment. Standard protocols provide directions for whatmust be documented and how the documentation is to be done, including how to recordinformation in notebooks. For labs that rely on manuals of standard practices, it is imperativethat tasks done to comply with the manuals be monitored and recorded. Control charts(Box 5-1) can be used to monitor performance on blanks, calibration checks, and spiked sam-ples to see if results are stable over time or to compare the work of different employees. Con-trol charts can also monitor sensitivity or selectivity, especially if a laboratory encounters awide variety of matrixes.
Government agencies such as the U.S. Environmental Protection Agency set require-ments for quality assurance for their own labs and for certification of other labs. Publishedstandard methods specify precision, accuracy, numbers of blanks, replicates, and calibrationchecks. To monitor drinking water, regulations state how often and how many samples are tobe taken. Documentation is necessary to demonstrate that all requirements have been met.Table 5-1 summarizes the quality assurance process.
5-2 Method ValidationMethod validation is the process of proving that an analytical method is acceptable for itsintended purpose.3 In pharmaceutical chemistry, method validation requirements for regula-tory submission include studies of method specificity, linearity, accuracy, precision, range,limit of detection, limit of quantitation, and robustness.
SpecificitySpecificity is the ability of an analytical method to distinguish the analyte from everythingelse that might be in the sample. Electrophoresis is an analytical method in which substances
82 CHAPTER 5 Quality Assurance and Calibration Methods
Table 5-1 Quality assurance process
Question Actions
Use ObjectivesWhy do you want the data and results • Write use objectivesand how will you use the results?
SpecificationsHow good do the numbers have to be? • Write specifications
• Pick methods to meet specifications• Consider sampling, precision, accuracy,
selectivity, sensitivity, detection limit,robustness, rate of false results
• Employ blanks, fortification, calibration checks,quality control samples, and control charts tomonitor performance
• Write and follow standard operating procedures
AssessmentWere the specifications achieved? • Compare data and results with specifications
• Document procedures and keep records suitableto meet use objectives
• Verify that use objectives were met

are separated from one another by their differing rates of migration in a strong electric field.An electropherogram is a graph of detector response versus time in an electrophoretic sepa-ration. Figure 5-1 shows an electropherogram of the drug cefotaxime (peak 4) spiked with0.2 wt% of known impurities normally present from the synthesis. A reasonable requirementfor specificity might be that there is baseline separation of analyte (cefotaxime) from allimpurities that might be present. Baseline separation means that the detector signal returns toits baseline before the next compound reaches the detector.
In Figure 5-1, impurity peak 3 is not completely resolved from the cefotaxime. In thiscase, another reasonable criterion for specificity might be that unresolved impurities at theirmaximum expected concentration will not affect the assay of cefotaxime by more than 0.5%.If we were trying to measure impurities, as opposed to assaying cefotaxime, a reasonable cri-terion for specificity is that all impurity peaks having of the area in the electrophero-gram are baseline separated from cefotaxime.
When developing an assay, we need to decide what impurities to deliberately add to testfor specificity. For analysis of a drug formulation, we would want to compare the pure drugwith one containing additions of all possible synthetic by-products and intermediates, degra-dation products, and excipients. (Excipients are substances added to give desirable form orconsistency.) Degradation products might be introduced by exposing the pure material toheat, light, humidity, acid, base, and oxidants to decompose of the original material.
LinearityLinearity measures how well a calibration curve follows a straight line. If you know the tar-get concentration of analyte in a drug preparation, for example, test the calibration curve forlinearity with five standard solutions spanning the range from 0.5 to 1.5 times the expectedanalyte concentration. Each standard should be prepared and analyzed three times. (This pro-cedure requires standards plus three blanks.) To prepare a calibration curve foran impurity that might be present at, say 0.1 to 1 wt%, you might prepare a calibration curvewith five standards spanning the range 0.05 to 2 wt%.
A superficial, but common, measure of linearity is the square of the correlationcoefficient,
(5-2)
where is the mean of all the x values and is the mean of all the y values. An easy way tofind is with the LINEST function in Excel. In the example on page 69, values of x andy are entered in columns A and B. LINEST produces a table in cells E3:F5 that contains in cell E5. must be very close to 1 to represent a linear fit. For a major component of anunknown, a value of above 0.995 or, perhaps, 0.999, is deemed a good fit for many pur-poses.4 For the data in Figure 4-9, which do not lie very close to the straight line, R2 � 0.985.
R2R2
R2R2
yx
R2 �[� (xi � x)(yi � y)]2
�(xi � x)2 � (yi � y)2
Square of correlationcoefficient:
R2:
3 5 � 15
�20%
70.1%
5-2 Method Validation 83
Abs
orba
nce
0.002
0.000
0.001
6 10 14
Time (min)
18 22
Cefotaxime
1
2
3
4
5
7
6
8
9
Figure 5-1 Electropherogram of the drug cefotaxime (peak 4) spiked with known impurities (peaks2, 3, 5–9) from synthesis of the drug. Peak 1 is a marker for electroosmotic flow. Smaller peaks fromunknown impurities also are observed. Separation was performed by micellar electrophoretic capillarychromatography (Section 26-6). [From H. Fabre and K. D. Altria, “Key Points for Validating CE Methods, Particularly in
Pharmaceutical Analysis,” LCGC 2001, 19, 498.]
can be used as a diagnostic. If decreases after a method is established,something has gone wrong with theprocedure.
R2R2

Another criterion for linearity is that the y-intercept of the calibration curve (after theresponse of the blank has been subtracted from each standard) should be close to 0. Anacceptable degree of “closeness to 0” might be 2% of the response for the target value of ana-lyte. For the assay of impurities, which are present at concentrations lower than that of themajor component, an acceptable value of might be for the range 0.1 to 2 wt% andthe y-intercept should be of the response for the 2 wt% standard.
AccuracyAccuracy is “nearness to the truth.” Ways to demonstrate accuracy include
1. Analyze a Standard Reference Material (Box 3-1) in a matrix similar to that of yourunknown. Your method should find the certified value for analyte in the referencematerial, within the precision (random uncertainty) of your method.
2. Compare results from two or more different analytical methods. They should agreewithin their expected precision.
3. Analyze a blank sample spiked with a known addition of analyte. The matrix must bethe same as your unknown. When assaying a major component, three replicate samplesat each of three levels ranging from 0.5 to 1.5 times the expected sample concentrationare customary. For impurities, spikes could cover three levels spanning an expectedrange of concentrations, such as 0.1 to 2 wt%.
4. If you cannot prepare a blank with the same matrix as the unknown, then it isappropriate to make standard additions (Section 5-3) of analyte to the unknown. Anaccurate assay will find the known amount of analyte that was added.
Spiking is the most common method to evaluate accuracy because reference materials are notusually available and a second analytical method may not be readily available. Spikingensures that the matrix remains nearly constant.
An example of a specification for accuracy is that the analysis will recover ofthe spike of a major constituent. For an impurity, the specification might be that recovery iswithin 0.1 wt% absolute or relative.
PrecisionPrecision is the reproducibility of a result. Instrument precision, also called injection preci-sion, is the reproducibility observed when the same quantity of one sample is repeatedlyintroduced into an instrument. Variability could arise from variation in theinjected quantity and variation of instrument response.
Intra-assay precision is evaluated by analyzing aliquots of a homogeneous material sev-eral times by one person on one day with the same equipment. Each analysis is independent,so the intra-assay precision is telling us how reproducible the analytical method can be. Intra-assay variability is greater than instrument variability, because more steps are involved.Examples of specifications might be that instrument precision is and intra-assay preci-sion is
Ruggedness, also called intermediate precision, is the variation observed when an assayis performed by different people on different instruments on different days in the same lab.Each analysis might incorporate fresh reagents and different chromatography columns.
Interlaboratory precision is the most general measure of reproducibility observed whenaliquots of the same sample are analyzed by different people in different laboratories. Inter-laboratory precision becomes poorer as the level of analyte decreases (Box 5-2).
RangeRange is the concentration interval over which linearity, accuracy, and precision are allacceptable. An example of a specification for range for a major component of a mixture is theconcentration interval providing a correlation coefficient of (a measure of linearity),spike recovery of (a measure of accuracy), and interlaboratory precision of For an impurity, an acceptable range might provide a correlation coefficient of spike recovery of and interlaboratory precision of
Limits of Detection and QuantitationThe detection limit (also called the lower limit of detection) is the smallest quantity of ana-lyte that is “significantly different” from the blank.6 Here is a procedure that produces a
15%.100 10%,R2 � 0.98,
3%.100 2%R2 � 0.995
�2%.�1%
(�10 times)
10%
100 2%
�10%�0.98R2
84 CHAPTER 5 Quality Assurance and Calibration Methods
Autosamplers in chromatography andgraphite furnace atomic spectroscopy, forexample, have improved injection precisionby a factor of 3–10 compared with thatattained by humans.
Confusing terms:Linear range: concentration range over which
calibration curve is linear (Figure 4-12)Dynamic range: concentration range over
which there is a measurable response (Figure 4-12)
Range: concentration range over whichlinearity, accuracy, and precision meetspecifications for analytical method
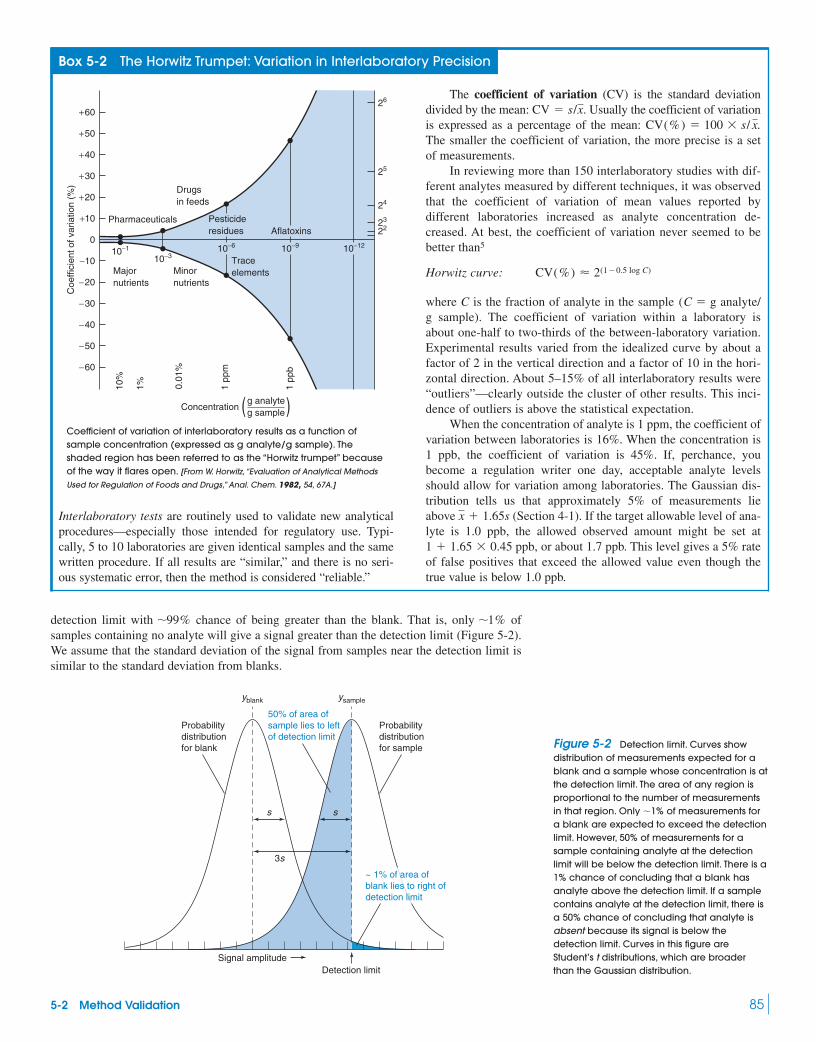
detection limit with chance of being greater than the blank. That is, only ofsamples containing no analyte will give a signal greater than the detection limit (Figure 5-2).We assume that the standard deviation of the signal from samples near the detection limit issimilar to the standard deviation from blanks.
�1%�99%
5-2 Method Validation 85
Box 5-2 The Horwitz Trumpet: Variation in Interlaboratory Precision
Interlaboratory tests are routinely used to validate new analyticalprocedures—especially those intended for regulatory use. Typi-cally, 5 to 10 laboratories are given identical samples and the samewritten procedure. If all results are “similar,” and there is no seri-ous systematic error, then the method is considered “reliable.”
Coefficient of variation of interlaboratory results as a function ofsample concentration (expressed as g analyte/g sample). Theshaded region has been referred to as the “Horwitz trumpet” becauseof the way it flares open. [From W. Horwitz, “Evaluation of Analytical Methods
Used for Regulation of Foods and Drugs,” Anal. Chem. 1982, 54, 67A.]
The coefficient of variation (CV) is the standard deviationdivided by the mean: Usually the coefficient of variationis expressed as a percentage of the mean: The smaller the coefficient of variation, the more precise is a setof measurements.
In reviewing more than 150 interlaboratory studies with dif-ferent analytes measured by different techniques, it was observedthat the coefficient of variation of mean values reported by different laboratories increased as analyte concentration de-creased. At best, the coefficient of variation never seemed to bebetter than5
Horwitz curve:
where C is the fraction of analyte in the sample analyte/g sample). The coefficient of variation within a laboratory isabout one-half to two-thirds of the between-laboratory variation.Experimental results varied from the idealized curve by about afactor of 2 in the vertical direction and a factor of 10 in the hori-zontal direction. About 5–15% of all interlaboratory results were“outliers”—clearly outside the cluster of other results. This inci-dence of outliers is above the statistical expectation.
When the concentration of analyte is 1 ppm, the coefficient ofvariation between laboratories is 16%. When the concentration is1 ppb, the coefficient of variation is 45%. If, perchance, youbecome a regulation writer one day, acceptable analyte levelsshould allow for variation among laboratories. The Gaussian dis-tribution tells us that approximately 5% of measurements lieabove (Section 4-1). If the target allowable level of ana-lyte is 1.0 ppb, the allowed observed amount might be set at
or about 1.7 ppb. This level gives a 5% rateof false positives that exceed the allowed value even though thetrue value is below 1.0 ppb.
1 � 1.65 0.45 ppb,
x � 1.65s
(C � g
CV(%) � 2(1�0.5 log C)
CV(%) � 100 s/ x.CV � s/x.
−20
−10
0
+20
−60
−50
−40
−30
+10
+30
+40
+50
+60
2223
24
25
26
10%
1% 0.01
%
1 pp
b
1 pp
m
Coe
ffici
ent o
f var
iatio
n (%
)
10−1
10−310−6 10−9 10−12
Pharmaceuticals
Drugsin feeds
Pesticideresidues Aflatoxins
Majornutrients
Minornutrients
Traceelements
Concentration ( )g analyteg sample
Detection limit
s s
3s
Signal amplitude
Probabilitydistributionfor blank
Probabilitydistributionfor sample
50% of area ofsample lies to leftof detection limit
~ 1% of area ofblank lies to right ofdetection limit
yblank ysample
Figure 5-2 Detection limit. Curves showdistribution of measurements expected for ablank and a sample whose concentration is atthe detection limit. The area of any region isproportional to the number of measurementsin that region. Only �1% of measurements fora blank are expected to exceed the detectionlimit. However, 50% of measurements for asample containing analyte at the detectionlimit will be below the detection limit. There is a1% chance of concluding that a blank hasanalyte above the detection limit. If a samplecontains analyte at the detection limit, there isa 50% chance of concluding that analyte isabsent because its signal is below thedetection limit. Curves in this figure areStudent’s t distributions, which are broaderthan the Gaussian distribution.

1. After estimating the detection limit from previous experience with the method, preparea sample whose concentration is to 5 times the detection limit.
2. Measure the signal from n replicate samples 3. Compute the standard deviation (s) of the n measurements.4. Measure the signal from n blanks (containing no analyte) and find the mean value, 5. The minimum detectable signal, is defined as
Signal detection limit: (5-3)
6. The corrected signal, is proportional to sample concentration:
Calibration line: (5-4)
where is the signal observed for the sample and m is the slope of the linear cali-bration curve. The minimum detectable concentration, also called the detection limit, isobtained by substituting from Equation 5-3 for in Equation 5-4:
Detection limit: Minimum detectable concentration (5-5)
Example Detection Limit
From previous measurements of a low concentration of analyte, the signal detection limitwas estimated to be in the low nanoampere range. Signals from seven replicate sampleswith a concentration about three times the detection limit were 5.0, 5.0, 5.2, 4.2, 4.6, 6.0,and 4.9 nA. Reagent blanks gave values of 1.4, 2.2, 1.7, 0.9, 0.4, 1.5, and 0.7 nA. Theslope of the calibration curve for higher concentrations is (a) Findthe signal detection limit and the minimum detectable concentration. (b) What is theconcentration of analyte in a sample that gave a signal of 7.0 nA?
Solution (a) First compute the mean for the blanks and the standard deviation of thesamples. Retain extra, insignificant digits to reduce round-off errors.
The signal detection limit from Equation 5-3 is
The minimum detectable concentration is obtained from Equation 5-5:
(b) To find the concentration of a sample whose signal is 7.0 nA, use Equation 5-4:
The lower limit of detection given in Equation 5-5 is where s is the standarddeviation of a low-concentration sample and m is the slope of the calibration curve. Thestandard deviation is a measure of the noise (random variation) in a blank or a small signal.When the signal is 3 times as great as the noise, it is readily detectable, but still too smallfor accurate measurement. A signal that is 10 times as great as the noise is defined as thelower limit of quantitation, or the smallest amount that can be measured with reasonableaccuracy.
(5-6)
Another common way to define detection limit is from the least-squares equation of acalibration curve: signal detection where b is the y-intercept and is givenby Equation 4-20.
sylimit � b � 3sy,
Lower limit of quantitation �10sm
3s/m,
1 concentration �ysample � yblank
m�
7.0 nA � 1.26 nA
0.229 nA/ M� 25.1 M
ysample � yblank � m concentration
Detection limit �3sm
�(3)(0.56 nA)
0.229 nA/ M� 7.3 M
ydl � yblank � 3s � 1.26 nA � (3)(0.56 nA) � 2.94 nA
Sample: Standard deviation � s � 0.56 nA
Blank: Average � yblank � 1.26 nA
m � 0.229 nA/ M.
�3sm
ysampleydl
ysample
ysample � yblank � m sample concentration
ysample � yblank,
ydl � yblank � 3s
ydl,yblank.
(n � 7).�1
86 CHAPTER 5 Quality Assurance and Calibration Methods
“is defined as.”The symbol � means
Quantitation limit �10sm
Detection limit �3sm
Det
ecto
r si
gnal
(nA
)
Concentration (µM)
Slope = 0.229 nA/µM
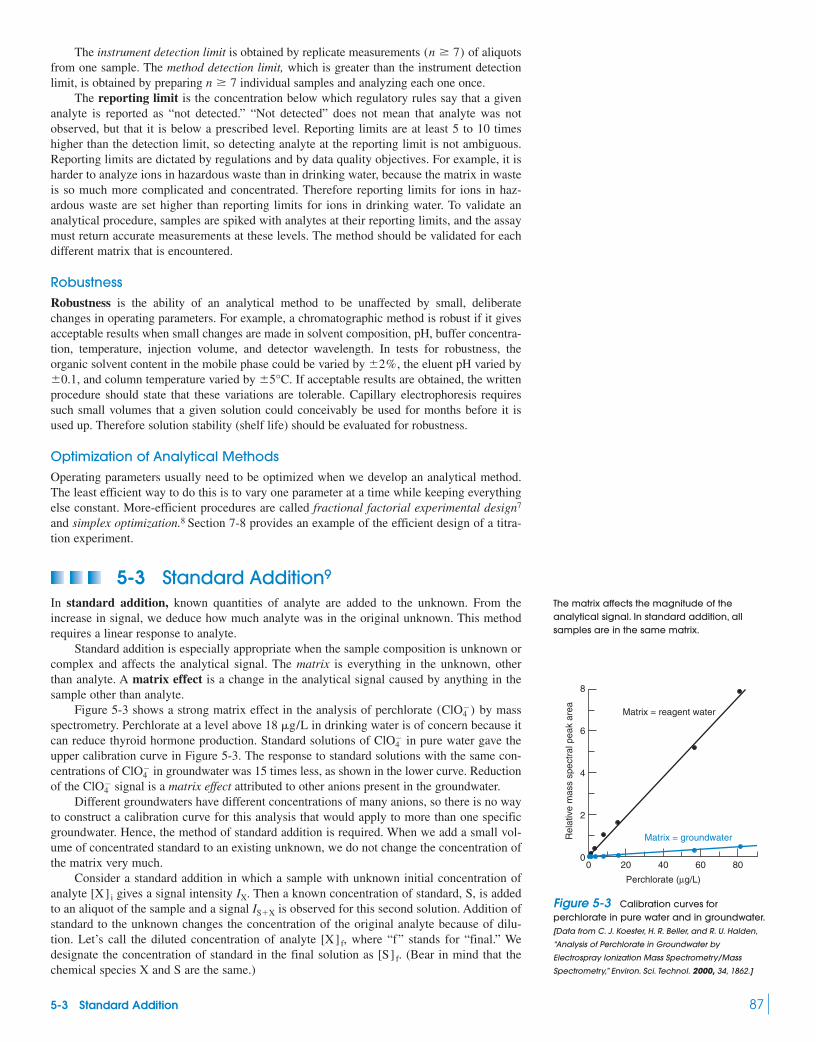
The instrument detection limit is obtained by replicate measurements of aliquotsfrom one sample. The method detection limit, which is greater than the instrument detectionlimit, is obtained by preparing individual samples and analyzing each one once.
The reporting limit is the concentration below which regulatory rules say that a givenanalyte is reported as “not detected.” “Not detected” does not mean that analyte was notobserved, but that it is below a prescribed level. Reporting limits are at least 5 to 10 timeshigher than the detection limit, so detecting analyte at the reporting limit is not ambiguous.Reporting limits are dictated by regulations and by data quality objectives. For example, it isharder to analyze ions in hazardous waste than in drinking water, because the matrix in wasteis so much more complicated and concentrated. Therefore reporting limits for ions in haz-ardous waste are set higher than reporting limits for ions in drinking water. To validate ananalytical procedure, samples are spiked with analytes at their reporting limits, and the assaymust return accurate measurements at these levels. The method should be validated for eachdifferent matrix that is encountered.
RobustnessRobustness is the ability of an analytical method to be unaffected by small, deliberatechanges in operating parameters. For example, a chromatographic method is robust if it givesacceptable results when small changes are made in solvent composition, pH, buffer concentra-tion, temperature, injection volume, and detector wavelength. In tests for robustness, theorganic solvent content in the mobile phase could be varied by the eluent pH varied by
and column temperature varied by If acceptable results are obtained, the writtenprocedure should state that these variations are tolerable. Capillary electrophoresis requiressuch small volumes that a given solution could conceivably be used for months before it isused up. Therefore solution stability (shelf life) should be evaluated for robustness.
Optimization of Analytical MethodsOperating parameters usually need to be optimized when we develop an analytical method.The least efficient way to do this is to vary one parameter at a time while keeping everythingelse constant. More-efficient procedures are called fractional factorial experimental design7
and simplex optimization.8 Section 7-8 provides an example of the efficient design of a titra-tion experiment.
5-3 Standard Addition9
In standard addition, known quantities of analyte are added to the unknown. From theincrease in signal, we deduce how much analyte was in the original unknown. This methodrequires a linear response to analyte.
Standard addition is especially appropriate when the sample composition is unknown orcomplex and affects the analytical signal. The matrix is everything in the unknown, otherthan analyte. A matrix effect is a change in the analytical signal caused by anything in thesample other than analyte.
Figure 5-3 shows a strong matrix effect in the analysis of perchlorate by massspectrometry. Perchlorate at a level above in drinking water is of concern because itcan reduce thyroid hormone production. Standard solutions of in pure water gave theupper calibration curve in Figure 5-3. The response to standard solutions with the same con-centrations of in groundwater was 15 times less, as shown in the lower curve. Reductionof the signal is a matrix effect attributed to other anions present in the groundwater.
Different groundwaters have different concentrations of many anions, so there is no wayto construct a calibration curve for this analysis that would apply to more than one specificgroundwater. Hence, the method of standard addition is required. When we add a small vol-ume of concentrated standard to an existing unknown, we do not change the concentration ofthe matrix very much.
Consider a standard addition in which a sample with unknown initial concentration ofanalyte gives a signal intensity Then a known concentration of standard, S, is addedto an aliquot of the sample and a signal is observed for this second solution. Addition ofstandard to the unknown changes the concentration of the original analyte because of dilu-tion. Let’s call the diluted concentration of analyte where “f” stands for “final.” Wedesignate the concentration of standard in the final solution as (Bear in mind that thechemical species X and S are the same.)
[S] f.[X] f,
IS�X
IX.[X] i
ClO�4
ClO�4
ClO�4
18 g/L(ClO�
4 )
5°C.0.1,2%,
n � 7
(n � 7)
5-3 Standard Addition 87
Matrix = reagent water
8
6
4
2
00 20 40
Perchlorate (µg/L)
60 80
Matrix = groundwaterRel
ativ
e m
ass
spec
tral
pea
k ar
ea
Figure 5-3 Calibration curves forperchlorate in pure water and in groundwater.[Data from C. J. Koester, H. R. Beller, and R. U. Halden,
“Analysis of Perchlorate in Groundwater by
Electrospray Ionization Mass Spectrometry/Mass
Spectrometry,” Environ. Sci. Technol. 2000, 34, 1862.]
The matrix affects the magnitude of theanalytical signal. In standard addition, allsamples are in the same matrix.
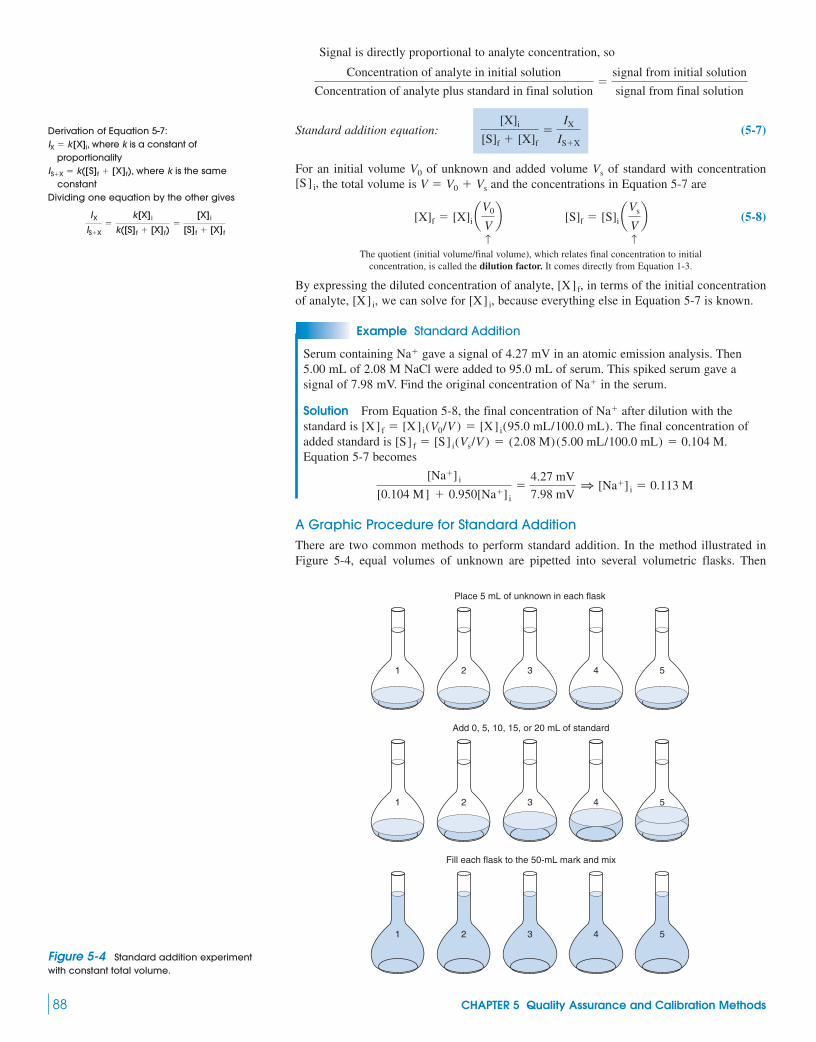
Signal is directly proportional to analyte concentration, so
Standard addition equation: (5-7)
For an initial volume of unknown and added volume of standard with concentrationthe total volume is and the concentrations in Equation 5-7 are
(5-8)
↑ ↑The quotient (initial volume/final volume), which relates final concentration to initial
concentration, is called the dilution factor. It comes directly from Equation 1-3.
By expressing the diluted concentration of analyte, in terms of the initial concentrationof analyte, we can solve for because everything else in Equation 5-7 is known.
Example Standard Addition
Serum containing gave a signal of 4.27 mV in an atomic emission analysis. Then5.00 mL of 2.08 M NaCl were added to 95.0 mL of serum. This spiked serum gave asignal of 7.98 mV. Find the original concentration of in the serum.
Solution From Equation 5-8, the final concentration of after dilution with thestandard is The final concentration ofadded standard is Equation 5-7 becomes
A Graphic Procedure for Standard AdditionThere are two common methods to perform standard addition. In the method illustrated inFigure 5-4, equal volumes of unknown are pipetted into several volumetric flasks. Then
[Na�] i
[0.104 M] � 0.950[Na�] i�
4.27 mV
7.98 mV1 [Na�] i � 0.113 M
[S] f � [S] i(Vs/V ) � (2.08 M)(5.00 mL/100.0 mL) � 0.104 M.[X]f � [X] i(V0/V ) � [X] i(95.0 mL/100.0 mL).
Na�
Na�
Na�
[X] i,[X] i,[X] f,
[X]f � [X]i aV0
Vb [S]f � [S]i aVs
Vb
V � V0 � Vs[S] i,VsV0
[X]i
[S]f � [X]f�
IX
IS�X
Concentration of analyte in initial solution
Concentration of analyte plus standard in final solution�
signal from initial solution
signal from final solution
88 CHAPTER 5 Quality Assurance and Calibration Methods
1 2 3 4 5
Place 5 mL of unknown in each flask
1 2 3 4 5
Add 0, 5, 10, 15, or 20 mL of standard
1 2 3 4 5
Fill each flask to the 50-mL mark and mix
Figure 5-4 Standard addition experimentwith constant total volume.
Derivation of Equation 5-7:IX k[X]i, where k is a constant of
proportionalityIS�X k([S]f [X]f), where k is the same
constantDividing one equation by the other gives
IX
IS�X�
k[X] i
k([S] f � [X] f)�
[X] i
[S] f � [X] f
��
�

5-3 Standard Addition 89
increasing volumes of standard are added to each flask and each is diluted to the same finalvolume. Every flask now contains the same concentration of unknown and differing concen-trations of standard. (Remember that the standard is the same substance as the unknown.) Foreach flask, a measurement of analytical signal, is then made. The added standardshould increase the analytical signal by a factor of 1.5 to 3. The method in Figure 5-4 is nec-essary when the analysis consumes some of the solution.
If the analysis does not consume solution, then we do not have to prepare individualsamples for every measurement. In this case, we begin with an unknown solution and mea-sure the analytical signal. Then we add a small volume of concentrated standard and measurethe signal again. We add several more small volumes of standard and measure the signal aftereach addition. The standard should be concentrated so that only small volumes are added andthe sample matrix is not appreciably altered.
Figure 5-5 shows data for an experiment in which ascorbic acid (vitamin C) was mea-sured in orange juice by an electrochemical method. The current between a pair of electrodesimmersed in the juice is proportional to the concentration of ascorbic acid. Eight standardadditions increased the current from 1.78 to (column C), which is at the upper endof the desired range of 1.5- to 3-fold increase in analytical signal.
Both methods of standard addition can be analyzed with the graph in Figure 5-6. Thetheoretical response to the additions is derived by substituting expressions for and [S] f[X] f
5.82 A
IS�X,
AVitamin C standard addition experiment
Add 0.279 M ascorbic acid to 50.0 mL orange juice
D7 = $A$8*B7/$A$6 E7 = C7*($A$6+B7)/$A$6
Vo (mL) =
[S]i (mM) =50
279
mL ascorbic
0.000acid added
0.0500.2500.4000.5500.7000.8501.0001.150
1.7802.0022.8243.3773.9234.4314.9435.4375.954
l(s+x) =
1.78µsignal ( A)
2.002.813.353.884.374.865.335.82
y-axis functionl(s+x)*V/Vo
0.0000.2791.3952.2323.0693.9064.7435.5806.417
x-axis functionSi*Vs/Vo
Vs =
1234567891011121314151617
B C D E
Figure 5-5 Data for standard addition experiment with variable total volume.
–3
Concentrationof unknown, [X]i
Reading of unknownwithout standard addition
76
6
5
4
3
2
1
54
A
B
Readin
gs o
btain
ed w
ith st
anda
rd a
dditio
ns
32
x = [S]i*Vs/V0
y =
l S+
X*V
/V0
y = 0.6463x + 1.8687
10–1–2
Figure 5-6 Graphical treatment of standardaddition data from Figure 5-5. Standard addi-tions should increase the analytical signal tobetween 1.5 and 3 times its original value(that is, to 2A).B � 0.5 A

from Equations 5-8 into Equation 5-7. Following a little rearrangement, we find
(5-9)
14243 14243Function to plot Function to plot
on y-axis on x-axis
A graph of (the corrected response) on the y-axis versus on thex-axis should be a straight line. The data plotted in Figure 5-6 are computed in columns Dand E of Figure 5-5. The right side of Equation 5-9 is 0 when The magnitude of the intercept on the x-axis is the original concentration of unknown,
mM in Figure 5-6.If all samples for the standard addition experiment are made up to a constant final vol-
ume, as in Figure 5-4, an alternate way to handle the data is to graph the signal versusthe concentration of diluted standard, In this case, the x-intercept of the graph is thefinal concentration of unknown, after dilution to the final sample volume.
The uncertainty in the x-intercept is10
(5-10)
where is the standard deviation of y (Equation 4-20), is the absolute value of the slopeof the least-squares line (Equation 4-16), n is the number of data points (nine in Figure 5-6),
is the mean value of y for the nine points, are the individual values of x for the ninepoints, and is the mean value of x for the nine points. For the points in Figure 5-6, theuncertainty in the x-intercept is mM.
The confidence interval is (standard deviation of x-intercept), where t is Student’st (Table 4-2) for degrees of freedom. The 95% confidence interval for the intercept inFigure 5-6 is The value was taken fromTable 4-2 for degrees of freedom.
5-4 Internal StandardsAn internal standard is a known amount of a compound, different from analyte, that is addedto the unknown. Signal from analyte is compared with signal from the internal standard to findout how much analyte is present.
Internal standards are especially useful for analyses in which the quantity of sample ana-lyzed or the instrument response varies slightly from run to run for reasons that are difficult tocontrol. For example, gas or liquid flow rates that vary by a few percent in a chromatographyexperiment (Figure 0-4) could change the detector response. A calibration curve is accurate onlyfor the one set of conditions under which it was obtained. However, the relative response of thedetector to the analyte and standard is usually constant over a wide range of conditions. If signalfrom the standard increases by 8.4% because of a change in flow rate, signal from the analyte usu-ally increases by 8.4% also. As long as the concentration of standard is known, the correct con-centration of analyte can be derived. Internal standards are widely used in chromatographybecause the small quantity of sample solution injected into the chromatograph is not reproducible.
Internal standards are also desirable when sample loss can occur during sample preparationsteps prior to analysis. If a known quantity of standard is added to the unknown prior to anymanipulations, the ratio of standard to analyte remains constant because the same fraction ofeach is lost in any operation.
To use an internal standard, we prepare a known mixture of standard and analyte to meas-ure the relative response of the detector to the two species. In the chromatogram in Figure 5-7,the area under each peak is proportional to the concentration of the species injected into the col-umn. However, the detector generally has a different response to each component. For example,if both analyte (X) and internal standard (S) have concentrations of 10.0 mM, the area under theanalyte peak might be 2.30 times greater than the area under the standard peak. We say that theresponse factor, F, is 2.30 times greater for X than for S.
(5-11)
AX
[X]� F a AS
[S]b
Area of analyte signal
Concentration of analyte� F a area of standard signal
concentration of standardbResponse
factor:
9 � 2 � 7t � 2.365(2.365)(0.098 mM) � 0.23 mM.
n � 2t 0.098
xxiy
0m 0sy
Standard deviationof x-intercept
�sy
0m 0 B1n
�y2
m2 � (xi � x)2
[X] f,[S] f.
IS�X
[X] i � 2.89
[S] i(Vs/V0) � �[X] i.
[S] i(Vs/V0)IS�X(V/V0)
IS�X a V
V0b � IX �
IX
[X]i[S]i aVs
V0bFor successive standard
additions to one solution:
90 CHAPTER 5 Quality Assurance and Calibration Methods
In standard addition, the standard is the same substance as the analyte.
An internal standard is a different substance from the analyte.
When the relative response of an instrument toanalyte and standard remains constant overa range of concentrations, we say there is alinear response. For critical work, thisassumption should be verified because it is not always true.11
If the detector responds equally to standardand analyte, F If the detector respondstwice as much to analyte as to standard,F If the detector responds half as much toanalyte as to standard, F � 0.5.
� 2.
� 1.
Plot versus
x- intercept is [X] i
[S]i aVs
V0bIS�X a V
V0b
The equation of the line in Figure 5-6 isThe x-intercept is obtained by
setting
x � �b/m
0 � mx � b
y � 0:y � mx � b.
Standard addition:For constant total volume, you can plot
versus and the x-intercept is If you plot
versus the x-intercept is [X] i.[S] i aVs
V0b,IS�X a V
V0b
[X] f.[S] f
IS�X

Summary 91
Terms to Understandassessmentcalibration checkcoefficient of variationcontrol chartdetection limitdilution factorfalse negativefalse positive
field blankinternal standardlinearitylower limit of quantitationmatrixmatrix effectmethod blankmethod validation
performance test samplequality assurancerangereagent blankreporting limitresponse factorrobustnessselectivity
sensitivityspecificationspecificityspikestandard additionstandard operating procedureuse objective
[X] and [S] are the concentrations of analyte and standard after they have been mixedtogether. Equation 5-11 is predicated on linear response to both the analyte and thestandard.
Example Using an Internal Standard
In a preliminary experiment, a solution containing 0.083 7 M X and 0.066 6 M S gavepeak areas of and (Areas are measured in arbitrary units by theinstrument’s computer.) To analyze the unknown, 10.0 mL of 0.146 M S were added to10.0 mL of unknown, and the mixture was diluted to 25.0 mL in a volumetric flask. Thismixture gave the chromatogram in Figure 5-7, for which and Findthe concentration of X in the unknown.
Solution First use the standard mixture to find the response factor in Equation 5-11:
Standard mixture:
In the mixture of unknown plus standard, the concentration of S is
14243 123Initial Dilution
concentration factor
Using the known response factor, we substitute back into Equation 5-11 to find theconcentration of unknown in the mixture:
Unknown mixture:
Because X was diluted from 10.0 to 25.0 mL when the mixture with S was prepared, theoriginal concentration of X in the unknown was 0.143 M.
(25.0 mL/10.0 mL)(0.057 21 M) �
553
[X]� 0.9700 a 582
0.058 4b 1 [X] � 0.057 21 M
AX
[X]� F a AS
[S]b
[S] � (0.146 M) a10.0
25.0b � 0.058 4 M
423
0.083 7� F a 347
0.066 6b 1 F � 0.9700
AX
[X]� F a AS
[S]b
AS � 582.AX � 553
AS � 347.AX � 423
10Time (min)
50
X
S
Det
ecto
r si
gnal
Figure 5-7 Chromatographic separation ofunknown (X) and internal standard (S). Aknown amount of S was added to theunknown. The relative areas of the signals fromX and S allow us to find out how much X is inthe mixture. It is necessary first to measure therelative response of the detector to eachcompound.
Quality assurance is what we do to get the right answer for our pur-pose. We begin by writing use objectives, from which specificationsfor data quality can be derived. Specifications could includerequirements for sampling, accuracy, precision, specificity, detec-tion limit, standards, and blank values. For any meaningful analysis,we must first collect a representative sample. In an analysis of stan-dards, the method must produce a result that is acceptably close tothe known value. A method blank contains all components exceptanalyte, and it is taken through all steps of the analytical procedure.We subtract the response of the method blank from the response of
a real sample prior to calculating the quantity of analyte in the sam-ple. A field blank tells us if analyte is inadvertently picked up byexposure to field conditions. Accuracy can be assessed by analyzingcertified standards, by calibration checks performed by the analyst,with spikes made by the analyst, and by blind quality control sam-ples. Written standard operating procedures must be followed rigor-ously to avoid inadvertent changes in procedure that could affectthe outcome. Assessment is the process of (1) collecting data toshow that analytical procedures are operating within specified lim-its and (2) verifying that final results meet use objectives. Control
Summary
The dilution factor converts initial
concentration into final concentration.
initial volumefinal volume

found to be 1.31 times more intense than the signal due to S. Findthe concentration of X in the unknown.
5-D. In Figure 5-6, the x-intercept is �2.89 mM and its standarddeviation is mM. Find the 90% and 99% confidence intervalsfor the intercept.
5-E. Control chart. Volatile compounds in human blood serum weremeasured by purge and trap gas chromatography/mass spectrometry.For quality control, serum was periodically spiked with a constantamount of 1,2-dichlorobenzene and the concentration was measured. Find the mean and standard deviation for the follow-ing spike data and prepare a control chart. State whether or not theobservations (Obs.) meet each of the criteria for stability of a controlchart.
(ng/g � ppb)
0.098
92 CHAPTER 5 Quality Assurance and Calibration Methods
Obs. Obs. Obs. Obs. Obs.Day (ppb) Day (ppb) Day (ppb) Day (ppb) Day (ppb)
0 1.05 91 1.13 147 0.83 212 1.03 290 1.041 0.70 101 1.64 149 0.88 218 0.90 294 0.853 0.42 104 0.79 154 0.89 220 0.86 296 0.596 0.95 106 0.66 156 0.72 237 1.05 300 0.837 0.55 112 0.88 161 1.18 251 0.79 302 0.67
30 0.68 113 0.79 167 0.75 259 0.94 304 0.6670 0.83 115 1.07 175 0.76 262 0.77 308 1.0472 0.97 119 0.60 182 0.93 277 0.85 311 0.8676 0.60 125 0.80 185 0.72 282 0.72 317 0.8880 0.87 128 0.81 189 0.87 286 0.68 321 0.6784 1.03 134 0.84 199 0.85 288 0.86 323 0.68
SOURCE: D. L. Ashley, M. A. Bonin, F. L. Cardinali, J. M. McCraw, J. S. Holler, L. L.Needham, and D. G. Patterson, Jr., “Determining Volatile Organic Compounds in Blood byUsing Purge and Trap Gas Chromatography/Mass Spectrometry,” Anal. Chem. 1992, 64, 1021.
Exercises5-A. Detection limit. In spectrophotometry, we measure the con-centration of analyte by its absorbance of light. A low-concentrationsample was prepared and nine replicate measurements gave ab-sorbances of 0.004 7, 0.005 4, 0.006 2, 0.006 0, 0.004 6, 0.005 6,0.005 2, 0.004 4, and 0.005 8. Nine reagent blanks gave valuesof 0.000 6, 0.001 2, 0.002 2, 0.000 5, 0.001 6, 0.000 8, 0.001 7,0.001 0, and 0.001 1.(a) Find the absorbance detection limit with Equation 5-3.(b) The calibration curve is a graph of absorbance versus concen-tration. Absorbance is a dimensionless quantity. The slope of thecalibration curve is Find the concentrationdetection limit with Equation 5-5.(c) Find the lower limit of quantitation with Equation 5-6.
5-B. Standard addition. An unknown sample of gave a cur-rent of 2.36 in an electrochemical analysis. When 0.500 mL ofsolution containing 0.028 7 M was added to 25.0 mL ofunknown, the current increased to 3.79 (a) Denoting the initial, unknown concentration as write anexpression for the final concentration, after 25.0 mL ofunknown was mixed with 0.500 mL of standard. Use the dilutionfactor for this calculation.(b) In a similar manner, write the final concentration of added stan-dard designated as (c) Find in the unknown.
5-C. Internal standard. A solution was prepared by mixing 5.00 mLof unknown (element X) with 2.00 mL of solution containing 4.13 of standard (element S) per milliliter, and diluting to 10.0 mL. Themeasured signal ratio in an atomic absorption experiment was
In a separate experi-ment, for equal concentrations of X and S, the signal due to X was(signal due to X)/(signal due to S) � 0.808.
g
[Ni2�] i
[S] f .Ni2�,
[Ni2�] f,[Ni2�] i,
A.Ni2�
ANi2�
m � 2.24 104 M�1.
Problems
charts can be used to monitor accuracy, precision, or instrumentperformance as a function of time.
Method validation is the process of proving that an analyticalmethod is acceptable for its intended purpose. In validating a method,we typically demonstrate that requirements are met for specificity, lin-earity, accuracy, precision, range, limit of detection, limit of quantita-tion, and robustness. Specificity is the ability to distinguish analytefrom anything else. Linearity is usually measured by the square of thecorrelation coefficient for the calibration curve. Types of precisioninclude instrument precision, intra-assay precision, ruggedness (inter-mediate precision), and, most generally, interlaboratory precision. The“Horwitz trumpet” is an empirical statement that precision becomespoorer as analyte concentration decreases. Range is the concentrationinterval over which linearity, accuracy, and precision are acceptable.The detection limit is usually taken as 3 times the standard deviationof the blank. The lower limit of quantitation is 10 times the standarddeviation of the blank. The reporting limit is the concentration belowwhich regulations say that analyte is reported as “not detected,” evenwhen it is observed. Robustness is the ability of an analytical methodto be unaffected by small changes in operating parameters.
A standard addition is a known quantity of analyte added to anunknown to increase the concentration of analyte. Standard addi-tions are especially useful when matrix effects are important. Amatrix effect is a change in the analytical signal caused by anythingin the sample other than analyte. You should be able to use Equa-tion 5-7 to compute the quantity of analyte in a standard additionexperiment. Equation 5-9 is used with multiple standard additionsto construct the graph in Figure 5-6, in which the x-intercept givesus the concentration of analyte.
An internal standard is a known amount of a compound, differ-ent from analyte, that is added to the unknown. Signal from analyteis compared with signal from the internal standard to find out howmuch analyte is present. Internal standards are useful when thequantity of sample analyzed is not reproducible, when instrumentresponse varies from run to run, or when sample losses occur insample preparation. The response factor in Equation 5-11 is the rel-ative response to analyte and standard.
Quality Assurance and Method Validation
5-1. Explain the meaning of the quotation at the beginning of thischapter: “Get the right data. Get the data right. Keep the data right.”
5-2. What are the three parts of quality assurance? What questionsare asked in each part and what actions are taken in each part?
5-3. How can you validate precision and accuracy?
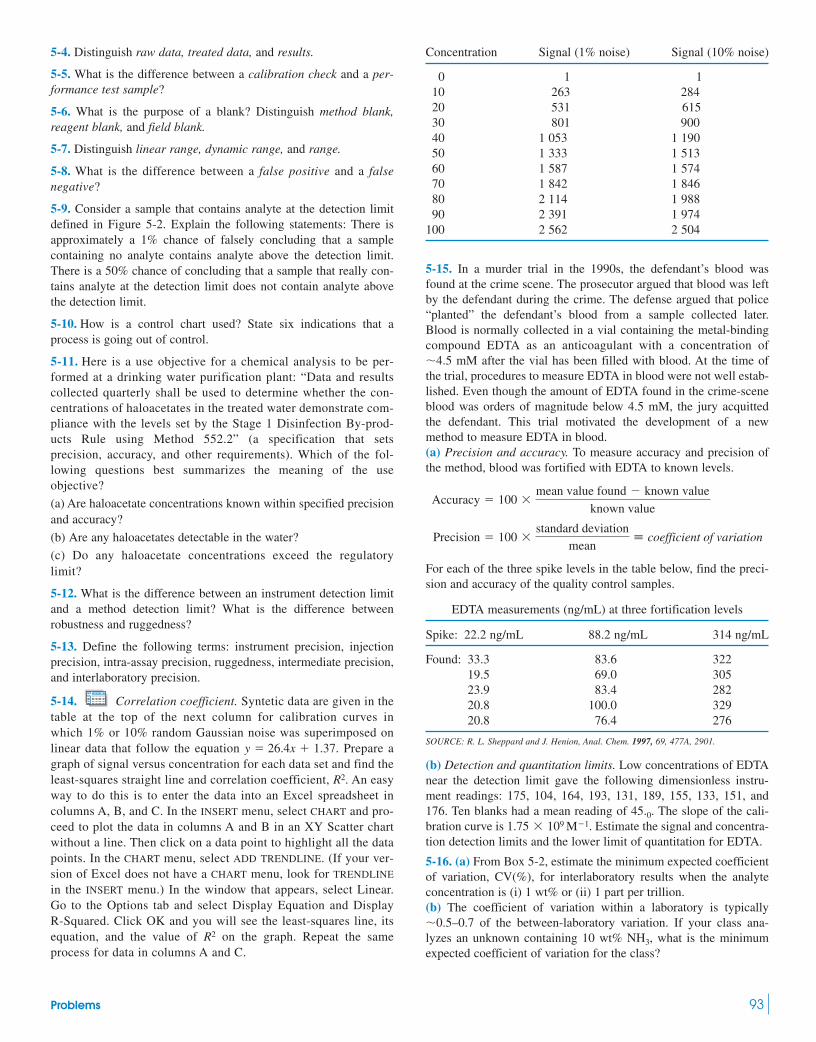
Problems 93
5-4. Distinguish raw data, treated data, and results.
5-5. What is the difference between a calibration check and a per-formance test sample?
5-6. What is the purpose of a blank? Distinguish method blank,reagent blank, and field blank.
5-7. Distinguish linear range, dynamic range, and range.
5-8. What is the difference between a false positive and a falsenegative?
5-9. Consider a sample that contains analyte at the detection limitdefined in Figure 5-2. Explain the following statements: There isapproximately a 1% chance of falsely concluding that a samplecontaining no analyte contains analyte above the detection limit.There is a 50% chance of concluding that a sample that really con-tains analyte at the detection limit does not contain analyte abovethe detection limit.
5-10. How is a control chart used? State six indications that aprocess is going out of control.
5-11. Here is a use objective for a chemical analysis to be per-formed at a drinking water purification plant: “Data and resultscollected quarterly shall be used to determine whether the con-centrations of haloacetates in the treated water demonstrate com-pliance with the levels set by the Stage 1 Disinfection By-prod-ucts Rule using Method 552.2” (a specification that setsprecision, accuracy, and other requirements). Which of the fol-lowing questions best summarizes the meaning of the use objective?
(a) Are haloacetate concentrations known within specified precisionand accuracy?
(b) Are any haloacetates detectable in the water?
(c) Do any haloacetate concentrations exceed the regulatorylimit?
5-12. What is the difference between an instrument detection limitand a method detection limit? What is the difference betweenrobustness and ruggedness?
5-13. Define the following terms: instrument precision, injectionprecision, intra-assay precision, ruggedness, intermediate precision,and interlaboratory precision.
5-14. Correlation coefficient. Syntetic data are given in thetable at the top of the next column for calibration curves inwhich 1% or 10% random Gaussian noise was superimposed onlinear data that follow the equation Prepare agraph of signal versus concentration for each data set and find theleast-squares straight line and correlation coefficient, An easyway to do this is to enter the data into an Excel spreadsheet incolumns A, B, and C. In the INSERT menu, select CHART and pro-ceed to plot the data in columns A and B in an XY Scatter chartwithout a line. Then click on a data point to highlight all the datapoints. In the CHART menu, select ADD TRENDLINE. (If your ver-sion of Excel does not have a CHART menu, look for TRENDLINE
in the INSERT menu.) In the window that appears, select Linear.Go to the Options tab and select Display Equation and DisplayR-Squared. Click OK and you will see the least-squares line, itsequation, and the value of on the graph. Repeat the sameprocess for data in columns A and C.
R2
R2.
26.4x � 1.37.y �
Concentration Signal (1% noise) Signal (10% noise)
0 1 110 263 28420 531 61530 801 90040 1 053 1 19050 1 333 1 51360 1 587 1 57470 1 842 1 84680 2 114 1 98890 2 391 1 974
100 2 562 2 504
5-15. In a murder trial in the 1990s, the defendant’s blood wasfound at the crime scene. The prosecutor argued that blood was leftby the defendant during the crime. The defense argued that police“planted” the defendant’s blood from a sample collected later.Blood is normally collected in a vial containing the metal-bindingcompound EDTA as an anticoagulant with a concentration of�4.5 mM after the vial has been filled with blood. At the time ofthe trial, procedures to measure EDTA in blood were not well estab-lished. Even though the amount of EDTA found in the crime-sceneblood was orders of magnitude below 4.5 mM, the jury acquittedthe defendant. This trial motivated the development of a newmethod to measure EDTA in blood.(a) Precision and accuracy. To measure accuracy and precision ofthe method, blood was fortified with EDTA to known levels.
For each of the three spike levels in the table below, find the preci-sion and accuracy of the quality control samples.
EDTA measurements (ng/mL) at three fortification levels
Spike: 22.2 ng/mL 88.2 ng/mL 314 ng/mL
Found: 33.3 83.6 32219.5 69.0 30523.9 83.4 28220.8 100.0 32920.8 76.4 276
SOURCE: R. L. Sheppard and J. Henion, Anal. Chem. 1997, 69, 477A, 2901.
(b) Detection and quantitation limits. Low concentrations of EDTAnear the detection limit gave the following dimensionless instru-ment readings: 175, 104, 164, 193, 131, 189, 155, 133, 151, and176. Ten blanks had a mean reading of The slope of the cali-bration curve is Estimate the signal and concentra-tion detection limits and the lower limit of quantitation for EDTA.
5-16. (a) From Box 5-2, estimate the minimum expected coefficientof variation, CV(%), for interlaboratory results when the analyteconcentration is (i) 1 wt% or (ii) 1 part per trillion.(b) The coefficient of variation within a laboratory is typically�0.5–0.7 of the between-laboratory variation. If your class ana-lyzes an unknown containing 10 wt% what is the minimumexpected coefficient of variation for the class?
NH3,
1.75 109 M�1.45.0.
Precision � 100 standard deviation
mean� coefficient of variation
Accuracy � 100 mean value found � known value
known value

5-17. The experimental data below show how the coefficient ofvariation increases as analyte concentration decreases in studiesconducted in single laboratories. Plot these two sets of data on onegraph and plot the Horwitz equation from Box 5-2 on the samegraph. These data give an idea of the variability in experimentalprecision.
HPLC determination Gas chromatographicof spiramycin antibiotic determination of ethanol
CV(%) CV(%)
0.000 1 39.7 0.000 01 3.580.000 2 23.4 0.000 10 1.300.000 5 20.7 0.000 25 0.650.001 12.3 0.001 00 0.550.002 5 5.30.005 2.60.01 1.6
SOURCE: J. Vial and A. Jardy, “Experimental Comparison of Different Approaches to Esti-mate LOD and LOQ of an HPLC Method,” Anal. Chem. 1999, 71, 2672; and J. M. Green,“A Practical Guide to Analytical Method Validation,” Anal. Chem. 1996, 68, 305A.
5-18. Spike recovery and detection limit. Species of arsenic foundin drinking water include (arsenite), (arsenate),
(dimethylarsinate), and (methylarsonate).Pure water containing no arsenic was spiked with 0.40 arsen-ate/L. Seven replicate determinations gave 0.39, 0.40, 0.38, 0.41,0.36, 0.35, and Find the mean percent recovery of thespike and the concentration detection limit
5-19. Detection limit. Low concentrations of Ni-EDTA near thedetection limit gave the following counts in a mass spectral mea-surement: 175, 104, 164, 193, 131, 189, 155, 133, 151, 176. Tenmeasurements of a blank had a mean of 45 counts. A sample con-taining 1.00 Ni-EDTA gave 1 797 counts. Estimate the detec-tion limit for Ni-EDTA.
5-20. Detection limit. A sensitive chromatographic method wasdeveloped to measure sub-part-per-billion levels of the disinfectantby-products iodate chlorite and bromate indrinking water. As the oxyhalides emerge from the column, theyreact with to make , which is measured by its strong absorp-tion at 267 nm. For example, each mole of bromate makes 3 mol of
by the reaction Bromate near its detection limit gave the following chromato-
graphic peak heights and standard deviations. The blank is 0because chromatographic peak height is measured from the base-line adjacent to the peak. For each concentration, estimate thedetection limit. Find the mean detection limit.
Peak height RelativeConcentration (arbitrary standard Number of( g /L) units) deviation (%) measurements
0.2 17 14.4 80.5 31 6.8 71.0 56 3.2 72.0 111 1.9 7
SOURCE: H. S. Weinberg and H. Yamada, “Post-Ion-Chromatography Derivatization for theDetermination of Oxyhalides at Sub-PPB Levels in Drinking Water,” Anal. Chem. 1998, 70, 1.
5-21. Olympic athletes are tested to see that they are not using ille-gal performance-enhancing drugs. Suppose that urine samples aretaken and analyzed and the rate of false positive results is 1%. Sup-
BrO�3 � 8Br� � 6H� S 3Br�
3 � 3H2O.Br�3
Br�3Br�
(BrO�3 )(ClO�
2 ),(IO�3 ),
M
( g/L).0.39 g/L.12
g(CH3)AsO2�
3(CH3)2AsO�2
AsO3�4AsO3�
3
C ag analyte
g samplebC ag analyte
g sampleb
94 CHAPTER 5 Quality Assurance and Calibration Methods
pose also that it is too expensive to refine the method to reducethe rate of false positive results. We certainly do not want toaccuse innocent people of using illegal drugs. What can you do toreduce the rate of false accusations even though the test always hasa false positive rate of 1%?
Standard Addition
5-22. Why is it desirable in the method of standard addition to adda small volume of concentrated standard rather than a large volumeof dilute standard?
5-23. An unknown sample of gave an absorbance of 0.262 inan atomic absorption analysis. Then 1.00 mL of solution containing
was mixed with 95.0 mL of unknown,and the mixture was diluted to 100.0 mL in a volumetric flask. Theabsorbance of the new solution was 0.500.(a) Denoting the initial, unknown concentration as write anexpression for the final concentration, after dilution. Unitsof concentration are ppm.(b) In a similar manner, write the final concentration of added stan-dard designated as (c) Find in the unknown.
5-24. Standard addition graph. Tooth enamel consistsmainly of the mineral calcium hydroxyapatite, Trace elements in teeth of archaeological specimens provide anthro-pologists with clues about diet and diseases of ancient people. Stu-dents at Hamline University measured strontium in enamel fromextracted wisdom teeth by atomic absorption spectroscopy. Solu-tions with a constant total volume of 10.0 mL contained 0.750 mgof dissolved tooth enamel plus variable concentrations of added Sr.
Added Sr (ng/mL ppb) Signal (arbitrary units)
0 28.02.50 34.35.00 42.87.50 51.510.00 58.6
SOURCE: V. J. Porter, P. M. Sanft, J. C. Dempich, D.D. Dettmer, A. E. Erickson, N. A.Dubauskie, S. T. Myster, E. H. Matts, and E. T. Smith, “Elemental Analysis of WisdomTeeth by Atomic Spectroscopy Using Standard Addition,” J. Chem. Ed. 2002, 79, 1114.
(a) Find the concentration of Sr and its uncertainty in the 10-mLsample solution in parts per (b) Find the concentration of Sr in tooth enamel in parts per
(c) If the standard addition intercept is the major source of uncer-tainty, find the uncertainty in the concentration of Sr in toothenamel in parts per million.(d) Find the 95% confidence interval for Sr in tooth enamel.
5-25. Europium is a lanthanide element found in parts per billionlevels in natural waters. It can be measured from the intensity oforange light emitted when a solution is illuminated with ultravioletradiation. Certain organic compounds that bind Eu(III) are requiredto enhance the emission. The figure shows standard addition exper-iments in which 10.00 mL of sample and 20.00 mL containing alarge excess of organic additive were placed in 50-mL volumetricflasks. Then Eu(III) standards (0, 5.00, 10.00, or 15.00 mL) wereadded and the flasks were diluted to 50.0 mL with Standardsadded to tap water contained 0.152 ng/mL (ppb) of Eu(III),but those added to pond water were 100 times more concentrated(15.2 ng/mL).
H2O.
million � g/g.
billion � ng/mL.
�
Ca10(PO4)6(OH)2.
[Cu2�] i
[S] f .Cu2�,
[Cu2�] f,[Cu2�] i,
100.0 ppm (� g/mL) Cu2�
Cu2�

(a) From the x-intercepts in the graph, calculate the concentrationof Eu(III) (ng/mL) in pond water and tap water.(b) For tap water, the emission peak area increases by 4.61 unitswhen 10.00 mL of 0.152 ng/mL standard are added. This responseis 4.61 units/1.52 units per ng of Eu(III). For pond water,the response is 12.5 units when 10.00 mL of 15.2 ng/mL stan-dard are added, or 0.082 2 units per ng. How would you explainthese observations? Why was standard addition necessary for thisanalysis?
5-26. Standard addition graph. Students performed anexperiment like that in Figure 5-4 in which each flask contained25.00 mL of serum, varying additions of 2.640 M NaCl standard,and a total volume of 50.00 mL.
Volume of Na� atomic emissionFlask standard (mL) signal (mV)
1 0 3.132 1.000 5.403 2.000 7.894 3.000 10.305 4.000 12.48
(a) Prepare a graph of Equation 5-9 and find in the serum.When you graph versus the x-intercept is
not(b) Find the standard deviation and 95% confidence interval for
5-27. Standard addition graph. An assay for substance X isbased on its ability to catalyze a reaction that produces radioactive Y.The quantity of Y produced in a fixed time is proportional to theconcentration of X in the solution. An unknown containing X in acomplex, unknown matrix with an initial volume of 50.0 mL wastreated with increments of standard 0.531 M X and the followingresults were obtained. Prepare a graph of Equation 5-9 and find [X]
[Na� ] .
[X] f.[X] i,[S]i(Vs /V0),IS�X(V/V0)
[Na�]
ng � 3.03
Problems 95
and its standard deviation in the original unknown. Also find the95% confidence interval for [X].
Volume of added X 0 100.0 200.0 300.0 400.0
Counts/min of radioactive Y: 1 084 1 844 2 473 3 266 4 010
Internal Standards
5-28. State when standard additions and internal standards, insteadof a calibration curve, are desirable, and why.
5-29. A solution containing 3.47 mM X (analyte) and 1.72 mM S(standard) gave peak areas of 3 473 and 10 222, respectively, in achromatographic analysis. Then 1.00 mL of 8.47 mM S was addedto 5.00 mL of unknown X, and the mixture was diluted to 10.0 mL.This solution gave peak areas of 5 428 and 4 431 for X and S,respectively.(a) Calculate the response factor for the analyte.(b) Find the concentration of S (mM) in the 10.0 mL of mixedsolution.(c) Find the concentration of X (mM) in the 10.0 mL of mixedsolution.(d) Find the concentration of X in the original unknown.
5-30. Chloroform is an internal standard in the determination of thepesticide DDT in a polarographic analysis in which each compoundis reduced at an electrode surface. A mixture containing 0.500 mMchloroform and 0.800 mM DDT gave signals of 15.3 for chlo-roform and 10.1 for DDT. An unknown solution (10.0 mL) con-taining DDT was placed in a 100-mL volumetric flask and 10.2 of chloroform (FM 119.39, were added.After dilution to the mark with solvent, polarographic signals of29.4 and 8.7 were observed for the chloroform and DDT,respectively. Find the concentration of DDT in the unknown.
5-31. Verifying constant response for an internal standard. When wedevelop a method using an internal standard, it is important to verifythat the response factor is constant over the calibration range. Dataare shown below for a chromatographic analysis of naphthalene
using deuterated naphthalene in which D is the iso-tope as an internal standard. The two compounds emerge fromthe column at almost identical times and are measured by a massspectrometer, which distinguishes them by molecular mass. Fromthe definition of response factor in Equation 5-11, we can write
Prepare a graph of peak area ratio versus concentra-tion ratio and find the slope, which is the responsefactor. Evaluate F for each of the three samples and find the stan-dard deviation of F to see how “constant” it is.
C10H8 C10D8 C10H8 C10D8
Sample (ppm) (ppm) peak area peak area
1 1.0 10.0 303 2 9922 5.0 10.0 3 519 6 1413 10.0 10.0 3 023 2 819
The volume of solution injected into the column was different in all three runs.
[C10H8] /[C10D8](C10H8/C10D8)
Area of analyte signal
Area of standard signal� F a concentration of analyte
concentration of standardb
2H)(C10D8(C10H8),
A
density � 1.484 g/mL) L
A A
( L):
–15
–14.6 mL
–6.0 mL
–10 –5 0
Added volume of standard (mL)
Tap water
Pond water
Em
issi
on p
eak
area
5 10
10
20
30
40
15
Standard addition of Eu(III) to pond water or tap water. [Data fromA. L. Jenkins and G. M. Murray, “Enhanced Luminescence of Lanthanides,” J. Chem.Ed. 1998, 75, 227.]

96 CHAPTER 6 Chemical Equilibrium
Part of the North Branch of the Potomac River runs crystal clear through the scenicAppalachian Mountains, but it is lifeless—a victim of acid drainage from abandoned coalmines. As the river passes a paper mill and a wastewater treatment plant near Westernport,Maryland, the pH rises from an acidic, lethal value of 4.5 to a neutral value of 7.2, at whichfish and plants thrive. This happy “accident” comes about because calcium carbonate exit-ing the paper mill equilibrates with massive quantities of carbon dioxide from bacterial res-piration at the sewage treatment plant. The resulting soluble bicarbonate neutralizes theacidic river and restores life downstream of the plant.1
Calcium carbonate Dissolved calcium bicarbonate
Bicarbonate Acid in river
The chemistry that helps the Potomac River endangers coral reefs, which are largely. Burning of fossil fuel has increased in the atmosphere from 280 ppm when Cap-
tain Cook first sighted the Great Barrier Reef in 1770 to 380 ppm today (Box 20-1). Increasedin the atmosphere adds to the ocean, dissolving from coral. Rising and,
perhaps, rising atmospheric temperature from the greenhouse effect threaten coral reefs withextinction.2 has lowered the average pH of the ocean from its preindustrial value of 8.16to 8.04 today.3 Without changes in our activities, the pH could be 7.7 by 2100.
CO2
CO2CaCO3CO2CO2
CO2CaCO3
HCO�3 (aq) � H�(aq)
neutralization ! CO2(g) � H2O(l)
CaCO3(s) � CO2(aq) � H2O(l) T Ca2�(aq) � 2HCO�3 (aq)
CHEMICAL EQUILIBRIUM IN THE ENVIRONMENT
Chemical Equilibrium6
Great Barrier Reef and other coral reefs arethreatened with extinction by rising atmo-spheric CO2. [Copyright Jon Arnold Images/Alamy.]
Paper mill on the Potomac River near Westernport, Maryland, neutralizes acid minedrainage in the water. Upstream of the mill, the river is acidic and lifeless; below themill, the river teems with life. [Photo courtesy C. Dalpra, Potomac River Basin Commission.]
Equilibria govern diverse phenomena from the folding of proteins to the action of acid rainon minerals to the aqueous reactions used in analytical chemistry. This chapter introducesequilibria for the solubility of ionic compounds, complex formation, and acid-base reactions.Chemical equilibrium provides a foundation not only for chemical analysis, but also for othersubjects such as biochemistry, geology, and oceanography.

Equilibrium constant: (6-2)
where the lowercase superscript letters denote stoichiometry coefficients and each capital let-ter stands for a chemical species. The symbol [A] stands for the concentration of A relative toits standard state (defined next). By definition, a reaction is favored whenever .
In the thermodynamic derivation of the equilibrium constant, each quantity inEquation 6-2 is expressed as the ratio of the concentration of a species to its concentration inits standard state. For solutes, the standard state is 1 M. For gases, the standard state is
, and for solids and liquids, the standard states are thepure solid or liquid. It is understood (but rarely written) that [A] in Equation 6-2 really means[A]/(1 M) if A is a solute. If D is a gas, [D] really means (pressure of D in bars)/(1 bar). Toemphasize that [D] means pressure of D, we usually write in place of [D]. The terms ofEquation 6-2 are actually dimensionless; therefore, all equilibrium constants are dimensionless.
For the ratios [A]/(1 M) and [D]/(1 bar) to be dimensionless, [A] must be expressed inmoles per liter (M), and [D] must be expressed in bars. If C were a pure liquid or solid, theratio [C]/(concentration of C in its standard state) would be unity (1) because the standardstate is the pure liquid or solid. If [C] is a solvent, the concentration is so close to that of pureliquid C that the value of [C] is still essentially 1.
The take-home lesson is this: When you evaluate an equilibrium constant,
1. Concentrations of solutes should be expressed as moles per liter.2. Concentrations of gases should be expressed in bars.3. Concentrations of pure solids, pure liquids, and solvents are omitted because they are unity.
These conventions are arbitrary, but you must use them if you wish to use tabulated values ofequilibrium constants, standard reduction potentials, and free energies.
Manipulating Equilibrium ConstantsConsider the reaction
If the direction of a reaction is reversed, the new value of K is simply the reciprocal of theoriginal value of K.
If two reactions are added, the new K is the product of the two individual values:
If n reactions are added, the overall equilibrium constant is the product of n individual equi-librium constants.
Example Combining Equilibrium Constants
The equilibrium constant for the reaction is called and has the value . Given that for the reaction
, find K for the reaction .NH�4 T NH3(aq) � H�NH3(aq) � H2O T NH�
4 � OH�
KNH3� 1.8 10�51.0 10�14 at 25°C
Kw(� [H�][OH�])H2O T H� � OH�
K3 � K1K2 �[H�][A�]
[HA]�
[CH�]
[H�][C]�
[A�][CH�]
[HA][C]Equilibrium constantfor sum of reactions:
HA T [H�] � A� K1
[H�] � C T CH� K2
HA � C T A� � CH� K3
H� � A� T HA K ¿1 �[HA]
[H�][A�]� 1/K1
Equilibrium constantfor reverse reaction:
HA T H� � A� K1 �[H�][A�]
[HA]
PD
1 bar (� 105 Pa; 1 atm � 1.013 25 bar)
K 7 1
K �[C]c[D]d
[A]a[B]b
6-1 The Equilibrium Constant 97
6-1 The Equilibrium ConstantFor the reaction
(6-1)
we write the equilibrium constant, K, in the form
aA � bB T cC � d D
Equation 6-2, also called the law of massaction, was formulated by the NorwegiansC. M. Guldenberg and P. Waage and firstpublished in 1864. Their derivation was basedon the idea that the forward and reverse ratesof a reaction at equilibrium must be equal.4
The equilibrium constant is more correctlyexpressed as a ratio of activities rather than ofconcentrations. We reserve the discussion ofactivity for Chapter 8.
Equilibrium constants are dimensionless.
Equilibrium constants are dimensionless but,when specifying concentrations, you must useunits of molarity (M) for solutes and bars forgases.
Throughout this book, assume that all speciesin chemical equations are in aqueous solu-tion, unless otherwise specified.
If a reaction is reversed, then . If tworeactions are added, then .K3 � K1K2
K¿ � 1/K

Solution The third reaction can be obtained by reversing the second reaction and addingit to the first reaction:
6-2 Equilibrium and ThermodynamicsEquilibrium is controlled by the thermodynamics of a chemical reaction. The heat absorbedor released (enthalpy) and the degree of disorder of reactants and products (entropy) inde-pendently contribute to the degree to which the reaction is favored or disfavored.
EnthalpyThe enthalpy change, for a reaction is the heat absorbed or released when the reactiontakes place under constant applied pressure.5 The standard enthalpy change, , refers tothe heat absorbed when all reactants and products are in their standard states:†
(6-3)
The negative sign of indicates that heat is released by Reaction 6-3—the solutionbecomes warmer. For other reactions, is positive, which means that heat is absorbed.Consequently, the solution gets colder during the reaction. A reaction for which is posi-tive is said to be endothermic. Whenever is negative, the reaction is exothermic.
EntropyThe entropy, S, of a substance is a measure of its “disorder,” which we will not attempt todefine in a quantitative way. The greater the disorder, the greater the entropy. In general, agas is more disordered (has higher entropy) than a liquid, which is more disordered than asolid. Ions in aqueous solution are normally more disordered than in their solid salt:
(6-4)
is the change in entropy (entropy of products minus entropy of reactants) when all speciesare in their standard states. The positive value of indicates that a mole of plusa mole of is more disordered than a mole of For Reaction 6-3,
. The aqueous ions are less disordered than gaseous HCl.
Free EnergySystems at constant temperature and pressure, which are common laboratory conditions,have a tendency toward lower enthalpy and higher entropy. A chemical reaction is driventoward the formation of products by a negative value of (heat given off ) or a positivevalue of (more disorder) or both. When is negative and is positive, the reaction isclearly favored. When is positive and is negative, the reaction is clearly disfavored.
When and are both positive or both negative, what decides whether a reactionwill be favored? The change in Gibbs free energy, , is the arbiter between opposing ten-dencies of and . At constant temperature, T,
Free energy: (6-5)
A reaction is favored if is negative.For the dissociation of HCl (Reaction 6-3) when all species are in their standard states,favors the reaction and disfavors it. To find the net result, we evaluate :
� �35.97 kJ/mol
� (�74.85 103 J/mol) � (298.15 K)(�130.4 J/K�mol)
�G° � �H° � T�S°
�G°�S°�H°
�G
�G � �H � T�S
�S�H�G
�S�H�S�H
�S�H�S�H
�S° � �130.4 J/(K�mol) at 25°CKCl(s).Cl�(aq)
K�(aq)�S°�S°
KCl(s) T K�(aq) � Cl�(aq) �S° � �76.4 J/ (K�mol) at 25°C
�H�H
�H�H°
HCl(g) T H�(aq) � Cl�(aq) �H° � �74.85 kJ/mol at 25°C
�H°�H,
H2O T H� � OH� K � Kw
NH4� � OH� T NH3(aq) � H2O K � 1/KNH3
NH4� T H� � NH3(aq) K � Kw �
1
KNH3
� 5.6 10�10
98 CHAPTER 6 Chemical Equilibrium
(�)
Heat is absorbedEndothermic
(�)
Heat is liberatedExothermic
�H �
�H �
(�)
Products more disorderedthan reactants
(�)
Products less disorderedthan reactants
�S �
�S �
†The definition of the standard state contains subtleties beyond the scope of this book. For Reaction 6-3, thestandard state of or is the hypothetical state in which each ion is present at a concentration of 1 M butbehaves as if it were in an infinitely dilute solution. That is, the standard concentration is 1 M, but the standardbehavior is what would be observed in a very dilute solution in which each ion is unaffected by surrounding ions.
Cl�H�
Note that 25.00°C � 298.15 K.

is negative, so the reaction is favored when all species are in their standard states. Thefavorable influence of is greater than the unfavorable influence of in this case.
The point of discussing free energy is to relate the equilibrium constant to the energetics( and ) of a reaction. The equilibrium constant depends on in the followingmanner:
Free energy and equilibrium: (6-6)
where R is the gas constant and T is temperature (kelvin). Themore negative the value of , the larger is the equilibrium constant. For Reaction 6-3,
Because the equilibrium constant is large, is very soluble in water and is nearly com-pletely ionized to and when it dissolves.
To summarize, a chemical reaction is favored by the liberation of heat ( negative)and by an increase in disorder ( positive). takes both effects into account to determinewhether or not a reaction is favorable. We say that a reaction is spontaneous if is nega-tive or, equivalently, if . The reaction is not spontaneous if is positive ( ).You should be able to calculate K from and vice versa.
Le Châtelier’s Principle
Suppose that a system at equilibrium is subjected to a change that disturbs the system.Le Châtelier’s principle states that the direction in which the system proceeds back to equi-librium is such that the change is partially offset.
To see what this statement means, let’s see what happens when we attempt to change theconcentration of one species in the reaction
(6-7)Bromate Chromium(III) Dichromate
In one particular equilibrium state of this system, the following concentrations exist: and
Suppose that the equilibrium is disturbed by adding dichromate to the solution to increase theconcentration of from 0.10 to 0.20 M. In what direction will the reaction proceed toreach equilibrium?
According to the principle of Le Châtelier, the reaction should go back to the left to par-tially offset the increase in dichromate, which appears on the right side of Reaction 6-7. Wecan verify this algebraically by setting up the reaction quotient, Q, which has the same formas the equilibrium constant. The only difference is that Q is evaluated with whatever concen-trations happen to exist, even though the solution is not at equilibrium. When the systemreaches equilibrium, . For Reaction 6-7,
Because , the reaction must go to the left to decrease the numerator and increase thedenominator, until .
1. If a reaction is at equilibrium and products are added (or reactants are removed), thereaction goes to the left.
2. If a reaction is at equilibrium and reactants are added (or products are removed), thereaction goes to the right.
When the temperature of a system is changed, so is the equilibrium constant. Equations6-5 and 6-6 can be combined to predict the effect of temperature on K:
(6-8)
The term is independent of T (at least over a limited temperature range in whichis constant). The term increases with increasing temperature if is positive�H°e��H°/RT�S°
e�S°/R
� e��H°/RT � e�S°/R
K � e��G°/RT � e�(�H°�T�S°)/RT � e(��H°/RT��S°/R)
Q � KQ 7 K
Q �(1.0)(0.20)(5.0)8
(0.043)(0.003 0)2� 2 1011 7 K
Q � K
[Cr2O2�7 ]
[BrO�3 ] � 0.043 M.5.0 M, [Cr2O7
2�] � 0.10 M, [Cr3�] � 0.003 0 M, [Br�] � 1.0 M,[H�] �
K �[Br�][Cr2O2�
7 ][H�]8
[BrO�3 ][Cr3�]2
� 1 1011 at 25°C
BrO�3 � 2Cr3� � 4H2O T Br� � Cr2O2�
7 � 8H�
�G°K 6 1�G°K 7 1
�G°�G�S
�HCl�H�
HCl(g)
K � e�(�35.97103 J/mol)/[8.314 472 J/(K�mol)](298.15 K) � 2.00 106
�G°[� 8.314 472 J/ (K�mol)]
K � e��G°/RT
�G°�S°�H°
�S°�H°�G°
6-2 Equilibrium and Thermodynamics 99
Challenge Satisfy yourself that if isnegative.
�G°K 7 1
(�)
Reaction is disfavored
(�)
Reaction is favored
�G �
�G �
Notice that is omitted from K because it isthe solvent.
H2O
The reaction quotient has the same formas the equilibrium constant, but the concentra-tions are generally not the equilibrium concen-trations.
If , then the reaction must proceed tothe right to reach equilibrium. If , thenthe reaction must proceed to the left to reachequilibrium.
Q 7 KQ 6 K

and decreases if is negative. Therefore,
1. The equilibrium constant of an endothermic reaction ( ) increases if thetemperature is raised.
2. The equilibrium constant of an exothermic reaction ( ) decreases if thetemperature is raised.
These statements can be understood in terms of Le Châtelier’s principle as follows. Con-sider an endothermic reaction:
If the temperature is raised, then heat is added to the system. The reaction proceeds to theright to partially offset this change.6
In dealing with equilibrium problems, we are making thermodynamic predictions, notkinetic predictions. We are calculating what must happen for a system to reach equilibrium,but not how long it will take. Some reactions are over in an instant; others will not reachequilibrium in a million years. For example, dynamite remains unchanged indefinitely, untila spark sets off the spontaneous, explosive decomposition. The size of an equilibrium con-stant tells us nothing about the rate (the kinetics) of the reaction. A large equilibrium constantdoes not imply that a reaction is fast.
6-3 Solubility ProductIn chemical analysis, we encounter solubility in precipitation titrations, electrochemical ref-erence cells, and gravimetric analysis. The effect of acid on the solubility of minerals and theeffect of atmospheric on the solubility (and death) of coral reefs are important in envi-ronmental science.
The solubility product is the equilibrium constant for the reaction in which a solid saltdissolves to give its constituent ions in solution. Solid is omitted from the equilibrium con-stant because it is in its standard state. Appendix F lists solubility products.
As an example, consider the dissolution of mercury(I) chloride ( , also calledmercurous chloride) in water. The reaction is
(6-9)
for which the solubility product, , is
(6-10)
A solution containing excess, undissolved solid is said to be saturatedwith that solid. The solution contains all the solid capable of being dis-solved under the prevailing conditions.
The physical meaning of the solubility product is this: If an aque-ous solution is left in contact with excess solid , the solid will dis-solve until the condition is satisfied. Thereafter, theamount of undissolved solid remains constant. Unless excess solidremains, there is no guarantee that . If and are mixed together (with appropriate counterions) such that the product
exceeds , then will precipitate.We most commonly use the solubility product to find the con-
centration of one ion when the concentration of the other is known orfixed by some means. For example, what is the concentration of inequilibrium with 0.10 M in a solution of KCl containing excess,undissolved ? To answer this question, we rearrange Equation6-10 to find
Because is so slightly soluble, additional obtained from is negligiblecompared with 0.10 M .
The solubility product does not tell the entire story of solubility. In addition to compli-cations described in Box 6-1, most salts form soluble ion pairs to some extent. That is,MX(s) can give MX(aq) as well as and . In a saturated solution of ,for example, two-thirds of the dissolved calcium is and one-third is .7 TheCaSO4(aq)Ca2�
CaSO4X�(aq)M�(aq)
Cl�
Hg2Cl2Cl�Hg2Cl2
[Hg2�2 ] �
Ksp
[Cl�]2�
1.2 10�18
0.102� 1.2 10�16 M
Hg2Cl2(s)Cl�
Hg2�2
Hg2Cl2Ksp[Hg2�2 ][Cl�]2
Cl�Hg2�2[Hg2�
2 ][Cl�]2 � Ksp
[Hg2�2 ][Cl�]2 � Ksp
Hg2Cl2
Ksp � [Hg2�2 ][Cl�]2 � 1.2 10�18
Ksp
Hg2Cl2(s) T Hg2�2 � 2Cl�
Hg2Cl2
CO2
Heat � reactants T products
�H° ��
�H° ��
�H°
100 CHAPTER 6 Chemical Equilibrium
Heat can be treated as if it were a reactant inan endothermic reaction and a product in anexothermic reaction.
Mercurous ion, , is a dimer (pronounced DIE mer),which means that it consists of two identical units boundtogether:
, and stabilize Hg(II), thereby convertingHg(I) into Hg(0) and Hg(II):
Hg(I) Hg(II) Hg(0)
Disproportionation is the process in which an element in anintermediate oxidation state gives products in both higher andlower oxidation states.
Hg2�2 � 2CN� S Hg(CN)2(aq) � Hg(l)
CN�OH�, S2�
[Hg�Hg]2�
�1 oxidation stateof mercury
250 pm ""
Hg2�2
A salt is any ionic solid, such as or.CaSO4
Hg2Cl2

ion pair is a closely associated pair of ions that behaves as one species in solu-tion. Appendix J and Box 8-1 provide information on ion pairs.8
Common Ion EffectFor the ionic solubility reaction
the product is constant at equilibrium in the presence of excess solid .If the concentration of were increased by adding another source of , such as then the concentration of must decrease so that the product remainsconstant. In other words, less will dissolve if or is already presentfrom some other source. Figure 6-1 shows how the solubility of decreases in the pres-ence of dissolved .
This application of Le Châtelier’s principle is called the common ion effect. A salt willbe less soluble if one of its constituent ions is already present in the solution.
Separation by PrecipitationPrecipitations can sometimes be used to separate ions from each other.11 For example, con-sider a solution containing lead(II) ( ) and mercury(I) ( ) ions, each at a concentra-tion of 0.010 M. Each forms an insoluble iodide (Figure 6-2), but the mercury(I) iodide isconsiderably less soluble, as indicated by the smaller value of :
Hg2I2(s) T Hg2�2 � 2I� Ksp � 4.6 10�29
PbI2(s) T Pb2� � 2I� Ksp � 7.9 10�9
Ksp
Hg2�2Pb2�
CaCl2
CaSO4
SO2�4Ca2�CaSO4(s)
[Ca2�][SO2�4 ]SO2�
4
CaCl2,Ca2�Ca2�
CaSO4[Ca2�][SO2�4 ]
CaSO4(s) T Ca2� � SO2�4 Ksp � 2.4 10�5
CaSO4(aq)
6-3 Solubility Product 101
Box 6-1 Solubility Is Governed by More Than the Solubility Product
If we want to know how much is dissolved in a saturatedsolution of we are tempted to look at Reaction 6-9 and tonote that two are created for each If we let x be theconcentration of we could say that the concentration of
is 2x. Substituting these values into the solubility productexpression 6-10, we could write and would find
However, this answer is incorrect because we have notaccounted for other reactions, such as
[Hg2�2 ] � x � 6.7 10�7 M.
Ksp � [Hg2�2 ][Cl�]2 � (x)(2x)2
Cl�
Hg2�2 ,
Hg2�2 .Cl�
Hg2Cl2,Hg2�
2 Hydrolysis:
Disproportionation:
Both reactions consume By Le Châtelier’s principle, ifis consumed, more will dissolve. We need to know
all significant chemical reactions to compute the solubility of acompound.
Hg2Cl2Hg2�2
Hg2�2 .
2Hg2�2 T Hg2� � Hg(l) K � 10�2.1
Hg2�2 � H2O T Hg2OH� � H� K � 10�5.3
Common ion effect: A salt is less soluble if oneof its ions is already present in the solution.Demonstration 6-1 illustrates the common ioneffect.
The smaller implies a lower solubility forbecause the stoichiometries of the two
reactions are the same. If the stoichiometrieswere different, it does not follow that thesmaller would imply lower solubility.Ksp
Hg2I2
Ksp
0.0500.025
Dissolved CaCl2 (M)
0.000
0.002
0.000
0.004
0.006
0.008
0.010
0.012
0.014
0.016
Sol
ubili
ty o
f CaS
O4
expr
esse
d as
tota
l dis
solv
ed s
ulfa
te (
M)
Figure 6-1 Solubility of in solutions contain-ing dissolved Solubility is expressed as totaldissolved sulfate, which is present as free and asthe ion pair, Data from reference 7.CaSO4(aq).
SO2�4
CaCl2.CaSO4
Figure 6-2 A yellow solid, lead(II) iodideprecipitates when a colorless solution
of lead nitrate is added to acolorless solution of potassium iodide (KI).[Photo by Chip Clark.]
(Pb(NO3)2)(PbI2),

Is it possible to lower the concentration of by 99.990% by selective precipitation with, without precipitating ?
We are asking whether we can lower to 0.010% of without precipitating . Here is the experiment: We add enough to precipitate 99.990%of if all the reacts with and none reacts with . To see if any should pre-cipitate, we need to know the concentration of in equilibrium with precipitated plus the remaining .
Will this concentration of cause to precipitate? We answer this ques-tion by seeing if the solubility product of is exceeded.
The reaction quotient, Q, is , which is less than for .Therefore, will not precipitate and separation of and is feasible. We predictthat adding to a solution of and will precipitate virtually all the mercury(I)before any lead(II) precipitates.
Life should be so easy! We have just made a thermodynamic prediction. If the systemcomes to equilibrium, we can achieve the desired separation. However, occasionally one sub-stance coprecipitates with the other. In coprecipitation, a substance whose solubility is notexceeded precipitates along with another substance whose solubility is exceeded. For exam-ple, some might become adsorbed on the surface of the crystal or might evenoccupy sites within the crystal. Our calculation says that the separation is worth trying. How-ever, only an experiment can show whether or not the separation actually works.
6-4 Complex FormationIf anion precipitates metal , it is often observed that a high concentration of causes solid MX to redissolve. The increased solubility arises from the formation of complexions, such as , which consist of two or more simple ions bonded to each other.
Lewis Acids and BasesIn complex ions such as , , and , iodide is said to be the ligand of . Aligand is any atom or group of atoms attached to the species of interest. We say that Pb2�
Pb2�PbI2�4PbI�
3PbI�
MX�2
X�M�X�
Hg2I2Pb2�
Hg2�2Pb2�I�
Hg2�2Pb2�Pb2�
PbI2Ksp(� 7.9 10�9)4.6 10�25
� 4.6 10�25 6 Ksp (for PbI2) Q � [Pb2�][I�]2 � (0.010)(6.8 10�12)2
PbI2
0.010 M Pb2�I�
[I�] � B4.6 10�29
1.0 10�6� 6.8 10�12 M
(1.0 10�6)[I�]2 � 4.6 10�29
[Hg2�2 ][I�]2 � Ksp
Hg2I2(s) ∆Ksp
Hg22� � 2I�
1.0 10�6 M Hg2�2
Hg2I2(s)I�
Pb2�Pb2�Hg22�I�Hg2
2�
I�Pb2�
0.010 M � 1.0 l0�6 M[Hg2�2 ]
Pb2�I�
Hg2�2
102 CHAPTER 6 Chemical Equilibrium
Question If you want to know whether a smallamount of coprecipitates with ,should you measure the concentrationin the mother liquor (the solution) or the concentration in the precipitate? Whichmeasurement is more sensitive? By “sensitive,”we mean responsive to a small amount ofcoprecipitation.(Answer: Measure in precipitate.)Pb2�
Pb2�
Pb2�
Hg2I2Pb2�
Demonstration 6-1 Common Ion Effect9,10
Fill two large test tubes about one-third full with saturated aque-ous KCl containing no excess solid. The solubility of KCl isapproximately 3.7 M, so the solubility product (ignoring activityeffects introduced later) is
Now add 1/3 of a test tube of 6 M HCl to one test tube and anequal volume of 12 M HCl to the other. Even though a commonion, is added in each case, KCl precipitates only in one tube.
To understand your observations, calculate the concentrationsof and in each tube after HCl addition. Then evaluate thereaction quotient, for each tube. Explain yourobservations.
Q � [K�][Cl�],Cl�K�
Cl�,
Ksp � [K�][Cl�] � (3.7)(3.7) � 13.7
KClprecipitate
SaturatedKCl(aq)
(no excess solid)
Homogeneoussolution
Add 1 volumeof 6 M HCl(aq)
Add 1 volumeof 12 M HCl(aq)
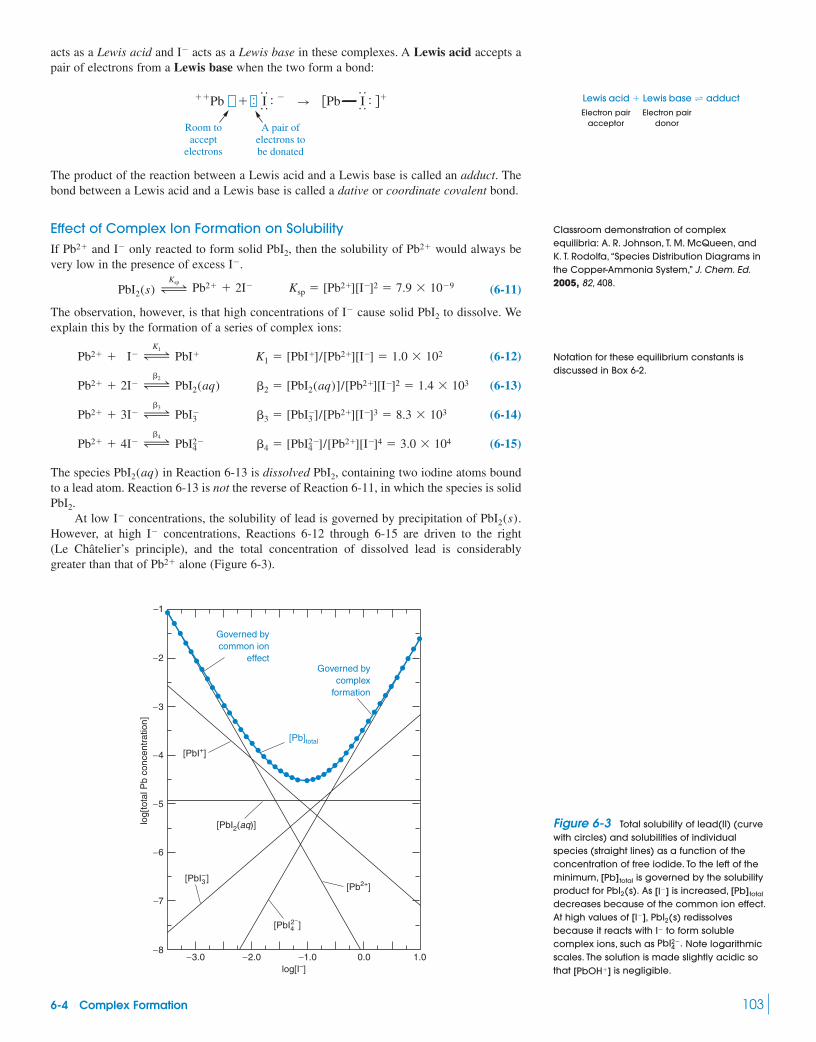
acts as a Lewis acid and acts as a Lewis base in these complexes. A Lewis acid accepts apair of electrons from a Lewis base when the two form a bond:
The product of the reaction between a Lewis acid and a Lewis base is called an adduct. Thebond between a Lewis acid and a Lewis base is called a dative or coordinate covalent bond.
Effect of Complex Ion Formation on SolubilityIf and only reacted to form solid , then the solubility of would always bevery low in the presence of excess .
(6-11)
The observation, however, is that high concentrations of cause solid to dissolve. Weexplain this by the formation of a series of complex ions:
(6-12)
(6-13)
(6-14)
(6-15)
The species in Reaction 6-13 is dissolved , containing two iodine atoms boundto a lead atom. Reaction 6-13 is not the reverse of Reaction 6-11, in which the species is solid
.At low concentrations, the solubility of lead is governed by precipitation of .
However, at high concentrations, Reactions 6-12 through 6-15 are driven to the right(Le Châtelier’s principle), and the total concentration of dissolved lead is considerablygreater than that of alone (Figure 6-3).Pb2�
I�
PbI2(s)I�
PbI2
PbI2PbI2(aq)
Pb2� � 4I� ∆�4
PbI2�4 �4 � [PbI2�
4 ]/[Pb2�][I�]4 � 3.0 104
Pb2� � 3I� ∆�3
PbI�3 �3 � [PbI�
3 ]/[Pb2�][I�]3 � 8.3 103
Pb2� � 2I� ∆�2
PbI2(aq) �2 � [PbI2(aq)]/[Pb2�][I�]2 � 1.4 103
Pb2� � I� ∆K1
PbI� K1 � [PbI�]/[Pb2�][I�] � 1.0 102
PbI2I�
Pb2� � 2I� Ksp � [Pb2�][I�]2 � 7.9 10�9∆Ksp
PbI2(s)
I�
Pb2�PbI2I�Pb2�
��Pb � : I : � B �Pb I : ��
::
::
Room toaccept
electrons
A pair ofelectrons tobe donated
: :
I�
6-4 Complex Formation 103
Classroom demonstration of complexequilibria: A. R. Johnson, T. M. McQueen, andK. T. Rodolfa, “Species Distribution Diagrams inthe Copper-Ammonia System,” J. Chem. Ed.2005, 82, 408.
Notation for these equilibrium constants isdiscussed in Box 6-2.
Electron pair Electron pairacceptor donor
Lewis acid � Lewis base T adduct
−1
1.0
log[
tota
l Pb
conc
entr
atio
n]
log[I–]
[PbI42–
]
[Pb2+][PbI3
–]
[PbI2(aq)]
[PbI+]
[Pb]total
Governed bycomplex
formation
Governed bycommon ion
effect−2
−3
−4
−5
−6
−7
−80.0−1.0−2.0−3.0
Figure 6-3 Total solubility of lead(II) (curvewith circles) and solubilities of individualspecies (straight lines) as a function of theconcentration of free iodide. To the left of theminimum, is governed by the solubilityproduct for As is increased,decreases because of the common ion effect.At high values of redissolvesbecause it reacts with to form solublecomplex ions, such as Note logarithmicscales. The solution is made slightly acidic sothat is negligible.[PbOH�]
PbI2�4 .
I�[I�], PbI2(s)
[Pb] total[I�]PbI2(s).[Pb] total

A most useful characteristic of chemical equilibrium is that all equilibria are satisfiedsimultaneously. If we know the concentration of , we can calculate the concentration of
by substituting this value into the equilibrium constant expression for Reaction 6-11,regardless of whether there are other reactions involving . The concentration of �
that satisfies any one equilibrium must satisfy all equilibria. There can be only one concen-tration of � in the solution.
Example Effect of I� on the Solubility of Pb2�
Find the concentrations of , , , and in a solution saturated withand containing dissolved with a concentration of (a) 0.001 0 M and (b) 1.0 M.
Solution (a) From for Reaction 6-11, we calculate
From Reactions 6-12 through 6-15, we then calculate the concentrations of the other lead-containing species:
(b) If, instead, we take , then analogous computations show that
The total concentration of dissolved lead in the preceding example is
When , of which 91% is . As increases,decreases by the common ion effect operating in Reaction 6-11. However, at suffi-
ciently high , complex formation takes over and increases (Figure 6-3). When, of which 76% is .
Tabulated Equilibrium Constants Are Usually Not “Constant”If you look up the equilibrium constant of a chemical reaction in two different books, there isan excellent chance that the values will be different (sometimes by a factor of 10 or more).12
This discrepancy occurs because the constant may have been determined under different con-ditions and, perhaps, by using different techniques.
A common source of variation in the reported value of K is the ionic composition of thesolution. It is important to note whether K is reported for a particular ionic composition (forexample, ) or whether K has been extrapolated to zero ion concentration. If youneed an equilibrium constant for your own work, choose a value of K measured under condi-tions as close as possible to those you will employ.
1 M NaClO4
PbI2�4[I�] � 1.0 M, [Pb]total � 3.2 10�4 M
[Pb]total[I�][Pb]total
[I�]Pb2�[I�] � 10�3 M, [Pb]total � 8.7 10�3 M
[Pb]total � [Pb2�] � [PbI�] � [PbI2(aq)] � [PbI�3 ] � [PbI2�
4 ]
[PbI2(aq)] � 1.1 10�5 M
[PbI�] � 7.9 10�7 M [PbI2�4 ] � 2.4 10�4 M
[Pb2�] � 7.9 10�9 M [PbI�3 ] � 6.6 10�5 M
[I�] � 1.0 M
[Pb2�4 ] � �4[Pb2�][I�]4 � 2.4 10�10 M
[PbI�3 ] � �3[Pb2�][I�]3 � 6.6 10�8 M
[PbI2(aq)] � �2[Pb2�][I�]2 � 1.1 10�5 M
� 7.9 10�4 M
[PbI�] � K1[Pb2�][I�] � (1.0 102)(7.9 10�3)(1.0 10�3)
[Pb2�] � Ksp/[I�]2 � (7.9 10�9) / (0.001 0)2 � 7.9 10�3 M
Ksp
I�PbI2(s)PbI2�
4PbI�3PbI2(aq)PbI�
Pb2
Pb2Pb2�
Pb2�
I�
104 CHAPTER 6 Chemical Equilibrium
The effect of dissolved ions on chemicalequilibria is the subject of Chapter 8.
Box 6-2 Notation for Formation Constants
Formation constants are the equilibrium constants for complexion formation. The stepwise formation constants, designatedare defined as follows:
MXn�1 � X ∆Kn
MXn Kn � [MXn]/[MXn�1][X]
MX � X ∆K2
MX2 K2 � [MX2]/[MX][X]
M � X ∆K1
MX K1 � [MX]/[M][X]
Ki,The overall, or cumulative, formation constants are denoted :
A useful relation is that �n � K1K2 ��� Kn.
M � nX ∆�n
MXn �n � [MXn]/[M][X]n
M � 2X ∆�2
MX2 �2 � [MX2]/[M][X]2
�i
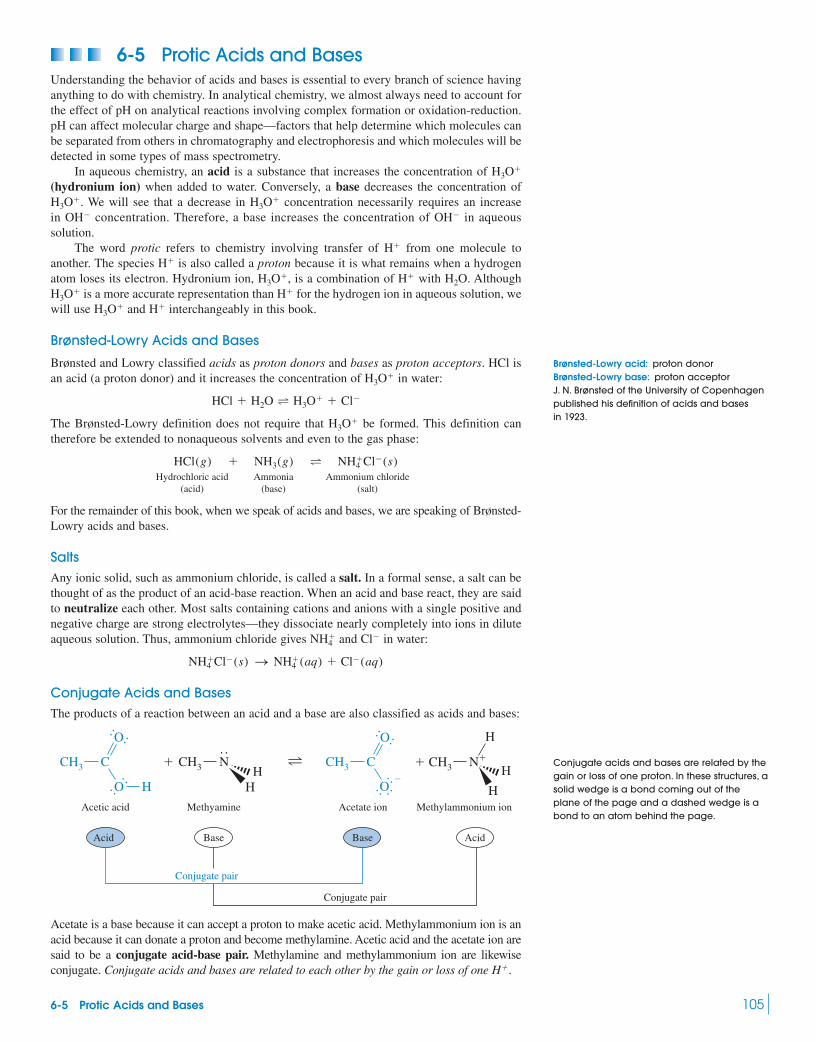
6-5 Protic Acids and BasesUnderstanding the behavior of acids and bases is essential to every branch of science havinganything to do with chemistry. In analytical chemistry, we almost always need to account forthe effect of pH on analytical reactions involving complex formation or oxidation-reduction.pH can affect molecular charge and shape—factors that help determine which molecules canbe separated from others in chromatography and electrophoresis and which molecules will bedetected in some types of mass spectrometry.
In aqueous chemistry, an acid is a substance that increases the concentration of (hydronium ion) when added to water. Conversely, a base decreases the concentration of
. We will see that a decrease in concentration necessarily requires an increasein concentration. Therefore, a base increases the concentration of in aqueoussolution.
The word protic refers to chemistry involving transfer of from one molecule toanother. The species is also called a proton because it is what remains when a hydrogenatom loses its electron. Hydronium ion, , is a combination of with . Although
is a more accurate representation than for the hydrogen ion in aqueous solution, wewill use and interchangeably in this book.
Brønsted-Lowry Acids and Bases
Brønsted and Lowry classified acids as proton donors and bases as proton acceptors. HCl isan acid (a proton donor) and it increases the concentration of in water:
The Brønsted-Lowry definition does not require that be formed. This definition cantherefore be extended to nonaqueous solvents and even to the gas phase:
Hydrochloric acid Ammonia Ammonium chloride(acid) (base) (salt)
For the remainder of this book, when we speak of acids and bases, we are speaking of Brønsted-Lowry acids and bases.
SaltsAny ionic solid, such as ammonium chloride, is called a salt. In a formal sense, a salt can bethought of as the product of an acid-base reaction. When an acid and base react, they are saidto neutralize each other. Most salts containing cations and anions with a single positive andnegative charge are strong electrolytes—they dissociate nearly completely into ions in diluteaqueous solution. Thus, ammonium chloride gives and in water:
Conjugate Acids and BasesThe products of a reaction between an acid and a base are also classified as acids and bases:
Acetate is a base because it can accept a proton to make acetic acid. Methylammonium ion is anacid because it can donate a proton and become methylamine. Acetic acid and the acetate ion aresaid to be a conjugate acid-base pair. Methylamine and methylammonium ion are likewiseconjugate. Conjugate acids and bases are related to each other by the gain or loss of one H�.
CH3 CH3 CH3C
O
O H
� � CH3N
HH
�
��
��
C
O
O
��
��
�
T�
N�
H
H
HAcetic acid Methyamine Acetate ion Methylammonium ion
Conjugate pair
AcidBase
Conjugate pair
Acid Base
NH�4 Cl�(s) S NH�
4 (aq) � Cl�(aq)
Cl�NH�4
HCl(g) � NH3(g) T NH�4 Cl�(s)
H3O�
HCl � H2O T H3O� � Cl�
H3O�
H�H3O�
H�H3O�
H2OH�H3O�
H�
H�
OH�OH�
H3O�H3O�
H3O�
6-5 Protic Acids and Bases 105
Brønsted-Lowry acid: proton donorBrønsted-Lowry base: proton acceptorJ. N. Brønsted of the University of Copenhagenpublished his definition of acids and basesin 1923.
Conjugate acids and bases are related by thegain or loss of one proton. In these structures, asolid wedge is a bond coming out of theplane of the page and a dashed wedge is abond to an atom behind the page.

The Nature of H� and OH�
It is certain that the proton does not exist by itself in water. The simplest formula found insome crystalline salts is . For example, crystals of perchloric acid monohydrate containpyramidal hydronium (also called hydroxonium) ions:
The formula is a way of specifying the composition of the substance when weare ignorant of its structure. A more accurate formula would be
Average dimensions of the cation in many crystals are shown in Figure 6-4. In aque-ous solution, is tightly associated with three molecules of water through exceptionallystrong hydrogen bonds (Figure 6-5). The cation is another simple species in which ahydrogen ion is shared by two water molecules.15
In the gas phase, can be found inside a dodecahedral shell of 20 water molecules(Figure 6-6).
The ion has been observed by X-ray crystallography.16 The centrallinkage contains the shortest hydrogen bond involving that has ever been
observed.
We will ordinarily write in most chemical equations, although we really meanTo emphasize the chemistry of water, we will write For example, water can be
either an acid or a base. Water is an acid with respect to methoxide:
But with respect to hydrogen bromide, water is a base:
Water Hydrogen Hydronium Bromidebromide ion
H2O � HBr T H3O� � Br�
T
��
��
��
��H HO H� �CH3 O� O� CH3 O H
Water Methoxide Hydroxide Methanol
H3O�.H3O�.H�
O • • • H
H
H• • • O
b 229 pm B
H2OOpHpOH3O�
2 (OH� � H2O)
H3O�
O • • • H
H
H H
H• • • O
b 243 pm B
H5O�2
H3O�
H3O�
H3O�ClO�4 .
HClO4 � H2O
�
HClO4 • H2O is really
� �
O
HH
H
Cl
OO
O
O
Hydronium Perchlorate
H3O�
106 CHAPTER 6 Chemical Equilibrium
We will write when we really mean .H3O�H�
102 pm
172 pm
110°
•••••••••••
•••
252 pm
Figure 6-4 Typical structure of hydroniumion, , found in many crystals.13 The bondenthalpy (heat needed to break a bond) ofthe OH bond of , about
greater than the OH bond enthalpyin H2O.84 kJ/mol
H3O� is 544 kJ/mol
H3O�
Figure 6-5 Environment of aqueous 13
Three molecules are bound to bystrong hydrogen bonds (dotted lines), and one
(at the top) is held by weaker ion-dipoleattraction (dashed line). The hydrogen-bonded distance of 252 pm(picometers, ) compares with an
distance of 283 pm betweenhydrogen-bonded water molecules. Thediscrete cation found in somecrystals is similar in structure to withthe weakly bonded at the top removed.14H2O
(H2O)4H3O�
(H2O)3H3O�
OßHpO10�12 m
OßHpOH2O
H3O�H2OH3O�.
Figure 6-6 In the gas phase, can betightly surrounded by 20 molecules of in aregular dodecahedron held together by 30hydrogen bonds. Small dark and white atomsare H. Dark H atoms are hydrogen bonded.[From S. Wei, Z. Shi, and A. W. Castleman, Jr.,
J. Chem. Phys. 1991, 94, 3268, and Chem. Eng. News,
8 April 1991.]
H2OH3O�

AutoprotolysisWater undergoes self-ionization, called autoprotolysis, in which it acts as both an acid anda base:
(6-16)or
(6-17)
Reactions 6-16 and 6-17 mean the same thing.Protic solvents have a reactive , and all protic solvents undergo autoprotolysis. An
example is acetic acid:
(6-18)
The extent of these reactions is very small. The autoprotolysis constants (equilibrium con-stants) for Reactions 6-17 and 6-18 are and , respectively, at
6-6 pHThe autoprotolysis constant for has the special symbol , where “w” stands for water:
(6-19)
Table 6-1 shows how varies with temperature. Its value at is .
Example Concentration of H� and OH� in Pure Water at 25°C
Calculate the concentrations of and in pure water at .
Solution The stoichiometry of Reaction 6-19 tells us that and are produced in amolar ratio. Their concentrations must be equal. Calling each concentration x, we can
write
The concentrations of and are both in pure water.
Example Concentration of OH� When [H�] Is Known
What is the concentration of if (From now on, assume thatthe temperature is unless otherwise stated.)
Solution Putting into the expression gives
A concentration of gives As theconcentration of H� increases, the concentration of necessarily decreases, andvice versa. A concentration of gives [H�] � 1.0 10�11 M.[OH�] � 1.0 10�3 M
OH�
[OH�] � 1.0 10�11 M.[H�] � 1.0 10�3 M
Kw � 1.0 10�14 � (1.0 10�3)[OH�] 1 [OH�] � 1.0 10�11 M
Kw[H�] � 1.0 10�3 M
25°C[H�] � 1.0 10�3 M?OH�
1.0 10�7 MOH�H�
Kw � 1.0 10�14 � [H�][OH�] � [x][x] 1 x � 1.0 10�7 M
1:1OH�H�
25°COH�H�
1.01 10�1425.0°CKw
H2O ∆Kw
H� � OH� Kw � [H�][OH�]Autoprotolysisof water:
KwH2O
25°C.3.5 10�151.0 10�14
2CH3COH—T—CH3C�——�—CH3C ® O�——™O
™O
OH
OH
(in acetic acid)
H�
H2O T H� � OH�
H2O � H2O T H3O� � OH�
6-6 pH 107
Examples of protic solvents (acidic protonbold):
Water Ethanol
CH3CH2OHH2O
Examples of aprotic solvents (no acidicprotons):
Diethyl ether Acetonitrile
CH3CNCH3CH2OCH2CH3
Table 6-1 Temperature dependence of Kwa
Temperature (�C) Kw Temperature (�C) Kw
0 14.938 40 13.5415 14.726 45 13.405
10 14.527 50 13.27515 14.340 100 12.26520 14.163 150 11.63825 13.995 200 11.28930 13.836 250 11.19135 13.685 300 11.406
a. Concentrations in the product [H�][OH�] in this table are expressed in molality rather than in molarity. Accuracy of log Kw is 0.01. To convert molality (mol/kg) into molarity (mol/L), multiply by the density of H2O at each temperature. At 25°C, Kw 10�13.995 (mol/kg)2(0.997 05 kg/L)2 10�13.998 (mol/L).
SOURCE: W. L. Marshall and E. U. Franck, “Ion Product of Water Substance, 0–1 000 �C, 1–10,000 Bars,” J. Phys. Chem. Ref. Data 1981, 10, 295.
��
3.93 10�122.07 10�146.44 10�121.46 10�145.14 10�121.01 10�142.30 10�126.88 10�155.43 10�134.57 10�155.31 10�142.97 10�153.94 10�141.88 10�152.88 10�141.15 10�15
pKw � �log KwpKw � �log Kw
Recall that (the solvent) is omitted from theequilibrium constant. The value at is accurate enough for our purposes inthis book.
25° CKw � 1.0 10�14
H2O

An approximate definition of pH is the negative logarithm of the concentration.
Approximate definition of pH: (6-20)
Chapter 8 defines pH more accurately in terms of activities, but, for most purposes, Equa-tion 6-20 is a good working definition. In pure water at with the pH is If the concentration of is then
and the pH is 11.00.A useful relation between the concentrations of and is
(6-21)
where just as This is a fancy way of saying that, ifthen or
A solution is acidic if A solution is basic if At ,an acidic solution has a pH below 7, and a basic solution has a pH above 7.
pH values for various common substances are shown in Figure 6-7.Although pH generally falls in the range 0 to 14, these are not the limits of pH. A pH of
for example, means or This concentration iseasily attained in a concentrated solution of a strong acid such as HCl.
Is There Such a Thing as Pure Water?In most labs, the answer is “No.” Pure water at should have a pH of 7.00. Distilledwater from the tap in most labs is acidic because it contains from the atmosphere. is an acid by virtue of the reaction
(6-22)Bicarbonate
can be largely removed by boiling water and then protecting it from the atmosphere.A century ago, careful measurements of the conductivity of water were made by
Friedrich Kohlrausch and his students. To remove impurities, they found it necessary to distillthe water 42 consecutive times under vacuum to reduce conductivity to a limiting value.
6-7 Strengths of Acids and BasesAcids and bases are commonly classified as strong or weak, depending on whether they reactnearly “completely” or only “partially” to produce or Because there is a continu-ous range of possibilities for “partial” reaction, there is no sharp distinction between weak
OH�.H�
CO2
CO2 � H2O T HCO�3 � H�
CO2CO2
25°C
[H�] � 10 M.�log[H�] � �1.00;�1.00,
Acidic
Neutral
Basic ∫∫B∫∫B
∫∫B
1514131211109876543210�1pH
b b
25°C[H�] 6 [OH�].[H�] 7 [OH�].[OH�] � 10�10.42 � 3.8 10�11 M.pOH � 14.00 � 3.58 � 10.42,pH � 3.58,
pH � �log[H�].pOH � �log[OH�],
pH � pOH � �log(Kw) � 14.00 at 25°C
OH�H�
[H�] � 1.0 10�11 M1.0 10�3 M,OH��log(1.0 10�7) � 7.00.
[H�] � 1.0 10�7 M,25°C
pH � �log[H�]
H�
108 CHAPTER 6 Chemical Equilibrium
Lye
Battery acid
Most acidic rainfall recorded in U.S. at Wheeling, W. Va.
Acidic mine water, Iron Mountain, Calif.
Vinegar
Most fish species die, pH 4.5–5.0
Theoretical “pure” rain, pH 5.6
Milk
Neutral
Human blood
Seawater
Milk of magnesia
Ammonia
Baking soda
Lemon juice
Apples
Average pH of rainfall,Toronto, February 1979
Tomato juice
Saliva, pH 5.7–7.1
Human urine
Lake Ontario
Acidic
Alkaline
1413
1211
109
87
65
43
2
01
–1–2
–3
Figure 6-7 pH of various substances. [FromChem. Eng. News, 14 September 1981.] The mostacidic rainfall (Box 15-1) is a stronger acid thanlemon juice. The most acidic natural watersknown are mine waters, with total dissolvedmetal concentrations of 200 g/L and sulfateconcentrations of 760 g/L. The pH of this water,
does not mean that ! It means that the activity of
(discussed in Chapter 8) is [D. K. Nordstrom,
C. N. Alpers, C. J. Ptacek, and D. W. Blowes, “Negative
pH and Extremely Acidic Mine Waters from Iron
Mountain, California,” Environ. Sci. Technol. 2000,
34, 254.]
103.6.H�4 000 M
[H�] � 103.6 M ��3.6,
. The term “pH” was introducedin 1909 by the Danish biochemist S. P. L.Sørensen, who called it the “hydrogen ionexponent.”17
pH � �log[H�]
Take the log of both sides of the expressionto derive Equation 6-21:
14.00 � pH � pOH (at 25°C)�log Kw � �log[H�] � log[OH�]
log Kw � log[H�] � log[OH�]Kw � [H�][OH�]
Kw
pH is usually measured with a glass electrode,whose operation is described in Chapter 15.
Table 6-2 Common strong acidsand bases
Formula Name
AcidsHCl Hydrochloric acid
(hydrogen chloride)HBr Hydrogen bromideHI Hydrogen iodide
a Sulfuric acidNitric acidPerchloric acid
BasesLiOH Lithium hydroxideNaOH Sodium hydroxideKOH Potassium hydroxideRbOH Rubidium hydroxideCsOH Cesium hydroxide
b Quaternary ammoniumhydroxide
a. For H2SO4, only the first proton ionization is complete.Dissociation of the second proton has an equilibriumconstant of .
b. This is a general formula for any hydroxide salt of anammonium cation containing four organic groups. Anexample is tetrabutylammonium hydroxide:( )4N�OH�.CH3CH2CH2CH2
1.0 10�2
R4NOH
HClO4
HNO3
H2SO4

and strong. However, some compounds react so completely that they are easily classified asstrong acids or bases—and, by convention, everything else is termed weak.
Strong Acids and BasesCommon strong acids and bases are listed in Table 6-2, which you need to memorize. Bydefinition, a strong acid or base is completely dissociated in aqueous solution. That is, theequilibrium constants for the following reactions are large.
Virtually no undissociated HCl or KOH exists in aqueous solution. Demonstration 6-2 showsone consequence of the strong-acid behavior of HCl.
Even though the hydrogen halides HCl, HBr, and HI are strong acids, HF is not astrong acid, as explained in Box 6-3. For most purposes, the hydroxides of the alkalineearth metals can be considered to be strong bases, althoughthey are far less soluble than alkali metal hydroxides and have some tendency to form
complexes (Table 6-3).MOH�
(Mg2�, Ca2�, Sr2�, and Ba2�)
KOH(aq) T K� � OH�
HCl(aq) T H� � Cl�
6-7 Strengths of Acids and Bases 109
Table 6-3 Equilibria of alkalineearth metal hydroxides
Metal log Ksp log K1
2.581.30
— 0.82— 0.64
NOTE: 25°C and ionic strength � 0.
Ba2�
Sr2�
�5.19Ca2�
�11.15Mg2�
K1 � [MOH�]/[M2�][OH�]M2� � OH� T MOH�
Ksp � [M2�][OH�]2M(OH)2(s) T M2� � 2OH�
Demonstration 6-2 The HCl Fountain
The complete dissociation of HCl into and makes extremely soluble in water.
(A)
(B)
(C)
Because the equilibrium of Reaction B lies far to the right, it pullsReaction A to the right as well.
Challenge The standard free energy change forReaction C is Show that the equilibriumconstant is
The extreme solubility of HCl(g) in water is the basis for theHCl fountain,18 assembled as shown below. In Figure a, an
2.0 106.�36.0 kJ/mol.
(�G°)
Net reaction: HCl(g) T H�(aq) � Cl�(aq)
HCl(aq) T H�(aq) � Cl�(aq)
HCl(g) T HCl(aq)
HCl(g)Cl�H�
inverted 250-mL round-bottom flask containing air is set up withits inlet tube leading to a source of and its outlet tubedirected into an inverted bottle of water. As HCl is admitted to theflask, air is displaced. When the bottle is filled with air, the flaskis filled mostly with
The hoses are disconnected and replaced with a beaker ofindicator and a rubber bulb (Figure b). For an indicator, we useslightly alkaline methyl purple, which is green above pH 5.4 andpurple below pH 4.8. When �1 mL of water is squirted from therubber bulb into the flask, a vacuum is created and indicator solu-tion is drawn up into the flask, making a fascinating fountain(Color Plate 1).
Question Why is a vacuum created when water is squirtedinto the flask and why does the indicator change color when itenters the flask?
HCl(g).
HCl(g)
Constriction
250-mLround-bottom
flask
Glasstubes
Rubberstopper
Hoses
HCl(g) infrom tank
Water
250-mLbottle
(a) (b)
Beaker containingyour favoriteindicator
2-mLrubber bulb
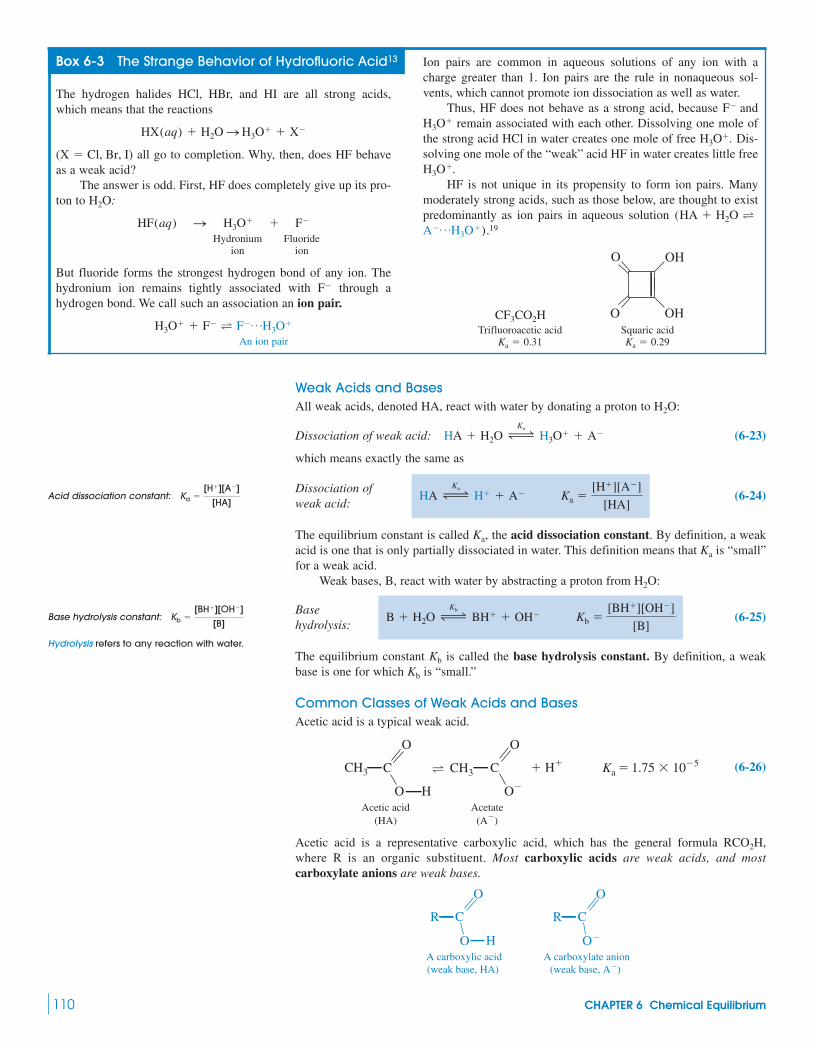
Weak Acids and BasesAll weak acids, denoted HA, react with water by donating a proton to
Dissociation of weak acid: (6-23)
which means exactly the same as
(6-24)
The equilibrium constant is called the acid dissociation constant. By definition, a weakacid is one that is only partially dissociated in water. This definition means that is “small”for a weak acid.
Weak bases, B, react with water by abstracting a proton from
(6-25)
The equilibrium constant is called the base hydrolysis constant. By definition, a weakbase is one for which is “small.”
Common Classes of Weak Acids and BasesAcetic acid is a typical weak acid.
(6-26)
Acetic acid is a representative carboxylic acid, which has the general formula where R is an organic substituent. Most carboxylic acids are weak acids, and mostcarboxylate anions are weak bases.
R C
O�
O
A carboxylate anion(weak base, A�)
R
H
C
O
O
A carboxylic acid(weak base, HA)
RCO2H,
CH3 C
O H
CH3 C � H� Ka � 1.75 10�5T
O�
O O
Acetic acid(HA)
Acetate(A�)
Kb
Kb
B � H2O ∆Kb
BH� � OH� Kb �[BH�][OH�]
[B]Basehydrolysis:
H2O:
Ka
Ka,
HA ∆Ka
H� � A� Ka �[H�][A�]
[HA]Dissociation ofweak acid:
HA � H2O ∆Ka
H3O� � A�
H2O:
110 CHAPTER 6 Chemical Equilibrium
Box 6-3 The Strange Behavior of Hydrofluoric Acid13
The hydrogen halides HCl, HBr, and HI are all strong acids,which means that the reactions
( ) all go to completion. Why, then, does HF behaveas a weak acid?
The answer is odd. First, HF does completely give up its pro-ton to
Hydronium Fluorideion ion
But fluoride forms the strongest hydrogen bond of any ion. Thehydronium ion remains tightly associated with through ahydrogen bond. We call such an association an ion pair.
An ion pair
H3O� � F� T F�pH3O�
F�
HF(aq) S H3O� � F�
H2O:
X � Cl, Br, I
HX(aq) � H2O S H3O� � X�
Ion pairs are common in aqueous solutions of any ion with acharge greater than 1. Ion pairs are the rule in nonaqueous sol-vents, which cannot promote ion dissociation as well as water.
Thus, HF does not behave as a strong acid, because remain associated with each other. Dissolving one mole of
the strong acid HCl in water creates one mole of free Dis-solving one mole of the “weak” acid HF in water creates little free
HF is not unique in its propensity to form ion pairs. Manymoderately strong acids, such as those below, are thought to existpredominantly as ion pairs in aqueous solution
19
Trifluoroacetic acid Squaric acidKa � 0.29Ka � 0.31
O
O
OH
OHCF3CO2H
A�pH3O�).(HA � H2O T
H3O�.
H3O�.H3O�
F� and
Base hydrolysis constant: Kb �[BH�][OH�]
[B]
Acid dissociation constant: Ka �[H�][A�]
[HA]
Hydrolysis refers to any reaction with water.

Methylamine is a typical weak base.
(6-27)
Amines are nitrogen-containing compounds:
Amines are weak bases, and ammonium ions are weak acids. The “parent” of all amines isammonia, When a base such as methylamine reacts with water, the product is the con-jugate acid. That is, methylammonium ion produced in Reaction 6-27 is a weak acid:
(6-28)
The methylammonium ion is the conjugate acid of methylamine.You should learn to recognize whether a compound is acidic or basic. The salt methyl-
ammonium chloride, for example, dissociates in aqueous solution to give methylammoniumcation and chloride:
(6-29)Methylammonium
chloride
Methylammonium ion, being the conjugate acid of methylamine, is a weak acid (Reaction6-28). Chloride is the conjugate base of HCl, a strong acid. In other words, has virtuallyno tendency to associate with or else HCl would not be a strong acid. Methylammoniumchloride is acidic because methylammonium ion is an acid and is not a base.
Metal cations, constitute another common class of weak acids.20 Figure 6-8 showsacid dissociation constants for the reaction
Mn� � H2O ∆Ka
MOH(n�1)� � H�
Mn�,Cl�
H�,Cl�
CH3N�
H3Cl�(s) S CH3N�
H3(aq) � Cl�(aq)
CH3NH3—T—CH3NH2 � H�———Ka � 2.26 10�11Ka
BH� B
� :
NH3.
RNH2 a primary amine RNH�
R2NH a secondary amine R2NH�
R3N a tertiary amine R3NH�
14
24
3
2
3
ammonium ions
¨
¨¨
CH3œ
NH—
�—
H2O T
H CH3œ
N�
H—�—OH�——Kb � 4.47 10�4
H
H
å
MethylamineB
Methylammonium ionBH�
6-7 Strengths of Acids and Bases 111
Figure 6-8 Acid dissociation constants for aqueous metal ions: For example,for In Chapter 9, we will learn that the numbers in this table are called Darkest shades are strongestacids. [Data from R. M. Smith, A. E. Martell, and R. J. Motekaitis, NIST Critical Stability Constants of Metal Complexes Database 46 (Gaithersburg, MD:
National Institute of Standards and Technology, 2001).]
pKa.Li�, Ka � 10�13.64.MOH(n�1)� � H�.Mn� � H2O ∆
Ka(�log Ka)
Li+
13.64Be
Stronger acidNa+
13.9Mg2+
11.4Al3+
5.00
K Ca2+
12.70
Rb Sr13.18
Cs Ba2+
13.36
Ce3+
9.1b
Sc3+
4.3
Y3+
7.7
La3+
8.5
Pr3+
9.4bNd3+
8.7b
Ti3+
1.3
Zr4+
–0.3
Hf
VO2+
5.7
Nb
Ta
Cr2+ 5.5a
Cr3+ 3.66
Sm3+
8.6b
Mo
W
Fe2+ 9.4
Fe3+ 2.19
Gd3+
9.1b
Ru
Os
Co2+ 9.7
Co3+ 0.5b
Tb3+
8.4d
Rh3+
3.33c
Ir
Ni2+
9.9
Dy3+
8.4d
Pd2+
1.0
Pt
Cu2+
7.5
Ho3+
8.3
Ag+
12.0
Au
Zn2+
9.0
Er3+
9.1b
Cd2+
10.1
Hg22+ 5.3d
Hg2+ 3.40
Ga3+
2.6
Tm3+
8.2d
In3+
3.9
Tl+
13.21
Ge
Yb3+
8.4b
Sn2+
3.4
Pb2+
7.6
Lu3+
8.2d
Sb
Bi3+
1.1
Mn2+
10.6
Eu3+
8.6d
Tc
Re
Pm
Ionic strength = 0 unless noted by superscripta. Ionic strength = 1 M b. Ionic strength = 3 M c. Ionic strength = 2.5 M d. Ionic strength = 0.5 M
Carboxylic acids ( ) and ammoniumions ( ) are weak acids. Carboxylateanions ( ) and amines ( ) are weakbases.
R3NRCO�2
R3NH�
RCO2H
Although we will usually write a base as B andan acid as HA, it is important to realize thatBH� is also an acid and A� is also a base.
Methylammonium chloride is a weak acidbecause1. It dissociates into and .2. is a weak acid, being conjugate to
, a weak base.3. has no basic properties. It is conjugate
to HCl, a strong acid. That is, HCl dissociatescompletely.
Cl�CH3NH2
CH3NH�3
Cl�CH3NH�3
Challenge Phenol ( ) is a weak acid.Explain why a solution of the ionic compoundpotassium phenolate ( ) is basic.C6H5O�K�
C6H5OH
Aqueous metal ions are associated with(hydrated by) several molecules, so amore accurate way to write the aciddissociation reaction is
M(H2O)n�x T M(H2O)x�1(OH)(n�1)� � H�
H2O

112 CHAPTER 6 Chemical Equilibrium
Monovalent metal ions are very weak acids Divalent ions tend to bestronger and trivalent ions are stronger yet
Polyprotic Acids and BasesPolyprotic acids and bases are compounds that can donate or accept more than one proton.For example, oxalic acid is diprotic and phosphate is tribasic:
(6-30)
(6-31)
(6-32)
(6-33)
(6-34)
The standard notation for successive acid dissociation constants of a polyprotic acid is ,, and so on, with the subscript “a” usually omitted. We retain or omit the subscript as
dictated by clarity. For successive base hydrolysis constants, we retain the subscript “b.” Thepreceding examples illustrate that refers to the acidic species with the most pro-tons, and refers to the basic species with the least number of protons. Carbonic acid, avery important diprotic carboxylic acid derived from is described in Box 6-4.
Relation Between Ka and Kb
A most important relation exists between and of a conjugate acid-base pair in aqueoussolution. We can derive this result with the acid HA and its conjugate base
When the reactions are added, their equilibrium constants are multiplied to give
(6-35)
Equation 6-35 applies to any acid and its conjugate base in aqueous solution.
Ka � Kb � KwRelation between Ka and Kb
for a conjugate pair:
�[H�][A�]
[HA]�
[HA][OH�]
[A�]
H2O T H� � OH� Kw � Ka � Kb
A� � H2O T HA � OH� Kb �[HA][OH�]
[A�]
HA T H� � A� Ka �[H�][A�]
[HA]
A�.KbKa
CO2,Kb1
Ka1 (or K1)
K3K2,K1
P �–H2O—T—�O OH
HO
O
P �–OH� Kb3 � 1.42 10�12
HO OH HO
O
Phosphoricacid
ç ç
™™
P �–H2O—T—�O OH
�O
O
P �–OH�— Kb2 � 1.60 10�7
�O OH HO
O
Dihydrogen phosphate
ç ç
™ ™
P �–H2O—T—�O O�
�O
ç ç
O
P �–OH�— Kb1 � 2.3 10�2
�O OH �O
O
Monohydrogenphosphate
Phosphate
™ ™
�OCCOH—T—H� � �OCCO�———— Ka2 � 5.42 10�5
Oxalate
™OO OO™ ™™
HOCCOH—T—H� � �OCCOH———— Ka1 � 5.37 10�2
Oxalicacid
Monohydrogenoxalate
OO O™O™™™
(Fe3�, Ka � 10�2.19).(Fe2�, Ka � 10�9.4)(Na�, Ka � 10�13.9).
Notation for acid and base equilibriumconstants: Ka1 refers to the acidic species withthe most protons and Kb1 refers to the basicspecies with the fewest protons. The subscript“a” in acid dissociation constants will usuallybe omitted.
for a conjugate acid-base pair inaqueous solution.Ka � Kb � Kw
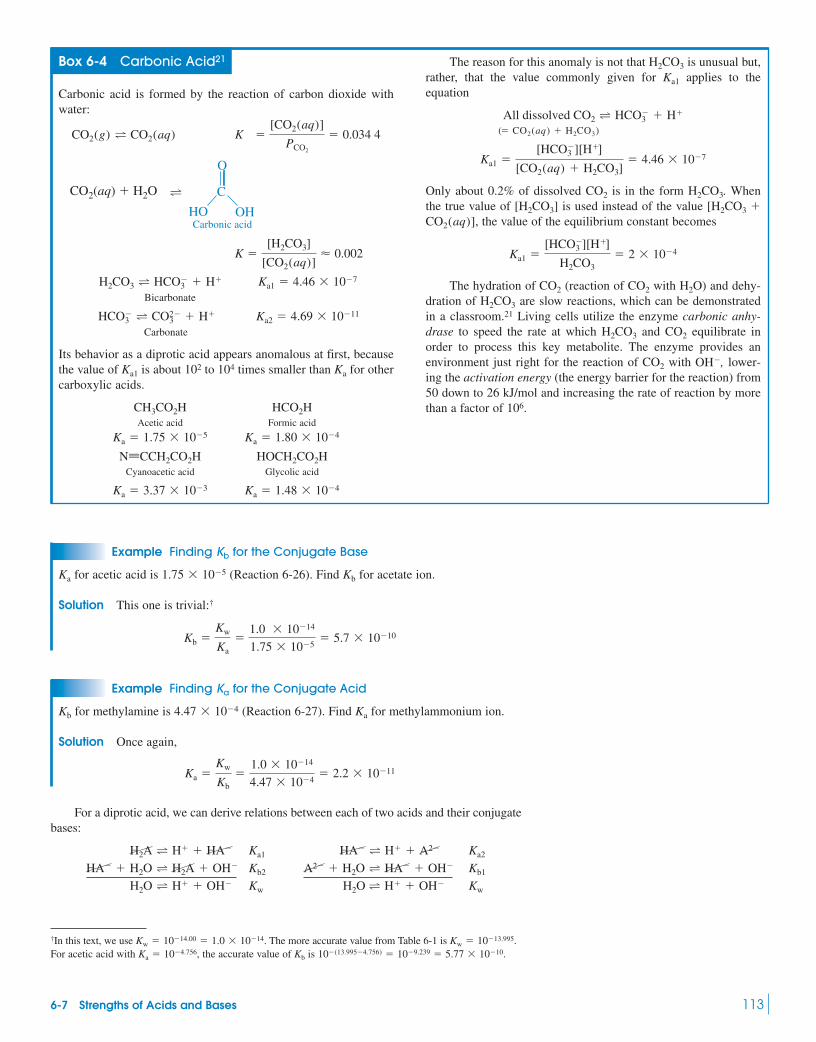
6-7 Strengths of Acids and Bases 113
Box 6-4 Carbonic Acid21
Carbonic acid is formed by the reaction of carbon dioxide withwater:
Bicarbonate
Carbonate
Its behavior as a diprotic acid appears anomalous at first, becausethe value of is about times smaller than for othercarboxylic acids.
Acetic acid Formic acid
Cyanoacetic acid Glycolic acid
Ka � 1.48 10�4Ka � 3.37 10�3
HOCH2CO2HNΩCCH2CO2H
Ka � 1.80 10�4Ka � 1.75 10�5
HCO2HCH3CO2H
Ka102 to 104Ka1
HCO�3 T CO2�
3 � H� Ka2 � 4.69 10�11
H2CO3 T HCO�3 � H� Ka1 � 4.46 10�7
K �[H2CO3]
[CO2(aq)]� 0.002
CO2(aq) � H2O T C
O
OHHOCarbonic acid
CO2(g) T CO2(aq) K �[CO2(aq)]
PCO2
� 0.034 4
The reason for this anomaly is not that is unusual but,rather, that the value commonly given for applies to theequation
Only about 0.2% of dissolved is in the form Whenthe true value of is used instead of the value
the value of the equilibrium constant becomes
The hydration of (reaction of with ) and dehy-dration of are slow reactions, which can be demonstratedin a classroom.21 Living cells utilize the enzyme carbonic anhy-drase to speed the rate at which and equilibrate inorder to process this key metabolite. The enzyme provides anenvironment just right for the reaction of with lower-ing the activation energy (the energy barrier for the reaction) from50 down to 26 kJ/mol and increasing the rate of reaction by morethan a factor of 106.
OH�,CO2
CO2H2CO3
H2CO3
H2OCO2CO2
Ka1 �[HCO�
3 ][H�]
H2CO3� 2 10�4
CO2(aq)],[H2CO3 �[H2CO3]
H2CO3.CO2
Ka1 �[HCO�
3 ][H�]
[CO2(aq) � H2CO3]� 4.46 10�7
(� CO2(aq) � H2CO3)
All dissolved CO2 T HCO�3 � H�
Ka1
H2CO3
Example Finding Kb for the Conjugate Base
for acetic acid is (Reaction 6-26). Find for acetate ion.
Solution This one is trivial:†
Example Finding Ka for the Conjugate Acid
for methylamine is (Reaction 6-27). Find for methylammonium ion.
Solution Once again,
For a diprotic acid, we can derive relations between each of two acids and their conjugatebases:
HA� T H� � A2� Ka2
A2� � H2O T HA� � OH� Kb1
H2O T H� � OH� Kw
H2A T H� � HA� Ka1
HA� � H2O T H2A � OH� Kb2
H2O T H� � OH� Kw
Ka �Kw
Kb�
1.0 10�14
4.47 10�4� 2.2 10�11
Ka4.47 10�4Kb
Kb �Kw
Ka�
1.0 10�14
1.75 10�5� 5.7 10�10
Kb1.75 10�5Ka
†In this text, we use The more accurate value from Table 6-1 is For acetic acid with the accurate value of is 10�(13.995�4.756) � 10�9.239 � 5.77 10�10.KbKa � 10�4.756,
Kw � 10�13.995.Kw � 10�14.00 � 1.0 10�14.
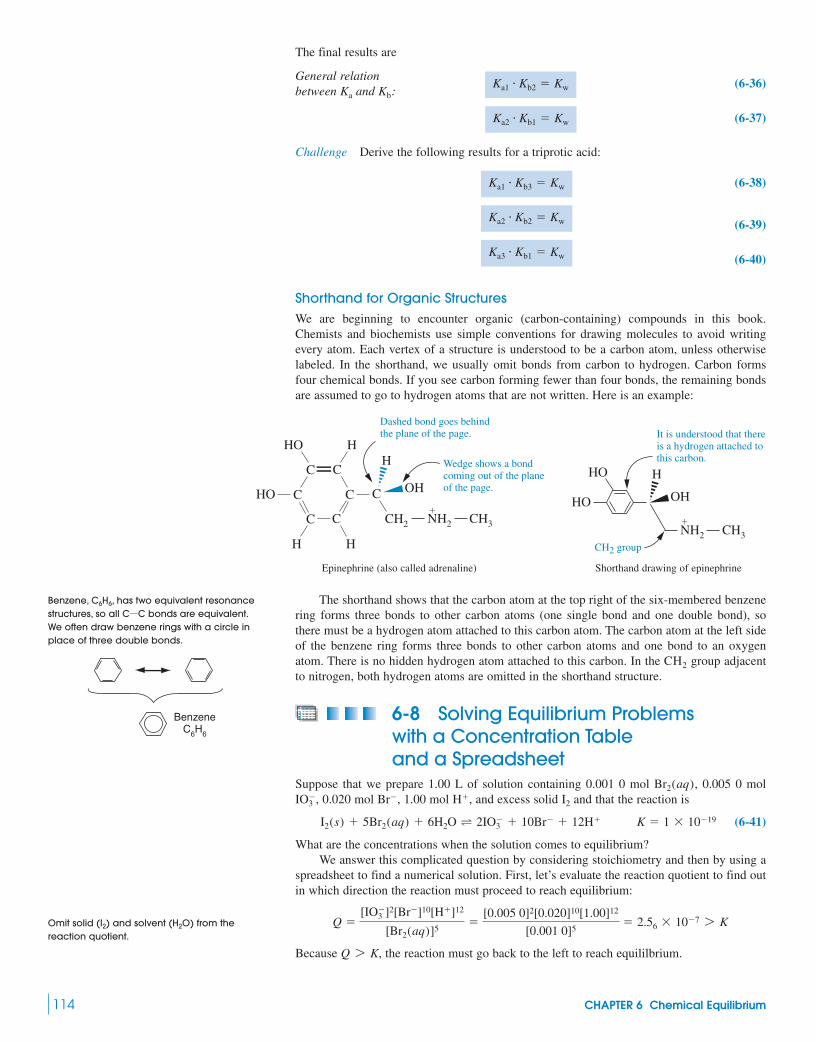
The final results are
(6-36)
(6-37)
Challenge Derive the following results for a triprotic acid:
(6-38)
(6-39)
(6-40)
Shorthand for Organic StructuresWe are beginning to encounter organic (carbon-containing) compounds in this book.Chemists and biochemists use simple conventions for drawing molecules to avoid writingevery atom. Each vertex of a structure is understood to be a carbon atom, unless otherwiselabeled. In the shorthand, we usually omit bonds from carbon to hydrogen. Carbon formsfour chemical bonds. If you see carbon forming fewer than four bonds, the remaining bondsare assumed to go to hydrogen atoms that are not written. Here is an example:
Ka3 � Kb1 � Kw
Ka2 � Kb2 � Kw
Ka1 � Kb3 � Kw
Ka2 � Kb1 � Kw
Ka1 � Kb2 � KwGeneral relationbetween Ka and Kb:
114 CHAPTER 6 Chemical Equilibrium
Epinephrine (also called adrenaline) Shorthand drawing of epinephrine
CC
C C C
CH2CC
HH
OHHO
HO
HH
�
Dashed bond goes behindthe plane of the page.
Wedge shows a bondcoming out of the plane of the page.
NH2 CH3
HO
HO
NH2 CH3
OH
H
�
It is understood that thereis a hydrogen attached tothis carbon.
CH2 group
The shorthand shows that the carbon atom at the top right of the six-membered benzenering forms three bonds to other carbon atoms (one single bond and one double bond), sothere must be a hydrogen atom attached to this carbon atom. The carbon atom at the left sideof the benzene ring forms three bonds to other carbon atoms and one bond to an oxygenatom. There is no hidden hydrogen atom attached to this carbon. In the group adjacentto nitrogen, both hydrogen atoms are omitted in the shorthand structure.
6-8 Solving Equilibrium Problems with a Concentration Table and a Spreadsheet
Suppose that we prepare 1.00 L of solution containing 0.001 0 mol 0.005 0 mol0.020 mol 1.00 mol , and excess solid and that the reaction is
(6-41)
What are the concentrations when the solution comes to equilibrium?We answer this complicated question by considering stoichiometry and then by using a
spreadsheet to find a numerical solution. First, let’s evaluate the reaction quotient to find outin which direction the reaction must proceed to reach equilibrium:
Because the reaction must go back to the left to reach equililbrium.Q 7 K,
Q �[IO�
3 ]2[Br�]10[H�]12
[Br2(aq)]5�
[0.005 0]2[0.020]10[1.00]12
[0.001 0]5� 2.56 10�7 7 K
I2(s) � 5Br2(aq) � 6H2O T 2IO�3 � 10Br� � 12H� K � 1 10�19
I2H�Br�,IO�3 ,
Br2(aq),
CH2
Benzene, , has two equivalent resonancestructures, so all bonds are equivalent.We often draw benzene rings with a circle inplace of three double bonds.
CßCC6H6
Omit solid ( ) and solvent ( ) from thereaction quotient.
H2OI2
BenzeneC6H6

The key step in solving the problem is to prepare a table showing initial concentra-tions and final concentrations after equilibrium is attained. Let’s say that x mol of areconsumed in the reaction. From the stoichiometry of Reaction 6-41, we know that 10 molof are consumed for every 2 mol of If x mol of are consumed, then mol of are consumed. Also, mol of must be consumed and mol of
must be made. Our table looks like this:Br2(aq)
52xH�12
2 x � 6xBr�
102 x � 5xIO�
3IO�3 .Br�
IO�3
6-8 Solving Equilibrium Problems with a Concentration Table and a Spreadsheet 115
Initial concentration excess 0.001 0 0.005 0 0.020 1.00Final concentration excess 0.001 0 � 2.5x 0.005 0 � x 0.020 � 5x 1.00 � 6x
I2(s) � 5Br2(aq) � 6H2O T 2IO�3 � 10Br� � 12H�
The equilibrium expression is
(6-42)
We can find a value of x that satisfies this equation by trial-and-error guessing withthe spreadsheet in Figure 6-9. In column A, enter the chemical species and, in column B,enter the initial concentrations. Cell B8, which we will not use, contains the value of theequilibrium constant just as a reminder. In cell B11 we guess a value for x. We know that xcannot exceed the initial concentration of , so we guess Cells C4:C7 givethe final concentrations computed from initial concentrations and the guessed value of x.Cell C11 computes the reaction quotient, Q, from the final concentrations in cells C4:C7.
Our strategy is to vary x in cell B11 until in cell C11. ColumnsF, G, and H are not part of the spreadsheet, but show the progress of guessing. When weguess then which is greater than K. Guessinggives which is still greater than K, but getting closer. Guessing
gives , which is less than K. Therefore x must be less than0.003 15. Columns F and G show that we can find x with several significant digits after afew guesses.
Using Excel GOAL SEEK
The Excel routine GOAL SEEK solves Equation 6-42 automatically by varying x systemati-cally until the equation is satisfied. With the spreadsheet in Figure 6-9, select OPTIONS
from the TOOLS menu. Select the Calculations tab and set Maximum change to 1e-24. Thissetting makes the computation fine enough to compute a reaction quotient of Highlight cell C11 and select GOAL SEEK from the TOOLS menu. In the GOAL SEEK win-dow, fill in the underlined values: Set cell C11 To value 1e-19 By changing cell B11.When you click OK, GOAL SEEK finds in cell B11, which gives
in cell C11.Q � 1.000 0 10�19x � 0.003 146 45
1 10�19.
Q � 9.50 10�20x � 0.003 15Q � 7.08 10�19,
x � 0.003Q � 1.63 10�11,x � 0.001,
Q � K � 1 10�19
x � 0.001.IO3�
K �[IO3
�]2[Br�]10[H�]12
[Br2(aq)]5�
[0.005 0 � x]2[0.020 � 5x]10[1.00 � 6x]12
[0.001 0 � 2.5x]5� 1 10�19
Figure 6-9 Spreadsheet for solving Equation 6-42.
1
2
3
4
5
6
7
8
9
10
11
[H�] =
[IO3�] =
[Br2(aq)] =
[Br�] =
12
1 0.9940000 0.0031 1.9131E-19 too big
9.505E-200.00315 too small
1.0962E-190.00314 too big
too big
too big
very close
1.0209E-19
1.0064E-19
1.0007E-19
0.003145
0.003146
0.0031464
=B5-5*B11 0.003 7.0795E-19
=B4-B11 0.001
Solving an Equation by Trial and Error
A B C D E F G H
value of x
Guessed Computed Q compared
Q
1.6343E-11too big
to K
too big
Initial Final
0.005 0.0040000
0.001 0.0035000
1.00E-19
x Q
C11 = $C$4^2*$C$5^10*$C$6^12/$C$7^5
0.001 1.6343E-11
=B7+2.5*B11Keq =
0.02 0.0150000
=B6-6*B11
a10 mol Br�
2 mol IO�3b (x mol IO�
3 ) � 5x mol Br�
Be sure you can derive eachconcentration. The volume is 1 L,so moles and moles/L are thesame in this example.

116 CHAPTER 6 Chemical Equilibrium
Terms to Understandacidacid dissociation constant acidic solutionamineammonium ionaprotic solventautoprotolysisbasebase hydrolysis constant basic solutionBrønsted-Lowry acid
Brønsted-Lowry basecarboxylate anioncarboxylic acidcommon ion effectcomplex ionconjugate acid-base paircoprecipitationcumulative formation constantdisproportionationendothermicenthalpy change
entropyequilibrium constantexothermicGibbs free energyhydronium ionion pairLe Châtelier’s principleLewis acidLewis baseligandneutralization
overall formation constantpHpolyprotic acidpolyprotic baseprotic solventreaction quotientsaltsaturated solutionsolubility productstandard statestepwise formation constant
(Kb)
(Ka)
SummaryFor the reaction the equilibrium constant is
Solute concentrations should be expressedin moles per liter; gas concentrations should be in bars; and the con-centrations of pure solids, liquids, and solvents are omitted. If thedirection of a reaction is changed, If two reactions areadded, The equilibrium constant can be calculatedfrom the free-energy change for a chemical reaction: The equation summarizes the observations thata reaction is favored if it liberates heat (exothermic, negative )or increases disorder (positive ). Le Châtelier’s principle predictsthe effect on a chemical reaction when reactants or products areadded or temperature is changed. The reaction quotient, Q, tellshow a system must change to reach equilibrium.
The solubility product is the equilibrium constant for the disso-lution of a solid salt into its constituent ions in aqueous solution.The common ion effect is the observation that, if one of the ions ofthat salt is already present in the solution, the solubility of a salt isdecreased. Sometimes, we can selectively precipitate one ion from asolution containing other ions by adding a suitable counterion. Athigh concentration of ligand, a precipitated metal ion may redis-solve by forming soluble complex ions. In a metal-ion complex, themetal is a Lewis acid (electron pair acceptor) and the ligand is aLewis base (electron pair donor).
Brønsted-Lowry acids are proton donors, and Brønsted-Lowrybases are proton acceptors. An acid increases the concentration of
in aqueous solution, and a base increases the concentrationof An acid-base pair related through the gain or loss of a sin-gle proton is described as conjugate. When a proton is transferred
OH�.H3O�
�S�H
�G � �H � T�SK � e��G°/RT.
K3 � K1 K2.K¿ � 1/K.
K � [C]c[D]d/[A]a[B]b.aA � bB T cC � dD, from one molecule to another molecule of a protic solvent, the reac-
tion is called autoprotolysis.The definition of pH is (which will be modi-
fied to include activity later). is the equilibrium constant for thedissociation of an acid: is the basehydrolysis constant for the reaction When either or is large, the acid or base is said to be strong;otherwise, the acid or base is weak. Common strong acids andbases are listed in Table 6-2, which you should memorize. The mostcommon weak acids are carboxylic acids and the mostcommon weak bases are amines Carboxylate anions
) are weak bases, and ammonium ions are weakacids. Metal cations also are weak acids. For a conjugate acid-basepair in water, For polyprotic acids, we denote thesuccessive acid dissociation constants as , or just
. For polybasic species, we denote successive hydrol-ysis constants . For a diprotic system, the relationsbetween successive acid and base equilibrium constants are
and For a triprotic system the rela-tions are and
In the chemists’ shorthand for organic structures, each vertex isa carbon atom. If fewer than four bonds to that carbon are shown, itis understood that H atoms are attached to the carbon so that itmakes four bonds.
You can solve for equilibrium concentrations in a chemicalreaction by first creating a table of initial and final concentrations ofeach species. Then find the final concentrations by systemic guess-ing with a spreadsheet or by using the Excel GOAL SEEK routine.
Ka3 � Kb1 � Kw.Ka2 � Kb2 � Kw,Ka1 � Kb3 � Kw,Ka2 � Kb1 � Kw.Ka1 � Kb2 � Kw
Kb1, Kb2, Kb3, pK1, K2, K3, p
Ka1, Ka2, Ka3, pKa � Kb � Kw.
(R3NH�)(RCO�2
(R3N:).(RCO2H),
KbKa
B � H2O T BH� � OH�.KbHA � H2O T H3O� � A�.
Ka
pH � �log[H�]
Exercises6-A. Consider the following equilibria, in which all ions are aqueous:
(1)
(2)
(3)
(a) Calculate the numerical value of the equilibrium constant for thereaction(b) Calculate the concentration of AgCl(aq) in equilibrium withexcess undissolved solid AgCl.(c) Find the numerical value of K for the reaction AgCl(s) � Cl�.
AgCl�2 T
AgCl(s) T AgCl(aq).
AgCl(s) T Ag� � Cl� K � 1.8 10�10
AgCl(aq) � Cl� T AgCl�2 K � 9.3 101
Ag� � Cl� T AgCl(aq) K � 2.0 103
6-B. Reaction 6-7 is allowed to come to equilibrium in a solutioninitially containing , , and
To find the concentrations at equilibrium, we canconstruct a table showing initial and final concentrations. We usethe stoichiometry coefficients of the reaction to say that, if x molof are created, then we must also make x mol of and8x mol of To produce x mol of we must have consumedx mol of and 2x mol of
(a) Write the equilibrium constant expression that you would use tosolve for x to find the concentrations at equilibrium. Do not try tosolve the equation.
Cr3�.BrO3�
Br�,H�.Cr2O2�
7Br�
1.00 M H�.0.010 0 M Cr3�BrO�
30.010 0 M
Initial concentration 0.010 0 0.010 0 1.00Final concentration 0.010 0 � x 0.010 0 � 2x x x 1.00 � 8x
BrO�3 � 2Cr3� � 4H2O T Br� � Cr2O2�
7 � 8H�
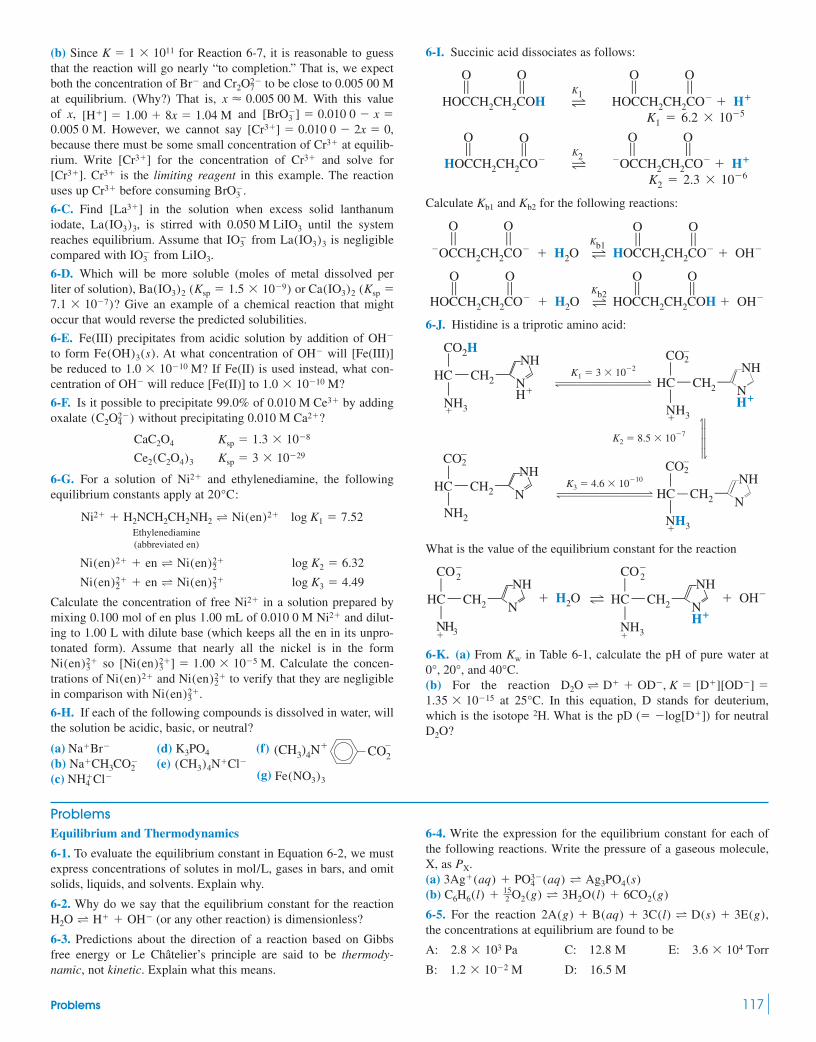
Problems 117
(b) Since for Reaction 6-7, it is reasonable to guessthat the reaction will go nearly “to completion.” That is, we expectboth the concentration of and to be close to at equilibrium. (Why?) That is, With this valueof x, and
However, we cannot say because there must be some small concentration of at equilib-rium. Write for the concentration of and solve for
is the limiting reagent in this example. The reactionuses up before consuming
6-C. Find in the solution when excess solid lanthanumiodate, is stirred with until the systemreaches equilibrium. Assume that from is negligiblecompared with from
6-D. Which will be more soluble (moles of metal dissolved perliter of solution), or
? Give an example of a chemical reaction that mightoccur that would reverse the predicted solubilities.
6-E. Fe(III) precipitates from acidic solution by addition of to form At what concentration of will [Fe(III)]be reduced to If Fe(II) is used instead, what con-centration of will reduce [Fe(II)] to
6-F. Is it possible to precipitate 99.0% of by addingoxalate without precipitating ?
6-G. For a solution of and ethylenediamine, the followingequilibrium constants apply at :
Ethylenediamine(abbreviated en)
Calculate the concentration of free in a solution prepared bymixing 0.100 mol of en plus 1.00 mL of and dilut-ing to 1.00 L with dilute base (which keeps all the en in its unpro-tonated form). Assume that nearly all the nickel is in the form
so Calculate the concen-trations of and to verify that they are negligiblein comparison with .
6-H. If each of the following compounds is dissolved in water, willthe solution be acidic, basic, or neutral?
(a) (f)(b)(c) (g) Fe(NO3)3NH�
4 Cl�
Na�CH3CO�2
(CH3)4N� CO2
�Na�Br�
Ni(en)2�3
Ni(en)2�2Ni(en)2�
[Ni(en)2�3 ] � 1.00 10�5 M.Ni(en)2�
3
Ni2�0.010 0 MNi2�
Ni(en)2�2 � en T Ni(en)2�
3 log K3 � 4.49
Ni(en)2� � en T Ni(en)2�2 log K2 � 6.32
Ni2� � H2NCH2CH2NH2 T Ni(en)2� log K1 � 7.52
20°CNi2�
Ce2(C2O4)3 Ksp � 3 10�29
CaC2O4 Ksp � 1.3 10�8
0.010 M Ca2�(C2O2�4 )
0.010 M Ce3�
1.0 10�10 M?OH�
1.0 10�10 M?OH�Fe(OH)3(s).
OH�
7.1 10�7)Ca(IO3)2 (Ksp �Ba(IO3)2 (Ksp � 1.5 10�9)
LiIO3.IO�3
La(IO3)3IO�3
0.050 M LiIO3La(IO3)3,[La3�]
BrO3�.Cr3�
Cr3�[Cr3�].Cr3�[Cr3�]
Cr3�
0.010 0 � 2x � 0,[Cr3�] �0.005 0 M.0.010 0 � x �[BrO3
�] �[H�] � 1.00 � 8x � 1.04 Mx � 0.005 00 M.
0.005 00 MCr2O2�7Br�
K � 1 1011 6-I. Succinic acid dissociates as follows:
Calculate and for the following reactions:
6-J. Histidine is a triprotic amino acid:
What is the value of the equilibrium constant for the reaction
6-K. (a) From in Table 6-1, calculate the pH of pure water atand
(b) For the reaction at . In this equation, D stands for deuterium,
which is the isotope What is the for neutralD2O?
pD (� �log[D�])2H.25°C1.35 10�15
D2O T D� � OD�, K � [D�][OD�] �40°C.0°, 20°,
Kw
å
å
å
å
NHCO�
2
HC ® CH2®
NH3�
N� H2O T
NHCO�
2
HC ® CH2®
NH3�
NH�
� OH�
å
å
å
å#£££££££4
å
å
å
å#£££££££4
1¡¡ @
NHCO2H
HC ® CH2®NH�
NHHC ® CH2
®N
K1 � 3 10�2
NHHC ® CH2®
NH2
NNH
HC ® CH2®
N
K3 � 4.6 10�10
K2 � 8.5 10�7
NH3�
NH3�
NH3�
CO2�
CO2�
CO2�
H�
HOCCH2CH2COH � OH�™O
™O
HOCCH2CH2CO� � H2O—T™O
™O
Kb2
HOCCH2CH2CO� � OH�™O
™O
�OCCH2CH2CO� � H2O—T™O
™O
Kb1
Kb2Kb1
HOCCH2CH2CO�——T——�OCCH2CH2CO� � H�
K2 � 2.3 10�6
™O
™O
™O
™O
K2
HOCCH2CH2COH——T——HOCCH2CH2CO� � H�
K1 � 6.2 10�5
™O
™O
™O
™O
K1
ProblemsEquilibrium and Thermodynamics
6-1. To evaluate the equilibrium constant in Equation 6-2, we mustexpress concentrations of solutes in gases in bars, and omitsolids, liquids, and solvents. Explain why.
6-2. Why do we say that the equilibrium constant for the reaction(or any other reaction) is dimensionless?
6-3. Predictions about the direction of a reaction based on Gibbsfree energy or Le Châtelier’s principle are said to be thermody-namic, not kinetic. Explain what this means.
H2O T H� � OH�
mol/L,
6-4. Write the expression for the equilibrium constant for each ofthe following reactions. Write the pressure of a gaseous molecule,X, as (a)(b)
6-5. For the reaction the concentrations at equilibrium are found to be
A: C: 12.8 M E:
B: D: 16.5 M1.2 10�2 M
3.6 104 Torr2.8 103 Pa
2A(g) � B(aq) � 3C(l) T D(s) � 3E(g),
C6H6(l) � 152 O2(g) T 3H2O(l) � 6CO2(g)
3Ag�(aq) � PO3�4 (aq) T Ag3PO4(s)
PX.
(d)(e) (CH3)4N�Cl�
K3PO4

118 CHAPTER 6 Chemical Equilibrium
Find the numerical value of the equilibrium constant that wouldappear in a conventional table of equilibrium constants.
6-6. From the equations
find the value of K for the reaction Allspecies are aqueous.
6-7. (a) A favorable entropy change occurs when is positive. Doesthe order of the system increase or decrease when is positive?(b) A favorable enthalpy change occurs when is negative. Doesthe system absorb heat or give off heat when is negative?(c) Write the relation between , , and . Use the results ofparts (a) and (b) to state whether must be positive or negativefor a spontaneous change.
6-8. For the reaction , at 298.15 K. Find the value of K for the reaction.
6-9. The formation of tetrafluoroethylene from its elements ishighly exothermic:
Fluorine Graphite Tetrafluoroethylene
(a) If a mixture of , graphite, and is at equilibrium in aclosed container, will the reaction go to the right or to the left if is added?(b) Rare bacteria from the planet Teflon eat and make Teflonfor their cell walls. Will the reaction go to the right or to the left ifthese bacteria are added?
(c) Will the reaction go right or left if solid graphite is added?(Neglect any effect of increased pressure due to the decreased vol-ume in the vessel when solid is added.)(d) Will the reaction go right or left if the container is crushed toone-eighth of its original volume?(e) Does the equilibrium constant become larger or smaller if thecontainer is heated?
6-10. When is dried in an oven, it loses gaseouswater:
(a) Write the equilibrium constant for this reaction. Calculate thevapor pressure of gaseous above at 298 K.(b) Assuming that and are not temperature dependent(a poor assumption), estimate the temperature at which the vaporpressure of above will be 1 bar.
6-11. The equilibrium constant for the reaction of ammonia withwater has the following values in the range
Kb � 1.570 10�5 at 10°C
Kb � 1.479 10�5 at 5°C
NH3(aq) � H2O T NH�4 � OH�
5°–10°C:
BaCl2 � H2O(s)H2O(g)
�S°�H°BaCl2 � H2OH2O
�S° � �148 J/ (K�mol) at 25°C
�H° � 63.11 kJ/mol at 25°C
BaCl2 � H2O(s) T BaCl2(s) � H2O(g)
BaCl2 � H2O(s)
ç ç
F2C
Cç
C
Cç
ç
CF2
Cçç
C
C
FF F F F F
F F F FF
FTeflon
C2F4
F2
C2F4F2
2F2(g) � 2C(s) T F2C¢CF2(g)
�G° � �59.0 kJ/molHCO�3 T H� � CO2�
3
�G�S�H�G�H�H
�S�S
HOBr T H� � OBr�.
HOCl � OBr� T HOBr � OCl� K � 15
HOCl T H� � OCl� K � 3.0 10�8
(a) Assuming that and are constant in the interval, use Equation 6-8 to find for the reaction in this tem-
perature range.(b) Describe how Equation 6-8 could be used to make a lineargraph to determine , if and were constant over somerange of temperature.
6-12. For the reaction at 1 362 K and is positive. A vessel is charged with 48.0 PaHBr, 1 370 Pa and 3 310 Pa at 1 362 K.(a) Will the reaction proceed to the left or the right to reachequilibrium?(b) Calculate the pressure (in pascals) of each species in the vesselat equilibrium.(c) If the mixture at equilibrium is compressed to half its originalvolume, will the reaction proceed to the left or the right to reestab-lish equilibrium?(d) If the mixture at equilibrium is heated from 1 362 to 1 407 K,will HBr be formed or consumed in order to reestablish equilibrium?
6-13. Henry’s law states that the concentration of a gas dissolved ina liquid is proportional to the pressure of the gas. This law is a con-sequence of the equilibrium
where is called the Henry’s law constant. (The same law applies tosolvents other than water, but the value of is different for each sol-vent.) For the gasoline additive MTBE, Supposewe have a closed container with aqueous solution and air in equilib-rium. If the concentration of MTBE in the liquid is found tobewhat is the pressure of MTBE in the air?
Methyl-t-butylether (MTBE, FM 88.15)
Solubility Product
6-14. Find the concentration of in equilibrium with
6-15. What concentration of (ferrocyanide) is in equilib-rium with Express your answerwith a prefix from Table 1-3.
6-16. Find in a solution saturated with is fixed at Note that gives
for 4 mol of
6-17. (a) From the solubility product of zinc ferrocyanide,, calculate the concentration of in
saturated with Assume that is anegligible source of (b) What concentration of should be in a suspension ofsolid in water to give ?
6-18. Solubility products predict that cation can be 99.999%separated from cation by precipitation with anion Whenthe separation is tried, we find 0.2% contamination of with
. Explain what might be happening.
6-19. A solution contains Canbe precipitated by sulfate without precipitating ?
What will be the concentration of begins toprecipitate?
Ca2� when Ag2SO4
Ag�99% of Ca2�
0.050 0 M Ca2� and 0.030 0 M Ag�.
B2�
AX3(s)X�.B2�
A3�
[Zn2�] � 5.0 10�7 MZn2Fe(CN)6
K4Fe(CN)6
Zn2�.Zn2Fe(CN)6Zn2Fe(CN)6.ZnSO4
0.10 mMFe(CN)4�6Zn2Fe(CN)6
Ksp � 2.3 10�69Cu4(OH)6(SO4)(s) T 4Cu2� � 6OH� � SO2�
4
Cu2�.1 mol of SO2�4
Cu4(OH)6(SO4)1.0 10�6 M.[OH�]Cu4(OH)6(SO4) if[Cu2�]
1.0 M Ag� and Ag4Fe(CN)6(s).Fe(CN)4�
6
and 0.10 M Br�.CuBr(s)Cu2�
CH3ßOßC(CH3)3
1.00 102 ppm (� 100 g MTBE/g solution � 100 g/mL),
Kh � 1.71 M/bar.Kh
Kh
X(g) ∆Kh
X(aq) Kh �[X]
PX
Br2H2,�H°
H2(g) � Br2(g) T 2HBr(g), K � 7.2 10�4
�S°�H°�H°
�H°5°–10°C�S°�H°
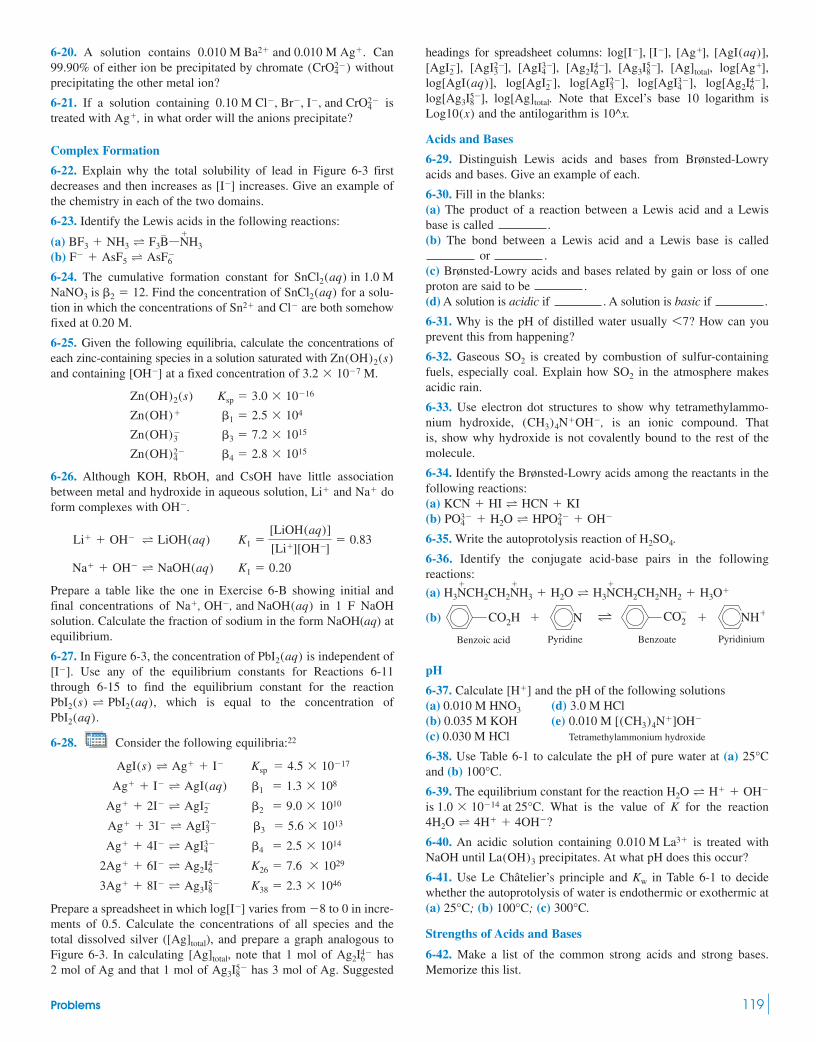
6-20. A solution contains Can99.90% of either ion be precipitated by chromate withoutprecipitating the other metal ion?
6-21. If a solution containing istreated with in what order will the anions precipitate?
Complex Formation
6-22. Explain why the total solubility of lead in Figure 6-3 firstdecreases and then increases as increases. Give an example ofthe chemistry in each of the two domains.
6-23. Identify the Lewis acids in the following reactions:
(a)(b)
6-24. The cumulative formation constant for Find the concentration of for a solu-
tion in which the concentrations of and are both somehowfixed at 0.20 M.
6-25. Given the following equilibria, calculate the concentrations ofeach zinc-containing species in a solution saturated with and containing at a fixed concentration of
6-26. Although KOH, RbOH, and CsOH have little associationbetween metal and hydroxide in aqueous solution, and doform complexes with
Prepare a table like the one in Exercise 6-B showing initial andfinal concentrations of in 1 F NaOHsolution. Calculate the fraction of sodium in the form NaOH(aq) atequilibrium.
6-27. In Figure 6-3, the concentration of is independent ofUse any of the equilibrium constants for Reactions 6-11
through 6-15 to find the equilibrium constant for the reactionwhich is equal to the concentration of
6-28. Consider the following equilibria:22
Prepare a spreadsheet in which varies from to 0 in incre-ments of 0.5. Calculate the concentrations of all species and thetotal dissolved silver ([Ag]total), and prepare a graph analogous toFigure 6-3. In calculating [Ag]total, note that 1 mol of has2 mol of Ag and that 1 mol of has 3 mol of Ag. SuggestedAg3I5�
8
Ag2I4�6
�8log[I�]
3Ag� � 8I� T Ag3I5�8 K38 � 2.3 1046
2Ag� � 6I� T Ag2I4�6 K26 � 7.6 1029
Ag� � 4I� T AgI3�4 �4 � 2.5 1014
Ag� � 3I� T AgI23� �3 � 5.6 1013
Ag� � 2I� T AgI�2 �2 � 9.0 1010
Ag� � I� T AgI(aq) �1 � 1.3 108
AgI(s) T Ag� � I� Ksp � 4.5 10�17
PbI2(aq).PbI2(s) T PbI2(aq),
[I�].PbI2(aq)
Na�, OH�, and NaOH(aq)
Na� � OH� T NaOH(aq) K1 � 0.20
Li� � OH� T LiOH(aq) K1 �[LiOH(aq)]
[Li�][OH�]� 0.83
OH�.Na�Li�
Zn(OH)2�4 �4 � 2.8 1015
Zn(OH)�3 �3 � 7.2 1015
Zn(OH)� �1 � 2.5 104
Zn(OH)2(s) Ksp � 3.0 10�16
3.2 10�7 M.[OH�]Zn(OH)2(s)
Cl�Sn2�
SnCl2(aq)NaNO3 is �2 � 12.SnCl2(aq) in 1.0 M
F� � AsF5 T AsF�6
BF3 � NH3 T F3B�
ßN�
H3
[I�]
Ag�,0.10 M Cl�, Br�, I�, and CrO2�
4
(CrO2�4 )
0.010 M Ba2� and 0.010 M Ag�. headings for spreadsheet columns: , , ,, , , , , ,
, , , , ,, Note that Excel’s base 10 logarithm is
and the antilogarithm is
Acids and Bases
6-29. Distinguish Lewis acids and bases from Brønsted-Lowryacids and bases. Give an example of each.
6-30. Fill in the blanks:(a) The product of a reaction between a Lewis acid and a Lewisbase is called .(b) The bond between a Lewis acid and a Lewis base is called
or .(c) Brønsted-Lowry acids and bases related by gain or loss of oneproton are said to be .(d) A solution is acidic if . A solution is basic if .
6-31. Why is the pH of distilled water usually ? How can youprevent this from happening?
6-32. Gaseous is created by combustion of sulfur-containingfuels, especially coal. Explain how in the atmosphere makesacidic rain.
6-33. Use electron dot structures to show why tetramethylammo-nium hydroxide, is an ionic compound. Thatis, show why hydroxide is not covalently bound to the rest of themolecule.
6-34. Identify the Brønsted-Lowry acids among the reactants in thefollowing reactions:(a)(b)
6-35. Write the autoprotolysis reaction of
6-36. Identify the conjugate acid-base pairs in the followingreactions:
(a)
(b)
pH
6-37. Calculate and the pH of the following solutions(a) (d)(b) (e)(c) Tetramethylammonium hydroxide
6-38. Use Table 6-1 to calculate the pH of pure water at (a)and (b)
6-39. The equilibrium constant for the reaction . What is the value of K for the reaction?
6-40. An acidic solution containing is treated withNaOH until precipitates. At what pH does this occur?
6-41. Use Le Châtelier’s principle and in Table 6-1 to decidewhether the autoprotolysis of water is endothermic or exothermic at(a) (b) (c)
Strengths of Acids and Bases
6-42. Make a list of the common strong acids and strong bases.Memorize this list.
300°C.100°C;25°C;
Kw
La(OH)3
0.010 M La3�
4H2O T 4H� � 4OH�
is 1.0 10�14 at 25°CH2O T H� � OH�
100°C.25°C
0.030 M HCl0.010 M [(CH3)4N�]OH�0.035 M KOH3.0 M HCl0.010 M HNO3
[H�]
TCO2H CO2��
�
Benzoic acid Pyridine Benzoate Pyridinium
N NH�
H3N�
CH2CH2N�
H3 � H2O T H3N�
CH2CH2NH2 � H3O�
H2SO4.
PO3�4 � H2O T HPO2�
4 � OH�
KCN � HI T HCN � KI
(CH3)4N�OH�,
SO2
SO2
67
10^x.Log10(x)log[Ag]total.log[Ag3I5�
8 ]log[Ag2I4�
6 ]log[AgI3�4 ]log[AgI2�
3 ]log[AgI�2 ]log[AgI(aq)]
log[Ag�][Ag]total,[Ag3I5�8 ][Ag2I4�
6 ][AgI3�4 ][AgI2�
3 ][AgI�2 ]
[AgI(aq)][Ag�]log[I�], [I�]
Problems 119

6-43. Write the formulas and names for three classes of weak acidsand two classes of weak bases.
6-44. Write the reaction for trichloroacetic acid, for
anilinium ion, , and for lanthanum ion,
6-45. Write the reactions for pyridine and for sodium 2-mercapto-ethanol.
6-46. Write the and reactions of
6-47. Write the stepwise acid-base reactions for the following ionsin water. Write the correct symbol (for example, ) for the equi-librium constant for each reaction.
(a) (b)
6-48. Which is a stronger acid, (a) or (b)?
(a) (b)
Which is a stronger base, (c) or (d)?
(c) (d)
6-49. Write the reaction of Given that the value forHCN is calculate
6-50. Write the reaction of phosphoric acid and thereaction of disodium oxalate
6-51. From the values for phosphate in Equations 6-32 through6-34, calculate the three values of phosphoric acid.
6-52. From the following equilibrium constants, calculate the equi-librium constant for the reaction HO2CCO2H T 2H� � C2O2�
4 .
Ka
Kb
(Na2C2O4).Kb2
(H3PO4)Ka2
Kb for CN�.6.2 10�10,KaCN�.Kb
H2NCNH2Urea
Kb = 1.5 10�14
OH2NNH2Hydrazine
Kb = 1.1 10�6
ClH2CCOH
O
Chloroacetic acidKa = 1.36 10�3
Cl2HCCOH
O
Dichloroacetic acidKa = 8 10�2
OCCH2CO� �
O O
Malonate ion
H3NCH2CH2NH3
� �
Ethylenediammonium ion
Kb1
NaHCO3.KbKa
�
��HOCH2CH2S
� �Na
Sodium 2-mercaptoethanol
�
Pyridine
N
Kb
La3�.NH3�
Cl3CCO2H,Ka
6-53. (a) Using only from Table 6-3, calculate how many molesof will dissolve in 1.00 L of water.(b) How will the solubility calculated in part (a) be affected by the
reaction in Table 6-3?
6-54. The planet Aragonose (which is made mostly of the mineralaragonite, whose composition is ) has an atmosphere con-taining methane and carbon dioxide, each at a pressure of 0.10 bar.The oceans are saturated with aragonite and have a concentration of
equal to Given the following equilibria, calcu-late how many grams of calcium are contained in 2.00 L ofAragonose seawater.
Don’t panic! Reverse the first reaction, add all the reactionstogether, and see what cancels.
Solving Numerical Equilibrium Problems
6-55. Reaction 6-41 came to equilibrium in a flask containingeach at a concentration of 5.00 mM,
plus excess solid In which direction must the reaction proceed toreach equilibrium? Find the concentrations at equilibrium.
6-56. Consider the reaction
in a solution initially containing 1.00 mM Find the concentrations of reactants and products
when the solution reaches equilibrium.1.00 mM H�.
IO�3 , 1.00 mM I�, and
IO�3 � 5I� � 6H� T 3I2(aq) � 3H2O K � 3 1048
I2.Br2(aq), IO�
3 , Br�, and H�,
K2 � 4.7 10�11HCO�
3 (aq) T H�(aq) � CO2�3 (aq)
K1 � 4.5 10�7CO2(aq) � H2O(l) T HCO�
3 (aq) � H�(aq)
KCO2� 3.4 10�2
CO2(g) T CO2(aq)
Ksp � 6.0 10�9CaCO3(s, aragonite) T Ca2�(aq) � CO2�
3 (aq)
1.8 10�7 M.H�
CaCO3
K1
Ca(OH)2
Ksp
T
OO OO
H� �OCCO�HOCCO� K2� 5.4 10�5
Oxalate�
THOCCOH
OO OO
Oxalic acidH� HOCCO� K1 = 5.4 10�2�
120 CHAPTER 6 Chemical Equilibrium

7-1 Titrations 121
EVOLUTION OF THE BURET1
Let the Titrations Begin7
Procedures in which we measure the volume of reagent needed to react with analyte arecalled volumetric analysis. In this chapter, we discuss principles that apply to all volumetricprocedures and then focus on precipitation titrations. We also introduce spectrophotometrictitrations, which are especially useful in biochemistry.
7-1 TitrationsIn a titration, increments of reagent solution—the titrant—are added to analyte until theirreaction is complete. From the quantity of titrant required, we can calculate the quantity ofanalyte that must have been present. Titrant is usually delivered from a buret (Figure 7-1).
The principal requirements for a titration reaction are that it have a large equilibriumconstant and proceed rapidly. That is, each increment of titrant should be completely and
Burets have terrorized students of analytical chemistry for two centuries. The original buretof Descroizilles was used in nearly the same manner as a graduated cylinder. Hole b at thetop was covered with a finger to admit air for fine control of liquid poured from spout a. InGay-Lussac’s buret, liquid was poured from the bent glass side tube. A cork fitted with ashort glass tube and rubber hose was inserted into the top of the buret. Liquid flow from theside tube was controlled by blowing into the rubber tube. Henry described the first glassburet with a copper stopcock, but this device was never widely accepted. Mohr’s buret witha brass pinchclamp on an India rubber tube (called caoutchouc, pronounced KOO-chook)dominated volumetric analysis for 100 years. The only common analytical reagent that wasincompatible with the rubber was potassium permanganate. The glass stopcock similar totoday’s Teflon stopcock was a contemporary of the pinchclamp, but the stopcock was notperfected and not widely used until the mid-twentieth century.
Mohr (1855)Glass stopcock
Mohr (1855)Compression clip
Henry (1846)Copper stopcock
Gay-Lussac (1824)Blow out liquid
Descroizilles (1806)Pour out liquid

122 CHAPTER 7 Let the Titrations Begin
quickly consumed by analyte until the analyte is used up. The most common titrations arebased on acid-base, oxidation-reduction, complex formation, or precipitation reactions.
The equivalence point occurs when the quantity of added titrant is the exact amountnecessary for stoichiometric reaction with the analyte. For example, 5 mol of oxalic acidreact with 2 mol of permanganate in hot acidic solution:
(7-1)Analyte Titrant
Oxalic acid Permanganate(colorless) (purple) (colorless) (colorless)
If the unknown contains 5.000 mmol of oxalic acid, the equivalence point is reached when2.000 mmol of have been added.
The equivalence point is the ideal (theoretical) result we seek in a titration. What weactually measure is the end point, which is marked by a sudden change in a physical prop-erty of the solution. In Reaction 7-1, a convenient end point is the abrupt appearance of thepurple color of permanganate in the flask. Prior to the equivalence point, all permanganate isconsumed by oxalic acid, and the titration solution remains colorless. After the equivalencepoint, unreacted accumulates until there is enough to see. The first trace of purplecolor is the end point. The better your eyes, the closer will be your measured end point to thetrue equivalence point. Here, the end point cannot exactly equal the equivalence point,because extra , beyond that needed to react with oxalic acid, is required to exhibitpurple color.
Methods for determining when the analyte has been consumed include (1) detecting asudden change in the voltage or current between a pair of electrodes (Figure 7-9), (2) observ-ing an indicator color change (Color Plate 2), and (3) monitoring absorption of light(Figure 7-5). An indicator is a compound with a physical property (usually color) thatchanges abruptly near the equivalence point. The change is caused by the disappearance ofanalyte or the appearance of excess titrant.
The difference between the end point and the equivalence point is an inescapable titra-tion error. By choosing a physical property whose change is easily observed (such as pH orthe color of an indicator), we find that the end point can be very close to the equivalencepoint. We estimate the titration error with a blank titration, in which we carry out the sameprocedure without analyte. For example, we can titrate a solution containing no oxalic acid tosee how much is needed to produce observable purple color. We then subtract thisvolume of from the volume observed in the analytical titration.
The validity of an analytical result depends on knowing the amount of one of the reac-tants used. If a titrant is prepared by dissolving a weighed amount of pure reagent in a knownvolume of solution, its concentration can be calculated. We call such a reagent a primarystandard because it is pure enough to be weighed and used directly. A primary standardshould be 99.9% pure, or better. It should not decompose under ordinary storage, andit should be stable when dried by heat or vacuum, because drying is required to removetraces of water adsorbed from the atmosphere. Primary standards for many elements aregiven in Appendix K. Box 7-1 discusses reagent purity. Box 3-1 described Standard Refer-ence Materials that allow laboratories to test the accuracy of their procedures.
Many reagents used as titrants, such as HCl, are not available as primary standards.Instead, we prepare titrant with approximately the desired concentration and use it totitrate a primary standard. By this procedure, called standardization, we determine theconcentration of titrant. We then say that the titrant is a standard solution. The validityof the analytical result ultimately depends on knowing the composition of a primarystandard.
In a direct titration, we add titrant to analyte until the reaction is complete. Occasion-ally, we perform a back titration, in which we add a known excess of one standard reagentto the analyte. Then we titrate the excess reagent with a second standard reagent. A backtitration is useful when its end point is clearer than the end point of the direct titration orwhen an excess of the first reagent is required for complete reaction with analyte. To graspthe difference between direct and back titrations, consider first the addition of permanganatetitrant to oxalic acid analyte in Reaction 7-1; this reaction is a direct titration. Alternatively,to perform a back titration, we could add a known excess of permanganate to consume oxalicacid. Then we could back-titrate the excess permanganate with standard to measurehow much permanganate was left after reaction with the oxalic acid.
Fe2�
MnO�4
MnO�4
MnO�4
MnO�4
MnO�4
5HO C C OH � 2MnO4 � 6H�
OO
10CO2 � 2Mn2�� 8H2O
�
Level oftitrant
Buretclamp
Buret
Stopcock
Solutionof analyte
Magneticstirrer
Magneticstirring
bar
Flask
Figure 7-1 Typical setup for a titration. Theanalyte is contained in the flask, and the titrantis in the buret. The stirring bar is a magnetcoated with Teflon, which is inert to mostsolutions. The bar is spun by a rotating magnetinside the stirring motor.

7-2 Titration Calculations 123
Box 7-1 Reagent Chemicals and Primary Standards
Chemicals are sold in many grades of purity. For analytical chem-istry, we usually use reagent-grade chemicals meeting purityrequirements set by the American Chemical Society (ACS) Com-mittee on Analytical Reagents.2 Sometimes “reagent grade” sim-ply meets purity standards set by the manufacturer. An actual lotanalysis for specified impurities should appear on the reagent bot-tle. For example, here is a lot analysis of zinc sulfate:
A few chemicals are sold in high enough purity to be primarystandard grade. Whereas reagent-grade potassium dichromate hasa lot assay of primary standard grade must bein the range 99.95–100.05%. Besides high purity, a key quality ofprimary standards is that they are indefinitely stable.
For trace analysis (analysis of species at ppm and lowerlevels), impurities in reagent chemicals must be extremely low.For this purpose, we use very-high-purity, expensive grades ofacids such as “trace metal grade” or HCl to dissolve sam-ples. We must pay careful attention to reagents and vessels whoseimpurity levels could be greater than the quantity of analyte weseek to measure.
To protect the purity of chemical reagents, you should
• Avoid putting a spatula into a bottle. Instead, pour chemical outof the bottle into a clean container (or onto weighing paper) anddispense the chemical from the clean container.
• Never pour unused chemical back into the reagent bottle.• Replace the cap on the bottle immediately to keep dust out.• Never put a glass stopper from a liquid-reagent container
down on the lab bench. Either hold the stopper or place it in aclean place (such as a clean beaker) while you dispensereagent.
• Store chemicals in a cool, dark place. Do not expose themunnecessarily to sunlight.
HNO3
K2Cr2O7�99.0%,
ACS Reagent Lot Analysis:
Assay: 100.6% Fe: 0.000 5% Ca: 0.001%
Insolublematter: 0.002% Pb: 0.002 8% Mg: 0.000 3%
pH of 5% solutionat 25�C: 5.6 Mn: 0.6 ppm K: 0.002%
Ammonium: 0.000 8% Nitrate: 0.000 4% Na: 0.003%
Chloride: 1.5 ppm
ZnSO4
The assay value of 100.6% means that a specified analysis for oneof the major components produced 100.6% of the theoreticalvalue. For example, if is contaminated with the lowermolecular mass the assay for will be higher thanthe value for pure Less pure chemicals, generally unsuitablefor analytical chemistry, carry designations such as “chemicallypure” (CP), “practical,” “purified,” or “technical.”
ZnSO4.Zn2�Zn(OH)2,
ZnSO4
In a gravimetric titration, titrant is measured by mass, not volume. Titrant concentra-tion is expressed as moles of reagent per kilogram of solution. Precision is improved from0.3% attainable with a buret to 0.1% with a balance. Experiments by Guenther and by Butlerand Swift on the Web site for this book (www.whfreeman.com/qca) provide examples. In agravimetric titration, there is no need for a buret. Titrant can be delivered from a squirt bottleor a pipet. “Gravimetric titrations should become the gold standard, and volumetric glass-ware should be seen in museums only.”3
7-2 Titration CalculationsHere are some examples to illustrate stoichiometry calculations in volumetric analysis. Thekey step is to relate moles of titrant to moles of analyte. We also introduce the Kjeldahl titra-tion as a representative volumetric procedure.
Example Standardization of Titrant Followed by Analysis of Unknown
The calcium content of urine can be determined by the following procedure:
Step 1 Precipitate with oxalate in basic solution:
Oxalate Calcium oxalate
Step 2 Wash the precipitate with ice-cold water to remove free oxalate, and dissolve thesolid in acid to obtain and in solution.
Step 3 Heat the solution to and titrate the oxalate with standardized potassiumpermanganate until the purple end point of Reaction 7-1 is observed.
Standardization Suppose that 0.356 2 g of is dissolved in a 250.0-mLvolumetric flask. If 10.00 mL of this solution require 48.36 mL of solution fortitration, what is the molarity of the permanganate solution?
KMnO4
Na2C2O4
60°CH2C2O4Ca2�
Ca2� � C2O2�4 S Ca(C2O4) � H2O(s)
Ca2�

Solution The concentration of the oxalate solution is
The moles of in 10.00 mL are Reaction 7-1 requires 2 mol of permanganate for 5 mol of
oxalate, so the delivered must have been
The concentration of in the titrant is therefore
Analysis of Unknown Calcium in a 5.00-mL urine sample was precipitated with redissolved, and then required 16.17 mL of standard solution. Find the
concentration of in the urine.
Solution In 16.17 mL of , there are This quantity will react with
Because there is one oxalate ion for each calcium ion in , there musthave been of in 5.00 mL of urine:
Example Titration of a Mixture
A solid mixture weighing 1.372 g containing only sodium carbonate and sodiumbicarbonate required 29.11 mL of 0.734 4 M HCl for complete titration:
FM 105.99
FM 84.01
Find the mass of each component of the mixture.
Solution Let’s denote the grams of by x and grams of by .The moles of each component must be
We know that the total moles of HCl used were From the stoichiometry of the two reactions, we can say that
The mixture contains 0.724 g of and .
Kjeldahl Nitrogen AnalysisDeveloped in 1883, the Kjeldahl nitrogen analysis remains one of the most accurate andwidely used methods for determining nitrogen in substances such as protein, milk, cereal,
1.372 � 0.724 � 0.648 g of NaHCO3Na2CO3
2 a x
105.99b �
1.372 � x
84.01� 0.021 38 1 x � 0.724 g
2 (mol Na2CO3) � mol NaHCO3 � 0.021 38
(0.029 11 L)(0.734 4 M) � 0.021 38 mol.
Moles of Na2CO3 �x g
105.99 g/mol Moles of NaHCO3 �
(1.372 � x) g
84.01 g/mol
1.372 � xNaHCO3Na2CO3
NaHCO3 � HCl S NaCl(aq) � H2O � CO2
Na2CO3 � 2HCl S 2NaCl(aq) � H2O � CO2
[Ca2�] �0.035 553 mmol
5.00 mL� 0.007 111 M
Ca2�0.035 553 mmolCa(C2O4) � H2O
Moles of C2O2�4 � a5 mol C2O2�
4
2 mol MnO�4b (mol MnO�
4 ) � 0.035 553 mmol
1.4221 10�5 mol MnO4�.
(0.016 17 L) (8.7947 10�4 mol/L) �MnO�4
Ca2�
MnO�4C2O2�
4 ,
Molarity of MnO�4 �
0.042 531 mmol
48.36 mL� 8.7947 10�4 M
MnO�4
Moles of MnO�4 � a2 mol MnO�
4
5 mol C2O2�4b (mol C2O2�
4 ) � 0.042 531 mmol
MnO�4
10�4 mol � 0.106 33 mmol.(0.010 633 mol/L) (0.010 00 L) � 1.0633 C2O4
2�
0.356 2 g Na2C2O4 / (134.00 g Na2C2O4/mol)
0.250 0 L� 0.010 633 M
124 CHAPTER 7 Let the Titrations Begin
We show an extra, subscripted digit forcalculations. In general, retain all extra digits inyour calculator. Do not round off until the endof a problem.
Reaction 7-1 requires 2 mol for 5 molC2O2�
4 .MnO�
4
Note that is the same as mol
L.
mmolmL
Reaction 7-1 requires 5 mol for 2 molMnO�
4 .C2O2�
4
Solving for two unknowns requires twoindependent pieces of information. Here wehave the mass of the mixture and the volumeof titrant.
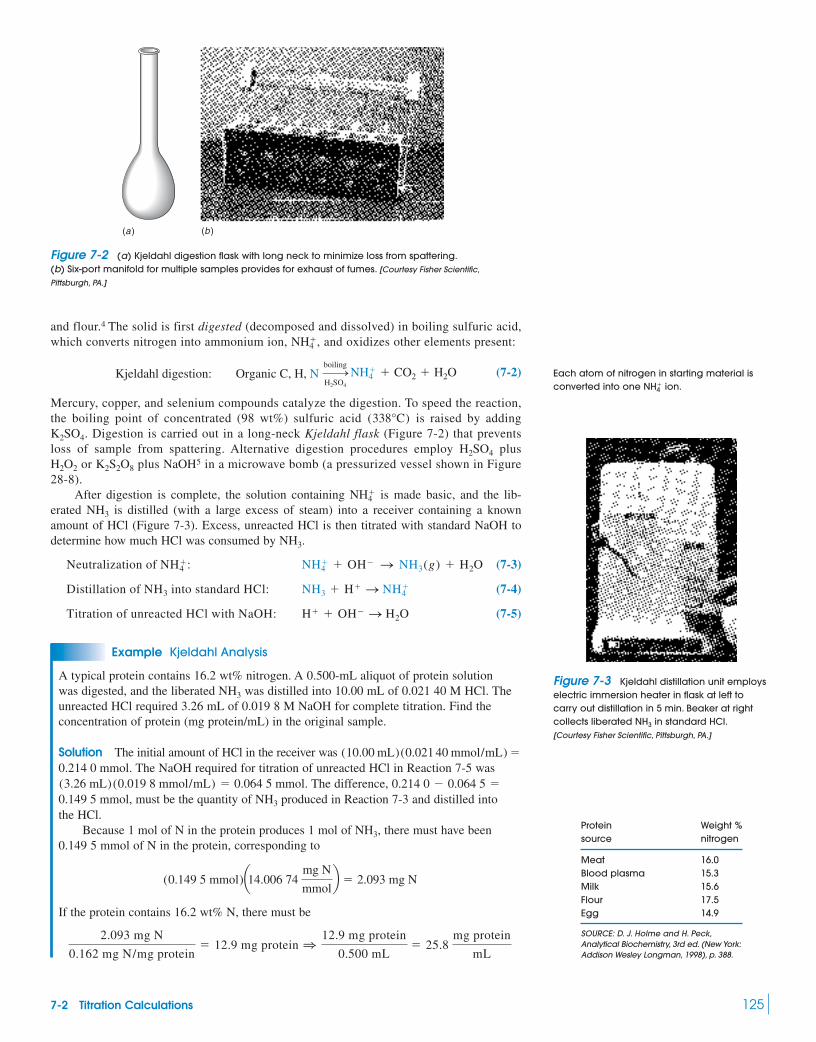
7-2 Titration Calculations 125
and flour.4 The solid is first digested (decomposed and dissolved) in boiling sulfuric acid,which converts nitrogen into ammonium ion, , and oxidizes other elements present:
(7-2)
Mercury, copper, and selenium compounds catalyze the digestion. To speed the reaction,the boiling point of concentrated (98 wt%) sulfuric acid is raised by adding
. Digestion is carried out in a long-neck Kjeldahl flask (Figure 7-2) that preventsloss of sample from spattering. Alternative digestion procedures employ plus
or plus 5 in a microwave bomb (a pressurized vessel shown in Figure28-8).
After digestion is complete, the solution containing is made basic, and the lib-erated is distilled (with a large excess of steam) into a receiver containing a knownamount of HCl (Figure 7-3). Excess, unreacted HCl is then titrated with standard NaOH todetermine how much HCl was consumed by .
(7-3)
(7-4)
(7-5)
Example Kjeldahl Analysis
A typical protein contains 16.2 wt% nitrogen. A 0.500-mL aliquot of protein solutionwas digested, and the liberated was distilled into 10.00 mL of 0.021 40 M HCl. Theunreacted HCl required 3.26 mL of 0.019 8 M NaOH for complete titration. Find theconcentration of protein (mg protein/mL) in the original sample.
Solution The initial amount of HCl in the receiver was . The NaOH required for titration of unreacted HCl in Reaction 7-5 was
. The difference, , must be the quantity of produced in Reaction 7-3 and distilled into
the HCl.Because 1 mol of N in the protein produces 1 mol of , there must have been
0.149 5 mmol of N in the protein, corresponding to
If the protein contains 16.2 wt% N, there must be
2.093 mg N
0.162 mg N/mg protein� 12.9 mg protein 1
12.9 mg protein
0.500 mL� 25.8
mg protein
mL
(0.149 5 mmol)a14.006 74 mg N
mmolb � 2.093 mg N
NH3
NH30.149 5 mmol0.214 0 � 0.064 5 �(3.26 mL)(0.019 8 mmol/mL) � 0.064 5 mmol
0.214 0 mmol(0.021 40 mmol/mL) �(10.00 mL)
NH3
Titration of unreacted HCl with NaOH: H� � OH� S H2O
Distillation of NH3 into standard HCl: NH3 � H� S NH�4
Neutralization of NH�4 : NH�
4 � OH� S NH3(g) � H2O
NH3
NH3
NH�4
NaOHK2S2O8H2O2
H2SO4
K2SO4
(338°C)
Kjeldahl digestion: Organic C, H, N !boiling
H2SO4
NH�4 � CO2 � H2O
NH�4
(a ) (b )
Figure 7-2 (a) Kjeldahl digestion flask with long neck to minimize loss from spattering.(b) Six-port manifold for multiple samples provides for exhaust of fumes. [Courtesy Fisher Scientific,
Pittsburgh, PA.]
Each atom of nitrogen in starting material isconverted into one ion.NH�
4
Protein Weight %source nitrogen
Meat 16.0Blood plasma 15.3Milk 15.6Flour 17.5Egg 14.9
SOURCE: D. J. Holme and H. Peck,Analytical Biochemistry, 3rd ed. (New York:Addison Wesley Longman, 1998), p. 388.
Figure 7-3 Kjeldahl distillation unit employselectric immersion heater in flask at left tocarry out distillation in 5 min. Beaker at rightcollects liberated in standard HCI.[Courtesy Fisher Scientific, Pittsburgh, PA.]
NH3

7-3 Spectrophotometric TitrationsWe can follow the course of a titration by any means that allows us to determine when the equiv-alence point has been reached. In Chapter 4, we used absorption of light to construct a calibra-tion curve. Now we will use absorption of light to monitor the progress of a titration.
A solution of the iron-transport protein, transferrin (Figure 7-4), can be titrated with ironto measure the transferrin content. Transferrin without iron, called apotransferrin, is color-less. Each molecule, with a molecular mass of 81 000, binds two ions. When iron bindsto the protein, a red color with an absorbance maximum at a wavelength of 465 nm develops.The absorbance is proportional to the concentration of iron bound to the protein. Therefore,the absorbance may be used to follow the course of a titration of an unknown amount of apo-transferrin with a standard solution of .
(7-6)(colorless) (red)
Apotransferrin � 2Fe3� S (Fe3�)2transferrin
Fe3�
Fe3�
126 CHAPTER 7 Let the Titrations Begin
Absorption of light is discussed in Sections 18-1and 18-2.
Figure 7-4 Each of the two Fe-binding sitesof transferrin is located in a cleft in the protein.
binds to one N atom from the amino acidhistidine and three O atoms from tyrosine andaspartic acid. The fifth and sixth ligand sites ofthe metal are occupied by O atoms from acarbonate anion ( ) anchored in place byelectrostatic interaction with the positivelycharged amino acid arginine and by hydrogenbonding to the protein helix. When transferrin istaken up by a cell, it is brought to a compart-ment whose pH is lowered to 5.5. then reactswith the carbonate ligand to make and
thereby releasing from the protein.[Adapted from E. N. Baker, B. F. Anderson, H. M. Baker,
M. Haridas, G. E. Norris, S. V. Rumball, and C. A. Smith,
“Metal and Anion Binding Sites in Lactoferrin and
Related Proteins,” Pure Appl. Chem. 1990, 62, 1067.]
Fe3�H2CO3,HCO�
3
H�
CO2�3
Fe3�
Ferric nitrilotriacetate is soluble at neutral pH.In the absence of nitrilotriacetate,precipitates as in neutral solution.Nitrilotriacetate binds through four atoms,shown in bold type:
Fe3�
Fe(OH)3
Fe3�
N�O2C
CO2�
CO2�
Nitrilotriacetate anion
0.400
300
Abs
orba
nce
at 4
65 n
m
µL of Fe(III) added2001000
0.300
0.200
0.100
End point
Figure 7-5 Spectrophotometric titrationof transferrin with ferric nitrilotriacetate. Absorbanceis corrected as if no dilution had taken place. Theinitial absorbance of the solution, before iron isadded, is due to a colored impurity.
••
••••
•••
Protein
Asparticacid 60
Histidine253
Tyrosine92
Tyrosine192
Carbonateanion
Proteinhelix
NHN
H NHO
C2–
O
ONH
N NH H
H HNH
FeO
O
NO O
Positivelycharged
arginine 121
+
Figure 7-5 shows the titration of 2.000 mL of apotransferrin with fer-ric nitrilotriacetate solution. As iron is added to the protein, red color develops andabsorbance increases. When the protein is saturated with iron, no further color can form,and the curve levels off. The extrapolated intersection of the two straight portions of thetitration curve at in Figure 7-5 is taken as the end point. The absorbance continuesto rise slowly after the equivalence point because ferric nitrilotriacetate has someabsorbance at 465 nm.
To construct the graph in Figure 7-5, dilution must be considered because the volumeis different at each point. Each point on the graph represents the absorbance that would beobserved if the solution had not been diluted from its original volume of 2.000 mL.
(7-7)
Example Correcting Absorbance for the Effect of Dilution
The absorbance measured after adding of ferric nitrilotriacetate to2.000 mL of apotransferrin was 0.260. Calculate the corrected absorbance that should beplotted in Figure 7-5.
Solution The total volume was . If the volume had been2.000 mL, the absorbance would have been greater than 0.260 by a factor of .
The absorbance plotted in Figure 7-5 is 0.276.
Corrected absorbance � a2.125 mL
2.000 mLb (0.260) � 0.276
2.125/2.0002.000 � 0.125 � 2.125 mL
125 L (� 0.125 mL)
Corrected absorbance � a total volume
initial volumeb (observed absorbance)
203 L
1.79 10�3 M

7-4 The Precipitation Titration Curve 127
7-4 The Precipitation Titration CurveWe now turn our attention to details of precipitation titrations as an illustration of principlesthat underlie all titrations. We first study how concentrations of analyte and titrant vary dur-ing a titration and then derive equations that can be used to predict titration curves. One rea-son to calculate titration curves is to understand the chemistry that occurs during titrations.A second reason is to learn how experimental control can be exerted to influence the qualityof an analytical titration. For example, certain titrations conducted at the wrong pH couldgive no discernible end point. In precipitation titrations, the concentrations of analyte andtitrant and the size of influence the sharpness of the end point. For acid-base titrations(Chapter 11) and oxidation-reduction titrations (Chapter 16), the theoretical titration curveenables us to choose an appropriate indicator.
The titration curve is a graph showing how the concentration of one of the reactantsvaries as titrant is added. Because concentration varies over many orders of magnitude, it ismost useful to plot the p function:
p function: (7-8)
where [X] is the concentration of X.Consider the titration of 25.00 mL of 0.100 0 M with 0.050 00 M ,
(7-9)
and suppose that we are monitoring the concentration with an electrode. Reaction 7-9 isthe reverse of the dissolution of AgI(s), whose solubility product is rather small:
(7-10)
Because the equilibrium constant for the titration reaction 7-9 is large , the equilibrium lies far to the right. It is reasonable to say that each aliquot of
reacts completely with , leaving only a tiny amount of in solution. At the equivalencepoint, there will be a sudden increase in the concentration because all the has beenconsumed and we are now adding directly to the solution.
What volume of titrant is needed to reach the equivalence point? We calculate thisvolume, designated , with the fact that 1 mol of reacts with 1 mol of .
1444442444443 14444244443
The titration curve has three distinct regions, depending on whether we are before, at, orafter the equivalence point. Let’s consider each region separately.
Before the Equivalence PointSuppose that 10.00 mL of have been added. There are more moles of than at thispoint, so virtually all is “used up” to make AgI(s). We want to find the small concentra-tion of remaining in solution after reaction with . Imagine that Reaction 7-9 has goneto completion and that some AgI redissolves (Reaction 7-10). The solubility of is deter-mined by the concentration of free remaining in the solution:
(7-11)
Free is overwhelmingly from the that has not been precipitated by 10.00 mL of .By comparison, from dissolution of AgI(s) is negligible.
So let’s find the concentration of unprecipitated :
The volume is , so the concentration is
(7-12)[I�] �0.002 000 mol I�
0.035 00 L� 0.057 14 M
0.035 00 L (25.00 mL � 10.00 mL)
� 0.002 000 mol I�
� (0.025 00 L) (0.100 mol/L) � (0.010 00 L) (0.050 00 mol/L)
Moles of I� � original moles of I� � moles of Ag� added
I�
I�
Ag�I�I�
[Ag�] �Ksp
[I�]
I�
Ag�
I�Ag�
Ag�
Ag�I�Ag�
1 Ve � 0.050 00 L � 50.00 mL
mol Ag�mol I�
(0.025 00 L)(0.100 0 mol I�/L) � (Ve) (0.050 00 mol Ag�/L)
I�Ag�Ve
Ag�
Ag�
I�Ag�
Ag�I�
Ag�1016)(K � 1/Ksp � 1.2
AgI(s) T Ag� � I� Ksp � [Ag�][I�] � 8.3 10�17
Ag�
I� � Ag� S AgI(s)
Ag�I�
pX � �log10[X]
Ksp
In Chapter 8, we define the p function correctlyin terms of activities instead of concentrations.For now, we use pX � �log[X].
Ve � volume of titrant at equivalence point
Eventually, we will derive a single, unifiedequation for a spreadsheet that treats allregions of the titration curve. To understand thechemistry of the titration, it is sensible to breakthe curve into three regions described byapproximate equations that are easy to usewith a calculator.
When the concentration of unreactedregulates the solubility of AgI.I�
V 6 Ve,

The concentration of in equilibrium with this much is
(7-13)
Finally, the p function we seek is
(7-14)
There are two significant figures in the concentration of because there are two signifi-cant figures in . The two figures in translate into two figures in the mantissa of thep function, which is correctly written as 14.84.
The preceding step-by-step calculation is a tedious way to find the concentration of .Here is a streamlined procedure that is well worth learning. Bear in mind that When 10.00 mL of have been added, the reaction is one-fifth complete because 10.00 mLout of the 50.00 mL of needed for complete reaction have been added. Therefore, four-fifths of the is unreacted. If there were no dilution, would be four-fifths of its originalvalue. However, the original volume of 25.00 mL has been increased to 35.00 mL. If no
had been consumed, the concentration would be the original value of times(25.00/35.00). Accounting for both the reaction and the dilution, we can write
b Original volume of I�
123 14243 123 aTotal volume of solutionFraction Original Dilution
remaining concentration factor
This is the same result found in Equation 7-12.
Example Using the Streamlined Calculation
Let’s calculate when (the volume added from the buret) is 49.00 mL.
Solution Because , the fraction of reacted is 49.00/50.00, and thefraction remaining is 1.00/50.00. The total volume is .
123 14243 123Fraction Original Dilution
remaining concentration factor
The concentration of is negligible compared with the concentration of unreacted ,even though the titration is 98% complete.
At the Equivalence PointNow we have added exactly enough to react with all the . We can imagine that all theAgI precipitates and some redissolves to give equal concentrations of and . The valueof is found by setting in the solubility product:
This value of is independent of the original concentrations or volumes.
After the Equivalence PointVirtually all added before the equivalence point has precipitated, so is deter-mined by added after the equivalence point. Suppose that . The vol-ume past the equivalence point is 2.00 mL. The calculation proceeds as follows:
a Total volume � 77.00 mL
[Ag�] � (0.000 100 mol) / (0.077 00 L) � 1.30 10�3 M 1 pAg� � 2.89
Moles of Ag� � (0.002 00 L) (0.050 00 mol Ag� /L) � 0.000 100 mol
VAg� � 52.00 mLAg�
[Ag�]Ag�
pAg�
(x)(x) � 8.3 10�17 1 x � 9.1 10�9 1 pAg� � �log x � 8.04
[Ag�][I�] � Ksp
[Ag�] � [I�] � xpAg�
I�Ag�
I�Ag�
I�Ag�
pAg� � �log[Ag�] � 12.91
[Ag�] � Ksp/[I�] � (8.3 10�17) / (6.76 10�4) � 1.23 10�13 M
[I�] � a 1.00
50.00b (0.100 0 M) a25.00
74.00b � 6.76 10�4 M
25.00 � 49.00 � 74.00 mLI�Ve � 50.00 mL
VAg�pAg�
[I�] � a4.000
5.000b (0.100 0 M) a25.00
35.00b � 0.057 14 M
[I�]I�
[I�]I�
Ag�
Ag�
Ve � 50.00 mL.I�
[Ag�]Ksp
Ag�
pAg� � �log[Ag�] � �log(1.45 10�15) � 14.84
[Ag�] �Ksp
[I�]�
8.3 10�17
0.057 14� 1.45 10�15 M
I�Ag�
128 CHAPTER 7 Let the Titrations Begin
Two significant Two digits infigures mantissa
Significant figures in logarithms were discussedin Section 3-2.
log(1.45 10�15) � 14.84
{ {
Streamlined calculation well worth using.
When [Ag�] is determined by thesolubility of pure AgI. This problem is the sameas if we had just added Agl(s) to water.
V � Ve,
When [Ag�] is determined by theexcess added from the buret.Ag�
V 7 Ve,

7-4 The Precipitation Titration Curve 129
We could justify three significant figures for the mantissa of , because there are nowthree significant figures in . For consistency with earlier results, we retain only twofigures. We will generally express p functions in this book with two decimal places.
For a streamlined calculation, the concentration of in the buret is 0.050 00 M, and2.00 mL of titrant are being diluted to . Hence, is
b Volume of excess Ag�
1442443 123 aTotal volume of solutionOriginal Dilution
concentration factorof
The Shape of the Titration CurveTitration curves in Figure 7-6 illustrate the effect of reactant concentration. The equivalencepoint is the steepest point of the curve. It is the point of maximum slope (a negative slope inthis case) and is therefore an inflection point (at which the second derivative is 0):
In titrations involving 1:1 stoichiometry of reactants, the equivalence point is the steepestpoint of the titration curve. This is true of acid-base, complexometric, and redox titrations aswell. For stoichiometries other than 1:1, such as the curveis not symmetric near the equivalence point. The equivalence point is not at the center of thesteepest section of the curve, and it is not an inflection point. In practice, conditions are cho-sen such that titration curves are steep enough for the steepest point to be a good estimate ofthe equivalence point, regardless of the stoichiometry.
2Ag� � CrO2�4 S Ag2CrO4(s),
Inflection point: d2y
dx2� 0
Steepest slope: dy
dx reaches its greatest value
Ag�
[Ag�] � (0.050 00 M) a 2.00
77.00b � 1.30 10�3 M
3Ag� 4(25.00 � 52.00) � 77.00 mLAg�
[Ag�]pAg�
14
70
pAg+
VAg+ (mL)6050403020100
12
10
8
6
4
2
0.001 M I–
Equivalencepoint
[Ag+] = [I–]
0.01 M I–
0.1 M I–
0.001 M I–
Excess I– in this region
0.1 M I–0.01 M I–
Excess Ag+
in this region
Figure 7-6 Titration curves showing theeffect of diluting the reactants.
Outer curve: titrated with
Middle curve: titrated with
Inner curve: titrated with 0.000 500 0 M Ag�
25.00 mL of 0.001 000 M I�0.005 000 M Ag�
25.00 mL of 0.010 00 M I�0.050 00 M Ag�
25.00 mL of 0.100 0 M I�
The streamlined calculation.
A complexometric titration involves complexion formation between titrant and analyte.
At the equivalence point, the titration curve issteepest for the least soluble precipitate.
Figure 7-7 illustrates how affects the titration of halide ions. The least soluble prod-uct, AgI, gives the sharpest change at the equivalence point. However, even for AgCl, thecurve is steep enough to locate the equivalence point accurately. The larger the equilibriumconstant for a titration reaction, the more pronounced will be the change in concentrationnear the equivalence point.
Ksp

Example Calculating Concentrations During a Precipitation Titration
25.00 mL of 0.041 32 M were titrated with 0.057 89 M
Iodate
For Find in the solution after addition of (a) 34.00 mL of (b) 36.00 mL of and (c) at the equivalence point.
Solution The volume of iodate needed to reach the equivalence point is found asfollows:
1442443 14444244443Moles of Moles of
(a) When the precipitation of is not yet complete.
b Original volume of
144424443 1442443 144424443 aTotal volume of solution
Fraction Original Dilutionremaining concentration factor
of
(b) When the precipitation is complete. We have gone past the equivalence point. The concentration of excess is
b Volume of excess
1442443 144424443 aTotal volume of solution
Original Dilutionconcentration factor
of
The concentration of in equilibrium with solid plus this much is
[Hg2�2 ] �
Ksp
[IO�3 ]2
�1.3 10�18
(2.9 10�4)2� 1.5 10�11 M
IO�3Hg2(IO3)2Hg2�
2
IO�3
[IO�3 ] � (0.057 89 M) a 0.31
25.00 � 36.00b � 2.9 10�4 M
IO�3
IO�30.31 mL
(36.00 � 35.69) �V � 36.00 mL,
Hg2�2
[Hg2�2 ] � a35.69 � 34.00
35.69b (0.041 32 M) a 25.00
25.00 � 34.00b � 8.29 10�4 M
Hg2�2
Hg2�2V � 34.00 mL,
Hg2�2IO�
3
(Ve) (0.057 89 M) � 2(25.00 mL)(0.041 32 M) 1 Ve � 35.69 mL
Moles of IO�3 � a 2 mol IO�
3
1 mol Hg2�2b (moles of Hg2�
2 )
KIO3;KIO3;[Hg2�
2 ]Hg2(IO3)2, Ksp � 1.3 10�18.
Hg2�2 � 2IO�
3 S Hg2(IO3)2(s)
KIO3.Hg2(NO3)2
130 CHAPTER 7 Let the Titrations Begin
14
70
pAg+
VAg+ (mL)6050403020100
12
10
8
6
4
2
I− (Ksp = 8.3 × 10⁻¹⁷)
Br− (Ksp = 5.0 × 10⁻¹³)
Cl− (Ksp = 1.8 × 10⁻¹⁰)I−
Br−
CI−
Figure 7-7 Titration curves showing the effectof Each curve is calculated for 25.00 mL of0.100 0 M halide titrated with Equivalence points are marked by arrows.
0.050 00 M Ag�.Ksp.

7-5 Titration of a Mixture 131
A liquid containing suspended particles is saidto be turbid because the particles scatter light.
700
50
mV
VAg+ (mL)403020100
600
500
400
300
200
100
0
−100
23.0 23.5 24.0
Iodideend point
(23.85 mL)
(a)
(b)
(a)
23.76 mL
Chlorideend point
(47.41 mL)
pAg+ controlledby excess Cl−inthis region
pAg+ controlledby excess I−
in this region
(b)
Buret(AgNO3)
pHmeter
Beaker
Glasselectrode
Stirringbar
Magneticstirrer
Ag electrode
Solution ofI– plus Cl–
Figure 7-8 Experimental titration curves. (a) Titration curve for 40.00 mL of 0.050 2 M KI plus 0.050 0 MKCl titrated with The inset is an expanded view of the region near the first equivalencepoint. (b) Titration curve for titrated with 0.084 5 M Ag�.20.00 mL of 0.100 4 M I�
0.084 5 M AgNO3.
Figure 7-9 Apparatus for measuring thetitration curves in Figure 7-8. The silver electroderesponds to changes in concentration,and the glass electrode provides a constantreference potential in this experiment. Themeasured voltage changes by approximately59 mV for each factor-of-10 change in [ ].All solutions, including were maintainedat pH 2.0 by using 0.010 M sulfate bufferprepared from and KOH.H2SO4
AgNO3,Ag�
Ag�
(c) At the equivalence point, there is exactly enough to react with all . We canimagine that all of the ions precipitate and then some redissolves, givingtwo moles of iodate for each mole of mercurous ion:
x 2x
The preceding calculations assume that the only chemistry that occurs is the reaction ofanion with cation to precipitate solid salt. If other reactions occur, such as complex formationor ion pair formation, we would have to modify the calculations.
7-5 Titration of a MixtureIf a mixture of two ions is titrated, the less soluble precipitate forms first. If the solubilitiesare sufficiently different, the first precipitation is nearly complete before the secondcommences.
Consider the addition of to a solution containing KI and KCl. BecauseAgI precipitates first. When precipitation of is almost complete,
the concentration of abruptly increases and AgCl begins to precipitate. When isconsumed, another abrupt increase in occurs. We expect to see two breaks in the titra-tion curve. The first corresponds to the AgI equivalence point, and the second to the AgClequivalence point.
Figure 7-8 shows an experimental curve for this titration. The apparatus used to measurethe curve is shown in Figure 7-9, and the theory of how this system measures concen-tration is discussed in Chapter 15.
The end point is taken as the intersection of the steep and nearly horizontal curvesshown in the inset of Figure 7-8. Precipitation of is not quite complete when begins toprecipitate. (The way we know that precipitation is not complete is by a calculation.That’s what these obnoxious calculations are for!) Therefore, the end of the steep portion (theintersection) is a better approximation of the equivalence point than is the middle of the steepsection. The end point is taken as the midpoint of the second steep section, at 47.41 mL.Cl�
I�
Cl�I�
I�
Ag�
[Ag�]Cl�Ag�
I�Ksp(AgI) V Ksp(AgCl),AgNO3
(x) (2x)2 � Ksp 1 x � [Hg2�2 ] � 6.9 10�7 M
Hg2(IO3)2(s) T Hg2�2 � 2IO�
3
Hg2(IO3)2(s)Hg2�
2IO�3
The product with the smaller precipitatesfirst, if the stoichiometry of the precipitates isthe same. Precipitation of and with produces two breaks in the titration curve. Thefirst corresponds to the reaction of and thesecond to the reaction of Cl�.
l�
Ag�Cl�l�
Ksp
Before precipitates, the calculations for Aglprecipitation are just like those in Section 7-4.
Cl�

The moles of in the sample equal the moles of delivered between the first andsecond end points. That is, it requires 23.85 mL of to precipitate and
of to precipitate Comparing the and pure titration curves in Figure 7-8 shows that the end
point is 0.38% too high in the titration. We expect the first end point at 23.76 mL, butit is observed at 23.85 mL. Two factors contribute to this high value. One is random experi-mental error, which is always present. This discrepancy is as likely to be positive as negative.However, the end point in some titrations, especially titrations, is systematically 0to 3% high, depending on conditions. This error is attributed to coprecipitation of AgCl withAgBr. Coprecipitation means that, even though the solubility of AgCl has not beenexceeded, some becomes attached to AgBr as it precipitates and carries down an equiva-lent amount of A high concentration of nitrate reduces coprecipitation, perhaps because
competes with for binding sites.The second end point in Figure 7-8 corresponds to complete precipitation of both
halides. It is observed at the expected value of The concentration of found fromthe difference between the two end points, will be slightly low in Figure 7-8, because the firstend point is slightly high.
7-6 Calculating Titration Curves with a Spreadsheet
By now you should understand the chemistry that occurs at different stages of a precipitationtitration, and you should know how to calculate the shape of a titration curve. We now intro-duce spreadsheet calculations that are more powerful than hand calculations and less prone toerror. If a spreadsheet is not available, you can skip this section with no loss in continuity.
Consider the addition of liters of cation (whose initial concentration is ) toliters of solution containing anion with a concentration .
(7-15)Titrant Analyte
, ,
The total moles of added must equal the moles of in solutionplus the moles of precipitated (This equality is called a mass balance,
even though it is really a mole balance). In a similar manner, we can write a mass balance for X.
Mass balance for M: (7-16)1442443
Total moles Moles of M Moles of M inof added M in solution precipitate
Mass balance for X: (7-17)1442443
Total moles Moles of X Moles of X inof added X in solution precipitate
Now equate mol from Equation 7-16 with mol from Equation 7-17:
which can be rearranged to
(7-18)
Equation 7-18 relates the volume of added to , , and the constants , and To use Equation 7-18 in a spreadsheet, enter values of pM and compute correspon-ding values of as shown in Figure 7-10 for the iodide titration of Figure 7-7. This is back-ward from the way you normally calculate a titration curve in which would be input andpM would be output. Column C of Figure 7-10 is calculated with the formula
and column D is given by Column E is calculated fromEquation 7-18. The first input value of pM (15.08) was selected by trial and error to producea small You can start wherever you like. If your initial value of pM is before the truestarting point, then in column E will be negative. In practice, you will want more pointsthan we have shown so that you can plot an accurate titration curve.
VM
VM.
[X�] � Ksp/[M�].[M�] � 10�pM,
VM
VM,C 0
M.C 0
X,V 0X[X�][M�]M�
VM � V0X aC0
X � [M�] � [X�]
C0M � [M�] � [X�]
bPrecipitation of X�
with M�:
C 0M � VM � [M�](VM � V 0
X) � C 0X � V 0
X � [X�](VM � V 0X)
MX(s)MX(s)
C 0X � V 0
X � [X�] (VM � V 0X) � mol MX(s)
C 0M � VM � [M�](VM � V 0
X) � mol MX(s)
MX(s).(� [M�](VM � V 0X)
M�M (� C 0M � VM)
V0XC0
XVMC0M
M� � X� ∆Ksp
MX(s)
C0XX�V 0
X
C0MM�VM
Cl�,VAg�.
Cl�NO�3
Ag�.Cl�
Br�/Cl�
I�/Cl�
I�I�I�/Cl�
Cl�.Ag�23.56 mL(47.41 � 23.85) �I�,Ag�
Ag�Cl�
132 CHAPTER 7 Let the Titrations Begin
The mass balance states that the moles of anelement in all species in a mixture equal thetotal moles of that element delivered to thesolution.
A supplementary section atwww.whfreeman.com/qca derives aspreadsheet equation for the titration of amixture, such as that in Figure 7-8.

7-7 End-Point Detection 133
(a)
(b)− +
−
−
−
−
−
−
−
−
−
−−−
+
+
+
+
+
+
+
+++
+
+
+ +
−
−
−
−
−
−
−
−
−
−
−−−
+
+
+
+
+
+
+
+++
+ +
−+
−
Adsorbedions
Adsorbedindicator
In2−
Figure 7-11 Ions from a solution areadsorbed on the surface of a growingcrystallite. (a) A crystal growing in thepresence of excess lattice anions (anions thatbelong in the crystal) will have a slightnegative charge because anions arepredominantly adsorbed. (b) A crystalgrowing in the presence of excess latticecations will have a slight positive charge andcan therefore adsorb a negative indicator ion.Anions and cations in the solution that do notbelong in the crystal lattice are less likely to beadsorbed than are ions belonging to thelattice. These diagrams omit other ions insolution. Overall, each solution plus its growingcrystallites must have zero total charge.
7-7 End-Point DetectionEnd-point detection for precipitation titrations commonly relies on electrodes (as in Figure 7-9)or indicators. This section discusses two indicator methods applied to the titration of with Titrations with are called argentometric titrations.
1. Volhard titration: formation of a soluble, colored complex at the end point2. Fajans titration: adsorption of a colored indicator on the precipitate at the end point
Volhard TitrationThe Volhard titration is a titration of in solution. For a back titration is nec-essary. First, is precipitated by a known, excess quantity of standard
The AgCl is filtered and washed, and excess in the combined filtrate is titrated withstandard KSCN (potassium thiocyanate) in the presence of
When all has been consumed, reacts with to form a red complex.
Red
The appearance of red color is the end point. Knowing how much was required for theback titration tells us how much was left over from the reaction with The totalamount of is known, so the amount consumed by can be calculated.
In the analysis of by the Volhard method, the end point would slowly fade if theAgCl were not filtered off, because AgCl is more soluble than AgSCN. The AgCl slowly dis-solves and is replaced by AgSCN. To eliminate this secondary reaction, we filter the AgCland titrate only the in the filtrate. and whose silver salts are less soluble thanAgSCN, can be titrated by the Volhard method without isolating the silver halide precipitate.
Fajans TitrationThe Fajans titration uses an adsorption indicator. To see how this works, consider the elec-tric charge at the surface of a precipitate. When is added to there is excess insolution prior to the equivalence point. Some is adsorbed on the AgCl surface, impartinga negative charge to the crystal (Figure 7-11a). After the equivalence point, there is excess
in solution. Adsorption of onto the AgCl surface places positive charge on the pre-cipitate (Figure 7-11b). The abrupt change from negative to positive occurs at the equiva-lence point.
Common adsorption indicators are anionic dyes, which are attracted to the positivelycharged particles produced immediately after the equivalence point. Adsorption of the nega-tively charged dye onto the positively charged surface changes the color of the dye. The colorchange is the end point in the titration. Because the indicator reacts with the precipitate
Ag�Ag�
Cl�
Cl�Cl�,Ag�
I�,Br�Ag�
Cl�
Cl�Ag�
Cl�.Ag�
SCN�
Fe3� � SCN� S FeSCN2�
Fe3�SCN�Ag�
Ag� � SCN� S AgSCN(s)
Fe3�.Ag�
Ag� � Cl� S AgCl(s)
AgNO3.Cl�
Cl�,HNO3Ag�
Ag�Ag�.Cl�
1 Titration of I- with Ag+
A
2
3 Ksp(Agl) = pAg [Ag+] [l-] Vm
Vo =
Co(l) =
C4 = 10^-B4
D4 = $A$4/C4
E4 = $A$6*($A$8+C4-D4)/($A$10-C4+D4)
8.30E-17 15.08 8.32E-16
1.00E-15
1.00E-14
1.00E-12
1.00E-10
1.00E-08
1.00E-06
1.00E-04
1.00E-03
1.00E-02
15
14
12
10
8
6
4
3
2
9.98E-02
8.30E-02
8.30E-03
8.30E-05
8.30E-07
8.30E-09
8.30E-11
8.30E-13
8.30E-14
8.30E-15
0.035
3.195
39.322
49.876
49.999
50.000
50.001
50.150
51.531
68.750
25
Co(Ag) =
0.1
0.05
4
5
6
7
8
9
10
11
12
13
14
15
16
B C ED Figure 7-10 Spreadsheet for titration of
.25 mL of 0.1 M I� with 0.05 M Ag�

134 CHAPTER 7 Let the Titrations Begin
surface, we want as much surface area as possible. To attain maximum surface area, we useconditions that keep the particles as small as possible, because small particles have more sur-face area than an equal volume of large particles. Low electrolyte concentration helps pre-vent coagulation of the precipitate and maintains small particle size.
The most common indicator for AgCl is dichlorofluorescein. This dye is greenish yellowin solution, but turns pink when adsorbed onto AgCl (Demonstration 7-1). Because the indi-cator is a weak acid and must be present in its anionic form, the pH of the reaction must becontrolled. The dye eosin is useful in the titration of and It gives a sharperend point than dichlorofluorescein and is more sensitive (that is, less halide can be titrated).It cannot be used for AgCl, because eosin is more strongly bound than to AgCl. Eosinbinds to AgCl crystallites even before the particles become positively charged.
In all argentometric titrations, but especially with adsorption indicators, strong light(such as daylight through a window) should be avoided. Light decomposes silver salts, andadsorbed indicators are especially light sensitive.
Applications of precipitation titrations are listed in Table 7-1. Whereas the Volhardmethod is an argentometric titration, the Fajans method has wider applications. Because theVolhard titration is carried out in acidic solution (typically 0.2 M ), it avoids certaininterferences that affect other titrations. Silver salts of , , and are solublein acidic solution, so these anions do not interfere.
AsO3�4C2O2�
4CO2�3
HNO3
Cl�
SCN�.Br�, I�,
Table 7–1 Applications of precipitation titrations
Species analyzed Notes
Volhard MethodPrecipitate removal is unnecessary.Precipitate removal required.
Back titration of left after reaction with
is first precipitated with a known excess of Remaining is precipitated with a known excess of . Unreacted is then titrated with
Fajans MethodTitration with Detection with dyes such as fluorescein, dichlorofluorescein, eosin,
bromophenol blue.Titration with to produce End point detected with alizarin red S.Titration with to produce End-point detection with diphenylamine.Titration with in 50 vol% aqueous methanol using alizarin red S as indicator.Titration with NaCl to produce End point detected with bromophenol blue.Titration with to give or End point detected with
dibromofluorescein or fluorescein (C2O2�4 ).(PO3�
4 )PbC2O4.Pb3(PO4)2Pb(CH3CO2)2PO3�
4 , C2O2�4
Hg2Cl2.Hg2�2
Ba(OH)2SO24�
K2Zn3[Fe(CN)6]2.K4Fe(CN)6Zn2�
ThF4.Th(NO3)4F�
Ag�.CI�, Br�, I�, SCN�, Fe(CN)4�6
SCN�.Ag�Ag�
(C6H5)4B�(C6H5)4B�.K�K�
BH�4 � 8Ag� � 8OH� S 8Ag(s) � H2BO�
3 � 5H2OBH�
4 :Ag�BH�4
CO2�3 , S2�, CrO2�
4
CI�, PO3�4 , CN�, C2O2�
4 ,Br�, I�, SCN�, CNO�, AsO3�
4
Cl
O
ClCO2
�
O�O
Br Br
BrBrCO2
�
�O OO
Dichlorofluorescein
Tetrabromofluorescein (eosin)
Demonstration 7-1 Fajans Titration
The Fajans titration of with convincingly demonstratesindicator end points in precipitation titrations. Dissolve 0.5 g ofNaCl plus 0.15 g of dextrin in 400 mL of water. The purposeof the dextrin is to retard coagulation of the AgCl precipitate.Add 1 mL of dichlorofluorescein indicator solution containingeither 1 mg/mL of dichlorofluorescein in 95% aqueous ethanol or1 mg/mL of the sodium salt in water. Titrate the NaCl solution
Ag�Cl�
with a solution containing About20 mL are required to reach the end point.
Color Plate 2a shows the yellow color of the indicator in theNaCl solution prior to the titration. Color Plate 2b shows themilky white appearance of the AgCl suspension during titration,before the end point is reached. The pink suspension in ColorPlate 2c appears at the end point, when the anionic indicatorbecomes adsorbed on the cationic particles of precipitate.
2 g of AgNO3 in 30 mL H2O.
7-8 Efficiency in Experimental Design6
Efficient experimental design is intended to provide the maximum amount of information inthe fewest number of trials. Suppose we have three different unknown solutions of acid, des-ignated A, B, and C. If we titrate each one once with base, we find its concentration, but haveno estimate of uncertainty. If we titrate each solution three times, for a total of nine measure-ments, we would find each concentration and its standard deviation.

7-8 Efficiency in Experimental Design 135
Figure 7-12 Spreadsheet for efficientexperimental design uses Excel LINEST routineto fit the function toexperimental data by a least-squaresprocedure.
y � mAxA � mBxB � mCxC
A more efficient experimental design provides concentrations and standard deviations infewer than nine experiments. One of many efficient designs is shown in Figure 7-12. Insteadof titrating each acid by itself, we titrate mixtures of the acids. For example, in row 5 of thespreadsheet, a mixture containing 2 mL A, 2 mL B, and 2 mL C required 23.29 mL of 0.120 4M NaOH, which amounts to 2.804 mmol of . In row 6, the acid mixture contained 2 mLA, 3 mL B, and 1 mL C. Other permutations are titrated in rows 7 and 8. Then row 5 isrepeated independently in row 9. Column E gives mmol of base for each run.
For each experiment, mmol of base consumed equals mmol of acid in the mixture:
(7-19)14243 123 123 123
y
where [A] is the concentration of acid A (mol/L) and is the volume of A in mL. Rows 5through 9 of the spreadsheet are equivalent to the following equalities:
(7-20)
Our problem is to find the best values for the molarities [A], [B], and [C].As luck would have it, Excel will find these values for us by the least-squares procedure
LINEST. On page 69, we used LINEST to find the slope and intercept in the equation. In Figure 7-12, we use LINEST to find the slopes for
(where the intercept, b, is 0). To execute LINEST, highlight cells C12:E14and type “ ”. Then press on a PC or COMMAND(�)�RETURN on a Mac. The first argument of LINEST, E5:E9, con-tains values of y . The second argument, A5:C9, contains values of x
. The third argument (FALSE) tells the computer to set the intercept (b) tozero and the fourth argument (TRUE) says that we want some statistics to be computed.
Excel finds the least-squares slopes in row 12 and their uncertainties in row 13. Theseslopes are the molarites [C], [B], and [A], in reverse order. So, for example, cells C12 andC13 tell us that the molarity of acid C is
We require at least n equations to solve for n unknowns. In this example, we have fiveequations (7-20), but just three unknowns ([A], [B], [C]). The two extra equations allow us toestimate uncertainty in the unknowns. If you do more experiments, you will generallydecrease the uncertainty in concentration. An efficient experimental design with five experi-ments leaves us with more uncertainty than if we had done nine experiments. However, wehave cut our effort nearly in half with the efficient design.
0.8099 0.0062 M.
(� volumes of acid)(� mmol OH�)
ENTERCTRL�SHIFT�� LINEST(E5:E9,A5:C9,FALSE,TRUE)mBxB � mCxC � b
y � mAxA �y � mx � b
14
42
44
32.804 � [A] � 2 � [B] � 2 � [C] � 2
2.409 � [A] � 2 � [B] � 3 � [C] � 1
2.615 � [A] � 3 � [B] � 1 � [C] � 2
3.433 � [A] � 1 � [B] � 2 � [C] � 3
2.801 � [A] � 2 � [B] � 2 � [C] � 2
VA
mCxCmBxBmAxA
mmol OH� � [A]VA � [B]VB � [C]VC
OH�
Acids could be delivered by transfer pipetswhose tolerances are given in Table 2-4. So2 mL means 2.000 0.006 mL.
amolLb � mL � mmol
For five equations and three unknowns, thereare degrees of freedom. With nodegrees of freedom, there is no informationwith which to estimate uncertainty.
5 � 3 � 2
1 Experimental Design
A
2
3 Volumes of unknown acids (mL) mL NaOH mmol
2
3
Molarity
Std. dev.
0.8099
0.0062
0.9994
0.4001
0.0062
0.0130
0.1962
0.0062
#N/A
Highlight cells C12:E14
Type "= LINEST(E5:E9,A5:C9,FALSE,TRUE)"
Press COMMAND+RETURN (on Mac)
Press CTRL +SHIFT+ENTER (on PC)
A B C
[C]
2
1
2
3
2
2
3
1
2
2
R2 Sy
(0.1204 M)
23.29
20.01
21.72
28.51
23.26
NaOH
[B] [A]
2.804
2.409
2.615
3.433
2.801
2
2
1
4
5
6
7
8
9
10
11
12
13
14
15
16
17
18
19
B C ED

136 CHAPTER 7 Let the Titrations Begin
Exercises7-A. Ascorbic acid (vitamin C) reacts with according to theequation
Ascorbic acid
Dehydroascorbic acid
Starch is used as an indicator in the reaction. The end point ismarked by the appearance of a deep blue starch-iodine complexwhen the first fraction of a drop of unreacted remains in thesolution.(a) If 29.41 mL of solution is required to react with 0.197 0 g ofpure ascorbic acid, what is the molarity of the solution?(b) A vitamin C tablet containing ascorbic acid plus an inert binderwas ground to a powder, and 0.424 2 g was titrated by 31.63 mL of
. Find the weight percent of ascorbic acid in the tablet.I�3
I�3
I�3
I�3
OH
HOOH
� 3I � 2H��
OH
OO
O
HOOH
O
HO OH
� I3 � H2O�
O
I�3 7-B. A solution of NaOH was standardized by titration of a known
quantity of the primary standard, potassium hydrogen phthalate:
Potassium hydrogen phthalateFM 204.221
The NaOH was then used to find the concentration of an unknownsolution of
(a) Titration of 0.824 g of potassium hydrogen phthalate required38.314 g of NaOH solution to reach the end point detected by phe-nolphthalein indicator. Find the concentration of NaOH (mol NaOH /kg solution).(b) A 10.00-mL aliquot of solution required 57.911 g ofNaOH solution to reach the phenolphthalein end point. Find themolarity of
7-C. A solid sample weighing 0.237 6 g contained only malonicacid and aniline hydrochloride. It required 34.02 mL of 0.087 71 MNaOH to neutralize the sample. Find the weight percent of eachcomponent in the solid mixture. The reactions are
Malonic acid MalonateFM 104.06
CH2(CO2H)2 � 2OH� S CH2(CO�2 )2 � 2H2O
H2SO4.
H2SO4
H2SO4 � 2NaOH S Na2SO4 � 2H2O
H2SO4:
CO2H
CO2K NaOH B �
CO2K
CO2NaH2O�
Terms to Understandadsorption indicatorargentometric titrationback titrationblank titrationcoprecipitationdirect titration
end pointequivalence pointFajans titrationgravimetric titrationindicatorKjeldahl nitrogen analysis
primary standardreagent-grade chemicalstandardizationstandard solutiontitranttitration
titration errortrace analysisVolhard titrationvolumetric analysis
SummaryThe volume of reagent (titrant) required for stoichiometric reactionof analyte is measured in volumetric analysis. The stoichiometricpoint of the reaction is called the equivalence point. What we mea-sure by an abrupt change in a physical property (such as the color ofan indicator or the potential of an electrode) is the end point. Thedifference between the end point and the equivalence point is atitration error. This error can be reduced by subtracting results of ablank titration, in which the same procedure is carried out in theabsence of analyte, or by standardizing the titrant, using the samereaction and a similar volume as that used for analyte.
The validity of an analytical result depends on knowing theamount of a primary standard. A solution with an approximatelydesired concentration can be standardized by titrating a primarystandard. In a direct titration, titrant is added to analyte until thereaction is complete. In a back titration, a known excess of reagentis added to analyte, and the excess is titrated with a second standardreagent. Calculations of volumetric analysis relate the known molesof titrant to the unknown moles of analyte.
In Kjeldahl analysis, a nitrogen-containing organic compoundis digested with a catalyst in boiling Nitrogen is convertedinto ammonium ion, which is converted into ammonia with baseand distilled into standard HCl. The excess, unreacted HCl tells ushow much nitrogen was present in the original analyte.
H2SO4.
In a spectrophotometric titration, absorbance of light is moni-tored as titrant is added. For many reactions, there is an abrupt changein absorbance when the equivalence point is reached. The Fajanstitration is based on the adsorption of a charged indicator onto thecharged surface of the precipitate after the equivalence point. TheVolhard titration, used to measure is based on the reaction of
with after the precipitation of AgSCN is complete.Concentrations of reactants and products during a precipita-
tion titration are calculated in three regions. Before the equiva-lence point, there is excess analyte. Its concentration is the prod-uct (fraction remaining) (original concentration) (dilutionfactor). The concentration of titrant can be found from the solu-bility product of the precipitate and the known concentration ofexcess analyte. At the equivalence point, concentrations of bothreactants are governed by the solubility product. After the equiv-alence point, the concentration of analyte can be determined fromthe solubility product of precipitate and the known concentrationof excess titrant.
Efficient experimental design decreases the number of experi-ments needed to obtain required information and an estimate ofuncertainty in that information. A trade-off is that the fewer experi-ments we do, the greater the uncertainty in the results.
SCN�Fe3�
Ag�,
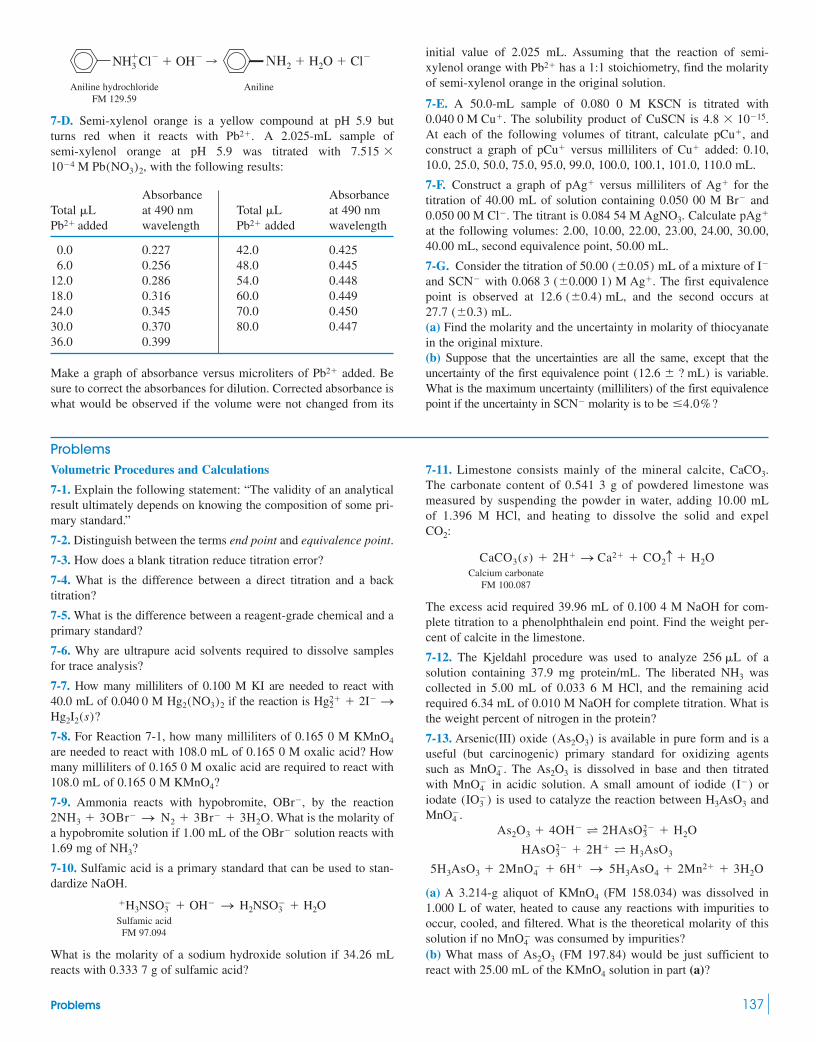
Problems 137
ProblemsVolumetric Procedures and Calculations
7-1. Explain the following statement: “The validity of an analyticalresult ultimately depends on knowing the composition of some pri-mary standard.”
7-2. Distinguish between the terms end point and equivalence point.
7-3. How does a blank titration reduce titration error?
7-4. What is the difference between a direct titration and a backtitration?
7-5. What is the difference between a reagent-grade chemical and aprimary standard?
7-6. Why are ultrapure acid solvents required to dissolve samplesfor trace analysis?
7-7. How many milliliters of 0.100 M KI are needed to react with40.0 mL of 0.040 0 M if the reaction is
7-8. For Reaction 7-1, how many milliliters of 0.165 0 M are needed to react with 108.0 mL of 0.165 0 M oxalic acid? Howmany milliliters of 0.165 0 M oxalic acid are required to react with108.0 mL of 0.165 0 M
7-9. Ammonia reacts with hypobromite, by the reactionWhat is the molarity of
a hypobromite solution if 1.00 mL of the solution reacts with1.69 mg of
7-10. Sulfamic acid is a primary standard that can be used to stan-dardize NaOH.
Sulfamic acidFM 97.094
What is the molarity of a sodium hydroxide solution if 34.26 mLreacts with 0.333 7 g of sulfamic acid?
�H3NSO�3 � OH� S H2NSO�
3 � H2O
NH3?OBr�
2NH3 � 3OBr� S N2 � 3Br� � 3H2O.OBr�,
KMnO4?
KMnO4
Hg2I2(s)?Hg2�
2 � 2I� SHg2(NO3)2
7-11. Limestone consists mainly of the mineral calcite, The carbonate content of 0.541 3 g of powdered limestone wasmeasured by suspending the powder in water, adding 10.00 mLof 1.396 M HCl, and heating to dissolve the solid and expel
Calcium carbonateFM 100.087
The excess acid required 39.96 mL of 0.100 4 M NaOH for com-plete titration to a phenolphthalein end point. Find the weight per-cent of calcite in the limestone.
7-12. The Kjeldahl procedure was used to analyze of asolution containing 37.9 mg protein/mL. The liberated wascollected in 5.00 mL of 0.033 6 M HCl, and the remaining acidrequired 6.34 mL of 0.010 M NaOH for complete titration. What isthe weight percent of nitrogen in the protein?
7-13. Arsenic(III) oxide is available in pure form and is auseful (but carcinogenic) primary standard for oxidizing agentssuch as . The is dissolved in base and then titratedwith in acidic solution. A small amount of iodide oriodate is used to catalyze the reaction between and
.
(a) A 3.214-g aliquot of (FM 158.034) was dissolved in1.000 L of water, heated to cause any reactions with impurities tooccur, cooled, and filtered. What is the theoretical molarity of thissolution if no was consumed by impurities?(b) What mass of (FM 197.84) would be just sufficient toreact with 25.00 mL of the solution in part (a)?KMnO4
As2O3
MnO�4
KMnO4
5H3AsO4 � 2Mn2� � 3H2O5H3AsO3 � 2MnO�4 � 6H� S
HAsO2�3 � 2H� T H3AsO3
As2O3 � 4OH� T 2HAsO2�3 � H2O
MnO�4
H3AsO3(IO�3 )
(I�)MnO�4
As2O3MnO�4
(As2O3)
NH3
256 L
CaCO3(s) � 2H� S Ca2� � CO2c � H2O
CO2:
CaCO3.
Aniline hydrochloride AnilineFM 129.59
7-D. Semi-xylenol orange is a yellow compound at pH 5.9 butturns red when it reacts with A 2.025-mL sample ofsemi-xylenol orange at pH 5.9 was titrated with
with the following results:
Absorbance AbsorbanceTotal L at 490 nm Total L at 490 nmPb2� added wavelength Pb2� added wavelength
0.0 0.227 42.0 0.4256.0 0.256 48.0 0.445
12.0 0.286 54.0 0.44818.0 0.316 60.0 0.44924.0 0.345 70.0 0.45030.0 0.370 80.0 0.44736.0 0.399
Make a graph of absorbance versus microliters of added. Besure to correct the absorbances for dilution. Corrected absorbance iswhat would be observed if the volume were not changed from its
Pb2�
10�4 M Pb(NO3)2,7.515
Pb2�.
NH3 Cl� � OH� B ��2 � H2O � Cl�� initial value of 2.025 mL. Assuming that the reaction of semi-
xylenol orange with has a 1:1 stoichiometry, find the molarityof semi-xylenol orange in the original solution.
7-E. A 50.0-mL sample of 0.080 0 M KSCN is titrated withThe solubility product of CuSCN is
At each of the following volumes of titrant, calculate andconstruct a graph of versus milliliters of added: 0.10,10.0, 25.0, 50.0, 75.0, 95.0, 99.0, 100.0, 100.1, 101.0, 110.0 mL.
7-F. Construct a graph of versus milliliters of for thetitration of 40.00 mL of solution containing 0.050 00 M and
. The titrant is Calculate at the following volumes: 2.00, 10.00, 22.00, 23.00, 24.00, 30.00,40.00 mL, second equivalence point, 50.00 mL.
7-G. Consider the titration of of a mixture of and with The first equivalencepoint is observed at and the second occurs at
(a) Find the molarity and the uncertainty in molarity of thiocyanatein the original mixture.(b) Suppose that the uncertainties are all the same, except that theuncertainty of the first equivalence point is variable.What is the maximum uncertainty (milliliters) of the first equivalencepoint if the uncertainty in molarity is to be �4.0%?SCN�
(12.6 ? mL)
27.7 (0.3) mL.12.6 (0.4) mL,
0.068 3 (0.000 1) M Ag�.SCN�
I�50.00 (0.05) mL
pAg�0.084 54 M AgNO3.0.050 00 M Cl�
Br�
Ag�pAg�
Cu�pCu�
pCu�,4.8 10�15.0.040 0 M Cu�.
Pb2�

138 CHAPTER 7 Let the Titrations Begin
(c) It was found that 0.146 8 g of required 29.98 mL ofsolution for the faint color of unreacted to appear.
In a blank titration, 0.03 mL of was required to produceenough color to be seen. Calculate the molarity of the perman-ganate solution.
7-14. A 0.238 6-g sample contained only NaCl and KBr. It was dis-solved in water and required 48.40 mL of 0.048 37 M forcomplete titration of both halides [giving AgCl(s) and AgBr(s)].Calculate the weight percent of Br in the solid sample.
7-15. A solid mixture weighing 0.054 85 g contained only ferrousammonium sulfate and ferrous chloride. The sample was dissolvedin 1 M , and the required 13.39 mL of for complete oxidation to .Calculate the weight percent of Cl in the original sample.
Ferrous ammonium sulfate Ferrous chlorideFM 392.13 FM 234.84
7-16. A cyanide solution with a volume of 12.73 mL was treatedwith 25.00 mL of solution (containing excess ) to convertthe cyanide into tetracyanonickelate(II):
The excess was then titrated with 10.15 mL of 0.013 07 Methylenediaminetetraacetic acid (EDTA):
does not react with EDTA. If 39.35 mL of EDTA wererequired to react with 30.10 mL of the original solution, calcu-late the molarity of in the 12.73-mL cyanide sample.
7-17. Managing a salt-water aquarium. A tank at the New JerseyState Aquarium has a volume of 2.9 million liters.7 Bacteria areused to remove nitrate that would otherwise build up to toxic lev-els. Aquarium water is first pumped into a 2 700-L deaeration tankcontaining bacteria that consume in the presence of addedmethanol:
(1)Methanol
Anoxic (deoxygenated) water from the deaeration tank flows into a1 500-L denitrification reactor containing colonies of Pseudomonasbacteria in a porous medium. Methanol is injected continuously andnitrate is converted into nitrite and then into nitrogen:
(2)Nitrate Nitrite
(3)N2 � CO2 � H2O � 2OH�!bacteria2NO�
2 � CH3OH
3NO�2 � CO2 � 2H2O
!bacteria3NO�
3 � CH3OH
2CO2 � 4H2O!bacteria
2CH3OH � 3O2
O2
CN�
Ni2�
Ni(CN)2�4
Ni2� � EDTA4� S Ni(EDTA)2�
Ni2�
4CN� � Ni2� S Ni(CN)2�4
Ni2�Ni2�
FeSO4 � (NH4)2SO4 � 6H2O FeCl2 � 6H2O
Fe3� (Ce4� � Fe2� S Ce3� � Fe3�)0.012 34 M Ce4�Fe2�H2SO4
AgNO3
MnO�4
MnO�4KMnO4
As2O3 (b) Write the net reaction showing nitrate plus methanol going tonitrogen. How many liters of are required by the net reac-tion for 2.9 million liters of aquarium water with a nitrate concen-tration of ?(c) In addition to consuming methanol for Reactions 1 through 3,the bacteria require 30% more methanol for their own growth. Whatis the total volume of methanol required to denitrify 2.9 millionliters of aquarium water?
Spectrophotometric Titrations
7-18. Why does the slope of the absorbance-versus-volume graph inFigure 7-5 change abruptly at the equivalence point?
7-19. A 2.00-mL solution of apotransferrin was titrated as illustratedin Figure 7-5. It required of 1.43 mM ferric nitrilotriacetateto reach the end point.(a) How many moles of Fe(III) wererequired to reach the end point?(b) Each apotransferrin molecule binds two ferric ions. Find theconcentration of apotransferrin in the 2.00-mL solution.
7-20. The iron-binding site of transferrin in Figure 7-4 can accom-modate certain other metal ions besides and certain otheranions besides . Data are given in the table for the titrationof transferrin (3.57 mg in 2.00 mL) with solutionin the presence of the anion oxalate, , and in the absence ofa suitable anion. Prepare a graph similar to Figure 7-5, showingboth sets of data. Indicate the theoretical equivalence point for thebinding of one and two ions per molecule of protein and theobserved end point. How many ions are bound to transferrinin the presence and in the absence of oxalate?
Titration in presence Titration in absenceof of anion
Total L Absorbance Total L AbsorbanceGa3� added at 241 nm Ga3� added at 241 nm
0.0 0.044 0.0 0.0002.0 0.143 2.0 0.0074.0 0.222 6.0 0.0126.0 0.306 10.0 0.0198.0 0.381 14.0 0.024
10.0 0.452 18.0 0.03012.0 0.508 22.0 0.03514.0 0.541 26.0 0.03716.0 0.55818.0 0.56221.0 0.56924.0 0.576
Shape of a Precipitation Curve
7-21. Describe the chemistry that occurs in each of the followingregions in curve (a) in Figure 7-8: (i) before the first equivalencepoint; (ii) at the first equivalence point; (iii) between the first andsecond equivalence points; (iv) at the second equivalence point; and(v) past the second equivalence point. For each region except (ii),write the equation that you would use to calculate .
7-22. Consider the titration of 25.00 mL of 0.082 30 M KI with. Calculate at the following volumes of
added : (a) 39.00 mL; (b) ; (c) 44.30 mL.VeAgNO3
pAg�0.051 10 M AgNO3
[Ag�]
C2O2�4
Ga3�
Ga3�
C2O2�4
6.64 mM Ga3�
CO2�3
Fe3�
(� ferric nitrilotriacetate)
163 L
8 100 M
CH3OH
(a) Deaeration can be thought of as a slow, bacteria-mediated titra-tion of by The concentration of in sea water at is . How many liters of
are required by Reaction 1 for 2.9 million liters ofaquarium water?0.791 g/mL)
CH3OH (FM 32.04, density �220 M24°CO2CH3OH.O2
Aquarium
Deaerationtank
CH3OH
CH3OHDenitrificationtank

Problems 139
7-23. The text claims that precipitation of is not completebefore begins to precipitate in the titration in Figure 7-8. Cal-culate the concentration of at the equivalence point in thetitration of alone. Show that this concentration of willprecipitate .
7-24. A 25.00-mL solution containing wastitrated with 0.025 70 M to precipitate calcium oxalate:
. Find at the following vol-umes of : (a) 10.00; (b) ; (c) 35.00 mL.
7-25. In precipitation titrations of halides by , the ion pairis in equilibrium with the precipitate. Use
Appendix J to find the concentrations of during the precipitations.
Titration of a Mixture
7-26. A procedure8 for determining halogens in organic compoundsuses an argentometric titration. To 50 mL of anhydrous ether isadded a carefully weighed sample (10–100 mg) of unknown, plus2 mL of sodium dispersion and 1 mL of methanol. (Sodium disper-sion is finely divided solid sodium suspended in oil. With methanol,it makes sodium methoxide, , which attacks the organiccompound, liberating halides.) Excess sodium is destroyed by slowaddition of 2-propanol, after which 100 mL of water are added.(Sodium should not be treated directly with water, because the produced can explode in the presence of
This procedure gives a two-phase mixture, withan ether layer floating on top of the aqueous layer that containsthe halide salts. The aqueous layer is adjusted to pH 4 andtitrated with , using the electrodes in Figure 7-9. Howmuch solution will be required to reach eachequivalence point when 82.67 mg of 1-bromo-4-chlorobutane
are analyzed?
7-27. Calculate at the following points in titration (a) in Figure 7-8: (a) 10.00 mL; (b) 20.00 mL; (c) 30.00 mL;(d) second equivalence point; (e) 50.00 mL.
7-28. A mixture having a volume of 10.00 mL and containingand was titrated with 0.100 0 M
KCN to precipitate and AgCN.(a) Calculate at each of the following volumes of addedKCN: 5.00, 10.00, 15.00, 19.90, 20.10, 25.00, 30.00, 35.00 mL.(b) Should any AgCN be precipitated at 19.90 mL?
Using Spreadsheets
7-29. Derive an expression analogous to Equation 7-18 for thetitration of with X�M�(concentration � C 0
M, volume � V 0M)
pCN�
Hg2(CN)2
0.100 0 M Hg2�20.100 0 M Ag�
pAg�
(BrCH2CH2CH2CH2Cl; FM 171.46)
0.025 70 M AgNO3
Ag�
2NaOH � H2.)O2: 2Na � 2H2O S
H2
CH3O�Na�
and AgI(aq)AgCl(aq), AgBr(aq),
AgX(aq)(X � Cl, Br, I)Ag�
VeCa(NO3)2
pCa2�Ca2� � C2O2�4 S CaC2O4(s)
Ca(NO3)2
0.031 10 M Na2C2O4
Cl�
Ag�I�
Ag�
Cl�
I� . Your equation should allow you tocompute the volume of titrant as a function of .
7-30. Use Equation 7-18 to reproduce the curves in Figure 7-7.Plot your results on a single graph.
7-31. Consider precipitation of with :
Write mass balance equations for M and X and derive the equation
where
7-32. Use the equation in Problem 7-31 to calculate thetitration curve for 10.0 mL of titrated with
to produce .
End-Point Detection
7-33. Why does the surface charge of a precipitate change sign atthe equivalence point?
7-34. Examine the procedure in Table 7-1 for the Fajans titration of. Do you expect the charge on the precipitate to be positive or
negative after the equivalence point?
7-35. Describe how to analyze a solution of NaI by using the Volhardtitration.
7-36. A 30.00-mL solution of was treated with 50.00 mL of. AgI(s) was filtered off, and the filtrate (plus
) was titrated with 0.287 0 M KSCN. When 37.60 mL had beenadded, the solution turned red. How many milligrams of were inthe original solution?
Experiment Design
7-37. Acid-base titrations were carried out in a similar man-ner to those in Section 7-8. Volumes and results are shown in thefollowing table.6 Use the Excel LINEST procedure to find the con-centrations of acids A, B, and C and estimate their uncertainty.
Acid volume (mL)mmol of OH�
A B C required
2 2 2 3.0150 2 2 1.3852 0 2 2.1802 2 0 2.5482 2 2 3.140
I�
Fe3�
0.365 0 M AgNO3
I�
Zn2�
Ag2CrO4(s)0.100 M Ag�
0.100 M CrO2�4
[Xx�] � (Ksp/[Mm�]x)1/m.
VM � V 0Xa xC 0
X � m[Mm�] � x[Xx�]
mC 0M � m[Mm�] � x[Xx�]
b
xMm� � mXx� T MxXm(s) Ksp � [Mm�]x[Xx�]m
Mm�Xx�
[X�](VX)(titrant concentration � C 0
X)

140 CHAPTER 8 Activity and the Systematic Treatment of Equilibrium
Ions and molecules in solution are surrounded by an organized sheath of solvent molecules.The oxygen atom of has a partial negative charge and each hydrogen atom has half asmuch positive charge.
Water binds to cations through the oxygen atom. The first coordination sphere of , forexample, is composed of � molecules.1 binds � molecules through hydro-gen atoms.1,2 exchanges rapidly between bulk solvent and ion-coordination sites.
Ionic radii in the figure are measured by X-ray diffraction of ions in crystals. Hydratedradii are estimated from diffusion coefficients of ions in solution and from the mobilities ofaqueous ions in an electric field.3,4 Smaller, more highly charged ions bind more water mol-ecules and behave as larger species in solution. The activity of aqueous ions, which westudy in this chapter, is related to the size of the hydrated species.
H2O6 H2OCl�4 H2O
Li�
O
H
Hδ�
2δ�
δ�
200 pm
O
H
H
Li�
H
O
220 pm
330 pm
H�Cl
H2O
HYDRATED IONS
Activity and the Systematic Treatment of Equilibrium8
Estimated Number of Watersof Hydration*
Molecule Tightly bound H2O
0000111.51.523
455679
1012
*From S. Fu and C. A. Lucy, “Prediction ofElectrophoretic Mobilities,” Anal. Chem. 1998, 70, 173.
NH�4
CH3SO3�
NH3
CH3SO3HCH3NH2
CH3CO�2
CH3NO2
CH3CNHCH3
O
CH3CΩNCH3CO2HCH3CH¢O(CH3)2C¢OCH3CH2OHCH3ßOßCH3
CH3CH2SHCH3CH2ClC6H6
CH3CH2CH3
Ionic and hydrated radii of several ions. Smaller, more highly charged ions bind water molecules moretightly and behave as larger hydrated species.3
Li+
Ionicradius
Hydratedradius
Be2+ Fe2+ CO2–3 F–
Na+ Mg2+ Fe3+ SO2–4 Cl–
K+ Ca2+ NO– CIO–43 Br–
Sr2+Rb+ NH+ IO–34 I–
500 pm
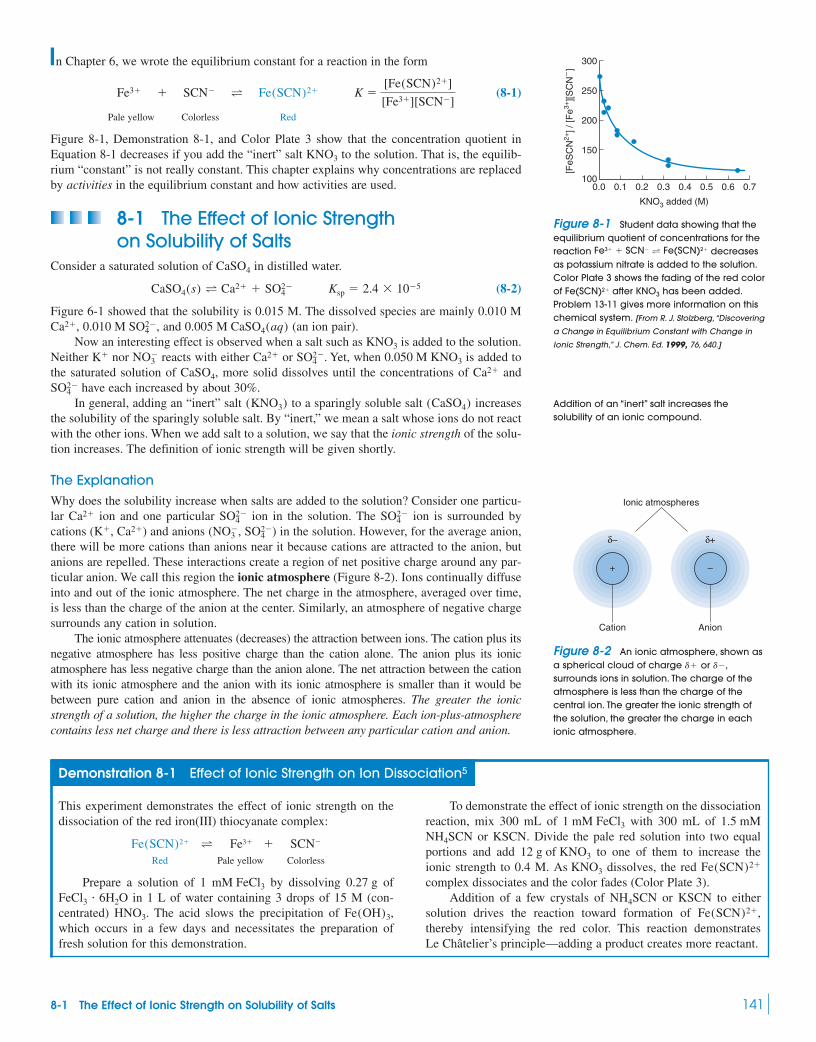
8-1 The Effect of Ionic Strength on Solubility of Salts 141
In Chapter 6, we wrote the equilibrium constant for a reaction in the form
(8-1)
Pale yellow Colorless Red
Figure 8-1, Demonstration 8-1, and Color Plate 3 show that the concentration quotient inEquation 8-1 decreases if you add the “inert” salt to the solution. That is, the equilib-rium “constant” is not really constant. This chapter explains why concentrations are replacedby activities in the equilibrium constant and how activities are used.
8-1 The Effect of Ionic Strength on Solubility of Salts
Consider a saturated solution of in distilled water.
(8-2)
Figure 6-1 showed that the solubility is 0.015 M. The dissolved species are mainly 0.010 M, , and (an ion pair).Now an interesting effect is observed when a salt such as is added to the solution.
Neither nor reacts with either or . Yet, when is added tothe saturated solution of , more solid dissolves until the concentrations of and
have each increased by about 30%.In general, adding an “inert” salt to a sparingly soluble salt increases
the solubility of the sparingly soluble salt. By “inert,” we mean a salt whose ions do not reactwith the other ions. When we add salt to a solution, we say that the ionic strength of the solu-tion increases. The definition of ionic strength will be given shortly.
The ExplanationWhy does the solubility increase when salts are added to the solution? Consider one particu-lar ion and one particular ion in the solution. The ion is surrounded bycations ( , ) and anions ( , ) in the solution. However, for the average anion,there will be more cations than anions near it because cations are attracted to the anion, butanions are repelled. These interactions create a region of net positive charge around any par-ticular anion. We call this region the ionic atmosphere (Figure 8-2). Ions continually diffuseinto and out of the ionic atmosphere. The net charge in the atmosphere, averaged over time,is less than the charge of the anion at the center. Similarly, an atmosphere of negative chargesurrounds any cation in solution.
The ionic atmosphere attenuates (decreases) the attraction between ions. The cation plus itsnegative atmosphere has less positive charge than the cation alone. The anion plus its ionicatmosphere has less negative charge than the anion alone. The net attraction between the cationwith its ionic atmosphere and the anion with its ionic atmosphere is smaller than it would bebetween pure cation and anion in the absence of ionic atmospheres. The greater the ionicstrength of a solution, the higher the charge in the ionic atmosphere. Each ion-plus-atmospherecontains less net charge and there is less attraction between any particular cation and anion.
SO2�4NO�
3Ca2�K�
SO2�4SO2�
4Ca2�
(CaSO4)(KNO3)SO2�
4
Ca2�CaSO4
0.050 M KNO3SO2�4Ca2�NO�
3K�
KNO3
0.005 M CaSO4(aq)0.010 M SO2�4Ca2�
CaSO4(s) T Ca2� � SO42� Ksp � 2.4 10�5
CaSO4
KNO3
Fe3� � SCN� T Fe(SCN)2� K �[Fe(SCN)2�]
[Fe3�][SCN�]
Demonstration 8-1 Effect of Ionic Strength on Ion Dissociation5
This experiment demonstrates the effect of ionic strength on thedissociation of the red iron(III) thiocyanate complex:
Red Pale yellow Colorless
Prepare a solution of 1 by dissolving ofin 1 L of water containing 3 drops of 15 M (con-
centrated) The acid slows the precipitation of which occurs in a few days and necessitates the preparation offresh solution for this demonstration.
Fe(OH)3,HNO3.FeCl3 � 6H2O
0.27 gmM FeCl3
Fe(SCN)2� T Fe3� � SCN�
To demonstrate the effect of ionic strength on the dissociationreaction, mix 300 mL of with 300 mL of
or KSCN. Divide the pale red solution into two equalportions and add to one of them to increase theionic strength to 0.4 M. dissolves, the red complex dissociates and the color fades (Color Plate 3).
Addition of a few crystals of or KSCN to eithersolution drives the reaction toward formation of thereby intensifying the red color. This reaction demonstratesLe Châtelier’s principle—adding a product creates more reactant.
Fe(SCN)2�,NH4SCN
Fe(SCN)2�As KNO3
12 g of KNO3
NH4SCN1.5 mM1 mM FeCl3
[FeS
CN
2+] /
[Fe3+
][SC
N–]
300
250
200
150
1000.70.0 0.1 0.2 0.3 0.4
KNO3 added (M)
0.5 0.6
Figure 8-1 Student data showing that theequilibrium quotient of concentrations for thereaction decreasesas potassium nitrate is added to the solution.Color Plate 3 shows the fading of the red colorof after has been added.Problem 13-11 gives more information on thischemical system. [From R. J. Stolzberg, “Discovering
a Change in Equilibrium Constant with Change in
Ionic Strength,” J. Chem. Ed. 1999, 76, 640.]
KNO3Fe(SCN)2�
Fe3� � SCN� T Fe(SCN)2�
Addition of an “inert” salt increases thesolubility of an ionic compound.
δ– δ+
AnionCation
Ionic atmospheres
+ –
Figure 8-2 An ionic atmosphere, shown asa spherical cloud of charge surrounds ions in solution. The charge of theatmosphere is less than the charge of thecentral ion. The greater the ionic strength ofthe solution, the greater the charge in eachionic atmosphere.
d� or d�,

Increasing ionic strength therefore reduces the attraction between any particular ion and any ion, relative to their attraction for each other in distilled water. The effectis to reduce their tendency to come together, thereby increasing the solubility of .
Increasing ionic strength promotes dissociation into ions. Thus, each of the followingreactions is driven to the right if the ionic strength is raised from, say, 0.01 to 0.1 M:
Thiocyanate
Potassium hydrogen tartrate
Figure 8-3 shows the effect of added salt on the solubility of potassium hydrogen tartrate.
What Do We Mean by “Ionic Strength”?Ionic strength, , is a measure of the total concentration of ions in solution. The morehighly charged an ion, the more it is counted.
Ionic strength: (8-3)
where is the concentration of the ith species and is its charge. The sum extends over allions in solution.
Example Calculation of Ionic Strength
Find the ionic strength of (a) ; (b) ; and (c) .
Solution
(a)
(b)
Note that because there are two moles of per mole of .
(c)
is called a 1:1 electrolyte because the cation and the anion both have a charge of 1.For 1:1 electrolytes, the ionic strength equals the molarity. For other stoichiometries (such asthe 2:1 electrolyte ), the ionic strength is greater than the molarity.
Computing the ionic strength of any but the most dilute solutions is complicated becausesalts with ions of charge are not fully dissociated. In Box 8-1 we find that, at a formalconcentration of 0.025 M , 35% of is bound in the ion pair, . Thehigher the concentration and the higher the ionic charge, the more the ion pairing. There is nosimple way to find the ionic strength of 0.025 M .MgSO4
MgSO4(aq)Mg2�MgSO4
�2
Na2SO4
NaNO3
�1
25 (0.020 � 1) � (0.020 � 1) � (0.020 � 1) � (0.010 � 4)6 � 0.050 M
�1
25[K�] � (�1)2 � [Br�] � (�1)2 � [Na�] � (�1)2 � [SO2�
4 ] � (�2)26Na2SO4Na�[Na�] � 0.020 M
�1
25 (0.020 � 1) � (0.010 � 4)6 � 0.030 M
�1
25[Na�] � (�1)2 � [SO2�
4 ] � (�2)26
�1
250.10 � 1 � 0.10 � 16 � 0.10 M
�1
25[Na�] � (�1)2 � [NO�
3 ] � (�1)26
0.020 M KBr plus 0.010 M Na2SO4
0.010 M Na2SO40.10 M NaNO3
zici
�1
2(c1z2
1 � c2z22 � p) �
1
2 aiciz2
i
HO2CCHCHCO2K(s)—T—HO2CCHCHCO�–�–K�å
HOåOH
åHO
åOH
2
OH T——
Phenol
O� �–H�
Phenolate
Fe(SCN)2� T Fe3� � SCN�
CaSO4
SO2�4
Ca2�
142 CHAPTER 8 Activity and the Systematic Treatment of Equilibrium
0.04
0.05MgSO4
NaCl
Glucose
KCl
0.03
0.02
0.01
0.000.00 0.02 0.04
Concentration of addedsubstance (M)
0.06 0.08 0.10
Pot
assi
um h
ydro
gen
tart
rate
sol
ubili
ty (
M)
Figure 8-3 Solubility of potassium hydrogentartrate increases when the salts
are added. There is no effect when theneutral compound glucose is added. Additionof KCl decreases the solubility. (Why?) [From
C. J. Marzzacco, “Effect of Salts and Nonelectrolytes
on the Solubility of Potassium Bitartrate,” J. Chem. Ed.
1998, 75,1628.]
or NaClMgSO4
IonicElectrolyte Molarity strength
1:1 M M2:1 M 3 M3:1 M 6 M2:2 M 4 M

8-2 Activity CoefficientsThe equilibrium constant expression in Equation 8-1 does not predict any effect of ionicstrength on a chemical reaction. To account for the effect of ionic strength, concentrations arereplaced by activities:
Activity of C: (8-4)
c c a Activity coefficientActivity Concentration of C
of C of C
The activity of species C is its concentration multiplied by its activity coefficient. The activ-ity coefficient measures the deviation of behavior from ideality. If the activity coefficientwere 1, then the behavior would be ideal and the form of the equilibrium constant in Equa-tion 8-1 would be correct.
The correct form of the equilibrium constant is
(8-5)
Equation 8-5 allows for the effect of ionic strength on a chemical equilibrium because theactivity coefficients depend on ionic strength.
For Reaction 8-2, the equilibrium constant is
If the concentrations of and are to increase when a second salt is added toincrease ionic strength, the activity coefficients must decrease with increasing ionic strength.
At low ionic strength, activity coefficients approach unity, and the thermodynamic equi-librium constant (8-5) approaches the “concentration” equilibrium constant (6-2). One wayto measure a thermodynamic equilibrium constant is to measure the concentration ratio (6-2)at successively lower ionic strengths and extrapolate to zero ionic strength. Commonly, tabu-lated equilibrium constants are not thermodynamic constants but just the concentration ratio(6-2) measured under a particular set of conditions.
Example Exponents of Activity Coefficients
Write the solubility product expression for with activity coefficients.
Solution Exponents of activity coefficients are the same as exponents of concentrations:
Ksp � A2La3�A3
SO2�4
� [La3�]2�2La3�[SO2�
4 ]3�3SO4
2�
La2(SO4)3
SO2�4Ca2�
Ksp � ACa2�ASO42� � [Ca2�]�Ca2�[SO2�
4 ]�SO42�
K �Ac
CAdD
AaAAb
B�
[C]c�cC[D]d�d
D
[A]a�aA[B]b�b
B
General form of equilibrium constant:
AC � [C]�C
8-2 Activity Coefficients 143
Box 8-1 Salts with Ions of Charge Do Not Fully Dissociate6� 02 0Salts composed of cations with a charge of and anions with acharge of dissociate almost completely at concentrations
Salts containing ions with a charge are less dissoci-ated, even in dilute solution. Appendix J gives formation constantsfor ion pairing:
Ion pair
where the are activity coefficients. With constants from Appen-dix J, activity coefficients from Equation 8-6, craft, and persist-ence, you might calculate the following percentages of ion pairingin 0.025 F solutions:
�i
K �[ML]�ML
[M]�M[L]�L
Mn�(aq) � Lm�(aq) T Mn�Lm�(aq)Ion pair formationconstant:
�26 0.1 M.�1
�1 Percentage of metal ion bound as ionpair in 0.025 F MxLy solutiona
ML
0.6% 4%8% 35%
a. The size of ML was taken as 500 pm to compute its activity coefficient.
The table tells us that 0.025 F NaCl is only 0.6% associated asand is 4% associated as . For
35% is ion paired. A solution of containsand The
ionic strength of is not 0.10 M, but just 0.065 M.Problem 8-26 provides an example of the type of calculation inthis box.
0.025 F MgSO4
0.009 M MgSO4(aq).0.016 M Mg2�, 0.016 M SO2�4 ,
0.025 F MgSO4MgSO4,NaSO�
4 (aq)Na2SO4Na�Cl�(aq)
Mg2�
Na�
SO2�4Cl�
Do not confuse the terms activity and activitycoefficient.
Equation 8-5 is the “real” equilibrium constant.Equation 6-2, the concentration quotient, Kc,did not include activity coefficients:
(6-2)Kc �[C]c[D]d
[A]a[B]b
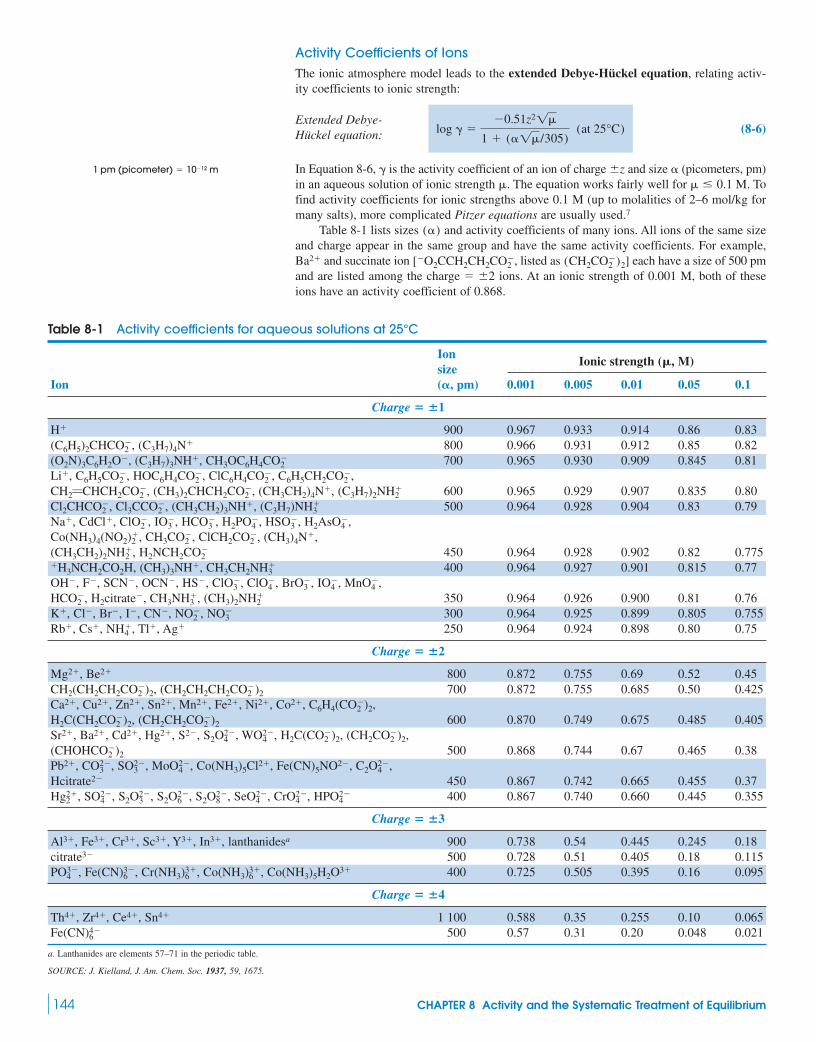
Activity Coefficients of IonsThe ionic atmosphere model leads to the extended Debye-Hückel equation, relating activ-ity coefficients to ionic strength:
(8-6)
In Equation 8-6, is the activity coefficient of an ion of charge and size (picometers, pm)in an aqueous solution of ionic strength . The equation works fairly well for . Tofind activity coefficients for ionic strengths above 0.1 M (up to molalities of 2–6 mol/kg formany salts), more complicated Pitzer equations are usually used.7
Table 8-1 lists sizes and activity coefficients of many ions. All ions of the same sizeand charge appear in the same group and have the same activity coefficients. For example,
and succinate ion , listed as each have a size of 500 pmand are listed among the charge ions. At an ionic strength of 0.001 M, both of theseions have an activity coefficient of 0.868.
� 2(CH2CO�
2 )2][�O2CCH2CH2CO�2Ba2�
(�)
� 0.1 M �z�
log � ��0.51z21
1 � (�1 /305) (at 25°C)
Extended Debye-Hückel equation:
144 CHAPTER 8 Activity and the Systematic Treatment of Equilibrium
Table 8-1 Activity coefficients for aqueous solutions at 25°C
IonIonic strength (�, M)
sizeIon (�, pm) 0.001 0.005 0.01 0.05 0.1
Charge � �1
H� 900 0.967 0.933 0.914 0.86 0.83(C6H5)2CHCO , (C3H7)4N� 800 0.966 0.931 0.912 0.85 0.82(O2N)3C6H2O�, (C3H7)3NH�, CH3OC6H4CO 700 0.965 0.930 0.909 0.845 0.81Li�, C6H5CO , HOC6H4CO , ClC6H4CO , C6H5CH2CO ,CH2£CHCH2CO , (CH3)2CHCH2CO , (CH3CH2)4N�, (C3H7)2NH 600 0.965 0.929 0.907 0.835 0.80Cl2CHCO , Cl3CCO , (CH3CH2)3NH�, (C3H7)NH 500 0.964 0.928 0.904 0.83 0.79Na�, CdCl�, ClO , IO , HCO , H2PO , HSO , H2AsO ,Co(NH3)4(NO2) , CH3CO , ClCH2CO , (CH3)4N�,(CH3CH2)2NH , H2NCH2CO 450 0.964 0.928 0.902 0.82 0.775�H3NCH2CO2H, (CH3)3NH�, CH3CH2NH 400 0.964 0.927 0.901 0.815 0.77OH�, F�, SCN�, OCN�, HS�, ClO , ClO , BrO , IO , MnO ,HCO , H2citrate�, CH3NH , (CH3)2NH 350 0.964 0.926 0.900 0.81 0.76K�, Cl�, Br�, I�, CN�, NO , NO 300 0.964 0.925 0.899 0.805 0.755Rb�, Cs�, NH , Tl�, Ag� 250 0.964 0.924 0.898 0.80 0.75
Charge � �2
Mg2�, Be2� 800 0.872 0.755 0.69 0.52 0.45CH2(CH2CH2CO )2, (CH2CH2CH2CO )2 700 0.872 0.755 0.685 0.50 0.425Ca2�, Cu2�, Zn2�, Sn2�, Mn2�, Fe2�, Ni2�, Co2�, C6H4(CO )2,H2C(CH2CO )2, (CH2CH2CO )2 600 0.870 0.749 0.675 0.485 0.405Sr2�, Ba2�, Cd2�, Hg2�, S2�, S2O , WO , H2C(CO )2, (CH2CO )2,(CHOHCO )2 500 0.868 0.744 0.67 0.465 0.38Pb2�, CO , SO , MoO , Co(NH3)5Cl2�, Fe(CN)5NO2�, C2O ,Hcitrate2� 450 0.867 0.742 0.665 0.455 0.37Hg , SO , S2O , S2O , S2O , SeO , CrO , HPO 400 0.867 0.740 0.660 0.445 0.355
Charge � �3
Al3�, Fe3�, Cr3�, Sc3�, Y3�, In3�, lanthanidesa 900 0.738 0.54 0.445 0.245 0.18citrate3� 500 0.728 0.51 0.405 0.18 0.115PO , Fe(CN) , Cr(NH3) , Co(NH3) , Co(NH3)5H2O3� 400 0.725 0.505 0.395 0.16 0.095
Charge � �4
Th4�, Zr4�, Ce4�, Sn4� 1 100 0.588 0.35 0.255 0.10 0.065Fe(CN) 500 0.57 0.31 0.20 0.048 0.021
a. Lanthanides are elements 57–71 in the periodic table.
SOURCE: J. Kielland, J. Am. Chem. Soc. 1937, 59, 1675.
4�6
3�6
3�6
3�6
3�4
2�4
2�4
2�4
2�8
2�6
2�3
2�4
2�2
2�4
2�4
2�3
2�3
�2
�2
�2
2�4
2�4
�2
�2
�2
�2
�2
�4
�3
�2
�2
�3
�2
�4
�4
�3
�4
�3
�3
�2
�2
�2
�2
�2
�4
�3
�4
�3
�3
�2
�3
�2
�2
�2
�2
�2
�2
�2
�2
�2
�2
�2
1 pm (picometer) � 10�12 m

The ion size in Equation 8-6 is an empirical parameter that provides agreementbetween measured activity coefficients and ionic strength up to . In theory, isthe diameter of the hydrated ion.8 However, sizes in Table 8-1 cannot be taken literally. Forexample, the diameter of ion in crystals is 340 pm. The hydrated ion must be largerthan the ion in the crystal, but the size of in Table 8-1 is only 250 pm.
Even though ion sizes in Table 8-1 are empirical parameters, trends among sizes are sensi-ble. Small, highly charged ions bind solvent more tightly and have larger effective sizes than dolarger or less highly charged ions. For example, the order of sizes in Table 8-1 is
, even though crystallographic radii are
Effect of Ionic Strength, Ion Charge,and Ion Size on the Activity CoefficientOver the range of ionic strengths from 0 to 0.1 M, the effect of each variable on activity coef-ficients is as follows:
1. As ionic strength increases, the activity coefficient decreases (Figure 8-4). The activitycoefficient approaches unity as the ionic strength approaches 0.
2. As the magnitude of the charge of the ion increases, the departure of its activitycoefficient from unity increases. Activity corrections are more important for ions with acharge of than for ions with a charge of (Figure 8-4).
3. The smaller the ion size , the more important activity effects become.
Example Using Table 8-1
Find the activity coefficient of in a solution of 3.3 mM .
Solution The ionic strength is
In Table 8-1, is listed under the charge and has a size of 600 pm. Thus when .
How to InterpolateIf you need to find an activity coefficient for an ionic strength that is between values in Table8-1, you can use Equation 8-6. Alternatively, in the absence of a spreadsheet, it is usually eas-ier to interpolate than to use Equation 8-6. In linear interpolation, we assume that valuesbetween two entries of a table lie on a straight line. For example, consider a table in which
when and when . What is the value of y when ?
x value y value
10 0.6716 ?20 0.83
To interpolate a value of y, we can set up a proportion:
Interpolation: (8-7)
For , our estimate of y is .0.766x � 16
0.83 � y
0.83 � 0.67�
20 � 16
20 � 101 y � 0.766
Unknown y interval
�y�
known x interval
�x
x � 16x � 20y � 0.83x � 10y � 0.67
� 0.010 M� � 0.6752Ca2�
�1
25(0.003 3) � 4 � (0.006 6) � 16 � 0.010 M
�1
25[Ca2�] � 22 � [Cl�] � (�1)26
CaCl2Ca2�
(�)13
( )(�)
Rb�.Li� 6 Na� 6 K� 6Li� 7 Na� 7 K� 7 Rb�
Cs�
Cs�Cs�
� � 0.1 M�
8-2 Activity Coefficients 145
Known xinterval
∆y
y = 0.83y = ?
y = 0.67
Unknown y interval
x = 10 x = 16 x = 20
∆x
1.0
0.1
Act
ivity
coe
ffici
ent (
γ)
Ionic strength (µ)0.010.001
0.0
0.2
0.4
0.6
0.8M±
M2±
M3±
M4±
Figure 8-4 Activity coefficients for differentlycharged ions with a constant ionic size (�) of500 pm. At zero ionic strength, Thegreater the charge of the ion, the more rapidly� decreases as ionic strength increases. Notethat the abscissa is logarithmic.
� � 1.
This calculation is equivalent to saying:
“16 is 60% of the way from 10 to 20. Thereforethe y value will be 60% of the way from 0.67to 0.83.”
Interpolation is the estimation of a number thatlies between two values in a table. Estimating anumber that lies beyond values in a table iscalled extrapolation.
Ionic and hydrated ion sizes are shown at theopening of this chapter.

Example Interpolating Activity Coefficients
Calculate the activity coefficient of when .
Solution is the first entry in Table 8-1.
0.01 0.9140.025 ?0.05 0.86
The linear interpolation is set up as follows:
Another Solution A better and slightly more tedious calculation uses Equation 8-6, withthe ion size listed for in Table 8-1:
Activity Coefficients of Nonionic CompoundsNeutral molecules, such as benzene and acetic acid, have no ionic atmosphere because theyhave no charge. To a good approximation, their activity coefficients are unity when the ionicstrength is less than 0.1 M. In this book, we set for neutral molecules. That is, theactivity of a neutral molecule will be assumed to be equal to its concentration.
For gases such as , the activity is written
where is pressure in bars. The activity of a gas is called its fugacity, and the activity coef-ficient is called the fugacity coefficient. Deviation of gas behavior from the ideal gas lawresults in deviation of the fugacity coefficient from unity. For gases at or below 1 bar, Therefore, for all gases, we will set .
High Ionic StrengthsAbove an ionic strength of approximately 1 M, activity coefficients of most ions increase, asshown for in solutions in Figure 8-5. We should not be too surprised that activitycoefficients in concentrated salt solutions are not the same as those in dilute aqueous solu-tion. The “solvent” is no longer but, rather, a mixture of and . Hereafter, welimit our attention to dilute aqueous solutions.
Example Using Activity Coefficients
Find the concentration of in equilibrium with 0.050 M NaF saturated with Thesolubility of is small, so the concentration of is 0.050 M from NaF.
Solution We find from the solubility product expression, including activity coef-ficients. The ionic strength of 0.050 M NaF is 0.050 M. At in Table 8-1,we find and .
[Ca2�] � 4.9 10�8 M
3.9 10�11 � [Ca2�](0.485)(0.050)2(0.81)2
Ksp � [Ca2�]�Ca2�[F�]2�2F�
�F� � 0.81�Ca2� � 0.485 � 0.050 0 M
[Ca2�]
F�CaF2
CaF2.Ca2�
NaClO4H2OH2O
NaClO4H�
A � P(bar)� � 1.
PH2
AH2� PH2
�H2
H2
� � 1
�H� � 10�0.05498 � 0.881
log �H� �(�0.51)(12)20.025
1 � (90020.025 / 305)� �0.05498
H�� � 900 pm
� � � 0.894
0.86 � �
0.86 � 0.914�
0.05 � 0.025
0.05 � 0.01
Unknown � interval
���
known interval
�
� for H�
H�
� 0.025 MH�
146 CHAPTER 8 Activity and the Systematic Treatment of Equilibrium
0 1 2 3µ (M)
0.5
1.0
1.5
2.0
2.5A
ctiv
ity c
oeffi
cien
t of H
+
Figure 8-5 Activity coefficient of insolutions containing andvarying amounts of [Data derived from
L. Pezza, M. Molina, M. de Moraes, C. B. Melios, and
J. O. Tognolli, Talanta 1996, 43, 1689.] The authoritativesource on electrolyte solutions is H. S. Harnedand B. B. Owen, The Physical Chemistry ofElectrolyte Solutions (New York: Reinhold, 1958).
NaClO4.0.010 0 M HClO4
H�
For neutral species, A [C]. A more accuraterelation is log for ion pairs,
and and fororganic molecules. For an ionic strength of
for ion pairs,and for organic molecules.� � 1.05for NH3,
� � 1.03 � 0.1 M, � � 1.00
k � 0.2CO2,k � 0.11 for NH3
� � k , where k � 0C �
For gases, A � P (bar).
At high ionic strength, increases with increasing .
Note that the activity coefficient of issquared.
F�

8-3 pH RevisitedThe definition in Chapter 6 is not exact. The real definition is
(8-8)
When we measure pH with a pH meter, we are measuring the negative logarithm of thehydrogen ion activity, not its concentration.
Example pH of Pure Water at 25�C
Let’s calculate the pH of pure water by using activity coefficients.
Solution The relevant equilibrium is
(8-9)
(8-10)
and are produced in a 1:1 mole ratio, so their concentrations must be equal.Calling each concentration x, we write
But the ionic strength of pure water is so small that it is reasonable to guess that. Using these values in the preceding equation gives
The concentrations of and are both . The ionic strength is , so each activity coefficient is very close to 1.00. The pH is
Example pH of Water Containing a Salt
Now let’s calculate the pH of water containing 0.10 M KCl at .
Solution Reaction 8-9 tells us that . However, the ionic strength of0.10 M KCl is 0.10 M. The activity coefficients of and in Table 8-1 are 0.83 and0.76, respectively, when . Putting these values into Equation 8-10 gives
The concentrations of and are equal and are both greater than The activities of and are not equal in this solution:
Finally, we calculate
The pH of water changes from 7.00 to 6.98 when we add 0.10 M KCl. KCl is not an acidor a base. The pH changes because KCl affects the activities of and . The pH changeof 0.02 unit lies at the limit of accuracy of pH measurements and is hardly important. How-ever, the concentration of in 0.10 M KCl is 26% greater than the con-centration of in pure water
8-4 Systematic Treatment of EquilibriumThe systematic treatment of equilibrium is a way to deal with all types of chemical equilibria,regardless of their complexity. After setting up general equations, we often introduce specificconditions or judicious approximations that allow simplification. Even simplified calcula-tions are usually very tedious, so we make liberal use of spreadsheets for numerical
(1.00 10�7 M).H�
(1.26 10�7 M)H�
OH�H�
pH � �log AH� � �log(1.05 10�7) � 6.98.
AOH� � [OH�]�OH� � (1.26 10�7)(0.76) � 0.96 10�7
AH� � [H�]�H� � (1.26 10�7)(0.83) � 1.05 10�7
OH�H�
1.0 10�7 M.OH�H�
x � 1.26 10�7 M
1.0 10�14 � (x) (0.83)(x) (0.76)
Kw � [H�]�H�[OH�]�OH�
� 0.10 MOH�H�
[H�] � [OH�]
25°C
pH � �log[H�]�H� � �log(1.0 10�7)(1.00) � 7.00
10�7 M1.0 1.0 10�7 MOH�H�
1.0 10�14 � x2 1 x � 1.0 10�7 M
�H� � �OH� � 1
Kw � 1.0 10�14 � (x)�H�(x)�OH�
OH�H�
Kw � AH�AOH� � [H�]�H�[OH�]�OH�
H2O ∆KW
H� � OH�
pH � �log AH� � �log[H�]�H�
pH � �log[H�]
8-4 Systematic Treatment of Equilibrium 147
The real definition of pH!

solutions. When you have mastered the systematic treatment of equilibrium, you should beable to explore the behavior of complex systems.
The systematic procedure is to write as many independent algebraic equations as thereare unknowns (species) in the problem. The equations are generated by writing all the chem-ical equilibrium conditions plus two more: the balances of charge and of mass. There is onlyone charge balance in a given system, but there could be several mass balances.
Charge BalanceThe charge balance is an algebraic statement of electroneutrality: The sum of the positivecharges in solution equals the sum of the negative charges in solution.
Suppose that a solution contains the following ionic species: , , , ,, and . The charge balance is
(8-11)
This statement says that the total charge contributed by and equals the magnitude ofthe charge contributed by all of the anions on the right side of the equation. The coefficient infront of each species always equals the magnitude of the charge on the ion. This statement istrue because a mole of, say, contributes three moles of negative charge. If
, the negative charge is .Equation 8-11 appears unbalanced to many people. “The right side of the equation has
much more charge than the left side!” you might think. But you would be wrong.For example, consider a solution prepared by weighing out 0.025 0 mol of plus
0.030 0 mol of KOH and diluting to 1.00 L. The concentrations of the species at equilibriumare calculated to be
This calculation, which you should be able to do when you have finished studying acids andbases, takes into account the reaction of with to produce and .
Are the charges balanced? Yes, indeed. Plugging into Equation 8-11, we find
The total positive charge is 0.055 0 M, and the total negative charge also is 0.055 0 M(Figure 8-6). Charges must balance in every solution. Otherwise, a beaker with excess pos-itive charge would glide across the lab bench and smash into another beaker with excessnegative charge.
The general form of the charge balance for any solution is
Charge balance: (8-12)
where [C] is the concentration of a cation, n is the charge of the cation, [A] is the concentra-tion of an anion, and m is the magnitude of the charge of the anion.
Example Writing a Charge Balance
Write the charge balance for a solution containing
Solution Neutral species contribute no charge, so thecharge balance is
Mass BalanceThe mass balance, also called the material balance, is a statement of the conservation ofmatter. The mass balance states that the quantity of all species in a solution containing a
[H�] � 3[Fe3�] � 2[Mg2�] � [NH�4 ] � [OH�] � [ClO�
4 ] � 3[Fe(CN)3�6 ] � [CN�]
(H2O, CH3OH, HCN, and NH3)
Fe3�, Mg2�, CH3OH, HCN, NH3, and NH�4 .CN�,
H2O, H�, OH�, ClO�4 , Fe(CN)3�
6 ,
n1[C1] � n2[C2] � p � m1[A1] � m2[A2] � p
0.055 0 M � 0.055 0 M
5.1 10�12 � 0.055 0 � 0.002 0 � 1.3 10�6 � 2(0.022 0) � 3(0.003 0)
[H�] � [K�] � [OH�] � [H2PO�4 ] � 2[HPO2�
4 ] � 3[PO3�4 ]
PO3�4HPO2�
4H2PO�4OH�
[OH�] � 0.002 0 M [PO3�4 ] � 0.003 0 M
[K�] � 0.055 0 M [HPO2�4 ] � 0.022 0 M
[H�] � 5.1 10�12 M [H2PO�4 ] � 1.3 10�6 M
KH2PO4
3[PO3�4 ] � 3(0.01) � 0.03 M[PO3�
4 ] � 0.01 MPO3�
4
K�H�
[H�] � [K�] � [OH�] � [H2PO�4 ] � 2[HPO2�
4 ] � 3[PO3�4 ]
PO3�4HPO2�
4
H2PO�4K�OH�H�
148 CHAPTER 8 Activity and the Systematic Treatment of Equilibrium
Solutions must have zero total charge.
The coefficient of each term in the chargebalance equals the magnitude of the chargeon each ion.
0.06Charge (M)
–0.06
PO34
–
–0.04 –0.02 0.00 0.02 0.04
HPO24
–
H2PO4–
OH–
K+
H+
Figure 8-6 Charge contributed by eachion in 1.00 L of solution containing
plus 0.030 0 mol KOH. The total positivecharge equals the total negative charge.KH2PO4
0.025 0 mol
[positive charges] � [negative charges]Activity coefficients do not appear in thecharge balance. The charge contributed by
is exactly 0.1 M. Think about this.0.1 M H�
gg
The mass balance is a statement of theconservation of matter. It really refers toconservation of atoms, not to mass.

particular atom (or group of atoms) must equal the amount of that atom (or group) deliv-ered to the solution. It is easier to see this relation through examples than by a generalstatement.
Suppose that a solution is prepared by dissolving 0.050 mol of acetic acid in water togive a total volume of 1.00 L. The acetic acid partially dissociates into acetate:
Acetic acid Acetate
The mass balance states that the quantity of dissociated and undissociated acetic acid in thesolution must equal the amount of acetic acid put into the solution.
What we put into Undissociated Dissociated the solution product product
When a compound dissociates in several ways, the mass balance must include all theproducts. Phosphoric acid , for example, dissociates to , , and .The mass balance for a solution prepared by dissolving 0.025 0 mol of in 1.00 L is
Example Mass Balance When the Total Concentration Is Known
Write the mass balances for and for phosphate in a solution prepared by mixing 0.025 0 mol plus 0.030 0 mol KOH and diluting to 1.00 L.
Solution The total is , so one mass balance is
The total of all forms of phosphate is 0.025 0 M, so the mass balance for phosphate is
Now consider a solution prepared by dissolving in water.
Iodate
We do not know how much or is dissolved, but we do know that there must bethree iodate ions for each lanthanum ion dissolved. That is, the iodate concentration must bethree times the lanthanum concentration. If and are the only species derived from
, then the mass balance is
If the solution also contains the ion pair and the hydrolysis product , themass balance would be
Example Mass Balance When the Total Concentration Is Unknown
Write the mass balance for a saturated solution of the slightly soluble salt , whichproduces and when it dissolves.
Solution If the phosphate in solution remained as we could write
because three silver ions are produced for each phosphate ion. However, phosphate reactswith water to give , , and , so the mass balance is
That is, the number of atoms of must equal three times the total number of atoms ofphosphorus, regardless of how many species contain phosphorus.
Ag�
[Ag�] � 35[PO3�4 ] � [HPO2�
4 ] � [H2PO�4 ] � [H3PO4]6
H3PO4H2PO�4HPO2�
4
[Ag�] � 3[PO3�4 ]
PO3�4 ,
3Ag�PO3�4
Ag3PO4
[IO�3 ] � [LaIO2�
3 ] � 35[La3�] � [LaIO2�3 ] � [LaOH2�]6
[Total iodate] � 3[total lanthanum]
LaOH2�LaIO2�3
[IO3�] � 3[La3�]
La(IO3)3
IO�3La3�
IO�3La3�
La(IO3)3(s) ∆Ksp
La3� � 3IO�3
La(IO3)3
[H3PO4] � [H2PO�4 ] � [HPO2�
4 ] � [PO3�4 ] � 0.025 0 M
[K�] � 0.055 0 M
0.025 0 M � 0.030 0 MK�
KH2PO4
K�
0.025 0 M � [H3PO4] � [H2PO�4 ] � [HPO2�
4 ] � [PO3�4 ]
H3PO4
PO3�4HPO2�
4H2PO4�(H3PO4)
0.050 M � [CH3CO2H] � [CH3CO2�]Mass balance for
acetic acid in water:
CH3CO2H T CH3CO2� � H�
8-4 Systematic Treatment of Equilibrium 149
Activity coefficients do not appear in the massbalance. The concentration of each speciescounts exactly the number of atoms of thatspecies.
Atoms of Ag � 3(atoms of P)
Box 8-2 illustrates the operation of a massbalance in natural waters.

Systematic Treatment of EquilibriumNow that we have considered the charge and mass balances, we are ready for the systematictreatment of equilibrium.10 Here is the general prescription:
Step l Write the pertinent reactions.Step 2 Write the charge balance equation.Step 3 Write mass balance equations. There may be more than one.Step 4 Write the equilibrium constant expression for each chemical reaction. This step is
the only one in which activity coefficients appear.Step 5 Count the equations and unknowns. There should be as many equations as
unknowns (chemical species). If not, you must either find more equilibria or fixsome concentrations at known values.
Step 6 By hook or by crook, solve for all the unknowns.
Steps 1 and 6 are the heart of the problem. Guessing what chemical equilibria exist in agiven solution requires a fair degree of chemical intuition. In this book, you will usually begiven help with step 1. Unless we know all the relevant equilibria, it is not possible to calcu-late the composition of a solution correctly. Because we do not know all the chemical reac-tions, we undoubtedly oversimplify many equilibrium problems.
Step 6 is likely to be your biggest challenge. With n equations involving n unknowns,the problem can always be solved, at least in principle. In the simplest cases, you can do thisby hand; but for most problems, approximations are made or a spreadsheet is employed.
8-5 Applying the Systematic Treatment of Equilibrium
The systematic treatment of equilibrium is best understood by studying some examples.
A Simple Example: Ionization of WaterThe dissociation of water into and occurs in every aqueous solution:
at (8-13)25°CH2O ∆Kw
H� � OH� Kw � 1.0 10�14
OH�H�
150 CHAPTER 8 Activity and the Systematic Treatment of Equilibrium
Box 8-2 Calcium Carbonate Mass Balance in Rivers
is the most common cation in rivers and lakes. It comesfrom dissolution of the mineral calcite by the action of toproduce 2 moles of for each mole of
(A)Calcite Bicarbonate
Near neutral pH, most of the product is bicarbonate, not. The mass balance for the dissolution of calcite is
therefore Indeed, measurements of andin many rivers conform to this mass balance, shown by the
straight line on the graph. Rivers such as the Danube, the Missis-sippi, and the Congo, which lie on the line appear to be saturated with calcium carbonate. If the river waterwere in equilibrium with atmospheric theconcentration of would be 20 mg/L (see Problem 8-28).Rivers with more than 20 mg of per liter have a higher con-centration of dissolved produced by respiration or frominflow of groundwaters with a high content. Rivers such asthe Nile, the Niger, and the Amazon, for which
are not saturated with Just between 1960 and 2000, in the atmosphere increased
by 17% (Box 20-1)—mostly from our burning of fossil fuel. Thisincrease drives Reaction A to the right and threatens the existence ofcoral reefs,9 which are huge, living structures consisting largelyof Coral reefs are a unique habitat for many aquatic species.CaCO3.
CO2
CaCO3.[HCO�3 ],
2[Ca2�] 6CO2
CO2
Ca2�
Ca2�
CO2 (PCO2� 10�3.4 bar),
[HCO�3 ] � 2[Ca2�],
HCO�3
Ca2�[HCO�3 ] � 2[Ca2�].
CO2�3 or H2CO3
CaCO3(s) � CO2(aq) � H2O T Ca2� � 2HCO�3
Ca2�:HCO�3
CO2
Ca2�
11
10
100
10 100
Congo
Fraser
St. LawrenceMississippi
RhineDanube
Don
Rio GrandeMackenzie
DvinaYukon
ColumbiaWorld
Nile
Niger
ParanaPechora
AmazonOrinoco
Uruguay
2[Ca
2+ ] = [HCO
− ]3
[Ca2 +] = 20 mg/Lfor normalatmosphericPCO2
= 10 − 3.4 bar
[Ca2 +] (mg/L)
[HC
O− ] (
mg
/L)
3
Concentrations of bicarbonate and calcium in many rivers conform tothe mass balance for Reaction A: [Data from W. Stumm and
J. J. Morgan, Aquatic Chemistry, 3rd ed. (New York: Wiley-lnterscience, 1996), p. 189;
and H. D. Holland, The Chemistry of the Atmosphere and Oceans (New York: Wiley-
Interscience, 1978).]
[HCO�3 ] � 2[Ca2�].

Let’s apply the systematic treatment to find the concentrations of and in pure water.
Step 1 Pertinent reactions. The only one is Reaction 8-13.Step 2 Charge balance. The only ions are and so the charge balance is
(8-14)
Step 3 Mass balance. Reaction 8-13 creates one for each . The mass balance issimply , which is the same as the charge balance for this system.
Step 4 Equilibrium constant expression.
(8-15)
This is the only step in which activity coefficients enter the problem.Step 5 Count equations and unknowns. We have two equations, 8-14 and 8-15, and two
unknowns, and .Step 6 Solve.
Now we must decide what to do about the activity coefficients. We expect that the ionicstrength of pure water will be very low. Therefore, it is reasonable to suppose that and are both unity.
Putting into Equation 8-15 gives
Also, . As a reminder, the pH is given by
Solubility of Calcium SulfateOur goal is to find the concentrations of the major species in a saturated solution of
Step l Pertinent reactions. Even in such a simple system, there are quite a few reactions:
(8-16)
(8-17)
(8-18)
(8-19)
(8-20)
There is no way you can be expected to come up with all of these reactions, so youwill be given help with this step.
Step 2 Charge balance. Equating positive and negative charges gives
(8-21)
Step 3 Mass balance. Reaction 8-16 produces 1 mole of sulfate for each mole of calcium.No matter what happens to these ions, the total concentration of all species withsulfate must equal the total concentration of all species with calcium:
(8-22)
Step 4 Equilibrium constant expressions. There is one for each chemical reaction.
(8-23)
(8-24)
(8-25)
(8-26)
(8-27)
Step 4 is the only one where activity coefficients come in.
Kw � [H�]�H�[OH�]�OH� � 1.0 10�14
Kbase �[HSO�
4 ]�HSO�4[OH�]�OH�
[SO2�4 ]�SO2�
4
� 9.8 10�13
Kacid �[CaOH�]�CaOH�[H�]�H�
[Ca2�]�Ca2�
� 2.0 10�13
Kion pair � [CaSO4(aq)] � 5.0 10�3
Ksp � [Ca2�]�Ca2�[SO2�4 ]�SO2�
4� 2.4 10�5
[Ca2�] � [CaSO4(aq)] � [CaOH�] � [SO2�4 ] � [HSO�
4 ] � [CaSO4(aq)]
[Total calcium] � [total sulfate]
2[Ca2�] � [CaOH�] � [H�] � 2[SO2�4 ] � [HSO�
4 ] � [OH�]
H2O ∆Kw
H� � OH� Kw � 1.0 10�14
SO2�4 � H2O ∆
Kbase
HSO�4 � OH� Kbase � 9.8 10�13
Ca2� � H2O ∆Kacid
CaOH� � H� Kacid � 2.0 10�13
CaSO4(s) ∆Kion pair
CaSO4(aq) Kion pair � 5.0 10�3
CaSO4(s) ∆Ksp
Ca2� � SO2�4 Ksp � 2.4 10�5
CaSO4.
pH � �log AH� � �log[H�]�H� � �log(1.0 10�7)(1) � 7.00
[OH�] � [H�] � 1.0 10�7 M
[H�] � 1.0 10�7 M
[H�] � 1 � [H�] � 1 � 1.0 10�14
[H�]�H�[OH�]�OH� � 1.0 10�14
[H�] � [OH�]�OH�
�H�( )
[OH�][H�]
Kw � [H�]�H�[OH�]�OH� � 1.0 10�14
[H�] � [OH�]OH�H�
[H�] � [OH�]
OH�,H�
OH�H�
8-5 Applying the Systematic Treatment of Equilibrium 151
We need n equations to solve for n unknowns.
Recall that approaches 1 as approaches 0.
The ionic strength is The assumptionthat is good.�H� � �OH� � 1
10�7 M.
This is the correct definition of pH. When weneglect activity coefficients, we will write
[H�].pH � �log
Caveat Emptor! In all equilibrium problems, weare limited by how much of the system’schemistry is understood. Unless we know allthe relevant equilibria, it is impossible tocalculate the composition.
Multiply by 2 because 1 molof each ion has 2 mol of charge.
[Ca2�] and [SO2�4 ]
The activity coefficient of the neutral speciesis 1.CaSO4(aq)
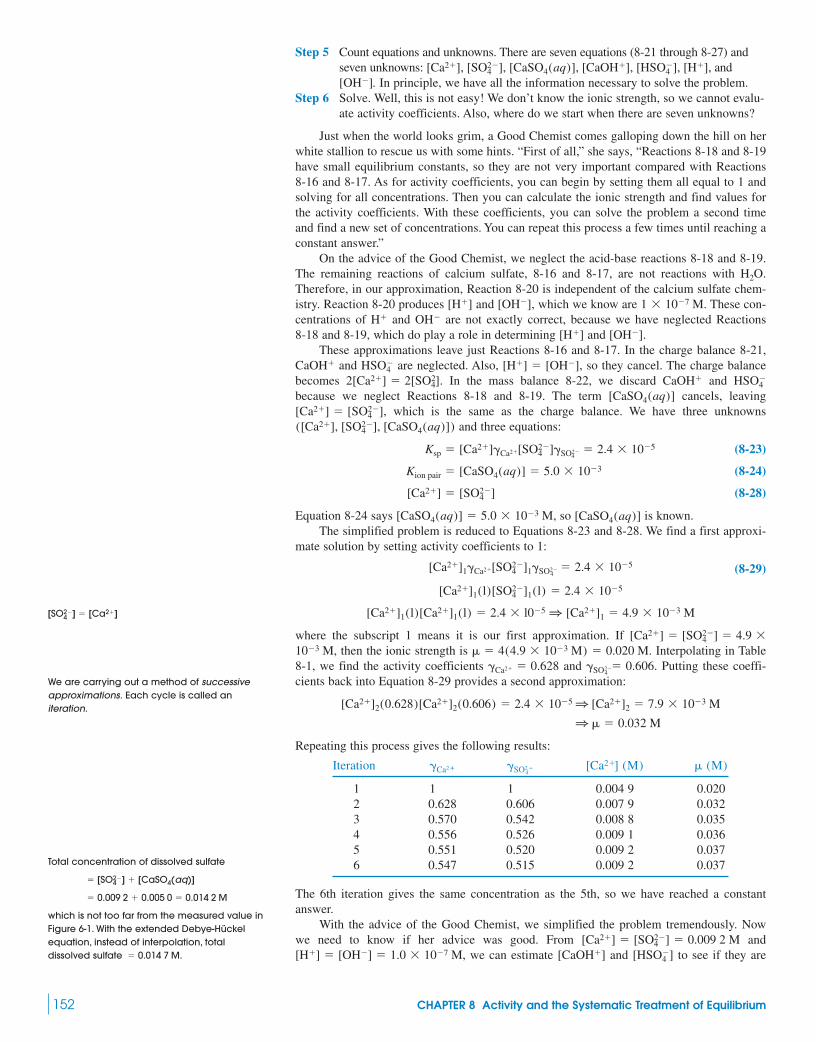
Step 5 Count equations and unknowns. There are seven equations (8-21 through 8-27) andseven unknowns: and
In principle, we have all the information necessary to solve the problem.Step 6 Solve. Well, this is not easy! We don’t know the ionic strength, so we cannot evalu-
ate activity coefficients. Also, where do we start when there are seven unknowns?
Just when the world looks grim, a Good Chemist comes galloping down the hill on herwhite stallion to rescue us with some hints. “First of all,” she says, “Reactions 8-18 and 8-19have small equilibrium constants, so they are not very important compared with Reactions8-16 and 8-17. As for activity coefficients, you can begin by setting them all equal to 1 andsolving for all concentrations. Then you can calculate the ionic strength and find values forthe activity coefficients. With these coefficients, you can solve the problem a second timeand find a new set of concentrations. You can repeat this process a few times until reaching aconstant answer.”
On the advice of the Good Chemist, we neglect the acid-base reactions 8-18 and 8-19.The remaining reactions of calcium sulfate, 8-16 and 8-17, are not reactions with .Therefore, in our approximation, Reaction 8-20 is independent of the calcium sulfate chem-istry. Reaction 8-20 produces and , which we know are . These con-centrations of and are not exactly correct, because we have neglected Reactions8-18 and 8-19, which do play a role in determining and
These approximations leave just Reactions 8-16 and 8-17. In the charge balance 8-21,and are neglected. Also, , so they cancel. The charge balance
becomes . In the mass balance 8-22, we discard and because we neglect Reactions 8-18 and 8-19. The term cancels, leaving
, which is the same as the charge balance. We have three unknownsand three equations:
(8-23)
(8-24)
(8-28)
Equation 8-24 says , so is known.The simplified problem is reduced to Equations 8-23 and 8-28. We find a first approxi-
mate solution by setting activity coefficients to 1:
(8-29)
where the subscript 1 means it is our first approximation. If then the ionic strength is . Interpolating in Table
8-1, we find the activity coefficients and . Putting these coeffi-cients back into Equation 8-29 provides a second approximation:
Repeating this process gives the following results:
Iteration
1 1 1 0.004 9 0.0202 0.628 0.606 0.007 9 0.0323 0.570 0.542 0.008 8 0.0354 0.556 0.526 0.009 1 0.0365 0.551 0.520 0.009 2 0.0376 0.547 0.515 0.009 2 0.037
The 6th iteration gives the same concentration as the 5th, so we have reached a constantanswer.
With the advice of the Good Chemist, we simplified the problem tremendously. Nowwe need to know if her advice was good. From and
, we can estimate and to see if they are[HSO�4 ][CaOH�][H�] � [OH�] � 1.0 10�7 M
[Ca2�] � [SO2�4 ] � 0.009 2 M
(M)[Ca2�] (M)�SO2 �4
�Ca2 �
1 � 0.032 M
[Ca2�]2(0.628)[Ca2�]2(0.606) � 2.4 10�5 1 [Ca2�]2 � 7.9 10�3 M
�SO2�4
� 0.606�Ca2� � 0.628 � 4(4.9 10�3 M) � 0.020 M10�3 M,
[Ca2�] � [SO2�4 ] � 4.9
[Ca2�]1(l)[Ca2�]1(l) � 2.4 l0�5 1 [Ca2�]1 � 4.9 10�3 M
[Ca2�]1(l)[SO2�4 ]1(l) � 2.4 10�5
[Ca2�]1�Ca2�[SO2�4 ]1�SO2�
4� 2.4 10�5
[CaSO4(aq)][CaSO4(aq)] � 5.0 10�3 M
[Ca2�] � [SO2�4 ]
Kion pair � [CaSO4(aq)] � 5.0 10�3
Ksp � [Ca2�]�Ca2�[SO2�4 ]�SO2�
4� 2.4 10�5
([Ca2�], [SO2�4 ], [CaSO4(aq)])
[Ca2�] � [SO2�4 ]
[CaSO4(aq)]HSO�
4CaOH�2[Ca2�] � 2[SO24]
[H�] � [OH�]HSO4�CaOH�
[OH�].[H�]OH�H�
1 10�7 M[OH�][H�]
H2O
[OH�].[Ca2�], [SO2�
4 ], [CaSO4(aq)], [CaOH�], [HSO�4 ], [H�],
152 CHAPTER 8 Activity and the Systematic Treatment of Equilibrium
[SO2�4 ] � [Ca2�]
We are carrying out a method of successiveapproximations. Each cycle is called aniteration.
Total concentration of dissolved sulfate
which is not too far from the measured value inFigure 6-1. With the extended Debye-Hückelequation, instead of interpolation, totaldissolved sulfate � 0.014 7 M.
� 0.009 2 � 0.005 0 � 0.014 2 M
� [SO2�4 ] � [CaSO4(aq)]

8-5 Applying the Systematic Treatment of Equilibrium 153
negligible. We are just looking for orders of magnitude, so we ignore activity coefficients.From Equation 8-25, we have
(8-25)
From Equation 8-26, we estimate
Both and are times less than and , so it was reason-able to neglect and in the charge and mass balances.
We Will Usually Omit Activity CoefficientsAlthough it is proper to write equilibrium constants in terms of activities, the complexity ofmanipulating activity coefficients is a nuisance. Most of the time, we will omit activity coef-ficients unless there is a particular point to be made. Occasional problems will remind youhow to use activities.
Solubility of Magnesium HydroxideLet’s find the concentrations of species in a saturated solution of , given the fol-lowing chemistry. For simplicity, we ignore activity coefficients.
(8-30)
(8-31)
(8-32)
Step 1 Pertinent reactions are listed above.Step 2 Charge balance: (8-33)Step 3 Mass balance. This is a little tricky. From Reaction 8-30, we could say that the con-
centrations of all species containing equal two times the concentrations of allmagnesium species. However, Reaction 8-32 also creates 1 for each Themass balance accounts for both sources of :
(8-34)144424443 144424443Species containing Species containing Mg2�
After all this work, Equation 8-34 is equivalent to Equation 8-33.Step 4 Equilibrium constant expressions are in Equations 8-30 through 8-32.Step 5 Count equations and unknowns. We have four equations (8-30 to 8-33) and four
unknowns: , , and .Step 6 Solve.
Before hitting the algebra, we can make one simplification. The solution must be verybasic because we made it from . In basic solution, , so we canneglect on the left side of Equation 8-33 in comparison with on the right side.The charge balance simplifies to
(8-35)
From the expression 8-31, we write . Substituting thisexpression for into Equation 8-35 gives
which we solve for :
[Mg2�] �[OH�]
2 � K1[OH�]
[Mg2�]
2[Mg2�] � K1[Mg2�][OH�] � [OH�]
[MgOH�][MgOH�] � K1[Mg2�][OH�]K1
2[Mg2�] � [MgOH�] � [OH�]
[OH�][H�][OH�] W [H�]Mg(OH)2
[OH�][H�][Mg2�], [MgOH�]
OH�
[OH�] � [MgOH�] � 25[Mg2�] � [MgOH�]6 � [H�]
OH�
H�.OH�
OH�
2[Mg2�] � [MgOH�] � [H�] � [OH�]
H2O ∆Kw
H� � OH� Kw � [H�][OH�] � 1.0 10�14
Mg2� � OH� ∆K1
MgOH� K1 �[MgOH�]
[Mg2�][OH�]� 3.8 102
Mg(OH)2(s) ∆Ksp
Mg2� � 2OH� Ksp � [Mg2�][OH�]2 � 7.1 10�12
Mg(OH)2
[HSO�4 ][CaOH�]
[SO2�4 ][Ca2�]�105[HSO�
4 ][CaOH�]
[HSO�4 ] �
(9.8 10�13)[SO2�4 ]
[OH�]�
(9.8 10�13)[0.009 2]
[1.0 10�7]� 9 10�8 M
[CaOH�] �(2.0 10�13)[Ca2�]
[H�]�
(2.0 10�13)[0.009 2]
[1.0 10�7]� 2 10�8 M
[CaOH�][H�]
[Ca2�]� 2.0 10�13
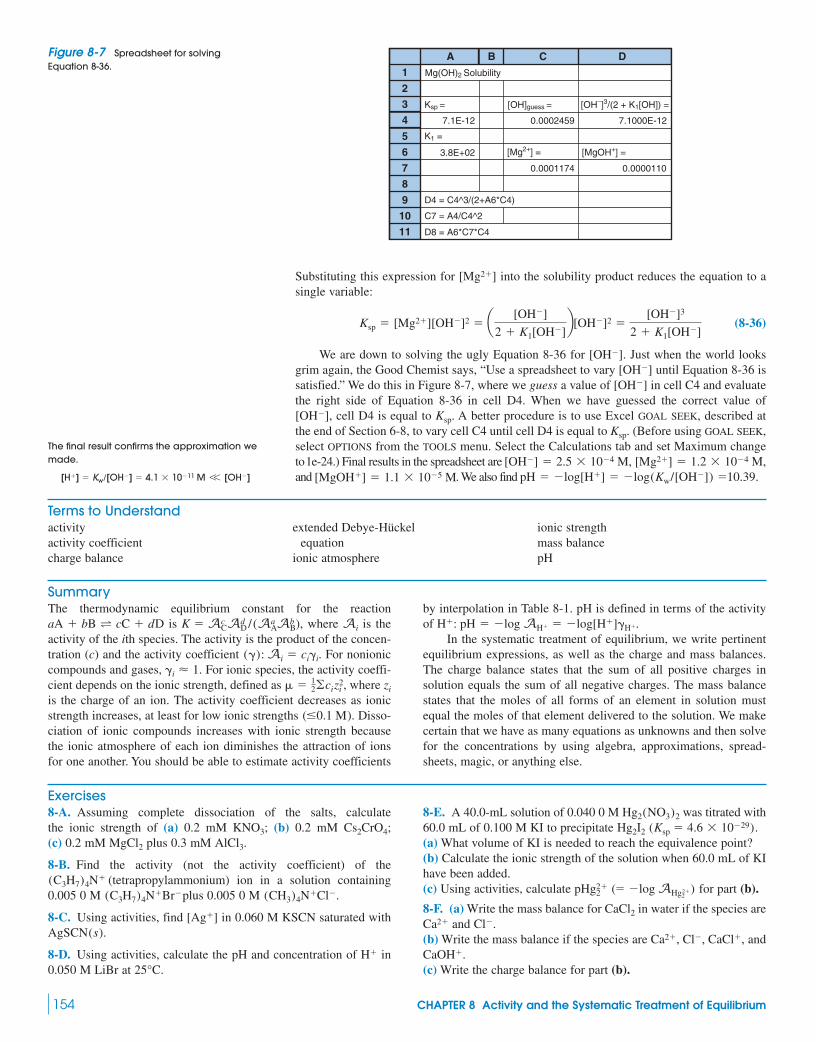
154 CHAPTER 8 Activity and the Systematic Treatment of Equilibrium
Substituting this expression for into the solubility product reduces the equation to asingle variable:
(8-36)
We are down to solving the ugly Equation 8-36 for . Just when the world looksgrim again, the Good Chemist says, “Use a spreadsheet to vary until Equation 8-36 issatisfied.” We do this in Figure 8-7, where we guess a value of in cell C4 and evaluatethe right side of Equation 8-36 in cell D4. When we have guessed the correct value of
cell D4 is equal to . A better procedure is to use Excel GOAL SEEK, described atthe end of Section 6-8, to vary cell C4 until cell D4 is equal to . (Before using GOAL SEEK,select OPTIONS from the TOOLS menu. Select the Calculations tab and set Maximum changeto1e-24.) Final results in the spreadsheet areand . We also find 10.39.pH � �log[H�] � �log(Kw/[OH�]) �[MgOH�] � 1.1 10�5 M
[OH�] � 2.5 10�4 M, [Mg2�] � 1.2 10�4 M,
Ksp
Ksp[OH�],
[OH�][OH�]
[OH�]
Ksp � [Mg2�][OH�]2 � a [OH�]
2 � K1[OH�]b[OH�]2 �
[OH�]3
2 � K1[OH�]
[Mg2�]
Figure 8-7 Spreadsheet for solvingEquation 8-36.
1 Mg(OH)2 Solubility
A
2
3 Ksp = [OH]guess = [OH_]3/(2 + K1[OH]) =
K1 =
7.1E-12
3.8E+02
0.0002459
0.0001174 0.0000110
7.1000E-12
[Mg2+] = [MgOH+] =
D4 = C4^3/(2+A6*C4)
D8 = A6*C7*C4
C7 = A4/C4^2
4
5
6
7
8
9
10
11
B C D
Terms to Understandactivityactivity coefficientcharge balance
extended Debye-Hückel equation
ionic atmosphere
ionic strengthmass balancepH
SummaryThe thermodynamic equilibrium constant for the reaction
is ), where is theactivity of the ith species. The activity is the product of the concen-tration (c) and the activity coefficient For nonioniccompounds and gases, For ionic species, the activity coeffi-cient depends on the ionic strength, defined as , where is the charge of an ion. The activity coefficient decreases as ionicstrength increases, at least for low ionic strengths Disso-ciation of ionic compounds increases with ionic strength becausethe ionic atmosphere of each ion diminishes the attraction of ionsfor one another. You should be able to estimate activity coefficients
(�0.1 M).
zi � 12�ciz2
i
�i � 1.(�): Ai � ci�i.
AiK � AcCAd
D /(AaAAb
BaA � bB T cC � dDby interpolation in Table 8-1. pH is defined in terms of the activityof
In the systematic treatment of equilibrium, we write pertinentequilibrium expressions, as well as the charge and mass balances.The charge balance states that the sum of all positive charges insolution equals the sum of all negative charges. The mass balancestates that the moles of all forms of an element in solution mustequal the moles of that element delivered to the solution. We makecertain that we have as many equations as unknowns and then solvefor the concentrations by using algebra, approximations, spread-sheets, magic, or anything else.
AH� � �log[H�]�H�.H�: pH � �log
Exercises8-A. Assuming complete dissociation of the salts, calculatethe ionic strength of (a) 0.2 mM (b) 0.2 mM (c) 0.2 mM plus 0.3 mM
8-B. Find the activity (not the activity coefficient) of the(tetrapropylammonium) ion in a solution containing
0.005 0 M plus 0.005 0 M
8-C. Using activities, find in 0.060 M KSCN saturated with
8-D. Using activities, calculate the pH and concentration of in0.050 M LiBr at .25°C
H�
AgSCN(s).[Ag�]
(CH3)4N�Cl�.(C3H7)4N�Br�
(C3H7)4N�
AlCl3.MgCl2
Cs2CrO4;KNO3;8-E. A 40.0-mL solution of 0.040 0 M was titrated with60.0 mL of 0.100 M KI to precipitate (a) What volume of KI is needed to reach the equivalence point?(b) Calculate the ionic strength of the solution when 60.0 mL of KIhave been added.(c) Using activities, calculate for part (b).
8-F. (a) Write the mass balance for in water if the species areand
(b) Write the mass balance if the species are and
(c) Write the charge balance for part (b).CaOH�.
Ca2�, Cl�, CaCl�,Cl�.Ca2�
CaCl2
pHg2�2 (� �log AHg2
2�)
4.6 10�29).Hg2I2 (Ksp �Hg2(NO3)2
The final result confirms the approximation wemade.
[H�] � Kw/[OH�] � 4.1 10�11 M V [OH�]

Problems 155
8-G. Write the charge and mass balances for dissolving inwater if the reactions are
8-H. Write charge and mass balances for aqueous if thespecies are and H3PO4.Ca2�, CaOH�, CaPO�
4 , PO3�4 , HPO4
2�, H2PO4�,
Ca3(PO4)2
HF(aq) � F� T HF2�
F� � H� T HF(aq)
CaF2(s) T CaF2(aq)
Ca2� � F� T CaF�
Ca2� � H2O T CaOH� � H�
CaF2(s) T Ca2� � 2F�
CaF2 8-I. (Warning: Long problem!) Using activities, find the con-centrations of the major species in 0.10 M saturated with
Take the ionic strength to be 0.10 M and suppose thatthe ion size of is the same as Consider just the fol-lowing chemistry:
Mn2� � OH� ∆K1
MnOH� K1 � 2.5 103
Mn(OH)2(s) ∆Ksp
Mn2� � 2OH� Ksp � 1.6 10�13
Mn2�.MnOH�
Mn(OH)2.NaClO4
ProblemsActivity Coefficients
8-1. Explain why the solubility of an ionic compound increases asthe ionic strength of the solution increases (at least up to �0.5 M).
8-2. Which statements are true: In the ionic strength range 0–0.1M, activity coefficients decrease with (a) increasing ionicstrength; (b) increasing ionic charge; (c) decreasing hydratedradius?
8-3. Calculate the ionic strength of (a) 0.008 7 M KOH and(b) 0.000 2 M (assuming complete dissociation at this lowconcentration and no hydrolysis reaction to make ).
8-4. Find the activity coefficient of each ion at the indicated ionicstrength:(a)(b)(c)(d)
8-5. Interpolate in Table 8-1 to find the activity coefficient of when
8-6. Calculate the activity coefficient of when by using (a) Equation 8-6; (b) linear interpolation in Table 8-1.
8-7. Calculate the activity coefficient of when Mby linear interpolation in Table 8-1.
8-8. The equilibrium constant for dissolution in water of a nonioniccompound, such as diethyl ether can bewritten
At low ionic strength, for neutral compounds. At high ionicstrength, most neutral molecules can be salted out of aqueous solu-tion. That is, when a high concentration of a saltsuch as NaCl is added to an aqueous solution, neutral moleculesusually become less soluble. Does the activity coefficient, increase or decrease at high ionic strength?
8-9. Find in saturated in 0.001 00 M KBr.
8-10. Find the concentration of in a 0.100 M solution saturated with
8-11. Find the activity coefficient of in a solution contain-ing 0.010 M HCl plus 0.040 M What is the pH of thesolution?
8-12. Using activities, calculate the pH of a solution containing0.010 M NaOH plus 0.012 0 M What would be the pH ifyou neglected activities?
LiNO3.
KClO4.H�
Ba(IO3)2.(CH3)4NIO3Ba2�
Hg2Br2[Hg2�2 ]
�ether,
(typically 7 1 M)
� � 1
ether(l) T ether(aq) K � [ether(aq)]�ether
(CH3CH2OCH2CH3),
� 0.083Al3�
� 0.083 MZn2�
� 0.030 M.H�
( � 0.05 M)(CH3CH2)3NH�
( � 0.1 M)Eu3�
( � 0.005 M)Sc3�
( � 0.01 M)SO2�4
LaOH2�
La(IO3)3
8-13. The temperature-dependent form of the extended Debye-Hückel equation 8-6 is
where is the (dimensionless) dielectric constant* of water, T is thetemperature (K), z is the charge of the ion, is the ionic strength(mol/L), and � is the ion size parameter (pm). The dependence of on temperature is
Calculate the activity coefficient of SO at when Compare your value with the one in Table 8-1.
8-14. Extended Debye-Hückel equation. Use Equation 8-6 tocalculate the activity coefficient as a function of ionic strength( ) for (a) For an ionic charge of and a size make a tableof for each value of (b) Do the same for ionic charges of (c) Plot versus to obtain a graph similar to Figure 8-5.
Systematic Treatment of Equilibrium
8-15. State the meaning of the charge and mass balance equations.
8-16. Why do activity coefficients not appear in the charge andmass balance equations?
8-17. Write a charge balance for a solution containing
8-18. Write a charge balance for a solution of in water if theionizes to and
8-19. Write the charge balance for an aqueous solution of arsenicacid, in which the acid can dissociate to
Look up the structure of arsenic acid inAppendix G and write the structure of HAsO2�
4 .HAsO2�
4 , and AsO3�4 .
H2AsO�4 ,H3AsO4,
SO2�4 .HSO�
4H2SO4
H2SO4
Ca2�, HCO�3 , CO2�
3 , Ca(HCO3)�, Ca(OH)�, K�, and ClO�4 .
H�, OH�,
log �
2, 3, and 4. .� (� 10�(log �))
� � 400 pm,1 � 0.000 1, 0.000 3, 0.001, 0.003, 0.01, 0.03, and 0.1 M.
(�)
0.100 M. �50.00°C2�
4
� � 79.755e(�4.610�3) (T�293.15)
�
�
log � �(�1.825 106)(�T )�3/2z22
1 � �2 / (2.002�T)
*The dimensionless dielectric constant, , measures how well a solvent can separate
oppositely charged ions. The force of attraction (newtons) between ions of charge q1
and q2 (coulombs) separated by distance r (meters) is
Force � �(8.988 109)
The larger the value of , the smaller the attraction between ions. Water, with 80,
separates ions very well. Here are some values of : methanol, 33; ethanol, 24; benzene,
2; vacuum and air, 1. Ionic compounds dissolved in less polar solvents than water may
exist predominantly as ion pairs, not separate ions.
�
� ��
q1q2
�r 2
�

156 CHAPTER 8 Activity and the Systematic Treatment of Equilibrium
8-20. (a) Write the charge and mass balances for a solution made bydissolving to give and (b) Modify the mass balance if the solution was made by dissolving0.2 mol in 1 L.
8-21. This problem demonstrates what would happen if charge bal-ance did not exist in a solution. The force between two charges wasgiven in the footnote to Problem 8-13. What is the force betweentwo beakers separated by 1.5 m if one contains 250 mL with
excess negative charge and the other has 250 mLwith excess positive charge? There are coulombs per mole of charge. Convert the force from N into poundswith the factor 0.224 8 pounds/N.
8-22. For a 0.1 M aqueous solution of sodium acetate, one mass balance is simply Write a mass balanceinvolving acetate.
8-23. Consider the dissolution of the compound which givesand Use the mass balance to find
an expression for in terms of the other concentrations. Sim-plify your answer as much as possible.
8-24. Write a mass balance for a solution of if thespecies are
8-25. (a) Following the example of in Section 8-5, writethe equations needed to find the solubility of Includeactivity coefficients where appropriate. Equilibrium constants are inAppendixes F and I. (b) Neglecting activity coefficients, compute the concentrations ofall species and compute the solubility of
8-26. Look up the equilibrium constant for the ion-pairing reactionin Appendix J.
(a) Use the systematic treatment of equilibrium to find inNeglect activity coefficients and any other reactions.
(b) Use the answer from part (a) to compute the ionic strength andactivity coefficients of and Then repeat the calculationusing activity coefficients. Repeat the procedure two more times tofind a good estimate of What percentage is ion paired? Whatis the ionic strength of the solution?
8-27. Finding solubility by iteration. Use the systematictreatment of equilibrium to find the concentrations of the majorspecies in a saturated aqueous solution of LiF. Consider the follow-ing reactions
(a) Initially, set the ionic strength to 0 and solve for all the concen-trations. Then compute the ionic strength and activity coefficientsand find new concentrations. Use several iterations to home in onthe correct solution.
(b) In the systematic treatment, you will find that the calculationsimplifies to . Set up the followingspreadsheet, in which ionic strength in cell B4 is initially given thevalue 0. Activity coefficients in cells B6 and B8 are from theextended Debye-Hückel equation. Cell B10 computes
With 0 in cell B4, your spreadsheet shouldcompute 1 in cells B6 and B8 and incell B10.
0.041 23 M[Li�] � [F�] �
[F�] � 2Ksp/ (�Li��F�).[Li�] �
[Li�] � [F�] � 2Ksp/ (�Li��F�)
LiF(s) T LiF(aq) Kion pair � LiF(aq)�LiF(aq) � 0.002 9
LiF(s) T Li� � F� Ksp � [Li�]�Li�[F�]�F� � 0.001 7
[Zn2�].
SO2�4 .Zn2�
0.010 F ZnSO4.[Zn2�]
Zn2� � SO2�4 T ZnSO4(aq)
Ca(OH)2 in g/L.
Ca(OH)2.Mg(OH)2
and HSO�4 .
Fe3�, Fe(OH)2�, Fe(OH)�2 , Fe2(OH)4�
2 , FeSO�4 , SO2�
4 ,Fe2(SO4)3
[Y2�]Y2�.X2Y2�
2 , X2Y4�, X2Y3(aq),X2Y3,
[Na�] � 0.1 M.Na�CH3CO�
2 ,
9.648 1041.0 10�6 M1.0 10�6 M
MgBr2
MgOH�.Mg2�, Br�, MgBr�,MgBr2
Because the ionic strength of a 1:1 electrolyte is equal to theconcentration, copy the value 0.041 23 from cell B10 into cellB4. (To transfer a numerical value, rather than a formula, COPY
cell B10 and then highlight cell B4. In the EDIT menu, selectPASTE SPECIAL and then choose Value. The numerical value fromB10 will be pasted into B4.) This procedure gives new activitycoefficients in cells B6 and B8 and a new concentration in cellB10. Copy the new concentration from cell B10 into cell B4 andrepeat this procedure several times until you have a constantanswer.(c) Using circular references in Excel. Take your spreadsheet andenter 0 in cell B4. The value 0.041 23 is computed in cell B10.Ideally, you would like to write “ ” in cell B4 so that thevalue from B10 would be copied to B4. Excel gives a “circularreference” error message because cell B10 depends on B4 and cellB4 depends on B10. To get around this problem, go to the TOOLS
menu and choose OPTIONS. Select Calculation and choose Itera-tion. Set the maximum change to 0.000 01. Click OK and Excelmerrily iterates between cells B10 and B4 until the two valuesagree within 0.000 01.
8-28. Heterogeneous equilibria and calcite solubility. If river waterin Box 8-2 is saturated with calcite is governed bythe following equilibria:
(a) From these reactions, find the equilibrium constant for thereaction
(A)
(b) The mass balance for Reaction A is Find(in mol/L and in mg/L) in equilibrium with atmospheric
if Locate this point on the line inBox 8-2. [Atmospheric is increasing so rapidly (Box 20-1)that needs to be revised between editions of this book. Weare changing our environment—with consequences left to thenext generation.]
PCO2
CO2
PCO2� 3.8 10�4 bar.CO2
[Ca2�][HCO�
3 ] � 2[Ca2�].
CaCO3(s) � CO2(aq)�H2O T Ca2� � 2HCO�3 K � ?
HCO�3 T CO2�
3 � H� K2 � 4.69 10�11
CO2(aq) � H2O T HCO�3 � H� K1 � 4.46 10�7
CO2(g) T CO2(aq) KCO2� 0.032
CaCO3(s) T Ca2� � CO2�3 Ksp � 4.5 10�9
(CaCO3), [Ca2�]
�B10
1 Spreadsheet for iterative LiF solubility computation
A
2
3 Size (pm) of Li+ = Ionic strength =
Activity coeff Li+ =
Activity coeff F– =
[Li+] = [F] =
Size (pm) of F– =
Ksp =
B6 = 10^((–0.51)*SQRT(B4)/(1+A4*SQRT(B4)/305))
B8 = 10^((–0.51)*SQRT(B4)/(1+A6*SQRT(B4)/305))
B10 = SQRT(A8/(B6*B8))
600 0.00000
1
1
0.04123
350
0.0017
4
5
6
7
8
9
10
11
12
13
14
B C

Problems 157
(c) The concentration of in the Don River is 80 mg/L. Whateffective is in equilibrium with this much How can theriver have this much
8-29. (Warning: This is a long problem, best done by five people,each completing one line of the table.) A fluoride ion-selective elec-trode responds to fluoride activity above in the follow-ing manner at
The constant depends on the reference electrode used with the fluo-ride electrode. A 20.00-mL solution containing 0.060 0 M NaF wastitrated with to precipitate Just consider-ing the precipitation reaction, fill in the following table and plot theexpected titration curve, assuming that the constant is �20.0 mV.
LaF3.0.020 0 M La(NO3)3
Potential (mV) � constant � 59.16 log AF�
25°C:AF� � 10�6
CO2?Ca2�?PCO2
Ca2� Ionic Potentialstrength (M) (mV)
0 0.060 0 0.060 0 0.80 58.05.00
10.0019.0020.0022.00
If you use a spreadsheet for this exercise, compute activity coeffi-cients with the extended Debye-Hückel equation and computemany more points. (You can look up the results of a similar titrationto compare with your calculations.11)
�F�[F�] (M)(mL)La(NO3)3

158 CHAPTER 9 Monoprotic Acid-Base Equilibria
MEASURING pH INSIDE CELLULAR COMPARTMENTS
Monoprotic Acid-Base Equilibria9
Macrophages are white blood cells that fight infection by ingesting and dissolving foreigncells—a process called phagocytosis. The compartment containing the ingested foreign cellmerges with compartments called lysosomes, which contain digestive enzymes that aremost active in acid. Low enzyme activity above pH 7 protects the cell from enzymes thatleak into the cell.
One way to measure pH inside the compartment containing the ingested particle anddigestive enzymes is to present macrophages with polystyrene beads coated with a lipidmembrane to which fluorescent (light-emitting) dyes are covalently bound. Panel d showsthat fluorescence intensity from the dye fluorescein depends on pH, but fluorescence fromtetramethylrhodamine does not. The ratio of emission from the dyes is a measure of pH.Panel e shows the fluorescence intensity ratio changing in 3 s as the bead is ingested andthe pH around the bead drops from 7.3 to 5.7 to allow digestion to commence.
(d) Fluorescence spectra oflipobeads in solutions at pH 5–8.(e) pH change duringphagocytosis of a single bead bya macrophage. [From McNamaraet al., ibid.]
(a) Mouse macrophage engulfstwo foreign red blood cells asphagocytosis begins. [From J. P.Revel, in B. Alberts, D. Bray, J. Lewis,M. Raff, K. Roberts, and J. D. Watson,Molecular Biology of the Cell, 2nd ed.(New York: Garland Publishing, 1989.](b) Two macrophages withingested 1.6-�m-diameterfluorescent beads. (c) Fluorescenceimage of panel b. [From K. P.McNamara, T. Nguyen, G. Dumitrascu,J. Ji, N. Rosenzweig, and Z. Rosenzweig,“Synthesis, Characterization, andApplication of Fluorescence SensingLipobeads for Intracellular pHMeasurements,” Anal. Chem. 2001,73, 3240.]
Flu
ores
cenc
e in
tens
ity
500 520
Wavelength (nm)
540 560 580 600
Tetramethylrhodamineemission
Fluoresceinemission
(d )
pH 8
pH 7
pH 6
pH 5
Flu
ores
cenc
e in
tens
ity r
atio
(flu
ores
cein
/rho
dam
ine)
0 5Time (s)
10 15 20
pH 7.3
pH 5.7
(e)
(c )(b)(a)

A cids and bases are essential to virtually every application of chemistry and for the intelli-gent use of analytical procedures such as chromatography and electrophoresis. It would bedifficult to have a meaningful discussion of, say, protein purification or the weathering ofrocks without understanding acids and bases. This chapter covers acid-base equilibria andbuffers. Chapter 10 treats polyprotic systems involving two or more acidic protons. Nearlyevery biological macromolecule is polyprotic. Chapter 11 describes acid-base titrations. Nowis the time to review fundamentals of acids and bases in Sections 6-5 through 6-7.
9-1 Strong Acids and BasesWhat could be easier than calculating the pH of 0.10 M HBr? HBr is a strong acid, so thereaction
goes to completion, and the concentration of is 0.10 M. It will be our custom to writeinstead of , and we can say
Example Activity Coefficient in a Strong-Acid Calculation
Calculate the pH of 0.10 M HBr, using activity coefficients.
Solution The ionic strength of 0.10 M HBr is 0.10 M, at which the activity coefficientof is 0.83 (Table 8-1). Remember that pH is , not :
pH � �log[H�]�H� � �log(0.10)(0.83) � 1.08
�log[H�]�logAH�H�
pH � �log[H�] � �log (0.10) � 1.00
H3O�H�
H3O�
HBr � H2O S H3O� � Br�
9-1 Strong Acids and Bases 159
Box 9-1 Concentrated HNO3 Is Only Slightly Dissociated2
Strong acids in dilute solution are essentially completely dissoci-ated. As concentration increases, the degree of dissociationdecreases. The figure shows a Raman spectrum of solutions ofnitric acid of increasing concentration. The spectrum measuresscattering of light whose energy corresponds to vibrational ener-gies of molecules. The sharp signal at in the spectrumof is characteristic of free anion.NO�
35.1 M NaNO3
1 049 cm�1
A solution has a strong signal at ,arising from from dissociated acid. Bands denoted by aster-isks arise from undissociated . As concentration increases,the signal disappears and signals attributed to undisso-ciated increase. The graph shows the fraction of dissocia-tion deduced from spectroscopic measurements. It is instructive torealize that, in , there are fewer molecules thanthere are molecules of . Dissociation decreases becausethere is not enough solvent to stabilize the free ions.
HNO3
H2O20 M HNO3
HNO3
1 049 cm�1
HNO3
NO3�
1 049 cm�110.0 M HNO3
Temperature (�C) Acid dissociation constant (Ka)
0 46.825 26.850 14.9
Ram
an s
catte
ring
23.4 M HNO3
98.6 wt % HNO3
48.3 wt % HNO3
1 360 cm–1 1 049 cm–1 720 cm–1
21.8 M HNO3
19.7 M HNO3
15.7 M HNO3
10.0 M HNO3
5.1 M NaNO3
**
*
** *
**
*
* *
Raman spectrum of aqueous at . Signals at 1 360,1 049, andarise from anion. Signals denoted by asterisks are from
undissociated . The wavenumber unit, is 1/wavelength.cm�1,HNO3
NO�3720 cm�1
25°CHNO3
1.0
0.8
0.6
0.4
0.2
0.00 105 15 20
Fract
ion of di
ssoci
ation
, α
Formal concentration (M)
Raman
H2O
HNO3
NMR
= 3 1 1 2
Table 6-2 gave a list of strong acids and basesthat you must memorize.
Equilibrium constants for the reaction1
is discussed in Box 9-1.HNO3
HNO3 Ka � 101.4
HI Ka � 1010.4
HBr Ka � 105.8
HCl Ka � 103.9
HX � H2O T H3O� � X�
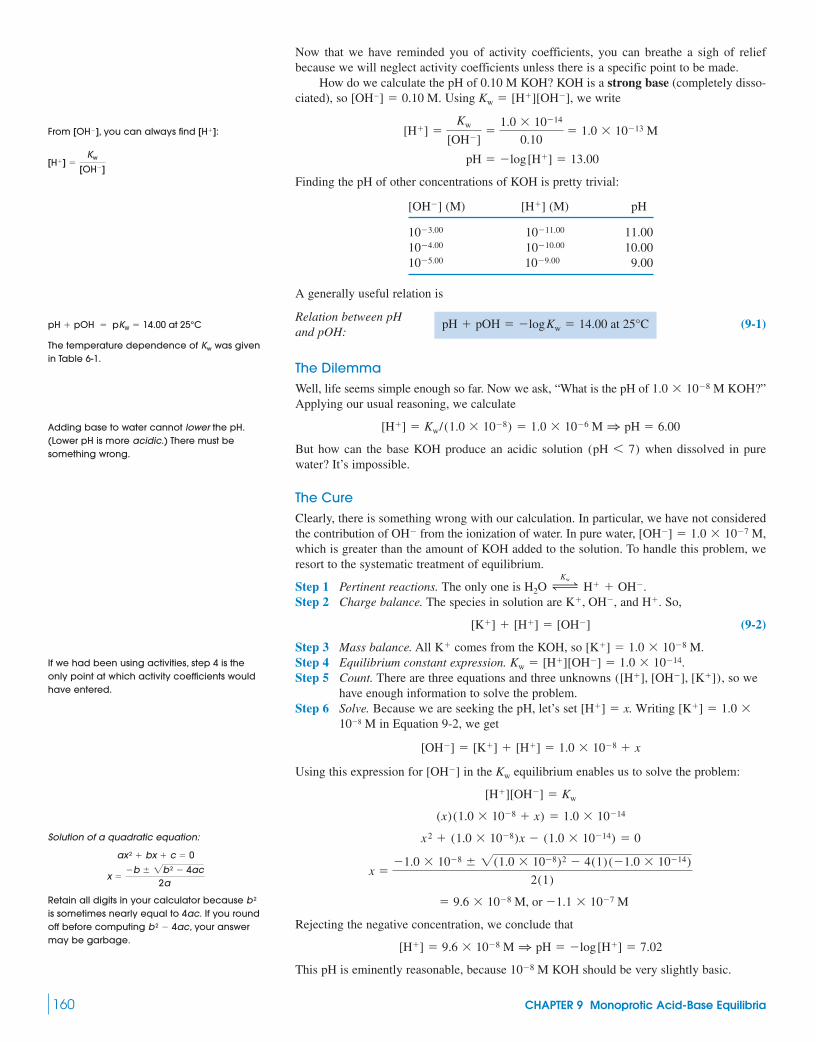
Now that we have reminded you of activity coefficients, you can breathe a sigh of reliefbecause we will neglect activity coefficients unless there is a specific point to be made.
How do we calculate the pH of 0.10 M KOH? KOH is a strong base (completely disso-ciated), so . Using , we write
Finding the pH of other concentrations of KOH is pretty trivial:
[OH�] (M) [H�] (M) pH
11.0010.009.00
A generally useful relation is
(9-1)
The DilemmaWell, life seems simple enough so far. Now we ask, “What is the pH of ”Applying our usual reasoning, we calculate
But how can the base KOH produce an acidic solution when dissolved in purewater? It’s impossible.
The CureClearly, there is something wrong with our calculation. In particular, we have not consideredthe contribution of from the ionization of water. In pure water, which is greater than the amount of KOH added to the solution. To handle this problem, weresort to the systematic treatment of equilibrium.
Step 1 Pertinent reactions. The only one is .Step 2 Charge balance. The species in solution are and . So,
(9-2)
Step 3 Mass balance. All comes from the KOH, so Step 4 Equilibrium constant expression.Step 5 Count. There are three equations and three unknowns , so we
have enough information to solve the problem.Step 6 Solve. Because we are seeking the pH, let’s set Writing
in Equation 9-2, we get
Using this expression for in the equilibrium enables us to solve the problem:
Rejecting the negative concentration, we conclude that
This pH is eminently reasonable, because KOH should be very slightly basic.10�8 M
[H�] � 9.6 10�8 M 1 pH � �log[H�] � 7.02
� 9.6 10�8 M, or �1.1 10�7 M
x ��1.0 10�8 2(1.0 10�8)2 � 4(1)(�1.0 10�14)
2(1)
x2 � (1.0 10�8)x � (1.0 10�14) � 0
(x) (1.0 10�8 � x) � 1.0 10�14
[H�][OH�] � Kw
Kw[OH�]
[OH�] � [K�] � [H�] � 1.0 10�8 � x
10�8 M[K�] � 1.0 [H�] � x.
([H�], [OH�], [K�])Kw � [H�][OH�] � 1.0 10�14.
[K�] � 1.0 10�8 M.K�
[K�] � [H�] � [OH�]
H�K�, OH�,H2O ∆
Kw
H� � OH�
[OH�] � 1.0 10�7 M,OH�
(pH 6 7)
[H�] � Kw/(1.0 10�8) � 1.0 10�6 M 1 pH � 6.00
1.0 10�8 M KOH?
pH � pOH � �logKw � 14.00 at 25°CRelation between pHand pOH:
10�9.0010�5.0010�10.0010�4.0010�11.0010�3.00
pH � �log[H�] � 13.00
[H�] �Kw
[OH�]�
1.0 10�14
0.10� 1.0 10�13 M
Kw � [H�][OH�][OH�] � 0.10 M
160 CHAPTER 9 Monoprotic Acid-Base Equilibria
From , you can always find :
[H�] �Kw
[OH�]
[H�][OH�]
The temperature dependence of Kw was givenin Table 6-1.
pH � pOH � pKW � 14.00 at 25°C
Adding base to water cannot lower the pH.(Lower pH is more acidic.) There must besomething wrong.
If we had been using activities, step 4 is theonly point at which activity coefficients wouldhave entered.
Solution of a quadratic equation:
Retain all digits in your calculator because is sometimes nearly equal to 4ac. If you roundoff before computing , your answermay be garbage.
b 2 � 4ac
b 2
x ��b 2b 2 � 4ac
2a
ax 2 � bx � c � 0

Figure 9-1 shows the pH calculated for different concentrations of strong base or strongacid in water. There are three regions:
1. When the concentration is “high” , pH is calculated by just considering theadded or . That is, the pH of is 9.00.
2. When the concentration is “low” , the pH is 7.00. We have not addedenough acid or base to change the pH of the water itself.
3. At intermediate concentrations of to , the effects of water ionization andthe added acid or base are comparable. Only in this region is a systematic equilibriumcalculation necessary.
Region 1 is the only practical case. Unless you were to protect from the air, thepH would be overwhelmingly governed by dissolved , not KOH. To obtain a pH near 7,we use a buffer, not a strong acid or base.
Water Almost Never Produces 10�7 M H� and 10�7 M OH�
The misconception that dissociation of water always produces and is true only in pure water with no added acid or base. Any acid or base suppresses water ion-ization, as predicted by Le Châtelier’s principle. In , for example, the pH is 4. Theconcentration of is . But the only source of is thedissociation of water. If water produces only , it must also produce only
because it makes one for every . In solution, water disso-ciation produces only and .
9-2 Weak Acids and BasesLet’s review the meaning of the acid dissociation constant, , for the acid HA:
(9-3)
A weak acid is one that is not completely dissociated. That is, Reaction 9-3 does not go tocompletion. For a base, B, the base hydrolysis constant, is defined by the reaction
(9-4)
A weak base is one for which Reaction 9-4 does not go to completion.pK is the negative logarithm of an equilibrium constant:
As K increases, pK decreases, and vice versa. Comparing formic and benzoic acids, we seethat formic acid is stronger, with a larger and smaller , than benzoic acid.
Formic acid Formate
Benzoic acid Benzoate
The acid HA and its corresponding base, , are said to be a conjugate acid-base pair,because they are related by the gain or loss of a proton. Similarly, B and are a conjugatepair. The important relation between and for a conjugate acid-base pair, derived inEquation 6-35, is
(9-5)Ka � Kb � KwRelation between Ka andKb for conjugate pair:
KbKa
BH�
A�
pKa � 4.202
Ka � 6.28 10�5
ß COH ß CO� � ��¡O
¡O
T
pKa � 3.744
Ka � 1.80 10�4
HCOH T H� � HCO�
¡O
¡O
pKaKa
pKb � �log Kb
pKa � �log Ka
pKw � �log Kw
B � H2O ∆Kb
BH� � OH� Kb �[BH�][OH�]
[B]Weak-baseequilibrium:
Kb,
HA ∆Ka
H� � A� Ka �[H�][A�]
[HA]Weak-acidequilibrium:
Ka
10�10 M H�10�10 M OH�
10�4 M HBrOH�H�10�10 M H�
10�10 M OH�
[OH�][OH�] � Kw/[H�] � 10�10 MOH�
10�4 M HBr
10�7 M OH�10�7 M H�
CO2
10�7 M KOH
10�8 M10�6
(�10�8 M)10�5.00 M KOHOH�H�
(�10�6 M)
9-2 Weak Acids and Bases 161
Systematictreatmentrequiredhere
12
–10
pH
log (concentration)–9–8–7–6–5–4–3–2
11
10
9
8
7
6
5
4
3
2
KOH
HBr
Question What concentrations of and are produced by dissociation in
0.01 M ?NaOHH2OOH�
H�
Of course, you know that Ka should reallybe expressed in terms of activities, notconcentrations: .Ka � AH�AA�/AHA
Hydrolysis refers to a reaction with water.
As Ka increases, pKa decreases. The smallerpKa is, the stronger the acid is.
HA and are a conjugate acid-base pair.B and also are conjugate.BH�
A�
Figure 9-1 Calculated pH as a function ofconcentration of strong acid or strong base inwater.
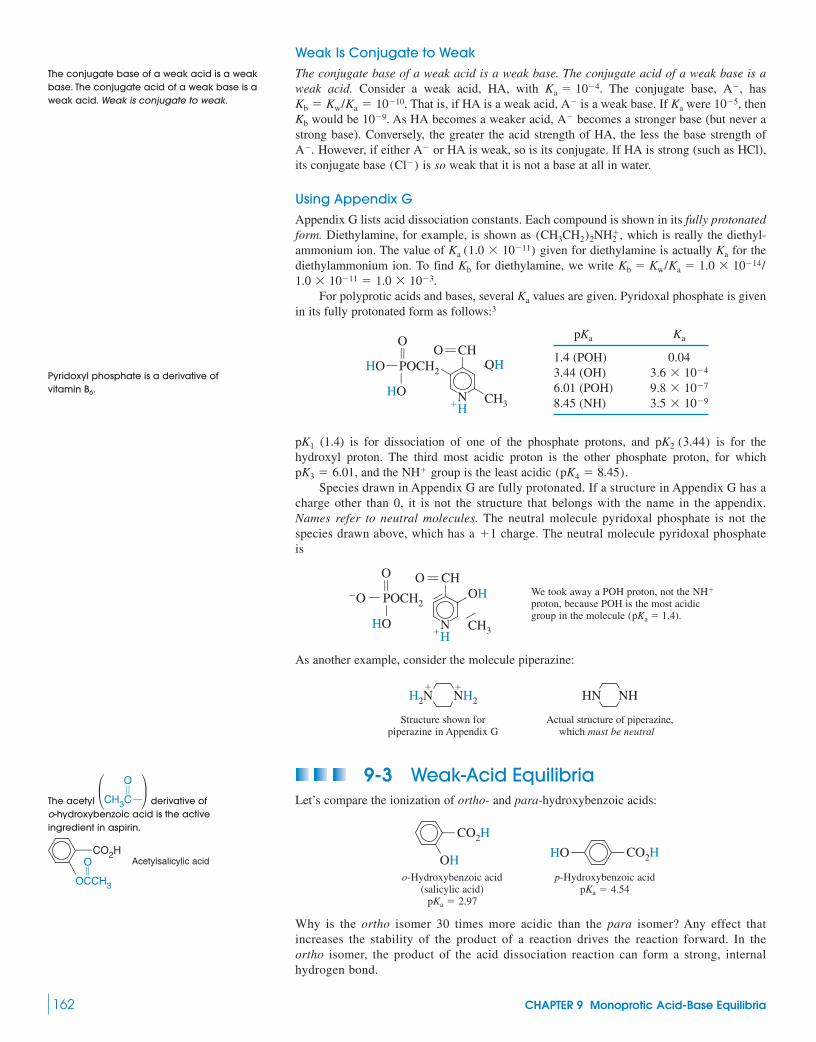
Weak Is Conjugate to WeakThe conjugate base of a weak acid is a weak base. The conjugate acid of a weak base is aweak acid. Consider a weak acid, HA, with . The conjugate base, has
. That is, if HA is a weak acid, is a weak base. If were thenwould be . As HA becomes a weaker acid, becomes a stronger base (but never a
strong base). Conversely, the greater the acid strength of HA, the less the base strength ofHowever, if either or HA is weak, so is its conjugate. If HA is strong (such as HCl),
its conjugate base is so weak that it is not a base at all in water.
Using Appendix GAppendix G lists acid dissociation constants. Each compound is shown in its fully protonatedform. Diethylamine, for example, is shown as , which is really the diethyl-ammonium ion. The value of given for diethylamine is actually for thediethylammonium ion. To find for diethylamine, we write
.For polyprotic acids and bases, several values are given. Pyridoxal phosphate is given
in its fully protonated form as follows:3
(1.4) is for dissociation of one of the phosphate protons, and is for thehydroxyl proton. The third most acidic proton is the other phosphate proton, for which
, and the group is the least acidic .Species drawn in Appendix G are fully protonated. If a structure in Appendix G has a
charge other than 0, it is not the structure that belongs with the name in the appendix.Names refer to neutral molecules. The neutral molecule pyridoxal phosphate is not thespecies drawn above, which has a charge. The neutral molecule pyridoxal phosphateis
As another example, consider the molecule piperazine:
Structure shown for Actual structure of piperazine,piperazine in Appendix G which must be neutral
9-3 Weak-Acid EquilibriaLet’s compare the ionization of ortho- and para-hydroxybenzoic acids:
o-Hydroxybenzoic acid p-Hydroxybenzoic acid(salicylic acid)
Why is the ortho isomer 30 times more acidic than the para isomer? Any effect thatincreases the stability of the product of a reaction drives the reaction forward. In theortho isomer, the product of the acid dissociation reaction can form a strong, internalhydrogen bond.
pKa � 2.97pKa � 4.54
CO2HßßHO
CO2Håß
OH
HN NHH2N NH2
� �
We took away a POH proton, not the NH�
proton, because POH is the most acidicgroup in the molecule (pKa � 1.4).
åå
å
å OH
CH3NH�
O CHßß
�O ß POCH2å
HO
ßß
O
�1
(pK4 � 8.45)NH�pK3 � 6.01
pK2 (3.44)pK1
Ka
1.0 10�11 � 1.0 10�3Kb � Kw/Ka � 1.0 10�14/Kb
KaKa (1.0 10�11)(CH3CH2)2NH�
2
(Cl�)A�A�.
A�10�9Kb
10�5,KaA�Kb � Kw/Ka � 10�10A�,Ka � 10�4
162 CHAPTER 9 Monoprotic Acid-Base Equilibria
HO ® POCH2
¡O
˚˚
˚
˚ ˚
HO
O £ CHOH
CH3NH�
1.4 (POH) 0.043.44 (OH)6.01 (POH)8.45 (NH) 3.5 10�9
9.8 10�73.6 10�4
KapKa
The conjugate base of a weak acid is a weakbase. The conjugate acid of a weak base is aweak acid. Weak is conjugate to weak.
Pyridoxyl phosphate is a derivative ofvitamin B6.
The acetyl derivative of o-hydroxybenzoic acid is the active ingredient in aspirin.
¢CH3C ß
•O°
OCCH3
™Oç Ç
ßÍCO2HAcetylsalicylic acid

The para isomer cannot form such a bond because the and groups are too farapart. By stabilizing the product, the internal hydrogen bond is thought to make o-hydroxy-benzoic acid more acidic than p-hydroxybenzoic acid.
A Typical Weak-Acid ProblemThe problem is to find the pH of a solution of the weak acid HA, given the formal con-centration of HA and the value of Let’s call the formal concentration F and use thesystematic treatment of equilibrium:
Reactions:
Charge balance: (9-6)
Mass balance: (9-7)
Equilibrium expressions: (9-8)
There are four equations and four unknowns , so the problem issolved if we can just do the algebra.
But it’s not so easy to solve these simultaneous equations. If you combine them, youwill discover that a cubic equation results. At this point, the Good Chemist rides down againfrom the mountain on her white stallion to rescue us and cries, “Wait! There is no reason tosolve a cubic equation. We can make an excellent, simplifying approximation. (Besides, Ihave trouble solving cubic equations.)”
For any respectable weak acid, from HA will be much greater than from When HA dissociates, it produces . When dissociates, it produces . If dissociationof HA is much greater than dissociation, then , and Equation 9-6 reduces to
(9-9)
To solve the problem, first set . Equation 9-9 says that also is equalto x. Equation 9-7 says that Putting these expressions intoEquation 9-8 gives
Setting and for o-hydroxybenzoic acid, we can solvethe equation, because it is just a quadratic equation.
(negative root rejected)
Was the approximation justified? The calculated pH is 2.17, which meansthat .
The assumption that is derived mainly from HA is excellent.H�
1 [H�] from H2O dissociation � 1.5 10�12 M
[OH�] (from H2O dissociation) � 1.5 10�12 M
1 [H�] from HA dissociation � 6.8 10�3 M
[A�] (from HA dissociation) � 6.8 10�3 M
[OH�] � Kw/[H�] � 1.5 10�12 M[H�] � [A�]
pH � �log x � 2.17
[HA] � F � x � 0.0432 M
[H�] � [A�] � x � 6.80 10�3 M
x � 6.80 10�3
x2 � (1.07 10�3)x � 5.35 10�5 � 0
x2
0.050 0 � x� 1.07 10�3
Ka � 1.07 10�3F � 0.050 0 M
Ka �[H�][A�]
[HA]�
(x)(x)
F � x
[HA] � F � [A�] � F � x.[A�][H�] � x
[H�] � [A�]
[A�] W [OH�]H2OOH�H2OA�
H2O.[H�][H�]
([A�], [HA], [H�], [OH�])
Kw � [H�][OH�]
Ka �[H�][A�]
[HA]
F � [A�] � [HA]
[H�] � [A�] � [OH�]
HA ∆Ka
H� � A� H2O ∆Kw
H� � OH�
Ka.4
ßCO�2ßOH
N
Cåå
ßO
O
O ß H
CO2Håß
OH
� � H�
Hydrogen bond
T
9-3 Weak-Acid Equilibria 163
Formal concentration is the total number ofmoles of a compound dissolved in a liter. Theformal concentration of a weak acid is thetotal amount of HA placed in the solution,regardless of the fact that some haschanged into .A�
in weak-acid problems.x � [H�]
For uniformity, we will usually express pH to the0.01 decimal place, regardless of the numberof places justified by significant figures.
In a solution of a weak acid, is derivedalmost entirely from HA, not from .H2O
H�

Fraction of DissociationThe fraction of dissociation, , is defined as the fraction of the acid in the form :
(9-10)
For 0.050 0 M o-hydroxybenzoic acid, we find
That is, the acid is 14% dissociated at a formal concentration of 0.050 0 M.The variation of with formal concentration is shown in Figure 9-2. Weak electrolytes
(compounds that are only partially dissociated) dissociate more as they are diluted. o-Hydroxyben-zoic acid is more dissociated than p-hydroxybenzoic acid at the same formal concentration becausethe ortho isomer is a stronger acid. Box 9-2 and Demonstration 9-1 illustrate weak-acid properties.
The Essence of a Weak-Acid ProblemWhen faced with finding the pH of a weak acid, you should immediately realize that
and proceed to set up and solve the equation
(9-11)
where F is the formal concentration of HA. The approximation would be pooronly if the acid were too dilute or too weak, neither of which constitutes a practical problem.
[H�] � [A�]
[H�][A�]
[HA]�
x2
F � x� KaEquation for weak acids:
[H�] � [A�] � x
�
� �6.8 10�3 M
0.050 0 M� 0.14
�x
x � (F � x)�
x
F� �
[A�]
[A�] � [HA]Fraction of dissociationof an acid:
A��
164 CHAPTER 9 Monoprotic Acid-Base Equilibria
Box 9-2 Dyeing Fabrics and the Fraction of Dissociation5
Cotton fabrics are largely cellulose, a polymer with repeatingunits of the sugar glucose:
Structure of cellulose. Hydrogen bonding between glucose unitshelps make the structure rigid.
Dyes are colored molecules that can form covalent bonds to fab-ric. For example, Procion Brilliant Blue M-R is a dye with a bluechromophore (the colored part) attached to a reactive dichloro-triazine ring:
Blue chromophore Procion Brilliant Blue M-R fabric dye
Oxygen atoms of the groups on cellulose can replace Clatoms of the dye to form covalent bonds that fix the dye perma-nently to the fabric:
ßßß ßß
ß
ßßßN
NNDye
Cl
Cl
�O ß Cellulose
ßßß ßß
ß
ßßßN
NNDye
O ß Cellulose
ClChemically reactiveform of cellulose isdeprotonated anion
� Cl�
ßCH2OH
ß
¡O
HN
SO3Na
ß
¡O
ß
ß
ß
SO3Na
HNß
ß
ß
ßN
NN
Cl
Cl
Chlorine atoms can bereplaced by oxygenatoms of cellulose
H
O
O
CH2OH
HO
OLHß OO
O CH2OH
OH
H OO
O
OHO
OK
O
CH2OH
These oxygen atoms can bind to dye
After the fabric has been dyed in cold water, excess dye isremoved with a hot wash. During the hot wash, the second Clgroup of the dye is replaced by a second cellulose or by water(giving dye ).
The chemically reactive form of cellulose is the conjugatebase:
Cellulose CH2OH #¢¢¢4 cellulose CH2O� � H�
ROH
To promote dissociation of the cellulose proton, dyeingis carried out in sodium carbonate solution with a pH around 10.6.The fraction of reactive cellulose is given by the fraction of disso-ciation of the weak acid at pH 10.6:
Because the fraction of dissociation of the very weak acid is sosmall, in the denominator, which is thereforeapproximately just [ROH]. The quotient can be cal-culated from and the pH:
Only about one cellulose group in is in the reactiveform at pH 10.6.
104ßCH2OH
� 10�4.4 � fraction of dissociation
Ka �[RO�][H�]
[ROH]1
[RO�]
[ROH]�
Ka
[H�]�
10�15
10�10.6
Ka
[RO�]/[ROH][ROH] W [RO�]
Fraction of dissociation �[RO�]
[ROH] � [RO�]�
[RO�]
[ROH]
ßCH2OH
RO�
ßKa�10�15
ß
ßOH
Frac
tion
of d
isso
ciat
ion
(α)
log (formal concentration)–6–3–2–10 –4 –5
0.10
1.00
0.90
0.80
0.70
0.60
0.50
0.40
0.30
0.20pKa = 4.54
HO CO2H
pKa = 2.97
CO2H
OH
Figure 9-2 Fraction of dissociation of aweak electrolyte increases as electrolyte isdiluted. The stronger acid is more dissociatedthan the weaker acid at all concentrations.

9-3 Weak-Acid Equilibria 165
* salts are not completely dissociated, because there are some ion pairs, (Box 8-1).Equilibrium constants for are given below. For 0.050 F solutions, the fraction ofion pairing is 4% in , 7% in , and 9% in
1.1 2.02.5 2.91.4 4.62.4 6.03.1
� CH3CH2CH2CH2ßMe � CH3ß, Et � CH3CH2ß, Pr � CH3CH2CH2ß, Bu
Br�Pr4N�
I�Bu4N�Br�Et4N�
I�Pr4N�Br�Me4N�
I�Et4N�Cl�Bu4N�
I�Me4N�Cl�Me4N�
Kion pairX�R4N�Kion pairX�R4N�
(CH3CH2CH2)4N�Br�.(CH3CH2)4N�Br�(CH3)4N�Br�
R4N� � X� T R4N�X�(aq)R4N�X�(aq)R4N�X�
Demonstration 9-1 Conductivity of Weak Electrolytes6
The relative conductivity of strong and weak acids is related to theirdifferent degrees of dissociation in aqueous solution. To demon-strate conductivity, we use a Radio Shack piezo alerting buzzer, butany kind of buzzer or light bulb could easily be substituted. Thevoltage required will depend on the buzzer or light chosen.
When a conducting solution is placed in the beaker, the hornsounds. First show that distilled water and sucrose solution arenonconductive. Solutions of the strong electrolytes NaCl or HClare conductive. Compare strong and weak electrolytes by demon-strating that 1 mM HCl gives a loud sound, whereas 1 mM aceticacid gives little or no sound. With 10 mM acetic acid, the strengthof the sound varies noticeably as the electrodes are moved awayfrom each other in the beaker.
When is absorbed by pure water, the conductivityincreases from dissociation of the (carbonic acid) formed.Atmospheric can be measured by conductivity.7CO2
H2CO3
CO2
Cu metal strips(~1 × 5 cm)
~20 Vpower supplyHorn
Beaker
has no acidic or basic properties becauseit is the conjugate base of the strong acid HCl.If had appreciable basicity, HCl would notbe completely dissociated.
Cl�
Cl�
Example A Weak-Acid Problem
Find the pH of 0.050 M trimethylammonium chloride.
Trimethylammonium chloride
Solution We assume that ammonium halide salts are completely dissociated to giveand .* We then recognize that trimethylammonium ion is a weak acid,
being the conjugate acid of trimethylamine, , a weak base. has no basic oracidic properties and should be ignored. In Appendix G, we find trimethylammonium ionlisted as trimethylamine, but drawn as trimethylammonium ion, with . So,
From here, everything is downhill.
x x
(9-12)
x � 2.8 10�6 M 1 pH � 5.55
x2
0.050 � x� 1.59 10�10
F � x
(CH3)3NH� ∆Ka
(CH3)3N � H�
Ka � 10�pKa � 10�9.799 � 1.59 10�10
pKa � 9.799
Cl�(CH3)3NCl�(CH3)3NH�
�
N Cl�
H3C H3CCH3
Hå
å
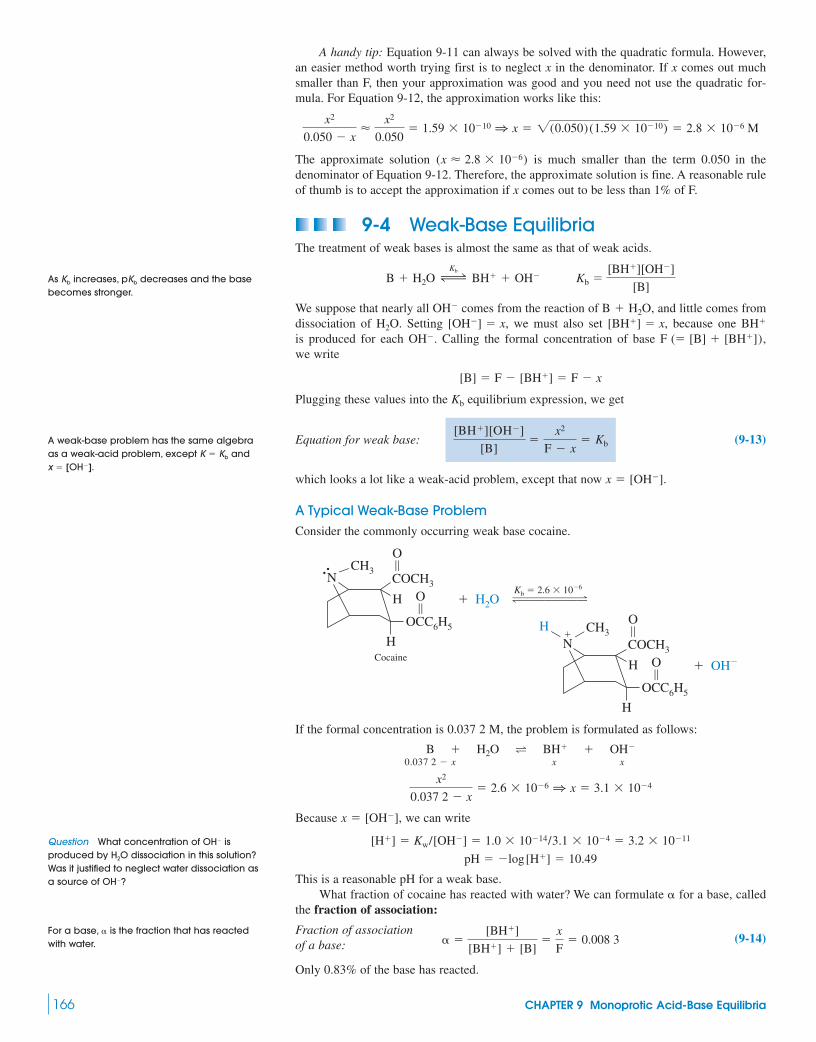
A handy tip: Equation 9-11 can always be solved with the quadratic formula. However,an easier method worth trying first is to neglect x in the denominator. If x comes out muchsmaller than F, then your approximation was good and you need not use the quadratic for-mula. For Equation 9-12, the approximation works like this:
The approximate solution is much smaller than the term 0.050 in thedenominator of Equation 9-12. Therefore, the approximate solution is fine. A reasonable ruleof thumb is to accept the approximation if x comes out to be less than 1% of F.
9-4 Weak-Base EquilibriaThe treatment of weak bases is almost the same as that of weak acids.
We suppose that nearly all comes from the reaction of , and little comes fromdissociation of . Setting we must also set because one is produced for each . Calling the formal concentration of base we write
Plugging these values into the equilibrium expression, we get
(9-13)
which looks a lot like a weak-acid problem, except that now .
A Typical Weak-Base ProblemConsider the commonly occurring weak base cocaine.
If the formal concentration is 0.037 2 M, the problem is formulated as follows:
Because , we can write
This is a reasonable pH for a weak base.What fraction of cocaine has reacted with water? We can formulate for a base, called
the fraction of association:
(9-14)
Only 0.83% of the base has reacted.
� �[BH�]
[BH�] � [B]�
x
F� 0.008 3
Fraction of associationof a base:
�
pH � �log[H�] � 10.49
[H�] � Kw/[OH�] � 1.0 10�14/3.1 10�4 � 3.2 10�11
x � [OH�]
x2
0.037 2 � x� 2.6 10�6 1 x � 3.1 10�4
xx0.037 2 � xB � H2O T BH� � OH�
COCH3Nœ CH3 ¡
H
O
OCC6H5
¡O � H2O #£££££4
� OH�
Kb � 2.6 10�6
COCH3
�N
ç œ CH3 ¡
H
H
O
OCC6H5
¡O
HH
Cocaine
x � [OH�]
[BH�][OH�]
[B]�
x2
F � x� KbEquation for weak base:
Kb
[B] � F � [BH�] � F � x
F (� [B] � [BH�]),OH�
BH�[BH�] � x,[OH�] � x,H2OB � H2OOH�
B � H2O ∆Kb
BH� � OH� Kb �[BH�][OH�]
[B]
(x � 2.8 10�6)
� 2(0.050)(1.59 10�10) � 2.8 10�6 Mx2
0.050 � x�
x2
0.050� 1.59 10�10 1 x
166 CHAPTER 9 Monoprotic Acid-Base Equilibria
As increases, decreases and the basebecomes stronger.
pKbKb
A weak-base problem has the same algebraas a weak-acid problem, except and
.x � [OH�]K � Kb
Question What concentration of isproduced by dissociation in this solution?Was it justified to neglect water dissociation asa source of ?OH�
H2OOH�
For a base, is the fraction that has reactedwith water.
�
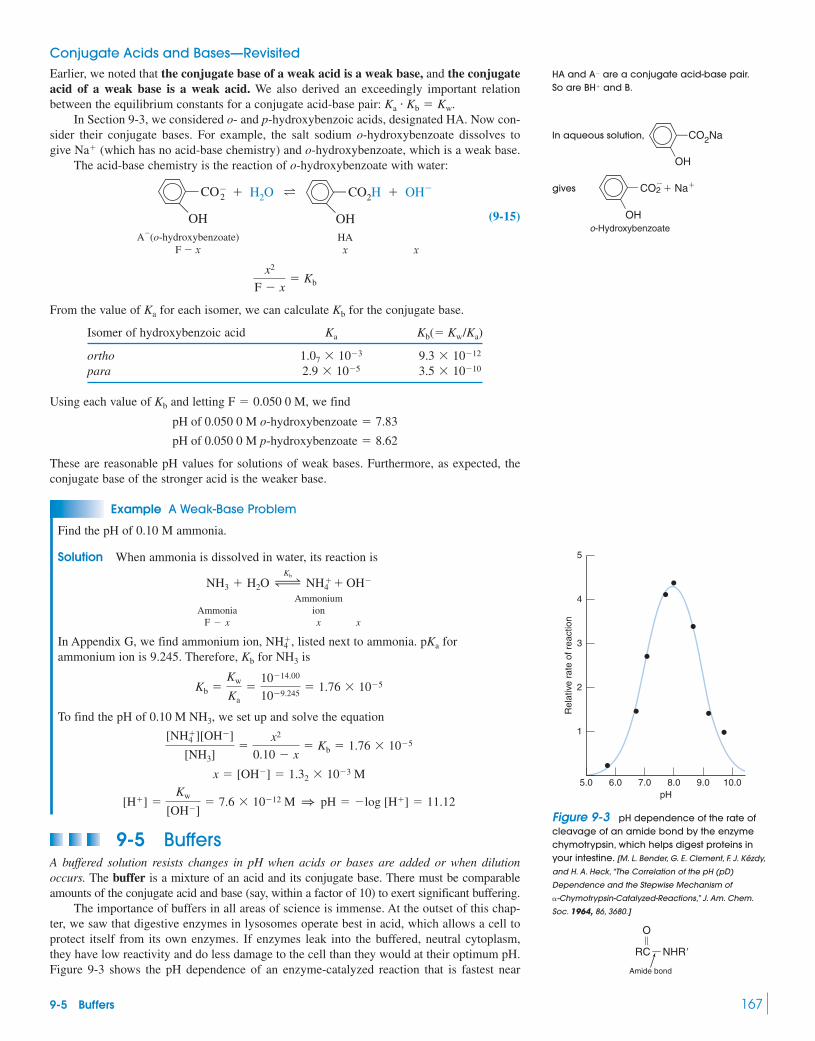
Conjugate Acids and Bases—RevisitedEarlier, we noted that the conjugate base of a weak acid is a weak base, and the conjugateacid of a weak base is a weak acid. We also derived an exceedingly important relationbetween the equilibrium constants for a conjugate acid-base pair: .
In Section 9-3, we considered o- and p-hydroxybenzoic acids, designated HA. Now con-sider their conjugate bases. For example, the salt sodium o-hydroxybenzoate dissolves togive (which has no acid-base chemistry) and o-hydroxybenzoate, which is a weak base.
The acid-base chemistry is the reaction of o-hydroxybenzoate with water:
(9-15)
From the value of for each isomer, we can calculate for the conjugate base.
Isomer of hydroxybenzoic acid Ka Kb(� Kw/Ka)
orthopara
Using each value of and letting , we find
These are reasonable pH values for solutions of weak bases. Furthermore, as expected, theconjugate base of the stronger acid is the weaker base.
Example A Weak-Base Problem
Find the pH of 0.10 M ammonia.
Solution When ammonia is dissolved in water, its reaction is
AmmoniumAmmonia ion
x x
In Appendix G, we find ammonium ion, , listed next to ammonia. for ammonium ion is 9.245. Therefore, for is
To find the pH of , we set up and solve the equation
9-5 BuffersA buffered solution resists changes in pH when acids or bases are added or when dilutionoccurs. The buffer is a mixture of an acid and its conjugate base. There must be comparableamounts of the conjugate acid and base (say, within a factor of 10) to exert significant buffering.
The importance of buffers in all areas of science is immense. At the outset of this chap-ter, we saw that digestive enzymes in lysosomes operate best in acid, which allows a cell toprotect itself from its own enzymes. If enzymes leak into the buffered, neutral cytoplasm,they have low reactivity and do less damage to the cell than they would at their optimum pH.Figure 9-3 shows the pH dependence of an enzyme-catalyzed reaction that is fastest near
[H�] �Kw
[OH�]� 7.6 � 10�12 M 1 pH � �log [H�] � 11.12
x � [OH�] � 1.32 � 10�3 M
[NH�4 ][OH�]
[NH3]�
x2
0.10 � x� Kb � 1.76 � 10�5
0.10 M NH3
Kb �Kw
Ka�
10�14.00
10�9.245� 1.76 � 10�5
NH3Kb
pKaNH�4
F � x
NH3 � H2O ∆Kb
NH�4 � OH�
pH of 0.050 0 M p-hydroxybenzoate � 8.62
pH of 0.050 0 M o-hydroxybenzoate � 7.83
F � 0.050 0 MKb
3.5 � 10�102.9 � 10�59.3 � 10�121.07 � 10�3
KbKa
x2
F � x� Kb
ßß
CO�2
OH
� H2O ßCO2H � OH�Tß
OHHAx x
A�(o-hydroxybenzoate)F � x
Na�
Ka � Kb � Kw
9-5 Buffers 167
HA and are a conjugate acid-base pair.So are and B.BH�
A�
In aqueous solution,
gives
o-Hydroxybenzoate
OHçßCO2Na
OHçßCO2
�� Na�
10.0
Rel
ativ
e ra
te o
f rea
ctio
n
pH9.08.07.06.05.0
1
2
3
4
5
Figure 9-3 pH dependence of the rate ofcleavage of an amide bond by the enzymechymotrypsin, which helps digest proteins inyour intestine. [M. L. Bender, G. E. Clement, F. J. Kézdy,
and H. A. Heck, “The Correlation of the pH (pD)
Dependence and the Stepwise Mechanism of
�-Chymotrypsin-Catalyzed-Reactions,” J. Am. Chem.
Soc. 1964, 86, 3680.]
RCß NHR�•O
Amide bond
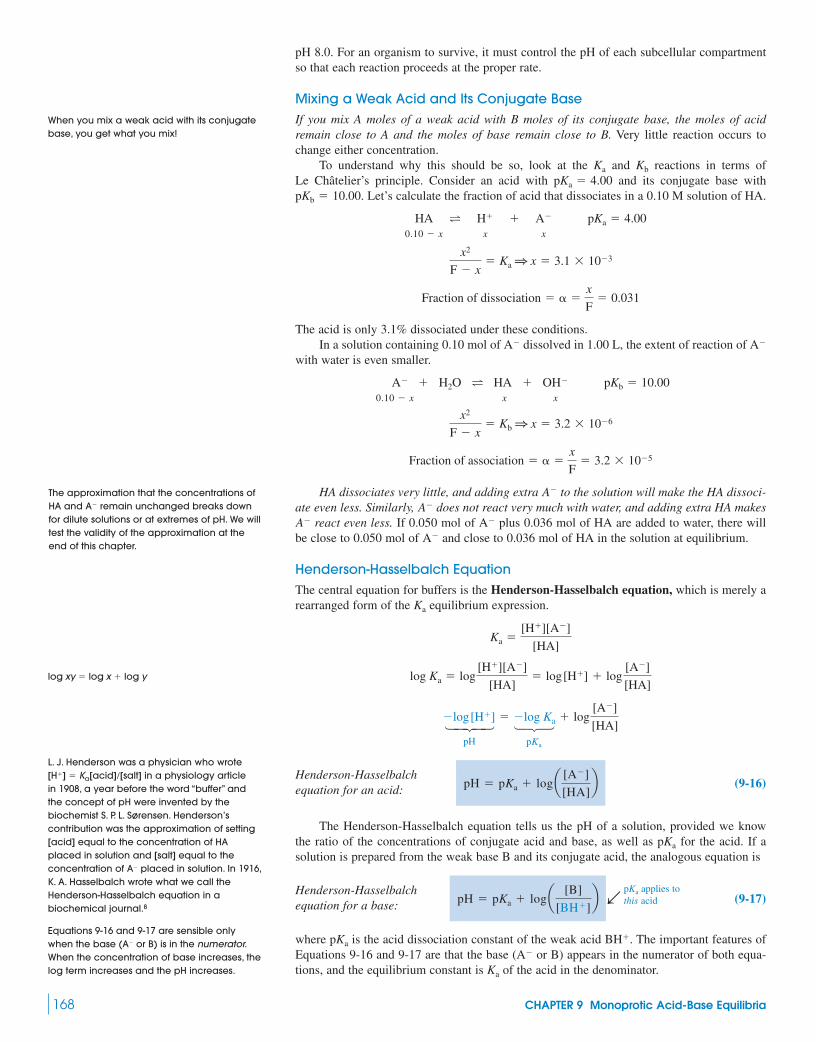
pH 8.0. For an organism to survive, it must control the pH of each subcellular compartmentso that each reaction proceeds at the proper rate.
Mixing a Weak Acid and Its Conjugate BaseIf you mix A moles of a weak acid with B moles of its conjugate base, the moles of acidremain close to A and the moles of base remain close to B. Very little reaction occurs tochange either concentration.
To understand why this should be so, look at the and reactions in terms ofLe Châtelier’s principle. Consider an acid with and its conjugate base with
. Let’s calculate the fraction of acid that dissociates in a 0.10 M solution of HA.
x x
The acid is only 3.1% dissociated under these conditions.In a solution containing 0.10 mol of dissolved in 1.00 L, the extent of reaction of
with water is even smaller.
x x
HA dissociates very little, and adding extra to the solution will make the HA dissoci-ate even less. Similarly, does not react very much with water, and adding extra HA makes
react even less. If 0.050 mol of plus 0.036 mol of HA are added to water, there willbe close to 0.050 mol of and close to 0.036 mol of HA in the solution at equilibrium.
Henderson-Hasselbalch EquationThe central equation for buffers is the Henderson-Hasselbalch equation, which is merely arearranged form of the equilibrium expression.
14243 123pH
(9-16)
The Henderson-Hasselbalch equation tells us the pH of a solution, provided we knowthe ratio of the concentrations of conjugate acid and base, as well as for the acid. If asolution is prepared from the weak base B and its conjugate acid, the analogous equation is
b (9-17)
where is the acid dissociation constant of the weak acid . The important features ofEquations 9-16 and 9-17 are that the base ( or B) appears in the numerator of both equa-tions, and the equilibrium constant is of the acid in the denominator.Ka
A�
BH�pKa
pKa applies tothis acidpH � pKa � loga [B]
[BH�]bHenderson-Hasselbalch
equation for a base:
pKa
pH � pKa � loga [A�]
[HA]bHenderson-Hasselbalch
equation for an acid:
pKa
�log[H�] � �log Ka � log[A�]
[HA]
log Ka � log[H�][A�]
[HA]� log[H�] � log
[A�]
[HA]
Ka �[H�][A�]
[HA]
Ka
A�
A�A�
A�
A�
Fraction of association � � �x
F� 3.2 10�5
x2
F � x� Kb 1 x � 3.2 10�6
0.10 � x
A� � H2O T HA � OH� pKb � 10.00
A�A�
Fraction of dissociation � � �x
F� 0.031
x2
F � x� Ka 1 x � 3.1 10�3
0.10 � x
HA T H� � A� pKa � 4.00
pKb � 10.00pKa � 4.00
KbKa
168 CHAPTER 9 Monoprotic Acid-Base Equilibria
When you mix a weak acid with its conjugatebase, you get what you mix!
The approximation that the concentrations ofHA and remain unchanged breaks downfor dilute solutions or at extremes of pH. We willtest the validity of the approximation at theend of this chapter.
A�
log xy � log x � log y
L. J. Henderson was a physician who wrotein a physiology article
in 1908, a year before the word “buffer” andthe concept of pH were invented by thebiochemist S. P. L. Sørensen. Henderson’scontribution was the approximation of setting[acid] equal to the concentration of HAplaced in solution and [salt] equal to theconcentration of placed in solution. In 1916,K. A. Hasselbalch wrote what we call theHenderson-Hasselbalch equation in abiochemical journal.8
A�
[H�] � Ka˛[acid]/[salt]
Equations 9-16 and 9-17 are sensible onlywhen the base ( or B) is in the numerator.When the concentration of base increases, thelog term increases and the pH increases.
A�
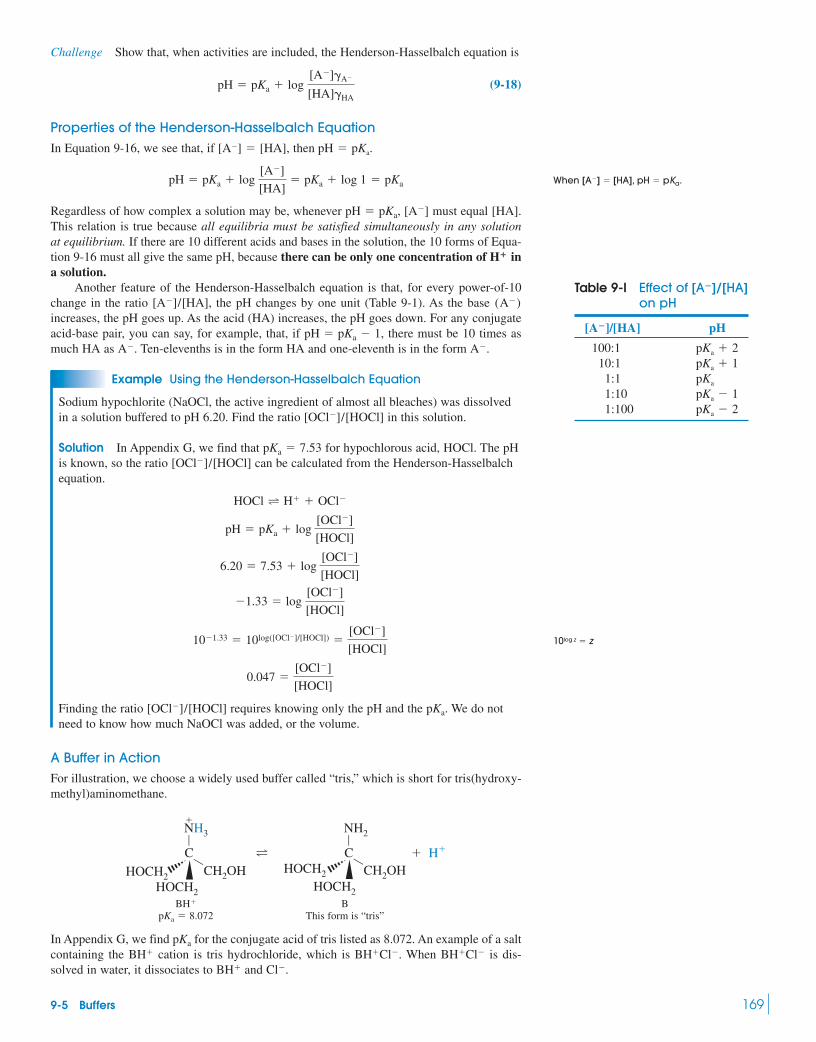
Challenge Show that, when activities are included, the Henderson-Hasselbalch equation is
(9-18)
Properties of the Henderson-Hasselbalch EquationIn Equation 9-16, we see that, if , then .
Regardless of how complex a solution may be, whenever , must equal [HA].This relation is true because all equilibria must be satisfied simultaneously in any solutionat equilibrium. If there are 10 different acids and bases in the solution, the 10 forms of Equa-tion 9-16 must all give the same pH, because there can be only one concentration of ina solution.
Another feature of the Henderson-Hasselbalch equation is that, for every power-of-10change in the ratio , the pH changes by one unit (Table 9-1). As the base increases, the pH goes up. As the acid (HA) increases, the pH goes down. For any conjugateacid-base pair, you can say, for example, that, if , there must be 10 times asmuch HA as . Ten-elevenths is in the form HA and one-eleventh is in the form .
Example Using the Henderson-Hasselbalch Equation
Sodium hypochlorite (NaOCl, the active ingredient of almost all bleaches) was dissolvedin a solution buffered to pH 6.20. Find the ratio in this solution.
Solution In Appendix G, we find that for hypochlorous acid, HOCl. The pHis known, so the ratio can be calculated from the Henderson-Hasselbalchequation.
Finding the ratio requires knowing only the pH and the . We do notneed to know how much NaOCl was added, or the volume.
A Buffer in ActionFor illustration, we choose a widely used buffer called “tris,” which is short for tris(hydroxy-methyl)aminomethane.
This form is “tris”
In Appendix G, we find for the conjugate acid of tris listed as 8.072. An example of a saltcontaining the cation is tris hydrochloride, which is . When is dis-solved in water, it dissociates to and .Cl�BH�
BH�Cl�BH�Cl�BH�
pKa
pKa � 8.072BBH�
C T
HOCH2HOCH2
�NH3å
CHOCH2
HOCH2
CH2OH
NH2å
å
CH2OH
å
� H�
pKa[OCl�]/[HOCl]
0.047 �[OCl�]
[HOCl]
10�1.33 � 10log([OCl�]/[HOCl]) �[OCl�]
[HOCl]
�1.33 � log[OCl�]
[HOCl]
6.20 � 7.53 � log[OCl�]
[HOCl]
pH � pKa � log[OCl�]
[HOCl]
HOCl T H� � OCl�
[OCl�]/[HOCl]pKa � 7.53
[OCl�]/[HOCl]
A�A�
pH � pKa � 1
(A�)[A�]/[HA]
H�
[A�]pH � pKa
pH � pKa � log[A�]
[HA]� pKa � log 1 � pKa
pH � pKa[A�] � [HA]
pH � pKa � log[A�]�A�
[HA]�HA
9-5 Buffers 169
When .[A�] � [HA], pH � pKa
Table 9-l Effect of [A�]/[HA]on pH
[A�]/[HA] pH
100:110:11:11:101:100 pKa � 2
pKa � 1pKa
pKa � 1pKa � 2
10log z � z

Example A Buffer Solution
Find the pH of a solution prepared by dissolving 12.43 g of tris (FM 121.135) plus 4.67 g of tris hydrochloride (FM 157.596) in 1.00 L of water.
Solution The concentrations of B and added to the solution are
Assuming that what we mixed stays in the same form, we plug these concentrations intothe Henderson-Hasselbalch equation to find the pH:
Notice that the volume of solution is irrelevant, because volume cancels in the numera-tor and denominator of the log term:
Example Effect of Adding Acid to a Buffer
If we add 12.0 mL of 1.00 M HCl to the solution used in the previous example, whatwill be the new pH?
Solution The key to this problem is to realize that, when a strong acid is added to aweak base, they react completely to give (Box 9-3). We are adding 12.0 mL of 1.00 M HCl, which contains . This much
will consume 0.012 0 mol of B to create , which is shown conveniently in a little table:
Tris From HCl
Initial moles 0.102 6 0.012 0 0.029 6Final moles 0.090 6 — 0.041 6
644474448 644474448(0.029 6 � 0.012 0)(0.102 6 � 0.012 0)
BH�SH��B
0.012 0 mol of BH�H�
(0.012 0 L)(1.00 mol/L) � 0.012 0 mol of H�
BH�
� pKa � logmoles of B
moles of BH�
pH � pKa � logmoles of B/L of solution
moles of BH�/L of solution
pH � pKa � log[B]
[BH�]� 8.072 � log
0.102 6
0.029 6� 8.61
[B] �12.43 g/L
121.135 g/mol� 0.102 6 M [BH�] �
4.67 g/L
157.596 g/mol� 0.029 6 M
BH�
170 CHAPTER 9 Monoprotic Acid-Base Equilibria
Box 9-3 Strong Plus Weak Reacts Completely
A strong acid reacts with a weak base essentially “completely”because the equilibrium constant is large.
Weak Strongbase acid
If B is tris(hydroxymethyl)aminomethane, the equilibrium con-stant for reaction with HCl is
A strong base reacts “completely” with a weak acid becausethe equilibrium constant is, again, very large.
Strong Weakbase acid
OH� � HA T A� � H2O K �1
Kb(for A�)
K �1
Ka
�1
10�8.072� 1.2 108
B � H� T BH� K �1
Ka(for BH�)
If HA is acetic acid, then the equilibrium constant for reactionwith NaOH is
The reaction of a strong acid with a strong base is even morecomplete than a strong plus weak reaction:
Strong Strongacid base
If you mix a strong acid, a strong base, a weak acid, and a weakbase, the strong acid and base will neutralize each other until oneis used up. The remaining strong acid or base will then react withthe weak base or weak acid.
H� � OH� T H2O K �1
KW
� 1014
K �1
Kb
�Ka(for HA)
KW
� 1.7 109
The pH of a buffer is nearly independent ofvolume.

The information in the table allows us to calculate the pH:
The volume of the solution is irrelevant.
We see that the pH of a buffer does not change very much when a limited amount ofstrong acid or base is added. Addition of 12.0 mL of 1.00 M HCl changed the pH from 8.61to 8.41. Addition of 12.0 mL of 1.00 M HCl to 1.00 L of unbuffered solution would have low-ered the pH to 1.93.
But why does a buffer resist changes in pH? It does so because the strong acid or base isconsumed by B or . If you add HCl to tris, B is converted into . If you add NaOH,
is converted into B. As long as you don’t use up the B or by adding too much HClor NaOH, the log term of the Henderson-Hasselbalch equation does not change very muchand the pH does not change very much. Demonstration 9-2 illustrates what happens when thebuffer does get used up. The buffer has its maximum capacity to resist changes of pH when
. We will return to this point later.pH � pKa
BH�BH�
BH�BH�
� 8.072 � log0.090 6
0.041 6� 8.41
pH � pKa � logmoles of B
moles of BH�
9-5 Buffers 171
Demonstration 9-2 How Buffers Work
A buffer resists changes in pH because the added acid or base isconsumed by the buffer. As the buffer is used up, it becomes lessresistant to changes in pH.
In this demonstration,9 a mixture containing approximately a10:1 mole ratio of is prepared. Because for is 7.2, the pH should be approximately
When formaldehyde is added, the net reaction is the consumptionof , but not of :
(A)
(B)
(In sequence A, bisulfite is consumed directly. In sequence B, thenet reaction is destruction of , with no change in the concentration.)
We can prepare a table showing how the pH should change asthe reacts.
Percentage of reaction Calculatedcompleted [SO2�
3 ]:[HSO�3] pH
0 1:10 6.290 1:1 7.299 1:0.1 8.299.9 1:0.01 9.299.99 1:0.001 10.2
HSO�3
SO2�3HSO�
3
H2C £ O � SO2� B H2C3
3
œ
ç
O�
SO� 3
H2Cœ
ç
O�
SO3�
H2Cœ
ç
OH
SO3�
Sulfite
� HSO� � SO2�B 3
H2C £ O � HSO� B H2C3
œ
ç
O�
SO3H
H2Cœ
ç
OH
SO3
B�
Formaldehyde Bisulfite
SO2�3HSO�
3
pH � pKa � log[SO2�
3 ]
[HSO�3 ]
� 7.2 � log1
10� 6.2
HSO3�pKaHSO�
3 :SO2�3
Through 90% completion, the pH should rise by just 1 unit. In thenext 9% of the reaction, the pH will rise by another unit. At theend of the reaction, the change in pH is very abrupt.
In the formaldehyde clock reaction, formaldehyde is added toa solution containing , and phenolphthalein indicator.Phenolphthalein is colorless below a pH of 8 and red above thispH. The solution remains colorless for more than a minute. Sud-denly the pH shoots up and the liquid turns pink. Monitoring thepH with a glass electrode gave the results in the graph.
HSO�3 , SO2�
3
Procedure: All solutions should be fresh. Prepare a solutionof formaldehyde by diluting 9 mL of 37 wt% formaldehyde to100 mL. Dissolve 1.5 g of 10 and 0.18 g of in400 mL of water, and add of phenolphthalein solution(Table 11-4). Add 23 mL of formaldehyde solution to the well-stirred buffer solution to initiate the clock reaction. The time ofreaction can be adjusted by changing the temperature, concen-trations, or volume.
�1 mLNa2SO3NaHSO3
Graph of pH versus time in the formaldehyde clock reaction.
10.0
120pH
Time (s)
9.0
8.0
7.0
6.0
9060300
Question Does the pH change in the rightdirection when HCl is added?
A buffer resists changes in pH . . .
. . . because the buffer consumes the addedacid or base.

Example Calculating How to Prepare a Buffer Solution
How many milliliters of 0.500 M NaOH should be added to 10.0 g of tris hydrochloride togive a pH of 7.60 in a final volume of 250 mL?
Solution The moles of tris hydrochloride in 10.0 g are . We can make a table to help solve the problem:
Reaction with OH�:
Initial moles 0.063 5 x —Final moles — x
The Henderson-Hasselbalch equation allows us to find x, because we know pH and .
This many moles of NaOH is contained in
Preparing a Buffer in Real Life!If you really wanted to prepare a tris buffer of pH 7.60, you would not do it by calculatingwhat to mix. Suppose that you wish to prepare 1.00 L of buffer containing 0.100 M tris at apH of 7.60. You have available solid tris hydrochloride and approximately 1 M NaOH. Here’show I would do it:
1. Weigh out 0.100 mol of tris hydrochloride and dissolve it in a beaker containing about800 mL of water.
2. Place a calibrated pH electrode in the solution and monitor the pH.3. Add NaOH solution until the pH is exactly 7.60.4. Transfer the solution to a volumetric flask and wash the beaker a few times. Add the
washings to the volumetric flask.5. Dilute to the mark and mix.
You do not simply add the calculated quantity of NaOH, because it would not give exactlythe desired pH. The reason for using 800 mL of water in the first step is so that the volumewill be reasonably close to the final volume during pH adjustment. Otherwise, the pH willchange slightly when the sample is diluted to its final volume and the ionic strength changes.
Buffer Capacity11
Buffer capacity, , is a measure of how well a solution resists changes in pH when strongacid or base is added. Buffer capacity is defined as
Buffer capacity: (9-19)
where and are the number of moles of strong acid and strong base per liter needed toproduce a unit change in pH. The greater the buffer capacity, the more resistant the solutionis to pH change.
Figure 9-4a shows versus pH for a solution containing 0.100 F HA with .The ordinate is the formal concentration of strong base needed to be mixed with 0.100 F HA to give the indicated pH. For example, a solution containing plus0.100 F HA would have a pH of 5.00 (neglecting activities).
Figure 9-4b, which is the derivative of the upper curve, shows buffer capacity for thesame system. Buffer capacity reaches a maximum when . That is, a buffer is mosteffective in resisting changes in pH when (that is, when ).[HA] � [A�]pH � pKa
pH � pKa
0.050 F OH�
(Cb)pKa � 5.00Cb
CbCa
� �dCb
dpH� �
dCa
dpH
�
0.016 0 mol
0.500 mol/L� 0.032 0 L � 32.0 mL
10�0.472 �x
0.063 5 � x1 x � 0.016 0 mol
�0.472 � logx
0.063 5 � x
7.60 � 8.072 � logx
0.063 5 � x
pH � pKa � logmol B
mol BH�
pKa
0.063 5 � x
BSOH��BH�
0.063 5(157.596 g/mol) �(10.0 g) /
172 CHAPTER 9 Monoprotic Acid-Base Equilibria
Figure 9-4 (a) b versus pH for a solutioncontaining 0.100 F HA with (b) Buffer capacity versus pH for the samesystem reaches a maximum when .The lower curve is the derivative of theupper curve.
pH � pKa
pKa � 5.00.C
0.18
13
Buf
fer
capa
city
(β)
(M
/pH
uni
t)
pH
0.16
0.14
0.12
0.10
0.08
0.06
0.04
0.02
0.00
0.16
0.14
0.12
0.10
0.08
0.06
0.04
0.02
0.001211109876543
(b )
(a )
Cb
(M)
Reasons why a calculation would be wrong:
1. You might have ignored activity coefficients.2. The temperature might not be just right.3. The approximations that and
could be in error.4. The reported for tris in your favorite table
is probably not what you would measure inyour lab.
5. You will probably make an arithmetic erroranyway.
pKa
[A�] � FA�
[HA] � FHA

9-5 Buffers 173
In choosing a buffer, seek one whose is as close as possible to the desired pH. Theuseful pH range of a buffer is usually considered to be . Outside this range,there is not enough of either the weak acid or the weak base to react with added base or acid.Buffer capacity can be increased by increasing the concentration of the buffer.
Buffer capacity in Figure 9-4b continues upward at high pH (and at low pH, which is notshown) simply because there is a high concentration of at high pH (or at low pH). Addi-tion of a small amount of acid or base to a large amount of (or ) will not have a largeeffect on pH. A solution of high pH is buffered by the conjugate acid–conjugate basepair. A solution of low pH is buffered by the conjugate acid–conjugate base pair.
Table 9-2 lists values for common buffers that are widely used in biochemistry. Themeasurement of pH with glass electrodes, and the buffers used by the U.S. National Institute ofStandards and Technology to define the pH scale, are described in Chapter 15.
Buffer pH Depends on Ionic Strength and TemperatureThe correct Henderson-Hasselbalch equation, 9-18, includes activity coefficients. Failure toinclude activity coefficients is the principal reason why calculated pH values do not agree withmeasured values. The buffer has a of 7.20 at 0 ionic strength. At 0.1 M ionicstrength, the pH of a 1:1 mole mixture of and is 6.86 (see Problem 9-43). Molecularbiology lab manuals list for phosphoric acid as 6.86, which is representative for ionic strengthsemployed in the lab. As another example of ionic strength effects, when a 0.5 M stock solution ofphosphate buffer at pH 6.6 is diluted to 0.05 M, the pH rises to 6.9—a rather significant effect.
Buffer depends on temperature. Tris has an exceptionally large dependence,units per degree, near room temperature. A solution of tris with pH 8.07 at
will have and .
When What You Mix Is Not What You GetIn dilute solution, or at extremes of pH, the concentrations of HA and are not equal totheir formal concentrations. Suppose we mix moles of HA and moles of the salt
. The mass and charge balances are
The substitution and a little algebra lead to the equations
(9-20)(9-21)
So far we have assumed that and and we used these values inthe Henderson-Hasselbalch equation. A more rigorous procedure is to use Equations 9-20and 9-21. If or is small, or if or is large, then the approximations
and are not good. In acidic solutions, , so can be ignored in Equations 9-20 and 9-21. In basic solutions, can be neglected.
Example A Dilute Buffer Prepared from a Moderately Strong Acid
What will be the pH if 0.010 0 mol of HA (with ) and 0.010 0 mol of aredissolved in water to make 1.00 L of solution?
Solution Because the solution is acidic we neglect inEquations 9-20 and 9-21. Setting in Equations 9-20 and 9-21, we use the equation to find :
x
(9-22)
The concentrations of HA and are not what we mixed:
In this example, HA is too strong and the concentrations are too low for HA and to beequal to their formal concentrations.
A�
[A�] � FA� � [H�] � 0.014 1 M
[HA] � FHA � [H�] � 0.005 86 M
A�
1 x � 0.004 14 M 1 pH � �log[H�] � 2.38
Ka �[H�][A�]
[HA]�
(x) (0.010 0 � x)
(0.010 � x)� 10�2.00
0.010 0 � x0.010 0 � x
HA T H� � A�
[H�]Ka[H�] � x
[OH�](pH � pKa � 2.00),
A�pKa � 2.00
[H�][OH�][H�] W [OH�][A�] � FA�[HA] � FHA
[OH�][H�]FA�FHA
[A�] � FA�,[HA] � FHA
[A�] � FA� � [H�] � [OH�][HA] � FHA � [H�] � [OH�]
[Na�] � FA�
Charge balance: [Na�] � [H�] � [OH�] � [A�]Mass balance: FHA � FA� � [HA] � [A�]
Na�A�
FA�FHA
A�
pH � 7.7 at 37°CpH � 8.7 at 4°C25°C�0.028 pKa
pKa
pKa
HPO2�4H2PO�
4
pKaH2PO�4 /HPO2�
4
pKa
H3O�/H2OH2O/OH�
H�OH�
H�OH�
pKa 1 pH unitpKa Choose a buffer whose is close to the
desired pH.pKa
Changing ionic strength changes pH.
Changing temperature changes pH.
What you mix is not what you get in dilutesolutions or at extremes of pH.
HA in this solution is more than 40%dissociated. The acid is too strong for theapproximation .[HA] � FHA
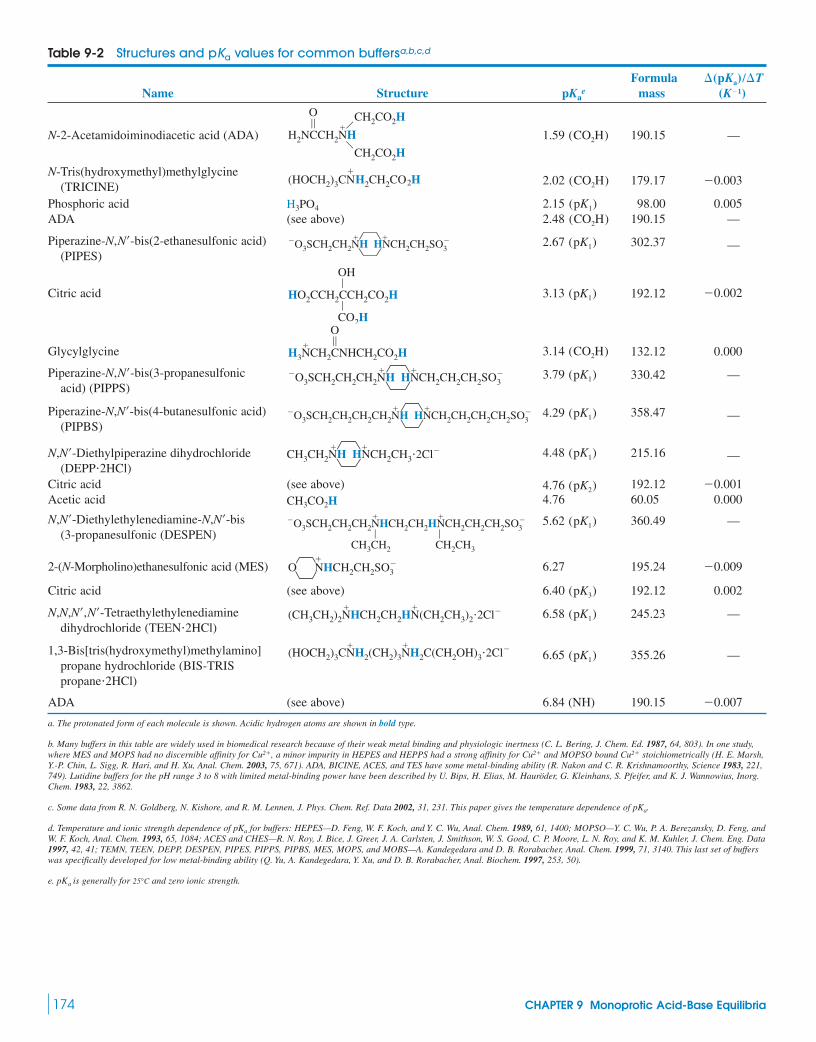
174 CHAPTER 9 Monoprotic Acid-Base Equilibria
Table 9-2 Structures and pKa values for common buffersa,b,c,d
FormulaName Structure mass
N-2-Acetamidoiminodiacetic acid (ADA) 190.15 —
2.02 179.17
Phosphoric acid 2.15 98.00 0.005ADA (see above) 2.48 190.15 —
302.37 —
Citric acid 192.12
Glycylglycine 132.12 0.000
330.42 —
358.47 —
215.16 —
Citric acid (see above) 192.12 �0.001Acetic acid 4.76 60.05 0.000
360.49 —
6.27 195.24 �0.009
Citric acid (see above) 192.12 0.002
245.23 —
355.26 —
ADA (see above) 6.84 (NH) 190.15 �0.007
6.65 (pK1)(HOCH2)3CNH2(CH2)3NH2C(CH2OH)3�2Cl�� �1,3-Bis[tris(hydroxymethyl)methylamino]
propane hydrochloride (BIS-TRISpropane�2HCl)
6.58 (pK1)(CH3CH2)2NHCH2CH2HN(CH2CH3)2�2Cl�� �N,N,N�,N�-Tetraethylethylenediamine
dihydrochloride (TEEN�2HCl)
6.40 (pK3)
�NHCH2CH2SO�
3O2-(N-Morpholino)ethanesulfonic acid (MES)
5.62 (pK1)�O3SCH2CH2CH2NHCH2CH2HNCH2CH2CH2SO�� �
3
CH2CH3CH3CH2
å å
N,N�-Diethylethylenediamine-N,N�-bis(3-propanesulfonic (DESPEN)
CH3CO2H4.76 (pK2)
4.48 (pK1)CH3CH2NH HNCH2CH3�2Cl�� �
N,N�-Diethylpiperazine dihydrochloride(DEPP�2HCl)
4.29 (pK1)�O3SCH2CH2CH2CH2NH HNCH2CH2CH2CH2SO�� �
3Piperazine-N,N�-bis(4-butanesulfonic acid)
(PIPBS)
3.79 (pK1)�O3SCH2CH2CH2NH HNCH2CH2CH2SO�� �
3Piperazine-N,N�-bis(3-propanesulfonic
acid) (PIPPS)
3.14 (CO2H)H3NCH2CNHCH2CO2H� •
O
�0.0023.13 (pK1)HO2CCH2CCH2CO2Hå
å
OH
CO2H
2.67 (pK1)�O3SCH2CH2NH HNCH2CH2SO�� �
3Piperazine-N,N�-bis(2-ethanesulfonic acid)
(PIPES)
(CO2H)(pK1)H3PO4
�0.003(CO2H)(HOCH2)3CN�
H2CH2CO2H
1.59 (CO2H)H2NCCH2NH•O
�œCH2CO H2
CH2CO2Hç
(K�1)pKae
�(pKa)/�T
a. The protonated form of each molecule is shown. Acidic hydrogen atoms are shown in bold type.
b. Many buffers in this table are widely used in biomedical research because of their weak metal binding and physiologic inertness (C. L. Bering, J. Chem. Ed. 1987, 64, 803). In one study,where MES and MOPS had no discernible affinity for Cu2�, a minor impurity in HEPES and HEPPS had a strong affinity for Cu2� and MOPSO bound Cu2� stoichiometrically (H. E. Marsh,Y.-P. Chin, L. Sigg, R. Hari, and H. Xu, Anal. Chem. 2003, 75, 671). ADA, BICINE, ACES, and TES have some metal-binding ability (R. Nakon and C. R. Krishnamoorthy, Science 1983, 221,749). Lutidine buffers for the pH range 3 to 8 with limited metal-binding power have been described by U. Bips, H. Elias, M. Hauröder, G. Kleinhans, S. Pfeifer, and K. J. Wannowius, Inorg.Chem. 1983, 22, 3862.
c. Some data from R. N. Goldberg, N. Kishore, and R. M. Lennen, J. Phys. Chem. Ref. Data 2002, 31, 231. This paper gives the temperature dependence of pKa.
d. Temperature and ionic strength dependence of pKa for buffers: HEPES—D. Feng, W. F. Koch, and Y. C. Wu, Anal. Chem. 1989, 61, 1400; MOPSO—Y. C. Wu, P. A. Berezansky, D. Feng, andW. F. Koch, Anal. Chem. 1993, 65, 1084; ACES and CHES—R. N. Roy, J. Bice, J. Greer, J. A. Carlsten, J. Smithson, W. S. Good, C. P. Moore, L. N. Roy, and K. M. Kuhler, J. Chem. Eng. Data1997, 42, 41; TEMN, TEEN, DEPP, DESPEN, PIPES, PIPPS, PIPBS, MES, MOPS, and MOBS—A. Kandegedara and D. B. Rorabacher, Anal. Chem. 1999, 71, 3140. This last set of bufferswas specifically developed for low metal-binding ability (Q. Yu, A. Kandegedara, Y. Xu, and D. B. Rorabacher, Anal. Biochem. 1997, 253, 50).
e. pKa is generally for and zero ionic strength.25°C
N-Tris(hydroxymethyl)methylglycine(TRICINE)
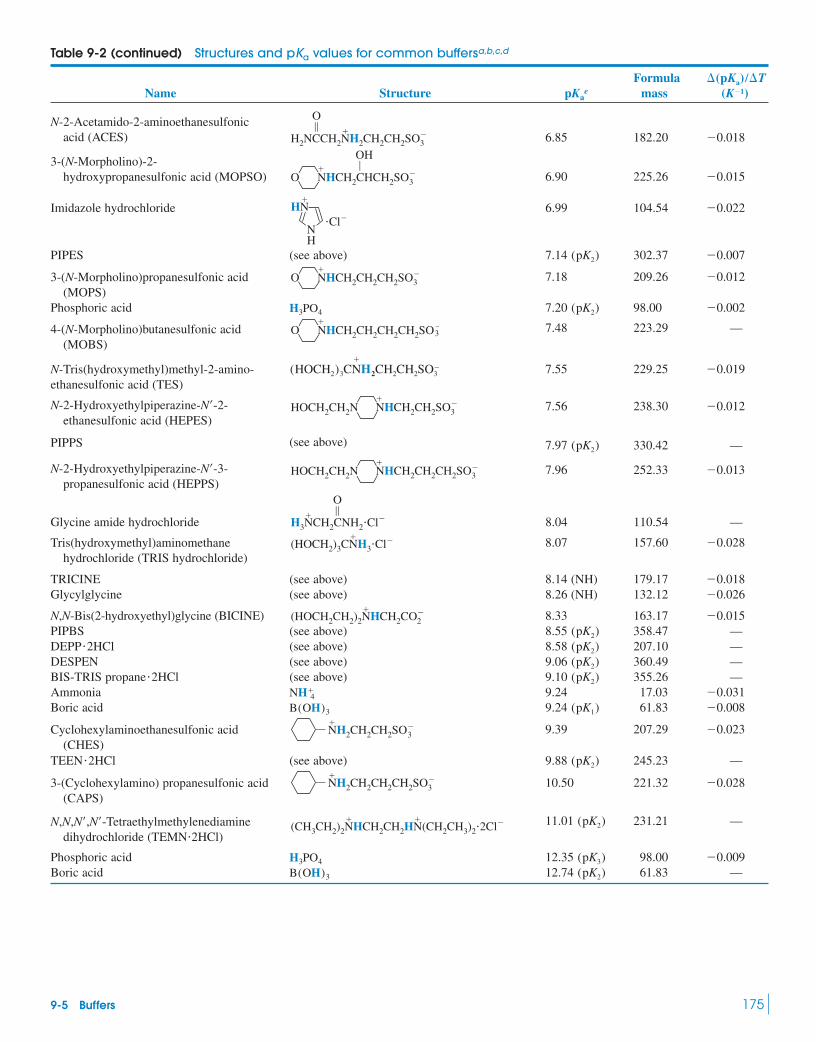
9-5 Buffers 175
Table 9-2 (continued) Structures and pKa values for common buffersa,b,c,d
FormulaName Structure mass
6.85 182.20 �0.018
6.90 225.26 �0.015
Imidazole hydrochloride 6.99 104.54 �0.022
PIPES (see above) 302.37 �0.007
7.18 209.26 �0.012
Phosphoric acid 98.00 �0.002
7.48 223.29 —
7.55 229.25 �0.019
7.56 238.30 �0.012
(see above) 330.42 —
7.96 252.33 �0.013
Glycine amide hydrochloride 8.04 110.54 —
8.07 157.60 �0.028(HOCH2)3CNH3�Cl��Tris(hydroxymethyl)aminomethane
hydrochloride (TRIS hydrochloride)
H3NCH2CNH2�Cl�� •
O
�NHCH2CH2CH2SO�
3HOCH2CH2NN-2-Hydroxyethylpiperazine-N�-3-propanesulfonic acid (HEPPS)
7.97 (pK2)PIPPS
�NHCH2CH2SO�
3HOCH2CH2NN-2-Hydroxyethylpiperazine-N�-2-ethanesulfonic acid (HEPES)
(HOCH2)3CN�
H2CH2CH2SO�3N-Tris(hydroxymethyl)methyl-2-amino-
ethanesulfonic acid (TES)
�O NHCH2CH2CH2CH2SO3
�4-(N-Morpholino)butanesulfonic acid(MOBS)
7.20 (pK2)H3PO4
�NHCH2CH2CH2SO�
3O3-(N-Morpholino)propanesulfonic acid(MOPS)
7.14 (pK2)
HN
NH
�Cl�
�
�NHCH2CHCH2SO�
3O
åOH3-(N-Morpholino)-2-
hydroxypropanesulfonic acid (MOPSO)
H2NCCH2NH2CH2CH2SO��
3
•ON-2-Acetamido-2-aminoethanesulfonic
acid (ACES)
(K�1)pKae
�(pKa)/�T
TRICINE (see above) 8.14 (NH) 179.17 �0.018Glycylglycine (see above) 8.26 (NH) 132.12 �0.026
N,N-Bis(2-hydroxyethyl)glycine (BICINE) 8.33 163.17 �0.015PIPBS (see above) 358.47 —
(see above) 207.10 —DESPEN (see above) 360.49 —BIS-TRIS (see above) 355.26 —Ammonia 9.24 17.03 �0.031Boric acid 61.83 �0.008
9.39 207.29 �0.023
(see above) 245.23 —
10.50 221.32 �0.028
231.21 —11.01 (pK2)N,N,N�,N�-Tetraethylmethylenediamine dihydrochloride (TEMN�2HCl)
�NH2CH2CH2CH2SO�
3ß3-(Cyclohexylamino) propanesulfonic acid(CAPS)
9.88 (pK2)TEEN�2HCl
�NH2CH2CH2SO�
3ßCyclohexylaminoethanesulfonic acid(CHES)
9.24 (pK1)B(OH)3
NH�4
9.10 (pK2)propane�2HCl9.06 (pK2)8.58 (pK2)DEPP�2HCl8.55 (pK2)
(HOCH2CH2)2NHCH2CO� 2
�
Phosphoric acid 98.00 �0.009Boric acid 61.83 —12.74 (pK2)B(OH)3
12.35 (pK3)H3PO4
(CH3CH2)2NHCH2CH2HN(CH2CH3)2�2Cl�� �

176 CHAPTER 9 Monoprotic Acid-Base Equilibria
The Henderson-Hasselbalch equation (with activity coefficients) is always true, becauseit is just a rearrangement of the equilibrium expression. Approximations that are notalways true are the statements and .
In summary, a buffer consists of a mixture of a weak acid and its conjugate base. Thebuffer is most useful when . Over a reasonable range of concentration, the pH of abuffer is nearly independent of concentration. A buffer resists changes in pH because it reactswith added acids or bases. If too much acid or base is added, the buffer will be consumed andwill no longer resist changes in pH.
Example Excel’s Goal Seek Tool and Naming of Cells
We saw in Section 6-8 that GOAL SEEK finds solutions to numerical equations. In settingup Equation 9-22, we made the (superb) approximation and neglected
With GOAL SEEK, it is easy to use Equations 9-20 and 9-21 without approximations:
(9-23)
The spreadsheet illustrates GOAL SEEK and the naming of cells to make formulasmore meaningful. In column A, enter labels for , and . Writenumerical values for , and in B1:B4. In cell B5, enter a guess for .
Now we want to name cells Bl through B6. Select cell Bl, go to the INSERT menu,select NAME and then DEFINE. The window will ask if you want to use the name “Ka” thatappears in cell Al. If you like this name, click OK. By this procedure, name the other cellsin column B “Kw”, “FHA”, “FA”, “H”, and “OH”. Now when you write a formula refer-ring to cell B2, you can write Kw instead of B2. Kw is an absolute reference to cell $B$2.
In cell B6 enter the formula “ ” and Excel returns the value 1E-11 for The beauty of naming cells is that “ ” is easier to understand than “ ”.
In cell D4, write “ ”, which is the quotient in Equa-tion 9-23. Excel returns the value 0.001 222 based on the guess in cell B5.
Now use GOAL SEEK to vary in cell B5 until the reaction quotient in cell D4equals 0.01, which is the value of In the TOOLS menu, select OPTIONS and go to Calcu-lation. Set Maximum Change to 1e-7 to find an answer within 0.000 000 1 of the desiredanswer. In the TOOLS menu, select GOAL SEEK. For Set cell, enter D4. For To value, enter0.01. For By changing cell, enter H. We just told GOAL SEEK to vary H (cell B5) until cellD4 equals . Click OK and the answer appears incell B5. Different starting guesses for H might give negative solutions or might not reacha solution. Only one positive value of H satisfies Equation 9-23.
H � 4.142 10�30.01 0.000 000 1
Ka.[H�]
[H�] � 0.001�H*(FA�H-OH)/(FHA-H�OH)
�$B$2/$B$5�Kw/H[OH�].�Kw/H
A
Ka =
Kw =
FHA =
FA =
[H+] =
[OH-] =
0.01
1.00E-14
0.01
1.000E-03
0.01
1E-11
B6 = Kw/H
<-Initial guess
D4 = H*(FA+H-OH)/(FHA-H+OH)
1
2
3
4
5
6
7
B C D E
Reaction quotient
for Ka =
[H+][A-]/[HA]=
0.001222222
[H�]FA�Ka, Kw, FHA
[OH�]Ka, Kw, FHA, FA�, [H�]
Ka �[H�][A�]
[HA]�
[H�](FA� � [H�] � [OH�])
FHA � [H�] � [OH�]
[OH�].[H�] W [OH�]
pH � pKa
[A�] � FA�[HA] � FHA
Ka
Strong acids or bases. For practical concentrations , pHor pOH can be found by inspection. When the concentration is near
we use the systematic treatment of equilibrium to calculatepH. At still lower concentrations, the pH is 7.00, set by autopro-tolysis of the solvent.
10�7 M,
(�10�6 M) Weak acids. For the reaction , we set up andsolve the equation , where , and
. The fraction of dissociation is given by . The term is defined as
.�log Ka
pKa �pKa[A�]/ ([HA] � [A�]) � x/F� �[HA] � F � x
[H�] � [A�] � xKa � x2/ (F � x)HA T H� � A�
acid dissociation constant, base hydrolysis constant, bufferbuffer capacityconjugate acid-base pair
Kb
Ka fraction of association, �(of a base)
fraction of dissociation, �(of an acid)
Henderson-Hasselbalch equation
strong acidstrong baseweak acid
pK weak baseweak electrolyte
Terms to Understand
Summary

Problems 177
Weak bases. For the reaction , we setup and solve the equation , where
and The conjugate acid of a weak base is aweak acid, and the conjugate base of a weak acid is a weak base. Fora conjugate acid-base pair, .
Buffers. A buffer is a mixture of a weak acid and its conjugatebase. It resists changes in pH because it reacts with added acid orbase. The pH is given by the Henderson-Hasselbalch equation:
where applies to the species in the denominator. The concentra-tions of HA and are essentially unchanged from those used toA�
pKa
pH � pKa � log[A�]
[HA]
Ka � Kb � Kw
[B] � F � x.[BH�] � x,[OH�] �Kb � x2/ (F � x)
B � H2O T BH� � OH� prepare the solution. The pH of a buffer is nearly independent ofdilution, but buffer capacity increases as the concentration of bufferincreases. The maximum buffer capacity is at , and theuseful range is .
The conjugate base of a weak acid is a weak base. The weakerthe acid, the stronger the base. However, if one member of a conju-gate pair is weak, so is its conjugate. The relation between for anacid and for its conjugate base in aqueous solution is
. When a strong acid (or base) is added to a weak base (or acid),they react nearly completely.Kw
Ka � Kb �Kb
Ka
pH � pKa 1pH � pKa
Exercises9-A. Using activity coefficients correctly, find the pH of
9-B. Calculate the pH of(a)(b) ( dissociates completely to plus at this low concentration).
9-C. What is the pH of a solution prepared by dissolving 1.23 g of2-nitrophenol (FM 139.11) in 0.250 L?
9-D. The pH of 0.010 M o-cresol is 6.16. Find for this weakacid.
o-Cresol
9-E. Calculate the limiting value of the fraction of dissociation (�)of a weak acid as the concentration of HA approaches0. Repeat the same calculation for .
9-F. Find the pH of 0.050 M sodium butanoate (the sodium salt ofbutanoic acid, also called butyric acid).
9-G. The pH of 0.10 M ethylamine is 11.82.(a) Without referring to Appendix G, find for ethylamine.(b) Using results from part (a), calculate the pH of 0.10 M ethyl-ammonium chloride.
9-H. Which of the following bases would be most suitable for prepar-ing a buffer of pH 9.00: (i) (ii) (aniline, ); (iii)
; (iv)
9-I. A solution contains 63 different conjugate acid-base pairs.Among them is acrylic acid and acrylate ion, with the equilibriumratio . What is the pH of the solution?
Acrylic acid
H2C¢CHCO2H pKa � 4.25
[acrylate]/[acrylic acid] � 0.75
C5H5N (pyridine, Kb � 1.58 10�9)?Kb � 1.05 10�6)(hydrazine,H2NNH2Kb� 3.99 10�10C6H5NH2
NH3 (ammonia, Kb � 1.76 10�5);
Kb
pKa � 9.00(pKa � 5.00)
ßß
OH
CH3
pKa
SO2�4
2H�H2SO41.0 10�8 M H2SO4
1.0 10�8 M HBr
10�2 M NaOH.1.0 9-J. (a) Find the pH of a solution prepared by dissolving 1.00 g of
glycine amide hydrochloride (Table 9-2) plus 1.00 g of glycineamide in 0.100 L.
(b) How many grams of glycine amide should be added to 1.00 gof glycine amide hydrochloride to give 100 mL of solution with pH8.00?(c) What would be the pH if the solution in part (a) were mixedwith 5.00 mL of 0.100 M HCl?(d) What would be the pH if the solution in part (c) were mixedwith 10.00 mL of 0.100 M NaOH?(e) What would be the pH if the solution in part (a) were mixedwith 90.46 mL of 0.100 M NaOH? (This is exactly the quantity ofNaOH required to neutralize the glycine amide hydrochloride.)
9-K. A solution with an ionic strength of 0.10 M containing 0.010 0 M phenylhydrazine has a pH of 8.13. Using activity coeffi-cients correctly, find for the phenylhydrazinium ion found inphenylhydrazine hydrochloride. Assume that .
Phenylhydrazine Phenylhydrazine hydrochlorideB
9-L. Use the GOAL SEEK spreadsheet at the end of the chap-ter to find the pH of 1.00 L of solution containing 0.030 mol HA
and 0.015 mol NaA. What would the pH be with theapproximations and [A�] � 0.015?[HA] � 0.030(pKa � 2.50)
BH�Cl�
NHNH3C1��
NHNH2ß
�BH� � 0.80pKa
Glycine amideC2H6N2OFM 74.08ßH2N ¡
O
NH2
Strong Acids and Bases
9-1. Why doesn’t water dissociate to produce andwhen some HBr is added?
9-2. Calculate the pH of (a) (b).
9-3. Calculate the pH of . What fraction ofthe total in this solution is derived from dissociation ofwater?
H�
5.0 10�8 M HClO4
10�2 M KOH1.0 1.0 10�3 M HBr;
10�7 M OH�
10�7 M H�
9-4. (a) The measured pH of 0.100 M HCl at is 1.092. Fromthis information, calculate the activity coefficient of and com-pare your answer with that in Table 8-1.(b) The measured pH of at is 2.102. From this information, calculate the activity coefficient of
in this solution.(c) The ionic strengths of the solutions in parts (a) and (b) are thesame. What can you conclude about the dependence of activitycoefficients on the particular ions in a solution?
H�
25°C0.010 0 M HCl � 0.090 0 M KCl
H�
25°C
Problems

178 CHAPTER 9 Monoprotic Acid-Base Equilibria
Weak-Acid Equilibria
9-5. Write the chemical reaction whose equilibrium constant is (a) for benzoic acid, (b) for benzoate ion, (c) for aniline, (d) for anilinium ion,
9-6. Find the pH and fraction of dissociation of a 0.100 M solu-tion of the weak acid HA with .
9-7. is a salt formed from the base B and perchloric acid. It dissociates into , a weak acid, and ,which is neither an acid nor a base. Find the pH of
.
9-8. Find the pH and concentrations of and ina 0.060 M solution of trimethylammonium chloride.
9-9. Use the reaction quotient, Q, to explain why the fraction of dis-sociation of weak acid, HA, increases when the solution is dilutedby a factor of 2.
9-10. When is a weak acid weak and when is a weak acid strong?Show that the weak acid HA will be 92% dissociated when dissolvedin water if the formal concentration is one-tenth of .Show that the fraction of dissociation is 27% when . Atwhat formal concentration will the acid be 99% dissociated? Com-pare your answer with the left-hand curve in Figure 9-2.
9-11. A 0.045 0 M solution of benzoic acid has a pH of 2.78. Cal-culate for this acid.
9-12. A 0.045 0 M solution of HA is 0.60% dissociated. Calculatefor this acid.
9-13. Barbituric acid dissociates as follows:
Barbituric acidHA
(a) Calculate the pH and fraction of dissociation of M barbi-turic acid.(b) Calculate the pH and fraction of dissociation of Mbarbituric acid.
9-14. Using activity coefficients, find the pH and fraction of disso-ciation of 50.0 mM hydroxybenzene (phenol) in 0.050 M LiBr.Take the size of to be 600 pm.
9-15. is acidic by virtue of the hydrolysis reaction
Ka1
[Further reactions produce , , and Findthe value of in Figure 6-8. Considering only the reaction,find the pH of 0.010 M . What fraction of chromium is inthe form ?
9-16. From the dissociation constant of at in Box 9-1,find the percent dissociated in and in
9-17. Excel GOAL SEEK. Solve the equation by using GOAL SEEK (Section 6-8). Guess a value of x in cell A4and evaluate in cell B4. Use GOAL SEEK to vary thevalue of x until is equal to K. Use your spreadsheet tocheck your answer to Problem 9-6.
x2/(F � x)x2/ (F � x)
x2/ (F � x) � K
1.00 M HNO3.0.100 M HNO3
25°CHNO3
Cr(OH)2�
Cr(ClO4)3
Ka1Ka1
Cr(OH)�4 .]Cr(OH)3Cr(OH)�
2
Cr3� � H2O ∆ Cr(OH)2� � H�
Cr3�
C6H5O�
10�10.00
10�2.00
A�
¡
NH
¡
HN¡O
¡
N:� � H�
¡
HN¡O
O O O O
#£££££4Ka� 9.8 10�5
pKa
pKa
F � 10Ka
Ka (F � Ka/10)
(CH3)3NH�(CH3)3N
BH�ClO�4
0.100 MClO�
4BH�
(Kb � 1.00 10�4)BH�ClO�4
Ka � 1.00 10�5
(�)
C6H5NH�3Ka
C6H5NH2Kb
C6H5CO�2Kb
C6H5CO2HKa
Weak-Base Equilibria
9-18. Covalent compounds generally have higher vapor pressurethan ionic compounds. The “fishy” smell of fish arises from aminesin the fish. Explain why squeezing lemon (which is acidic) onto fishreduces the fishy smell (and taste).
9-19. Find the pH and fraction of association of a 0.100 Msolution of the weak base B with .
9-20. Find the pH and concentrations of and in a 0.060 M solution of trimethylamine.
9-21. Find the pH of 0.050 M NaCN.
9-22. Calculate the fraction of association for , and M sodium acetate. Does � increase
or decrease with dilution?
9-23. A 0.10 M solution of a base has . Find .
9-24. A 0.10 M solution of a base is 2.0% hydrolyzed Find .
9-25. Show that the limiting fraction of association of a base inwater, as the concentration of base approaches 0, is
Find the limiting value of for and for
Buffers
9-26. Describe how to prepare 100 mL of 0.200 M acetate buffer,pH 5.00, starting with pure liquid acetic acid and solutions contain-ing and .
9-27. Why is the pH of a buffer nearly independent of concentration?
9-28. Why does buffer capacity increase as the concentration ofbuffer increases?
9-29. Why does buffer capacity increase as a solution becomes veryacidic or very basic
9-30. Why is the buffer capacity maximum when ?
9-31. Explain the following statement: The Henderson-Hasselbalchequation (with activity coefficients) is always true; what may not becorrect are the values of and [HA] that we choose to use in theequation.
9-32. Which of the following acids would be most suitable forpreparing a buffer of pH 3.10: (i) hydrogen peroxide; (ii) propanoicacid; (iii) cyanoacetic acid; (iv) 4-aminobenzenesulfonic acid?
9-33. A buffer was prepared by dissolving 0.100 mol of the weakacid HA plus 0.050 mol of its conjugate base
in 1.00 L. Find the pH.
9-34. Write the Henderson-Hasselbalch equation for a solutionof formic acid. Calculate the quotient at (a) pH 3.000; (b) pH 3.744; (c) pH 4.000.
9-35. Given that for nitrite ion is 10.85, find the quo-tient in a solution of sodium nitrite at (a) pH 2.00;(b) pH 10.00.
[HNO2]/[NO2�]
(NO2�)pKb
[HCO�2 ]/[HCO2H]
Na�A�
(Ka � 1.00 10�5)
[A�]
pH � pKa
(pH � 13)?(pH � 1)
�3 M NaOH�3 M HCl
Kb � 10�10.Kb � 10�4�(1 � 107 Kb).
Kb/� � 107
Kb
(� � 0.020).
KbpH � 9.28
1.00 10�121.00 10�2
1.00 10�1,(�)
(CH3)3NH�(CH3)3N
Kb � 1.00 10�5
(�)
A
Using Excel GOAL SEEK
x =
F =
0.01
0.1
1
2
3
4
5
6
B
x2/(F-x) =
1.1111E-03

Problems 179
9-36. (a) Would you need NaOH or HCl to bring the pH of 0.050 0M HEPES (Table 9-2) to 7.45?(b) Describe how to prepare 0.250 L of 0.050 0 M HEPES, pH 7.45.
9-37. How many milliliters of 0.246 M should be added to213 mL of 0.006 66 M -bipyridine to give a pH of 4.19?
9-38. (a) Write the chemical reactions whose equilibrium constantsare and for imidazole and imidazole hydrochloride, respectively.(b) Calculate the pH of a solution prepared by mixing 1.00 g ofimidazole with 1.00 g of imidazole hydrochloride and diluting to100.0 mL.(c) Calculate the pH of the solution if 2.30 mL of 1.07 M areadded.(d) How many milliliters of 1.07 M should be added to 1.00 gof imidazole to give a pH of 6.993?
9-39. Calculate the pH of a solution prepared by mixing 0.080 0 molof chloroacetic acid plus 0.040 0 mol of sodium chloroacetate in1.00 L of water.(a) First do the calculation by assuming that the concentrations ofHA and equal their formal concentrations.(b) Then do the calculation, using the real values of [HA] and in the solution.(c) Using first your head, and then the Henderson-Hasselbalchequation, find the pH of a solution prepared by dissolving all thefollowing compounds in one beaker containing a total volume of1.00 L: 0.180 mol , 0.020 mol , 0.080mol and 0.080 mol . Assume that dissoci-ates completely.
9-40. Calculate how many milliliters of 0.626 M KOH should beadded to 5.00 g of MOBS (Table 9-2) to give a pH of 7.40.
9-41. (a) Use Equations 9-20 and 9-21 to find the pH and concentra-tions of HA and in a solution prepared by mixing 0.002 00 mol ofacetic acid plus 0.004 00 mol of sodium acetate in 1.00 L of water.
A�
Ca(OH)2Ca(OH)2HNO3,ClCH2CO2NaClCH2CO2H
[A�]A�
HClO4
HClO4
KaKb
2,2¿HNO3
(b) After working part (a) by hand, use Excel GOAL SEEK tofind the same answers.
9-42. (a) Calculate the pH of a solution prepared by mixing 0.010 0mol of the base B with 0.020 0 mol of anddiluting to 1.00 L. First calculate the pH by assuming and Compare this answer with the pH calcu-lated without making such an assumption.
(b) After working part (a) by hand, use Excel GOAL SEEK tofind the same answers.
9-43. Effect of ionic strength on for the buffer is
If you mix a 1:1 mole ratio of and at 0 ionic strength,the pH is 7.20. Find the pH of a 1:1 mixture of and at an ionic strength of 0.10. Remember that
9-44. Systematic treatment of equilibrium. The acidity of isdetermined by the following reactions. Write the equations neededto find the pH of at a formal concentration F.
3Al3� � 4H2O ∆K43
Al3(OH)5�4 � 4H�
Al3� � 4H2O ∆�4
Al(OH)4� � 4H�
Al3� � 3H2O ∆�3
Al(OH)3(aq) � 3H�
2Al3� � 2H2O ∆K22
Al2(OH)4�2 � 2H�
Al3� � 2H2O ∆�2
Al(OH)�2 � 2H�
Al3� � H2O ∆�1
AlOH2� � H�
Al(ClO4)3
Al3�
�log[H�]�H�.pH � �log AH� �
HPO2�4H2PO�
4
HPO2�4H2PO�
4
Ka �[HPO2�
4 ][H�]�HPO2�4�H�
[H2PO�4 ]�H2PO�
4
� 10�7.20
H2PO4�/HPO2�
4KapKa.
[BH�] � 0.020 0 M.[B] � 0.010 0
BH�Br�(Kb � 10�2.00)

180 CHAPTER 10 Polyprotic Acid-Base Equilibria
Proteins perform biological functions such as structural support, catalysis of chemicalreactions, immune response to foreign substances, transport of molecules across mem-branes, and control of genetic expression. The three-dimensional structure and function of aprotein is determined by the sequence of amino acids from which the protein is made. Thediagram below shows how amino acids are connected to make a polypeptide. Of the20 common amino acids, three have basic substituents and four have acidic substituents.Myoglobin, shown above, folds into several helical (spiral) regions that control access ofoxygen and other small molecules to the heme group, whose function is to store in mus-cle cells. Of the 153 amino acids in sperm-whale myoglobin, 35 have basic side groups and23 are acidic.
O2
PROTEINS ARE POLYPROTIC ACIDS AND BASES
Polyprotic Acid-Base Equilibria10
R1
H
H3N
¡O
�ç
CO2C�
ç
R2
H
H3N�
çCO2C
�
ç
R3
H
H3N�
çCO2C
�
ç� �
R1
H
H3N�
çCC
ç
R2
Hç
CCç
R3
H
Nç
CO2C�
çN
¡O
Hç
Hç
�2H2O
�mino acids
A polypeptide(A long polypeptideis called a protein.)
C-terminalresiduePeptide
bond
N-terminalresidue
A side group(also called asubstituent)
We now introduce polyprotic systems—acids or bases that can donate or accept morethan one proton. After we have studied diprotic systems (with two acidic or basic sites),the extension to three or more acidic sites is straightforward. Then we step back and takea qualitative look at the big picture and think about which species are dominant at anygiven pH.
Polypeptide backbone of myoglobin.Substituents are deleted for clarity. The hemegroup contains an iron atom that binds O2, CO,and other small molecules. [From M. F. Perutz, “TheHemoglobin Molecule.” Copyright © 1964 by ScientificAmerican, Inc. All rights reserved.]
COO–
CH2
CH2
C
HC
CC
CC
CH3
CH2
CH2
COO–
C
CH
C
C CH3
CC
N
CH CH2
CH
C
N
C
C
C
Fe
N N
C
C
H3C
HC
CH
H2C
CH3
HemeMyoglobin
60
50
40
30
20
70
10
130
80 140 150
15390
110
Hemegroup
1

10-1 Diprotic Acids and BasesThe amino acid building blocks of proteins have the general structure
where R is a different group for each amino acid. The carboxyl group, drawn here in its ion-ized (basic) form, is a stronger acid than the ammonium group. Therefore, the nonionizedform rearranges spontaneously to the zwitterion:
Zwitterion
At low pH, both the ammonium group and the carboxyl group are protonated. At high pH,neither is protonated. Acid dissociation constants of amino acids are listed in Table 10-1,where each compound is drawn in its fully protonated form.
Zwitterions are stabilized in solution by interactions of and with water.The zwitterion is also the stable form of the amino acid in the solid state, where hydrogenbonding from to of neighboring molecules occurs. In the gas phase, thereare no neighbors to stabilize the charges, so the nonionized structure with intramolecularhydrogen bonding from to a carboxyl oxygen predominates:
Our discussion will focus on the amino acid leucine, designated HL.
LeucineHL
The equilibrium constants refer to the following reactions:
Diprotic acid: (10-1)
(10-2)
Diprotic base: (10-3)
(10-4)
Recall that the relations between acid and base equilibrium constants are
(10-5)
(10-6)Ka2 � Kb1 � Kw
Ka1 � Kb2 � KwRelations betweenKa and Kb:
HL � H2O T H2L� � OH� Kb2
L� � H2O T HL � OH� Kb1
HL T L� � H� Ka2 � K2
H2L� T HL � H� Ka1 � K1
L�H2L�
#£££££4pKa1 � 2.328
#£££££4pKa2 � 9.744
H3NCHCO2H�
H3NCHCO2� � H2NCHCO2
�
ßNH2
ßCO�2ßNH�
3
ßCO�2ßNH�
3
H2N
HO2C
CH R
H3N
�O2C
�
CH R
H3N
¡C
�
CH
O�
R
O
Ammonium group
Carboxyl group
Substituent
10-1 Diprotic Acids and Bases 181
270 pm
288 pmGas-phase structure of alanine determined bymicrowave spectroscopy. [From S. Blanco, A. Lesarri,
J. C. López, and J. L. Alonso, “The Gas-Phase Structure of
Alanine,” J. Am. Chem. Soc. 2004, 126, 11675.]
A zwitterion is a molecule with both positiveand negative charges.
values of amino acids in living cells aresomewhat different from those in Table 10-1because physiologic temperature is not and the ionic strength is not 0.
25°C
pKa
The substituent R in leucine is an isobutylgroup: (CH3)2CHCH2ß
We customarily omit the subscript “a” in and . We will always write the subscript “b” in
and .Kb2Kb1
Ka2
Ka1

We now set out to calculate the pH and composition of individual solutions of, , and . Our methods are general. They do not
depend on the charge type of the acids and bases. That is, we would use the same procedureto find the pH of the diprotic , where A is anything, or , where HL is leucine.
The Acidic Form, H2L�
Leucine hydrochloride contains the protonated species , which can dissociate twice(Reactions 10-1 and 10-2). Because , is a weak acid. HL is an evenweaker acid, because . It appears that the will dissociate only partly,and the resulting HL will hardly dissociate at all. For this reason, we make the (superb)approximation that a solution of behaves as a monoprotic acid, with Ka � K1.H2L�
H2L�K2 � 1.80 10�10H2L�K1 � 4.70 10�3H2L�
H2L�H2A
0.050 0 M L�0.050 0 M HL0.050 0 M H2L�
182 CHAPTER 10 Polyprotic Acid-Base Equilibria
Table 10-1 Acid dissociation constants of amino acids
Carboxylic acidb Ammoniumb Substituentb FormulaAmino acida Substituenta pKa pKa pKa mass
Alanine (A) 2.344 9.868 89.09
Arginine (R) 1.823 8.991 (12.1c) 174.20
Asparagine (N) 132.12Aspartic acid (D) 1.990 10.002 3.900 133.10Cysteine (C) (1.7) 10.74 8.36 121.16Glutamic acid (E) 2.16 9.96 4.30 147.13
Glutamine (Q) 146.15Glycine (G) 2.350 9.778 75.07
Histidine (H) (1.6) 9.28 5.97 155.16
Isoleucine (I) 2.318 9.758 131.17Leucine (L) 2.328 9.744 131.17Lysine (K) (1.77) 9.07 10.82 146.19Methionine (M) 149.21
Phenylalanine (F) 2.20 9.31 165.19
Proline (P) 1.952 10.640 115.13
Serine (S) 2.187 9.209 105.09Threonine (T) 2.088 9.100 119.12
Tryptophan (W) 204.23
Tyrosine (Y) 181.19
Valine (V) 2.286 9.719 117.15
a. The acidic protons are shown in bold type. Each amino acid is written in its fully protonated form. Standard abbreviations are shown in parentheses.
b. pKa values refer to 25�C and zero ionic strength unless marked by c. Values considered to be uncertain are enclosed in parentheses.
c. For these entries, the ionic strength is 0.1 M, and the constant refers to a product of concentrations instead of activities.
SOURCE: A. E. Martell and R. J. Motekaitis, NIST Database 46 (Gaithersburg, MD: National Institute of Standards and Technology, 2001).
ßCH(CH3)2
11.01c8.67c2.41cß ß�CH2 OH
9.33c2.37c
NH
∂�CH2å
ßCH(CH3)(OH)ßCH2OH
�H2N∂
HO2C
Structureof entireamino acid
CH2ßß
9.08c2.18cßCH2CH2SCH3
ßCH2CH2CH2CH2NH3�
ßCH2CH(CH3)2
ßCH(CH3)(CH2CH3)
NH�CH2
�
NH
ßH9.00c2.19c�CH2CH2CNH2
¡O
ßCH2CH2CO2HßCH2SHßCH2CO2H
8.73c2.16c�CH2CNH2
¡O
�CH2CH2CH2NHC ç
NH2�
NH2
•
ßCH3
Easy stuff.

With this approximation, the calculation of the pH of 0.050 0 M is a trivial matter.
x x
What is the concentration of in the solution? We have already assumed that it is verysmall, but it cannot be 0. We can calculate from the equation, with the concentrationsof HL and that we just computed.
(10-7)
The approximation reduces Equation 10-7 to .Our approximation is confirmed by this last result. The concentration of is about
eight orders of magnitude smaller than that of HL. The dissociation of HL is indeed negli-gible relative to the dissociation of . For most diprotic acids, is sufficiently largerthan for this approximation to be valid. Even if were just 10 times less than , calculated by ignoring the second ionization would be in error by only 4%. The error in pHwould be only 0.01 pH unit. In summary, a solution of a diprotic acid behaves like a solutionof a monoprotic acid, with
The Basic Form, L�
The species , found in a salt such as sodium leucinate, can be prepared by treating leucine(HL) with an equimolar quantity of NaOH. Dissolving sodium leucinate in water gives asolution of , the fully basic species. values for this dibasic anion are
tells us that will not hydrolyze (react with water) very much to give HL. Furthermore,tells us that the resulting HL is such a weak base that hardly any further reaction to make
will occur.We therefore treat as a monobasic species, with . The results of this (fantas-
tic) approximation are outlined as follows.
HLx x
[L�] � F � x � 4.84 10�2 M
[H�] � Kw/[OH�] � Kw/x � 6.11 10�12 M 1 pH � 11.21
[HL] � x � 1.64 10�3 M
x2
F � x� 5.55 10�5 1 x � 1.64 10�3 M
Kb � Kb1 �Kw
Ka2� 5.55 10�5
0.050 0 � xOH�L�
#£££££4H2NCHCO2 H3NCHCO2
Kb1 � �� � H2O OH��
Kb � Kb1L�
H2L�
Kb2
L�Kb1
HL � H2O T H2L� � OH� Kb2 � Kw/Ka1 � 2.13 10�12
L� � H2O T HL � OH� Kb1 � Kw/Ka2 � 5.55 10�5
KbL�
L�
Ka � Ka1.
[H�]K1K2K2
K1H2L�
L�
[L�] � Ka2 � 1.80 10�10 M[H�] � [HL]
[L�] �(1.80 10�10)(1.32 10�2)
(1.32 10�2)� 1.80 10�10 M (� Ka2)
Ka2 �[H�][L�]
[HL]1 [L�] �
Ka2[HL]
[H�]
H�
Ka2[L�]L�
[H2L�] � F � x � 3.68 10�2 M
[H�] � x � 1.32 10�2 M 1 pH � 1.88
[HL] � x � 1.32 10�2 M
x2
F � x� Ka 1 x � 1.32 10�2 M
Ka � K1 � 4.70 10�3
0.050 0 � xH�HLH2L�
H3NCHCO2H�
H3NCHCO2� �
� H�#£££££4K1
H2L�
10-1 Diprotic Acids and Bases 183
can be treated as monoprotic withKa � Ka1.H2L�
Solve for x with the quadratic equation.
More easy stuff.
Hydrolysis is the reaction of anything withwater. Specifically, the reaction
is called hydrolysis.L� � H2O T HL � OH�
can be treated as monobasic with Kb � Kb1.L�
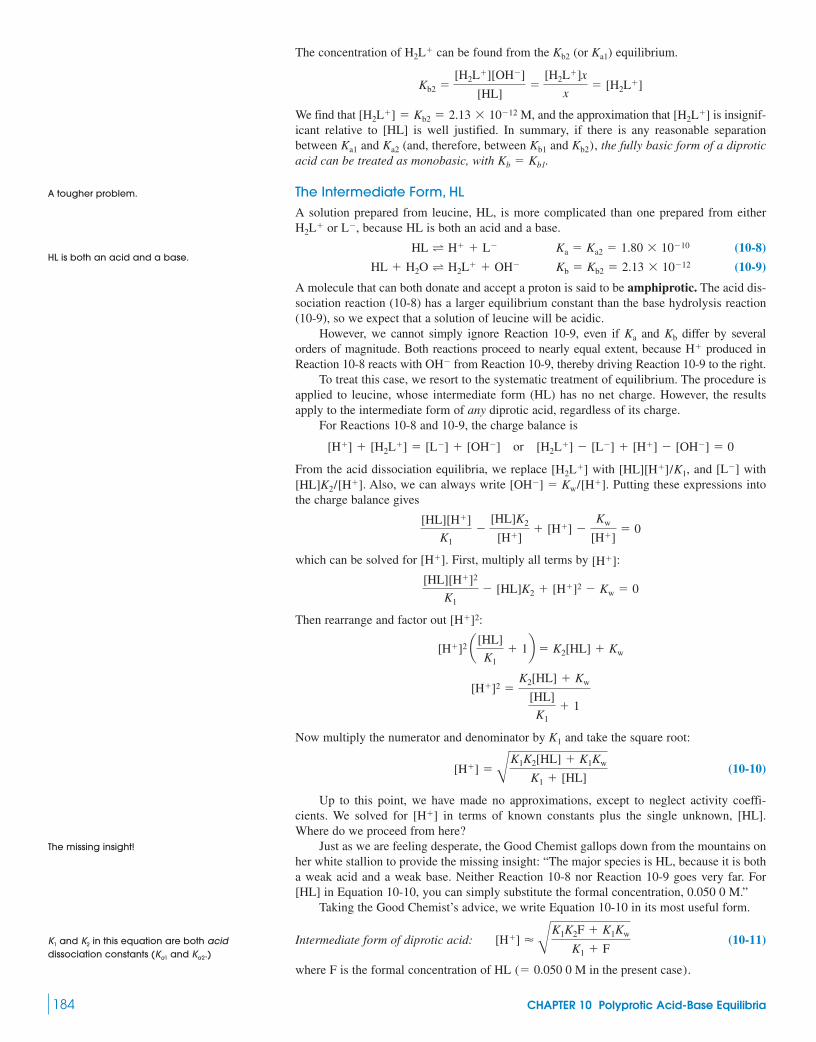
The concentration of can be found from the (or ) equilibrium.
We find that , and the approximation that is insignif-icant relative to [HL] is well justified. In summary, if there is any reasonable separationbetween and (and, therefore, between and , the fully basic form of a diproticacid can be treated as monobasic, with
The Intermediate Form, HLA solution prepared from leucine, HL, is more complicated than one prepared from either
or , because HL is both an acid and a base.
(10-8)
(10-9)
A molecule that can both donate and accept a proton is said to be amphiprotic. The acid dis-sociation reaction (10-8) has a larger equilibrium constant than the base hydrolysis reaction(10-9), so we expect that a solution of leucine will be acidic.
However, we cannot simply ignore Reaction 10-9, even if and differ by severalorders of magnitude. Both reactions proceed to nearly equal extent, because produced inReaction 10-8 reacts with from Reaction 10-9, thereby driving Reaction 10-9 to the right.
To treat this case, we resort to the systematic treatment of equilibrium. The procedure isapplied to leucine, whose intermediate form (HL) has no net charge. However, the resultsapply to the intermediate form of any diprotic acid, regardless of its charge.
For Reactions 10-8 and 10-9, the charge balance is
or
From the acid dissociation equilibria, we replace with , and with. Also, we can always write . Putting these expressions into
the charge balance gives
which can be solved for . First, multiply all terms by :
Then rearrange and factor out :
Now multiply the numerator and denominator by and take the square root:
(10-10)
Up to this point, we have made no approximations, except to neglect activity coeffi-cients. We solved for in terms of known constants plus the single unknown, [HL].Where do we proceed from here?
Just as we are feeling desperate, the Good Chemist gallops down from the mountains onher white stallion to provide the missing insight: “The major species is HL, because it is botha weak acid and a weak base. Neither Reaction 10-8 nor Reaction 10-9 goes very far. For[HL] in Equation 10-10, you can simply substitute the formal concentration, 0.050 0 M.”
Taking the Good Chemist’s advice, we write Equation 10-10 in its most useful form.
Intermediate form of diprotic acid: (10-11)
where F is the formal concentration of .HL (� 0.050 0 M in the present case)
[H�] � BK1K2F � K1Kw
K1 � F
[H�]
[H�] � BK1K2[HL] � K1Kw
K1 � [HL]
K1
[H�]2 �K2[HL] � Kw
[HL]
K1� 1
[H�]2 a [HL]
K1� 1b � K2[HL] � Kw
[H�]2
[HL][H�]2
K1� [HL]K2 � [H�]2 � Kw � 0
[H�][H�]
[HL][H�]
K1�
[HL]K2
[H�]� [H�] �
Kw
[H�]� 0
[OH�] � Kw/[H�][HL]K2/[H�][L�][HL][H�]/K1[H2L�]
[H2L�] � [L�] � [H�] � [OH�] � 0[H�] � [H2L�] � [L�] � [OH�]
OH�
H�
KbKa
HL � H2O T H2L� � OH� Kb � Kb2 � 2.13 � 10�12
HL T H� � L� Ka � Ka2 � 1.80 � 10�10
L�H2L�
Kb � Kb1.Kb2)Kb1Ka2Ka1
[H2L�][H2L�] � Kb2 � 2.13 � 10�12 M
Kb2 �[H2L�][OH�]
[HL]�
[H2L�]x
x� [H2L�]
Ka1Kb2H2L�
184 CHAPTER 10 Polyprotic Acid-Base Equilibria
A tougher problem.
HL is both an acid and a base.
The missing insight!
and in this equation are both aciddissociation constants ( and .)Ka2Ka1
K2K1
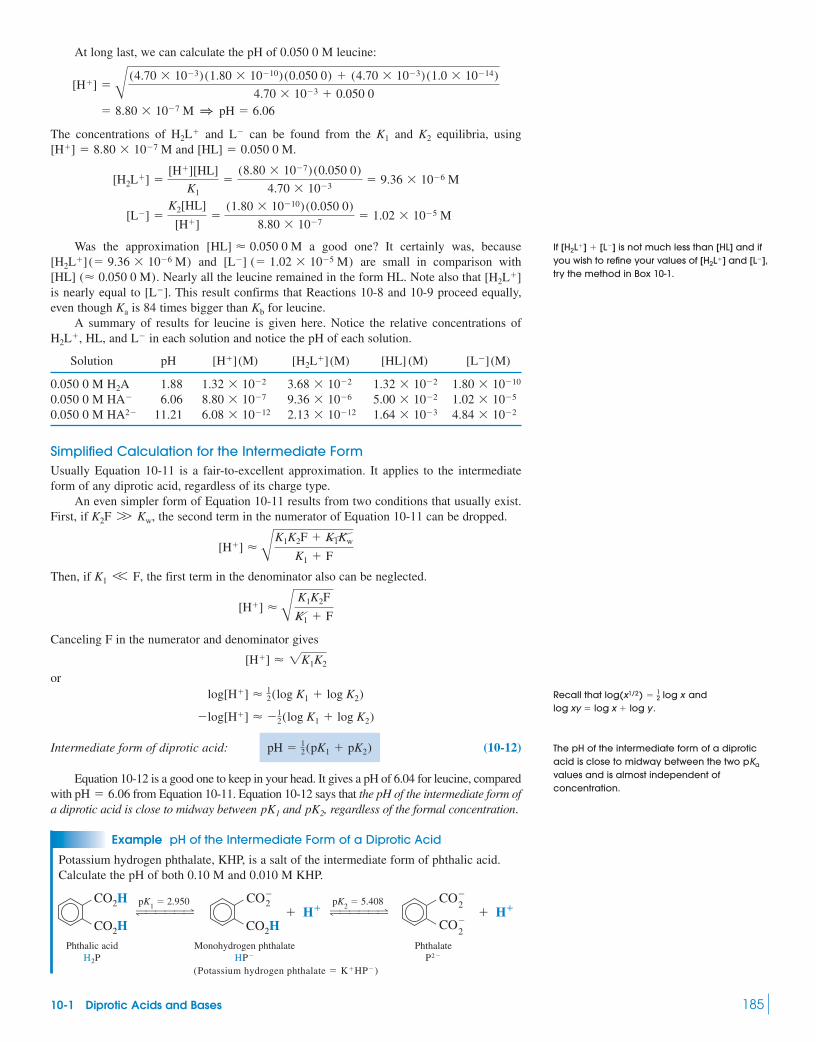
At long last, we can calculate the pH of 0.050 0 M leucine:
The concentrations of and can be found from the and equilibria, usingand .
Was the approximation a good one? It certainly was, becauseand are small in comparison with
. Nearly all the leucine remained in the form HL. Note also that is nearly equal to . This result confirms that Reactions 10-8 and 10-9 proceed equally,even though is 84 times bigger than for leucine.
A summary of results for leucine is given here. Notice the relative concentrations of, , and in each solution and notice the pH of each solution.
Solution pH [H�](M) [H2L�](M) [HL] (M) [L�](M)
0.050 0 M 1.880.050 0 M 6.060.050 0 M 11.21
Simplified Calculation for the Intermediate FormUsually Equation 10-11 is a fair-to-excellent approximation. It applies to the intermediateform of any diprotic acid, regardless of its charge type.
An even simpler form of Equation 10-11 results from two conditions that usually exist.First, if , the second term in the numerator of Equation 10-11 can be dropped.
Then, if , the first term in the denominator also can be neglected.
Canceling F in the numerator and denominator gives
or
Intermediate form of diprotic acid: (10-12)
Equation 10-12 is a good one to keep in your head. It gives a pH of 6.04 for leucine, comparedwith from Equation 10-11. Equation 10-12 says that the pH of the intermediate form ofa diprotic acid is close to midway between and , regardless of the formal concentration.
Example pH of the Intermediate Form of a Diprotic Acid
Potassium hydrogen phthalate, KHP, is a salt of the intermediate form of phthalic acid.Calculate the pH of both 0.10 M and 0.010 M KHP.
Phthalic acid Monohydrogen phthalate Phthalate
(Potassium hydrogen phthalate � K�HP�)P2�HP�H2P
CO2H
CO2H
∂∂
pK1 � 2.950#££££4
CO�2
CO2H
∂∂
pK2 � 5.408#££££4� H�
CO� 2
CO� 2
∂∂ � H�
pK2pK1
pH � 6.06
pH � 12(pK1 � pK2)
�log[H�] � �12(log K1 � log K2)
log[H�] � 12(log K1 � log K2)
[H�] � 2K1K2
[H�] � B K1K2F
K1 � F
K1 V F
[H�] � BK1K2F � K1Kw
K1 � F
K2F W Kw
4.84 � 10�21.64 � 10�32.13 � 10�126.08 � 10�12HA2�
1.02 � 10�55.00 � 10�29.36 � 10�68.80 � 10�7HA�
1.80 � 10�101.32 � 10�23.68 � 10�21.32 � 10�2H2A
L�HLH2L�
KbKa
[L�][H2L�][HL] (� 0.050 0 M)
[L�] (� 1.02 � 10�5 M)[H2L�] (� 9.36 � 10�6 M)[HL] � 0.050 0 M
[L�] �K2[HL]
[H�]�
(1.80 � 10�10)(0.050 0)
8.80 � 10�7� 1.02 � 10�5 M
[H2L�] �[H�][HL]
K1�
(8.80 � 10�7)(0.050 0)
4.70 � 10�3� 9.36 � 10�6 M
[HL] � 0.050 0 M8.80 � 10�7 M[H�] �K2K1L�H2L�
� 8.80 � 10�7 M 1 pH � 6.06
[H�] � B (4.70 � 10�3)(1.80 � 10�10)(0.050 0) � (4.70 � 10�3)(1.0 � 10�14)
4.70 � 10�3 � 0.050 0
10-1 Diprotic Acids and Bases 185
If is not much less than [HL] and ifyou wish to refine your values of and ,try the method in Box 10-1.
[L�][H2L�][H2L�] � [L�]
Recall that and.log xy � log x � log y
log(x1/2) � 12 log x
The pH of the intermediate form of a diproticacid is close to midway between the two values and is almost independent ofconcentration.
pKa
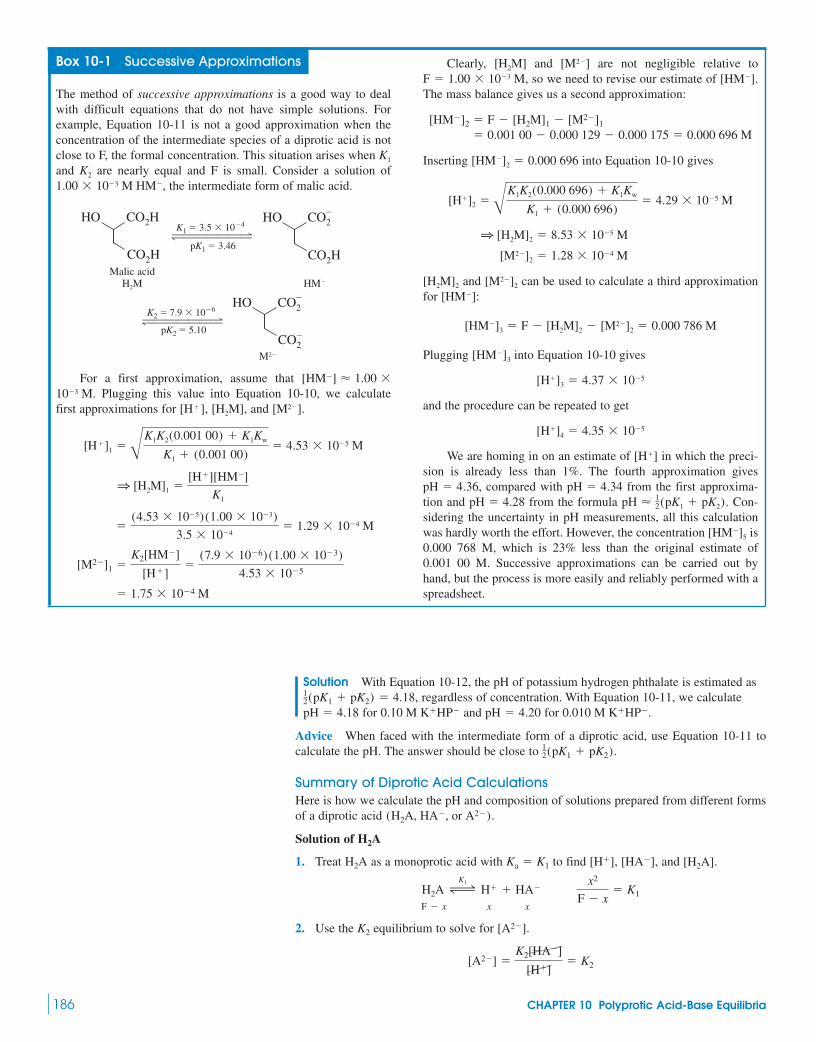
Solution With Equation 10-12, the pH of potassium hydrogen phthalate is estimated as, regardless of concentration. With Equation 10-11, we calculate
for and for .
Advice When faced with the intermediate form of a diprotic acid, use Equation 10-11 tocalculate the pH. The answer should be close to .
Summary of Diprotic Acid CalculationsHere is how we calculate the pH and composition of solutions prepared from different formsof a diprotic acid .
Solution of
1. Treat as a monoprotic acid with to find , , and .
x x
2. Use the equilibrium to solve for .
[A2�] �K2[HA�]
[H�]� K2
[A2�]K2
F � x
H2A ∆K1
H� � HA� x2
F � x� K1
[H2A][HA�][H�]Ka � K1H2A
H2A
(H2A, HA�, or A2�)
12(pK1 � pK2)
0.010 M K�HP�pH � 4.200.10 M K�HP�pH � 4.18
12(pK1 � pK2) � 4.18
186 CHAPTER 10 Polyprotic Acid-Base Equilibria
Box 10-1 Successive Approximations
The method of successive approximations is a good way to dealwith difficult equations that do not have simple solutions. Forexample, Equation 10-11 is not a good approximation when theconcentration of the intermediate species of a diprotic acid is notclose to F, the formal concentration. This situation arises when and are nearly equal and F is small. Consider a solution of
, the intermediate form of malic acid.
Malic acid
For a first approximation, assume that . Plugging this value into Equation 10-10, we calculate
first approximations for , , and .
� 1.75 � 10�4 M
[M2�]1 �K2[HM�]
[H�]�
(7.9 � 10�6)(1.00 � 10�3)
4.53 � 10�5
�(4.53 � 10�5) (1.00 � 10�3)
3.5 � 10�4� 1.29 � 10�4 M
1 [H2M]1 �[H�][HM�]
K1
[H�]1 � BK1K2(0.001 00) � K1Kw
K1 � (0.001 00)� 4.53 � 10�5 M
[M2�][H2M][H�]10�3 M
[HM�] � 1.00 �
M2�
HO �
�
CO2
CO2
#£££££4K2 � 7.9 � 10�6
pK2 � 5.10
HM�H2M
HO CO2H
CO2H
HO CO2
CO2H
�
#£££££4K1 � 3.5 � 10�4
pK1 � 3.46
1.00 � 10�3 M HM�
K2
K1
Clearly, and are not negligible relative to, so we need to revise our estimate of .
The mass balance gives us a second approximation:
Inserting into Equation 10-10 gives
and can be used to calculate a third approximationfor :
Plugging into Equation 10-10 gives
and the procedure can be repeated to get
We are homing in on an estimate of in which the preci-sion is already less than 1%. The fourth approximation gives
, compared with from the first approxima-tion and from the formula . Con-sidering the uncertainty in pH measurements, all this calculationwas hardly worth the effort. However, the concentration is0.000 768 M, which is 23% less than the original estimate of0.001 00 M. Successive approximations can be carried out byhand, but the process is more easily and reliably performed with aspreadsheet.
[HM�]5
pH � 12(pK1 � pK2)pH � 4.28
pH � 4.34pH � 4.36
[H�]
[H�]4 � 4.35 � 10�5
[H�]3 � 4.37 � 10�5
[HM�]3
[HM�]3 � F � [H2M]2 � [M2�]2 � 0.000 786 M
[HM�][M2�]2[H2M]2
[M2�]2 � 1.28 � 10�4 M
1 [H2M]2 � 8.53 � 10�5 M
[H�]2 � BK1K2(0.000 696) � K1Kw
K1 � (0.000 696)� 4.29 � 10�5 M
[HM�]2 � 0.000 696
� 0.001 00 � 0.000 129 � 0.000 175 � 0.000 696 M[HM�]2 � F � [H2M]1 � [M2�]1
[HM�]F � 1.00 � 10�3 M[M2�][H2M]

Solution of
1. Use the approximation and find the pH with Equation 10-11.
The pH should be close to 2. With from step 1 and , solve for and , using the and
equilibria.
Solution of
1. Treat as monobasic, with to find , , and .
x x
2. Use the equilibrium to solve for .
10-2 Diprotic BuffersA buffer made from a diprotic (or polyprotic) acid is treated in the same way as a buffermade from a monoprotic acid. For the acid , we can write two Henderson-Hasselbalchequations, both of which are always true. If we happen to know and , then wewill use the equation. If we know and , we will use the equation.
Example A Diprotic Buffer System
Find the pH of a solution prepared by dissolving 1.00 g of potassium hydrogen phthalateand 1.20 g of disodium phthalate in 50.0 mL of water.
Solution Monohydrogen phthalate and phthalate were shown in the preceding example.The formula masses are and We know and , so we use the Henderson-Hasselbalch equation to findthe pH:
is the acid dissociation constant of , which appears in the denominator of the logterm. Notice that the volume of solution was not used to answer the question.
Example Preparing a Buffer in a Diprotic System
How many milliliters of 0.800 M KOH should be added to 3.38 g of oxalic acid to give apH of 4.40 when diluted to 500 mL?
Oxalic acid
Solution The desired pH is above . We know that a 1:1 mole ratio of would have . If the pH is to be 4.40, there must be more thanOx2�pH � pK2 � 4.266
HOx�: Ox2�pK2
Formula mass � 90.035(H2Ox)
pK2 � 4.266pK1 � 1.27HOCCOH
™ ™OO
HP�K2
pH � pK2 � log[P2�]
[HP�]� 5.408 � log
(1.20 g) / (210.094 g/mol)
(1.00 g) / (204.221 g/mol)� 5.47
pK2[P2�][HP�]Na2P � C8H4O4Na2 � 210.094.KHP � C8H5O4K � 204.221
pH � pK1 � log[HA�]
[H2A] pH � pK2 � log
[A2�]
[HA�]
pK2[A2�][HA�]pK1
[HA�][H2A]H2A
[H2A] �[HA�][H�]
Ka1�
[HA�](Kw/[OH�])
Ka1� Kb2
[H2A]K1
[H�] �Kw
[OH�]�
Kw
x
F � x
A2� � H2O ∆Kb1
HA� � OH� x2
F � x� Kb1 �
Kw
Ka2
[H�][HA�][A2�]Kb � Kb1 � Kw/Ka2A2�
A2�
[H2A] �[HA�][H�]
K1 [A2�] �
K2[HA�]
[H�]
K2K1[A2�][H2A][HA�] � F[H�]
12(pK1 � pK2).
[H�] � BK1K2F � K1Kw
K1 � F
[HA�] � F
HA�
10-2 Diprotic Buffers 187
The calculations we have been doing arereally important to understand and use.However, we should not get too cocky aboutour great powers, because there could beequilibria we have not considered. Forexample, or in solutions of or form weak ion pairs that we have neglected:1
K� � HA� T {K�HA�}
K� � A2� T {K�A2�}
A2�HA�K�Na�
All Henderson-Hasselbalch equations (withactivity coefficients) are always true for asolution at equilibrium.

present. We must add enough base to convert all of the into , plusenough additional base to convert the right amount of into .
In 3.38 g of , there are . The volume of 0.800 M KOH needed to reactwith this much to make is .
To produce a pH of 4.40 requires more OH�:
HOx� � OH� Ox2�
Initial moles x —Final moles — x
The volume of KOH needed to deliver mole is . The total volume of KOH needed to bring the pH to 4.40 is
10-3 Polyprotic Acids and BasesThe treatment of diprotic acids and bases can be extended to polyprotic systems. By way ofreview, let’s write the pertinent equilibria for a triprotic system.
We deal with triprotic systems as follows:
1. is treated as a monoprotic weak acid, with .2. is treated as the intermediate form of a diprotic acid.
(10-13)
3. is also treated as the intermediate form of a diprotic acid. However, is“surrounded” by and , so the equilibrium constants to use are and
, instead of and .
(10-14)
4. is treated as monobasic, with .Kb � Kb1 � Kw/Ka3A3�
[H�] � BK2K3F � K2Kw
K2 � F
K2K1K3
K2A3�H2A�
HA2�HA2�
[H�] � BK1K2F � K1Kw
K1 � F
H2A�
Ka � K1H3A
H2A� � H2O T H3A � OH� Kb3 �Kw
Ka1
HA2� � H2O T H2A� � OH� Kb2 �Kw
Ka2
A3� � H2O T HA2� � OH� Kb1 �Kw
Ka3
HA2� T A3� � H� Ka3 � K3
H2A� T HA2� � H� Ka2 � K2
H3A T H2A� � H� Ka1 � K1
73.97 mL.46.92 � 27.05 �27.05 mL
(0.021 64 mol) / (0.800 M) �0.021 64
4.40 � 4.266 � logx
0.037 54 � x1 x � 0.021 64 mol
pH � pK2 � log[Ox2�]
[HOx�]
0.037 54 � x0.037 54
S
(0.037 54 mol) / (0.800 M) � 46.92 mLHOx�H2Ox0.037 54 molH2Ox
H2Ox � OH� B HOx�� � H2O
HOx� � OH� B Ox2� � H2O
apH � 1 (pK1 � pK2) � 2.772
aßßßßßßßßßßßßßßßaA 1:1 mixture would have
pH � pK2 � 4.266
21
Ox2�HOx�
HOx�H2OxHOx�
188 CHAPTER 10 Polyprotic Acid-Base Equilibria
The K values in Equations 10-13 and 10-14 arevalues for the triprotic acid.Ka

Example A Triprotic System
Find the pH of , , 0.10 M HHis, and , whereHis stands for the amino acid histidine.
Solution Treating as a monoprotic acid, we write
x x
Using Equation 10-13, we find
which is close to .
0.10 M HHis: Equation 10-14 gives
which is the same as .
Treating as monobasic, we can write
x x
We have reduced acid-base problems to just three types. When you encounter an acid orbase, decide whether you are dealing with an acidic, basic, or intermediate form. Then do theappropriate arithmetic to answer the question at hand.
pH � �log aKw
xb � 11.14
x2
F � x� Kb1 �
Kw
Ka3� 1.9 � 10�5 1 x � 1.37 � 10�3 M
F � x
His� � H2O T HHis � OH�
His�0.10 M His�:
12(pK2 � pK3) � 7.62
� 2.37 � 10�8 M 1 pH � 7.62
[H�] � B (10�5.97) (10�9.28) (0.10) � (10�5.97) (1.0 � 10�14)
10�5.97 � 0.10
12(pK1 � pK2) � 3.78
� 1.47 � 10�4 M 1 pH � 3.83
[H�] � B (10�1.6) (10�5.97) (0.10) � (10�1.6) (1.0 � 10�14)
10�1.6 � 0.10
0.10 M H2His�:
x2
F � x� K1 � 10�1.6 1 x � 3.9 � 10�2 M 1 pH � 1.41
F � x
H3His2� T H2His� � H�
H3His2�0.10 M H3His2�:
0.10 M His�0.10 M H2His�0.10 M H3His2�
10-3 Polyprotic Acids and Bases 189
CO2H
#£££4pK1 � 1.6
NH�
HNNH3
�
CO2
NH�
HNNH3
�
�
H3His2� H2His�
#£
££
££
4
pK2 � 5.97
CO2
#£££4pK3 � 9.28
NHNNH2
CO2
NHNNH3
�
�
His�HHis
Histidine
�
Three forms of acids and bases:• acidic• basic• intermediate (amphiprotic)

10-4 Which Is the Principal Species?We are often faced with the problem of identifying which species of acid, base, or intermediateis predominant under given conditions. A simple example is, “What is the principal form of ben-zoic acid at pH 8?”
Benzoic acid
for benzoic acid is 4.20. This means that, at pH 4.20, there is a 1:1 mixture of ben-zoic acid (HA) and benzoate ion . At , the quotient is 10:1. At , the quotient is 100:1. As pH increases, thequotient increases still further.
For a monoprotic system, the basic species, , is the predominant form when The acidic species, HA, is the predominant form when . The predominant form ofbenzoic acid at pH 8 is the benzoate anion, .
Example Principal Species—Which One and How Much?
What is the predominant form of ammonia in a solution at pH 7.0? Approximately whatfraction is in this form?
Solution In Appendix G, we find for the ammonium ion ( , theconjugate acid of ammonia, ). At , . Below pH 9.24, will be the predominant form. Because is about 2 pH units below , thequotient will be about 100:1. More than 99% is in the form .
For polyprotic systems, our reasoning is similar, but there are several values of . Consideroxalic acid, , with and . At , . At
, . The chart in the margin shows the major species in each pH region.
Example Principal Species in a Polyprotic System
The amino acid arginine has the following forms:
Appendix G tells us that the -ammonium group (at the left) is more acidic than thesubstituent (at the right). What is the principal form of arginine at pH 10.0?Approximately what fraction is in this form? What is the second most abundant form at this pH?
Solution We know that, at , . At . At , the major species is HArg. Because pH 10.0 is about one
pH unit higher than , we can say that . About 90% of arginineis in the form HArg. The second most important species is , which makes up about10% of the arginine.
Example More on Polyprotic Systems
In the pH range 1.82 to 8.99, is the principal form of arginine. Which is thesecond most prominent species at pH 6.0? at pH 5.0?
H2Arg�
H2Arg�
[HArg]/[H2Arg�] � 10:1pK2
pH � 10.0[HArg] � [Arg�]pH � pK3 � 12.1,[H2Arg�] � [HArg]pH � pK2 � 8.99
�
CHCH2CH2CH2NHCç
ç
NH2
CO2
¡
ç
NH2�
NH2
#£££££4pK3 � 12.1
CHCH2CH2CH2NHCç
ç
NH2
CO2
¡
ç
NH
NH2�
HArgArginine
Arg�
�
CHCH2CH2CH2NHCç
ç
3 �
CO2H
¡
ç
NH2
Substituent
#£££££4pK1 � 1.82
CHCH2CH2CH2NHCç
ç
CO2
¡
ç
NH2�
#£££££4pK2 � 8.99
H3Arg2� H2Arg�
NH 2
�NH 3�NH
2�NH
a
[HOx�] � [Ox2�]pH � pK2
[H2Ox] � [HOx�]pH � pK1pK2 � 4.27pK1 � 1.27H2OxpKa
NH�4[NH�
4 ]/[NH3]pKapH � 7.0
NH�4[NH�
4 ] � [NH3]pH � 9.24NH3
NH�4pKa � 9.24
C6H5CO�2
pH 6 pKa
pH 7 pKa.A�
[A�]/[HA][A�]/[HA]pH � pKa � 2 (� 6.20)
[A�]/[HA]pH � pKa � 1 (� 5.20)(A�)pKa
CO2Hß pKa � 4.20
190 CHAPTER 10 Polyprotic Acid-Base Equilibria
An example of when you need to knowprincipal species is when you design achromatographic or electrophoreticseparation. You would use different strategiesfor separating cations, anions, and neutralcompounds.
At because
.pH � pKa � log[A�]
[HA]
pH � pKa, [A�] � [HA]
HA A�Predominant
form
d MorepH
More Sacidic basic
cpKa
pH Major species
HAA�7pKa
6pKa
pH Major species
A2�pH 7 pK2
HA�pK1 6 pH 6 pK2
H2ApH 6 pK1
A2�H2A HA�
d MorepH
More Sacidic basic
c cpK1 pK2

Solution We know that the pH of the pure intermediate (amphiprotic) species, , is
Above pH 5.40 (and below ), HArg, the conjugate base of , will be thesecond most important species. Below pH 5.40 (and above ), will bethe second most important species.
Figure 10-1 summarizes how we think of a triprotic system. We determine the principalspecies by comparing the pH of the solution with the values.
Speciation describes the distribution of analyte among possible species. For an acid or base,speciation describes how much of each protonated form is present. When you ingest inor-ganic arsenic ( and ) from drinking water, it is methylated to speciessuch as , , , , ,and . Speciation describes the forms and quantities that are present.
10-5 Fractional Composition EquationsWe now derive equations that give the fraction of each species of acid or base at a given pH.These equations will be useful for acid-base and EDTA titrations, as well as for electro-chemical equilibria. They will be of key value in Chapter 13.
Monoprotic SystemsOur goal is to find an expression for the fraction of an acid in each form (HA and ) as afunction of pH. We can do this by combining the equilibrium constant with the mass balance.Consider an acid with formal concentration F:
Rearranging the mass balance gives , which can be plugged into the expression to give
or, with a little algebra,
(10-15)
The fraction of molecules in the form HA is called
(10-16)
Dividing Equation 10-15 by F gives
Fraction in the form HA: (10-17)
In a similar manner, the fraction in the form , designated can be obtained:
Fraction in the form (10-18)�A� �[A�]
F�
Ka
[H�] � KaA�:
AA�,A�
�HA �[HA]
F�
[H�]
[H�] � Ka
�HA �[HA]
[HA] � [A�]�
[HA]
F
AHA.
[HA] �[H�]F
[H�] � Ka
Ka �[H�](F � [HA])
[HA]
Ka[A�] � F � [HA]
Mass balance: F � [HA] � [A�]
HA ∆Ka
H� � A� Ka �[H�][A�]
[HA]
A�
(CH3)3As(CH3)3AsO(CH3)2As(OH)(CH3)2AsO(OH)(CH3)As(OH)2(CH3)AsO(OH)2
As(OH)3AsO(OH)3
pKa
H3Arg2�pH � pK1
H2Arg�pH � pK2
pH of H2Arg� � 12 (pK1 � pK2) � 5.40
H2Arg�
10-5 Fractional Composition Equations 191
H3APredominantform
H2A–
HA2– A3–
pK1 pK2 pK3
Morebasic
pHMoreacidic
pH = (pK1 + pK2)
[H3A] = [HA2–]
12
pH = (pK2 + pK3)
[H2A–] = [A3–]
12
Figure 10-1 The predominant molecularform of a triprotic system in the variouspH intervals.
(H3A)
Go back and read the Example “Preparing aBuffer in a Diprotic System” on page 187. See ifit makes more sense now.
�HA � �A� � 1
�A� � fraction of species in the form A�
�HA � fraction of species in the form HA
The fraction denoted here as is the samething we called the fraction of dissociationpreviously.
(�)�A�
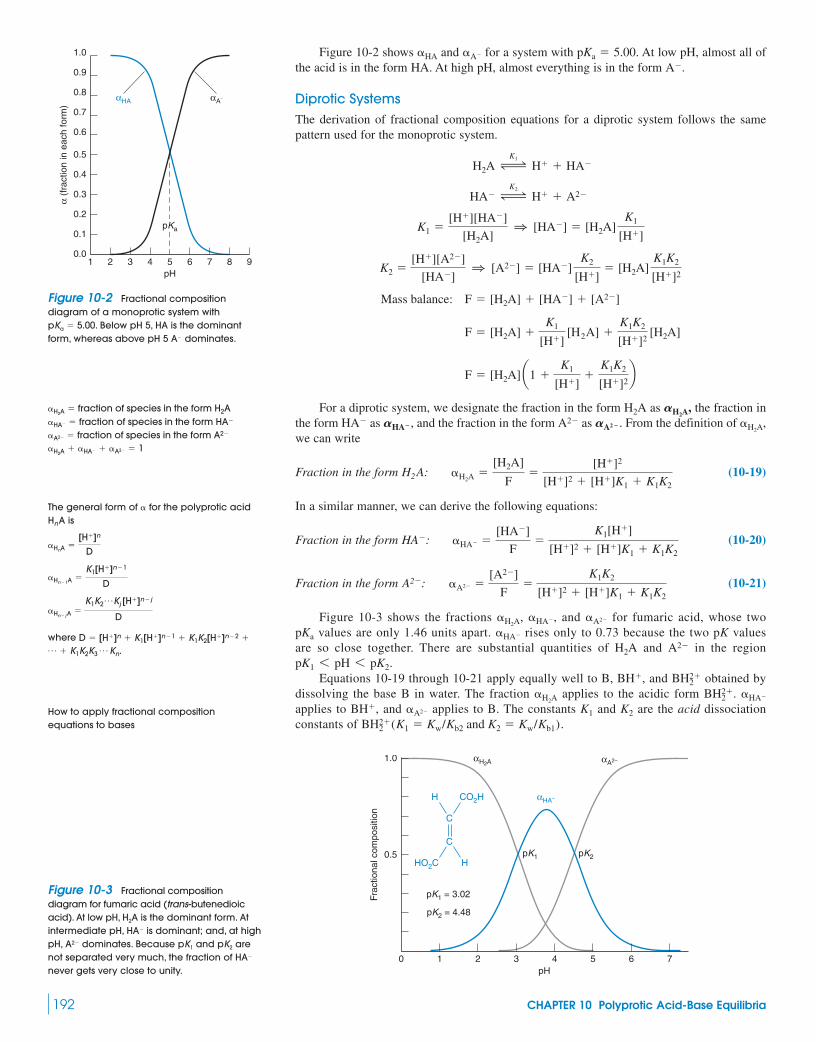
Figure 10-2 shows and for a system with . At low pH, almost all ofthe acid is in the form HA. At high pH, almost everything is in the form .
Diprotic SystemsThe derivation of fractional composition equations for a diprotic system follows the samepattern used for the monoprotic system.
For a diprotic system, we designate the fraction in the form as the fraction inthe form as , and the fraction in the form as . From the definition of we can write
Fraction in the form (10-19)
In a similar manner, we can derive the following equations:
Fraction in the form (10-20)
Fraction in the form (10-21)
Figure 10-3 shows the fractions , , and for fumaric acid, whose twovalues are only 1.46 units apart. rises only to 0.73 because the two pK values
are so close together. There are substantial quantities of and in the region.
Equations 10-19 through 10-21 apply equally well to B, , and obtained bydissolving the base B in water. The fraction applies to the acidic form . applies to , and applies to B. The constants and are the acid dissociationconstants of .BH2�
2 (K1 � Kw/Kb2 and K2 � Kw/Kb1)K2K1�A2�BH�
�HA�BH2�2�H2A
BH2�2BH�
pK1 6 pH 6 pK2
A2�H2A�HA�pKa
�A2��HA��H2A
�A2� �[A2�]
F�
K1K2
[H�]2 � [H�]K1 � K1K2
A2�:
�HA� �[HA�]
F�
K1[H�]
[H�]2 � [H�]K1 � K1K2
HA�:
�H2A�
[H2A]
F�
[H�]2
[H�]2 � [H�]K1 � K1K2
H2 A:
�H2A,AA2 �A2�AHA�HA�
AH2A,H2A
F � [H2A] a1 �K1
[H�]�
K1K2
[H�]2b
F � [H2A] �K1
[H�][H2A] �
K1K2
[H�]2[H2A]
Mass balance: F � [H2A] � [HA�] � [A2�]
K2 �[H�][A2�]
[HA�]1 [A2�] � [HA�]
K2
[H�]� [H2A]
K1K2
[H�]2
K1 �[H�][HA�]
[H2A]1 [HA�] � [H2A]
K1
[H�]
HA� ∆K2
H� � A2�
H2A ∆K1
H� � HA�
A�
pKa � 5.00�A��HA
192 CHAPTER 10 Polyprotic Acid-Base Equilibria
α (f
ract
ion
in e
ach
form
)
0.0
0.1
0.2
0.3
0.4
0.5
0.6
0.7
0.8
0.9
1.0
94321 5 6 7 8pH
pKa
αHA αA−
Figure 10-2 Fractional compositiondiagram of a monoprotic system with
. Below pH 5, HA is the dominantform, whereas above pH 5 dominates.A�
pKa � 5.00
�H2A � �HA� � �A2� � 1�A2� � fraction of species in the form A2�
�HA� � fraction of species in the form HA�
�H2A � fraction of species in the form H2A
The general form of for the polyprotic acidis
where p � K1K2K3
p Kn.D � [H�]n � K1[H�]n�1 � K1K2[H�]n�2 �
�Hn� jA �K1K2
pKj [H�]n� j
D
�Hn�1A �K1[H�]n�1
D
�HnA �[H�]n
D
HnA�
How to apply fractional compositionequations to bases
1.0
Frac
tiona
l com
posi
tion
pH
0.5
0 7654321
pK1 = 3.02
pK2 = 4.48
C
HHO2C
C
H CO2H
αH2A αA2–
αHA–
pK1 pK2
Figure 10-3 Fractional compositiondiagram for fumaric acid (trans-butenedioicacid). At low pH, is the dominant form. Atintermediate pH, is dominant; and, at highpH, dominates. Because and arenot separated very much, the fraction of never gets very close to unity.
HA�
pK2pK1A2�
HA�
H2A
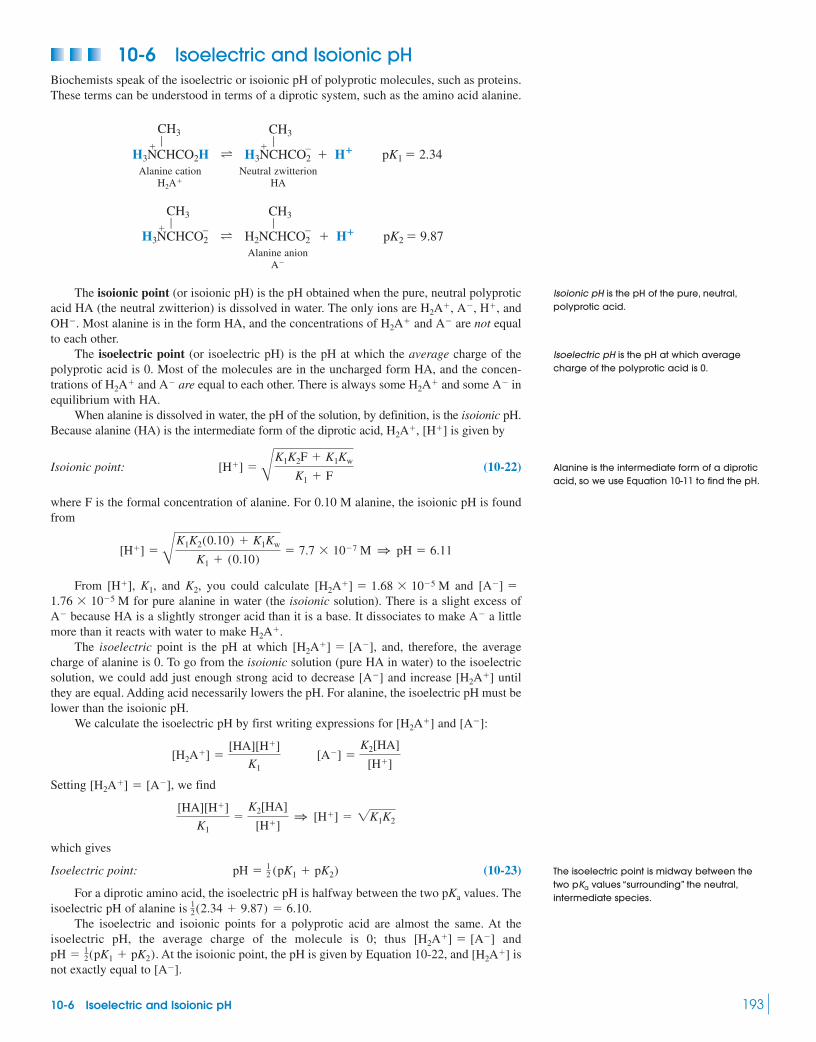
10-6 Isoelectric and Isoionic pH 193
10-6 Isoelectric and Isoionic pHBiochemists speak of the isoelectric or isoionic pH of polyprotic molecules, such as proteins.These terms can be understood in terms of a diprotic system, such as the amino acid alanine.
Alanine cation Neutral zwitterionHA
Alanine anion
The isoionic point (or isoionic pH) is the pH obtained when the pure, neutral polyproticacid HA (the neutral zwitterion) is dissolved in water. The only ions are , , , and
Most alanine is in the form HA, and the concentrations of and are not equalto each other.
The isoelectric point (or isoelectric pH) is the pH at which the average charge of thepolyprotic acid is 0. Most of the molecules are in the uncharged form HA, and the concen-trations of and are equal to each other. There is always some and some inequilibrium with HA.
When alanine is dissolved in water, the pH of the solution, by definition, is the isoionic pH.Because alanine (HA) is the intermediate form of the diprotic acid, , is given by
Isoionic point: (10-22)
where F is the formal concentration of alanine. For 0.10 M alanine, the isoionic pH is foundfrom
From , , and , you could calculate and for pure alanine in water (the isoionic solution). There is a slight excess of
because HA is a slightly stronger acid than it is a base. It dissociates to make a littlemore than it reacts with water to make .
The isoelectric point is the pH at which , and, therefore, the averagecharge of alanine is 0. To go from the isoionic solution (pure HA in water) to the isoelectricsolution, we could add just enough strong acid to decrease and increase untilthey are equal. Adding acid necessarily lowers the pH. For alanine, the isoelectric pH must belower than the isoionic pH.
We calculate the isoelectric pH by first writing expressions for and :
Setting , we find
which gives
Isoelectric point: (10-23)
For a diprotic amino acid, the isoelectric pH is halfway between the two values. Theisoelectric pH of alanine is .
The isoelectric and isoionic points for a polyprotic acid are almost the same. At theisoelectric pH, the average charge of the molecule is 0; thus and
. At the isoionic point, the pH is given by Equation 10-22, and isnot exactly equal to .[A�]
[H2A�]pH � 12(pK1 � pK2)
[H2A�] � [A�]
12(2.34 � 9.87) � 6.10
pKa
pH � 12 (pK1 � pK2)
[HA][H�]
K1�
K2[HA]
[H�]1 [H�] � 2K1K2
[H2A�] � [A�]
[H2A�] �[HA][H�]
K1 [A�] �
K2[HA]
[H�]
[A�][H2A�]
[H2A�][A�]
[H2A�] � [A�]H2A�
A�A�
1.76 � 10�5 M[A�] �[H2A�] � 1.68 � 10�5 MK2K1[H�]
[H�] � BK1K2(0.10) � K1Kw
K1 � (0.10)� 7.7 � 10�7 M 1 pH � 6.11
[H�] � BK1K2F � K1Kw
K1 � F
[H�]H2A�
A�H2A�A�H2A�
A�H2A�OH�.H�A�H2A�
A�
H3NCHCO2
çCH3
�t H2NCHCO2
çCH3
�� H�� pK2 � 9.87�
H2A�
H3NCHCO2HçCH3
�t H3NCHCO2
çCH3
� �� H�� pK1 � 2.34
Isoionic pH is the pH of the pure, neutral,polyprotic acid.
Isoelectric pH is the pH at which averagecharge of the polyprotic acid is 0.
Alanine is the intermediate form of a diproticacid, so we use Equation 10-11 to find the pH.
The isoelectric point is midway between thetwo values “surrounding” the neutral,intermediate species.
pKa
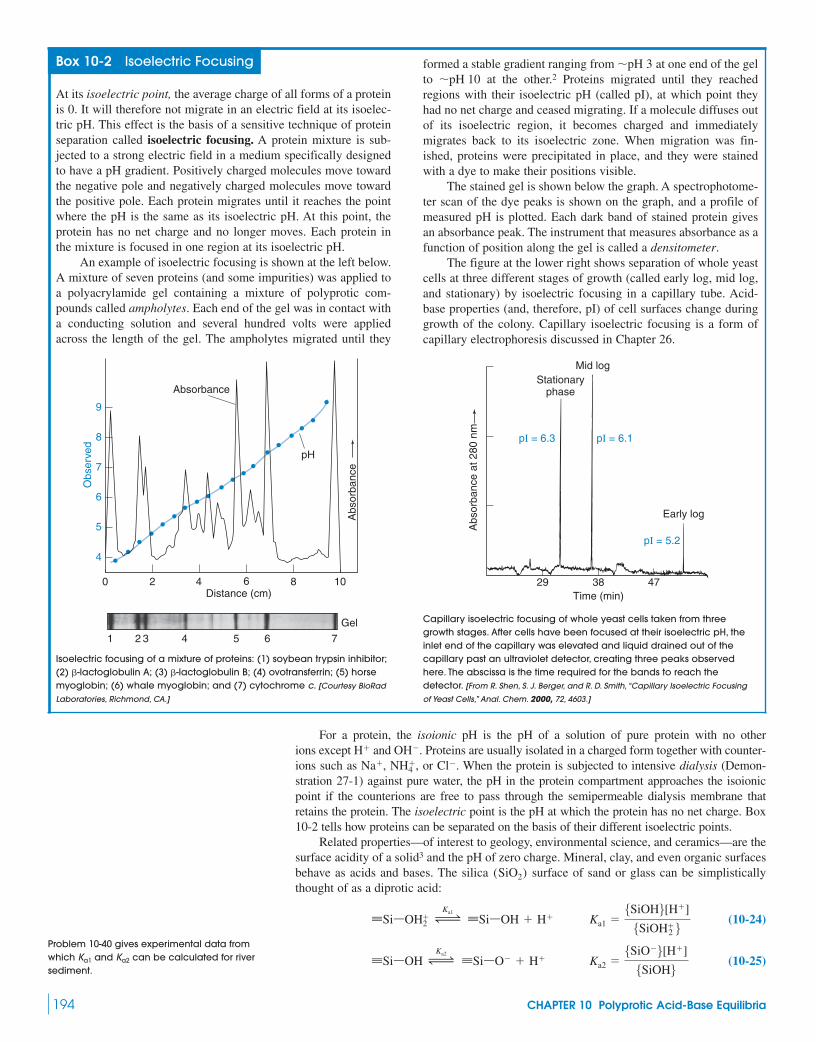
194 CHAPTER 10 Polyprotic Acid-Base Equilibria
Box 10-2 Isoelectric Focusing
At its isoelectric point, the average charge of all forms of a proteinis 0. It will therefore not migrate in an electric field at its isoelec-tric pH. This effect is the basis of a sensitive technique of proteinseparation called isoelectric focusing. A protein mixture is sub-jected to a strong electric field in a medium specifically designedto have a pH gradient. Positively charged molecules move towardthe negative pole and negatively charged molecules move towardthe positive pole. Each protein migrates until it reaches the pointwhere the pH is the same as its isoelectric pH. At this point, theprotein has no net charge and no longer moves. Each protein inthe mixture is focused in one region at its isoelectric pH.
An example of isoelectric focusing is shown at the left below.A mixture of seven proteins (and some impurities) was applied toa polyacrylamide gel containing a mixture of polyprotic com-pounds called ampholytes. Each end of the gel was in contact witha conducting solution and several hundred volts were appliedacross the length of the gel. The ampholytes migrated until they
formed a stable gradient ranging from at one end of the gelto at the other.2 Proteins migrated until they reachedregions with their isoelectric pH (called pI), at which point theyhad no net charge and ceased migrating. If a molecule diffuses outof its isoelectric region, it becomes charged and immediatelymigrates back to its isoelectric zone. When migration was fin-ished, proteins were precipitated in place, and they were stainedwith a dye to make their positions visible.
The stained gel is shown below the graph. A spectrophotome-ter scan of the dye peaks is shown on the graph, and a profile ofmeasured pH is plotted. Each dark band of stained protein givesan absorbance peak. The instrument that measures absorbance as afunction of position along the gel is called a densitometer.
The figure at the lower right shows separation of whole yeastcells at three different stages of growth (called early log, mid log,and stationary) by isoelectric focusing in a capillary tube. Acid-base properties (and, therefore, pI) of cell surfaces change duringgrowth of the colony. Capillary isoelectric focusing is a form ofcapillary electrophoresis discussed in Chapter 26.
�pH 10�pH 3
For a protein, the isoionic pH is the pH of a solution of pure protein with no otherions except and . Proteins are usually isolated in a charged form together with counter-ions such as , , or . When the protein is subjected to intensive dialysis (Demon-stration 27-1) against pure water, the pH in the protein compartment approaches the isoionicpoint if the counterions are free to pass through the semipermeable dialysis membrane thatretains the protein. The isoelectric point is the pH at which the protein has no net charge. Box10-2 tells how proteins can be separated on the basis of their different isoelectric points.
Related properties—of interest to geology, environmental science, and ceramics—are thesurface acidity of a solid3 and the pH of zero charge. Mineral, clay, and even organic surfacesbehave as acids and bases. The silica surface of sand or glass can be simplisticallythought of as a diprotic acid:
(10-24)
(10-25)ΩSißOH ∆Ka2
ΩSißO� � H� Ka2 �5SiO�6[H�]
5SiOH6
ΩSißOH2� ∆
Ka1
ΩSißOH � H� Ka1 �5SiOH6[H�]
5SiOH�2 6
(SiO2)
Cl�NH�4Na�
OH�H�
9
10
Obs
erve
d
Distance (cm)86420
8
7
6
5
4
Absorbance
pH
Abs
orba
nce
1 32 4 5 6 7
Gel
29 38
Stationaryphase
Mid log
pI = 6.3 pI = 6.1
pI = 5.2
Early log
Time (min)47
Abs
orba
nce
at 2
80 n
m
Isoelectric focusing of a mixture of proteins: (1) soybean trypsin inhibitor; (2) -lactoglobulin A; (3) -lactoglobulin B; (4) ovotransferrin; (5) horsemyoglobin; (6) whale myoglobin; and (7) cytochrome c. [Courtesy BioRad
Laboratories, Richmond, CA.]
��
Capillary isoelectric focusing of whole yeast cells taken from threegrowth stages. After cells have been focused at their isoelectric pH, theinlet end of the capillary was elevated and liquid drained out of thecapillary past an ultraviolet detector, creating three peaks observedhere. The abscissa is the time required for the bands to reach thedetector. [From R. Shen, S. J. Berger, and R. D. Smith, “Capillary Isoelectric Focusing
of Yeast Cells,” Anal. Chem. 2000, 72, 4603.]
Problem 10-40 gives experimental data fromwhich and can be calculated for riversediment.
Ka2Ka1

Exercises 195
Terms to Understandamino acidamphiproticdiprotic acids and bases
hydrolysisisoelectric focusingisoelectric point
isoionic pointpolyprotic acids and bases
speciationzwitterion
SummaryDiprotic acids and bases fall into three categories:
1. The fully acidic form, , behaves as a monoprotic acid,, for which we solve the equation
where , and .From and , can be found from the equilibrium.
2. The fully basic form, , behaves as a base, , for which we solve the equation
, where , and. From these concentrations, can be
found from the or equilibria.3. The intermediate (amphiprotic) form, is both an acid
and a base. Its pH is given by
where and are acid dissociation constants for , andF is the formal concentration of the intermediate. In mostcases, this equation reduces to the form ,in which pH is independent of concentration.
In triprotic systems, there are two intermediate forms. The pH ofeach is found with an equation analogous to that for the intermediateform of a diprotic system. Triprotic systems also have one fully acidic
pH � 12(pK1 � pK2)
H2AK2K1
[H�] � BK1K2F � K1Kw
K1 � F
HA�,Kb2Ka1
[H2A][A2�] � F � x[OH�] � [HA�] � xKb1 � x2/ (F � x)
HA� � OH�
A2� � H2O TA2�
Ka2[A2�][H�][HA�][H2A] � F � x[H�] � [HA�] � xx2/ (F � x),
Ka1 �H2A T H� � HA�
H2A
and one fully basic form; these species can be treated as monoproticfor the purpose of calculating pH. For polyprotic buffers, we writethe appropriate Henderson-Hasselbalch equation connecting the twoprincipal species in the system. The pK in this equation is the onethat applies to the acid in the denominator of the log term.
The principal species of a monoprotic or polyprotic system isfound by comparing the pH with the various values. For
, the fully protonated species, , is the predominantform. For , the form is favored; and, ateach successive pK value, the next deprotonated species becomesprincipal. Finally, at pH values higher than the highest pK, the fullybasic form is dominant. The fractional composition of a solu-tion is expressed by , given in Equations 10-17 and 10-18 fora monoprotic system and Equations 10-19 through 10-21 for adiprotic system.
The isoelectric pH of a polyprotic compound is that pH atwhich the average charge of all species is 0. For a diprotic aminoacid whose amphiprotic form is neutral, the isoelectric pH is givenby . The isoionic pH of a polyprotic species isthe pH that would exist in a solution containing only the ionsderived from the neutral polyprotic species and from . For adiprotic amino acid whose amphiprotic form is neutral, the isoionicpH is found from , where Fis the formal concentration of the amino acid.
[H�] � 2(K1K2F � K1Kw)/(K1 � F)
H2O
pH � 12(pK1 � pK2)
�(An�)
Hn�1A�pK1 6 pH 6 pK2
HnApH 6 pK1
pKa
The notation represents a surface silicon atom. Silanol groups can donateor accept a proton to give the surface a negative or positive charge. In the equilibrium con-stants, the concentrations of the surface species , {SiOH}, and are measuredin moles per gram of solid.
The pH of zero charge is the pH at which and, therefore, the surfacehas no net charge. Like the isoelectric point of a diprotic acid, the pH of zero charge is
. Colloidal particles (those with diameters in the range 1–100 nm) tend toremain dispersed when they are charged, but they flocculate (come together and precipitate)near the pH of zero charge. In capillary electrophoresis (Chapter 26), the surface charge ofthe silica capillary governs the rate at which solvent moves through the capillary.
12(pKa1 � pKa2)
5SiOH�2 6 � 5SiO�6
5SiO�65SiOH�2 6
(ΩSißOH)ΩSi
Exercises10-A. Find the pH and the concentrations of , , and
in each solution: (a) ; (b) ;(c) .
10-B. (a) How many grams of (FM 84.007) must beadded to 4.00 g of (FM 138.206) to give a pH of 10.80 in500 mL of water?(b) What will be the pH if 100 mL of 0.100 M HCl are added to thesolution in part (a)?(c) How many milliliters of should be added to4.00 g of to give a pH of 10.00 in 250 mL?
10-C. How many milliliters of 0.800 M KOH should be added to5.02 g of 1,5-pentanedoic acid ( , FM 132.11) to give a pHof 4.40 when diluted to 250 mL?
C5H8O4
K2CO3
0.320 M HNO3
K2CO3
NaHCO3
0.050 M Na2SO3
0.050 M NaHSO30.050 M H2SO3SO2�3
HSO�3H2SO3 10-D. Calculate the pH of a 0.010 M solution of each amino acid in
the form drawn here.
(a) (b) (c)Glutamine Cysteine Arginine
H2NCHCO2
CH2ç
CH2ç
¡
ç
ç
�
NH2
H2N�
NH2
CH2
ç
çC
H3NCHCO2
Sç
CH2ç� �
�
O
H3NCHCO2
CH2ç
CH2ç
¡
ç
ç
�
NH2
C
�

196 CHAPTER 10 Polyprotic Acid-Base Equilibria
ProblemsDiprotic Acids and Bases
10-1. Consider , the intermediate form of a diprotic acid. forthis species is and is . Nonetheless, the and reac-tions proceed to nearly the same extent when NaHA is dissolved inwater. Explain.
10-2. Write the general structure of an amino acid. Why do someamino acids in Table 10-1 have two pK values and others three?
10-3. Write the chemical reactions whose equilibrium constants are and for the amino acid proline. Find the values of and .
10-4. Consider the diprotic acid with and. Find the pH and concentrations of , ,
and in (a) ; (b) 0.100 M NaHA; (c)
10-5. We will abbreviate malonic acid, , as .Find the pH and concentrations of , , and in(a) ; (b) 0.100 M NaHM; (c) .
10-6. Calculate the pH of 0.300 M piperazine. Calculate the con-centration of each form of piperazine in this solution.
10-7. Use the method of Box 10-1 to calculate the concentrations of, , , and in 0.001 00 M monosodium oxalate, NaHA.
10-8. Activity. In this problem, we calculate the pH of the interme-diate form of a diprotic acid, taking activities into account.(a) Including activity coefficients, derive Equation 10-11 for potas-sium hydrogen phthalate ( in the example following Equa-tion 10-12).(b) Calculate the pH of 0.050 M KHP, using the results in part (a).Assume that the sizes of both and are 600 pm.
10-9. Intermediate form of diprotic acid. Use the method inBox 10-1 to find the pH and concentration of in a 0.01 F solu-tion of the amphiprotic salt derived from the diprotic acid
with and (a) or (b) .
10-10. Heterogeneous equilibrium. dissolves in water to give“carbonic acid” (which is mostly dissolved , as described inBox 6-4).
(The equilibrium constant is called the Henry’s law constant forcarbon dioxide, because Henry’s law states that the solubility of agas in a liquid is proportional to the pressure of the gas.) The aciddissociation constants listed for “carbonic acid” in Appendix Gapply to . Given that in the atmosphere is atm,find the pH of water in equilibrium with the atmosphere.
Diprotic Buffers
10-11. How many grams of (FM 105.99) should be mixedwith 5.00 g of (FM 84.01) to produce 100 mL of bufferwith pH 10.00?
NaHCO3
Na2CO3
10�3.4PCO2CO2(aq)
CO2(g) T CO2(aq) K � 10�1.5
CO2
CO2
pK2 � 5pK2 � 8pK1 � 4H2ANa�HA�
HA�
P2�HP�
K�HP�
A2�HA�H2AH�
0.100 M Na2M0.100 M H2MM2�HM�H2M
H2MCH2(CO2H)2
0.100 M Na2A.0.100 M H2AA2�
HA�H2AK2 � 1.00 � 10�8K1 � 1.00 � 10�4H2A
Kb2Kb1Kb2
Kb1
KbKa10�8Kb10�4KaHA�
10-12. How many milliliters of 0.202 M NaOH should be added to25.0 mL of 0.023 3 M salicylic acid (2-hydroxybenzoic acid) toadjust the pH to 3.50?
10-13. Describe how you would prepare exactly 100 mL of 0.100 Mpicolinate buffer, pH 5.50. Possible starting materials are purepicolinic acid (pyridine-2-carboxylic acid, FM 123.11), 1.0 M HCl,and 1.0 M NaOH. Approximately how many milliliters of the HClor NaOH will be required?
10-14. How many grams of (FM 142.04) should be added tohow many grams of sulfuric acid (FM 98.08) to give 1.00 L of bufferwith pH 2.80 and a total sulfur con-centration of 0.200 M?
Polyprotic Acids and Bases
10-15. Phosphate, present to an extent of 0.01 M, is one of the mainbuffers in blood plasma, whose pH is 7.45. Would phosphate be asuseful if the plasma pH were 8.5?
10-16. Starting with the fully protonated species, write the stepwiseacid dissociation reactions of the amino acids glutamic acid and tyro-sine. Be sure to remove the protons in the correct order. Which speciesare the neutral molecules that we call glutamic acid and tyrosine?
10-17. (a) Calculate the quotient in
(b) Find the same quotient for .
10-18. (a) Which two of the following compounds would you mixto make a buffer of pH 7.45: (FM 98.00), (FM119.98), (FM 141.96), and (FM 163.94)?(b) If you wanted to prepare 1.00 L of buffer with a total phosphateconcentration of 0.050 0 M, how many grams of each of the twoselected compounds would you mix together?(c) If you did what you calculated in part (b), you would not get apH of exactly 7.45. Explain how you would really prepare thisbuffer in the lab.
10-19. Find the pH and the concentration of each species of lysinein a solution of , lysine monohydrochloride.
10-20. How many milliliters of 1.00 M KOH should be added to100 mL of solution containing 10.0 g of histidine hydrochloride
to get a pH of 9.30?
10-21. (a) Using activity coefficients, calculate the pH of a solutioncontaining a 2.00:1.00 mole ratio of , where is citricacid. Assume that ionic strength .(b) What will be the pH if the ionic strength is raised to 0.10 M andthe mole ratio is kept constant?
Which Is the Principal Species?
10-22. The acid HA has .(a) Which is the principal species, HA or , at pH 6.00?(b) Which is the principal species at pH 8.00?(c) What is the quotient at pH 7.00? at pH 6.00?[A�]/[HA]
A�
pKa � 7.00
HC2�:C3�
� 0.010 MH3CHC2�:C3�
(His � HCl, FM 191.62)
0.010 0 M lysine � HCl
Na3PO4Na2HPO4
NaH2PO4H3PO4
0.050 0 M K2HPO4
KH2PO4.0.050 0 M[H3PO4]/[H2PO�
4 ]
(� SO2�4 � HSO�
4 � H2SO4)
Na2SO4
10-E. (a) Draw the structure of the predominant form (principalspecies) of 1,3-dihydroxybenzene at pH 9.00 and at pH 11.00.(b) What is the second most prominent species at each pH?(c) Calculate the percentage in the major form at each pH.
10-F. Draw the structures of the predominant forms of glutamicacid and tyrosine at pH 9.0 and pH 10.0. What is the second mostabundant species at each pH?
10-G. Calculate the isoionic pH of 0.010 M lysine.
10-H. Neutral lysine can be written HL. The other forms of lysineare , , and . The isoelectric point is the pH at whichthe average charge of lysine is 0. Therefore, at the isoelectric point,
. Use this condition to calculate theisoelectric pH of lysine.2[H3L2�] � [H2L�] � [L�]
L�H2L�H3L2�

Problems 197
10-23. The diprotic acid has and .(a) At what pH is ?(b) At what pH is ?(c) Which is the principal species at pH 2.00: , , or ?(d) Which is the principal species at pH 6.00?(e) Which is the principal species at pH 10.00?
10-24. The base B has .(a) What is the value of for the acid ?(b) At what pH is ?(c) Which is the principal species at pH 7.00: B or ?(d) What is the quotient at pH 12.00?
10-25. Draw the structure of the predominant form of pyridoxal-5-phosphate at pH 7.00.
Fractional Composition Equations
10-26. The acid HA has . Use Equations 10-17 and10-18 to find the fraction in the form HA and the fraction in theform at . Does your answer agree with what youexpect for the quotient at pH 5.00?
10-27. A dibasic compound, B, has and .Find the fraction in the form at pH 7.00, using Equation 10-19.Note that and in Equation 10-19 are acid dissociation con-stants for and .
10-28. What fraction of ethane-1,2-dithiol is in each form ( ,, ) at pH 8.00? at pH 10.00?
10-29. Calculate , , and for cis-butenedioic acid at pH1.00, 1.92, 6.00, 6.27, and 10.00.
10-30. (a) Derive equations for , , , and for atriprotic system.(b) Calculate the values of these fractions for phosphoric acid atpH 7.00.
10-31. A solution containing acetic acid, oxalic acid, ammonia, andpyridine has a pH of 9.00. What fraction of ammonia is not protonated?
10-32. A solution was prepared from 10.0 mL of 0.100 M cacodylicacid and 10.0 mL of 0.080 0 M NaOH. To this mixture was added1.00 mL of M morphine. Calling morphine B, calcu-late the fraction of morphine present in the form .
10-33. Fractional composition in a diprotic system. Create aspreadsheet that uses Equations 10-19 through 10-21 to computethe three curves in Figure 10-3. Use graphics software to plot thesethree curves in a beautifully labeled figure.
10-34. Fractional composition in a triprotic system. For atriprotic system, the fractional composition equations are
�A3� �K1K2K3
D�H2A� �
K1[H�]2
D
�HA2� �K1K2[H�]
D�H3A
�[H�]3
D
ß
OHO
N
Morphine
OH
CH3:
Kb � 1.6 � 10�6
(CH3)2AsOH
Ka � 6.4 � 10�7
O
Cacodylic acid
BH�
1.27 � 10�6
�A3��HA2��H2A��H3A
�A2��HA��H2A
A2�HA�
H2A
K2 � Kw/Kb1)BH2�2 (K1 � Kw/Kb2
K2K1
BH2�2
pKb2 � 6.00pKb1 � 4.00
[A�]/[HA]pH � 5.00A�
pKa � 4.00
[B]/[BH�]BH�
[BH�] � [B]BH�pKa
pKb � 5.00
A2�HA�H2A[HA�] � [A2�][H2A] � [HA�]
pK2 � 8.00pK1 � 4.00H2A where . Use theseequations to create a fractional composition diagram analogous toFigure 10-3 for the amino acid tyrosine. What is the fraction of eachspecies at pH 10.00?
10-35. Fractional composition in a tetraprotic system. Pre-pare a fractional composition diagram analogous to Figure 10-3 forthe tetraprotic system derived from hydrolysis of :
(Yes, the values of and are equal.)(a) Use these equilibrium constants to prepare a fractional composi-tion diagram for this tetraprotic system.(b) You should do this part with your head and your calculator, notyour spreadsheet. The solubility of is given by
What concentration of is in equilibrium with solid?
(c) What concentration of is in equilibrium withif the solution pH is adjusted to 4.00?
Isoelectric and Isoionic pH
10-36. What is the difference between the isoelectric pH andthe isoionic pH of a protein with many different acidic and basicsubstituents?
10-37. What is wrong with the following statement: At its iso-electric point, the charge on all molecules of a particular proteinis 0.
10-38. Calculate the isoelectric and isoionic pH of 0.010 M threonine.
10-39. Explain how isoelectric focusing works.
10-40. pH of zero charge. Data in the spreadsheets on thenext page were obtained by adding or 0.100 MNaOH to a stirred mixture of 10.0 g of dry, sieved river sedimentin 100 mL of to maintain constant ionic strength.pH was recorded for each addition after 10 min for equilibration.
We analyze the data in terms of Reactions 10-24 and 10-25.Let the total concentration of surface species (mol/g) be
. was taken as three times themoles of that exchanged with sediment in 3 h. The sur-face charge of the solid (mol/g) is . Whena concentration (mol/L) of or a concentration of NaOHis added to sediment, the positive surface charge on the solid is
(A)
where m is the solid concentration (g/L). For addition of ,. For addition of , . For pH well below the pH
of zero charge, the charged surface species is , so . Therefore,
(B)Ka1 �5SiOH6[H�]
5SiOH�2 6 �
(5S6tot � Q)[H�]
Q
5�SißOH�2 6
Q ��SißOH�2
Ca � 0NaOHCb � 0HNO3
Q �Ca � Cb � [OH�] � [H�]
m
CbHNO3Ca
Q � 5SiOH�2 6 � 5SiO�6Co(NH3)3�
6
5S6tot5SiOH�2 6 � 5SiOH6 � 5SiO�6 5S6tot �
0.10 M NaNO3
0.100 M HNO3
Cr(OH)3(s)Cr(OH)2�
Cr(OH)3(s)Cr(OH)3(aq)
Cr(OH)3(s) T Cr(OH)3(aq) K � 10�6.84
Cr(OH)3
Ka3Ka2
Cr(OH)3(aq) � H2O T Cr(OH)�4 � H� Ka4 � 10�11.40
Cr(OH) �2 � H2O T Cr(OH)3(aq) � H� Ka3 � 10�6.40
Cr(OH)2� � H2O T Cr(OH)�2 � H� Ka2 � 10�6.40
Cr3� � H2O T Cr(OH)2� � H� Ka1 � 10�3.80
Cr3�
D � [H�]3 � K1[H�]2 � K1K2[H�] � K1K2K3

198 CHAPTER 10 Polyprotic Acid-Base Equilibria
For pH well above the pH of zero charge, the charged surfacespecies is , so . Therefore,
(C)
In the spreadsheet, , whereV is mL of added . where is theactivity coefficient of at an ionic strength of 0.1 M.
, where is the activity coefficient of . QOH��OH�(10pH�14) /�OH�
[OH�] �H�
�H�[H�] � (10�pH) /�H�,HNO3
Ca � 0.100*V/ (100 � V)HNO3
Ka2 �5SiO�6[H�]
5SiOH6 �Q[H�]
5S6tot � Q
Q � 5�SißO�6�SißO�
is given by Equation A and is given by Equation B with mol/g. In the NaOH spreadsheet,
where V is mL of added NaOH. , and Q have the same formulas as in the spreadsheet, and is given by Equation C.
Complete the spreadsheets and prepare a graph of versus Qfor each titration. Fit the points with a straight line and find theintercept at . The intercept of the graph is taken as and the intercept of the NaOH graph is taken as . Find the pH ofzero charge, given by .1
2(pKa1 � pKa2)Ka2
Ka1HNO3Q � 0
pKa
Ka2HNO3
[OH�],[H�]0.100*V(100 � V),Cb �1.30 � 10�45S6tot �
Ka1
1
2
3
4
5
6
7
8
9
10
11 10
γ (OH-) =
0.83
0.76
γ(H+) =
mol/g
12
0.00010 5.33
4.86
4.47
4.32
4.023.72
3.54
3.41
3.35
3.15
1.30E-04
Titration of sediment with HNO3
A B C D E F G H I
5.64E-06 2.81E-09 9.43E-06
[H+] [OH-] Q (mol/g)
7.21E-05 4.14
Stot = HNO3 (mL) Ca (M) Ka1 pKa1pH
0.1
0.2
0.6
0.81.0
1.4
1.6
2.0
0.5
1.2grams ofsoil =
1
2
3
4
5
6
7
8
9
10
11 10
γ (OH-) =
0.83
0.76
γ(H+) =
mol/g
12
0.00010 6.92
7.07
7.20
7.317.567.66
7.80
7.93
8.06
8.13
1.30E-04
Titration of sediment with NaOH
A B C D E F G H I
1.45E-07 1.09E-07 –9.99E-06
[H+] [OH-] Q (mol/g)
1.03E-08 7.99
Stot = NaOH (mL) Cb (M) Ka2 pKa2pH
0.1
0.2
0.4
0.50.6
0.8
0.9
1.0
0.3
0.7grams ofsoil =
Spreadsheets for titration of river sediment with or NaOH. [Data from M. Davranche, S. Lacour, F. Bordas, and
J.-C. Bollinger, “Determination of the Surface Chemical Properties of Natural Solids,” J. Chem. Ed. 2003, 80, 76.]
HNO3

199
ACID-BASE TITRATION OF A PROTEIN
Acid-Base Titrations11
Ribonuclease is an enzyme with 124 amino acids. Its function is to cleave ribonucleic acid(RNA) into small fragments. A solution containing pure protein, with no other ions presentexcept and derived from the protein and water, is said to be isoionic. From this pointnear pH 9.6 in the graph, the protein can be titrated with acid or base. Of the 124 amino acids,16 can be protonated by acid and 20 can lose protons to added base. From the shape of thetitration curve, it is possible to deduce the approximate for each titratable group.1,2 Thisinformation provides insight into the environment of that amino acid in the protein. Inribonuclease, three tyrosine residues have “normal” values of (Table 10-1) andthree others have . The interpretation is that three tyrosine groups are accessibleto , and three are buried inside the protein where they cannot be easily titrated. Thesolid line in the illustration is calculated from values for all titratable groups.
Theoretical titration curves for enzymes can be calculated from known crystal struc-tures and first principles of electrostatics. Key amino acids at the active site have signifi-cantly perturbed values and unusual regions in which they are partially protonated overa wide pH region.3 In principle, such titration calculations can identify the active site of aprotein whose structure is known, but whose function is not.
pKa
pKa
OH�
pKa 7 12pKa (�10)
pKa
OH�H�
From an acid-base titration curve, we can deduce the quantities and values of acidic andbasic substances in a mixture. In medicinal chemistry, the and lipophilicity of a candidatedrug predict how easily it will cross cell membranes. We saw in Chapter 10 that from andpH, we can compute the charge of a polyprotic acid. Usually, the more highly charged a drug,the harder it is to cross a cell membrane. In this chapter, we learn how to predict the shapesof titration curves and how to find end points with electrodes or indicators.
pKa
pKa
pKa
Isoionicpoint
Isoelectricpoint
15
2
4
6
8
10
12
pH
10 5 0 5OH− added
per moleculeH+ addedper molecule
10
OH
OH
OH
Easily accessible
Inaccessible
Tyrosinephenol group
Protein
O−OH−
Acid-base titration of the enzyme ribonuclease. The isoionicpoint is the pH of the pure protein with no ions present exceptH� and OH�. The isoelectric point is the pH at which theaverage charge on the protein is 0. [C. T. Tanford and J. D. Hauenstein, “Hydrogen Ion Equilibria of Ribonuclease,” J. Am. Chem.Soc. 1956, 78, 5287.]
If tyrosine is buried deep inside theprotein, it is not readily accessibleand a high concentration of OH� isrequired to remove the proton fromthe phenol group.
Lipophilicity is a measure of solubility innonpolar solvents. It is determined from theequilibrium distribution of a drug betweenwater and octanol.
Lipophilicity � log a [drug (in octanol )]
[drug(aq)]b
Drug(aq) T drug (in octanol )

11-1 Titration of Strong Base with Strong AcidFor each type of titration in this chapter, our goal is to construct a graph showing how the pHchanges as titrant is added. If you can do this, then you understand what is happening duringthe titration, and you will be able to interpret an experimental titration curve.
The first step in each case is to write the chemical reaction between titrant and analyte. Thenuse that reaction to calculate the composition and pH after each addition of titrant. As a simpleexample, let’s focus on the titration of 50.00 mL of 0.020 00 M KOH with 0.100 0 M HBr. Thechemical reaction between titrant and analyte is merely
Because the equilibrium constant for this reaction is , it is fair to say that it “goes tocompletion.” Any amount of H� added will consume a stoichiometric amount of
It is useful to know the volume of needed to reach the equivalence point:
144424443 14444244443mmol of HBr mmol of
at equivalence point being titrated
When 10.00 mL of HBr have been added, the titration is complete. Prior to this point, thereis excess, unreacted present. After there is excess in the solution.
In the titration of any strong base with any strong acid, there are three regions of thetitration curve that require different kinds of calculations:
1. Before the equivalence point, the pH is determined by excess in the solution.2. At the equivalence point, is just sufficient to react with all to make .
The pH is determined by dissociation of water.3. After the equivalence point, pH is determined by excess in the solution.
We will do one sample calculation for each region. Complete results are shown in Table 11-1and Figure 11-1. As a reminder, the equivalence point occurs when the added titrant isexactly enough for stoichiometric reaction with the analyte. The equivalence point is theideal result we seek in a titration. What we actually measure is the end point, which ismarked by a sudden physical change, such as indicator color or an electrode potential.
H�
H2OOH�H�
OH�
H�Ve,OH�
OH�
(Ve (mL))(0.100 0 M) � (50.00 mL)(0.020 00 M) 1 Ve � 10.00 mL
HBr (Ve)OH�.
1014
H� � OH� S H2O K � 1/Kw � 1014
200 CHAPTER 11 Acid-Base Titrations
Table 11-1 Calculation of the titration curve for 50.00 mL of 0.020 00 M KOHtreated with 0.100 0 M HBr
mL HBr Concentration of Concentration ofadded (Va) unreacted OH� (M) excess H� (M) pH
0.00 0.020 0 12.301.00 0.017 6 12.242.00 0.015 4 12.183.00 0.013 2 12.124.00 0.011 1 12.045.00 0.009 09 11.95Region 16.00 0.007 14 11.857.00 0.005 26 11.728.00 0.003 45 11.539.00 0.001 69 11.229.50 0.000 840 10.929.90 0.000 167 10.229.99 0.000 016 6 9.22
Region 2 10.00 — — 7.0010.01 0.000 016 7 4.7810.10 0.000 166 3.7810.50 0.000 826 3.08
Region 3 11.00 0.001 64 2.7912.00 0.003 23 2.4913.00 0.004 76 2.3214.00 0.006 25 2.2015.00 0.007 69 2.1116.00 0.009 09 2.04
(excess H�)
(excess OH�)
pH
2
3
4
5
6
7
8
9
10
11
12
13
ExcessOH−
Equivalencepoint
Inflectionpoint
( = 0)d 2ydx 2
ExcessH+
160 8Va (mL)
146 124 102
First, write the reaction between titrant andanalyte.
The titration reaction.
Figure 11-1 Calculated titration curve,showing how pH changes as 0.100 0 M HBr isadded to 50.00 mL of 0.020 00 M KOH. Theequivalence point is also an inflection point.

11-1 Titration of Strong Base with Strong Acid 201
Region 1: Before the Equivalence PointWhen 3.00 mL of HBr have been added, the reaction is three-tenths complete because
. The fraction of left unreacted is seven-tenths. The concentration ofremaining in the flask is
b Initial volume
of
(11-1)
144424443 1442443 144424443Fraction Initial Dilution
a Total volume
of concentration factorof solution
remaining of
Equation 11-1 is an example of the streamlined calculation introduced in Section 7-4 inconnection with precipitation titrations. This equation tells us that the concentration of
is equal to a certain fraction of the initial concentration, with a correction for dilu-tion. The dilution factor equals the initial volume of analyte divided by the total volumeof solution.
In Table 11-1, the volume of acid added is designated . pH is expressed tothe 0.01 decimal place, regardless of what is justified by significant figures. We do thisfor the sake of consistency and also because 0.01 is near the limit of accuracy in pHmeasurements.
Region 2: At the Equivalence PointRegion 2 is the equivalence point, where just enough has been added to consume .We could prepare the same solution by dissolving KBr in water. The pH is determined by thedissociation of water:
x x
The pH at the equivalence point in the titration of any strong base (or acid) with strong acid(or base) will be 7.00 at .
As we will soon discover, the pH is not 7.00 at the equivalence point in the titration ofweak acids or bases. The pH is 7.00 only if the titrant and analyte are both strong.
Region 3: After the Equivalence PointBeyond the equivalence point, we are adding excess HBr to the solution. The concentrationof excess at, say, 10.50 mL is given by
bVolume ofexcess
14243 1442443 a Total volumeInitial Dilution
of solutionconcentration factor
of
At , there is an excess of just .That is the reason why 0.50 appears in the dilution factor.
The Titration CurveThe complete titration curve in Figure 11-1 exhibits a rapid change in pH near the equiv-alence point. The equivalence point is where the slope is greatest (and the sec-ond derivative is 0, which makes it an inflection point). To repeat an important statement,the pH at the equivalence point is 7.00 only in a strong-acid–strong-base titration. If oneor both of the reactants are weak, the equivalence point pH is not 7.00.
(dpH/dVa)
Va � Ve � 10.50 � 10.00 � 0.50 mL of HBrVa � 10.50 mL
pH � �log[H�] � 3.08
H�
[H�] � (0.100 0 M) a 0.50
50.00 � 10.50b � 8.26 � 10�4 M
H�
H�
25°C
Kw � x2 1 x � 1.00 � 10�7 M 1 pH � 7.00
H2O T H� � OH�
OH�H�
Va
OH�
[H�] �Kw
[OH�]�
1.0 � 10�14
0.013 2� 7.58 � 10�13 M 1 pH � 12.12
OH�
OH�
[OH�] � a10.00 � 3.00
10.00b (0.020 00 M) a 50.00
50.00 � 3.00b � 0.013 2 M
OH�
OH�
OH�Ve � 10.00 mLBefore the equivalence point, there is excessOH�.
This “streamlined” calculation was firstdescribed on page 128.
Challenge Using a setup similar to Equation11-1, calculate when 6.00 mL of HBr havebeen added. Check your pH against the valuein Table 11-1.
[OH�]
At the equivalence point, , but only ina strong acid–strong base reaction.
pH � 7.00
After the equivalence point, there is excess .H�

11-2 Titration of Weak Acid with Strong BaseThe titration of a weak acid with a strong base allows us to put all our knowledge of acid-base chemistry to work. The example we examine is the titration of 50.00 mL of 0.020 00 MMES with 0.100 0 M NaOH. MES is an abbreviation for 2-(N-morpholino)ethanesulfonicacid, which is a weak acid with
The titration reaction is
(11-2)
HA
Reaction 11-2 is the reverse of the reaction for the base . Therefore, the equilibriumconstant for Reaction 11-2 is . The equilib-rium constant is so large that we can say that the reaction goes “to completion” after eachaddition of . As we saw in Box 9-3, strong plus weak react completely.
Let’s first calculate the volume of base, , needed to reach the equivalence point:
144424443 1444244443mmol of base mmol of HA
The titration calculations for this problem are of four types:
1. Before any base is added, the solution contains just HA in water. This is a weak acidwhose pH is determined by the equilibrium
2. From the first addition of NaOH until immediately before the equivalence point, there isa mixture of unreacted HA plus the produced by Reaction 11-2. Aha! A buffer! Wecan use the Henderson-Hasselbalch equation to find the pH.
3. At the equivalence point, “all” HA has been converted into . The same solutioncould have been made by dissolving in water. We have a weak base whose pH isdetermined by the reaction
4. Beyond the equivalence point, excess NaOH is being added to a solution of . To agood approximation, pH is determined by the strong base. We calculate the pH as if wehad simply added excess NaOH to water. We neglect the tiny effect of .
Region 1: Before Base Is AddedBefore adding any base, we have a solution of 0.020 00 M HA with . This is sim-ply a weak-acid problem.
x x
Region 2: Before the Equivalence PointAdding creates a mixture of HA and . This mixture is a buffer whose pH can be calculated with the Henderson-Hasselbalch equation (9-16) from the quotient
Suppose we wish to calculate when 3.00 mL of have been added.Because , we have added enough base to react with three-tenths of the HA.We can make a table showing the relative concentrations before and after the reaction:
Titration reaction:
Relative initial quantities 1 — —Relative final quantities — —3
107
10
310(HA � 1)
HA � OH� S A� � H2O
Ve � 10.00 mLOH�[A�]/[HA]
[A�]/[HA].
A�OH�
x2
0.020 00 � x� Ka 1 x � 1.03 � 10�4 1 pH � 3.99
F � x
HA T H� � A� Ka � 10�6.27
pKa � 6.27
A�
A�
A� � H2O ∆Kb
HA � OH�
A�
A�
A�
HA ∆Ka
H� � A�
(Vb (mL))(0.100 0 M) � (50.00 mL)(0.020 00 M) 1 Vb � 10.00 mL
Vb
OH�
K � 1/Kb � 1/(Kw/Ka (for HA)) � 5.4 � 107A�Kb
MES, pKa � 6.27A�
NHCH2CH2SO� � OH� B 3O NCH2CH2SO� � H2O3O�
pKa � 6.27.
202 CHAPTER 11 Acid-Base Titrations
Always start by writing the titration reaction.
Strong � weak S complete reaction
The initial solution contains just the weak acid HA.
Before the equivalence point, there is a mixtureof HA and , which is a buffer.A�
We only need relative concentrations becausepH depends on the quotient .[A�]/[HA]

11-2 Titration of Weak Acid with Strong Base 203
Once we know the quotient in any solution, we know its pH:
The point at which the volume of titrant is is a special one in any titration.
Titration reaction:
Relative initial quantities 1 — —Relative final quantities — —
When the volume of titrant is , for the acid HA (neglecting activity coeffi-cients). From an experimental titration curve, you can find the approximate value of byreading the pH when , where is the volume of added base. (To find the true valueof requires activity coefficients.)
Advice As soon as you recognize a mixture of HA and in any solution, you have abuffer! You can calculate the pH from the quotient .
Learn to recognize buffers! They lurk in every corner of acid-base chemistry.
Region 3: At the Equivalence PointAt the equivalence point, there is exactly enough NaOH to consume HA.
Titration reaction:
Relative initial quantities 1 1 — —Relative initial quantities — — 1 —
The solution contains “just” . We could have prepared the same solution by dissolvingthe salt in distilled water. A solution of is merely a solution of a weakbase.
To compute the pH of a weak base, we write the reaction of the weak base with water:
x x
The only tricky point is that the formal concentration of is no longer 0.020 00 M, whichwas the initial concentration of HA. The has been diluted by NaOH from the buret:
b Initial volume
of HA
1442443 144424443 a Total volumeInitial Dilution of solution
concentration factorof HA
With this value of , we can solve the problem:
The pH at the equivalence point in this titration is 9.25. It is not 7.00. The equivalence-point pH will always be above 7 for the titration of a weak acid, because the acid is convertedinto its conjugate base at the equivalence point.
pH � �log[H�] � �log aKw
xb � 9.25
x2
F¿ � x� Kb �
Kw
Ka� 1.86 � 10�8 1 x � 1.76 � 10�5 M
F¿
F¿ � (0.020 00 M) a 50.00
50.00 � 10.00b � 0.016 7 M
A�
A�
F � x
Kb �Kw
KaA� � H2O T HA � OH�
Na�A�Na�A�
A�
HA � OH� S A� � H2O
pH � pKa � log a [A�]
[HA]b
[A�]/[HA]A�
pKa
VbVb � 12Ve
pKa
pH � pKa12Ve
pH � pKa � log a1/2
1/2b � pKa
12
12
12
HA � OH� S A� � H2O
12Ve
pH � pKa � log a [A�]
[HA]b � 6.27 � log a3/10
7/10b � 5.90
[A�]/[HA]
When .This is a landmark in any titration.
Vb � 12Ve, pH � pKa
At the equivalence point, HA has beenconverted into , a weak base.A�
The pH is always higher than 7 at theequivalence point in the titration of a weakacid with a strong base.

Region 4: After the Equivalence PointNow we are adding NaOH to a solution of . NaOH is so much stronger a base than that it is fair to say that the pH is determined by the excess .
Let’s calculate the pH when , which is just 0.10 mL past . The concen-tration of excess is
bVolume of
excess
1442443144424443a Total volumeInitial Dilution of solution
concentration factorof
The Titration CurveCalculations for the titration of MES with NaOH are shown in Table 11-2. The calculatedtitration curve in Figure 11-2 has two easily identified points. One is the equivalence point,which is the steepest part of the curve. The other landmark is the point where and . This latter point is also an inflection point, having the minimum slope.
If you look back at Figure 9-4b, you will note that the maximum buffer capacity occurswhen . That is, the solution is most resistant to pH changes when (and
); the slope is therefore at its minimum.Figure 11-3 shows how the titration curve depends on the acid dissociation constant
of HA and on the concentrations of reactants. As HA becomes a weaker acid, or as theconcentrations of analyte and titrant decrease, the inflection near the equivalence pointdecreases, until the equivalence point becomes too shallow to detect. It is not practical totitrate an acid or base when its strength is too weak or its concentration too dilute.
(dpH/dVb)Vb � 12Ve
pH � pKapH � pKa
pH � pKa
Vb � 12Ve
pH � �log a Kw
[OH�]b � 10.22
OH�
[OH�] � (0.100 0 M) a 0.10
50.00 � 10.00b � 1.66 � 10�4 M
OH�
OH�
VeVb � 10.10 mLOH�
A�A�
204 CHAPTER 11 Acid-Base Titrations
Table 11-2 Calculation of the titration curve for50.00 mL of 0.020 00 M MES treated with0.100 0 M NaOH
mL base added (Vb) pH
Region 1 0.00 3.99(weak acid) 0.50 4.99
1.00 5.322.00 5.673.00 5.904.00 6.09
Region 2 5.00 6.27
(buffer) 6.00 6.457.00 6.648.00 6.879.00 7.229.50 7.559.90 8.27
Region 3 10.00 9.25(weak base) 10.10 10.22
10.50 10.9111.00 11.21
Region 4 12.00 11.5013.00 11.6714.00 11.7915.00 11.8816.00 11.95
(excess OH�)Figure 11-2 Calculated titration curve forthe reaction of 50.00 mL of 0.020 00 M MES with0.100 0 M NaOH. Landmarks occur at half ofthe equivalence volume and at theequivalence point, which is the steepest part ofthe curve.
(pH � pKa)
Here we assume that the pH is governed bythe excess .OH�
Challenge Compare the concentration offrom excess titrant at to the
concentration of from hydrolysis of .Satisfy yourself that it is fair to neglect thecontribution of to the pH after theequivalence point.
A�
A�OH�
Vb � 10.10 mLOH�
Landmarks in a titration:At , the curve is steepest.At and the slope is minimal.Vb � 1
2Ve, pH � pKa
Vb � Ve
The buffer capacity measures the ability of thesolution to resist changes in pH.
12
Equivalence pointMaximumslope(inflectionpoint)
Minimum slope(inflection point)
pH = pKa
Bufferregion
ExcessOH–
Ve/2
Vb(mL)
Ve
11
10
9
8
7
6
5
4
3160 2 4 6 8 10 12 14
pH

11-3 Titration of Weak Base with Strong Acid 205
11-3 Titration of Weak Base with Strong AcidThe titration of a weak base with a strong acid is just the reverse of the titration of a weakacid with a strong base. The titration reaction is
Because the reactants are a weak base and a strong acid, the reaction goes essentially to com-pletion after each addition of acid. There are four distinct regions of the titration curve:
1. Before acid is added, the solution contains just the weak base, B, in water. The pH isdetermined by the reaction.
x x
2. Between the initial point and the equivalence point, there is a mixture of B and —Aha! A buffer! The pH is computed by using
In adding acid (increasing ), we reach the special point where and (for ). As before, (and therefore ) can be determined easily from the titrationcurve.
3. At the equivalence point, B has been converted into , a weak acid. The pH iscalculated by considering the acid dissociation reaction of .
F � x x x
The formal concentration of , , is not the original formal concentration of B,because some dilution has occurred. The solution contains at the equivalencepoint, so it is acidic. The pH at the equivalence point must be below 7.
4. After the equivalence point, the excess strong acid determines the pH. We neglect thecontribution of weak acid, .
Example Titration of Pyridine with HCl
Consider the titration of 25.00 mL of 0.083 64 M pyridine with 0.106 7 M HCl.
Pyridine
N: Kb � 1.59 � 10�9 X Ka �Kw
� 6.31 � 10�6Kb
pKa � 5.20
BH�
BH�
F¿BH�
BH� T B � H� Ka �Kw
Kb
BH�
BH�
pKbpKaBH�
pH � pKaVa � 12VeVa
pH � pKa (for BH�) � log a [B]
[BH�]b
BH�
F � x
B � H2O ∆Kb
BH� � OH�
Kb
B � H� S BH�
2
3
4
5
6
7
8
9
10
11
12
0
(a) (b)
2Vb (mL)
pKa = 10
pKa = 8
pKa = 6
pKa = 4
pKa = 2
Strong acid
Vb (mL)4 6 8 10 12 14 16 0 2 4 6 8 10 12 14
20 mM HA
2 mM HA
0.2 mM HA
0.02 mM HA
0.002 mM HA
16
pH
Figure 11-3 (a) Calculated curves showingthe titration of 50.0 mL of 0.020 0 M HA with0.100 M NaOH. (b) Calculated curves showingthe titration of 50.0 mL of HA withNaOH whose concentration is five timesgreater than that of HA. As the acid becomesweaker or more dilute, the end point becomesless distinct.
(pKa � 5)
When , wehave a weak-base problem.
Va (� volume of added acid) � 0
When , we have a buffer.0 6 Va 6 Ve
When , the solution contains the weakacid .BH�
Va � Ve
For , there is excess strong acid.Va 7 Ve

The titration reaction is
and the equivalence point occurs at 19.60 mL:
144424443 14444244443mmol of HCl mmol of pyridine
Find the pH when
Solution Part of the pyridine has been neutralized, so there is a mixture of pyridineand pyridinium ion—Aha! A buffer! The fraction of pyridine that has been titratedis , because it takes 19.60 mL to titrate the whole sample. Thefraction of pyridine remaining is . The pH is
11-4 Titrations in Diprotic SystemsThe principles developed for titrations of monoprotic acids and bases are readily extended totitrations of polyprotic acids and bases. We will examine two cases.
A Typical CaseThe upper curve in Figure 11-4 is calculated for the titration of 10.0 mL of 0.100 M base (B)with 0.100 M HCl. The base is dibasic, with and . The titrationcurve has reasonably sharp breaks at both equivalence points, corresponding to the reactions
The volume at the first equivalence point is 10.00 mL because
144424443 14444244443mmol of HCl mmol of B
The volume at the second equivalence point must be , because the second reactionrequires the same number of moles of HCl as the first reaction.
The pH calculations are similar to those for corresponding points in the titration of amonobasic compound. Let’s examine points A through E in Figure 11-4.
2Ve
(Ve (mL))(0.100 M) � (10.00 mL)(0.100 0 M) 1 Ve � 10.00 mL
BH� � H� S BH2�2
B � H� S BH�
pKb2 � 9.00pKb1 � 4.00
� 5.20 � log0.764
0.236� 5.71
pH � pKa � log a [B]
[BH�]b
1 � 0.236 � 0.7644.63/19.60 � 0.236
Va � 4.63 mL.
(Ve (mL))(0.106 7 M) � (25.00 mL)(0.083 64 M) 1 Ve � 19.60 mL
N: � H� B NH�
206 CHAPTER 11 Acid-Base Titrations
, always.Ve2 � 2Ve1
First bufferregion
A
B
C
(a)
(b)
D
E
J
0 21
2
3
4
5
6
pH
7
8
9
10pK2
pK1
11
12
4 6 8 10 12 14 16 18 20 22 24 26
I
H
2Ve
Va (mL)
Ve
G
F
Second bufferregion
ExcessH+
Figure 11-4 (a) Titration of 10.0 mL of0.100 M base with0.100 M HCl. The two equivalence points are Cand E. Points B and D are the half-neutralizationpoints, whose pH values equal and ,respectively. (b) Titration of 10.0 mL of 0.100 Mnicotine with0.100 M HCl. There is no sharp break at thesecond equivalence point, J, because the pHis too low.
(pKb1 � 6.15, pKb2 � 10.85)
pKa1pKa2
(pKb1 � 4.00, pKb2 � 9.00)

11-4 Titrations in Diprotic Systems 207
Point ABefore acid is added, the solution contains just weak base, B, whose pH is governed by thereaction
x x
Point BAt any point between A (the initial point) and C (the first equivalence point), we have abuffer containing B and . Point B is halfway to the equivalence point, so .The pH is calculated from the Henderson-Hasselbalch equation for the weak acid, ,whose acid dissociation constant is .
So the pH at point B is just .To calculate the quotient at any point in the buffer region, just find what frac-
tion of the way from point A to point C the titration has progressed. For example, if, then
because 10.0 mL are required to reach the equivalence point and we have added just 1.5 mL.The pH at is
Point CAt the first equivalence point, B has been converted into , the intermediate form of thediprotic acid, �. � is both an acid and a base. From Section 10-1, we know that
(11-3)
where and are the acid dissociation constants of .The formal concentration of is calculated by considering dilution of the original
solution of B.
bInitial volume
of B
14243 123Original Dilution
a Total volume
concentration factorof solution
of B
Plugging all the numbers into Equation 11-3 gives
Note that, in this example, .Point C in Figure 11-4 shows where the intermediate form of a diprotic acid lies on a
titration curve. This is the least-buffered point on the whole curve, because the pH changesmost rapidly if small amounts of acid or base are added. There is a misconception that theintermediate form of a diprotic acid behaves as a buffer when, in fact, it is the worst choicefor a buffer.
pH � 12(pKa1 � pKa2)
pH � 7.50
[H�] � B (10�5)(10�10)(0.050 0) � (10�5)(10�14)
10�5 � 0.050 0� 3.16 � 10�8
F � (0.100 M) a10.0
20.0b � 0.050 0 M
BH�
BH2�2K2K1
[H�] � BK1K2F � K1Kw
K1 � F
BHBH22
BH�
pH � 10.00 � log8.5
1.5� 10.75
Va � 1.5 mL
[B]
[BH�]�
8.5
1.5
Va � 1.5 mL
[B]/[BH�]pKa2
pH � pKa2 � log[B]
[BH�]� 10.00 � log1 � 10.00
Ka2 (for BH2�2 ) � Kw/Kb1 � 10�10.00
BH�
[B] � [BH�]BH�
[H�] �Kw
x1 pH � 11.49
x2
0.100 � x� 1.00 � 10�4 1 x � 3.11 � 10�3
0.100 � x
B � H2O ∆Kb1
BH� � OH� Recall that the fully basic form of a dibasiccompound can be treated as if it weremonobasic. (The reaction can beneglected.)
Kb2
Of course, you remember that
Ka1 �Kw
Kb2Ka2 �
Kw
Kb1
is the intermediate form of a diprotic acid.BH�
pH � 12(pK1 � pK2)
The intermediate form of a polyprotic acid isthe worst possible choice for a buffer.

Point DAt any point between C and E, there is a buffer containing (the base) and (theacid). When , and
Point EPoint E is the second equivalence point, at which the solution is formally the same as oneprepared by dissolving in water. The formal concentration of is
bOriginal volume
of B
a Total volumeof solution
The pH is determined by the acid dissociation reaction of .
F � x x x
Beyond the second equivalence point , the pH of the solution can be cal-culated from the volume of strong acid added to the solution. For example, at ,there is an excess of 5.00 mL of 0.100 M HCl in a total volume of The pH is found by writing
Blurred End PointsTitrations of many diprotic acids or bases show two clear end points, as in curve a inFigure 11-4. Some titrations do not show both end points, as illustrated by curve b, whichis calculated for the titration of 10.0 mL of 0.100 M nicotine with 0.100 M HCl. The two reactions are
There is no perceptible break at the second equivalence point (J), because is too strongan acid (or, equivalently, is too weak a base). As the titration approaches low the approximation that HCl reacts completely with to give breaks down. To cal-culate pH between points I and J requires the systematic treatment of equilibrium. Later inthis chapter, we describe how to calculate the whole curve with a spreadsheet.
In the titration of ribonuclease at the beginning of this chapter, there is a continuouschange in pH, with no clear breaks. The reason is that 29 groups are titrated in the pH inter-val shown. The 29 end points are so close together that a nearly uniform rise results. Thecurve can be analyzed to find the many values, but this analysis requires a computer;and, even then, the individual values will not be determined very precisely.
11-5 Finding the End Point with a pH Electrode
Titrations are most commonly performed either to find out how much analyte is present or tomeasure equilibrium constants of the analyte. We can obtain the information necessary forboth purposes by monitoring the pH of the solution as the titration is performed.
pKa
pKa
BH2�2BH�
pH (�3),BH�
BH2�2
N
E NåCH3
N
E �N
CH3
œ çH N
�
H
E �N
CH3
œ çH
Nicotine (B) BH� BH2�2
(pKb1 � 6.15, pKb2 � 10.85)
[H�] � (0.100 M) a 5.00
35.00b � 1.43 � 10�2 M 1 pH � 1.85
10.00 � 25.00 � 35.00 mL.Va � 25.00 mL
(Va 7 20.0 mL)
x2
0.033 3 � x� 1.0 � 10�5 1 x � 5.72 � 10�4 1 pH � 3.24
BH2�2 T BH� � H� Ka1 �
Kw
Kb2
BH2�2
F � (0.100 M)a10.0
30.0b � 0.033 3 M
BH2�2BH2Cl2
pH � pKa1 � log[BH�]
[BH2�2 ]
� 5.00 � log 1 � 5.00
[BH�] � [BH2�2 ]Va � 15.0 mL
BH2�2BH�
208 CHAPTER 11 Acid-Base Titrations
Challenge Show that if Va were 17.2 mL, theratio in the log term would be
[BH�]
[BH2�2 ]
�20.0 � 17.217.2 � 10.0
�2.87.2
At the second equivalence point, we havemade , which can be treated as amonoprotic weak acid.
BH2�2
When the pH is too low or too high or whenvalues are too close together, end points
are obscured.pKa
Box 11-1 illustrates an important application ofacid-base titrations in environmental analysis.
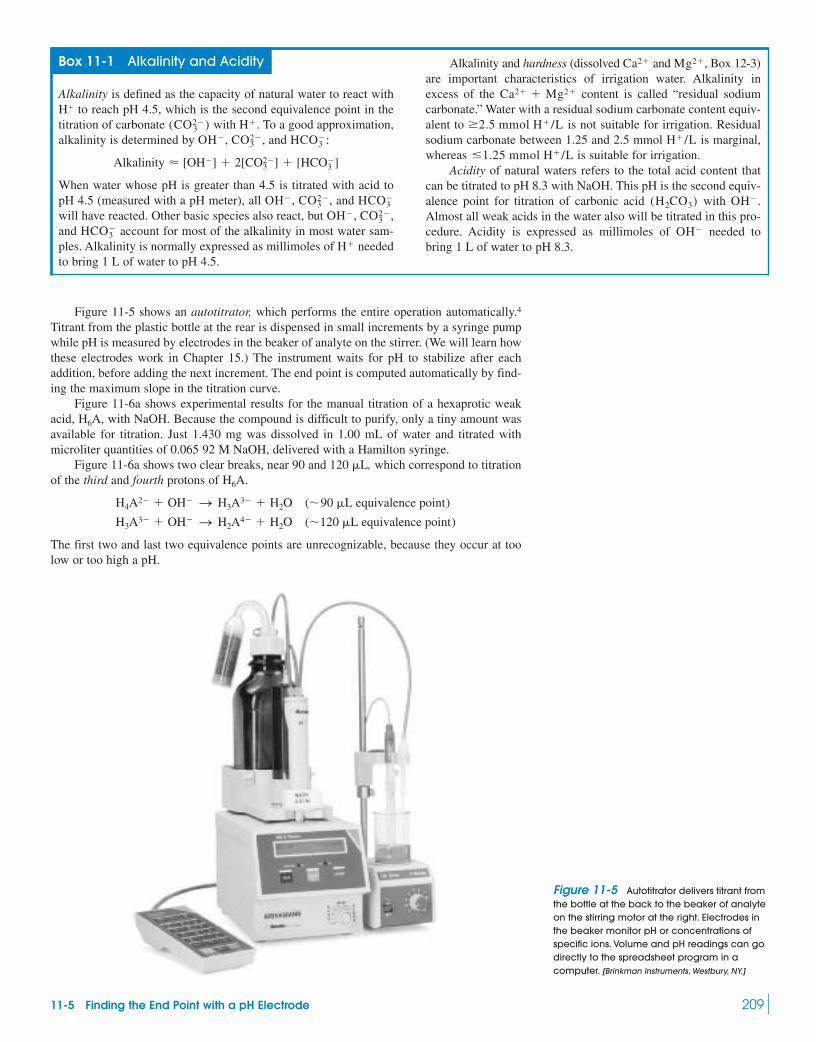
11-5 Finding the End Point with a pH Electrode 209
Box 11-1 Alkalinity and Acidity
Alkalinity is defined as the capacity of natural water to react withto reach pH 4.5, which is the second equivalence point in the
titration of carbonate with . To a good approximation,alkalinity is determined by , , and :
When water whose pH is greater than 4.5 is titrated with acid topH 4.5 (measured with a pH meter), all , , and will have reacted. Other basic species also react, but , ,and account for most of the alkalinity in most water sam-ples. Alkalinity is normally expressed as millimoles of neededto bring 1 L of water to pH 4.5.
H�
HCO�3
CO2�3OH�
HCO�3CO2�
3OH�
Alkalinity � [OH�] � 2[CO2�3 ] � [HCO�
3 ]
HCO�3CO2�
3OH�
H�(CO2�3 )
H�
Alkalinity and hardness (dissolved and , Box 12-3)are important characteristics of irrigation water. Alkalinity inexcess of the content is called “residual sodiumcarbonate.” Water with a residual sodium carbonate content equiv-alent to is not suitable for irrigation. Residualsodium carbonate between 1.25 and 2.5 mmol is marginal,whereas is suitable for irrigation.
Acidity of natural waters refers to the total acid content thatcan be titrated to pH 8.3 with NaOH. This pH is the second equiv-alence point for titration of carbonic acid with .Almost all weak acids in the water also will be titrated in this pro-cedure. Acidity is expressed as millimoles of needed tobring 1 L of water to pH 8.3.
OH�
OH�(H2CO3)
�1.25 mmol H� /LH� /L
2.5 mmol H� /L
Ca2� � Mg2�
Mg2�Ca2�
Figure 11-5 shows an autotitrator, which performs the entire operation automatically.4
Titrant from the plastic bottle at the rear is dispensed in small increments by a syringe pumpwhile pH is measured by electrodes in the beaker of analyte on the stirrer. (We will learn howthese electrodes work in Chapter 15.) The instrument waits for pH to stabilize after eachaddition, before adding the next increment. The end point is computed automatically by find-ing the maximum slope in the titration curve.
Figure 11-6a shows experimental results for the manual titration of a hexaprotic weakacid, , with NaOH. Because the compound is difficult to purify, only a tiny amount wasavailable for titration. Just 1.430 mg was dissolved in 1.00 mL of water and titrated withmicroliter quantities of 0.065 92 M NaOH, delivered with a Hamilton syringe.
Figure 11-6a shows two clear breaks, near 90 and , which correspond to titrationof the third and fourth protons of .
The first two and last two equivalence points are unrecognizable, because they occur at toolow or too high a pH.
H3A3� � OH� S H2A4� � H2O (�120 �L equivalence point)
H4A2� � OH� S H3A3� � H2O (�90 �L equivalence point)
H6A120 �L
H6A
Figure 11-5 Autotitrator delivers titrant fromthe bottle at the back to the beaker of analyteon the stirring motor at the right. Electrodes inthe beaker monitor pH or concentrations ofspecific ions. Volume and pH readings can godirectly to the spreadsheet program in acomputer. [Brinkman Instruments, Westbury, NY.]

210 CHAPTER 11 Acid-Base Titrations
Using Derivatives to Find the End PointThe end point is taken as the volume where the slope (dpH/dV) of the titration curve is great-est. The slope (first derivative) in Figure 11-6b is calculated in Table 11-3. The first twocolumns contain experimental volume and pH. (The pH meter was precise to three digits,even though accuracy ends in the second decimal place.) To compute the first derivative,each pair of volumes is averaged and the quantity is calculated. is the changein pH between consecutive readings and is the change in volume between consecutiveadditions. Figure 11-6c and the last two columns of Table 11-3 give the second derivative,computed in an analogous manner. The end point is the volume at which the second deriva-tive is 0. Figure 11-7 allows us to make good estimates of the end points.
�V�pH�pH/�V
The end point has maximum slope and thesecond derivative is 0.
(c)
20
−0.05
0.00
0.05
3
4
5
6
7
pH
8
9
10
11
0.1
2nd
Der
ivat
ive
1st D
eriv
ativ
e
0.2
0.3
0 40 60 80 100NaOH (µL)
120 140 160 180
(b)
(a)Figure 11-6 (a) Experimental points in thetitration of 1.430 mg of xylenol orange, ahexaprotic acid, dissolved in 1.000 mL ofaqueous . The titrant was 0.065 92 M NaOH. (b) The first derivative,
, of the titration curve. (c) The secondderivative, , which is thederivative of the curve in panel b. Derivativesfor the first end point are calculated in Table11-3. End points are taken as maxima in thederivative curve and zero crossings of thesecond derivative.
�(�pH/�V )/�V�pH/�V
0.10 M NaNO3
Table 11-3 Computation of first and second derivatives for a titration curve
First derivative Second derivative
pH
85.0 4.24585.5 0.155
86.0 4.400 86.0 0.071 086.5 0.226
87.0 4.626 87.0 0.081 087.5 0.307
88.0 4.933 88.0 0.033 088.5 0.340
89.0 5.273 89.089.5 0.257
90.0 5.530 90.090.5 0.189
91.0 5.719 91.2592.0 0.130
93.0 5.980
�0.039 0
�0.068 0
�0.083 0
� (�pH/��L)
��L�L
�pH
��L�L�L NaOH
vvvvvvv
vvvvvv

Example Computing Derivatives of a Titration Curve
Let’s see how the first and second derivatives in Table 11-3 are calculated.
Solution The first number in the third column, 85.5, is the average of the first twovolumes (85.0 and 86.0) in the first column. The derivative is calculated fromthe first two pH values and the first two volumes:
The coordinates are one point in the graph of the first derivativein Figure 11-6.
The second derivative is computed from the first derivative. The first entry inthe fifth column of Table 11-3 is 86.0, which is the average of 85.5 and 86.5.The second derivative is
The coordinates are plotted in the second derivative graph atthe bottom of Figure 11-6. These calculations are tedious by hand, but trivial with a spreadsheet.
Using a Gran Plot to Find the End Point5,6
A problem with using derivatives to find the end point is that titration data are least accurateright near the end point, because buffering is minimal and electrode response is sluggish. AGran plot uses data from before the end point (typically from or up to ) tolocate the end point.
Consider the titration of a weak acid, HA:
It will be necessary to include activity coefficients in this discussion because a pH electroderesponds to hydrogen ion activity, not concentration.
At any point between the initial point and the end point of the titration, it is usually agood approximation to say that each mole of NaOH converts 1 mol of HA into 1 mol of .A�
HA T H� � A� Ka �[H�]�H�[A�]�A�
[HA]�HA
Ve0.9 Ve0.8 Ve
(x � 86.0, y � 0.071)
� (�pH/�V)
�V�
0.226 � 0.155
86.5 � 85.5� 0.071
(x � 85.5, y � 0.155)
�pH
�V�
4.400 � 4.245
86.0 � 85.0� 0.155
�pH/�V
11-5 Finding the End Point with a pH Electrode 211
118.9 µL
88.2 µL
85 86 87 88 89 90 91 92 93
115 116−0.1
0.0
2nd
Der
ivat
ive
0.1
−0.1
0.0
2nd
Der
ivat
ive
0.1
117 118 119 120 121 122 123
Volume (µL)
Figure 11-7 Enlargement of the end-point regions in the second derivative curve shown inFigure 11-6c.
A related method uses data from the middle ofthe titration (not near the equivalence point) todeduce and .7KaVe
Strong plus weak react completely.

If we have titrated of HA (whose formal concentration is ) with of NaOH(whose formal concentration is ), we can write
Substitution of these values of and [HA] into the equilibrium expression gives
which can be rearranged to
(11-4)123
The term on the left is because . The term in parentheses on theright is
Equation 11-4 can, therefore, be written in the form
Gran plot equation: (11-5)
A graph of versus is called a Gran plot. If is constant, the graphis a straight line with a slope of and an x-intercept of . Figure 11-8 showsa Gran plot for the titration in Figure 11-6. Any units can be used for , but the sameunits must be used on both axes. In Figure 11-8, is expressed in microliters on bothaxes.
The beauty of a Gran plot is that it enables us to use data taken before the end pointto find the end point. The slope of the Gran plot enables us to find . Although wederived the Gran function for a monoprotic acid, the same plot ( versus )applies to polyprotic acids (such as in Figure 11-6).
The Gran function, , does not actually go to 0, because is never 0. Thecurve must be extrapolated to find . The reason the function does not reach 0 is that wehave used the approximation that every mole of generates 1 mol of , which is nottrue as approaches . Only the linear portion of the Gran plot is used.
Another source of curvature in the Gran plot is changing ionic strength, which causesto vary. In Figure 11-6, this variation was avoided by maintaining nearly constant
ionic strength with . Even without added salt, the last 10–20% of data before gives a fairly straight line because the quotient does not change very much. TheGran plot in the acidic region gives accurate results even if is dissolved in the strong-base titrant. The Gran plot in the basic region can be used to measure in the strongbase.5
Challenge Show that when weak base, B, is titrated with a strong acid, the Gran function is
(11-6)
where is the volume of strong acid and is the acid dissociation constant of . Agraph of versus should be a straight line with a slope of and an x-intercept of .
11-6 Finding the End Point with IndicatorsAn acid-base indicator is itself an acid or base whose various protonated species havedifferent colors. An example is thymol blue.
Ve
��B/(�BH�Ka)VaVa10�pHBH�KaVa
Va10�pH � a 1
Ka�
�B
�BH�
b (Ve � Va)
CO2
CO2
�HA/�A�
VeNaNO3
�HA/�A�
VeVb
A�OH�
Ve
10�pHVb10�pHH6A
VbVb10�pHKa
Vb
Vb
Ve�Ka�HA/�A�
�HA/�A�VbVb10�pH
Vb10�pH ��HA
�A�
Ka(Ve � Vb)
VaFa � VbFb
Fb�
VaFa
Fb� Vb � Ve � Vb
[H�]�H� � 10�pHVb10�pH,
10�pH
Vb[H�]�H� ��HA
�A�
Ka aVaFa � VbFb
Fbb
Ka �[H�]�H�VbFb�A�
(VaFa � VbFb)�HA
[A�]
[HA] �original moles of HA � moles of OH�
total volume�
VaFa � VbFb
Va � Vb
[A�] �moles of OH� delivered
total volume�
VbFb
Vb � Va
Fb
Vb mLFaVa mL
212 CHAPTER 11 Acid-Base Titrations
A H� � [H�]�H� � 10�pH
VaFa � VeFb 1 Ve �VaFa
Fb
Gran plot:Plot versus
Slope � �Ka�HA/�A�
x-intercept � Ve
VbVb10�pH
An indicator is an acid or a base whosevarious protonated forms have different colors.
0.002
80 82 84 86Vb (µL)
Slope = −Ka
Ve = 88.4 µL
88 90
0.004
0.006
0.008
0.010
0.012
Vb
• 10
−pH
γHAγ
A−
Figure 11-8 Gran plot for the firstequivalence point of Figure 11-6. This plotgives an estimate of that differs from that inFigure 11-7 by 0.2 (88.4 versus 88.2 ). Thelast 10–20% of volume prior to is normallyused for a Gran plot.
Ve
�L�LVe

Below pH 1.7, the predominant species is red; between pH 1.7 and pH 8.9, the predominantspecies is yellow; and above pH 8.9, the predominant species is blue (Color Plate 4). For sim-plicity, we designate the three species R, , and
The equilibrium between R and can be written
(11-7)
pH [Y�]:[R] Color
0.7 1:10 red1.7 1:1 orange2.7 10:1 yellow
At pH , there will be a 1:1 mixture of the yellow and red species, which appearsorange. As a crude rule of thumb, we can say that the solution will appear red when
and yellow when . From Equation 11-7, we see that thesolution will be red when and yellow when . In tables of indi-cator colors, thymol blue is listed as red below pH 1.2 and yellow above pH 2.8. The pH val-ues predicted by our rule of thumb are 0.7 and 2.7. Between pH 1.2 and 2.8, the indicatorexhibits various shades of orange. The pH range (1.2 to 2.8) over which the color changes iscalled the transition range. Whereas most indicators have a single color change, thymolblue has another transition, from yellow to blue, between pH 8.0 and pH 9.6. In this range,various shades of green are seen.
Acid-base indicator color changes are featured in Demonstration 11-1. Box 11-2 showshow optical absorption by indicators allows us to measure pH.
Choosing an IndicatorA titration curve for which at the equivalence point is shown in Figure 11-9. Anindicator with a color change near this pH would be useful in determining the end point ofthe titration. In Figure 11-9, the pH drops steeply (from 7 to 4) over a small volume interval.Therefore, any indicator with a color change in this pH interval would provide a fair approx-imation to the equivalence point. The closer the point of color change is to pH 5.54, the moreaccurate will be the end point. The difference between the observed end point (color change)and the true equivalence point is called the indicator error.
pH � 5.54
pH � pK1 � 1pH � pK1 � 1[Y�]/[R] � 10/1[Y�]/[R] � 1/10
1.7 (� pK1)
R ∆K1
Y� � H� pH � pK1 � log[Y�]
[R]
Y�
B2�.Y�
11-6 Finding the End Point with Indicators 213
S
ååå
ç
åç
çç
œœçœÅ
Å Ç
⁄
⁄
HO OH
OO
O
åpK1 � 1.7
#£££4pK2 � 8.9
#£££4
å
åå
å
çç
œœçœ
œ Å
¡
¡åå
O
SO� 3
OH å
åå
å
çç
œœçœ
œ Å
¡
¡åå
O
SO� 3
O�
Red (R)Thymol blue
Yellow (Y�) Blue (B2�)
One of the most common indicators isphenolphthalein, usually used for its colorless-to-pink transition at pH 8.0–9.6.
In strong acid, the colorless form ofphenolphthalein turns orange-red. In strongbase, the red species loses its color.8
Colorless(pH � 11)
ß ß
ßß
ß
O ß C OH
OH
œ‰i
O
£ £C�O2Cç
ç
ç
œO � 2H2O
�O
#£
££
4
2OH�2H�
Colorless phenolphthaleinpH � 8.0
Pink phenolphthaleinpH � 9.6
Orange-red(in 65–98% H2SO4)
ß ß�O2C
O�
O�
çå
å
åHO ß C
ß ßC�HO2Cç
ç
ç
œOH
HO
Bromocresol purple,transition range
Purple
Blue
Yellow
0 22
3
4
5
6
pH
7
8
9
10
11
4 6 8 10 12Va (mL)
14 16 18 20 22 24 26
Yellow
Bromocresol green,transition range
pH = 5.54 atequivalence point
Figure 11-9 Calculated titration curve forthe reaction of 100 mL of 0.010 0 M base
with 0.050 0 M HCl.(pKb � 5.00)

214 CHAPTER 11 Acid-Base Titrations
Box 11-2 What Does a Negative pH Mean?
In the 1930s, Louis Hammett and his students measured thestrengths of very weak acids and bases, using a weak referencebase (B), such as p-nitroaniline , whose basestrength could be measured in aqueous solution.
p-Nitroanilinium ion p-NitroanilineB
Suppose that some p-nitroaniline and a second base, C, aredissolved in a strong acid, such as 2 M HCl. The of can be measured relative to that of by first writing aHenderson-Hasselbalch equation for each acid:
Setting the two equations equal (because there is only one pH)gives
1444442444443
The ratio of activity coefficients is close to unity, so the secondterm on the right is close to 0. Neglecting this last term gives anoperationally useful result:
That is, if you have a way to find the concentrations of B, C, and and if you know for , then you can find
for .Concentrations can be measured with a spectrophotome-
ter10 or by nuclear magnetic resonance,11 so for canbe determined. Then, with as the reference, the foranother compound, , can be measured. This procedure canbe extended to measure the strengths of successively weakerbases (such as nitrobenzene, ), far too weak to beprotonated in water.
pKa � �11.38
DH�
pKaCH�
CH�pKa
CH�pKa
BH�pKaCH�
BH�,
�pKa � log[B][CH�]
[C][BH�]
�pKa
pKa (for CH�) � pKa (for BH�) � log[B][CH�]
[C][BH�]� log
�B�CH�
�C�BH�
pH � pKa (for CH�) � log[C]�C
[CH�]�CH�
pH � pKa (for BH�) � log[B]�B
[BH�]�BH�
BH�
CH�pKa
BH�
(pKa � 0.99)
The acidity of a solvent that protonates the weak base, B, isdefined as the Hammett acidity function:
For dilute aqueous solutions, approaches pH. For concentratedacids, is a measure of the acid strength. The weaker a base, B,the stronger the acidity of the solvent must be to protonate thebase. Acidity of strongly acidic solvents is now measured moreconveniently by electrochemical methods.12
When we refer to negative pH, we usually mean values.For example, as measured by its ability to protonate very weakbases, has a “pH” close to . The figure shows that
is a stronger acid than other mineral acids. Values of for several powerfully acidic solvents are tabulated here.
Acid Name H0
(100%) sulfuric acidfuming sulfuric acid
(oleum)fluorosulfuric acid“super acid”
— �19.35HSO3F � 7% SbF5 � 3SO3
�18.94HSO3F � 10% SbF5
�15.07HSO3F
�14.14H2SO4 � SO3
�11.93H2SO4
H0HClO4
�48 M HClO4
H0
0
+2
0
−2
−4
−6
−8H
0
−10HClO4
HCO2H
CF3CO2H
HNO3
HCl
H2SO4
HF
−12
0.2 0.4Mole fraction of acid
0.6 0.8 1.0
H0
H0
H0 � pKa (for BH�) � log[B]
[BH�]
Hammett acidityfunction:
Hammett acidity function, H0, for aqueous solutions of acids. [Data from
R. A. Cox and K. Yates, “Acidity Functions,” Can. J. Chem. 1983, 61, 2225.]
Demonstration 11-1 Indicators and the Acidity of CO2
This one is just plain fun.9 Place 900 mL of water and a magneticstirring bar in each of two 1-L graduated cylinders. Add 10 mL of
to each. Then put 2 mL of phenolphthalein indicatorsolution in one and 2 mL of bromothymol blue indicator solution inthe other. Both indicators will have the color of their basic species.
Drop a few chunks of Dry Ice into each cylinder.As the bubbles through each cylinder, the solutions becomeCO2
(solid CO2)
1 M NH3
more acidic. First, the pink phenolphthalein color disappears.After some time, the pH drops low enough for bromothymol blueto change from blue to green, but not all the way to yellow.
Add 20 mL of 6 M HCl to the bottom of each cylinder, usinga length of Tygon tubing attached to a funnel. Then stir each solu-tion for a few seconds on a magnetic stirrer. Explain what hap-pens. The sequence of events is shown in Color Plate 5.
O
O� �
ß ß�N
�NH3 #££££4
ç
iß ß
�N
ç
i
pKa � 0.99NH2 � H�
O
O

11-6 Finding the End Point with Indicators 215
If you dump half a bottle of indicator into your reaction, you will introduce a differentindicator error. Because indicators are acids or bases, they react with analyte or titrant. Themoles of indicator must be negligible relative to the moles of analyte. Never use more than afew drops of dilute indicator solution.
Several of the indicators in Table 11-4 would be useful for the titration in Figure 11-9.If bromocresol purple were used, we would use the purple-to-yellow color change asthe end point. The last trace of purple should disappear near pH 5.2, which is quite closeto the true equivalence point in Figure 11-9. If bromocresol green were used as the indi-cator, a color change from blue to green would mark the end point(Box 11-3).
In general, we seek an indicator whose transition range overlaps the steepest part ofthe titration curve as closely as possible. The steepness of the titration curve near theequivalence point in Figure 11-9 ensures that the indicator error caused by the noncoinci-dence of the end point and equivalence point will not be large. If the indicator end point
(� yellow � blue)
Table 11-4 Common Indicators
Transition Acid BaseIndicator range (pH) color color Preparation
Methyl violet 0.0–1.6 Yellow Violet 0.05 wt% in Cresol red 0.2–1.8 Red Yellow 0.1 g in 26.2 mL 0.01 M NaOH.
Then add �225 mL H2O.Thymol blue 1.2–2.8 Red Yellow 0.1 g in 21.5 mL 0.01 M NaOH.
Then add �225 mL H2O.Cresol purple 1.2–2.8 Red Yellow 0.1 g in 26.2 mL 0.01 M NaOH.
Then add �225 mL H2O.Erythrosine, 2.2–3.6 Orange Red 0.1 wt% in
disodiumMethyl orange 3.1–4.4 Red Yellow 0.01 wt% in Congo red 3.0–5.0 Violet Red 0.1 wt% in Ethyl orange 3.4–4.8 Red Yellow 0.1 wt% in Bromocresol green 3.8–5.4 Yellow Blue 0.1 g in 14.3 mL 0.01 M NaOH.
Then add �225 mL H2O.Methyl red 4.8–6.0 Red Yellow 0.02 g in 60 mL ethanol.
Then add 40 mL .Chlorophenol red 4.8–6.4 Yellow Red 0.1 g in 23.6 mL 0.01 M NaOH.
Then add �225 mL H2O.Bromocresol purple 5.2–6.8 Yellow Purple 0.1 g in 18.5 mL 0.01 M NaOH.
Then add �225 mL H2O.p-Nitrophenol 5.6–7.6 Colorless Yellow 0.1 wt% in Litmus 5.0–8.0 Red Blue 0.1 wt% in Bromothymol blue 6.0–7.6 Yellow Blue 0.1 g in 16.0 mL 0.01 M NaOH.
Then add �225 mL H2O.Phenol red 6.4–8.0 Yellow Red 0.1 g in 28.2 mL 0.01 M NaOH.
Then add �225 mL H2O.Neutral red 6.8–8.0 Red Yellow 0.01 g in 50 mL ethanol.
Then add 50 mL .Cresol red 7.2–8.8 Yellow Red See above.
7.3–8.7 Pink Green 0.1 g in 50 mL ethanol.Then add 50 mL .
Cresol purple 7.6–9.2 Yellow Purple See above.Thymol blue 8.0–9.6 Yellow Blue See above.Phenolphthalein 8.0–9.6 Colorless Red 0.05 g in 50 mL ethanol.
Then add 50 mL .Thymolphthalein 8.3–10.5 Colorless Blue 0.04 g in 50 mL ethanol.
Then add 50 mL .Alizarin yellow 10.1–12.0 Yellow Orange-red 0.01 wt% in Nitramine 10.8–13.0 Colorless Orange-brown 0.1 g in 70 mL ethanol.
Then add 30 mL .Tropaeolin O 11.1–12.7 Yellow Orange 0.1 wt% in H2O
H2O
H2OH2O
H2O
H2O�-Naphtholphthalein
H2O
H2OH2O
H2O
H2OH2OH2O
H2O
H2O
Choose an indicator whose transition rangeoverlaps the steepest part of the titration curve.

were at pH 6.4 (instead of 5.54), the error in would be only 0.25% in this particularcase. You can estimate the indicator error by calculating the volume of titrant required toattain pH 6.4 instead of pH 5.54.
11-7 Practical NotesAcids and bases in Table 11-5 can be obtained pure enough to be primary standards.17 NaOHand KOH are not primary standards, because they contain carbonate (from reaction withatmospheric ) and adsorbed water. Solutions of NaOH and KOH must be standardizedagainst a primary standard such as potassium hydrogen phthalate. Solutions of NaOH fortitrations are prepared by diluting a stock solution of 50 wt% aqueous NaOH. Sodium car-bonate is insoluble in this stock solution and settles to the bottom.
Alkaline solutions (for example, 0.1 M NaOH) must be protected from the atmosphere;otherwise they absorb
changes the concentration of strong base over a period of time and decreases the extentof reaction near the end point in the titration of weak acids. If solutions are kept in tightlycapped polyethylene bottles, they can be used for about a week with little change.
Strongly basic solutions attack glass and are best stored in plastic containers. Such solu-tions should not be kept in a buret longer than necessary. Boiling 0.01 M NaOH in a flask for1 h decreases the molarity by 10%, owing to the reaction of with glass.18
11-8 The Leveling EffectThe strongest acid that can exist in water is and the strongest base is If an acidstronger than is dissolved in water, it protonates to make . If a base strongerthan is dissolved in water, it deprotonates to make . Because of this levelingeffect, and HCl behave as if they had the same acid strength; both are leveled to
HCl � H2O S H3O� � Cl�
HClO4 � H2O S H3O� � ClO4�
H3O�:HClO4
OH�H2OOH�
H3O�H2OH3O�
OH�.H3O�
OH�
CO2
OH� � CO2 S HCO3�
CO2:
CO2
Ve
216 CHAPTER 11 Acid-Base Titrations
Procedures for preparing standard acid andbase are given at the end of this chapter.
Box 11-3 World Record Small Titration
The titration of 29 fmol of in a 1.9-pL water drop under a layer of hexanein a Petri dish was carried out with 2% precision, using KOHdelivered by diffusion from the tip of a glass cap-illary tube. The agar plug in the tip of the pipet regulates diffusion
1-�m-diameter
(p � pico � 10�12)HNO3(f � femto � 10�15)
of titrant, resulting in a constant delivery rate on the order offmol/s.13 A mixture of the indicators bromothymol blue andbromocresol purple, with a distinct yellow-to-purple transition atpH 6.7, allowed the end point to be observed through a micro-scope by a video camera. Metal ions in picoliter volumes could betitrated with the reagent EDTA, using indicators or electrodes tolocate the end point.14
Heptane Sample
Plastic Petri dishAgar plug in tipto regulate diffusion
Diffusionalmicroburet
From light source
Titration of femtoliter samples. The frames to the right show a larger 8.7-pL droplet before and afterthe end point, with the microburet making contact at the right side. [M. Gratzl and C. Yi, “Diffusional
Microtitration: Acid/Base Titrations in Pico- and Femtoliter Samples,” Anal. Chem. 1993, 65, 2085.
Photo courtesy M. Gratzl, Case Western Reserve University.]

11-8 The Leveling Effect 217
Table 11-5 Primary standards
Density (g/mL)for buoyancy
Compound corrections Notes
ACIDS
1.64 The pure commercial material is dried at and used tostandardize base. A phenolphthalein end point is satisfactory.
Potassium hydrogen phthalateFM 204.221
HCl — HCl and water distill as an azeotrope (a mixture) whoseHydrochloric acid composition depends on pressure. The compositionFM 36.461 is tabulated as a function of the pressure during distillation.
See Problem 11-55 for more information.
— This is a strong acid, so any indicator with an end pointPotassium hydrogen iodate between and is adequate.FM 389.912
— 1 mol of commercial grade sulfosalicylic acid is combined with 0.75 mol of reagent-grade , recrystallized severaltimes from water, and dried at to produce the doublesalt with ions and one titratable .15 Phenolphthalein isused as the indicator for titration with NaOH.
Sulfosalicylic acid double salt FM 550.639
2.15 Sulfamic acid is a strong acid with one acidic proton, so anySulfamic acid indicator with an end point between and is suitable.FM 97.094
BASES
1.33 The pure commercial material is dried at andTris(hydroxymethyl)aminomethane titrated with strong acid. The end point is in the range pH (also called tris or tham) 4.5–5.FM 121.135
HgO 11.1 Pure HgO is dissolved in a large excess of or ,Mercuric oxide whereupon 2 are liberated:FM 216.59
The base is titrated, using an indicator end point.
2.53 Primary standard grade is commercially available.Sodium carbonate Alternatively, recrystallized can be heated for FM 105.988 1 h at to produce pure . Sodium
carbonate is titrated with acid to an end point of pH 4–5.
Just before the end point, the solution is boiled to expel .1.73 The recrystallized material is dried in a chamber containing
Borax an aqueous solution saturated with NaCl and sucrose.FM 381.372 This procedure gives the decahydrate in pure form.16
The standard is titrated with acid to a methyl red end point.
“B4O7 � 10H2O2�” � 2H� S 4B(OH)3 � 5H2O
Na2B4O7 � 10H2OCO2
Na2CO3260°–270°CNaHCO3
Na2CO3Na2CO3
HgO � 4I� � H2O S HgI2�4 � 2OH�
OH�
Br�I�
H2NC(CH2OH)3 � H� B H3NC(CH2OH)3�
100°–103°CH2NC(CH2OH)3
�9�5H3N
�SO�
3
H�3 K�
110°CKHCO3CO2Hç
å
å
SO3K
OHCO2Kç
å
å
SO3K
OH
�9�5KH(IO3)2
(�6 M)
CO2H
CO�2
çœ � OH� B
CO�2
CO�
2
çœ � H2O
105°CCO2H
CO2K
çœ

218 CHAPTER 11 Acid-Base Titrations
In acetic acid solvent, which is less basic than and HCl are not leveled tothe same strength:
Acetic acid solvent
The equilibrium constants show that is a stronger acid than HCl in acetic acid solvent.Figure 11-10 shows a titration curve for a mixture of five acids titrated with 0.2 M tetra-
butylammonium hydroxide in methyl isobutyl ketone solvent. This solvent is not protonatedto a great extent by any of the acids. We see that perchloric acid is a stronger acid than HClin this solvent as well.
Now consider a base such as urea, , that is too weak togive a distinct end point when titrated with a strong acid in water.
The end point cannot be recognized, because the equilibrium constant for the titration reac-tion is not large enough. If an acid stronger than were available, the titration reactionmight have an equilibrium constant large enough to give a distinct end point. If the samebase were dissolved in acetic acid and titrated with in acetic acid, a clear end pointmight be observed. The reaction
14243An ion pair
might have a large equilibrium constant, because is a much stronger acid than .(The product in this reaction is written as an ion pair because the dielectric constant of aceticacid is too low to allow ions to separate extensively.) Titrations that are not feasible in watermight be feasible in other solvents.19
11-9 Calculating Titration Curveswith Spreadsheets
This chapter has been critical for developing your understanding of the chemistry that occursduring titrations. However, the approximations we used are of limited value when concentra-tions are too dilute or equilibrium constants are not of the right magnitude or values aretoo closely spaced, like those in a protein. This section develops equations to deal with titra-tions in a general manner, using spreadsheets.20 You should understand the principles wellenough to derive equations to treat future problems that you encounter.
Titrating a Weak Acid with a Strong BaseConsider the titration of a volume of acid HA (initial concentration ) with a volume of NaOH of concentration . The charge balance for this solution is
Charge balance: [H�] � [Na�] � [A�] � [OH�]
Cb
VbCaVa
Ka
H3O�HClO4
Titration with HClO4 in CH3CO2H: B � HClO4 [ BH�ClO�4
HClO4
H3O�
Titration with HClO4 in H2O: B � H3O� „ BH� � H2O
(H2N)2C¢O (Kb � 1.3 � 10�14)
HClO4
HCl � CH3CO2H „ CH3CO2H2� � Cl� K � 2.8 � 10�9
HClO4 � CH3CO2H „ CH3CO2H2� � ClO4
� K � 1.3 � 10�5
H2O, HClO4
–1100
Pot
entia
l (m
V)
Volume of titrant
Hydrochloric acid
–900
–700
–500
–300
100
–100
300
500
Perchloric acid
2-Hydroxybenzoic acid
Acetic acid
Hydroxybenzene
0.4 mL
Figure 11-10 Titration of a mixture ofacids with tetrabutylammonium hydroxide inmethyl isobutyl ketone solvent shows that theorder of acid strength is
Measurements were madewith a glass electrode and a platinumreference electrode. The ordinate isproportional to pH, with increasing pH as thepotential becomes more positive. [D. B. Bruss and
G. E. A. Wyld, “Methyl Isobutyl Ketone as a Wide-Range
Solvent for Titration of Acid Mixtures and Nitrogen
Bases,” Anal Chem. 1957, 29, 232.]
hydroxybenzene.acid 7 acetic acid 72-hydroxybenzoic
HClO4 7 HCl 7
In acetic acid solution, is a stronger acidthan HCl; but, in aqueous solution, both areleveled to the strength of .H3O�
HClO4
Question Where do you think the end pointfor the acid would come in Figure11-10?
H3O�ClO�4
A base too weak to be titrated by inwater might be titrated by in aceticacid solvent.
HClO4
H3O�
Dielectric constant is discussed inProblem 8-13.

11-9 Calculating Titration Curves with Spreadsheets 219
and the concentration of is just
because we have diluted moles of NaOH to a total volume of . Similarly, theformal concentration of the weak acid is
because we have diluted moles of HA to a total volume of .Now we use the fractional composition equations from Chapter 10. Equation 10-18 told
us that
(11-8)
where and is the acid dissociation constant of HA. Substitutingfor and in the charge balance gives
which you can rearrange to the form
(11-9)
At last! Equation 11-9 is really useful. It relates the volume of titrant to the pH anda bunch of constants. The quantity , which is the quotient , is the fraction of theway to the equivalence point, . When , the volume of base added, , is equal to .Equation 11-9 works backward from the way you are accustomed to thinking, because youneed to put in pH (on the right) to get out volume (on the left). Let me say that again: We putin a concentration of and get out the volume of titrant that produces that concentration.
Let’s set up a spreadsheet to use Equation 11-9 to calculate the titration curve for 50.00 mLof the weak acid 0.020 00 M MES with 0.100 0 M NaOH, which was shown in Figure 11-2and Table 11-2. The equivalence volume is . We use the quantities in Equa-tion 11-9 as follows:
The input to the spreadsheet in Figure 11-11 is pH in column B and the output is in col-umn G. From the pH, the values of , , and are computed in columns C, D, andE. Equation 11-9 is used in column F to find the fraction of titration, . From this value, wecalculate the volume of titrant, , in column G.
How do we know what pH values to put in? Trial-and-error allows us to find the startingpH, by putting in a pH and seeing whether is positive or negative. In a few tries, it is easy tohome in on the pH at which . In Figure 11-11, a pH of 3.90 is too low, because and Vare both negative. Input values of pH are spaced as closely as you like, so that you can generatea smooth titration curve. To save space, we show only a few points in Figure 11-11, including themidpoint and the end point . Thisspreadsheet reproduces Table 11-2 without approximations other than neglecting activitycoefficients. It gives correct results even when the approximations used in Table 11-2 fail.
10.00 mL)(pH 9.25 1 Vb �(pH 6.27 1 Vb � 5.00 mL)
�Vb � 0Vb
Vb
��A�[OH�][H�]
Vb
Vb ��CaVa
Cb is the outputpH is the input
Kw � 10�14
�A� �Ka
[H�] � KaKa � 5.37 � 10�7
Va � 50
[OH�] � Kw/[H�]Ca � 0.02
[H�] � 10�pHCb � 0.1
Ve � 10.00 mL
H�
VeVb� � 1Ve
CbVb/CaVa�(Vb)
� �CbVb
CaVa�
�A� �[H�] � [OH�]
Ca
1 �[H�] � [OH�]
Cb
Fraction of titration forweak acid by strong base:
[H�] �CbVb
Va � Vb�
�A� � CaVa
Va � Vb� [OH�]
[A�][Na�]Ka�A� � Ka/ ([H�] � Ka)
[A�] � �A� � FHA ��A� � CaVa
Va � Vb
Va � VbCaVa
FHA � [HA] � [A�] �CaVa
Va � Vb
Va � VbCbVb
[Na�] �CbVb
Va � Vb
Na�
:
�A� �[A�]
FHA
�A� � fraction of acid in the form A�
is the fraction of the way to theequivalence point:
� Volume of base
0.512 Vb � 2Ve
Vb � Ve
Vb � 12Ve
� � CbVb/CaVa
2-(N-Morpholino)ethanesulfonic acidMES, pKa � 6.27
�
NHCH2CH2SO3O �
In Figure 11-11, you could use Excel GOAL
SEEK described on page 115 to vary the pH incell B5 until in cell G5 is 0.Vb

Titrating a Weak Acid with a Weak BaseNow consider the titration of mL of acid HA (initial concentration ) with mL of baseB whose concentration is . Let the acid dissociation constant of HA be and the acid dis-sociation constant of be . The charge balance is
As before, we can say that , where and .
We can write an analogous expression for , which is a monoprotic weak acid. Ifthe acid were HA, we would use Equation 10-17 to say
where applies to the acid HA. For the weak acid , we write
where the formal concentration of base is Substituting for and in the charge balance gives
which can be rearranged to the useful result
(11-10)
Equation 11-10 for a weak base looks just like Equation 11-9 for a strong base, except thatreplaces 1 in the denominator.
Table 11-6 gives useful equations derived by writing a charge balance and substitutingfractional compositions for various concentrations. For titration of the diprotic acid, , is the fraction of the way to the first equivalence point. When , we are at the secondequivalence point. It should not surprise you that, when , and, when
, . When , we have the intermediate and .pH � 12(pK1 � pK2)HA�� � 1pH � pK2� � 1.5
pH � pK1� � 0.5� � 2
�H2A
�BH�
� �CbVb
CaVa�
�A� �[H�] � [OH�]
Ca
�BH� �[H�] � [OH�]
Cb
Fraction of titration forweak acid by weak base:
[H�] ��BH� � CbVb
Va � Vb�
�A� � CaVa
Va � Vb� [OH�]
[A�][BH�]FB � CbVb/ (Va � Vb).
[BH�] � �BH� � FB �BH� �[H�]
[H�] � KBH�
BH�Ka
[HA] � �HAFHA �HA �[H�]
[H�] � Ka
[BH�]Vb)CaVa/ (Va �
FHA ��A� � Ka/ ([H�] � Ka)[A�] � �A� � FHA
Charge balance: [H�] � [BH�] � [A�] � [OH�]
KBH�BH�
KaCb
VbCaVa
220 CHAPTER 11 Acid-Base Titrations
A B C D E F G
17
16
18
15
14
13
12
11
10
9
8
7
6
5
4
[H+] Vb (mL)
3.993.90
5.00
6.00
6.27
7.00
8.00
9.00
9.25
10.00
11.00
12.00
1.02E-041.26E-04
1.00E-05
1.00E-06
5.37E-07
1.00E-07
1.00E-08
1.00E-09
5.62E-10
1.00E-10
1.00E-11
1.00E-12
[OH-]
9.77E-117.94E-11
1.00E-09
1.00E-08
1.86E-08
1.00E-07
1.00E-06
1.00E-05
1.78E-05
1.00E-04
1.00E-03
1.00E-02
α(A-)
0.0050.004
0.051
0.349
0.500
0.843
0.982
0.998
0.999
1.000
1.000
1.000
3 pH
Titration of weak acid with strong base
C4 = 10^-B4
D4 = $A$12/C4
19 E4 = $A$10/(C4+$A$10)
2
1
0.1
0.02
50
5.37E-07
1.E-14
Cb =
Ca =
Ka =
Kw =
Va =
F4 = (E4-(C4-D4)/$A$6)/(1+(C4-D4)/$A$4)
G4 = F4*$A$6*$A$8/$A$4
φ
0.000-0.002
0.050
0.349
0.500
0.843
0.982
0.999
1.000
1.006
1.061
1.667
0.001-0.020
0.505
3.493
5.000
8.430
9.818
9.987
10.000
10.058
10.606
16.667
Figure 11-11 Spreadsheetthat uses Equation 11-9 tocalculate the titration curve for50 mL of the weak acid 0.02 MMES treated with0.1 M NaOH. We provide pHas input in column B and thespreadsheet tells us whatvolume of base is required togenerate that pH.
(pKa � 6.27)
�HA �[HA]
FHA
�HA � fraction of acid in the form HA
�BH� �[BH�]
FB
�BH� � fraction of base in the form BH�

11-9 Calculating Titration Curves with Spreadsheets 221
Table 11-6 Titration equations for spreadsheets
CALCULATION OF
Titrating strong acid with strong base Titrating weak acid (HA) with strong base
Titrating strong base with strong acid Titrating weak base (B) with strong acid
Titrating weak acid (HA) with weak base (B) Titrating weak base (B) with weak acid (HA)
Titrating with strong base Titrating with strong base
Titrating dibasic B with strong acid Titrating tribasic B with strong acid
SYMBOLS
CALCULATION OF �Monoprotic systems
SYMBOLS
acid dissociation constant of HAK acid dissociation constant of
Diprotic systems
SYMBOLS
and for the acid are the acid dissociation constants of and , respectively.and for the base refer to the acid dissociation constants of and , respectively:
Triprotic systems
�A3� �K1K2K3
[H�]3 � [H�]2K1 � [H�]K1K2 � K1K2K3�HA2� �
[H�]K1K2
[H�]3 � [H�]2K1 � [H�]K1K2 � K1K2K3
�H2A� �[H�]2K1
[H�]3 � [H�]2K1 � [H�]K1K2 � K1K2K3�H3A �
[H�]3
[H�]3 � [H�]2K1 � [H�]K1K2 � K1K2K3
K1 � Kw/Kb2; K2 � Kw/Kb1BH�BH2�2K2K1
HA�H2AK2K1
�B �K1K2
[H�]2 � [H�]K1 � K1K2�BH� �
[H�]K1
[H�]2 � [H�]K1 � K1K2�BH2�
2�
[H�]2
[H�]2 � [H�]K1 � K1K2
�A2� �K1K2
[H�]2 � [H�]K1 � K1K2�HA� �
[H�]K1
[H�]2 � [H�]K1 � K1K2�H2A �
[H�]2
[H�]2 � [H�]K1 � K1K2
BH� (� Kw/Kb)BH� ��B �
KBH�
[H�] � KBH�
�BH� �[H�]
[H�] � KBH�
Ka ��A� �
Ka
[H�] � Ka�HA �
[H�]
[H�] � Ka
Vb � volume of baseCb � initial concentration of baseVa � volume of acidCa � initial concentration of acid
of association of baseequivalence point� � fraction of dissociation of acid or fraction� � fraction of the way to the first
� �CaVa
CbVb�
�BH� � 2�BH2�2
� 3�BH3�3
�[H�] � [OH�]
Cb
1 �[H�] � [OH�]
Ca
� �CaVa
CbVb�
�BH� � 2�BH2�2
�[H�] � [OH�]
Cb
1 �[H�] � [OH�]
Ca
(S S S BH3�3 )(S S BH2�
2 )
� �CbVb
CaVa�
�H2A� � 2�HA2� � 3�A3� �[H�] � [OH�]
Ca
1 �[H�] � [OH�]
Cb
� �CbVb
CaVa�
�HA� � 2�A2� �[H�] � [OH�]
Ca
1 �[H�] � [OH�]
Cb
(S S S A3�)H3A(S S A2�)H2A
� �CaVa
CbVb�
�BH� �[H�] � [OH�]
Cb
�A� �[H�] � [OH�]
Ca
� �CbVb
CaVa�
�A� �[H�] � [OH�]
Ca
�BH� �[H�] � [OH�]
Cb
� �CaVa
CbVb�
�BH� �[H�] � [OH�]
Cb
1 �[H�] � [OH�]
Ca
� �CaVa
CbVb�
1 �[H�] � [OH�]
Cb
1 �[H�] � [OH�]
Ca
� �CbVb
CaVa�
�A� �[H�] � [OH�]
Ca
1 �[H�] � [OH�]
Cb
� �CbVb
CaVa�
1 �[H�] � [OH�]
Ca
1 �[H�] � [OH�]
Cb
�
222 CHAPTER 11 Acid-Base Titrations
Exercises11-A. Calculate the pH at each of the following points in the titrationof 50.00 mL of 0.010 0 M NaOH with 0.100 M HCl. Volume of acidadded: 0.00, 1.00, 2.00, 3.00, 4.00, 4.50, 4.90, 4.99, 5.00, 5.01, 5.10,5.50, 6.00, 8.00, and 10.00 mL. Make a graph of pH versus volume ofHCl added.
11-B. Calculate the pH at each point listed for the titration of 50.0 mLof 0.050 0 M formic acid with 0.050 0 M KOH. The points to calcu-late are , 10.0, 20.0, 25.0, 30.0, 40.0, 45.0, 48.0, 49.0, 49.5,50.0, 50.5, 51.0, 52.0, 55.0, and 60.0 mL. Draw a graph of pH versus
11-C. Calculate the pH at each point listed for the titration of100.0 mL of 0.100 M cocaine (Section 9-4, ) with0.200 M . The points to calculate are , 10.0, 20.0,25.0, 30.0, 40.0, 49.0, 49.9, 50.0, 50.1, 51.0, and 60.0 mL. Draw agraph of pH versus .
11-D. Consider the titration of 50.0 mL of 0.050 0 M malonic acid with0.100 M NaOH. Calculate the pH at each point listed and sketch thetitration curve: , 8.0, 12.5, 19.3, 25.0, 37.5, 50.0, and 56.3 mL.
11-E. Write the chemical reactions (including structures of reac-tants and products) that occur when the amino acid histidine istitrated with perchloric acid. (Histidine is a molecule with no netcharge.) A solution containing 25.0 mL of 0.050 0 M histidine wastitrated with 0.050 0 M . Calculate the pH at the followingvalues of : 0, 4.0, 12.5, 25.0, 26.0, and 50.0 mL.Va
HClO4
Vb � 0.0
Va
Va � 0.0HNO3
Kb � 2.6 � 10�6
Vb.Vb � 0.0
11-F. Select indicators from Table 11-4 that would be useful for thetitrations in Figures 11-1 and 1l-2 and the curve inFigure 11-3. Select a different indicator for each titration and statewhat color change you would use as the end point.
11-G. When 100.0 mL of a weak acid was titrated with 0.093 81 MNaOH, 27.63 mL were required to reach the equivalence point. ThepH at the equivalence point was 10.99. What was the pH when only19.47 mL of NaOH had been added?
11-H. A 0.100 M solution of the weak acid HA was titrated with0.100 M NaOH. The pH measured when was 4.62. Usingactivity coefficients, calculate . The size of the anion is450 pm.
11-I. Finding the end point from pH measurements. Here are datapoints around the second apparent end point in Figure 11-6:
Vb (�L) pH Vb (�L) pH
107 6.921 117 7.878110 7.117 118 8.090113 7.359 119 8.343114 7.457 120 8.591115 7.569 121 8.794116 7.705 122 8.952
A�pKa
Vb � 12Ve
pKa � 8
Terms to UnderstandGran plotHammett acidity function
indicatorindicator error
leveling effecttransition range
SummaryKey equations used to calculate titration curves:
Strong acid/strong base titration
pH is determined by the concentration of excess unreacted or
Weak acid titrated with
: pH determined by
when (neglecting activity)
At : pH governed by After : pH is determined by excess
Weak base titrated with
: pH determined by :when
At : pH governed by After : pH is determined by excess H�Ve
KBH� (BH� ∆KBH�
B � H�)Ve
Va � 12VepH � pKBH�
pH � pKBH� � log([B]/[BH�])0 6 Va 6 Ve
Kb (B � H2O ∆Kb
BH� � OH�)Va � 0
(Va � volume of added acid)B � H� S BH� (Ve � equivalence volume)
H�
OH�Ve
Kb (A� � H2O ∆Kb
HA � OH�)Ve
Vb � 12VepH � pKa
0 6 Vb 6 Ve: pH � pKa � log([A�]/[HA])Ka (HA ∆
Ka
H� � A�)Vb � 0
(Vb � volume of added base)(Ve � equivalence volume)HA � OH� S A� � H2O
OH�
OH�
H�
H� � OH� S H2O
titrated with
Equivalence volumes:
: pH determined by :
when
At :
:when
At : pH governed by
After : pH is determined by excess
Behavior of derivatives at the equivalent pointFirst derivative: has greatest magnitudeSecond derivative:
Gran plotPlot versus
;
Choosing an indicator: Color transition range should match pH at. Preferably the color change should occur entirely within the
steep portion of the titration curve.Ve
� � activity coefficientKa � acid dissociation constant
slope � �Ka�HA/�A�x-intercept � Ve
VbVb � 10�pH
�(�pH/�V) /�V � 0�pH/�V
OH�Ve2
(A2� � H2O ∆Kb1
HA� � OH�)
Kb1Ve2
Vb � 32Ve1pH � pK2
pH � pK2 � log([A2�]/[HA�])Ve1 6 Vb 6 Ve2
F¿ � formal concentration of HA�
1 pH � 12(pK1 � pK2)
[H�] � BK1K2F¿ � K1Kw
K1 � F¿Ve1
Vb � 12Ve1pH � pK1
pH � pK1 � log([HA�]/[H2A])0 6 Vb 6 Ve1
K1 (H2A ∆K1
H� � HA�)Vb � 0
Ve2 � 2Ve1
H2AOH�! HA� OH�! A2�
OH�H2 A
Problems 223
(a) Prepare a table analogous to Table 11-3, showing the first andsecond derivatives. Plot both derivatives versus and locate theend point in each plot.(b) Prepare a Gran plot analogous to Figure 11-8. Use the least-squares procedure to find the best straight line and find the endpoint. You will have to use your judgment as to which points lie onthe “straight” line.
11-J. Indicator error. Consider the titration in Figure 11-2 inwhich the equivalence point pH in Table 11-2 is 9.25 at a volume of10.00 mL.(a) Suppose you used the yellow-to-blue transition of thymol blueindicator to find the end point. According to Table 11-4, the lasttrace of green disappears near pH 9.6. What volume of base isrequired to reach pH 9.6? The difference between this volume and10 mL is the indicator error.(b) If you used cresol red with a color change at pH 8.8, whatwould be the indicator error?
Vb
11-K. Spectrophotometry with indicators.* Acid-base indicatorsare themselves acids or bases. Consider an indicator, HIn, whichdissociates according to the equation
The molar absorptivity, , is for HIn andfor , at a wavelength of 440 nm.
(a) Write an expression for the absorbance of a solution containingHIn at a concentration [HIn] and at a concentration in acell of pathlength 1.00 cm. The total absorbance is the sum ofabsorbances of each component.(b) A solution containing indicator at a formal concentration of
is adjusted to pH 6.23 and found to exhibit anabsorbance of 0.868 at 440 nm. Calculate for this indicator.pKa
1.84 � 10�4 M
[In�]In�
In�14 200 M�1 cm�12 080 M�1 cm�1�
HIn ∆Ka
H� � In�
ProblemsTitration of Strong Acid with Strong Base
11-1. Distinguish the terms end point and equivalence point.
11-2. Consider the titration of 100.0 mL of 0.100 M NaOH with1.00 M HBr. Find the pH at the following volumes of acid addedand make a graph of pH versus : , 1, 5, 9, 9.9, 10, 10.1,and 12 mL.
11-3. Why does an acid-base titration curve (pH versus volume oftitrant) have an abrupt change at the equivalence point?
Titration of Weak Acid with Strong Base
11-4. Sketch the general appearance of the curve for the titration ofa weak acid with a strong base. Explain (in words) what chemistrygoverns the pH in each of the four distinct regions of the curve.
11-5. Why is it not practical to titrate an acid or base that is tooweak or too dilute?
11-6. A weak acid HA was titrated with 1.00 MKOH. The acid solution had a volume of 100.0 mL and a molarityof 0.100 M. Find the pH at the following volumes of base addedand make a graph of pH versus : , 1, 5, 9, 9.9, 10, 10.1,and 12 mL.
11-7. Consider the titration of the weak acid HA with NaOH. Atwhat fraction of does ? At what fraction of does ? Use these two points, plus ,and to sketch the titration curve for the reaction of 100 mL of0.100 M anilinium bromide (“ ”) with 0.100 MNaOH.
11-8. What is the pH at the equivalence point when 0.100 Mhydroxyacetic acid is titrated with 0.050 0 M KOH?
11-9. Find the equilibrium constant for the reaction of MES(Table 9-2) with NaOH.
11-10. When 22.63 mL of aqueous NaOH was added to 1.214 gof cyclohexylaminoethanesulfonic acid (FM 207.29, structure inTable 9-2) dissolved in 41.37 mL of water, the pH was 9.24. Calcu-late the molarity of the NaOH.
11-11. Use activity coefficients to calculate the pH after 10.0 mL of0.100 M trimethylammonium bromide was titrated with 4.0 mL of0.100 M NaOH.
aminobenzene � HBr1.2Ve
Vb � 0, 12Ve, VepH � pKa � 1
VepH � pKa � 1Ve
Vb � 0Vb
(pKa � 5.00)
Va � 0Va
Titration of Weak Base with Strong Acid
11-12. Sketch the general appearance of the curve for the titrationof a weak base with a strong acid. Explain (in words) what chem-istry governs the pH in each of the four distinct regions of thecurve.
11-13. Why is the equivalence point pH necessarily below 7 when aweak base is titrated with strong acid?
11-14. A 100.0-mL aliquot of 0.100 M weak base B was titrated with 1.00 M . Find the pH at the following vol-umes of acid added and make a graph of pH versus : , 1, 5,9, 9.9, 10, 10.1, and 12 mL.
11-15. At what point in the titration of a weak base with astrong acid is the maximum buffer capacity reached? This is thepoint at which a given small addition of acid causes the least pHchange.
11-16. What is the equilibrium constant for the reaction betweenbenzylamine and HCl?
11-17. A 50.0-mL solution of 0.031 9 M benzylamine was titratedwith 0.050 0 M HCl. Calculate the pH at the following volumes ofadded acid: , and 35.0 mL.
11-18. Calculate the pH of a solution made by mixing 50.00 mL of0.100 M NaCN with(a) 4.20 mL of 0.438 M (b) 11.82 mL of 0.438 M (c) What is the pH at the equivalence point with 0.438 M
?
Titrations in Diprotic Systems
11-19. Sketch the general appearance of the curve for the titrationof a weak diprotic acid with NaOH. Explain (in words) what chem-istry governs the pH in each distinct region of the curve.
11-20. The opening page of this chapter shows the titration curvefor an enzyme. Is the average charge of the protein positive, nega-tive, or neutral at its isoionic point? How do you know?
11-21. The base , whose anion is dibasic, was titrated withHCl to give curve b in Figure 11-4. Is point H, the first equivalencepoint, the isoelectric point or the isoionic point?
Na�A�
HClO4
HClO4
HClO4
Va � 0, 12.0, 12Ve, 30.0, Ve
Va � 0Va
HClO4
(pKb � 5.00)
*This problem is based on Beer’s law in Section 18-2.

224 CHAPTER 11 Acid-Base Titrations
11-22. The figure compares the titration of a monoprotic weak acidwith a monoprotic weak base and the titration of a diprotic acidwith strong base.(a) Write the reaction between the weak acid and the weak base andshow that the equilibrium constant is . This large value means thatthe reaction goes “to completion” after each addition of reagent.(b) Why does intersect the upper curve at and the lowercurve at ? On the lower curve, “ ” is for the acid, .
11-23. The dibasic compound B wastitrated with 1.00 M HCl. The initial solution of B was 0.100 M andhad a volume of 100.0 mL. Find the pH at the following volumes ofacid added and make a graph of pH versus : , 1, 5, 9, 10,11, 15, 19, 20, and 22 mL.
11-24. A 100.0-mL aliquot of 0.100 M diprotic acid was titrated with 1.00 M NaOH. Find the pH at
the following volumes of base added and make a graph of pH ver-sus : , 1, 5, 9, 10, 11, 15, 19, 20, and 22 mL.
11-25. Calculate the pH at 10.0-mL intervals (from 0 to 100 mL) inthe titration of 40.0 mL of 0.100 M piperazine with 0.100 M HCl.Make a graph of pH versus .
11-26. Calculate the pH when 25.0 mL of 0.020 0 M 2-aminophenolhas been titrated with 10.9 mL of .
11-27. Consider the titration of 50.0 mL of 0.100 M sodium glyci-nate, , with 0.100 M HCl.(a) Calculate the pH at the second equivalence point.(b) Show that our approximate method of calculations gives incor-rect (physically unreasonable) values of pH at and
.
11-28. A solution containing 0.100 M glutamic acid (the moleculewith no net charge) was titrated to its first equivalence point with0.025 0 M RbOH.(a) Draw the structures of reactants and products.(b) Calculate the pH at the first equivalence point.
11-29. Find the pH of the solution when 0.010 0 M tyrosine istitrated to the equivalence point with .
11-30. This problem deals with the amino acid cysteine, which wewill abbreviate .H2C
0.004 00 M HClO4
101.0 mLVa �Va � 90.0
H2NCH2CO2Na
0.015 0 M HClO4
Va
Vb � 0Vb
4.00, pK2 � 8.00)H2A (pK1 �
Va � 0Va
(pKb1 � 4.00, pKb2 � 8.00)
250 100 150
Vb (mL)
Ve 2Ve
200 2500
3pK1
pK2
4
5
6
pH 7
8
9
10
11H2A + OH−
(a)
HA + B (b)
12
BH�pKapK22Ve
32VepK2
107.78
(a) A 0.030 0 M solution was prepared by dissolving dipotassiumcysteine, , in water. Then 40.0 mL of this solution were titratedwith . Calculate the pH at the first equivalencepoint.(b) Calculate the quotient in a solution of 0.050 0 Mcysteinium bromide (the salt ).
11-31. How many grams of dipotassium oxalate (FM 166.22) shouldbe added to 20.0 mL of to give a pH of 4.40 whenthe solution is diluted to 500 mL?
11-32. When 5.00 mL of 0.103 2 M NaOH were added to 0.112 3 gof alanine (FM 89.093) in 100.0 mL of , the measuredpH was 9.57. Use activity coefficients to find for alanine. Con-sider the ionic strength of the solution to be 0.10 M and considereach ionic form of alanine to have an activity coefficient of 0.77.
Finding the End Point with a pH Electrode
11-33. What is a Gran plot used for?
11-34. Data for the titration of 100.00 mL of a weak acid by NaOHare given below. Find the end point by preparing a Gran plot, usingthe last 10% of the volume prior to .
mL mL mLNaOH pH NaOH pH NaOH pH
0.00 4.14 20.75 6.09 22.70 6.701.31 4.30 21.01 6.14 22.76 6.742.34 4.44 21.10 6.15 22.80 6.783.91 4.61 21.13 6.16 22.85 6.825.93 4.79 21.20 6.17 22.91 6.867.90 4.95 21.30 6.19 22.97 6.92
11.35 5.19 21.41 6.22 23.01 6.9813.46 5.35 21.51 6.25 23.11 7.1115.50 5.50 21.61 6.27 23.17 7.2016.92 5.63 21.77 6.32 23.21 7.3018.00 5.71 21.93 6.37 23.30 7.4918.35 5.77 22.10 6.42 23.32 7.7418.95 5.82 22.27 6.48 23.40 8.3019.43 5.89 22.37 6.53 23.46 9.2119.93 5.95 22.48 6.58 23.55 9.8620.48 6.04 22.57 6.63
11-35. Prepare a second derivative graph to find the end point fromthe following titration data.
mL mL mLNaOH pH NaOH pH NaOH pH
10.679 7.643 10.725 6.222 10.750 4.44410.696 7.447 10.729 5.402 10.765 4.22710.713 7.091 10.733 4.99310.721 6.700 10.738 4.761
Finding the End Point with Indicators
11-36. Explain the origin of the rule of thumb that indicator colorchanges occur at .
11-37. Why does a properly chosen indicator change color near theequivalence point in a titration?
11-38. The pH of microscopic vesicles (compartments) in livingcells can be estimated by infusing an indicator (HIn) into the com-partment and measuring the quotient from the spectrumof the indicator inside the vesicle. Explain how this tells us the pH.
[In�]/[HIn]
pKHIn � 1
Ve
pK2
0.10 M KNO3
0.800 M HClO4
H3C�Br�
[C2�]/[HC�]
0.060 0 M HClO4
K2C
(a) Titration of 100 mL of 0.050 M H2A with0.050 M NaOH. (b) Titration of 100 mL of the weak acid HA
with the weak base B .(0.050 M, pKb � 3.36)(0.050 M, pKa � 2.86)
(pK1 � 2.86, pK2 � 10.64)
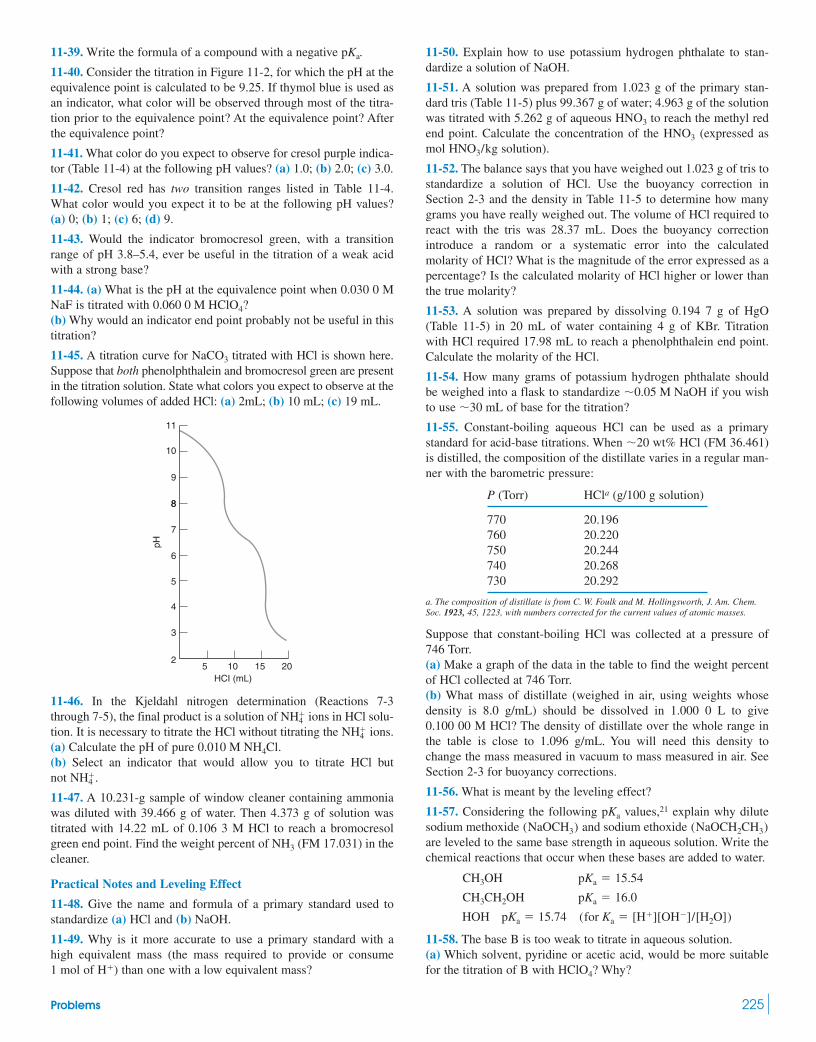
Problems 225
11-39. Write the formula of a compound with a negative .
11-40. Consider the titration in Figure 11-2, for which the pH at theequivalence point is calculated to be 9.25. If thymol blue is used asan indicator, what color will be observed through most of the titra-tion prior to the equivalence point? At the equivalence point? Afterthe equivalence point?
11-41. What color do you expect to observe for cresol purple indica-tor (Table 11-4) at the following pH values? (a) 1.0; (b) 2.0; (c) 3.0.
11-42. Cresol red has two transition ranges listed in Table 11-4.What color would you expect it to be at the following pH values?(a) 0; (b) 1; (c) 6; (d) 9.
11-43. Would the indicator bromocresol green, with a transitionrange of pH 3.8–5.4, ever be useful in the titration of a weak acidwith a strong base?
11-44. (a) What is the pH at the equivalence point when 0.030 0 MNaF is titrated with ?(b) Why would an indicator end point probably not be useful in thistitration?
11-45. A titration curve for titrated with HCl is shown here.Suppose that both phenolphthalein and bromocresol green are presentin the titration solution. State what colors you expect to observe at thefollowing volumes of added HCl: (a) 2mL; (b) 10 mL; (c) 19 mL.
11-46. In the Kjeldahl nitrogen determination (Reactions 7-3through 7-5), the final product is a solution of ions in HCl solu-tion. It is necessary to titrate the HCl without titrating the ions.(a) Calculate the pH of pure .(b) Select an indicator that would allow you to titrate HCl but not
11-47. A 10.231-g sample of window cleaner containing ammoniawas diluted with 39.466 g of water. Then 4.373 g of solution wastitrated with 14.22 mL of 0.106 3 M HCl to reach a bromocresolgreen end point. Find the weight percent of (FM 17.031) in thecleaner.
Practical Notes and Leveling Effect
11-48. Give the name and formula of a primary standard used tostandardize (a) HCl and (b) NaOH.
11-49. Why is it more accurate to use a primary standard with ahigh equivalent mass (the mass required to provide or consume1 mol of ) than one with a low equivalent mass?H�
NH3
NH�4 .
0.010 M NH4ClNH�
4
NH�4
25
pH
HCI (mL)10 15 20
3
4
5
6
7
88
9
10
11
NaCO3
0.060 0 M HClO4
pKa 11-50. Explain how to use potassium hydrogen phthalate to stan-dardize a solution of NaOH.
11-51. A solution was prepared from 1.023 g of the primary stan-dard tris (Table 11-5) plus 99.367 g of water; 4.963 g of the solutionwas titrated with 5.262 g of aqueous to reach the methyl redend point. Calculate the concentration of the (expressed asmol solution).
11-52. The balance says that you have weighed out 1.023 g of tris tostandardize a solution of HCl. Use the buoyancy correction inSection 2-3 and the density in Table 11-5 to determine how manygrams you have really weighed out. The volume of HCl required toreact with the tris was 28.37 mL. Does the buoyancy correctionintroduce a random or a systematic error into the calculatedmolarity of HCl? What is the magnitude of the error expressed as apercentage? Is the calculated molarity of HCl higher or lower thanthe true molarity?
11-53. A solution was prepared by dissolving 0.194 7 g of HgO(Table 11-5) in 20 mL of water containing 4 g of KBr. Titrationwith HCl required 17.98 mL to reach a phenolphthalein end point.Calculate the molarity of the HCl.
11-54. How many grams of potassium hydrogen phthalate shouldbe weighed into a flask to standardize if you wishto use of base for the titration?
11-55. Constant-boiling aqueous HCl can be used as a primarystandard for acid-base titrations. When wt% HCl (FM 36.461)is distilled, the composition of the distillate varies in a regular man-ner with the barometric pressure:
P (Torr) HCla (g/100 g solution)
770 20.196760 20.220750 20.244740 20.268730 20.292
a. The composition of distillate is from C. W. Foulk and M. Hollingsworth, J. Am. Chem.Soc. 1923, 45, 1223, with numbers corrected for the current values of atomic masses.
Suppose that constant-boiling HCl was collected at a pressure of746 Torr.(a) Make a graph of the data in the table to find the weight percentof HCl collected at 746 Torr.(b) What mass of distillate (weighed in air, using weights whosedensity is 8.0 g/mL) should be dissolved in 1.000 0 L to give0.100 00 M HCl? The density of distillate over the whole range inthe table is close to 1.096 g/mL. You will need this density tochange the mass measured in vacuum to mass measured in air. SeeSection 2-3 for buoyancy corrections.
11-56. What is meant by the leveling effect?
11-57. Considering the following values,21 explain why dilutesodium methoxide and sodium ethoxide are leveled to the same base strength in aqueous solution. Write thechemical reactions that occur when these bases are added to water.
11-58. The base B is too weak to titrate in aqueous solution.(a) Which solvent, pyridine or acetic acid, would be more suitablefor the titration of B with ? Why?HClO4
HOH pKa � 15.74 (for Ka � [H�][OH�]/[H2O])
CH3CH2OH pKa � 16.0
CH3OH pKa � 15.54
(NaOCH2CH3)(NaOCH3)pKa
�20
�30 mL�0.05 M NaOH
HNO3/kgHNO3
HNO3
226 CHAPTER 11 Acid-Base Titrations
11-66. Titrating diprotic acid with strong base. Use a spread-sheet to prepare a family of graphs for the titration of 50.0 mLof with 0.100 M NaOH. Consider the followingcases: (a) , ; (b) , ; (c) , .
11-67. Titrating nicotine with strong acid. Prepare a spread-sheet to reproduce the lower curve in Figure 11-4.
11-68. Titrating triprotic acid with strong base. Prepare aspreadsheet to graph the titration of 50.0 mL of
with 0.100 M NaOH. Treat withthe triprotic acid equation in Table 11-6.
11-69. A tetraprotic system. Write an equation for the titrationof tetrabasic base with strong acid ( .You can do this by inspection of Table 11-6 or you can derive itfrom the charge balance for the titration reaction. Use a spreadsheetto graph the titration of 50.0 mL of 0.020 0 M sodium pyrophos-phate with . Pyrophosphate is the anionof pyrophosphoric acid.
Using Beer’s Law with Indicators
11-70. Spectrophotometric properties of a particular indicator aregiven below:†
�max � 395 nm �max � 604 nm�395 � 1.80 � 104 M�1 cm�1 �604 � 4.97 � 104 M�1 cm�1
�604 � 0
A solution with a volume of 20.0 mL containing indicator plus 0.050 0 M benzene-1,2,3-tricarboxylic acid wastreated with 20.0 mL of aqueous KOH. The resulting solution hadan absorbance at 604 nm of 0.118 in a 1.00-cm cell. Calculate themolarity of the KOH solution.
11-71. A certain acid-base indicator exists in three coloredforms:†
Red Yellow Red
The units of molar absorptivity, , are . A solutioncontaining 10.0 mL of indicator was mixed with90.0 mL of 0.1 M phosphate buffer (pH 7.50). Calculate theabsorbance of this solution at 435 nm in a 1.00-cm cell.
5.00 � 10�4 MM�1 cm�1�
�435 � 1.15 � 104�572 � 2.00 � 102�572 � 2.03 � 104�520 � 2.50 � 104�520 � 2.13 � 103�435 � 1.67 � 104
�572 � 4.97 � 104�435 � 1.80 � 104�520 � 5.00 � 104�max � 572 nm�max � 435 nm�max � 520 nm
In2�#£££pK2�7.95
4HIn�#£££pK1�1.00
4H2In
1.40 � 10�5 M
In� � H�#£££pKa�7.95
4HIn
0.100 M HClO4(Na4P2O7)
B � H� S S S S BH4�4
histidine � 2HClhistidine � 2HCl0.020 0 M
pK2 � 5.00pK1 � 4.00pK2 � 6.00pK1 � 4.00pK2 � 8.00pK1 � 4.00
0.020 0 M H2A
(b) Which solvent would be more suitable for the titration of a veryweak acid with tetrabutylammonium hydroxide? Why?
11-59. Explain why sodium amide and phenyl lithiumare leveled to the same base strength in aqueous solution.
Write the chemical reactions that occur when these are added towater.
11-60. Pyridine is half protonated in aqueous phosphate buffer atpH 5.2. If you mix 45 mL of phosphate buffer with 55 mL ofmethanol, the buffer must have a pH of 3.2 to half protonate pyri-dine. Suggest a reason why.
Calculating Titration Curves with Spreadsheets
11-61. Derive the following equation analogous to those inTable 11-6 for the titration of potassium hydrogen phthalate
with NaOH:
11-62. Effect of in the titration of weak acid with strongbase. Use Equation 11-9 with a spreadsheet such as the one shownin Figure 11-11 to compute and plot the family of curves at the leftside of Figure 11-3. For a strong acid, choose a large , such as
or .
11-63. Effect of concentration in the titration of weak acidwith strong base. Use your spreadsheet from Problem 11-62 to pre-pare a family of titration curves for , with the followingcombinations of concentrations: (a) , ;(b) , ; (c) , .
11-64. Effect of in the titration of weak base with strongacid. Using the appropriate equation in Table 11-6, prepare aspreadsheet to compute and plot a family of curves analogous to theleft part of Figure 11-3 for the titration of 50.0 mL of 0.020 0 M B
with 0.100 M HCl.(The value represents a strong base.) In the expres-sion for , .
11-65. Titrating weak acid with weak base.(a) Use a spreadsheet to prepare a family of graphs for the titrationof 50.0 mL of 0.020 0 M HA with 0.100 M B
.(b) Write the acid-base reaction that occurs when acetic acid andsodium benzoate (the salt of benzoic acid) are mixed, and find theequilibrium constant for the reaction. Find the pH of a solution pre-pared by mixing 212 mL of 0.200 M acetic acid with 325 mL of0.050 0 M sodium benzoate.
3.00, 6.00, and 9.00)(pKb �(pKa � 4.00)
KBH� � Kw/Kb�BH�
pKb � �2.00(pKb � �2.00, 2.00, 4.00, 6.00, 8.00, and 10.00)
pKb
Cb � 1 mMCa � 0.2 mMCb � 10 mMCa � 2 mMCb � 100 mMCa � 20 mM
pKa � 6
pKa � �2Ka � 102Ka
pKa
� �CbVb
CaVa�
�HP� � 2�P2� � 1 �[H�] � [OH�]
Ca
1 �[H�] � [OH�]
Cb
(K�HP�)
(C6H5Li)(NaNH2)
Reference Procedure: Preparing Standard Acid and Base
Standard 0.1 M NaOH1. Prepare 50 wt% aqueous NaOH solution in advance and allow
the precipitate to settle overnight. ( is insolublein this solution.) Store the solution in a tightly sealedpolyethylene bottle and avoid disturbing the precipitate whensupernate is taken. The density is close to 1.50 g of solutionper milliliter.
Na2CO3Na2CO3
2. Dry primary-standard-grade potassium hydrogen phthalate for1 h at and store it in a desiccator.
Potassium hydrogen phthalateFM 204.221
ç
œ CO�K�2
CO2H� NaOH
ç
œ CO�K�2
CO�Na� 2
� H2O
110°C
†This problem is based on Beer’s law in Section 18-2.
Reference Procedure: Preparing Standard Acid and Base 227
3. Boil 1 L of water for 5 min to expel . Pour the water into apolyethylene bottle, which should be tightly capped wheneverpossible. Calculate the volume of 50 wt% NaOH needed( ) to produce 1 L of Use a graduatedcylinder to transfer this much NaOH to the bottle of water. Mixwell and allow the solution to cool to room temperature(preferably overnight).
4. Weigh out four portions of potassium hydrogenphthalate and dissolve each in of distilled water in a125-mL flask. Each sample should require of 0.1 MNaOH. Add 3 drops of phenolphthalein indicator (Table 11-4)to each, and titrate one of them rapidly to find the approximateend point. The buret should have a loosely fitted cap tominimize entry of .
5. Calculate the volume of NaOH required for each of the otherthree samples and titrate them carefully. During each titration,periodically tilt and rotate the flask to wash liquid from thewalls into the solution. When very near the end, deliver lessthan 1 drop of titrant at a time. To do this, carefully suspend afraction of a drop from the buret tip, touch it to the inside wallof the flask, wash it into the bulk solution by careful tilting,and swirl the solution. The end point is the first appearance ofpink color that persists for 15 s. The color will slowly fade as
from air dissolves in the solution.6. Calculate the average molarity the standard deviation (s),
and the relative standard deviation ( ). If you have used somecare, the relative standard deviation should be .6 0.2%
s/x( x ),
CO2
CO2
�25 mL�25 mL
�0.51-g
�0.1 M NaOH.�5.3 mL
CO2 Standard 0.1 M HCl
1. The inside cover of this book tells us that 8.2 mL of wt%HCl should be added to 1 L of water to produce .Prepare this solution in a capped polyethylene bottle, using agraduated cylinder to deliver the HCl.
2. Dry primary-standard-grade for 1 h at and coolit in a desiccator.
3. Weigh four samples containing enough to react withof 0.1 M HCl from a buret and place each in a 125-mL
flask. When ready to titrate each one, dissolve it in ofdistilled water.
FM 105.988
Add 3 drops of bromocresol green indicator (Table 11-4) andtitrate one sample rapidly to a green color to find theapproximate end point.
4. Carefully titrate each of the other samples until it just turnsfrom blue to green. Then boil the solution to expel . Thesolution should return to a blue color. Carefully add HCl fromthe buret until the solution turns green again.
5. Titrate one blank prepared from 3 drops of indicator plus50 mL of 0.05 M NaCl. Subtract the blank volume of HClfrom that required to titrate .
6. Calculate the mean HCl molarity, standard deviation, andrelative standard deviation.
Na2CO3
CO2
2HCl � Na2CO3 S CO2 � 2NaCl � H2O
�25 mL�25 mL
Na2CO3
110°CNa2CO3
�0.1 M HCl�37

228 CHAPTER 12 EDTA Titrations
ION CHANNELS IN CELL MEMBRANES
EDTA Titrations12
Gramicidin A is an antibiotic that kills cells by making their membranes permeable to and Gramicidin A is made of 15 amino acids wound into a helix with a 0.4-nm-diameterchannel through the middle. The channel is lined by polar amide groups and the outside ofgramicidin is covered by nonpolar hydrocarbons (page 182). Polar groups have positive andnegative regions that attract neighboring molecules by electrostatic forces. Nonpolar groupshave little charge separation and are soluble inside the nonpolar cell membrane.
Metal cations dissolve in water and are said to be hydrophilic (“water loving”). Cellmembranes exclude water and are described as hydrophobic (“water hating”). Gramicidin Alodges in the cell membrane because the outside of the molecule is hydrophobic. and
pass through each hydrophilic pore at a rate of The pore is selective formonovalent cations; it excludes anions and more highly charged cations.
Part of the Nobel Prize in Chemistry in 2003 was awarded to Roderick MacKinnon forelucidating the structure of potassium channels that selectively permit to pass throughmembranes of cells such as nerves.1 Amide oxygen atoms of the protein backbone in thechannel are spaced just right to replace waters of hydration from There is littlechange in energy when hydrated sheds and binds inside the channel. The spacingof amide oxygens is too great by 0.04 nm to displace from Hydrated remains outside the channel while hydrated sheds and binds inside the channel.
passes at a rate of per channel—100 times faster than Na�.108 ions/sK�
H2OK�
Na�Na(H2O)�6 .H2O
H2OK�
K(H2O)�6 .
K�
107 ions/s.K�
Na�
K�.Na�
Protein ion porespans cell membrane
Pore
Side view ofGramicidin A dimer
View downion channel
Mol
ecul
e 1
Mol
ecul
e 2
EDTA is a merciful abbreviation for ethylenediaminetetraacetic acid, a compound thatforms strong 1:1 complexes with most metal ions (Figure 12-1) and finds wide use in quanti-tative analysis. EDTA plays a larger role as a strong metal-binding agent in industrialprocesses and in products such as detergents, cleaning agents, and food additives that preventmetal-catalyzed oxidation of food. EDTA is an emerging player in environmental chemistry.2
For example, the majority of nickel discharged into San Francisco Bay and a significant frac-tion of the iron, lead, copper, and zinc are EDTA complexes that pass unscathed throughwastewater treatment plants.
Left and center: Two gramicidin A molecules associate to span a cell membrane. Right: Axial viewshowing ion channel. [Structure from B. Roux, “Computational Studies of the Gramicidin Channel,” Acc. Chem. Res.2002, 35, 366, based on solid-state nuclear magnetic resonance. Schematic at left from L. Stryer, Biochemistry,4th ed. (New York: W. H. Freeman, 1995).]
O
C N
HAmidegroup
Dissolved nickel in the south San Francisco Bayreaches 110 nM in the summer.

12-1 Metal-Chelate ComplexesMetal ions are Lewis acids, accepting electron pairs from electron-donating ligands that areLewis bases. Cyanide is called a monodentate ligand because it binds to a metal ionthrough only one atom (the carbon atom). Most transition metal ions bind six ligand atoms.A ligand that attaches to a metal ion through more than one ligand atom is said to be multi-dentate (“many toothed”), or a chelating ligand (pronounced KEE-late-ing).
A simple chelating ligand is 1,2-diaminoethane ( also called ethylene-diamine), whose binding to a metal ion is shown in the margin. We say that ethylenediamineis bidentate because it binds to the metal through two ligand atoms.
The chelate effect is the ability of multidentate ligands to form more stable metal com-plexes than those formed by similar monodentate ligands.4 For example, the reaction of
with two molecules of ethylenediamine is more favorable than its reaction withfour molecules of methylamine:
(12-1)
(12-2)
At pH 12 in the presence of 2 M ethylenediamine and 4 M methylamine, the quotientis 30.
An important tetradentate ligand is adenosine triphosphate (ATP), which binds to diva-lent metal ions (such as and through four of their six coordinationpositions (Figure 12-2). The fifth and sixth positions are occupied by water molecules. Thebiologically active form of ATP is generally the complex.
The octadentate ligand in Figure 12-3 is being evaluated as an anticancer agent.5 Thischelate binds a metal through four N atoms and four O atoms. The chelate is covalentlyattached to a monoclonal antibody, which is a protein produced by one specific type of cell inresponse to one specific foreign substance called an antigen. In this case, the antibody binds toa specific feature of a tumor cell. The chelate attached to the antibody carries a tightly bound,
Mg2�
Ni2�)Co2�,Mn2�,Mg2�,
[Cd(ethylenediamine)2�2 ]/[Cd(methylamine)2�
4 ]
Cd
OH2
OH2
ååMethylamine
2�
4H2O�
H3CNH2
H3CNH2
H2NCH3
H2NCH3
Cd(H2O)6� + 4CH3NH2 T&&2
K Ω �4 � 4 � 106
Cd
OH2
OH2
åå
H2N
H2N
NH2
NH2
Ethylenediamine
2�
4H2O�&& &&
2H2N NH2 T2Cd(H2O)6� +
K Ω �2 � 8 � 109
Cd(H2O)2�6
H2NCH2CH2NH2
� �
(CN�)
12-1 Metal-Chelate Complexes 229
Mn O C N
+ Mn2+
EDTA4–
CO–2
CO–2
CO–2
CO–2
N
N
Figure 12-1 EDTA forms strong 1:1complexes with most metal ions, bindingthrough four oxygen and two nitrogen atoms.The six-coordinate geometry of found in the compound wasdeduced from X-ray crystallography. [J. Stein,
J. P. Fackler, Jr., G. J. McClune, J. A. Fee, and L. T. Chan,
“Reactions of Mn-EDTA and MnCyDTA Complexes with
O2�. X-Ray Structure of ” Inorg. Chem.
1979, 18, 3511.]
KMnEDTA � 2H2O,
KMnEDTA � 2H2OMn2�-EDTA
Lewis acid Lewis base(electron pair (electron pair
acceptor) donor)
Complex ion
[:NΩCßAgßCΩN:]�
Ag+ + 2 CΩN T�
&& &&
The term “chelate” is derived from the greatclaw, or chela (from the Greek chē lē), of thelobster.3
H2N NH2 + Cu2+
Ethylenediamine
H2N NH2
Cu2+
Bidentate coordination
&& &&
Chelate effect: A bidentate ligand forms amore stable complex than do twomonodentate ligands.
Nomenclature for formation constants (K and) was discussed in Box 6-2.�
We have drawn trans isomers of theoctahedral complexes (with ligands atopposite poles), but cis isomers also arepossible (with ligands adjacent to eachother).
H2O
H2O
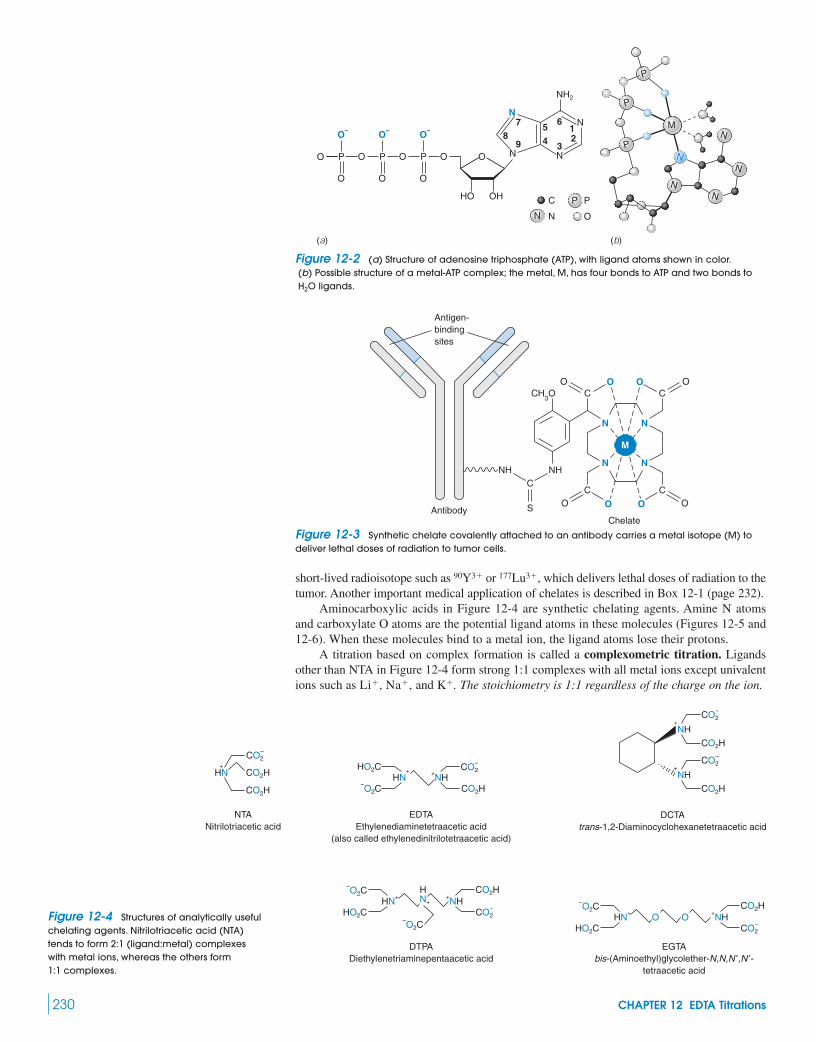
short-lived radioisotope such as or which delivers lethal doses of radiation to thetumor. Another important medical application of chelates is described in Box 12-1 (page 232).
Aminocarboxylic acids in Figure 12-4 are synthetic chelating agents. Amine N atomsand carboxylate O atoms are the potential ligand atoms in these molecules (Figures 12-5 and12-6). When these molecules bind to a metal ion, the ligand atoms lose their protons.
A titration based on complex formation is called a complexometric titration. Ligandsother than NTA in Figure 12-4 form strong 1:1 complexes with all metal ions except univalentions such as and The stoichiometry is 1:1 regardless of the charge on the ion.K�.Na�,Li�,
177Lu3�,90Y3�
230 CHAPTER 12 EDTA Titrations
O–
PO O
O
HO OH
NH2
N7
89
54 3
6
N
(a) (b)
O–
P O
O
O–
P O
O
O
12
N
N
N
C
N O
P
N
N
N
N
N
P
P
P
P
M
Figure 12-2 (a) Structure of adenosine triphosphate (ATP), with ligand atoms shown in color.(b) Possible structure of a metal-ATP complex; the metal, M, has four bonds to ATP and two bonds to
ligands.H2O
Antigen-bindingsites
AntibodyChelate
CH3O
NH
N
NHC
C
S
O
N
CO O
O
N
CO
N
COO
O
M
NTANitrilotriacetic acid
+HN
CO2–
CO2H
CO2H
DTPADiethylenetriaminepentaacetic acid
HO2C
CO2H+NHHN+
–O2C
–O2C
HN+
EGTAbis-(Aminoethyl)glycolether-N,N,N ′,N ′-
tetraacetic acid
CO2–HO2C
CO2H+NHHN+
–O2CO O
EDTAEthylenediaminetetraacetic acid
(also called ethylenedinitrilotetraacetic acid)
CO2H
CO–
+NHHN+HO2C
–O2C
DCTAtrans-1,2-Diaminocyclohexanetetraacetic acid
CO2H
CO2–
+NH
CO2H
CO2–
+NH
2
CO–2
Figure 12-3 Synthetic chelate covalently attached to an antibody carries a metal isotope (M) todeliver lethal doses of radiation to tumor cells.
Figure 12-4 Structures of analytically usefulchelating agents. Nitrilotriacetic acid (NTA)tends to form 2:1 (ligand:metal) complexeswith metal ions, whereas the others form1:1 complexes.
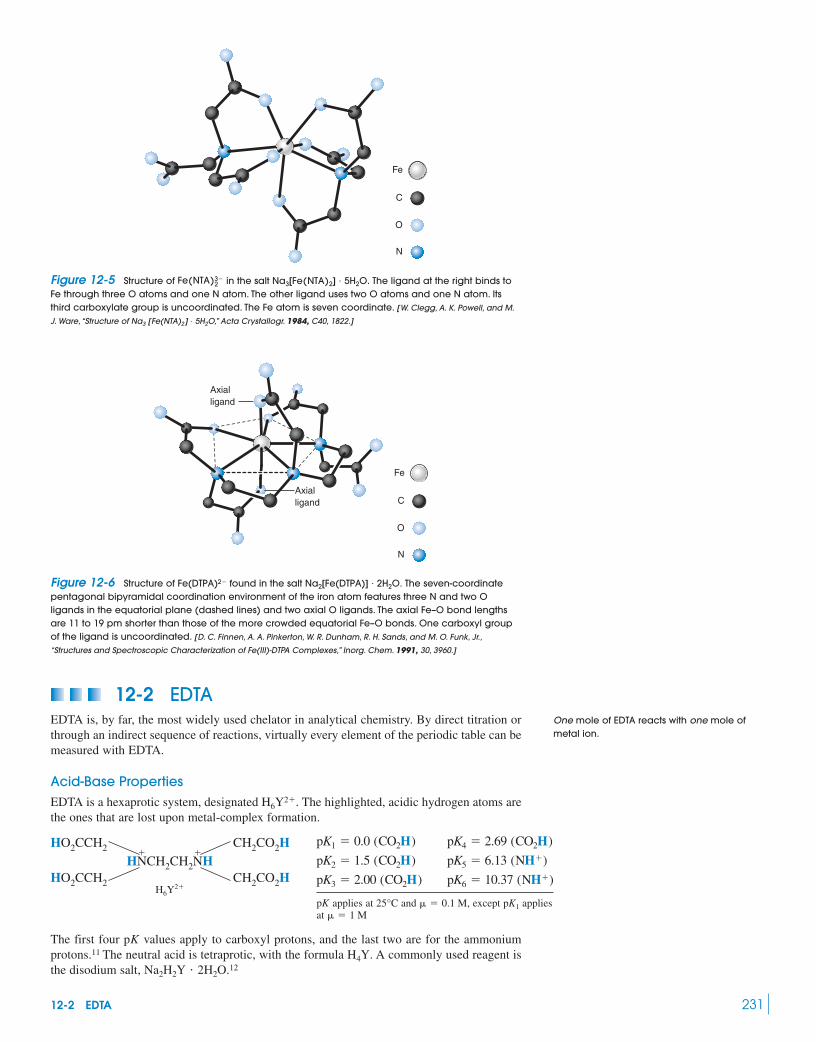
12-2 EDTA 231
Fe
C
O
N
Figure 12-5 Structure of in the salt The ligand at the right binds toFe through three O atoms and one N atom. The other ligand uses two O atoms and one N atom. Itsthird carboxylate group is uncoordinated. The Fe atom is seven coordinate. [W. Clegg, A. K. Powell, and M.
J. Ware, “Structure of Na3 [Fe(NTA)2 ] � 5H2O,” Acta Crystallogr. 1984, C40, 1822.]
Na3[Fe(NTA)2] � 5H2O.Fe(NTA)3�2
Fe
C
O
N
Axialligand
Axialligand
Figure 12-6 Structure of found in the salt The seven-coordinatepentagonal bipyramidal coordination environment of the iron atom features three N and two Oligands in the equatorial plane (dashed lines) and two axial O ligands. The axial Fe–O bond lengthsare 11 to 19 pm shorter than those of the more crowded equatorial Fe–O bonds. One carboxyl groupof the ligand is uncoordinated. [D. C. Finnen, A. A. Pinkerton, W. R. Dunham, R. H. Sands, and M. O. Funk, Jr.,
“Structures and Spectroscopic Characterization of Fe(III)-DTPA Complexes,” Inorg. Chem. 1991, 30, 3960.]
Na2[Fe(DTPA)] � 2H2O.Fe(DTPA)2�
12-2 EDTAEDTA is, by far, the most widely used chelator in analytical chemistry. By direct titration orthrough an indirect sequence of reactions, virtually every element of the periodic table can bemeasured with EDTA.
Acid-Base PropertiesEDTA is a hexaprotic system, designated The highlighted, acidic hydrogen atoms arethe ones that are lost upon metal-complex formation.
H6Y2�.
applies at and except appliesat � � 1 M
pK1� � 0.1 M,25°CpK
pK6 � 10.37 (NH�)pK3 � 2.00 (CO2H)
pK5 � 6.13 (NH�)pK2 � 1.5 (CO2H)
pK4 � 2.69 (CO2H)pK1 � 0.0 (CO2H)HO2CCH2 CH2CO2H
H6Y2�
HO2CCH2 CH2CO2HHNCH2CH2NH
� �
The first four values apply to carboxyl protons, and the last two are for the ammoniumprotons.11 The neutral acid is tetraprotic, with the formula A commonly used reagent isthe disodium salt, Na2H2Y � 2H2O.12
H4Y.pK
One mole of EDTA reacts with one mole ofmetal ion.

232 CHAPTER 12 EDTA Titrations
Box 12-1 Chelation Therapy and Thalassemia
Oxygen is carried in blood by the iron-containing protein hemo-globin, which consists of two pairs of subunits, designated and
-Thalassemia major is a genetic disease in which the subunits ofhemoglobin are not synthesized in adequate quantities. Childrenafflicted with this disease survive only with frequent transfusions ofnormal red blood cells. The problem with this treatment is thatpatients accumulate 4–8 g of iron per year from the hemoglobin inthe transfused cells. The body has no mechanism for excretinglarge quantities of iron, and most patients die by age 20 from thetoxic effects of iron overload.
To enhance iron excretion, intensive chelation therapy is used.The most successful drug is desferrioxamine B, a powerful -chelator produced by the microbe Streptomyces pilosus.6 The for-mation constant for the Fe(III) complex, called ferrioxamine B, is
Used in conjunction with ascorbic acid—vitamin C, a reduc-ing agent that reduces to the more soluble —desferrioxamine clears several grams of iron per year from an over-loaded patient. The ferrioxamine complex is excreted in the urine.
Desferrioxamine reduces the incidence of heart and liver diseasein thalassemia patients. In patients for whom desferrioxamine effec-tively controls iron overload, there is a 91% rate of cardiacdisease–free survival after 15 years of therapy.7 There are negativeeffects of desferrioxamine treatment; for example, too high a dosestunts a child’s growth.
Desferrioxamine is expensive and must be taken by continu-ous injection. It is not absorbed through the intestine. Many potentiron chelators have been tested to find an effective one that can betaken orally, but only the drug deferiprone is currently usedorally.8,9 In the long term, bone marrow transplants or gene ther-apy10 might cure the disease.
Fe2�Fe3�
1030.6.
Fe3�
���.�
Fe
O O
O O
O O
NHO
NN
NH2
CH3
HNN
O
Hydroxamategroup
N C
O– O
Ferrioxamine B
= Fe= O= N= C
Key
Crystal structure of ferrioxamine E
0
Per
cent
age
surv
ival
Age (years)
0
20
40
60
80
100
10 20 30
No treatment
Transfusionand desferrioxamine
Transfusiononly
?
The fraction of EDTA in each of its protonated forms is plotted in Figure 12-7. As in Sec-tion 10-5, we can define for each species as the fraction of EDTA in that form. For example,
is defined as
Fraction of EDTA in the form
(12-3)
where [EDTA] is the total concentration of all free EDTA species in the solution. By “free,”we mean EDTA not complexed to metal ions. Following the derivation in Section 10-5, wecan show that is given by
(12-4)� [H�]2K1K2K3K4 � [H�]K1K2K3K4K5 � K1K2K3K4K5K66�Y4� � K1K2K3K4K5K6/5[H�]6 � [H�]5K1 � [H�]4K1K2 � [H�]3K1K2K3
�Y4�
�Y4� �[Y4�]
[EDTA]
�Y4� �[Y4�]
[H6Y2�] � [H5Y�] � [H4Y] � [H3Y�] � [H2Y2�] � [HY3�] � [Y4�]
Y4�:
�Y4�
�
Structures above show the iron complex ferrioxamine B and the relatedcompound, ferrioxamine E, in which the chelate has a cyclic structure.Graph shows success of transfusions and transfusions plus chelationtherapy. [Crystal structure kindly provided by M. Neu, Los Alamos National Laboratory,
based on D. Van der Helm and M. Poling, J. Am. Chem. Soc. 1976, 98, 82. Graph from
P. S. Dobbin and R. C. Hider, “Iron Chelation Therapy,” Chem. Br. 1990, 26, 565.]
ß
CH3
ß ßH3C OHN � Fe3� T � 3H�3
£O
Deferiprone

12-2 EDTA 233
Table 12-1 gives values for as a function of pH.
Example What Does Mean?
The fraction of all free EDTA in the form is called At pH 6.00 at a formalconcentration of 0.10 M, the composition of an EDTA solution is
Find
Solution is the fraction in the form
EDTA ComplexesThe equilibrium constant for the reaction of a metal with a ligand is called the formationconstant, or the stability constant:
Formation constant: (12-5)
Note that for EDTA is defined in terms of the species reacting with the metal ion. Theequilibrium constant could have been defined for any of the other six forms of EDTA in thesolution. Equation 12-5 should not be interpreted to mean that only reacts with metalions. Table 12-2 shows that formation constants for most EDTA complexes are quite largeand tend to be larger for more positively charged cations.
In many complexes, EDTA engulfs the metal ion, forming the six-coordinate species inFigure 12-1. If you try to build a space-filling model of a six-coordinate metal-EDTAcomplex, you will find that there is considerable strain in the chelate rings. This strain is relievedwhen the O ligands are drawn back toward the N atoms. Such distortion opens up a seventh
Y4�
Y4�Kf
Mn� � Y4� T MYn�4 Kf �[MYn�4]
[Mn�][Y4�]
Kf,
� 1.8 � 10�5
� (0.043) � (1.8 � 10�6)
�1.8 � 10�6
(8.9 � 10�20) � (8.9 � 10�14) � (2.8 � 10�7) � (2.8 � 10�5) � (0.057)
�Y4� �[Y4�]
[H6Y2�] � [H5Y�] � [H4Y] � [H3Y�] � [H2Y2�] � [HY3�] � [Y4�]
Y4�:�Y4�
�Y4�.
[Y4�] � 1.8 � 10�6 M
[HY3�] � 0.043 M[H2Y2�] � 0.057 M[H3Y�] � 2.8 � 10�5 M
[H4Y] � 2.8 � 10�7 M[H5Y�] � 8.9 � 10�14 M[H6Y2�] � 8.9 � 10�20 M
�Y4�.Y4�
�Y4�
�Y4�
Table 12-1 Values of for EDTAat and
pH
01234
56789 0.041
10 0.3011 0.8112 0.9813 1.0014 1.00
4.2 � 10�33.8 � 10�41.8 � 10�52.9 � 10�7
3.0 � 10�92.1 � 10�112.6 � 10�141.4 � 10�181.3 � 10�23
�Y4�
� � 0.10 M20°C�Y4�
H5Y+
H3Y−
H6Y2+
H2Y2− HY3− Y4−
pK5 pK6
H4Y
Fra
ctio
nal c
ompo
sitio
n
0
0.1
0.2
0.3
0.4
0.5
0.6
0.7
0.8
0.9
1
14131211109876543210
pH
Figure 12-7 Fractional compositiondiagram for EDTA.
Question From Figure 12-7, which species hasthe greatest concentration at pH 6? At pH 7? AtpH 11?

coordination position, which can be occupied by as in Figure 12-8. In some complexes,such as the metal ion is so large that it accommodates eight ligandatoms.13 Larger metal ions require more ligand atoms. In the Fe(III) complex ferrioxamine E,whose structure is shown in Box 12-1, the metal coordination sphere is completed by six lig-ands. When Fe(III) is replace by the larger Pu(IV), three molecules are required to com-plete the coordination sphere for a total of nine ligands bound to Pu(IV).14
Even if is attached to the metal ion, the formation constant is still given byEquation 12-5. The relation remains true because solvent is omitted from the reactionquotient.
Conditional Formation ConstantThe formation constant describes the reaction between and ametal ion. As you see in Figure 12-7, most EDTA is not below pH 10.37. The species
and so on, predominate at lower pH. From the definition we can express the concentration of as
where [EDTA] is the total concentration of all EDTA species not bound to metal ion.The formation constant can now be rewritten as
If the pH is fixed by a buffer, then is a constant that can be combined with
Conditional formation constant: (12-6)
The number is called the conditional formation constant, or the effective for-mation constant. It describes the formation of at any particular pH. Later, after welearn to use Equation 12-6, we will modify it to allow for the possibility that not all the metalion is in the form Mn�.
MYn�4K ¿f � �Y4� Kf
K ¿f � �Y4� Kf �[MYn�4]
[Mn�][EDTA]
Kf:�Y4�
Kf �[MYn�4]
[Mn�][Y4�]�
[MYn�4]
[Mn�]�Y4�[EDTA]
[Y4�] � �Y4� [EDTA]
Y4�
�Y4� � [Y4�]/[EDTA],HY3�, H2Y2�,Y4�
Y4�Kf � [MYn�4]/[Mn�][Y4�]
(H2O)H2O
H2O
Ca(EDTA)(H2O)2�2 ,
H2O,
234 CHAPTER 12 EDTA Titrations
Ion log Kf
2.951.860.89.78.79
10.658.727.887.4
18.0815.36
14.3016.4518.418.7821.3Ti3�
Cu2�
Ni2�
Co2�
Fe2�
13.89Mn2�
13.6aCr2�
12.7aV2�
La3�
Y3�
23.1aSc3�
Ra2�
Ba2�
Sr2�
Ca2�
Mg2�
Be2�
K�
Na�
Li�
Ion log Kf
35.3
15.9316.3016.5116.917.0617.2517.3517.8718.3018.5618.8919.3219.4919.7423.225.7U4�
Th4�
Lu3�
Yb3�
Tm3�
Er3�
Ho3�
Dy3�
Tb3�
Gd3�
Eu3�
Sm3�
Pm3�
Nd3�
Pr3�
Ce3�
27.8aBi3�
Tl3�
Ion log Kf
25.225.141.429.329.518.715.57.206.41
16.516.521.5
18.016.421.724.9In3�
Ga3�
Al3�
Pb2�
18.3bSn2�
Hg2�
Cd2�
Zn2�
25.6aPd2�
Tl�
Ag�
VO�2
VO2�
Hf4�
Zr4�
Co3�
Fe3�
Mn3�
23.4aCr3�
25.9aV3�
Table 12-2 Formation constants for metal-EDTA complexes
NOTE: The stability constant is the equilibrium constant for the reaction Values in table apply at 25�Cand ionic strength 0.1 M unless otherwise indicated.
a. 20 �C, ionic strength 0.1 M. b. 20�C, ionic strength 1 M.
SOURCE: A. E. Martell, R. M. Smith, and R. J. Motekaitis, NIST Critically Selected Stability Constants of Metal Complexes,NIST Standard Reference Database 46, Gaithersburg, MD 2001.
��
Mn� � Y 4� T MYn�4.
H H
Fe O C N
Figure 12-8 Seven-coordinate geometry ofOther metal ions that form
seven-coordinate EDTA complexes include
and Some ofthese same ions also form six-coordinate EDTAcomplexes. Eight-coordinate complexes areformed by and [T. Mizuta,
J. Wang, and K. Miyoshi, “ A 7-Coordinate Structure of
Fe(III)-EDTA,” Bull. Chem. Soc. Japan 1993, 66, 2547.]
Zr4�.Yb3�,Er3�,Ca2�,
Ti4�.Os4�,Sn4�,In3�,Ti3�,V3�,Co3�,Cr3�,Ru3�,Mn2�,Co2�,Cd2�,Mg2�,Fe2�,
Fe(EDTA)(H2O)�.
Only some of the free EDTA is in the form .Y4�
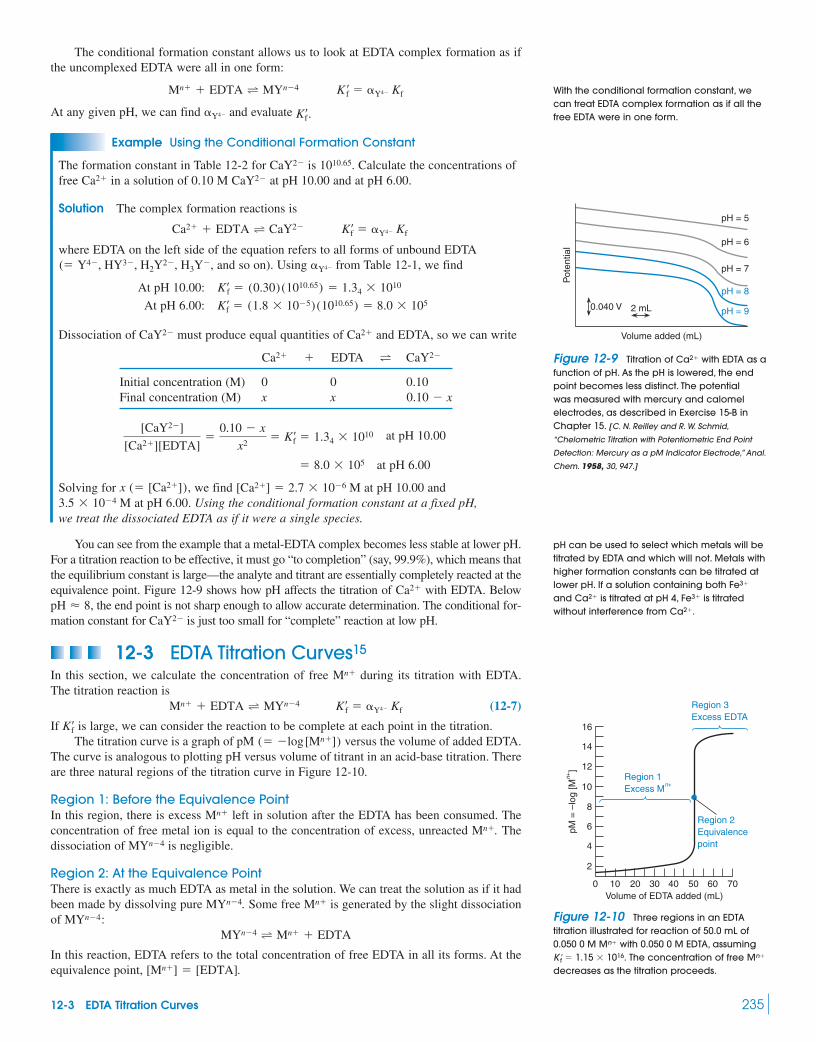
The conditional formation constant allows us to look at EDTA complex formation as ifthe uncomplexed EDTA were all in one form:
At any given pH, we can find and evaluate
Example Using the Conditional Formation Constant
The formation constant in Table 12-2 for is Calculate the concentrations offree in a solution of 0.10 M at pH 10.00 and at pH 6.00.
Solution The complex formation reactions is
where EDTA on the left side of the equation refers to all forms of unbound EDTAand so on). Using from Table 12-1, we find
At pH 10.00:
At pH 6.00:
Dissociation of must produce equal quantities of and EDTA, so we can write
Ca2� � EDTA CaY2�
Initial concentration (M) 0 0 0.10Final concentration (M) x x
at pH 10.00
at pH 6.00
Solving for we find at pH 10.00 andat pH 6.00. Using the conditional formation constant at a fixed pH,
we treat the dissociated EDTA as if it were a single species.
You can see from the example that a metal-EDTA complex becomes less stable at lower pH.For a titration reaction to be effective, it must go “to completion” (say, 99.9%), which means thatthe equilibrium constant is large—the analyte and titrant are essentially completely reacted at theequivalence point. Figure 12-9 shows how pH affects the titration of with EDTA. Below
the end point is not sharp enough to allow accurate determination. The conditional for-mation constant for is just too small for “complete” reaction at low pH.
12-3 EDTA Titration Curves15
In this section, we calculate the concentration of free during its titration with EDTA.The titration reaction is
(12-7)
If is large, we can consider the reaction to be complete at each point in the titration.The titration curve is a graph of versus the volume of added EDTA.
The curve is analogous to plotting pH versus volume of titrant in an acid-base titration. Thereare three natural regions of the titration curve in Figure 12-10.
Region 1: Before the Equivalence PointIn this region, there is excess left in solution after the EDTA has been consumed. Theconcentration of free metal ion is equal to the concentration of excess, unreacted Thedissociation of is negligible.
Region 2: At the Equivalence PointThere is exactly as much EDTA as metal in the solution. We can treat the solution as if it hadbeen made by dissolving pure Some free is generated by the slight dissociationof
In this reaction, EDTA refers to the total concentration of free EDTA in all its forms. At theequivalence point, [Mn�] � [EDTA].
MYn�4 T Mn� � EDTAMYn�4:
Mn�MYn�4.
MYn�4Mn�.
Mn�
pM (� �log[Mn�])K¿f
Mn� � EDTA T MYn�4 K¿f � �Y4� Kf
Mn�
CaY2�
pH � 8,Ca2�
3.5 � 10�4 M[Ca2�] � 2.7 � 10�6 Mx (� [Ca2�]),
� 8.0 � 105
[CaY2�]
[Ca2�][EDTA]�
0.10 � x
x2� K¿f � 1.34 � 1010
0.10 � x
T
Ca2�CaY2�
K¿f � (1.8 � 10�5)(1010.65) � 8.0 � 105
K¿f � (0.30)(1010.65) � 1.34 � 1010
�Y4�(� Y4�, HY3�, H2Y2�, H3Y�,
K¿f � �Y4� KfCa2� � EDTA T CaY2�
CaY2�Ca2�
1010.65.CaY2�
K¿f .�Y4�
K ¿f � �Y4� KfMn� � EDTA T MYn�4
12-3 EDTA Titration Curves 235
With the conditional formation constant, wecan treat EDTA complex formation as if all thefree EDTA were in one form.
Pot
entia
l
Volume added (mL)
0.040 V 2 mL
pH = 5
pH = 6
pH = 7
pH = 8
pH = 9
2
0
pM =
–lo
g [M
n+]
Volume of EDTA added (mL)
Region 1Excess Mn+
Region 3Excess EDTA
Region 2Equivalencepoint
10 20 30 40 50 60 70
16
4
6
8
10
12
14
pH can be used to select which metals will betitrated by EDTA and which will not. Metals withhigher formation constants can be titrated atlower pH. If a solution containing both and is titrated at pH 4, is titratedwithout interference from Ca2�.
Fe3�Ca2�
Fe3�
Figure 12-9 Titration of with EDTA as afunction of pH. As the pH is lowered, the endpoint becomes less distinct. The potentialwas measured with mercury and calomelelectrodes, as described in Exercise 15-B inChapter 15. [C. N. Reilley and R. W. Schmid,
“Chelometric Titration with Potentiometric End Point
Detection: Mercury as a pM Indicator Electrode,” Anal.
Chem. 1958, 30, 947.]
Ca2�
Figure 12-10 Three regions in an EDTAtitration illustrated for reaction of 50.0 mL of0.050 0 M with 0.050 0 M EDTA, assuming
The concentration of free decreases as the titration proceeds.
Mn�K ¿f � 1.15 � 1016.Mn�
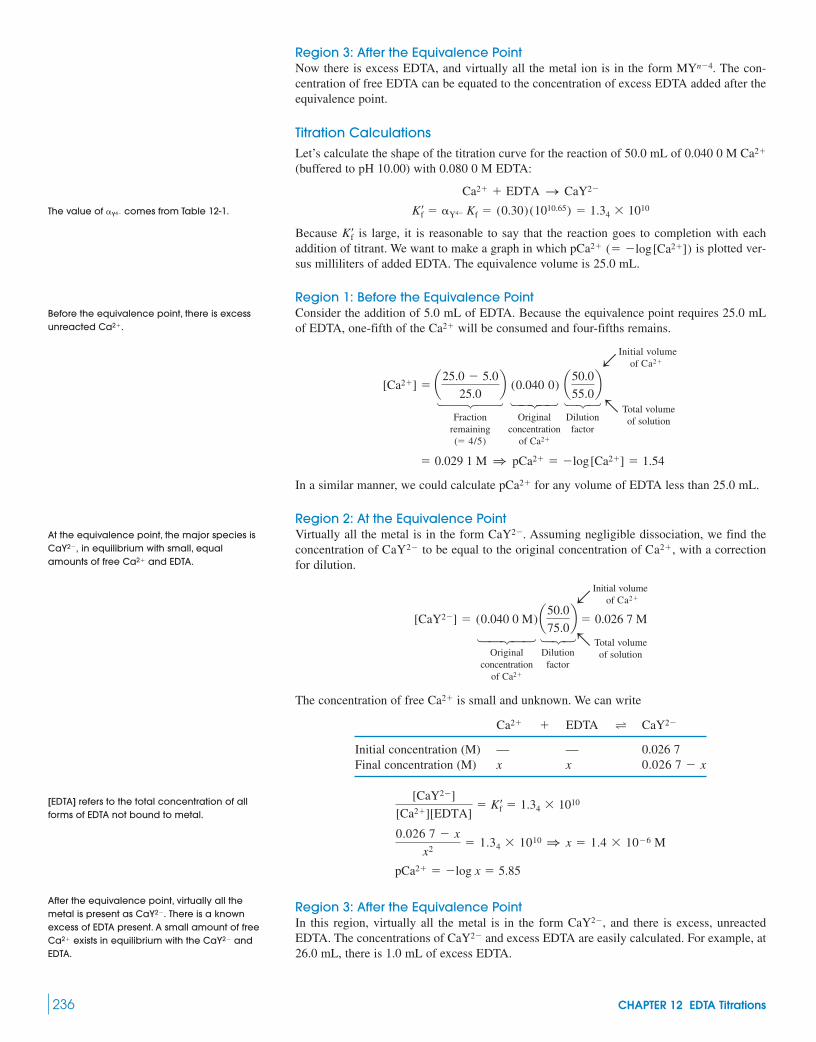
Region 3: After the Equivalence PointNow there is excess EDTA, and virtually all the metal ion is in the form The con-centration of free EDTA can be equated to the concentration of excess EDTA added after theequivalence point.
Titration CalculationsLet’s calculate the shape of the titration curve for the reaction of 50.0 mL of 0.040 0 M (buffered to pH 10.00) with 0.080 0 M EDTA:
Because is large, it is reasonable to say that the reaction goes to completion with eachaddition of titrant. We want to make a graph in which is plotted ver-sus milliliters of added EDTA. The equivalence volume is 25.0 mL.
Region 1: Before the Equivalence PointConsider the addition of 5.0 mL of EDTA. Because the equivalence point requires 25.0 mLof EDTA, one-fifth of the will be consumed and four-fifths remains.
bInitial volume
of
14243 14243 123Fraction Original Dilution
a Total volume
remaining concentration factorof solution
of
In a similar manner, we could calculate for any volume of EDTA less than 25.0 mL.
Region 2: At the Equivalence PointVirtually all the metal is in the form Assuming negligible dissociation, we find theconcentration of to be equal to the original concentration of with a correctionfor dilution.
bInitial volume
of
14243 123a Total volumeOriginal Dilution of solution
concentration factorof
The concentration of free is small and unknown. We can write
Ca2� � EDTA CaY2�
Initial concentration (M) — — 0.026 7Final concentration (M) x x
Region 3: After the Equivalence PointIn this region, virtually all the metal is in the form and there is excess, unreactedEDTA. The concentrations of and excess EDTA are easily calculated. For example, at26.0 mL, there is 1.0 mL of excess EDTA.
CaY2�
CaY2�,
pCa2� � �log x � 5.85
0.026 7 � x
x2� 1.34 � 1010 1 x � 1.4 � 10�6 M
[CaY2�]
[Ca2�][EDTA]� K¿f � 1.34 � 1010
0.026 7 � x
T
Ca2�
Ca2�
[CaY2�] � (0.040 0 M) a50.0
75.0b � 0.026 7 M
Ca2�
Ca2�,CaY2�
CaY2�.
pCa2�
� 0.029 1 M 1 pCa2� � �log[Ca2�] � 1.54
Ca2�(� 4/5)
[Ca2�] � a25.0 � 5.0
25.0b (0.040 0) a50.0
55.0b
Ca2�
Ca2�
(� �log[Ca2�])pCa2�
K¿f
K¿f � �Y4� Kf � (0.30)(1010.65) � 1.34 � 1010
Ca2� � EDTA S CaY2�
Ca2�
MYn�4.
236 CHAPTER 12 EDTA Titrations
The value of comes from Table 12-1.�Y4�
Before the equivalence point, there is excessunreacted Ca2�.
At the equivalence point, the major species isin equilibrium with small, equal
amounts of free and EDTA.Ca2�
CaY2�,
[EDTA] refers to the total concentration of allforms of EDTA not bound to metal.
After the equivalence point, virtually all themetal is present as There is a knownexcess of EDTA present. A small amount of free
exists in equilibrium with the andEDTA.
CaY2�Ca2�
CaY2�.

b Volume ofexcess EDTA
14243123Original Dilution
a Total volume
concentration factor of solution
of EDTA
bOriginal volume
of
14243 123Original Dilution
a Total volume
concentration factor of solution
of
The concentration of is governed by
The same sort of calculation can be used for any volume past the equivalence point.
The Titration CurveCalculated titration curves for and in Figure 12-11 show a distinct break at theequivalence point, where the slope is greatest. The end point is more distinct than the
end point because the conditional formation constant, for is greater thanthat of If the pH is lowered, the conditional formation constant decreases (because
decreases), and the end point becomes less distinct, as we saw in Figure 12-9. The pHcannot be raised arbitrarily high because metal hydroxide might precipitate.
12-4 Do It with a SpreadsheetLet’s see how to reproduce the EDTA titration curves in Figure 12-11 by using one equationthat applies to the entire titration. Because the reactions are carried out at fixed pH, the equi-libria and mass balances are sufficient to solve for all unknowns.
Consider the titration of metal ion M (concentration initial volume with asolution of ligand L (concentration volume added to form a 1:1 complex:
(12-8)
The mass balances for metal and ligand are
Mass balance for M:
Mass balance for L:
Substituting (from Equation 12-8) for [ML] in the mass balances gives
(12-9)
(12-10)
Now substitute the expression for [L] from Equation 12-10 back into Equation 12-9
[M]°
1 � Kf
ClVl
Vm � Vl
1 � Kf[M]¢
�CmVm
Vm � Vl
[L](1 � Kf[M]) �ClVl
Vm � Vl1 [L] �
ClVl
Vm � Vl
1 � Kf[M]
[M](1 � Kf[L]) �CmVm
Vm � Vl
Kf[M][L]
[L] � [ML] �ClVl
Vm � Vl
[M] � [ML] �CmVm
Vm � Vl
[ML] � Kf[M][L]1Kf �[ML]
[M][L]M � L T ML
� Vl)� Cl,� Vm)� Cm,
�Y4�
SrY2�.CaY2��Y4� Kf,Sr2�
Ca2�
Sr2�Ca2�
[Ca2�] � 1.9 � 10�9 M 1 pCa2� � 8.73
[2.63 � 10�2]
[Ca2�](1.05 � 10�3)� 1.34 � 1010
[CaY2�]
[Ca2�][EDTA]� K¿f � 1.34 � 1010
Ca2�
Ca2�
[CaY2�] � (0.040 0) a50.0
76.0b � 2.63˛ � 10�2 M
Ca2�
[EDTA] � (0.080 0) a 1.0
76.0b � 1.05 � 10�3 M
12-4 Do It with a Spreadsheet 237
pM
2
0 5 10 15 20 25 30 35
4
6
8
10
0
Volume of EDTA (mL)
Excess metal
K f = 1.6 × 10⁸'
'K f = 1.3 × 10¹⁰
Sr+
Ca2+
Ca2+ equivalence point
Sr 2+ equivalence point
ExcessEDTA
Figure 12-11 Theoretical titration curves forthe reaction of 50.0 mL of 0.040 0 M metal ionwith 0.080 0 M EDTA at pH 10.00.
Total metal concentration
�CmVm
Vm � Vl
�initial moles of metal
total volume
Total ligand concentration
�C1V1
Vm � V1
�moles of ligand added
total volume

and do about five lines of algebra to solve for the fraction of titration
(12-11)
As in acid-base titrations in Table 11-6, is the fraction of the way to the equivalence point.When When And so on.
For a titration with EDTA, you can follow the derivation through and find that the for-mation constant, should be replaced in Equation 12-11 by the conditional formationconstant, which applies at the fixed pH of the titration. Figure 12-12 shows a spreadsheetin which Equation 12-11 is used to calculate the titration curve in Figure 12-11. As inacid-base titrations, your input in column B is pM and the output in column E is volume oftitrant. To find the initial point, vary pM until is close to 0.
If you reverse the process and titrate ligand with metal ion, the fraction of the way to theequivalence point is the inverse of the fraction in Equation 12-11:
(12-12)
12-5 Auxiliary Complexing AgentsEDTA titrations in this chapter were selected such that the metal hydroxide would not pre-cipitate at the chosen pH. To permit many metals to be titrated in alkaline solutions withEDTA, we use an auxiliary complexing agent. This is a ligand, such as ammonia, tartrate,citrate, or triethanolamine, that binds the metal strongly enough to prevent metal hydroxidefrom precipitating but weakly enough to give up the metal when EDTA is added. isusually titrated in ammonia buffer, which fixes the pH and complexes the metal ion to keepit in solution. Let’s see how this works.
Metal-Ligand Equilibria16
Consider a metal ion that forms two complexes with the auxiliary complexing ligand L:
(12-13)
(12-14)�2 �[ML2]
[M][L]2M � 2L T ML2
�1 �[ML]
[M][L]M � L T ML
Zn2�
� �CmVm
ClVl�
Kf[M] �[M] � Kf[M]2
Cl
1 � Kf [M] �[M] � Kf[M]2
Cm
Spreadsheet equation fortitration of L with M:
Vl
Ca2�
K¿f,Kf,
V1 � 12Ve.� � 1
2,Vl � Ve.� � 1,�
� �ClVl
CmVm�
1 � Kf[M] �[M] � Kf[M]2
Cm
Kf[M] �[M] � Kf[M]2
Cl
Spreadsheet equation fortitration of M with L:
�:
238 CHAPTER 12 EDTA Titrations
A B C D E
17
16
15
14
13
12
11
10
9
8
7
6
5
4 0.04
50
0.08
1.34E+10
3 Cm =
Vm =
Kf' =
Titration of 50 mL of 0.04 M Ca2+ with 0.08 M EDTA
C(ligand) =
2
1
C4 = 10^-B4
Equation 12-11:
pM
1.398
1.537
2.003.00
4.005.85
7.00 1.00E-07 1.001 25.019
8.00 1.00E-08 1.007 25.187
8.73 1.86E-09 1.040 26.002
D4 = (1+$A$10*C4-(C4+C4*C4*$A$10)/$A$4)/
(C4*$A$10+(C4+C4*C4*$A$10)/$A$8)E4 = D4*$A$4*$A$6/$A$8
Phi
0.000
0.201
0.6670.963
0.996
1.000
M
4.00E-02
2.90E-02
1.00E-02
1.00E-03
1.00E-041.41E-06
V(ligand)
0.002
5.026
16.667
24.074
24.906
25.0000
Figure 12-12 Spreadsheet for the titrationof 50.0 mL of 0.040 0 M with 0.080 0 MEDTA at pH 10.00. This spreadsheet reproducescalculations of Section 12-3. pM was variedby trial-and-error to find volumes of 5.00, 25.00,and 26.00 mL used in the preceding section.Better yet, use GOAL SEEK (page 115) to varypM in cell B9 until the volume in cell E9 is25.000 mL.
Mg2�
Replace by if L � EDTA.K¿fKf
Replace by if L � EDTA.K¿fKf
N(CH2CH2OH)3
Triethanolamine
HO
HO2C
CO2H
CO2HCitric acid
HO OH
HO2C CO2HTartaric acid

The equilibrium constants, are called overall or cumulative formation constants. Thefraction of metal ion in the uncomplexed state, M, can be expressed as
(12-15)
where refers to the total concentration of all forms of M and in this case).Now let’s find a useful expression for The mass balance for metal is
Equations 12-13 and 12-14 allow us to say and Therefore,
Substituting this last result into Equation 12-15 gives the desired result:
(12-16)
Example Ammonia Complexes of Zinc
and form the complexes and If the concentration of free, unprotonated is 0.10 M, find the fraction of zinc in theform (At any pH, there will also be some in equilibrium with
Solution Appendix I gives formation constants for the complexes
The appropriate form of Equation 12-16 is
(12-17)
Equation 12-17 gives the fraction of zinc in the form Putting in and the four values of gives which means there is very little free in the presence of 0.10 M
EDTA Titration with an Auxiliary Complexing AgentNow consider a titration of by EDTA in the presence of The extension of Equation12-7 requires a new conditional formation constant to account for the fact that only some of theEDTA is in the form and only some of the zinc not bound to EDTA is in the form
(12-18)
In this expression, is given by Equation 12-17 and is given by Equation 12-4. For par-ticular values of pH and we can compute and proceed with titration calculations as inSection 12-3, substituting for An assumption in this process is that EDTA is a muchstronger complexing agent than ammonia, so essentially all the EDTA binds until the metalion is consumed.
Example EDTA Titration in the Presence of Ammonia
Consider the titration of 50.0 mL of with EDTA atpH 10.00 in the presence of 0.10 M (This is the concentration of There is also
in the solution.) The equivalence point is at 50.0 mL. Find after addition of20.0, 50.0, and 60.0 mL of EDTA.
Solution In Equation 12-17, we found that Table 12-1 tells us that Therefore, the conditional formation constant is
(a) Before the equivalence point—20.0 mL: Because the equivalence point is 50.0 mL,the fraction of remaining is 30.0/50.0. The dilution factor is 50.0/70.0. Therefore,the concentration of zinc not bound to EDTA is
CZn2� � a30.0
50.0b (1.00 � 10�3 M)a50.0
70.0b � 4.3 � 10�4 M
Zn2�
K–f � �Zn2� �Y4� Kf � (1.8 � 10�5)(0.30)(1016.5) � 1.7 � 1011
�Y4� � 0.30.�Zn2� � 1.8 � 10�5.
pZn2�NH�4
NH3.NH3.1.00 � 10�3 MZn2�1.00 � 10�3 M
Zn2�
K ¿f .K–fK–f[NH3],
�Y4��Zn2�
K–f � �Zn2� �Y4� Kf
Zn2�:Y4�
NH3.Zn2�
NH3.Zn2�
�Zn2� � 1.8 � 10�5,�i
[L] � 0.10 MZn2�.
�Zn2� �1
1 � �1[L] � �2[L]2 � �3[L]3 � �4[L]4
(�4 � 108.70).(�3 � 106.74), and Zn(NH3)2�
4Zn(NH3)2�3(�2 � 104.43),Zn(NH3)2�
2(�1 � 102.18),Zn(NH3)2�
NH3.)NH�4Zn2�.
NH3
Zn(NH3)2�4 .Zn(NH3)2�
3 ,Zn(NH3)2�2 ,Zn(NH3)2�,NH3Zn2�
�M �[M]
[M]51 � �1[L] � �2[L]26 �1
1 � �1[L] � �2[L]2
Fraction of freemetal ion:
� [M]51 � �1[L] � �2[L]26CM � [M] � �1[M][L] � �2[M][L]2
[ML2] � �2[M][L]2.[ML] � �1[M][L]
CM � [M] � [ML] � [ML2]
�M.ML2(� M, ML,CM
�M �[M]
CM
�i,
12-5 Auxiliary Complexing Agents 239
Overall and stepwise (K ) formationconstants were distinguished in Box 6-2. Therelation between and the stepwiseformation constants is
�n � K1K2K3p Kn
�n
(�)
If the metal forms more than two complexes,Equation 12-16 takes the form
�M �1
1 � �1[L] � �2[L]2 � p � �n[L]n
is the effective formation constant at afixed pH and fixed concentration of auxiliarycomplexing agent. Box 12-2 describes theinfluence of metal ion hydrolysis on theeffective formation constant.
K –f

However, nearly all zinc not bound to EDTA is bound to The concentration of free is
Let’s try a reality check. The product is which does not exceed the solubility product of (b) At the equivalence point—50.0 mL: At the equivalence point, the dilution factor is50.0/100.0, so As inSection 12-3, we write
CZn2� � EDTA ZnY2�
Initial concentration (M) 0 0Final concentration (M) x x
(c) After the equivalence point—60.0 mL: Almost all zinc is in the form Witha dilution factor of 50.0/110.0 for zinc, we find
[ZnY2�] � a 50.0
110.0b (1.00 � 10�3 M) � 4.5 � 10�4 M
ZnY2�.
1 pZn2� � �log[Zn2�] � 12.01
[Zn2�] � �Zn2� CZn2� � (1.8 � 10�5)(5.4 � 10�8) � 9.7 � 10�13 M
1 x � CZn2� � 5.4 � 10�8 M
K–f � 1.7 � 1011 �[ZnY2�]
[CZn2�][EDTA]�
5.00 � 10�4 � x
x2
5.00 � 10�4 � x5.00 � 10�4
T
[ZnY2�] � (50.0/100.0)(1.00 � 10�3 M) � 5.00 � 10�4 M.
(Ksp � 10�15.52).Zn(OH)2
[10�4.00]2 � 10�16.11,[10�8.11][OH�]2[Zn2�]
1 pZn2� � �log[Zn2�] � 8.11
[Zn2�] � �Zn2� CZn2� � (1.8 � 10�5)(4.3 � 10�4) � 7.7 � 10�9 MZn2�
NH3.
240 CHAPTER 12 EDTA Titrations
Box 12-2 Metal Ion Hydrolysis Decreases the Effective Formation Constant for EDTA Complexes
Contributions of and to the effective formation constant,for Curves were calculated by considering the species
and FeHY.FeY�,Fe(OH)�2 ,Fe(OH)2�,Fe3�,Y4�,HY3�,H2Y2�,H3Y�,H4Y,H5Y�,
H6Y2�,FeY�.Kf‡,�FeY��Fe3�,�Y4�,
Equation 12-18 states that the effective (conditional) formation con-stant for an EDTA complex is the product of the formation constant,
times the fraction of metal in the form times the fraction ofEDTA in the form Table 12-1 told us that
increases with pH until it levels off at 1 near pH 11.In Section 12-3 we had no auxiliary complexing ligand and
we implicitly assumed that In fact, metal ions reactwith water to form species. Combinations of pH andmetal ion in Section 12-3 were selected so that hydrolysis to
is negligible. We can find such conditions for most ions, but not for or Even in acidic solution, hydrolyzes to and 17 (Appendix I gives for-mation constants for hydroxide complexes.) The graph shows that
is close to 1 between pH 1 and 2 but thendrops as hydrolysis occurs. At pH 5, the fraction of Fe(III) in theform is
The effective formation constant for in the graph hasthree contributions:
As pH increases, increases, which increases As pHincreases, metal hydrolysis occurs, so decreases. Theincrease in is canceled by the decrease in so isnearly constant above pH 3. The third contribution to is which is the fraction of the EDTA complex in the form Atlow pH, some of the complex gains a proton to form FeHY, whichdecreases near pH 1. In the pH range 2 to 5, is nearlyconstant at 1. In neutral and basic solution, complexes such as
and are formed and decreases.�FeY�[Fe(OH)Y]4�2Fe(OH)Y2�
�FeY��FeY�
FeY�.�FeY�,Kf‡Kf‡�Fe3�,�Y4�
�Fe3�
Kf‡ .�Y4�
Kf‡ ��Fe3� �Y4�
�FeY�
Kf
FeY�
�10�5.Fe3�
(log �Fe3� � 0),�Fe3�
Fe(OH)�2 .Fe(OH)2�
Fe3�M4�.M3�
M2�M(OH)n
M(OH)n
�Mm� � 1.
�Y4�
K–f � �Mm� �Y4� Kf .Y4�:Mm�Kf,
Take-home message: In this book, we restrict ourselves tocases in which there is no hydrolysis and is controlled by adeliberately added auxiliary ligand. In reality, hydrolysis of and MY influences most EDTA titrations and makes the theoreti-cal analysis more complicated than we pretend in this chapter.
Mm�
�Mm�
0
15
K f'''
αFeY–
αY4–
αFe3+
10
5
–5
–10
–15
–201 2 3
pH4 5
log
The relation follows fromEquation 12-15.
[Zn2�] � �Zn2�C Zn2�
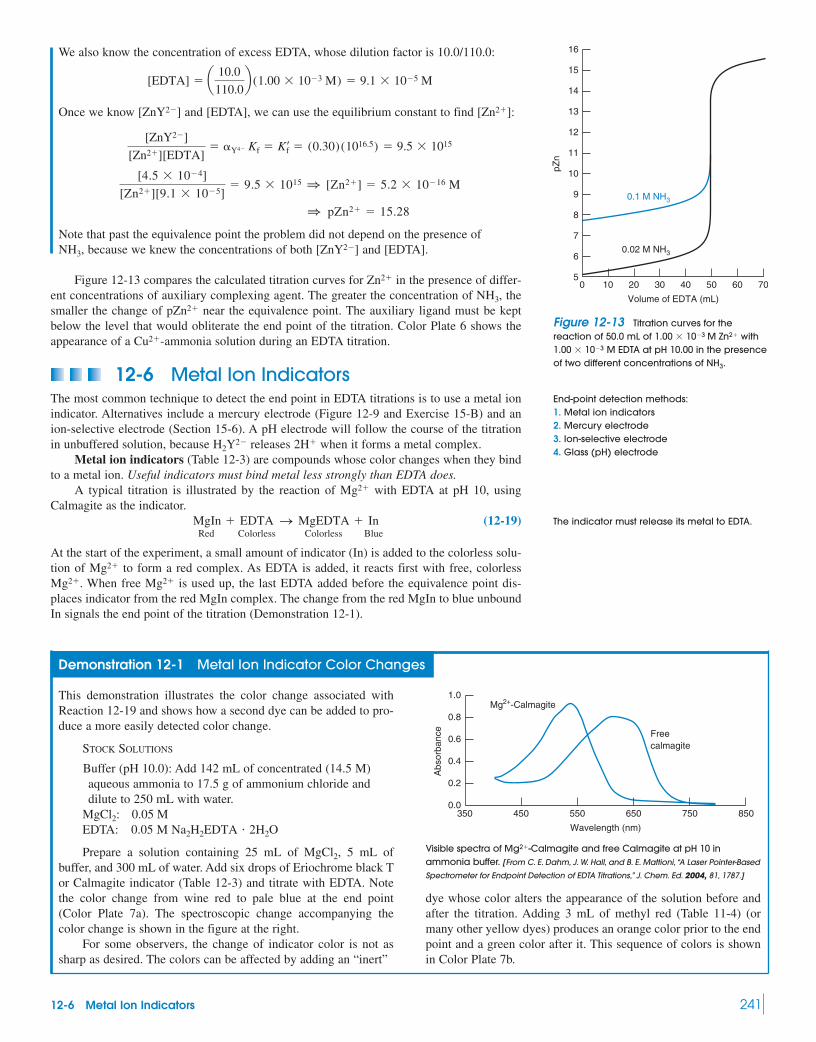
We also know the concentration of excess EDTA, whose dilution factor is 10.0/110.0:
Once we know and [EDTA], we can use the equilibrium constant to find
Note that past the equivalence point the problem did not depend on the presence of because we knew the concentrations of both and [EDTA].
Figure 12-13 compares the calculated titration curves for in the presence of differ-ent concentrations of auxiliary complexing agent. The greater the concentration of thesmaller the change of near the equivalence point. The auxiliary ligand must be keptbelow the level that would obliterate the end point of the titration. Color Plate 6 shows theappearance of a -ammonia solution during an EDTA titration.
12-6 Metal Ion IndicatorsThe most common technique to detect the end point in EDTA titrations is to use a metal ionindicator. Alternatives include a mercury electrode (Figure 12-9 and Exercise 15-B) and anion-selective electrode (Section 15-6). A pH electrode will follow the course of the titrationin unbuffered solution, because releases when it forms a metal complex.
Metal ion indicators (Table 12-3) are compounds whose color changes when they bindto a metal ion. Useful indicators must bind metal less strongly than EDTA does.
A typical titration is illustrated by the reaction of with EDTA at pH 10, usingCalmagite as the indicator.
(12-19)Red Colorless Colorless Blue
At the start of the experiment, a small amount of indicator (In) is added to the colorless solu-tion of to form a red complex. As EDTA is added, it reacts first with free, colorless
When free is used up, the last EDTA added before the equivalence point dis-places indicator from the red MgIn complex. The change from the red MgIn to blue unboundIn signals the end point of the titration (Demonstration 12-1).
Mg2�Mg2�.Mg2�
MgIn � EDTA S MgEDTA � In
Mg2�
2H�H2Y2�
Cu2�
pZn2�
NH3,Zn2�
[ZnY2�]NH3,
1 pZn2� � 15.28
[4.5 � 10�4]
[Zn2�][9.1 � 10�5]� 9.5 � 1015 1 [Zn2�] � 5.2 � 10�16 M
[ZnY2�]
[Zn2�][EDTA]� �Y4� Kf � K¿f � (0.30)(1016.5) � 9.5 � 1015
[Zn2�]:[ZnY2�]
[EDTA] � a 10.0
110.0b (1.00 � 10�3 M) � 9.1 � 10�5 M
12-6 Metal Ion Indicators 241
pZn
16
15
14
13
12
11
0.1 M NH3
0.02 M NH3
10
9
8
7
6
5700 10 20 30
Volume of EDTA (mL)
40 50 60
Figure 12-13 Titration curves for thereaction of 50.0 mL of with
M EDTA at pH 10.00 in the presenceof two different concentrations of NH3.1.00 � 10�3
Zn2�1.00 � 10�3 M
Demonstration 12-1 Metal Ion Indicator Color Changes
This demonstration illustrates the color change associated withReaction 12-19 and shows how a second dye can be added to pro-duce a more easily detected color change.
STOCK SOLUTIONS
Buffer (pH 10.0): Add 142 mL of concentrated (14.5 M)aqueous ammonia to 17.5 g of ammonium chloride anddilute to 250 mL with water.
EDTA: 0.05 M
Prepare a solution containing 25 mL of 5 mL ofbuffer, and 300 mL of water. Add six drops of Eriochrome black Tor Calmagite indicator (Table 12-3) and titrate with EDTA. Notethe color change from wine red to pale blue at the end point(Color Plate 7a). The spectroscopic change accompanying thecolor change is shown in the figure at the right.
For some observers, the change of indicator color is not assharp as desired. The colors can be affected by adding an “inert”
MgCl2,
Na2H2EDTA � 2H2OMgCl2: 0.05 M
dye whose color alters the appearance of the solution before andafter the titration. Adding 3 mL of methyl red (Table 11-4) (ormany other yellow dyes) produces an orange color prior to the endpoint and a green color after it. This sequence of colors is shownin Color Plate 7b.
1.0
0.0
0.2
0.4
0.6
0.8
850350 450 550
Wavelength (nm)
Mg2+-Calmagite
Freecalmagite
650 750
Abs
orba
nce
Visible spectra of -Calmagite and free Calmagite at pH 10 inammonia buffer. [From C. E. Dahm, J. W. Hall, and B. E. Mattioni,“A Laser Pointer-Based
Spectrometer for Endpoint Detection of EDTA Titrations,” J. Chem. Ed. 2004, 81, 1787.]
Mg2�
End-point detection methods:1. Metal ion indicators2. Mercury electrode3. Ion-selective electrode4. Glass (pH) electrode
The indicator must release its metal to EDTA.

242 CHAPTER 12 EDTA Titrations
Most metal ion indicators are also acid-base indicators, with values listed inTable 12-3. Because the color of free indicator is pH dependent, most indicators can be usedonly in certain pH ranges. For example, xylenol orange (pronounced ZY-leen-ol) changesfrom yellow to red when it binds to a metal ion at pH 5.5. This is an easy color change toobserve. At pH 7.5, the change is from violet to red and rather difficult to see. A spectropho-tometer can measure the color change, but it is more convenient if we can see it. Figure 12-14shows pH ranges in which many metals can be titrated and indicators that are useful indifferent ranges.
The indicator must give up its metal ion to the EDTA. If a metal does not freely dissoci-ate from an indicator, the metal is said to block the indicator. Eriochrome black T is blockedby and It cannot be used for the direct titration of anyof these metals. It can be used for a back titration, however. For example, excess standardEDTA can be added to Then indicator is added and the excess EDTA is back-titratedwith Mg2�.
Cu2�.
Al3�.Fe3�,Cr3�,Co2�,Ni2�,Cu2�,
pKa
Table 12-3 Common metal ion indicators
Color of free Color of metalName Structure pKa indicator ion complex
PREPARATION AND STABILITY:
Calmagite: 0.05 g/100 mL H2O; solution is stable for a year in the dark.
Eriochrome black T: Dissolve 0.1 g of the solid in 7.5 mL of triethanolamine plus 2.5 mL of absolute ethanol; solution is stablefor months; best used for titrations above pH 6.5.
Murexide: Grind 10 mg of murexide with 5 g of reagent NaCl in a clean mortar; use 0.2–0.4 g of the mixture for each titration.
Xylenol orange: 0.5 g/100 mL H2O; solution is stable indefinitely.
Pyrocatechol violet: 0.1 g/100 mL; solution is stable for several weeks.
Blue
H4In redH3In� yellowH2In2� violetHIn3� red-purple
pK1 � 0.2pK2 � 7.8pK3 � 9.8pK4 � 11.7
ß
(H3In�)
£O
ßOHOHç OH
SO3�
Pyrocatecholviolet
Red
H5In� yellowH4In2� yellowH3In3� yellowH2In4� violetHIn5� violetIn6� violet
pK2 � 2.32pK3 � 2.85pK4 � 6.70pK5 � 10.47pK6 � 12.23
ß
(H3In3�)
�O2C£O
ßCH3CH3ç OH
�NHHN��O2C
CO2�
CO2�
SO3�
Xylenolorange
Yellow (withCo2�, Ni2�,Cu2�); redwith Ca2�
H4In� red-violetH3In2� violetH2In3� blue
pK2 � 9.2pK3 � 10.9
ON
O
ß
(H4In�)
�OOç
O
£O£
£
£
£
£HN
HN
NH
NHMurexide
Wine redH2In� redHIn2� blueIn3� orange
pK2 � 6.3pK3 � 11.6
ß
ßOH
NO2
ç
�O3S N £ N
OH
ß ß
ç(H2In�)
Eriochromeblack T
Wine redH2In� redHIn2� blueIn3� orange
pK2 � 8.1pK3 � 12.4
ç
N £ N
HO
ß ßß
(H2In�)CH3
ç
çOH
SO3�
Calmagite
Question What will the color change bewhen the back titration is performed?
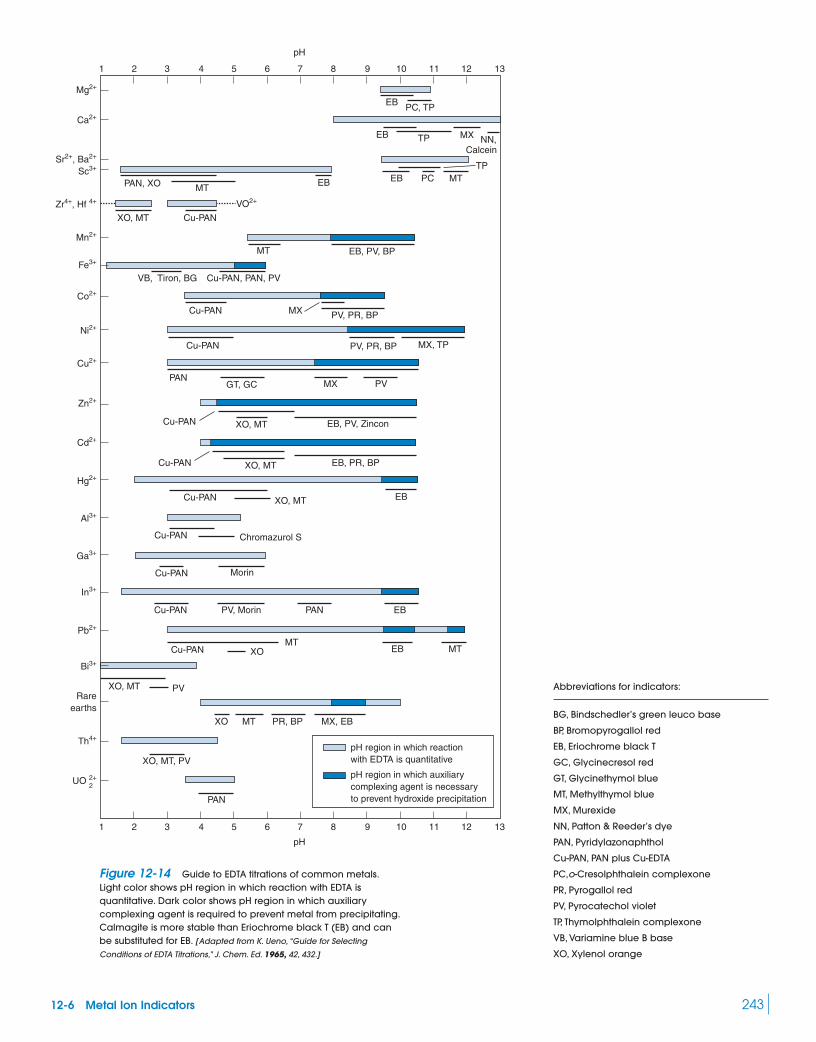
12-6 Metal Ion Indicators 243
Mg2+
Ca2+
VO2+
Sc3+
Mn2+
Fe3+
Co2+
Ni2+
Cu2+
Zn2+
Cd2+
Hg2+
Al3+
Ga3+
In3+
Pb2+
Bi3+
Th4+
UO 2+
1 2 3 4 5 6 7
pH
pH
8 9 10 12 1311
1 2 3 4 5 6 7 8 9 10 12 1311
EB
EB
EBEBMT
MT EB, PV, BP
MX PV
MX
PC MT
TP
TP
Calcein
MX NN,
PC, TP
XO, MT
GT, GC
XO, MT
XO, MT
XO, MT
XO, MT
XO, MT, PV
MX, TP
PV, PR, BP
PV, PR, BP
EB, PR, BP
EB
EB
PV
EB MTMT
XO
XO MT PR, BP MX, EB
PV,
EB, PV, Zincon
VB, Tiron, BG Cu-PAN, PAN, PV
Cu-PAN
Cu-PAN
Cu-PAN
Cu-PAN
Cu-PAN
Cu-PAN
Cu-PAN
Cu-PAN
Cu-PAN
Cu-PAN
PAN
PAN
PANMorin
Morin
Chromazurol S
pH region in which reactionwith EDTA is quantitative
pH region in which auxiliarycomplexing agent is necessaryto prevent hydroxide precipitation
PAN, XO
2
Rareearths
Sr2+, Ba2+
Zr4+, Hf 4+
Abbreviations for indicators:
BG, Bindschedler’s green leuco base
BP, Bromopyrogallol red
EB, Eriochrome black T
GC, Glycinecresol red
GT, Glycinethymol blue
MT, Methylthymol blue
MX, Murexide
NN, Patton & Reeder’s dye
PAN, Pyridylazonaphthol
Cu-PAN, PAN plus Cu-EDTA
PC,o-Cresolphthalein complexone
PR, Pyrogallol red
PV, Pyrocatechol violet
TP, Thymolphthalein complexone
VB, Variamine blue B base
XO, Xylenol orange
Figure 12-14 Guide to EDTA titrations of common metals.Light color shows pH region in which reaction with EDTA isquantitative. Dark color shows pH region in which auxiliarycomplexing agent is required to prevent metal from precipitating.Calmagite is more stable than Eriochrome black T (EB) and canbe substituted for EB. [Adapted from K. Ueno, “Guide for Selecting
Conditions of EDTA Titrations,” J. Chem. Ed. 1965, 42, 432.]

12-7 EDTA Titration TechniquesBecause so many elements can be analyzed with EDTA, there is extensive literature dealingwith many variations of the basic procedure.15,19
Direct TitrationIn a direct titration, analyte is titrated with standard EDTA. The analyte is buffered to a pHat which the conditional formation constant for the metal-EDTA complex is large and thecolor of the free indicator is distinctly different from that of the metal-indicator complex.
Auxiliary complexing agents such as tartrate, citrate, or triethanolamine may beemployed to prevent metal ion from precipitating in the absence of EDTA. For example,
is titrated in buffer at pH 10 in the presence of tartrate, which complexes anddoes not allow to precipitate. The lead-tartrate complex must be less stable than thelead-EDTA complex, or the titration would not be feasible.
Back TitrationIn a back titration, a known excess of EDTA is added to the analyte. Excess EDTA is thentitrated with a standard solution of a second metal ion. A back titration is necessary if analyteprecipitates in the absence of EDTA, if it reacts too slowly with EDTA, or if it blocks theindicator. The metal ion for the back titration must not displace analyte from EDTA.
Example A Back Titration
can be analyzed by a back titration by using standard at pH 5.5 with xylenolorange indicator. A solution containing 25.00 mL of in dilute HCl is treated with25.00 mL of 0.052 83 M The solution is neutralized with NaOH, and the pHis adjusted to 5.5 with acetate buffer. The solution turns yellow when a few drops ofindicator are added. Titration with 0.022 99 M requires 17.61 mL to reach the redend point. What is the molarity of in the unknown?
Solution The unknown was treated with 25.00 mL of 0.052 83 M EDTA, whichcontains of EDTA. Back titration required
of . Because 1 mol of EDTA reactswith 1 mol of any metal ion, there must have been
The concentration of is
Back titration prevents precipitation of analyte. For example, precipitates atpH 7 in the absence of EDTA. An acidic solution of can be treated with excess EDTA,adjusted to pH 7–8 with sodium acetate, and boiled to ensure complete formation of stable,soluble The solution is then cooled, Eriochrome black T indicator is added, andback titration with standard is performed.
Displacement Titrationdoes not have a satisfactory indicator, but a displacement titration is feasible. is
treated with excess to displace which is titrated with standard EDTA.
(12-20)
The conditional formation constant for must be greater than foror else is not displaced from
There is no suitable indicator for However, will displace from tetra-cyanonickelate(II) ion:
The liberated can then be titrated with EDTA to find out how much was added.
Indirect TitrationAnions that precipitate with certain metal ions can be analyzed with EDTA by indirecttitration. For example, sulfate can be analyzed by precipitation with excess at pH 1.Ba2�
Ag�Ni2�
2Ag� � Ni(CN)2�4 S 2Ag(CN)�
2 � Ni2�
Ni2�Ag2�Ag�.Mg(EDTA)2�.Mg2�Mg(EDTA)2�,
K¿fHg(EDTA)2�
Mn� � MgY2� S MYn�4 � Mg2�
Mg2�,Mg(EDTA)2�
Hg2�Hg2�
Zn2�
Al(EDTA)�.
Al3�
Al(OH)3
0.915 9 mmol/25.00 mL � 0.036 64 M.Ni2�
1.320 8 mmol EDTA � 0.404 9 mmol Zn2� � 0.915 9 mmol Ni2�
Zn2�(17.61 mL)(0.022 99 M) � 0.404 9 mmol(25.00 mL)(0.052 83 M) � 1.320 8 mmol
Ni2�
Zn2�
Na2EDTA.Ni2�
Zn2�Ni2�
Pb(OH)2
Pb2�NH3Pb2�
NH3,
244 CHAPTER 12 EDTA Titrations
Phytoremediation.18 An approach to removingtoxic metals from contaminated soil is to growplants that accumulate 1–15 g metal/g drymass of plant. The plant is harvested to recovermetals such as Pb, Cd, and Ni. Phytoremediationis greatly enhanced by adding EDTA to mobilizeinsoluble metals. Unfortunately, rain spreadssoluble metal-EDTA complexes through the soil.The natural chelate EDDS mobilizes metal andbiodegrades before it can spread very far.
S,S-Ethylenediaminedisuccinic acid (EDDS)
NH
HN
CO2H
CO2H
CO2H
HO2C

Terms to Understand 245
Terms to Understandauxiliary complexing agentback titrationblockingchelate effectchelating ligand
complexometric titrationconditional formation constantcumulative formation constantdemaskingdirect titration
displacement titrationformation constantindirect titrationLewis acidLewis base
masking agentmetal ion indicatormonodentatemultidentatestability constant
The is washed and then boiled with excess EDTA at pH 10 to bring back intosolution as Excess EDTA is back-titrated with
Alternatively, an anion can be precipitated with excess metal ion. The precipitate is fil-tered and washed, and excess metal ion in the filtrate is titrated with EDTA. Anions such as
and can be determined by indirect titration with EDTA.20
MaskingA masking agent is a reagent that protects some component of the analyte from reactionwith EDTA. For example, in a mixture of and can be measured by firstmasking the with thereby leaving only the to react with EDTA.
Cyanide masks and but not or When cyanide is added to a solution containing and only reacts with EDTA. (Caution: Cyanide forms toxic gaseous HCN belowpH 11. Cyanide solutions should be strongly basic and only handled in a hood.) Fluoridemasks and (Caution: HF formed by in acidic solution isextremely hazardous and should not contact skin and eyes. It may not be immediatelypainful, but the affected area should be flooded with water and then treated with calciumgluconate gel that you have on hand before the accident. First aid providers must wearrubber gloves to protect themselves.) Triethanolamine masks and and 2,3-dimercapto-1-propanol masks and
Demasking releases metal ion from a masking agent. Cyanide complexes can bedemasked with formaldehyde:
Thiourea masks by reducing it to and complexing the Copper can be liberatedfrom thiourea by oxidation with Selectivity afforded by masking, demasking, and pH con-trol allows individual components of complex mixtures of metal ions to be analyzed by EDTA titration.
H2O2.Cu�.Cu�Cu2�
n–m + mH2CO + mH+ S mH2C + Mn+ Formaldehyde
OH
CNç
çM(CN)m
Pb2�.Hg2�,Cu2�,Cd2�,Bi3�,Mn2�;Fe3�,Al3�,
F�Be2�.Ti4�,Fe3�,Al3�,
Pb2�Pb2�,Cd2�Pb2�.Mn2�,Ca2�,Mg2�,Fe3�,Fe2�,Pt2�,Pd2�,Ni2�,Ag�,Cu�,Co2�,Hg2�,Zn2�,Cd2�,
Mg2�F�,Al3�
Al3�Mg2�Al3�
SO2�4S2�,CrO2�
4 ,CO2�3 ,
Mg2�.Ba(EDTA)2�.Ba2�BaSO4(s)
Masking prevents one species from interferingin the analysis of another. Masking is notrestricted to EDTA titrations. Box 12-3 gives animportant application of masking.
SH
HOCH2CHCH2SH2,3-Dimercapto-1-propanol
Box 12-3 Water Hardness
Hardness is the total concentration of alkaline earth (Group 2)ions, which are mainly and in water. Hardness iscommonly expressed as the equivalent number of milligrams of
per liter. Thus, if we wouldsay that the hardness is 100 mg per liter because
Water whose hardness is lessthan 60 mg per liter is considered to be “soft.” If the hard-ness is above 270 mg/L, the water is considered to be “hard.”
Hard water reacts with soap to form insoluble curds:
(A)Soap Precipitate
R is a long-chain hydrocarbon such as
Enough soap to consume and must be used beforesoap is useful for cleaning. Hard water leaves solid deposits calledscale on pipes when it evaporates. It is not believed that hardwater is unhealthy. Hardness is beneficial in irrigation waterbecause alkaline earth ions tend to flocculate (cause to aggregate)
Mg2�Ca2�
C17H35ß
Ca2� � 2RCO�2 S Ca(RCO2)2(s)
CaCO3
100 mg CaCO3 � 1 mmol CaCO3.CaCO3
[Ca2�] � [Mg2�] � 1 mM,CaCO3
Mg2�,Ca2�
colloidal particles in soil and thereby increase the permeability ofthe soil to water. Soft water etches concrete, plaster, and grout.
To measure hardness, the sample is treated with ascorbic acid(or hydroxylamine) to reduce to and with cyanide tomask and several other minor metal ions. Titration withEDTA at pH 10 in buffer then gives the total concentrations of
and can be determined separately if the titrationis carried out at pH 13 without ammonia. At this pH, pre-cipitates and is inaccessible to EDTA. Interference by many metalions can be reduced by the right choice of indicators.21
Insoluble carbonates are converted into soluble bicarbonatesby excess carbon dioxide:
(B)
Heat converts bicarbonate into carbonate (driving off andprecipitates scale that clogs boiler pipes. The fraction ofhardness due to is called temporary hardnessbecause this calcium is lost (by precipitation of upon heat-ing. Hardness arising from other salts (mainly dissolved iscalled permanent hardness because it is not removed by heating.
CaSO4)CaCO3)
Ca(HCO3)2(aq)CaCO3
CO2)
CaCO3(s) � CO2 � H2O S Ca(HCO3)2(aq)
Mg(OH)2
Ca2�Mg2�.Ca2�
NH3
Cu�,Fe2�,Fe2�Fe3�
246 CHAPTER 12 EDTA Titrations
Exercises12-A. Potassium ion in a 250.0 water sample was pre-cipitated with sodium tetraphenylborate:
The precipitate was filtered, washed, dissolved in an organic solvent,and treated with excess
The liberated EDTA was titrated with 28.73 of 0.043 7Find (and its absolute uncertainty) in the
original sample.
12-B. A 25.00-mL sample containing and required16.06 mL of 0.050 83 M EDTA for complete titration. A 50.00-mLsample of the unknown was treated with to protect the Then was reduced and masked by thiourea. Addition of25.00 mL of 0.050 83 M EDTA liberated from its fluoridecomplex to form an EDTA complex. The excess EDTA required19.77 mL of 0.018 83 M to reach a xylenol orange end point.Find in the unknown.
12-C. Calculate (to the 0.01 decimal place) at each of the fol-lowing points in the titration of 50.0 mL of 0.040 0 M EDTA with0.080 0 M at pH 5.00: 0.1, 5.0, 10.0, 15.0, 20.0, 24.0, 25.0,26.0, and 30.0 mL. Make a graph of versus volume of titrant.
12-D. Calculate the concentration of at the equivalencepoint in Exercise 12-C.
H2Y2�
pCu2�
Cu(NO3)2
pCu2�
[Cu2�]Pb2�
Fe3�
Cu2�
Fe3�.NH4F
Cu2�Fe3�
[K�]Zn2�.(�0.000 1) M(�0.03) mL
H3BO3 � 4C6H5Hg� � 4HY3� � OH�
4HgY2� � (C6H5)4B� � 4H2O S
Hg(EDTA)2�:
K� � (C6H5)4B� S KB(C6H5)4(s)
(�0.1)-mL 12-E. Suppose that 0.010 0 M is titrated with 0.005 00 MEDTA at pH 7.00.(a) What is the concentration of free at the equivalence point?(b) What is the quotient in the solution when thetitration is just 63.7% of the way to the equivalence point?
12-F. A solution containing 20.0 mL of inthe presence of 0.10 M at pH 9.00 was titrated with
EDTA. Using formation constants from AppendixI, calculate for the following volumes of added EDTA: 0,1.00, 2.00, and 3.00 mL. Consider the concentration of to befixed at 0.10 M. Sketch a graph of versus milliliters of addedEDTA.
12-G. Iminodiacetic acid forms 2:1 complexes with many metal ions:
A solution of volume 25.0 mL containing 0.120 M iminodiaceticacid buffered to pH 7.00 was titrated with 25.0 mL of 0.050 0 M
Given that at pH 7.00, calculate the con-centration of in the resulting solution.Cu2�
�X2� � 4.6 � 10�3Cu2�.
Cu2� � 2X2� T CuX2�2 K � 3.5 � 1016
�X2� �[X2�]
[H3X�] � [H2X] � [HX�] � [X2�]
H2N Ω H3X+
CH2CO2H
CH2CO2H
ç
∂+
pCo2�
C2O2�4
pCo2�
1.00 � 10�2 MC2O2�
4
1.00 � 10�3 M Co2�
[H3Y�]/[H2Y2�]Mn2�
Mn2�
Problems
EDTA
12-1. What is the chelate effect?
12-2. State (in words) what means. Calculate for EDTA at(a) pH 3.50 and (b) pH 10.50.
12-3. (a) Find the conditional formation constant for at pH 9.00.(b) Find the concentration of free in 0.050 M at pH 9.00.
Na2[Mg(EDTA)]Mg2�
Mg(EDTA)2�
�Y4��Y4�
12-4. Metal ion buffers. By analogy to a hydrogen ion buffer, ametal ion buffer tends to maintain a particular metal ion concentra-tion in solution. A mixture of the acid HA and its conjugate base
maintains defined by the equation A mixture of and serves as a buffer governed bythe equation How many grams of
(FM 372.23) should be mixed with 1.95 g of(FM 200.12) in a 500-mL volumetric flask to
give a buffer with at pH 9.00?pCa2� � 9.00Ca(NO3)2 � 2H2ONa2EDTA � 2H2O
1/K¿f � [EDTA][Ca2�]/[CaY2�].Ca2�Y4�CaY2�
Ka � [A�][H�]/[HA].[H�]A�
SummaryIn a complexometric titration, analyte and titrant form a complexion, and the equilibrium constant is called the formation constant,
Chelating (multidentate) ligands form more stable complexesthan do monodentate ligands, because the entropy of complex for-mation favors the binding of one large ligand rather than manysmall ligands. Synthetic aminocarboxylic acids such as EDTA havelarge metal-binding constants.
Formation constants for EDTA are expressed in terms of even though there are six protonated forms of EDTA. Because the frac-tion of free EDTA in the form depends on pH, we define aconditional (or effective) formation constant as
This constant describes the hypo-thetical reaction where EDTA refers to allforms of EDTA not bound to metal ion. Titration calculations fall intothree categories. When excess unreacted is present, pM is calcu-lated directly from When excess EDTA is present,we know both and [EDTA], so can be calculatedfrom the conditional formation constant. At the equivalence point, the
[Mn�][MYn�4]pM � �log[Mn�].
Mn�
Mn� � EDTA T MYn�4,�Y4� Kf � [MYn�4]/[Mn�][EDTA].
K¿f �Y4�(�Y4�)
[Y4�],
Kf .
condition allows us to solve for A singlespreadsheet equation applies in all three regions of the titration curve.
The greater the effective formation constant, the sharper is theEDTA titration curve. Addition of auxiliary complexing agents,which compete with EDTA for the metal ion and thereby limit thesharpness of the titration curve, is often necessary to keep the metalin solution. Calculations for a solution containing EDTA and anauxiliary complexing agent utilize the conditional formation con-stant where is the fraction of free metal ionnot complexed by the auxiliary ligand.
For end-point detection, we commonly use metal ion indica-tors, a glass electrode, an ion-selective electrode, or a mercury elec-trode. When a direct titration is not suitable, because the analyte isunstable, reacts slowly with EDTA, or has no suitable indicator, aback titration of excess EDTA or a displacement titration of
may be feasible. Masking prevents interference byunwanted species. Indirect EDTA titrations are available for manyanions and other species that do not react directly with the reagent.
Mg(EDTA)2�
�MK–f � �M �Y4� Kf,
[Mn�].[Mn�] � [EDTA]

Problems 247
EDTA Titration Curves
12-5. The ion (100.0 mL of 0.050 0 M metal ion buffered topH 9.00) was titrated with 0.050 0 M EDTA.(a) What is the equivalence volume, in milliliters?(b) Calculate the concentration of at (c) What fraction of free EDTA is in the form at pH 9.00?(d) The formation constant is Calculate the value of theconditional formation constant (e) Calculate the concentration of at (f) What is the concentration of at
12-6. Calculate at each of the following points in the titrationof 25.00 mL of 0.020 26 M by 0.038 55 M EDTA at pH 6.00:(a) 12.00 mL; (b) (c) 14.00 mL.
12-7. Consider the titration of 25.0 mL of 0.020 0 M with0.010 0 M EDTA in a solution buffered to pH 8.00. Calculate at the following volumes of added EDTA and sketch the titration curve:(a) 0 mL (d) 49.0 mL (g) 50.1 mL(b) 20.0 mL (e) 49.9 mL (h) 55.0 mL(c) 40.0 mL (f) 50.0 mL (i) 60.0 mL
12-8. Using the same volumes as in Problem 12-7, calculate for the titration of 25.00 mL of 0.020 00 M EDTA with 0.010 00 M
at pH 10.00.
12-9. Calculate the molarity of in a solution prepared by mix-ing 10.00 mL of 0.010 0 M 9.90 mL of 0.010 0 M EDTA,and 10.0 mL of buffer with a pH of 4.00.
12-10. Titration of metal ion with EDTA. Use Equation 12-11 to compute curves (pM versus mL of EDTA added) for thetitration of 10.00 mL of 1.00 mM with10.0 mM EDTA at pH 5.00. Plot both curves on one graph.
12-11. Effect of pH on the EDTA titration. Use Equation 12-11to compute curves versus mL of EDTA added) for the titra-tion of 10.00 mL of 1.00 mM with 1.00 mM EDTA at pH5.00, 6.00, 7.00, 8.00, and 9.00. Plot all curves on one graph andcompare your results with Figure 12-9.
12-12. Titration of EDTA with metal ion. Use Equation 12-12to reproduce the results of Exercise 12-C.
Auxiliary Complexing Agents
12-13. State the purpose of an auxiliary complexing agent and givean example of its use.
12-14. According to Appendix I, forms two complexes withacetate:
(a) Referring to Box 6-2, find for the reaction
(b) Consider 1.00 L of solution prepared by mixing and 0.100 mol Use Equation 12-16 to find
the fraction of copper in the form
12-15. Calculate at each of the following points in the titra-tion of 50.00 mL of 0.001 00 M with 0.001 00 M EDTA at pH11.00 in a solution whose concentration is somehow fixed at0.100 M:(a) 0 mL (c) 45.00 mL (e) 55.00 mL(b) 1.00 mL (d) 50.00 mL
NH3
Cu2�
pCu2�
Cu2�.CH3CO2Na.Cu(ClO4)2
1.00 � 10�4 mol
Cu(CH3CO2)� � CH3CO�2 T Cu(CH3CO2)2(aq) K2
K2
Cu2� � 2CH3CO�2 T Cu(CH3CO2)2(aq) �2
Cu2� � CH3CO�2 T Cu(CH3CO2)� �1 (� K1)
Cu2�
Ca2�
(pCa2�
(� Cd2� or Cu2�)M2�
VOSO4,HY3�
CaSO4
pCa2�
pMn2�
MnSO4
Ve;Co2�
pCo2�
V � 1.100 Ve?Mn�
V � Ve.Mn�
K ¿f (� �Y4� Kf).1012.00.(Kf)
Y4�(�Y4�)V � 1
2Ve.Mn�
Ve,
Mn�
12-16. Consider the derivation of the fraction in Equa-tion 12-16.(a) Derive the following expressions for the fractions and
(b) Calculate the values of and for the conditions in Prob-lem 12-14.
12-17. Microequilibrium constants for binding of metal to a protein.The iron-transport protein, transferrin, has two distinguishablemetal-binding sites, designated a and b. The microequilibrium for-mation constants for each site are defined as follows:
For example, the formation constant refers to the reaction in which the metal ion binds to site a:
(a) Write the chemical reactions corresponding to the conventionalmacroscopic formation constants, and (b) Show that and (c) Show that This expression means that, if youknow any three of the microequilibrium constants, you automati-cally know the fourth one.(d) A challenge to your sanity: From the equilibrium constantsbelow, find the equilibrium fraction of each of the four species(shown in the diagram) in circulating blood that is 40% saturatedwith iron (that is, because each protein canbind 2Fe).
Effective formation constants for blood plasma at pH 7.4
The binding constants are so large that you may assume thatthere is negligible free To get started, let’s use the abbrevi-ations and
Now we can write
(A)
Mass balance for iron:
(B)
Combined equilibria: (C)
Now you have three equations with three unknowns and should beable to tackle this problem.
12-18. Spreadsheet equation for auxiliary complexing agent. Considerthe titration of metal M with a solution of EDTA
in the presence of an auxiliary complexing ligand (such asVEDTA)volume added �(concentration � CEDTA,
Vm)(concentration � Cm, initial volume �
K1
K2� 19.44 �
[FeT]2
[T][Fe2T]
[FeT] � 2[Fe2T]
[T] � [FeT] � [Fe2T]� [FeT] � 2[Fe2T] � 0.8
Mass balance for protein: [T] � [FeT] � [Fe2T] � 1
[Fe2transferrin].[Fe2T] �[transferrin], [FeT] � [FeaT] � [FebT],[T] �
Fe3�.
K2 � 3.6 � 1021K1 � 7.0 � 1022k2b � 4.2 � 1021k1b � 1.0 � 1022k2a � 2.4 � 1022k1a � 6.0 � 1022
Fe/transferrin � 0.80,
k1ak2b � k1bk2a.K�1
2 � k�12a � k�1
2b .K1 � k1a � k1b
K2.K1
k1a �[Featransferrin]
[Fe3�][transferrin]
transferrin T Featransferrin,Fe3� �k1a
Febtransferrin
Featransferrin
Transferrin Fe2transferrin
k1b k2a
k2bk1a
#£
4
#£
4
#£
4
#£
4
�ML2�ML
�ML ��1[L]
1 � �1[L] � �2[L]2 �ML2
��2[L]2
1 � �1[L] � �2[L]2
�ML2:�ML
�M
248 CHAPTER 12 EDTA Titrations
ammonia). Follow the general procedure of the derivation in Sec-tion 12-4 to show that the master equation for the titration is
where is the conditional formation constant in the presence ofauxiliary complexing agent at the fixed pH of the titration (Equation12-18) and is the total concentration of metal not bound toEDTA. is the same as in Equation 12-15. (We changedthe symbol to avoid confusing and ) The equation above isthe same as Equation 12-11, with [M] replaced by and replaced by
12-19. Auxiliary complexing agent. Use the equation derivedin Problem 12-18 for this exercise.(a) Prepare a spreadsheet to reproduce the 20-, 50-, and 60-mLpoints in the EDTA titration of in the presence of in theexample in Section 12-5.(b) Use your spreadsheet to plot the curve for the titration of 50.00 mLof 0.050 0 M by 0.100 M EDTA at pH 11.00 in the presenceof 0.100 M oxalate.
12-20. Spreadsheet equation for formation of the complexes ML and Consider the titration of metal M initial with ligand L
which can form 1:1 and 2:1 complexes:
Let be the fraction of metal in the form M, be the fractionin the form ML, and be the fraction in the form Follow-ing the derivation in Section 12-5, you could show that these frac-tions are given by
The concentrations of ML and are
because is the total concentration of all metal inthe solution. The mass balance for ligand is
By substituting expressions for [ML] and into the mass bal-ance, show that the master equation for a titration of metal byligand is
12-21. Titration of M with L to form ML and Use theequation derived in Problem 12-20, where M is and L isacetate. Consider the addition of 0.500 M acetate to 10.00 mL of
Cu2�
ML2.
� �ClVl
CmVm�
�ML � 2�ML2� ([L]/Cm)
1 � ([L]/C1)
[ML2]
[L] � [ML] � 2[ML2] �ClVl
Vm � Vl
CmVm/(Vm � V1)
[ML] � �ML
CmVm
Vm � Vl [ML2] � �ML2
CmVm
Vm � Vl
ML2
�ML2�
�2[L]2
1 � �1[L] � �2[L]2
�M �1
1 � �1[L] � �2[L]2 �ML �
�1[L]
1 � �1[L] � �2[L]2
ML2.�ML2
�ML�M
M � 2L T ML2 �2 �[ML2]
[M][L]2
M � L T ML �1 �[ML]
[M][L]
added � Vl),volume(concentration � Cl,volume � Vm)
(concentration � Cm,ML2.
Ni2�
NH3Zn2�
K–f .Kf[M]tot
Cm.CM
CM[M]tot
[M]tot
K–f
� �CEDTAVEDTA
CmVm�
1 � K–f [M]tot �[M]tot � K–f [M]2
tot
Cm
K–f [M]tot �[M]tot � K–f [M]2
tot
CEDTA
0.050 0 M at pH 7.00 (so that all ligand is present as not Formation constants for and
are given in Appendix I. Construct a spreadsheet inwhich the input is pL and the output is [L], [M], [ML], and Prepare a graph showing the concentrations of L, M,ML, and as ranges from 0 to 3 mL.
Metal Ion Indicators
12-22. Explain why the change from red to blue in Reaction 12-19occurs suddenly at the equivalence point instead of graduallythroughout the entire titration.
12-23. List four methods for detecting the end point of an EDTAtitration.
12-24. Calcium ion was titrated with EDTA at pH 11, using Cal-magite as indicator (Table 12-3). Which is the principal species ofCalmagite at pH 11? What color was observed before the equiva-lence point? After the equivalence point?
12-25. Pyrocatechol violet (Table 12-3) is to be used as a metal ionindicator in an EDTA titration. The procedure is as follows:
1. Add a known excess of EDTA to the unknown metal ion.2. Adjust the pH with a suitable buffer.3. Back-titrate the excess chelate with standard
From the following available buffers, select the best buffer, and thenstate what color change will be observed at the end point. Explainyour answer.(a) pH 6–7 (b) pH 7–8 (c) pH 8–9 (d) pH 9–10
EDTA Titration Techniques
12-26. Give three circumstances in which an EDTA back titrationmight be necessary.
12-27. Describe what is done in a displacement titration and give anexample.
12-28. Give an example of the use of a masking agent.
12-29. What is meant by water hardness? Explain the differencebetween temporary and permanent hardness.
12-30. How many milliliters of 0.050 0 M EDTA are required toreact with 50.0 mL of 0.010 0 M With 50.0 mL of 0.010 0 M
12-31. A 50.0-mL sample containing was treated with 25.0 mLof 0.050 0 M EDTA to complex all the and leave excessEDTA in solution. The excess EDTA was then back-titrated, requir-ing 5.00 mL of 0.050 0 M What was the concentration of
in the original solution?
12-32. A 50.0-mL aliquot of solution containing 0.450 g of (FM 120.37) in 0.500 L required 37.6 mL of EDTA solution fortitration. How many milligrams of (FM 100.09) will reactwith 1.00 mL of this EDTA solution?
12-33. A 1.000-mL sample of unknown containing and was treated with 25.00 mL of 0.038 72 M EDTA. Back titration with0.021 27 M at pH 5 required 23.54 mL to reach the xylenolorange end point. A 2.000-mL sample of unknown was passedthrough an ion-exchange column that retards more than The that passed through the column was treated with 25.00 mLof 0.038 72 M EDTA and required 25.63 mL of 0.021 27 M forback titration. The emerged from the column later. It, too, wastreated with 25.00 mL of 0.038 72 M EDTA. How many millilitersof 0.021 27 M will be required for back titration?Zn2�
Co2�
Zn2�
Ni2�
Ni2�.Co2�
Zn2�
Ni2�Co2�
CaCO3
MgSO4
Ni2�
Zn2�.
Ni2�
Ni2�
Al3�?Ca2�?
Al3�.
VlML2
[ML2].Vl,
Cu(CH3CO2)2
Cu(CH3CO2)�CH3CO2H).CH3CO�
2 ,Cu2�
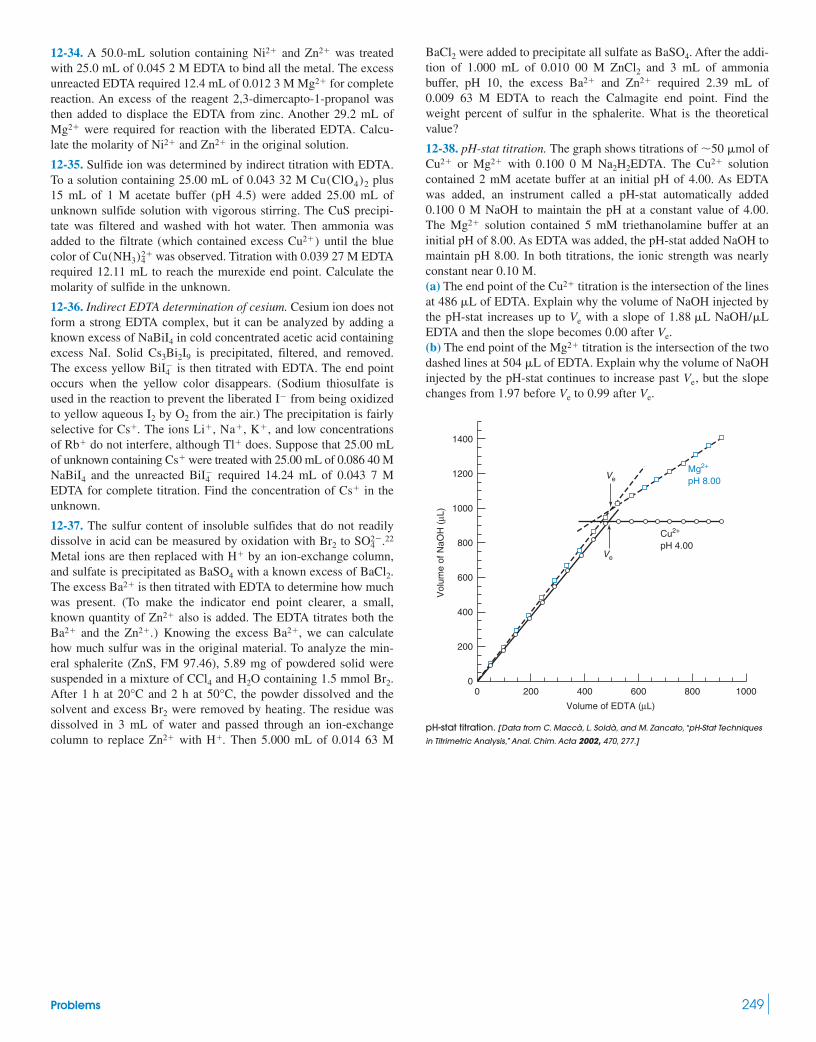
Problems 249
12-34. A 50.0-mL solution containing and was treatedwith 25.0 mL of 0.045 2 M EDTA to bind all the metal. The excessunreacted EDTA required 12.4 mL of 0.012 3 M for completereaction. An excess of the reagent 2,3-dimercapto-1-propanol wasthen added to displace the EDTA from zinc. Another 29.2 mL of
were required for reaction with the liberated EDTA. Calcu-late the molarity of and in the original solution.
12-35. Sulfide ion was determined by indirect titration with EDTA.To a solution containing 25.00 mL of 0.043 32 M plus15 mL of 1 M acetate buffer (pH 4.5) were added 25.00 mL ofunknown sulfide solution with vigorous stirring. The CuS precipi-tate was filtered and washed with hot water. Then ammonia wasadded to the filtrate (which contained excess until the bluecolor of was observed. Titration with 0.039 27 M EDTArequired 12.11 mL to reach the murexide end point. Calculate themolarity of sulfide in the unknown.
12-36. Indirect EDTA determination of cesium. Cesium ion does notform a strong EDTA complex, but it can be analyzed by adding aknown excess of in cold concentrated acetic acid containingexcess NaI. Solid is precipitated, filtered, and removed.The excess yellow is then titrated with EDTA. The end pointoccurs when the yellow color disappears. (Sodium thiosulfate isused in the reaction to prevent the liberated from being oxidizedto yellow aqueous by from the air.) The precipitation is fairlyselective for The ions and low concentrationsof do not interfere, although does. Suppose that 25.00 mLof unknown containing were treated with 25.00 mL of 0.086 40 M
and the unreacted required 14.24 mL of 0.043 7 MEDTA for complete titration. Find the concentration of in theunknown.
12-37. The sulfur content of insoluble sulfides that do not readilydissolve in acid can be measured by oxidation with to 22
Metal ions are then replaced with by an ion-exchange column,and sulfate is precipitated as with a known excess of The excess is then titrated with EDTA to determine how muchwas present. (To make the indicator end point clearer, a small,known quantity of also is added. The EDTA titrates both the
and the Knowing the excess we can calculatehow much sulfur was in the original material. To analyze the min-eral sphalerite (ZnS, FM 97.46), 5.89 mg of powdered solid weresuspended in a mixture of and containing 1.5 mmol After 1 h at and 2 h at the powder dissolved and thesolvent and excess were removed by heating. The residue wasdissolved in 3 mL of water and passed through an ion-exchangecolumn to replace with Then 5.000 mL of 0.014 63 MH�.Zn2�
Br2
50°C,20°CBr2.H2OCCl4
Ba2�,Zn2�.)Ba2�
Zn2�
Ba2�
BaCl2.BaSO4
H�
SO2�4 .Br2
Cs�
BiI�4NaBiI4
Cs�
Tl�Rb�
K�,Na�,Li�,Cs�.O2I2
I�
BiI�4
Cs3Bi2I9
NaBiI4
Cu(NH3)2�4
Cu2�)
Cu(ClO4)2
Zn2�Ni2�
Mg2�
Mg2�
Zn2�Ni2� were added to precipitate all sulfate as After the addi-tion of 1.000 mL of 0.010 00 M and 3 mL of ammoniabuffer, pH 10, the excess and required 2.39 mL of0.009 63 M EDTA to reach the Calmagite end point. Find theweight percent of sulfur in the sphalerite. What is the theoreticalvalue?
12-38. pH-stat titration. The graph shows titrations of ofor with 0.100 0 M EDTA. The solution
contained 2 mM acetate buffer at an initial pH of 4.00. As EDTAwas added, an instrument called a pH-stat automatically added0.100 0 M NaOH to maintain the pH at a constant value of 4.00.The solution contained 5 mM triethanolamine buffer at aninitial pH of 8.00. As EDTA was added, the pH-stat added NaOH tomaintain pH 8.00. In both titrations, the ionic strength was nearlyconstant near 0.10 M.(a) The end point of the titration is the intersection of the linesat of EDTA. Explain why the volume of NaOH injected bythe pH-stat increases up to with a slope of EDTA and then the slope becomes 0.00 after (b) The end point of the titration is the intersection of the twodashed lines at of EDTA. Explain why the volume of NaOHinjected by the pH-stat continues to increase past but the slopechanges from 1.97 before to 0.99 after
Vol
ume
of N
aOH
(µL
)1400
1200
1000
Ve
Ve
Cu2+
pH 4.00
Mg2+
pH 8.00
800
600
400
200
010000 200 400 600
Volume of EDTA (µL)
800
Ve.Ve
Ve,504 �L
Mg2�
Ve.NaOH/�L1.88 �LVe
486 �LCu2�
Mg2�
Cu2�Na2H2Mg2�Cu2�
�50 �mol
Zn2�Ba2�
ZnCl2
BaSO4.BaCl2
pH-stat titration. [Data from C. Maccà, L. Soldà, and M. Zancato, “pH-Stat Techniques
in Titrimetric Analysis,” Anal. Chim. Acta 2002, 470, 277.]

250 CHAPTER 13 Advanced Topics in Equilibrium
Limestone and marble are building materials whose main constituent is calcite, the com-mon crystalline form of calcium carbonate. This mineral is not very soluble in neutral orbasic solution but it dissolves in acid by virtue of two coupled equi-libria, in which the reactions have a species in common—carbonate in this case:
Calcite Carbonate
Bicarbonate
Carbonate produced in the first reaction is protonated to form bicarbonate in the secondreaction. Le Châtelier’s principle tells us that, if we remove a product of the first reaction,we will draw the reaction to the right, making calcite more soluble. This chapter deals withcoupled equilibria in chemical systems.
Between 1980 and 1990, mm of the thickness of the external stone walls of St. Paul’sCathedral in London was dissolved by acidic rainfall. A corner of the building facing apower station dissolved at 10 times the rate of the rest of the building until the station wasclosed. The power station and other industries that burn coal emit which is a majorsource of acid rain (described in Box 15-1). Loss of heavy industry and laws limiting emis-sions decreased atmospheric from as high as 100 ppb in the 1970s to 10 ppb in 2000.Correspondingly, only mm of St. Paul’s external stone disappeared between 1990 and2000.1,2
14
SO2
SO2,
12
CO2�3 � H� T HCO�
3
CaCO3(s) T Ca2� � CO2�3
(Ksp � 4.5 � 10�9),
ACID RAIN
Advanced Topics in Equilibrium13
This optional chapter provides tools to compute the concentrations of species in systemswith many simultaneous equilibria.3 The most important tool is the systematic treatment ofequilibrium from Chapter 8. The other tool is a spreadsheet for numerical solution of theequilibrium equations. We will also see how to incorporate activity coefficients into equilib-rium calculations. Later chapters in this book do not depend on this chapter.
St. Paul’s Cathedral, London. [Pictor International/Picture Quest.]
Emissions over Europe estimated by Schöpp and colleagues. [From R. F. Wright, T. Larssen, L. Camarero,B. J. Crosby, R. C. Ferrier, R. Helliwell, M. Forsius, A. Jenkins, J. Kopáček, V. Majer, F. Moldan, M. Posch, M. Rogora, andW. Schöpp,“Recovery of Acidified European Surface Waters,” Environ. Sci. Technol. 2005, 39, 64A.]
Em
issi
ons
(109 k
g/yr
)
70
60
50
40
30
20
10
20301880 1910 1940 1970
SO2
NO2
NH3
2000
Year

13-1 General Approach to Acid-Base Systems
We first illustrate a general approach to find the concentrations of species in mixtures ofacids and bases. Consider a solution made by dissolving 20.0 mmol sodium tartrate
15.0 mmol pyridinium chloride and 10.0 mmol KOH in a volumeof 1.00 L. The problem is to find the pH and concentrations of all species in the solution.
The chemical reactions and equilibrium constants at 0 ionic strength are
(13-1)
(13-2)
(13-3)
(13-4)
The charge balance is
(13-5)
and there are several mass balances:
There are 10 independent equations and 10 species, so we have enough information to solvefor all the concentrations.
There is a systematic way to handle this problem without algebraic gymnastics.
Step 1 Write a fractional composition equation from Section 10-5 for each acid or basethat appears in the charge balance.
Step 2 Substitute the fractional composition expressions into the charge balance andenter known values for and Also, write At this point, you will have a complicated equation in which the only variableis
Step 3 Use your trusty spreadsheet to solve for
Here is a recap of the fractional composition equations from Section 10-5 for any mono-protic acid HA and any diprotic acid
Monoprotic system: (13-6a)
(13-6b)
Diprotic system: (13-7a)
(13-7b)
(13-7c)
In each equation, is the fraction in each form. For example, is the fraction of diproticacid in the form When we multiply times (the total or formal concentration of
the product is the concentration of A2�.H2A),FH2A
�A2�A2�.�A2��i
[A2�] � �A2�FH2A�
K1K2FH2A
[H�]2 � [H�]K1 � K1K2
[HA�] � �HA�FH2A�
K1[H�]FH2A
[H�]2 � [H�]K1 � K1K2
[H2A] � �H2AFH2A
�[H�]2FH2A
[H�]2 � [H�]K1 � K1K2
[A�] � �A�FHA �KaFHA
[H�] � Ka
[HA] � �HAFHA �[H�]FHA
[H�] � Ka
H2A.
[H�].[H�].
[OH�] � Kw/[H�].[Cl�].[K�],[Na�],
[H2T] � [HT�] � [T2�] � 0.020 0 M [PyH�] � [Py] � 0.015 0 M
[Na�] � 0.020 0 M [K�] � 0.010 0 M [Cl�] � 0.015 0 M
[H�] � [PyH�] � [Na�] � [K�] � [OH�] � [HT�] � 2[T2�] � [Cl�]
H2O T H� � OH� Kw � 10�14.00
PyH� T Py � H� Ka � 10�5.20
HT� T T2� � H� K2 � 10�4.366
H2T T HT� � H� K1 � 10�3.036
pKa � 5.20pK2 � 4.366pK1 � 3.036,PyH�Cl�H2T
NH Cl��
Pyridinium chlorideD-Tartaric acid
OHHO
CO2HHO2C
(PyH�Cl�),(Na�HT�),
13-1 General Approach to Acid-Base Systems 251
The approach to equilibrium problems in thischapter is adapted from Julian Roberts,University of Redlands.
For this example, we designate the two aciddissociation constants of as and . Wedesignate the acid dissociation constant of
as Ka.PyH�
K2K1H2T
There is a factor of 2 in front of [ T2�] becausethe ion has a charge �2.1 M T2� contributes a charge of 2 M.
“Independent” equations cannot be derivedfrom one another. As a trivial example, theequations and are notindependent. The three equilibrium expressionsfor and for a weak acid and itsconjugate base provide only two independentequations because we can derive from and : Kb � Kw/Ka.Kw
KaKb
KwKb,Ka,
2a � 2b � 2ca � b � c
FHA � [HA] � [A�]
FH2A � [H2A] � [HA�] � [A2�]
Table 11-6 gave fractional compositionequations for H3A.

Applying the General ProcedureNow let’s apply the general procedure to the mixture of 0.020 0 M sodium tartrate
0.015 0 M pyridinium chloride and 0.010 0 M KOH. We designatethe formal concentrations as and
Step 1 Write a fractional composition equation for each acid or base that appears in thecharge balance.
(13-8)
(13-9)
(13-10)
All quantities on the right side of these expressions are known, except for Step 2 Substitute the fractional composition expressions into the charge balance 13-5.
Enter values for and and write
(13-5)
(13-11)
Step 3 The spreadsheet in Figure 13-1 solves Equation 13-11 for
In Figure 13-1, shaded boxes contain input. Everything else is computed by the spread-sheet. Values for and were given in the problem. The initialvalue of pH in cell H13 is a guess. We will use Excel SOLVER to vary pH until the sum of
[K�]pKa,FPyH�,pK2,pK1,FH2T,
[H�].
[H�] � �PyH�FPyH� � [0.020 0] � [0.010 0]
�Kw
[H�]� �HT� FH2T
� 2�T2� FH2T� [0.015 0]
[H�] � [PyH�] � [Na�] � [K�] � [OH�] � [HT�] � 2[T2�] � [Cl�]
[OH�] � Kw/[H�].[Cl�],[K�],[Na�],
[H�].
[T2�] � �T2�FH2T�
K1K2FH2T
[H�]2 � [H�]K1 � K1K2
[HT�] � �HT�FH2T�
K1[H�]FH2T
[H�]2 � [H�]K1 � K1K2
[PyH�] � �PyH�FPyH� �[H�]FPyH�
[H�] � Ka
FPH� � 0.015 0 M.FH2T� 0.020 0 M
(PyH�Cl�),(Na�HT�),
252 CHAPTER 13 Advanced Topics in Equilibrium
1
2
3
4
5
6
7
8
9
10
11 [PyH+] =
H10 = B10^2*B3/(B10^2+B10*B6+B6*B7)
E12 = B6*B7*B3/(B10^2+B10*B6+B6*B7)
E11 = B6*B10*B3/(B10^2+B10*B6+B6*B7)
H11 = E5*E3/(B10+E5)
B11 = B10*E3/(B10+E5)
B10 = 10^-H13
Formulas:
Check: [H2T] + [HT-] + [T2-] =
[K+] =
[Na+] =
Species in charge balance: Other concentrations:
K2 =
K1 =
pK2 =
pK1 =
12
13
14
15
16
17
18
19
20
21
22
23
24
25
0.020
3.036
9.20E-04
4.31E-05
1.00E-06
2.05E-03
0.020
0.010
B6 = 10^-B4
B13 = H3B12 = B3
E5 = 10^-E4
E13 = E3
E10 = H4/B10B7 = 10^-B5
Check: [PyH+] + [Py] =
0.02000
0.01500
(= H10+E11+E12)
(= B11+H11)
Positive charge minus negative charge = ← vary pH in H13 with Solver to make this 0
E15 = B10+B11+B12+B13-E10-E11-2*E12-E13
[H+] =
[HT-] =
[Cl-] =
[T2-] =
[OH-] =
4.54E-04
0.015
1.95E-02
1.00E-08
1.29E-02
4.93E-07
[Py] =
← initial value
is a guess
[H2T] =
FH2T =
Ka =
pKa =
FPyH+ =
Mixture of 0.020 M Na+HT-, 0.015 M PyH+Cl-, and 0.010 M KOH
A B C D E F G H I
4.366
0.015 [K+] =
5.20 Kw =
6.31E-06
-2.25E-02
pH = 6.000
0.010
1.00E-14
Figure 13-1 Spreadsheet for mixtureof acids and bases uses SOLVER to findthe value of pH in cell H13 that satisfiesthe charge balance in cell E15. The sums
in cell D17 andin cell D18 are
computed to verify that the formulas foreach of the species do not havemistakes. These sums are independentof pH.
[H2T] � [HT�] � [T2�][PyH�] � [Py]
and are contained in the expressions. The only variable in Equation 13-11 is .[H�]
�
[H�]K2,K1,Ka,
Key step: Guess a value for and use ExcelSOLVER to vary until it satisfies the chargebalance.
[H�][H�]

charges in cell E15 is 0. Species in the charge balance are in cells B10:E13. in cell B10 iscomputed from the pH we guessed in cell H13. in cell B11 is computed with Equa-tion 13-8. Known values are entered for and is computed from
and in cells E11 and E12 are computed with Equations 13-9 and 13-10.The sum of charges,
is computed in cell E15. If we had guessed the correct pH in cell H13, the sum of thecharges would be 0. Instead, the sum is We use Excel SOLVER to vary pHin cell H13 until the sum of charges in cell E15 is 0.
Using Excel SOLVER
Select SOLVER on the TOOLS menu and a window similar to the one in Figure 19-4 appears.In this window, Set Target Cell E15 Equal To Value of 0 By Changing Cells H13. Then clickSolve. SOLVER will vary the pH in cell H13 to make the net charge in cell E15 equal to 0.Starting with a pH of 6 in cell H13, SOLVER returns a net charge of in cell E15 byadjusting the pH in cell H13 to 4.298.
The reason the charge is instead of 0 is that the default precision of SOLVER isTo get a charge closer to 0, select SOLVER and choose Options in the SOLVER window.
Precision will probably have the default setting of 0.000 001. Enter 1e-16 for Precision andclick OK. Run SOLVER again. This time, the charge in cell E15 is reduced to The pHin cell H13 is still 4.298 (to three decimal places). The difference in pH required to reducethe net charge from to is not perceptible in the third decimal place of pH. Manychemistry problems involve very large or very small numbers for which you might need toadjust the precision of SOLVER. The concentrations after executing SOLVER are
Ignorance Is Bliss: A Complication of Ion PairingWe should not get too cocky with our newfound power to handle complex problems, becausewe have oversimplified the actual situation. For one thing, we have not included activitycoefficients, which ordinarily affect the answer by a few tenths of a pH unit. In Section 13-2,we will show how to incorporate activity coefficients.
Even with activity coefficients, we are always limited by chemistry that we do not know.In the mixture of sodium hydrogen tartrate pyridinium chloride andKOH, several possible ion-pair equilibria are
(13-12)
(13-13)
(13-14)
Some equilibrium constants at 0 ionic strength are listed above. Values for the other reactionsare not available, but there is no reason to believe that the reactions do not occur.
How could we add ion pairing to our spreadsheet? For simplicity, we outline how to addjust Reactions 13-12 and 13-13. With these reactions, the mass balance for sodium is
(13-15)[Na�] � [NaT�] � [NaHT] � FNa � FH2T� 0.020 0 M
PyH� � T2� T PyHT� KPyHT� � ?
PyH� � Cl� T PyH�Cl� KPyHCl � ?
K� � HT� T KHT KKHT � ?
K� � T2 T KT� KKT� � 3
Na� � Py T PyNa� KPyNa� � 1.0
Na� � HT� T NaHT KNaHT �[NaHT]
[Na�][HT�]� 1.6
Na� � T2� T NaT� KNaT� �[NaT�]
[Na�][T2�]� 8
(PyH�Cl�),(Na�HT�),
A B C D E F G H
15
14
13
12
[HT-] =
[T2-] =
[Cl-] =
9.71E-17
[Py] =
pH =
1.05E-02 1.67E-03
4.2980.010
0.020
0.015
8.95E-03
11 1.33E-02
Species in charge balance:
Positive charge minus negative charge =
Other concentrations:
10
9
[H+] = [OH-] = [H2T] =
[PyH+] =
[Na+] =
[K+] =
5.04E-05 1.99E-10 5.73E-04
10�1610�6
�10�16.
10�6.10�6
�10�6
�2.25 � 10�2 M.[Cl�],
[H�] � [PyH�] � [Na�] � [K�] � [OH�] � [HT�] � 2[T2�] �[T2�][HT�]KW/[H�].
[OH�][Cl�].[K�],[Na�],[PyH�]
[H�]
13-1 General Approach to Acid-Base Systems 253
Equilibrium constants from A. E. Martell, R. M.Smith, and R. J. Motekaitis, NIST StandardReference Database 46, Version 6.0, 2001.

From the ion-pair equilibria, we write and With these substitutions for and in the mass balance for
sodium, we find an expression for
(13-16)
A bigger nuisance when considering ion pairs is that the fractional composition equa-tions for and also are changed because the mass balance for nowhas five species in it instead of three:
(13-17)
We must derive new equations analogous to 13-9 and 13-10 from the mass balance 13-17.The new fractional composition equations are somewhat messy, so we reserve this case
for Problem 13-18. The end result is that adding the ion-pair equilibria 13-12 and 13-13changes the calculated pH from 4.30 to 4.26. This change is not large, so neglecting ion pairswith small equilibrium constants does not lead to serious error. We find that 7% of sodium istied up in ion pairs. Our ability to compute the distribution of species in a solution is limitedby our knowledge of relevant equilibria.
13-2 Activity CoefficientsEven if we know all reactions and equilibrium constants for a given system, we cannot com-pute concentrations accurately without activity coefficients. Chapter 8 gave the extendedDebye-Hückel equation 8-6 for activity coefficients with size parameters in Table 8-1. Manyions of interest are not in Table 8-1 and we do not know their size parameter. Therefore weintroduce the Davies equation, which has no size parameter:
Davies equation: (13-18)
where is the activity coefficient for an ion of charge z at ionic strength Equation 13-18is used up to (Figure 13-2) but is more accurate at lower ionic strength. For bestaccuracy, Pitzer’s equations are used (Chapter 8, reference 7).
Now consider a primary standard buffer containing 0.025 0 m and 0.025 0 mIts pH at is 4 The concentration unit, m, is molality, which
means moles of solute per kilogram of solvent. For precise chemical measurements, concen-trations are often expressed in molality, rather than molarity, because molality is independentof temperature. Tabulated equilibrium constants usually apply to molality, not molarity.Uncertainties in equilibrium constants are usually sufficiently great so that the dif-ference between molality and molarity of dilute solutions is unimportant.
Acid-base equilibrium constants for at at are
(13-19)
(13-20)
(13-21)
Equilibrium constants can be determined by measuring concentration quotients at several lowionic strengths and extrapolating to 0 ionic strength.
For we rearrange the equilibrium constant expression to incorporate activitycoefficients into an effective equilibrium constant, at the given ionic strength.
(13-22)
(13-23)K¿2 � K2 a �H2PO�4
�HPO2�4�H�
b �[HPO2�
4 ][H�]
[H2PO�4 ]
K¿1 � K1 a �H3PO4
�H2PO�4�H�
b �[H2PO�
4 ][H�]
[H3PO4]
K¿,� � 0,
HPO2�4 T PO3�
4 � H� K3 �[PO3�
4 ]�PO3�4
[H�]�H�
[HPO2�4 ]�HPO2�
4
� 10�12.375
H2PO�4 T HPO2�
4 � H� K2 �[HPO2�
4 ]�HPO2�4
[H�]�H�
[H2PO�4 ]�H2PO�
4
� 10�7.198
H3PO4 T H2PO�4 � H� K1 �
[H2PO�4 ]�H2PO�
4[H�]�H�
[H3PO4]�H3PO4
� 10�2.148
25°C� � 0H3PO4
�0.3%
6.865 � 0.006.25°CNa2HPO4.KH2PO4
� � 0.5 M�.�
(at 25°C)log � � �0.51z2 a 1�
1 � 1�� 0.3�b
FH2T� [H2T] � [HT�] � [T2�] � [NaT�] � [NaHT]
H2T[T2�][HT�],[H2T],
[Na�] �FH2T
1 � KNaT�[T2�] � KNaHT[HT�]
[Na�]:[NaHT][NaT�]KNaHT[Na�][HT�].
[NaHT] �[NaT�] � KNaT�[Na�][T2�]
254 CHAPTER 13 Advanced Topics in Equilibrium
Act
ivity
coe
ffici
ent
0.0
0.1
0.2
0.3
0.4
0.5
0.6
0.7
0.8
0.9
1.0
0.50.40.3
Ionic strength (M)
0.20.10.0
Debye-Hückel
Davies|z | = 2
|z | = 3
|z | = 1
Figure 13-2 Activity coefficients fromextended Debye-Hückel and Daviesequations. Shaded areas give Debye-Hückelactivity coefficients for the range of ion sizes inTable 8-1.
A 0.5 wt% solution of has a molarityof 0.028 13 mol/L and a molality of0.028 20 mol/kg. The difference is 0.25%.
KH2PO4
gives the concentration quotient
at a specified ionic strength.
[HPO2�4 ][H�]
[H2PO�4 ]
K ¿2

(13-24)
For ionic species, we compute activity coefficients with the Davies equation 13-18. For theneutral species we assume that
Now we remind ourselves of the equations for water ionization:
(13-25)
(13-26)
Here is how we use effective equilibrium constants:
Step 1 Solve the acid-base problem with the constants and which apply atActivity coefficients are considered to be unity in this first step.
Step 2 From the results of step 1, compute the ionic strength. Then use the Daviesequation to compute activity coefficients. With these activity coefficients, computethe effective equilibrium constants, and
Step 3 Solve the acid-base problem again, this time with and Step 4 From the results of step 3, compute a new ionic strength and a new set of
values. Repeat the process several times until the ionic strength is constant.
Let’s find the pH of 0.025 0 m plus 0.025 0 m The chemical reactionsare 13-19 through 13-21 plus water ionization. The mass balances are
and total The charge balance is
(13-27)
Our strategy is to substitute expressions into the charge balance to obtain an equation inwhich the only variable is For this purpose, we use the fractional composition equa-tions for the triprotic acid, which we abbreviate as
(13-28)
(13-29)
(13-30)
(13-31)
Figure 13-3 puts everything together in a spreadsheet. Input values for p p p and p are in the shaded cells. We guess a value for pH in cell H15 and writethe initial ionic strength of 0 in cell C19. Cells A9:H10 compute activities with the Daviesequation. With all activity coefficients are 1. Cells A13:H16 compute concentrations.
in cell B13 is Cell E18 computes the sum of charges.Not shown in Figure 13-3 is that an initial guess of in cell H15 gives a net
charge of 0.005 6 m in cell E18. Excel SOLVER was then used to vary pH in cell H15 to pro-duce a net charge near 0 in cell E18. For this purpose, the precision was set to le-16 inSOLVER Options. Figure 13-3 shows that executing SOLVER gives in cell H15and a net charge of in cell E18. The calculated ionic strength in cell C20 is0.100 m.
For the second iteration, we write the ionic strength 0.100 m in cell C19 of Figure 13-4.This ionic strength automatically gives new activity coefficients in cells A9:H10 and neweffective equilibrium constants in cells H3:H6. The sum of charges in cell E18 is no longernear zero. Application of SOLVER to vary pH in cell H15 to try to get 0 net charge produces anet charge of in cell E18. The new ionic strength in cell C20 remains 0.100 m,so we are done. When the new ionic strength in cell C20 equals the old ionic strength in cellC19 (say, to three decimal places), there is no need for further iteration.
The final pH in cell H15 of Figure 13-4 is 6.876, which differs from the certified pH of6.865 by 0.011. This difference is about as close an agreement between a measured and
9 � 10�17 m
�2 � 10�17 mpH � 7.198
pH � 7(10�pH) /�H� � (10�-H15)/B9.[H�]
� � 0,
KwK3,K2,K1,FNa2HPO4
,FKH2PO4,
[H3P] � �H3PFH3P
�[H�]3FH3P
[H�]3 � [H�]2K¿1 � [H�]K¿1K¿2 � K¿1K¿2K¿3
[H2P�] � �H2P�FH3P�
[H�]2K¿1FH3P
[H�]3 � [H�]2K¿1 � [H�]K¿1K¿2 � K¿1K¿2K¿3
[HP2�] � �HP2�FH3P�
[H�]K¿1K¿2FH3P
[H�]3 � [H�]2K¿1 � [H�]K¿1K¿2 � K¿1K¿2K¿3
[P3�] � �P3�FH3P�
K¿1K¿2K¿3FH3P
[H�]3 � [H�]2K¿1 � [H�]K¿1K¿2 � K¿1K¿2K¿3
H3P:H3PO4,[H�].
[Na�] � [K�] � [H�] � [H2PO�4 ] � 2[HPO2�
4 ] � 3[PO3�4 ] � [OH�]
phosphate � FH3P� 0.050 0 m.[Na�] � 0.050 0 m,
[K�] � 0.025 0 m,Na2HPO4.KH2PO4
K¿K¿w.K¿3,K¿2,K¿1,
K¿w.K¿3,K¿2,K¿1,
� � 0.K3,K2,K1,
pH � �log([H�]�H�)
K¿w �Kw
�H��OH�
� [H�][OH�] 1 [OH�] � K¿w/[H�]
H2O T H� � OH� Kw � [H�]�H�[OH�]�OH� � 10�13.995
� � 1.00.H3PO4,
K¿3 � K3 a �HPO2�4
�PO3�4
�H�
b �[PO3�
4 ][H�]
[HPO2�4 ]
13-2 Activity Coefficients 255
Values of Kw are found in Table 6-1.

256 CHAPTER 13 Advanced Topics in Equilibrium
Positive charge minus negative charge =
Ionic strength =
New ionic strength =
←initial value is 0
←substitute this value into cell C19 for next iteration
Formulas:
H3 = 10^-E3*E9/(E10*B9)
H5 = 10^-E5*H9/(H10*B9)
H4 = 10^-E4*E10/(H9*B9)
H6 = 10^-E6/(B9*B10)
B9 = B10 = E10 = 10^(-0.51*1^2*(SQRT($C$19)/(1+SQRT($C$19))-0.3*$C$19))
H9 = 10^(-0.51*2^2*(SQRT($C$19)/(1+SQRT($C$19))-0.3*$C$19))
H10 = 10^(-0.51*3^2*(SQRT($C$19)/(1+SQRT($C$19))-0.3*$C$19))
B13 = (10^-H15)/B9 B14 = 2*B4 B15 = B3 E13 = H6/(B13)
E14 = B13^2*H3*B5/(B13^3+B13^2*H3+B13*H3*H4+H3*H4*H5)
E15 = B13*H3*H4*B5/(B13^3+B13^2*H3+B13*H3*H4+H3*H4*H5)
E16 = H3*H4*H5*B5/(B13^3+B13^2*H3+B13*H3*H4+H3*H4*H5)
H13 = B13^3*B5/(B13^3+B13^2*H3+B13*H3*H4+H3*H4*H5)
E18 = B13+B14+B15-E13-E14-2*E15-3*E16
C20 = 0.5*(B13+B14+B15+E13+E14+4*E15+9*E16)
1
2
3
4
5
6
7
8
9
10
11
12
13
14
15
16
17
18
19
20
21
22
23
24
25
26
27
28
29
30
31
32
33
34
A B C D E F G H
Mixture of KH2PO4 and Na2HPO4 including activity coefficients from Davies equation
FKH2PO4 =
FH3P =
H+ =
OH- =
Species in charge balance:
[H+] =
[Na+] =
[K+] =
FNa2HPO4 =
Activity coefficients:
0.0250
0.0250
0.0500
1.00
1.00
6.34E-08
0.050000
0.025000
(=B3+B4)
0.1000
pK2 =
pK3 =
pKw =
pK1 =
H2P-=
H3P =
[OH-] =
[H2P-] =
[HP2-] =
[P3-] =
[H3P] =
pH =
2.148
7.198
12.375
13.995
1.00
1.00
1.60E-07
2.50E-02
2.50E-02
1.66E-07
-2.27E-17
(fixed at 1)
K1' =
K2' =
K3' =
Kw' =
HP2- =
P3- =
Other concentrations:
↑ initial value is a guess
7.11E-03
6.34E-08
4.22E-13
1.01E-14
1.00
1.00
2.23E-07
7.198
0.0000
1
2
3
4
5
6
7
8
9
10
11
New ionic strength = 0.1000 ← substitute this value into cell C19 for next iteration
Positive charge minus negative charge =
Ionic strength = 0.1000 ← initial value is 0
[H+] =
[Na+] = [H2P-] =
HP2- =
FH3P =
FNa2HPO4 =
12
13
14
15
16
17
18
19
20
0.0250
0.0250
0.78
1.70E-07
0.050000 2.50E-02
0.025000 [HP2-] =
8.56E-17
[K+] =
2.73E-07 ↑ initial value is a guess[P3-] =
H+ = H3P =
OH-=
[OH-] =
H2P- =
9.74E-08
0.78 0.11P3- =
FKH2PO4 =
pK3 =
pKw = 13.995
pK2 =
pK1 =
K3' =
Kw' =
1.86E-12
1.66E-14
K2' =
K1' =
Mixture of KH2PO4 and Na2HPO4 including activity coefficients from Davies equation
A B C D E F G H
0.0500 (=B3+B4)
0.78 1.00 (fixed at 1) 0.37
2.148
7.198
12.375
2.50E-02 pH = 6.876
[H3P] = 3.65E-07
1.17E-02
1.70E-07
Species in charge balance: Other concentrations:
Activity coefficients:
Figure 13-4 Second iteration ofspreadsheet solved for the system 0.025 0 m
plus 0.025 0 m with ionicstrength from the first iteration.� 0.100
Na2HPO4KH2PO4
Figure 13-3 Spreadsheet solved for thesystem 0.025 0 m plus 0.025 0 m
with initial ionic strength andactivity coefficients � 1.
� 0Na2HPO4
KH2PO4

13-3 Dependence of Solubility on pH 257
computed pH as you will encounter. If we had used extended Debye-Hückel activity coefficientsfor in Table 8-1, the computed pH would be 6.859, differing from the stated pH byjust 0.006.
Sometimes SOLVER cannot find a solution if Precision is set too small in the Optionswindow. You can make the Precision larger and see if SOLVER can find a solution. You canalso try a different initial guess for pH.
Back to BasicsA spreadsheet operating on the charge balance to reduce the net charge to zero is an excel-lent, general method for solving complex equilibrium problems. However, we did learn howto find the pH of a mixture of plus back in Chapter 9 by a simple, lessrigorous method. Recall that, when we mix a weak acid and its conjugate base
what we mix is what we get. The pH is estimated from the Henderson-Hasselbalchequation 9-18 with activity coefficients:
(9-18)
For 0.025 m plus 0.025 m the ionic strength is
In Table 8-1, the activity coefficients at are 0.775 for and 0.355 for Inserting these values into Equation 9-18 gives
The answer is the same that we generate with the spreadsheet because the approximation thatwhat we mix is what we get is excellent in this case.
So you already knew how to find the pH of this buffer by a simple calculation. The valueof the general method with the charge balance in the spreadsheet is that it applies evenwhen what you mix is not what you get, because the concentrations are very low or is notso small or there are additional equilibria.
Ignorance Is Still BlissEven in such a simple solution as plus for which we were justifiablyproud of computing an accurate pH, we have overlooked numerous ion-pair equilibria:
The reliability of the calculated concentrations depends on knowing all relevant equilibriaand having the fortitude to include them all in the computation, which is by no means trivial.
13-3 Dependence of Solubility on pHAn important example of the effect of pH on solubility is tooth decay. Tooth enamel containsthe mineral hydroxyapatite, which is insoluble near neutral pH, but dissolves in acid becauseboth phosphate and hydroxide in the hydroxyapatite react with
Calcium hydroxyapatite
Bacteria on the surface of our teeth metabolize sugars to produce lactic acid, which lowersthe pH enough to slowly dissolve tooth enamel. Fluoride inhibits tooth decay because itforms fluorapatite, which is more acid resistant than hydroxyapatite.Ca10(PO4)6F2,
Ca10(PO4)6(OH)2(s) � 14H� T 10Ca2� � 6H2PO�4 � 2H2O
H�:
K � 5.4 � 1010Na2PO�4 � H� T Na2HPO4
K � 14NaPO2�4 � Na� T Na2PO�
4 K � 2H2PO�4 � Na� T NaHPO4
K � 12HPO2�4 � Na� T NaHPO�
4 K � 27PO3�4 � Na� T NaPO2�
4
Na2HPO4,KH2PO4
K2
pH � 7.198 � log[0.025]0.355
[0.025]0.775� 6.859
HPO2�4 .H2PO�
4� � 0.1 m
�1
2([0.025] � 1 � [0.025] � 1 � [0.050] � 1 � [0.025] � 4) � 0.100 m
� �1
2aiciz2
i �1
2([K�] � (�1)2 � [H2PO�
4 ] � (�1)2 � [Na�] � (�1)2 � [HPO2�4 ] � (�2)2)
Na2HPO4,KH2PO4
pH � pKa � log[A�]�A�
[HA]�HA� pK2 � log
[HPO2�4 ]�HPO2�
4
[H2PO�4 ]�H2PO�
4
(HPO2�4 ),
(H2PO�4 )
Na2HPO4KH2PO4
� � 0.1 m
There is an analogous set of reactions for whose equilibrium constants are similar tothose for Na�.
K�,
L-Lactic acid
CO2H
H3C
HO
H
in Equation 9-18 applies at � � 0.pKa � pK2

Solubility of CaF2
The mineral fluorite, in Figure 13-5 has a cubic crystal structure and often cleaves toform nearly perfect octahedra (eight-sided solids with equilateral triangular faces). Depend-ing on impurities, the mineral takes on a variety of colors and may fluoresce when irradiatedwith an ultraviolet lamp.
The solubility of is governed by for the salt, hydrolysis of and of andby ion pairing between and
(13-32)
(13-33)
(13-34)
(13-35)
(13-36)
The charge balance is
Charge balance: (13-37)
To find the mass balance, we need to realize that all of the calcium and fluoride species comefrom Therefore, the total fluoride equals two times the total calcium:
Mass balance: (13-38)
There are seven independent equations and seven unknowns, so we have enough infor-mation.
For simplicity, we omit activity coefficients, but you do know how to use them. Youwould solve the problem with all activity coefficients equal to 1, find the ionic strength,and then compute activity coefficients with the Davies equation. Then you would com-pute effective equilibrium constants incorporating activity coefficients and solve theproblem again. After each iteration, you would find a new ionic strength and a new set ofactivity coefficients. Repeat the process until ionic strength is constant. Wow! You aresmart!
We want to reduce seven equations with seven unknowns to one equation with oneunknown—but this is not easy. However, we can express all concentrations in terms of [H�]
2[Ca2�] � 2[CaOH�] � [CaF�] � [F�] � [HF]
25[Ca2�] � [CaOH�] � [CaF�]6 � [F�] � [HF] � [CaF�]
2[total calcium species] � [total fluoride species]
CaF2.
[H�] � 2[Ca2�] � [CaOH�] � [CaF�] � [OH�] � [F�]
H2O T H� � OH� Kw � [H�][OH�] � 1.0 � 10�14
Ca2� � F� T CaF� Kip �[CaF�]
[Ca2�][F�]� 4.3
Ca2� � H2O T CaOH� � H� Ka �[CaOH�][H�]
[Ca2�]� 2 � 10�13
HF T H� � F� KHF �[H�][F�]
[HF]� 6.8 � 10�4
CaF2(s) T Ca2� � 2F� Ksp � [Ca2�][F�]2 � 3.2 � 10�11
F�:Ca2�
Ca2�,F�KspCaF2
CaF2,
258 CHAPTER 13 Advanced Topics in Equilibrium
Figure 13-5 (a) Crystals of the mineralfluorite, (b) Each ion is surroundedby eight F� ions at the corners of a cube. EachF� ion is surrounded by four Ca2� ions at thecorners of a tetrahedron. If you imagine thenext unit cell above this one, you should seethat the ion at the center of the top faceof the cell shown here is adjacent to four ions in this cell and four ions in the next cellabove it.
F�
F�
Ca2�
Ca2�CaF2.
F
Ca
0.546 nm
(a) (b)
Solubility products are in Appendix F. The aciddissociation constant of HF is from Appendix G.The hydrolysis constant for Ca is the inverse ofthe formation constant of in AppendixI. The ion pair formation constant for islisted in Appendix J.
CaF�
CaOH�
How to use activity coefficients

13-3 Dependence of Solubility on pH 259
1
2
3
4
5
6
7
8
9
Ka =
KHF =
3.2E-11
6.8E-04
1.E+00
pH sum [Ca2+]
0
1
2
3
4
5
6
7
8
9
10
11
12
13
14
1.E-01
1.E-02
1.E-03
1.E-04
1.E-05
1.E-06
1.E-07
1.E-08
1.E-09
1.E-10
1.E-11
1.E-12
1.E-13
1.E-14
3.517E-05
7.561E-05
1.597E-04
2.960E-04
3.822E-04
3.982E-04
3.999E-04
4.001E-04
4.001E-04
4.001E-04
4.004E-04
4.028E-04
4.252E-04
5.770E-04
1.104E-03
5.6E-17
0.0E+00
-2.8E-17
-1.2E-17
-1.5E-17
-7.8E-18
-1.0E-17
-1.0E-17
-1.1E-17
-2.5E-17
-8.7E-18
-2.5E-17
-5.5E-17
-2.0E-17
Ksp =
Mass
Kip =
Kw =
4.3
1.0E-14
Mass balance:
Finding the concentrations of species in saturated calcium fluoride solution
2.E-13
[H+] SOLVER [CaOH+] [CaF+] [HF]
Input [F-] found by balance
10
11
12
13
14
15
16
17
18
19
20
21
22
23
24
25
26 B10 = 10^-A10
27 G10 = $B$6*$B$3/C10 H10 = B10*C10/$B$4
28 D10 = 2*$B$3/C10^2+2*$B$5*$B$3/(B10*C10^2)+$B$6*$B$3/C10-C10-B10*C10/$B$4
29 J10 = B10+2*E10+F10+G10-I10-C10
A B C D E F G H
2.6E-02
5.6E-03
1.3E-03
3.7E-04
2.2E-04
2.0E-04
2.0E-04
2.0E-04
2.0E-04
2.0E-04
2.0E-04
2.0E-04
1.8E-04
9.6E-05
2.6E-05
5.17E-15
1.12E-14
2.51E-14
7.31E-14
4.38E-13
4.04E-12
4.00E-11
4.00E-10
4.00E-09
4.00E-08
3.99E-07
3.95E-06
3.54E-05
1.92E-04
5.25E-04
3.9E-06
1.8E-06
8.6E-07
4.6E-07
3.6E-07
3.5E-07
3.4E-07
3.4E-07
3.4E-07
3.4E-07
3.4E-07
3.4E-07
3.2E-07
2.4E-07
1.2E-07
5.17E-02
1.11E-02
2.35E-03
4.35E-04
5.62E-05
5.86E-06
5.88E-07
5.88E-08
5.88E-09
5.88E-10
5.89E-11
5.92E-12
6.25E-13
8.48E-14
1.62E-14
[OH-]
I
1.0E-14
1.0E-13
1.0E-12
1.0E-11
1.0E-10
1.0E-09
1.0E-08
1.0E-07
1.0E-06
1.0E-05
1.0E-04
1.0E-03
1.0E-02
1.0E-01
1.0E+00
charges
J
1.1E+00
1.1E-01
1.2E-02
1.4E-03
1.6E-04
1.6E-05
1.6E-06
5.8E-08
-9.9E-07
-1.0E-05
-1.0E-04
-1.0E-03
-1.0E-02
-1.0E-01
-1.0E+00
Sum of
E10 = $B$3/C10^2 F10 = $B$5*$B$3/(B10*C10^2)
I10 = $B$7/B10
-7.6E-17
2Ksp KipKsp
KHF
2KaKsp
[F−]2 [F−][F−]
[H+][F−]2
[H+][F−]+ + − − = 0
and , so we can reduce the mass and charge balance to two equations with twounknowns. Here are the substitutions from the equilibrium expressions:
Putting these expressions into the charge balance gives
(13-39a)
(13-39b)
Substitution in the mass balance gives
(13-40)
We could do some messy algebra to solve Equation 13-39b for and substitute thisexpression for into Equation 13-40 to get an equation with as the only unknown.
Instead, we will use a spreadsheet for a numerical solution. Suppose that the pH is some-how fixed by a buffer. The mass balance relating calcium to fluoride is still correct. However,the charge balance is no longer valid, because the buffer introduces additional ions into thesolution. We will find a way around the loss of the charge balance shortly.
In the spreadsheet in Figure 13-6, enter pH in column A. Compute incolumn B and guess a value for in column C. With these values of and , compute[F�][H�][F�]
[H�] � 10�pH
[F�][H�][H�]
2Ksp
[F�]2�
2KaKsp
[H�][F�]2�
KipKsp
[F�]� [F�] �
[H�][F�]
KHF� 0
2[Ca2�] � 2[CaOH�] � [CaF�] � [F�] � [HF] � 0
[H�] �2Ksp
[F�]2�
KaKsp
[H�][F�]2�
KipKsp
[F�]�
Kw
[H�]� [F�] � 0
[H�] � 2[Ca2�] � [CaOH�] � [CaF�] � [OH�] � [F�] � 0
[CaF�] � Kip[Ca2�][F�] �KipKsp
[F�][CaOH�] �
Ka[Ca2�]
[H�]�
KaKsp
[H�][F�]2
[HF] � [H�][F�]/KHF[Ca2�] � Ksp/[F�]2
[F�]
Figure 13-6 Spreadsheetusing SOLVER for saturated at fixed pH values.
CaF2
The first expression for is from Equation 13-34. The second expression isobtained by substituting intothe first equation.
[Ca2�] � Ksp /[F�]2
[CaOH�]
When buffer is added, the mass balance stillapplies but the original charge balance is nolonger correct.
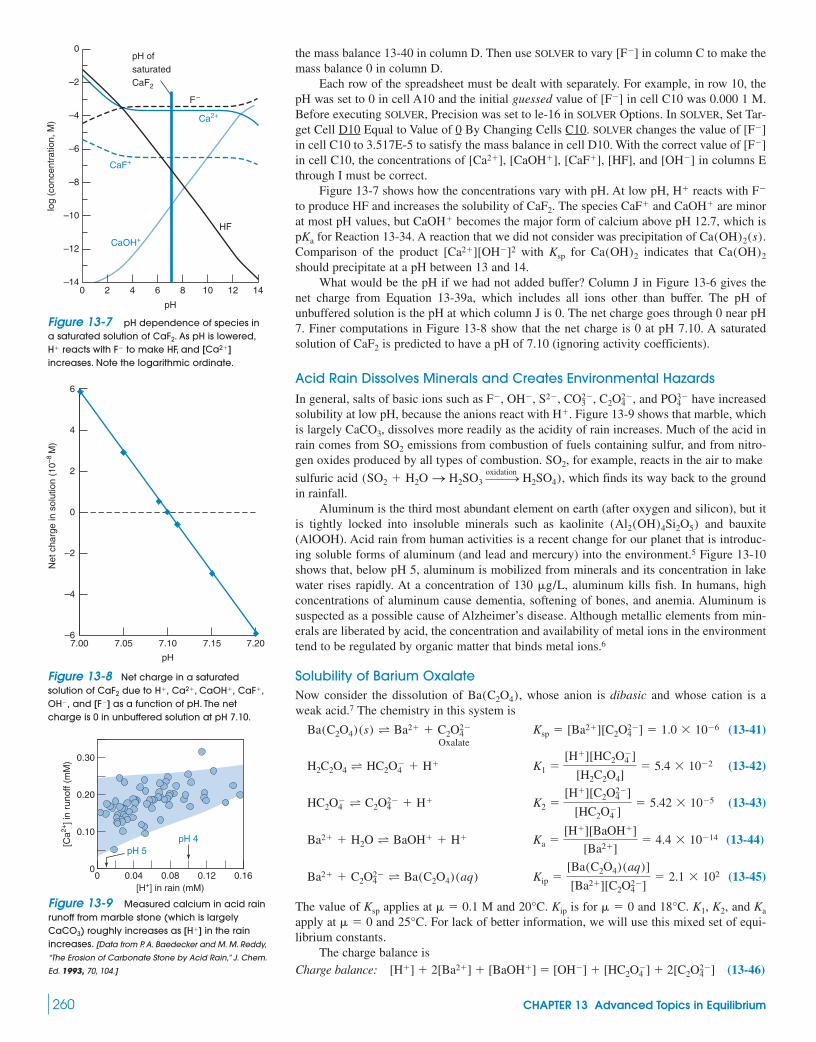
the mass balance 13-40 in column D. Then use SOLVER to vary in column C to make themass balance 0 in column D.
Each row of the spreadsheet must be dealt with separately. For example, in row 10, thepH was set to 0 in cell A10 and the initial guessed value of in cell C10 was 0.000 1 M.Before executing SOLVER, Precision was set to le-16 in SOLVER Options. In SOLVER, Set Tar-get Cell D10 Equal to Value of 0 By Changing Cells C10. SOLVER changes the value of in cell C10 to 3.517E-5 to satisfy the mass balance in cell D10. With the correct value of in cell C10, the concentrations of and in columns Ethrough I must be correct.
Figure 13-7 shows how the concentrations vary with pH. At low pH, reacts with to produce HF and increases the solubility of The species and are minorat most pH values, but becomes the major form of calcium above pH 12.7, which is
for Reaction 13-34. A reaction that we did not consider was precipitation of Comparison of the product with for indicates that should precipitate at a pH between 13 and 14.
What would be the pH if we had not added buffer? Column J in Figure 13-6 gives thenet charge from Equation 13-39a, which includes all ions other than buffer. The pH ofunbuffered solution is the pH at which column J is 0. The net charge goes through 0 near pH7. Finer computations in Figure 13-8 show that the net charge is 0 at pH 7.10. A saturatedsolution of is predicted to have a pH of 7.10 (ignoring activity coefficients).
Acid Rain Dissolves Minerals and Creates Environmental HazardsIn general, salts of basic ions such as and have increasedsolubility at low pH, because the anions react with Figure 13-9 shows that marble, whichis largely dissolves more readily as the acidity of rain increases. Much of the acid inrain comes from emissions from combustion of fuels containing sulfur, and from nitro-gen oxides produced by all types of combustion. for example, reacts in the air to make
sulfuric acid which finds its way back to the groundin rainfall.
Aluminum is the third most abundant element on earth (after oxygen and silicon), but itis tightly locked into insoluble minerals such as kaolinite and bauxite(AlOOH). Acid rain from human activities is a recent change for our planet that is introduc-ing soluble forms of aluminum (and lead and mercury) into the environment.5 Figure 13-10shows that, below pH 5, aluminum is mobilized from minerals and its concentration in lakewater rises rapidly. At a concentration of 130 aluminum kills fish. In humans, highconcentrations of aluminum cause dementia, softening of bones, and anemia. Aluminum issuspected as a possible cause of Alzheimer’s disease. Although metallic elements from min-erals are liberated by acid, the concentration and availability of metal ions in the environmenttend to be regulated by organic matter that binds metal ions.6
Solubility of Barium OxalateNow consider the dissolution of whose anion is dibasic and whose cation is aweak acid.7 The chemistry in this system is
(13-41)Oxalate
(13-42)
(13-43)
(13-44)
(13-45)
The value of applies at M and is for and and apply at and For lack of better information, we will use this mixed set of equi-librium constants.
The charge balance isCharge balance: (13-46)[H�] � 2[Ba2�] � [BaOH�] � [OH�] � [HC2O�
4 ] � 2[C2O2�4 ]
25°C.� � 0KaK2,K1,18°C.� � 0Kip20°C.� � 0.1Ksp
Kip �[Ba(C2O4)(aq)]
[Ba2�][C2O2�4 ]
� 2.1 � 102Ba2� � C2O2�4 T Ba(C2O4)(aq)
Ka �[H�][BaOH�]
[Ba2�]� 4.4 � 10�14Ba2� � H2O T BaOH� � H�
K2 �[H�][C2O2�
4 ]
[HC2O�4 ]
� 5.42 � 10�5HC2O�4 T C2O2�
4 � H�
K1 �[H�][HC2O�
4 ]
[H2C2O4]� 5.4 � 10�2H2C2O4 T HC2O�
4 � H�
Ksp � [Ba2�][C2O2�4 ] � 1.0 � 10�6Ba(C2O4)(s) T Ba2� � C2O2�
4
Ba(C2O4),
�g/L,
(Al2(OH)4Si2O5)
(SO2 � H2O S H2SO3!oxidation
H2SO4),
SO2,SO2
CaCO3,H�.
PO3�4C2O2�
4 ,CO2�3 ,S2�,OH�,F�,
CaF2
Ca(OH)2Ca(OH)2Ksp[Ca2�][OH�]2Ca(OH)2(s).pKa
CaOH�
CaOH�CaF�CaF2.F�H�
[OH�][HF],[CaF�],[CaOH�],[Ca2�],[F�][F�]
[F�]
[F�]
260 CHAPTER 13 Advanced Topics in Equilibrium
pH ofsaturatedCaF2
log
(con
cent
ratio
n, M
)0
–2
–4
–6
–8
–10
–12
–14140 2 4 6 8
pH
10 12
F –
Ca2+
CaF+
CaOH+
HF
Figure 13-7 pH dependence of species ina saturated solution of . As pH is lowered,
reacts with to make HF, and increases. Note the logarithmic ordinate.
[Ca2�]F�H�
CaF2
6
4
2
0
–2
–4
–67.207.00 7.05 7.10
pH
7.15
Net
cha
rge
in s
olut
ion
(10–8
M)
Figure 13-8 Net charge in a saturatedsolution of due to ,
and [F�] as a function of pH. The netcharge is 0 in unbuffered solution at pH 7.10.OH�,
CaF�,CaOH�,Ca2�H�,CaF2
pH 5pH 4
0.30
0.16
[Ca2+
] in
runo
ff (m
M)
[H+] in rain (mM)
0.20
0.10
00.120.080.040
Figure 13-9 Measured calcium in acid rainrunoff from marble stone (which is largely
roughly increases as in the rainincreases. [Data from P. A. Baedecker and M. M. Reddy,
“The Erosion of Carbonate Stone by Acid Rain,” J. Chem.
Ed. 1993, 70, 104.]
[H�]CaCO3)

The mass balance states that the total moles of barium equal the total moles of oxalate:
Mass balance: (13-47)14444244443 1444444442444444443
FBa
There are eight unknowns and eight independent equations (including so we have enough information to find the concentrations of all species.
We deal with ion pairing by adding Reactions 13-41 and 13-45 to find
(13-48)
Therefore, as long as undissolved is present.Now for our old friends, the fractional composition equations. Abbreviating oxalic acid
as we can write
(13-49)
(13-50)
(13-51)
Also, and are a conjugate acid-base pair. behaves as a monoprotic acid,HA, and is the conjujate base
(13-52)
(13-53)
Suppose that the pH is fixed by adding a buffer (and therefore the charge balance 13-46is no longer valid). From we can write
But the mass balance 13-47 told us that Therefore,
(13-54)1 FBa � B Ksp
�Ba2��Ox2�
Ksp � �Ba2�FBa�Ox2�FH2Ox � �Ba2�FBa�Ox2�FBa
FBa � FH2Ox.
Ksp � [Ba2�][C2O2�4 ] � �Ba2�FBa�Ox2�FH2Ox
Ksp,
[BaOH�] � �BaOH�FBa �KaFBa
[H�] � Ka
[Ba2�] � �Ba2�FBa �[H�]FBa
[H�] � Ka
A�.BaOH�
Ba2�BaOH�Ba2�
[Ox2�] � �Ox2�FH2Ox �K1K2FH2Ox
[H�]2 � [H�]K1 � K1K2
[HOx�] � �HOx�FH2Ox �K1[H�]FH2Ox
[H�]2 � [H�]K1 � K1K2
[H2Ox] � �H2OxFH2Ox �[H�]2FH2Ox
[H�]2 � [H�]K1 � K1K2
H2Ox,
Ba(C2O4)(s)[Ba(C2O4)(aq)] � 2.1 � 10�4 M
K � [Ba(C2O4)(aq)] � KspKip � 2.1 � 10�4Ba(C2O4)(s) T Ba(C2O4)(aq)
[OH�] � Kw/[H�]),
FH2Ox
[Ba2�] � [BaOH�] � [H2C2O4] � [HC2O�4 ] � [C2O2
4�]
� [C2O2�4 ] � [Ba(C2O4)(aq)]
[Ba2�] � [BaOH�] � [Ba(C2O4)(aq)] � [H2C2O4] � [HC2O�4 ]
[Total barium] � [total oxalate]
13-3 Dependence of Solubility on pH 261
0 100 200 280
5.0
5.5
6.0
6.5
7.0
4.5
Al concentration > 130 µg/Lendangers fish
pH
Total Al ( µg/L)
Figure 13-10 Relation of total aluminum(including dissolved and suspended species)in 1 000 Norwegian lakes as a function of thepH of the lake water. The more acidic thewater, the greater the aluminum concentration.[From G. Howells, Acid Rain and Acid Waters, 2nd ed.
(Hertfordshire: Ellis Horwood, 1995).]
We are defining and to exclude theion pair Ba(C2O4)(aq).
FH2OxFBa
The ion pair has a constantconcentration in this system.
Ba(C2O4)(aq)
FH2Ox � [H2C2O4] � [HC2O�4 ] � [C2O2�
4 ]
FBa � [Ba2�] � [BaOH�]

In the spreadsheet in Figure 13-11, pH is specified in column A. From this pH, plus and the fractions and are computed with Equations 13-49 through 13-51in columns C, D, and E. From the pH and the fractions and are computedwith Equations 13-52 and 13-53 in columns F and G. The total concentrations of barium andoxalate, and are equal and calculated in column H from Equation 13-54. In a realspreadsheet, we would have continued to the right with column I. To fit on this page, thespreadsheet was continued in row 18. In this lower section, the concentrations of and
are computed with Equations 13-52 and 13-53. and are found with Equations 13-49 through 13-51.
The net charge iscomputed beginning in cell H19. If we had not added buffer to fix the pH, the net chargewould be 0. Net charge goes from positive to negative between pH 6 and 8. By usingSOLVER, we find the pH in cell A11 that makes the net charge 0 in cell H23 (with SOLVER
This pH, 7.64, is the pH of unbuffered solution.Results in Figure 13-12 show that the solubility of barium oxalate is steady at M in
the middle pH range. Solubility increases below pH 5 because reacts with to makeSolubility increases above pH 13 because reacts with to make
A final point is to see that the solubility of is not exceeded. Evaluation ofthe product shows that is not exceeded below pH 13.9. Wepredict that will begin to precipitate at pH 13.9.Ba(OH)2(s)
Ksp � 3 � 10�4[Ba2�][OH�]2Ba(OH)2(s)
BaOH�.OH�Ba2�HC2O�4 .
H�C2O2�4
10�3Precision � 1e-16).
(� [H�] � 2[Ba2�] � [BaOH�] � [OH�] � [HC2O�4 ] � 2[C2O2�
4 ])
[C2O2�4 ][HC2O�
4 ],[H2C2O4],[BaOH�][Ba2�]
FH2Ox,FBa
�BaOH��Ba2�Ka,�Ox2��HOx�,�H2Ox,K2,
K1
262 CHAPTER 13 Advanced Topics in Equilibrium
1
2
3
4
5
6
7
8
9
10
11
pH
Ka =
12
13
14
15
16
17
18
19
20
21
22
23
24
25
26
27
28
29
30
31
32
33
34
35
[H+] α(Ba2+) α(BaOH+) = FH2Ox
pH α(Ox2-)
4.4E-141.0E+00 6.0E-01
4.4E-121.0E+00 1.5E-02
1.7E-03
1.0E-03
1.0E-03
1.0E-03
4.4E-10
4.4E-08
1.9E-06
4.4E-06
1.0E+00
1.0E+00
1.0E+00
1.0E+00
1.0E+00
9.6E-01
12
Ksp =
K2 =
K1 =
Finding the concentrations of species in saturated barium oxalate solution
A B C D E F G H
5.4E-02 Kip =
5.42E-05 Kw =FBa
2.1E+02
1.0E-14
1.0E-03
1.0E-03
2.3E-03
net
4.4E-04
4.2E-02
8.1E-011.9E-01
2.2E+001.0E-141.7E-06
2.7E-021.0E-126.7E-05
1.2E-031.0E-105.9E-04
1.9E-051.0E-089.9E-04
6.9E-184.4E-071.0E-03
-8.1E-071.0E-061.0E-03
-1.0E-041.0E-041.0E-03
-1.0E-021.0E-021.0E-03
-1.0E+001.0E+00
1.0E-06
4.4E-14
1.E+00
1.E-02
1.E-04
1.E-06
1.E-12
1.E-14
2.E-08
1.E-08
1.E-10
6.0E-01
1.5E-02
1.7E-03
1.0E-03
1.0E-03
1.0E-03
1.0E-03
9.8E-04
4.3E-04
α(H2Ox)
9.5E-01
1.6E-01
1.2E-03
3.4E-07
1.8E-10
3.4E-11
3.4E-15
3.4E-19
3.4E-23
2.6E-14
6.5E-14
7.4E-13
4.4E-11
1.9E-09
4.4E-09
4.4E-07
4.3E-05
1.9E-03
α(HOx-)
5.1E-02
8.4E-01
6.5E-01
1.8E-02
4.2E-04
1.8E-04
1.8E-06
1.8E-08
1.8E-10
5.7E-01
2.3E-03
2.0E-06
3.4E-10
1.8E-13
3.4E-14
3.4E-18
3.5E-22
7.9E-26
α(Ox2-)
2.8E-06
4.6E-03
3.5E-01
9.8E-01
1.0E+00
1.0E+00
1.0E+00
1.0E+00
1.0E+00
3.1E-02
1.2E-02
1.1E-03
1.8E-05
4.2E-07
1.8E-07
1.8E-09
1.9E-11
4.3E-13 2.3E-03
0
2
4
6
7.643
8
10
12
14
0
2
4
6
7.643
8
10
12
14
[Ba2+] [H2Ox] [Ox2-] [OH-] charge[BaOH+] [HOx-]
B7 = 10^-A7
C7 = $B7^2/($B7^2+$B7*$E$3+$E$3*$E$4)
D7 = $B7*$E$3/($B7^2+$B7*$E$3+$E$3*$E$4)
E7 $E$3*$E$4/($B7^2+$B7*$E$3+$E$3*$E$4)
F7 = B7/(B7+$B$4)
G7 = $B$4/(B7+$B$4)
H7 = SQRT($B$3/(E7*F7))
B19 = F7*H7
C19 = G7*H7
D19 = C7*H7
E19 = D7*H7
F19 = E7*H7
G19 = $H$4/B7
H19 = B7+2*B19+C19-G19-E19-2*F19
Figure 13-11 Spreadsheet for saturated SOLVER was used to find the pH in cell A11necessary to make the net charge 0 in cell H23.
BaC2O4.
0
–1
–2
–3
–4
–5
–6
–7140 2 4 6 8
pH
10 12
log
(con
cent
ratio
n, M
)
pH 7.64withoutbuffer
Ba2+
BaOH+HOx–
H2Ox
Ox2–
Ox2–
Ba2+
BaOx(aq)
Figure 13-12 pH dependence of theconcentrations of species in saturated As pH is lowered, reacts with to make
and and the concentration ofincreases.Ba2�
H2C2O4,HC2O�4
C2O2�4H�
BaC2O4.
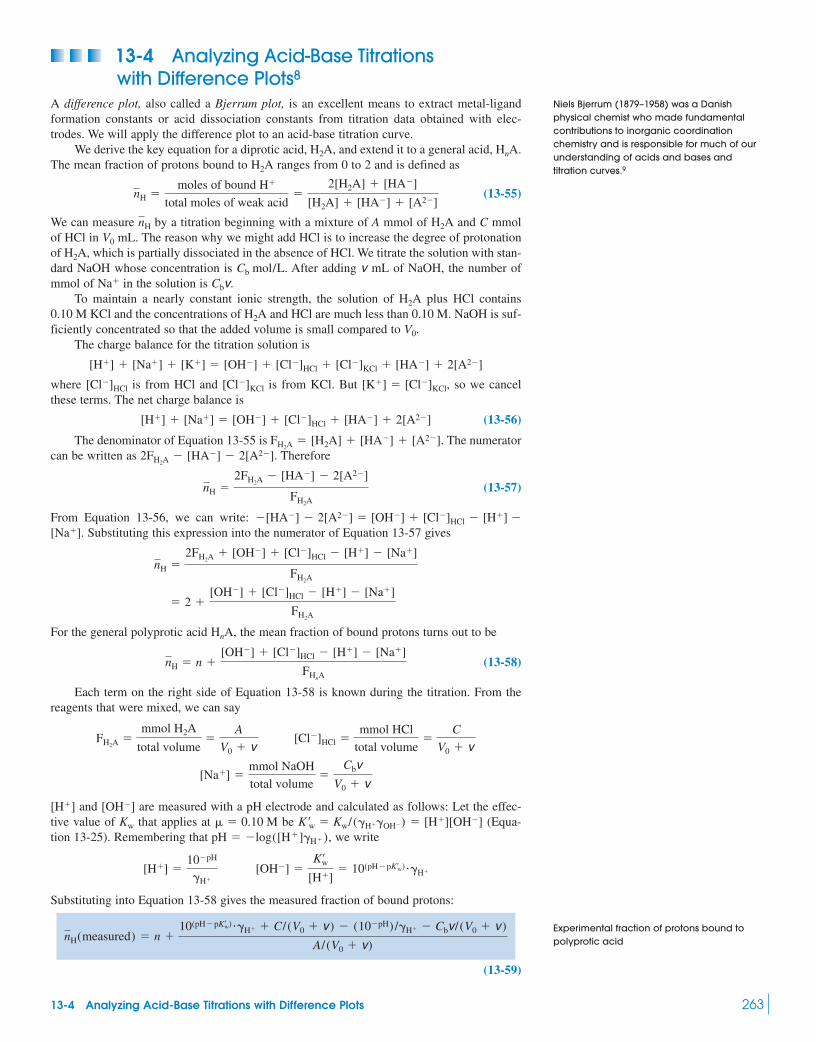
13-4 Analyzing Acid-Base Titrations with Difference Plots8
A difference plot, also called a Bjerrum plot, is an excellent means to extract metal-ligandformation constants or acid dissociation constants from titration data obtained with elec-trodes. We will apply the difference plot to an acid-base titration curve.
We derive the key equation for a diprotic acid, and extend it to a general acid, The mean fraction of protons bound to ranges from 0 to 2 and is defined as
(13-55)
We can measure by a titration beginning with a mixture of A mmol of and C mmolof HCl in mL. The reason why we might add HCl is to increase the degree of protonationof which is partially dissociated in the absence of HCl. We titrate the solution with stan-dard NaOH whose concentration is After adding of NaOH, the number ofmmol of in the solution is
To maintain a nearly constant ionic strength, the solution of plus HCl contains0.10 M KCl and the concentrations of and HCl are much less than 0.10 M. NaOH is suf-ficiently concentrated so that the added volume is small compared to
The charge balance for the titration solution is
where is from HCl and is from KCl. But so we cancelthese terms. The net charge balance is
(13-56)
The denominator of Equation 13-55 is The numeratorcan be written as Therefore
(13-57)
From Equation 13-56, we can write: Substituting this expression into the numerator of Equation 13-57 gives
For the general polyprotic acid the mean fraction of bound protons turns out to be
(13-58)
Each term on the right side of Equation 13-58 is known during the titration. From thereagents that were mixed, we can say
and are measured with a pH electrode and calculated as follows: Let the effec-tive value of that applies at be (Equa-tion 13-25). Remembering that we write
Substituting into Equation 13-58 gives the measured fraction of bound protons:
(13-59)
nH(measured) � n �10(pH�pK¿w)��H� � C/ (V0 � v ) � (10�pH) /�H� � Cbv/ (V0 � v )
A/ (V0 � v)
[OH�] �K¿w
[H�]� 10(pH�pK¿w)��H�[H�] �
10�pH
�H�
pH � �log([H�]�H� ),K ¿w � Kw/(�H��OH�) � [H�][OH�]� � 0.10 MKw
[OH�][H�]
[Na�] �mmol NaOH
total volume�
Cbv
V0 � v
[Cl�]HCl �mmol HCl
total volume�
C
V0 � vFH2A
�mmol H2A
total volume�
A
V0 � v
nH � n �[OH�] � [Cl�]HCl � [H�] � [Na�]
FHnA
HnA,
� 2 �[OH�] � [Cl�]HCl � [H�] � [Na�]
FH2A
nH �2FH2A
� [OH�] � [Cl�]HCl � [H�] � [Na�]
FH2A
[Na�].�[HA�] � 2[A2�] � [OH�] � [Cl�]HCl � [H�] �
nH �2FH2A
� [HA�] � 2[A2�]
FH2A
2FH2A� [HA�] � 2[A2�].
FH2A� [H2A] � [HA�] � [A2�].
[H�] � [Na�] � [OH�] � [Cl�]HCl � [HA�] � 2[A2�]
[K�] � [Cl�]KCl,[Cl�]KCl[Cl�]HCl
[H�] � [Na�] � [K�] � [OH�] � [Cl�]HCl � [Cl�]KCl � [HA�] � 2[A2�]
V0.H2A
H2ACbv.Na�
v mLCb mol/L.H2A,
V0
H2AnH
nH �moles of bound H�
total moles of weak acid�
2[H2A] � [HA�]
[H2A] � [HA�] � [A2�]
H2AHnA.H2A,
13-4 Analyzing Acid-Base Titrations with Difference Plots 263
Niels Bjerrum (1879–1958) was a Danishphysical chemist who made fundamentalcontributions to inorganic coordinationchemistry and is responsible for much of ourunderstanding of acids and bases and titration curves.9
Experimental fraction of protons bound topolyprotic acid

In acid-base titrations, a difference plot, or Bjerrum plot, is a graph of the mean fractionof protons bound to an acid versus pH. The mean fraction is calculated with Equation 13-59.For complex formation, the difference plot gives the mean number of ligands bound to a metalversus
Equation 13-59 gives the measured value of What is the theoretical value? For adiprotic acid, the theoretical mean fraction of bound protons is
(13-60)
where is the fraction of acid in the form and is the fraction in the form You should be able to write expressions for and in your sleep by now.
(13-61)
We extract and from an experimental titration by constructing a difference plotwith Equation 13-59. This plot is a graph of versus pH. We then fit the theo-retical curve (Equation 13-60) to the experimental curve by the method of least squares tofind the values of and that minimize the sum of the squares of the residuals:
(13-62)
Experimental data for a titration of the amino acid glycine are given in Figure 13-13.The initial 40.0-mL solution contained 0.190 mmol of glycine plus 0.232 mmol of HCl toincrease the fraction of fully protonated Aliquots of 0.490 5 M NaOH wereadded and the pH was measured after each addition. Volumes and pH are listed in columns Aand B beginning in row 16. pH was precise to the 0.001 decimal place, but the accuracy ofpH measurement is, at best,
Input values of concentration, volume, and moles are in cells B3:B6 in Figure 13-13.Cell B7 has the value 2 to indicate that glycine is a diprotic acid. Cell B8 has the activitycoefficient of computed with the Davies equation, 13-18. Cell B9 begins with the effec-H�
�0.02.
�H3NCH2CO2H.
� (residuals)2 � �[nH(measured) � nH(theoretical)]2
K2K1
nH(measured)K2K1
�HA� �[H�]K1
[H�]2 � [H�]K1 � K1K2�H2A
�[H�]2
[H�]2 � [H�]K1 � K1K2
�HA��H2A
HA�.�HA�H2A�H2A
nH(theoretical) � 2�H2A� �HA�
nH.pL(� �log[ligand]).
nH
264 CHAPTER 13 Advanced Topics in Equilibrium
If Equation 13-60 is not obvious, you can deriveit from Equation 13-55 by writing the right-handside as
� 2�H2A � �HA�
�2[H2A]
FH2A�
[HA�]
FH2A
�2[H2A] � [HA�]
FH2A
2[H2A] � [HA�]
[H2A] � [HA�] � [A2�]
1
2
3
4
5
6
7
8
9
10
11
12
13
14
15
16
17
18
19
20
21
22
23
24
25
26
27
0.04
0.02
0.00PH
α(Ox2-)
pKw' =pK1 =
pK2 =
A B C D
40
0.190
0.232
2
0.4905
13.807
0.78
2.312
9.625
0.0048
2.266
2.234
2.244
2.254
2.278
2.291
2.675
11.492
11.519
11.541
Cb (M)
V0 (mL)
L (mmol)
A (mmol)
nγH
= sum of column I
0.06
0.08
0.10
:
0.50
:
1.56
1.58
1.60
v pH [OH-] =[H+] =
Titrant NaOH =
Initial volume =
Glycine =
HCl added =
Number of H+ =
Activity coeff =
Σ(resid)2 =
K1 =
K2 =
mL NaOH
6.95E-03
7.14E-03
7.31E-03
7.48E-03
6.76E-03
6.56E-03
2.71E-03
4.13E-12
3.88E-12
3.69E-12
(10-pH)/γH
2.24E-12
2.18E-12
2.13E-12
2.08E-12
2.30E-12
2.38E-12
5.75E-12
3.77E-03
4.01E-03
4.22E-03
(10-pKw)/[H+]
F G H
0.412
0.405
0.400
0.394
0.419
0.426
0.643
0.017
0.016
0.015
0.588
0.595
0.600
0.606
0.581
0.574
0.357
0.000
0.000
0.000
nH
1.588
1.595
1.600
1.606
1.581
1.574
1.357
0.017
0.016
0.015
Theoretical
0.001656
0.000879
0.000319
0.000174
0.000056
0.000020
0.000022
0.000000
0.000004
0.000000
(nmeas -nthoer)2
(residuals)2 =
1.601
1.612
1.630
1.646
0.0048713
2.371E-10
1.589
1.578
1.353
0.016
0.018
0.015
Measured
I
αH2A αHA-
C16 = 10^-B16/$B$8
D16 = 10^-$B$9/C16
E16 = $B$7+($B$6-$B$3*A16-(C16-D16)*($B$4+A16))/$B$5
F16 + $C16^2/($C16^2+$C16*$E$10+$E$10*$E$11)
G16 = $C16*$E$10/($C16^2+$C16*$E$10+$E$10*$E$11)
H16 = 2*F16+G16
I16 = (E16-H16)^2
nH
= 10^-B10
= 10^-B11
E
Difference plot for glycine
Figure 13-13 Spreadsheetfor difference plot of the titrationof 0.190 mmol glycine plus0.232 mmol HCl in 40.0 mL with0.490 5 M NaOH. Cells A16:B27give only a fraction of theexperimental data. Completedata listed in Problem 13-15provided by A. Kraft, Heriot-WattUniversity.
Best values of K1 and K2 minimize the sum ofthe squares of the residuals.
GlycinepK1 � 2.35 at � � 0pK2 � 9.78 at � � 0
H3NCH2CO2H

tive value of in 0.1 M KCl.10 We allowed the spreadsheet to vary for bestfit of the experimental data, giving 13.807 in cell B9. Cells B10 and B11 began with esti-mates of and for glycine. We used the values 2.35 and 9.78 from Table 10-1, whichapply at As explained in the next subsection, we use SOLVER to vary and
for best fit of the experimental data, giving 2.312 and 9.625 in cells B10 and B11.The spreadsheet in Figure 13-13 computes and in columns C and D, begin-
ning in row 16. The mean fraction of protonation, from Equation 13-59, is incolumn E. The Bjerrum difference plot in Figure 13-14 shows versus pH. Val-ues of and from Equations 13-61 are computed in columns F and G, and
was computed with Equation 13-60 in column H. Column I contains thesquares of the residuals, The sum of the squares of theresiduals is in cell B12.
Using Excel SOLVER to Optimize More Than One ParameterWe want values of and that minimize the sum of squares of residuals in cellB12. Select SOLVER from the TOOLS menu. In the SOLVER window, Set Target Cell B12Equal to Min By Changing Cells B9, B10, B11. Then click Solve and SOLVER finds the bestvalues in cells B9, B10, and B11 to minimize the sum of squares of residuals in cell B12.Starting with 13.797, 2.35, and 9.78 in cells B9, B10, and B11 gives a sum of squares ofresiduals equal to 0.110 in cell B12. After SOLVER is executed, cells B9, B10, and B11become 13.807, 2.312, and 9.625. The sum in cell B12 is reduced to 0.0048. When you useSOLVER to optimize several parameters at once, it is a good idea to try different starting val-ues to see if the same solution is reached. Sometimes a local minimum can be reached that isnot as low as might be reached elsewhere in parameter space.
The theoretical curve using the results of SOLVER arecontained in columns F, G, and H in Figure 13-13 and shown by the solid curve in Fig-ure 13-14. The curve fits the experimental data very well, suggesting that we have foundreliable values of and
It may seem inappropriate to allow to vary, because we claimed to know at theoutset. The change of from 13.797 to 13.807 significantly improved the fit. The value13.797 gave values of that became level near 0.04 at the end of the titration inFigure 13-14. This behavior is qualitatively incorrect, because must approach 0 at highpH. A small change in markedly improves the fit as approaches 0.nHpK¿w
nH
nH(measured)pK¿w
pK¿wpK¿wpK2.pK1
nH(theoretical) � 2�H2A� �HA�
pK2pK1,pK¿w,
[nH(measured) � nH(theoretical)]2.nH(theoretical)
�HA��H2A
nH(measured)nH(measured)
[OH�][H�]pK¿w
pK2,pK1,� � 0.pK2pK1
pK¿wpK¿w � 13.797
Summary 265
1.6
0.0
0.2
0.4
0.6
0.8
1.0
1.2
1.4
n (m
easu
red)
121110987
pH
65432
Theoretical fit
Data
Strictly speaking, and should haveprimes to indicate that they apply in 0.10 MKCl. We left off the primes to avoidcomplicating the symbols. We did distinguish
, which applies at from whichapplies at � � 0.10 M.
K ¿w,� � 0,Kw
pK2pK1
Figure 13-14 Bjerrum difference plot forthe titration of glycine. Many experimentalpoints are omitted from the figure for clarity.
Terms to Understandcoupled equilibria difference plot
SummaryCoupled equilibria are reversible reactions that have a species incommon. Therefore each reaction has an effect on the other.
The general treatment of acid-base systems begins with chargeand mass balances and equilibrium expressions. There should be asmany independent equations as chemical species. Substitute a frac-
tional composition equation for each acid or base into the chargebalance. After you enter known concentrations of species such as
and for the remaining vari-able should be Use Excel SOLVER to find and then solvefor all other concentrations from If there are equilibria in[H�].
[H�][H�].[OH�],Cl�and substitute Kw/[H�]Na�
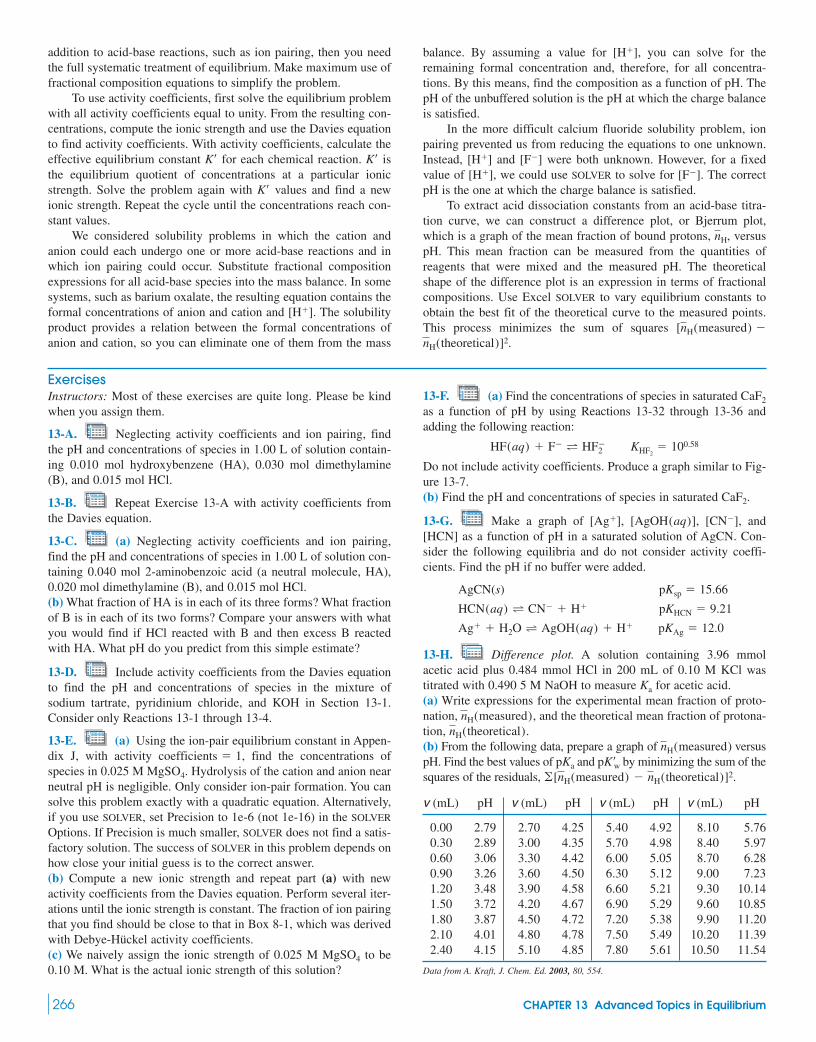
266 CHAPTER 13 Advanced Topics in Equilibrium
ExercisesInstructors: Most of these exercises are quite long. Please be kindwhen you assign them.
13-A. Neglecting activity coefficients and ion pairing, findthe pH and concentrations of species in 1.00 L of solution contain-ing 0.010 mol hydroxybenzene (HA), 0.030 mol dimethylamine(B), and 0.015 mol HCl.
13-B. Repeat Exercise 13-A with activity coefficients fromthe Davies equation.
13-C. (a) Neglecting activity coefficients and ion pairing,find the pH and concentrations of species in 1.00 L of solution con-taining 0.040 mol 2-aminobenzoic acid (a neutral molecule, HA),0.020 mol dimethylamine (B), and 0.015 mol HCl.(b) What fraction of HA is in each of its three forms? What fractionof B is in each of its two forms? Compare your answers with whatyou would find if HCl reacted with B and then excess B reactedwith HA. What pH do you predict from this simple estimate?
13-D. Include activity coefficients from the Davies equationto find the pH and concentrations of species in the mixture ofsodium tartrate, pyridinium chloride, and KOH in Section 13-1.Consider only Reactions 13-1 through 13-4.
13-E. (a) Using the ion-pair equilibrium constant in Appen-dix J, with activity find the concentrations ofspecies in 0.025 M Hydrolysis of the cation and anion nearneutral pH is negligible. Only consider ion-pair formation. You cansolve this problem exactly with a quadratic equation. Alternatively,if you use SOLVER, set Precision to 1e-6 (not 1e-16) in the SOLVER
Options. If Precision is much smaller, SOLVER does not find a satis-factory solution. The success of SOLVER in this problem depends onhow close your initial guess is to the correct answer.(b) Compute a new ionic strength and repeat part (a) with newactivity coefficients from the Davies equation. Perform several iter-ations until the ionic strength is constant. The fraction of ion pairingthat you find should be close to that in Box 8-1, which was derivedwith Debye-Hückel activity coefficients.(c) We naively assign the ionic strength of 0.025 M to be0.10 M. What is the actual ionic strength of this solution?
MgSO4
MgSO4.coefficients � 1,
13-F. (a) Find the concentrations of species in saturated as a function of pH by using Reactions 13-32 through 13-36 andadding the following reaction:
Do not include activity coefficients. Produce a graph similar to Fig-ure 13-7.(b) Find the pH and concentrations of species in saturated
13-G. Make a graph of and[HCN] as a function of pH in a saturated solution of AgCN. Con-sider the following equilibria and do not consider activity coeffi-cients. Find the pH if no buffer were added.
AgCN(s)
13-H. Difference plot. A solution containing 3.96 mmolacetic acid plus 0.484 mmol HCl in 200 mL of 0.10 M KCl wastitrated with 0.490 5 M NaOH to measure for acetic acid.(a) Write expressions for the experimental mean fraction of proto-nation, and the theoretical mean fraction of protona-tion,(b) From the following data, prepare a graph of versuspH. Find the best values of and by minimizing the sum of thesquares of the residuals, �[nH(measured) � nH(theoretical)]2.
pK¿wpKa
nH(measured) nH(theoretical).
nH(measured),
Ka
pKAg � 12.0Ag� � H2O T AgOH(aq) � H�
pKHCN � 9.21HCN(aq) T CN� � H�
pKsp � 15.66
[CN�],[AgOH(aq)],[Ag�],
CaF2.
KHF2� 100.58HF(aq) � F� T HF�
2
CaF2
v (mL) pH v (mL) pH v (mL) pH v (mL) pH
0.00 2.79 2.70 4.25 5.40 4.92 8.10 5.760.30 2.89 3.00 4.35 5.70 4.98 8.40 5.970.60 3.06 3.30 4.42 6.00 5.05 8.70 6.280.90 3.26 3.60 4.50 6.30 5.12 9.00 7.231.20 3.48 3.90 4.58 6.60 5.21 9.30 10.141.50 3.72 4.20 4.67 6.90 5.29 9.60 10.851.80 3.87 4.50 4.72 7.20 5.38 9.90 11.202.10 4.01 4.80 4.78 7.50 5.49 10.20 11.392.40 4.15 5.10 4.85 7.80 5.61 10.50 11.54
Data from A. Kraft, J. Chem. Ed. 2003, 80, 554.
addition to acid-base reactions, such as ion pairing, then you needthe full systematic treatment of equilibrium. Make maximum use offractional composition equations to simplify the problem.
To use activity coefficients, first solve the equilibrium problemwith all activity coefficients equal to unity. From the resulting con-centrations, compute the ionic strength and use the Davies equationto find activity coefficients. With activity coefficients, calculate theeffective equilibrium constant for each chemical reaction. isthe equilibrium quotient of concentrations at a particular ionicstrength. Solve the problem again with values and find a newionic strength. Repeat the cycle until the concentrations reach con-stant values.
We considered solubility problems in which the cation andanion could each undergo one or more acid-base reactions and inwhich ion pairing could occur. Substitute fractional compositionexpressions for all acid-base species into the mass balance. In somesystems, such as barium oxalate, the resulting equation contains theformal concentrations of anion and cation and The solubilityproduct provides a relation between the formal concentrations ofanion and cation, so you can eliminate one of them from the mass
[H�].
K¿
K¿K¿
balance. By assuming a value for you can solve for theremaining formal concentration and, therefore, for all concentra-tions. By this means, find the composition as a function of pH. ThepH of the unbuffered solution is the pH at which the charge balanceis satisfied.
In the more difficult calcium fluoride solubility problem, ionpairing prevented us from reducing the equations to one unknown.Instead, and were both unknown. However, for a fixedvalue of we could use SOLVER to solve for The correctpH is the one at which the charge balance is satisfied.
To extract acid dissociation constants from an acid-base titra-tion curve, we can construct a difference plot, or Bjerrum plot,which is a graph of the mean fraction of bound protons, versuspH. This mean fraction can be measured from the quantities ofreagents that were mixed and the measured pH. The theoreticalshape of the difference plot is an expression in terms of fractionalcompositions. Use Excel SOLVER to vary equilibrium constants toobtain the best fit of the theoretical curve to the measured points.This process minimizes the sum of squares nH(theoretical)]2.
[nH(measured) �
nH,
[F�].[H�],[F�][H�]
[H�],

Problems 267
ProblemsInstructors: Most of these problems are quite long. Please be kindwhen you assign them.
13-1. Why does the solubility of a salt of a basic anion increasewith decreasing pH? Write chemical reactions for the mineralsgalena (PbS) and cerussite to explain how acid rain mobi-lizes traces of metal from relatively inert forms into the environ-ment, where the metals can be taken up by plants and animals.
13-2. (a) Considering just acid-base chemistry, not ion pair-ing and not activity coefficients, use the systematic treatment ofequilibrium to find the pH of 1.00 L of solution containing 0.010 0mol hydroxybenzene (HA) and 0.005 0 mol KOH.(b) What pH would you have predicted from your knowledge ofChapter 9?(c) Find the pH if [HA] and [KOH] were both reduced by a factorof 100.
13-3. Repeat part (a) of Problem 13-2 with Davies activitycoefficients. Remember that
13-4. From and for glycine at in Table 10-1, com-pute and which apply at Use the Davies equa-tion for activity coefficients. Compare your answer with experi-mental values in cells B10 and B11 of Figure 13-13.
13-5. Considering just acid-base chemistry, not ion pairingand not activity coefficients, use the systematic treatment of equi-librium to find the pH and concentrations of species in 1.00 L ofsolution containing 0.100 mol ethylenediamine and 0.035 mol HBr.Compare the pH with that found by the methods of Chapter 11.
13-6. Considering just acid-base chemistry, not ion pairingand not activity coefficients, find the pH and concentrations ofspecies in 1.00 L of solution containing 0.040 mol benzene-1,2,3-tricarboxylic acid 0.030 mol imidazole (a neutral molecule,HB), and 0.035 mol NaOH.
13-7. Considering just acid-base chemistry, not ion pairingand not activity coefficients, find the pH and concentrations ofspecies in 1.00 L of solution containing 0.020 mol arginine,0.030 mol glutamic acid, and 0.005 mol KOH.
13-8. Solve Problem 13-7 by using Davies activity coefficients.
13-9. A solution containing 0.008 695 m and0.030 43 m is a primary standard buffer with a stated pH of7.413 at Calculate the pH of this solution by using thesystematic treatment of equilibrium with activity coefficients from(a) the Davies equation and (b) the extended Debye-Hückel equation.
13-10. Considering just acid-base chemistry, not ion pair-ing and not activity coefficients, find the pH and compositionof 1.00 L of solution containing 0.040 mol ethylenedinitrilotetraacetic 0.030 mol lysine (neu-tral and 0.050 mol NaOH.
13-11. The solution containing no added for Figure 8-1contains 5.0 mM NaSCN, and 15 mM We will use Davies activity coefficients to find the concentrationsof all species by using the following reactions:
(� � 0)pKa � 2.195Fe3� � H2O T FeOH2� � H�
(� � 0)log �2 � 4.6Fe3� � 2SCN� T Fe(SCN)�2
(� � 0)log �1 � 3.03Fe3� � SCN� T Fe(SCN)2�
HNO3.5.0 �MFe(NO3)3,KNO3
molecule � HL),acid � H4A),
(EDTA �H4EDTA
25°C.Na2HPO4
KH2PO4
(H3A),
� � 0.1 M.pK¿2,pK¿1� � 0pK2pK1
pH � �log([H�]�H�).
(PbCO3)
This problem is harder than you might think, so we will guide youthrough the steps,(a) Write the four equilibrium expressions (including Expressthe effective equilibrium constants in terms of equilibrium con-stants and activity coefficients. For example, Write expressions for and
in terms of and (b) Write the charge balance.(c) Write mass balances for iron, thiocyanate, and (d) Substitute expressions from part (a) into the mass balance forthiocyanate to find an expression for in terms of (e) Substitute expressions from part (a) into the mass balance foriron to find an expression for in terms of and
(f) In a spreadsheet, guess a value for From this value,compute from part (d). From and compute
from part (e).(g) Compute the concentrations of all other species from
, and(h) Compute the net charge. We want to vary to reducethe net charge to 0. When the net charge is 0, you have the correctconcentrations. SOLVER did not work well for these equations.You have several recourses. One is to use GOAL SEEK, which issimilar to SOLVER but only handles 1 unknown. Start with and guess In the TOOLS menu, select OPTIONS
and Calculation. Set Maximum change to 1e-16. In the TOOLS
menu, select GOAL SEEK. Set cell: {net charge} To value: 0 Bychanging cell: {[SCN�]}. Click OK and GOAL SEEK finds a solu-tion. Calculate the new ionic strength and activity coefficientsfrom the Davies equation. Calculate effective equilibrium con-stants. Repeat the process until is constant to three significantdigits. If GOAL SEEK fails to work at some stage, vary byhand to reduce the net charge to near 0. When you are close to acorrect answer, GOAL SEEK can take you the rest of the way.When you have a solution, verify that the mass balances are satis-fied and compute (i) Find the quotient This is the point for in Figure 8-1. Compare youranswer with Figure 8-1. The ordinate of Figure 8-1 is labeled
but really refers to the totalconcentration of iron not bound to thiocyanate.(j) Find the quotient in part (i) when the solution also contains 0.20 M
Compare your answer with Figure 8-1.
13-12. (a) Follow the steps of Problem 13-11 to solve thisone. From the following equilibria, find the concentrations ofspecies and the pH of 1.0 mM Use Davies activity coef-ficients. You may wish to use GOAL SEEK in place of SOLVER asdescribed in Problem 13-11.
(b) If were a strong electrolyte, what would be the ionicstrength of 1.0 mM What is the actual ionic strength ofthis solution?(c) What fraction of lanthanum is (d) Why did we not consider hydrolysis of to give (e) Will precipitate in this solution?La(OH)3(s)
HSO�4 ?SO2�
4
La3�?
La2(SO4)3?La2(SO4)3
(� � 0)Ka � 10�8.5La3� � H2O T LaOH2� � H�
(� � 0)�2 � 105.3La3� � 2SO2�4 T La(SO4)�
2
(� � 0)�1 � 103.64La3� � SO2�4 T La(SO4)�
La2(SO4)3.
KNO3.
[Fe3�][Fe(SCN)2�]/ ([Fe3�][SCN�]),
[KNO3] � 0[Fe(SCN)2�]/(5[Fe3�] � [FeOH2�]6[SCN�]).
pH � �log([H�]�H�).
[SCN�]�
[SCN�] � 1e-6.� � 0
[SCN�][H�].[Fe3�]
[SCN�],[H�]
[Fe3�],[SCN�][Fe3�][SCN�].
[SCN�].[Fe3�][H�]
[SCN�].[Fe3�]
NO�3 .Na�,
[H�].[SCN�],[Fe3�],[OH�][FeOH2�],[Fe(SCN)�
2 ],[Fe(SCN)2�],K¿w � Kw/�H��OH�.
Kw).
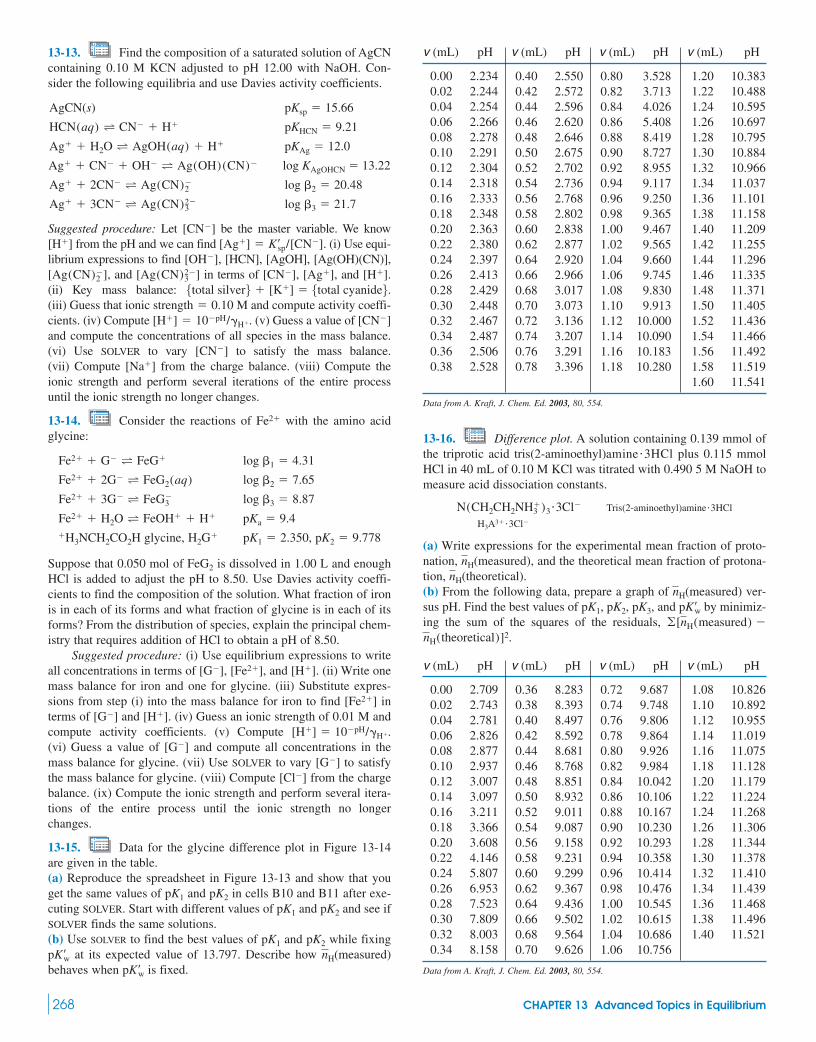
13-13. Find the composition of a saturated solution of AgCNcontaining 0.10 M KCN adjusted to pH 12.00 with NaOH. Con-sider the following equilibria and use Davies activity coefficients.
AgCN(s)
Suggested procedure: Let be the master variable. We knowfrom the pH and we can find (i) Use equi-
librium expressions to find [HCN], [AgOH], [Ag(OH)(CN)],and in terms of and
(ii) Key mass balance: (iii) Guess that ionic strength and compute activity coeffi-cients. (iv) Compute (v) Guess a value of and compute the concentrations of all species in the mass balance.(vi) Use SOLVER to vary to satisfy the mass balance.(vii) Compute from the charge balance. (viii) Compute theionic strength and perform several iterations of the entire processuntil the ionic strength no longer changes.
13-14. Consider the reactions of with the amino acidglycine:
glycine,
Suppose that 0.050 mol of is dissolved in 1.00 L and enoughHCl is added to adjust the pH to 8.50. Use Davies activity coeffi-cients to find the composition of the solution. What fraction of ironis in each of its forms and what fraction of glycine is in each of itsforms? From the distribution of species, explain the principal chem-istry that requires addition of HCl to obtain a pH of 8.50.
Suggested procedure: (i) Use equilibrium expressions to writeall concentrations in terms of and (ii) Write onemass balance for iron and one for glycine. (iii) Substitute expres-sions from step (i) into the mass balance for iron to find interms of and (iv) Guess an ionic strength of 0.01 M andcompute activity coefficients. (v) Compute (vi) Guess a value of and compute all concentrations in themass balance for glycine. (vii) Use SOLVER to vary to satisfythe mass balance for glycine. (viii) Compute from the chargebalance. (ix) Compute the ionic strength and perform several itera-tions of the entire process until the ionic strength no longerchanges.
13-15. Data for the glycine difference plot in Figure 13-14are given in the table.(a) Reproduce the spreadsheet in Figure 13-13 and show that youget the same values of and in cells B10 and B11 after exe-cuting SOLVER. Start with different values of and and see ifSOLVER finds the same solutions.(b) Use SOLVER to find the best values of and while fixing
at its expected value of 13.797. Describe how (measured)behaves when is fixed.pK¿w
nHpK¿wpK2pK1
pK2pK1
pK2pK1
[Cl�][G�]
[G�][H�] � 10�pH/�H�.
[H�].[G�][Fe2�]
[H�].[Fe2�],[G�],
FeG2
pK2 � 9.778pK1 � 2.350,H2G��H3NCH2CO2H
pKa � 9.4Fe2� � H2O T FeOH� � H�
log �3 � 8.87Fe2� � 3G� T FeG�3
log �2 � 7.65Fe2� � 2G� T FeG2(aq)
log �1 � 4.31Fe2� � G� T FeG�
Fe2�
[Na�][CN�]
[CN�][H�] � 10�pH/�H�.� 0.10 M5total silver6 � [K�] � 5total cyanide6.[H�].[Ag�],[CN�],[Ag(CN)2�
3 ][Ag(CN)�2 ],
[OH�],[Ag�] � K¿sp/[CN�].[H�]
[CN�]
log �3 � 21.7Ag� � 3CN� T Ag(CN)2�3
log �2 � 20.48Ag� � 2CN� T Ag(CN)�2
log KAgOHCN � 13.22Ag� � CN� � OH� T Ag(OH)(CN)�
pKAg � 12.0Ag� � H2O T AgOH(aq) � H�
pKHCN � 9.21HCN(aq) T CN� � H�
pKsp � 15.66
268 CHAPTER 13 Advanced Topics in Equilibrium
13-16. Difference plot. A solution containing 0.139 mmol ofthe triprotic acid tris(2-aminoethyl) plus 0.115 mmolHCl in 40 mL of 0.10 M KCl was titrated with 0.490 5 M NaOH tomeasure acid dissociation constants.
Tris(2-aminoethyl)amine
(a) Write expressions for the experimental mean fraction of proto-nation, (measured), and the theoretical mean fraction of protona-tion, (theoretical).(b) From the following data, prepare a graph of (measured) ver-sus pH. Find the best values of and by minimiz-ing the sum of the squares of the residuals, nH(theoretical)]2.
�[nH(measured) �pK¿wpK3,pK2,pK1,
nH
nH
nH
H3A3��3Cl�
�3HClN(CH2CH2NH�3 )3�3Cl�
amine�3HCl
v (mL) pH v (mL) pH v (mL) pH v (mL) pH
0.00 2.2340.02 2.2440.04 2.2540.06 2.2660.08 2.2780.10 2.2910.12 2.3040.14 2.3180.16 2.3330.18 2.3480.20 2.3630.22 2.3800.24 2.3970.26 2.4130.28 2.4290.30 2.4480.32 2.4670.34 2.4870.36 2.5060.38 2.528
Data from A. Kraft, J. Chem. Ed. 2003, 80, 554.
0.40 2.5500.42 2.5720.44 2.5960.46 2.6200.48 2.6460.50 2.6750.52 2.7020.54 2.7360.56 2.7680.58 2.8020.60 2.8380.62 2.8770.64 2.9200.66 2.9660.68 3.0170.70 3.0730.72 3.1360.74 3.2070.76 3.2910.78 3.396
0.80 3.5280.82 3.7130.84 4.0260.86 5.4080.88 8.4190.90 8.7270.92 8.9550.94 9.1170.96 9.2500.98 9.3651.00 9.4671.02 9.5651.04 9.6601.06 9.7451.08 9.8301.10 9.9131.12 10.0001.14 10.0901.16 10.1831.18 10.280
1.20 10.3831.22 10.4881.24 10.5951.26 10.6971.28 10.7951.30 10.8841.32 10.9661.34 11.0371.36 11.1011.38 11.1581.40 11.2091.42 11.2551.44 11.2961.46 11.3351.48 11.3711.50 11.4051.52 11.4361.54 11.4661.56 11.4921.58 11.5191.60 11.541
v (mL) pH v (mL) pH v (mL) pH v (mL) pH
0.00 2.7090.02 2.7430.04 2.7810.06 2.8260.08 2.8770.10 2.9370.12 3.0070.14 3.0970.16 3.2110.18 3.3660.20 3.6080.22 4.1460.24 5.8070.26 6.9530.28 7.5230.30 7.8090.32 8.0030.34 8.158
Data from A. Kraft, J. Chem. Ed. 2003, 80, 554.
0.36 8.2830.38 8.3930.40 8.4970.42 8.5920.44 8.6810.46 8.7680.48 8.8510.50 8.9320.52 9.0110.54 9.0870.56 9.1580.58 9.2310.60 9.2990.62 9.3670.64 9.4360.66 9.5020.68 9.5640.70 9.626
0.72 9.6870.74 9.7480.76 9.8060.78 9.8640.80 9.9260.82 9.9840.84 10.0420.86 10.1060.88 10.1670.90 10.2300.92 10.2930.94 10.3580.96 10.4140.98 10.4761.00 10.5451.02 10.6151.04 10.6861.06 10.756
1.08 10.8261.10 10.8921.12 10.9551.14 11.0191.16 11.0751.18 11.1281.20 11.1791.22 11.2241.24 11.2681.26 11.3061.28 11.3441.30 11.3781.32 11.4101.34 11.4391.36 11.4681.38 11.4961.40 11.521
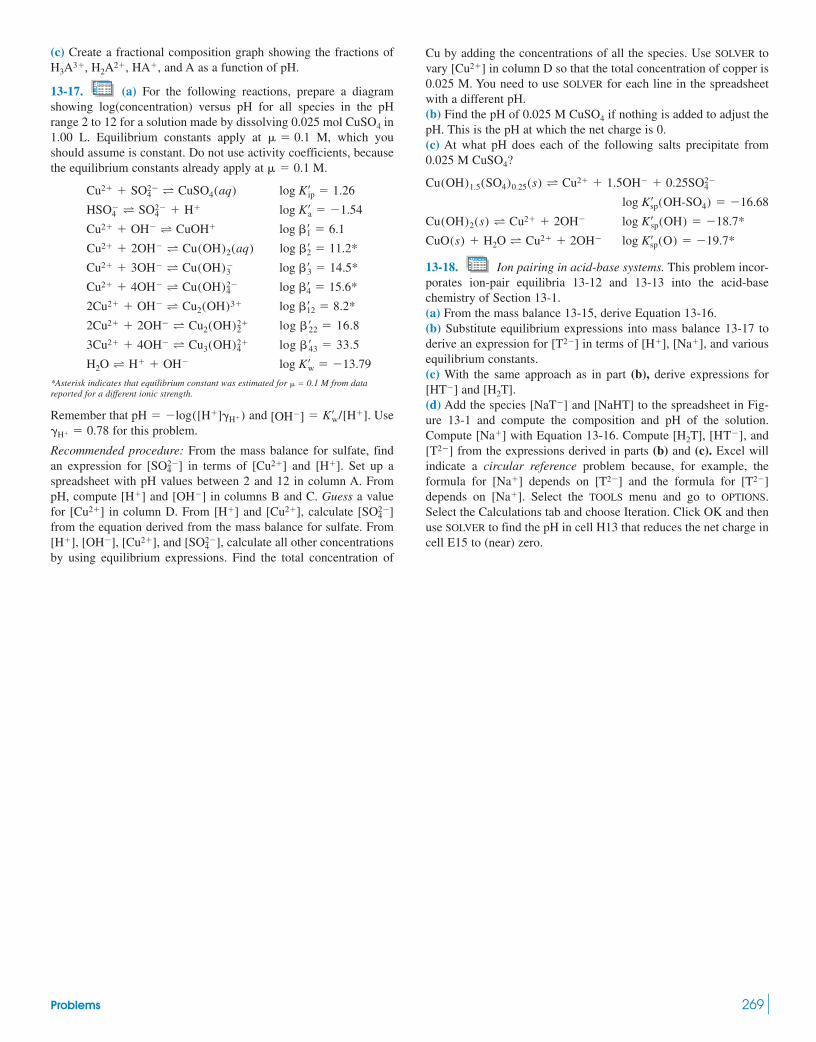
Cu by adding the concentrations of all the species. Use SOLVER tovary in column D so that the total concentration of copper is0.025 M. You need to use SOLVER for each line in the spreadsheetwith a different pH.(b) Find the pH of 0.025 M if nothing is added to adjust thepH. This is the pH at which the net charge is 0.(c) At what pH does each of the following salts precipitate from0.025 M
13-18. Ion pairing in acid-base systems. This problem incor-porates ion-pair equilibria 13-12 and 13-13 into the acid-basechemistry of Section 13-1.(a) From the mass balance 13-15, derive Equation 13-16.(b) Substitute equilibrium expressions into mass balance 13-17 toderive an expression for in terms of and variousequilibrium constants.(c) With the same approach as in part (b), derive expressions for
and(d) Add the species and to the spreadsheet in Fig-ure 13-1 and compute the composition and pH of the solution.Compute with Equation 13-16. Compute , and
from the expressions derived in parts (b) and (c). Excel willindicate a circular reference problem because, for example, theformula for depends on and the formula for depends on Select the TOOLS menu and go to OPTIONS.Select the Calculations tab and choose Iteration. Click OK and thenuse SOLVER to find the pH in cell H13 that reduces the net charge incell E15 to (near) zero.
[Na�].[T2�][T2�][Na�]
[T2�][HT�][H2T],[Na�]
[NaHT][NaT�][H2T].[HT�]
[Na�],[H�],[T2�]
log K¿sp(O) � �19.7*CuO(s) � H2O T Cu2� � 2OH�
log K¿sp(OH) � �18.7*Cu(OH)2(s) T Cu2� � 2OH�
log K¿sp(OH-SO4) � �16.68
Cu(OH)1.5(SO4)0.25(s) T Cu2� � 1.5OH� � 0.25SO2�4
CuSO4?
CuSO4
[Cu2�]
Problems 269
(c) Create a fractional composition graph showing the fractions ofand A as a function of pH.
13-17. (a) For the following reactions, prepare a diagramshowing log(concentration) versus pH for all species in the pHrange 2 to 12 for a solution made by dissolving 0.025 mol in1.00 L. Equilibrium constants apply at M, which youshould assume is constant. Do not use activity coefficients, becausethe equilibrium constants already apply at M.
*Asterisk indicates that equilibrium constant was estimated for 0.1 M from datareported for a different ionic strength.
Remember that and Usefor this problem.
Recommended procedure: From the mass balance for sulfate, findan expression for in terms of and Set up aspreadsheet with pH values between 2 and 12 in column A. FrompH, compute and in columns B and C. Guess a valuefor in column D. From and calculate from the equation derived from the mass balance for sulfate. From
and calculate all other concentrationsby using equilibrium expressions. Find the total concentration of
[SO2�4 ],[Cu2�],[OH�],[H�],
[SO2�4 ][Cu2�],[H�][Cu2�]
[OH�][H�]
[H�].[Cu2�][SO2�4 ]
�H� � 0.78� K¿w/[H�].[OH�]pH � �log([H�]�H�)
� �
log K¿w � �13.79H2O T H� � OH�
log � ¿43 � 33.53Cu2� � 4OH� T Cu3(OH)2�4
log � ¿22 � 16.82Cu2� � 2OH� T Cu2(OH)2�2
log �¿12 � 8.2*2Cu2� � OH� T Cu2(OH)3�
log �¿4 � 15.6*Cu2� � 4OH� T Cu(OH)2�4
log �¿3 � 14.5*Cu2� � 3OH� T Cu(OH)�3
log �¿2 � 11.2*Cu2� � 2OH� T Cu(OH)2(aq)
log �¿1 � 6.1Cu2� � OH� T CuOH�
log K¿a � �1.54HSO�4 T SO2�
4 � H�
log K¿ip � 1.26Cu2� � SO2�4 T CuSO4(aq)
� � 0.1
� � 0.1CuSO4
HA�,H2A2�,H3A3�,

270 CHAPTER 14 Fundamentals of Electrochemistry
Microbes residing in sediment beneath oceans and lakes derive energy by oxidizing organicmatter. is available as the oxidant at the sediment–water interface, but it is depletedwithin millimeters below the interface. Nitrate and Fe(III) oxidants are available in the firstfew centimeters of sediment. When they are exhausted, sulfate becomes the predominantoxidant for a distance of The sulfate reduction product, is released in millimolarconcentrations into solution in the sediment pores.
Two large, perforated graphite electrodes positioned above and below the sediment–waterinterface act as a fuel cell—a device that derives electricity from a continuous flow of fuel andoxidizer. The electrode in the water is in an oxidizing environment, and the electrode in thesediment is in a reducing environment. A prototype cell in a coastal salt marsh generated
0.27 V over a 4-month period (panel b). Power losses occurred three times whenthe cathode became covered with sediment. Panel c shows depletion of sulfide in the sedimentnear the anode, confirming that sulfide is a fuel consumed at this electrode. Oxidation of sul-fide accounts for half of the power output. The other half is likely derived from oxidation ofacetate (from organic matter) by microorganisms colonizing the anode, with direct transfer ofelectrons to the anode. Suitably large electrodes could one day provide power to operateremote oceanographic instruments.
25 mW/m2 at
HS�,�1 m.
O2
ELECTRICITY FROM THE OCEAN FLOOR
Fundamentals of Electrochemistry14H2O
Water
Sediment
30 cm
Graphite cathode
Oceanographicinstrument
Graphite anode
2H+ + 2e� +
S + H+ + 2e�
SO2�
CO2 Organicmatter
HS�
HS–
4
e�
e�~0.3 V
O221
Microbe
A major branch of analytical chemistry uses electrical measurements of chemical processesat the surface of an electrode for analytical purposes. For example, hormones released from asingle cell can be measured in this manner. Principles developed in this chapter provide afoundation for potentiometry, redox titrations, electrogravimetric and coulometric analysis,voltammetry, and amperometry in the following chapters.1,2
14-1 Basic ConceptsA redox reaction involves transfer of electrons from one species to another. A species is saidto be oxidized when it loses electrons. It is reduced when it gains electrons. An oxidizing
40
30
20
10
00 4 8
Week
12 16
Pow
er o
utpu
t (m
W/m
2 )
Sediment removedfrom cathode bydiver
Sulfide (mM)
0 1 2 3 4 5
6
8
4
2
0
–2
–4
–6
–8
Dis
tanc
e fr
om a
node
(cm
)
Active cell
Control(inactive) cell
(a) Fuel cell formed by electrodes above and below the sediment–water interface on the ocean floor.[Adapted from C. E. Reimers, L. M. Tender, S. Fertig, and W. Wang,“Harvesting Energy from the Marine Sediment–WaterInterface, Environ. Sci. Technol. 2001, 35, 192.] (b) Power output from prototype fuel cell. (c) Sulfide in sediment pore water is depleted adjacent to anode. [Charts from L. M. Tender, C. E. Reimers, H. A. Stecher III,D. W. Holmes, D. R. Bond, D. A. Lowry, K. Pilobello, S. J. Fertig, and D. R. Lovley, “Harnessing Microbially GeneratedPower on the Seafloor,” Nat. Biotechnol. 2002, 20, 821.]
Electrodes next to an adrenal cell measurerelease of the hormone epinephrine. [Photo
courtesy R. M. Wightman, University of North Carolina.]
(a)
(c )
(b)

agent, also called an oxidant, takes electrons from another substance and becomes reduced.A reducing agent, also called a reductant, gives electrons to another substance and is oxi-dized in the process. In the reaction
(14-1)Oxidizing Reducing
agent agent
is the oxidizing agent because it takes an electron from is the reducing agentbecause it gives an electron to is reduced, and is oxidized as the reaction pro-ceeds from left to right. Appendix D reviews oxidation numbers and balancing of redoxequations.
Chemistry and ElectricityWhen electrons from a redox reaction flow through an electric circuit, we can learn some-thing about the reaction by measuring current and voltage. Electric current is proportional tothe rate of reaction, and the cell voltage is proportional to the free-energy change for the elec-trochemical reaction. In techniques such as voltammetry, the voltage can be used to identifyreactants.
Electric ChargeElectric charge, q, is measured in coulombs (C). The magnitude of the charge of a single elec-tron is so a mole of electrons has a charge of
which is called the Faraday constant, F.
(14-2)
Coulombs mol e�
where n is the number of moles of electrons transferred.
Example Relating Coulombs to Quantity of Reaction
If 5.585 g of were reduced in Reaction 14-1, how many coulombs of charge musthave been transferred from to
Solution First, we find that 5.585 g of equal 0.100 0 mol of Because each ion requires one electron in Reaction 14-1, 0.100 0 mol of electrons must have been
transferred. Using the Faraday constant, we find that 0.100 0 mol of electrons corresponds to
Electric CurrentThe quantity of charge flowing each second through a circuit is called the current. The unitof current is the ampere, abbreviated A. A current of 1 ampere represents a charge of1 coulomb per second flowing past a point in a circuit.
Example Relating Current to Rate of Reaction
Suppose that electrons are forced into a platinum wire immersed in a solution containing(Figure 14-1), which is reduced to at a constant rate of 4.24 mmol/h. How
much current passes through the solution?
Solution Two electrons are required to reduce one ion:
If reacts at a rate of 4.24 mmol/h, electrons flow at a rate of which corresponds to
8.48 mmol e�/h
3 600 s/h� 2.356 � 10�3
mmol e�
s� 2.356 � 10�6
mol e�
s
8.48 mmol/h,2(4.24 mmol/h) �Sn4�
Sn4� � 2e� S Sn2�
Sn4�
Sn2�Sn4�
q � nF � (0.100 0 mol e�) a9.649 � 104C
mol e�b � 9.649 � 103 C
Fe3�
Fe3�.Fe3�
Fe3�?V2�
Fe3�
Coulombs
mol e�
q � n � FRelation betweencharge and moles:
1023 mol�1) � 9.649 � 104 C,(1.602 � 10�19 C)(6.022 �1.602 � 10�19 C,
V2�Fe3�Fe3�.V2�V2�.Fe3�
Fe3� � V2� S Fe2� � V3�
14-1 Basic Concepts 271
e–
Sn4+
Sn2+
Figure 14-1 Electrons flowing into a coil of Pt wire at which ions in solution arereduced to . This process could nothappen by itself, because there is nocomplete circuit. If is to be reduced at this Pt electrode, some other species must beoxidized at some other place.
Sn4�
Sn2�
Sn4�
Oxidation: loss of electronsReduction: gain of electronsOxidizing agent: takes electronsReducing agent: gives electrons
V2� S V3� � e�
Fe3� � e� S Fe2�
Faraday constant (F ) �coulombs
mole of electrons
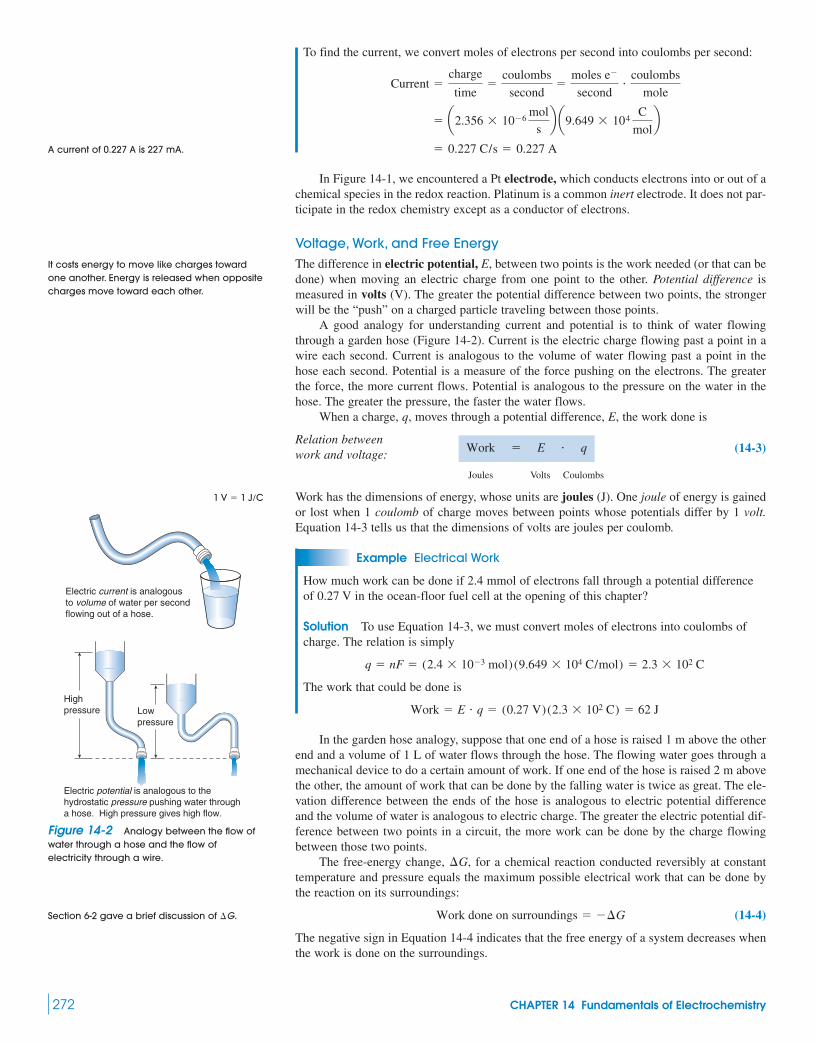
To find the current, we convert moles of electrons per second into coulombs per second:
In Figure 14-1, we encountered a Pt electrode, which conducts electrons into or out of achemical species in the redox reaction. Platinum is a common inert electrode. It does not par-ticipate in the redox chemistry except as a conductor of electrons.
Voltage, Work, and Free EnergyThe difference in electric potential, E, between two points is the work needed (or that can bedone) when moving an electric charge from one point to the other. Potential difference ismeasured in volts (V). The greater the potential difference between two points, the strongerwill be the “push” on a charged particle traveling between those points.
A good analogy for understanding current and potential is to think of water flowingthrough a garden hose (Figure 14-2). Current is the electric charge flowing past a point in awire each second. Current is analogous to the volume of water flowing past a point in thehose each second. Potential is a measure of the force pushing on the electrons. The greaterthe force, the more current flows. Potential is analogous to the pressure on the water in thehose. The greater the pressure, the faster the water flows.
When a charge, q, moves through a potential difference, E, the work done is
Relation between(14-3)work and voltage:
Joules Volts Coulombs
Work has the dimensions of energy, whose units are joules (J). One joule of energy is gainedor lost when 1 coulomb of charge moves between points whose potentials differ by 1 volt.Equation 14-3 tells us that the dimensions of volts are joules per coulomb.
Example Electrical Work
How much work can be done if 2.4 mmol of electrons fall through a potential differenceof 0.27 V in the ocean-floor fuel cell at the opening of this chapter?
Solution To use Equation 14-3, we must convert moles of electrons into coulombs ofcharge. The relation is simply
The work that could be done is
In the garden hose analogy, suppose that one end of a hose is raised 1 m above the otherend and a volume of 1 L of water flows through the hose. The flowing water goes through amechanical device to do a certain amount of work. If one end of the hose is raised 2 m abovethe other, the amount of work that can be done by the falling water is twice as great. The ele-vation difference between the ends of the hose is analogous to electric potential differenceand the volume of water is analogous to electric charge. The greater the electric potential dif-ference between two points in a circuit, the more work can be done by the charge flowingbetween those two points.
The free-energy change, for a chemical reaction conducted reversibly at constanttemperature and pressure equals the maximum possible electrical work that can be done bythe reaction on its surroundings:
(14-4)
The negative sign in Equation 14-4 indicates that the free energy of a system decreases whenthe work is done on the surroundings.
Work done on surroundings � ��G
�G,
Work � E � q � (0.27 V)(2.3 � 102 C) � 62 J
q � nF � (2.4 � 10�3 mol)(9.649 � 104 C/mol) � 2.3 � 102 C
Work � E � q
� 0.227 C/s � 0.227 A
� a2.356 � 10�6mol
sb a9.649 � 104
C
molb
Current �charge
time�
coulombs
second�
moles e�
second�
coulombs
mole
272 CHAPTER 14 Fundamentals of Electrochemistry
A current of 0.227 A is 227 mA.
It costs energy to move like charges towardone another. Energy is released when oppositecharges move toward each other.
1 V � 1 J/C
Section 6-2 gave a brief discussion of �G.
Electric current is analogousto volume of water per secondflowing out of a hose.
Figure 14-2 Analogy between the flow ofwater through a hose and the flow ofelectricity through a wire.
Highpressure
Electric potential is analogous to thehydrostatic pressure pushing water througha hose. High pressure gives high flow.
Lowpressure
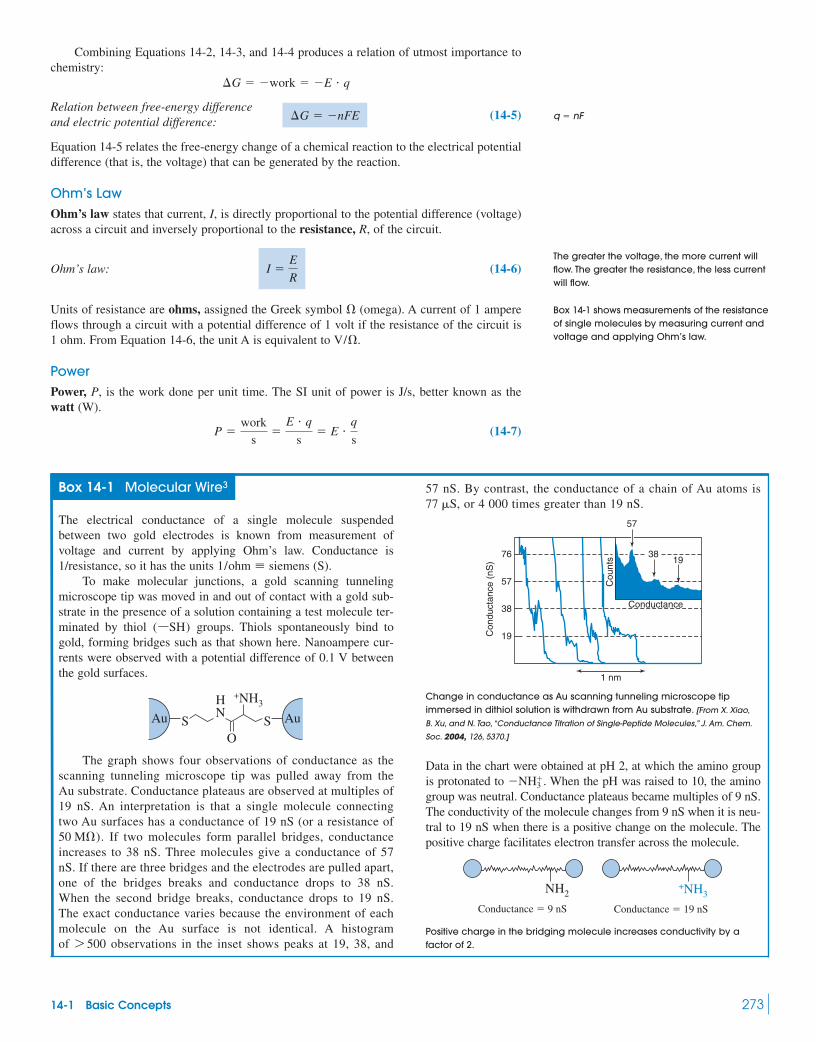
Combining Equations 14-2, 14-3, and 14-4 produces a relation of utmost importance tochemistry:
Relation between free-energy differenceand electric potential difference: (14-5)
Equation 14-5 relates the free-energy change of a chemical reaction to the electrical potentialdifference (that is, the voltage) that can be generated by the reaction.
Ohm’s LawOhm’s law states that current, I, is directly proportional to the potential difference (voltage)across a circuit and inversely proportional to the resistance, R, of the circuit.
Ohm’s law: (14-6)
Units of resistance are ohms, assigned the Greek symbol (omega). A current of 1 ampereflows through a circuit with a potential difference of 1 volt if the resistance of the circuit is1 ohm. From Equation 14-6, the unit A is equivalent to
PowerPower, P, is the work done per unit time. The SI unit of power is J/s, better known as thewatt (W).
(14-7)P �work
s�
E � q
s� E �
q
s
V/�.
�
I �E
R
�G � �nFE
�G � �work � �E � q
14-1 Basic Concepts 273
Box 14-1 Molecular Wire3
The electrical conductance of a single molecule suspendedbetween two gold electrodes is known from measurement ofvoltage and current by applying Ohm’s law. Conductance is1/resistance, so it has the units (S).
To make molecular junctions, a gold scanning tunnelingmicroscope tip was moved in and out of contact with a gold sub-strate in the presence of a solution containing a test molecule ter-minated by thiol groups. Thiols spontaneously bind togold, forming bridges such as that shown here. Nanoampere cur-rents were observed with a potential difference of 0.1 V betweenthe gold surfaces.
The graph shows four observations of conductance as thescanning tunneling microscope tip was pulled away from theAu substrate. Conductance plateaus are observed at multiples of19 nS. An interpretation is that a single molecule connectingtwo Au surfaces has a conductance of 19 nS (or a resistance of
If two molecules form parallel bridges, conductanceincreases to 38 nS. Three molecules give a conductance of 57nS. If there are three bridges and the electrodes are pulled apart,one of the bridges breaks and conductance drops to 38 nS.When the second bridge breaks, conductance drops to 19 nS.The exact conductance varies because the environment of eachmolecule on the Au surface is not identical. A histogramof observations in the inset shows peaks at 19, 38, and7 500
50 M�).
NH +NH3
S SO
AuAu
(ßSH)
1/ohm � siemens
57 nS. By contrast, the conductance of a chain of Au atoms isor 4 000 times greater than 19 nS.
Data in the chart were obtained at pH 2, at which the amino groupis protonated to When the pH was raised to 10, the aminogroup was neutral. Conductance plateaus became multiples of 9 nS.The conductivity of the molecule changes from 9 nS when it is neu-tral to 19 nS when there is a positive change on the molecule. Thepositive charge facilitates electron transfer across the molecule.
Positive charge in the bridging molecule increases conductivity by afactor of 2.
NH2
Conductance � 9 nS
+NH3
Conductance � 19 nS
�NH�3 .
Con
duct
ance
(nS
)
Cou
nts
19
38
57
76
Conductance
1 nm
57
3819
77 �S,
q � nF
The greater the voltage, the more current willflow. The greater the resistance, the less currentwill flow.
Box 14-1 shows measurements of the resistanceof single molecules by measuring current andvoltage and applying Ohm’s law.
Change in conductance as Au scanning tunneling microscope tipimmersed in dithiol solution is withdrawn from Au substrate. [From X. Xiao,
B. Xu, and N. Tao, “Conductance Titration of Single-Peptide Molecules,” J. Am. Chem.
Soc. 2004, 126, 5370.]

Because q/s is the current, I, we can write
(14-8)
A cell capable of delivering 1 ampere at a potential difference of 1 volt has a power output of1 watt.
Example Using Ohm’s Law
In the circuit in Figure 14-3, the battery generates a potential difference of 3.0 V, and theresistor has a resistance of We assume that the resistance of the wire connectingthe battery and the resistor is negligible. How much current and how much power aredelivered by the battery in this circuit?
Solution The current in this circuit is
The power produced by the battery must be
What happens to the power generated by the circuit? The energy appears as heat in theresistor. The power (90 mW) equals the rate at which heat is produced in the resistor.
Here is a summary of symbols, units, and relations from the last few pages:
Relation betweencharge and moles:
Charge Moles C/mole(coulombs, C)
Relation betweenwork and voltage:
Joules, J Volts, V Coulombs
Relation between free-energy differenceand electric potential difference:
Joules
Ohm’s law:Current Volts Resistance
(A) (V) (ohms, �)
Electric power:
Power J/s Volts Amperes(watts, W)
14-2 Galvanic CellsA galvanic cell (also called a voltaic cell) uses a spontaneous chemical reaction to generateelectricity. To accomplish this, one reagent must be oxidized and another must be reduced.The two cannot be in contact, or electrons would flow directly from the reducing agent to theoxidizing agent. Instead, the oxidizing and reducing agents are physically separated, andelectrons are forced to flow through an external circuit to go from one reactant to the other.Batteries5 and fuel cells6 are galvanic cells that consume their reactants to generate electric-ity. A battery has a static compartment filled with reactants. In a fuel cell, fresh reactants flowpast the electrodes and products are continuously flushed from the cell.
A Cell in ActionFigure 14-4 shows a galvanic cell with two electrodes suspended in a solution of Oneelectrode is cadmium; the other is metallic silver coated with solid AgCl. The reactions are
Net reaction: Cd(s) � 2AgCl(s) T Cd2�(aq) � 2Ag(s) � 2Cl�(aq)
Oxidation: Cd(s) T Cd2� (aq) � 2e�
Reduction: 2AgCl(s) � 2e� T 2Ag(s) � 2Cl�(aq)
CdCl2.
P � work
s � E � I
I � E / R
�G � �nFE
Work � E � q
q � n � F
P � E � I � (3.0 V)(0.030 A) � 90 mW
I �E
R�
3.0 V
100 �� 0.030 A � 30 mA
100 �.
P � E � I
274 CHAPTER 14 Fundamentals of Electrochemistry
Battery3.0 V
+
–
Resistor100 Ω
Electronsflow in thisdirection
Power P � E � I � (IR ) � I � I 2R
(watts) � work per second
Figure 14-3 A circuit with a battery and aresistor. Benjamin Franklin investigated staticelectricity in the 1740s.4 He thought electricitywas a fluid that flows from a silk cloth to a glassrod when the rod is rubbed with the cloth. Wenow know that electrons flow from glass to silk.However, Franklin’s convention for the directionof electric current has been retained, so wesay that current flows from positive tonegative—in the opposite direction ofelectron flow.
F is the Faraday constant (96 485 C/mol).
E is electric potential difference measured involts (V). E is the work (J) needed to move acoulomb of positive charge from one point tothe other.
n is moles of charge moved through thepotential difference, E.
I is electric current, measured in amperes (A).It is coulombs per second moving past apoint in the circuit. R is resistance in ohms Units: A � V/�.
(�).
Power is work per unit time (J/s) done byelectricity moving through a circuit.
A galvanic cell uses a spontaneous chemicalreaction to generate electricity.

The net reaction is composed of a reduction and an oxidation, each of which is called a half-reaction. The two half-reactions are written with equal numbers of electrons so that theirsum includes no free electrons.
Oxidation of Cd metal to provides electrons that flow through the circuit tothe Ag electrode in Figure 14-4. At the Ag surface, (from AgCl) is reduced to Ag(s).Chloride from AgCl goes into solution. The free-energy change for the net reaction, per mole of Cd, provides the driving force that pushes electrons through the circuit.
Example Voltage Produced by a Chemical Reaction
Calculate the voltage that would be measured by the potentiometer in Figure 14-4.
Solution Because of Cd, we can use Equation 14-5 (where n is thenumber of moles of electrons transferred in the balanced net reaction) to write
A spontaneous chemical reaction (negative produces a positive voltage.
Chemists define the electrode at which reduction occurs as the cathode. The anode isthe electrode at which oxidation occurs. In Figure 14-4, Ag is the cathode because reductiontakes place at its surface and Cd is the anode because it isoxidized
Salt BridgeConsider the cell in Figure 14-5, in which the reactions are intended to be
(14-9) Net reaction: Cd(s) � 2Ag�(aq) T Cd2� (aq) � 2Ag(s)
Anode: Cd(s) T Cd2� (aq) � 2e�
Cathode: 2Ag�(aq) � 2e� T 2Ag(s)
(Cd S Cd2� � 2e�).(2AgCl � 2e� S 2Ag � 2Cl�),
�G)
� �0.777 J/C � �0.777 V
E � ��G
nF� �
�150 � 103 J
(2 mol) a9.649 � 104C
molb
�G � �150 kJ/mol
�150 kJAg�
Cd2�(aq)
14-2 Galvanic Cells 275
AgCd
V
+–
Wiree−
Cd2+(aq )
0.016 7 M CdCl2(aq )
Potentiometer
Cathode(reduction)
Anode(oxidation)
Cl−(aq )
AgCl(s )
Figure 14-4 A simple galvanic cell. The potentiometer measures voltage. It has positive andnegative terminals. When electrons flow into the negative terminal, as in this illustration, the voltage ispositive.
Recall that is negative for a spontaneousreaction.
�G
Reminder: 1 J/C � 1 volt
Cathode: where reduction occursAnode: where oxidation occurs

The net reaction is spontaneous, but little current flows through the circuit because isnot forced to be reduced at the Ag electrode. Aqueous can react directly at the Cd(s) sur-face, giving the same net reaction with no flow of electrons through the external circuit.
We can separate the reactants into two half-cells9 if we connect the two halves with asalt bridge, as shown in Figure 14-6. The salt bridge is a U-shaped tube filled with a gel con-taining a high concentration of (or other electrolyte that does not affect the cell reac-tion). The ends of the bridge are porous glass disks that allow ions to diffuse but minimizemixing of the solutions inside and outside the bridge. When the galvanic cell is operating, from the bridge migrates into the cathode compartment and a small amount of migratesfrom the cathode into the bridge. Ion migration offsets the charge buildup that would other-wise occur as electrons flow into the silver electrode. The migration of ions out of the bridgeis greater than the migration of ions into the bridge because the salt concentration in the
NO�3
K�
KNO3
Ag�
Ag�
276 CHAPTER 14 Fundamentals of Electrochemistry
Figure 14-6 A cell that works—thanks to the salt bridge!
3Cd2+(aq), NO–(aq )
AgCd
V
+–
Ag+(aq), NO–(aq)3
Figure 14-5 A cell that will not work. The solution contains and AgNO3.Cd(NO3)2
A salt bridge maintains electroneutrality (nocharge buildup) throughout the cell. SeeDemonstration 14-1.
The cell in Figure 14-5 is short-circuited.
Porousglassplates AgNO3(aq)Cd(NO3)2(aq)
Cd
Salt bridge
Cd2+
e–
– +
V
Ag
NO–
K+NO3
–
NO3– K+
AnodeCd(s) Cd2+(aq) + 2e–
Cathode2Ag+(aq ) + 2e– 2Ag(s )
3
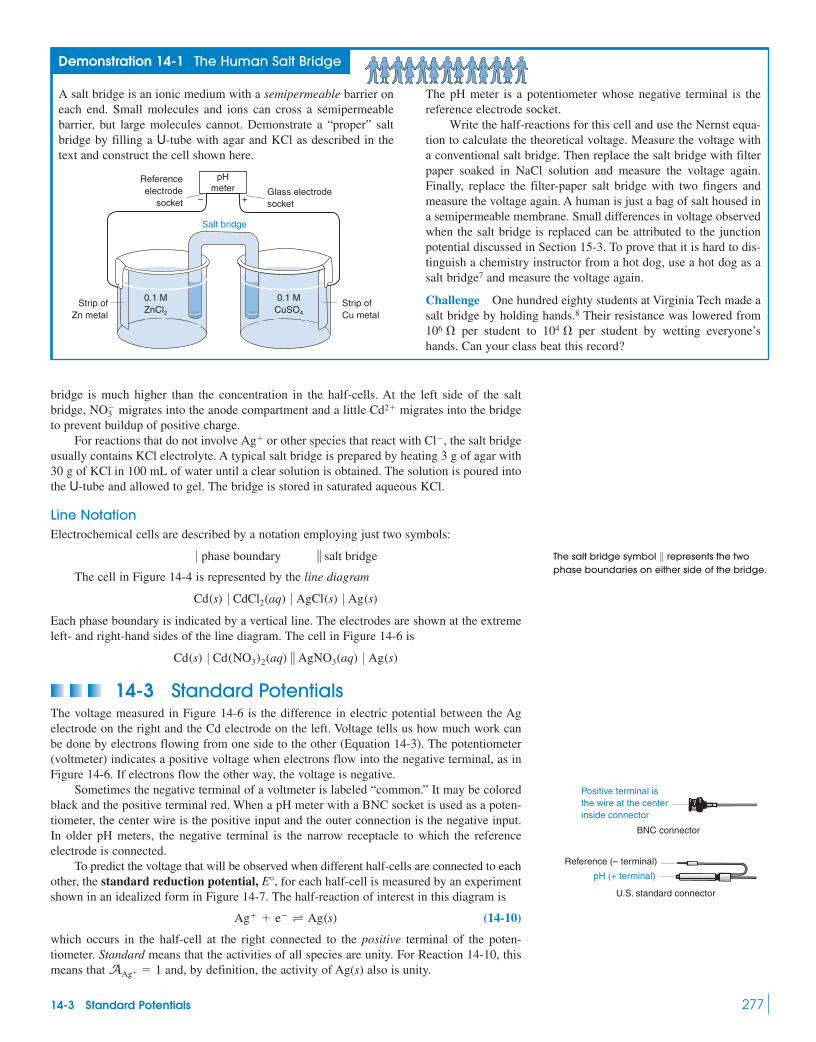
bridge is much higher than the concentration in the half-cells. At the left side of the saltbridge, migrates into the anode compartment and a little migrates into the bridgeto prevent buildup of positive charge.
For reactions that do not involve or other species that react with the salt bridgeusually contains KCl electrolyte. A typical salt bridge is prepared by heating 3 g of agar with30 g of KCl in 100 mL of water until a clear solution is obtained. The solution is poured intothe U-tube and allowed to gel. The bridge is stored in saturated aqueous KCl.
Line NotationElectrochemical cells are described by a notation employing just two symbols:
The cell in Figure 14-4 is represented by the line diagram
Each phase boundary is indicated by a vertical line. The electrodes are shown at the extremeleft- and right-hand sides of the line diagram. The cell in Figure 14-6 is
14-3 Standard PotentialsThe voltage measured in Figure 14-6 is the difference in electric potential between the Agelectrode on the right and the Cd electrode on the left. Voltage tells us how much work canbe done by electrons flowing from one side to the other (Equation 14-3). The potentiometer(voltmeter) indicates a positive voltage when electrons flow into the negative terminal, as inFigure 14-6. If electrons flow the other way, the voltage is negative.
Sometimes the negative terminal of a voltmeter is labeled “common.” It may be coloredblack and the positive terminal red. When a pH meter with a BNC socket is used as a poten-tiometer, the center wire is the positive input and the outer connection is the negative input.In older pH meters, the negative terminal is the narrow receptacle to which the referenceelectrode is connected.
To predict the voltage that will be observed when different half-cells are connected to eachother, the standard reduction potential, for each half-cell is measured by an experimentshown in an idealized form in Figure 14-7. The half-reaction of interest in this diagram is
(14-10)
which occurs in the half-cell at the right connected to the positive terminal of the poten-tiometer. Standard means that the activities of all species are unity. For Reaction 14-10, thismeans that and, by definition, the activity of Ag(s) also is unity.AAg� � 1
Ag� � e� T Ag(s)
E°,
Cd(s) 0 Cd(NO3)2(aq) � AgNO3(aq) 0 Ag(s)
Cd(s) 0 CdCl2(aq) 0 AgCl(s) 0 Ag(s)
0 phase boundary � salt bridge
Cl�,Ag�
Cd2�NO�3
14-3 Standard Potentials 277
Demonstration 14-1 The Human Salt Bridge
A salt bridge is an ionic medium with a semipermeable barrier oneach end. Small molecules and ions can cross a semipermeablebarrier, but large molecules cannot. Demonstrate a “proper” saltbridge by filling a U-tube with agar and KCl as described in thetext and construct the cell shown here.
Strip ofZn metal
Referenceelectrode
socket – +
Salt bridge
0.1 MZnCl2
0.1 MCuSO4
Glass electrodesocket
Strip ofCu metal
pHmeter
The pH meter is a potentiometer whose negative terminal is thereference electrode socket.
Write the half-reactions for this cell and use the Nernst equa-tion to calculate the theoretical voltage. Measure the voltage witha conventional salt bridge. Then replace the salt bridge with filterpaper soaked in NaCl solution and measure the voltage again.Finally, replace the filter-paper salt bridge with two fingers andmeasure the voltage again. A human is just a bag of salt housed ina semipermeable membrane. Small differences in voltage observedwhen the salt bridge is replaced can be attributed to the junctionpotential discussed in Section 15-3. To prove that it is hard to dis-tinguish a chemistry instructor from a hot dog, use a hot dog as asalt bridge7 and measure the voltage again.
Challenge One hundred eighty students at Virginia Tech made asalt bridge by holding hands.8 Their resistance was lowered from
per student to per student by wetting everyone’shands. Can your class beat this record?
104 �106 �
The salt bridge symbol represents the twophase boundaries on either side of the bridge.
�
U.S. standard connector
Reference (– terminal)
pH (+ terminal)
BNC connector
Positive terminal isthe wire at the centerinside connector

The left half-cell, connected to the negative terminal of the potentiometer, is called thestandard hydrogen electrode (S.H.E.). It consists of a catalytic Pt surface in contact with anacidic solution in which A stream of bubbled through the electrode satu-rates the solution with The activity of is unity if the pressure of is 1 bar.The reaction that comes to equilibrium at the surface of the Pt electrode is
(14-11)
We arbitrarily assign a potential of 0 to the standard hydrogen electrode at The voltagemeasured by the meter in Figure 14-7 can therefore be assigned to Reaction 14-10, whichoccurs in the right half-cell. The measured value is the standard reductionpotential for Reaction 14-10. The positive sign tells us that electrons flow from left to rightthrough the meter.
We can arbitrarily assign a potential to Reaction 14-11 because it serves as a referencepoint from which we can measure other half-cell potentials. An analogy is the arbitraryassignment of to the freezing point of water. Relative to this freezing point, hexane boilsat and benzene boils at The difference between boiling points is If we had assigned the freezing point of water to be instead of hexane boils at
and benzene boils at The difference between boiling points is still Regardlessof where we set zero on the scale, differences between points remain constant.
The line notation for the cell in Figure 14-7 is
or
By convention, the left-hand electrode (Pt) is attached to the negative (reference) terminal ofthe potentiometer and the right-hand electrode is attached to the positive terminal. A stan-dard reduction potential is really a potential difference between the potential of the reactionof interest and the potential of S.H.E, which we have arbitrarily set to 0.
To measure the standard potential of the half-reaction
(14-12)
we construct the cell
with the cadmium half-cell connected to the positive terminal of the potentiometer. In thiscase, we observe a negative voltage of The negative sign means that electronsflow from Cd to Pt, a direction opposite that of the cell in Figure 14-7.
Appendix H contains standard reduction potentials arranged alphabetically by element.If the half-reactions were arranged according to descending value of (as in Table 14-1),E°
�0.402 V.
S.H.E. � Cd�(aq, A � 1) 0 Cd(s)
Cd2� � 2e� T Cd(s)
S.H.E. � Ag�(aq, A � 1) 0 Ag(s)
Pt(s) 0 H2(g, A � 1) 0 H�(aq, A � 1) � Ag�(aq, A � 1) 0 Ag(s)
11°.280°.269°0°C,200°C
80° � 69° � 11°.80°.69°0°C
E° � �0.799 V
25°C.
H�(aq, A � 1) � e� T 12 H2(g, A � 1)
H2(g)H2(g)H2(aq).H2(g)AH� � 1.
278 CHAPTER 14 Fundamentals of Electrochemistry
H+(aq, A = 1)
e–
Bubblesof H2
Glasstube
Salt bridge
– +
+0.799 V
Ag
Standard hydrogen electrode(S.H.E.)
Pt(s) H2(g, A = 1) Ag+(aq, A = 1) Ag(s)
Pt
H2(g )(A H2 = 1)
H+
(A H+ = 1)Ag+
(A Ag+ = 1)
Figure 14-7 Cell used to measure thestandard potential of the reaction
This cell is hypotheticalbecause it is usually not possible to adjust theactivity of a species to 1.
Ag� � e� T Ag(s).
Question What is the pH of the standardhydrogen electrode?
We will write all half-reactions as reductions.By convention, for S.H.E.E° � 0
Walther Nernst appears to have been the firstto assign the potential of the hydrogenelectrode as 0 in 1897.10
We always attach the left-hand electrode tothe negative terminal of the potentiometerand the right-hand electrode to the positiveterminal. The voltage on the meter is thedifference:
left-hand electrode potentialVoltage � right-hand electrode potential �
Challenge Draw a picture of the cell S.H.E. and showthe direction of electron flow.
� Cd2�(aq, A � 1) 0 Cd(s)

we would find the strongest oxidizing agents at the upper left and the strongest reducingagents at the lower right. If we connected the two half-cells represented by Reactions 14-10and 14-12, would be reduced to Ag(s) as Cd(s) is oxidized to
14-4 Nernst EquationLe Châtelier’s principle tells us that increasing reactant concentrations drives a reaction tothe right and increasing the product concentrations drives a reaction to the left. The net driv-ing force for a reaction is expressed by the Nernst equation, whose two terms include thedriving force under standard conditions which applies when all activities are unity) anda term showing the dependence on reagent concentrations. The Nernst equation tells us thepotential of a cell whose reagents are not all at unit activity.
Nernst Equation for a Half-ReactionFor the half-reaction
the Nernst equation giving the half-cell potential, E, is
Nernst equation: (14-13)
where standard reduction potential
R � gas constant
T � temperature (K)
n � number of electrons in the half-reaction
F � Faraday constant
� activity of species i
The logarithmic term in the Nernst equation is the reaction quotient, Q.
(14-14)
Q has the same form as the equilibrium constant, but the activities need not have their equi-librium values. Pure solids, pure liquids, and solvents are omitted from Q because their activ-ities are unity (or close to unity); concentrations of solutes are expressed as moles per liter,and concentrations of gases are expressed as pressures in bars. When all activities are unity,
and ln thus giving E � E°.Q � 0,Q � 1
Q � AbB/Aa
A
Ai
(9.649 � 104 C/mol)
(8.314 J/ (K � mol) � 8.314 (V � C)/(K � mol))
(AA � AB � 1)E° �
E � E° �RT
nFln
AbB
AaA
aA � ne� T bB
(E°,
Cd2�.Ag�
14-4 Nernst Equation 279
Table 14-1 Ordered redox potentials
Oxidizing agent Reducing agent E�(V)
2.8902.075
1.507
0.799
0.339
0.000
�3.040 Li� � e� T Li(s)�2.936 K� � e� T K(s)
o�0.402 Cd2� � 2e� T Cd(s)
o 2H� � 2e� T H2(g)
o Cu2� � 2e� T Cu(s)
o Ag� � e� T Ag(s)
o MnO�
4 � 8H� � 5e� T Mn2� � 4H2Oo
O3(g) � 2H� � 2e� T O2(g) � H2O F2(g) � 2e� T 2F�
Oxi
dizi
ng p
ower
incr
ease
s “
““
““
““
1
B“
““
““
““
Red
ucin
g po
wer
incr
ease
s
Question The potential for the reactionis This means that
is a very poor oxidizing agent. (It does notreadily accept electrons.) Does this imply that
is therefore a good reducing agent?
Answer: No! To be a good reducing agent,would have to give up electrons easily(forming which it cannot do. (But thelarge negative reduction potential does implythat K(s) is a good reducing agent.)
K2�),
K�
K�
K��2.936 V.K� � e� T K(s)
A reaction is spontaneous if is negativeand E is positive. and refer to thefree-energy change and potential when theactivities of reactants and products are unity.
.�G° � �nFE°
E°�G°
�G
Challenge Show that Le Châtelier’s principlerequires a negative sign in front of the reactionquotient term in the Nernst equation.Hint: The more favorable a reaction, the morepositive is E.
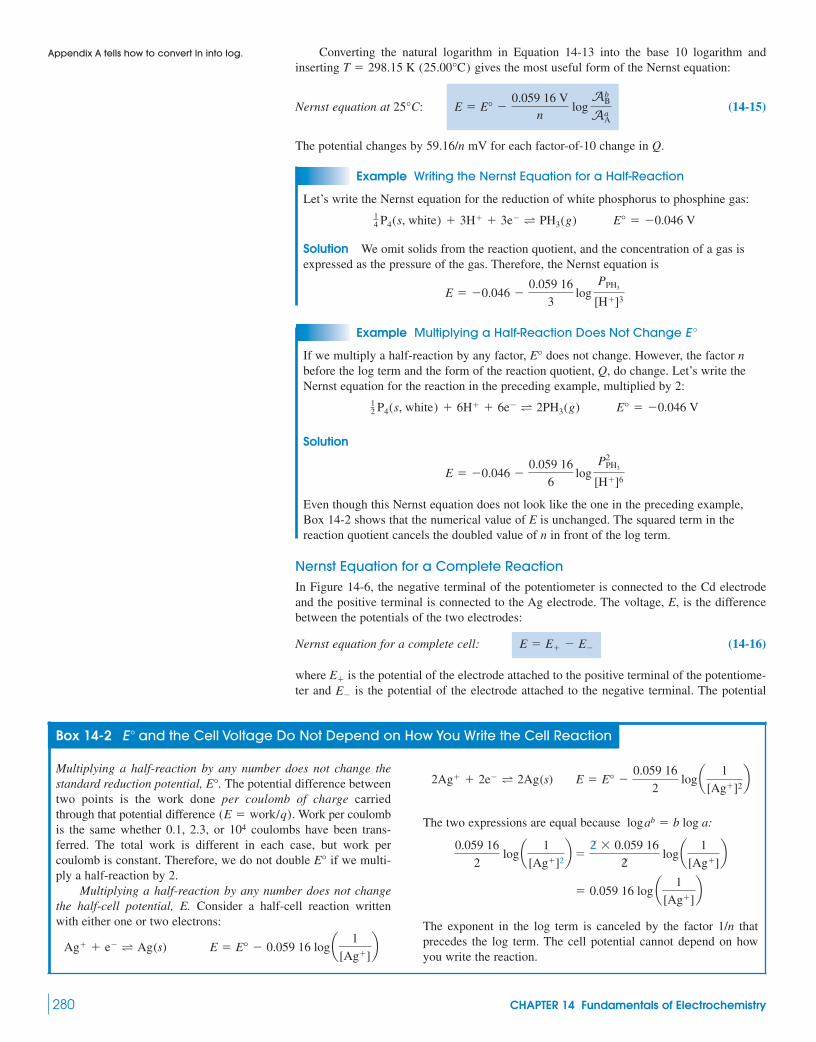
Converting the natural logarithm in Equation 14-13 into the base 10 logarithm andinserting gives the most useful form of the Nernst equation:
Nernst equation at (14-15)
The potential changes by 59.16/n mV for each factor-of-10 change in Q.
Example Writing the Nernst Equation for a Half-Reaction
Let’s write the Nernst equation for the reduction of white phosphorus to phosphine gas:
Solution We omit solids from the reaction quotient, and the concentration of a gas isexpressed as the pressure of the gas. Therefore, the Nernst equation is
Example Multiplying a Half-Reaction Does Not Change E �
If we multiply a half-reaction by any factor, does not change. However, the factor nbefore the log term and the form of the reaction quotient, Q, do change. Let’s write theNernst equation for the reaction in the preceding example, multiplied by 2:
Solution
Even though this Nernst equation does not look like the one in the preceding example,Box 14-2 shows that the numerical value of E is unchanged. The squared term in thereaction quotient cancels the doubled value of n in front of the log term.
Nernst Equation for a Complete ReactionIn Figure 14-6, the negative terminal of the potentiometer is connected to the Cd electrodeand the positive terminal is connected to the Ag electrode. The voltage, E, is the differencebetween the potentials of the two electrodes:
Nernst equation for a complete cell: (14-16)
where is the potential of the electrode attached to the positive terminal of the potentiome-ter and is the potential of the electrode attached to the negative terminal. The potentialE�
E�
E � E� � E�
E � �0.046 �0.059 16
6log
P2PH3
[H�]6
12 P4(s, white) � 6H� � 6e� T 2PH3(g) E° � �0.046 V
E°
E � �0.046 �0.059 16
3log
PPH3
[H�]3
14 P4(s, white) � 3H� � 3e� T PH3(g) E° � �0.046 V
E � E° �0.059 16 V
nlog
AbB
AaA
25°C:
T � 298.15 K (25.00°C)
280 CHAPTER 14 Fundamentals of Electrochemistry
Box 14-2 E� and the Cell Voltage Do Not Depend on How You Write the Cell Reaction
Multiplying a half-reaction by any number does not change thestandard reduction potential, The potential difference betweentwo points is the work done per coulomb of charge carriedthrough that potential difference Work per coulombis the same whether 0.1, 2.3, or coulombs have been trans-ferred. The total work is different in each case, but work percoulomb is constant. Therefore, we do not double if we multi-ply a half-reaction by 2.
Multiplying a half-reaction by any number does not changethe half-cell potential, E. Consider a half-cell reaction writtenwith either one or two electrons:
E � E° � 0.059 16 log a 1
[Ag�]bAg� � e� T Ag(s)
E°
104(E � work/q).
E°.
The two expressions are equal because
The exponent in the log term is canceled by the factor 1/n thatprecedes the log term. The cell potential cannot depend on howyou write the reaction.
� 0.059 16 log a 1
[Ag�]b
0.059 16
2 log a 1
[Ag�]2b �
2 � 0.059 16
2 log a 1
[Ag�]b
logab � b log a:
E � E° �0.059 16
2 log a 1
[Ag�]2b2Ag� � 2e� T 2Ag(s)
Appendix A tells how to convert ln into log.

of each half-reaction (written as a reduction) is governed by a Nernst equation likeEquation 14-13, and the voltage for the complete reaction is the difference between the twohalf-cell potentials.
Here is a procedure for writing a net cell reaction and finding its voltage:
Step 1 Write reduction half-reactions for both half-cells and find for each in AppendixH. Multiply the half-reactions as necessary so that they both contain the samenumber of electrons. When you multiply a reaction, you do not multiply
Step 2 Write a Nernst equation for the right half-cell, which is attached to the positiveterminal of the potentiometer. This is
Step 3 Write a Nernst equation for the left half-cell, which is attached to the negativeterminal of the potentiometer. This is
Step 4 Find the net cell voltage by subtraction:
Step 5 To write a balanced net cell reaction, subtract the left half-reaction from the right half-reaction. (Subtraction is equivalent to reversing the left-half reaction and adding.)
If the net cell voltage, is positive, then the net cell reaction is spontaneous inthe forward direction. If the net cell voltage is negative, then the reaction is spontaneous inthe reverse direction.
Example Nernst Equation for a Complete Reaction
Find the voltage of the cell in Figure 14-6 if the right half-cell contains 0.50 Mand the left half-cell contains 0.010 M Write the net cell reac-
tion and state whether it is spontaneous in the forward or reverse direction.
Solution
Step 1 Right electrode:
Left electrode:
Step 2 Nernst equation for right electrode:
Step 3 Nernst equation for left electrode:
Step 4 Cell voltage:
Step 5 Net cell reaction:
�
Because the voltage is positive, the net reaction is spontaneous in the forward direction.Cd(s) is oxidized and is reduced. Electrons flow from the left-hand electrode to theright-hand electrode.
What if you had written the Nernst equation for the right half-cell with just one electroninstead of two?
Would the net cell voltage be different from what we calculated? It better not be, because thechemistry is still the same. Box 14-2 shows that neither nor E depends on how we writethe reaction. Box 14-3 shows how to derive standard reduction potentials for half-reactionsthat are the sum of other half-reactions.
An Intuitive Way to Think About Cell Potentials2
In the preceding example, we found that E for the silver half-cell was 0.781 V and Efor the cadmium half-cell was Place these values on the number line in�0.461 V.
E°
Ag� � e� T Ag(s)
Ag�
Cd(s) � 2Ag� T Cd2� � 2Ag(s)
Cd2� � 2e� T Cd(s)
2Ag� � 2e� T 2Ag(s)
E � E� � E� � 0.781 � (�0.461) � �1.242 V
E� � E°� �0.059 16
2log
1
[Cd2�]� �0.402 �
0.059 16
2log
1
[0.010]� �0.461 V
E� � E°� �0.059 16
2log
1
[Ag�]2� 0.799 �
0.059 16
2log
1
[0.50]2� 0.781 V
E°� � �0.402 VCd2� � 2e� T Cd(s)
E°� � 0.799 V2Ag� � 2e� T 2Ag(s)
Cd(NO3)2(aq).AgNO3(aq)
E(� E� � E�),
E � E� � E�.
E�.
E�.
E°.
E°
14-4 Nernst Equation 281
net cell reaction goes net cell reaction goes dE 6 0:
SE 7 0:
Pure solids, pure liquids, and solvents areomitted from Q.
Subtracting a reaction is the same as reversingthe reaction and adding.
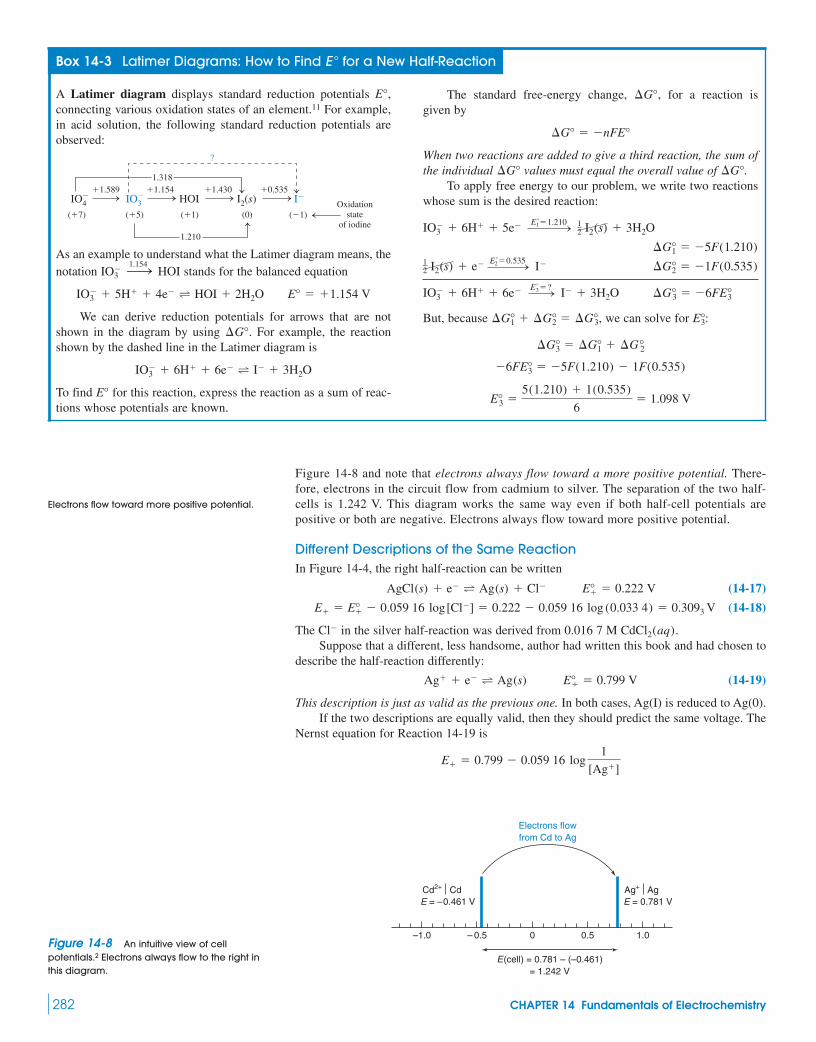
Figure 14-8 and note that electrons always flow toward a more positive potential. There-fore, electrons in the circuit flow from cadmium to silver. The separation of the two half-cells is 1.242 V. This diagram works the same way even if both half-cell potentials arepositive or both are negative. Electrons always flow toward more positive potential.
Different Descriptions of the Same ReactionIn Figure 14-4, the right half-reaction can be written
(14-17)
(14-18)
The in the silver half-reaction was derived from 0.016 7 M Suppose that a different, less handsome, author had written this book and had chosen to
describe the half-reaction differently:
(14-19)
This description is just as valid as the previous one. In both cases, Ag(I) is reduced to Ag(0).If the two descriptions are equally valid, then they should predict the same voltage. The
Nernst equation for Reaction 14-19 is
E� � 0.799 � 0.059 16 log1
[Ag�]
Ag� � e� T Ag(s) E°� � 0.799 V
CdCl2(aq).Cl�
E� � E°� � 0.059 16 log[Cl�] � 0.222 � 0.059 16 log (0.033 4) � 0.3093 V
AgCl(s) � e� T Ag(s) � Cl� E°� � 0.222 V
282 CHAPTER 14 Fundamentals of Electrochemistry
Box 14-3 Latimer Diagrams: How to Find E � for a New Half-Reaction
A Latimer diagram displays standard reduction potentials connecting various oxidation states of an element.11 For example,in acid solution, the following standard reduction potentials areobserved:
As an example to understand what the Latimer diagram means, thenotation stands for the balanced equation
We can derive reduction potentials for arrows that are notshown in the diagram by using For example, the reactionshown by the dashed line in the Latimer diagram is
To find for this reaction, express the reaction as a sum of reac-tions whose potentials are known.
E°
IO�3 � 6H� � 6e� T I� � 3H2O
�G°.
E° � �1.154 VIO�3 � 5H� � 4e� T HOI � 2H2O
IO�3 ¡
1.154HOI
IO4 IO3 HOI I2(s) I�� ��1.589 �1.430 �0.535�1.154
?
(�7) (�5) (�1) (0) (�1)
1.210
1.318
Oxidationstate
of iodine
E°, The standard free-energy change, for a reaction isgiven by
When two reactions are added to give a third reaction, the sum ofthe individual values must equal the overall value of
To apply free energy to our problem, we write two reactionswhose sum is the desired reaction:
But, because we can solve for
E°3 �5(1.210) � 1(0.535)
6� 1.098 V
�6FE°3 � �5F(1.210) � 1F(0.535)
�G°3 � �G°1 � �G°2
E°3:�G°1 � �G°2 � �G°3,
�G°3 � �6FE°3IO�3 � 6H� � 6e� E°
3�?! I� � 3H2O
�G°2 � �1F(0.535)12 I2(s) � e� E°
2�0.535! I�
�G°1 � �5F(1.210)
IO�3 � 6H� � 5e� E°
1�1.210! 12 I2(s) � 3H2O
�G°.�G°
�G° � �nFE°
�G°,
–1.0 – 0.5 0 0.5 1.0
E(cell) = 0.781 – (–0.461)= 1.242 V
E = –0.461 VCd2+ Cd
E = 0.781 VAg+ Ag
Electrons flowfrom Cd to Ag
Electrons flow toward more positive potential.
Figure 14-8 An intuitive view of cellpotentials.2 Electrons always flow to the right inthis diagram.

To find the concentration of we use the solubility product for AgCl. Because the cellcontains 0.033 4 M and solid AgCl, we can say
Putting this value into the Nernst equation gives
which differs from the value calculated in Equation 14-18 because of the accuracy of andthe neglect of activity coefficients. Equations 14-17 and 14-19 give the same voltage becausethey describe the same cell.
Advice for Finding Relevant Half-ReactionsWhen faced with a cell drawing or a line diagram, first write reduction reactions for eachhalf-cell. To do this, look in the cell for an element in two oxidation states. For the cell
we see Pb in two oxidation states, as Pb(s) and and Cu in two oxidation states, asand Cu(s). Thus, the half-reactions are
(14-20)
You might have chosen to write the Pb half-reaction as
(14-21)
because you know that, if is present, there must be some in the solution.Reactions 14-20 and 14-21 are equally valid and should predict the same cell voltage.Your choice of reactions depends on whether the or concentration is easier tofigure out.
We described the left half-cell in terms of a redox reaction involving Pb because Pb isthe element that appears in two oxidation states. We would not write a reaction such as
, because is not shown in the line diagram of the cell.
The Nernst Equation Is Used inMeasuring Standard Reduction PotentialsThe standard reduction potential would be observed if the half-cell of interest (with unitactivities) were connected to a standard hydrogen electrode, as it is in Figure 14-7. It isnearly impossible to construct such a cell, because we have no way to adjust concentrationsand ionic strength to give unit activities. In reality, activities less than unity are used in eachhalf-cell, and the Nernst equation is employed to extract the value of from the cell volt-age.12 In the hydrogen electrode, standard buffers with known pH (Table 15-3) are used toobtain known activities of
14-5 E � and the Equilibrium ConstantA galvanic cell produces electricity because the cell reaction is not at equilibrium. Thepotentiometer allows negligible current (Box 14-4), so concentrations in the cell remainunchanged. If we replaced the potentiometer with a wire, there would be much more cur-rent and concentrations would change until the cell reached equilibrium. At that point,nothing would drive the reaction, and E would be 0. When a battery (which is a galvaniccell) runs down to 0 V, the chemicals inside have reached equilibrium and the battery is“dead.”
Now let’s relate E for a whole cell to the reaction quotient, Q, for the net cell reaction.For the two half-reactions
Right electrode:
Left electrode: E°�dD � ne� T bB
E°�aA � ne� T cC
H�.
E°
F2(g)F2(g) � 2e� T 2F�
Pb2�F�
Pb2�PbF2(s)
Left half-cell: Pb2� � 2e� T Pb(s)
Left half-cell: PbF2(s) � 2e� T Pb(s) � 2F�
Right half-cell: Cu2� � 2e� T Cu(s)
Cu2�
PbF2(s),
Pb(s) 0 PbF2(s) 0 F�(aq) � Cu2� (aq) 0 Cu(s)
Ksp
E� � 0.799 � 0.059 16 log1
5.4 � 10�9� 0.3099 V
[Ag�] �Ksp(for AgCl)
[Cl�]�
1.8 � 10�10
0.033 4� 5.4 � 10�9 M
Cl�
Ag�,
14-5 E° and the Equilibrium Constant 283
Ksp � [Ag�][CI�]
The cell voltage cannot depend on how wewrite the reaction!
How to figure out the half-cell reactions
Don’t invent species not shown in the cell. Usewhat is shown in the line diagram to select thehalf-reactions.
Problem 14-20 gives an example of the use ofthe Nernst equation to find E°.
At equilibrium, E (not E°) � 0.

the Nernst equation looks like this:
(14-22)
14243 123Q
Equation 14-22 is true at any time. In the special case when the cell is at equilibrium,and the equilibrium constant. Therefore, Equation 14-22 is transformed into
these most important forms at equilibrium:
Finding from K: (14-23)
Finding K from (14-24)
Equation 14-24 allows us to deduce the equilibrium constant from Alternatively, we canfind from K with Equation 14-23.
Example Using E � to Find the Equilibrium Constant
Find the equilibrium constant for the reaction
Solution The reaction is divided into two half-reactions found in Appendix H:
�
Then we find for the net reaction
and compute the equilibrium constant with Equation 14-24:
A modest value of produces a large equilibrium constant. The value of K is correctlyexpressed with one significant figure, because has three digits. Two are used for theexponent (14), and only one is left for the multiplier (4).
E°E°
K � 10(2)(0.432)/(0.059 16) � 4 � 1014
E° � E°� � E°� � 0.771 � 0.339 � 0.432 V
E°
Cu(s) � 2Fe3� T 2Fe2� � Cu2�
E°� � 0.339 VCu2� � 2e� T Cu(s)
E°� � 0.771 V2Fe3� � 2e� T 2Fe2�
Cu(s) � 2Fe3� T 2Fe2� � Cu2�
E°E°.
(at 25°C)K � 10nE°/0.059 16E°:
(at 25°C)E° �0.059 16
nlog KE°
Q � K,E � 0
E°
E � (E°� � E°�) �0.059 16
n log
AcCAd
D
AaAAb
B� E° �
0.059 16n
log Q
E � E� � E� � E°� �0.059 16
nlog
AcC
AaA
� aE°� �0.059 16
nlog
AbB
AdDb
284 CHAPTER 14 Fundamentals of Electrochemistry
Box 14-4 Concentrations in the Operating Cell
Why doesn’t operation of a cell change the concentrations in thecell? Cell voltage is measured under conditions of negligible cur-rent flow. The resistance of a high-quality pH meter is Ifyou use this meter to measure a potential of 1 V, the current is
If the cell in Figure 14-6 produces 50 mV, the current through thecircuit is This value correspondsto a flow of
0.050 V/1013 � � 5 � 10�15 A.
I �E
R�
1 V
1013 �� 10�13 A
1013 �.The rate at which is produced is whichhas a negligible effect on the cadmium concentration in the cell.The meter measures the voltage of the cell without affectingconcentrations in the cell.
If the salt bridge were left in a real cell for very long, con-centrations and ionic strength would change because of diffu-sion between each compartment and the salt bridge. We assumethat cells are set up for such a short time that mixing does nothappen.
2.5 � 10�20 mol/s,Cd2�
5 � 10�15 C/s
9.649 � 104 C/mol� 5 � 10�20 mol e�/s
log a � log b � log ab
To go from Equation 14-23 to 14-24:
K � 10nE°/0.059 16
10logK � 10nE°/0.059 16
log K �nE°
0.059 16
0.059 16n
log K � E°
We associate with the half-reaction thatmust be reversed to get the desired netreaction.
E°�
Significant figures for logs and exponents werediscussed in Section 3-2.
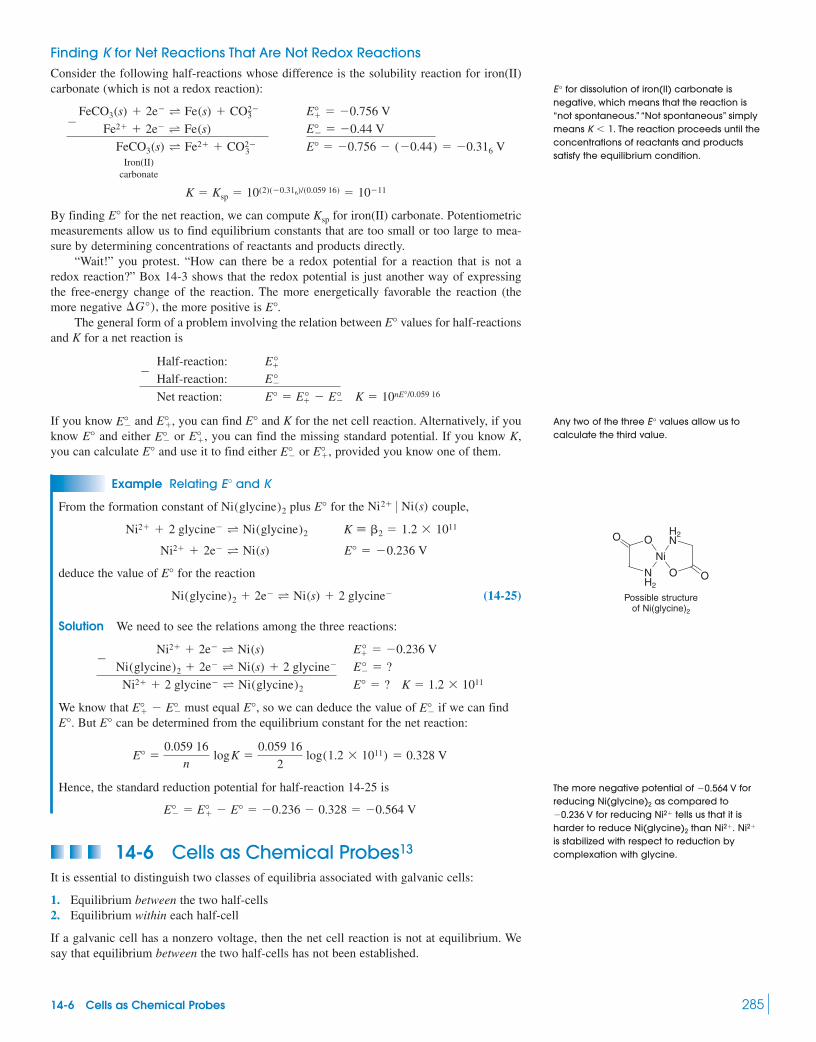
Finding K for Net Reactions That Are Not Redox ReactionsConsider the following half-reactions whose difference is the solubility reaction for iron(II)carbonate (which is not a redox reaction):
Iron(II)carbonate
By finding for the net reaction, we can compute for iron(II) carbonate. Potentiometricmeasurements allow us to find equilibrium constants that are too small or too large to mea-sure by determining concentrations of reactants and products directly.
“Wait!” you protest. “How can there be a redox potential for a reaction that is not aredox reaction?” Box 14-3 shows that the redox potential is just another way of expressingthe free-energy change of the reaction. The more energetically favorable the reaction (themore negative the more positive is
The general form of a problem involving the relation between values for half-reactionsand K for a net reaction is
If you know and you can find and K for the net cell reaction. Alternatively, if youknow and either or you can find the missing standard potential. If you know K,you can calculate and use it to find either or provided you know one of them.
Example Relating E� and K
From the formation constant of plus for the couple,
deduce the value of for the reaction
(14-25)
Solution We need to see the relations among the three reactions:
We know that must equal so we can deduce the value of if we can findBut can be determined from the equilibrium constant for the net reaction:
Hence, the standard reduction potential for half-reaction 14-25 is
14-6 Cells as Chemical Probes13
It is essential to distinguish two classes of equilibria associated with galvanic cells:
1. Equilibrium between the two half-cells2. Equilibrium within each half-cell
If a galvanic cell has a nonzero voltage, then the net cell reaction is not at equilibrium. Wesay that equilibrium between the two half-cells has not been established.
E°� � E°� � E° � �0.236 � 0.328 � �0.564 V
E° �0.059 16
n logK �
0.059 16
2 log(1.2 � 1011) � 0.328 V
E°E°.E°�E°,E°� � E°�
Ni2� � 2e� T Ni(s)�
Ni(glycine)2 � 2e� T Ni(s) � 2 glycine�
Ni2� � 2 glycine� T Ni(glycine)2
E°� � �0.236 V
E°� � ?
E° � ? K � 1.2 � 1011
Ni(glycine)2 � 2e� T Ni(s) � 2 glycine�
E°
Ni2� � 2e� T Ni(s) E° � �0.236 V
Ni2� � 2 glycine� T Ni(glycine)2 K � �2 � 1.2 � 1011
Ni2� 0 Ni(s)E°Ni(glycine)2
E°�,E°�E°E°�,E°�E°
E°E°�,E°�
Half-reaction: E°�� Half-reaction: E°� Net reaction: E° � E°� � E°�
K � 10nE°/0.059 16
E°E°.�G°),
KspE°
K � Ksp � 10(2)(�0.316)/(0.059 16) � 10�11
E°� � �0.756 V
E°� � �0.44 V
E° � �0.756 � (�0.44) � �0.316 V
FeCO3(s) � 2e� T Fe(s) � CO2�3
� Fe2� � 2e� T Fe(s)
FeCO3(s) T Fe2� � CO2�3
14-6 Cells as Chemical Probes 285
for dissolution of iron(II) carbonate isnegative, which means that the reaction is “not spontaneous.”“Not spontaneous” simplymeans The reaction proceeds until theconcentrations of reactants and productssatisfy the equilibrium condition.
K 6 1.
E°
Any two of the three values allow us tocalculate the third value.
E°
Possible structureof Ni(glycine)2
O
O
O
ONH2
Ni
H2N
The more negative potential of forreducing as compared to
for reducing tells us that it isharder to reduce than is stabilized with respect to reduction bycomplexation with glycine.
Ni2�Ni2�.Ni(glycine)2
Ni2��0.236 VNi(glycine)2
�0.564 V

286 CHAPTER 14 Fundamentals of Electrochemistry
A chemical reaction that can occur within onehalf-cell will reach equilibrium and is assumedto remain at equilibrium. Such a reaction is notthe net cell reaction.
Question Why can we assume that theconcentrations of acetic acid and acetate ionare equal to their initial (formal) concentrations?
We allow half-cells to stand long enough to come to chemical equilibrium within eachhalf-cell. For example, in the right-hand half-cell in Figure 14-9, the reaction
is at equilibrium. It is not part of the net cell reaction. It is simply a reaction that occurs whenAgCl(s) is in contact with water. In the left half-cell, the reaction
has also come to equilibrium. Neither of them is part of the net cell redox reaction.The reaction for the right half-cell of Figure 14-9 is
But what is the reaction in the left half-cell? The only element we find in two oxidation statesis hydrogen. We see that bubbles into the cell, and we also realize that every aqueoussolution contains Therefore, hydrogen is present in two oxidation states, and the half-reaction can be written as
The net cell reaction is not at equilibrium, because the measured voltage is 0.503 V, not 0 V.The Nernst equation for the cell reaction is
When we put in all the known quantities, we discover that the only unknown is Themeasured voltage therefore allows us to find [ �] in the left half-cell:
This, in turn, allows us to evaluate the equilibrium constant for the acid-base reaction that hascome to equilibrium in the left half-cell:
The cell in Figure 14-9 acts as a probe to measure in the left half-cell. Using thistype of cell, we could determine the equilibrium constant for acid dissociation or basehydrolysis in the left half-cell.
[H�]
Ka �[CH3CO�
2 ][H�]
[CH3CO2H]�
(0.005 0)(1.8 � 10�4)
0.050� 1.8 � 10�5
1 [H�] � 1.8 � 10�4 M
0.503 � (0.222 � 0.059 16 log[0.10]) � a0 �0.059 16
2log
1.00
[H�]2b
H[H�].
E � E� � E� � (0.222 � 0.059 16 log[Cl�]) � a0 �0.059 16
2log
PH2
[H�]2b
E°� � 02H�(aq, ? M) � 2e� T H2(g, 1.00 bar)
H�.H2(g)
E°� � 0.222 VAgCl(s) � e� T Ag(s) � Cl�(aq, 0.10 M)
CH3CO2H T CH3CO�2 � H�
AgCl(s) T Ag�(aq) � Cl�(aq)
Pt
Aha! A buffer!
Salt bridgeH2
(1.00 bar)
– +
+0.503 V
0.10 MKCl AgCl(s)
CH3CO2H(0.050 M)CH3CO2Na(0.005 0 M)
Ag
Pt(s) H2(1.00 bar) CH3CO2H(0.050 M), CH3CO2Na(0.005 0 M) Cl–(0.10 M) AgCl(s) Ag(s)
Figure 14-9 This galvanic cell can be usedto measure the pH of the left half-cell.

14-6 Cells as Chemical Probes 287
The half-reactions that you write must involvespecies that appear in two oxidation states inthe cell.
Survival TipsProblems in this chapter include some brainbusters designed to bring together your knowl-edge of electrochemistry, chemical equilibrium, solubility, complex formation, and acid-basechemistry. They require you to find the equilibrium constant for a reaction that occurs in onlyone half-cell. The reaction of interest is not the net cell reaction and is not a redox reaction.Here is a good approach:
Step 1 Write the two half-reactions and their standard potentials. If you choose a half-reaction for which you cannot find then find another way to write thereaction.
Step 2 Write a Nernst equation for the net reaction and put in all the known quantities. Ifall is well, there will be only one unknown in the equation.
Step 3 Solve for the unknown concentration and use that concentration to solve thechemical equilibrium problem that was originally posed.
Example Analyzing a Very Complicated Cell
The cell in Figure 14-10 measures the formation constant of Theright-hand compartment contains 0.500 mmol of and 2.00 mmol of EDTA in 0.100 Lbuffered to pH 6.00. The voltage is Find the value of for
Solution
Step 1 The left half-cell is a standard hydrogen electrode for which we can say In the right half-cell, mercury is in two oxidation states. So let’s write the half-reaction
In the right half-cell, the reaction between and EDTA is
Because we expect to be large, we assume that virtually all the has reactedto make Therefore, the concentration of is
The remaining EDTA has a total concentration of The right-hand compartment therefore contains 0.005 00 M
0.015 0 M EDTA, and a small, unknown concentration of Hg2�.HgY2�,100 mL � 0.015 0 M.
(2.00 � 0.50) mmol/0.005 00 M.0.500 mmol/100 mL �HgY2�HgY2�.
Hg2�Kf
Hg2� � Y4� ∆Kf
HgY2�
Hg2�
E� � 0.852 �0.059 16
2log a 1
[Hg2�]b
E°� � 0.852 VHg2� � 2e� T Hg(l)
E� � 0.
Hg(EDTA)2�.Kf�0.342 V.Hg2�
Hg(EDTA)2�.(Kf)
E°,
+0.342 V
H2
– +
Solution prepared from50.0 mL of 0.010 0 M HgCl240.0 mL of 0.050 0 M EDTA10.0 mL of buffer, pH 6.00
Salt bridge
Hg(/) Pt contact
Standard hydrogenelectrode
S.H.E. Hg(EDTA)2–(aq, 0.005 00 M), EDTA(aq, 0.015 0 M) Hg(l )
Pt
Figure 14-10 A galvanic cell that can be used to measure the formation constant for Hg(EDTA)2�.
The formation constant for can be written
where [EDTA] is the formal concentration of EDTA not bound to metal. Inthis cell, The fraction of EDTA in the form is (Section 12-2). Because we know that all we need tofind is in order to evaluate
Step 2 The Nernst equation for the net cell reaction is
in which the only unknown is Step 3 Now we solve the Nernst equation to find and this
value of allows us to evaluate the formation constant for
The mixture of EDTA plus in the cathode serves as a mercuric ion“buffer” that fixes the concentration of This concentration, in turn, deter-mines the cell voltage.
14-7 Biochemists Use E �Perhaps the most important redox reactions in living organisms are in respiration, in whichmolecules of food are oxidized by to yield energy or metabolic intermediates. The stan-dard reduction potentials that we have been using so far apply to systems in which all activi-ties of reactants and products are unity. If is involved in the reaction, applies when
Whenever � appears in a redox reaction, or whenever reactants orproducts are acids or bases, reduction potentials are pH dependent.
Because the pH inside a plant or animal cell is about 7, reduction potentials that apply atpH 0 are not particularly appropriate. For example, at pH 0, ascorbic acid (vitamin C) is amore powerful reducing agent than succinic acid. However, at pH 7, this order is reversed. Itis the reducing strength at pH 7, not at pH 0, that is relevant to a living cell.
The standard potential for a redox reaction is defined for a galvanic cell in which allactivities are unity. The formal potential is the reduction potential that applies under a spec-ified set of conditions (including pH, ionic strength, and concentration of complexingagents). Biochemists call the formal potential at pH 7 E�� (read “E zero prime”). Table 14-2lists values for various biological redox couples.
Relation Between E� and E�
Consider the half-reaction
in which A is an oxidized species and B is a reduced species. Both A and B might be acids orbases, as well. The Nernst equation for this half-reaction is
To find we rearrange the Nernst equation to a form in which the log term containsonly the formal concentrations of A and B raised to the powers a and b, respectively.
Recipe for (14-26)1442443
All of this is called when
The entire collection of terms over the brace, evaluated at is called To convert [A] or [B] into or we use fractional composition equations (Section
10-5), which relate the formal (that is, total) concentration of all forms of an acid or aFB,FA
E°¿.pH � 7,
pH � 7E°¿
E � E° � other terms �0.059 16
nlog
FbB
FaA
E°¿:
E°¿,
E � E° �0.059 16
nlog
[B]b[H�]m
[A]a
E°aA � ne� T bB � mH�
E°¿
H(AH� � 1).pH � 0E°H�
O2
Hg2�.Hg(EDTA)2�
� 3 � 1021
Kf �[HgY2�]
[Hg2�]�Y4�[EDTA]�
(0.005 00)
(5.7 � 10�18)(1.8 � 10�5)(0.015 0)
HgY2�:[Hg2�][Hg2�] � 5.7 � 10�18 M,
[Hg2�].
E � 0.342 � E� � E� � a0.852 �0.059 16
2log a 1
[Hg2�]bb � (0)
Kf.[Hg2�][HgY2�] � 0.005 00 M,
�Y4�Y4�[EDTA] � 0.015 0 M.
Kf �[HgY2�]
[Hg2�][Y4�]�
[HgY2�]
[Hg2�]�Y4�[EDTA]
HgY2�
288 CHAPTER 14 Fundamentals of Electrochemistry
Recall that [Y4�] � �Y4�[EDTA].
The value of comes from Table 12-1.�Y4�
The formal potential at is called E°¿.pH � 7
If we had included activity coefficients, theywould appear in also.E°¿

base to its concentration in a particular form:
Monoprotic system: (14-27)
(14-28)
Diprotic system: (14-29)
(14-30)
(14-31)
where F is the formal concentration of HA or is the acid dissociation constant forHA, and and are the acid dissociation constants for
Example Finding the Formal Potential
Find for the reaction
(14-32)
OHHO
OH
HO
O � 2H� � 2e� TßÍ E
ß
O
O∞ ß
ß
ßß ∞HO
HO
HO OH
OO� H2O
Acidicprotons
Dehydroascorbicacid
(oxidized)
Ascorbic acid(vitamin C)(reduced)
pK1 � 4.10 pK2 � 11.79
E � = 0.390 V
E S S
E°¿
H2A.K2K1
KaH2A,
[A2�] � �A2 �F �K1K2F
[H�]2 � [H�]K1 � K1K2
[HA�] � �HA�F �K1[H�]F
[H�]2 � [H�]K1 � K1K2
[H2A] � �H2AF �
[H�]2F
[H�]2 � [H�]K1 � K1K2
[A�] � �A�F �KaF
[H�] � Ka
[HA] � �HAF �[H�]F
[H�] � Ka
14-7 Biochemists Use E° 289
Table 14-2 Reduction potentials of biological interest
Reaction E� (V) E� (V)
Cytochrome a a
Cytochrome c c —2,6-Dichlorophenolindophenol
reduced 2,6-dichlorophenolindophenol —DehydroascorbateFumarateMethylene blueGlyoxylate —OxaloacetatePyruvateRiboflavin —
—glutathione-SH —
Safranine �0.235—
—Cystine cysteine —Acetoacetate L-�-hydroxybutyrate —Xanthine —
0.000Gluconate —
—— �0.5272SO2�
3 � 2e� � 4H� T S2O2�4 � 2H2O
�0.454SO2�4 � 2e� � 2H� T SO2�
3 � H2O�0.44� 2H� � 2e� T glucose � H2O�0.4142H� � 2e� T H2
�0.371� 2H� � 2e� T hypoxanthine � H2O�0.346� 2H� � 2e� T�0.340� 2H� � 2e� T 2�0.324NADP� � H� � 2e� T NADPH�0.320�0.105NAD� � H� � 2e� T NADH�0.30(C6H5S)2 � 2H� � 2e� T 2C6H5SH�0.289T � 2e� T leucosafranine T�0.23(Glutathione-S)2 � 2H� � 2e� T 2�0.219FAD � 2H� � 2e� T FADH2
�0.208� 2H� � 2e� T reduced riboflavin�0.190�0.224� 2H� � 2e� T lactate�0.102�0.330� 2H� � 2e� T malate�0.090� 2H� � 2e� T glycolate�0.011�0.532� 2H� � 2e� T reduced product�0.031�0.433� 2H� � 2e� T succinate�0.058�0.390� 2H� � 2e� T ascorbate � H2O�0.22
� 2H� � 2e� T�0.254(Fe2� )(Fe3� ) � e� T cytochrome�0.281�0.695O2(g) � 2H� � 2e� T H2O2
�0.290�0.290(Fe2� )(Fe3� ) � e� T cytochrome�0.535�0.535I2 � 2e� � 2I�
�0.771�0.771Fe3� � e� T Fe2�
�0.816�1.229O2 � 4H� � 4e� T 2H2O
For a monoprotic acid:
F � [HA] � [A�]
For a diprotic acid:
F � [H2A] � [HA�] � [A2�]
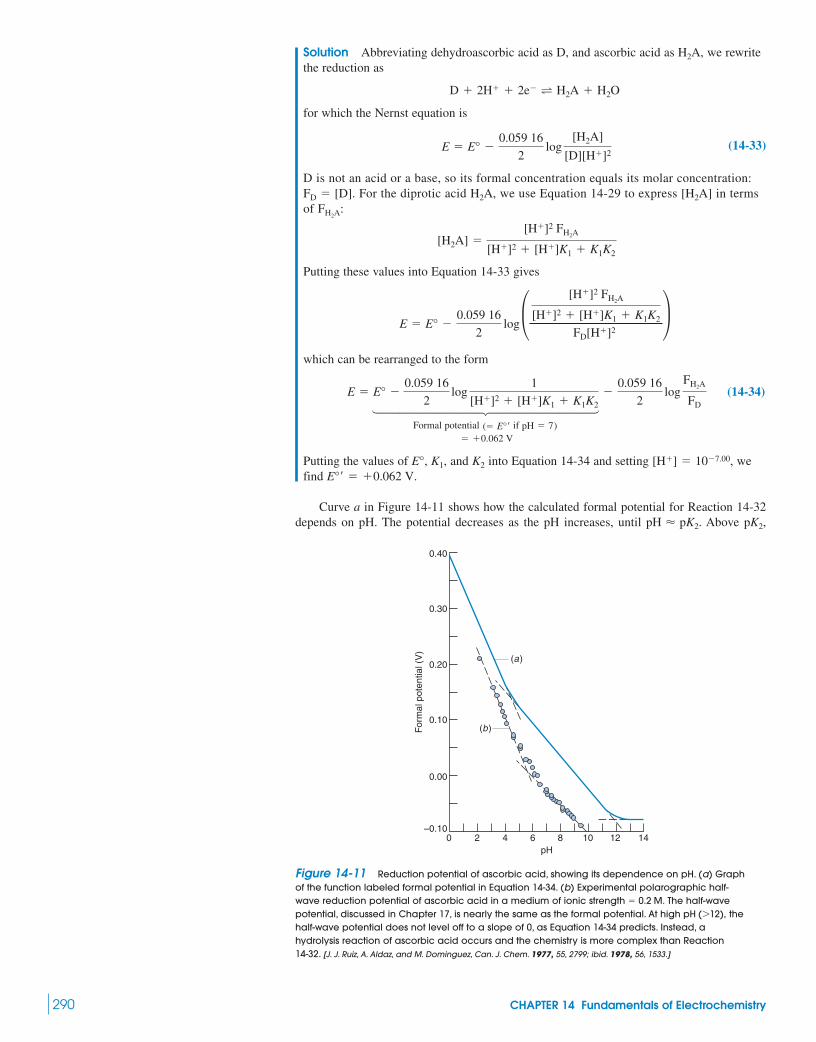
290 CHAPTER 14 Fundamentals of Electrochemistry
–0.100
For
mal
pot
entia
l (V
)
pH
0.00
0.10
0.20
0.30
0.40
(a)
2 4 6 8 10 12 14
(b)
Figure 14-11 Reduction potential of ascorbic acid, showing its dependence on pH. (a) Graphof the function labeled formal potential in Equation 14-34. (b) Experimental polarographic half-wave reduction potential of ascorbic acid in a medium of ionic The half-wavepotential, discussed in Chapter 17, is nearly the same as the formal potential. At high thehalf-wave potential does not level off to a slope of 0, as Equation 14-34 predicts. Instead, ahydrolysis reaction of ascorbic acid occurs and the chemistry is more complex than Reaction14-32. [J. J. Ruiz, A. Aldaz, and M. Dominguez, Can. J. Chem. 1977, 55, 2799; ibid. 1978, 56, 1533.]
pH (712),strength � 0.2 M.
Solution Abbreviating dehydroascorbic acid as D, and ascorbic acid as we rewritethe reduction as
for which the Nernst equation is
(14-33)
D is not an acid or a base, so its formal concentration equals its molar concentration:For the diprotic acid we use Equation 14-29 to express in terms
of
Putting these values into Equation 14-33 gives
which can be rearranged to the form
(14-34)14444444244444443
Formal potential if
Putting the values of and into Equation 14-34 and setting wefind
Curve a in Figure 14-11 shows how the calculated formal potential for Reaction 14-32depends on pH. The potential decreases as the pH increases, until Above pK2,pH � pK2.
E°¿ � �0.062 V.[H�] � 10�7.00,K2K1,E°,
� �0.062 VpH � 7)(� E°¿
E � E° �0.059 16
2log
1
[H�]2 � [H�]K1 � K1K2�
0.059 16
2log
FH2A
FD
E � E° �0.059 16
2log£ [H�]2 FH2A
[H�]2 � [H�]K1 � K1K2
FD[H�]2 ≥
[H2A] �[H�]2 FH2A
[H�]2 � [H�]K1 � K1K2
FH2A:
[H2A]H2A,FD � [D].
E � E° �0.059 16
2log
[H2A]
[D][H�]2
D � 2H� � 2e� T H2A � H2O
H2A,

is the dominant form of ascorbic acid, and no protons are involved in the net redox reac-tion. Therefore, the potential becomes independent of pH.
A biological example of is the reduction of Fe(III) in the protein transferrin, whichwas introduced in Figure 7-4. This protein has two Fe(III)-binding sites, one in each half ofthe molecule designated C and N for the carboxyl and amino terminals of the peptide chain.Transferrin carries Fe(III) through the blood to cells that require iron. Membranes of thesecells have a receptor that binds Fe(III)-transferrin and takes it into a compartment called anendosome into which is pumped to lower the pH to Iron is released from transfer-rin in the endosome and continues into the cell as Fe(II) attached to an intracellular metal-transport protein. The entire cycle of transferrin uptake, metal removal, and transferrinrelease back to the bloodstream takes 1–2 min. The time required for Fe(III) to dissociatefrom transferrin at pH 5.8 is min, which is too long to account for release in the endo-some. The reduction potential of Fe(III)-transferrin at pH 5.8 is which is toolow for physiologic reductants to reach.
The mystery of how Fe(III) is released from transferrin in the endosome was solved bymeasuring for the Fe(III)-transferrin-receptor complex at pH 5.8. To simplify the chem-istry, transferrin was cleaved and only the C-terminal half of the protein (designated was used. Figure 14-12 shows measurements of for free pro-tein and for the protein-receptor complex. In Equation 14-26, when the log term iszero (that is, when Figure 14-12 shows that for
is near but for the -receptor complex is Thereducing agents NADH and NADPH in Table 14-2 are strong enough to reduce bound to its receptor at pH 5.8, but not strong enough to reduce free Fe(III)-transferrin.
Fe(III)TrfC
�0.29 V.Fe(III)TrfCE°¿�0.50 V,Fe(III)TrfC
E°¿[Fe(III)TrfC] � [Fe(II)TrfC]).E � E°¿
log5[Fe(III)TrfC]/[Fe(II)TrfC]6 TrfC)E°¿
E°¿ � �0.52 V,�6
�5.8.H�
E°¿
A2�
Summary 291
Terms to Understandampereanodecathodecoulombcurrent
electric potentialelectrodeFaraday constant
formal potentialgalvanic cellhalf-reactionjouleLatimer diagramNernst equationohmOhm’s lawoxidant
oxidationoxidizing agentpotentiometerpowerreaction quotientredox reactionreducing agentreductantreduction
resistancesalt bridgestandard hydrogen electrodestandard reduction potentialvoltwattE°¿
Figure 14-12 Spectroscopic measurementof versus potentialat pH 5.8. [S. Dhungana, C. H. Taboy, O. Zak, M. Larvie,
A. L. Crumbliss, and P. Aisen,“Redox Properties of Human
Transferrin Bound to Its Receptor,” Biochemistry, 2004,
43, 205.]
log{[Fe(III)TrfC]/[Fe(II)TrfC]}
2.5
2.0
1.5
1.0
0.5
0.0
–0.5–0.1–0.5 –0.4 –0.3 –0.2
log
{[ox
idiz
ed fo
rm]/[
redu
ced
form
]}
FreeFe-Trfc Fe-Trfc-receptor
complex
°E ' °E '
E (V vs. S.H.E.)
SummaryWork done when a charge of q coulombs passes through a potentialdifference of E volts is The maximum work that canbe done on the surroundings by a spontaneous chemical reaction isrelated to the free-energy change for the reaction: Ifthe chemical change produces a potential difference, E, the relationbetween free energy and the potential difference is Ohm’s law describes the relation between current, volt-age, and resistance in an electric circuit. It can be combined withthe definitions of work and power per second) to give
A galvanic cell uses a spontaneous redox reaction to produceelectricity. The electrode at which oxidation occurs is the anode,and the electrode at which reduction occurs is the cathode. Twohalf-cells are usually separated by a salt bridge that allows ions tomigrate from one side to the other to maintain charge neutrality butprevents reactants in the two half-cells from mixing. The standardreduction potential of a half-reaction is measured by pairing thathalf-reaction with a standard hydrogen electrode. The term “stan-dard” means that activities of reactants and products are unity. Ifseveral half-reactions are added to give another half-reaction, thestandard potential of the net half-reaction can be found by equatingthe free energy of the net half-reaction to the sum of free energies ofthe component half-reactions.
P � E � I � I 2R.(P � work
(I � E/R)�G � �nFE.
work � ��G.
work � E � q.The voltage for a complete reaction is the difference between
the potentials of the two half-reactions: where isthe potential of the half-cell connected to the positive terminal of thepotentiometer and is the potential of the half-cell connected tothe negative terminal. The potential of each half-reaction is given bythe Nernst equation: (at whereeach reaction is written as a reduction and Q is the reaction quotient.The reaction quotient has the same form as the equilibrium constant,but it is evaluated with concentrations existing at the time of interest.Electrons flow through the circuit from the electrode with the morenegative potential to the electrode with the more positive potential.
Complex equilibria can be studied by making them part of anelectrochemical cell. If we measure the voltage and know the con-centrations (activities) of all but one of the reactants and products,the Nernst equation allows us to compute the concentration of theunknown species. The electrochemical cell serves as a probe forthat species.
Biochemists use the formal potential of a half-reaction at pH 7instead of the standard potential which applies at pH 0.
is found by writing the Nernst equation for the half-reaction andgrouping together all terms except the logarithm containing the for-mal concentrations of reactant and product. The combination ofterms, evaluated at pH 7, is E°¿.
E°¿(E°),(E°¿)
25°C),E � E° � (0.059 16/n) log Q
E�
E�E � E� � E�,

292 CHAPTER 14 Fundamentals of Electrochemistry
Exercises14-A. A mercury cell formerly used to power heart pacemakers hasthe following reaction:
If the power required to operate the pacemaker is 0.010 0 W, howmany kilograms of HgO (FM 216.59) will be consumed in 365 days?How many pounds of HgO is this?
14-B. Calculate and K for each of the following reactions.(a)(b)(c)(d)(e)(f)
14-C. Calculate the voltage of each of the following cells. With thereasoning in Figure 14-8, state the direction of electron flow.(a)(b)(c)
14-D. The left half-reaction of the cell drawn here can be written ineither of two ways:
(1)
or
(2)
The right half-cell reaction is
(3)
(a) Using Reactions 2 and 3, calculate and write the Nernstequation for the cell.(b) Use the value of for AgI to compute and find the cellvoltage. By the reasoning in Figure 14-8, in which direction doelectrons flow?(c) Suppose, instead, that you wish to describe the cell with Reac-tions 1 and 3. We know that the cell voltage (E, not must be thesame, no matter which description we use. Write the Nernst equa-
E°)
[Ag�]Ksp
E°
Salt bridge
– +
V
I−(aq )
Ag wire coatedwith Agl(s )
Ag(s ) Agl(s ) Nal (0.10 M) HCI (0.10 M) H2(g, 0.20 bar) Pt(s )
Pt
Pt
H+(aq )
H2(g )in
H� � e� T 12 H2(g)
Ag� � e� T Ag(s)
AgI(s) � e� T Ag(s) � I�
Cl2(g, 0.50 bar) 0 Pt(s)Hg(l) 0 Hg2Cl2(s) 0 KCl(0.060 M) � KCl(0.040 M) 0Cu(s) 0 Cu(NO3)2(0.020 M) � Fe(NO3)2(0.050 M) 0 Fe(s)Fe(s) 0 FeBr2(0.010 M) � NaBr(0.050 M) 0 Br2(l) 0 Pt(s)
CuI(s) T Cu� � I�
Ag� � 2S2O2�3 T Ag(S2O3)3�
2
5MnO2(s) � 4H� T 3Mn2� � 2MnO�4 � 2H2O
Mg(s) � Cl2(g) T Mg2� � 2Cl�
Cr2� � Fe(s) T Fe2� � Cr(s)I2(s) � 5Br2(aq) � 6H2O T 2IO�
3 � 10Br� � 12H�
E°
(1 pound � 453.6 g)
E° � 1.35 VZn(s) � HgO(s) S ZnO(s) � Hg(l)
tion for Reactions 1 and 3 and use it to find in Reaction 1. Com-pare your answer with the value in Appendix H.
14-E. Calculate the voltage of the cell
buffer to pH
by considering the following reactions:
By the reasoning in Figure 14-8, in which direction do electronsflow?
14-F. (a) Write a balanced equation for the reaction and calculate for the reaction.
(b) Predict whether an equimolar mixture of and willoxidize to at a pH of 2.00 and Will beliberated at pH 7.00?
14-G. Calculate the voltage of the following cell, in which KHP ispotassium hydrogen phthalate, the monopotassium salt of phthalicacid.
14-H. The following cell has a voltage of 0.083 V:
From this voltage, calculate the equilibrium constant for the reaction
In 0.5 M KI, virtually all the mercury is present as
14-I. The formation constant for is andis for the reaction From this
information, find for the reaction
14-J. On the basis of the following reaction, state which com-pound, or glucose, is the more powerful reducing agent at
14-K. Living cells convert energy derived from sunlight or com-bustion of food into energy-rich ATP (adenosine triphosphate)
CO2H
HCOH
HOCH
HCOH
HCOH
CH2OH
CHO
HCOH
HOCH
HCOH
HCOH
CH2OH
� 2H� � 2e� � H2O
Gluconic acidpKa � 3.56
Glucose(no acidic protons)
E�¿ � �0.45 V
pH � 0.00.H2(g)
CuY2� � 2e� T Cu(s) � Y4�
E°Cu2� � 2e� T Cu(s).�0.339 VE°
6.3 � 1018,Cu(EDTA)2�
HgI2�4 .
Hg2� � 4I� T HgI2�4
Hg(l) 0 Hg(NO3)2(0.001 0 M), KI(0.500 M) 7 S.H.E.
H2(g, 1.00 bar) 0 Pt(s)Hg(l) 0 Hg2Cl2(s) 0 KCl(0.10 M) 7 KHP(0.050 M) 0
O2PO2� 0.20 bar.O2H2O
PuO�2PuO2�
2
cPuO2 PuO2 Pu4� Pu3�¡ ¡2� �
1.021
�0.966 �1.006?¡
E°Pu4�
PuO�2 S
HCN T H� � CN� pKa � 9.21
Ag(CN)�2 � e� T Ag(s) � 2CN� E° � �0.310 V
8.21 0 Ag(s)HCN(0.10 F),
Cu(s) 0 Cu2�(0.030 M) � K�Ag(CN)�2 (0.010 M),
E°

Problems 293
molecules. For ATP synthesis, This energy isthen made available to the cell when ATP is hydrolyzed to ADP(adenosine diphosphate). In animals, ATP is synthesized when pro-tons pass through a complex enzyme in the mitochondrial mem-brane.14 Two factors account for the movement of protons throughthis enzyme into the mitochondrion (see the figure): (1) ishigher outside the mitochondrion than inside because protons arepumped out of the mitochondrion by enzymes that catalyze the oxi-dation of food. (2) The inside of the mitochondrion is negativelycharged with respect to the outside.(a) The synthesis of one ATP molecule requires to passthrough the phosphorylation enzyme. The difference in free energywhen a molecule travels from a region of high activity to a region oflow activity is
How big must the pH difference be (at 298 K) if the passage oftwo protons is to provide enough energy to synthesize one ATPmolecule?(b) pH differences this large have not been observed in mitochon-dria. How great an electric potential difference between inside andoutside is necessary for the movement of two protons to provideenergy to synthesize ATP? In answering this question, neglect anycontribution from the pH difference.(c) The energy for ATP synthesis is thought to be provided byboth the pH difference and the electric potential. If the pH differ-ence is 1.00 pH unit, what is the magnitude of the potential difference?
�G � �RT lnA high
A low
2H�
[H�]
�G � �34.5 kJ/mol.
Negative electricpotential
Phosphorylationenzyme
ADP + HPO2–
2H+
2H+
H+ drivenout of
mitochondrionduring
respiration
H+ H+
Low H+
concentration
High H+
concentration
Positive electricpotential
+
–
+
–
+
–
+
–
+
–
+
–Mitochondrial membrane
4 ATP
Problems
Basic Concepts
14-1. Explain the difference between electric charge (q, coulombs),electric current (I, amperes), and electric potential (E, volts).
14-2. (a) How many electrons are in one coulomb?(b) How many coulombs are in one mole of charge?
14-3. The basal rate of consumption of by a 70-kg human isabout 16 mol of per day. This oxidizes food and is reduced to
providing energy for the organism:
(a) To what current does this respiration ratecorrespond? (Current is defined by the flow of electrons from foodto(b) Compare your answer in part (a) with the current drawn by arefrigerator using at 115 V. Remember that power
(c) If the electrons flow from nicotinamide adenine dinucleotide(NADH) to , they experience a potential drop of 1.1 V. What isthe power output (in watts) of our human friend?
14-4. A 6.00-V battery is connected across a resistor.(a) How many electrons per second flow through the circuit?(b) How many joules of heat are produced for each electron?(c) If the circuit operates for 30.0 min, how many moles of elec-trons will have flowed through the resistor?(d) What voltage would the battery need to deliver for the power tobe 1.00 � 102 W?
2.00-k�
O2
(in watts) � work/s � E � I.5.00 � 102 W
O2.)
(in amperes � C/s)
O2 � 4H� � 4e� T 2H2O
H2O,O2O2
O2
14-5. Consider the redox reaction
Thiosulfate Tetrathionate
(a) Identify the oxidizing agent on the left side of the reaction andwrite a balanced oxidation half-reaction.(b) Identify the reducing agent of the left side of the reaction andwrite a balanced reduction half-reaction.(c) How many coulombs of charge are passed from reductant tooxidant when 1.00 g of thiosulfate reacts?(d) If the rate of reaction is 1.00 g of thiosulfate consumed perminute, what current (in amperes) flows from reductant to oxidant?
14-6. The space shuttle’s expendable booster engines derive theirpower from solid reactants:
FM 117.49
(a) Find the oxidation numbers of the elements N, Cl, and Al inreactants and products. Which reactants act as reducing agents andwhich act as oxidants?(b) The heat of reaction is for every 10 mol of Al con-sumed. Express this as heat released per gram of total reactants.
Galvanic Cells
14-7. Explain how a galvanic cell uses a spontaneous chemicalreaction to generate electricity.
�9 334 kJ
� 5Al2O3(s) � 6HCl(g)6NH�
4 ClO�4 (s) � 10Al(s) S 3N2(g) � 9H2O(g)
I2 � 2S2O2�3 T 2I� � S4O2�
6

294 CHAPTER 14 Fundamentals of Electrochemistry
KOH(aq)FeO(s )
Ag2O(s )
Fe Ag
V
+–
K2SO4(aq) H2SO4(aq )
PbPb
V
+–
PbO2(s )PbSO4(s )PbSO4(s )
14-8. Write a line notation and two reduction half-reactions for eachcell pictured above.
14-9. Draw a picture of the following cell and write reduction half-reactions for each electrode:
14-10. Consider the rechargeable battery
(a) Write reduction half-reactions for each electrode. From whichelectrode will electrons flow from the battery into a circuit if theelectrode potentials are not too different from values?(b) If the battery delivers a constant current of for1.00 h, how many kilograms of will be consumed?
14-11. (a) Organic matter whose composition is approximately falls to the ocean floor near continental areas at a rate of 2 to 10 molof carbon per per year. The net cell reaction at the opening ofthis chapter is Write balanced half-reactions for this net reaction.(b) If organic matter is completely consumed, how many coulombsof charge would flow in 1 year through a cell whose electrodesoccupy 1 How much steady electric current (C/s) does thisrepresent?(c) If the current flows through a potential difference of 0.3 V, howmuch power would be generated?(d) Write the two electrode reactions and explain why one is differ-ent from the answer to part (a).
Standard Potentials
14-12. Which will be the strongest oxidizing agent under standardconditions (that is, all or
14-13. (a) Cyanide ion causes for Fe(III) to decrease:
Ferric Ferrous
Ferricyanide Ferrocyanide
Which ion, Fe(III) or Fe(II), is stabilized more by complexing withCN�?
Fe(CN)3�6 � e� T Fe(CN)4�
6 E° � 0.356 V
Fe3� � e� T Fe2� E° � 0.771 V
E°
MnO2?H2SO3,Cl2,UO2�
2 ,Se,HNO2,activities � 1):
m2?
CH2O � O2 S CO2 � H2O.m2
CH2O
Cl2
1.00 � 103 AE°
Zn(s) 0 ZnCl2(aq) � Cl�(aq) 0 Cl2(l) 0 C(s)
Cr2O2�7 (aq),Cr3� (aq), HA(aq) 0 Pt(s)
Pt(s) 0 Fe3� (aq), Fe2�(aq) �
(b) Using Appendix H, answer the same question when the ligand isphenanthroline instead of cyanide.
Nernst Equation
14-14. What is the difference between E and for a redox reac-tion? Which one runs down to 0 when the complete cell comes toequilibrium?
14-15. (a) Use the Nernst equation to write the spontaneous chemi-cal reaction that occurs in the cell in Demonstration 14-1.(b) If you use your fingers as a salt bridge in Demonstration 14-1,will your body take in or
14-16. Write the Nernst equation for the following half-reaction andfind E when and
Arsine
14-17. (a) Write the line notation for the following cell.
(b) Calculate the potential of each half-cell and the cell voltage, E.In which direction will electrons flow through the circuit? Write thespontaneous net cell reaction.
HBr(aq, 0.10 M)
Br2(/) Al(NO3)3(aq, 0.010 M)
V
+–
AlPt
As(s) � 3H� � 3e� T AsH3(g) E° � �0.238 V
PAsH3� 1.0 mbar.pH � 3.00
Zn2�?Cu2�
E°
N NPhenanthroline
Galvanic cells for Problem 14-8.

(c) The left half-cell was loaded with 14.3 mL of The aluminum electrode contains 12.0 g of Al. Which
element, or Al, is the limiting reagent? (That is, which reagentwill be used up first?)(d) If the cell is somehow operated under conditions in which itproduces a constant voltage of 1.50 V, how much electrical workwill have been done when 0.231 mL of has been consumed?(e) If the potentiometer is replaced by a resistor and if theheat dissipated by the resistor is at what rate(grams per second) is Al(s) dissolving? (In this question, the voltageis not 1.50 V.)
14-18. A nickel-metal hydride rechargeable battery for laptop com-puters is based on the following chemistry:
Cathode:
Anode:
The anode material, MH, is a transition metal hydride or rare earthalloy hydride. Explain why the voltage remains nearly constant dur-ing the entire discharge cycle.
14-19. Suppose that the concentrations of NaF and KCl were each0.10 M in the cell
(a) Using the half-reactions and calculate the cell voltage.(b) Now calculate the cell voltage by using the reactions
and For this part, you willneed the solubility products for and AgCl.
14-20. The following cell was set up to measure the standard reduc-tion potential of the couple:
The temperature was (the standard condition) and at-mospheric pressure was 751.0 Torr. Because the vapor pressureof water is 23.8 Torr at in the cell was
The Nernst equation for the cell,including activity coefficients, is derived as follows:
Given a measured cell voltage of and using activitycoefficients from Table 8-1, find Be sure to express inbar in the reaction quotient.
PH2E°Ag� 0Ag.
�0.798 3 V
E � E� � E� � E°Ag� 0Ag � 0.059 16 log a [H�]�H�
P1/2H2
[Ag�]�Ag�
b
E� � 0 � 0.059 16 log a P1/2H2
[H�]�H�
b
E� � E°Ag� 0Ag � 0.059 16 log a 1
[Ag�]�Ag�
b Left electrode: H� � e� T 1
2 H2(g) E°� � 0 V
Right electrode: Ag� � e� T Ag(s) E°� � E°Ag� 0Ag
751.0 � 23.8 � 727.2 Torr.PH2
25°C,
25°C
Pt(s) 0 HCl(0.010 00 M), H2(g) 7 AgNO3(0.010 00 M) 0 Ag(s)
Ag� 0 Ag
PbF2
Pb2� � 2e� T Pb(s).2e� T 2Ag(s)2Ag� �
PbF2(s) � 2e� T Pb(s) � 2F�,2AgCl(s) � 2e� T 2Ag(s) � 2Cl�
Pb(s) 0 PbF2(s) 0 F�(aq) 7 Cl�(aq) 0 AgCl(s) 0 Ag(s)
MH(s) � OH� #¢¢4discharge
chargeM(s) � H2O � e�
NiOOH(s) � H2O � e� #¢¢4discharge
charge Ni(OH)2(s) � OH�
1.00 � 10�4 J/s,1.20-k�
Br2(l)
Br2
3.12 g/mL).(density �Br2(l)
Problems 295
14-21. Write a balanced chemical equation (in acidic solution) forthe reaction represented by the question mark on the lower arrow.15
Calculate for the reaction.
14-22. What must be the relation between and if the speciesis to diproportionate spontaneously under standard conditions toand X(s)? Write a balanced equation for the disproportionation.
14-23. Including activities, calculate the voltage of the cell Assume that the
salts are completely dissociated (that is, neglect ion-pair formation).
Relation of E� and the Equilibrium Constant
14-24. For the reaction permole of CO at 298 K. Find and the equilibrium constant for thereaction.
14-25. Calculate and K for the following reactions.(a)(b)
14-26. A solution contains 0.100 M 0.100 M and 1.00 M
(a) Write a balanced net reaction that can occur between species inthis solution.(b) Calculate and K for the reaction.(c) Calculate E for the conditions given.(d) Calculate for the conditions given.(e) At what pH would the given concentrations of
and be in equilibrium at 298 K?
14-27. For the cell
Write the net cell reaction and calculate its equi-librium constant. Do not use values from Appendix H to answerthis question.
14-28. Calculate for the half-reaction given that for is and
for the reaction
14-29. From the standard potentials for reduction of andin Appendix H, calculate the solubility of in water at
Express your answer as g/L.
14-30. Given the following information, calculate the standardpotential for the reaction where Y is EDTA.
14-31. For modest temperature excursions away from thechange in for a half-reaction can be written in the form
E°(T) � E° � adE°
dTb�T
E°25°C,
Kf � 1.3 � 1025FeY�:
Kf � 2.0 � 1014FeY2�:
E° � �0.730 VFeY� � e� T Fe2� � Y4�
FeY� � e� T FeY2�,
25°C.Br2Br2(l)
Br2(aq)
Pd2� � 2e� T Pd(s).0.915 VE° �3 � 10�28Pd(OH)2KspPd(s) � 2OH�
Pd(OH)2(s) � 2e� TE°
E°E°) � �0.289 V.
E(notSn4�(0.031 8 M) 0 Pt(s),H�(1.57 M) 7 Sn2� (0.031 8 M),V3� (0.116 M),Pt(s) 0 VO2� (0.116 M),
MnO�4Mn2�,
Ce3�,Ce4�,�G
�G°
HClO4.MnO�4 ,Mn2�,1.00 � 10�4 M
1.00 � 10�4 M Ce4�,Ce3�,
Ag(S2O3)3�2 � Fe(CN)4�
6 T Ag(s) � 2S2O2�3 � Fe(CN)3�
6
4Co3� � 2H2O T 4Co2� � O2(g) � 4H�
�G°,E°,
E°�G° � �257 kJCO � 1
2 O2 T CO2,
NiSO4(0.002 0 M) � CuCl2(0.003 0 M) 0 Cu(s).Ni(s) 0
X3� X� X(s)E˚ 1 E˚ 2
X3�
X�
E°2E°1
BrO3 HOBr Br2(aq) Br��
1.491 1.0981.584
?
1.441
E°
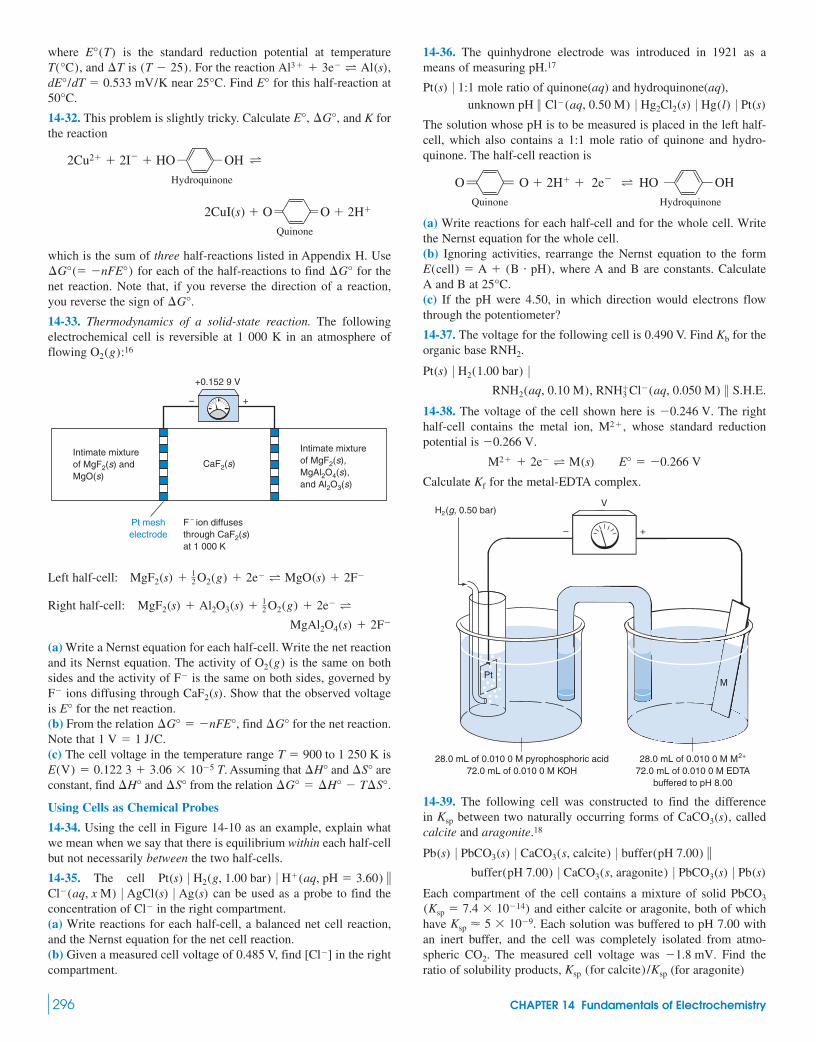
where is the standard reduction potential at temperatureand is For the reaction
near Find for this half-reaction at
14-32. This problem is slightly tricky. Calculate and K forthe reaction
which is the sum of three half-reactions listed in Appendix H. Usefor each of the half-reactions to find for the
net reaction. Note that, if you reverse the direction of a reaction,you reverse the sign of
14-33. Thermodynamics of a solid-state reaction. The followingelectrochemical cell is reversible at 1 000 K in an atmosphere offlowing 16
Left half-cell:
Right half-cell:
(a) Write a Nernst equation for each half-cell. Write the net reactionand its Nernst equation. The activity of is the same on bothsides and the activity of is the same on both sides, governed by
ions diffusing through Show that the observed voltageis for the net reaction.(b) From the relation find for the net reaction.Note that (c) The cell voltage in the temperature range is
Assuming that and areconstant, find and from the relation
Using Cells as Chemical Probes
14-34. Using the cell in Figure 14-10 as an example, explain whatwe mean when we say that there is equilibrium within each half-cellbut not necessarily between the two half-cells.
14-35. The cell can be used as a probe to find the
concentration of in the right compartment.(a) Write reactions for each half-cell, a balanced net cell reaction,and the Nernst equation for the net cell reaction.(b) Given a measured cell voltage of 0.485 V, find in the rightcompartment.
[Cl�]
Cl�
Cl�(aq, x M) 0 AgCl(s) 0 Ag(s)Pt(s) 0 H2(g, 1.00 bar) 0 H�(aq, pH � 3.60) �
�G° � �H° � T�S°.�S°�H°�S°�H°E(V) � 0.122 3 � 3.06 � 10�5 T.
T � 900 to 1 250 K1 V � 1 J/C.
�G°�G° � �nFE°,E°
CaF2(s).F�
F�
O2(g)
MgAl2O4(s) � 2F�
MgF2(s) � Al2O3(s) � 12 O2(g) � 2e� T
MgF2(s) � 12 O2(g) � 2e� T MgO(s) � 2F�
Intimate mixture of MgF2(s) and MgO(s)
F – ion diffusesthrough CaF2(s)at 1 000 K
Pt meshelectrode
Intimate mixture of MgF2(s),MgAl2O4(s),and Al2O3(s)
CaF2(s)
+0.152 9 V
– +
O2(g):
�G°.
�G°�G°(� �nFE°)
2Cu2� � 2I� � HO OH T∫ ∫
£ £ O � 2H�
Hydroquinone
Quinone
2CuI(s) � O
�G°,E°,
50°C.E°25°C.dE°/dT � 0.533 mV/K
Al3� � 3e� T Al(s),(T � 25).�TT(°C),E°(T)
296 CHAPTER 14 Fundamentals of Electrochemistry
14-36. The quinhydrone electrode was introduced in 1921 as ameans of measuring pH.17
1:1 mole ratio of quinone(aq) and hydroquinone(aq),
The solution whose pH is to be measured is placed in the left half-cell, which also contains a 1:1 mole ratio of quinone and hydro-quinone. The half-cell reaction is
(a) Write reactions for each half-cell and for the whole cell. Writethe Nernst equation for the whole cell.(b) Ignoring activities, rearrange the Nernst equation to the form
where A and B are constants. CalculateA and B at (c) If the pH were 4.50, in which direction would electrons flowthrough the potentiometer?
14-37. The voltage for the following cell is 0.490 V. Find for theorganic base
14-38. The voltage of the cell shown here is The righthalf-cell contains the metal ion, whose standard reductionpotential is
Calculate for the metal-EDTA complex.
14-39. The following cell was constructed to find the difference in between two naturally occurring forms of calledcalcite and aragonite.18
Each compartment of the cell contains a mixture of solid and either calcite or aragonite, both of which
have Each solution was buffered to pH 7.00 withan inert buffer, and the cell was completely isolated from atmo-spheric The measured cell voltage was Find theratio of solubility products, (for aragonite)(for calcite) /KspKsp
�1.8 mV.CO2.
Ksp � 5 � 10�9.(Ksp � 7.4 � 10�14)
PbCO3
buffer(pH 7.00) 0 CaCO3(s, aragonite) 0 PbCO3(s) 0 Pb(s)
Pb(s) 0 PbCO3(s) 0 CaCO3(s, calcite) 0 buffer(pH 7.00) �
CaCO3(s),Ksp
– +
VH2(g, 0.50 bar)
M
28.0 mL of 0.010 0 M pyrophosphoric acid72.0 mL of 0.010 0 M KOH
28.0 mL of 0.010 0 M M2+
72.0 mL of 0.010 0 M EDTAbuffered to pH 8.00
Pt
Kf
M2� � 2e� T M(s) E° � �0.266 V
�0.266 V.M2�,
�0.246 V.
RNH2(aq, 0.10 M), RNH�3 Cl�(aq, 0.050 M) 7 S.H.E.
Pt(s) 0 H2(1.00 bar) 0RNH2.
Kb
25°C.E(cell) � A � (B � pH),
O O � 2H� � 2e� T HO ∫ ∫£ £ OH
HydroquinoneQuinone
unknown pH 7 Cl�(aq, 0.50 M) 0 Hg2Cl2(s) 0 Hg(l) 0 Pt(s)Pt(s) 0
14-40. Do not ignore activity coefficients in this problem. If thevoltage for the following cell is 0.512 V, find for Neglect any ion pairing.
Biochemists Use E�
14-41. Explain what is and why it is preferred over inbiochemistry.
14-42. We are going to find for the reaction
(a) Write the Nernst equation for the half-reaction, using fromAppendix H.(b) Rearrange the Nernst equation to the form
(c) The quantity is Evaluate for
14-43. Evaluate for the half-reaction
14-44. Calculate for the reaction
Oxalic acid Formic acid
14-45. HOx is a monoprotic acid with and is a diprotic acid with and Find
for the reaction
HOx � e� T H2Red� E°¿ � 0.062 V
E°K2 � 8.1 � 10�8.K1 � 3.6 � 10�4
H2Red�Ka � 1.4 � 10�5
H2C2O4 � 2H� � 2e� T 2HCO2H E° � 0.204 V
E°¿
2HCN(aq).(CN)2(g) � 2H� � 2e� TE°¿
pH � 7.00.E°¿E°¿.(E° � other terms)
E � E° � other terms �0.059 16
2 log aPC2H4
PC2H2
b
E°2e� T C2H4(g).
C2H2(g) � 2H� �E°¿
E°E°¿
Ni(s) 0 NiSO4(0.002 5 M) � KIO3(0.10 M) 0 Cu(IO3)2(s) 0 Cu(s)
Cu(IO3)2.Ksp
Problems 297
14-46. Given the following information, find for nitrous acid,
14-47. Using the reaction
and acid dissociation constants from Appendix G, calculate forthe reaction
14-48. This problem requires knowledge of Beer’s law fromChapter 18. The oxidized form (Ox) of a flavoprotein that func-tions as a one-electron reducing agent has a molar absorptivity
of at 457 nm at pH 7.00. For thereduced form (Red), at 457 nm atpH 7.00.
The substrate (S) is the molecule reduced by the protein.
Both S and are colorless. A solution at pH 7.00 was prepared bymixing enough protein plus substrate to produce initialconcentrations [Red] � [S] � . The absorbance at457 nm was 0.500 in a 1.00-cm cell.(a) Calculate the concentrations of Ox and Red from the absorbancedata.(b) Calculate the concentrations of S and .(c) Calculate the value of for the reaction S � e� T S�.E°¿
S�
5.70 � 10�5 M(Red � S)
S�
Red � S T Ox � S�
Ox � e� T Red E°¿ � �0.128 V
� � 3.82 � 103 M�1 � cm�11.12 � 104 M�1 � cm�1(�)
H2PO�4 � H� � 2e� T HPO2�
3 � H2O
E°
HPO2�4 � 2H� � 2e� T HPO2�
3 � H2O E° � �0.234 V
E°¿ � 0.433 V
NO�3 � 3H� � 2e� T HNO2 � H2O E° � 0.940 V
HNO2.Ka

298 CHAPTER 15 Electrodes and Potentiometry
Blood clotting must be precisely regulated in the human body to minimize hemorrhage(bleeding) in an injury and thrombosis (uncontrolled clotting) in healthy tissue. Clotting isregulated by numerous substances, including heparin, a highly negatively charged mole-cule secreted by mast cells near the walls of blood vessels.2
Heparin administered during surgery to inhibit clotting must be monitored to preventuncontrolled bleeding. Until recently, only clotting time could be measured; there was nodirect, rapid determination of heparin at physiologic levels. Now, a rotating ion-selectiveelectrode is available that can respond to clinically relevant concentrations of heparin inreal time during surgery.3 In this chapter, we study the principles governing electrodes thatrespond selectively to particular analytes.
A HEPARIN SENSOR
Electrodes and Potentiometry15
Mi
Mast cell (noncirculating white blood cell) withdark granules containing regulatory moleculessuch as heparin. (Mi indicates details of a cell’ssurface called microvilli and microfolds.) [From R. G. Kessel and R. H. Kardon, Tissues and Organs(San Francisco: W. H. Freeman, 1978), p. 14; D. Lagunoff,J. Invest. Dermatol. 1972, 58, 296.]
O
OO O
O
OO O
O
OO O
O
OO
O O
O
O
–O3SO
–O3SO
–O3SO
–O3SO –O
3SO–O
3SO –O3SO
–O3SO
OSO3
–OOC–OOC
–OOC–OOC
NHSO3 NHSO
3NHSO
3
NCOCH3
NHSO3
–OOC
–– –
––
Partial structure of heparin, showing negatively charged substituents. Heparin is a proteoglycan,containing 95% polysaccharide (sugar) and 5% protein. [Structure from R. Sasisekharan, Massachusetts Institute of Technology.]
SO– Na+ Na+
Na+
Na+
H3CN+
Cl– H3CN+
Cl–
Heparin
3
SO–3
SO–3
SO–3
Membrane ofion-selectiveelectrode
Ion exchange between heparin and Cl�associated with tetraalkylammonium ions in the membrane of the ion-selective electrode.Ion-selective electrodes described in this chapter reach an equilibrium electric potentialat the membrane-solution interface. Unlikethose electrodes, the heparin sensor has a nonequilibrium response that depends on thesteady-state flux of heparin to the membranesurface a few minutes after the membrane is exposed to heparin.1
Rotating ion-selective heparin electrode. Figure 17-12 shows that rotation brings analyteto the electrode surface by convection.
Rotation of heparin electrode improves sensitivity by anorder of magnitude. [From Q. Ye and M. E. Meyerhoff,“Rotating Electrode Potentiometry: Lowering the Detection Limitof Nonequilibrium Polyion-Sensitive Membrane Electrodes,”Anal. Chem. 2001, 73, 332.]
V
– +
Rotator
Fillingsolution
Ion-exchangemembrane
electrodeAg AgCl Internal
electrodeAg AgCl External
Pot
entia
l (m
V)
0
–10
–20
–30
–40
–50
–60
0.01
Heparin (units/mL)
0.1 1
Rotating at5 000 rpm
Norotation

15-1 Reference Electrodes 299
C lever chemists have designed electrodes that respond selectively to specific analytes insolution or in the gas phase. Typical ion-selective electrodes are about the size of your pen.Really clever chemists created ion-sensing field effect transistors that are just hundreds ofmicrometers in size and can be inserted into a blood vessel. The use of electrodes to measurevoltages that provide chemical information is called potentiometry.
In the simplest case, analyte is an electroactive species that is part of a galvanic cell. Anelectroactive species is one that can donate or accept electrons at an electrode. We turn theunknown solution into a half-cell by inserting an electrode, such as a Pt wire, that can trans-fer electrons to or from the analyte. Because this electrode responds to analyte, it is called theindicator electrode. We then connect this half-cell to a second half-cell by a salt bridge. Thesecond half-cell has a fixed composition, so it has a constant potential. Because of its con-stant potential, the second half-cell is called a reference electrode. The cell voltage is thedifference between the variable potential of the analyte half-cell and the constant potential ofthe reference electrode.
15-1 Reference ElectrodesSuppose you want to measure the relative amounts of and in a solution. You canmake this solution part of a galvanic cell by inserting a Pt wire and connecting the cell to aconstant-potential half-cell by a salt bridge, as shown in Figure 15-1.
The two half-reactions (written as reductions) are
Right electrode:
Left electrode:
The electrode potentials are
and the cell voltage is the difference
But in the left half-cell is constant, fixed by the solubility of KCl, with which the solu-tion is saturated. Therefore, the cell voltage changes only when the quotient changes.
The half-cell on the left in Figure 15-1 can be thought of as a reference electrode. Wecan picture the cell and salt bridge enclosed by the dashed line as a single unit dipped into the
[Fe2�]/[Fe3�][Cl�]
E � e0.771 � 0.059 16 log a [Fe2�]
[Fe3�]b f � 50.222 � 0.059 16 log[Cl�]6
E� � E�:
E� � 0.222 � 0.059 16 log[Cl�]
E� � 0.771 � 0.059 16 log a [Fe2�]
[Fe3�]b
E°� � 0.222 VAgCl(s) � e� T Ag(s) � Cl�
E°� � 0.771 VFe3� � e� T Fe2�
Fe3�Fe2�
Dan received intravenous heparin inDecember 2004, but never stopped typing![Photo from Sally Harris.]
Salt bridge
V
+–
SolidKCl
PtAgCl
Ag
Salt bridge
Fe2+, Fe3+
Ag(s) AgCl(s) Cl–(aq) Fe2+(aq), Fe3+(aq) Pt(s)
Anode: Ag + Cl– AgCl + e– Cathode: Fe3+ + e– Fe2+
SaturatedKCl solution
Indicator electrode: responds to analyteactivity
Reference electrode: maintains a fixed(reference) potential
is the potential of the electrode attached tothe positive input of the potentiometer. is thepotential of the electrode attached to thenegative input of the potentiometer.
E�
E�
The voltage really tells us the quotient ofactivities, However, we willneglect activity coefficients and write theNernst equation with concentrationsinstead of activities.
AFe2�/AFe3�.
Figure 15-1 A galvanic cell that can beused to measure the quotient inthe right half-cell. The Pt wire is the indicatorelectrode, and the entire left half-cell plus saltbridge (enclosed by the dashed line) can beconsidered a reference electrode.
[Fe2�]/[Fe3�]
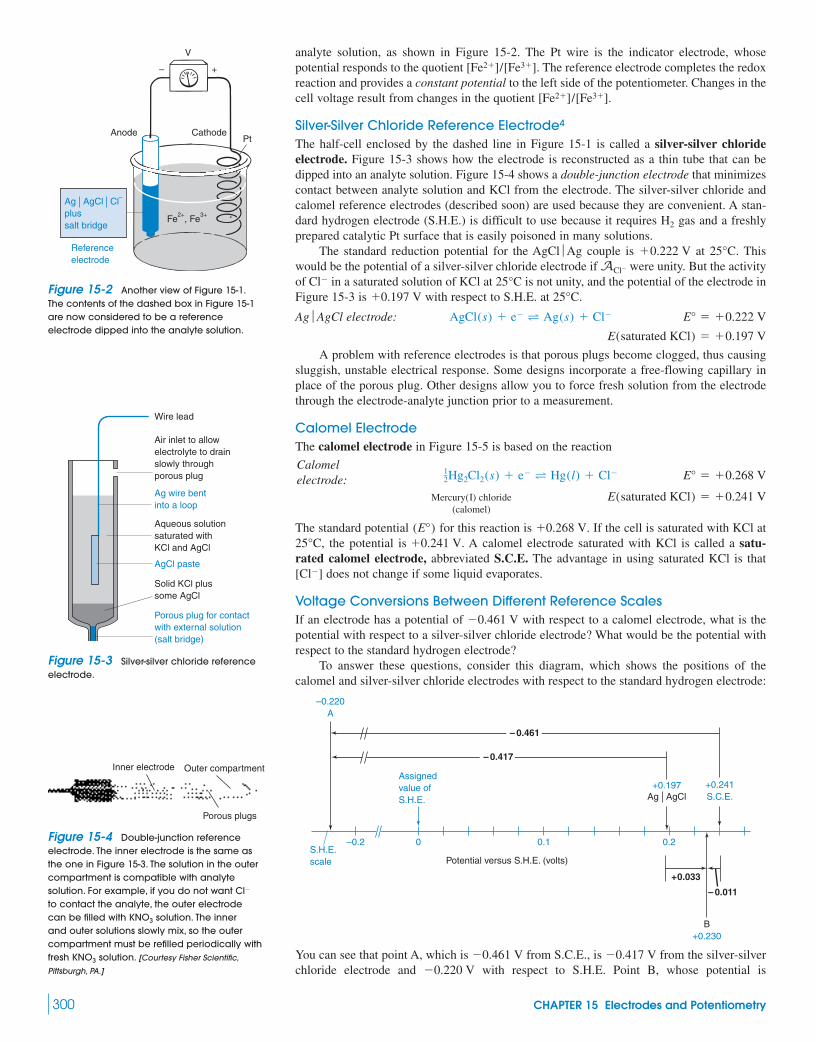
analyte solution, as shown in Figure 15-2. The Pt wire is the indicator electrode, whosepotential responds to the quotient The reference electrode completes the redoxreaction and provides a constant potential to the left side of the potentiometer. Changes in thecell voltage result from changes in the quotient
Silver-Silver Chloride Reference Electrode4
The half-cell enclosed by the dashed line in Figure 15-1 is called a silver-silver chlorideelectrode. Figure 15-3 shows how the electrode is reconstructed as a thin tube that can bedipped into an analyte solution. Figure 15-4 shows a double-junction electrode that minimizescontact between analyte solution and KCl from the electrode. The silver-silver chloride andcalomel reference electrodes (described soon) are used because they are convenient. A stan-dard hydrogen electrode (S.H.E.) is difficult to use because it requires gas and a freshlyprepared catalytic Pt surface that is easily poisoned in many solutions.
The standard reduction potential for the AgCl ƒ Ag couple is at Thiswould be the potential of a silver-silver chloride electrode if were unity. But the activityof in a saturated solution of KCl at is not unity, and the potential of the electrode inFigure 15-3 is with respect to S.H.E. at
Ag ƒ AgCl electrode:
A problem with reference electrodes is that porous plugs become clogged, thus causingsluggish, unstable electrical response. Some designs incorporate a free-flowing capillary inplace of the porous plug. Other designs allow you to force fresh solution from the electrodethrough the electrode-analyte junction prior to a measurement.
Calomel ElectrodeThe calomel electrode in Figure 15-5 is based on the reaction
Mercury(I) chloride(calomel)
The standard potential for this reaction is If the cell is saturated with KCl atthe potential is A calomel electrode saturated with KCl is called a satu-
rated calomel electrode, abbreviated S.C.E. The advantage in using saturated KCl is thatdoes not change if some liquid evaporates.
Voltage Conversions Between Different Reference ScalesIf an electrode has a potential of with respect to a calomel electrode, what is thepotential with respect to a silver-silver chloride electrode? What would be the potential withrespect to the standard hydrogen electrode?
To answer these questions, consider this diagram, which shows the positions of thecalomel and silver-silver chloride electrodes with respect to the standard hydrogen electrode:
You can see that point A, which is from S.C.E., is from the silver-silverchloride electrode and with respect to S.H.E. Point B, whose potential is�0.220 V
�0.417 V�0.461 V
+0.241S.C.E.
+0.197
+0.033
– 0.011
B+0.230
0.20.10
Potential versus S.H.E. (volts)
Assignedvalue ofS.H.E.
–0.2S.H.E.scale
–0.220A
– 0.461
– 0.417
Ag AgCl
�0.461 V
[Cl�]
�0.241 V.25°C,�0.268 V.(E°)
E(saturated KCl) � �0.241 V
E° � �0.268 V12Hg2Cl2(s) � e� T Hg(l) � Cl�
Calomelelectrode:
E(saturated KCl) � �0.197 V
E° � �0.222 VAgCl(s) � e� T Ag(s) � Cl�
25°C.�0.197 V25°CCl�
ACl�
25°C.�0.222 V
H2
[Fe2�]/[Fe3�].
[Fe2�]/[Fe3�].
300 CHAPTER 15 Electrodes and Potentiometry
Anode CathodePt
V
+–
Referenceelectrode
Fe2+, Fe3+
Agplussalt bridge
AgCl Cl–
Wire lead
Air inlet to allowelectrolyte to drainslowly throughporous plug
Ag wire bentinto a loop
Aqueous solutionsaturated withKCl and AgCl
AgCl paste
Porous plug for contactwith external solution(salt bridge)
Solid KCl plussome AgCl
Outer compartment
Porous plugs
Inner electrode
Figure 15-2 Another view of Figure 15-1.The contents of the dashed box in Figure 15-1are now considered to be a referenceelectrode dipped into the analyte solution.
Figure 15-3 Silver-silver chloride referenceelectrode.
Figure 15-4 Double-junction referenceelectrode. The inner electrode is the same asthe one in Figure 15-3. The solution in the outercompartment is compatible with analytesolution. For example, if you do not want Cl�
to contact the analyte, the outer electrodecan be filled with KNO3 solution. The innerand outer solutions slowly mix, so the outercompartment must be refilled periodically withfresh KNO3 solution. [Courtesy Fisher Scientific,
Pittsburgh, PA.]

from silver-silver chloride, is from S.C.E. and from S.H.E.By keeping this diagram in mind, you can convert potentials from one scale to another.
15-2 Indicator ElectrodesWe will study two broad classes of indicator electrodes. Metal electrodes described in thissection develop an electric potential in response to a redox reaction at the metal surface. Ion-selective electrodes, described later, are not based on redox processes. Instead, selectivebinding of one type of ion to a membrane generates an electric potential.
The most common metal indicator electrode is platinum, which is relatively inert—itdoes not participate in many chemical reactions. Its purpose is simply to transmit electrons toor from species in solution. Gold electrodes are even more inert than Pt. Various types of car-bon are used as indicator electrodes because the rates of many redox reactions on the carbonsurface are fast. A metal electrode works best when its surface is large and clean. To clean theelectrode, dip it briefly in hot 8 M and rinse with distilled water.
Figure 15-6 shows how a silver electrode can be used with a reference electrode tomeasure concentration.5 The reaction at the Ag indicator electrode is
The calomel reference half-cell reaction is
and the reference potential not is fixed at 0.241 V because the reference cell issaturated with KCl. The Nernst equation for the entire cell is therefore
(15-1)
That is, the voltage of the cell in Figure 15-6 provides a measure of Ideally, the volt-age changes by 59.16 mV (at ) for each factor-of-10 change in
In Figure 7-9, we used a silver indicator electrode and a glass reference electrode. Theglass electrode responds to pH and the cell in Figure 7-9 contains a buffer to maintain con-stant pH. Therefore, the glass electrode remains at a constant potential; it is being used in anunconventional way as a reference electrode.
Example Potentiometric Precipitation Titration
A 100.0-mL solution containing 0.100 0 M NaCl was titrated with 0.100 0 M and the voltage of the cell shown in Figure 15-6 was monitored. Calculate thevoltage after the addition of 65.0 mL of
Solution The titration reaction is
for which the equivalence point is 100.0 mL. At 65.0 mL, 65.0% of has precipitatedand 35.0% remains in solution:
To find the cell voltage in Equation 15-1, we need to know
The cell voltage is therefore
E � 0.558 � 0.059 16 log(8.5 � 10�9) � 0.081 V
[Ag�][Cl�] � Ksp 1 [Ag�] �Ksp
[Cl�]�
1.8 � 10�10
0.021 2� 8.5 � 10�9 M
[Ag�]:
[Cl�] � (0.350) (0.100 0 M)
Fractionremaining
Total volumeof solution
100.0165.0( ) � 0.021 2 M
Originalconcentration
of Cl�
Dilutionfactor
Initial volumeof Cl�
Cl�
Ag� � Cl� S AgCl(s)
AgNO3.
AgNO3,
[Ag�].25°C[Ag�].
E � 0.558 � 0.059 16 log[Ag�]
E � E� � E� � {0.799 � 0.059 16 log ( 1 )} � {0.241}
Potential of Ag � Ag�
indicator electrodePotential of
S.C.E. reference electrode
[Ag�]
E°�)(E�,
E� � 0.241 VHg2Cl2(s) � 2e� T 2Hg(l) � 2Cl�
E°� � 0.799 VAg� � e� T Ag(s)
Ag�
HNO3
�0.230 V�0.011 V�0.033 V
15-2 Indicator Electrodes 301
Wire lead
Pt wire
Hole to allowdrainage throughporous plug
Hg(/)
Glass wool
Opening
KCl(s)
Hg, Hg2Cl2+ KCl
Saturated KClsolution
Glass wall
Porous plug(salt bridge)
Ag+(aq)Double-junction
saturatedcalomel
electrode
V
+–
Ag wire
Figure 15-5 A saturated calomelelectrode (S.C.E.).
Figure 15-6 Use of Ag and calomelelectrodes to measure The calomelelectrode has a double junction, like that inFigure 15-4. The outer compartment of theelectrode is filled with KNO3, so there is nodirect contact between Cl� in the innercompartment and in the beaker.Ag�
[Ag�].

We see from the example that a silver electrode is also a halide electrode, if solid silverhalide is present.6 If the solution contains AgCl(s), we substitute intoEquation 15-1 to find an expression relating the cell voltage to
Metals, including Ag, Cu, Zn, Cd, and Hg, can be used as indicator electrodes for theiraqueous ions. Most metals, however, are unsuitable for this purpose, because the equilibrium
is not readily established at the metal surface.Mn� � ne� T M
E � 0.558 � 0.059 16 log a Ksp
[Cl�]b[Cl�]:
[Ag�] � Ksp/[Cl�]
302 CHAPTER 15 Electrodes and Potentiometry
Demonstration 15-1 Potentiometry with an Oscillating Reaction7
The Belousov-Zhabotinskii reaction is a cerium-catalyzed oxidationof malonic acid by bromate, in which the quotient oscillates by a factor of 10 to 100.8
Malonic acid Bromate
Bromomalonic acid
When the concentration is high, the solution is yellow.When predominates, the solution is colorless. With redoxindicators (Section 16-2), this reaction oscillates through asequence of colors.9
Oscillation between yellow and colorless is set up in a 300-mLbeaker with the following solutions:
160 mL of 1.5 M 40 mL of 2 M malonic acid30 mL of 0.5 M (or saturated 4 mL of saturated ceric ammonium sulfate,
After an induction period of 5 to 10 min with magnetic stirring,oscillations can be initiated by adding 1 mL of ceric ammoniumsulfate solution. The reaction may need more over a 5-minperiod to initiate oscillations.
A galvanic cell is built around the reaction as shown in thefigure. The quotient is monitored by Pt andcalomel electrodes. You should be able to write the cell reactionsand a Nernst equation for this experiment.
[Ce3�]/[Ce4�]
Ce4�
(Ce(SO4)2 � 2(NH4)2SO4 � 2H2O)
KBrO3)NaBrO3
H2SO4
Ce3�
Ce4�
2BrCH(CO2H)2 � 3CO2 � 4H2O
3CH2(CO2H)2 � 2BrO�3 � 2H� S
[Ce3�]/[Ce4�]
Apparatus used to monitor the quotient for an oscillatingreaction. [The idea for this demonstration came from George Rossman, California
Institute of Technology.]
In place of a potentiometer (a pH meter), use a computer orrecorder to show the oscillations. Because the potential oscillatesover a range of 100 mV but is centered near 1.2 V, the cellvoltage is offset by 1.2 V with any available power supply.10
Trace a shows what is usually observed. The potential changesrapidly during the abrupt colorless-to-yellow change and gradu-ally during the gentle yellow-to-colorless change. Trace b showstwo different cycles superimposed in the same solution. This unusualevent occurred in a reaction that had been oscillating normally forabout 30 min.11
���
[Ce3�]/[Ce4�]
Saturatedcalomel
electrode
Oscillatingreaction
Stirring bar
Pt wire
Powersupply
Computeror recorder
~1.2 V
+ – + –
~100 mV scale
Time Time
Pot
entia
l 20 mV1 min
(a) (b )
The cell responds to a change in which necessarily changes because[Ag�][Cl�] � Ksp.
[Ag�][Cl�],
Demonstration 15-1 is a great example ofindicator and reference electrodes.

15-3 What Is a Junction Potential?Whenever dissimilar electrolyte solutions are in contact, a voltage difference called the junc-tion potential develops at their interface. This small voltage (usually a few millivolts) isfound at each end of a salt bridge connecting two half-cells. The junction potential puts afundamental limitation on the accuracy of direct potentiometric measurements, because weusually do not know the contribution of the junction to the measured voltage.
To see why the junction potential occurs, consider a solution of NaCl in contact withdistilled water (Figure 15-7). and ions begin to diffuse from the NaCl solution intothe water. However, ion has a greater mobility than That is, diffuses faster than
As a result, a region rich in with excess negative charge, develops at the front.Behind it is a positively charged region depleted of The result is an electric potential dif-ference at the junction of the NaCl and phases. The junction potential opposes themovement of and accelerates the movement of The steady-state junction potentialrepresents a balance between the unequal mobilities that create a charge imbalance and thetendency of the resulting charge imbalance to retard the movement of Cl�.
Na�.Cl�
H2OCl�.
Cl�,Na�.Cl�Na�.Cl�
Cl�Na�
15-4 How Ion-Selective Electrodes Work 303
Eobserved � Ecell � Ejunction
Because the junction potential is usuallyunknown, is uncertain.Ecell
Hydrophobic: “water hating” (does not mixwith water)
Table 15-1 Mobilities of ions in water at 25°C
Ion Mobility [m2/(s V)]a
a. The mobility of an ion is the terminal velocity thatthe particle achieves in an electric field of 1 V/m.Mobility � velocity/field. The units of mobility aretherefore (m/s)/(V/m) � m2/(s V).�
4.24 � 10�8CH3CO�2
4.61 � 10�8HCO�3
5.70 � 10�8F�
7.05 � 10�8ClO�4
7.40 � 10�8NO�3
7.91 � 10�8Cl�
7.96 � 10�8I�
8.13 � 10�8Br�
8.27 � 10�8SO2�4
10.47 � 10�8Fe(CN)3�6
11.45 � 10�8Fe(CN)4�6
20.50 � 10�8OH�
4.01 � 10�8Li�
5.19 � 10�8Na�
5.56 � 10�8Cu2�
6.12 � 10�8Ca2�
6.42 � 10�8Ag�
6.59 � 10�8Ba2�
7.21 � 10�8La3�
7.61 � 10�8NH�4
7.62 � 10�8K�
7.92 � 10�8Rb�
36.30 � 10�8H�
�
Figure 15-7 Development of the junction potential caused by unequal mobilities of and Cl�.Na�
WaterNaClsolution
Region richin Na+
Region richin Cl–
Water
+ –
+ –
+ –
Na+
Cl–NaClsolution
Table 15-1 shows mobilities of several ions and Table 15-2 lists some liquid junctionpotentials. Saturated KCl is used in a salt bridge because and have similar mobilities.Junction potentials at the two interfaces of a KCl salt bridge are slight.
Nonetheless, the junction potential of 0.1 M HCl ƒ 3.5 M KCl is 3.1 mV. A pH electrodehas a response of 59 mV per pH unit. A pH electrode dipped into 0.1 M HCl will have a junc-tion potential of 3 mV, or an error of 0.05 pH units (12% error in
Example Junction Potential
A 0.1 M NaCl solution was placed in contact with a 0.1 M solution. Which sideof the junction is positive?
Solution Because is equal on both sides, there is no net diffusion of across the junction. However, diffuses into and diffuses into NaCl. Themobility of is greater than that of so the NaCl region will be depleted of faster than the region will be depleted of The side will becomenegative, and the NaCl side will become positive.
15-4 How Ion-Selective Electrodes Work12
Ion-selective electrodes, discussed in the remainder of this chapter, respond selectively toone ion. These electrodes are fundamentally different from metal electrodes in that ion-selective electrodes do not involve redox processes. The key feature of an ideal ion-selectiveelectrode is a thin membrane capable of binding only the intended ion.
Consider the liquid-based ion-selective electrode in Figure 15-8a. The electrode is saidto be “liquid based” because the ion-selective membrane is a hydrophobic organic polymerimpregnated with a viscous organic solution containing an ion exchanger and, sometimes, aligand that selectively binds the analyte cation, The inside of the electrode contains fill-ing solution with the ions and The outside of the electrode is immersed inanalyte solution containing and, perhaps, other ions. Ideally, it does notmatter what and and the other ions are. The electric potential difference (the voltage)across the ion-selective membrane is measured by two reference electrodes, which might beAg ƒ AgCl. If the concentration (really, the activity) of in the analyte solution changes, theC�
B�A�
A�(aq),C�(aq),B�(aq).C�(aq)
C�.
NaNO3NO�3 .NaNO3
Cl�NO�3 ,Cl�
NO�3NaNO3,Cl�
Na�[Na�]
NaNO3
[H�]).�
Cl�K�
Table 15-2 Liquid junctionpotentials at 25°C
PotentialJunction (mV)
NOTE: A positive sign means that the right side of thejunction becomes positive with respect to the left side.
�3.10.1 M HCl 0 3.5 M KCl�270.1 M HCl 0 0.1 M KCl�1.91 M NaCl 0 3.5 M KCl�0.20.1 M NaCl 0 3.5 M KCl�6.40.1 M NaCl 0 0.1 M KCl

voltage measured between the two reference electrodes also changes. By using a calibrationcurve, the voltage tells us the activity of in the analyte solution.
Figure 15-8b shows how the electrode works. The key in this example is the ligand, L(called an ionophore), that is soluble inside the membrane and selectively binds analyte ion.In a potassium ion-selective electrode, for example, L could be valinomycin, a natural antibi-otic secreted by certain microorganisms to carry ion across cell membranes. The ligand,L, is chosen to have a high affinity for analyte cation, C�, and low affinity for other ions. Inan ideal electrode, L binds only Real electrodes always have some affinity for othercations, so these cations interfere to some degree with the measurement of For chargeneutrality, the membrane also contains a hydrophobic anion, such as tetraphenylborate,
that is soluble in the membrane and poorly soluble in water.Almost all analyte ion inside the membrane in Figure 15-8b is bound in the complex
which is in equilibrium with a small amount of free in the membrane. The mem-brane also contains excess free L. can diffuse across the interface. In an ideal electrode,
cannot leave the membrane, because it is not soluble in water, and the aqueous anion cannot enter the membrane, because it is not soluble in the organic phase. As soon as a few
ions diffuse from the membrane into the aqueous phase, there is excess positive charge inthe aqueous phase. This imbalance creates an electric potential difference that opposes diffu-sion of more into the aqueous phase.
When diffuses from a region of activity in the membrane to a region of activityin the outer solution, the free-energy change is
�G RT lnsolvation �
�G due to change in solvent
�G due tochange in activity (concentration)
(Am)Ao�G �
Ao
AmC�
C�
C�
A�R�
C�
C�LC�,
(C6H5)4B�,R�,
C�.C�.
K�
C�
304 CHAPTER 15 Electrodes and Potentiometry
Ion-selective electrode
Internal referenceelectrode
External referenceelectrode
Analytesolution
Filling solution
Ion-selectivemembrane
Ion-selectivemembrane
Filling solutioninside electrode
Inner surfaceof membrane
B–
B–B–
B–B–
C+
C+C+
C+
R–
R–
L
L
L
L
L
L
R–
R–
R–
R–
R–R–
R–
R–Example:
C+ = K+
R– = (C6H5)4B–
L = valinomycin
Excess negative charge
Excess positive charge
LC+
LC+
LC+
C+
C+
C+A–
A–
A–
LC+LC+
LC+
LC+
LC+ LC+
R–R–
C+ C+
C+
C+
Outer surfaceof membrane
Analyte solutionoutside electrode
(a)
(b)
Figure 15-8 (a) Ion-selective electrodeimmersed in aqueous solution containinganalyte cation, Typically, the membraneis made of poly(vinyl chloride) impregnatedwith the plasticizer dioctyl sebacate, anonpolar liquid that softens the membraneand dissolves the ion-selective ionophore (L),the complex and a hydrophobic anion
(b) Close-up of membrane. Ellipsesencircling pairs of ions are a guide for the eyeto count the charge in each phase. Boldcolored ions represent excess charge in eachphase. The electric potential difference acrosseach surface of the membrane depends onthe activity of analyte ion in the aqueoussolution contacting the membrane.
(R�).(LC�),
C�.
Valinomycin- complex has six carbonyloxygen atoms in octahedral coordinationaround [From L. Stryer, Biochemistry, 4th ed
(New York: W. H. Freeman, 1995), p. 273.]
K�.
K�
L has some ability to bind other ions besidesso those other ions interfere to some extent
with the measurement of An ion-selectiveelectrode uses a ligand with a strongpreference to bind the desired ion.
C�.C�,
K CO N
The region of charge imbalance extends just afew nanometers into the membrane and intothe neighboring solution.
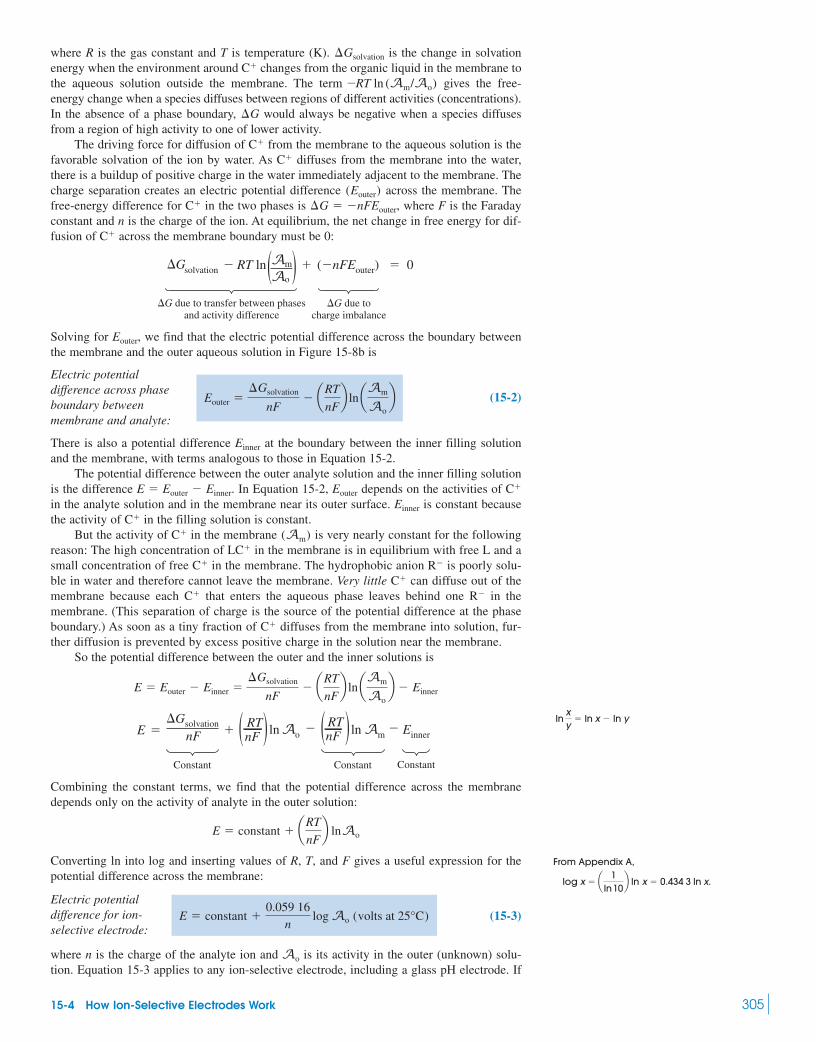
where R is the gas constant and T is temperature (K). is the change in solvationenergy when the environment around changes from the organic liquid in the membrane tothe aqueous solution outside the membrane. The term gives the free-energy change when a species diffuses between regions of different activities (concentrations).In the absence of a phase boundary, would always be negative when a species diffusesfrom a region of high activity to one of lower activity.
The driving force for diffusion of from the membrane to the aqueous solution is thefavorable solvation of the ion by water. As diffuses from the membrane into the water,there is a buildup of positive charge in the water immediately adjacent to the membrane. Thecharge separation creates an electric potential difference across the membrane. Thefree-energy difference for in the two phases is where F is the Faradayconstant and n is the charge of the ion. At equilibrium, the net change in free energy for dif-fusion of across the membrane boundary must be 0:
Solving for we find that the electric potential difference across the boundary betweenthe membrane and the outer aqueous solution in Figure 15-8b is
(15-2)
There is also a potential difference at the boundary between the inner filling solutionand the membrane, with terms analogous to those in Equation 15-2.
The potential difference between the outer analyte solution and the inner filling solutionis the difference In Equation 15-2, depends on the activities of in the analyte solution and in the membrane near its outer surface. is constant becausethe activity of in the filling solution is constant.
But the activity of in the membrane is very nearly constant for the followingreason: The high concentration of in the membrane is in equilibrium with free L and asmall concentration of free in the membrane. The hydrophobic anion is poorly solu-ble in water and therefore cannot leave the membrane. Very little can diffuse out of themembrane because each that enters the aqueous phase leaves behind one in themembrane. (This separation of charge is the source of the potential difference at the phaseboundary.) As soon as a tiny fraction of diffuses from the membrane into solution, fur-ther diffusion is prevented by excess positive charge in the solution near the membrane.
So the potential difference between the outer and the inner solutions is
Combining the constant terms, we find that the potential difference across the membranedepends only on the activity of analyte in the outer solution:
Converting ln into log and inserting values of R, T, and F gives a useful expression for thepotential difference across the membrane:
(15-3)
where n is the charge of the analyte ion and is its activity in the outer (unknown) solu-tion. Equation 15-3 applies to any ion-selective electrode, including a glass pH electrode. If
Ao
E � constant �0.059 16
nlog Ao (volts at 25°C)
Electric potentialdifference for ion-selective electrode:
E � constant � aRT
nFb lnAo
( )�Gsolvation �AonF
Constant Constant Constant
ln Am� Einner�E nF
RTnFRT( ) ln�
E � Eouter � Einner ��Gsolvation
nF� aRT
nFb ln aAm
Aob � Einner
C�
R�C�
C�
R�C�
LC�
(Am)C�
C�
Einner
C�EouterE � Eouter � Einner.
Einner
Eouter ��Gsolvation
nF� aRT
nFb ln aAm
Aob
Electric potentialdifference across phaseboundary betweenmembrane and analyte:
Eouter,
�G RT lnsolvation � � (�nFEouter) � 0
�G due to transfer between phasesand activity difference
�G due tocharge imbalance
(Am)Ao
C�
�G � �nFEouter,C�
(Eouter)
C�
C�
�G
�RT ln (Am/Ao)C�
�Gsolvation
15-4 How Ion-Selective Electrodes Work 305
lnxy
� ln x � ln y
From Appendix A,
x � 0.434 3 ln x.log x � a 1ln10
b ln

the analyte is an anion, the sign of n is negative. Later, we will modify the equation toaccount for interfering ions.
A difference of 59.16 mV (at builds up across a glass pH electrode for everyfactor-of-10 change in activity of in the analyte solution. Because a factor-of-10 differ-ence in activity of is 1 pH unit, a difference of, say, 4.00 pH units would lead to a potentialdifference of The charge of a calcium ion is so a potentialdifference of is expected for every factor-of-10 change in activity of
in the analyte measured with a calcium ion-selective electrode.
15-5 pH Measurementwith a Glass Electrode
The glass electrode used to measure pH is the most common ion-selective electrode. A typi-cal pH combination electrode, incorporating both glass and reference electrodes in onebody, is shown in Figure 15-9. A line diagram of this cell can be written as follows:
The pH-sensitive part of the electrode is the thin glass bulb or cone at the bottom of the elec-trodes in Figures 15-9 and 15-10. The reference electrode at the left of the preceding line dia-gram is the coiled Ag ƒ AgCl electrode in the combination electrode in Figure 15-9. The ref-erence electrode at the right side of the line diagram is the straight Ag AgCl electrode at thecenter of the electrode in Figure 15-9. The two reference electrodes measure the electric
0
Outer referenceelectrode
H� outsideglass electrode
(analyte solution)
H� insideglass
electrode
Inner referenceelectrode
Ag(s) å AgCl(s) å Cl�(aq) ƒ H�(aq, outside) H�(aq, inside), Cl�(aq) å AgCl(s) å Ag(s)
Glass membraneselectively binds H�
Ca2�
59.16/2 � 29.58 mVn � 2,4.00 � 59.16 � 237 mV.
H�
H�
25°C)
306 CHAPTER 15 Electrodes and Potentiometry
(+)
(–)Leads to pH meter
Air inlet
Aqueous filling solutionsaturated with AgCl and KCl
Porous plug to allowslow drainage ofelectrolyte out ofelectrode
Solution levelof analyte inbeaker
0.1 M HClsaturated withAgCl
Glass membrane
AgCl(s) + KCl(s)
AgCl paste suspendedbetween two sides of
folded Ag wire
Ag wire
Liquid level ofouter reference
electrode
Liquid level ofinner reference
electrode
(a)
Saltbridge
Ag AgCl
pH sensitiveglass
(b)
Platinum“diaphragm”
M. Cremer at the Institute of Physiology atMunich discovered in 1906 that a potentialdifference of 0.2 V developed across a glassmembrane with acid on one side and neutralsaline solution on the other. The studentKlemensiewicz, working with F. Haber inKarlsruhe in 1908, improved the glass electrodeand carried out the first acid-base titration tobe monitored with a glass electrode.13
pH electrodes other than glass can be usedwhen glass is unsuitable.14
Figure 15-9 Diagram of a glass combination electrode with a silver-silver chloride reference electrode. The glass electrode is immersed in a solution of unknown pH so that the porous plug on the lower right is below the surface of the liquid. The two silver electrodes measure the voltage across the glass membrane.
Figure 15-10 (a) Glass-body combinationelectrode with pH-sensitive glass bulb at thebottom. The porous ceramic plug (the salt bridge)connects analyte solution to the referenceelectrode. Two silver wires coated with AgCl arevisible inside the electrode. [Courtesy Fisher Scientific,
Pittsburgh PA.] (b) A pH electrode with a platinumdiaphragm (a bundle of Pt wires), which is said tobe less prone to clogging than a ceramic plug.[W. Knappek, Am.Lab. News Ed. July 2003, p. 14.]

potential difference across the glass membrane. The salt bridge in the line diagram is theporous plug at the bottom-right side of the combination electrode in Figure 15-9.
Figure 15-11 shows the irregular structure of the silicate lattice in glass. Negativelycharged oxygen atoms in glass can bind to cations of suitable size. Monovalent cations, par-ticularly can move sluggishly through the silicate lattice. A schematic cross section ofthe glass membrane of a pH electrode is shown in Figure 15-12. The two surfaces swell asthey absorb water. Metal ions in these hydrated gel regions of the membrane diffuse out ofthe glass and into solution. can diffuse into the membrane to replace the metal ions.The reaction in which replaces cations in the glass is an ion-exchange equilibrium(Figure 15-13). A pH electrode responds selectively to because is the only ion thatbinds significantly to the hydrated gel layer.
To perform an electrical measurement, at least some tiny current must flow through theentire circuit—even across the glass pH electrode membrane. Studies with tritium (radioac-tive ) show that does not cross the glass membrane. However, sluggishly crossesthe membrane. The -sensitive membrane may be thought of as two surfaces electricallyconnected by transport. The membrane’s resistance is typically so little currentactually flows across it.
The potential difference between inner and outer silver-silver chloride electrodes inFigure 15-9 depends on the chloride concentration in each electrode compartment and on thepotential difference across the glass membrane. Because is fixed in each compartmentand because is fixed on the inside of the glass membrane, the only variable is the pH ofanalyte solution outside the glass membrane. Equation 15-3 states that the voltage of theideal pH electrode changes by 59.16 mV for every pH-unit change of analyte activity at
The response of real glass electrodes is described by the Nernst-like equation
(15-4)
The value of the electromotive efficiency, is close to 1.00 (typically We measurethe constant and when we calibrate the electrode in solutions of known pH.�
70.98).�,
E � constant � �(0.059 16) pH(outside) (at 25°C)
E � constant � �(0.059 16) log AH�(outside)Response ofglass electrode:
25°C.
[H�][Cl�]
108 �,Na�
H�
Na�H�3H
H�H�
H�
H�
Na�,
15-5 pH Measurement with a Glass Electrode 307
Hydrated gellayer
Dry glasslayer
Hydrated gellayer
External solution(AH+ is variable)
10 nm 10 nm0.1 mm (105 nm)
Internal solution(AH+ ≈ 0.1)
(Exchange sitesoccupied by H+
and Na+)
(All sitesoccupiedby Na+)
(Exchange sitesoccupied by H+
and Na+)
Figure 15-11 Schematic structure of glass, whichconsists of an irregular network of tetrahedraconnected through oxygen atoms. � � O, � � Si,� � cation. Cations such as and are coordinated to the oxygen atoms. The silicatenetwork is not planar. This diagram is a projection ofeach tetrahedron onto the plane of the page.[Adapted from G. A. Perley, “Glasses for Measurement of pH,”
Anal. Chem. 1949, 21, 394.]
Ca2�K�,Na�,Li�,
SiO4
Figure 15-12 Schematic cross section of the glass membrane of a pH electrode.
–O
H+
Internalsolution
Externalsolution
H+
H+
H+
H+
H+
–O–O–O
–O
–O–O–O H+
H+
H+Glass
Na+
Figure 15-13 Ion-exchange equilibria onsurfaces of a glass membrane: replacesmetal ions bound to the negatively chargedoxygen atoms. The pH of the internal solution isfixed. As the pH of the external solution (thesample) changes, the electric potentialdifference across the glass membrane changes.
H�
Electrodes
So little current flows across a glass electrodethat it was not practical when discovered in1906. One of the first people to use a vacuumtube amplifier to measure pH with a glasselectrode was an undergraduate, W. H. Wrightat the University of Illinois in 1928, who knewabout electronics from amateur radio. ArnoldBeckman at Caltech invented a portable,rugged, vacuum tube pH meter in 1935, whichrevolutionized chemical instrumentation.15
Beckman’s pH meter
The pH electrode measures activity, not concentration.
H�H�
The number 0.059 16 V is where R is the
gas constant, T is temperature, and F is theFaraday constant.
RT ln 10F
,

Calibrating a Glass ElectrodeA pH electrode should be calibrated with two (or more) standard buffers selected so that thepH of the unknown lies within the range of the standards. Standards in Table 15-3 are accu-rate to pH unit.16
When you calibrate an electrode with standard buffers, you measure a voltage with theelectrode in each buffer. The pH of buffer S1 is and the measured electrode potential inthis buffer is The pH of buffer S2 is and the measured electrode potential is The equation of the line through the two standard points is
(15-5)
The slope of the line is which is 59.16 mV/pHunit at for an ideal electrode and (59.16) mV/pH unit for a real electrode, where isthe correction factor in Equation 15-4.
To measure the pH of an unknown, measure the potential of the unknown with the cali-brated electrode and find pH by substitution in Equation 15-5.
(15-6)Eunknown � ES1
pHunknown � pHS1�
ES2 � ES1
pHS2 � pHS1
��25°C�E/�pH � (ES2 � ES1) / (pHS2 � pHS1),
E � ES1
pH � pHS1�
ES2 � ES1
pHS2 � pHS1
ES2.pHS2ES1.pHS1
�0.01
308 CHAPTER 15 Electrodes and Potentiometry
Table 15-3 pH values of National Institute of Standards and Technology buffers
Saturated (25°C) 0.05 m 0.05 mpotassium potassium potassium 0.08 m MOPSOhydrogen dihydrogen hydrogen 0.08 m NaMOPSO
Temperature tartrate citrate phthalate 0.08 m NaCl(°C) (1) (2) (3) (4)
0 — 3.863 4.003 7.2685 — 3.840 3.999 7.18210 — 3.820 3.998 7.09815 — 3.802 3.999 7.01820 — 3.788 4.002 6.94025 3.557 3.776 4.008 6.86530 3.552 3.766 4.015 6.79235 3.549 3.759 4.024 6.72237 3.548 3.756 4.028 6.69540 3.547 3.753 4.035 6.65445 3.547 3.750 4.047 6.58850 3.549 3.749 4.060 6.52455 3.554 — 4.075 —60 3.560 — 4.091 —70 3.580 — 4.126 —80 3.609 — 4.164 —90 3.650 — 4.205 —95 3.674 — 4.227 —
NOTE: The designation m stands for molality. Masses in the buffer recipes below are apparent masses measured in air.In the buffer solution preparations, it is essential to use high-purity materials and freshly distilled or deionized water of resistivity greater than Solutions having pH 6 or
above should be stored in plastic containers, preferably ones with an NaOH trap to prevent ingress of atmospheric carbon dioxide. They can normally be kept for 2–3 weeks, or slightly longerin a refrigerator. Buffer materials in this table are available as Standard Reference Materials from the National Institute of Standards and Technology. http://ts.nist.gov/srm. pH standards forD2O and aqueous-organic solutions can be found in P. R. Mussini, T. Mussini, and S. Rondinini, Pure Appl. Chem. 1997, 69, 1007.
1. Saturated (25°C) potassium hydrogen tartrate, An excess of the salt is shaken with water, and it can be stored in this way. Before use, it should be filtered or decanted at atemperature between 22° and 28°C.
2. 0.05 m potassium dihydrogen citrate, Dissolve 11.41 g of the salt in 1 L of solution at 25°C.
3. 0.05 m potassium hydrogen phthalate. Although this is not usually essential, the crystals may be dried at 100°C for 1 h, then cooled in a desiccator. At 25°C, 10.12 g C6H4(CO2H)(CO2K)are dissolved in water, and the solution made up to 1 L.
4. 0.08 m MOPSO ((3-N-morpholino)-2-hydroxypropanesulfonic acid, Table 9-2), 0.08 m sodium salt of MOPSO, 0.08 m NaCl. Buffers 4 and 6 are recommended for 2-point standardizationof electrodes for pH measurements of physiologic fluids. MOPSO is crystallized twice from 70 wt% ethanol and dried in vacuum at 50°C for 24 h. NaCl is dried at 110°C for 4 h. Na�MOPSO�
may be prepared by neutralization of MOPSO with standard NaOH. The sodium salt is also available as a Standard Reference Material. Dissolve 18.00 g MOPSO, 19.76 g Na�MOPSO�,and 4.674 g NaCl in 1.000 kg H2O.
KH2C6H5O7.
KHC4H4O6.
2 000 ohm � m.
A pH electrode must be calibrated before it canbe used. It should be calibrated about every 2 hduring sustained use. The pH of the calibrationstandards should bracket the pH of the unknown.
Graph of Equation 15-5
250
200
150
100
0
50
–100
–50
–200
–150
7
Calibration line
Standardbuffers
4 5 6 8 9 10 11
E (
mV
)
pH

Alas, modern pH meters are “black boxes” that do these calculations for us by applyingEquations 15-5 and 15-6 and automatically displaying pH.
Before using a pH electrode, be sure that the air inlet near the upper end of the electrodein Figure 15-9 is not capped. (This hole is capped during storage to prevent evaporation ofthe reference electrode filling solution.) Wash the electrode with distilled water and gentlyblot it dry with a tissue. Do not wipe it, because this action might produce a static charge onthe glass.
To calibrate the electrode, dip it in a standard buffer whose pH is near 7 and allow the elec-trode to equilibrate with stirring for at least a minute. Following the manufacturer’s instruc-tions, press a key that might say “calibrate” or “read” on a microprocessor-controlled meter oradjust the reading of an analog meter to indicate the pH of the standard buffer. Then wash theelectrode with water, blot it dry, and immerse it in a second standard whose pH is farther from7 than the pH of the first standard. Enter the second buffer on the meter. Finally, dip the elec-trode in the unknown, stir the liquid, allow the reading to stabilize, and read the pH.
Store a glass electrode in aqueous solution to prevent dehydration of the glass. Ideally,the solution should be similar to that inside the reference compartment of the electrode. If theelectrode has dried, recondition it in dilute acid for several hours. If the electrode is to beused above pH 9, soak it in a high-pH buffer. (The field effect transistor pH electrode inSection 15-8 is stored dry. Prior to use, scrub it gently with a soft brush and soak it in pH 7buffer for 10 min.)
15-5 pH Measurement with a Glass Electrode 309
0.025 m potassium 0.008 695 m potassium 0.025 m sodiumdihydrogen phosphate 0.08 m HEPES dihydrogen phosphate bicarbonate0.025 m disodium 0.08 m NaHEPES 0.030 43 m disodium 0.01 m 0.025 m sodiumhydrogen phosphate 0.08 m NaCl hydrogen phosphate borax carbonate(5) (6) (7) (8) (9)
6.984 7.853 7.534 9.464 10.3176.951 7.782 7.500 9.395 10.2456.923 7.713 7.472 9.332 10.1796.900 7.646 7.448 9.276 10.1186.881 7.580 7.429 9.225 10.0626.865 7.516 7.413 9.180 10.0126.853 7.454 7.400 9.139 9.9666.844 7.393 7.389 9.102 9.9256.840 7.370 7.384 9.081 9.9106.838 7.335 7.380 9.068 9.8896.834 7.278 7.373 9.038 9.8566.833 7.223 7.367 9.011 9.8286.834 — — 8.985 —6.836 — — 8.962 —6.845 — — 8.921 —6.859 — — 8.885 —6.877 — — 8.850 —6.886 — — 8.833 —
5. 0.025 m disodium hydrogen phosphate, 0.025 m potassium dihydrogen phosphate. The anhydrous salts are best; each should be dried for 2 h at 120°C and cooled in a desiccator, becausethey are slightly hygroscopic. Higher drying temperatures should be avoided to prevent formation of condensed phosphates. Dissolve 3.53 g and 3.39 g in water to give 1L of solution at 25°C.
6. 0.08 m HEPES (N-2-hydroxyethylpiperazine-N-2-ethanesulfonic acid, Table 9-2), 0.08 m sodium salt of HEPES, 0.08 m NaCl. Buffers 4 and 6 are recommended for 2-point standardizationof electrodes for pH measurements of physiologic fluids. HEPES is crystallized twice from 80 wt% ethanol and dried in vacuum at 50�C for 24 h. NaCl is dried at 110°C for 4 h. Na�
may be prepared by neutralization of HEPES with standard NaOH. The sodium salt is also available as a Standard Reference Material. Dissolve 19.04 g HEPES, 20.80 g Na� and4.674 g NaCl in 1.000 kg
7. 0.008 695 m potassium dihydrogen phosphate, 0.030 43 m disodium hydrogen phosphate. Prepare like Buffer 5; dissolve 1.179 g and 4.30 g in water to give 1 L ofsolution at 25°C.
8. 0.01 m sodium tetraborate decahydrate. Dissolve 3.80 g in water to give 1 L of solution. This borax solution is particularly susceptible to pH change from carbon dioxideabsorption, and it should be correspondingly protected.
9. 0.025 m sodium bicarbonate, 0.025 m sodium carbonate. Primary standard grade is dried at 250°C for 90 min and stored over and Drierite. Reagent-grade isdried over molecular sieves and Drierite for 2 days at room temperature. Do not heat or it may decompose to Dissolve 2.092 g of and 2.640 g of in 1 Lof solution at 25°C.
SOURCES: R. G. Bates, J. Res. Natl. Bureau Stds. 1962, 66A, 179; B. R. Staples and R. G. Bates, J. Res. Natl. Bureau Stds. 1969, 73A, 37. Data on HEPES and MOPSO are from Y. C. Wu,P. A. Berezansky, D. Feng, and W. F. Koch, Anal. Chem. 1993, 65, 1084, and D. Feng, W. F. Koch, and Y. C. Wu, Anal. Chem. 1989, 61, 1400. Instructions for preparing some of these solutionsare from G. Mattock in C. N. Reilley, ed., Advances in Analytical Chemistry and Instrumentation (New York: Wiley, 1963), Vol. 2, p. 45. See also R. G. Bates, Determination of pH: Theory andPractice, 2nd ed. (New York: Wiley, 1973), Chap. 4.
Na2CO3NaHCO3Na2CO3.NaHCO3,NaHCO3CaCl2Na2CO3
Na2B4O7 �10H2O
Na2HPO4KH2PO4
H2O.HEPES�,
HEPES�
KH2PO4Na2HPO4
Table 15-3 (Continued) pH values of National Institute of Standards and Technology buffers
Do not leave a glass electrode out of water(or in a nonaqueous solvent) any longer thannecessary.
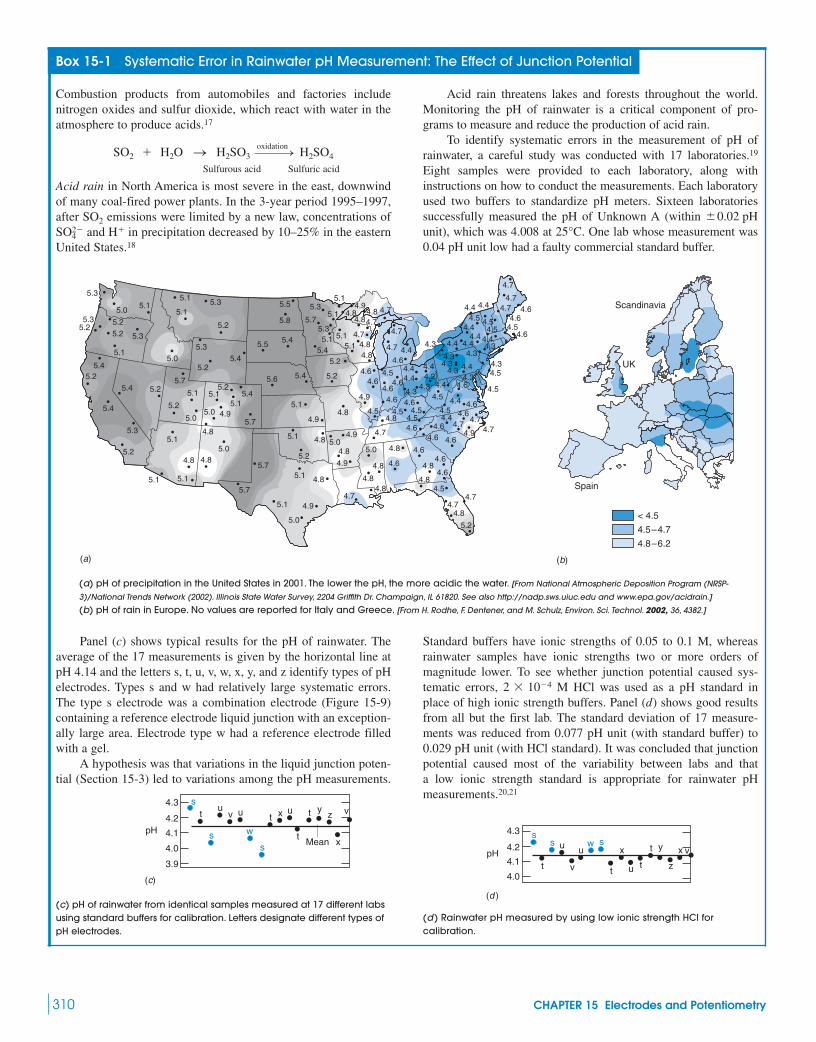
310 CHAPTER 15 Electrodes and Potentiometry
Box 15-1 Systematic Error in Rainwater pH Measurement: The Effect of Junction Potential
Combustion products from automobiles and factories includenitrogen oxides and sulfur dioxide, which react with water in theatmosphere to produce acids.17
Sulfurous acid Sulfuric acid
Acid rain in North America is most severe in the east, downwindof many coal-fired power plants. In the 3-year period 1995–1997,after emissions were limited by a new law, concentrations of
and in precipitation decreased by 10–25% in the easternUnited States.18
H�SO2�4
SO2
SO2 � H2O S H2SO3 !oxidation H2SO4
Panel (c) shows typical results for the pH of rainwater. Theaverage of the 17 measurements is given by the horizontal line atpH 4.14 and the letters s, t, u, v, w, x, y, and z identify types of pHelectrodes. Types s and w had relatively large systematic errors.The type s electrode was a combination electrode (Figure 15-9)containing a reference electrode liquid junction with an exception-ally large area. Electrode type w had a reference electrode filledwith a gel.
A hypothesis was that variations in the liquid junction poten-tial (Section 15-3) led to variations among the pH measurements.
(c) pH of rainwater from identical samples measured at 17 different labsusing standard buffers for calibration. Letters designate different types ofpH electrodes.
4.3
pHMean
4.2
4.1
4.0
3.9
st
uv u t x u
s w
st
t yz
x
v
(c)
Standard buffers have ionic strengths of 0.05 to 0.1 M, whereasrainwater samples have ionic strengths two or more orders ofmagnitude lower. To see whether junction potential caused sys-tematic errors, M HCl was used as a pH standard inplace of high ionic strength buffers. Panel (d) shows good resultsfrom all but the first lab. The standard deviation of 17 measure-ments was reduced from 0.077 pH unit (with standard buffer) to0.029 pH unit (with HCl standard). It was concluded that junctionpotential caused most of the variability between labs and thata low ionic strength standard is appropriate for rainwater pHmeasurements.20,21
(d) Rainwater pH measured by using low ionic strength HCl forcalibration.
pH
4.3
4.2
4.1
4.0
uss
w s
v
u
t
x
u t
t y
z
x v
t
(d )
2 � 10�4
Acid rain threatens lakes and forests throughout the world.Monitoring the pH of rainwater is a critical component of pro-grams to measure and reduce the production of acid rain.
To identify systematic errors in the measurement of pH ofrainwater, a careful study was conducted with 17 laboratories.19
Eight samples were provided to each laboratory, along withinstructions on how to conduct the measurements. Each laboratoryused two buffers to standardize pH meters. Sixteen laboratoriessuccessfully measured the pH of Unknown A (within unit), which was 4.008 at One lab whose measurement was0.04 pH unit low had a faulty commercial standard buffer.
25°C.�0.02 pH
5.3
5.0
5.25.3
5.2
5.1
5.35.2
5.1
5.0
5.15.3
5.2
5.55.1
4.8
4.84.8
4.7
4.7
4.7
4.7
4.84.8
5.15.1
4.95.35.1
5.35.7
5.45.2
5.2
4.8
4.95.0
4.8
4.9
4.7
5.1
5.8
5.45.55.3
5.25.4
5.4
5.3
5.2
5.44.7 4.4
4.54.6
4.64.6
4.64.6
4.9
4.5
4.6
4.8
4.7
5.0
4.8 4.6
4.8
4.84.6
4.6
4.64.74.9
4.74.6
4.74.44.5
4.64.4
4.64.3
4.54.4
4.5
4.4 4.4
4.34.3
4.34.5
4.3
4.4 4.44.4
4.44.5
4.4 4.4
4.54.5
4.44.3
4.54.6
4.64.64.7
4.7
4.7
4.34.3 4.4
4.24.44.3
4.3
4.64.6
4.6
4.54.7
4.74.8
5.2
4.8
4.84.8
4.64.54.5
4.54.6
5.6 5.4
5.1
4.9
4.8
4.8
5.1
5.1
5.1
5.7
5.7
5.0
4.9
5.25.2
5.1 5.1
4.8
5.1
4.8
5.7
5.2
5.0
5.15.25.4
5.0
5.1
4.9
4.8
5.05.7
5.45.1
5.2
5.1
(a)
Scandinavia
UK
Spain
4.8–6.2
4.5–4.7
< 4.5
(b)
(a) pH of precipitation in the United States in 2001. The lower the pH, the more acidic the water. [From National Atmospheric Deposition Program (NRSP-
3)/National Trends Network (2002). Illinois State Water Survey, 2204 Griffith Dr. Champaign, IL 61820. See also http://nadp.sws.uiuc.edu and www.epa.gov/acidrain.]
(b) pH of rain in Europe. No values are reported for Italy and Greece. [From H. Rodhe, F. Dentener, and M. Schulz, Environ. Sci. Technol. 2002, 36, 4382.]

15-6 Ion-Selective Electrodes 311
If electrode response becomes sluggish or if an electrode cannot be calibrated properly,try soaking it in 6 M HCl, followed by water. As a last resort, soak the electrode in 20 wt%aqueous ammonium bifluoride, for 1 min in a plastic beaker. This reagent dissolvesglass and exposes fresh surface. Wash the electrode with water and try calibrating it again.Avoid contact with ammonium bifluoride, which produces a painful HF burn.
Errors in pH Measurement1. Standards. A pH measurement cannot be more accurate than our standards, which are
typically pH unit.2. Junction potential. A junction potential exists at the porous plug near the bottom of the
electrode in Figure 15-9. If the ionic composition of the analyte solution is differentfrom that of the standard buffer, the junction potential will change even if the pH ofthe two solutions is the same (Box 15-1). This effect gives an uncertainty of at least
0.01 pH unit.3. Junction potential drift. Most combination electrodes have a Ag ƒ AgCl reference
electrode containing saturated KCl solution. More than 350 mg Ag/L dissolve in theKCl, mainly as and In the porous plug, KCl is diluted and AgCl canprecipitate. If analyte solution contains a reducing agent, Ag(s) also can precipitate inthe plug. Both effects change the junction potential, causing a slow drift of the pHreading (solid colored circles in Figure 15-14). You can compensate for this error byrecalibrating the electrode every 2 h.
AgCl2�3 .AgCl3�
4
�
�0.01
NH4HF2,
The apparent pH will charge if the ioniccomposition of the analyte changes, evenwhen the actual pH is constant.
pH r
eadi
ng
7.5
8
73020100
Days
Junctionpotential drift
Ion-exchangeresin inside electrode
–1.0
–2
Err
or, ∆
pH
pH
–0.5
0
0.50 2 4 6 8 10 12 14
A
B
F
E
D
C
G
Figure 15-14 Solid colored circles show the drift inapparent pH of a low-conductivity industrial water supplymeasured continuously by a single electrode. Individualmeasurements with a freshly calibrated electrode (blackcircles) demonstrate that the pH is not drifting. Drift isattributed to slow clogging of the electrode’s porous plugwith AgCl(s). When a cation-exchange resin was placedinside the reference electrode near the porous plug, Ag(I)was bound by the resin and did not precipitate. Thiselectrode gave the drift-free, continuous reading shown by open diamonds. [From S. Ito, H. Hachiya, K. Baba, Y. Asano,
and H. Wada,“Improvement of the Ag | AgCl Reference Electrode
and Its Application to pH Measurement,” Talanta 1995, 42, 1685.]
Figure 15-15 Acid and alkaline errors ofsome glass electrodes. A: Corning 015,B: Corning 015, HCl. C: Corning 015, 1 M D: Beckman-GP, 1 M E: L & N Black Dot,1 M F: Beckman Type E, 1 M G: Rosselectrode.22 [From R. G. Bates, Determination of pH:
Theory and Practice, 2nd ed. (New York: Wiley, 1973).
Ross electrode data are from Orion, Ross pH Electrode
Instruction Manual.]
Na�.Na�.Na�.
Na�.H2SO4.
Challenge Use Equation 15-4 to show that thepotential of the glass electrode changes by1.3 mV when changes by 5.0%. Show that
unit.Moral: A small uncertainty in voltage
(1.3 mV) or pH (0.02 unit) corresponds to a largeuncertainty (5%) in analyte concentration.Similar uncertainties arise in otherpotentiometric measurements.
1.3 mV � 0.02 pHAH�
4. Sodium error. When is very low and is high, the electrode responds to and the apparent pH is lower than the true pH. This is called the sodium error oralkaline error (Figure 15-15).
5. Acid error. In strong acid, the measured pH is higher than the actual pH, perhapsbecause the glass is saturated with and cannot be further protonated (Figure 15-15).
6. Equilibration time. It takes time for an electrode to equilibrate with a solution. A well-buffered solution requires 30 s with adequate stirring. A poorly buffered solution(such as one near the equivalence point of a titration) needs many minutes.
7. Hydration of glass. A dry electrode requires several hours of soaking before it respondsto correctly.
8. Temperature. A pH meter should be calibrated at the same temperature at which themeasurement will be made.
9. Cleaning. If an electrode has been exposed to a hydrophobic liquid, such as oil, itshould be cleaned with a solvent that will dissolve the liquid and then conditioned wellin aqueous solution. The reading of an improperly cleaned electrode can drift for hourswhile the electrode re-equilibrates with aqueous solution.
Errors 1 and 2 limit the accuracy of pH measurement with the glass electrode to pHunit, at best. Measurement of pH differences between solutions can be accurate to about
pH unit, but knowledge of the true pH will still be at least an order of magnitude moreuncertain. An uncertainty of pH unit corresponds to an uncertainty of in
15-6 Ion-Selective Electrodes23
A critically ill patient is wheeled into the emergency room, and the doctor needs blood chem-istry information quickly to help her make a diagnosis. Analytes in Table 15-4 are part of thecritical care profile of blood chemistry. Every analyte in the table can be measured by
AH�.�5%�0.02�0.002
�0.02
H�
�
H�
Na�[Na�][H�]
electrochemical means. Ion-selective electrodes are the method of choice for pH,and The “Chem 7” test constitutes up to 70% of tests performed in the hospital lab. Itmeasures total glucose, urea, and creatinine, four of which are analyzedwith ion-selective electrodes.
Most ion-selective electrodes fall into one of the following classes:
1. Glass membranes for and certain monovalent cations2. Solid-state electrodes based on inorganic salt crystals3. Liquid-based electrodes using a hydrophobic polymer membrane saturated with a
hydrophobic liquid ion exchanger4. Compound electrodes with a species-selective electrode enclosed by a membrane that is
able to separate that species from others or that generates the species in a chemicalreaction.
We will discuss the last three types of electrodes as soon as we introduce the language forcharacterizing the selectivity of an electrode.
Selectivity CoefficientNo electrode responds exclusively to one kind of ion, but the glass pH electrode is among themost selective. Sodium ion is the principal interfering species, and its effect on the pH read-ing is only significant when and (Figure 15-15).
An electrode intended to measure ion A also responds to ion X. The selectivity coeffi-cient gives the relative response of the electrode to different species with the same charge:
Selectivity coefficient: (15-7)
The smaller the selectivity coefficient, the less the interference by X. A ion-selectiveelectrode that uses the chelator valinomycin as the liquid ion exchanger has selectivity coef-ficients and These coefficients tell us that
hardly interferes with the measurement of but and interfere strongly. Infact, the electrode responds more to than to
For interfering ions with the same charge as the primary ion, the response of ion-selectiveelectrodes is described by the equation12,24
(15-8)
where is the activity of the primary ion (A), is the activity of an interfering species(X), and is the selectivity coefficient. The magnitude of the charge of A is n. If theion-selective electrode is connected to the positive terminal of the potentiometer, the sign ofthe log term is positive if A is a cation and negative if A is an anion. is near 1 for mostelectrodes.
Example Using the Selectivity Coefficient
A fluoride ion-selective electrode has a selectivity coefficient Whatwill be the change in electrode potential when at pH 5.5 is raised topH 10.5?
Solution Using Equation 15-8 with we find that the potential with negligibleat pH 5.5 is
At pH 10.50, so the electrode potential is
The change is which is quite significant. If you didn’tknow about the pH change, you would think that the concentration of had increasedby 32%.
F�
229.5 � 236.6 � �7.1 mV,
� constant � 229.5 mV
E � constant � 0.059 16 log[1.0 � 10�4 � (0.1)(3.2 � 10�4)]
[OH�] � 3.2 � 10�4 M,
E � constant � 0.059 16 log[1.0 � 10�4] � constant � 236.6 mV
OH�
� � 1,
F�1.0 � 10�4 M� 0.1.kF�,OH�
�
kA,X
AXAA
E � constant � �0.059 16
nlog cAA � a
X(kA,XAX) dResponse of ion-
selective electrode:
K�.Rb�
Rb�Cs�K�,Na�
kK�,Rb� � 2.8.kK�,Cs� � 0.44,kK�,Na� � 1 � 10�5,
K�
kA,X �response to X
response to A
[Na�] � �10�2 M[H�] � �10�12 M
H�
CO2,Cl�,K�,Na�,PCO2
.Cl�,K�,Na�,
312 CHAPTER 15 Electrodes and Potentiometry
Table 15-4 Critical care profile
Function Analyte
ConductionContractionEnergy level Glucose,
lactate,hematocrit
VentilationPerfusion Lactate,
hematocritAcid-base pH, Osmolality glucoseElectrolyte
balanceRenal function Blood urea
nitrogen,creatinine
SOURCE: C. C. Young, “Evolution of Blood ChemistryAnalyzers Based on Ion Selective Electrodes,” J. Chem.Ed. 1997, 74, 177.
Mg2�
Ca2�,K�,Na�,Na�,
HCO�3PCO2
,
SO2%,PCO2
PO2,
PO2,
Mg2�Ca2�,Ca2�K�,
The United States conducts more than 200 million clinical assays of each yearwith ion-selective electrodes.
K�

Reminder: How Ion-Selective Electrodes WorkIn Figure 15-8, analyte ions equilibrate with ion-exchange sites at the outer surface of theion-selective membrane. Diffusion of analyte ions out of the membrane creates a slightcharge imbalance (an electric potential difference) across the interface between the mem-brane and the analyte solution. Changes in analyte ion concentration in the solution changethe potential difference across the outer boundary of the ion-selective membrane. By using acalibration curve, we can relate the potential difference to analyte concentration.
An ion-selective electrode responds to the activity of free analyte, not complexedanalyte. For example, when the in tap water at pH 8 was measured with a sensitiveion-selective electrode, the result was When lead in the same tapwater was measured by inductively coupled plasma–mass spectrometry (Section 21-6), theresult was more than 10 times greater: The discrepancy arose because theinductively coupled plasma measures all lead and the ion-selective electrode measures freePb2�. In tap water at pH 8, much of the lead is complexed by OH�, and other anions.When the pH of tap water was adjusted to 4, dissociated from its complexes and theconcentration indicated by the ion-selective electrode was —equal to that meas-ured by inductively coupled plasma.
Solid-State ElectrodesA solid-state ion-selective electrode based on an inorganic crystal is shown in Figure 15-16.A common electrode of this type is the fluoride electrode, employing a crystal of dopedwith Doping means adding a small amount of in place of The filling solu-tion contains 0.1 M NaF and 0.1 M NaCl. Fluoride electrodes are used to monitor and con-trol the fluoridation of municipal water supplies.
To conduct a tiny electric current, migrates across the crystal, as shown inFigure 15-17. Anion vacancies are created within the crystal when we dope with An adjacent fluoride ion can jump into the vacancy, leaving a new vacancy behind. In thismanner, diffuses from one side to the other.
By analogy with the pH electrode, the response of the electrode is
Response of electrode: (15-9)
where is close to 1.00. Equations 15-9 and 15-4 have opposite signs before the log termbecause one equation applies to anions and one to cations. The electrode has a nearlyNernstian response over a concentration range from about to 1 M (Figure 15-18).The electrode is more responsive to than to most other ions by The only inter-fering species is for which the selectivity coefficient is At low pH, isconverted into HF to which the electrode is insensitive.
A routine procedure for measuring is to dilute the unknown in a high ionic strengthbuffer containing acetic acid, sodium citrate, NaCl, and NaOH to adjust the pH to 5.5. Thebuffer keeps all standards and unknowns at a constant ionic strength, so the fluoride activitycoefficient is constant in all solutions (and can therefore be ignored).
F�
(pKa � 3.17),F�kF�,OH� � 0.1.OH�,
7 1 000.F�
10�6 MF�
F�
�
E � constant � �(0.059 16) log AF�(outside)F�
F�
F�
EuF2.LaF3
LaF3F�
La3�.Eu2�Eu2�.LaF3
3 � 10�9 MPb2�
CO2�3 ,
3 � 10�9 M.
[Pb2�] � 2 � 10�10 M.25Pb2�
15-6 Ion-Selective Electrodes 313
Analyte ions establish an ion-exchangeequilibrium at the surface of the ion-selectivemembrane. Other ions that bind to the samesites interfere with the measurement.
Silver-silverchloride electrode
Filling solution
Inorganic crystal
To potentiometer
Vacancy
F– La3+ Eu2+
Figure 15-16 Diagram of an ion-selectiveelectrode employing an inorganic salt crystalas the ion-selective membrane.
Figure 15-17 Migration of through doped with Because has less charge thanan anion vacancy occurs for every A neighboring can jump into the vacancy, thereby
moving the vacancy to another site. Repetition of this process moves through the lattice.F�
F�Eu2�.La3�,Eu2�EuF2.LaF3F�
E (
mV
)
350
300
250
200
150
100
50
00−1−2−3−4−5−6−7
log[F−]
The ion-selective electrode responds to with little response to or Pb(CO3)(aq).Pb(OH)�
Pb2�
Figure 15-18 Calibration curve for fluorideion-selective electrode. [Data from M. S. Frant and
J. W. Ross, Jr., “Electrode for Sensing Fluoride Ion Activity
in Solution,” Science 1966, 154, 1553.]

314 CHAPTER 15 Electrodes and Potentiometry
Table 15-5 Properties of solid-state ion-selective electrodes
Concentration Membrane pH InterferingIon range (M) material range species
10�6–1 5–810�4–1 AgCl 2–1110�5–1 AgBr 2–1210�6–1 AgI 3–1210�5–1 AgSCN 2–1210�6–10�2 AgI 11–1310�5–1 13–14Ag2SS2�
I�S2�,CN�
S2O2�3Br�,CN�,I�,S2�,SCN�
S2�I�I�S2�,CN�,Br�
Br�S2O2�3 ,I�,S2�,CN�,Cl�
OH�(0.1 M)LaF3F�
Liquid-Based Ion-Selective Electrodes
A liquid-based ion-selective electrode is similar to the solid-state electrode in Figure 15-16,except that the liquid-based electrode has a hydrophobic membrane impregnated with
1444442444443This expression is constant because
is constant at constant ionic strength
At pH 5.5, there is no interference by and little conversion of into HF. Citrate com-plexes and which would otherwise bind and interfere with the analysis.
Example Response of an Ion-Selective Electrode
When a fluoride electrode was immersed in standard solutions (maintained at a constantionic strength of 0.1 M with the following potentials (versus S.C.E.) wereobserved:
[F�] (M) E (mV)
100.041.5
Because the ionic strength is constant, the response should depend on the logarithm of theconcentration. Find in an unknown that gave a potential of 0.0 mV.
Solution We fit the calibration data with Equation 15-9:
123y x
Plotting E versus gives a straight line with a slope and a y-intercept Setting we solve for
Another common inorganic crystal electrode uses for the membrane. This elec-trode responds to and to If we dope the electrode with CuS, CdS, or PbS, we canprepare electrodes sensitive to or respectively (Table 15-5).
Figure 15-19 illustrates the mechanism by which a CdS crystal responds selectivelyto certain ions. The crystal can be cleaved to expose planes of Cd atoms or S atoms. TheCd plane in Figure 15-19a selectively adsorbs ions, whereas an S plane does notinteract strongly with Figure 15-19b shows strong response of the exposed Cd faceto but only weak response when the S face is exposed. The opposite behavior isobserved in response to ions. The partial response of the S face to in the uppercurve is attributed to about 10% of the exposed atoms actually being Cd instead of S.
HS�Cd2�
HS�,HS�.
HS�
Pb2�,Cd2�,Cu2�,S2�.Ag�
Ag2S
0.0 � (�58.5)log[F�] � 192.5 1 [F�] � 5.1 � 10�4 M
[F�]:E � 0.0 mV,b � �192.5 mV.m � �58.5 mVlog[F�]
E � m log[F�] � b
[F�]F�
�17.01.00 � 10�31.00 � 10�41.00 � 10�5
NaNO3),
F�Al3�,Fe3�
F�OH�
�F�
� constant � �(0.059 16)log�F� � �(0.059 16) log[F�]
E � constant � �(0.059 16) log[F�]�F�
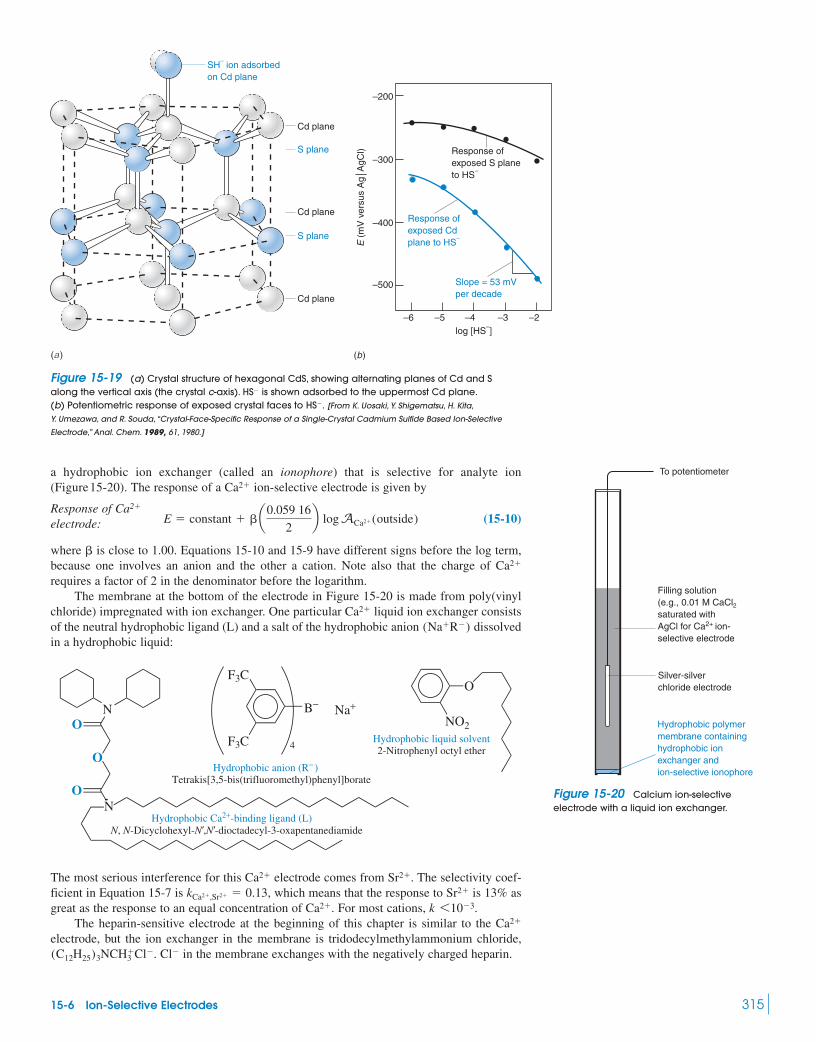
a hydrophobic ion exchanger (called an ionophore) that is selective for analyte ion(Figure15-20). The response of a ion-selective electrode is given by
(15-10)
where is close to 1.00. Equations 15-10 and 15-9 have different signs before the log term,because one involves an anion and the other a cation. Note also that the charge of requires a factor of 2 in the denominator before the logarithm.
The membrane at the bottom of the electrode in Figure 15-20 is made from poly(vinylchloride) impregnated with ion exchanger. One particular liquid ion exchanger consistsof the neutral hydrophobic ligand (L) and a salt of the hydrophobic anion dissolvedin a hydrophobic liquid:
The most serious interference for this electrode comes from The selectivity coef-ficient in Equation 15-7 is which means that the response to is 13% asgreat as the response to an equal concentration of For most cations,
The heparin-sensitive electrode at the beginning of this chapter is similar to the electrode, but the ion exchanger in the membrane is tridodecylmethylammonium chloride,
in the membrane exchanges with the negatively charged heparin.Cl�(C12H25)3NCH3�Cl�.
Ca2�
k 610�3.Ca2�.Sr2�kCa2�,Sr2� � 0.13,
Sr2�.Ca2�
N
O
O
OB−
F3C
F3C
NO2
Na
N
+
Hydrophobic anion (R− )Tetrakis[3,5-bis(trifluoromethyl)phenyl]borate
Hydrophobic liquid solvent2-Nitrophenyl octyl ether
Hydrophobic Ca2+-binding ligand (L)N, N-Dicyclohexyl-N¿,N¿-dioctadecyl-3-oxapentanediamide
O
4
(Na�R�)Ca2�
Ca2�
�
E � constant � � a0.059 16
2b log ACa2�(outside)
Response of Ca2�
electrode:
Ca2�
15-6 Ion-Selective Electrodes 315
SH– ion adsorbedon Cd plane
Cd plane
S plane
Cd plane
S plane
Cd plane
(a )
–500
–6log [HS–]
–5 –4 –3 –2
–400
–300
–200
Response ofexposed Cdplane to HS–
Slope = 53 mVper decade
Response of exposed S planeto HS–
E (
mV
ver
sus
Ag
AgC
l)(b)
Figure 15-19 (a) Crystal structure of hexagonal CdS, showing alternating planes of Cd and Salong the vertical axis (the crystal c-axis). is shown adsorbed to the uppermost Cd plane.(b) Potentiometric response of exposed crystal faces to [From K. Uosaki, Y. Shigematsu, H. Kita,
Y. Umezawa, and R. Souda, “Crystal-Face-Specific Response of a Single-Crystal Cadmium Sulfide Based Ion-Selective
Electrode,” Anal. Chem. 1989, 61, 1980.]
HS�.HS�
To potentiometer
Silver-silverchloride electrode
Hydrophobic polymer membrane containing hydrophobic ion exchanger andion-selective ionophore
Filling solution(e.g., 0.01 M CaCl2saturated withAgCl for Ca2+ ion-selective electrode
Figure 15-20 Calcium ion-selectiveelectrode with a liquid ion exchanger.

Breakthrough in Ion-Selective Electrode Detection Limits25
The black curve in Figure 15-21 is typical of many liquid-based ion-selective electrodes. Theresponse of this electrode levels off at an analyte concentration around Theelectrode detects changes in concentration above but not below The solu-tion in the internal electrode compartment contains 0.5 mM
The colored curve in Figure 15-21 was obtained with the same electrode components,but the internal filling solution was replaced by a metal ion buffer (Section 15-7) that fixes
at Now the electrode responds to changes in analyte concentrationdown to The buffer for this electrode is described in Problem 15-43.
The sensitivity of liquid-based ion-selective electrodes has been limited by leakage ofthe primary ion in this case) from the internal filling solution through the ion-exchange membrane. Leakage provides a substantial concentration of primary ion at theexternal surface of the membrane. If analyte concentration is below leakage fromthe electrode maintains an effective concentration near at the outer surface of theelectrode. If we can lower the concentration of primary ion inside the electrode, the concen-tration of leaking ion outside the membrane is reduced by orders of magnitude and the detectionlimit is correspondingly reduced. The sensitivity of a solid-state electrode cannot be loweredby changing the filling solution, because analyte concentration is governed by the solubilityof the inorganic salt crystal forming the ion-sensitive membrane.
The response of the electrode with in the filling solution is limited byinterference from from the internal solution that contains 0.05 M from themetal ion buffer. When the filling solution is buffered to the apparent selec-tivity coefficient (Equation 15-7) is decreased by one to five orders of magnitude for mostinterfering cations. Not only is the detection limit for improved by but the observedselectivity for over other cations increases by several orders of magnitude.
Compound ElectrodesCompound electrodes contain a conventional electrode surrounded by a membrane that iso-lates (or generates) the analyte to which the electrode responds. The gas-sensing elec-trode in Figure 15-22 consists of an ordinary glass pH electrode surrounded by a thin layer ofelectrolyte solution enclosed in a semipermeable membrane made of rubber, Teflon, or poly-ethylene. A Ag AgCl reference electrode is immersed in the electrolyte solution. When diffuses through the semipermeable membrane, it lowers the pH in the electrolyte. Theresponse of the glass electrode to the change in pH is a measure of the concentrationoutside the electrode.28 Other acidic or basic gases, including (nitrogenNOxH2S,SO2,NH3,
CO2
CO20
CO2
Pb2�
105,Pb2�
10�12 M Pb2�,Na2EDTANa�
Pb2�10�12 M
10�6 M10�6 M,
(Pb2�,
�10�11 M.Pb2�10�12 M.[Pb2�]
PbCl2.10�6 M.10�6 M,
10�6 M.Pb2�
316 CHAPTER 15 Electrodes and Potentiometry
150
100
50
0
–50
–100
–150
E (
mV
)
–12 –10 –8 –6 –4 –2
log[Pb2+]
Conventionalfilling solution
10–12 M Pb2+
filling solution
Figure 15-21 Response of liquid-based ion-selective electrode with (blackcurve) conventional filling solution containing0.5 mM or (colored curve) metal ionbuffer filling solution in which [From T. Sokalski, A. Ceresa, T. Zwickl, and E. Pretsch,
“Large Improvement of the Lower Detection Limit of
Ion-Selective Polymer Membrane Electrodes,” J. Am.
Chem. Soc. 1997, 119, 11347.]
[Pb2�] � 10�12 M.Pb2�
Pb2�
0.1 M HCl
To potentiometer
Internal silver-silverchloride electrode
0.1 M KCl electrolytewith weak bicarbonatebuffer
Glass electrodemembrane
CO2 permeable membrane
Spacer
Silver-silver chlorideelectrode in KCl
electrolyte
O-ring
Figure 15-22 CO2 gas-sensing electrode. The membrane is stretched taut and there is a thin layerof electrolyte between the membrane and the glass bulb.
Lower detection limits for and ion-selective electrodes
were demonstrated when concentrations werereduced in the internal filling solutions.26 Afuture improvement will come when theionophore is dissolved in a conductivepolymer in direct electrical contact with ametal conductor.27 This electrode entirelyomits the inner filling solution.
Metal
Conductivepolymer
Ion-selectivemembrane
ClO�4I�,Na�,
K�,Ag�,Cd2�,Ca2�,

oxides), and (hydrazoic acid) can be detected in the same manner. These electrodes canbe used to measure gases in solution or in the gas phase.
Numerous ingenious compound electrodes using enzymes have been built.29 Thesedevices contain a conventional electrode coated with an enzyme that catalyzes a reaction ofthe analyte. The product of the reaction is detected by the electrode.
15-7 Using Ion-Selective ElectrodesIon-selective electrodes respond linearly to the logarithm of analyte activity over four to sixorders of magnitude. Electrodes do not consume unknowns, and they introduce negligiblecontamination. Response time is seconds or minutes, so electrodes are used to monitor flowstreams in industrial applications. Color and turbidity do not hinder electrodes. Microelec-trodes can be used inside living cells.
Precision is rarely better than 1%, and usually it is worse. Electrodes can be fouled by pro-teins or other organic solutes, which lead to sluggish, drifting response. Certain ions interferewith or poison particular electrodes. Some electrodes are fragile and have limited shelf life.
Electrodes respond to the activity of uncomplexed analyte ion. Therefore, ligands mustbe absent or masked. Because we usually wish to know concentrations, not activities, an inertsalt is often used to bring all standards and samples to a high, constant ionic strength. Ifactivity coefficients are constant, the electrode potential gives concentrations directly.
Standard Addition with Ion-Selective ElectrodesWhen ion-selective electrodes are used, it is important that the composition of the standardsolution closely approximates the composition of the unknown. The medium in which theanalyte exists is called the matrix. For complex or unknown matrixes, the standard addi-tion method (Section 5-3) can be used. In this technique, the electrode is immersed inunknown and the potential is recorded. Then a small volume of standard solution is added, soas not to perturb the ionic strength of the unknown. The change in potential tells how theelectrode responds to analyte and, therefore, how much analyte was in the unknown. It is bestto add several successive aliquots and use a graphical procedure to extrapolate back to theconcentration of unknown. Standard addition is best if the additions increase analyte to 1.5 to 3times its original concentration.
The graphical procedure is based on the equation for the response of the ion-selectiveelectrode, which we will write in the form
(15-11)
where E is the meter reading in volts and [X] is the concentration of analyte. This reading isthe difference in potential of the ion-selective electrode and the reference electrode. The con-stants k and depend on the particular ion-selective electrode. The factor (RT/F) ln 10 is0.059 16 V at 298.15 K. If then the response is Nernstian. We abbreviate the term
ln 10 as S.Let the initial volume of unknown be and the initial concentration of analyte be
Let the volume of added standard be and the concentration of standard be Then thetotal concentration of analyte after standard is added is Substitut-ing this expression for [X] in Equation 15-11 and doing some rearrangement give
(15-12)1442443 14243 123 c
y b m x
A graph of on the y-axis versus on the x-axis has a slope anda y-intercept of The x-intercept is found by setting
(15-13)
Equation 15-13 gives us the concentration of unknown, from and the x-intercept.Figure 15-23 is a graph of Equation 15-12 used in Exercise 15-F.
A weakness of standard addition with ion-selective electrodes is that we cannot measurein Equation 15-11 in the unknown matrix. We could measure in a series of standard solu-
tions (not containing unknown) and use this value to compute S in the function��
cS,V0,cX,
x-intercept � �bm
� �10 k/SV0cX
10k/ScS� �
V0cX
cS
y � 0:10k/SV0cX.m � 10k/ScSVS(V0 � VS)10E/S
(V0 � VS)10E/S � 10k/SV0cX � 10k/ScSVSStandard addition plot forion-selective electrode:
(V0cX � VScS) / (V0 � VS).cS.VS
cX.V0
(�RT/nF)� � 1,
�
E � k � � aRT ln10
nFb log[X]
HN3
15-7 Using Ion-Selective Electrodes 317
Acidic or basic gases are detected by a pHelectrode surrounded by an electrolyte andenclosed in a gas-permeable membrane.
Advantages of ion-selective electrodes:1. Linear response to over a wide range2. Nondestructive3. Noncontaminating4. Short response time5. Unaffected by color or turbidity
log A
A 1-mV error in potential corresponds to a 4%error in monovalent ion activity. A 5-mV errorcorresponds to a 22% error. The relative errordoubles for divalent ions and triples fortrivalent ions.
Electrodes respond to the activity ofuncomplexed ion. If ionic strength is constant,concentration is proportional to activity andthe electrode measures concentration.
F � Faraday constantn � charge of the ion being detectedT � temperature (K)R � gas constant
–1 2 3 41
1
2
3
4
0
Intercept =–0.590 mL
y = 0.744 8x + 0.439 2
(V0
+V
S)
· 10E
/S
VS (mL)
Figure 15-23 Standard addition graphfor ion-selective electrode based onEquation 15-12. [Data from G. Li, B. J. Polk, L.A. Meazell,
and D. W. Hatchett, “ISE Analysis of Hydrogen Sulfide in
Cigarette Smoke,” J. Chem. Ed. 2000, 77, 1049.]

in Equation 15-12. Another procedure is to add a concentrated, knownmatrix to the unknown and to all standards so that the matrix is essentially the same in allsolutions.
Metal Ion BuffersIt is pointless to dilute to for standardizing an ion-selective electrode. At thislow concentration, will be lost by adsorption on glass or reaction with impurities.
An alternative is to prepare a metal ion buffer from the metal and a suitable ligand. Forexample, consider the reaction of with nitrilotriacetic acid (NTA) at a pH high enoughfor NTA to be in its fully basic form
(15-14)
If equal concentrations of and are present in a solution,
Example Preparing a Metal Ion Buffer
What concentration of should be added to in 0.1 Mto give
Solution From Equation 15-14, we write
These are practical concentrations of and of
A metal ion buffer is the only way to get the concentration for thefilling solution in the electrode in Figure 15-21.
15-8 Solid-State Chemical SensorsSolid-state chemical sensors are fabricated by the same technology used for microelectronicchips. The field effect transistor (FET) is the heart of commercially available sensors such asthe pH electrode in Figure 15-24.
Semiconductors and DiodesSemiconductors such as Si (Figure 15-25), Ge, and GaAs are materials whose electricalresistivity30 lies between those of conductors and insulators. The four valence electrons of thepure materials are all involved in bonds between atoms (Figure 15-26a). A phosphorus impu-rity, with five valence electrons, provides one extra conduction electron that is free to movethrough the crystal (Figure 15-26b). An aluminum impurity has one less bonding electronthan necessary, creating a vacancy called a hole, which behaves as a positive charge carrier.When a neighboring electron fills the hole, a new hole appears at an adjacent position (Fig-ure 15-26c). A semiconductor with excess conduction electrons is called n-type, and one withexcess holes is called p-type.
[Pb2�] � 10�12 M
NTA3�.CaNTA�
[NTA3�] �[CaNTA�]
Kf[Ca2�]�
1.00 � 10�2
(106.46) (1.00 � 10�6)� 3.47 � 10�3 M
[Ca2�] � 1.00 � 10�6 M?KNO3
CaNTA�1.00 � 10�2 MNTA3�
[Ca2�] �[CaNTA�]
Kf[NTA3�]� 10�6.46 M
CaNTA�NTA3�
Kf �[CaNTA�]
[Ca2�][NTA3�]� 106.46 in 0.1 M KNO3
Ca2� � NTA3� T CaNTA�
(NTA3�):Ca2�
Ca2�
10�6 MCaCl2
(V0 � VS)10E/S
318 CHAPTER 15 Electrodes and Potentiometry
If the pH were not so high that all ligand is inthe form you would need to calculatethe fraction in the form for use in Equa-tion 15-14. This approach is used with
for EDTA in Section 12-2.�Y4�
NTA3�
NTA3�,
Glass vessels are not used for very dilutesolutions, because ions are adsorbed on theglass. Plastic bottles are better than glass fordilute solutions. Adding strong acid (0.1–1 M)to any solution helps minimize adsorption ofcations on the walls of the container, because
competes with other cations for ion-exchange sites.H�
pK4 � 10.334pK2 � 1.650pK3 � 2.940pK1 � 1.1
H4NTA�
HN(CH2CO2H)�3
Thermistor
Referenceelectrode
FET pHsensor
(a)
(b)
Figure 15-24 (a) pH-sensitive field effecttransistor. (b) Combination pH electrodebased on field effect transistor. The thermistorsenses temperature and is used for automatictemperature compensation. [Courtesy Sentron,
Federal Way, WA.]
Figure 15-25 Diamondlike structure of silicon. Eachatom is tetrahedrally bonded to four neighbors, with aSi–Si distance of 235 pm.

15-8 Solid-State Chemical Sensors 319
n-type silicon(b )
Conduction electron
Si
Si
Si
Si
Si
Si
Si
Si Si
Si
Si
Si
Si
Si
Si
SiP P
(+)
(–)
Si
Si
Si
Si
Si
Si
Si
SiSi
Each bond represents a pairof bonding electrons
(a)
p-type silicon(c )
A “hole” (electron vacancy)
Si
Si
Si
Si
Si
Si
Si
Si Si
Si
Si
Si
Si
Si
Si
SiAl Al(–)
(+)
Figure 15-26 (a) The electrons of puresilicon are all involved in the sigma-bondingframework. (b) An impurity atom such asphosphorus adds one extra electron (•),which is relatively free to move through thecrystal. (c) An aluminum impurity atom lacksone electron needed for the sigma-bondingframework. The hole (�) introduced by theAl atom can be occupied by an electron froma neighboring bond, effectively movingthe hole to the neighboring bond.
Forward bias (current flows)(a)
++
+
++
p-Si n-Si
(+) (–)
Reverse bias (no current flows)(b)
+
+
+
+ –
–
–
–
––
––
–
p-Si n-Si
(–) (+)
Depletionregion
(~10–6 m)Negative electron
Positive hole
Figure 15-27 Behavior of a pn junction, showing that current (a) can flow under forward biasconditions, but (b) is prevented from flowing under reverse bias.
A diode is a pn junction (Figure 15-27a). If n-Si is made negative with respect to p-Si,electrons flow from the external circuit into the n-Si. At the pn junction, electrons and holescombine. As electrons move from the p-Si into the circuit, a fresh supply of holes is createdin the p-Si. The net result is that current flows when n-Si is negative with respect to p-Si. Thediode is said to be forward biased.
If the polarity is reversed (Figure 15-27b), electrons are drawn out of n-Si and holes aredrawn out of p-Si, leaving a thin depletion region devoid of charge carriers near the pn junc-tion. The diode is reverse biased and does not conduct current in the reverse direction.
An activation energy is needed to get thecharge carriers to move across the diode.For Si, of forward bias is requiredbefore current will flow. For Ge, therequirement is �0.2 V.
�0.6 V
For moderate reverse bias voltages, no currentflows. If the voltage is sufficiently negative,breakdown occurs and current flows in thereverse direction.
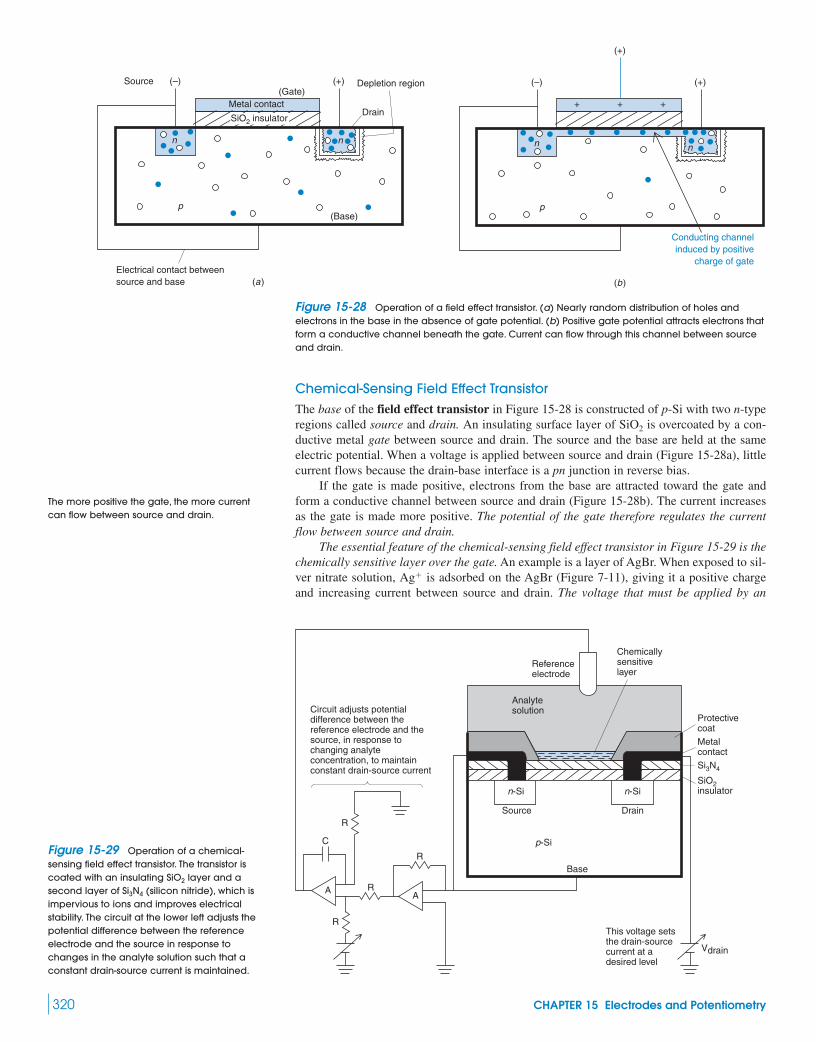
Chemical-Sensing Field Effect TransistorThe base of the field effect transistor in Figure 15-28 is constructed of p-Si with two n-typeregions called source and drain. An insulating surface layer of is overcoated by a con-ductive metal gate between source and drain. The source and the base are held at the sameelectric potential. When a voltage is applied between source and drain (Figure 15-28a), littlecurrent flows because the drain-base interface is a pn junction in reverse bias.
If the gate is made positive, electrons from the base are attracted toward the gate andform a conductive channel between source and drain (Figure 15-28b). The current increasesas the gate is made more positive. The potential of the gate therefore regulates the currentflow between source and drain.
The essential feature of the chemical-sensing field effect transistor in Figure 15-29 is thechemically sensitive layer over the gate. An example is a layer of AgBr. When exposed to sil-ver nitrate solution, is adsorbed on the AgBr (Figure 7-11), giving it a positive chargeand increasing current between source and drain. The voltage that must be applied by an
Ag�
SiO2
320 CHAPTER 15 Electrodes and Potentiometry
(a)
n
(+)(–)
n
p
Depletion region
Drain
(Gate)
(Base)
Source
Metal contact
Electrical contact betweensource and base
SiO2 insulator
n
(+)(–)
(+)
n
p
Conducting channelinduced by positive
charge of gate
+++
(b)
Figure 15-28 Operation of a field effect transistor. (a) Nearly random distribution of holes andelectrons in the base in the absence of gate potential. (b) Positive gate potential attracts electrons thatform a conductive channel beneath the gate. Current can flow through this channel between sourceand drain.
R
Circuit adjusts potential difference between the reference electrode and the source, in response to changing analyte concentration, to maintain constant drain-source current
C
A
R
R
R
A
p-Si
Base
Drain
n-Si
Source
n-Si
ProtectivecoatMetalcontactSi3N4
SiO2insulator
Chemicallysensitivelayer
Referenceelectrode
Analytesolution
Vdrain
This voltage sets the drain-source current at a desired level
Figure 15-29 Operation of a chemical-sensing field effect transistor. The transistor iscoated with an insulating layer and asecond layer of (silicon nitride), which isimpervious to ions and improves electricalstability. The circuit at the lower left adjusts thepotential difference between the referenceelectrode and the source in response tochanges in the analyte solution such that aconstant drain-source current is maintained.
Si3N4
SiO2
The more positive the gate, the more currentcan flow between source and drain.
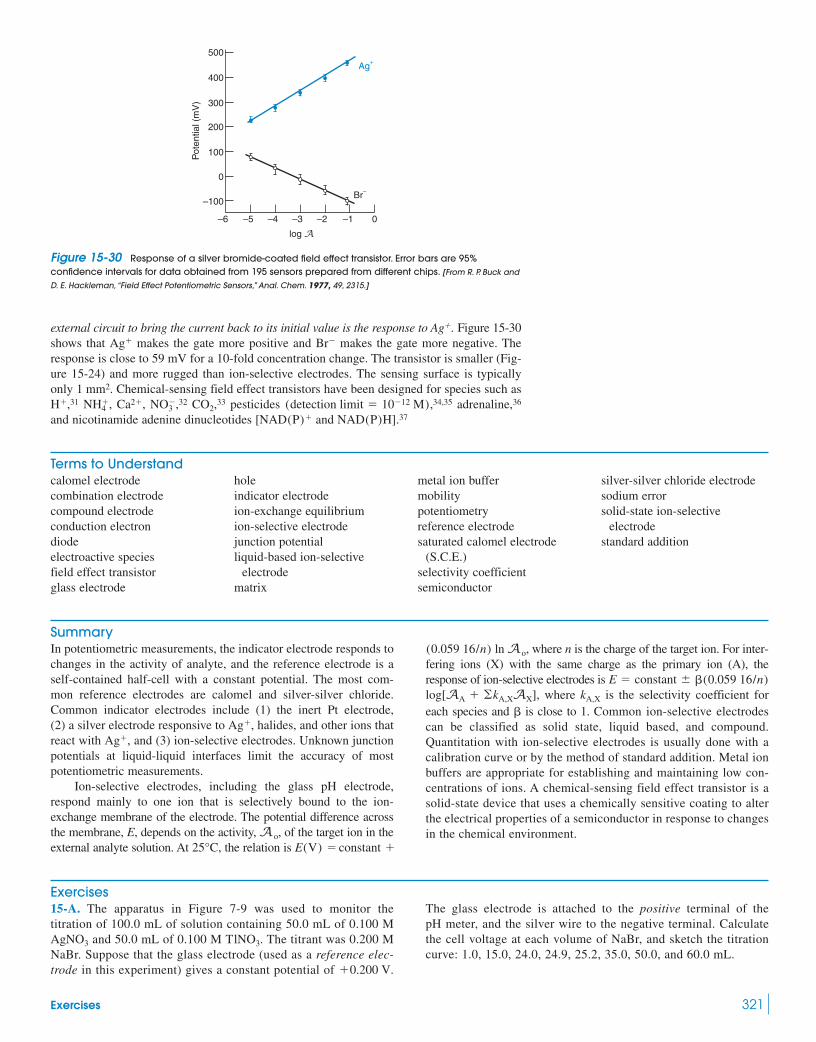
external circuit to bring the current back to its initial value is the response to Ag�. Figure 15-30shows that makes the gate more positive and makes the gate more negative. Theresponse is close to 59 mV for a 10-fold concentration change. The transistor is smaller (Fig-ure 15-24) and more rugged than ion-selective electrodes. The sensing surface is typicallyonly Chemical-sensing field effect transistors have been designed for species such as
31 32 33 pesticides ,34,35 adrenaline,36
and nicotinamide adenine dinucleotides and 37NAD(P)H].[NAD(P)�
(detection limit � 10�12 M)CO2,NO�3 ,Ca2�,NH�
4 ,H�,1 mm2.
Br�Ag�
Exercises 321
–100
–6
Pot
entia
l (m
V)
log AA
0
100
200
300
400
500
–5 –4 –3 –2 –1 0
Br–
Ag+
Figure 15-30 Response of a silver bromide-coated field effect transistor. Error bars are 95%confidence intervals for data obtained from 195 sensors prepared from different chips. [From R. P. Buck and
D. E. Hackleman,“Field Effect Potentiometric Sensors,” Anal. Chem. 1977, 49, 2315.]
Terms to Understandcalomel electrodecombination electrodecompound electrodeconduction electrondiodeelectroactive speciesfield effect transistorglass electrode
holeindicator electrodeion-exchange equilibriumion-selective electrodejunction potentialliquid-based ion-selective
electrodematrix
metal ion buffermobilitypotentiometryreference electrodesaturated calomel electrode
(S.C.E.)selectivity coefficientsemiconductor
silver-silver chloride electrodesodium errorsolid-state ion-selective
electrodestandard addition
Exercises15-A. The apparatus in Figure 7-9 was used to monitor thetitration of 100.0 mL of solution containing 50.0 mL of 0.100 M
and 50.0 mL of 0.100 M The titrant was 0.200 MNaBr. Suppose that the glass electrode (used as a reference elec-trode in this experiment) gives a constant potential of �0.200 V.
TlNO3.AgNO3
The glass electrode is attached to the positive terminal of thepH meter, and the silver wire to the negative terminal. Calculatethe cell voltage at each volume of NaBr, and sketch the titrationcurve: 1.0, 15.0, 24.0, 24.9, 25.2, 35.0, 50.0, and 60.0 mL.
SummaryIn potentiometric measurements, the indicator electrode responds tochanges in the activity of analyte, and the reference electrode is aself-contained half-cell with a constant potential. The most com-mon reference electrodes are calomel and silver-silver chloride.Common indicator electrodes include (1) the inert Pt electrode,(2) a silver electrode responsive to halides, and other ions thatreact with and (3) ion-selective electrodes. Unknown junctionpotentials at liquid-liquid interfaces limit the accuracy of mostpotentiometric measurements.
Ion-selective electrodes, including the glass pH electrode,respond mainly to one ion that is selectively bound to the ion-exchange membrane of the electrode. The potential difference acrossthe membrane, E, depends on the activity, of the target ion in theexternal analyte solution. At the relation is constant �E(V) �25°C,
A o,
Ag�,Ag�,
ln where n is the charge of the target ion. For inter-fering ions (X) with the same charge as the primary ion (A), theresponse of ion-selective electrodes is
where is the selectivity coefficient foreach species and � is close to 1. Common ion-selective electrodescan be classified as solid state, liquid based, and compound.Quantitation with ion-selective electrodes is usually done with acalibration curve or by the method of standard addition. Metal ionbuffers are appropriate for establishing and maintaining low con-centrations of ions. A chemical-sensing field effect transistor is asolid-state device that uses a chemically sensitive coating to alterthe electrical properties of a semiconductor in response to changesin the chemical environment.
kA,Xlog[AA � �kA,XAX],�(0.059 16/n)E � constant �
A o,(0.059 16/n)

322 CHAPTER 15 Electrodes and Potentiometry
Pt wirein contactwith Hg
Small glasscup
Glasstube
Hole inbottom of tube
Hg(/)
Hg indicatorelectrode
Stirring bar
Analyte + Hg(EDTA)2–
Referenceelectrode
Buret
V
+–
(a) (b)
15-B. The apparatus in the figure above can follow the course of anEDTA titration and was used to generate the curves in Figure 12-9.The heart of the cell is a pool of liquid Hg in contact with the solu-tion and with a Pt wire. A small amount of added to the ana-lyte equilibrates with a very tiny amount of
(A)
The redox equilibrium is established rapidlyat the surface of the Hg electrode, so the Nernst equation for the cellcan be written in the form
(B)
where is the constant potential of the reference electrode. FromEquation A, and this can be substi-tuted into Equation B to give
(C)
where is the formation constant for This apparatus thusresponds to the changing EDTA concentration during an EDTAtitration.
Suppose that 50.0 mL of 0.010 0 M are titrated with0.020 0 M EDTA at pH 10.0, using the apparatus in the figure withan S.C.E. reference electrode. Analyte contains
added at the beginning of the titration. Calculate theHg(EDTA)2�
1.0 � 10�4 M
MgSO4
HgY2�.Kf
� 0.852 � E� �0.059 16
2log a Kf
[HgY2�]b �
0.059 16
2log[Y4�]
E � 0.852 �0.059 16
2log a [Y4�]Kf
[HgY2�]b � E�
[Hg2�] � [HgY2�]/Kf[Y4�],E�
E � E� � E� � a0.852 �0.059 16
2log a 1
[Hg2�]bb � E�
Hg2� � 2e� T Hg(l)
Kf �[HgY2�]
[Hg2�][Y4�]� 1021.5
Hg2� � Y4� T HgY�2
Hg2�:HgY2�
cell voltage at the following volumes of added EDTA, and draw agraph of millivolts versus milliliters: 0, 10.0, 20.0, 24.9, 25.0, and26.0 mL.
15-C. A solid-state fluoride ion-selective electrode responds to but not to HF. It also responds to hydroxide ion at high concentra-tion when Suppose that such an electrode gave apotential of (versus S.C.E.) in NaF and in NaF. Sketch qualitatively how the potential would vary ifthe electrode were immersed in NaF and the pH rangedfrom 1 to 13.
15-D. One commercial glass-membrane sodium ion-selective elec-trode has a selectivity coefficient When this electrodewas immersed in 1.00 mM NaCl at pH 8.00, a potential of (versus S.C.E.) was recorded.(a) Neglecting activity coefficients and assuming in Equa-tion 15-8, calculate the potential if the electrode were immersed in5.00 mM NaCl at pH 8.00.(b) What would the potential be for 1.00 mM NaCl at pH 3.87? Youcan see that pH is a critical variable for the sodium electrode.
15-E. An ammonia gas-sensing electrode gave the following cali-bration points when all solutions contained 1 M NaOH.
E (mV) E (mV)
268.0 368.0310.0 386.4326.8 427.6
A dry food sample weighing 312.4 mg was digested by the Kjeldahlprocedure (Section 7-2) to convert all nitrogen into Thedigestion solution was diluted to 1.00 L, and 20.0 mL were trans-ferred to a 100-mL volumetric flask. The 20.0-mL aliquot was
NH�4 .
5.00 � 10�31.00 � 10�41.00 � 10�35.00 � 10�55.00 � 10�41.00 � 10�5
NH3 (M)NH3 (M)
� � 1
�38 mVkNa�,H� � 36.
10�5 M10�4 M
�41 mV10�5 M�100 mV[OH�] � [F�]/10.
F�,
(a) Apparatus for Exercise 15-B. (b) Enlarged view of mercury electrode.
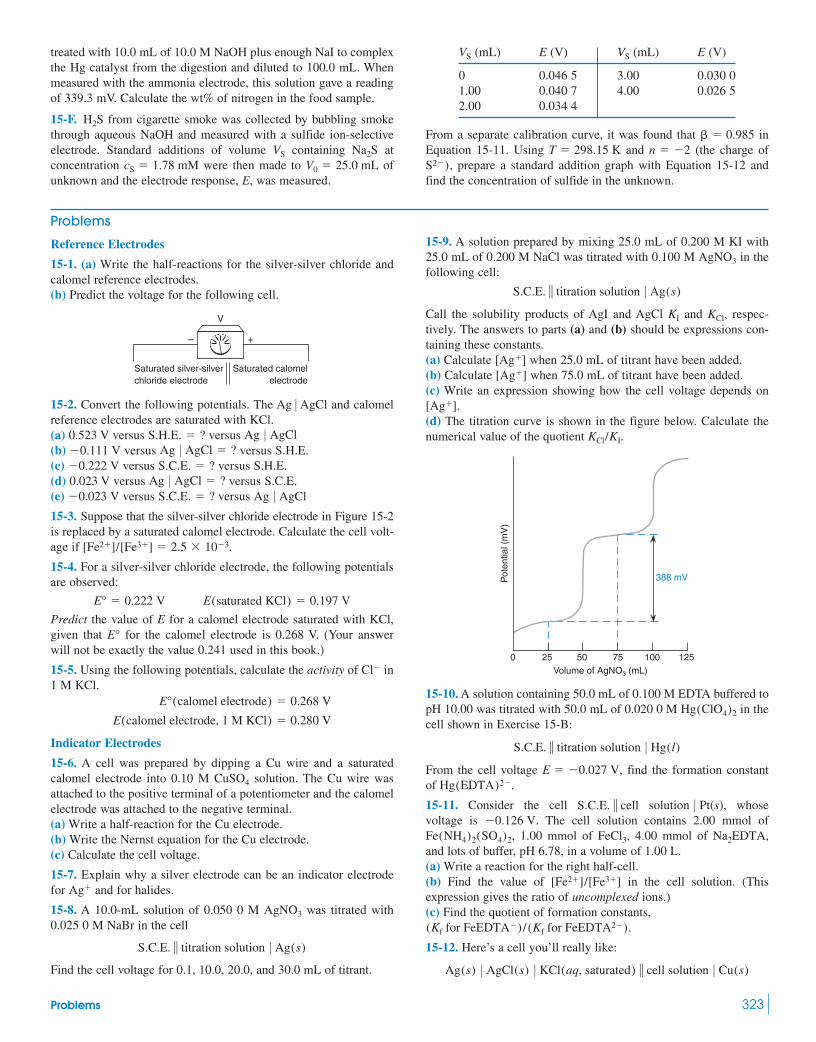
Problems 323
Problems
Reference Electrodes
15-1. (a) Write the half-reactions for the silver-silver chloride andcalomel reference electrodes.(b) Predict the voltage for the following cell.
15-2. Convert the following potentials. The Ag AgCl and calomelreference electrodes are saturated with KCl.(a) 0.523 V versus versus (b) versus versus S.H.E.(c) versus versus S.H.E.(d) 0.023 V versus versus S.C.E.(e) versus versus
15-3. Suppose that the silver-silver chloride electrode in Figure 15-2is replaced by a saturated calomel electrode. Calculate the cell volt-age if
15-4. For a silver-silver chloride electrode, the following potentialsare observed:
Predict the value of E for a calomel electrode saturated with KCl,given that for the calomel electrode is 0.268 V. (Your answerwill not be exactly the value 0.241 used in this book.)
15-5. Using the following potentials, calculate the activity of in1 M KCl.
Indicator Electrodes
15-6. A cell was prepared by dipping a Cu wire and a saturatedcalomel electrode into 0.10 M solution. The Cu wire wasattached to the positive terminal of a potentiometer and the calomelelectrode was attached to the negative terminal.(a) Write a half-reaction for the Cu electrode.(b) Write the Nernst equation for the Cu electrode.(c) Calculate the cell voltage.
15-7. Explain why a silver electrode can be an indicator electrodefor and for halides.
15-8. A 10.0-mL solution of 0.050 0 M was titrated with0.025 0 M NaBr in the cell
Find the cell voltage for 0.1, 10.0, 20.0, and 30.0 mL of titrant.
S.C.E. � titration solution 0 Ag(s)
AgNO3
Ag�
CuSO4
E(calomel electrode, 1 M KCl) � 0.280 V
E°(calomel electrode) � 0.268 V
Cl�
E°
E(saturated KCl) � 0.197 VE° � 0.222 V
[Fe2�]/[Fe3�] � 2.5 � 10�3.
Ag 0 AgClS.C.E. � ?�0.023 VAg 0 AgCl � ?
S.C.E. � ?�0.222 VAg 0 AgCl � ?�0.111 V
Ag 0 AgClS.H.E. � ?
0
V
+–
Saturated silver-silverchloride electrode
Saturated calomelelectrode
15-9. A solution prepared by mixing 25.0 mL of 0.200 M KI with25.0 mL of 0.200 M NaCl was titrated with 0.100 M in thefollowing cell:
Call the solubility products of AgI and AgCl and respec-tively. The answers to parts (a) and (b) should be expressions con-taining these constants.(a) Calculate when 25.0 mL of titrant have been added.(b) Calculate when 75.0 mL of titrant have been added.(c) Write an expression showing how the cell voltage depends on
(d) The titration curve is shown in the figure below. Calculate thenumerical value of the quotient
15-10. A solution containing 50.0 mL of 0.100 M EDTA buffered topH 10.00 was titrated with 50.0 mL of 0.020 0 M Hg in thecell shown in Exercise 15-B:
From the cell voltage find the formation constantof
15-11. Consider the cell solution Pt(s), whose voltage is The cell solution contains 2.00 mmol of
1.00 mmol of 4.00 mmol of and lots of buffer, pH 6.78, in a volume of 1.00 L.(a) Write a reaction for the right half-cell.(b) Find the value of in the cell solution. (Thisexpression gives the ratio of uncomplexed ions.)(c) Find the quotient of formation constants,
15-12. Here’s a cell you’ll really like:
Ag(s) 0 AgCl(s) 0 KCl(aq, saturated) � cell solution 0 Cu(s)
(Kf for FeEDTA2�).(Kf for FeEDTA�) /
[Fe2�]/[Fe3�]
Na2EDTA,FeCl3,(SO4)2,Fe(NH4)2
�0.126 V.0S.C.E. � cell
Hg(EDTA)2�.E � �0.027 V,
S.C.E. � titration solution 0 Hg(l)
(ClO4)2
0
Pot
entia
l (m
V)
Volume of AgNO3 (mL)25 50 75 100 125
388 mV
KCl/KI.
[Ag�].
[Ag�][Ag�]
KCl,KI
S.C.E. � titration solution 0 Ag(s)
AgNO3
treated with 10.0 mL of 10.0 M NaOH plus enough NaI to complexthe Hg catalyst from the digestion and diluted to 100.0 mL. Whenmeasured with the ammonia electrode, this solution gave a readingof 339.3 mV. Calculate the wt% of nitrogen in the food sample.
15-F. from cigarette smoke was collected by bubbling smokethrough aqueous NaOH and measured with a sulfide ion-selectiveelectrode. Standard additions of volume containing atconcentration were then made to ofunknown and the electrode response, E, was measured.
V0 � 25.0 mLcS � 1.78 mMNa2SVS
H2S
(mL) E (V) (mL) E (V)
0 0.046 5 3.00 0.030 01.00 0.040 7 4.00 0.026 52.00 0.034 4
From a separate calibration curve, it was found that inEquation 15-11. Using and (the charge of
prepare a standard addition graph with Equation 15-12 andfind the concentration of sulfide in the unknown.S2�),
n � �2T � 298.15 K� � 0.985
VSVS

324 CHAPTER 15 Electrodes and Potentiometry
The cell solution was made by mixing
25.0 mL of 4.00 mM KCN25.0 mL of 4.00 mM 25.0 mL of 0.400 M acid, HA, with 25.0 mL of KOH solution
The measured voltage was Calculate the molarity of theKOH solution. Assume that essentially all copper(I) is Alittle HCN comes from the reaction of KCN with HA. Neglect thesmall amount of HA consumed by reaction with HCN. For the righthalf-cell, the reaction is
Junction Potential
15-13. What causes a junction potential? How does this potentiallimit the accuracy of potentiometric analyses? Identify a cell in theillustrations in Section 14-2 that has no junction potential.
15-14. Why is the 0.1 M HCl 0.1 M KCl junction potential ofopposite sign and greater magnitude than the 0.1 M NaCl 0.1 M KClpotential in Table 15-2?
15-15. Which side of the liquid junction 0.1 M NaClwill be negative?
15-16. How many seconds will it take for (a) and (b) tomigrate a distance of 12.0 cm in a field of (Referto the footnote in Table 15-1.)
15-17. Suppose that an ideal hypothetical cell such as that inFigure 14-7 were set up to measure for the half-reaction
(a) Calculate the equilibrium constant for the net cell reaction.(b) If there were a junction potential of (increasing E from0.799 to 0.801 V), by what percentage would the calculated equilib-rium constant increase?(c) Answer parts (a) and (b), using 0.100 V instead of 0.799 V forthe value of for the silver reaction.
15-18. Explain how the cell can be used to measure the 0.1 M
KCl junction potential.
15-19. The junction potential, between solutions and can be estimated with the Henderson equation:
where is the charge of species i, is the mobility of species i(Table 15-1), is the concentration of species i in phase and
is the concentration in phase (Activity coefficients areneglected in this equation.)(a) Using your calculator, show that the junction potential of 0.1 MHCl 0.1 M KCl is 26.9 mV at (Note that
(b) Set up a spreadsheet to reproduce the result in part (a). Thenuse your spreadsheet to compute and plot the junction potential for0.1 M KCl, where x varies from 1 mM to 4 M.M HCl 0 x
0.059 16 log x.)(RT/F) ln x �25°C.0
�.Ci(�)�,Ci(�)
uizi
Ej �a
i
�zi �ui
zi[Ci(�) � Ci(�)]
ai
�zi �ui[Ci(�) � Ci(�)]
RT
Flna
i�zi �uiCi(�)
ai
�zi �uiCi(�)
Solution α | Solution β
V
+–
��Ej,
HCl 0 0.1 M0.1 M KCl 0 AgCl(s) 0 Ag(s)
Ag(s) 0 AgCl(s) 0 0.1 M HCl 0E°
�2 mV
Ag� � e� T Ag(s).E°
7.80 � 103 V/m?NO�
3H�
KNO3 0 0.1 M
00
Cu(CN)�2 � e� T Cu(s) � 2CN�.
Cu(CN)�2 .
�0.440 V.
pKa � 9.50KCu(CN)2
(c) Use your spreadsheet to explore the behavior of the junctionpotential for y M KCl, where and
and or 4 M.
pH Measurement with a Glass Electrode
15-20. Describe how you would calibrate a pH electrode and mea-sure the pH of blood (which is 7.5) at Use the standardbuffers in Table 15-3.
15-21. List the sources of error associated with pH measurementwith the glass electrode.
15-22. If electrode C in Figure 15-15 were placed in a solution ofpH 11.0, what would the pH reading be?
15-23. Which National Institute of Standards and Technologybuffer(s) would you use to calibrate an electrode for pH measure-ments in the range 3–4?
15-24. Why do glass pH electrodes tend to indicate a pH lower thanthe actual pH in strongly basic solution?
15-25. Suppose that the outer electrode in Figure 15-9 isfilled with 0.1 M NaCl instead of saturated KCl. Suppose that theelectrode is calibrated in a dilute buffer containing 0.1 M KCl at pH6.54 at The electrode is then dipped in a second buffer at thesame pH and same temperature, but containing 3.5 M KCl. UseTable 15-2 to estimate how much the indicated pH will change.
15-26. (a) When the difference in pH across the membrane of aglass electrode at is 4.63 pH units, how much voltage is gen-erated by the pH gradient?(b) What would the voltage be for the same pH difference at
15-27. When calibrating a glass electrode, 0.025 m potassium dihy-drogen phosphate/0.025 m disodium hydrogen phosphate buffer(Table 15-3) gave a reading of at and 0.05 mpotassium hydrogen phthalate buffer gave a reading of What is the pH of an unknown giving a reading of What is the slope of the calibration curve (mV/pH unit) and what isthe theoretical slope at Find the value of in Equation 15-4.
15-28. Activity problem. The 0.025 0 mbuffer (5) in Table 15-3 has a pH of 6.865 at (a) Show that the ionic strength of the buffer is (b) From the pH and for phosphoric acid, find the quotient ofactivity coefficients, at (c) You have the urgent need to prepare a pH 7.000 buffer to beused as a calibration standard.38 You can use the activity coeffi-cient ratio from part (b) to accurately prepare such a buffer if theionic strength is kept at 0.100 m. What molalities of and
should be mixed to obtain a pH of 7.000 and
Ion-Selective Electrodes
15-29. Explain the principle of operation of ion-selective elec-trodes. How does a compound electrode differ from a simple ion-selective electrode?
15-30. What does the selectivity coefficient tell us? Is it better tohave a large or a small selectivity coefficient?
15-31. What makes a liquid-based ion-selective electrode specificfor one analyte?
15-32. Why is it preferable to use a metal ion buffer to achieverather than just dissolving enough M to give a
solution?10�8 MpM � 8,
� � 0.100 m?Na2HPO4
KH2PO4
� � 0.100 m.�HPO2�4
/�H2PO�4,
K2
� � 0.100 m.25°C.
KH2PO4/0.025 0 m Na2HPO4
�20°C?
�50.0 mV?�146.3 mV.
20°C�18.3 mV
37°C?
25°C
25°C.
Ag 0 AgCl
37°C.�
x � 1 mM10�1 M10�2,10�3,y � 10�4,M HCl 0 x
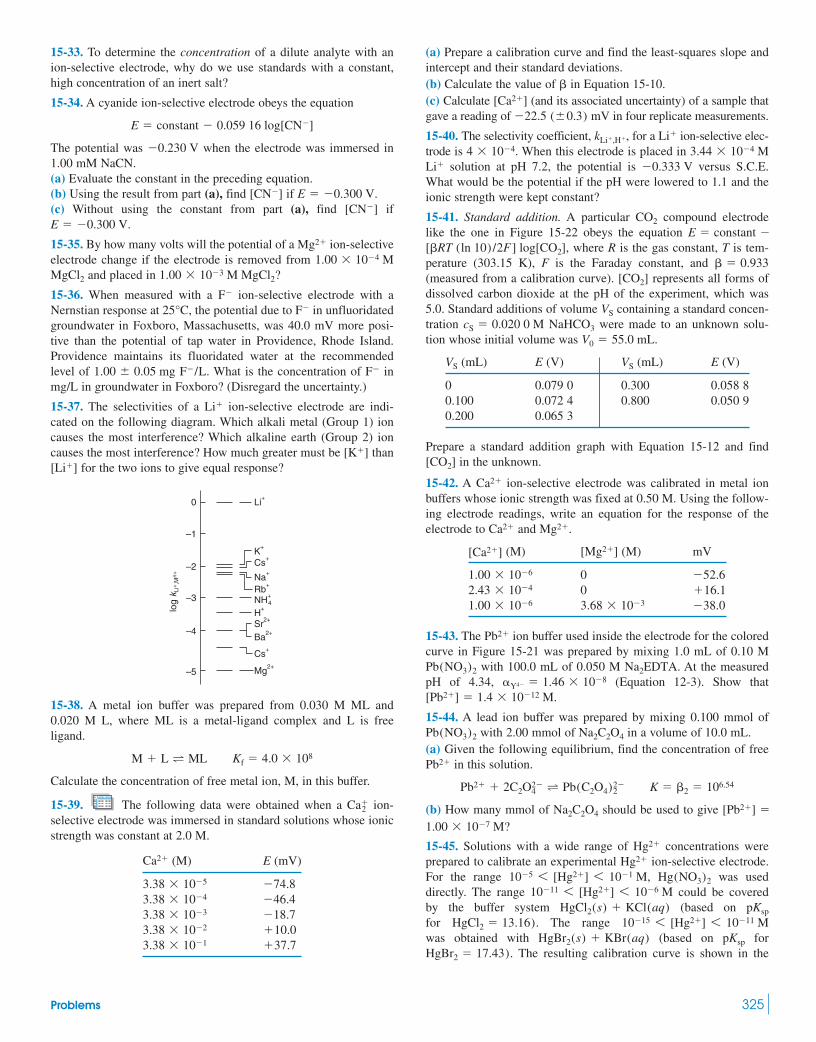
Problems 325
15-33. To determine the concentration of a dilute analyte with anion-selective electrode, why do we use standards with a constant,high concentration of an inert salt?
15-34. A cyanide ion-selective electrode obeys the equation
The potential was when the electrode was immersed in1.00 mM NaCN.(a) Evaluate the constant in the preceding equation.(b) Using the result from part (a), find if (c) Without using the constant from part (a), find if
15-35. By how many volts will the potential of a ion-selectiveelectrode change if the electrode is removed from
and placed in
15-36. When measured with a ion-selective electrode with aNernstian response at the potential due to in unfluoridatedgroundwater in Foxboro, Massachusetts, was 40.0 mV more posi-tive than the potential of tap water in Providence, Rhode Island.Providence maintains its fluoridated water at the recommendedlevel of What is the concentration of inmg/L in groundwater in Foxboro? (Disregard the uncertainty.)
15-37. The selectivities of a ion-selective electrode are indi-cated on the following diagram. Which alkali metal (Group 1) ioncauses the most interference? Which alkaline earth (Group 2) ioncauses the most interference? How much greater must be than
for the two ions to give equal response?
15-38. A metal ion buffer was prepared from 0.030 M ML and0.020 M L, where ML is a metal-ligand complex and L is freeligand.
Calculate the concentration of free metal ion, M, in this buffer.
15-39. The following data were obtained when a ion-selective electrode was immersed in standard solutions whose ionicstrength was constant at 2.0 M.
(M) E (mV)
�37.73.38 � 10�1�10.03.38 � 10�2�18.73.38 � 10�3�46.43.38 � 10�4�74.83.38 � 10�5
Ca2�
Ca�2
Kf � 4.0 � 108M � L T ML
0
log
k Li+
,Mn
+
–1
–2
–3
–4
–5
Li+
K+
Cs+
Na+
Rb+
NH+4
H+
Sr2+
Ba2+
Cs+
Mg2+
[Li�][K�]
Li�
F�F�/L.1.00 � 0.05 mg
F�25°C,F�
1.00 � 10�3 M MgCl2?MgCl2
1.00 � 10�4 MMg2�
E � �0.300 V.[CN�]
E � �0.300 V.[CN�]
�0.230 V
E � constant � 0.059 16 log[CN�]
(a) Prepare a calibration curve and find the least-squares slope andintercept and their standard deviations.(b) Calculate the value of in Equation 15-10.(c) Calculate (and its associated uncertainty) of a sample thatgave a reading of mV in four replicate measurements.
15-40. The selectivity coefficient, for a ion-selective elec-trode is When this electrode is placed in
solution at pH 7.2, the potential is versus S.C.E.What would be the potential if the pH were lowered to 1.1 and theionic strength were kept constant?
15-41. Standard addition. A particular compound electrodelike the one in Figure 15-22 obeys the equation
where R is the gas constant, T is tem-perature (303.15 K), F is the Faraday constant, and (measured from a calibration curve). represents all forms ofdissolved carbon dioxide at the pH of the experiment, which was5.0. Standard additions of volume containing a standard concen-tration were made to an unknown solu-tion whose initial volume was
(mL) E (V) (mL) E (V)
0 0.079 0 0.300 0.058 80.100 0.072 4 0.800 0.050 90.200 0.065 3
Prepare a standard addition graph with Equation 15-12 and findin the unknown.
15-42. A ion-selective electrode was calibrated in metal ionbuffers whose ionic strength was fixed at 0.50 M. Using the follow-ing electrode readings, write an equation for the response of theelectrode to and
(M) (M) mV
00
15-43. The ion buffer used inside the electrode for the coloredcurve in Figure 15-21 was prepared by mixing 1.0 mL of 0.10 M
with 100.0 mL of 0.050 M At the measuredpH of 4.34, (Equation 12-3). Show that
15-44. A lead ion buffer was prepared by mixing 0.100 mmol ofwith 2.00 mmol of in a volume of 10.0 mL.
(a) Given the following equilibrium, find the concentration of freein this solution.
(b) How many mmol of should be used to give
15-45. Solutions with a wide range of concentrations wereprepared to calibrate an experimental ion-selective electrode.For the range was useddirectly. The range could be coveredby the buffer system (based on for The range was obtained with (based on for
The resulting calibration curve is shown in theHgBr2 � 17.43).pKspHgBr2(s) � KBr(aq)
10�15 6 [Hg2�] 6 10�11 MHgCl2 � 13.16).pKspHgCl2(s) � KCl(aq)
10�11 6 [Hg2�] 6 10�6 MHg(NO3)210�5 6 [Hg2�] 6 10�1 M,
Hg2�
Hg2�
1.00 � 10�7 M?[Pb2�] �Na2C2O4
K � �2 � 106.54Pb2� � 2C2O2�4 T Pb(C2O4)2�
2
Pb2�
Na2C2O4Pb(NO3)2
[Pb2�] � 1.4 � 10�12 M.�Y4� � 1.46 � 10�8
Na2EDTA.Pb(NO3)2
Pb2�
�38.03.68 � 10�31.00 � 10�6�16.12.43 � 10�4�52.61.00 � 10�6
[Mg2�][Ca2�]
Mg2�.Ca2�
Ca2�
[CO2]
VSVS
V0 � 55.0 mL.NaHCO3cS � 0.020 0 M
VS
[CO2]� � 0.933
[�RT (ln 10)/2F] log[CO2],E � constant �
CO2
�0.333 VLi�
3.44 � 10�4 M4 � 10�4.Li�kLi�,H�,
(�0.3)�22.5[Ca2�]
�

326 CHAPTER 15 Electrodes and Potentiometry
figure. Calibration points for the buffer are not in linewith the other data. Suggest a possible explanation.
15-46. Activity problem. Citric acid is a triprotic acid whose anion forms stable complexes with many metal ions.
forms a 1:1 complex with citrate under the conditions of thisproblem.
Ca2� � A3� ∆Kf
CaA�
Ca2�
(A3�)(H3A)
500
400
300
200
100
0
log[Hg2+]
Hg(NO3)2
HgBr2+
KBr
HgCI2+
KCI
–15 –10 –5 –0
E(m
V v
s. S
.C.E
.)
HgCl2/KCl A calcium ion-selective electrode gave a calibration curve similar toFigure B-2 in Appendix B, with a slope of 29.58 mV. When the elec-trode was immersed in a solution having thereading was Calcium citrate solution was prepared bymixing equal volumes of solutions 1 and 2.
Solution 1:
Solution 2:
When the electrode was immersed in the calcium citrate solution,the reading was �25.90 mV.(a) Calculate the activity of in the calcium citrate solution.(b) Calculate the formation constant, for Assume that thesize of is 500 pm. At pH 8.00 and the fractionof free citrate in the form is 0.998.
Solid-State Chemical Sensors
15-47. What does analyte do to a chemical-sensing field effect tran-sistor to produce a signal related to the activity of analyte?
A3�
� � 0.10 M,CaA�
CaA�.Kf,Ca2�
� � 0.10 MpH � 8.00,[Citrate]total � 1.00 � 10�3 M,
� � 0.10 MpH � 8.00,[Ca2�] � 1.00 � 10�3 M,
�2.06 mV.ACa2� � 1.00 � 10�3,
ion-selective electrode calibration curve from J. A. Shatkin, H. S. Brown,and S. Licht, “Composite Graphite Ion Selective Electrode ArrayPotentiometry for the Detection of Mercury and Other Relevant Ions inAquatic Systems,” Anal. Chem. 1995, 67, 1147. It was not stated in the paper,but we presume that all solutions had the same ionic strength.
Hg2�
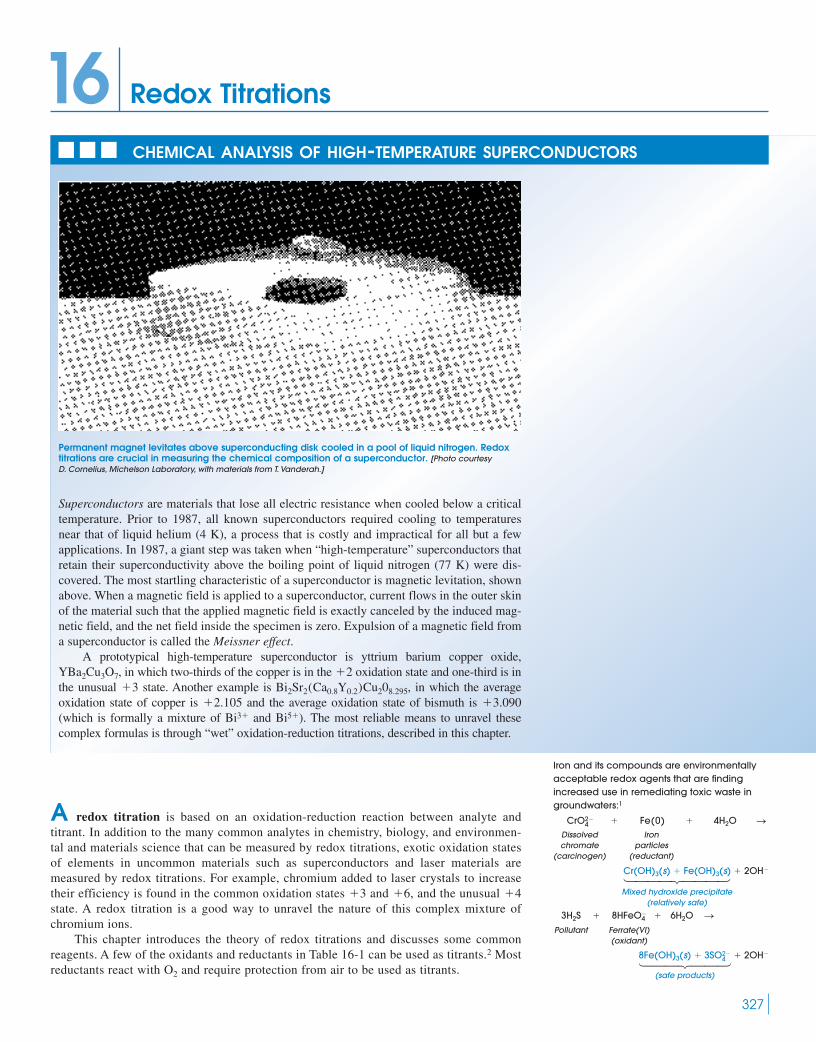
327
Superconductors are materials that lose all electric resistance when cooled below a criticaltemperature. Prior to 1987, all known superconductors required cooling to temperaturesnear that of liquid helium (4 K), a process that is costly and impractical for all but a fewapplications. In 1987, a giant step was taken when “high-temperature” superconductors thatretain their superconductivity above the boiling point of liquid nitrogen (77 K) were dis-covered. The most startling characteristic of a superconductor is magnetic levitation, shownabove. When a magnetic field is applied to a superconductor, current flows in the outer skinof the material such that the applied magnetic field is exactly canceled by the induced mag-netic field, and the net field inside the specimen is zero. Expulsion of a magnetic field froma superconductor is called the Meissner effect.
A prototypical high-temperature superconductor is yttrium barium copper oxide,, in which two-thirds of the copper is in the oxidation state and one-third is in
the unusual state. Another example is , in which the averageoxidation state of copper is and the average oxidation state of bismuth is (which is formally a mixture of and ). The most reliable means to unravel thesecomplex formulas is through “wet” oxidation-reduction titrations, described in this chapter.
Bi5�Bi3�
�3.090�2.105Bi2Sr2(Ca0.8Y0.2)Cu208.295�3
�2YBa2Cu3O7
CHEMICAL ANALYSIS OF HIGH-TEMPERATURE SUPERCONDUCTORS
Redox Titrations16
Permanent magnet levitates above superconducting disk cooled in a pool of liquid nitrogen. Redoxtitrations are crucial in measuring the chemical composition of a superconductor. [Photo courtesy D. Cornelius, Michelson Laboratory, with materials from T. Vanderah.]
A redox titration is based on an oxidation-reduction reaction between analyte andtitrant. In addition to the many common analytes in chemistry, biology, and environmen-tal and materials science that can be measured by redox titrations, exotic oxidation statesof elements in uncommon materials such as superconductors and laser materials aremeasured by redox titrations. For example, chromium added to laser crystals to increasetheir efficiency is found in the common oxidation states and , and the unusual state. A redox titration is a good way to unravel the nature of this complex mixture ofchromium ions.
This chapter introduces the theory of redox titrations and discusses some commonreagents. A few of the oxidants and reductants in Table 16-1 can be used as titrants.2 Mostreductants react with and require protection from air to be used as titrants.O2
�4�6�3
Iron and its compounds are environmentallyacceptable redox agents that are findingincreased use in remediating toxic waste ingroundwaters:1
Dissolved Ironchromate particles
(carcinogen) (reductant)
144424443Mixed hydroxide precipitate
(relatively safe)
Pollutant Ferrate(VI)(oxidant)
1442443(safe products)
8Fe(OH)3(s) � 3SO2�4 � 2OH�
3H2S � 8HFeO�4 � 6H2O S
Cr(OH)3(s) � Fe(OH)3(s) � 2OH�
CrO2�4 � Fe(0) � 4H2O S

16-1 The Shape of a Redox Titration CurveConsider the titration of iron(II) with standard cerium(IV), monitored potentiometricallywith Pt and calomel electrodes as shown in Figure 16-1. The titration reaction is
(16-1)Ceric Ferrous Cerous Ferrictitrant analyte
Titration reaction: Ce4� � Fe2� S Ce3� � Fe3�
328 CHAPTER 16 Redox Titrations
Table 16-1 Oxidizing and reducing agents
Oxidants Reductants
BismuthateBromate
Br2 BromineCe4� Ceric
Chloramine T
Cl2 ChlorineClO2 Chlorine dioxide
DichromateFerrate(VI)
H2O2 Hydrogen peroxideFe2� � H2O2 Fenton reagent3
OCl� HypochloriteIodate
I2 IodinePb(acetate)4 Lead(IV) acetateHNO3 Nitric acidO Atomic oxygenO2 Dioxygen (oxygen)O3 OzoneHClO4 Perchloric acid
PeriodatePermanganatePeroxydisulfateS2O2�
8
MnO�4
IO�4
IO�3
FeO2�4
Cr2O2�7
SO2NCl�Na�ß ßCH3
BrO3�
BiO3�
Ascorbic acid (vitamin C)
BorohydrideCr2� Chromous
DithioniteFe2� FerrousN2H4 Hydrazine
Hydroquinone
NH2OH HydroxylamineH3PO2 Hypophosphorous acid
Retinol (vitamin A)
Sn2� StannousSulfite
SO2 Sulfur dioxideThiosulfate
�-Tocopherol (vitamin E)
ßß
CH3
CH3
ß ß
ß
H3C
HO
O CH3
ßCH2 ß CH2 ß CH2 ß CH ß CH2 3 ß H
CH3
S2O2�3
SO2�3
ßßß
ß CH3CH3H3C CH3
CH3ß
CH2OH
OHß ßHO
S2O2�4
BH�4
ßßßHO
HO
OH OH
OOß ¢
The way in which we write redox reactions is misleading. Reaction 16-1 appears as if anelectron moves from to to give and . In fact, this reaction and manyothers are thought to proceed through atom transfer, not electron transfer.* In this case, ahydrogen atom (a proton plus an electron) could be transferred from aqueous toaqueous species:
Other common redox reactions between metallic species could proceed through transfer ofoxygen atoms or halogen atoms to effect net electron transfer from one metal to another.
*D. T. Sawyer, “Conceptual Considerations in Molecular Science,” J. Chem. Ed.. 2005, 82, 985.
CeH2O
OH2
OH2
OH2OH2
H2OH2O
O H
2
H+ CeH2O
OH2
OH2
OH2OH2
H2OH2O
OH2 +
OH
Fe
OH2OH2
OH2
O
H2O
H
Fe
OH2
OH2OH2
OH2
HO
H2O
“Ce4+” “Ce3+”“Fe2+” “Fe3+”Ce(H2O)7(OH)3+
Fe(H2O)5(OH)2+Fe(H2O)62+ Ce(H2O)8
3+
Ce4�
Fe2�
Ce2�Fe3�Ce4�Fe2�
The titration reaction goes to completion aftereach addition of titrant. The equilibriumconstant is at .25�CK � 10nE �/0.059 16

16-1 The Shape of a Redox Titration Curve 329
for which in . Each mole of ceric ion oxidizes 1 mol of ferrous ion rap-idly and quantitatively. The titration reaction creates a mixture of inthe beaker in Figure 16-1.
At the Pt indicator electrode, two reactions come to equilibrium:
(16-2)
(16-3)
The potentials cited here are the formal potentials that apply in . The Pt indicatorelectrode responds to the relative concentrations (really, activities) of
.We now set out to calculate how the cell voltage changes as is titrated with .
The titration curve has three regions.
Region 1: Before the Equivalence PointAs each aliquot of is added, titration reaction 16-1 consumes the and creates anequal number of moles of and . Prior to the equivalence point, excess unreacted
remains in the solution. Therefore, we can find the concentrations of and without difficulty. On the other hand, we cannot find the concentration of withoutsolving a fancy little equilibrium problem. Because the amounts of and areboth known, it is convenient to calculate the cell voltage by using Reaction 16-2 instead ofReaction 16-3.
(16-4)
(16-5)
Formal potential for Potential of reduction in saturated calomel
electrode
(16-6)
One special point is reached before the equivalence point. When the volume of titrant isone-half of the amount required to reach the equivalence point In this case, the log term is 0, and for the couple. The point at whichFe3� 0 Fe2�E� � E°
(V � 12Ve), [Fe3�] � [Fe2�].
E � 0.526 � 0.059 16 log a [Fe2�]
[Fe3�]b
1 M HClO4
Fe3�
cc
E � c0.767 � 0.059 16 log a [Fe2�]
[Fe3�]b d � 0.241
E � E� � E�
Fe3�Fe2�
Ce4�
Fe3�Fe2�Fe2�
Fe3�Ce3�
Ce4�Ce4�
Ce4�Fe2�
and Fe2�
Ce4� and Ce3� or Fe3�
1 M HClO4
Indicator half-reaction: Ce4� � e� T Ce3� E° � 1.70 V
Indicator half-reaction: Fe3� � e� T Fe2� E° � 0.767 V
Ce4�, Ce3�, Fe2�, and Fe3�
1 M HClO4K � 1016
Buret containing Ce4+
–
V
+
Calomelreferenceelectrode
Pt wire
Magneticstirring bar
Fe2+ in 1 M HCIO4
Figure 16-1 Apparatus for potentiometrictitration of with .Ce4�Fe2�
Equilibria 16-2 and 16-3 are both established atthe Pt electrode.
We can use either Reaction 16-2 or Reaction16-3 to describe the cell voltage at any time.However, because we know the concentrationsof and , it is more convenient for nowto use Reaction 16-2.
Fe3�Fe2�
is the potential of the Pt electrodeconnected to the positive terminal of thepotentiometer in Figure 16-1. is the potentialof the calomel electrode connected to thenegative terminal.
E�
E�
For Reaction 16-2,when .V � 1
2Ve
E� � E �(Fe3� 0 Fe2�)
is analogous to the point at which when in an acid-basetitration.
The voltage at zero titrant volume cannot be calculated, because we do not know howmuch is present. If , the voltage calculated with Equation 16-6 would be .In fact, there must be some in each reagent, either as an impurity or from oxidation of
by atmospheric oxygen. In any case, the voltage could never be lower than that neededto reduce the solvent
Region 2: At the Equivalence PointExactly enough has been added to react with all the . Virtually all cerium is in theform , and virtually all iron is in the form . Tiny amounts of and arepresent at equilibrium. From the stoichiometry of Reaction 16-1, we can say that
(16-7)
and
(16-8)
To understand why Equations 16-7 and 16-8 are true, imagine that all the cerium and theiron have been converted into and . Because we are at the equivalence point,
. Now let Reaction 16-1 come to equilibrium:
If a little bit of goes back to , an equal number of moles of must be made. So.
At any time, Reactions 16-2 and 16-3 are both in equilibrium at the Pt electrode. At theequivalence point, it is convenient to use both reactions to describe the cell voltage. TheNernst equations for these reactions are
(16-9)
(16-10)
Here is where we stand: Equations 16-9 and 16-10 are both statements of algebraictruth. But neither one alone allows us to find , because we do not know exactly what tinyconcentrations of and are present. It is possible to solve the four simultaneous equa-tions 16-7 through 16-10 by first adding Equations 16-9 and 16-10:
But, because and at the equivalence point, the ratio of con-centrations in the log term is unity. Therefore, the logarithm is 0 and
The cell voltage is
(16-11)
In this particular titration, the equivalence-point voltage is independent of the concentrationsand volumes of the reactants.
Region 3: After the Equivalence PointNow virtually all iron atoms are . The moles of equal the moles of , and thereis a known excess of unreacted . Because we know both and , it is con-venient to use Reaction 16-3 to describe the chemistry at the Pt electrode:
(16-12)
At the special point when and .E� � E°(Ce4� 0 Ce3�) � 1.70 VV � 2Ve, [Ce3�] � [Ce4�]
E � E� � E(calomel) � c1.70 � 0.059 16 log a[Ce3�]
[Ce4�]b d � 0.241
[Ce4�][Ce3�]Ce4�
Fe3�Ce3�Fe3�
E � E� � E(calomel) � 1.23 � 0.241 � 0.99 V
2E� � 2.467 V 1 E� � 1.23 V
[Ce4�] � [Fe2�][Ce3�] � [Fe3�]
2E� � 2.467 � 0.059 16 log a[Fe2�][Ce3�]
[Fe3�][Ce4�]b
2E� � 0.767 � 1.70 � 0.059 16 log a [Fe2�]
[Fe3�]b � 0.059 16 log a [Ce3�]
[Ce4�]b
Ce4�Fe2�
E�
E� � 1.70 � 0.059 16 log a [Ce3�]
[Ce4�]b
E� � 0.767 � 0.059 16 log a [Fe2�]
[Fe3�]b
[Ce4�] � [Fe2�]Ce4�Fe2�Fe3�
Fe3� � Ce3� T Fe2� � Ce4� (reverse of Reaction 16-1)
[Ce3�] � [Fe3�]Fe3�Ce3�
[Ce4�] � [Fe2�]
[Ce3�] � [Fe3�]
Fe2�Ce4�Fe3�Ce3�
Fe2�Ce4�
(H2O � e� S 12H2 � OH�).
Fe2�
Fe3�
��[Fe3�] � 0Fe3�
V � 12 VepH � pKaV � 1
2Ve
330 CHAPTER 16 Redox Titrations
At the equivalence point, we use bothReactions 16-2 and 16-3 to calculate the cellvoltage. This is strictly a matter of algebraicconvenience.
log a � log b � log ab
After the equivalence point, we use Reaction16-3 because we can easily calculate theconcentrations of and . It is notconvenient to use Reaction 16-2, because wedo not know the concentration of , whichhas been “used up.”
Fe2�
Ce4�Ce3�

Before the equivalence point, the indicator electrode potential is fairly steady near.4 After the equivalence point, the indicator electrode potential
levels off near . At the equivalence point, there is a rapid rise involtage.
Example Potentiometric Redox Titration
Suppose that we titrate 100.0 mL of with , using the cellin Figure 16-1. The equivalence point occurs when . Calculate the cellvoltage at 36.0, 50.0, and 63.0 mL.
Solution At 36.0 mL: This is 36.0/50.0 of the way to the equivalence point. Therefore,36.0/50.0 of the iron is in the form and 14.0/50.0 is in the form . Putting
into Equation 16-6 gives
At 50.0 mL: Equation 16-11 tells us that the cell voltage at the equivalence point is 0.99 V,regardless of the concentrations of reagents for this particular titration.
At 63.0 mL: The first 50.0 mL of cerium have been converted into . Because13.0 mL of excess has been added, in Equation 16-12,and .
Shapes of Redox Titration CurvesThe calculations described above allow us to plot the titration curve for Reaction 16-1 inFigure 16-2, which shows potential as a function of the volume of added titrant. The equiva-lence point is marked by a steep rise in voltage. The value of at is the formal potentialof the couple, because the quotient is unity at this point. The volt-age at any point in this titration depends only on the ratio of reactants; their concentrationsdo not figure in any calculations in this example. We expect, therefore, that the curve in Fig-ure 16-2 will be independent of dilution. We should observe the same curve if both reactantswere diluted by a factor of 10.
For Reaction 16-1, the titration curve in Figure 16-2 is symmetric near the equivalencepoint because the reaction stoichiometry is 1:1. Figure 16-3 shows the curve calculated forthe titration of by in 1.00 M HCl.
(16-13)
The curve is not symmetric about the equivalence point, because the stoichiometry of reac-tants is 2:1, not 1:1. Still, the curve is so steep near the equivalence point that negligible erroris introduced if the center of the steep part is taken as the end point. Demonstration 16-1 pro-vides an example of an asymmetric titration curve whose shape also depends on the pH ofthe reaction medium.
IO�3 � 2Tl� � 2Cl� � 6H� S ICl�
2 � 2Tl3� � 3H2O
IO�3Tl�
[Fe2�]/[Fe3�]Fe3� 0 Fe2�
12VeE�
E � 1.424 V[Ce3�]/[Ce4�] � 50.0/13.0Ce4�
Ce3�
E � 0.550 V.14.0/36.0[Fe2�]/[Fe3�] �Fe2�Fe3�
VCe4� � 50.0 mL0.100 M Ce4�0.050 0 M Fe2�
E°(Ce4� 0 Ce3�) � 1.70 VE°(Fe3� 0 Fe2�) � 0.77 V
16-1 The Shape of a Redox Titration Curve 331
1.4
70
Pot
entia
l (V
vs.
S.C
.E.)
VCe4+ (mL)60500 40302010
E = E+ – E–
= E � (Fe3+ Fe2+)
– E (S.C.E.)
Equivalence point(inflection point)
1.3
1.2
1.1
1.0
0.9
0.8
0.7
0.6
0.5
0.4
0.3
Ve12
Figure 16-2 Theoretical curve for titration of100.0 mL of 0.050 0 M with 0.100 M in1 M . You cannot calculate the potentialfor zero titrant, but you can start at a smallvolume such as .VCe4� � 0.1 mL
HClO4
Ce4�Fe2�
1.0
70
Pot
entia
l (V
vs.
S.C
.E.)
VIO– (mL)
0.9
0.8
0.7
0.6
0.5
0.46050403020100
Ve12
Equivalence point
E+ = E°(TI3+ TI+)
3
Figure 16-3 Theoretical curve for titration of100.0 mL of 0.010 0 M with 0.010 0 M in1.00 M HCl. The equivalence point at 0.842 V isnot at the center of the steep part of the curve.When the stoichiometry of the reaction is not1:1, the curve is not symmetric.
IO�3Tl�
Anyone with a serious need to calculate redoxtitration curves should use a spreadsheetwith a more general set of equations than weuse in this section.5 The supplement atwww.freeman.com/qca explains how to usespreadsheets to compute redox titration curves.
The curve in Figure 16-2 is essentiallyindependent of the concentrations of analyteand titrant. The curve is symmetric near Ve
because the stoichiometry is 1:1.
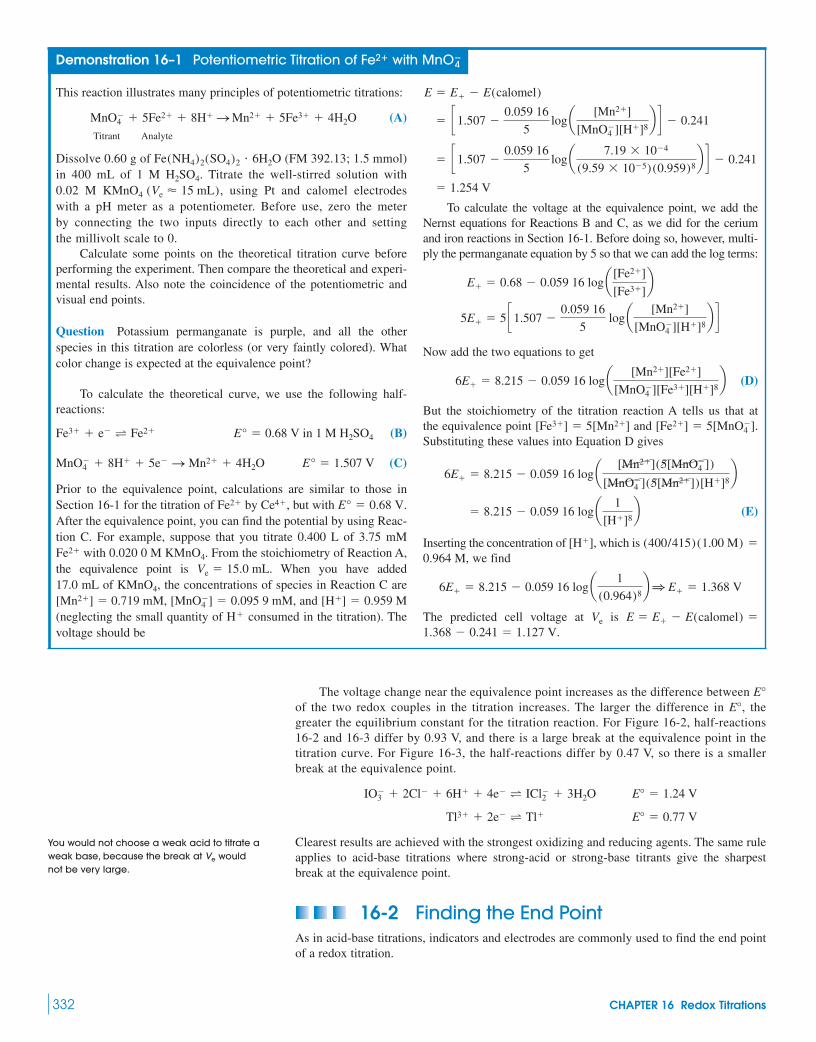
The voltage change near the equivalence point increases as the difference between of the two redox couples in the titration increases. The larger the difference in , thegreater the equilibrium constant for the titration reaction. For Figure 16-2, half-reactions16-2 and 16-3 differ by 0.93 V, and there is a large break at the equivalence point in thetitration curve. For Figure 16-3, the half-reactions differ by 0.47 V, so there is a smallerbreak at the equivalence point.
Clearest results are achieved with the strongest oxidizing and reducing agents. The same ruleapplies to acid-base titrations where strong-acid or strong-base titrants give the sharpestbreak at the equivalence point.
16-2 Finding the End PointAs in acid-base titrations, indicators and electrodes are commonly used to find the end pointof a redox titration.
Tl3� � 2e� T Tl� E° � 0.77 V
IO�3 � 2Cl� � 6H� � 4e� T ICl�
2 � 3H2O E° � 1.24 V
E°E°
332 CHAPTER 16 Redox Titrations
Demonstration 16–1 Potentiometric Titration of Fe2� with MnO�4
This reaction illustrates many principles of potentiometric titrations:
(A)Titrant Analyte
Dissolve 0.60 g of (FM 392.13; 1.5 mmol)in 400 mL of 1 M . Titrate the well-stirred solution with0.02 M , using Pt and calomel electrodeswith a pH meter as a potentiometer. Before use, zero the meterby connecting the two inputs directly to each other and settingthe millivolt scale to 0.
Calculate some points on the theoretical titration curve beforeperforming the experiment. Then compare the theoretical and experi-mental results. Also note the coincidence of the potentiometric andvisual end points.
Question Potassium permanganate is purple, and all the otherspecies in this titration are colorless (or very faintly colored). Whatcolor change is expected at the equivalence point?
To calculate the theoretical curve, we use the following half-reactions:
(B)
(C)
Prior to the equivalence point, calculations are similar to those inSection 16-1 for the titration of by , but with After the equivalence point, you can find the potential by using Reac-tion C. For example, suppose that you titrate 0.400 L of 3.75 mM
with 0.020 0 M . From the stoichiometry of Reaction A,the equivalence point is . When you have added17.0 mL of , the concentrations of species in Reaction C are
, , and (neglecting the small quantity of consumed in the titration). Thevoltage should be
H�
[H�] � 0.959 M[MnO�4 ] � 0.095 9 mM0.719 mM[Mn2�] �
KMnO4
Ve � 15.0 mLKMnO4Fe2�
E° � 0.68 V.Ce4�Fe2�
E° � 1.507 VMnO�4 � 8H� � 5e� S Mn2� � 4H2O
E° � 0.68 V in 1 M H2SO4Fe3� � e� T Fe2�
KMnO4 (Ve � 15 mL)H2SO4
Fe(NH4)2(SO4)2 � 6H2O
MnO�4 � 5Fe2� � 8H� S Mn2� � 5Fe3� � 4H2O
To calculate the voltage at the equivalence point, we add theNernst equations for Reactions B and C, as we did for the ceriumand iron reactions in Section 16-1. Before doing so, however, multi-ply the permanganate equation by 5 so that we can add the log terms:
Now add the two equations to get
(D)
But the stoichiometry of the titration reaction A tells us that atthe equivalence point and Substituting these values into Equation D gives
(E)
Inserting the concentration of , which is , we find
The predicted cell voltage at is .1.368 � 0.241 � 1.127 V
E � E� � E(calomel) �Ve
6E� � 8.215 � 0.059 16 log a 1
(0.964)8b1 E� � 1.368 V
0.964 M(400/415)(1.00 M) �[H�]
� 8.215 � 0.059 16 log a 1
[H�]8b
6E� � 8.215 � 0.059 16 log a [Mn2�](5[MnO�4 ])
[MnO�4 ](5[Mn2�])[H�]8
b
[Fe2�] � 5[MnO�4 ].[Fe3�] � 5[Mn2�]
6E� � 8.215 � 0.059 16 log a [Mn2�][Fe2�]
[MnO�4 ][Fe3�][H�]8
b
5E� � 5 c1.507 �0.059 16
5 log a [Mn2�]
[MnO�4 ][H�]8
b d E� � 0.68 � 0.059 16 log a [Fe2�]
[Fe3�]b
� 1.254 V
� c1.507 �0.059 16
5log a 7.19 � 10�4
(9.59 � 10�5)(0.959)8b d � 0.241
� c1.507 �0.059 16
5log a [Mn2�]
[MnO�4 ][H�]8
b d � 0.241
E � E� � E(calomel)
You would not choose a weak acid to titrate aweak base, because the break at Ve wouldnot be very large.

Redox IndicatorsA redox indicator is a compound that changes color when it goes from its oxidized to itsreduced state. The indicator ferroin changes from pale blue (almost colorless) to red.
To predict the potential range over which the indicator color will change, we first writea Nernst equation for the indicator.
(16-14)
As with acid-base indicators, the color of In(reduced) will be observed when
and the color of In(oxidized) will be observed when
Putting these quotients into Equation 16-14 tells us that the color change will occur over therange
For ferroin, with (Table 16-2), we expect the color change to occur in theapproximate range 1.088 V to 1.206 V with respect to the standard hydrogen electrode. Witha saturated calomel reference electrode, the indicator transition range will be
(16-15)
Ferroin would therefore be a useful indicator for the titrations in Figures 16-2 and 16-3.
� 0.847 to 0.965 V (versus S.C.E.)
� (1.088 to 1.206) � (0.241)
° Indicator transitionrange versus calomel
electrode (S.C.E.)¢ � ° transition range
versus standard hydrogenelectrode (S.H.E.)
¢ � E(calomel)
E° � 1.147 V
E � aE° �0.059 16
nb volts
[In(reduced)]
[In(oxidized)]�
1
10
[In(reduced)]
[In(oxidized)]�
10
1
E � E° �0.059 16
n log a [In(reduced)]
[In(oxidized)]b
In(oxidized) � ne� T In(reduced)
Fe(II)
2�
� e� #££4N
N
3
Reduced ferroin(red)
In(reduced)
Fe(III)N
N
3
3�
Oxidized ferroin(pale blue)
In(oxidized)
16-2 Finding the End Point 333
Table 16-2 Redox indicators
Color
Indicator Oxidized Reduced E�
Phenosafranine Red Colorless 0.28Indigo tetrasulfonate Blue Colorless 0.36Methylene blue Blue Colorless 0.53Diphenylamine Violet Colorless 0.75
-Ethoxy-2,4-diaminoazobenzene Yellow Red 0.76Diphenylamine sulfonic acid Red-violet Colorless 0.85Diphenylbenzidine sulfonic acid Violet Colorless 0.87Tris( -bipyridine)iron Pale blue Red 1.120Tris(1,10-phenanthroline)iron (ferroin) Pale blue Red 1.147Tris(5-nitro-1,10-phenanthroline)iron Pale blue Red-violet 1.25Tris( -bipyridine)ruthenium Pale blue Yellow 1.292,2¿
2,2¿
4¿
A redox indicator changes color over a rangeof , centered at E � for the indicator.n is the number of electrons in the indicatorhalf-reaction.
�(59/n) mV
See the diagram on page 300 for a betterunderstanding of Equation 16-15.
The indicator transition range should overlapthe steep part of the titration curve.
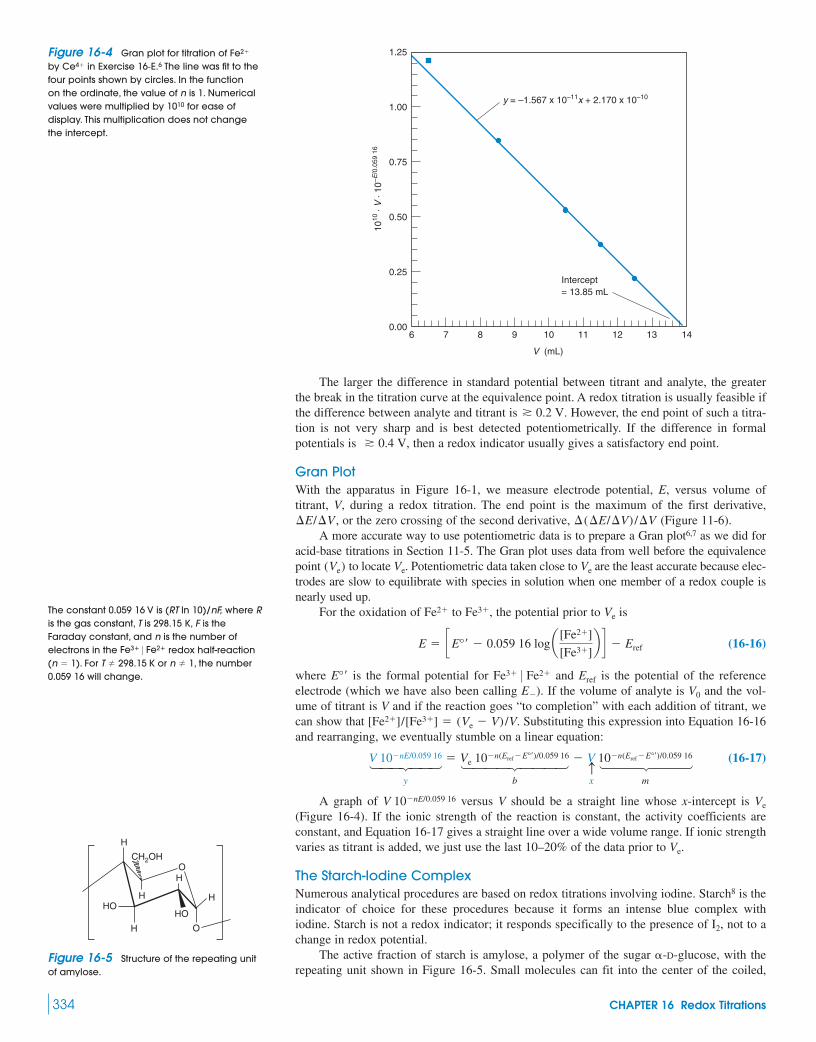
The larger the difference in standard potential between titrant and analyte, the greaterthe break in the titration curve at the equivalence point. A redox titration is usually feasible ifthe difference between analyte and titrant is . However, the end point of such a titra-tion is not very sharp and is best detected potentiometrically. If the difference in formalpotentials is , then a redox indicator usually gives a satisfactory end point.
Gran PlotWith the apparatus in Figure 16-1, we measure electrode potential, E, versus volume oftitrant, V, during a redox titration. The end point is the maximum of the first derivative,
, or the zero crossing of the second derivative, (Figure 11-6).A more accurate way to use potentiometric data is to prepare a Gran plot6,7 as we did for
acid-base titrations in Section 11-5. The Gran plot uses data from well before the equivalencepoint to locate . Potentiometric data taken close to are the least accurate because elec-trodes are slow to equilibrate with species in solution when one member of a redox couple isnearly used up.
For the oxidation of to , the potential prior to is
(16-16)
where is the formal potential for and is the potential of the referenceelectrode (which we have also been calling ). If the volume of analyte is and the vol-ume of titrant is V and if the reaction goes “to completion” with each addition of titrant, wecan show that Substituting this expression into Equation 16-16and rearranging, we eventually stumble on a linear equation:
(16-17)1442443 144424443 1442443y b
cx m
A graph of versus V should be a straight line whose x-intercept is (Figure 16-4). If the ionic strength of the reaction is constant, the activity coefficients areconstant, and Equation 16-17 gives a straight line over a wide volume range. If ionic strengthvaries as titrant is added, we just use the last 10–20% of the data prior to .
The Starch-Iodine ComplexNumerous analytical procedures are based on redox titrations involving iodine. Starch8 is theindicator of choice for these procedures because it forms an intense blue complex withiodine. Starch is not a redox indicator; it responds specifically to the presence of , not to achange in redox potential.
The active fraction of starch is amylose, a polymer of the sugar -D-glucose, with therepeating unit shown in Figure 16-5. Small molecules can fit into the center of the coiled,
�
I2
Ve
VeV 10�nE/0.059 16
V 10�nE/0.059 16 � Ve 10�n(Eref�E°¿)/0.059 16 � V 10�n(Eref�E°¿)/0.059 16
[Fe2�]/[Fe3�] � (Ve � V) /V.
V0E�
ErefFe3� 0 Fe2�E°¿
E � cE°¿ � 0.059 16 log a[Fe2�]
[Fe3�]b d � Eref
VeFe3�Fe2�
VeVe(Ve)
�(�E/�V) /�V�E/�V
� 0.4 V
� 0.2 V
334 CHAPTER 16 Redox Titrations
y = –1.567 x 10⁻¹¹x + 2.170 x 10⁻¹⁰
1.00
1.25
0.75
0.50
0.25
0.00
1010
·V· 1
0–E/0
.059
16
V (mL)
Intercept= 13.85 mL
6 7 8 9 10 11 12 13 14
Figure 16-4 Gran plot for titration of by in Exercise .6 The line was fit to thefour points shown by circles. In the functionon the ordinate, the value of n is 1. Numericalvalues were multiplied by for ease ofdisplay. This multiplication does not changethe intercept.
1010
16-ECe4�
Fe2�
The constant 0.059 16 V is (RT ln 10)/nF, where Ris the gas constant, T is 298.15 K, F is theFaraday constant, and n is the number ofelectrons in the redox half-reaction
. For or , the number0.059 16 will change.
n � 1T � 298.15 K(n � 1)Fe3� 0 Fe2�
H
CH2OH
HOH
HO
H
H
H O
O
Figure 16-5 Structure of the repeating unitof amylose.

helical polymer in Figure 16-6. In the presence of starch, iodine forms chains inside theamylose helix and the color turns dark blue.
I$I$I$I$I$I
Starch is readily biodegraded, so it should be freshly dissolved or the solution shouldcontain a preservative, such as or thymol. A hydrolysis product ofstarch is glucose, which is a reducing agent. Therefore, partially hydrolyzed starch solutioncan be a source of error in a redox titration.
16-3 Adjustment of Analyte Oxidation StateSometimes we need to adjust the oxidation state of analyte before it can be titrated. Forexample, can be preoxidized to and then titrated with standard . Pre-adjustment must be quantitative, and you must eliminate excess preadjustment reagent.
PreoxidationSeveral powerful oxidants can be easily removed after preoxidation. Peroxydisulfate ( ,also called persulfate) is a strong oxidant that requires as a catalyst.
14243Two powerful
oxidants
Excess reagent is destroyed by boiling the solution after oxidation of analyte is complete.
The and mixture oxidizes to , to , to , andto .
Silver(II) oxide (AgO) dissolves in concentrated mineral acids to give , with oxi-dizing power similar to plus . Excess can be removed by boiling:
Solid sodium bismuthate has an oxidizing strength similar to that of and. Excess solid oxidant is removed by filtration.
Hydrogen peroxide is a good oxidant in basic solution. It can transform into ,into , and into . In acidic solution it can reduce to and
to . Excess spontaneously disproportionates in boiling water.
2H2O2!boiling O2 � 2H2O
H2O2Mn2�MnO�4
Cr3�Cr2O2�7MnO2Mn2�Fe3�Fe2�
Co3�Co2�
S2O2�8
Ag2�(NaBiO3)
4Ag2� � 2H2O !boiling 4Ag� � O2 � 4H�
Ag2�Ag�S2O2�8
Ag2�
VO�2VO2�
Cr2O2�7Cr3�Ce4�Ce3�MnO�
4Mn2�Ag�S2O2�8
2S2O2�8 � 2H2O !boiling
4SO2�4 � O2 � 4H�
S2O2�8 � Ag� S SO2�
4 � SO�4 � Ag2�
Ag�
S2O2�8
Fe2�MnO�4Mn2�
HgI2 (�1 mg/100 mL)
I6
16-3 Adjustment of Analyte Oxidation State 335
O O
OO
O
O
O
O
O
O
O
O
O
O
OO
O
O
O
O O
OO
O
O
I
I
I
I
I
I
OO
O
O
O
O
O
O
O
O
Figure 16-6 (a) Schematic structure of the starch-iodine complex. The amylose chain forms a helixaround units. [Adapted from A. T. Calabrese and A. Khan, “Amylose-Iodine Complex Formation with KI: Evidence for
Absence of Iodide Ions Within the Complex,” J. Polymer Sci. 1999, A37, 2711.] (b) View down the starch helix,showing iodine inside the helix.8 [Figure kindly provided by R. D. Hancock, Power Engineering, Salt Lake City.]
I6
(b)(a)
Excess preadjustment reagent must bedestroyed so that it will not interfere in thesubsequent titration.
In disproportionation, a reactant is convertedinto products in higher and lower oxidationstates. The compound oxidizes and reducesitself.
Challenge Write a half-reaction in which behaves as an oxidant and a half-reaction inwhich it behaves as a reductant.
H2O2

336 CHAPTER 16 Redox Titrations
PrereductionStannous chloride will reduce to in hot HCl. Excess reductant isdestroyed by adding excess :
The is then titrated with an oxidant.Chromous chloride is a powerful reductant sometimes used to prereduce analyte to a
lower oxidation state. Excess is oxidized by atmospheric . Sulfur dioxide and hydro-gen sulfide are mild reducing agents that can be expelled by boiling an acidic solution afterthe reduction is complete.
An important prereduction technique uses a column packed with a solid reducing agent.Figure 16-7 shows the Jones reductor, which contains zinc coated with zinc amalgam. Anamalgam is a solution of anything in mercury. The amalgam is prepared by mixing granularzinc with 2 wt% aqueous for 10 min and then washing with water. You can reduce
to by passage through a Jones reductor, using as solvent. Wash thecolumn well with water and titrate the combined washings with standard , , or
. Perform a blank determination with a solution passed through the reductor in thesame manner as the unknown.
Most reduced analytes are reoxidized by atmospheric oxygen. To prevent oxidation, thereduced analyte can be collected in an acidic solution of . Ferric ion is reduced to ,which is stable in acid. The is then titrated with an oxidant. By this means, elementssuch as Cr, Ti, V, and Mo can be indirectly analyzed.
Zinc is a powerful reducing agent, with for the reaction , so the Jones reductor is not very selective. The Walden reductor, filled with solid Ag
and 1 M HCl, is more selective. The reduction potential for is highenough that species such as and are not reduced and therefore do not interfere inthe analysis of a metal such as . Another selective reductor uses granular Cd metal. Indetermining levels of nitrogen oxides for air-pollution monitoring,9 the gases are first con-verted into , which is not easy to analyze. Passing nitrate through a Cd-filled columnreduces to , for which a convenient spectrophotometric analysis is available.
16-4 Oxidation with Potassium PermanganatePotassium permanganate is a strong oxidant with an intense violet color. Instrongly acidic solutions , it is reduced to colorless .
Permanganate Manganous
In neutral or alkaline solution, the product is the brown solid, .
Manganesedioxide
In strongly alkaline solution (2 M NaOH), green manganate ion is produced.
Manganate
Representative permanganate titrations are listed in Table 16-3. For titrations in stronglyacidic solution, serves as its own indicator because the product, , is colorless(Color Plate 8). The end point is taken as the first persistent appearance of pale pink .If the titrant is too dilute to be seen, an indicator such as ferroin can be used.
Preparation and StandardizationPotassium permanganate is not a primary standard because traces of are invariably pres-ent. In addition, distilled water usually contains enough organic impurities to reduce somefreshly dissolved to . To prepare a 0.02 M stock solution, dissolve in dis-tilled water, boil it for an hour to hasten the reaction between and organic impurities, andfilter the resulting mixture through a clean, sintered-glass filter to remove precipitated .Do not use filter paper (organic matter!) for the filtration. Store the reagent in a dark glass bot-tle. Aqueous is unstable by virtue of the reaction
4MnO�4 � 2H2O S 4MnO2(s) � 3O2 � 4OH�
KMnO4
MnO2
MnO�4
KMnO4MnO2MnO�4
MnO2
MnO�4
Mn2�KMnO4
MnO�4 � e� T MnO2�
4 E° � 0.56 V
MnO�4 � 4H� � 3e� T MnO2(s) � 2H2O E° � 1.692 V
MnO2
MnO�4 � 8H� � 5e� T Mn2� � 4H2O E° � 1.507 V
Mn2�(pH � 1)(KMnO4)
NO�2NO�
3
NO�3
Fe3�
TiO2�Cr3�
Ag 0 AgCl (0.222 V)Zn(s)
Zn2� � 2e� TE° � �0.764
Fe2�
Fe2�Fe3�
Cr2O2�7
Ce4�MnO�4
1 M H2SO4Fe2�Fe3�
HgCl2
O2Cr2�
Fe2�
Sn2� � 2HgCl2 S Sn4� � Hg2Cl2 � 2Cl�
HgCl2
Fe2�Fe3�(SnCl2)Analytesolution
Solidreductant
Sintered-glass disk
Reducedanalyte
Figure 16-7 A column filled with a solidreagent used for prereduction of analyte iscalled a reductor. Often the analyte is drawnthrough by suction.
serves as its own indicator in acidicsolution.KMnO4
is not a primary standard.KMnO4
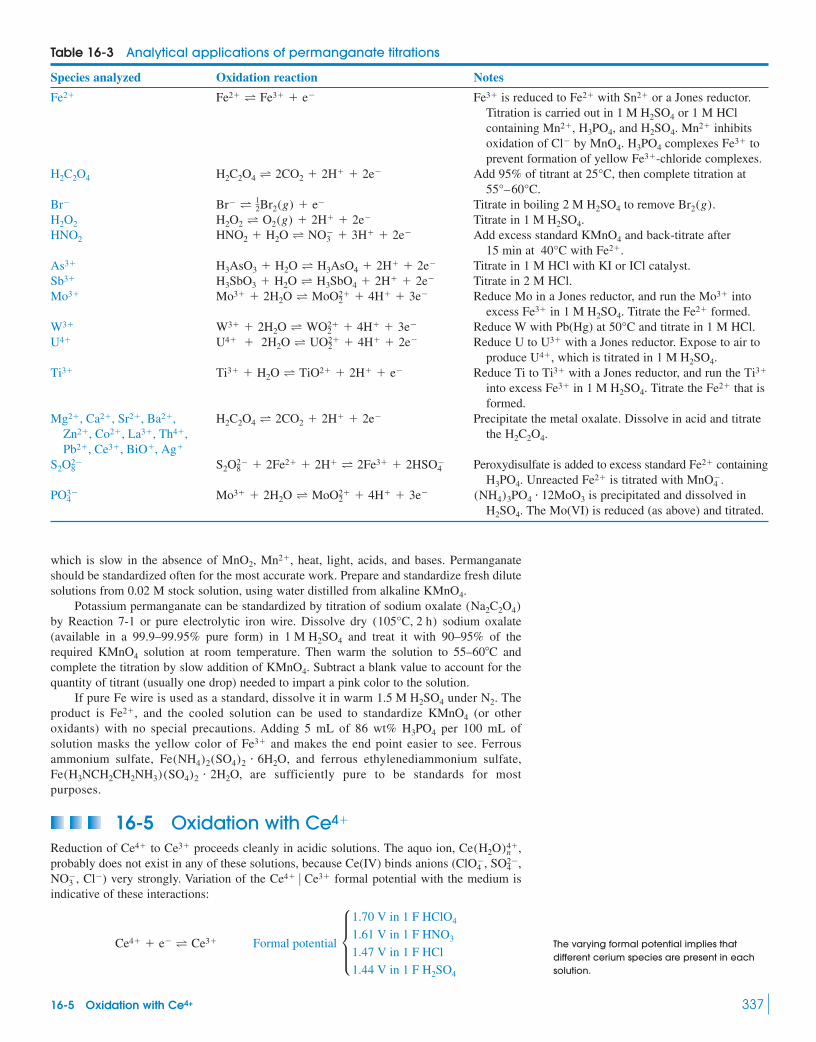
16-5 Oxidation with Ce4+ 337
Table 16-3 Analytical applications of permanganate titrations
Species analyzed Oxidation reaction Notes
is reduced to with or a Jones reductor.Titration is carried out in or 1 M HClcontaining , , and . inhibitsoxidation of by . complexes toprevent formation of yellow -chloride complexes.
Add 95% of titrant at , then complete titration at 55°–60°C.
Titrate in boiling to remove .Titrate in .Add excess standard and back-titrate after
15 min at with .Titrate in 1 M HCl with KI or ICl catalyst.Titrate in 2 M HCl.Reduce Mo in a Jones reductor, and run the into
excess in . Titrate the formed.Reduce W with Pb(Hg) at and titrate in 1 M HCl.Reduce U to with a Jones reductor. Expose to air to
produce , which is titrated in .Reduce Ti to with a Jones reductor, and run the
into excess in . Titrate the that isformed.
, Precipitate the metal oxalate. Dissolve in acid and titrate, the .
Peroxydisulfate is added to excess standard containing. Unreacted is titrated with .
is precipitated and dissolved in. The Mo(VI) is reduced (as above) and titrated.H2SO4
(NH4)3PO4 � 12MoO3Mo3� � 2H2O T MoO22� � 4H� � 3e�PO4
3�
MnO4�Fe2�H3PO4
Fe2�S2O82� � 2Fe2� � 2H� T 2Fe3� � 2HSO4
�S2O82�
Pb2�, Ce3�, BiO�, Ag�
H2C2O4Zn2�, Co2�, La3�, Th4�
H2C2O4 T 2CO2 � 2H� � 2e�Mg2�, Ca2�, Sr2�, Ba2�
Fe2�1 M H2SO4Fe3�
Ti3�Ti3�Ti3� � H2O T TiO2� � 2H� � e�Ti3�
1 M H2SO4U4�
U3�U4� � 2H2O T UO22� � 4H� � 2e�U4�
50°CW3� � 2H2O T WO22� � 4H� � 3e�W3�
Fe2�1 M H2SO4Fe3�
Mo3�Mo3� � 2H2O T MoO22� � 4H� � 3e�Mo3�
H3SbO3 � H2O T H3SbO4 � 2H� � 2e�Sb3�
H3AsO3 � H2O T H3AsO4 � 2H� � 2e�As3�
Fe2�40°CKMnO4HNO2 � H2O T NO3
� � 3H� � 2e�HNO2
1 M H2SO4H2O2 T O2(g) � 2H� � 2e�H2O2
Br2(g)2 M H2SO4Br� T 12Br2(g) � e�Br�
25°CH2C2O4 T 2CO2 � 2H� � 2e�H2C2O4
Fe3�
Fe3�H3PO4MnO4Cl�
Mn2�H2SO4H3PO4Mn2�
1 M H2SO4
Sn2�Fe2�Fe3�Fe2� T Fe3� � e�Fe2�
which is slow in the absence of , , heat, light, acids, and bases. Permanganateshould be standardized often for the most accurate work. Prepare and standardize fresh dilutesolutions from 0.02 M stock solution, using water distilled from alkaline .
Potassium permanganate can be standardized by titration of sodium oxalate by Reaction 7-1 or pure electrolytic iron wire. Dissolve dry sodium oxalate(available in a 99.9–99.95% pure form) in and treat it with 90–95% of therequired solution at room temperature. Then warm the solution to 55–60�C andcomplete the titration by slow addition of . Subtract a blank value to account for thequantity of titrant (usually one drop) needed to impart a pink color to the solution.
If pure Fe wire is used as a standard, dissolve it in warm under . Theproduct is , and the cooled solution can be used to standardize (or otheroxidants) with no special precautions. Adding 5 mL of 86 wt% per 100 mL ofsolution masks the yellow color of and makes the end point easier to see. Ferrousammonium sulfate, , and ferrous ethylenediammonium sulfate,
, are sufficiently pure to be standards for mostpurposes.
16-5 Oxidation with Ce4�
Reduction of to proceeds cleanly in acidic solutions. The aquo ion, ,probably does not exist in any of these solutions, because Ce(IV) binds anions ( , ,
, ) very strongly. Variation of the formal potential with the medium isindicative of these interactions:
Ce4� � e� T Ce3� Formal potential µ1.70 V in 1 F HClO4
1.61 V in 1 F HNO3
1.47 V in 1 F HCl
1.44 V in 1 F H2SO4
Ce4� 0 Ce3�Cl�NO�3
SO2�4ClO�
4
Ce(H2O)4�nCe3�Ce4�
Fe(H3NCH2CH2NH3)(SO4)2 � 2H2OFe(NH4)2(SO4)2 � 6H2O
Fe3�
H3PO4
KMnO4Fe2�
N21.5 M H2SO4
KMnO4
KMnO4
1 M H2SO4
(105°C, 2 h)(Na2C2O4)
KMnO4
Mn2�MnO2
The varying formal potential implies thatdifferent cerium species are present in eachsolution.

is yellow and is colorless, but the color change is not distinct enough forcerium to be its own indicator. Ferroin and other substituted phenanthroline redox indicators(Table 16-2) are well suited to titrations with .
can be used in place of in most procedures. In the oscillating reaction inDemonstration 15-1, oxidizes malonic acid to and formic acid:
Malonic acid Formic acid
This reaction can be used for quantitative analysis of malonic acid by heating a sample inwith excess standard and back-titrating unreacted with . Analo-
gous procedures are available for many alcohols, aldehydes, ketones, and carboxylic acids.
Preparation and StandardizationPrimary-standard-grade ammonium hexanitratocerate(IV), , can be dis-solved in and used directly. Although the oxidizing strength of is greater in
or , these solutions undergo slow photochemical decomposition with concomi-tant oxidation of water. in is stable indefinitely, despite the fact that the reductionpotential of 1.44 V is great enough to oxidize to . The reaction with water is very slow,even though it is thermodynamically favorable. Solutions in HCl are unstable because isoxidized to —rapidly when the solution is hot. Sulfuric acid solutions of can be usedfor titrations of unknowns in HCl because the reaction with analyte is fast, whereas reactionwith is slow. Less expensive salts, including , , and(NH4)4Ce(SO4)4 � 2H2OCe(HSO4)4Cl�
Ce4�Cl2
Cl�
O2H2OH2SO4Ce4�
HNO3HClO4
Ce4�1 M H2SO4
(NH4)2Ce(NO3)6
Fe2�Ce4�Ce4�4 M HClO4
CH2(CO2H)2 � 2H2O � 6Ce4� S 2CO2 � HCO2H � 6Ce3� � 6H�
CO2Ce4�
KMnO4Ce4�
Ce4�
Ce3�Ce4�
338 CHAPTER 16 Redox Titrations
Box 16-1 Environmental Carbon Analysis and Oxygen Demand
Drinking water and industrial waste streams are partially charac-terized and regulated on the basis of their carbon content and oxy-gen demand.10 Inorganic carbon (IC) is the liberatedwhen water is acidified to with and purged withAr or . IC corresponds to and in the sample. Afterinorganic carbon is removed, total organic carbon (TOC) is the
produced by oxidizing the remaining organic matter:
Total carbon (TC) is defined as the sum .Instruments using different oxidation techniques produce dif-
ferent values for TOC, because not all organic matter is oxidizedby each technique. The current state of the art is such that TOC isreally defined by the result obtained with a particular instrument.
Commercial instruments that measure TOC by thermal oxi-dation have detection limits of 4–50 ppb (4–50 C/L). A typical
water sample is analyzed in 3 min, using infrared absorp-tion to measure . Other instruments oxidize organic matter byirradiating a suspension of solid catalyst (0.2 g/L) in water atpH 3.5 with ultraviolet light.11 Light creates electron-hole pairs(Section 15-8) in the . Holes oxidize to hydroxyl radical
, a powerful oxidant that converts organic carbon into ,which is measured by the electrical conductivity of carbonicacid.12 Color Plate 9 shows an instrument in which in acidis exposed to ultraviolet radiation to generate sulfate radical
, which oxidizes organic matter to . (Pure hardlyabsorbs visible light, so it cannot use sunlight efficiently. By dop-ing with wt% carbon, the efficiency of using visible lightis markedly increased.13)
TOC is widely used to determine compliance with dischargelaws. Municipal and industrial wastewater typically has
. Tap water TOC is 50–500 ng C/mL. High-puritywater for the electronics industry has .TOC 6 1 ng C/mL1 mg C/mL
TOC 7
�1TiO2
TiO2CO2(SO�4 )
K2S2O8
CO2(HO�)H2OTiO2
TiO2
CO2
20-�L�g
TC � TOC � IC
TOC analysis: Organic carbon !O2/�700°C
metal catalystCO2
CO2
HCO�3CO2�
3N2
H3PO4pH 6 2CO2(g)
Total oxygen demand (TOD) tells us how much isrequired for complete combustion of pollutants in a waste stream.A volume of containing a known quantity of is mixed withthe sample and complete combustion is carried out. The remain-ing is measured by a potentiometric sensor (Box 17-1). Differ-ent species in the waste stream consume different amounts of .For example, urea consumes five times as much as formic aciddoes. Species such as and also contribute to TOD.
Pollutants can be oxidized by refluxing with dichromate. Chemical oxygen demand (COD) is defined as the
that is chemically equivalent to the consumed in thisprocess. Each consumes (to make ) and each consumes (to make ). Therefore, 1 mol of ischemically equivalent to 1.5 mol of for this computation. CODanalysis is carried out by refluxing polluted water for 2 h withexcess standard in solution containing cata-lyst. Unreacted is measured by titration with standard
or by spectrophotometry. Permits for industry may includeCOD limits for waste streams. “Oxidizability,” which is used inFe2�
Cr2O2�7
Ag�H2SO4Cr2O2�7
O2
Cr2O2�7H2O4e�
O22Cr3�6e�Cr2O2�7
Cr2O2�7
O2(Cr2O2�7 )
H2SNH3
O2
O2
O2
O2N2
O2
hν
H2O
HO • + H+
H2O
O2
TiO2
e− h+
Ultraviolet radiation absorbed by creates an electron-hole pair. Thehole oxidizes to the powerful oxidant . The electron reduces to
by a chain of reactions. is a catalyst and is consumed in thenet reaction: organic .C � O2 S CO2
O2TiO2H2OO2HO�H2O
TiO2

(also called ), are adequate for preparing titrants that are subsequentlystandardized with or Fe as described for .
16-6 Oxidation with Potassium DichromateIn acidic solution, orange dichromate ion is a powerful oxidant that is reduced to chromic ion:
Dichromate Chromic
In 1 M HCl, the formal potential is just 1.00 V and, in , it is 1.11 V; so dichromateis a less powerful oxidizing agent than or . In basic solution, is convertedinto yellow chromate ion ( ), whose oxidizing power is nil:
Potassium dichromate, , is a primary standard. Its solutions are stable, and it ischeap. Because is orange and complexes of range from green to violet, indica-tors with distinctive color changes, such as diphenylamine sulfonic acid or diphenylbenzi-dine sulfonic acid, are used to find a dichromate end point. Alternatively, reactions can bemonitored with Pt and calomel electrodes.
is not as strong an oxidant as or . It is employed chiefly for thedetermination of and, indirectly, for species that will oxidize to . For indirectanalyses, the unknown is treated with a measured excess of . Then unreacted istitrated with . For example, , , , and organic peroxides can be ana-lyzed this way. Box 16-1 describes the use of dichromate in water pollution analysis.
MnO�4NO�
3ClO�3K2Cr2O7
Fe2�Fe2�
Fe3�Fe2�Fe2�
Ce4�KMnO4K2Cr2O7
Cr3�Cr2O2�7
K2Cr2O7
CrO2�4 � 4H2O � 3e� T Cr(OH)3(s, hydrated) � 5OH� E° � �0.12 V
CrO2�4
Cr2O2�7Ce4�MnO�
4
2 M H2SO4
Cr2O2�7 � 14H� � 6e� T 2Cr3� � 7H2O E° � 1.36 V
MnO�4Na2C2O4
Ce(OH)4CeO2 � xH2O
16-6 Oxidation with Potassium Dichromate 339
Europe, is analogous to COD. Oxidizability is measured byrefluxing with permanganate in acid solution at for 10 min.Each consumes five electrons and is chemically equivalentto 1.25 mol of . Electrochemical methods based on photooxida-tion with could replace cumbersome refluxing with or . Problem 17-20 describes one proven method.
Biochemical oxygen demand (BOD) is the required forbiochemical degradation of organic matter by microorganisms.The procedure calls for incubating a sealed container of waste-water with no extra air space for 5 days at in the dark whilemicrobes metabolize organic compounds in the waste. The dis-solved in the solution is measured before and after the incubation.The difference is BOD.15 BOD also measures species such as and that may be in the water. Inhibitors are added to preventoxidation of nitrogen species such as . There is great interestin developing a rapid analysis to provide information equivalentto BOD. This goal could be achieved by substituting ferricyanide
for as the electron sink for bacterial degradationof organic matter. Ferricyanide requires just 3 h and results aresimilar to that of the 5-day standard procedure.16
O2(Fe(CN)3�6 )
NH3
Fe2�
HS�
O2
20°C
O2
MnO�4
Cr2O2�7TiO2
O2
MnO�4
100°CBound nitrogen includes all nitrogen-containing compounds,
except , dissolved in water. Kjeldahl nitrogen analysis,described in Section 7-2, is excellent for amines and amides butfails to respond to many other forms of nitrogen. An automatedcombustion analyzer converts almost all forms of nitrogen inaqueous samples into NO, which is measured by chemilumines-cence after reaction with ozone:17
Bound nitrogenanalysis:
Nitrous oxide Ozone Nitric oxideExcited electronic state
Characteristiclight emission
Among common forms of nitrogen, only azide andhydrazines are not quantitatively converted into NOby this combustion method. Bound nitrogen measurements arerequired for compliance with wastewater discharge regulations.
(RNHNH2)(N�
3 )
NO*2 S NO2 � h�
NO � O3 S NO*2
Nitrogen compounds !O2 /�1 000°C
catalyst NO
N2
-blended PVC before irradiationTiO2 After irradiation for 20 days
Here is a “green” idea: can be blendedinto polyvinyl chloride (PVC) plastic so that theplastic degrades in sunlight.14 Ordinary PVClasts many years in municipal landfills after it is discarded. -blended PVC woulddecompose in a short time. [Courtesy H. Hidaka
and S. Horikoshi, Meisei University, Tokyo.]
TiO2
TiO2
Cr(VI) waste is toxic and should not be poureddown the drain. See Box 2-1.
�O3S SO3�N N
Diphenylbenzidine sulfonate (oxidized, violet)
� 2H� � 2e�
¡
�O3S SO3�NH NH
Diphenylbenzidine sulfonate (reduced, colorless)

340 CHAPTER 16 Redox Titrations
16-7 Methods Involving IodineWhen a reducing analyte is titrated directly with iodine (to produce ), the method is callediodimetry. In iodometry, an oxidizing analyte is added to excess to produce iodine, whichis then titrated with standard thiosulfate solution.
Molecular iodine is only slightly soluble in water , but its solu-bility is enhanced by complexation with iodide.
Iodine Iodide Triiodide
A typical 0.05 M solution of for titrations is prepared by dissolving 0.12 mol of KI plus0.05 mol of in 1 L of water. When we speak of using iodine as a titrant, we almost alwaysmean that we are using a solution of plus excess .
Use of Starch IndicatorAs described in Section 16-2, starch is used as an indicator for iodine. In a solution with noother colored species, it is possible to see the color of . With starch, the limit ofdetection is extended by about a factor of 10.
In iodimetry (titration with ), starch can be added at the beginning of the titration. Thefirst drop of excess after the equivalence point causes the solution to turn dark blue. Iniodometry (titration of ), is present throughout the reaction up to the equivalence point.Starch should not be added to such a reaction until immediately before the equivalence point(as detected visually, by fading of the ; Color Plate 10). Otherwise some iodine tends toremain bound to starch particles after the equivalence point is reached.
Starch-iodine complexation is temperature dependent. At , the color is only one-tenth as intense as at . If maximum sensitivity is required, cooling in ice water is rec-ommended.20 Organic solvents decrease the affinity of iodine for starch and markedly reducethe utility of the indicator.
Preparation and Standardization of I�3 SolutionsTriiodide ( ) is prepared by dissolving solid in excess KI. Sublimed is pure enough tobe a primary standard, but it is seldom used as a standard because it evaporates while it isbeing weighed. Instead, the approximate amount is rapidly weighed, and the solution of isstandardized with a pure sample of analyte or .
Acidic solutions of are unstable because the excess is slowly oxidized by air:
In neutral solutions, oxidation is insignificant in the absence of heat, light, and metal ions. At, triiodide disproportionates to hypoiodous acid, iodate, and iodide.
An excellent way to prepare standard is to add a weighed quantity of potassiumiodate to a small excess of KI.21 Then add excess strong acid (giving ) to produce by quantitative reverse disproportionation:
(16-18)( primary standard)
Freshly acidified iodate plus iodide can be used to standardize thiosulfate. The must beused immediately or else it is oxidized by air. The disadvantage of is its low molecularmass relative to the number of electrons it accepts. This property leads to a larger-than-desirablerelative weighing error in preparing solutions.
Use of Sodium ThiosulfateSodium thiosulfate is the almost universal titrant for triiodide. In neutral or acidic solution,triiodide oxidizes thiosulfate to tetrathionate:
(16-19)I3 � 2S2O3 T 3I� � O £ S ß S ß S ß S £ O� 2�
O�
O
£ß
O�
O
£ß
Thiosulfate Tetrathionate
KIO3
I�3
KIO3
IO�3 � 8I� � 6H� T 3I�
3 � 3H2O
I�3pH � 1
I�3
pH � 11
6I� � O2 � 4H� S 2I�3 � 2H2O
I�I�3
Na2S2O3
I�3
I2I2I�3
25°C50°C
I�3
I�3I�
3
I�3
I�3
�5 �M I�3
I�I2
I2
I�3
I2(aq) � I� T I�3 K � 7 � 102
(1.3 � 10�3 M at 20°C)
I�
I�
A solution made from inwater contains18
0.3 �M HOI0.6 mM I�3
40 nM I2�60.9 mM I�
5 �M I�50.9 mM I2
1.5 mM I2 � 1.5 mM KI
An alternative to using starch is to add a fewmilliliters of p-xylene to the vigorously stirredtitration vessel. After each addition of reagentnear the end point, stop stirring long enoughto examine the color of the organic phase.is 400 times more soluble in p-xylene than inwater, and its color is readily detected in theorganic phase.19
I2
There is a significant vapor pressure of toxic above solid and aqueous . Vessels
containing or should be capped and keptin a fume hood. Waste solutions of shouldnot be dumped into a sink in the open lab.
I�3
I�3I2
I�3I2I2
HOI: hypoiodous acid: iodateIO�
3
Iodimetry: titration with iodineIodometry: titration of iodine produced by a
chemical reaction

In basic solution, disproportionates to and HOI, which can oxidize to .Reaction 16-19 needs to be carried out below pH 9. The common form of thiosulfate,
, is not pure enough to be a primary standard. Instead, thiosulfate is usuallystandardized by reaction with a fresh solution of prepared from plus KI or a solutionof standardized with .
A stable solution of can be prepared by dissolving the reagent in high-quality,freshly boiled distilled water. Dissolved makes the solution acidic and promotes dispro-portionation of :
(16-20)Bisulfite Sulfur
and metal ions catalyze atmospheric oxidation of thiosulfate:
Thiosulfate solutions should be stored in the dark. Addition of 0.1 g of sodium carbonateper liter maintains the pH in an optimum range for stability of the solution. Three drops ofchloroform should also be added to each bottle of thiosulfate solution to help prevent bac-terial growth. An acidic solution of thiosulfate is unstable, but the reagent can be used totitrate in acidic solution because the reaction with triiodide is faster than Reaction 16-20.
Analytical Applications of IodineReducing agents can be titrated directly with standard in the presence of starch, untilreaching the intense blue starch-iodine end point (Table 16-4). An example is the iodimetric
I�3
I�3
2Cu� � 12 O2 � 2H� S 2Cu2� � H2O
2Cu2� � 2S2O2�3 S 2Cu� � S4O2�
6
S2O2�3 � H� T HSO�
3 � S(s)
S2O2�3
CO2
Na2S2O3
As4O6I�3
KIO3I�3
Na2S2O3 � 5H2O
SO2�4S2O2�
3I�I�3
16-7 Methods Involving Iodine 341
Table 16-4 Titrations with standard triiodide (iodimetric titrations)
Species analyzed Oxidation reaction Notes
Titrate directly in solution with .Sn(IV) is reduced to Sn(II) with granular Pb or
Ni in 1 M HCl and titrated in the absence ofoxygen.
Titrate in solution.Add (or or or ) to excess
standard in dilute acid and back-titrateunreacted with standard thiosulfate.
Add to excess in 1 M HCl and back-titrate with thiosulfate.
, , Precipitate and wash metal sulfide.Dissolve in 3 M HCl with excess standard and back-titrate with thiosulfate.
Cysteine, glutathione, Titrate the sulfhydryl compound at pH 4–5thioglycolic acid, with .mercaptoethanol
HCN Titrate in carbonate-bicarbonate buffer, using p-xylene as an extraction indicator.
Add excess plus NaOH to the unknown.After 5 min, add HCl and back-titrate withthiosulfate.
Glucose (and other Add excess plus NaOH to the sample. After 5reducing sugars) min, add HCl and back-titrate with thiosulfate.
Ascorbic acid (vitamin C) Titrate directly with .Titrate in solution.NaHCO3H3PO3 � H2O T H3PO4 � 2H� � 2e�H3PO3
I�3Ascorbate � H2O T dehydroascorbate � 2H� � 2e�
I�3
I�3H2CO � 3OH� T HCO�
2 � 2H2O � 2e�H2C¢O
I2 � HCN T ICN � I� � H�
I�3
2RSH T RSSR � 2H� � 2e�
I�3MS(s) T M2� � S � 2e�
M2� � H2S S MS(s) � 2H�Pb2�Hg2�Cd2�Zn2�,
I�3H2SH2S T S(s) � 2H� � 2e�H2S
I�3
I�3H2SO3 � H2O T SO2�
4 � 4H� � 2e�
SO2�3HSO�
3H2SO3SO2SO2 � H2O T H2SO3SO2
NaHCO3N2H4 T N2 � 4H� � 4e�N2H4
SnCl2�4 � 2Cl� T SnCl2�
6 � 2e�Sn2�
I�3NaHCO3H3AsO3 � H2O T H3AsO4 � 2H� � 2e�As3�
RCH � 3OH� T RCO2 � 2H2O � 2e�
O
�
Anhydrous, primary standard can beprepared from the pentahydrate.22
Na2S2O3
Reducing agent � I�3 S 3I�

342 CHAPTER 16 Redox Titrations
Box 16-2 Iodometric Analysis of High-Temperature Superconductors
An important application of superconductors (see beginning ofthis chapter) is in powerful electromagnets needed for medicalmagnetic resonance imaging. Ordinary conductors in such mag-nets require a huge amount of electric power. Because electricitymoves through a superconductor with no resistance, the voltagecan be removed from the electromagnetic coil once the current hasstarted. Current continues to flow, and the power consumption is because the resistance is .
A breakthrough in superconductor technology came with thediscovery24 of yttrium barium copper oxide, , whosecrystal structure is shown here. When heated, the material readilyloses oxygen atoms from the Cu–O chains, and any compositionbetween and is observable.
When high-temperature superconductors were discovered,the oxygen content in the formula was unknown.
represents an unusual set of oxidation states, becausethe common states of yttrium and barium are and , andBa2�Y3�
YBa2Cu3O7
YBa2Cu3Ox
Cu–O chains
Cu–O planes
Y
Ba
Cu
O
a
b
c
YBa2Cu3O6YBa2Cu3O7
YBa2Cu3O7
00
the common states of copper are and . If all the copperwere , the formula of the superconductor would be
, with a cation charge of and ananion charge of . If is present, the oxygen content wouldbe less than 6.5 per formula unit. The composition requires , which is rather rare. Formally, can bethought of as with a cationcharge of and an anion charge of .
Redox titrations proved to be the most reliable way to mea-sure the oxidation state of copper and thereby deduce the oxygencontent of .25 An iodometric method includes twoexperiments. In Experiment A, is dissolved in diluteacid, in which is converted into . For simplicity, wewrite the equations for the formula , but you couldbalance these equations for .26
(1)
The total copper content is measured by treatment with iodide
(2)
and titration of the liberated triiodide with standard thiosulfateby Reaction 16-19. Each mole of Cu in is equivalentto 1 mol of in Experiment A.
In Experiment B, is dissolved in dilute acid con-taining . Each mole of produces 1 mol of , and eachmole of produces 0.5 mol of .
(3)
(4)
The moles of required in Experiment A equal the totalmoles of Cu in the superconductor. The difference in required between Experiments B and A gives the content.From this difference, you can find x in the formula .27
Although we can balance cation and anion charges in the for-mula by including in the formula, there is noevidence for discrete ions in the crystal. There is also no evi-dence that some of the oxygen is in the form of peroxide, ,which also would balance the cation and anion charges. The bestdescription of the valence state in the solid crystal involves elec-trons and holes delocalized in the Cu–O planes and chains.Nonetheless, the formal designation of and Equations 1through 4 accurately describe the redox chemistry of .Problem 16-34 describes titrations that separately measure theoxidation numbers of Cu and Bi in superconductors such as
.Bi2Sr2(Ca0.8Y0.2)Cu2O8.295
YBa2Cu3O7
Cu3�
O2�2
Cu3�
Cu3�YBa2Cu3O7
YBa2Cu3Ox
Cu3�
S2O2�3
S2O2�3
Cu2� � 52 I� S CuI(s) � 1
2 I�3
Cu3� � 4I� S CuI(s) � I�3
I�3Cu2�
I�3Cu3�I�
YBa2Cu3Ox
S2O2�3
YBa2Cu3O7
3Cu2� � 152 I� S 3CuI(s) � 3
2 I�3
Y3� � 2Ba2� � 3Cu2� � 132 H2O � 1
4 O2
YBa2Cu3O7 � 13H� S
x � 7YBa2Cu3O7
Cu2�Cu3�
YBa2Cu3Ox
YBa2Cu3Ox
�14�14(Y3�)(Ba2�)2(Cu2�)2(Cu3�)(O2�)7
YBa2Cu3O7Cu3�
YBa2Cu3O7
Cu��13�13(Ba2�)2(Cu2�)3(O2�)6.5(Y3�)
Cu2�
Cu�Cu2�
Structure of , reproduced from G. F. Holland and A. M. Stacy,“Physical Properties of the Quaternary Oxide Superconductor ,”Acc. Chem. Res. 1988, 21, 8. One-dimensional Cu–O chains (shown incolor) run along the crystallographic b-axis, and two-dimensional Cu–Osheets lie in the a–b plane. Loss of colored oxygen atoms from thechains at elevated temperature results in YBa2Cu3O6.
YBa2Cu3Ox
YBa2Cu3O7

Summary 343
determination of vitamin C:
Oxidizing agents can be treated with excess to produce (Table 16-5, Box 16-2).The iodometric analysis is completed by titrating the liberated with standard thiosulfate.Starch is not added until just before the end point.
I�3
I�3I�
ßßß ∞
HOOH
HO OH
OO
Ascorbic acid(vitamin C)
Dehydroascorbicacid23
ß
� I3 � H2O
ß
ß
∞ßßOH
OH
OH
HO
O � 3I� � 2H�O
OS�
Table 16-5 Titration of I�3 produced by analyte (iodometric titrations)
Species analyzed Reaction Notes
Reaction in dilute acid.HOCl Reaction in 0.5 M .
Reaction in dilute acid.Reaction in 0.5 M .Reaction in 0.5 M HCl.Reaction in 0.5 M HCl.The sample is treated with , NaOH, and KI.
After 1 min, it is acidified with , and theis titrated.
Reaction in 1 M with catalyst.is passed through neutral 2 wt% KI solution.
Add and titrate.The nitric oxide is removed (by bubbling
generated in situ) prior to titration of .Reaction in 5 M HCl.Reaction in neutral solution. Then acidify and
titrate.is used as a buffer.
Reaction in 1 M HCl.Reaction in 0.1 M HCl.Reaction in 0.5 M or HCl.Reaction in 0.4 M HCl requires 5 min for
completion and is particularly sensitive to air oxidation.
Reaction in 1 M .
a. The pH must be when O3 is added to I�. In acidic solution, each O3 produces 1.25 I�3 , not 1 I�
3 . [N. V. Klassen, D. Marchington, and H. C. E. McGowan, Anal. Chem. 1994, 66, 2921.]�7
H2SO42Ce4� � 3I� T 2Ce3� � I�3Ce4�
Cr2O2�7 � 14H� � 9I� T 2Cr3� � 3I�
3 � 7H2OCr2O2�7
H3PO4MnO2(s) � 4H� � 3I� T Mn2� � I�3 � 2H2OMnO2
2MnO�4 � 16H� � 15I� T 2Mn2� � 5I�
3 � 8H2OMnO�4
2Fe(CN)3�6 � 3I� T 2Fe(CN)4�
6 � I�3Fe(CN)3�
6
NH4HF22Cu2� � 5I� T 2CuI(s) � I�3Cu2�
S2O2�8 � 3I� T 2SO2�
4 � I�3S2O2�
8
H3AsO4 � 2H� � 3I� T H3AsO3 � I�3 � H2OAs5�
I�3
CO22HNO2 � 2H� � 3I� T 2NO � I�3 � 2H2ONO�
2
H2SO4
O3O3 � 3I� � 2H� T O2 � I�3 � H2OO3
aNH4MoO3H2SO4H2O2 � 3I� � 2H� T I�
3 � 2H2OH2O2
I�3
H2SO42Mn(OH)3 � 6H� � 3I� T 2Mn2� � I�3 � 6H2O
Mn2�O2 � 4Mn(OH)2 � 2H2O T 4Mn(OH)3O2
2IO�4 � 22I� � 16H� T 8I�
3 � 8H2OIO�4
2IO�3 � 16I� � 12H� T 6I�
3 � 6H2OIO�3
H2SO4BrO�3 � 6H� � 9I� T Br� � 3I�
3 � 3H2OBrO�3
Br2 � 3I� T 2Br� � I�3Br2
H2SO4HOCl � H� � 3I� T Cl� � I�3 � H2O
Cl2 � 3I� T 2Cl� � I�3Cl2
Oxidizing agent � 3I� S I�3
Terms to Understandamalgamdisproportionation
preoxidationprereduction
redox indicatorredox titration
SummaryRedox titrations are based on an oxidation-reduction reaction betweenanalyte and titrant. Sometimes a quantitative chemical preoxidation(with reagents such as , AgO, , or ) or prereduc-tion (with reagents such as , , , , or a metallicreductor column) is necessary to adjust the oxidation state of the ana-lyte prior to analysis. The end point of a redox titration is commonlydetected by potentiometry or with a redox indicator. A useful indicatormust have a transition range ) thatoverlaps the abrupt change in potential of the titration curve.
The greater the difference in reduction potential between ana-lyte and titrant, the sharper will be the end point. Plateaus before
0.059 16/n V(� E°(indicator) �
H2SSO2CrCl2SnCl2
H2O2NaBiO3S2O2�8
and after the equivalence point are centered near (analyte) and (titrant). Prior to the equivalence point, the half-reaction involv-
ing analyte is used to find the voltage because the concentrations ofboth the oxidized and the reduced forms of analyte are known.After the equivalence point, the half-reaction involving titrant isemployed. At the equivalence point, both half-reactions are usedsimultaneously to find the voltage.
Common oxidizing titrants include , , and .Many procedures are based on oxidation with or titration of liberated in a chemical reaction.
I�3I�
3
K2Cr2O7Ce4�KMnO4
E°E°
344 CHAPTER 16 Redox Titrations
Problems
Shape of a Redox Titration Curve
16-1. Consider the titration in Figure 16-2.(a) Write a balanced titration reaction.(b) Write two different half-reactions for the indicator electrode.(c) Write two different Nernst equations for the cell voltage.(d) Calculate E at the following volumes of : 10.0, 25.0,49.0, 50.0, 51.0, 60.0, and 100.0 mL. Compare your results withFigure 16-2.
16-2. Consider the titration of 100.0 mL of 0.010 0 M in 1 Mby 0.040 0 M to give and , using Pt and sat-
urated electrodes to find the end point.(a) Write a balanced titration reaction.(b) Write two different half-reactions for the indicator electrode.(c) Write two different Nernst equations for the cell voltage.(d) Calculate E at the following volumes of : 1.00, 12.5, 24.5,25.0, 25.5, 30.0, and 50.0 mL. Sketch the titration curve.
16-3. Consider the titration of 25.0 mL of 0.010 0 M by0.050 0 M in 1 M HCl, using Pt and saturated calomel elec-trodes to find the end point.(a) Write a balanced titration reaction.(b) Write two different half-reactions for the indicator electrode.(c) Write two different Nernst equations for the cell voltage.(d) Calculate E at the following volumes of : 1.00, 2.50, 4.90,5.00, 5.10, and 10.0 mL. Sketch the titration curve.
16-4. Ascorbic acid (0.010 0 M) was added to 10.0 mL of 0.020 0 Min a solution buffered to pH 0.30, and the potential was moni-
tored with Pt and saturated electrodes.
E° � 0.390 VDehydroascorbic acid � 2H� � 2e� T ascorbic acid � H2O
Ag 0 AgClFe3�
Tl3�
Tl3�
Sn2�
Cu�
Ag 0 AgClCu2�Ce3�Cu�HClO4
Ce4�
Ce4�
(a) Write a balanced equation for the titration reaction.(b) Using for the couple, calculate thecell voltage when 5.0, 10.0, and 15.0 mL of ascorbic acid have beenadded. (Hint: Refer to the calculations in Demonstration 16-1.)
16-5. Consider the titration of 25.0 mL of 0.050 0 M with0.100 M in 1 M HCl to give and , using Pt andcalomel electrodes.(a) Write a balanced titration reaction.(b) Write two half-reactions for the indicator electrode.(c) Write two Nernst equations for the cell voltage.(d) Calculate E at the following volumes of : 1.0, 12.5, 24.0,25.0, 26.0, and 30.0 mL. Sketch the titration curve.
Finding the End Point
16-6. Select indicators from Table 16-2 that would be suitable forfinding the end point in Figure 16-3. What color changes would beobserved?
16-7. Would tris( )iron be a useful indicator for thetitration of with Mn ? (Hint: The potential at the equiv-alence point must be between the potentials for each redox couple.)
Adjustment of Analyte Oxidation State
16-8. Explain what we mean by preoxidation and prereduction.Why is it important to be able to destroy the reagents used for thesepurposes?
16-9. Write balanced reactions for the destruction of , ,and by boiling.
16-10. What is a Jones reductor and what is it used for?
16-11. Why don’t and interfere in the analysis of when a Walden reductor, instead of a Jones reductor, is used forprereduction?
Fe3�TiO2�Cr3�
H2O2
Ag2�S2O2�8
(EDTA)�Sn2�
2,2¿-bipyridine
Fe3�
Sn4�Fe2�Fe3�
Sn2�
Fe3� 0 Fe2�E° � 0.767 V
Exercises16-A. A 20.0-mL solution of 0.005 00 M in 1 M HCl was titratedwith 0.020 0 M to give and . Calculate the potential(versus S.C.E.) at the following volumes of : 0.100, 1.00, 5.00,9.50, 10.00, 10.10, and 12.00 mL. Sketch the titration curve.
16-B. Would indigo tetrasulfonate be a suitable redox indicator forthe titration of with in 1 M HCl? (Hint: The poten-tial at the equivalence point must be between the potentials for eachredox couple.)
16-C. Compute the titration curve for Demonstration 16-1, in which400.0 mL of 3.75 mM are titrated with 20.0 mM at afixed pH of 0.00 in 1 M . Calculate the potential versus S.C.E.at titrant volumes of 1.0, 7.5, 14.0, 15.0, 16.0, and 30.0 mL andsketch the titration curve.
16-D. A 128.6-mg sample of a protein (FM 58 600) was treatedwith 2.000 mL of 0.048 7 M to react with all the serine andthreonine residues.
Serine (R � H)Threonine (R � CH3)
� IO4� � NH4
� IO3��
R
HOCH
H3NCHCO2
��
R
O¢CH
O¢CH
CO2�
�S
NaIO4
H2SO4
MnO�4Fe2�
Tl3�Fe(CN)4�6
Ce4�
Ce3�Sn4�Ce4�
Sn2� The solution was then treated with excess iodide to convert theunreacted periodate into iodine:
Titration of the iodine required 823 of 0.098 8 M thiosulfate.Calculate the number of serine plus threonine residues per moleculeof protein. Answer to the nearest integer.
16-E. A titration of 50.0 mL of unknown with 0.100 M at monitored with Pt and calomel electrodes gave data in thefollowing table.6 Prepare a Gran plot and decide which data lie on astraight line. Find the x-intercept of this line, which is the equiva-lence volume. Calculate the molarity of in the unknown.
Titrant volume, V (mL) E (volts)
6.50 0.6358.50 0.651
10.50 0.66911.50 0.68012.50 0.696
Fe2�
25°CCe4�Fe2�
�L
IO�4 � 3I� � H2O T IO�
3 � I�3 � 2OH�
Problems 345
Redox Reactions of KMnO4, Ce(IV), and K2Cr2O7
16-12. From information in Table 16-3, explain how you would useto find the content of in a solid mixture
with . What is the purpose of phosphoric acid in theprocedure?
16-13. Write balanced half-reactions in which acts as an oxi-dant at (a) ; (b) ; (c) .
16-14. When 25.00 mL of unknown were passed through a Jonesreductor, molybdate ion was converted into . Thefiltrate required 16.43 mL of 0.010 33 M to reach the pur-ple end point.
A blank required 0.04 mL. Balance the reaction and find the molar-ity of molybdate in the unknown.
16-15. A 25.00-mL volume of commercial hydrogen peroxide solu-tion was diluted to 250.0 mL in a volumetric flask. Then 25.00 mLof the diluted solution was mixed with 200 mL of water and 20 mLof 3 M and titrated with 0.021 23 M . The first pinkcolor was observed with 27.66 mL of titrant. A blank prepared fromwater in place of required 0.04 mL to give visible pink color.Using the reaction in Table 16-3, find the molarity of thecommercial .
16-16. Two possible reactions of with to produce and are:
(a) Complete the half-reactions for both schemes by adding ,, and and write a balanced net equation for each scheme.
(b) Sodium peroxyborate tetrahydrate, (FM 153.86),produces when dissolved in acid:
. To decide whether Scheme 1 or Scheme 2 occurs, studentsat the U.S. Naval Academy28 weighed 1.023 g intoa 100-mL volumetric flask, added 20 mL of 1 M , and dilutedto the mark with . Then they titrated 10.00 mL of this solutionwith 0.010 46 M until the first pale pink color persisted.How many mL of are required in Scheme 1 and in Scheme2? (The Scheme 1 stoichiometry was observed.)
16-17. A 50.00-mL sample containing was treated withsodium oxalate to precipitate , which was washed, dis-solved in acid, and titrated with 18.04 mL of 0.006 363 M .Calculate the molarity of in the unknown.
16-18. An aqueous glycerol solution weighing 100.0 mg wastreated with 50.0 mL of 0.083 7 M in 4 M at for15 min to oxidize the glycerol to formic acid:
The excess required 12.11 mL of 0.044 8 M to reach aferroin end point. What is the weight percent of glycerol in theunknown?
Fe2�Ce4�
GlycerolFM 92.095
HCO2H
Formic acid
CH2 CH CH2
OH OH OH
60°CHClO4Ce4�
La3�
KMnO4
La2(C2O4)3
La3�
KMnO4
KMnO4
H2OH2SO4
NaBO3 � 4H2OH2BO�
3
BO�3 � 2H2O S H2O2 �H2O2
NaBO3 � 4H2OH�H2O
e�
H2O2 S H2O
Scheme 2: MnO�4 S O2 � Mn2�
H2O2 S O2
Scheme 1: MnO�4 S Mn2�
Mn2�
O2H2O2MnO�4
H2O2
H2O2
H2O2
KMnO4H2SO4
MnO�4 � Mo3� S Mn2� � MoO2�
2
KMnO4
Mo3�(MoO2�4 )
pH � 15pH � 10pH � 0MnO�
4
(NH4)2SO4
(NH4)2S2O8KMnO4
16-19. Nitrite can be determined by oxidation with excess, followed by back titration of the unreacted . A 4.030-g
sample of solid containing only (FM 68.995) and was dissolved in 500.0 mL. A 25.00-mL sample of this solution wastreated with 50.00 mL of 0.118 6 M in strong acid for 5 min,and the excess was back-titrated with 31.13 mL of 0.042 89 Mferrous ammonium sulfate.
Calculate the weight percent of in the solid.
16-20. Calcium fluorapatite , FM 1 008.6) laser crys-tals were doped with chromium to improve their efficiency. It wassuspected that the chromium could be in the oxidation state.
1. To measure the total oxidizing power of chromium in thematerial, a crystal was dissolved in 2.9 M at ,cooled to , and titrated with standard , using Pt and
electrodes to find the end point. Chromium oxidizedabove the state should oxidize an equivalent amount of
in this step. That is, would consume one , andeach atom of in would consume three
2. In a second step, the total chromium content was measured bydissolving a crystal in 2.9 M at and cooling to
. Excess and were then added to oxidize allchromium to Unreacted was destroyed by boil-ing, and the remaining solution was titrated with standard
In this step, each Cr in the original unknown reacts withthree
In step 1, 0.437 5 g of laser crystal required 0.498 mL of2.786 mM (prepared by dissolving in 2 M ). In step 2, 0.156 6 g of crystal required 0.703 mLof the same solution. Find the average oxidation numberof Cr in the crystal and find the total micrograms of Cr pergram of crystal.
Methods Involving Iodine
16-21. Why is iodine almost always used in a solution containingexcess ?
16-22. State two ways to make standard triiodide solution.
16-23. In which technique, iodimetry or iodometry, is starch indica-tor not added until just before the end point? Why?
16-24. (a) Potassium iodate solution was prepared by dissolving1.022 g of (FM 214.00) in a 500-mL volumetric flask. Then50.00 mL of the solution was pipetted into a flask and treated withexcess KI (2 g) and acid (10 mL of 0.5 M ). How manymoles of are created by the reaction?(b) The triiodide from part (a) reacted with 37.66 mL of solution. What is the concentration of the solution?(c) A 1.223-g sample of solid containing ascorbic acid and inertingredients was dissolved in dilute and treated with 2 g ofKI and 50.00 mL of solution from part (a). Excess triiodideKIO3
H2SO4
Na2S2O3
Na2S2O3
I�3
H2SO4
KIO3
I�
Fe2�
HClO4
Fe(NH4)2(SO4)2 � 6H2OFe2�
12 Cr2O2�
7 � 3Fe2� S Cr3� � 3Fe3�
Crx� ¡S2O2�
8
Cr2O2�7
Fe2�.Fe2�.
S2O2�8Cr2O2�
7 .Ag�S2O2�
820°C100°CHClO4
12 Cr2O2�
7 � 3Fe2� S Cr3� � 3Fe3�
Cr4� � Fe2� S Cr3� � Fe3�
Fe2�:Cr2O2�7Cr6�
Fe2�Cr4�Fe2�
�3Ag 0 AgCl
Fe2�20°C100°CHClO4
�4
(Ca10(PO4)6F2
NaNO2
Ce4� � Fe2� S Ce3� � Fe3�
2Ce4� � NO�2 � H2O S 2Ce3� � NO�
3 � 2H�
Ce4�
Ce4�
NaNO3NaNO2
Ce4�Ce4�
(NO�2 )

346 CHAPTER 16 Redox Titrations
required 14.22 mL of solution from part (b). Find theweight percent of ascorbic acid (FM 176.13) in the unknown.(d) Does it matter whether starch indicator is added at the beginningor near the end point in the titration in part (c)?
16-25. A 3.026-g portion of a copper(II) salt was dissolved in a250-mL volumetric flask. A 50.0-mL aliquot was analyzed byadding 1 g of KI and titrating the liberated iodine with 23.33 mL of0.046 68 M . Find the weight percent of Cu in the salt.Should starch indicator be added to this titration at the beginning orjust before the end point?
16-26. was measured by slowly adding 25.00 mL of aqueousto 25.00 mL of acidified standard 0.010 44 M to precipi-
tate elemental sulfur. (If M, then precipitated sulfurtraps some solution, which is not subsequently titrated.) Theremaining was titrated with 14.44 mL of 0.009 336 M Find the molarity of the solution. Should starch indicator beadded to this titration at the beginning or just before the endpoint?
16-27. From the following reduction potentials,
(a) Calculate the equilibrium constant for (b) Calculate the equilibrium constant for (c) Calculate the solubility (g/L) of in water.
16-28. The Kjeldahl analysis in Section 7-2 is used to measure thenitrogen content of organic compounds, which are digested in boil-ing sulfuric acid to decompose to ammonia, which, in turn, is dis-tilled into standard acid. The remaining acid is then back-titratedwith base. Kjeldahl himself had difficulty in 1880 discerning bylamplight the methyl red indicator end point in the back titration.He could have refrained from working at night, but instead he choseto complete the analysis differently. After distilling the ammoniainto standard sulfuric acid, he added a mixture of and KI tothe acid. The liberated iodine was then titrated with thiosulfate,using starch for easy end-point detection—even by lamplight.29
Explain how the thiosulfate titration is related to the nitrogen con-tent of the unknown. Derive a relation between moles of liber-ated in the digestion and moles of thiosulfate required for titrationof iodine.
16-29. Some people have an allergic reaction to the food preserva-tive sulfite . Sulfite in wine was measured by the followingprocedure: To 50.0 mL of wine were added 5.00 mL of solutioncontaining . Acidification with1.0 mL of 6.0 M quantitatively converted into . The
reacted with to generate , leaving excess in solu-tion. The excess required 12.86 mL of 0.048 18 M toreach a starch end point.(a) Write the reaction that occurs when is added to
and explain why 5 g KI were added to the stock solu-tion. Is it necessary to measure out 5 g very accurately? Is it neces-sary to measure 1.0 mL of very accurately?(b) Write a balanced reaction between and sulfite.(c) Find the concentration of sulfite in the wine. Express youranswer in mol/L and in mg per liter.(d) t test. Another wine was found to contain 277.7 mg with a standard deviation of for three determinations�2.2 mg/L
SO2�3 /L
SO2�3
I�3
H2SO4
KIO3 � KIH2SO4
Na2S2O3I�3
I�3SO2�
4SO2�3I�
3
I�3IO�
3H2SO4
(0.804 3 g KIO3 � 5 g KI) /100 mL
(SO2�3 )
NH3
KIO3
I2(s)I2(s) � I� T I�
3 .I2(aq) � I� T I�
3 .
I�3 � 2e� T 3I� E° � 0.535 V
I2(aq) � 2e� T 2I� E° � 0.620 V
I2(s) � 2e� T 2I� E° � 0.535 V
H2SNa2S2O3.I�
3
I�3
[H2S] 7 0.01I�3H2S
H2S
Na2S2O3
Na2S2O3 by the iodimetric method. A spectrophotometric method gavein three determinations. Are these results signif-
icantly different at the 95% confidence level?
16-30. Potassium bromate, , is a primary standard for thegeneration of in acidic solution:
The can be used to analyze many unsaturated organic com-pounds. was analyzed as follows: An unknown was treatedwith 8-hydroxyquinoline (oxine) at pH 5 to precipitate aluminumoxinate, . The precipitate was washed, dissolved inwarm HCl containing excess KBr, and treated with 25.00 mL of0.020 00 M .
The excess was reduced with KI, which was converted into .The required 8.83 mL of 0.051 13 M to reach a starchend point. How many milligrams of Al were in the unknown?
16-31. Iodometric analysis of high-temperature superconductor.The procedure in Box 16-2 was carried out to find the effective cop-per oxidation state, and therefore the number of oxygen atoms, inthe formula , where z ranges from 0 to 0.5.(a) In Experiment A of Box 16-2, 1.00 g of superconductor required4.55 mmol of . In Experiment B, 1.00 g of superconductorrequired 5.68 mmol of . Calculate the value of z in the for-mula .(b) Propagation of uncertainty. In several replications of Experi-ment A, the thiosulfate required was 4.55 ( ) mmol of per gram of . In Experiment B, the thiosulfate requiredwas 5.68 ( ) mmol of per gram. Calculate the uncer-tainty of x in the formula .
16-32. Here is a description of an analytical procedure for super-conductors containing unknown quantities of Cu(I), Cu(II), Cu(III),and peroxide :30 “The possible trivalent copper and/or peroxide-type oxygen are reduced by Cu(I) when dissolving the sample(ca. 50 mg) in deoxygenated HCl solution (1 M) containing aknown excess of monovalent copper ions (ca. 25 mg CuCl). On theother hand, if the sample itself contained monovalent copper, theamount of Cu(I) in the solution would increase upon dissolvingthe sample. The excess Cu(I) was then determined by coulometricback-titration . . . in an argon atmosphere.” The abbreviation “ca.”means “approximately.” Coulometry is an electrochemical methodin which the electrons liberated in the reaction are measured from the charge flowing through an electrode.Explain with your own words and equations how this analysisworks.
16-33. is an anode for high-energy-density lithium bat-teries. Cobalt is present as a mixture of Co(III) and Co(II). Mostpreparations also contain inert lithium salts and moisture. To findthe stoichiometry, Co was measured by atomic absorption and itsaverage oxidation state was measured by a potentiometric titra-
Li1�yCoO2
Cu� S Cu2� � e�
(O2�2 )
YBa2Cu3Ox
S2O2�3�0.05
YBa2Cu3O7�z
S2O2�3�0.10
(FM 666.246 � 15.999 4z)YBa2Cu3O7�z
S2O2�3
S2O2�3
YBa2Cu3O7�z
Na2S2O3I�3
I�3Br2
� 2Br2
OH
ß NOH
ßß
N� 2H� � 2Br�
Br ß
Br
S
Al(C9H6ON)3 Al3� � 3
OH
ß N
H�
S
KBrO3
Al(C9H6ON)3
Al3�
Br2
BrO�3 � 5Br� � 6H� T 3Br2(aq) � 3H2O
Br2
KBrO3
273.2 � 2.1 mg/L

Problems 347
tion.31 For the titration, 25.00 mg of solid were dissolved under in 5.000 mL containing 0.100 0 M in 6 M plus 6 M
to give a clear pink solution:
Unreacted required 3.228 mL of 0.015 93 M forcomplete titration.(a) How many mmol of are contained in 25.00 mg of thematerial?(b) Atomic absorption found 56.4 wt% Co in the solid. What is theaverage oxidation state of Co?(c) Find y in the formula .(d) What is the theoretical quotient wt% Li/wt% Co in the solid?The observed quotient, after washing away inert lithium salts, was
. Is the observed quotient consistent with theaverage cobalt oxidation state?
16-34. Warning! The Surgeon General has determined that thisproblem is hazardous to your health. The oxidation numbersof Cu and Bi in high-temperature superconductors of the type
(which could contain , , , andcan be measured by the following procedure.32 In Experiment
A, the superconductor is dissolved in 1 M HCl containing excess2 mM CuCl. (written as ) and consume tomake :
(1)
(2)Cu3� � Cu� S 2Cu2�
BiO�3 � 2Cu� � 4H� S BiO� � 2Cu2� � 2H2O
Cu2�
Cu�Cu3�BiO�3Bi5�
Bi5�)Bi3�Cu3�Cu2�(Ca0.8Y0.2)Cu2OxBi2Sr2
0.138 8 � 0.000 6
Li1�yCoO2
Co3�
K2Cr2O7Fe2�
Co3� � Fe2� S Co2� � Fe3�
H3PO4
H2SO4Fe2�
N2 The excess, unreacted is then titrated by coulometry, which isdescribed in Chapter 17. In Experiment B, the superconductor isdissolved in 1 M HCl containing excess 1 . reacts with the but not with .33
(3)
(4)
The excess, unreacted is then titrated by coulometry. The totaloxidation number of is measured in Experiment A, and theoxidation number of Bi is determined in Experiment B. The differ-ence gives the oxidation number of Cu.(a) In Experiment A, a sample of (FM
) (containing no yttrium) weighing 102.3 mg was dis-solved in 100.0 mL of 1 M HCl containing 2.000 mM CuCl. Afterreaction with the superconductor, coulometry detected 0.108 5mmol of unreacted in the solution. In Experiment B, 94.6 mgof superconductor were dissolved in 100.0 mL of 1 M HCl contain-ing 1.000 mM . After reaction with the superconduc-tor, coulometry detected 0.057 7 mmol of unreacted . Find theaverage oxidation numbers of Bi and Cu in the superconductor andthe oxygen stoichiometry coefficient, x.(b) Find the uncertainties in the oxidation numbers and x if thequantities in Experiment A are 102.3 ( ) mg and 0.108 5( ) mmol and the quantities in Experiment B are 94.6( ) mg and 0.057 7 ( ) mmol. Assume negligible uncer-tainty in other quantities.
�0.000 7�0.2�0.000 7
�0.2
Fe2�
FeCl2 � 4H2O
Cu�
15.999 4x760.37 �Bi2Sr2CaCu2Ox
Cu � BiFe2�
Cu3� � 12 H2O S Cu2� � 1
4 O2 � H�
BiO�3 � 2Fe2� � 4H� S BiO� � 2Fe3� � 2H2O
Cu3�Fe2�
Bi5�mM FeCl2 � 4H2O
Cu�

348 CHAPTER 17 Electroanalytical Techniques
HOW SWEET IT IS!
Electroanalytical Techniques17Chromatographycolumn
Exit
Liquidflow
Stainlesssteelexit arm(auxiliaryelectrode)
Copper working electrode where sugars are oxidized
Ag AgCl referenceelectrode
(a)
0 10Time (min)
Fructose(peak 5)
20
Det
ecto
r cu
rren
t
3
4 5
6
123
4
5
67
8
50 nA
HO OOH
HH HO
HO H
H
(b )
(a) Electrochemical detector measures sugarsemerging from a chromatography column.Sugars are oxidized at the Cu electrode, whosepotential is regulated with respect to the
reference electrode. Reductionoccurs at the stainless
steel exit arm, and electric current ismeasured between Cu and steel. [Adapted fromBioanalytical Systems, West Lafayette, IN.]
(H2O � e� S 12 H2 � OH�)
Ag ƒ AgCl
(b) Anion-exchange separation of sugars in 0.1 M NaOH with CarboPac PA1 column. Upper chromatogram shows a standard mixture of (1) fucose,(2) methylglucose, (3) arabinose, (4) glucose, (5) fructose, (6) lactose,(7) sucrose, and (8) cellobiose. Lower chromatogram was obtained with Bud Dry beer diluted by a factor of 100 with water and filtered through a membrane to remove particles. [P. Luo, M. Z. Luo, and R. P. Baldwin,“Determination of Sugars in Food Products,” J. Chem. Ed. 1993, 70, 679.]
0.45-�m
You can measure sugars in your favorite beverage by separating them by anion-exchangechromatography (Chapter 26) in strongly basic solution and detecting them with an elec-trode as they emerge from the column.1 The groups of sugars such as fructose, whosestructure is shown in the chromatogram, partially dissociate to anions in 0.1 MNaOH. Anions are separated from one another when they pass through a column that hasfixed positive charges. As sugars emerge from the column, they are detected by oxidation ata Cu electrode poised at a potential of versus . The chromatogram is agraph of detector current versus time. Each sugar gives a peak whose area is proportional tothe moles exiting the column.
Sugar concentration (g/L)
Brand Glucose Fructose Lactose Maltose
Budweiser 0.54 0.26 0.84 2.05Bud Dry 0.14 0.29 0.46 —Coca-Cola 45.1 68.4 — 1.04Pepsi 44.0 42.9 — 1.06Diet Pepsi 0.03 0.01 — —
Ag ƒ AgCl�0.55 V
ßO�
ßOH

17-1 Fundamentals of Electrolysis 349
17-1 Fundamentals of ElectrolysisSuppose we dip Cu and Pt electrodes into a solution of and force electric currentthrough to deposit copper metal at the cathode and to liberate at the anode.
Cathode:
Anode: (17-1)
Net reaction:
Figure 17-1 shows how we might conduct the experiment. The potentiometer measures thevoltage applied by the power source between the two electrodes. The ammeter measures thecurrent flowing through the circuit.
The electrode at which the reaction of interest occurs is called the working electrode. InFigure 17-1, we happen to be interested in reduction of , so Cu is the working electrode.The other electrode is called the counter electrode. We adopt the convention that current ispositive if reduction occurs at the working electrode.
Current Measures the Rate of ReactionIf a current I flows for a time t, the charge q passing any point in the circuit is
(17-2)
Coulombs
The number of moles of electrons is
Moles of e� �coulombs
coulombs/mole�
I � t
F
Amperes � Seconds
q � I � tRelation of charge to current and time:
Cu2�
H2O � Cu2� T Cu(s) � 12O2(g) � 2H�
H2O T 12O2(g) � 2H� � 2e�
Cu2� � 2e� T Cu(s)
O2
Cu2�
Previous chapters dealt with potentiometry—in which voltage was measured in the absenceof significant electric current. Now we consider electroanalytical methods in which current isessential to the measurement.3 Techniques in this chapter are all examples of electrolysis—the process in which a chemical reaction is forced to occur at an electrode by an imposedvoltage (Demonstration 17-1).
Cathode(reduction)
Variablevoltagesource
Voltmeter(potentiometer)
Ammeter
e–
e–
+–
Pt
Cu
H2O Cu(s)
Counterelectrode
Workingelectrode
12 O2 + 2H+ + 2e– Cu2+ + 2e–
Power supply
+ –
Figure 17-1 Electrolysis experiment. The
power supply is a variable voltage
source. The potentiometer measures voltageand the ammeter measures current.
+ –
Electrolytic production of aluminum by theHall-Heroult process consumes % of theelectrical output of the United States! in amolten solution of and cryolite is reduced to Al at the cathode of a cell thattypically draws 250 kA. This process wasinvented by Charles Hall in 1886 when he was22 years old, just after graduating form OberlinCollege.2
(Na3AlF6)Al2O3
Al3�
�5
Charles Martin Hall. [Photo courtesy of Alcoa.]
Convention: cathodic current is consideredpositive.
An ampere is an electric current of 1 coulombper second
A coulomb contains electronsFaraday constant:
Moles of electrons �I � tF
F � 9.648 5 � 104 C/mol
6.241 5 � 1018

If a reaction requires n electrons per molecule, the quantity reacting in time t is
(17-3)
Example Relating Current, Time, and Amount of Reaction
If a current of 0.17 A flows for 16 min through the cell in Figure 17-1, how many gramsof Cu(s) will be deposited?
Solution We first calculate the moles of flowing through the cell:
The cathode half-reaction requires for each Cu deposited. Therefore,
The mass of Cu(s) deposited is .
Voltage Changes When Current FlowsFigure 17-1 is drawn with the same conventions as Figures 14-4 and 14-6. The cathode—where reduction occurs—is at the right side of the figure. The positive terminal of the poten-tiometer is on the right-hand side.
If electric current is negligible, the cell voltage is
(17-4)
In Chapter 14, we wrote , where is the potential of the electrode attached tothe positive terminal of the potentiometer and is the potential of the electrode attached tothe negative terminal of the potentiometer. Equation 17-4 is equivalent to . Thepolarity of the potentiometer in Figure 17-1 is the same as in Figures 14-4 and 14-6. In an
E � E� � E�
E�
E�E � E� � E�
E � E(cathode) � E(anode)
(8.45 � 10�4 mol)(63.546 g/mol) � 0.054 g
Moles of Cu(s) � 12 (moles of e�) � 8.45 � 10�4 mol
2e�
Moles of e� �I � t
F�
a0.17Csb (16 min)a60
s
minb
96 485a C
molb
� 1.69 � 10�3 mol
e�
Moles reacted �I � t
nF
Relation of moles to current and time:
350 CHAPTER 17 Electroanalytical Techniques
Demonstration 17-1 Electrochemical Writing4
Approximately 7% of electric power in the United States goesinto electrolytic chemical production. The electrolysis apparatuspictured here consists of a sheet of Al foil taped or cemented toa wood surface. Any size will work, but an area about 15 cm on aside is convenient for a classroom demonstration. Tape to themetal foil (at one edge only) a sandwich consisting of filter paper,
Glass orwood
Filterpaper
Typingpaper
Metalfoil
~12 V DC
Tape
Glasstube
Wirestylus
Front view
AlligatorclipWood
Papersandwich
(a )
Side view
(b)
Foil
printer paper, and another sheet of filter paper. Make a stylus fromCu wire (18 gauge or thicker) looped at one end and passedthrough a length of glass tubing.
Prepare a fresh solution from 1.6 g of KI, 20 mL of water,5 mL of 1 wt% starch solution, and 5 mL of phenolphthalein indi-cator solution. (If the solution darkens after several days, decolorizeit with a few drops of dilute .) Soak the three layers ofpaper with the KI-starch-phenolphthalein solution. Connect thestylus and foil to a 12-V DC power source, and write on the paperwith the stylus.
When the stylus is the cathode, water is reduced to plusand pink color appears from the reaction of with
phenolphthalein.
When the polarity is reversed and the stylus is the anode, is oxidized to and a black (very dark blue) color appears fromthe reaction of with starch.
Pick up the top sheet of filter paper and the printer paper, and youwill discover that the writing appears in the opposite color on thebottom sheet of filter paper (Color Plate 11).
Anode: I� S 12 I2 � e�
I2
I2
I�
Cathode: H2O � e� S 12 H2(g) � OH�
OH�OH�
H2
Na2S2O3
To use , youmust write both reactions as reductions.
is called the open-circuit voltage. It is the (imaginary)voltage that would be measured if there wereno electrical connection between cathodeand anode, so no current could flow.
E(cathode) � E(anode)
E � E(cathode) � E(anode)
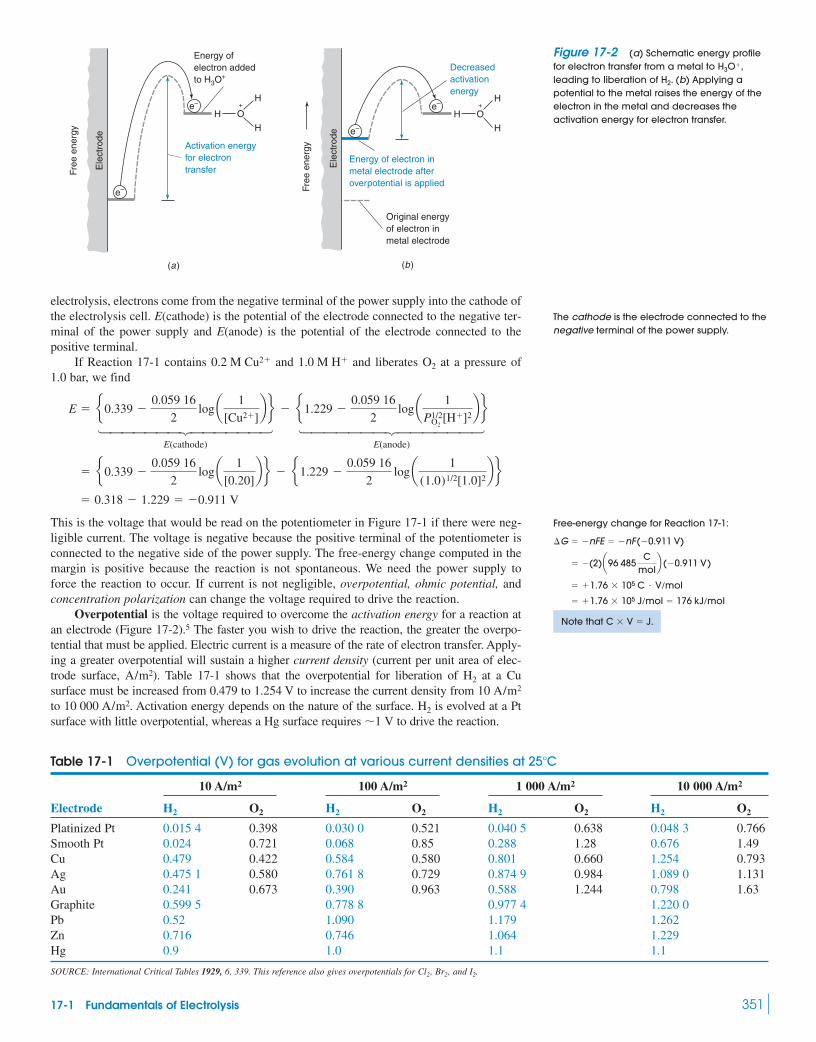
electrolysis, electrons come from the negative terminal of the power supply into the cathode ofthe electrolysis cell. E(cathode) is the potential of the electrode connected to the negative ter-minal of the power supply and E(anode) is the potential of the electrode connected to thepositive terminal.
If Reaction 17-1 contains and and liberates at a pressure of1.0 bar, we find
144444424444443 144444424444443E(cathode) E(anode)
This is the voltage that would be read on the potentiometer in Figure 17-1 if there were neg-ligible current. The voltage is negative because the positive terminal of the potentiometer isconnected to the negative side of the power supply. The free-energy change computed in themargin is positive because the reaction is not spontaneous. We need the power supply toforce the reaction to occur. If current is not negligible, overpotential, ohmic potential, andconcentration polarization can change the voltage required to drive the reaction.
Overpotential is the voltage required to overcome the activation energy for a reaction atan electrode (Figure 17-2).5 The faster you wish to drive the reaction, the greater the overpo-tential that must be applied. Electric current is a measure of the rate of electron transfer. Apply-ing a greater overpotential will sustain a higher current density (current per unit area of elec-trode surface, ). Table 17-1 shows that the overpotential for liberation of at a Cusurface must be increased from 0.479 to 1.254 V to increase the current density from to . Activation energy depends on the nature of the surface. is evolved at a Ptsurface with little overpotential, whereas a Hg surface requires to drive the reaction.�1 V
H210 000 A/m210 A/m2
H2A/m2
� 0.318 � 1.229 � �0.911 V
� e0.339 �0.059 16
2log a 1
[0.20]b f � e1.229 �
0.059 16
2log a 1
(1.0)1/2[1.0]2b f
E � e0.339 �0.059 16
2log a 1
[Cu2�]b f � e1.229 �
0.059 16
2log a 1
P1/2O2
[H�]2b f
O21.0 M H�0.2 M Cu2�
17-1 Fundamentals of Electrolysis 351
+ +
Energy ofelectron addedto H3O+
H O
H
H
Activation energyfor electrontransfer
(a)
Ele
ctro
de
Free
ene
rgy
Decreasedactivationenergy
H O
H
H
Energy of electron in metal electrode after overpotential is applied
(b)
Ele
ctro
de
Original energyof electron inmetal electrode
Free
ene
rgy
e–
e–
e–
e–
Table 17-1 Overpotential (V) for gas evolution at various current densities at 25�C
10 A/m2 100 A/m2 1 000 A/m2 10 000 A/m2
Electrode H2 O2 H2 O2 H2 O2 H2 O2
Platinized Pt 0.015 4 0.398 0.030 0 0.521 0.040 5 0.638 0.048 3 0.766Smooth Pt 0.024 0.721 0.068 0.85 0.288 1.28 0.676 1.49Cu 0.479 0.422 0.584 0.580 0.801 0.660 1.254 0.793Ag 0.475 1 0.580 0.761 8 0.729 0.874 9 0.984 1.089 0 1.131Au 0.241 0.673 0.390 0.963 0.588 1.244 0.798 1.63Graphite 0.599 5 0.778 8 0.977 4 1.220 0Pb 0.52 1.090 1.179 1.262Zn 0.716 0.746 1.064 1.229Hg 0.9 1.0 1.1 1.1
SOURCE: International Critical Tables 1929, 6, 339. This reference also gives overpotentials for Cl2, Br2, and I2.
Figure 17-2 (a) Schematic energy profilefor electron transfer from a metal to ,leading to liberation of . (b) Applying apotential to the metal raises the energy of theelectron in the metal and decreases theactivation energy for electron transfer.
H2
H3O�
The cathode is the electrode connected to thenegative terminal of the power supply.
Free-energy change for Reaction 17-1:
Note that .C � V � J
� �1.76 � 105 J/mol � 176 kJ/mol
� �1.76 � 105 C � V/mol
� �(2)a96 485C
molb (�0.911 V)
�G � �nFE � �nF(�0.911 V)

Ohmic potential is the voltage needed to overcome electrical resistance, R, of the solu-tion in the electrochemical cell when a current, I, is flowing:
Ohmic potential: (17-5)
If the cell has a resistance of 2 ohms and a current of 20 mA is flowing, the voltage requiredto overcome the resistance is .
Concentration polarization occurs when the concentrations of reactants or productsare not the same at the surface of the electrode as they are in bulk solution. For Reaction 17-1,the Nernst equation should be written
where is the concentration in the solution at the surface of the electrode. If reductionof occurs rapidly, could be very small because cannot diffuse to the elec-trode as fast as it is consumed. As decreases, E(cathode) becomes more negative.
Overpotential, ohmic potential, and concentration polarization make electrolysis moredifficult. They drive the cell voltage more negative, requiring more voltage from the powersupply in Figure 17-1 to drive the reaction forward.
(17-6)14444244443These terms include the effectsof concentration polarization
There can be concentration polarization and overpotential at both the cathode and the anode.
Example Effects of Ohmic Potential, Overpotential,and Concentration Polarization
Suppose we wish to electrolyze to in a 0.10 M KI solution containing at pH 10.00 with fixed at 1.00 bar.
(a) Find the cell voltage if no current is flowing. (b) Then suppose that electrolysisincreases to , but other concentrations are unaffected. Suppose that thecell resistance is , the current is 63 mA, the cathode overpotential is 0.382 V, and theanode overpotential is 0.025 V. What voltage is needed to drive the reaction?
Solution (a) The open-circuit voltage is :
We would have to apply to force the reaction to occur.(b) Now E(cathode) is unchanged but E(anode) changes because is different from
in bulk solution.
Instead of , we need to apply to drive the reaction.�1.644 V�1.081 V
� �1.644 V
� �0.591 V � 0.520 V � (2.0 �) (0.063 A) � 0.382 V � 0.025 V
E � E(cathode) � E(anode) � IR � overpotentials
E(anode) � 0.535 �0.059 16
2log a [0.10]3
[3.0 � 10�4]b � 0.520 V
[I�3 ]
[I�3 ]s
�1.081 V
E � E(cathode) � E(anode) � �1.081 V
� 0.535 �0.059 16
2 loga [0.10]3
[3.0 � 10�5]b � 0.490 V
E(anode) � 0.535 �0.059 16
2 loga [I�]3
[I�3 ]b
� �0.828 �0.059 16
2 log[(1.00)(1.0 � 10�4)2] � �0.591 V
E(cathode) � �0.828 �0.059 16
2 log(PH2
[OH�]2)
Anode: I�3 � 2e� S 3I� E° � 0.535 V
Cathode: 2H2O � 2e� S H2(g) � 2OH� E° � �0.828 V
E(cathode) � E(anode)
2.0 �3.0 � 10�4 M[I�
3 ]s
3I� � 2H2O S I�3 � H2(g) � 2OH�
PH2
3.0 � 10�5 M I�3I�
3I�
E � E(cathode) � E(anode) � IR � overpotentials
[Cu2�]s
Cu2�[Cu2�]sCu2�
[Cu2�]s
E(cathode) � 0.339 �0.059 16
2log a 1
[Cu2�]sb
E � (2 �)(20 mA) � 0.040 V
Eohmic � IR
352 CHAPTER 17 Electroanalytical Techniques
Resistance is measured in ohms, whosesymbol is capital Greek omega, .�
Electrodes respond to concentrations ofreactants and products adjacent to theelectrode, not to concentrations in the bulksolution.
If were reduced from 0.2 M to ,E(cathode) would change from 0.318 to 0.170 V.
2 �M[Cu2�]s

Controlled-Potential Electrolysis with a Three-Electrode CellAn electroactive species is one that can be oxidized or reduced at an electrode. We regulatethe potential of the working electrode to control which electroactive species react and whichdo not. Metal electrodes are said to be polarizable, which means that their potentials are eas-ily changed when small currents flow. A reference electrode such as calomel or issaid to be nonpolarizable, because its potential does not vary much unless a significant cur-rent is flowing. Ideally, we want to measure the potential of a polarizable working electrodewith respect to a nonpolarizable reference electrode. How can we do this if there is to be sig-nificant current at the working electrode and negligible current at the reference electrode?
The answer is to introduce a third electrode (Figure 17-3). The working electrode is theone at which the reaction of interest occurs. A calomel or other reference electrode is usedto measure the potential of the working electrode. The auxiliary electrode (the counterelec-trode) is the current-supporting partner of the working electrode. Current flows between theworking and the auxiliary electrodes. Negligible current flows through the reference electrode,so its potential is unaffected by ohmic potential, concentration polarization, and overpoten-tial. It truly maintains a constant reference potential. In controlled-potential electrolysis, thevoltage difference between working and reference electrodes in a three-electrode cell is reg-ulated by an electronic device called a potentiostat.
Concentration polarization and overpotential can both occur at the working and auxil-iary electrodes. There is an ohmic potential drop between working and auxiliary electrodes.To obtain the best measurement of the working electrode potential, the reference electrodeshould be placed as close as possible to the working electrode (Figure 17-4).
Ag 0 AgCl
17-2 Electrogravimetric Analysis 353
Electrolysis cell
Anode(auxiliaryelectrode)
Referenceelectrodesuch ascalomel
Cathode(working
electrode)
Ammeter
A
V
Controlledpotential
Potentiostat
e−
e−
working electrode
auxiliary electrode
reference electrode
Referenceelectrode
Porous plugat baseof electrode
Droppingmercuryelectrode
Hg
Capillaryopening
Luggincapillary
Figure 17-3 Circuit used for controlled-potential electrolysis with a three-electrode cell.
Figure 17-4 Use of a Luggin capillary to position a reference electrode as close as possible to theworking electrode (shown as a dropping mercury electrode in this illustration). The capillary, with anopening of , is filled with the same electrolyte that is in the analyte solution. The referenceelectrode is in contact with the capillary solution. There is negligible current flow in the capillary, sothere is negligible ohmic loss between the tip of the capillary and the reference electrode.
�0.2 mm
17-2 Electrogravimetric AnalysisIn electrogravimetric analysis, analyte is quantitatively deposited on an electrode by electroly-sis. The electrode is weighed before and after deposition. The increase in mass tells us how muchanalyte was deposited. We can measure in a solution by reducing it to Cu(s) on a clean Ptgauze cathode with a large surface area (Figure 17-5). is liberated at the counter electrode.
How do you know when electrolysis is complete? One way is to observe the disappear-ance of color in a solution from which a colored species such as or is removed.Another way is to expose most, but not all, of the surface of the cathode to the solution dur-ing electrolysis. To test whether or not the reaction is complete, raise the beaker or add waterso that fresh surface of the cathode is exposed to the solution. After an additional period ofelectrolysis (15 min, say), see if the newly exposed electrode surface has a deposit. If it does,
Co2�Cu2�
O2
Cu2�
Working electrode: where the analyticalreaction occurs
Auxiliary electrode: the other electrodeneeded for current flow
Reference electrode: used to measure thepotential of the working electrode
The chromatographic detector at the openingof this chapter has a Cu working electrode, astainless steel auxiliary electrode, and a
reference electrode.Ag 0 AgCl
Test for completion of the deposition:• disappearance of color• no deposition on freshly exposed electrode
surface• qualitative test for analyte in solution
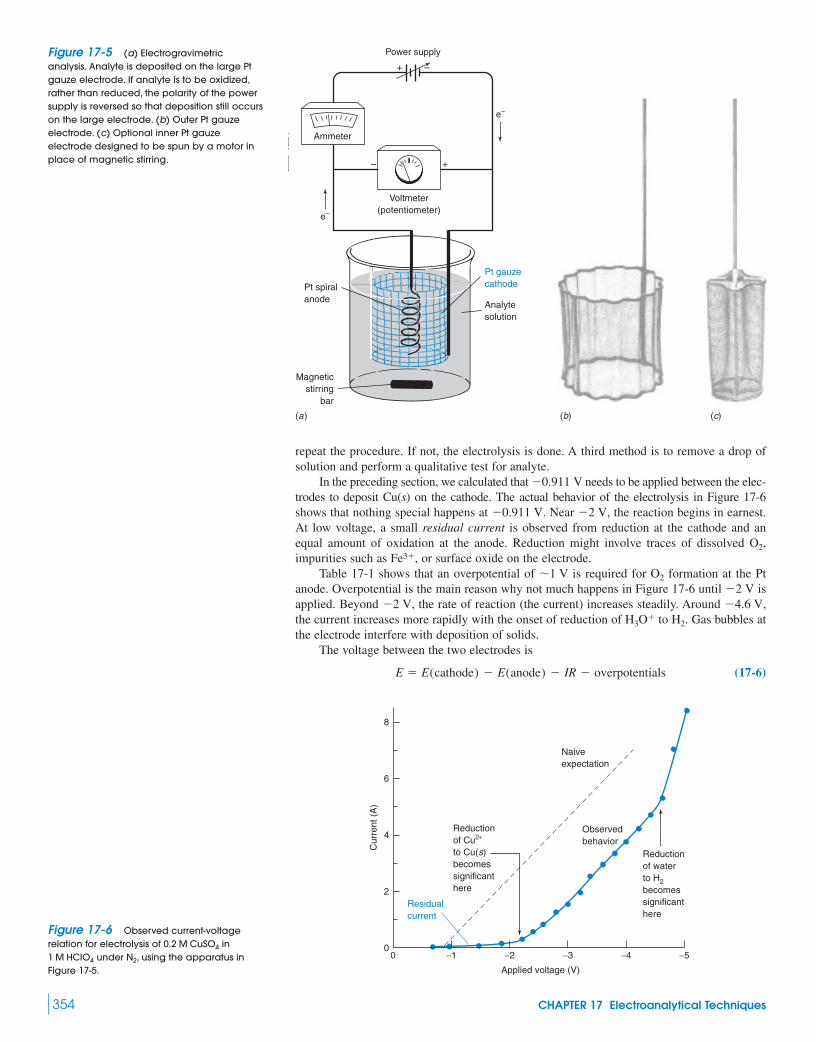
354 CHAPTER 17 Electroanalytical Techniques
Ammeter
Pt spiral anode
Pt gauzecathodePt spiral
anodeAnalytesolution
Magneticstirring
bar
(a)
Voltmeter(potentiometer)
–
+
Power supply
Voltmeter(potentiometer)
Ammeter
e–
e–
+
+–
–
(b) (c)
repeat the procedure. If not, the electrolysis is done. A third method is to remove a drop ofsolution and perform a qualitative test for analyte.
In the preceding section, we calculated that needs to be applied between the elec-trodes to deposit Cu(s) on the cathode. The actual behavior of the electrolysis in Figure 17-6shows that nothing special happens at . Near , the reaction begins in earnest.At low voltage, a small residual current is observed from reduction at the cathode and anequal amount of oxidation at the anode. Reduction might involve traces of dissolved ,impurities such as , or surface oxide on the electrode.
Table 17-1 shows that an overpotential of is required for formation at the Ptanode. Overpotential is the main reason why not much happens in Figure 17-6 until isapplied. Beyond , the rate of reaction (the current) increases steadily. Around ,the current increases more rapidly with the onset of reduction of to . Gas bubbles atthe electrode interfere with deposition of solids.
The voltage between the two electrodes is
(17-6)E � E(cathode) � E(anode) � IR � overpotentials
H2H3O�
�4.6 V�2 V�2 V
O2�1 VFe3�
O2
�2 V�0.911 V
�0.911 V
Cur
rent
(A
)
8
6
4
2
0−5−4−3−2−10
Applied voltage (V)
Observedbehavior
Naiveexpectation
Reductionof Cu2+
to Cu(s)becomessignificanthere
Reductionof waterto H2becomessignificanthere
Residualcurrent
Figure 17-5 (a) Electrogravimetricanalysis. Analyte is deposited on the large Ptgauze electrode. If analyte is to be oxidized,rather than reduced, the polarity of the powersupply is reversed so that deposition still occurson the large electrode. (b) Outer Pt gauzeelectrode. (c) Optional inner Pt gauzeelectrode designed to be spun by a motor inplace of magnetic stirring.
Figure 17-6 Observed current-voltagerelation for electrolysis of in
under , using the apparatus inFigure 17-5.
N21 M HCIO4
0.2 M CuSO4

Suppose we hold the applied potential at . As is used up, the currentdecreases and both ohmic and overpotentials decrease in magnitude. E(anode) is fairlyconstant because of the high concentration of solvent being oxidized at the anode
. If E and E(anode) are constant and if IR and overpotentialsdecrease in magnitude, then E(cathode) must become more negative to maintain the algebraicequality in Equation 17-6. E(cathode) drops in Figure 17-7 to , at which is reducedto . As E(cathode) falls from to , other ions such as , , and can be reduced. In general, then, when the applied voltage is constant, the cathode potentialdrifts to more negative values and solutes more easily reduced than H� will be electrolyzed.
To prevent the cathode potential from becoming so negative that unintended ions arereduced, a cathodic depolarizer such as can be added to the solution. The cathodicdepolarizer is more easily reduced than :
Alternatively, we can use a three-electrode cell (Figure 17-3) with a potentiostat to controlthe cathode potential and prevent unwanted side reactions.
Example Controlled-Potential Electrolysis
What cathode potential is required to reduce 99.99% of 0.10 to Cu(s)? Is itpossible to remove this without reducing in the same solution?
Solution If 99.99% of were reduced, the concentration of remaining wouldbe , and the required cathode potential would be
aThe cathode potential required to reduce is
aWe do not expect reduction of at a cathode potential more positive than .The reduction of 99.99% of without reducing appears feasible.
17-3 CoulometryCoulometry is a chemical analysis based on counting the electrons used in a reaction. Forexample, cyclohexene can be titrated with generated by electrolytic oxidation of :
(17-7)
(17-8)
The initial solution contains an unknown quantity of cyclohexene and a large amount of When Reaction 17-7 has generated just enough to react with all the cyclohexene, themoles of electrons liberated in Reaction 17-7 are equal to twice the moles of and there-fore twice the moles of cyclohexene.
The reaction is carried out at a constant current with the apparatus in Figure 17-8. generated at the Pt anode at the left reacts with cyclohexene. When cyclohexene is con-sumed, the concentration of Br2 suddenly rises, signaling the end of the reaction.
The rise in Br2 concentration is detected by measuring the current between the twodetector electrodes at the right in Figure 17-8. A voltage of 0.25 V applied between these twoelectrodes is not enough to electrolyze any solute, so only a tiny current of flows6 1 �A
Br2
Br2
Br2
Br�.
∫∫BBr2 �
Br
BrCyclohexene trans-1,2-Dibromocyclohexane
2Br� S Br2 � 2e�
Br�Br2
Sn2�Cu2�
�0.17 VSn2�
[Sn2�]
E(cathode, for reduction of Sn2�) � �0.141 �0.059 16
2log a 1
0.10b � �0.17 V
Sn2�
[Cu2�]
E(cathode) � 0.339 �0.059 16
2log a 1
1.0 � 10�5b � 0.19 V
1.0 � 10�5 MCu2�Cu2�
Sn2� � 2e� T Sn(s) E° � �0.141 V
Cu2� � 2e� T Cu(s) E° � 0.339 V
0.10 M Sn2�Cu2�
M Cu2�
NO�3 � 10H� � 8e� S NH�
4 � 3H2O
H3O�
NO�3
Ni2�Sn2�Co2��0.4 V�0.3 VH2
H3O��0.4 V
(H2O S 12O2 � 2H� � 2e�)
Cu2�E � �2.0 V
17-3 Coulometry 355
0.3
E(c
atho
de)
(V)
Time
0.2
0.1
0
–0.1
–0.2
–0.3
–0.4
Potential forreduction of Cu2+
Any speciesthat can be reduced in this potential rangewill interferewith the analysis
Potentialfor reductionof H+
Figure 17-7 E(cathode) becomes morenegative with time when electrolysis isconducted in a two-electrode cell with aconstant voltage between the electrodes.
A cathodic depolarizer is reduced inpreference to solvent. For oxidation reactions,anodic depolarizers include (hydrazine)and (hydroxylamine).NH2OH
N2H4
Coulometric methods are based onmeasuring the number of electrons thatparticipate in a chemical reaction.

through the microammeter. At the equivalence point, cyclohexene is consumed, sud-denly increases, and detector current flows by virtue of the reactions:
In practice, enough is first generated in the absence of cyclohexene to give a detec-tor current of . When cyclohexene is added, the current decreases to a tiny valuebecause is consumed. is then generated by the coulometric circuit, and the end pointis taken when the detector again reaches . Because the reaction is begun with present, impurities that can react with before analyte is added are eliminated.
The electrolysis current (not to be confused with the detector current) for the -generating electrodes can be controlled by a hand-operated switch. As the detector cur-
rent approaches , you close the switch for shorter and shorter intervals. This practiceis analogous to adding titrant dropwise from a buret near the end of a titration. The switch inthe coulometer circuit serves as a “stopcock” for addition of to the reaction.
Example Coulometric Titration
A 2.000-mL volume containing 0.611 3 mg of cyclohexene/mL is to be titrated in Figure 17-8. With a constant current of 4.825 mA, how much time is required forcomplete titration?
Solution The quantity of cyclohexene is
In Reactions 17-7 and 17-8, each mole of cyclohexene requires 1 mol of , whichrequires 2 mol of electrons. For 0.014 88 mmol of cyclohexene to react, 0.029 76 mmolof electrons must flow. From Equation 17-3,
It will require just under 10 min to complete the reaction.
Commercial coulometers deliver electrons with an accuracy of . With extremecare, the Faraday constant has been measured to within several parts per million by coulom-
�0.1%
t �(0.029 76 � 10�3 mol)(96 485 C/mol)
(4.825 � 10�3 C/s)� 595.1 s
Moles of e� �I � t
F1 t �
(moles of e�)F
I
Br2
(2.000 mL)(0.611 3 mg/mL)
(82.146 mg/mmol)� 0.014 88 mmol
Br2
20.0 �ABr2
Br2
Br220.0 �ABr2Br2
20.0 �ABr2
Detector cathode: Br2 � 2e� S 2Br�
Detector anode: 2Br� S Br2 � 2e�
[Br2]
356 CHAPTER 17 Electroanalytical Techniques
− +
To constant-currentcoulometric powersupply
Port for adding reagents,with ground-glass stopper
Microammeter
Voltmeter
Amperometricend-point detectorcircuit
Pt detectorelectrodes
Pt generatoranode
Pt cathode
Magneticstirring bar
Figure 17-8 Apparatus for coulometrictitration of cyclohexene with . The solutioncontains cyclohexene, 0.15 M KBr, and 3 mMmercuric acetate in a mixed solvent of aceticacid, methanol, and water. Mercuric acetatecatalyzes the addition of to the olefin.[Adapted from D. H. Evans, “Coulometric Titration of
Cyclohexene with Bromine,” J. Chem. Ed. 1968, 45, 88.]
Br2
Br2
Both and must be present for thedetector half-reactions to occur. Prior to theequivalence point, there is , but virtuallyno .Br2
Br�
Br�Br2
Advantages of coulometry:• precision• sensitivity• generation of unstable reagents in situ
(in place)

etry.6 Automated coulometers commonly generate , , , and to titrate analytesincluding , sulfites in food, and sulfide in wastewater.7 Unstable reagents such as ,
, , and can be generated and used in situ.In Figure 17-8, the reactive species is generated at the anode. The cathode prod-
ucts ( from solvent and Hg from the catalyst) do not interfere with the reaction of andcyclohexene. In some cases, however, or Hg could react with analyte. Then it is desirableto separate the counter electrode from the analyte, using the cell in Figure 17-9. bubblesinnocuously out of the cathode chamber without mixing with the bulk solution.
Types of CoulometryCoulometry employs either a constant current or a controlled potential. Constant-currentmethods, like the preceding /cyclohexene example, are called coulometric titrations. Ifwe know the current and the time of reaction, we know how many coulombs have beendelivered from Equation 17-2: .
Controlled-potential coulometry in a three-electrode cell is more selective than constant-current coulometry. Because the working electrode potential is constant, current decreasesexponentially as analyte concentration decreases. Charge is measured by integrating currentover the time of the reaction:
(17-9)
In controlled-potential coulometry, current decays exponentially. You can approach theequivalence point by letting the current decay to an arbitrarily set value. For example, thecurrent (above the residual current) will ideally be 0.1% of its initial value when 99.9% ofthe analyte has been consumed.
17-4 AmperometryIn amperometry, we measure the electric current between a pair of electrodes that are driv-ing an electrolysis reaction. One reactant is the intended analyte and the measured current isproportional to the concentration of analyte. The measurement of dissolved with theClark electrode in Box 17-1 is based on amperometry. Numerous biosensors also employamperometry. Biosensors8,9 use biological components such as enzymes, antibodies, or DNAfor highly selective response to one analyte. Biosensors can be based on any kind of analyti-cal signal, but electrical and optical signals are most common. A different kind of sensorbased on conductivity—the “electronic nose”—is described in Box 17-2 (page 360).
Blood Glucose MonitorPeople with diabetes may need to monitor their blood sugar (glucose) level several times aday to control their disease through diet and insulin injections. Figure 17-10 shows a homeglucose monitor featuring a disposable test strip with two carbon working electrodes and a
reference electrode. As little as of blood applied in the circular opening4 �LAg 0 AgCl
O2
q � t
0I dt
q � I � t
Br2
H2
H2
Br2H2
(Br2)Ti3�Mn3�Cu�
Ag2�CO2
I2Ag�OH�H�
17-4 Amperometry 357
Gas outlet
Inert electrolyte
Counter electrode
Fritted-glassdisk
Magneticstirring bar
Generatorelectrode
Analytesolution
To power supply
The Latin in situ means “in place.” Reagent isused right where it is generated.
The number of coulombs is equal to the areaunder a curve of current versus time. Problem17-20 provides an example.
Amperometry: Electric current is proportionalto the concentration of analyte.
Coulometry: Total number of electrons( time) tells us how much analyteis present.� current �
Enzyme: A protein that catalyzes abiochemical reaction. The enzyme increasesthe rate of reaction by many orders ofmagnitude.
Antibody: A protein that binds to a specifictarget molecule called an antigen. Antibodiesbind to foreign cells that infect your body toinitiate their destruction or identify them forattack by immune system cells.
Figure 17-9 Isolating the counter electrodefrom analyte. Ions can flow through the porousfritted-glass disk. The liquid level in the counterelectrode compartment should be higher thanthe liquid in the reactor so that analyte solutiondoes not flow into the compartment.

358 CHAPTER 17 Electroanalytical Techniques
Box 17-1 Oxygen Sensors
in solution is measured amperometrically with a Clark elec-trode, in which a Pt cathode is held at with respect to a
anode. The cell is covered by a semipermeable mem-brane, across which can diffuse in a few seconds. The currentis proportional to the dissolved concentration.
The electrode must be calibrated in solutions of known concentration.
To polarizerand to readout
Cap
Outer body
Electrolyte
Teflonmembrane
Platinumcathode
Ag AgCl anode
O-ring andsilicone rubberdiaphragm
O2
Cathode reaction: O2 � 4H� � 4e� T 2H2O
O2
O2
Ag ƒ AgCl�0.6 V
O2
A Clark electrode can fit into the tip of a surgical catheterthat is stored in a dry, sterile state. When inserted through theumbilical artery of a newborn infant, water diffuses in and acti-vates the electrode. By this means, blood is monitored todetect respiratory distress. For longer-term monitoring ( day),
-sensing catheters can be coated with a nitric oxide (NO)–releasing polymer that inhibits blood clotting on the sensor.10
Micron-size amperometric sensors have been designed forinsertion into single cells.11 The graph shows the gradient of dis-solved measured by a micro-Clark electrode next to a clusterof pancreatic cells. The concentration next to the cells is lowbecause the cells consume .
220
200
180
160
1405000 100 200
Distance from cell cluster (µm)
300[O
2] (
µM)
O2
O2
O2
O2
�1O2
Clark oxygen electrode. [D. T. Sawyer, A. Sobkowiak, and J. L. Roberts, Jr., Electro-
chemistry for Chemists, 2nd ed. (New York: Wiley, 1995).] A modern, commercialoxygen electrode is a three-electrode design with a Au cathode, a Aganode, a reference electrode, and a fluorinatedethylene-propylene polymer membrane. Leland Clark, who invented theClark oxygen electrode, also invented the glucose monitor and the heart-lung machine.
50-�m-thickAg ƒ AgBr
Gradient of dissolved near a cluster of cells measured by microoxygen electrode. [S.-K. Jung, J. R. Trimarchi, R. H. Sanger, and P. J. S. Smith,
“Development and Application of a Self-Referencing Glucose Microsensor for the
Measurement of Glucose Consumption by Pancreatic �-Cells,” Anal. Chem.
2001, 73, 3759.]
O2
Teststrip
(a) (b)
Carbon working electrode 1 coatedwith glucose oxidase and mediator
Carbon working electrode 2 coatedwith mediator but no enzyme
Ag I AgCIreference electrode
Blood isappliedhereElectrical
contacts
Hydrophilic mesh wicksblood over the electrodes
Figure 17-10 (a) Personal glucose monitor used by diabetics to measure blood sugar level.(b) Detailsof disposable test strip to which a drop of blood is applied. [Courtesy Abbott Laboratories MediSense Products,
Bedford, MA.]

17-4 Amperometry 359
Construction of zirconia sensor forautomobiles. [From J. T. Woestman and E. M.
Logothetis, The Industrial Physicist (supplement
to Physics Today), December 1995, p. 20.]
O2
Redox chemistry at the two surfaces of thesensor. The voltage difference between
the two electrodes is governed by the Nernstequation: ,where R is the gas constant, T is the sensortemperature, and F is the Faraday constant.
�V � (RT/2F) ln{PO2(left)/PO2
(right)}
O2
The catalytic converter of an automobile decreases emissionsof CO, nitrogen oxides , and hydrocarbons. When engineexhaust enters the converter, CO and hydrocarbons are oxidized to
and nitrogen oxides are reduced to by Pt and Rh catalysts.The balance between oxidation and reduction requires an opti-mized air-to-fuel ratio. Too much air prohibits the reduction of
and too little air prevents complete combustion of CO andhydrocarbons. A potentiometric sensor is critical for maintain-ing the correct air-to-fuel ratio. This sensor contains a layer of
-doped coated with porous Pt electrodes. Just as doped with contains mobile ions (Figure 15-17), doped with has oxide vacancies that allow ions to dif-fuse through the solid at . One side of the sensor isexposed to exhaust gas and the other side is exposed to air. If is higher on the left side than on the right, diffuses through theporous Pt electrode at the left and is reduced to at the surfaceof the -doped . Oxide ions diffuse through the solid andare oxidized at the right-hand electrode. This galvanic cell pro-duces a voltage difference between the two electrodes that ismeasured by a potentiometer.12
ZrO2Y2O3
O2�
O2
PO2
�600°CO2�Y2O3
ZrO2F�EuF2
LaF3ZrO2Y2O3
O2
NOx
N2CO2
(NOx)Outerelectrode
Spinelcoating
Shroud opening
Zirconiathimble
Air
Heater
Innerelectrode
Exhaust
Heaterwires
Electrodeoutput
Porous Pt Porous PtZrO2 dopedwith Y2O3
O −2
VReference O2 flow Unknown O2 flow
O2 + 4e− → 2O2−2O2− → O2 + 4e−
at the right of the figure is wicked over all three electrodes by a thin hydrophilic (“water-loving”) mesh. A 20-s measurement begins when the liquid reaches the reference electrode.
Working electrode 1 is coated with the enzyme glucose oxidase and a mediator, whichwe describe soon. The enzyme catalyzes the reaction of glucose with :
Reaction in coating above working electrode 1:
(17-10)
In the absence of enzyme, the oxidation of glucose is negligible.Early glucose monitors measured from Reaction 17-10 by oxidation at a single
working electrode, which was held at versus :
(17-11)
The current is proportional to the concentration of , which, in turn, is proportional to theglucose concentration in blood (Figure 17-11).
One problem with early glucose monitors is that their response depended on the concen-tration of in the enzyme layer, because participates in Reaction 17-10. If the con-centration is low, the monitor responds as though the glucose concentration were low.
O2O2O2
H2O2
H2O2 S O2 � 2H� � 2e�Reaction at workingelectrode 1:
Ag 0 AgCl�0.6 VH2O2
CH2OH
OH
OH
OH
HH
HOO2
O
�
CH2OH
OH
OH
H
HOH2O2
O
� O
glucoseoxidase
GluconolactoneOxygenGlucose Hydrogenperoxide
O2
Typical bloodglucose level
Cur
rent
(nA
)
5
2
0
4
6
10 15
[Glucose] (mM)
Figure 17-11 Response of an amperometricglucose electrode with dissolved concen-tration corresponding to an oxygen pressure of0.027 bar, which is 20% lower than the typicalconcentration in subcutaneous tissue. [Data from
S.-K. Jung and G. W. Wilson,“Polymeric Mercaptosilane-
Modified Platinum Electrodes for Elimination of Interfer-
ants in Glucose Biosensors,” Anal. Chem. 1996, 68, 591.]
O2

A good way to reduce dependence is to incorporate into the enzyme layer a speciesthat substitutes for in Reaction 17-10. A substance that transports electrons between theanalyte (glucose, in this case) and the electrode is called a mediator.
Reaction in coating above working electrode 1:
(17-12)
Mediator
The mediator consumed in Reaction 17-12 is then regenerated at the working electrode:
(17-13)
The current at the working electrode is proportional to the concentration of ferrocene, which,in turn, is proportional to the concentration of glucose in the blood.
One problem with glucose monitors is that species such as ascorbic acid (vitamin C),uric acid, and acetaminophen (Tylenol) found in blood can be oxidized at the same potentialrequired to oxidize the mediator in Reaction 17-13. To correct for this interference, the teststrip in Figure 17-10 has a second indicator electrode coated with mediator, but not with glu-cose oxidase. Interfering species that are reduced at electrode 1 are also reduced at electrode2. The current due to glucose is the current at electrode 1 minus the current at electrode 2(both measured with respect to the reference electrode). Now you see why the test strip hastwo working electrodes.
A challenge is to manufacture glucose monitors in such a reproducible manner that theydo not require calibration. A user expects to add a drop of blood to the test strip and get areliable reading without first constructing a calibration curve from known concentrations ofglucose in blood. Each lot of test strips is highly reproducible and calibrated at the factory.
�CH3
FeCH3
workingelectrode
�e�
CH3
FeCH3
Reaction at workingelectrode 1:
�CH3
FeCH3
Glucose � 2
glucoseoxidase gluconolactone � 2 � 2H+
CH3
FeCH3
1,1'-Dimethylferrocene1,1'-Dimethylferricinium cation
O2
O2
360 CHAPTER 17 Electroanalytical Techniques
Box 17-2 What Is an “Electronic Nose”?
In the “old days,” chemists prided themselves on their ability toidentify compounds by odor. Smelling unknown chemicals is abad idea because some vapors are toxic. Chemists are developing“electronic noses” to recognize odors to assess the freshness ofmeat, to find out if fruit is internally bruised, and to detect adul-teration of food products.13
One approach to recognize vapors is to coat interdigitatedelectrodes with an electronically conductive polymer, such as aderivative of polypyrrole.
When gaseous odor molecules are absorbed by the polymer, theelectrical conductivity of the polymer changes. Different gasesaffect conductivity in different ways. Other sensor coatings arepolymers containing conductive particles of silver or graphite.
HN
HN
NH
NH
Polypyrrole
When the polymer absorbs small molecules, it swells and the con-ductivity decreases.
One commercial “nose” has 32 sets of electrodes, eachcoated with a different polymer. The sensor yields 32 differentresponses when exposed to a vapor. The 32 changes are a “finger-print” of the vapor. The electronic nose must be “trained” to rec-ognize an odor by its characteristic fingerprint. Pattern recogni-tion algorithms are employed for this purpose. Other electronicnoses are based on changes in optical absorption of polymers atthe tips of optical fibers and on changes at the gates of field effecttransistors (Section 15-8).
Pt/Au interdigitated electrodes
Conductivepolymer layer
Interdigitated electrodes coated with conductive polymer to create anelectronic nose. The conductivity of the polymer changes when itabsorbs odor molecules. The spacing between “fingers” is .�0.25 mm
Ferrocene contains flat, five-membered rings,similar to benzene. Each ring formally carriesone negative charge, so the oxidation stateof Fe, which sits between the rings, is . Thismolecule is called a sandwich complex.
�2
The mediator lowers the required workingelectrode potential from 0.6 V to 0.2 V versus
, thereby improving the stability of thesensor and eliminating some interference byother species in the blood.
Ag 0 AgCl
A cleverly modified amperometric sensormeasures glucose at a concentration of 2 fMin a volume containing just 36 000molecules of glucose.14
30-�L
A mediator transports electrons between theanalyte and the working electrode. Themediator undergoes no net reaction itself.

Rotating Disk ElectrodeA molecule has three ways to reach the surface of an electrode: (1) diffusion through a con-centration gradient; (2) convection, which is the movement of bulk fluid by physical meanssuch a stirring or boiling; and (3) migration, which is the attraction or repulsion of an ionby a charged surface. A common working electrode for amperometry is the rotating diskelectrode, for which convection and diffusion control the flux of analyte to the electrode.15
When the electrode in Figure 17-12a is spun at revolutions per minute, a vortexis established that brings analyte near the electrode very rapidly by convection. If the poten-tial is great enough, analyte reacts very rapidly at the electrode, reducing the concentrationright at the surface to near 0. The resulting concentration gradient is shown schematically inFigure 17-12b. Analyte must traverse the final, short distance by diffusionalone.
The rate at which analyte diffuses from bulk solution to the surface of the electrode isproportional to the concentration difference between the two regions:
(17-14)
where is the concentration in bulk solution and is the concentration at the surface ofthe electrode. At sufficiently great potential, the rate of reaction at the electrode is so fast that
and Equation 17-14 reduces to
(17-15)
The limiting current is called the diffusion current because it is governed by the rate atwhich analyte can diffuse to the electrode. The proportionality of diffusion current to bulk-solute concentration is the basis for quantitative analysis by amperometry and, in the nextsection, voltammetry.
The faster a rotating disk electrode spins, the thinner is the diffusion layer in Figure 17-12band the greater is the diffusion current. A rapidly rotating Pt electrode can measure in rainwater.16 is oxidized to at (versus S.C.E.) at the Pt surface and the cur-rent is proportional to in the rainwater.[H2O2]
�0.4 VO2H2O2
20 nM H2O2
Limiting current � diffusion current � [C]0
[C]s V [C]0
[C]s[C]0
Current � rate of diffusion � [C]0 � [C]s
(�10–100 �m)
�1 000
17-4 Amperometry 361
Three ways for analyte to reach an electrode:• diffusion• convection• migration
Flexibleconnectionto motor
Topotentiometer
Metal connection
Metal shaft
Cap
Electrode tip(typically Pt)
Polishedface ofelectrode
Bottomview
Teflonjacket
Liquid flow patterninduced by electroderotation
Spring
Carbon contact
Diffusionlayer
Convectionregion
Reactantconcentrationin bulk solution
δ
Distance from electrode surface
Rea
ctan
t con
cent
ratio
n
The symbol means “is proportional to.”�
Figure 17-12 (a) Rotating disk electrode. Only the polished bottom surface of the electrode, whichis typically 5 mm in diameter, contacts the solution. (b) Schematic concentration profile of analytenear the surface of the rotating disk electrode when the potential is great enough to reduce theconcentration of analyte to 0 at the electrode surface.
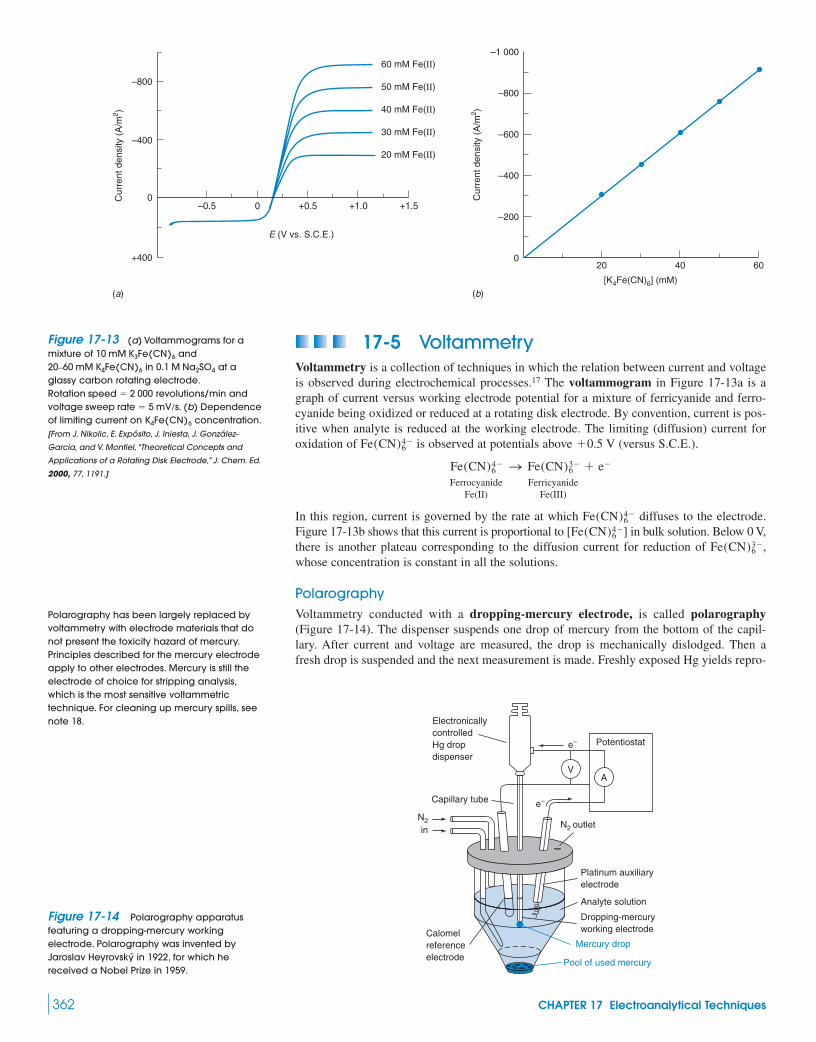
17-5 VoltammetryVoltammetry is a collection of techniques in which the relation between current and voltageis observed during electrochemical processes.17 The voltammogram in Figure 17-13a is agraph of current versus working electrode potential for a mixture of ferricyanide and ferro-cyanide being oxidized or reduced at a rotating disk electrode. By convention, current is pos-itive when analyte is reduced at the working electrode. The limiting (diffusion) current foroxidation of is observed at potentials above (versus S.C.E.).
Ferrocyanide FerricyanideFe(II) Fe(III)
In this region, current is governed by the rate at which diffuses to the electrode.Figure 17-13b shows that this current is proportional to in bulk solution. Below 0 V,there is another plateau corresponding to the diffusion current for reduction of ,whose concentration is constant in all the solutions.
PolarographyVoltammetry conducted with a dropping-mercury electrode, is called polarography(Figure 17-14). The dispenser suspends one drop of mercury from the bottom of the capil-lary. After current and voltage are measured, the drop is mechanically dislodged. Then afresh drop is suspended and the next measurement is made. Freshly exposed Hg yields repro-
Fe(CN)3�6
[Fe(CN)4�6 ]
Fe(CN)4�6
Fe(CN)4�6 S Fe(CN)3�
6 � e�
�0.5 VFe(CN)4�6
362 CHAPTER 17 Electroanalytical Techniques
Cur
rent
den
sity
(A
/m2 )
Cur
rent
den
sity
(A
/m2 )
–1 000
–800–800
–400
0
+400
–600
–400
–200
20
(b)(a)
40 600
[K4Fe(CN)6] (mM)
E (V vs. S.C.E.)
60 mM Fe(II)
50 mM Fe(II)
40 mM Fe(II)
30 mM Fe(II)
20 mM Fe(II)
–0.5 0 +0.5 +1.0 +1.5
Figure 17-13 (a) Voltammograms for amixture of and
in at aglassy carbon rotating electrode.
revolutions/min and. (b) Dependence
of limiting current on concentration.[From J. Nikolic, E. Expósito, J. Iniesta, J. González-
Garcia, and V. Montiel, “Theoretical Concepts and
Applications of a Rotating Disk Electrode,” J. Chem. Ed.
2000, 77, 1191.]
K4Fe(CN)6
voltage sweep rate � 5 mV/sRotation speed � 2 000
0.1 M Na2SO420–60 mM K4Fe(CN)6
10 mM K3Fe(CN)6
ElectronicallycontrolledHg dropdispenser
N2 N2 outlet
Platinum auxiliaryelectrode
Potentiostat
Analyte solution
Dropping-mercuryworking electrode
Mercury dropCalomelreferenceelectrode Pool of used mercury
in
Capillary tube
e–
VA
e–
Figure 17-14 Polarography apparatusfeaturing a dropping-mercury workingelectrode. Polarography was invented byJaroslav Heyrovský in 1922, for which hereceived a Nobel Prize in 1959.
Polarography has been largely replaced byvoltammetry with electrode materials that donot present the toxicity hazard of mercury.Principles described for the mercury electrodeapply to other electrodes. Mercury is still theelectrode of choice for stripping analysis,which is the most sensitive voltammetrictechnique. For cleaning up mercury spills, seenote 18.
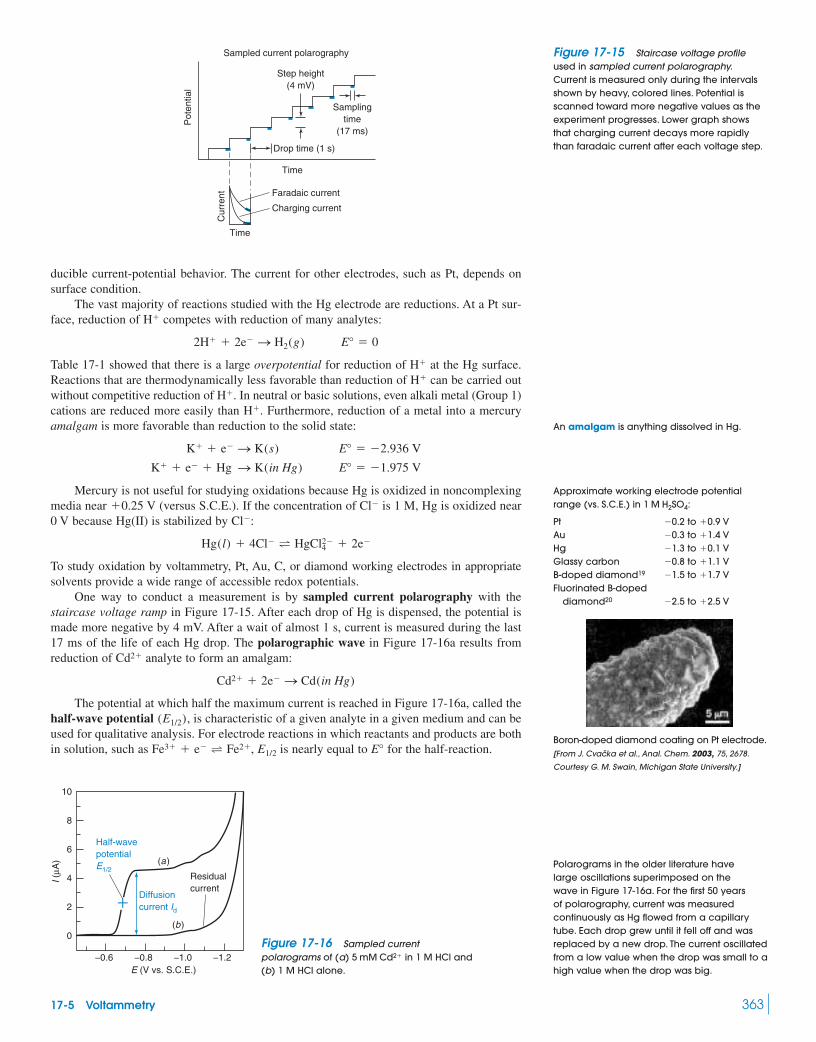
ducible current-potential behavior. The current for other electrodes, such as Pt, depends onsurface condition.
The vast majority of reactions studied with the Hg electrode are reductions. At a Pt sur-face, reduction of competes with reduction of many analytes:
Table 17-1 showed that there is a large overpotential for reduction of at the Hg surface.Reactions that are thermodynamically less favorable than reduction of can be carried outwithout competitive reduction of . In neutral or basic solutions, even alkali metal (Group 1)cations are reduced more easily than . Furthermore, reduction of a metal into a mercuryamalgam is more favorable than reduction to the solid state:
Mercury is not useful for studying oxidations because Hg is oxidized in noncomplexingmedia near (versus S.C.E.). If the concentration of is 1 M, Hg is oxidized near0 V because Hg(II) is stabilized by :
To study oxidation by voltammetry, Pt, Au, C, or diamond working electrodes in appropriatesolvents provide a wide range of accessible redox potentials.
One way to conduct a measurement is by sampled current polarography with thestaircase voltage ramp in Figure 17-15. After each drop of Hg is dispensed, the potential ismade more negative by 4 mV. After a wait of almost 1 s, current is measured during the last17 ms of the life of each Hg drop. The polarographic wave in Figure 17-16a results fromreduction of analyte to form an amalgam:
The potential at which half the maximum current is reached in Figure 17-16a, called thehalf-wave potential , is characteristic of a given analyte in a given medium and can beused for qualitative analysis. For electrode reactions in which reactants and products are bothin solution, such as , is nearly equal to for the half-reaction.E°E1/2Fe3� � e� T Fe2�
(E1/2)
Cd2� � 2e� S Cd(in Hg)
Cd2�
Hg(l) � 4Cl� T HgCl2�4 � 2e�
Cl�
Cl��0.25 V
K� � e� � Hg S K(in Hg) E° � �1.975 V
K� � e� S K(s) E° � �2.936 V
H�
H�
H�
H�
2H� � 2e� S H2(g) E° � 0
H�
17-5 Voltammetry 363
Pot
entia
l
Sampled current polarography
Samplingtime
(17 ms)
Step height(4 mV)
Drop time (1 s)
Time
Faradaic current
Charging current
TimeC
urre
nt
I (µA
)
10
8
6
4
2
0
−1.2−1.0−0.8−0.6E (V vs. S.C.E.)
(a)
(b)
Residualcurrent
Diffusioncurrent Id
Half-wavepotentialE1/2
+
Figure 17-15 Staircase voltage profileused in sampled current polarography.Current is measured only during the intervalsshown by heavy, colored lines. Potential isscanned toward more negative values as theexperiment progresses. Lower graph showsthat charging current decays more rapidlythan faradaic current after each voltage step.
Figure 17-16 Sampled currentpolarograms of (a) in 1 M HCl and(b) 1 M HCl alone.
5 mM Cd2�
An amalgam is anything dissolved in Hg.
Approximate working electrode potentialrange (vs. S.C.E.) in :
Pt to Au to Hg to Glassy carbon to B-doped diamond19 toFluorinated B-doped
diamond20 to �2.5 V�2.5
�1.7 V�1.5�1.1 V�0.8�0.1 V�1.3�1.4 V�0.3�0.9 V�0.2
1 M H2SO4
Boron-doped diamond coating on Pt electrode.[From J. Cvačka et al., Anal. Chem. 2003, 75, 2678.
Courtesy G. M. Swain, Michigan State University.]
Polarograms in the older literature havelarge oscillations superimposed on thewave in Figure 17-16a. For the first 50 yearsof polarography, current was measuredcontinuously as Hg flowed from a capillarytube. Each drop grew until it fell off and wasreplaced by a new drop. The current oscillatedfrom a low value when the drop was small to ahigh value when the drop was big.

For quantitative analysis, the diffusion current in the plateau region is proportional to theconcentration of analyte. Diffusion current is measured from the baseline recorded withoutanalyte in Figure 17-16b. The residual current in the absence of analyte is due to reductionof impurities in solution and on the surface of the electrodes. Near in Figure 17-16,current increases rapidly as reduction of to commences.
For quantitative analysis, the limiting current should be controlled by the rate at whichanalyte can diffuse to the electrode. We minimize convection by using an unstirred solution.We minimize migration (electrostatic attraction of analyte) by using a high concentration ofsupporting electrolyte, such as 1 M HCl in Figure 17-16.
Oxygen must be absent because gives two polarographic waves when it is reduced toand then to (Figure 17-17). Typically, is bubbled through analyte solution for
10 min to remove .21 Then flow in the gas phase is continuted to keep out. The liq-uid should not be purged with during a measurement, because we do not want convectionof analyte to the electrode.
Faradaic and Charging CurrentsThe current we seek to measure in voltammetry is faradaic current due to reduction or oxi-dation of analyte at the working electrode. In Figure 17-16a, faradaic current comes fromreduction of at the Hg electrode. Another current, called charging current (or capaci-tor current or condenser current) interferes with every measurement. We step the workingelectrode to a more negative potential by forcing electrons into the electrode from the poten-tiostat. In response, cations in solution flow toward the electrode, and anions flow away fromthe electrode (Box 17-3). This flow of ions and electrons, called the charging current, is notfrom redox reactions. We try to minimize charging current, which obscures faradaic current.The charging current usually controls the detection limit in voltammetry.
The little graph at the bottom of Figure 17-15 shows the behavior of faradaic and charg-ing currents after each potential step. Faradaic current decays because analyte cannot diffuseto the electrode fast enough to sustain the high reaction rate. Charging current decays evenfaster because ions near the electrode redistribute themselves rapidly. A second after eachpotential step, the faradaic current is still significant and the charging current is very small.
Square Wave VoltammetryThe most efficient voltage profile for voltammetry, called square wave voltammetry, usesthe waveform in Figure 17-18, which consists of a square wave superimposed on a stair-case.22 During each cathodic pulse, there is a rush of analyte to be reduced at the electrode
Cd2�
N2
O2N2O2
N2H2OH2O2
O2
H2H�
�1.2 V
364 CHAPTER 17 Electroanalytical Techniques
I (µA
)8
6
4
2
0
−1.6−1.2−0.8−0.40.0
Saturatedwith air
After purging with N2
E (V vs. S.C.E.)
O2 + 2H+ + 2e– H2O2
H2O2 + 2H+ + 2e–
2H2O
→
→
Figure 17-17 Sampled currentpolarogram of 0.1 M KCl saturated with air andafter bubbling through to remove .O2N2
Cathodicpulse
Anodicpulse
Ep
2
ES
Squarewave
Staircasewave
τ
1
Figure 17-18 Waveform for square wave voltammetry. Typical parameters are pulse height, step height , and . Current is measured in regions 1
and 2. Optimum values are and , where n is the number of electronsin the half-reaction.
Es � 10/n mVEp � 50/n mVpulse period (t) � 5 ms(Es) � 10 mV(Ep) � 25 mV
Faradaic current: due to redox reaction at the electrode
Charging current: due to electrostatic attrac-tion or repulsion of ions in solution and elec-trons in the electrode
Faradaic current is the signal of interest.Charging current obscures the signal ofinterest, so we seek to minimize chargingcurrent.
+
+
++
+
+
e−
−−
−−
−
−
−
Hg
Capillary
Cation insolution
e−
CdCd2+

surface. During the anodic pulse, analyte that was just reduced is reoxidized. The squarewave polarogram in Figure 17-19 is the difference in current between intervals 1 and 2 inFigure 17-18. Electrons flow from the electrode to analyte at point 1 and in the reverse direc-tion at point 2. Because the two currents have opposite signs, their difference is larger thaneither current alone. When the difference is plotted, the shape of the square wave polarogramin Figure 17-19 is essentially the derivative of the sampled current polarogram.
The signal in square wave voltammetry is increased relative to a sampled currentvoltammogram and the wave becomes peak shaped. The signal is increased because reducedproduct from each cathodic pulse is right at the surface of the electrode waiting to be oxidized
17-5 Voltammetry 365
Box 17-3 The Electric Double Layer
When a power supply pumps electrons into or out of an electrode,the charged surface of the electrode attracts ions of oppositecharge. The charged electrode and the oppositely charged ionsnext to it constitute the electric double layer.
A given solution has a potential of zero charge at which thereis no excess charge on the electrode. This potential is (versus a calomel electrode containing 1 M KCl) for a mercuryelectrode immersed in 0.1 M KBr. It shifts to for thesame electrode in 0.1 M KI.
The first layer of molecules at the surface of the electrode isspecifically adsorbed by van der Waals and electrostatic forces.The adsorbed solute could be neutral molecules, anions, orcations. Iodide is more strongly adsorbed than bromide, so thepotential of zero charge for KI is more negative than for KBr: A
�0.72 V
�0.58 V
more negative potential is required to expel adsorbed iodide fromthe electrode surface.
The next layer beyond the specifically adsorbed layer is richin cations attracted by the negative electrode. The excess ofcations decreases with increasing distance from the electrode.This region, whose composition is different from that of bulksolution, is called the diffuse part of the double layer and is typi-cally 0.3–10 nm thick. The thickness is controlled by the balancebetween attraction toward the electrode and randomization bythermal motion.
When a species is created or destroyed by an electrochemicalreaction, its concentration near the electrode is different from itsconcentration in bulk solution (Figure 17-12 and Color Plate 12).The region containing excess product or decreased reactant iscalled the diffusion layer (not to be confused with the diffuse partof the double layer).
Specificallyadsorbedsolute
Other solute
Solution
Specificallyadsorbedsolvent
Solvated cation
Solvatedanion
Diffuse part ofdouble layer(0.3–10 nm)
Bulk solutionTightly adsorbedinner layer
Electrode
+
+
+
+
+
–
–
–
+
+
++
Electrode-solution interface. Thetightly adsorbed inner layer (alsocalled the compact, Helmholtz, orStern layer) may include solventand any solute molecules. Cationsin the inner layer do notcompletely balance the charge ofthe electrode. Therefore, excesscations are required in the diffusepart of the double layer forcharge balance.
Cur
rent
(µA
)
Square wave
Sampled current
30
20
0.0 –0.2 –0.4 –0.6 –0.8 –1.0 –1.2
10
0
Potential (V vs. S.C.E.)
Figure 17-19 Comparison of polarogramsof in 1 M HCl. Waveforms areshown in Figures 17-15 and 17-18. Sampledcurrent: , ,
. Square wave:, ,
, ,.sampling time � 17 ms
pulse height � 25 mVpulse period � 67 msstep height � 4 mVdrop time � 1 s
sampling time � 17 msstep height � 4 mVdrop time � 1 s
5 mM Cd2�
Advantages of square wave voltammetry:• increased signal• derivative (peak) shape permits better
resolution of neighboring signals• faster measurement
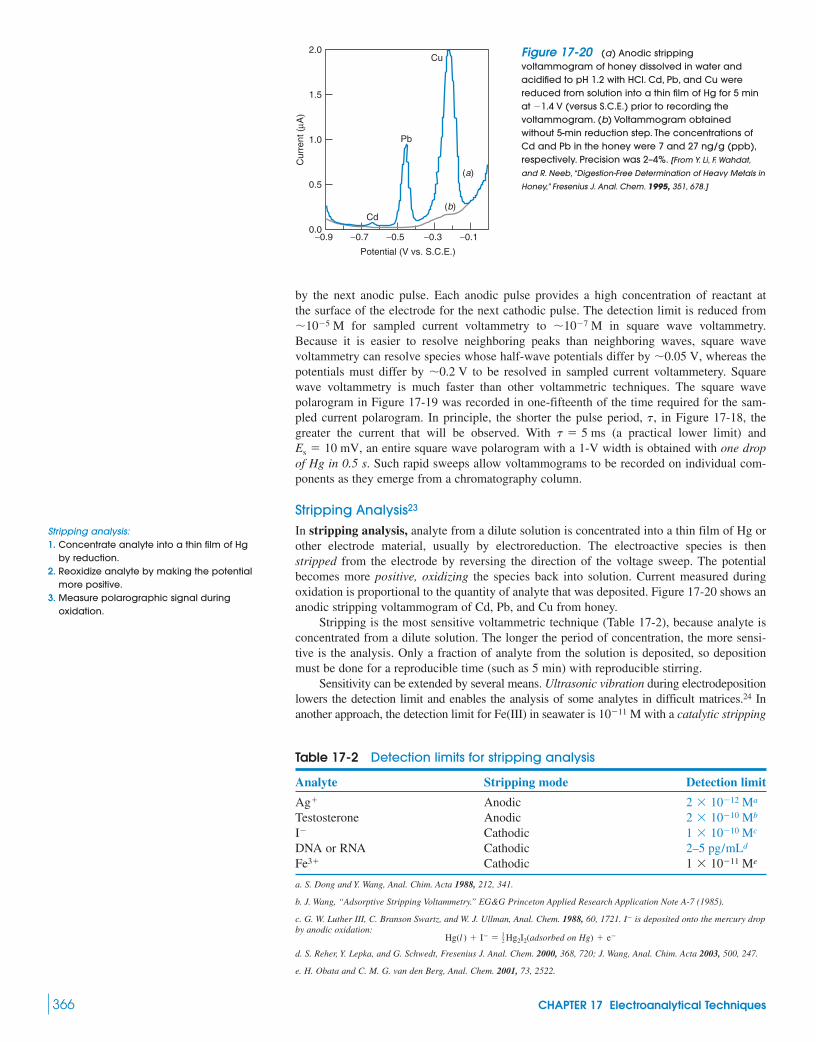
by the next anodic pulse. Each anodic pulse provides a high concentration of reactant atthe surface of the electrode for the next cathodic pulse. The detection limit is reduced from
for sampled current voltammetry to in square wave voltammetry.Because it is easier to resolve neighboring peaks than neighboring waves, square wavevoltammetry can resolve species whose half-wave potentials differ by , whereas thepotentials must differ by to be resolved in sampled current voltammetery. Squarewave voltammetry is much faster than other voltammetric techniques. The square wavepolarogram in Figure 17-19 was recorded in one-fifteenth of the time required for the sam-pled current polarogram. In principle, the shorter the pulse period, , in Figure 17-18, thegreater the current that will be observed. With (a practical lower limit) and
, an entire square wave polarogram with a 1-V width is obtained with one dropof Hg in 0.5 s. Such rapid sweeps allow voltammograms to be recorded on individual com-ponents as they emerge from a chromatography column.
Stripping Analysis23
In stripping analysis, analyte from a dilute solution is concentrated into a thin film of Hg orother electrode material, usually by electroreduction. The electroactive species is thenstripped from the electrode by reversing the direction of the voltage sweep. The potentialbecomes more positive, oxidizing the species back into solution. Current measured duringoxidation is proportional to the quantity of analyte that was deposited. Figure 17-20 shows ananodic stripping voltammogram of Cd, Pb, and Cu from honey.
Stripping is the most sensitive voltammetric technique (Table 17-2), because analyte isconcentrated from a dilute solution. The longer the period of concentration, the more sensi-tive is the analysis. Only a fraction of analyte from the solution is deposited, so depositionmust be done for a reproducible time (such as 5 min) with reproducible stirring.
Sensitivity can be extended by several means. Ultrasonic vibration during electrodepositionlowers the detection limit and enables the analysis of some analytes in difficult matrices.24 Inanother approach, the detection limit for Fe(III) in seawater is with a catalytic stripping10�11 M
Es � 10 mVt � 5 ms
t
�0.2 V�0.05 V
�10�7 M�10�5 M
366 CHAPTER 17 Electroanalytical Techniques
Table 17-2 Detection limits for stripping analysis
Analyte Stripping mode Detection limit
AnodicTestosterone Anodic
CathodicDNA or RNA Cathodic
Cathodic
a. S. Dong and Y. Wang, Anal. Chim. Acta 1988, 212, 341.
b. J. Wang, “Adsorptive Stripping Voltammetry.” EG&G Princeton Applied Research Application Note A-7 (1985).
c. G. W. Luther III, C. Branson Swartz, and W. J. Ullman, Anal. Chem. 1988, 60, 1721. I� is deposited onto the mercury dropby anodic oxidation:
Hg(l ) � I� � (adsorbed on Hg) � e�
d. S. Reher, Y. Lepka, and G. Schwedt, Fresenius J. Anal. Chem. 2000, 368, 720; J. Wang, Anal. Chim. Acta 2003, 500, 247.
e. H. Obata and C. M. G. van den Berg, Anal. Chem. 2001, 73, 2522.
12 Hg2I2
1 � 10�11 MeFe3�
2–5 pg/mLd1 � 10�10 McI�
2 � 10�10 Mb2 � 10�12 MaAg�
−0.9 −0.7 −0.5
Potential (V vs. S.C.E.)
Cur
rent
(µA
)
−0.1−0.3
2.0
1.5
1.0
0.5
0.0
Pb
Cu
Cd
(a)
(b)
Stripping analysis:1. Concentrate analyte into a thin film of Hg
by reduction.2. Reoxidize analyte by making the potential
more positive.3. Measure polarographic signal during
oxidation.
Figure 17-20 (a) Anodic strippingvoltammogram of honey dissolved in water andacidified to pH 1.2 with HCl. Cd, Pb, and Cu werereduced from solution into a thin film of Hg for 5 minat (versus S.C.E.) prior to recording thevoltammogram. (b) Voltammogram obtainedwithout 5-min reduction step. The concentrations ofCd and Pb in the honey were 7 and 27 ng/g (ppb),respectively. Precision was 2–4%. [From Y. Li, F. Wahdat,
and R. Neeb, “Digestion-Free Determination of Heavy Metals in
Honey,” Fresenius J. Anal. Chem. 1995, 351, 678.]
�1.4 V

process. First, 2,3-dihydroxynaphthalene (L), 20 mM bromate and pH 8.0buffer are added to seawater that has been purged with to remove . Dihydroxynaphtha-lene forms a complex, , which adsorbs onto a mercury drop electrode poised at
versus during 60 s of vigorous stirring. After stirring is stopped and thesolution becomes stationary, the potential is scanned from to to give the lowertrace in Figure 17-21. At , Fe(III) is reduced to Fe(II), which begins to diffuse awayfrom the electrode. Before Fe(II) goes very far, oxidizes Fe(II) back to Fe(III), whichbecomes readsorbed and available to be reduced again. The cathodic stripping current is 290times greater in the presence of 20 mM than without . Fe(II) is a catalyst for the netreduction of .
Cyclic VoltammetryIn cyclic voltammetry, we apply the triangular waveform in Figure 17-22 to the workingelectrode. After the application of a linear voltage ramp between times and (typically afew seconds), the ramp is reversed to bring the potential back to its initial value at time .The cycle may be repeated many times.
The initial portion of the cyclic voltammogram in Figure 17-23, beginning at , exhibits acathodic wave. Instead of leveling off at the top of the wave, current decreases at more negativepotential because analyte becomes depleted near the electrode. Diffusion is too slow to replen-ish analyte near the electrode. At the time of peak voltage in Figure 17-23, the cathodic cur-rent has decayed to a small value. After , the potential is reversed and, eventually, reducedproduct near the electrode is oxidized, thereby giving rise to an anodic wave. Finally, as thereduced product is depleted, the anodic current decays back toward its initial value at .
Figure 17-23a illustrates a reversible reaction that is fast enough to maintain equilibriumconcentrations of reactant and product at the electrode surface. The peak anodic and peakcathodic currents have equal magnitudes in a reversible process, and
(17-16)
where and are the potentials at which the peak anodic and peak cathodic currents areobserved and n is the number of electrons in the half-reaction. The half-wave potential, ,lies midway between the two peak potentials. For an irreversible reaction, the cathodic andanodic peaks are drawn out and more separated (Figure 17-23b). At the limit of irreversibil-ity, where the oxidation is very slow, no anodic peak is seen.
E1/2
EpcEpa
Epa � Epc �2.22RT
nF�
57.0n
(mV) (at 25°C)
t2
t1
(t1)
t0
t2
t1t0
LnFe(III)in diffusion layer
BrO�3
¡
¡
LnFe(III)adsorbed � e� !cathodic
stripping LnFe(II)in diffusion layer
BrO�3
BrO�3BrO�
3
BrO�3
�0.6 V�0.8 V�0.1
Ag 0 AgCl�0.1 VLnFe(III)
O2N2
(BrO�3 ),20 �M
17-5 Voltammetry 367
2,3-Dihydroxynaphthalene(Presumably, the polarizable pi electron
cloud of naphthalene is bound to thepolarizable Hg by van der Waals forces)
ß
ß
OH
OH
Current decreases after the cathodic peakbecause of concentration polarization.
–0.4 –0.5 –0.6
Potential (V vs. Ag
–0.7 –0.8
Seawater
AgCl)
1 nA
+ 100 pM Fe(lll)
+ 50 pM Fe(lll)
Figure 17-21 Sampled current cathodic stripping voltammogram of Fe(III) in seawater plus twostandard additions of 50 pM Fe(III). [From H. Obata and C. M G. van den Berg, “Determination of Picomolar Levels
of Iron in Seawater Using Catalytic Cathodic Stripping Voltammetry,” Anal. Chem. 2001, 73, 2522.]
Cat
hodi
c po
tent
ial
t0Time
t1 t2
Figure 17-22 Waveform for cyclicvoltammetry. Corresponding times are indicatedin Figure 17-23.

For a reversible reaction, the peak current ( , amperes) for the forward sweep of thefirst cycle is proportional to the concentration of analyte and the square root of sweep rate:
(17-17)
where n is the number of electrons in the half-reaction, A is the area of the electrode , Cis the concentration (mol/L), D is the diffusion coefficient of the electroactive species ,and is sweep rate (V/s). The faster the sweep rate, the greater the peak current, as long asthe reaction remains reversible. If the electroactive species is adsorbed on the electrode, thepeak current is proportional to rather than
For catalytic stripping in Figure 17-21, current was proportional to consistent with therate-limiting step being diffusion of to the electrode. If the rate-limiting step were reduc-tion of Fe(III) adsorbed on the electrode, the peak current would have been proportional to .
Cyclic voltammetry is used to characterize the redox behavior of compounds such as in Figure 17-24 and to elucidate the kinetics of electrode reactions.25
C60
�BrO3
�
1�,1�.�
�(m2/s)(m2)
Ipc � (2.69 � 108)n3/2ACD1/2�1/2 (at 25°C)
Ipc
368 CHAPTER 17 Electroanalytical Techniques
Figure 17-23 Cyclic voltammograms of(a) in acetonitrile with 0.10 M
electrolyte and (b) 0.060 mM 2-nitropropane in acetonitrile with 0.10 M
electrolyte. The reactionin curve a is
Superoxide
Working electrode, Hg; reference electrode,
in acetonitrile; . is thepeak anodic current and is the peakcathodic current. and are the potentialsat which these currents are observed. [From D. H.
Evans, K. M. O’Connell, R. A. Petersen, and M. J. Kelly,
“Cyclic Voltammetry,” J. Chem. Ed. 1983, 60, 290.]
EpcEpa
Ipc
Ipascan rate � 100 V/sAg 0 0.001 M AgNO3(aq) 0 0.10 M (C2H5)4N�ClO�
4
O2 � e� T O�2
(n-C7H15)4N�ClO�4
(C2H5)4N�ClO�4
1 mM O2
Cathodicpeak
Anodicpeak
100 µA
50 µA
t1
t1
t 0
–1.75
Cur
rent
Potential (V)
–2.00 –2.25
–1.00 –1.25 –1.50
(a)
(b)
lpc
Epa E1/2
EpcE1/2
t 2
t 0
t 2
lpa
C60
(a)
10 µA
(b)
–1.0 –2.0 –3.0
Potential (V vs. ferrocene ferricinium+)
5 µA
(c)
Figure 17-24 (a) Structure of C60
(buckminsterfullerene). (b) Cyclic voltammetryand (c) polarogram of , showing sixwaves for reduction to , , . . . , . Theacetonitrile/toluene solution was at with
supporting electrolyte. Thereference electrode contains the ferrocene
redox couple. Ferrocene isand ferricinium cation is .
The structure of ferrocene was shown inReaction 17-12. [From Q. Xie, E. Pérez-Cordero, and
L. Echegoyen, “Electrochemical Detection of C6�60 and
C6�70 ,” J. Am. Chem. Soc. 1992, 114, 3978.]
(C5H5)2Fe�(C5H5)2Feferricinium�
0(n-C4H9)4N�PF�
6
�10°CC6�
60C2�60C�
60
0.8 mM C60

MicroelectrodesMicroelectrodes have working dimensions from a few tens of micrometers down to nanome-ters.26 The surface area of the electrode is small, so the current is tiny. With a small current,the ohmic drop in a highly resistive medium is small, allowing microelectrodes to beused in poorly conducting nonaqueous media (Figure 17-25). The electrical capacitance ofthe double layer (Box 17-3) of a microelectrode is very small. Low capacitance gives lowbackground charging current relative to the faradaic current of a redox reaction, lowering thedetection limit by as much as three orders of magnitude over conventional electrodes. Lowcapacitance also enables the potential to be varied at rates up to 500 kV/s, thus allowingshort-lived species with lifetimes of less than to be studied.
Sufficiently small electrodes fit inside a living cell. A carbon fiber coated with insulatingpolymer provides a working electrode at the exposed tip. Carbon is fouled byadsorption of organic molecules inside living cells, so a thin layer of Pt or Au is electrolyti-cally plated onto the exposed carbon. The metallized electrode is cleaned in situ (inside thecell during an experiment) by an anodic voltage pulse that desorbs surface-bound species andproduces an oxide layer on the metal, followed by a cathodic pulse to reduce the oxide.27
Figure 17-26 shows a carbon fiber coated with a cation-exchange membrane calledNafion. This membrane, whose structure is shown in Problem 17-7, has fixed negativecharges. Cations diffuse through the membrane, but anions are excluded. The electrode canmeasure the cationic neurotransmitter dopamine in a rat brain.28 Negatively charged ascor-bate, which ordinarily interferes with dopamine analysis, is excluded by Nafion. Theresponse to dopamine is 1 000 times higher than the response to ascorbate.
The gold electrode in Figure 17-27 has a spherical tip with a diameter of 300 nm. Thestructure is coated with insulating paint deposited by electrophoresis, in which positively
1-�m-diameter
1 �s
(� IR)
17-5 Voltammetry 369
0
0.1
0.2
Cur
rent
(nA
)
–2–1012
Potential (V)
Au˜147
core
ss
s
sss
ss
s6/5 5/4 4/33/2 2/1 1/0
0/–1–1/–2
–2/–3–3/–4
–4/–5
–5/–6–6/–7
7/6
8/7
4 µm
Figure 17-25 Voltammogram of gold nanoparticles ( capped with hexanethiolmolecules) in 1,2-dichloroethane solution recorded with Pt working electrode. Thenanoparticle exhibits oxidation states from to over the potential range of this scan. Supportingelectrolyte: . Potential measured versus “quasi-reference”electrode—a silver wire whose potential is versus . [From B. M. Quinn, P. Liljeroth, V. Ruiz,
T. Laaksonen, and K. Kontturi, “Electrochemical Resolution of 15 Oxidation States for Monolayer Protected Gold
Nanoparticles,” J. Am. Chem. Soc. 2003, 125, 6644.]
Ag 0 AgCl�0.1 V[(C6F5)4B]�10 mM [(C6H5)3P¢N¢P(C6H5)3]�
�8�725-�m-diameter
�50Au�147 Figure 17-26 Electron micrograph of the tip of a Nafion-coated carbon fiber electrode.The carbon inside the electrode has a diameterof . Nafion permits cations to pass butexcludes anions. [Photo courtesy R. M. Wightman.
From R. M. Wightman, L. J. May, and A. C. Michael,
“Detection of Dopamine Dynamics in the Brain,” Anal.
Chem. 1988, 60, 769A.]
10 �m
Figure 17-27 Gold microelectrode with spherical tip. [From J. Abbou, C. Demaille, M. Druet, and
J. Moiroux, “Fabrication of Submicrometer-Sized Gold Electrodes of Controlled Geometry for Scanning Electrochemical-
Atomic Force Microscopy,” Anal. Chem. 2002, 74, 6355.]
Advantages of ultramicroelectrodes:• Fit into small places• Useful in resistive, nonaqueous media
(because of small ohmic losses)• Rapid voltage scans (possible because
of small double-layer capacitance) allowshort-lived species to be studied
• Sensitivity increased by orders of magnitudebecause of low charging current
¡HO
NH3
¡
Dopamine
¡HO
�
O
NH3O�
¡¡
� 2H � 2e�� ¡¡
Fecrystalson tipInsulated
ExposedAu tip

charged paint is attracted to the negatively charged metal. A high voltage pulse then exposesthe spherical tip. When is reduced, crystalline Fe(s) is deposited only at thespherical tip. This electrode can be used for scanning electrochemical microscopy, in which amicroelectrode is used to probe the local electrochemical reactivity of a surface.29
17-6 Karl Fischer Titration of H2OThe Karl Fischer titration,30 which measures traces of water in transformer oil, solvents,foods, polymers, and other substances, is performed half a million times each day.31 Thetitration is usually performed by delivering titrant from an automated buret or by coulometricgeneration of titrant. The volumetric procedure tends to be appropriate for larger amounts ofwater (but can go as low as ) and the coulometric procedure tends to be appro-priate for smaller amounts of water.
We illustrate the coulometric procedure in Figure 17-28, in which the main compartmentcontains anode solution plus unknown. The smaller compartment at the left has an internal Ptelectrode immersed in cathode solution and an external Pt electrode immersed in the anodesolution of the main compartment. The two compartments are separated by an ion-permeablemembrane. Two Pt electrodes are used for end-point detection.
Anode solution contains an alcohol, a base, , , and possibly another organic sol-vent. Methanol and diethylene glycol monomethyl ether aretypical alcohols. Typical bases are imidazole and diethanolamine. The organic solvent maycontain chloroform, formamide, or other solvents. The trend is to avoid chlorinated solventsbecause of their environmental hazards. When analyzing nonpolar substances such as trans-former oil, sufficient solvent, such as chloroform, should be used to make the reaction homo-geneous. Otherwise, moisture trapped in oily emulsions is inaccessible. (An emulsion is afine suspension of liquid-phase droplets in another liquid.)
The anode at the lower left in Figure 17-28 generates by oxidation of . In the pres-ence of , reactions occur between the alcohol (ROH), base (B), , and .
(17-18)
(17-19)
The net reaction is oxidation of by , with formation of . One mole of is con-sumed for each mole of when the solvent is methanol. In other solvents, the stoichiom-etry can be more complex.31
In a typical procedure, the main compartment in Figure 17-28 is filled with anode solutionand the coulometric generator is filled with cathode solution that may contain reagents designedto be reduced at the cathode. Current is run until moisture in the main compartment is consumed,as indicated by the end-point detection system described after the Example. An unknown isinjected through the septum and the coulometer is run again until moisture has been consumed.Two moles of electrons correspond to 1 mol of if the stoichiometry is 1:1.I2:H2OH2O
H2OI2ROSO�
3I2SO2
H2O � I2 � ROSO�2 � 2B S ROSO�
3 � 2BH�I�
ROH � SO2 � B S BH� � ROSO�2
I2SO2H2OI�I2
(CH3OCH2CH2OCH2CH2OH)I�SO2
�1 mg H2O
FeSO4(aq)
370 CHAPTER 17 Electroanalytical Techniques
Pt electrodes forcoulometricgeneration of I2
Cathodesolution
Cathode ofgenerator
Ion-permeablemembrane
Anode whereI2 is generated
Magnetic stirring bar
Anode solutionto which unknownis added
Septum forsample injection
Pt electrodes forbipotentiometricend-point detection
Figure 17-28 Apparatus for coulometricKarl Fischer titration.
N
NH
Imidazole
HO
NH
HODiethanolamine
pH is maintained in the range 4 to 7. AbovepH 8, nonstoichiometric side reactions occur.Below pH 3, the reaction is very slow.

Example Standardization and Blank Correction in Karl Fischer Titration
It is routine to standardize Karl Fischer reagents, or even a coulometer, with a standard suchas lincomycin hydrochloride monohydrate, which contains 3.91 wt% . The coulometer isrun until the end point is reached, indicating that the Karl Fischer reagent is dry. A port isopened briefly to add solid lincomycin, which is then titrated to the same end point. Then anunknown is added and titrated in the same manner. Find the wt% in the unknown.
Milligrams Difference �lincomycin observed theoretical blank correction
3.89 172.4 152.1 172.4 � 152.1 � 20.313.64 556.3 533.3 556.3 � 533.3 � 23.019.25 771.4 752.7 771.4 � 752.7 � 18.7
Average � 20.7
Milligrams corrected wt% unknown observed in unknown
24.17 540.8 520.1 520.1 �g/24.17 mg � 2.15%17.08 387.6 366.9 366.9 �g/17.08 mg � 2.15%
SOURCE: Data from W. C. Schinzer, Pfizer Co., Michigan Pharmaceutical Sciences, Portage, MI.
Solution For lincomycin, we observe more than expected, independent ofthe sample size. Excess comes from the atmosphere when the port is opened to addsolid. To determine moisture in unknowns, subtract this blank from the total moisturetitrated. This procedure can generate very reproducible data.
A bipotentiometric measurement is the most common way to detect the end point of aKarl Fischer titration. The detector circuit maintains a constant current (usually 5 or )between the two detector electrodes at the right in Figure 17-28 while measuring the voltageneeded to sustain the current. Prior to the equivalence point, the solution contains , but lit-tle (which is consumed in Reaction 17-19 as fast as it is generated). To maintain a currentof , the cathode potential must be negative enough to reduce some component ofthe solvent system. At the equivalence point, excess suddenly appears and current can becarried at very low voltage by Reactions A and B in Demonstration 17-2. The abrupt voltagedrop marks the end point.
I2
10 �AI2
I�
10 �A
H2OH2O�20.7 �g
(� observed � 20.7)H2O�g H2O
�g H2O
(�g)�g H2O�g H2O
H2O
H2O
17-6 Karl Fischer Titration of H2O 371
Lincomycin hydrochloride monohydrateC18H37N2O7SCI, FM 461.01
3.91 wt% H2O
CH3CH2CH2
�H2O�HCl
HH
CH3
H
H
H
SCH3
CH
OH
OH
HO
HO
H
CH
CONH
CH3
H
H
H
H
HO
N
Demonstration 17-2 The Karl Fischer Jacks of a pH Meter
Some pH meters contain a pair of sockets at the back labeled“K-F” or “Karl Fischer.” When the manufacturer’s instructions arefollowed, a constant current (usually about ) is appliedacross these terminals. To perform a bipotentiometric titration, Ptelectrodes are connected to the K-F sockets. The meter is set tothe millivolt scale, which displays the voltage needed to maintainthe constant current between the electrodes.
Pot
entia
l (m
v)
Volume (mL)
400
300
200
100
5 10 15 20
10 �A
The figure shows the results of a bipotentiometric titration ofascorbic acid with . Ascorbic acid (146 mg) was dissolved in200 mL of water in a 400-mL beaker. Two Pt electrodes wereattached to the K-F outlets of the pH meter and spaced about 4 cmapart in the magnetically stirred solution. The solution was titratedwith (prepared by dissolving 2.4 g of KI plus 1.2 g of in 100 mL of water), and the voltage was recorded after each addi-tion. Prior to the equivalence point, all the is reduced to bythe excess ascorbic acid. Reaction B can occur, but Reaction Acannot. A voltage of about 300 mV is required to support a con-stant current of . (The coupledoes not react at a Pt electrode and cannot carry current.) After theequivalence point, excess is present, so Reactions A and B bothoccur, and the voltage drops precipitously.
(A)
(B) Anode: 3I� S I�3 � 2e�
Cathode: I�3 � 2e� S 3I�
I�3
ascorbate 0 dehydroascorbate10 �A
I�I�3
I20.04 M I�3
I�3

Terms to Understandamalgamampereamperometryauxiliary electrodebiosensorbipotentiometric titrationcharging currentClark electrodeconcentration polarizationcontrolled-potential electrolysiscoulomb
coulometric titrationcoulometrycyclic voltammetrydepolarizerdiffusion currentdropping-mercury electrodeelectric double layerelectroactive specieselectrogravimetric analysiselectrolysisfaradaic current
half-wave potentialKarl Fischer titrationmediatornonpolarizable electrodeohmic potentialoverpotentialpolarizable electrodepolarographic wavepolarographypotentiostatreference electrode
residual currentrotating disk electrodesampled current polarographysquare wave voltammetrystripping analysisvoltammetryvoltammogramworking electrode
SummaryIn electrolysis, a chemical reaction is forced to occur by the flow ofelectricity through a cell. The moles of electrons flowing through thecell are It/F, where I is current, t is time, and F is the Faraday con-stant. The magnitude of the voltage that must be applied to an elec-trolysis cell is
1. Overpotential is the voltage required to overcome the activa-tion energy of an electrode reaction. A greater overpotential isrequired to drive a reaction at a faster rate.
2. Ohmic potential is that voltage needed to overcomeinternal resistance of the cell.
3. Concentration polarization occurs when the concentration ofelectroactive species near an electrode is not the same as itsconcentration in bulk solution. Concentration polarization isembedded in the terms E(cathode) and E(anode).
Overpotential, ohmic potential, and concentration polarizationalways oppose the desired reaction and require a greater voltage tobe applied for electrolysis.
Controlled-potential electrolysis is conducted in a three-electrodecell in which the potential of the working electrode is measuredwith respect to a reference electrode to which negligible currentflows. Current flows between the working and auxiliary electrodes.
In electrogravimetric analysis, analyte is deposited on an elec-trode, whose increase in mass is then measured. With a constant volt-age in a two-electrode cell, electrolysis is not very selective, becausethe working electrode potential changes as the reaction proceeds.
In coulometry, the moles of electrons needed for a chemical reac-tion are measured. In a coulometric (constant current) titration, thetime needed for complete reaction measures the number of electronsconsumed. Controlled-potential coulometry is more selective than
(� IR)
E � E(cathode) � E(anode) � IR � overpotentials.
constant-current coulometry, but slower. Electrons consumed in thereaction are measured by integration of the current-versus-time curve.
In amperometry, the current at the working electrode is propor-tional to analyte concentration. The amperometric glucose monitorgenerates by enzymatic oxidation of glucose and the ismeasured by oxidation at an electrode. A mediator is employed torapidly shuttle electrons between electrode and analyte.
Voltammetry is a collection of methods in which the dependenceof current on the applied potential of the working electrode isobserved. Polarography is voltammetry with a dropping-mercuryworking electrode. This electrode gives reproducible results becausefresh surface is always exposed. Hg is useful for reductions becausethe high overpotential for reduction on Hg prevents interferenceby reduction. Oxidations are usually studied with other electrodesbecause Hg is readily oxidized. For quantitative analysis, the diffu-sion current is proportional to analyte concentration if there is a suffi-cient concentration of supporting electrolyte. The half-wave potentialis characteristic of a particular analyte in a particular medium.
Sampled current voltammetry uses a staircase voltage profilefor measurements with successive, static drops of Hg. One secondafter each voltage step, charging current is nearly 0, but there is stillsubstantial faradaic current from the redox reaction.
Square wave voltammetry achieves increased sensitivity and aderivative peak shape by applying a square wave superimposed ona staircase voltage ramp. With each cathodic pulse, there is a rushof analyte to be reduced at the electrode surface. During the anodicpulse, reduced analyte is reoxidized. The voltammogram is the dif-ference between the cathodic and the anodic currents. Square wavevoltammetry permits fast, real-time measurements not possiblewith other electrochemical methods.
H�
H�
H2O2H2O2
A trend in Karl Fischer coulometric instrumentation is to eliminate the separate cathodecompartment in Figure 17-28 to reduce conditioning time required before samples can beanalyzed and to eliminate clogging of the membrane.32 The challenge is to minimize inter-ference by products of the cathodic reaction.
End points in Karl Fischer titrations tend to drift because of slow reactions and leak-age of water into the cell from the air. Some instruments measure the rate at which mustbe generated to maintain the end point and compare this rate with that measured beforesample was added. Other instruments allow you to set a “persistence of end point” time,typically 5 to 60 s, during which the detector voltage must be stable to define the endpoint.
A round robin study of accuracy and precision of the coulometric procedure identifiedsources of systematic error.33 In some labs, either the instruments were inaccurate or workersdid not measure the quantity of standards accurately. In other cases, the solvent was notappropriate. Commercial reagents are designed for Karl Fischer analysis. Reagents recom-mended by the instrument manufacturer should be used with each instrument.
I2
372 CHAPTER 17 Electroanalytical Techniques

Exercises 373
Exercises17-A. A dilute solution is to be electrolyzed with a pair ofsmooth Pt electrodes at a current density of and a currentof 0.100 A. The products are and at 1.00 bar. Calculatethe required voltage if the cell resistance is and there is noconcentration polarization. What would your answer be if the Ptelectrodes were replaced by Au electrodes?
17-B. (a) At what cathode potential will Sb(s) deposition com-mence from solution at pH 0.00? Express thispotential versus S.H.E. and versus .
(b) What percentage of could be reduced electrolyti-cally to Cu(s) before in the same solution begins tobe reduced at pH 0.00?
17-C. Calculate the cathode potential (versus S.C.E.) needed toreduce cobalt(II) to 1.0 in each of the following solutions. Ineach case, Co(s) is the product of the reaction.(a)(b)
This question is asking you to find the potential at whichwill be .
(c) 0.10 M EDTA at pH 7.00
17-D. Ions that react with can be determined electrogravimet-rically by deposition on a silver working anode:
(a) What will be the final mass of a silver anode used to electrolyze75.00 mL of 0.023 80 M KSCN if the initial mass of the anode is12.463 8 g?(b) At what electrolysis voltage (versus S.C.E.) will AgBr(s) bedeposited from ? (Consider negligible current flow, sothat there is no ohmic potential, concentration polarization, or over-potential.)(c) Is it theoretically possible to separate 99.99% of 0.10 M KI from0.10 M KBr by controlled-potential electrolysis?
17-E. Chlorine has been used for decades to disinfect drinking water.An undesirable side effect of this treatment is reaction with organicimpurities to create organochlorine compounds, some of which couldbe toxic. Monitoring total organic halide (designated TOX) isrequired for many water providers. A standard procedure for TOX isto pass water through activated charcoal that adsorbs organic com-pounds. Then the charcoal is combusted to liberate hydrogen halides:
HX is absorbed into aqueous solution and measured by coulometrictitration with a silver anode:
X�(aq) � Ag(s) S AgX(s) � e�
Organic halide (RX) !O2/800°CCO2 � H2O � HX
0.10 M Br�
Ag(s) � X� S AgX(s) � e�
Ag�
1.0 �M[Co(C2O4)2�2 ]
Co(C2O4)2�2 � 2e� T Co(s) � 2C2O2�
4 E° � �0.474 V
0.10 M C2O2�4
0.10 M HClO4
�M
0.010 M SbO�
0.10 M Cu2�
SbO� � 2H� � 3e� T Sb(s) � H2O E° � 0.208 V
Ag 0 AgCl0.010 M SbO�
2.00 �O2(g)H2(g)
100 A/m2Na2SO4 When 1.00 L of drinking water was analyzed, a current of 4.23 mA was
required for 387 s. A blank prepared by oxidizing charcoal required 6 s at4.23 mA. Express the TOX of the drinking water as .If all halogen is chlorine, express the TOX as .
17-F. was used as an internal standard in the analysis of by square wave polarography. gives a reductionwave at and gives a reduction wave at
. It was first verified that the ratio of peak heights isproportional to the ratio of concentrations over the whole range employedin the experiment. Here are results for known and unknown mixtures:
Analyte Concentration (M) Current
Known
Unknown � Internal Standard??
The unknown mixture was prepared by mixing of unknown (containing only ) plus of
and diluting to mL.(a) Disregarding uncertainties, find in the undiluted unknown.(b) Find the absolute uncertainty for the answer to part (a).
17-G. Consider the cyclic voltammogram of the compound. Suggest a chemical reaction to account for each wave.
Are the reactions reversible? How many electrons are involved in eachstep? Sketch the sampled current and square wave polarogramsexpected for this compound.
E1/2 (V vs. S.C.E.)
1.01 601.00 60�2.38
�1.38
Epa � Epc (mV)Ipa/Ipc
Co
CH
–1.5
Cur
rent
Volts–2.0
2 µA
–2.5
Co(B9C2H11)�2
Co3�
[Pb2�]50.00 (�0.05)3.23 (�0.01) � 10�4 M Cd2�
10.00 (�0.05) mLPb2�
25.00 (�0.05) mL
3.00 (�0.03)Pb2�
2.00 (�0.03)Cd2�
1.58 (�0.03)4.18 (�0.01) � 10�5Pb2�
1.64 (�0.03)3.23 (�0.01) � 10�5Cd2�
(�A)
�0.40 (�0.02) VPb2��0.60 (�0.02) V
Cd2�Pb2�
Cd2�
�g Cl/L�mol halogen/L
Stripping is the most sensitive form of voltammetry. In anodicstripping polarography, analyte is concentrated into a single drop ofmercury by reduction at a fixed voltage for a fixed time. The potentialis then made more positive, and current is measured as analyte isreoxidized. In cyclic voltammetry, a triangular waveform is applied,and cathodic and anodic processes are observed in succession. Micro-electrodes fit into small places and their low current allows them tobe used in resistive, nonaqueous media. Their low capacitance
increases sensitivity by reducing charging current and permits rapidvoltage scanning, which allows very short-lived species to be studied.
The Karl Fischer titration of water uses a buret to deliverreagent or coulometry to generate reagent. In bipotentiometric end-point detection, the voltage needed to maintain a constant currentbetween two Pt electrodes is measured. The voltage changesabruptly at the equivalence point, when one member of a redox coupleis either created or destroyed.
Cyclic voltammogram of . [W. E. Geiger, Jr., W. L. Bowden, and
N. El Murr, “An Electrochemical Study of the Protonation Site of the Cobaltocene Anion
and of Cyclopentadienylcobalt(I) Dicarbollides,” Inorg. Chem. 1979, 18, 2358.]
Co(B9C2H11)�2

374 CHAPTER 17 Electroanalytical Techniques
17-H. In a coulometric Karl Fischer water analysis, 25.00 mL ofpure “dry” methanol required 4.23 C to generate enough to reactwith the residual in the methanol. A suspension of 0.847 6 g ofH2O
I2
finely ground polymeric material in 25.00 mL of the same “dry”methanol required 63.16 C. Find the weight percent of in thepolymer.
H2O
Problems
Fundamentals of Electrolysis
17-1. The figure below shows the behavior of Pt and Ag cathodes atwhich reduction of to occurs. Explain why the twocurves are not superimposed.
17-2. How many hours are required for 0.100 mol of electrons toflow through a circuit if the current is 1.00 A?
17-3. The standard free-energy change for the formation of from is . The reactions are
Calculate the standard voltage needed to decompose waterinto its elements by electrolysis. What does the word standardmean in this question?
17-4. Consider the following electrolysis reactions.
(a) Calculate the voltage needed to drive the net reaction if currentis negligible.(b) Suppose that the cell has a resistance of and a current of100 mA. How much voltage is needed to overcome the cell resist-ance? This is the ohmic potential.(c) Suppose that the anode reaction has an overpotential of 0.20 Vand that the cathode overpotential is 0.40 V. What voltage is neededto overcome these effects combined with those of parts (a) and (b)?(d) Suppose that concentration polarization occurs. The concentra-tion of at the cathode surface increases to 1.0 M and the con-centration of at the anode surface decreases to 0.010 M. Whatvoltage is needed to overcome these effects combined with those ofparts (b) and (c)?
17-5. Which voltage, or , in the diagram, is constant incontrolled-potential electrolysis?
V2V1
Br�
OH�
2.0 �
Anode: Br�(aq, 0.10 M) T 12 Br2(l) � e�
Cathode: H2O(l) � e� T 12 H2(g, 1.0 bar) � OH�(aq, 0.10 M)
(E°)
Anode: H2O T 12 O2(g) � 2H� � 2e�
Cathode: 2H2O � 2e� T H2(g) � 2OH�
�G° � �237.13 kJH2O(l)12O2(g)
H2(g) �
Cur
rent
−0.9−0.8−0.7−0.6−0.4−0.3−0.2E (vs. S.C.E.)
Pt Ag
0.5 µA
H2(g)H3O�
17-6. The Weston cell shown here is a stable voltage standard for-merly used in potentiometers. (The potentiometer compares anunknown voltage with that of the standard. In contrast with the con-ditions of this problem, very little current may be drawn from thecell if it is to be an accurate voltage standard.)
(a) How much work (J) can be done by the Weston cell if thevoltage is 1.02 V and 1.00 mL of Hg ( ) isdeposited?(b) If the cell passes current through a resistor that dissipatesheat at a rate of 0.209 J/min, how many grams of Cd are oxidizedeach hour? (This question is not meant to be consistent with part(a). The voltage is no longer 1.02 volts.)
17-7. The chlor-alkali process,34 in which seawater is electrolyzedto produce and NaOH, is the second most important commer-cial electrolysis, behind production of aluminum.
The semipermeable Nafion membrane used to separate the anodeand cathode compartments resists chemical attack. Its anionic sidechains permit conduction of , but not anions. The cathode com-partment is loaded with pure water, and the anode compartment con-tains seawater from which and have been removed.Explain how the membrane allows NaOH to be formed free of NaCl.
Mg2�Ca2�
Na�
Hg Cathode: Na� � H2O � e� S NaOH � 12 H2
Anode: Cl� S 12 Cl2 � e�
Cl2
100-�
density � 13.53 g/mL
Hg(I)
CdSO4(aq)(saturated at 4°C)
Permeablemembrane
Hg2SO4(s)
Permeablemembraneto retainamalgam
Saturated Cdamalgam
e– e–Pt contacts
Hg2SO4 + Cd(in Hg) 2Hg + CdSO4
A
V2
V1
Current versus voltage for Pt and Ag electrodes in , aqueous adjusted to pH 3.2. [From D. Marín, F. Mendicuti, and C. Teijeiro, “An Electrochemistry
Experiment: Hydrogen Evolution Reaction on Different Electrodes,” J. Chem. Ed. 1994,
71, A277.]
H2SO4O2-free
A saturated Weston cell containing excess solid is a more precisevoltage standard than the unsaturated cell but is more sensitive totemperature and mechanical shock and cannot be easily incorporatedinto portable equipment.
CdSO4
Diagram for Problem 17-5.

Problems 375
17-8. The lead-acid battery in a car has six cells in series, eachdelivering close to 2.0 V for a total of 12 V when the battery isdischarging. To recharge the battery requires per cell, or
for the entire battery.35 Explain these observations in termsof Equation 17-6.
Electrogravimetric Analysis
17-9. A 0.326 8-g unknown containing (leadlactate, FM 385.3) plus inert material was electrolyzed to produce0.111 1 g of (FM 239.2). Was the deposited at the anodeor at the cathode? Find the weight percent of lead lactate in theunknown.
17-10. A solution of is to be electrolyzed to reduce the toSn(s). Calculate the cathode potential (versus S.H.E.) needed toreduce the concentration to if no concentrationpolarization occurs. What would be the potential versus S.C.E.instead of S.H.E? Would the potential be more positive or morenegative if concentration polarization occurred?
17-11. What cathode potential (versus S.H.E.) is required to reduce99.99% of Cd(II) from a solution containing 0.10 M Cd(II) in 1.0 Mammonia if there is negligible current? Consider the following reac-tions and assume that nearly all Cd(II) is in the form .
Coulometry
17-12. Explain how the amperometric end-point detector in Fig-ure 17-8 operates.
17-13. What does a mediator do?
17-14. The sensitivity of a coulometer is governed by the deliveryof its minimum current for its minimum time. Suppose that 5 mAcan be delivered for 0.1 s.(a) How many moles of electrons are delivered by 5 mA for 0.1 s?(b) How many milliliters of a 0.01 M solution of a two-electronreducing agent are required to deliver the same number of electrons?
17-15. The experiment in Figure 17-8 required 5.32 mA for 964 sfor complete reaction of a 5.00-mL aliquot of unknown cyclohexenesolution.(a) How many moles of electrons passed through the cell?(b) How many moles of cyclohexene reacted?(c) What was the molarity of cyclohexene in the unknown?
17-16. can be analyzed by titration with coulometricallygenerated .
To 50.00 mL of sample were added 4 g of KI. Electrolysis required812 s at 52.6 mA. Calculate the concentration of ) inthe sample.
H2S(�g/mL
H2S � I2 S S(s) � 2H� � 2I�
I2
H2S(aq)
Cd2� � 2e� T Cd(s) E° � �0.402 V
Cd2� � 4NH3 T Cd(NH3)2�4 �4 � 3.6 � 106
Cd(NH3)2�4
1.0 � 10�8 MSn2�
Sn2�Sn2�
PbO2PbO2
Pb(CH3CHOHCO2)2
�14 V�2.4 V
CF2 n��CF2
Oç
CFCF2
�
ç
O
CF2ç
CFCF3ç
CF2CF2SO3Na�
ç
Nafion
x17-17. is to be generated in solution for coulo-metric reduction of azobenzene.
Azobenzene
Aniline
At the counter electrode, water is oxidized, and is liberated at apressure of 0.20 bar. Both electrodes are made of smooth Pt, andeach has a total surface area of . The rate of reduction ofthe azobenzene is 25.9 nmol/s, and the resistance of the solutionbetween the generator electrodes is .(a) Calculate the current density ( ) at the electrode surface.Use Table 17-1 to estimate the overpotential for liberation.(b) Calculate the cathode potential (versus S.H.E.) assuming that
and .(c) Calculate the anode potential (versus S.H.E.).(d) What should the applied voltage be?
17-18. In an extremely accurate measurement of the Faraday con-stant, a pure silver anode was oxidized to with a constant cur-rent of for to give a mass loss of from the anode.Given that the atomic mass of Ag is , find thevalue of the Faraday constant and its uncertainty.
17-19. Coulometric titration of sulfite in wine.36 Sulfur dioxide isadded to many foods as a preservative. In aqueous solution, the fol-lowing species are in equilibrium:
(A)Sulfur dioxide Sulfurous acid Bisulfite Sulfite
Bisulfite reacts with aldehydes in food near neutral pH:
(B)
Sulfite is released from the adduct in 2 M NaOH and can be ana-lyzed by its reaction with to give and sulfate. Excess mustbe present for quantitative reaction.
Here is a coulometric procedure for analysis of total sulfite inwhite wine. Total sulfite means all species in Reaction (A) and theadduct in Reaction (B). We use white wine so that we can see thecolor of a starch-iodine end point.
1. Mix 9.00 mL of wine plus 0.8 g NaOH and dilute to 10.00 mL.The NaOH releases sulfite from its organic adducts.
2. Generate at the working electrode (the anode) by passinga known current for a known time through the cell in Fig-ure 17-9. The cell contains 30 mL of 1 M acetate buffer(pH 3.7) plus 0.1 M KI. The reaction in the cathode compart-ment is reduction of to . The frit retards diffu-sion of into the main compartment, where it would reactwith to give .
3. Generate at the anode with a current of 10.00 mA for4.00 min.
4. Inject 2.000 mL of the wine/NaOH solution into the cell,where the sulfite reacts with , leaving excess .
5. Add 0.500 mL of 0.050 7 M thiosulfate to consume byReaction 16-19 and leave excess thiosulfate.
I�3
I�3I�
3
I�3
IO�I�3
OH�
H2 � OH�H2O
I�3
I�3I�I�
3
�HSO3HO R
H�SO3
Aldehyde Adduct
C
H
R
O �
SO2 T H2SO3 T HSO�3 T SO2�
3
107.868 2 (�0.000 2)4.097 900 (�0.000 003) g
18 000.075 (�0.010) s0.203 639 0 (�0.000 000 4) AAg�
[Ti3�]surface � 0.10 M[TiO2�]surface � [TiO2�]bulk � 0.050 M
O2
A/m252.4 �
1.00 cm2
O2
2C6H5NH2 � 4TiO2� � 4H�
4Ti3� � C6H5N¢NC6H5 � 4H2O STiO2� � 2H� � e� T Ti3� � H2O E° � 0.100 V
0.10 M HClO4Ti3�

376 CHAPTER 17 Electroanalytical Techniques
6. Add starch indicator to the cell and generate fresh with aconstant current of 10.0 mA. A time of 131 s was required toconsume excess thiosulfate and reach the starch end point.
(a) In what pH range is each form of sulfurous acid predominant?(b) Write balanced half-reactions for the anode and cathode.(c) At pH 3.7, the dominant form of sulfurous acid is and thedominant form of sulfuric acid is . Write balanced reactionsbetween and and between and thiosulfate.(d) Find the concentration of total sulfite in undiluted wine.
17-20. Chemical oxygen demand by coulometry. An electrochemi-cal device incorporating photooxidation on a surface couldreplace refluxing with to measure chemical oxygen demand(Box 16-1). The diagram shows a working electrode held at versus and coated with nanoparticles of . Upon ultra-violet irradiation, electrons and holes are generated in the Holesoxidize organic matter at the surface. Electrons reduce at the aux-iliary electrode in a compartment connected to the working compart-ment by a salt bridge. The sample compartment is only 0.18 mm thickwith a volume of . It requires for all organic matter todiffuse to the surface and be exhaustively oxidized.
The blank curve in the graph below shows the response whenthe sample compartment contains just electrolyte. Before irradiation,no current is observed. Ultraviolet radiation causes a spike in the cur-rent with a rapid decrease to a steady level near . This currentarises from oxidation of water at the surface under ultravioletexposure. The upper curve shows the same experiment, but with
300
240
180
120
60
0
0 20 40 60 80 100 120 140
Time (s)
Sample
Blank
Pho
tocu
rren
t (µA
)
TiO2
40 �A
Workingelectrode heldat +0.30 V vs.
Ultravioletradiation
Organicmatter
Oxidationproducts
TiO2 nanoparticlecoating onelectrode surface
AgCl
e–
Ag
TiO2
�1 min13.5 �L
H2OTiO2.
TiO2Ag 0 AgCl�0.3 V
Cr2O2�7
TiO2
I�3HSO�
3I�3
HSO�4
HSO�3
I�3 wastewater in the sample compartment. The increased current arises
from oxidation of organic matter. When the organic matter is con-sumed, the current decreases to the blank level. The area betweenthe two curves tells us how many electrons flow from oxidation oforganic matter in the sample.(a) Balance the oxidation half-reaction that occurs in this cell:
where X is any halogen. Express the stoichiometry coefficients A,B, C, D, E, and F in terms of c, h, o, n, and x.(b) How many molecules of are required to balance the half-reaction in part (a) by reduction of oxygen
(c) The area between the two curves in the graph is This is the number of electrons liberated by
complete oxidation of the sample. How many moles of would berequired for the same oxidation?(d) Chemical oxygen demand (COD) is expressed as mg of required to oxidize 1 L of sample. Find the COD for this sample.(e) If the only oxidizable substance in the sample were
what is its concentration in mol/L?
Amperometry
17-21. What is a Clark electrode, and how does it work?
17-22. (a) How does the glucose monitor work?(b) Why is a mediator advantageous in the glucose monitor?
17-23. For a rotating disk electrode operating at sufficiently greatpotential, the redox reaction rate is governed by the rate at whichanalyte diffuses through the diffusion layer to the electrode(Figure 17-12b). The thickness of the diffusion layer is
where D is the diffusion coefficient of reactant , is thekinematic viscosity of the liquid , and
is the rotation rate (radians/s) of the electrode. There are radi-ans in a circle. The current density is
where n is the number of electrons in the half-reaction, F is theFaraday constant, and is the concentration of the electroactivespecies in bulk solution ( , not mol/L). Consider the oxida-tion of in a solution of 10.0 mM
at �0.90 V (versus S.C.E.) at a rotation speed ofrevolutions per minute.15 The diffusion coefficient ofis , and the kinematic viscosity is
Calculate the thickness of the diffusion layer andthe current density. If you are careful, the current density shouldlook like the value in Figure 17-13b.
Voltammetry
17-24. In solution, is reduced to near (versus S.C.E.), and is reduced to Cu(in Hg) near
.(a) Sketch a qualitative sampled current polarogram for a solutionof .(b) Sketch a polarogram for a solution of .(c) Suppose that Pt, instead of Hg, were used as the working elec-trode. Which, if any, reduction potential would you expect tochange?
Cu2�
Cu�
�0.6 VCu��0.3
Cu�Cu2�1 M NH3/1 M NH4Cl
1.1 � 10�6 m2/s.2.5 � 10�9 m2/sFe(CN)4�
6
1032.00 �K4Fe(CN)6
K3Fe(CN)6 � 50.0 mMFe(CN)4�6
mol/m3C0
Current density � 0.62nFD23��16�12C0
(A/m2)2��
(� viscosity/density � m2/s)�(m2/s)
d � 1.61D1/3�1/6��1/2
C9H6NO2ClBr2,
O2
O2
Iblank)dt � 9.43 mC.��
0 (Isample �
2H2O)?(O2 � 4H� � 4e� S
O2
CcHhOoNnXx � AH2O S BCO2 � CX� � DNH3 � EH� � Fe�
Photocurrent response for sample and blank. Both solutions contain. [From H. Zhao, D. Jiang, S. Zhang, K. Catterall, and R. John, “Development
of a Direct Photoelectrochemical Method for Determination of Chemical Oxygen
Demand,” Anal. Chem. 2004, 76, 155.]
2 M NaNO3

Problems 377
17-25. (a) Explain the difference between charging current andfaradaic current.(b) What is the purpose of waiting 1 s after a voltage pulse beforemeasuring current in sampled current voltammetry?(c) Why is square wave voltammetry more sensitive than sampledcurrent voltammetry?
17-26. Suppose that the diffusion current in a polarogram for reduc-tion of at a mercury electrode is . If the solution con-tains 25 mL of 0.50 mM , what percentage of is reducedin the 3.4 min required to scan from to ?
17-27. The drug Librium gives a polarographic wave with (versus S.C.E.) in . A 50.0-mL sample
containing Librium gave a wave height of . When 2.00 mLof 3.00 mM Librium in were added to the sample,the wave height increased to . Find the molarity of Libriumin the unknown.
17-28. Explain what is done in anodic stripping voltammetry. Whyis stripping the most sensitive polarographic technique?
17-29. The figure below shows a series of standard additions of to acidified tap water measured by anodic stripping voltammetry atan iridium electrode. The unknown and all standard additions weremade up to the same final volume.(a) What chemical reaction occurs during the concentration stage ofthe analysis?(b) What chemical reaction occurs during the stripping stage of theanalysis?(c) Find the concentration of in the tap water.
17-30. From the two standard additions of 50 pm Fe(III) in Fig-ure 17-21, find the concentration of Fe(III) in the seawater. Esti-mate where the baseline should be drawn for each trace and meas-ure the peak height from the baseline. Consider the volume to beconstant for all three solutions.
+ 500 ppb
+ 400 ppb
+ 300 ppb
+ 200 ppb
+ 100 ppb
Tapwater
0
2.0
1.6
1.2
Cur
rent
(µA
)
0.8
0.4
0.1 0.2 0.3 0.4
Potential (V vs. Ag AgCl)
Cu2�
Cu2�
0.80 �A0.05 M H2SO4
0.37 �A0.05 M H2SO4�0.265 V
E1/2 �
�1.2 V�0.6Cd2�Cd2�
14 �ACd2�
17-31. The cyclic voltammogram of the antibiotic chloramphenicol(abbreviated ) is shown here. The scan was started at 0 V,and potential was swept toward negative voltage. The first cathodicwave, A, is from the reaction
. Explain what happens at peaks B and C by using the reactionWhy was peak C not seen in the
initial scan?
17-32. Peak current and scan rate ( ) are listed for cyclicvoltammetry of a water-soluble ferrocene deriv-ative in 0.1 M NaCl.37
If a graph of versus gives a straight line, then the reaction isdiffusion controlled. Prepare such a graph and use it to find the dif-fusion coefficient of the reactant for this one-electron oxidation.The area of the working electrode is and the concentra-tion of reactant is 1.00 mM.
17-33. What are the advantages of using a microelectrode forvoltammetric measurements?
17-34. What is the purpose of the Nafion membrane in Figure 17-26?
Karl Fischer Titration
17-35. Write the chemical reactions that show that 1 mol of isrequired for 1 mol of in a Karl Fischer titration.
17-36. Explain how the end point is detected in a Karl Fischer titra-tion in Figure 17-28.
H2OI2
0.020 1 cm2
1�Ip
Scan rate Peak anodic current(V/s) (�A)
0.019 2 2.180.048 9 3.460.075 1 4.170.125 5.660.175 6.540.251 7.55
PF6
�
N�CH33
Fe
�
(Fe(II) S Fe(III))�(Ip)
0
0.8
Cur
rent
(µA
)
Potential (V vs. Ag AgCl)
A
B
C
–0.8–0.400.4
40
20
OH OH
RNO2
O2N NHCOCHCl2
Chloramphenicol
RNO � 2e� � 2H� T RNHOH.H2O
RNO2 � 4e� � 4H� S RNHOH �
RNO2
Anodic stripping voltammograms of tap water and five standard additionsof . [From M. A. Nolan and S. P. Kounaves, “Microfabricated Array of Ir
Microdisks for Determination of Cu2� or Hg2� Using Square Wave Stripping
Voltammetry,” Anal. Chem. 1999, 71, 3567.]
100 ppb Cu2�
Cyclic voltammogram of chloramphenicol in 0.1 M acetate buffer,pH 4.62. The voltage of the carbon paste working electrode was scannedat a rate of 350 mV/s. [P. T. Kissinger and W. R. Heineman,“Cyclic Voltammetry,”
J. Chem. Ed. 1983, 60, 702.]
3.7 � 10�4

378 CHAPTER 18 Fundamentals of Spectrophotometry
Ozone, formed at altitudes of 20 to 40 km by the action of solar ultraviolet radiation on , absorbs ultraviolet radiation that causes sunburns and skin cancer.
Ozone
In 1985, the British Antarctic Survey reported that the total ozone in the Antarctic strato-sphere had decreased by 50% in early spring, relative to levels observed in the preceding20 years. Ground, airborne, and satellite observations have since shown that this “ozonehole” occurs only in early spring (Figure 1-1) and continued to deepen until the year 2000.
An explanation begins with chlorofluorocarbons such as Freon-12 , formerlyused in refrigerators and air conditioners. These long-lived compounds, which are notfound in nature,2 diffuse to the stratosphere, where they catalyze ozone decomposition.
(1) Photochemical Cl formation
(2)
(3) s(4)
Cl produced in step 4 reacts again in step 2, so a single Cl atom can destroy mole-cules of . The chain is terminated when Cl or ClO reacts with hydrocarbons or toform HCl or .
Stratospheric clouds3 formed during the antarctic winter catalyze the reaction of HClwith to form , which is split by sunlight into Cl atoms to initiate destruction:
Polar stratospheric clouds require winter cold to form. Only when the sun is rising inSeptember and October, and clouds are still present, are conditions right for destruction.
To protect life from ultraviolet radiation, international treaties now ban or phase outchlorofluorocarbons, and there is an effort to find safe substitutes.
O3
HCl � ClONO2!surface of
polar cloudsCl2 � HNO3 Cl2 ¡h�
2Cl
O3Cl2ClONO2
ClONO2
NO2O3
7 105
O � ClO S Cl � O2
Net reaction of (2)–(4):Catalytic O3 destruction
2O3 S 3O2
O3 ¡h�O � O2
Cl � O3 S ClO � O2
CCl2F2 ¡h�CClF2 � Cl
(CCl2F2)
O2 ¡h�2O O � O2 S O3
O2
(h�)
THE OZONE HOLE1
Fundamentals of Spectrophotometry18
Spectrum of ozone, showing maximumabsorption of ultraviolet radiation at awavelength near 260 nm. [Adapted fromR. P. Wayne, Chemistry of Atmospheres (Oxford:Clarendon Press, 1991).]
Spectroscopically measured concentrationsof and ClO (measured in ) in thestratosphere near the South Pole in 1987.The loss of at latitudes where ClO has a high concentration is consistent with the knownchemistry of catalytic destruction of byhalogen radicals. [From J. G. Anderson, W. H. Brune,and M. H. Proffitt, J. Geophys. Res. 1989, 94D, 11465.]
O3
O3
ppb � nL/LO3
Mean atmospheric at Halley in Antarcticain October. Dobson units are defined in Problem18-13. [From J. D. Shanklin, British Antarctic Survey,http://www.antarctica.ac.uk/met/jds/ozone/]
O3
10–17
1000
250Mol
ar a
bsor
ptiv
ity (
M–1
cm
–1)
Wavelength (nm)
Absorption cross section (cm
2)
10–18
10–19
10–20
10–21
100
10
1
0.1350 300
16 September 1987
1 000
800
600
400
200
62 63 64 65 66 67 68 69 70 71 72Latitude (degrees south)
3 000
2 000
1 000
O3
ClO0
350
300
250
200
150
100
50Tot
al o
zone
(D
obso
n un
its)
Year
1950 1960 1970 1980 1990 2000 2010
Ozone hole appears to have reached bottom

18-1 Properties of LightIt is convenient to describe light in terms of both particles and waves. Light waves consistof perpendicular, oscillating electric and magnetic fields. For simplicity, a plane-polarizedwave is shown in Figure 18-1. In this figure, the electric field is in the xy plane, and the mag-netic field is in the xz plane. Wavelength, , is the crest-to-crest distance between waves.Frequency, , is the number of complete oscillations that the wave makes each second. Theunit of frequency is . One oscillation per second is also called one hertz (Hz). A fre-quency of is therefore said to be Hz, or 1 megahertz (MHz).
The relation between frequency and wavelength is
(18-1)
where c is the speed of light ( in vacuum). In a medium other than vacuum,the speed of light is c/n, where n is the refractive index of that medium. For visible wave-lengths in most substances, , so visible light travels more slowly through matter thanthrough vacuum. When light moves between media with different refractive indexes, the fre-quency remains constant but the wavelength changes.
With regard to energy, it is more convenient to think of light as particles called photons.Each photon carries the energy, E, which is given by
(18-2)
where h is Planck’s constant .Equation 18-2 states that energy is proportional to frequency. Combining Equations 18-1
and 18-2, we can write
(18-3)
where is called wavenumber. Energy is inversely proportional to wavelength anddirectly proportional to wavenumber. Red light, with a longer wavelength than blue light, isless energetic than blue light. The most common unit for wavenumber in the literature is
, read “reciprocal centimeters” or “wavenumbers.”cm�1
�� (� 1/�)
E �hc
�� hc��
(� 6.626 � 10�34 J � s)
E � h�Relation between energyand frequency:
n 7 1
2.998 � 108 m/s
�� � cRelation between frequencyand wavelength:
106106 s�1second�1
��
18-1 Properties of Light 379
Spectrophotometry is any technique that uses light to measure chemical concentrations.A procedure based on absorption of visible light is called colorimetry. The most-cited articlein the journal Analytical Chemistry from 1945 to 1999 describes a colorimetric method bywhich biochemists measure sugars.4
y
Electric field
Magnetic fieldz
x
λ
CO2 O2
Tim
e
10 5 0Vol%
25 20 15 10
Here is an example of what spectrophotometrycan do. These traces show the continuousmeasurement of O2 and CO2 in the airway ofa healthy person. O2 is detected by ultravioletabsorption at a wavelength of 147 nm. CO2
is detected by infrared absorption at awavenumber of [P. B. Arnoudse,
H. L. Pardue, J. D. Bourland, R. Miller, and L. A. Geddes,
“Breath-by-Breath Determination of O2 and CO2 Based
on Nondispersive Absorption Measurements,” Anal.
Chem. 1992, 64, 200.]
2.3 � 103 cm�1.
Figure 18-1 Plane-polarized electromagnetic radiation of wavelength , propagating along thex-axis. The electric field of plane-polarized light is confined to a single plane. Ordinary, unpolarizedlight has electric field components in all planes.
�
After the discovery of the Antarctic ozone “hole” in 1985,atmospheric chemist Susan Solomon led the first expedition in1986 specifically intended to make chemical measurements ofthe Antarctic atmosphere by using balloons and ground-basedspectroscopy. The expedition discovered that ozone depletionoccurred after polar sunrise and that the concentration of chemi-cally active chlorine in the stratosphere was �100 times greaterthan had been predicted from gas-phase chemistry. Solomon’sgroup identified chlorine as the culprit in ozone destruction and polar stratospheric clouds as the catalytic surface for therelease of so much chlorine.

Regions of the electromagnetic spectrum are labeled in Figure 18-2. Names are histor-ical. There are no abrupt changes in characteristics as we go from one region to the next,such as visible to infrared. Visible light—the kind of electromagnetic radiation we see—rep-resents only a small fraction of the electromagnetic spectrum.
18-2 Absorption of LightWhen a molecule absorbs a photon, the energy of the molecule increases. We say thatthe molecule is promoted to an excited state (Figure 18-3). If a molecule emits a photon, theenergy of the molecule is lowered. The lowest energy state of a molecule is called theground state. Figure 18-2 indicates that microwave radiation stimulates rotation of mole-cules when it is absorbed. Infrared radiation stimulates vibrations. Visible and ultravioletradiation promote electrons to higher-energy orbitals. X-rays and short-wavelength ultravio-let radiation break chemical bonds and ionize molecules. Medical X-rays damage the humanbody, so your exposure should be minimized.
Example Photon Energies
By how many kilojoules per mole is the energy of increased when it absorbsultraviolet radiation with a wavelength of 147 nm? How much is the energy of increased when it absorbs infrared radiation with a wavenumber of ?
Solution For the ultraviolet radiation, the energy increase is
(1.35 � 10�18 J/molecule)(6.022 � 1023 molecules/mol) � 814 kJ/mol
� (6.626 � 10�34 J � s) c (2.998 � 108 m/s)
(147 nm)(10�9 m/nm)d � 1.35 � 10�18 J/molecule
�E � h� � hc
�
2 300 cm�1CO2
O2
380 CHAPTER 18 Fundamentals of Spectrophotometry
γ-rays X-rays Ultraviolet Infrared Microwave Radio
Vis
ible
Frequency (Hz) 1020 1018 1016 1014 1012 108
10–110–310–610–810–11Wavelength (m)
Visible spectrum
Vio
let
Red
Ora
nge
Yello
w
Gre
en
Blu
e
700 800600500400Wavelength (nm)
1.2 × 10⁷ 12 000 310 150 0.12 0.001 2Energy (kJ/mol)
Electronicexcitation
Bond breakingand ionization
Vibration Rotatione–
Figure 18-2 Electromagnetic spectrum,showing representative molecular processesthat occur when light in each region isabsorbed. The visible spectrum spans thewavelength range 380–780 nanometers
.(1 nm � 10�9 m)
Figure 18-3 Absorption of light increasesthe energy of a molecule. Emission of lightdecreases its energy.
Excited states
Ground stateEmissionAbsorption
Ene
rgy

This is enough energy to break the bond in oxygen. For , the energy increase is
Infrared absorption increases the amplitude of the vibrations of the bonds.
When light is absorbed by a sample, the irradiance of the beam of light is decreased.Irradiance, P, is the energy per second per unit area of the light beam. A rudimentary spec-trophotometric experiment is illustrated in Figure 18-4. Light is passed through a monochro-mator (a prism, a grating, or even a filter) to select one wavelength (Color Plate 13). Lightof a single wavelength is said to be monochromatic, which means “one color.” The mono-chromatic light, with irradiance , strikes a sample of length b. The irradiance of the beamemerging from the other side of the sample is P. Some of the light may be absorbed by thesample, so .
Transmittance, T, is defined as the fraction of the original light that passes through thesample.
Transmittance: (18-4)
Therefore, T has the range 0 to 1. The percent transmittance is simply 100T and rangesbetween 0 and 100%. Absorbance is defined as
Absorbance: (18-5)
When no light is absorbed, and . If 90% of the light is absorbed, 10% is trans-mitted and . This ratio gives . If only 1% of the light is transmitted, .Absorbance is sometimes called optical density.
Absorbance is so important because it is directly proportional to the concentration, c,of the light-absorbing species in the sample (Color Plate 14).
Beer’s law: (18-6)
Equation 18-6, which is the heart of spectrophotometry as applied to analytical chemistry, iscalled the Beer-Lambert law,6 or simply Beer’s law. Absorbance is dimensionless, but somepeople write “absorbance units” after absorbance. The concentration of the sample, c, is usu-ally given in units of moles per liter (M). The pathlength, b, is commonly expressed in cen-timeters. The quantity (epsilon) is called the molar absorptivity (or extinction coefficientin the older literature) and has the units to make the product dimensionless.Molar absorptivity is the characteristic of a substance that tells how much light is absorbed ata particular wavelength.
Example Absorbance, Transmittance, and Beer’s Law
Find the absorbance and transmittance of a 0.002 40 M solution of a substance with amolar absorptivity of in a cell with a 2.00-cm pathlength.
Solution Equation 18-6 gives us the absorbance.
A � �bc � (313 M�1 cm�1)(2.00 cm)(0.002 40 M) � 1.50
313 M�1 cm�1
�bcM�1 cm�1�
A � �bc
A � 2A � 1P � P0/10A � 0P � P0
A � log aP0
Pb � �log T
T �P
P0
P � P0
P0
CO2
� 4.6 � 10�20 J/molecule � 28 kJ/mol
� (6.626 � 10�34 J � s) (2.998 � 108 m/s)(2 300 cm�1)(100 cm/m)
�E � h� � hc
�� hc�� arecall that �� �
1
�b
CO2O¢O
18-2 Absorption of Light 381
Lightsource
Wavelengthselector
(monochromator)Sample Light
detector
P0 P
b
Figure 18-4 Schematic diagram of a single-beam spectrophotometric experiment. P0, irradiance ofbeam entering sample; P, irradiance of beam emerging from sample; b, length of path through sample.
Irradiance is the energy per unit time per unitarea in the light beam (watts per squaremeter, ). The terms intensity or radiantpower have been used for this same quantity.
W/m2
Monochromatic light consists of “one color”(one wavelength). The better themonochromator, the narrower is the range ofwavelengths in the emerging beam.
Relation between transmittance andabsorbance:
P/P0 % T A
1 100 00.1 10 10.01 1 2
Box 18-1 explains why absorbance, nottransmittance, is directly proportional toconcentration.

Transmittance is obtained from Equation 18-5 by raising 10 to the power equal to theexpression on each side of the equation:
Just 3.16% of the incident light emerges from this solution.
Equation 18-6 could be written
because A and depend on the wavelength of light. The quantity is simply a coefficient ofproportionality between absorbance and the product bc. The greater the molar absorptivity,the greater the absorbance. An absorption spectrum is a graph showing how A (or ) varieswith wavelength. Demonstration 18-1 illustrates the meaning of an absorption spectrum.
The part of a molecule responsible for light absorption is called a chromophore. Anysubstance that absorbs visible light appears colored when white light is transmitted through itor reflected from it. (White light contains all the colors in the visible spectrum.) The sub-stance absorbs certain wavelengths of the white light, and our eyes detect the wavelengthsthat are not absorbed. Table 18-1 gives a rough guide to colors. The observed color is calledthe complement of the absorbed color. For example, bromophenol blue has maximumabsorbance at 591 nm and its observed color is blue.
When Beer’s Law FailsBeer’s law states that absorbance is proportional to the concentration of the absorbingspecies. It applies to monochromatic radiation8 and it works very well for dilute solutions
of most substances.(� 0.01 M)
�
��
A� � ��bc
T � 10log T � 10�A � 10�1.50 � 0.031 6
log T � �A
382 CHAPTER 18 Fundamentals of Spectrophotometry
Box 18-1 Why Is There a Logarithmic Relation Between Transmittance and Concentration?5
Beer’s law, Equation 18-6, states that absorbance is directly pro-portional to the concentration of the absorbing species. The frac-tion of light passing through a sample (the transmittance) isrelated logarithmically, not linearly, to the sample concentration.Why should this be?
Imagine light of irradiance P passing through an infinites-imally thin layer of solution whose thickness is dx. A physicalmodel of the absorption process suggests that, within the infinites-imally thin layer, decrease in power (dP) ought to be proportionalto the incident power (P), to the concentration of absorbingspecies (c), and to the thickness of the section (dx):
(A)
where is a constant of proportionality and the minus sign indi-cates a decrease in P as x increases. The rationale for saying thatthe decrease in power is proportional to the incident power may beunderstood from a numerical example. If 1 photon out of 1 000incident photons is absorbed in a thin layer, we would expect that2 out of 2 000 incident photons would be absorbed. The decreasein photons (power) is proportional to the incident flux of photons(power).
Equation A can be rearranged and integrated to find anexpression for P:
�
dP � ��Pc dx
The limits of integration are at and at
Convert ln into log, using the relation ln , toobtain Beer’s law:
123 123Absorbance
The logarithmic relation of to concentration arisesbecause, in each infinitesimal portion of the total volume, thedecrease in power is proportional to the power incident upon thatsection. As light travels through the sample, the power loss ineach succeeding layer decreases, because the magnitude of theincident power that reaches each layer is decreasing. Molarabsorptivity ranges from 0 (if the probability for photon absorp-tion is 0) to approximately (when the probabilityfor photon absorption approaches unity).
105 M�1 cm�1
P0/P
Constant � �
log aP0
Pb � a �
ln 10bcb 1 A � �cb
(log z)z � (ln 10)
�ln P � (�ln P0) � �cb 1 ln aP0
Pb � �cb
x � b.P � Px � 0P � P0
�dP
P� �c dx 1 �
P
P0
dP
P� �c
b
0
dx
b
Incidentlight
dx
P P – dP Emerginglight
x = 0 x = b
Absorbingsolution
If , .10x � 10yx � y
The plural of “spectrum” is “spectra.”
The color of a solution is the complement of the color of the light that it absorbs.The color we perceive depends not only onthe wavelength of light, but on its intensity.
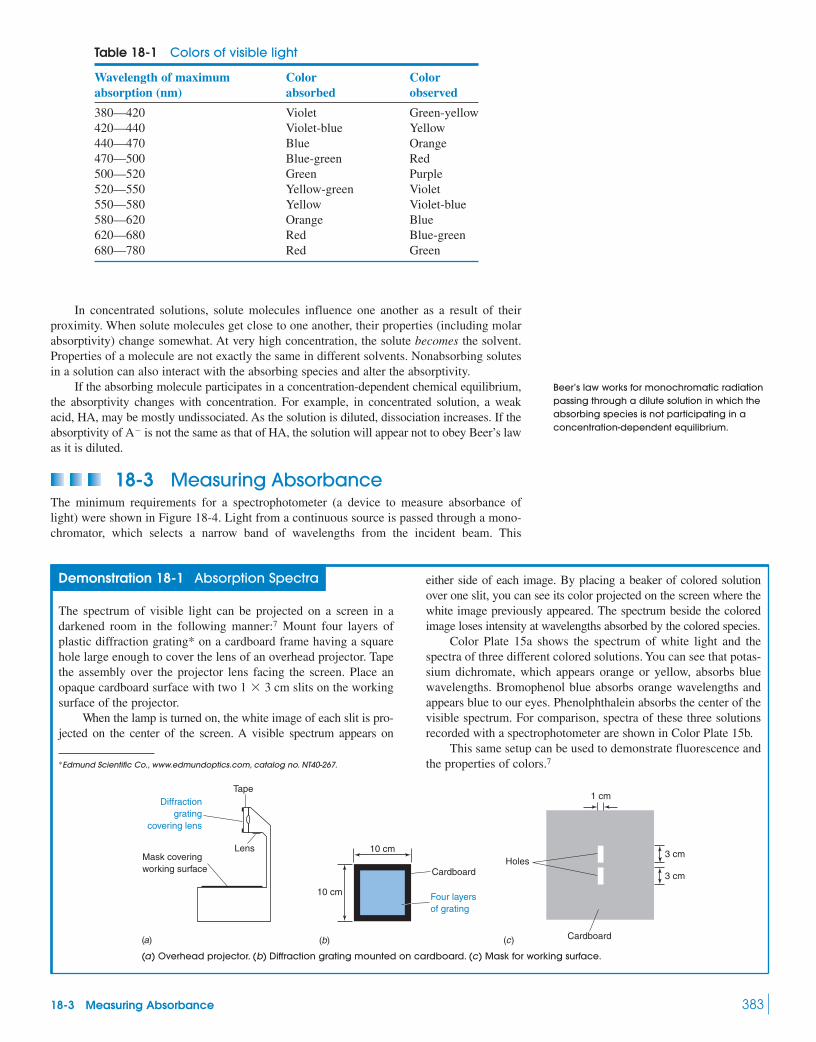
In concentrated solutions, solute molecules influence one another as a result of theirproximity. When solute molecules get close to one another, their properties (including molarabsorptivity) change somewhat. At very high concentration, the solute becomes the solvent.Properties of a molecule are not exactly the same in different solvents. Nonabsorbing solutesin a solution can also interact with the absorbing species and alter the absorptivity.
If the absorbing molecule participates in a concentration-dependent chemical equilibrium,the absorptivity changes with concentration. For example, in concentrated solution, a weakacid, HA, may be mostly undissociated. As the solution is diluted, dissociation increases. If theabsorptivity of is not the same as that of HA, the solution will appear not to obey Beer’s lawas it is diluted.
18-3 Measuring AbsorbanceThe minimum requirements for a spectrophotometer (a device to measure absorbance oflight) were shown in Figure 18-4. Light from a continuous source is passed through a mono-chromator, which selects a narrow band of wavelengths from the incident beam. This
A�
18-3 Measuring Absorbance 383
Table 18-1 Colors of visible light
Wavelength of maximum Color Colorabsorption (nm) absorbed observed
380—420 Violet Green-yellow420—440 Violet-blue Yellow440—470 Blue Orange470—500 Blue-green Red500—520 Green Purple520—550 Yellow-green Violet550—580 Yellow Violet-blue580—620 Orange Blue620—680 Red Blue-green680—780 Red Green
Demonstration 18-1 Absorption Spectra
The spectrum of visible light can be projected on a screen in adarkened room in the following manner:7 Mount four layers ofplastic diffraction grating* on a cardboard frame having a squarehole large enough to cover the lens of an overhead projector. Tapethe assembly over the projector lens facing the screen. Place anopaque cardboard surface with two slits on the workingsurface of the projector.
When the lamp is turned on, the white image of each slit is pro-jected on the center of the screen. A visible spectrum appears on
1 � 3 cm
either side of each image. By placing a beaker of colored solutionover one slit, you can see its color projected on the screen where thewhite image previously appeared. The spectrum beside the coloredimage loses intensity at wavelengths absorbed by the colored species.
Color Plate 15a shows the spectrum of white light and thespectra of three different colored solutions. You can see that potas-sium dichromate, which appears orange or yellow, absorbs bluewavelengths. Bromophenol blue absorbs orange wavelengths andappears blue to our eyes. Phenolphthalein absorbs the center of thevisible spectrum. For comparison, spectra of these three solutionsrecorded with a spectrophotometer are shown in Color Plate 15b.
This same setup can be used to demonstrate fluorescence and the properties of colors.7
1 cm
Holes
Cardboard
3 cm
3 cm
(a) Overhead projector. (b) Diffraction grating mounted on cardboard. (c) Mask for working surface.
Diffractiongrating
covering lens
Mask coveringworking surface
Lens
Tape
10 cm
10 cm
Cardboard
Four layersof grating
(c)(a) (b)
Beer’s law works for monochromatic radiationpassing through a dilute solution in which theabsorbing species is not participating in aconcentration-dependent equilibrium.
*Edmund Scientific Co., www.edmundoptics.com, catalog no. NT40-267.
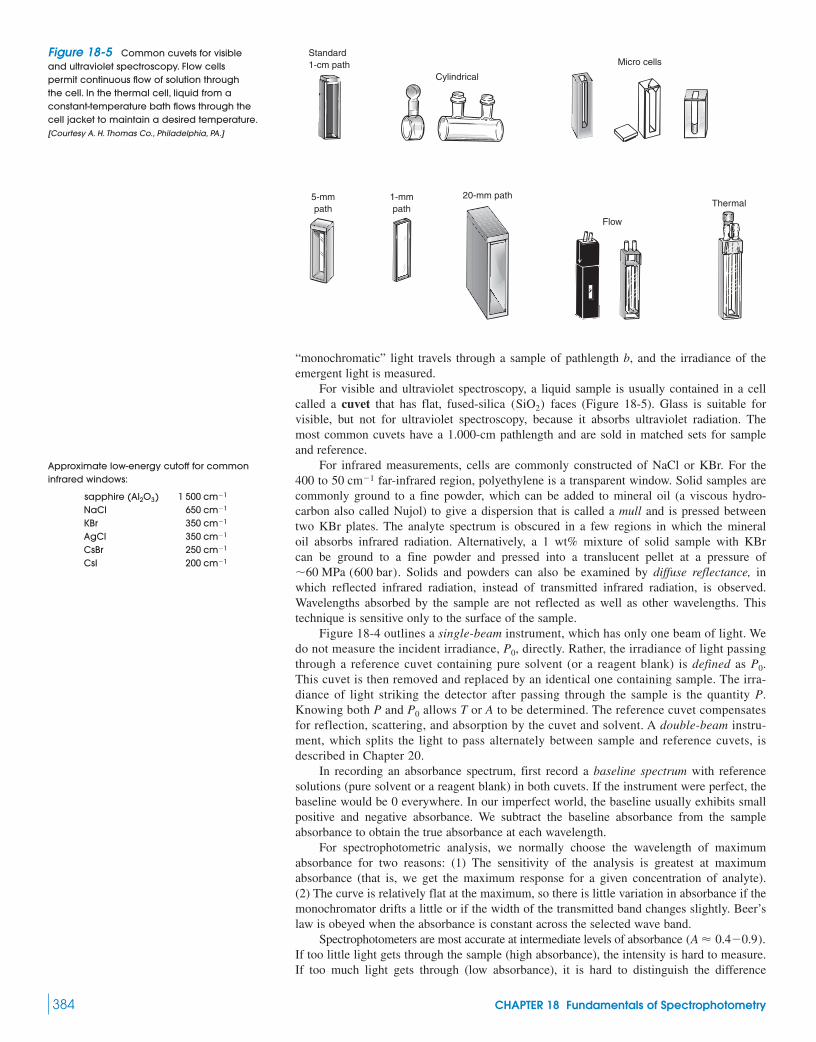
“monochromatic” light travels through a sample of pathlength b, and the irradiance of theemergent light is measured.
For visible and ultraviolet spectroscopy, a liquid sample is usually contained in a cellcalled a cuvet that has flat, fused-silica faces (Figure 18-5). Glass is suitable forvisible, but not for ultraviolet spectroscopy, because it absorbs ultraviolet radiation. Themost common cuvets have a 1.000-cm pathlength and are sold in matched sets for sampleand reference.
For infrared measurements, cells are commonly constructed of NaCl or KBr. For the400 to far-infrared region, polyethylene is a transparent window. Solid samples arecommonly ground to a fine powder, which can be added to mineral oil (a viscous hydro-carbon also called Nujol) to give a dispersion that is called a mull and is pressed betweentwo KBr plates. The analyte spectrum is obscured in a few regions in which the mineraloil absorbs infrared radiation. Alternatively, a 1 wt% mixture of solid sample with KBrcan be ground to a fine powder and pressed into a translucent pellet at a pressure of
. Solids and powders can also be examined by diffuse reflectance, inwhich reflected infrared radiation, instead of transmitted infrared radiation, is observed.Wavelengths absorbed by the sample are not reflected as well as other wavelengths. Thistechnique is sensitive only to the surface of the sample.
Figure 18-4 outlines a single-beam instrument, which has only one beam of light. Wedo not measure the incident irradiance, , directly. Rather, the irradiance of light passingthrough a reference cuvet containing pure solvent (or a reagent blank) is defined as .This cuvet is then removed and replaced by an identical one containing sample. The irra-diance of light striking the detector after passing through the sample is the quantity P.Knowing both P and allows T or A to be determined. The reference cuvet compensatesfor reflection, scattering, and absorption by the cuvet and solvent. A double-beam instru-ment, which splits the light to pass alternately between sample and reference cuvets, isdescribed in Chapter 20.
In recording an absorbance spectrum, first record a baseline spectrum with referencesolutions (pure solvent or a reagent blank) in both cuvets. If the instrument were perfect, thebaseline would be 0 everywhere. In our imperfect world, the baseline usually exhibits smallpositive and negative absorbance. We subtract the baseline absorbance from the sampleabsorbance to obtain the true absorbance at each wavelength.
For spectrophotometric analysis, we normally choose the wavelength of maximumabsorbance for two reasons: (1) The sensitivity of the analysis is greatest at maximumabsorbance (that is, we get the maximum response for a given concentration of analyte).(2) The curve is relatively flat at the maximum, so there is little variation in absorbance if themonochromator drifts a little or if the width of the transmitted band changes slightly. Beer’slaw is obeyed when the absorbance is constant across the selected wave band.
Spectrophotometers are most accurate at intermediate levels of absorbance If too little light gets through the sample (high absorbance), the intensity is hard to measure.If too much light gets through (low absorbance), it is hard to distinguish the difference
(A � 0.4�0.9).
P0
P0
P0
�60 MPa (600 bar)
50 cm�1
(SiO2)
384 CHAPTER 18 Fundamentals of Spectrophotometry
Standard1-cm path
Cylindrical
5-mmpath
1-mmpath
20-mm path
Micro cells
Flow
Thermal
Figure 18-5 Common cuvets for visibleand ultraviolet spectroscopy. Flow cellspermit continuous flow of solution throughthe cell. In the thermal cell, liquid from a constant-temperature bath flows through thecell jacket to maintain a desired temperature.[Courtesy A. H. Thomas Co., Philadelphia, PA.]
Approximate low-energy cutoff for commoninfrared windows:
sapphire NaClKBrAgClCsBrCsI 200 cm�1
250 cm�1
350 cm�1
350 cm�1
650 cm�1
1 500 cm�1(Al2O3)

between the sample and the reference. It is desirable to adjust the sample concentration sothat absorbance falls in an intermediate range. Compartments must be tightly closed to avoidstray light, which leads to false readings.
Figure 18-6 shows measured spectrophotometer errors. Electrical noise was only mod-estly dependent on sample absorbance. The largest source of imprecision for wasirreproducible positioning of the cuvet in the sample holder, despite care in placing the cuvet.The resulting error curve reaches a minimum near . In Section 5-2, we learned thatthe detection limit for an analytical procedure is determined by the reproducibility of themeasurement. The less noise, the lower the concentration of analyte that can be detected.
Keep containers covered to avoid dust, which scatters light and appears to the spec-trophotometer to be absorbance. Filtering the final solution through a very fine filter may benecessary in critical work. Handle cuvets with a tissue to avoid putting fingerprints on thefaces—fingerprints scatter and absorb light—and keep your cuvets scrupulously clean.
Slight mismatch between sample and reference cuvets, over which you have little con-trol, leads to systematic errors in spectrophotometry. For best precision, you should placecuvets in the spectrophotometer as reproducibly as possible. Random variation in absorbancearises from slight misplacement of the cuvet in its holder, or turning a flat cuvet around by
, or rotation of a circular cuvet.
18-4 Beer’s Law in Chemical AnalysisFor a compound to be analyzed by spectrophotometry, it must absorb light, and this absorp-tion should be distinguishable from that due to other substances in the sample. Because mostcompounds absorb ultraviolet radiation, measurements in this region of the spectrum tend tobe inconclusive, and analysis is usually restricted to the visible spectrum. If there are nointerfering species, however, ultraviolet absorbance is satisfactory. Proteins are normallyassayed in the ultraviolet region at 280 nm because the aromatic groups present in virtuallyevery protein have an absorbance maximum at 280 nm.
Example Measuring Benzene in Hexane
(a) Pure hexane has negligible ultraviolet absorbance above a wavelength of 200 nm. Asolution prepared by dissolving 25.8 mg of benzene in hexane anddiluting to 250.0 mL had an absorption peak at 256 nm and an absorbance of 0.266 in a1.000-cm cell. Find the molar absorptivity of benzene at this wavelength.
Solution The concentration of benzene is
We find the molar absorptivity from Beer’s law:
(b) A sample of hexane contaminated with benzene had an absorbance of 0.070 at 256 nmin a cuvet with a 5.000-cm pathlength. Find the concentration of benzene in mg/L.
Solution Using Beer’s law with the molar absorptivity from part (a), we find:
Serum Iron DeterminationIron for biosynthesis is transported through the bloodstream by the protein transferrin. Thefollowing procedure measures the Fe content of transferrin.10 This analysis requires onlyabout for an accuracy of 2–5%. Human blood usually contains about 45 vol% cells and55 vol% plasma (liquid). If blood is collected without an anticoagulant, the blood clots, andthe liquid that remains is called serum. Serum normally contains about of Fe/mLattached to transferrin.
1 �g
1 �g
[C6H6] � a6.95 � 10�5mol
Lb a78.11 � 103
mg
molb � 5.4
mg
L
[C6H6] �A
�b�
0.070
(201.3 M�1 cm�1)(5.000 cm)� 6.95 � 10�5 M
Molar absorptivity � � �A
bc�
(0.266)
(1.000 cm)(1.321 � 10�3 M)� 201.3 M�1 cm�1
[C6H6] �(0.025 8 g) / (78.11 g/mol)
0.250 0 L� 1.321 � 10�3 M
(C6H6, FM 78.11)
180°
A � 0.6
A 6 0.6
18-4 Beer’s Law in Chemical Analysis 385
This example illustrates the measurement ofmolar absorptivity from a single solution. It isbetter to measure several concentrations toobtain a more reliable absorptivity and todemonstrate that Beer’s law is obeyed.
Absorbance
Rel
ativ
e pr
ecis
ion
of r
eplic
ate
mea
sure
men
ts (
%) 5
4
3
2
1
1.0 2.0
Instrumentalelectrical noise
Cell positioningimprecision
Resultant error
Figure 18-6 Errors in spectrophotometricmeasurements due to dark current noise and cell positioning imprecision in a research-qualityinstrument. [Data from L. D. Rothman, S. R. Crouch,and
J.D. Ingle, Jr., “Theoretical and Experimental Investigation
of Factors Affecting Precision in Molecular Absorption
Spectrophotometry,” Anal. Chem. 1975, 47, 1226.]
For a laboratory experiment or research project,you can measure total iron and at ppblevels in rainwater.9 decreases during day-light hours when sunlight plus reducing agents(organic matter?) convert into . Atnight, oxidation by restores the .Fe3�O2
Fe2�Fe3�
Fe3�
Fe3�

The serum iron determination has three steps:
Step 1 Reduce in transferrin to , which is released from the protein. Commonlyemployed reducing agents are hydroxylamine hydrochloride ,thioglycolic acid, or ascorbic acid.
Thioglycolic acid
Step 2 Add trichloroacetic acid to precipitate proteins, leaving insolution. Centrifuge the mixture to remove the precipitate. If protein were left inthe solution, it would partially precipitate in the final solution. Light scattered bythe precipitate would be mistaken for absorbance.
Step 3 Transfer a measured volume of supernatant liquid from step 2 to a fresh vessel andadd buffer plus excess ferrozine to form a purple complex. Measure the absorbanceat the 562-nm peak (Figure 18-7). The buffer provides a pH at which complexformation is complete.
Purple complex
In most spectrophotometric analyses, it is important to prepare a reagent blank contain-ing all reagents, but with analyte replaced by distilled water. Any absorbance of the blank isdue to the color of uncomplexed ferrozine plus the color caused by the iron impurities in thereagents and glassware. Subtract the blank absorbance from the absorbance of samples andstandards before doing any calculations.
�max � 562 nm
Fe2� � 3ferrozine2� S (ferrozine)3Fe4�
Protein(aq) ------¡CCl3CO2H
protein(s)
Fe2�(Cl3CCO2H)
2Fe3� � 2HSCH2CO2H S 2Fe2� � HO2CCH2SßSCH2CO2H � 2H�
(NH3OH�Cl�)Fe2�Fe3�
386 CHAPTER 18 Fundamentals of Spectrophotometry
25 000
700
ε (M
–1 c
m–1
)
Wavelength (nm)
20 000
15 000
10 000
5 000
600500400
–O3SN
NN
N
Fe(II)
33SO–
Figure 18-7 Visible absorption spectrum of the complex used in the colorimetricanalysis of iron.
(ferrozine)3Fe(II)
ß∞HO
OH
HO OH
OO
Ascorbic acid(vitamin C)
ç
œ
œœ å
Supernate: the liquid layer above the solidthat collects at the bottom of a tube duringcentrifugation.
The blank described here contains all sourcesof absorbance other than analyte. Analternative blank for some analyses containsanalyte but no color-forming reagent. Thechoice of blank depends on which speciesinterfere at the analytical wavelength.
Use a series of iron standards for a calibration curve (Figure 18-8) to show that Beer’slaw is obeyed. Standards are prepared by the same procedure as unknowns. The absorbanceof the unknown should fall within the region covered by the standards. Pure iron wire (witha shiny, rust-free surface) is dissolved in acid to prepare accurate iron standards. Ferrousammonium sulfate and ferrous ethylenediammonium sulfate
are suitable standards for less accurate work.If unknowns and standards are prepared with identical volumes, then the quantity of iron
in the unknown can be calculated from the least-squares equation for the calibration line. For
(Fe(H3NCH2CH2NH3)(SO4)2 � 4H2O)(Fe(NH4)2(SO4)2 � 6H2O)

example, in Figure 18-8, if the unknown has an absorbance of 0.357 (after subtracting theabsorbance of the blank), the sample contains of iron.
In the preceding iron determination, the results would be about 10% high because serumcopper also forms a colored complex with ferrozine. Interference is eliminated ifneocuproine or thiourea is added. These reagents mask by forming strong complexesthat prevent from reacting with ferrozine.
Example Serum Iron Analysis
Serum iron and standard iron solutions were analyzed as follows:
Step 1 To 1.00 mL of sample, add 2.00 mL of reducing agent and 2.00 mL of acid toreduce and release Fe from transferrin.
Step 2 Precipitate proteins with 1.00 mL of 30 wt% trichloroacetic acid. For calcula-tions, assume that the volume is (nochange in volume due to mixing). Centrifuge the mixture to remove protein.
Step 3 Transfer 4.00 mL of supernatant liquid to a fresh test tube and add 1.00 mL ofsolution containing ferrozine and buffer. Measure the absorbance after 10 min.
Step 4 To establish the calibration curve in Figure 18-8, dilute 1.00 mL of standard ironto 6.00 mL with other reagents. Transfer 4.00 mL (containing 4.00/6.00
of the Fe) to a new vessel and dilute with 1.00 mL of ferrozine plus buffer.
The blank absorbance was 0.038 at 562 nm in a 1.000-cm cell. A serum sample had anabsorbance of 0.129. After the blank was subtracted from each standard absorbance, thepoints in Figure 18-8 were obtained. The least-squares line through the standard points is
According to Beer’s law, the intercept should be 0, not . However, we will use theobserved intercept for our analysis. Find the concentration of iron in the serum.
Solution Rearranging the least-squares equation of the calibration line and insertingthe corrected absorbance of unknown,we find
The concentration of Fe in the serum is
18-5 What Happens When a MoleculeAbsorbs Light?
When a molecule absorbs a photon, the molecule is promoted to a more energetic excitedstate (Figure 18-3). Conversely, when a molecule emits a photon, the energy of the moleculefalls by an amount equal to the energy of the photon.
For example, consider formaldehyde in Figure 18-9a. In its ground state, the molecule isplanar, with a double bond between carbon and oxygen. From the electron dot description offormaldehyde, we expect two pairs of nonbonding electrons to be localized on the oxygenatom. The double bond consists of a sigma bond between carbon and oxygen and a pi bondmade from the (out-of-plane) atomic orbitals of carbon and oxygen.2py
� a 1.336 � 10�6 g Fe
55.845 g Fe/mol Feb^(1.00 � 10�3 L) � 2.39 � 10�5 M
[Fe] � moles of Fe/liters of serum
�g Fe in unknown �absorbance � 0.0015
0.0670�
0.091 � 0.0015
0.0670� 1.336 �g
(observed � blank � 0.129 � 0.038 � 0.091)
0.0015
Absorbance � 0.0670 � (�g Fe in initial sample) � 0.0015
(2–9 �g)
1.00 � 2.00 � 2.00 � 1.00 � 6.00 mL
� Cu�
ß
ß
CH3
CH3
2 Cuß
ß
CH3
CH3
ß
H3C
H3C
�
Neocuproine Tightly bound complex with littleabsorbance at 562 nm
¡
ß
N
N
N
N
N
N
Cu�
Cu�
3.59 �g
18-5 What Happens When a Molecule Absorbs Light? 387
0.800
9
Abs
orba
nce
at 5
62 n
m
µg of Fe analyzed87654321
0.700
0.600
0.500
0.400
0.300
0.200
0.100
Absorbanceof unknown
Iron contentof unknown
Figure 18-8 Calibration curve showing thevalidity of Beer’s law for the complex used in serum iron determination.Each sample was diluted to a final volume of5.00 mL. Therefore, of iron is equivalentto a concentration of .3.58 � 10�6 M
1.00 �g
(ferrozine)3Fe(II)
S0 state
S1 state
120 pm
110 pm
132 pm
109 pm
H
H
H
H
C
C
O
116.5°
x
z
119°
31°
(a)
(b)
O
Figure 18-9 Geometry of formaldehyde.(a) Ground state. (b) Lowest excited singletstate.
To find the uncertainty in , use Equation 4-27.
�g Fe

Electronic States of FormaldehydeMolecular orbitals describe the distribution of electrons in a molecule, just as atomicorbitals describe the distribution of electrons in an atom. In the molecular orbital diagram forformaldehyde in Figure 18-10, one of the nonbonding orbitals of oxygen is mixed with thethree sigma bonding orbitals. These four orbitals, labeled through , are each occupiedby a pair of electrons with opposite spin . At higherenergy is an occupied pi bonding orbital , made of the atomic orbitals of carbon andoxygen. The highest-energy occupied orbital is the nonbonding orbital (n), composed princi-pally of the oxygen atomic orbital. The lowest-energy unoccupied orbital is the pi anti-bonding orbital . Electrons in this orbital produce repulsion, rather than attraction,between carbon and oxygen atoms.
In an electronic transition, an electron from one molecular orbital moves to anotherorbital, with a concomitant increase or decrease in the energy of the molecule. The lowest-energy electronic transition of formaldehyde promotes a nonbonding (n) electron to theantibonding pi orbital .11 There are two possible transitions, depending on the spin quan-tum numbers in the excited state (Figure 18-11). The state in which the spins are opposed iscalled a singlet state. If the spins are parallel, we have a triplet state.
The lowest-energy excited singlet and triplet states are called and , respectively. Ingeneral, has lower energy than . In formaldehyde, the transition requiresn S *(T1)S1T1
T1S1
(*)
(*)2px
py()(spin quantum numbers � �1
2 and �12)
41
388 CHAPTER 18 Fundamentals of Spectrophotometry
H
C
H
C
H
HCO
H
OH
H
O H
O H
O H
O H
O H
C O piantibondingorbital
Nonbondingoxygen orbital
Ene
rgy
Three sigmabondingorbitalsplus onenonbondingorbital
C O pibonding orbital
σ1
σ2
σ4
σ3
n
π
π∗ π∗
n
π
σ4
σ3
σ2
σ1
C
H
C
C
H
C
H
Figure 18-10 Molecular orbital diagram of formaldehyde, showing energy levels and orbitalshapes. The coordinate system of the molecule was shown in Figure 18-9. [From W. L. Jorgensen and
L. Salem, The Organic Chemist’s Book of Orbitals (New York: Academic Press, 1973).]
The terms “singlet” and “triplet” are usedbecause a triplet state splits into three slightlydifferent energy levels in a magnetic field, buta singlet state is not split.
π* π*
n n
(a) (b)
Singlet Triplet
Figure 18-11 Two possible electronicstates arise from an transition.(a) Excited singlet state, . (b) Excited tripletstate, .T1
S1
n S *

the absorption of visible light with a wavelength of 397 nm. The transitionoccurs when ultraviolet radiation with a wavelength of 355 nm is absorbed.
With an electronic transition near 397 nm, you might expect from Table 18-1 thatformaldehyde appears green-yellow. In fact, formaldehyde is colorless, because the proba-bility of undergoing any transition between singlet and triplet states (such as )is exceedingly small. Formaldehyde absorbs so little light at 397 nm that our eyes do notdetect any absorbance at all. Singlet-to-singlet transitions such as are muchmore probable, and the ultraviolet absorption is more intense.
Although formaldehyde is planar in its ground state, it has a pyramidal structure in boththe (Figure 18-9b) and excited states. Promotion of a nonbonding electron to an anti-bonding orbital lengthens the bond and changes the molecular geometry.
Vibrational and Rotational States of FormaldehydeAbsorption of visible or ultraviolet radiation promotes electrons to higher-energy orbitals informaldehyde. Infrared and microwave radiation are not energetic enough to induce elec-tronic transitions, but they can change the vibrational or rotational motion of the molecule.
Each of the four atoms of formaldehyde can move along three axes in space, so theentire molecule can move in different ways. Three of these motions correspondto translation of the entire molecule in the x, y, and z directions. Another three motions cor-respond to rotation about the x-, y-, and z-axes of the molecule. The remaining six motionsare vibrations shown in Figure 18-12.
When formaldehyde absorbs an infrared photon with a wavenumber of , the asymmetric bending vibration in Figure 18-12 is stimulated: Oscilla-
tions of the atoms are increased in amplitude, and the energy of the molecule increases.Spacings between rotational energy levels of a molecule are even smaller than vibra-
tional energy spacings. A molecule in the rotational ground state could absorb microwavephotons with energies of 0.029 07 or 0.087 16 kJ/mol (wavelengths of 4.115 or 1.372 mm) tobe promoted to the two lowest excited states. Absorption of microwave radiation causes themolecule to rotate faster than it does in its ground state.
(� 14.97 kJ/mol)1 251 cm�1
4 � 3 � 12
CßOCßOT1S1
n(S0) S *(S1)
n(S0) S *(T1)
n S *(S1)
18-5 What Happens When a Molecule Absorbs Light? 389
Remember, the shorter the wavelength ofelectromagnetic radiation, the greater theenergy.
A nonlinear molecule with n atoms has vibrational modes and three rotations. A linearmolecule can rotate about only two axes; ittherefore has vibrational modes andtwo rotations.
3n � 5
3n � 6
Asymmetricbending
1 251 cm–1
Out-of-planebending
1 167 cm–1
–
+ +
+
C–Ostretching1 746 cm–1
Symmetricbending
1 500 cm–1
SymmetricC–H stretching
2 766 cm–1
AsymmetricC–H stretching
2 843 cm–1
O
C
H H
Figure 18-12 The six kinds of vibrations offormaldehyde. The wavenumber of infraredradiation needed to stimulate each kind ofmotion is given in units of reciprocalcentimeters, .cm�1
The stretching vibration of formaldehydeis reduced from in the state to
in the state because the strengthof the bond decreases when theantibonding orbital is populated.*
CßOS11 183 cm�1
S01 746 cm�1
CßO
Your microwave oven heats food by transferring rotational energy to water molecules in the food.

Combined Electronic, Vibrational, and Rotational TransitionsIn general, when a molecule absorbs light having sufficient energy to cause an electronictransition, vibrational and rotational transitions—that is, changes in the vibrational androtational states—occur as well. Formaldehyde can absorb one photon with just the rightenergy to cause the following simultaneous changes: (1) a transition from the to the electronic state, (2) a change in vibrational energy from the ground vibrational state of toan excited vibrational state of , and (3) a transition from one rotational state of to a dif-ferent rotational state of .
Electronic absorption bands are usually broad (Figure 18-7) because many differentvibrational and rotational levels are available at slightly different energies. A molecule canabsorb photons with a wide range of energies and still be promoted from the ground elec-tronic state to one particular excited electronic state.
What Happens to Absorbed Energy?Suppose that absorption promotes a molecule from the ground electronic state, , to a vibra-tionally and rotationally excited level of the excited electronic state (Figure 18-13). Usu-ally, the first process after absorption is vibrational relaxation to the lowest vibrational levelof In this radiationless transition, labeled in Figure 18-13, vibrational energy is trans-ferred to other molecules (solvent, for example) through collisions, not by emission of a pho-ton. The net effect is to convert part of the energy of the absorbed photon into heat spreadthrough the entire medium.
At the level, several events can happen. The molecule could enter a highly excitedvibrational level of having the same energy as . This is called internal conversion (IC).From this excited state, the molecule can relax back to the ground vibrational state and transferits energy to neighboring molecules through collisions. This radiationless process is labeled .If a molecule follows the path in Figure 18-13, the entire energy of the photonwill have been converted into heat.
Alternatively, the molecule could cross from into an excited vibrational level of .Such an event is known as intersystem crossing (ISC). After the radiationless vibrationalrelaxation , the molecule finds itself at the lowest vibrational level of . From here, themolecule might undergo a second intersystem crossing to , followed by the radiationlessrelaxation . All processes mentioned so far simply convert light into heat.
A molecule could also relax from or to by emitting a photon. The radiationaltransition is called fluorescence (Box 18-2), and the radiational transition is called phosphorescence. The relative rates of internal conversion, intersystem crossing,fluorescence, and phosphorescence depend on the molecule, the solvent, and conditions suchas temperature and pressure. The energy of phosphorescence is less than the energy of fluo-rescence, so phosphorescence comes at longer wavelengths than fluorescence (Figure 18-14).
T1 S S0S1 S S0
S0T1S1
R4
S0
T1R3
T1S1
A–R1–IC–R2
R2
S1S0
S1
R1S1.
S1
S0
S1
S0S1
S0
S1S0
390 CHAPTER 18 Fundamentals of Spectrophotometry
Vibrational transitions usually involvesimultaneous rotational transitions. Electronictransitions usually involve simultaneousvibrational and rotational transitions.
Ene
rgy
R2
S0
R4
S1
R1
T1
R3
Excited vibrationaland rotationallevels of T1electronic state
Internalconversion
Intersystemcrossing to T1
Intersystemcrossing to S0
Fluorescence(10�8–10�4 s)
Phosphorescence(10�4–102 s)
Absorption(10�15 s)
Figure 18-13 Physical processes that can occur after a molecule absorbs an ultraviolet or visiblephoton. is the ground electronic state. and are the lowest excited singlet and triplet electronicstates. Straight arrows represent processes involving photons, and wavy arrows are radiationless transitions.R denotes vibrational relaxation. Absorption could terminate in any of the vibrational levels of , not justthe one shown. Fluorescence and phosphorescence can terminate in any of the vibrational levels of .S0
S1
T1S1S0
Internal conversion: a radiationless transitionbetween states with the same spin quantumnumbers (e.g., ).S1 S S0
Intersystem crossing: a radiationless transitionbetween states with different spin quantumnumbers (e.g., ).T1 S S0
Fluorescence: the emission of a photon during a transition between states with the samespin quantum numbers (e.g., ).
Phosphorescence: the emission of a photon during a transition between states withdifferent spin quantum numbers (e.g., ).T1 S S0
S1 S S0

Fluorescence and phosphorescence are relatively rare. Molecules generally decay fromthe excited state by radiationless transitions. The lifetime of fluorescence is always very short
. The lifetime of phosphorescence is much longer . Therefore,phosphorescence is even rarer than fluorescence, because a molecule in the state has agood chance of undergoing intersystem crossing to before phosphorescence can occur.S0
T1
(10�4 to 102 s)(10�8 to 10�4 s)
18-5 What Happens When a Molecule Absorbs Light? 391
Box 18-2 Fluorescence All Around Us
A fluorescent lamp is a glass tube filled with Hg vapor. Theinner walls are coated with a phosphor (luminescent substance)consisting of calcium halophosphate dopedwith and . Hg atoms, promoted to an excited state bySb3�Mn2�
(Ca5(PO4)3F1�xClx)
A 13-W fluorescent light that fits in a standard screw-insocket provides the same light as the 60-W bulb it replaces. Theexpected lifetime of the fluorescent lamp is 10 000 h, whereas thatof the incandescent bulb is 750 h. The fluorescent light is moreexpensive than the incandescent bulb but saves a great deal ofelectricity and money over its lifetime.
Most white fabrics also fluoresce. Just for fun, turn on anultraviolet lamp in a darkened room containing several people (butdo not look directly at the lamp). You will discover emission from
electric current passing through the lamp, emit ultraviolet radia-tion at 185 and 254 nm, and a series of visible lines in panel a.This radiation is absorbed by , and some of the energyis passed on to . emits blue light, and emitsyellow light (panel b), with the combined emission appearingwhite.
Mn2�Sb3�Mn2�
Sb3�
white fabrics (shirts, pants, shoelaces, unmentionables) containingfluorescent compounds to enhance whiteness. You might see fluo-rescence from teeth and from recently bruised areas of skin thatshow no surface damage. Many demonstrations of fluorescenceand phosphorescence have been described.12
A fluorescent whitenerfrom laundry detergent
SO�Na� 3
�O3S Na�
700
Inte
nsity
Wavelength (nm)(b)
600500400
Mn2+Sb3+
200 300 400 500 600
Wavelength (nm)
Inte
nsity
(a)
Emission spectrum of Hg vapor (a) and phosphor (b) in fluorescent lamps. [From S. R. Goode and
L. A. Metz, “Emission Spectroscopy in the Undergraduate Laboratory,” J. Chem. Ed. 2003, 80, 1455; J. A. DeLuca,
“An Introduction to Luminescence in Inorganic Solids,” J. Chem. Ed. 1980, 57, 541.]
500 550 600
Fluorescence25°C
Phosphorescence–78°C (×10)E
mis
sion
inte
nsity
Wavelength (nm)
Figure 18-14 Example showing that phosphorescence comes at lower energy than fluorescencefrom the same molecule. The phosphorescence is times weaker than the fluorescence and isobserved only when the sample is cooled. [Data from J. C. Fister III, J. M. Harris, D. Rank, and W. Wacholtz, “Molecular
Photophysics of Acridine Yellow Studied by Phosphorescence and Delayed Fluorescence,” J. Chem. Ed. 1997, 74, 1208.]
�10
The lifetime of a state is the time needed forthe population of that state to decay to 1/e ofits initial value, where e is the base of naturallogarithms.

18-6 LuminescenceFluorescence and phosphorescence are examples of luminescence, which is emission of lightfrom an excited state of a molecule. Luminescence is inherently more sensitive than absorp-tion. Imagine yourself in a stadium at night; the lights are off, but each of the 50 000 ravingfans is holding a lighted candle. If 500 people blow out their candles, you will hardly noticethe difference. Now imagine that the stadium is completely dark; then 500 people suddenlylight their candles. In this case, the effect is dramatic. The first example is analogousto changing transmittance from 100% to 99%, which is equivalent to an absorbance of
. It is hard to measure such a small absorbance because the backgroundis so bright. The second example is analogous to observing fluorescence from 1% of the mol-ecules in a sample. Against the black background, the fluorescence is striking.
Luminescence is sensitive enough to observe single molecules.13 Figure 18-15 showsobserved tracks of two molecules of the highly fluorescent Rhodamine 6G at 0.78-s intervalsin a thin layer of silica gel. These direct observations confirm the “random walk” of diffusingmolecules postulated by Albert Einstein in 1905.
�log 0.99 � 0.004 4
392 CHAPTER 18 Fundamentals of Spectrophotometry
1 µm
9 consecutiveobservations ofmolecule A inone small area
Molecule A
Molecule B
Relation Between Absorption and Emission SpectraFigure 18-13 shows that fluorescence and phosphorescence come at lower energy thanabsorption (the excitation energy). That is, molecules emit radiation at longer wavelengthsthan the radiation they absorb. Examples are shown in Figure 18-16 and Color Plate 16.
300 800700600500400
Abs
orba
nce
λ0 forabsorption
λ0 foremission
Em
issi
on
Absorption10–6 M
Wavelength (nm)
Fluorescence10–11 M
CH2
CH2
N
C
C N
C
C
O
O
O
O
Figure 18-15 Tracks of two molecules of 20 pM rhodamine 6G in silica gel observed by fluorescenceintegrated over 0.20-s periods at 0.78-s intervals. Some points are not connected, because the moleculedisappeared above or below the focal plane in the -thick film and was not observed in aparticular observation interval. In the nine periods when molecule A was in one location, it might havebeen adsorbed to a particle of silica. An individual molecule emits thousands of photons in 0.2 s as themolecule cycles between ground and excited states. Only a fraction of these photons reach the detector,which generates a burst of electrons. [From K. S. McCain, D. C. Hanley, and J. M. Harris, “Single-Molecule
Fluorescence Trajectories for Investigating Molecular Transport in Thin Silica Sol-Gel Films,” Anal. Chem. 2003, 75, 4351.]
�10–50
0.45-�m
Figure 18-16 Absorption (black line) andemission (colored line) of bis(benzylimido)perylene in dichloromethane solution,illustrating the approximate mirror imagerelation between absorption and emission.The solution used for emission had anaverage of just 10 analyte molecules in thevolume probed by the 514-nm excitation laser.[From P. J. G. Goulet, N. P. W. Pieczonka, and R. F. Aroca,
“Overtones and Combinations in Single-Molecule
Surface-Enhanced Resonance Raman Scattering
Spectra,” Anal. Chem. 2003, 75, 1918.]
10�11 M
CO2CH2CH3
Cl��NHO
Rhodamine 6G
HN

Figure 18-17 explains why emission comes at lower energy than absorption and why theemission spectrum is roughly the mirror image of the absorption spectrum. In absorption,wavelength corresponds to a transition from the ground vibrational level of to thelowest vibrational level of . Absorption maxima at higher energy (shorter wavelength)correspond to the transition accompanied by absorption of one or more quanta ofvibrational energy. In polar solvents, vibrational structure is usually broadened beyondrecognition, and only a broad envelope of absorption is observed. In less polar or nonpolarsolvents, vibrational structure is observed.
After absorption, the vibrationally excited molecule relaxes back to the lowest vibra-tional level of prior to emitting any radiation. Emission from in Figure 18-17 can go toany vibrational level of . The highest-energy transition comes at wavelength , with aseries of peaks following at longer wavelength. The absorption and emission spectra willhave an approximate mirror image relation if the spacings between vibrational levels areroughly equal and if the transition probabilities are similar.
The transitions in Figure 18-16 (and later in Figure 18-21) do not exactly overlap.In the emission spectrum, comes at slightly lower energy than in the absorption spec-trum. The reason is seen in Figure 18-18. A molecule absorbing radiation is initially in itselectronic ground state, . This molecule possesses a certain geometry and solvation.Suppose that the excited state is . The electronic transition is faster than the vibrationalmotion of atoms or the translational motion of solvent molecules. When radiation is firstabsorbed, the excited molecule still possesses its geometry and solvation. ShortlyS0S1
S1
S0
�0
�0
�0S0
S1S1
S1
S0-to-S1
S1
S0�0
18-6 Luminescence 393
Absorption Emission
Vibrationallevels ofS1
Vibrationallevels ofS0
Absorption spectrum Emission spectrum
WavelengthWavelength
λ+5 λ 0 λ 0 λ–5
Vibrationallevels ofS1
Vibrationallevels ofS0
λ+5 λ 0 λ–5λ 0
Figure 18-17 Energy-level diagramshowing why structure is seen in the absorptionand emission spectra and why the spectra areroughly mirror images of each other. Inabsorption, wavelength comes at lowestenergy, and is at highest energy. Inemission, wavelength comes at highestenergy, and is at lowest energy.��5
�0
��5
�0
S0 with S0 geometryand solvation
Ene
rgy
abso
rbed
S1 with S0 geometryand solvation
Ene
rgy
Ene
rgy
emitt
ed
S1 with S1 geometryand solvation
S0 with S1 geometryand solvation
Figure 18-18 Diagram showing why the transitions do not exactly overlap inFigures 18-16 and 18-21.
�0
Electronic transitions are so fast, relative tonuclear motion, that each atom has nearlythe same position and momentum beforeand after a transition. This is called the Franck-Condon principle.
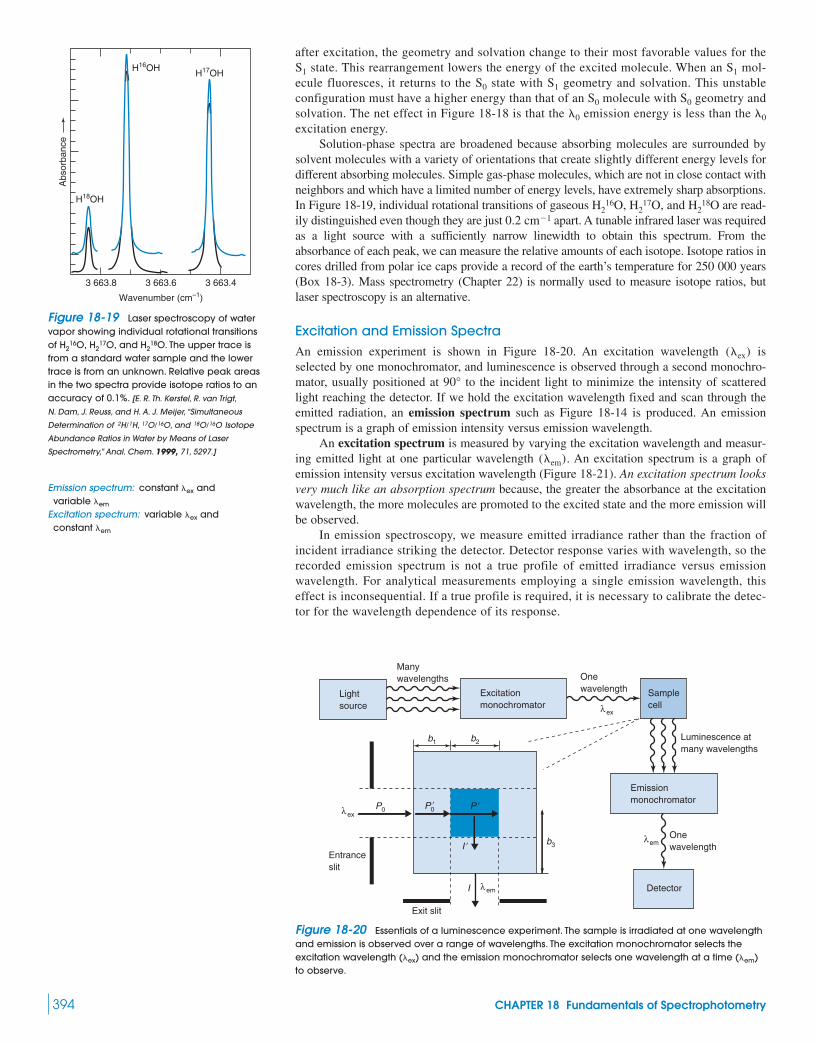
after excitation, the geometry and solvation change to their most favorable values for thestate. This rearrangement lowers the energy of the excited molecule. When an mol-
ecule fluoresces, it returns to the state with geometry and solvation. This unstableconfiguration must have a higher energy than that of an molecule with geometry andsolvation. The net effect in Figure 18-18 is that the emission energy is less than the excitation energy.
Solution-phase spectra are broadened because absorbing molecules are surrounded bysolvent molecules with a variety of orientations that create slightly different energy levels fordifferent absorbing molecules. Simple gas-phase molecules, which are not in close contact withneighbors and which have a limited number of energy levels, have extremely sharp absorptions.In Figure 18-19, individual rotational transitions of gaseous are read-ily distinguished even though they are just apart. A tunable infrared laser was requiredas a light source with a sufficiently narrow linewidth to obtain this spectrum. From theabsorbance of each peak, we can measure the relative amounts of each isotope. Isotope ratios incores drilled from polar ice caps provide a record of the earth’s temperature for 250 000 years(Box 18-3). Mass spectrometry (Chapter 22) is normally used to measure isotope ratios, butlaser spectroscopy is an alternative.
Excitation and Emission SpectraAn emission experiment is shown in Figure 18-20. An excitation wavelength isselected by one monochromator, and luminescence is observed through a second monochro-mator, usually positioned at to the incident light to minimize the intensity of scatteredlight reaching the detector. If we hold the excitation wavelength fixed and scan through theemitted radiation, an emission spectrum such as Figure 18-14 is produced. An emissionspectrum is a graph of emission intensity versus emission wavelength.
An excitation spectrum is measured by varying the excitation wavelength and measur-ing emitted light at one particular wavelength . An excitation spectrum is a graph ofemission intensity versus excitation wavelength (Figure 18-21). An excitation spectrum looksvery much like an absorption spectrum because, the greater the absorbance at the excitationwavelength, the more molecules are promoted to the excited state and the more emission willbe observed.
In emission spectroscopy, we measure emitted irradiance rather than the fraction ofincident irradiance striking the detector. Detector response varies with wavelength, so therecorded emission spectrum is not a true profile of emitted irradiance versus emissionwavelength. For analytical measurements employing a single emission wavelength, thiseffect is inconsequential. If a true profile is required, it is necessary to calibrate the detec-tor for the wavelength dependence of its response.
(�em)
90°
(�ex)
0.2 cm�1H2
16O, H217O, and H2
18O
�0�0
S0S0
S1S0
S1S1
394 CHAPTER 18 Fundamentals of Spectrophotometry
H18OH
3 663.8 3 663.6
Wavenumber (cm–1)
3 663.4
H16OH H17OHA
bsor
banc
e
Figure 18-19 Laser spectroscopy of watervapor showing individual rotational transitionsof . The upper trace isfrom a standard water sample and the lowertrace is from an unknown. Relative peak areasin the two spectra provide isotope ratios to anaccuracy of 0.1%. [E. R. Th. Kerstel, R. van Trigt,
N. Dam, J. Reuss, and H. A. J. Meijer, “Simultaneous
Determination of Isotope
Abundance Ratios in Water by Means of Laser
Spectrometry,” Anal. Chem. 1999, 71, 5297.]
18O/16O2H/1H, 17O/16O, and
H216O, H2
17O, and H218O
Lightsource
Manywavelengths
Excitationmonochromator
Onewavelength
Onewavelength Sample
cell
Luminescence atmany wavelengths
Emissionmonochromator
Detector
λex
λem
λex
λem
Entranceslit
Exit slit
b1
P0
I
b2
b3
P �
I �
P0�
Figure 18-20 Essentials of a luminescence experiment. The sample is irradiated at one wavelengthand emission is observed over a range of wavelengths. The excitation monochromator selects theexcitation wavelength and the emission monochromator selects one wavelength at a time to observe.
(�em)(�ex)
Emission spectrum: constant and variable
Excitation spectrum: variable and constant �em
�ex
�em
�ex

Luminescence IntensityA simplified view of processes occurring during a luminescence measurement is shown inthe enlarged sample cell at the lower left of Figure 18-20. We expect emission to be propor-tional to the irradiance absorbed by the sample. In Figure 18-20, the irradiance incident on the sample cell is . Some is absorbed over the pathlength , so the irradiancestriking the central region of the cell is
(18-7)
where is the molar absorptivity at the wavelength and c is the concentration of ana-lyte. The irradiance of the beam when it has traveled the additional distance is
(18-8)P¿ � P¿010��exb2c
b2
�ex�ex
Irradiance striking central region � P¿0 � P010��exb1c
b1P0
(W/m2)
18-6 Luminescence 395
Box 18-3 Instability of the Earth’s Climate
Natural oxygen is 99.8% , , and . Smallvariations in isotope ratios in in the ocean, the atmosphere,and rain and snow depend on local temperature. The warmer theair, the more enriched it is in . The content of snow pre-served in glaciers provides a record of air temperatures for
years in 2-km-long cores drilled from ice sheets inGreenland and Antarctica. Depth in the ice pack has been corre-lated with age in years by a variety of measurements.
The figure shows variations in the content of icedeposited in Greenland over the past 160 000 years. The measuredquantities are depth in the ice and , defined as
, where is the ratio in ice and isthe ratio in a reference material, which is modern sea-water. is the change in ratio between ice and the refer-ence material, measured in parts per thousand . The derivedquantities are age of the ice and the air temperature at which thesnow fell.
The past 10 000 years have been an exceptionally stable,high-temperature period. Over most of the ice-core record, tem-perature switched between two “quasi-stationary climatestages.”14 From 20 000 to 80 000 years ago, the warm-climateair temperature was about and the cold temperature wasnear . Transitions between the two climates required as lit-tle as 10–20 years, and each climate persisted between 70 and5 000 years.
Similar changes are seen in other terrestrial and marine geo-logical records from the North Atlantic region, but not from theAntarctic. Circulation changes in the North Atlantic Ocean areconjectured to be the driving force for the climate changes.
�42°C�35°C
(‰)
18O/16Od18O
18O/16ORref
18O/16ORice[Rice � Rref]/Rref
1 000 �d18O
18O
�250 000
18OH218O
H2O0.04% 17O0.2% 18O16O
content of ice core drilled from Summit in central Greenland.[M. Anklin et al., “Climate Instability During the Last Interglacial Period Recorded in
the GRIP Ice Core,” Nature 1993, 364, 203.]
18O
0
20
40
60
80
100
120
Tho
usan
ds o
f yea
rs b
efor
e pr
esen
t
140
160–45 –40
18O (‰)δ
–35 –30
–45 –25–40 –35
Air temperature (°C)
–30
Inte
nsity
ExcitationAnthracene
Fluorescence
Wavelength (nm)
300 340 380 420 460
λ0 λ0
Figure 18-21 Excitation and emissionspectra of anthracene have the same mirrorimage relation as the absorption and emissionspectra in Figure 18-16. An excitation spectrumis nearly the same as an absorption spectrum.[C. M. Byron and T. C. Werner, “Experiments in
Synchronous Fluorescence Spectroscopy for the
Undergraduate Instrumental Chemistry Course,”
J. Chem. Ed. 1991, 68, 433.]
Equation 18-7 comes from Equations 18-5 and18-6. If species other than analyte absorbed atthe wavelengths of interest, we would have toinclude them.

Emission intensity I is proportional to the irradiance absorbed in the central region of the cell:
(18-9)
where is a constant of proportionality. Not all radiation emitted from the center of the cellin the direction of the exit slit is observed. Some is absorbed between the center and the edgeof the cell. Emission intensity I emerging from the cell is given by Beer’s law:
(18-10)
where is the molar absorptivity at the emission wavelength and is the distance fromthe center to the edge of the cell.
Combining Equations 18-9 and 18-10 gives an expression for emission intensity:
(18-11)
Substituting expressions for and from Equations 18-7 and 18-8, we obtain a relationbetween incident irradiance and emission intensity:
(18-12)1231442443 123
Loss of intensity Absorption Loss of intensityin region 1 in region 2 in region 3
Consider the limit of low concentration, which means that the exponents , ,and are all very small. The terms , , and are all close to unity.We can replace and with 1 in Equation 18-12. We cannot replace with 1, because we are subtracting this term from 1 and would be left with 0. Instead, weexpand in a power series:
(18-13)
Each term of Equation 18-13 becomes smaller and smaller, so we just keep the first two terms.The central factor in Equation 18-12 becomes
and the entire equation can be written
(18-14)
where is a constant.Equation 18-14 says that, at low concentration, emission intensity is proportional to analyte
concentration. Data for anthracene in Figure 18-22 are linear below . Blank samplesinvariably scatter light and must be run in every analysis. Equation 18-14 tells us that doubling theincident irradiance will double the emission intensity (up to a point). In contrast, doubling has no effect on absorbance, which is a ratio of two intensities. The sensitivity of a luminescencemeasurement can be increased by more than a factor of 3 by the simple expedient of using a mir-ror coating on the two walls of the sample cell opposite the slits in Figure 18-20.15
For higher concentrations, we need all the terms in Equation 18-12. As concentrationincreases, a peak emission is reached. Then emission decreases because absorptionincreases more rapidly than the emission. We say the emission is quenched (decreased) byself-absorption, which is the absorption of excitation or emission energy by analyte mole-cules in the solution. At high concentration, even the shape of the emission spectrum canchange, because absorption and emission both depend on wavelength.
Example: Fluorimetric Assay of Selenium in Brazil NutsSelenium is a trace element essential to life. For example, the selenium-containing enzymeglutathione peroxidase catalyzes the destruction of peroxides (ROOH) that are harmful tocells. Conversely, at high concentration, selenium can be toxic.
To measure selenium in Brazil nuts, 0.1 g of nut is digested with 2.5 mL of 70 wt% ina Teflon bomb (Figure 28-8) in a microwave oven. Hydrogen selenate in the digestis reduced to hydrogen selenite ( ) with hydroxylamine . Selenite is thenderivatized to form a fluorescent product that is extracted into cyclohexane.
(18-15)+ H2SeO3pH = 2
50�C+ 3H2O
NH2
NH2Se
N
N
2,3-Diaminonaphthalene Fluorescent product
¡
(NH2OH)H2SeO3
(H2SeO4)HNO3
P0(P0)
10�6 M
k � k¿�exb2 ln 10
I � kP0ck¿P0(�exb2c ln 10) �Emission intensity at low concentration:
�exb2c ln 10(1 � 10��exb2c) � (1 � [1 � �exb2c ln 10]) �
10��exb2c � 1 � �exb2c ln 10 �(�exb2c ln 10)2
2!�
(�exb2c ln 10)3
3!� . . .
10��exb2c
10��exb2c10��emb3c10��exb1c10��emb3c10��exb2c10��exb1c�emb3c
�exb2c�exb1c
� k¿P010��exb1c(1 � 10��exb2c)10��emb3c
I � k¿ (P010��exb1c � P010��exb1c 10��exb2c)10��emb3c
P¿P¿0
I � k¿(P¿0 � P¿)10��em b3c
b3�em
I � I ¿ 10��emb3c
k¿Emission intensity � I ¿ � k ¿(P ¿0 � P ¿)
396 CHAPTER 18 Fundamentals of Spectrophotometry
Flu
ores
cenc
e in
tens
ity(a
rbitr
ary
units
)
Concentration (µM)
00 0.1 0.2 0.3 0.4 0.5 0.6
40
80
120
Figure 18-22 Linear calibration curve forfluorescence of anthracene measured at thewavelength of maximum fluorescence inFigure 18-21. [C. M. Byron and T. C. Werner,
“Experiments in Synchronous Fluorescence
Spectroscopy for the Undergraduate Instrumental
Chemistry Course,” J. Chem. Ed. 1991, 68, 433.]
The series 18-13 follows from the relationand the expansion
of :
ex � 1 �x1
1 !�
x2
2 !�
x 3
3 !� . . .
ex
10�A � (eln10)�A � e�Aln10
Derivatization: the chemical alteration ofanalyte so that it can be detected easily orseparated easily from other species.

Summary 397
Terms to Understandabsorbanceabsorption spectrumBeer’s lawchemiluminescencechromophorecuvetderivatizationelectromagnetic spectrumelectronic transition
emission spectrumexcitation spectrumexcited statefluorescencefrequencyground statehertzirradianceluminescence
maskingmolar absorptivitymolecular orbitalmonochromatic lightmonochromatorphosphorescencephotonreagent blankrefractive index
rotational transitionself-absorptionsinglet statespectrophotometrytransmittancetriplet statevibrational transitionwavelengthwavenumber
SummaryLight can be thought of as waves whose wavelength ( ) and fre-quency ( ) have the important relation , where c is thespeed of light. Alternatively, light may be viewed as consistingof photons whose energy (E) is given by ,where h is Planck’s constant and is the wavenumber.Absorption of light is commonly measured by absorbance (A) ortransmittance (T ), defined as and ,where is the incident irradiance and P is the exiting irradi-ance. Absorption spectroscopy is useful in quantitative analysisbecause absorbance is proportional to the concentration of the
P0
T � P/P0A � log(P0/P)
� (� 1/�)E � h � hc/� � hc �
� � c � absorbing species in dilute solution (Beer’s law): . In
this equation, b is pathlength, c is concentration, and is themolar absorptivity (a constant of proportionality).
Basic components of a spectrophotometer include a radiationsource, a monochromator, a sample cell, and a detector. To minimizeerrors in spectrophotometry, samples should be free of particles, cuvetsmust be clean, and they must be positioned reproducibly in the sampleholder. Measurements should be made at a wavelength of maximumabsorbance. Instrument errors tend to be minimized if the absorbancefalls in the range .A � 0.4�0.9
�A � �bc
Maximum response of the fluorescent product was observed with an excitation wave-length of 378 nm and an emission wavelength of 518 nm in Figure 18-23. Emission is pro-portional to concentration only up to . Beyond , the responsebecomes curved, eventually reaches a maximum, and finally decreases with increasing con-centration as self-absorption dominates. This behavior is predicted by Equation 18-12.
Luminescence in Analytical ChemistrySome analytes, such as riboflavin and polycyclic aromatic compounds (animportant class of carcinogens), are naturally fluorescent and can be analyzed directly. Mostcompounds are not luminescent. However, coupling to a fluorescent moiety provides a routeto sensitive analyses. Fluorescein is a strongly fluorescent compound that can be coupled tomany molecules for analytical purposes. Fluorescent labeling of fingerprints is a powerfultool in forensic analysis.17 Sensor molecules whose luminescence responds selectively to avariety of simple cations and anions are available.18 can be measured from the fluores-cence of a complex it forms with a derivative of fluorescein called calcein.
Molecular biologists use DNA microarrays (“gene chips”) to monitor gene expressionand mutations and to detect and identify pathological microorganisms.19 A single chip cancontain thousands of known single-strand DNA sequences in known locations. The chip isincubated with unknown single-strand DNA that has been tagged with fluorescent labels.After the unknown DNA has bound to its complementary strands on the chip, the amountbound to each spot on the chip is measured by fluorescence intensity.
Chemiluminescence—the emission of light arising from a chemical reaction—is valu-able in chemical analysis.20 Light from a firefly or light stick is chemiluminescence.21
within cellular organelles such as mitochondria can be monitored by observing light emittedwhen binds to the protein aequorin obtained from jellyfish.22 Nitric oxide (NO), whichtransmits signals between cells, can be measured at the parts per billion level by its chemilu-minescent reaction with the compound luminol.23 The hormone thyroxine can be measuredover the concentration range to by a chemiluminescent method.2410�7 M10�14
Ca2�
Ca2�
(�O2CCH2)2N
ßCO2H
Fluorescein Calcein
ßßßO OHO
ßCO2H
ßßßO OHO
Chelatingaminodiacetate
group
ß ß
¡
N(CH CO�)22 2
Ca2�
(vitamin B2)16
0.1 �g Se/mL�0.1 �g Se/mL
Flu
ores
cenc
e in
tens
ity
1 2 3Se (µg/mL)
4 5 60
Figure 18-23 Fluorescence calibrationcurve for the selenium-containing product inReaction 18-15. The curvature and maximumare due to self-absorption. [From M.-C. Sheffield
and T. M. Nahir, “Analysis of Selenium in Brazil Nuts by
Microwave Digestion and Fluorescence Detection,”
J. Chem. Ed. 2002, 79, 1345.]
NH2
Luminol(5-amino-2,3-dihydro-1,4-phthalazinedione)
O
O
NH
NH
NH2
� N2 � blue light
oxidant (such asNO or H
2O
2)
OH�, metal catalyst
CO�2
CO�2
ç
œ
å

398 CHAPTER 18 Fundamentals of Spectrophotometry398 CHAPTER 18 Fundamentals of Spectrophotometry
When a molecule absorbs light, it is promoted to an excited statefrom which it returns to the ground state by radiationless processes orby fluorescence or phosphorescence
. Emission intensity is proportional toconcentration at low concentration. At sufficiently high concentration,emission decreases because of self-absorption by the analyte. An exci-tation spectrum (a graph of emission intensity versus excitation wave-
(triplet S singlet emission)(singlet S singlet emission)
length) is similar to an absorption spectrum (a graph of absorbance ver-sus wavelength). An emission spectrum (a graph of emission intensityversus emission wavelength) is observed at lower energy than theabsorption spectrum and tends to be the mirror image of the absorptionspectrum. A molecule that is not fluorescent can be analyzed by attach-ing a fluorescent group to it. Light emitted by a chemical reaction—chemiluminescence—also is used for quantitative analysis.
20.00 mL organicphase containing allCu-neocuproine
25.00 mL aqueousphase containingno CuFlask CFlask B
Add 10.00mL ofaqueousreagent +20.00 mLorganicsolvent
Add20.00mL ofreagents
Flask A250.0 mL
Rock
Transfer10.00 mL
Transfer15.00 mL
Transfer allliquid to flask
Grind rock to finepowder and extractCu from powderwith strong acidFigure for Exercise 18-D.
Exercises18-A. (a) What value of absorbance corresponds to 45.0% T?(b) If a 0.010 0 M solution exhibits 45.0% T at some wavelength,what will be the percent transmittance for a 0.020 0 M solution ofthe same substance?
18-B. (a) A solution of compound A exhibited anabsorbance of 0.624 at 238 nm in a 1.000-cm cuvet; a blanksolution containing only solvent had an absorbance of 0.029 atthe same wavelength. Find the molar absorptivity of compoundA.(b) The absorbance of an unknown solution of compound A in thesame solvent and cuvet was 0.375 at 238 nm. Find the concentra-tion of A in the unknown.(c) A concentrated solution of compound A in the same solvent wasdiluted from an initial volume of 2.00 mL to a final volumeof 25.00 mL and then had an absorbance of 0.733. What is theconcentration of A in the concentrated solution?
18-C. Ammonia can be determined spectrophotometrically byreaction with phenol in the presence of hypochlorite :
A 4.37-mg sample of protein was chemically digested to convertits nitrogen into ammonia and then diluted to 100.0 mL. Then10.0 mL of the solution were placed in a 50-mL volumetric flaskand treated with 5 mL of phenol solution plus 2 mL of sodiumhypochlorite solution. The sample was diluted to 50.0 mL, andthe absorbance at 625 nm was measured in a 1.00-cm cuvet after30 min. For reference, a standard solution was prepared from0.010 0 g of dissolved in 1.00 L of water.Then 10.0 mL of this standard were placed in a 50-mL volumet-ric flask and analyzed in the same manner as the unknown. Areagent blank was prepared by using distilled water in place ofunknown.
(FM 53.49)NH4Cl
Blue product, �max � 625 nm
O N O�OH � NH3
Phenol(colorless)
2
Ammonia(colorless)
OCl�
(OCl�)
3.96 � 10�4 M
AbsorbanceSample at 625 nm
Blank 0.140Reference 0.308Unknown 0.592
(a) Calculate the molar absorptivity of the blue product.(b) Calculate the weight percent of nitrogen in the protein.
18-D. reacts with neocuproine to form the colored complex, with an absorption maximum at 454 nm.
Neocuproine is particularly useful because it reacts with few othermetals. The copper complex is soluble in 3-methyl-1-butanol(isoamyl alcohol), an organic solvent that does not dissolve appre-ciably in water. In other words, when isoamyl alcohol is added towater, a two-layered mixture results, with the denser water layer atthe bottom. If is present, virtually all of it goesinto the organic phase. For the purpose of this problem, assume thatthe isoamyl alcohol does not dissolve in the water at all and that allthe colored complex will be in the organic phase. Suppose that thefollowing procedure is carried out:
1. A rock containing copper is pulverized, and all metalsare extracted from it with strong acid. The acidic solution isneutralized with base and made up to 250.0 mL in flask A.
2. Next, 10.00 mL of the solution are transferred to flask B andtreated with 10.00 mL of a reducing agent to reduce all to . Then 10.00 mL of buffer is added to bring the pH to avalue suitable for complex formation with neocuproine.
3. After that, 15.00 mL of this solution are withdrawn and placed inflask C. To the flask are added 10.00 mL of an aqueous solutioncontaining neocuproine and 20.00 mL of isoamyl alcohol. Afterthe mixture has been shaken well and the phases allowed to sepa-rate, all is in the organic phase.
4. A few milliliters of the upper layer are withdrawn, and theabsorbance at 454 nm is measured in a 1.00-cm cell. A blank car-ried through the same procedure gives an absorbance of 0.056.
(neocuproine)2Cu�
Cu�
Cu2�
(neocuproine)2Cu�
(neocuproine)2Cu�
Cu�

Problems 399
(a) Suppose that the rock contained 1.00 mg of Cu. What will be theconcentration of Cu (moles per liter) in the isoamyl alcohol phase?(b) If the molar absorptivity of is
, what will be the observed absorbance? Remember that ablank carried through the same procedure gave an absorbance of 0.056.(c) A rock is analyzed and found to give a final absorbance of 0.874(uncorrected for the blank). How many milligrams of Cu are in the rock?
18-E. The figure below shows an infrared absorption peak forsolutions containing 10 to 50 vol% acetone in water.The shape of the spectrum is somewhat different for each mixture,which shifts the baseline (dotted line) and position of the absorptionpeak. The baseline is the blank absorbance that must be subtractedfrom each peak absorbance to obtain corrected absorbance.
1 200
Abs
orba
nce
Wavenumber (cm–1)
0.4
1.2
1.0
0.8
0.6
1 300
50% baseline 10% baseline
10 vol%
20 vol%
30 vol%
40 vol%
50 vol%
([CH3]2C¢O)
103 M�1 cm�17.90 �(neocuproine)2Cu�
(a) Using a millimeter ruler, measure to the nearest 0.1 mm howmany millimeters correspond to 0.8 absorbance units (from 0.4 to1.2) on the ordinate (y-axis) of the spectrum.(b) Measure the corrected height of the peak corresponding to50 vol% acetone, using the distance from the baseline marked“50%.” By comparing your measurement in part (b) with that inpart (a), find the corrected absorbance of the 50 vol% acetone peak.For example, if 0.8 and the peak heightis 63.7 mm, then the corrected absorbance is found from theproportion
(c) The baselines for 10 and 50 vol% acetone are shown in the fig-ure. Draw baselines for the 20, 30, and 40 vol% acetone spectra andfind the corrected absorbance for the 10–40 vol% solutions.(d) Make a calibration curve showing corrected absorbance versusvolume percent of acetone. (This curve does not go through theorigin.)(e) Find the least-squares equation of the calibration line, includinguncertainties in the slope and intercept.(f) Find vol% acetone in a solution for which three replicate mea-surements gave an average absorbance of 0.611. Use Equation 4-27to find the uncertainty.
corrected peak absorbance � 0.873
63.7 mm
58.4 mm�
corrected peak absorbance
0.8 absorbance unit1
corrected peak absorbance
0.8 absorbance unit
Corrected peak height (mm)
Length for 0.8 absorbance unit (mm)�
absorbance unit � 58.4 mm
Problems
Properties of Light
18-1. Fill in the blanks.(a) If you double the frequency of electromagnetic radiation, you___________ the energy.(b) If you double the wavelength, you ___________ the energy.(c) If you double the wavenumber, you ___________ the energy.
18-2. (a) How much energy (in kilojoules) is carried by one mole ofphotons of red light with ?(b) How many kilojoules are carried by one mole of photons of vio-let light with ?
18-3. Calculate the frequency (Hz), wavenumber , andenergy (J/photon and J/[mol of photons]) of visible light with awavelength of 562 nm.
18-4. Which molecular processes correspond to the energies ofmicrowave, infrared, visible, and ultraviolet photons?
18-5. The characteristic orange light produced by sodium in a flameis due to an intense emission called the sodium D line. This “line” isactually a doublet, with wavelengths (measured in vacuum) of589.157 88 and 589.755 37 nm. The index of refraction of air at a
(cm�1)
� � 400 nm
� � 650 nm
wavelength near 589 nm is 1.000 292 6. Calculate the frequency,wavelength, and wavenumber of each component of the D line,measured in air.
Absorption of Light and Measuring Absorbance
18-6. Explain the difference between transmittance, absorbance,and molar absorptivity. Which one is proportional to concentration?
18-7. What is an absorption spectrum?
18-8. Why does a compound whose visible absorption maximum isat 480 nm (blue-green) appear to be red?
18-9. Why is it most accurate to measure absorbances in the range?
18-10. The absorbance of a solution of a compoundis 0.822 at a wavelength of 266 nm in a 1.00-cm cell. Calculate themolar absorptivity at 266 nm.
18-11. What color would you expect to observe for a solution of theion , which has a visible absorbance maximum at562 nm?
Fe(ferrozine)4�3
2.31 � 10�5 M
A � 0.4–0.9
Figure for Exercise 18-E. Infrared absorption spectra of 10–50 vol% acetonein water. Vertical arrow shows corrected absorbance for 50 vol% acetone,which is obtained by subtracting baseline absorbance from peakabsorbance. [Spectra from A. Afran, “FTIR Absorbance Linearity of Square Column
Attenuated Total Reflectance,” Am. Lab. February 1993, p. 40MMM.]
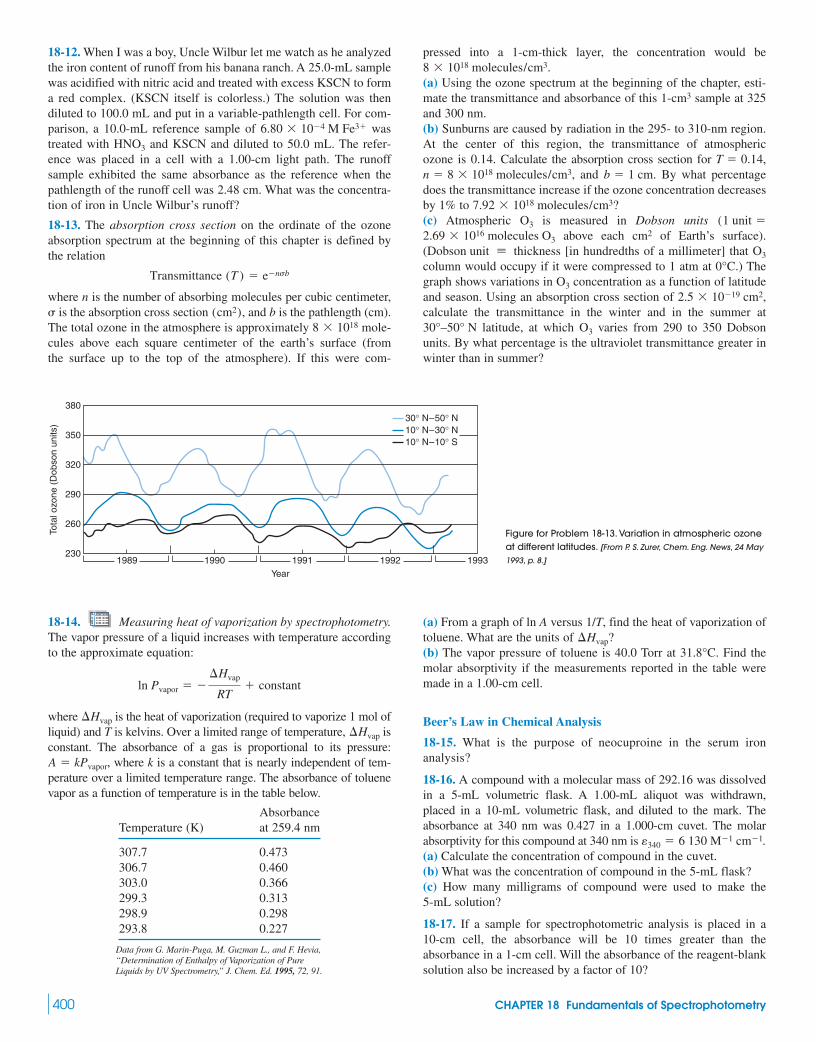
400 CHAPTER 18 Fundamentals of Spectrophotometry
18-12. When I was a boy, Uncle Wilbur let me watch as he analyzedthe iron content of runoff from his banana ranch. A 25.0-mL samplewas acidified with nitric acid and treated with excess KSCN to forma red complex. (KSCN itself is colorless.) The solution was thendiluted to 100.0 mL and put in a variable-pathlength cell. For com-parison, a 10.0-mL reference sample of wastreated with and KSCN and diluted to 50.0 mL. The refer-ence was placed in a cell with a 1.00-cm light path. The runoffsample exhibited the same absorbance as the reference when thepathlength of the runoff cell was 2.48 cm. What was the concentra-tion of iron in Uncle Wilbur’s runoff?
18-13. The absorption cross section on the ordinate of the ozoneabsorption spectrum at the beginning of this chapter is defined bythe relation
where n is the number of absorbing molecules per cubic centimeter,is the absorption cross section , and b is the pathlength (cm).
The total ozone in the atmosphere is approximately mole-cules above each square centimeter of the earth’s surface (fromthe surface up to the top of the atmosphere). If this were com-
8 � 1018(cm2)
Transmittance (T ) � e�nb
HNO3
6.80 � 10�4 M Fe3�
pressed into a 1-cm-thick layer, the concentration would be.
(a) Using the ozone spectrum at the beginning of the chapter, esti-mate the transmittance and absorbance of this sample at 325and 300 nm.(b) Sunburns are caused by radiation in the 295- to 310-nm region.At the center of this region, the transmittance of atmosphericozone is 0.14. Calculate the absorption cross section for ,
, and . By what percentagedoes the transmittance increase if the ozone concentration decreasesby 1% to ?(c) Atmospheric is measured in Dobson units
above each of Earth’s surface).( [in hundredths of a millimeter] that column would occupy if it were compressed to 1 atm at .) Thegraph shows variations in concentration as a function of latitudeand season. Using an absorption cross section of ,calculate the transmittance in the winter and in the summer at
latitude, at which varies from 290 to 350 Dobsonunits. By what percentage is the ultraviolet transmittance greater inwinter than in summer?
O330°–50° N
2.5 � 10�19 cm2O3
0°CO3Dobson unit � thickness
cm22.69 � 1016 molecules O3
(1 unit �O3
7.92 � 1018 molecules/cm3
b � 1 cm1018 molecules/cm3n � 8 �T � 0.14
1-cm3
8 � 1018 molecules/cm3
380
1993
Tota
l ozo
ne (
Dob
son
units
)
Year
350
320
290
260
2301992199119901989
30° N–50° N10° N–30° N10° N–10° S
18-14. Measuring heat of vaporization by spectrophotometry.The vapor pressure of a liquid increases with temperature accordingto the approximate equation:
where is the heat of vaporization (required to vaporize 1 mol ofliquid) and T is kelvins. Over a limited range of temperature, isconstant. The absorbance of a gas is proportional to its pressure:
, where k is a constant that is nearly independent of tem-perature over a limited temperature range. The absorbance of toluenevapor as a function of temperature is in the table below.
AbsorbanceTemperature (K) at 259.4 nm
307.7 0.473306.7 0.460303.0 0.366299.3 0.313298.9 0.298293.8 0.227
Data from G. Marin-Puga, M. Guzman L., and F. Hevia,“Determination of Enthalpy of Vaporization of PureLiquids by UV Spectrometry,” J. Chem. Ed. 1995, 72, 91.
A � kPvapor
�Hvap
�Hvap
ln Pvapor � ��Hvap
RT� constant
(a) From a graph of ln A versus 1/T, find the heat of vaporization oftoluene. What are the units of ?(b) The vapor pressure of toluene is 40.0 Torr at . Find themolar absorptivity if the measurements reported in the table weremade in a 1.00-cm cell.
Beer’s Law in Chemical Analysis
18-15. What is the purpose of neocuproine in the serum ironanalysis?
18-16. A compound with a molecular mass of 292.16 was dissolvedin a 5-mL volumetric flask. A 1.00-mL aliquot was withdrawn,placed in a 10-mL volumetric flask, and diluted to the mark. Theabsorbance at 340 nm was 0.427 in a 1.000-cm cuvet. The molarabsorptivity for this compound at 340 nm is (a) Calculate the concentration of compound in the cuvet.(b) What was the concentration of compound in the 5-mL flask?(c) How many milligrams of compound were used to make the 5-mL solution?
18-17. If a sample for spectrophotometric analysis is placed in a10-cm cell, the absorbance will be 10 times greater than theabsorbance in a 1-cm cell. Will the absorbance of the reagent-blanksolution also be increased by a factor of 10?
�340 � 6 130 M�1 cm�1.
31.8°C�Hvap
Figure for Problem 18-13. Variation in atmospheric ozoneat different latitudes. [From P. S. Zurer, Chem. Eng. News, 24 May
1993, p. 8.]
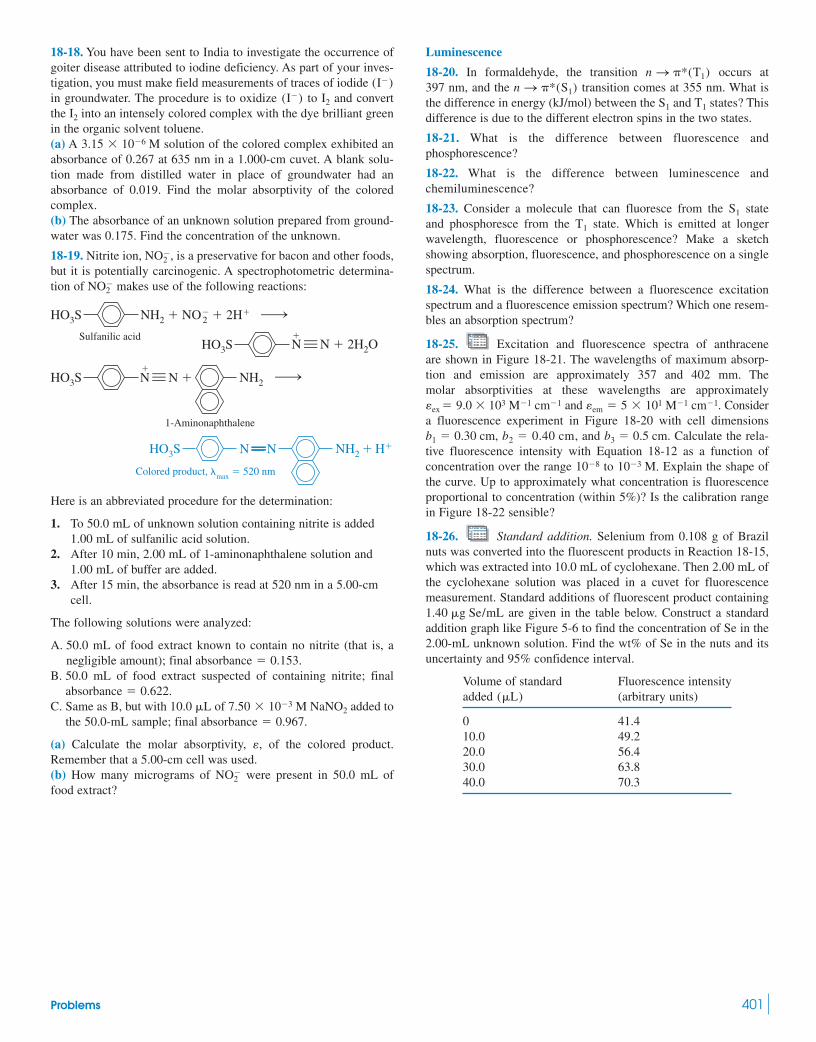
Problems 401
18-18. You have been sent to India to investigate the occurrence ofgoiter disease attributed to iodine deficiency. As part of your inves-tigation, you must make field measurements of traces of iodide in groundwater. The procedure is to oxidize to and convertthe into an intensely colored complex with the dye brilliant greenin the organic solvent toluene.(a) A solution of the colored complex exhibited anabsorbance of 0.267 at 635 nm in a 1.000-cm cuvet. A blank solu-tion made from distilled water in place of groundwater had anabsorbance of 0.019. Find the molar absorptivity of the coloredcomplex.(b) The absorbance of an unknown solution prepared from ground-water was 0.175. Find the concentration of the unknown.
18-19. Nitrite ion, , is a preservative for bacon and other foods,but it is potentially carcinogenic. A spectrophotometric determina-tion of makes use of the following reactions:
Here is an abbreviated procedure for the determination:
1. To 50.0 mL of unknown solution containing nitrite is added1.00 mL of sulfanilic acid solution.
2. After 10 min, 2.00 mL of 1-aminonaphthalene solution and1.00 mL of buffer are added.
3. After 15 min, the absorbance is read at 520 nm in a 5.00-cmcell.
The following solutions were analyzed:
A. 50.0 mL of food extract known to contain no nitrite (that is, anegligible amount); .
B. 50.0 mL of food extract suspected of containing nitrite; final.
C. Same as B, but with of added tothe 50.0-mL sample; .
(a) Calculate the molar absorptivity, , of the colored product.Remember that a 5.00-cm cell was used.(b) How many micrograms of were present in 50.0 mL offood extract?
NO�2
�
final absorbance � 0.9677.50 � 10�3 M NaNO210.0 �L
absorbance � 0.622
final absorbance � 0.153
Colored product, �max � 520 nm
HO3S NH2 � H�N N
1-Aminonaphthalene
HO3S�
NH2N ßßß N � ¡
NH2 � NO� � 2H�
Sulfanilic acid
HO3S
HO3S�
2 ¡
N � 2H2ON ßßß
NO�2
NO�2
3.15 � 10�6 M
I2
I2(I�)(I�)
Luminescence
18-20. In formaldehyde, the transition occurs at397 nm, and the transition comes at 355 nm. What isthe difference in energy (kJ/mol) between the and states? Thisdifference is due to the different electron spins in the two states.
18-21. What is the difference between fluorescence and phosphorescence?
18-22. What is the difference between luminescence and chemiluminescence?
18-23. Consider a molecule that can fluoresce from the stateand phosphoresce from the state. Which is emitted at longerwavelength, fluorescence or phosphorescence? Make a sketchshowing absorption, fluorescence, and phosphorescence on a singlespectrum.
18-24. What is the difference between a fluorescence excitationspectrum and a fluorescence emission spectrum? Which one resem-bles an absorption spectrum?
18-25. Excitation and fluorescence spectra of anthraceneare shown in Figure 18-21. The wavelengths of maximum absorp-tion and emission are approximately 357 and 402 mm. Themolar absorptivities at these wavelengths are approximately
and . Considera fluorescence experiment in Figure 18-20 with cell dimensions
, , and . Calculate the rela-tive fluorescence intensity with Equation 18-12 as a function ofconcentration over the range to . Explain the shape ofthe curve. Up to approximately what concentration is fluorescenceproportional to concentration (within 5%)? Is the calibration rangein Figure 18-22 sensible?
18-26. Standard addition. Selenium from 0.108 g of Brazilnuts was converted into the fluorescent products in Reaction 18-15,which was extracted into 10.0 mL of cyclohexane. Then 2.00 mL ofthe cyclohexane solution was placed in a cuvet for fluorescencemeasurement. Standard additions of fluorescent product containing
are given in the table below. Construct a standardaddition graph like Figure 5-6 to find the concentration of Se in the2.00-mL unknown solution. Find the wt% of Se in the nuts and itsuncertainty and 95% confidence interval.
Volume of standard Fluorescence intensityadded (arbitrary units)
0 41.410.0 49.220.0 56.430.0 63.840.0 70.3
(�L)
1.40 �g Se/mL
10�3 M10�8
b3 � 0.5 cmb2 � 0.40 cmb1 � 0.30 cm
�em � 5 � 101 M�1 cm�1�ex � 9.0 � 103 M�1 cm�1
T1
S1
T1S1
n S *(S1)n S *(T1)

This chapter describes several applications of absorption and emission of electromagneticradiation in chemical analysis. Another application—spectrophotometric titrations—wasalready covered in Section 7-3. We also use Excel SOLVER and spreadsheet matrix manipula-tions as powerful tools for numerical analysis.
19-1 Analysis of a MixtureThe absorbance of a solution at any wavelength is the sum of absorbances of all the speciesin the solution.
Absorbance of a mixture: (19-1)
where is the molar absorptivity of each species at the wavelength in question and b isthe cell pathlength (Figure 18-4). If we know the spectra of the pure components, we canmathematically disassemble the spectrum of a mixture into those of its components. In acid-
�
A � �Xb[X] � �Yb[Y] � �Zb[Z] � p
402 CHAPTER 19 Applications of Spectrophotometry
FLUORESCENCE RESONANCE ENERGY TRANSFER BIOSENSOR
Applications of Spectrophotometry19
Biorecognitionelement such as an antibody
Distance toogreat forenergy transfer
Fluorescenceresonanceenergy transfer
Nofluorescence
Analyte analogattached toflexible arm600 nm
510 nm510 nmAnalyte
Flexiblearm
Radiant energy absorber (donor)
Radiant energy emitter (acceptor)
Substrate
0 10 20 30 40 50
Analyte concentration (TNT, mg/L)
Dec
reas
e in
fluo
resc
ence
60
Response of biosensor to TNT is a decrease influorescence with increasing concentration ofanalyte. [From I. L. Medintz, E. R. Goldman, M. E.Lassman, A. Hayhurst, A. W. Kusterbeck, and J. R.Deschamps, “Self-Assembled TNT Biosensor Basedon Modular Multifunctional Surface-TetheredComponents,” Anal. Chem. 2005, 77, 365.]
Absorbance is additive.
This biosensor consists of two surface-tethered components. The biorecognition elementcan be an antibody (Section 19-5), DNA, RNA, or carbohydrate with specific affinity foranalyte. A structural analog of the analyte is bound to a flexible arm adjacent to the recog-nition element. In the absence of analyte, the tethered analog binds to the recognitionelement.
A chromophore that efficiently absorbs radiant energy is attached to the recognitionelement adjacent to the recognition site. The fluorescent chromophore is attached tothe flexible arm adjacent to the analyte structural analog. At the left side of the figure,absorbing and emitting chromophores are close to each other. Radiant energy with a wave-length of 510 nm is absorbed by and efficiently transferred through space to , whichfluoresces strongly at 600 nm. This fluorescence resonance energy transfer decreases withthe 6th power of the distance between the donor and acceptor.1
When analyte is added, it displaces the tethered analog from this biorecognition ele-ment. The higher the concentration of analyte, the more displacement occurs. When theanalog is displaced from the binding site, and are no longer close enough forenergy transfer, and fluorescence is decreased. In the graph, analyte is trinitrotoluene (theexplosive, TNT) and the detection limit is 0.1 mg/L (0.1 ppm). After a measurement, thesensor is washed to remove analyte and then reused for more analyses.

base chemistry, such a procedure allows us to measure the concentrations of the acidic andbasic forms of an indicator. This information, combined with the Henderson-Hasselbalchequation (9-16), provides a precise measurement of pH by spectrophotometry.2
For a mixture of compounds X and Y, two cases are distinguished. In Figure 19-1a, theabsorption bands of pure X and pure Y overlap significantly everywhere. This case is besttreated by a spreadsheet procedure that uses measurements at many wavelengths. In Fig-ure 19-1b, X and Y have relatively little overlap in some regions. We can analyze this casewith a pair of measurements at wavelength where X makes the major contribution, andwavelength where Y makes the major contribution.
What to Do When the Individual Spectra OverlapWe will apply a really simple least-squares analysis of Equation 19-1 to the spectrum of anunknown mixture of complexes of Ti(IV) and V(V) in Figure 19-2. The figure alsoshows spectra of standard 1.32 mM Ti(IV) and 1.89 mM V(V).
H2O2
�–,�¿,
19-1 Analysis of a Mixture 403
Abs
orba
nce
Wavelength
X
Y
λ′
λ′′
X Y
Abs
orba
nce
(a )
(b )
Figure 19-1 Two cases for analysis of amixture. (a) Spectra of the pure componentshave substantial overlap. (b) Regions exist inwhich each component makes the majorcontribution.
Figure 19-2 Visible spectra of 1.32 mM Ti(IV), 1.89 mM V(V), and an unknown mixture containingboth ions. All solutions contain 0.5 wt% and 0.01 M Absorbance at points shown by dotsis listed in Figure 19-3. [From M. Blanco, H. Iturriaga, S. Maspoch, and P. Tarín, “A Simple Method for Spectrophotometric
Determination of Two Components with Overlapped Spectra,” J. Chem. Ed. 1989, 66, 178.]
H2SO4.H2O2
0400
Abs
orba
nce
Wavelength (nm)450 500 550 600350
0.1
0.2
0.3
0.4
0.5
0.6
0.7
0.8
0.9
1
Mixture
Ti
V
A B C D E F G H
7
6 390 0.895
5
4
Absorbance
of Mixture AbsorbanceMolar Absorptivity
Am
Calculated
Acalc [Acalc-Am]^2Titanium Vanadium
Absorbance of Standard:
Titanium Vanadium
3
Analysis of a Mixture When You Have More Data Points Than Components of the Mixture
2
1
Measured
Wave-
length
15
14 0.00132 [Ti] =
0.00189
Pathlength E6 = B6/($A$19*$A$14)
13
12 Concentrations in the mixture
(to be found by Solver)
sum = 1.034E-0111
10
9
510
Standards
[Ti](M) =
[V](M) = [V] =
0.173
20 H6 = (G6-D6)^2
19
18
17
(cm) = F6 = C6/($A$19*$A$16)
1.000 G6 = E6*$A$19*$D$14+F6*$A$19*$D$15
8
430
470
450
0.884
0.481
0.694
0.326
0.374
0.497
0.512
0.528
0.651
0.314
0.743
0.547
0.665
678.0
131.1
669.7
364.4
525.8
172.5
197.9
263.0
270.9
279.4
0.8505
0.3289
0.9327
0.6353
0.8051
3.981E-02
2.233E-04
3.597E-02
7.796E-03
1.963E-02
16
0.001000
0.001000
Figure 19-3Spreadsheet usingSOLVER to analyze the mixture in Figure 19-2.
First, we measure the absorbance of each standard at several wavelengths shown by dotsin Figure 19-2. Results are listed in columns A–C of Figure 19-3. Concentrations of the stan-dards are entered in cells A14 and A16 and the pathlength (1.000 cm) is indicated in cell A19.
Measure absorbance at more wavelengthsthan there are components in the mixture. Fora two-component mixture, use at least threewavelengths. More wavelengths increase theaccuracy.
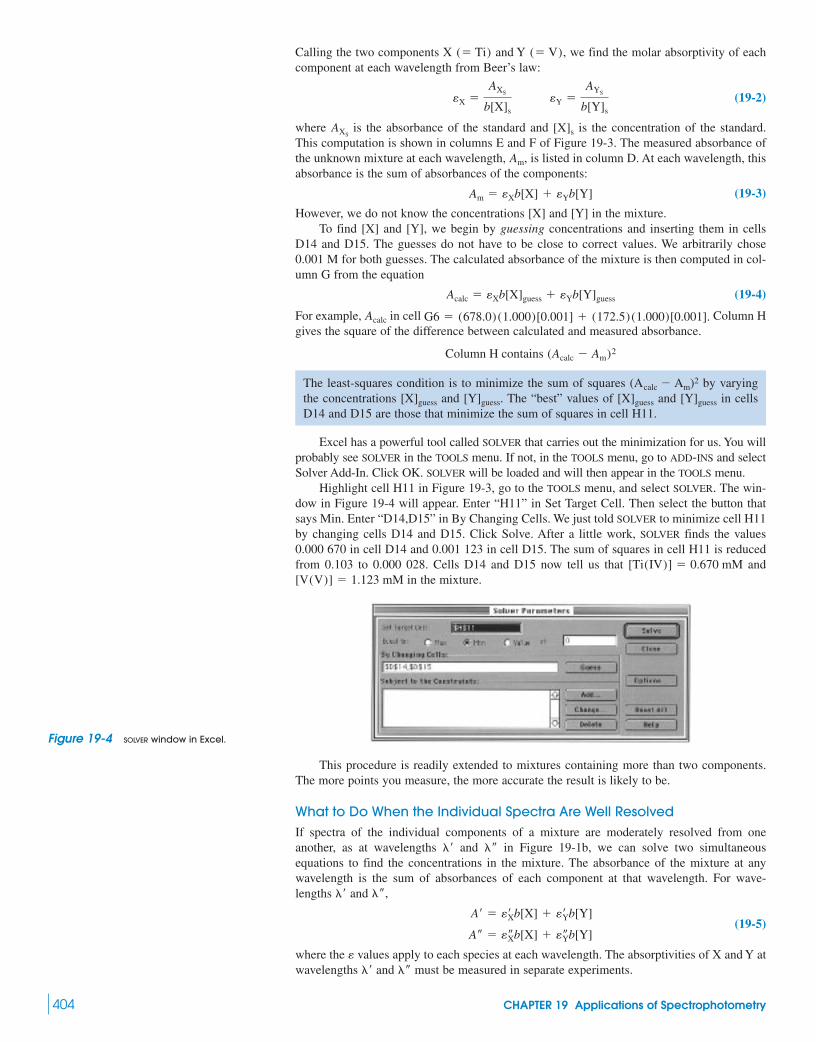
Calling the two components X and Y we find the molar absorptivity of eachcomponent at each wavelength from Beer’s law:
(19-2)
where is the absorbance of the standard and is the concentration of the standard.This computation is shown in columns E and F of Figure 19-3. The measured absorbance ofthe unknown mixture at each wavelength, is listed in column D. At each wavelength, thisabsorbance is the sum of absorbances of the components:
(19-3)
However, we do not know the concentrations [X] and [Y] in the mixture.To find [X] and [Y], we begin by guessing concentrations and inserting them in cells
D14 and D15. The guesses do not have to be close to correct values. We arbitrarily chose0.001 M for both guesses. The calculated absorbance of the mixture is then computed in col-umn G from the equation
(19-4)
For example, in cell Column Hgives the square of the difference between calculated and measured absorbance.
Excel has a powerful tool called SOLVER that carries out the minimization for us. You willprobably see SOLVER in the TOOLS menu. If not, in the TOOLS menu, go to ADD-INS and selectSolver Add-In. Click OK. SOLVER will be loaded and will then appear in the TOOLS menu.
Highlight cell H11 in Figure 19-3, go to the TOOLS menu, and select SOLVER. The win-dow in Figure 19-4 will appear. Enter “H11” in Set Target Cell. Then select the button thatsays Min. Enter “D14,D15” in By Changing Cells. We just told SOLVER to minimize cell H11by changing cells D14 and D15. Click Solve. After a little work, SOLVER finds the values0.000 670 in cell D14 and 0.001 123 in cell D15. The sum of squares in cell H11 is reducedfrom 0.103 to 0.000 028. Cells D14 and D15 now tell us that and
in the mixture.[V(V)] � 1.123 mM[Ti(IV)] � 0.670 mM
The least-squares condition is to minimize the sum of squares (Acalc � Am)2 by varyingthe concentrations [X]guess and [Y]guess. The “best” values of [X]guess and [Y]guess in cellsD14 and D15 are those that minimize the sum of squares in cell H11.
Column H contains (Acalc � Am)2
G6 � (678.0)(1.000)[0.001] � (172.5)(1.000)[0.001].Acalc
Acalc � �Xb[X]guess � �Yb[Y]guess
Am � �Xb[X] � �Yb[Y]
Am,
[X]sAXS
�Y �AYS
b[Y]s�X �
AXS
b[X]s
(� V),(� Ti)
404 CHAPTER 19 Applications of Spectrophotometry
Figure 19-4 SOLVER window in Excel.
This procedure is readily extended to mixtures containing more than two components.The more points you measure, the more accurate the result is likely to be.
What to Do When the Individual Spectra Are Well ResolvedIf spectra of the individual components of a mixture are moderately resolved from oneanother, as at wavelengths and in Figure 19-1b, we can solve two simultaneousequations to find the concentrations in the mixture. The absorbance of the mixture at anywavelength is the sum of absorbances of each component at that wavelength. For wave-lengths and
(19-5)
where the values apply to each species at each wavelength. The absorptivities of X and Y atwavelengths and must be measured in separate experiments.�–�¿
�
A– � �–Xb[X] � �–Yb[Y]
A¿ � �¿Xb[X] � �¿Yb[Y]
�–,�¿
�–�¿
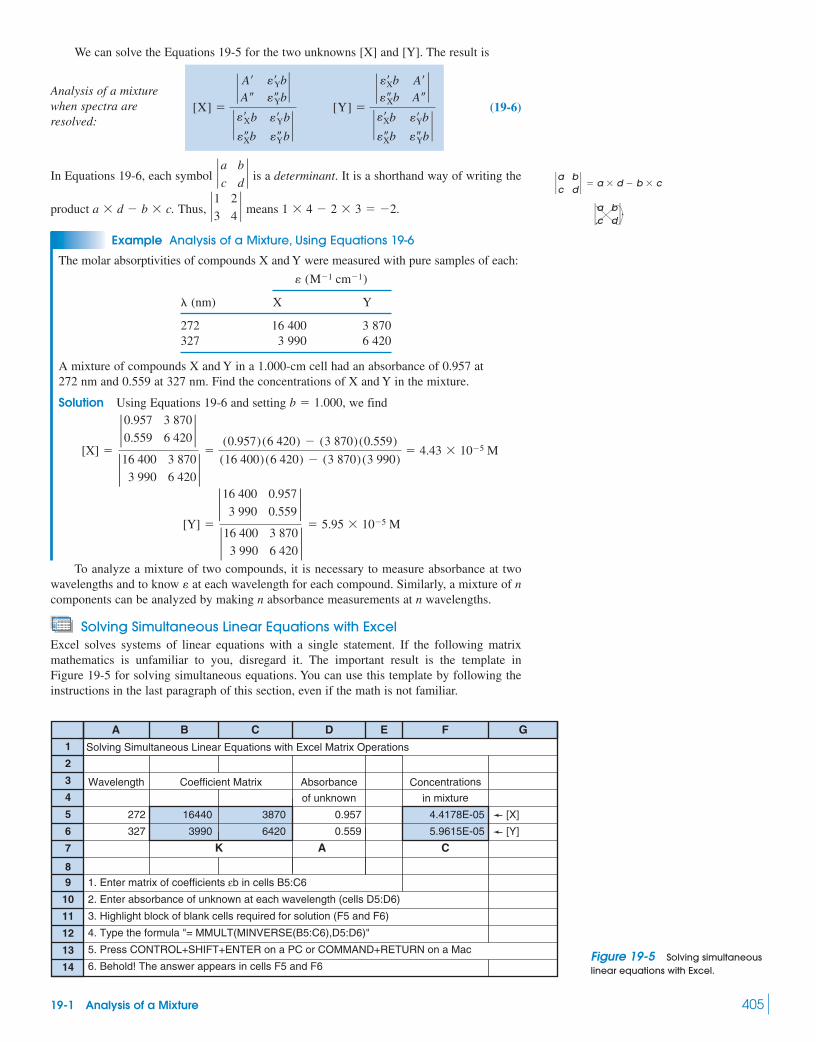
We can solve the Equations 19-5 for the two unknowns [X] and [Y]. The result is
(19-6)
In Equations 19-6, each symbol is a determinant. It is a shorthand way of writing the
product Thus, means
Example Analysis of a Mixture, Using Equations 19-6
The molar absorptivities of compounds X and Y were measured with pure samples of each:
(nm) X Y
272 16 400 3 870327 3 990 6 420
A mixture of compounds X and Y in a 1.000-cm cell had an absorbance of 0.957 at272 nm and 0.559 at 327 nm. Find the concentrations of X and Y in the mixture.
Solution Using Equations 19-6 and setting we find
To analyze a mixture of two compounds, it is necessary to measure absorbance at twowavelengths and to know at each wavelength for each compound. Similarly, a mixture of ncomponents can be analyzed by making n absorbance measurements at n wavelengths.
Solving Simultaneous Linear Equations with ExcelExcel solves systems of linear equations with a single statement. If the following matrixmathematics is unfamiliar to you, disregard it. The important result is the template inFigure 19-5 for solving simultaneous equations. You can use this template by following theinstructions in the last paragraph of this section, even if the math is not familiar.
�
[Y] �
2 16 400
3 990
0.957
0.5592
2 16 400
3 990
3 870
6 4202 � 5.95 � 10�5 M
[X] �
2 0.957
0.559
3 870
6 4202
2 16 400
3 990
3 870
6 4202 � (0.957)(6 420) � (3 870)(0.559)
(16 400)(6 420) � (3 870)(3 990)� 4.43 � 10�5 M
b � 1.000,
�
� (M�1 cm�1)
1 � 4 � 2 � 3 � �2.`1 2
3 4`a � d � b � c.
` a b
c d`
[X] �
` A¿ �¿YbA– �–Yb
`` �¿Xb �¿Yb
�–Xb �–Yb` [Y] �
` �¿Xb A¿�–Xb A–
`` �¿Xb �¿Yb
�–Xb �–Yb`
Analysis of a mixturewhen spectra areresolved:
19-1 Analysis of a Mixture 405
A B C
K A C
D E F G
7
6 327
1. Enter matrix of coefficients εb in cells B5:C6
2. Enter absorbance of unknown at each wavelength (cells D5:D6)
3. Highlight block of blank cells required for solution (F5 and F6)
4. Type the formula "= MMULT(MINVERSE(B5:C6),D5:D6)"
5. Press CONTROL+SHIFT+ENTER on a PC or COMMAND+RETURN on a Mac
6. Behold! The answer appears in cells F5 and F6
3990
5
4 of unknown
Absorbance Concentrations
0.957 4.4178E-05387016440272
3
Solving Simultaneous Linear Equations with Excel Matrix Operations
2
1
Wavelength Coefficient Matrix
14
13
12
11
10
98
6420 0.559 5.9615E-05
[X]
[Y]
in mixture
`a bc d
`
`a bc d
` � a � d � b � c
Figure 19-5 Solving simultaneouslinear equations with Excel.

The simultaneous equations of the preceding example are
which can be written in matrix notation in the form
(19-7)
A K C
K is the matrix of molar absorptivity times pathlength, A is the matrix of absorbance ofthe unknown. A matrix, such as A, with only one column or one row is called a vector. C isthe vector of unknown concentrations.
A matrix called the inverse of K, is such that the products or are equalto a unit matrix with 1’s on the diagonal and 0 elsewhere.3 We can solve Equation 19-7 forthe concentration vector, C, by multiplying both sides of the equation by
123� C
The algorithm for solving simultaneous equations is really simple: Find the inversematrix K�1 and multiply it times A. The product is C, the concentrations in the unknownmixture.
In Figure 19-5, we enter the wavelengths in column A just to keep track of information.We will not use these wavelengths for computation. Enter the products for pure X in col-umn B and for pure Y in column C. The array in cells B5:C6 is the matrix K. The Excelfunction MINVERSE(B5:C6) gives the inverse matrix, The function MMULT(matrix 1,matrix 2) gives the product of two matrices (or a matrix and a vector). The concentrationvector, C, is equal to which we get with the single statement
144424443 123A
To use the template in Figure 19-5, enter the coefficients, measured from the purecompounds, in cells B5:C6. Enter the absorbance of the unknown in cells D5:D6. High-light cells F5:F6 and type the formula “�MMULT(MINVERSE(B5:C6), D5:D6)”. Press
on a PC or COMMAND(�) on a Mac. The con-centrations [X] and [Y] in the mixture now appear in cells F5:F6.
Isosbestic Points
Often one absorbing species, X, is converted into another absorbing species, Y, in thecourse of a chemical reaction. This transformation leads to an obvious behavior shown inFigure 19-6. If the spectra of pure X and pure Y cross each other at any wavelength, thenevery spectrum recorded during this chemical reaction will cross at that same point,called an isosbestic point. An isosbestic point is good evidence that only two principalspecies are present.4
�RETURNCONTROL�SHIFT�ENTER
�b,
K�1
� MMULT(MINVERSE(B5:C6), D5:D6)
K�1A,
K�1.�b
�b
K�1KC � K�1A
KC � A
K�1:
K�1KKK�1K�1,
�b.
�
c0.957
0.559d � c16 400 3 870
3 990 6 420d c [X]
[Y]d
0.559 � 3 990[X] � 6 420[Y] A– � �–Xb[X] � �–Yb[Y]
0.957 � 16 440[X] � 3 870[Y]1 A¿ � �¿Xb[X] � �¿Yb[Y]
406 CHAPTER 19 Applications of Spectrophotometry
0.5
420
Abs
orba
nce
Wavelength (nm)
1.0
470 520 570 6200370
Isosbesticpoint
5.5
5.0
4.5
4.5
5.0
5.5
7.1
7.1
Figure 19-6 Absorption spectrum of M methyl red between pH 4.5 and 7.1. [From E. J. King,
Acid-Base Equilibria (Oxford: Pergamon Press, 1965).]
3.7 � 10�4
The product is just C:
123K�1K C C
c1 00 1
d c [X][Y]d � c [X]
[Y]d
K�1KC
Procedure for solving simultaneousequations with Excel
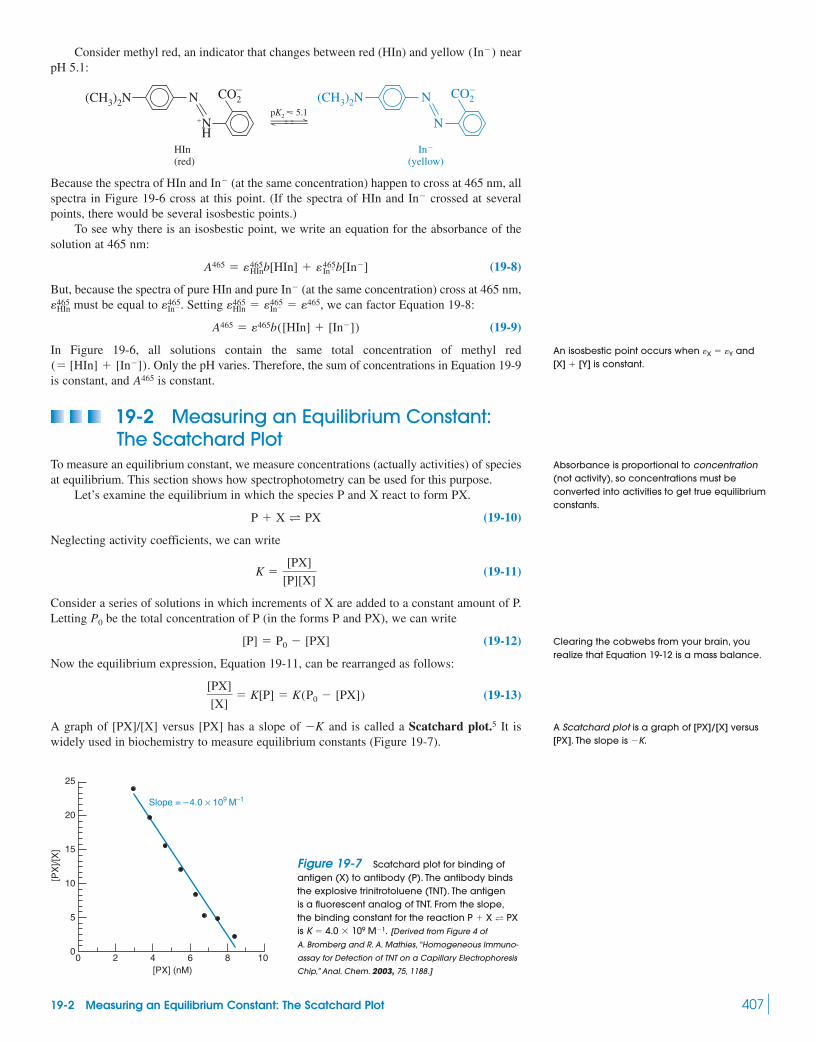
Consider methyl red, an indicator that changes between red (HIn) and yellow nearpH 5.1:
Because the spectra of HIn and (at the same concentration) happen to cross at 465 nm, allspectra in Figure 19-6 cross at this point. (If the spectra of HIn and crossed at severalpoints, there would be several isosbestic points.)
To see why there is an isosbestic point, we write an equation for the absorbance of thesolution at 465 nm:
(19-8)
But, because the spectra of pure HIn and pure (at the same concentration) cross at 465 nm,must be equal to Setting we can factor Equation 19-8:
(19-9)
In Figure 19-6, all solutions contain the same total concentration of methyl redOnly the pH varies. Therefore, the sum of concentrations in Equation 19-9
is constant, and is constant.
19-2 Measuring an Equilibrium Constant:The Scatchard Plot
To measure an equilibrium constant, we measure concentrations (actually activities) of speciesat equilibrium. This section shows how spectrophotometry can be used for this purpose.
Let’s examine the equilibrium in which the species P and X react to form PX.
(19-10)
Neglecting activity coefficients, we can write
(19-11)
Consider a series of solutions in which increments of X are added to a constant amount of P.Letting be the total concentration of P (in the forms P and PX), we can write
(19-12)
Now the equilibrium expression, Equation 19-11, can be rearranged as follows:
(19-13)
A graph of [PX]/[X] versus [PX] has a slope of and is called a Scatchard plot.5 It iswidely used in biochemistry to measure equilibrium constants (Figure 19-7).
�K
[PX]
[X]� K[P] � K(P0 � [PX])
[P] � P0 � [PX]
P0
K �[PX]
[P][X]
P � X T PX
A465(� [HIn] � [In�]).
A465 � �465b([HIn] � [In�])
�465Hln � �465
In� � �465,�465In�.�465
HIn
In�
A465 � �465HInb[HIn] � �465
In�b[In�]
In�
In�
#‹4
(CH3)2N N
�NH
CO2�
N
CO2�
HIn(red)
In�
(yellow)
(CH3)2N NpK2 � 5.1
(In�)
19-2 Measuring an Equilibrium Constant: The Scatchard Plot 407
An isosbestic point occurs when andis constant.[X] � [Y]
�X � �Y
Absorbance is proportional to concentration(not activity), so concentrations must beconverted into activities to get true equilibriumconstants.
Clearing the cobwebs from your brain, yourealize that Equation 19-12 is a mass balance.
A Scatchard plot is a graph of [PX]/[X] versus[PX]. The slope is �K.
[PX
]/[X
]
25
0
5
10
15
20
1080 2 4[PX] (nM)
6
Slope = –4.0 × 10⁹ M–1
Figure 19-7 Scatchard plot for binding ofantigen (X) to antibody (P). The antibody bindsthe explosive trinitrotoluene (TNT). The antigenis a fluorescent analog of TNT. From the slope,the binding constant for the reaction is [Derived from Figure 4 of
A. Bromberg and R. A. Mathies, “Homogeneous Immuno-
assay for Detection of TNT on a Capillary Electrophoresis
Chip,” Anal. Chem. 2003, 75, 1188.]
K � 4.0 � 109 M�1.P � X T PX

If we know [PX], we can find [X] with the mass balance
To measure [PX], we might use spectrophotometric absorbance. Suppose that P and PX eachhave some absorbance at wavelength but X has no absorbance at this wavelength. For sim-plicity, let all measurements be made in a cell of pathlength 1.000 cm so that we can omit
when writing Beer’s law.The absorbance at some wavelength is the sum of absorbances of PX and P:
Substituting we can write
(19-14)123
A0
But is the initial absorbance before any X is added. Therefore,
(19-15)
where and is the observed absorbance after each addition ofX minus the initial absorbance.
Substituting [PX] from Equation 19-15 into Equation 19-13 gives
Scatchard equation: (19-16)
A graph of versus should be a straight line with a slope of Absorbancemeasured while P is titrated with X can be used to find K for the reaction of X with P.
Two cases commonly arise in the application of Equation 19-16. If K is small, then largeconcentrations of X are needed to produce PX. Therefore, and Alterna-tively, if K is not small, then and [X] must be measured, either at another wave-length or by measuring a different physical property.
Errors in a Scatchard plot could be substantial. We define the fraction of saturation as
Fraction of saturation (19-17)
The most accurate data are obtained for 6 A range representing 75% of thetotal saturation curve should be measured before concluding that equilibrium (19-10) isobeyed. People have made mistakes by exploring too little of the binding curve.
19-3 The Method of Continuous VariationSuppose that several complexes can form between species P and X:
(19-18)
(19-19)
(19-20)
If one complex (say, predominates, the method of continuous variation (also calledJob’s method) allows us to identify the stoichiometry of the predominant complex.
The classical procedure is to mix P and X and dilute to constant volume so that the totalconcentration is constant. For example, 2.50 mM solutions of P and X could bemixed as shown in Table 19-1 to give various X:P ratios, but constant total concentration.The absorbance of each solution is measured, typically at for the complex, and a graphis made showing corrected absorbance (defined in Equation 19-21) versus mole fraction ofX. Maximum absorbance is reached at the composition corresponding to the stoichiometry ofthe predominant complex.
Corrected absorbance is the measured absorbance minus the absorbance that would beproduced by free P and free X alone:
(19-21)Corrected absorbance � measured absorbance � �PbPT � �XbXT
�max
[P] � [X]
PX2)
P � 3X T PX3
P � 2X T PX2
P � X T PX
�0.2 � S � 0.8.
� S �[PX]
P0
[X] � X0,[X] � X0.X0 W P0,
�K.�A�A/[X]
�A
[X]� K��P0 � K�A
�A(� A � A0)�� � �PX � �P
A � [PX](�PX � �P) � A0 1 [PX] ��A
��
A0,�PP0
A � �PX[PX] � �PP0 � �P[PX]
[P] � P0 � [PX],
A � �PX[PX] � �P[P]
b(� 1.000 cm)
�,
X0 � [total X] � [PX] � [X]
408 CHAPTER 19 Applications of Spectrophotometry
Problem 19-13 gives an alternate way to find Kby using Excel SOLVER.
Equation 19-13 can be recast as S/[X] � K(1 � S). Plot S/[X] versus S.
For the reaction you could showthat [PXn] reaches a maximum when the initialconcentrations have the ratio To dothis, write /and set the partial derivatives / and
/ equal to 0.0[P]00[PXn]0[P]00[PXn]
{([P]0 � [PXn])([X]0 � n[PXn])}K � [PXn][X]0 � n[P]0.
P � nX T PXn,

where and are the molar absorptivities of pure P and pure X, b is the pathlength, and and are the total concentrations of P and X in the solution. For the first solution inTable 19-1, and
If P and X do not absorb at the wavelength of interest, no absorbance correction isneeded.
Maximum absorbance occurs at the mole fraction of X corresponding to the stoichiom-etry of the complex (Figure 19-8). If the predominant complex is the maximum occursat mole fraction of
Mole fraction of X in when and
If P3X were predominant, the maximum would occur at (mole fraction of X) � 1/(1 � 3) �0.250.
Here are some precautions for the method of continuous variation:
1. Verify that the complex follows Beer’s law.2. Use constant ionic strength and pH, if applicable.3. Take readings at more than one wavelength; the maximum should occur at the same
mole fraction for each wavelength.4. Do experiments at different total concentrations of If a second set of solutions
were prepared in the proportions given in Table 19-1, but from stock concentrations of5.00 mM, the maximum should still occur at the same mole fraction.
P � X.
a � 1)b � 2PaXb �b
b � a (� 0.667
X � 2/(2 � 1) � 0.667.PX2,
0.900 mM.(2.50 mM) �XT � (9.00/25.0)PT � (1.00/25.0)(2.50 mM) � 0.100 mM
XT
PT�X�P
19-3 The Method of Continuous Variation 409
Table 19-1 Solutions for the method of continuous variation
Mole fraction of XmL of mL of Mole ratio2.50 mM P 2.50 mM X (X:P)
1.00 9.00 9.00:1 0.9002.00 8.00 4.00:1 0.8002.50 7.50 3.00:1 0.7503.33 6.67 2.00:1 0.6674.00 6.00 1.50:1 0.6005.00 5.00 1.00:1 0.5006.00 4.00 1:1.50 0.4006.67 3.33 1:2.00 0.3337.50 2.50 1:3.00 0.2508.00 2.00 1:4.00 0.2009.00 1.00 1:9.00 0.100
NOTE: All solutions are diluted to a total volume of 25.0 mL with a buffer.
a mol Xmol X � mol P
b
P3X PX PX2
Mole fraction of X
Cor
rect
ed a
bsor
banc
e
1.0
0.8
0.6
0.4
0.2
0.00.0 0.1 0.2 0.3 0.4 0.5 0.6 0.7 0.8 0.9 1.0
Method of continuous variation:
Maximum absorbance occurs when (mole fraction of X) � n/(n � 1).
P � nX T PXn
Figure 19-8 Ideal behavior of Job plots for formation of the complexes PX, and PX2.P3X,

The method of continuous variation can be carried out with many separate solutions, asin Table 19-1. However, a titration is more sensible. Figure 19-9a shows a titration of EDTAwith In Figure 19-9b, the abscissa has been transformed into mole fraction of
instead of volume of The sharp maximum at a mole fraction of 0.5 indicates formation of a 1:1 complex. If theequilibrium constant is not large, the maximum is more curved than in Figure 19-9b. Thecurvature can be used to estimate the equilibrium constant.7
19-4 Flow Injection Analysis8
In flow injection analysis, a sample is injected into a moving liquid stream to which variousreagents can be added. After a suitable time, the reacted sample reaches a detector, which isusually a spectrophotometric cell. Flow injection is widely used in medical and pharmaceuti-cal analysis, water analysis, and industrial process control.
In the Figure 19-10a, a solvent carrier stream is pumped continuously through the sam-ple injector, in which 40 to of sample is added to the stream. A reagent stream is thencombined with the carrier stream, and the resulting solution passes through a coil to give timefor reaction. The concentration of analyte in the sample is determined by measuringabsorbance of the stream in a cell like that shown in Figure 25-19. Typical flow rates are0.5–2.5 mL/min, and the diameter of the inert Teflon tubing from which the system is con-structed is about 0.5 mm. Coils are 10–200 cm in length to allow suitable reaction times.Replicate analyses can be completed in 20–60 s.
Figure 19-10b gives an idea of possible variations. Reagents 1 and 2 are mixed and addedto the sample in the carrier before reagent 3 is added. Commercial apparatus (Figure 19-11)allows different flow paths to be readily assembled. Other schemes are based on catalysisby analyte in an unknown.9 The more analyte, the further the analytical reaction proceedsin a fixed time and the greater the concentration of product that is measured. Reagentstreams can be passed through reactive columns, ion exchangers, dialysis tubes, gas dif-fusers, photochemical reactors, and solvent extractors. Detectors might employ absorbance,10
200 �L
Cu2�.Cu2�(� [moles of Cu2�]/[moles of Cu2� � moles of EDTA])Cu2�.
410 CHAPTER 19 Applications of Spectrophotometry
Figure 19-9 (a) Spectrophotometric titration of 30.0 mL of EDTA in acetate buffer with in thesame buffer. Upper curve: Lower curve: Theabsorbance has not been “corrected” in any way. (b) Transformation of data into mole fraction format.The absorbance of free at the same formal concentration has been subtracted from each pointin panel a. EDTA is transparent at this wavelength. [From Z. D. Hill and P. MacCarthy, “Novel Approach to Job’s
Method,” J. Chem. Ed. 1986, 63, 162.]
CuSO4
[EDTA] � [Cu2�] � 2.50 mM.[EDTA] � [Cu2�] � 5.00 mM.CuSO4
Abs
orba
nce
(745
nm
)
Volume of Cu2+ (mL)
Cor
rect
ed a
bsor
banc
e
Mole fraction of Cu2+
0.32
0.24
0.16
0.08
00
20 40 60 80 100
(a )
0.24
0.16
0.08
00
0.2 0.4 0.6 0.8 1.0
(b )
(a )
(b )
Carrier stream
Reagent stream
PumpSample injector
Coil
Detector
To waste
20–60 s
Carrier
Reagent 1
Reagent 2
Reagent 3
D
Figure 19-10 Schematic diagrams of flowinjection analysis, showing two differentreagent addition schemes.

luminescence,11 chemiluminescence,12 or electrochemistry. A key feature of flow injection israpid, repetitive analysis (Figure 19-12).
19-5 Immunoassays and AptamersAn important application of fluorescence is in immunoassays, which employ antibodies todetect analyte. An antibody is a protein produced by the immune system of an animal inresponse to a foreign molecule called an antigen. The antibody recognizes the antigen thatstimulated synthesis of the antibody. The formation constant for the antibody-antigen com-plex is very large, whereas the binding of the antibody to other molecules is weak.
Figure 19-13 illustrates the principle of an enzyme-linked immunosorbent assay, abbre-viated ELISA in biochemical literature. Antibody 1, which is specific for the analyte of inter-est (the antigen), is bound to a polymeric support. In steps 1 and 2, analyte is incubated withthe polymer-bound antibody to form a complex. The fraction of antibody sites that bind ana-lyte is proportional to the concentration of analyte in the unknown. The surface is then
19-5 Immunoassays and Aptamers 411
Figure 19-11 Flow injection analysis system with enlarged view of chemistry section. Differentmodular chemistry units are installed for different analyses. [Courtesy Skalar, Inc., Norcross, GA.]
Flu
ores
cenc
e in
tens
ity
Time
0.8
1.0 ppb
0.6
0.4
0.2
8 min
Figure 19-12 Flow injection analysis of ppblevels of in air based on formation of afluorescent product. [From J. Li and P. K. Dasgupta,
“Measurement of Atmospheric H2O2 and Hydroxymethyl
Hydroperoxide with a Diffusion Scrubber and Light
Emitting Diode-Liquid Core Waveguide-Based
Fluorometry,” Anal. Chem. 2000, 72, 5338.]
H2O2
Rosalyn Yalow received the Nobel Prize inmedicine in 1977 for developing immunoassaytechniques in the 1950s, using proteins labeledwith radioactive 131I to enable their detection.13
Yalow, a physicist, worked with Solomon Berson,a medical doctor, in this pioneering effort.
Figure 19-13 Enzyme-linked immunosorbentassay. Antibody 1, which is specific for the analyte ofinterest, is bound to a polymer support and treatedwith unknown. After excess, unbound moleculeshave been washed away, the analyte remainsbound to antibody 1. The bound analyte is thentreated with antibody 2, which recognizes a differentsite on the analyte and to which an enzyme iscovalently attached. After unbound material hasbeen washed away, each molecule of analyte iscoupled to an enzyme that will be used in Figure 19-14.
Polymer support
Antibody 1
1. Add sample containing analyte2. Wash to remove unbound molecules
3. Add enzyme-labeled antibody 24. Wash to remove unbound antibody
Antibody 2
Analyte proteinbound toantibody 1
Enzyme covalentlybound to antibody 2
Pump, chemistry, and detectorAutosampler

412 CHAPTER 19 Applications of Spectrophotometry
Colorlessreactant
Coloredproduct
Enzyme boundto antibody 2
Antibody 2
Analyte protein
Antibody 1
Nonfluorescentreactant
Fluorescentproduct
Figure 19-14 Enzyme bound to antibody 2can catalyze reactions that produce coloredor fluorescent products. Each molecule ofanalyte bound in the immunoassay leads tomany molecules of colored or fluorescentproduct that are easily measured.
washed to remove unbound substances. In steps 3 and 4, the antibody-antigen complex istreated with antibody 2, which recognizes a different region of the analyte. Antibody 2 wasspecially prepared for the immunoassay by covalent attachment of an enzyme that will beused later in the process. Again, excess unbound substances are washed away.
The enzyme attached to antibody 2 is critical for quantitative analysis. Figure 19-14 showstwo ways in which the enzyme can be used. The enzyme can transform a colorless reactant into acolored product. Because one enzyme molecule catalyzes the same reaction many times, manymolecules of colored product are created for each analyte molecule. The enzyme thereby amplifiesthe signal in the chemical analysis. The higher the concentration of analyte in the originalunknown, the more enzyme is bound and the greater the extent of the enzyme-catalyzed reaction.Alternatively, the enzyme can convert a nonfluorescent reactant into a fluorescent product. Colori-metric and fluorometric enzyme-linked immunosorbent assays are sensitive to less than ananogram of analyte. Pregnancy tests are based on the immunoassay of a placental protein in urine.
Immunoassays in Environmental AnalysisCommercial immunoassay kits are available for screening and analysis of pesticides, indus-trial chemicals, explosives, and microbial toxins at the parts per trillion to parts per millionlevels in groundwater, soil, and food.14 An advantage of screening in the field is that uncon-taminated regions that require no further attention are readily identified. An immunoassaycan be 20–40 times less expensive than a chromatographic analysis and can be completed in0.3–3 h in the field, using 1-mL samples. Chromatography generally must be done in a laband might require several days, because analyte must first be extracted or concentrated fromliter-quantity samples to obtain a sufficient concentration.
Time-Resolved Fluorescence Immunoassays15
The sensitivity of fluorescence immunoassays can be enhanced by a factor of 100 (to detectanalyte) with time-resolved measurements of luminescence from the lanthanide ion
Organic chromophores such as fluorescein are plagued by background fluorescence at350–600 nm from solvent, solutes, and particles. This background decays to a negligiblelevel within after excitation. Sharp luminescence at 615 nm from however, hasa much longer lifetime, falling to 1/e of its initial intensity in approximately
In a time-resolved fluorescence measurement (Figure 19-15), luminescence is mea-sured between 200 and after a brief laser pulse at 340 nm. The next pulse is flashed at
and the cycle is repeated approximately 1 000 times per second. Rejecting emis-sion within of the excitation eliminates most of the background fluorescence.
Figure 19-16 shows how can be incorporated into an immunoassay. A chelating groupthat binds lanthanide ions is attached to antibody 2 in Figure 19-13. While bound to the antibody,
has weak luminescence. After all steps in Figure 19-13 have been completed, the pH of thesolution is lowered in the presence of a soluble chelator that extracts into solution. Strongluminescence from the soluble metal ion is then easily detected by a time-resolved measurement.
Eu3�
Eu3�
Eu3�
200 �s1 000 �s,
600 �s700 �s.
(� 37%)Eu3�,100 �s
Eu3�.10�13 M
Flu
ores
cenc
e in
tens
ity
Backgroundfluorescence
Laserpulse
Observeemissionin thistime window
Eu3+
luminescence
0 200 400 600 800 1 000
Time (�s)
Eu3+ bound to antibodyby chelating groups isnot strongly luminescent
Lower pH and addsoluble chelator
to remove Eu3+
from antibody
Free Eu3+ is highlyluminescent
Figure 19-15 Emission intensity in a time-resolved fluorescence experiment.
Figure 19-16 Antibody 2 in theimmunosorbent assay of Figure 19-13 canbe labeled with which is not stronglyluminescent when bound to the antibody. Tocomplete the analysis, the pH of the solutionis lowered to liberate strongly luminescent
ion.Eu3�
Eu3�,

Aptamers: Synthetic Nucleic Acid “Antibodies”Aptamers are 15–40-base-long pieces of DNA (deoxyribonucleic acid) or RNA (ribonucleic acid)that strongly and selectively bind to a specific molecule. An aptamer for a desired target molecule is cho-sen from a pool of random DNA or RNA sequences by successive cycles of binding to the target, remov-ing unbound material, and replicating the bound nucleic acid.16 Once the sequence of nucleic acids in anaptamer for a specific target is known, that aptamer can be synthesized in large quantities. The aptamerbehaves as a custom-made, synthetic “antibody.” Aptamers can bind to small sections of macro-molecules, such as proteins, or they can engulf an entire small molecule, as in Figure 19-17.
Figure 19-17 also indicates that flat, aromatic molecules can be inserted between theflat, hydrogen-bonded nucleotide base pairs of DNA. We say that the flat molecule is inter-calated between the base pairs. One of many analytical applications of aptamers utilizes a“molecular light switch” intercalated in the aptamer.
The ruthenium complex in the margin is slightly luminescent in aqueous solution but is stronglyluminescent when intercalated in DNA. To measure the protein immunoglobulin E (IgE), an aptameris selected that binds IgE. Excess ruthenium complex is added to the aptamer, so that the rutheniumis highly luminescent. When IgE is added to the intercalated aptamer, the aptamer binds to IgE andthe ruthenium complex is expelled. Each “light switch” molecule that is expelled loses most of itsluminescence.Figure 19-18 shows the decrease in luminescence with increasing concentration of IgE.At low concentrations, the effect is linear and can be used to measure the concentration of added IgE.
�
19-5 Immunoassays and Aptamers 413
Citrullineenmeshedwithinaptamer
Flat aromaticmolecule can beinserted betweennucleotide basepairs of DNA
0.40
0.35
0.30
0.25
0.18
0.15
0.12
0.09
0.06
0.03
0.00
0.0
0.20
0.15
0.10
0.05
0.00
700 10 20
[IgE] (nM)
[IgE] (nM)
30 40 50 60
Rel
ativ
e lu
min
esce
nce
decr
ease
Rel
ativ
e lu
min
esce
nce
decr
ease
0.2 0.4 0.6 0.8
Figure 19-17 Aptamer that specificallybinds citrulline within a pocket in a shortstretch of RNA. Long straight lines representhydrogen-bonded nucleotide bases. The three-dimensional structure was deducedfrom nuclear magnetic resonance.[M. Famulok, G. Mayer, and M. Blind, “Nucleic Acid
Aptamers—From Selection in Vitro to Applications
in Vivo,” Acc. Chem. Res. 2000, 33, 591.]
NH2
–O2C
O
NH3+
NH
Citrulline
Figure 19-18 Response of “molecular lightswitch” to immunoglobulin E (IgE). Aptamerconcentration is 5 nM and ruthenium complexconcentration is 40 nM. Addition of IgEdisplaces the ruthenium complex from theaptamer and decreases luminescence at610 nm. Excitation [From Y. Jiang, X. Fang, and C. Bai, “Signaling
Aptamer/Protein Binding by a Molecular Light Switch
Complex,” Anal. Chem. 2004, 76, 5230.]
wavelength � 450 nm.
Unlike antibodies, which are fragile proteinsthat must be refrigerated for storage, aptamersare stable organic molecules with a long shelflife at room temperature. Aptamers havetremendous potential for use in highly specificchemical sensors.
“Molecular light switch”
N
N
Ru
N
N
N N
NN
Flat aromaticstructure can
intercalate intoDNA
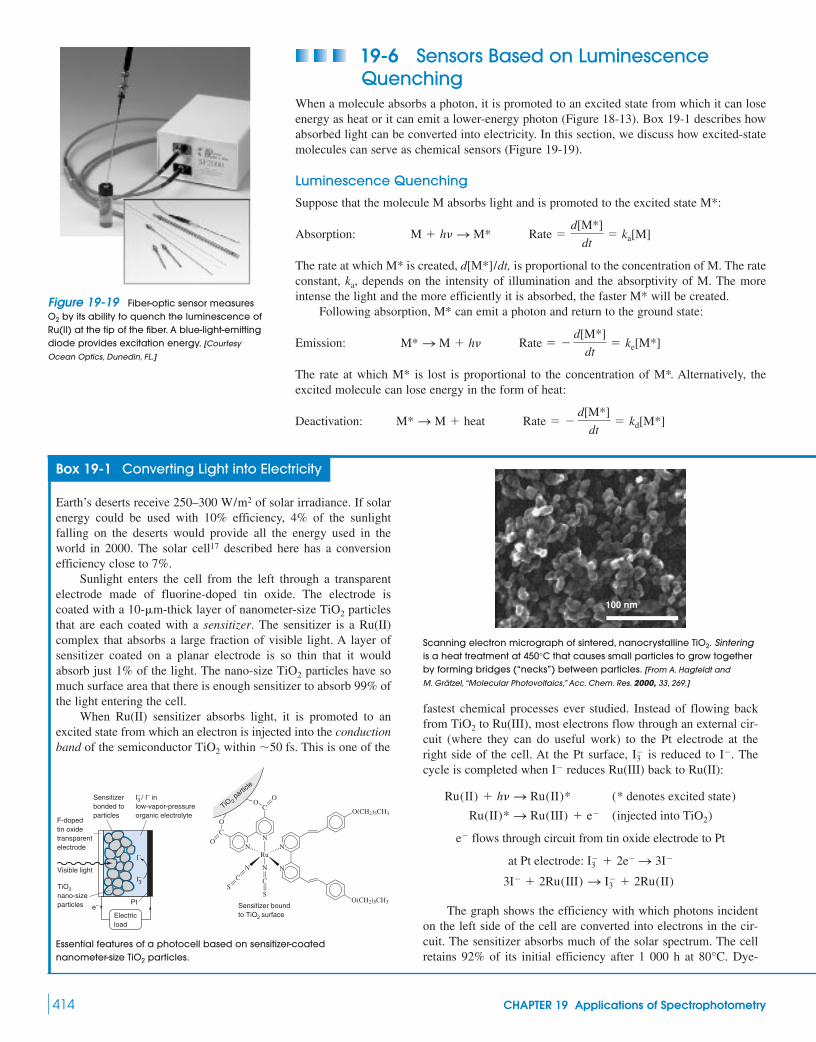
19-6 Sensors Based on LuminescenceQuenching
When a molecule absorbs a photon, it is promoted to an excited state from which it can loseenergy as heat or it can emit a lower-energy photon (Figure 18-13). Box 19-1 describes howabsorbed light can be converted into electricity. In this section, we discuss how excited-statemolecules can serve as chemical sensors (Figure 19-19).
Luminescence Quenching
Suppose that the molecule M absorbs light and is promoted to the excited state M*:
Absorption:
The rate at which M* is created, is proportional to the concentration of M. The rateconstant, depends on the intensity of illumination and the absorptivity of M. The moreintense the light and the more efficiently it is absorbed, the faster M* will be created.
Following absorption, M* can emit a photon and return to the ground state:
Emission:
The rate at which M* is lost is proportional to the concentration of M*. Alternatively, theexcited molecule can lose energy in the form of heat:
Deactivation: Rate � �d[M*]
dt� kd[M*]M* S M � heat
Rate � �d[M*]
dt� ke[M*]M* S M � h
ka,d[M*]/dt,
Rate �d[M*]
dt� ka[M]M � h S M*
414 CHAPTER 19 Applications of Spectrophotometry
Figure 19-19 Fiber-optic sensor measuresby its ability to quench the luminescence of
Ru(II) at the tip of the fiber. A blue-light-emittingdiode provides excitation energy. [Courtesy
Ocean Optics, Dunedin, FL.]
O2
Box 19-1 Converting Light into Electricity
Earth’s deserts receive 250–300 of solar irradiance. If solarenergy could be used with 10% efficiency, 4% of the sunlightfalling on the deserts would provide all the energy used in theworld in 2000. The solar cell17 described here has a conversionefficiency close to 7%.
Sunlight enters the cell from the left through a transparentelectrode made of fluorine-doped tin oxide. The electrode iscoated with a layer of nanometer-size particlesthat are each coated with a sensitizer. The sensitizer is a Ru(II)complex that absorbs a large fraction of visible light. A layer ofsensitizer coated on a planar electrode is so thin that it wouldabsorb just 1% of the light. The nano-size particles have somuch surface area that there is enough sensitizer to absorb 99% ofthe light entering the cell.
When Ru(II) sensitizer absorbs light, it is promoted to anexcited state from which an electron is injected into the conductionband of the semiconductor within This is one of the
Essential features of a photocell based on sensitizer-coated nanometer-size particles.TiO2
TiO2nano-sizeparticles
Sensitizerbonded toparticles
Pt Sensitizer boundto TiO2 surface
Visible light
F-dopedtin oxidetransparentelectrode
I−
e−
Electricload
I−3
I / I− inlow-vapor-pressureorganic electrolyte
−3
Ru
O(CH2)5CH3
O(CH2)5CH3
N
N
N
N
C
N
O
C
SS
OC
C
O
OTiO 2
particle
N
�50 fs.TiO2
TiO2
TiO210-�m-thick
W/m2
Scanning electron micrograph of sintered, nanocrystalline Sinteringis a heat treatment at that causes small particles to grow togetherby forming bridges (“necks”) between particles. [From A. Hagfeldt and
M. Grätzel, “Molecular Photovoltaics,” Acc. Chem. Res. 2000, 33, 269.]
fastest chemical processes ever studied. Instead of flowing backfrom to Ru(III), most electrons flow through an external cir-cuit (where they can do useful work) to the Pt electrode at theright side of the cell. At the Pt surface, is reduced to Thecycle is completed when reduces Ru(III) back to Ru(II):
flows through circuit from tin oxide electrode to Pt
3I� � 2Ru(III) S I�3 � 2Ru(II)
at Pt electrode: I�3 � 2e� S 3I�
e�
Ru(II)* S Ru(III) � e� (injected into TiO2)
Ru(II) � h S Ru(II)* (* denotes excited state)
I�
I�.I�3
TiO2
450°CTiO2.
100 nm
The graph shows the efficiency with which photons incidenton the left side of the cell are converted into electrons in the cir-cuit. The sensitizer absorbs much of the solar spectrum. The cellretains 92% of its initial efficiency after 1 000 h at Dye-80°C.

19-6 Sensors Based on Luminescence Quenching 415
Photoaction spectrum showing the efficiency with which photons incidenton the solar cell are converted into electrons in the circuit. [From P. Wang,
C. Klein, R. Humphry-Baker, S. M. Zakeeruddin, and M. Grätzel, “A High Molecular
Extinction Coefficient Sensitizer for Stable Dye-Sensitized Solar Cells,” J. Am. Chem. Soc.
2005, 127, 808.]
Estimated cost and emissions for building 1.3-GW (gigawatt) powerplants in 2000 and operating them for 20 years. [Data from S. Pacca and
A. Horvath, “Greenhouse Gas Emissions from Building and Operating Electric Power
Plants in the Upper Colorado River Basin,” Environ. Sci. Technol. 2002, 36, 3194.]
CO2
sensitized photocells suitable for external use on buildings arenow commercially available.18 The competing technology, whichis more efficient at converting sunlight into electricity, is photo-voltaic cells made of silicon.
Converting sunlight directly into electricity is good, but con-verting sunlight into a fuel such as or would be evenbetter. The fuel could be used when it is needed, not just when thesun is shining. Green leaves of plants use sunlight to reduce to carbohydrates, a fuel that is oxidized back to by animalsand plants to provide energy.
We are rapidly exhausting the earth’s supply of fossil fuels(coal, oil, and gas), which are also raw materials for plastics, fabrics,and many essential items. We face a major problem when the supplyof raw materials is gone. Moreover, burning fossil fuels increases
in the atmosphere, which threatens to alter the climate.Why do we burn irreplaceable raw materials? The shortsighted
answer is that electricity from fossil-fuel-burning generators is
CO2
CO2
CO2
CH3OHH2
90
60
30
0
Photo
n-to-e
lect
ron
conv
ersio
n effic
iency
(%)
Wavelength (nm)
450 600 750
cheaper than energy from renewable sources, such as solar, wind,and geothermal. The chart shows the estimated costs of generatingelectricity in the year 2000. Only hydroelectric power is less expen-sive than fossil-fuel generators. The chart also shows estimated emissions from each source of power. Fossil fuels are, by far, theworst. We will probably consume fossil fuel until this increasinglyscarce resource becomes more expensive than the cost of renewableenergy—which is likely to happen in your lifetime.
Nuclear energy is cost competitive with fossil fuel, has verylow greenhouse gas emission, and creates far less air pollution.However, fear of potential accidents and intractable issues ofwaste containment have prevented construction of nuclear powerplants in the United States for three decades.
Photovoltaic
Wind
Natural gas
Coal
Hydroelectric
0.150.100.05
Cost [$/(kW*h)]
0.00 0.20
Photovoltaic
Wind
Natural gas
Coal
Hydroelectric
600400200
g CO2 /(kW*h)
0 800
CO2
Still another possibility is that the excited molecule can transfer energy to a differentmolecule, called a quencher (Q), to promote the quencher to an excited state (Q*):
Quenching:
The excited quencher can then lose its energy by a variety of processes.Under constant illumination, the system soon reaches a steady state in which the con-
centrations of M* and M remain constant. In the steady state, the rate of appearance of M*must equal the rate of destruction of M*. The rate of appearance is
Rate of appearance of
The rate of disappearance is the sum of the rates of emission, deactivation, and quenching
Rate of disappearance of
Setting the rates of appearance and disappearance equal to each other gives
(19-22)
The quantum yield for a photochemical process is the fraction of absorbed photons thatproduce a desired result. If the result occurs every time a photon is absorbed, then the quan-tum yield is unity. The quantum yield is a number between 0 and 1.
The quantum yield for emission from M* is the rate of emission divided by the rate ofabsorption. In the absence of quencher, we designate this quantum yield
�0 �photons emitted per second
photons absorbed per second�
emission rate
absorption rate�
ke[M*]
ka[M]
�0:
ka[M] � ke[M*] � kd[M*] � kq[M*][Q]
M* � ke[M*] � kd[M*] � kq[M*][Q]
M* �d[M*]
dt� ka[M]
Rate � �d[M*]
dt� kq[M*][Q]M* � Q S M � Q*
Quenching is the process whereby emissionfrom an excited molecule is decreased byenergy transfer to another molecule (thequencher).

416 CHAPTER 19 Applications of Spectrophotometry
Substituting in the value of from Equation 19-22 and setting gives an expres-sion for the quantum yield of emission in the steady state:
(19-23)
If then the quantum yield for emission is
(19-24)
In luminescence-quenching experiments, we measure emission in the absence and pres-ence of a quencher. Equations 19-23 and 19-24 tell us that the relative yields are
Stern-Volmer equation: (19-25)
The Stern-Volmer equation says that, if we measure relative emission as a func-tion of quencher concentration and plot this quantity versus [Q], we should observe astraight line. The quantity in Equation 19-25 is equivalent to where is theemission intensity in the absence of quencher and is the intensity in the presence ofquencher.
A Luminescent Intracellular O2 SensorWe illustrate our discussion with Ru(II) complexes, which strongly absorb visible light,efficiently emit light at significantly longer wavelengths than they absorb, are stable forlong periods, and have a long-lived excited state whose emission is quenched by (ColorPlate 17).19 A widely used luminescent Ru(II) complex is
Oxygen is a good quencher because its ground state has two unpaired electrons—it isa triplet state designated has a low-lying singlet state with no unpaired electrons.Figure 18-13 showed that the lowest-lying excited state of many molecules is a triplet. Thistriplet excited state can transfer energy to to produce a ground-state singlet moleculeand excited
3M* � 3O21M � 1O2*
Excited Ground Ground Excitedstate state state state
There are two electron spins up and two down in both the reactants and products. This energytransfer therefore conserves the net spin and is more rapid than processes that change thespin.
Color Plate 18 shows tiny dots of light from fluorescent silica beads shot into livingcells by a “gene-gun” that is usually used to infect cells with DNA-coated particles. Twodyes are bound inside each porous bead whose size is 100 to 600 nm.
When illuminated with blue light, one dye emits green light near 525 nm and the otheremits red light near 610 nm (Figure 19-20). The green dye is not affected by but the redruthenium dye is affected. From the ratio of red-to-green emission intensity, we can calculatethe concentration of in the vicinity of the beads. Results show that more than three-fourthsof available intracellular is consumed by the cells within 2 min at after removing O221°CO2
O2
O2,
S
1O2*.
3O23M*
O23O2.
N
NRu(II) (dpp)3Ru(II)
3 dpp � 4,7-diphenyl-1,10-phenanthrolineœ
ç
C6H5
C6H5
Ru(dpp)2�3 � 2Cl�.
O2
IQ
I0I0/IQ,�0/�Q
(�0/�Q)
�0
�Q�
ke � kd � kq[Q]
ke � kd� 1 � a kq
ke � kdb [Q]
�Q �ke[M*]
ke[M*] � kd[M*] � kq[M*][Q]�
ke
ke � kd � kq[Q]
(�Q)[Q] � 0,
�0 �ke[M*]
ke[M*] � kd[M*] � kq[M*][0]�
ke
ke � kd
[Q] � 0ka[M]
Quantum yield for emission in the absence ofquenching .(�0)
Quenching reduces the quantum yield foremission (�Q 6 �0).
Graph of Stern-Volmer equation:
[Q]
Φ0
/ ΦQ (
=I 0
/ I Q)
1kq
ke + kdSlope =
The ground state of Ru(II) is a singlet, and thelowest excited state is a triplet. When Ru(II)absorbs visible light, it is promoted to theluminescent triplet state. quenches theluminescence by providing a radiationlesspathway by which the triplet is convertedinto the ground-state singlet.
O2

Exercises 417
Terms to Understandaptamerflow injection analysis
immunoassayisosbestic point
method of continuous variationquantum yield
quenchingScatchard plot
SummaryThe absorbance of a mixture is the sum of absorbances of the indi-vidual components. At a minimum, you should be able to find theconcentrations of two species in a mixture by writing and solvingtwo simultaneous equations for absorbance at two wavelengths.This procedure is most accurate if the two absorption spectra haveregions where they do not overlap very much. With a spreadsheet,you should be able to use matrix operations to solve n simultaneousBeer’s law equations for n components in a solution, with measure-ments at n wavelengths. You should be able to use Excel SOLVER todecompose a spectrum into a sum of spectra of the components byminimizing the function
Isosbestic (crossing) points are observed when a solution con-tains variable proportions of two components with a constant totalconcentration. A Scatchard plot is used to measure an equilibriumconstant, and the method of continuous variation allows us to deter-mine the stoichiometry of a complex. In flow injection analysis,
(Acalc � Am)2.
sample injected into a carrier stream is mixed with a color-formingreagent and passed into a flow-through detector.
Immunoassays use antibodies to detect the analyte of interest.In an enzyme-linked immunosorbent assay, signal is amplified bycoupling analyte to an enzyme that catalyzes many cycles of a reac-tion that produces a colored or fluorescent product. Time-resolvedfluorescence measurements provide sensitivity by separating ana-lyte fluorescence in time and wavelength from background fluores-cence. Aptamers are short pieces of DNA or RNA that are selectedto bind tightly to a target molecule that can be small or large. Oncean aptamer is identified for a particular target, it can be synthesizedand used in place of antibodies in chemical analyses.
Luminescence intensity is proportional to the concentration ofthe emitting species if the concentration is low enough. We canmeasure some analytes, such as by their ability to quench(decrease) the luminescence of another compound.
O2,
Flu
ores
cenc
e in
tens
ity
500 550 600 650
Wavelength (nm)
'
Red dye,sensitive to O2
Purgedwith O2
Green dye, not sensitive to O2
Solution purgedwith N2
Purgedwith air
700
from the external liquid medium. The sensitivity of intracellular measurement has beenincreased further by using luminescent Pt-based dyes.20
Conditions Intracellular (ppm)
Air-saturated buffer solutionCells in air-saturated bufferCells in buffer 25 s after removing Cells in buffer 120 s after removing � 1.5O2
6.5 � 1.7O2
7.9 � 2.18.8 � 0.8
O2
O2
Figure 19-20 Fluorescence from -indicator beads showing constant intensity
near 525 nm and variable intensity near610 nm. The ratio of emission intensity at thesetwo wavelengths is related to concentration.[From H. Xu, J. W. Aylott, R. Kopelman, T. J. Miller, and
M. A. Philbert, “Real-Time Method for Determination of
O2 Inside Living Cells Using Optical Nanosensors,” Anal.
Chem. 2001, 73, 4124.]
O2
O2
Exercises
19-A. This problem can be worked with Equations 19-6 on acalculator or with the spreadsheet in Figure 19-5. Transferrin is theiron-transport protein found in blood. It has a molecular mass of81 000 and carries two ions. Desferrioxamine B is a chelatorFe3�
used to treat patients with iron overload (Box 12-1). It has a molec-ular mass of about 650 and can bind one Desferrioxaminecan take iron from many sites within the body and is excreted (withits iron) through the kidneys. The molar absorptivities of these
Fe3�.

418 CHAPTER 19 Applications of Spectrophotometry
Problems
Analysis of a Mixture
19-1. This problem can be worked by calculator or with thespreadsheet in Figure 19-5. Consider compounds X and Y in theexample labeled “Analysis of a Mixture, Using Equations 19-6” inSection 19-1. Find [X] and [Y] in a solution whose absorbance is0.233 at 272 nm and 0.200 at 327 nm in a 0.100-cm cell.
19-2. The figure (see next page) shows spectra of and an unknown mixture
of both, all in 1.000-cm-pathlength cells. Absorbances are given in1.00 � 10�4 M Cr2O2�
7 ,10�4 M MnO�4 ,
1.00 �
the table. Use the least-squares procedure in Figure 19-3 to find theconcentration of each species in the mixture.
Wavelength(nm) standard standard Mixture
266 0.042 0.410 0.766288 0.082 0.283 0.571320 0.168 0.158 0.422350 0.125 0.318 0.672360 0.056 0.181 0.366
Cr2O2�7MnO�
4
19-C. Compound P, which absorbs light at 305 nm, was titratedwith X, which does not absorb at this wavelength. The product, PX,also absorbs at 305 nm. Absorbance was measured in a 1.000-cmcell, and the concentration of free X was determined independently,
1234567891011
375
(nm)
121314
1.324E+04
Wavelength
Ponceau 4R
Mixture of Dyes
A B C D E
of mixtureAbsorbance
Am
Molar Absorptivity
Tartrazine Sunset Yellow
2.144E+04
2.514E+04
2.200E+04
1.055E+04
0.000E+00
1.403E+03
0.000E+00
0.000E+00
4.474E+03
7.403E+03
8.551E+03
1.275E+04
1.940E+04
1.869E+04
7.641E+03
3.959E+02
0.000E+00
2.313E+03
3.310E+03
4.534E+03
6.575E+03
1.229E+04
1.673E+04
1.528E+04
9.522E+03
1.814E+03
0.853
1.332
1.603
1.792
2.006
1.821
1.155
0.445
0.084
400
425
450
475
500
525
550
575
350 6.229E+03 2.019E+03 4.172E+03 0.557
Data from J. J. B. Nevado, J. R. Flores, and M. J. V. Llerena, “Simultaneous Spectrophoto-metric Determination of Tartrazine, Sunset Yellow, and Ponceau 4R in Commercial Products,”Fresenius J. Anal. Chem. 1998, 361, 465.
compounds (saturated with iron) at two wavelengths are given inthe table below. Both compounds are colorless (no visible absorp-tion) in the absence of iron.
(nm) Transferrin Desferrioxamine
428 3 540 2 730470 4 170 2 290
(a) A solution of transferrin exhibits an absorbance of 0.463 at470 nm in a 1.000-cm cell. Calculate the concentration of transfer-rin in milligrams per milliliter and the concentration of bound ironin micrograms per milliliter.(b) After adding desferrioxamine (which dilutes the sample), theabsorbance at 470 nm was 0.424, and the absorbance at 428 nm was0.401. Calculate the fraction of iron in transferrin and the fraction indesferrioxamine. Remember that transferrin binds two iron atomsand desferrioxamine binds only one.
19-B. The spreadsheet lists molar absorptivities of threedyes and the absorbance of a mixture of the dyes at visible wave-lengths. Use the least-squares procedure in Figure 19-3 to find theconcentration of each dye in the mixture.
�
�(M�1 cm�1)
with results in the table. Prepare a Scatchard plot and find the equi-librium constant for the reaction
Experiment (M) (M) A [X] (M)
0 0.010 0 0 0.213 01 0.010 0 0.001 00 0.3032 0.010 0 0.002 00 0.3943 0.010 0 0.003 00 0.4844 0.010 0 0.004 00 0.5755 0.010 0 0.005 00 0.6636 0.010 0 0.006 00 0.7527 0.010 0 0.007 00 0.8408 0.010 0 0.008 00 0.9269 0.010 0 0.009 00 1.006
10 0.010 0 0.010 00 1.06611 0.010 0 0.020 00 1.117
19-D. Complex formation by 3-aminopyridine and picric acid inchloroform solution gives a yellow product with an absorbancemaximum at 400 nm. Neither starting material absorbs significantlyat this wavelength. Stock solutions containing ofeach compound were mixed as indicated, and the absorbances ofthe mixtures were recorded. Prepare a graph of absorbance versusmole fraction of 3-aminopyridine and find the stoichiometry of thecomplex.
Picric acid 3-Aminopyridine Absorbance(mL) (mL) at 400 nm
2.70 0.30 0.1062.40 0.60 0.2142.10 0.90 0.3111.80 1.20 0.4021.50 1.50 0.4421.20 1.80 0.4040.90 2.10 0.3180.60 2.40 0.2220.30 2.70 0.110
SOURCE: Data from E. Bruneau, D. Lavabre, G. Levy, and J. C. Micheau,“Quantitative Analysis of Continuous-Variation Plots with a Comparison ofSeveral Methods,” J. Chem. Ed. 1992, 69, 833.
N
NH2NO2
NO2
OHO2N
1.00 � 10�4 M
9.66 � 10�35.87 � 10�42.69 � 10�41.42 � 10�48.20 � 10�55.52 � 10�53.57 � 10�52.47 � 10�51.60 � 10�59.10 � 10�64.42 � 10�6
X0P0
X � P T PX.

Problems 419
19-3. When are isosbestic points observed and why?
19-4. The metal ion indicator xylenol orange (Table 12-3) is yellowat pH 6 The spectral changes that occur as is added to the indicator at pH 6 are shown below. The mole ratio
orange at each point is
Trace Mole ratio Trace Mole ratio Trace Mole ratio
0 0 6 0.60 12 1.31 0.10 7 0.70 13 1.52 0.20 8 0.80 14 2.03 0.30 9 0.90 15 3.14 0.40 10 1.0 16 4.15 0.50 11 1.1
Suggest a sequence of chemical reactions to explain the spectralchanges, especially the isosbestic points at 457 and 528 nm.
VO2�/xylenol
VO2�(�max � 439 nm).
0300
Abs
orba
nce
Wavelength (nm)
0.1
0.2
0.3
0.6
0.5
0.4
0.9
0.8
0.7
1
350250 500450400 600550 650
Mixture
Cr2O2–7
MnO–4
Visible spectrum of and an unknown mixture containingboth ions. [From M. Blanco, H. Iturriaga, S. Maspoch, and P. Tarín, “A Simple Method for
Spectrophotometric Determination of Two-Components with Overlapped Spectra,”
J. Chem. Ed. 1989, 66, 178.]
MnO�4 , Cr2O2�
7 ,
Figure for Problem 19-4. Absorption spectra for thereaction of xylenol orange with at pH 6.0. [From
D. C. Harris and M. H. Gelb, “Binding of Xylenol Orange to
Transferrin: Demonstration of Metal-Anion Linkage,” Biochim.
Biophys. Acta 1980, 623, 1.]
VO2�
19-5. Infrared spectra are customarily recorded on a transmittancescale so that weak and strong bands can be displayed on the samescale. The region near in the infrared spectra of com-pounds A and B is shown in the figure. Note that absorption corre-sponds to a downward peak on this scale. The spectra were recordedfrom a 0.010 0 M solution of each, in cells with 0.005 00-cmpathlengths. A mixture of A and B in a 0.005 00-cm cell gave atransmittance of 34.0% at and 38.3% at Find the concentrations of A and B.
19-6. Spectroscopic data for the indicators thymol blue (TB),semithymol blue (STB), and methylthymol blue (MTB) are shownin the table. A solution of TB, STB, and MTB in a 1.000-cm cuvethad absorbances of 0.412 at 455 nm, 0.350 at 485 nm, and 0.632 at545 nm. Modify the spreadsheet in Figure 19-5 to handle three
Wavenumber
2 022 cm–1
1 993 cm–1
Pure A
31.0% T
79.7% T
Pure B
97.4% T
20.0% T
20
2 100
Tran
smitt
ance
(%
)
Wavenumber (cm–1)2 000 1 900
60
80
100
40
0
A
B2 022cm–1
1 993cm–1
1 993 cm�1.2 022 cm�1
2 000 cm�1
400
Abs
orba
nce
Wavelength (nm)500 600
0.1 Absorbance unit
0123
0
12
34
9
10
11
12
13
14
15
16

420 CHAPTER 19 Applications of Spectrophotometry
simultaneous equations and find [TB], [STB], and [MTB] in themixture.
(nm) TB STB MTB
455 4 800 11 100 18 900485 7 350 11 200 11 800545 36 400 13 900 4 450
SOURCE: Data from S. Kiciak, H. Gontarz, and E. Krzy anowska, “Monitoringthe Synthesis of Semimethylthymol Blue and Methylthymol Blue,” Talanta 1995,42, 1245.
19-7. The table below gives the product for four purecompounds and a mixture at infrared wavelengths. Modify Fig-ure 19-5 to solve four equations and find the concentration of eachcompound. You can treat the coefficient matrix as if it were molarabsorptivity because the pathlength was constant (but unknown) forall measurements.
�b
z#
�
�(M�1 cm�1)
(a) From Beer’s law for the mixture, write equations for andin terms of the absorbances at 620 and 434 nm andThen show that
(A)
(b) From the mass balance (1) and the acid dissociation constantshow that
(B)
(C)
(c) Show that (D)(d) From the carbonic acid dissociation equilibria, show that
(E)
(F)
(e) Write the charge balance for the solution in the sensor compart-ment. Substitute in expressions B, C, E, and F for
and(f) Suppose that the various constants have the following values:
From the measured absorbance ratio findin the seawater.
(g) Approximately what is the ionic strength inside the sensor com-partment? Were we justified in neglecting activity coefficients inworking this problem?
Measuring an Equilibrium Constant
19-10. Figure 19-7 is a Scatchard plot for the addition of 0–20 nMantigen X to a fixed concentration of antibody Prepare a Scatchard plot from the data in the table (on the nextpage) and find K for the reaction The table gives mea-sured concentrations of unbound X and the complex PX. It is recom-mended that the fraction of saturation should span the range 0.2–0.8.What is the range of the fraction of saturation for the data?
�
P � X T PX.
P (P0 � 10 nM).
[CO2(aq)]RA � A620/A434 � 2.84,
Kw � 6.7 � 10�15�In2�
620 � 1.70 � 104 M�1 cm�1
KIn � 2.0 � 10�7�In2�
434 � 1.90 � 103 M�1 cm�1
K2 � 3.3 � 10�11�HIn�
620 � 0
K1 � 3.0 � 10�7�HIn�
434 � 8.00 � 103 M�1 cm�1
[CO2�3 ].[HCO�
3 ],[In2�],[HIn�],
[CO2�3 ] �
K1K2[CO2(aq)]
[H�]2
[HCO�3 ] �
K1[CO2(aq)]
[H�]
[H�] � KIn/RIn.
[In2�] �KInFIn
[H�](RIn � 1)
[HIn�] �FIn
RIn � 1
KIn,
[In2�]
[HIn�]�
RA�HIn�
434 � �HIn�
620
�In2�
620 � RA�In2�
434� RIn
A434).(A620[In2�]
[HIn�]
CO2(aq)CO2(aq)
CO2(g)
HCO3
HIn– In2– + H+
CO3 + H+
K1
K2
KIn
2–
CO2(aq) + H2O HCO3 + H+–
–
ε
ε
ε
ε
HIn620HIn434
In620In434
Inside sensor compartment
Silicone membrane allows CO2,but not other species, to diffuse across
Seawater
Wavelength Coefficient matrix ( b) Absorbance
(�m) p-xylene m-xylene o-xylene ethylbenzene of unknown
12.5 1.5020 0.0514 0 0.0408 0.1013
13.0 0.0261 1.1516 0 0.0820 0.09943
13.4 0.0342 0.0355 2.532 0.2933 0.2194
14.3 0.0340 0.0684 0 0.3470 0.03396
�
Data from Z. Zdravkovski, “Mathcad in Chemistry Calculations. II. Arrays,” J. Chem. Ed.1992, 69, 242A.
19-8. A solution was prepared by mixing 25.00 mL of 0.080 0 Maniline, 25.00 mL of 0.060 0 M sulfanilic acid, and 1.00 mL of
HIn and then diluting to 100.0 mL. (HIn stands forprotonated indicator.)
Anilinium ion Sulfanilic acid
Q a
The absorbance measured at 550 nm in a 5.00-cm cell was 0.110.Find the concentrations of HIn and and for HIn.
19-9. Chemical equilibrium and analysis of a mixture. A remoteoptical sensor for in the ocean was designed to operate withoutthe need for calibration.21 The sensor compartment is separatedfrom seawater by a silicone membrane through which but notdissolved ions, can diffuse. Inside the sensor, equilibrates with
and . For each measurement, the sensor is flushed withfresh solution containing 50.0 �M bromothymol blue indicator(NaHIn) and NaOH. All indicator is in the form or near neutral pH, so we can write two mass balances:(1) and (2)
has an absorbance maxi-mum at 434 nm and has a maximum at 620 nm. The sensormeasures the absorbance ratio reproducibly withoutneed for calibration. From this ratio, we can find in theseawater as outlined here:
[CO2(aq)]RA � A620/A434
In2�
HIn�92.0 �M.50.0 �M � 42.0 �M �
[Na�] � FNa �50.0 �M[HIn�] � [In2�] � FIn �In2�
HIn�42.0 �M
CO2�3HCO�
3
CO2
CO2,
CO2
pKaln�
�550 � 1.53 � 104 M�1 cm�1�550 � 2.26 � 104 M�1 cm�1
�325 � 4.39 � 103 M�1 cm�1�325 � 2.45 � 104 M�1 cm�1
HIn T H� � In�
pKa � 3.232pKa � 4.601
NH3
�NH3
�O3S
�
1.23 � 10�4 M

Problems 421
[X] (nM) [PX] (nM) [X] (nM) [PX] (nM)
19-11. Compound P was titrated with X to form the complex PX. Aseries of solutions was prepared with the total concentration of Premaining fixed at Both P and X have no visibleabsorbance, but PX has an absorption maximum at 437 nm. Thetable below shows how the absorbance at 437 nm in a 5.00-cm celldepends on the total concentration of added X
A A
0 0.000 0.020 0 0.5350.002 00 0.125 0.040 0 0.6310.004 00 0.213 0.060 0 0.7000.006 00 0.286 0.080 0 0.7080.008 00 0.342 0.100 0.7650.010 00 0.406
(a) Make a Scatchard plot of versus In this plot, [X]refers to the species X, not to However, because wecan safely say that in this experiment.(b) From the slope of the graph, find the equilibrium constant, K.
19-12. Iodine reacts with mesitylene to form a complex with anabsorption maximum at 332 nm in solution:
Iodine Mesitylene Complex
(a) Given that the product absorbs at 332 nm, but neither reactanthas significant absorbance at this wavelength, use the equilibriumconstant, K, and Beer’s law to show that
where A is the absorbance at 332 nm, is the molar absorptivity ofthe complex at 332 nm, [mesitylene] is the concentration of freemesitylene, and is the total concentration of iodine in thesolution The cell pathlength is 1.000 cm.(b) Spectrophotometric data for this reaction are shown in the tablebelow. Because we can say that
Prepare a graph of versusand find the equilibrium constant and molar absorptivity of
the complex.
Absorbance(M) (M) at 332 nm
1.690 0.3690.921 8 0.8220.633 8 0.7870.482 9 0.7030.390 0 0.6240.327 1 0.556
SOURCE: Data from P. J. Ogren and J. R. Norton, “Applying a Simple Linear Least-Squares Algorithm to Data with Uncertainties in Both Variables,” J. Chem. Ed. 1992, 69,A130.
3.934 � 10�43.788 � 10�43.573 � 10�43.224 � 10�42.558 � 10�47.817 � 10�5
[I2]tot[Mesitylene]tot
A/[I2]tot
A/ ([mesitylene][I2]tot)[mesitylene]tot.[mesitylene]�[mestitylene]tot W [I2],
(� [I2] � [complex]).[I2]tot
�
A
[Mesitylene][I2]tot� K� �
KA
[I2]tot
�max � 332 nm�332 � 0�332 � 0
�I2 I2 K � [I2][mesitylene]
[complex]=
CCl4
[X] � XT
XT W [P],XT.�A.�A/[X]
XT (M)XT (M)
(XT � [X] � [PX]).
1.00 � 10�5 M.
8.453.615.540.450
7.521.504.660.296
6.771.223.800.192
6.290.7312.870.120
19-13. Now we use SOLVER to find K for Problem 19-12. Theonly absorbing species at 332 nm is the complex, so, from Beer’slaw, (because is eitherfree or bound in the complex, so There isa huge excess of mesitylene, so
The spreadsheet below shows some of the data. You will need to useall the data. Column A contains [mesitylene] and column B contains
Column C lists the measured absorbance. Guess a value ofthe molar absorptivity of the complex, in cell A7. Then computethe concentration of the complex in column D. The equi-librium constant in column E is given by ([I2][mesitylene]) � (D2)/((B2-D2)*A2).
E2 � [complex]/(� A/�)
�,[I2]tot.
K �[complex]
[I2][mesitylene]�
A/�
([I2]tot � A/�)[mesitylene]tot
[mesitylene]tot.[mesitylene] �[I2] � [I2]tot � [complex].
I2pathlength � 1.000 cm).[complex] � A/�
1
2
3
4
5
6
7
Guess for ε:
0.6338
0.9218 0.822
1.6900 0.369 7.380E-05 9.992821.644E-04
1.574E-04
[Mesitylene] [I2]tot A Keq[Complex] = A /εA B C D E
1.50511
2.558E-04
7.817E-05
3.224E-04 0.787
Standard Dev =
Stdev/Average =
3.32038
0.93758
Average = 3.54144
1.95128
5.000E+03
What should we minimize with SOLVER? We want to vary incell A7 until the values of K in column E are as constant as possible.We would like to minimize a function like where
is the value in each line of the table and is the average ofall computed values. The problem with is that wecan minimize this function simply by making very small, but notnecessarily constant. What we really want is for all the to be clus-tered around the mean value. A good way to do this is to minimizethe relative standard deviation of the which is (standard devia-tion)/average. In cell E5, we compute the average value of K and incell E6, the standard deviation. Cell E7 contains the relative stan-dard deviation. Use SOLVER to minimize cell E7 by varying cell A7.Compare your answer with that of Problem 19-12.
Method of Continuous Variation
19-14. Method of continuous variation. Make a graph of absorbanceversus mole fraction of thiocyanate for the data in the table.
mL Fe3� mL SCN� Absorbancesolutiona solutionb at 455 nm
30.00 0 0.00127.00 3.00 0.12224.00 6.00 0.22621.00 9.00 0.29318.00 12.00 0.33115.00 15.00 0.34612.00 18.00 0.3279.00 21.00 0.2866.00 24.00 0.2143.00 27.00 0.1090 30.00 0.002
a. Fe3� solution: 1.00 mM Fe(NO3)3 � 10.0 mM HNO3.
b. SCN� solution: 1.00 mM KSCN � 15.0 mM HCl.
SOURCE: Data from Z. D. Hill and P. MacCarthy, “Novel Approach toJob’s Method,” J. Chem. Ed. 1986, 63, 162.
Ki,
Ki
Ki
g (Ki � Kaverage)2KaverageKi
g(Ki � Kaverage)2,
�

422 CHAPTER 19 Applications of Spectrophotometry
(a) What is the stoichiometry of the predominant species?(b) Why is the peak not as sharp as those in Figure 19-8?(c) Why does one solution contain 10.0 mM acid and the other15.0 mM acid?
19-15. Simulating a Job’s plot. Consider the reaction for which Suppose that the
following mixtures of A and B at a fixed total concentration of M are prepared:
(M) (M) (M) (M)
(a) Prepare a spreadsheet to find the concentration of for eachmixture, for equilibrium constants of and Oneway to do this is to enter the values of and in columnsA and B, respectively. Then put a trial (guessed) value of in column C. From the mass balances and we can write
In column D, enterthe reaction quotient For example, cell D2 has theformula Then vary the value of
in cell C2 with SOLVER until the reaction quotient in cellD2 is equal to the desired equilibrium constant (such as (b) Prepare a graph by the method of continuous variation in whichyou plot versus mole fraction of A for each equilibrium con-stant. Explain the shapes of the curves.
19-16. A study was conducted with derivatives of the DNAnucleotide bases adenine and thymine bound inside micelles (Box26-1) in aqueous solution.
Adenine derivative Thymine derivative Sodium dodecyl sulfate
Sodium dodecyl sulfate forms micelles with the hydrocarbon tailspointed inward and ionic headgroups exposed to water. It washypothesized that the bases would form a 1:1 hydrogen-bondedcomplex inside the micelle as they do in DNA.
N
N
HN
NN
N
CH3CNH
O
O
O
N(CH3)3Br��
CH3(CH2)11OSO�Na�
O
O
� �
[AB2]
108).[AB2]
“�C2/((A2-C2)(B2-2*C2)^2)”.[AB2]/[A][B]2.
[AB2]/5([A]total � [AB2])([B]total � 2[AB2])26.K � [AB2]/[A][B]2 �[B]total � [B] � 2[AB2],[A]total � [A] � [AB2]
[AB2][B]total[A]total
108.K � 106, 107,AB2
6.00 � 10�54.00 � 10�51.00 � 10�59.00 � 10�56.67 � 10�53.33 � 10�52.00 � 10�58.00 � 10�57.00 � 10�53.00 � 10�53.00 � 10�57.00 � 10�57.50 � 10�52.50 � 10�54.00 � 10�56.00 � 10�58.00 � 10�52.00 � 10�55.00 � 10�55.00 � 10�59.00 � 10�51.00 � 10�5
[B]total[A]total[B]total[A]total
10�4
K � [AB2]/[A][B]2.2B T AB2,A �
Fe(SCN)3�nn
Hydrogen-bonded base pair inside micelle with hydrocarbon tailsanchoring the bases to the micelle.
To test the hypothesis, aliquots of 5.0 mM adenine derivativewere mixed with aliquots of 5.0 mM thymine derivative in proportionsshown in the table. Each solution also contained 20 mM sodiumdodecyl sulfate. The concentration of product measured by nuclearmagnetic resonance also is shown in the table. Are the results con-sistent with formation of a 1:1 complex? Explain your answer.
Adenine volume Thymine volume Concentration of(mL) (mL) product (mM)
0.450 0.0500.400 0.1000.350 0.1500.300 0.2000.250 0.2500.200 0.3000.150 0.3500.100 0.4000.050 0.450
Luminescence and Immunoassay
19-17. Explain how signal amplification is achieved in enzyme-linked immunosorbent assays.
19-18. What is the advantage of a time-resolved emission measure-ment with versus measurement of fluorescence from organicchromophores?
19-19. Here is an immunoassay for explosives such as trinitro-toluene
Trinitrotoluene (TNT)
Flexiblelink Fluorescent
group
Fluorescently labeled TNT
NO2
NO2
NO2
CH3
NO2
O2N
O2N
(TNT).22
Eu3�
0.103 � 0.1040.187 � 0.1100.260 � 0.1220.296 � 0.0730.312 � 0.0600.307 � 0.0320.265 � 0.0210.202 � 0.0380.118 � 0.009
+
–
–
–
–
––––
–
–
–
–
––
– ––
–
+
+++
+
+
+
+
+
+
+
++
+
H N
N (CH3)3
NN
N
N N HO
O
O
+

Problems 423
1. A column is prepared with covalently bound antibodies toTNT. Fluorescence-labeled TNT is passed through the columnto saturate the antibodies with labeled TNT. The column iswashed with excess solvent until no fluorescence is detected atthe outlet.
2. Air containing TNT vapors is drawn through a sampling devicethat concentrates traces of the gaseous vapors into distilled water.
3. Aliquots of water from the sampler are injected into theantibody column. The fluorescence intensity of the liquid exitingthe column is proportional to the concentration of TNT in thewater from the sampler over the range 20 to 1 200 ng/mL.
Draw pictures showing the state of the column in steps 1 and 3 andexplain how this detector works.
19-20. The graph below shows the effect of pH on quenching ofluminescence of Ru(II) by 2,6-dimethylphenol.The ordinate, is the collection of constants, in theStern-Volmer equation 19-25. The greater the greater thequenching. Suggest an explanation for the shape of the graph andestimate pKa for 2,6-dimethylphenol.
19-21. Fluorescence quenching in micelles. Consider an aqueoussolution with a high concentration of micelles (Box 26-1) and rela-tively low concentrations of the fluorescent molecule pyrene and aquencher (cetylpyridinium chloride, designated Q), both of whichdissolve in the micelles.
Quenching occurs if pyrene and Q are in the same micelle. Letthe total concentration of quencher be [Q] and the concentration ofmicelles be [M]. The average number of quenchers per micelle is
åN� Cl�
CH2(CH2)14CH3
Pyrene(fluorescent species)
Cetylpyridinium chloride(quencher, Q)
1 500
1 000
500
01312111098
pH
KS
V
åå
N
NRu2�
3
œ
ç
ß OH
2,6-Dimethylphenol
Tris(2,2'-bipyridine)ruthenium(II)
KSV,kq/ (ke � kd),KSV,
tris(2,2¿-bipyridine)
If Q is randomly distributed among the micelles,then the probability that a particular micelle has n molecules of Q isgiven by the Poisson distribution:23
Probability of n molecules of Q in (1)
where n! is n factorial The probabilitythat there are no molecules of Q in a micelle is
Probability of 0 molecules of Q in (2)
becauseLet be the fluorescence intensity of pyrene in the absence of
Q and let be the intensity in the presence of Q (both measured atthe same concentration of micelles). The quotient must be
which is the probability that a micelle does not possess aquencher molecule. Substituting gives
(3)
Micelles are made of the surfactant molecule, sodium dodecylsulfate (shown in Problem 19-16). When surfactant is added to asolution, no micelles form until a minimum concentration called thecritical micelle concentration (CMC) is attained. When the totalconcentration of surfactant, [S], exceeds the critical concentration,then the surfactant found in micelles is The molarconcentration of micelles is
(4)
where is the average number of molecules of surfactant in eachmicelle.
Combining Equations 3 and 4 gives an expression for fluores-cence as a function of total quencher concentration, [Q]:
(5)
By measuring fluorescence intensity as a function of [Q] at fixed[S], we can find the average number of molecules of S per micelleif we know the critical micelle concentration (which is indepen-dently measured in solutions of S). The table below gives data for3.8 pyrene in a micellar solution with a total concentration ofsodium dodecyl sulfate
Q (�M) I0/IQ Q (�M) I0/IQ Q (�M) I0/IQ
0 1 158 2.03 316 4.0453 1.28 210 2.60 366 5.02
105 1.61 262 3.30 418 6.32
SOURCE: Data from M. F. R. Prieto, M. C. R. Rodríguez, M. M. González, A. M. R.Rodríguez, and J. C. M. Fernández, “Fluorescene Quenching in MicroheterogeneousMedia,” J. Chem. Ed. 1995, 72, 662.
(a) If micelles were not present, quenching would be expected tofollow the Stern-Volmer equation 19-25. Show that the graph of
versus [Q] is not linear.(b) The critical micelle concentration is 8.1 mM. Prepare a graph ofln versus [Q]. Use Equation 5 to find the average num-ber of sodium dodecyl sulfate molecules per micelle.(c) Find the concentration of micelles, [M], and the average numberof molecules of Q per micelle, when (d) Compute the fractions of micelles containing 0, 1, and 2 mole-cules of Q when [Q] � 0.200 mM.
[Q] � 0.200 mM.Q,
Nav,(I0/IQ)
I0/IQ
[S] � 20.8 mM.�M
lnI0
IQ�
[Q]Nav
[S] � [CMC]
Nav
[M] �[S] � [CMC]
Nav
[S] � [CMC].
IQ/I0 � e�Q � e�[Q]/[M]
Q � [Q]/[M]e�Q,
IQ/I0
IQ
I0
0! � 1.
micelle �Q0
0!e�Q � e�Q
(� n[n � 1][n � 2] . . . [1]).
micelle � Pn �Qn
n!e�Q
Q � [Q]/[M].
Quenching of -bipyridine)Ru(II) by 2,6-dimethylphenol as a functionof pH. [Data from H. Gsponer, G. A. Argüello, and G. A. Argüello, “Determinations of pKa
from Luminescence Quenching Data,” J. Chem. Ed. 1997, 74, 968.]
tris(2,2¿

424 CHAPTER 20 Spectrophotometers
Cavity ring-down can measure absorbance as low as and has the potential to providesensitive detectors for chromatography.1 In part (a), a laser pulse is directed into a cavity withmirrors on both ends. If the mirror reflectivity is 99.98%, then 0.02% of the power penetratesmirror and enters the cavity. The laser is shut off and light inside the cavity bounces back andforth, losing 0.02% of its intensity each time it strikes a mirror. A detector outside mirror measures light leaking through M2. Graph (b) shows decay of the detector signal from a cavitycontaining a nonabsorbing liquid. If an absorbing species is present, decay is faster because sig-nal is lost by absorption during each pass between the mirrors. The difference in signal decaytime with and without absorber provides a measure of absorbance. Because decay time for anindividual laser pulse is measured, fluctuation in light intensity from pulse to pulse has littleinfluence on the measured absorbance. The effective pathlength is times the length of thecavity because light makes passes between mirrors during the measurement.
Spectrum (c) shows absorbance measured for with the natural mixture of98.9% and 1.1% . Peaks arise from transitions between rotational levels of twovibrational states. The spectral region was chosen to include a strong absorption of and a weak absorption of , so that the intensities of the isotopic peaks are similar.Each point in the spectrum was obtained by varying the laser frequency.
The areas of the and peaks from human breath were used to determinewhether a patient was infected with Helicobacter pylori, a bacterium that causes ulcers.After ingesting , H. pylori converts into , which appears in thepatient’s breath. The ratio in the breath of an infected person increases by 1–5%,whereas the ratio from an uninfected person is constant to within 0.1%.13C/12C
13C/12C
13CO213C-urea13C-urea
12CO213CO2
12CO2
13CO2
13C12CCO2(g)
�103�103
M2
M1
�10�6
CAVITY RING-DOWN SPECTROSCOPY: DO YOU HAVE AN ULCER?
Spectrophotometers20
Figure 18-4 showed the essential features of a single-beam spectrophotometer. Light from asource is separated into narrow bands of wavelength by a monochromator, passed through asample, and measured by a detector. We measure the irradiance striking thedetector with a reference cell (a solvent blank or reagent blank) in the sample compartment.When the reference is replaced by the sample of interest, some radiation is usually absorbedand the irradiance striking the detector, P, is smaller than . The quotient , which is anumber between 0 and 1, is the transmittance, T. Absorbance, which is proportional to con-centration, is
A single-beam spectrophotometer is inconvenient because the sample and referencemust be placed alternately in the beam. For measurements at multiple wavelengths, the refer-ence must be run at each wavelength. A single-beam instrument is poorly suited to measuring
A � log P0/P � �log T.
P/P0P0
(P0, watts/m2)
Cavity ring-down spectrum of �3 mbar ofCO2, which is similar to the concentration inhuman breath. [From E. R. Crosson, K. N. Ricci, B. A.Richman, F. C. Chilese, T. G. Owano, R. A. Provencal,M. W. Todd, J. Glasser, A. A. Kachanov, B. A. Paldus, T. G.Spence, and R. N. Zare, “Stable Isotope Ratios UsingCavity Ring-Down Spectroscopy: Determination of13C/12C for Carbon Dioxide in Human Breath,”Anal. Chem. 2002, 74, 2003.]
(a)
Tunablelaser
Highly reflective mirror
Ring-down cavityDetectorM1 M2
0.0 0.5
Time (µs)
1.0 1.5
Withabsorber
WithoutabsorberIn
tens
ity
6 261.6 6 262.0
Wavenumber (cm–1)
13CO2
12CO210–6
absorbanceunits
6 262.4
c � concentrationb � pathlength� � molar absorptivityA � �log T � �bcT � P/P0
(b) (c)

absorbance as a function of time, as in a kinetics experiment, because both the source inten-sity and the detector response slowly drift.
Figure 20-1 shows a double-beam spectrophotometer, in which light alternately passesthrough the sample and reference (blank), directed by a rotating mirror (the chopper) intoand out of the light path. When light passes through the sample, the detector measuresirradiance P. When the chopper diverts the beam through the reference cuvet, the detectormeasures . The beam is chopped several times per second, and the circuitry automaticallycompares P and to obtain transmittance and absorbance. This procedure provides auto-matic correction for changes of the source intensity and detector response with time andwavelength, because the power emerging from the two samples is compared so frequently.Most research-quality spectrophotometers provide automatic wavelength scanning and con-tinuous recording of absorbance versus wavelength.
It is routine to first record a baseline spectrum with reference solution in both cuvets.The baseline absorbance at each wavelength is then subtracted from the measured absorbanceof the sample to obtain the true absorbance of the sample at each wavelength.
A double-beam ultraviolet-visible spectrophotometer is shown in Figure 20-2. Visiblelight comes from a quartz-halogen lamp (like that in an automobile headlight), and the ultra-violet source is a deuterium arc lamp that emits in the range 200 to 400 nm. Only one lampis used at a time. Grating 1 selects a narrow band of wavelengths to enter the monochroma-tor, which selects an even narrower band to pass through the sample. After being chopped
P0
P0
425
Samplecuvet
Semitransparentmirror
Rotating mirror(Beam chopper)
Mirror Mirror
P
P0
Lightsource
Scanningmonochromator
Detector
Referencecuvet
Mot
or
Amplifier Display
Figure 20-1 Schematic diagram of adouble-beam scanning spectrophotometer.The incident beam is passed alternatelythrough the sample and reference cuvets bythe rotating beam chopper.
Detector
Photo-multiplier
tube
Chopper
Ultravioletlamp Grating 1
Visible lamp
Entrance slit
Grating 2Exit slit
Mirrors
Monochromator
Referenceposition
Sampleposition
Samplecompartment
Chopper
Lightsource
(b )
Figure 20-2 (a) Varian Cary 3E Ultraviolet-Visible Spectrophotometer. (b) Optical train.[Courtesy Varian Australia Pty, Ltd., Victoria, Australia.]
(b)
Source, monochromator, detector
Samplecompartment
Display andcontrols
(a)

and transmitted through the sample and reference cells, the signal is detected by a photomul-tiplier tube, which creates an electric current proportional to irradiance. Now we describe thecomponents of the spectrophotometer in more detail.
20-1 Lamps and Lasers: Sources of LightA tungsten lamp is an excellent source of continuous visible and near-infrared radiation. Atypical tungsten filament operates at a temperature near 3 000 K and produces useful radia-tion in the range 320 to 2 500 nm (Figure 20-3). This range covers the entire visible regionand parts of the infrared and ultraviolet regions as well. Ultraviolet spectroscopy normallyemploys a deuterium arc lamp in which an electric discharge (a spark) causes to dissoci-D2
426 CHAPTER 20 Spectrophotometers
Wavelength (nm)
Ligh
t int
ensi
ty
200 400 600 800 1 000
Deuterium lamp
Tungstenlamp
Figure 20-3 Intensity of a tungsten filamentat 3 200 K and a deuterium arc lamp.
Box 20-1 Blackbody Radiation and the Greenhouse Effect
When an object is heated, it emits radiation—it glows. Even atroom temperature, objects radiate at infrared frequencies. Imag-ine a hollow sphere whose inside surface is perfectly black. Thatis, the surface absorbs all radiation striking it. If the sphere is atconstant temperature, it must emit as much radiation as itabsorbs. If a small hole were made in the wall, we wouldobserve that the escaping radiation has a continuous spectral dis-tribution. The object is called a blackbody, and the radiation iscalled blackbody radiation. Emission from real objects such asthe tungsten filament of a light bulb resembles that from an idealblackbody.
The power per unit area radiating from the surface of anobject is called the exitance (or emittance), M, and is given by
Exitance from blackbody:
where is the Stefan-Boltzmann constant A blackbody whose temperature is 1 000 K radiateswatts per square meter of surface area. If the tempera-
ture is doubled, the exitance increases by a factor of .24 � 165.67 � 104(m2 � K4)).
10�8 W/(5.669 8 �
M � T 4
Sun
100 unitsof visibleradiation
4% reflectedfrom Earth
25% reflectedfrom atmosphere
23% absorbedby atmosphere
T = 254 K
6% radiated tospace from Earth
65% radiated tospace from atmosphere
48% absorbedby Earth
Atmosphere
T = 287 K Infrared radiationfrom Earth toatmosphere Infrared radiation
from atmosphere
to EarthEarth
Incoming energy
Outgoing energy
Greenhouse gases
Balance between energy reaching Earth from the sun and energy reradiated to space. Exchange of infraredradiation between Earth and its atmosphere keeps Earth’s surface 33 K warmer than the upper atmosphere.
The blackbody emission spectrum at right changes with tem-perature, as shown in the graph. Near 300 K, maximum emissionoccurs at infrared wavelengths. The outer region of the sunbehaves like a blackbody with a temperature near 5 800 K,emitting mainly visible light.
Of the solar flux of reaching the upper atmo-sphere, 23% is absorbed by the atmosphere and 25% is reflectedback into space. Earth absorbs 48% of the solar flux and reflects4%. Radiation reaching Earth should be just enough to keep thesurface temperature at 254 K, which would not support life as weknow it. Why does the average temperature of Earth’s surface stayat a comfortable 287 K?
The blackbody curves tell us that Earth radiates mainlyinfrared radiation, rather than visible light. Although the atmo-sphere is transparent to incoming visible light, it strongly absorbsoutgoing infrared radiation. The main absorbers, called green-house gases, are water3 and and, to lesser extents, , ,chlorofluorocarbons, and . Radiation emitted from Earth isabsorbed by the atmosphere and part of it is reradiated back toEarth. The atmosphere behaves like an insulating blanket, main-
N2OCH4O3CO2
1 368 W/m2
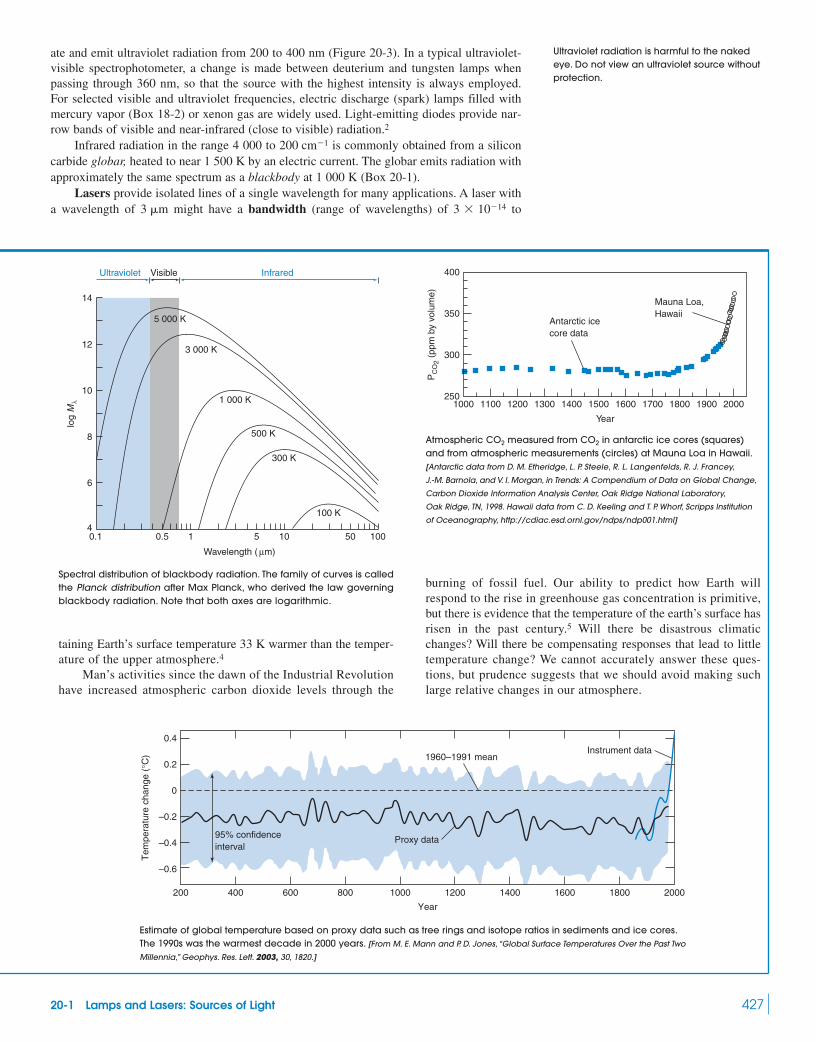
ate and emit ultraviolet radiation from 200 to 400 nm (Figure 20-3). In a typical ultraviolet-visible spectrophotometer, a change is made between deuterium and tungsten lamps whenpassing through 360 nm, so that the source with the highest intensity is always employed.For selected visible and ultraviolet frequencies, electric discharge (spark) lamps filled withmercury vapor (Box 18-2) or xenon gas are widely used. Light-emitting diodes provide nar-row bands of visible and near-infrared (close to visible) radiation.2
Infrared radiation in the range 4 000 to is commonly obtained from a siliconcarbide globar, heated to near 1 500 K by an electric current. The globar emits radiation withapproximately the same spectrum as a blackbody at 1 000 K (Box 20-1).
Lasers provide isolated lines of a single wavelength for many applications. A laser witha wavelength of might have a bandwidth (range of wavelengths) of to3 � 10�143 �m
200 cm�1
20-1 Lamps and Lasers: Sources of Light 427
Spectral distribution of blackbody radiation. The family of curves is calledthe Planck distribution after Max Planck, who derived the law governingblackbody radiation. Note that both axes are logarithmic.
Ultraviolet Visible Infrared
5 000 K
3 000 K
1 000 K
500 K
300 K
100 K
Wavelength ( µm)
log
Mλ
0.1 0.5 1 5 10 50 1004
6
8
10
12
14
taining Earth’s surface temperature 33 K warmer than the temper-ature of the upper atmosphere.4
Man’s activities since the dawn of the Industrial Revolutionhave increased atmospheric carbon dioxide levels through the
Atmospheric measured from in antarctic ice cores (squares)and from atmospheric measurements (circles) at Mauna Loa in Hawaii.[Antarctic data from D. M. Etheridge, L. P. Steele, R. L. Langenfelds, R. J. Francey,
J.-M. Barnola, and V. I. Morgan, in Trends: A Compendium of Data on Global Change,
Carbon Dioxide Information Analysis Center, Oak Ridge National Laboratory,
Oak Ridge, TN, 1998. Hawaii data from C. D. Keeling and T. P. Whorf, Scripps Institution
of Oceanography, http://cdiac.esd.ornl.gov/ndps/ndp001.html]
CO2CO2
Estimate of global temperature based on proxy data such as tree rings and isotope ratios in sediments and ice cores.The 1990s was the warmest decade in 2000 years. [From M. E. Mann and P. D. Jones, “Global Surface Temperatures Over the Past Two
Millennia,” Geophys. Res. Lett. 2003, 30, 1820.]
Ultraviolet radiation is harmful to the nakedeye. Do not view an ultraviolet source withoutprotection.
burning of fossil fuel. Our ability to predict how Earth willrespond to the rise in greenhouse gas concentration is primitive,but there is evidence that the temperature of the earth’s surface hasrisen in the past century.5 Will there be disastrous climaticchanges? Will there be compensating responses that lead to littletemperature change? We cannot accurately answer these ques-tions, but prudence suggests that we should avoid making suchlarge relative changes in our atmosphere.
PC
O2 (
ppm
by
volu
me)
400
350
300
2501000 1100 1200 1300 1400 1500
Year
1600 1700 1800 1900 2000
Antarctic icecore data
Mauna Loa,Hawaii
0.4
0.2
0
–0.2
–0.4
–0.6
Tem
pera
ture
cha
nge
(°C
)
2000200 400 600 800 1000
Year
1200 1400 1600 1800
Instrument data
Proxy data95% confidenceinterval
1960–1991 mean

. The bandwidth is measured where the radiant power falls to half of its maxi-mum value. The brightness of a low-power laser at its output wavelength is timesgreater than that of the sun at its brightest (yellow) wavelength. (Of course, the sun emits allwavelengths, whereas the laser emits only a narrow band. The total brightness of the sun ismuch greater than that of the laser.) The angular divergence of the laser beam from its direc-tion of travel is typically less than , a property that allows us to illuminate a small tar-get. Laser light is typically plane polarized, with the electric field oscillating in one planeperpendicular to the direction of travel (Figure 18-1). Laser light is coherent, which meansthat all waves emerging from the laser oscillate in phase with one another.
A necessary condition for lasing is population inversion, in which a higher energy statehas a greater population, n, than a lower energy state in the lasing medium. In Figure 20-4a,this condition occurs when the population of state exceeds that of . Molecules in groundstate of the lasing medium are pumped to excited state by broadband radiation from apowerful lamp or by an electric discharge. Molecules in state rapidly relax to , whichhas a relatively long lifetime. After a molecule in decays to , it rapidly relaxes to theground state, (thereby keeping the population of greater than the population of ).
A photon with an energy that exactly spans two states can be absorbed to raise a mole-cule to an excited state. Alternatively, that same photon can stimulate the excited molecule toemit a photon and return to the lower state. This is called stimulated emission. When a pho-ton emitted by a molecule falling from to strikes another molecule in , a second pho-ton can be emitted with the same phase and polarization as the incident photon. If there is apopulation inversion , one photon stimulates the emission of many photons as ittravels through the laser.
Figure 20-4b shows essential components of a laser. Pump energy directed through theside of the lasing medium creates the population inversion. One end of the laser cavity is a mir-ror that reflects all light (0% transmittance). The other end is a partially transparent mirror thatreflects most light (1% transmittance). Photons with energy that bounce back andforth between the mirrors stimulate an avalanche of new photons. The small fraction of lightpassing through the partially transparent mirror at the right is the useful output of the laser.
A helium-neon laser is a common source of red light with a wavelength of 632.8 nm andan output power of 0.1–25 mW. An electric discharge pumps helium atoms to state in Fig-ure 20-4. The excited helium transfers energy by colliding with a neon atom, raising the neonto state . The high concentration of helium and intense electric pumping create a popula-tion inversion among neon atoms.
In a laser diode, population inversion of charge carriers in a semiconductor is achievedby a very high electric field across a pn junction in gallium arsenide.6 Most laser diodes oper-ate at red and near-infrared wavelengths (680–1 550 nm).
E2
E3
E2 � E1
(n2 7 n1)
E2E1E2
E1E2E0
E1E2
E2E3
E3E0
E1E2
0.05°
1013
3 � 10�8 �m
428 CHAPTER 20 Spectrophotometers
(b)
Lasing medium
Energy
hν
Mirror0% T
Mirror1% T
Relaxation
Laseraction
Relaxation
(a)
E1
E2
Pump
E3
E0
Population inversionn2 > n1
Figure 20-4 (a) Energy-level diagram illustrating the principle of operation of a laser. (b) Basiccomponents of a laser. The population inversion is created in the lasing medium. Pump energy mightbe derived from intense lamps or an electric discharge.
Properties of laser light:monochromatic: one wavelengthextremely bright: high power at one
wavelengthcollimated: parallel rayspolarized: electric field oscillates in
one planecoherent: all waves in phase

20-2 MonochromatorsA monochromator disperses light into its component wavelengths and selects a narrow bandof wavelengths to pass on to the sample or detector. The monochromator in Figure 20-2 con-sists of entrance and exit slits, mirrors, and a grating to disperse the light. Prisms were usedinstead of gratings in older instruments.
Gratings7
A grating is a reflective or transmissive optical component with a series of closely ruledlines. When light is reflected from or transmitted through the grating, each line behaves as aseparate source of radiation. Different wavelengths of light are reflected or transmitted at dif-ferent angles from the grating (Color Plate 13). The bending of light rays by a grating iscalled diffraction. (The bending of light rays by a prism or lens, which is called refraction,is discussed in Section 20-4.)
In the grating monochromator in Figure 20-5, polychromatic radiation from the entranceslit is collimated (made into a beam of parallel rays) by a concave mirror. These rays fall ona reflection grating, whereupon different wavelengths are diffracted at different angles. Thelight strikes a second concave mirror, which focuses each wavelength at a different point onthe focal plane. The orientation of the reflection grating directs only one narrow band ofwavelengths to the exit slit of the monochromator. Rotation of the grating allows differentwavelengths to pass through the exit slit.
20-2 Monochromators 429
Concavemirrors
Entranceslit
Reflectiongrating
Exitslit
Focalplane
λ2 λ1
Figure 20-5 Czerny-Turner grating monochromator.
β
Incident light
Blaze angle
Emerging light
Grating
Facetnormal
α
d
b aθ
θ φ
φ
Figure 20-6 Principle of a reflection grating.
Grating: optical element with closely spacedlines
Diffraction: bending of light by a gratingRefraction: bending of light by a lens or prism
Polychromatic: many wavelengthsMonochromatic: one wavelength
The reflection grating in Figure 20-6 is ruled with a series of closely spaced, parallelgrooves with a repeat distance d. The grating is coated with aluminum to make it reflective.A thin protective layer of silica on top of the aluminum protects the metal surfacefrom oxidizing, which would reduce its reflectivity. When light is reflected from the grating,each groove behaves as a source of radiation. When adjacent light rays are in phase, they
(SiO2)

reinforce one another. When they are not in phase, they partially or completely cancel oneanother (Figure 20-7).
Consider the incident and emerging light rays shown in Figure 20-6. Fully constructiveinterference occurs when the difference in length of the two paths is an integral multiple ofthe wavelength of light. The difference in pathlength is the distance in Figure 20-6.Constructive interference occurs if
(20-1)
where the diffraction order The interference maximum for whichis called first-order diffraction. When , we have second-order diffraction,
and so on.In Figure 20-6, the incident angle is defined to be positive. The diffraction angle
goes in the opposite direction from , so, by convention, is negative. It is possible for tobe on the same side of the normal as , in which case would be positive. In Figure 20-6,
and (because is negative and is negative). Substitutinginto Equation 20-1 gives the condition for constructive interference:
Grating equation: (20-2)
where d is the distance between adjacent grooves. For each incident angle, , there is a seriesof reflection angles, , at which a given wavelength will produce maximum constructiveinterference (Color Plate 19).
Resolution, Dispersion, and Efficiency of a GratingResolution measures the ability to separate two closely spaced peaks. The greater the resolu-tion, the smaller is the difference between two wavelengths that can be distinguishedfrom each other. The precise definition (which is beyond the scope of this discussion) meansthat the valley between the two peaks is about three-fourths of the height of the peaks whenthey are just barely resolved. The resolution of a grating is given by
Resolution of grating: (20-3)
where is wavelength, n is the diffraction order in Equation 20-2, and N is the number ofgrooves of the grating that are illuminated. The more grooves in a grating, the better the res-olution between closely spaced wavelengths. Equation 20-3 tells us that, if we desire a first-order resolution of , there must be grooves in the grating. If the grating has a ruledlength of 10 cm, we require .
Dispersion measures the ability to separate wavelengths differing by through thedifference in angle, . For the grating in Figure 20-6, the dispersion is
Dispersion of grating: (20-4)��
���
n
d cos �
�� (radians)��
103 grooves/cm104104
�
�
��� nN
(��)
��
n� � d(sin � � sin �)
sin ��b � �d sin �a � d sin ���
�����
n � �2n � �1n � �1, �2, �3, �4, . . .
n� � a � b
a � b
430 CHAPTER 20 Spectrophotometers
Constructiveinterference
Waves in phase
(a ) Result
Waves partially out of phase
(b ) Result
Waves completely out of phase
Destructiveinterference
(c ) Result
Figure 20-7 Interference of adjacentwaves that are (a) , (b) , and (c) outof phase.
180°90°0°
Resolution: ability to distinguish two closelyspaced peaks
Dispersion: ability to produce angularseparation of adjacent wavelengths

where n is the diffraction order. Dispersion and resolution both increase with decreasinggroove spacing. Equation 20-4 tells us that a grating with provides a resolu-tion of 0.102 radians per micrometer of wavelength if and . Wave-lengths differing by would be separated by an angle of .
Decreasing the monochromator exit slit width decreases the bandwidth of radiation anddecreases the energy reaching the detector. Thus, resolution of closely spaced absorptionbands is achieved at the expense of decreased signal-to-noise ratio. For quantitative analysis,a monochromator bandwidth that is of the width of the absorption band (measured athalf the peak height) is reasonable.
The relative efficiency of a grating (which is typically 45–80%) is defined as
(20-5)
where (grating) is the irradiance at a particular wavelength diffracted in the order of inter-est, n, and (mirror) is the irradiance at the same wavelength that would be reflected by amirror with the same coating as the grating. Efficiency is partially controlled by the blazeangle at which the grooves are cut in Figure 20-6. To direct a certain wavelength into the dif-fraction order of interest, the blaze angle is chosen such that in Figure 20-6, becausethis condition gives maximum reflection. Each grating is optimized for a limited range ofwavelengths, so a spectrophotometer may require several different gratings to scan throughits entire spectral range.
Choosing the Monochromator BandwidthThe wider the exit slit in Figure 20-5, the wider the band of wavelengths selected by themonochromator. We usually measure slit width in terms of the bandwidth of radiationselected by the slit. Instead of saying that a slit is 0.3 mm wide, we might say that the band-width getting through the slit is 1.0 nm.
A wide slit increases the energy reaching the detector and gives a high signal-to-noiseratio, leading to good precision in measuring absorbance. However, Figure 20-8 shows that,if the bandwidth is large relative to the width of the peak being measured, peak shape is dis-torted. We choose a bandwidth as wide as the spectrum permits to allow the most possiblelight to reach the detector. A monochromator bandwidth that is 1/5 as wide as the absorptionpeak generally gives acceptably small distortion of the peak shape.8
� � �
E�
En�
Relative efficiency �En
�(grating)
E�(mirror)
�1/5
5.8°1 �m� � 10°n � 1(5.8°)
103 grooves/cm
20-2 Monochromators 431
Abs
orba
nce
606 608 610 612 614
5
4
3
2
1
Monochromatorbandwidth
2.0 nm
1.0 nm
0.5 nm
0.3 nm
0.1 nm
λ max (good choice ofwavelength)
λ ≠ λmax (poor choice ofwavelength)
Wavelength (nm)
Figure 20-8 Increasing monochromatorbandwidth broadens the bands anddecreases the apparent absorbance of ina crystal of yttrium aluminum garnet (a lasermaterial). [Courtesy M. D. Seltzer, Michelson
Laboratory, China Lake, CA.]
Pr3�
Trade-off between resolution and signal: Thenarrower the exit slit, the greater the resolutionand the noisier the signal.
For a flat reflective surface, the angle ofincidence ( in Figure 20-6) is equal to theangle of reflection ( ).�
�
Monochromator bandwidth should be aslarge as possible, but small compared with thewidth of the peak being measured.
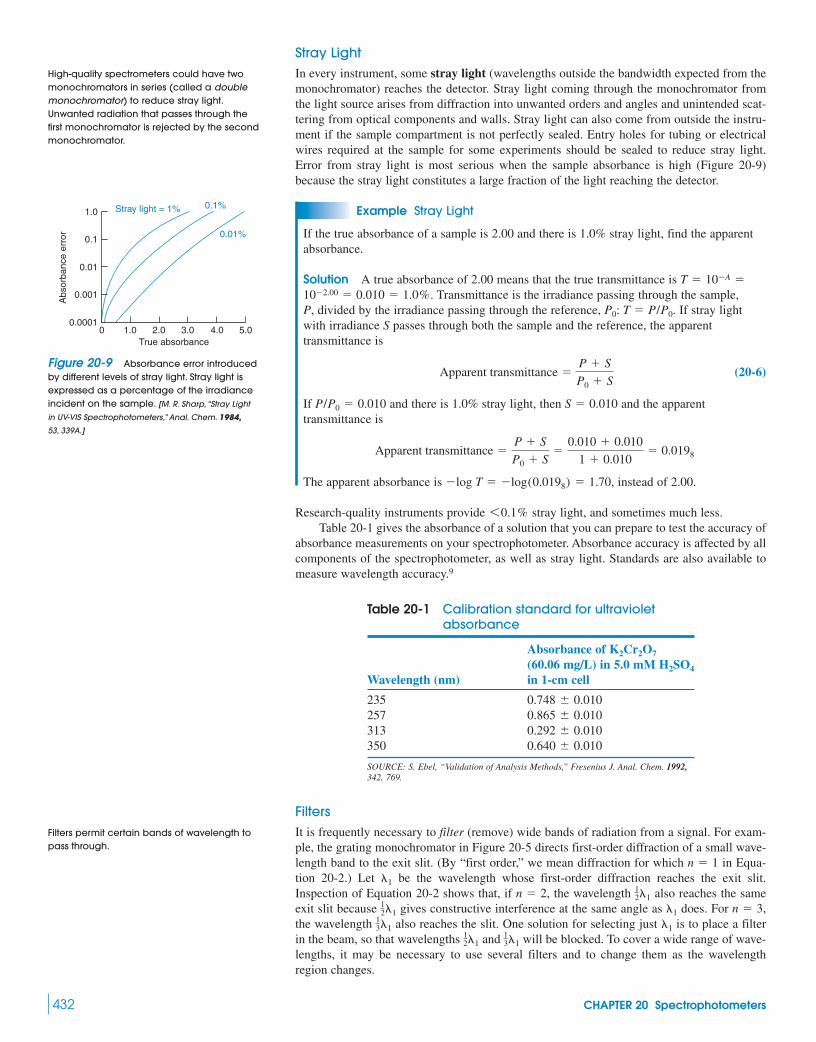
Stray LightIn every instrument, some stray light (wavelengths outside the bandwidth expected from themonochromator) reaches the detector. Stray light coming through the monochromator fromthe light source arises from diffraction into unwanted orders and angles and unintended scat-tering from optical components and walls. Stray light can also come from outside the instru-ment if the sample compartment is not perfectly sealed. Entry holes for tubing or electricalwires required at the sample for some experiments should be sealed to reduce stray light.Error from stray light is most serious when the sample absorbance is high (Figure 20-9)because the stray light constitutes a large fraction of the light reaching the detector.
Example Stray Light
If the true absorbance of a sample is 2.00 and there is 1.0% stray light, find the apparentabsorbance.
Solution A true absorbance of 2.00 means that the true transmittance is . Transmittance is the irradiance passing through the sample,
P, divided by the irradiance passing through the reference, . If stray lightwith irradiance S passes through both the sample and the reference, the apparenttransmittance is
(20-6)
If and there is 1.0% stray light, then and the apparenttransmittance is
The apparent absorbance is , instead of 2.00.
Research-quality instruments provide stray light, and sometimes much less.Table 20-1 gives the absorbance of a solution that you can prepare to test the accuracy of
absorbance measurements on your spectrophotometer. Absorbance accuracy is affected by allcomponents of the spectrophotometer, as well as stray light. Standards are also available tomeasure wavelength accuracy.9
6 0.1%
�log T � �log(0.0198) � 1.70
Apparent transmittance �P � S
P0 � S�
0.010 � 0.010
1 � 0.010� 0.0198
S � 0.010P/P0 � 0.010
Apparent transmittance �P � S
P0 � S
P0: T � P/P0
10�2.00 � 0.010 � 1.0%T � 10�A �
432 CHAPTER 20 Spectrophotometers
Stray light = 1% 0.1%
0.01%
0 1.0 2.0 3.0 4.0 5.0
0.001
0.01
0.1
1.0
Abs
orba
nce
erro
r
True absorbance
0.0001
Table 20-1 Calibration standard for ultravioletabsorbance
Absorbance of K2Cr2O7
(60.06 mg/L) in 5.0 mM H2SO4
Wavelength (nm) in 1-cm cell
235257313350
SOURCE: S. Ebel, “Validation of Analysis Methods,” Fresenius J. Anal. Chem. 1992,342, 769.
0.640 � 0.0100.292 � 0.0100.865 � 0.0100.748 � 0.010
Figure 20-9 Absorbance error introducedby different levels of stray light. Stray light isexpressed as a percentage of the irradianceincident on the sample. [M. R. Sharp, “Stray Light
in UV-VIS Spectrophotometers,” Anal. Chem. 1984,
53, 339A.]
High-quality spectrometers could have twomonochromators in series (called a doublemonochromator) to reduce stray light.Unwanted radiation that passes through thefirst monochromator is rejected by the secondmonochromator.
Filters permit certain bands of wavelength topass through.
FiltersIt is frequently necessary to filter (remove) wide bands of radiation from a signal. For exam-ple, the grating monochromator in Figure 20-5 directs first-order diffraction of a small wave-length band to the exit slit. (By “first order,” we mean diffraction for which in Equa-tion 20-2.) Let be the wavelength whose first-order diffraction reaches the exit slit.Inspection of Equation 20-2 shows that, if , the wavelength also reaches the sameexit slit because gives constructive interference at the same angle as does. For the wavelength also reaches the slit. One solution for selecting just is to place a filterin the beam, so that wavelengths and will be blocked. To cover a wide range of wave-lengths, it may be necessary to use several filters and to change them as the wavelengthregion changes.
13�1
12�1
�113�1
n � 3,�112�1
12�1n � 2
�1
n � 1
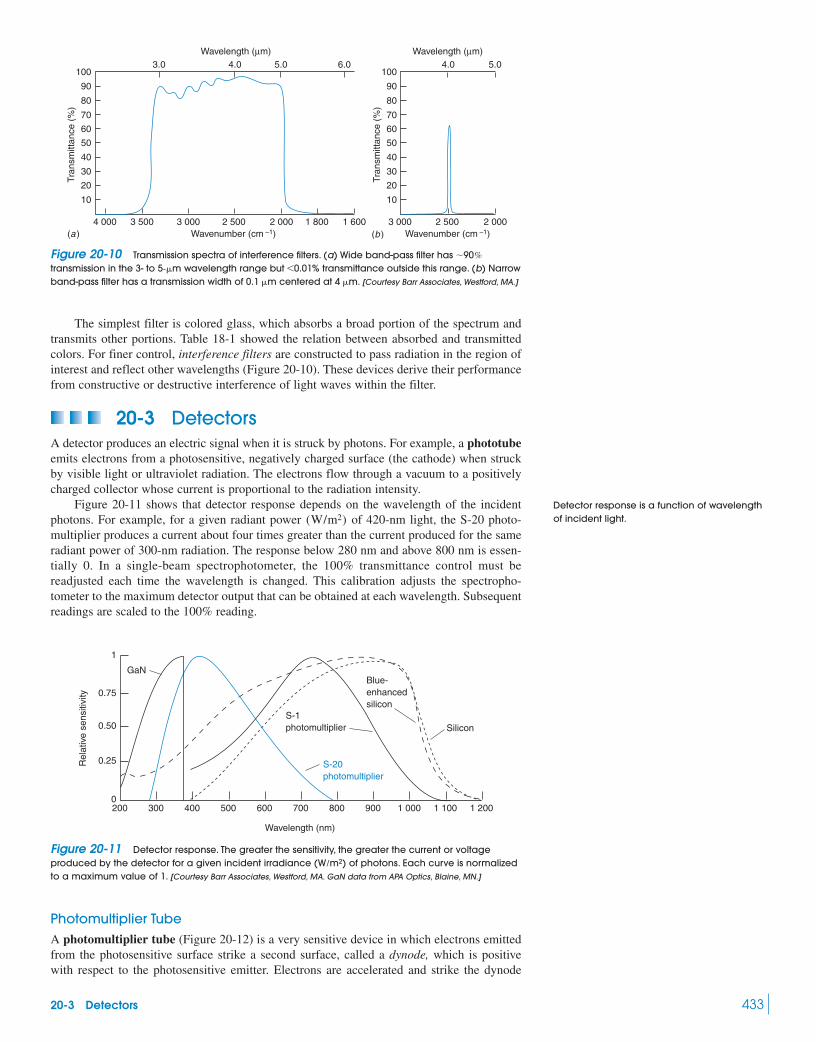
The simplest filter is colored glass, which absorbs a broad portion of the spectrum andtransmits other portions. Table 18-1 showed the relation between absorbed and transmittedcolors. For finer control, interference filters are constructed to pass radiation in the region ofinterest and reflect other wavelengths (Figure 20-10). These devices derive their performancefrom constructive or destructive interference of light waves within the filter.
20-3 DetectorsA detector produces an electric signal when it is struck by photons. For example, a phototubeemits electrons from a photosensitive, negatively charged surface (the cathode) when struckby visible light or ultraviolet radiation. The electrons flow through a vacuum to a positivelycharged collector whose current is proportional to the radiation intensity.
Figure 20-11 shows that detector response depends on the wavelength of the incidentphotons. For example, for a given radiant power of 420-nm light, the S-20 photo-multiplier produces a current about four times greater than the current produced for the sameradiant power of 300-nm radiation. The response below 280 nm and above 800 nm is essen-tially 0. In a single-beam spectrophotometer, the 100% transmittance control must bereadjusted each time the wavelength is changed. This calibration adjusts the spectropho-tometer to the maximum detector output that can be obtained at each wavelength. Subsequentreadings are scaled to the 100% reading.
(W/m2)
20-3 Detectors 433
3.0 4.0 5.0 6.0
4 000 3 500 3 000 2 500 2 000 1 800 1 600
100
90
80
70
60
50
40
30
20
10
Tran
smitt
ance
(%
)
100
90
80
70
60
50
40
30
20
10
Tran
smitt
ance
(%
)
Wavelength (µm)4.0 5.0
Wavelength (µm)
Wavenumber (cm –1) Wavenumber (cm –1)3 000 2 500 2 000
(a ) (b )
1
0.75
0.50
0.25
0200 300 400 500 600 700 800 900 1 000 1 100 1 200
Rel
ativ
e se
nsiti
vity
Wavelength (nm)
S-1photomultiplier
S-20photomultiplier
Blue-enhancedsilicon
Silicon
GaN
Figure 20-11 Detector response. The greater the sensitivity, the greater the current or voltageproduced by the detector for a given incident irradiance of photons. Each curve is normalizedto a maximum value of 1. [Courtesy Barr Associates, Westford, MA. GaN data from APA Optics, Blaine, MN.]
(W/m2)
Figure 20-10 Transmission spectra of interference filters. (a) Wide band-pass filter has transmission in the 3- to wavelength range but % transmittance outside this range. (b) Narrowband-pass filter has a transmission width of centered at . [Courtesy Barr Associates, Westford, MA.]4 �m0.1 �m
60.015-�m�90%
Photomultiplier TubeA photomultiplier tube (Figure 20-12) is a very sensitive device in which electrons emittedfrom the photosensitive surface strike a second surface, called a dynode, which is positivewith respect to the photosensitive emitter. Electrons are accelerated and strike the dynode
Detector response is a function of wavelengthof incident light.

with more than their original kinetic energy. Each energetic electron knocks more than oneelectron from the dynode. These new electrons are accelerated toward a second dynode,which is more positive than the first dynode. Upon striking the second dynode, even moreelectrons are knocked off and accelerated toward a third dynode. This process is repeatedseveral times, so more than electrons are finally collected for each photon striking thefirst surface. Extremely low light intensities are translated into measurable electric signals.As sensitive as a photomultiplier is, your eye is even more sensitive (Box 20-2).
Photodiode ArrayConventional spectrophotometers scan through a spectrum one wavelength at a time. Newerinstruments record the entire spectrum at once in a fraction of a second. One application ofrapid scanning is chromatography, in which the full spectrum of a compound is recorded inseconds as it emerges from the chromatography column.
At the heart of rapid spectroscopy is the photodiode array shown in Figure 20-13 (orthe charge coupled device described later). Rows of p-type silicon on a substrate (the under-lying body) of n-type silicon create a series of pn junction diodes. A reverse bias is applied toeach diode, drawing electrons and holes away from the junction. There is a depletion regionat each junction, in which there are few electrons and holes. The junction acts as a capacitor,with charge stored on either side of the depletion region. At the beginning of the measure-ment cycle, each diode is fully charged.
When radiation strikes the semiconductor, free electrons and holes are created andmigrate to regions of opposite charge, partially discharging the capacitor. The more radiationthat strikes each diode, the less charge remains at the end of the measurement. The longer thearray is irradiated between readings, the more each capacitor is discharged. The state of eachcapacitor is determined at the end of the cycle by measuring the current needed to rechargethe capacitor.
106
434 CHAPTER 20 Spectrophotometers
Grill
Incidentradiation (h )
Transparentwindow
Photoelectronsemitted fromcathode
Many electrons emittedfrom dynode 1 for
each electronstriking dynode 1
Dynode
Anode, > 106
electrons foreach photon
Photoemissivecathode
1
2
3
45
6
7
8
9
Figure 20-12 Diagram of a photomultipliertube with nine dynodes. Amplification of thesignal occurs at each dynode, which isapproximately 90 volts more positive than theprevious dynode.
n-type Si
Light
p -type SiSiO2 protective layer
Depletionregion
(a ) (b )
25 µm
Figure 20-13 (a) Schematic cross-sectional view of photodiode array. (b) Photograph of arraywith 1 024 elements, each wide and 2.5 mm high. The central black rectangle is thephotosensitive area. The entire chip is 5 cm in length. [Courtesy Oriel Corporation, Stratford, CT.]
25 �m
For a refresher on semiconductors, see Section 15-8.

In a dispersive spectrometer (Figure 20-1), only one narrow band of wavelengthsreaches the detector at any time. In a photodiode array spectrophotometer (Figure 20-14), allwavelengths are recorded simultaneously, allowing more rapid acquisition of the spectrum orhigher signal-to-noise ratio, or some combination of both. In the photodiode array spec-trophotometer in Figure 20-14, white light (with all wavelengths) passes through the sample.The light then enters a polychromator, which disperses the light into its component wave-lengths and directs the light at the diode array. Each diode receives a different wavelength,and all wavelengths are measured simultaneously. Resolution depends on how closely spacedthe diodes are and how much dispersion is produced by the polychromator. The spectrum inFigure 21-26 (in the next chapter) was produced with a photodiode array detector.
Photodiode arrays allow faster spectral acquisition (�1 s) than dispersive instruments(which require several minutes). Photodiode array instruments have almost no moving parts,so they are more rugged than dispersive instruments that must rotate the grating and change
20-3 Detectors 435
Box 20-2 The Most Important Photoreceptor
The retina at the back of your eye contains photosensitive cells,called rods and cones, that are sensitive to levels of light varying overseven orders of magnitude. Light impinging on these cells is trans-lated into nerve impulses that are transmitted by the optic nerve tothe brain. Rod cells detect the dimmest light but cannot distinguishcolors. Cone cells operate in bright light and give us color vision.
A stack of about 1 000 disks in each rod cell contains the light-sensing protein rhodopsin,10 in which the chromophore 11-cis-retinal(from vitamin A) is attached to the protein opsin. When light isabsorbed by rhodopsin, a series of rapid transformations releases all-trans-retinal. At this stage, the pigment is bleached (loses all color)and cannot respond to more light until retinal isomerizes back to the11-cis form and recombines with the protein.
In the dark, there is a continuous flow of ions persecond out of the rod cell’s inner segment, through the adjoiningmedium, and into the cell’s outer segment. An energy-dependentprocess using adenosine triphosphate (ATP) and oxygen pumps
out of the cell. Another process involving a molecule calledcyclic GMP keeps the gates of the outer segment open for ions toflow back into the cell. When light is absorbed and rhodopsin isbleached, a series of reactions leads to destruction of cyclic GMPand shutdown of the channels through which flows into thecell. A single photon reduces the ion current by 3%—correspondingto a decreased current of ions per second. This amplifica-tion is greater than that of a photomultiplier tube, which is one ofthe most sensitive man-made photodetectors. The ion currentreturns to its dark value as the protein and retinal recombine andcyclic GMP is restored to its initial concentration.
3 � 107
Na�
Na�
109 Na�
Disks
Plasmamembrane
Outersegment
Cytoplasm
Na+
Nucleus
Innersegment
Synapse
Na+
Rod cell
cis double bond
NH—Protein
Chromophore
Rhodopsin
+
Light
Opsin+
O
All-trans-retinal
Bleached products
Grating polychromator
Sample
Lightsource
Ellipticalmirror
Photodiode arraydetector
Mirror
Figure 20-14 Schematic design ofphotodiode array spectrophotometer.
A photodiode array spectrophotometermeasures all wavelengths at once, givingfaster acquisition and higher signal-to-noiseratio.

filters to scan through the spectrum. The resolution of �0.1 nm attainable with a dispersiveinstrument and the wavelength accuracy are better than those of a photodiode array (�0.5–1.5 nm resolution). Stray light is less in a dispersive instrument than in a photodiodeinstrument, giving the dispersive instrument a greater dynamic range for measuring highabsorbance. Stray light in a photodiode array instrument is not substantially increased whenthe sample compartment is open. In a dispersive instrument, the compartment must be tightlyclosed.
Charge Coupled Device11
A charge coupled device is an extremely sensitive detector that stores photo-generatedcharge in a two-dimensional array. The device in Figure 20-15a is constructed of p-doped Sion an n-doped substrate. The structure is capped with an insulating layer of , on top ofwhich is placed a pattern of conducting Si electrodes. When light is absorbed in the p-dopedregion, an electron is introduced into the conduction band and a hole is left in the valenceband. The electron is attracted to the region beneath the positive electrode, where it is stored.The hole migrates to the n-doped substrate, where it combines with an electron. Each elec-trode can store electrons before electrons spill out into adjacent elements.
The charge coupled device is a two-dimensional array, as shown in Figure 20-15b. Afterthe desired observation time, electrons stored in each pixel (picture element) of the top roware moved into the serial register at the top and then moved, one pixel at a time, to the topright position, where the charge is read out. Then the next row is moved up and read out, andthe sequence is repeated until the entire array has been read. The transfer of stored charges iscarried out by an array of electrodes considerably more complex than we have indicated inFigure 20-15a. Charge transfer from one pixel to the next is extremely efficient, with a lossof approximately five of every million electrons.
The minimum detectable signal for visible light in Table 20-2 is 17 photons/s. The sen-sitivity of the charge coupled device is derived from its high quantum efficiency (electronsgenerated per incident photon), low background electrical noise (thermally generated free
105
SiO2
436 CHAPTER 20 Spectrophotometers
– – –
576rows
384 columns
Serial register
Amplifier
Serial shiftdirection
Imagetransferdirection
(b )
– +
+ 10 volt
Si electrode
LightSiO2insulator
Electronsstoredbeneathpositiveelectrode
Electronand holegeneratedby photonp-doped Si
n-doped Si substrate
(a )
Table 20-2 Minimum detectable signal (photons/s/detector element) of ultraviolet/visible detectors
Photodiode array Photomultiplier tube Charge coupled deviceSignal acquisition time(s) Ultraviolet Visible Ultraviolet Visible Ultraviolet Visible
1 6 000 3 300 30 122 31 1710 671 363 6.3 26 3.1 1.7
100 112 62 1.8 7.3 0.3 0.2
SOURCE: R. B. Bilhorn, J. V. Sweedler, P. M. Epperson, and M. B. Denton, “Charge Transfer Device Detectors for Analytical Optical Spectroscopy,” Appl. Spectros. 1987, 41, 1114.
Figure 20-15 Schematic representation of a charge coupled device. (a) Cross-sectional view,indicating charge generation and storage in each pixel. (b) Top view, showing two-dimensional natureof an array. An actual array is about the size of a postage stamp.
Digital cameras use charge coupled devicesto record the image.
Electrons from adjacent pixels can becombined to create a single, larger pictureelement. This process, called binning,increases the sensitivity of the charge coupleddevice at the expense of resolution.
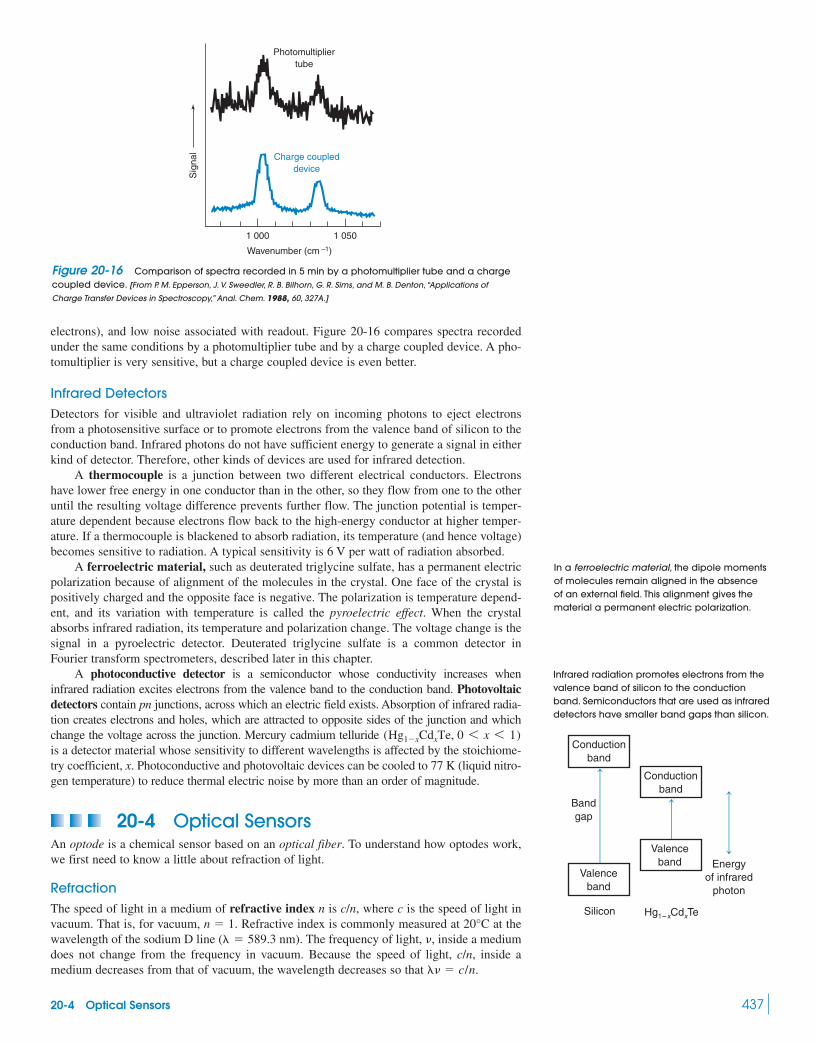
20-4 Optical Sensors 437
electrons), and low noise associated with readout. Figure 20-16 compares spectra recordedunder the same conditions by a photomultiplier tube and by a charge coupled device. A pho-tomultiplier is very sensitive, but a charge coupled device is even better.
Infrared DetectorsDetectors for visible and ultraviolet radiation rely on incoming photons to eject electronsfrom a photosensitive surface or to promote electrons from the valence band of silicon to theconduction band. Infrared photons do not have sufficient energy to generate a signal in eitherkind of detector. Therefore, other kinds of devices are used for infrared detection.
A thermocouple is a junction between two different electrical conductors. Electronshave lower free energy in one conductor than in the other, so they flow from one to the otheruntil the resulting voltage difference prevents further flow. The junction potential is temper-ature dependent because electrons flow back to the high-energy conductor at higher temper-ature. If a thermocouple is blackened to absorb radiation, its temperature (and hence voltage)becomes sensitive to radiation. A typical sensitivity is 6 V per watt of radiation absorbed.
A ferroelectric material, such as deuterated triglycine sulfate, has a permanent electricpolarization because of alignment of the molecules in the crystal. One face of the crystal ispositively charged and the opposite face is negative. The polarization is temperature depend-ent, and its variation with temperature is called the pyroelectric effect. When the crystalabsorbs infrared radiation, its temperature and polarization change. The voltage change is thesignal in a pyroelectric detector. Deuterated triglycine sulfate is a common detector inFourier transform spectrometers, described later in this chapter.
A photoconductive detector is a semiconductor whose conductivity increases wheninfrared radiation excites electrons from the valence band to the conduction band. Photovoltaicdetectors contain pn junctions, across which an electric field exists. Absorption of infrared radia-tion creates electrons and holes, which are attracted to opposite sides of the junction and whichchange the voltage across the junction. Mercury cadmium telluride is a detector material whose sensitivity to different wavelengths is affected by the stoichiome-try coefficient, x. Photoconductive and photovoltaic devices can be cooled to 77 K (liquid nitro-gen temperature) to reduce thermal electric noise by more than an order of magnitude.
20-4 Optical SensorsAn optode is a chemical sensor based on an optical fiber. To understand how optodes work,we first need to know a little about refraction of light.
RefractionThe speed of light in a medium of refractive index n is c/n, where c is the speed of light invacuum. That is, for vacuum, . Refractive index is commonly measured at at thewavelength of the sodium D line ( ). The frequency of light, , inside a mediumdoes not change from the frequency in vacuum. Because the speed of light, c/n, inside amedium decreases from that of vacuum, the wavelength decreases so that .� � c/n
� � 589.3 nm20°Cn � 1
(Hg1�xCdxTe, 0 6 x 6 1)
Sig
nal
Photomultipliertube
Charge coupleddevice
Wavenumber (cm –1)
1 000 1 050
Figure 20-16 Comparison of spectra recorded in 5 min by a photomultiplier tube and a chargecoupled device. [From P. M. Epperson, J. V. Sweedler, R. B. Bilhorn, G. R. Sims, and M. B. Denton, “Applications of
Charge Transfer Devices in Spectroscopy,” Anal. Chem. 1988, 60, 327A.]
In a ferroelectric material, the dipole momentsof molecules remain aligned in the absenceof an external field. This alignment gives thematerial a permanent electric polarization.
Infrared radiation promotes electrons from thevalence band of silicon to the conductionband. Semiconductors that are used as infrareddetectors have smaller band gaps than silicon.
Conductionband
Conductionband
Valenceband
Valenceband
Energyof infrared
photon
Bandgap
Silicon Hg1�xCdxTe

When light is reflected, the angle of reflection is equal to the angle of incidence (Fig-ure 20-17). When light passes from one medium into another, its path is bent (Color Plate 20).This bending, called refraction, is described by Snell’s law:
Snell’s law: (20-7)
where and are the refractive indexes of the two media and and are angles definedin Figure 20-17.
Example Refraction of Light by Water
Visible light travels from air (medium 1) into water (medium 2) at a angle ( in Figure 20-17). At what angle, , does the light ray pass through the water?
Solution The refractive index for air is close to 1, and for water, 1.33. From Snell’s law,
What is if the incident ray is perpendicular to the surface (that is, )?
A perpendicular ray is not refracted.
Optical FibersOptical fibers carry light by total internal reflection. Optical fibers are replacing electricwires for communication because fibers are immune to electrical noise, transmit data at ahigher rate, and can handle more signals. Optical fibers can bring an optical signal frominside a chemical reactor out to a spectrophotometer for process monitoring.
A flexible optical fiber has a high-refractive-index, transparent core enclosed in a lower-refractive-index, transparent cladding (Figure 20-18a). The cladding is enclosed in a protec-tive plastic jacket. The core and the coating can be made from glass or polymer.
Consider the light ray striking the wall of the core in Figure 20-18b at the angle of inci-dence . Part of the ray is reflected inside the core, and part might be transmitted into thecladding at the angle of refraction, (Color Plate 21). If the index of refraction of the core is
and the index of the cladding is , Snell’s law (Equation 20-7) tells us that
(20-8)
If is greater than 1, no light is transmitted into the cladding because can-not be greater than 1. In such a case, exceeds the critical angle for total internal reflection.If , there is a range of angles �i in which essentially all light is reflected at the wallsof the core, and a negligible amount enters the cladding. All rays entering one end of the fiberwithin a certain cone of acceptance emerge from the other end of the fiber with little loss.
n1/n2 7 1�i
sin �rsin �i(n1/n2)
n1 sin �i � n2 sin �r 1 sin �r �n1
n2 sin �i
n2n1
�r
�i
(1.00)(sin 0°) � (1.33)(sin �2) 1 �2 � 0°
�1 � 0°�2
(1.00)(sin 45°) � (1.33)(sin �2) 1 �2 � 32°
�2
�145°
�2�1n2n1
n1 sin �1 � n2 sin �2
438 CHAPTER 20 Spectrophotometers
Reflectedray
Incidentray
Refractedray
θ1
θ2
θ1
Refractiveindex = n2
Refractiveindex = n1
Figure 20-17 Illustration of Snell’s law:. When light passes from air
into any medium, the greater the refractiveindex of the medium, the smaller is .�2
n1 sin �1 � n2 sin �2
Refractive index at sodium D line:
vacuum 1air (0�, 1 bar) 1.000 29water 1.33fused silica 1.46benzene 1.50bromine 1.66iodine 3.34
Cladding
Core
Jacket
(a ) (b)
Cladding (n2)
n1Corei
rCone ofacceptance
θ
θ
OptodesWe can create optical sensors for specific analytes by placing a chemically sensitive layer atthe end of the fiber. An optical fiber sensor is called an optode (or optrode), derived from thewords “optical” and “electrode.” Optodes have been designed to respond to diverse analytessuch as sulfites in food, nitric oxide in cells, and explosives in groundwater.12
The end of the optode in Color Plate 22 is coated with a Ru(II) complex in a layerof polymer. Luminescence from Ru(II) is quenched (decreased) by , as discussed inSection 19-6. The optode is inserted into a sample as small as on the100 fL (100 � 10�15 L)
O2
O2
Figure 20-18 (a) Optical fiberconstruction and (b) principle ofoperation. Any light ray entering withinthe cone of acceptance will be totallyreflected at the wall of the fiber.
Light traveling from a region of high refractiveindex (n1) to a region of low refractive index(n2) is totally reflected if the angle of incidenceexceeds the critical angle given by
.sin �critical � n2/n1

20-4 Optical Sensors 439
stage of a microscope. The degree of quenching tells us the concentration of in the sam-ple. The detection limit is 10 amol of . By incorporating the enzyme glucose oxidase(Equation 17-10), the optode becomes a glucose sensor with a detection limit of 1 fmol ofglucose.13 An optode for measuring biochemical oxygen demand (Box 16-1) uses yeast cellsimmobilized in a membrane to consume and Ru(II) luminescence for measuring .14
The upper part of the photo in Figure 20-19 shows the end of a 0.5-mm-diameter bundleof optical fibers etched briefly with HF. The glass core dissolves more rapidly thanthe cladding, leaving a small well at the end of each fiber. A droplet of liquid containing
microspheres functionalized with synthetic single strands of DNA is evaporated on thetip of the fiber, leaving microspheres in many of the wells. Excess microspheres not con-tained in wells are washed away. The synthetic DNA is complementary to desired analyticaltarget DNA, such as part of the gene associated with the disease cystic fibrosis.
The fiber with its microspheres is incubated with known fluorescence-labeled target strandsof DNA. Figure 20-19 shows that 10 of the 6 000 wells become fluorescent, indicating that theycontain microspheres that bind the known target. The image of the fluorescent wells is made witha camera and optics at the far end of the fiber bundle. The target is removed by washing underconditions that dissociate double strands of DNA. The fiber bundle is then incubated withunknown fluorescence-labeled DNA. A new image is then recorded. If the unknown containedthe target sequence, the same wells will light up. Luminescence intensity is a measure of the con-centration of target DNA. Different wells can contain different synthetic DNA strands to detectdifferent targets simultaneously. The detection limit is 600 molecules of DNA. A variant of thisapproach can study the biochemistry of individual live cells in each well.15
Attenuated Total ReflectanceFigure 20-18 shows total internal reflection of a light ray bouncing back and forth as it trav-els along an optical fiber. The same behavior is observed in a flat layer of material whoserefractive index, , is greater than the refractive index of the surroundings, . A planar layerin which light is totally reflected is called a waveguide. A chemical sensor can be fabricatedby placing a chemically sensitive layer on a waveguide.16
When the light wave in Figure 20-18 strikes the wall, the ray is totally reflected if exceeds the critical angle given by . Even though light is totally reflected, theelectric field of the light penetrates the cladding to some extent. Figure 20-20 shows that, whenthe oscillating electric field encounters the reflective interface, the field dies out exponentiallyinside the cladding. The part of the light that penetrates the wall of an optical fiber or waveguideis called an evanescent wave.
sin �critical � n2/n1
�i
n2n1
3-�m
�6 000
O2O2
O2
O2
Fluorescence-labeledtarget DNA
Microsphere withshort single strandsof synthetic DNA
Complementary targetDNA hybridized toDNA on microsphere
Ele
ctric
fiel
d
Waveguide
Totalreflectionat thisinterface
Cladding
Exponential decay ofevanescent wave
Sinusoidal oscillation of electric field
dp
( )E01e
E0
Figure 20-20 Behavior of anelectromagnetic wave when it strikes a surfacefrom which it is totally reflected. The fieldpenetrates the reflective barrier and dies outexponentially.
Figure 20-19 Fiber-optic sensor fordetection of specific DNA sequences. Upperhalf shows circular wells in etched tip ofbundle. Fluorescence image in lower halfidentifies wells to which fluorescent target DNAhas bound. [From J. R. Epstein, M. Lee, and D. R. Walt,
“High-Density Fiber-Optic Genosensor Microsphere
Array Capable of Zeptomole Detection Limits,”
Anal. Chem. 2002, 74, 1836. Photo courtesy D. R. Walt,
Tufts University.]
Question How many molecules are in10 amol?
Evanescent means “vanishing” or “fleeting.”Light “escapes” from the waveguide, but itvanishes over a short distance.

The electric field, E, of the evanescent wave in Figure 20-20 is given by
(20-9)
where is the magnitude of the field at the reflective interface, x is the distance into thecladding, and is the wavelength of light in a vacuum. The penetration depth, , is the dis-tance at which the evanescent field dies down to 1/e of its value at the interface. Consider awaveguide with and , giving a critical angle of . If light with awavelength of 590 nm has a angle of incidence, then the penetration depth is 140 nm.This depth is great enough to allow the light to interact with many layers of large molecules,such as proteins, whose dimensions are on the order of 10 nm.
Figure 20-21a shows a sensor based on attenuated total reflectance of light passingthrough a coated waveguide. “Attenuated” means “decreased.” When light passes throughthe waveguide, it is totally reflected at both surfaces. On the upper surface is a thin layer of alow-refractive-index cation-exchange membrane impregnated with the metal-binding ligandPAN. When test fluid containing is circulated over the membrane, isformed in the membrane. Figure 20-21b shows that the absorbance of increasesuntil the membrane is saturated with above 0.5 mM.
Surface Plasmon Resonance17
Conduction electrons in a metal are nearly free to move within the metal in response to anapplied electric field. A surface plasma wave, also called a surface plasmon, is an electro-magnetic wave that propagates along the boundary between a metal and a dielectric (an elec-trical insulator). The electromagnetic field decreases exponentially into both layers but isconcentrated in the dielectric layer.
Figure 20-22a shows essentials of one common surface plasmon resonance measurement.Monochromatic light whose electric field oscillates in the plane of the page is directed into aprism whose bottom face is coated with a thin layer of gold. The bottom surface ofthe gold is coated with a chemical layer that selectively binds an analyte of inter-(�2–20 nm)
(�50 nm)
Cu2�
Cu(PAN)�
Cu(PAN)�Cu2�
70°58.5°n2 � 1.45n1 � 1.70
dp�E0
E � E0e�x/dp adp ��/n1
22sin2�i � (n2/n1)2b
440 CHAPTER 20 Spectrophotometers
(a ) (b )
Cu2+
analyte
Cation-exchangefilm containingligand PAN
Intensity of lightdecreases each timeit is reflected fromion-exchange layer
iθ
550-nmlight in
Waveguide(refractiveindex n1)
Test fluid
Couplingprism
00.0
0.1 0.2 0.3 0.4 0.5
0.1
0.2
0.3
0.4
Abs
orba
nce
at 5
50 n
m
[Cu2�(aq)]
Position-sensitivedetector
Polarizedmonochromaticlight
Au (~50 nm thick)
Chemicalsensing layer
(a)
Prism
Test fluid
θ θ
Fluid in Fluid out
Per
cent
ref
lect
ivity
100
80
60
40
20
051 52 53
Au onprism
Au andpolymeron prism
54
Angle of incidence
55 56 5750 58
(b)
Figure 20-21 Attenuated total reflectancesensor for . Light traveling through thewaveguide is attenuated (decreased) in thecation-exchange film in the presence of .[Data from T. Shtoyko, I. Zudans, C. J. Seliskar,
W. R. Heineman, and J. N. Richardson, “An Attenuated
Total Reflectance Sensor for Copper,” J. Chem. Ed.
2004, 81, 1617.]
Cu2�
Cu2�
Figure 20-22 (a) Essentials of a surface plasmon resonance measurement.(b) Reflectivity versus angle, . [Adapted from J. M. Brockman, B. P, Nelson, and R. M. Corn, “Surface Plasmon
Resonance Imaging Measurements of Ultrathin Organic Films,” Ann. Rev. Phys. Chem. 2000, 51, 41.]
�
1-(2-Pyridylazo)-2-naphthol(PAN)
N N
OHN

est. At low angles of incidence, , much but not all of the light is reflected by the gold. When increases to the critical angle for total internal reflection, the reflectivity is ideally 100%. As increases further, a surface plasmon (oscillating electron cloud) is set up, absorbing energy fromthe incident light. Because some of the energy is absorbed in the gold layer, the reflectivitydecreases from 100%. There is a small range of angles at which the plasmon is in resonance withthe incident light, creating the sharp dip in the curve in Figure 20-22b. As increases beyond theresonance condition, less energy is absorbed and the reflectivity increases.
The angle at which reflectivity is minimum depends on the refractive indexes of all thelayers in Figure 20-22a. When analyte binds to the chemically sensitive layer, the refractiveindex of that layer changes slightly and the angle of minimum reflectivity changesslightly. Commercial instruments can measure changes in the surface plasmon resonanceangle with a precision of to degrees.
For biosensors, the chemically sensitive layer might contain an antibody or antigen,DNA or RNA, a protein, or a carbohydrate that has a selective interaction with some analyte.An example of a synthetic sensing layer is a molecularly imprinted polymer (Box 26-2) witha polyacrylamide backbone (Figure 26-12) and phenylboronic acid substituents. When thepolymer is synthesized in the presence of the intended analyte nicotinamide adenine dinu-cleotide ( ), pockets are formed in which amide and boronic acid groups are properlydisposed for hydrogen bonding to . The can be removed from the polymer bytreatment with , leaving behind empty pockets that selectively bind , as shownbelow.
NAD�NH3
NAD�NAD�
NAD�
10�5�10�4
�
���
20-4 Optical Sensors 441
NH2
O
Acrylamide
NH
O B OHHO
3-Acrylamidophenylboronic acid
NH
O
NH
O
N,N '-Methylenebisacrylamide
O
H
O
H
OBH
N+
NH2OC
N
HH
HHO
NH C
O
O P
O
O
HO
O P
O
N
OC N
H
H
OH
OC N
H
H
OO
H
H
H
OH
H
OHH
N
N
N
N
H2N
H
NC H
C
O
O
H
N
H
C H
O
NAD+ in polymer pocket
1 wt%NH3
Empty pocket
CO N
H
H CO N
H
H H
H
O
N
N
C
BOHHO
H
O
C
NHH
O
onto Au surfaceto which acrylic
acid is covalentlyattached
Polymerize inpresence of
NAD�
£
£
£
£
£
£
£
£
£
£
¥¥
££
£ £
Polymer
Au
NAD+
NAD+
NAD+
NAD+
NAD+
NH2
O
Acrylamide
NH
O B OHHO
3-Acrylamidophenylboronic acid
NH
O
NH
O
N,N '-Methylenebisacrylamide
onto Au surfaceto which acrylic
acid is covalentlyattached
Polymerize inpresence of
NAD�
££
£ £
Polymer
Au
NAD+
NAD+
NAD+
NAD+
NAD+

The surface plasmon resonance minimum reflectivity in Figure 20-23 shifts by when binds to the imprinted polymer. The shift is not as great for the relatedspecies NADH, , and NADPH, confirming that the imprinted polymer selectivelybinds . When the observed reflectivity was fitted to the theoretical response, thepolymer film was calculated to be thick and had a binding capacity of
. When binds to the polymer, the refractive index of thepolymer layer changes from 1.45 to 1.40 and the layer thickness increases by
20-5 Fourier Transform InfraredSpectroscopy18
A photodiode array or charge coupled device can measure an entire spectrum at once. Thespectrum is spread into its component wavelengths, and each wavelength is directed onto onedetector element. For the infrared region, the most important method for observing the entirespectrum at once is Fourier transform spectroscopy.
Fourier AnalysisFourier analysis is a procedure in which a curve is decomposed into a sum of sine andcosine terms, called a Fourier series. To analyze the curve in Figure 20-24, which spans theinterval to the Fourier series has the form.
Fourier series:
(20-10)
where
(20-11)
Equation 20-10 says that the value of y for any value of x can be expressed by an infinitesum of sine and cosine waves. Successive terms correspond to waves with increasingfrequency.
� �2
x2 � x1�
2
10 � 0�
5
� a�
n�0[an sin(n�x ) � bn cos(n�x)]
� a2 sin(2�x) � b2 cos(2�x) � p y � a0 sin(0�x) � b0 cos(0�x) � a1 sin(1�x) � b1 cos(1�x)
x2 � 10,x1 � 0
3.0 � 0.2 nm.
1 mM NAD�2.26 �g NAD�/cm222 � 3 nm
NAD�
NADP�
1 mM NAD�
�0.15°
442 CHAPTER 20 Spectrophotometers
Ref
lect
ivity
(ar
bitr
ary
units
)
20 Imprintedpolymer
Imprinted polymerplus 1 mM NAD+16
12
8
64
(a)
66 68
Angle of incidence
70 72
0.1°
NADPH
NADP+
NADH
NAD+
10–610–7 10–5 10–4 10–3
Change insurfaceplasmonresonanceangle
Analyte concentration (M)
(b)
0.5
0.4
0.3
0.2
0.1
00 2 4 6 8 10
y
x
Figure 20-23 (a) Surface plasmon resonance spectrum of sensor coated with molecularlyimprinted polymer that selectively binds . (b) Response of sensor to four similar molecules showslargest response to , which was the template for polymerization. [From O. A. Raitman, V. I. Chegel, A. B.
Kharitonov, M. Zayats, E. Katz, and I. Willner, “Analysis of NAD(P)� and NAD(P)H Cofactors by Means of Imprinted Polymers
Associated with Au Surfaces: A Surface Plasmon Resonance Study,” Anal. Chim. Acta 2004, 504, 101.]
NAD�
NAD�
Figure 20-24 A curve to be decomposedinto a sum of sine and cosine terms by Fourieranalysis.

Figure 20-25 shows how sequences of three, five, or nine sine and cosine waves givebetter and better approximations to the curve in Figure 20-24. The coefficients and required to construct the curves in Figure 20-25 are given in Table 20-3.
InterferometryThe heart of a Fourier transform infrared spectrophotometer is the interferometer inFigure 20-26. Radiation from the source at the left strikes a beamsplitter, which transmitssome light and reflects some light. For the sake of this discussion, consider a beam of mono-chromatic radiation. (In fact, the Fourier transform spectrophotometer uses a continuumsource of infrared radiation, not a monochromatic source.) For simplicity, suppose that thebeamsplitter reflects half of the light and transmits half. When light strikes the beamsplitterat point O, some is reflected to a stationary mirror at a distance OS and some is transmittedto a movable mirror at a distance OM. The rays reflected by the mirrors travel back to thebeamsplitter, where half of each ray is transmitted and half is reflected. One recombined raytravels in the direction of the detector, and another heads back to the source.
In general, the paths OM and OS are not equal, so the two waves reaching the detectorare not in phase. If the two waves are in phase, they interfere constructively to give a wave
bnan
20-5 Fourier Transform Infrared Spectroscopy 443
Albert Michelson developed the interferometerabout 1880 and conducted the Michelson-Morley experiment in 1887, in which it wasfound that the speed of light is independent ofthe motion of the source and the observer. Thiscrucial experiment led Einstein to the theory ofrelativity. Michelson also used the interferometerto create the predecessor of today’s lengthstandard based on the wavelength of light. Hereceived the Nobel Prize in 1907 “for precisionoptical instruments and the spectroscopic andmetrological investigations carried out withtheir aid.”
Table 20-3 Fourier coefficients for Figure 20-25
n an bn
0 0 0.136 91212 0.015 185 0.037 7053 0.024 7184 0.007 8605 0.000 089 0.034 86467 0.006 059 0.004 5808 0.003 019�0.004 399
�0.018 858�0.004 813
�0.043 718�0.014 397
�0.160 994�0.006 906
Figure 20-25 Fourier seriesreconstruction of the curve in Figure 20-24.Solid line is the original curve and dashedlines are made from a series of to
, or 8 in Equation 20-10. Coefficientsan and bn are given in Table 20-3.n � 2, 4
n � 0
Figure 20-26 Schematicdiagram of Michelsoninterferometer. Detectorresponse as a function ofretardation isshown for monochromaticincident radiation ofwavelength .�
(� 2[OM � OS])
y
x
n = 0, 1, 2
n = 0, 1, 2, 3, 4
n = 0, 1, ..., 8
Inte
nsity
Stationarymirror
S
Beamsplitter
Source
Movablemirror
M
Light waves frommirrors M and S aregenerally out ofphase with each other
Sampleposition
Detector
Beams from mirrorsM and S are shownseparated, but theyare actuallysuperimposed
δ = 0 δ = λ δ = 2λ
δ (= 2[OM – OS])
δ = λ2
δ = 3λ2
O
Distance= λ /4

444 CHAPTER 20 Spectrophotometers
Figure 20-27 Interferograms produced by different spectra.
0.5
2
–10.5
2 4 6 8 100
1.0
1.5
2.0
0.5 1.0 2.01.5
1
2
0
–2
Spectrum Interferogram
(a )
(b )
(c )
1.0
1.5
2.0
0 4 6 8 10
–1
0.5 1.0 2.01.5
1
2
0
–2
0.5
2
–10.5
2 4 6 8 100
1.0
1.5
2.0
0.5 1.0 2.01.5
1
2
0
–2
(d )
1.0
1.5
2.0
0 4 6 8 10
–1
0.5 1.0 2.01.5
1
2
0
–2
B (
)~
(cm−1)~
(cm−1)~
B
()
~ B
()
~ B
()
~
(cm−1)~
(cm−1)~
δ (cm)
δ (cm)
δ (cm)
δ (cm)
l(δ)
l(δ)
l(δ)
l(δ)
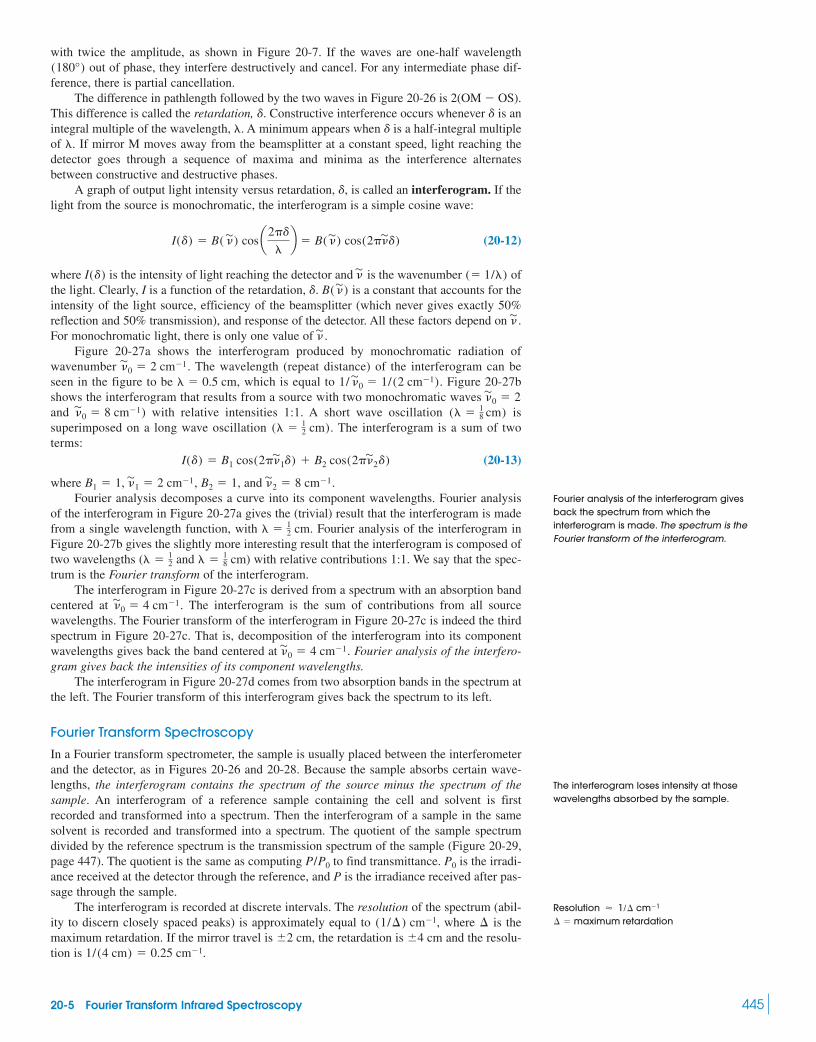
20-5 Fourier Transform Infrared Spectroscopy 445
with twice the amplitude, as shown in Figure 20-7. If the waves are one-half wavelengthout of phase, they interfere destructively and cancel. For any intermediate phase dif-
ference, there is partial cancellation.The difference in pathlength followed by the two waves in Figure 20-26 is 2(OM � OS).
This difference is called the retardation, . Constructive interference occurs whenever is anintegral multiple of the wavelength, . A minimum appears when is a half-integral multipleof . If mirror M moves away from the beamsplitter at a constant speed, light reaching thedetector goes through a sequence of maxima and minima as the interference alternatesbetween constructive and destructive phases.
A graph of output light intensity versus retardation, , is called an interferogram. If thelight from the source is monochromatic, the interferogram is a simple cosine wave:
(20-12)
where is the intensity of light reaching the detector and is the wavenumber ofthe light. Clearly, I is a function of the retardation, . is a constant that accounts for theintensity of the light source, efficiency of the beamsplitter (which never gives exactly 50%reflection and 50% transmission), and response of the detector. All these factors depend on .For monochromatic light, there is only one value of .
Figure 20-27a shows the interferogram produced by monochromatic radiation ofwavenumber . The wavelength (repeat distance) of the interferogram can beseen in the figure to be , which is equal to . Figure 20-27bshows the interferogram that results from a source with two monochromatic waves and ) with relative intensities 1:1. A short wave oscillation issuperimposed on a long wave oscillation . The interferogram is a sum of twoterms:
(20-13)
where , , , and .Fourier analysis decomposes a curve into its component wavelengths. Fourier analysis
of the interferogram in Figure 20-27a gives the (trivial) result that the interferogram is madefrom a single wavelength function, with . Fourier analysis of the interferogram inFigure 20-27b gives the slightly more interesting result that the interferogram is composed oftwo wavelengths ( and ) with relative contributions 1:1. We say that the spec-trum is the Fourier transform of the interferogram.
The interferogram in Figure 20-27c is derived from a spectrum with an absorption bandcentered at . The interferogram is the sum of contributions from all sourcewavelengths. The Fourier transform of the interferogram in Figure 20-27c is indeed the thirdspectrum in Figure 20-27c. That is, decomposition of the interferogram into its componentwavelengths gives back the band centered at . Fourier analysis of the interfero-gram gives back the intensities of its component wavelengths.
The interferogram in Figure 20-27d comes from two absorption bands in the spectrum atthe left. The Fourier transform of this interferogram gives back the spectrum to its left.
Fourier Transform Spectroscopy
In a Fourier transform spectrometer, the sample is usually placed between the interferometerand the detector, as in Figures 20-26 and 20-28. Because the sample absorbs certain wave-lengths, the interferogram contains the spectrum of the source minus the spectrum of thesample. An interferogram of a reference sample containing the cell and solvent is firstrecorded and transformed into a spectrum. Then the interferogram of a sample in the samesolvent is recorded and transformed into a spectrum. The quotient of the sample spectrumdivided by the reference spectrum is the transmission spectrum of the sample (Figure 20-29,page 447). The quotient is the same as computing to find transmittance. is the irradi-ance received at the detector through the reference, and P is the irradiance received after pas-sage through the sample.
The interferogram is recorded at discrete intervals. The resolution of the spectrum (abil-ity to discern closely spaced peaks) is approximately equal to , where is themaximum retardation. If the mirror travel is , the retardation is and the resolu-tion is .1/ (4 cm) � 0.25 cm�1
�4 cm�2 cm�(1/�) cm�1
P0P/P0
&
0 � 4 cm�1
&
0 � 4 cm�1
� � 18 cm� � 1
2
� � 12 cm
&
2 � 8 cm�1B2 � 1 &
1 � 2 cm�1B1 � 1
I(d) � B1 cos(2 &
1d) � B2 cos(2 &
2d)
(� � 12 cm)
(� � 18 cm)
&0 � 8 cm�1
&
0 � 21/
&0 � 1/(2 cm�1)� � 0.5 cm
&
0 � 2 cm�1
&
&
B( &
)d
(� 1/�) &
I(d)
I(d) � B( &
) cos a2d
�b � B(
&) cos(2
&d)
d
�d�
dd
(180°)
Fourier analysis of the interferogram givesback the spectrum from which theinterferogram is made. The spectrum is theFourier transform of the interferogram.
The interferogram loses intensity at thosewavelengths absorbed by the sample.
� � maximum retardationResolution � 1/� cm�1
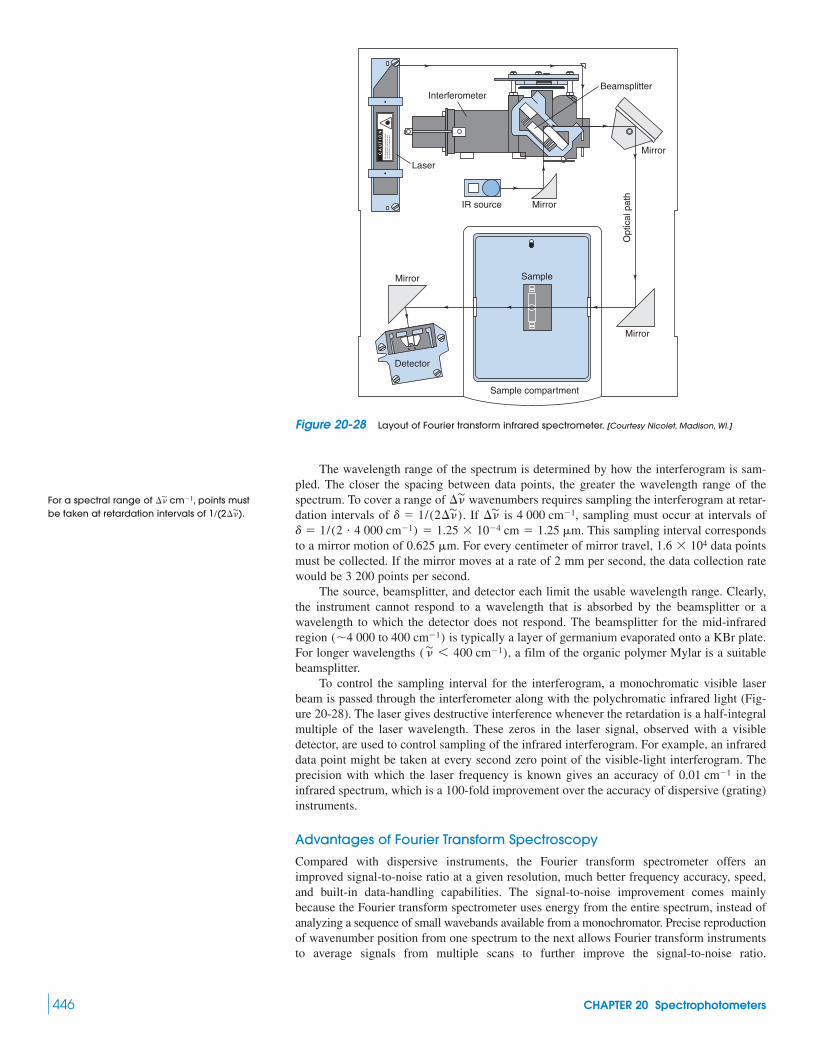
446 CHAPTER 20 Spectrophotometers
C A
U T
I O
N
Interferometer
Laser
SampleMirror
Detector
Mirror
Sample compartment
IR source Mirror
Mirror
Opt
ical
pat
h
Beamsplitter
Figure 20-28 Layout of Fourier transform infrared spectrometer. [Courtesy Nicolet, Madison, WI.]
The wavelength range of the spectrum is determined by how the interferogram is sam-pled. The closer the spacing between data points, the greater the wavelength range of thespectrum. To cover a range of wavenumbers requires sampling the interferogram at retar-dation intervals of . If is , sampling must occur at intervals of
. This sampling interval correspondsto a mirror motion of . For every centimeter of mirror travel, data pointsmust be collected. If the mirror moves at a rate of 2 mm per second, the data collection ratewould be 3 200 points per second.
The source, beamsplitter, and detector each limit the usable wavelength range. Clearly,the instrument cannot respond to a wavelength that is absorbed by the beamsplitter or awavelength to which the detector does not respond. The beamsplitter for the mid-infraredregion is typically a layer of germanium evaporated onto a KBr plate.For longer wavelengths , a film of the organic polymer Mylar is a suitablebeamsplitter.
To control the sampling interval for the interferogram, a monochromatic visible laserbeam is passed through the interferometer along with the polychromatic infrared light (Fig-ure 20-28). The laser gives destructive interference whenever the retardation is a half-integralmultiple of the laser wavelength. These zeros in the laser signal, observed with a visibledetector, are used to control sampling of the infrared interferogram. For example, an infrareddata point might be taken at every second zero point of the visible-light interferogram. Theprecision with which the laser frequency is known gives an accuracy of in theinfrared spectrum, which is a 100-fold improvement over the accuracy of dispersive (grating)instruments.
Advantages of Fourier Transform Spectroscopy
Compared with dispersive instruments, the Fourier transform spectrometer offers animproved signal-to-noise ratio at a given resolution, much better frequency accuracy, speed,and built-in data-handling capabilities. The signal-to-noise improvement comes mainlybecause the Fourier transform spectrometer uses energy from the entire spectrum, instead ofanalyzing a sequence of small wavebands available from a monochromator. Precise reproductionof wavenumber position from one spectrum to the next allows Fourier transform instrumentsto average signals from multiple scans to further improve the signal-to-noise ratio.
0.01 cm�1
( & 6 400 cm�1)
(�4 000 to 400 cm�1)
1.6 � 1040.625 �md � 1/(2 � 4 000 cm�1) � 1.25 � 10�4 cm � 1.25 �m
4 000 cm�1� &
d � 1/(2� &
)�
&For a spectral range of , points mustbe taken at retardation intervals of .1/(2�
&)
� &
cm�1

20-5 Fourier Transform Infrared Spectroscopy 447
Figure 20-29 Fourier transform infrared spectrum of polystyrene film. The Fourier transform ofthe background interferogram gives a spectrum determined by the source intensity, beamsplitterefficiency, detector response, and absorption by traces of and in the atmosphere. The samplecompartment is purged with dry to reduce the levels of and . The transform of thesample interferogram is a measure of all the instrumental factors, plus absorption by the sample. Thetransmission spectrum is obtained by dividing the sample transform by the background transform.Each interferogram is an average of 32 scans and contains 4 096 data points, giving a resolution of
. The mirror velocity was 0.693 cm/s. [Courtesy M. P. Nadler, Michelson Laboratory, China Lake, CA.]4 cm�1
CO2H2ON2
CO2H2O
Background interferogram
Retardation ( )
Det
ecto
r vo
ltage
Sample interferogramD
etec
tor
volta
ge
Background transform Sample transform
Transmission spectrum
Tran
smitt
ance
(%
)
Wavenumber (cm–1)4 000 3 600 3 200 2 800 2 400 2 000 1 600 1 200 800 400 4 000 3 600 3 200 2 800 2 400 2 000 1 600 1 200 800 400
Wavenumber (cm–1)
Wavenumber (cm–1)
4 000 3 600 3 200 2 800 2 400 2 000 1 600 1 200 800 400
20
100
80
60
40
0
δRetardation ( )δ

Wavenumber precision and low noise levels allow spectra with slight differences to be sub-tracted from each other to expose those differences. Fourier transform instruments are not asaccurate as dispersive spectrometers for measuring transmittance.
Advantages of Fourier transform infrared spectrometers are so great that it is nearlyimpossible to purchase a dispersive infrared spectrometer. Fourier transform visible andultraviolet spectrometers are not commercially available, because of the requirement to sam-ple the interferometer at intervals of . For visible spectroscopy, could be
(corresponding to 400 nm), giving and a mirror movement ofbetween data points. Such fine control over significant ranges of mirror motion is not
feasible.
20-6 Dealing with Noise19
An advantage of Fourier transform spectroscopy is that the entire interferogram is recordedin a few seconds and stored in a computer. The signal-to-noise ratio can be improved by col-lecting tens or hundreds of interferograms and averaging them.
Signal AveragingSignal averaging can improve the quality of data, as illustrated in Figure 20-30.20 The low-est trace contains a great deal of noise. A simple way to estimate the noise level is to measurethe maximum amplitude of the noise in a region free of signal. The signal is measured fromthe middle of the baseline noise to the middle of the noisy peak. By this criterion, the lowesttrace of Figure 20-30 has a signal-to-noise ratio of .
A more common measurement of noise, which requires a digitized signal and a com-puter, is the root-mean-square (rms) noise, defined as
Root-mean-square noise: (20-14)
where is the measured signal for the ith data point, is the mean signal, and n is the num-ber of data points. For a large number of data points, the rms noise is the standard deviationof the noise. It is best to apply Equation 20-14 where the signal is flat, as it is at the left andright sides of Figure 20-30. If you must use data at the center of Figure 20-30, the average must be fitted to the continuously rising or falling signal. The rms noise is times less thanthe peak-to-peak noise. If we used rms noise instead of peak-to-peak noise, we would saythat the noise in the bottom spectrum of Figure 20-30 is and the signal-to-noiseratio is . Clearly, the signal-to-noise ratio depends on how you define noise.
Consider what happens if you record the spectrum twice and add the results. The signalis the same in both spectra and adds to give twice the value of each spectrum. If n spectra areadded, the signal will be n times as large as in the first spectrum. Noise is random, so it maybe positive or negative at any point. It turns out that, if n spectra are added, the noiseincreases in proportion to . Because the signal increases in proportion to n, the signal-to-noise ratio increases in proportion to .
When we average n spectra, the signal-to-noise ratio is improved by . To improvethe signal-to-noise ratio by a factor of 2 requires averaging four spectra. To improve the sig-nal-to-noise ratio by a factor of 10 requires averaging 100 spectra. Spectroscopists record asmany as to scans to observe weak signals. It is rarely possible to do better than thisbecause instrumental instabilities cause drift in addition to random noise.
Types of Noise
Figure 20-31 shows three common types of noise in electrical instruments.21 The upper traceis ordinary, random white noise (also called Gaussian noise) arising from causes such as therandom motion of electrons in a circuit. The second trace shows 1/f noise, also called drift,which is greatest at zero frequency and decreases in proportion to 1/frequency. An exampleof low-frequency noise in laboratory instruments is flickering or drifting of a light source ina spectrophotometer or a flame in atomic spectroscopy. Drift arises from causes such as slowchanges in instrument components with temperature and age and variation of power-linevoltage to an instrument. The classical way to detect and account for drift is to periodically
105104
1nn/1n � 1n
1n
14/1.8 � 7.89/5 � 1.8
�5A
AAi
rms noise �R ai
(Ai � A)2
n
14/9 � 1.6
0.1 �md � 0.2 �m25 000 cm�1
� &
d � 1/(2� &
)
448 CHAPTER 20 Spectrophotometers
Abs
orba
nce
Wavelength
256
64
16
4
1Signal = 14 units
Noise =9 units
Figure 20-30 Effect of signal averaging ona simulated noisy spectrum. Labels refer tonumber of scans averaged. [From R. Q. Thompson,
“Experiments in Software Data Handling,” J. Chem.
Ed. 1985, 62, 866.]
1/f noise(drift)
Am
plitu
de
Frequency
Am
plitu
deA
mpl
itude
White noise(Gaussian noise)
Line noise(interference)
Figure 20-31 Three types of noise inelectrical instruments. White noise is alwayspresent. A beam chopping frequency can beselected to reduce 1/f noise and line noise toinsignificant values.

measure standards and correct the instrument reading for any observed change.22 The bottomtrace contains line noise (also called interference or whistle noise) at discrete frequenciessuch as the 60-Hz transmission-line frequency or the 0.2-Hz vibrational frequency when ele-phants walk through the basement of your building.
Beam ChoppingThe spectrophotometer in Figure 20-1 has a rotating mirror called a chopper that alternatelysends light through the sample and reference cells. Chopping allows both cells to be sampledalmost continuously, and it provides a means of noise reduction. Beam chopping moves theanalytical signal from zero frequency to the frequency of the chopper. The chopping fre-quency can be selected so that 1/f noise and line noise are minimal. High-frequency detectorcircuits are required to take advantage of beam chopping.
Summary 449
Terms to Understandattenuated total reflectancebandwidthbeam choppingblackbody radiationcharge coupled devicediffractiondispersionferroelectric material
Fourier analysisgratinginterferograminterferometerlasermonochromatoroptical fiberoptode
photoconductive detectorphotodiode arrayphotomultiplier tubephototubephotovoltaic detectorpolychromatorrefractionrefractive index
resolutionroot-mean-square (rms) noisesignal averagingSnell’s lawstray lightsurface plasmon resonancethermocouplewaveguide
SummaryComponents of spectrophotometers include the source, sample cell,monochromator, and detector. Tungsten and deuterium lamps pro-vide visible and ultraviolet radiation; a silicon carbide globar is agood infrared source. Tungsten and silicon carbide lamps behaveapproximately as blackbodies, which are objects that absorb alllight striking them. Emission of radiant energy from the surface ofthe blackbody is proportional to the fourth power of temperatureand shifts to shorter wavelengths as temperature increases. Lasersprovide high-intensity, coherent, monochromatic radiation by stim-ulated emission from a medium in which an excited state has beenpumped to a higher population than that of a lower state. Samplecells must be transparent to the radiation of interest. A referencesample compensates for reflection and scattering by the cell andsolvent. A grating monochromator disperses light into its compo-nent wavelengths. The finer a grating is ruled, the higher the resolu-tion and the greater the dispersion of wavelengths over angles. Nar-row slits improve resolution but increase noise, because less lightreaches the detector. A bandwidth that is 1/5 of the width of thespectral peak is a good compromise between maximizing signal-to-noise ratio and minimizing peak distortion. Stray light introducesabsorbance errors that are most serious when the transmittance of asample is very low. Filters pass wide bands of wavelength andreject other bands.
A photomultiplier tube is a sensitive detector of visible andultraviolet radiation; photons cause electrons to be ejected from ametallic cathode. The signal is amplified at each successive dynodeon which the photoelectrons impinge. Photodiode arrays and chargecoupled devices are solid-state detectors in which photons createelectrons and holes in semiconductor materials. Coupled to a poly-chromator, these devices can record all wavelengths of a spectrumsimultaneously, with resolution limited by the number and spacingof detector elements. Common infrared detectors include thermo-couples, ferroelectric materials, and photoconductive and photo-voltaic devices.
When light passes from a region of refractive index to aregion of refractive index , the angle of refraction ( ) is related tothe angle of incidence ( ) by Snell’s law: .Optical fibers and flat waveguides transmit light by a series of totalinternal reflections. Optodes are sensors based on optical fibers.Some optodes have a layer of material whose absorbance or fluo-rescence changes in the presence of analyte. Light can be carried toand from the tip by the optical fiber. When light is transmittedthrough a fiber optic or a waveguide by total internal reflectance,some light, called the evanescent wave, penetrates through the reflec-tive interface during each reflection. In attenuated total reflectancedevices, the waveguide is coated with a substance that absorbs lightin the presence of analyte. In a surface plasmon resonance sensor,we measure the change in the angle of minimum reflectance from agold film coated with a chemically sensitive layer on the back faceof a prism.
Fourier analysis decomposes a signal into its componentwavelengths. An interferometer contains a beamsplitter, a station-ary mirror, and a movable mirror. Reflection of light from thetwo mirrors creates an interferogram. Fourier analysis of theinterferogram tells us what frequencies went into the interfero-gram. In a Fourier transform spectrophotometer, the interfero-gram of the source is first measured without sample. Then sampleis placed in the beam and a second interferogram is recorded. Thetransforms of the interferograms tell what amount of light at eachfrequency reaches the detector with and without the sample. Thequotient of the two transforms is the transmission spectrum. Theresolution of a Fourier transform spectrum is approximately ,where is the maximum retardation. To cover a wavenumberrange requires sampling the interferogram at intervals of
. If you average n scans, the signal-to-noise ratioshould increase by . Beam chopping in a dual-beam spec-trophotometer reduces 1/f and line noise.
1nd � 1/(2�
&)
� &�
1/�
n1 sin �1 � n2 sin �2�1
�2n2
n1
Question By what factor should the signal-to-noise ratio be improved when 16 spectraare averaged? Measure the noise level inFigure 20-30 to test your prediction.

450 CHAPTER 20 Spectrophotometers
Exercises20-A. (a) If a diffraction grating has a resolution of , is it possi-ble to distinguish two spectral lines with wavelengths of 10.00 and
?(b) With a resolution of , how close in wavenumbers ( ) isthe closest line to that can barely be resolved?(c) Calculate the resolution of a 5.0-cm-long grating ruled at250 lines/mm for first-order ( ) diffraction and tenth-order( ) diffraction.(d) Find the angular dispersion ( , in radians and degrees)between light rays with wavenumbers of 1 000 and forsecond-order diffraction ( ) from a grating with 250 lines/mmand .
20-B. The true absorbance of a sample is 1.000, but the monochro-mator passes 1.0% stray light. Add the light coming through thesample to the stray light to find the apparent transmittance of thesample. Convert this back into absorbance and find the relativeerror in the calculated concentration of the sample.
20-C. Refer to the Fourier transform infrared spectrum in Fig-ure 20-29.(a) The interferogram was sampled at retardation intervals of
. What is the theoretical wavenumber range (0 to ?) of the spectrum?(b) A total of 4 096 data points were collected from to
. Compute the value of , the maximum retardation.(c) Calculate the approximate resolution of the spectrum.(d) How many microseconds elapse between each datum?(e) How many seconds were required to record each interferogramonce?
�d � ��d � ��
1.266 0 � 10�4 cm
� � 30°n � 2
1 001 cm�1��
n � 10n � 1
1 000 cm�1cm�1104
10.01 �m
104 (f) What kind of beamsplitter is typically used for the region 400 to? Why is the region below not observed?
20-D. The table below shows signal-to-noise ratios recorded ina nuclear magnetic resonance experiment. Construct graphs of(a) signal-to-noise ratio versus n and (b) signal-to-noise ratio versus
, where n is the number of scans. Draw error bars correspon-ding to the standard deviation at each point. Is the signal-to-noiseratio proportional to ? Find the 95% confidence interval foreach row of the table.
Signal-to-noise ratio at the aromatic protonsof 1% ethylbenzene in CCl4
Number of Number of Signal-to-noise Standardexperiments accumulations ratio deviation
8 1 18.9 1.96 4 36.4 3.76 9 47.3 4.98 16 66.7 7.06 25 84.6 8.66 36 107.2 10.76 49 130.3 13.34 64 143.2 15.14 81 146.2 15.04 100 159.4 17.1
SOURCE: Data from M. Henner, P. Levior, and B. Ancian, “An NMR Spectrometer-Computer Interface Experiment,” J. Chem. Ed. 1979, 56, 685.
1n
1n
400 cm�14 000 cm�1
Problems
The Spectrophotometer
20-1. Describe the role of each component of the spectrophotometerin Figure 20-1.
20-2. Explain how a laser generates light. List important propertiesof laser light.
20-3. Would you use a tungsten or a deuterium lamp as a source of300-nm radiation?
20-4. Which variables increase the resolution of a grating?
20-5. What is the role of a filter in a grating monochromator?
20-6. What are the advantages and disadvantages of decreasingmonochromator slit width?
20-7. Deuterated triglycine sulfate (abbreviated DTGS) is a com-mon ferroelectric infrared detector material. Explain how it works.
20-8. Consider a reflection grating operating with an incident angleof in Figure 20-6.(a) How many lines per centimeter should be etched in the gratingif the first-order diffraction angle for 600 nm (visible) light is tobe(b) Answer the same question for (infrared) light.
20-9. Show that a grating with grooves/cm provides a dispersionof per of wavelength if and in Equation 20-4.
20-10. (a) What resolution is required for a diffraction grating toresolve wavelengths of 512.23 and 512.26 nm?(b) With a resolution of , how close in nm is the closest line to512.23 nm that can barely be resolved?
104
� � 10°n � 1�m5.8°103
1 000 cm�1�30°?
40°
(c) Calculate the fourth-order resolution of a grating that is 8.00 cmlong and is ruled at 185 lines/mm.(d) Find the angular dispersion ( ) between light rays with wave-lengths of 512.23 and 512.26 nm for first-order diffraction ( )and thirtieth-order diffraction from a grating with 250 lines/mm and
.
20-11. The true absorbance of a sample is 1.500, but 0.50% straylight reaches the detector. Find the apparent transmittance andapparent absorbance of the sample.
20-12. The pathlength of a cell for infrared spectroscopy can bemeasured by counting interference fringes (ripples in the transmis-sion spectrum). The spectrum below shows 30 interference maximabetween 1 906 and obtained by placing an empty KBrcell in a spectrophotometer.
80
1 800
Tran
smitt
ance
(%
)
Wavenumber (cm–1)
Wavelength ( m)
90
100
2 000 1 600 1 400 1 200 1 000 800
5
698 cm–11 906 cm–1
10 15 20 25
6 7 8 9 10 12 14 16
600
1 2 3 4 5
µ
698 cm�1
� � 3.0°
n � 1��

Problems 451
The fringes arise because light reflected from the cell compartmentinterferes constructively or destructively with the unreflectedbeam.
If the reflected beam travels an extra distance , it will inter-fere constructively with the unreflected beam. If the reflection path-length is , destructive interference occurs. Peaks therefore arisewhen and troughs occur when , where m isan integer. If the medium between the KBr plates has refractiveindex n, the wavelength in the medium is , so the equationsbecome and . The cell pathlength can beshown to be given by
where N maxima occur between wavelengths and . Calculatethe pathlength of the cell that gave the interference fringes shownearlier.
20-13. Calculate the power per unit area (the exitance, ) radi-ating from a blackbody at 77 K (liquid nitrogen temperature) and at298 K (room temperature).
20-14. The exitance (power per unit area per unit wavelength) froma blackbody (Box 20-1) is given by the Planck distribution:
where is wavelength, T is temperature (K), h is Planck’s constant,c is the speed of light, and k is Boltzmann’s constant. The areaunder each curve between two wavelengths in the blackbody graphin Box 20-1 is equal to the power per unit area ( ) emittedbetween those two wavelengths. We find the area by integrating thePlanck function between wavelengths and :
For a narrow wavelength range, , the value of is nearly con-stant and the power emitted is simply the product .(a) Evaluate at and at at 1 000 K.(b) Calculate the power emitted per square meter at 1 000 K in theinterval to by evaluating the product
, where .(c) Repeat part (b) for the interval 9.99 to .(d) The quantity is the rela-tive exitance at the two wavelengths. Compare the relative exitanceat these two wavelengths at 1 000 K with the relative exitance at100 K. What does your answer mean?
[M� (� � 2 �m)]/[M� (� � 10 �m)]10.01 �m
�� � 0.02 �mM���� � 2.01 �m� � 1.99 �m
T �� � 10.00 �m� � 2.00 �mM�
M���M���
Power emitted � ��2
�1
M� d�
�2�1
W/m2
�
M� �2hc2
�5a 1
ehc/�kT � 1b
W/m2
�2�1
b �N
2n�
�1�2
�2 � �1�
N
2n�
1
&
1 � &
2
m�/2n � 2bm�/n � 2b�/n
m�/2 � 2bm� � 2b�/2
�
Cellcompartment
b
KBr plate KBr plate
SourceUnreflected ray
Reflected rayDetector
Extrapathlength = 2b
20-15. In the cavity ring-down measurement at the opening of thischapter, absorbance is given by
where L is the length of the cavity between mirrors, c is the speedof light, is the ring-down lifetime with sample in the cavity, and
is the ring-down lifetime with no sample in the cavity. Ring-down lifetime is obtained by fitting the observed ring-down signalintensity I to an exponential decay of the form , where is the initial intensity and t is time. A measurement of is madeat a wavelength absorbed by the molecule. The ring-down lifetimefor a 21.0-cm-long empty cavity is and for a cav-ity containing . Find the absorbance of at this wavelength.
Optical Sensors
20-16. Light passes from benzene (medium 1) to water (medium 2)in Figure 20-17 at (a) or (b) . Find the angle ineach case.
20-17. Explain how an optical fiber works. Why does the fiber stillwork when it is bent?
20-18. (a) Explain how the attenuated total reflection sensor in Fig-ure 20-21 works.(b) For a given angle of incidence, the sensitivity of the attenuatedtotal reflectance sensor increases as the thickness of the waveguidedecreases. Explain why. (The waveguide can be less than thick.)
20-19. (a) Find the critical value of in Figure 20-18 beyondwhich there is total internal reflection in a infrared opti-cal fiber whose core refractive index is 1.52 and whose claddingrefractive index is 1.50.(b) The loss of radiant power (due to absorption and scatter) in anoptical fiber of length is expressed in decibels per meter (dB/m),defined as
Calculate the quotient power out/power in for a 20.0-m-long fiberwith a loss of 0.010 0 dB/m.
20-20. Find the minimum angle for total reflection in the opticalfiber in Figure 20-18 if the index of refraction of the cladding is1.400 and the index of refraction of the core is (a) 1.600 or(b) 1.800.
20-21. The prism shown below is used to totally reflect light at aangle. No surface of this prism is silvered. Use Snell’s law to
explain why total reflection occurs. What is the minimum refractiveindex of the prism for total reflection?
Total reflection
1
2
1 2
90° 45°
90°
�i
Power out
Power in� 10�/(dB/m)/10
/
ZrF4-based�i
1 �m
�2�1 � 0°�1 � 30°
CO2CO2
16.06 �s18.52 �s
CO2
I0I � I0e�t/t
t0
t
A �L
c ln 10a1t
�1t0b

452 CHAPTER 20 Spectrophotometers
20-22. Here is an extremely sensitive method for measuring nitritedown to 1 nM in natural waters. The water sample is treated
with sulfanilamide and N-(1-naphthylethylenediamine) in acid solu-tion to produce a colored product with a molar absorptivity of
at 540 nm. The colored solution is pumpedinto a 4.5-meter-long, coiled Teflon tube whose fluorocarbon wallhas a refractive index of 1.29. The aqueous solution inside the tubehas a refractive index near 1.33. The colored solution is pumpedthrough the coiled tube. An optical fiber delivers white light intoone end of the tube, and an optical fiber at the other end leads to apolychromator and detector.
Long-pathlength spectrometer. [Adapted from W. Yao, R. H. Byrne, and R. D.
Waterbury, “Determination of Nanomolar Concentrations of Nitrite and Nitrate Using
Long Path Length Absorbance Spectroscopy,” Environ. Sci. Technol. 1998, 32, 2646.]
(a) Explain the purpose of the coiled Teflon tube and explain how itfunctions.(b) What is the critical angle of incidence for total internal reflec-tion at the Teflon water interface?(c) What is the predicted absorbance of a 1.0 nM solution of col-ored reagent?
20-23. (a) A particular silica glass waveguide is reported to have aloss coefficient of 0.050 dB/cm (power out/power in, defined inProblem 20-19) for 514-nm-wavelength light. The thickness of thewaveguide is and the length is 3.0 cm. The angle of inci-dence ( in Figure 20-21) is . What fraction of the incident radi-ant intensity is transmitted through the waveguide?(b) If the index of refraction of the waveguide material is 1.5, what isthe wavelength of light inside the waveguide? What is the frequency?
20-24. The variation of refractive index n, with wavelengthfor fused silica is given by
where is expressed in .(a) Make a graph of n versus with points at the following wave-lengths: 0.2, 0.4, 0.6, 0.8, 1, 2, 3, 4, 5, and .(b) The ability of a prism to spread apart (disperse) neighboringwavelengths increases as the slope increases. Is the disper-sion of fused silica greater for blue light or red light?
Fourier Transform Spectroscopy
20-25. The interferometer mirror of a Fourier transform infraredspectrophotometer travels .(a) How many centimeters is the maximum retardation, ?(b) State what is meant by resolution.(c) What is the approximate resolution ( ) of the instrument?(d) At what retardation interval, , must the interferogram be sam-pled (converted into digital form) to cover a spectral range of 0 to
?2 000 cm�1
d
cm�1
��1 cm
dn/d�
6 �m�
�m�
�(0.897 479 4)�2
�2 � (9.896 161)2
n2 � 1 �(0.696 166 3)�2
�2 � (0.068 404 3)2�
(0.407 942 6)�2
�2 � (0.116 241 4)2
70°�i
0.60 �m
0
Pumpliquid in
CCDdetector
Opticalfiber
Lamp
To waste
Polychromator
Aqueous reagent solution
Teflon tubing(4.5 m long, bent into a coil)(560-µm inner diameter,120-µm wall thickness)
4.5 � 104 M�1 cm�1
(NO�2 )
20-26. Explain why the transmission spectrum in Figure 20-29 iscalculated from the quotient (sample transform)/(background trans-form) instead of the difference (sample transform) � (backgroundtransform).
Dealing with Noise
20-27. A spectrum has a signal-to-noise ratio of 8/1. How many spec-tra must be averaged to increase the signal-to-noise ratio to 20/1?
20-28. A measurement with a signal-to-noise ratio of 100/1 can bethought of as a signal, S, with 1% uncertainty, e. That is, the mea-surement is .(a) Use the rules for propagation of uncertainty to show that, if youadd two such signals, the result is total signal , givinga signal-to-noise ratio of .(b) Show that, if you add four such measurements, the signal-to-noise ratio increases to 200/1.(c) Show that averaging n measurements increases the signal-to-noise ratio by a factor of compared with the value for onemeasurement.
20-29. Results of an electrochemical experiment are shown in thefigure below. In each case, a voltage is applied between two elec-trodes at time and the absorbance of a solution decreasesuntil the voltage is stepped back to its initial value at time .The upper traces show the average results for 100, 300, and 1 000repetitions of the experiment. The measured signal-to-rms noiseratio in the upper trace is 60.0. Predict the signal-to-noise ratiosexpected for 300, 100, and 1 cycle and compare your answers withthe observed values in the figure.
Signal averaging in an experiment in which absorbance is measured afterthe electric potential is changed at 20 s. [From A. F. Slaterbeck, T. H. Ridgeway,
C. J. Seliskar, and W. R. Heineman, “Spectroelectrochemical Sensing Based on Multimode
Selectivity Simultaneously Achievable in a Single Device,” Anal. Chem. 1999, 71, 1196.]
300 cycles
1 000 cycles S/N = 60.0
S/N = 35.9
S/N = 20.9
S/N = 1.95
Signal
100 cycles
1 cycle
Abs
orba
nce
Time (s)
200 40 60 80
� 60 s� 20 s
1n
200/22 � 141/1� 200 � 22
S � e � 100 � 1

453
In atomic spectroscopy, a substance is decomposed into atoms in a flame, furnace, orplasma. (A plasma is a gas that is hot enough to contain ions and free electrons.) Each ele-ment is measured by absorption or emission of ultraviolet or visible radiation by thegaseous atoms. To measure trace elements in a tooth, tiny portions of the tooth are vapor-ized (ablated) by a laser pulse1 and swept into a plasma. The plasma ionizes some of theatoms, which pass into a mass spectrometer that separates ions by their mass and measurestheir quantity.
Elements are incorporated into teeth from the diet or by inhalation. The figure showstrace element profiles measured by laser ablation–plasma ionization–mass spectrometryof the dentine of teeth from a modern person and one who lived in Scandinavia aboutA.D. 1800. The contrast is striking. The old tooth contains significant amounts of tin andbismuth, which are nearly absent in the modern tooth. The old tooth contains more leadand antimony than the modern tooth. Tin and lead are constituents of pewter, which wasused for cooking vessels and utensils. Bismuth and antimony also might come frompewter.
Even more striking in the old tooth is the abundance of rare earths (dysprosium,holmium, erbium, thulium, ytterbium, and lutetium) and the elements tantalum, tungsten,gold, thorium, and uranium. Rare earth minerals are found in Scandinavia (in fact, manyrare earth elements were discovered there), but what were they used for? Did people pre-pare food with them? Did they somehow get into the food chain?
Trace element profile of a tooth from amodern man and from a person who lived inScandinavia 200 years ago. [From A. Cox,F. Keenan, M. Cooke, and J. Appleton, “Trace ElementProfiling of Dental Tissues Using Laser AblationInductively Coupled Plasma–Mass Spectrometry,”Fresenius J. Anal. Chem. 1996, 354, 254.]
AN ANTHROPOLOGY PUZZLE
Atomic Spectroscopy21Modern tooth from Krakow, Poland
Atomic mass
Mas
s sp
ectr
omet
er s
igna
l
Ag
Ag
107
109
Sb12
1
123
I
I
127
Hg
Hg
200
202
Pb
Pb
206 20
8
In
115
Sn
SbHo
165
Dy Er
Tm
169
Yb
Lu
Hf
Ta17
8
175
180
181
W
182
184
186
Au
197
Bi
209
Th
232
U
238
Tooth from Spitsbergen, Norway, circa A.D. 1800
110 120 170 180 190 200 210 220 230
In atomic spectroscopy, samples are vaporized at 2 000–8 000 K and decompose into atoms.Concentrations of atoms in the vapor are measured by emission or absorption of characteristicwavelengths of radiation. Because of its high sensitivity, its ability to distinguish one element
Inductively coupled argon plasma atomizessubstances at 6 000 K.
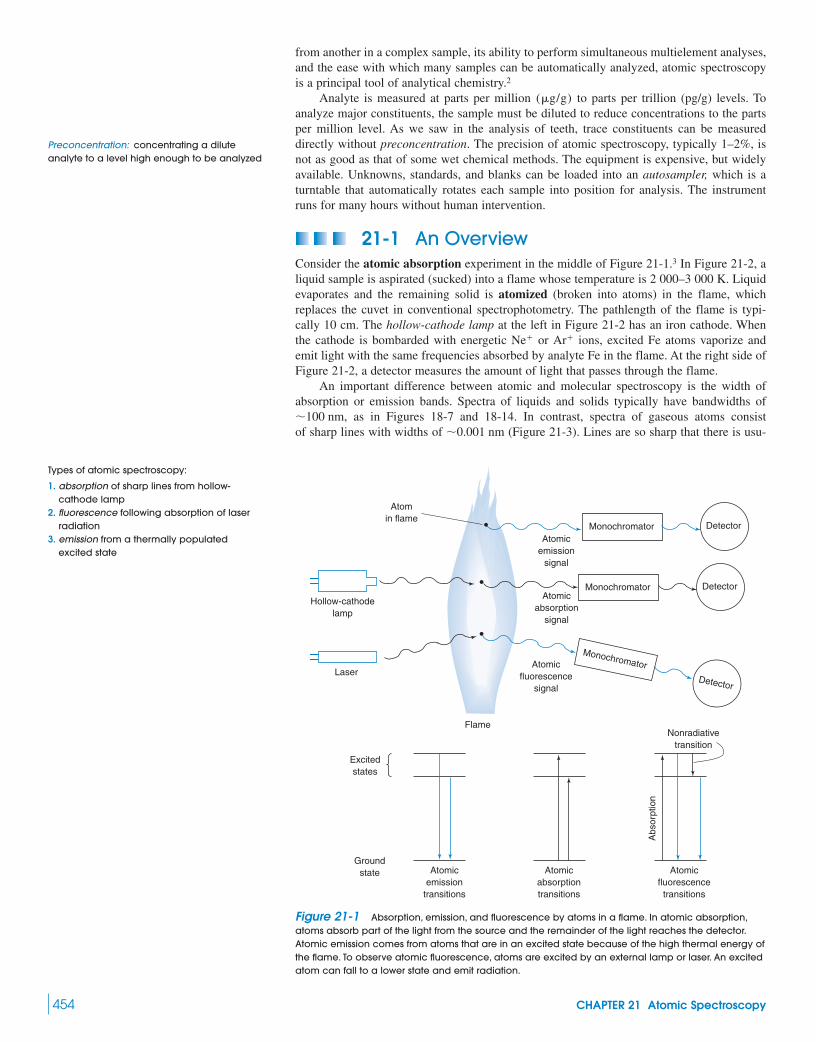
454 CHAPTER 21 Atomic Spectroscopy
from another in a complex sample, its ability to perform simultaneous multielement analyses,and the ease with which many samples can be automatically analyzed, atomic spectroscopyis a principal tool of analytical chemistry.2
Analyte is measured at parts per million to parts per trillion (pg/g) levels. Toanalyze major constituents, the sample must be diluted to reduce concentrations to the partsper million level. As we saw in the analysis of teeth, trace constituents can be measureddirectly without preconcentration. The precision of atomic spectroscopy, typically 1–2%, isnot as good as that of some wet chemical methods. The equipment is expensive, but widelyavailable. Unknowns, standards, and blanks can be loaded into an autosampler, which is aturntable that automatically rotates each sample into position for analysis. The instrumentruns for many hours without human intervention.
21-1 An OverviewConsider the atomic absorption experiment in the middle of Figure 21-1.3 In Figure 21-2, aliquid sample is aspirated (sucked) into a flame whose temperature is 2 000–3 000 K. Liquidevaporates and the remaining solid is atomized (broken into atoms) in the flame, whichreplaces the cuvet in conventional spectrophotometry. The pathlength of the flame is typi-cally 10 cm. The hollow-cathode lamp at the left in Figure 21-2 has an iron cathode. Whenthe cathode is bombarded with energetic or ions, excited Fe atoms vaporize andemit light with the same frequencies absorbed by analyte Fe in the flame. At the right side ofFigure 21-2, a detector measures the amount of light that passes through the flame.
An important difference between atomic and molecular spectroscopy is the width ofabsorption or emission bands. Spectra of liquids and solids typically have bandwidths of
, as in Figures 18-7 and 18-14. In contrast, spectra of gaseous atoms consistof sharp lines with widths of (Figure 21-3). Lines are so sharp that there is usu-�0.001 nm�100 nm
Ar�Ne�
(�g/g)
Groundstate
Monochromator
Atomin flame
Atomicemission
signal
Atomicabsorption
signal
Atomicfluorescence
signal
Excitedstates
Atomicabsorptiontransitions
Atomicemission
transitions
Atomicfluorescence
transitions
Abs
orpt
ion
Nonradiativetransition
Monochromator
Monochromator
Detector
Detector
Detector
Flame
Hollow-cathodelamp
Laser
Figure 21-1 Absorption, emission, and fluorescence by atoms in a flame. In atomic absorption,atoms absorb part of the light from the source and the remainder of the light reaches the detector.Atomic emission comes from atoms that are in an excited state because of the high thermal energy ofthe flame. To observe atomic fluorescence, atoms are excited by an external lamp or laser. An excitedatom can fall to a lower state and emit radiation.
Preconcentration: concentrating a diluteanalyte to a level high enough to be analyzed
Types of atomic spectroscopy:
1. absorption of sharp lines from hollow-cathode lamp
2. fluorescence following absorption of laserradiation
3. emission from a thermally populatedexcited state

21-1 An Overview 455
ally little overlap between the spectra of different elements in the same sample. Therefore,some instruments can measure more than 70 elements simultaneously. We will see later thatsharp analyte absorption lines require that the light source also have sharp lines.
Figure 21-1 also illustrates an atomic fluorescence experiment. Atoms in the flame areirradiated by a laser to promote them to an excited electronic state from which they can fluo-resce to return to the ground state. Figure 21-4 shows atomic fluorescence from 2 ppb of leadin tap water. Atomic fluorescence is potentially a thousand times more sensitive than atomicabsorption, but equipment for atomic fluorescence is not common. An important example ofatomic fluorescence is in the analysis of mercury (Box 21-1).
By contrast, atomic emission (Figure 21-1) is widely used.5 Collisions in the very hotplasma promote some atoms to excited electronic states from which they can emit photons to
P0
Flame
PMonochromator Detector Amplifier
Readoutdevice
Analyte samplein beaker
Fuel
Air
Hollow-cathode
lamp
Wavelength (nm)
Fe
Fe+
Ni
Fe
Cr
Cr+
Fe
300.3300.4 300.2 300.1
Sig
nal (
thou
sand
s of
cou
nts)
in c
harg
e co
uple
d de
vice
500
Capillarytube
193 nm laserfor excitation
Liquiddrop
1 nm
Signal from tapwater containing2 ppb Pb
Standards
40 ppb20
105
0
Atomicfluorescenceat 406 nm
Detector
1 064 nmlaser forvaporization
400
300
200
100
0400 10 20
[Pb] (parts per billion)30
Figure 21-3 A portion of the emissionspectrum of a steel hollow-cathode lamp,showing lines from gaseous Fe, Ni,and Cr atomsand weak lines from and ions. Themonochromator resolution is 0.001 nm, which iscomparable to the true linewidths.[From A. P. Thorne, “Fourier Transform Spectrometry in
the Ultraviolet,” Anal. Chem. 1991, 63, 57A.]
Fe�Cr�
Figure 21-4 Atomic fluorescence from Pb at 405.8 nm. Water containing parts per billion (ppb) of colloidal was ejected from a capillary tube and exposed to a 6-ns pulse of 1 064-nm laser radiation focused on the drop. This pulse created a plume of vapor moving toward the laser. After , the plume was exposed to a 193-nm laser pulse, creating excited Pb atoms whose fluorescence was measured for with an optical system whose resolution was 0.2 nm. The figure shows a calibration curve constructed from colloidal standards and the signal from tap water containing 2 ppb Pb. [From S. K. Ho and N. H. Cheung, “Sub-Part-per-Billion
Analysis of Aqueous Lead Colloids by ArF Laser Induced Atomic Fluorescence,” Anal. Chem. 2005, 77, 193.]
PbCO3
0.1 �s2.5 �s
PbCO3
Figure 21-2 Atomic absorption experiment. As in Figure 18-4, and. In practice, is the irradiance reaching the detector when no sample is
going into the flame, and P is measured while sample is present.P0absorbance � A � �log T
transmittance � T � P/P0
Fluorescence is more sensitive than absorptionbecause we can observe a weak fluorescencesignal above a dark background. In absorption,we are looking for small differences betweenlarge amounts of light reaching the detector.

return to lower-energy states. No lamp is required. Emission intensity is proportional to theconcentration of the element in the sample. Emission from atoms in a plasma is now thedominant form of atomic spectroscopy.
21-2 Atomization: Flames, Furnaces,and Plasmas
In atomic spectroscopy, analyte is atomized in a flame, an electrically heated furnace, or aplasma. Flames were used for decades, but they have been replaced by the inductively cou-pled plasma and the graphite furnace. We begin our discussion with flames because they arestill common in teaching labs.
FlamesMost flame spectrometers use a premix burner, such as that in Figure 21-5, in which fuel,oxidant, and sample are mixed before introduction into the flame. Sample solution is drawninto the pneumatic nebulizer by the rapid flow of oxidant (usually air) past the tip of the sam-ple capillary. Liquid breaks into a fine mist as it leaves the capillary. The spray is directedagainst a glass bead, upon which the droplets break into smaller particles. The formation ofsmall droplets is termed nebulization. A fine suspension of liquid (or solid) particles in a gasis called an aerosol. The nebulizer creates an aerosol from the liquid sample. The mist, oxi-
456 CHAPTER 21 Atomic Spectroscopy
Box 21-1 Mercury Analysis by Cold Vapor Atomic Fluorescence
Mercury is a volatile toxic pollutant. The map shows Hg(0) con-centrations in the air near Earth’s surface. Mercury is also foundas Hg(II)(aq) in clouds and on particles in the atmosphere.
Approximately two-thirds of atmospheric mercury comes fromhuman activities, including coal burning, waste incineration, and
production by the chlor-alkali process (Problem 17-7).A sensitive method to measure mercury in matrices such as
water, soil, and fish generates Hg(g), which is measured by atomicabsorption or fluorescence. For most environmental samples,automated digestion/analysis equipment is available.4 For wateranalysis by one standard method, all mercury is first oxidized toHg(II) with BrCl in the purge flask in the drawing. Halogensare reduced with hydroxylamine , and Hg(II) is reducedto Hg(0) with . Hg(0) is then purged from solution by bub-bling purified Ar or . Hg(0) is collected at room temperature inN2
SnCl2
(NH2OH)
Cl2
the sample trap, which contains gold-coated silica sand. Hg bindsto Au while other gases in the purge stream pass through. Thesample trap is then heated to to release Hg(g), which iscaught in the analytical trap at room temperature. Two traps areused so that all other gaseous impurities are removed prior toanalysis. Hg(g) is then released from the analytical trap by heatingand flows into the fluorescence cell. Fluorescence intensitystrongly depends on gaseous impurities that can quench the emis-sion from Hg.
The lower limit of quantitation is (parts per tril-lion). To measure such small quantities requires extraordinary careat every stage of analysis to prevent contamination. Mercuryamalgam fillings in a worker’s teeth can contaminate samplesexposed to exhaled breath.
�0.5 ng/L
450°C
Mercury analysis by U.S. Environmental Protection Agency Method 1631.
Ar in
O2removaltrap
Hgremovaltrap (Au)
Bubbler
NaOH/CaOtrap for acid fumes
Sampletrap
Analyticaltrap
Fluorescencecell
Hg lamp
Interferencefilter
Flowmeter
Hgremovaltrap (Au)
Vent
450�C 450�C
hν
Hg
Hg
HgFluorescence
Photo-multipliertube
Global annual average surface concentration of Hg(0). [From C. Seigneur,
K. Vijayaraghavan, P. Karamchandani, and C. Scott, “Global Source Attribution of
Mercury Deposition in the United States,” Environ. Sci. Technol. 2004, 38, 555.]
1.1 1.4 1.5 1.6 1.7 1.9 2.1 ng Hg(0)/m3
Organic solvents with surface tensions lowerthan that of water are excellent for atomicspectroscopy because they form smallerdroplets, thus leading to more efficientatomization.
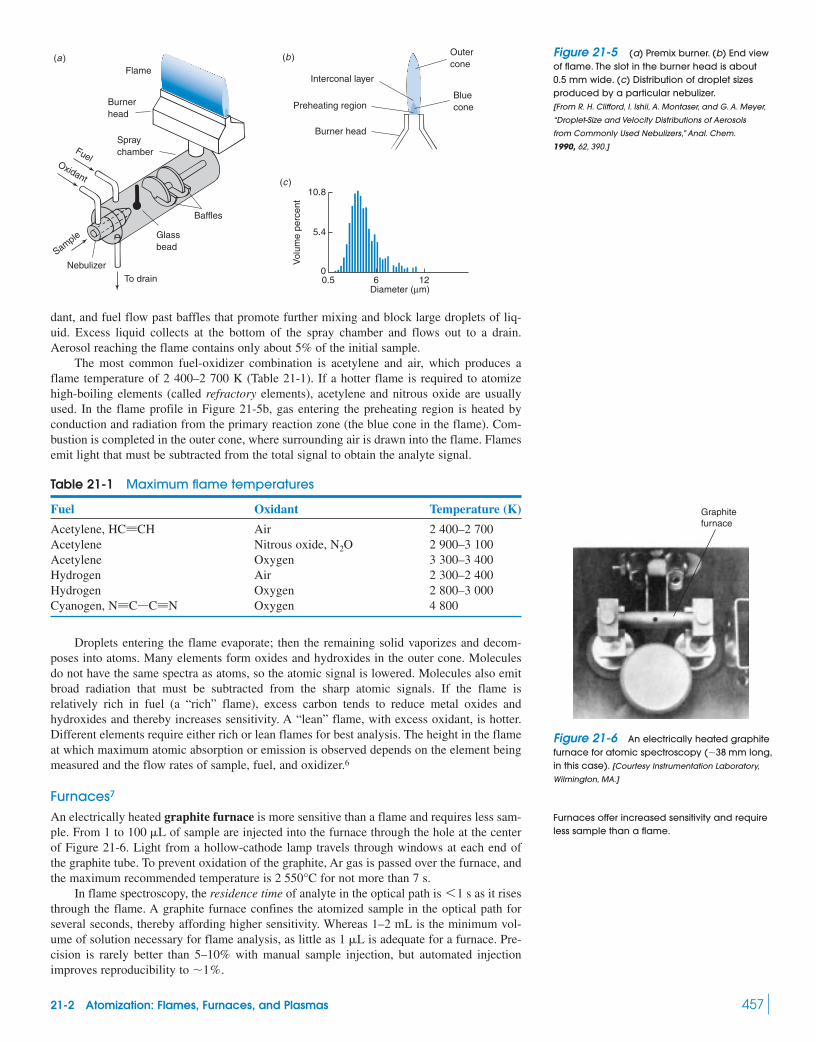
21-2 Atomization: Flames, Furnaces, and Plasmas 457
dant, and fuel flow past baffles that promote further mixing and block large droplets of liq-uid. Excess liquid collects at the bottom of the spray chamber and flows out to a drain.Aerosol reaching the flame contains only about 5% of the initial sample.
The most common fuel-oxidizer combination is acetylene and air, which produces aflame temperature of 2 400–2 700 K (Table 21-1). If a hotter flame is required to atomizehigh-boiling elements (called refractory elements), acetylene and nitrous oxide are usuallyused. In the flame profile in Figure 21-5b, gas entering the preheating region is heated byconduction and radiation from the primary reaction zone (the blue cone in the flame). Com-bustion is completed in the outer cone, where surrounding air is drawn into the flame. Flamesemit light that must be subtracted from the total signal to obtain the analyte signal.
Vol
ume
perc
ent
0
5.4
10.8
Diameter (µm)60.5 12
(c )
(b )(a )Flame
Burnerhead
SpraychamberFuel
Oxidant
Sample
Baffles
Glassbead
NebulizerTo drain
Interconal layer
Preheating region
Outercone
Bluecone
Burner head
Table 21-1 Maximum flame temperatures
Fuel Oxidant Temperature (K)
Acetylene, Air 2 400–2 700Acetylene Nitrous oxide, 2 900–3 100Acetylene Oxygen 3 300–3 400Hydrogen Air 2 300–2 400Hydrogen Oxygen 2 800–3 000Cyanogen, Oxygen 4 800NΩCßCΩN
N2OHCΩCH
Figure 21-5 (a) Premix burner. (b) End viewof flame. The slot in the burner head is about0.5 mm wide. (c) Distribution of droplet sizesproduced by a particular nebulizer.[From R. H. Clifford, I. Ishii, A. Montaser, and G. A. Meyer,
“Droplet-Size and Velocity Distributions of Aerosols
from Commonly Used Nebulizers,” Anal. Chem.
1990, 62, 390.]
Graphitefurnace
Figure 21-6 An electrically heated graphitefurnace for atomic spectroscopy ( long,in this case). [Courtesy Instrumentation Laboratory,
Wilmington, MA.]
�38 mm
Furnaces offer increased sensitivity and requireless sample than a flame.
Droplets entering the flame evaporate; then the remaining solid vaporizes and decom-poses into atoms. Many elements form oxides and hydroxides in the outer cone. Moleculesdo not have the same spectra as atoms, so the atomic signal is lowered. Molecules also emitbroad radiation that must be subtracted from the sharp atomic signals. If the flame isrelatively rich in fuel (a “rich” flame), excess carbon tends to reduce metal oxides andhydroxides and thereby increases sensitivity. A “lean” flame, with excess oxidant, is hotter.Different elements require either rich or lean flames for best analysis. The height in the flameat which maximum atomic absorption or emission is observed depends on the element beingmeasured and the flow rates of sample, fuel, and oxidizer.6
Furnaces7
An electrically heated graphite furnace is more sensitive than a flame and requires less sam-ple. From 1 to of sample are injected into the furnace through the hole at the centerof Figure 21-6. Light from a hollow-cathode lamp travels through windows at each end ofthe graphite tube. To prevent oxidation of the graphite, Ar gas is passed over the furnace, andthe maximum recommended temperature is for not more than 7 s.
In flame spectroscopy, the residence time of analyte in the optical path is as it risesthrough the flame. A graphite furnace confines the atomized sample in the optical path forseveral seconds, thereby affording higher sensitivity. Whereas 1–2 mL is the minimum vol-ume of solution necessary for flame analysis, as little as is adequate for a furnace. Pre-cision is rarely better than 5–10% with manual sample injection, but automated injectionimproves reproducibility to .�1%
1 �L
6 1 s2 550°C
100 �L

458 CHAPTER 21 Atomic Spectroscopy
When you inject sample, the droplet should contact the floor of the furnace and remainin a small area (Figure 21-7a). If you inject the droplet too high (Figure 21-7b), it splashesand spreads, leading to poor precision. In the worst case, the drop adheres to the tip of thepipet and is finally deposited around the injector hole when the pipet is withdrawn.
Compared with flames, furnaces require more operator skill to find proper conditions foreach type of sample. The furnace is heated in three or more steps to properly atomize the sam-ple. To measure Fe in the iron-storage protein ferritin, of sample containing Fe are injected into the furnace at . The furnace is programmed to dry the sample at
for 20 s to remove solvent. Drying is followed by 60 s of charring at to destroyorganic matter. Charring is also called pyrolysis, which means decomposing with heat. Charringcreates smoke that would interfere with the Fe determination. After charring, the sample isatomized at for 10 s. Absorbance reaches a maximum and then decreases as Fe evapo-rates from the oven. The analytical signal is the time-integrated absorbance during atomization.After atomization, the furnace is heated to for 3 s to clean out any remaining residue.
The furnace is purged with Ar or during each step except atomization to removevolatile material. Gas flow is halted during atomization to avoid blowing analyte out of thefurnace. When developing a method for a new kind of sample, it is important to record thesignal as a function of time, because signals are also observed from smoke during charringand from the glow of the red-hot oven in the last part of atomization. A skilled operator mustinterpret which signal is due to analyte so that the right peak is integrated.
The furnace in Figure 21-8a performs better than a simple graphite tube. Sample isinjected onto a platform that is heated by radiation from the furnace wall, so its temperaturelags behind that of the wall. Analyte does not vaporize until the wall reaches constant tem-perature (Figure 21-8b). At constant furnace temperature, the area under the absorbance peakin Figure 21-8b is a reliable measure of the analyte. A heating rate of 2 000 K/s rapidly dis-sociates molecules and increases the concentration of free atoms in the furnace.
The furnace in Figure 21-8a is heated transversely (from side to side) to provide nearlyuniform temperature over the whole furnace. In furnaces with longitudinal (end-to-end) heat-ing, the center of the furnace is hotter than the ends. Atoms from the central region condenseat the ends, where they can vaporize during the next sample run. Interference from previousruns, called a memory effect, is reduced in a transversely heated furnace. To further reducememory effects, ordinary graphite is coated with a dense layer of pyrolytic graphite formedby thermal decomposition of an organic vapor. The coating seals the relatively porousgraphite, so it cannot absorb foreign atoms.
A sample can be preconcentrated by injecting and evaporating multiple aliquots in thegraphite furnace prior to analysis.8 To measure traces of As in drinking water, a 30-�L
N2
2 500°C
2 100°C
1 400°C125°C�90°C
�0.1 ppm10 �L
You must determine reasonable time andtemperature for each stage of the analysis.Once a program is established, it can beapplied to a large number of similar samples.
Figure 21-7 (a) The correct position forinjecting sample into a graphite furnacedeposits the droplet in a small volume on thefloor of the furnace. (b) If injection is too high,the sample splatters and precision is poor. [From
P. K. Booth, “Improvements in Method Development for
Graphite Furnace Atomic Absorption Spectrometry,”
Am. Lab. February 1995, p. 48X.]
Tem
pera
ture
Abs
orba
nce
Time
From wall
Fromplatform
Sample port Lightin
Lightout
Furnacewall
Endview
CurvedL’vovplatform
Furnace walltemperature
(b )(a )
Figure 21-8 (a) Transversely heated graphite furnace maintains nearly constant temperature overits whole length, thereby reducing memory effect from previous runs. The L’vov platform is uniformlyheated by radiation from the outer wall, not by conduction. The platform is attached to the wall by onesmall connection that is hidden from view. [Courtesy Perkin-Elmer Corp., Norwalk, CT.] (b) Heating profilescomparing analyte evaporation from wall and from platform. [From W. Slavin, “Atomic Absorption
Spectroscopy,” Anal. Chem. 1982, 54, 685A.]
Droplet Pipet
(a)
Dro
plet
(b)

aliquot of water plus matrix modifier was injected and evaporated. The procedure wasrepeated five more times so that the total sample volume was . The detection limit forAs was . Without preconcentration, the detection limit wouldhave been . This increased capability is critical because As is considered to be ahealth hazard at concentrations of just a few parts per billion.
Liquid samples are ordinarily used in furnaces. However, in direct solid sampling, asolid is analyzed without sample preparation (Figure 21-9). For example, trace impurities intungsten powder used to make components for industry can be analyzed by weighing 0.1 to100 mg of powder onto a graphite platform.9 The platform is transferred into the furnace andheated to to atomize impurities in the tungsten, but not the tungsten itself, whichmelts at . After several runs, residual tungsten is scraped off the platform, whichcould be reused 400 times. Because so much more sample is analyzed when solid is injectedthan when liquid is injected, detection limits for trace impurities can be as much as 100 timeslower than those obtained for liquid injection. For example, Zn could be detected at a level of10 pg/g (10 parts per trillion) when 100 mg of tungsten were analyzed. Calibration curves areobtained by injecting standard solutions of the trace elements and analyzing them as conven-tional liquids. Results obtained from direct solid sampling are in good agreement with resultsobtained by laboriously dissolving the solid. Other solids that have been analyzed by directsolid sampling include graphite, silicon carbide, cement, and river sediments.10
Matrix Modifiers for FurnacesEverything in a sample other than analyte is called the matrix. Ideally, the matrix decom-poses and vaporizes during the charring step. A matrix modifier is a substance added to thesample to reduce the loss of analyte during the charring by making the matrix more volatileor the analyte less volatile.
The matrix modifier ammonium nitrate can be added to seawater to increase the volatil-ity of the matrix NaCl. Figure 21-10a shows a graphite furnace heating profile used toanalyze Mn in seawater. When 0.5 M NaCl solution is subjected to this profile, signals areobserved at the analytical wavelength of Mn, (Figure 21-10b). Much of the apparentabsorbance is probably due to optical scatter by smoke created by heating NaCl. Absorptionat the start of the atomization step interferes with the measurement of Mn. Adding to the sample in Figure 21-10c reduces matrix absorption peaks. plus NaCl give
and , which cleanly evaporate instead of making smoke.NaNO3NH4ClNH4NO3
NH4NO3
3 410°C2 600°C
1.8 �g/L0.3 �g/L (parts per billion)
180 �L
21-2 Atomization: Flames, Furnaces, and Plasmas 459
Solid sampleweighed ontographiteplatform
Time (s)
Tem
pera
ture
(°C
)A
bsor
banc
eA
bsor
banc
e
2 000
1 000
0
0
0
0
0.3
0.2
40 80 120
Ato
miz
e
Char
Dry
(b )
(c )
(a )
Figure 21-9 Direct solid sampling showingend view of furnace.
Figure 21-10 Reduction of interference byusing a matrix modifier. (a) Graphite furnacetemperature profile for analysis of Mn inseawater. (b) Absorbance profile when of0.5 M reagent-grade NaCl is subjected to thetemperature profile in panel a. Absorbanceis monitored at the Mn wavelength of 279.5 nmwith a bandwidth of 0.5 nm. (c) Reducedabsorbance from of 0.5 M NaCl plus of 50 wt% matrix modifier. [From M. N.
Quigley and F. Vernon, “Matrix Modification Experiment
for Electrothermal Atomic Absorption
Spectrophotometry,” J. Chem. Ed. 1996, 73, 980.]
NH4NO3
10 �L10 �L
10 �L

The matrix modifier is added to seawater to decrease the volatility of the ana-lyte Sb. In the absence of modifier, 90% of Sb is lost during charring at . With themodifier, the seawater matrix can be largely evaporated at without loss of Sb.11
When a graphite furnace is used, it is important to monitor the absorption signal as afunction of time, as in Figure 21-10b. Peak shapes help you decide how to adjust time andtemperature for each step to obtain a clean signal from analyte. Also, a graphite furnace hasa finite lifetime. Degradation of peak shape or a large change in the slope of the calibrationcurve tells you that it is time to change the furnace.
The matrix modifier raises the temperature for atomization of Al analyte.12
At high temperature, decomposes to MgO(g) and Al is converted into . Atsufficiently high temperature, decomposes to Al and O, and Al evaporates. Evapora-tion of Al is retarded by MgO(g) by virtue of the reaction
(21-1)
When MgO has evaporated, Reaction 21-1 no longer occurs and decomposes andevaporates. A matrix modifier that raises the boiling temperature of analyte allows a highercharring temperature to be used to remove matrix without losing analyte.
Inductively Coupled PlasmasThe inductively coupled plasma13 shown at the beginning of the chapter is twice as hot as acombustion flame (Figure 21-11). The high temperature, stability, and relatively inert Arenvironment in the plasma eliminate much of the interference encountered with flames.Simultaneous multielement analysis, described in Section 21-4, is routine for inductively cou-pled plasma atomic emission spectroscopy, which has replaced flame atomic absorption. Theplasma instrument costs more to purchase and operate than a flame instrument.
The cross-sectional view of an inductively coupled plasma burner in Figure 21-12 showstwo turns of a 27- or 41-MHz induction coil wrapped around the upper opening of the quartzapparatus. High-purity Ar gas is fed through the plasma gas inlet. After a spark from a Teslacoil ionizes Ar, free electrons are accelerated by the radio-frequency field. Electrons collidewith atoms and transfer their energy to the entire gas, maintaining a temperature of 6 000 to10 000 K. The quartz torch is protected from overheating by Ar coolant gas.
The concentration of analyte needed for adequate signal is reduced by an order of mag-nitude with an ultrasonic nebulizer (Figure 21-13), in which sample solution is directed ontoa piezoelectric crystal oscillating at 1 MHz. The vibrating crystal creates a fine aerosol that iscarried by a stream of Ar through a heated tube, where solvent evaporates. The stream thenpasses through a refrigerated zone in which solvent condenses and is removed. Analytereaches the plasma flame as an aerosol of dry, solid particles. Plasma energy is not needed toevaporate solvent, so more energy is available for atomization. Also, a larger fraction of thesample reaches the plasma than with a conventional nebulizer.
Al2O3
3MgO(g) � 2Al(s) T 3Mg(g) � Al2O3(s)
Al2O3
Al2O3Mg(NO3)2
Mg(NO3)2
1 400°C1 250°C
Pd(NO3)2
460 CHAPTER 21 Atomic Spectroscopy
Temperature (K)( 10%)
6 000
6 200
6 5006 800
(estimate)
10 000
Sampleaerosol
Hei
ght a
bove
load
coi
l (m
m)
15
20
25
8 000
+ −
Figure 21-11 Temperature profile of induc-tively coupled plasma. [From V. A. Fassel,“Simultane-
ous or Sequential Determination of the Elements at All
Concentration Levels,” Anal. Chem. 1979, 51, 1290A.]
Quartz bonnet
Two-turnradio-frequency
load coil
Capillaryinjection tube
Plasma tube
Coolant tube
Sample tube
Coolantgas inlet
Plasmagas inlet
Sample aerosolinlet
Figure 21-12 Inductively coupled plasmaburner. [From R. N. Savage and G. M. Hieftje, “Miniature
Inductively Coupled Plasma Source for Atomic Emission
Spectrometry,” Anal. Chem. 1979, 51, 408.]
Desolvatedaerosol toplasma
Coolant in
Drain
Drain
Coolant out
Condenser
HeatedtubeHeat sink
Gas inlet
Aerosol chamber
Sample inlet
Piezoelectric crystal
(a )
Figure 21-13 (a) Ultrasonic nebulizerlowers the detection limit for most elementsby an order of magnitude. (b) Mist createdwhen sample is sprayed against vibratingcrystal. [Courtesy Cetac Technologies,
Omaha, NB.]
A piezoelectric crystal is one whose dimensionschange in an applied electric field. A sinusoidalvoltage applied between two faces of thecrystal causes it to oscillate. Quartz is the mostcommon piezoelectric material.
(b)

Sensitivity with an inductively coupled plasma is further enhanced by a factor of 3–10by observing emission along the length of the plasma instead of across the diameter of theplasma. Additional sensitivity is obtained by detecting ions with a mass spectrometer insteadof by optical emission (Table 21-2), as described in Section 21-6.
21-3 How Temperature Affects Atomic Spectroscopy
Temperature determines the degree to which a sample breaks down into atoms and the extentto which a given atom is found in its ground, excited, or ionized states. Each of these effectsinfluences the strength of the signal we observe.
The Boltzmann DistributionConsider an atom with energy levels and separated by (Figure 21-14). An atom(or molecule) may have more than one state at a given energy. Figure 21-14 shows threestates at and two at . The number of states at each energy is called the degeneracy. Wewill call the degeneracies and .
The Boltzmann distribution describes the relative populations of different states atthermal equilibrium. If equilibrium exists (which is not true in the blue cone of a flame but isprobably true above the blue cone), the relative population of any two states is
Boltzmann distribution: (21-2)
where T is temperature (K) and k is Boltzmann’s constant .
Effect of Temperature on Excited-State PopulationThe lowest excited state of a sodium atom lies above the ground state.The degeneracy of the excited state is 2, whereas that of the ground state is 1. The fraction ofNa in the excited state in an acetylene-air flame at 2 600 K is, from Equation 21-2,
That is, less than 0.02% of the atoms are in the excited state.If the temperature were 2 610 K, the fraction of atoms in the excited state would be
The fraction of atoms in the excited state is still less than 0.02%, but that fraction hasincreased by .
The Effect of Temperature on Absorption and EmissionWe see that more than 99.98% of the sodium atoms are in their ground state at 2 600 K. Vary-ing the temperature by 10 K hardly affects the ground-state population and would not notice-ably affect the signal in atomic absorption.
100(1.74 � 1.67)/1.67 � 4%
N*
N0� a2
1b e�(3.371 � 10�19 J)/[(1.381 � 10�23 J/K) � (2 610 K)] � 1.74 � 10�4
N*
N0� a2
1b e�(3.371 � 10�19 J)/[(1.381 � 10�23 J/K) � (2 600 K)] � 1.67 � 10�4
3.371 � 10�19 J/atom
(1.381 � 10�23 J/K)
N*
N0�
g*
g0 e��E/kT
(N*/N0)
g*g0
E0E*
�EE*E0
21-3 How Temperature Affects Atomic Spectroscopy 461
Abs
orpt
ion
Em
issi
on
∆E
E *, g* = 3, excitedstate
E0, g0 = 2, groundstate
Figure 21-14 Two energy levels withdifferent degeneracies. Ground-state atomscan absorb light to be promoted to theexcited state. Excited-state atoms can emitlight to return to the ground state.
The Boltzmann distribution applies to a systemat thermal equilibrium.
A 10-K temperature rise changes the excited-state population by 4% in this example.
Table 21-2 Comparison of detection limits for Ni� ion at 231 nm
Detection limits forTechniquea different instruments (ng/mL)
ICP/atomic emission 3–50(pneumatic nebulizer)
ICP/atomic emission 0.3–4(ultrasonic nebulizer)
Graphite furnace/ 0.02–0.06atomic absorption
ICP/mass spectrometry 0.001–0.2
a. ICP � inductively coupled plasma.
SOURCE: J. M. Mermet and E. Poussel, “ICP Emission Spectrometers: AnalyticalFigures of Merit,” Appl. Spectros. 1995, 49, 12A.

How would emission intensity be affected by a 10 K rise in temperature? In Figure 21-14,absorption arises from ground-state atoms, but emission arises from excited-state atoms.Emission intensity is proportional to the population of the excited state. Because the excited-state population changes by 4% when the temperature rises 10 K, emission intensity rises by4%. It is critical in atomic emission spectroscopy that the flame be very stable or emissionintensity will vary significantly. In atomic absorption spectroscopy, temperature variation isimportant but not as critical.
Almost all atomic emission is carried out with an inductively coupled plasma, whosetemperature is more stable than that of a flame. The plasma is normally used for emission,not absorption, because it is so hot that there is a substantial population of excited-stateatoms and ions. Table 21-3 compares excited-state populations for a flame at 2 500 K and aplasma at 6 000 K. Although the fraction of excited atoms is small, each atom emits manyphotons per second because it is rapidly promoted back to the excited state by collisions.
Energy levels of halogen atoms (F, Cl, Br, I) are so high that they emit ultraviolet radia-tion below 200 nm. This spectral region is called vacuum ultraviolet because radiation below200 nm is absorbed by , so spectrometers for the far-ultraviolet were customarily evacu-ated. Some plasma emission spectrometers are now purged with to exclude air so that theregion 130 to 200 nm is accessible and Cl, Br, I, P, and S can be analyzed.14
21-4 InstrumentationFundamental requirements for an atomic absorption experiment are shown in Figure 21-2.Principal differences between atomic and ordinary molecular spectroscopy lie in the lightsource (or lack of a light source in atomic emission), the sample container (the flame, fur-nace, or plasma), and the need to subtract background emission.
Atomic Linewidths15
Beer’s law requires that the linewidth of the radiation source should be substantially narrowerthan the linewidth of the absorbing sample. Otherwise, the measured absorbance will not beproportional to the sample concentration. Atomic absorption lines are very sharp, with anintrinsic width of only .
Linewidth is governed by the Heisenberg uncertainty principle, which says that theshorter the lifetime of the excited state, the more uncertain is its energy:
Heisenberg uncertainty principle: (21-3)
where is the uncertainty in the energy difference between ground and excited states, isthe lifetime of the excited state before it decays to the ground state, and h is Planck’s con-stant. Equation 21-3 says that the uncertainty in the energy difference between two statesmultiplied by the lifetime of the excited state is at least as big as . If decreases, then
increases. The lifetime of an excited state of an isolated gaseous atom is . There-fore, the uncertainty in its energy is
Suppose that the energy difference between the ground and the excited states ofan atom corresponds to visible light with a wavelength of . This energy dif-ference is (Equation 18-3, c is the speed of light). The rela-tive uncertainty in the energy difference is .dE/�E � (10�25 J) / (4.0 � 10�19 J) � 2 � 10�7
�E � hc/� � 4.0 � 10�19 J� � 500 nm
(�E)
dE �h
4dt�
6.6 � 10�34 J � s
4(10�9 s)� 10�25 J
�10�9 sdEdth/4
dtdE
dEdt �h
4
�10�4 nm
N2
O2
462 CHAPTER 21 Atomic Spectroscopy
The linewidth of the source must be narrowerthan the linewidth of the atomic vapor forBeer’s law to be obeyed. “Linewidth” and“bandwidth” are used interchangeably, but“lines” are narrower than “bands.”
E in Equation 21-2 is the difference in energybetween ground and excited states. E inEquation 21-3 is the uncertainty in E. E is asmall fraction of E.�
d�
d
�
Table 21-3 Effect of energy difference and temperature on population of excited states
Excited-state fraction (N*/N0)aWavelength difference Energy differenceof states (nm) of states (J/atom) 2 500 K 6 000 K
250500750
a. Based on the equation N*/N0 � (g*/g0)e��E/kT in which g* � g0 � 1.
4.1 � 10�24.6 � 10�42.65 � 10�198.3 � 10�31.0 � 10�53.97 � 10�196.8 � 10�51.0 � 10�107.95 � 10�19
Atomic absorption is not as sensitive totemperature as atomic emission, which isexponentially sensitive to temperature.

The relative uncertainty in wavelength is the same as the relative uncertainty inenergy:
(21-4)
The inherent linewidth of an atomic absorption or emission signal is because ofthe short lifetime of the excited state.
Two mechanisms broaden the lines to to in atomic spectroscopy. One isthe Doppler effect. An atom moving toward the radiation source samples the oscillatingelectromagnetic wave more frequently than one moving away from the source (Figure 21-15).That is, an atom moving toward the source “sees” higher-frequency light than that encoun-tered by one moving away. In the laboratory frame of reference, the atom moving toward thesource absorbs lower-frequency light than that absorbed by the one moving away. Thelinewidth, , due to the Doppler effect, is
Doppler linewidth: (21-5)
where T is temperature (K) and M is the mass of the atom in atomic mass units. For an emis-sion line near from at 2 500 K in Figure 21-3,the Doppler linewidth is , which is an orderof magnitude greater than the natural linewidth.
Linewidth is also affected by pressure broadening from collisions between atoms. Col-lisions shorten the lifetime of the excited state. The uncertainty in the frequency of atomicabsorption and emission lines is roughly numerically equal to the collision frequencybetween atoms and is proportional to pressure. The Doppler effect and pressure broadeningare similar in magnitude and yield linewidths of to in atomic spectroscopy.
Hollow-Cathode LampMonochromators generally cannot isolate lines narrower than to . To producenarrow lines of the correct frequency, we use a hollow-cathode lamp containing a vapor ofthe same element as that being analyzed.
A hollow-cathode lamp, in Figure 21-16, is filled with Ne or Ar at a pressure of. The cathode is made of the element whose emission lines we want.
When are applied between the anode and the cathode, gas is ionized and positive ionsare accelerated toward the cathode. After ionization occurs, the lamp is maintained at a con-stant current of 2–30 mA by a lower voltage. Cations strike the cathode with enough energy to“sputter” metal atoms from the cathode into the gas phase. Gaseous atoms excited by colli-sions with high-energy electrons emit photons. This atomic radiation has the same frequencyabsorbed by analyte in the flame or furnace. Atoms in the lamp are cooler than atoms in aflame, so lamp emission is sufficiently narrower than the absorption bandwidth of atoms in theflame to be nearly “monochromatic” (Figure 21-17). The purpose of a monochromator inatomic spectroscopy is to select one line from the hollow-cathode lamp and to reject as muchemission from the flame or furnace as possible. A different lamp is usually required for eachelement, although some lamps are made with more than one element in the cathode.
�500 V�130–700 Pa (1–5 Torr)
10�2 nm10�3
10�2 nm10�3
(300 nm)(7 � 10�7)22 500/56 � 0.001 4 nmFe (M � 56 atomic mass units)� � 300 nm
d� � �(7 � 10�7) B T
M
d�
10�2 nm10�3
�10�4 nm
d�
��dE
�E� 2 � 10�7 1 d� � 10�4 nm
(d�/�)
21-4 Instrumentation 463
Doppler and pressure effects broaden theatomic lines by one to two orders of magnituderelative to their inherent linewidths.
(+)
(–)
Insulating disk
AnodeHollowcathode
Quartz orglass window
Figure 21-16 A hollow-cathode lamp.
Inte
nsity
Wavelength
Monochromatorbandwidth
(~100× greater thanatomic lines)
Bandwidth ofabsorption line
Bandwidth ofhollow-cathodelamp emission
Figure 21-17 Relative bandwidths ofhollow-cathode emission, atomic absorption,and a monochromator. Linewidths aremeasured at half the signal height. Thelinewidth from the hollow cathode is relativelynarrow because the gas temperature in thelamp is lower than a flame temperature(so there is less Doppler broadening) and thepressure in the lamp is lower than the pressurein a flame (so there is less pressurebroadening).
is the width of an absorption or emissionline measured at half the height of the peak.��
Ligh
t sou
rce
Figure 21-15 The Doppler effect. A moleculemoving (a) toward the radiation source “feels”the electromagnetic field oscillate more oftenthan one moving (b) away from the source.
Ligh
t sou
rce
(a)
(b)
Multielement Detection with the Inductively Coupled PlasmaAn inductively coupled plasma emission spectrometer does not require any lamps and canmeasure as many as elements simultaneously. Color Plates 23 and 24 illustrate twodesigns for multielement analysis. In Plate 23, atomic emission enters the polychromator and
�70

is dispersed into its component wavelengths by the grating at the bottom. One photomulti-plier detector (Figure 20-12) is required at the correct position for each element to beanalyzed.
In Plate 24, atomic emission entering from the top right is reflected by a collimatingmirror (which makes the light rays parallel), dispersed in the vertical plane by a prism, andthen dispersed in the horizontal plane by a grating. Dispersed radiation lands on a chargeinjection device (CID) detector, which is related to the charge coupled device (CCD) inFigure 20-15. Different wavelengths are spread over the 262 000 pixels of the CID shown atthe upper left of Plate 24. In a CCD detector, each pixel must be read one at a time in row-by-row order. Each pixel of a CID detector can be read individually at any time. Anotheradvantage of the CID detector over the CCD detector is that strong signals in one pixel areless prone to spill over into neighboring pixels (a process called blooming in CCD detectors).CID detectors can therefore measure weak emission signals adjacent to strong signals.Figure 21-18 shows an actual spectrum as seen by a CID detector.
The spectrometer in Color Plate 24 is purged with or Ar to exclude , therebyallowing ultraviolet wavelengths in the 100–200 nm range to be observed. This spectralregion permits more sensitive detection of some elements that are normally detected atlonger wavelengths and allows halogens, P, S, and N to be measured (with poor detectionlimits of tens of parts per million). These nonmetallic elements cannot be observed at wave-lengths above 200 nm. The photomultiplier spectrometer in Color Plate 23 is more expensiveand complicated than the CID spectrometer in Color Plate 24 but provides lower detectionlimits because a photomultiplier tube is more sensitive than a CID detector.
O2N2
464 CHAPTER 21 Atomic Spectroscopy
Fe238.204(n = 141)
Fe239.562(n = 140)
Fe259.940(n = 129)
Fe259.837(n = 129)
Fe240.488(n = 139)
Fe238.204(n = 140)
Fe239.562(n = 139)
224
238
301
416
844
1 055
nm Ar 763.510 (n = 44) Ar 696.543 (n = 48)
Figure 21-18 “Constellation image” of inductively coupled plasma emission from seen by charge injection detector. Almost all peaks are from iron. Horizontally blurred “galaxies” nearthe top are Ar plasma emission. A prism spreads wavelengths of 200–400 nm over most of the detector.
are bunched together at the top. A grating provides high resolution in thehorizontal direction. Selected peaks are labeled with wavelength (in nanometers) and diffraction order(n in Equation 20-1) in parentheses. Two Fe peaks labeled in color at the lower left and lower right areboth the same wavelength (238.204 nm) diffracted into different orders by the grating. [Courtesy
M. D. Seltzer, Michelson Laboratory, China Lake, CA.]
Wavelengths 7 400 nm
200 �g Fe/mL

Background CorrectionAtomic spectroscopy must provide background correction to distinguish analyte signalfrom absorption, emission, and optical scattering of the sample matrix, the flame, plasma, orwhite-hot graphite furnace. Figure 21-19 shows the spectrum of a sample analyzed in agraphite furnace. Sharp atomic signals with a maximum absorbance near 1.0 are superim-posed on a broad background with an absorbance of 0.3. If we did not subtract the back-ground absorbance, significant errors would result. Background correction is critical forgraphite furnaces, which tend to contain residual smoke from charring. Optical scatter fromsmoke must be distinguished from optical absorption by analyte.
Figure 21-20 shows how background is subtracted in an emission spectrum collectedwith a charge injection device detector. The figure shows 15 pixels from one row of thedetector centered on an analytical peak. (The spectrum is manipulated by a computer algo-rithm to make it look smooth, even though the original data consist of a single reading foreach pixel and would look like a bar graph.) Pixels 7 and 8 were selected to represent thepeak. Pixels 1 and 2 represent the baseline at the left and pixels 14 and 15 represent the base-line at the right. The mean baseline is the average of pixels 1, 2, 14, and 15. The mean peakamplitude is the average of pixels 7 and 8. The corrected peak height is the mean peak ampli-tude minus the mean baseline amplitude.
For atomic absorption, beam chopping or electrical modulation of the hollow-cathodelamp (pulsing it on and off) can distinguish the signal of the flame from the atomic line at thesame wavelength. Figure 21-21 shows light from the lamp being periodically blocked by arotating chopper. Signal reaching the detector while the beam is blocked must be from flameemission. Signal reaching the detector when the beam is not blocked is from the lamp and theflame. The difference between the two signals is the desired analytical signal.
Beam chopping corrects for flame emission but not for scattering. Most spectrometersprovide an additional means to correct for scattering and broad background absorption. Deu-terium lamps and Zeeman correction systems are most common.
For deuterium lamp background correction, broad emission from a lamp (Figure 20-3)is passed through the flame in alternation with that from the hollow cathode. The monochro-mator bandwidth is so wide that a negligible fraction of radiation is absorbed by the ana-lyte atomic absorption line. Light from the hollow-cathode lamp is absorbed by analyte andabsorbed and scattered by background. Light from the lamp is absorbed and scatteredonly by background. The difference between absorbance measured with the hollow-cathodeand absorbance measured with the lamp is the absorbance due to analyte.D2
D2
D2
D2
21-4 Instrumentation 465
0.6
248.0
Abs
orba
nce
Wavelength (nm)248.5 249.0 249.5247.5
0.3
0.9
1.2
0.0
Pb
Fe
Fe
Fe Fe
FeFe
Fe
Cu
Figure 21-19 Graphite furnace absorptionspectrum of bronze dissolved in . [From
B. T. Jones, B. W. Smith, and J. D. Winefordner,
“Continuum Source Atomic Absorption Spectrometry in
a Graphite Furnace with Photodiode Array Detection,”
Anal. Chem. 1989, 61, 1670.]
HNO3
Background correction methods:
• adjacent pixels of CID display• beam chopping• D2 lamp• Zeeman
1 2 7 8 14 15
Pixel
Sig
nal
Figure 21-20 Data from chargeinjection detector illustrating baselinecorrection in plasma emission spectrometry.The mean value of pixels on either side of apeak is subtracted from the mean value ofpixels under the peak. [Courtesy M. D. Seltzer,
Michelson Laboratory, China Lake, CA.]
Lamp
(a )
Burner
Lamp
Rotating chopper
(b )
(c ) Det
ecto
r si
gnal Lamp and flame Flame
Analyticalsignal
Burner
Time
Figure 21-21 Operation of a beam chopperfor subtracting the signal due to flame back-ground emission. (a) Lamp and flame emissionreach detector. (b) Only flame emission reachesdetector. (c) Resulting square wave signal.
Background signal arises from absorption,emission, or scatter by everything in the samplebesides analyte (the matrix), as well as fromabsorption, emission, or scatter by the flame,the plasma, or the furnace.
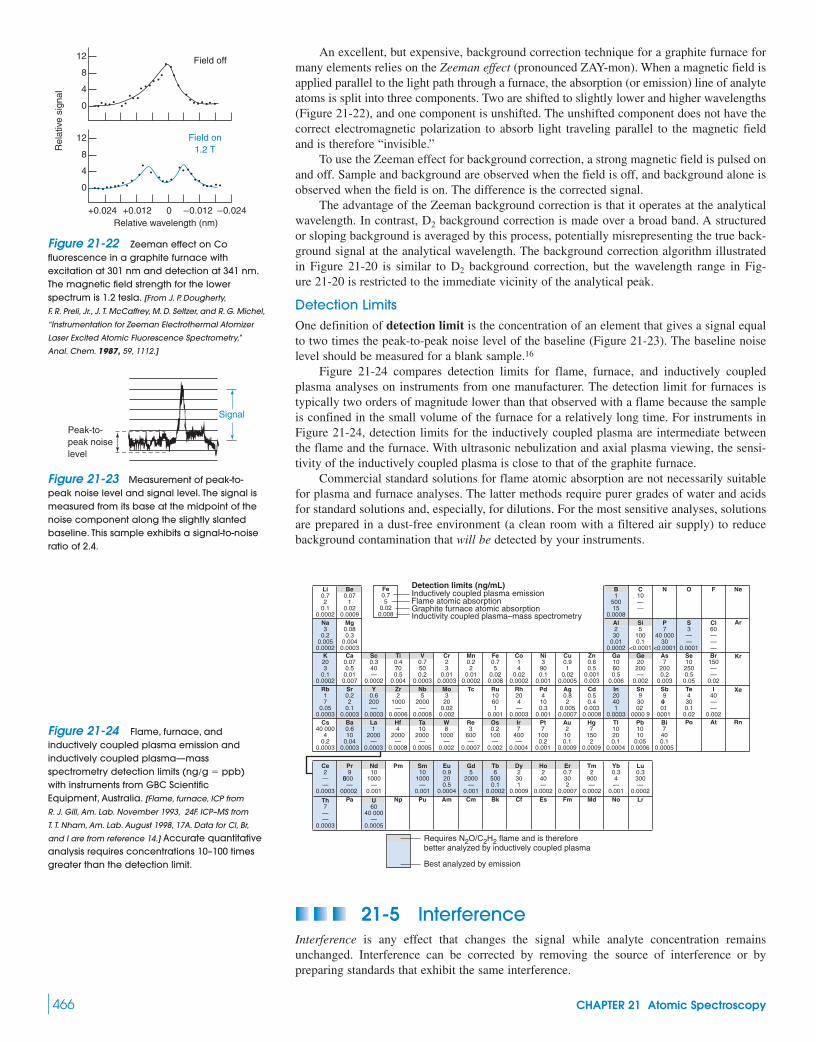
An excellent, but expensive, background correction technique for a graphite furnace formany elements relies on the Zeeman effect (pronounced ZAY-mon). When a magnetic field isapplied parallel to the light path through a furnace, the absorption (or emission) line of analyteatoms is split into three components. Two are shifted to slightly lower and higher wavelengths(Figure 21-22), and one component is unshifted. The unshifted component does not have thecorrect electromagnetic polarization to absorb light traveling parallel to the magnetic fieldand is therefore “invisible.”
To use the Zeeman effect for background correction, a strong magnetic field is pulsed onand off. Sample and background are observed when the field is off, and background alone isobserved when the field is on. The difference is the corrected signal.
The advantage of the Zeeman background correction is that it operates at the analyticalwavelength. In contrast, background correction is made over a broad band. A structuredor sloping background is averaged by this process, potentially misrepresenting the true back-ground signal at the analytical wavelength. The background correction algorithm illustratedin Figure 21-20 is similar to background correction, but the wavelength range in Fig-ure 21-20 is restricted to the immediate vicinity of the analytical peak.
Detection LimitsOne definition of detection limit is the concentration of an element that gives a signal equalto two times the peak-to-peak noise level of the baseline (Figure 21-23). The baseline noiselevel should be measured for a blank sample.16
Figure 21-24 compares detection limits for flame, furnace, and inductively coupledplasma analyses on instruments from one manufacturer. The detection limit for furnaces istypically two orders of magnitude lower than that observed with a flame because the sampleis confined in the small volume of the furnace for a relatively long time. For instruments inFigure 21-24, detection limits for the inductively coupled plasma are intermediate betweenthe flame and the furnace. With ultrasonic nebulization and axial plasma viewing, the sensi-tivity of the inductively coupled plasma is close to that of the graphite furnace.
Commercial standard solutions for flame atomic absorption are not necessarily suitablefor plasma and furnace analyses. The latter methods require purer grades of water and acidsfor standard solutions and, especially, for dilutions. For the most sensitive analyses, solutionsare prepared in a dust-free environment (a clean room with a filtered air supply) to reducebackground contamination that will be detected by your instruments.
D2
D2
466 CHAPTER 21 Atomic Spectroscopy
12R
elat
ive
sign
al
Relative wavelength (nm)
8
4
0
12
8
4
0
+0.024 +0.012 0 –0.012 –0.024
Field off
Field on1.2 T
Figure 21-22 Zeeman effect on Co fluorescence in a graphite furnace withexcitation at 301 nm and detection at 341 nm.The magnetic field strength for the lowerspectrum is 1.2 tesla. [From J. P. Dougherty,
F. R. Preli, Jr., J. T. McCaffrey, M. D. Seltzer, and R. G. Michel,
“Instrumentation for Zeeman Electrothermal Atomizer
Laser Excited Atomic Fluorescence Spectrometry,”
Anal. Chem. 1987, 59, 1112.]
Figure 21-23 Measurement of peak-to-peak noise level and signal level. The signal ismeasured from its base at the midpoint of thenoise component along the slightly slantedbaseline. This sample exhibits a signal-to-noiseratio of 2.4.
Li0.72
0.10.0002
Be0.07
10.02
0.0009Na3
0.20.0050.0002
Mg0.080.3
0.0040.0003
K203
0.10.0002
Ca0.070.50.010.007
Rb17
0.050.0003
Sr0.22
0.10.0003
Cs40 000
40.2
0.0003
Ba0.610
0.040.0003
Sc0.340—
0.0002
Ti0.4700.5
0.004Y
0.6200—
0.0003
Zr2
1000—
0.0006La1
2000—
0.0003
Hf4
2000—
0.0008
V0.7500.2
0.0003
Cr23
0.010.0003
Nb5
2000—
0.0008
Mo3
200.020.002
Ta10
2000—
0.0005
W8
1000—
0.002
Mn0.22
0.010.0002
Fe0.75
0.020.008
Tc Ru10601
0.001Re3
600—
0.0007
Os0.2100—
0.002
Co14
0.020.0002
Ni3900.1
0.001Rh204—
0.0003
Pd4100.3
0.001Ir7
400—
0.0004
Pt7
1000.2
0.001
Cu0.91
0.020.0005
Zn0.60.5
0.0010.003
Ag0.82
0.0050.0007
Cd0.50.4
0.0030.0008
Au2100.1
0.0009
Hg7
1502
0.0009
Ga10600.5
0.006
Ge20
200—
0.002In20401
0.0003
Sn9300.2
0.000 9Tl10200.1
0.0004
Pb1010
0.050.0006
As7
2000.2
0.003
Se10
2500.5
0.05Sb9400.1
0.001
Te4
300.1
0.02Bi7
400.1
0.0005
Po
Br150——
0.02I
40——
0.002At
Kr
Xe
Rn
B1
50015
0.0008
C10——
Al230
0.010.0002
Si5
1000.1
<0.0001
N O
P7
40 00030
<0.0001
S3——
0.0001
F
Cl60———
Ne
Ar
Ce2——
0.0003
Pr9
6000—
0.0002
Th7——
0.0003
Pa
Nd10
1000—
0.001
Pm
U60
40 000—
0.0005
Np
Sm10
1000—
0.001
Eu0.9200.5
0.0004Pu Am
Gd5
2000—
0.001
Tb6
5000.1
0.0002Cm Bk
Dy2301
0.0009
Ho240—
0.0002Cf Es
Er0.7302
0.0007
Tm2
900—
0.0002Fm Md
Yb0.34—
0.001
Lu0.3300—
0.0002No Lr
Fe0.75
0.020.008
Inductively coupled plasma emissionFlame atomic absorptionGraphite furnace atomic absorptionInductivity coupled plasma–mass spectrometry
Requires N2O/C2H2 flame and is thereforebetter analyzed by inductively coupled plasma
Best analyzed by emission
Detection limits (ng/mL)
Figure 21-24 Flame, furnace, andinductively coupled plasma emission andinductively coupled plasma—massspectrometry detection limits with instruments from GBC Scientific Equipment, Australia. [Flame, furnace, ICP from
R. J. Gill, Am. Lab. November 1993, 24F. ICP–MS from
T. T. Nham, Am. Lab. August 1998, 17A. Data for Cl, Br,
and I are from reference 14.] Accurate quantitativeanalysis requires concentrations 10–100 timesgreater than the detection limit.
(ng/g � ppb)
Signal
Peak-to-peak noiselevel
21-5 InterferenceInterference is any effect that changes the signal while analyte concentration remainsunchanged. Interference can be corrected by removing the source of interference or bypreparing standards that exhibit the same interference.

Types of InterferenceSpectral interference refers to the overlap of analyte signal with signals due to other ele-ments or molecules in the sample or with signals due to the flame or furnace. Interferencefrom the flame can be subtracted by using or Zeeman background correction. The bestmeans of dealing with overlap between lines of different elements in the sample is to chooseanother wavelength for analysis. High-resolution spectrometers eliminate interference fromother elements by resolving closely spaced lines (Figure 21-25).
Elements that form very stable diatomic oxides are incompletely atomized at the tem-perature of the flame or furnace. The spectrum of a molecule is much broader and more com-plex than that of an atom, because vibrational and rotational transitions are combined withelectronic transitions (Section 18-5). The broad spectrum leads to spectral interference atmany wavelengths. Figure 21-26 shows a plasma containing Y and Ba atoms as well as YOmolecules. Note how broad the molecular emission is relative to the atomic emission.
When trace impurities in tungsten powder are analyzed by graphite furnace atomicabsorption using direct solid sampling (page 459), from the surface of the powder sub-limes and fills the furnace with vapor, creating spectral interference throughout the visibleand ultraviolet regions. By heating the powder under at in the furnaceprior to atomization, is reduced to metallic tungsten and the interference is eliminated.9
Chemical interference is caused by any component of the sample that decreases theextent of atomization of analyte. For example, and hinder the atomization of
, perhaps by forming nonvolatile salts. Releasing agents are chemicals that are added toa sample to decrease chemical interference. EDTA and 8-hydroxyquinoline protect from the interfering effects of and . also can be used as a releasing agent,apparently because it preferentially reacts with and frees the . A fuel-rich flamereduces certain oxidized analyte species that would otherwise hinder atomization. Higherflame temperatures eliminate many kinds of chemical interference.
Ionization interference can be a problem in the analysis of alkali metals at relativelylow temperature and in the analyses of other elements at higher temperature. For any ele-ment, we can write a gas-phase ionization reaction:
(21-6)
Because alkali metals have low ionization potentials, they are most extensively ionized.At 2 450 K and a pressure of 0.1 Pa, sodium is 5% ionized. With its lower ionization poten-tial, potassium is 33% ionized. Ionized atoms have different energy levels from those ofneutral atoms, so the desired signal is decreased. If there is a strong signal from the ion, youcould use the ion signal rather than the atomic signal.
An ionization suppressor decreases the extent of ionization of analyte. For example, inthe analysis of potassium, it is recommended that solutions contain 1 000 ppm of CsCl,because cesium is more easily ionized than potassium. By producing a high concentration ofelectrons in the flame, ionization of Cs suppresses ionization of K. Ionization suppression isdesirable in a low-temperature flame in which we want to observe neutral atoms.
The method of standard addition (Section 5-3) compensates for many types of interfer-ence by adding known quantities of analyte to the unknown in its complex matrix. For exam-ple, Figure 21-27 shows the analysis of strontium in aquarium water by standard addition.
M(g) T M�(g) � e�(g) K �[M�][e�]
[M]
Ca2�PO3�4
La3�PO3�4SO2�
4
Ca2�
Ca2�
PO3�4SO2�
4
WO3
1 000–1 200°CH2
WO3
D2
21-5 Interference 467
As228.812
nmCd
228.802nm
Em
issi
on in
tens
ity
540
Em
issi
on in
tens
ity
Wavelength (nm)
Y
580 620
Ba
Ba
YO
Standard addition(Sr in aquarium water)
Standard curve(Sr in H2O)
Abs
orba
nce
Intercept= –7.41 ppm
0.4
0.3
0.2
0.1
–8 –6 –4 –2 0 2 4 6 8 10Added strontium (ppm)
Figure 21-25 A Cd line at 228.802 nmcauses spectral interference with the As line at228.812 nm in most spectrometers. Withsufficiently high resolution, the two peaks areseparated and there is no interference. Theinstrument used for this spectrum has a 1-mCzerny-Turner monochromator (Figure 20-5)with a resolution of 0.005 nm from 160 to 320 nmand 0.010 nm from 320 to 800 nm. [Courtesy Jobin
Yvon Horiba Group, Longjumeau Cedex, France.]
Figure 21-26 Emission from a plasmaproduced by laser irradiation of the high-temperature superconductor . Solidis vaporized by the laser and excited atomsand molecules such as YO emit light atcharacteristic wavelengths. [From W. A. Weimer,
“Plasma Emission from Laser Ablation of YBa2Cu3O7,”
Appl. Phys. Lett. 1988, 52, 2171.]
YBa2Cu3O7
Figure 21-27 Atomic absorptioncalibration curve for Sr added to distilled waterand standard addition of Sr to aquariumwater. All solutions are made up to a constantvolume, so the ordinate is the concentrationof added Sr. [Data from L. D. Gilles de Pelichy,
C. Adams, and E. T. Smith, “Analysis of Sr in Marine
Aquariums by Atomic Absorption Spectroscopy,”
J. Chem. Ed. 1997, 74, 1192.]
Le Châtelier’s principle tells us that addingelectrons to the right side of Reaction 21-6drives the reaction back to the left.
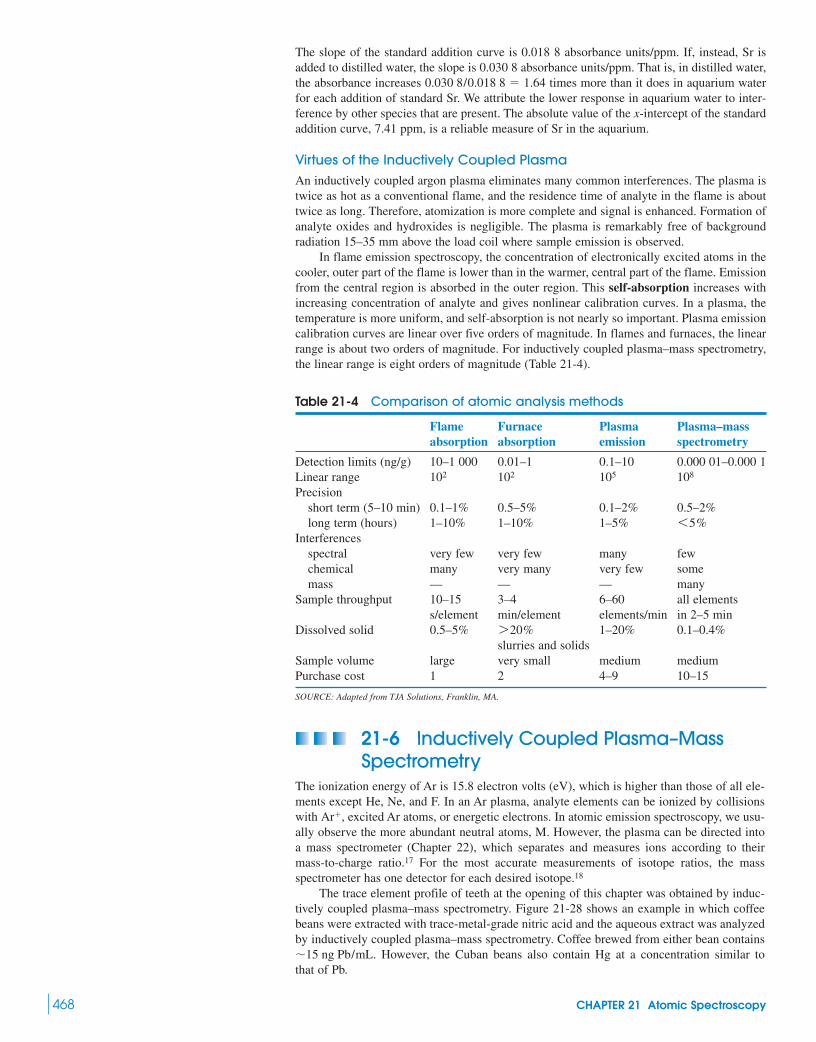
The slope of the standard addition curve is 0.018 8 absorbance units/ppm. If, instead, Sr isadded to distilled water, the slope is 0.030 8 absorbance units/ppm. That is, in distilled water,the absorbance increases times more than it does in aquarium waterfor each addition of standard Sr. We attribute the lower response in aquarium water to inter-ference by other species that are present. The absolute value of the x-intercept of the standardaddition curve, 7.41 ppm, is a reliable measure of Sr in the aquarium.
Virtues of the Inductively Coupled PlasmaAn inductively coupled argon plasma eliminates many common interferences. The plasma istwice as hot as a conventional flame, and the residence time of analyte in the flame is abouttwice as long. Therefore, atomization is more complete and signal is enhanced. Formation ofanalyte oxides and hydroxides is negligible. The plasma is remarkably free of backgroundradiation 15–35 mm above the load coil where sample emission is observed.
In flame emission spectroscopy, the concentration of electronically excited atoms in thecooler, outer part of the flame is lower than in the warmer, central part of the flame. Emissionfrom the central region is absorbed in the outer region. This self-absorption increases withincreasing concentration of analyte and gives nonlinear calibration curves. In a plasma, thetemperature is more uniform, and self-absorption is not nearly so important. Plasma emissioncalibration curves are linear over five orders of magnitude. In flames and furnaces, the linearrange is about two orders of magnitude. For inductively coupled plasma–mass spectrometry,the linear range is eight orders of magnitude (Table 21-4).
0.030 8/0.018 8 � 1.64
468 CHAPTER 21 Atomic Spectroscopy
Table 21-4 Comparison of atomic analysis methods
Flame Furnace Plasma Plasma–massabsorption absorption emission spectrometry
Detection limits (ng/g) 10–1 000 0.01–1 0.1–10 0.000 01–0.000 1Linear rangePrecision
short term (5–10 min) 0.1–1% 0.5–5% 0.1–2% 0.5–2%long term (hours) 1–10% 1–10% 1–5%
Interferencesspectral very few very few many fewchemical many very many very few somemass — — — many
Sample throughput 10–15 3–4 6–60 all elementss/element min/element elements/min in 2–5 min
Dissolved solid 0.5–5% 1–20% 0.1–0.4%slurries and solids
Sample volume large very small medium mediumPurchase cost 1 2 4–9 10–15
SOURCE: Adapted from TJA Solutions, Franklin, MA.
7 20%
6 5%
108105102102
21-6 Inductively Coupled Plasma–MassSpectrometry
The ionization energy of Ar is 15.8 electron volts (eV), which is higher than those of all ele-ments except He, Ne, and F. In an Ar plasma, analyte elements can be ionized by collisionswith , excited Ar atoms, or energetic electrons. In atomic emission spectroscopy, we usu-ally observe the more abundant neutral atoms, M. However, the plasma can be directed intoa mass spectrometer (Chapter 22), which separates and measures ions according to theirmass-to-charge ratio.17 For the most accurate measurements of isotope ratios, the massspectrometer has one detector for each desired isotope.18
The trace element profile of teeth at the opening of this chapter was obtained by induc-tively coupled plasma–mass spectrometry. Figure 21-28 shows an example in which coffeebeans were extracted with trace-metal-grade nitric acid and the aqueous extract was analyzedby inductively coupled plasma–mass spectrometry. Coffee brewed from either bean contains
. However, the Cuban beans also contain Hg at a concentration similar tothat of Pb.�15 ng Pb/mL
Ar�

The difficulty in sampling anything with a mass spectrometer is that the spectrometerrequires high vacuum to avoid collisions between ions and background gas molecules thatdivert the ions from their trajectory in a magnetic field. Figure 21-29 shows an example of aninterface between a horizontal Ar plasma and a mass spectrometer. The plasma at the left isdirected onto a water-cooled Ni sampling cone with a 1-mm-diameter orifice through whicha fraction of the plasma can pass. Behind the sampling cone is a water-cooled skimmer conewith an even smaller orifice. The extraction lens behind the skimmer cone has a high nega-tive potential to attract positive ions from the plasma. The pressure is reduced in each suc-cessive section of the instrument.
From the skimmer cone, ions enter a collision cell that might contain or He or both.The collision cell guides ions to the entrance of the mass separator and reduces the spread ofion kinetic energies by a factor of 10. More important, molecular ions such as , ,and dissociate when they strike the gas in the collision cell. If these species did notdissociate, they would interfere with the analysis of elements of the same mass. For example,
has nearly the same mass as , and has nearly the same mass as .Interference by ions of similar mass is called isobaric interference. Doubly ionized interferes with because each has approximately the same mass-to-charge ratio
. High-resolution mass spectrometers19 eliminate isobaric interference byseparating species such as and , but most systems do not have sufficientresolution to separate these species. After dissociation in the collision cell, ions are separated
56Fe�40Ar16O�
(138/2 � 69/1)
69Ga�
138Ba2�
80Se�40Ar�2
56Fe�40Ar16O�
ArCl�
Ar�2ArO�
H2
21-6 Inductively Coupled Plasma–Mass Spectrometry 469
Hawaiian coffee
Cuban coffee
Hg + Pb
Pb
Hg
Atomic mass (m/z)
Det
ecto
r co
unts
30 000
20 000
10 000
0
0
30 000
20 000
10 000
197 198 199 200 201 202 203 204 205 206 207 208
Figure 21-28 Partial elemental profile ofcoffee beans by inductively coupledplasma–mass spectrometry. Both beans havesimilar Pb content, but the Cuban beans havea much higher Hg content than the Hawaiianbeans. A blank has not been subtracted fromeither spectrum, so the small amount of Hg inthe upper spectrum could be in the blank.[Courtesy G. S. Ostrom and M. D. Seltzer, Michelson
Laboratory, China Lake, CA.]
Samplingcone
High-voltageextraction lens Electrostatic
collimator(ion optics)
Hexapolecollision cell Photon
path
Deflectorplates
Quadrupolemass separator
Electrostaticdeflector plates
DetectorIon path
Photon path
Ionpath
He inSkimmercone
Plasma
Torch
1 bar
Tovacuumpump
Tovacuumpump
Tovacuumpump
Tovacuumpump
10–3 bar 10–5 bar
10–9 bar
Figure 21-29 Interface betweeninductively coupled plasma and massspectrometer. [Courtesy TJA Solutions, Franklin, MA.]
Chapter 22 discusses mass spectrometry.
Ar is an “inert” gas with virtually no chemistry.However, has the same electronicconfiguration as Cl, and its chemistry is similarto that of halogens.
Ar�
and differ by 0.02 atomic massunits.
56Fe�40Ar16O�

by a mass spectrometer. Ions are deflected into the detector at the right of the diagram, andphotons from the plasma that transit through the mass spectrometer miss the detector. Pho-tons hitting the detector would generate a signal.
For elements with multiple isotopes, you can check for isobaric interference by measur-ing isotope ratios. For example, if the ratio of Se isotopes agrees with those found in nature
then itis unlikely that there is interference at any of these masses.
Detection limits for inductively coupled plasma–mass spectrometry are so low (Fig-ure 21-24 and Table 21-2) as to tax the cleanliness of reagents, glassware, and procedures.Solutions must be made from extremely pure water and trace-metal-grade in Teflon orpolyethylene vessels protected from dust. HCl and are avoided because they createisobaric interferences. The plasma–mass spectrometer interface cannot tolerate high concen-trations of dissolved solids that clog the orifice of the sampling cone. The plasma reducesorganic matter to carbon that can clog the orifice. Organic material can be analyzed if some
is fed into the plasma to oxidize the carbon.Matrix effects on the yield of ions in the plasma are important, so calibration standards
should be in the same matrix as the unknown. Alternatively, internal standards can be used ifthey have nearly the same ionization energy as the analyte. For example, Tm can be used asan internal standard for U. The ionization energies of these two elements are 5.81 and 6.08 eV,respectively, so they should ionize to nearly the same extent in different matrices. If possible,internal standards with just one major isotope should be selected for maximum response.
At the opening of this chapter, we saw an example of laser ablation–inductively coupledplasma–mass spectrometry20 for the analysis of teeth. In laser ablation, a pulsed, high-energy laser beam is focused onto a microscopic spot on a solid sample, creating an explo-sion of particles, atoms, electrons, and ions into the gas phase. Material is typically removedto a depth of 0.02 to by each pulse (Figure 21-30). Ablation product generated in asealed chamber is swept by Ar or He through a Teflon-coated tube into the plasma for analy-sis by mass spectrometry or atomic emission.
A major problem for quantitative analysis by laser ablation is that elements can beselectively ablated, selectively transported to the plasma, or selectively atomized in theplasma. Therefore, the relative numbers of ions detected are not necessarily equal to relativeamounts of the elements in the solid sample. The most reliable—but usually unattainable—calibration method is to make a standard sample containing elements of interest in thesame matrix as the unknown. Mussel shell in Figure 21-30 is composed principally of
. A calibration standard was made by dissolving known quantities of metals with alarge excess of in acid solution and precipitating everything with . The carbon-ate precipitate was washed, dried, and pressed into a dense pellet whose ablation behavioris similar to that of mussel shell. In the absence of matrix-matched standards, results fromlaser ablation can be compared with results obtained by completely digesting a materialand analyzing the homogeneous solution.
CO2�3Ca2�
CaCO3
5 �m
O2
H2SO4
HNO3
(74Se : 76Se : 77Se : 78Se : 80Se : 82Se � 0.008 7 : 0.090 : 0.078 : 0.235 : 0.498 : 0.092),
470 CHAPTER 21 Atomic Spectroscopy
Terms to Understandablationaerosolatomic absorptionatomic emissionatomic fluorescenceatomizationbackground correction
Boltzmann distributionchemical interferencedetection limitDoppler effectgraphite furnaceHeisenberg uncertainty principlehollow-cathode lamp
inductively coupled plasmaionization interferenceionization suppressorisobaric interferencematrixmatrix modifiernebulization
piezoelectric crystalplasmapremix burnerpressure broadeningreleasing agentself-absorptionspectral interference
SummaryIn atomic spectroscopy, absorption, emission, or fluorescence fromgaseous atoms is measured. Liquids may be atomized by a plasma,a furnace, or a flame. Flame temperatures are usually in the range2 300–3 400 K. The choice of fuel and oxidant determines the tem-perature of the flame and affects the extent of spectral, chemical, orionization interference that will be encountered. Temperature insta-bility affects atomization in atomic absorption and has an evenlarger effect on atomic emission, because the excited-state popula-
tion is exponentially sensitive to temperature. An electrically heatedgraphite furnace requires less sample than a flame and has a lowerdetection limit. In an inductively coupled plasma, a radio-frequencyinduction coil heats ions to 6 000–10 000 K. At this high tem-perature, emission is observed from electronically excited atomsand ions. There is little chemical interference in an inductivelycoupled plasma, the temperature is very stable, and little self-absorption is observed.
Ar�
20 µm
Figure 21-30 Microscopic crater ablatedinto a mussel shell by 10 pulses from a 266-nmlaser with a beam energy of 4.5 mJ per 10-nspulse and a repetition rate of 10 Hz. [From V. R.
Bellotto and N. Miekely, “Improvements in Calibration
Procedures for the Quantitative Determination of Trace
Elements in Carbonate Material (Mussel Shells) by
Laser Ablation ICP–MS,” Fresenius J. Anal. Chem.
2000, 367, 635.]

Exercises 471
Plasma emission spectroscopy does not require a light sourceand is capable of measuring elements simultaneously with acharge injection device detector. Background correction for a givenemission peak is based on subtracting the intensity of neighboringpixels in the detector. The lowest detection limits are obtained bydirecting the plasma into a mass spectrometer that separates andmeasures ions from the plasma. In flame and furnace atomicabsorption spectroscopy, a hollow-cathode lamp made of the ana-lyte element provides spectral lines sharper than those of the atomicvapor. The inherent linewidth of atomic lines is limited by theHeisenberg uncertainty principle. Lines in a flame, furnace, orplasma are broadened by a factor of 10–100 by the Doppler effectand by atomic collisions. Correction for background emission fromthe flame is possible by electrically pulsing the lamp on and off ormechanically chopping the beam. Light scattering and spectral
�70background can be subtracted by measuring absorption of a deu-terium lamp or by Zeeman background correction, in whichthe atomic energy levels are alternately shifted in and out of resonancewith the lamp frequency by a magnetic field. Chemical interferencecan be reduced by addition of releasing agents, which preventthe analyte from reacting with interfering species. Ionization inter-ference in flames is suppressed by adding easily ionized elementssuch as Cs.
In inductively coupled plasma–mass spectrometry, isobaricinterference occurs between species with the same mass and charge.Interference can be eliminated if the mass spectral resolution is suf-ficiently great or by dissociating an interfering polyatomic specieswith a collision cell. When laser ablation is used to sample a solid,matrix-matched standards are often necessary for quantitativeanalysis.
Exercises21-A. Li was determined by atomic emission with the methodof standard addition. Use a graph similar to Figure 5-6 to find theconcentration of Li and its uncertainty in pure unknown. The Listandard contained .
EmissionUnknown Standard Final volume intensity(mL) (mL) (mL) (arbitrary units)
10.00 0.00 100.0 30910.00 5.00 100.0 45210.00 10.00 100.0 60010.00 15.00 100.0 76510.00 20.00 100.0 906
21-B. Mn was used as an internal standard for measuring Fe byatomic absorption. A standard mixture containing and gave a quotient
. A mixture with a volume of 6.00 mL was prepared bymixing 5.00 mL of unknown Fe solution with 1.00 mL containing
. The absorbance of this mixture at the Mn wave-length was 0.128, and the absorbance at the Fe wavelength was0.185. Find the molarity of the unknown Fe solution.
21-C. The atomic absorption signal shown below was obtainedwith in a graphite furnace. Estimate the detec-tion limit for Fe, defined for this problem as the concentration of Fethat gives a signal-to-noise ratio of 2.
0.048 5 �g Fe/mL
13.5 �g Mn/mL
1.05/1.00(Fe signal/Mn signal) �2.50 �g Fe/mL
2.00 �g Mn/mL
1.62 �g Li/mL
21-D. The measurement of Li in brine (salt water) is used bygeochemists to help determine the origin of this fluid in oil fields.Flame atomic emission and absorption of Li are subject to inter-ference by scattering, ionization, and overlapping spectral emis-sion from other elements. Atomic absorption analysis of replicatesamples of a marine sediment gave the results in the table below.
Sample and Li found Analytical Flametreatment method type
1. None 25.1 standard curve2. Dilute to 1/10 64.8 standard curve
with3. Dilute to 1/10 82.5 standard addition
with4. None 77.3 standard curve5. Dilute to 1/10 79.6 standard curve
with6. Dilute to 1/10 80.4 standard addition
with
SOURCE: B. Baraj, L. F. H. Niencheski, R. D. Trapaga, R. G. França, V. Cocoli, andD. Robinson, “Interference in the Flame Atomic Absorption Determination of Li,” FreseniusJ. Anal. Chem. 1999, 364, 678.
(a) Suggest a reason for the increasing apparent concentration of Liin samples 1 through 3.
(b) Why do samples 4 through 6 give an almost constant result?
(c) What value would you recommend for the real concentration ofLi in the sample?
H2ON2O/C2H2
H2ON2O/C2H2
N2O/C2H2
H2Oair/C2H2
H2Oair/C2H2
air/C2H2
(�g/g)

472 CHAPTER 21 Atomic Spectroscopy
Problems
Techniques of Atomic Spectroscopy
21-1. In which technique, atomic absorption or atomic emission, isflame temperature stability more critical? Why?
21-2. State the advantages and disadvantages of a furnace comparedwith a flame in atomic absorption spectroscopy.
21-3. Figure 21-10 shows a temperature profile for a furnace atomicabsorption experiment. Explain the purpose of each different part ofthe heating profile.
21-4. State the advantages and disadvantages of the inductivelycoupled plasma compared with conventional flames in atomicspectroscopy.
21-5. Explain what is meant by the Doppler effect. Rationalize whyDoppler broadening increases with increasing temperature anddecreasing mass in Equation 21-5.
21-6. Explain how the following background correction techniqueswork: (a) beam chopping; (b) deuterium lamp; (c) Zeeman.
21-7. Explain what is meant by spectral, chemical, ionization, andisobaric interference.
21-8. (a) Explain the purpose of the collision cell in Figure 21-29.(b) An unusual use of a collision cell is to intentionally create mol-ecules. In geologic strontium isotopic analysis, there is isobaricinterference between and . Collision with con-verts into . How does this reaction eliminate the isobaricinterference?
21-9. The laser atomic fluorescence excitation and emission spectraof sodium in an air-acetylene flame are shown below. In the excita-tion spectrum, the laser was scannedthrough various wavelengths while the detector monochromator
was held fixed near 589 nm. In the emissionspectrum, the laser was fixed at 589.0 nm, and the detector mono-chromator wavelength was varied. Explain why the emission spec-trum gives one broad band, whereas the excitation spectrum givestwo sharp lines. How can the excitation linewidths be much nar-rower than the detector monochromator bandwidth?
Fluorescence excitation and emission spectra of the two sodium D linesin an air-acetylene flame. (a) In the excitation spectrum, the laser wasscanned. (b) In the emission spectrum, the monochromator was scanned.The monochromator slit width was the same for both spectra. [From S. J.
Weeks, H. Haraguchi, and J. D. Winefordner, “Improvement of Detection Limits in Laser-
Excited Atomic Fluorescence Flame Spectrometry,” Anal. Chem. 1978, 50, 360.]
0.03 nm
0.03 nm
589.0 589.6
(a )
1.6 nm
592 590 588
(b ) Wavelength (nm)Wavelength (nm)
(bandwidth � 1.6 nm)
(bandwidth � 0.03 nm)
SrF�Sr�
CH3F87Sr�87Rb�
21-10. Concentrations (pg per g of snow) of metals by atomic fluores-cence in the Agassiz Ice Cap in Greenland for the period 1988–1992are:21
. The mean annualsnowfall was . Calculate the mean annual flux of eachmetal in units of . Flux means how much metal falls oneach .
21-11. Calculate the emission wavelength (nm) of excited atomsthat lie per molecule above the ground state.
21-12. Derive the entries for 500 nm in Table 21-3. Find at6 000 K if and .
21-13. Calculate the Doppler linewidth for the 589-nm line of Naand for the 254-nm line of Hg, both at 2 000 K.
21-14. The first excited state of Ca is reached by absorption of422.7-nm light.(a) Find the energy difference (kJ/mol) between ground and excitedstates.(b) The degeneracies are for Ca. Find at 2 500 K.(c) By what percentage will change with a 15-K rise intemperature?(d) Find at 6 000 K.
21-15. An electron volt (eV) is the energy change of an electronmoved through a potential difference of 1 volt:
96.49 KJ per moleof electrons. Use the Boltzmann distribution to fill in the table andexplain why Br is not readily observed in atomic absorption oratomic emission.
Element: Na Cu Br
Excited state energy (eV): 2.10 3.78 8.04Wavelength (nm):Degeneracy ratio : 3 3 2/3
at 2 600 K in flame:at 6 000 K in plasma:
21-16. MgO prevents premature evaporation of Al in a furnace bymaintaining the aluminum as . Another type of matrix modifierprevents loss of signal from the atom X that readily forms the molec-ular carbide XC in a graphite furnace (a source of carbon). For exam-ple, adding yttrium to a sample containing barium increases the Basignal by 30%. The bond dissociation energy of YC is greater thanthat of BaC. Explain what is happening to increase the Ba signal.
Quantitative Analysis by Atomic Spectroscopy
21-17. Why is an internal standard most appropriate for quantitativeanalysis when unavoidable sample losses are expected during sam-ple preparation?
21-18. Standard addition. To measure Ca in breakfast cereal,0.521 6 g of crushed Cheerios was ashed in a crucible at in airfor 2 h.22 The residue was dissolved in 6 M HCl, quantitatively trans-ferred to a volumetric flask, and diluted to 100.0 mL. Then 5.00-mLaliquots were transferred to 50-mL volumetric flasks. Each was treatedwith standard (containing ), diluted to volume with
, and analyzed by flame atomic absorption. Construct a standardaddition graph and use the method of least squares to find the x-intercept and its uncertainty. Find wt% Ca in Cheerios and itsuncertainty.
H2O20.0 �g/mLCa2�
600°C
Al2O3
N*/N0
N*/N0
(g*/g0)
10�19 C)(1 V) � 1.602 � 10�19 J per electron �eV � (1.602 �
N*/N0
N*/N0
N*/N0g*/g0 � 3
g0 � 1g* � 3N*/N0
3.371 � 10�19 J
cm2ng/cm2
11.5 g/cm21.74 (�0.26) � 102; and Al, 6.1 (�1.7) � 103
Pb, 1.04 (�0.17) � 102; Tl, 0.43 � 0.087; Cd, 3.5 � 0.87; Zn,

Problems 473
standard standard(mL) Absorbance (mL) Absorbance
0 0.151 8.00 0.3881.00 0.185 10.00 0.4453.00 0.247 15.00 0.5725.00 0.300 20.00 0.723
21-19. Internal standard. A solution was prepared by mixing10.00 mL of unknown (X) with 5.00 mL of standard (S) contain-ing and diluting the mixture to 50.0 mL. The mea-sured signal quotient was (signal due to X/signal due to S) �1.690/1.000.(a) In a separate experiment in which the concentrations of X andS were equal, the quotient was (signal due to X/signal due to S) �0.930/1.000. What is the concentration of X in the unknown?(b) Answer the same question if, in a separate experiment in whichthe concentration of X was 3.42 times the concentration of S, thequotient was (signal due to X/signal due to S) � 0.930/1.000.
21-20. Potassium standards gave the following emissionintensities at 404.3 nm. Emission from the unknown was 417. Find
and its uncertainty in the unknown.
Sample : 0 5.00 10.00 20.00 30.00
Relative emission: 0 124 243 486 712
21-21. Free cyanide in aqueous solution can be determined indi-rectly by atomic absorption on the basis of its ability to dissolve sil-ver as it passes through a porous silver membrane filter at pH 12.23
A series of silver standards gave a linear calibration curve in flameatomic absorption with a slope of 807 meter units per ppm Ag in thestandard. (The meter units are arbitrary numbers proportional toabsorbance, and ppm refers to .) An unknown cyanidesolution passed through the silver membrane gave a meter readingof 198 units. Find the molarity of in the unknown.
21-22. Quality assurance. Tin is leached (dissolved) into cannedfoods from the tin-plated steel can.24 For analysis by inductivelycoupled plasma atomic emission, food is digested by microwaveheating in a Teflon bomb (Figure 28-8) in three steps with ,
, and HCl.(a) CsCl is added to the final solution at a concentration of 1 g/L.What is the purpose of the CsCl?
H2O2
HNO3
CN�
�g Ag/mL
4Ag(s) � 8CN� � 2H2O � O2 S 4Ag(CN)�2 � 4OH�
(�g K/mL)
[K�]
8.24 �g S/mL
Ca2�Ca2� (b) Calibration data are shown in the table. Find the slope andintercept and their standard deviations and , which is a measure ofthe goodness of fit of the data to a line. Draw the calibration curve.
Emission at 189.927 nm
0 4.010.0 8.520.0 19.630.0 23.640.0 31.160.0 41.7
100.0 78.8200.0 159.1
(c) Interference by high concentrations of other elements was as-sessed at different emission lines of Sn. Foods containing little tinwere digested and spiked with Sn at . Then other ele-ments were deliberately added. The following table shows selectedresults. Which elements interfere at each of the two wavelengths?Which wavelength is preferred for the analysis?
Sn found Sn found Element added with 189.927-nm with 235.485-nmat 50 mg/L emission line emission line
None 100.0 100.0Ca 96.4 104.2Mg 98.9 92.6P 106.7 104.6Si 105.7 102.9Cu 100.9 116.2Fe 103.3 intense emissionMn 99.5 126.3Zn 105.3 112.8Cr 102.8 76.4
(d) Limits of detection and quantitation. The slope of the calibrationcurve in part (a) is 0.782 units per of Sn. Food containinglittle Sn gave a mean signal of 5.1 units for seven replicates. Foodspiked with gave a mean signal of 29.3 units with astandard deviation of 2.4 units for seven replicates. Use Equations 5-5and 5-6 to estimate the limits of detection and quantitation.(e) A 2.0-g food sample was digested and eventually diluted to50 mL for analysis. Express the limit of quantitation from part(d) in terms of mg Sn/kg food.
30.0 �g Sn/L
(�g/L)
(�g/L)(�g/L)
100.0 �g/L
Sn (�g/L)
R2
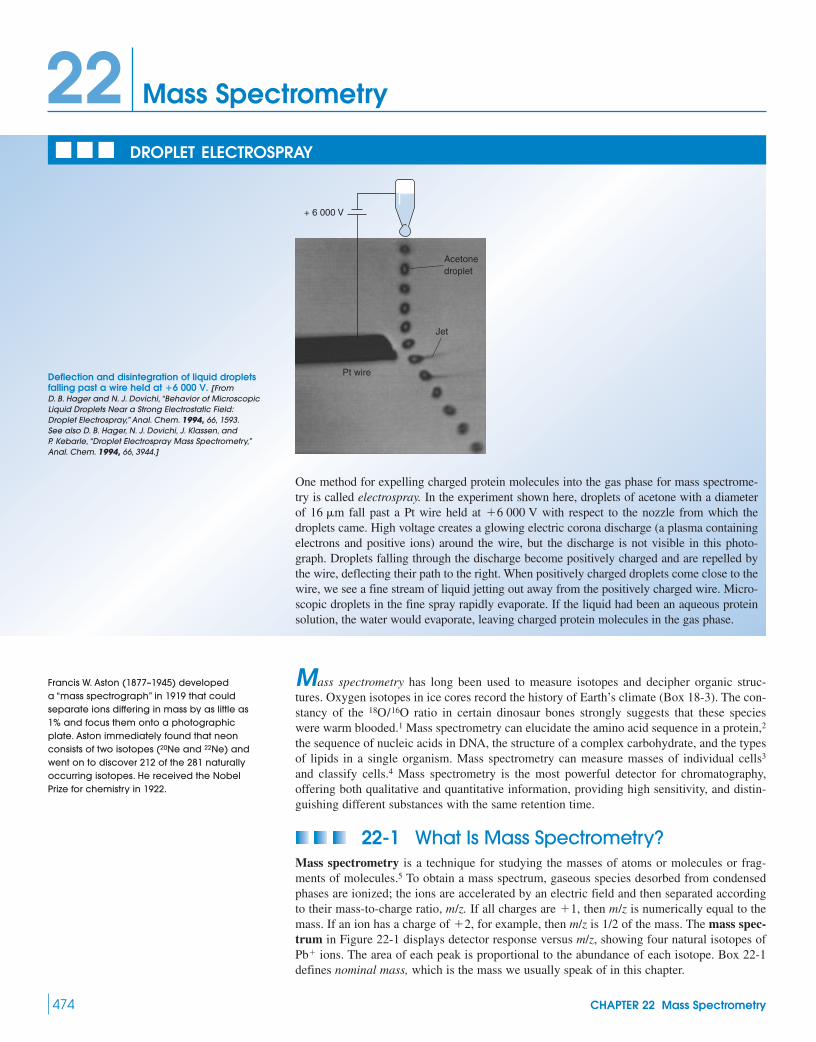
474 CHAPTER 22 Mass Spectrometry
Mass Spectrometry
Mass spectrometry has long been used to measure isotopes and decipher organic struc-tures. Oxygen isotopes in ice cores record the history of Earth’s climate (Box 18-3). The con-stancy of the ratio in certain dinosaur bones strongly suggests that these specieswere warm blooded.1 Mass spectrometry can elucidate the amino acid sequence in a protein,2
the sequence of nucleic acids in DNA, the structure of a complex carbohydrate, and the typesof lipids in a single organism. Mass spectrometry can measure masses of individual cells3
and classify cells.4 Mass spectrometry is the most powerful detector for chromatography,offering both qualitative and quantitative information, providing high sensitivity, and distin-guishing different substances with the same retention time.
22-1 What Is Mass Spectrometry?Mass spectrometry is a technique for studying the masses of atoms or molecules or frag-ments of molecules.5 To obtain a mass spectrum, gaseous species desorbed from condensedphases are ionized; the ions are accelerated by an electric field and then separated accordingto their mass-to-charge ratio, m/z. If all charges are , then m/z is numerically equal to themass. If an ion has a charge of , for example, then m/z is 1/2 of the mass. The mass spec-trum in Figure 22-1 displays detector response versus m/z, showing four natural isotopes of
ions. The area of each peak is proportional to the abundance of each isotope. Box 22-1defines nominal mass, which is the mass we usually speak of in this chapter.Pb�
�2�1
18O/16O
One method for expelling charged protein molecules into the gas phase for mass spectrome-try is called electrospray. In the experiment shown here, droplets of acetone with a diameterof fall past a Pt wire held at with respect to the nozzle from which thedroplets came. High voltage creates a glowing electric corona discharge (a plasma containingelectrons and positive ions) around the wire, but the discharge is not visible in this photo-graph. Droplets falling through the discharge become positively charged and are repelled bythe wire, deflecting their path to the right. When positively charged droplets come close to thewire, we see a fine stream of liquid jetting out away from the positively charged wire. Micro-scopic droplets in the fine spray rapidly evaporate. If the liquid had been an aqueous proteinsolution, the water would evaporate, leaving charged protein molecules in the gas phase.
�6 000 V16 �m
DROPLET ELECTROSPRAY
22
Deflection and disintegration of liquid dropletsfalling past a wire held at �6 000 V. [From D. B. Hager and N. J. Dovichi, “Behavior of MicroscopicLiquid Droplets Near a Strong Electrostatic Field:Droplet Electrospray,” Anal. Chem. 1994, 66, 1593.See also D. B. Hager, N. J. Dovichi, J. Klassen, andP. Kebarle, “Droplet Electrospray Mass Spectrometry,”Anal. Chem. 1994, 66, 3944.]
Pt wire
+ 6 000 V
Jet
Acetonedroplet
Francis W. Aston (1877–1945) developeda “mass spectrograph” in 1919 that couldseparate ions differing in mass by as little as1% and focus them onto a photographicplate. Aston immediately found that neonconsists of two isotopes ( and ) andwent on to discover 212 of the 281 naturallyoccurring isotopes. He received the NobelPrize for chemistry in 1922.
22Ne20Ne

22-1 What Is Mass Spectrometry? 475
Figure 22-2 shows a magnetic sector mass spectrometer, which uses a magnetic fieldto allow ions of a selected m/z to pass from the ion source to the detector.6 Gaseous mole-cules entering at the upper left are converted into ions (usually positive ions), accelerated byan electric field, and expelled into the analyzer tube, where they encounter a magnetic fieldperpendicular to their direction of travel. The tube is maintained under high vacuum
so that ions are not deflected by collision with background gas molecules. Themagnet deflects ions toward the detector at the far end of the tube (see Box 22-2). Heavy ionsare not deflected enough and light ones are deflected too much to reach the detector. Thespectrum of masses is obtained by varying the magnetic field strength.
At the electron multiplier detector, each arriving ion starts a cascade of electrons, just asa photon starts a cascade of electrons in a photomultiplier tube (Figure 20-12). A series ofdynodes multiplies the number of electrons by before they reach the anode where cur-rent is measured. The mass spectrum shows detector current as a function of m/z selected bythe magnetic field.
Mass spectrometers work equally well for negative and positive ions by reversing volt-ages where the ions are formed and detected. To detect negative ions, a conversion dynodewith a positive potential is placed before the conventional detector. When bombarded by neg-ative ions, this dynode liberates positive ions that are accelerated into the electron multiplier,which amplifies the signal.
Electron IonizationMolecules entering the ion source in Figure 22-2 are converted into ions by electron ioniza-tion. Electrons emitted from a hot filament (like the one in a light bulb) are accelerated through70 V before interacting with incoming molecules. Some molecules (M) absorb asmuch as 12–15 electron volts , which is enough for ionization:
70 eV Molecular ion 0.1 ev�55 eV
M � e� S M�� � e� � e�
(1 eV � 96.5 kJ/mol)(�0.01%)
�105
(�10�5 Pa)
Sig
nal i
nten
sity
Width = m1/2 = 0.146
203 204 205 206 207 208 209
206Pb
204Pb
207Pb
208Pb
m/z
Figure 22-1 Mass spectrum showingnatural isotopes of Pb observed as an impurityin brass. [From Y. Su, Y. Duan, and Z. Jin, “Development
and Evaluation of a Glow Discharge Microwave-
Induced Plasma Tandem Source for Time-of-Flight
Mass Spectrometry,” Anal. Chem. 2000, 72, 5600.]
The variability of isotopic abundances in Pbfrom natural sources creates a largeuncertainty in the atomic mass (207.2 � 0.1)in the periodic table.
Electronmultiplier detector
Cathode Anode
DynodesElectronsIonsin
From reservoirsampling system
Ionsource
Tovacuumpump
Magnet
Heavier ions
Analyzer tube
Separated ion beam
Ion exit slit
Lighter ions
Ion sourceNeutral molecules
Repeller
Electronbeam
Ion focusplates
Ions
Ionaccelerationplates
Filament
Direction ofmagneticfield, B
Figure 22-2 Magnetic sector massspectrometer. [Adapted from F. W. McLafferty,
Interpretation of Mass Spectra (New York:
Benjamin, 1966).]
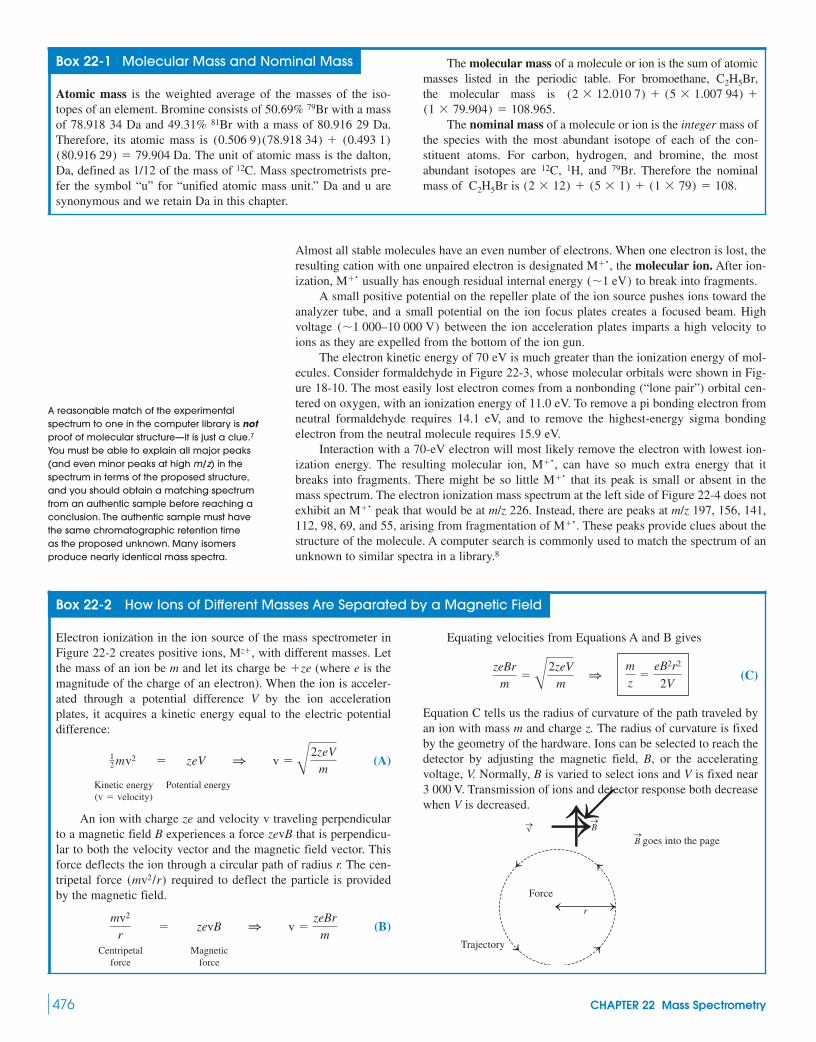
476 CHAPTER 22 Mass Spectrometry
Almost all stable molecules have an even number of electrons. When one electron is lost, theresulting cation with one unpaired electron is designated , the molecular ion. After ion-ization, usually has enough residual internal energy to break into fragments.
A small positive potential on the repeller plate of the ion source pushes ions toward theanalyzer tube, and a small potential on the ion focus plates creates a focused beam. Highvoltage between the ion acceleration plates imparts a high velocity toions as they are expelled from the bottom of the ion gun.
The electron kinetic energy of 70 eV is much greater than the ionization energy of mol-ecules. Consider formaldehyde in Figure 22-3, whose molecular orbitals were shown in Fig-ure 18-10. The most easily lost electron comes from a nonbonding (“lone pair”) orbital cen-tered on oxygen, with an ionization energy of 11.0 eV. To remove a pi bonding electron fromneutral formaldehyde requires 14.1 eV, and to remove the highest-energy sigma bondingelectron from the neutral molecule requires 15.9 eV.
Interaction with a 70-eV electron will most likely remove the electron with lowest ion-ization energy. The resulting molecular ion, , can have so much extra energy that itbreaks into fragments. There might be so little that its peak is small or absent in themass spectrum. The electron ionization mass spectrum at the left side of Figure 22-4 does notexhibit an peak that would be at m/z 226. Instead, there are peaks at m/z 197, 156, 141,112, 98, 69, and 55, arising from fragmentation of . These peaks provide clues about thestructure of the molecule. A computer search is commonly used to match the spectrum of anunknown to similar spectra in a library.8
M��M��
M��M��
(�1 000–10 000 V)
(�1 eV)M��M��
Box 22-1 Molecular Mass and Nominal Mass
Atomic mass is the weighted average of the masses of the iso-topes of an element. Bromine consists of 50.69% with a massof 78.918 34 Da and 49.31% with a mass of 80.916 29 Da.Therefore, its atomic mass is
. The unit of atomic mass is the dalton,Da, defined as 1/12 of the mass of . Mass spectrometrists pre-fer the symbol “u” for “unified atomic mass unit.” Da and u aresynonymous and we retain Da in this chapter.
12C(80.916 29) � 79.904 Da
(0.493 1)(0.506 9)(78.918 34) �
81Br
79Br
The molecular mass of a molecule or ion is the sum of atomicmasses listed in the periodic table. For bromoethane, ,the molecular mass is
.The nominal mass of a molecule or ion is the integer mass of
the species with the most abundant isotope of each of the con-stituent atoms. For carbon, hydrogen, and bromine, the mostabundant isotopes are , , and . Therefore the nominalmass of is .(2 � 12) � (5 � 1) � (1 � 79) � 108 C2H5Br
79Br1H12C
(1 � 79.904) � 108.965(2 � 12.010 7) � (5 � 1.007 94) �
C2H5Br
Box 22-2 How Ions of Different Masses Are Separated by a Magnetic Field
Electron ionization in the ion source of the mass spectrometer inFigure 22-2 creates positive ions, , with different masses. Letthe mass of an ion be m and let its charge be (where e is themagnitude of the charge of an electron). When the ion is acceler-ated through a potential difference V by the ion accelerationplates, it acquires a kinetic energy equal to the electric potentialdifference:
(A)
Kinetic energy Potential energy( )
An ion with charge ze and velocity v traveling perpendicularto a magnetic field B experiences a force zevB that is perpendicu-lar to both the velocity vector and the magnetic field vector. Thisforce deflects the ion through a circular path of radius r. The cen-tripetal force required to deflect the particle is providedby the magnetic field.
(B)
Centripetal Magneticforce force
mv2
r � zevB 1 v �
zeBrm
(mv2/r)
v � velocity
12 mv2 � zeV 1 v � B2zeV
m
�zeMz�
Equating velocities from Equations A and B gives
(C)
Equation C tells us the radius of curvature of the path traveled byan ion with mass m and charge z. The radius of curvature is fixedby the geometry of the hardware. Ions can be selected to reach thedetector by adjusting the magnetic field, B, or the acceleratingvoltage, V. Normally, B is varied to select ions and V is fixed near3 000 V. Transmission of ions and detector response both decreasewhen V is decreased.
Sc b
Force
Trajectory
BvB goes into the page
r
mz
�eB2r2
2VzeBr
m� B2zeV
m 1
A reasonable match of the experimentalspectrum to one in the computer library is notproof of molecular structure—it is just a clue.7
You must be able to explain all major peaks(and even minor peaks at high m/z) in thespectrum in terms of the proposed structure,and you should obtain a matching spectrumfrom an authentic sample before reaching aconclusion. The authentic sample must havethe same chromatographic retention timeas the proposed unknown. Many isomersproduce nearly identical mass spectra.

22-1 What Is Mass Spectrometry? 477
If you lower the kinetic energy of electrons in the ionization source to, say, 20 eV, therewill be a lower yield of ions and less fragmentation. You would likely observe a greaterabundance of molecular ions. We customarily used 70 eV because it gives reproducible frag-mentation patterns that can be compared with library spectra.
The most intense peak in a mass spectrum is called the base peak. Intensities of otherpeaks are expressed as a percentage of the base peak intensity. In the electron ionizationspectrum in Figure 22-4, the base peak is at m/z 141.
Chemical ionization produces less fragmentation than electron ionization. For chemicalionization, the ionization source is filled with a reagent gas such as methane, isobutane, orammonia, at a pressure of . Energetic electrons (100–200 eV) convert into avariety of reactive products:
is a potent proton donor that reacts with analyte to give the protonated molecule,which is usually the most abundant ion in the chemical ionization mass spectrum.
In the chemical ionization spectrum in Figure 22-4, at m/z 227 is the second strongestpeak and there are fewer fragments than in the electron ionization spectrum.
Ammonia or isobutane are used in place of to reduce the fragmentation of .These reagents bind more strongly than does and impart less energy to whenthe proton is transferred to M. is a mild, versatile ionization reagent generated from NOby radioactive .10 Negative chemical ionization reagents include , , and .10SF�
6F�O2�210Po
NO�
MH�CH4H�
MH�CH4
MH�
CH�5 � M S CH4 � MH�
MH�,CH�5
CH 3� � CH4 S C2H�
5 � H2
CH 4�� S CH�
3 � H�CH�
4� � CH4 S CH�
5 � �CH3
CH4 � e� S CH�4� � 2e�
CH4�1 mbar
Rel
ativ
e ab
unda
nce
m/z
Electronionization
PentobarbitalNominal mass = 226
Chemicalionization
50
100
60 80 100 120 140 160 180 200 220 240 260
Rel
ativ
e ab
unda
nce
m/z
50
100
60 80 100 120 140 160 180 200 220 240 260
55 69
8098 112
129
141156
173197
59 83 97 111 139
157
171
185
197207
213
227
255
O
O OHN
NH
MH+
Figure 22-4 Mass spectra of the sedative pentobarbital, by using electron ionization (left) orchemical ionization (right). The molecular ion is not evident with electron ionization. Thedominant ion from chemical ionization is . The peak at m/z 255 in the chemical ionizationspectrum is from . [Courtesy Varian Associates, Sunnyvale, CA.]M(C2H5)�
MH�
(M��, m/z 226)
CH
HO
NonbondingelectronI.E. = 11.0 eV
Sigma bondingelectronI.E. = 15.9 eV
Pi bondingelectronI.E. = 14.1 eV
Figure 22-3 Ionization energies (I.E.) of valenceelectrons in formaldehyde. [Data from C. R. Brundle,
M. B. Robin, N. A. Kuebler, and H. Basch, “Perfluoro Effects in
Photoelectron Spectroscopy,”J. Am. Chem. Soc. 1972, 94,1451.]
Here are other first ionization energies:
10.6 eV (sigma)9.6 eV (pi)
9.6 eV (nonbonding)
8.6 eV (nonbonding)
9.2 eV (pi)
NH
(CH3CH2)2 O
CH2¢CHCH2CH3
CH3CH2CH2CH3
is described as a tripod with anadded unit. is held together bytwo electrons distributed over three atoms.Atoms of the unit rapidly exchange withatoms of the unit.9CH3
H2
[HßCßH]H2
CH3CH�5
The molecular ion, , can be formed byreactions such as
is the protonated molecule, not themolecular ion.MH�
CH�4� � M S CH4 � M��
M��

478 CHAPTER 22 Mass Spectrometry
Resolving PowerMass spectra in Figure 22-4 are computer-generated bar graphs. In contrast, Figure 22-1shows the actual detector signal. Each mass spectral peak has a width that limits how closelytwo peaks could be spaced and still be resolved. If peaks are too close, they appear to be asingle peak.
The higher the resolving power of a mass spectrometer, the better it is able to separatetwo peaks with similar mass.
(22-1)
Figure 22-5a Figure 22-5b
where m is the smaller value of m/z. The denominator is defined in two different ways. InFigure 22-5a, the denominator is the separation of the two peaks when the overlap attheir base is 10% as high as the peak. The resolving power in Figure 22-5a is
In Figure 22-5b, the denominator is taken as , the width of thepeak at half the maximum height, which is 0.481 Da (dalton, see Box 22-1). By this defini-tion, the resolving power is for the same two peaks. Fig-ure 22-5c shows that, when the expression gives a resolving power of ,two peaks at m/z 500 and 501 are barely discernible. Specify which definition you use whenexpressing resolving power.
Example Resolving Power
Using the peak in Figure 22-1, find the resolving power from the expression .
Solution The width at half height is 0.146 m/z units. Therefore,
An instrument with a resolving power of separates peaks well near m/z 200but gives a barely discernible separation at m/z 1 420.
22-2 Oh, Mass Spectrum, Speak to Me!*Each mass spectrum has a story to tell. The molecular ion, , tells us the molecular massof an unknown. Unfortunately, with electron ionization, some compounds do not exhibit amolecular ion, because breaks apart so efficiently. However, the fragments provide themost valuable clues to the structure of an unknown. To find the molecular mass, we canobtain a chemical ionization mass spectrum, which usually has a strong peak for .
The nitrogen rule helps us propose compositions for molecular ions: If a compound hasan odd number of nitrogen atoms—in addition to any number of C, H, halogens, O, S, Si, andP—then has an odd nominal mass. For a compound with an even number of nitrogenatoms (0, 2, 4, and so on), has an even nominal mass. A molecular ion at m/z 128 canhave 0 or 2 N atoms, but it cannot have 1 N atom.
M��M��
MH�
M��
M��
1.42 � 103
Resolving power �m
m1/2�
208
0.146� 1.42 � 103
m/m1/2208Pb
5.00 � 102m/m1/2
m/m1/2 � 500/0.481 � 1.04 � 103
m1/2500/1.00 � 5.00 � 102.m/�m �
(�m)
Resolving power �m
�m or
mm1/2
Det
ecto
r si
gnal
1.0
0.8
0.6
0.4
0.2
499 500
m/z m/z m/z
501 502 499 500 501 502 499 500
Dip is 8%below peak
501 502
(a) (b) (c)
Resolving power = = 500m∆m
∆m = 1
Resolving power = = 1 040mm
1/2
m1/2
m1/2 = 1
Resolving power = = 500mm
1/2
= 0.481
Figure 22-5 Resolving power. (a) By one definition, the resolving power is .(b) By a second definition, the resolving power for the same pair of peaks is .(c) With the second definition, two peaks at m/z 500 and 501 are just barely discernible if the resolvingpower is 500.
m/m1/2 � 500/0.481 � 1 040m/�m � 500/1 � 500
The expression m/m1/2 gives a value twice asgreat as m/�m for resolving power.
Resolution, which is the inverse of resolvingpower (�m/m), is the smallest mass differencethat can be detected as separate peaks.Resolving power is a big number, andresolution is a small number.
*An expression borrowed from O. DavidSparkman, a master teacher.
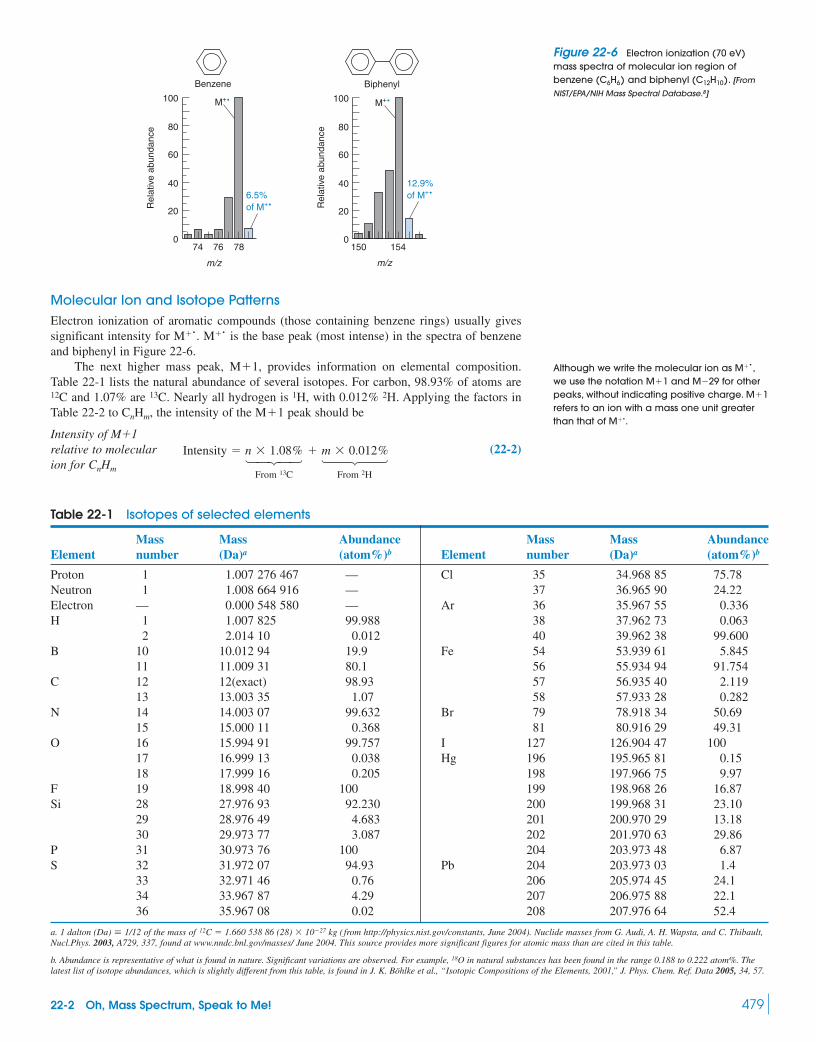
22-2 Oh, Mass Spectrum, Speak to Me! 479
Molecular Ion and Isotope PatternsElectron ionization of aromatic compounds (those containing benzene rings) usually givessignificant intensity for . is the base peak (most intense) in the spectra of benzeneand biphenyl in Figure 22-6.
The next higher mass peak, , provides information on elemental composition.Table 22-1 lists the natural abundance of several isotopes. For carbon, 98.93% of atoms are
and 1.07% are . Nearly all hydrogen is , with . Applying the factors inTable 22-2 to , the intensity of the peak should be
(22-2)14243 14243
From From 2H13C
Intensity � n � 1.08% � m � 0.012%Intensity of M�1relative to molecularion for CnHm
M�1CnHm
0.012% 2H1H13C12C
M�1
M��M��
100
80
60
40
20
0
100
80
60
40
20
0
12.9%of M+6.5%
of M+Rel
ativ
e ab
unda
nce
BiphenylBenzene
M+M+
m/zm/z
74 76 78 150 154
Rel
ativ
e ab
unda
nce
Table 22-1 Isotopes of selected elements
Mass Mass Abundance Mass Mass AbundanceElement number (Da)a (atom%)b Element number (Da)a (atom%)b
Proton 1 1.007 276 467 — Cl 35 34.968 85 75.78Neutron 1 1.008 664 916 — 37 36.965 90 24.22Electron — 0.000 548 580 — Ar 36 35.967 55 0.336H 1 1.007 825 99.988 38 37.962 73 0.063
2 2.014 10 0.012 40 39.962 38 99.600B 10 10.012 94 19.9 Fe 54 53.939 61 5.845
11 11.009 31 80.1 56 55.934 94 91.754C 12 12(exact) 98.93 57 56.935 40 2.119
13 13.003 35 1.07 58 57.933 28 0.282N 14 14.003 07 99.632 Br 79 78.918 34 50.69
15 15.000 11 0.368 81 80.916 29 49.31O 16 15.994 91 99.757 I 127 126.904 47 100
17 16.999 13 0.038 Hg 196 195.965 81 0.1518 17.999 16 0.205 198 197.966 75 9.97
F 19 18.998 40 100 199 198.968 26 16.87Si 28 27.976 93 92.230 200 199.968 31 23.10
29 28.976 49 4.683 201 200.970 29 13.1830 29.973 77 3.087 202 201.970 63 29.86
P 31 30.973 76 100 204 203.973 48 6.87S 32 31.972 07 94.93 Pb 204 203.973 03 1.4
33 32.971 46 0.76 206 205.974 45 24.134 33.967 87 4.29 207 206.975 88 22.136 35.967 08 0.02 208 207.976 64 52.4
a. 1 dalton (Da) 1/12 of the mass of 12C � 1.660 538 86 (28) � 10�27 kg ( from http://physics.nist.gov/constants, June 2004). Nuclide masses from G. Audi, A. H. Wapsta, and C. Thibault,Nucl.Phys. 2003, A729, 337, found at www.nndc.bnl.gov/masses/ June 2004. This source provides more significant figures for atomic mass than are cited in this table.
b. Abundance is representative of what is found in nature. Significant variations are observed. For example, 18O in natural substances has been found in the range 0.188 to 0.222 atom%. Thelatest list of isotope abundances, which is slightly different from this table, is found in J. K. Böhlke et al., “Isotopic Compositions of the Elements, 2001,” J. Phys. Chem. Ref. Data 2005, 34, 57.
�
Figure 22-6 Electron ionization (70 eV)mass spectra of molecular ion region ofbenzene and biphenyl . [From
NIST/EPA/NIH Mass Spectral Database.8]
(C12H10)(C6H6)
Although we write the molecular ion as ,we use the notation and for otherpeaks, without indicating positive charge.refers to an ion with a mass one unit greaterthan that of .M��
M�1M�29M�1
M��

480 CHAPTER 22 Mass Spectrometry
For benzene, , is observed at m/z 78. The predicted intensity at m/z 79 isof the abundance of . The observed intensity in Fig-
ure 22-6 is 6.5%. An intensity within of the expected value (5.9 to 7.2, in this case) iswithin the precision of ordinary mass spectrometers. For biphenyl , we predict that
should have of the intensity of . The observedvalue is 12.9%.
Example Listening to a Mass Spectrum
In the chemical ionization mass spectrum of pentobarbital in Figure 22-4, the peak withthe most significant intensity at the high end of the mass spectrum at m/z 227 is suspectedto be . If this is so, then the nominal mass of M is 226. The nitrogen rule tells us thata molecule with an even mass must have an even number of nitrogen atoms. If you knowfrom elemental analysis that the compound contains only C, H, N, and O, how manyatoms of carbon would you suspect are in the molecule?
Solution The m/z 228 peak has 12.0% of the height of the m/z 227 peak. Table 22-2tells us that n carbon atoms will contribute intensity at m/z 228 from .Contributions from and are small. makes a larger contribution, but there areprobably few atoms of nitrogen in the compound. Our first guess is
The actual composition of at m/z 227 is . From the factors in Table 22-2,the theoretical intensity at m/z 228 is
14243 1442443 14243 14243
The theoretical intensity is within the 10% uncertainty of the observed value of 12.0%.
Ions containing Cl or Br have distinctive isotopic peaks shown in Figure 22-7.11 In themass spectrum of 1-bromobutane in Figure 22-8, two nearly equal peaks at m/z 136 and 138
15N17O2H13C
Intensity � 11 � 1.08% � 19 � 0.012% � 3 � 0.038% � 2 � 0.369% � 13.0%
C11H19O3N2MH�
Number of C atoms �observed peak intensity for M�1
contribution per carbon atom�
12.0%
1.08%� 11.1 � 11
15N17O2H
13Cn � 1.08%
MH�
M��12 � 1.08 � 10 � 0.012 � 13.1%M�1(C12H10)
�10%M��6 � 1.08 � 6 � 0.012 � 6.55%
M��C6H6
Table 22-2 Isotope abundance factors (%) for interpreting mass spectra
Element X�1 X�2 X�3 X�4 X�5 X�6
H 0.012nC 1.08nN 0.369nO 0.038n 0.205nF 0Si 5.08n 3.35nP 0S 0.801n 4.52nCl — 32.0n — —Br — 97.3n — —I 0
EXAMPLE: For a peak at m/z � X containing n carbon atoms, the intensity from carbon at is of the intensity at X. The intensity atis of the intensity at X. Contributions from isotopes of other atoms in the ion are additive.n(n � 1) � 0.005 8%X�2
n � 1.08%X�1
15.3n(n � 1)(n � 2)47.3n(n � 1)0.544n(n � 1)(n � 2)5.11n(n � 1)
0.102n(n � 1)0.036n(n � 1)
0.056n(n � 1)0.170n(n � 1)
0.005 8n(n � 1)
CI BrCI2 CI3 Br2 Br2CI CI2BrBr3
Rel
ativ
e ab
unda
nce
100
80
60
40
20
X+
2
X+
2X
+4
XX X+
2XX
+2
X+
4X
+6
X X+
2X
+4
X+
6
X X+
2X
+4
X+
6
X X+
2X
+4
X+
6
XX+
2X
+4
X
Figure 22-7 Calculated isotopic patterns for species containing Cl and Br.
Rel
ativ
e ab
unda
nce
20
0
40
60
80
100
40 60 80 100m /z
120 140
Bromine!
M–29107
CH3CH2CH2CH2Br
M–9541
M–7957
M+
136
Figure 22-8 Electron ionization massspectrum (70 eV) of 1-bromobutane. [From
A. Illies, P. B. Shevlin, G. Childers, M. Peschke, and
J. Tsai, “Mass Spectrometry for Large Undergraduate
Laboratory Sections,” J. Chem. Ed. 1995, 72, 717.
Referee from Maddy Harris.]
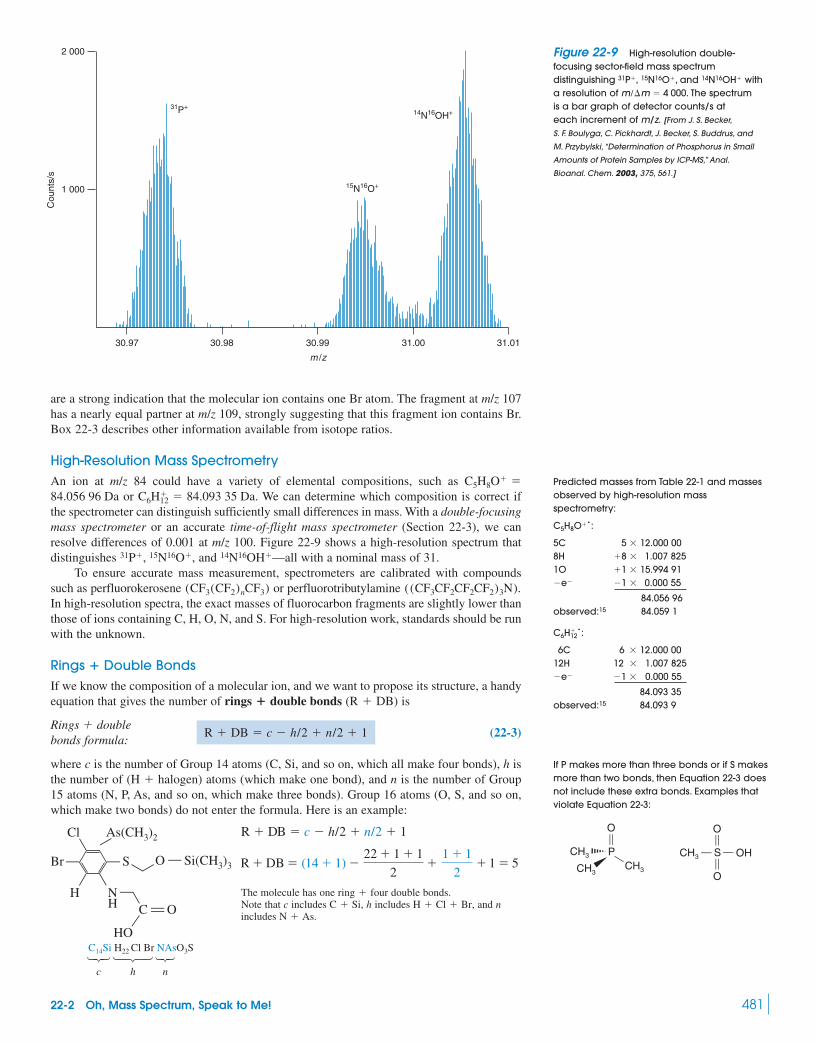
22-2 Oh, Mass Spectrum, Speak to Me! 481
are a strong indication that the molecular ion contains one Br atom. The fragment at m/z 107has a nearly equal partner at m/z 109, strongly suggesting that this fragment ion contains Br.Box 22-3 describes other information available from isotope ratios.
High-Resolution Mass SpectrometryAn ion at m/z 84 could have a variety of elemental compositions, such as
or . We can determine which composition is correct ifthe spectrometer can distinguish sufficiently small differences in mass. With a double-focusingmass spectrometer or an accurate time-of-flight mass spectrometer (Section 22-3), we canresolve differences of 0.001 at m/z 100. Figure 22-9 shows a high-resolution spectrum thatdistinguishes , and —all with a nominal mass of 31.
To ensure accurate mass measurement, spectrometers are calibrated with compoundssuch as perfluorokerosene or perfluorotributylamine In high-resolution spectra, the exact masses of fluorocarbon fragments are slightly lower thanthose of ions containing C, H, O, N, and S. For high-resolution work, standards should be runwith the unknown.
Rings � Double BondsIf we know the composition of a molecular ion, and we want to propose its structure, a handyequation that gives the number of ( ) is
(22-3)
where c is the number of Group 14 atoms (C, Si, and so on, which all make four bonds), h isthe number of ( ) atoms (which make one bond), and n is the number of Group15 atoms (N, P, As, and so on, which make three bonds). Group 16 atoms (O, S, and so on,which make two bonds) do not enter the formula. Here is an example:
The molecule has one ring four double bonds.Note that c includes , h includes , and nincludes .
123 123 123c h n
C14Si H22 Cl Br NAsO3S
N � AsH � Cl � BrC � Si
�
R � DB � (14 � 1) �22 � 1 � 1
2�
1 � 1
2� 1 � 5
R � DB � c � h/2 � n/2 � 1
ß ß
ß
ç
ç çCl
Br
H
As(CH3)2
HO
O ß Si(CH3)3
NH
Sç
ç
œ
çœ
C £ O
H � halogen
R � DB � c � h/2 � n/2 � 1Rings � doublebonds formula:
R � DBrings � double bonds
((CF3CF2CF2CF2)3N).(CF3(CF2)nCF3)
14N16OH�31P�, 15N16O�
C6H�12 � 84.093 35 Da84.056 96 Da
C5H8O� �
2 000
31P+
15N16O+
14N16OH+
1 000
31.0131.0030.99
m /z
30.9830.97
Cou
nts/
s
Predicted masses from Table 22-1 and massesobserved by high-resolution massspectrometry:
:
5C 5 � 12.000 008H �8 � 1.007 8251O �1 � 15.994 91�e� �1 � 0.000 55
84.056 96observed:15 84.059 1
:
6C 6 � 12.000 0012H 12 � 1.007 825�e� �1 � 0.000 55
84.093 35observed:15 84.093 9
C6H12� �
C5H8O��
If P makes more than three bonds or if S makesmore than two bonds, then Equation 22-3 doesnot include these extra bonds. Examples thatviolate Equation 22-3:
P —CH3
O
S
O
ç
™™
CH3CH3™
ç çCH3
O
OH
Figure 22-9 High-resolution double-focusing sector-field mass spectrumdistinguishing , and witha resolution of . The spectrumis a bar graph of detector counts/s ateach increment of m/z. [From J. S. Becker,
S. F. Boulyga, C. Pickhardt, J. Becker, S. Buddrus, and
M. Przybylski, “Determination of Phosphorus in Small
Amounts of Protein Samples by ICP-MS,” Anal.
Bioanal. Chem. 2003, 375, 561.]
m/�m � 4 000
14N16OH�31P�, 15N16O�
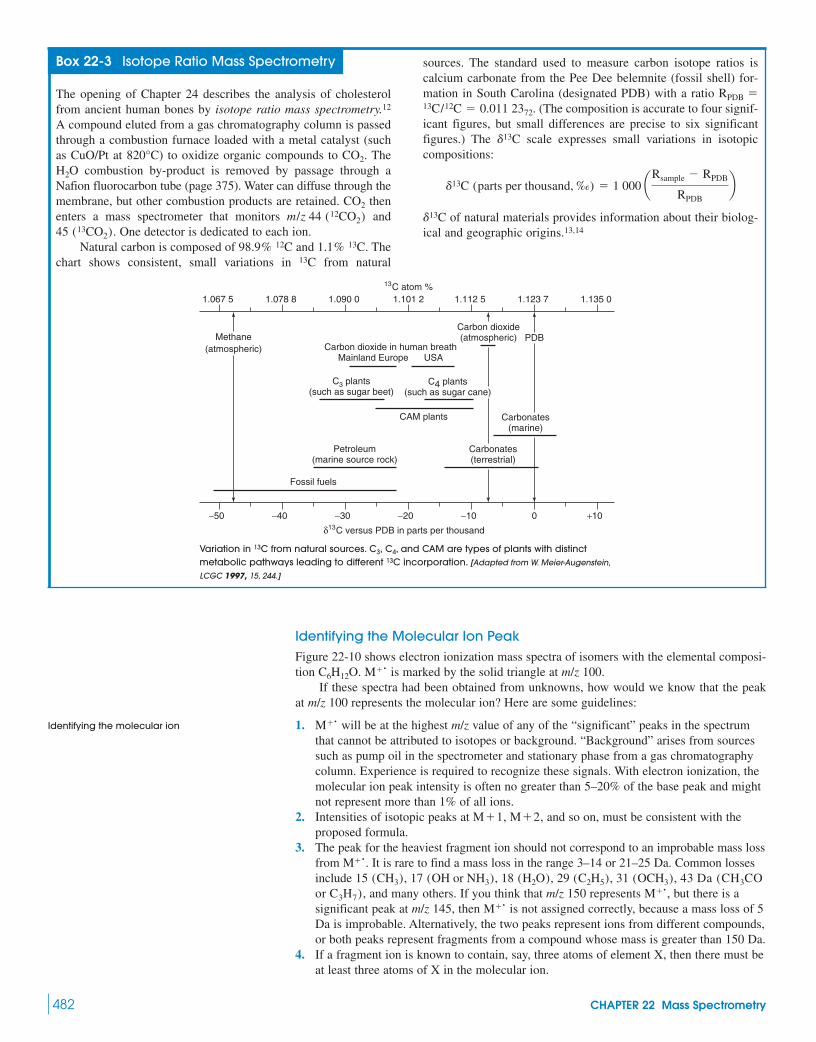
482 CHAPTER 22 Mass Spectrometry
Identifying the Molecular Ion PeakFigure 22-10 shows electron ionization mass spectra of isomers with the elemental composi-tion . is marked by the solid triangle at m/z 100.
If these spectra had been obtained from unknowns, how would we know that the peakat m/z 100 represents the molecular ion? Here are some guidelines:
1. will be at the highest m/z value of any of the “significant” peaks in the spectrumthat cannot be attributed to isotopes or background. “Background” arises from sourcessuch as pump oil in the spectrometer and stationary phase from a gas chromatographycolumn. Experience is required to recognize these signals. With electron ionization, themolecular ion peak intensity is often no greater than 5–20% of the base peak and mightnot represent more than 1% of all ions.
2. Intensities of isotopic peaks at , , and so on, must be consistent with theproposed formula.
3. The peak for the heaviest fragment ion should not correspond to an improbable mass lossfrom . It is rare to find a mass loss in the range 3–14 or 21–25 Da. Common lossesinclude , , , , ,
, and many others. If you think that m/z 150 represents , but there is asignificant peak at m/z 145, then is not assigned correctly, because a mass loss of 5Da is improbable. Alternatively, the two peaks represent ions from different compounds,or both peaks represent fragments from a compound whose mass is greater than 150 Da.
4. If a fragment ion is known to contain, say, three atoms of element X, then there must beat least three atoms of X in the molecular ion.
M��M��or C3H7)
43 Da (CH3CO31 (OCH3)29 (C2H5)18 (H2O)17 (OH or NH3)15 (CH3)M��
M�2M�1
M��
M��C6H12O
Box 22-3 Isotope Ratio Mass Spectrometry
The opening of Chapter 24 describes the analysis of cholesterolfrom ancient human bones by isotope ratio mass spectrometry.12
A compound eluted from a gas chromatography column is passedthrough a combustion furnace loaded with a metal catalyst (suchas CuO/Pt at ) to oxidize organic compounds to . The
combustion by-product is removed by passage through aNafion fluorocarbon tube (page 375). Water can diffuse through themembrane, but other combustion products are retained. thenenters a mass spectrometer that monitors and
. One detector is dedicated to each ion.Natural carbon is composed of and . The
chart shows consistent, small variations in from natural13C1.1% 13C98.9% 12C
45 (13CO2)m/z 44 (12CO2)
CO2
H2OCO2820°C
sources. The standard used to measure carbon isotope ratios iscalcium carbonate from the Pee Dee belemnite (fossil shell) for-mation in South Carolina (designated PDB) with a ratio
. (The composition is accurate to four signif-icant figures, but small differences are precise to six significantfigures.) The scale expresses small variations in isotopiccompositions:
of natural materials provides information about their biolog-ical and geographic origins.13,14d13C
d13C (parts per thousand, ‰) � 1 000 aRsample � RPDB
RPDBb
d13C
13C/12C � 0.011 2372
RPDB �
1.067 5 1.078 8 1.090 0 1.101 2 1.112 5 1.123 7 1.135 0
−50 −40 −30 −20 −10 0 +10
13C atom %
δ13C versus PDB in parts per thousand
Methane(atmospheric) Carbon dioxide in human breath
Mainland Europe USA
Carbon dioxide(atmospheric) PDB
C3 plants(such as sugar beet)
C4 plants(such as sugar cane)
CAM plants Carbonates(marine)
Carbonates(terrestrial)
Petroleum(marine source rock)
Fossil fuels
Variation in from natural sources. , and CAM are types of plants with distinctmetabolic pathways leading to different incorporation. [Adapted from W. Meier-Augenstein,
LCGC 1997, 15, 244.]
13CC3, C4
13C
Identifying the molecular ion

22-2 Oh, Mass Spectrum, Speak to Me! 483
In both spectra in Figure 22-10, the peak at highest m/z with “significant” intensity ism/z 100. The next-highest significant peak is m/z 85, representing a loss of 15 Da (probably
). Peaks at m/z 85 and 100 are consistent with m/z 100 representing . If has aneven mass, the nitrogen rule says there cannot be an odd number of N atoms in the molecule.
In both spectra, the peak has 6% of the intensity of the peak, with just onesignificant digit in the measurement. From the intensity of the peak for , we estimatethe number of C atoms:
If there are six C atoms and no N atoms, a possible composition is . The expectedintensity of is
14243 1442443 1442443
The observed intensity of 6% for is within experimental error of 6.7%, so isconsistent with the data so far. requires one ring or double bond.
Interpreting Fragmentation PatternsConsider how the 2-hexanone molecular ion can break apart to give the many peaks in Figure22-10. Reactions A and B in Figure 22-11 show derived from loss of a nonbonding elec-tron from oxygen, which has the lowest ionization energy. In Reaction A, the bond adja-cent to splits so that one electron goes to each C atom. The products are a neutral butylradical and . Only the ion is detected by the mass spectrometer, giving theCH3CO��(�C4H9)
C¢OCßC
M��
C6H12OC6H12OM�1
17O2H13C
Intensity � 6 � 1.08%�12 � 0.012%�1 � 0.038% � 6.7% of M��
M�1C6H12O
Number of C atoms �observed (M�1)/M�� intensity
contribution per carbon atom�
6%
1.08%� 5.6 � 6
M�1M��M�1
M��M��CH3
100
50
0
10 20 30 40 50 60 70 80 90 100
Rel
ativ
e ab
unda
nce
m/z
10 20
29151008571
58
65
43 2
1
43 43
29
15
58
10085
30 40 50 60 70 80 90 100
m/z
2-Hexanone4-Methyl-2-pentanone
C6H12OC6H12O
M+1 =6% of M+
M+1 =6% of M+
M+M+
O OFigure 22-10 Electron ionization (70 eV)mass spectra of isomeric ketones with thecomposition . [From NIST/EPA/NIH Mass
Spectral Database.8]
C6H12O
C
O™
CH3CH2CH2CH2œ œ
$
CH3
�
C
O™
CH3CH2CH2CH2 CH3CH2CH2CH2 ¬ C Ω O CH3œ œCH3
$�
$�
C
O™
CH3CH2CH2CH2 CH3CH2CH2CH2
CH3
œ
$ $
C
O™
™™
œ
œ
œ
œ
œ
œCH3�CH3
œCH3H
C
O
CH3CH2
$�
C
O
CH3H2C
��
��
homolyticcleavage
A
homolyticcleavage
B
heterolyticcleavage
C
McLaffertyrearrangement
D
CH3CH2CH2CH2 O Ω C ¬ CH3
m/z � 43
m/z � 85
Propene(neutral molecule)
m/z � 15H
m/z � 58
$$
$
�
�
M+
The small peak at m/z 86 is not a loss of 14 Dafrom . It is the isotopic partner of the m/z 85peak containing .13C
M��
We see no evidence at , , and for the elements Cl, Br, Si, or S.
M�3M�2M�1
Challenge What intensities would you seeat and if there were one Cl, one Br,one Si, or one S in the molecule?
M�3M�2
� 6 � 12/2 � 0 � 1 � 1
R � DB � c � h/2 � n/2 � 1
Figure 22-11 Four possible fragmentationpathways for the molecular ion of 2-hexanone.
is transfer of one electronis transfer of two electrons"
"
Types of bond breaking:
• Homolytic cleavage: 1 electron remains witheach fragment
• Heterolytic cleavage: Both electrons stay withone fragment
In general, the most intense peaks correspondto the most stable fragments.
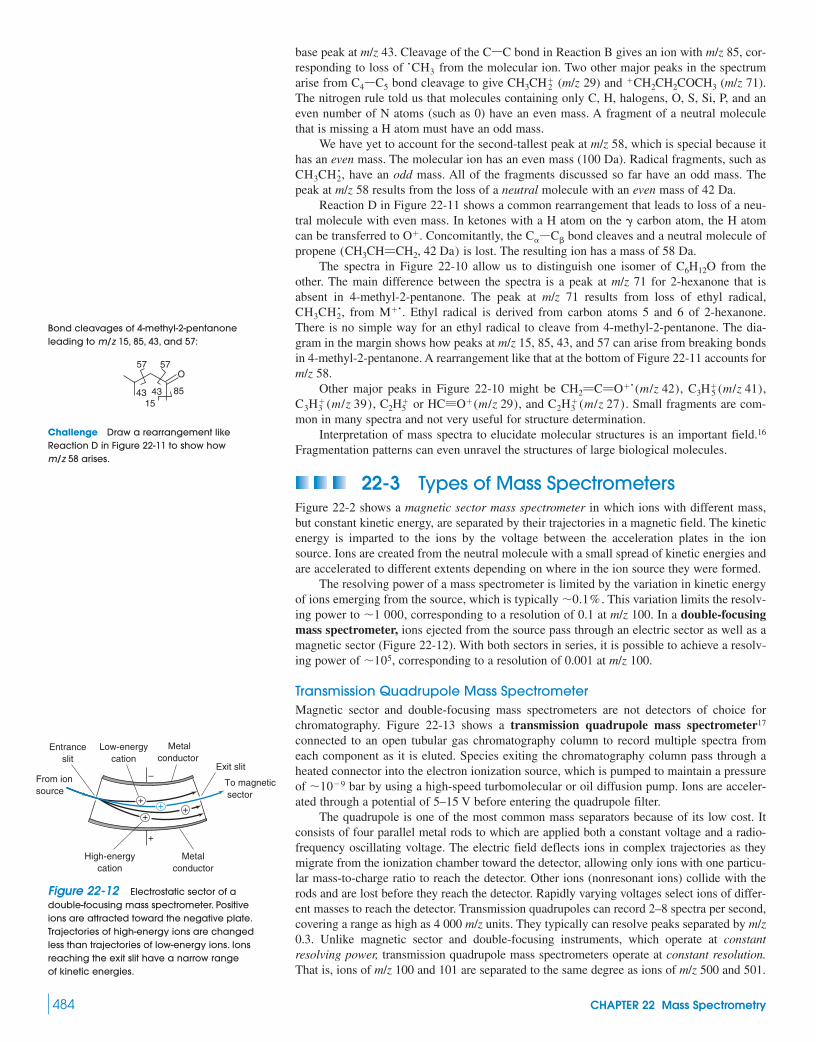
484 CHAPTER 22 Mass Spectrometry
base peak at m/z 43. Cleavage of the bond in Reaction B gives an ion with m/z 85, cor-responding to loss of from the molecular ion. Two other major peaks in the spectrumarise from bond cleavage to give (m/z 29) and (m/z 71).The nitrogen rule told us that molecules containing only C, H, halogens, O, S, Si, P, and aneven number of N atoms (such as 0) have an even mass. A fragment of a neutral moleculethat is missing a H atom must have an odd mass.
We have yet to account for the second-tallest peak at m/z 58, which is special because ithas an even mass. The molecular ion has an even mass (100 Da). Radical fragments, such as
, have an odd mass. All of the fragments discussed so far have an odd mass. Thepeak at m/z 58 results from the loss of a neutral molecule with an even mass of 42 Da.
Reaction D in Figure 22-11 shows a common rearrangement that leads to loss of a neu-tral molecule with even mass. In ketones with a H atom on the carbon atom, the H atomcan be transferred to . Concomitantly, the bond cleaves and a neutral molecule ofpropene is lost. The resulting ion has a mass of 58 Da.
The spectra in Figure 22-10 allow us to distinguish one isomer of from theother. The main difference between the spectra is a peak at m/z 71 for 2-hexanone that isabsent in 4-methyl-2-pentanone. The peak at m/z 71 results from loss of ethyl radical,
, from . Ethyl radical is derived from carbon atoms 5 and 6 of 2-hexanone.There is no simple way for an ethyl radical to cleave from 4-methyl-2-pentanone. The dia-gram in the margin shows how peaks at m/z 15, 85, 43, and 57 can arise from breaking bondsin 4-methyl-2-pentanone. A rearrangement like that at the bottom of Figure 22-11 accounts form/z 58.
Other major peaks in Figure 22-10 might be , ,, or , and . Small fragments are com-
mon in many spectra and not very useful for structure determination.Interpretation of mass spectra to elucidate molecular structures is an important field.16
Fragmentation patterns can even unravel the structures of large biological molecules.
22-3 Types of Mass SpectrometersFigure 22-2 shows a magnetic sector mass spectrometer in which ions with different mass,but constant kinetic energy, are separated by their trajectories in a magnetic field. The kineticenergy is imparted to the ions by the voltage between the acceleration plates in the ionsource. Ions are created from the neutral molecule with a small spread of kinetic energies andare accelerated to different extents depending on where in the ion source they were formed.
The resolving power of a mass spectrometer is limited by the variation in kinetic energyof ions emerging from the source, which is typically . This variation limits the resolv-ing power to , corresponding to a resolution of 0.1 at m/z 100. In a double-focusingmass spectrometer, ions ejected from the source pass through an electric sector as well as amagnetic sector (Figure 22-12). With both sectors in series, it is possible to achieve a resolv-ing power of , corresponding to a resolution of 0.001 at m/z 100.
Transmission Quadrupole Mass SpectrometerMagnetic sector and double-focusing mass spectrometers are not detectors of choice forchromatography. Figure 22-13 shows a transmission quadrupole mass spectrometer17
connected to an open tubular gas chromatography column to record multiple spectra fromeach component as it is eluted. Species exiting the chromatography column pass through aheated connector into the electron ionization source, which is pumped to maintain a pressureof bar by using a high-speed turbomolecular or oil diffusion pump. Ions are acceler-ated through a potential of 5–15 V before entering the quadrupole filter.
The quadrupole is one of the most common mass separators because of its low cost. Itconsists of four parallel metal rods to which are applied both a constant voltage and a radio-frequency oscillating voltage. The electric field deflects ions in complex trajectories as theymigrate from the ionization chamber toward the detector, allowing only ions with one particu-lar mass-to-charge ratio to reach the detector. Other ions (nonresonant ions) collide with therods and are lost before they reach the detector. Rapidly varying voltages select ions of differ-ent masses to reach the detector. Transmission quadrupoles can record 2–8 spectra per second,covering a range as high as 4 000 m/z units. They typically can resolve peaks separated by m/z0.3. Unlike magnetic sector and double-focusing instruments, which operate at constantresolving power, transmission quadrupole mass spectrometers operate at constant resolution.That is, ions of m/z 100 and 101 are separated to the same degree as ions of m/z 500 and 501.
�10�9
�105
�1 000�0.1%
C2H3�(m/z 27)HCΩO�(m/z 29)C2H5
�C3H3�(m/z 39)
C3H 5�(m/z 41)CH2¢C¢O��(m/z 42)
M��CH3CH2�
C6H12O(CH3CH¢CH2, 42 Da)
C�ßC�O�
�
CH3CH2�
�CH2CH2COCH3CH3CH 2�C4ßC5
�CH3
CßC
++
++
+
–To magnetic sector
Exit slit
Metalconductor
Low-energycation
From ionsource
Metalconductor
High-energycation
Entranceslit
Figure 22-12 Electrostatic sector of adouble-focusing mass spectrometer. Positiveions are attracted toward the negative plate.Trajectories of high-energy ions are changedless than trajectories of low-energy ions. Ionsreaching the exit slit have a narrow rangeof kinetic energies.
Bond cleavages of 4-methyl-2-pentanoneleading to m/z 15, 85, 43, and 57:
O5757
854315
43
Challenge Draw a rearrangement likeReaction D in Figure 22-11 to show how m/z 58 arises.
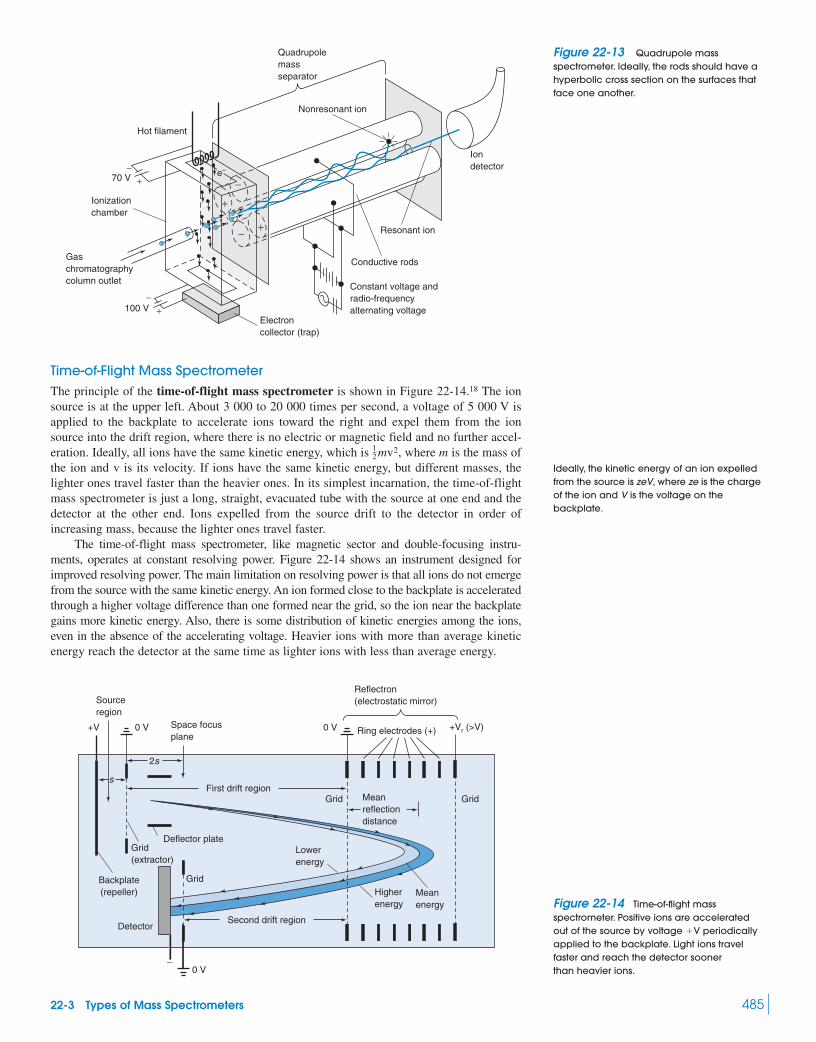
22-3 Types of Mass Spectrometers 485
Hot filament
e–
Quadrupolemassseparator
Nonresonant ion
Resonant ion
Conductive rods
Iondetector
Constant voltage andradio-frequencyalternating voltage
Ionizationchamber
Electroncollector (trap)
Gaschromatographycolumn outlet
100 V
70 V
+
+
+
+
−
−
−
−
Time-of-Flight Mass SpectrometerThe principle of the time-of-flight mass spectrometer is shown in Figure 22-14.18 The ionsource is at the upper left. About 3 000 to 20 000 times per second, a voltage of 5 000 V isapplied to the backplate to accelerate ions toward the right and expel them from the ionsource into the drift region, where there is no electric or magnetic field and no further accel-eration. Ideally, all ions have the same kinetic energy, which is , where m is the mass ofthe ion and v is its velocity. If ions have the same kinetic energy, but different masses, thelighter ones travel faster than the heavier ones. In its simplest incarnation, the time-of-flightmass spectrometer is just a long, straight, evacuated tube with the source at one end and thedetector at the other end. Ions expelled from the source drift to the detector in order ofincreasing mass, because the lighter ones travel faster.
The time-of-flight mass spectrometer, like magnetic sector and double-focusing instru-ments, operates at constant resolving power. Figure 22-14 shows an instrument designed forimproved resolving power. The main limitation on resolving power is that all ions do not emergefrom the source with the same kinetic energy. An ion formed close to the backplate is acceleratedthrough a higher voltage difference than one formed near the grid, so the ion near the backplategains more kinetic energy. Also, there is some distribution of kinetic energies among the ions,even in the absence of the accelerating voltage. Heavier ions with more than average kineticenergy reach the detector at the same time as lighter ions with less than average energy.
12 mv2
Second drift region
Meanreflectiondistance
First drift region
Deflector plate
2s
s
Lowerenergy
Grid(extractor)
Higherenergy
Meanenergy
Grid
Sourceregion
Grid
Grid
Detector
Backplate(repeller)
Space focusplane
0 V
0 V
0 V +Vr (>V)+V Ring electrodes (+)
Reflectron(electrostatic mirror)
�
Ideally, the kinetic energy of an ion expelledfrom the source is zeV, where ze is the chargeof the ion and V is the voltage on thebackplate.
Figure 22-13 Quadrupole massspectrometer. Ideally, the rods should have ahyperbolic cross section on the surfaces thatface one another.
Figure 22-14 Time-of-flight massspectrometer. Positive ions are acceleratedout of the source by voltage periodicallyapplied to the backplate. Light ions travelfaster and reach the detector sooner than heavier ions.
�V
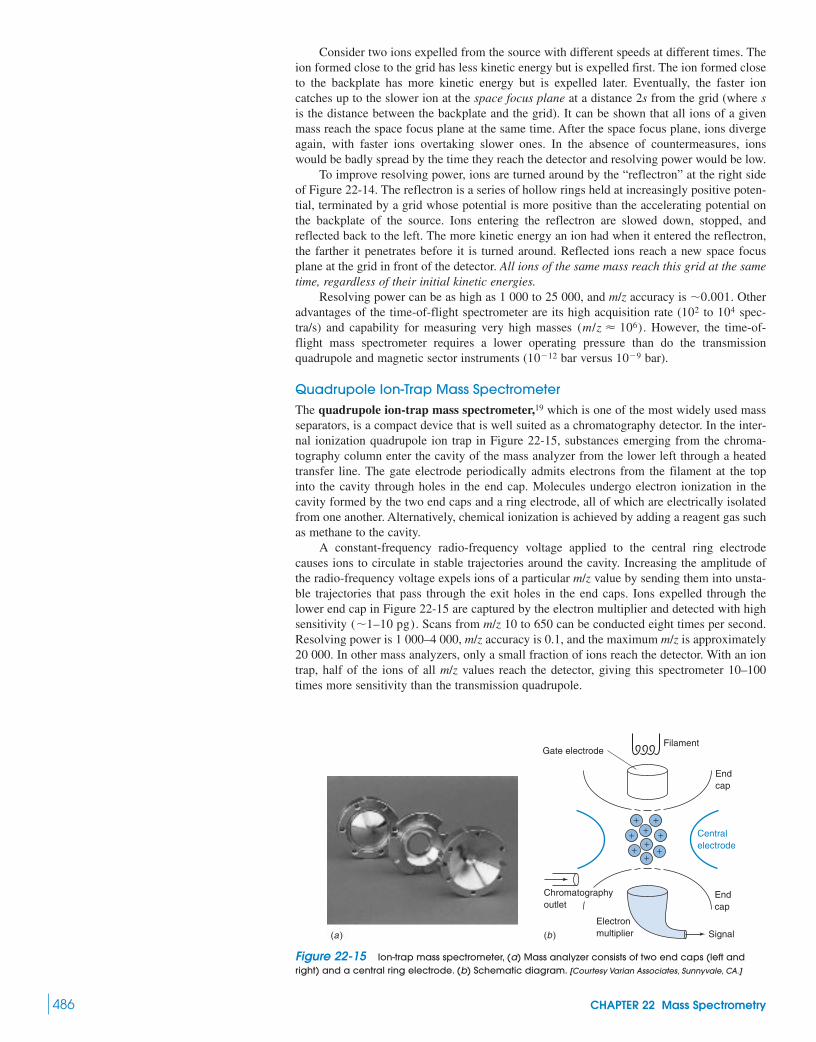
486 CHAPTER 22 Mass Spectrometry
Consider two ions expelled from the source with different speeds at different times. Theion formed close to the grid has less kinetic energy but is expelled first. The ion formed closeto the backplate has more kinetic energy but is expelled later. Eventually, the faster ioncatches up to the slower ion at the space focus plane at a distance 2s from the grid (where sis the distance between the backplate and the grid). It can be shown that all ions of a givenmass reach the space focus plane at the same time. After the space focus plane, ions divergeagain, with faster ions overtaking slower ones. In the absence of countermeasures, ionswould be badly spread by the time they reach the detector and resolving power would be low.
To improve resolving power, ions are turned around by the “reflectron” at the right sideof Figure 22-14. The reflectron is a series of hollow rings held at increasingly positive poten-tial, terminated by a grid whose potential is more positive than the accelerating potential onthe backplate of the source. Ions entering the reflectron are slowed down, stopped, andreflected back to the left. The more kinetic energy an ion had when it entered the reflectron,the farther it penetrates before it is turned around. Reflected ions reach a new space focusplane at the grid in front of the detector. All ions of the same mass reach this grid at the sametime, regardless of their initial kinetic energies.
Resolving power can be as high as 1 000 to 25 000, and m/z accuracy is . Otheradvantages of the time-of-flight spectrometer are its high acquisition rate ( to spec-tra/s) and capability for measuring very high masses . However, the time-of-flight mass spectrometer requires a lower operating pressure than do the transmissionquadrupole and magnetic sector instruments ( bar versus bar).
Quadrupole Ion-Trap Mass SpectrometerThe quadrupole ion-trap mass spectrometer,19 which is one of the most widely used massseparators, is a compact device that is well suited as a chromatography detector. In the inter-nal ionization quadrupole ion trap in Figure 22-15, substances emerging from the chroma-tography column enter the cavity of the mass analyzer from the lower left through a heatedtransfer line. The gate electrode periodically admits electrons from the filament at the topinto the cavity through holes in the end cap. Molecules undergo electron ionization in thecavity formed by the two end caps and a ring electrode, all of which are electrically isolatedfrom one another. Alternatively, chemical ionization is achieved by adding a reagent gas suchas methane to the cavity.
A constant-frequency radio-frequency voltage applied to the central ring electrodecauses ions to circulate in stable trajectories around the cavity. Increasing the amplitude ofthe radio-frequency voltage expels ions of a particular m/z value by sending them into unsta-ble trajectories that pass through the exit holes in the end caps. Ions expelled through thelower end cap in Figure 22-15 are captured by the electron multiplier and detected with highsensitivity . Scans from m/z 10 to 650 can be conducted eight times per second.Resolving power is 1 000–4 000, m/z accuracy is 0.1, and the maximum m/z is approximately20 000. In other mass analyzers, only a small fraction of ions reach the detector. With an iontrap, half of the ions of all m/z values reach the detector, giving this spectrometer 10–100times more sensitivity than the transmission quadrupole.
(�1–10 pg)
10�910�12
(m/z � 106)104102
�0.001
(a )
FilamentGate electrode
Endcap
Endcap
Centralelectrode
Electronmultiplier Signal
Chromatographyoutlet
+ +++
+++
+
+
(b )
Figure 22-15 Ion-trap mass spectrometer, (a) Mass analyzer consists of two end caps (left andright) and a central ring electrode. (b) Schematic diagram. [Courtesy Varian Associates, Sunnyvale, CA.]
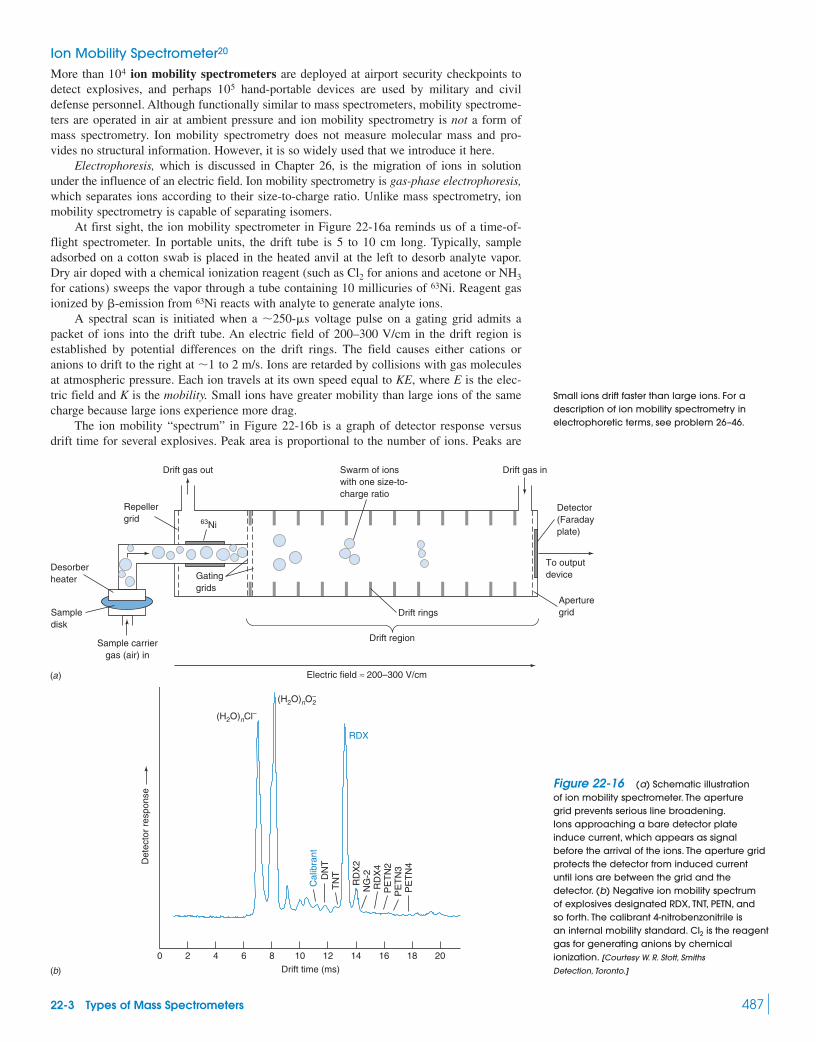
22-3 Types of Mass Spectrometers 487
Ion Mobility Spectrometer20
More than ion mobility spectrometers are deployed at airport security checkpoints todetect explosives, and perhaps hand-portable devices are used by military and civildefense personnel. Although functionally similar to mass spectrometers, mobility spectrome-ters are operated in air at ambient pressure and ion mobility spectrometry is not a form ofmass spectrometry. Ion mobility spectrometry does not measure molecular mass and pro-vides no structural information. However, it is so widely used that we introduce it here.
Electrophoresis, which is discussed in Chapter 26, is the migration of ions in solutionunder the influence of an electric field. Ion mobility spectrometry is gas-phase electrophoresis,which separates ions according to their size-to-charge ratio. Unlike mass spectrometry, ionmobility spectrometry is capable of separating isomers.
At first sight, the ion mobility spectrometer in Figure 22-16a reminds us of a time-of-flight spectrometer. In portable units, the drift tube is 5 to 10 cm long. Typically, sampleadsorbed on a cotton swab is placed in the heated anvil at the left to desorb analyte vapor.Dry air doped with a chemical ionization reagent (such as for anions and acetone or for cations) sweeps the vapor through a tube containing 10 millicuries of . Reagent gasionized by from reacts with analyte to generate analyte ions.
A spectral scan is initiated when a voltage pulse on a gating grid admits apacket of ions into the drift tube. An electric field of 200–300 V/cm in the drift region isestablished by potential differences on the drift rings. The field causes either cations oranions to drift to the right at to 2 m/s. Ions are retarded by collisions with gas moleculesat atmospheric pressure. Each ion travels at its own speed equal to KE, where E is the elec-tric field and K is the mobility. Small ions have greater mobility than large ions of the samecharge because large ions experience more drag.
The ion mobility “spectrum” in Figure 22-16b is a graph of detector response versusdrift time for several explosives. Peak area is proportional to the number of ions. Peaks are
�1
�250-�s
63Ni�-emission
63NiNH3Cl2
105104
Sampledisk
Desorberheater
Drift gas out Drift gas inSwarm of ionswith one size-to-charge ratio
Sample carriergas (air) in
Repellergrid
Drift rings
Drift region
Electric field ≈ 200–300 V/cm
Aperturegrid
Detector(Faradayplate)
To outputdeviceGating
grids
63Ni
0 2 4 6
Det
ecto
r re
spon
se
8 10 12
Drift time (ms)
14 16 18 20
(H2O)nCl–(H2O)nO
–
RDX
DN
TC
alib
rant
TN
T
RD
X2
NG
-2R
DX
4P
ET
N2
PE
TN
3P
ET
N4
2
(a)
(b)
Figure 22-16 (a) Schematic illustrationof ion mobility spectrometer. The aperturegrid prevents serious line broadening.Ions approaching a bare detector plateinduce current, which appears as signalbefore the arrival of the ions. The aperture gridprotects the detector from induced currentuntil ions are between the grid and thedetector. (b) Negative ion mobility spectrumof explosives designated RDX, TNT, PETN, andso forth. The calibrant 4-nitrobenzonitrile isan internal mobility standard. is the reagentgas for generating anions by chemicalionization. [Courtesy W. R. Stott, Smiths
Detection, Toronto.]
Cl2
Small ions drift faster than large ions. For adescription of ion mobility spectrometry inelectrophoretic terms, see problem 26–46.

identified by their mobility, which is reproducibly measured relative to that of an internalstandard. Runs are repeated times per second. The displayed spectrum averages manyruns and requires 2–5 s to obtain.
Detection limits are 0.1 to 1 pg for compounds with favorable ionization chemistry.Mobility spectrometers have limited resolution, but false positives are minimized by com-bining mobility determinations with selective ionization.
22-4 Chromatography–Mass SpectrometryMass spectrometry is widely used as the detector in chromatography to provide both qualita-tive and quantitative information. The spectrometer can be highly selective for the analyte ofinterest. This selectivity eases the requirements for sample preparation or complete chro-matographic separation of components in a mixture, and it increases signal-to-noise ratio.
Mass spectrometry requires high vacuum to prevent molecular collisions during ionseparation. Chromatography is inherently a high-pressure technique. The problem in marry-ing the two techniques is to remove the huge excess of matter between the chromatographand the spectrometer. Gas chromatography felicitously evolved to employ narrow capillarycolumns whose eluate does not overwhelm the pumping capabilities of the mass spectrometervacuum system. The capillary column is connected directly to the inlet of the mass spec-trometer through a heated transfer line, as in Figures 22-13 and 22-15.21
Liquid chromatography creates a huge volume of gas when solvent vaporizes at theinterface between the column and the mass spectrometer.22 Most of this gas must be removedprior to ion separation. Nonvolatile mobile-phase additives (such as phosphate buffer), whichare commonly used in chromatography, need to be avoided when using mass spectrometry.Pneumatically assisted electrospray and atmospheric pressure chemical ionization are domi-nant methods for introducing eluate from liquid chromatography into a mass spectrometer.
ElectrosprayPneumatically assisted electrospray,24 also called ion spray, is illustrated in Figure 22-17a.Liquid from the chromatography column enters the steel nebulizer capillary at the upper left,along with a coaxial flow of gas. For positive ion mass spectrometry, the nebulizer is heldat 0 V and the spray chamber is held at . For negative ion mass spectrometry, allvoltages would be reversed. The strong electric field at the nebulizer outlet, combined withthe coaxial flow of gas, creates a fine aerosol of charged particles.
Ions that vaporize from aerosol droplets were already in solution in the chromatographycolumn. For example, protonated bases and ionized acids can be observed.Other gas-phase ions arise from complexation between analyte, M (which could be neutral orcharged), and stable ions from the solution. Examples include
Positive ions from the aerosol are attracted toward the glass capillary leading into themass spectrometer by an even more negative potential of . Gas flowing fromatmospheric pressure in the spray chamber transports ions to the right through the capillary toits exit, where the pressure is reduced to by a vacuum pump.
Figure 22-17b provides more detail on ionization. Voltage imposed between the steelnebulizer capillary and the inlet to the mass spectrometer creates excess charge in the liquidby redox reactions. If the nebulizer is positively biased, oxidation enriches the liquid in pos-itive ions by reactions such as
Electrons from the oxidation flow through the external circuit and eventually neutralizegaseous positive ions at the inlet to the mass spectrometer. It is possible for analyte to bechemically altered by species such as generated during electrospray.25
Charged liquid exiting the capillary forms a cone and then a fine filament and finallybreaks into a spray of fine droplets (see Figure 22-17c and the opening of this chapter). Adroplet shrinks to by solvent evaporation until the repulsive force of the excesscharge equals the cohesive force of surface tension. At that point, the droplet breaks up by
�1 �m
HO�
H2O(l) S 12 O2 � 2H� � 2e�
Fe(s) S Fe2� � 2e�
�3 mbar
�4 500 V
M(CH3CO�2 )(mass � M � 59)M(Na�)(mass � M � 23)
M(HCO�2 )(mass � M � 45)M(NH�
4 )(mass � M � 18)
M(K�)(mass � M � 39)MH�(mass � M � 1)
(A�)(BH�)
N2
�3 500 VN2
�20
488 CHAPTER 22 Mass Spectrometry
Volatile buffer components and additives forliquid chromatography that are compatiblewith mass spectrometry include , ,
, , , and .Avoid additive concentrations .720 mM
(C2H5)3N(CH3)3NCCl3CO2HCH3CO2HHCO2HNH3
J. B. Fenn received part of the Nobel Prize inchemistry in 200223 for electrospray ionization.K. Tanaka received part of the same prize formatrix-assisted laser desorption/ionization,described in Box 22-4.
You, the chemist, need to adjust the pH of thechromatography solvent to favor or formass spectrometric detection.
A�BH�
Electrospray requires low-ionic-strength solventso that buffer ions do not overwhelm analyteions in the mass spectrum. Low-surface-tensionorganic solvent is better than water. In reversed-phase chromatography (Section 25-1), it isgood to use a stationary phase that stronglyretains analyte so that a high fraction oforganic solvent can be used. A flow rate of 0.05to 0.4 mL/min is best for electrospray.

22-4 Chromatography–Mass Spectrometry 489
++ +++ ++
+ + + + +++
–4 500 V–100 V–20 V
–3 500 V
Spraychamber
Nebulizinggas (N2) in
Liquid fromchromatograph
Drying gas(N2) in
Nebulizer
Glasscapillary
Dryinggas
Electrostatic lensesfocus and collimate ions
Skimmercones
10–7 bar
10–9 bar
N2
N2
10–4 bar
3 mbar
+40 V1 bar
Drain Pump
Pump Pump PumpQuadrupolemass separator
Detector
Collisionallyactivateddissociationoccurs betweencapillary and skimmer(a)
+
+ ++
+++
++
++
+ +
++
+
+
++
+++ +
+++
++ ++ +++
++ +++
−−
−
−
−−
−
+ −
Metal capillaryTaylorcone
Fine filamentof liquid Relatively
largedroplet
High-voltagepower supply
e−
e−
Smallerdroplet
Fine spray
Unstabledroplet
Gas-phaseion
Inlet to massspectrometer
Liquid
(b)
–4 500 V0 V
(c)
Figure 22-17 (a) Pneumatically assistedelectrospray interface for mass spectrometry.(b) Gas-phase ion formation. [Adapted from
E. C. Huang, T. Wachs, J. J. Conboy, and J. D. Henion,
“Atmospheric Pressure Ionization Mass Spectrometry,”
Anal. Chem. 1990, 62, 713A, and P. Kebarle and L. Tang,
“From Ions in Solution to Ions in the Gas Phase,” Anal.
Chem.1993, 65, 972A.] (c) Electrospray from asilica capillary. [Courtesy R. D. Smith, Pacific
Northwest Laboratory, Richland, WA.]

490 CHAPTER 22 Mass Spectrometry
ejecting tiny droplets with diameters of . They evaporate, leaving their cargo of ionsin the gas phase.
In electrospray, little fragmentation of analyte occurs and mass spectra are simple. Frag-mentation can be intentionally increased by collisionally activated dissociation (also referredto as collision-induced dissociation) in the region between the glass capillary and the skimmercone in Figure 22-17a. The pressure in this region is and the background gas ismainly . In Figure 22-17a, the outlet of the glass capillary is coated with a metal layer thatis held at . The potential difference between the metal skimmer cone and the capillaryis . Positive ions accelerated through 60 V collide with moleculeswith enough energy to break into a few fragments. Adjusting the skimmer cone voltage con-trols the degree of fragmentation. A small voltage difference favors molecular ions, whereas alarge voltage difference creates fragments that aid in identification of analyte. Collisionallyactivated dissociation also tends to break apart complexes such as .
For example, with a cone voltage difference of , the positive ion spectrum of thedrug acetaminophen exhibits a base peak at m/z 152 for the protonated molecule, (colored species in the margin). A smaller peak at m/z 110 probably corresponds to the frag-ment shown in the margin. When the cone voltage difference is , collisionally activateddissociation decreases the peak at m/z 152 and increases the fragment peak at m/z 110. Thenegative ion spectrum has a large peak at m/z 150 for . As the cone voltage differenceis raised from to , this peak decreases and a fragment at m/z 107 increases.
Figure 22-18 shows an electrospray interface for capillary electrophoresis. The silicacapillary is contained in a stainless steel capillary held at the required outlet potential forelectrophoresis. The steel makes electrical contact with the liquid inside the silica by a liquidsheath flowing between the capillaries. The sheath liquid, which is typically a mixed organic/aqueous solvent, constitutes of the aerosol.
Atmospheric Pressure Chemical IonizationIn atmospheric pressure chemical ionization, heat and a coaxial flow of convert eluateinto a fine mist from which solvent and analyte evaporate (Figure 22-19). Like chemical ion-ization in the ion source of a mass spectrometer, atmospheric pressure chemical ionizationcreates new ions from gas-phase reactions between ions and molecules. The distinguishingfeature of this technique is that a high voltage is applied to a metal needle in the path of theaerosol. An electric corona (a plasma containing charged particles) forms around the needle,
N2
�90%
�50 V�20 V[M�H]�
�50 V
[M�H]�
�20 VM(Na�)
N2�20 � (40) � �60 V�40 V
N2
�3 mbar
�10 nmCollisionally activated dissociation ofacetaminophen:
çåœç
å
å
£
OH
NH2
å
å
OH
NH3
O
[M�H]�
m/z � 152
�
�
m/z � 110
œ
å
£O�
O�
O
[M�H]�
m/z � 150
m/z � 107
collisionallyactivated
dissociation
NH
å
åNH
Negative ionsPositive ions
Liquid sheath
Electrospray
Stainless steelcapillary
(+3–6 kV withrespect to massspectrometer inlet)
Fused silicacapillary
Figure 22-18 Electrospray interface forcapillary electrophoresis/mass spectrometry.
Makeup gas
−−−+
++Liquidfromchroma-tograph
Nebulizinggas (N2)
N2
Heater (~500°C)
Fine mist heatsup to ~125°C Corona
needlecreateselectricdischarge
Atmosphericpressure
High vacuum(0.01 Pa)
Quadrupolemass separator
Skimmercone
+6 000 V –100 V –140 V(a)
Figure 22-19 (a) Atmospheric pressure chemical ionization interface between a liquidchromatography column and a mass spectrometer. A fine aerosol is produced by the nebulizing gasflow and the heater. The electric discharge from the corona needle creates gaseous ions from theanalyte. [Adapted from E. C. Huang, T. Wachs, J. J. Conboy, and J. D. Henion, “Atmospheric Pressure Ionization Mass
Spectrometry,” Anal. Chem. 1990, 62, 713A.] (b) Atmospheric pressure chemical ionization probe. [Courtesy
Shimadzu Scientific Instruments, Columbia, MD.]
(b)
Unlike electrospray, atmospheric pressurechemical ionization does create gaseous ionsfrom neutral analyte molecules. Analyte musthave some volatility. For nonvolatile moleculessuch as sugars and proteins, electrospray canbe used.
Coronaneedle
Spray exits from orifice

22-4 Chromatography–Mass Spectrometry 491
injecting electrons into the aerosol and creating ions. For example, protonated analyte, can be formed in the following manner:
Analyte M might also form a negative ion by electron capture:
A molecule, , in the eluate might create a negative ion by the reaction
The species could abstract a proton from a weakly acidic analyte, AH:
Atmospheric pressure chemical ionization handles a variety of analytes and accepts chro-matography flow rates up to 2 mL/min. Generally, to be observed, analyte M must be capableof forming the protonated ion, . Atmospheric pressure chemical ionization tends to producesingle-charge ions and is unsuitable for macromolecules such as proteins. There is little frag-mentation, but the skimmer cone voltage difference can be adjusted to favor collisionally acti-vated dissociation into a small number of fragments.
Selected Ion Monitoring and Selected Reaction MonitoringSelected ion monitoring and selected reaction monitoring increase the selectivity of massspectrometry for individual analytes and improve the sensitivity by decreasing the responseto everything else (that is, decreasing background noise). Figure 22-20a shows a liquid
MH�
AH � Y� S A� � HYY�
XßY � e� S X� � Y�
XßYM � e� S M��
H3O�(H2O)n � M S MH� � (n � 1)H2O
H3O� � nH2O S H3O�(H2O)n
H2O�� � H2O S H3O� � �OH
N�4� � H2O S H2O�� � 2N2
N�2� � 2N2 S N�
4� � N2
N2 � e� S N�2� � 2e�
MH�,
Time (min)
Reconstructed total ion chromatogram
1 2
34
5 6
Time (min)
Ultraviolet detection
Selected ion monitoringm/z 312
ImazaquinH�
m/z = 312
(a )
(b)
25 15 20 2550 1510
Time (min)0 5 10 15 20 25
20
1
3
6
4
5
6
2
Abs
orba
nce
at 2
40 n
mT
otal
ion
curr
ent
(c )
Sel
ecte
d io
n cu
rren
t (m
/z=
312)
£
O
CO2H
HN
HN�
N
The cluster ion, (g), was shown inFigure 6-6.
H3O�(H2O)20
At least one commercial detector respondsto an increased range of analytes bysimultaneous electrospray and atmosphericpressure chemical ionization. Ions producedby electrospray are routed directly to themass analyzer. Neutral molecules left afterelectrospray then undergo atmosphericpressure chemical ionization.26
Figure 22-20 Chromatograms ofherbicides (designated 1–6) spiked into riverwater at a level near 1 ppb demonstrateincreased signal-to-noise ratio in selected ionmonitoring. (a) Ultraviolet detection at 240 nm.(b) Electrospray reconstructed total ionchromatogram. (c) Electrospray selected ionmonitoring at m/z 312. [From A. Laganà, G. Fago,
and A. Marino, “Simultaneous Determination of
Imidazolinone Herbicides from Soil and Natural
Waters,” Anal. Chem. 1998, 70,121.]

492 CHAPTER 22 Mass Spectrometry
chromatogram using ultraviolet absorbance to detect a mixture of herbicides (designated 1–6)spiked at a level near 1 ppb into river water. (Spiked means deliberately added.) The broadhump underlying the analytes represents many natural substances in the river water. The sim-plest way to use a mass spectrometer as a chromatographic detector is to substitute it for theultraviolet monitor and add up the total current of all ions of all masses detected above aselected value. This reconstructed total ion chromatogram is shown in Figure 22-20b,which is just as congested as the ultraviolet chromatogram because all substances emergingat any moment contribute to the signal. This chromatogram is “reconstructed” by a computerfrom individual mass spectra recorded during chromatography.
To be more selective, we use selected ion monitoring in which the mass spectrometer isset to monitor just a few values of m/z (never more than four or five in any time interval).Figure 22-20c shows the selected ion chromatogram in which just m/z 312 is monitored.The signal corresponds to from herbicide 6, which is imazaquin. The signal-to-noiseratio in selected ion monitoring is greater than the signal-to-noise ratio in chromatogram aor b because (1) most of the spectral acquisition time is spent collecting data in a small massrange and (2) little but the intended analyte gives a signal at m/z 312.
Selectivity and signal-to-noise ratio can be increased markedly by selected reactionmonitoring, illustrated in Figure 22-21 with a triple quadrupole mass spectrometer. A mix-ture of ions enters quadrupole Q1, which passes just one selected precursor ion to the sec-ond stage, Q2. The second stage passes all ions of all masses straight on to the third stage,Q3. However, while inside Q2, which is called a collision cell, the precursor ion collides with
or Ar at a pressure of to bar and breaks into fragments called product ions.Quadrupole Q3 allows only specific product ions to reach the detector.
Selected reaction monitoring is extremely selective for the analyte of interest. An exam-ple is provided by the analysis of human estrogens in sewage at parts per trillion levels (ng/L).Estrogens are hormones in the ovarian cycle. The synthetic estrogen
is a contraceptive. Even at parts per trillion levels, some estrogens can pro-voke reproductive disturbances in fish.
A project in Italy measured the estrogens entering the aquatic environment fromhuman waste. Now think about this problem. Sewage contains thousands of organic com-pounds—many at high concentrations. To measure nanograms of one analyte was beyondthe capabilities of analytical chemistry until recently. Some sample preparation was nec-essary to remove polar compounds from the less polar analyte and to preconcentrate ana-lyte. Raw sewage (150 mL) was filtered to remove particles and then passedthrough a solid-phase extraction cartridge (Section 28-3) containing carbon adsorbentthat retained analyte. The cartridge was washed with polar solvents to remove polar mate-rials. A fraction containing estrogens was taken from the cartridge by a mixture ofdichloromethane and methanol. This fraction was evaporated and dissolved in ofaqueous solution containing another estrogen as internal standard. A volume of wasinjected for chromatography.
50 �L200 �L
71.5 �m
(designated EE2)17�-ethinylestradiol
10�6�10�8N2
MH�
Collision gas(N2 or Ar) in
Mixture ofions fromchromatographycolumn
Quadrupolemass separator
Q1 Q2 Q3
Quadrupolemass separator
DetectorCutaway view ofcollision cell
Precursor ion(parent ion)
Product ions(daughter ions)
Selected ionfor monitoring
+ + + + ++
++ +
++
++
+
++
++ +++
++
Figure 22-21 Principle of selected reaction monitoring, also called tandem mass spectrometry,mass spectrometry/mass spectrometry, or MS/MS.
Selected reaction monitoring is one of severaltechniques carried out by consecutive massfilters. These techniques are collectively calledtandem mass spectrometry or massspectrometry/mass spectrometry or simplyMS/MS. The process in Q2 is collisionallyactivated dissociation.
In preconcentration, analyte collected from150 mL was dissolved in . Theconcentration increased by a factor of
3.6 ng/L in sewage became for chromatography.2.7 �g/L
750 � 3.6 ng/L �
150 � 10�3 L200 � 10�6 L
� 750
200 �L

22-4 Chromatography–Mass Spectrometry 493
Figure 22-22a shows the collisionally activated dissociation mass spectrum of thedeprotonated molecule of estrogen . The precursor ion obtained byelectrospray was isolated by mass separator Q1 in Figure 22-21 and sent into Q2 for colli-sionally activated dissociation. Then all fragments were analyzed by Q3 to givethe mass spectrum in Figure 22-22a. For subsequent selected reaction monitoring, only theproduct ions at m/z 159 and 145 would be selected by Q3. The chromatogram in Figure 22-22bshows the signal from these product ions when m/z 295 was selected by Q1. From thearea of the peak for , its concentration in the sewage is calculated to be 3.6 ng/L. Amaz-ingly, there are other compounds that contribute mass spectral signals for this same set ofmasses at elution times of 15–18 min. was identified by its reten-tion time and its complete mass spectrum.
Electrospray of Proteins
Electrospray is well suited for the study of charged macromolecules such as proteins.29,30 Ithas been used to study intact viruses with masses up to 40 MDa.31 A typical protein hascarboxylic acid and amine side chains (Table 10-1) that give it a net positive or negativecharge, depending on pH. Electrospray (Figure 22-17) ejects preexisting ions from solutioninto the gas phase.
Each peak in the mass spectrum of the protein cytochrome c in Figure 22-23 arisesfrom molecules with different numbers of protons, .32 Although we have labeledcharges on four of the peaks, we do not know what these charges are without analyzing thespectrum. If we can find the charge for each species, we can find the molecular mass, M,of the neutral protein.
MHn�n
EE2(295 S 159 � 145)
EE2
7 m/z 140
[M�H]� (m/z 295)EE2
145.0
159.0
170.9
199.1
213.1
225.1247.0
269.2183.0
295.2
160
20
40
60
100
80
180 200 220 240 260 280 300 15 20
Rel
ativ
e ab
unda
nce
Time (min)(a) (b)m/z
Sig
nal f
or m
/z=
159
+ 1
45fr
om Q
3
[M–H]–
EE2
Figure 22-22 (a) Electrospray tandem mass spectrum of pure estrogen . The ion was selected by quadrupole Q1 in Figure 22-21 and dissociated in Q2; the full spectrum of fragments wasmeasured by Q3. (b) Selected reaction monitoring chromatogram showing the elution of 3.6 ng/L ofestrogen extracted from sewage. The signal is the sum of m/z from Q3 when m/z 295 wasselected by Q1. [From C. Baronti, R. Curini, G. D’Ascenzo, A. di Corcia, A. Gentili, and R. Samperi, “Monitoring Estrogens
at Activated Sludge Sewage Treatment Plants and in a Receiving River Water,” Environ. Sci. Technol. 2000, 34, 5059.]
159 � 145EE2
[M�H]�(m /z 295)EE2
Box 22-4 describes MALDI, the other mostuseful way to introduce proteins into a massspectrometer.
Figure 22-23 Electrospray quadrupole mass spectrum of acidified bovine cytochrome c showingpeaks from species with different numbers of protons, . [From T. Wachs and J. Henion, “Electrospray Device
for Coupling Microscale Separations and Other Miniaturized Devices with Electrospray Mass Spectrometry,” Anal. Chem.
2001, 73, 632.]
MHn�n
Abu
ndan
ce
765.3
816.3
874.4
941.8
1 020.41 112.8 1 223.7 1 359.1
720.4
680.4
644.8MH9+
9
MH19+19
MH16+16
MH10+10
m/z
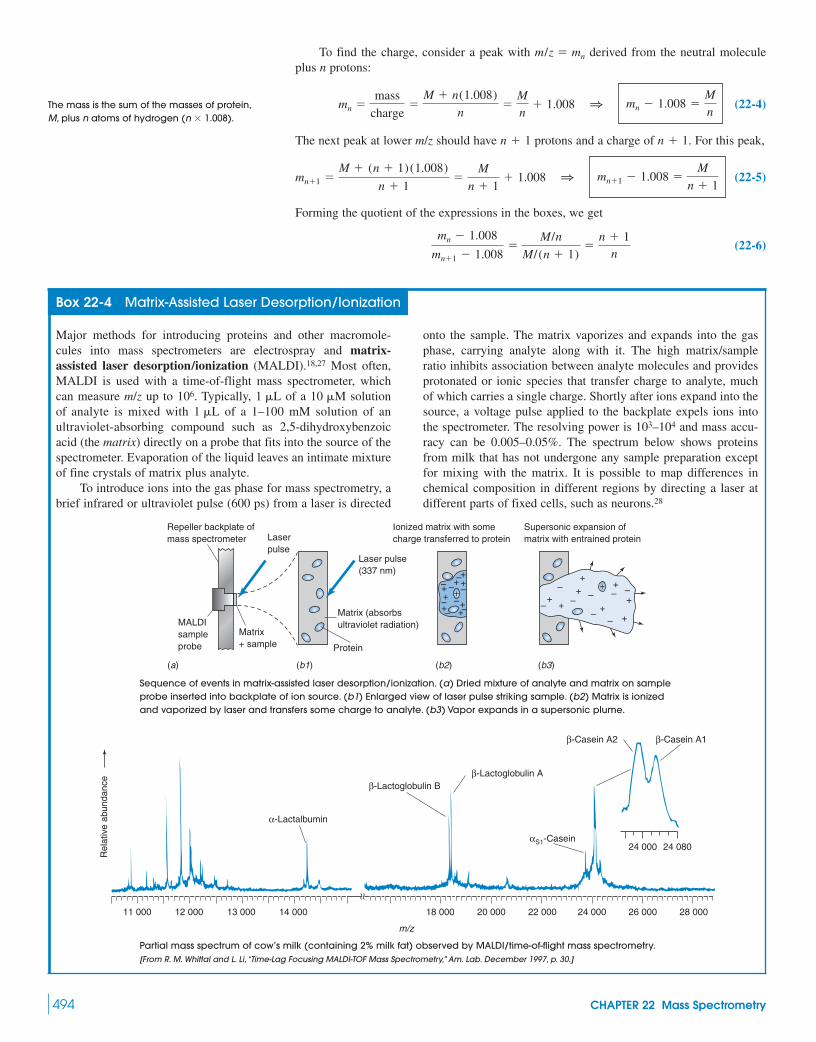
494 CHAPTER 22 Mass Spectrometry
To find the charge, consider a peak with derived from the neutral moleculeplus n protons:
(22-4)
The next peak at lower m/z should have protons and a charge of . For this peak,
(22-5)
Forming the quotient of the expressions in the boxes, we get
(22-6)mn � 1.008
mn�1 � 1.008�
M/n
M/ (n � 1)�
n � 1n
mn�1 � 1.008 �M
n � 1mn�1 �
M � (n � 1)(1.008)
n � 1�
M
n � 1� 1.008 1
n � 1n � 1
mn � 1.008 �Mn
mn �mass
charge�
M � n(1.008)n
�Mn
� 1.008 1
m/z � mn
The mass is the sum of the masses of protein,M, plus n atoms of hydrogen .(n � 1.008)
Box 22-4 Matrix-Assisted Laser Desorption/Ionization
Major methods for introducing proteins and other macromole-cules into mass spectrometers are electrospray and matrix-assisted laser desorption/ionization (MALDI).18,27 Most often,MALDI is used with a time-of-flight mass spectrometer, whichcan measure m/z up to . Typically, of a solutionof analyte is mixed with of a 1–100 mM solution of anultraviolet-absorbing compound such as 2,5-dihydroxybenzoicacid (the matrix) directly on a probe that fits into the source of thespectrometer. Evaporation of the liquid leaves an intimate mixtureof fine crystals of matrix plus analyte.
To introduce ions into the gas phase for mass spectrometry, abrief infrared or ultraviolet pulse (600 ps) from a laser is directed
1 �L10 �M1 �L106
onto the sample. The matrix vaporizes and expands into the gasphase, carrying analyte along with it. The high matrix/sampleratio inhibits association between analyte molecules and providesprotonated or ionic species that transfer charge to analyte, muchof which carries a single charge. Shortly after ions expand into thesource, a voltage pulse applied to the backplate expels ions intothe spectrometer. The resolving power is and mass accu-racy can be 0.005–0.05%. The spectrum below shows proteinsfrom milk that has not undergone any sample preparation exceptfor mixing with the matrix. It is possible to map differences inchemical composition in different regions by directing a laser atdifferent parts of fixed cells, such as neurons.28
103–104
Sequence of events in matrix-assisted laser desorption/ionization. (a) Dried mixture of analyte and matrix on sampleprobe inserted into backplate of ion source. (b1) Enlarged view of laser pulse striking sample. (b2) Matrix is ionizedand vaporized by laser and transfers some charge to analyte. (b3) Vapor expands in a supersonic plume.
Partial mass spectrum of cow’s milk (containing 2% milk fat) observed by MALDI/time-of-flight mass spectrometry.[From R. M. Whittal and L. Li, “Time-Lag Focusing MALDI-TOF Mass Spectrometry,” Am. Lab. December 1997, p. 30.]
++
++ ++
++ +
++
–
–– – –
––
––
–
––
––
–
–
++
+
++
+
+
Laser pulse(337 nm)
Laserpulse
Matrix (absorbsultraviolet radiation)
Ionized matrix with somecharge transferred to protein
Repeller backplate ofmass spectrometer
Supersonic expansion ofmatrix with entrained protein
Protein
MALDIsampleprobe
Matrix+ sample
(a) (b1) (b2) (b3)
Rel
ativ
e ab
unda
nce
α-Lactalbumin
β-Lactoglobulin Bβ-Lactoglobulin A
αS1-Casein
β-Casein A2 β-Casein A1
24 000
24 00022 00020 00018 00014 00013 00012 00011 000 26 000 28 000
24 080
m/z
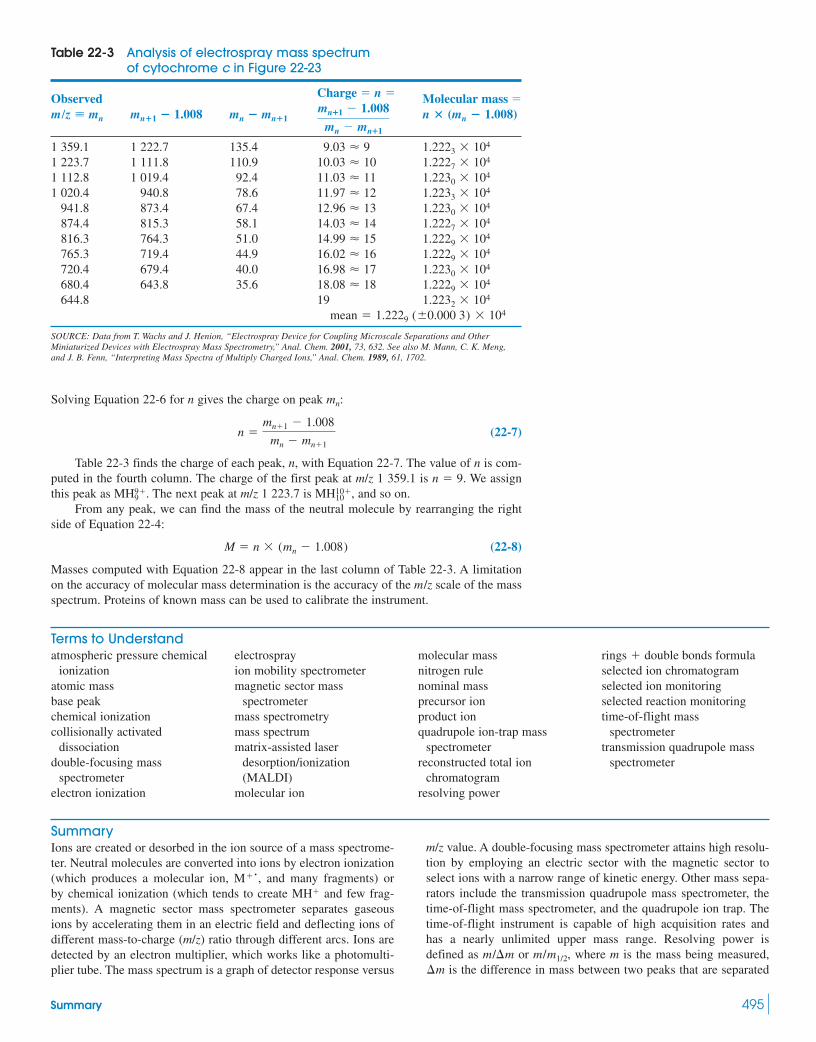
Summary 495
Terms to Understandatmospheric pressure chemical
ionizationatomic massbase peakchemical ionizationcollisionally activated
dissociationdouble-focusing mass
spectrometerelectron ionization
electrosprayion mobility spectrometermagnetic sector mass
spectrometermass spectrometrymass spectrummatrix-assisted laser
desorption/ionization(MALDI)
molecular ion
molecular massnitrogen rulenominal massprecursor ionproduct ionquadrupole ion-trap mass
spectrometerreconstructed total ion
chromatogramresolving power
selected ion chromatogramselected ion monitoringselected reaction monitoringtime-of-flight mass
spectrometertransmission quadrupole mass
spectrometer
rings � double bonds formula
SummaryIons are created or desorbed in the ion source of a mass spectrome-ter. Neutral molecules are converted into ions by electron ionization(which produces a molecular ion, , and many fragments) orby chemical ionization (which tends to create and few frag-ments). A magnetic sector mass spectrometer separates gaseousions by accelerating them in an electric field and deflecting ions ofdifferent mass-to-charge (m/z) ratio through different arcs. Ions aredetected by an electron multiplier, which works like a photomulti-plier tube. The mass spectrum is a graph of detector response versus
MH�
M��
m/z value. A double-focusing mass spectrometer attains high resolu-tion by employing an electric sector with the magnetic sector toselect ions with a narrow range of kinetic energy. Other mass sepa-rators include the transmission quadrupole mass spectrometer, thetime-of-flight mass spectrometer, and the quadrupole ion trap. Thetime-of-flight instrument is capable of high acquisition rates andhas a nearly unlimited upper mass range. Resolving power isdefined as or , where m is the mass being measured,
is the difference in mass between two peaks that are separated�mm/m1/2m/�m
Table 22-3 Analysis of electrospray mass spectrum of cytochrome c in Figure 22-23
Observed Charge � n � Molecular mass �mn�1 � 1.008 mn � mn�1
1 359.1 1 222.7 135.41 223.7 1 111.8 110.91 112.8 1 019.4 92.41 020.4 940.8 78.6
941.8 873.4 67.4874.4 815.3 58.1816.3 764.3 51.0765.3 719.4 44.9720.4 679.4 40.0680.4 643.8 35.6644.8 19
SOURCE: Data from T. Wachs and J. Henion, “Electrospray Device for Coupling Microscale Separations and OtherMiniaturized Devices with Electrospray Mass Spectrometry,” Anal. Chem. 2001, 73, 632. See also M. Mann, C. K. Meng,and J. B. Fenn, “Interpreting Mass Spectra of Multiply Charged Ions,” Anal. Chem. 1989, 61, 1702.
mean � 1.2229 (�0.000 3) � 1041.2232 � 1041.2229 � 10418.08 � 181.2230 � 10416.98 � 171.2229 � 10416.02 � 161.2229 � 10414.99 � 151.2227 � 10414.03 � 141.2230 � 10412.96 � 131.2233 � 10411.97 � 121.2230 � 10411.03 � 111.2227 � 10410.03 � 101.2223 � 1049.03 � 9
n � (mn � 1.008)mn�1 � 1.008
mn � mn�1
m/z � mn
Solving Equation 22-6 for n gives the charge on peak :
(22-7)
Table 22-3 finds the charge of each peak, n, with Equation 22-7. The value of n is com-puted in the fourth column. The charge of the first peak at m/z 1 359.1 is . We assignthis peak as . The next peak at m/z 1 223.7 is , and so on.
From any peak, we can find the mass of the neutral molecule by rearranging the rightside of Equation 22-4:
(22-8)
Masses computed with Equation 22-8 appear in the last column of Table 22-3. A limitationon the accuracy of molecular mass determination is the accuracy of the m/z scale of the massspectrum. Proteins of known mass can be used to calibrate the instrument.
M � n � (mn � 1.008)
MH10�10MH9�
9
n � 9
n �mn�1 � 1.008
mn � mn�1
mn

496 CHAPTER 22 Mass Spectrometry
Exercises22-A. Measure the width at half-height of the peak at m/z 53 andcalculate the resolving power of the spectrometer from the expres-sion . Would you expect to be able to resolve two peaks at100 and 101 Da?
Mass spectrum from V. J. Angelico, S. A. Mitchell, and V. H. Wysocki,“Low-Energy Ion–Surface Reactions of Pyrazine with Two Classes ofSelf-Assembled Monolayers,” Anal. Chem. 2000, 72, 2603.
22-B. What resolving power is required to distinguish from ?
22-C. Isotope patterns. Consider an element with two isotopeswhose natural abundances are a and b . If there are natoms of the element in a compound, the probability of finding eachcombination of isotopes is derived from the expansion of the bino-mial . For carbon, the abundances are for and for . The probability of finding atomsin acetylene, , is given by the first term of the expansionof . The value of is
so the probability of finding atoms in acetyleneis 0.978 7. The probability of finding is
. The probability of finding is. The molecular ion, by definition, contains
atoms. The peak contains . The intensityof relative to will be .(We are ignoring because its natural abundance is small.) Predict2H
(0.021 2) / (0.978 7) � 0.021 7M��M�11 12C � 1 13CM�12 12C
(0.010 7)2 � 0.000 1142 13C2(0.989 3)(0.010 7) � 0.021 22ab �1 12C � 1 13C
2 12C0.978 7,(0.989 3)2 �a2(a � b)2 � a2 � 2ab � b2
HCΩCH2 12C13Cb � 0.010 7
12Ca � 0.989 3(a � b)n
(a � b � 1)
HCΩO�
CH3CH 2�
50 60
m/z = 53
m/z
m/m1/2
the relative amounts of , and in1,2-dichlorobenzene. Draw a stick diagram of the distribution, likeFigure 22-6.
22-D. (a) Find the number of rings plus double bonds in a mole-cule with the composition and draw one plausible structure.(b) For an ion or radical, the formula givesnoninteger answers because the formula is based on valences in neutralmolecules with all electrons paired. How many rings plus double bondsare predicted for ? Draw one structure for .
22-E. (a) Spectra A and B belong to the isomers of below.Explain how you can tell which isomer goes with each spectrum.
Mass spectra of isomeric ketones with the composition C6H12O fromNIST/EPA/NIH Mass Spectral Database.8
(b) The intensity of the peak at m/z 101 must be incorrect inboth spectra. It is entirely missing in spectrum A and too intense(15.6% of intensity of ) in spectrum B. What should be theintensity of relative to for the composition ?C6H12OM��M�1
M��
M�1
50
0
30 40 50 60 70 80 90 100
50
0
30 40 50 60 70 80 90 100
29
29
57
43
72
85
10085
100
Rel
ativ
e ab
unda
nce
57
41
m/zm/z
A B
3,3-Dimethyl-2-butanone
O
£
3-Methyl-2-pentanone
O
£
C6H12O
C4H10NO�C4H10NO�
rings � double bondsC14H12
C6H437Cl2C6H4
35 Cl2, C6H435 Cl37Cl
with a 10% valley between them, and is the width of a peak athalf-height. An ion mobility spectrometer separates gas-phase ionsby their different mobilities when migrating in an electric fieldthrough gas at atmospheric pressure.
In a mass spectrum, the molecular ion is at the highest m/zvalue of any “significant” peak that cannot be attributed to isotopesor background signals. For a given composition, you should be ableto predict the relative intensities of the isotopic peaks at ,
, and so on. Among common elements, Cl and Br have partic-ularly diagnostic isotope patterns. From a molecular composition,the equation helps us propose structures. Anorganic compound with an odd number of nitrogen atoms will havean odd mass. Fragment ions arising from bond cleavage andrearrangements provide clues to molecular structure.
Gas emerging from a capillary gas chromatography columncan go directly into the ion source of a well-pumped mass spec-trometer to provide qualitative and quantitative information aboutthe components of a mixture. For liquid chromatography, atmo-spheric pressure chemical ionization utilizes a corona dischargeneedle to create a variety of gaseous ions. Alternatively, electro-spray employs high voltage at the exit of the column, combined
rings � double bonds
M�2M�1
m1/2 with coaxial gas flow, to create a fine aerosol containing chargedspecies that were already present in the liquid phase. Analyte isoften associated with other ions to give species such as or
. Control of pH helps ensure that selected analytesare in anionic or cationic form. Both atmospheric pressure chemicalionization and electrospray tend to produce unfragmented ions.Collisionally activated dissociation to produce fragment ions iscontrolled by the cone voltage at the mass spectrometer inlet. Elec-trospray of proteins typically creates an array of highly chargedions such as . Matrix-assisted laser desorption/ionization is agentle way to produce predominantly singly charged, intact proteinions for mass spectrometry.
A reconstructed total ion chromatogram shows the signal fromall ions above a chosen m/z emerging from chromatography as afunction of time. Selected ion monitoring of one or a few values ofm/z is selective for one or a few analytes. In selected reaction mon-itoring, a precursor ion isolated by one mass filter passes into a col-lision cell in which it breaks into products. One (or more) production is then selected by a second mass filter for passage to the detec-tor. This process is extremely selective for just one analyte andvastly increases the signal-to-noise ratio for this analyte.
MHn�n
[M(CH3CO2)]�
[MNa]�
N2
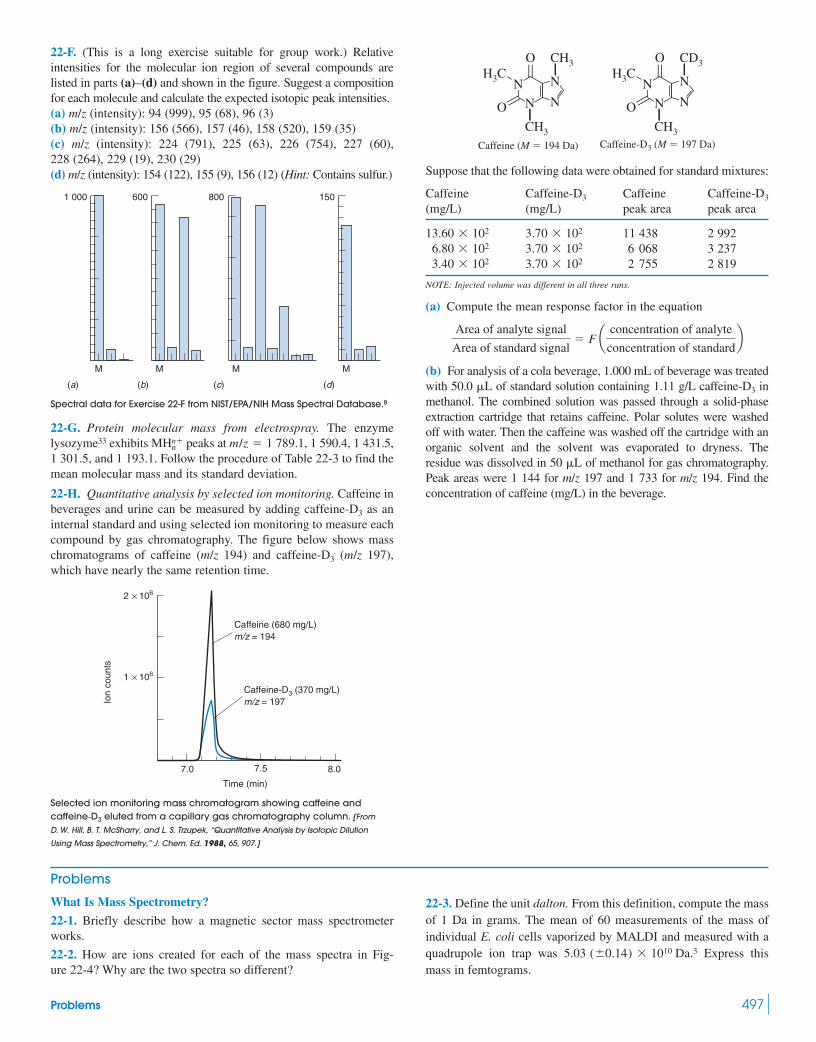
Problems 497
22-F. (This is a long exercise suitable for group work.) Relativeintensities for the molecular ion region of several compounds arelisted in parts (a)–(d) and shown in the figure. Suggest a compositionfor each molecule and calculate the expected isotopic peak intensities.(a) m/z (intensity): 94 (999), 95 (68), 96 (3)(b) m/z (intensity): 156 (566), 157 (46), 158 (520), 159 (35)(c) m/z (intensity): 224 (791), 225 (63), 226 (754), 227 (60),228 (264), 229 (19), 230 (29)(d) m/z (intensity): 154 (122), 155 (9), 156 (12) (Hint: Contains sulfur.)
Spectral data for Exercise 22-F from NIST/EPA/NIH Mass Spectral Database.8
22-G. Protein molecular mass from electrospray. The enzymelysozyme33 exhibits peaks at , 1 590.4, 1 431.5,1 301.5, and 1 193.1. Follow the procedure of Table 22-3 to find themean molecular mass and its standard deviation.
22-H. Quantitative analysis by selected ion monitoring. Caffeine inbeverages and urine can be measured by adding as aninternal standard and using selected ion monitoring to measure eachcompound by gas chromatography. The figure below shows masschromatograms of caffeine (m/z 194) and (m/z 197),which have nearly the same retention time.
Selected ion monitoring mass chromatogram showing caffeine andeluted from a capillary gas chromatography column. [From
D. W. Hill, B. T. McSharry, and L. S. Trzupek, “Quantitative Analysis by Isotopic Dilution
Using Mass Spectrometry,” J. Chem. Ed. 1988, 65, 907.]
caffeine-D3
Ion
coun
ts
2 106×
1 106×
8.07.57.0
Time (min)
Caffeine (680 mg/L)m/z = 194
Caffeine-D3 (370 mg/L)m/z = 197
caffeine-D3
caffeine-D3
m/z � 1 789.1MHnn�
1 000 600 150800
M M MM
(a) (b) (c) (d)
Suppose that the following data were obtained for standard mixtures:
Caffeine Caffeine(mg/L) (mg/L) peak area peak area
11 438 2 9926 068 3 2372 755 2 819
NOTE: Injected volume was different in all three runs.
(a) Compute the mean response factor in the equation
(b) For analysis of a cola beverage, 1.000 mL of beverage was treatedwith 50.0 �L of standard solution containing 1.11 g/L caffeine-D3 inmethanol. The combined solution was passed through a solid-phaseextraction cartridge that retains caffeine. Polar solutes were washedoff with water. Then the caffeine was washed off the cartridge with anorganic solvent and the solvent was evaporated to dryness. Theresidue was dissolved in 50 �L of methanol for gas chromatography.Peak areas were 1 144 for m/z 197 and 1 733 for m/z 194. Find theconcentration of caffeine (mg/L) in the beverage.
Area of analyte signal
Area of standard signal� F a concentration of analyte
concentration of standardb
3.70 � 1023.40 � 1023.70 � 1026.80 � 1023.70 � 10213.60 � 102
Caffeine-D3Caffeine-D3
Caffeine (M � 194 Da) Caffeine-D3 (M � 197 Da)
N
CH3
£
£O
OH3C
CH3
N
NN
N
CH3
£
£O
OH3C
CD3
N
NN
Problems
What Is Mass Spectrometry?
22-1. Briefly describe how a magnetic sector mass spectrometerworks.
22-2. How are ions created for each of the mass spectra in Fig-ure 22-4? Why are the two spectra so different?
22-3. Define the unit dalton. From this definition, compute the massof 1 Da in grams. The mean of 60 measurements of the mass ofindividual E. coli cells vaporized by MALDI and measured with aquadrupole ion trap was .3 Express thismass in femtograms.
5.03 (�0.14) � 1010 Da

498 CHAPTER 22 Mass Spectrometry
22-4. Nickel has two major and three minor isotopes. For the pur-pose of this problem, suppose that the only isotopes are and
. The atomic mass of is 57.935 3 Da and the mass of is 59.933 2 Da. From the amplitude of the peaks in the spectrumbelow, calculate the atomic mass of Ni and compare your answerwith the value in the periodic table.
Mass spectrum from Y. Su, Y. Duan, and Z. Jin, “Helium Plasma SourceTime-of-Flight Mass Spectrometry: Off-Cone Sampling for ElementalAnalysis,” Anal. Chem. 2000, 72, 2455.
22-5. Measure the width at half-height of the tallest peak in the fol-lowing spectrum and calculate the resolving power of the spectrom-eter from the expression . Would you expect to be able todistinguish two peaks at 10 000 and 10 001 Da?
MALDI mass spectrum of the peptide melittin from P. B. O’Connor and C. E.Costello, “Application of Multishot Acquisition in Fourier Transform MassSpectrometry,” Anal. Chem. 2000, 72, 5125.
22-6. The two peaks near m/z 31.00 in Figure 22-9 differ in mass by0.010 Da. Estimate the resolving power of the spectrometer from theexpression without making any measurements in the figure.
22-7. The highest-resolution mass spectra are obtained by Fouriertransform ion cyclotron resonance mass spectrometry.34 Molecularions of two peptides (chains of seven amino acids) differing in massby 0.000 45 Da were separated with a 10% valley between them.The ions each have a mass of 906.49 Da and a width at half-heightof 0.000 27 Da. Compute the resolving power by the 10% valleyformula and by the half-width formula. Compare the difference inmass of these two compounds with the mass of an electron.
The Mass Spectrum
22-8. The mass of a fragment ion in a high-resolution spectrum is83.086 5 Da. Which composition, or , better matchesthe observed mass?
C6H�11C5H7O�
m/�m
2 845 2 848
m/z
m/m1/2
60Ni
58Ni
58
m/z
60
60Ni58Ni60Ni
58Ni22-9. Calculate the theoretical masses of the species in Figure 22-9and compare your answers with the values observed in the figure.
22-10. Isotope patterns. Referring to Exercise 22-C, predict the relative amounts of , , and in1,2-dibromoethylene. Compare your answer with Figure 22-7.
22-11. Isotope patterns. Referring to Exercise 22-C, predict the relativeabundances of , , and for diborane .
22-12. Find the number of rings plus double bonds in moleculeswith the following compositions and draw one plausible structurefor each: (a) ; (b) ; (c) a fragment in amass spectrum with the composition .
22-13. (Each part of this problem is quite long and best worked bygroups of students.) Peak intensities of the molecular ion region arelisted in parts (a)–(g) and shown in the figure below. Identify whichpeak represents the molecular ion, suggest a composition for it, andcalculate the expected isotopic peak intensities. Restrict your atten-tion to elements in Table 22-1.(a) m/z (intensity): 112 (999), 113 (69), 114 (329), 115 (21)(b) m/z (intensity): 146 (999), 147 (56), 148 (624), 149 (33),150 (99), 151 (5)(c) m/z (intensity): 90 (2), 91 (13), 92 (96), 93 (999), 94 (71), 95 (2)(d) m/z (intensity): 226 (4), 227 (6), 228 (130), 229 (215), 230(291), 231 (168), 232 (366), 233 (2), 234 (83) (Calculate expectedintensities from isotopes of the major element present.)(e) m/z (intensity): 172 (531), 173 (12), 174 (999), 175 (10), 176 (497)(f) m/z (intensity): 177 (3), 178 (9), 179 (422), 180 (999), 181(138), 182 (9)(g) m/z (intensity): 182 (4), 183 (1), 184 (83), 185 (16), 186 (999),187 (132), 188 (10)
C3H�5
C12H15BrNPOSC11H18N2O3
(B2H6)11B2H610B11BH6
10B2H6
C2H281Br2C2H2
79Br81BrC2H279Br2
Spectral data for Problem 22-13 from NIST/EPA/NIH Mass SpectralDatabase.8
1 000
172
(e)
1 000
182
(g)
1 000
177
(f )
1 000
146
(b)
1 000
112
(a)
1 000
90
(c)
400
226
(d)

Problems 499
22-14. Suggest a composition for the halogen compound whose massspectrum is shown above. Assign each of the major peaks.
22-15. The chart in Box 22-3 shows that in human breath inthe United States has a value of different from that of inhuman breath in mainland Europe. Suggest an explanation.
22-16. (a) The mass of in Table 22-1 is 1.007 825 Da. Compare itwith the sum of the masses of a proton and an electron given in the table.(b) (deuterium) contains one proton, one neutron, and one elec-tron. Compare the sum of the masses of these three particles withthe mass of .(c) The discrepancy in part (b) comes from the conversion of massinto binding energy that holds the nucleus together. The relation ofmass, m, to energy, E, is , where c is the speed of light.From the discrepancy in part (b), calculate the binding energy of in joules and in kJ/mol. (d) The binding energy (ionization energy) of the electron in ahydrogen or deuterium atom is 13.6 eV. Use Table 1-4 to convertthis number into kJ/mol and compare it with the binding energy ofthe nucleus.(e) A typical bond dissociation energy in a molecule is 400 kJ/mol.How many times larger is the nuclear binding energy of than abond energy?
22-17. Isotope patterns. From the natural abundance of and predict the relative amounts of , , ,and . As explained in Exercise 22-C, the fraction of each iso-topic molecule comes from the expansion of , where a isthe abundance of and b is the abundance of . Note that
. Compare your answer with Figure 22-7.
22-18. Isotope patterns. (Caution: This problem could leadto serious brain injury.) For an element with three isotopes withabundances a, b, and c, the distribution of isotopes in a moleculewith n atoms is based on the expansion of . Predictwhat the mass spectrum of will look like.
Mass Spectrometers
22-19. Explain how a double-focusing mass spectrometer achieveshigh resolution.
22-20. A limitation on how many spectra per second can berecorded by a time-of-flight mass spectrometer is the time it takesthe slowest ions to go from the source to the detector. Suppose wewant to scan up to m/z 500. Calculate the speed of this heaviest ionif it is accelerated through 5.00 kV in the source. How long would
Si2
(a � b � c)n
an�3b3 � p
n(n � 1)(n � 2)
3!an�2b2 �
n(n � 1)
2!an � nan�1b �(a � b)n �
81Br79Br(a � b)3
CH81Br3
CH79Br81Br2CH79Br281BrCH79Br3
81Br,79Br
2H
2H
(1 Da � 1.660 538 73 � 10�27 kg.)
2HE � mc2
2H
2H
1H
CO2d13CCO2
it take to drift 2.00 m through a spectrometer? At what frequencycould you record spectra if a new extraction cycle were begun eachtime this heaviest ion reached the detector? What would be the fre-quency if you wanted to scan up to m/z 1 000?
22-21. What is the purpose of the reflectron in a time-of-flight massspectrometer?
22-22. The mean free path is the average distance a molecule travelsbefore colliding with another molecule. The mean free path, , is givenby , where k is Boltzmann’s constant, T is the tem-perature (K), P is the pressure (Pa), and is the collision cross section.For a molecule with a diameter d, the collision cross section is . Thecollision cross section is the area swept out by the molecule withinwhich it will strike any other molecule it encounters. The magnetic sec-tor mass spectrometer is maintained at a pressure of so thations do not collide with (and deflect) each other as they travel throughthe mass analyzer. What is the mean free path of a molecule with adiameter of 1 nm at 300 K in the mass analyzer?
Chromatography–Mass Spectrometry
22-23. Which liquid chromatography–mass spectrometry interface,atmospheric pressure chemical ionization or electrospray, requiresanalyte ions to be in solution prior to the interface? How does theother interface create gaseous ions from neutral species in solution?
22-24. What is collisionally activated dissociation? At what pointsin a mass spectrometer does it occur?
22-25. What is the difference between a total ion chromatogram anda selected ion chromatogram?
22-26. What is selected reaction monitoring? Why is it also calledMS/MS? Why does it improve the signal-to-noise ratio for a partic-ular analyte?
22-27. (a) To detect the drug ibuprofen by liquid chromatography–mass spectrometry, would you choose the positive or negative ionmode for the spectrometer? Would you choose acidic or neutralchromatography solvent? State your reasons.
(b) If the unfragmented ion has an intensity of 100, what should bethe intensity of ?
22-28. An electrospray/transmission quadrupole mass spectrum ofthe of hemoglobin from acidic solution exhibits nine peakscorresponding to . Find the charge, n, for peaks A–I. CalculateMHn�
n
� chain
M�1
CO2Hœ œç
åœ ç
å
Ibuprofen (FM 206)
�10�5 Pa
d2
� � kT/ (22 P)�
Mass spectrum for Problem 22-14 from NIST/EPA/NIH Mass Spectral Database.8
Rel
ativ
e ab
unda
nce
100
25
30 40 50
m/z
60 70 80 90 100 110 120 130 140 150 160 170 180 190 200 210
158
160
162171
170160
160
9179
48
35 173
208
173
175
127

500 CHAPTER 22 Mass Spectrometry
the molecular mass of the neutral protein, M, from peaks A, B, G, H,and I, and find the mean value.
Peak m/z Amplitude Peak m/z Amplitude
A 1 261.5 0.024 F not stated 1.000B 1 164.6 0.209 G 834.3 0.959C not stated 0.528 H 797.1 0.546D not stated 0.922 I 757.2 0.189E not stated 0.959
22-29. The molecular ion region in the mass spectrum of a largemolecule, such as a protein, consists of a cluster of peaks differ-ing by 1 Da. The reason is that a molecule with many atoms hasa high probability of containing one or several atoms of ,
, , and . In fact, the probability of finding a moleculewith only , , , and may be so small that thenominal molecular ion is not observed. The electrospray massspectrum of the rat protein interleukin-8 consists of a series ofclusters of peaks arising from intact molecular ions with differentcharge. One cluster has peaks at m/z 1 961.12, 1 961.35, 1 961.63,1 961.88, 1 962.12 (tallest peak), 1 962.36, 1 962.60, 1 962.87,1 963.10, 1 963.34, 1 963.59, 1 963.85, and 1 964.09. These peakscorrespond to isotopic ions differing by 1 Da. From theobserved peak separation, find the charge of the ions in this clus-ter. From m/z of the tallest peak, estimate the molecular mass ofthe protein.
22-30. Phytoplankton at the ocean surface maintain the fluidity oftheir cell membranes by altering their lipid (fat) composition whenthe temperature changes. When the ocean temperature is high,plankton synthesize relatively more 37:2 than 37:3.35
After they die, plankton sink to the ocean floor and end up buried insediment. The deeper we sample a sediment, the farther back intotime we delve. By measuring the relative quantities of cell-membranecompounds at different depths in the sediment, we can infer thetemperature of the ocean long ago.
The molecular ion regions of the chemical ionization massspectra of 37:2 and 37:3 are listed in the table. Predict the expectedintensities of M, , and for each of the four species listed.Include contributions from C, H, O, and N, as appropriate. Compareyour predictions with the observed values. Discrepant intensities inthese data are typical unless care is taken to obtain high-qualitydata.
Species inRelative intensities
Compound mass spectrum M
37:3 100 35.8 7.037:3 100 23.0 8.037:2 100 40.8 3.737:2 100 33.4 8.4
a. Chemical ionization with ammonia.b. Chemical ionization with isobutane.
[MH]�(m/z 531)b[MNH4]�(m/z 548)a[MH]�(m/z 529)b[MNH4]�(m/z 546)a
M�2M�1
M�2M�1
O
£ (CH2)4 ££(CH2)5 (CH2)5 (CH2)13CH3£37:3 = C37H68O
O
£ (CH2)11 (CH2)5 (CH2)13CH3
37:2 = C37H70O
32S1H16O14N12C,
34S2H18O
15N,13C
22-31. Chlorate , chlorite , bromate , andiodate can be measured in drinking water at the 1-ppb levelwith 1% precision by selected reaction monitoring.36 Chlorate andchlorite arise from used as a disinfectant. Bromate and iodatecan be formed from or when water is disinfected with ozone
. For the highly selective measurement of chlorate, the nega-tive ion selected by Q1 in Figure 22-21 is m/z 83 and the negativeion selected by Q3 is m/z 67. Explain how this measurement worksand how it distinguishes from , , and .
22-32. Quantitative analysis by isotope dilution. In isotope dilution,a known amount of an unusual isotope (called the spike) is added toan unknown as an internal standard for quantitative analysis. Afterthe mixture has been homogenized, some of the element of interestmust be isolated. The ratio of the isotopes is then measured. Fromthis ratio, the quantity of the element in the original unknown canbe calculated.
Natural vanadium has atom fractions and. The atom fraction is defined as
A spike enriched in has atom fractions and.
(a) Let isotope A be and isotope B be . Let be the atomfraction of isotope A ( ) inan unknown. Let be the atom fraction of B in an unknown. Let
and be the corresponding atom fractions in a spike. Let bethe total concentration of all isotopes of vanadium ( ) in theunknown and let be the concentration in the spike. Let be themass of unknown and be the mass of spike. After grams ofunknown are mixed with grams of spike, the ratio of isotopes inthe mixture is found to be R. Show that
(A)
(b) Solve Equation A for to show that
(B)
(c) A 0.401 67-g sample of crude oil containing an unknown con-centration of natural vanadium was mixed with 0.419 46 g of spikecontaining enriched with (atom fractions:
, ).37 After dissolution and equilibra-tion of the oil and the spike, some of the vanadium was isolated byion-exchange chromatography. The measured isotope ratio in theisolated vanadium was . Find the concentra-tion of vanadium ( ) in the crude oil.(d) Examine the calculation in part (c) and express the answer withthe correct number of significant figures.
22-33. A literature project. Until the 1960s, dinosaurs were thoughtto be cold-blooded animals, which means they could not regulatetheir body temperature. Reference 1 describes how the ratio in dinosaur bones suggests that some species were warmblooded. Find reference 1, preferably at http://pubs.acs.org/ac ifyour institution has an electronic subscription to Analytical Chem-istry. Explain how the ratio implies that an animal is warmor cold blooded. Explain the criteria that were used to determine thelikelihood that in bone phosphate was altered after thedinosaur died. Describe how bone samples were prepared for analy-sis of oxygen isotopes and state the results of the measurements.
18O/16O
18O/16O
18O/16O
�mol/gR � 51V/50V � 10.545
50V � 0.360 951V � 0.639 1
50V2.243 5 �mol V/g
Cx � aCsms
mxb aAs � RBs
RBx � Axb
Cx
R �mol A
mol B�
AxCx mx � AsCsms
BxCx mx � BsCsms
ms
mxms
mxCs
�mol/gCxBsAs
Bx
� atoms of A/[atoms of A � atoms of B]Ax
50V51V
50V � 0.360 9
51V � 0.639 150V
Atom fraction of 51V �atoms of 51V
atoms of 50V � atoms of 51V
50V � 0.002 5
51V � 0.997 5
IO�3BrO�
3ClO�2ClO�
3
(O3)I�Br�
ClO2
(IO�3 )
(BrO�3 )(ClO�
2 )(ClO�3 )

501
Name: D3 D4 D5 D6Molecular mass: 222 296 370 444Main fragments: 207 281 73, 267, 355 73, 341, 429
O
O SiOSi
Si
Si
O
—
—
—
—
Si
O
—
—
—
Si
O
—
—
O
O SiOSi
Si
Si
O—
—
—
—
Si
O
—
—
O
O Si
OSi
Si
Si
O—
—
— —
O
OSi
O
Si Si
——
—
— —
—
—
——
—
———
Selected ion monitoring gas chromatogram of plasma extract showing traces of siloxanes 5 years after5-year-old breast implants were removed. [From D. Flassbeck, B. Pfleiderer, R. Grumping, and A. V. Hirner,“Determination of Low Molecular Weight Silicones in Women After Exposure to Breast Implants by GC/MS,”Anal. Chem. 2001, 73, 606.]
MEASURING SILICONES LEAKING FROM BREAST IMPLANTS
Introduction to Analytical Separations23D
etec
tor
coun
ts
4
5 000
0
10 000
15 000
20 000
25 000
50 000
55 000
6 8
D43 ppb
m/z = 281
D528 ppb
m/z = 355D6
17 ppbm/z = 341
Internalstandardm/z = 281
Unidentifiedpeaks atm/z = 341
10 12 14 16 18 20 22 24
Time (min)
High-molecular-mass poly(dimethylsiloxane), , is used as a stationary phasein gas chromatography (Table 24-1) and as the gel in breast implants. Approximately 1–2%of silicones in breast implants are low-molecular-mass materials that can leak from intactimplants and travel through the circulatory and lymph systems to take up residence in lipid-rich tissues.
Gas chromatography with selected ion mass spectrometric detection (Section 22-4)provides a specific, sensitive means to measure silicones. Analytes were extracted withhexane from 1 mL of blood plasma to which the internal standard, , wasadded. Each analyte was monitored at the mass of its most abundant fragment. The chro-matogram on this page would be enormously more complex if detection were not byselected ion monitoring. By setting the mass spectrometer to observe only each intendedanalyte near its known retention time, everything else eluted from the column becomesinvisible.
The observation of silicones at part per billion levels in human tissue does not neces-sarily imply a health risk. Risk must be assessed in medical studies that make use of theanalytical data.
[(CH3)3SiO]4Si
[(CH3)2SiO]n

502 CHAPTER 23 Introduction to Analytical Separations
In the vast majority of real analytical problems, we must separate, identify, and measure oneor more components from a complex mixture. This chapter discusses fundamentals of ana-lytical separations, and the next three chapters describe specific methods.
23-1 Solvent ExtractionExtraction is the transfer of a solute from one phase to another. Common reasons to carryout an extraction in analytical chemistry are to isolate or concentrate the desired analyte or toseparate it from species that would interfere in the analysis. The most common case is theextraction of an aqueous solution with an organic solvent. Diethyl ether, toluene, and hexaneare common solvents that are immiscible with and less dense than water. They form a sepa-rate phase that floats on top of the aqueous phase, as shown in Color Plate 25. Chloroform,dichloromethane, and carbon tetrachloride are common solvents that are denser than water.*In the two-phase mixture, one phase is predominantly water and the other phase is predomi-nantly organic.
Suppose that solute S is partitioned between phases 1 and 2, as depicted in Figure 23-1.The partition coefficient, K, is the equilibrium constant for the reaction
Partition coefficient: (23-1)
where refers to the activity of solute in phase 1. Lacking knowledge of the activity coef-ficients, we will write the partition coefficient in terms of concentrations.
Suppose that solute S in of solvent 1 (water) is extracted with of solvent2 (toluene). Let m be the moles of S in the system and let q be the fraction of S remainingin phase 1 at equilibrium. The molarity in phase 1 is therefore . The fraction oftotal solute transferred to phase 2 is , and the molarity in phase 2 is .Therefore,
from which we can solve for q:
(23-2)
Equation 23-2 says that the fraction of solute remaining in the water (phase 1) dependson the partition coefficient and the volumes. If the phases are separated and fresh toluene(solvent 2) is added, the fraction of solute remaining in the water at equilibrium will be
After n extractions with volume , the fraction remaining in the water is
(23-3)
Example Extraction Efficiency
Solute A has a partition coefficient of 3 between toluene and water, with three timesas much in the toluene phase. Suppose that 100 mL of a 0.010 M aqueous solution ofA is extracted with toluene. What fraction of A remains in the aqueous phase (a) if oneextraction with 500 mL is performed or (b) if five extractions with 100 mL areperformed?
Fraction remaining in phase 1after n extractions
� qn � a V1
V1 � KV2bn
V2
Fraction remaining in phase 1after 2 extractions
� q � q � a V1
V1 � KV2b2
Fraction remaining in phase 1after 1 extraction
� q �V1
V1 � KV2
K �[S]2
[S]1�
(1 � q)m/V2
qm/V1
(1 � q)m/V2(1 � q)qm/V1
V2 mLV1 mL
AS1
K �AS2
AS1
�[S]2
[S]1
S (in phase 1) T S (in phase 2)Phase 2[S]2
Phase 1[S]1
Figure 23-1 Partitioning of a solutebetween two liquid phases.
*Whenever a choice exists between CHCl3 and CCl4, the less toxic CHCl3 should be chosen. Hexane andtoluene are greatly preferred over benzene, which is a carcinogen.
Two liquids are miscible if they form a singlephase when they are mixed in any ratio.Immiscible liquids remain in separate phases.Organic solvents with low polarity aregenerally immiscible with water, which ishighly polar.
For simplicity, we assume that the two phasesare not soluble in each other. A more realistictreatment considers that most liquids arepartially soluble in each other.1
The larger the partition coefficient, the lesssolute remains in phase 1.
Extraction example: If , then of the soluteremains in phase 1 after one extraction. Asecond extraction reduces the concentrationto of the value after the first extraction �
of the initial concentration.(14)(1
4) � 116
14
14q � 1
4

23-1 Solvent Extraction 503
Solution (a) With water as phase 1 and toluene as phase 2, Equation 23-2 says that,after a 500-mL extraction, the fraction remaining in the aqueous phase is
(b) With five 100-mL extractions, the fraction remaining is given by Equation 23-3:
It is more efficient to do several small extractions than one big extraction.
pH EffectsIf a solute is an acid or base, its charge changes as the pH is changed. Usually, a neutral speciesis more soluble in an organic solvent and a charged species is more soluble in aqueous solution.Consider a basic amine whose neutral form, B, has partition coefficient K between aqueous phase1 and organic phase 2. Suppose that the conjugate acid, , is soluble only in aqueous phase 1.Let’s denote its acid dissociation constant as . The distribution coefficient, D, is defined as
Distribution coefficient: (23-4)
which becomes
(23-5)
Substituting and into Equation 23-5 leads to
(23-6)
where is the fraction of weak base in the neutral form, B, in the aqueous phase. The dis-tribution coefficient D is used in place of the partition coefficient K in Equation 23-2 whendealing with a species that has more than one chemical form, such as B and �.
Charged species tend to be more soluble in water than in organic solvent. To extract abase into water, use a pH low enough to convert B into (Figure 23-2). To extract theacid HA into water, use a pH high enough to convert HA into .
Challenge Suppose that the acid HA (with dissociation constant ) is partitionedbetween aqueous phase 1 and organic phase 2. Calling the partition coefficient K for HAand assuming that is not soluble in the organic phase, show that the distribution coef-ficient is given by
(23-7)
where is the fraction of weak acid in the form HA in the aqueous phase.
Example Effect of pH on Extraction
Suppose that the partition coefficient for an amine, B, is and the acid dissociationconstant of is . If 50 mL of 0.010 M aqueous amine is extractedwith 100 mL of solvent, what will be the formal concentration remaining in the aqueousphase (a) at pH 10.00? (b) at pH 8.00?
Solution (a) At pH 10.00, . Using D in place of K, Equation 23-2 says that the fraction
remaining in the aqueous phase is
The concentration of amine in the aqueous phase is 15% of .0.010 M � 0.001 5 M
q �50
50 � (2.73)(100)� 0.15 1 15% left in water
1.0 � 10�10) � 2.73D � KKa/ (Ka � [H�]) � (3.0)(1.0 � 10�9) / (1.0 � 10�9 �
Ka � 1.0 � 10�9BH�
K � 3.0
�HA
D �K � [H�]
[H�] � Ka� K � �HA
Distribution of acidbetween two phases:
A�
Ka
A�
BH�
BH
�B
D �K � Ka
Ka � [H�]� K � �B
Distribution of basebetween two phases:
Ka � [H�][B]1/[BH�]1K � [B]2/[B]1
D �[B]2
[B]1 � [BH�]1
D �total concentration in phase 2
total concentration in phase 1
Ka
BH�
Fraction remaining � a 100
100 � (3)(100)b5
� 0.000 98 � 0.1%
q �100
100 � (3)(500)� 0.062 � 6%
pKa
–6
4
log
D
pH
Mainly BH+
6 8 10 122
–4
–2
0
Mainly B
Figure 23-2 Effect of pH on the distributioncoefficient for the extraction of a base into anorganic solvent. In this example, and
for is 9.00.BH�pKa
K � 3.0
Many small extractions are much moreeffective than a few large extractions.
�B �[B]aq
[B]aq � [BH�]aq
is the same as in Equation 10-18.�A��B
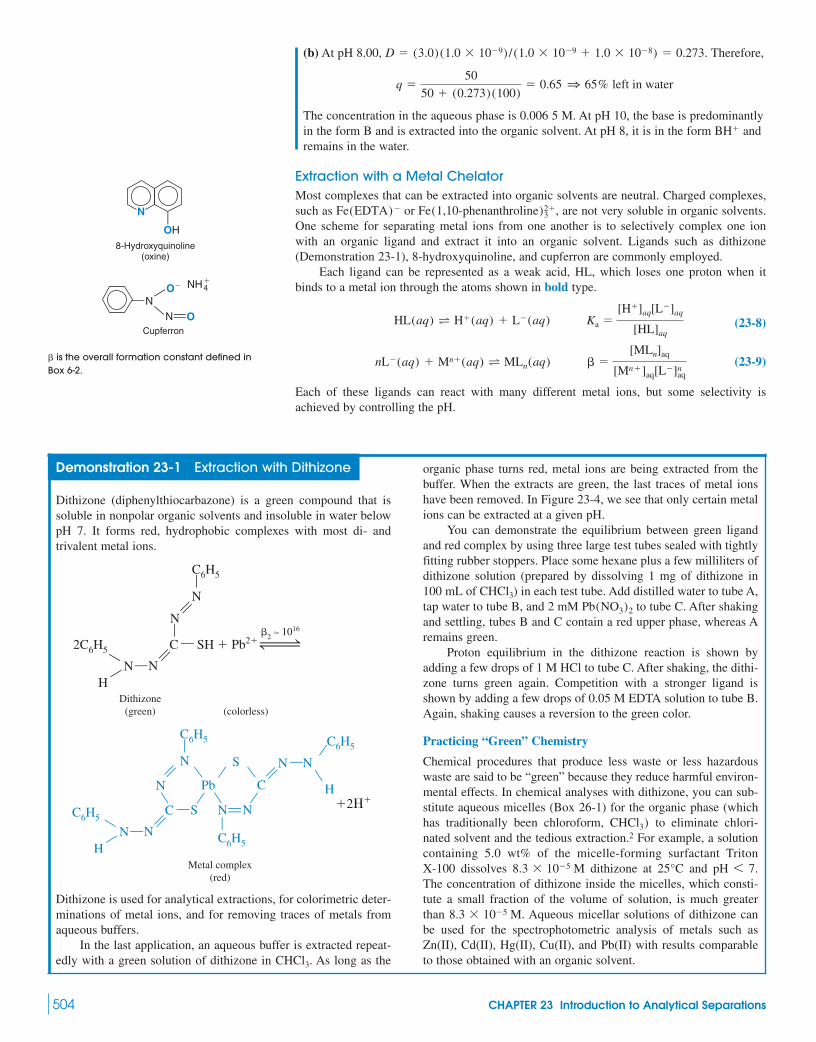
504 CHAPTER 23 Introduction to Analytical Separations
(b) At pH 8.00, . Therefore,
The concentration in the aqueous phase is 0.006 5 M. At pH 10, the base is predominantlyin the form B and is extracted into the organic solvent. At pH 8, it is in the form andremains in the water.
Extraction with a Metal ChelatorMost complexes that can be extracted into organic solvents are neutral. Charged complexes,such as or , are not very soluble in organic solvents.One scheme for separating metal ions from one another is to selectively complex one ionwith an organic ligand and extract it into an organic solvent. Ligands such as dithizone(Demonstration 23-1), 8-hydroxyquinoline, and cupferron are commonly employed.
Each ligand can be represented as a weak acid, HL, which loses one proton when itbinds to a metal ion through the atoms shown in bold type.
(23-8)
(23-9)
Each of these ligands can react with many different metal ions, but some selectivity isachieved by controlling the pH.
nL�(aq) � Mn�(aq) T MLn(aq) � �[MLn]aq
[Mn�]aq[L�]naq
HL(aq) T H�(aq) � L�(aq) Ka �[H�]aq[L�]aq
[HL]aq
Fe(1,10-phenanthroline)2�3Fe(EDTA)�
BH�
q �50
50 � (0.273)(100)� 0.65 1 65% left in water
D � (3.0)(1.0 � 10�9) / (1.0 � 10�9 � 1.0 � 10�8) � 0.273
ß ¡
O�ßß
NH4
N
ON
�
Cupferron
OH
ß
N
8-Hydroxyquinoline(oxine)
Demonstration 23-1 Extraction with Dithizone
Dithizone (diphenylthiocarbazone) is a green compound that issoluble in nonpolar organic solvents and insoluble in water belowpH 7. It forms red, hydrophobic complexes with most di- andtrivalent metal ions.
Dithizone is used for analytical extractions, for colorimetric deter-minations of metal ions, and for removing traces of metals fromaqueous buffers.
In the last application, an aqueous buffer is extracted repeat-edly with a green solution of dithizone in . As long as theCHCl3
ß
¡
C S
ß
¡ß ß
N
N
C6H5
N
ß
N
ß
C6H5
H
ß
ßPb¡
N N
ß
S ß
ßC
ß N Nß
ß
ßC6H5
H
ß¡
C6H5
�2��
Metal complex(red)
ß
¡
C SH
ß
¡ß ß
N
N
2C6H5
N
ß
N
ß
C6H5
H
� Pb2��2 � 1016
Dithizone(green) (colorless)
organic phase turns red, metal ions are being extracted from thebuffer. When the extracts are green, the last traces of metal ionshave been removed. In Figure 23-4, we see that only certain metalions can be extracted at a given pH.
You can demonstrate the equilibrium between green ligandand red complex by using three large test tubes sealed with tightlyfitting rubber stoppers. Place some hexane plus a few milliliters ofdithizone solution (prepared by dissolving 1 mg of dithizone in100 mL of ) in each test tube. Add distilled water to tube A,tap water to tube B, and 2 mM to tube C. After shakingand settling, tubes B and C contain a red upper phase, whereas Aremains green.
Proton equilibrium in the dithizone reaction is shown byadding a few drops of 1 M HCl to tube C. After shaking, the dithi-zone turns green again. Competition with a stronger ligand isshown by adding a few drops of 0.05 M EDTA solution to tube B.Again, shaking causes a reversion to the green color.
Practicing “Green” Chemistry
Chemical procedures that produce less waste or less hazardouswaste are said to be “green” because they reduce harmful environ-mental effects. In chemical analyses with dithizone, you can sub-stitute aqueous micelles (Box 26-1) for the organic phase (whichhas traditionally been chloroform, to eliminate chlori-nated solvent and the tedious extraction.2 For example, a solutioncontaining 5.0 wt% of the micelle-forming surfactant Triton X-100 dissolves dithizone at and .The concentration of dithizone inside the micelles, which consti-tute a small fraction of the volume of solution, is much greaterthan . Aqueous micellar solutions of dithizone canbe used for the spectrophotometric analysis of metals such asZn(II), Cd(II), Hg(II), Cu(II), and Pb(II) with results comparableto those obtained with an organic solvent.
8.3 � 10�5 M
pH 6 725°C8.3 � 10�5 M
CHCl3)
Pb(NO3)2
CHCl3
is the overall formation constant defined inBox 6-2.�

23-1 Solvent Extraction 505
Let’s derive an equation for the distribution coefficient of a metal between two phaseswhen essentially all the metal in the aqueous phase (aq) is in the form and all the metalin the organic phase (org) is in the form (Figure 23-3). We define the partition coeffi-cients for ligand and complex as follows:
(23-10)
(23-11)
The distribution coefficient we seek is
(23-12)
From Equations 23-11 and 23-9, we can write
Using from Equation 23-8 gives
Putting this value of into Equation 23-12 gives
Because most HL is in the organic phase, we substitute to produce themost useful expression for the distribution coefficient:
(23-13)
We see that the distribution coefficient for metal ion extraction depends on pH andligand concentration. It is often possible to select a pH where D is large for one metal andsmall for another. For example, Figure 23-4 shows that could be separated from and by extraction with dithizone at pH 5. Demonstration 23-1 illustrates the pHdependence of an extraction with dithizone. Box 23-1 describes crown ethers that are used toextract polar reagents into nonpolar solvents for chemical reactions.
Zn2�
Pb2�Cu2�
D �KM�Kn
a
KnL
[HL]norg
[H�]naq
Distribution of metal-chelatecomplex between phases:
[HL]aq � [HL]org/KL
D �KM�Kn
a[HL]naq
[H�]naq
[MLn]org
[MLn]org �KM�[Mn�]aqKn
a[HL]naq
[H�]naq
[L�]aq
[MLn]org � KM[MLn]aq � KM�[Mn�]aq[L�]naq
D �[total metal]org
[total metal]aq�
[MLn]org
[Mn�]aq
MLn(aq) T MLn(org) KM �[MLn]org
[MLn]aq
HL(aq) T HL(org) KL �[HL]org
[HL]aq
MLn
Mn�
Aqueousphase
Denseorganicphase(such asCHCl3)
H+
+L– + Mn+
HL
HL
MLn
MLn
Figure 23-3 Extraction of a metal ion with achelator. The predominant form of metal in theaqueous phase is , and the predominantform in the organic phase is .MLn
Mn�
is in the aqueous phase and is in theorganic phase.
MLnMn�
You can select a pH to bring the metal intoeither phase.
20
0
Per
cent
age
extr
acte
d
pH
0
40
60
80
100
1 2 3 4 5 6 7 8 9 10 11 12 13
Hg(II)
Bi(III)
Ag(I)
Cu(II)
Sn(II)
Pb(II)
Zn(II) Tl(I) Cd(II)
Figure 23-4 Extraction of metal ions by dithizone into . At pH 5, is completely extractedinto , whereas and remain in the aqueous phase. [Adapted from G. H. Morrison and H. Freiser
in C. L. Wilson and D. Wilson, eds., Comprehensive Analytical Chemistry, Vol. IA (New York: Elsevier, 1959).]
Zn2�Pb2�CCl4
Cu2�CCl4

506 CHAPTER 23 Introduction to Analytical Separations
23-2 What Is Chromatography?Chromatography operates on the same principle as extraction, but one phase is held in placewhile the other moves past it.4,5 Figure 23-5 shows a solution containing solutes A and Bplaced on top of a column packed with solid particles and filled with solvent. When the out-let is opened, solutes A and B flow down into the column. Fresh solvent is then applied to thetop of the column and the mixture is washed down the column by continuous solvent flow. Ifsolute A is more strongly adsorbed than solute B on the solid particles, then solute A spendsa smaller fraction of the time free in solution. Solute A moves down the column more slowlythan solute B and emerges at the bottom after solute B. We have just separated a mixture intoits components by chromatography.
The mobile phase (the solvent moving through the column) in chromatography is eithera liquid or a gas. The stationary phase (the one that stays in place inside the column) ismost commonly a viscous liquid chemically bonded to the inside of a capillary tube or ontothe surface of solid particles packed in the column. Alternatively, as in Figure 23-5, the
Box 23-1 Crown Ethers
Crown ethers are synthetic compounds that envelop metal ions(especially alkali metal cations) in a pocket of oxygen ligands.Crown ethers are used as phase transfer catalysts because they
can extract water-soluble ionic reagents into nonpolar solvents,where reaction with hydrophobic compounds can occur. In thepotassium complex of dibenzo-30-crown-10, is engulfed by10 oxygen atoms, with distances averaging 288 pm. Onlythe hydrophobic outside of the complex is exposed to solvent.
KßOK�
O
OO
O O
OO
O
O
O
(a ) (b ) C O K
(a) Molecular structure of dibenzo-30-crown-10. (b) Three-dimensional structure of its K� complex.[Adapted from M. A. Bush and M. R. Truter, “Crystal Structures of Alkali-Metal Complexes with Cyclic Polyethers,”
J. Chem. Soc. Chem. Commun. 1970, 1439.]
Fresh solvent(eluent)
Initial bandwith A and B solutes
Column packing(stationary phase)
suspended insolvent (mobile phase)
Porous disk
Solvent flowingout (eluate)
(a) (b) (c) (d) (e)
B
emerges
A
emerges
B AFigure 23-5 The idea behindchromatography: Solute A, with a greateraffinity than solute B for the stationary phase,remains on the column longer.
In 1903, M. Tswett first applied adsorptionchromatography to the separation of plantpigments, using a hydrocarbon solvent andinulin powder (a carbohydrate) as stationaryphase. The separation of colored bands led tothe name chromatography, from the Greekword chromatos, meaning “color.” Tswett laterfound that or sucrose also could beused as stationary phases.3
CaCO3

23-2 What Is Chromatography? 507
solid particles themselves may be the stationary phase. In any case, the partitioning ofsolutes between mobile and stationary phases gives rise to separation.
Fluid entering the column is called eluent. Fluid emerging from the end of the column iscalled eluate:
The process of passing liquid or gas through a chromatography column is called elution.Columns are either packed or open tubular. A packed column is filled with particles of
stationary phase, as in Figure 23-5. An open tubular column is a narrow, hollow capillarywith stationary phase coated on the inside walls.
Types of ChromatographyChromatography is divided into categories on the basis of the mechanism of interaction ofthe solute with the stationary phase, as shown in Figure 23-6.
eluentin
S COLUMN S eluateout
–+
–
–
–
+
Solute adsorbedon surface ofstationary phase
Adsorption chromatography Partition chromatography
Mobile anionsheld near cationsthat are covalentlyattached tostationary phase
Small moleculespenetrate poresof particles
Anion-exchangeresin; onlyanions can beattracted to it
Ion-exchange chromatography
Large moleculesare excluded
Molecular exclusion chromatography
Affinity chromatography
All othermolecules simplywash through
One kind of moleculein complex mixturebecomes attached tomolecule that iscovalently boundto stationary phase
– ––
– –
––
–
– ––
––
–
– –
–––
–
––
–
–
––
– – –
–– +
+
+ +
+
+++
+ +
+
++
+
+
+
+
++
Solute dissolvedin liquid phasebonded to the surface of column
Cross sectionof open tubularcolumn
Figure 23-6 Major types of chromatography.
eluent—ineluate—out

508 CHAPTER 23 Introduction to Analytical Separations
Adsorption chromatography. A solid stationary phase and a liquid or gaseous mobile phaseare used. Solute is adsorbed on the surface of the solid particles. The more strongly a soluteis adsorbed, the slower it travels through the column.
Partition chromatography. A liquid stationary phase is bonded to a solid surface, which istypically the inside of the silica chromatography column in gas chromatography.Solute equilibrates between the stationary liquid and the mobile phase, which is a flowinggas in gas chromatography.
Ion-exchange chromatography. Anions such as or cations such as arecovalently attached to the stationary solid phase, usually a resin, in this type of chromatog-raphy. Solute ions of the opposite charge are attracted to the stationary phase by electro-static force. The mobile phase is a liquid.
Molecular exclusion chromatography. Also called gel filtration or gel permeation chro-matography, this technique separates molecules by size, with the larger solutes passingthrough most quickly. In the ideal case of molecular exclusion, there is no attractive inter-action between the stationary phase and the solute. Rather, the liquid or gaseous mobilephase passes through a porous gel. The pores are small enough to exclude large solute mol-ecules but not small ones. Large molecules stream past without entering the pores. Smallmolecules take longer to pass through the column because they enter the gel and thereforemust flow through a larger volume before leaving the column.
Affinity chromatography. This most selective kind of chromatography employs specificinteractions between one kind of solute molecule and a second molecule that is covalentlyattached (immobilized) to the stationary phase. For example, the immobilized moleculemight be an antibody to a particular protein. When a mixture containing a thousand proteinsis passed through the column, only the one protein that reacts with the antibody binds to thecolumn. After all other solutes have been washed from the column, the desired protein isdislodged by changing the pH or ionic strength.
23-3 A Plumber’s View of ChromatographyThe speed of the mobile phase passing through a chromatography column is expressed eitheras a volume flow rate or as a linear flow rate. Consider a liquid chromatography experimentin which the column has an inner diameter of and themobile phase occupies 20% of the column volume. Each centimeter of column length has avolume of , of which is mobile phase (solvent). The volume flow rate, such as 0.30 mL/min, tells how many mil-liliters of solvent per minute travel through the column. The linear flow rate tells how manycentimeters are traveled in 1 min by the solvent. Because 1 cm of column length contains0.056 5 mL of mobile phase, 0.30 mL would occupy of column length. The linear flow rate corresponding to 0.30 mL/min is 5.3 cm/min.
The ChromatogramSolutes eluted from a chromatography column are observed with various detectors describedin later chapters. A chromatogram is a graph showing the detector response as a function ofelution time. Figure 23-7 shows what might be observed when a mixture of octane, nonane,and an unknown is separated by gas chromatography, which is described in Chapter 24. The
(0.30 mL)/(0.056 5 mL/cm) � 5.3 cm
20% (� 0.056 5 mL)(r2 � length) � (0.30 cm)2(1 cm) � 0.283 mL
0.60 cm (radius � r � 0.30 cm)
ßN(CH3)�3ßSO�
3
(SiO2)
Time
Det
ecto
r re
spon
se
Injectiontime
CH4 Octane Unknown Nonane
tm
t r
rt'
For their pioneering work on liquid-liquidpartition chromatography in 1941, A. J. P. Martinand R. L. M. Synge received a Nobel Prizein 1952.
B. A. Adams and E. L. Holmes developed thefirst synthetic ion-exchange resins in 1935.Resins are relatively hard, amorphous organicsolids. Gels are relatively soft.
Volume flow rate � volume of solvent per unit time traveling through column
Linear flow rate � distance per unit time traveled by solvent
Large molecules pass through the columnfaster than small molecules.
This form of chromatography was invented byTswett in 1903.
Figure 23-7 Schematic gas chromatogramshowing measurement of retention times.

23-3 A Plumber’s View of Chromatography 509
retention time, , for each component is the time needed after injection of the mixture ontothe column until that component reaches the detector. Retention volume, , is the volumeof mobile phase required to elute a particular solute from the column.
Unretained mobile phase travels through the column in the minimum possible time, des-ignated . The adjusted retention time, , for a solute is the additional time required forsolute to travel the length of the column beyond the time required by unretained solvent:
Adjusted retention time: (23-14)
In gas chromatography, is usually taken as the time needed for to travel through thecolumn (Figure 23-7).
For any two components 1 and 2, the relative retention, , is the ratio of their adjustedretention times:
Relative retention: (23-15)
where , so . The greater the relative retention, the greater the separationbetween two components. Relative retention is fairly independent of flow rate and can there-fore be used to help identify peaks when the flow rate changes.
For each peak in the chromatogram, the capacity factor, , is defined as
Capacity factor: (23-16)
The longer a component is retained by the column, the greater is the capacity factor. To mon-itor the performance of a particular column, it is good practice to periodically measure thecapacity factor of a standard, the number of plates (Equation 23-28), and peak asymmetry(Figure 23-13). Changes in these parameters indicate degradation of the column.
Example Retention Parameters
A mixture of benzene, toluene, and methane was injected into a gas chromatograph.Methane gave a sharp spike in 42 s, whereas benzene required 251 s and toluene waseluted in 333 s. Find the adjusted retention time and capacity factor for each solute andthe relative retention.
Solution The adjusted retention times are
The capacity factors are
The relative retention is expressed as a number greater than unity:
Relation Between Retention Time and the Partition CoefficientThe capacity factor in Equation 23-16 is equivalent to
(23-17)
Let’s see why this is true. If the solute spends all its time in the mobile phase and none inthe stationary phase, it would be eluted in time , by definition. Putting into Equa-tion 23-16 gives , because solute spends no time in the stationary phase. Suppose thatsolute spends equal time in the stationary and mobile phases. The retention time would thenbe and . If solute spends three times as much time in the sta-tionary phase as in the mobile phase, and .k¿ � (4tm � tm)/tm � 3tr � 4tm
k¿ � (2tm � tm)/tm � 1tr � 2tm
k¿ � 0tr � tmtm
k¿ �time solute spends in stationary phase
time solute spends in mobile phase
� �t ¿r(toluene)
t ¿r(benzene)�
333 � 42
251 � 42� 1.39
Benzene: k¿ �tr � tm
tm�
251 � 42
42� 5.0 Toluene: k¿ �
333 � 42
42� 6.9
Benzene: tr¿ � tr � tm � 251 � 42 � 209 s Toluene: t¿r � 333 � 42 � 291 s
k¿ �tr � tm
tm
k¿
� 7 1t ¿r2 7 t ¿r1
� �t ¿r2t ¿r1
�
CH4tm
t ¿r � tr � tm
t¿rtm
Vr
tr
Capacity factor is also called retention factor,capacity ratio, or partition ratio and isfrequently written as k instead of .k¿

510 CHAPTER 23 Introduction to Analytical Separations
If solute spends three times as much time in the stationary phase as in the mobile phase,there will be three times as many moles of solute in the stationary phase as in the mobilephase at any time. The quotient in Equation 23-17 is equivalent to
(23-18)
where is the concentration of solute in the stationary phase, is the volume of the stationary phase,is the concentration of solute in the mobile phase, and is the volume of the mobile phase.The quotient is the ratio of concentrations of solute in the stationary and mobile
phases. If the column is run slowly enough to be near equilibrium, the quotient is thepartition coefficient, K, introduced in connection with solvent extraction. Therefore, we castEquation 23-18 in the form
(23-19)
which relates the retention time to the partition coefficient and the volumes of stationary andmobile phases. Because , relative retention can also be expressed as
(23-20)
That is, the relative retention of two solutes is proportional to the ratio of their partition coef-ficients. This relation is the physical basis of chromatography.
Example Retention Time and the Partition Coefficient
In the preceding example, methane gave a sharp spike in 42 s, whereas benzene required251 s. The open tubular chromatography column has an inner diameter of and iscoated on the inside with a layer of stationary phase thick. Estimate the partitioncoefficient for benzene between stationary and mobile phases and statewhat fraction of the time benzene spends in the mobile phase.
Solution We need to calculate the relative volumes of the stationary and mobile phases.The column is an open tube with a thin coating of stationary phase on the inside wall.
Radius of hollow cavity: Radius to middle of stationary phase:
The relative volumes of the phases are proportional to the relative cross-sectional areas ofthe phases. Therefore, . In thepreceding example, we found that the capacity factor for benzene is
Substituting this value into Equation 23-19 gives the partition coefficient:
To find the fraction of time spent in the mobile phase, we use Equations 23-16 and 23-17:
where is the time in the stationary phase. The fraction of time in the mobile phase is
Fraction of time in mobile phase �tm
ts � tm�
tm
k¿tm � tm�
1
k¿ � 1�
1
5.0 � 1� 0.17
ts
k¿ �time in stationary phase
time in mobile phase�
tr � tm
tm�
ts
tm1 ts � k¿tm
k¿ � KVs
Vm1 5.0 � K (0.016 1) 1 K � 310
k¿ �tr � tm
tm�
251 � 42
42� 5.0
Vs/Vm � (7.8 � 102 �m2)/(4.83 � 104 �m2) � 0.016 1
r2 � 124.5 �m
r1 � 124 �m
Cross-sectional area of column � r21
� (124 �m)2 � 4.83 � 104 �m2
Cross-sectional area of coating � 2r2 � thickness� 2(124.5 �m)(1.0 �m) � 7.8 � 102 �m2
1-µm-thick layerof stationary
phase
Column wall
248 µm
(K � Cs/Cm)1.0 �m
250 �m
Relative retention: � �t ¿r2t ¿r1
�k¿2k¿1
�K2
K1
t ¿r � k¿ � K
k¿ � KVs
Vm �
Eq. 23-16
tr � tm
tm�
t ¿rtm
Relation of retention timeto partition coefficient:
Cs/Cm
Cs/Cm
VmCm
VsCs
k¿ �CsVs
CmVm
Time solute spends in stationary phase
Time solute spends in mobile phase�
moles of solute in stationary phase
moles of solute in mobile phase
Partition coefficient � K �Cs
Cm
Physical basis of chromatographyThe greater the ratio of partition coefficientsbetween mobile and stationary phases,the greater the separation between twocomponents of a mixture.

23-4 Efficiency of Separation 511
Retention volume, , is the volume of mobile phase required to elute a particular solutefrom the column:
Retention volume: (23-21)
where is the volume flow rate (volume per unit time) of the mobile phase. The retentionvolume of a particular solute is constant over a range of flow rates.
Scaling Up
We normally carry out chromatography for analytical purposes (to separate and identify ormeasure the components of a mixture) or for preparative purposes (to purify a significantquantity of a component of a mixture). Analytical chromatography is usually performed withthin columns that provide good separation. For preparative chromatography, we use fattercolumns that can handle more load (Figure 23-8).6 Preparative chromatography is especiallyimportant in the pharmaceutical industry, which can afford the high cost of separating com-pounds such as optical isomers of drugs (Boxes 24-1 and 25-2).
If you have developed a chromatographic procedure to separate 2 mg of a mixture on acolumn with a diameter of 1.0 cm, what size column should you use to separate 20 mg of themixture? The most straightforward way to scale up is to maintain the same column lengthand to increase the cross-sectional area to maintain a constant ratio of sample mass to columnvolume. Because cross-sectional area is , where r is the column radius, the desired diam-eter is given by
Scaling equation: (23-22)
A column with a diameter near 3 cm would be appropriate.To reproduce the conditions of the smaller column in the larger column, the linear
flow rate (not the volume flow rate) should be kept constant. Because the area (and hencevolume) of the large column is 10 times greater than that of the small column in this exam-ple, the volume flow rate should be 10 times greater to maintain a constant linear flow rate.If the small column had a volume flow rate of 0.3 mL/min, the large column should be runat 3 mL/min.
23-4 Efficiency of SeparationTwo factors contribute to how well compounds are separated by chromatography. One is thedifference in elution times between peaks: The farther apart, the better their separation. Theother factor is how broad the peaks are: The wider the peaks, the poorer their separation. Thissection discusses how we measure the efficiency of a separation.
Resolution
Solute moving through a chromatography column tends to spread into a Gaussian shape withstandard deviation (Figure 23-9). The longer a solute spends passing through a column, thebroader the band becomes. Common measures of breadth are (1) the width measured ata height equal to half of the peak height and (2) the width w at the baseline between tangentsdrawn to the steepest parts of the peak. From Equation 4-3 for a Gaussian peak, it is possibleto show that and .
In chromatography, the resolution of two peaks from each other is defined as
Resolution: (23-23)
where or is the separation between peaks (in units of time or volume) and isthe average width of the two peaks in corresponding units. (Peak width is measured at thebase, as shown in Figure 23-9.) Alternatively, the last expression in Equation 23-23 uses
wav�Vr�tr
Resolution ��tr
wav�
�Vr
wav�
0.589�tr
w1/2av
w � 4w1/2 � 2.35
w1/2
Large column radius � 1.58 cm
20 mg
2 mg� a large column radius
0.50 cmb2
Large mass
Small mass� a large column radius
small column radiusb2
r2
uv
Vr � tr � uv
Vr Volume is proportional to time, so any ratio oftimes can be written as the correspondingratio of volumes. For example,
k¿ �tr � tm
tm�
Vr � Vm
Vm
where is the retention volume for solute andis the elution volume for an unretained
component. is equal to the volume ofmobile phase in the column.
Vm
Vm
Vr
Scaling rules:• Keep column length constant.• Cross-sectional area of column mass of
analyte:
(The symbol means “is proportional to.”)
• Maintain constant linear flow rate:
• Sample volume applied to column massof analyte.
• If you do change the length of the column,then the mass of sample can be increasedin proportion to the increase in length.
�
Volume flow2
Volume flow1� a radius2
radius1b2
�
Mass2
Mass1� a radius2
radius1b2
�
Figure 23-8 Industrial-scale preparativechromatography column can purify akilogram of material. The column volume is300 L. [Courtesy Prochrom, Inc., Indianapolis, IN.]

512 CHAPTER 23 Introduction to Analytical Separations
, the width at half-height of Gaussian peaks. Figure 23-10 shows the overlap of twopeaks with different degrees of resolution. For quantitative analysis, a resolution ishighly desirable.
Example Measuring Resolution
A peak with a retention time of 407 s has a width at the base of 13 s. A neighboring peakis eluted at 424 s with a width of 16 s. Find the resolution for these two components.
Solution Resolution ��tr
wav�
424 � 40712(13 � 16)
� 1.17
71.5w1/2av
Time or volume
Det
ecto
r re
spon
se
t r or Vr
Inflection point(steepest portionof curve) σσ
w1/2 = 2.35σ h
w = 4σ
t = 0(injection)
12
h
Resolution= 1.50
Resolution= 0.75
Time
Sig
nal
Sig
nal
3σ
6σ
Resolution= 1.00
Resolution= 0.50
Time
Sig
nal
Sig
nal
2σ
4σ
Figure 23-10 Resolution of Gaussian peaks of equal area and amplitude. Dashed lines showindividual peaks, and solid lines are the sum of two peaks. Overlapping area is shaded.
Figure 23-9 Idealized Gaussian chromatogram showing how w and w1/2 are measured. The valueof w is obtained by extrapolating the tangents to the inflection points down to the baseline.
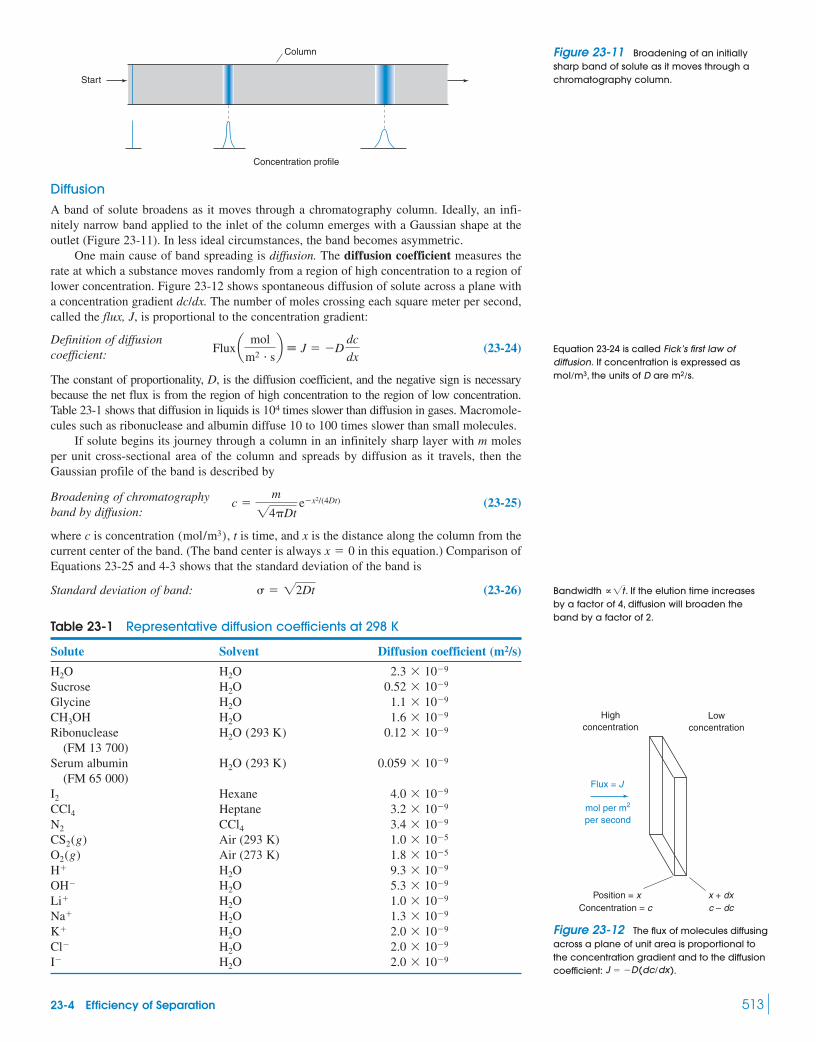
23-4 Efficiency of Separation 513
DiffusionA band of solute broadens as it moves through a chromatography column. Ideally, an infi-nitely narrow band applied to the inlet of the column emerges with a Gaussian shape at theoutlet (Figure 23-11). In less ideal circumstances, the band becomes asymmetric.
One main cause of band spreading is diffusion. The diffusion coefficient measures therate at which a substance moves randomly from a region of high concentration to a region oflower concentration. Figure 23-12 shows spontaneous diffusion of solute across a plane witha concentration gradient dc/dx. The number of moles crossing each square meter per second,called the flux, J, is proportional to the concentration gradient:
(23-24)
The constant of proportionality, D, is the diffusion coefficient, and the negative sign is necessarybecause the net flux is from the region of high concentration to the region of low concentration.Table 23-1 shows that diffusion in liquids is times slower than diffusion in gases. Macromole-cules such as ribonuclease and albumin diffuse 10 to 100 times slower than small molecules.
If solute begins its journey through a column in an infinitely sharp layer with m molesper unit cross-sectional area of the column and spreads by diffusion as it travels, then theGaussian profile of the band is described by
(23-25)
where c is concentration , t is time, and x is the distance along the column from thecurrent center of the band. (The band center is always in this equation.) Comparison ofEquations 23-25 and 4-3 shows that the standard deviation of the band is
Standard deviation of band: (23-26) � 22Dt
x � 0(mol/m3)
c �m24Dt
e�x2/(4Dt)Broadening of chromatographyband by diffusion:
104
Flux a mol
m2 � sb � J � �D
dc
dx
Definition of diffusioncoefficient:
Table 23-1 Representative diffusion coefficients at 298 K
Solute Solvent Diffusion coefficient (m2/s)
SucroseGlycine
Ribonuclease(FM 13 700)
Serum albumin(FM 65 000)
HexaneHeptane
Air (293 K)Air (273 K)
2.0 � 10�9H2OI�
2.0 � 10�9H2OCl�
2.0 � 10�9H2OK�
1.3 � 10�9H2ONa�
1.0 � 10�9H2OLi�
5.3 � 10�9H2OOH�
9.3 � 10�9H2OH�
1.8 � 10�5O2(g)1.0 � 10�5CS2(g)3.4 � 10�9CCl4N2
3.2 � 10�9CCl4
4.0 � 10�9I2
0.059 � 10�9H2O (293 K)
0.12 � 10�9H2O (293 K)1.6 � 10�9H2OCH3OH1.1 � 10�9H2O
0.52 � 10�9H2O2.3 � 10�9H2OH2O
Start
Column
Concentration profile
Highconcentration
Lowconcentration
Flux = J
mol per m2
per second
Position = xConcentration = c
x + dxc – dc
Figure 23-11 Broadening of an initiallysharp band of solute as it moves through achromatography column.
Figure 23-12 The flux of molecules diffusingacross a plane of unit area is proportional tothe concentration gradient and to the diffusioncoefficient: .J � �D(dc/dx)
Equation 23-24 is called Fick’s first law ofdiffusion. If concentration is expressed as
, the units of D are .m2/smol/m3
Bandwidth . If the elution time increasesby a factor of 4, diffusion will broaden theband by a factor of 2.
�2t

514 CHAPTER 23 Introduction to Analytical Separations
Plate Height: A Measure of Column EfficiencyEquation 23-26 tells us that the standard deviation for diffusive band spreading is . Ifsolute has traveled a distance x at the linear flow rate , then the time it has been onthe column is . Therefore
123
Plate height: (23-27)
Plate height is the constant of proportionality between the variance, , of the band andthe distance it has traveled, x. The name came from the theory of distillation in which sepa-ration could be performed in discrete stages called plates. Plate height is also called theheight equivalent to a theoretical plate. Plate height is approximately the length of columnrequired for one equilibration of solute between mobile and stationary phases. We explorethis concept further in Box 23-2. The smaller the plate height, the narrower the bandwidth.
The ability of a column to separate components of a mixture is improved by decreasingplate height. An efficient column has more theoretical plates than an inefficient column. Differ-ent solutes passing through the same column have different plate heights because they have dif-ferent diffusion coefficients. Plate heights are to 1 mm in gas chromatography, in high-performance liquid chromatography, and in capillary electrophoresis.
Plate height is the length , where is the standard deviation of the Gaussian band inFigure 23-9 and x is the distance traveled. For solute emerging from a column of length L,the number of plates, N, in the entire column is the length L divided by the plate height:
because and . In this expression, w has units of length and the number ofplates is dimensionless. If we express L and w (or ) in units of time instead of length, N isstill dimensionless. We obtain the most useful expression for N by writing
Number of plates on column: (23-28a)
where is the retention time of the peak and w is the width at the base in Figure 23-9 in unitsof time. If we use the width at half-height instead of the width at the base, we get
Number of plates on column: (23-28b)
Example Measuring Plates
A solute with a retention time of 407 s has a width at the base of 13 s on a column 12.2 mlong. Find the number of plates and plate height.
Solution
To estimate the number of theoretical plates for the asymmetric peak in Figure 23-13,draw a horizontal line across the band at 1/10th of the maximum height. The quantities A andB can then be measured, and the number of plates is7
(23-29)
where is the width at 1/10th .height (� A � B)w0.1
N �41.7(tr/w0.1)2
A/B � 1.25
H �L
N�
12.2 m
1.57 � 104� 0.78 mm
N �16t2
r
w2�
16 � 4072
132� 1.57 � 104
N �5.55t2
r
w21/2
tr
N �16t2
r
w2�
t2r
2
� w/4x � L
N �L
H�
Lx
2�
L2
2�
16L2
w2
2/x6 1 �m
�10 �m�0.1
2
H � 2/x
Plate height � H
2 � 2Dt � 2Dxux
� a2Duxbx � Hx
t � x/ux
ux (m/s)22Dt
uv � volume flow rate (volume/time)ux � linear flow rate (distance/time)
The term plate height comes from distillationtheory. Some high-performance distillationcolumns contain discrete units called plates, inwhich liquid and vapor equilibrate with eachother. As a teenager, A. J. P. Martin, coinventorof partition chromatography, built distillationcolumns in discrete sections from coffee cans.(We don’t know what he was distilling!) Whenhe formulated the theory of partitionchromatography, he adopted terms fromdistillation theory.
better separations narrow peaks 1Small plate height 1
Choose a peak with a capacity factor greaterthan 5 when you measure plate height for acolumn.
Challenge If N is constant, show that the widthof a chromatographic peak increases withincreasing retention time. That is, successivepeaks in a chromatogram should beincreasingly broad.
All quantities must be measured in the sameunits, such as minutes or centimeters of chartpaper.

23-4 Efficiency of Separation 515
Factors Affecting ResolutionFor two closely spaced peaks, the relation between plates and resolution is8
(23-30)
where N is the number of theoretical plates and is the separation factor, defined as thequotient of linear velocities of the two solutes . Retention time is inversely propor-tional to velocity. If the retention times for two components are and ,
.One important feature of Equation 23-30 is that resolution is proportional to .
Therefore, doubling the column length increases resolution by . Figure 23-14 showsthe effect of column length on the separation of L-phenylalanine (Table 10-1) fromL , in which the phenyl ring bears five deuterium atoms. The mixture waspassed through a pair of liquid chromatography columns by an ingenious valving system thatrecycled the mixture through the same two columns over and over. After 1 pass in Figure 23-14,the relative retention, , is only 1.03. By 15 passes, baseline separation has been achieved.The inset of Figure 23-14 shows that the square of resolution is proportional to the number ofpasses, as predicted by Equation 23-30.
�
-phenylalanine-D5
222N
� � 348/341 � 1.021tB � 348 stA � 341 s
(� 7 1)�
Resolution �2N
4(� � 1)
t r
Det
ecto
r re
spon
se
Time
B A
910
110
Det
ecto
r re
spon
se (Res
olut
ion)
2
2
3
45
1015
1
5 10
Number of passes
15
2
3
4n = 1
Phe-D5
Phe
Number of passes through columns (n)
Figure 23-14 Separation of 0.5 mM L-phenylalanine and 0.5 mM L-phenylalanine-D5 by repeatedpasses through a pair of Hypersil C8 liquid chromatography columns eluted with10:90 acetonitrile:water containing 25 mM and 0.1% trifluoroacetic acid in the water. [From K. Lan
and J. W. Jorgensen, “Pressure-Induced Retention Variations in Reversed-Phase Alternate-Pumping Recycle
Chromatography,” Anal. Chem. 1998, 70, 2773.]
Na2SO4
(25 cm � 4.6 mm)
Separation factor: � �uA
uB�
tBtA
Resolution �2N �2L
tA, tB � retention times of components A and B
uA, uB � linear velocities of components A and B
Figure 23-13 Asymmetric peak showing parameters used to estimate the number of theoreticalplates.

516 CHAPTER 23 Introduction to Analytical Separations
Equation 23-30 also tells us that resolution increases as the separation factor increases.The separation factor is the relative velocity of the two components through the column. Theway to change relative velocity is to change the stationary phase in gas chromatography oreither the stationary or the mobile phase in liquid chromatography. Important equations fromchromatography are summarized in Table 23-2.
Example Plates Needed for Desired Resolution
Two solutes have a separation factor of . How many plates are required to give aresolution of 1.0? of 2.0? If the plate height is 0.20 mm, how long must the column befor a resolution of 1.0?
Solution We use Equation 23-30:
To double the resolution to 2.0 requires four times as .For a resolution of 1.0, the length of column required is
.
23-5 Why Bands Spread9
A band of solute invariably spreads as it travels through a chromatography column (Fig-ure 23-11) and emerges at the detector with a standard deviation . Each individual mechanism
0.88 m(4.4 � 103 plates) �(0.20 mm/plate) �
many plates � 1.8 � 104 plates
Resolution � 1.0 �2N
4(� � 1) 1 N � a 4(1.0)
1.06 � 1b2
� 4.4 � 103 plates
� � 1.06
�
Table 23-2 Summary of chromatography equations
Quantity Equation Parameters
Partition coefficient
Retention volumeCapacity factor
Relative retention Subscripts 1 and 2 refer to two solutes
Number of plates
Plate height
Resolution
� � separation factor (� 7 1)N � number of platesResolution �
1N
4(� � 1)
same units as numerator (time or volume)wav � average width measured at baseline in�Vr � difference in retention volumes�tr � difference in retention timesResolution �
�tr
wav�
�Vr
wav
N � number of plates on columnL � length of columnx � distance traveled by center of band � standard deviation of bandH �
2
x�
L
N
w1/2 � width at half-heightw � width at baseN �
16t2r
w2�
5.55t2r
w21/2
t1 � retention time of solute 1t2 � retention time of solute 2� � t2/t1 (� 7 1)Separation factor
� �t¿r2t¿r1
�k¿2k¿1
�K2
K1
tm � time solute spends in mobile phasets � time solute spends in stationary phasek¿ �
ts
tm
Vm � volume of mobile phaseVs � volume of stationary phasek¿ � t¿r /tm � KVs/Vm
uv � volume flow rate � volume/unit timeVr � tr � uv
tm � retention time of unretained solutetr � retention time of solute of interestt ¿r � tr � tmAdjusted retention timeCm � concentration of solute in mobile phaseCs � concentration of solute in stationary phaseK � Cs/Cm
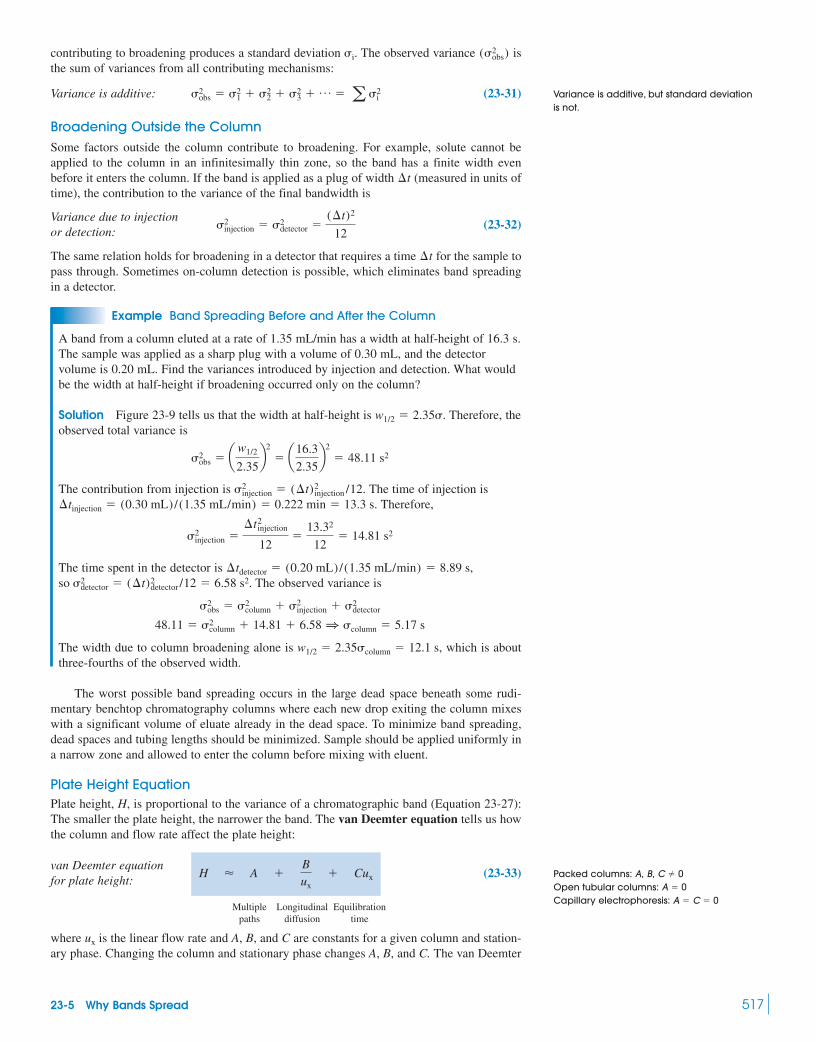
23-5 Why Bands Spread 517
contributing to broadening produces a standard deviation . The observed variance isthe sum of variances from all contributing mechanisms:
Variance is additive: (23-31)
Broadening Outside the ColumnSome factors outside the column contribute to broadening. For example, solute cannot beapplied to the column in an infinitesimally thin zone, so the band has a finite width evenbefore it enters the column. If the band is applied as a plug of width (measured in units oftime), the contribution to the variance of the final bandwidth is
(23-32)
The same relation holds for broadening in a detector that requires a time for the sample topass through. Sometimes on-column detection is possible, which eliminates band spreadingin a detector.
Example Band Spreading Before and After the Column
A band from a column eluted at a rate of 1.35 mL/min has a width at half-height of 16.3 s.The sample was applied as a sharp plug with a volume of 0.30 mL, and the detectorvolume is 0.20 mL. Find the variances introduced by injection and detection. What wouldbe the width at half-height if broadening occurred only on the column?
Solution Figure 23-9 tells us that the width at half-height is . Therefore, theobserved total variance is
The contribution from injection is . The time of injection is. Therefore,
The time spent in the detector is . The observed variance is
The width due to column broadening alone is , which is aboutthree-fourths of the observed width.
The worst possible band spreading occurs in the large dead space beneath some rudi-mentary benchtop chromatography columns where each new drop exiting the column mixeswith a significant volume of eluate already in the dead space. To minimize band spreading,dead spaces and tubing lengths should be minimized. Sample should be applied uniformly ina narrow zone and allowed to enter the column before mixing with eluent.
Plate Height EquationPlate height, H, is proportional to the variance of a chromatographic band (Equation 23-27):The smaller the plate height, the narrower the band. The van Deemter equation tells us howthe column and flow rate affect the plate height:
(23-33)
Multiple Longitudinal Equilibrationpaths diffusion time
where is the linear flow rate and A, B, and C are constants for a given column and station-ary phase. Changing the column and stationary phase changes A, B, and C. The van Deemter
ux
H � A � Bux � Cux
van Deemter equationfor plate height:
w1/2 � 2.35column � 12.1 s
48.11 � 2column � 14.81 � 6.58 1 column � 5.17 s
2obs � 2
column � 2injection � 2
detector
so 2detector � (�t)2
detector /12 � 6.58 s2�tdetector � (0.20 mL)/(1.35 mL/min) � 8.89 s,
2injection �
�tinjection2
12�
13.32
12� 14.81 s2
�tinjection � (0.30 mL)/(1.35 mL/min) � 0.222 min � 13.3 s2
injection � (�t)2injection /12
2obs � aw1/2
2.35b2
� a16.3
2.35b2
� 48.11 s2
w1/2 � 2.35
�t
2injection � 2
detector �(�t)2
12Variance due to injectionor detection:
�t
2obs � 2
1 � 22 � 2
3 � p � a 2i
(2obs)i
Variance is additive, but standard deviationis not.
Packed columns: A, B, C 0Open tubular columns: Capillary electrophoresis: A � C � 0
A � 0�
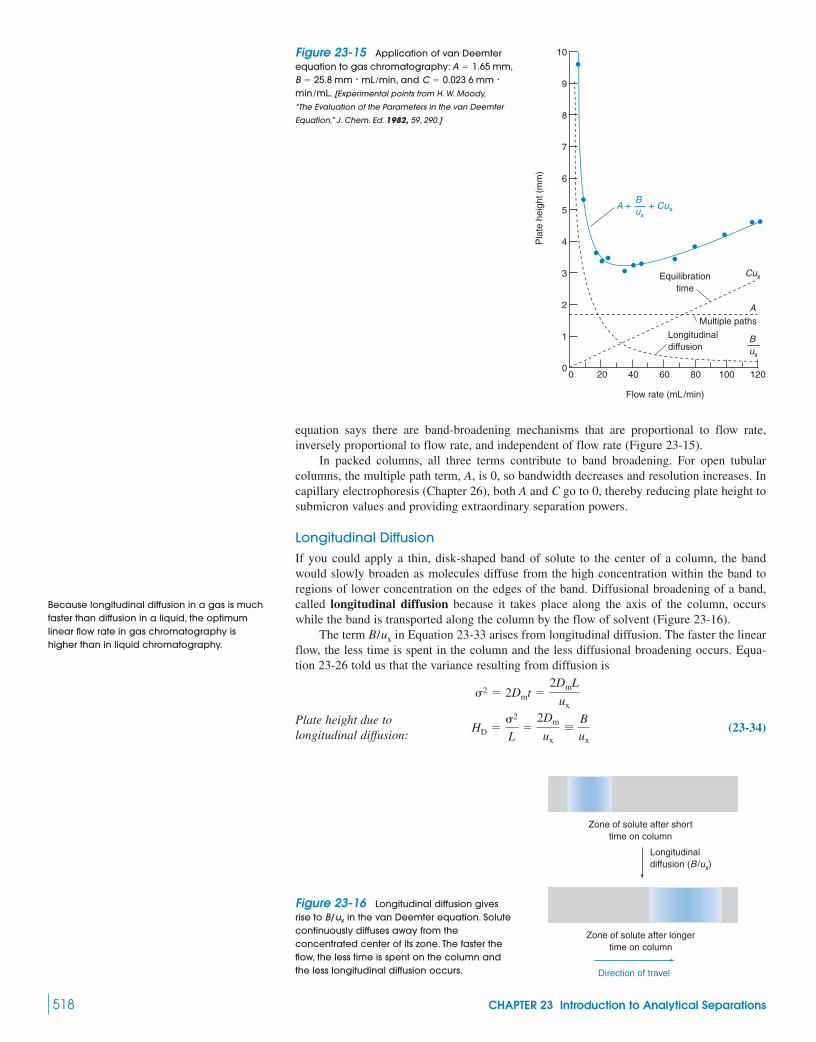
518 CHAPTER 23 Introduction to Analytical Separations
equation says there are band-broadening mechanisms that are proportional to flow rate,inversely proportional to flow rate, and independent of flow rate (Figure 23-15).
In packed columns, all three terms contribute to band broadening. For open tubularcolumns, the multiple path term, A, is 0, so bandwidth decreases and resolution increases. Incapillary electrophoresis (Chapter 26), both A and C go to 0, thereby reducing plate height tosubmicron values and providing extraordinary separation powers.
Longitudinal DiffusionIf you could apply a thin, disk-shaped band of solute to the center of a column, the bandwould slowly broaden as molecules diffuse from the high concentration within the band toregions of lower concentration on the edges of the band. Diffusional broadening of a band,called longitudinal diffusion because it takes place along the axis of the column, occurswhile the band is transported along the column by the flow of solvent (Figure 23-16).
The term in Equation 23-33 arises from longitudinal diffusion. The faster the linearflow, the less time is spent in the column and the less diffusional broadening occurs. Equa-tion 23-26 told us that the variance resulting from diffusion is
(23-34)HD �2
L�
2Dm
ux�
Bux
Plate height due tolongitudinal diffusion:
2 � 2Dmt �2DmL
ux
B/ux
Figure 23-16 Longitudinal diffusion givesrise to B/ux in the van Deemter equation. Solutecontinuously diffuses away from theconcentrated center of its zone. The faster theflow, the less time is spent on the column andthe less longitudinal diffusion occurs.
Zone of solute after shorttime on column
Longitudinaldiffusion (B /ux)
Zone of solute after longertime on column
Because longitudinal diffusion in a gas is muchfaster than diffusion in a liquid, the optimumlinear flow rate in gas chromatography ishigher than in liquid chromatography.
A
1
20
Pla
te h
eigh
t (m
m)
Flow rate (mL/min)
2
3
4
5
6
7
8
9
10
00 40 60 80 100 120
Equilibrationtime
Multiple paths
Longitudinaldiffusion
Cux
Bux
A + + CuxBux
Figure 23-15 Application of van Deemterequation to gas chromatography: ,
, and . [Experimental points from H. W. Moody,
“The Evaluation of the Parameters in the van Deemter
Equation,” J. Chem. Ed. 1982, 59, 290.]
min /mL�C � 0.023 6 mmmL /min�B � 25.8 mm
A � 1.65 mm
Direction of travel

23-5 Why Bands Spread 519
where is the diffusion coefficient of solute in the mobile phase, t is time, and is theplate height due to longitudinal diffusion. The time needed to travel the length of the columnis , where L is the column length and is the linear flow rate.
Finite Equilibration Time Between PhasesThe term in Equation 23-33 comes from the finite time required for solute to equilibratebetween mobile and stationary phases. Although some solute is stuck in the stationary phase,the remainder in the mobile phase moves forward, thereby resulting in spreading of the over-all zone of solute (Figure 23-17).
Cux
uxL/ux
HDDm
Mobilephase
Stationaryphase
Directionof elution
Bandwidth
Slowequilibration (Cux)
Bandwidthafter some
travel
Figure 23-17 The finite time required for solute to equilibrate between mobile and stationaryphases gives rise to in the van Deemter equation. The slower the linear flow, the more completeequilibration is and the less zone broadening occurs.
Cux
The plate height from finite equilibration time, also called the mass transfer term, is
(23-35)
where describes the rate of mass transfer through the stationary phase and describesmass transfer through the mobile phase. Specific equations for and depend on the typeof chromatography.
For gas chromatography in an open tubular column, the terms are
(23-35a)
(23-35b)
where is the capacity factor, d is the thickness of stationary phase, is the diffusioncoefficient of solute in the stationary phase, r is the column radius, and is the diffusioncoefficient of solute in the mobile phase. Decreasing stationary phase thickness, d,reduces plate height and increases efficiency because solute can diffuse faster from thefarthest depths of the stationary phase into the mobile phase. Decreasing column radius, r,reduces plate height by decreasing the distance through which solute must diffuse to reachthe stationary phase.
Mass transfer plate height is also decreased by increasing temperature, which increasesthe diffusion coefficient of solute in the stationary phase. In Figure 23-18, raising the tem-perature allows the linear flow rate to be increased by a factor of 5 while maintaining accept-able resolution. Resolution is maintained because of the increased rate of mass transferbetween phases at elevated temperature. Many common silica-based stationary phases forliquid chromatography are not stable at elevated temperature. The zirconia material in Figure 23-18 is used because it is stable.
(ZrO2)-based
Dm
Dsk¿
Cm �1 � 6k¿ � 11k¿2
24(k¿ � 1)2
r2
Dm
Mass transfer inmobile phase:
Cs �2k¿
3(k¿ � 1)2
d2
Ds
Mass transfer instationary phase:
CmCs
CmCs
Hmass transfer � Cux � (Cs � Cm)uxPlate height due to finiteequilibration time:
2
1
2
5
4
3
1
34
5
0.0 0.80.60.40.2
0 12963
100°C5 mL /min
30°C1 mL/min
Time (min)
Abs
orba
nce
at 2
54 n
m
Figure 23-18 Liquid chromatographyshowing decreased analysis time whentemperature is raised from 30° to 100°C.1, uracil; 2, p-nitroaniline; 3, methyl benzoate; 4, phenetole; 5, toluene. The
column waspacked with zirconia coated with 2.1 wt% polybutadiene and elutedwith 20 vol% acetonitrile in water. [J. Li, Y. Hu, and
P. W. Carr, “Fast Separations at Elevated Temperatures on
Polybutadiene-Coated Zirconia Reversed-Phase Material,”
Anal. Chem. 1997, 69, 3884.] For a silica-basedstationary phase, temperature is usually keptbelow 60°C to prevent hydrolysis of the silica.
(ZrO2)4.5-�m-diameter4.6-mm-diameter � 100-cm-long

520 CHAPTER 23 Introduction to Analytical Separations
Multiple Flow Paths
The term A in the van Deemter equation (23-33) arises from multiple effects for which thetheory is murky. Figure 23-19 is a pictorial explanation of one effect. Because some flowpaths are longer than others, molecules entering the column at the same time on the left areeluted at different times on the right. For simplicity, we approximate many different effectsby the constant A in Equation 23-33.
Table 23-3 Comparison of packed and wall-coated open tubular column performancea
Property Packed Open tubular
Column length, L 2.4 m 100 mLinear gas velocity 8 cm/s 16 cm/sPlate height for methyl oleate 0.73 mm 0.34 mmCapacity factor, , for methyl oleate 58.6 2.7Theoretical plates, N 3 290 294 000Resolution of methyl stearate and methyl oleate 1.5 10.6Retention time of methyl oleate 29.8 min 38.5 min
a. Methyl stearate (CH3(CH2)16CO2CH3) and methyl oleate (cis-CH3(CH2)7CH CH(CH2)7CO2CH3) were separated oncolumns with poly(diethylene glycol succinate) stationary phase at .
SOURCE: L. S. Ettre. Introduction to Open Tubular Columns (Norwalk, CT: Perkin-Elmer Corp., 1979), p. 26.
180°C¢
k¿
Compared with packed columns, opentubular columns allow1. increased linear flow rate or a longer
column or both2. decreased plate height, which means
higher resolution
1
3
2 2
3
1
Time
Figure 23-19 Band spreading from multiple flow paths. The smaller the stationary phase particles,the less serious this problem is. This process is absent in an open tubular column. [Adapted from H. M.
McNair and E. J. Bonelli, Basic Gas Chromatography (Palo Alto, CA: Varian Instrument Division, 1968).]
The term A was formerly called the eddydiffusion term.
For a given pressure, flow rate is proportionalto the cross-sectional area of the column andinversely proportional to column length:
Flow �area
length
Compared with packed columns, opentubular columns can provide1. higher resolution2. shorter analysis time3. increased sensitivity4. lower sample capacity
Advantages of Open Tubular Columns
In gas chromatography, we have a choice of using open tubular columns or packedcolumns. For similar analysis times, open tubular columns provide higher resolution andincreased sensitivity to small quantities of analyte. Open tubular columns have smallsample capacity, so they are not useful for preparative separations.
Particles in a packed column resist flow of the mobile phase, so the linear flow ratecannot be very fast. For the same length of column and applied pressure, the linear flowrate in an open tubular column is much higher than that of a packed column. Therefore,the open tubular column can be made 100 times longer than the packed column, to givea similar pressure drop and linear flow rate. If plate height is the same, the longer col-umn provides 100 times more theoretical plates, yielding times moreresolution.
Plate height is reduced in an open tubular column because band spreading by multi-ple flow paths (Figure 23-19) cannot occur. In the van Deemter curve for the packed col-umn in Figure 23-15, the A term accounts for half of the plate height at the most efficientflow rate (minimum H) near 30 mL/min. If A were deleted, the number of plates on thecolumn would be doubled. To obtain high performance from an open tubular column, theradius of the column must be small and the stationary phase must be as thin as possibleto ensure rapid exchange of solute between mobile and stationary phases.
Table 23-3 compares the performances of packed and open tubular gas chromatog-raphy columns with the same stationary phase. For similar analysis times, the open tubu-lar column gives resolution seven times better (10.6 versus 1.5) than that of the packed
2100 � 10
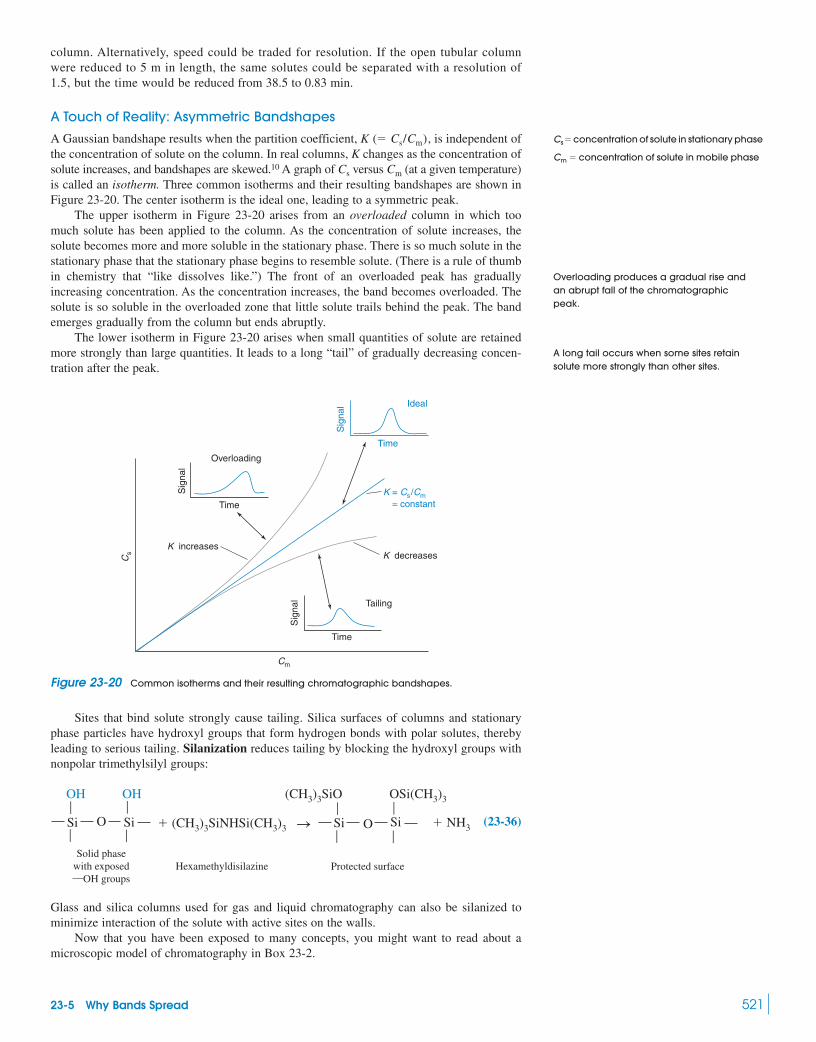
23-5 Why Bands Spread 521
column. Alternatively, speed could be traded for resolution. If the open tubular columnwere reduced to 5 m in length, the same solutes could be separated with a resolution of1.5, but the time would be reduced from 38.5 to 0.83 min.
A Touch of Reality: Asymmetric Bandshapes
A Gaussian bandshape results when the partition coefficient, , is independent ofthe concentration of solute on the column. In real columns, K changes as the concentration ofsolute increases, and bandshapes are skewed.10 A graph of versus (at a given temperature)is called an isotherm. Three common isotherms and their resulting bandshapes are shown inFigure 23-20. The center isotherm is the ideal one, leading to a symmetric peak.
The upper isotherm in Figure 23-20 arises from an overloaded column in which toomuch solute has been applied to the column. As the concentration of solute increases, thesolute becomes more and more soluble in the stationary phase. There is so much solute in thestationary phase that the stationary phase begins to resemble solute. (There is a rule of thumbin chemistry that “like dissolves like.”) The front of an overloaded peak has graduallyincreasing concentration. As the concentration increases, the band becomes overloaded. Thesolute is so soluble in the overloaded zone that little solute trails behind the peak. The bandemerges gradually from the column but ends abruptly.
The lower isotherm in Figure 23-20 arises when small quantities of solute are retainedmore strongly than large quantities. It leads to a long “tail” of gradually decreasing concen-tration after the peak.
CmCs
K (� Cs/Cm)
Cm
Cs
Sig
nal
Overloading
Time
Ideal
Sig
nal
Time
Sig
nal
Time
Tailing
K = Cs/Cm
K increasesK decreases
= constant
Figure 23-20 Common isotherms and their resulting chromatographic bandshapes.
Cm � concentration of solute in mobile phase
Cs� concentration of solute in stationary phase
Overloading produces a gradual rise and an abrupt fall of the chromatographicpeak.
A long tail occurs when some sites retainsolute more strongly than other sites.
Sites that bind solute strongly cause tailing. Silica surfaces of columns and stationaryphase particles have hydroxyl groups that form hydrogen bonds with polar solutes, therebyleading to serious tailing. Silanization reduces tailing by blocking the hydroxyl groups withnonpolar trimethylsilyl groups:
(23-36)
Glass and silica columns used for gas and liquid chromatography can also be silanized tominimize interaction of the solute with active sites on the walls.
Now that you have been exposed to many concepts, you might want to read about amicroscopic model of chromatography in Box 23-2.
� (CH3)3SiNHSi(CH3)3 Sç
Oç
ç
çSi Si
(CH3)3SiO OSi(CH3)3
� NH3
çO
ç
çOH
çSi
OH
Si
Solid phasewith exposed—OH groups
Hexamethyldisilazine Protected surface
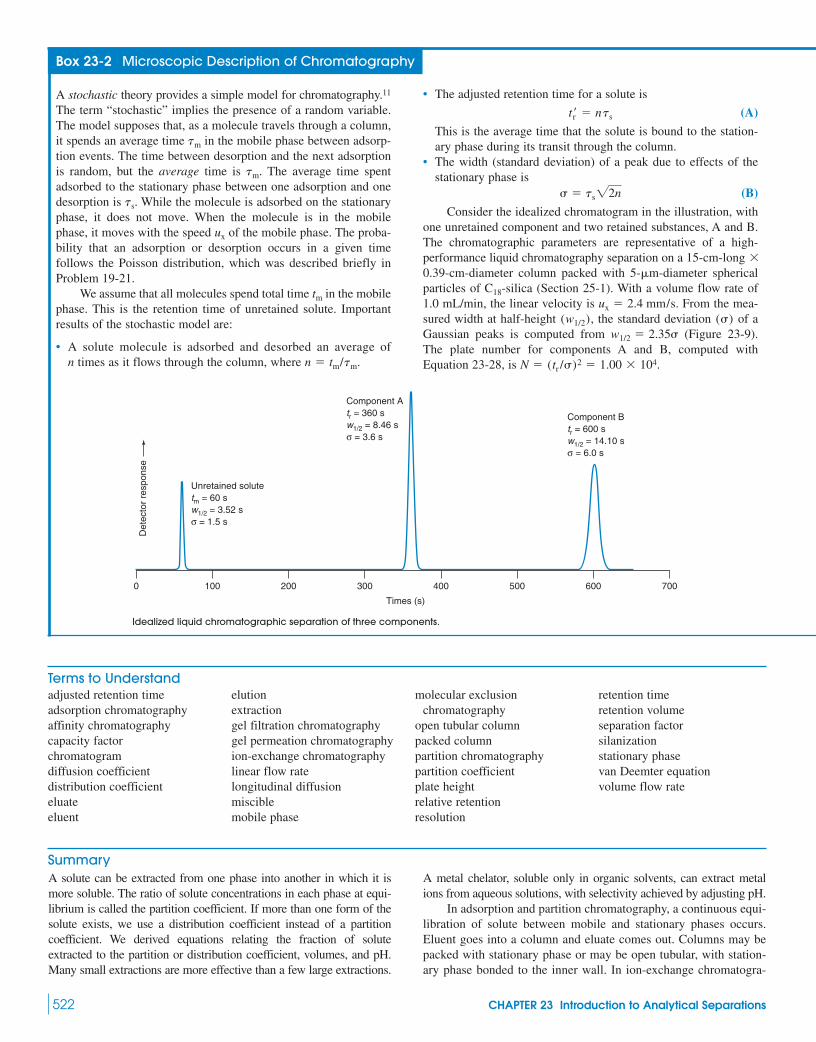
522 CHAPTER 23 Introduction to Analytical Separations
Box 23-2 Microscopic Description of Chromatography
A stochastic theory provides a simple model for chromatography.11
The term “stochastic” implies the presence of a random variable.The model supposes that, as a molecule travels through a column,it spends an average time in the mobile phase between adsorp-tion events. The time between desorption and the next adsorptionis random, but the average time is . The average time spentadsorbed to the stationary phase between one adsorption and onedesorption is . While the molecule is adsorbed on the stationaryphase, it does not move. When the molecule is in the mobilephase, it moves with the speed of the mobile phase. The proba-bility that an adsorption or desorption occurs in a given timefollows the Poisson distribution, which was described briefly inProblem 19-21.
We assume that all molecules spend total time in the mobilephase. This is the retention time of unretained solute. Importantresults of the stochastic model are:
• A solute molecule is adsorbed and desorbed an average ofn times as it flows through the column, where .n � tm/tm
tm
ux
ts
tm
tm
• The adjusted retention time for a solute is
(A)
This is the average time that the solute is bound to the station-ary phase during its transit through the column.
• The width (standard deviation) of a peak due to effects of thestationary phase is
(B)
Consider the idealized chromatogram in the illustration, withone unretained component and two retained substances, A and B.The chromatographic parameters are representative of a high-performance liquid chromatography separation on a
column packed with sphericalparticles of (Section 25-1). With a volume flow rate of1.0 mL/min, the linear velocity is . From the mea-sured width at half-height , the standard deviation of aGaussian peaks is computed from (Figure 23-9).The plate number for components A and B, computed withEquation 23-28, is .N � (tr /)2 � 1.00 � 104
w1/2 � 2.35()(w1/2)
ux � 2.4 mm/sC18-silica
5-�m-diameter0.39-cm-diameter15-cm-long �
� ts22n
tr¿ � nts
Unretained solutetm = 60 sw1/2 = 3.52 sσ = 1.5 s
0 100
Det
ecto
r re
spon
se
200 300
Times (s)
400 500 600 700
Component Atr = 360 sw1/2 = 8.46 sσ = 3.6 s
Component Btr = 600 sw1/2 = 14.10 sσ = 6.0 s
Idealized liquid chromatographic separation of three components.
Terms to Understandadjusted retention timeadsorption chromatographyaffinity chromatographycapacity factorchromatogramdiffusion coefficientdistribution coefficienteluateeluent
elutionextractiongel filtration chromatographygel permeation chromatographyion-exchange chromatographylinear flow ratelongitudinal diffusionmisciblemobile phase
molecular exclusionchromatography
open tubular columnpacked columnpartition chromatographypartition coefficientplate heightrelative retentionresolution
retention timeretention volumeseparation factorsilanizationstationary phasevan Deemter equationvolume flow rate
SummaryA solute can be extracted from one phase into another in which it ismore soluble. The ratio of solute concentrations in each phase at equi-librium is called the partition coefficient. If more than one form of thesolute exists, we use a distribution coefficient instead of a partitioncoefficient. We derived equations relating the fraction of soluteextracted to the partition or distribution coefficient, volumes, and pH.Many small extractions are more effective than a few large extractions.
A metal chelator, soluble only in organic solvents, can extract metalions from aqueous solutions, with selectivity achieved by adjusting pH.
In adsorption and partition chromatography, a continuous equi-libration of solute between mobile and stationary phases occurs.Eluent goes into a column and eluate comes out. Columns may bepacked with stationary phase or may be open tubular, with station-ary phase bonded to the inner wall. In ion-exchange chromatogra-

Summary 523
The stochastic model applies to processes involving the sta-tionary phase. To analyze the chromatogram, we need to subtractcontributions to peak broadening from dispersion in the mobilephase and extra-column effects such as finite injection width andfinite detector volume. These effects account for the width of theunretained peak. To subtract the unwanted effects, we write
For component A, . For component B,
we find . The adjusted retention time forcomponent A is . For componentB,
Now we use and for each component tofind physically meaningful parameters. Combining Equations Aand B, we find
and we already knew that . From the parameters in theillustration, we compute the results in the table.
Component A Component B
n 16 800 17 30017.8 ms 31.2 ms3.6 ms 3.5 ms
Distance betweenadsorptions
We see that both components spend nearly the same timein the mobile phase between adsorption events. Com-
ponent A spends an average of 17.8 ms bound to the stationary(�3.5 ms)
(� uxtm)8.4 �m8.6 �m
tm
ts
tm � tm /n
n � 2 a t¿rb2
ts � a 2
2t ¿rb
(� stationary phase)t¿r540 s.t¿r � 600 � 60 �
t¿r � tr � tm � 360 � 60 � 300 sstationary phase � 5.81 s
(3.6 s)2 � (1.5 s)2 1 stationary phase � 3.27 s2
unretained peak �2stationary phase � 2
observed �
2stationary phase � 2
observed � 2unretained peak
2observed � 2
stationary phase � 2unretained peak
phase each time it is adsorbed, and component B spends an aver-age of 31.2 ms. This difference in is the reason why A and B areseparated from each other.
During its transit through the column, each substancebecomes adsorbed times. The distance traveledbetween adsorptions is . The chromatogram was simu-lated for a column with theoretical plates. The plateheight is . In Section 23-4, westated that plate height is approximately the length of columnrequired for one equilibration of solute between mobile and sta-tionary phases. From the stochastic theory in this example, wefind that there are approximately two equilibrations with thestationary phase in each length corresponding to the plateheight.
The time required for a solute to flow past a given particle ofstationary phase whose diameter is is
. The stochastic theory predicts that the fraction of time thata molecule in the mobile phase will travel less than distance d is
. That is, approximatelyhalf of the time, a solute molecule does not travel as far as thenext particle of stationary phase before becoming adsorbedagain to the same particle from which it just desorbed. If welined up spherical particles of stationary phase, it would take30 000 particles to cover the 15-cm length of the column. Eachsolute molecule binds times as it transits the column,and half of those binding steps are to the same particle fromwhich it just desorbed.
The simple model provides microscopic insight into eventsthat occur during chromatography. The model omits some phe-nomena that occur in real columns. For example, in a porousstationary phase, the mobile phase could be stagnant inside thepores. When a molecule enters such a pore, it will adsorb anddesorb many times from the same particle before escaping fromthe pore.
�17 000
1 � e�d/tm � 1 � e�(2.1 ms)/(3.5 ms) � 0.55
2.1 ms(5 �m)/(2.4 mm/s) �5 �m
15 cm/(10 000 plates) � 15 �mN � 10 000�8.6 �m
n � 17 000
ts
phy, the solute is attracted to the stationary phase by coulombicforces. In molecular exclusion chromatography, the fraction of sta-tionary phase volume available to solute decreases as the size of thesolute molecules increases. Affinity chromatography relies onspecific, noncovalent interactions between the stationary phase andone solute in a complex mixture.
The relative retention of two components is the quotient oftheir adjusted retention times. The capacity factor for a single com-ponent is the adjusted retention time divided by the elution time forsolvent. Capacity factor gives the ratio of time spent by solute in thestationary phase to time spent in the mobile phase. When a separa-tion is scaled up from a small load to a large load, the cross-sectional area of the column should be increased in proportion tothe loading. Column length and linear flow rate are held constant.
Plate height is related to the breadth of a bandemerging from the column. The smaller the plate height, the sharperthe band. The number of plates for a Gaussian peak is
. Plate height is approximately the length of col-umn required for one equilibrium of solute between mobile and sta-tionary phases. Resolution of neighboring peaks is the difference inretention time divided by the average width (measured at the base-
N � 5.55 t2r /w2
1/2
(H � 2/x)
line, ). Resolution is proportional to and increases withthe separation factor, , which is the quotient of linear velocities oftwo components. Doubling the length of a column increases resolu-tion by .
The standard deviation of a diffusing band of solute iswhere D is the diffusion coefficient and t is time. The van
Deemter equation describes band broadening on the chromatographiccolumn: , where H is plate height, is linearflow rate, and A, B, and C are constants. The first term represents irreg-ular flow paths; the second, longitudinal diffusion; and the third, thefinite rate of transfer of solute between mobile and stationary phases.The optimum flow rate, which minimizes plate height, is faster forgas chromatography than for liquid chromatography. The number ofplates and the optimal flow rate increase as the stationary phase par-ticle size decreases. In gas chromatography, open tubular columnscan provide higher resolution or shorter analysis times than packedcolumns. Bands spread during injection and detection, as well asduring passage through the column. The observed variance of theband is the sum of the variances for all mechanisms of spreading.Overloading and tailing can be corrected by using smaller samplesand by masking strong adsorption sites on the stationary phase.
uxH � A � B/ux � Cux
� 22Dt,
22
�2Nw � 4

524 CHAPTER 23 Introduction to Analytical Separations
Problems
Solvent Extraction
23-1. If you are extracting a substance from water into ether, is itmore effective to do one extraction with 300 mL of ether or threeextractions with 100 mL?
23-2. If you wish to extract aqueous acetic acid into hexane, is itmore effective to adjust the aqueous phase to pH 3 or pH 8?
23-3. Why is it difficult to extract the EDTA complex of aluminum intoan organic solvent but easy to extract the 8-hydroxyquinoline complex?
23-4. Why is the extraction of a metal ion into an organic solventwith 8-hydroxyquinoline more complete at higher pH?
23-5. The distribution coefficient for extraction of a metalcomplex from aqueous to organic solvents is D � [total metal]org/
Exercises23-A. Consider a chromatography experiment in which two com-ponents with capacity factors and are injectedinto a column with theoretical plates. The reten-tion time for the less-retained component is .(a) Calculate and . Find (width at half-height) and w(width at the base) for each peak.(b) Using graph paper, sketch the chromatogram analogous toFigure 23-7, supposing that the two peaks have the same amplitude(height). Draw the half-widths accurately.(c) Calculate the resolution of the two peaks and compare this valuewith those drawn in Figure 23-10.
23-B. A solute with a partition coefficient of 4.0 is extracted from10 mL of phase 1 into phase 2.(a) What volume of phase 2 is needed to extract 99% of the solutein one extraction?(b) What is the total volume of solvent 2 needed to remove 99% ofthe solute in three equal extractions instead?
23-C. (a) Find the capacity factors for octane and nonane in Figure 23-7.(b) Find the ratio
(c) Find the relative retention for octane and nonane.(d) Find the partition coefficient for octane by assuming that the vol-ume of the stationary phase equals half the volume of the mobile phase.
23-D. A gas chromatogram of a mixture of toluene and ethyl acetateis shown here.
(a) Use the width of each peak (measured at the base) to calculate thenumber of theoretical plates in the column. Estimate all lengths to thenearest 0.1 mm.(b) Using the width of the toluene peak at its base, calculate the widthexpected at half-height. Compare the measured and calculated values.When the thickness of the pen trace is significant relative to the lengthbeing measured, it is important to take the pen width into account. Youcan measure from the edge of one trace to the corresponding edge ofthe other trace, as shown in the diagram in the next column.
Time
Det
ecto
r re
spon
se Toluene
Ethylacetate
Start
Time octane spends in stationary phase
Total time octane spends on column
w1/2tr2tm
tr1 � 10.0 minN � 1.00 � 103
k2¿ � 5.00k1¿ � 4.00
23-E. The three chromatograms shown below were obtained with 2.5,1.0, and of ethyl acetate injected on the same column under thesame conditions. Explain why the peak becomes less symmetric withincreasing sample size.
23-F. The relative retention for two compounds in gas chromatog-raphy is 1.068 on a column with a plate height of 0.520 mm. Thecapacity factor for compound 1 is 5.16.(a) Find the separation factor for the two compounds.(b) What length of column will separate the compounds with a res-olution of 1.00?(c) The retention time for air is 2.00 min. If the number ofplates is the same for both compounds, find and for eachpeak.(d) If the ratio of stationary phase to mobile phase is 0.30, find thepartition coefficient for compound 1.
w1/2tr
(tm)
(�)
2.5 µL
1.0 µL
0.4 µL
Time
0.4 �L
Measurethis
distance
Pen linethickness

Problems 525
. Give physical reasons why and appear in thenumerator of Equation 23-13, but and appear in thedenominator.
23-6. Give a physical interpretation of Equations 23-6 and 23-7 interms of the fractional composition equations for a monoprotic aciddiscussed in Section 10-5.
23-7. Solute S has a partition coefficient of 4.0 between water(phase 1) and chloroform (phase 2) in Equation 23-1.(a) Calculate the concentration of S in chloroform if is0.020 M.(b) If the volume of water is 80.0 mL and the volume of chloroformis 10.0 mL, find the quotient (mol S in chloroform)/(mol S inwater).
23-8. The solute in Problem 23-7 is initially dissolved in 80.0 mL ofwater. It is then extracted six times with 10.0-mL portions of chlo-roform. Find the fraction of solute remaining in the aqueous phase.
23-9. The weak base equilibrates betweenwater (phase 1) and benzene (phase 2).(a) Define the distribution coefficient, D, for this system.(b) Explain the difference between D and K, the partition coefficient.(c) Calculate D at pH 8.00 if .(d) Will D be greater or less at pH 10 than at pH 8? Explain why.
23-10. Consider the extraction of from aqueous solution intoorganic solution by reaction with protonated ligand, HL:
Rewrite Equation 23-13 in terms of and express in terms of the constants in Equation 23-13. Give a physical reasonwhy each constant increases or decreases .
23-11. Butanoic acid has a partition coefficient of 3.0 (favoringbenzene) when distributed between water and benzene. Find theformal concentration of butanoic acid in each phase when 100 mLof 0.10 M aqueous butanoic acid is extracted with 25 mL of ben-zene (a) at pH 4.00 and (b) at pH 10.00.
23-12. For a given value of in Equation 23-13, over whatpH range (how many pH units) will D change from 0.01 to 100 if
?
23-13. For the extraction of by dithizone in , , , , , and
.(a) Calculate the distribution coefficient for extraction of
into by 0.1 mM dithizone at pH 1.0 and pH 4.0.(b) If 100 mL of aqueous are extracted once with10 mL of 0.1 mM dithizone at pH 1.0, what fraction of remains in the aqueous phase?
23-14. Consider the extraction of 100.0 mL of by 2.0 mLof dithizone in , for which ,
, , , and .(a) Derive an expression for the fraction of metal ion extracted intothe organic phase, in terms of the distribution coefficient and vol-umes of the two phases.
(b) Prepare a graph of the percentage of metal ion extractedover the pH range 0 to 5.
n � 2� � 5 � 1018Ka � 3 � 10�5KM � 7 � 104KL � 1.1 � 104CHCl31 � 10�5
M2�(aq)
Cu2�
Cu2�0.1 �MCCl4Cu2�
0.1 �Mn � 2
� � 5 � 1022Ka � 3 � 10�5KM � 7 � 1041.1 � 104KL �CCl4Cu2�
n � 2
[HL]org
Kextraction
KextractionKextraction
Kextraction �[MLn]org[H�]n
aq
[Mn�]aq[HL]norg
Mn�(aq) � nHL(org) T MLn(org) � nH�(aq)
Mn�
K � 50.0
B (Kb � 1.0 � 10�5)
[S(aq)]
[H�]aqKL
Ka�[total metal]aq A Plumber’s View of Chromatography
23-15. Match the terms in the first list with the characteristics in thesecond list.
1. adsorption chromatography2. partition chromatography3. ion-exchange chromatography4. molecular exclusion chromatography5. affinity chromatography
A. Ions in mobile phase are attracted to counterions covalentlyattached to stationary phase.
B. Solute in mobile phase is attracted to specific groups cova-lently attached to stationary phase.
C. Solute equilibrates between mobile phase and surface ofstationary phase.
D. Solute equilibrates between mobile phase and film of liquidattached to stationary phase.
E. Different-sized solutes penetrate voids in stationary phase todifferent extents. Largest solutes are eluted first.
23-16. The partition coefficient for a solute in chromatography is, where is the concentration in the stationary phase
and is the concentration in the mobile phase. The larger thepartition coefficient, the longer it takes a solute to be eluted.Explain why.
23-17. (a) Write the meaning of the capacity factor, , in terms oftime spent by solute in each phase.(b) Write an expression in terms of for the fraction of time spentby a solute molecule in the mobile phase.(c) The retention ratio in chromatography is defined as
Show that R is related to the capacity factor by the equation.
23-18. (a) A chromatography column with a length of 10.3 cmand inner diameter of 4.61 mm is packed with a stationaryphase that occupies 61.0% of the volume. If the volume flow rate is1.13 mL/min, find the linear flow rate in cm/min.(b) How long does it take for solvent (which is the same as unre-tained solute) to pass through the column?(c) Find the retention time for a solute with a capacity factor of 10.0.
23-19. An open tubular column is 30.1 m long and has an innerdiameter of 0.530 mm. It is coated on the inside wall with a layer ofstationary phase that is thick. Unretained solute passesthrough in 2.16 min, whereas a particular solute has a retention timeof 17.32 min.(a) Find the linear and volume flow rates.(b) Find the capacity factor for the solute and the fraction of timespent in the stationary phase.(c) Find the partition coefficient, , for this solute.
23-20. A chromatographic procedure separates 4.0 mg of unknownmixture on a column with a length of 40 cm and a diameter of0.85 cm.(a) What size column would you use to separate 100 mg of thesame mixture?(b) If the flow is 0.22 mL/min on the small column, what volumeflow rate should be used on the large column?(c) If mobile phase occupies 35% of the column volume, calculatethe linear flow rates for the small column and the large column.
Cs/Cm
3.1 �m
R � 1/(k¿ � 1)
R �time for solvent to pass through column
time for solute to pass through column�
tm
tr
k¿
k¿
Cm
CsK � Cs/Cm

526 CHAPTER 23 Introduction to Analytical Separations
23-21. Solvent passes through a column in 3.0 min, but soluterequires 9.0 min.(a) Calculate the capacity factor, .(b) What fraction of time is the solute in the mobile phase in thecolumn?(c) The volume of stationary phase is 1/10th of the volume of themobile phase in the column . Find the partitioncoefficient, K, for this system.
23-22. Solvent occupies 15% of the volume of a chromatographycolumn whose inner diameter is 3.0 mm. If the volume flow rate is0.2 mL/min, find the linear flow rate.
23-23. Consider a chromatography column in which .Find the capacity factor if and if .
23-24. The retention volume of a solute is 76.2 mL for a columnwith and . Calculate the capacity fac-tor and the partition coefficient for this solute.
23-25. An open tubular column has a diameter of and thethickness of the stationary phase on the inner wall is .Unretained solute passes through in 63 s and a particular soluteemerges in 433 s. Find the partition coefficient for this solute andfind the fraction of time spent in the stationary phase.
23-26. Isotopic compounds are separated in Figure 23-14 byrepeated passage through a pair of columns. Each cycle in the fig-ure represents one pass through total length containingN theoretical plates. The separation factor is .(a) The observed resolution after 10 cycles is 1.60. Calculate thenumber of theoretical plates, N, in column length L. The mixturehas passed through length 10L in 10 cycles.(b) Find the plate height in .(c) Predict the resolution expected after just two cycles. The observedvalue is 0.71.
Efficiency and Band Spreading
23-27. Chromatograms of compounds A and B were obtained at thesame flow rate with two columns of equal length.
(a) Which column has more theoretical plates?(b) Which column has a larger plate height?(c) Which column gives higher resolution?(d) Which column gives a greater relative retention?(e) Which compound has a higher capacity factor?(f) Which compound has a greater partition coefficient?(g) What is the numerical value of the separation factor?
23-28. Why does plate height depend on linear flow rate, not vol-ume flow rate?
23-29. Which column is more efficient: (a) 0.1 mmor (b) 1 mm?
plate height �
Time
Det
ecto
r re
spon
se tm
Column 1
Column 2
A
B
0 2 4 6 8 10 12
�m
� � 1.018L � 50 cm
0.50 �m207 �m
Vs � 12.7 mLVm � 16.6 mL
K � 30K � 3Vs � Vm/5
(Vs � 0.10 Vm)
k¿
23-30. Why is longitudinal diffusion a more serious problem in gaschromatography than in liquid chromatography?
23-31. In chromatography, why is the optimal flow rate greaterif the stationary phase particle size is smaller?
23-32. What is the optimal flow rate in Figure 23-15 for best sepa-ration of solutes?
23-33. Explain how silanization reduces tailing of chromatographicpeaks.
23-34. Describe how nonlinear partition isotherms lead to non-Gaussian bandshapes. Draw the bandshape produced by an over-loaded column and a column with tailing.
23-35. A separation of 2.5 mg of an unknown mixture has beenoptimized on a column of length L and diameter d. Explain whyyou might not achieve the same resolution for 5.0 mg on a columnof length 2L and diameter d.
23-36. An infinitely sharp zone of solute is placed at the center of acolumn at time . After diffusion for time , the standard devi-ation of the Gaussian band is 1.0 mm. After 20 min more, at time the standard deviation is 2.0 mm. What will be the width afteranother 20 min, at time ?
23-37. A chromatogram with ideal Gaussian bands has and .(a) How many theoretical plates are present?(b) Find the plate height if the column is 10 cm long.
23-38. (a) The asymmetric chromatogram in Figure 23-13 has aretention time equal to 15 min, and the values of A and B are 33 and11 s, respectively. Find the number of theoretical plates.(b) The width of the Gaussian peak in Figure 23-9 at a height equalto 1/10th of the peak height is . Suppose that the peak in part(a) is symmetric with . Use Equations 23-28 and 23-29to find the plate number.
23-39. Two chromatographic peaks with widths, w, of 6 min areeluted at 24 and 29 min. Which diagram in Figure 23-10 will mostclosely resemble the chromatogram?
23-40. A chromatographic band has a width, w, of 4.0 mL and aretention volume of 49 mL. What width is expected for a band witha retention volume of 127 mL? Assume that the only band spread-ing occurs on the column itself.
23-41. A band from a column eluted at 0.66 mL/min has a widthat half-height, , of 39.6 s. The sample was applied as a sharpplug with a volume of 0.40 mL, and the detector volume is 0.25mL. Find the variances introduced by injection and detection.What would be if the only broadening occurred on thecolumn?
23-42. Two compounds with partition coefficients of 15 and 18 areto be separated on a column with and Calculate the number of theoretical plates needed to produce a res-olution of 1.5.
23-43. (a) Calculate the number of theoretical plates needed toachieve a resolution of 2.0 for compounds with relative retentiontimes of , 1.05, or 1.10.(b) How can you increase N and in a chromatographyexperiment?
� � t2/t1
t2/t1 � 1.01
tm � 1.0 min.Vm/Vs � 3.0
w1/2
w1/2
A � B � 22 s4.297
w1/2 � 2.0 mintr � 9.0 min
t3
t2,t1t � 0

Problems 527
23-44. Consider the peaks for pentafluorobenzene and benzene inthe chromatogram shown above. The elution time for unretainedsolute is 1.06 min. The open tubular column is 30.0 m in length and0.530 mm in diameter, with a layer of stationary phase thickon the inner wall.(a) Find the adjusted retention times and capacity factors for bothcompounds.(b) Find the relative retention, .(c) Find the separation factor, .(d) Measuring on the chromatogram, find the number of plates,
and , and the plate height for these two compounds.(e) Measuring the width, w, at the baseline on the chromatogram,find the number of plates for these two compounds.(f) Use your answer to part (e) to find the resolution between thetwo peaks.(g) Using the number of plates [ , with values from part(e)] and the observed separation factor, calculate what the resolutionshould be and compare your answer with the measured resolution inpart (f).
23-45. A layer with negligible thickness containing 10.0 nmolof methanol was placed in a tube of water(D � 1.6 � 10�9 m2/s)
N � 2N1N2
N2N1
w1/2
�
�
3.0 �m
5.00 cm in diameter and allowed to spread by diffusion. UsingEquation 23-25, prepare a graph showing the Gaussian concentrationprofile of the methanol zone after 1.00, 10.0, and 100 min. Preparea second graph showing the same experiment with the enzymeribonuclease .
23-46. A 0.25-mm-diameter open tubular gas chromatogra-phy column is coated with stationary phase that is thick.The diffusion coefficient for a compound with a capacity factor
is in the gas phase and in the stationary phase. Consider longitudinal diffusion
and finite equilibration time in the mobile and stationary phases assources of broadening. Prepare a graph showing the plate heightfrom each of these three sources and the total plate height as a func-tion of linear flow rate (from 2 cm/s to 1 m/s). Then change the sta-tionary phase thickness to and repeat the calculations.Explain the difference in the two results.
23-47. Consider two Gaussian peaks with relative areas 4:1.Construct a set of graphs to show the overlapping peaks if the reso-lution is 0.5, 1, or 2.
2 �m
10�9 m2/sDs � 1.0 �Dm � 1.0 � 10�5 m2/sk¿ � 10
0.25 �m
(D � 0.12 � 10�9 m2/s)
Det
ecto
r re
spon
se
13.00 13.50 14.00 14.50Time (min)
12.98 min
13.20 min
13.81 min
14.56 min
14.77 min
F F
F
FF
H
FF
n-C7H16
Figure for Problem 23-44

Chapter 23 gave a foundation for understanding chromatographic separations. Chapters 24through 26 discuss specific methods and instrumentation. The goal is for you to understandhow chromatographic methods work and what parameters you can control for best results.
24-1 The Separation Processin Gas Chromatography
In gas chromatography,1,2 gaseous analyte is transported through the column by a gaseousmobile phase, called the carrier gas. In gas-liquid partition chromatography, the stationaryphase is a nonvolatile liquid bonded to the inside of the column or to a fine solid support
528 CHAPTER 24 Gas Chromatography
The content of cholesterol preserved in ancient bones provides information on the dietsof people who lived long ago. Approximately 1.1% of natural carbon is and 98.9% is Different types of plants and animals have consistent, slightly different ratios of ,which reflect their biosynthetic pathways.
To learn whether people from the ancient British coastal town of Barton-on-Humber atemainly plants or fish, cholesterol from the bones of 50 people was extracted with organicsolvent, isolated by gas chromatography, combusted to convert it into CO2, and its ratio measured by mass spectrometry. Observed ratios differ from that of a standardmaterial by about to parts per thousand. A diet of local plants yields a value(defined in Box 22-3) in cholesterol of parts per thousand. Values more positive than
parts per thousand are indicative of a marine diet. It appears that the population gotmuch of its food from the sea.�28
�28d13C�24�21
13C/12C
13C/12C
13C/12C
12C.13C
13C
WHAT DID THEY EAT IN THE YEAR 1000?
Gas Chromatography24Cholesterol
Internal standardn - C34H70
3020Time (min)
Det
ecto
r re
spon
se
δ13C for marine diet
δ13C forterrestrialdiet
Num
ber
of p
eopl
e
Cholesterol δ13C value
0
5
10
15
−28 −27 −26 −25 −24 −23 −22 −21 −20
Gas chromatogram of cholesterol and otherlipids extracted from bones and derivatizedwith trimethylsilyl ((CH3)3Si ) groups to increasevolatility for chromatography. Bone contains2 to 50 �g cholesterol/gram of dry bone.[From A. W. Stott and R. P. Evershed, “ 13C Analysis ofCholesterol Preserved in Archaeological Bones andTeeth,” Anal. Chem. 1996, 68, 4402.]
d
ß
13C content of cholesterol from bones of50 people who lived on British coast in theyears A.D. 500–1800. 13C is the deviation ofthe atomic ratio 13C/12C from that of a standardmaterial, measured in parts per thousand.[Data from A. W. Stott and R. P. Evershed, “ 13C Analysisof Cholesterol Preserved in Archaeological Bonesand Teeth,” Anal. Chem. 1996, 68, 4402.]
d
d
Gas chromatography:
mobile phase: gasstationary phase: usually a nonvolatile liquid,
but sometimes a solidanalyte: gas or volatile liquid
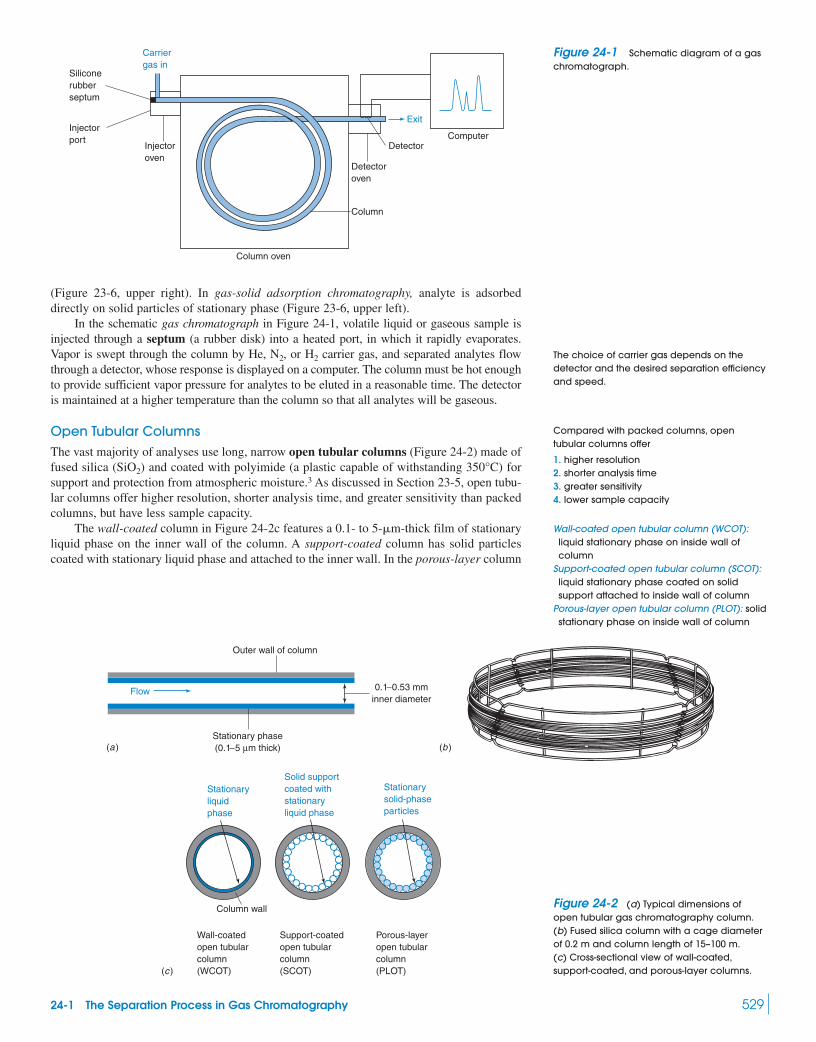
24-1 The Separation Process in Gas Chromatography 529
(Figure 23-6, upper right). In gas-solid adsorption chromatography, analyte is adsorbeddirectly on solid particles of stationary phase (Figure 23-6, upper left).
In the schematic gas chromatograph in Figure 24-1, volatile liquid or gaseous sample isinjected through a septum (a rubber disk) into a heated port, in which it rapidly evaporates.Vapor is swept through the column by He, , or carrier gas, and separated analytes flowthrough a detector, whose response is displayed on a computer. The column must be hot enoughto provide sufficient vapor pressure for analytes to be eluted in a reasonable time. The detectoris maintained at a higher temperature than the column so that all analytes will be gaseous.
Open Tubular ColumnsThe vast majority of analyses use long, narrow open tubular columns (Figure 24-2) made offused silica ( ) and coated with polyimide (a plastic capable of withstanding ) forsupport and protection from atmospheric moisture.3 As discussed in Section 23-5, open tubu-lar columns offer higher resolution, shorter analysis time, and greater sensitivity than packedcolumns, but have less sample capacity.
The wall-coated column in Figure 24-2c features a 0.1- to film of stationaryliquid phase on the inner wall of the column. A support-coated column has solid particlescoated with stationary liquid phase and attached to the inner wall. In the porous-layer column
5-�m-thick
350°CSiO2
H2N2
Carriergas in
Injectoroven
Siliconerubberseptum
Injectorport
Column oven
Detectoroven
Column
Detector
Exit
Computer
(b )
Stationaryliquidphase
Column wall
Solid supportcoated withstationaryliquid phase
Stationarysolid-phaseparticles
Wall-coatedopen tubularcolumn(WCOT)
Support-coatedopen tubularcolumn(SCOT)
Porous-layeropen tubularcolumn(PLOT)(c )
Outer wall of column
Stationary phase(0.1 − 5 µm thick)
0.1 −0.53 mminner diameter
Flow
(a )
The choice of carrier gas depends on thedetector and the desired separation efficiencyand speed.
Compared with packed columns, opentubular columns offer
1. higher resolution2. shorter analysis time3. greater sensitivity4. lower sample capacity
Figure 24-2 (a) Typical dimensions ofopen tubular gas chromatography column.(b) Fused silica column with a cage diameterof 0.2 m and column length of 15–100 m.(c) Cross-sectional view of wall-coated,support-coated, and porous-layer columns.
Figure 24-1 Schematic diagram of a gaschromatograph.
Wall-coated open tubular column (WCOT):liquid stationary phase on inside wall ofcolumn
Support-coated open tubular column (SCOT):liquid stationary phase coated on solidsupport attached to inside wall of column
Porous-layer open tubular column (PLOT): solidstationary phase on inside wall of column

530 CHAPTER 24 Gas Chromatography
in Figure 24-3, solid particles are the active stationary phase. With their high surface area,support-coated columns can handle larger samples than can wall-coated columns. The per-formance of support-coated columns is intermediate between those of wall-coated columnsand packed columns.
Column inner diameters are typically 0.10 to 0.53 mm and lengths are 15 to 100 m,with 30 m being common. Narrow columns provide higher resolution than wider columns(Figure 24-4) but require higher operating pressure and have less sample capacity. Diame-ters of 0.32 mm or greater tend to overload the gas-handling system of a mass spectrome-ter, so the gas stream must be split and only a fraction is sent to the mass spectrometer. Thenumber of theoretical plates, N, on a column is proportional to the length. In Equation 23-30,resolution is proportional to and, therefore, to the square root of column length(Figure 24-5).
2N
Carbon layer
Fused silica
(a )0
Det
ecto
r re
spon
se
3 6 9 12
2
1
3
4
56
7
8
910
11
Time (min)(b)
1 Acetaldehyde2 Methanol3 Ethanol4 Ethyl acetate5 2-Methyl-2-propanol6 1-Butanol
7 2-Methyl-1-butanol 8 3-Methyl-1-butanol 9 Isoamyl acetate10 Ethyl caproate11 2-Phenylethanol
1. 1,3-Dichlorobenzene2. 1,4-Dichlorobenzene3. sec-Butylbenzene4. 1,2-Dichlorobenzene
0.32-mminnerdiameter
1.5 2.0 2.5 1.5
Time (min)
2.0 2.5
2
1
1
3
3
4
4
2
Det
ecto
r re
spon
se
0.25-mminnerdiameter
Figure 24-3 (a) Porous carbon stationary phase (2 �m thick) on inside wall of fused silica opentubular column. (b) Chromatogram of vapors from the headspace of a beer can, obtained with 0.25-mm-diameter � 30-m-long porous carbon column operated at 30�C for 2 min and then ramped up to 160�C at 20�/min. [Courtesy Alltech Associates, State College, PA.]
Figure 24-4 Effect of open tubular column inner diameter on resolution. Narrower columns providehigher resolution. Notice the increased resolution of peaks 1 and 2 in the narrow column. Conditions:DB-1 stationary phase (0.25 �m thick) in 15-m wall-coated column operated at 95�C with He linearvelocity of 34 cm/s. [Courtesy J&W Scientific, Folsom, CA.]

24-1 The Separation Process in Gas Chromatography 531
At the constant linear velocity in Figure 24-6, increasing the thickness of the stationaryphase increases retention time and sample capacity and increases the resolution of early-elutingpeaks with a capacity factor of . (Capacity factor was defined in Equation 23-16).Thick films of stationary phase can shield analytes from the silica surface and reduce tailing(Figure 23-20) but can also increase bleed (decomposition and evaporation) of the stationaryphase at elevated temperature. A thickness of is standard, but thicker films are usedfor volatile analytes.
The choice of liquid stationary phase (Table 24-1) is based on the rule “like dissolveslike.” Nonpolar columns are best for nonpolar solutes (Table 24-2). Columns of intermediatepolarity are best for intermediate polarity solutes, and strongly polar columns are best forstrongly polar solutes. As a column ages, stationary phase bakes off, surface silanol groups
are exposed, and tailing increases. Exposure to from air at high temperaturesalso degrades the column. To reduce the tendency of stationary phase to bleed from the col-umn at high temperature, it is usually bonded (covalently attached) to the silica surface orcovalently cross-linked to itself. Box 24-1 describes chiral (optically active) bonded phasesfor separating optical isomers.
O2(SißOßH)
0.25 �m
k¿ � 5
1.5
15 m
1
2
3
41
1
22
3
34
4
30 m 60 m
2.0
Time (min) Time (min) Time (min)
Det
ecto
r re
spon
se
3.0 3.5 4.0 6.5 7.0 7.5
Time (min) Time (min)
1.6
1
2
34 5
6
0.25-µm-thick film
1.0-µm-thick film
1. Methanol2. Ethanol3. Acetonitrile4. Acetone5. 2-Propanol6. Diethyl ether7. Dichloromethane
7 1
2
34
56
7
1.4 1.6 1.8 2.0 2.2 2.4
Det
ecto
r re
spon
se
Figure 24-5 Resolution increases in proportion to the square root of column length. Notice theincreased resolution of peaks 1 and 2 as length is increased. Conditions: DB-1 stationary phase (0.25 �m thick) in 0.32-mm-diameter wall-coated column operated at 95�C with He linear velocity of 34 cm/s. Compounds 1–4 are the same as in Figure 24-4. [Courtesy J&W Scientific, Folsom, CA.]
Figure 24-6 Effect of stationary phase thickness on open tubular column performance. Increasingthickness increases retention time and increases resolution of early-eluting peaks. Conditions: DB-1stationary phase in wall-coated column operated at with He linear velocity of 38 cm/s. [Courtesy J&W Scientific, Folsom, CA.]
40°C15-m-long � 0.32-mm-diameter

532 CHAPTER 24 Gas Chromatography
Table 24-1 Common stationary phases in capillary gas chromatography
Temperature rangeStructure Polarity (°C)
NonpolarNonpolarIntermediate
polarityIntermediate
polarity
(Diphenyl)x(dimethyl)1�x
polysiloxane
Intermediate polarity
(Cyanopropylphenyl)0.14
(dimethyl)0.86 polysiloxane
Strongly polarCarbowax
(poly(ethylene glycol))
Strongly polar
(Biscyanopropyl)0.9
(cyanopropylphenyl)0.1 polysiloxane
0°–275°Si
CN CN
CN
SiO O
0.9 0.1
40°–250° [ßCH2CH2ßOßß]n
�20°–280°Si
CN
SiO O
CH3
CH3
0.14 0.86
50°–370°x � 0.65
0°–300°x � 0.35�60°–320°x � 0.05�60°–320°x � 0
Si SiO O
CH3
CH3
x 1 � x
Table 24-2 Polarity of solutes
Nonpolar Weak intermediate polarity
Saturated hydrocarbons EthersOlefinic hydrocarbons KetonesAromatic hydrocarbons AldehydesHalocarbons EstersMercaptans Tertiary aminesSulfides Nitro compounds (without atoms)
Nitriles (without )
Strong intermediate polarity Strongly polar
Alcohols PolyhydroxyalcoholsCarboxylic acids Amino alcoholsPhenols Hydroxy acidsPrimary and secondary amines Polyprotic acidsOximes PolyphenolsNitro compounds (with atoms)Nitriles (with atoms)
SOURCE: Adapted from H. M. McNair and E. J. Bonelli, Basic Gas Chromatography (Palo Alto, CA: Varian InstrumentDivision, 1968).
�-H�-H
�-atomsCS2
�-H

24-1 The Separation Process in Gas Chromatography 533
Box 24-1 Chiral Phases for Separating Optical Isomers
Optical isomers—also called enantiomers—are mirror imagecompounds that cannot be superimposed. For example, the naturalamino acid building blocks of proteins are L-amino acids.
Enantiomers of an amino acid
Volatile derivative for gas chromatography
Chromatography with a chiral (optically active) stationary phaseis one of the few ways to separate enantiomers. We can estimateages of fossils up to 500 million years old by measuring the frac-tion of amino acid that has transformed into the D enantiomer in afossil.4,5 Amino acids do not have enough vapor pressure for gaschromatography. A volatile derivative suitable for gas chromatog-raphy is shown in the figure above.6
CO2CH3
RCH3OCNH
H
O
CO2
CH3N
�NH3�
�
RH
CO2
C
�
RH
L-amino acid D-amino acid
Mirror plane
Common chiral stationary phases for gas chromatographyhave cyclodextrins bonded to a conventional polysiloxane station-ary phase.7,8 Cyclodextrins are naturally occurring cyclic sugars.
has a 0.78-nm-diameter opening into a chiral,hydrophobic cavity. The hydroxyls are capped with alkyl groupsto decrease the polarity of the faces.9
Enantiomers have different affinities for the cyclodextrincavity, so they separate as they travel through the chromatographycolumn. The chromatogram below shows a chiral separation of aby-product found in pesticides.
�-Cyclodextrin
N
Cl ClCl
Cl
Cl
Cl
CH3
N
N
ClClCl
Cl
Cl
Cl
CH3
N
Mirror plane
Chlorinated pesticide impurity. The two rings are perpendicular to eachother. The mirror images are not superimposable, because there is nofree rotation about the C–N bond between the rings.
(a) Structure of , a cyclic sugar made of seven glucosemolecules. ( contains six monomers and contains eight.) (b) Primary hydroxyl groups lie on one face and thesecondary hydroxyl groups lie on the other face.
�-cyclodextrin�-Cyclodextrin�-cyclodextrin
Programmed temperature chiral separation on aopen tubular column with a stationary
phase containing 10 wt% fully methylated chemicallybonded to dimethyl polysiloxane. [From W. Vetter and W. Jun, “Elucidation of a
Polychlorinated Bipyrrole Structure Using Enantioselective GC,” Anal. Chem. 2002,
74, 4287.]
�-cyclodextrin0.25-�m-thick0.25-mm � 25-m
(120°–200°C)
O
Secondaryalcohol
Primaryalcohol
O
OH
HO
O
HO
O
OH HO
OH
O
OO
H
HOO
HO
O
OH
HO
O
HO
O
OH
HO
OH
O
OH
HO O
HO
OOH
HO
OHO
HO
OH
HO OH
HO OHHO HO
0.78nm
Hydrophilicentrance
Secondaryface
(14 OH groups)
Primary face(7 OH groups)
(a )
(b )
Chiral hydrophobiccavity
OH
Mas
s sp
ectr
al to
tal i
on c
urre
nt
18 19
Time (min)
20
Enantiomers
21

534 CHAPTER 24 Gas Chromatography
Among the solids used for porous-layer open tubular columns, alumina ( ) can sep-arate hydrocarbons in gas-solid adsorption chromatography. Molecular sieves (Figure 24-7)are inorganic or organic materials with cavities into which small molecules enter and are par-tially retained.10 Molecules such as , , , , and can be separated from oneanother. Gases can be dried by passage through traps containing molecular sieves becausewater is strongly retained. Inorganic sieves can be regenerated (freed of water) by heating to
in vacuum or under flowing .
Packed ColumnsPacked columns contain fine particles of solid support coated with nonvolatile liquid stationaryphase, or the solid itself may be the stationary phase. Compared with open tubular columns,packed columns provide greater sample capacity but give broader peaks, longer retention times,and less resolution. (Compare Figure 24-8 with Figure 24-3.) Despite their inferior resolution,packed columns are used for preparative separations, which require a great deal of stationaryphase, or to separate gases that are poorly retained. Packed columns are usually made of stain-less steel or glass and are typically 3–6 mm in diameter and 1–5 m in length. The solid supportis often silica that is silanized (Reaction 23-36) to reduce hydrogen bonding to polar solutes.For tenaciously binding solutes, Teflon is a useful support, but it is limited to .6 200°C
N2300°C
CH4CO2N2O2H2
Al2O3
Cubo-octahedron
Open cavitySi or AlOxygen(a ) (b )
Figure 24-7 Structure of the zeolitemolecular sieve, .(a) Aluminosilicate framework of one cubo-octahedron of a mineral class called zeolites.(b) Interconnection of eight cubo-octahedrato produce a cavity into which smallmolecules can enter.
Na12(Al12Si12O48) � 27H2O
Time (min)
Det
ecto
r re
spon
se
Solvents
2,3-Dimethyl-2-butanol
OH
1-Butanol1-Pentanol
1-Hexanol
Injection5 10 15 20 25 30 35 40 45
Figure 24-8 Chromatogram of alcohol mixture at using packed columncontaining 20% Carbowax 20M on Gas-Chrom R
support and flame ionization detector. [Courtesy Norman Pearson.]
(2 mm inner diameter � 76 cm long)40°C
Teflon is a chemically inert polymer with thestructure .ßCF2ßCF2ßCF2ßCF2ß

24-1 The Separation Process in Gas Chromatography 535
In a packed column, uniform particle size decreases the multiple path term in the vanDeemter equation (23-33), thereby reducing plate height and increasing resolution. Smallparticle size decreases the time required for solute equilibration, thereby improving columnefficiency. However, the smaller the particle size, the less space between particles and themore pressure required to force mobile phase through the column. Particle size is expressedin micrometers or as a mesh size, which refers to the size of screens through which the parti-cles are passed or retained (Table 28-2). A 100/200 mesh particle passes through a 100 meshscreen, but not through a 200 mesh screen. The mesh number equals the number of openingsper linear inch of screen.
Retention IndexFigure 24-9 illustrates how the relative retention times of polar and nonpolar solutes changeas the polarity of the stationary phase changes. In Figure 24-9a, 10 compounds are elutednearly in order of increasing boiling point from a nonpolar stationary phase. The principaldeterminant of retention on this column is the volatility of the solutes. In Figure 24-9b, thestrongly polar stationary phase strongly retains the polar solutes. The three alcohols are thelast to be eluted, following the three ketones, which follow four alkanes. Hydrogen bondingto the stationary phase is probably the strongest force leading to retention. Dipole interactionsof the ketones are the second strongest force.
The Kovats retention index, I, for a linear alkane equals 100 times the number of carbonatoms. For octane, ; and for nonane, . A compound eluted between octane andnonane (Figure 23-7) has a retention index between 800 and 900 computed by the formula
Retention index: (24-1)
where n is the number of carbon atoms in the smaller alkane; N is the number of carbonatoms in the larger alkane; is the adjusted retention time of the smaller alkane; and
is the adjusted retention time of the larger alkane.t¿r(N)t¿r(n)
I � 100 cn � (N � n)log t¿r(unknown) � log t¿r(n)
log t¿r(N) � log t¿r(n)d
I � 900I � 800
Pentane
1
3
4
6
7
9
25 8 10
14
396
2 1816141210864
(b )
Solvent CompoundBoiling
point (°C)
Octane10Pentanol9Heptane83-Pentanone7Butanol6Hexane5Methyl ethyl ketone4Propanol3
2Acetone1
12613898
1021176980973656
810
2 4 6Time (min)
52(a )
7
Time (min)
Det
ecto
r re
spon
se
Det
ecto
r re
spon
se
Figure 24-9 Separation of 10 compounds on (a) nonpolar poly(dimethylsiloxane) and (b) stronglypolar poly(ethylene glycol) stationary phases in opentubular columns at 70�C. [Courtesy Restek Co., Bellefonte, PA.]
0.32-mm-diameter � 30-m-long1-�m-thick
Retention index relates the retention time of asolute to the retention times of linear alkanes.
through columntm � time for unretained solute (CH4) to passtr � retention time for solute
Adjusted retention time � t ¿r � tr � tm
Example Retention Index
If the retention times in Figure 23-7 are , ,, and , find the retention index for the
unknown.
Solution The index is computed with Equation 24-1:
I � 100 c8 � (9 � 8)log 15.2 � log 13.8
log 18.0 � log 13.8d � 836
tr(nonane) � 18.5 mintr(unknown) � 15.7 mintr(octane) � 14.3 mintr(CH4) � 0.5 min
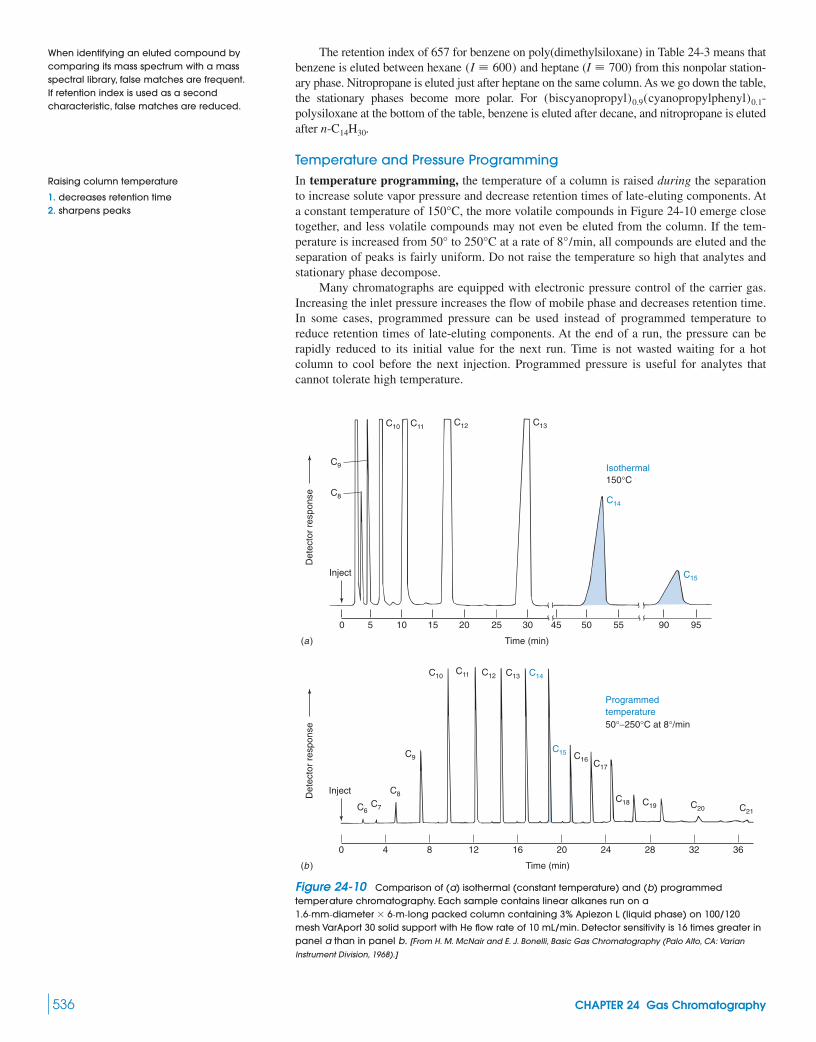
536 CHAPTER 24 Gas Chromatography
The retention index of 657 for benzene on poly(dimethylsiloxane) in Table 24-3 means thatbenzene is eluted between hexane and heptane ( ) from this nonpolar station-ary phase. Nitropropane is eluted just after heptane on the same column. As we go down the table,the stationary phases become more polar. For -polysiloxane at the bottom of the table, benzene is eluted after decane, and nitropropane is elutedafter .
Temperature and Pressure ProgrammingIn temperature programming, the temperature of a column is raised during the separationto increase solute vapor pressure and decrease retention times of late-eluting components. Ata constant temperature of , the more volatile compounds in Figure 24-10 emerge closetogether, and less volatile compounds may not even be eluted from the column. If the tem-perature is increased from to at a rate of , all compounds are eluted and theseparation of peaks is fairly uniform. Do not raise the temperature so high that analytes andstationary phase decompose.
Many chromatographs are equipped with electronic pressure control of the carrier gas.Increasing the inlet pressure increases the flow of mobile phase and decreases retention time.In some cases, programmed pressure can be used instead of programmed temperature toreduce retention times of late-eluting components. At the end of a run, the pressure can berapidly reduced to its initial value for the next run. Time is not wasted waiting for a hotcolumn to cool before the next injection. Programmed pressure is useful for analytes thatcannot tolerate high temperature.
8°/min250°C50°
150°C
n-C14H30
(cyanopropylphenyl)0.1(biscyanopropyl)0.9
I � 700(I � 600)
C10 C11 C12 C13
C14
C15
C9
C8
Inject
0 5 10 15 20 25 30 45 50 9555 90
Time (min)
Isothermal
Det
ecto
r re
spon
se
(a )
C6C7
C8
C9
C10C11 C12 C13 C14
C15 C16 C17
C18 C19 C20 C21
0 4 8 12 16 20 24 28 32 36
Inject
Time (min)
Programmedtemperature50°−250°C at 8°/min
Det
ecto
r re
spon
se
(b )
150°C
Figure 24-10 Comparison of (a) isothermal (constant temperature) and (b) programmedtemperature chromatography. Each sample contains linear alkanes run on a
packed column containing 3% Apiezon L (liquid phase) on 100/120mesh VarAport 30 solid support with He flow rate of 10 mL/min. Detector sensitivity is 16 times greater inpanel a than in panel b. [From H. M. McNair and E. J. Bonelli, Basic Gas Chromatography (Palo Alto, CA: Varian
Instrument Division, 1968).]
1.6-mm-diameter � 6-m-long
When identifying an eluted compound bycomparing its mass spectrum with a massspectral library, false matches are frequent.If retention index is used as a secondcharacteristic, false matches are reduced.
Raising column temperature
1. decreases retention time2. sharpens peaks

24-1 The Separation Process in Gas Chromatography 537
Carrier GasHelium is the most common carrier gas and is compatible with most detectors. For a flameionization detector, N2 gives a lower detection limit than He. Figure 24-11 shows that H2, He,and N2 give essentially the same optimal plate height (0.3 mm) at significantly different flowrates. Optimal flow rate increases in the order . Fastest separations can beachieved with H2 as carrier gas, and H2 can be run much faster than its optimal velocity withlittle penalty in resolution.11 Figure 24-12 shows the effect of carrier gas on the separation oftwo compounds on the same column with the same temperature program.
There are drawbacks to using H2. It can catalytically react with unsaturated compounds onmetal surfaces, and it cannot be used with a mass spectrometric detector, because H2 breaksdown vacuum pump oil in the detector. The main reason why H2 was not used more often in the
N2 6 He 6 H2
Table 24-3 Retention indexes for several compounds on common stationary phases
Retention indexa
Benzene Butanol 2-Pentanone 1-Nitropropane PyridinePhase b.p. 80°C b.p. 117°C b.p. 102°C b.p. 132°C b.p. 116°C
Poly(dimethylsiloxane) 657 648 670 708 737(Diphenyl)0.05(dimethyl)0.95- 672 664 691 745 761
polysiloxane(Diphenyl)0.35(dimethyl)0.65- 754 717 777 871 879
polysiloxane(Cyanopropylphenyl)0.14- 726 773 784 880 852
(dimethyl)0.86polysiloxane(Diphenyl)0.65(dimethyl)0.35- 797 779 824 941 943
polysiloxanePoly(ethylene glycol) 956 1 142 987 1 217 1 185(Biscyanopropyl)0.9- 1 061 1 232 1 174 1 409 1 331
(cyanopropylphenyl)0.1-polysiloxane
a. For reference, boiling points (b.p.) for various alkanes are hexane, 69°C; heptane, 98°C; octane, 126°C; nonane, 151°C; decane, 174°C;undecane, 196°C. Retention indexes for the straight-chain alkanes are fixed values and do not vary with the stationary phase: hexane, 600;heptane, 700; octane, 800; nonane, 900; decane, 1 000; undecane, 1 100.
SOURCE: Restek Chromatography Products Catalog, 1993–94, Bellefonte, PA.
NNO2
OOH
0.2
10P
late
hei
ght (
mm
)
Linear velocity (cm/s)20 30 40 50 60 70 80 90
0.4
0.6
0.8
1.0
1.2
H2
He
N2
N2 carrier10 cm/sR = 0.87
14 15 16 9.5 10.0
Time (min)
10.5 7.5 8.0 8.5
He carrier32 cm/sR = 1.44
H2 carrier60 cm/sR = 1.78
Det
ecto
r re
spon
se
Figure 24-11 Van Deemter curves for gaschromatography of n-C17H36 at 175�C using N2,He, or H2 in a wall-coated column with OV-101 stationaryphase. [From R. R. Freeman, ed., High Resolution Gas
Chromatography (Palo Alto, CA: Hewlett Packard Co.,
1981).]
0.25-mm-diameter � 25-m-long
Figure 24-12 Separation of twopolyaromatic hydrocarbons on a wall-coatedopen tubular column with different carriergases. Resolution, R, increases and analysis timedecreases as we change from N2 to He to H2
carrier gas. [Courtesy J&W Scientific, Folsom, CA.]

538 CHAPTER 24 Gas Chromatography
past is that it forms explosive mixtures in air when H2 is greater than 4 vol%. Flow rates in cap-illary chromatography are unlikely to create a dangerous concentration of H2. Electrolytic gener-ators produce high-purity H2 and eliminate the need for tanks of compressed H2.
H2 and He give better resolution (smaller plate height) than N2 at high flow rate becausesolutes diffuse more rapidly through H2 and He than through N2. The more rapidly a solutediffuses between phases, the smaller is the mass transfer ( ) term in the van Deemter equa-tion (23-33). Equations 23-35a and 23-35b describe the effects of the finite rate of masstransfer in an open tubular column. If the stationary phase is thin enough ( ), masstransfer is dominated by slow diffusion through the mobile phase rather than through the sta-tionary phase. That is, in Equations 23-35a and 23-35b. For a column of a givenradius, r, and a solute of a given capacity factor, , the only variable affecting the rate ofmass transfer in the mobile phase (Equation 23-35b) is the diffusion coefficient of solutethrough the mobile phase. Diffusion coefficients follow the order .
Most analyses are run at carrier gas velocities that are 1.5 to 2 times as great as the opti-mum velocity at the minimum of the van Deemter curve. The higher velocity is chosen togive the maximum efficiency (most theoretical plates) per unit time. A small decrease in res-olution is tolerated in return for faster analyses.
Gas flow through a narrow column may be too low for best detector performance.Therefore, the optimum gas for separation is used in the column and the best gas for detec-tion (called makeup gas) is added between the column and the detector.
Impurities in the carrier gas degrade the stationary phase. High-quality gases should beused, and even they should be passed through purifiers to remove O2, H2O, and traces oforganic compounds prior to entering the column. Steel or copper tubing, rather than plastic orrubber tubing, should be used for gas lines because metals are less permeable to air and donot release volatile contaminants into the gas stream.
Guard Columns and Retention GapsIn gas chromatography, a guard column and a retention gap are each typically a 3- to 10-meterlength of empty capillary in front of the capillary chromatography column. The capillary issilanized so that solutes are not retained by the bare silica wall. Physically, the guard columnand the retention gap are identical, but they are employed for different purposes.
The purpose of a guard column is to accumulate nonvolatile substances that would oth-erwise contaminate the chromatography column and degrade its performance. The guardcolumn is normally the same diameter as the chromatography column. Periodically, thebeginning of the guard column should be cut off to eliminate the nonvolatile residues. Trimthe guard column when you observe irregular peak shapes from a column that had beenproducing symmetric peaks.
A retention gap is used to improve peak shapes under certain conditions. If you introducea large volume of sample ( ) by splitless or on-column injection (described in the nextsection), microdroplets of liquid solvent can persist inside the column for the first few meters.Solutes dissolved in the droplets are carried along with them and give rise to a series of raggedbands. The retention gap allows solvent to evaporate prior to entering the chromatographycolumn. Use at least 1 m of retention gap per microliter of solvent. Even small volumes of sol-vent that have a very different polarity from the stationary phase can cause irregular solute peakshapes. The retention gap helps separate solvent from solute to improve peak shapes.
We calculate plate number, N, with Equation 23-28 by using retention time and peakwidth. Plate height, H, is the length of the column, L, divided by N. Do not include the reten-tion gap or guard column as part of L for calculating H.12 For peaks with a capacity factor
, plate height might not be meaningful when a guard column or retention gap is used.
24-2 Sample Injection13
Figure 24-13 shows a good technique for using a syringe to inject liquid sample into a gaschromatograph. After cleaning the syringe several times with solvent, take up air, then sol-vent, then air, then sample, and then more air. When the needle is inserted through the rubberseptum into the heated injection port of the chromatograph, sample does not immediatelyevaporate, because there is no sample in the needle. If there were sample in the needle, themost volatile components would begin to evaporate and would be depleted before the sampleis injected. The air bubble behind the sample plug prevents sample and solvent from mixing.The solvent plug washes sample out of the needle, and the final air plug expels solvent fromthe needle. Many autosamplers are capable of this “sandwich” injection.
k¿ 6 5
7 2 �L
H2 7 He 7 N2
k¿Cs V Cm
�0.5 �m
Cux
Guard column: accumulates nonvolatilesubstances that would contaminatechromatography column
Retention gap: improves peak shape byseparating volatile solvent from less volatilesolutes prior to chromatography

24-2 Sample Injection 539
An injection port with a silanized glass liner is shown in Figure 24-14. Carrier gassweeps vaporized sample from the port into the chromatography column. For analytical chro-matography, the injected volume is typically of liquid sample. Gases are injectedby a gas-tight syringe into the same kind of sample loop used in liquid chromatography(Figure 25-18). Decomposed sample, nonvolatile components, and septum debris accumulatein the glass liner, which is periodically replaced. The liner must seal properly or carrier gaswill bypass the liner. The lifetime of the rubber septum could be as little as 20 manual injec-tions or autosampler injections.
Split InjectionIf analytes of interest constitute of the sample, split injection is usually preferred.For high-resolution work, best results are obtained with the smallest amount of sample( ) that can be adequately detected—preferably containing of each component.A complete injection contains too much material for a 0.32-mm-diameter or smaller column.A split injection delivers only 0.2–2% of the sample to the column. In Figure 24-14, sampleis injected rapidly ( ) through the septum into the evaporation zone. The injector temper-ature is kept high (for example, ) to promote fast evaporation. A brisk flow of carriergas sweeps the sample through the mixing chamber, where complete vaporization and goodmixing occur. At the split point, a small fraction of vapor enters the chromatography column,but most passes through needle valve 2 to a waste vent. The pressure regulator leading toneedle valve 2 controls the fraction of sample discarded. The proportion of sample that doesnot reach the column is called the split ratio and typically ranges from 50:1 to 600:1. Aftersample has been flushed from the injection port ( ), needle valve 2 is closed and carriergas flow is correspondingly reduced. Quantitative analysis with split injection can be inaccu-rate because the split ratio is not reproducible from run to run.
�30 s
350°C6 1 s
�1 ng�1 �L
7 0.1%
�100
0.1–2 �L
Glass barrel
Air Air
1 2 3 4
AirSample Solvent
1
2
To vent
Needlevalve Sample evaporation
zoneHeated
metal wallSilanizedglass liner
Mixingchamber
Split point
Chromatographycolumn
Needlevalve
To vent
PressureregulatorFlow controller
Carriergas in
Injecthere
Septum
Molecularsieves
Hydrocarbontrap
Oxygenscrubber
Figure 24-13 “Sandwich” injectiontechnique. [Adapted from J. T. Watson, Introduction
to Mass Spectrometry, 3rd ed. (Philadelphia: Lippincott-
Raven, 1997).]
Figure 24-14 Injection port for splitinjection into an open tubular column.The glass liner is slowly contaminated bynonvolatile and decomposed samples andmust be replaced periodically. For splitlessinjection, the glass liner is a straight tube withno mixing chamber. For dirty samples, splitinjection is used and a packing materialcan be placed inside the liner to adsorbundesirable components of the sample.
Different injection port liners are designed forsplit, splitless, and on-column injection and foruse with solid-phase microextraction.
Injection into open tubular columns:
split: routine for introducing small samplevolume into open tubular column
splitless: best for trace levels of high-boilingsolutes in low-boiling solvents
on-column: best for thermally unstable solutesand high-boiling solvents; best for quantitativeanalysis
A liquid injection creates roughly 0.5 mL of gas volume, which can fill the glassliner in Figure 24-14. Some vapor can escape backward toward the septum. Lower-boilingcomponents evaporate first and are more likely to escape than components with higherboiling points. The injection port temperature should be high enough to minimize this frac-tionation of the sample. However, if the injector temperature is too high, decomposition canoccur. During injection and chromatography, septum purge gas flow through needle valve 1in Figure 24-14 is run at to remove excess sample vapor and gas that bleedsfrom the hot rubber septum.
Splitless InjectionFor trace analysis of analytes that are less than 0.01% of the sample, splitless injection isappropriate. The same port shown for split injection in Figure 24-14 is used. However, the
�1 mL/min
1-�L

540 CHAPTER 24 Gas Chromatography
glass liner is a straight, empty tube with no mixing chamber, as shown in Figure 24-15. Alarge volume ( ) of dilute solution in a low-boiling solvent is injected slowly ( )into the liner, with the split vent closed. Slow flow through the septum purge is main-tained during injection and chromatography to remove any vapors that escape from theinjection liner. Injector temperature for splitless injection is lower ( ) than that forsplit injection, because the sample spends more time in the port and we do not want it todecompose. The residence time of the sample in the glass liner is , because carriergas flows through the liner at the column flow rate, which is . In splitlessinjection, of the sample is applied to the column, and little fractionation occursduring injection.
The initial column temperature is set below the boiling point of the solvent, whichtherefore condenses at the beginning of the column. As solutes catch up with the condensedplug of solvent, they are trapped in the solvent in a narrow band at the beginning of the col-umn. This solvent trapping leads to sharp chromatographic peaks. Without solvent trapping,the bands could not be sharper than the 1-min injection time. Chromatography is initiated byraising the column temperature to vaporize the solvent trapped at the head of the column.
An alternative means of condensing solutes in a narrow band at the beginning of the col-umn is called cold trapping. The initial column temperature is lower than the boilingpoints of the solutes of interest. Solvent and low-boiling components are eluted rapidly, buthigh-boiling solutes remain in a narrow band at the beginning of the column. The column isthen rapidly warmed to initiate chromatography of the high-boiling solutes. For low-boilingsolutes, cryogenic focusing is required, with an initial column temperature below roomtemperature.
Figure 24-16 shows effects of operating parameters in split and splitless injections. Exper-iment A is a standard split injection with brisk flow through the split vent in Figure 24-15. Thecolumn was kept at . The injection liner was purged rapidly by carrier gas, and peaks arequite sharp. Experiment B shows the same sample injected in the same way, except the splitvent was closed. Then the injection liner was purged slowly, and sample was applied to thecolumn over a long time. Peaks are broad, and they tail badly because fresh carrier gas con-tinuously mixes with vapor in the injector, making it more and more dilute but never com-pletely flushing the sample from the injector. Peak areas in B are much greater than those inA because the entire sample reaches the column in B, whereas only a small fraction of sam-ple reaches the column in A.
Experiment C is the same as B, but the split vent was opened after 30 s to rapidly purge allvapors from the injection liner. The bands in chromatogram C would be similar to those in B, butthe bands are truncated after 30 s. Experiment D was the same as C, except that the columnwas initially cooled to to trap solvent and solutes at the beginning of the column. Thisis the correct condition for splitless injection. Solute peaks are sharp because the solutes wereapplied to the column in a narrow band of trapped solvent. Detector response in D is differ-ent from A–C. Actual peak areas in D are greater than those in A because most of the sampleis applied to the column in D, but only a small fraction is applied in A. To make experimentD a proper splitless injection, the sample would need to be much more dilute.
25°C
75°C
150°C
40°C
�80%�1 mL/min�1 min
�220°C
�2 s�2 �L
Syringe
Septum Septumpurge
1 mL/min
350°C
Column
Splitvent
100 mL/min
1 mL/min
Column
Split injection
220°C
Splitless injection
1 mL/min
0 mL/min0 mL/min
At initialoventemperature(e.g., 50°C)
On-column injection
102 mL/min 1 mL/min 1 mL/min 1 mL/min 0 mL/min2 mL/min
Figure 24-15 Representative injection conditions for split, splitless, and on-column injection into anopen tubular column.
For solvent trapping, sample should contain104 times as much solvent as analyte andcolumn temperature should be 40�C belowthe solvent’s boiling point.
For cold trapping, stationary phase filmthickness must be .�2 �m

24-3 Detectors 541
On-Column InjectionOn-column injection is used for samples that decompose above their boiling points and ispreferred for quantitative analysis. Solution is injected directly into the column, withoutgoing through a hot injector (Figure 24-15). The initial column temperature is low enough tocondense solutes in a narrow zone. Warming the column initiates chromatography. Samplesare subjected to the lowest possible temperature in this procedure, and little loss of any soluteoccurs. The needle of a standard microliter syringe fits inside a 0.53-mm-diameter column,but this column does not give the best resolution. For 0.20- to 0.32-mm-diameter columns,which give better resolution, special syringes with thin silica needles are required.
24-3 DetectorsFor qualitative analysis, two detectors that can identify compounds are the mass spectrome-ter (Section 22-4) and the Fourier transform infrared spectrometer (Section 20-5). A peak canbe identified by comparing its spectrum with a library of spectra recorded in a computer. Formass spectral identification, sometimes two prominent peaks are selected in the electron ion-ization spectrum. The quantitation ion is used for quantitative analysis. The confirmation ionis used for qualitative identification. For example, the confirmation ion might be expected tobe 65% as abundant as the quantitation ion. If the observed abundance is not close to 65%,then we suspect that the compound is misidentified.
Another method to identify a peak is to compare its retention time with that of an authenticsample of the suspected compound. The most reliable way to compare retention times is byco-chromatography, in which an authentic compound is added to the unknown. If the addedcompound is identical with a component of the unknown, then the relative area of that onepeak will increase. Identification is tentative only when carried out with one column, but it isfirmer when carried out on several columns with different stationary phases.
Quantitative analysis is based on the area of a chromatographic peak. In the linearresponse concentration range, the area of a peak is proportional to the quantity of that com-ponent. In most instruments, peak area is measured automatically by a computer. Judgment is
Time (min)
Time (min)
Det
ecto
r re
spon
se
0 2 4
0 2 40 2 4
0 2 4 6 8
Solvent Solvent
Solvent Solvent
2
3
23
2
3
2
3
Split injectionA: B: Split vent closed
C: Same as B, but splitvent opened after 30 s
D: Solvent trapping
Figure 24-16 Split and splitless injectionsof a solution containing 1 vol% methyl isobutylketone (b.p. 118�C) and 1 vol% p-xylene(b.p. 138�C) in dichloromethane (b.p. 40�C)on a BP-10 moderately polar cyanopropylphenyl methyl silicone open tubularcolumn ( ,
,). Vertical scale is the
same for A–C. In D, signal heights should bemultiplied by 2.33 to be on the same scaleas A–C. [From P. J. Marriott and P. D. Carpenter,
“Capillary Gas Chromatography Injection,” J. Chem.
Ed. 1996, 73, 96.]
temperature � 75°Ccolumnfilm thickness � 0.25 �m
0.22 mm diameter � 10 m long
Linear response means that peak area isproportional to analyte concentration. For verynarrow peaks, peak height is often substitutedfor peak area.

542 CHAPTER 24 Gas Chromatography
required to draw baselines beneath peaks and decide where to measure the area.14 If peakarea must be measured by hand and if the peak has a Gaussian shape, then the area is
(24-2)
where is the width at half-height (Figure 23-9). Quantitative analysis is almost alwaysperformed by adding a known quantity of internal standard to the unknown (Section 5-4).After measurement of the response factor with standard mixtures, the equation in the marginis used to measure the quantity of unknown.
Thermal Conductivity DetectorIn the past, thermal conductivity detectors were most common in gas chromatographybecause they are simple and universal: They respond to all analytes. Unfortunately, thermalconductivity is not sensitive enough to detect minute quantities of analyte eluted from opentubular columns smaller than 0.53 mm in diameter. Thermal conductivity detectors are stillused for 0.53-mm columns and for packed columns.
Thermal conductivity measures the ability of a substance to transport heat from a hotregion to a cold region (Table 24-4). Helium is the carrier gas commonly used with a thermalconductivity detector. Helium has the second highest thermal conductivity (after H2), so anyanalyte mixed with helium lowers the conductivity of the gas stream. In Figure 24-17, eluatefrom the chromatography column flows over a hot tungsten-rhenium filament. When analyteemerges from the column, the conductivity of the gas stream decreases, the filament gets hot-ter, its electrical resistance increases, and the voltage across the filament changes. The detec-tor measures the change in voltage.
It is common to split the carrier gas into two streams, sending part through the analyti-cal column and part through a matched reference column. Each stream is passed over a dif-ferent filament or alternated over a single filament. The resistance of the sample filament ismeasured with respect to that of the reference filament. The reference column minimizesflow differences when temperature is changed. Sensitivity increases with the square of thefilament current. However, the maximum recommended current should not be exceeded, toavoid burning out the filament. The filament should be off when carrier gas is not flowing.
The sensitivity of a thermal conductivity detector (but not that of the flame ionizationdetector, described next) is inversely proportional to flow rate: It is more sensitive at a lowerflow rate. Sensitivity also increases with increasing temperature differences between the fila-ment and the surrounding block in Figure 24-17. The block should therefore be maintained atthe lowest temperature that allows all solutes to remain gaseous.
Flame Ionization DetectorIn the flame ionization detector in Figure 24-18, eluate is burned in a mixture of H2 and air.Carbon atoms (except carbonyl and carboxyl carbons) produce CH radicals, which arethought to produce ions and electrons in the flame.
CH � O S CHO� � e�
CHO�
w1/2
Area of Gaussian peak � 1.064 � peak height � w1/2
Table 24-4 Thermal conductivityat 273 K and 1 atm
Thermal conductivityGas
0.170He 0.141
0.021 50.024 30.017 00.024 6
Ar 0.016 20.015 10.014 40.007 6
The energy per unit area per unit time flowing from a hotregion to a cold region is given by
where is the thermal conductivity [ ]and dT/dx is the temperature gradient (K/m). Thermalconductivity is to energy flux as the diffusion coefficientis to mass flux.
units � J/ (K � m � s)�
Energy flux (J/m2 � s) � ��(dT/dx)
Cl2
CO2
C3H8
O2
C2H4
N2
NH3
H2
J/(K � m � s)
Quantitative analysis with internal standard:
F � response factor[S] � concentration of standard[X] � concentration of analyteAS � area of internal standardAX � area of analyte signal
AX
[X]� F aAS
[S]b
Thermal conductivity detector:
• linear response range• and He give lowest detection limit• sensitivity increases with
increasing filament currentdecreasing flow ratelower detector block temperature
H2
104
Block
Electrical leads topower supply andexternal bridgecircuit
Gasflowout
FilamentGasflowin
Igniter coil
Airinlet
Collector(positive electrode)
Flame tip(negative electrode)
Glass insulation
Air diffuser
Gasflowfromcolumn
Hydrogen inletFigure 24-17 Thermal conductivitydetector. [Courtesy Varian Associates, Palo Alto, CA.] Figure 24-18 Flame ionization detector. [Courtesy Varian Associates, Palo Alto, CA.]

24-3 Detectors 543
Only about 1 in 105 carbon atoms produces an ion, but ion production is proportional to thenumber of susceptible carbon atoms entering the flame. In the absence of analyte, Aflows between the flame tip and the collector, which is held at to 300 V with respect tothe flame tip. Eluted analytes produce a current of A, which is converted to voltage,amplified, filtered to remove high-frequency noise, and finally converted to a digital signal.
Response to organic compounds is proportional to solute mass over seven orders ofmagnitude. The detection limit is times smaller than that of the thermal conductivitydetector (Table 24-5) and is reduced by 50% when N2 carrier gas is used instead of He. Foropen tubular columns, N2 makeup gas is added to the H2 or He eluate before it enters thedetector. The flame ionization detector is sensitive enough for narrow-bore columns. Itresponds to most hydrocarbons and is insensitive to nonhydrocarbons such as H2, He, N2, O2,CO, CO2, H2O, NH3, NO, H2S, and SiF4.
Electron Capture DetectorMost detectors other than flame ionization and thermal conductivity respond to limitedclasses of analytes. The electron capture detector is sensitive to halogen-containing mole-cules, conjugated carbonyls, nitriles, nitro compounds, and organometallic compounds butrelatively insensitive to hydrocarbons, alcohols, and ketones. The carrier or makeup gas mustbe either N2 or 5% methane in Ar. Moisture decreases the sensitivity. Gas entering the detec-tor is ionized by high-energy electrons (“ ”) emitted from a foil containing radioactive
. Electrons thus formed are attracted to an anode, producing a small, steady current.When analytes with a high electron affinity enter the detector, they capture some electrons.The detector responds by varying the frequency of voltage pulses between anode and cathodeto maintain a constant current. The electron capture detector is extremely sensitive (Table 24-5),with a detection limit comparable to that of mass spectrometric selected ion monitoring.Figure 24-19 shows an application in which this detector was used to measure halogenated“greenhouse gases” (Box 20-1) in the lower atmosphere.
63Ni�-rays
�100
�10�12�200
�10�14
Table 24-5 Detection limits and linear ranges of gas chromatography detectors
Detector Approximate detection limit Linear range
Thermal conductivity 400 pg/mL (propane) !Flame ionization 2 pg/s !Electron captureFlame photometric " !
" !Nitrogen-phosphorus 100 fg/sSulfur chemiluminescence 100 fg/s (sulfur)Photoionization 25 pg to 50 pg (aromatics) !Fourier transform infrared 200 pg to 40 ngMass spectrometric 25 fg to 100 pg
SOURCE: Most data are from D. G. Westmoreland and G. R. Rhodes, “Detectors for Gas Chromatography,” Pure Appl.Chem. 1989, 61, 1147.
10510410510510510310 pg/s (sulfur)1041 pg/s (phosphorus)104As low as 5 fg/s107105
Flame ionization detector:
• gives best detection limit• signal proportional to number of susceptible
carbon atoms• 100-fold better detection than thermal
conductivity• linear response range107
N2
5 6 7 8 9 10 11 12 13 14 15
CB
rF3
OC
SH
CF
C-2
2
CFC-12
CH
3Cl
CF
C-1
14 CB
rClF
2
CH
3Br
CFC-11
CH
3I CH
2Cl 2
CFC-113
CH
Cl 3
CH3CHCl2 CCl4
CH
2Br 2
Time (min)
Det
ecto
r re
spon
se
HC
lC
CC
l 2
Cl 2
C
CC
l 2
Figure 24-19 Partial gaschromatogram for which an electroncapture detector was used to measurehalogenated compounds in aircollected by an aircraft at an altitudeof 800 m at a location 1 400 km southof New Zealand in 1995. [From F. S. Rowland,
“Stratospheric Ozone Depletion by
Chlorofluorocarbons,” Angew. Chem. Int. Ed.
Engl. 1996, 35, 1787.]

544 CHAPTER 24 Gas Chromatography
Other DetectorsThe nitrogen-phosphorus detector, also called an alkali flame detector, is a modified flameionization detector that is especially sensitive to compounds containing N and P.15 Itsresponse to N and P is times greater than the response to carbon. It is particularlyimportant for drug, pesticide, and herbicide analyses. Ions such as , , and , pro-duced by these elements when they contact a -containing glass bead at the burner tip,create the current that is measured. N2 from air is inert to this detector and does not interfere.The bead must be replaced periodically because is consumed. Figure 24-26 (in thenext section) shows a chromatogram from a nitrogen-phosphorus detector.
A flame photometric detector measures optical emission from phosphorus, sulfur, lead,tin, or other selected elements. When eluate passes through a H2-air flame, as in the flameionization detector, excited atoms emit characteristic light. Phosphorus emission at 536 nmor sulfur emission at 394 nm can be isolated by a narrow-band interference filter and detectedwith a photomultiplier tube.
A photoionization detector uses a vacuum ultraviolet source to ionize aromatic andunsaturated compounds, with little response to saturated hydrocarbons or halocarbons. Elec-trons produced by the ionization are collected and measured.
A sulfur chemiluminescence detector takes exhaust from a flame ionization detector, inwhich sulfur has been oxidized to SO, and mixes it with ozone ( ) to form an excited state of
that emits blue light and ultraviolet radiation. Emission intensity is proportional to themass of sulfur eluted, regardless of the source, and the response to S is times greater thanthe response to C (Figure 24-20). A nitrogen chemiluminescence detector is analogous. Com-bustion of eluate at converts nitrogen into NO, which reacts with to create achemiluminescent product. The response to N is times greater than the response to C.107
O31 800°C
107SO2
O3
Rb2SO4
Rb2SO4
PO2�CN�NO2
�
104–106
Figure 24-20 Gas chromatograms showing sulfur compounds in natural gas: (a) flame ionizationdetector response and (b) sulfur chemiluminescence detector response.The organosulfur compounds aretoo dilute to be seen in flame ionization, and the sulfur chemiluminescence is insensitive to hydrocarbons.[From N. G. Johansen and J. W. Birks,“Determination of Sulfur Compounds in Difficult Matrices,” Am. Lab. February 1991, 112.]
128mV
Met
hane
Eth
ane
Propane
i -Butane
n-Butane
i-Pentane
n-Pentane2-Methylpentane
3-Methylpentanen-Hexane
Methylcyclopentane
0 5 10 15
Time (min)
0 5 10 15
Time (min)
1 mV
H2S
COS
SO2
CH3SHCH3CH2SH
CS2
(CH3)2CHSH
(CH3)3CSH
CH3CHCH2CH3
SH
Det
ecto
r re
spon
seD
etec
tor
resp
onse
(a)
(b)
Other gas chromatography detectors:
electron capture: halogens, conjugated
nitrogen-phosphorus: highlights P, Nflame photometer: individual selected
elements, such as P, S, Sn, Pbphotoionization: aromatics, unsaturated
compoundssulfur chemiluminescence: Snitrogen chemiluminescence: Natomic emission: most elements (selected
individually)mass spectrometer: most analytesinfrared spectrometer: most analytes
C¢O, ßCΩN, ßNO2
Reactions thought to give sulfurchemiluminescence:
SO2* S SO2 � h
(SO2* � excited state)SO � O3 S SO2* � O2
Sulfur compound ----------------¡H2�O2 flame
SO � products
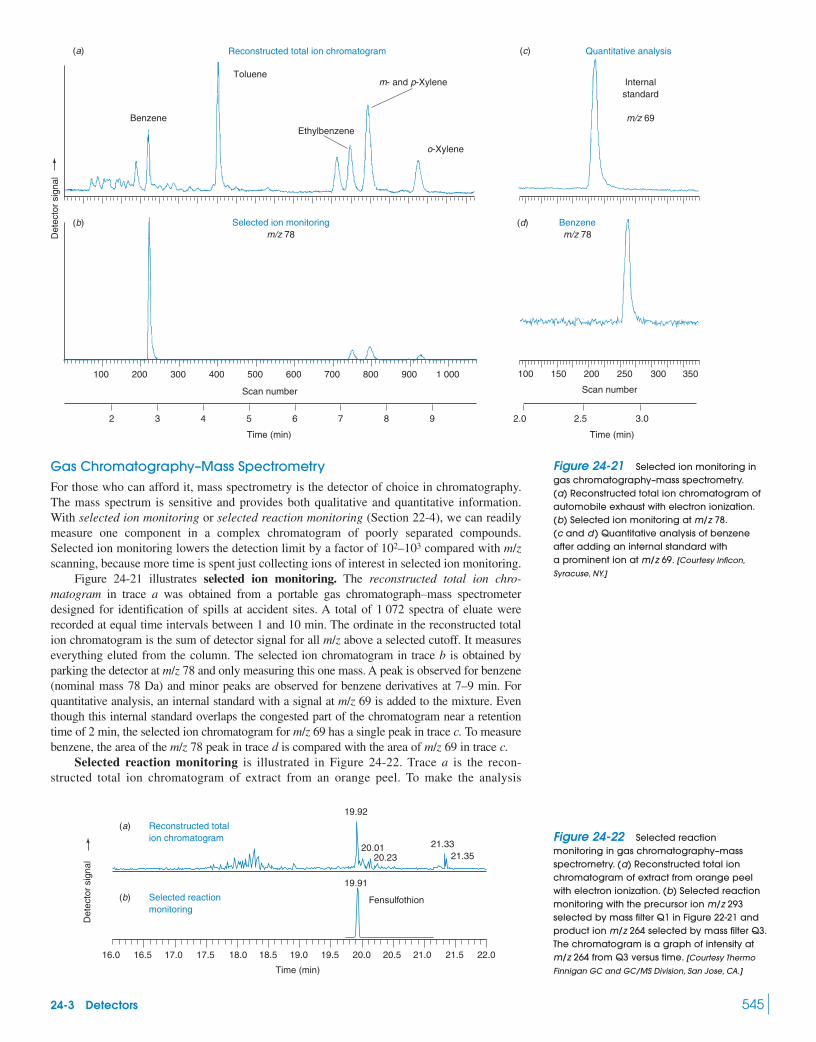
24-3 Detectors 545
Gas Chromatography–Mass SpectrometryFor those who can afford it, mass spectrometry is the detector of choice in chromatography.The mass spectrum is sensitive and provides both qualitative and quantitative information.With selected ion monitoring or selected reaction monitoring (Section 22-4), we can readilymeasure one component in a complex chromatogram of poorly separated compounds.Selected ion monitoring lowers the detection limit by a factor of compared with m/zscanning, because more time is spent just collecting ions of interest in selected ion monitoring.
Figure 24-21 illustrates selected ion monitoring. The reconstructed total ion chro-matogram in trace a was obtained from a portable gas chromatograph–mass spectrometerdesigned for identification of spills at accident sites. A total of 1 072 spectra of eluate wererecorded at equal time intervals between 1 and 10 min. The ordinate in the reconstructed totalion chromatogram is the sum of detector signal for all m/z above a selected cutoff. It measureseverything eluted from the column. The selected ion chromatogram in trace b is obtained byparking the detector at m/z 78 and only measuring this one mass. A peak is observed for benzene(nominal mass 78 Da) and minor peaks are observed for benzene derivatives at 7–9 min. Forquantitative analysis, an internal standard with a signal at m/z 69 is added to the mixture. Eventhough this internal standard overlaps the congested part of the chromatogram near a retentiontime of 2 min, the selected ion chromatogram for m/z 69 has a single peak in trace c. To measurebenzene, the area of the m/z 78 peak in trace d is compared with the area of m/z 69 in trace c.
Selected reaction monitoring is illustrated in Figure 24-22. Trace a is the recon-structed total ion chromatogram of extract from an orange peel. To make the analysis
102–103
Selected ion monitoringm/z 78
Benzenem/z 78
Scan number Scan number
Det
ecto
r si
gnal
Benzene
TolueneInternal
standard
m/z 69
m- and p-Xylene
o-Xylene
Ethylbenzene
100 200 300 400 500 600 700 800 100 150 200 250 300 350900 1 000
2 3 4 5 6 7 8 9 2.0 2.5 3.0
Time (min) Time (min)
(a) (c)
(b) (d)
Reconstructed total ion chromatogram Quantitative analysis
Det
ecto
r si
gnal
22.021.521.020.520.0
19.91
19.92
20.0120.23
21.3321.35
19.519.0
Time (min)
18.518.017.517.016.516.0
Reconstructed totalion chromatogram
(a)
Selected reactionmonitoring
(b) Fensulfothion
Figure 24-21 Selected ion monitoring ingas chromatography–mass spectrometry.(a) Reconstructed total ion chromatogram ofautomobile exhaust with electron ionization.(b) Selected ion monitoring at m/z 78.(c and d) Quantitative analysis of benzeneafter adding an internal standard witha prominent ion at m/z 69. [Courtesy Inficon,
Syracuse, NY.]
Figure 24-22 Selected reactionmonitoring in gas chromatography–massspectrometry. (a) Reconstructed total ionchromatogram of extract from orange peelwith electron ionization. (b) Selected reactionmonitoring with the precursor ion m/z 293selected by mass filter Q1 in Figure 22-21 andproduct ion m/z 264 selected by mass filter Q3.The chromatogram is a graph of intensity atm/z 264 from Q3 versus time. [Courtesy Thermo
Finnigan GC and GC/MS Division, San Jose, CA.]

546 CHAPTER 24 Gas Chromatography
selective for the pesticide fensulfothion, the precursor ion m/z 293 selected by mass filterQ1 in Figure 22-21 was passed to collision cell Q2 in which it broke into fragments witha prominent ion at m/z 264. Trace b in Figure 24-22 shows the detector signal at m/z 264from mass filter Q3. Only one peak is observed because few compounds other than fen-sulfothion give rise to an ion at m/z 293 producing a fragment at m/z 264. Selected reac-tion monitoring increases the signal-to-noise ratio in chromatographic analysis and elimi-nates much interference.
Fensulfothion(nominal mass 308 Da)
OP
CH3CH2OOCH2CH3
SS
O�
OCH2CH3
collisioncell, Q2
M � 15 � 29 (m/z 264)Selected by Q3
M � 15 (m/z 293)Selected by Q1
S
O�
O
OP
SS
O
CH3
OP
CH3CH2OOCH2CH3
S � e�
� CH3
S
Element-Specific Plasma DetectorsEluate from a chromatography column can be passed through a plasma to atomize and ionizeits components and measure selected elements by atomic emission spectroscopy or massspectrometry. An atomic emission detector directs eluate through a helium plasma in amicrowave cavity. Every element of the periodic table produces characteristic emission thatcan be detected by a photodiode array polychromator (Figure 20-14). Sensitivity for sulfurcan be 10 times better than the sensitivity of a flame photometric detector.
The extremely sensitive inductively coupled plasma–mass spectrometer was describedin Section 21-6. Figure 24-23 shows 15 pesticides measured by gas chromatography–-inductively coupled plasma–mass spectrometry. Eluate was atomized and ionized in theplasma. Ions were measured by a mass spectrometer that could monitor any set of m/z values.The figure shows traces for P, S, I, Cl, or Br.
10 15 20 25
Time (min)
30 35
Det
ecto
r re
spon
se
1,2,
3-Tr
ichl
orob
enze
ne
Dic
hlob
enil
Eth
opro
p Pho
rate
Terb
ufos D
iazi
non
Ioxy
nil-m
ethy
l
Chl
orpy
rifos
Mal
athi
on
Trip
heny
lpho
spha
te
Phosphorus
Sulfur
Iodine
Chlorine
Decachlorobiphenyl
Bromine
4,4-DBOB
2,4,6-TBA
PC
NB
Silv
ex
Figure 24-23 Extracted element chromatograms produced by gas chromatography–inductivelycoupled plasma–mass spectrometry. Each trace responds to just one element. [From D. Profrock,
P. Leonhard, S. Wilbur, and A. Prange, “Sensitive, Simultaneous Determination of P, S, Cl, Br, and I Containing Pesticides
in Environmental Samples by GC Hyphenated with Collision-Cell ICP-MS,” J. Anal. Atom. Spectros. 2004, 19, 1.]

24-4 Sample Preparation 547
24-4 Sample PreparationSample preparation is the process of transforming a sample into a form that is suitablefor analysis. This process might entail extracting analyte from a complex matrix, pre-concentrating very dilute analytes to get a concentration high enough to measure, remov-ing or masking interfering species, or chemically transforming (derivatizing) analyteinto a more convenient or more easily detected form. Chapter 28 is devoted to samplepreparation, so we now describe only techniques that are especially applicable to gaschromatography.
Solid-phase microextraction is a method to extract compounds from liquids, air, oreven sludge without using any solvent.16 The key component is a fused-silica fiber coatedwith a film of stationary phase similar to those used in gas chromatog-raphy. Figure 24-24 shows the fiber attached to the base of a syringe with a fixed metal nee-dle. The fiber can be extended from the needle or retracted inside the needle. Figure 24-25demonstrates the procedure of exposing the fiber to a sample solution (or the gaseous head-space above the liquid) for a fixed time while stirring and, perhaps, heating. It is best todetermine by experiment how much time is required for the fiber to become saturated withanalyte and to allow this much time for extraction. If you use shorter times, the concentrationof analyte in the fiber is likely to vary from sample to sample. Only a fraction of the analytein the sample is extracted into the fiber. When you extract the headspace, liquid sampleshould occupy about two-thirds of the vial. Too much headspace volume reduces extractionefficiency.
10- to 100-�m-thick
Example of derivatization:
Nonvolatilecarboxylic acid
Volatile trimethylsilylester derivative
O
RCOSi(CH3)3
O
RCOH
Syringebarrel
Septum piercing needle
Fiber attachment tubing
Fused silica fiberwith stationaryliquid-phasecoating
Pierce sampleseptum withmetal needle
Retract fiberand withdrawneedle
Piercechromatographyseptum withmetal needle
Retract fiberand withdrawneedle
Expose fiberto solution orheadspace forfixed time withstirring
Expose hot fiberto carrier gasfor fixed time(column is cold)
Figure 24-24 Syringe for solid-phasemicroextraction. The fused silica fiber iswithdrawn inside the steel needle after samplecollection and when the syringe is used topierce a septum.
Figure 24-25 Sampling by solid-phase microextraction and desorption of analyte from the coatedfiber into a gas chromatograph. [Adapted from Supelco Chromatography Products catalog, Bellefonte, PA.]
After sample collection, retract the fiber and insert the syringe into a gas chromatograph.Extend the fiber into the hot injection liner, where analyte is thermally desorbed from thefiber in splitless mode for a fixed time. Collect desorbed analyte by cold trapping (Sec-tion 24-2) at the head of the column prior to chromatography. If there will be a long timebetween sampling and injection, insert the needle into a septum to seal the fiber from theatmosphere. Figure 24-26 shows a chromatogram of chemical warfare nerve agents isolatedfrom seawater by solid-phase microextraction and detected with a nitrogen-phosphorusdetector. The chromatogram is deceptively simple because the detector responds only tocompounds containing N and P.

548 CHAPTER 24 Gas Chromatography
In solid-phase microextraction, the mass of analyte ( ) absorbed in the coatedfiber is
Mass of analyte extracted: (24-3)
where is the volume of film on the fiber, is the volume of solution being extracted, andis the initial concentration of analyte in the solution being extracted. K is the
partition coefficient for solute between the film and the solution: , where is theconcentration of analyte in the film and is the concentration of analyte in the solution. Ifyou extract a large volume of solution such that , then Equation 24-3 reduces to
. That is, the mass extracted is proportional to the concentration of analyte insolution. For quantitative analysis, you can construct a calibration curve by extracting knownsolutions. Alternatively, internal standards and standard additions are both useful for solid-phase microextraction.
Purge and trap is a method for removing volatile analytes from liquids or solids (suchas groundwater or soil), concentrating the analytes, and introducing them into a gas chro-matograph. In contrast with solid-phase microextraction, which removes only a portion ofanalyte from the sample, the goal in purge and trap is to remove 100% of analyte from thesample. Quantitative removal of polar analytes from polar matrices can be difficult.
Figure 24-27 shows apparatus for measuring volatile flavor components in carbonatedbeverages. Helium purge gas from a stainless steel needle is bubbled through the cola in thesample vial, which is heated to to aid evaporation of analytes. Purge gas exiting thesample vial passes through an adsorption tube containing three layers of adsorbent com-pounds with increasing adsorbent strength. For example, the moderate adsorbent could be anonpolar phenylmethylpolysiloxane, the stronger adsorbent could be the polymer Tenax, andthe strongest adsorbent could be carbon molecular sieves.17
During the purge and trap process, gas flows through the adsorbent tube from end A toend B in Figure 24-27. After purging all analyte from the sample into the adsorption tube,reverse the gas flow to go from B to A and purge the trap at to remove as much wateror other solvent as possible from the adsorbents. Then connect outlet A of the adsorption tubeto the injection port of a gas chromatograph operating in splitless mode and heat the trap to
. Desorbed analytes flow into the chromatography column, where they are concen-trated by cold trapping. After complete desorption from the trap, warm the chromatographycolumn to initiate the separation.
Thermal desorption is a method to release volatile compounds from solid samples. Aweighed sample is placed in a steel or glass tube and held in place with glass wool. The sam-ple is purged with carrier gas to remove , which is vented to the air, not into the chro-O2
�200°C
25°C
50°C
m � KVfC0
Vs W KVf
Cs
CfK � Cf/Cs
(�g/mL)C0
VsVf
m �KVfC0Vs
KVf � Vs
m, �g
Soman
Tabun
Sarin
6 8 10 12 14 16Time (min)
Det
ecto
r re
spon
se
CH3
O
OP
F
Figure 24-26 Gas chromatogram of nerveagents sampled by solid-phase microextraction for30 min from seawater spiked with 60 nL of eachagent per liter (60 ppb by volume). The fiber had a65-�m-thick coating of copoly(dimethylsiloxane/divinylbenzene). The nitrogen-phosphorus detectorhad a detection limit of 0.05 ppb. Analytes weredesorbed from the fiber for 2 min at 250�C in splitlessmode in the injection port. The column temperaturewas 30�C during desorption and then it was rampedup at during chromatography. The columnwas with a coating of
. Soman appearsas a split peak because it has two isomers.[From H.-Å. Lakso and W. F. Ng, “Determination of Chemical
Warfare Agents in Natural Water Samples by Solid-Phase
Microextraction,” Anal. Chem. 1997, 69, 1866.]
(phenyl)0.05(methyl)0.95polysiloxane1-�m0.32 mm � 30 m
10°C/min
Adsorptiontube
Strongestadsorbent
Strongeradsorbent
Moderateadsorbent
Silanizedglass wool
Purge gas
Oven
Injection port
Sample vial
A
B
Figure 24-27 Purge and trap apparatusfor extracting volatile substances from a liquidor solid by flowing gas.
You need to establish the time and temperaturerequired to purge 100% of the analyte from thesample in separate control experiments.
Tenax
C6H5
C6H5
n
O

matography column. The desorption tube is then connected to the chromatography columnand heated to release volatile substances that are collected by cold trapping at the beginningof the column. The column is then heated rapidly to initiate chromatography.
24-5 Method Developmentin Gas Chromatography
With the bewildering choice of parameters in gas chromatography, is there a rational way tochoose a procedure for a particular problem? In general, there are many satisfactory solu-tions. We now discuss some broad guidelines for selecting a method to use.18 The orderin which decisions should be made is to consider (1) the goal of the analysis, (2) samplepreparation, (3) detector, (4) column, and (5) injection.
Goal of the AnalysisWhat is required from the analysis? Is it qualitative identification of components in a mix-ture? Will you require high-resolution separation of everything or do you just need goodresolution in a portion of the chromatogram? Can you sacrifice resolution to shorten theanalysis time? Do you need quantitative analysis of one or many components? Do youneed high precision? Will analytes be present in adequate concentration or do you needpreconcentration or a very sensitive detector for ultratrace analysis? How much can theanalysis cost? Each of these factors creates trade-offs in selecting techniques.
Sample PreparationThe key to successful chromatography of a complex sample is to clean it up before it eversees the column. In Section 24-4, we described solid-phase microextraction, purge and trap,and thermal desorption to isolate volatile components from complex matrices. Other methodsinclude liquid extraction, supercritical fluid extraction, and solid-phase extraction, most ofwhich are described in Chapter 28. These techniques isolate desired analytes from interferingsubstances, and they can concentrate dilute analytes up to detectable levels. If you do notclean up your samples, chromatograms could contain a broad “forest” of unresolved peaks,and nonvolatile substances will ruin the expensive chromatography column.
Choosing the DetectorThe next step is to choose a detector. Do you need information about everything in the sam-ple or do you want a detector that is specific for a particular element or a particular class ofcompounds?
The most general purpose detector for open tubular chromatography is a mass spec-trometer. Flame ionization is probably the most popular detector, but it mainly responds tohydrocarbons; and Table 24-5 shows that it is not as sensitive as electron capture, nitrogen-phosphorus, or chemiluminescence detectors. The flame ionization detector requires the sam-ple to contain of each analyte for split injection. The thermal conductivity detectorresponds to all classes of compounds, but it is not sensitive enough for high-resolution, narrow-bore, open tubular columns.
Sensitive detectors for ultratrace analysis each respond to a limited class of analytes.The electron capture detector is specific for halogen-containing molecules, nitriles, nitrocompounds, and conjugated carbonyls. For split injection, the sample should contain
of each analyte if an electron capture detector is to be used. A photoionizationdetector can be specific for aromatic and unsaturated compounds. The nitrogen-phosphorusdetector has enhanced response to compounds containing either of these two elements, but italso responds to hydrocarbons. Sulfur and nitrogen chemiluminescence detectors eachrespond to just one element. Flame photometric detectors are specific for selected elements,such as S, P, Pb, or Sn. A selective detector might be chosen to simplify the chromatogramby not responding to everything that is eluted (as in Figure 24-23). Mass spectrometry withselected reaction monitoring (Figure 24-21) is an excellent way to monitor one analyte ofinterest in a complex sample.
If qualitative information is required to identify eluates, then mass spectral or infrareddetectors are good choices. The infrared detector, like the thermal conductivity detector, isnot sensitive enough for high-resolution, narrow-bore, open tubular columns.
�100 ppb
�10 ppm
24-5 Method Development in Gas Chromatography 549
Order of decisions:
1. goal of analysis2. sample preparation3. detector4. column5. injection
Garbage in—garbage out!

550 CHAPTER 24 Gas Chromatography
Selecting the ColumnThe basic choices are the stationary phase, column diameter and length, and the thickness ofstationary phase. A nonpolar stationary phase in Table 24-1 is most useful. An intermediatepolarity stationary phase will handle most separations that the nonpolar column cannot. Forhighly polar compounds, a strongly polar column might be necessary. Optical isomers andclosely related geometric isomers require special stationary phases for separation.
Table 24-6 shows that there are only a few sensible combinations of column diameterand film thickness. Highest resolution is afforded by the narrowest columns. Thin-film,narrow-bore columns are especially good for separating mixtures of high-boiling-point com-pounds that are retained too strongly on thick-film columns. Short retention times providehigh-speed analyses. However, thin-film, narrow-bore columns have very low sample capac-ity, require high-sensitivity detectors (flame ionization might not be adequate), do not retainlow-boiling-point compounds well, and could suffer from exposure of surface active sites onthe silica.
Thick-film, narrow-bore columns in Table 24-6 provide a good compromise betweenresolution and sample capacity. They can be used with most detectors (but usually not ther-mal conductivity or infrared) and with compounds of high volatility. Retention times arelonger than those of thin-film columns. Thick-film, wide-bore columns are required for usewith thermal conductivity and infrared detectors. They have high sample capacity and canhandle highly volatile compounds, but they give low resolution and have long retentiontimes.
If a particular column meets most of your requirements but does not provide sufficientresolution, then a longer column of the same type could be used. Doubling the length of acolumn doubles the number of plates and, according to Equation 23-30, increases resolutionby . This is not necessarily the best way to increase resolution, because it doubles theretention time. Using a narrower column increases resolution with no penalty in retentiontime. Selecting another stationary phase changes the separation factor ( in Equation 23-30)and might resolve components of interest.
If you have measured resolution of a few key components of a mixture under a smallnumber of conditions, commercial software is available to optimize conditions (such as tem-perature and pressure programming) for the best separation.19 Just over the horizon, greatlyimproved separations will be possible by coupling two different columns in series with pro-grammable control of the flow rates (pressure) in each column during the separation.20
�
22
Table 24-6 Gas chromatography column comparisons18
Description Thin-film narrow-bore Thick-film narrow-bore Thick-film wide-bore
Inner diameter 0.10–0.32 mm 0.25–0.32 mm 0.53 mm
Film thickness
Advantages High resolution Good capacity High capacity (100 ng/Trace analysis Good resolution solute)Fast separations (4 000 plates/m) Good for thermal conductivityLow temperatures Easy to use and infrared detectorsElute high-b.p. compounds Retains volatile compounds Simple injection techniques
Good for mass spectrometry
Disadvantages Low capacity Moderate resolution Low resolution( ng/solute) Long retention time for (500–2 000 plates/m)
Requires high-sensitivity high-b.p. compounds Long retention time fordetector (not mass spectrometry) high-b.p. compounds
Surface activity of exposed silica
�1
�2–5 �m�1–2 �m�0.2 �m
To improve resolution, use a:
• longer column• narrower column• different stationary phase
Exercises 551
Terms to Understandcarrier gasco-chromatographycold trappingelectron capture detectorflame ionization detectorgas chromatographyguard column
molecular sieveon-column injectionopen tubular columnpacked columnpurge and trapretention gapretention index
sample preparationselected ion monitoringselected reaction monitoringseptumsolid-phase microextractionsolvent trappingsplit injection
splitless injectiontemperature programmingthermal conductivity detectorthermal desorption
SummaryIn gas chromatography, a volatile liquid or gaseous solute is carriedby a gaseous mobile phase over a stationary phase on the inside ofan open tubular column or on a solid support. Long, narrow, fused-silica open tubular columns have low capacity but give excellentseparation. They can be wall coated, support coated, or porouslayer. Packed columns provide high capacity but poor resolution.Each liquid stationary phase most strongly retains solutes in its ownpolarity class (“like dissolves like”). Solid stationary phases includeporous carbon, alumina, and molecular sieves. The retention indexmeasures elution times in relation to those of linear alkanes. Tem-perature or pressure programming reduces elution times of stronglyretained components. Without compromising separation efficiency,the linear flow rate may be increased when or He, instead of ,is used as carrier gas. Split injection provides high-resolution sepa-rations of relatively concentrated samples. Splitless injection ofvery dilute samples requires solvent trapping or cold trapping toconcentrate solutes at the start of the column (to give sharp bands).On-column injection is best for quantitative analysis and for ther-mally unstable solutes.
Quantitative analysis is usually done with internal standards ingas chromatography. Co-chromatography of an authentic sample
N2H2
with an unknown on several different columns is useful for qualita-tive identification of a peak. Mass spectral and infrared detectorsprovide qualitative information that helps identify peaks fromunknown compounds. The mass spectrometer becomes more sensi-tive and less subject to interference when selected ion monitoringor selected reaction monitoring is employed. Thermal conductivitydetection has universal response but is not sensitive enough fornarrow-bore, open tubular columns. Flame ionization detection issensitive enough for most columns and responds to most organiccompounds. Electron capture, nitrogen-phosphorus, flame photom-etry, photoionization, chemiluminescence, and atomic emissiondetectors are specific for certain classes of compounds or individualelements.
You need to decide the goal of an analysis before developinga chromatographic method. The key to successful chromatogra-phy is to have a clean sample. Solid-phase microextraction, purgeand trap, and thermal desorption can isolate volatile componentsfrom complex matrices. After the sample preparation method hasbeen chosen, the remaining decisions for method development areto select a detector, a column, and the injection method, in thatorder.
Choosing the Injection MethodThe last major decision is how to inject the sample. Split injection is best for high concentra-tions of analyte or gas analysis. Quantitative analysis is very poor. Less volatile componentscan be lost during injection. Split injection offers high resolution and can handle dirty sam-ples if an adsorbent packing is added to the injection liner. Thermally unstable compoundscan decompose during the high-temperature injection.
Splitless injection is required for very dilute solutions. It offers high resolution but ispoor for quantitative analysis because less volatile compounds can be lost during injection. Itis better than split injection for compounds of moderate thermal stability because the injec-tion temperature is lower. Splitless injection introduces sample onto the column slowly, sosolvent trapping or cold trapping is required. Therefore, splitless injection cannot be used forisothermal chromatography. Samples containing less than 100 ppm of each analyte can beanalyzed with a column film thickness with splitless injection. Samples containing100–1 000 ppm of each analyte require a column film thickness .
On-column injection is best for quantitative analysis and for thermally sensitive com-pounds. It is strictly a low-resolution technique and cannot be used with columns whose innerdiameter is less than 0.2 mm. It can handle dilute or concentrated solutions and relatively largeor small volumes. Other column requirements are the same as in splitless injection.
�1 �m61 �m
Split injection:
• concentrated sample• high resolution• dirty samples (use packed liner)• could cause thermal decomposition
Splitless injection:
• dilute sample• high resolution• requires solvent trapping or cold trapping
On-column injection:
• best for quantitative analysis• thermally sensitive compounds• low resolution
Exercises24-A. (a) When a solution containing 234 mg of butanol (FM 74.12)and 312 mg of hexanol (FM 102.17) in 10.0 mL was separated by gaschromatography, the relative peak areas were
. Considering butanol to be the internal standard, find theresponse factor for hexanol.(b) Use Equation 24-2 to estimate the areas of the peaks for butanoland hexanol in Figure 24-8.
1.00:1.45butanol:hexanol �
(c) The solution from which the chromatogram was generatedcontained 112 mg of butanol. What mass of hexanol was in thesolution?(d) What is the largest source in uncertainty in this problem? Howgreat is this uncertainty?24-B. When 1.06 mmol of 1-pentanol and 1.53 mmol of 1-hexanolwere separated by gas chromatography, they gave relative peak
552 CHAPTER 24 Gas Chromatography
areas of 922 and 1 570 units, respectively. When 0.57 mmol of pen-tanol was added to an unknown containing hexanol, the relativechromatographic peak areas were 843:816 (pentanol:hexanol). Howmuch hexanol did the unknown contain?
24-C. (a) In Table 24-3, 2-pentanone has a retention index of 987 ona poly(ethylene glycol) column (also called Carbowax). Betweenwhich two straight-chain hydrocarbons is 2-pentanone eluted?(b) An unretained solute is eluted from a certain column in 1.80 min.Decane is eluted in 15.63 min and undecane iseluted in 17.22 min. What is the retention time of a compoundwhose retention index is 1 050?
24-D. For a homologous series of compounds (those with similarstructures, but differing by the number of groups in a chain),
is usually a linear function of the number of carbon atoms. Acompound was known to be a member of the family
(a) From the gas chromatographic retention times given here, preparea graph of versus n and estimate the value of n in the chemicalformula.
4.0 min 1.1 min6.5 min unknown 42.5 min
86.9 minn � 14n � 8
CH4n � 7
log t¿r
(CH3)2CH(CH2)nCH2OSi(CH3)3
log t¿rCH2
(C11H24)(C10H22)
Problems24-1. (a) What is the advantage of temperature programming in gaschromatography?(b) What is the advantage of pressure programming?
24-2. (a) What are the relative advantages and disadvantages ofpacked and open tubular columns in gas chromatography?(b) Explain the difference between wall-coated, support-coated, andporous-layer open tubular columns.(c) What is the advantage of bonding (covalently attaching) thestationary phase to the column wall or cross-linking the stationaryphase to itself?
24-3. (a) Why do open tubular columns provide greater resolutionthan packed columns in gas chromatography?(b) Why do and He allow more rapid linear flow rates in gaschromatography than does, without loss of column efficiency(Figure 24-12)?
24-4. (a) When would you use split, splitless, or on-column injec-tion in gas chromatography?(b) Explain how solvent trapping and cold trapping work in split-less injection.
24-5. To which kinds of analytes do the following gas chromatogra-phy detectors respond?(a) thermal conductivity (f) photoionization(b) flame ionization (g) sulfur chemiluminescence(c) electron capture (h) atomic emission(d) flame photometric (i) mass spectrometer(e) nitrogen-phosphorus
24-6. Why does a thermal conductivity detector respond to all ana-lytes except the carrier gas? Why isn’t the flame ionization detectoruniversal?
24-7. Explain what is displayed in a reconstructed total ion chro-matogram, selected ion monitoring, and selected reaction monitoring.Which technique is most selective and which is least selective and why?
N2
H2
24-8. Use Table 24-3 to predict the elution order of the followingcompounds from columns containing (a) poly(dimethylsiloxane),(b) , and (c) poly(ethyleneglycol): hexane, heptane, octane, benzene, butanol, 2-pentanone.
24-9. Use Table 24-3 to predict the elution order of the followingcompounds from columns containing (a) poly(dimethylsiloxane),(b) , and (c) poly(ethyleneglycol):
1. 1-pentanol 4. octane
2. 2-hexanone 5. nonane
3. heptane 6. decane
24-10. This problem reviews concepts from Chapter 23. An unre-tained solute passes through a chromatography column in 3.7 minand analyte requires 8.4 min.(a) Find the adjusted retention time and capacity factor for the analyte.(b) The volume of the mobile phase is 1.4 times the volume of thestationary phase. Find the partition coefficient for the analyte.
24-11. If retention times in Figure 23-7 are 1.0 min for , 12.0 minfor octane, 13.0 min for unknown, and 15.0 min for nonane, findthe Kovats retention index for the unknown.
24-12. Retention time depends on temperature, T, according to theequation , where a and b are constants for a spe-cific compound on a specific column. A compound is eluted froma gas chromatography column at an adjusted retention time
when the column temperature is 373 K. At 363 K,. Find the parameters a and b and predict at 353 K.
24-13. What is the purpose of derivatization in chromatography?Give an example.
t¿rt¿r � 20.0 mint¿r � 15.0 min
log t¿r � (a/T) � b
CH4
(n-C10H22, b.p. 174°C)(n-C7H16, b.p. 98°C)
(n-C9H20, b.p. 151°C)(CH3C(¢O)C4H9, b.p. 128°C)
(n-C8H18, b.p. 126°C)(n-C5H11OH, b.p. 138°C)
(diphenyl)0.35(dimethyl)0.65polysiloxane
(diphenyl)0.35(dimethyl)0.65polysiloxane
(b) Calculate the capacity factor for the unknown.
24-E. Resolution of two peaks depends on the column plate num-ber, N, and the separation factor, , as given by Equation 23-30.Suppose you have two peaks with a resolution of 1.0 and you wantto increase the resolution to 1.5 for a baseline separation for quanti-tative analysis (Figure 23-10).(a) You can increase the resolution to 1.5 by increasing columnlength. By what factor must the column length be increased? If flowrate is constant, how much longer will the separation require whenthe length is increased?(b) You might change the separation factor by choosing a differentstationary phase. If was 1.013, to what value must it beincreased to obtain a resolution of 1.5? If you were separating twoalcohols with a polysiloxane station-ary phase (Table 24-1), what stationary phase would you chooseto increase ? Will this change affect the time required for chro-matography?
�
(diphenyl)0.05(dimethyl)0.95
�
�

Problems 553
24-14. Explain how solid-phase microextraction works. Why is coldtrapping necessary during injection with this technique? Is all theanalyte in an unknown extracted into the fiber in solid-phasemicroextraction?
24-15. Why is splitless injection used with purge and trap samplepreparation?
24-16. State the order of decisions in method development for gaschromatography.
24-17. (a) Why is it illogical to use a thin stationary phase in a wide-bore (0.53-mm) open tubular column?(b) Consider a narrow-bore (0.25 mm diameter), thin-film column with 5 000 plates per meter. Consider also a wide-bore (0.53-mm diameter), thick-film column with 1 500 platesper meter. The density of stationary phase is approximately 1.0 g/mL.What mass of stationary phase is in each column in a length equiva-lent to one theoretical plate? How many nanograms of analyte can beinjected into each column if the mass of analyte is not to exceed 1.0%of the mass of stationary phase in one theoretical plate?
24-18. How can you improve the resolution between two closelyspaced peaks in gas chromatography?
24-19. (a) When a solution containing 234 mg of pentanol (FM 88.15)and 237 mg of 2,3-dimethyl-2-butanol (FM 102.17) in 10.0 mL wasseparated, the relative peak areas were
. Considering pentanol to be the internal stan-dard, find the response factor for 2,3-dimethyl-2-butanol.(b) Use Equation 24-2 to find the areas for pentanol and 2,3-dimethyl-2-butanol in Figure 24-8.(c) The concentration of pentanol internal standard in the unknownsolution was 93.7 mM. What was the concentration of 2,3-dimethyl-2-butanol?
24-20. A standard solution containing iodoacetoneand p-dichlorobenzene (an internal standard) gavepeak areas of 395 and 787, respectively, in a gas chromatogram. A3.00-mL unknown solution of iodoacetone was treated with 0.100 mLof p-dichlorobenzene and the mixture was diluted to10.00 mL. Gas chromatography gave peak areas of 633 and 520 foriodoacetone and p-dichlorobenzene, respectively. Find the concen-tration of iodoacetone in the 3.00 mL of original unknown.
24-21. An unknown compound was co-chromatographed withheptane and decane. The adjusted retention times were heptane,12.6 min; decane, 22.9 min; unknown, 20.0 min. The retentionindexes for heptane and decane are 700 and 1 000, respectively.Find the retention index for the unknown.
24-22. The gasoline additive methyl t-butyl ether (MTBE) has beenleaking into groundwater ever since its introduction in the 1990s.MTBE can be measured at parts per billion levels by solid-phasemicroextraction from groundwater to which 25% (wt/vol) NaClhas been added (salting out, Problem 8-8). After microextraction,analytes are thermally desorbed from the fiber in the port of a gaschromatograph. The figure shows a reconstructed total ion chro-matogram and selected ion monitoring of substances desorbed fromthe extraction fiber.
Methyl t-butyl ether Ethyl t-butyl ether t-Amyl methyl etherMTBE ETBE TAME
Nominal mass: 88 102 102
OOO
1.6 � 10�5 M
2.0 � 10�7 M6.3 � 10�8 M
butanol � 0.913:1.00pentanol:2,3-dimethyl-2-
(5.0 �m)
(0.10 �m)
(0.2 �m)
(a) What is the purpose of adding NaCl prior to extraction?(b) What nominal mass is being observed in selected ion monitor-ing? Why are only three peaks observed?(c) Here is a list of major ions above m/z 50 in the mass spectra. Thebase (tallest) peak is marked by an asterisk. Given that MTBE andTAME have an intense peak at m/z 73 and there is no significantpeak at m/z 73 for ETBE, suggest a structure for m/z 73. Suggeststructures for all ions listed in the table.
MTBE ETBE TAME
73* 87 8757 59* 73*
57 7155
Reconstructed total ion chromatogram and selected ion monitoring ofsolid-phase microextract of groundwater. Chromatography conditions:
column with film of poly(dimethylsiloxane).for 4 min, then raised to , held for 3 min,
and then raised to . [From D. A. Cassada, Y. Zhang, D. D. Snow,
and R. F. Spalding, “Trace Analysis of Ethanol, MTBE, and Related Oxygenate
Compounds in Water Using Solid-Phase Microextraction and Gas Chromatography/
Mass Spectrometry,” Anal. Chem. 2000, 72, 4654.]
24-23. Here is a student procedure to measure nicotine in urine. A1.00-mL sample of biological fluid was placed in a 12-mL vialcontaining powder. After of the internalstandard 5-aminoquinoline were injected, the vial was cappedwith a Teflon-coated silicone rubber septum. The vial was heatedto for 20 min and then a solid-phase microextraction needlewas passed through the septum and left in the headspace for 5.00min. The fiber was retracted and inserted into a gas chromato-graph. Volatile substances were desorbed from the fiber at for 9.5 min in the injection port while the column was at .The column temperature was then raised to at and eluate was monitored by electron ionization mass spectrome-try with selected ion monitoring at m/z 84 for nicotine andm/z 144 for internal standard. Calibration data from replicate
25°C/min260°C60°C250°C
80°C
5.00 �g0.7 g Na2CO3
200°C40°C/min90°C20°C/minTemperature � 50°C
5-�m0.32 mm � 30 m
1 2 3 4 5
Time (min)
6 7 8 9 10 11
TAME
MTBE
Selected ion monitoring(m/z 72.7 to 73.7)
Abu
ndan
ce
Reconstructed totalion chromatogram
* Unidentified**
*
TA
ME
ET
BE
MT
BE
Eth
anol
n-P
ropy
l alc
ohol
t-B
utyl
alc
ohol
i-Pro
pyl a
lcoh
ol

554 CHAPTER 24 Gas Chromatography
standard mixtures taken through the same procedure are given inthe table.
Nicotine in urine ( ) Area ratio m/z 84/144
12 0.056, 0.059
51 0.402, 0.391
102 0.684, 0.669
157 1.011, 1.063
205 1.278, 1.355
Based on A. E. Wittner, D. M. Klinger, X. Fan, M. Lam, D. T. Mathers, andS. A. Mabury, “Quantitative Determination of Nicotine and Cotinine inUrine and Sputum Using a Combined SPME-GC/MS Method,” J. Chem.Ed. 2002, 79, 1257.
(a) Why was the vial heated to before and during extraction?(b) Why was the chromatography column kept at during ther-mal desorption of the extraction fiber?(c) Suggest a structure for m/z 84 from nicotine. What is the m/z 144ion from the internal standard, 5-aminoquinoline?
(d) Urine from an adult female nonsmoker had an area ratioand 0.53 in replicate determinations. Urine
from a nonsmoking girl whose parents are heavy smokers had anarea ratio 1.18 and 1.32. Find the nicotine concentration ( ) andits uncertainty in the urine of each person.
24-24. Nitric oxide (NO) is a cell-signaling agent in numerousphysiologic processes including vasodilation, inhibition of clotting,and inflammation. A sensitive chromatography–mass spectrometrymethod was developed to measure two of its metabolites, nitrite( ) and nitrate ( ), in biological fluids. Internal standards,
and , were added to the fluid at concentrations of 80.0and , respectively. The naturally occurring and
plus the internal standards were then converted into volatilederivatives in aqueous acetone:
Because biological fluids are so complex, the derivatives were firstisolated by high-performance liquid chromatography. For quantita-tive analysis, liquid chromatography peaks corresponding to the twoproducts were injected into a gas chromatograph, ionized by nega-tive ion chemical ionization (giving major peaks for and ),and the products measured by selected ion monitoring. Results areshown in the figure in the next column. If the internal standardsundergo the same reactions and same separations at the same rate asthe analytes, then the concentrations of analytes are simply
[14NO�x ] � [15NO�
x ](R � Rblank)
14N
15N
NO�3NO2
�
BrF
F F
F
F
O�NO2
F
F F
F
F
F
F F
F
F
S
S
NO3
NO2
�
�
O�NOPentafluorobenzyl
bromide
m/z 62 for 14Nm/z 63 for 15N
m/z 46 for 14Nm/z 47 for 15N
14NO�3
14NO�2800.0 �M
15NO�3
15NO�2
NO3�NO�
2
�g/L
m/z 84/144 � 0.51
NicotineC10H14N2
NH2
N
N
CH3N
5-AminoquinolineC9H8N2
60°C80°C
�g/L
where R is the measured peak area ratio (m/z 46/47 for nitrite andm/z 62/63 for nitrate) and is the measured ratio of peak areas ina blank prepared from the same buffers and reagents with no addednitrate or nitrite. The ratios of peak areas are and
. The ratios for the blank were and . Find the concentrations of nitrite
and nitrate in the urine.
Selected ion chromatogram showing negative ions at m/z 46, 47, 62, and63 obtained by derivatizing nitrite and nitrate plus internal standards( and ) in urine. [From D. Tsikas, “Derivatization and Quantification of
Nitrite and Nitrate in Biological Fluids by Gas Chromatography/Mass Spectrometry,”
Anal. Chem. 2000, 72, 4064.]
24-25. van Deemter equation for open tubular column. Equa-tion 23-33 contains terms (A, B, and C) describing three band-broadening mechanisms.(a) Which term is 0 for an open tubular column? Why?(b) Express the value of B in terms of measurable physical properties.(c) Express the value of C in terms of measurable physical quantities.(d) The linear flow rate that produces minimum plate height is foundby setting the derivative . Find an expression of theminimum plate height in terms of the measurable physical quantitiesused to answer parts (b) and (c).
24-26. Theoretical performance in gas chromatography. As the insideradius of an open tubular gas chromatography column is decreased,the maximum possible column efficiency increases and samplecapacity decreases. For a thin stationary phase that equilibrates rap-idly with analyte, the minimum theoretical plate height is given by
where r is the inside radius of the column and is the capacity factor.(a) Find the limit of the square-root term as (unretainedsolute) and as (infinitely retained solute).(b) If the column radius is 0.10 mm, find for the two cases inpart (a).(c) What is the maximum number of theoretical plates in a 50-m-long column with a 0.10-mm radius if ?(d) The relation between capacity factor and partition coefficientK (Equation 23-19) can also be written , where t is thethickness of the stationary phase in a wall-coated column and r isthe inside radius of the column. Derive the equation andfind if , , and .
24-27. Consider the open tubular gas chromatography of on a column of 5% phenyl–95%25-m-long � 0.53-mm-diameter
n-C12H26
r � 0.10 mmt � 0.20 �mK � 1 000k¿k¿ � 2tK/r
k¿ � 2tK/rk¿
k¿ � 5.0
Hmin
k¿ S �k¿ S 0
k¿
Hmin
r� B1 � 6k¿ � 11k¿2
3(1 � k¿)2
dH/dux � 0
15NO�3
15NO�2
Abu
ndan
ce
15NO3–
15NO2–
14NO3–
14NO2–
2.82.6 3.0 3.2
Time (min)
3.4 3.6
m/z 62/63 � 0.0580.040m/z 46/47 �m/z 62/63 � 0.538
m/z 46/47 � 0.062
Rblank

Problems 555
methyl polysiloxane with a stationary phase thickness of with He carrier gas at . The observed capacity factor for
is 8.0. Measurements were made of plate height, H (m), atvarious values of linear velocity, . A least-squares curvethrough the data points is given by
From the coefficients of the van Deemter equation, find the diffu-sion coefficient of in the mobile and stationary phases.Why is one of these diffusion coefficients so much greater than theother?
24-28. Efficiency of solid-phase microextraction. Equation 24-3gives the mass of analyte extracted into a solid-phase microextrac-tion fiber as a function of the partition coefficient between the fibercoating and the solution.(a) A commercial fiber with a coating has a filmvolume of .21 Suppose that the initial concentrationof analyte in solution is . Use a spread-sheet to prepare a graph showing the mass of analyte extracted intothe fiber as a function of solution volume for partition coefficientsof 10 000, 5 000, 1 000, and 100. Let the solution volume vary from0 to 100 mL.(b) Evaluate the limit of Equation 24-3 as gets big relative to Does the extracted mass in your graph approach this limit?(c) What percentage of the analyte from 10.0 mL of solution isextracted into the fiber when and when ?
24-29. Mass spectral interpretation. Box 24-1 shows the separationof enantiomers with the formula .(a) Verify that the formula for (22-3) agreeswith the structure.(b) Find the nominal mass of (Box 22-1).(c) The high-mass region of the electron impact mass spectrum ofone enantiomer is shown here. Suggest an assignment for m/z 350,315, 280, 245, and 210.(d) The relative abundance of and in a molecule contain-ing n Cl atoms is given by the terms of the binomial expansion
where a is the natural abundance of (0.757 7) and35Clan�3b3 � p(a � b)n � an � nan�1b �
n(n � 1)
2!an�2b2 �
n(n � 1)(n � 2)
3!
37Cl35Cl
C9H4N2Cl6
rings � double bondsC9H4N2Cl6
K � 10 000K � 100
KVf.Vs
C0 � 0.10 �g/mL (100 ppb)6.9 � 10�4 mL
100-�m-thick
n-C12H26
H � (6.0 � 10�5 m2/s) /ux � (2.09 � 10�3 s)ux
ux (m/s)n-C12H26
125°C3.0 �m
b is the natural abundance of (0.242 3). The first term gives theabundance of , the second term gives , and soforth. The spreadsheet shows how to compute the terms of with Excel in cells D8:D14. In cell D8, the function is “�BINOMDIST(A8,$B$5,$B$3,FALSE)” �BINOMDIST(6,6,0.7577,FALSE), whichtranslates into . When you highlight cell D8 andFILL DOWN, the function in cell D9 is “�BINOMDIST(A9,$B$5,$B$3,FALSE)” �BINOMDIST(5,6,0.7577,FALSE), which translatesinto —the second term of the expansion.Column E normalizes the abundances in column D so that the mostintense peak is 100. The spreadsheet predicts that a molecule with 6Cl atoms will have a ratio of intensities
(if there are no other significant isotopes of other elements in themolecule). Compute the expected abundances of Cl isotopes forspecies with 5, 4, 3, and 2 Cl atoms and compare your results withthe observed clusters in the mass spectrum.
M�8 : M�10 : M�12 � 52.12 : 100 : 79.95 : 34.09 : 8. 18 : 1.05 : 0.06M : M�2 : M�4 : M�6 :
D9 � 6(0.757 7)5(0.242 3)1
D8 � (0.757 7)6
(a � b)6
35Cln�137Cl1
35Cln37Cl0
37Cl
Spreadsheet illustrating use ofbinomial distribution function.
A B C D E
17
16
15
14
13
12
11
10
9
8
7
6
5
4
Formula35Cl637Cl035Cl537Cl135Cl437Cl235Cl337Cl335Cl237Cl435Cl137Cl535Cl037Cl6
Mass
M
M�2
M�4
M�6
M�8
M�10
M�12
Abundance
0.18923
0.36307
0.29026
0.12376
0.02968
0.00380
0.00020
Relative
abundance
52.12
100.00
79.95
34.09
8.18
1.05
0.06
3
Isotopic abundance from binomial distribution
D8 = BINOMDIST (A8,$B$5,$B$3,FALSE)
E8 = 100*D8/MAX($D$8:$D$14)
2
1
6
5
4
3
2
1
0
6
0.7577
0.2423
35Cl =37Cl =
n =
35Cl
natural abundance
natural abundance
Mass spectrum of one enantiomer of from Box 24-1. [From W. Vetter
and W. Jun,“Elucidation of a Polychlorinated Bipyrrole Structure Using Enantioselective
GC,” Anal. Chem. 2002, 74, 4287.]
C9H4N2Cl6
200
210239
245
276
315
317
282
280
352
350
300
m/z
Det
ecto
r re
spon
se

556 CHAPTER 25 High-Performance Liquid Chromatography
IN VIVO MICRODIALYSIS FOR MEASURING DRUG METABOLISM
High-Performance Liquid Chromatography25
Dialysis is the process in which small molecules diffuse across a semipermeable membranethat has pore sizes large enough to pass small molecules but not large ones. A microdialysisprobe has a semipermeable membrane attached to the shaft of a hypodermic needle, whichcan be inserted into an animal. Fluid is pumped through the probe from the inlet to the out-let. Small molecules from the animal diffuse into the probe and are rapidly transported to theoutlet. Fluid exiting the probe (dialysate) can be analyzed by liquid chromatography.
The chromatogram and bar graph show results of a study of aspirin metabolism in arat. Aspirin is converted into salicylic acid by enzymes in the bloodstream. To measure theconversion rate, aspirin was injected into a rat and dialysate from a microdialysis probe in avein of the rat was monitored by liquid chromatography. If you simply withdrew blood foranalysis, aspirin would continue to be metabolized by enzymes in the blood. Microdialysisseparates the small aspirin molecule from large enzyme molecules.
L iquid chromatography is important because most compounds are not sufficiently volatilefor gas chromatography. High-performance liquid chromatography (HPLC) uses highpressure to force solvent through closed columns containing very fine particles that givehigh-resolution separations.1,2 The HPLC system in Figure 25-1 consists of a solvent deliverysystem, a sample injection valve, a high-pressure column, a detector, and a computer to con-trol the system and display results. Many systems include an oven for temperature control of
Inlet
Outlet
Steelhypodermicneedle
Fused silicacapillary
Laser-drilledhole
Semipermeable membraneallows small molecules topass through, but blockslarge molecules
Aspirin(acetylsalicylicacid)
Salicylicacid
Time Time (min)
Asp
irin
conc
entr
atio
n ( µ
g/m
L)
(a ) (b )10 20 30
100
200
300
400
Det
ecto
r re
spon
se
Microdialysis probe. Enlarged view of the lowerend shows a semipermeable membrane thatallows small molecules to pass in bothdirections, but excludes large molecules.
(a) Chromatogram of blood microdialysis sam-ple drawn 5 min after intravenous injection ofaspirin. (b) Aspirin concentration in bloodversus time after injection of aspirin. [From K. L.Steele, D. O. Scott, and C. E. Lunte, “PharmacokineticStudies of Aspirin in Rats Using in Vivo MicrodialysisSampling,” Anal. Chim. Acta 1991, 246, 181.]
The first equipment for high-performance liquidchromatography was built by C. Horváth in1965 at Yale University.

25-1 The Chromatographic Process 557
the column. These components and the factors that govern the quality of a chromatographicseparation are discussed in this chapter. For now, we restrict ourselves to liquid-liquidpartition and liquid-solid adsorption chromatography. Chapter 26 deals with ion-exchange,molecular exclusion, and affinity chromatography.
25-1 The Chromatographic ProcessIncreasing the rate at which solute equilibrates between stationary and mobile phasesincreases the efficiency of chromatography. For gas chromatography with an open tubularcolumn, rapid equilibration is accomplished by reducing the diameter of the column so thatmolecules can diffuse quickly between the channel and the stationary phase on the wall. Dif-fusion in liquids is 100 times slower than diffusion in gases. Therefore, in liquid chromatog-raphy, it is not generally feasible to use open tubular columns, because the diameter of thesolvent channel is too great to be traversed by a solute molecule in a short time. Liquid chro-matography is conducted with packed columns.
Small Particles Give High Efficiency but Require High PressureThe efficiency of a packed column increases as the size of the stationary phase particlesdecreases. Typical particle sizes in HPLC are . Figures 25-2a and b illustrate theincreased resolution afforded by decreasing particle size from 4 to . Plate numberincreased from 2 000 to 7 500 when the particle size decreased, so the peaks are sharper withthe smaller particle size. In Figure 25-2c, a stronger solvent was used to elute the peaks fromthe column in trace b in less time. Decreasing particle size permits us to improve resolutionor to maintain the same resolution while decreasing run time.
Example Scaling Relations Between Columns
Commonly, silica particles occupy of the column volume and solvent occupiesof the column volume, regardless of particle size. The column in Figure 25-2a has
an inside diameter of 4.6 mm and was run at a volume flow rate, , of 3.0 mL/min with asample size of . The column in Figure 25-2b has a diameter of . Whatflow rate should be used in trace b to achieve the same linear velocity, , as in trace a?What sample volume should be injected?
Solution Column volume is proportional to the square of column diameter. Changingthe diameter from 4.6 to 2.1 mm reduces volume by a factor of .Therefore, should be reduced by a factor of 0.208 to maintain the same linear velocity.
To maintain the same ratio of injected sample to column volume,
� (0.208)(20 �L) � 4.2 �L
Injection volume in small column � 0.208 � (injection volume in large column)
uv(small column) � 0.208 � uv(large column) � (0.208)(3.0 mL/min) � 0.62 mL/min
uv
(2.1/4.6)2 � 0.208
ux
dc � 2.1 mm20 �Luv
�60%�40%
1.7 �m3–5 �m
Two pumps forgradient elution
Injection port
Det
ecto
r re
spon
se
Particle size= 4 µm
Particle size= 1.7 µm
N = 2 000plates
N = 7 500plates
Particle size= 1.7 µm
0 1 2
Time (min)
3 4 5
(a)
(b)
(c)
Figure 25-1 Equipment for high-performance liquid chromatography (HPLC).[Courtesy Rainin Instrument Co., Emeryville, CA.]
Figure 25-2 (a and b) Chromatogramsof the same sample run at the same linearvelocity on 5.0-cm-long columns packed withC18-silica. (c) A stronger solvent was used toelute solutes more rapidly from the column inpanel b. [Y. Yang and C. C. Hodges, “Assay Transfer
from HPLC to UPLC for Higher Analysis Throughput,”
LCGC Supplement May 2005, p. 31.]
Increasing efficiency is equivalent todecreasing plate height, H, in the van Deemterequation (23-33):
ux � linear flow rate
H � A �Bux
� Cux
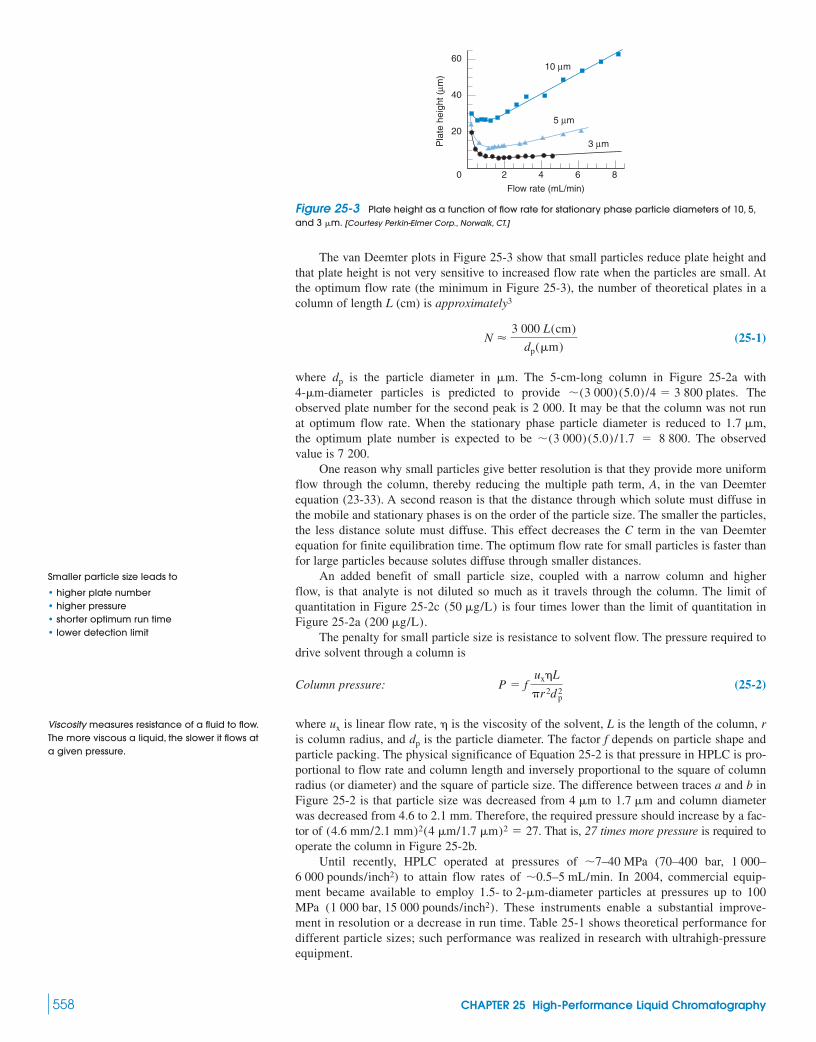
The van Deemter plots in Figure 25-3 show that small particles reduce plate height andthat plate height is not very sensitive to increased flow rate when the particles are small. Atthe optimum flow rate (the minimum in Figure 25-3), the number of theoretical plates in acolumn of length L (cm) is approximately3
(25-1)
where is the particle diameter in . The 5-cm-long column in Figure 25-2a withparticles is predicted to provide . The
observed plate number for the second peak is 2 000. It may be that the column was not runat optimum flow rate. When the stationary phase particle diameter is reduced to ,the optimum plate number is expected to be . The observedvalue is 7 200.
One reason why small particles give better resolution is that they provide more uniformflow through the column, thereby reducing the multiple path term, A, in the van Deemterequation (23-33). A second reason is that the distance through which solute must diffuse inthe mobile and stationary phases is on the order of the particle size. The smaller the particles,the less distance solute must diffuse. This effect decreases the C term in the van Deemterequation for finite equilibration time. The optimum flow rate for small particles is faster thanfor large particles because solutes diffuse through smaller distances.
An added benefit of small particle size, coupled with a narrow column and higherflow, is that analyte is not diluted so much as it travels through the column. The limit ofquantitation in Figure 25-2c is four times lower than the limit of quantitation inFigure 25-2a .
The penalty for small particle size is resistance to solvent flow. The pressure required todrive solvent through a column is
Column pressure: (25-2)
where is linear flow rate, is the viscosity of the solvent, L is the length of the column, ris column radius, and is the particle diameter. The factor f depends on particle shape andparticle packing. The physical significance of Equation 25-2 is that pressure in HPLC is pro-portional to flow rate and column length and inversely proportional to the square of columnradius (or diameter) and the square of particle size. The difference between traces a and b inFigure 25-2 is that particle size was decreased from to and column diameterwas decreased from 4.6 to 2.1 mm. Therefore, the required pressure should increase by a fac-tor of . That is, 27 times more pressure is required tooperate the column in Figure 25-2b.
Until recently, HPLC operated at pressures of (70–400 bar, ) to attain flow rates of . In 2004, commercial equip-
ment became available to employ particles at pressures up to 100MPa . These instruments enable a substantial improve-ment in resolution or a decrease in run time. Table 25-1 shows theoretical performance fordifferent particle sizes; such performance was realized in research with ultrahigh-pressureequipment.
(1 000 bar, 15 000 pounds/inch2)1.5- to 2-�m-diameter
�0.5–5 mL/min6 000 pounds/inch21 000–�7–40 MPa
(4.6 mm/2.1 mm)2(4 �m/1.7 �m)2 � 27
1.7 �m4 �m
dp
#ux
P � f ux#L
r 2d
2p
(200 �g/L)(50 �g/L)
�(3 000)(5.0) /1.7 � 8 8001.7 �m
�(3 000)(5.0) /4 � 3 800 plates4-�m-diameter�mdp
N �3 000 L(cm)
dp(�m)
558 CHAPTER 25 High-Performance Liquid Chromatography
10 µm
5 µm
3 µm
0 2 4 6 8
60
40
20
Flow rate (mL/min)
Pla
te h
eigh
t (µm
)
Smaller particle size leads to
• higher plate number• higher pressure• shorter optimum run time• lower detection limit
Viscosity measures resistance of a fluid to flow.The more viscous a liquid, the slower it flows ata given pressure.
Figure 25-3 Plate height as a function of flow rate for stationary phase particle diameters of 10, 5,and 3 �m. [Courtesy Perkin-Elmer Corp., Norwalk, CT.]
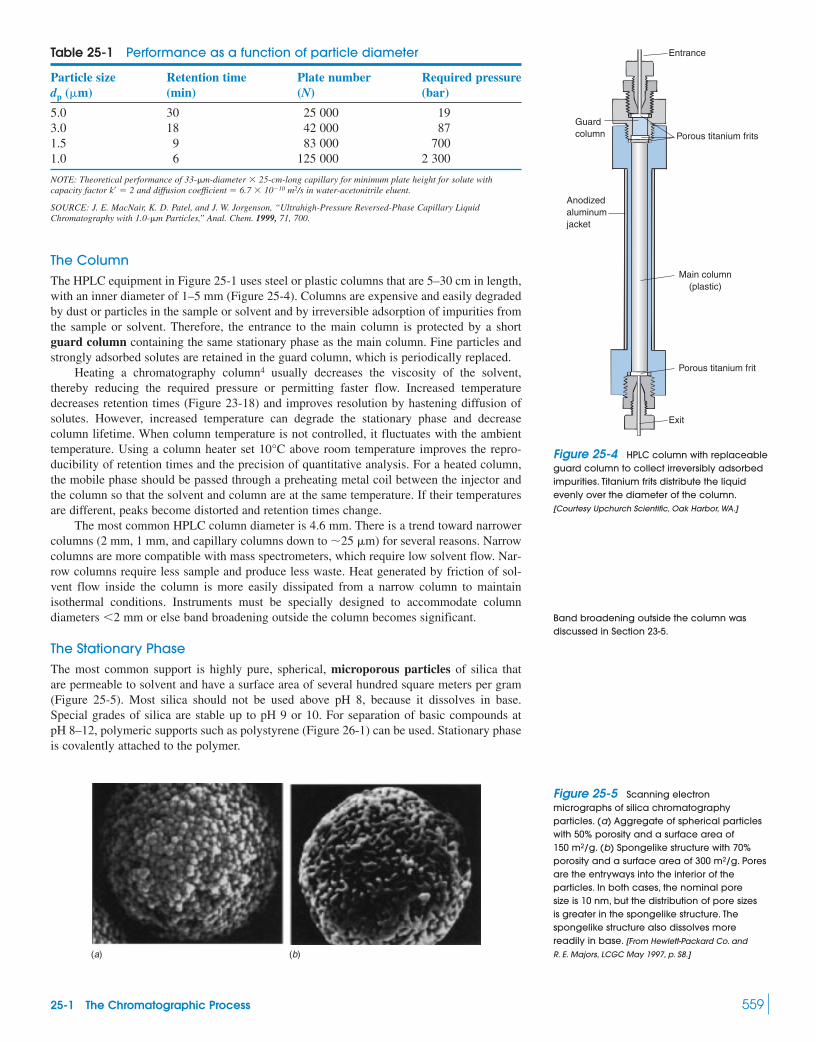
25-1 The Chromatographic Process 559
The ColumnThe HPLC equipment in Figure 25-1 uses steel or plastic columns that are 5–30 cm in length,with an inner diameter of 1–5 mm (Figure 25-4). Columns are expensive and easily degradedby dust or particles in the sample or solvent and by irreversible adsorption of impurities fromthe sample or solvent. Therefore, the entrance to the main column is protected by a shortguard column containing the same stationary phase as the main column. Fine particles andstrongly adsorbed solutes are retained in the guard column, which is periodically replaced.
Heating a chromatography column4 usually decreases the viscosity of the solvent,thereby reducing the required pressure or permitting faster flow. Increased temperaturedecreases retention times (Figure 23-18) and improves resolution by hastening diffusion ofsolutes. However, increased temperature can degrade the stationary phase and decreasecolumn lifetime. When column temperature is not controlled, it fluctuates with the ambienttemperature. Using a column heater set above room temperature improves the repro-ducibility of retention times and the precision of quantitative analysis. For a heated column,the mobile phase should be passed through a preheating metal coil between the injector andthe column so that the solvent and column are at the same temperature. If their temperaturesare different, peaks become distorted and retention times change.
The most common HPLC column diameter is 4.6 mm. There is a trend toward narrowercolumns (2 mm, 1 mm, and capillary columns down to ) for several reasons. Narrowcolumns are more compatible with mass spectrometers, which require low solvent flow. Nar-row columns require less sample and produce less waste. Heat generated by friction of sol-vent flow inside the column is more easily dissipated from a narrow column to maintainisothermal conditions. Instruments must be specially designed to accommodate columndiameters "2 mm or else band broadening outside the column becomes significant.
The Stationary PhaseThe most common support is highly pure, spherical, microporous particles of silica thatare permeable to solvent and have a surface area of several hundred square meters per gram(Figure 25-5). Most silica should not be used above pH 8, because it dissolves in base.Special grades of silica are stable up to pH 9 or 10. For separation of basic compounds atpH 8–12, polymeric supports such as polystyrene (Figure 26-1) can be used. Stationary phaseis covalently attached to the polymer.
�25 �m
10°C
Table 25-1 Performance as a function of particle diameter
Particle size Retention time Plate number Required pressuredp (�m) (min) (N) (bar)
5.0 30 25 000 193.0 18 42 000 871.5 9 83 000 7001.0 6 125 000 2 300
NOTE: Theoretical performance of 33-�m-diameter � 25-cm-long capillary for minimum plate height for solute withcapacity factor k� � 2 and diffusion coefficient � 6.7 � 10�10 m2/s in water-acetonitrile eluent.
SOURCE: J. E. MacNair, K. D. Patel, and J. W. Jorgenson, “Ultrahigh-Pressure Reversed-Phase Capillary LiquidChromatography with 1.0-�m Particles,” Anal. Chem. 1999, 71, 700.
Band broadening outside the column wasdiscussed in Section 23-5.
Exit
Entrance
Guardcolumn Porous titanium frits
Anodizedaluminumjacket
Main column(plastic)
Porous titanium frit
Figure 25-4 HPLC column with replaceableguard column to collect irreversibly adsorbedimpurities. Titanium frits distribute the liquidevenly over the diameter of the column.[Courtesy Upchurch Scientific, Oak Harbor, WA.]
Figure 25-5 Scanning electronmicrographs of silica chromatographyparticles. (a) Aggregate of spherical particleswith 50% porosity and a surface area of150 m2/g. (b) Spongelike structure with 70%porosity and a surface area of 300 m2/g. Poresare the entryways into the interior of theparticles. In both cases, the nominal poresize is 10 nm, but the distribution of pore sizesis greater in the spongelike structure. Thespongelike structure also dissolves morereadily in base. [From Hewlett-Packard Co. and
R. E. Majors, LCGC May 1997, p. S8.](a) (b)

A silica surface (Figure 25-6) has up to of silanol groups per squaremeter. Silanol groups are protonated at pH . They dissociate to negative over abroad pH range above 3. Exposed groups strongly retain protonated bases (for exam-ple, ) and lead to tailing (Figure 25-7). Metallic impurities in silica also cause tailing.Type B silica in Figure 25-7 has fewer exposed silanol groups and less metallic impurities.Type C silica causes even less tailing because 90% of the group are replaced by
bonds, which do not retain solutes by hydrogen bonding.SißHSißOH
RNH�3
SißO�
SißO��2–3(SißOH)8 �mol
560 CHAPTER 25 High-Performance Liquid Chromatography
Isolatedsilanolgroups
Siloxanebonds
Geminalsilanolgroups
HO
HO
OH
OHOH
OH
OH
OH
OH
OH
OHOH
OH
OH
OHSi
Si Si
Si Si Si
Si
Si
Si
Si
Si
SiSi
Si
Si
Si
Si
SiSi
Si
Si
Si
O
O
O
O
O
O
O
O
O
O
OO
O
O
O
O
O
OO
OO
OO O
OO O
O
Hydrogen-bonded vicinal silanol groups
Type A SilicaZorbax-ODS(Dimethyl-C18)
Type B SilicaZorbax Rx-C18(Dimethyl-C18) 1
2
3
4
1
23
4
Time (min)
Det
ecto
r re
spon
se (a )
(b )
1 Doxepin2 Desipramine3 Amitriptyline4 Trimipramine
0.125 µg0.25 µg0.25 µg0.25 µg
20 4 6 8 10 12 14 16 18 20 22 24 26
Figure 25-6 Schematic structure of silica particle. [From R. E. Majors, LCGC May 1997, p. S8.] In particlesthat are "2 �m in diameter, some of the bridges inside the silica are replaced by
bridges, which provide mechanical rigidity to withstand high pressure.SißCH2ßCH2ßSiSißOßSi
Figure 25-7 Tailing of amine bases on silica: (a) Type A silica support gives distorted peaks.(b) Less acidic type B silica with fewer groups and less metallic impurity gives symmetric peakswith shorter retention time. In both cases, chromatography was performed with a columneluted at 1.0 mL/min at with 30 vol% acetonitrile/70 vol% sodium phosphate buffer (pH 2.5)containing 0.2 wt% triethylamine and 0.2 wt% trifluoroacetic acid. The detector measured ultravioletabsorbance at 254 nm. Additives such as triethylamine and trifluoroacetic acid are often used to maskstrong adsorption sites to reduce tailing. [From J. J. Kirkland, Am. Lab. June 1994, p. 28K.]
40°C0.46 � 15 cm
SißOH

Bare silica can be used as the stationary phase for adsorption chromatography. Mostcommonly, liquid-liquid partition chromatography is conducted with a bonded stationaryphase covalently attached to the silica surface by reactions such as
Common polar phases Common nonpolar phases
amino octadecylcyano octyldiol phenyl
There are of R groups per square meter of support surface area, with little bleedingof the stationary phase from the column during chromatography. For separating optical iso-mers (Figure 25-8), many optically active R groups, such as the one Exercise 25-B, are com-mercially available.5
The siloxane bond hydrolyzes below pH 2, so HPLC with a bondedphase on a silica support is generally limited to the pH range 2–8. If bulky isobutyl groupsare attached to the silicon atom of the bonded phase (Figure 25-9), the stationary phase isprotected from attack by and is stable for long periods at low pH, even at elevatedH3O�
(SißOßSiR)
�4 �mol
R � (CH2)3C6H5R � (CH2)2OCH2CH(OH)CH2OHR � (CH2)7CH3R � (CH2)3CΩNR � (CH2)17CH3R � (CH2)3NH2
� Cl2SiR2
� 2HCl
Si OH
Si OH
Si O
Si O
SiR2
Silicasurface
Si OH � ClSi R Si O Si R
CH3
CH3
� HCl
CH3
CH3
25-1 The Chromatographic Process 561
Residual silanol groups on the silica surfaceare capped with trimethylsilyl groups byreaction with to eliminate polaradsorption sites that cause tailing.
ClSi(CH3)3
SiO R
CH3
CH3
SiSilicaparticle
Bonded stationaryphase
The octadecyl stationary phase is by farthe most common in HPLC. It is frequentlydesignated ODS, for octadecylsilane.
(C18)
Bidentate stationary phase stable in the pHrange 2–11.5:
O O
C18 C18
Si Si
CH3 H3C
Silica
C18
L enantiomertr = 4.70 minw1/2 = 0.28 min
D enantiomertr = 5.37 minw1/2 = 0.35 min
4 5
Time (min)
6
Det
ecto
r re
spon
se
Figure 25-8 Baseline separation of enantiomers of the drug Ritalin by HPLC with a chiral stationaryphase. One enantiomer is pharmacologically active for treating attention deficit disorder andnarcolepsy. The other enantiomer has little activity but could contribute to undesired side effects.Pharmaceutical companies are moving toward providing enantiomerically pure drugs, which couldbe safer than mixtures of optical isomers. [From R. Bakhtiar, L. Ramos, and F. L. S. Tse, “Quantification of
Methylphenidate in Plasma Using Chiral Liquid-Chromatography/Tandem Mass Spectrometry: Application
to Toxicokinetic Studies,” Anal. Chim. Acta 2002, 469, 261.]
Figure 25-9 Bulky isobutyl groups protectsiloxane bonds from hydrolysis at low pH. [From
J. J. Kirkland, Am. Lab. June 1994, p. 28K.]
OO
OHCH3
C18
H3O+
Si
Silica
H3C
CH3H3C
CH
CH
CH2
CH3
CH3
CH3
CH3
CH2
O
CH3
C18Si
OH
C18Si
Silica
O C18Si
H3C
CH3H3C
CH
CH
CH2
CH2

temperature (for example, pH 0.9 at ).6 Box 25-1 describes a new kind of silica station-ary phase.
Figure 25-10 shows a rapid separation of proteins on superficially porous particles,which consist of a porous silica layer on a nonporous silicacore. A stationary phase such as is bonded to the thin, porous outer layer. Mass transferof solute into a layer is 10 times faster than mass transfer into fully porousparticles with a radius of , enabling high efficiency at high flow rate. Superficiallyporous particles are especially suitable for separation of macromolecules such as proteins,which diffuse more slowly than small molecules.
Porous graphitic carbon deposited on silica8 is a stationary phase that exhibits increasedretention of nonpolar compounds relative to retention by . Graphite has high affinity forpolar compounds and separates isomers that cannot be separated on . The stationary phaseis stable in 10 M acid and 10 M base.
C18
C18
2.5 �m0.25-�m-thick
C18
5-�m-diameter0.25-�m-thick
90°C
562 CHAPTER 25 High-Performance Liquid Chromatography
Superficially porous particles:
• rapid mass transfer into thin porous layer• diameter does not require high column
pressure• low sample capacity
5-�m
0.2
0.1
00 15 30
Time (s)
45
15 µm
0.25 µm
2
34
5
67
8
60
Abs
orba
nce
Solidsilicacore
Superficiallyporousparticle
Box 25-1 Monolithic Silica Columns
Time is money. In commercial laboratories, the faster an analysiscan be done, the less it costs. Monolithic silica columns enable usto increase the flow rate in liquid chromatography while retaininggood separation.7
Each column in the left-hand photograph is a single, poroussilica rod polymerized from liquid precursors. The adjacentmicrographs show the silica skeleton with a network of pores. The inside of the skeleton contains a finer network of
pores that are too small to be seen in the micrographs.Approximately 80% of the volume of the rod is empty space. The�13-nm
�2-�m
surface area is , which compares favorably with that ofexcellent stationary phase materials. or other bonded phasesare attached to the silica for reversed-phase chromatography. Afterfabrication, the silica rod is tightly encased in a chemically resist-ant plastic tube made of polyether ether ketone.
Because of its open, rigid structure, solvent flows through themonolithic column with relatively little resistance. The same pres-sure required to obtain a flow rate of 1 mL/min with spherical particles provides a flow rate of 9 mL/min in the mono-lithic column. At 9 mL/min, the plate height in the monolithic col-umn is only 50% greater than the minimum plate height observedat 2 mL/min.
3.5-�m
C18
300 m2/g
Monolithic silica rods. Structure of rod showing �2-�m pores. Enlarged view. Invisible 13-nm pores arelocated within the silica skeleton.
[Photos courtesy D. Cunningham, Merck KGaA, Darmstadt, Germany.]
Figure 25-10 Rapid separation ofproteins on superficially porous in
column containing Poroshell300SB-C18. Mobile phase A: 0.1 wt%trifluoroacetic acid in . Mobile phase B:0.07 wt% trifluoroacetic acid in acetonitrile.Solvent was changed continuously from95 vol% A/5 vol% B to 100% B over 1 min.
at at 26 MPa (260 bar)with ultraviolet detection at 215 nm.Peaks: 1, angiotensin II; 2, neurotensin;3, ribonuclease; 4, insulin; 5, lysozyme;6, myoglobin; 7, carbonic anhydrase;8, ovalbumin. [From R. E. Majors, LCGC Column
Technology Supplement June 2004, p. 8K.
Courtesy Agilent Technologies.]
70°CFlow � 3 mL/min
H2O
2.1 � 75 mmC18-silica
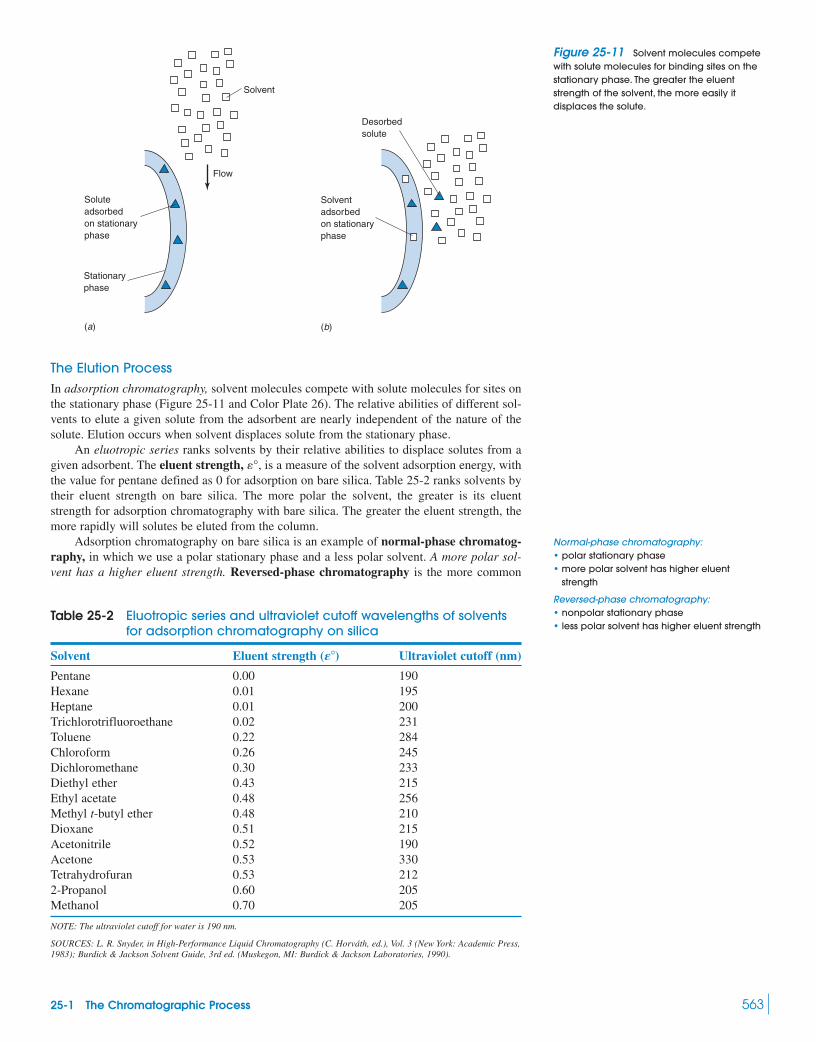
The Elution ProcessIn adsorption chromatography, solvent molecules compete with solute molecules for sites onthe stationary phase (Figure 25-11 and Color Plate 26). The relative abilities of different sol-vents to elute a given solute from the adsorbent are nearly independent of the nature of thesolute. Elution occurs when solvent displaces solute from the stationary phase.
An eluotropic series ranks solvents by their relative abilities to displace solutes from agiven adsorbent. The eluent strength, , is a measure of the solvent adsorption energy, withthe value for pentane defined as 0 for adsorption on bare silica. Table 25-2 ranks solvents bytheir eluent strength on bare silica. The more polar the solvent, the greater is its eluentstrength for adsorption chromatography with bare silica. The greater the eluent strength, themore rapidly will solutes be eluted from the column.
Adsorption chromatography on bare silica is an example of normal-phase chromatog-raphy, in which we use a polar stationary phase and a less polar solvent. A more polar sol-vent has a higher eluent strength. Reversed-phase chromatography is the more common
�°
25-1 The Chromatographic Process 563
Table 25-2 Eluotropic series and ultraviolet cutoff wavelengths of solventsfor adsorption chromatography on silica
Solvent Eluent strength ( �) Ultraviolet cutoff (nm)
Pentane 0.00 190Hexane 0.01 195Heptane 0.01 200Trichlorotrifluoroethane 0.02 231Toluene 0.22 284Chloroform 0.26 245Dichloromethane 0.30 233Diethyl ether 0.43 215Ethyl acetate 0.48 256Methyl t-butyl ether 0.48 210Dioxane 0.51 215Acetonitrile 0.52 190Acetone 0.53 330Tetrahydrofuran 0.53 2122-Propanol 0.60 205Methanol 0.70 205
NOTE: The ultraviolet cutoff for water is 190 nm.
SOURCES: L. R. Snyder, in High-Performance Liquid Chromatography (C. Horváth, ed.), Vol. 3 (New York: Academic Press,1983); Burdick & Jackson Solvent Guide, 3rd ed. (Muskegon, MI: Burdick & Jackson Laboratories, 1990).
E
Soluteadsorbedon stationaryphase
Stationaryphase
Solventadsorbedon stationaryphase
(a) (b)
Solvent
Flow
Desorbedsolute
Figure 25-11 Solvent molecules competewith solute molecules for binding sites on thestationary phase. The greater the eluentstrength of the solvent, the more easily itdisplaces the solute.
Normal-phase chromatography:• polar stationary phase• more polar solvent has higher eluent
strength
Reversed-phase chromatography:• nonpolar stationary phase• less polar solvent has higher eluent strength

564 CHAPTER 25 High-Performance Liquid Chromatography
0 5 10 15 20 25 30 35 40 45Time (min)
0 5 10 15 20 25 30 35 40 45Time (min)
0 5 10 15 20 25 30 35 60 65 70Time (min)
0 5 10Time (min)
0 5Time (min)
0 5Time (min)
0 5Time (min)
Abs
orba
nce
at 2
20 n
mA
bsor
banc
e at
220
nm
Abs
orba
nce
at 2
20 n
mA
bsor
banc
e at
220
nm
Abs
orba
nce
at 2
20 n
m
0 5 10 15 20 25Time (min)
1
1
2
3
4
4
5
55
4 4
5
67 8
1
23
4 5
1
2
3
4 5
6 7
8
1
4
5
6
7
8
8
888
1,2,3,4
2,3
5,6,7 1,2,3
1,2,3
6,7 6,76,7
2,3
90% B 80% B70% B
60% B
50% B
40% B
30% B
35% B
120 125 130
Figure 25-12 Isocratic HPLC separation of a mixture of aromatic compounds at 1.0 mL/min on aHypersil ODS column at ambient temperature : (1) benzyl
alcohol; (2) phenol; (3) ; (4) benzoin; (5) ethyl benzoate; (6) toluene;(7) 2,6-dimethoxytoluene; (8) o-methoxybiphenyl. Eluent consisted of aqueous buffer (designated A)and acetonitrile (designated B). The notation “90% B” in the first chromatogram means 10 vol% A and90 vol% B. The buffer contained 25 mM plus 0.1 g/L sodium azide adjusted to pH 3.5 with HCl.KH2PO4
3¿, 4¿-dimethoxyacetophenone(�22°C)(C18 on 5-�m silica)0.46 � 25 cm
• Aqueous buffers for HPLC are prepared andthe pH adjusted prior to mixing with organicsolvent.9
• Ultrapure water for HPLC should be freshlyprepared by a purification train or bydistillation. Water extracts impurities frompolyethylene or glass after storage for afew hours.
• To prepare 70% B, for example, mix 70 mLof B with 30 mL of A. The result is different fromplacing 70 mL of B in a volumetric flask anddiluting to 100 mL with A because there is avolume change when A and B are mixed.
General elution problem: For a complexmixture, isocratic conditions can often befound to produce adequate separation ofearly-eluting peaks or late-eluting peaks,but not both. This problem drives us to usegradient elution.

25-1 The Chromatographic Process 565
scheme in which the stationary phase is nonpolar or weakly polar and the solvent is morepolar. A less polar solvent has a higher eluent strength. Reversed-phase chromatographyeliminates peak tailing because the stationary phase has few sites that can strongly adsorb asolute to cause tailing (Figure 23-20). Reversed-phase chromatography is also less sensitiveto polar impurities (such as water) in the eluent.
Isocratic and Gradient ElutionIsocratic elution is performed with a single solvent (or constant solvent mixture). If one sol-vent does not provide sufficiently rapid elution of all components, then gradient elution canbe used. In this case, increasing amounts of solvent B are added to solvent A to create acontinuous gradient.
Figure 25-12 shows the effect of increasing eluent strength in the isocratic elution ofeight compounds from a reversed-phase column. In a reversed-phase separation, eluentstrength decreases as the solvent becomes more polar. The first chromatogram (upper left)was obtained with a solvent consisting of 90 vol% acetonitrile and 10 vol% aqueous buffer.Acetonitrile has a high eluent strength, and all compounds are eluted rapidly. Only threepeaks are observed because of overlap. It is customary to call the aqueous solvent A and theorganic solvent B. The first chromatogram was obtained with 90% B. When eluent strengthis reduced by changing the solvent to 80% B, there is slightly more separation and five peaksare observed. At 60% B, we begin to see a sixth peak. At 40% B, there are eight clear peaks,but compounds 2 and 3 are not fully resolved. At 30% B, all peaks would be resolved, but theseparation takes too long. Backing up to 35% B (the bottom trace) separates all peaks in a lit-tle over 2 h (which is still too long for many purposes).
From the isocratic elutions in Figure 25-12, the gradient in Figure 25-13 was selected toresolve all peaks in 38 min. First, 30% B was run for 8 min to separatecomponents 1, 2, and 3. The eluent strength was then increased steadily over 5 min to 45% Band held there for 15 min to elute peaks 4 and 5. Finally, the solvent was changed to 80% Bover 2 min and held there to elute the last peaks.
(B � acetonitrile)
40
20
0
60
80
100
Vol
% C
H3C
N
30% CH3CN
45% CH3CN
80% CH3CN
tm 1
2
3
4
5
6
7
8
Time (min)0 5 10 15 20 25 30 35
Time (min)0 5 10 15 20 25 30 35
Abs
orba
nce
at 2
20 n
m
Figure 25-13 Gradient elution of the same mixture of aromatic compounds in Figure 25-12 with thesame column, flow rate, and solvents. The upper trace is the segmented gradient profile, so namedbecause it is divided into several different segments.
Isocratic elution: one solventGradient elution: continuous change of
solvent composition to increase eluentstrength. Gradient elution in HPLC isanalogous to temperature programmingin gas chromatography. Increased eluentstrength is required to elute more stronglyretained solutes.
Box 25-2 (pages 568–569) describes gradientelution in supercritical fluid chromatography.

Selecting the Separation ModeThere can be many ways to separate components of a given mixture. Figure 25-14 is adecision tree for choosing a starting point. If the molecular mass of analyte is below 2 000,use the upper part of the figure; if the molecular mass is greater than 2 000, use the lowerpart. In either part, the first question is whether the solutes dissolve in water or in organic sol-vents. Suppose we have a mixture of small molecules soluble indichloromethane. Table 25-2 is essentially a ranking of solvent polarity, with the most-polarsolvents at the bottom. The eluent strength of dichloromethane (0.30) is closer to that of chlo-roform (0.26) than it is to those of alcohols, acetonitrile, or ethyl acetate . Therefore,(�0.48)
(molecular mass 62 000)
566 CHAPTER 25 High-Performance Liquid Chromatography
Figure 25-14 Guide to HPLC mode selection.
Molecular mass < 2 000
Soluble in organic solvents Soluble in water
Soluble innonpolar to weakly
polar solvents(hexane to CHCI3)
Soluble inmoderately polarto polar solvents
(CHCI3 to CH3OH)
Nonionic orion-paired
Ionic
Bondedreversed-phasechromatography
Soluble in CHCI3
Soluble in alcohol,acetonitrile, orethyl acetate
Bonded normal-phaseor hydrophilic interaction
chromatography
Ion-exchange or ionchromatography
C18, C8, C4, C2, C1phenyl, cyano
Adsorptionchromatography
Bonded normal-phasechromatography
Cyano, amino orzwitterion, silica
Silica Cyano, amino, diol
Molecular mass > 2 000
Soluble in organic solvents Soluble in water
Molecularsize < 30 nm
Molecular size30–400 nm
Bondedreversed-phasechromatography
C18, C8, C4
Molecular exclusionchromatography
Nonionic orion-paired
Molecularsize < 30 nm
Molecular size30–400 nm
Ion-exchangechromatography
Ionic
Bonded reversed-phaseor hydrophobic
interactionchromatography
Molecular exclusionchromatography
C18, C8, C4, orphenyl or polyether
resin
There are no firm rules in Figure 25-14. Methodsin either part of the diagram may workperfectly well for molecules whose sizebelongs to the other part.

25-1 The Chromatographic Process 567
Figure 25-14 suggests that we try adsorption chromatography on silica. The decision path ishighlighted in color.
If solutes dissolve only in nonpolar or weakly polar solvents, the decision tree suggeststhat we try reversed-phase chromatography. Our choices include bonded phases containingoctadecyl , octyl, butyl, ethyl, methyl, phenyl, and cyano groups.
If the molecular masses of solutes are and if they are soluble in organic solventsand their molecular diameter is , Figure 25-14 tells us to try molecular exclusionchromatography. Stationary phases for this type of separation are described in Chapter 26. Ifthe molecular masses of solutes are , and they are soluble in water, but not ionic, andhave diameters , the decision tree says to use reversed-phase chromatography, orhydrophobic interaction chromatography.
Hydrophobic interaction chromatography is based on the interaction of a hydropho-bic stationary phase with a hydrophobic region of a solute such as a protein. (Hydropho-bic substances repel water, and their surfaces are not wetted by water. Hydrophilic sub-stances are soluble in water or attract water to their surfaces. A protein can havehydrophilic regions that make it soluble in water and hydrophobic regions capable ofinteracting with a hydrophobic stationary phase.) Two hydrophobic stationary phases areshown in Figure 25-15. The bulk particle can be a polymer with 100-nm pores, throughwhich most molecules can diffuse. The surface is coated with phenyl groups or withpoly(ethylene glycol), both of which attract hydrophobic solutes and provide a means ofchromatographic separation. Proteins are adsorbed on the hydrophobic surface when theaqueous mobile phase contains high salt concentration. Eluent strength is increased bydecreasing the salt concentration.
Hydrophilic interaction chromatography is most useful for small molecules that aretoo polar to be retained by reversed-phase columns. Stationary phases for hydrophilicinteraction chromatography, such as those in Figure 25-15, are strongly polar. The mobilephase contains polar organic solvent mixed with water. Solutes equilibratebetween the mobile phase and a layer of aqueous phase on the surface of the stationaryphase. Eluent strength is increased by increasing the fraction of water in the mobilephase. In normal-phase chromatography, the solvent is nonaqueous. To increase eluentstrength, we increase the polarity of the nonaqueous solvent. In reversed-phase chro-matography, the solvent is usually aqueous, and eluent strength is increased by decreasingthe fraction of water in the mobile phase to increase the solubility of solutes in the mobilephase.
(�80%)
630 nm72 000
730 nm72 000
(C18)
Pore into whichsolutes can diffuse (OCH2C
H2)nOH
HO(CH2 CH
2 O)n
(OCH 2
CH 2) nOH
Stationary phase particle Stationary phase particle
Stationary phases for hydrophobic interaction chromatography
OOO
Si OH
Sili
caS
ilica
OOO
Si O�
Zwitterionic bonded phase Bare sillica
N�
CH3
�
CH3
Sili
caS
ilica CH2CH2CH2SO3CH2
Stationary phases for hydrophilic interaction chromatography
Figure 25-15 Stationary phases for hydrophobic and hydrophilic interaction chromatography.
Water does not wet a hydrophobic surfacemade of carbon nanotubes, so a dropremains almost spherical. The drop wouldflatten out on a hydrophilic surface, such asglass. [Courtesy Karen Gleason, MassachusettsInstitute of Technology.13]
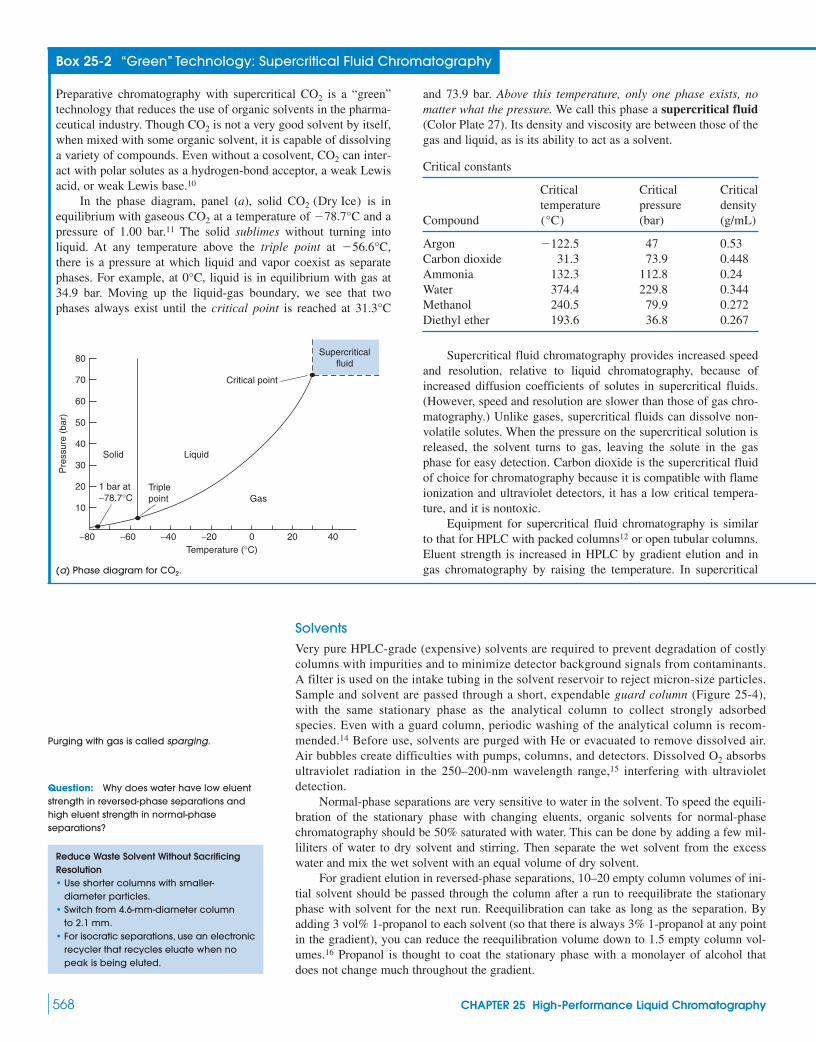
SolventsVery pure HPLC-grade (expensive) solvents are required to prevent degradation of costlycolumns with impurities and to minimize detector background signals from contaminants.A filter is used on the intake tubing in the solvent reservoir to reject micron-size particles.Sample and solvent are passed through a short, expendable guard column (Figure 25-4),with the same stationary phase as the analytical column to collect strongly adsorbedspecies. Even with a guard column, periodic washing of the analytical column is recom-mended.14 Before use, solvents are purged with He or evacuated to remove dissolved air.Air bubbles create difficulties with pumps, columns, and detectors. Dissolved absorbsultraviolet radiation in the 250–200-nm wavelength range,15 interfering with ultravioletdetection.
Normal-phase separations are very sensitive to water in the solvent. To speed the equili-bration of the stationary phase with changing eluents, organic solvents for normal-phasechromatography should be 50% saturated with water. This can be done by adding a few mil-liliters of water to dry solvent and stirring. Then separate the wet solvent from the excesswater and mix the wet solvent with an equal volume of dry solvent.
For gradient elution in reversed-phase separations, 10–20 empty column volumes of ini-tial solvent should be passed through the column after a run to reequilibrate the stationaryphase with solvent for the next run. Reequilibration can take as long as the separation. Byadding 3 vol% 1-propanol to each solvent (so that there is always 3% 1-propanol at any pointin the gradient), you can reduce the reequilibration volume down to 1.5 empty column vol-umes.16 Propanol is thought to coat the stationary phase with a monolayer of alcohol thatdoes not change much throughout the gradient.
O2
568 CHAPTER 25 High-Performance Liquid Chromatography
Box 25-2 “Green” Technology: Supercritical Fluid Chromatography
Preparative chromatography with supercritical is a “green”technology that reduces the use of organic solvents in the pharma-ceutical industry. Though is not a very good solvent by itself,when mixed with some organic solvent, it is capable of dissolvinga variety of compounds. Even without a cosolvent, can inter-act with polar solutes as a hydrogen-bond acceptor, a weak Lewisacid, or weak Lewis base.10
In the phase diagram, panel (a), solid is inequilibrium with gaseous at a temperature of and apressure of 1.00 bar.11 The solid sublimes without turning intoliquid. At any temperature above the triple point at ,there is a pressure at which liquid and vapor coexist as separatephases. For example, at , liquid is in equilibrium with gas at34.9 bar. Moving up the liquid-gas boundary, we see that twophases always exist until the critical point is reached at 31.3°C
0°C
�56.6°C
�78.7°CCO2
CO2 (Dry Ice)
CO2
CO2
CO2
Supercriticalfluid
Pre
ssur
e (b
ar)
Temperature (°C)−80 −60 −40 −20 0 20 40
10
20
30
40
50
60
70
80
Critical point
Liquid
Gas
Solid
Triplepoint
1 bar at−78.7°C
(a) Phase diagram for CO2.
and 73.9 bar. Above this temperature, only one phase exists, nomatter what the pressure. We call this phase a supercritical fluid(Color Plate 27). Its density and viscosity are between those of thegas and liquid, as is its ability to act as a solvent.
Critical constants
Critical Critical Criticaltemperature pressure density
Compound (bar) (g/mL)
Argon �122.5 47 0.53Carbon dioxide 31.3 73.9 0.448Ammonia 132.3 112.8 0.24Water 374.4 229.8 0.344Methanol 240.5 79.9 0.272Diethyl ether 193.6 36.8 0.267
Supercritical fluid chromatography provides increased speedand resolution, relative to liquid chromatography, because ofincreased diffusion coefficients of solutes in supercritical fluids.(However, speed and resolution are slower than those of gas chro-matography.) Unlike gases, supercritical fluids can dissolve non-volatile solutes. When the pressure on the supercritical solution isreleased, the solvent turns to gas, leaving the solute in the gasphase for easy detection. Carbon dioxide is the supercritical fluidof choice for chromatography because it is compatible with flameionization and ultraviolet detectors, it has a low critical tempera-ture, and it is nontoxic.
Equipment for supercritical fluid chromatography is similarto that for HPLC with packed columns12 or open tubular columns.Eluent strength is increased in HPLC by gradient elution and ingas chromatography by raising the temperature. In supercritical
(°C)
Purging with gas is called sparging.
Question: Why does water have low eluentstrength in reversed-phase separations andhigh eluent strength in normal-phaseseparations?
Reduce Waste Solvent Without SacrificingResolution• Use shorter columns with smaller-
diameter particles.• Switch from 4.6-mm-diameter column
to 2.1 mm.• For isocratic separations, use an electronic
recycler that recycles eluate when nopeak is being eluted.

Maintaining Symmetric BandshapeHPLC columns should be capable of providing narrow, symmetric peaks. If a new columndoes not reproduce the quality of the separation of a standard mixture that the manufacturerstates it should and if you have satisfied yourself that the problem is not in the rest of yoursystem, return the column.
The asymmetry factor A/B in Figure 23-13 should rarely be outside the range 0.9–1.5.Tailing of amines (Figure 25-7) might be eliminated by adding 30 mM triethylamine to themobile phase. The additive binds to sites on silica that would otherwise strongly bind ana-lyte. Tailing of acidic compounds might be eliminated by adding 30 mM ammonium acetate.For unknown mixtures, 30 mM triethylammonium acetate is useful. If tailing persists, 10mM dimethyloctylamine or dimethyloctylammonium acetate might be effective. A problemwith additives is that they increase the equilibration time required when changing solvents.Improved grades of silica (types B and C) have reduced tailing and, therefore, reduced theneed for additives.
Columns should be washed periodically to prevent buildup of strongly adsorbed com-pounds that can reduce column performance.14 Tailing or splitting of peaks can occur if thefrit at the beginning of the column becomes clogged with particles.17 You can try to unclogthe frit by disconnecting and reversing the column and flushing it with 20–30 mL. Thecolumn should not be connected to the detector during reverse flushing. If peaks are still dis-torted, it is time to discard the column.
Doubled peaks or altered retention times (Figure 25-16) sometimes occur if the solventin which sample is dissolved has much greater eluent strength than the mobile phase. Try todissolve the sample in a solvent of lower eluent strength or in the mobile phase itself.
25-1 The Chromatographic Process 569
Abs
orba
nce
(280
nm
)
8
6
4
2
0
0 1 2 3 4 5
Time (min) Time (min)
6 7 8 9 10 0 10
10
8
6
4
2
0
20 30 40 50 60
Enantiomer 1
Enantiomer 2
Fractionscollected
(c) Preparative separation of enantiomers by supercritical fluid chromatography. Single injection (left) and multipleoverlapping injections (right) on a Chiralcel OD column eluted with 68 vol% % (25 mMisobutylamine in methanol) at 50 mL/min with (100 bar). Each 2-mL injection contains 320 mgof solute. [From C. J. Welch, W. R. Leonard, Jr., O. DaSilva, M. Biba, J. Albaneze-Walker, D. W. Henderson, B. Laing, and D. J. Mathre, “Preparative
Chiral SFC as a Green Technology for Rapid Access to Enantiopurity in Pharmaceutical Process Research,” LCGC 2005, 23, 16A.]
outlet pressure � 10 MPaCO2/32 vol2 cm � 25 cm
fluid chromatography, eluent strength is increased by makingthe solvent denser by increasing the pressure. The chromatogramin panel (b) illustrates density gradient elution.
Separation of enantiomers is important in the pharmaceuti-cal industry, where one enantiomer could be beneficial and theother could be harmful. Chromatographic separation of enantiomersuses an optically active stationary phase (Box 24-1). Supercriticalfluid chromatography with a mixture of and organic solventreduces organic solvent use by up to 90%. The low viscosity ofthe supercritical fluid also permits faster flow rates that increaseproductivity. The chromatograms in panel (c) show a single injectionand multiple overlapping injections for the preparative separationof enantiomers of a developmental drug candidate. Automatedinjection into a conventional laboratory-size column can purify upto of enantiomers in several days. Larger industrial columnsallow kilogram quantities to be separated, with dramatic savingsin organic solvent.
�100 g
CO2
0 25 55 Time (min)
Det
ecto
r re
spon
se
N
N
N
N
N
N
0.25 0.25 0.45 0.658 Density (g/mL)
A standard mixture should be injected eachday to evaluate the HPLC system. Changes inpeak shapes or retention times alert you toa problem.
(b) Open tubular capillary supercritical chromatogram of aromatic com-pounds with CO2, using density gradient elution at 140�C. [From R. D. Smith, B.W.
Wright, and C. R. Yonker,“Supercritical Fluid Chromatography,”Anal.Chem.1988, 60,1323A.]

Overloading causes the distorted shape shown in Figure 23-20.18 To see whether over-loading is occurring, reduce the sample mass by a factor of 10 and see whether retentiontimes increase or peaks become narrower. If either change occurs, reduce the mass againuntil the injection size does not affect retention time and peak shape. In general, reversed-phase columns can handle of sample per gram of silica. A 4.6-mm-diameter col-umn contains 1 g of silica in a length of 10 cm. To prevent peak broadening from too largean injection volume, the injected volume should be less than 15% of the peak volumemeasured at the baseline. For example, if a peak eluted at 1 mL/min has a width of 0.2min, the peak volume is 0.2 mL. The injection volume should not exceed 15% of 0.2 mL,or .
The volume of a chromatography system outside of the column from the point of injec-tion to the point of detection is called the dead volume, or the extra-column volume. Exces-sive dead volume allows bands to broaden by diffusion or mixing. Use short, narrow tubingwhenever possible, and be sure that connections are made with matched fittings to minimizedead volume and thereby minimize extra-column band spreading.
HPLC columns have a typical lifetime of 500 to 2 000 injections.3 You can monitor thehealth of a column by keeping a record of pressure, resolution, and peak shape. The pressurerequired to maintain a given flow rate increases as a column ages. System wear becomesserious when pressure exceeds 17 MPa . It is desirable to developmethods in which pressure does not exceed 14 MPa . When the pres-sure reaches 17 MPa, the in-line frit between the autosampler and the column shouldbe replaced. If this does not help, it is probably time for a new column. If you use a columnfor repetitive analyses, replace the column when the required resolution is lost or when tail-ing becomes significant. Resolution and tailing criteria should be established during methoddevelopment.
25-2 Injection and Detection in HPLCWe now consider the hardware required to inject sample and solvent onto the column andto detect compounds as they leave the column. Mass spectrometric detection, which isextremely powerful and important, was discussed in Section 22-4.
Pumps and Injection ValvesThe quality of a pump for HPLC is measured by how steady and reproducible a flow itcan produce. A fluctuating flow rate can create detector noise that obscures weak signals.Figure 25-17 shows a pump with two sapphire pistons that produce a programmable, con-stant flow rate up to 10 mL/min at pressures up to 40 MPa .Gradients made from up to four solvents are constructed by proportioning the liquidsthrough a four-way valve at low pressure and then pumping the mixture at high pressure
(400 bar, 6 000 pounds/inch2)
0.5-�m(2 000 pounds/inch2)
(2 500 pounds/inch2)
30 �L
1–10 �g
570 CHAPTER 25 High-Performance Liquid Chromatography
Figure 25-16 Effect of sample solventon retention time and peak shape ofn-butylaniline. Eluent (1 mL/min) is
with 0.1 wt%trifluoroacetic acid. Lower sample was dissolvedin eluent. Upper sample was dissolved inmethanol, which is a much stronger solventthan eluent. Column: ,
, . Injection: containing analyte. Ultraviolet detectionat 254 nm. [Courtesy Supelco, Bellefonte, PA.]
0.5 �g10 �L30°C5-�m-diameter C18-silica
15 cm � 4.6 mm
90:10 (vol/vol) H2O/acetonitrile
10864
Time (min)
20
Sample dissolvedin CH3OH
Sample dissolvedin 90:10H2O/acetonitrile
The longer the time spent in any part of thechromatographic system, the more a bandbroadens by diffusion. Section 23-5 discussesband spreading in the injector and detector.
Damper
Spring-loadedoutlet valve
To column
Coolingwater
Active inletvalve
Intakefilter
Solventreservoir
100-µL-volumepiston
50-µL-volumepiston
Figure 25-17 High-pressure piston pump forHPLC. Solvent at the left passes through anelectronic inlet valve synchronized with the largepiston and designed to minimize the formationof solvent vapor bubbles during the intakestroke. The spring-loaded outlet valve maintainsa constant outlet pressure, and the damperfurther reduces pressure surges. Pressure surgesfrom the first piston are decreased in thedamper that “breathes” against a constantoutside pressure. Pressure surges are typically"1% of the operating pressure. As the largepiston draws in liquid, the small piston propelsliquid to the column. During the return stroke ofthe small piston, the large piston delivers solventinto the expanding chamber of the small piston.Part of the solvent fills the chamber while theremainder flows to the column. Delivery rateis controlled by the stroke volumes.[Courtesy Hewlett-Packard Co., Palo Alto, CA.]

into the column. The gradient is electronically controlled and programmable in 0.1 vol%increments.
The injection valve in Figure 25-18 has interchangeable sample loops, each of whichholds a fixed volume. Loops of different sizes hold volumes that range from 2 to .In the load position, a syringe is used to wash and load the loop with fresh sample at atmo-spheric pressure. High-pressure flow from the pump to the column passes through the seg-ment of valve at the lower left. When the valve is rotated counterclockwise, the contentof the sample loop is injected into the column at high pressure.
Spectrophotometric DetectorsAn ideal detector of any type (Table 25-3) is sensitive to low concentrations of every analyte,provides linear response, and does not broaden the eluted peaks. It is also insensitive tochanges in temperature and solvent composition. To prevent peak broadening, the detectorvolume should be less than 20% of the volume of the chromatographic band. Gas bubbles inthe detector create noise, so back pressure may be applied to the detector to prevent bubbleformation during depressurization of eluate.
An ultraviolet detector using a flow cell such as that in Figure 25-19 is the most com-mon HPLC detector, because many solutes absorb ultraviolet light. Simple systems employthe intense 254-nm emission of a mercury lamp. More versatile instruments have deuterium,xenon, or tungsten lamps and a monochromator, so you can choose the optimum ultraviolet
60°
1 000 �L
25-2 Injection and Detection in HPLC 571
Syringe Syringe
Towaste
Fixed-volume sampleloop
Solvent in
Load position
Tocolumn
Towaste
Sampleloop
Solvent in
Inject position
Tocolumn
(a ) (b )
Figure 25-18 Injection valve for HPLC. Replaceable sample loop comes in various fixed-volume sizes.
Table 25-3 Comparison of commercial HPLC detectors
Approximate limit Useful withDetector of detectiona (ng) gradient?
Ultraviolet 0.1–1 YesRefractive index 100–1 000 NoEvaporative light-scattering 0.1–1 YesElectrochemical 0.01–1 NoFluorescence 0.001–0.01 Yes
Nitrogen 0.3 YesConductivity 0.5–1 NoMass spectrometry 0.1–1 YesFourier transform infrared 1 000 Yes
a. Most detection limits from E. W. Yeung and R. E. Synovec, “Detectors for Liquid Chromatography,” Anal. Chem. 1986, 58, 1237A.
(N !combustion NO !O3 NO2
* S h )
DetectorLight
source
Eluate in
Eluate out
Figure 25-19 Light path in aspectrophotometric micro flow cell. Onecommon cell with a pathlength of 1 cm hasa volume of . Another cell with a 0.5-cmpathlength contains only .2.5 �L
8 �L
• Pass samples through a filter toremove particles prior to injection.
• The HPLC syringe needle is blunt, notpointed, to prevent damage to theinjection port.
0.5-�m

or visible wavelength for your analytes. The system in Figure 25-20 uses a photodiode arrayto record the spectrum of each solute as it is eluted. High-quality detectors provide full-scaleabsorbance ranges from 0.000 5 to 3 absorbance units, with a noise level near 1% of fullscale. The linear range extends over five orders of magnitude of solute concentration (whichis another way of saying that Beer’s law is obeyed over this range). Ultraviolet detectors aregood for gradient elution with nonabsorbing solvents. Table 25-2 gave the approximate cut-off wavelengths below which a solvent absorbs too strongly.
Fluorescence detectors excite the eluate with a laser and measure fluorescence (Fig-ures 18-13 and 18-20). These detectors are very sensitive but respond only to the few ana-lytes that fluoresce. To increase the utility of fluorescence and electrochemical detectors(described later), fluorescent or electroactive groups can be covalently attached to theanalyte.19 This process of derivatization can be performed on the mixture prior to chro-matography or by addition of reagents to the eluate between the column and the detector(called post-column derivatization). For example, can be added to the hor-mones epinephrine (page 114), norepinephrine, and dopamine emerging from a chromatog-raphy column.20 These compounds form complexes with Tb(III) which can be excited near300 nm and emit strongly at 500–600 nm. The detection limit is 10 to 100 nM with Tbfluorescence.
Refractive Index DetectorA refractive index detector responds to almost every solute, but its detection limit is about1 000 times poorer than that of the ultraviolet detector. The deflection-type detector in Fig-ure 25-21 has two triangular 5- to compartments through which pure solvent or eluatepasses. Collimated (parallel) visible light filtered to remove infrared radiation (which wouldheat the sample) passes through the cell with pure solvent in both compartments and isdirected to a photodiode array by the deflection plate. When solute with a different refractiveindex enters the cell, the beam is deflected and different pixels of the array are irradiated.
10-�L
Tb(EDTA)�
572 CHAPTER 25 High-Performance Liquid Chromatography
0
0 5
Time (min)
195 345295245
Wavelength (nm)(c )
0.0010
Abs
orba
nce
Anthracenespectrum
Abs
orba
nce
0.2 nganthracene
(b )
Photodiodearrays
Deuteriumlamp
Beamsplitter
Referenceaperture
Sampleflow cell
Concaveholographic
grating
(a )
Figure 25-20 Photodiode array ultraviolet detector for HPLC. (a) Dual-beam optical system usesgrating polychromator, one diode array for the sample spectrum, and another diode array for thereference spectrum. Photodiode arrays are described in Section 20-3. (b) Reversed-phasechromatography (using ) of sample containing 0.2 ng of anthracene, with detection at 250nm. Full-scale absorbance is 0.001. (c) Spectrum of anthracene recorded as it emerged from thecolumn. [Courtesy Perkin-Elmer Corp., Norwalk, CT.]
C18-silica
A photodiode array was used to recordthe ultraviolet spectrum of each peak in Figure 25-12 as it was eluted. By this means,it was possible to determine whichcompounds were in each peak.
Refraction is described in Section 20-4.
Linear range: analyte concentration rangeover which detector response is proportionalto concentration
Dynamic range: range over which detectorresponds in any manner (not necessarilylinearly) to changes in analyte concentration(see page 71)
Detection limit: concentration of analyte thatgives a specified signal-to-noise ratio

Refractive index detectors are useless in gradient elution because it is impossible tomatch exactly the sample and the reference while the solvent composition is changing.Refractive index detectors are sensitive to changes in pressure and temperature .Because of their low sensitivity, refractive index detectors are not useful for trace analysis.They also have a small linear range, spanning only a factor of 500 in solute concentration.The primary appeal of this detector is its nearly universal response to all solutes, includingthose that have little ultraviolet absorption.
Evaporative Light-Scattering DetectorAn evaporative light-scattering detector responds to any analyte that is significantly lessvolatile than the mobile phase.21 In Figure 25-22, eluate enters the detector at the top. In thenebulizer, eluate is mixed with nitrogen gas and forced through a small-bore needle to form a
(�0.01°C)
25-2 Injection and Detection in HPLC 573
Deflection plate
Sample out
Sample inLight
source
Reference in
Reference out
Cell
Path taken whenrefractive indexof eluatechanges
Path taken withpure solvent inboth compartments
Photodiodearray
Figure 25-21 Deflection-type refractive index detector.
Columneffluent
Nebulizerpressure relief
Nitrogen gasNebulizer
Heated drifttube
Sampledroplets
Laser light source
Exhaust
Photodetector
3. Detection
2. Mobile-phase evaporation
1. Nebulization
0 20
Time (min)
40
Absorbance at 232 nm
Absorbance at 205 nm
Evaporative light scattering
Figure 25-22 (a) Operation of an evaporative light-scattering detector. [Courtesy Alltech Associates, Deerfield, IL.]
(b) Comparison of ultraviolet absorbance and evaporative light-scattering detector response. Soluble componentswere extracted from a drug tablet and separated by reversed-phase liquid chromatography on a column containing with a 30-nm pore size for separating polymers. Solvent A is 0.01 wt% trifluoroaceticacid in . Solvent B is 45 wt% propanol and 0.01 wt% trifluoroacetic acid in . A gradient was run from10 vol% B up to 90 vol% B at 1 mL/min. Gradient time was not stated. [From L. A. Doshier, J. Hepp, and K. Benedek,
“Method Development Tools for the Analysis of Complex Pharmaceutical Samples,” Am. Lab. December 2002, p. 18.]
H2OH2OC18-silica
4.6 � 150 mm
(a) (b)
uniform dispersion of droplets. Solvent evaporates from the droplets in the heated drift tube,leaving a fine mist of solid particles to enter the detection zone at the bottom. The particlesare detected by the light that they scatter from a diode laser to a photodiode.
The evaporative light-scattering detector response is related to the mass of analyte, notto the structure or molecular mass of the analyte. If you see a large peak and a small peak,you can be pretty sure that there is less material in the small peak than in the large peak. Withan ultraviolet detector, a small mass of strongly absorbing analyte can give a stronger signalthan a large mass of weakly absorbing analyte. The evaporative light-scattering detectorresponse is fit to the equation.
(25-3)
where A is the area of the signal (in a graph of scattered light intensity versus time), m is themass of analyte, and a and b are constants to fit the calibration curve.
The evaporative light-scattering detector is compatible with gradient elution. Also,there are no peaks associated with the solvent front, so there is no interference with early-eluting peaks. What do we mean by the solvent front? In Figure 25-13, you can see smallpositive and negative signals at 3–4 min. These signals arise from changes in the refrac-tive index of the mobile phase due to solvent in which the sample was dissolved. Thischange displaces the ultraviolet detector signal at the time required for unretainedmobile phase to pass through the column. If a peak is eluted close to the time , it can bedistorted by the solvent front peaks. An evaporative light-scattering detector has no sol-vent front peaks.
If you use a buffer in the eluent, it must be volatile or else it will evaporate down to solidparticles that scatter light and obscure the analyte. Low-concentration buffers made fromacetic, formic, or trifluoroacetic acid, ammonium acetate, diammonium phosphate, ammonia,or triethylamine are suitable. Buffers for evaporative light scattering are the same as for massspectrometric detection.
Figure 25-22b compares evaporative light scattering with ultraviolet absorbance forthe detection of soluble components of a drug tablet containing polymers and small-mol-ecule active ingredients. Two components have absorbance at 232 nm. Four or five com-ponents are evident with 205-nm detection. The solvent gradient produces a sloping base-line at 205 nm. All components are observed by evaporative light scattering and there isno slope to the baseline. Some broad peaks arise from polymers with a distribution ofmolecular mass.
Electrochemical Detector
An electrochemical detector responds to analytes that can be oxidized or reduced, such asphenols, aromatic amines, peroxides, mercaptans, ketones, aldehydes, conjugated nitriles,aromatic halogen compounds, and aromatic nitro compounds. The opening of Chapter 17shows a detector in which eluate is oxidized or reduced at the working electrode. The poten-tial is maintained at a selected value with respect to the reference electrode, andcurrent is measured between the working electrode and the stainless steel auxiliary electrode.For oxidizable solutes, copper or glassy carbon working electrodes are common. For reduciblesolutes, a drop of mercury is a good working electrode. Current is proportional to solute con-centration over six orders of magnitude. Aqueous or other polar solvents containing dis-solved electrolytes are required, and they must be rigorously free of oxygen. Metal ionsextracted from tubing can be masked by adding EDTA to the solvent. The detector is sensi-tive to flow rate and temperature changes.
Pulsed electrochemical measurements at Au or Pt working electrodes expand the classesof detectable compounds to include alcohols, carbohydrates, and sulfur compounds.22 Theelectrode is held at (versus a saturated calomel electrode) for 120 ms to oxidativelydesorb organic compounds from the electrode surface and to oxidize the metal surface. Thenthe electrode is brought to for 200 ms to reduce the oxide to pristine metal. The elec-trode is then brought to a constant working potential (typically in the range to at which analyte is oxidized or reduced. After a delay of 400 ms for the charging current(Figure 17-15) to decay to 0, current is integrated for the next 200 ms to measure analyte.The sequence of pulses just described is then repeated to measure successive data points aseluate emerges from the column. By this means, 10 ppb ethylene glycol inFigure 25-23 gives a signal-to-noise ratio of 3.
(HOCH2CH2OH)
�0.4 V),�0.4�0.6 V
�0.8 V
Ag 0 AgCl
tm
tm
log A � a � b log m
574 CHAPTER 25 High-Performance Liquid Chromatography

25-3 Method Development for Reversed-Phase Separations1
Many separations encountered in industrial and research laboratories can be handled byreversed-phase chromatography. We now describe a general procedure for developing anisocratic separation of an unknown mixture with a reversed-phase column. The next sec-tion deals with gradient separations. In method development, the goals are to obtain ade-quate separation in a reasonable time. Ideally, the procedure should be rugged, whichmeans that the separation will not be seriously degraded by gradual deterioration of thecolumn, small variations in solvent composition, pH, and temperature, or use of a differ-ent batch of the same stationary phase, perhaps from a different manufacturer. If your col-umn does not have temperature control, you can at least insulate it to reduce temperaturefluctuations.
Reversed-phase chromatography is usually adequate to separate mixtures of low-molecular-mass neutral or charged organic compounds. If isomers do not separate well, normal-phasechromatography or porous graphitic carbon is recommended because solutes have stronger,more specific interactions with the stationary phase. For enantiomers, chiral stationaryphases (Box 24-1) are required. Separations of inorganic ions, polymers, and biologicalmacromolecules are described in Chapter 26.
As in gas chromatography (Section 24-5), the first steps in method development are to(1) determine the goal of the analysis, (2) select a method of sample preparation to ensure a“clean” sample, and (3) choose a detector that allows you to observe the desired analytes inthe mixture. The remainder of method development described in the following sectionsassumes that steps 1 through 3 have been carried out.
Criteria for an Adequate Separation
The capacity factor (Equation 23-16) is a measure of retention time, , in units of the time required for mobile phase or an unretained solute to pass through the column. Reasonableseparations demand that the capacity factors for all peaks be in the range 0.5–20. If thecapacity factor is too small, the first peak is distorted by the solvent front. If the capacity fac-tor is too great, the run takes too long. In the lowest trace in Figure 25-12, is the time whenthe first baseline disturbance is observed near 3 min. If you do not observe a baseline distur-bance, you can estimate
Solvent front: (25-4)
where is the volume at which unretained solute is eluted solventfront appears), L is the length of the column (cm), is the column diameter (cm), and F isdc
(� volume at whichVm
Vm �Ld
2c
2 or, equivalently, tm �
Ld 2c
2F
tm
tmtr
25-3 Method Development for Reversed-Phase Separations 575
5 min
Time
Nan
ocou
lom
bs
13
12
1110
9
8
7
6
5
15
143
12
4
Inje
ct
Figure 25-23 Pulsed electrochemical detection of alcohols separated on Dionex AS-1 anion-exchange column with . Peaks: 1, glycerol; 2, ethylene glycol; 3, propylene glycol; 4, methanol; 5, ethanol; 6, 2-propanol; 7, 1-propanol; 8, 2-butanol; 9, 2-methyl-1-propanol; 10, 1-butanol; 11, 3-methyl-1-butanol; 12, 1-pentanol; 13, cyclohexanol; 14, diethylene glycol. [From D. C. Johnson and
W. R. LaCourse, “Liquid Chromatography with Pulsed Electrochemical Detection at Gold and Platinum Electrodes,”
Anal. Chem. 1990, 62, 589A.]
0.05 M HClO4
Desired attributes of a new chromatographicmethod:
• adequate resolution of desired analytes• short run time• rugged (not drastically affected by small
variations in conditions)
Initial steps in method development
1. determine goal2. select method of sample preparation3. choose detector
Capacity factor:
tr � retention time of analytetm � elution time for mobile phase or
unretained solute
k¿ �t r � tm
tm

the flow rate (mL/min) (Figure 25-24). In reversed-phase chromatography, could be mea-sured by running the unretained solutes uracil (detected at 260 nm) or (detected at210 nm) through the column.
For quantitation, a minimum resolution (Figure 23-10) of 1.5 between the two closestpeaks is desired so that neighboring peaks are separated. For ruggedness, a resolution of 2 iseven better. That way, resolution is still adequate if small changes in conditions or slow dete-rioration of the column degrades the resolution.
Another criterion for a successful chromatographic method is not to exceed theupper operating pressure for your hardware. Keeping pressure below �15 MPa (150 bar,2 200 pounds/inch2) prolongs the life of the pump, valves, seals, and autosampler. Pressurecan double during the life of a column because of progressive clogging. Establishing an oper-ating pressure of during method development allows for column degradation.
All peaks (certainly all peaks that need to be measured) should be symmetric, with anasymmetry factor A/B in Figure 23-13 in the range 0.9–1.5. Asymmetric peak shapes shouldbe corrected as described at the end of Section 25-1 before optimizing a separation.
Optimization with One Organic SolventCombinations of acetonitrile, methanol, and tetrahydrofuran with water (or aqueous buffer)provide a sufficient range of dipolar and hydrogen-bonding interactions with solutes to sepa-rate a vast number of compounds in reversed-phase chromatography. The first solvent mix-ture to try is acetonitrile and water. Acetonitrile has low viscosity, which allows relativelylow operating pressure, and it permits ultraviolet detection down to 190 nm (Table 25-2). At190 nm, many analytes have some absorbance. Methanol is the second choice for organicsolvent because it has a higher viscosity and longer wavelength ultraviolet cutoff. Tetrahy-drofuran is the third choice because it has less usable ultraviolet range, it is slowly oxi-dized,24 and it equilibrates more slowly with stationary phase. Starting conditions forreversed-phase HPLC are listed in Table 25-4.
�15 MPa
NaNO3
tm
576 CHAPTER 25 High-Performance Liquid Chromatography
Column length (cm)
Flow rate = 0.5 mL/min
1 mL/min
2 mL/min
t m (
min
)
50 201510 25
6
5
4
3
2
1
0
Figure 25-24 Time (tm) for mobile phase totraverse a 4.6-mm-diameter HPLC column, estimatedwith the equation , where L is the lengthof the column (cm), dc is the column diameter (cm),and F is the flow rate (mL/min).
tm � Ld 2c/(2F )
Table 25-4 Starting conditions for reversed-phase chromatography1
Stationary phase: or on spherical silica particles. Less acidictype B silica is preferred. For operation above , stericallyprotected silica (Figure 25-9) is preferred.
Column: column for particlesa
column for particles (shorter run, sameresolution)
Flow rate: 2.0 mL/min
Mobile phase: for neutral analytesbufferb for ionic analytes
5 vol% in to 100% for gradient elution
Temperature: if temperature control is available
Sample size: containing of each analyte
a. A column reduces solvent consumption to of the volume required for 0.46-cm diameter,reducing the flow to .
b. Buffer is 25–50 mM phosphate/pH 2–3 made by treating with KOH. is more soluble than in organicsolvents and leads to less tailing. Add 0.2 g sodium azide per liter as a preservative if the buffer will not be used quickly.
Na�K�H3PO4
(0.43)(2.0 mL/min) � 0.86 mL/min(0.30/0.46)2 � 43%0.30 � 15 cm
�25–50 �g25–50 �L
35°– 40°C
CH3CNH2OCH3CNCH3CN/aqueousCH3CN/H2O
3.5-�m0.46 � 7.5 cm5-�m0.46 � 15 cm
50°C5-�m-diameterC8C18
Attributes of a good separation
•••• 0.9 � asymmetry factor � 1.5
operating pressure � 15 MParesolution � 20.5 � k¿ � 20
Choice of organic solvent
1. acetonitrile2. methanol3. tetrahydrofuran
To avoid disposing of acetonitrile as hazardouswaste, you can hydrolyze it to sodium acetateand flush it down the drain.23
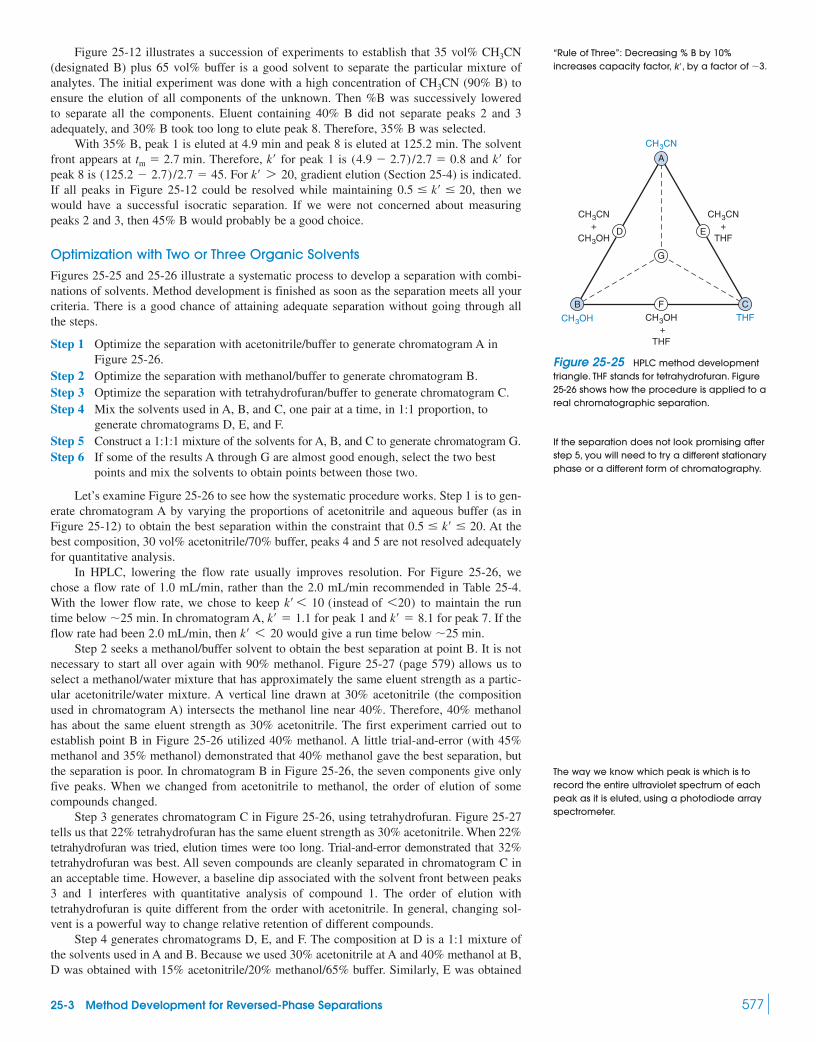
Figure 25-12 illustrates a succession of experiments to establish that 35 vol% (designated B) plus 65 vol% buffer is a good solvent to separate the particular mixture ofanalytes. The initial experiment was done with a high concentration of (90% B) toensure the elution of all components of the unknown. Then %B was successively loweredto separate all the components. Eluent containing 40% B did not separate peaks 2 and 3adequately, and 30% B took too long to elute peak 8. Therefore, 35% B was selected.
With 35% B, peak 1 is eluted at 4.9 min and peak 8 is eluted at 125.2 min. The solventfront appears at . Therefore, for peak 1 is and forpeak 8 is . For , gradient elution (Section 25-4) is indicated.If all peaks in Figure 25-12 could be resolved while maintaining , then wewould have a successful isocratic separation. If we were not concerned about measuringpeaks 2 and 3, then 45% B would probably be a good choice.
Optimization with Two or Three Organic Solvents
Figures 25-25 and 25-26 illustrate a systematic process to develop a separation with combi-nations of solvents. Method development is finished as soon as the separation meets all yourcriteria. There is a good chance of attaining adequate separation without going through allthe steps.
Step 1 Optimize the separation with acetonitrile/buffer to generate chromatogram A inFigure 25-26.
Step 2 Optimize the separation with methanol/buffer to generate chromatogram B.Step 3 Optimize the separation with tetrahydrofuran/buffer to generate chromatogram C.Step 4 Mix the solvents used in A, B, and C, one pair at a time, in 1:1 proportion, to
generate chromatograms D, E, and F.Step 5 Construct a 1:1:1 mixture of the solvents for A, B, and C to generate chromatogram G.Step 6 If some of the results A through G are almost good enough, select the two best
points and mix the solvents to obtain points between those two.
Let’s examine Figure 25-26 to see how the systematic procedure works. Step 1 is to gen-erate chromatogram A by varying the proportions of acetonitrile and aqueous buffer (as inFigure 25-12) to obtain the best separation within the constraint that . At thebest composition, 30 vol% acetonitrile/70% buffer, peaks 4 and 5 are not resolved adequatelyfor quantitative analysis.
In HPLC, lowering the flow rate usually improves resolution. For Figure 25-26, wechose a flow rate of 1.0 mL/min, rather than the 2.0 mL/min recommended in Table 25-4.With the lower flow rate, we chose to keep to maintain the runtime below . In chromatogram A, for peak 1 and for peak 7. If theflow rate had been 2.0 mL/min, then would give a run time below .
Step 2 seeks a methanol/buffer solvent to obtain the best separation at point B. It is notnecessary to start all over again with 90% methanol. Figure 25-27 (page 579) allows us toselect a methanol/water mixture that has approximately the same eluent strength as a partic-ular acetonitrile/water mixture. A vertical line drawn at 30% acetonitrile (the compositionused in chromatogram A) intersects the methanol line near 40%. Therefore, 40% methanolhas about the same eluent strength as 30% acetonitrile. The first experiment carried out toestablish point B in Figure 25-26 utilized 40% methanol. A little trial-and-error (with 45%methanol and 35% methanol) demonstrated that 40% methanol gave the best separation, butthe separation is poor. In chromatogram B in Figure 25-26, the seven components give onlyfive peaks. When we changed from acetonitrile to methanol, the order of elution of somecompounds changed.
Step 3 generates chromatogram C in Figure 25-26, using tetrahydrofuran. Figure 25-27tells us that 22% tetrahydrofuran has the same eluent strength as 30% acetonitrile. When 22%tetrahydrofuran was tried, elution times were too long. Trial-and-error demonstrated that 32%tetrahydrofuran was best. All seven compounds are cleanly separated in chromatogram C inan acceptable time. However, a baseline dip associated with the solvent front between peaks3 and 1 interferes with quantitative analysis of compound 1. The order of elution withtetrahydrofuran is quite different from the order with acetonitrile. In general, changing sol-vent is a powerful way to change relative retention of different compounds.
Step 4 generates chromatograms D, E, and F. The composition at D is a 1:1 mixture ofthe solvents used in A and B. Because we used 30% acetonitrile at A and 40% methanol at B,D was obtained with 15% acetonitrile/20% methanol/65% buffer. Similarly, E was obtained
�25 mink¿ 6 20k¿ � 8.1k¿ � 1.1�25 min
k¿ 6 10 (instead of 620)
0.5 � k¿ � 20
0.5 � k¿ � 20k¿ 7 20(125.2 � 2.7) /2.7 � 45
k¿(4.9 � 2.7) /2.7 � 0.8k¿tm � 2.7 min
CH3CN
CH3CN
25-3 Method Development for Reversed-Phase Separations 577
Figure 25-25 HPLC method developmenttriangle. THF stands for tetrahydrofuran. Figure25-26 shows how the procedure is applied to areal chromatographic separation.
CH3CN
CH3CN+
CH3OH
CH3OH CH3OH +
THF
THF
CH3CN+
THF
A
B C
D E
F
G
“Rule of Three”: Decreasing % B by 10%increases capacity factor, , by a factor of .�3k¿
If the separation does not look promising afterstep 5, you will need to try a different stationaryphase or a different form of chromatography.
The way we know which peak is which is torecord the entire ultraviolet spectrum of eachpeak as it is eluted, using a photodiode arrayspectrometer.
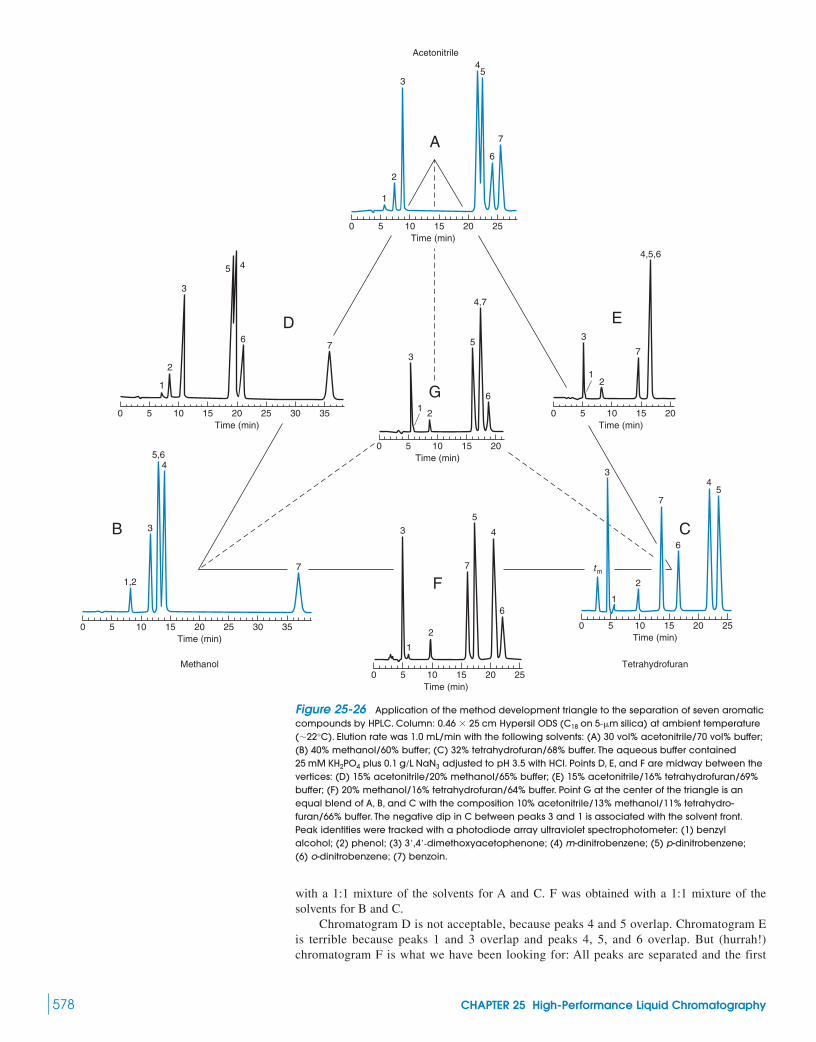
with a 1:1 mixture of the solvents for A and C. F was obtained with a 1:1 mixture of thesolvents for B and C.
Chromatogram D is not acceptable, because peaks 4 and 5 overlap. Chromatogram Eis terrible because peaks 1 and 3 overlap and peaks 4, 5, and 6 overlap. But (hurrah!)chromatogram F is what we have been looking for: All peaks are separated and the first
578 CHAPTER 25 High-Performance Liquid Chromatography
A
B C
D E
F
G
0 5 10 15 20 25 30 35
1
2
3
7
3
4
5
4
1 2
3
5
6
61
2
3
7
6
45
12
3
7
1
2
3
45
67
1
2
3
45
6
7
1,2
5,6
4,7
4,5,6
Time (min)
0 5 10 15 20 25 30 35Time (min)
0 5 10 15 20 25Time (min)
0 5 10 15 20 25Time (min)
0 5 10 15 20Time (min)
0 5 10 15 20Time (min)
0 5 10 15 20 25Time (min)
tm
Acetonitrile
TetrahydrofuranMethanol
7
Figure 25-26 Application of the method development triangle to the separation of seven aromaticcompounds by HPLC. Column: Hypersil ODS at ambient temperature
. Elution rate was 1.0 mL/min with the following solvents: (A) 30 vol% acetonitrile/70 vol% buffer;(B) 40% methanol/60% buffer; (C) 32% tetrahydrofuran/68% buffer. The aqueous buffer contained
plus adjusted to pH 3.5 with HCl. Points D, E, and F are midway between thevertices: (D) 15% acetonitrile/20% methanol/65% buffer; (E) 15% acetonitrile/16% tetrahydrofuran/69%buffer; (F) 20% methanol/16% tetrahydrofuran/64% buffer. Point G at the center of the triangle is anequal blend of A, B, and C with the composition 10% acetonitrile/13% methanol/11% tetrahydro-furan/66% buffer. The negative dip in C between peaks 3 and 1 is associated with the solvent front.Peak identities were tracked with a photodiode array ultraviolet spectrophotometer: (1) benzylalcohol; (2) phenol; (3) ; (4) m-dinitrobenzene; (5) p-dinitrobenzene; (6) o-dinitrobenzene; (7) benzoin.
3¿,4¿-dimethoxyacetophenone
0.1 g/L NaN325 mM KH2PO4
(�22°C)(C18 on 5-�m silica)0.46 � 25 cm

peak (3) is adequately removed from the solvent dip. We are finished! The solvent com-position at F (20% methanol/16% tetrahydrofuran/64% buffer) does the job. Peaks 4 and6 have the minimum resolution of 1.8. (We would have preferred resolution .) Allpeaks are symmetric and within the range . The operating pressureremained reasonable.
If none of the trials had worked, step 5 would generate chromatogram G in Figure 25-26,using a 1:1:1 mixture of solvents from A, B, and C. For completeness, the result at G isshown. Peaks 1 and 3 overlap and peaks 4 and 7 overlap.
If some of the compositions A through G were almost good enough, compositionsbetween the points might have been better. For example, if A and D were almost goodenough, perhaps a mixture of the solvents for A and D might have been better.
Temperature as a Variable
Column temperature affects the relative retention of different compounds and elevated tem-perature permits high-speed chromatography to be conducted.25 Figure 25-28 suggests a sys-tematic procedure for method development in which solvent composition and temperatureare the two independent variables.1 For elevated temperature operation, pH should be below6 to retard dissolution of silica. Alternatively, zirconia-based stationary phases work up to atleast .
Do It with a Computer!
Method development is vastly simplified by computer simulations using commercial soft-ware. With input from a small number of real experiments, a program can predict the effectsof solvent composition and temperature in isocratic or gradient separations. You can selectoptimum conditions in minutes with the computer instead of days in the lab. Of course, youmust verify the prediction by a real experiment. Commercial software saves huge expenses inmethod development in industrial laboratories.
Choosing a Stationary Phase
is the most common stationary phase and it separates a wide range of mixtureswhen the solvent is chosen carefully, as in Figure 25-26. However, it cannot achieve allseparations. Table 25-5 is a guide to selecting other bonded phases.
C18-silica
200°C
k¿ � 0.9 � 7.572.0
25-3 Method Development for Reversed-Phase Separations 579
Acetonitrile/H2O
Methanol/H2O
Tetrahydrofuran/H2O0 10 20 30 40 50 60 70 80 90 100
0 20 40 60 80 100
0 10 20 30 40 50 60 70 80 90 100Figure 25-27 Nomograph showing volumepercentage of solvents having the sameeluent strength. A vertical line intersects eachsolvent line at the same eluent strength. Forexample, 30 vol% acetonitrile/70 vol% waterhas about the same eluent strength as 40 vol%methanol or 22 vol% tetrahydrofuran. [From L. R.
Snyder, J. J. Kirkland, and J. L. Glajch, Practical HPLC
Method Development (New York: Wiley, 1997).]
AT
%B
High %BLow T
High %BHigh T
Low %BLow T
Low %BHigh T
B C
D
Figure 25-28 Isocratic method developmentfor HPLC, using solvent composition, % B, andtemperature, T, as independent variables. % Band T are each varied between selected lowand high values. From the appearance ofchromatograms resulting from conditions A–D,we can select intermediate conditions toimprove the separation.
w1/2 � average width at half-height wav � average width at baseline �tr � separation between peaks
Resolution ��trwav
��tr
1.70w1/2
After optimizing the solvent, you might stillneed to improve resolution. To increaseresolution, you can
• decrease flow rate• increase column length• decrease particle size
Table 25-5 Selection of bonded stationary phases for HPLC
Bonded group Polarity Retention mechanisms Comments
Nonpolar van der Waals does not retain hydrophobic compounds as stronglyas
Phenyl Nonpolar Hydrophobic and pi-pi
Cyano Intermediate Hydrophobic, dipole-dipole, Resolves polar organic compounds by reversed-phaseand pi-pi or normal-phase chromatography
Amino Polar or Dipole-dipole and H-bonding Normal-phase or ion-exchange separations; separatesionic carbohydrates, polar organic compounds, and inorganic
ions; reacts with aldehydes and ketones
Bare silica Very polar H-bonding Normal-phase separations
SOURCE: C. S. Young and R. J. Weigand, “An Efficient Approach to Column Selection in HPLC Method Development,” LCGC 2002, 20, 464.
(ßNH3�)
(ßNH2)
C18
C8C18, C8, C4

Example Selecting a Bonded Phase
Suggest an approach to resolve the following compounds in a short time.
Solution Compounds with the most similar structures are likely to be hardest toseparate. Of the compounds in the mixture, 5 and 6 are most similar, differing by just one
bond. Table 25-5 suggests that a stationary phase with phenyl or cyano groups,which retain analytes by pi-pi interactions, might be good for distinguishing 5 and 6. Forrapid analysis but good resolution, select a short column with small particle size and runit at a rapid flow rate. Figure 25-29 shows that 5 and 6 are resolved by a phenyl columnbut not by a column.C18
C¢C
580 CHAPTER 25 High-Performance Liquid Chromatography
HO O
OH
OHOH
OH
O4. Quercitin
HO O
OH
OHOH
OH
2. Chatechin
HO O
O
OHOH
O O
OH OH
OH
OH
OH
OH
O
1. Rutin
HOO H3C
HO O
OOH
OH
OH
OH
OH
3. Myricetin
HO O
OH
OH O5. Apigenin
Doublebond
HO O
OH
OH O6. Naringenin
Singlebond
0 1
11
2
2
Time (min)
3
3 3
4
4 4
5
5, 66
Det
ecto
r re
spon
se
0 1 2
2
Time (min)
3 4
(a) (b)
Figure 25-29 Separation of six compoundson (a) phenyl- and (b) columnswith particle size using 35:65 (vol/vol)acetonitrile/0.2% aqueous trifluoroacetic acid.Column size: ; [From C. S. Young and R. J. Weigand, “An Efficient
Approach to Column Selection in HPLC Method
Development,” LCGC 2002, 20, 464. Courtesy Alltech
Associates.]
flow rate � 2.5 mL/min.7 � 53 mm
3-�mC18-silica
We have discussed several ways to change the relative retention of two closely spacedpeaks. Some methods are harder to implement than others. One suggested order of steps totry—from easiest to hardest—is: (1) change the solvent strength by varying the fraction ofeach solvent; (2) change the temperature; (3) change the pH (in small steps); (4) use a differ-ent solvent; (5) use a different kind of stationary phase.26
25-4 Gradient SeparationsFigure 25-12 shows an isocratic separation of eight compounds that required a run time ofmore than 2 h. When eluent strength was low enough to resolve early peaks (2 and 3), theelution of later peaks was very slow. To retain the desired resolution but decrease the analy-sis time, the segmented gradient (a gradient with several distinct parts) in Figure 25-13was selected. Peaks 1–3 were separated with a low eluent strength (30% B). Between 8 and13 min, B was increased linearly from 30 to 45% to elute the middle peaks. Between 28 and30 min, B was increased linearly from 45 to 80% to elute the final peaks.

25-4 Gradient Separations 581
Dwell Volume and Dwell TimeThe volume between the point at which solvents are mixed and the beginning of the columnis called the dwell volume. The dwell time, , is the time required for the gradient to reachthe column. Dwell volumes range from 0.5 to 10 mL in different systems. For Figure 25-13,the dwell volume is 5 mL, and the flow rate is 1.0 mL/min. Therefore, the dwell time is 5 min.A solvent change initiated at 8 min does not reach the column until 13 min.
Differences in dwell volumes between different systems are an important reason why con-ditions for gradient separations on one chromatograph do not necessarily transfer to another. Itis helpful to state the dwell volume for your system when you report a gradient separation. Oneway to compensate for dwell volume is to inject sample at the time instead of at .
You can measure dwell volume by first disconnecting the column and connecting theinlet tube directly to the outlet tube. Place water in reservoirs A and B of the solvent deliverysystem. Add 0.1 vol% acetone to reservoir B. Program the gradient to go from 0 to 100% Bin 20 min and begin the gradient at . With the detector set to 260 nm, the response willideally look like that in Figure 25-30. The delay between the start of the gradient and the firstresponse at the detector is the dwell time, .
Gradient Elution Is a Fine Way to Begin Method DevelopmentThe quickest way to survey a new mixture to decide whether to use isocratic or gradient elu-tion is to run a broad gradient, as in Figure 25-31a.27 This figure shows how the sample mix-ture in Figure 25-12 is separated by a linear gradient from 10 to 90% acetonitrile in 40 min.
tD
t � 0
t � 0tD
tD
Abs
orba
nce
at 2
20 n
mA
bsor
banc
e at
220
nm
(a )
(b )
(c )
1
2
3
4
5
6
7
8
1
2
3
4
5
6
7
8
1
2
3
4
5
6
7
8
10% B to 90% Bover 40 min
30% B to 82% Bover 40 min
30% B to 82% Bover 20 min
0 5 10 15 20 25 30 35Time (min)
40
0 5 10 15 20 25 30 35Time (min)
Abs
orba
nce
at 2
20 n
m
0 5 10 15 20Time (min)
Figure 25-31 Linear gradient separationsof the same mixture used in Figure 25-12 inthe same column and solvent system [buffer(solvent A) with acetonitrile (solvent B)] ata flow rate of 1.0 mL/min. The dwell timewas 5 min.
Figure 25-30 Measurement of dwell time,using nonabsorbing solvent in reservoir A anda weak absorber in reservoir B. The gradientfrom 0 to 100% B is begun at time butdoes not reach the detector until time tD. Thecolumn is removed from the system for thismeasurement. Real response will be roundedinstead of having the sharp intersectionsshown in this illustration.
t � 0
Det
ecto
r re
spon
se
Timet = 0
tD
tD �dwell volume (mL)
flow rate (mL/min)

The gradient time, , is the time over which the solvent composition is changed (40 min).Box 25-3 tells you how to select . Let be the difference in the retention time between thefirst and the last peak in the chromatogram. In Figure 25-31a, .The criterion to choose whether to use a gradient is
If all peaks are eluted over a narrow solvent range, then isocratic elution is feasible. If awide solvent range is required, then gradient elution is more practical. In Figure 25-31a,
. Therefore, gradient elution is recommended. Isocratic elu-tion is possible, but the time required in Figure 25-12 is impractically long.
If isocratic elution is indicated because , then a good starting solvent is thecomposition at the point halfway through the interval . That is, if the first peak is eluted at10 min and the last peak is eluted at 20 min, a reasonable isocratic solvent has the composi-tion at 15 min in the gradient.
Developing a Gradient SeparationThe first run should survey a broad range of eluent strength such as 10 to 90% B in 40 minin Figure 25-31a. Because the dwell time was 5 min and the gradient began at , thegradient did not reach the column until . (It would have been better to inject thet � 5 min
t � 0
�t�t/tG 6 0.25
�t/tG � 21.5/40 � 0.54 7 0.25
Use a gradient if �t/tG 7 0.25 Use isocratic elution if �t/tG 6 0.25
�t � 35.5 � 14.0 � 21.5 min�ttG
tG
582 CHAPTER 25 High-Performance Liquid Chromatography
Box 25-3 Choosing Gradient Conditions and Scaling Gradients
We now provide equations that allow you to select sensible lineargradient conditions (as in Figure 25-32) and to scale gradientsfrom one column to another.
The retention of a compound in isocratic elution depends onsolvent composition:
(25-5)
where is the capacity factor, would be the capacity factorfor 100% aqueous eluent, is the fraction of organic solvent
, and S is a con-stant for each compound, with a typical value of for smallmolecules. From two experiments with different values of ,you can compute and S. These values are input for soft-ware that predicts how chromatograms will appear for differentconditions.
For gradient elution, an average capacity factor k* applies toall peaks:
(25-6)
where is gradient time (min), F is flow rate (mL/min), isthe change in solvent composition during the gradient, is thevolume of mobile phase in the column (mL), and S is measuredwith Equation 25-5. We take for this discussion.
In isocratic elution, a capacity factor provides separa-tion from the solvent front and does not require excessive time.For gradient elution, is a reasonable starting condition.Let’s calculate a sensible gradient time for the experiment inFigure 25-3la, in which we chose a gradient from 10% to 90% B
in a column eluted at 1.0 mL/min.From Equation 25-4,
We calculate the required gradient time by rearrangingEquation 25-6:
(25-7)tG �k*��VmS
F�
(5)(0.8)(2.65 mL)(4)
(1.0 mL/min)� 42 min
2.65 mL.Vm � Ld2
c/2 � (25 cm)(0.46 cm)2/2 �0.46 � 25 cm(�� � 0.8)
k* � 5
k¿ � 5S � 4
Vm
��tG
k* �tGF
��VmS
k¿w�
�4(� � 0.4 for 40 vol% CH3CN/60 vol% H2O)
�k¿wk¿
log k¿ � log k ¿w � S�
A reasonable gradient time would be 42 min. In Figure 25-31a, is 40 min, giving . In Figure 25-31b, we changed thegradient to , giving better separation:
The separation is poorer in Figure 25-31c, for which .If you have a successful gradient separation and want to
transfer it from column 1 to column 2, whose dimensions are dif-ferent, the scaling relations are:
(25-8)
where F is volume flow rate (mL/min), m is the mass of sample, dis the delay time before the gradient reaches the column, and V istotal column volume. The gradient time, , should not be changed.In Figure 25-32, the delay time min is due to the dwell vol-ume between the mixer and the column. Equation 25-8 tells us tochange volume flow rate, sample mass, and dwell time in propor-tion to column volume. If dwell volume is small in comparisonwith the volume of solvent on the column, , the delay time dcan be inconsequential. If dwell volume is large, it becomes animportant factor over which you might have little control.
Suppose that you have optimized a gradient on a column and you want to transfer it to a column.The quotient is , where r is column radiusand L is column length. For these columns, . Equa-tion 25-8 tells us to decrease the volume flow rate, the samplemass, and the delay time to 0.083 times the values used for thelarge column. The gradient time should not be changed.
When you make these changes, you will discover that k* isthe same for both columns. If you change a condition that affectsk*, you should make a compensating change to restore k*. Forexample, Equation 25-6 tells us that if we choose to double weshould cut the flow rate in half so that the product is constantand k* remains constant.
tGFtG
V2/V1 � 0.083(r2L)2/ (r2L)1V2/V1
0.21 � 10 cm0.46 � 25 cm
Vm
d � 5tG
F2
F1�
m2
m1�
d2
d1�
V2
V1
k* � 3.6
k* �tG
F
��VmS�
(40 min)(1.0 mL/min)
(0.52)(2.65 mL)(4)� 7.3
�� � 0.52k* � 4.7
tG
• The first run on a new mixture should be agradient.
• If , use gradient elution.• If , use isocratic elution.• Isocratic solvent should have composition
applied to column halfway through theperiod .�t
�t/tG 6 0.25�t/tG 7 0.25

sample at , but this was not done.) Serendipitously, the first run in Figure 25-31separated all eight peaks. We could stop at this point if we were willing to settle for a36-min run time.
The next step in developing a gradient method is to spread the peaks out by choosing ashallower gradient. For a dwell time of 5 min, the gradient profile for Figure 25-31a lookslike Figure 25-32. Peak 1 was eluted at 14.0 min when the solvent was 28% B. Peak 8 waseluted near 35.5 min, when the solvent was 71% B. The portions of the gradient from 10 to28% B and 71 to 90% B were not really needed. Therefore, the second run could be madewith a gradient from 28 to 71% B over the same (40 min). Conditions chosen for the runin Figure 25-31b were 30 to 82% B in 40 min. This gradient spread the peaks out andreduced the run time slightly to 32 min.
In Figure 25-31c, we want to see whether a steeper gradient could be used to reduce therun time. The gradient limits were the same as in trace b, but was reduced to 20 min. Peaks6 and 7 are not fully resolved with the shorter gradient time. Trace b represents reasonableconditions for the gradient separation.
If the separation in Figure 25-31b were not acceptable, you could try to improve it byreducing the flow rate or going to a segmented gradient, as in Figure 25-13. The rationale fora segmented gradient is to use a good solvent composition for each region of the chro-matogram and then to increase % B for the next region. It is easy to experiment with flowrate and gradient profiles. More difficult approaches to improve the separation are to changethe solvent, use a longer column, use a smaller particle size, or change the stationary phase.
With all these tools, you can usually find a way to separate the components of a mixtureif it does not contain too many compounds. If reversed-phase chromatography fails, normal-phase chromatography or one of the methods in Chapter 26 could be appropriate. Methoddevelopment is part science, part art, and part luck.
tG
tG
t � 5 min
Summary 583
Terms to Understandbonded stationary phasedead volumederivatizationdialysisdwell volumeelectrochemical detectoreluent strength
evaporative light-scatteringdetector
gradient elutionguard columnhigh-performance liquid
chromatography (HPLC)hydrophilic substance
hydrophobic substanceisocratic elutionmicroporous particlesnormal-phase chromatographyrefractive index detectorreversed-phase chromatographyseparation factor
supercritical fluidsuperficially porous particleultraviolet detector
SummaryIn high-performance liquid chromatography (HPLC), solvent ispumped at high pressure through a column containing stationaryphase particles with diameters of . The smaller the parti-cle size, the more efficient the column, but the greater the resistanceto flow. Microporous silica particles with a covalently bonded liq-uid phase such as octadecyl groups ( ) are most common.Eluent strength measures the ability of a given solvent to elutesolutes from the column. In normal-phase chromatography, thestationary phase is polar and a less polar solvent is used. Eluent
ßC18H37
1.5–5 �m
strength increases as the polarity of the solvent increases. Reversed-phase chromatography employs a nonpolar stationary phase andpolar solvent. Eluent strength increases as the polarity of the solventdecreases. Most separations of organic compounds can be done onreversed-phase columns. Normal-phase chromatography or porousgraphitic carbon are good for separating isomers. Chiral phasesare used for optical isomers. Techniques for separating inorganicions, polymers, and biological macromolecules are described inChapter 26.
0
20
40
0 10 20 30 40 50
60
80
100
Time from injection (min)
% B
Figure 25-32 Solvent gradient forFigure 25-31a. The gradient was begun at thetime of injection , but the dwell time was5 min. Therefore, the solvent was 10% B for thefirst 5 min. Then the composition increasedlinearly to 90% B over 40 min. After ,the composition was constant at 90% B.
t � 45 min
(t � 0)
Steps in gradient method development:
1. Run a wide gradient (e.g., 5 to 100% B) over40–60 min. From this run, decide whethergradient or isocratic elution is best.
2. If gradient elution is chosen, eliminateportions of the gradient prior to the first peakand following the last peak. Use the samegradient time as in step 1.
3. If the separation in step 2 is acceptable, tryreducing the gradient time to reduce therun time.

nonvolatile solute. Electrochemical and fluorescence detectors areextremely sensitive but selective. In supercritical fluid chromatog-raphy, nonvolatile solutes are separated by a process whose effi-ciency, speed, and detectors more closely resemble those of gaschromatography than of liquid chromatography.
Steps in method development: (1) determine the goal of theanalysis, (2) select a method of sample preparation, (3) choose adetector, and (4) use a systematic procedure to select solvent forisocratic or gradient elution. Aqueous acetonitrile, methanol, andtetrahydrofuran are customary solvents for reversed-phase separa-tions. A separation can be optimized by varying several solvents orby using one solvent and temperature as the principal variables. Iffurther resolution is required, flow rate can be decreased and youcan use a longer column with smaller particle size. Criteria for asuccessful separation are , resolution , operatingpressure , and asymmetry factor in the range 0.9–1.5.In gradient elution, solvent composition does not begin to changeuntil the dwell volume has passed from the point of solvent mixingto the start of the column. A wide gradient is a good first choice todetermine whether to use isocratic or gradient elution.
�15 MPa�2.00.5 � k¿ � 20
If a solution of organic solvent and water is used in reversed-phase chromatography, eluent strength increases as the percentageof organic solvent increases. If the solvent has a fixed composition,the process is called isocratic elution. In gradient elution, eluentstrength is increased during chromatography by increasing the per-centage of strong solvent.
A short guard column containing the same stationary phase asthe analytical column is placed before the analytical column to pro-tect it from contamination with particles or irreversibly adsorbedsolutes. A high-quality pump provides smooth solvent flow. Theinjection valve allows rapid, precise sample introduction. The col-umn is best housed in an oven to maintain a reproducible tempera-ture. Column efficiency increases at elevated temperature becausethe rate of mass transfer between phases is increased. Mass spectro-metric detection provides quantitative and qualitative informationfor each substance eluted from the column. Ultraviolet detection ismost common and it can provide qualitative information if a photo-diode array is used to record a full spectrum of each analyte.Refractive index detection has universal response but is not verysensitive. Evaporative light scattering responds to the mass of each
Exercises25-A. A known mixture of compounds A and B gave the followingHPLC results:
Concentration(mg/mL in Peak area
Compound mixture) (arbitrary units)
A 1.03 10.86B 1.16 4.37
A solution was prepared by mixing 12.49 mg of B plus 10.00 mL ofunknown containing just A and diluting to 25.00 mL. Peak areas of5.97 and 6.38 were observed for A and B, respectively. Find theconcentration of A (mg/mL) in the unknown.
25-B. A bonded stationary phase for the separation of optical iso-mers has the structure
To resolve the enantiomers of amines, alcohols, or thiols, the com-pounds are first derivatized with a nitroaromatic group thatincreases their interaction with the bonded phase and makes themobservable with a spectrophotometric detector.
O2N
O2N
H NH2
OHR enantiomer
H2N H
OHS enantiomer
� N ∞ C ∞ O
NO2
NO2
RNH C NH
O™
Aromatic derivative(mixture of two enantiomers)
Mixture to beresolved(RNH2)
O
O
Particle
OCH2CH3
Si O C
O
N
H
C
H(CH3)2CH
®® ®® ®® ®®®® ®®
™
Optically activecenter
When the mixture is eluted with 20 vol% 2-propanol in hexane, theR enantiomer is eluted before the S enantiomer, with the followingchromatographic parameters:
where is the average width of the two Gaussian peaks at theirbase.
(a) Find , , and , with units of minutes.(b) The width of a peak at half-height is (Figure 23-9). Ifthe plate number for each peak is the same, find for eachpeak.(c) The area of a Gaussian peak is ,where is the width at half-height in Figure 23-9. Given that theareas under the two bands should be equal, find the relative peakheights ( ).
25-C. (a) Make a graph showing the retention time of each peak inFigure 25-26 in chromatograms A, D, and B as a function of posi-tion along the line AB. Predict the retention times for solvent com-positions midway between A and D and midway between D and B.Draw a stick diagram (representing each peak as a vertical line) ofthe two predicted chromatograms.(b) What would be the solvent compositions midway between Aand D and midway between D and B?
25-D. Two peaks emerge from a chromatography column as sketchedin the following illustration.
heightR/heightS
w1/2
1.064 � peak height � w1/2
w1/2
w1/2
wavt2t1
t = 0 tm
t1
R isomer
S isomer
t2
Time
wav
k¿ for R isomer � 1.35 tm � 1.00 min
Resolution ��tr
wav� 7.7 Relative retention (�) � 4.53
584 CHAPTER 25 High-Performance Liquid Chromatography
NO2
NO2
RNH C NH
O™
Aromatic derivative(mixture of two enantiomers)
Aromatic derivative(mixture of two enantiomers)

According to Equation 23-30, the resolution is given by
Resolution �2N
4(� 1)
Sig
nal
Time
Problems 585
where N is the number of theoretical plates and is the separationfactor, defined as the quotient of linear velocities of the two solutes
.(a) If you change the solvent or the stationary phase, you willchange the separation factor. Sketch the chromatogram if increasesbut N is constant.(b) If you increase the column length or decrease the particle sizeor flow rate, you can increase the number of plates. Sketch thechromatogram if N increases but is constant.�
�
(� 7 1)
�
Problems
High-Performance Liquid Chromatography
25-1. (a) Why does eluent strength increase as solvent becomesless polar in reversed-phase chromatography, whereas eluentstrength increases as solvent becomes more polar in normal-phasechromatography?(b) What kind of gradient is used in supercritical fluidchromatography?
25-2. Why are the relative eluent strengths of solvents in adsorptionchromatography fairly independent of solute?
25-3. (a) Why is high pressure needed in HPLC?(b) What is a bonded phase in liquid chromatography?
25-4. (a) Use Equation 25-1 to estimate the length of column requiredto achieve plates if the stationary phase particle size is10.0, 5.0, 3.0, or .(b) Why do smaller particles give better resolution?
25-5. If a 15-cm-long column has a plate height of , whatwill be the half-width (in seconds) of a peak eluted at 10.0 min? Ifplate , what will be ?
25-6. Why are silica stationary phases generally limited to operat-ing in the pH range 2–8? Why does the silica in Figure 25-9 haveimproved stability at low pH?
25-7. How do additives such as triethylamine reduce tailing of cer-tain solutes?
25-8. HPLC peaks should generally not have an asymmetry factorA/B in Figure 23-13 outside the range 0.9–1.5.(a) Sketch the shape of a peak with an asymmetry of 1.8.(b) What might you do to correct the asymmetry?
25-9. (a) Sketch a graph of the van Deemter equation (plate heightversus flow rate). What would the curve look like if the multiplepath term were 0? If the longitudinal diffusion term were 0? If thefinite equilibration time term were 0?(b) Explain why the van Deemter curve for particles in Fig-ure 25-3 is nearly flat at high flow rate. What can you say abouteach of the terms in the van Deemter equation for 3-m particles?(c) Why is superficially porous silica used for separating largemolecules, such as proteins?
25-10. (a) From and in Figure 25-8, find N for each peak.(b) From and , find the resolution.(c) Use Equation 23-30 with the average N to find the resolution.
25-11. (a) According to Equation 25-2, if all conditions are constant,but particle size is reduced from , by what factormust pressure be increased to maintain constant linear velocity?
3 m to 0.7 m
w1/2tr
w1/2tr
3-m
w1/2height � 25 m
5.0 m
1.5 m1.0 � 104
(b) If all conditions except pressure are constant, by what factorwill linear velocity increase if column pressure is increased by afactor of 10?(c) With particles in a col-umn, increasing pressure from 70 MPa to 700 MPa decreasedanalysis time by approximately a factor of 10 while increasing platecount from 12 000 to 45 000.28 Explain why small particles permit10-fold faster flow without losing efficiency or, in this case, withimproved efficiency.
25-12. Using Figure 25-14, suggest which type of liquid chro-matography you could use to separate compounds in each of thefollowing categories:(a) , soluble in octane(b) soluble in dioxane(c) ionic(d) soluble in water, nonionic, size 50 nm(e) soluble in water, ionic(f) soluble in tetrahydrofuran, size 50 nm
25-13. Explain the following statements:(a) Normal-phase chromatography generally uses nonaqueous sol-vents, and eluent strength increases as the solvent becomes more polar.(b) Reversed-phase chromatography generally uses aqueous organicsolvents, and eluent strength increases as the fraction of organic sol-vent increases.(c) Hydrophilic interaction chromatography uses aqueous organicsolvents, and eluent strength increases as the fraction of water in theaqueous solvent increases.
25-14. Microporous silica particles with a density of 2.2 g/mL and adiameter of have a measured surface area of . Cal-culate the surface area of the spherical silica as if it were simplysolid particles. What does this calculation tell you about the shapeor porosity of the particles?
25-15. (a) Nonpolar aromatic compounds were separated by HPLCon an octadecyl ( ) bonded phase. The eluent was 65 vol%methanol in water. How would the retention times be affected if90% methanol were used instead?(b) Octanoic acid and 1-aminooctane were passed through the samecolumn described in part (a), using an eluent of 20% methanol/80%buffer (pH 3.0). State which compound is expected to be eluted firstand why.
Octanoic acid
1-Aminooctane
CH3CH2CH2CH2CH2CH2CH2CH2NH2
CH3CH2CH2CH2CH2CH2CH2CO2H
C18
300 m2/g10 m
FM 7 2 000,FM 7 2 000,FM 7 2 000,FM 6 2 000,FM 6 2 000,FM 6 2 000
50-m-diameter � 9-cm-long0.7-m

586 CHAPTER 25 High-Performance Liquid Chromatography
emerged at 1.5 min and morphine at 2.8 min. Explain the order ofelution.(c) Column B was eluted with a 5.0-min gradient beginning at90 vol% acetonitrile in water and ending at 50 vol% acetonitrile inwater. Both solvents contained 10 mM ammonium formate, pH 3.Morphine emerged at 1.3 min and morphine 3- -D-emerged at 2.7 min. Explain the order of elution. Why does the gra-dient go to decreasing acetonitrile?(d) Find the capacity factor for each solute on column A, using
.(e) From Box 25-3, estimate assuming and with
.
25-19. Chromatography–mass spectrometry. Cocaine metabolismin rats can be studied by injecting the drug and periodically with-drawing blood to measure levels of metabolites by HPLC–massspectrometry. For quantitative analysis, isotopically labeled internalstandards are mixed with the blood sample. Blood was analyzed byreversed-phase chromatography with an acidic eluent and atmo-spheric pressure chemical ionization mass spectrometry for detec-tion. The mass spectrum of the collisionally activated dissociationproducts from the m/z 304 positive ion is shown in the figure.Selected reaction monitoring (m/z 304 from mass filter Q1 and m/z182 from Q3 in Figure 22-21) gave a single chromatographic peakat 9.22 min for cocaine. The internal standard gave asingle peak at 9.19 min for (a) Draw the structure of the ion at m/z 304.(b) Suggest a structure for the ion at m/z 182.(c) The intense peaks at m/z 182 and 304 do not have isotopicpartners at m/z 183 and 305. Explain why.(d) Rat plasma is exceedingly complex. Why does the chromatogramshow just one clean peak?(e) Given that has only two major mass spectral peaksat m/z 309 and 182, which atoms are labeled with deuterium?(f) Explain how you would use for measuring cocainein blood.
Cocaine
O
O
CO2CH3
C6H5
NCH3
2H5-cocaine
2H5-cocaine
13C
m/z 309 (Q1) S 182 (Q3).
2H5-cocaine
0.50 mintm �S � 4k*
tm � 0.65 mink¿
glucuronide�
50 100 150 200 250 300 9 10 11 12
m/z Time (min)
9.19
Cocainem/z 304 m/z 182
Mass spectrum ofm/z 304 aftercollisionally activateddissociation
Abu
ndan
ce
9.22
2H5-Cocainem/z 309 m/z 182
82 105 150
182
304
Figure for Problem 25-19Left: Mass spectrum of collisionallyactivated dissociation productsfrom m/z 304 positive ion fromatmospheric pressure chemicalionization mass spectrum ofcocaine. Right: Chromatogramobtained by selected reactionmonitoring. [From G. Singh, V. Arora,
P. T. Fenn, B. Mets, and I. A. Blair, “Isotope
Dilution Liquid Chromatography
Tandem Mass Spectrometry Assay for
Trace Analysis of Cocaine and Its
Metabolites in Plasma,” Anal. Chem.
1999, 71, 2021.]
25-16. Suppose that an HPLC column produces Gaussian peaks.The detector measures absorbance at 254 nm. A sample containingequal moles of compounds A and B was injected into the column.Compound A ( ) has a height 128 mm and a half-width . Compound B
has . What is the height ofpeak B in millimeters?
25-17. Capacity factors for three solutes separated on a nonpolarstationary phase are listed in the table. Eluent was a 70:30 (vol/vol)mixture of 50 mM citrate buffer (adjusted to pH with ) plusmethanol. Draw the dominant species of each compound at each pHin the table and explain the behavior of the capacity factors.
Analyte pH 3 pH 5 pH 7
Acetophenone 4.21 4.28 4.37Salicylic acid 2.97 0.65 0.62Nicotine 0.00 0.13 3.11
Acetophenone Salicylic acid Nicotine
25-18. Morphine and morphine 3- -D- were separated ontwo different with particles.29 Column A was run at 1.4 mL/min and columnB was bare silica run at 2.0 mL/min.
(a) Estimate the volume, , and time, , at which unretainedsolute would emerge from each column. The observed times are0.65 min for column A and 0.50 min for column B.(b) Column A was eluted with 2 vol% acetonitrile in water containing10 mM ammonium formate at pH 3. Morphine 3- -D-glucuronide�
tmVm
NCH3
HO
H
HO
HO2C
HO
HO OH
OO
Morphine Morphine 3-β-D-glucuronide
NCH3
HO
HO
O
C18-silica3-m4.6-mm-diameter � 50-mm-long columns
glucuronide�
pK2 � 7.85pK1 � 3.15pKa � 2.97
O
CH3C6H5
CO2H
OH CH3N
N
NH3
C8
w1/2 � 7.6 mm104 M1 cm1)1.68 �(�254 �w1/2 � 10.1 mm
h ��254 � 2.26 � 104 M1 cm1

Problems 587
25-20. Chromatography–mass spectrometry. Figure 25-8 shows theseparation of enantiomers of the drug Ritalin.
Ritalin (methylphenidate)
(a) Detection in Figure 25-8 is by atmospheric pressure chemicalionization with selected reaction monitoring of the transition. Explain how this detection works and propose structuresfor m/z 234 and m/z 84.(b) For quantitative analysis, the internal standard witha deuterated methyl group was added. The deuterated enantiomershave the same retention times as the unlabeled enantiomers. Whichselected reaction monitoring transition should be monitored to pro-duce a chromatogram of the internal standard in which unlabeledRitalin will be invisible?
Method Development
25-21. (a) Explain how to measure and resolution.(b) State three methods for measuring in reversed-phasechromatography.(c) Estimate for a column containing parti-cles operating at a flow rate of 1.5 mL/min. Estimate if the particlesize were instead.
25-22. What is the difference between dead volume and dwell vol-ume? How do each of these volumes affect a chromatogram?
25-23. What does it mean for a separation procedure to be “rugged”and why is it desirable?
25-24. What are criteria for an adequate isocratic chromatographicseparation?
25-25. Explain how to use a gradient for the first run to decidewhether isocratic or gradient elution would be more appropriate.
25-26. What are the general steps in developing an isocratic separa-tion for reversed-phase chromatography with one organic solvent?
25-27. What are the general steps in developing an isocratic separa-tion for reversed-phase chromatography with two organic solvents?
25-28. What are the general steps in developing an isocratic separa-tion for reversed-phase chromatography with one organic solventand temperature as variables?
25-29. The “rule of three” states that the capacity factor for a givensolute increases approximately threefold when the organic phaseincreases by 10%. In Figure 25-12, . Find for peak 5at 50% B. Predict the retention time for peak 5 at 40% B and com-pare the observed and predicted times.
25-30. Make a graph showing the retention times of peaks 6, 7, and8 in Figure 25-12 as a function of % acetonitrile (% B). Predict theretention time of peak 8 at 45% B.
k¿tm � 2.7 min
3.5 mtm
5-m0.46 � 15 cmtm
tm
k¿
2H3-Ritalin
m/z 234 S 84
Nominal mass � 233C14H19O2N
CO2CH3
NH
25-31. (a) Make a graph showing the retention time of each peak inFigure 25-26 in chromatograms B, F, and C as a function of posi-tion along the line BC. Predict the retention times for solvent com-positions midway between B and F and midway between F and C.Draw a stick diagram (representing each peak as a vertical line) ofeach of the two predicted chromatograms.(b) What would be the solvent compositions midway betweenB and F and midway between F and C?
25-32. Suppose that in Figure 25-26 the optimum concentrations ofsolvents at points A, B, and C are 50% acetonitrile, 60% methanol,and 40% tetrahydrofuran, respectively. What will be the solventcompositions at points D, E, F, and G?
25-33. A reversed-phase separation of a reaction mixture calls forisocratic elution with 48% methanol/52% water. If you want tochange the procedure to use acetonitrile/water, what is a good start-ing percentage of acetonitrile to try?
25-34. (a) When you try separating an unknown mixture byreversed-phase chromatography with 50% acetonitrile/50% water,the peaks are too close together and are eluted in the range Should you use a higher or lower concentration of acetonitrile in thenext run?(b) When you try separating an unknown mixture by normal-phasechromatography with pure 50% hexane/50% methyl t-butyl ether, thepeaks are too close together and are eluted in the range Should you use a higher or lower concentration of hexane in thenext run?
25-35. A mixture of 14 compounds was subjected to a reversed-phase gradient separation going from 5% to 100% acetonitrile with agradient time of 60 min. The sample was injected at .All peaks were eluted between 22 and 41 min.(a) Is the mixture more suitable for isocratic or gradient elution?(b) If the next run is a gradient, select the starting and ending %acetonitrile and the gradient time.
25-36. (a) List ways in which the resolution between two closelyspaced peaks might be changed.(b) After optimization of an isocratic elution with several solvents,the resolution of two peaks is 1.2. How might you improve the res-olution without changing solvents or the kind of stationary phase?
25-37. (a) You wish to use a wide gradient from 5 vol% to 95 vol%B for the first separation of a mixture of small molecules to decidewhether to use gradient or isocratic elution. What should be the gra-dient time, , for a column containing parti-cles with a flow of 1.0 mL/min?(b) You optimized the gradient separation going from 20 vol% to34 vol% B in 11.5 min at 1.0 mL/min. Find k* for this optimizedseparation. To scale up to a column, what should bethe gradient time and the volume flow rate? If the sample load onthe small column was 1 mg, what sample load can be applied to thelarge column? Verify that k* is unchanged.
1.0 � 15 cm
3-m0.46 � 15 cmtG
t � dwell time
k¿ � 2–6.
k¿ � 2–6.

588 CHAPTER 26 Chromatographic Methods and Capillary Electrophoresis
Electrochromatography1 uses an electric field, rather than pressure, to propel mobile phasethrough a capillary column with uniform, pluglike flow (Color Plate 28). The capillary inthe photograph contains a monolithic silicate structure similar to that in Box 25-1. Poly-merization of soluble precursors inside the capillary forms chemical structures such asthat shown below. The surface is coated with covalently anchored, positively charged qua-ternary ammonium groups. Mobile anions in solution provide charge balance. A strongelectric field draws anions toward the anode, pulling the entire solution in the capillaryalong with them.
groups attached to the quaternary ammonium cations are the chromatographic sta-tionary phase. Solutes passing through the capillary are separated when they partitionbetween the mobile solvent and the stationary phase.C18
C18
CAPILLARY ELECTROCHROMATOGRAPHY
Chromatographic Methods and Capillary Electrophoresis26
0 2015105Time (min)
Ultr
avio
let a
bsor
banc
e
Silica capillary wall
CH3
(CH2)17
(CH2)3
+N CH3
CH3
CH3
Si O Si O – –
OO – –
H3C–
Si
SiO
– –
O Si O Si O Si O Si O
O
O
Cl–
C18groups
Mobileanion
Anchoredcation
CH3
(CH2)17
(CH2)3
+N CH3
CH3
CH3
Si SiOO– –
OO – –
H3C
Cl–
Si– –
O
OO OH
The inside of a monolithic electrochromatography column contains silicate “fingers” coated withstationary phase. Aromatic compounds were separated with a mean plate number of 80 000 in a50-cm column with 15-kV applied voltage. [From J. D. Hayes and A. Malik, “Sol-Gel Monolithic Columns withReversed Electroosmotic Flow for Capillary Electrochromatography,” Anal. Chem. 2000, 72, 4090. Photo courtesy A. Malik, University of South Florida.]
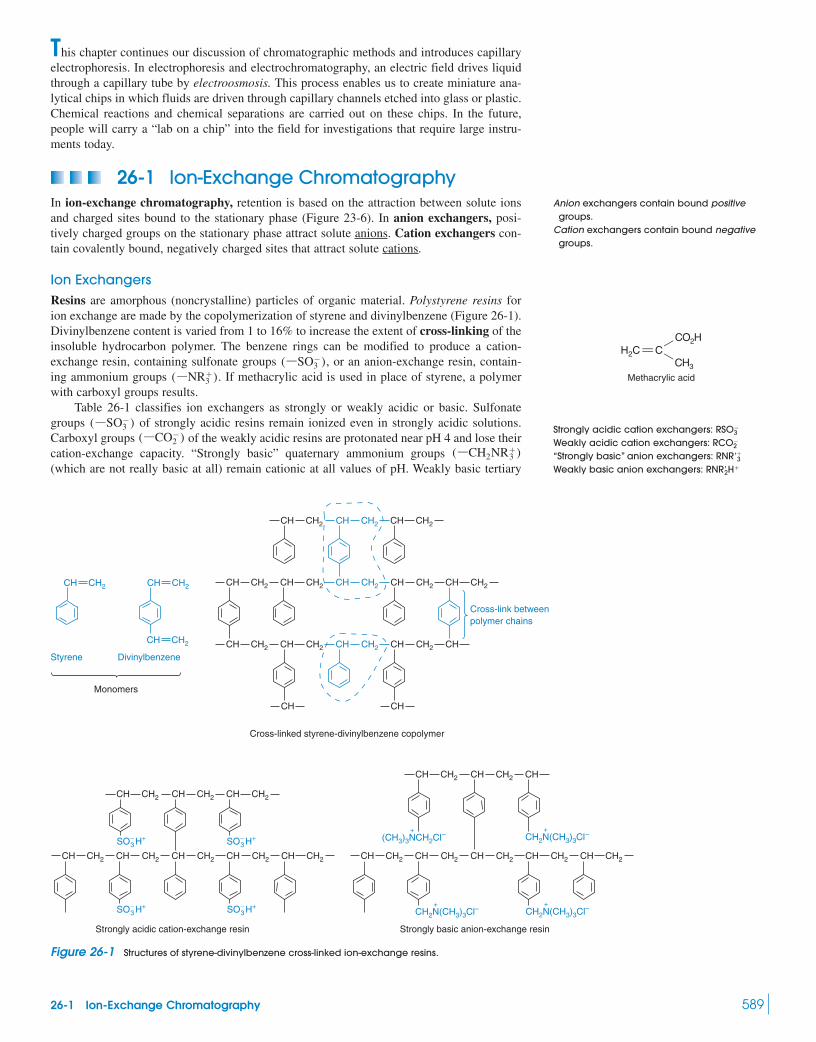
26-1 Ion-Exchange Chromatography 589
This chapter continues our discussion of chromatographic methods and introduces capillaryelectrophoresis. In electrophoresis and electrochromatography, an electric field drives liquidthrough a capillary tube by electroosmosis. This process enables us to create miniature ana-lytical chips in which fluids are driven through capillary channels etched into glass or plastic.Chemical reactions and chemical separations are carried out on these chips. In the future,people will carry a “lab on a chip” into the field for investigations that require large instru-ments today.
26-1 Ion-Exchange ChromatographyIn ion-exchange chromatography, retention is based on the attraction between solute ionsand charged sites bound to the stationary phase (Figure 23-6). In anion exchangers, posi-tively charged groups on the stationary phase attract solute anions. Cation exchangers con-tain covalently bound, negatively charged sites that attract solute cations.
Ion ExchangersResins are amorphous (noncrystalline) particles of organic material. Polystyrene resins forion exchange are made by the copolymerization of styrene and divinylbenzene (Figure 26-1).Divinylbenzene content is varied from 1 to 16% to increase the extent of cross-linking of theinsoluble hydrocarbon polymer. The benzene rings can be modified to produce a cation-exchange resin, containing sulfonate groups , or an anion-exchange resin, contain-ing ammonium groups . If methacrylic acid is used in place of styrene, a polymerwith carboxyl groups results.
Table 26-1 classifies ion exchangers as strongly or weakly acidic or basic. Sulfonategroups of strongly acidic resins remain ionized even in strongly acidic solutions.Carboxyl groups of the weakly acidic resins are protonated near pH 4 and lose theircation-exchange capacity. “Strongly basic” quaternary ammonium groups (which are not really basic at all) remain cationic at all values of pH. Weakly basic tertiary
(ßCH2NR�3 )
(ßCO2)
(ßSO3)
(ßNR3�)
(ßSO3)
Monomers
DivinylbenzeneStyrene
CH CH2 CH CH2
CH CH2
CH2CH
CH2CH
(CH3)3NCH2Cl– CH2N(CH3)3Cl–
CH2N(CH3)3Cl– CH2N(CH3)3Cl–
Cross-link betweenpolymer chains
+ +
++
CHCH2CH CH2
CH2CH CH2CH CH2CH CH2CH
CH2CH
CH2CH
CHCH2CH
CH2CH CHCH2CH
CH2
CH2CH CH2CH CH2CH CH2CH CH2CHCH2CH CH2CH CH2CH CH2CH
CH2CHCH2CH
CH CH
CH2CH CH2CH CH
Strongly acidic cation-exchange resin Strongly basic anion-exchange resin
Cross-linked styrene-divinylbenzene copolymer
SO H+−3SO H+−
3
SO H+−3SO H+−
3
Figure 26-1 Structures of styrene-divinylbenzene cross-linked ion-exchange resins.
Anion exchangers contain bound positivegroups.
Cation exchangers contain bound negativegroups.
Methacrylic acid
H2C £ Cœ
ç
CO2H
CH3
Strongly acidic cation exchangers: Weakly acidic cation exchangers: “Strongly basic” anion exchangers: Weakly basic anion exchangers: RNR¿2H�
RNR¿�3RCO
2
RSO3

590 CHAPTER 26 Chromatographic Methods and Capillary Electrophoresis
ammonium anion exchangers are deprotonated in moderately basic solutionand lose their ability to bind anions.
The extent of cross-linking is indicated by the notation “-XN” after the name of theresin. For example, Dowex 1-X4 contains 4% divinylbenzene, and Bio-Rad AG 50W-X12contains 12% divinylbenzene. The resin becomes more rigid and less porous as cross-linkingincreases. Lightly cross-linked resins permit rapid equilibration of solute between the insideand the outside of the particle. However, resins with little cross-linking swell in water.Hydration decreases both the density of ion-exchange sites and the selectivity of the resin fordifferent ions. More heavily cross-linked resins exhibit less swelling and higher exchangecapacity and selectivity, but they have longer equilibration times. The charge density of poly-styrene ion exchangers is so great that highly charged macromolecules such as proteins maybe irreversibly bound.
Cellulose and dextran ion exchangers, which are polymers of the sugar glucose, pos-sess larger pore sizes and lower charge densities than those of polystyrene resins. They arewell suited to ion exchange of macromolecules, such as proteins. Dextran, cross-linked byglycerin, is sold under the name Sephadex (Figure 26-2). Other macroporous ion exchang-ers are based on the polysaccharide agarose and on polyacrylamide. Table 26-2 listscharged functional groups used to derivatize polysaccharide hydroxyl groups. DEAE-Sephadex, for example, refers to an anion-exchange Sephadex containing diethyl-aminoethyl groups.
(ßCH2NHR�2 )
Table 26-1 Ion-exchange resins
Common trade names
Chemical Usual form Rohm Dow ThermalResin type constitution as purchased & Haas Chemical Selectivity stability
Strongly Sulfonic acid Amberlite Dowex Ag� Rb� Cs� Good up to acidic cation groups attached IR-120 50W K� NH�
4 Na� 150�Cexchanger to styrene and H� Li�
divinylbenzene Zn2� Cu2� Ni2�
copolymer Co2�
Weakly Carboxylic acid Amberlite — Good up toacidic cation groups attached IRC-50 100�Cexchanger to acrylic and
divinylbenzenecopolymer
Strongly Quaternary Amberlite Dowex 1 formbasic anion ammonium IRA-400 fair up toexchanger groups attached
to styrene and HSO3 NO
2 anddivinylbenzene other formscopolymer good up to
Weakly Polyalkylamine Amberlite Dowex 3 Extensive basic anion groups attached IR-45 informationexchanger to styrene and not available;
divinylbenzene tentatively copolymer limited to
SOURCE: Adapted from J. X. Khym, Analytical Ion-Exchange Procedures in Chemistry and Biology (Englewood Cliffs, NJ: Prentice Hall, 1974).
CH3CO2H 7 H2CO3
HCO2H 765°C7 HCl 7 HF 7
HNO3 7 HI 7 HBrH3PO4 7 H3AsO4 7tartaric 7 oxalic 7CrO3 7 H2SO4 7ArylßSO3H 7 citric 7ArylßNH(R)�
2 Cl
150°Cacetate 7 OH 7 F7 HCOO 7Cl 7 HCO
3 7 IO3
Cl
50°CNO3 7 Br 7 CN
HSO4 7 ClO
3 7OHI 7 phenolate 7ArylßCH2N(CH3)�
3 Cl
Sr2� 7 Ca2� 7 Mg2�
H� W Fe2� 7 Ba2�
Na� 7 Li�
H� W Ag� 7 K� 7RßCOONa�
ArylßSO3 H�
Because they are much softer than polystyreneresins, dextran and its relatives are called gels.
Figure 26-12 shows the structure ofpolyacrylamide.
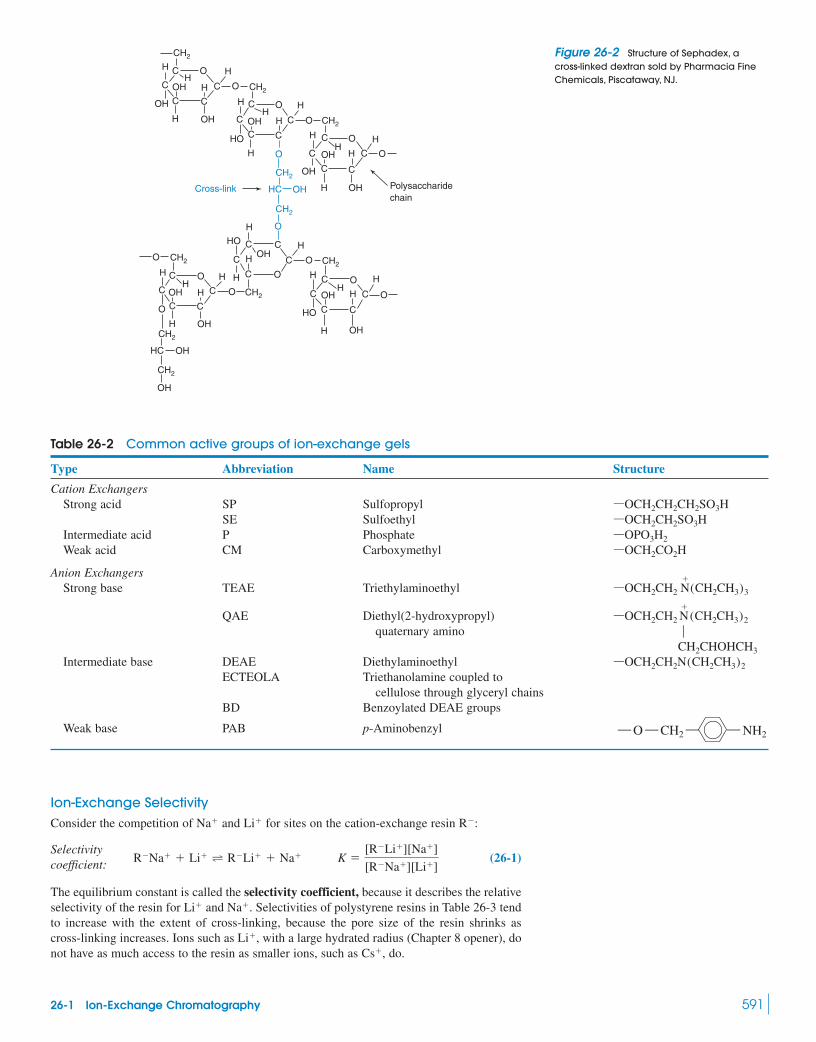
26-1 Ion-Exchange Chromatography 591
Ion-Exchange SelectivityConsider the competition of and for sites on the cation-exchange resin :
(26-1)
The equilibrium constant is called the selectivity coefficient, because it describes the relativeselectivity of the resin for and . Selectivities of polystyrene resins in Table 26-3 tendto increase with the extent of cross-linking, because the pore size of the resin shrinks ascross-linking increases. Ions such as , with a large hydrated radius (Chapter 8 opener), donot have as much access to the resin as smaller ions, such as , do.Cs�
Li�
Na�Li�
RNa� � Li� T RLi� � Na� K �[RLi�][Na�]
[RNa�][Li�]Selectivitycoefficient:
RLi�Na�
H O
C
HO
OH
CH2
Cross-link Polysaccharidechain
OHOH
OH
C
CH
H
C
H
H
C O
H
C
CH2
CH2
OH
H
C
C
C
C
OH
O
H
HH
C OH
C
COH
H
H
CH2
O
C
C
OHOHHC
H
O
CH2
O
H
CH2COH
CHO
H
C
C
C
H O
OHH H CH
OHC
CHO
CH2OC
CH2
OCH
CH
H
C
OH
C
OH
O
H
O
CH2
OH
CH2
HC
OH
OH
H
H
H
C
C
O
O
Figure 26-2 Structure of Sephadex, across-linked dextran sold by Pharmacia FineChemicals, Piscataway, NJ.
Table 26-2 Common active groups of ion-exchange gels
Type Abbreviation Name Structure
Cation ExchangersStrong acid SP Sulfopropyl
SE SulfoethylIntermediate acid P PhosphateWeak acid CM Carboxymethyl
Anion ExchangersStrong base TEAE Triethylaminoethyl
QAE Diethyl(2-hydroxypropyl)quaternary amino
Intermediate base DEAE DiethylaminoethylECTEOLA Triethanolamine coupled to
cellulose through glyceryl chainsBD Benzoylated DEAE groups
Weak base PAB p-Aminobenzyl ß ßß O ß CH2 NH2
ßOCH2CH2N(CH2CH3)2
CH2CHOHCH3
ħOCH2CH2 N
�(CH2CH3)2
ßOCH2CH2 N�
(CH2CH3)3
ßOCH2CO2HßOPO3H2
ßOCH2CH2SO3HßOCH2CH2CH2SO3H

592 CHAPTER 26 Chromatographic Methods and Capillary Electrophoresis
In general, ion exchangers favor the binding of ions of higher charge, decreased hydratedradius, and increased polarizability. A fairly general order of selectivity for cations is
Reaction 26-1 can be driven in either direction, even though is bound moretightly than . Washing a column containing with a substantial excess of willreplace with . Washing a column in the form with will convert it into the
form.Ion exchangers loaded with one kind of ion bind small amounts of a different ion nearly
quantitatively. resin will bind small amounts of nearly quantitatively, eventhough the selectivity is greater for . The same column binds large quantities of or
, because the resin has greater selectivity for these ions than for . Even though is bound more tightly than , can be quantitatively removed from the resin by washingwith excess acid.
Donnan EquilibriumWhen an ion exchanger is placed in an electrolyte solution, the concentration of electrolyte ishigher outside the resin than inside it. The equilibrium between ions in solution and ionsinside the resin is called the Donnan equilibrium.
Consider a quaternary ammonium anion-exchange resin in its form immersedin a solution of KCl. Let the concentration of an ion inside the resin be and the concen-tration outside the resin be . It can be shown from thermodynamics that the ion productinside the resin is approximately equal to the product outside the resin:
(26-2)
From considerations of charge balance, we know that
(26-3)
Inside the resin, there are three charged species, and the charge balance is
(26-4)
where is the concentration of quaternary ammonium ions attached to the resin. Substi-tuting Equations 26-3 and 26-4 into Equation 26-2 gives
(26-5)
which says that must be greater than .[K�]i[K�]o
[K�]i([K�]i � [R�]i) � [K�]2o
[R�]
[R�]i � [K�]i � [Cl]i
[K�]o � [Cl]o
[K�]i[Cl]i � [K�]o[Cl]o
[X]o
[X]i
Cl(R�)
Fe3�H�
Fe3�Na�Fe3�
Ni2�Na�
Li�Na�-loaded
Na�
Na�Li�Li�Na�
Li�Na�Li�
Na�
NH�4 7 Na� 7 H� 7 Li�
Co2� 7 Zn2� 7 Mg2� 7 UO2�2 W Ti� 7 Ag� 7 Rb� 7 K� 7
Ba2� 7 Pb2� 7 Sr2� 7 Ca2� 7 Ni2� 7 Cd2� 7 Cu2� 7Pu4� W La3� 7 Ce3� 7 Pr3� 7 Eu3� 7 Y3� 7 Sc3� 7 Al3� W
Table 26-3 Relative selectivity coefficients of ion-exchange resins
Sulfonic acid cation-exchange resin
Relative selectivity forQuarternary ammonium
divinylbenzene contentanion-exchange resin
RelativeCation 4% 8% 10% Anion selectivity
1.00 1.00 1.00 0.091.30 1.26 1.45 0.091.49 1.88 2.23 1.01.75 2.22 3.07 2.82.09 2.63 4.15 3.82.22 2.89 4.19 8.72.37 2.91 4.15 10.04.00 7.36 19.45.20 9.66 22.2
SOURCE: Amberlite Ion Exchange Resins—Laboratory Guide (Rohm & Haas Co., 1979).
Tl�
Ag�
ClO4Cs�
IRb�
NO3K�
BrNH�4
ClNa�
OHH�
FLi�
Polarizability is a measure of the ability ofan ion’s electron cloud to be deformed bynearby charges. Deformation of the electroncloud induces a dipole in the ion. Theattraction between the induced dipole andthe nearby charge increases the binding ofthe ion to the resin.
Remember that has a smaller hydratedradius than .Li�
Na�
A phase containing bound charges tends toexclude electrolyte.
We are ignoring and , which areassumed to be negligible.
OHH�

26-1 Ion-Exchange Chromatography 593
Example Exclusion of Cations by an Anion Exchanger
Suppose that the concentration of cationic sites in the resin is 6.0 M. When the formof this resin is immersed in 0.050 M KCl, what will be the ratio ?
Solution Let us assume that remains 0.050 M. Equation 26-5 gives
The concentration of inside the resin is less than 1% of that outside the resin.
Ions with the same charge as the resin are excluded. (The quaternary ammonium resinexcludes .) The counterion, , is not excluded from the resin. There is no electrostaticbarrier to penetration of an anion into the resin. Anion exchange takes place freely in the qua-ternary ammonium resin even though cations are repelled from the resin.
The Donnan equilibrium is the basis of ion-exclusion chromatography. Because diluteelectrolytes are excluded from the resin, they pass through a column faster than nonelec-trolytes, such as sugar, which freely penetrates the resin. When a solution of NaCl and sugaris applied to an ion-exchange column, NaCl emerges from the column before the sugar.
Conducting Ion-Exchange ChromatographyIon-exchange resins are used for applications involving small molecules , whichcan penetrate the small pores of the resin. A mesh size (Table 28-2) of 100/200 is suitable formost work. Higher mesh numbers (smaller particle size) lead to finer separations but slowercolumn operation. For preparative separations, the sample may occupy 10 to 20% of the col-umn volume. Ion-exchange gels are used for large molecules (such as proteins and nucleicacids), which cannot penetrate the pores of resins. Separations involving harsh chemical con-ditions (high temperature, high radiation levels, strongly basic solution, or powerful oxidiz-ing agents) employ inorganic ion exchangers, such as hydrous oxides of Zr, Ti, Sn, and W.
Gradient elution with increasing ionic strength or changing pH is extremely valuable inion-exchange chromatography. Consider a column to which anion is bound more tightlythan anion is. We separate from by elution with , which is less tightly boundthan either or . As the concentration of is increased, is eventually displaced andmoves down the column. At a still higher concentration of , the anion also is eluted.
In Figure 26-3, an gradient was used for a cation-exchange separation. The columnfor this separation has nitrilotriacetic acid groups that bind lanthanide cations in the order
[H�]AC
BCBA
CBAB
A
(FM � 500)
ClK�
K�
[K�]i([K�]i � 6.0) � (0.050)2 1 [K�]i � 0.000 42 M
[K�]o
[K�]o/[K�]i
Cl
Det
ecto
r re
spon
se
22201816141210Time (min)
86420
80
60
40
[HN
O3] (
mM
)
20
0
La
Ce Pr NdSm
Eu, Gd
Tb
DyHo
Er TmYb Lu
Figure 26-3 Elution of lanthanide(III) ions from a cation-exchange resin. Eluent was varied from 20to over 25 min. The higher the atomic number of the lanthanide, the smaller is its ionicradius and the more strongly it binds to the resin. Lanthanides were detected by reaction with a color-forming reagent after elution. [From Y. Inoue. H. Kumagai, Y. Shimomura, T. Yokoyama, and T. M. Suzuki, “Ion
Chromatographic Separation of Rare-Earth Elements Using a Nitrilotriacetate-Type Chelating Resin as the Stationary
Phase,” Anal. Chem. 1996, 68, 1517.]
80 mM HNO3
The high concentration of positive chargeswithin the resin repels cations from the resin.
Three classes of ion exchangers:
1. resins2. gels3. inorganic exchangers
An ionic strength gradient is analogous to asolvent or temperature gradient.
Nitrilotriacetic acid
CO2H
CO2H
CO2H
Resin
NH�
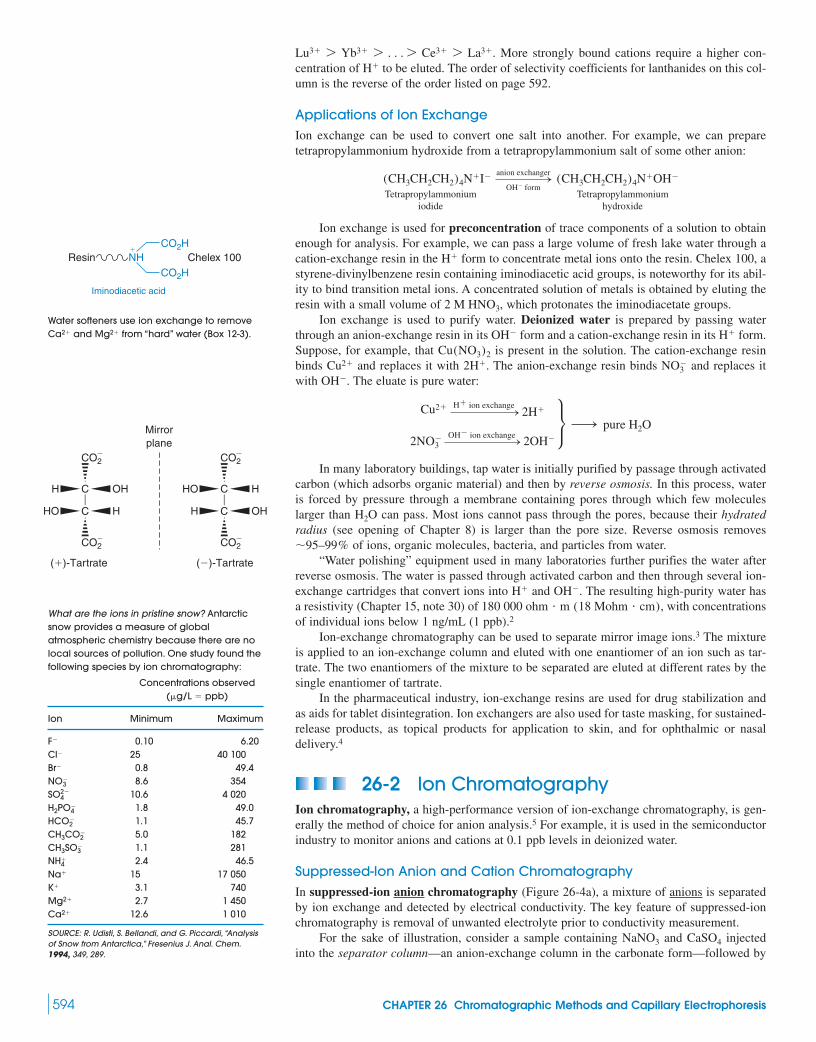
594 CHAPTER 26 Chromatographic Methods and Capillary Electrophoresis
. More strongly bound cations require a higher con-centration of to be eluted. The order of selectivity coefficients for lanthanides on this col-umn is the reverse of the order listed on page 592.
Applications of Ion ExchangeIon exchange can be used to convert one salt into another. For example, we can preparetetrapropylammonium hydroxide from a tetrapropylammonium salt of some other anion:
Tetrapropylammonium Tetrapropylammoniumiodide hydroxide
Ion exchange is used for preconcentration of trace components of a solution to obtainenough for analysis. For example, we can pass a large volume of fresh lake water through acation-exchange resin in the form to concentrate metal ions onto the resin. Chelex 100, astyrene-divinylbenzene resin containing iminodiacetic acid groups, is noteworthy for its abil-ity to bind transition metal ions. A concentrated solution of metals is obtained by eluting theresin with a small volume of , which protonates the iminodiacetate groups.
Ion exchange is used to purify water. Deionized water is prepared by passing waterthrough an anion-exchange resin in its form and a cation-exchange resin in its form.Suppose, for example, that is present in the solution. The cation-exchange resinbinds and replaces it with . The anion-exchange resin binds and replaces itwith . The eluate is pure water:
In many laboratory buildings, tap water is initially purified by passage through activatedcarbon (which adsorbs organic material) and then by reverse osmosis. In this process, wateris forced by pressure through a membrane containing pores through which few moleculeslarger than can pass. Most ions cannot pass through the pores, because their hydratedradius (see opening of Chapter 8) is larger than the pore size. Reverse osmosis removes
of ions, organic molecules, bacteria, and particles from water.“Water polishing” equipment used in many laboratories further purifies the water after
reverse osmosis. The water is passed through activated carbon and then through several ion-exchange cartridges that convert ions into and . The resulting high-purity water hasa resistivity (Chapter 15, note 30) of , with concentrationsof individual ions below 1 ng/mL (1 ppb).2
Ion-exchange chromatography can be used to separate mirror image ions.3 The mixtureis applied to an ion-exchange column and eluted with one enantiomer of an ion such as tar-trate. The two enantiomers of the mixture to be separated are eluted at different rates by thesingle enantiomer of tartrate.
In the pharmaceutical industry, ion-exchange resins are used for drug stabilization andas aids for tablet disintegration. Ion exchangers are also used for taste masking, for sustained-release products, as topical products for application to skin, and for ophthalmic or nasaldelivery.4
26-2 Ion ChromatographyIon chromatography, a high-performance version of ion-exchange chromatography, is gen-erally the method of choice for anion analysis.5 For example, it is used in the semiconductorindustry to monitor anions and cations at 0.1 ppb levels in deionized water.
Suppressed-Ion Anion and Cation ChromatographyIn suppressed-ion anion chromatography (Figure 26-4a), a mixture of anions is separatedby ion exchange and detected by electrical conductivity. The key feature of suppressed-ionchromatography is removal of unwanted electrolyte prior to conductivity measurement.
For the sake of illustration, consider a sample containing and injectedinto the separator column—an anion-exchange column in the carbonate form—followed by
CaSO4NaNO3
180 000 ohm � m (18 Mohm � cm)OHH�
�95–99%
H2O
Cu2� H� ion exchange! 2H�
2NO3
OH ion exchange ! 2OH
s ¡ pure H2O
OH
NO32H�Cu2�
Cu(NO3)2
H�OH
2 M HNO3
H�
(CH3CH2CH2)4N�I !anion exchanger
OH form (CH3CH2CH2)4N�OH
H�
Lu3� 7 Yb3� 7 . . . 7 Ce3� 7 La3�
CO2H
CO2HNH�
Resin Chelex 100
Iminodiacetic acid
Water softeners use ion exchange to removeand from “hard” water (Box 12-3).Mg2�Ca2�
What are the ions in pristine snow? Antarcticsnow provides a measure of globalatmospheric chemistry because there are nolocal sources of pollution. One study found thefollowing species by ion chromatography:
Concentrations observed(g/L � ppb)
Ion Minimum Maximum
F 0.10 6.20Cl 25 40 100Br 0.8 49.4NO
3 8.6 35410.6 4 020
1.8 49.01.1 45.75.0 1821.1 2812.4 46.5
15 17 0503.1 7402.7 1 450
12.6 1 010
SOURCE: R. Udisti, S. Bellandi, and G. Piccardi, “Analysisof Snow from Antarctica,” Fresenius J. Anal. Chem.1994, 349, 289.
Ca2�
Mg2�
K�
Na�
NH�4
CH3SO3
CH3CO2
HCO2
H2PO4
SO24
OHH
HHO
C
C˚
CO2
CO2
HHO
OHH
C
C˚
CO2
CO2
Mirrorplane
(�)-Tartrate ()-Tartrate

26-2 Ion Chromatography 595
elution with KOH. and equilibrate with the resin and are slowly displaced by theeluent. and cations are not retained and simply wash through. Eventually,and are eluted from the separator column, as shown in the upper graph of Fig-
ure 26-4a. These species cannot be easily detected, however, because the solvent contains ahigh concentration of KOH, whose high conductivity obscures that of the analyte species.
To remedy this problem, the solution next passes through a suppressor, in which cationsare replaced by . exchanges with , in this example, through a cation-exchangemembrane in the suppressor. diffuses from high concentration outside the membrane tolow concentration inside the membrane. diffuses from high concentration inside to lowconcentration outside. is carried away outside the membrane, so its concentration isalways low on the outside. The net result is that KOH eluent, which has high conductivity, isconverted into , which has low conductivity. When analyte is present, or with high conductivity is produced and detected.
Suppressed-ion cation chromatography is conducted in a similar manner, but thesuppressor replaces from eluent with through an anion-exchange membrane.Figure 26-4b illustrates the separation of and . With HCl eluent, NaCl and
emerge from the cation-exchange separator column, and NaOH and emergefrom the suppressor column. HCl eluate is converted into in the suppressor.
Figure 26-5 illustrates a student experiment to measure ions in pond water. Eluent forthe anion separation was buffer. The product from eluent after passingthrough the suppressor is , which has low conductivity.
In automated systems, and eluents and suppressors are generated by electroly-sis of .6 Figure 26-6 shows a system that generates KOH for of isocraticor gradient elution before it is necessary to refresh the reagents. Water in the reservoirof aqueous decomposes at the metal anode to produce and . reactswith to form . For each ion that is generated, one ion migrates throughK�H�H2PO2
4HPO4
H�O2(g)H�K2HPO4
7 1 000 hoursH2OOHH�
H2CO3
NaHCO3/Na2CO3
H2OCa(OH)2CaCl2
CaSO4NaNO3
OHCl
H2SO4HNO3H2O
K�
K�
H�
K�H�H�
K2SO4KNO3
Ca2�Na�OH
SO24NO
3
Elution time
K2SO4
Elution time Elution time
Elution time
Con
cent
ratio
n
KOHeluent
in
SampleNaNO3 + CaSO4
Conductivitydetector
To waste
KOH
KNO3
HNO3H2SO4
Conductivitydetector
Cationseparatorcolumn(strong-
acid cationexchangerin H+ form)
NaOH
Ca(OH)2
HCl
NaCl
CaCl2
HCleluent
in
SampleNaNO3 + CaSO4
Con
cent
ratio
n
Con
cent
ratio
n
Con
cent
ratio
n
To waste
(b )(a )
Anionseparatorcolumn(strong-
base anionexchanger in CO
form)
2−3
Anionchromatography
Cationchromatography
Suppressor
H+
SO2–4
NO–3
H+
Cation-exchangemembrane
K+
K+
Separator Separator
Suppressor
OH–
Ca2+
Na+
OH–
Anion-exchangemembrane
Cl–
Cl–
The separator column separates the analytes,and the suppressor replaces the ionic eluentwith a nonionic species.
Benzene-1,4-diammonium cation is a strongereluent that can be used instead of forsuppressed-ion cation chromatography. Aftersuppression, a neutral product is formed:
Benzene-l,4-diammonium ion
ß ßH2N NH2
ß ßH3N�
NH3
�¡OH
H�
Figure 26-4 Schematic illustrations of (a) suppressed-ion anion chromatography and (b) suppressed-ion cation chromatography.

596 CHAPTER 26 Chromatographic Methods and Capillary Electrophoresis
the cation-exchange barrier membrane, which transports , but not anions, and allows neg-ligible liquid to pass. The barrier membrane must withstand the high pressure of liquid in theKOH generation chamber destined for the chromatography column. For each generatedat the anode, one flows through the cation-exchange barrier and one is generated atthe cathode. Liquid exiting the KOH generation chamber contains KOH and . The streampasses through an anion trap that removes traces of anions such as carbonate and degradationproducts from the ion-exchange resin. The trap is continuously replenished with electrolyti-cally generated , which is not shown in the diagram. After the anion trap, the liquidflows through a polymeric capillary that is permeable to . The diffuses into an externalliquid stream and is removed. The concentration of KOH produced by the apparatus in Fig-ure 26-6 is governed by the liquid flow rate and the electric current. With computer control ofthe power supply, a precise gradient can be generated.
In the past, KOH eluent was usually contaminated with . When passesthrough the suppressor after the ion chromatography column, it is converted into ,which has some electrical conductivity that interferes with detection of analytes. In gradient
H2CO3
CO2�3CO2�
3
H2H2
OH�
H2
OH�K�
H�
K�
Con
duct
ivity
0 3 6 9 12 15 0 2
Retention time (min)
4 6 8 10 12 14
Standards StandardsF–
CI–
CI–
43.6Pond water Pond water
NO3
HPO4
SO4
NO35.5
–
4
SO2–
12.6
NH+
0.2Mg2+
7.3
Ca2+
24.0
Na+
2.8
Na+
K+
LI+ Mg2+ Ca2+
NH4+
K+
3.5F–
0.264
–
2–
2–
Cation-exchangebarrier membrane
K+ reservoir:2 L of 2 MK2HPO4
2H+
Pt anode
Vent
+ 2e–12 O2
H2O
H2O in
K+
KOH out tochromatographycolumn
Liquidin
Capillarypermeableto H2
H2 stripper
Anion trap
Liquidout
Controlledcurrentpowersupply
+
–
Pump
KOH generationchamber
Pt cathode2H2O + 2e–
H2(g)+ 2OH–KOH + 1
2 H(g) out
Figure 26-6 Electrolytic KOH eluentgenerator for ion chromatography. [Adapted
from Y. Liu, K. Srinivasan, C. Pohl, and N. Avdalovic,
“Recent Developments in Electrolytic Devices for Ion
Chromatography,” J. Biochem. Biophys. Methods
2004, 60, 205.]
Figure 26-5 Ion chromatography of pondwater. Upper chromatograms were obtainedfrom mixtures of standards. Concentrations ofions in lower chromatograms from pond waterare in units of . Anion analysiswas done with an IonPac AS14 column with
eluent withion suppression and conductivity detection.Cation analysis used an IonPac CS12A columnwith eluent, ion suppression, andconductivity detection. [From K. Sinniah and K.
Piers, “Ion Chromatography: Analysis of Ions in Pond
Waters,” J Chem. Ed. 2001, 78, 358.]
11 mM H2SO4
1.0 mM NaHCO3/3.5 mM Na2CO3
�g/mL (ppm)

26-2 Ion Chromatography 597
elution with increasing KOH, the concentration of also increases, and so does thebackground conductivity. The feedstock for the electrolytic generator is pure and theproduct is aqueous KOH containing very little Figure 26-7 shows an impressive sepa-ration of 31 anions with a hydroxide gradient.
The suppressors in Figure 26-4 also have been replaced by electrolytic units that gener-ate or necessary to neutralize the eluate and require only as feedstock.6 Withelectrolytic eluent generation and electrolytic suppression, ion chromatography has beensimplified and highly automated. Readily available software can be used to simulate andoptimize ion chromatographic separations.7
Ion Chromatography Without SuppressionIf the ion-exchange capacity of the separator column is sufficiently low and if dilute eluent isused, ion suppression is unnecessary. Also, anions of weak acids, such as borate, silicate, sul-fide, and cyanide, cannot be determined with ion suppression, because these anions are con-verted into very weakly conductive products (such as ).
For nonsuppressed anion chromatography, we use a resin with an exchange capacitynear , with or salts of benzoic, p-hydroxybenzoic, or phthalicacid as eluent. These eluents give a low background conductivity, and analyte anions aredetected by a small change in conductivity as they emerge from the column. By judiciouschoice of pH, an average eluent charge between 0 and can be obtained, which allows con-trol of eluent strength. Even dilute carboxylic acids (which are slightly ionized) are suitableeluents for some separations. Nonsuppressed cation chromatography is conducted with dilute
eluent for monovalent ions and with ethylenediammonium salts for divalent ions.
DetectorsConductivity detectors respond to all ions. In suppressed-ion chromatography, it is easy tomeasure analyte because eluent conductivity is reduced to near 0 by suppression. Suppres-sion also allows us to use eluent concentration gradients.
In nonsuppressed anion chromatography, the conductivity of the analyte anion is higherthan that of the eluent, so conductivity increases when analyte emerges from the column.Detection limits are normally in the mid-ppb to low-ppm range but can be lowered by a fac-tor of 10 by using carboxylic acid eluents instead of carboxylate salts.
(�H2NCH2CH2NH2�)HNO3
2
K�104 M Na�5 equiv/g
H2S
H2OOHH�
CO23
H2OH2CO3
Con
duct
ivity
0 5
Time (min)
1
2 3
4
5
67
8
9
11
12
10
13
14
15
21
2223
24
25
26 27
28
29
30
31
16
18
17
19
20
10 15
Figure 26-7 Anion separation by ion chromatography with a gradient of electrolytically generatedKOH and conductivity detection after suppression. Column: Dionex IonPac AS11; diameter � 4 mm;
. Eluent: 0.5 mM KOH for 2.5 min, 0.5 to 5.0 mM KOH from 2.5 to 6 min; 5.0 to 38.2 mMKOH from 6 to 18 min. Peaks: (1) quinate, (2) , (3) acetate, (4) propanoate, (5) formate,(6) methylsulfonate, (7) pyruvate, (8) valerate, (9) chloroacetate, (10) , (11) ,(13) trifluoroacetate, (14) , (15) , (16) , (17) selenite, (18) , (19) malonate,(20) maleate, (21) , (22) , (23) tungstate, (24) phthalate, (25) phosphate, (26) chromate,(27) citrate, (28) tricarballylate, (29) isocitrate, (30) cis-aconitate, (31) trans-aconitate.[Courtesy Dionex Corp., Sunnyvale, CA]
C2O42SO2
4
CO23ClO
3NO3Br
Cl (12) NO2BrO
3
F
flow � 2.0 mL/min
Benzoate p-Hydroxybenzoate
Phthalate
œ
ç
CO2
CO2
ßßHO CO2ß CO2

598 CHAPTER 26 Chromatographic Methods and Capillary Electrophoresis
Using benzoate or phthalate eluents provides for sensitive indirect detection ofanions. In Figure 26-8, eluate has strong, constant ultraviolet absorption. As each analyteemerges, nonabsorbing analyte anion replaces an equivalent amount of absorbing eluentanion. Absorbance therefore decreases when analyte appears. For cation chromatography,
is a suitable ultraviolet-absorbing eluent.
Ion-Pair ChromatographyIon-pair chromatography uses a reversed-phase HPLC column instead of an ion-exchangecolumn. To separate a mixture of cations (for example, protonated organic bases), an anionicsurfactant (Box 26-1) such as is added to the mobile phase. The surfactant lodgesin the stationary phase, effectively transforming the stationary phase into an ion exchanger(Figure 26-9). When analyte cations pass through the column, they can associate with the sta-
n-C8H17SO3
CuSO4
( 6 1 ppm)
Figure 26-8 Indirect spectrophotometricdetection of transparent ions. The column waseluted with 1 mM sodium phthalate plus 1 mMborate buffer, pH 10. The principle of indirectdetection is illustrated in Figure 26-30.[Reproduced from H. Small, “Indirect Photometric
Chromotography,” Anal. Chem. 1982, 54, 462.]
Box 26-1 Surfactants and Micelles
A surfactant is a molecule that accumulates at the interfacebetween two phases and modifies the surface tension. (Surfacetension is the energy per unit area needed to form a surface orinterface.) One common class of surfactants for aqueous solutionare molecules with long hydrophobic tails and ionic head groups,such as
Cetyltrimethylammonium bromideC16H33N(CH3)3
�Br
A micelle is an aggregate of surfactants. In water, thehydrophobic tails form clusters that are, in effect, little oil dropsinsulated from the aqueous phase by the ionic head groups. At lowconcentration, surfactant molecules do not form micelles. When theirconcentration exceeds the critical micelle concentration, sponta-neous aggregation into micelles occurs.8 Isolated surfactant mole-cules exist in equilibrium with micelles. Nonpolar organic solutes
�
CH3
CH3
CH3
BrN
�
are soluble inside micelles. Cetyltrimethylammonium bromideforms micelles containing inwater at at a critical micelle concentration of 0.9 mM.
Structure of a micelle formed when ionic molecules with long, nonpolartails aggregate in aqueous solution. The interior of the micelle resemblesa nonpolar organic solvent, whereas the exterior charged groupsinteract strongly with water. [F. M. Menger, R, Zana, and B. Lindman,“Portraying
the Structure of Micelles,” J. Chem. Ed. 1998, 75, 115.]
Molecule with longorganic tail andcharged head group
Nonpolar organicmolecule dissolvedin interior of micelle
Counterionsin solution
+ + +
+
++
+++
+++
+
+
+
+
− −
−
−
−−−
−
−
−−
−
25°C�61 molecules (mass � 22 000 Da)
Time (min)0 3 6 9
Abs
orba
nce
Cl−
CO2−3 N−
3
NO−3
PO3−4
Silica
BondedC18 groups
C8H17 S O−
O
O
Na+
Na+
Na+
−
−
−
Na+
Na+
Na+
−
−
−
BH+
BH+
BH+
Cl−
Cl−
Cl−
Figure 26-9 Principle of ion-pair chromatography. The surfactant sodium octanesulfonate added tothe mobile phase binds to the nonpolar stationary phase. Negative sulfonate groups protruding fromthe stationary phase then act as ion-exchange sites for analyte cations such as protonated organic bases, .BH�

26-3 Molecular Exclusion Chromatography 599
tionary phase by electrostatic attraction to the surfactant anions.9 The retention mechanism is amixture of reversed-phase and ion-exchange interactions. To separate analyte anions, tetrabutyl-ammonium salts can be added to the mobile phase as the ion-pair reagent (Figure 26-10).
Ion-pair chromatography is more complex than reversed-phase chromatography becauseequilibration of the surfactant with the stationary phase is slow, the separation is more sensi-tive to variations in temperature and pH, and the concentration of surfactant affects the separation. Methanol is the organic solvent of choice because ionic surfactants are more sol-uble in methanol/water mixtures than in acetonitrile/water mixtures. Strategies for methoddevelopment analogous to the scheme in Figure 25-28 vary the pH and surfactant concentra-tion with fixed methanol concentration and temperature.10 Because of the slow equilibrationof surfactant with the stationary phase, gradient elution is not recommended in ion-pair chromatography.
26-3 Molecular Exclusion ChromatographyIn molecular exclusion chromatography (also called size exclusion or gel filtration or gelpermeation chromatography), molecules are separated according to size. Small moleculespenetrate the pores in the stationary phase, but large molecules do not (Figure 23-6).Because small molecules must pass through an effectively larger volume, large moleculesare eluted first (Figure 26-11). This technique is widely used in biochemistry to purifymacromolecules.
Flu
ores
cenc
e
302520151050
Excessderivatizingreagent
Lact
ose G
alac
tose
Glu
cose
Xyl
ose
Ara
bino
seG
alac
tose
uro
nic
acid
Glu
cose
uro
nic
acid
Man
nose
Ace
tylg
luco
sam
ine
Gly
cerin
alde
hyde
Retention time (min)
Large molecules pass through the columnfaster than small molecules do.
Figure 26-10 Separation of carbohydrates by ion-pair chromatography. Carbohydrates werederivatized by covalently attaching p-aminobenzoate , which changes carbohydratesinto fluorescent anions. The anions were separated on a column of AQUA usingtetrabutylammonium cation as the ion-pair reagent. Eluent was a linear 60-min gradient starting with 20mM aqueous , pH 2.0 (solvent A), and ending with 50:50 A:methanol. The method wasused to measure carbohydrates at 10–100-ng/mL levels in water leaching from landfills. [From A. Meyer,
C. Raba, and K. Fischer, “Ion-Pair HPLC Determination of Sugars, Amino Sugars, and Uronic Acids,” Anal. Chem. 2001,
73, 2377.]
(n-C4H9)4N�HSO4
C18-silica0.30 � 25 cm(H2NßC6H4ßCO
2 )
VtV0
(a ) (b )
Figure 26-11 (a) Large molecules cannotpenetrate the pores of the stationary phase.They are eluted by a volume of solvent equalto the volume of mobile phase. (b) Smallmolecules that can be found inside or outsidethe gel require a larger volume for elution. Vt isthe total column volume occupied by gel plussolvent. V0 is the volume of the mobile phaseoutside the gel particles.
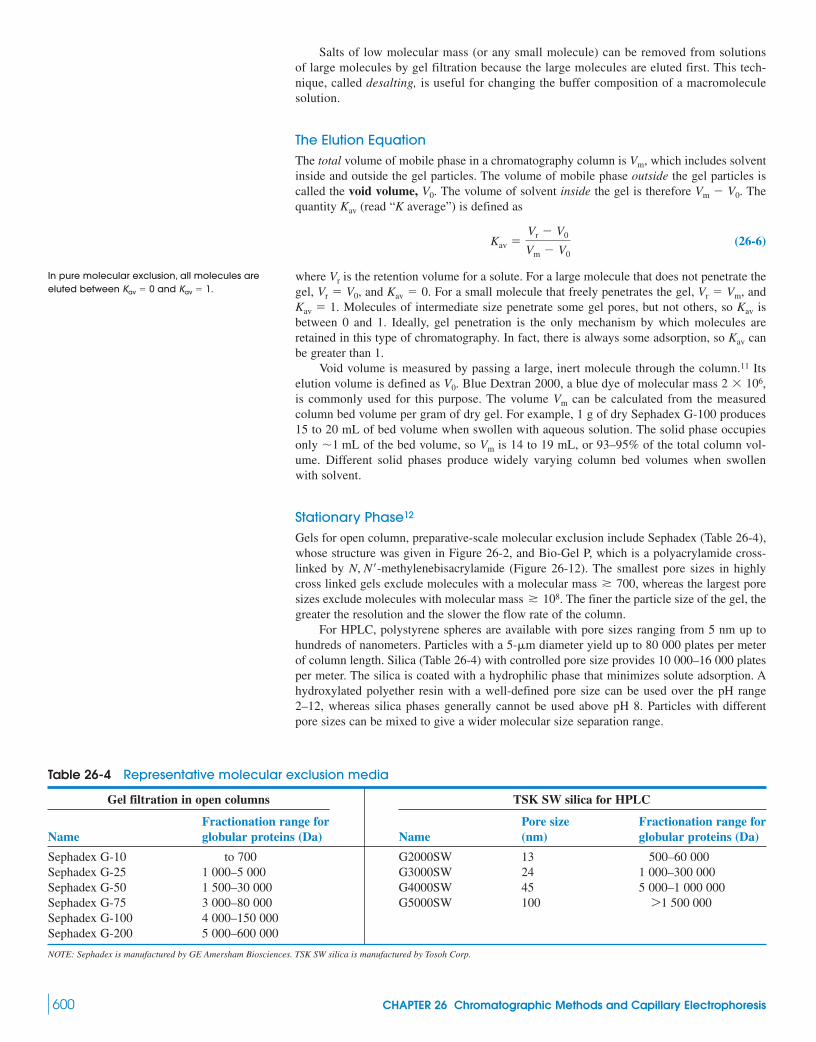
600 CHAPTER 26 Chromatographic Methods and Capillary Electrophoresis
Salts of low molecular mass (or any small molecule) can be removed from solutionsof large molecules by gel filtration because the large molecules are eluted first. This tech-nique, called desalting, is useful for changing the buffer composition of a macromoleculesolution.
The Elution EquationThe total volume of mobile phase in a chromatography column is , which includes solventinside and outside the gel particles. The volume of mobile phase outside the gel particles iscalled the void volume, . The volume of solvent inside the gel is therefore . Thequantity (read “K average”) is defined as
(26-6)
where is the retention volume for a solute. For a large molecule that does not penetrate thegel, , and . For a small molecule that freely penetrates the gel, , and
. Molecules of intermediate size penetrate some gel pores, but not others, so isbetween 0 and 1. Ideally, gel penetration is the only mechanism by which molecules areretained in this type of chromatography. In fact, there is always some adsorption, so canbe greater than 1.
Void volume is measured by passing a large, inert molecule through the column.11 Itselution volume is defined as . Blue Dextran 2000, a blue dye of molecular mass ,is commonly used for this purpose. The volume can be calculated from the measuredcolumn bed volume per gram of dry gel. For example, 1 g of dry Sephadex G-100 produces15 to 20 mL of bed volume when swollen with aqueous solution. The solid phase occupiesonly of the bed volume, so is 14 to 19 mL, or 93–95% of the total column vol-ume. Different solid phases produce widely varying column bed volumes when swollenwith solvent.
Stationary Phase12
Gels for open column, preparative-scale molecular exclusion include Sephadex (Table 26-4),whose structure was given in Figure 26-2, and Bio-Gel P, which is a polyacrylamide cross-linked by (Figure 26-12). The smallest pore sizes in highlycross linked gels exclude molecules with a molecular mass , whereas the largest poresizes exclude molecules with molecular mass . The finer the particle size of the gel, thegreater the resolution and the slower the flow rate of the column.
For HPLC, polystyrene spheres are available with pore sizes ranging from 5 nm up tohundreds of nanometers. Particles with a diameter yield up to 80 000 plates per meterof column length. Silica (Table 26-4) with controlled pore size provides 10 000–16 000 platesper meter. The silica is coated with a hydrophilic phase that minimizes solute adsorption. Ahydroxylated polyether resin with a well-defined pore size can be used over the pH range2–12, whereas silica phases generally cannot be used above pH 8. Particles with differentpore sizes can be mixed to give a wider molecular size separation range.
5-m
� 108� 700
N, N ¿-methylenebisacrylamide
Vm�1 mL
Vm
2 � 106V0
Kav
KavKav � 1Vr � VmKav � 0Vr � V0
Vr
Kav �Vr V0
Vm V0
Kav
Vm V0V0
Vm
In pure molecular exclusion, all molecules areeluted between and .Kav � 1Kav � 0
Table 26-4 Representative molecular exclusion media
Gel filtration in open columns TSK SW silica for HPLC
Fractionation range for Pore size Fractionation range forName globular proteins (Da) Name (nm) globular proteins (Da)
Sephadex G-10 to 700 G2000SW 13 500–60 000Sephadex G-25 1 000–5 000 G3000SW 24 1 000–300 000Sephadex G-50 1 500–30 000 G4000SW 45 5 000–1 000 000Sephadex G-75 3 000–80 000 G5000SW 100Sephadex G-100 4 000–150 000Sephadex G-200 5 000–600 000
NOTE: Sephadex is manufactured by GE Amersham Biosciences. TSK SW silica is manufactured by Tosoh Corp.
71 500 000
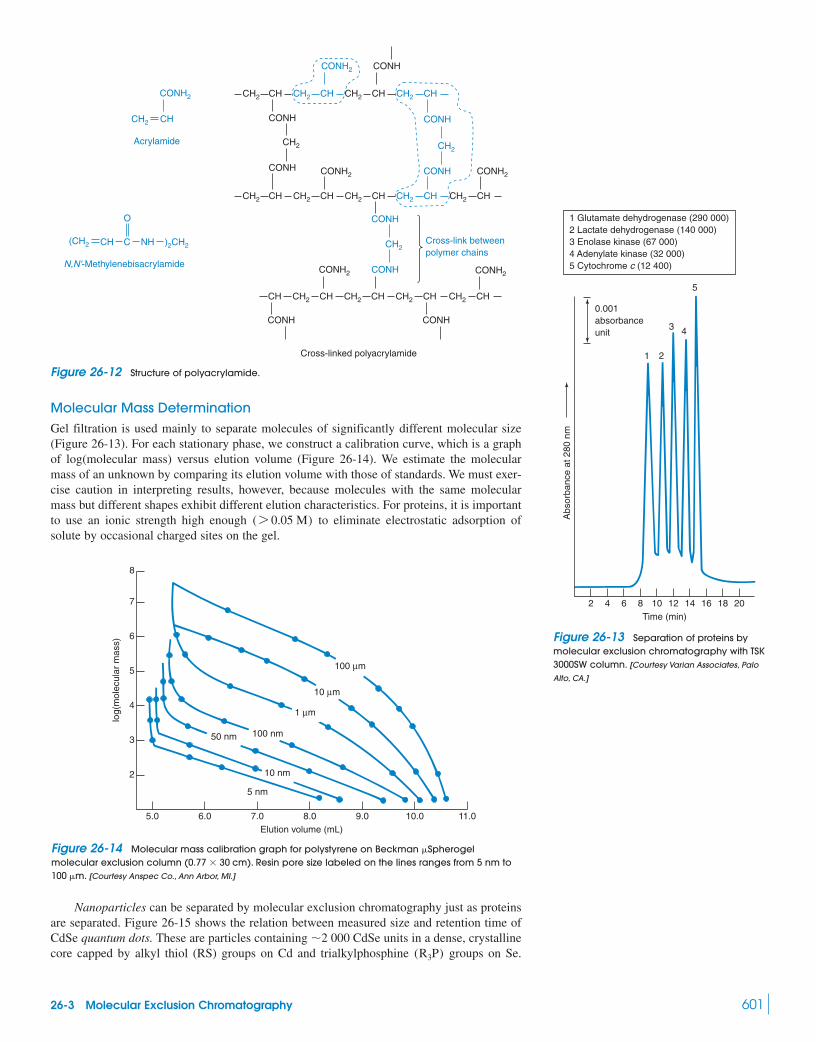
26-3 Molecular Exclusion Chromatography 601
Molecular Mass DeterminationGel filtration is used mainly to separate molecules of significantly different molecular size(Figure 26-13). For each stationary phase, we construct a calibration curve, which is a graphof log(molecular mass) versus elution volume (Figure 26-14). We estimate the molecularmass of an unknown by comparing its elution volume with those of standards. We must exer-cise caution in interpreting results, however, because molecules with the same molecularmass but different shapes exhibit different elution characteristics. For proteins, it is importantto use an ionic strength high enough to eliminate electrostatic adsorption ofsolute by occasional charged sites on the gel.
( 7 0.05 M)
CONH2
CH
Acrylamide
CH2
(CH2
O
CH
N,N'-Methylenebisacrylamide
C NH )2CH2
CONH
CH
CONH2
CONH
CH2CHCH2CHCH2CHCH2
CONH
CH2
CONH
CHCH2CHCH2CHCH2CHCH2 CHCH2
CONH2CONH
CH2
CONH2
CONH
CH2
CONH
CHCH2CHCH2CHCH2CH CHCH2
CONH2
CONH CONH
CONH2
Cross-linked polyacrylamide
Cross-link betweenpolymer chains
2
Abs
orba
nce
at 2
80 n
m
Time (min)
1 Glutamate dehydrogenase (290 000)2 Lactate dehydrogenase (140 000)3 Enolase kinase (67 000)4 Adenylate kinase (32 000)5 Cytochrome c (12 400)
0.001absorbanceunit
1 2
3 4
5
4 6 8 10 12 14 16 18 20
2
5.0
log(
mol
ecul
ar m
ass)
Elution volume (mL)
100 µm
10 µm
1 µm
100 nm50 nm
10 nm
5 nm
3
4
5
6
7
8
6.0 7.0 8.0 9.0 10.0 11.0
Figure 26-12 Structure of polyacrylamide.
Figure 26-13 Separation of proteins bymolecular exclusion chromatography with TSK3000SW column. [Courtesy Varian Associates, Palo
Alto, CA.]
Figure 26-14 Molecular mass calibration graph for polystyrene on Beckman molecular exclusion column . Resin pore size labeled on the lines ranges from 5 nm to
. [Courtesy Anspec Co., Ann Arbor, MI.]100 m(0.77 � 30 cm)
Spherogel
Nanoparticles can be separated by molecular exclusion chromatography just as proteinsare separated. Figure 26-15 shows the relation between measured size and retention time ofCdSe quantum dots. These are particles containing units in a dense, crystallinecore capped by alkyl thiol (RS) groups on Cd and trialkylphosphine groups on Se.(R3P)
�2 000 CdSe

602 CHAPTER 26 Chromatographic Methods and Capillary Electrophoresis
Quantum dots are useful because the wavelength of their visible emission depends on theirsize. Size is controlled during synthesis of the quantum dot by reaction time or other condi-tions. Quantum dots with different sizes can be used as spectroscopic labels in biologicalexperiments.13
26-4 Affinity ChromatographyAffinity chromatography is used to isolate a single compound from a complex mixture. Thetechnique is based on specific binding of that one compound to the stationary phase (Figure23-6). When sample is passed through the column, only one solute is bound. After everythingelse has washed through, the one adhering solute is eluted by changing a condition such aspH or ionic strength to weaken its binding. Affinity chromatography is especially applicablein biochemistry and is based on specific interactions between enzymes and substrates,antibodies and antigens, or receptors and hormones.
Figure 26-16 shows the isolation of the protein immunoglobulin G (IgG) by affinitychromatography on a column containing covalently bound protein A. Protein A binds to
Log
(par
ticle
dia
met
er, n
m)
Par
ticle
dia
met
er (
nm)
0.9
0.8
0.7
0.66.50 6.75 7.00
Retention time (min)
7.25
7
6
5
4
Cd
S
S
S
S
S
S P
P
P
P
P
P
Se
Se
Cd
Cd
Se
SeCd Cd Se SeCd
Se Cd Se Cd
CdSe Se Cd
Se Cd
CdSe
Effective particle diameter
Figure 26-15 Larger CdSe quantum dots are eluted before smaller quantum dots by 0.1 Mtrioctylphosphine in toluene at 1.0 mL/min in size exclusion chromatography on a cross-linked polystyrene column of 100-nm pore size Polymer Labs PLgel . Triangles are CdSe andsquares are polystyrene calibration standards. The size of the CdSe core was measured with atransmission electron microscope and the length of 1-dodecanethiol endcaps (0.123 nm) was addedto the radius. [Data from K. M. Krueger, A. M. Al-Somali, J. C. Falkner, and V. L. Colvin, “Characterization of
Nanocrystalline CdSe by Size Exclusion Chromatography,” Anal. Chem. 2005, 77, 3511.]
5 m7.5 � 300 mm
(a) (b)
Abs
orba
nce
at 2
80 n
m
Time (min)
0.005absorbanceunits
lgG1
0.2 0.4 0.6 0.8 1 1.2 1.4 1.6 1.8
Figure 26-16 Purification of monoclonal antibody IgG by affinity chromatography ona column containing protein A covalently attached to polymer support. Other proteins inthe sample are eluted from 0 to 0.3 min at pH 7.6. When eluent pH is lowered to 2.6, IgG is freed fromprotein A and emerges from the column. [From B. J. Compton and L. Kreilgaard, “Chromatographic Analysis of
Therapeutic Proteins,” Anal. Chem. 1994, 66, 1175A.]
0.46 � 5 cm

26-5 Principles of Capillary Electrophoresis 603
one specific region of IgG at . When a crude mixture containing IgG and otherproteins was passed through the column at pH 7.6, everything except IgG was elutedwithin 0.3 min. At 1 min, the eluent pH was lowered to 2.6 and IgG was cleanly eluted at1.3 min.
Optical isomers of a drug can have completely different therapeutic effects. Affinitychromatography can be used to isolate individual optical isomers for drug testing.14 The drugcandidate in the margin has two chiral carbon atoms indicated by colored dots. With two pos-sible geometries at each site, there are four stereoisomers. The mixture of isomers was cova-lently attached to protein and injected into mice to raise a mixture of antibodies to allstereoisomers. Antibodies are produced by B cells in the spleen. One B cell produces onlyone kind of antibody. By isolating individual B cells, it is possible to isolate the gene for theantibody to each of the stereoisomers. The gene can be transplanted into E. coli cells formass production of a single kind of antibody, called a monoclonal antibody. When the mix-ture of stereoisomers is passed through a column to which just one kind of antibody isattached, only one of the four stereoisomers is retained. By lowering the pH, the retainedisomer is eluted in pure form.
Box 26-2 shows how molecularly imprinted polymers can be used as affinity media.Aptamers (Section 19-5) are another class of chromatographically useful compounds withhigh affinity for a selected target.16
26-5 Principles of CapillaryElectrophoresis17,18
Electrophoresis is the migration of ions in solution under the influence of an electric field.In the capillary electrophoresis experiment shown in Figure 26-17, components of a solu-tion are separated by applying a voltage of from end to end of a fused-silica capillary tube that is 50 cm long and has an inner diameter of . Different solutes25–75 m
(SiO2)�30 kV
pH � 7.2
Box 26-2 Molecular Imprinting15
A molecularly imprinted polymer is one that is polymerized inthe presence of a template molecule to which components of thepolymer have some affinity. When the template is removed, the
polymer is “imprinted” with the shape of the template and withcomplementary functional groups that can bind the template.The imprinted polymer can be a stationary phase in affinitychromatography or a recognition element in a chemical sensorbecause the polymer preferentially binds the original templatemolecule. Optical isomers can be separated by passage through amolecularly imprinted polymer for which one of the optical iso-mers was the template.Polymer formed
around templatemolecule
Templatemolecule
Y
Y
X
X
YX
0 5 10 15
Time (min)
Abs
orba
nce
Caf
fein
e
The
ophy
lline
Separation of theophylline and caffeine by column containing polymerimprinted with theophylline. Caffeine washed right through with CHCl3solvent. Addition of 20 L of CH3OH to the solvent breaks hydrogen bondsbetween theophylline and the polymer and elutes theophylline in avolume of 1 mL. [From W. M. Mullett and E. P. C. Lai, Anal. Chem. 1998, 70, 3636.]
Imprinted polymer with the right shapeand functional groups to bind thetemplate molecule
Y
Y
Y
removetemplate
ß ß ßß
ß ß
NC
N
N
N
ßHßCH2C6H5
HO H
Cations are attracted to the negative terminal(the cathode).
Anions are attracted to the positive terminal(the anode).
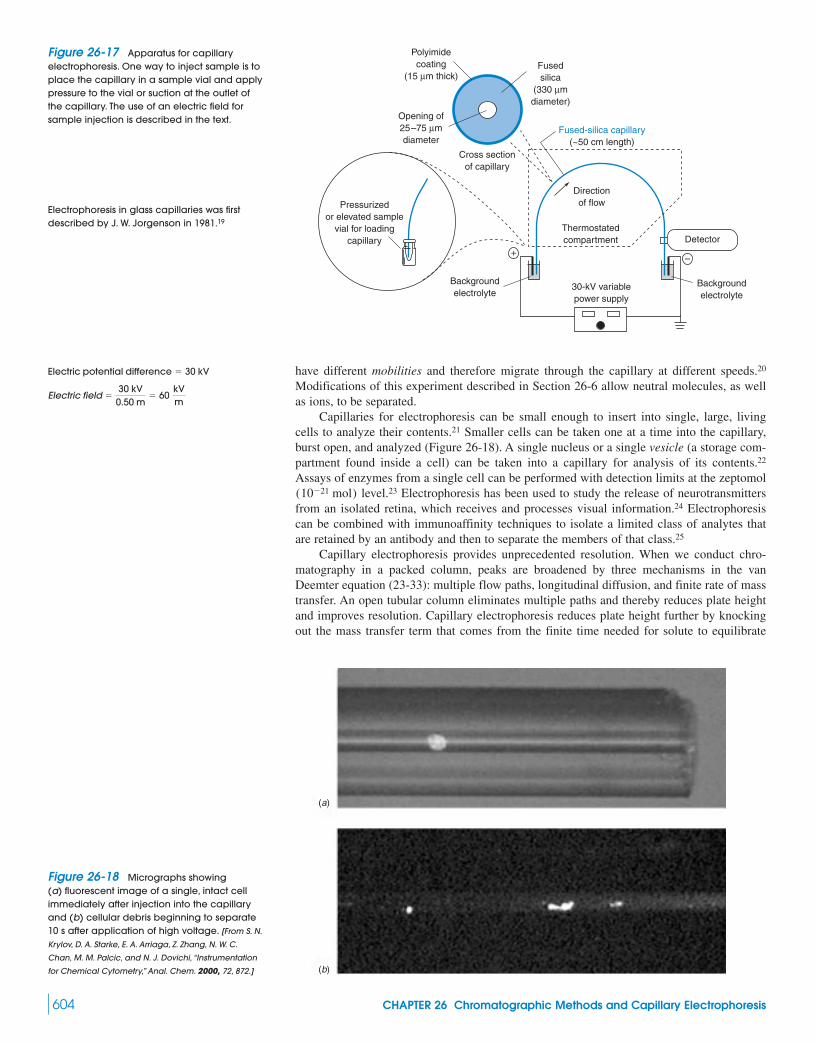
604 CHAPTER 26 Chromatographic Methods and Capillary Electrophoresis
have different mobilities and therefore migrate through the capillary at different speeds.20
Modifications of this experiment described in Section 26-6 allow neutral molecules, as wellas ions, to be separated.
Capillaries for electrophoresis can be small enough to insert into single, large, livingcells to analyze their contents.21 Smaller cells can be taken one at a time into the capillary,burst open, and analyzed (Figure 26-18). A single nucleus or a single vesicle (a storage com-partment found inside a cell) can be taken into a capillary for analysis of its contents.22
Assays of enzymes from a single cell can be performed with detection limits at the zeptomollevel.23 Electrophoresis has been used to study the release of neurotransmitters
from an isolated retina, which receives and processes visual information.24 Electrophoresiscan be combined with immunoaffinity techniques to isolate a limited class of analytes thatare retained by an antibody and then to separate the members of that class.25
Capillary electrophoresis provides unprecedented resolution. When we conduct chro-matography in a packed column, peaks are broadened by three mechanisms in the vanDeemter equation (23-33): multiple flow paths, longitudinal diffusion, and finite rate of masstransfer. An open tubular column eliminates multiple paths and thereby reduces plate heightand improves resolution. Capillary electrophoresis reduces plate height further by knockingout the mass transfer term that comes from the finite time needed for solute to equilibrate
(1021 mol)
Polyimidecoating
(15 µm thick)
Opening of25–75 µmdiameter
Fusedsilica
(330 µmdiameter)
Cross sectionof capillary
Fused-silica capillary(~50 cm length)
Directionof flow
Thermostatedcompartment Detector
Backgroundelectrolyte
Pressurizedor elevated sample
vial for loadingcapillary
30-kV variablepower supply
Backgroundelectrolyte
+–
Electrophoresis in glass capillaries was firstdescribed by J. W. Jorgenson in 1981.19
Figure 26-17 Apparatus for capillaryelectrophoresis. One way to inject sample is toplace the capillary in a sample vial and applypressure to the vial or suction at the outlet ofthe capillary. The use of an electric field forsample injection is described in the text.
(a)
(b)
Figure 26-18 Micrographs showing(a) fluorescent image of a single, intact cellimmediately after injection into the capillaryand (b) cellular debris beginning to separate10 s after application of high voltage. [From S. N.
Krylov, D. A. Starke, E. A. Arriaga, Z. Zhang, N. W. C.
Chan, M. M. Palcic, and N. J. Dovichi, “Instrumentation
for Chemical Cytometry,” Anal. Chem. 2000, 72, 872.]
Electric field �30 kV
0.50 m� 60
kVm
Electric potential difference � 30 kV
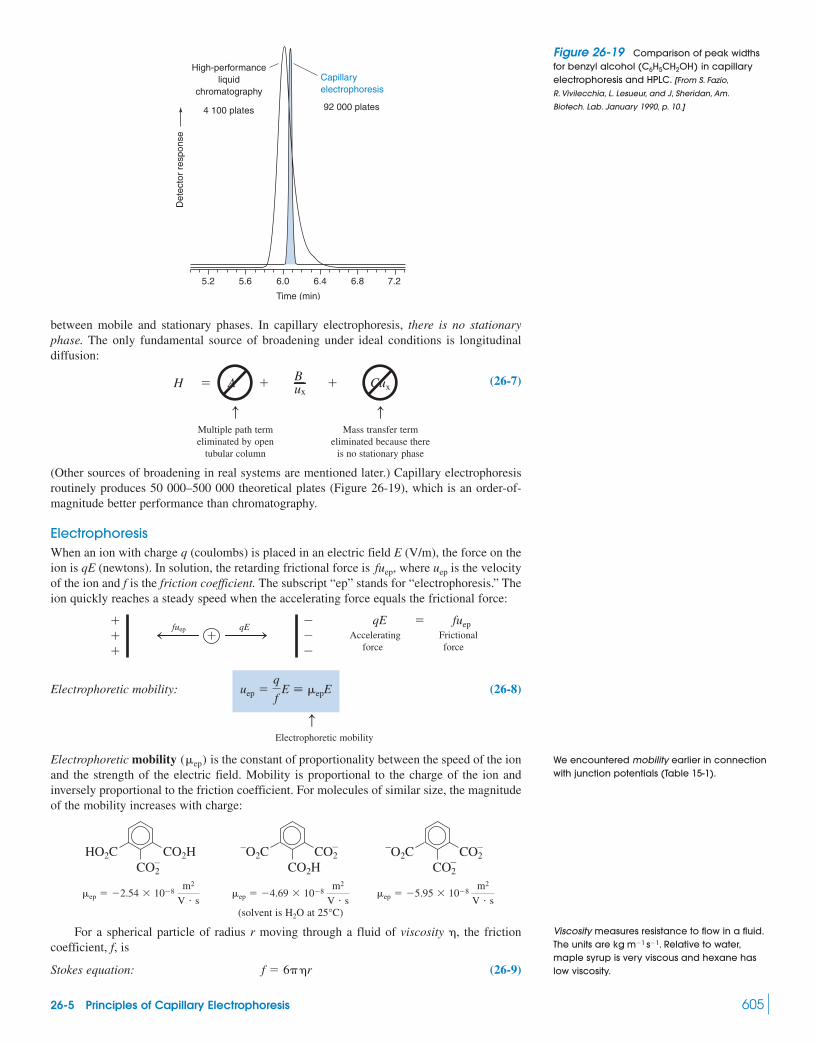
26-5 Principles of Capillary Electrophoresis 605
between mobile and stationary phases. In capillary electrophoresis, there is no stationaryphase. The only fundamental source of broadening under ideal conditions is longitudinaldiffusion:
(26-7)
c cMultiple path term Mass transfer termeliminated by open eliminated because there
tubular column is no stationary phase
(Other sources of broadening in real systems are mentioned later.) Capillary electrophoresisroutinely produces 50 000–500 000 theoretical plates (Figure 26-19), which is an order-of-magnitude better performance than chromatography.
ElectrophoresisWhen an ion with charge q (coulombs) is placed in an electric field E (V/m), the force on theion is qE (newtons). In solution, the retarding frictional force is , where is the velocityof the ion and f is the friction coefficient. The subscript “ep” stands for “electrophoresis.” Theion quickly reaches a steady speed when the accelerating force equals the frictional force:
Accelerating Frictionalforce force
Electrophoretic mobility: (26-8)
cElectrophoretic mobility
Electrophoretic mobility is the constant of proportionality between the speed of the ionand the strength of the electric field. Mobility is proportional to the charge of the ion andinversely proportional to the friction coefficient. For molecules of similar size, the magnitudeof the mobility increases with charge:
(solvent is H2O at 25°C)
For a spherical particle of radius r moving through a fluid of viscosity , the frictioncoefficient, f, is
Stokes equation: (26-9)f � 6��r
�
ep � 5.95 � 108m2
V � sep � 4.69 � 108
m2
V � sep � 2.54 � 108
m2
V � s
CO2
CO2
O2CCO2
CO2HO2C
CO2
HO2C
CO2H
(ep)
uep �q
fE � epE
qE � fuep���
�
fuep qE" "
uepfuep
uxH � A � �
B Cux
High-performanceliquid
chromatography
Capillaryelectrophoresis
92 000 plates
Time (min)
Det
ecto
r re
spon
se
4 100 plates
5.2 5.6 6.0 6.4 6.8 7.2
We encountered mobility earlier in connectionwith junction potentials (Table 15-1).
Viscosity measures resistance to flow in a fluid.The units are . Relative to water,maple syrup is very viscous and hexane haslow viscosity.
kg m1 s1
Figure 26-19 Comparison of peak widthsfor benzyl alcohol in capillaryelectrophoresis and HPLC. [From S. Fazio,
R. Vivilecchia, L. Lesueur, and J, Sheridan, Am.
Biotech. Lab. January 1990, p. 10.]
(C6H5CH2OH)

606 CHAPTER 26 Chromatographic Methods and Capillary Electrophoresis
Mobility is q/f, so, the greater the radius, the lower the mobility. Most molecules are notspherical, but Equation 26-9 defines an effective hydrodynamic radius of a molecule, as if itwere a sphere, based on its observed mobility.
ElectroosmosisThe inside wall of a fused-silica capillary is covered with silanol groups with anegative charge above . Figure 26-20a shows the electric double layer(Box 17-3) at the wall of the capillary. The double layer consists of fixed negative charge onthe wall and excess cations near the wall. A tightly adsorbed, immobile layer of cations par-tially neutralizes the negative charge. The remaining negative charge is neutralized by mobilecations in the diffuse part of the double layer in solution near the wall. The thickness of thediffuse part of the double layer ranges from when the ionic strength is 1 mM to
when the ionic strength is 1 M.�0.3 nm�10 nm
pH � 2(SißO)(SißOH)
If you measure the friction coefficient of amolecule with Equation 26-8 and the solutionviscosity, then r in Equation 26-9 is thehydrodynamic radius of the molecule.
++ +
–+
Bulk solution(cations = anions)
Diffuse part of doublelayer (rich in cations)
Surface-bound O– andtightly adsorbed cations
Net flowtowardcathode
CathodeAnode
Fused silica(a )
(b )
+ ++
+
+ +
+
++
+
+ + +
+
+
+
++
++
+
–
–
–
–
––
–
–
–
– – – – – – –– ––––– ––
+ ++
++
++
++
+
++
+
+
++ +++
++
+
+
+
–
–
–
––
–
–
–
–
– – – – – – –– ––––– ––
Figure 26-20 (a) Electric double layer created by negatively charged silica surface and nearbycations. (b) Predominance of cations in diffuse part of the double layer produces net electroosmoticflow toward the cathode when an external field is applied.
Anode Cathode
Electroosmotic velocity profile
Highpressure
Lowpressure
Hydrodynamic velocity profile(laminar flow)
(a )
(b )
+ –
Figure 26-21 (a) Electroosmosis givesuniform flow over more than 99.9% of the crosssection of the capillary. The speed decreasesimmediately adjacent to the capillary wall,(b) Parabolic velocity profile of hydrodynamicflow (also called laminar flow), with the highestvelocity at the center of the tube and zerovelocity at the walls. Experimentally observedvelocity profiles are shown in Color Plate 28
Ions in the diffuse part of the double layeradjacent to the capillary wall are the “pump”that drives electroosmotic flow.
In an electric field, cations are attracted to the cathode and anions are attracted to theanode (Figure 26-20b). Excess cations in the diffuse part of the double layer impart netmomentum toward the cathode. This pumping action, called electroosmosis (or electroen-dosmosis), is driven by cations within of the walls and creates uniform pluglikeelectroosmotic flow of the entire solution toward the cathode (Figure 26-2la). This process isin sharp contrast with hydrodynamic flow, which is driven by a pressure difference. In hydro-
�10 nm
26-5 Principles of Capillary Electrophoresis 607
dynamic flow, the velocity profile through a cross section of the fluid is parabolic: It is fastestat the center and slows to 0 at the walls (Figure 26-21b and Color Plate 28).
The constant of proportionality between electroosmotic velocity, , and applied field iscalled electroosmotic mobility, .
Electroosmotic mobility: (26-10)
cElectroosmotic mobility
Electroosmotic mobility is proportional to the surface charge density on the silica andinversely proportional to the square root of ionic strength. Electroosmosis decreases at lowpH ( decreases surface charge density) and high ionic strength. At pH 9 in20 mM borate buffer, electroosmotic flow is . At pH 3, flow is reduced by an orderof magnitude.
Uniform electroosmotic flow contributes to the high resolution of capillary elec-trophoresis. Any effect that decreases uniformity creates band broadening and decreasesresolution. The flow of ions in the capillary generates heat (called Joule heating) at a rate of
joules per second, where I is current (A) and R is the resistance of the solution (ohms)(Section 14-1). Typically, the centerline of the capillary channel is 0.02 to 0.3 K hotter thanthe edge of the channel. Viscosity is lower in the warmer region, disturbing the flat elec-troosmotic profile of the fluid. Joule heating is not a serious problem in a capillary tube witha diameter of , but the temperature gradient would be prohibitive if the diameter were
. Some instruments cool the capillary to reduce the electrical conductivity of solutioninside the capillary and prevent runaway Joule heating.
MobilityThe apparent (or observed) mobility, , of an ion is the sum of the electrophoretic mobil-ity of the ion plus the electroosmotic mobility of the solution.
Apparent mobility: (26-11)
For an analyte cation moving in the same direction as the electroosmotic flow, and have the same sign, so is greater than . Electrophoresis transports anions in theopposite direction from electroosmosis (Figure 26-20b), so for anions the two terms in Equa-tion 26-11 have opposite signs. At neutral or high pH, brisk electroosmosis transports anionsto the cathode because electroosmosis is usually faster than electrophoresis. At low pH, elec-troosmosis is weak and anions may never reach the detector. If you want to separate anions atlow pH, you can reverse the polarity of the instrument to make the sample side negative andthe detector side positive.
The apparent mobility, , of a particular species is the net speed, , of the speciesdivided by the electric field, E:
Apparent mobility: (26-12)
where is the length of column from injection to the detector, is the total length of thecolumn from end to end, V is the voltage applied between the two ends, and t is the timerequired for solute to migrate from the injection end to the detector. Electroosmotic flow ismeasured by adding an ultraviolet-absorbing neutral solute to the sample and measuring itsmigration time, , to the detector.
For quantitative analysis by electrophoresis, normalized peak areas are required. Thenormalized peak area is the measured peak area divided by the migration time. In chro-matography, each analyte passes through the detector at the same rate, so peak area is pro-portional to the quantity of analyte. In electrophoresis, analytes with different apparentmobilities pass through the detector at different rates. The higher the apparent mobility, theshorter the migration time and the less time the analyte spends in the detector. To correct fortime spent in the detector, divide the peak area for each analyte by its migration time.
tneutral
LtLd
app �unet
E�
Ld/t
V/Lt
unetapp
epapp
eoep
app � ep � eo
app
�1 mm50 m
I2R
�2 mm/sSißO S SißOH
(units � m2/[V � s])
ueo � eoE
eo
ueo Electroosmotic velocity is measured by addingto the sample a neutral molecule to which thedetector responds.
distance from injector to detector
migration time of neutral molecule
Electroosmotic velocity �
The capillary must be thin enough to dissipateheat rapidly. Temperature gradients disturb theflow and reduce resolution.
applied voltsdistance between ends of capillary
�VL t
Electric field �
Speed �distance to detector
migration time�
Ld
t
For quantitative analysis, use
Peak areaMigration time

608 CHAPTER 26 Chromatographic Methods and Capillary Electrophoresis
Electroosmotic mobility is the speed of the neutral species, , divided by theelectric field:
Electroosmotic mobility: (26-13)
The electrophoretic mobility of an analyte is the difference .For maximum precision, mobilities are measured relative to an internal standard.
Absolute variation from run to run should not affect relative mobilities, unless there are time-dependent (nonequilibrium) interactions of the solute with the wall.
For molecules of similar size, the magnitude of the electrophoretic mobility increases withcharge. A protein “charge ladder” is a synthetic mixture made from a single protein with manydifferent charges. For example, we can obtain such a mixture by acetylating variable numbersof lysine amino acid side chains (Table 10-1) to reduce their charge from to 0
.26
Lysine Acetic anhydride Acetylated product (ßNHAc)
Protein NH2 � CH3C O CCH3
O O
Protein NHCCH3
O
� CH3CO2H
(RßNHC(¢O)CH3)�1 (RßNH3
�)
app eo
eo �uneutral
E�
Ld/tneutral
V/Lt
uneutral
H3N
NH3
NH3
NH3
�
�
�
�H3N
NH3
NHAc NHAc
NH3
�
�
� �AcHN
NH3
NH3
�
NHAc
AcHN
NH3
NHAc
�
NHAc
AcHN
NHAc
NHAc
acetylation� � �
Protein (�4) �3 �1 0�2
Lysine groups have . At pH 8.3, 99% of these groups are protonated. Acetylation gives a mixture with every possible number of modified amino groups
from 0 to the total number of lysine residues. This mixture gives the electropherogram in Fig-ure 26-22 with a series of nearly evenly spaced peaks. Each molecule has approximately thesame size and shape (and therefore nearly the same friction coefficient) but a different charge.
Example Mobilities in a Protein Charge Ladder
Bovine carbonic anhydrase is a protein with 18 lysine residues. The 19 peaks in Figure 26-22arise from unmodified protein plus protein with every possible degree of acetyla-tion: . The voltage applied to the 0.840-m-long capil-lary is . A neutral marker molecule, carried by electroosmotic flow, requires308 s to travel 0.640 m from the inlet to the detector. Migration times of and are 343 s and 355 s, respectively. Find the electroosmotic velocity and electroosmoticmobility. Find the apparent and electrophoretic mobilities of and .P(n�1)Pn
P(n�1)Pn
2.50 � 104 VP(n�1), P(n�2), P(n�3), . . . , P(n�18)
(Pn)
(ßNH3�)
pKa � 10.3ßNH2
Abs
orba
nce (n +18)–
300 350 400
Neutralmarker
Unmodifiedprotein
(n–)
450
Migration time (s)
500 550 600
(n + 5)–(n + 10)–
Figure 26-22 Protein charge ladder. Bovinecarbonic anhydrase was acetylated to givespecies with charges of ,
. Electrophoresis was carried out atpH 8.3 at in a capillary with alength of 0.840 m and a distance to thedetector of 0.640 m. The neutral, ultraviolet-absorbing marker used to measureelectroosmotic flow was mesityl oxide,
. [From M. K. Menon and
A. L. Zydney, “Determination of Effective Protein Charge
by Capillary Electrophoresis,” Anal. Chem. 2000,
72, 5714.]
(CH3)2C¢CHC(¢O)CH3
2.50 � 104 Vacetylated)
(fully(n � 1), (n � 2), . . . , (n � 18)
n(unacetylated)
Problem 26-39 shows how to find the charge ofunmodified protein from the charge ladder.

26-5 Principles of Capillary Electrophoresis 609
Solution Electroosmotic velocity is found from the migration time of the neutralmarker:
Electric field is the voltage divided by the total length, , of the column: . Mobility is the constant of proportionality between velocity
and electric field:
The mobility of the neutral marker, which we just calculated, is the electroosmoticmobility for the entire solution.
The apparent mobility of is obtained from its migration time:
Electrophoretic mobility describes the response of the ion to the electric field. We subtractthe electroosmotic mobility from the apparent mobility to find electrophoretic mobility:
The electrophoretic mobility is negative because the protein has a negative charge andmigrates in a direction opposite that of electroosmotic flow. Electroosmotic flow at pH 8.3is faster than electromigration, so the protein does get carried to the detector. Similarcalculations for the modified protein give and
. The electrophoretic mobility of is more negativethan that of because the charge is more negative.
Theoretical Plates and ResolutionConsider a capillary of length from the inlet to the detector. In Section 23-4, we definedthe number of theoretical plates as , where is the standard deviation of the band.If the only mechanism of zone broadening is longitudinal diffusion, the standard deviationwas given by Equation 23-26: , where D is the diffusion coefficient and t is themigration time . Combining these equations with the definition ofelectric field ( , where V is the applied voltage) gives an expression for the numberof plates:
Number of plates: (26-14)
How many theoretical plates might we hope to attain? Using a typical value of(derived for a 10-min migration time in a capillary with
) and using diffusion coefficients from Table 23-1,we find
For
For serum albumin:
For the small, rapidly diffusing ion, we expect 100 000 plates. For the slowly diffusingprotein serum albumin (FM 65 000), we expect more than 3 million plates. High plate countmeans that bands are very narrow and resolution between adjacent bands is excellent.
In reality, additional sources of zone broadening include the finite width of the injectedband (Equation 23-32), a parabolic flow profile from heating inside the capillary, adsorptionof solute on the capillary wall (which acts as a stationary phase), the finite length of thedetection zone, and mobility mismatch of solute and buffer ions that leads to nonideal elec-
K�
N �[2 � 108 m2/(V � s)][25 000 V]
2(0.059 � 109 m2/s)
0.50 m
0.60 m� 3.5 � 106 plates
N �[2 � 108 m2/(V � s)][25 000 V]
2(2 � 109 m2/s)
0.50 m
0.60 m� 1.0 � 105 platesK�:
Lt � 60 cm, Ld � 50 cm, and 25 kVapp � 2 � 108 m2/(V � s)
N �appV
2D
Ld
Lt
E � V/Lt
(� Ld/unet � Ld/[appE ])� � 22Dt
�N � Ld2/�2
Ld
Pn
P(n�1)ep � 0.93 � 108 m2/(V � s)app � 6.05 � 108 m2/(V � s)P(n�1)
� (6.26 6.98) � 108m2
V � s� 0.72 � 108
m2
V � s
app � ep � eo 1 ep � app eo
app �unet
E�
0.640 m/343 s
2.98 � 104 V/m� 6.26 � 108
m2
V � s
Pn
ueo � eoE 1 eo �ueo
E�
0.002 08 m/s
2.98 � 104 V/m� 6.98 � 108
m2
V � s
0.840 m � 2.98 � 104 V/mE � 25 000 V/Lt
Electroosmotic velocity �distance to detector (Ld)
migration time�
0.640 m
308 s� 2.08 mm/s
Number of plates:
.
L t � total length of column
� � standard deviation of Gaussian bandLd � distance to detector
N �Ld
2
�2
Under special conditions in which a reversehydrodynamic flow was imposed to slow thepassage of analytes through the capillary, upto 17 million plates were observed in theseparation of small molecules!27
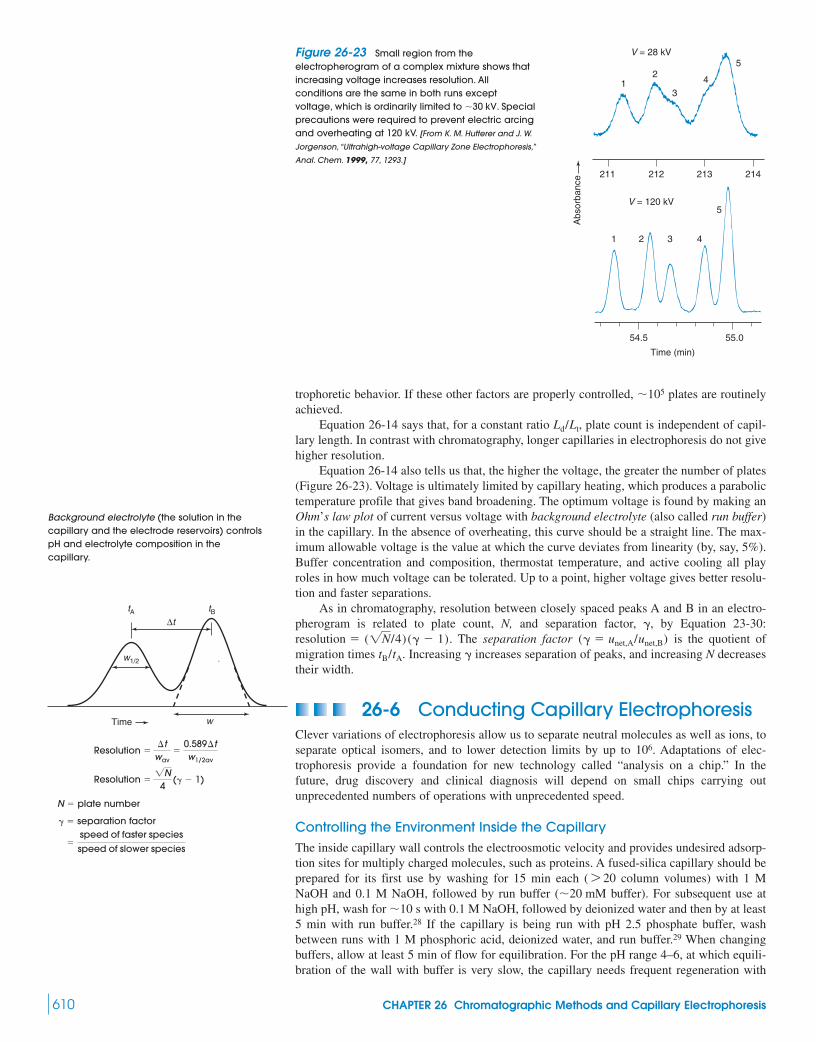
610 CHAPTER 26 Chromatographic Methods and Capillary Electrophoresis
trophoretic behavior. If these other factors are properly controlled, plates are routinelyachieved.
Equation 26-14 says that, for a constant ratio , plate count is independent of capil-lary length. In contrast with chromatography, longer capillaries in electrophoresis do not givehigher resolution.
Equation 26-14 also tells us that, the higher the voltage, the greater the number of plates(Figure 26-23). Voltage is ultimately limited by capillary heating, which produces a parabolictemperature profile that gives band broadening. The optimum voltage is found by making anOhm’s law plot of current versus voltage with background electrolyte (also called run buffer)in the capillary. In the absence of overheating, this curve should be a straight line. The max-imum allowable voltage is the value at which the curve deviates from linearity (by, say, 5%).Buffer concentration and composition, thermostat temperature, and active cooling all playroles in how much voltage can be tolerated. Up to a point, higher voltage gives better resolu-tion and faster separations.
As in chromatography, resolution between closely spaced peaks A and B in an electro-pherogram is related to plate count, N, and separation factor, , by Equation 23-30:
. The separation factor is the quotient ofmigration times . Increasing increases separation of peaks, and increasing N decreasestheir width.
26-6 Conducting Capillary ElectrophoresisClever variations of electrophoresis allow us to separate neutral molecules as well as ions, toseparate optical isomers, and to lower detection limits by up to . Adaptations of elec-trophoresis provide a foundation for new technology called “analysis on a chip.” In thefuture, drug discovery and clinical diagnosis will depend on small chips carrying outunprecedented numbers of operations with unprecedented speed.
Controlling the Environment Inside the CapillaryThe inside capillary wall controls the electroosmotic velocity and provides undesired adsorp-tion sites for multiply charged molecules, such as proteins. A fused-silica capillary should beprepared for its first use by washing for 15 min each ( column volumes) with 1 MNaOH and 0.1 M NaOH, followed by run buffer ( buffer). For subsequent use athigh pH, wash for with 0.1 M NaOH, followed by deionized water and then by at least5 min with run buffer.28 If the capillary is being run with pH 2.5 phosphate buffer, washbetween runs with 1 M phosphoric acid, deionized water, and run buffer.29 When changingbuffers, allow at least 5 min of flow for equilibration. For the pH range 4–6, at which equili-bration of the wall with buffer is very slow, the capillary needs frequent regeneration with
�10 s�20 mM
7 20
106
�tB/tA
(� � unet,A/unet,B)resolution � (2N/4)(� 1)�
Ld/Lt
�105
Background electrolyte (the solution in thecapillary and the electrode reservoirs) controlspH and electrolyte composition in thecapillary.
Abs
orba
nce 211 212
55.054.5
Time (min)
213 214
1 2 3 4
5
12
34
5
V = 120 kV
V = 28 kVFigure 26-23 Small region from theelectropherogram of a complex mixture shows thatincreasing voltage increases resolution. Allconditions are the same in both runs exceptvoltage, which is ordinarily limited to . Specialprecautions were required to prevent electric arcingand overheating at 120 kV. [From K. M. Hutterer and J. W.
Jorgenson, “Ultrahigh-voltage Capillary Zone Electrophoresis,”
Anal. Chem. 1999, 77, 1293.]
�30 kV
tA∆t
Time
w1/2
w
tB
N � plate number
� � separation factor
�speed of faster speciesspeed of slower species
Resolution �2N4
(� 1)
Resolution ��t
wav�
0.589�tw1/2av

26-6 Conducting Capillary Electrophoresis 611
0.1 M NaOH if migration times become erratic. Buffer in both reservoirs should be replacedperiodically because ions become depleted and electrolysis raises the pH at the cathode andlowers the pH at the anode. The capillary inlet should be away from and below theelectrode to minimize entry of electrolytically generated acid or base into the column.30
Stored capillaries should be filled with distilled water.Different separations require more or less electroosmotic flow. Small anions with high
mobility and highly negatively charged proteins require brisk electroosmotic flow or they willnot travel toward the cathode. At pH 2, there is little charge on the silanol groups and littleelectroosmotic flow. At pH 11, the wall is highly charged and electroosmotic flow is strong.Proteins with many positively charged substituents can bind tightly to negatively charged sil-ica. To control this, 30–60 mM diaminopropane (which gives ) maybe added to the run buffer to neutralize charge on the wall. The wall charge can be reduced tonear 0 by covalent attachment of silanes with neutral, hydrophilic substituents. However,many coatings are unstable under alkaline conditions.
You can reverse the direction of electroosmotic flow by adding a cationic surfactant, such asdidodecyldimethylammonium bromide, to the run buffer.31 This molecule has a positive charge atone end and two long hydrocarbon tails. The surfactant coats the negatively charged silica withthe tails pointing away from the surface (Figure 26-24). A second layer of surfactant orientsitself in the opposite direction so that the tails form a nonpolar hydrocarbon layer. This bilayeradheres tightly to the wall of the capillary and effectively reverses the wall charge from nega-tive to positive. Buffer anions create electroosmotic flow from cathode to anode when voltageis applied. Best results are obtained when the capillary is freshly regenerated for each run.
Sample Injection and CompositionInjection may be hydrodynamic (using a pressure difference between the two ends of thecapillary) or electrokinetic (using an electric field to drive sample into the capillary). Forhydrodynamic injection (Figure 26-17), the capillary is dipped into a sample solution and theinjected volume is
Hydrodynamic injection: (26-15)
where is the pressure difference between the ends of the capillary, d is the inner diameterof the capillary, t is the injection time, is the sample viscosity, and is the total length ofthe capillary.
Example Hydrodynamic Injection Time
How much time is required to inject a sample equal to 1.0% of the length of a 50-cmcapillary if the diameter is and the pressure difference is ?Assume that the viscosity is , which is close to the viscosity of water.
Solution The injection plug will be 0.50 cm long and occupy a volume of . The required time is
The units work out when we realize that Pa � force/area � (kg � m/s2) /m2 � kg/(m � s2).
t �128�Lt(volume)
�P�d4�
128[0.001 0 kg/(m � s)](0.50 m)(9.8 � 1012 m3)
(2.0 � 104 Pa)�(50 � 106 m)4� 5.0 s
length � �(25 � 106 m)2(0.5 � 102 m) � 9.8 � 1012 m3�r2 �
0.001 0 kg/(m � s)2.0 � 104 Pa (0.20 bar)50 m
Lt��P
Volume ��P�d4t
128�Lt
�H3NCH2CH2CH2NH3�
�2 mm
Example of covalent coating that helpsprevent protein from sticking to the capillaryand provides reproducible migration times:
O
O
OCH3
OSi
œœ œ
ç
ç ç
ß
ß PolyacrylamideO
– –
–– – – –
–
Silica wall with boundnegative charges
Cationicsurfactant bilayer
Anode
Electroosmoticflow
Buffer anion
Cathode
–
–+ –
– – – – – – –
– ––
+++ + + +
+ + +
+++ + +
++ ++ +
Figure 26-24 Charge reversal created bya cationic surfactant bilayer coated onthe capillary wall. The diffuse part of thedouble layer contains excess anions, andelectroosmotic flow is in the directionopposite that shown in Figure 26-20. Thesurfactant is the didodecyldimethylammoniumion, , represented as
in the illustration.
+
(n-C12H25)N(CH3)�2
For quantitative analysis, it is critical to use aninternal standard because the amount ofsample injected into the capillary is not veryreproducible.
612 CHAPTER 26 Chromatographic Methods and Capillary Electrophoresis
For electrokinetic injection, the capillary is dipped in the sample and a voltage isapplied between the ends of the capillary. The moles of each ion taken into the capillaryin t seconds are
Electrokinetic injection: (26-16)123
Effective electric field
where is the apparent mobility of analyte , E is the applied electric field(V/m), r is the capillary radius, C is the sample concentration , and is the ratioof conductivities of the buffer and sample. One problem with electrokinetic injection is thateach analyte has a different mobility. For quantitative analysis, the injected sample does nothave the same composition as the original sample. Electrokinetic injection is most usefulfor capillary gel electrophoresis (described later), in which the liquid in the capillary is tooviscous for hydrodynamic injection.
Example Electrokinetic Injection Time
How much time is required to inject a sample equal to 1.0% of the length of a 50-cmcapillary if the diameter is and the injection electric field is 10 kV/m? Assume thatthe sample has 1/10 of the conductivity of background electrolyte and
.
Solution Equation 26-16 is simpler than it looks. The factor is 10 in this case. Thelength of sample plug injected onto the column is just .The desired injection plug will be 0.50 cm long. The required time is
Equation 26-16 multiplies the plug length times its cross-sectional area to find its volumeand then multiplies by concentration to find the moles in that volume.
Conductivity Effects: Stacking and Skewed BandsWe choose conditions so that analyte is focused into narrow bands at the start of the capillaryby a process called stacking. Without stacking, if you inject a zone with a length of 5 mm, noanalyte band can be narrower than 5 mm when it reaches the detector.
Stacking depends on the relation between the electric field in the zone of injected sam-ple and that in the background electrolyte on either side of the sample. Optimal buffer con-centration in the sample solution is 1/10 of the background electrolyte concentration, and thesample concentration should be 1/500 of the background electrolyte concentration. If thesample has a much lower ionic strength than the run buffer, the sample’s conductivity islower and its resistance is much greater. Electric field is inversely proportional to conductiv-ity: The lower the conductivity, the greater the electric field. The electric field across thesample plug inside the capillary is higher than the electric field in the background electrolyte.Figure 26-25 shows ions in the sample plug migrating very fast, because the electric field isvery high. When ions reach the zone boundary, they slow down because the field is loweroutside the sample plug. This process of stacking continues until most of the analyte cationsare concentrated at one end of the sample plug and most of the analyte anions are at the otherend. The broad injection becomes concentrated into narrow bands of analyte cations oranions. Figure 26-26 shows signal enhancement by stacking.
If the conductivity of an analyte band is significantly different from the conductivityof the background electrolyte, peak distortion occurs. Figure 26-27 shows a band contain-ing one analyte (as opposed to the sample plug in Figure 26-25, which contains all analytesin the entire injection). Suppose that the background conductivity is greater than the ana-lyte conductivity . Under these conditions, the electric field is lower outside theanalyte band than inside the band. The band migrates to the right in Figure 26-27. An ana-lyte molecule that diffuses past the front on the right suddenly encounters a lower electricfield and it slows down. Soon, the analyte zone catches up with the molecule and it is backin the zone. A molecule that diffuses out of the zone on the left encounters a lower electricfield and it also slows down. The analyte zone is moving faster than the wayward molecule
(�b 7 �a)
t �plug length
speed�
plug length
appaE �b
�sb
�0.005 0 m
[2.0 � 108 m2/(V � s)](10 000 V/m)(10)� 2.5 s
(sample speed) � (time) � app Et�b/�s
2.0 � 108 m2/(V � s)app �
50 m
�b/�s(mol/m3)(� ep � eo)app
Moles injected � appaE �b
�sb t�r2C

26-6 Conducting Capillary Electrophoresis 613
DetectorsWater is so transparent that ultraviolet detectors can operate at wavelengths as short as 185 nm,where most solutes have strong absorption. To take advantage of short-wavelength ultravio-let detection, background electrolyte must have very low absorption. Borate buffers are com-
–
Sampleplug
(low conductivity)
Background buffer(high conductivity)
Background buffer(high conductivity)
Low electric field Highelectric field
Low electric field
CathodeAnode
AnionCation
(a )
(b )
(c )
(d )
+
Withstacking
Abs
orba
nce
8
12
34
9 10
Time (min)
11
Nostacking
1
2
3
4
TimeTime
κb κa κb
Backgroundbuffer
Analyteband
Backgroundbuffer
Diffusinganalytemolecules
κb < κa κb > κa
unet
Figure 26-25 Stacking of anions and cations at opposite ends of the low-conductivity sample plug(zone) occurs because the electric field in the sample plug is much higher than the electric field in thebackground electrolyte. Time increases from panels a to d. Electroneutrality is maintained by migrationof background electrolyte ions, which are not shown.
Figure 26-26 Lower trace: Sample injectedelectrokinetically for 2 s without stacking islimited in volume to prevent band broadening.Upper trace: With stacking, 15 times moresample could be injected (for 30 s), so thesignal is 15 times stronger with no increasein bandwidth. [From Y. Zhao and C. E. Lunte,
“pH-Mediated Field Amplification On-Column
Preconcentration of Anions in Physiological Samples
for Capillary Electrophoresis,” Anal. Chem. 1999,
71, 3985.]
Figure 26-27 Irregular peak shapes arise when the conductivity of the analyte band, �a, is not thesame as the background conductivity, �b.
and pulls away. This condition leads to a sharp front and a broad tail, as shown in thelower right electropherogram in Figure 26-27. When , we observe the oppositeelectropherogram.
To minimize band distortion, sample concentration must be much less than the back-ground electrolyte concentration. Otherwise it is necessary to choose a buffer co-ion that hasthe same mobility as the analyte ion. (The co-ion is the buffer ion with the same charge asanalyte. The counterion has the opposite charge.)
�b 6 �a

614 CHAPTER 26 Chromatographic Methods and Capillary Electrophoresis
monly used in electrophoresis because of their transparency.32 Sensitivity is poor because theoptical pathlength is only as wide as the capillary, which is . Figure 26-28 shows a“bubble cell” that increases the absorbance signal-to-noise ratio by a factor of 3 to 5 and aright-angle bend that increases signal-to-noise by a factor of 10. However, the greater path-length in the right-angle bend design leads to some band broadening. Successive peaks mustbe separated by 3 mm or they will overlap in the detector.
Fluorescence detection is sensitive to naturally fluorescent analytes or to fluorescentderivatives. Amperometric detection is sensitive to analytes that can be oxidized or reducedat an electrode (Figure 26-29). Conductivity detection with ion-exchange suppression ofthe background electrolyte (as in Figure 26-4) can detect small analyte ions at 1–10 ng/mL.Electrospray mass spectrometry (Figure 22-18) provides low detection limits and givesqualitative information about analytes.33
25–75 m
(a)
50 µm
1
2
3
150 µm
(b)
Light path
Lightpath
Figure 26-28 Capillary designs to increase pathlength for measuring ultraviolet absorption,(a) Bubble cell. “Plug” of solute zone is maintained as it passes through the bubble, (b) Right-anglebend. Light path is made of black fused silica to reduce stray light. Reflective interior serves as a “lightpipe” to maximize transmission. Detector response is linear up to 1.4 absorbance units. [Courtesy
Agilent Technologies, Palo Alto, CA.]
Pt auxiliaryelectrode
Ag | AgCl referenceelectrode
Buffercompartment Cu working
electrode
Electrophoresiscathode (grounded)
Capillary
Micropositioner
(a)
2 nA
0Time (min)
4 8 12 16 20
Sucrose
Lactose
Glucose
Fructose
Ribose
Det
ecto
r cu
rren
t
(b)
Figure 26-29 (a) Amperometric detection with macroscopic working electrode at the outlet of thecapillary. (b) Electropherogram of sugars separated in 0.1 M NaOH, in which OH groups are partiallyionized, thereby turning the molecules into anions. [From J. Ye and R. P. Baldwin, “Amperometric Detection in
Capillary Electrophoresis with Normal Size Electrodes,” Anal. Chem. 1993, 65, 3525.]
Figure 26-30 shows the principle of indirect detection,34 which applies to fluorescence,absorbance, amperometry, conductivity, and other forms of detection. A substance with asteady background signal is added to the background electrolyte. In the analyte band, analytemolecules displace the chromophoric substance, so the detector signal decreases when ana-lyte passes by. Figure 26-31 shows an impressive separation of isotopes with indirectCl

26-6 Conducting Capillary Electrophoresis 615
detection in the presence of the ultraviolet-absorbing anion chromate. Electroneutrality dic-tates that an analyte band containing must have a lower concentration of than isfound in the background electrolyte. With less to absorb ultraviolet radiation, a nega-tive peak appears when reaches the detector. Benzoate and phthalate are other anionsuseful for this purpose. Detection limits in capillary electrophoresis are generally about anorder of magnitude higher than detection limits in ion chromatography but one to two ordersof magnitude lower than detection limits for ion-selective electrodes.
Cl
CrO42
CrO42Cl
Bright solventzone
Dark analytezone
Bright solventzone
Figure 26-30 Principle of indirect detection. When analyte emerges from the capillary, the strongbackground signal decreases.
Figure 26-31 Separation of natural isotopes ofby capillary electrophoresis with indirect
spectrophotometric detection at 254 nm. Backgroundelectrolyte contains to provide absorbanceat 254 nm and 2 mM borate buffer, pH 9.2. The capillaryhad a diameter of , a total length of 47 cm
, and an applied voltage of20 kV. The difference in electrophoretic mobility of and is just 0.12%. Conditions were adjusted so thatelectroosmotic flow was nearly equal to and oppositeelectrophoretic flow. The resulting near-zero net velocitygave the two isotopes maximum time to be separatedby their slightly different mobilties. [From C. A. Lucy and
T. L. McDonald, “Separation of Chloride Isotopes by Capillary
Electrophoresis Based on the Isotope Effect on Ion Mobility,” Anal.
Chem. 1995, 67, 1074.]
37Cl35Cl
(length to detector � 40 cm)75 m
5 mM CrO42
0.56 mM Cl
35 40 45Time (min)
0.001absorbanceunit
35Cl−
37Cl−
Abs
orba
nce
at 2
54 n
m
–+Electrophoreticflow of negativemicelle
Anode Cathode
Neutral molecule equilibratesbetween free solution and
inside of micelle–+
–+
–+
–+
–+
–+
–+
–+
–+
–+
–+
–+
–+
–+
–+
–+
–+
–+
–+
–+
–+
–+
–+
–+
–+
–+
–+
–+
–+
–+
–+
–+
–+
–+
–+
–+
––
––
––––
–
––
––
––
––––
–
––
––
––
––––
–
–– Electroosmotic
flow
Figure 26-32 Negatively charged sodiumdodecyl sulfate micelles migrate upstreamagainst the electroosmotic flow. Neutralmolecules (solid color) are in dynamicequilibrium between free solution and theinside of the micelle. The more time spent inthe micelle, the more the neutral moleculelags behind the electroosmotic flow.
Normal order of elution in capillary zoneelectrophoresis:
1. cations (highest mobility first)2. all neutrals (unseparated)3. anions (highest mobility last)
Sodium dodecyl sutfate (n-C12H25OSO3 Na�)
œ œç œç œç œç œççOSO
3 Na�
Approximate detection limits (M) for indirectdetection in electrophoresis:
Ultraviolet absorption 1–100Fluorescence 0.001–1Chemiluminescence 0.001–0.01Conductivity 0.01–100Amperometry 105–10Mass spectrometry 0.001–0.01
SOURCE: Mostly from C. Vogt and G. L. Klunder,“Separation of Metal Ions by Capillary Electrophoresis—Diversity, Advantages, and Drawbacks of DetectionMethods,” Fresenius J. Anal. Chem. 2001, 370, 316.
Micellar Electrokinetic Chromatography35
The type of electrophoresis we have been discussing so far is called capillary zone elec-trophoresis. Separation is based on differences in electrophoretic mobility. If the capillarywall is negative, electroosmotic flow is toward the cathode (Figure 26-20) and the order ofelution is cations before neutrals before anions. If the capillary wall charge is reversed bycoating it with a cationic surfactant (Figure 26-24) and the instrument polarity is reversed,then the order of elution is anions before neutrals before cations. Neither scheme separatesneutral molecules from one another.
Micellar electrokinetic chromatography separates neutral molecules and ions. We illus-trate a case in which the anionic surfactant sodium dodecyl sulfate is present above its criticalmicelle concentration (Box 26-1), so negatively charged micelles are formed.36 In Figure 26-32,electroosmotic flow is to the right. Electrophoretic migration of the negatively chargedmicelles is to the left, but net motion is to the right because the electroosmotic flow dominates.
Micellar electrokinetic chromatography:The more time the neutral analyte spendsinside the micelle, the longer is its migrationtime. This technique was introduced byS. Terabe in 1984.37

616 CHAPTER 26 Chromatographic Methods and Capillary Electrophoresis
In the absence of micelles, all neutral molecules reach the detector in time . Micellesinjected with the sample reach the detector in time , which is longer than because themicelles migrate upstream. If a neutral molecule equilibrates between free solution and theinside of the micelles, its migration time is increased, because it migrates at the slower rate ofthe micelle part of the time. The neutral molecule reaches the detector at a time between and . The more time the neutral molecule spends inside the micelle, the longer is its migra-tion time. Migration times of cations and anions also are affected by micelles, because ionspartition between the solution and the micelles and interact electrostatically with themicelles.
Micellar electrokinetic chromatography is a form of chromatography because the micellesbehave as a pseudostationary phase. Separation of neutral molecules is based on partitioningbetween the solution and the pseudostationary phase. The mass transfer term is no longer0 in the van Deemter equation 26-7, but mass transfer into the micelles is fairly fast and bandbroadening is modest.
Imagination runs wild with the variables in micellar electrokinetic chromatography.We can add anionic, cationic, zwitterionic, and neutral surfactants to change the partitioncoefficients of analytes. (Cationic surfactants also change the charge on the wall and thedirection of electroosmotic flow.) We can add solvents such as acetonitrile or N-methyl-formamide to increase the solubility of organic analytes and to change the partition coef-ficient between the solution and the micelles.38,39 We can add cyclodextrins (Box 24-1)to separate optical isomers that spend different fractions of the time associated withthe cyclodextrins.40 In Figure 26-33, chiral micelles were used to separate enantiomers ofchiral drugs.
Sweeping is a method to concentrate analyte by a factor of for trace analysis bymicellar electrokinetic chromatography. Recall that stacking occurs when analyte in a low-conductivity electrolyte is injected into a capillary containing higher-conductivity electrolyte.The stronger electric field in the low-conductivity region forces ions to migrate rapidly andstack at the boundaries of the two electrolytes (Figure 26-25). In sweeping, a migrating ionicreagent such as sodium dodecyl sulfate micelles or a chelator binds analyte and concentratesit into a narrow band.
Figure 26-34 shows how analyte cations can be swept to concentrate them from tracelevels to detectable levels. We begin in panel a with a capillary filled with
. Pressure is applied in panel b to inject a plug of to occupy10% of the column, followed by a short plug of . In panel c, analyte cations areinjected electrokinetically with positive voltage at the left. The electric field is relatively highin the low-conductivity and relatively low in the high-conductivity . As inFigure 26-25, stacks at the interface when the electric field abruptly decreases at theinterface between and . Electrokinetic injection is continued for 200–600 s to fillmuch of the zone with a high concentration of in panel d before discon-necting from the electric field.
C�100 mM H3PO4
H3PO4H2OC�
100 mM H3PO4H2O
C�H2O100 mM H3PO410% CH3OH
50 mM H3PO4/
103–105
Cux
tmc
t0
t0tmc
t0
10 20
Mas
s sp
ectr
al s
igna
l
1
2
3 4
5
6
O
O
NH
OHH 7 8
30 40
Time (min)
Compound 5(oxprenolol)
Chiralcenter
50 60
Figure 26-33 Separation of enantiomers of eight drugs by micellar electrokineticchromatography at pH 8.0 in a 120-cm capillary at 30 kV. Micelles were formed by a polymer surfactantcontaining L-leucinate substituents for chiral recognition. The structure of one compound is shown.[From C. Akbay, S, A. A. Rizvi, and S. A. Shamsi, “Simultaneous Enantioseparation and Tandem UV-MS Detection of Eight
�-Blockers in Micellar Electrokinetic Chromatography Using a Chiral Molecular Micelle,” Anal. Chem. 2005, 77, 1672.]
�-blocker
Stacking: rapid migration of analyte in alow-conductivity region to concentrate atthe interface with a high-conductivity region
Sweeping: migration of a collector speciessuch as a micelle or chelator to concentrateanalyte in a narrow region at the front of themigrating collector
Sweeping was introduced by J. P. Quirino andS. Terabe, “Exceeding 5000-Fold Concentratonof Dilute Analytes in Micellar ElectrokineticChromatography,” Science 1998, 282, 465.
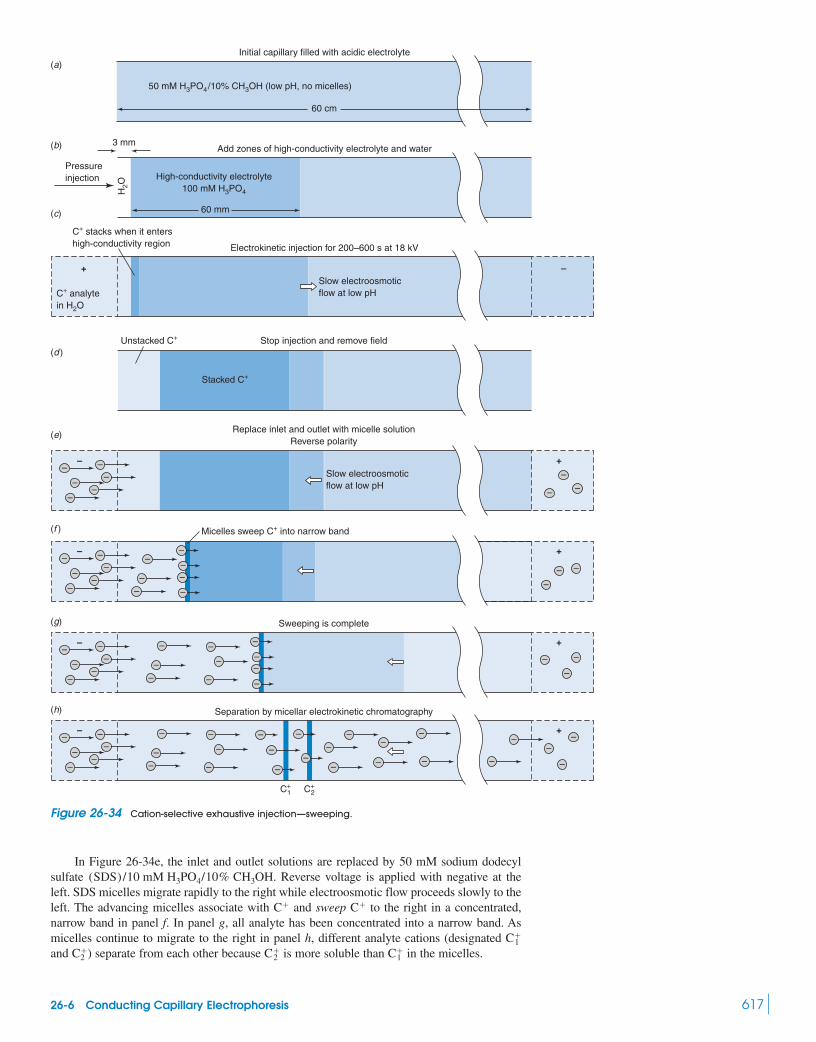
26-6 Conducting Capillary Electrophoresis 617
In Figure 26-34e, the inlet and outlet solutions are replaced by 50 mM sodium dodecylsulfate . Reverse voltage is applied with negative at theleft. SDS micelles migrate rapidly to the right while electroosmotic flow proceeds slowly to theleft. The advancing micelles associate with and sweep to the right in a concentrated,narrow band in panel f. In panel g, all analyte has been concentrated into a narrow band. Asmicelles continue to migrate to the right in panel h, different analyte cations (designated and ) separate from each other because is more soluble than in the micelles.C1
�C2�C2
�
C1�
C�C�
(SDS)/10 mM H3PO4/10% CH3OH
Figure 26-34 Cation-selective exhaustive injection—sweeping.
(a)Initial capillary filled with acidic electrolyte
Add zones of high-conductivity electrolyte and water3 mm
Pressureinjection
50 mM H3PO4/10% CH3OH (low pH, no micelles)
60 cm
60 mm
(b)
(c)
(d )
(e)
(f )
(g)
(h)
H2O
High-conductivity electrolyte100 mM H3PO4
Slow electroosmoticflow at low pH
Electrokinetic injection for 200–600 s at 18 kV
C+ analytein H2O
C+ stacks when it entershigh-conductivity region
Unstacked C+ Stop injection and remove field
Slow electroosmoticflow at low pH
Replace inlet and outlet with micelle solutionReverse polarity
Sweeping is complete
Separation by micellar electrokinetic chromatography
C+1 C+
2
Micelles sweep C+ into narrow band
Stacked C+
+ –
–
– –
+––
––
––
––
–
–
+––
––
–– –
–
––
––
–
–
–
– –
+––
––
–– –
–
–
–
–
– –
––
–
–
–
––
+––
––
–– –
–
–
–
– ––
– –
––
– –
–– – –
––
–
–

618 CHAPTER 26 Chromatographic Methods and Capillary Electrophoresis
In Figure 26-35, the concentration of injected analyte cation is times greater in theupper trace than in the lower trace. In the lower trace, sweeping increases the signal by
. Procedures have been described for sweeping neutral analytes41 or anions derivedfrom weak acids42 and sweeping of metal ions by a chelator.43 Another powerful method toconcentrate analyte utilizes dynamic changes in pH inside the capillary.44
Capillary electrochromatography, described at the opening of this chapter, differsfrom micellar electrokinetic chromatography by using a true stationary phase.45 The capillaryis filled with stationary phase and solvent is driven by electroosmosis. Capillary electrochro-matography provides about twice as many plates as HPLC for the same particle size andcolumn length. Pressure is not used to drive the mobile phase, so there is no pressure dropassociated with the small particles. The opening of this chapter showed an electrochro-matography capillary with a continuous stationary phase instead of discrete particles. Capillaryelectrochromatography has a full range of applications, such as separation of enantiomers,46
ion exchange,47 and trace analysis.48
Capillary Gel ElectrophoresisCapillary gel electrophoresis is a variant of gel electrophoresis, which has been a primarytool in biochemistry for four decades. Slabs of polymer gel used to separate macromoleculesaccording to size have customarily been chemical gels, in which chains are cross-linked bychemical bonds (Figure 26-36a). Chemical gels cannot be flushed from a capillary, so physi-cal gels (Figure 26-36b) in which polymers are simply entangled are used. Physical gels canbe flushed and reloaded to generate a fresh capillary for each separation.
Macromolecules are separated in a gel by sieving, in which smaller molecules migratefaster than large molecules through the entangled polymer network. Color Plate 29 showspart of a deoxyribonucleic acid (DNA) sequence analysis in which a mixture of fluorescence-labeled fragments with up to 400 nucleotides was separated in a capillary containing 6%polyacrylamide (Figure 26-12, with no cross-links). DNA with 30 nucleotides had a migra-tion time of 9 min and DNA with 400 nucleotides required 34 min. The terminal nucleotideof each fragment was labeled with one of two fluorescent labels, each of which was detectedby fluorescence at two wavelengths. The combination of two labels and two wavelengthsallows a unique assignment of each of the four possible nucleotides.49 Capillary electrophoresiswas an enabling technology for determining the sequence of nucleic acids in the humangenome.50
A beautiful example of sieving in electrophoresis is illustrated in Figure 26-37. Quartzpillars were etched into a channel in a quartz plate by lithographic techniquesused to make electronic chips. The pillars at the top left of the figure are 200 nm in diameter.A cover was placed over the pillars and the channel was filled with run buffer. Fluorescentlylabeled DNA fragments applied to the beginning of the channel separated after passingthrough 8 mm of the channel. The smallest fragments pass through first.
25-m-wide
7 � 104
104
0 3 6 9
Time (min)
12 15 18
29.1 ppm C+ (0.6 mm injected zone)Capillary zone electrophoresis
582 ppb C+ (600 s injection)Capillary zone electrophoresis
Analyte zone
2.91 ppb C+ (600 s injection)Sweeping micellar electrokinetic chromatography
C+
C+
C+=
1-Naphthylammonium
C+
NH+3
Confusing terms:Micellar electrokinetic chromatography:
electrophoresis with micelles acting aspseudostationary phase
Capillary electrochromatography: similar toHPLC, except mobile phase is driven byelectroosmosis instead of pressure
Figure 26-35 Effect of sweepingin capillary electrophoresis of 1-naphthylammonium ion. Upper: Capillaryzone electrophoresis of a 0.6-mm-long sampleinjection. Middle: Capillary zone electrophoresisof a 600-s injection. Bottom: Effect of sweepingon the 600-s injection. Ultraviolet (220 nm)absorbance detection scale is the same for alltraces. [From J. P. Quirino and S. Terabe, “Approaching
a Million-Fold Sensitivity Increase in Capillary
Electrophoresis with Direct Ultraviolet Detection:
Cation-Selective Exhaustive Injection and Sweeping,”
Anal. Chem. 2000, 72, 1023.]
(b )
(a )
Polymer chain
Covalentcross-link
Chemical gel(has chemical bondsbetween chains)
Physical gel(no bonds —just entanglement)
Figure 26-36 (a) A chemical gel containscovalent cross-links between different polymerchains. (b) A physical gel is not cross-linkedbut derives its properties from physicalentanglement of the polymers.

26-6 Conducting Capillary Electrophoresis 619
Biochemists measure molecular mass of proteins by sodium dodecyl sulfate (SDS)–gelelectrophoresis. Proteins are first denatured (unfolded to random coils) by reducing theirdisulfide bonds with excess 2-mercaptoethanol and addingsodium dodecyl sulfate . Dodecyl sulfate anion coats hydrophobicregions and gives the protein a large negative charge that is approximately proportional to thelength of the protein. Denatured proteins are then separated by electrophoresis through asieving gel. Large molecules are retarded more than small molecules, which is the oppositebehavior from size exclusion chromatography. In Figure 26-38, the logarithm of molecularmass of the SDS-coated protein is proportional to 1/(migration time). Absolute migrationtimes vary from run to run, so relative migration times are measured. The relative migrationtime is the migration time of a protein divided by the migration time of a fast-moving smalldye molecule.
(C12H25OSO3Na�)
(HSCH2CH2OH)(ßSßSß)
400Pillars etched on quartz plate
Cross section of pillars etchedinto channel on quartz plate
Top view of pillars in channel
Fluorescence from separatedfragments viewed here
DNAfragmentsin
480
2.0and2.3 k
4.4 k6.6 k
9.4 k
23 k
580
Flu
ores
cenc
e in
tens
ity
Time (s)
640
200 nm
Figure 26-37 Separation of 2 000- to 23 000-Da DNA fragments by sieving through quartz pillars in acapillary electrophoresis channel on a quartz plate. [From N. Kaji, Y, Tezuka, Y. Takamura, M. Ueda, T. Nishimoto,
H. Nakanishi, Y. Horiike, and Y. Baba, “Separation of Long DNA Molecules by Quartz Nanopillar Chips Under a Direct
Current Electric Field,” Anal. Chem. 2004, 76, 15.]
Figure 26-38 Calibration curve forprotein molecular mass in sodium dodecylsulfate–capillary gel electrophoresis. Theabscissa, , is the migration time of eachprotein divided by the migration time ofa small dye molecule. [Data from J. K, Grady,
J. Zang, T. M. Laue, P. Arosio, and N. D, Chasteen,
“Characterization of the H- and L-Subunit Ratios in
Ferritins by Sodium Dodecyl Sulfate–Capillary Gel
Electrophoresis,” Anal. Biochem. 2002, 302, 263.]
trel
0.90.4 0.5 0.6
1/t rel
0.7 0.8
5.4
5.2
5.0
4.8
4.6
4.4
4.2
4.0
log(
mol
ecul
ar m
ass)
Myosin 205 000 Da
β-Galactosidase 116 000 Da
α-Lactalbumin 14 200 Da
Phosphorylase B 97 000 Da
Bovine serum albumin 66 000 Da
Ovalbumin 45 000 Da
Carbonic anhydrase 29 000 Da

Method DevelopmentCapillary electrophoresis is not used as much as liquid chromatography. Advantages of elec-trophoresis relative to chromatography include (1) higher resolution, (2) low waste produc-tion, and (3) generally simpler equipment. Drawbacks of electrophoresis include (1) higherlimits of detection, (2) run-to-run irreproducibility of migration times, (3) insolubility ofsome analytes in common electrolyte solutions, and (4) inability to scale up to a preparativeseparation.
Liquid chromatography is two decades more mature than capillary electrophoresis. Astrained “electropherographers” become more common, more separations will be handled byelectrophoresis. For example, electrophoresis displaced liquid chromatography as the pre-ferred method for forensic analysis of alkaloids in opium and heroin.51 The enabling technol-ogy for this application was dynamic coating of the capillary between runs to eliminateadsorption of analytes on the silica surface and decrease variations in migration times to lessthan 0.5%.
Method development for capillary electrophoresis addresses the following points:52
1. Select a detection method that provides the required limit of detection. For ultravioletabsorption, select the optimum wavelength. If necessary, use indirect detection orderivatization.
2. If there is a choice, separate analytes as anions, which do not stick to the negativelycharged wall. If separating polycations, such as proteins at low pH, select additives tocoat the walls or to reverse the wall charge.
3. Dissolve the entire sample. If the sample is not soluble in dilute aqueous buffer, tryadding 6 M urea or surfactants. Acetate buffer tends to dissolve more organic solutesthan does phosphate buffer. If necessary, nonaqueous solvents can be used.53
4. Determine how many peaks are present. Assign each peak by using authentic samplesof analytes and diode array ultraviolet detection or mass spectrometry.
5. For complex mixtures, use computerized experimental design to help optimizeseparation conditions.54
6. Use the short end of the capillary in Figure 26-17 for quick scouting runs to determinethe direction of migration and whether broad peaks are present. Broad peaks indicatethat wall effects are occurring and a coating could be required.
7. See if pH alone provides adequate separation. For acids, begin with 50 mM boratebuffer, pH 9.3. For bases, try 50 mM phosphate, pH 2.5. If the separation is notadequate, try adjusting buffer pH close to the average of the solutes.
8. If pH does not provide adequate separation or if analytes are neutral, use surfactants formicellar electrokinetic capillary chromatography. For chiral solutes, try addingcyclodextrins.
9. Select a capillary wash procedure. If migration times are reproducible from run to runwith no wash, then no wash is required. If migration times increase, wash for 5 to 10 swith 0.1 M NaOH, followed by 5 min with buffer. If migration times still drift, tryincreasing or decreasing the NaOH wash time by a few seconds. If migration timesdecrease, wash with 0.1 M . If proteins or other cations stick to the walls, trywashing with 0.1 M sodium dodecyl sulfate or use a commercial dynamic coating.
10. If necessary, select a sample cleanup method. Cleanup could be required if resolution ispoor, if the salt content is high, or if the capillary fouls. Cleanup might involve solid-phase extraction (Section 28-3), protein precipitation, or dialysis (Demonstration 27-1).
11. If the detection limit is not sufficient, select a stacking or sweeping method toconcentrate analyte in the capillary.
12. For quantitative analysis, determine the linear range required to measure the leastconcentrated and most concentrated analytes. If desired, select an internal standard. Ifthe migration time or peak area of the standard changes, then you have an indicationthat some condition has drifted out of control.
26-7 Lab on a ChipOne of the most exciting and rapidly developing areas of analytical chemistry is the “lab ona chip.”55 Liquids can be moved with precise control by electroosmosis or by pressurethrough micron-size channels etched into glass or plastic chips that are currently about thesize of a microscope slide. Chemical reactions can be conducted by moving picoliters offluid from different reservoirs, mixing them, and subjecting the products to chemical analy-
H3PO4
pKa
620 CHAPTER 26 Chromatographic Methods and Capillary Electrophoresis

26-7 Lab on a Chip 621
sis on the chip with a variety of detectors (Color Plate 30).56 Microreactors consumingmicrograms of reactants can be used to optimize conditions for synthetic reactions, exploringdozens of conditions in a short time.57
Figure 26-39 shows a chip designed to replicate as few as 15 molecules of DNA by thepolymerase chain reaction and then separate and characterize the products.58 A DNAsample is placed in reservoir 3, along with a supply of deoxynucleotide triphosphate (DNAbuilding blocks), primers (short pieces of DNA that match sections of the DNA to be repli-cated), and a heat-resistant polymerase (an enzyme that synthesizes DNA). Reservoir 3 istaken through 25 heating cycles in 20 min. The number of DNA molecules is doubled in eachcycle. A voltage applied between points 3 and 4 fills the channel with DNA solution by elec-troosmosis between these two points. To concentrate DNA in the channel between points 1and 2, voltage is applied to drive liquid from point 3 to point 5. Small molecules and watercan pass through the porous membrane between the 1–2 channel and the 5–5 channel. DNAis too big to pass through the pores and is concentrated in the 1–2 channel.59 The DNA isthen analyzed by gel electrophoresis conducted by applying voltage between points 1 and 2with laser-induced fluorescence detection near point 2. The electropherogram shows onepredominant product with 199 base pairs.
Figure 26-40 shows an integrated plastic biochip capable of conducting genetic analysisof whole blood—including target cell capture, sample preparation, DNA amplification,hybridization with target DNA, and electrochemical detection. This disposable device isinserted into nondisposable hardware that provides electric power, microprocessor control,detector electronics, readout, and a magnet to manipulate beads that capture specific cells inthe sample. The ancillary hardware could potentially be shrunk to hand-held size. Applica-tions of this device include pathogenic bacteria detection and genetic screening.
5-L
Cover plate
Glass
Fluorescence
Detection of fluorescent product
1
5
5
2
PhotomultipliertubeFilter
removesλ = 488 nm
Thermocycledregion
Samplewaste
Sample
Sidechannel
Injection junction withporous membrane structure
Porous polysilicatemembrane (~4 µm thick)
Separation column
Detection point
Waste
Buffer
1
2
5
5
4
3
Lens
Channel
40 50 60Time (s)
Primers
DNA product
Markers
199
50 150 300 500
70
Argon laser
488 nm
3
4
Flu
ores
cenc
eFigure 26-39 MicroChannel device for replication and analysis of DNA. Channels are deepand wide. [From J. Khandurina, T. E. McKnight, S. C. Jacobson, L. C, Waters, R. S. Foot, and J. M. Ramsey,
“Integrated System for Rapid-PCR-Based DNA Analysis in Microfluidic Devices,” Anal. Chem. 2000, 72, 2995.]
40–45 m7–10 m
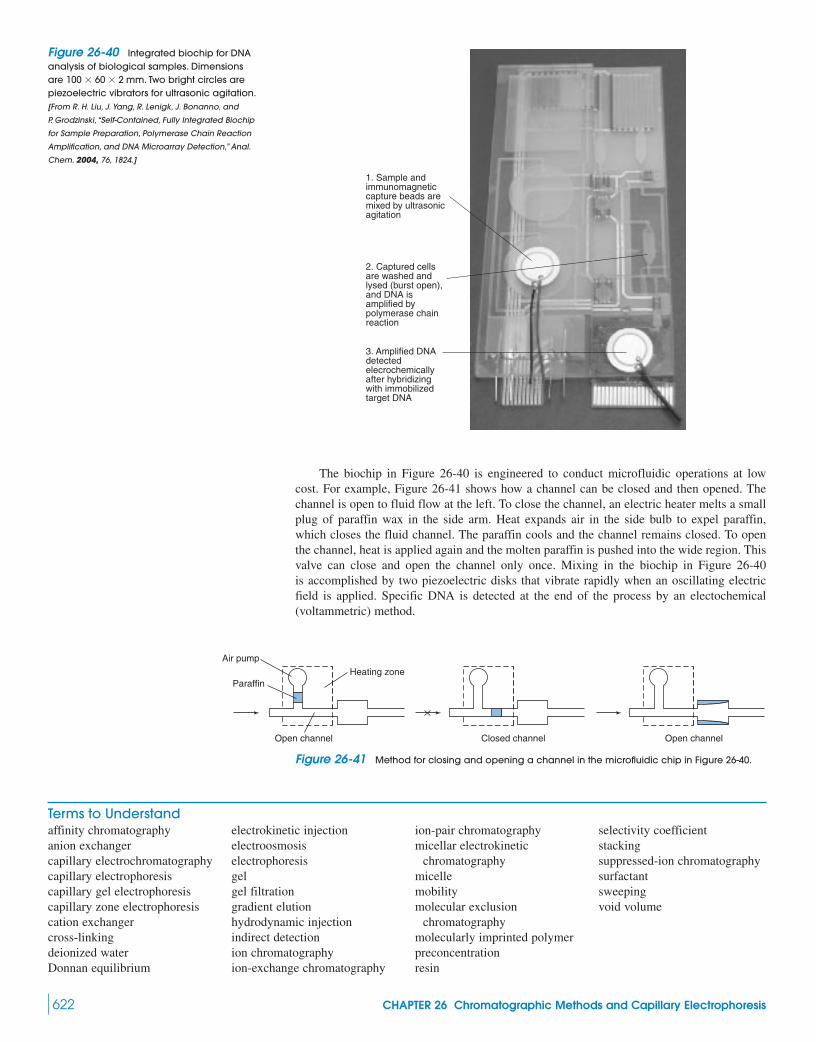
622 CHAPTER 26 Chromatographic Methods and Capillary Electrophoresis
The biochip in Figure 26-40 is engineered to conduct microfluidic operations at lowcost. For example, Figure 26-41 shows how a channel can be closed and then opened. Thechannel is open to fluid flow at the left. To close the channel, an electric heater melts a smallplug of paraffin wax in the side arm. Heat expands air in the side bulb to expel paraffin,which closes the fluid channel. The paraffin cools and the channel remains closed. To openthe channel, heat is applied again and the molten paraffin is pushed into the wide region. Thisvalve can close and open the channel only once. Mixing in the biochip in Figure 26-40is accomplished by two piezoelectric disks that vibrate rapidly when an oscillating electricfield is applied. Specific DNA is detected at the end of the process by an electochemical(voltammetric) method.
1. Sample and immunomagnetic capture beads are mixed by ultrasonic agitation
2. Captured cells are washed and lysed (burst open), and DNA is amplified by polymerase chain reaction
3. Amplified DNA detectedelecrochemicallyafter hybridizing with immobilized target DNA
Air pump
Heating zone
Open channel Closed channel Open channel
Paraffin
Figure 26-40 Integrated biochip for DNAanalysis of biological samples. Dimensionsare . Two bright circles arepiezoelectric vibrators for ultrasonic agitation.[From R. H. Liu, J. Yang, R. Lenigk, J. Bonanno, and
P. Grodzinski, “Self-Contained, Fully Integrated Biochip
for Sample Preparation, Polymerase Chain Reaction
Amplification, and DNA Microarray Detection,” Anal.
Chem. 2004, 76, 1824.]
100 � 60 � 2 mm
Figure 26-41 Method for closing and opening a channel in the microfluidic chip in Figure 26-40.
Terms to Understandaffinity chromatographyanion exchangercapillary electrochromatographycapillary electrophoresiscapillary gel electrophoresiscapillary zone electrophoresiscation exchangercross-linkingdeionized waterDonnan equilibrium
electrokinetic injectionelectroosmosiselectrophoresisgelgel filtrationgradient elutionhydrodynamic injectionindirect detectionion chromatographyion-exchange chromatography
ion-pair chromatographymicellar electrokinetic
chromatographymicellemobilitymolecular exclusion
chromatographymolecularly imprinted polymerpreconcentrationresin
selectivity coefficientstackingsuppressed-ion chromatographysurfactantsweepingvoid volume

Problems 623
SummaryIon-exchange chromatography employs resins and gels with cova-lently bound charged groups that attract solute counterions (and thatexclude ions having the same charge as the resin). Polystyrene resinsare useful for small ions. Greater cross-linking of the resin increasesthe capacity, selectivity, and time needed for equilibration. Ion-exchange gels based on cellulose and dextran have large pore sizesand low charge densities, suitable for the separation of macromole-cules. Certain inorganic solids have ion-exchange properties and areuseful at extremes of temperature or radiation. Ion exchangers oper-ate by the principle of mass action, with a gradient of increasingionic strength most commonly used to effect a separation.
In suppressed-ion chromatography, a separator column sepa-rates ions of interest, and a suppressor membrane converts eluentinto a nonionic form so that analytes can be detected by their con-ductivity. Alternatively, nonsuppressed ion chromatography uses anion-exchange column and low-concentration eluent. If the eluentabsorbs light, indirect spectrophotometric detection is convenientand sensitive. Ion-pair chromatography utilizes an ionic surfactantin the eluent to make a reversed-phase column function as an ion-exchange column.
Molecular exclusion chromatography is based on the inabilityof large molecules to enter small pores in the stationary phase.Small molecules enter these pores and therefore exhibit longer elu-tion times than large molecules. Molecular exclusion is used forseparations based on size and for molecular mass determinations ofmacromolecules. In affinity chromatography, the stationary phaseretains one particular solute in a complex mixture. After all othercomponents have been eluted, the desired species is liberated by achange in conditions.
In capillary zone electrophoresis, ions are separated by differ-ences in mobility in a strong electric field applied between the
ends of a silica capillary tube. The greater the charge and thesmaller the hydrodynamic radius, the greater the electrophoreticmobility. Normally, the capillary wall is negative, and solution istransported from anode to cathode by electroosmosis of cations inthe electric double layer. Solute cations arrive first, followed byneutral species, followed by solute anions (if electroosmosis isstronger than electrophoresis). Apparent mobility is the sum ofelectrophoretic mobility and electroosmotic mobility (which is thesame for all species). Zone dispersion (broadening) arises mainlyfrom longitudinal diffusion and the finite length of the injectedsample. Stacking of solute ions in the capillary occurs when thesample has a low conductivity. Electroosmotic flow is reduced atlow pH because surface groups are protonated. groups can be masked by polyamine cations, and the wall chargecan be reversed by a cationic surfactant that forms a bilayer alongthe wall. Covalent coatings reduce electroosmosis and walladsorption. Hydrodynamic sample injection uses pressure orsiphoning; electrokinetic injection uses an electric field. Ultravio-let absorbance is commonly used for detection. Micellar elec-trophoretic chromatography uses micelles as a pseudostationaryphase to separate neutral molecules and ions, which can be con-centrated by stacking. Micelles can also be used to sweep longplugs of analyte into concentrated bands, thereby lowering detec-tion limits by factors of . Capillary electrochromatographyis essentially the same as HPLC, but the mobile phase is driven byelectroosmosis instead of pressure. Capillary gel electrophoresisseparates macromolecules by sieving. In contrast with molecularexclusion chromatography, small molecules move fastest in gelelectrophoresis. The “lab on a chip” uses electroosmotic or hydro-dynamic liquid flow in lithographically fabricated chips to con-duct chemical reactions and chemical analysis.
103–105
SißOSißO
Exercises26-A. Vanadyl sulfate ( , FM 163.00), as supplied commer-cially, is contaminated with (FM 98.08) and . A solutionwas prepared by dissolving 0.244 7 g of impure in 50.0 mLof water. Spectrophotometric analysis indicated that the concentra-tion of the blue ion was 0.024 3 M. A 5.00-mL sample waspassed through a cation-exchange column loaded with . When
from the 5.00-mL sample became bound to the column, thereleased required 13.03 mL of 0.022 74 M NaOH for titration.
Find the weight percent of each component ( , , and) in the vanadyl sulfate.
26-B. Blue Dextran 2000 was eluted during gel filtration in a vol-ume of 36.4 mL from a columnof Sephadex G-50, which fractionates molecules in the molecularmass range 1 500 to 30 000.(a) At what retention volume would hemoglobin (molecular mass64 000) be expected?
2.0 � 40 cm (diameter � length)
H2OH2SO4VOSO4
H�
VO2�
H�
VO2�
VOSO4
H2OH2SO4
VOSO4 (b) Suppose that , which is not adsorbed on thecolumn, is eluted in a volume of 109.8 mL. What would be theretention volume of a molecule with ?
26-C. Consider a capillary electrophoresis experiment conductednear pH 9, at which the electroosmotic flow is stronger than theelectrophoretic flow.(a) Draw a picture of the capillary, showing the placement of theanode, cathode, injector, and detector. Show the direction of elec-troosmotic flow and the direction of electrophoretic flow of a cationand an anion. Show the direction of net flow.(b) Using Table 15-1, explain why has a shorter migration timethan . Predict whether will have a shorter migration time than
or a greater migration time than .(c) Why is the mobility of greater than that of ?ClI
ICl
BrI
Cl
Kav � 0.65
radioactive 22NaCl
Problems
Ion-Exchange and Ion Chromatography26-1. State the purpose of the separator and suppressor insuppressed-ion chromatography. For cation chromatography, why isthe suppressor an anion-exchange membrane?
26-2. State the effects of increasing cross-linking on an ion-exchangecolumn.
26-3. What is deionized water? What kind of impurities are notremoved by deionization?
26-4. The exchange capacity of an ion-exchange resin can bedefined as the number of moles of charged sites per gram of dryresin. Describe how you would measure the exchange capacity of
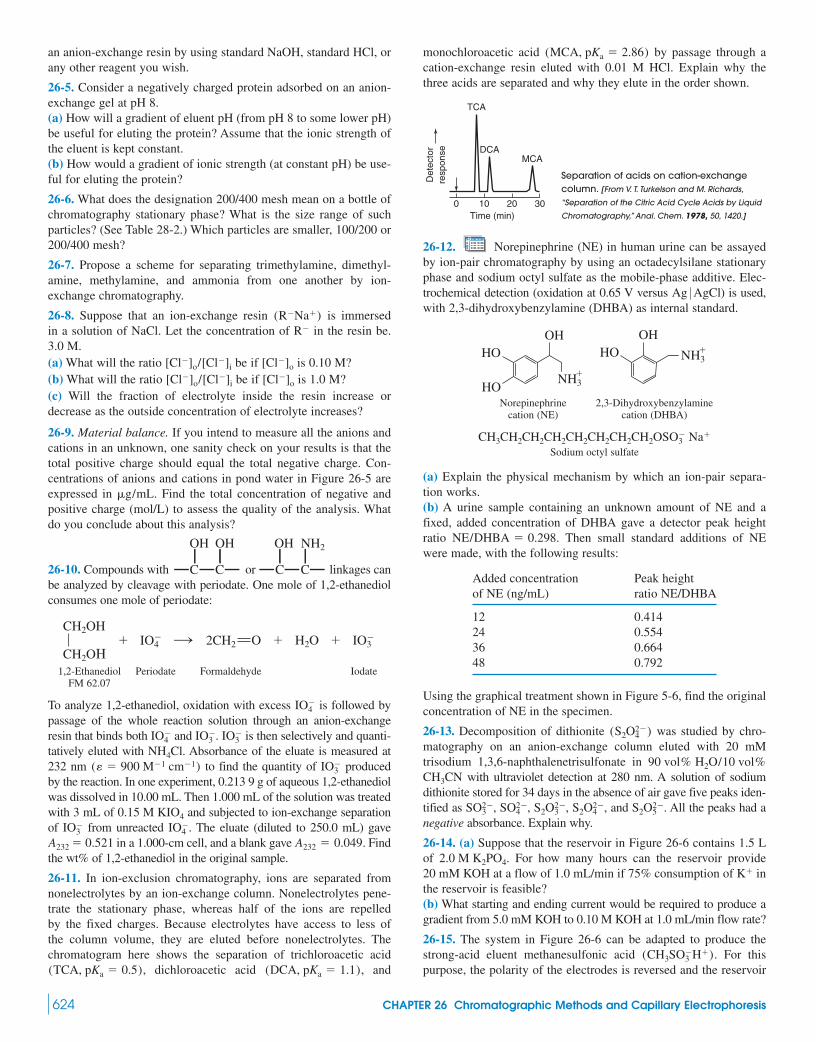
624 CHAPTER 26 Chromatographic Methods and Capillary Electrophoresis
an anion-exchange resin by using standard NaOH, standard HCl, orany other reagent you wish.
26-5. Consider a negatively charged protein adsorbed on an anion-exchange gel at pH 8.(a) How will a gradient of eluent pH (from pH 8 to some lower pH)be useful for eluting the protein? Assume that the ionic strength ofthe eluent is kept constant.(b) How would a gradient of ionic strength (at constant pH) be use-ful for eluting the protein?
26-6. What does the designation 200/400 mesh mean on a bottle ofchromatography stationary phase? What is the size range of suchparticles? (See Table 28-2.) Which particles are smaller, 100/200 or200/400 mesh?
26-7. Propose a scheme for separating trimethylamine, dimethyl-amine, methylamine, and ammonia from one another by ion-exchange chromatography.
26-8. Suppose that an ion-exchange resin is immersedin a solution of NaCl. Let the concentration of in the resin be.3.0 M.(a) What will the ratio be if is 0.10 M?(b) What will the ratio be if is 1.0 M?(c) Will the fraction of electrolyte inside the resin increase ordecrease as the outside concentration of electrolyte increases?
26-9. Material balance. If you intend to measure all the anions andcations in an unknown, one sanity check on your results is that thetotal positive charge should equal the total negative charge. Con-centrations of anions and cations in pond water in Figure 26-5 areexpressed in . Find the total concentration of negative andpositive charge (mol/L) to assess the quality of the analysis. Whatdo you conclude about this analysis?
26-10. Compounds with or linkages canbe analyzed by cleavage with periodate. One mole of 1,2-ethanediolconsumes one mole of periodate:
1,2-Ethanediol Periodate Formaldehyde IodateFM 62.07
To analyze 1,2-ethanediol, oxidation with excess is followed bypassage of the whole reaction solution through an anion-exchangeresin that binds both and . is then selectively and quanti-tatively eluted with . Absorbance of the eluate is measured at232 nm to find the quantity of producedby the reaction. In one experiment, 0.213 9 g of aqueous 1,2-ethanediolwas dissolved in 10.00 mL. Then 1.000 mL of the solution was treatedwith 3 mL of and subjected to ion-exchange separationof from unreacted . The eluate (diluted to 250.0 mL) gave
in a 1.000-cm cell, and a blank gave Findthe wt% of 1,2-ethanediol in the original sample.
26-11. In ion-exclusion chromatography, ions are separated fromnonelectrolytes by an ion-exchange column. Nonelectrolytes pene-trate the stationary phase, whereas half of the ions are repelledby the fixed charges. Because electrolytes have access to less ofthe column volume, they are eluted before nonelectrolytes. Thechromatogram here shows the separation of trichloroacetic acid
, dichloroacetic acid , and(DCA, pKa � 1.1)(TCA, pKa � 0.5)
A232 � 0.049.A232 � 0.521IO4
IO3
0.15 M KIO4
IO3(� � 900 M1 cm1)
NH4ClIO3
IO3IO4
IO4
CH2OH
CH2O�� IO4 2CH2 O � �H2O IO3
C C
OH NH2OH OH
C C
g/mL
[Cl]o[Cl]o/[Cl]i
[Cl]o[Cl]o/[Cl]i
R
(RNa�)
monochloroacetic acid by passage through acation-exchange resin eluted with 0.01 M HCl. Explain why thethree acids are separated and why they elute in the order shown.
26-12. Norepinephrine (NE) in human urine can be assayedby ion-pair chromatography by using an octadecylsilane stationaryphase and sodium octyl sulfate as the mobile-phase additive. Elec-trochemical detection (oxidation at 0.65 V versus ) is used,with 2,3-dihydroxybenzylamine (DHBA) as internal standard.
Norepinephrine 2,3-Dihydroxybenzylaminecation (NE) cation (DHBA)
Sodium octyl sulfate
(a) Explain the physical mechanism by which an ion-pair separa-tion works.(b) A urine sample containing an unknown amount of NE and afixed, added concentration of DHBA gave a detector peak heightratio . Then small standard additions of NEwere made, with the following results:
Added concentration Peak heightof NE (ng/mL) ratio NE/DHBA
12 0.41424 0.55436 0.66448 0.792
Using the graphical treatment shown in Figure 5-6, find the originalconcentration of NE in the specimen.
26-13. Decomposition of dithionite was studied by chro-matography on an anion-exchange column eluted with 20 mMtrisodium 1,3,6-naphthalenetrisulfonate in
with ultraviolet detection at 280 nm. A solution of sodiumdithionite stored for 34 days in the absence of air gave five peaks iden-tified as , , , , and . All the peaks had anegative absorbance. Explain why.
26-14. (a) Suppose that the reservoir in Figure 26-6 contains 1.5 Lof . For how many hours can the reservoir provide20 mM KOH at a flow of 1.0 mL/min if 75% consumption of inthe reservoir is feasible?(b) What starting and ending current would be required to produce agradient from 5.0 mM KOH to 0.10 M KOH at 1.0 mL/min flow rate?
26-15. The system in Figure 26-6 can be adapted to produce thestrong-acid eluent methanesulfonic acid . For thispurpose, the polarity of the electrodes is reversed and the reservoir
(CH3SO3H�)
K�
2.0 M K2PO4
S2O52S2O4
2S2O32SO4
2SO32
CH3CN90 vol% H2O/10 vol%
(S2O42)
NE/DHBA � 0.298
CH3CH2CH2CH2CH2CH2CH2CH2OSO3 Na�
OHHO NH3
�
OHHO
HONH3
�
Ag 0AgCl
Separation of acids on cation-exchangecolumn. [From V. T. Turkelson and M. Richards,
“Separation of the Citric Acid Cycle Acids by Liquid
Chromatography,” Anal. Chem. 1978, 50, 1420.]Time (min)10 20 30
TCA
DCAMCA
Det
ecto
rre
spon
se
0
(MCA, pKa � 2.86)

Problems 625
can contain . The barrier membrane and the resin bedat the bottom of the figure must both be anion exchangers loadedwith . Draw this system and write the chemistry thatoccurs in each part.
Molecular Exclusion and Affinity Chromatography
26-16. (a) How can molecular exclusion chromatography be used tomeasure the molecular mass of a protein?(b) Which pore size in Figure 26-14 is most suitable for chroma-tography of molecules with molecular mass near 100 000?
26-17. A gel filtration column has a radius, r, of 0.80 cm and alength, l, of 20.0 cm.(a) Calculate the volume, , of the column, which is equal to .(b) The void volume, , was 18.1 mL and the total volume ofmobile phase was 35.8 mL. Find for a solute eluted at 27.4 mL.
26-18. Ferritin (molecular mass 450 000), transferrin (molecularmass 80 000), and ferric citrate were separated by molecular exclu-sion chromatography on Bio-Gel P-300. The column had a lengthof 37 cm and a 1.5-cm diameter. Eluate fractions of 0.65 mL werecollected. The maximum of each peak came at the following frac-tions: ferritin, 22; transferrin, 32; and ferric citrate, 84. (That is, theferritin peak came at an elution volume of .)Assuming that ferritin is eluted at the void volume and that ferriccitrate is eluted at , find for transferrin.
26-19. (a) The void volume in Figure 26-14 is the volume at whichthe curves rise vertically at the left. What is the smallest molecularmass of molecules excluded from the 10-nm-pore-size column?(b) What is the molecular mass of molecules eluted at 6.5 mL fromthe 10-nm column?
26-20. A polystyrene resin molecular exclusion HPLC column hasa diameter of 7.8 mm and a length of 30 cm. The solid portions ofthe gel particles occupy 20% of the volume, the pores occupy 40%,and the volume between particles occupies 40%.(a) At what volume would totally excluded molecules be expectedto emerge?(b) At what volume would the smallest molecules be expected?(c) A mixture of polyethylene glycols of various molecular massesis eluted between 23 and 27 mL. What does this imply about theretention mechanism for these solutes on the column?
26-21. The following substances were separated on a gel fil-tration column. Estimate the molecular mass of the unknown.
MolecularCompound mass (Da)
Blue Dextran 2000 17.7Aldolase 35.6 158 000Catalase 32.3 210 000Ferritin 28.6 440 000Thyroglobulin 25.1 669 000Unknown 30.3 ?
Capillary Electrophoresis
26-22. What is electroosmosis?
26-23. Electroosmotic velocities of buffered solutions are shownfor a bare silica capillary and one with aminopropyl groups
covalently attached to the wall. Apositive sign means that flow is toward the cathode. Explain thesigns and relative magnitudes of the velocities.
(silicaßSißCH2CH2CH2NH2)
2 � 106
Vr(mL)
KavVm
22 � 0.65 � 14.3 mL
Kav
V0
�r2lVt
CH3SO3
NH4�CH3SO3
Electroosmotic velocity (mm/s)for
pH 10 pH 2.5
Bare silicaAminopropyl-modified silica
SOURCE: K. Emoto, J. M. Harris, and M. Van Alstine, “Grafting Poly(ethylene glycol)Epoxide to Amino-Derivatized Quartz: Effect of Temperature and pH on Grafting Density,”Anal. Chem. 1996, 68, 3751.
26-24. Fluorescent derivatives of amino acids separated by capil-lary zone electrophoresis had migration times with the followingorder: arginine (fastest) � phenylalanine � asparagine � serine �glycine (slowest). Explain why arginine has the shortest migrationtime.
26-25. What is the principal source of zone broadening in idealcapillary electrophoresis?
26-26. (a) An electrophoresis channel etched into a glass plate has arectangular cross section. How long (mm) is the sam-ple zone for a sample?(b) If sample travels 24 mm in 8 s to reach the detector, what is thestandard deviation in bandwidth contributed by the finite length ofthe injection zone? (Hint: See Equation 23-32.)(c) If the diffusion coefficient of a solute is , what isthe diffusional contribution (standard deviation) to band broadening?(d) What is the expected total bandwidth at the baseline ?
26-27. State three different methods to reduce electroosmotic flow.Why does the direction of electroosmotic flow change when a silicacapillary is washed with a cationic surfactant?
26-28. Explain how neutral molecules can be separated bymicellar electrokinetic chromatography. Why is this a form ofchromatography?
26-29. (a) What pressure difference is required to inject a sampleequal to 1.0% of the length of a 60.0-cm capillary in 4.0 s if thediameter is ? Assume that the viscosity of the solution is
.(b) The pressure exerted by a column of water of height h is ,where is the density of water and g is the acceleration of gravity
. To what height would you need to raise the sample vialto create the necessary pressure to load the sample in 4.0 s? Is itpossible to raise the inlet of this column to this height? How couldyou obtain the desired pressure?
26-30. (a) How many moles of analyte are present in a solution that occupies 1.0% of the length of a capillary?(b) What voltage is required to inject this many moles into a capil-lary in 4.0 s if the sample has 1/10 of the conductivity of back-ground electrolyte, , and the sampleconcentration is ?10.0 M
app � 3.0 � 108 m2/(V � s)
25-m � 60.0-cm10.0 M
(9.8 m/s2)ρ
hρg0.001 0 kg/(m � s)
50 m
(w � 4�)
1.0 � 108 m2/s
100-pL12 � 50 m
HO OO
CO2
HN NHCHCO2
S R
Amino acid
Fluorescentmoiety
1.3�1.8�0.2�3.1
E � 4.0 � 104 V/m

626 CHAPTER 26 Chromatographic Methods and Capillary Electrophoresis
26-31. Measure the number of plates for the electrophoretic peak inFigure 26-19. Use the formula for asymmetric peaks to find thenumber of plates for the chromatographic peak.
26-32. (a) A long thin molecule has a greater friction coefficientthan a short fat molecule. Predict whether fumarate or maleate willhave greater electrophoretic mobility.
Fumarate Maleate
(b) Electrophoresis is run with the injection end positive and thedetection end negative. At pH 8.5, both anions have a charge of The electroosmotic flow from the positive terminal to the negativeterminal is greater than the electrophoretic flow, so these twoanions have a net migration from the positive to the negative end ofthe capillary in electrophoresis. From your answer to part (a), pre-dict the order of elution of these two species.(c) At pH 4.0, both anions have a charge close to , and the elec-troosmotic flow is weak. Therefore electrophoresis is run with theinjection end negative and the detection end positive. The anionsmigrate from the negative end of the capillary to the positive end.Predict the order of elution.
26-33. (a) A particular solution in a particular capillary has anelectroosmotic mobility of at pH 2 and
at pH 12. How long will it take a neutralsolute to travel 52 cm from the injector to the detector if 27 kV isapplied across the 62-cm-long capillary tube at pH 2? At pH 12?(b) An analyte anion has an electrophoretic mobility of
. How long will it take to reach the detector at pH 2?At pH 12?
26-34. Figure 26-23 shows the effect on resolution of increasingvoltage from 28 to 120 kV.(a) What is the expected ratio of migration times inthe two experiments? Measure the migration times for peak 1 andfind the observed ratio.(b) What is the expected ratio of plates in the twoexperiments?(c) What is the expected ratio of bandwidths ?(d) What is the physical reason why increasing voltage decreasesbandwidth and increases resolution?
26-35. The observed behavior of benzyl alcohol incapillary electrophoresis is given here. Draw a graph showing thenumber of plates versus the electric field and explain what happensas the field increases.
Electric field (V/m) Number of plates
6 400 38 00012 700 78 00019 000 96 00025 500 124 00031 700 124 00038 000 96 000
26-36. Measure the width of the peak at half-height in Figure26-31 and calculate the plate number. The capillary was 40.0 cm inlength. Find the plate height.
26-37. The migration time for in a capillary zone electrophore-sis experiment is 17.12 min and the migration time for is 17.78I
Cl
35Cl
(C6H5CH2OH)
(�120 kV/�28 kV)
(N120 kV/N28 kV)
(t120 kV/t28 kV)
108 m2/(V � s)1.6 �
8.1 � 108 m2/(V � s)1.3 � 108 m2/(V � s)
1
2.
O2C
CO2
O2C CO2
min. From mobilities in Table 15-1, predict the migration time of. (The observed value is 19.6 min.)
26-38. Molecular mass by sodium dodecylsulfate–gel elec-trophoresis. Ferritin is a hollow iron-storage protein60 consisting of24 subunits that are a variable mixture of heavy (H) or light (L)chains, arranged in octahedral symmetry. The hollow center, with adiameter of 8 nm, can hold up to 4 500 iron atoms in the approxi-mate form of the mineral . Iron(II)enters the protein through eight pores located on the 3-fold symme-try axes of the octahedron. Oxidation to Fe(III) occurs at catalyticsites on the H chains. Other sites on the inside of the L chainsappear to nucleate the crystallization of ferrihydrite.
Migration times for protein standards and the ferritin subunitsare given in the table. Prepare a graph of log(molecular mass) versus1/(relative migration time), where relative migration time �(migration time)/(migration time of marker dye). Compute themolecular mass of the ferritin light and heavy chains. The masses ofthe chains, computed from amino acid sequences, are 19 766 and21 099 Da.
Molecular MigrationProtein mass (Da) time (min)
Orange G marker dye small 13.1714 200 16.46
Carbonic anhydrase 29 000 18.66Ovalbumin 45 000 20.16Bovine serum albumin 66 000 22.36Phosphorylase B 97 000 23.56
116 000 24.97Myosin 205 000 28.25Ferritin light chain 17.07Ferritin heavy chain 17.97
SOURCE: J. K. Grady, J. Zang, T. M. Laue, P. Arosio, and N. D. Chasteen, “Characterizationof the H- and L-Subunit Ratios in Ferritins by Sodium Dodecyl Sulfate–Capillary GelElectrophoresis,” Anal. Biochem. 2002, 302, 263.
26-39. Protein charge ladder. Electrophoretic mobility isproportional to charge. If members of a charge ladder (Figure 26-22)have the same friction coefficient (that is, the same size and shape),then the charge of the unmodified protein divided by its elec-trophoretic mobility, , is equal to the charge of the nth memberdivided by its electrophoretic mobility . Setting thesetwo expressions equal to each other and rearranging gives
where is the charge of the unmodified protein, is the chargedifference between the nth modified protein and the unmodifiedprotein, is the electrophoretic mobility of the nth modifiedprotein, and is the electrophoretic mobility of the unmodifiedprotein. The migration time of the neutral marker molecule inFigure 26-22 is 308.5 s. The migration time of the unmodified pro-tein is 343.0 s. Other members of the charge ladder have migrationtimes of 355.4, 368.2, 382.2, 395.5, 409.1, 424.9, 438.5, 453.0,467.0, 482.0, 496.4, 510.1, 524.1, 536.9, 551.4, 565.1, 577.4, and588.5 s. Calculate the electrophoretic mobility of each proteinand prepare a plot of versus . If the points lie ona straight line, the slope is the charge of the unmodified protein,
. Prepare such a plot, suggest an explanation for its shape, andfind .z0
z0
(n/0) 1�zn
0
n
�znz0
�zn � z0an
0 1b
(z0 � �zn) /n
z0/0
�-Galactosidase
�-Lactalbumin
ferrihydrite (5Fe2O3 � 9H2O)
Br

Problems 627
26-40. Resolution. Suppose that the electroosmotic mobility of asolution is How many plates are requiredto separate sulfate from bromide with a resolution of 2.0? Use Table15-1 for mobilities and Equation 23-30 for resolution.
26-41. The water-soluble vitamins niacinamide (a neutral com-pound), riboflavin (a neutral compound), niacin (an anion), and thi-amine (a cation) were separated by micellar electrokinetic chro-matography in 15 mM borate buffer (pH 8.0) with 50 mM sodiumdodecyl sulfate. The migration times were niacinamide (8.1 min),riboflavin (13.0 min), niacin (14.3 min), and thiamine (21.9 min).What would the order have been in the absence of sodium dodecylsulfate? Which compound is most soluble in the micelles?
26-42. When the following three compounds are separated bymicellar electrokinetic chromatography at pH 9.6, three peaks areobserved. When is added to the run buffer,two of the three peaks split into two peaks, giving a total of fivepeaks. Explain this observation and predict which compound doesnot split.
26-43. A van Deemter plot for the separation of neutral dyes bymicellar electrokinetic chromatography follows.61
(a) Explain why plate height increases at low and high velocities.(b) The irregular flow path term, A, in the van Deemter equationshould really be 0 for the ideal case of micellar electrokinetic chro-matography. The observed value of A is , which accountsfor two-thirds of the band broadening at the optimum velocity. Sug-gest some reasons why A is not 0.
26-44. To obtain the best separation of two weak acids incapillary electrophoresis, it makes sense to use the pH at whichtheir charge difference is greatest. Prepare a spreadsheet to examinethe charges of malonic and phthalic acid as a function of pH. Atwhat pH is the difference greatest?
26-45. Optimizing a separation of acids. Benzoic acid containingcan be separated from benzoic acid containing by elec-
trophoresis at a suitable pH because they have slightly differentacid dissociation constants. The difference in mobility is causedby the different fraction of each acid in the anionic form, .A
18O16O
2.32 m
Electroosmotic velocity (mm/s)
Pla
te h
eigh
t (µm
)
0 0.5 1 1.52.5
3.0
3.5
4.0
4.5
5.0
5.5
6.0
CH3
CH3
CH3
NN
NHNH
C3H7
C2H5C2H5
H H
Cyclobarbital Thiopental Phenobarbital
O OO
O O
O
NH
O
O
S
1 2 3
N
10 mM �-cyclodextrin
�1.61 � 107 m2/(V � s).Calling this fraction , we can write
where K is the equilibrium constant. The greater the fraction ofacid in the form , the faster it will migrate in the electric field. Itcan be shown that, for electrophoresis, the maximum separationwill occur when is a maximum. In this expression,
, and is the average fraction of dissociation.
(a) Let us denote the ratio of acid dissociation constants as. In general, R will be close to unity. For benzoic
acid, . Abbreviate as K and write . Derivean expression for in terms of K, , and R. Because bothequilibrium constants are nearly equal (R is close to unity), set equal to in your expression.(b) Find the maximum value of by taking the derivativewith respect to and setting it equal to 0. Show that the maxi-mum difference in mobility of isotopic benzoic acids occurs when
.(c) Show that, for , this expression simplifies to ,or . That is, the maximum electrophoretic separa-tion should occur when the column buffer has ,regardless of the exact value of R.62
26-46. (a) Ion mobility spectrometry (Section 22-3) is gas-phase elec-trophoresis. Describe how ion mobility spectrometry works and statethe analogies between this technique and capillary electrophoresis.
(b) As in electrophoresis, the velocity, u, of a gas-phase ionis , where is the mobility of the ion and E is the electricfield ( , where V is the voltage difference across distance L).In ion mobility spectrometry, the time to go from the gate to thedetector (Figure 22-16a) is called drift time, . Drift time is related tovoltage: . Plate numberis , where is the width of the peak at half-height. Ideally, peak width depends only on the width of the gatepulse that admits ions to the drift tube and on diffusive broadeningof ions while they migrate:63
Initial width Diffusivefrom gate pulse broadening
where is the time that the ion gate is open, k is Boltzmann’s con-stant, T is temperature, V is the potential difference from the gate tothe detector, e is the elementary charge, and z is the charge of theion. Prepare a graph of N versus for anion with , and , or 0.2 ms at300 K. Let the length of the drift region be . Explain theshapes of the curves. What is the disadvantage of using short ?(c) Why does decreasing T increase N?(d) In a well-optimized ion mobility spectrometer, protonated argi-nine ion had a drift time of 24.925 ms and at 300 K. Find N. For and , what is thetheoretical plate number?(e) Resolution is given by , where is theratio of drift times for two components. In a well-optimized ionmobility spectrometer, protonated leucine had andprotonated isoleucine had Both had . Whatis the resolution of the two peaks?
N � 80 000td � 22.0 ms.td � 22.5 ms
�R � (2N/4)(� 1)
tg � 0.05 msV � 12 500 Vw1/2 � 0.154 ms(z � 1)
tg
L � 0.2 mtg � 0, 0.05 � 8 � 105 m2/(s � V)
V (0 � V � 20 000)
tg
w21/2 � t2
g � a16kT ln2
Vezb t2
d
w1/2N � 5.55(td/w1/2)2td � L/u � L/ (E) � L/ ((V/L)) � L2/V
td
E � V/Lu � E
pH � pK 0.30pH � pK 0.30
[H�] � 2KR � 1[H�] � (K/2R)(1 � 21 � 8R)
[H�]��/2�
16��
[H�]��/2�
18K � K/R16K R � 1.020R � 16K/18K
[� 12(16� � 18�)]
��� � 16� 18���/2�
A
16� �16K
16K � [H�] 18� �
18K18K � [H�]
H16A ∆16K
H� � 16A H18A ∆18K
H� � 18A
�

628 CHAPTER 27 Gravimetric and Combustion Analysis
In the 1800s, geologists understood that new layers (strata) of rock are deposited on top ofolder layers. Characteristic fossils in each layer helped geologists to identify strata from thesame geologic era all around the world. However, the actual age of each layer was unknown.
In 1910, Arthur Holmes, a 20-year-old geology student at Imperial College in London,realized that radioactive decay could be used to measure the age of a rock. Physicists haddiscovered that U decays with a half life of 4.5 billion years to eight atoms of He and sus-pected that the final product was Pb. Holmes conjectured that when a U-containing mineralcrystallized, it should be relatively free of impurities. Once the mineral solidified, Pb wouldbegin to accumulate. The ratio Pb/U is a “clock” giving the age of the mineral.
Holmes isolated U minerals from a ‘Devonian’-age rock. He measured the U contentby the rate of production of radioactive Rn gas, which is a decay product along the way toPb. To measure Pb, he fused (Section 28-2) each mineral in borax, dissolved the fused massin acid, and quantitatively precipitated milligram quantities of . The nearly constantratio in 15 minerals was consistent with the hypotheses that Pb is theend product of radioactive decay and that little Pb had been present when the minerals crys-tallized. More importantly, the average age of the minerals was 370 million years.
Geologic ages deduced by Holmes in 1911
Geologic period Pb/U (g/g) Millions of years Today’s accepted value
Carboniferous 0.041 340 362–330Devonian 0.045 370 380–362Silurian 0.053 430 443–418Precambrian 0.125–0.20 1 025–1 640 900–2 500
SOURCE: C. Lewis, The Dating Game (Cambridge: Cambridge University Press, 2000); A. Holmes, “The Association ofLead with Uranium in Rock-Minerals, and Its Application to the Measurement of Geological Time,” Proc. Royal Soc.Lond. A 1911, 85, 248.
Pb/U � 0.046 g/gPbSO4
THE GEOLOGIC TIME SCALE AND GRAVIMETRIC ANALYSIS
Gravimetric and Combustion Analysis27
Layers of rock exposed in the Grand Canyon by the erosive action of the Colorado River provide a window on abillion years of Earth’s history. [From J. Grotzinger, T. H. Jordan, F. Press, and R. Siever, Understanding Earth, 5th ed. (New York:W. H. Freeman, 2006), p. 177.]
In gravimetric analysis, the mass of a product is used to calculate the quantity of the origi-nal analyte (the species being analyzed). Exceedingly careful gravimetric analysis by T. W.Richards and his colleagues early in the twentieth century determined the atomic masses of

27-1 An Example of Gravimetric Analysis 629
Ag, Cl, and N to six-figure accuracy.1 This Nobel Prize–winning research allowed the accuratedetermination of atomic masses of many elements. In combustion analysis, a sample isburned in excess oxygen and products are measured. Combustion is typically used to mea-sure C, H, N, S, and halogens in organic compounds. To measure other elements in food,organic matter is burned in a closed system, the products and ash (unburned material) are dis-solved in acid or base, and measured by inductively coupled plasma with atomic emission ormass spectrometry.
27-1 An Example of Gravimetric AnalysisAn example of gravimetric analysis is the determination of by precipitation with :
(27-1)
The mass of AgCl produced tells us how much was originally present.
Example A Gravimetric Calculation
A 10.00-mL solution containing was treated with excess to precipitate0.436 8 g of AgCl. What was the molarity of in the unknown?
Solution The formula mass of AgCl is 143.321. A precipitate weighing 0.436 8 g contains
Because 1 mol of AgCl contains 1 mol of there must have been of in the unknown.
Example Marie Curie’s Measurement of the Atomic Mass of Radium
As part of her Ph.D. research (Radioactive Substances, 1903), Marie Curie measured theatomic mass of radium, a new, radioactive element that she discovered. She knew thatradium is in the same family as barium, so the formula of radium chloride is . Inone experiment, 0.091 92 g of pure was dissolved and treated with excess to precipitate 0.088 90 g of AgCl. How many moles of were in the ? Fromthis measurement, find the atomic mass of Ra.
Solution AgCl precipitate weighing 0.088 90 g contains
Because 1 mol of AgCl contains 1 mol of there must have been in the . For 2 mol of Cl, there must be 1 mol of Ra, so
Let the formula mass of be x. We found that 0.091 92 g contains. Therefore
The atomic mass of Cl is 35.453, so the formula mass of is
1 atomic mass of Ra � 225.5 g/mol
Formula mass of RaCl2 � atomic mass of Ra � 2(35.453 g/mol) � 296.38 g/mol
RaCl2
x �0.091 92 g RaCl
3.1014 � 104 mol RaCl2� 296.38
3.1014 � 104 mol RaCl2 �0.091 92 g RaCl
x g RaCl2/mol RaCl2
3.1014 � 104 mol RaCl2
RaCl2RaCl2
mol radium �6.2029 � 104 mol Cl
2 mol Cl/mol Ra� 3.1014 � 104 mol
RaCl2of Cl
6.2029 � 104 molCl,
0.088 90 g AgCl
143.321 g AgCl/mol AgCl� 6.2029 � 104 mol AgCl
RaCl2Cl
AgNO3RaCl2
RaCl2
[Cl] �3.048 � 103 mol
0.010 00 L� 0.304 8 M
Cl
3.048 � 103 molCl,
0.436 8 g AgCl
143.321 g AgCl/mol AgCl� 3.048 � 103 mol AgCl
Cl
AgNO3Cl
Cl
Ag� � Cl S AgCl(s)
Ag�Cl
Gravimetry was the main form of chemicalanalysis in the eighteenth and nineteenthcenturies but is too tedious to be a method ofchoice today. However, gravimetry is still oneof the most accurate methods. Standards usedto calibrate instruments are frequently derivedfrom gravimetric or titrimetric procedures.
Nineteenth-century balance reproduced fromFresenius’ Quantitative Chemical Analysis, 2ndAmerican ed., 1881.
Marie and Pierre Curie and Henri Becquerelshared the Nobel Prize in physics in 1903 forpioneering investigations of radioactivity. TheCuries needed 4 years to isolate 100 mg of
from several tons of ore. Marie receivedthe Nobel Prize in chemistry in 1911 for herisolation of metallic radium. Linus Pauling, JohnBardeen, and Frederick Sanger are the onlyothers who received two Nobel Prizes.
RaCl2
The inside cover of this book lists the atomicnumber (the integer mass) of the long-livedisotope of Ra, which is 226.

630 CHAPTER 27 Gravimetric and Combustion Analysis
Representative analytical precipitations are listed in Table 27-1. A few common organicprecipitants (agents that cause precipitation) are listed in Table 27-2. Conditions must becontrolled to selectively precipitate one species. Potentially interfering substances may needto be removed prior to analysis.
27-2 PrecipitationThe ideal product of a gravimetric analysis should be very pure, insoluble, and easily filter-able, and it should possess a known composition. Few substances meet all these requirements,but appropriate techniques can help optimize the properties of gravimetric precipitates. Forexample, solubility is usually decreased by cooling the solution.
Particles of precipitate should not be so small that they clog or pass through the filter.Large crystals also have less surface area to which impurities can become attached. At theother extreme is a colloidal suspension of particles that have diameters in the approximaterange 1–500 nm and pass through most filters (Figure 27-1 and Demonstration 27-1). Precip-itation conditions have much to do with the resulting particle size.
Crystal GrowthCrystallization occurs in two phases: nucleation and particle growth. During nucleation, mole-cules in solution come together randomly and form small aggregates. Particle growth requiresthe addition of more molecules to a nucleus to form a crystal. When a solution contains moresolute than should be present at equilibrium, the solution is said to be supersaturated.
Nucleation proceeds faster than particle growth in a highly supersaturated solution. Theresult is a suspension of tiny particles or, worse, a colloid. In a less supersaturated solution,nucleation is slower, and the nuclei have a chance to grow into larger, more tractable particles.
Table 27-1 Representative gravimetric analyses
Species analyzed Precipitated form Form weighed Interfering species
KB(C6H5)4
Mg2P2O7 Many metals except and CaCO3 or CaO Many metals except
BaSO4 BaSO4
Same citrate, HF
V2O5
Many metalsFe2O3 Many metals
SameCuSCN CuSCN
Many metalsCeO2
Same Many metalsSnO2 As(III)
PbSO4 PbSO4 , HCl,
AgCl AgCl S2,AgBr AgBr S2,AgI AgICuSCN CuSCNAgCN AgCN ,
Many metals (except alkali metals), KClO4 KClO4
BaSO4 BaSO4
Many metals except Nitron nitrate Nitron nitrateCO2 (by acidification) CO2 (The liberated is trapped with Ascarite and weighed.)CO2CO2
3
C2O24Br,NO
2 ,ClO3 ,CrO2
4 ,SCN,I,ClO4,NO3
K�Na�,Mg2P2O7Mg(NH4)PO4 � 6H2OPO34
NO3Pb2�,Sr2�,Fe3�,Cr3�,Al3�,Ca2�,Li�,K�,Na�,SO2
4
ClO4
CO23SiO4
4 ,(C6H5)3SnF(C6H5)3SnFF
S2O23S2SCN,I,Br,Cl,CN
Ag�Hg2�,Pb2�,NH�4 ,SCN
CNS2O23 ,S2,SCN,Br,Cl,I
CNS2O23 ,SCN,I,Cl,Br
CNS2O23 ,SCN,I,Br,Cl
Cs�Rb�,K�,NH4B(C6H5)4NH4B(C6H5)4NH�4
HNO3Ag�Hg2�,Ba2�,Sr2�,Ca2�,Pb2�
Pb2�,Cu2�,Sn(cupferron)4Sn4�
Al(8-hydroxyquinolate)3Al3�
Zr4�Ti4�,Th4�,Ce(IO3)4Ce4�
Zn2P2O7Zn(NH4)PO4 � H2OZn2�
Ag�Hg2�,Pb2�,NH4�,Cu2�
Au3�Bi3�,Pt2�,Pd2�,Ni(dimethylglyoximate)2Ni2�
with H2SO4)Zr4�Pd2�,Fe3�,CoSO4 (by reactionCo(1-nitroso-2-naphtholate)3Co2�
Fe(HCO2)3Fe3�
Mn2P2O7Mn(NH4)PO4 � H2OMn2�
NH�4Ag�,PbCrO4PbCrO4Cr3�
PO34AsO3
4 ,CrO24 ,SO2
4 ,I,Br,Cl,Hg3VO4VO34
hydroxyquinoline)2
C2O24 ,Cu2�,Zr4�,Fe3�,TiO(5,7-dibromo-8-Ti4�
NO3Pb2�,Sr2�,Fe3�,Cr3�,Al3�,Ca2�,Li�,K�,Na�,Ba2�
K�Na�,Mg2�,CaC2O4 � H2OCa2�
K�Na�Mg(NH4)PO4 � 6H2OMg2�
Cs�Rb�,Tl�,Hg2�,Ag�,NH�4 ,KB(C6H5)4K�
Rel
ativ
e nu
mbe
r of
par
ticle
s
Fe3+-hydroxide
Fe3+-phosphate Fe3+-silicate
Particle diameter (nm)
200 240 280
Figure 27-1 Measured particle-sizedistribution of colloids formed when wasoxidized to in in the presenceof phosphate silicate or noadded anions. [From M. L. Magnuson, D. A. Lytle,
C. M. Frietch, and C. A. Kelty, “Characterization of
Submicron Aqueous Iron(III) Colloids by Sedimentation
Field Flow Fractionation,” Anal. Chem. 2001, 73, 4815.]
(SiO44 ),(PO3
4 ),104 M OHFe3�
FeSO4
Supersaturation tends to decrease the particlesize of a precipitate.
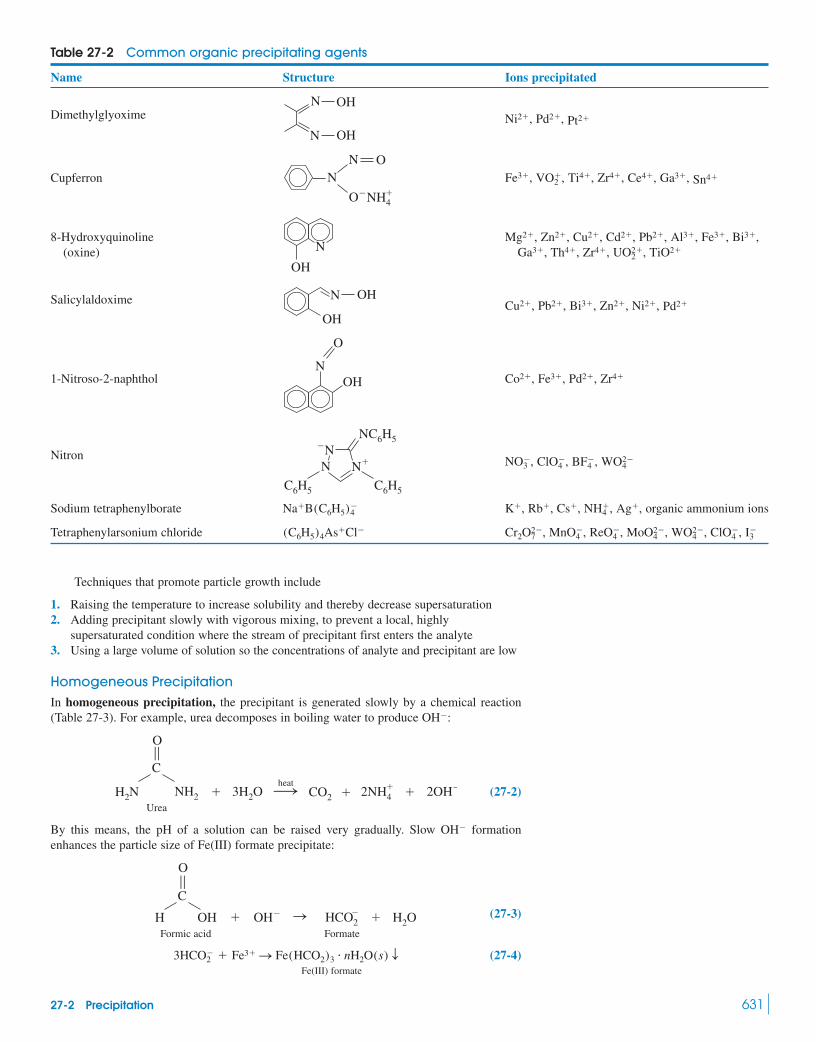
27-2 Precipitation 631
Table 27-2 Common organic precipitating agents
Name Structure Ions precipitated
Dimethylglyoxime
Cupferron
8-Hydroxyquinoline(oxine)
Salicylaldoxime
1-Nitroso-2-naphthol
Nitron
Sodium tetraphenylborate organic ammonium ions
Tetraphenylarsonium chloride I3ClO
4 ,WO24 ,MoO2
4 ,ReO4 ,MnO
4 ,Cr2O27 ,(C6H5)4As�Cl
Ag�,NH�4 ,Cs�,Rb�,K�,Na�B(C6H5)
4
WO24BF
4 ,ClO4 ,NO
3 ,
C6H5 C6H5
N
NN �
NC6H5
Zr4�Pd2�,Fe3�,Co2�,
O
NOH
Pd2�Ni2�,Zn2�,Bi3�,Pb2�,Cu2�,N
OH
OH
TiO2�UO2�2 ,Zr4�,Th4�,Ga3�,
Bi3�,Fe3�,Al3�,Pb2�,Cd2�,Cu2�,Zn2�,Mg2�,N
OH
Sn4�Ga3�,Ce4�,Zr4�,Ti4�,VO�2 ,Fe3�,
N
ONH4
N�
O
Pt2�Pd2�,Ni2�,N
OHN
OH
Techniques that promote particle growth include
1. Raising the temperature to increase solubility and thereby decrease supersaturation2. Adding precipitant slowly with vigorous mixing, to prevent a local, highly
supersaturated condition where the stream of precipitant first enters the analyte3. Using a large volume of solution so the concentrations of analyte and precipitant are low
Homogeneous PrecipitationIn homogeneous precipitation, the precipitant is generated slowly by a chemical reaction(Table 27-3). For example, urea decomposes in boiling water to produce :
(27-2)
By this means, the pH of a solution can be raised very gradually. Slow formationenhances the particle size of Fe(III) formate precipitate:
(27-3)
(27-4)Fe(III) formate
3HCO2 � Fe3� S Fe(HCO2)3 � nH2O(s) T
OH�Formic acid Formate
S � H2OHCO2OHH
O
C
£
OH
2OHCO2� 2NH4
heat�
��3H2ONH2H2N
O
C
£
Urea
OH

632 CHAPTER 27 Gravimetric and Combustion Analysis
Precipitation in the Presence of ElectrolyteIonic compounds are usually precipitated in the presence of an electrolyte. To understandwhy, we must discuss how tiny colloidal crystallites coagulate (come together) into largercrystals. We illustrate the case of AgCl, which is commonly formed in .
Figure 27-2 shows a colloidal particle of AgCl growing in a solution containing excessand . The surface of the particle has excess positive charge due to the adsorption
of extra silver ions on exposed chloride ions. (To be adsorbed means to be attached to theNO3
H�,Ag�,
0.1 M HNO3
Demonstration 27-1 Colloids and Dialysis
Colloids are particles with diameters of . They arelarger than molecules but too small to precipitate. They remain insolution indefinitely, suspended by the Brownian motion (randommovement) of solvent molecules.2
To prepare colloid iron(III) hydroxide, heat 200 mL of dis-tilled water in a beaker to and leave an identical beakerof water at room temperature. Add 1 mL of to eachbeaker and stir. The warm solution turns brown-red in a few sec-onds, whereas the cold solution remains yellow (Color Plate 31).The yellow color is characteristic of low-molecular-mass compounds. The red color results from colloidal aggregates of
ions held together by hydroxide, oxide, and some chlorideions. These particles have a molecular mass of and a diameterof 10 nm, and they contain atoms of Fe.
You can demonstrate the size of colloidal particles with adialysis experiment in which two solutions are separated by asemipermeable membrane that has pores with diameters of 1–5nm.3 Small molecules diffuse through these pores, but large mol-ecules (such as proteins or colloids) cannot. (Collecting biologi-cal samples by microdialysis was discussed at the opening ofChapter 25.)
Pour some of the brown-red colloidal Fe solution into a dial-ysis tube knotted at one end; then tie off the other end. Drop thetube into a flask of distilled water to show that the color remainsentirely within the bag after several days (Color Plate 31). Forcomparison, leave an identical bag containing a dark blue solutionof in another flask of water. diffuses outand the solution in the flask will be a uniform light blue color in24 h. The yellow food coloring, tartrazine, can be used in place of
Cu2�1 M CuSO4 � 5H2O
103105
Fe3�
Fe3�
1 M FeCl3
70°–90°C
�1–500 nm
Large molecules remain trapped inside a dialysis bag, whereas smallmolecules diffuse through the membrane in both directions.
Dialysis tubingknotted at eachend
2.5-nm-diameterpores
Largemolecules
Smallmolecules
. If dialysis is conducted in hot water, it is completed duringone class period.4
Dialysis is used to treat patients suffering from kidney failure.Blood is passed over a membrane through which metabolic wasteproducts diffuse and are diluted into a large volume of liquid that isdiscarded. Protein molecules, which are a necessary part of the bloodplasma, are too large to cross the membrane and are retained in theblood.
Cu2�
+
Ag+
Cl–
–
+
–
+
H+
H+
H+
H+
H+
H+
+
–
+
–
+
+
–
+
–
+
Cl– Ag+Ag+
Cl–
Ag+
Ag+
Ag+
+
–
+
–
+
+
+
–
–
–
+
+
–
–
–
+
+
–
–
–
+
+
–
–
–
Boundary ofionic atmosphere
Ag+
Ag+
NO−3
NO−3
NO−3
NO−3
NO−3
NO−3
NO−3
NO−3
NO−3
An electrolyte is a compound that dissociatesinto ions when it dissolves.
Figure 27-2 Colloidal particle of AgClgrowing in a solution containing excess
and . The particle has a net positivecharge because of adsorbed . Theregion of solution surrounding the particleis called the ionic atmosphere. It has a netnegative charge because the particleattracts anions and repels cations.
Ag� ionsNO
3H�,Ag�,
Although it is common to find the excesscommon ion adsorbed on the crystal surface,it is also possible to find other ions selectivelyadsorbed. In the presence of citrate andsulfate, there is more citrate than sulfateadsorbed on a particle of .BaSO4

27-2 Precipitation 633
surface. In contrast, absorption means penetration beyond the surface, to the inside.) Thepositively charged surface attracts anions and repels cations from the ionic atmosphere(Figure 8-2) surrounding the particle. The positively charged particle and the negativelycharged ionic atmosphere together are called the electric double layer.
Colloidal particles must collide with one another to coalesce. However, the negativelycharged ionic atmospheres of the particles repel one another. The particles, therefore, musthave enough kinetic energy to overcome electrostatic repulsion before they can coalesce.
Heat promotes coalescence by increasing the kinetic energy. Increasing electrolyteconcentration ( for AgCl) decreases the volume of the ionic atmosphere and allowsparticles to come closer together before electrostatic repulsion becomes significant. For thisreason, most gravimetric precipitations are done in the presence of an electrolyte.
DigestionAfter precipitation, most procedures call for a period of standing in the presence of the hotmother liquor. This treatment, called digestion, promotes slow recrystallization of the pre-cipitate. Particle size increases and impurities tend to be expelled from the crystal.
PurityAdsorbed impurities are bound to the surface of a crystal. Absorbed impurities (within thecrystal) are classified as inclusions or occlusions. Inclusions are impurity ions that randomlyoccupy sites in the crystal lattice normally occupied by ions that belong in the crystal. Inclu-sions are more likely when the impurity ion has a size and charge similar to those of one ofthe ions that belongs to the product. Occlusions are pockets of impurity that are literallytrapped inside the growing crystal.
Adsorbed, occluded, and included impurities are said to be coprecipitated. That is, theimpurity is precipitated along with the desired product, even though the solubility of theimpurity has not been exceeded. Coprecipitation tends to be worst in colloidal precipitates
HNO3
Table 27-3 Common reagents used for homogeneous precipitation
Some elementsPrecipitant Reagent Reaction precipitated
Urea Al, Ga, Th, Bi,Fe, Sn
Potassium cyanate Cr, FeHydrogen cyanate
Thioacetamidea Sb, Mo, Cu,Cd
Sulfamic acid Ba, Ca, Sr,Pb
Dimethyl oxalate Ca, Mg, Zn
Trimethyl Zr, Hfphosphate
Chromic ion plus Pbbromate
8-Hydroxyquinoline 8-Acetoxyquinoline Al, U, Mg,Zn
a. Hydrogen sulfide is volatile and toxic; it should be handled only in a well-vented hood. Thioacetamide is a carcinogen that should be handledwith gloves. If thioacetamide contacts your skin, wash yourself thoroughly immediately. Leftover reagent is destroyed by heating at 50°C with5 mol of NaOCl per mole of thioacetamide. [H. Elo, J. Chem. Ed. 1987, 64, A144.]
H2O
CH3CO
N
O
� S
OH
N� CH3CO2H
2Cr3� � BrO3 � 5H2O S 2CrO4
2 � Br � 10H�CrO24
(CH3O)3P¢O � 3H2O S 3CH3OH � PO43 � 3H�PO4
3
� 2H2O S 2CH3OH � C2O42 � 2H�
O
CH3OCCOCH3
£
O
£
C2O24
H3N�
SO3 � H2O S NH4
� � SO42 � H�SO4
2
� H2S
O
CH3CNH2
£
� H2O S
S
CH3CNH2
£
S2
HOCN � 2H2O S NH4� � CO2 � OHOH
(H2N)2CO � 3H2O S CO2 � 2NH�4 � 2OHOH
Liquid from which a substance precipitates orcrystallizes is called the mother liquor.

such as and which have large surface area. Many procedures callfor washing away the mother liquor, redissolving the precipitate, and reprecipitating theproduct. During the second precipitation, the concentration of impurities in solution is lowerthan during the first precipitation, and the degree of coprecipitation therefore tends to belower. Occasionally, a trace component is intentionally isolated by coprecipitation with amajor component of the solution. The precipitate used to collect the trace component is saidto be a gathering agent, and the process is called gathering.
Some impurities can be treated with a masking agent to prevent them from reactingwith the precipitant. In the gravimetric analysis of or with thereagent N-p-chlorophenylcinnamohydroxamic acid, impurities such as
and are kept in solution by excess KCN. and are masked with a mixture of citrate and oxalate.
Analyte N-p-Chlorophenyl- Precipitatecinnamohydroxamic acid
Impurity Masking agent Stays in solution
Even when a precipitate forms in a pure state, impurities might collect on the productwhile it is standing in the mother liquor. This is called postprecipitation and usually involvesa supersaturated impurity that does not readily crystallize. An example is the crystallizationof on .
Washing a precipitate on a filter helps remove droplets of liquid containing excesssolute. Some precipitates can be washed with water, but many require electrolyte to maintaincoherence. For these precipitates, the ionic atmosphere is required to neutralize the surfacecharge of the tiny particles. If electrolyte is washed away with water, the charged solid parti-cles repel one another and the product breaks up. This breaking up, called peptization,results in loss of product through the filter. AgCl will peptize if washed with water, so it iswashed with dilute instead. Electrolyte used for washing must be volatile so that itwill be lost during drying. Volatile electrolytes include HCl, and
.
Product CompositionThe final product must have a known, stable composition. A hygroscopic substance is onethat picks up water from the air and is therefore difficult to weigh accurately. Many precipi-tates contain a variable quantity of water and must be dried under conditions that give aknown (possibly zero) stoichiometry of .
Ignition (strong heating) is used to change the chemical form of some precipitates.For example, igniting at for 1 h gives and igniting
at gives .In thermogravimetric analysis, a substance is heated, and its mass is measured as a
function of temperature. Figure 27-3 shows how the composition of calcium salicylatechanges in four stages:
(27-5)
The composition of the product depends on the temperature and duration of heating.
27-3 Examples of Gravimetric CalculationsWe now examine some examples that illustrate how to relate the mass of a gravimetric pre-cipitate to the quantity of the original analyte. The general approach is to relate the moles ofproduct to the moles of reactant.
O
H2OCO2CaO2C
OH
Ca
HO. ~200�C
CO2CaO2C
OH HO
~300�C
O
~500�C~700�CCaCO3CaO
O
Calcium salicylate monohydrate
Calcium oxide Calcium carbonate
Mg2P2O71 100°CMg(NH4)PO4 � 6H2OFe2O3,850°CFe(HCO2)3 � nH2O
H2O
(NH4)2CO3
NH4NO3, NH4Cl,HNO3,HNO3
CaC2O4MgC2O4
Mn2� � 6CN S Mn(CN)46
Ca2� � 2RH S CaR2(s) T � 2H�
Mo6�Bi3�, Zr4�, Ti4�, V5�,Pb2�, Pd2�, Sb3�, Sn2�,Ga3�Cd2�, Hg2�, Fe2�,
Ag�, Mn2�, Zn2�,Ba2�Be2�, Mg2�, Ca2�,
Fe(OH)3,Al(OH)3,BaSO4,
634 CHAPTER 27 Gravimetric and Combustion Analysis
Reprecipitation improves the purity of someprecipitates.
One way to remove arsenic from drinkingwater in Bangladesh is by coprecipitation with
.5 Fe(II) or Fe(s) is added to the waterand allowed to oxidize in air for several hoursto precipitate . After filtration throughsand to remove solids, the water is drinkable.
Fe(OH)3
Fe(OH)3
N-p-Chlorophenylcinnamo-hydroxamic acid (RH)
(ligand atoms are bold)
N£
£
OHO
Cl
Ammonium chloride, for example,decomposes as follows when it is heated:
NH4Cl(s) S NH3(g) � HCl(g)
80
200
Mas
s lo
ss (
%)
Temperature (°C)
100
60
40
20
0
400 600 800 1 000
CaC14H10O6 H2O
CaC14H10O6
CaC7O3H4
CaCO3CaO
Figure 27-3 Thermogravimetric curve forcalcium salicylate. [From G. Liptay, ed., Atlas of
Thermoanalytical Curves (London: Heyden and
Son, 1976).]

27-3 Examples of Gravimetric Calculations 635
Example Relating Mass of Product to Mass of Reactant
The piperazine content of an impure commercial material can be determined byprecipitating and weighing the diacetate:6
(27-6)
In one experiment, 0.312 6 g of the sample was dissolved in 25 mL of acetone, and 1 mLof acetic acid was added. After 5 min, the precipitate was filtered, washed with acetone,dried at and found to weigh 0.712 1 g. What is the weight percent of piperazinein the commercial material?
Solution For each mole of piperazine in the impure material, 1 mol of product is formed.
This many moles of piperazine corresponds to
which gives
An alternative (but equivalent) way to work this problem is to realize that 206.240 g(1 mol) of product will be formed for every 86.136 g (1 mol) of piperazine analyzed.Because 0.712 1 g of product was formed, the amount of reactant is given by
The quantity 86.136/206.240 is the gravimetric factor relating the mass of starting materialto the mass of product.
For a reaction in which the stoichiometric relation between analyte and product is not 1:1,we must use the correct stoichiometry in formulating the gravimetric factor. For example, anunknown containing can be analyzed gravimetrically to pro-duce magnesium pyrophosphate ( FM 222.553). The gravimetric factor would be
because it takes 2 mol of to make 1 mol of .
Example Calculating How Much Precipitant to Use
(a) To measure the nickel content in steel, the alloy is dissolved in 12 M HCl and neutralizedin the presence of citrate ion, which maintains iron in solution. The slightly basic solution iswarmed, and dimethylglyoxime (DMG) is added to precipitate the red DMG-nickel complexquantitatively. The product is filtered, washed with cold water, and dried at
(27-7)Ni2� � 2
DMGFM 116.12FM 58.69
Bis(dimethylglyoximate)nickel(II)FM 288.91
N
OH
N
OH
� 2H�
N
O
N
O
Ni
N
O
N
O
�
�
H
H
110°C.
Mg2P2O7Mg2�
Grams of Mg in analyte
Grams of Mg2P2O7 formed�
2 � (24.305 0)
222.553
Mg2P2O7,Mg2� (atomic mass � 24.305 0)
1 x � a86.136 g piperazine
206.240 g productb 0.712 1 g product � 0.297 4 g piperazine
x g piperazine
0.712 1 g product�
86.136 g piperazine
206.243 g product
Percentage of piperazine in analyte �0.297 4 g
0.312 6 g� 100 � 95.14%
Grams of piperazine � (3.453 � 103 mol)a86.136g
molb � 0.297 4 g
Moles of product �0.712 1 g
206.240 g/mol� 3.453 � 103 mol
110°C,
2CH3CO2H:NH HN: � S H2N NH2
� �(CH3CO2)2
PiperazineFM 86.136
Acetic acidFM 60.052
Piperazine diacetateFM 206.240
If you were performing this analysis, it wouldbe important to determine that the impuritiesin the piperazine do not precipitate—otherwisethe result will be high.
The gravimetric factor relates mass of productto mass of analyte.

636 CHAPTER 27 Gravimetric and Combustion Analysis
If the nickel content is known to be near 3 wt% and you wish to analyze 1.0 g of steel,what volume of 1.0 wt% alcoholic DMG solution should be used to give a 50% excessof DMG for the analysis? Assume that the density of the alcohol solution is 0.79 g/mL.
Solution Because the Ni content is about 3%, 1.0 g of steel will contain about 0.03 gof Ni, which corresponds to
This amount of metal requires
because 1 mol of requires 2 mol of DMG. A 50% excess of DMG would be. This much DMG is contained in
which occupies a volume of
(b) If 1.163 4 g of steel gives 0.179 5 g of precipitate, what is the percentage of Niin the steel?
Solution For each mole of Ni in the steel, 1 mol of precipitate will be formed.Therefore, 0.179 5 g of precipitate corresponds to
The Ni in the alloy must therefore be
The mass percent of Ni in steel is
A slightly simpler way to approach this problem comes from realizing that 58.69 gof Ni (1 mol) would give 288.91 g (1 mol) of product. Calling the mass of Ni in thesample x, we can write
Example A Problem with Two Components
A mixture of the 8-hydroxyquinoline complexes of Al and Mg weighed 1.084 3 g. Whenignited in a furnace open to the air, the mixture decomposed, leaving a residue of andMgO weighing 0.134 4 g. Find the weight percent of in the original mixture.
Solution We will abbreviate the 8-hydroxyquinoline anion as Q. Letting the mass ofbe x and the mass of be y, we can write
Mass of Mass ofAlQ3 MgQ2
x � y � 1.084 3 g
MgQ2AlQ3
3
O
NAl �
2
O
NMg heat Al2O3 � MgO
AlQ3FM 459.43
MgQ2FM 312.61 FM 101.96 FM 40.304
Al(C9H6NO)3
Al2O3
Grams of Ni analyzed
Grams of product formed�
x
0.179 5�
58.69
288.911 Ni � 0.036 46 g
0.036 46 g Ni
1.163 4 g steel� 100 � 3.134%
(6.213 � 104 mol Ni) a58.69g
mol Nib � 0.036 46 g
0.179 5 g Ni(DMG)2
288.91 g Ni(DMG)2/mol Ni(DMG)2� 6.213 � 104 mol Ni(DMG)2
17.8 g solution
0.79 g solution/mL� 23 mL
0.178 g DMG
0.010 g DMG/g solution� 17.8 g solution
(1.5)(0.119 g) � 0.178 gNi2�
2(5.11 � 104 mol Ni)(116.12 g DMG/mol Ni) � 0.119 g DMG
0.03 g Ni
58.69 g Ni/mol Ni� 5.11 � 104 mol Ni

27-4 Combustion Analysis 637
The moles of Al are x/459.43, and the moles of Mg are y/312.61. The moles of areone-half of the total moles of Al, because it takes 2 mol of Al to make 1 mol of .
The moles of MgO will equal the moles of . Now we can write
Mass of Al2O3 Mass of MgO644474448 6447448
14243 14243 123 14243
Mol Al2O3 mol MgO
Substituting into the preceding equation gives
from which we find which is 27.70% of the original mixture.
27-4 Combustion AnalysisA historically important form of gravimetric analysis was combustion analysis, used to determinethe carbon and hydrogen content of organic compounds burned in excess (Figure 27-4).Instead of weighing combustion products, modern instruments use thermal conductivity, infraredabsorption, or coulometry (with electrochemically generated reagents) to measure the products.
O2
x � 0.300 3 g,
a1
2b a x
459.43b (101.96) � a1.084 3 x
312.61b (40.304) � 0.134 4 g
y � 1.084 3 x
g MgO
mol MgO
g Al2O3
mol Al2O3
a1
2b x
459.43(101.96) �
y
312.61(40.304) � 0.134 4 g
Mg � y/312.61
Moles of Al2O3 � a1
2b x
459.43
Al2O3
Al2O3
Sample inPt boat
O2 in
Electric oven
Catalysts
Burner
O2 out
P4O10or Mg(ClO4)2
NaOH onasbestos
P4O10+ NaOH/asbestos
(guard tube)
Figure 27-4 Gravimetric combustion analysis for carbon and hydrogen.
Gravimetric Combustion AnalysisIn gravimetric combustion analysis, partially combusted product is passed through catalystssuch as Pt gauze, CuO, or at elevated temperature to complete the oxidation to
and . The combustion products are flushed through a chamber containing (“phosphorus pentoxide”), which absorbs water, and then through a chamber of Ascarite(NaOH on asbestos), which absorbs . The increase in mass of each chamber tells howmuch hydrogen and carbon, respectively, were initially present. A guard tube preventsatmospheric or from entering the chambers.
Example Combustion Analysis Calculations
A compound weighing 5.714 mg produced 14.414 mg of and 2.529 mg of uponcombustion. Find the weight percent of C and H in the sample.
Solution One mole of contains 1 mol of carbon. Therefore,
Weight percent of C �3.934 mg C
5.714 mg sample� 100 � 68.84%
Mass of C in sample � (3.275 � 104 mol C)(12.010 7 g/mol C) � 3.934 mg
�14.414 � 103 g CO2
44.010 g/mol CO2� 3.275 � 104 mol
Moles of C in sample � moles of CO2 produced
CO2
H2OCO2
CO2H2O
CO2
P4O10H2OCO2
MnO2PbO2,

638 CHAPTER 27 Gravimetric and Combustion Analysis
One mole of contains 2 mol of H. Therefore,
Combustion Analysis Today7
Figure 27-5 shows an instrument that measures C, H, N, and S in a single operation. First, asample is accurately weighed and sealed in a tin or silver capsule. The analyzer is
swept with He gas that has been treated to remove traces of and . At the start ofa run, a measured excess of is added to the He stream. Then the capsule is dropped into apreheated ceramic crucible, where the capsule melts and sample is rapidly oxidized.
1442443
Products pass through hot catalyst to complete the combustion of carbon to . In thenext zone, metallic Cu at converts into and removes excess :
The mixture of and is separated by gas chromatography (Figure 27-6),and each component is measured with a thermal conductivity detector (Section 24-3). Fig-ure 27-7 shows a different C,H,N,S analyzer that uses infrared absorbance to measure
and and thermal conductivity for .A key to elemental analysis is dynamic flash combustion, which creates a short burst of
gaseous products, instead of slowly bleeding products out over several minutes. This featureis important because chromatographic analysis requires that the whole sample be injected atonce. Otherwise, the injection zone is so broad that the products cannot be separated.
N2SO2H2O,CO2,
SO2N2,H2O,CO2,
Cu � 12 O2
!850°C CuO(s)
Cu � SO3!850°C SO2 � CuO(s)
O2SO2SO3850°CCO2WO3
95% SO2
C, H, N, S !1 050°C/O2 CO2(g) � H2O(g) � N2(g) � SO2(g) � SO3(g)
O2
CO2H2O,O2,�2-mg
Weight percent of H �0.283 0 mg H
5.714 mg sample� 100 � 4.952%
Mass of H in sample � (2.808 � 104 mol H)(1.007 9 g/mol H) � 2.830 � 104 g
� 2 a2.529 � 103 g H2O
18.015 g/mol H2Ob � 2.808 � 104 mol
Moles of H in sample � 2(moles of H2O produced)
H2O
Oxygen
Helium
Autosampler
Encapsulated sample
Ceramiccrucible
1 050°C
850°CCureductioncatalystand O2scavenger
WO3oxidationcatalyst
Gas chromatograph
Thermal conductivitydetector
Exit
Data station
N2 CO2 H2O SO2
Figure 27-5 Diagram of C,H,N,S elemental analyzer that uses gas chromatographic separationand thermal conductivity detection. [Adapted from E. Pella, “Elemental Organic Analysis. 2. State of the Art,”
Am. Lab, August 1990, p. 28.]
Elemental analyzers use an oxidation catalystto complete the oxidation of sample and areduction catalyst to carry out any requiredreduction and to remove excess O2.

27-4 Combustion Analysis 639
In dynamic flash combustion, the tin-encapsulated sample is dropped into the preheatedfurnace shortly after the flow of a mixture is started (Figure 27-8).The Sn capsule melts at and is instantly oxidized to thereby liberating 594 kJ/mol,and heating the sample to . If the sample is dropped in before very much is present, decomposition (cracking) occurs prior to oxidation, which minimizes the forma-tion of nitrogen oxides. (Flammable liquid samples would be admitted prior to any to pre-vent explosions.)
Analyzers that measure C, H, and N, but not S, use catalysts that are better optimized forthis process. The oxidation catalyst is . The gas then passes through hot coatedwith Ag to absorb halogens and sulfur. A hot Cu column then scavenges excess .
Oxygen analysis requires a different strategy. The sample is thermally decomposed (aprocess called pyrolysis) in the absence of added . Gaseous products are passed throughnickelized carbon at to convert oxygen from the compound into CO (not ).Other products include and hydrogen halides. Acidic products are absorbed byNaOH, and the remaining gases are separated and measured by gas chromatography with athermal conductivity detector.
CH4,H2,N2,CO21 075°C
O2
O2
Co3O4Cr2O3
O2
O21 700°–1 800°CSnO2,235°C
50 vol% O2/50 vol% He
1 mV
180
Det
ecto
r re
spon
se
Time (s)0 360 540 720
N2 CO2 H2O SO2
Figure 27-7 Combustion analyzer that uses infrared absorbance to measure and and thermal conductivity to measure . Three separate infrared cells in series are equipped with filtersthat isolate wavelengths absorbed by one of the products. Absorbance is integrated over time as thecombustion product mixture is swept through each cell. [Courtesy Leco Corp., St. Joseph, MI.]
N2
SO2H2O,CO2,
Injected O2
Sample in
Flash combustion
Eluted N2
Start
120 90 60 30 0Time (s)
Figure 27-8 Sequence of events in dynamicflash combustion. [From E. Pella, “Elemental Organic
Analysis. 1. Historical Developments,” Am. Lab.
February 1990, p. 116.]
Figure 27-6 Gas chromatographic trace from elemental analyzer, showing substantially completeseparation of combustion products. The area of each peak (when they are not off scale) isproportional to the mass of each product. [From E. Pella, “Elemental Organic Analysis. 2. State of the Art,” Am. Lab.
August 1990, p. 28.]
The Sn capsule is oxidized to SnO2, which
1. liberates heat to vaporize and crack(decompose) sample
2. uses available oxygen immediately3. ensures that sample oxidation occurs in gas
phase4. acts as an oxidation catalyst

640 CHAPTER 27 Gravimetric and Combustion Analysis
For halogenated compounds, combustion gives and .The HX is trapped in aqueous solution and titrated with ions in a coulometer (Sec-tion 17-3). This instrument counts the electrons produced (one electron for each ) duringcomplete reaction with HX.
Table 27-4 shows results of five replicate analyses of pure acetanilide on two differentcommercial instruments. Chemists consider a result within of the theoretical percent-age of an element to be good evidence that the compound has the expected formula. For N inacetanilide, corresponds to a relative error of which is not hard toachieve. For C, corresponds to a relative error of which is notso easy. The standard deviation for C in Instrument 1 is ; for Instrument2, it is .
Silicon compounds, such as SiC, and silicates (rocks), can be analyzed by com-bustion with elemental fluorine in a nickel vessel to produce volatile and fluori-nated products of every element in the periodic table except O, N, He, Ne, Ar, and Kr.8 Allmajor and minor combustion products can then be measured by mass spectrometry. Nitrogenin and some other metal nitrides can be analyzed by heating to in an inertatmosphere to liberate nitrogen as which is measured by thermal conductivity in apparatussimilar to that in Figure 27-7.
N2,3 000°CSi3N4
SiF4(F2)Si3N4,
1.1/71.22 � 1.5%0.41/71.17 � 0.6%
0.3/71.09 � 0.4%,�0.30.3/10.36 � 3%,�0.3
�0.3
Ag�
Ag�
HX (X � halogen)N2,H2O,CO2,
Terms to Understandabsorptionadsorptioncolloidcombustion analysiscoprecipitation
dialysisdigestionelectric double layergatheringgravimetric analysis
homogeneous precipitationhygroscopic substanceignitionmasking agentnucleation
peptizationprecipitantpyrolysissupersaturated solutionthermogravimetric analysis
SummaryGravimetric analysis is based on the formation of a product whosemass can be related to the mass of analyte. Most commonly, analyteion is precipitated by a suitable counterion. Measures taken toreduce supersaturation and promote the formation of large, easily fil-tered particles (as opposed to colloids) include (1) raising the tem-perature during precipitation, (2) slowly adding and vigorously mix-ing reagents, (3) maintaining a large sample volume, and (4) usinghomogeneous precipitation. Precipitates are usually digested in hotmother liquor to promote particle growth and recrystallization. Allprecipitates are then filtered and washed; some must be washed witha volatile electrolyte to prevent peptization. The product is heated todryness or ignited to achieve a reproducible, stable composition.Gravimetric calculations relate moles of product to moles of analyte.
In combustion analysis, an organic compound in a tin capsuleis rapidly heated with excess oxygen to give predominantly
and HX (hydrogen halides). A hot oxidation catalystcompletes the process, and hot Cu scavenges excess oxygen. Forsulfur analysis, hot copper also converts into . Productsmay be separated by gas chromatography and measured by theirthermal conductivity. Some instruments use infrared absorption orcoulometric reactions (counting electrons with an electronic circuit)to measure the products. Oxygen analysis is done by pyrolysis inthe absence of oxygen, a process that ultimately converts oxygenfrom the compound into CO.
SO2SO3
SO2,N2,H2O,CO2,
Exercises27-A. An organic compound with a formula mass of 417 was ana-lyzed for ethoxyl groups by the reactions
CH3CH2I � Ag� � OH S AgI(s) � CH3CH2OH
ROCH2CH3 � HI S ROH � CH3CH2I
(CH3CH2Oß)A 25.42-mg sample of compound produced 29.03 mg of AgI. Howmany ethoxyl groups are there in each molecule?
27-B. A 0.649-g sample containing only (FM 174.27) and(FM 132.14) was dissolved in water and treated with
to precipitate all as (FM 233.39). Find theBaSO4SO24Ba(NO3)2
(NH4)2SO4
K2SO4
Table 27-4 C, H, and N in acetanilide:
TheoreticalElement value (wt%) Instrument 1 Instrument 2
C 71.09H 6.71N 10.36
SOURCE: Data from E. M. Hodge, H. P. Patterson, M. C. Williams, and E. S. Gladney, Am. Lab. June 1991. p. 34.Uncertainties are standard deviations from five replicate determinations.
10.33 � 0.1310.34 � 0.086.84 � 0.106.76 � 0.12
71.22 � l.l71.17 � 0.41
(C8H9NO)
O
NHCCH3
F2 is exceedingly reactive and thereforeexceedingly dangerous. It must be handledonly in systems especially designed for its use.
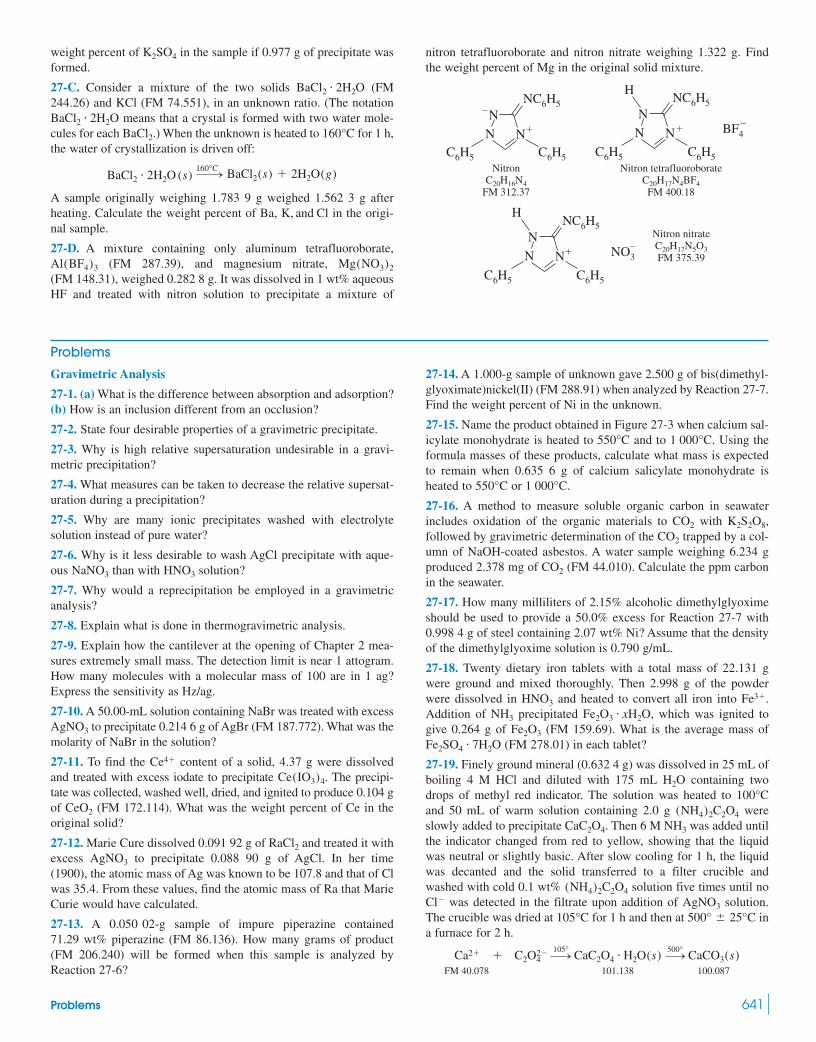
Problems 641
Problems
Gravimetric Analysis
27-1. (a) What is the difference between absorption and adsorption?(b) How is an inclusion different from an occlusion?
27-2. State four desirable properties of a gravimetric precipitate.
27-3. Why is high relative supersaturation undesirable in a gravi-metric precipitation?
27-4. What measures can be taken to decrease the relative supersat-uration during a precipitation?
27-5. Why are many ionic precipitates washed with electrolytesolution instead of pure water?
27-6. Why is it less desirable to wash AgCl precipitate with aque-ous than with solution?
27-7. Why would a reprecipitation be employed in a gravimetricanalysis?
27-8. Explain what is done in thermogravimetric analysis.
27-9. Explain how the cantilever at the opening of Chapter 2 mea-sures extremely small mass. The detection limit is near 1 attogram.How many molecules with a molecular mass of 100 are in 1 ag?Express the sensitivity as Hz/ag.
27-10. A 50.00-mL solution containing NaBr was treated with excessto precipitate 0.214 6 g of AgBr (FM 187.772). What was the
molarity of NaBr in the solution?
27-11. To find the content of a solid, 4.37 g were dissolvedand treated with excess iodate to precipitate . The precipi-tate was collected, washed well, dried, and ignited to produce 0.104 gof (FM 172.114). What was the weight percent of Ce in theoriginal solid?
27-12. Marie Cure dissolved 0.091 92 g of and treated it withexcess to precipitate 0.088 90 g of AgCl. In her time(1900), the atomic mass of Ag was known to be 107.8 and that of Clwas 35.4. From these values, find the atomic mass of Ra that MarieCurie would have calculated.
27-13. A 0.050 02-g sample of impure piperazine contained71.29 wt% piperazine (FM 86.136). How many grams of product(FM 206.240) will be formed when this sample is analyzed byReaction 27-6?
AgNO3
RaCl2
CeO2
Ce(IO3)4
Ce4�
AgNO3
HNO3NaNO3
27-14. A 1.000-g sample of unknown gave 2.500 g of bis(dimethyl-glyoximate)nickel(II) (FM 288.91) when analyzed by Reaction 27-7.Find the weight percent of Ni in the unknown.
27-15. Name the product obtained in Figure 27-3 when calcium sal-icylate monohydrate is heated to and to . Using theformula masses of these products, calculate what mass is expectedto remain when 0.635 6 g of calcium salicylate monohydrate isheated to or .
27-16. A method to measure soluble organic carbon in seawaterincludes oxidation of the organic materials to with followed by gravimetric determination of the trapped by a col-umn of NaOH-coated asbestos. A water sample weighing 6.234 gproduced 2.378 mg of (FM 44.010). Calculate the ppm carbonin the seawater.
27-17. How many milliliters of 2.15% alcoholic dimethylglyoximeshould be used to provide a 50.0% excess for Reaction 27-7 with0.998 4 g of steel containing 2.07 wt% Ni? Assume that the densityof the dimethylglyoxime solution is 0.790 g/mL.
27-18. Twenty dietary iron tablets with a total mass of 22.131 gwere ground and mixed thoroughly. Then 2.998 g of the powderwere dissolved in and heated to convert all iron into .Addition of precipitated which was ignited togive 0.264 g of (FM 159.69). What is the average mass of
(FM 278.01) in each tablet?
27-19. Finely ground mineral (0.632 4 g) was dissolved in 25 mL ofboiling 4 M HCl and diluted with 175 mL containing twodrops of methyl red indicator. The solution was heated to and 50 mL of warm solution containing 2.0 g wereslowly added to precipitate . Then 6 M was added untilthe indicator changed from red to yellow, showing that the liquidwas neutral or slightly basic. After slow cooling for 1 h, the liquidwas decanted and the solid transferred to a filter crucible andwashed with cold 0.1 wt% solution five times until no
was detected in the filtrate upon addition of solution.The crucible was dried at for 1 h and then at ina furnace for 2 h.
FM 40.078 101.138 100.087
Ca2� � C2O24
!105° CaC2O4 � H2O(s) !500°
CaCO3(s)
500° � 25°C105°CAgNO3Cl
(NH4)2C2O4
NH3CaC2O4
(NH4)2C2O4
100°CH2O
Fe2SO4 � 7H2OFe2O3
Fe2O3 � xH2O,NH3
Fe3�HNO3
CO2
CO2
K2S2O8,CO2
1 000°C550°C
1 000°C550°C
weight percent of in the sample if 0.977 g of precipitate wasformed.
27-C. Consider a mixture of the two solids (FM244.26) and KCl (FM 74.551), in an unknown ratio. (The notation
means that a crystal is formed with two water mole-cules for each .) When the unknown is heated to for 1 h,the water of crystallization is driven off:
A sample originally weighing 1.783 9 g weighed 1.562 3 g afterheating. Calculate the weight percent of Ba, K, and Cl in the origi-nal sample.
27-D. A mixture containing only aluminum tetrafluoroborate,(FM 287.39), and magnesium nitrate,
(FM 148.31), weighed 0.282 8 g. It was dissolved in 1 wt% aqueousHF and treated with nitron solution to precipitate a mixture of
Mg(NO3)2Al(BF4)3
BaCl2 � 2H2O (s) !160°C BaCl2(s) � 2H2O(g)
160°CBaCl2
BaCl2 � 2H2O
BaCl2 � 2H2O
K2SO4 nitron tetrafluoroborate and nitron nitrate weighing 1.322 g. Findthe weight percent of Mg in the original solid mixture.
C6H5
N
NN �
C6H5
NC6H5H
NO3
Nitron nitrateC20H17N5O3FM 375.39
N
NN �
C6H5C6H5
NC6H5H
BF4
Nitron tetrafluoroborateC20H17N4BF4FM 400.18
NitronC20H16N4
FM 312.37
C6H5
N
NN �
C6H5
NC6H5

642 CHAPTER 27 Gravimetric and Combustion Analysis
The mass of the empty crucible was 18.231 1 g and the mass of thecrucible with was 18.546 7 g.(a) Find the wt% Ca in the mineral.(b) Why is the unknown solution heated to boiling and the precipi-tant solution, also heated before slowly mixing thetwo?(c) What is the purpose of washing the precipitate with 0.1 wt%
?(d) What is the purpose of testing the filtrate with solution?
27-20. A 1.475-g sample containing (FM 53.492), (FM 138.21), and inert ingredients was dissolved to give 0.100 L ofsolution. A 25.0-mL aliquot was acidified and treated with excesssodium tetraphenylborate, to precipitate and
ions completely:
FM 358.33
FM 337.27
The resulting precipitate amounted to 0.617 g. A fresh 50.0-mLaliquot of the original solution was made alkaline and heated todrive off all the :
It was then acidified and treated with sodium tetraphenylborate togive 0.554 g of precipitate. Find the weight percent of and
in the original solid.
27-21. A mixture containing only (FM 101.96) and (FM 159.69) weighs 2.019 g. When heated under a stream of
is unchanged, but is converted into metallic Fe plus. If the residue weighs 1.774 g, what is the weight percent
of in the original mixture?
27-22. A solid mixture weighing 0.548 5 g contained only ferrousammonium sulfate hexahydrate and ferrous chloride hexahydrate.The sample was dissolved in 1 M oxidized to with
and precipitated with cupferron. The ferric cupferron complexwas ignited to produce 0.167 8 g of ferric oxide, (FM159.69). Calculate the weight percent of Cl in the original sample.
Ferrous ammonium sulfate Ferrous chloridehexahydrate hexahydrateFM 392.13 FM 234.84
27-23. Propagation of error. A mixture containing only silvernitrate and mercurous nitrate was dissolved in water and treatedwith excess sodium cobalticyanide, to precipitateboth cobalticyanide salts:
AgNO3 FM 169.873
Ag3[Co(CN)6] FM 538.643
Hg2(NO3)2 FM 525.19
(Hg2)3[Co(CN)6]2 FM 1 633.62
(a) The unknown weighed 0.432 1 g and the product weighed0.451 5 g. Find wt% in the unknown. Caution: Keep all theAgNO3
Na3[Co(CN)6]
CupferronFM 155.16
NO
O NH4
N�
FeCl2 � 6H2OFeSO4 � (NH4)2SO4 � 6H2O
Fe2O3
H2O2,Fe3�H2SO4,
Fe2O3
H2O(g)Fe2O3Al2O3
H2,Fe2O3Al2O3
K2CO3
NH4Cl
NH�4 � OH S NH3(g) � H2O
NH3
(C6H5)4B � NH�4 S (C6H5)4BNH4(s)
(C6H5)4B � K� S (C6H5)4BK(s)
NH�4
K�Na�B(C6H5)4 ,
K2CO3NH4Cl
AgNO3
(NH4)2C2O4
(NH4)2C2O4,
CaCO3(s)digits in your calculator or else serious rounding errors may occur.Do not round off until the end.(b) Even a skilled analyst is not likely to have less than a 0.3% errorin isolating the precipitate. Suppose that there is negligible error inall quantities, except the mass of product. Suppose that the mass ofproduct has an uncertainty of 0.30%. Calculate the relative uncer-tainty in the mass of in the unknown.
27-24. The thermogravimetric trace below shows mass loss byupon heating. In the first step, waters of hydration
are lost to give mass loss. After a second decomposition step,19.2% of the original mass is lost. Finally, the composition stabi-lizes at above .(a) Find x in the formula . Because the 8.1%mass loss is not accurately defined in the experiment, use the 31.8%total mass loss for your calculation.(b) Suggest a formula for the material remaining at the 19.2%plateau. Be sure that the charges of all ions in your formula sum to 0.The cation is .
Thermogravimetric analysis of [From T. Hours, P. Bergez,
J. Charpin, A. Larbot, C. Guizard, and L. Cot, “Preparation and Characterization of
Yttrium Oxide by a Sol-Gel Process,” Ceramic Bull. 1992, 71, 200.]
27-25. When the high-temperature superconductor yttrium bariumcopper oxide (see beginning of Chapter 16 and Box 16-2) is heatedunder flowing the solid remaining at is a mixture of
BaO, and Cu. The starting material has the formulain which the oxygen stoichiometry varies between 7
and .
FM666.19 16.00x
1444442444443
(a) Thermogravimetric analysis. When 34.397 mg of were subjected to this analysis, 31.661 mg of solid remained afterheating to . Find the value of x in .(b) Propagation of error. Suppose that the uncertainty in each massin part (a) is . Find the uncertainty in the value of x.�0.002 mg
YBa2Cu3O7x1 000°C
YBa2Cu3O7x
YBa2Cu3O3.5
12 Y2O3(s) � 2BaO(s) � 3Cu(s) � (3.5 x)H2O(g)
YBa2Cu3O7x(s) � (3.5 x)H2(g) !1 000°C
6.5 (x � 0 to 0.5)YBa2Cu3O7x,Y2O3,
1 000°CH2,
Y2(OH)5Cl � xH2O
Mas
s lo
ss (
%)
Temperature (°C)200 400 600 1 000 1 500
5
10
15
20
25
30 Y2O3FW 225.81
31.8%
19.2%
Y2(OH)5ClFW 298.30
8.1%
Y2(OH)5Cl x H2OFW 298.30 + x (18.015)
Y3�
Y2(OH)5Cl � xH2O800°CY2O3
�8.1%Y2(OH)5Cl � xH2O
AgNO3
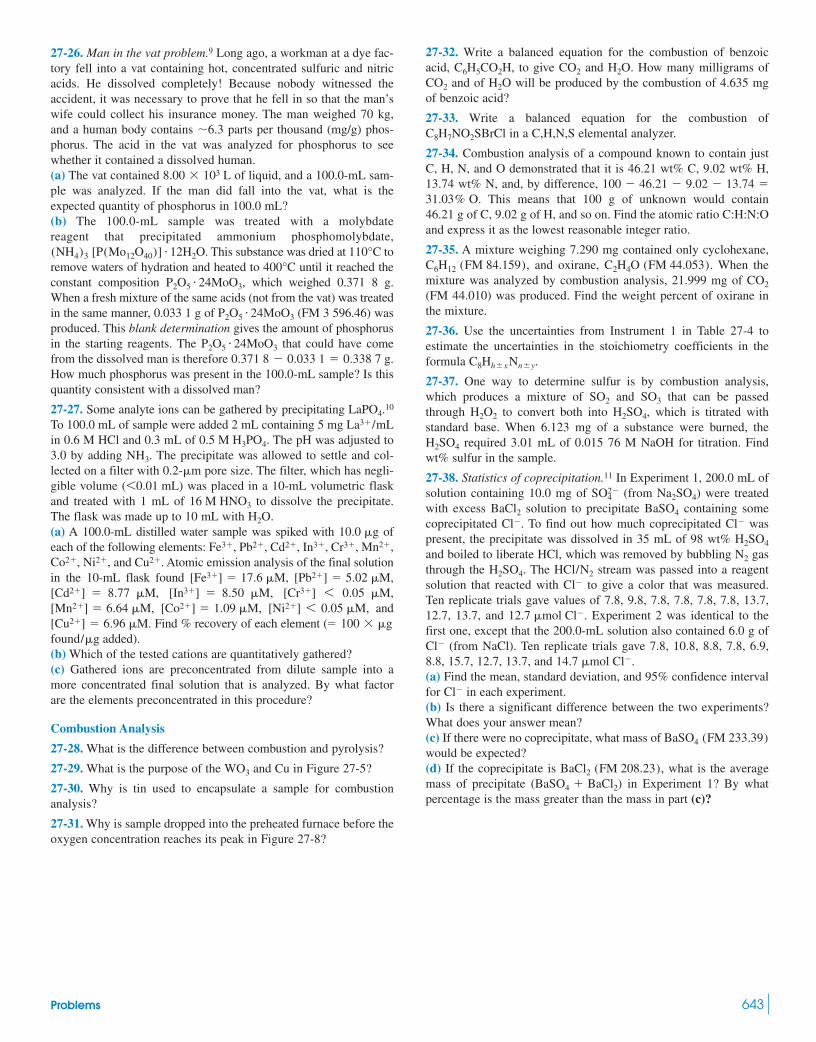
Problems 643
27-26. Man in the vat problem.9 Long ago, a workman at a dye fac-tory fell into a vat containing hot, concentrated sulfuric and nitricacids. He dissolved completely! Because nobody witnessed theaccident, it was necessary to prove that he fell in so that the man’swife could collect his insurance money. The man weighed 70 kg,and a human body contains parts per thousand (mg/g) phos-phorus. The acid in the vat was analyzed for phosphorus to seewhether it contained a dissolved human.(a) The vat contained of liquid, and a 100.0-mL sam-ple was analyzed. If the man did fall into the vat, what is theexpected quantity of phosphorus in 100.0 mL?(b) The 100.0-mL sample was treated with a molybdatereagent that precipitated ammonium phosphomolybdate,
. This substance was dried at toremove waters of hydration and heated to until it reached theconstant composition which weighed 0.371 8 g.When a fresh mixture of the same acids (not from the vat) was treatedin the same manner, 0.033 1 g of (FM 3 596.46) wasproduced. This blank determination gives the amount of phosphorusin the starting reagents. The that could have comefrom the dissolved man is therefore .How much phosphorus was present in the sample? Is thisquantity consistent with a dissolved man?
27-27. Some analyte ions can be gathered by precipitating .10
To 100.0 mL of sample were added 2 mL containing in 0.6 M HCl and 0.3 mL of . The pH was adjusted to3.0 by adding . The precipitate was allowed to settle and col-lected on a filter with pore size. The filter, which has negli-gible volume ( ) was placed in a 10-mL volumetric flaskand treated with 1 mL of to dissolve the precipitate.The flask was made up to 10 mL with .(a) A 100.0-mL distilled water sample was spiked with ofeach of the following elements:
and . Atomic emission analysis of the final solutionin the 10-mL flask found
and. Find % recovery of each element (
).(b) Which of the tested cations are quantitatively gathered?(c) Gathered ions are preconcentrated from dilute sample into amore concentrated final solution that is analyzed. By what factorare the elements preconcentrated in this procedure?
Combustion Analysis
27-28. What is the difference between combustion and pyrolysis?
27-29. What is the purpose of the and Cu in Figure 27-5?
27-30. Why is tin used to encapsulate a sample for combustionanalysis?
27-31. Why is sample dropped into the preheated furnace before theoxygen concentration reaches its peak in Figure 27-8?
WO3
found/g added� 100 � g[Cu2�] � 6.96 M
[Ni2�] 6 0.05 M,[Co2�] � 1.09 M,[Mn2�] � 6.64 M,[Cr3�] 6 0.05 M,[In3�] � 8.50 M,[Cd2�] � 8.77 M,
[Pb2�] � 5.02 M,[Fe3�] � 17.6 M,Cu2�Ni2�,Co2�,
Mn2�,Cr3�,In3�,Cd2�,Pb2�,Fe3�,10.0 g
H2O16 M HNO3
60.01 mL0.2-m
NH3
0.5 M H3PO4
5 mg La3�/mLLaPO4
100.0-mL0.371 8 0.033 1 � 0.338 7 g
P2O5 � 24MoO3
P2O5 � 24MoO3
P2O5 � 24MoO3,400°C
110°C[P(Mo12O40)] � 12H2O(NH4)3
8.00 � 103 L
�6.3
27-32. Write a balanced equation for the combustion of benzoicacid, to give and . How many milligrams of
and of will be produced by the combustion of 4.635 mgof benzoic acid?
27-33. Write a balanced equation for the combustion of in a C,H,N,S elemental analyzer.
27-34. Combustion analysis of a compound known to contain justC, H, N, and O demonstrated that it is 46.21 wt% C, 9.02 wt% H,13.74 wt% N, and, by difference,
. This means that 100 g of unknown would contain46.21 g of C, 9.02 g of H, and so on. Find the atomic ratio C:H:N:Oand express it as the lowest reasonable integer ratio.
27-35. A mixture weighing 7.290 mg contained only cyclohexane,and oxirane, . When the
mixture was analyzed by combustion analysis, 21.999 mg of (FM 44.010) was produced. Find the weight percent of oxirane inthe mixture.
27-36. Use the uncertainties from Instrument 1 in Table 27-4 toestimate the uncertainties in the stoichiometry coefficients in theformula .
27-37. One way to determine sulfur is by combustion analysis,which produces a mixture of and that can be passedthrough to convert both into which is titrated withstandard base. When 6.123 mg of a substance were burned, the
required 3.01 mL of 0.015 76 M NaOH for titration. Findwt% sulfur in the sample.
27-38. Statistics of coprecipitation.11 In Experiment 1, 200.0 mL ofsolution containing 10.0 mg of (from ) were treatedwith excess solution to precipitate containing somecoprecipitated . To find out how much coprecipitated waspresent, the precipitate was dissolved in 35 mL of 98 wt% and boiled to liberate HCl, which was removed by bubbling gasthrough the . The stream was passed into a reagentsolution that reacted with to give a color that was measured.Ten replicate trials gave values of 7.8, 9.8, 7.8, 7.8, 7.8, 7.8, 13.7,12.7, 13.7, and . Experiment 2 was identical to thefirst one, except that the 200.0-mL solution also contained 6.0 g of
(from NaCl). Ten replicate trials gave 7.8, 10.8, 8.8, 7.8, 6.9,8.8, 15.7, 12.7, 13.7, and .(a) Find the mean, standard deviation, and 95% confidence intervalfor in each experiment.(b) Is there a significant difference between the two experiments?What does your answer mean?(c) If there were no coprecipitate, what mass of would be expected?(d) If the coprecipitate is what is the averagemass of precipitate ( ) in Experiment 1? By whatpercentage is the mass greater than the mass in part (c)?
BaSO4 � BaCl2
BaCl2 (FM 208.23),
BaSO4 (FM 233.39)
Cl
14.7 mol Cl
Cl
12.7 mol Cl
Cl
HCl/N2H2SO4
N2
H2SO4
ClCl
BaSO4BaCl2
Na2SO4SO24
H2SO4
H2SO4,H2O2
SO3SO2
C8Hh�xNn�y
CO2
C2H4O (FM 44.053)C6H12 (FM 84.159),
31.03% O100 46.21 9.02 13.74 �
SBrClC8H7NO2
H2OCO2
H2OCO2C6H5CO2H,

644 CHAPTER 28 Sample Preparation
EXTRACTION MEMBRANES
Sample Preparation28
Desired analytes or unwanted impurities in liquid samples can be trapped in solid-phaseextraction membranes containing any stationary phase used in high-performance liquidchromatography. The micrograph shows ion-exchange beads entangled ina loose membrane of polytetrafluoroethylene (Teflon). The membrane is a circular disk thatfits into a plastic holder attached to a syringe. To conduct an extraction, solution from thesyringe is simply forced through the disk.
A sandwich made of a cation-exchange membrane loaded with and an anion-exchange membrane loaded with deionizes a solution, because all entering cations areexchanged for outgoing and all incoming anions are exchanged for outgoing Acation-exchange membrane loaded with selectively removes halides from asample, forming AgX(s) on the membrane. A cation-exchange membrane loaded with selectively removes sulfate by forming BaSO4(s).
Ba2�
(X)Ag�
OH.H�
OH
H�
25-m-diameter
Is it alive? Ion-exchange beads enmeshed in a polytetrafluoroethylenemembrane. [Courtesy Bio-Rad Laboratories, Hercules, CA.]
Solid-phase extraction cartridge. [Courtesy Alltech Associates,Deerfield, IL.]
Solid-phase extraction membrane.[Courtesy Alltech Associates, Deerfield, IL.]
A chemical analysis is meaningless unless you begin with a meaningful sample. To mea-sure cholesterol in a dinosaur skeleton or herbicide in a truckload of oranges, you must havea strategy for selecting a representative sample from a heterogeneous material. Figure 28-1shows that the concentration of nitrate in sediment beneath a lake drops by two orders ofmagnitude in the first 3 mm below the surface. If you want to measure nitrate in sediment, itmakes an enormous difference whether you select a core sample that is 1 m deep or skim thetop 2 mm of sediment for analysis. Sampling is the process of collecting a representative
Heterogeneous: different composition fromplace to place in a material
Homogeneous: same compositioneverywhere
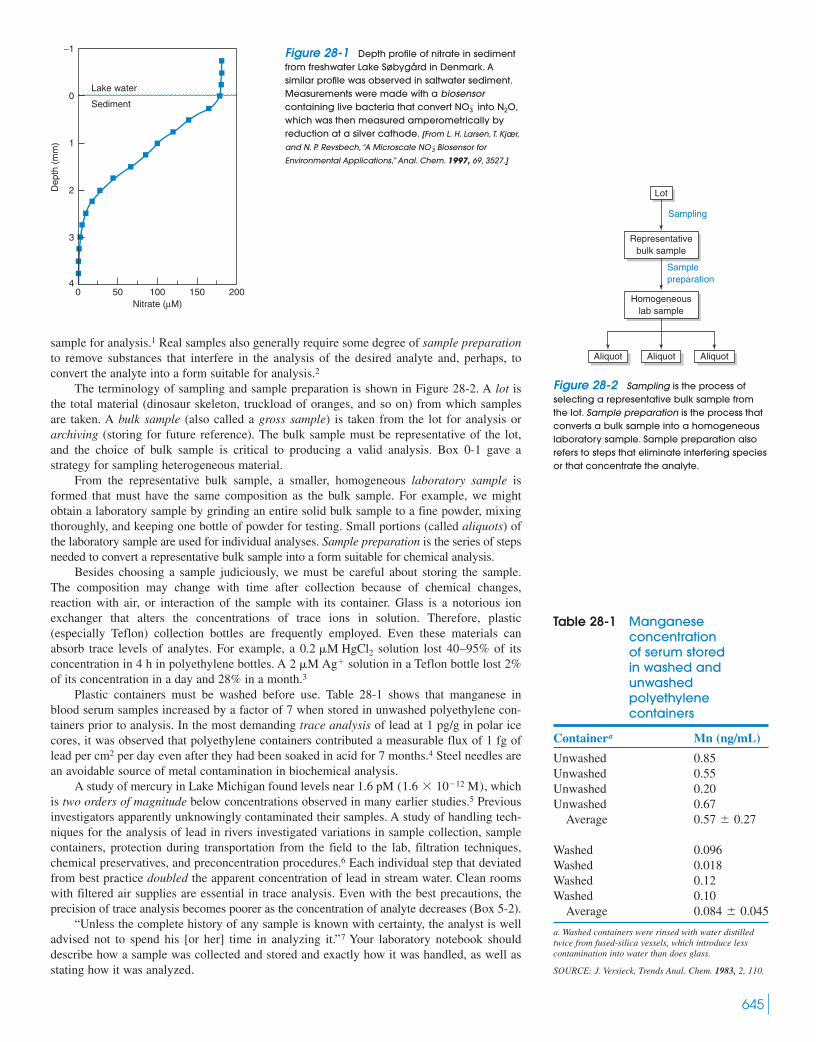
645
sample for analysis.1 Real samples also generally require some degree of sample preparationto remove substances that interfere in the analysis of the desired analyte and, perhaps, toconvert the analyte into a form suitable for analysis.2
The terminology of sampling and sample preparation is shown in Figure 28-2. A lot isthe total material (dinosaur skeleton, truckload of oranges, and so on) from which samplesare taken. A bulk sample (also called a gross sample) is taken from the lot for analysis orarchiving (storing for future reference). The bulk sample must be representative of the lot,and the choice of bulk sample is critical to producing a valid analysis. Box 0-1 gave astrategy for sampling heterogeneous material.
From the representative bulk sample, a smaller, homogeneous laboratory sample isformed that must have the same composition as the bulk sample. For example, we mightobtain a laboratory sample by grinding an entire solid bulk sample to a fine powder, mixingthoroughly, and keeping one bottle of powder for testing. Small portions (called aliquots) ofthe laboratory sample are used for individual analyses. Sample preparation is the series of stepsneeded to convert a representative bulk sample into a form suitable for chemical analysis.
Besides choosing a sample judiciously, we must be careful about storing the sample.The composition may change with time after collection because of chemical changes,reaction with air, or interaction of the sample with its container. Glass is a notorious ionexchanger that alters the concentrations of trace ions in solution. Therefore, plastic(especially Teflon) collection bottles are frequently employed. Even these materials canabsorb trace levels of analytes. For example, a solution lost 40–95% of itsconcentration in 4 h in polyethylene bottles. A solution in a Teflon bottle lost 2%of its concentration in a day and 28% in a month.3
Plastic containers must be washed before use. Table 28-1 shows that manganese inblood serum samples increased by a factor of 7 when stored in unwashed polyethylene con-tainers prior to analysis. In the most demanding trace analysis of lead at 1 pg/g in polar icecores, it was observed that polyethylene containers contributed a measurable flux of 1 fg oflead per cm2 per day even after they had been soaked in acid for 7 months.4 Steel needles arean avoidable source of metal contamination in biochemical analysis.
A study of mercury in Lake Michigan found levels near 1.6 pM whichis two orders of magnitude below concentrations observed in many earlier studies.5 Previousinvestigators apparently unknowingly contaminated their samples. A study of handling tech-niques for the analysis of lead in rivers investigated variations in sample collection, samplecontainers, protection during transportation from the field to the lab, filtration techniques,chemical preservatives, and preconcentration procedures.6 Each individual step that deviatedfrom best practice doubled the apparent concentration of lead in stream water. Clean roomswith filtered air supplies are essential in trace analysis. Even with the best precautions, theprecision of trace analysis becomes poorer as the concentration of analyte decreases (Box 5-2).
“Unless the complete history of any sample is known with certainty, the analyst is welladvised not to spend his [or her] time in analyzing it.”7 Your laboratory notebook shoulddescribe how a sample was collected and stored and exactly how it was handled, as well asstating how it was analyzed.
(1.6 � 1012 M),
2 M Ag�
0.2 M HgCl2
Dep
th (
mm
)−1
200150100Nitrate (µM)
500
0
1
2
3
4
Lake water
Sediment
Figure 28-1 Depth profile of nitrate in sedimentfrom freshwater Lake Søbygård in Denmark. Asimilar profile was observed in saltwater sediment.Measurements were made with a biosensorcontaining live bacteria that convert intowhich was then measured amperometrically byreduction at a silver cathode. [From L. H. Larsen, T. Kjær,
and N. P. Revsbech, “A Microscale NO3 Biosensor for
Environmental Applications,” Anal. Chem. 1997, 69, 3527.]
N2O,NO3
Figure 28-2 Sampling is the process ofselecting a representative bulk sample fromthe lot. Sample preparation is the process thatconverts a bulk sample into a homogeneouslaboratory sample. Sample preparation alsorefers to steps that eliminate interfering speciesor that concentrate the analyte.
Table 28-1 Manganeseconcentrationof serum storedin washed andunwashedpolyethylenecontainers
Containera Mn (ng/mL)
Unwashed 0.85Unwashed 0.55Unwashed 0.20Unwashed 0.67
Average
Washed 0.096Washed 0.018Washed 0.12Washed 0.10
Average
a. Washed containers were rinsed with water distilledtwice from fused-silica vessels, which introduce lesscontamination into water than does glass.
SOURCE: J. Versieck, Trends Anal. Chem. 1983, 2, 110.
0.084 � 0.045
0.57 � 0.27
Lot
Sampling
Samplepreparation
Representativebulk sample
Homogeneouslab sample
AliquotAliquot Aliquot

646 CHAPTER 28 Sample Preparation
28-1 Statistics of Sampling8
For random errors, the overall variance, is the sum of the variance of the analytical pro-cedure, and the variance of the sampling operation, :
Additivity of variance: (28-1)
If either or is sufficiently smaller than the other, there is little point in trying to reducethe smaller one. For example, if is 10% and is 5%, the overall standard deviation is 11%
A more expensive and time-consuming analytical procedure thatreduces to 1% only improves from 11 to 10%
Origin of Sampling Variance
To understand the nature of the uncertainty in selecting a sample for analysis, consider a ran-dom mixture of two kinds of solid particles. The theory of probability allows us to state thelikelihood that a randomly drawn sample has the same composition as the bulk sample. Itmay surprise you to learn how large a sample is required for accurate sampling.9
Suppose that the mixture contains particles of type A and particles of type B. Theprobabilities of drawing A or B from the mixture are
(28-2)
(28-3)
If n particles are drawn at random, the expected number of particles of type A is np and thestandard deviation of many drawings is known from the binomial distribution to be
(28-4)
Example Statistics of Drawing Particles
A mixture contains 1% KCl particles and 99% particles. If particles are taken,what is the expected number of KCl particles, and what will be the standard deviation ifthe experiment is repeated many times?
Solution The expected number is just
and the standard deviation will be
The standard deviation applies to both kinds of particles. The standarddeviation is 9.9% of the expected number of KCl particles, but only 0.1% of the expectednumber of particles If you want to know how much nitrate is inthe mixture, this sample is probably sufficient. For chloride, 9.9% uncertainty may notbe acceptable.
How much sample corresponds to particles? Suppose that the particles are 1-mm-diameter spheres. The volume of a 1-mm-diameter sphere is Thedensity of KCl is 1.984 g/mL and that of is 2.109 g/mL, so the average density of themixture is The mass of mixture containing
particles is If you take 11.0-g test por-tions from a larger laboratory sample, the expected sampling standard deviation for chlorideis 9.9%. The sampling standard deviation for nitrate will be only 0.1%.
How can you prepare a mixture of 1-mm-diameter particles? You might make such amixture by grinding larger particles and passing them through a 16 mesh sieve, whose screenopenings are squares with sides of length 1.18 mm (Table 28-2). Particles that pass throughthe screen are then passed through a 20 mesh sieve, whose openings are 0.85 mm, and
(104)(0.524 � 103 mL)(2.108 g/mL) � 11.0 g.104(0.01)(1.984) � (0.99)(2.109) � 2.108 g/mL.
KNO3
43�(0.5 mm)3 � 0.524 L.
104
(nq � 9 900).KNO3
2npq
Standard deviation � 2npq � 2(104)(0.01)(0.99) � 9.9
Expected number of KCl particles � np � (104)(0.01) � 100 particles
104KNO3
sn � 2npqStandard deviation in sampling operation:
q � probability of drawing B �nB
nA � nB� 1 p
p � probability of drawing A �nA
nA � nB
nBnA
(20.102 � 0.012 � 0.10).sosa
(20.102 � 0.052 � 0.11).sass
sssa
so2 � sa
2 � ss2
ss2sa
2,so
2,Variance � (standard deviation)2
Totalvariance �
analyticalvariance �
samplingvariance
Wow! I’m surprised that such a large samplehas such a large standard deviation.

28-1 Statistics of Sampling 647
material that does not pass is retained for your sample. This procedure gives particles whosediameters are in the range 0.85–1.18 mm. We refer to the size range as 16/20 mesh.
Suppose that much finer particles of 80/120 mesh size were used instead. Now the mass containing particles is
reduced from 11.0 to 0.038 8 g. We could analyze a larger sample to reduce the samplinguncertainty for chloride.
Example Reducing Sample Uncertainty with a Larger Test Portion
How many grams of 80/120 mesh sample are required to reduce the chloride samplinguncertainty to 1%?
Solution We are looking for a standard deviation of 1% of the number of KCl:
Using and we find particles. With a particle volumeof 1.84 nL and an average density of 2.108 g/mL, the mass required for 1% chloridesampling uncertainty is
Even with an average particle diameter of we must analyze 3.84 g to reducethe sampling uncertainty to 1%. There is no point using an expensive analytical methodwith a precision of 0.1%, because the overall uncertainty will still be 1% from samplinguncertainty.
Sampling uncertainty arises from the random nature of drawing particles from a mixture.If the mixture is a liquid and the particles are molecules, there are about Itwill not require much volume of homogeneous liquid solution to reduce the sampling error toa negligible value. Solids, however, must be ground to very fine dimensions, and large quan-tities must be used to ensure a small sampling variance. Grinding invariably contaminates thesample with material from the grinding apparatus.
Table 28-3 illustrates another problem with heterogeneous materials. Nickel ore wascrushed into small particles that were sieved and analyzed. Parts of the ore that are deficientin nickel are relatively resistant to fracture, so the larger particles do not have the same chem-ical composition as the smaller particles. It is necessary to grind the entire ore to a fine powerto have any hope of obtaining a representative sample.
1022 particles/mL.
152 m,
Mass � (9.9 � 105 particles) a1.84 � 106mL
particleb a2.108
g
mLb � 3.84 g
n � 9.9 � 105q � 0.99,p � 0.01
�n � 2npq � (0.01)np
particles (� 1% of np)
104average volume � 1.84 nL)(average diameter � 152 m,
Table 28-2 Standard test sieves
Screen opening Screen openingSieve number (mm) Sieve number (mm)
5 4.00 45 0.3556 3.35 50 0.3007 2.80 60 0.2508 2.36 70 0.212
10 2.00 80 0.18012 1.70 100 0.15014 1.40 120 0.12516 1.18 140 0.10618 1.00 170 0.09020 0.850 200 0.07525 0.710 230 0.06330 0.600 270 0.05335 0.500 325 0.04540 0.425 400 0.038
EXAMPLE: Particles designated 50/100 mesh pass through a 50 mesh sieve but are retained by a 100 mesh sieve. Their sizeis in the range 0.150–0.300 mm.
There is no advantage to reducing theanalytical uncertainty if the samplinguncertainty is high, and vice versa.
Table 28-3 Nickel contentof crushed ore
Particle Ni contentmesh size (wt%)
120/23025/12010/25
NOTE: Uncertainty is standard deviation.
SOURCE: J. G. Dunn. D. N. Phillips. and W. vanBronswijk. “An Exercise to Illustrate the Importanceof Sample Preparation in Analytical Chemistry,” J. Chem. Ed. 1997, 74, 1188.
�1
9.08 � 0.697 1010.54 � 0.8413.22 � 0.4913.20 � 0.7413.52 � 0.696 230

648 CHAPTER 28 Sample Preparation
Choosing a Sample SizeA well-mixed powder containing KCl and is an example of a heterogeneous materialin which the variation from place to place is random. How much of a random mixture shouldbe analyzed to reduce the sampling variance for one analysis to a desired level?
To answer this question, consider Figure 28-3, which shows results for sampling theradioisotope in human liver. The tissue was “homogenized” in a blender but was nottruly homogeneous, because it was a suspension of small particles in water. The averagenumber of radioactive counts per second per gram of sample was about 237. When the massof sample for each analysis was about 0.09 g, the standard deviation (shown by the error barat the left in the diagram) was counts per second per gram of homogenate, which is
of the mean value (237). When the sample size was increased to about 1.3 g, thestandard deviation decreased to or of the mean. For a sample sizenear 5.8 g, the standard deviation was reduced to or of the mean.�2.4%�5.7 counts/s/g,
�5.5%�13 counts/s/g,�13.1%
�31
24Na
KNO3
210
0.1
Cou
nts
per
seco
nd p
er g
ram
Sample mass (g)
Average= 237
Ks
170
250
290
1 10
Figure 28-3 Sampling diagram of experi-mental results for in liver homogenate.Dots are experimental points, and error barsextend standard deviation about the mean.Note that the scale on the abscissa is logarithmic.[From B.Kratochvil and J.K. Taylor, “Sampling for
Chemical Analysis,” Anal. Chem. 1981, 53, 925A;
National Bureau of Standards Internal Report 80-2164,
1980, p. 66.]
�1
24Na
Table 28-4 Calculation of sampling constantfor Figure 28-3
Sample Relativemass, m standard mR2
(g) deviation (%) (g)
0.09 13.1 15.41.3 5.5 39.35.8 2.4 33.4
Equation 28-4 told us that when n particles are drawn from a mixture of two kinds ofparticles (such as liver tissue particles and droplets of water), the sampling standard devia-tion will be where p and q are the fraction of each kind of particle present. Therelative standard deviation is The relative variance, istherefore
(28-5)
Noting that the mass of sample drawn, m, is proportional to the number of particles drawn,we can rewrite Equation 28-5 in the form
Sampling constant: (28-6)
in which R is the relative standard deviation (expressed as a percentage) due to sampling andis called the sampling constant. is the mass of sample producing a relative sampling
standard deviation of 1%.Let’s see if Equation 28-6 describes Figure 28-3. Table 28-4 shows that is approxi-
mately constant for large samples, but agreement is poor for the smallest sample. Attributingthe poor agreement at low mass to random sampling variation, we assign in Equa-tion 28-6. This is the average from the 1.3- and 5.8-g samples in Table 28-4.
Example Mass of Sample Required to Produce a Given Sampling Variance
What mass in Figure 28-3 will give a sampling standard deviation of ?
Solution With the sampling constant the answer is
A 0.7-g sample should give sampling standard deviation. This is strictly a samplingstandard deviation. The net variance will be the sum of variances from sampling and fromanalysis (Equation 28-1).
�7%
m �Ks
R2�
36 g
72� 0.73 g
Ks � 36 g,
�7%
Ks � 36 g
mR2
KsKs
mR2 � Ks
Relative variance � R2 � a�n
nb2
�pq
n1 nR2 � pq
(�n/n)2,�n/n � 2npq/n � 2pq/n.�n � 2npq,
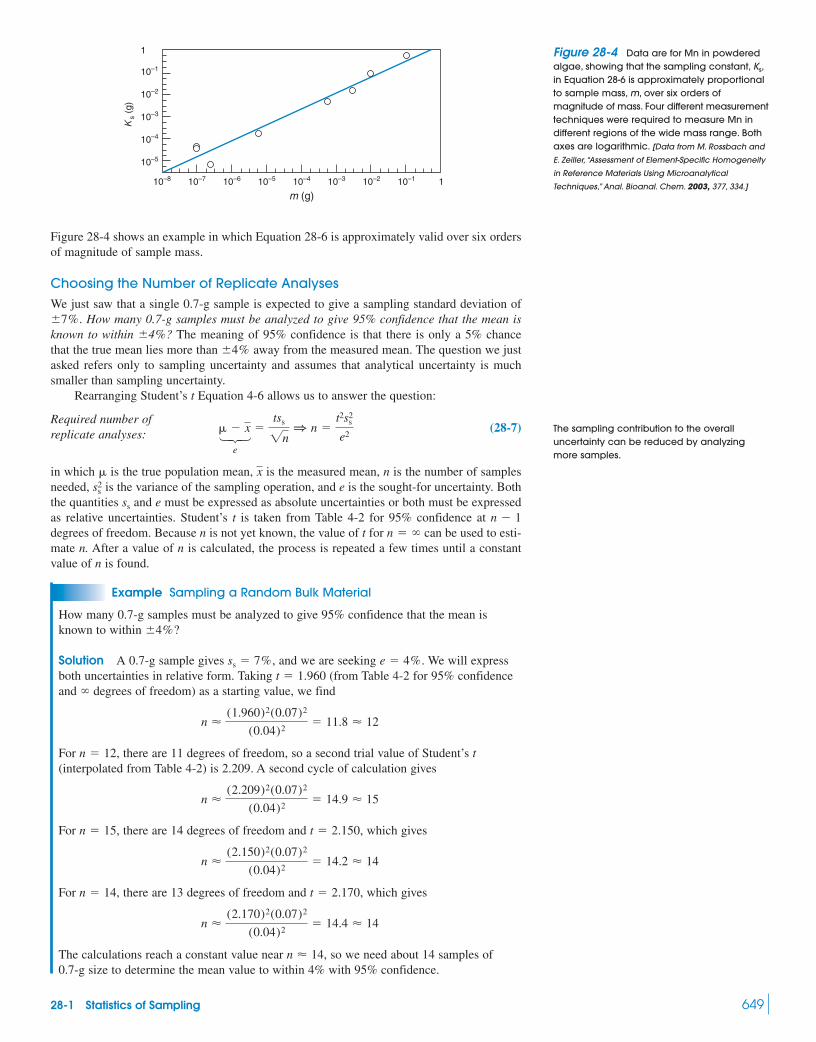
28-1 Statistics of Sampling 649
Figure 28-4 shows an example in which Equation 28-6 is approximately valid over six ordersof magnitude of sample mass.
Choosing the Number of Replicate AnalysesWe just saw that a single 0.7-g sample is expected to give a sampling standard deviation of
. How many 0.7-g samples must be analyzed to give 95% confidence that the mean isknown to within ? The meaning of 95% confidence is that there is only a 5% chancethat the true mean lies more than away from the measured mean. The question we justasked refers only to sampling uncertainty and assumes that analytical uncertainty is muchsmaller than sampling uncertainty.
Rearranging Student’s t Equation 4-6 allows us to answer the question:
(28-7)123
e
in which is the true population mean, is the measured mean, n is the number of samplesneeded, is the variance of the sampling operation, and e is the sought-for uncertainty. Boththe quantities and e must be expressed as absolute uncertainties or both must be expressedas relative uncertainties. Student’s t is taken from Table 4-2 for 95% confidence at degrees of freedom. Because n is not yet known, the value of t for can be used to esti-mate n. After a value of n is calculated, the process is repeated a few times until a constantvalue of n is found.
Example Sampling a Random Bulk Material
How many 0.7-g samples must be analyzed to give 95% confidence that the mean isknown to within ?
Solution A 0.7-g sample gives and we are seeking We will expressboth uncertainties in relative form. Taking (from Table 4-2 for 95% confidenceand degrees of freedom) as a starting value, we find
For there are 11 degrees of freedom, so a second trial value of Student’s t(interpolated from Table 4-2) is 2.209. A second cycle of calculation gives
For there are 14 degrees of freedom and which gives
For there are 13 degrees of freedom and which gives
The calculations reach a constant value near so we need about 14 samples of0.7-g size to determine the mean value to within 4% with 95% confidence.
n � 14,
n �(2.170)2(0.07)2
(0.04)2� 14.4 � 14
t � 2.170,n � 14,
n �(2.150)2(0.07)2
(0.04)2� 14.2 � 14
t � 2.150,n � 15,
n �(2.209)2(0.07)2
(0.04)2� 14.9 � 15
n � 12,
n �(1.960)2(0.07)2
(0.04)2� 11.8 � 12
�t � 1.960
e � 4%.ss � 7%,
�4%
n � �n 1
ss
s2s
x
x �tss2n
1 n �t2s2
s
e2
Required number ofreplicate analyses:
�4%�4%
�7%
Ks
(g)
m (g)
1
10–1
10–2
10–3
10–4
10–5
10–8 10–7 10–6 10–5 10–4 10–3 10–2 10–1 1
The sampling contribution to the overalluncertainty can be reduced by analyzingmore samples.
Figure 28-4 Data are for Mn in powderedalgae, showing that the sampling constant,in Equation 28-6 is approximately proportionalto sample mass, m, over six orders ofmagnitude of mass. Four different measurementtechniques were required to measure Mn indifferent regions of the wide mass range. Bothaxes are logarithmic. [Data from M. Rossbach and
E. Zeiller, “Assessment of Element-Specific Homogeneity
in Reference Materials Using Microanalytical
Techniques,” Anal. Bioanal. Chem. 2003, 377, 334.]
Ks,
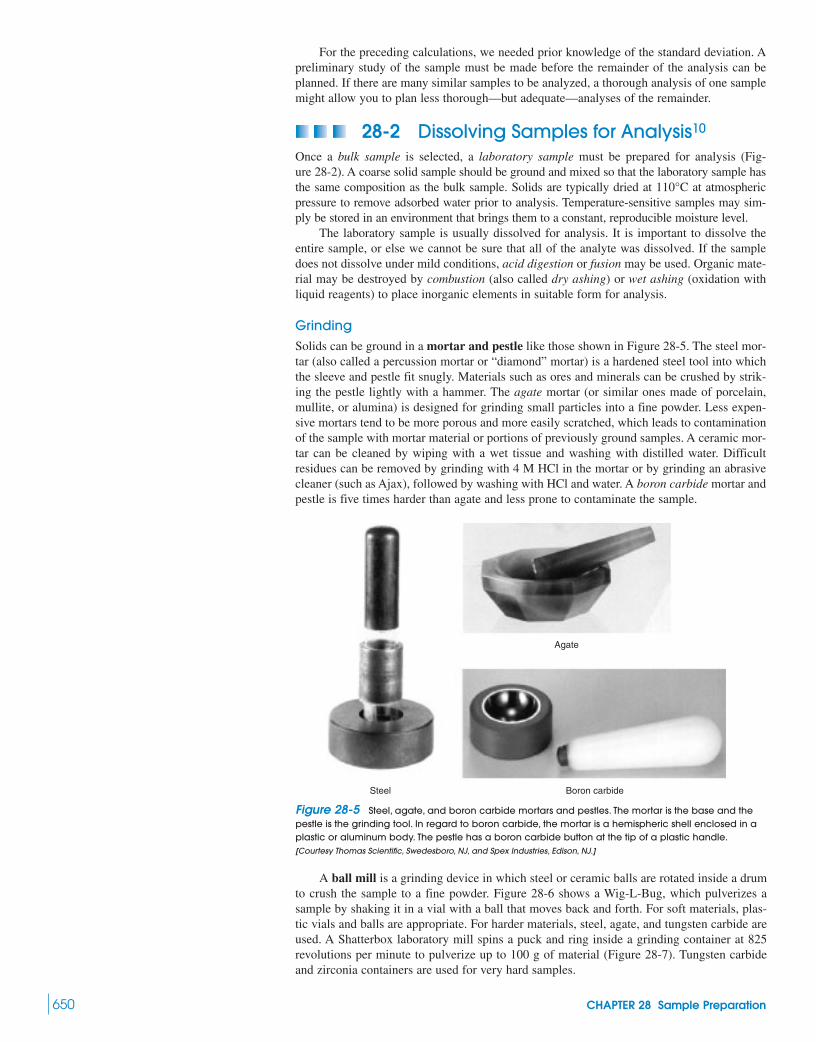
650 CHAPTER 28 Sample Preparation
For the preceding calculations, we needed prior knowledge of the standard deviation. Apreliminary study of the sample must be made before the remainder of the analysis can beplanned. If there are many similar samples to be analyzed, a thorough analysis of one samplemight allow you to plan less thorough—but adequate—analyses of the remainder.
28-2 Dissolving Samples for Analysis10
Once a bulk sample is selected, a laboratory sample must be prepared for analysis (Fig-ure 28-2). A coarse solid sample should be ground and mixed so that the laboratory sample hasthe same composition as the bulk sample. Solids are typically dried at at atmosphericpressure to remove adsorbed water prior to analysis. Temperature-sensitive samples may sim-ply be stored in an environment that brings them to a constant, reproducible moisture level.
The laboratory sample is usually dissolved for analysis. It is important to dissolve theentire sample, or else we cannot be sure that all of the analyte was dissolved. If the sampledoes not dissolve under mild conditions, acid digestion or fusion may be used. Organic mate-rial may be destroyed by combustion (also called dry ashing) or wet ashing (oxidation withliquid reagents) to place inorganic elements in suitable form for analysis.
GrindingSolids can be ground in a mortar and pestle like those shown in Figure 28-5. The steel mor-tar (also called a percussion mortar or “diamond” mortar) is a hardened steel tool into whichthe sleeve and pestle fit snugly. Materials such as ores and minerals can be crushed by strik-ing the pestle lightly with a hammer. The agate mortar (or similar ones made of porcelain,mullite, or alumina) is designed for grinding small particles into a fine powder. Less expen-sive mortars tend to be more porous and more easily scratched, which leads to contaminationof the sample with mortar material or portions of previously ground samples. A ceramic mor-tar can be cleaned by wiping with a wet tissue and washing with distilled water. Difficultresidues can be removed by grinding with 4 M HCl in the mortar or by grinding an abrasivecleaner (such as Ajax), followed by washing with HCl and water. A boron carbide mortar andpestle is five times harder than agate and less prone to contaminate the sample.
110°C
Agate
Boron carbideSteel
Figure 28-5 Steel, agate, and boron carbide mortars and pestles. The mortar is the base and thepestle is the grinding tool. In regard to boron carbide, the mortar is a hemispheric shell enclosed in aplastic or aluminum body. The pestle has a boron carbide button at the tip of a plastic handle.[Courtesy Thomas Scientific, Swedesboro, NJ, and Spex Industries, Edison, NJ.]
A ball mill is a grinding device in which steel or ceramic balls are rotated inside a drumto crush the sample to a fine powder. Figure 28-6 shows a Wig-L-Bug, which pulverizes asample by shaking it in a vial with a ball that moves back and forth. For soft materials, plas-tic vials and balls are appropriate. For harder materials, steel, agate, and tungsten carbide areused. A Shatterbox laboratory mill spins a puck and ring inside a grinding container at 825revolutions per minute to pulverize up to 100 g of material (Figure 28-7). Tungsten carbideand zirconia containers are used for very hard samples.

28-2 Dissolving Samples for Analysis 651
Dissolving Inorganic Materials with AcidsTable 28-5 lists acids commonly used for dissolving inorganic materials. The nonoxidizing acidsHCl, HBr, HF, , dilute and dilute dissolve metals by the redox reaction
(28-8)
Metals with negative reduction potentials should dissolve, although some, such as Al, form aprotective oxide coat that inhibits dissolution. Volatile species formed by protonation ofanions such as carbonate sulfide phosphide
fluoride and borate will be lost from hot acidsin open vessels. Volatile metal halides such as and and some molecular oxidessuch as and also can be lost. Hot hydrofluoric acid is especially useful for dis-solving silicates. Glass or platinum vessels can be used for HCl, HBr, and
HF should be used in Teflon, polyethylene, silver, or platinum vessels. The highest-quality acids must be used to minimize contamination by the concentrated reagent.
Substances that do not dissolve in nonoxidizing acids may dissolve in the oxidizingacids hot, concentrated or hot, concentrated HClO4. Nitric acid attacks mostmetals, but not Au and Pt, which dissolve in the 3:1 (vol/vol) mixture of calledaqua regia. Strong oxidants such as or in HCl dissolve difficult materials such asIr at elevated temperature. A mixture of and HF attacks the refractory carbides,nitrides, and borides of Ti, Zr, Ta, and W. A powerful oxidizing solution known as “piranhasolution” is a 1:1 (vol/vol) mixture of 30 wt% plus 98 wt% Hot, concentrated
(described later for organic substances) is a DANGEROUS, powerful oxidant whose oxi-dizing power is increased by adding concentrated and catalysts such as or
Digestion is conveniently carried out in a Teflon-lined bomb (a sealed vessel) heated ina microwave oven.11 The vessel in Figure 28-8 has a volume of 23 mL and digests up to 1 gof inorganic material in up to 15 mL of concentrated acid or digests 0.1 g of organic material,
CrO3.V2O5H2SO4
HClO4
H2SO4.H2O2
HNO3
HClO4Cl2
HCl:HNO3
H2SO4,HNO3,
HClO4.H3PO4,H2SO4,
RuO4OsO4
HgCl2SnCl4
(BO33 S H3BO3)(F S HF),(P3 S PH3),
(S2 S H2S),(CO23 S H2CO3 S CO2),
M � nH� S Mn� �n
2H2
HClO4H2SO4,H3PO4
Shatterbox grinding action
Figure 28-6 Wig-L-Bug sample shaker and polystyrene vial and ball for pulverizing soft materials.The arrow shows the direction of shaking. [Courtesy Spex Industries, Edison, NJ.]
Figure 28-7 Shatterbox laboratory millspins a puck and ring inside a container athigh speed to grind up to 100 mL of sample toa fine powder. [Courtesy Spex Industries, Edison, NJ.]
HF causes excruciating burns. Exposure of just2% of your body to concentrated (48 wt%) HFcan kill you. Flood the affected area with waterfor 5 min and then coat the skin with 2.5%calcium gluconate gel kept in the lab for thispurpose, and seek medical help. If the gel isnot available, use whatever calcium salt ishandy. HF damage can continue to developdays after exposure.

652 CHAPTER 28 Sample Preparation
which releases a great deal of Microwave energy heats the contents to in aminute. To prevent explosions, the lid releases gas from the vessel if the internal pressureexceeds 8 MPa (80 bar). The bomb cannot be made of metal, which absorbs microwaves. Anadvantage of a bomb is that it is cooled prior to opening, thus preventing loss of volatileproducts.
Dissolving Inorganic Materials by FusionSubstances that will not dissolve in acid can usually be dissolved by a hot, molten inorganicflux (Table 28-6). Finely powdered unknown is mixed with 2 to 20 times its mass of solidflux, and fusion (melting) is carried out in a platinum–gold alloy crucible at to in a furnace or over a burner. The apparatus in Figure 28-9 fuses three samples at once overpropane burners with mechanical agitation of the crucibles. When the samples are homoge-
1 200°C300°
200°CCO2(g).
Pressure-relieflid
TeflonO-ring
Teflonvessel
and cap
Nonmetallicouter body
Figure 28-9 Automated apparatus thatfuses three samples at once over propaneburners. It also provides mechanical agitationof the Pt/Au crucibles. Crucibles are shownin the tipped position used to pour contentsout after fusion is complete. [Courtesy Spex
Industries, Edison, NJ.]
Figure 28-8 Microwave digestion bomb lined with Teflon. The outer container retains strength tobut rarely reaches [Courtesy Parr Instrument Co., Moline, IL.]50°C.150°C
Table 28-5 Acids for sample dissolution
Typicalcomposition(wt% and
Acid density) Notes
HCl 37% Nonoxidizing acid useful for many metals, oxides, sulfides, carbonates, and phosphates. Constant1.19 g/mL boiling composition at is 20% HCl. As, Sb, Ge, and Pb form volatile chlorides that may
be lost from an open vessel.
HBr 48–65% Similar to HCl in solvent properties. Constant boiling composition at is 48% HBr.
95–98% Good solvent at its boiling point of Attacks metals. Dehydrates and oxidizes organic1.84 g/mL compounds.
85% Hot acid dissolves refractory oxides insoluble in other acids. Becomes anhydrous above 1.70 g/mL Dehydrates to pyrophosphoric acid above and dehydrates further
to metaphosphoric acid above
HF 50% Used primarily to dissolve silicates, making volatile This product and excess HF are removed1.16 g/mL by adding or and heating. Constant boiling composition at is 38% HF.
Used in Teflon, silver, or platinum containers. Extremely harmful upon contact or inhalation.Fluorides of As, B, Ge, Se, Ta, Nb, Ti, and Te are volatile. and precipitate.
is removed by adding and taking to dryness with present.
60–72% Cold and dilute acid are not oxidizing, but hot, concentrated acid is an extremely powerful,1.54–1.67 g/mL explosive oxidant, especially useful for organic matter that has already been partially oxidized
by hot Constant boiling composition at is 72%. Before using evaporatethe sample to near dryness several times with hot to destroy as much organicmaterial as possible.
HNO3
HClO4,203°CHNO3.
HClO4
H2SO4H3BO3F
YF3CaF2,LaF3,
112°CHClO4H2SO4
SiF4.
300°C.([HPO3]n)200°C(H2PO3ßOßPO3H2)
150°C.H3PO4
338°C.H2SO4
124°C
109°C

28-2 Dissolving Samples for Analysis 653
neous, the molten flux is poured into beakers containing 10 wt% aqueous to dissolvethe product.
Most fusions use lithium tetraborate lithium metaborateor a mixture of the two. A nonwetting agent such as KI can be added
to prevent the flux from sticking to the crucible. For example, 0.2 g of cement might be fusedwith 2 g of and 30 mg of KI.
A disadvantage of a flux is that impurities are introduced by the large mass of solidreagent. If part of the unknown can be dissolved with acid prior to fusion, it should be dis-solved. Then the insoluble component is dissolved with flux and the two portions are com-bined for analysis.
Basic fluxes in Table 28-6 ( NaOH, KOH, and ) are best used todissolve acidic oxides of Si and P. Acidic fluxes ( and ) aremost suitable for basic oxides (including cements and ores) of the alkali metals, alkalineearths, lanthanides, and Al. is useful for lanthanide oxides. Sulfides and some oxides,some iron and platinum alloys, and some silicates require an oxidizing flux for dissolution.For this purpose, pure may be suitable or oxidants such as or Na2O2KClO3,KNO3,Na2O2
KHF2
B2O3K2S2O7,Na2B4O7,Li2B4O7,Na2O2LiBO2, Na2CO3,
Li2B4O7
(LiBO2, m.p. 845°C),(Li2B4O7, m.p. 930°C),
HNO3
Table 28-6 Fluxes for sample dissolution
Flux
oror
NaOH orKOH
Li2B4O7 �Li2SO4
(2:1 wt/wt)
B2O3
K2S2O7
Na2O2
Na2B4O7
LiBO2
Li2B4O7
Na2CO3
Crucible
Pt
Pt, graphiteAu-Pt alloy,Au-Rh-Pt alloy
Au, Ag
Zr, Ni
Porcelain,Au, Pt
Pt
Pt
SiO2,
Uses
For dissolving silicates (clays, rocks,minerals, glasses), refractory oxides,insoluble phosphates, and sulfates.
Individual or mixed borates are used todissolve aluminosilicates, carbonates, andsamples with high concentrations of basicoxides. is called tetraborate and is metaborate.
Dissolves silicates and SiC. Frothing occurswhen is eliminated from flux, so it isbest to prefuse flux and then add sample.Analytical capabilities are limited byimpurities in NaOH and KOH.
Strong base and powerful oxidant good forsilicates not dissolved by Useful for iron and chromium alloys. Because itslowly attacks crucibles, a good procedureis to coat the inside of a Ni crucible withmolten cool, and add Theperoxide melts at lower temperature thanthe carbonate, which shields the cruciblefrom the melt.
Potassium pyrosulfate is preparedby heating until all water is lost andfoaming ceases. Alternatively, potassiumpersulfate decomposes to upon heating. Good for refractory oxides,not silicates.
Useful for oxides and silicates. Principaladvantage is that flux can be completelyremoved as volatile methyl borate
by several treatments with HClin methanol.
Example of a powerful mixture for dissolvingrefractory silicates and oxides in 10–20 minat One gram of flux dissolves 0.1 gof sample. The solidified melt dissolvesreadily in 20 mL of hot 1.2 M HCl.
1 000°C.
([CH3O]3B)
K2S2O7(K2S2O8)
KHSO4
(K2S2O7)
Na2O2.Na2CO3,
Na2CO3.
H2O
BO2B4O7
2
Fusion is a last resort, because the flux canintroduce impurities.

654 CHAPTER 28 Sample Preparation
can be added to Boric oxide can be converted into after fusion and com-pletely evaporated. The solidified flux is treated with 100 mL of methanol saturated with HClgas and heated gently. The procedure is repeated several times, if necessary, to remove all ofthe boron.
Decomposition of Organic SubstancesDigestion of organic material is classified as either dry ashing, when the procedure does notinclude liquid, or wet ashing, when liquid is used. Occasionally, fusion with (calledParr oxidation) or alkali metals may be carried out in a sealed bomb. Section 27-4 discussedcombustion analysis, in which C, H, N, S, and halogens are measured.
Convenient wet-ashing procedures include microwave digestion with acid in a Teflonbomb (Figure 28-8). For example, 0.25 g of animal tissue can be digested for metal analysisby placing the sample in a 60-mL Teflon vessel containing 1.5 mL of high-purity 70% plus 1.5 mL of high-purity 96% and heating it in a 700-W kitchen microwave ovenfor 1 min.12 Teflon bombs fitted with temperature and pressure sensors allow safe, program-mable control of digestion conditions. An important wet-ashing process is Kjeldahl digestionwith for nitrogen analysis (Section 7-2).
In the Carius method, digestion is performed with fuming (which contains excessdissolved ) in a sealed, heavy-walled glass tube at For safety, the glass Car-ius tube should be contained in a steel vessel pressurized to approximately the same pressureexpected inside the glass tube.13 For trace analysis, sample should be placed inside a fused-silica tube inside the glass tube. Silica provides as little as 1–10% as much extractable metalas glass.14
Figure 28-10 shows microwave wet-ashing apparatus. Sulfuric acid or a mixture ofand ( of acid per gram of unknown) is added to an organic substance
in a glass digestion tube fitted with the reflux cap. In the first step, the sample is carbonizedfor 10 to 20 min at gentle reflux until all particles have dissolved and the solution has a uni-form black appearance. Power is turned off and the sample is allowed to cool for l–2 min.Next, oxidation is carried out by adding or through the reflux cap until the colordisappears or the solution is just barely tinted. If the solution is not homogeneous, the poweris turned up and the sample is heated to bring all solids into solution. Repeated cycles of
HNO3H2O2
�15 mLHNO3H2SO4
200°–300°C.NO2
HNO3
H2SO4
H2SO4
HNO3
Na2O2
B(OCH3)3Na2CO3.
Reflux capDigestiontubes
Microwave heaterand controller
Peristalticpump
Figure 28-10 Microwave apparatus for digesting organic materials by wet ashing.[Courtesy Spex Industries, Edison, NJ.]
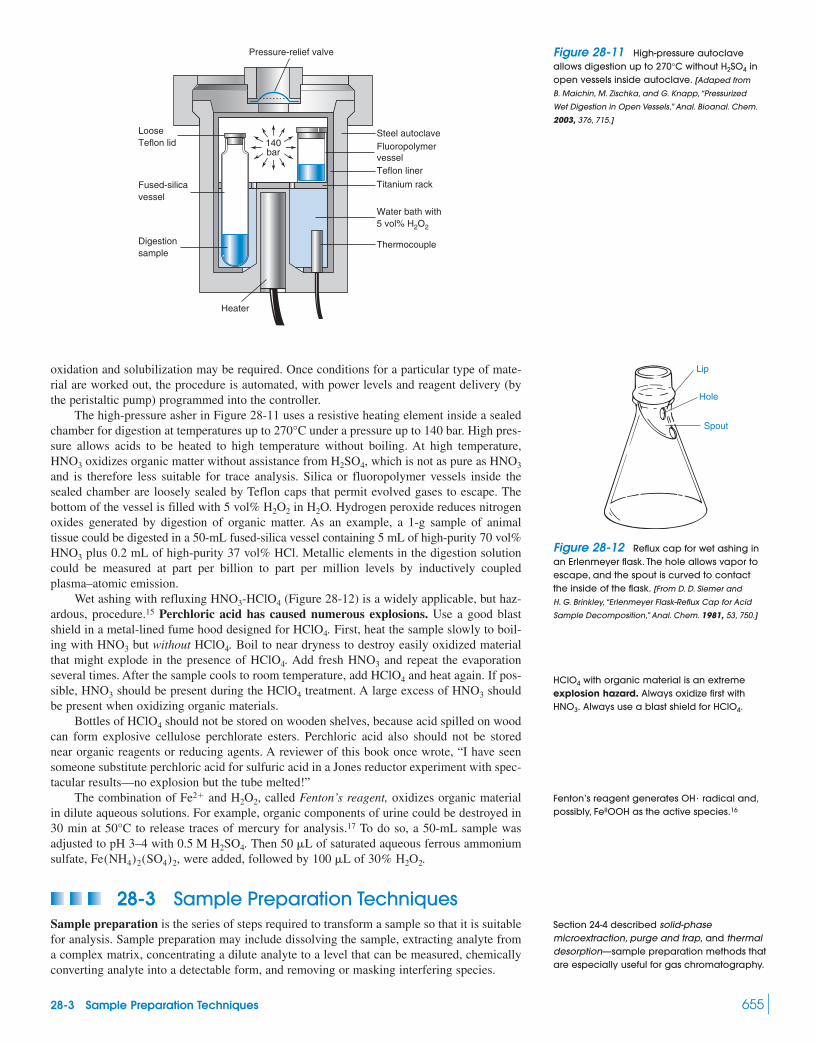
28-3 Sample Preparation Techniques 655
oxidation and solubilization may be required. Once conditions for a particular type of mate-rial are worked out, the procedure is automated, with power levels and reagent delivery (bythe peristaltic pump) programmed into the controller.
The high-pressure asher in Figure 28-11 uses a resistive heating element inside a sealedchamber for digestion at temperatures up to under a pressure up to 140 bar. High pres-sure allows acids to be heated to high temperature without boiling. At high temperature,
oxidizes organic matter without assistance from which is not as pure as and is therefore less suitable for trace analysis. Silica or fluoropolymer vessels inside thesealed chamber are loosely sealed by Teflon caps that permit evolved gases to escape. Thebottom of the vessel is filled with 5 vol% in Hydrogen peroxide reduces nitrogenoxides generated by digestion of organic matter. As an example, a 1-g sample of animaltissue could be digested in a 50-mL fused-silica vessel containing 5 mL of high-purity 70 vol%
plus 0.2 mL of high-purity 37 vol% HCl. Metallic elements in the digestion solutioncould be measured at part per billion to part per million levels by inductively coupledplasma–atomic emission.
Wet ashing with refluxing (Figure 28-12) is a widely applicable, but haz-ardous, procedure.15 Perchloric acid has caused numerous explosions. Use a good blastshield in a metal-lined fume hood designed for First, heat the sample slowly to boil-ing with but without Boil to near dryness to destroy easily oxidized materialthat might explode in the presence of Add fresh and repeat the evaporationseveral times. After the sample cools to room temperature, add and heat again. If pos-sible, should be present during the treatment. A large excess of shouldbe present when oxidizing organic materials.
Bottles of should not be stored on wooden shelves, because acid spilled on woodcan form explosive cellulose perchlorate esters. Perchloric acid also should not be storednear organic reagents or reducing agents. A reviewer of this book once wrote, “I have seensomeone substitute perchloric acid for sulfuric acid in a Jones reductor experiment with spec-tacular results—no explosion but the tube melted!”
The combination of and called Fenton’s reagent, oxidizes organic materialin dilute aqueous solutions. For example, organic components of urine could be destroyed in30 min at to release traces of mercury for analysis.17 To do so, a 50-mL sample wasadjusted to pH 3–4 with Then of saturated aqueous ferrous ammoniumsulfate, were added, followed by of
28-3 Sample Preparation TechniquesSample preparation is the series of steps required to transform a sample so that it is suitablefor analysis. Sample preparation may include dissolving the sample, extracting analyte froma complex matrix, concentrating a dilute analyte to a level that can be measured, chemicallyconverting analyte into a detectable form, and removing or masking interfering species.
30% H2O2.100 LFe(NH4)2(SO4)2,50 L0.5 M H2SO4.
50°C
H2O2,Fe2�
HClO4
HNO3HClO4HNO3
HClO4
HNO3HClO4.HClO4.HNO3
HClO4.
HNO3-HClO4
HNO3
H2O.H2O2
HNO3H2SO4,HNO3
270°C
Pressure-relief valve
Steel autoclaveLooseTeflon lid
Fused-silicavessel
Digestionsample
Heater
Fluoropolymervessel
Titanium rack
Water bath with5 vol% H2O2
Thermocouple
Teflon liner
140bar
Figure 28-11 High-pressure autoclaveallows digestion up to without inopen vessels inside autoclave. [Adaped from
B. Maichin, M. Zischka, and G. Knapp,“Pressurized
Wet Digestion in Open Vessels,” Anal. Bioanal. Chem.
2003, 376, 715.]
H2SO4270°C
Lip
Hole
Spout
Figure 28-12 Reflux cap for wet ashing inan Erlenmeyer flask. The hole allows vapor toescape, and the spout is curved to contactthe inside of the flask. [From D. D. Siemer and
H. G. Brinkley, “Erlenmeyer Flask-Reflux Cap for Acid
Sample Decomposition,” Anal. Chem. 1981, 53, 750.]
with organic material is an extremeexplosion hazard. Always oxidize first with
Always use a blast shield for HClO4.HNO3.
HClO4
Fenton’s reagent generates radical and,possibly, as the active species.16FeIIOOH
OH�
Section 24-4 described solid-phasemicroextraction, purge and trap, and thermaldesorption—sample preparation methods thatare especially useful for gas chromatography.

656 CHAPTER 28 Sample Preparation
Liquid Extraction TechniquesIn extraction, analyte is dissolved in a solvent that does not necessarily dissolve the entiresample and does not decompose the analyte. In a typical microwave-assisted extraction ofpesticides from soil, a mixture of soil plus acetone and hexane is placed in a Teflon-linedbomb (Figures 28-8 and 28-13) and heated by microwaves to This temperature is to higher than the boiling points of solvents at atmospheric pressure. Pesticides dis-solve, but the soil remains behind. The liquid is then analyzed by chromatography.
Acetone absorbs microwaves, so it can be heated in a microwave oven. Hexane does notabsorb microwaves. To perform an extraction with pure hexane, the liquid is placed in afluoropolymer insert inside the Teflon vessel in Figure 28-8.18 The walls of the insertcontain carbon black, which absorbs microwaves and heats the solvent.
Supercritical fluid extraction uses a supercritical fluid (Box 25-2) as the extractionsolvent.20 is the most common supercritical fluid because it is inexpensive and it elimi-nates the need for costly disposal of waste organic solvents. Addition of a second solventsuch as methanol increases the solubility of polar analytes. Nonpolar substances, such aspetroleum hydrocarbons, can be extracted with supercritical argon.21 The extraction processcan be monitored by infrared spectroscopy because Ar has no infrared absorption.
Figure 28-14a shows how a supercritical fluid extraction can be carried out. Pressurizedfluid is pumped through a heated extraction vessel. Fluid can be left in contact with the sam-ple for some time or it can be pumped through continuously. At the outlet of the extractionvessel, the fluid flows through a capillary tube to release pressure. Exiting evaporates,leaving extracted analyte in the collection vessel. Alternatively, the can be bubbledthrough a solvent in the collection vessel to leave a solution of analyte.
Figure 28-14b shows the extraction of organic compounds from dust collected with avacuum cleaner from door mats at the chemistry building of Ohio State University. The chro-matogram of the extract in Figure 28-14c exhibits myriad organic compounds that you and Iinhale in every breath.
Figure 28-15 shows glassware for continuous liquid-liquid extraction of a nonvolatileanalyte. In Figure 28-15a, the extracting solvent is denser than the liquid being extracted.Solvent boils from the flask and condenses into the extraction vessel. Dense droplets of
CO2
CO2
CO2
100°50°150°C.
Figure 28-13 Extraction vessels in a microwave oven that processes up to 12 samples in under 30 min. Each 100-mL vessel has a vent tube that releases vapor if the pressure exceeds 14 bar. Vaporsfrom the chamber are ultimately vented to a fume hood. The temperature inside each vessel can bemonitored and used to control the microwave power. [Courtesy CEM Corp., Matthews, NC.]
Some chelators can extract metal ions intosupercritical (containing small quantitiesof methanol or water). The ligand belowdissolves lanthanides and actinides:19
CO2
OO
£ £
CF2CF2CF3
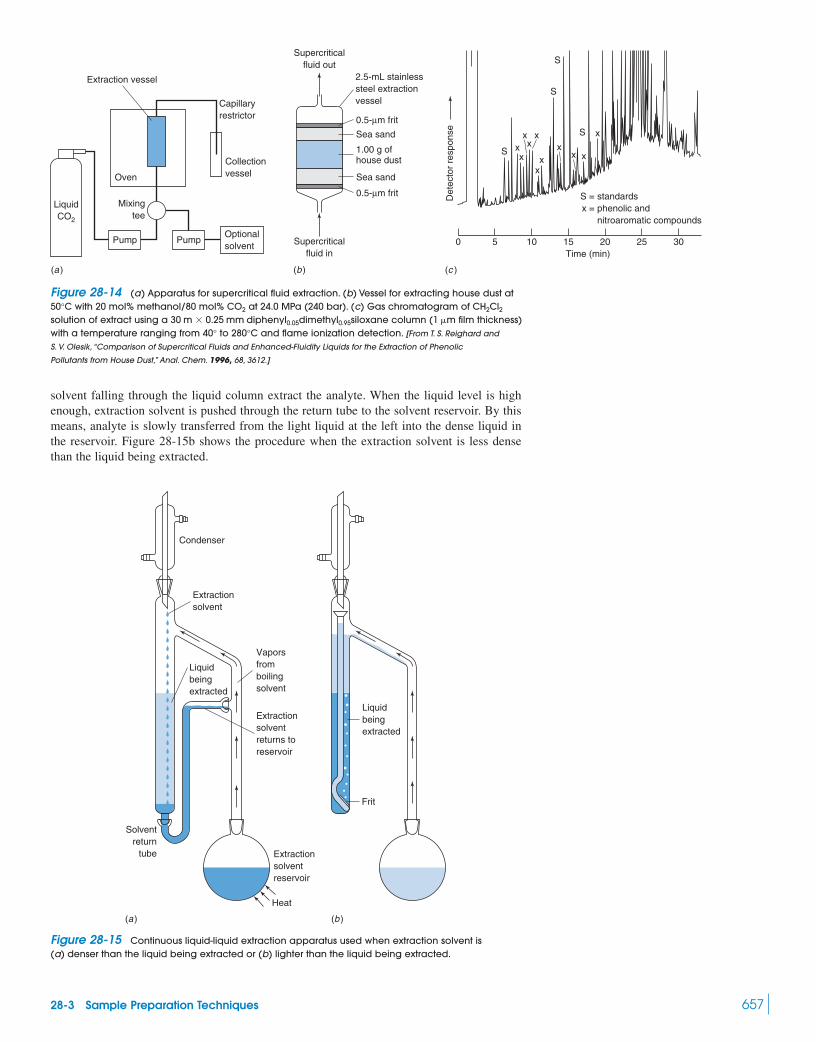
28-3 Sample Preparation Techniques 657
solvent falling through the liquid column extract the analyte. When the liquid level is highenough, extraction solvent is pushed through the return tube to the solvent reservoir. By thismeans, analyte is slowly transferred from the light liquid at the left into the dense liquid inthe reservoir. Figure 28-15b shows the procedure when the extraction solvent is less densethan the liquid being extracted.
S =x =
standardsphenolic andnitroaromatic compounds
30252015Time (min)
1050
Det
ecto
r re
spon
se
Supercriticalfluid out
Supercriticalfluid in
2.5-mL stainlesssteel extractionvessel
0.5-µm frit
0.5-µm frit
1.00 g ofhouse dust
Sea sand
Sea sand
LiquidCO2
Extraction vessel
Oven
Pump Pump
Mixingtee
Collectionvessel
Capillaryrestrictor
Optionalsolvent
(a ) (b ) (c )
S
S
S
S xx
xx
x
xx
xx x
x
Figure 28-14 (a) Apparatus for supercritical fluid extraction. (b) Vessel for extracting house dust atwith 20 mol% methanol/80 mol% at 24.0 MPa (240 bar). (c) Gas chromatogram of
solution of extract using a column ( film thickness)with a temperature ranging from to and flame ionization detection. [From T. S. Reighard and
S. V. Olesik, “Comparison of Supercritical Fluids and Enhanced-Fluidity Liquids for the Extraction of Phenolic
Pollutants from House Dust,” Anal. Chem. 1996, 68, 3612.]
280°C40°
1 m30 m � 0.25 mm diphenyl0.05dimethyl0.95siloxaneCH2Cl2CO250°C
Liquidbeingextracted
Frit
Liquidbeingextracted
Solventreturn
tube
Heat
Extractionsolventreservoir
Extractionsolventreturns toreservoir
Extractionsolvent
Vaporsfromboilingsolvent
Condenser
(a ) (b )
Figure 28-15 Continuous liquid-liquid extraction apparatus used when extraction solvent is(a) denser than the liquid being extracted or (b) lighter than the liquid being extracted.

658 CHAPTER 28 Sample Preparation
Solid-Phase Extraction22
Solid-phase extraction uses a small volume of a chromatographic stationary phase or mole-cularly imprinted polymer23 (Box 26-2) to isolate desired analytes from a sample. Theextraction removes much of the sample matrix to simplify the analysis. The opening of thischapter shows a solid-phase extraction membrane and extraction cartridges mounted onsyringes.
1. MeOH2. H2O
Desired analyte
Weaksolvent
Strongersolvent
Still strongersolvent
Conditioncolumn
(a) (b) (c) (d ) (e)
Apply crudesample
Elute weakly boundsolutes
Elute desiredanalyte
Figure 28-16 Steps in solid-phase extraction.
0 321 4 5
Time (min)
Abs
orba
nce
Direct injectionwithout cleanup
Proteins andnaproxen
Proteins
Naproxen
Nitrobenzeneinternal standard
Nitrobenzeneinternal standard
With solid-phaseextraction cleanup
Figure 28-17 HPLC of naproxen in bloodserum with no cleanup (upper trace) or withprior sample cleanup (lower trace) by solid-phase extraction on [From R. E. Majors
and A. D. Broske, “New Directions in Solid-Phase
Extraction Particle Design,” Am Lab. February 2002,
p. 22.]
C8-silica.
Figure 28-16 shows steps in the solid-phase extraction of 10 ng/mL of steroids fromurine. First, a syringe containing 1 mL of is conditioned with 2 mL of methanolto remove adsorbed organic material (Figure 28-16a). Then the column is washed with2 mL of water. When the 10-mL urine sample is applied, nonpolar components adhereto the and polar components pass through (Figure 28-16b). The column isthen rinsed with 4 mL of 25 mM borate buffer at pH 8 to remove polar substances (Figure28-16c). Then rinses with 4 mL of 40 vol% methanol/60% water and 4 mL of 20%acetone/80% water remove less polar substances (Figure 28-16d). Finally, elution withtwo 0.5-mL aliquots of 73% methanol/27% water washes the steroids from the column(Figure 28-16e).
Figure 28-17 compares chromatograms of the drug naproxen in blood serum with orwithout sample cleanup by solid-phase extraction. Without cleanup, serum proteins over-lap and obscure the signal from naproxen. Solid-phase extraction removes most of theprotein.
Solid-phase extractions can reduce solvent consumption in analytical chemistry. Forexample, a standard procedure approved by the U.S. Environmental Protection Agency forthe analysis of pesticides in wastewater requires 200 mL of dichloromethane for the liquid-liquid extraction of 1 L of water. The same analytes can be isolated by solid-phase extractionon disks. The pesticides are recovered from the disks by supercritical fluid extrac-tion with that is finally vented into a small volume of hexane. This one kind of analysiscan save of per year.24
PreconcentrationTrace analysis often requires preconcentration of analyte to bring it to a higher concen-tration prior to analysis. Metal ions in natural waters can be preconcentrated with cation-exchange resin. For example, a 500-mL volume of seawater adjusted to pH 6.5 withammonium acetate and ammonia was passed through 2 g of Chelex-100 in the formto trap all the trace-metal ions. Washing with eluted the metals in a total volumeof 10 mL, thereby giving a concentration increase of Metals in the solution were then analyzed by graphite furnace atomic absorption, with a typical detectionlimit for Pb being 15 pg/mL. The detection limit for Pb in the seawater is therefore 50times lower, or 0.3 pg/mL. Figure 28-18 shows the effect of pH on the recovery of metals
HNO3500/10 � 50.2 M HNO3
Mg2�
CH2Cl2105 kgCO2
C18-silica
C18-silica,
C18-silica
N Mg2�Resin ��
Chelex-100 in Mg2� form
CH2CO2
CH2CO2

28-3 Sample Preparation Techniques 659
from seawater. At low pH, competes with the metal ions for ion-exchange sites andprevents complete recovery.
Ion-exchange resins can capture basic or acidic gases. Carbonate liberated as fromused in nuclear fuel reprocessing can be measured by placing a
known amount of powdered solid in the test tube in Figure 28-19 and adding When the solution is purged with is captured quantitatively by moist anion-exchange resin in the side arm:
Carbonate is eluted from the resin with and measured by titration with acid.Table 28-7 gives other applications of this technique.
DerivatizationDerivatization is a procedure in which analyte is chemically modified to make it easier todetect or separate. For example, formaldehyde and other aldehydes and ketones in air, breath,or cigarette smoke25 can be trapped and derivatized by passing air through a tiny cartridgecontaining 0.35 g of silica coated with 0.3 wt% 2,4-dinitrophenylhydrazine. Carbonyls areconverted into the 2,4-dinitrophenylhydrazone derivative, which is eluted with 5 mL of aceto-nitrile and analyzed by HPLC. The products are readily detected by their strong ultravioletabsorbance near 360 nm.
1 M NaNO3
2 resin�OH � H2CO3 S (resin�)2CO23 � 2H2O
CO2 � H2O S H2CO3
CO2N2,3 M HNO3.
(ZrO)2CO3(OH)2 � xH2OCO2
H�
Figure 28-18 The pH dependence of the recovery of trace metals from seawater by Chelex-100. Thegraph shows the pH of the seawater when it was passed through the column. [From S.-C. Pai, Anal. Chim.
Acta 1988, 211, 271.]
0.5
2
Frac
tion
reco
vere
d
pH
1.0
3 4 5 6 7 81
Fe
Cu
CoZn
Ni
Cd
Mn
Pb
Table 28-7 Use of ion-exchange resin for trapping gases
Gas Species trapped Eluent Analytical method
Titrate with acidis oxidized to by The sulfate is measured by ion
chromatography.is oxidized to by The sulfate is measured by ion
chromatography.HCN Titration of with hypobromite:
NH�4 Colorimetric assay with Nessler’s reagent:
Nessler’s Absorbs stronglyreagent at 400–425 nm
SOURCE: D. D. Siemer, “Ion Exchange Resins for Trapping Gases: Carbonate Determination,” Anal. Chem. 1987, 59, 2439.
2K2HgI4 � 2NH3 S NH2Hg2I3 � 4KI � NH4I1 M NaNO3NH3
CN � OBr S CNO � Br
CN1 M Na2SO4CN
H2O2.SO42SO3
20.5 M Na2CO3 � H2O2SO32SO2
H2O2.SO42S20.5 M Na2CO3 � H2O2S2H2S
1 M NaNO3CO32CO2
Figure 28-19 Apparatus for trapping basicor acidic gases by ion exchange.[From D.D. Siemer,
“Ion Exchange Resins for Trapping Gases: Carbonate
Determination,” Anal. Chem. 1987, 59, 2439.]
Syringe
Needle
Ion-exchangeresin in1-mL chamber
Test tube
Plastic tube
Sample
R1
R2
O � H2NNH
Aldehydeor ketone
2,4-Dinitrophenylhydrazine
NO2
NO2
————
2,4-Dinitrophenylhydrazoneλmax ≈ 360 nm
R1
R2
NNH NO2
NO2—
———

660 CHAPTER 28 Sample Preparation
Terms to Understandaqua regiaball millbombderivatization
dry ashingextractionfluxfusion
mortar and pestlepreconcentrationsample preparationsampling
solid-phase extractionsupercritical fluid extractionwet ashing
SummaryThe variance of an analysis is the sum of the sampling variance andthe analytical variance. Sampling variance can be understood interms of the statistics of selecting particles from a heterogeneousmixture. If the probabilities of selecting two kinds of particles froma two-particle mixture are p and q, the standard deviation in select-ing n particles is . You should be able to use this relation toestimate how large a sample is required to reduce the sampling vari-ance to a desired level. Student’s t can be used to estimate howmany repetitions of the analysis are required to reach a certain levelof confidence in the final result.
Many inorganic materials can be dissolved in strong acids withheating. Glass vessels are often useful, but Teflon, platinum, or sil-ver are required for HF, which dissolves silicates. If a nonoxidizing
1npq
acid is insufficient, aqua regia or other oxidizing acids may do thejob. A Teflon-lined bomb heated in a microwave oven is a conven-ient means of dissolving difficult samples. If acid digestion fails,fusion in a molten salt will usually work, but the large quantity offlux adds trace impurities. Organic materials are decomposed bywet ashing with hot concentrated acids or by dry ashing with heat.
Analytes can be separated from complex matrices by samplepreparation techniques that include liquid extraction, supercriticalfluid extraction, and solid-phase extraction. Dilute ionic analytescan be preconcentrated by adsorption onto an ion-exchange resin.Nonionic analytes can be concentrated by solid-phase extraction.Derivatization transforms the analyte into a more easily detected orseparated form.
Exercises28-A. A box contains 120 000 red marbles and 880 000 yellowmarbles.(a) If you draw a random sample of 1 000 marbles from the box,what are the expected numbers of red and yellow marbles?(b) Now put those marbles back in the box and repeat the experi-ment. What will be the absolute and relative standard deviations forthe numbers in part (a) after many drawings of 1 000 marbles?(c) What will be the absolute and relative standard deviations aftermany drawings of 4 000 marbles?(d) If you quadruple the size of the sample, you decrease the sam-pling standard deviation by a factor of _____. If you increase thesample size by a factor of n, you decrease the sampling standarddeviation by a factor of _____.(e) What sample size is required to reduce the sampling standarddeviation of red marbles to ?
28-B. (a) What mass of sample in Figure 28-3 is expected to give asampling standard deviation of ?(b) With the mass from part (a), how many samples should be takento assure 95% confidence that the mean is known to within counts per second per gram?
28-C. Because they were used in gasoline to boost octane rating,alkyl lead compounds found their way into the environment as toxicpollutants. One way to measure lead compounds in natural waters isby anodic stripping voltammetry (Figure 17-20), in which the leadis first reduced to the element at a mercury electrode and dissolvesin the mercury. Reoxidation occurs when the electrode potential ismade sufficiently positive, with current proportional to the concen-tration of dissolved Pb.
Inorganic (ionic) forms of lead are present in much higher concen-
Pb (in Hg) S Pb2�(aq)Oxidation at 0.5 V:
(CH3CH2)3PbCl S Pb (in Hg)Reduction at 1.2 V:
�20
�10%
�2%
trations than alkyl lead in natural samples, so inorganic lead mustbe removed before analysis of alkyl lead. One way to do this is bycoprecipitation with as shown in the figure.
Coprecipitation of with from distilled water at pH 2. [Data from
N. Mikac and M. Branica, “Separation of Dissolved Alkyllead and Inorganic Lead
Species by Coprecipitation with BaSO4,” Anal. Chim. Acta 1988, 212, 349.]
In this experiment, added to in distilled water at theconcentration on the abscissa was precipitated with a 20% excessof and the residual concentration of lead was measuredby stripping voltammetry. Suggest control experiments thatshould be performed to show that coprecipitation can be used toremove a large amount of inorganic lead from a small quantity of
in seawater, without removing the alkyl leadcompound.
28-D. A soil sample contains some acid-soluble inorganic matter,some organic material, and some minerals that do not dissolve inany combination of hot acids that you try. Suggest a procedure fordissolving the entire sample.
(CH3CH2)3PbCl
Na2SO4
Pb2�BaCl2
BaSO4Pb2�
−8
−9
−10
−4−5 −3log [BaCl2] (M, added)
log
[Pb]
(M, d
isso
lved
)
BaSO4,

Problems 661
Problems
Statistics of Sampling
28-1. Explain what is meant by the statement “Unless the completehistory of any sample is known with certainty, the analyst is welladvised not to spend his or her time in analyzing it.”
28-2. Explain what is meant by “analytical quality” and “data quality”in the following quotation: “We need to update the environmentaldata quality model to explicitly distinguish analytical quality fromdata quality. We need to begin spending as much effort ensuringsample and subsample representativeness for heterogeneous matri-ces as we spend overseeing the analysis of an extract. We need tostop acting like data variability stemming from laboratory analysisis all-important while variability stemming from the samplingprocess can be ignored. . . .”26
28-3. (a) In the analysis of a barrel of powder, the standard devia-tion of the sampling operation is and the standard deviationof the analytical procedure is What is the overall standarddeviation?(b) To what value must the sampling standard deviation be reducedso that the overall standard deviation is ?
28-4. What mass of sample in Figure 28-3 is expected to give asampling standard deviation of ?
28-5. Explain how to prepare a powder with an average particlediameter near by using sieves from Table 28-2. How wouldsuch a particle mesh size be designated?
28-6. An example of a mixture of 1-mm-diameter particles of KCland in a number ratio 1:99 follows Equation 28-4. A samplecontaining particles weighs 11.0 g. What is the expected num-ber and relative standard deviation of KCl particles in a sampleweighing ?
28-7. When you flip a coin, the probability of its landing on eachside is in Equations 28-2 and 28-3. If you flip it n times,the expected number of heads equals the expected number of
The expected standard deviation for n flipsis From Table 4-1, we expect that 68.3% of the resultswill lie within and 95.5% of the results will lie within (a) Find the expected standard deviation for the number of heads in1 000 coin flips.(b) By interpolation in Table 4-1, find the value of z that includes90% of the area of the Gaussian curve. We expect that 90% ofthe results will lie within this number of standard deviations fromthe mean.(c) If you repeat the 1 000 coin flips many times, what is theexpected range for the number of heads that includes 90% of theresults? (For example, your answer might be “The range 490 to 510will be observed 90% of the time.”)
28-8. In analyzing a lot with random sample variation, you find asampling standard deviation of Assuming negligible error inthe analytical procedure, how many samples must be analyzed togive 95% confidence that the error in the mean is within ofthe true value? Answer the same question for a confidence levelof 90%.
28-9. In an experiment analogous to that in Figure 28-3, the sam-pling constant is found to be (a) What mass of sample is required for a sampling standarddeviation?
�2%Ks � 20 g.
�4%
�5%.
�2�n.�1�n
�n � 2npq.tails � np � nq � 1
2n.
p � q � 12
11.0 � 102 g
104KNO3
100 m
�6%
�4%
�3%.�4%
(b) How many samples of the size in part (a) are required to pro-duce 90% confidence that the mean is known to within 1.5%?
28-10. isotopes ratios were measured in polar ice cores ofvarying sample size. The 95% confidence interval, expressed as apercentage of the mean isotope ratio, decreased withincreasing quantity of Sr measured:
Confidence Confidencepg Sr interval pg Sr interval
57 50668 515
110 916110 955
SOURCE: Data from G. R. Burton, V. I. Morgan, C. F. Boutron, and K. J. R. Rosman,“High-Sensitivity Measurements of Strontium Isotopes in Polar Ice,” Anal. Chim.Acta 2002, 469, 225.
We postulate that the confidence interval is related to the mass ofsample by the relation where m is the mass of Sr inpicograms, R is the confidence interval expressed as a percentageof the isotope ratio (R � 0.022 for the 955-pg sample), and isa constant with units of picograms. Find the average value of and its standard deviation. Justify why we expect tohold if all measurements are made with the same number ofreplications.
28-11. Consider a random mixture containing 4.00 g of (density 2.532 g/mL) and 96.00 g of with a uniform spherical particle radius of 0.075 mm.(a) Calculate the mass of a single particle of and the num-ber of particles of in the mixture. Do the same for (b) What is the expected number of particles in 0.100 g of themixture?(c) Calculate the relative sampling standard deviation in the numberof particles of each type in a 0.100-g sample of the mixture.
Sample Preparation
28-12. From their standard reduction potentials, which of the fol-lowing metals would you expect to dissolve in HCl by the reaction
: Zn, Fe, Co, Al, Hg, Cu, Pt, Au? (Whenthe potential predicts that the element will not dissolve, it probablywill not. If it is expected to dissolve, it may dissolve if some otherprocess does not interfere. Predictions based on standard reductionpotentials at are only tentative, because the potentials andactivities in hot, concentrated solutions vary widely from those inthe table of standard potentials.)
28-13. The following wet-ashing procedure was used to measurearsenic in organic soil samples by atomic absorption spectroscopy:A 0.1- to 0.5-g sample was heated in a 150-mL Teflon bomb in amicrowave oven for 2.5 min with 3.5 mL of After thesample cooled, a mixture containing 3.5 mL of 1.5 mLof and 1.0 mL of was added and the samplewas reheated for three 2.5-min intervals with 2-min unheated peri-ods in between. The final solution was diluted with 0.2 M HCl foranalysis. Explain why was not introduced until the secondheating.
HClO4
H2SO470% HClO4,70% HNO3,
70% HNO3.
25°C
M � nH� S Mn� � n2H2
K2CO3.Na2CO3
Na2CO3
K2CO3 (density 2.428 g/mL)Na2CO3
mR2 � Ks
Ks
Ks
mR2 � Ks,
�0.022%�0.045%�0.018%�0.049%�0.027%�0.069%�0.035%�0.057%
87Sr/86Sr
87Sr/86Sr
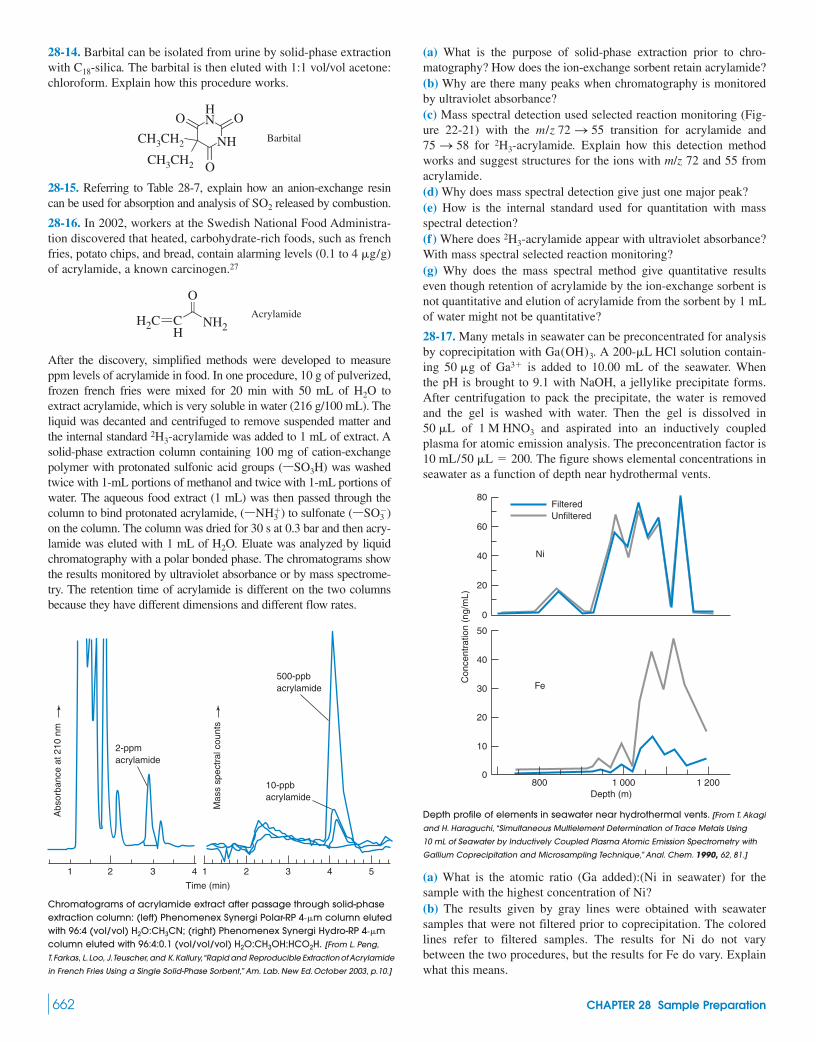
662 CHAPTER 28 Sample Preparation
28-14. Barbital can be isolated from urine by solid-phase extractionwith The barbital is then eluted with 1:1 vol/vol acetone:chloroform. Explain how this procedure works.
28-15. Referring to Table 28-7, explain how an anion-exchange resincan be used for absorption and analysis of released by combustion.
28-16. In 2002, workers at the Swedish National Food Administra-tion discovered that heated, carbohydrate-rich foods, such as frenchfries, potato chips, and bread, contain alarming levels ( )of acrylamide, a known carcinogen.27
After the discovery, simplified methods were developed to measureppm levels of acrylamide in food. In one procedure, 10 g of pulverized,frozen french fries were mixed for 20 min with 50 mL of toextract acrylamide, which is very soluble in water (216 g/100 mL). Theliquid was decanted and centrifuged to remove suspended matter andthe internal standard was added to 1 mL of extract. Asolid-phase extraction column containing 100 mg of cation-exchangepolymer with protonated sulfonic acid groups ( ) was washedtwice with 1-mL portions of methanol and twice with 1-mL portions ofwater. The aqueous food extract (1 mL) was then passed through thecolumn to bind protonated acrylamide, ( ) to sulfonate ( )on the column. The column was dried for 30 s at 0.3 bar and then acry-lamide was eluted with 1 mL of Eluate was analyzed by liquidchromatography with a polar bonded phase. The chromatograms showthe results monitored by ultraviolet absorbance or by mass spectrome-try. The retention time of acrylamide is different on the two columnsbecause they have different dimensions and different flow rates.
H2O.
ßSO3ßNH�
3
ßSO3H
2H3-acrylamide
H2O
Acrylamide
O
££
NH2H2C CH
0.1 to 4 g/g
SO2
OO
£
££
O
CH3CH2
CH3CH2
NH
HN
Barbital
C18-silica.(a) What is the purpose of solid-phase extraction prior to chro-matography? How does the ion-exchange sorbent retain acrylamide?(b) Why are there many peaks when chromatography is monitoredby ultraviolet absorbance?(c) Mass spectral detection used selected reaction monitoring (Fig-ure 22-21) with the transition for acrylamide and
for Explain how this detection methodworks and suggest structures for the ions with m/z 72 and 55 fromacrylamide.(d) Why does mass spectral detection give just one major peak?(e) How is the internal standard used for quantitation with massspectral detection?(f) Where does appear with ultraviolet absorbance?With mass spectral selected reaction monitoring?(g) Why does the mass spectral method give quantitative resultseven though retention of acrylamide by the ion-exchange sorbent isnot quantitative and elution of acrylamide from the sorbent by 1 mLof water might not be quantitative?
28-17. Many metals in seawater can be preconcentrated for analysisby coprecipitation with A solution contain-ing of is added to 10.00 mL of the seawater. Whenthe pH is brought to 9.1 with NaOH, a jellylike precipitate forms.After centrifugation to pack the precipitate, the water is removedand the gel is washed with water. Then the gel is dissolved in
of and aspirated into an inductively coupledplasma for atomic emission analysis. The preconcentration factor is
The figure shows elemental concentrations inseawater as a function of depth near hydrothermal vents.10 mL/50 L � 200.
1 M HNO350 L
Ga3�50 g200-L HClGa(OH)3.
2H3-acrylamide
2H3-acrylamide.75 S 58m/z 72 S 55
3 4 1 2 3 4 521
Time (min)
Abs
orba
nce
at 2
10 n
m
Mas
s sp
ectr
al c
ount
s
2-ppmacrylamide
500-ppbacrylamide
10-ppbacrylamide
Chromatograms of acrylamide extract after passage through solid-phaseextraction column: (left) Phenomenex Synergi Polar-RP column eluted with 96:4 (vol/vol) ; (right) Phenomenex Synergi Hydro-RP column eluted with 96:4:0.1 (vol/vol/vol) [From L. Peng,
T.Farkas, L.Loo, J.Teuscher, and K.Kallury,“Rapid and Reproducible Extractionof Acrylamide
in French Fries Using a Single Solid-Phase Sorbent,” Am. Lab. New Ed.October 2003, p.10.]
H2O:CH3OH:HCO2H.4-mH2O:CH3CN
4-m
Depth profile of elements in seawater near hydrothermal vents. [From T. Akagi
and H. Haraguchi, “Simultaneous Multielement Determination of Trace Metals Using
10 mL of Seawater by Inductively Coupled Plasma Atomic Emission Spectrometry with
Gallium Coprecipitation and Microsampling Technique,” Anal. Chem. 1990, 62, 81.]
800 1 000 1 2000
10
20
30
40
50
0
20
40
60
80
Ni
Fe
FilteredUnfiltered
Depth (m)
Con
cent
ratio
n (n
g/m
L)
(a) What is the atomic ratio (Ga added):(Ni in seawater) for thesample with the highest concentration of Ni?(b) The results given by gray lines were obtained with seawatersamples that were not filtered prior to coprecipitation. The coloredlines refer to filtered samples. The results for Ni do not varybetween the two procedures, but the results for Fe do vary. Explainwhat this means.

Problems 663
Diagram of county landfill showing the location of wells used to monitorgroundwater. [Adapted from P.-C. Li and R. Rajagopal, Am. Environ. Lab. October 1994,
p. 37.]
28-18. Barium titanate, a ceramic used in electronics, was analyzedby the following procedure: Into a Pt crucible was placed 1.2 g of
and 0.8 g of plus 0.314 6 g of unknown. Afterfusion at in a furnace for 30 min, the cooled solid wasextracted with 50 mL of 6 M HCl, transferred to a 100-mL volu-metric flask, and diluted to the mark. A 25.00-mL aliquot wastreated with 5 mL of 15% tartaric acid (which complexes andkeeps it in aqueous solution) and 25 mL of ammonia buffer, pH 9.5.The solution was treated with organic reagents that complex and the Ba complex was extracted into After acidification (torelease the from its organic complex), the was back-extracted into 0.1 M HCl. The final aqueous sample was treatedwith ammonia buffer and methylthymol blue (a metal ion indicator)and titrated with 32.49 mL of 0.011 44 M EDTA. Find the weightpercent of Ba in the ceramic.
28-19. Acid-base equilibria of Cr(III) were summarized in Problem10-35. Cr(VI) in aqueous solution above pH 6 exists as the yellowtetrahedral chromate ion, . Between pH 2 and 6, Cr(VI)exists as an equilibrium mixture of and orange-red dichro-mate, Cr(VI) is a carcinogen, but Cr(III) is not consideredto be as harmful. The following procedure was used to measureCr(VI) in airborne particulate matter in workplaces.
1. Particles were collected by drawing a known volume of airthrough a polyvinyl chloride filter with pore size.
2. The filter was placed in a centrifuge tube and 10 mL ofbuffer, pH 8, were added. The
immersed filter was agitated by ultrasonic vibration for 30 minat to extract all Cr(III) and Cr(VI) into solution.
3. A measured volume of extract was passed through a “stronglybasic” anion exchanger (Table 26-1) in the form. Then theresin was washed with distilled water. Liquid containingCr(III) from the extract and the wash was discarded.
4. Cr(VI) was then eluted from the column with 0.5 M (NH4)2SO4/0.05 M NH3 buffer, pH 8, and collected in a vial.
5. The eluted Cr(VI) solution was acidified with HCl and treatedwith a solution of 1,5-diphenylcarbazide, a reagent that forms a
Cl
35°C
0.05 M (NH4)2SO4/0.05 M NH3
5-M
Cr2O27 .
HCrO4
CrO24
Ba2�Ba2�
CCl4.Ba2�,
Ti4�
1 000°CNa2B4O7Na2CO3
colored complex with Cr(VI). The concentration of the complexwas measured by its visible absorbance.
(a) What are the dominant species of Cr(VI) and Cr(III) at pH 8?(b) What is the purpose of the anion exchanger in step 3?(c) Why is a “strongly basic” anion exchanger used instead of a“weakly basic” exchanger?(d) Why is Cr(VI) eluted in step 4 but not step 3?
28-20. The county landfill in the diagram was monitored to verifythat toxic compounds were not leaching into the local water supply.Wells drilled at 21 locations were monitored over a year and pollu-tants were observed only at sites 8, 11, 12, and 13. Monitoring all21 sites each month is very expensive. Suggest a strategy to use com-posite samples (Box 0-1) made from more than one well at a time toreduce the cost of routine monitoring. How will your scheme affectthe minimum detectable level for pollutants at a particular site?
1
2
3
4
5
6 7
8
9
10
11
12
13
14
15
1617
18
19
20
21
Trench
Monitoringsites
Barrier wall
Creek
Landfill

This page intentionally left blank

Notes and References NR1
Chapter 01. J. Stocker, D. Balluch, M. Gsell, H. Harms, J. Feliciano, S. Daunert,
K. A. Malik, and J. R. Van der Meer, “Development of a Set of Simple BacterialBiosensors for Quantitative and Rapid Measurements of Arsenite and Arsenatein Potable Water,” Environ. Sci. Technol. 2003, 37, 4743. [This notation refers tothe journal Environmental Science and Technology, volume 37, page 4743, in theyear 2003.]
2. For related biosensors, see A. Roda, M. Guardigli, E. Michelini, M. Mirasoli,and P. Pasini, “Analytical Bioluminescence and Chemiluminescence,” Anal.Chem. 2003, 75, 462A.
3. G. Tannenbaum, “Chocolate: A Marvelous Natural Product of Chemistry,”J. Chem. Ed. 2004, 81, 1131.
4. T. J. Wenzel, “A New Approach to Undergraduate Analytical Chemistry,”Anal. Chem. 1995, 67, 470A. See also T. J. Wenzel, “The Lecture as a LearningDevice,” Anal. Chem. 1999, 71, 817A; T. J. Wenzel, “Cooperative StudentActivities as Learning Devices,” Anal. Chem. 2000, 72, 293A; T. J. Wenzel,“Practical Tips for Cooperative Learning,” Anal. Chem. 2000, 72, 359A;T. J. Wenzel, “Undergraduate Research as a Capstone Learning Experience,”Anal. Chem. 2000, 72, 547A.
5. W. R. Kreiser and R. A. Martin, Jr., J. Assoc. Off. Anal. Chem. 1978, 61, 1424;W. R. Kreiser and R. A. Martin, Jr., J. Assoc. Off. Anal. Chem. 1980, 63, 591.Today you would find many more recent references on caffeine.
6. A good source for many well-tested analytical procedures is W. Horwitz,Official Methods of Analysis of AOAC International, 17th ed. (Gaithersburg,MD: AOAC International, 2000).
7. W. Fresenius, “The Position of the Analyst as Expert: Yesterday and Today,”Fresenius J. Anal. Chem. 2000, 368, 548.
Chapter 11. J. R. de Laeter and H. S. Peiser, “A Century of Progress in the Sciences
Due to Atomic Weight and Isotopic Composition Measurements,” Anal.Bioanal. Chem. 2003, 375, 62.
2. S. J. Hawkes, “Salts Are Mostly Not Ionized,” J. Chem. Ed. 1996, 73, 421.is called an ion pair. See Box 8-1.
3. J. L. Sarmiento and N. Gruber, “Sinks for Anthropogenic Carbon,” PhysicsToday, August 2002, p. 30.
4. U. Shahin, S.-M. Yi, R. D. Paode, and T. M. Holsen, “Long-Term ElementalDry Deposition Fluxes Measured Around Lake Michigan,” Environ. Sci.Technol. 2000, 34, 1887.
Chapter 21. M. Sepaniak, P. Datskos, N. Lavrik, and C. Tipple, “Microcantilever
Transducers: A New Approach in Sensor Technology,” Anal. Chem. 2002, 74,568A; C. Ziegler, “Cantilever-Based Biosensors,” Anal. Bioanal. Chem. 2004,379, 946.
2. F. Tian, K. M. Hansen, T. L. Ferrell, T. Thundat, and D. C. Hansen,“Dynamic Microcantilever Sensors for Discerning Biomolecular Interactions,”Anal. Chem. 2005, 77, 1601; C. Savran, S. M. Knudsen, A. D. Ellington, andS. R. Manalis, “Micromechanical Detection of Proteins Using Aptamer-BasedReceptor Molecules,” Anal. Chem. 2004, 76, 3194; P. Dutta, C. A. Tipple,N. V. Lavrik, P. G. Datskos, H. Hofstetter, O. Hofstetter, and M. J. Sepaniak,“Enantioselective Sensors Based on Antibody-Mediated Nanomechanics,”Anal. Chem. 2003, 75, 2342.
3. A related, but less sensitive technology, uses the quartz crystal microbalance,in which the crystal has dimensions of millimeters. When analyte binds to achemically sensitive layer on a gold coating on the surface of quartz, the oscillatingfrequency of the crystal is altered. See, for example, B. Zuo, S. Li, Z. Guo,J. Zhang, and C. Chen, “Piezoelectric Immunosensor for SARS-Associated
Coronavirus,” Anal. Chem. 2004, 76, 3536; A.-S. Cans, F. Höök, O. Shupliakov,A. G. Ewing, P. S. Eriksson, L. Brodin, and O. Orwar, “Measurement of theDynamics of Exocytosis and Vesicle Retrieval at Cell Populations Using a QuartzCrystal Microbalance,” Anal. Chem. 2001, 73, 5805; X. Su, R. Robelek, Y. Wu,G. Wang, and W. Knoll, “Detection of Point Mutations and Insertion Mutationsin DNA Using a Quartz Crystal Microbalance and MutS, a Mismatch BindingProtein,” Anal. Chem. 2004, 76, 489.
4. Recycling of certain household waste, such as televisions, computers, andrechargeable batteries, is desirable to control toxic pollution. Televisions are asignificant source of lead that can leach into groundwater from dump sites.[S. E. Musson, Y.-C. Jang, T. G. Townsend, and I.-H. Chung, “Characterizationof Lead Leachability from Cathode Ray Tubes,” Environ. Sci. Technol. 2000,34, 4376.]
5. Handling and disposing of chemicals is described in Prudent Practices forHandling Hazardous Chemicals in Laboratories (1983) and Prudent Practicesfor Disposal of Chemicals in Laboratories (1983), both available from NationalAcademy Press, 2101 Constitution Avenue N.W., Washington, DC 20418.See also P. Patnaik, A Comprehensive Guide to the Hazardous Properties ofChemical Substances, 2nd ed. (New York: Wiley, 1999); G. Lunn and E. B.Sansone, Destruction of Hazardous Chemicals in the Laboratory (New York:Wiley, 1994); and M. A. Armour, Hazardous Laboratory Chemical DisposalGuide (Boca Raton, FL: CRC Press, 1991).
6. To recover gold from electronics, see J. W. Hill and T. A. Lear, “Recoveryof Gold from Electronic Scrap,” J. Chem. Ed. 1988, 65, 802. To remove Hgfrom gold, soak it in a 1:1 mixture of 0.01 M (NH4)2S2O8 and 0.01 M HNO3
[T. Nomura and M. Fujisawa, “Electrolytic Determination of Mercury(II) inWater with a Piezoelectric Quartz Crystal,” Anal. Chim. Acta 1986, 182, 267].
7. Compact disks illustrating basic laboratory techniques are available fromhttp://jchemed.chem.wisc.edu/
8. J. M. Bonicamp, “Weigh This Way,” J. Chem. Ed. 2002, 79, 476.
9. For a demonstration of buoyancy, see K. D. Pinkerton, “Sink or Swim:The Cartesian Diver,” J. Chem. Ed. 2001, 78, 200A (JCE Classroom ActivityNo. 33).
10. R. Batting and A. G. Williamson, “Single-Pan Balances, Buoyancy, andGravity or ‘A Mass of Confusion,’” J. Chem. Ed. 1984, 61, 51; J. E. Lewis andL. A. Woolf, “Air Buoyancy Corrections for Single-Pan Balances,” J. Chem.Ed. 1971, 48, 639; F. F. Cantwell, B. Kratochvil, and W. E. Harris, “Air BuoyancyErrors and the Optical Scale of a Constant Load Balance,” Anal. Chem. 1978,50, 1010; G. D. Chapman, “Weighing with Electronic Balances,” NationalResearch Council of Canada, Report NRCC 38659 (1996).
11. Air density (g/L) where B isbarometric pressure (Pa), V is the vapor pressure of water in the air (Pa), and Tis air temperature (K).
12. U. Henriksson and J. C. Eriksson, “Thermodynamics of Capillary Rise:Why Is the Meniscus Curved?” J. Chem. Ed. 2004, 81, 150.
13. Cleaning solution is prepared by dissolving 36 g of ammoniumperoxydisulfate, (NH4)2S2O8, in a loosely stoppered 2.2-L (“one gallon”) bottleof 98 wt% sulfuric acid [H. M. Stahr, W. Hyde, and L. Sigler, “Oxidizing AcidBaths—Without Chromate Hazards,” Anal. Chem. 1982, 54, 1456A]. Add(NH4)2S2O8 every few weeks to maintain oxidizing power. Keep it looselystoppered to prevent gas buildup [P. S. Surdhar, “Laboratory Hazard,” Anal.Chem. 1992, 64, 310A]. The commercial cleaning solution EOSULF (containingthe metal binder, EDTA, and a sulfonate detergent) is an alternative for removingbaked-on lipid or protein from glassware. [P. L. Manske, T. M. Stimpfel, and E. L. Gershey, “A Less Hazardous Chromic Acid Substitute for Cleaning Glassware,”J. Chem. Ed. 1990, 67, A280.] Another powerful oxidizing cleaning solution, called“piranha solution,” is a 1:1 (vol/vol) mixture of 30 wt% H2O2 plus 98 wt% H2SO4.
14. W. B. Guenther, “Supertitrations: High-Precision Methods,” J. Chem. Ed.1988, 65, 1097; D. D. Siemer, S. D. Reeder, and M. A. Wade, “Syringe BuretAdaptor,” J. Chem. Ed. 1988, 65, 467.
� (0.003 485 B 0.001 318 V ) /T,
MgCl�
Notes and References

15. M. M. Singh, C. McGowan, Z. Szafran, and R. M. Pike, “A ModifiedMicroburet for Microscale Titration,” J. Chem. Ed. 1998, 75, 371; “A ComparativeStudy of Microscale and Standard Burets,” J. Chem. Ed. 2000, 77, 625.
16. D. R. Burfield and G. Hefter, “Oven Drying of Volumetric Glassware,”J. Chem. Ed. 1987, 64, 1054.
17. M. Connors and R. Curtis, “Pipetting Error,” Am. Lab. News Ed., June 1999,p. 20; ibid., December 1999, p. 12; R. H. Curtis and G. Rodrigues, ibid.,February 2004, p. 12.
18. Calibrate your micropipet by measuring the mass of water it delivers[B. Kratochvil and N. Motkosky, “Precision and Accuracy of Mechanical-Action Micropipets,” Anal. Chem. 1987, 59, 1064]. A colorimetric calibrationkit is available from Artel, Inc., Westbrook, ME; 207-854-0860.
19. E. J. Billo, Microsoft Excel for Chemists, 2nd ed. (New York: Wiley, 2001);R. de Levie, How to Use Excel® in Analytical Chemistry and in GeneralScientific Data Analysis (Cambridge: Cambridge University Press, 2001);R. de Levie, Advanced Excel for Scientific Data Analysis (Oxford: OxfordUniversity Press, 2004); B. V. Liengme, A Guide to Microsoft Excel 2002,3rd ed. (Amsterdam: Elsevier, 2002).
20. D. Bohrer, P. Cícero do Nascimento, P. Martins, and R. Binotto, “Availabilityof Aluminum from Glass on an Al Form Ion Exchanger in the Presence ofComplexing Agents and Amino Acids,” Anal. Chim. Acta 2002, 459, 267.
Chapter 31. A catalog of Standard Reference Materials is available from
[email protected]. European Reference Materials are available fromhttp://www.erm-crm.org. See H. Emons, J. Marriott, and R. Matchatt,“ERM—A New Landmark for Reference Materials,” Anal. Bioanal. Chem.2005, 381, 28.
2. P. De Bièvre, S. Valkiers, and P. D. P. Taylor, “The Importance ofAvogadro’s Constant for Amount-of-Substance Measurements,” FreseniusJ. Anal. Chem. 1998, 361, 227.
Chapter 41. Excellent, readable sources on statistics are J. C. Miller and J. N. Miller,
Statistics and Chemometrics for Analytical Chemistry, 4th ed. (Harlow, UK:Prentice Hall, 2000) and P. C. Meier and R. E. Zünd, Statistical Methods inAnalytical Chemistry, 2nd ed. (New York: Wiley, 2000).
2. H. Mark and J. Workman, Jr., Statistics in Spectroscopy, 2nd ed.(Amsterdam: Elsevier, 2003); J. E. DeMuth, Basic Statistics and PharmaceuticalStatistical Applications (New York: Marcel Dekker, 1999); and R. N. Forthoferand E. S. Lee, Introduction to Biostatistics (San Diego: Academic Press, 1995).
3. L. H. Keith, W. Crummett, J. Deegan, Jr., R. A. Libby, J. K. Taylor, andG. Wentler, “Principles of Environmental Analysis,” Anal. Chem. 1983, 55,2210. See also C. A. Kuffner, Jr., E. Marchi, J. M. Morgado, and C. R. Rubio,“Capillary Electrophoresis and Daubert: Time for Admission,” Anal. Chem.1996, 68, 241A.
4. R. Bate, ed., What Risk? (Oxford: Butterworth-Heinemann, 1999).
5. In Figure 4-8, cells F12 and F13 give results of a 2-tailed significance test,which we used in Section 4-3 without stating so. If we have no reason to presumethat one method should give a higher result than the other, we use a 2-tailed test.If we have reason to think that method 1 gives a higher result than method 2, weuse the 1-tailed test whose results are displayed in cells F10 and F11. The 1-tailedtest evaluates the null hypothesis that “method 1 does not give a higher resultthan method 2.” Cell F11 says that the critical value of t for the 1-tailed test is1.77. Because tcalculated we conclude that the null hypothesisis false. Cell F10 states that the probability of observing these two mean valuesand standard deviations by random chance if method 1 does not give a higherresult than method 2 is
6. For a comprehensive approach to least-squares fitting of nonlinear curves,including analysis of uncertainty, see J. Tellinghuisen, “Understanding LeastSquares Through Monte Carlo Calculations,” J. Chem. Ed. 2005, 82, 157; P. Ogren,B. Davis, and N. Guy, “Curve Fitting, Confidence Intervals and Correlations,and Monte Carlo Visualizations for Multilinear Problems in Chemistry: AGeneral Spreadsheet Approach,” J. Chem. Ed. 2001, 78, 827; see also D. C.Harris, “Nonlinear Least-Squares Curve Fitting with Microsoft Excel Solver,”J. Chem. Ed. 1998, 75, 119; C. Salter and R. de Levie, “Nonlinear Fits of
1.66 � 1011.
(� 20.2) 7 1.77,
NR2 Notes and References
Standard Curves: A Simple Route to Uncertainties in Unknowns,” J. Chem.Ed. 2002, 79, 268; R. de Levie, “Estimating Parameter Precision in NonlinearLeast Squares with Excel’s Solver,” J. Chem. Ed. 1999, 76, 1594; S. E. Fellerand C. F. Blaich, “Error Estimates for Fitted Parameters,” J. Chem. Ed. 2001,78, 409; R. de Levie, “When, Why, and How to Use Weighted Least Squares,”J. Chem. Ed. 1986, 63, 10; and P. J. Ogren and J. R. Norton, “Applying a SimpleLinear Least-Squares Algorithm to Data with Uncertainties in Both Variables,”J. Chem. Ed. 1992, 69, A130.
7. In this book, we plot analytical response on the y-axis versus concentrationon the x-axis. The inverse calibration (y � concentration, x � response) is saidto provide a less biased estimate of concentration from a measured response.See V. Centner, D. L. Massart, and S. de Jong, “Inverse Calibration PredictsBetter Than Classical Calibration,” Fresenius J. Anal. Chem. 1998, 361, 2;D. Grientschnig, “Relation Between Prediction Errors of Inverse and ClassicalCalibration,” Fresenius J. Anal. Chem. 2000, 367, 497; J. Tellinghuisen, “Inversevs Classical Calibration for Small Data Sets,” Fresenius J. Anal. Chem. 2000,368, 585.
8. K. Danzer and L. A. Currie, “Guidelines for Calibration in AnalyticalChemistry,” Pure Appl. Chem. 1998, 70, 993.
9. C. Salter, “Error Analysis Using the Variance-Covariance Matrix,” J. Chem.Ed. 2000, 77, 1239. Salter’s Equation 8 is equivalent to Equation 4-27, althoughthis is not obvious.
10. D. Sterzenbach, B. W. Wenclawiak, and V. Weigelt, “Determination ofChlorinated Hydrocarbons in Marine Sediments at the Part-per-Trillion Levelwith Supercritical Fluid Extraction,”Anal. Chem. 1997, 69, 831.
11. J. W. Gramlich and L. A. Machlan, “Isotopic Variations in CommercialHigh-Purity Gallium,” Anal. Chem. 1985, 57, 1788.
12. S. Ahmed, N. Jabeen, and E. ur Rehman, “Determination of LithiumIsotopic Composition by Thermal Ionization Mass Spectrometry,” Anal. Chem.2002, 74, 4133; L. W. Green, J. J. Leppinen, and N. L. Elliot, “Isotopic Analysisof Lithium as Thermal Dilithium Fluoride Ions,” Anal. Chem. 1988, 60, 34.
13. D. T. Harvey, “Statistical Evaluation of Acid/Base Indicators,” J. Chem.Ed. 1991, 68, 329.
14. N. J. Lawryk and C. P. Weisel, “Concentration of Volatile OrganicCompounds in the Passenger Compartments of Automobiles,” Environ. Sci.Technol. 1996, 30, 810.
15. I. Sarudi and I. Nagy, “A Gas Chromatographic Method for theDetermination of Nitrite in Natural Waters,” Talanta 1995, 42, 1099.
Chapter 51. C. Hogue, “Ferreting Out Erroneous Data,” Chem. Eng. News, 1 April 2002,
p. 49.
2. B. W. Wenclawiak, M. Koch, and E. Hadjicostas, eds., Quality Assurancein Analytical Chemistry (Heidelberg: Springer-Verlag, 2004); P. Quevauviller,Quality Assurance for Water Analysis (Chichester, UK: Wiley, 2002); M. Valcárcel,Principles of Analytical Chemistry (Berlin: Springer-Verlag, 2000); J. Kenkel,A Primer on Quality in the Analytical Laboratory (Boca Raton, FL: Lewis Press,1999); F. E. Prichard, Quality in the Analytical Chemistry Laboratory (New York:Wiley, 1995); J. K. Taylor, Quality Assurance of Chemical Measurements(Chelsea, MI: Lewis Publishers, 1987).
3. J. M. Green, “A Practical Guide to Analytical Method Validation,” Anal.Chem. 1996, 68, 305A; M. Swartz and I. S. Krull, “Validation of BioanalyticalMethods—Highlights of FDA’s Guidance,” LCGC 2003, 21, 136; J. D. Orr,I. S. Krull, and M. E. Swartz, “Validation of Impurity Methods,” LCGC 2003,21, 626 and 1146; P. Nader, G. Dremmydiotis, J. Tremblay, G. Lévesque, andA. Bartlett, “Validation of Bioanalytical Capillary Gel Electrophoresis Methodsfor the Determination of Oligonucleotides,” LCGC 2002, 20, 856.
4. R. de Levie, “Two Linear Correlation Coefficients,” J. Chem. Ed. 2003,80, 1030.
5. W. Horwitz, L. R. Kamps, and K. W. Boyer, J. Assoc. Off. Anal. Chem.1980, 63, 1344; W. Horwitz, “Evaluation of Analytical Methods Used forRegulation of Foods and Drugs,” Anal. Chem. 1982, 54, 67A; P. Hall andB. Selinger, “A Statistical Justification Relating Interlaboratory Coefficientsof Variation with Concentration Levels,” Anal. Chem. 1989, 61, 1465; andR. Albert and W. Horwitz, “A Heuristic Derivation of the Horwitz Curve,”Anal. Chem. 1997, 69, 789.

Notes and References NR3
6. J. Vial and A. Jardy, “Experimental Comparison of the Different Approachesto Estimate LOD and LOQ of an HPLC Method,” Anal. Chem. 1999, 71, 2672;G. L. Long and J. D. Winefordner, “Limit of Detection,” Anal. Chem. 1983, 55,713A; W. R. Porter, “Proper Statistical Evaluation of Calibration Data,” Anal. Chem.1983, 55, 1290A; S. Geiss and J. W. Einmax, “Comparison of Detection Limitsin Environmental Analysis,” Fresenius J. Anal. Chem. 2001, 370, 673; M. E. Zorn,R. D. Gibbons, and W. C. Sonzogni, “Evaluation of Approximate Methods forCalculating the Limit of Detection and Limit of Quantitation,” Environ. Sci.Technol. 1999, 33, 2291; J. D. Burdge, D. L. MacTaggart, and S. O. Farwell,“Realistic Detection Limits from Confidence Bands,” J. Chem. Ed. 1999, 76, 434.
7. D. Montgomery, Design and Analysis of Experiments, 5th ed. (New York,Wiley, 2001); C. F. Wu and M. Hamada, Experiments: Planning, Analysis, andParameter Design Optimization (New York: Wiley, 2000); M. Anderson andP. Whitcomb, DoE Simplified: Practical Tools for Effective Experimentation(Portland, OR: Productivity, Inc., 2000); E. Morgan, Chemometrics:Experimental Design (Chichester, UK: Wiley, 1991); D. L. Massart,A. Dijkstra, and L. Kaufman, Evaluation and Optimization of LaboratoryMethods and Analytical Procedures (Amsterdam: Elsevier, 1978); G. E. P. Box,W. G. Hunter, and J. S. Hunter, Statistics for Experimenters: An Introduction toDesign Data Analysis and Model Building (New York: Wiley, 1978); R. S.Strange, “Introduction to Experimental Design for Chemists,” J. Chem. Ed.1990, 67, 113.
8. S. N. Deming and S. L. Morgan, “Simplex Optimization of Variablesin Analytical Chemistry,” Anal. Chem. 1973, 45, 278A; D. J. Leggett,“Instrumental Simplex Optimization,” J. Chem. Ed. 1983, 60, 707; S. Srijaranai,R. Burakham, T. Khammeng, and R. L. Deming, “Use of the Simplex Methodto Optimize the Mobile Phase for the Micellar Chromatographic Separation ofInorganic Anions,” Anal. Bioanal. Chem. 2002, 374, 145; D. Betteridge, A. P.Wade, and A. G. Howard, “Reflections on the Modified Simplex,” Talanta 1985,32, 709, 723.
9. M. Bader, “A Systematic Approach to Standard Addition Methods inInstrumental Analysis,” J. Chem. Ed. 1980, 57, 703.
10. G. R. Bruce and P. S. Gill, “Estimates of Precision in a Standard AdditionsAnalysis,” J. Chem. Ed. 1999, 76, 805.
11. J. R. Troost and E. Y. Olavasen [“Gas Chromatographic/Mass SpectrometricCalibration Bias,” Anal. Chem. 1996, 68, 708] discovered that a chromatographyprocedure from the U.S. Environmental Protection Agency had a nonlinearresponse on a variety of instruments. The assumption of constant response factorled to errors as great as 40%.
12. J. A. Day, M. Montes-Bayón, A. P. Vonderheide, and J. A. Caruso, “A Studyof Method Robustness for Arsenic Speciation in Drinking Water Samples byAnion Exchange HPLC-ICP-MS,” Anal. Bioanal. Chem. 2002, 373, 664.
Chapter 61. D. P. Sheer and D. C. Harris, “Acidity Control in the North Branch
Potomac,” J. Water Pollution Control Federation 1982, 54, 1441.
2. R. E. Weston, Jr., “Climate Change and Its Effect on Coral Reefs,” J. Chem.Ed. 2000, 77, 1574.
3. P. D. Thacker, “Global Warming’s Other Effects on the Oceans,” Environ.Sci. Technol. 2005, 39, 10A.
4. J. K. Baird, “A Generalized Statement of the Law of Mass Action,”J. Chem. Ed. 1999, 76, 1146; R. de Levie, “What’s in a Name?” J. Chem. Ed.2000, 77, 610.
5. For thermodynamic data, see N. Jacobson, “Use of TabulatedThermochemical Data for Pure Compounds,” J. Chem. Ed. 2001, 78, 814;http://webbook.nist.gov/chemistry/ and http://www.crct.polymtl.ca/fact/websites.htm; M. W. Chase, Jr., NIST-JANAF Thermochemical Tables, 4th ed;J. Phys. Chem. Ref. Data, Monograph 9 (New York: American ChemicalSociety and American Physical Society, 1998).
6. The solubility of most ionic compounds increases with temperature, despitethe fact that the standard heat of solution is negative for about half ofthem. Discussions of this seeming contradiction can be found in G. M. Bodner,“On the Misuse of Le Châtelier’s Principle for the Prediction of the TemperatureDependence of the Solubility of Salts,” J. Chem. Ed. 1980, 57, 117, and R. S.Treptow, “Le Châtelier’s Principle Applied to the Temperature Dependence ofSolubility,” J. Chem. Ed. 1984, 61, 499.
(�H°)
7. A. K. Sawyer, “Solubility and of Calcium Sulfate: A General ChemistryLaboratory Experiment,” J. Chem. Ed. 1983, 60, 416.
8. A really good book to read about solubility and all types of equilibriumcalculations is W. B. Guenther, Unified Equilibrium Calculations (New York:Wiley, 1991).
9. E. Koubek, “Demonstration of the Common Ion Effect,” J. Chem. Ed. 1993,70, 155.
10. For many great chemical demonstrations, see B. Z. Shakhashiri, ChemicalDemonstrations: A Handbook for Teachers of Chemistry (Madison, WI:University of Wisconsin Press, 1983–1992), 4 volumes. See also L. E.Summerlin and J. L. Ealy, Jr., Chemical Demonstrations: A Sourcebook forTeachers, 2nd ed. (Washington, DC: American Chemical Society, 1988).
11. A demonstration of selective precipitation by addition of to a solutioncontaining and is described by T. P. Chirpich, “A Simple, VividDemonstration of Selective Precipitation,” J. Chem. Ed. 1988, 65, 359.
12. A computer database of critically selected equilibrium constants is foundin R. M. Smith, A. E. Martell, and R. J. Motekaitis, NIST Critical StabilityConstants of Metal Complexes Database 46 (Gaithersburg, MD: NationalInstitute of Standards and Technology, 2001). Books dealing with theexperimental measurement of equilibrium constants include A. Martell andR. Motekaitis, Determination and Use of Stability Constants (New York: VCH,1992); K. A. Conners, Binding Constants: The Measurement of MolecularComplex Stability (New York: Wiley, 1987); and D. J. Leggett, ed.,Computational Methods for the Determination of Formation Constants(New York: Plenum Press, 1985).
13. P. A. Giguère, “The Great Fallacy of the Ion,” J. Chem. Ed. 1979, 56,571; P. A. Giguère and S. Turrell, “The Nature of Hydrofluoric Acid: ASpectroscopic Study of the Proton-Transfer Complex, ” J. Am.Chem. Soc. 1980, 102, 5473.
14. F. A. Cotton, C. K. Fair, G. E. Lewis, G. N. Mott, K. K. Ross, A. J. Schultz,and J. M. Williams, “X-Ray and Neutron Diffraction Studies of[V(H2O)6][H5O2][CF3SO3]4,” J. Am. Chem. Soc. 1984, 106, 5319.
15. Z. Xie, R. Bau, and C. A. Reed, “A Crystalline Hydronium Saltwith a Weakly Coordinating Anion,” Inorg. Chem. 1995, 34, 5403.
16. K. Abu-Dari, K. N. Raymond, and D. P. Freyberg, “The BihydroxideAnion,” J. Am. Chem. Soc. 1979, 101, 3688.
17. W. B. Jensen, “The Symbol for pH,” J. Chem. Ed. 2004, 81, 21.
18. For a related demonstration with NH3, see M. D. Alexander, “The AmmoniaSmoke Fountain,” J. Chem. Ed. 1999, 76, 210; N. C. Thomas, “AChemiluminescent Ammonia Fountain,” J. Chem. Ed. 1990, 67, 339; andN. Steadman, “Ammonia Fountain Improvements,” J. Chem. Ed. 1992, 66, 764.
19. L. M. Schwartz, “Ion-Pair Complexation in Moderately Strong AqueousAcids,” J. Chem. Ed. 1995, 72, 823. Even though it is not “free,” in ionpairs with anions such as and appears to participate in ionicconductance [R. I. Gelb and J. S. Alper, “Anomalous Conductance in ElectrolyteSolutions,” Anal. Chem. 2000, 72, 1322].
20. S. J. Hawkes, “All Positive Ions Give Acid Solutions in Water,” J. Chem.Ed. 1996, 73, 516.
21. M. Kern, “The Hydration of Carbon Dioxide,” J. Chem. Ed. 1960, 37, 14.Great demonstrations with CO2, including one with carbonic anhydrase, aredescribed by J. A. Bell, “Every Year Begins a Millennium,” J. Chem. Ed. 2000,77, 1098.
22. The equilibrium constants apply in 4 M NaClO4 at Structures of someof these complexes are discussed by G. B. Kauffman, M. Karabassi, andG. Bergerhoff, “Metallo Complexes: An Experiment for the UndergraduateLaboratory,” J. Chem. Ed. 1984, 61, 729.
Chapter 71. F. Szabadváry, History of Analytical Chemistry (Langhorne, PA: Gordon
and Breach, 1992); E. R. Madsen, The Development of Titrimetric Analysis ’till1806 (Copenhagen: E. E. C. Gad, 1958); C. Duval, J. Chem. Ed. 1951, 28, 508;A. Johansson, Anal. Chim. Acta 1988, 206, 97; and J. T. Stock, “A BackwardLook at Scientific Instrumentation,” Anal. Chem. 1993, 65, 344A. Instructionsfor use of the burets were taken from Szabadváry’s History of AnalyticalChemistry and from O. D. Allen, ed., Fresenius’ Quantitative Chemical Analysis
25°C.
CCl3CO2CF3CO2
H3O�
(H3O2)
[H9O4]�
H3O� � F,
H�
ICO32
Pb2�
Ksp

(2nd American ed., 1881). Drawings originally appeared in F. A. H. Descroizilles,Ann. Chim. 1806, 60, 17; J. L. Gay-Lussac, Ann. Chim. Phys. 1824, 26, 152;É. O. Henry, J. Chim. Pharm. 1846, 6, 301; F. Mohr, Lehrbuch der Chemisch-Analytischen Titrirmethode (Braunschweig, 1855). The picture of the Gay-Lussacburet is from Fresenius’ Quantitative Chemical Analysis.
2. Reagent Chemicals, 9th ed. (Washington, DC: American Chemical Society,1999).
3. R. W. Ramette, “In Support of Weight Titrations,” J. Chem. Ed. 2004, 81, 1715.
4. The Kjeldahl digestion captures amine or amide nitrogens (where R can be H or an organic group), but not oxidized nitrogensuch as nitro or azo groups, which must be reduced firstto amines or amides.
5. W. Maher, F. Krikowa, D. Wruck, H. Louie, T. Nguyen, and W. Y. Huang,“Determination of Total Phosphorus and Nitrogen in Turbid Waters by Oxidationwith Alkaline Potassium Peroxodisulfate,” Anal. Chim. Acta 2002, 463, 283.
6. P. de. B. Harrington, E. Kolbrich, and J. Cline, “Experimental Design andMultiplexed Modeling Using Titrimetry and Spreadsheets,” J. Chem. Ed. 2002,79, 863.
7. G. Grguric, “Denitrification as a Model Chemical Process,” J. Chem. Ed.2002, 79, 179.
8. M. L. Ware, M. D. Argentine, and G. W. Rice, “Potentiometric Determinationof Halogen Content in Organic Compounds Using Dispersed Sodium Reduction,”Anal. Chem. 1988, 60, 383.
Chapter 81. H. Ohtaki and T. Radnal, “Structure and Dynamics of Hydrated Ions,”
Chem. Rev. 1993, 93, 1157.
2. A. G. Sharpe, “The Solvation of Halide Ions and Its Chemical Significance,”J. Chem. Ed. 1990, 67, 309.
3. E. R. Nightingale, Jr., “Phenomenological Theory of Ion Solvation:Effective Radii of Hydrated Ions,” J. Phys. Chem. 1959, 63, 1381.
4. K. H. Stern and E. S. Amis, “Ionic Size,” Chem. Rev. 1959, 59, 1.
5. D. R. Driscol, “‘Invitation to Enquiry’: The Equilibrium,”J. Chem. Ed. 1979, 56, 603.
6. S. J. Hawkes, “Salts Are Mostly NOT Ionized,” J. Chem. Ed. 1996, 73, 421;S. O. Russo and G. I. H. Hanania, “Ion Association, Solubilities, and ReductionPotentials in Aqueous Solution,” J. Chem. Ed. 1989, 66, 148.
7. K. S. Pitzer, Activity Coefficients in Electrolyte Solutions, 2nd ed. (BocaRaton, FL: CRC Press, 1991); B. S. Krumgalz, R. Pogorelskii, A. Sokolov, andK. S. Pitzer, “Volumetric Ion Interaction Parameters for Single-Solute AqueousElectrolyte Solutions at Various Temperatures,” J. Phys. Chem. Ref. Data 2000,29, 1123.
8. J. Kielland, “Individual Activity Coefficients of Ions in Aqueous Solutions,”J. Am. Chem. Soc. 1937, 59, 1675.
9. R. E. Weston, Jr., “Climate Change and Its Effect on Coral Reefs,” J. Chem.Ed. 2000, 77, 1574; R. A. Feely, C. L. Sabine, K. Lee, W. Berelson, J. Kleypas,Vi. J. Fabry, and F. J. Millero, “Impact of Anthropogenic CO2 on the CaCO3
System in the Oceans,” Science 2004, 305, 362.
10. For more about equilibrium calculations, see W. B. Guenther, UnifiedEquilibrium Calculations (New York: Wiley, 1991); J. N. Butler, IonicEquilibrium: Solubility and pH Calculations (New York: Wiley, 1998); andM. Meloun, Computation of Solution Equilibria (New York: Wiley, 1988). Forequilibrium calculation software, see http://www.micromath.com/ andhttp://www.acadsoft.co.uk/
11. M. S. Frant and J. W. Ross, Jr., “Electrode for Sensing Fluoride Ion Activityin Solution,” Science 1966, 154, 1553.
Chapter 91. R. Schmid and A. M. Miah, “The Strength of the Hydrohalic Acids,”
J. Chem. Ed. 2001, 78, 116.
2. T. F. Young, L. F. Maranville, and H. M. Smith, “Raman SpectralInvestigations of Ionic Equilibria in Solutions of Strong Electrolytes” in W. J.Hamer, ed., The Structure of Electrolytic Solutions (New York: Wiley, 1959).
Fe3�/CNS
(ßN¢Nß)(ßNO2)
(ßC[¢O]NR2)(ßNR2)
NR4 Notes and References
3. Acid dissociation constants do not tell us which protons dissociate in eachstep. Assignments for pyridoxal phosphate come from nuclear magneticresonance spectroscopy [B. Szpoganicz and A. E. Martell, “Thermodynamic andMicroscopic Equilibrium Constants of Pyridoxal 5�-Phosphate,” J. Am. Chem.Soc. 1984, 106, 5513].
4. For an alternative treatment approach, see H. L. Pardue, I. N. Odeh, andT. M. Tesfai, “Unified Approximations: A New Approach for Monoprotic WeakAcid-Base Equilibria,” J. Chem. Ed. 2004, 81, 1367.
5. M. C. Bonneau, “The Chemistry of Fabric Reactive Dyes,” J. Chem. Ed.1995, 72, 724.
6. R. T. da Rocha, I. G. R. Gutz, and C. L. do Lago, “A Low-Cost and High-Performance Conductivity Meter,” J. Chem. Ed. 1997, 74, 572; G. Berenato andD. F. Maynard, “A Simple Audio Conductivity Device,” J. Chem. Ed. 1997, 74,415; S. K. S. Zawacky, “A Cheap, Semiquantitative Hand-Held ConductivityTester,” J. Chem. Ed. 1995, 72, 728; T. R. Rettich, “An Inexpensive and EasilyConstructed Device for Quantitative Conductivity Experiments,” J. Chem. Ed.1989, 66, 168; and D. A. Katz and C. Willis, “Two Safe Student ConductivityApparatus,” J. Chem. Ed. 1994, 71, 330.
7. L. R. Kuck, R. D. Godec, P. P. Kosenka, and J. W. Birks, “High-PrecisionConductometric Detector for the Measurement of Atmospheric CO2,” Anal.Chem. 1998, 70, 4678.
8. H. N. Po and N. M. Senozan, “The Henderson-Hasselbalch Equation:Its History and Limitations,” J. Chem. Ed. 2001, 78, 1499; R. de Levie, “TheHenderson-Hasselbalch Equation: Its History and Limitations,” J. Chem. Ed.2003, 80, 146.
9. F. B. Dutton and G. Gordon in H. N. Alyea and F. B. Dutton, eds., TestedDemonstrations in Chemistry, 6th ed. (Easton, PA: Journal of ChemicalEducation, 1965), p. 147; R. L. Barrett, “The Formaldehyde Clock Reaction,”J. Chem. Ed. 1955, 32, 78. See also J. J. Fortman and J. A. Schreier, “SomeModified Two-Color Formaldehyde Clock Salutes for Schools with Colors ofGold and Green or Gold and Red,” J. Chem. Ed. 1991, 68, 324; M. G. Burnett,“The Mechanism of the Formaldehyde Clock Reaction,” J. Chem. Ed. 1982, 59,160; and P. Warneck, “The Formaldehyde-Sulfite Clock Reaction Revisited,”J. Chem. Ed. 1989, 66, 334.
10. The chemical we call sodium bisulfite (NaHSO3) is apparently not thesolid in the reagent bottle, which is reported to be sodium metabisulfite (Na2S2O5)[D. Tudela, “Solid NaHSO3 Does Not Exist,” J. Chem. Ed. 2000, 77, 830; seealso H. D. B. Jenkins and D. Tudela, “New Methods to Estimate Lattice Energies:Application to Bisulfite and Metabisulfite,” J. Chem. Ed. 2003, 80, 1482]. NaHSO3
is produced when Na2S2O5 dissolves in water. A reagent bottle I use for theformaldehyde clock reaction is labeled “sodium bisulfite,” but no formula is given.The label gives the reagent assay “as SO2: minimum 58.5%.” Pure NaHSO3 isequivalent to 61.56 wt% SO2 and pure Na2S2O5 is equivalent to 67.40 wt% SO2.
11. E. T. Urbansky and M. R. Schock, “Understanding, Deriving, andComputing Buffer Capacity,” J. Chem. Ed. 2000, 77, 1640.
Chapter 101. P. G. Daniele, “ and Complexes of Low Molecular Weight
Ligands in Aqueous Solution,” J. Chem. Soc. Dalton Trans. 1985, 2353.
2. P. G. Righetti, E. Gianazza, C. Gelfi, M. Chiari, and P. K. Sinha, “IsoelectricFocusing in Immobilized pH Gradients,” Anal. Chem. 1989, 61, 1602.
3. Experiment on surface acidity of a solid: L. Tribe and B. C. Barja,“Adsorption of Phosphate on Goethite,” J. Chem. Ed. 2004, 81, 1624.
Chapter 111. B. Mörnstam, K.-G. Wahlund, and B. Jönsson, “Potentiometric Acid-Base
Titration of a Colloidal Solution,” Anal. Chem. 1997, 69, 5037. For titration ofentire cell surfaces, see I. Sokolov, D. S. Smith, G. S. Henderson, Y. A. Gorby, andF. G. Ferris, “Cell Surface Electrochemical Heterogeneity of the Fe(III)-ReducingBacteria Shewanella putrefaciens,” Environ. Sci. Technol. 2001, 35, 341.
2. A method to measure total charge on a protein as it binds to assorted ions isdescribed by M. K. Menon and A. L. Zydney, “Measurement of Protein Chargeand Ion Binding Using Capillary Electrophoresis,” Anal. Chem. 1998, 70, 1581.
3. M. J. Ondrechen, J. G. Clifton, and D. Ringe, “THEMATICS: A SimpleComputational Predictor of Enzyme Function from Structure,” Proc. Natl. Acad.Sci. USA, 2001, 98, 12473.
Ca2�Na�, K�,

Notes and References NR5
4. K. R. Williams, “Automatic Titrators in the Analytical and PhysicalChemistry Laboratories,” J. Chem. Ed. 1998, 75, 1133; K. L. Headrick,T. K. Davies, and A. N. Haegele, “A Simple Laboratory-Constructed AutomaticTitrator,” J. Chem. Ed. 2000, 77, 389.
5. M. Inoue and Q. Fernando, “Effect of Dissolved CO2 on Gran Plots,”J. Chem. Ed. 2001, 78, 1132; G. Gran, “Equivalence Volumes in PotentiometricTitrations,” Anal. Chim. Acta 1988, 206, 111; F. J. C. Rossotti and H. Rossotti,“Potentiometric Titrations Using Gran Plots,” J. Chem. Ed. 1965, 42, 375;L. M. Schwartz, “Uncertainty of a Titration Equivalence Point,” J. Chem. Ed.1992, 69, 879. L. M. Schwartz, “Advances in Acid-Base Gran PlotMethodology,” J. Chem. Ed. 1987, 64, 947.
6. M. Rigobello-Masini and J. C. Masini, “Application of Modified GranFunctions and Derivative Methods to Potentiometric Acid Titration Studies ofthe Distribution of Inorganic Carbon Species in Cultivation Medium of MarineMicroalgae,” Anal. Chim. Acta 2001, 448, 239.
7. G. Papanastasiou and I. Ziogas, “Simultaneous Determination ofEquivalence Volumes and Acid Dissociation Constants from PotentiometricTitration Data,” Talanta 1995, 42, 827.
8. G. Wittke, “Reactions of Phenolphthalein at Various pH Values,” J. Chem.Ed. 1983, 60, 239.
9. Demonstrations with universal indicator (a mixed indicator with manycolor changes) are described in J. T. Riley, “Flashy Solutions,” J. Chem.Ed. 1977, 54, 29.
10. T. A. Canada, L. R. Allain, D. B. Beach, and Z. Xue, “High-AcidityDetermination in Salt-Containing Acids by Optical Sensors,” Anal. Chem. 2002,74, 2535.
11. D. Fárcasiu and A. Ghenciu, “Acidity Functions from ” J. Am.Chem. Soc. 1993, 115, 10901.
12. B. Hammouti, H. Oudda, A. El Maslout, and A. Benayada, “A Sensor forthe In Situ Determination of Acidity Levels in Concentrated Sulfuric Acid,”Fresenius J. Anal. Chem. 1999, 365, 310. For use of glass electrodes to measurepH as low as 4, see D. K. Nordstrom, C. N. Alpers, C. J. Ptacek, andD. W. Blowes, “Negative pH and Extremely Acidic Mine Waters from IronMountain, California,” Environ. Sci. Technol. 2000, 34, 254.
13. C. Yi and M. Gratzl, “Diffusional Mictrotitration: Reagent Delivery by aDiffusional Microburet into Microscopic Samples,” Anal. Chem. 1994, 66, 1976;M. Gratzl, H. Lu, T. Matsumoto, C. Yi, and G. R. Bright, “Fine ChemicalManipulations of Microscopic Liquid Samples,” Anal. Chem. 1999, 71, 2751;H. Lu and M. Gratzl, “Optical Detection in Microscopic Domains,” Anal.Chem. 2000, 72, 1569; K. Tohda, H. Lu, Y. Umezawa, and M. Gratzl, “OpticalDetection in Microscopic Domains: Monitoring Nonfluorescent Molecules withFluorescence,” Anal. Chem. 2001, 73, 2070; E. Litborn, M. Stjernström, andJ. Roeraade, “Nanoliter Titration Based on Piezoelectric Drop-on-DemandTechnology and Laser-Induced Fluorescence Detection,” Anal. Chem. 1998,70, 4847.
14. C. Yi, D. Huang, and M. Gratzl, “Complexometric Determination ofMetal Ions by Microscopic Diffusional Titration,” Anal. Chem. 1996, 68,1580; H. Xie and M. Gratzl, “Diffusional Titration of Metal Ions inMicroliter Samples with Potentiometric Indication,” Anal. Chem. 1996,68, 3665.
15. R. A. Butler and R. G. Bates, “Double Potassium Salt of Sulfosalicylic Acidin Acidmetry and pH Control,” Anal. Chem. 1976, 48, 1669.
16. Borax goes down to the pentahydrate upon standing: R. Naumann,C. Alexander-Weber, and F. G. K. Baucke, “Limited Stability of the pHReference Material Sodium Tetraborate Decahydrate (“Borax”),” FreseniusJ. Anal. Chem. 1994, 350, 119.
17. Instructions for purifying and using primary standards can be found inthe following books: J. A. Dean, Analytical Chemistry Handbook (New York:McGraw-Hill, 1995), pp. 3-28 to 3-30; J. Bassett, R. C. Denney, G. H. Jeffery,and J. Mendham, Vogel’s Textbook of Quantitative Inorganic Analysis, 4th ed.(Essex, UK: Longman, 1978), pp. 296–306; I. M. Kolthoff and V. A. Stenger,Volumetric Analysis, Vol. 2 (New York: Wiley-Interscience, 1947).
18. A. A. Smith, “Consumption of Base by Glassware,” J. Chem. Ed.1986, 63, 85; G. Perera and R. H. Doremus, “Dissolution Rates of Commercial Soda-Lime and Pyrex Borosilicate Glasses,” J. Am. Ceram. Soc.1991, 74, 1554.
13C-NMR,
19. J. S. Fritz, Acid-Base Titrations in Nonaqueous Solvents (Boston: Allyn &Bacon, 1973); J. Kucharsky and L. Safarik, Titrations in Non-Aqueous Solvents(New York: Elsevier, 1963); W. Huber, Titrations in Nonaqueous Solvents (NewYork: Academic Press, 1967); I. Gyenes, Titration in Non-Aqueous Media(Princeton, NJ: Van Nostrand, 1967).
20. R. de Levie, “A General Simulator for Acid-Base Titrations,” J. Chem. Ed.1999, 76, 987; R. de Levie, “Explicit Expressions of the General Form of theTitration Curve in Terms of Concentration,” J. Chem. Ed. 1993, 70, 209; R. deLevie, “General Expressions for Acid-Base Titrations of Arbitrary Mixtures,”Anal. Chem. 1996, 68, 585; R. de Levie, Principles of Quantitative ChemicalAnalysis (New York: McGraw-Hill, 1997).
21. P. Ballinger and F. A. Long, “Acid Ionization Constants of Alcohols,” J. Am.Chem. Soc. 1960, 82, 795.
Chapter 121. R. MacKinnon, “Potassium Channels and the Atomic Basis of Selective Ion
Conduction” (Nobel Lecture), Angew. Chem. Int. Ed. 2004, 43, 4265.
2. W. D. Bedsworth and D. L. Sedlak, “Sources and Environmental Fate ofStrongly Complexed Nickel in Estuariane Waters,” Environ. Sci. Technol. 1999,33, 926; B. Nowack, “Environmental Chemistry of AminopolycarboxylateChelating Agents,” Environ. Sci. Technol. 2002, 36, 4009.
3. D. T. Haworth, “Some Linguistic Details on Chelation,” J. Chem. Ed.1998, 75, 47.
4. The chelate effect is often attributed to a favorable entropy change formultidentate binding. Recent work does not support this explanation: V. Vallet,U. Wahlgren, and I. Grenthe, “Chelate Effect and Thermodynamics of MetalComplex Formation in Solution: A Quantum Chemical Study,” J. Am. Chem.Soc. 2003, 125, 14941.
5. R. Mullin, “Targeted Drugs,” Chem. Eng. News, 16 May 2005, p. 9; M. R.McDevitt, D. Ma, L. T. Lai, J. Simon, P. Borchardt, R. K. Frank, K. Wu, V.Pellegrini, M. J. Curcio, M. Miederer, N. H. Bander, and D. A. Scheinberg,“Tumor Therapy with Targeted Atomic Nanogenerators,” Science 2001,294, 1537.
6. Z. Hou, K. N. Raymond, B. O’Sullivan, T. W. Esker, and T. Nishio,“Microbial Macrocyclic Dihydroxamate Chelating Agents,” Inorg. Chem. 1998,37, 6630.
7. N. F. Olivieri and G. M. Brittenham, “Iron-Chelating Therapy and theTreatment of Thalassemia,” Blood 1997, 89, 739.
8. D. R. Richardson and P. Ponka, “Development of Iron Chelators to TreatIron Overload Disease,” Am. J. Hematol. 1998, 58, 299.
9. J. Savulescu, “Thalassaemia Major: The Murky Story of Deferiprone,” Br. Med. J. 2004, 328, 358.
10. C. May, S. Rivella, J. Callegari, G. Heller, K. M. L. Gaensler, L. Luzzatto,and M. Sadelain, “Therapeutic Haemoglobin Synthesis in -Thalassaemic MiceExpressing Lentivirus-Encoded Human -Globin,” Nature 2000, 406, 82.
11. A. E. Martell, R. M. Smith, and R. J. Motekaitis, NIST Standard ReferenceDatabase 46 (Gaithersburg, MD: National Institute of Standards andTechnology, 2001).
12. H4Y can be dried at for 2 h and used as a primary standard. It can bedissolved by adding NaOH solution from a plastic container. NaOH solution froma glass bottle should not be used, because it contains alkaline earth metals leachedfrom the glass. Reagent-grade contains excess water. Itmay be used in this form with suitable correction for the mass of excess water ordried to the composition at [W. J. Blaedel and H. T. Knight,“Purification and Properties of Disodium Salt of Ethylenediaminetetraacetic Acidas a Primary Standard,” Anal. Chem. 1954, 26, 741.]
13. R. L. Barnett and V. A. Uchtman, “Crystal Structures ofand NaCaNTA,” Inorg. Chem. 1979, 18, 2674.
14. S. G. John, C. E. Ruggiero, L. E. Hersman, C.-S. Tung, and M. P. Neu,“Siderophore Mediated Plutonium Accumulation by Microbacteriumflavescens,” Environ. Sci. Technol. 2001, 35, 2942.
15. A definitive reference for the theory of EDTA titration curves isA. Ringbom, Complexation in Analytical Chemistry (New York: Wiley, 1963).
16. For discussion of metal-ligand equilibria with numerous examples, seeP. Letkeman, “Computer-Modeling of Metal Speciation in Human Blood Serum,”
Ca(CaEDTA) � 7H2O
80°C.Na2H2Y � 2H2O
�0.3%Na2H2Y � 2H2O
140°C
�
�

J. Chem. Ed. 1996, 73, 165; A. Rojas-Hernández, M. T. Ramírez, I. González,and J. G. Ibanez, “Predominance-Zone Diagrams in Solution Chemistry,”J. Chem. Ed. 1995, 72, 1099; and A. Bianchi and E. Garcia-España, “Use ofCalculated Species Distribution Diagrams to Analyze ThermodynamicSelectivity,” J. Chem. Ed. 1999, 76, 1727.
17. W. N. Perara and G. Hefter, “Mononuclear Cyano- and Hydroxo-Complexesof Iron(III),” Inorg. Chem. 2003, 42, 5917.
18. S. Tandy, K. Bossart, R. Mueller, J. Ritschel, L. Hauser, R. Schulin, andB. Nowack, “Extraction of Heavy Metals from Soils Using BiodegradableChelating Agents,” Environ. Sci. Technol. 2004, 38, 937; B. Kos and D. Leštan,“Induced Phytoextraction/Soil Washing of Lead Using Biodegradable Chelateand Permeable Barriers, Environ. Sci. Technol. 2003, 37, 624; S. V. Sahi,N. L. Bryant, N. C. Sharma, and S. R. Singh, “Characterization of a LeadHyperaccumulator Shrub,” Environ. Sci. Technol. 2002, 36, 4676.
19. G. Schwarzenbach and H. Flaschka, Complexometric Titrations, H. M.N. H. Irving, trans. (London: Methuen, 1969); H. A. Flaschka, EDTA Titrations(New York: Pergamon Press, 1959); J. A. Dean, Analytical Chemistry Handbook(New York: McGraw-Hill, 1995); A. E. Martell and R. D. Hancock, MetalComplexes in Aqueous Solution (New York: Plenum Press, 1996).
20. Indirect determinations of monovalent cations are described by I. M. Yurist,M. M. Talmud, and P. M. Zaitsev, “Complexometric Determination ofMonovalent Metals,” J. Anal. Chem. USSR 1987, 42, 911.
21. D. P. S. Rathore, P. K. Bhargava, M. Kumar, and R. K. Talra, “Indicatorsfor the Titrimetric Determination of Ca and Total with EDTA,” Anal.Chim. Acta 1993, 281, 173.
22. T. Darjaa, K. Yamada, N. Sato, T. Fujino, and Y. Waseda, “Determinationof Sulfur in Metal Sulfides by Bromine Water- Oxidative Dissolution andModified EDTA Titration,” Fresenius J. Anal. Chem. 1998, 361, 442.
Chapter 131. J. Gorman in Science News, 9 September 2000, p. 165.
2. R. F. Wright et al., “Recovery of Acidified European Surface Waters,”Environ. Sci. Technol. 2005, 39, 64A.
3. Books that will teach you more about equilibrium calculations includeW. B. Guenther, Unified Equilibrium Calculations (New York: Wiley, 1991);J. N. Butler, Ionic Equilibrium: Solubility and pH Calculations (New York:Wiley, 1998); and M. Meloun, Computation of Solution Equilibria (New York:Wiley, 1988). For commercial software that performs complex equilibriumcalculations, see http://www.micromath.com/ and http://www.acadsoft.co.uk/.
4. R. G. Bates, Determination of pH, 2nd ed. (New York: Wiley, 1973), p. 86,is the authoritative reference on pH. The pH uncertainty of primary standardscould be greater than at temperatures other than .
5. R. B. Martin, “Aluminum: A Neurotoxic Product of Acid Rain,” Acc. Chem.Res. 1994, 27, 204.
6. R. Jugdaohsingh, M. M. Campbell, R. P. H. Thompson, C. R. McCrohan,K. N. White, and J. J. Powell, “Mucus Secretion by the Freshwater Snail Lymnaeastagnalis Limits Aluminum Concentrations of the Aqueous Environment,” Environ.Sci. Technol. 1998, 32, 2591; M. Ravichandran, G. R. Aiken, M. M. Reddy, andJ. N. Ryan, “Enhanced Dissolution of Cinnabar (Mercuric Sulfide) by DissolvedOrganic Matter Isolated from the Florida Everglades,” Environ. Sci. Technol. 1998,32, 3305; S. Sauvé, M. McBride, and W. Hendershot, “Lead Phosphate Solubilityin Water and Soil Suspensions,” Environ. Sci. Technol. 1998, 32, 388.
7. Our approach is similar to one by J. L. Guiñón, J. Garcia-Antón, andV. Pérez-Herranz, “Spreadsheet Techniques for Evaluating the Solubility ofSparingly Soluble Salts of Weak Acids,” J. Chem. Ed. 1999, 76, 1157.
8. A. Kraft, “Determination of the p of Multiprotic, Weak Acids byAnalyzing Potentiometric Acid-Base Titration Data with Difference Plots,”J. Chem. Ed. 2003, 80, 554.
9. G. B. Kauffman, “Niels Bjerrum: A Centenial Evaluation,” J. Chem. Ed.1980, 57, 779, 863.
10. Table 6-1 gives at at The expression of towhich this value applies is given in terms of molalities, m:
Kw �mH��H�mOH�OH
AH2O� 1013.995
Kw25°C. � 0pKw � 13.995
Ka
25°C�0.006
CCl4
Ca � Mg
NR6 Notes and References
We want to evaluate for 0.1 M KCl. The factor for converting molality intomolarity in 0.1 M K is 0.994 in Table 12-1-1A of H. S. Harned and B. B. Owen,Physical Chemistry of Electrolyte Solutions, 3rd ed. (New York: Reinhold,1958), p. 725. The factor is 0.626 in 0.10 M KCl, interpolatedfrom Table 15-2-1A of Harned and Owen, p. 752. is the product ofconcentrations
Chapter 141. General treatments of electrochemistry: A. Hamnett, C. H. Hamann, and
W. Vielstich, Electrochemistry (New York: Wiley, 1998); Z. Galus, Fundamentalsof Electrochemical Analysis (New York: Ellis Horwood, 1994); C. M. A. Brettand A. M. O. Brett, Electrochemistry (Oxford: Oxford University Press, 1993);and H. B. Oldham and J. C. Myland, Fundamentals of Electrochemical Science(San Diego: Academic Press, 1993).
2. K. Rajeshwar and J. G. Ibanez, Environmental Electrochemistry (San Diego:Academic Press, 1997).
3. N. J. Tao, “Measurement and Control of Single-Molecule Conductance,”J. Mater. Chem. 2005, 15, 3260; N. Tao, “Electrochemical Fabrication ofMetallic Quantum Wires,” J. Chem. Ed. 2005, 82, 720; S. Lindsay, “Single-Molecule Electronic Measurements with Metal Electrodes,” J. Chem. Ed. 2005,82, 727; R. A. Wassel and C. B. Gorman, “Establishing the Molecular Basis forMolecular Electronics,” Angew. Chem. Int. Ed. 2004, 43, 5120.
4. S. Weinberg, The Discovery of Subatomic Particles (Cambridge: CambridgeUniversity Press, 2003), pp. 13–16. A wonderful book by a Nobel Prize winner.
5. M. J. Smith and C. A. Vincent, “Structure and Content of Some PrimaryBatteries,” J. Chem. Ed. 2001, 78, 519; R. S. Treptow, “The Lead-Acid Battery:Its Voltage in Theory and in Practice,” J. Chem. Ed. 2002, 79, 334; M. J. Smithand C. A. Vincent, “Why Do Some Batteries Last Longer Than Others?”J. Chem. Ed. 2002, 79, 851.
6. O. Zerbinati, “A Direct Methanol Fuel Cell,” J. Chem. Ed. 2002, 79, 829;J. M. Ogden, “Hydrogen: The Fuel of the Future?” Physics Today, April 2002, 69.
7. P. Krause and J. Manion, “A Novel Approach to Teaching ElectrochemicalPrinciples,” J. Chem. Ed. 1996, 73, 354.
8. L. P. Silverman and B. B. Bunn, “The World’s Longest Human Salt Bridge,”J. Chem. Ed. 1992, 69, 309.
9. Classroom demonstration of half-cells: J. D. Ciparick, “Half Cell Reactions:Do Students Ever See Them?” J. Chem. Ed. 1991, 68, 247.
10. A. W. von Smolinski, C. E. Moore, and B. Jaselskis, “The Choice ofthe Hydrogen Electrode as the Base for the Electromotive Series” inElectrochemistry, Past and Present, ACS Symposium Series 390, J. T. Stockand M. V. Orna, eds. (Washington, DC: American Chemical Society, 1989),Chap. 9.
11. H. Frieser, “Enhanced Latimer Potential Diagrams via Spreadsheets,”J. Chem. Ed. 1994, 71, 786.
12. A. Arévalo and G. Pastor, “Verification of the Nernst Equation andDetermination of a Standard Electrode Potential,” J. Chem. Ed. 1985, 62, 882.
13. For a classroom demonstration using a cell as a chemical probe, seeR. H. Anderson, “An Expanded Silver Ion Equilibria Demonstration: IncludingUse of the Nernst Equation and Calculation of Nine Equilibrium Constants,”J. Chem. Ed. 1993, 70, 940.
14. J. E. Walker, “ATP Synthesis by Rotary Catalysis (Nobel Lecture),” Angew.Chem. Int. Ed. 1998, 37, 2309; P. D. Boyer, “Energy, Life, and ATP (NobelLecture),” Angew. Chem. Int. Ed. 1998, 37, 2297; W. S. Allison, “F1-ATPase,”Acc. Chem. Res. 1998, 31, 819.
15. For an advanced equilibrium problem based on the bromine Latimerdiagram, see T. Michalowski, “Calculation of pH and Potential E for BromineAqueous Solution,” J. Chem. Ed. 1994, 71, 560.
� 1013.995(0.9942)a 1
0.626b � 1013.797
[H�][OH] �mH�(0.994)�H�mOH(0.994)�OH
AH2O
AH2O
�H��OH
[H�][OH]:Kw¿
�H��OH /AH2O
Kw¿

Notes and References NR7
16. K. T. Jacob, K. P. Jayadevan, and Y. Waseda, “Electrochemical Determinationof the Gibbs Energy of Formation of MgAl2O4,” J. Am. Ceram. Soc. 1998,81, 209.
17. J. T. Stock, “Einar Biilmann (1873–1946): pH Determination Made Easy,”J. Chem. Ed. 1989, 66, 910.
18. The cell in this problem would not give an accurate result, because of thejunction potential at each liquid junction (Section 15-3). A cell without a liquidjunction is described by P. A. Rock, “Electrochemical Double Cells,” J. Chem. Ed.1975, 52, 787.
Chapter 151. B. Fu, E. Bakker, J. H. Yun, V. C. Yang, and M. E. Meyerhoff, “Response
Mechanism of Polymer Membrane-Based Potentiometric Polyion Sensors,”Anal. Chem. 1994, 66, 2250.
2. I. Capila and R. J. Linhardt, “Heparin-Protein Interactions,” Angew. Chem.Int. Ed. 2002, 41, 390.
3. W. Qin, W. Zhang, K. P. Xiao, and M. E. Meyerhoff, “EnhancedSensitivity Electrochemical Assay of Low-Molecular-Weight Heparins UsingRotating Polyion-Sensitive Membrane Electrodes,” Anal. Bioanal. Chem.2003, 377, 929.
4. Practical aspects of electrode fabrication are discussed in D. T. Sawyer,A. Sobkowiak, and J. L. Roberts, Jr., Electrochemistry for Chemists, 2nd ed.(New York: Wiley, 1995); G. A. East and M. A. del Valle, “Easy-to-MakeAg/AgCl Reference Electrode,” J. Chem. Ed. 2000, 77, 97.
5. A demonstration of potentiometry with a silver electrode (or a microscaleexperiment for general chemistry) is described by D. W. Brooks, D. Epp, andH. B. Brooks, “Small-Scale Potentiometry and Silver One-Pot Reactions,”J. Chem. Ed. 1995, 72, A162.
6. D. Dobčnik, J. Stergulec, and S. Gomišček, “Preparation of an IodideIon-Selective Electrode by Chemical Treatment of a Silver Wire,” FreseniusJ. Anal. Chem. 1996, 354, 494.
7. I. R. Epstein and J. A. Pojman, An Introduction to Nonlinear ChemicalDynamics: Oscillations, Waves, Patterns, and Chaos (New York: OxfordUniversity Press, 1998); I. R. Epstein, K. Kustin, P. De Kepper, and M. Orbán,Scientific American, March 1983, p. 112; and H. Degn, “Oscillating ChemicalReactions in Homogeneous Phase,” J. Chem. Ed. 1972, 49, 302.
8. Mechanisms of oscillating reactions are discussed by O. Benini,R. Cervellati, and P. Fetto, “The BZ Reaction: Experimental and Model Studiesin the Physical Chemistry Laboratory,” J. Chem. Ed. 1996, 73, 865; R. J. Fieldand F. W. Schneider, “Oscillating Chemical Reactions and NonlinearDynamics,” J. Chem. Ed. 1989, 66, 195; R. M. Noyes, “Some Models ofChemical Oscillators,” J. Chem. Ed. 1989, 66, 190; P. Ruoff, M. Varga, andE. Körös, “How Bromate Oscillators Are Controlled,” Acc. Chem. Res. 1988, 21,326; M. M. C. Ferriera, W. C. Ferriera, Jr., A. C. S. Lino, and M. E. G. Porto,“Uncovering Oscillations, Complexity, and Chaos in Chemical Kinetics UsingMathematica,” J. Chem. Ed. 1999, 76, 861; G. Schmitz, L. Kolar-Anić, S. Anić,and Z. C̆upić, “The Illustration of Multistability,” J. Chem. Ed. 2000, 77, 1502.
9. H. E. Prypsztejn, “Chemiluminescent Oscillating Demonstrations: TheChemical Buoy, the Lighting Wave, and the Ghostly Cylinder,” J. Chem. Ed.2005, 82, 53; D. Kolb, “Overhead Projector Demonstrations,” J. Chem. Ed.1988, 65, 1004; R. J. Field, “A Reaction Periodic in Time and Space,” J. Chem.Ed. 1972, 49, 308; J. N. Demas and D. Diemente, “An Oscillating ChemicalReaction with a Luminescent Indicator,” J. Chem. Ed. 1973, 50, 357;J. F. Lefelhocz, “The Color Blind Traffic Light,” J. Chem. Ed. 1972, 49, 312:P. Aroca, Jr., and R. Aroca, “Chemical Oscillations: A Microcomputer-ControlledExperiment,” J. Chem. Ed. 1987, 64, 1017: J. Amrehn, P. Resch, and F. W.Schneider, “Oscillating Chemiluminescence with Luminol in the ContinuousFlow Stirred Tank Reactor,” J. Phys. Chem. 1988, 92, 3318; D. Avnir,“Chemically Induced Pulsations of Interfaces: The Mercury Beating Heart,”J. Chem. Ed. 1989, 66, 211; K. Yoshikawa, S. Nakata, M. Yamanaka, andT. Waki, “Amusement with a Salt-Water Oscillator,” J. Chem. Ed. 1989, 66, 205;L. J. Soltzberg, M. M. Boucher, D. M. Crane, and S. S. Pazar, “Far fromEquilibrium—The Flashback Oscillator,” J. Chem. Ed. 1987, 64, 1043; S. M.Kaushik, Z. Yuan, and R. M. Noyes, “A Simple Demonstration of a GasEvolution Oscillator,” J. Chem. Ed. 1986, 63, 76; R. F. Melka, G. Olsen,L. Beavers, and J. A. Draeger, “The Kinetics of Oscillating Reactions,” J. Chem.Ed. 1992, 69, 596; J. M. Merino, “A Simple, Continuous-Flow Stirred-Tank
Reactor for the Demonstration and Investigation of Oscillating Reactions,”J. Chem. Ed. 1992, 69, 754.
10. T. Kappes and P. C. Hauser, “A Simple Supplementary Offset Device forData Acquisition Systems,” J. Chem. Ed. 1999, 76, 1429.
11. [Br] also oscillates in this experiment. For an [I] oscillator, see T. S.Briggs and W. C. Rauscher, “An Oscillating Iodine Clock,” J. Chem. Ed. 1973,50, 496.
12. E. Bakker, P. Bühlmann, and E. Pretsch, “Carrier-Based Ion-SelectiveElectrodes and Bulk Optodes,” Chem. Rev. 1997, 97, 3083; ibid. 1998, 98, 1593.
13. C. E. Moore, B. Jaselskis, and A. von Smolinski, “Development of the GlassElectrode” in Electrochemistry, Past and Present, ACS Symposium Series 390,J. T. Stock and M. V. Orna, eds. (Washington, DC: American Chemical Society,1989), Chap. 19.
14. electrodes (commercially available from Cypress Systems,Lawrence, KS) can measure pH in harsh environments or microscopic spaces[S. A. M. Marzouk, “Improved Electrodeposited Iridium Oxide pH SensorFabricated on Etched Titanium Substrates,” Anal. Chem. 2003, 75, 1258; A. N.Bezbaruah and T. C. Zhang, “Fabrication of Anodically ElectrodepositedIridium Oxide Film pH Microelectrodes for Microenvironmental Studies,” Anal.Chem. 2002, 74, 5726; D. O. Wipf, F. Ge, T. W. Spaine, and J. E. Baur,“Microscopic Measurement of pH with IrO2 Microelectrodes,” Anal. Chem.2000, 72, 4921]. For pH measurement in nanoscopic spaces, see X. Zhang,B. Ogorevc, and J. Wang, “Solid-State pH Nanoelectrode Based on PolyanilineThin Film Electrodeposited onto Ion-Beam Etched Carbon Fiber,” Anal. Chim.Acta 2002, 452, 1. A ZrO2 electrode can measure pH up to [L. W.Niedrach, “Electrodes for Potential Measurements in Aqueous Systems at HighTemperatures and Pressures,” Angew. Chem. 1987, 26, 161].
15. B. Jaselskis, C. E. Moore, and A. von Smolinski, “Development of the pHMeter” in Electrochemistry, Past and Present, ACS Symposium Series 390,J. T. Stock and M. V. Orna, eds. (Washington, DC: American Chemical Society,1989), Chap. 18.
16. H. B. Kristensen, A. Salomon, and G. Kokholm, “International pH Scalesand Certification of pH,” Anal. Chem. 1991, 63, 885A.
17. L. M. Goss, “A Demonstration of Acid Rain and Lake Acidification: WetDeposition of Sulfur Dioxide,” J. Chem. Ed. 2003, 80, 39.
18. J. A. Lynch, V. C. Bowersox, and J. W. Grimm, “Acid Rain Reduced inEastern United States,” Environ. Sci. Technol. 2000, 34, 940; R. E. Baumgardner,Jr., T. F. Lavery, C. M. Rogers, and S. S. Isil, “Estimates of the AtmosphericDeposition of Sulfur and Nitrogen Species: Clean Air Status and TrendsNetwork, 1990–2000,” Environ. Sci. Technol. 2002, 36, 2614;www.epa.gov/acidrain
19. W. F. Koch, G. Marinenko, and R. C. Paule, “An Interlaboratory Test of pHMeasurements in Rainwater,” J. Res. Natl. Bur. Stds. 1986, 91, 23.
20. Free diffusion junction electrodes are designed to minimize junctionpotentials. The junction is a Teflon capillary tube containing electrolyte that isperiodically renewed by syringe.
21. Spectrophotometry with acid-base indictors is another means for measuring thepH of low ionic strength natural waters. C. R. French, J. J. Carr, E. M. Dougherty,L. A. K. Eidson, J. C. Reynolds, and M. D. DeGrandpre, “Spectrophotometric pHMeasurements of Freshwater,” Anal. Chim. Acta 2002, 453, 13.
22. The reference electrode in the Ross combination electrode is Pt Thiselectrode is claimed to give improved precision and accuracy over conventionalpH electrodes [R. C. Metcalf, Analyst 1987, 112, 1573].
23. History of ion-selective electrodes: M. S. Frant, “Where Did Ion SelectiveElectrodes Come From?” J. Chem. Ed. 1997, 74, 159; J. Ruzicka, “TheSeventies—Golden Age for Ion Selective Electrodes,” J. Chem. Ed. 1997,74,167; T. S. Light, “Industrial Use and Applications of Ion SelectiveElectrodes,” J. Chem. Ed. 1997, 74, 171; and C. C. Young, “Evolution of BloodChemistry Analyzers Based on Ion Selective Electrodes,” J. Chem. Ed. 1997, 74,177; R. P. Buck and E. Lindner, “Tracing the History of Selective Ion Sensors,”Anal. Chem. 2001, 73, 88A.
24. The Nicolsky-Eisenman equation (15-8) is predicated on equal chargesfor the primary (A) and interfering (X) ions [E. Bakker, R. Meruva, E. Pretsch,and M. Meyerhoff, “Selectivity of Polymer Membrane-Based Ion-SelectiveElectrodes,” Anal. Chem. 1994, 66, 3021]. Recipes for measuring selectivity
0 I2, I.
300°C
Ir 0 IrO2

coefficients for ions of different charge and discussions of subtle pitfalls can befound in E. Bakker, E. Pretsch, and P. Bühlmann, Anal. Chem. 2000, 72, 1127;and K. Ren, “Selectivity Problems of Membrane Ion-Selective Electrodes,”Fresenius J. Anal. Chem. 1999, 365, 389.
25. E. Bakker and E. Pretsch, “The New Wave of Ion-Selective Electrodes,”Anal. Chem. 2002, 74, 420A.
26. A. Radu, M. Telting-Diaz, and E. Bakker, “Rotating Disk Potentiometry forInner Solution Optimization of Low-Detection-Limit Ion-Selective Electrodes,”Anal. Chem. 2003, 75, 6922.
27. J. Bobacka, T. Lindfors, A. Lewenstam, and A. Ivaska, “All-Solid-StateIon Sensors Using Conducting Polymers as Ion-to-Electron Transducers,” Am.Lab., February 2004, 13; A. Konopka, T. Sokalski, A. Michalska, A. Lewenstam,and M. Maj-Zurawska, “Factors Affecting the Potentiometric Response ofAll-Solid-State Solvent Polymeric Membrane Calcium-Selective Electrode forLow-Level Measurement,” Anal. Chem. 2004, 76, 6410; M. Fouskaki andN. A. Chaniotakis, “Thick Membrane, Solid Contact Ion Selective Electrode forthe Detection of Lead at Picomolar Levels,” Anal. Chem. 2005, 77, 1780.
28. Many other kinds of electrodes have been described [e.g., J. H. Shin,J. S. Lee, S. H. Choi, D. K. Lee, H. Nam, and G. S. Cha, “A Planar pCO2
Sensor with Enhanced Electrochemical Properties,” Anal, Chem. 2000, 72,4468]. Carbonate liquid-based ion-selective electrodes also are available:Y. S. Choi, L. Lvova, J. H. Shin, S. H. Oh, C. S. Lee, B. H. Kim, G. S. Cha,and H. Nam, “Determination of Oceanic Carbon Dioxide Using a Carbonate-Selective Electrode,” Anal. Chem. 2002, 74, 2435.
29. J. D. Czaban, “Electrochemical Sensors in Clinical Chemistry,” Anal. Chem.1985, 57, 345A.
30. Resistivity, measures how well a substance retards the flow of electriccurrent when an electric field is applied: where J is current density(current flowing through a unit cross section of the material, A/m2) and E iselectric field (V/m). Units of resistivity are or because
where Conductors have resistivities near semiconductors have resistivities of to and insulators haveresistivities of to The reciprocal of resistivity is conductivity.Resistivity does not depend on the dimensions of the substance. Resistance, R,is related to resistivity by the equation where l is the length and A isthe cross-sectional area of the conducting substance.
31. S.-S. Jan, J.-L. Chiang, Y.-C. Chen, J.-C. Chou, and C.-C Cheng,“Characteristics of the Hydrogen Ion-Sensitive Field Effect Transistors withSol-Gel-Derived Lead Titanate Gate,” Anal. Chim. Acta 2002, 469, 205.
32. C. Jiménez, I. Marqués, and J. Bartrolí, “Continuous-Flow Systems forOn-Line Water Monitoring Using Back-Side Contact ISFET-Based Sensors,”Anal. Chem. 1996, 68, 3801.
33. J. H. Shin, H. J. Lee, C. Y. Kim, B. K. Oh, K. L. Rho, H. Nam, andG. S. Cha, “ISFET-Based Differential pCO2 Sensors Employing a Low-Resistance Gas-Permeable Membrane,” Anal. Chem. 1996, 68, 3166.
34. A. M. Nyamsi Hendji, N. Jaffrezic-Renault, C. Martelet, P. Clechet, A. A.Shul’ga, V. I. Strikha, L. I. Netchiporuk, A. P. Soldatkin, and W. B. Wlodarski,“Sensitive Detection of Pesticides Using Differential ISFET-Based System withImmobilized Cholinesterases,” Anal. Chim. Acta 1993, 281, 3.
35. M. Lahav, A. B. Kharitonov, O. Katz, T. Kunitake, and I. Willner, “TailoredChemosensors for Chloroaromatic Acids Using Molecular Imprinted TiO2 ThinFilms on Ion-Sensitive Field-Effect Transistor,” Anal. Chem. 2001, 73, 720.
36. A. B. Kharitonov, A. N. Shipway, and I. Willner, “An Au Nanoparticle/Bisbipyridinium Cyclophane-Functionalized Ion-Sensitive Field-EffectTransistor for the Sensing of Adrenaline,” Anal. Chem. 1999, 71, 5441.
37. S. P. Pogorelova, M. Zayats, T. Bourenko, A. B. Kharitonov, O.Lioubashevski, E. Katz, and I. Willner, “Analysis of NAD(P)�/NAD(P)HCofactors by Imprinted Polymer Membranes Associated with Ion-Sensitive Field-Effect Transistor Devices and Au-Quartz Crystals,” Anal. Chem. 2003, 75, 509.
38. D. C. Jackman, “A Recipe for the Preparation of a pH 7.00 CalibrationBuffer,” J. Chem. Ed. 1993, 70, 853.
Chapter 161. T. Astrup, S. L. S. Stipp, and T. H. Christensen, “Immobilization of
Chromate from Coal Fly Ash Leachate Using an Attenuating Barrier ContainingZero-Valent Iron,” Environ. Sci. Technol. 2000, 34, 4163; S. H. Joo, A. J. Feitz,
R � ρl/A,
1020 � � m.1012
107 � � m,104
108 � � m,� � ohm.� � V/A,� � m,V � m/A
J � E/ρ,ρ,
CO2
NR8 Notes and References
and T. D. Waite, “Oxidative Degradation of the Carbothiolate Herbicide,Molinate, Using Nanoscale Zero-Valent Iron,” Environ. Sci. Technol. 2004, 38,2242; R. Miehr, P. G. Tratnyek, J. Z. Bandstra, M. M. Scherer, M. J. Alowitz,and E. U. Bylaska, “Diversity of Contaminant Reduction Reactions byZerovalent Iron: Role of the Reductant,” Environ. Sci. Technol. 2004, 38, 139;V. K. Sharma, C. R. Burnett, D. B. O’Connor, and D. Cabelli, “Iron(VI) andIron(V) Oxidation of Thiocyanate,” Environ. Sci. Technol. 2002, 36, 4182.
2. Information on redox titrations: J. Bassett, R. C. Denney, G. H. Jeffery,and J. Mendham, Vogel’s Textbook of Inorganic Analysis, 4th ed. (Essex, UK:Longman, 1978); H. A. Laitinen and W. E. Harris, Chemical Analysis, 2nd ed.(New York: McGraw-Hill, 1975); I. M. Kolthoff, R. Belcher, V. A. Stenger, andG. Matsuyama, Volumetric Analysis, Vol. 3 (New York: Wiley, 1957); A. Berka,J. Vulterin, and J. Zýka, Newer Redox Titrants, H. Weisz, trans. (Oxford:Pergamon, 1965).
3. J. Ermírio, F. Moraes, F. H. Quina, C. A. O. Nascimento, D. N. Silva,and O. Chiavone-Filho, “Treatment of Saline Wastewater Contaminate withHydrocarbons by the Photo-Fenton Process,” Environ. Sci. Technol. 2004,38, 1183; B. Gözmen, M. A. Oturan, N. Oturan, and O. Erbatur, “IndirectElectrochemical Treatment of Bisphenol A in Water via ElectrochemicallyGenerated Fenton’s Reagent,” Environ. Sci. Technol. 2003, 37, 3716; P. S. Zurer,“Ridding the World of Unwanted Chemicals,” Chem. Eng. News, 2 September2002, p. 34.
4. Equations 16-9 and 16-10 are analogous to the Henderson-Hasselbalchequation of acid-base buffers. Prior to the equivalence point, the redox titrationis buffered to a potential near formal potential for by thepresence of and After the equivalence point, the reaction is bufferedto a potential near E� � formal potential for [R. de Levie “RedoxBuffer Strength,” J. Chem. Ed. 1999, 76, 574.]
5. D. W. King, “A General Approach for Calculating Speciation and PoisingCapacity of Redox Systems with Multiple Oxidation States: Application to RedoxTitrations and the Generation of Diagrams,” J. Chem. Ed. 2002, 79, 1135.
6. T. J. MacDonald, B. J. Barker, and J. A. Caruso, “Computer Evaluation ofTitrations by Gran’s Method,” J. Chem. Ed. 1972, 49, 200.
7. M. da Conceição Silva Barreto, L. de Lucena Medieros, and P. C.de Holanda Furtado, “Indirect Potentiometric Titration of Fe(III) with Ce(IV)by Gran’s Method,” J. Chem. Ed. 2001, 78, 91.
8. R. D. Hancock and B. J. Tarbet, “The Other Double Helix: The FascinatingChemistry of Starch,” J. Chem. Ed. 2000, 77, 988.
9. J. H. Margeson, J. C. Suggs, and M. R. Midgett, “Reduction of Nitrate toNitrite with Cadmium,” Anal. Chem. 1980, 52, 1955.
10. E. T. Urbansky, “Total Organic Carbon Analyzers as Tools for MeasuringCarbonaceous Matter in Natural Waters,” J. Environ. Monit. 2001, 3, 102.General references on environmental analysis: M. Radojevic and V. N. Bashkin,Practical Environmental Analysis (Cambridge: Royal Society of Chemistry,1999); and D. Perez-Bendito and S. Rubio, Environmental Analytical Chemistry(Amsterdam: Elsevier, 1998).
11. L. J. Stolzberg and V. Brown, “Note on Photocatalytic Destruction ofOrganic Wastes: Methyl Red as a Substrate,” J. Chem. Ed. 2005, 82, 526;J. A. Poce-Fatou, M. L. A. Gil, R. Alcántara, C. Botella, and J. Martin,“Photochemical Reactor for the Study of Kinetics and Adsorption Phenomena,”J. Chem. Ed. 2004, 81, 537; J. C. Yu and L. Y. L. Chan, “PhotocatalyticDegradation of a Gaseous Organic Pollutant,” J. Chem. Ed. 1998, 75, 750.
12. R. Dunn, “New Developments in Membrane-Selective ConductometricInstruments for Total Organic Carbon Determination in Water,” Am. Lab.,September 2004, p. 22.
13. S. Sakthivel and H. Kisch, “Daylight Photocatalysis by Carbon-ModifiedTitanium Dioxide,” Angew. Chem. Int. Ed. 2003, 42, 4908.
14. S. Horikoshi, N. Serpone, Y. Hisamatsu, and H. Hidaka, “PhotocatalyzedDegradation of Polymers in Aqueous Semiconductor Suspensions,” Environ. Sci.Technol. 1998, 32, 4010.
15. BOD and COD procedures are described in Standard Methods for theExamination of Wastewater, 20th ed. (Washington, DC: American Public HealthAssociation, 1998), which is the standard reference for water analysis.
16. K. Catterall, H. Zhao, N. Pasco, and R. John, “Development of a RapidFerricyanide-Mediated Assay for Biochemical Oxygen Demand Using a MixedMicrobial Consortium,” Anal. Chem. 2003, 75, 2584.
p�-pH
Ce4� 0 Ce3�.Fe2�.Fe3�
Fe3� 0 Fe2�E� �

Notes and References NR9
17. B. Wallace and M. Purcell, “The Benefits of Nitrogen and Total OrganicCarbon Determination by High-Temperature Combustion,” Am. Lab. News Ed.,February 2003, p. 58.
18. W. Gottardi, “Redox-Potentiometric/Titrimetric Analysis of Aqueous IodineSolutions,” Fresenius J. Anal. Chem. 1998, 362, 263.
19. S. C. Petrovic and G. M. Bodner, “An Alternative to Halogenated Solventsfor Halogen/Halide Extractions,” J. Chem. Ed. 1991, 68, 509.
20. G. L. Hatch, “Effect of Temperature on the Starch-Iodine SpectrophotometricCalibration Line,” Anal. Chem. 1982, 54, 2002.
21. Y. Xie, M. R. McDonald, and D. W. Margerum, “Mechanism of the ReactionBetween Iodate and Iodide Ions in Acid Solutions,” Inorg. Chem. 1999, 38, 3938.
22. Prepare anhydrous Na2S2O3 by refluxing 21 g of with100 mL of methanol for 20 min. Then filter the anhydrous salt, wash with 20 mLof methanol, and dry at for 30 min. [A. A. Woolf, “Anhydrous SodiumThiosulfate as a Primary Iodometric Standard,” Anal. Chem. 1982, 54, 2134.]
23. J. Hvoslef and B. Pedersen, “The Structure of Dehydroascorbic Acid inSolution,” Acta Chem. Scand. 1979, B33, 503, and D. T. Sawyer, G. Chiericato,Jr., and T. Tsuchiya, “Oxidation of Ascorbic Acid and Dehydroascorbic Acid bySuperoxide in Aprotic Media,” J. Am. Chem. Soc. 1982, 104, 6273.
24. R. J. Cava, “Oxide Superconductors,” J. Am. Ceram. Soc. 2000, 83, 5.
25. D. C. Harris, M. E. Hills, and T. A. Hewston, “Preparation, IodometricAnalysis, and Classroom Demonstration of Superconductivity in ”J. Chem. Ed. 1987, 64, 847; D. C. Harris, “Oxidation State Chemical Analysis,”in T. A. Vanderah, ed., Chemistry of Superconductor Materials (Park Ridge, NJ:Noyes, 1992); B. D. Fahlman, “Superconductor Synthesis—An Improvement,”J. Chem. Ed. 2001, 78, 1182. Superconductor demonstration kits can bepurchased from several vendors, including Sargent-Welch, 7400 N. Linder Ave.,Skokie, IL 60077-1026.
26. Experiments with an 18O-enriched superconductor show that the O2 evolved inReaction 1 is all derived from the solid, not from the solvent [M. W. Shafer, R. A.de Groot, M. M. Plechaty, G. J. Scilla, B. L. Olson, and E. I. Cooper, “Evolution andChemical State of Oxygen upon Acid Dissolution of ” Mater. Res.Bull. 1989, 24, 687; P. Salvador, E. Fernandez-Sanchez, J. A. Garcia Dominguez,J. Amdor, C. Cascales, and I. Rasines, “Spontaneous O2 Release from High Tc Superconductor in Contact with Water,” Solid State Commun. 1989, 70, 71].
27. A more sensitive and elegant iodometric procedure is described by E. H.Appelman, L. R. Morss, A. M. Kini, U. Geiser, A. Umezawa, G. W. Crabtree, andK. D. Carlson, “Oxygen Content of Superconducting Perovskites and YBa2Cu3Oy,” Inorg. Chem. 1987, 26, 3237. This method can be modified byadding standard Br2 to analyze superconductors with oxygen in the range 6.0–6.5,in which there is formally Cu� and Cu2�. The use of electrodes instead of starchto find the end point in iodometric titrations of superconductors is recommended[P. Phinyocheep and I. M. Tang, “Determination of the Hole Concentration(Copper Valency) in the High Tc Superconductors,” J. Chem. Ed. 1994, 71, A115].
28. C. L. Copper and E. Koubek, “Analysis of an Oxygen Bleach,” J. Chem. Ed.2001, 78, 652.
29. M. T. Garrett, Jr., and J. F. Stehlik, “Classical Analysis,” Anal. Chem. 1992,64, 310A.
30. K. Peitola, K. Fujinami, M. Karppinen, H. Yamauchi, and L. Niiniströ,“Stoichiometry and Copper Valence in the System,” J. Mater.Chem. 1999, 9, 465.
31. S. Scaccia and M. Carewska, “Determination of Stoichiometry of Li1�yCoO2
Materials by Flame Atomic Absorption Spectrometry and AutomatedPotentiometric Titration,” Anal. Chim. Acta 2002, 453, 35.
32. M. Karppinen, A. Fukuoka, J. Wang, S. Takano, M. Wakata, T. Ikemachi,and H. Yamauchi, “Valence Studies on Various Superconducting Bismuth andLead Cuprates and Related Materials,” Physica 1993, C208, 130.
33. The oxygen liberated in Reaction 4 of this problem may be derived from thesuperconductor, not from solvent water. In any case, reacts with Fe2�, andCu3� does not, when the sample is dissolved in acid.
Chapter 171. T. R. I. Cataldi, C. Campa, and G. E. De Benedetto, “Carbohydrate Analysis
by High-Performance Anion-Exchange Chromatography with PulsedAmperometric Detection,” Fresenius J. Anal. Chem. 2000, 368, 739.
BiO3
Ba1yCuO2�d
La2xSrxCuOy
SmBa2Cu3O7x
YBa2Cu3O6.98,
YBa2Cu3O8x,
70°C
Na2S2O3 � 5H2O
2. W. E. Haupin, “Electrochemistry of the Hall-Heroult Process for AluminumSmelting,” J. Chem. Ed. 1983, 60, 279; N. C. Craig, “Charles Martin Hall—TheYoung Man, His Mentor, and His Metal,” J. Chem. Ed. 1986, 63, 557.
3. A. J. Bard and L. R. Faulkner, Electrochemical Methods and Applications,2nd ed. (New York: Wiley, 2001); J. Wang, Analytical Electrochemistry, 2nd ed.(New York: Wiley, 2000); J. O’M. Bockris and A. K. N. Reddy, ModernElectrochemistry, 2nd ed. (Dordrecht, Netherlands: Kluwer, 1998–2001), 3 vols.;F. Scholz, ed., Electroanalytical Methods (Berlin: Springer-Verlag, 2002);P. Vanysek, Modern Techniques in Electroanalysis (New York: Wiley, 1996);A. J. Bard and M. Stratmann, eds., Encyclopedia of Electrochemistry(New York: Wiley-VCH, 2002).
4. E. C. Gilbert in H. N. Alyea and F. B. Dutton, eds., Tested Demonstrationsin Chemistry (Easton, PA: Journal of Chemical Education, 1965), p. 145.
5. J. O’M. Bockris, “Overpotential: A Lacuna in Scientific Knowledge,”J. Chem. Ed. 1971, 48, 352.
6. D. N. Craig, J. I. Hoffman, C. A. Law, and W. J. Hamer, “Determination ofthe Value of the Faraday with a Silver-Perchloric Acid Coulometer,” J. Res. Natl.Bur. Stds. 1960, 64A, 381; H. Diehl, “High-Precision Coulometry and the Valueof the Faraday,” Anal. Chem. 1979, 51, 318A.
7. J. Greyson and S. Zeller, “Analytical Coulometry in Monier-WilliamsSulfite-in-Food Determinations,” Am. Lab., July 1987, p. 44; D. T. Pierce, M. S.Applebee, C. Lacher, and J. Bessie, “Low Parts Per Billion Determination ofSulfide by Coulometric Argentometry,” Environ. Sci. Technol. 1998, 32, 1734.
8. A. Mulchandani and O. A. Sadik, eds., Chemical and Biological Sensors forEnvironmental Monitoring Biosensors (Washington, DC: American ChemicalSociety, 2000); D. Diamond, ed., Principles of Chemical and Biological Sensors(New York: Wiley, 1998); A. Cunningham, Introduction to Bioanalytical Sensors(New York: Wiley, 1998); G. Ramsay, Commercial Biosensors: Applications toClinical, Bioprocess, and Environmental Samples (New York: Wiley, 1998);K. R. Rogers and A. Mulchandani, eds., Affinity Biosensors, Techniques andProtocols (Totowa, NJ: Humana Press, 1998); E. Palaček and M. Fojta,“Detecting DNA Hybridization and Damage,” Anal. Chem. 2001, 73, 75A.
9. Examples of biosensors: J. H. Thomas, S. K. Kim, P. J. Hesketh, H. B.Halsall, and W. R. Heineman, “Bead-Based Electrochemical Immunoassay forBacteriophage MS2,” Anal. Chem. 2004, 76, 2700; Y. Zhang, H.-H. Kim, andA. Heller, “Enzyme-Amplified Amperometric Detection of 3000 Copies of DNAin a 10- L Droplet at 0.5 fM Concentration,” Anal. Chem. 2003, 75, 3267; A. S.Mittelmann, E. Z. Ron, and J. Rishpon, “Amperometric Quantification of TotalColiforms and Specific Detection of E. coli,” Anal. Chem. 2002, 74, 903;A. Avramescu, S. Andreescu, T. Noguer, C. Bala, D. Andreescu, and J.-L. Marty,“Biosensors Designed for Environmental and Food Quality Control,” Anal.Bioanal. Chem. 2002, 374, 25; T. M. O’Regan, L. J. O’Riordan, M. Pravda,C. K. O’Sullivan, and G. G. Guilbault, “Direct Detection of Myoglobin inWhole Blood Using a Disposable Amperometric Immunosensor,” Anal. Chim.Acta 2002, 460, 141.
10. M. C. Frost, S. M. Rudich, H. Zhang, M. A. Maraschio, and M. E. Meyerhoff,“In Vivo Biocompatibility and Analytical Performance of IntravascularAmperometric Oxygen Sensors Prepared with Improved Nitric Oxide-ReleasingSilicone Rubber Coating,” Anal. Chem. 2002, 74, 5942.
11. S.-K. Jung, W. Gorski, C. A. Aspinwall, L. M. Kauri, and R. T. Kennedy,“Oxygen Microsensor and Its Application to Single Cells and Mouse PancreaticIslets,” Anal. Chem. 1999, 71, 3642.
12. When current is applied to a Y2O3-doped ZrO2 oxygen electrode, theelectrode becomes a coulometric generator of O2 and has been used foroxidative titrations at [K. Hirakata, W. E. Rhine, and M. J. Cima,“Carbon Determination in Small Amounts of Ceramic Powder by CoulombicTitration,” J. Am. Ceram. Soc. 1995, 78, 2834.] The solid electrode material canbe used for O2 filtration, O2 generation, or O2 removal. [S. P. S. Badwal andF. T. Ciachhi, “Ceramic Membrane Technologies for Oxygen Separation,”Adv. Mater. 2001, 13, 993.]
13. J. Yinon, “Detection of Explosives by Electronic Noses,” Anal. Chem. 2003,75, 99A; M. C. C. Oliveros, J. L. P. Pavón, C. G. Pinto, M. E. F. Laespada,B. M. Cordero, and M. Forina, “Electronic Nose Based on Metal OxideSemiconductor Sensors as a Fast Alternative for the Detection of Adulteration ofVirgin Olive Oils,” Anal. Chim. Acta 2002, 459, 219; C. L. Honeybourne,“Organic Vapor Sensors for Food Quality Assessment,” J. Chem. Ed. 2000, 77,338; E. Zubritsky, “E-Noses Keep an Eye on the Future,” Anal. Chem. 2000, 72,
600°C.

421A; D. J. Strike, M. G. H. Meijerink, and M. Koudelka-Hep, “ElectronicNoses—A Mini-Review,” Fresenius J. Anal. Chem. 1999, 364, 499.
14. N. Mano and A. Heller, “Detection of Glucose at 2 fM Concentration,”Anal. Chem. 2005, 77, 729.
15. J. Nikolic, E. Expósito, J. Iniesta, J. González-Garcia, and V. Montiel,“Theoretical Concepts and Applications of a Rotating Disk Electrode,” J. Chem.Ed. 2000, 77, 1191.
16. J. Lagrange and P. Lagrange, “Voltammetric Method for the Determinationof H2O2 in Rainwater,” Fresenius J. Anal. Chem. 1991, 339, 452.
17. A. J. Bard and C. G. Zoski, “Voltammetry Retrospective,” Anal. Chem.2000, 72, 346A; A. M. Bond, Broadening Electrochemical Horizons (Oxford:Oxford University Press, 2002).
18. To clean a mercury spill, consolidate the droplets with a piece of cardboard.Then suck the mercury into a filter flask with an aspirator. A disposable Pasteurpipet attached to a hose makes a good vacuum cleaner. To remove residualmercury, sprinkle elemental zinc powder on the surface and dampen the powderwith 5% aqueous H2SO4 to make a paste. Mercury dissolves in the zinc. Afterworking the paste into contaminated areas with a sponge or brush, allow thepaste to dry and sweep it up. Discard the powder as contaminated mercurywaste. This procedure is better than sprinkling sulfur on the spill. Sulfur coatsthe mercury but does not react with the bulk of the droplet [D. N. Easton,“Management and Control of Hg Exposure,” Am. Lab., July 1988, p. 66].
19. Boron-doped chemical-vapor-deposited diamond is an exceptionally inertcarbon electrode with a very wide potential window and very low voltammetricbackground current. [A. E. Fischer, Y. Show, and G. M. Swain, “ElectrochemicalPerformance of Diamond Thin-Film Electrodes from Different CommercialSources,” Anal. Chem. 2004, 76, 2553.]
20. S. Ferro and A. De Battisti, “The 5-V Window of Polarizability of FluorinatedDiamond Electrodes in Aqueous Solution,” Anal. Chem. 2003, 75, 7040.
21. To remove traces of O2 from N2 for voltammetry, the gas is bubbled throughtwo consecutive columns of liquid. The first column removes O2 by reactionwith and the second saturates the gas stream with water at the same vaporpressure as that found in the voltammetry cell. The second column contains thesame supporting electrolyte solution used for voltammetry. The first column isprepared by boiling 2 g of NH4VO3 (ammonium metavanadate) with 25 mL of12 M HCl and reducing to with zinc amalgam. (Amalgam is prepared bycovering granulated Zn with 2 wt% HgCl2 solution and stirring for 10 min toreduce to Hg, which coats the Zn. The liquid is decanted, and theamalgam is washed three times with water by decantation. Amalgamationincreases the overpotential for reduction at the Zn surface, so the Zn is notwasted by reaction with acid.) The blue or green oxidized vanadium solutionturns violet upon reduction. When the violet color is exhausted through use, itcan be regenerated by adding more zinc amalgam or HCl or both. Two bubble tubes can be used in series (in addition to a third tube with supportingelectrolyte). When in the first tube is expended, the second tube is stilleffective.
22. J. G. Osteryoung and R. A. Osteryoung, “Square Wave Voltammetry,” Anal.Chem. 1985, 57, 101A; J. G. Osteryoung, “Voltammetry for the Future,” Acc.Chem. Res. 1993, 26, 77.
23. J. Wang, Stripping Analysis: Principles, Instrumentation and Applications(Deerfield Beach, FL: VCH, 1984); Kh. Z. Brainina, N. A. Malakhova, andN. Yu. Stojko, “Stripping Voltammetry in Environmental and Food Analysis,”Fresenius J. Anal. Chem. 2000, 368, 307.
24. A. J. Saterlay and R. G. Compton, “Sonoelectroanalysis—An Overview,”Fresenius J. Anal. Chem. 2000, 367, 308; A. O. Sim, C. E. Banks, andR. G. Compton, “Sonically Assisted Electroanalytial Detection of UltratraceArsenic,” Anal. Chem. 2004, 76, 5051.
25. P. Zanello, Inorganic Electrochemistry: Theory, Practice and Application(Cambridge: Royal Society of Chemistry, 2003); G. A. Mabbott, “AnIntroduction to Cyclic Voltammetry,” J. Chem. Ed. 1983, 60, 697; P. T. Kissingerand W. R. Heineman, “Cyclic Voltammetry,” J. Chem. Ed. 1983, 60, 702;D. H. Evans, K. M. O’Connell, R. A. Petersen, and M. J. Kelly, “CyclicVoltammetry,” J. Chem. Ed. 1983, 60, 290; H. H. Thorp, “Electrochemistry ofProton-Coupled Redox Reactions,” J. Chem. Ed. 1992, 69, 251.
26. J. J. Watkins, B. Zhang, and H. S. White, “Electrochemistry at Nanometer-Scaled Electrodes,” J. Chem. Ed. 2005, 82, 713; R. J. Forster, “Microelectrodes:
V2�
V2�
H�
Hg2�
V2�
V2�,
NR10 Notes and References
New Dimensions in Electrochemistry,” Chem. Soc. Rev. 1994, 289; S. Ching,R. Dudek, and E. Tabet, “Cyclic Voltammetry with Ultramicroelectrodes,”J. Chem. Ed. 1994, 71, 602; E. Howard and J. Cassidy, “Analysis withMicroelectrodes Using Microsoft Excel Solver,” J. Chem. Ed. 2000, 77, 409.
27. T. K. Chen, Y. Y. Lau, D. K. Y. Wong, and A. G. Ewing, “Pulse Voltammetryin Single Cells Using Platinum Microelectrodes,” Anal. Chem. 1992, 64, 1264.
28. A. J. Cunningham and J. B. Justice, Jr., “Approaches to Voltammetric andChromatographic Monitoring of Neurochemicals in Vivo,” J. Chem. Ed. 1987,64, A34. Another Nafion-coated electrode can detect mol of theneurotransmitter nitric oxide within a single cell [T. Malinski and Z. Taha,“Nitric Oxide Release from a Single Cell Measured in Situ by a Porphyrinic-Based Microsensor,” Nature 1992, 358, 676].
29. A. J. Bard and M. V. Mirkin, eds., Scanning Electrochemical Microscopy(New York: Marcel Dekker, 2001).
30. S. K. MacLeod, “Moisture Determination Using Karl Fischer Titrations,”Anal. Chem. 1991, 63, 557A.
31. S. Grünke and G. Wünsch, “Kinetics and Stoichiometry in the Karl FischerSolution,” Fresenius J. Anal. Chem. 2000, 368, 139.
32. A. Cedergren and S. Jonsson, “Progress in Karl Fischer Coulometry UsingDiaphragm-Free Cells,” Anal. Chem. 2001, 73, 5611.
33. S. A. Margolis and J. B. Angelo, “Interlaboratory Assessment ofMeasurement Precision and Bias in the Coulometric Karl Fischer Determinationof Water,” Anal. Bioanal. Chem. 2002, 374, 505.
34. C. M. Sánchez-Sánchez, E. Expósito, A. Frías-Ferrer, J. González-García,V. Montiel, and A. Aldaz, “Chlor-Alkali Industry: A Laboratory ScaleApproach,” J. Chem. Ed. 2004, 81, 698; D. J. Wink, “The Conversion ofChemical Energy,” J. Chem. Ed. 1992, 69, 108; S. Venkatesh and B. V. Tilak,“Chlor-Alkali Technology,” J. Chem. Ed. 1983, 60, 276. Nafion is a trademarkof Du Pont Co.
35. R. S. Treptow, “The Lead-Acid Battery: Its Voltage in Theory and Practice,”J. Chem. Ed. 2002, 79, 334. Includes activity coefficients of electrolyte in thebattery.
36. D. Lowinsohn and M. Bertotti, “Coulometric Titrations in Wine Samples:Determination of S(IV) and the Formation of Adducts,” J. Chem. Ed. 2002, 79,103. Some species in wine in addition to sulfite react with A blank titrationto correct for such reactions is described in this article.
37. M. E. Gomez and A. E. Kaifer, “Voltammetric Behavior of a FerroceneDerivative.” J. Chem. Ed. 1992, 69, 502.
Chapter 181. R. S. Stolarski, “The Antarctic Ozone Hole,” Scientific American, January
1988. The 1995 Nobel Prize in Chemistry was shared by Paul Crutzen, MarioMolina, and F. Sherwood Rowland for “their work in atmospheric chemistry,particularly concerning the formation and decomposition of ozone.” Their Nobellectures can be found in P. J. Crutzen, “My Life with O3, NOx, and Other YZOx
Compounds,” Angew. Chem. Int. Ed. Engl. 1996, 35, 1759; M. J. Molina, “PolarOzone Depletion,” ibid., 1779; F. S. Rowland, “Stratospheric Ozone Depletionby Chlorofluorocarbons,” ibid., 1787.
2. J. H. Butler, M. Battle, M. L. Bender, S. A. Montzka, A. D. Clarke,E. S. Saltzman, C. M. Sucher, J. P. Severinghaus, and J. W. Elkins, “A Recordof Atmospheric Halocarbons During the Twentieth Century from Polar Firn Air,”Nature 1999, 399, 749.
3. O. B. Toon and R. P. Turco, “Polar Stratospheric Clouds and OzoneDepletion,” Scientific American, June 1991; A. J. Prenni and M. A. Tolbert,“Studies of Polar Stratospheric Cloud Formation,” Acc. Chem. Res. 2001,234, 545.
4. The most-cited article is by M. Dubois, K. A. Gilles, J. K. Hamilton, P. A.Rebers, and F. Smith, “Colorimetric Method for Determination of Sugars andRelated Substances,” Anal. Chem. 1956, 28, 350. [J. Riordon, E. Zubritsky, andA. Newman, “Top 10 Articles,” Anal. Chem. 2000, 72, 324A.]
5. Classroom exercise to “derive” Beer’s law: R. W. Ricci, M. A. Ditzler, andL. P. Nestor, “Discovering the Beer-Lambert Law,” J. Chem. Ed. 1994, 71, 983.An alternate derivation: W. D. Bare, “A More Pedagogically Sound Treatment ofBeer’s Law: A Derivation Based on a Corpuscular-Probability Model,” J. Chem.Ed. 2000, 77, 929.
I3 .
1020

Notes and References NR11
6. D. R. Malinin and J. H. Yoe, “Development of the Laws of Colorimetry:A Historical Sketch,” J. Chem. Ed. 1961, 38, 129. The equation that we call“Beer’s law” embodies contributions by P. Bouguer (1698–1758), J. H. Lambert(1728–1777), and A. Beer (1825–1863). Beer published his work in 1852, andsimilar conclusions were independently reached and published within a fewmonths by F. Bernard.
7. D. H. Alman and F. W. Billmeyer, Jr., “A Simple System for Demonstrationsin Spectroscopy,” J. Chem. Ed. 1976, 53, 166. For another approach, see F. H.Juergens, “Spectroscopy in Large Lecture Halls,” J. Chem. Ed. 1988, 65, 266.
8. For Beer’s law, “monochromatic” means that the bandwidth of the lightmust be substantially smaller than the width of the absorption band in thespectrum of the chromophore [W. E. Wentworth, “Dependence of the Beer-Lambert Absorption Law on Monochromatic Radiation,” J. Chem. Ed. 1966,43, 262].
9. K. S. Patel, A. Shukla, A. Goswami, S. K. Chandavanshi, and P. Hoffmann,“A New Spectrophotometric Method for the Determination of Total and FerricIron in Rainwater at the ppb Level,” Fresenius J. Anal. Chem. 2001, 369, 530.
10. D. C. Harris, “Serum Iron Determination: A Sensitive ColorimetricExperiment,” J. Chem. Ed. 1978, 55, 539.
11. A pictorial description of the dynamics of the and transitions is given by G. Henderson, “A New Look at Carbonyl ElectronicTransitions,” J. Chem. Ed. 1990, 67, 392.
12. J. W. Bozzelli, “A Fluorescence Lecture Demonstration,” J. Chem. Ed.1982, 59, 787; G. L. Goe, “A Phosphorescence Demonstration,” J. Chem. Ed.1972, 49, 412; E. M. Schulman, “Room Temperature Phosphorescence,”J. Chem. Ed. 1976, 53, 522; F. B. Bramwell and M. L. Spinner, “Phosphorescence:A Demonstration,” J. Chem. Ed. 1977, 54, 167; S. Roalstad, C. Rue, C. B.LeMaster, and C. Lasko, “A Room-Temperature Emission Lifetime Experimentfor the Physical Chemistry Laboratory,” J. Chem. Ed. 1997, 74, 853.
13. C. Zander, J. Enderlein, and R. Keller, eds., Single Molecule Detection inSolution (New York: Wiley, 2002); R. A. Keller, W. P. Ambrose, A. A. Arias,H. Cai, S. R. Emory, P. M. Goodwin, and J. H. Jett, “Analytical Applicationsof Single-Molecule Detection,” Anal. Chem. 2002, 74, 317A; J. Zimmermann,A. van Dorp, and A. Renn, “Fluorescence Microscopy of Single Molecules,”J. Chem. Ed. 2004, 81, 553; T. A Byassee, W. C. W. Chan, and S. Nie,“Probing Single Molecules in Single Living Cells,” Anal. Chem. 2000,72, 5606.
14. S. J. Johnsen, H. B. Clausen, W. Dansgaard, K. Fuhrer, N. Gundestrup,C. U. Hammer, P. Iversen, J. Jouzel, B. Stauffer, and J. P. Steffensen, “IrregularGlacial Interstadials Recorded in a New Greenland Ice Core,” Nature 1992,359, 311; W. Dansgaard, S. J. Johnsen, H. B. Clausen, D. Dahl-Jensen,N. S. Gundestrup, C. U. Hammer, C. S. Hvidberg, J. P. Steffensen, A. E.Sveinbjörnsdottir, J. Jouzel, and G. Bond, “Evidence for General Instability ofPast Climate from a 250-kyr Ice-Core Record,” Nature 1993, 364, 218;M. Anklin et al., “Climate Instability During the Last Interglacial PeriodRecorded in the GRIP Ice Core,” Nature 1993, 364, 203.
15. B. Fanget, O. Devos, and M. Draye, “Correction of Inner Filter Effect inMirror Coating Cells for Trace Level Fluorescence Measurements, ”Anal. Chem.2003, 75, 2790.
16. D. S. Chatellier and H. B. White III, “What Color Is Egg White? ABiochemical Demonstration of the Formation of a Vitamin-Protein ComplexUsing Fluorescence Quenching,” J. Chem. Ed. 1988, 65, 814.
17. E. R. Menzel, “Detection of Latent Fingerprints by Laser-ExcitedLuminescence,” Anal. Chem. 1989, 61, 557A.
18. S. O. Obare and C. J. Murphy, “A Two-Color Fluorescent Lithium IonSensor,” Inorg. Chem. 2001, 40, 6080; L. Fabbrizzi, N. Marcotte, F. Stomeo, andA. Taglietti, “Pyrophosphate Detection in Water by Fluorescence CompetitionAssays,” Angew. Chem. Int. Ed. 2002, 41, 3811.
19. J. B. Rampal, ed., DNA Arrays: Methods and Protocols (Totowa, NJ: HumanaPress, 2001); D. Gerion, F. Chen, B. Kannan, A. Fu, W. J. Parak, D. J. Chen,A. Majumdar, and A. P. Alivisatos, “Room-Temperature Single-NucleotidePolymorphism and Multiallele DNA Detection Using Fluorescent Nanocrystalsand Microarrays,” Anal. Chem. 2003, 75, 4766.
20. A. M. Garcia-Campana and W. R. G. Baeyens, eds., Chemiluminescence inAnalytical Chemistry (New York: Marcel Dekker, 2001); L. J. Kricka, ”ClinicalApplications of Chemiluminescence,” Anal. Chim. Acta 2003, 500, 279.
� S �*n S �*
21. C. Salter, K. Range, and G. Salter, “Laser-Induced Fluorescence ofLightsticks,” J. Chem. Ed. 1999, 76, 84; E. Wilson, “Light Sticks,” Chem. Eng.News, 18 January 1999, p. 65.
22. R. Rizzuto, A. W. M. Simpson, M. Brini, and T. Pozzan, “Rapid Changes ofMitochondrial Revealed by Specifically Targeted Recombinant Aequorin,”Nature 1992, 358, 325; A. Toda, P. Pasini, M. Guardigli, M. Baraldini,M. Musiani, and M. Mirasoli, “Bio- and Chemiluminescence in Bioanalysis,”Fresenius J. Anal. Chem. 2000, 366, 752; M. L. Grayeski, “ChemiluminescenceAnalysis,” Anal. Chem. 1987, 59, 1243A.
23. J. K. Robinson, M. J. Bollinger, and J. W. Birks, “Luminol/H2O2
Chemiluminescence Detector for the Analysis of NO in Exhaled Breath,” Anal.Chem. 1999, 71, 5131. Many substances can be analyzed by coupling theirchemistry to luminol oxidation. See, for example, O. V. Zui and J. W. Birks,“Trace Analysis of Phosphorus in Water by Sorption Preconcentration andLuminol Chemiluminescence,” Anal. Chem. 2000, 72, 1699.
24. J. C. Lewis and S. Daunert, “Bioluminescence Immunoassay for ThyroxineEmploying Genetically Engineered Mutant Aequorins Containing UniqueCysteine Residues,” Anal. Chem. 2001, 732, 3227.
Chapter 191. L. Stryer, “Fluorescence Energy Transfer as a Spectroscopic Ruler,” Annu.
Rev. Biochem. 1978, 47, 819; C. Berney and G. Danuser, “FRET or No FRET: AQuantitative Comparison,” Biophys. J. 2003, 84, 3992; http://www.probes.com/handbook/.
2. T. R. Martz, J. J. Carr, C. R. French, and M. D. DeGrandpre, “ASubmersible Autonomous Sensor for Spectrophotometric pH Measurementsof Natural Waters,” Anal. Chem. 2003, 75, 1844; W. Yao and R. H. Byrne,“Spectrophotometric Determination of Freshwater pH Using BromocresolPurple and Phenol Red,” Environ. Sci. Technol. 2001, 35, 1197; H. Yamazaki,R. P. Sperline, and H. Freiser, “Spectrophotometric Determination of pH andIts Applications to Determination of Thermodynamic Equilibrium Constants,”Anal. Chem. 1992, 64, 2720.
3. To multiply a matrix times a vector, multiply each row of the matrix timeseach element of the vector as follows:
The product is a vector. The product of a matrix times a matrix is another matrixobtained by multiplying rows times columns:
The matrix B below is the inverse of A because their product is the unit matrix:
A B Unit matrix
4. Under certain conditions, it is possible for a solution with more thantwo principal species to exhibit an isosbestic point. See D. V. Stynes,“Misinterpretation of Isosbestic Points: Ambident Properties of Imidazole,”Inorg. Chem. 1975, 14, 453.
5. G. Scatchard, Ann. N. Y. Acad. Sci. 1949, 51, 660.
6. D. A. Deranleau, “Theory of the Measurement of Weak MolecularComplexes,” J. Am. Chem. Soc. 1969, 91, 4044.
7. E. Bruneau, D. Lavabre, G. Levy, and J. C. Micheau, “Quantitative Analysisof Continuous-Variation Plots with a Comparison of Several Methods,” J. Chem.Ed. 1992, 69, 833; V. M. S. Gil and N. C. Oliveira, “On the Use of the Methodof Continuous Variation,” J. Chem. Ed. 1990, 67, 473; Z. D. Hill andP. MacCarthy, “Novel Approach to Job’s Method,” J. Chem. Ed. 1986, 63, 162.
8. M. Trojanowicz, Flow Injection Analysis (River Edge, NJ: World ScientificPublishing, 2000); M. Valcárcel and M. D. Luque de Castro, Flow InjectionAnalysis (Chichester, UK: Ellis Horwood, 1987); J. Ruzicka and E. H. Hansen,
c10
01dc1 � 2 � 2 � 3
2 1 � 1 � 2 � 12
3 � 2 � 4 � 32 3 � 1 � 4 � 1
2d �c2 1
32 1
2d �c1 2
3 4d
� c a1c1 � a2d1
b1c1 � b2d1
a1c2 � a2d2
b1c2 � b2d2d
� c row 1 � column 1row 2 � column 1
row 1 � column 2row 2 � column 2
dc c1
d1
c2
d2dca1
b1
a2
b2d
ca1
b1
a2
b2d cX
Yd � ca1X � a2Y
b1X � b2Yd
Ca2�

“Flow Injection Analysis: From Beaker to Microfluidics,” Anal. Chem. 2000,72, 212A; J. Ruzicka and L. Scampavia, “From Flow Injection to BeadInjection,” Anal. Chem. 1999, 71, 257A.
9. A. A. Ensafi and G. B. Dehaghi, “Ultra-Trace Analysis of Nitrite in FoodSamples by Flow Injection with Spectrophotometric Detection,” FreseniusJ. Anal. Chem. 1999, 363, 131.
10. D. Thouron, R. Vuillemin, X. Philippon, A. Lourenço, C. Provost, A. Cruzado,and V. Garçon, “An Autonomous Nutrient Analyzer for Oceanic Long-Term inSitu Biogeochemical Monitoring,” Anal. Chem. 2003, 75, 2601.
11. H. Mana and U. Spohn, “Sensitive and Selective Flow Injection Analysis ofHydrogen Sulfite/Sulfur Dioxide by Fluorescence Detection with and withoutMembrane Separation by Gas Diffusion, Anal. Chem. 2001, 73, 3187.
12. J. Zheng, S. R. Springston, and J. Weinstein-Lloyd, “Quantitative Analysisof Hydroperoxyl Radical Using Flow Injection Analysis withChemiluminescence Detection,” Anal. Chem. 2003, 75, 2601; A. R. Bowie,E. P. Achterberg, P. N. Sedwick, S. Ussher, and P. J. Worsfold, “Real-TimeMonitoring of Picomolar Concentrations of Iron(II) in Marine Waters UsingAutomated Flow Injection-Chemiluminescence Instrumentation, Environ. Sci.Technol. 2002, 36, 4600.
13. R. S. Yalow, “Development and Proliferation of RadioimmunoassayTechnology,” J. Chem. Ed. 1999, 76, 767; R. P. Ekins, “Immunoassay, DNAAnalysis, and Other Ligand Binding Assay Techniques” J. Chem. Ed. 1999, 76,769; E. F. Ullman, “Homogeneous Immunoassays,” J. Chem. Ed. 1999, 76, 781;E. Straus, “Radioimmunoassay of Gastrointestinal Hormones,” J. Chem. Ed.1999, 76, 788.
14. S. J. Gee, B. D. Hammock, and J. V. Van Emon, EnvironmentalImmunochemical Analysis for Detection of Pesticides and Other Chemicals:A User’s Guide (Westwood, NJ: Noyes, 1997); E. M. Brun, M. Garcés-García,E. Escuín, S. Morais, R. T. Puchades, and A. Maquieira, “Assessment of NovelDiazinon Immunoasays for Water Analysis,” Environ. Sci. Technol. 2004, 38,1115; J. Zeravik, K. Skryjová, Z. Nevoranková, and M. Fránek, “Developmentof Direct ELISA for the Determination of 4-Nonylphenol and Octylphenol,”Anal. Chem. 2004, 76, 1021.
15. E. P. Diamandis and T. K. Christopoulos, “Europium Chelate Labels inTime-Resolved Fluorescence Immunoassays and DNA Hybridization Assays,”Anal. Chem. 1990, 62, 1149A.
16. R. Mukhopadhyay, “Aptamers Are Ready for the Spotlight,” Anal. Chem.2005, 77, 114A; S. D. Mendonsa and M. T. Bowser, “In Vitro Selection of High-Affinity DNA Ligands for Human IgE Using Capillary Electrophoresis,” Anal.Chem. 2004, 76, 5387.
17. G. J. Meyer, “Efficient Light-to-Electrical Energy Conversion:Nanocrystalline TiO2 Films Modified with Inorganic Sensitizers,” J. Chem. Ed.1997, 74, 652. For a student experiment to construct a photocell, see G. P.Smestad and M. Grätzel, “Demonstrating Electron Transfer and Nanotechnology:A Natural Dye-Sensitized Nanocrystalline Energy Converter,” J. Chem. Ed.1998, 75, 752.
18. http://www.greatcell.com
19. K. A. Kneas, W. Xu, J. N. Demas, and B. A. DeGraff, “DramaticDemonstration of Oxygen Sensing by Luminescence Quenching,” J. Chem. Ed.1997, 74, 696.
20. Y.-E. L. Koo, Y. Cao, R. Kopelman, S. M. Koo, M. Brasuel, and M. A.Philbert, “Real-Time Measurements of Dissolved Oxygen Inside Living Cellsby Organically Modified Silicate Fluorescent Nanosensors,” Anal. Chem. 2004,76, 2498.
21. M. D. DeGrandpre, M. M. Baehr, and T. R. Hammar, “Calibration-FreeOptical Chemical Sensors,” Anal. Chem. 1999, 71, 1152.
22. J. P. Whelan, A. W. Kusterbeck, G. A. Wemhoff, R. Bredehorst, andF. S. Ligler, “Continuous-Flow Immunosensor for Detection of Explosives,”Anal. Chem. 1993, 65, 3561; U. Narang, P. R. Gauger, and F. S. Ligler,“A Displacement Flow Immunosensor for Explosive Detection UsingMicrocapillaries,” Anal. Chem. 1997, 69, 2779.
23. A Poisson distribution is valid when (a) all possible outcomes are randomand independent of one another, (b) the maximum possible value of n is a largenumber, and (c) the average value of n is a small fraction of the maximumpossible value.
NR12 Notes and References
Chapter 201. K. L. Bechtel, R. N. Zare, A. A. Kachanov, S. S. Sanders, and B. A. Paldus,
“Cavity Ring-Down Spectroscopy for HPLC,” Anal. Chem. 2005, 77, 1177;B. Bahnev, L. van der Sneppen, A. E. Wiskerke, F. Ariese, C. Gooijer, andW. Ubachs, “Miniaturized Cavity Ring-Down Detection in a Liquid Flow Cell,”Anal. Chem. 2005, 77, 1188.
2. A. Bergh, G. Craford, A. Duggal, and R. Haitz, “The Promise andChallenge of Solid-State Lighting,” Physics Today, December 2001, p. 42;H. Sevian, S. Müller, H. Rudmann, and M. F. Rubner, “Using Organic Light-Emitting Electrochemical Thin-Film Devices to Teach Materials Science,”J. Chem. Ed. 2004, 81, 1620.
3. J. M. Kauffman, “Water in the Atmosphere,” J. Chem. Ed. 2004, 81, 1229.
4. S. K. Lower, “Thermal Physics (and Some Chemistry) of the Atmosphere,”J. Chem. Ed. 1998, 75, 837; W. C. Trogler, “Environmental Chemistry of TraceAtmospheric Gases,” J. Chem. Ed. 1995, 72, 973.
5. B. Hileman, “Climate Change,” Chem. Eng. News, 15 December 2003,p. 27; E. Raschke, “Is the Additional Greenhouse Effect Already Evident inthe Current Climate?” Fresenius J. Anal. Chem. 2001, 371, 791.
6. M. G. D. Baumann, J. C. Wright, A. B. Ellis, T. Kuech, and G. C. Lisensky,“Diode Lasers,” J. Chem. Ed. 1992, 69, 89; T. Imasaka and N. Ishibashi, “DiodeLasers and Practical Trace Analysis,” Anal. Chem. 1990, 62, 363A.
7. W. E. L. Grossman, “The Optical Characteristics and Production ofDiffraction Gratings,” J. Chem. Ed. 1993, 70, 741.
8. G. C.-Y. Chan and W. T. Chan, “Beer’s Law Measurements Using Non-Monochromatic Light Sources—A Computer Simulation,” J. Chem. Ed. 2001,78, 1285.
9. J. C. Travis et al., “Intrinsic Wavelength Standard Absorption Bands inHolmium Oxide Solution for UV/Visible Molecular AbsorptionSpectrophotometry,” J. Phys. Chem. Ref. Data 2005, 34, 41.
10. K. Palczewski et al., “Crystal Structure of Rhodopsin,” Science 2000, 289, 739.
11. J. M. Harnly and R. E. Fields, “Solid-State Array Detectors for AnalyticalSpectrometry,” Appl. Spectros. 1997, 51, 334A; Q. S. Hanley, C. W. Earle,F. M. Pennebaker, S. P. Madden, and M. B. Denton, “Charge-Transfer Devicesin Analytical Instrumentation,” Anal. Chem. 1996, 68, 661A; J. V. Sweedler,K. L. Ratzlaff, and M. B. Denton, eds., Charge Transfer Devices inSpectroscopy (New York: VCH, 1994).
12. S. K. van Bergen, I. B. Bakaltcheva, J. S. Lundgren, and L. C. Shriver-Lake,“On-Site Detection of Explosives in Groundwater with a Fiber Optic Biosensor,”Environ. Sci. Technol. 2000, 34, 704; P. T. Charles, P. R. Gauger, C. H.Patterson, Jr., and A. W. Kusterbeck, “On-Site Immunoanalysis of Nitrate andNitroaromatic Compounds in Groundwater,” Environ. Sci. Technol. 2000, 34,4641; W. Tan, R. Kopenman, S. L. R. Barker, and M. T. Miller, “UltrasmallOptical Sensors for Cellular Measurements,” Anal. Chem. 1999, 71, 606A;S. L. R. Barker, Y. Zhao, M. A. Marletta, and R. Kopelman, “CellularApplications of a Fiber-Optic Biosensor Based on a Dye-Labeled GuanylateCyclase,” Anal. Chem. 1999, 71, 2071; M. Kuratli and E. Pretsch, “SO2-Selective Optodes,” Anal. Chem. 1994, 66, 85.
13. Z. Rosenzweig and R. Kopelman, “Analytical Properties and Sensor SizeEffects of a Micrometer-Sized Optical Fiber Glucose Biosensor,” Anal. Chem.1996, 68, 1408.
14. C. Preininger, I. Klimant, and O. S. Wolfbeis, “Optical Fiber Sensor forBiological Oxygen Demand,” Anal. Chem. 1994, 66, 1841.
15. I. Biran and D. R. Walt, “Optical Imaging Fiber-Based Single Live CellArrays,” Anal. Chem. 2002, 74, 3046.
16. J. T. Bradshawl, S. B. Mendes, and S. S. Saavedra, “Planar IntegratedOptical Waveguide Spectroscopy,” Anal. Chem. 2005, 77, 28A.
17. J. M. Brockman, B. P. Nelson, and R. M. Corn, “Surface PlasmonResonance Imaging Measurements of Ultrathin Organic Films,” Annu. Rev.Phys. Chem. 2000, 51, 41; J. Homola, “Present and Future of Surface PlasmonResonance Biosensors,” Anal. Bioanal. Chem. 2003, 377, 528; H. Q. Zhang,S. Boussasad, and N. J. Tao, “High-Performance Differential Surface PlasmonResonance Sensor Using Quadrant Cell Photodetector,” Rev. Sci. Instrum. 2003,74, 150; M. Suzuki, F. Ozawa, W. Sugimoto, and S. Aso, “Miniature Surface-Plasmon Resonance Immunosensors—Rapid and Repetitive Procedure,” Anal.Bioanal. Chem. 2002, 372, 301.

Notes and References NR13
18. P. R. Griffiths and J. A. de Haseth, Fourier Transform Infrared Spectrometry(New York: Wiley, 1986), and W. D. Perkins, “Fourier Transform-InfraredSpectroscopy,” J. Chem. Ed. 1986, 63, A5; 1987, 64, A269, A296.
19. There are many excellent digital and electronic techniques for improving thequality of a spectrum without having to average numerous scans. See T. C.O’Haver, “An Introduction to Signal Processing in Chemical Measurement,”J. Chem. Ed. 1991, 68, A147; M. G. Prais, “Spreadsheet Exercises for InstrumentalAnalysis,” J. Chem. Ed. 1992, 69, 488; R. Q. Thompson, “Experiments in SoftwareData Handling,” J. Chem. Ed. 1985, 62, 866; M. P. Eastman, G. Kostal, andT. Mayhew, “An Introduction to Fast Fourier Transforms Through the Studyof Oscillating Reactions,” J. Chem. Ed. 1986, 63, 453; and B. H. Vassos andL. López, “Signal-to-Noise Improvement,” J. Chem. Ed. 1985, 62, 542.
20. G. M. Hieftje, “Signal-to-Noise Enhancement Through InstrumentalTechniques,” Anal. Chem. 1972, 44, 81A [No. 6], 69A [No. 7]; D. C. Tardy,“Signal Averaging,” J. Chem. Ed. 1986, 63, 648. See also T. Kaneta, “HadamardTransform CE,” Anal. Chem. 2001, 73, 540A.
21. N. N. Sesi, M. W. Borer, T. K. Starn, and G. M. Hieftje, “A StandardApproach to Collecting and Calculating Noise Amplitude Spectra,” J. Chem. Ed.1998, 75, 788.
22. M. L. Salit and G. C. Turk, “A Drift Correction Procedure,” Anal. Chem.1998, 70, 3184.
Chapter 211. E. R. Denoyer, K. J. Fredeen, and J. W. Hager, “Laser Solid Sampling for
Inductively Coupled Plasma Mass Spectrometry,” Anal. Chem. 1991, 63, 445A;K. Niemax, “Laser Ablation—Reflections on a Very Complex Technique forSolid Sampling,” Fresenius J. Anal. Chem. 2001, 370, 332. A major challengefor laser ablation–mass spectrometry is quantitative analysis. One schemeachieves semiquantitative analysis without standards by comparing the signalfrom each element with the total mass spectrometric signal: A. M. Leach andG. M. Hieftje, “Standardless Semiquantitative Analysis of Metals Using Single-Shot Laser Ablation Inductively Couple Plasma Time-of-Flight MassSpectrometry,” Anal. Chem. 2001, 73, 2959.
2. L. H. J. Lajunen and P. Perämäki, Spectrochemical Analysis by AtomicAbsorption (Cambridge: Royal Society of Chemistry, 2004).
3. History: A. Walsh, “The Development of Atomic Absorption Methods ofElemental Analysis 1952–1962,” Anal. Chem. 1991, 63, 933A; B. V. L’vov,“Graphite Furnace Atomic Absorption Spectrometry,” Anal. Chem. 1991, 63,924A.
4. D. L. Pfeil and A. Reed, “Automating the Digestion and Determination ofMercury in a Variety of Environmental Sample Matrices,” Am. Lab., March2002, p. 26.
5. History: R. F. Jarrell, “A Brief History of Atomic Emission SpectrochemicalAnalysis, 1666–1950,” J. Chem. Ed. 2000, 77, 573; R. F. Jarrell, F. Brech,and M. J. Gustafson, “A History of Thermo Jarrell Ash Corporation andSpectroscopist Richard F. Jarrell,” J. Chem. Ed. 2000, 77, 592; G. M. Hieftje,“Atomic Emission Spectroscopy—It Lasts and Lasts and Lasts,” J. Chem. Ed.2000, 77, 577.
6. R. J. Stolzberg, “Optimizing Signal-to-Noise Ratio in Flame AtomicAbsorption Using Sequential Simplex Optimization,” J. Chem. Ed. 1999,76, 834.
7. D. J. Butcher and J. Sneddon, A Practical Guide to Graphite FurnaceAtomic Absorption Spectrometry (New York: Wiley, 1998).
8. J. B. Voit, “Low-Level Determination of Arsenic in Drinking Water,”Am. Lab. News Ed., February 2002, p. 62.
9. M. Hornung and V. Krivan, “Determination of Trace Impurities in Tungstenby Direct Solid Sampling Using a Transversely Heated Graphite Tube,” Anal.Chem. 1998, 70, 3444.
10. U. Schäffer and V. Krivan, “Analysis of High Purity Graphite and SiliconCarbide by Direct Solid Sampling Electrothermal Atomic AbsorptionSpectrometry,” Fresenius J. Anal. Chem. 2001, 371, 859; R. Nowka andH. Müller, “Direct Analysis of Solid Samples by Graphite Furnace AtomicAbsorption Spectrometry,” Fresenius J. Anal. Chem. 1997, 359, 132.
11. J. Y. Cabon, “Influence of Experimental Parameters on the Determinationof Antimony in Seawater by Atomic Absorption Spectrometry,” Anal. Bioanal.Chem. 2003, 374, 1282.
12. D. L. Styris and D. A. Redfield, “Mechanisms of Graphite FurnaceAtomization of Aluminum by Molecular Beam Sampling Mass Spectrometry,”Anal. Chem. 1987, 59, 2891.
13. S. Greenfield, “Invention of the Annular Inductively Coupled Plasma as aSpectroscopic Source,” J. Chem. Ed. 2000, 77, 584.
14. V. B. E. Thomsen, G. J. Roberts, and D. A. Tsourides, “VacuumlessSpectrochemistry in the Vacuum Ultraviolet,” Am. Lab., August 1997, p. 18H.
15. V. B. E. Thomsen, “Why Do Spectral Lines Have a Linewidth?” J. Chem.Ed. 1995, 72, 616.
16. A better measure of noise is the root-mean-square noise (Equation 20-14),which is times less than the peak-to-peak noise. Therefore 2 times the peak-to-peak noise level is times the root-mean-square noise. The detection limitthat is 2 times the peak-to-peak noise level is close to the limit of quantitation inEquation 5-6. The lesson is that you should define how you express a detectionlimit when you report one.
17. R. Thomas, Practical Guide to ICP-MS (New York: Marcel Dekker, 2004);H. E. Taylor, Inductively Coupled Plasma-Mass Spectrometry (San Diego:Academic Press, 2001); C. M. Barshick, D. C. Duckworth, and D. H. Smith,eds., Inorganic Mass Spectrometry (New York: Marcel Dekker, 2000); S. J. Hill,ed., Inductively Coupled Plasma Spectrometry and Its Applications (Sheffield,UK: Sheffield Academic Press, 1999); A. Montaser, ed., Inductively CoupledPlasma Mass Spectrometry (New York: Wiley, 1998); G. Holland andS. D. Tanner, eds., Plasma Source Mass Spectrometry (Cambridge: RoyalSociety of Chemistry, 1997, 1999).
18. M. J. Felton, “Plasma Opens New Doors in Isotope Ratio MS,” Anal. Chem.2003, 75, 119A.
19. L. Moens and N. Jakubowski, “Double-Focusing Mass Spectrometers inICPMS,” Anal. Chem. 1998, 70, 251A; F. A. M. Planchon, C. F. Boutron,C. Barbante, E. W. Wolff, G. Cozzi, V. Gaspari, C. P. Ferrari, and P. Cescon,“Ultrasensitive Determination of Heavy Metals at the Sub-pg/g Level inUltraclean Antarctic Snow Samples by Inductively Coupled Plasma SectorField Mass Spectrometry,” Anal. Chem. Acta 2001, 450, 193.
20. B. Hattendorf, C. Latkoczy, and D. Günther, “Laser Ablation–ICPMS,”Anal. Chem. 2003, 75, 341A; R. E. Russo, X. Mao, and S. S. Mao, “The Physicsof Laser Ablation in Microchemical Analysis,” Anal. Chem. 2002, 74, 71A.
21. V. Cheam, G. Lawson, I. Lechner, and R. Desrosiers, “Recent MetalPollution in Agassiz Ice Cap,” Environ. Sci. Technol. 1998, 32, 3974.
22. A. Bazzi, B. Kreuz, and J. Fischer, “Determination of Calcium in Cerealwith Flame Atomic Absorption Spectroscopy,” J. Chem. Ed. 2004, 81, 1042.
23. J. J. Rosentreter and R. K. Skogerboe, “Trace Determination and Speciationof Cyanide Ion by Atomic Absorption Spectroscopy,” Anal. Chem. 1991, 63, 682.
24. L. Perring and M. Basic-Dvorzak, “Determination of Total Tin in CannedFood Using Inductively Coupled Plasma Atomic Emission Spectroscopy,” Anal.Bioanal. Chem. 2002, 374, 235.
Chapter 221. W. J. Showers, R. Barrick, and B. Genna, “Isotopic Analysis of Dinosaur
Bones,” Anal. Chem. 2002, 74, 142A.
2. F. Klink, Introduction to Protein and Peptide Analysis with MassSpectrometry (Fullerton, CA: Academy Savant, 2004), computer trainingProgram CMSP-10.
3. W.-P. Peng, Y.-C. Yang, M.-W. Kang, Y. T. Lee, and H.-C. Chang,“Measuring Masses of Single Bacterial Whole Cells with a Quadrupole IonTrap,” J. Am. Chem. Soc. 2004, 126, 11766–11767.
4. D. P. Fergenson et al., “Reagentless Detection and Classification ofIndividual Bioaerosol Particles in Seconds,” Anal. Chem. 2004, 76, 373;J. J. Jones, M. J. Stump, R. C. Fleming, J. O. Lay, Jr., and C. L. Wilkins,“Investigation of MALDI-TOF and FT-MS Techniques of Analysis ofEschericia coli Whole Cells,” Anal. Chem. 2003, 75, 1340.
5. J. H. Gross, Mass Spectrometry: A Textbook (Berlin: Springer-Verlag, 2004);K. Doward, Mass Spectrometry: A Foundation Course (Cambridge: RoyalSociety of Chemistry, 2004); C. G. Herbert and R. A. W. Johnstone, MassSpectrometry Basics (Boca Raton, FL: CRC Press, 2002); J. Barker, MassSpectrometry, 2nd ed. (Chichester, UK: Wiley, 1999); J. T. Watson, Introductionto Mass Spectrometry, 3rd ed. (Philadelphia: Lippincott-Raven, 1997); R. A. W.
�10�5

Johnstone and M. E. Rose, Mass Spectrometry for Chemists and Biochemists(Cambridge: Cambridge University Press, 1996); C. Dass, Principles andPractice of Biological Mass Spectrometry (New York: Wiley, 2001).
6. For a demonstration of mass spectrometry, see N. C. Grim and J. L. Sarquis,“Mass Spectrometry Analogy on the Overhead Projector,” J. Chem. Ed. 1995,72, 930.
7. O. D. Sparkman, “Evaluating Electron Ionization Mass Spectral LibrarySearch Results,” J. Am. Soc. Mass Spectrom. 1996, 7, 313.
8. The NIST/EPA/NIH Mass Spectral Database ([email protected])includes more than 100 000 compounds. The Wiley/NIST Registry of MS data is available from Palisade Corp. at http://www.palisade-ms.com.Electron ionization mass spectra of many compounds can be viewed at http://webbook.nist.gov/chemistry.
9. O. Asvany, P. Kumar P, B. Redlich, I. Hegemann, S. Schlemmer, and D. Marx,“Understanding the Infrared Spectrum of Bare ” Science 2005, 309, 1219.
10. J. D. Hearn and G. D. Smith, “A Chemical Ionization Mass SpectrometryMethod for the Online Analysis of Organic Aerosols,” Anal. Chem. 2004,76, 2820.
11. R. A. Gross, Jr., “A Mass Spectral Chlorine Rule for Use in StructureDeterminations in Sophomore Organic Chemistry,” J. Chem. Ed. 2004, 81, 1161.
12. I. T. Platzner, Modern Isotope Ratio Mass Spectrometry (New York: Wiley,1997).
13. W. Chen and M. V. Orna, “Recent Advances in Archaeological Chemistry,”J. Chem. Ed. 1996, 73, 485.
14. A. M. Pollard and C. Heron, Archaeological Chemistry (Cambridge: RoyalSociety of Chemistry, 1996).
15. J. T. Watson and K. Biemann, “High-Resolution Mass Spectra of CompoundsEmerging from a Gas Chromatograph,” Anal. Chem. 1964, 36, 1135. A classicpaper on gas chromatography/mass spectrometry.
16. R. M. Smith, Understanding Mass Spectra: A Basic Approach, 2nd ed.(Hoboken, NJ: Wiley, 2004).
17. P. E. Miller and M. B. Denton, “The Quadrupole Mass Filter: BasicOperating Concepts,” J. Chem. Ed. 1986, 63, 617; M. Henchman and C. Steel,“Design and Operation of a Portable Quadrupole Mass Spectrometer for theUndergraduate Curriculum,” J. Chem. Ed. 1998, 75, 1042; C. Steel andM. Henchman, “Understanding the Quadrupole Mass Filter Through ComputerSimulation,” J. Chem. Ed. 1998, 75, 1049; J. J. Leary and R. L. Schidt,“Quadrupole Mass Spectrometers: An Intuitive Look at the Math,” J. Chem.Ed. 1996, 73, 1142.
18. R. J. Cotter, Time-of-Flight Mass Spectrometry (Washington, DC: AmericanChemical Society, 1997); R. J. Cotter, “The New Time-of-Flight MassSpectrometry,” Anal. Chem. 1999, 71, 445A.
19. Z. Ziegler, “Ion Traps Come of Age,” Anal. Chem. 2002, 74, 489A;C. M. Henry, “The Incredible Shrinking Mass Spectrometers,” Anal. Chem.1999, 71, 264A; R. G. Cooks and R. E. Kaiser, Jr., “Quadrupole Ion Trap MassSpectrometry,” Acc. Chem. Res. 1990, 23, 213.
20. G. A. Eiceman and J. A. Stone, “Ion Mobility Spectrometers in NationalDefense,” Anal. Chem. 2004, 76, 392A; H. H. Hill, W. F. Siems, R. H. St. Louis,and D. G. McMinn, “Ion Mobility Spectrometry,” Anal. Chem. 1990, 62,1201A;G. A. Eiceman and Z. Karpas, Ion Mobility Spectrometry, 2nd ed. (Boca Raton,FL: Taylor and Francis CRC Press, 2005); R. A. Miller, G. A. Eiceman,E. G. Nazarov, and A. T. King, “A Micro-Machined High-Field AsymmetricWaveform-Ion Mobility Spectrometer (FA-IMS),” Sens. Actuators B Chem.2000, 67, 300.
21. H.-J. Hübschmann, Handbook of GC/MS: Fundamentals and Applications(Weinheim: Wiley-VCH, 2001); M. Oehme, Practical Introduction to GC-MSAnalysis with Quadrupoles (Heidelberg: Hüthig Verlag, 1998); F. G. Kitson,B. S. Larsen, and C. N. McEwen, Gas Chromatography and Mass Spectrometry:A Practical Guide (San Diego: Academic Press, 1996).
22. B. Ardrey, Liquid Chromatography-Mass Spectrometry: An Introduction(Chichester, UK: Wiley, 2003); W. M. A. Niessen, Liquid Chromatography-MassSpectrometry, 2nd ed (New York: Marcel Dekker, 1999); M. S. Lee, LC/MSApplications in Drug Development (New York: Wiley, 2002); J. Abian,“Historical Feature: The Coupling of Gas and Liquid Chromatography withMass Spectrometry,” J. Mass Spectrom. 1999, 34, 157.
CH�5 ,
NR14 Notes and References
23. M. M. Vestling, “Using Mass Spectrometry for Proteins,” J. Chem. Ed.2002, 80, 122; C. M. Henry, “Winning Ways,” Chem. Eng. News, 18 November2002, p. 62.
24. R. B. Cole, ed., Electrospray Ionization Mass Spectrometry: Fundamentals,Instrumentation, and Applications (New York: Wiley, 1997).
25. S. Liu, W. J. Griffiths, and J. Sjövall, “On-Column Electrochemical ReactionsAccompanying the Electrospray Process,” Anal. Chem. 2003, 75, 1022.
26. W. P. Duncan and P. D. Perkins, “LC-MS with Simultaneous Electrosprayand Atmospheric Pressure Chemical Ionization,” Am. Lab., March 2005, p. 28.
27. C. Fenselau, “MALDI MS and Strategies for Protein Analysis,” Anal. Chem.1997, 69, 661A; R. W. Nelson, D. Nedelkov, and K. A. Tubbs, “BiomolecularInteraction Analysis Mass Spectrometery,” Anal. Chem. 2000, 72, 405A; J. J.Thomas, R. Bakhtiar, and G. Siuzdak, “Mass Spectrometry in Viral Proteomics,”Acc. Chem. Res. 2000, 33, 179; A. P. Snyder, Interpreting Protein Mass Spectra(Washington, DC: American Chemical Society, 2000); S. C. Moyer and R. J.Cotter, “Atmospheric Pressure MALDI,” Anal. Chem. 2002, 74, 469A.
28. S. S. Rubakhin, W. T. Greenough, and J. V. Sweedler, “Spatial Profilingwith MALDI MS: Distribution of Neuropeptides Within Single Neurons,” Anal.Chem. 2003, 75, 5374.
29. S. A. Hofstadler, R. Bakhtiar, and R. D. Smith, “Electrospray IonizationMass Spectrometry: Instrumentation and Spectral Interpretation,” J. Chem. Ed.1996, 73, A82.
30. R. Bakhtiar, R. Hofstadler, and R. D. Smith, “Electrospray Ionization MassSpectrometry: Characterization of Peptides and Proteins,” J. Chem. Ed. 1996,73, A118; C. E. C. A. Hop and R. Bakhtiar, “Electrospray Ionization MassSpectrometry: Applications in Inorganic Chemistry and Synthetic PolymerChemistry,” J. Chem. Ed. 1996, 73, A162.
31. S. D. Fuerstenau, W. H. Benner, J. J. Thomas, C. Brugidou, B. Bothner, andG. Siuzdak, “Mass Spectrometry of an Intact Virus,” Angew. Chem. Int. Ed.2001, 40, 542.
32. Multiply charged ions can be converted into singly charged ions by passagethrough a corona discharge between the electrospray nozzle and the massanalyzer. With a time-of-flight spectrometer to measure high m/z, singly chargedions simplify protein analysis. D. D. Ebeling, M. S. Westphall, M. Scalf, andL. M. Smith, “Corona Discharge in Charge Reduction Electrospray MassSpectrometry,” Anal. Chem. 2000, 72, 5158.
33. S. D. Maleknia and K. M. Downard, “Charge Ratio Analysis Method:Approach for the Deconvolution of Electrospray Mass Spectra,” Anal. Chem.2005, 77, 111.
34. F. He, C. L. Hendrickson, and A. G. Marshall, “Baseline Mass Resolutionof Peptide Isobars: A Record for Molecular Mass Resolution,” Anal. Chem.2001, 73, 647.
35. R. Chaler, J. O. Grimalt, C. Pelejero, and E. Calvo, “Sensitivity Effects inPaleotemperature Estimation by Chemical Ionization Mass Spectrometry,”
Anal. Chem. 2000, 72, 5892.
36. L. Charles and D. Pépin, “Electrospray Ion Chromatography–Tandem MassSpectrometry of Oxyhalides at Sub-ppb Levels,” Anal. Chem. 1998, 70, 353.
37. J. D. Fassett and P. J. Paulsen, “Isotope Dilution Mass Spectrometry forAccurate Elemental Analysis,” Anal. Chem. 1989, 61, 643A.
Chapter 231. T. Michalowski, “Effect of Mutual Solubility of Solvents in Multiple
Liquid-Liquid Extraction,” J. Chem. Ed. 2002, 79, 1267.
2. R. P. Paradkar and R. R. Williams, “Micellar Colorimetric Determinationof Dithizone Metal Chelates,” Anal. Chem. 1994, 66, 2752.
3. H. H. Strain and J. Sherma, “M. Tswett: Adsorption Analysis andChromatographic Methods,” J. Chem. Ed. 1967, 44, 238 (a translation ofTswett’s original article); H. H. Strain and J. Sherma, “Michael Tswett’sContributions to Sixty Years of Chromatography,” J. Chem. Ed. 1967, 44, 235;L. S. Ettre, “M. S. Tswett and the Invention of Chromatography,” LCGC 2003,21, 458; L. S. Ettre, “The Birth of Partition Chromatography,” LCGC 2001, 19,506; L. S. Ettre, “The Story of Thin-Layer Chromatography,” LCGC 2001,19, 712; L. S. Ettre, “A. A. Zhuykhovitskii—A Russian Pioneer of GasChromatography,” LCGC 2000, 18, 1148; V. R. Meyer, “Michael Tswett and HisMethod,” Anal. Chem. 1997, 69, 284A; Ya. I. Yashin, “History of Chromatography
U37k¿

Notes and References NR15
(1903–1993),” Russ. J. Anal. Chem. 1994, 49, 939; K. I. Sakodynskii,“Discovery of Chromatography by M. S. Tsvet,” Russ. J. Anal. Chem. 1994,48, 897.
4. C. F. Poole, The Essence of Chromatography (Amsterdam: Elsevier, 2003)(graduate-level treatment of theory and specific techniques); J. M. Miller,Chromatography: Concepts and Contrasts, 2nd ed. (Hoboken, NJ: Wiley, 2005).
5. C. A. Smith and F. W. Villaescusa, “Simulating ChromatographicSeparations in the Classroom,” J. Chem. Ed. 203, 80, 1023.
6. S. Miller, “Prep LC Systems for Chemical Separations,” Anal. Chem. 2003,75, 477A; R. E. Majors, “The Role of the Column in Preparative HPLC,” LCGC2004, 22, 416; A. Brandt and S. Kueppers, “Practical Aspects of PreparativeHPLC in Pharmaceutical Development and Production,” LCGC 2002, 20, 14.
7. J. P. Foley and J. G. Dorsey, “Equations for Calculation of ChromatographicFigures of Merit for Ideal and Skewed Peaks,” Anal. Chem. 1983, 55, 730;B. A. Bidlingmeyer and F. V. Warren, Jr., “Column Efficiency Measurement,”Anal. Chem. 1984, 56, 1583A.
8. M. T. Bowser, G. M. Bebault, X. Peng, and D. D. Y. Chen, “Redefining theSeparation Factor: Pathway to a Unified Separation Science,” Electrophoresis1997, 18, 2928. The conventional equation is resolutionwhere is relative retention, is the capacity factor for the more retainedcomponent, and is the average capacity factor for the two components. Thisexpression is equivalent to for closely spaced peaks for which
9. J. C. Giddings, Unified Separation Science (New York: Wiley, 1991); S. J. Hawkes, “Modernization of the van Deemter Equation for ChromatographicZone Dispersion,” J. Chem. Ed. 1983, 60, 393.
10. For numerical simulation of skewed bandshapes, see S. Sugata and Y. Abe,“An Analogue Column Model for Nonlinear Isotherms: The Test Tube Model,”J. Chem. Ed. 1997, 74, 406, and B. R. Sundheim, “Column Operations:A Spreadsheet Model,” J. Chem. Ed. 1992, 69, 1003.
11. A. Felinger, “Molecular Movement in an HPLC Column: A StochasticAnalysis,” LCGC 2004, 22, 642; J. C. Giddings, Dynamics of Chromatography(New York: Marcel Dekker, 1965).
Chapter 241. J. V. Hinshaw and L. S. Ettre, Introduction to Open Tubular Gas
Chromatography (Cleveland, OH: Advanstar Communications, 1994); H. M.McNair and J. M. Miller, Basic Gas Chromatography (New York: Wiley, 1998);R. L. Grob and E. F. Barry, eds., Modern Practice of Gas Chromatography(New York: Wiley, 2004).
2. A. Wollrab, “Lecture Experiments in Gas-Liquid Chromatography,” J. Chem.Ed. 1982, 59, 1042; C. E. Bricker, M. A. Taylor, and K. E. Kolb, “SimpleClassroom Demonstration of Gas Chromatography,” J. Chem. Ed. 1981, 58, 41.
3. L. S. Ettre, “Evolution of Capillary Columns for Gas Chromatography,”LCGC 2001, 19, 48.
4. V. R. Meyer, “Amino Acid Racemization: A Tool for Fossil Dating,”Chemtech, July 1992, p. 412. For another application, see T. F. Bidleman andR. L. Falconer, “Using Enantiomers to Trace Pesticide Emissions,” Environ.Sci. Technol. 1999, 33, 206A.
5. A. M. Pollard and C. Heron, Archaeological Chemistry (Cambridge: RoyalSociety of Chemistry, 1996)—a very good book.
6. I. Molnár-Perl, Quantitation of Amino Acids and Amines by Chromatography(New York: Elsevier, 2005).
7. T. J. Ward, “Chiral Separations,” Anal. Chem. 2002, 74, 2863; J. Hernández-Benito, M. P. Garcia-Santos, E. O’Brien, E. Calle, and J. Casado, “A PracticalIntegrated Approach to Supramolecular Chemistry III. Thermodynamics ofInclusion Phenomena,” J. Chem. Ed. 2004, 81, 540; B. D. Wagner, P. J.MacDonald, and M. Wagner, “Visual Demonstration of SupramolecularChemistry: Fluorescence Enhancement upon Host-Guest Inclusion,” J. Chem.Ed. 2000, 77,178; D. Díaz, I. Vargas-Baca, and J. Graci-Mora, “ -CyclodextrinInclusion Complexes with Iodine,” J. Chem. Ed. 1994, 71, 708.
8. Ionic liquids are low-melting salts that have very low volatility. An opticallyactive ionic liquid can be the stationary phase for gas chromatographic separationof enantiomers. J. Ding, T. Welton, and D. W. Armstrong, “Chiral Ionic Liquidsas Stationary Phases in Gas Chromatography,” Anal. Chem. 2004, 76, 6819.
�
k¿A � k¿B � k¿av.
2N4 (� 1)
k¿av
k¿2�� 2N
4 1� 1� 2 1 k ¿2
1 � k ¿av2,
9. A. Berthod, W. Li, and D. W. Armstrong, “Multiple EnantioselectiveRetention Mechanisms on Derivatized Cyclodextrin Gas ChromatographicChiral Stationary Phases,” Anal. Chem. 1992, 64, 873; K. Bester, “ChiralAnalysis for Environmental Applications,” Anal. Bioanal. Chem. 2003,376, 302.
10. E. N. Coker and P. J. Davis, “Experiments with Zeolites at the Secondary-School Level,” J. Chem. Ed. 1999, 76, 1417.
11. In programmed temperature runs with a constant inlet pressure, the flowrate decreases during the run because the viscosity of the carrier gas increases astemperature increases. The effect can be significant (e.g., 30% decrease in linearvelocity for a temperature increase), so it is a good idea to set the initiallinear velocity above the optimum value so it does not decrease too far belowthe optimum. Equations for calculating flow rates as a function of temperatureand pressure are given by J. V. Hinshaw and L. S. Ettre, Introduction to OpenTubular Gas Chromatography (Cleveland, OH: Advanstar Communications,1994), and L. S. Ettre and J. V. Hinshaw, Basic Relationships of GasChromatography (Cleveland, OH: Advanstar Communications, 1993).
12. J. V. Hinshaw, “The Retention Gap Effect,” LCGC 2004, 22, 624.
13. K. Grob, Split and Splitless Injection for Quantitative Gas Chromatography(New York: Wiley, 2001).
14. A. N. Papas and M. F. Delaney, “Evaluation of Chromatographic Integratorsand Data Systems,” Anal. Chem. 1987, 59, 55A.
15. B. Erickson, “Measuring Nitrogen and Phosphorus in the Presence ofHydrocarbons,” Anal. Chem. 1998, 70, 599A.
16. J. Pawliszyn, Solid Phase Microextraction (New York: Wiley, 1997);S. A. S. Wercinski, ed., Solid Phase Microextraction: A Practical Guide(New York: Marcel Dekker, 1999); Z. Zhang, M. J. Yang, and J. Pawliszyn, “Solid-Phase Microextraction,” Anal. Chem. 1994, 66, 844A; P. Mayer, J. Tolls,J. C. M. Hermens, and D. MacKay, “Equilibrium Sampling Devices,” Environ.Sci. Technol. 2003, 37, 185A.
17. K. Dettmer and W. Engewald, “Absorbent Materials Commonly Used in AirAnalysis for Adsorptive Enrichment and Thermal Desorption of Volatile OrganicCompounds,” Anal. Bioanal. Chem. 2002, 373, 490.
18. S. Cram, “How to Develop, Validate, and Troubleshoot Capillary GCMethods,” American Chemical Society Short Course, 1996.
19. J. V. Hinshaw, “Strategies for GC Optimization: Software,” LCGC 2000,18, 1040. Provides equations for optimizing isothermal gas chromatographywith a spreadsheet.
20. R. Sacks, C. Coutant, and A. Grall, “Advancing the Science of ColumnSelectivity,” Anal. Chem. 2000, 72, 525A.
21. J. J. Langenfeld, S. B. Hawthorne, and D. J. Miller, “Quantitative Analysisof Fuel-Related Hydrocarbons in Surface Water and Wastewater by Solid-PhaseMicroextraction,” Anal. Chem. 1996, 68, 144.
Chapter 251. L. R. Snyder, J. J. Kirkland, and J. L. Glajch, Practical HPLC MethodDevelopment (New York: Wiley, 1997). This is the definitive source on methoddevelopment.
2. S. Kromidas, More Practical Problem Solving in HPLC (Weinheim:Wiley-VCH, 2005); S. Kromidas, Practical Problem Solving in HPLC (NewYork: Wiley, 2000); V. R. Meyer, Practical High-Performance LiquidChromatography, 4th ed. (New York: Wiley-VCH, 2004); T. Hanai andR. M. Smith, HPLC: A Practical Guide (New York: Springer-Verlag, 1999);V. R. Meyer, Pitfalls and Errors of HPLC in Pictures (New York: Wiley,1998); R. Eksteen, P. Schoenmakers, and N. Miller, eds., Handbook of HPLC(New York: Marcel Dekker, 1998); U. D. Neue, HPLC Columns: Theory,Technology, and Practice (New York: Wiley, 1997); A. Weston and P. R.Brown, HPLC and CE (San Diego: Academic Press, 1997); L. R. Snyder,“HPLC—Past and Present,” Anal. Chem. 2000, 72, 412A.
3. J. W. Dolan, “LC Troubleshooting,” LCGC 2003, 21, 888.
4. J. W. Dolan, “The Importance of Temperature,” LCGC 2002, 20, 524; Y. Yangand D. R. Lynch, Jr., “Stationary Phases for High-Temperature LC Separations,”LCGC (June 2004 supplement), p. 34.
5. D. W. Armstrong and B. Zhang, “Chiral Stationary Phases for HPLC,” Anal.Chem. 2001, 73, 557A.
200°

6. For high-pH operation of any silica-based stationary phase, temperatureshould not exceed organic buffers should be used instead of phosphate orcarbonate, and methanol instead of acetonitrile should be the organic solvent.[J. J. Kirkland, J. D. Martosella, J. W. Henderson, C. H. Dilks, Jr., andJ. B. Adams, Jr., “HPLC of Basic Compounds at High pH with a Silica-BasedBidentate-C18 Bonded-Phase Column,” Am. Lab., November 1999, p. 22;E. D. Neue, “HPLC Troubleshooting,” Am. Lab., February 2002, p. 72.]
7. N. Tanaka, H. Kobayashi, K. Nakanishi, H. Minakuchi, and N. Ishizuka,“Monolithic LC Columns,” Anal. Chem. 2001, 73, 421A; N. Tanaka andH. Kobayashi, “Monolithic Columns for Liquid Chromatogaphy,” Anal. Bioanal.Chem. 2003, 376, 298; F. Svec, T. B. Tennikova, and Z. Deyl, eds., MonolithicMaterials: Preparation, Properties and Applications (Amsterdam: Elsevier, 2003).
8. P. Ross, “Porous Graphitic Carbon in HPLC,” LCGC 2000, 18, 18;S. Mazan, G. Crétier, N. Gilon, J.-M. Mermet, and J.-L. Rocca, “PorousGraphitic Carbon as Stationary Phase for LC-ICPMS Separation of ArsenicCompounds,” Anal. Chem. 2002, 74, 1281. For another robust stationary phase,see C. J. Dunlap, C. V. McNeff, D. Stoll, and P. W. Carr, “Zirconia StationaryPhases for Extreme Separations,” Anal. Chem. 2001, 73, 599A.
9. A. P. Schellinger and P. W. Carr, “Solubility of Buffers in Aqueous-OrganicEluents for Reversed-Phase Liquid Chromatography,” LCGC 2004, 22, 544;D. Sykora, E. Tesarova, and D. W. Armstrong, “Practical Considerations of theInfluence of Organic Modifiers on the Ionization of Analytes and Buffers inReversed-Phase LC,” LCGC 2002, 20, 974; G. W. Tindall, “Mobile-PhaseBuffers. I. The Interpretation of pH in Partially Aqueous Mobile Phases,” LCGC2002, 20, 102; S. Espinosa, E. Bosch, and M. Rosés, “Acid-Base Constants ofNeutral Bases in Acetonitrile-Water Mixtures,” Anal. Chim. Acta 2002, 454, 157.
10. P. Raveendran, Y. Ikushima, and S. L. Wallen, “Polar Attributes ofSupercritical Carbon Dioxide,” Acc. Chem. Res. 2005, 38, 478.
11. V. T. Lieu, “Simple Experiment for Demonstration of Phase Diagram ofCarbon Dioxide,” J. Chem. Ed. 1996, 73, 837.
12. K. Anton and C. Berger, eds., Supercritical Fluid Chromatography withPacked Columns—Techniques and Applications (New York: Marcel Dekker, 1998).
13. K. K. S. Lau, J. Bico, K. B. K. Teo, M. Chhowalla, G. A. J. Amaratunga,W. I. Milne, G. H. McKinley, and K. K. Gleason, “Superhydrophobic CarbonNanotube Forests,” Nano Lett. 2003, 3, 1701.
14. Remove the guard column before washing the analytical column, so thatimpurities from the guard column are not washed into the analytical column.Bare silica and cyano- and diol-bonded phases are washed (in order) withheptane, chloroform, ethyl acetate, acetone, ethanol, and water. Then the order isreversed, using dried solvents, to reactivate the column. Use 10 empty columnvolumes of each solvent. Amino-bonded phases are washed in the same manneras silica, but a 0.5 M ammonia wash is used after water. C18 and other nonpolarphases are washed with water, acetonitrile, and chloroform, and then the order isreversed. If this is insufficient, wash with 0.5 M sulfuric acid, and then water.[F. Rabel and K. Palmer, Am. Lab., August 1992, p. 65.] Between uses,reversed-phase columns can be stored in methanol or in water-organic solventmixtures that do not contain salts. Normal-phase columns should be stored in2-propanol or hexane. See also R. E. Majors, “The Cleaning and Regenerationof Reversed-Phase HPLC Columns,” LCGC 2003, 21, 19.
15. Y. Egi and A. Ueyanagi, “Ghost Peaks and Aerated Sample Solvent,” LCGC1998, 16, 112.
16. D. L. Warner and J. G. Dorsey, “Reduction of Total Analysis Time in GradientElution, Reversed-Phase Liquid Chromatography,” LCGC 1997, 15, 254.
17. C. Hawkins and J. W. Dolan, “Understanding Split Peaks,” LCGC 2003, 21,1134.
18. J. W. Dolan, “How Much Is Too Much?” LCGC 1999, 17, 508.
19. H. Lingeman and W. J. M. Underberg, eds., Detection-Oriented DerivatizationTechniques in Liquid Chromatography (New York: Marcel Dekker, 1990).
20. M. A. Fotopoulou and P. C. Ioannou, “Post-Column Terbium Complexationand Sensitized Fluorescence for the Determination of Norepinephrine, Epinephrineand Dopamine Using High-Performance Liquid Chromatography,” Anal. Chim.Acta 2002, 462, 179.
21. J. A. Koropchak, S. Sadain, X. Yang, L.-E. Magnusson, M. Heybroek,M. Anisimov, and S. L. Kaufman, “Nanoparticle Detection Technology,” Anal.Chem. 1999, 71, 386A; C. S. Young and J. W. Dolan, “Success with EvaporativeLight-Scattering Detection,” LCGC 2003, 21, 120.
40°C,
NR16 Notes and References
22. W. R. LaCourse, Pulsed Electrochemical Detection in High-PerformanceLiquid Chromatography (New York: Wiley, 1997).
23. Acetonitrile can be hydrolyzed to sodium acetate and poured down the drainfor disposal: Dilute thechromatography eluate to 10 vol% CH3CN with water. To 1.0 L of 10 vol%CH3CN, add 475 mL of 10 M NaOH. The solution can be left at for 25days in a hood or heated to for 70 min to reduce the CH3CN concentrationto 0.025 vol%. Mix the hydrolysate with waste acid so that it is approximatelyneutral before disposal down the drain. [K. Gilomen, H. P. Stauffer, and V. R.Meyer, LCGC 1996, 14, 56.]
24. Tetrahydrofuran can be stored for at least half a year without oxidation byadding 25 vol% H2O. [J. Zhao and P. W. Carr, “The Magic of Water inTetrahydrofuran—Preventing Peroxide Formation,” LCGC 1999, 17, 346.]
25. J. D. Thompson and P. W. Carr, “High-Speed Liquid Chromatography bySimultaneous Optimization of Temperature and Eluent Composition,” Anal.Chem. 2002, 74, 4150.
26. J. W. Dolan, “Resolving Minor Peaks,” LCGC 2002, 20, 594.
27. For more on developing gradient separations, see reference 1 and J. W.Dolan, “The Scouting Gradient Alternative,” LCGC 2000, 18, 478.
28. J. M. Cintrón and L. A. Colón, “Organo-Silica Nano-Particles Used inUltrahigh-Pressure Liquid Chromatography,” Analyst 2002, 127, 705.
29. E. S. Grumbach, D. M. Wagrowski-Diehl, J. R. Mazzeo, B. Alden, and P. C.Iraneta, “Hydrophilic Interaction Chromatography Using Silica Columns for theRetention of Polar Analytes and Enhanced ESI-MS Sensitivity,” LCGC 2004,22, 1010.
Chapter 261. K. K. Unger, M. Huber, K. Walhagen, T. P. Hennessy, and M. T. W. Hearn,
“A Critical Appraisal of Capillary Electrochromatography,” Anal. Chem. 2002,74, 200A.
2. B. A. Kyereboah-Taylor, “Ultrapure Water for Ion Chromatography,” Am.Lab., August 1995, p. 24; B. M. Stewart and D. Darbouret, “Ultrapure Water forICP-MS,” Am. Lab. News Ed., April 1998, p. 36; A. de Chatellus, “PurificationMedia,” Am. Lab. News Ed., January 1998, p. 8.
3. A mixture of enantiomers of cationic metal complexes was applied to a cation-exchange column and eluted by one enantiomer of tartrate anion. The tartrate hasa different ion-pair formation constant with each enantiomer of the metal complexand therefore removes one metal enantiomer from the column before the othermetal enantiomer. M. Cantuel, G. Bernardinelli, G. Muller, J. P. Riehl, andC. Piguet, “The First Enantiomerically Pure Helical Noncovalent Tripod forAssembling Nine-Coordinate Lanthanide(III) Podates,” Inorg. Chem. 2004, 43,1840; Y. Yoshikawa and K. Yamasaki, “Chromatographic Resolution of MetalComplexes on Sephadex Ion Exchangers,” Coord. Chem. Rev. 1979, 28, 2005.
4. D. P. Elder, “Pharmaceutical Applications of Ion-Exchange Resins,”J. Chem. Ed. 2005, 82, 575.
5. J. S. Fritz and D. T. Gjerde, Ion Chromatography, 3rd ed. (New York:Wiley-VCH, 2000); J. Weiss, Handbook of Ion Chromatography (Weinheim:Wiley-VCH, 2004); P. R. Haddad and P. E. Jackson, Ion Chromatography:Principles and Applications (New York: Elsevier, 1990); H. Small, IonChromatography (New York: Plenum Press, 1989); P. R. Haddad, “IonChromatography Retrospective,” Anal. Chem. 2001, 73, 266A; H. Small, “IonChromatography: An Account of Its Conception and Early Development,”J. Chem. Ed. 2004, 81, 1277; B. Evans, “The History of Ion Chromatography:The Engineering Perspective,” J. Chem. Ed. 2004, 81, 1285.
6. Y. Liu, K. Srinivasan, C. Pohl, and N. Avdalovic, “Recent Developments inElectrolytic Devices for Ion Chromatography,” J. Biochem. Biophys. Methods2004, 60, 205.
7. J. E. Madden, M. J. Shaw, G. W. Dicinoski, and P. R. Haddad, “Simulationand Optimization of Retention in Ion Chromatography Using Virtual Column 2Software,” Anal. Chem. 2002, 74, 6023; P. R. Haddad, M. J. Shaw, J. E. Madden,and G. W. Dicinoski, “Computer-Based Undergraduate Exercise Using Internet-Accessible Simulation Software for the Study of Retention Behavior andOptimization of Separation Conditions in Ion Chromatography,” J. Chem. Ed.2004, 81, 1293; http://www.virtualcolumn.com.
8. P. C. Schulz and D. Clausse, “An Undergraduate Physical ChemistryExperiment on Surfactants: Electrochemical Study of Commercial Soap,”
80°C20°C
CH3CN � NaOH � H2O S CH3CO2Na � NH3.

Notes and References NR17
J. Chem. Ed. 2003, 80, 1053; A. Domínguez, A. Fernández, N. González,E. Iglesias, and L. Montenegro, “Determination of Critical MicelleConcentration of Some Surfactants by Three Techniques,” J. Chem. Ed. 1997,74,1227; K. R. Williams and L. H. Tennant, “Micelles in the Physical/AnalyticalChemistry Laboratory: Acid Dissociation of Neutral Red Indicator,” J. Chem.Ed. 2001, 78, 349; S. A. Tucker, V. L. Amszi, and W. E. Acree, Jr., “StudyingAcid-Base Equilibria in Two-Phase Solvent Media,” J. Chem. Ed. 1993, 70, 80.
9. M. A. Hervas and C. E. Fabara, “A Simple Demonstration of the Ion-PairingEffect on the Solubility of Charged Molecules.” J. Chem. Ed. 1995, 72, 437.
10. L. R. Snyder, J. J. Kirkland, and J. L. Glajch, Practical HPLC MethodDevelopment (New York: Wiley, 1997); J. W. Dolan, “Improving an Ion-PairingMethod,” LCGC 1996, 14, 768.
11. T. W. Perkins, T. W. Root, and E. N. Lightfoot, “Measuring Column VoidVolumes with NMR,” Anal. Chem. 1997, 69, 3293.
12. C.-S. Wu, ed., Handbook of Size Exclusion Chromatography, 2nd ed.(New York: Marcel Dekker, 2004); R. K. Scopes, Protein Purification, 3rd ed.(New York: Springer-Verlag, 1994).
13. M. A. Hahn, J. S. Tabb, and T. D. Krauss, “Detection of Single BacterialPathogens with Semiconductor Quantum Dots,” Anal. Chem. 2005, 77, 4861;E. M. Boatman, G. C. Lisensky, and K. J. Nordell, “A Safer, Easier, FasterSynthesis for CdSe Quantum Dot Nanocrystals,” J. Chem. Ed. 2005, 82, 1697;L. D. Winkler, J. F. Arceo, W. C. Hughes, B. A. DeGraff, and B. H. Augustine,“Quantum Dots: An Experiment for Physical or Materials Chemistry,” J. Chem.Ed. 2005, 82, 1700.
14. T. K. Nevanen, H. Simolin, T. Suortti, A. Koivula, and H. Söderlund,“Development of a High-Throughput Format for Solid-Phase Extraction ofEnantiomers Using an Immunosorbent in 384-Well Plates,” Anal. Chem. 2005,77, 3038.
15. E. Turiel and A. Martin-Esteban, “Molecularly Imprinted Polymers: TowardHighly Selective Stationary Phases in Liquid Chromatography and CapillaryElectrophoresis,” Anal. Bioanal. Chem. 2004, 378, 1876; K. Haupt, “MolecularlyImprinted Polymers: The Next Generation,” Anal. Chem. 2003, 75, 376A.
16. Q. Deng, I. German, D. Buchanan, and R. T. Kennedy, “Retention andSeparation of Adenosine and Analogues by Affinity Chromatography with anAptamer Stationary Phase,” Anal. Chem. 2001, 73, 5415.
17. R. Weinberger, Practical Capillary Electrophoresis, 2nd ed. (San Diego,CA: Academic Press, 2000); T. Wehr, R. Rodríguez-Diaz, and M. Zhu, CapillaryElectrophoresis of Proteins (New York: Marcel Dekker, 1999); M. G. Khaledi, ed.,High Performance Capillary Electrophoresis: Theory, Techniques, and Applications(New York: Wiley, 1998); P. Camilleri, ed., Capillary Electrophoresis: Theory andPractice (Boca Raton, FL: CRC Press, 1998); J. P. Landers, Handbook of CapillaryElectrophoresis, 2nd ed. (Boca Raton, FL: CRC Press, 1997); H. Shintani andJ. Polonský, Handbook of Capillary Electrophoresis Applications (London:Blackie, 1997); J. R. Petersen and A. A. Mohammad, eds. Clinical and ForensicApplications of Capillary Electrophoresis (Totowa, NJ: Humana Press, 2001).
18. C. L. Cooper, “Capillary Electrophoresis: Theoretical and ExperimentalBackground,” J. Chem. Ed. 1998, 75, 343; C. L. Cooper and K. W. Whitaker,“Capillary Electrophoresis: Applications,” J. Chem. Ed. 1998, 75, 347.
19. J. W. Jorgensen and K. D. Lukacs, “Zone Electrophoresis in Open TubularGlass Capillaries,” Anal. Chem. 1981, 53, 1298.
20. For a demonstration of electrophoresis, see J. G. Ibanez, M. M. Singh,R. M. Pike, and Z. Szafran, “Microscale Electrokinetic Processing of Soils,”J. Chem. Ed. 1998, 75, 634.
21. T. M. Olefirowicz and A. G. Ewing, “Capillary Electrophoresis in 2 and5 m Diameter Capillaries: Application to Cytoplasmic Analysis,” Anal. Chem.1990, 62, 1872; Q. Xue and E. S. Yeung, “Variability of Intracellular LactateDehydrogenase Isoenzymes in Single Human Erythrocytes,” Anal. Chem. 1994,66, 1175; K. Bächmann, H. Lochmann, and A. Bazzanella, “Microscale Processesin Single Plant Cells,” Anal. Chem. 1998, 70, 645A; P. D. Floyd, L. L. Moroz,R. Gillette, and J. V. Sweedler, “Capillary Electrophoresis Analysis of NOSynthase Related Metabolites in Single Neurons,” Anal. Chem. 1998, 70, 2243.
22. G. Xiong, Y. Chen, and E. A. Arriaga, “Measuring the Doxorubicin Contentof Single Nuclei by Micellar Electrokinetic Capillary Chromatography withLaser-Induced Fluorescence Detection,” Anal. Chem. 2005, 77, 3488; S. J.Lillard, D. T. Chiu, R. H. Scheller, R. N. Zare, S. E. Rodríguez-Cruz, E. R.Williams, O. Orwar, M. Sandberg, and J. A. Lundqvist, “Separation and
Characterization of Amines from Individual Atrial Gland Vesicles of Aplysiacalifornica,” Anal. Chem. 1998, 70, 3517.
23. G. K. Shoemaker, J. Lorieau, L. H. Lau, C. S. Gillmor, and M. M. Palcic,“Multiple Sampling in Single-Cell Enzyme Assays,” Anal. Chem. 2005, 77,3132; X. Sun and W. Jin, “Catalysis-Electrochemical Determination ofZeptomol Enzyme and Its Application for Single-Cell Analysis,” Anal. Chem.2003, 75, 6050.
24. K. B. O’Brien, M. Esguerra, R. F. Miller, and M. T. Bowser, “MonitoringNeurotransmitter Release from Isolated Retinas Using Online Microdialysis-Capillary Electrophoresis,” Anal. Chem. 2004, 76, 5069.
25. N. A. Guzman and T. M. Phillips, “Immunoaffinity CE for ProteomicsStudies,” Anal. Chem. 2005, 77, 60A.
26. J. D. Carbeck, I. J. Colton, J. Gao, and G. M. Whitesides, “Protein ChargeLadders, Capillary Electrophoresis, and the Role of Electrostatics in BiomolecularRecognition,” Acc. Chem. Res. 1998, 31, 343.
27. C. T. Culbertson and J. W. Jorgenson, “Flow Counterbalanced CapillaryElectrophoresis,” Anal. Chem. 1994, 66, 955.
28. R. Weinberger, “Capillary Electrophoresis,” Am. Lab., April 2005, p. 25.
29. H. Watley, “Making CE Work—Points to Consider,” LCGC 1999, 17, 426.
30. M. Macka, P. Andersson, and P. R. Haddad, “Changes in Electrolyte pH Due toElectrolysis During Capillary Zone Electrophoresis,” Anal. Chem. 1998, 70, 743.
31. N. E. Baryla, J. E. Melanson, M. T. McDermott, and C. A. Lucy,“Characterization of Surfactant Coatings in Capillary Electrophoresis by AtomicForce Microscopy,” Anal. Chem. 2001, 73, 4558; M. M. Yassine and C. A. Lucy,“Enhanced Stability Self-Assembled Coatings for Protein Separations byCapillary Zone Electrophoresis Through the Use of Long-Chained Surfactants,”Anal. Chem. 2005, 77, 62.
32. At a wavelength of 190 nm, phosphate at pH 7.2 has about three times theabsorbance of borate at pH 9.2. Glycine, citrate, HEPES, and TRIS buffers havesignificant absorption near 210 nm. Borate buffer should be prepared fromsodium tetraborate (borax, Na2B4O7 � 10H2O), not from boric acid (B(OH)3),which has somewhat different acid-base chemistry. An ultraviolet-absorbingimpurity in borate buffer can be removed by passage through a C18 solid-phaseextraction column.
33. M. Serwe and G. A. Ross, “Comparison of CE-MS and LC-MS for PeptideSamples,” LCGC 2000, 18, 46.
34. E. S. Yeung and W. G. Kuhr, “Indirect Detection Methods for CapillarySeparations,” Anal. Chem. 1991, 63, 275A; J. Ren and X. Huang, “IndirectChemiluminescence Detection for Capillary Electrophoresis of Cations UsingCo(III) as a Probe Ion,” Anal. Chem. 2001, 731, 2663; M. Macka, C. Johns,P. Doble, and P. R. Haddad, “Indirect Photometric Detection in CE UsingBuffered Electrolytes,” LCGC 2001, 19, 38, 178.
35. A. Berthod and C. García-Alvarez-Coque, Micellar Liquid Chromatography(New York: Marcel Dekker, 2000); S. Terabe, “Micellar ElectrokineticChromatography,” Anal. Chem. 2004, 76, 240A; U. Pyell, “MicellarElectrokinetic Chromatography—From Theoretical Concepts to Real Samples(Review),” Fresenius J. Anal. Chem. 2001, 371, 691.
36. Demonstrations: N. Gani and J. Khanam, “Are Surfactant Molecules ReallyOriented in the Interface?” J. Chem. Ed. 2002, 79, 332; C. J. Marzzacco,“The Effect of SDS Micelle on the Rate of a Reaction,” J. Chem. Ed. 1992, 69,1024; C. P. Palmer, “Demonstrating Chemical and Analytical Concepts UsingElectrophoresis and Micellar Electrokinetic Chromatography,” J. Chem. Ed.1999, 76, 1542.
37. S. Terabe, K. Otsuka, K. Ichikawa, A. Tsuchiya, and T. Ando, “ElectrokineticSeparations with Micellar Solutions and Open Tubular Capillaries,” Anal. Chem.1984, 56, 111; ibid., 1985, 57, 834.
38. Polar organic solvents with electrolytes such as sodium p-toluenesulfonateare compatible with capillary electrophoresis. Background electrolyte need notbe an aqueous solution. [P. B. Wright, A. S. Lister, and J. G. Dorsey, “Behaviorand Use of Nonaqueous Media Without Supporting Electrolyte in CapillaryElectrophoresis and Capillary Electrochromatography,” Anal. Chem. 1997, 69,3251; I. E. Valkó, H. Sirén, and M.-L. Riekkola, “Capillary Electrophoresis inNonaqueous Media: An Overview,” LCGC 1997, 15, 560.]
39. S. Li and S. G. Wever, “Separation of Neutral Compounds in NonaqueousSolvents by Capillary Zone Electrophoresis,” J. Am. Chem. Soc. 2000, 122, 3787.

40. S. Conradi, C. Vogt, and E. Rohde, “Separation of EnantiomericBarbiturates by Capillary Electrophoresis Using a Cyclodextrin-Containing RunBuffer,” J. Chem. Ed. 1997, 74, 1122; F.-T. Chen and R. A. Evangelista, “HighlySulfated Cyclodextrins: The Solution for Chiral Analysis,” Am. Lab., August2002, p. 30; M. A. Schwarz and P. C. Hauser, “Chiral On-Chip Separations ofNeurotransmitters,” Anal. Chem. 2000, 752, 4691; W. Zhu and G. Vigh,“A Family of Single-Isomer, Sulfated -Cyclodextrin Chiral Resolving Agentsfor Capillary Electrophoresis,” Anal. Chem. 2000, 72, 310.
41. J. Palmer, N. J. Munro, and J. P. Landers, “A Universal Concept for StackingNeutral Analytes in Micellar Capillary Electrophoresis,” Anal. Chem. 1999, 71,1679; J. Palmer, D. S. Burji, N. J. Munro, and J. P. Landers, “ElectrokineticInjection for Stacking Neutral Analytes in Capillary and MicrochipElectrophoresis,” Anal. Chem. 2001, 73, 725; J. P. Quirino, S. Terabe, andP. Bocek, “Sweeping of Neutral Analytes in Electrokinetic Chromatographywith High-Salt-Containing Matrixes,” Anal. Chem. 2000, 72, 1934.
42. L. Zhu, C. Tu, and H. K. Lee, “On-Line Concentration of AcidicCompounds by Anion-Selective Exhaustive Injection-Sweeping-MicellarElectrokinetic Chromatography,” Anal. Chem. 2002, 74, 5820.
43. K. Isoo and S. Terabe, “Analysis of Metal Ions by Sweeping via DynamicComplexation and Cation-Selective Exhaustive Injection in CapillaryElectrophoresis,” Anal. Chem. 2003, 75, 6789.
44. W. Wei, G. Zue, and E. S. Yeung, “One-Step Concentration of Analytes Basedon Dynamic Change in pH in Capillary Zone Electrophoresis,” Anal. Chem. 2002,74, 934; P. Britz-McKibbin, K. Otsuka, and S. Terabe, “On-Line Focusing of FlavinDerivatives Using Dynamic pH Junction-Sweeping Capillary Electrophoresis withLaser-Induced Fluorescence Detection,” Anal. Chem. 2002, 74, 3736.
45. L. A. Colón, Y. Guo, and A. Fermier, “Capillary Electrochromatography,”Anal. Chem. 1997, 69, 461A.
46. Y. Gong and H. K. Lee, “Application of Cyclam-Capped -Cyclodextrin-Bonded Silica Particles as a Chiral Stationary Phase in CapillaryElectrochromatography for Enantiomeric Separations,” Anal. Chem. 2003, 75,1348; M. W. Kamande, X. Zhu, C. Kapnissi-Christodoulou, and I. M. Warner,“Chiral Separations Using a Polypeptide and Polymeric Dipeptide SurfactantPolyelectrolyte Multilayer Coating in Open-Tubular CapillaryElectrochromatography,” Anal. Chem. 2004, 76, 6681.
47. J. R. Hutchinson, P. Zakaria, A. R. Bowie, M. Macka, N. Avdalovic, and P. R.Haddad, “Anion-Exchange Capillary Electrochromatography and In-Line SamplePreconcentration in Capillary Electrophoresis,” Anal. Chem. 2005, 77, 407.
48. J. P. Quirino, M. T. Duylay, B. D. Bennett, and R. N. Zare, “Strategy forOn-Line Preconcentration in Chromatographic Separations,” Anal. Chem.2001, 73, 5539; J. P. Quirino, M. T. Duylay, and R. N. Zare, “On-LinePreconcentration in Capillary Electrochromatography Using a PorousMonolith Together with Solvent Gradient and Sample Stacking,” Anal. Chem.2001, 73, 5557.
49. DNA sequencing systems can read 500 000 bases per day: J. P. Smith andV. Henson-Smith, “DNA Sequencers Rely on CE,” Anal. Chem. 2001, 73, 327A;O. Salas-Solano, E. Carrilho, L. Kotler, A. W. Miller, W. Goetzinger, Z. Sosic,and B. L. Karger, “Routine DNA Sequencing of 1 000 Bases in Less Than OneHour,” Anal. Chem. 1998, 70, 3996.
50. E. Zubritsky, “How Analytical Chemists Saved the Human Genome Project,”Anal. Chem. 2002, 74, 23A.
51. R. Weinberger, “An Interview with Ira Lurie of the DEA,” Am. Lab.,January 2005, p. 6; I. S. Lurie, P. A. Hays, A. D. Garcia, and S. Panicker, “Useof Dynamically Coated Capillaries for the Determination of Heroin, BasicImpurities and Adulterants with Capillary Electrophoresis,” J. Chromatogr. A2004, 1034, 227.
52. R. Weinberger, “Method Development for Capillary Electrophoresis,”Am. Lab., March 2003, p. 54.
53. M. L. Riekkola, M. Jussila, S. P. Possas, and I. E. Valko, “Non-AqueousCapillary Electrophoresis,” J. Chromatogr. A 2000, 892, 155.
54. A. M. Siouffi and R. Phan-Tan-Luu, “Optimization Methods inChromatography and Electrophoresis,” J. Chromatogr. A 2000, 892, 75.
55. D. R. Reyes, D. Iossifidis, P.-A. Auroux, and A. Manz, “Micro TotalAnalysis Systems. 1. Introduction, Theory, and Technology, Anal. Chem. 2002,74, 2623; P.-A. Auroux, D. Iossifidis, D. R. Reyes, and A. Manz, “Micro Total
�
�
NR18 Notes and References
Analysis Systems. 2. Analytical Standard Operations and Applications,” Anal.Chem. 2002, 74, 2637; R. T. Kelly and A. T. Wooley, “Microfluidic Systemsfor Integrated, High-Throughput DNA Analysis,” Anal. Chem. 2005, 77, 96A;C. A. Emrich, H. Tian, I. L. Medintz, and R. A. Mathies, “Microfabricated 384-Lane Capillary Array Electrophoresis Bioanalyzer for Ultrahigh-ThroughputGenetic Analysis,” Anal. Chem. 2002, 74, 5076; T. D. Boone, Z. H. Fan, H. H.Hooper, A. J. Ricco, H. Tan, and S. J. Williams, “Plastic Advances MicrofluidicChips,” Anal. Chem. 2002, 74, 78A; R. F. Renzi, J. Stamps, B. A. Horn,S. Ferko, V. A. VanderNoot, J. A. A. West, R. Crocker, B. Wiedenman, D. Yee,and J. A. Fruetel, “Hand-Held Microanalytical Instrument for Chip-BasedElectrophoretic Separations of Proteins,” Anal. Chem. 2005, 77, 435; J. G. E.Gardeniers and A. van den Berg, “Lab-on-a-Chip Systems for Biomedical andEnvironmental Monitoring,” Anal. Bioanal. Chem. 2004, 378, 1700; J. C.McDonald and G. M. Whitesides, “Poly(dimethylsiloxane) as a Material forFabricating Microfluidic Devices,” Acc. Chem. Res. 2002, 35, 491; Y. Huang,S. Joo, M. Duhon, M. Heller, B. Wallace, and X. Xu, “Dielectrophoretic CellSeparation and Gene Expression Profiling on Microelectronic Chip Arrays,”Anal. Chem. 2002, 74, 3362; D. Figeys and D. Pinto, “Lab-on-a-Chip: ARevolution in Biological and Medical Sciences,” Anal. Chem. 2000, 72, 330A;C. H. Legge, “Chemistry Under the Microscope—Lab-on-a-Chip Technologies,”J. Chem. Ed. 2002, 79, 173.
56. J. A. C. Broekaert, “The Development of Microplasmas for SpectrochemicalAnalysis,” Anal. Bioanal. Chem. 2002, 374, 182; T. Kitamori, M. Tokeshi,A. Hibara, and K. Sato, “Thermal Lens Microscopy and Microchip Chemistry,”Anal. Chem. 2004, 76, 52A; R. P. Baldwin, T. J. Roussel, Jr., M. M. Crain,V. Bathlagunda, D. J. Jackson, J. Gullapalli, J. A. Conklin, R. Pai, J. F. Naber,K. M. Walsh, and R. S. Keynton, “Fully Integrated On-Chip ElectrochemicalDetection for Capillary Electrophoresis in a Microfabricated Device,” Anal.Chem. 2002, 74, 3690; M. L. Chabinyc, D. T. Chiu, J. C. McDonald, A. D.Strook, J. F. Christian, A. M. Karger, and G. M. Whitesides, “An IntegratedFluorescence Detection System in Poly(dimethylsiloxane) for MicrofluidicApplications,” Anal. Chem. 2001, 73, 4491.
57. D. M. Ratner, E. R. Murphy, M. Jhunjhunwala, D. A. Snyder, K. F. Jensen,and P. H. Seeberger, “Microreactor-Based Reaction Optimization in OrganicChemistry—Glycosylation as a Challenge,” Chem. Commun. 2005, 578.
58. M. G. Roper, C. J. Easley, and J. P. Landers, “Advances in PolymeraseChain Reaction on Microfluidic Chips,” Anal. Chem. 2005, 77, 3887; K. D.Dorfman, M. Chabert, J.-H. Codarbox, G. Rousseau, P. de Cremoux, and J.-L.Viovy, “Contamination-Free Continuous Flow Microfluidic Polymerase ChainReaction for Quantitative and Clinical Applications,” Anal. Chem. 2005,77, 3700.
59. A similar scheme can be used to concentrate proteins: R. S. Foot, J.Khandurina, S. C. Jacobson, and J. M. Ramsey, “Preconcentration of Proteins onMicrofluidic Devices Using Porous Silica Membranes,” Anal. Chem. 2005, 77, 57.
60. N. D. Chasteen and P. M. Harrison, “Mineralization in Ferritin: An EfficientMeans of Iron Storage,” J. Struct. Biol. 1999, 126, 182.
61. Data from A. W. Moore, Jr., S. C. Jacobson, and J. M. Ramsey, “MicrochipSeparations of Neutral Species via Micellar Electrokinetic CapillaryChromotography,” Anal. Chem. 1995, 67, 4184.
62. The optimum pH for separating cations is pK � 0.30: K. K.-C. Yeung andC. A. Lucy, “Isotopic Separation of [14N]- and [15N] Aniline by CapillaryElectrophoresis Using Surfactant-Controlled Reversed Electroosmotic Flow,”Anal. Chem. 1998, 70, 3286.
63. G. R. Asbury and H. H. Hill, Jr., “Evaluation of Ultrahigh Resolution IonMobility Spectrometry as an Analytical Separation Device in ChromatographicTerms,” J. Microcolumn Sep. 2000, 12, 172; H. E. Revercomb and E. A. Mason,“Theory of Plasma Chromatography/Gaseous Electrophoresis,” Anal. Chem.1975, 47, 970.
Chapter 271. T. W. Richards, Chem. Rev. 1925, 1, 1; C. M. Beck II, “Classical Analysis:
A Look at the Past, Present, and Future,” Anal. Chem. 1994, 66, 225A; I. M.Kolthoff, “Analytical Chemistry in the U.S.A. in the First Quarter of ThisCentury,” Anal. Chem. 1994, 66, 241A; D. T. Burns, “Highlights in the Historyof Quantitation in Chemistry,” Fresenius J. Anal. Chem. 1990, 337, 205;L. Niiniströ, “Analytical Instrumentation in the 18th Century,” Fresenius J. Anal.Chem. 1990, 337, 213.

Notes and References NR19
2. For an experiment with colloids, see C. D. Keating, M. D. Musick, M. H.Keefe, and M. J. Natan, “Kinetics and Thermodynamics of Au ColloidMonolayer Self Assembly,” J. Chem. Ed. 1999, 76, 949.
3. Cellulose tubing such as catalog number 3787, sold by Thomas Scientific,www.thomassci.com, is adequate for this demonstration.
4. M. Suzuki, “The Movement of Molecules and Heat Energy: TwoDemonstrative Experiments,” J. Chem. Ed. 1993, 70, 821.
5. L. C. Roberts, S. J. Hug, T. Ruettimann, M. Billah, A. W. Khan, and M. T.Rahman, “Arsenic Removal with Iron(II) and Iron(III) Waters with High Silicateand Phosphate Concentrations,” Environ. Sci. Technol. 2004, 38, 307.
6. G. W. Latimer, Jr., “Piperazine as the Diacetate,” J. Chem. Ed. 1966, 43,148; G. R. Bond, Anal. Chem. 1962, 32, 1332.
7. E. Pella, “Elemental Organic Analysis. 1. Historical Developments,” Am.Lab., February 1990, p. 116; “Elemental Organic Analysis. 2. State of the Art,”August 1990, p. 28.
8. K. Russe, H. Kipphardt, and J. A. C. Broekaert, “Determination of Mainand Minor Components of Silicon Based Materials by Combustion with F2,”Anal. Chem. 2000, 72, 3875.
9. R. W. Ramette, “Stoichiometry to the Rescue (A Calculation Challenge),”J. Chem. Ed. 1988, 65, 800.
10. S. Kagaya, M. Saiki, Z. A. Malek, Y. Araki, and K. Hasegawa,“Coprecipitation with Lanthanum Phosphate as a Technique for Separationand Preconcentration of Iron(III) and Lead,” Fresenius J. Anal. Chem. 2001,371, 391.
11. F. Torrades and M. Castellvi, “Spectrophotometric Determination of inBaSO4 Precipitate,” Fresenius J. Anal. Chem. 1994, 349, 734.
Chapter 281. E. P. Popek, Sampling and Analysis of Environmental Chemical Pollutants
(Amsterdam: Academic Press, 2003); P. Gy, Sampling for Analytical Purposes(Chichester, UK: Wiley, 1998); B. B. Kebbekus and S. Mitra, EnvironmentalChemical Analysis (London: Blackie, 1998); N. T. Crosby and I. Patel, GeneralPrinciples of Good Sampling Practice (Cambridge: Royal Society of Chemistry,1995); K. G. Carr-Brion and J. R. P. Clarke, Sampling Systems for ProcessAnalysis, 2nd ed. (Oxford: Butterworth-Heinemann, 1996); L. H. Keith,Environmental Sampling and Analysis: A Practical Guide (Chelsea, MI: Lewis,1991); R. F. Cross, “Reducing Sample Size and Obtaining RepresentativeSamples,” LCGC 2000, 18, 468.
2. S. Mitra, ed., Sample Preparation Techniques in Analytical Chemistry(Hoboken, NJ: Wiley, 2003).
3. D. T. Sawyer, A. Sobkowiak, and J. L. Roberts, Jr., Electrochemistry forChemists, 2nd ed. (New York: Wiley, 1995), p. 262.
4. P. Vallelonga, K. Van de Velde, J. P. Candelone, C. Ly, K. J. R. Rosman,C. F. Boutron, V. I. Morgan, and D. J. Mackey, “Recent Advances inMeasurement of Pb Isotopes in Polar Ice and Snow at Sub-Picogram Per GramConcentrations Using Thermal Ionisation Mass Spectrometry,” Anal. Chim. Acta2002, 453, 1.
5. R. P. Mason and K. A. Sullivan, “Mercury in Lake Michigan,” Environ. Sci.Technol. 1997, 31, 942.
6. G. Benoit, K. S. Hunter, and T. F. Rozan, “Sources of Trace MetalContamination Artifacts During Collection, Handling, and Analysis ofFreshwaters,” Anal. Chem. 1997, 69, 1006.
7. R. E. Thiers, Methods of Biochemical Analysis (D. Glick, ed.), Vol. 5(New York: Interscience, 1957), p. 274.
8. B. Kratochvil and J. K. Taylor, “Sampling for Chemical Analysis,” Anal.Chem. 1981, 53, 924A; H. A. Laitinen and W. E. Harris, Chemical Analysis, 2nded. (New York: McGraw-Hill, 1975), Chap. 27; S. K. Thompson, Sampling(New York, Wiley, 1992).
9. J. E. Vitt and R. C. Engstrom, “Effect of Sample Size on Sampling Error,”J. Chem. Ed. 1999, 76, 99; R. D. Guy, L. Ramaley, and P. D. Wentzell,“Experiment in the Sampling of Solids for Chemical Analysis,” J. Chem. Ed.1998, 75, 1028. Demonstrations: M. R. Ross, “A Classroom Exercise inSampling Technique,” J. Chem. Ed. 2000, 77, 1015; J. R. Hartman, “In-ClassExperiment on the Importance of Sampling Techniques and Statistical Analysisof Data,” J. Chem. Ed. 2000, 77, 1017.
Cl
10. D. C. Bogen, Treatise on Analytical Chemistry, 2nd ed. (P. J. Elving,E. Grushka, and I. M. Kolthoff, eds.), Part I, Vol. 5 (New York: Wiley, 1982),Chap. 1.
11. H. M. Kingston and S. J. Haswell, Microwave-Enhanced Chemistry(Washington, DC: American Chemical Society, 1997).; B. D. Zehr,“Development of Inorganic Microwave Dissolutions,” Am. Lab., December1992, p. 24; B. D. Zehr, J. P. VanKuren, and H. M. McMahon, “InorganicMicrowave Digestions Incorporating Bases,” Anal. Chem. 1994, 66, 2194.
12. P. Aysola, P. Anderson, and C. H. Langford, “Wet Ashing in BiologicalSamples in a Microwave Oven Under Pressure Using Poly(tetrafluoroethylene)Vessels,” Anal. Chem. 1987, 59, 1582.
13. S. E. Long and W. R. Kelly, “Determination of Mercury in Coal by IsotopeDilution Cold-Vapor Generation Inductively Coupled Plasma Mass Spectrometry,”Anal. Chem. 2002, 74, 1477.
14. M. Rehkämper, A. N. Halliday, and R. F. Wentz, “Low-Blank Digestion ofGeological Samples for Pt-Group Analysis Using a Modified Carius TubeDesign,” Fresenius J. Anal. Chem. 1998, 361, 217.
15. A. A. Schilt, Perchloric Acid and Perchlorates, 2nd ed. (Powell, OH: GFSChemicals, 2003).
16. C. Walling, “Intermediates in the Reactions of Fenton Type Reagents,” Acc.Chem. Res. 1998, 31, 155; P. A. MacFaul, D. D. M. Wayner, and K. U. Ingold,“A Radical Account of ‘Oxygenated Fenton Chemistry,’” Acc. Chem. Res. 1998,31, 159; D. T. Sawyer, A. Sobkowiak, and T. Matsushita, “Oxygenated FentonChemistry,” Acc. Chem. Res. 1996, 29, 409.
17. L. Ping and P. K. Dasgupta, “Determination of Total Mercury in Water andUrine by a Gold Film Sensor Following Fenton’s Reagent Digestion,” Anal.Chem. 1989, 61, 1230.
18. G. LeBlanc, “Microwave-Accelerated Techniques for Solid SampleExtraction,” LCGC 1999, 17, S30 (June 1999 supplement).
19. Y. Lin and C. M. Wai, “Supercritical Fluid Extraction of Lanthanides withFluorinated -Diketones and Tributyl Phosphate,” Anal. Chem. 1994, 66, 1971.
20. L. T. Taylor, Supercritical Fluid Extraction (New York: Wiley, 1996);C. L. Phelps, N. G. Smart, and C. M. Wai, “Past, Present, and Possible FutureApplications of Supercritical Fluid Extraction Technology,” J. Chem. Ed. 1996, 73,1163; M. E. P. McNally, “Advances in Environmental SFE,” Anal. Chem. 1995, 67,308A; L. T. Taylor, “Strategies for Analytical SFE,” Anal. Chem. 1995, 67, 364A.
21. S. Liang and D. C. Tilotta, “Extraction of Petroleum Hydrocarbons fromSoil Using Supercritical Argon,” Anal. Chem. 1998, 70, 616.
22. E. M. Thurman and M. S. Mills, Solid-Phase Extraction: Principles andPractice (New York: Wiley, 1998); N. J. K. Simpson, Solid-Phase Extraction(New York: Marcel Dekker, 2000).
23. C. Crescenzi, S. Bayoudh, P. A. G. Cormack, T. Klein, and K. Ensing,“Determination of Clenbuterol in Bovine Liver by Combining Matrix Solid-Phase Dispersion and Molecularly Imprinted Solid-Phase Extraction Followedby Liquid Chromatography/Mass Spectrometry,” Anal. Chem. 2001, 73, 2171;W. M. Mullett, P. Martin, and J. Pawliszyn, “In-Tube Molecularly ImprintedPolymer Solid-Phase Microextraction for the Selective Determination ofPropranolol,” Anal. Chem. 2001, 73, 2383; N. Masqué, R. M. Marcé, F. Borrull,P. A. G. Cormack, and D. C. Sherrington, “Synthesis and Evaluation of aMolecularly Imprinted Polymer for Solid-Phase Extraction of 4-Nitrophenolfrom Environmental Water,” Anal. Chem. 2000, 72, 4122.
24. R. Hites and V. S. Ong, “Determination of Pesticides and PolychlorinatedBiphenyls in Water: A Low-Solvent Method,” Environ. Sci. Technol. 1995, 29, 1259.
25. J. W. Wong, K. K. Ngim, T. Shibamoto, S. A. Mabury, J. P. Eiserich, andH. C. H. Yeo, “Determination of Formaldehyde in Cigarette Smoke,” J. Chem.Ed. 1997, 74, 1100. As another example, an analysis of nitrite in naturalwaters is based on its reaction with 2,4-dinitrophenylhydrazine to give an azide(R-N3) that is measured by HPLC with ultraviolet detection at 307 nm.[R. J. Kieber and P. J. Seaton, “Determination of Subnanomolar Concentrationsof Nitrite in Natural Waters,” Anal. Chem. 1995, 67, 3261.]
26. D. M. Crumbling, Letter to Editor, C&E News, 12 August 2002, p. 4.
27. E. Tareke, P. Rydberg, P. Karlsson, S. Eriksson, and M. Tornqvist, “Analysisof Acrylamide, a Carcinogen Formed in Heated Foodstuffs,” J. Agric. Food Chem.2002, 50. 4998; B. E. Erickson, “Finding Acrylamide,” Anal. Chem. 2004, 76. 247A.See collection of papers in J. AOAC Int., January/February 2005, 88, 227–330.
(NO2)
�

This page intentionally left blank

Glossary GL1
ablation Vaporization of a small volume of material by a laser pulse.
abscissa Horizontal (x) axis of a graph.
absolute uncertainty An expression of the margin of uncertaintyassociated with a measurement. Absolute error also could refer to thedifference between a measured value and the “true” value.
absorbance, A Defined as log(P0 /P), where P0 is the radiant power oflight (power per unit area) striking the sample on one side and P is theradiant power emerging from the other side. Also called optical density.
absorptance, a Fraction of incident radiant power absorbed by a sample.
absorption Occurs when a substance is taken up inside another. See alsoadsorption.
absorption coefficient Light absorbed by a sample is attenuated atthe rate , where is the initial radiant power, is thepower after traversing a pathlength b, and is called the absorptioncoefficient.
absorption spectrum A graph of absorbance or transmittance of lightversus wavelength, frequency, or wavenumber.
accuracy A measure of how close a measured value is to the “true” value.
acid A substance that increases the concentration of when added towater.
acid-base titration One in which the reaction between analyte and titrantis an acid-base reaction.
acid dissociation constant, Ka Equilibrium constant for the reaction of anacid, HA, with :
acid error Occurs in strongly acidic solutions, where glass electrodes tendto indicate a value of pH that is too high.
acidic solution One in which the activity of is greater than the activityof
acidity In natural waters, the quantity of carbonic acid and otherdissolved acids that react with strong base when the pH of the sample israised to 8.3. Expressed as mmol needed to raise the pH of 1 L topH 8.3.
acid wash Procedure in which glassware is soaked in 3–6 M HCl for 1 h(followed by rinsing well with distilled water and soaking in distilled water)to remove traces of cations adsorbed on the surface of the glass and toreplace them with
activation energy, Ea Energy needed for a process to overcome a barrierthat otherwise prevents the process from occurring.
activity, The value that replaces concentration in a thermodynamicallycorrect equilibrium expression. The activity of X is given by where is the activity coefficient and [X] is the concentration.
activity coefficient, � The number by which the concentration must bemultiplied to give activity.
adduct Product formed when a Lewis base combines with a Lewis acid.
adjusted retention time In chromatography, this parameter iswhere is the retention time of a solute and is the time
needed for mobile phase to travel the length of the column.
adsorption Occurs when a substance becomes attached to the surface ofanother substance. See also absorption.
adsorption chromatography A technique in which solute equilibratesbetween the mobile phase and adsorption sites on the stationary phase.
adsorption indicator Used for precipitation titrations, it becomes attachedto a precipitate and changes color when the surface charge of the precipitatechanges sign at the equivalence point.
aerosol A suspension of very small liquid or solid particles in air or gas.Examples include fog and smoke.
tmtrt¿r � tr tm,t¿r
�x
A x � [X]�x,A
H�.
OH
OH.H�
HA � H2O T A � H3O� Ka �AAAH3O�
AHA
H2O
H�
�P2P1P2/P1 � e�b
A �
affinity chromatography A technique in which a particular solute isretained by a column by virtue of a specific interaction with a moleculecovalently bound to the stationary phase.
aliquot Portion.
alkali flame detector Modified flame ionization detector that responds toN and P, which produce ions when they contact a -containing glassbead in the flame. Also called nitrogen-phosphorus detector.
alkalimetric titration With reference to EDTA, this technique involvestitration of the protons liberated from EDTA upon binding to a metal.
alkaline error See sodium error.
alkalinity In natural water, the quantity of base (mainly and) that reacts with strong acid when the pH of the sample is lowered to
4.5. Expressed as mmol needed to lower the pH of 1 L to pH 4.5.
allosteric interaction An effect at one part of a molecule caused by achemical reaction or conformational change at another part of the molecule.
amalgam A solution of anything in mercury.
amine A compound with the general formula or where R is any group of atoms.
amino acid One of 20 building blocks of proteins, having the general structure
where R is a different substituent for each acid.
ammonium ion The ammonium ion is An ammonium ion is any ionof the type or where R is an organicsubstituent.
ampere, A One ampere is the current that will produce a force of exactlywhen that current flows through two “infinitely” long, parallel
conductors of negligible cross section, with a spacing of 1 m, in a vacuum.
amperometric detector See electrochemical detector.
amperometric titration One in which the end point is determined bymonitoring the current passing between two electrodes immersed in thesample solution and maintained at a constant potential difference.
amperometry Measurement of electric current for analytical purposes.
amphiprotic molecule One that can act as both a proton donor and a protonacceptor. The intermediate species of polyprotic acids are amphiprotic.
analysis of variance A statistical tool used to dissect the overall randomerror into contributions from several sources.
analyte Substance being analyzed.
analytical chromatography Chromatography of small quantities of materialconducted for the purpose of qualitative or quantitative analysis or both.
analytical concentration See formal concentration.
anhydrous Adjective describing a substance from which all water has beenremoved.
anion A negatively charged ion.
anion exchanger An ion exchanger with positively charged groupscovalently attached to the support. It can reversibly bind anions.
anode Electrode at which oxidation occurs. In electrophoresis, it is thepositively charged electrode.
anodic depolarizer A molecule that is easily oxidized, therebypreventing the anode potential of an electrochemical cell from becomingtoo positive.
anodic wave In polarography, a flow of current due to oxidation of analyte.
anolyte Solution present in the anode chamber of an electrochemical cell.
antibody A protein manufactured by an organism to sequester foreignmolecules and mark them for destruction.
antigen A molecule that is foreign to an organism and that causesantibodies to be made.
2 � 107 N/m
R4N�,RNH�3 , R2NH�
2 , R3NH�,NH�
4 .
R
H3N�
CƒCO2
R3N,RNH2, R2NH,
H�
OH
HCO3, CO2
3 ,
Rb2SO4
Glossary

antilogarithm The antilogarithm of a is b if
antireflection coating A coating placed on an optical component todiminish reflection. Ideally, the index of refraction of the coating should be
where is the refractive index of the surrounding medium and is the refractive index of the optical component. The thickness of thecoating should be one-fourth of the wavelength of light inside the coating.Antireflection coatings are also made by layers that produce a gradation ofrefractive index.
apparent mobility Constant of proportionality, between the net speed,of an ion in solution and the applied electric field,
Apparent mobility is the sum of the electrophoretic and electroosmoticmobilities.
aprotic solvent One that cannot donate protons (hydrogen ions) in an acid-base reaction.
aptamer A short (15–40 bases long) length of single- or double-strandedDNA (deoxyribonucleic acid) or RNA (ribonucleic acid) that strongly bindsto a selected molecule.
aqua regia A 3:1 (vol/vol) mixture of concentrated (37 wt%) HCl andconcentrated (70 wt%)
aqueous In water (as an aqueous solution).
aquo ion The species containing just the cation M and itstightly bound water ligands.
argentometric titration One using ion.
Arrhenius equation Empirical relation between the rate constant, k, for achemical reaction and temperature, T, in kelvins: where R isthe gas constant, is the free energy of activation for the chemicalreaction, and B is a constant called the preexponential factor. This equationis more commonly written in the form where is called theactivation energy.
ashless filter paper Specially treated paper that leaves a negligible residueafter ignition. It is used for gravimetric analysis.
assessment In quality assurance, the process of (1) collecting data to showthat analytical procedures are operating within specified limits and (2)verifying that final results meet use objectives.
asymmetry potential When the activity of analyte is the same on theinside and outside of an ion-selective electrode, there should be no voltageacross the membrane. In fact, the two surfaces are never identical, and somevoltage (called the asymmetry potential) is usually observed.
atmosphere, atm One atm is defined as a pressure of 101 325 Pa. It isequal to the pressure exerted by a column of Hg 760 mm in height at theearth’s surface.
atmospheric pressure chemical ionization A method to interface liquidchromatography to mass spectrometry. Liquid is nebulized into a fineaerosol by a coaxial gas flow and the application of heat. Electrons from ahigh-voltage corona discharge create cations and anions from analyte exitingthe chromatography column. The most common species observed with thisinterface is the protonated analyte, with little fragmentation.
atomic absorption spectroscopy A technique in which the absorption oflight by free gaseous atoms in a flame or furnace is used to measure theconcentration of atoms.
atomic emission spectroscopy A technique in which the emission of lightby thermally excited atoms in a flame or furnace is used to measure theconcentration of atoms.
atomic fluorescence spectroscopy A technique in which electronictransitions of atoms in a flame, furnace, or plasma are excited by light, andthe fluorescence is observed at a right angle to the incident beam.
atomic mass Number of grams of an element containing Avogadro’snumber of atoms.
atomization Process in which a compound is decomposed into its atoms athigh temperature.
attenuated total reflection An analytical technique based on passage oflight through a waveguide or optical fiber by total internal reflection. Theabsorption of the cladding is sensitive to the presence of analyte. Some ofthe evanescent wave is absorbed in the cladding during each reflection inthe presence of analyte. The more analyte, the more signal is lost.
MH�,
Eak � AeEa/RT,
�G‡k � Be�G‡/RT,
Ag�
M(H2O)m�
n ,
HNO3.
E: unet � appE.unet,app,
n2n11n1n2,
10 a � b. autoprotolysis Reaction of a neutral solvent, in which two molecules ofthe same species transfer a proton from one to the other, thereby producingions; e.g.,
auxiliary complexing agent A species, such as ammonia, that is added toa solution to stabilize another species and keep that other species insolution. It binds loosely enough to be displaced by a titrant.
auxiliary electrode Current-carrying partner of the working electrode inan electrolysis.
average The sum of several values divided by the number of values. Alsocalled mean.
Avogadro’s number The number of atoms in exactly 0.012 kg of
azeotrope The constant-boiling distillate produced by two liquids. It is ofconstant composition, containing both substances.
background buffer In capillary electrophoresis, the buffer in whichseparation is carried out. Also called run buffer.
background correction In atomic spectroscopy, a means of distinguishingsignal due to analyte from signal due to absorption, emission, or scatteringby the flame, furnace, plasma, or sample matrix.
back titration One in which an excess of standard reagent is added toreact with analyte. Then the excess reagent is titrated with a second reagentor with a standard solution of analyte.
ball mill A drum in which solid sample is ground to fine powder bytumbling with hard ceramic balls.
band gap Energy separating the valence band and conduction band in asemiconductor.
band-pass filter A filter that allows a band of wavelengths to pass throughit while absorbing or reflecting other wavelengths.
bandwidth Usually, the range of wavelengths or frequencies of anabsorption or emission band, measured at a height equal to half of the peakheight. It also refers to the width of radiation emerging from the exit slit ofa monochromator.
base A substance that decreases the concentration of when added to water.
base “dissociation” constant A misnomer for base hydrolysis constant,
base hydrolysis constant, The equilibrium constant for the reaction ofa base, B, with :
base peak Most intense peak in a mass spectrum.
basic solution One in which the activity of is greater than the activityof
beam chopper A rotating mirror that directs light alternately through thesample and reference cells of a double-beam spectrophotometer.
beam chopping A technique using a rotating beam chopper to modulatethe signal in a spectrophotometer at a frequency at which noise is reduced.In atomic absorption, periodic blocking of the beam allows a distinction tobe made between light from the source and light from the flame.
beamsplitter A partially reflective, partially transparent plate that reflectssome light and transmits some light.
Beer’s law Relates the absorbance, A, of a sample to its concentration, c,pathlength, b, and molar absorptivity, :
biamperometric titration An amperometric titration conducted with twopolarizable electrodes held at a constant potential difference.
bilayer Formed by a surfactant, a two-dimensional membrane structure inwhich polar or ionic headgroups are pointing outward and nonpolar tails arepointing inward.
biochemical oxygen demand, BOD In a water sample, the quantity ofdissolved oxygen consumed by microorganisms during a 5-day incubationin a sealed vessel at Oxygen consumption is limited by organicnutrients, so BOD is a measure of pollutant concentration.
biosensor Device that uses biological components such as enzymes,antibodies, or DNA, in combination with electrical, optical, or other signals,to achieve a highly selective response to one analyte.
20°C.
A � �bc.�
H�.OH
B � H2O T BH� � OH Kb �ABH
�AOH
AB
H2OKb
Kb.
H�
12C.
CH3OH � CH3OH T CH3OH�2 � CH3O.
GL2 Glossary
Glossary GL3
bipotentiometric titration A potentiometric titration in which a constantcurrent is passed between two polarizable electrodes immersed in thesample solution. An abrupt change in potential characterizes the end point.
Bjerrum plot See difference plot.
blackbody An ideal surface that absorbs all photons striking it. If theblackbody is at constant temperature, it must emit as much radiant energyas it absorbs.
blackbody radiation Radiation emitted by a blackbody. The energy andspectral distribution of the emission depend only on the temperature of theblackbody.
blank solution A solution not intended to contain analyte. It could bemade from all reagents—except unknown—that would be used in ananalytical procedure. Analyte signal measured with a blank solution couldbe due to impurities in the reagents or, possibly, interference.
blank titration One in which a solution containing all reagents exceptanalyte is titrated. The volume of titrant needed in the blank titration shouldbe subtracted from the volume needed to titrate unknown.
blind sample See performance test sample.
blocking Occurs when a metal ion binds tightly to a metal ion indicator. Ablocked indicator is unsuitable for a titration because no color change isobserved at the end point.
bolometer An infrared detector whose electrical resistance changes whenit is heated by infrared radiation.
Boltzmann distribution Relative population of two states at thermalequilibrium:
where is the population of the state, is the degeneracy of the state, is the energy of the state, k is Boltzmann’s constant, and T is temperature inkelvins. Degeneracy refers to the number of states with the same energy.
bomb Sealed vessel for conducting high-temperature, high-pressure reactions.
bonded stationary phase In high-performance liquid chromatography, astationary liquid phase covalently attached to the solid support.
Brewster window A flat optical window tilted at an angle such that lightwhose electric vector is polarized parallel to the plane of the window is100% transmitted. Light polarized perpendicular to the window is partiallyreflected. It is used on the ends of a laser to produce light whose electricfield oscillates perpendicularly to the long axis of the laser.
Brønsted-Lowry acid A proton (hydrogen ion) donor.
Brønsted-Lowry base A proton (hydrogen ion) acceptor.
buffer A mixture of an acid and its conjugate base. A buffered solution isone that resists changes in pH when acids or bases are added.
buffer capacity, � A measure of the ability of a buffer to resist changes inpH. The larger the buffer capacity, the greater the resistance to pH change.The definition of buffer capacity is where and are the number of moles of strong acid or base per liter needed toproduce a unit change in pH. Also called buffer intensity.
buffer intensity See buffer capacity.
bulk sample Material taken from lot being analyzed—usually chosen to berepresentative of the entire lot. Also called gross sample.
bulk solution Chemists’ jargon referring to the main body of a solution. Inelectrochemistry, we distinguish properties of the bulk solution fromproperties that may be different in the immediate vicinity of an electrode.
buoyancy Upward force exerted on an object in a liquid or gaseous fluid.An object weighed in air appears lighter than its actual mass by an amountequal to the mass of air that it displaces.
buret A calibrated glass tube with a stopcock at the bottom. Used todeliver known volumes of liquid.
calibration Process of measuring the actual physical quantity (such asmass, volume, force, or electric current) corresponding to an indicatedquantity on the scale of an instrument.
calibration check In a series of analytical measurements, a calibrationcheck is an analysis of a solution formulated by the analyst to contain a
Cb
Ca� � dCb/dpH � dCa/dpH,
EigiNi
N2
N1�
g2
g1e(E2E1)/kT
known concentration of analyte. It is the analyst’s own check thatprocedures and instruments are functioning correctly.calibration curve A graph showing the value of some property versusconcentration of analyte. When the corresponding property of an unknownis measured, its concentration can be determined from the graph.calomel electrode A common reference electrode based on the half-reaction
candela, cd Luminous intensity, in a given direction, of a source that emitsmonochromatic radiation of frequency 540 THz and that has a radiantintensity of 1/683 W/sr in that direction.capacitor current See charging current.
capacity factor, In chromatography, the adjusted retention time for apeak divided by the time for the mobile phase to travel through the column.Capacity factor is also equal to the ratio of the time spent by the solute inthe stationary phase to the time spent in the mobile phase. Also calledretention factor, capacity ratio, and partition ratio.
capacity ratio See capacity factor.
capillary constant The quantity characteristic of each dropping Hgelectrode. The rate of flow is m (mg/s) and t is the drop interval (s). Thecapillary constant is proportional to the square root of the Hg height.capillary electrochromatography A version of high-performance liquidchromatography in which mobile phase is driven by electroosmosis insteadof a pressure gradient.capillary electrophoresis Separation of a mixture into its components byusing a strong electric field imposed between the two ends of a narrowcapillary tube filled with electrolyte solution.capillary gel electrophoresis A form of capillary electrophoresis inwhich the tube is filled with a polymer gel that serves as a sieve formacromolecules. The largest molecules have the slowest migration throughthe gel.capillary zone electrophoresis A form of capillary electrophoresis inwhich ionic solutes are separated because of differences in theirelectrophoretic mobility.carboxylate anion Conjugate base of a carboxylic acid.carboxylic acid A molecule with the general structure where Ris any group of atoms.carcinogen A cancer-causing agent.carrier gas Mobile-phase gas in gas chromatography.catalytic wave One that results when the product of a polarographicreaction is rapidly regenerated by reaction with another species and thepolarographic wave height increases.cathode Electrode at which reduction occurs. In electrophoresis, it is thenegatively charged electrode.cathodic depolarizer A molecule that is easily reduced, therebypreventing the cathode potential of an electrochemical cell from becomingvery low.catholyte Solution present in the cathode chamber of an electrochemical cell.cation A positively charged ion.cation exchanger An ion exchanger with negatively charged groupscovalently attached to the support. It can reversibly bind cations.chain of custody Trail followed by a sample from the time it is collectedto the time it is analyzed and, possibly, archived.characteristic The part of a logarithm at the left of the decimal point.charge balance A statement that the sum of all positive charge in solutionequals the magnitude of the sum of all negative charge in solution.charge coupled device An extremely sensitive detector in which lightcreates electrons and holes in a semiconductor material. The electrons areattracted to regions near positive electrodes, where the electrons are“stored” until they are ready to be counted. The number of electrons in eachpixel (picture element) is proportional to the number of photons striking thepixel.charging current Electric current arising from charging or discharging ofthe electric double layer at the electrode-solution interface. Also calledcapacitor current or condenser current.
RCO2H,(RCO
2 )
m2/3t1/6
k¿
Hg2Cl2(s) � 2e T 2Hg(l) � 2Cl

charring In a gravimetric analysis, the precipitate (and filter paper) are firstdried gently. Then the filter paper is charred at intermediate temperature todestroy the paper without letting it inflame. Finally, the precipitate is ignitedat high temperature to convert it into its analytical form.
chelate effect The observation that a single multidentate ligand formsmetal complexes that are more stable than those formed by severalindividual ligands with the same ligand atoms.
chelating ligand A ligand that binds to a metal through more than one atom.
chemical coulometer A device that measures the yield of an electrolysisreaction to determine how much electricity has flowed through a circuit.
chemical interference In atomic spectroscopy, any chemical reaction thatdecreases the efficiency of atomization.
chemical ionization A gentle method of producing ions for a massspectrometer without extensive fragmentation of the analyte molecule, M.A reagent gas such as is bombarded with electrons to make which transfers to M, giving
chemical oxygen demand, COD In a natural water or industrial effluentsample, the quantity of equivalent to the quantity of consumedby refluxing the sample with a standard dichromate–sulfuric acidsolution containing catalyst. Because 1 mol of consumes
it is equivalent to 1.5 mol of
chemiluminescence Emission of light by an excited-state product of achemical reaction.
chromatogram A graph showing chromatography detector response as afunction of elution time or volume.
chromatograph A machine used to perform chromatography.
chromatography A technique in which molecules in a mobile phase areseparated because of their different affinities for a stationary phase. Thegreater the affinity for the stationary phase, the longer a molecule is retained.
chromophore The part of a molecule responsible for absorption of light ofa particular frequency.
chronoamperometry A technique in which the potential of a workingelectrode in an unstirred solution is varied rapidly while the currentbetween the working and the auxiliary electrodes is measured. Suppose thatthe analyte is reducible and that the potential of the working electrode ismade more negative. Initially, no reduction occurs. At a certain potential,the analyte begins to be reduced and the current increases. As the potentialbecomes more negative, the current increases further until the concentrationof analyte at the surface of the electrode is sufficiently depleted. Then thecurrent decreases, even though the potential becomes more negative. Themaximum current is proportional to the concentration of analyte in bulksolution.
chronopotentiometry A technique in which a constant current is forced toflow between two electrodes. The voltage remains fairly steady until theconcentration of an electroactive species becomes depleted. Then the voltagechanges rapidly as a new redox reaction assumes the burden of current flow.The elapsed time when the voltage suddenly changes is proportional to theconcentration of the initial electroactive species in bulk solution.
Clark electrode One that measures the activity of dissolved oxygen byamperometry.
coagulation With respect to gravimetric analysis, small crystallites comingtogether to form larger crystals.
co-chromatography Simultaneous chromatography of known compoundswith an unknown. If a known and an unknown have the same retention timeon several columns, they are probably identical.
coefficient of variation The standard deviation, s, expressed as apercentage of the mean value : coefficient of variation � 100 � Alsocalled relative standard deviation.
coherence Degree to which electromagnetic waves are in phase with oneanother. Laser light is highly coherent.
co-ion An ion with the same charge as the ion of interest.
cold trapping Splitless gas chromatography injection technique in whichsolute is condensed far below its boiling point in a narrow band at the startof the column.
collimated light Light in which all rays travel in parallel paths.
s/x.x
O2(O S O2).6e(Cr6� S Cr3�),K2Cr2O7Ag�
K2Cr2O7O2
MH�.H�
CH�5 ,CH4
collimation Process of making light rays travel parallelly to one another.colloid A dissolved particle with a diameter in the approximate range1–100 nm. It is too large to be considered one molecule but too small tosimply precipitate.collisionally activated dissociation Fragmentation of an ion in a massspectrometer by high-energy collisions with gas molecules. In atmosphericpressure chemical ionization or electrospray interfaces, collisionallyactivated dissociation at the inlet to the mass filter can be promoted byvarying the cone voltage. In tandem mass spectrometry, dissociation occursin a collision cell between the two mass separators.collision cell Middle stage of a tandem mass spectrometer in which theprecursor ion selected by the first stage is fragmented by collisions with gasmolecules.combination electrode Consists of a glass electrode with a concentricreference electrode built on the same body.combustion analysis A technique in which a sample is heated in anatmosphere of to oxidize it to and which are collected andweighed or measured by gas chromatography. Modifications permit thesimultaneous analysis of N, S, and halogens.common ion effect Occurs when a salt is dissolved in a solution alreadycontaining one of the ions of the salt. The salt is less soluble than it wouldbe in a solution without that ion. An application of Le Châtelier’s principle.complex ion Historical name for any ion containing two or more ions ormolecules that are each stable by themselves; e.g., contains
complexometric titration One in which the reaction between analyte andtitrant involves complex formation.composite sample A representative sample prepared from a heterogeneousmaterial. If the material consists of distinct regions, the composite is madeof portions of each region, with relative amounts proportional to the size ofeach region.compound electrode An ion-selective electrode consisting of aconventional electrode surrounded by a barrier that is selectivelypermeable to the analyte of interest. Alternatively, the barrier regionmight convert external analyte into a different species, to which the innerelectrode is sensitive.concentration An expression of the quantity per unit volume or unit massof a substance. Common measures of concentration are molarity (mol/L)and molality (mol/kg of solvent).concentration cell A galvanic cell in which both half-reactions are thesame, but the concentrations in each half-cell are not identical. The cellreaction increases the concentration of species in one half-cell anddecreases the concentration in the other.concentration polarization Occurs when an electrode reaction occurs sorapidly that the concentration of solute near the surface of the electrode isnot the same as the concentration in bulk solution.condenser current See charging current.
conditional formation constant See effective formation constant.
conduction band Energy levels containing conduction electrons in asemiconductor.conduction electron An electron free to move about within a solid andcarry electric current. In a semiconductor, the energies of the conductionelectrons are above those of the valence electrons that are localized inchemical bonds. The energy separating the valence and conduction bands iscalled the band gap.
conductivity, � Proportionality constant between electric current density,and electric field, E (V/m): Units are
Conductivity is the reciprocal of resistivity.cone voltage Voltage applied between the skimmer cone and a nearbyorifice through which gaseous ions flow into the mass separator of a massspectrometer. The magnitude of the voltage can be increased to promotecollisionally activated dissociation of ions prior to mass separation.confidence interval Range of values within which there is a specifiedprobability that the true value lies.conjugate acid-base pair An acid and a base that differ only through thegain or loss of a single proton.
�1m1.J � �E.J(A/m2),
Cu� � 3Cl.CuCl
3
H2O,CO2O2
GL4 Glossary

Glossary GL5
constant-current electrolysis Electrolysis in which a constant currentflows between working and auxiliary electrodes. As reactants areconsumed, an ever-increasing voltage is required to keep the currentflowing, so this is the least selective form of electrolysis.
constant mass In gravimetric analysis, the product is heated and cooled toroom temperature in a desiccator until successive weighings are “constant.”There is no standard definition of “constant mass”; but, for ordinary work, itis usually taken to be about Constancy is usually limited by theirreproducible regain of moisture during cooling and weighing.
constant-voltage electrolysis Electrolysis in which a constant voltage ismaintained between working and auxiliary electrodes. This is less selectivethan controlled-potential electrolysis because the potential of the workingelectrode becomes more extreme as ohmic potential and overpotential change.
control chart A graph in which periodic observations of a process arerecorded to determine whether the process is within specified controllimits.
controlled-potential electrolysis A technique for selective reduction (oroxidation), in which the voltage between working and reference electrodesis held constant.
convection Process in which solute is carried from one place to another bybulk motion of the solution.
cooperativity Interaction between two parts of a molecule such that an eventat one part affects the behavior of the other. Consider a molecule, M, with twosites to which two identical species, S, can bind to form MS and Whenbinding at one site makes binding at the second site more favorable than in theabsence of the first binding, there is positive cooperativity. When the firstbinding makes the second binding less favorable, there is negativecooperativity. In noncooperative binding, neither site affects the other.
coprecipitation Occurs when a substance whose solubility is not exceededprecipitates along with one whose solubility is exceeded.
correlation coefficient The square of the correlation coefficient, is ameasure of goodness of fit of data points to a straight line. The closer isto 1, the better the fit.
coulomb, C Amount of charge per second that flows past any point in acircuit when the current is 1 ampere. There are approximately 96 485coulombs in a mole of electrons.
coulometric titration One conducted with a constant current for ameasured time.
coulometry A technique in which the quantity of analyte is determined bymeasuring the number of coulombs needed for complete electrolysis.
countercurrent distribution A technique in which a series of solventextractions is used to separate solutes from one another.
counterelectrode Current-carrying partner of the working electrode. Alsocalled auxiliary electrode.
counterion An ion with a charge opposite that of the ion of interest.
coupled equilibria Reversible chemical reactions that have a species incommon. For example, the product of one reaction could be a reactant inanother reaction.
critical point Critical temperature and pressure of a substance.
critical pressure Pressure above which a fluid cannot be condensed to twophases (liquid and gas), no matter how low the temperature.
critical temperature Temperature above which a fluid cannot be condensedto two phases (liquid and gas), no matter how great a pressure is applied.
cross-linking Covalent linkage between different strands of a polymer.
crystallization Process in which a substance comes out of solution slowlyto form a solid with a regular arrangement of atoms.
cumulative formation constant, �n Equilibrium constant for a reaction ofthe type . Also called overall formation constant.
current, I Amount of charge flowing through a circuit per unit time(A/s).current density Electric current per unit area
cuvet A cell with transparent walls used to hold samples forspectrophotometric measurements.
cyclic voltammetry A polarographic technique with a triangular waveform.Both cathodic and anodic currents are observed for reversible reactions.
(A/m2).
M � nX T MXn
R2R2,
MS2.
�0.3 mg.
data quality objective Accuracy, precision, and sampling requirements foran analytical method.
dead stop end point End point of a biamperometric titration.
dead volume Volume of a chromatography system (not including thecolumn) between the point of injection and the point of detection. Alsocalled extra-column volume.
Debye-Hückel equation Gives the activity coefficient, as a functionof ionic strength, The extended Debye-Hückel equation, applicableto ionic strengths up to about 0.1 M, is
where z is the ionic charge and is the effectivehydrated radius in picometers.
decant To pour liquid off a solid or, perhaps, a denser liquid. The denserphase is left behind.
decomposition potential In an electrolysis, that voltage at which rapidreaction first begins.
degree of freedom In statistics, the number of independent observationson which a result is based.
deionized water Water that has been passed through a cation exchanger (inthe form) and an anion exchanger (in the form) to remove ionsfrom the solution.
deliquescent substance Like a hygroscopic substance, one thatspontaneously picks up water from the air. It can eventually absorb somuch water that the substance completely dissolves.
demasking Removal of a masking agent from the species protected by themasking agent.
density Mass per unit volume.
depolarizer A molecule that is oxidized or reduced at a modest potential.It is added to an electrolytic cell to prevent the cathode or anode potentialfrom becoming too extreme.
derivatization Chemical alteration to attach a group to a molecule so thatthe molecule can be detected conveniently. Alternatively, treatment can altervolatility or solubility.
desalting Removal of salts (or any small molecules) from a solution ofmacromolecules. Gel filtration or dialysis is used for desalting.
desiccant A drying agent.
desiccator A sealed chamber in which samples can be dried in thepresence of a desiccant or by vacuum pumping or both.
detection limit The smallest quantity of analyte that is “significantlydifferent” from a blank. The detection limit is often taken as the mean signalfor blanks plus 3 times the standard deviation of a low-concentration sample.If you have a recorder trace with a signal plus adjacent baseline noise, thedetection limit is sometimes taken as twice the peak-to-peak noise level or10 times the root-mean-square noise level (which is 1/5 of the peak-to-peaknoise level). Also called lower limit of detection.
determinant The value of the two-dimensional determinant is the
difference ad bc.
determinate error See systematic error.
deuterium arc lamp Source of broadband ultraviolet radiation. An electricdischarge (a spark) in deuterium gas causes molecules to dissociate andemit many wavelengths of radiation.
dialysis A technique in which solutions are placed on either side of asemipermeable membrane that allows small molecules, but not largemolecules, to cross. Small molecules in the two solutions diffuse across andequilibrate between the two sides. Large molecules are retained on theiroriginal side.
dielectric constant, � The electrostatic force, F, between two chargedparticles is given by where k is a constant, and are thecharges, r is the separation between particles, and is the dielectricconstant of the medium. The higher the dielectric constant, the less force isexerted by one charged particle on another.
difference plot A graph of the mean fraction of protons bound to an acidversus pH. For complex formation, the difference plot gives the mean numberof ligands bound to a metal versus pL (� log[ligand concentration]). Alsocalled Bjerrum plot.
�q2q1F � kq1q2��r2,
D2
`a b
c d`
OHH�
�[1 � (�1 /305)],log � � [0.51z2 1]/
.�,

differential pulse polarography A technique in which current is measuredbefore and at the end of potential pulses superimposed on a voltage ramp. Itis more sensitive than ordinary polarography, and the signal closelyapproximates the derivative of a polarographic wave.
diffraction Occurs when electromagnetic radiation passes through or isreflected from slits with a spacing comparable to the wavelength.Interference of waves from adjacent slits produces a spectrum of radiation,with each wavelength emerging at a different angle.
diffuse part of the double layer Region of solution near a charged surfacein which excess counterions are attracted to the charge. The thickness ofthis layer is 0.3–10 nm.
diffuse reflection Occurs when a rough surface reflects light in alldirections.
diffusion Random motion of molecules in a liquid or gas (or, very slowly,in a solid).
diffusion coefficient, D Defined by Fick’s first law of diffusion:where J is the rate at which molecules diffuse across a
plane of unit area and dc/dx is the concentration gradient in the direction ofdiffusion.
diffusion current In polarography, the current observed when the rateof reaction is limited by the rate of diffusion of analyte to the electrode.
diffusion layer Region near an electrode containing excess product ordecreased reactant involved in the electrode reaction. The thickness of thislayer can be hundreds of micrometers.
digestion Process in which a precipitate is left (usually warm) in thepresence of mother liquor to promote particle recrystallization and growth.Purer, more easily filterable crystals result. Also used to describe anychemical treatment in which a substance is decomposed to transform theanalyte into a form suitable for analysis.
dilution factor Factor (initial volume of reagent)/(total volume of solution)used to multiply the initial concentration of reagent to find the dilutedconcentration.
dimer A molecule made from two identical units.
diode A semiconductor device consisting of a pn junction through whichcurrent can pass in only one direction. Current flows when the n-typematerial is made negative and the p-type material is made positive. A voltagesufficient to overcome the activation energy for carrier movement must besupplied before any current flows. For silicon diodes, this voltage is If a sufficiently large voltage, called the breakdown voltage, is applied in thereverse direction, current will flow in the wrong direction through the diode.
diprotic acid One that can donate two protons.
direct current polarography Classical form of polarography, in which alinear voltage ramp is applied to the working electrode.
direct titration One in which the analyte is treated with titrant and thevolume of titrant required for complete reaction is measured.
dispersion A measure of the ability of a monochromator to separatewavelengths differing by through the angle The greater thedispersion, the greater the angle separating two closely spaced wavelengths.For a prism, dispersion refers to the rate of change of refractive index withwavelength,
displacement titration An EDTA titration procedure in which analyteis treated with excess to displace
The liberated is thentitrated with EDTA. This procedure is useful if there is not a suitableindicator for direct titration of
disproportionation A reaction in which an element in one oxidation stategives products containing that element in both higher and lower oxidationstates; e.g.,
distribution coefficient, D For a solute partitioned between two phases,the distribution coefficient is the total concentration of all forms of solute inphase 2 divided by the total concentration in phase 1.
Donnan equilibrium Ions of the same charge as those fixed on anexchange resin are repelled from the resin. Thus, anions do not readilypenetrate a cation-exchange resin, and cations are repelled from an anion-exchange resin.
2Cu� T Cu2� � Cu(s).
Mn�.
Mg2�T MEDTAn 4 � Mg2�.MgEDTA2
Mg2�: Mn� �MgEDTA2
dn/d�.
��.��
�0.6 V.
Diffusion current � limiting current residual current.
J � D(dc/dx),
dopant When small amounts of substance B are added to substance A, wecall B a dopant and say that A is doped with B. Doping is done to alter theproperties of A.
Doppler effect A molecule moving toward a source of radiationexperiences a higher frequency than one moving away from the source.
double-focusing mass spectrometer A spectrometer that uses electric andmagnetic sectors in series to obtain high resolution.
double layer See electric double layer.
drift Slow change in the response of an instrument due to various causessuch as changes in electrical components with temperature, variation inpower-line voltage to an instrument, and aging of components withininstruments. Same as 1/f noise or flicker noise.
dropping-mercury electrode One that delivers fresh drops of Hg to apolarographic cell.
dry ashing Oxidation of organic matter with at high temperature toleave behind inorganic components for analysis.
dwell volume Volume in chromatography between the point of mixingsolvents and the start of the column.
dynamic range Range of analyte concentration over which a change inconcentration gives a change in detector response.
Standard reduction potential.
Effective standard reduction potential at pH 7 (or at some otherspecified conditions).
EDTA (ethylenediaminetetraacetic acid)the most widely used reagent for complexometric titrations.
It forms 1:1 complexes with virtually all cations with a charge of 2 or more.
effective formation constant Equilibrium constant for formation of acomplex under a particular stated set of conditions, such as pH, ionicstrength, and concentration of auxiliary complexing species. Also calledconditional formation constant.
effervescence Rapid release of gas with bubbling and hissing.
efflorescence Property by which the outer surface or entire mass of asubstance turns into powder from loss of water of crystallization.
effluent See eluate.
einstein A mole of photons. The symbol of this unit is the same as itsname, einstein.
electric discharge emission spectroscopy A technique in whichatomization and excitation are stimulated by an electric arc, a spark, ormicrowave radiation.
electric double layer Region comprising the charged surface of anelectrode or a particle plus the oppositely charged region of solutionadjacent to the surface. Also called double layer.
electric potential The electric potential (in volts) at a point is the energy(in joules) needed to bring 1 coulomb of positive charge from infinity tothat point. The potential difference between two points is the energy neededto transport 1 coulomb of positive charge from the negative point to thepositive point.
electroactive species Any species that can be oxidized or reduced at anelectrode.
electrocapillary maximum Potential at which the net charge on a mercurydrop from a dropping-mercury electrode is 0 (and the surface tension of thedrop is maximal).
electrochemical detector Liquid chromatography detector that measurescurrent when an electroactive solute emerges from the column and passesover a working electrode held at a fixed potential with respect to areference electrode. Also called amperometric detector.
electrochemistry Use of electrical measurements on a chemical system foranalytical purposes. Also refers to use of electricity to drive a chemicalreaction or use of a chemical reaction to produce electricity.
electrode A device through which electrons flow into or out of chemicalspecies involved in a redox reaction.
electroendosmosis See electroosmosis.
(CH2CO2H)2,(HO2CCH2)2NCH2CH2N-
E��
E�
O2
GL6 Glossary

Glossary GL7
electrogravimetric analysis A technique in which the mass of anelectrolytic deposit is used to quantify the analyte.
electrokinetic injection In capillary electrophoresis, the use of an electricfield to inject sample into the capillary. Because different species havedifferent mobilities, the injected sample does not have the samecomposition as the original sample.
electrolysis Process in which the passage of electric current causes achemical reaction to occur.
electrolyte A substance that produces ions when dissolved.
electrolytic cell A cell in which a chemical reaction that would nototherwise occur is driven by a voltage applied between two electrodes.
electromagnetic spectrum The whole range of electromagnetic radiation,including visible light, radio waves, X-rays, etc.
electron capture detector Gas chromatography detector that is particularlysensitive to compounds with halogen atoms, nitro groups, and other groupswith high electron affinity. Makeup gas ( or in Ar) is ionized by
from to liberate electrons that produce a small, steady current.High-electron-affinity analytes capture some of the electrons and reduce thedetector current.
electronic balance A weighing device that uses an electromagneticservomotor to balance the load on the pan. The mass of the load isproportional to the current needed to balance it.
electronic transition One in which an electron is promoted from oneenergy level to another.
electron ionization Interaction of analyte molecules (M) with high-energyelectrons in the ion source of a mass spectrometer to give the cation radical,
and fragments derived from
electron multiplier An ion detector that works like a photomultiplier tube.Cations striking a cathode liberate electrons. A series of dynodes multipliesthe number of electrons by before they reach the anode.
electroosmosis Bulk flow of fluid in a capillary tube induced by an electricfield. Mobile ions in the diffuse part of the double layer at the wall of thecapillary serve as the “pump.” Also called electroendosmosis.
electroosmotic flow Uniform, pluglike flow of fluid in a capillary tubeunder the influence of an electric field. The greater the charge on the wallof the capillary, the greater the number of counterions in the double layerand the stronger the electroosmotic flow.
electroosmotic mobility, �eo Constant of proportionality between theelectroosmotic speed, of a fluid in a capillary and the applied electricfield,
electroosmotic velocity Speed with which solvent flows through acapillary electrophoresis column. It is measured by adding a detectableneutral molecule to the sample. Electroosmotic velocity is the distance frominjector to detector divided by the time required for the neutral molecule toreach the detector.
electropherogram A graph of detector response versus time forelectrophoresis.
electrophoresis Migration of ions in solution in an electric field. Cationsmove toward the cathode and anions move toward the anode.
electrophoretic mobility, �ep Constant of proportionality between theelectrophoretic speed, of an ion in solution and the applied electricfield,
electrospray A method for interfacing liquid chromatography to massspectrometry. A high potential applied to the liquid at the column exitcreates charged droplets in a fine aerosol. Gaseous ions are derived fromions that were already in the mobile phase on the column. It is common toobserve protonated bases ionized acids and complexesformed between analyte, M (which could be neutral or charged), andstable ions such as or that were already insolution.
eluate What comes out of a chromatography column. Also called effluent.
eluent Solvent applied to the beginning of a chromatography column.
eluent strength, �� A measure of the ability of a solvent to elute solutesfrom a chromatography column. Also called solvent strength, eluentstrength is a measure of the adsorption energy of a solvent on the stationaryphase in chromatography.
CH3CO2NH�
4 , Na�, HCO2 ,
(A),(BH�),
E: uep � epE.uep,
E: ueo � eoE.ueo,
�105
M��.M��,
63Ni�-rays5% CH4N2
eluotropic series Ranks solvents according to their ability to displacesolutes from the stationary phase in adsorption chromatography.
elution Process of passing a liquid or a gas through a chromatographycolumn.
emission spectrum A graph of luminescence intensity versusluminescence wavelength (or frequency or wavenumber), obtained with afixed excitation wavelength.
emissivity A quotient given by the radiant emission from a real objectdivided by the radiant emission of a blackbody at the same temperature.
emulsion A fine suspension of immiscible liquid droplets in another liquidphase.
enantiomers Mirror image isomers that cannot be superimposed on eachother. Also called optical isomers.
endergonic reaction One for which is positive; it is not spontaneous.
endothermic reaction One for which is positive; heat must besupplied to reactants for them to react.
end point Point in a titration at which there is a sudden change in aphysical property, such as indicator color, pH, conductivity, or absorbance.Used as a measure of the equivalence point.
enthalpy change, �H The heat absorbed or released when a reactionoccurs at constant pressure.
enthalpy of hydration Heat liberated when a gaseous species istransferred to water.
entropy A measure of the “disorder” of a substance.
enzyme A protein that catalyzes a chemical reaction.
equilibrium State in which the forward and reverse rates of all reactionsare equal, so the concentrations of all species remain constant.
equilibrium constant, K For the reaction , where is the activity of the ith species.
equimolar mixture of compounds One that contains an equal number ofmoles of each compound.
equivalence point Point in a titration at which the quantity of titrant isexactly sufficient for stoichiometric reaction with the analyte.
equivalent For a redox reaction, the amount of reagent that can donate oraccept 1 mole of electrons. For an acid-base reaction, the amount of reagentthat can donate or accept 1 mole of protons.
equivalent weight The mass of substance containing one equivalent.
evanescent wave Light that penetrates the walls of an optical fiber orwaveguide in which the light travels by total internal reflection.
evaporative light-scattering detector A liquid chromatography detectorthat makes a fine mist of eluate and evaporates solvent from the mist in aheated zone. The remaining particles of liquid or solid solute flow past alaser beam and are detected by their ability to scatter the light.
excitation spectrum A graph of luminescence (measured at a fixedwavelength) versus excitation frequency or wavelength. It closelycorresponds to an absorption spectrum because the luminescence isgenerally proportional to the absorbance.
excited state Any state of an atom or a molecule having more than theminimum possible energy.
exergonic reaction One for which is negative; it is spontaneous.
exitance, M Power per unit area radiating from the surface of an object.
exothermic reaction One for which is negative; heat is liberated whenproducts are formed.
extended Debye-Hückel equation See Debye-Hückel equation.
extensive property A property of a system or chemical reaction, such asentropy, that depends on the amount of matter in the system; e.g., which is twice as large when 2 moles of product are formed as it is when1 mole is formed. See also intensive property.
extinction coefficient See molar absorptivity.
extra-column volume See dead volume.
extraction Process in which a solute is transferred from one phase toanother. Analyte is sometimes removed from a sample by extraction into asolvent that dissolves the analyte.
�G,
�H
�G
AiAcCAd
D/AaAAb
B
aA � bB T cC � dD, K �
�H
�G

extrapolation Estimation of a value that lies beyond the range of measureddata.
F test For two variances, and (with chosen to be the larger of thetwo), the statistic F is defined as To decide whether issignificantly greater than we compare F with the critical values in atable based on a certain confidence level. If the calculated value of F isgreater than the value in the table, the difference is significant.Fajans titration A precipitation titration in which the end point is signaledby adsorption of a colored indicator on the precipitate.false negative A conclusion that the concentration of analyte is below acertain limit when, in fact, the concentration is above the limit.false positive A conclusion that the concentration of analyte exceeds acertain limit when, in fact, the concentration is below the limit.Farad, F Unit of electrical capacitance; 1 farad of capacitance will store1 coulomb of charge in a potential difference of 1 volt.faradaic current That component of current in an electrochemical cell dueto oxidation and reduction reactions.Faraday constant of charge.Faraday cup A mass spectrometric ion detector in which each arrivingcation is neutralized by an electron. The current required to neutralize theions is proportional to the number of cations arriving at the Faraday cup.Faraday’s laws Two laws stating that the extent of an electrochemicalreaction is directly proportional to the quantity of electricity that has passedthrough the cell. The mass of substance that reacts is proportional to itsformula mass and inversely proportional to the number of electronsrequired in its half-reaction.ferroelectric material A solid with a permanent electric polarization(dipole) in the absence of an external electric field. The polarization resultsfrom alignment of molecules within the solid.field blank A blank sample exposed to the environment at the samplecollection site and transported in the same manner as other samplesbetween the lab and the field.field effect transistor A semiconductor device in which the electric fieldbetween gate and base governs the flow of current between source and drain.filtrate Liquid that passes through a filter.fines The smallest particles of stationary phase used for chromatography. Itis desirable to remove the fines before packing a column because they plugthe column and retard solvent flow.Fischer titration See Karl Fischer titration.
flame ionization detector A gas chromatography detector in which soluteis burned in a -air flame to produce ions. The current carriedthrough the flame by these ions is proportional to the concentration ofsusceptible species in the eluate.flame photometer A device that uses flame atomic emission and a filterphotometer to quantify Li, Na, K, and Ca in liquid samples.flame photometric detector Gas chromatography detector that measuresoptical emission from S and P in flame.flow adaptor An adjustable plungerlike device that may be used on eitherside of a chromatographic bed to support the bed and to minimize the deadspace through which liquid can flow outside of the column bed.flow injection analysis Analytical technique in which sample is injectedinto a flowing stream. Other reagents also can be injected into the stream,and some type of measurement, such as absorption of light, is madedownstream. Because the sample spreads out as it travels, differentconcentrations of sample are available in different parts of the band when itreaches the detector.fluorescence Process in which a molecule emits a photon to after absorbing a photon. It results from a transition between states of thesame spin multiplicity (e.g., ).flux In sample preparation, flux is the agent used as the medium for afusion. In transport phenomena, flux is the quantity of whatever you likecrossing each unit area in one unit of time. For example, the flux ofdiffusing molecules could be Heat flux would be formal concentration The molarity of a substance if it did not change itschemical form on being dissolved. It represents the total number of moles
J/ (m2�s).mol/ (m2�s).
singlet S singlet
104 s108
H2-O2
CHO�H2
9.648 533 83 � 104 C/mol
s2,s1F � s2
1/s22.s1s2
2s21
of substance dissolved in a liter of solution, regardless of any reactionsthat take place when the solute is dissolved. Also called analyticalconcentration.
formality, F See formal concentration.
formal potential Potential of a half-reaction (relative to a standardhydrogen electrode) when the formal concentrations of reactants andproducts are unity. Any other conditions (such as pH, ionic strength, andconcentrations of ligands) also must be specified.
formation constant Equilibrium constant for the reaction of a metal withits ligands to form a metal-ligand complex. Also called stability constant.
formula mass, FM The mass containing 1 mole of the indicated chemicalformula of a substance. For example, the formula mass of isthe sum of the masses of copper, sulfate, and five water molecules.
fortification Same as a spike—a deliberate addition of analyte to a sample.
Fourier analysis Process of decomposing a function into an infinite seriesof sine and cosine terms. Because each term represents a certain frequencyor wavelength, Fourier analysis decomposes a function into its componentfrequencies or wavelengths.
Fourier series Infinite sum of sine and cosine terms that add to give aparticular function in a particular interval.
fraction of association, For the reaction of a base (B) with thefraction of base in the form
fraction of dissociation, For the dissociation of an acid (HA), thefraction of acid in the form
frequency The number of oscillations of a wave per second.
friction coefficient A molecule migrating through a solution is retarded bya force that is proportional to its speed. The constant of proportionality isthe friction coefficient.
fugacity The activity of a gas.
fugacity coefficient Activity coefficient for a gas.
fusion Process in which an otherwise insoluble substance is dissolved in amolten salt such as or KOH. Once the substance hasdissolved, the melt is cooled, dissolved in aqueous solution, and analyzed.
galvanic cell One that produces electricity by means of a spontaneouschemical reaction. Also called a voltaic cell.
gas chromatography A form of chromatography in which the mobilephase is a gas.
gathering A process in which a trace constituent of a solution isintentionally coprecipitated with a major constituent.
Gaussian distribution Theoretical bell-shaped distribution ofmeasurements when all error is random. The center of the curve is themean, and the width is characterized by the standard deviation, Anormalized Gaussian distribution, also called the normal error curve, has anarea of unity and is given by
gel Chromatographic stationary phase particles, such as Sephadex orpolyacrylamide, which are soft and pliable.
gel filtration chromatography See molecular exclusion chromatography.
gel permeation chromatography See molecular exclusion chromatography.
geometric mean For a series of n measurements with the values
Gibbs free energy, G The change in Gibbs free energy, for any processat constant temperature is related to the change in enthalpy, and entropy,
by the equation where T is temperature in kelvins. Aprocess is spontaneous (thermodynamically favorable) if is negative.
glass electrode One that has a thin glass membrane across which a pH-dependent voltage develops. The voltage (and hence pH) is measuredby a pair of reference electrodes on either side of the membrane.
glassy carbon electrode An inert carbon electrode, impermeable to gas,and especially well suited as an anode. The isotropic structure (same in alldirections) is thought to consist of tangled ribbons of graphitelike sheets,with some cross-linking.
�G�G � �H T�S,�S,
�H,�G,
geometric mean � 1n x1�x2p xn.
xi,
y �1
�22� e(x)2/2�2
�.,
Na2CO3, Na2O2,
A.
BH�.H2O,
CuSO4 � 5H2O
GL8 Glossary

Glossary GL9
globar An infrared radiation source made of a ceramic such as siliconcarbide heated by passage of electricity.
Golay cell Infrared detector that uses expansion of a gas in a blackenedchamber to deform a flexible mirror. Deflection of a beam of light by themirror changes the power impinging on a phototube.
Gooch crucible A short, cup-shaped container with holes at the bottom,used for filtration and ignition of precipitates. For ignition, the crucible ismade of porcelain or platinum and lined with a mat of ceramic fibers toretain the precipitate. For precipitates that do not need ignition, the crucibleis made of glass and has a porous glass disk instead of holes at the bottom.
gradient elution Chromatography in which the composition of the mobilephase is progressively changed to increase the eluent strength of the solvent.
graduated cylinder A tube with volume calibrations along its length. Alsocalled graduate.
gram-atom The amount of an element containing Avogadro’s number ofatoms; it is the same as a mole of the element.
Gran plot A graph such as the plot of versus used to find theend point of a titration. is the volume of base (titrant) added to an acidbeing titrated. The slope of the linear portion of the graph is related to thedissociation constant of the acid.
graphite furnace A hollow graphite rod that can be heated electrically toabout 2 500 K to decompose and atomize a sample for atomic spectroscopy.
grating Either a reflective or a transmitting surface etched with closelyspaced lines; used to disperse light into its component wavelengths.
gravimetric analysis Any analytical method that relies on measuring themass of a substance (such as a precipitate) to complete the analysis.
gravimetric titration A titration in which the mass of titrant is measured,instead of the volume. Titrant concentration is conveniently expressed asmol reagent/kg titrant solution. Gravimetric titrations can be more accurateand precise than volumetric titrations.
gross sample See bulk sample.
ground state State of an atom or a molecule with the minimum possibleenergy.
guard column In high-performance liquid chromatography, a short columnpacked with the same material as the main column, placed between theinjector and the main column. The guard column removes impurities thatmight irreversibly bind to the main column and degrade it. Also calledprecolumn. In gas chromatography, the guard column is a length of empty,silanized capillary ahead of the chromatography column. Nonvolatileresidues accumulate in the guard column.
half-cell Part of an electrochemical cell in which half of an electrochemicalreaction (either the oxidation or the reduction reaction) occurs.
half-height Half of the maximum amplitude of a signal.
half-reaction Any redox reaction can be conceptually broken into two half-reactions, one involving only oxidation and one involving only reduction.
half-wave potential Potential at the midpoint of the rise in the current of apolarographic wave.
half-width Width of a signal at its half-height.
Hall process Electrolytic production of aluminum metal from a moltensolution of and cryolite
Hammett acidity function The acidity of a solvent that protonates theweak base, B, is called the Hammett acidity function, and is given by
For dilute aqueous solutions, approaches pH.
hanging-drop electrode One with a stationary drop of Hg that is used forstripping analysis.
hardness Total concentration of alkaline earth ions in natural waterexpressed as mg per liter of water as if all of the alkaline earthspresent were
Heisenberg uncertainty principle Certain pairs of physical quantitiescannot be known simultaneously with arbitrary accuracy. If � is theuncertainty in the energy difference between two atomic states and � is thet
E
CaCO3.CaCO3
H0
H0 � pKa(for BH�) � log [B]
[BH�]
H0,
(Na3AlF6).Al2O3
Vb
VbVb �10pH
lifetime of the excited state, their product cannot be known more accuratelythan �E�t where h is Planck’s constant. A similar relation holdsbetween the position and the momentum of a particle. If position is knownvery accurately, then the uncertainty in momentum is large, and vice versa.
Henderson-Hasselbalch equation A logarithmic rearranged form of theacid dissociation equilibrium equation:
Henry’s law The partial pressure of a gas in equilibrium with gasdissolved in a solution is proportional to the concentration of dissolved gas:
The constant k is called the Henry’s law constant. Itis a function of the gas, the liquid, and the temperature.
hertz, Hz Unit of frequency,
heterogeneous Not uniform throughout.
HETP, height equivalent to a theoretical plate The length of achromatography column divided by the number of theoretical plates in the column.
hexadentate ligand One that binds to a metal atom through six ligand atoms.
high-performance liquid chromatography, HPLC A chromatographictechnique using very small stationary phase particles and high pressure toforce solvent through the column.
hole Absence of an electron in a semiconductor. When a neighboringelectron moves into the hole, a new hole is created where the electron camefrom. By this means, a hole can move through a solid just as an electroncan move through a solid.
hollow-cathode lamp One that emits sharp atomic lines characteristic ofthe element from which the cathode is made.
homogeneous Having the same composition everywhere.
homogeneous precipitation A technique in which a precipitating agent isgenerated slowly by a reaction in homogeneous solution, effecting a slowcrystallization instead of a rapid precipitation of product.
hydrated radius, Effective size of an ion or a molecule plus itsassociated water molecules in solution.
hydrodynamic flow Motion of fluid through a tube, driven by a pressuredifference. Hydrodynamic flow is usually laminar, in which there is aparabolic profile of velocity vectors, with the highest velocity at the centerof the stream and zero velocity at the walls.
hydrodynamic injection In capillary electrophoresis, the use of a pressuredifference between the two ends of the capillary to inject sample into thecapillary. Injection is achieved by applying pressure on one end, byapplying suction on one end, or by siphoning.
hydrodynamic radius Effective radius of a molecule migrating through afluid. It is defined by the Stokes equation, in which the friction coefficientis where is the viscosity of the fluid and r is the hydrodynamicradius of the molecule.
hydrolysis “Reaction with water.” The reaction is often called hydrolysis of a base.
hydronium ion, What we really mean when we write
hydrophilic substance One that is soluble in water or attracts water to itssurface.
hydrophobic interaction chromatography Chromatographic separationbased on the interaction of a hydrophobic solute with a hydrophobicstationary phase.
hydrophobic substance One that is insoluble in water or repels water fromits surface.
hygroscopic substance One that readily picks up water from theatmosphere.
ignition The heating to high temperature of some gravimetric precipitatesto convert them into a known, constant composition that can be weighed.
immunoassay An analytical measurement using antibodies.
inclusion An impurity that occupies lattice sites in a crystal.
indeterminate error See random error.
H�(aq).H3O�
BH� � OHTB � H2O
�6��r,
s1.
P � k[dissolved gas].
pH � pKa � log [A]
[HA]
g h/ (4�),

indicator A compound having a physical property (usually color) thatchanges abruptly near the equivalence point of a chemical reaction.
indicator electrode One that develops a potential whose magnitudedepends on the activity of one or more species in contact with the electrode.
indicator error Difference between the indicator end point of a titrationand the true equivalence point.
indirect detection Chromatographic detection based on the absence of signalfrom a background species. For example, in ion chromatography, a light-absorbing ionic species can be added to the eluent. Nonabsorbing analytereplaces an equivalent amount of light-absorbing eluent when analyte emergesfrom the column, thereby decreasing the absorbance of eluate.
indirect titration One that is used when the analyte cannot be directlytitrated. For example, analyte A may be precipitated with excess reagent R.The product is filtered, and the excess R washed away. Then AR isdissolved in a new solution, and R can be titrated.
inductive effect Attraction of electrons by an electronegative elementthrough the sigma-bonding framework of a molecule.
inductively coupled plasma A high-temperature plasma that derives itsenergy from an oscillating radio-frequency field. It is used to atomize asample for atomic emission spectroscopy.
inflection point One at which the derivative of the slope is 0: That is, the slope reaches a maximum or minimum value.
injection precision See instrument precision.
inner Helmholtz plane Imaginary plane going through the centers of ionsor molecules specifically adsorbed on an electrode.
inorganic carbon In a natural water or industrial effluent sample, thequantity of dissolved carbonate and bicarbonate.
instrument precision Reproducibility observed when the same quantity ofone sample is repeatedly introduced into an instrument. Also calledinjection precision.
intensity See irradiance.
intensive property A property of a system or chemical reaction that doesnot depend on the amount of matter in the system; e.g., temperature andelectric potential. See also extensive property.
intercalation Binding of a flat, aromatic molecule between the flat,hydrogen-bonded base pairs in DNA or RNA.
intercept For a straight line whose equation is b is theintercept. It is the value of y when
interference A phenomenon in which the presence of one substancechanges the signal in the analysis of another substance.
interference filter A filter that transmits a particular band of wavelengthsand reflects others. Transmitted light interferes constructively within thefilter, whereas light that is reflected interferes destructively.
interferogram A graph of light intensity versus retardation (or time) forthe radiation emerging from an interferometer.
interferometer A device with a beamsplitter, fixed mirror, and movingmirror that breaks input light into two beams that interfere with each other.The degree of interference depends on the difference in pathlength of thetwo beams.
interlaboratory precision The reproducibility observed when aliquots ofthe same sample are analyzed by different people in different laboratories.
intermediate precision See ruggedness.
internal conversion A radiationless, isoenergetic, electronic transitionbetween states of the same electron-spin multiplicity.
internal standard A known quantity of a compound other than analyte addedto a solution containing an unknown quantity of analyte. The concentration ofanalyte is then measured relative to that of the internal standard.
interpolation Estimation of the value of a quantity that lies between twoknown values.
intersystem crossing A radiationless, isoenergetic, electronic transitionbetween states of different electron-spin multiplicity.
intra-assay precision Precision observed when analyzing aliquots of ahomogeneous material several times by one person on one day with thesame equipment.
x � 0.y � mx � b,
d2y/dx2 � 0.
iodimetry Use of triiodide (or iodine) as a titrant.
iodometry A technique in which an oxidant is treated with to producewhich is then titrated (usually with thiosulfate).
ion chromatography High-performance liquid chromatography ion-exchangeseparation of ions. See also suppressed-ion chromatography and single-columnion chromatography.
ion-exchange chromatography A technique in which solute ions areretained by oppositely charged sites in the stationary phase.
ion-exchange equilibrium An equilibrium involving replacement of acation by a different cation or replacement of an anion by a different anion.Usually the ions in these reactions are bound by electrostatic forces.
ion-exchange membrane Membrane containing covalently bound chargedgroups. Oppositely charged ions in solution penetrate the membrane freely,but similarly charged ions tend to be excluded from the membrane by thebound charges.
ion-exclusion chromatography A technique in which electrolytes areseparated from nonelectrolytes by an ion-exchange resin.
ionic atmosphere The region of solution around an ion or a chargedparticle. It contains an excess of oppositely charged ions.
ionic radius Effective size of an ion in a crystal.
ionic strength, Given by � !12! "i cizi
2, where is the concentration of
the ith ion in solution and is the charge on that ion. The sum extends overall ions in solution, including the ions whose activity coefficients are beingcalculated.
ionization interference In atomic spectroscopy, a lowering of signalintensity as a result of ionization of analyte atoms.
ionization suppressor An element used in atomic spectroscopy todecrease the extent of ionization of the analyte.
ion mobility spectrometer An instrument that measures the drift time of gaseous ions migrating in an electric field against a flow of gas. The“spectrum” of detector current versus drift time is really anelectropherogram of a gas.
ionophore A molecule with a hydrophobic outside and a polar inside thatcan engulf an ion and carry the ion through a hydrophobic phase (such as a cell membrane).
ion pair A closely associated anion and cation, held together byelectrostatic attraction. In solvents less polar than water, ions are usuallyfound as ion pairs.
ion-pair chromatography Separation of ions on reversed-phase high-performance liquid chromatography column by adding to the eluent a hydrophobic counterion that pairs with analyte ion and is attracted tostationary phase.
ion-selective electrode One whose potential is selectively dependent onthe concentration of one particular ion in solution.
ion spray See electrospray.
irradiance Power per unit area of a beam of electromagneticradiation. Also called radiant power or intensity.
isobaric interference In mass spectrometry, overlap of two peaks withnearly the same mass. For example, and differ by 0.01 atomicmass unit and appear as a single peak unless the spectrometer resolution isgreat enough to separate them.
isocratic elution Chromatography using a single solvent for the mobilephase.
isoelectric buffer A neutral, polyprotic acid occasionally used as a low-conductivity “buffer” for capillary zone electrophoresis. For example, asolution of pure aspartic acid has Calling pure aspartic acid a “buffer” isan oxymoron, because the buffer capacity is a minimum at pH 2.94 andincreases to maxima at pH 1.99 and 3.90. However, as the pH drifts awayfrom 2.94, the solution gains significant buffer capacity. Whenelectrophoresis is conducted in a background electrolyte of aspartic acid,the pH stays near 2.94 and conductivity remains very low, permitting a highelectric field to be used, thus enabling rapid separations.
isoelectric focusing A technique in which a sample containing polyproticmolecules is subjected to a strong electric field in a medium with a pH
pH � 12(pK1 � pK2) � 2.94.
(pK1 � 1.99, pK2 � 3.90, pK3 � 10.00)
40ArH�41K�
(W/m2)
zi
ci�
I3 ,
I
GL10 Glossary

Glossary GL11
gradient. Each species migrates until it reaches the region of its isoelectricpH. In that region, the molecule has no net charge, ceases to migrate, andremains focused in a narrow band.
isoelectric pH That pH at which the average charge of a polyprotic speciesis 0. Same as isoelectric point.
isoionic pH The pH of a pure solution of a neutral, polyprotic molecule.The only ions present are and those derived from the polyproticspecies. Same as isoionic point.
isosbestic point A wavelength at which the absorbance spectra of twospecies cross each other. The appearance of isosbestic points in a solutionin which a chemical reaction is occurring is evidence that there are onlytwo components present, with a constant total concentration.
isotope ratio mass spectrometry A mass spectrometric technique designedto provide accurate measurements of the ratio of different ions of a selectedelement. The instrument has one detector dedicated to each isotope.
Job’s method See method of continuous variation.
Jones reductor A column packed with zinc amalgam. An oxidized analyteis passed through to reduce the analyte, which is then titrated with anoxidizing agent.
joule, J SI unit of energy. One joule is expended when a force of 1 N actsover a distance of 1 m. This energy is equivalent to that required to raise102 g (about pound) by 1 m at sea level.
Joule heating Heat produced in an electric circuit by the flow ofelectricity. where I is the current (A) and R is theresistance (ohms).
junction potential An electric potential that exists at the junction betweentwo different electrolyte solutions or substances. It arises in solutions as aresult of unequal rates of diffusion of different ions.
Karl Fischer titration A sensitive technique for determining water, basedon the reaction of with an amine, and an alcohol.
kelvin, K Absolute unit of temperature defined such that the temperatureof water at its triple point (where water, ice, and water vapor are atequilibrium) is 273.16 K and the absolute zero of temperature is 0 K.
Kieselguhr German term for diatomaceous earth, which was formerly usedas a solid support in gas chromatography.
kilogram, kg SI unit of mass equal to the mass of a particular Pt-Ir cylinderkept at the International Bureau of Weights and Measures, Sèvres, France.
kinetic current A polarographic wave that is affected by the rate of achemical reaction involving the analyte and some species in the solution.
kinetic polarization Occurs whenever an overpotential is associated withan electrode process.
Kjeldahl nitrogen analysis Procedure for the analysis of nitrogen inorganic compounds. The compound is digested with boiling toconvert nitrogen into which is treated with base and distilled as into a standard acid solution. The moles of acid consumed equal the molesof liberated from the compound.
Kovats index See retention index.
laboratory sample Portion of bulk sample taken to the lab for analysis.Must have the same composition as the bulk sample.
laminar flow Motion with a parabolic velocity profile of fluid through atube. Motion is fastest at the center and zero at the walls.
laser Source of intense, coherent monochromatic radiation. Light isproduced by stimulated emission of radiation from a medium in which anexcited state has been pumped to a high population. Coherence means thatall light exiting the laser has the same phase.
Latimer diagram One that shows the reduction potentials connecting aseries of species containing an element in different oxidation states.
law of mass action States that, for the chemical reaction the condition at equilibrium is where
is the activity of the ith species. The law is usually used in approximateform, in which the activities are replaced by concentrations.
A iK � A cCA d
D/A aAA b
B,cC � dD,TaA � bB
NH3
NH3NH4�,
H2SO4
SO2,I2,H2O
Power (J/s) � I 2R,
14
OH,H�,
least squares Process of fitting a mathematical function to a set ofmeasured points by minimizing the sum of the squares of the distancesfrom the points to the curve.
Le Châtelier’s principle If a system at equilibrium is disturbed, thedirection in which it proceeds back to equilibrium is such that thedisturbance is partly offset.
leveling effect The strongest acid that can exist in solution is the protonatedform of the solvent. A stronger acid will donate its proton to the solvent and beleveled to the acid strength of the protonated solvent. Similarly, the strongestbase that can exist in a solvent is the deprotonated form of the solvent.
Lewis acid One that can form a chemical bond by sharing a pair ofelectrons donated by another species.
Lewis base One that can form a chemical bond by sharing a pair of itselectrons with another species.
ligand An atom or a group attached to a central atom in a molecule. Theterm is often used to mean any group attached to anything else of interest.
limiting current In a polarographic experiment, the current that is reachedat the plateau of a polarographic wave. See also diffusion current.
limit of quantitation The minimum signal that can be measured“accurately,” often taken as the mean signal for blanks plus 10 times thestandard deviation of a low-concentration sample.
linear flow rate In chromatography, the distance per unit time traveled bythe mobile phase.
linear interpolation A form of interpolation in which the variation insome quantity is assumed to be linear. For example, to find the value of bwhen in the following table,
a: 32 32.4 33b: 12.85 x 17.96
you can set up the proportion
which gives linearity A measure of how well data in a graph follow a straight line.
linear range Concentration range over which the change in detectorresponse is proportional to the change in analyte concentration.
linear response The case in which the analytical signal is directlyproportional to the concentration of analyte.
linear voltage ramp The linearly increasing potential that is applied to theworking electrode in polarography.
line noise Noise concentrated at discrete frequencies that come fromsources external to an intended measuring system. Common sources includeradiation emanating from the 60-Hz power line, vacuum-pump motors, andradio-frequency devices. Same as interference or whistle noise.
lipid bilayer Double layer formed by molecules containing hydrophilicheadgroup and hydrophobic tail. The tails of the two layers associate witheach other and the headgroups face the aqueous solvent.
liquid-based ion-selective electrode One that has a hydrophobic membraneseparating an inner reference electrode from the analyte solution. Themembrane is saturated with a liquid ion exchanger dissolved in a nonpolarsolvent. The ion-exchange equilibrium of analyte between the liquid ionexchanger and the aqueous solution gives rise to the electrode potential.
liquid chromatography A form of chromatography in which the mobilephase is a liquid.
liter, L Common unit of volume equal to exactly
Littrow prism A prism with a reflecting back surface.
logarithm The base 10 logarithm of n is a if (which means). The natural logarithm of n is a if (which means ).
The number is called the base of the natural logarithm.
longitudinal diffusion Diffusion of solute molecules parallel to thedirection of travel through a chromatography column.
Lorentzian A function commonly used to describe the shape of aspectroscopic band: where is thefrequency (or wavenumber), is the frequency (or wavenumber) at the#0
#amplitude � Amax$2/[$2 � (# #0)2],
e (�2.718 28 . . . )ln n � aea � nlog n � a
10a � n
1 000 cm3.
x � 14.89.
32.4 32
33 32�
x 12.85
17.96 12.85
a � 32.4

center of the band, is the width at half-height, and is the maximumamplitude.lot Entire material that is to be analyzed. Examples are a bottle of reagent,a lake, or a truckload of gravel.lower limit of detection See detection limit.lower limit of quantitation Smallest amount of analyte that can bemeasured with reasonable accuracy. Usually taken as 10 times the standarddeviation of a low-concentration sample. Also called quantitation limit.luminescence Any emission of light by a molecule.L’vov platform Platform on which sample is placed in a graphite-rodfurnace for atomic spectroscopy to prevent sample vaporization before thewalls reach constant temperature.
magnetic sector mass spectrometer A device that separates gaseous ionsthat have the same kinetic energy by passing them through a magnetic fieldperpendicular to their velocity. Trajectories of ions with a certain mass-to-charge ratio are bent exactly enough to reach the detector. Other ions aredeflected too much or too little.makeup gas Gas added to the exit stream from a gas chromatographycolumn for the purpose of changing flow rate or gas composition tooptimize detection of analyte.MALDI See matrix-assisted laser desorption/ionization.mantissa The part of a logarithm to the right of the decimal point.Mariotte flask A reservoir that maintains a constant hydrostatic pressurefor liquid chromatography.masking Process of adding a chemical substance (a masking agent) to asample to prevent one or more components from interfering in a chemicalanalysis.masking agent A reagent that selectively reacts with one (or more)component(s) of a solution to prevent the component(s) from interfering ina chemical analysis.mass balance A statement that the sum of the moles of any element in allof its forms in a solution must equal the moles of that element delivered tothe solution.mass chromatogram See selected ion chromatogram.mass spectrometer An instrument that converts gaseous molecules intoions, accelerates them in an electric field, separates them according to theirmass-to-charge ratio, and detects the amount of each species.mass spectrometry A technique in which gaseous molecules are ionized,accelerated by an electric field, and then separated according to their mass.mass spectrometry–mass spectrometry, MS–MS See selected reactionmonitoring.mass spectrum In mass spectrometry, a graph showing the relativeabundance of each ion as a function of its mass-to-charge ratio.mass titration One in which the mass of titrant, instead of the volume, ismeasured.matrix The medium containing analyte. For many analyses, it is importantthat standards be prepared in the same matrix as the unknown.matrix-assisted laser desorption/ionization, MALDI A gentle techniquefor introducing predominantly singly charged, intact macromolecular ions intothe gas phase. An intimate solid mixture of analyte plus a large excess of asmall, ultraviolet-absorbing molecule is irradiated by a pulse from an ultravioletlaser. The small molecule (the matrix) absorbs the radiation, becomes ionized,evaporates, and expands in a supersonic jet that carries analyte into the gasphase. Matrix ions apparently transfer charge to the analyte.matrix effect A change in analytical signal caused by anything in thesample other than analyte.matrix modifier Substance added to sample for atomic spectroscopy tomake the matrix more volatile or the analyte less volatile so that the matrixevaporates before analyte does.maximum suppressor A surface-active agent (such as the detergent TritonX-100) used to eliminate current maxima in polarography.mean The average of a set of all results.mean activity coefficient For the salt the meanactivity coefficient, is related to the individual ion activity coefficients( and ) by the equation �� � (��
m�n )1/(m�n).���
�� ,(cation)m(anion)n,
Amax2$ mechanical balance A balance having a beam that pivots on a fulcrum.Standard masses are used to measure the mass of an unknown.
median For a set of data, that value above and below which there are equalnumbers of data.
mediator In electrolysis, a molecule that carries electrons between theelectrode and the intended analyte. Used when the analyte cannot reactdirectly at the electrode or when analyte concentration is so low that otherreagents react instead. Mediator is recycled indefinitely by oxidation orreduction at the counterelectrode.
meniscus Curved surface of a liquid.
mesh size The number of spacings per linear inch in a standard screenused to sort particles.
metal ion buffer Consists of a metal-ligand complex plus excess freeligand. The two serve to fix the concentration of free metal ion through thereaction
metal ion indicator A compound whose color changes when it binds toa metal ion.
meter, m SI unit of length defined as the distance that light travels in avacuum during of a second.
method blank A sample without deliberately added analyte. The methodblank is taken through all steps of a chemical analysis, including samplepreparation.
method of continuous variation Procedure for finding the stoichiometry ofa complex by preparing a series of solutions with different metal-to-ligandratios. The ratio at which the extreme response (such as spectrophotometricabsorbance) occurs corresponds to the stoichiometry of the complex. Alsocalled Job’s method.
method of least squares Process of fitting a mathematical function to a setof measured points by minimizing the sum of the squares of the distancesfrom the points to the curve.
method validation Process of proving that an analytical method isacceptable for its intended purpose.
micellar electrokinetic chromatography A form of capillaryelectrophoresis in which a micelle-forming surfactant is present. Migrationtimes of solutes depend on the fraction of time spent in the micelles.
micelle An aggregate of molecules with ionic headgroups and long,nonpolar tails. The inside of the micelle resembles hydrocarbon solvent,whereas the outside interacts strongly with aqueous solution.
microelectrode An electrode with a diameter on the order of (or less). Microelectrodes fit into small places, such as living cells. Theirsmall current gives rise to little ohmic loss, so they can be used in resistive,nonaqueous media. Small double-layer capacitance allows their voltage tobe changed rapidly, permitting short-lived species to be studied.
microequilibrium constant An equilibrium constant that describes thereaction of a chemically distinct site in a molecule. For example, a basemay be protonated at two distinct sites, each of which has a differentequilibrium constant.
microporous particles Chromatographic stationary phase consisting ofporous particles in diameter, with high efficiency and highcapacity for solute.
migration Electrostatically induced motion of ions in a solution under theinfluence of an electric field.
miscible liquids Two liquids that form a single phase when mixed in any ratio.
mobile phase In chromatography, the phase that travels through the column.
mobility The terminal velocity that an ion reaches in a field of 1 V/m.
modulation amplitude In polarography, the magnitude of the voltagepulse applied to the working electrode.
Mohr titration Argentometric titration conducted in the presence ofchromate. The end point is signaled by the formation of red
molality A measure of concentration equal to the number of moles ofsolute per kilogram of solvent.
molar absorptivity, � Constant of proportionality in Beer’s law: where A is absorbance, b is pathlength, and c is the molarity of theabsorbing species. Also called extinction coefficient.
A � �bc,
Ag2CrO4(s).
Velocity � mobility � field.
3–10 m
10 m
1299 792 458
M � nL T MLn.
GL12 Glossary

Glossary GL13
molarity, M A measure of concentration equal to the number of moles ofsolute per liter of solution.
mole, mol SI unit for the amount of substance that contains as manymolecules as there are atoms in 12 g of There are approximately
molecules per mole.
molecular exclusion chromatography A technique in which thestationary phase has a porous structure into which small molecules canenter but large molecules cannot. Molecules are separated by size, withlarger molecules moving faster than smaller ones. Also called gel filtrationor gel permeation or size exclusion chromatography.
molecular ion In mass spectrometry, an ion that has not lost or gained anyatoms during ionization.
molecularly imprinted polymer A polymer synthesized in the presence ofa template molecule. After the template is removed, the polymer has a voidwith the right shape to hold the template, and polymer functional groupsare positioned correctly to bind to template functional groups.
molecular mass Number of grams of a substance that contains Avogadro’snumber of molecules.
molecular orbital Describes the distribution of an electron within amolecule.
molecular sieve A solid particle with pores the size of small molecules.Zeolites (sodium aluminosilicates) are a common type.
mole fraction Number of moles of a substance in a mixture divided by thetotal number of moles of all components present.
monochromatic light Light of a single wavelength (color).
monochromator A device (usually a prism, grating, or filter) thatdisperses light into its component wavelengths and selects a narrow band ofwavelengths to pass through the exit slit.
monodentate ligand One that binds to a metal ion through only oneatom.
monolithic column Chromatographic column in which polymerization isconducted inside the column to fill the column with porous stationaryphase. Monolithic columns allow faster flow rates because the porestructure is maintained at high pressure.
mortar and pestle A mortar is a hard ceramic or steel vessel in which asolid sample is ground with a hard tool called a pestle.
mother liquor Solution from which a substance has crystallized.
mull A fine dispersion of a solid in an oil.
multidentate ligand One that binds to a metal ion through more thanone atom.
natural logarithm The natural logarithm (ln) of a is b if See alsologarithm.
nebulization Process of breaking the liquid sample into a mist of fine droplets.
nebulizer In atomic spectroscopy, this device breaks the liquid sample intoa mist of fine droplets.
needle valve A valve with a tapered plunger that fits into a small orifice toconstrict flow.
nephelometry A technique in which the intensity of light scattered at by a suspension is measured to determine the concentration of suspendedparticles. In a precipitation titration, the scattering increases until theequivalence point is reached, and then remains constant.
90°
eb � a.
6.022 � 1023
12 C.
Nernst equation Relates the voltage of a cell, E, to the activities ofreactants and products:
where R is the gas constant, T is temperature in kelvins, F is the Faradayconstant, Q is the reaction quotient, and n is the number of electronstransferred in the balanced reaction. is the cell voltage when all activitiesare unity.
neutralization Process in which a stoichiometric equivalent of acid isadded to a base (or vice versa).
neutron-activation analysis A technique in which radiation is observedfrom a sample bombarded by slow neutrons. The radiation gives bothqualitative and quantitative information about the sample composition.
newton, N SI unit of force. One newton will accelerate a mass of 1 kg by
nitrogen-phosphorus detector See alkali flame detector.
nitrogen rule A compound with an odd number of nitrogen atoms—inaddition to C, H, halogens, O, S, Si, and P—will have an odd nominalmass. A compound with an even number of nitrogen atoms (0, 2, 4, etc.)will have an even nominal mass.
noise Signals originating from sources other than those intended to bemeasured. See, for example, line noise and white noise.
nominal mass Integer mass of the species with the most abundant isotopeof each of the constituent atoms. For C, H, and Br, the most abundantisotopes are and Therefore, the nominal mass of is
nonelectrolyte A substance that does not dissociate into ions when dissolved.
nonpolarizable electrode One whose potential remains nearly constant,even when current flows; e.g., a saturated calomel electrode.
normal error curve A Gaussian distribution whose area is unity.
normal hydrogen electrode, N.H.E. See standard hydrogen electrode (S.H.E.).
normality n times the molarity of a redox reagent, where n is the numberof electrons donated or accepted by that species in a particular chemicalreaction. For acids and bases, it is also n times the molarity, but n is thenumber of protons donated or accepted by the species.
normal-phase chromatography A chromatographic separation utilizing apolar stationary phase and a less polar mobile phase.
normal pulse polarography A polarographic technique in which a voltagepulse is applied to each drop of mercury near the end of its lifetime.Current is measured for a short time near the end of each pulse. The voltageis reduced to its baseline value for most of the life of each new drop and thepulse is applied only near the end of the drop life.
nucleation Process whereby molecules in solution come together randomlyto form small crystalline aggregates that can grow into larger crystals.
null hypothesis In statistics, the supposition that two quantities do notdiffer from each other or that two methods do not give different results.
occlusion An impurity that becomes trapped (sometimes with solvent) in apocket within a growing crystal.ohm, SI unit of electrical resistance. A current of 1 A flows across apotential difference of 1 V if the resistance of the circuit is ohmic potential Voltage required to overcome the electric resistance of anelectrochemical cell.Ohm’s law States that the current, I, in a circuit is proportional to voltage,E, and inversely proportional to resistance, R:Ohm’s law plot In capillary electrophoresis, a graph of current versusapplied voltage. The graph deviates from a straight line when Joule heatingbecomes significant.on-column injection Used in gas chromatography to place a thermallyunstable sample directly on the column without excessive heating in aninjection port. Solute is condensed at the start of the column by lowtemperature, and then the temperature is raised to initiate chromatography.open tubular column In chromatography, a capillary column whose wallsare coated with stationary phase.optical density, OD See absorbance.
I � E/R.
1 �.
(2 � 12) � (5 � 1) � (1 � 79) � 108.C2H5Br79Br.12C, 1H,
1 m/s2.
E°
E � E° RT
nFln Q
Titration reactionsolution
Lightsource
Nephelometrymeasuresscattered light
Turbidimetrymeasurestransmittedlight

optical fiber Fiber that carries light by total internal reflection because thetransparent core has a higher refractive index than the surrounding cladding.optical isomers See enantiomers.
optode A sensor based on an optical fiber. Also called optrode.
ordinate Vertical, y, axis of a graph.osmolarity An expression of concentration that gives the total number ofparticles (ions and molecules) per liter of solution. For nonelectrolytes suchas glucose, the osmolarity equals the molarity. For the strong electrolyte
the osmolarity is three times the molarity, because each mole ofprovides 3 mol of ions
outer Helmholtz plane Imaginary plane passing through centers ofhydrated ions just outside the layer of specifically adsorbed molecules onthe surface of an electrode.overall formation constant, �n See cumulative formation constant.
overpotential Potential above that expected from the equilibrium potential,concentration polarization, and ohmic potential needed to carry out anelectrolytic reaction at a given rate. It is 0 for a reversible reaction.oxidant See oxidizing agent.
oxidation A loss of electrons or a raising of the oxidation state.oxidation number See oxidation state.
oxidation state A bookkeeping device used to tell how many electronshave been gained or lost by a neutral atom when it forms a compound. Alsocalled oxidation number.
oxidizability In a natural water or industrial effluent sample, the quantityof equivalent to the quantity of consumed by refluxing thesample with standard permanganate. Each consumes five electronsand is chemically equivalent to 1.25 mol of oxidizing agent A substance that takes electrons in a chemical reaction.Also called oxidant.
p function The negative logarithm (base 10) of a quantity:
packed column A chromatography column filled with stationary phaseparticles.
parallax Apparent displacement of an object when the observer changesposition. Occurs when the scale of an instrument is viewed from a position thatis not perpendicular to the scale. The apparent reading is not the true reading.
particle growth Process in which molecules become attached to a crystalto form a larger crystal.
partition chromatography A technique in which separation is achievedby equilibration of solute between two phases.
partition coefficient, K The equilibrium constant for the reaction inwhich a solute is partitioned between two phases:
partition ratio See capacity factor.
pascal, Pa SI unit of pressure equal to There are in 1 barand 101 325 Pa in 1 atm.
pellicular particles A type of stationary phase used in liquidchromatography. Contains a thin layer of liquid coated on a spherical bead.It has high efficiency (low plate height) but low capacity.
peptization Occurs when washing some ionic precipitates with distilledwater causes the ions that neutralize the charges of individual particles to bewashed away. The particles then repel one another, disintegrate, and passthrough the filter with the wash liquid.
performance test sample In a series of analytical measurements, aperformance test sample is inserted to see if the procedure gives correct resultswhen the analyst does not know the right answer. The performance test sampleis formulated by someone other than the analyst to contain a knownconcentration of analyte. Also called a quality control sample or blind sample.
permanent hardness Component of water hardness not due to dissolvedalkaline earth bicarbonates. This hardness remains in the water after boiling.
pH Defined as where is the activity of In mostapproximate applications, the pH is taken as
phase transfer catalysis A technique in which a compound such as acrown ether is used to extract a reactant from one phase into another inwhich a chemical reaction can occur.
log [H�].H�.AH�pH � log AH�
105 Pa1 N/m2.
solute (in phase 2).Tsolute (in phase 1)
pX � log X.
O2.KMnO4
KMnO4O2
(Ca2� � 2Cl).CaCl2
CaCl2,
pH meter A potentiometer that can measure voltage when extremely littlecurrent is flowing. It is used with a glass electrode to measure pH.
pH of zero charge The pH at which the net charge on the surface of asolid is zero.
phospholipid A molecule with a phosphate-containing polar headgroupand long hydrocarbon (lipid) tail.
phosphorescence Emission of light during a transition between states ofdifferent spin multiplicity (e.g., triplet → singlet). Phosphorescence isslower than fluorescence, with emission occurring to afterabsorption of a photon.
photochemistry Chemical reaction initiated by absorption of a photon.
photoconductive detector A detector whose conductivity changes whenlight is absorbed by the detector material.
photodiode array An array of semiconductor diodes used to detect light. Thearray is normally used to detect light that has been spread into its componentwavelengths. One small band of wavelengths falls on each detector.
photomultiplier tube One in which the cathode emits electrons whenstruck by light. The electrons then strike a series of dynodes (plates that arepositive with respect to the cathode), and more electrons are released eachtime a dynode is struck. As a result, more than electrons may reach theanode for every photon striking the cathode.
photon A “particle” of light with energy where h is Planck’s constantand # is the frequency of the light.
phototube A vacuum tube with a photoemissive cathode. The electriccurrent flowing between the cathode and the anode is proportional to theintensity of light striking the cathode.
photovoltaic detector A photodetector with a junction across which thevoltage changes when light is absorbed by the detector material.
pH-stat A device that maintains a constant pH in a solution by continuallyinjecting (or electrochemically generating) acid or base to counteract pHchanges.
piezoelectric crystal A crystal that deforms when an electric field is applied.
piezoelectric effect Development of electric charge on the surface ofcertain crystals when subjected to pressure. Conversely, application of anelectric field deforms the crystal.
pilot ion In polarography, an internal standard.
pipet A glass tube calibrated to deliver a fixed or variable volume of liquid.
pK The negative logarithm (base 10) of an equilibrium constant:
Planck distribution Equation giving the spectral distribution of blackbodyradiation:
where h is Planck’s constant, c is the speed of light, is the wavelength oflight, k is Boltzmann’s constant, and T is temperature in kelvins. is thepower (watts) per square meter of surface per meter of wavelength radiating
from the surface. The integral gives the power emitted per unit
area in the wavelength interval from to Planck’s constant Fundamental constant of nature equal to the energy oflight divided by its frequency:
plasma A gas that is hot enough to contain free ions and electrons, as wellas neutral molecules.
plate height, H Length of a chromatography column divided by thenumber of theoretical plates in the column.
polarizability Proportionality constant relating the induced dipole to thestrength of the electric field. When a molecule is placed in an electric field,a dipole is induced in the molecule by attraction of the electrons toward thepositive pole and attraction of the nuclei toward the negative pole.
polarizable electrode One whose potential can change readily when a smallcurrent flows. Examples are Pt or Ag wires used as indicator electrodes.
polarogram A graph showing the relation between current and potentialduring a polarographic experiment.
h � E /# � 6.626 � 1034 J � s.
�2.�1
��2
�1
M� d�
M�
�
M� �2�hc2
�5a 1
ehc/�kT 1b
pK � log K.
h#,
106
102 s~104
GL14 Glossary

Glossary GL15
polarograph An instrument used to obtain and record a polarogram.
polarographic wave S-shaped increase in current during a redox reactionin polarography.
polarography A voltammetry experiment using a dropping-mercuryelectrode.
polychromator A device that spreads light into its component wavelengthsand directs each small band of wavelengths to a different region where it isdetected by a photodiode array.
polyprotic acid or base Compound that can donate or accept more thanone proton.
population inversion A necessary condition for laser operation in whichthe population of an excited energy level is greater than that of a lowerenergy level.
porous-layer column Gas chromatography column containing anadsorptive solid phase coated on the inside surface of its wall.
postprecipitation Adsorption of otherwise soluble impurities on thesurface of a precipitate after the precipitation is over.
potential See electric potential.
potentiometer A device that measures electric potential by balancing itwith a known potential of the opposite sign. A potentiometer measures thesame quantity as that measured by a voltmeter, but the potentiometer isdesigned to draw much less current from the circuit being measured.
potentiometric stripping analysis Technique in which analyte iselectrochemically concentrated onto the working electrode at a controlledpotential. The potentiostat is then disconnected and the voltage of theworking electrode is measured as a function of time, during which a speciesin solution oxidizes or reduces the concentrated analyte back into solution.The time required to reach the potentiometric end point is proportional tothe quantity of analyte.
potentiometry An analytical method in which an electric potentialdifference (a voltage) of a cell is measured.
potentiostat An electronic device that maintains a constant voltagebetween a pair of electrodes.
power Amount of energy per unit time (J/s) being expended.
ppb, parts per billion An expression of concentration denoting nanogramsof solute per gram of solution.
ppm, parts per million An expression of concentration denotingmicrograms of solute per gram of solution.
precipitant A substance that precipitates a species from solution.
precipitation Occurs when a substance leaves solution rapidly (to formeither microcrystalline or amorphous solid).
precipitation titration One in which the analyte forms a precipitate withthe titrant.
precision A measure of the reproducibility of a measurement.
precolumn See guard column.
preconcentration Process of concentrating trace components of a mixtureprior to their analysis.
precursor ion In tandem mass spectrometry (selected reactionmonitoring), the ion selected by the first mass separator for fragmentationin the collision cell.
premix burner In atomic spectroscopy, one in which the sample isnebulized and simultaneously mixed with fuel and oxidant before being fed into the flame.
preoxidation In some redox titrations, adjustment of the analyte oxidationstate to a higher value so that it can be titrated with a reducing agent.
preparative chromatography Chromatography of large quantities ofmaterial conducted for the purpose of isolating pure material.
prereduction Process of reducing an analyte to a lower oxidation stateprior to performing a titration with an oxidizing agent.
pressure Force per unit area, commonly measured in pascals (N/m) or bars.
pressure broadening In spectroscopy, line broadening due to collisionsbetween molecules.
primary standard A reagent that is pure enough and stable enough to beused directly after weighing. The entire mass is considered to be pure reagent.
(106 g)
(109 g)
prism A transparent, triangular solid. Each wavelength of light passingthrough the prism is bent (refracted) at a different angle as it passesthrough.
product The species created in a chemical reaction. Products appear on theright side of the chemical equation.
product ion In tandem mass spectrometry (selected reaction monitoring),the fragment ion from the collision cell selected by the final mass separatorfor passage through to the detector.
protic solvent One with an acidic hydrogen atom.
protocol In quality assurance, written directions stating what must bedocumented and how the documentation is to be done, including how torecord information in notebooks.
proton The ion
proton acceptor A Brønsted-Lowry base: a molecule that combines with
protonated molecule In mass spectrometry, the ion resulting fromaddition of to the analyte.
proton donor A Brønsted-Lowry acid: a molecule that can provide toanother molecule.
purge To force a fluid (usually gas) to flow through a substance or achamber, usually to extract something from the substance being purged orto replace the fluid in the chamber with the purging fluid.
purge and trap A method for removing volatile analytes from liquids orsolids, concentrating the analytes, and introducing them into a gaschromatograph. A carrier gas bubbled through a liquid or solid extractsvolatile analytes, which are then trapped in a tube containing adsorbent.After analyte has been collected, the adsorbent tube is heated and purged todesorb the analytes, which are collected by cold trapping at the start of agas chromatography column.
pyroelectric effect Variation with temperature in the electric polarizationof a ferroelectric material.
pyrolysis Thermal decomposition of a substance.
Q test Statistical test used to decide whether to discard a datum thatappears discrepant.
quadrupole ion-trap mass spectrometer An instrument that separatesgaseous ions by trapping them in stable trajectories inside a metallicchamber to which a radio-frequency electric field is applied. Application ofan oscillating electric field between the ends of the chamber destabilizes thetrajectories of ions with a particular mass-to-charge ratio, expelling themfrom the cavity and into a detector.
qualitative analysis Process of determining the identity of the constituentsof a substance.
quality assurance Quantitative indications that demonstrate whether datarequirements have been met. Also refers to the broader process thatincludes quality control, quality assessment, and documentation ofprocedures and results designed to ensure adequate data quality.
quality control Active measures taken to ensure the required accuracy andprecision of a chemical analysis.
quality control sample See performance test sample.
quantitation limit See lower limit of quantitation.
quantitative analysis Process of measuring how much of a constituent ispresent in a substance.
quantitative transfer To transfer the entire contents from one vessel toanother. This process is usually accomplished by rinsing the first vessel severaltimes with fresh liquid and pouring each rinse into the receiving vessel.
quantum yield In photochemistry, the fraction of absorbed photons thatproduce a particular result. For example, if a molecule can isomerize from acis to a trans isomer when light is absorbed, the quantum yield forisomerization is the number of molecules that isomerize divided by thenumber that absorb photons. Quantum yield is in the range 0 to 1.
quaternary ammonium ion A cation containing four substituents attachedto a nitrogen atom; e.g., the tetraethylammonium ion.
quenching Process in which emission from an excited molecule isdecreased by energy transfer to another molecule called a quencher.
(CH3CH2)4N�,
H�
H�
MH�
H�.
H�.

radian, rad SI unit of plane angle. There are radians in a complete circle.
radiant power See irradiance. Also called intensity.
random error A type of error, which can be either positive or negative andcannot be eliminated, based on the ultimate limitations on a physicalmeasurement. Also called indeterminate error.
random heterogeneous material A material in which there are differencesin composition with no pattern or predictability and on a fine scale. Whenyou collect a portion of the material for analysis, you obtain some of eachof the different compositions.
random sample Bulk sample constructed by taking portions of the entirelot at random.
range Difference between the highest and the lowest values in a set ofdata. Also called spread. With respect to an analytical method, range is theconcentration interval over which linearity, accuracy, and precision are allacceptable.
raw data Individual values of a measured quantity, such as peak areasfrom a chromatogram or volumes from a buret.
reactant The species consumed in a chemical reaction. It appears on theleft side of a chemical equation.
reaction quotient, Q Expression having the same form as the equilibriumconstant for a reaction. However, the reaction quotient is evaluated for aparticular set of existing activities (concentrations), which are generally notthe equilibrium values. At equilibrium,
reagent blank A solution prepared from all of the reagents, but no analyte.The blank measures the response of the analytical method to impurities in thereagents or any other effects caused by any component other than the analyte.
reagent gas In a chemical ionization source for mass spectrometry, reagentgas (normally methane, isobutane, or ammonia at ) is convertedinto strongly proton donating species such as by a process beginningwith electron ionization. Protonated reagent gas reacts with analyte tocreate protonated analyte.
reagent-grade chemical A high-purity chemical generally suitable for usein quantitative analysis and meeting purity requirements set by organizationssuch as the American Chemical Society.
reconstructed total ion chromatogram In chromatography, a graph of thesum of intensities of all ions detected at all masses (above a selected cutoff)versus time.
redox couple A pair of reagents related by electron transfer; e.g., or
redox indicator A compound used to find the end point of a redox titrationbecause its various oxidation states have different colors. The standardpotential of the indicator must be such that its color changes near theequivalence point of the titration.
redox reaction A chemical reaction in which electrons are transferredfrom one element to another.
redox titration One in which the reaction between analyte and titrant is anoxidation-reduction reaction.
reduced plate height In chromatography, the quotient plate height/d,where the numerator is the height equivalent to a theoretical plate and thedenominator is the diameter of stationary phase particles.
reducing agent A substance that donates electrons in a chemical reaction.Also called reductant.
reductant See reducing agent.
reduction A gain of electrons or a lowering of the oxidation state.
reference electrode One that maintains a constant potential against whichthe potential of another half-cell may be measured.
reflectance, R Fraction of incident radiant power reflected by an object.
refraction Bending of light when it passes between media with differentrefractive indexes.
refractive index, n The speed of light in any medium is c/n, where c isthe speed of light in vacuum and n is the refractive index of the medium.The refractive index also measures the angle at which a light ray is bentwhen it passes from one medium into another. Snell’s law states that
, where is the refractive index for each medium and is the angle of the ray with respect to the normal between the two media.
%inin1 sin %1 � n2 sin %2
MnO4 0Mn2�.
Fe3� 0 Fe2�
CH�5
�1 mbar
Q � K.
2� refractive index detector Liquid chromatography detector that measuresthe change in refractive index of eluate as solutes emerge from the column.
relative retention In chromatography, the ratio of adjusted retention timesfor two components. If component 1 has an adjusted retention time of andcomponent 2 has an adjusted retention time of the relativeretention is
relative standard deviation See coefficient of variation.
relative supersaturation Defined as , where S is theconcentration of solute in a saturated solution and Q is the concentration ina particular supersaturated solution.
relative uncertainty Uncertainty of a quantity divided by the value of thequantity. It is usually expressed as a percentage of the measured quantity.
releasing agent In atomic spectroscopy, a substance that prevents chemicalinterference.
replicate measurements Repeated measurements of the same quantity.
reporting limit Concentration below which regulations dictate that ananalyte is reported as “not detected.” The reporting limit is typically set 5 to10 times higher than the detection limit.
reprecipitation Sometimes a gravimetric precipitate can be freed ofimpurities only by redissolving it and reprecipitating it. The impurities arepresent at lower concentration during the second precipitation and are lesslikely to coprecipitate.
residual current The small current that is observed prior to thedecomposition potential in an electrolysis.
resin Small, hard particles of an ion exchanger, such as polystyrene withionic substituents.
resistance, R A measure of the retarding force opposing the flow ofelectric current.
resistivity, � A measure of the ability of a material to retard the flow ofelectric current. where J is the current density and E iselectric field (V/m). Units of resistivity are The resistance, of a conductor with a given length and cross-sectionalarea is given by
resolution How close two bands in a spectrum or a chromatogram can beto each other and still be seen as two peaks. In chromatography, it isdefined as the difference in retention times of adjacent peaks divided bytheir width.
resolving power In mass spectrometry, the value of m/z at which twopeaks separated by 1 mass unit are distinguishable. If resolving power istaken as then the overlap at the base of the peaks is 10% of the peakheight. If resolving power is taken as , then the dip between thetwo peaks is 8% below the peak heights. In these definitions, is theseparation between the peaks and is the width of each peak at halfthe maximum height.
response factor, F Relative response of a detector to analyte (X) andinternal standard (S): Onceyou have measured F with a standard mixture, you can use it to find [X]in an unknown if you know [S] and the quotient (signal from X)/(signalfrom S).
results What we ultimately report after applying statistics to treated data.
retardation, � Difference in pathlength between light striking thestationary and moving mirrors of an interferometer.
retention factor See capacity factor.
retention gap In gas chromatography, a 3- to 10-m length of empty,silanized capillary ahead of the chromatography column. The retention gapimproves the peak shape of solutes that elute close to solvent when largevolumes of solvent are injected or when the solvent has a very differentpolarity from that of the stationary phase.
retention index, I In gas chromatography, the Kovats retention index is alogarithmic scale that relates the retention time of a compound to those oflinear alkanes. Pentane would be given an index of 500, hexane 600,heptane 700, etc.
retention ratio In chromatography, the time required for solvent to passthrough the column divided by the time required for solute to pass throughthe column.
(signal from X)/[X] � F(signal from S)/[S].
�m1/2
�mm /�m1/2
m/�m,
R � ρ � length/area.�,
V � m/A � ohm � m � � � m.(A/m2)J � E /ρ,
(Q S) /S
� � t¿r2/t¿r1.t¿r2(7 t¿r1),
t¿r1
GL16 Glossary

Glossary GL17
retention time The time, measured from injection, needed for a solute tobe eluted from a chromatography column.
retention volume The volume of solvent needed to elute a solute from achromatography column.
reversed-phase chromatography A technique in which the stationaryphase is less polar than the mobile phase.
rings double bonds formula The number of rings � double bonds in amolecule with the formula is where cincludes all Group 14 atoms (C, Si, etc., which all make four bonds),h includes (which make one bond), and n is the number ofGroup 15 atoms (N, P, As, etc., which make three bonds). Group 16 atoms(which make two bonds) do not affect the result.
robustness Ability of an analytical method to be unaffected by small,deliberate changes in operating parameters.
root-mean-square (rms) noise Standard deviation of the noise in a regionwhere the signal is flat:
where is the measured signal for the ith data point, is the mean signal,and n is the number of data points.
rotating-disk electrode A motor-driven electrode with a smooth flat facein contact with the solution. Rapid convection created by rotation bringsfresh analyte to the surface of the electrode. A Pt electrode is especiallysuitable for studying anodic processes, in which a mercury electrode wouldbe too easily oxidized.
rotational transition Occurs when a molecule changes its rotation energy.
rubber policeman A glass rod with a flattened piece of rubber on the tip.The rubber is used to scrape solid particles from glass surfaces ingravimetric analysis.
ruggedness Precision observed when an assay is performed by differentpeople on different instruments on different days in the same lab. Alsocalled intermediate precision.
run buffer See background buffer.
salt An ionic solid.
salt bridge A conducting ionic medium in contact with two electrolytesolutions. It allows ions to flow without allowing immediate diffusion ofone electrolyte solution into the other.
sample cleanup Removal of portions of the sample that do not containanalyte and may interfere with analysis.
sampled current polarography Polarographic technique in which thevoltage is increased for each drop of mercury and current is measured for ashort time at the end of each drop life.
sample preparation Transforming a sample into a state that is suitable foranalysis. This process can include concentrating a dilute analyte andremoving or masking interfering species.
sampling The process of collecting a representative sample for analysis.
sampling variance The square of the standard deviation arising fromheterogeneity of the sample, not from the analytical procedure. Forinhomogeneous materials, it is necessary to take larger portions or moreportions to reduce the uncertainty of composition due to variation from oneregion to another. Total variance is the sum of variances from sampling andfrom analysis.
saturated solution One that contains the maximum amount of a compoundthat can dissolve at equilibrium.
Scatchard plot A graph used to find the equilibrium constant for areaction such as It is a graph of [PX]/[X] versus [PX] or anyfunctions proportional to these quantities. The magnitude of the slope of thegraph is the equilibrium constant.
S.C.E., saturated calomel electrode A calomel electrode saturated withKCl. The electrode half-reaction is Hg2Cl2(s) � 2e T 2Hg(l) � 2Cl.
X � P T PX.
AAi
rms noise �R ai
(Ai A)2
n
H � halogens
c h/2 � n/2 � 1,CcHhNnOx
second, s SI unit of time equal to the duration of 9 192 631 770 periods ofthe radiation corresponding to the transition between two hyperfine levelsof the ground state of
segregated heterogeneous material A material in which differences incomposition are on a large scale. Different regions have obviously differentcomposition.
selected ion chromatogram A graph of detector response versus timewhen a mass spectrometer monitors just one or a few species of selectedmass-to-charge ratio, m/z, emerging from a chromatograph.
selected ion monitoring Use of a mass spectrometer to monitor specieswith just one or a few mass-to-charge ratios, m/z.
selected reaction monitoring A technique in which the precursor ion selectedby one mass separator passes through a collision cell in which the precursorbreaks into several fragment ions (product ions). A second mass separator thenselects one (or a few) of these ions for detection. Selected reaction monitoringimproves chromatographic signal-to-noise ratio because it is insensitive toalmost everything other than the intended analyte. Also called massspectrometry–mass spectrometry (MS–MS) or tandem mass spectrometry.
selectivity Capability of an analytical method to distinguish analyte fromother species in the sample. Also called specificity.
selectivity coefficient With respect to an ion-selective electrode, a measureof the relative response of the electrode to two different ions. In ion-exchange chromatography, the selectivity coefficient is the equilibriumconstant for displacement of one ion by another from the resin.
self-absorption In a luminescence measurement, a high concentration ofanalyte molecules can absorb excitation energy from excited analyte. If theabsorbed energy is dissipated as heat instead of light, fluorescence does notincrease in proportion to analyte concentration. Analyte concentration canbe so high that fluorescence decreases with increasing concentration. Inflame emission atomic spectroscopy, there is a lower concentration ofexcited-state atoms in the cool, outer part of the flame than in the hot, innerflame. The cool atoms can absorb emission from the hot ones and therebydecrease the observed signal.
semiconductor A material whose conductivity ( to ) isintermediate between that of good conductors ( ) and that ofinsulators ( to ).
semipermeable membrane A thin layer of material that allows somesubstances, but not others, to pass across the material. A dialysis membraneallows small molecules to pass, but not large molecules.
sensitivity Response of an instrument or method to a given amount of analyte.
separation factor For components A and B separated by chromatographyor electrophoresis, the separation factor is the quotient of linear velocities:
where u is linear velocity and t is retention time.
separator column Ion-exchange column used to separate analyte speciesin ion chromatography.
septum A disk, usually made of silicone rubber, covering the injection port ofa gas chromatograph. The sample is injected by syringe through the septum.
SI units International system of units based on the meter, kilogram,second, ampere, kelvin, candela, mole, radian, and steradian.
sieving In electrophoresis, the separation of macromolecules by migrationthrough a polymer gel. Movement of the smallest molecules is fastest andthat of the largest is slowest.
signal averaging Improvement of a signal by averaging successive scans.The signal increases in proportion to the number of scans accumulated. Thenoise increases in proportion to the square root of the number of scans.Therefore, the signal-to-noise ratio improves in proportion to the squareroot of the number of scans collected.
significant figure The number of significant digits in a quantity is theminimum number of digits needed to express the quantity in scientificnotation. In experimental data, the first uncertain figure is the lastsignificant figure.
silanization Treatment of a chromatographic solid support or glasscolumn with hydrophobic silicon compounds that bind to the most reactive
groups. It reduces irreversible adsorption and tailing of polarsolutes.SißOH
� � uA/uB � tB/tA,�
�1 � m110121020108 �1 � m1
�1 � m1104107
133Cs.

silver-silver chloride electrode A common reference electrode containing asilver wire coated with AgCl paste and dipped in a solution saturated with AgCland (usually) KCl. The half-reaction is
single-column ion chromatography Separation of ions on a low-capacityion-exchange column, using low-ionic-strength eluent.
single-electrode potential Voltage measured when the electrode of interestis connected to the positive terminal of a potentiometer and a standardhydrogen electrode is connected to the negative terminal.
singlet state One in which all electron spins are paired.
size exclusion chromatography See molecular exclusion chromatography.
slope For a straight line whose equation is the value of m isthe slope. It is the ratio for any segment of the line.
slurry A suspension of a solid in a solvent.
Smith-Hieftje background correction In atomic absorption spectroscopy,a method of distinguishing analyte signal from background signal, basedon applying a periodic pulse of high current to the hollow-cathode lampto distort the lamp signal. Signal detected during the current pulse is subtractedfrom signal detected without the pulse to obtain the corrected response.
smoothing Use of a mathematical procedure or electrical filtering toimprove the quality of a signal.
Snell’s law Relates angle of refraction, to angle of incidence, forlight passing from a medium with refractive index to a medium ofrefractive index Angles are measured with respectto the normal to the surface between the two media.
sodium error Occurs when a glass pH electrode is placed in a stronglybasic solution containing very little and a high concentration of The electrode begins to respond to as if it were so the pH readingis lower than the actual pH. Also called alkaline error.
solid-phase extraction Preconcentration procedure in which a solution ispassed through a short column of chromatographic stationary phase, suchas on silica. Trace solutes adsorbed on the column can be eluted with asmall volume of solvent of high eluent strength.
solid-phase microextraction Extraction of compounds from liquids orgases into a coated fiber dispensed from a syringe needle. After extraction,the fiber is withdrawn into the needle and the needle is injected through theseptum of a chromatograph. The fiber is extended inside the injection portand adsorbed solutes are desorbed by heating (for gas chromatography) orsolvent (for liquid chromatography).
solid-state ion-selective electrode An ion-selective electrode that has asolid membrane made of an inorganic salt crystal. Ion-exchange equilibriabetween the solution and the surface of the crystal account for the electrodepotential.
solubility product, Ksp Equilibrium constant for the dissociation of a solidsalt to give its ions in solution. For the reaction
where is the activity of each species.
solute A minor component of a solution.
solvation Interaction of solvent molecules with solute. Solvent moleculesorient themselves around solute to minimize the energy through dipole andvan der Waals forces.
solvent Major constituent of a solution.
solvent extraction A method in which a chemical species is transferred fromone liquid phase to another. It is used to separate components of a mixture.
solvent strength See eluent strength.
solvent trapping Splitless gas chromatography injection technique inwhich solvent is condensed near its boiling point at the start of the column.Solutes dissolve in a narrow band in the condensed solvent.
speciation Describes the distribution of an element or compound amongdifferent chemical forms.
species Chemists refer to any element, compound, or ion of interest as aspecies. The word species is both singular and plural.
specifications In quality assurance, written statements describing howgood analytical results need to be and what precautions are required in ananalytical method.
specific adsorption Process in which molecules are held tightly to asurface by van der Waals or electrostatic forces.
AnNm, Ksp � AmMn�An
Nm
MmNn(s) T mMn� �
C18
H�,Na�
Na�.H�
n2: n1 sin %1 � n2 sin %2.n1
%1,%2,
�y/�xy � mx � b,
AgCl(s) � e T Ag(s) � Cl.
specific gravity A dimensionless quantity equal to the mass of a substancedivided by the mass of an equal volume of water at Specific gravity isvirtually identical with density in g/mL.
specificity Ability of an analysis to distinguish the intended analyte fromanything else that might be in the sample. Also called selectivity.
spectral interference In atomic spectroscopy, any physical process thataffects the light intensity at the analytical wavelength. Created bysubstances that absorb, scatter, or emit light of the analytical wavelength.
spectrophotometer A device used to measure absorption of light. Itincludes a source of light, a wavelength selector (monochromator), and anelectrical means of detecting light.
spectrophotometric analysis Any method in which light absorption,emission, reflection, or scattering is used to measure chemicalconcentrations.
spectrophotometric titration One in which absorption of light is used tomonitor the progress of a chemical reaction.
spectrophotometry In a broad sense, any method using light to measurechemical concentrations.
specular reflection Reflection of light at an angle equal to the angle ofincidence.
spike Addition of a known compound (usually at a known concentration)to an unknown. In isotope dilution mass spectrometry, the spike is theadded, unusual isotope. Spike is a noun and a verb.
split injection Used in capillary gas chromatography to inject a smallfraction of sample onto the column while the rest of the sample is discarded.
splitless injection Used in capillary gas chromatography for trace analysisand quantitative analysis. The entire sample in a low-boiling solvent isdirected to the column, where the sample is concentrated by solventtrapping (condensing the solvent below its boiling point) or cold trapping(condensing solutes far below their boiling range). The column is thenwarmed to initiate separation.
spontaneous process One that is energetically favorable. It will eventuallyoccur, but thermodynamics makes no prediction about how long it will take.
spread See range.
square wave voltammetry A form of voltammetry (measurement of currentversus potential in an electrochemical cell) in which the potential waveformconsists of a square wave superimposed on a voltage staircase. The techniqueis faster and more sensitive than voltammetry with other waveforms.
stability constant See formation constant.
stacking In electrophoresis, the process of concentrating ions into a narrowband at the interface of electrolytes of low conductivity and highconductivity. Stacking occurs because the electric field in low-conductivityelectrolyte is stronger than the field in high-conductivity electrolyte. Ions inthe low-conductivity region migrate rapidly until they reach the interface,where the electric field is much smaller.
standard addition A technique in which an analytical signal due to anunknown is first measured. Then a known quantity of analyte is added, andthe increase in signal is recorded. From the response, it is possible tocalculate what quantity of analyte was in the unknown.
standard curve A graph showing the response of an analytical techniqueto known quantities of analyte.
standard deviation A statistic measuring how closely data are clusteredabout the mean value. For a finite set of data, the standard deviation, s, iscomputed from the formula
s � �� � �� ��where n is the number of results, is an individual result, and is the meanresult. For a large number of measurements, s approaches the true standarddeviation of the population, and approaches the true population mean.
standard hydrogen electrode, S.H.E. One that contains bubblingover a catalytic Pt surface immersed in aqueous The activities of and
are both unity in the hypothetical standard electrode. The reaction isAlso called normal hydrogen electrode (N.H.E.).H� � e T 1
2 H2(g).H�
H2H�.H2(g)
,x�,
xxi
("ixi)2
!n(n 1)"i(xi
2)!n 1
"i(xi –x )2
!!n 1
4°C.
GL18 Glossary

Glossary GL19
standardization Process of determining the concentration of a reagent byreaction with a known quantity of a second reagent.standard operating procedure A written procedure that must be rigorouslyfollowed to ensure the quality of a chemical analysis.standard reduction potential, E� The voltage that would be measuredwhen a hypothetical cell containing the desired half-reaction (with allspecies present at unit activity) is connected to a standard hydrogenelectrode anode.Standard Reference Materials Certified samples sold by the U.S. NationalInstitute of Standards and Technology (or national measurement institutesof other countries) containing known concentrations or quantities ofparticular analytes. Used to standardize testing procedures in differentlaboratories.standard solution A solution whose composition is known by virtue of theway that it was made from a reagent of known purity or by virtue of itsreaction with a known quantity of a standard reagent.standard state The standard state of a solute is 1 M and the standard stateof a gas is 1 bar. Pure solids and liquids are considered to be in theirstandard states. In equilibrium constants, dimensionless concentrations areexpressed as a ratio of the concentration of each species to its concentrationin its standard state.stationary phase In chromatography, the phase that does not move throughthe column.stepwise formation constant, Kn Equilibrium constant for a reaction ofthe type steradian, sr Unit of solid angle. There are steradians in a complete sphere.stimulated emission Emission of a photon induced by the passage ofanother photon of the same wavelength.stoichiometry Calculation of quantities of substances participating in achemical reaction.Stokes equation The friction coefficient for a molecule migrating throughsolution is , where is the viscosity of the fluid and r is thehydrodynamic radius (equivalent spherical radius) of the molecule.stray light In spectrophotometry, light reaching the detector that is not partof the narrow set of wavelengths expected from the monochromator.stripping analysis A sensitive polarographic technique in which analyte isconcentrated from dilute solution by reduction into a drop (or a film) of Hg.It is then analyzed polarographically during an anodic redissolutionprocess. Some analytes can be oxidatively concentrated onto an electrodeother than Hg and stripped in a reductive process.strong acids or bases Those that are completely dissociated (to or
) in water.strong electrolyte One that mostly dissociates into ions in solution.Student’s t A statistical tool used to express confidence intervals and tocompare results from different experiments.sulfur chemiluminescence detector Gas chromatography detector for theelement sulfur. Exhaust from a flame ionization detector is mixed with toform an excited state of that emits light, which is detected.superconductor A material that loses all electric resistance when cooledbelow a critical temperature.supercritical fluid A fluid whose temperature is above its criticaltemperature and whose pressure is above its critical pressure. It hasproperties of both a liquid and a gas.supercritical fluid chromatography Chromatography using supercriticalfluid as the mobile phase. Capable of highly efficient separations ofnonvolatile solutes and able to use detectors suitable for gas or liquid.supercritical fluid extraction Extraction of compounds (usually fromsolids) with a supercritical fluid solvent.superficially porous particle A stationary phase particle for liquidchromatography containing a thin, porous outer layer and a dense,nonporous core. Mass transfer is faster in the superfically porous particlethan in a fully porous particle of the same diameter.supernatant liquid Liquid remaining above the solid after a precipitation.Also called supernate.
supersaturated solution One that contains more dissolved solute thanwould be present at equilibrium.
SO2
O3
OH
H�
�6��r
4�
MLn1 � L T MLn.
support-coated column Open tubular gas chromatography column inwhich the stationary phase is coated on solid support particles attached tothe inside wall of the column.
supporting electrolyte An unreactive salt added in high concentration tosolutions for voltammetric measurements (such as polarography). Thesupporting electrolyte carries most of the ion-migration current and thereforedecreases the coulombic migration of electroactive species to a negligiblelevel. The electrolyte also decreases the resistance of the solution.
suppressed-ion chromatography Separation of ions by using an ion-exchange column followed by a suppressor (membrane or column) toremove ionic eluent.
suppressor column Ion-exchange column used in ion chromatography totransform ionic eluent into a nonionic form.
surface-modified electrode An electrode whose surface has been changedby a chemical reaction. For example, electroactive materials that reactspecifically with certain solutes can be attached to the electrode.
surface plasmon resonance A sensitive means to measure the binding ofmolecules to a thin gold layer on the underside of a prism. Light directedthrough the prism is reflected from the gold surface. There is one narrowrange of angles at which reflection is nearly 0 because the gold absorbs thelight to set up oscillations (called plasmons) of the electron cloud in themetal. When a thin layer of material (such as protein or DNA) binds to theside of the gold away from the prism, the electrical properties of the goldare changed and the reflectivity changes.
surfactant A molecule with an ionic or polar headgroup and a long, nonpolartail. Surfactants aggregate in aqueous solution to form micelles. Surfactantsderive their name from the fact that they accumulate at boundaries betweenpolar and nonpolar phases and modify the surface tension, which is the freeenergy of formation of the surface. Soaps are surfactants.
sweeping In capillary electrophoresis, migration of a collector species suchas a micelle or chelator to concentrate analyte into a narrow region at thefront of the migrating collector species.
syringe A device having a calibrated barrel into which liquid is suckedby a plunger. The liquid is expelled through a needle by pushing on theplunger.
systematic error Error due to procedural or instrumental factors that causea measurement to be consistently too large or too small. The error can, inprinciple, be discovered and corrected. Also called determinate error.
systematic treatment of equilibrium A method that uses the charge balance,mass balance(s), and equilibria to completely specify a system’s composition.
t test Statistical test used to decide whether the results of two experimentsare within experimental uncertainty of each other. The uncertainty must bespecified to within a certain probability.
tailing Asymmetric chromatographic band in which the later part elutesvery slowly. It often results from adsorption of a solute onto a few activesites on the stationary phase.
tandem mass spectrometry See selected reaction monitoring.
tare As a noun, tare is the mass of an empty vessel used to receive asubstance to be weighed. As a verb, tare means setting the balance readingto 0 when an empty vessel or weighing paper is placed on the pan.
temperature programming Raising the temperature of a gaschromatography column during a separation to reduce the retention time oflate-eluting components.
temporary hardness Component of water hardness due to dissolvedalkaline earth bicarbonates. It is temporary because boiling causesprecipitation of the carbonates.
test portion Part of the laboratory sample used for one analysis. Alsocalled aliquot.
theoretical plate An imaginary construct in chromatography denoting asegment of a column in which one equilibration of solute occurs betweenstationary and mobile phases. The number of theoretical plates on a columnwith Gaussian bandshapes is defined as where is the retentiontime of a peak and � is the standard deviation of the band.
thermal conductivity, � Rate at which a substance transports heat(energy per unit time per unit area) through a temperature gradient
trN � t2r /�2,

(degrees per unit distance). Energy flow where � is the thermal conductivity and dT/dx is thetemperature gradient (K/m).
thermal conductivity detector A device that detects substances elutedfrom a gas chromatography column by measuring changes in the thermalconductivity of the gas stream.
thermal desorption A sample preparation technique used in gaschromatography to release volatile substances from a solid sample by heating.
thermistor A device whose electrical resistance changes markedly withchanges in temperature.
thermocouple An electrical junction across which a temperature-dependentvoltage exists. Thermocouples are calibrated for measurement of temperatureand usually consist of two dissimilar metals in contact with each other.
thermogravimetric analysis A technique in which the mass of a substanceis measured as the substance is heated. Changes in mass indicatedecomposition of the substance, often to well-defined products.
thermometric titration One in which the temperature is measured todetermine the end point. Most titration reactions are exothermic, so thetemperature rises during the reaction and suddenly stops rising when theequivalence point is reached.
thin-layer chromatography Liquid chromatography in which thestationary phase is coated on a flat glass or plastic plate. Solute is spottednear the bottom of the plate. The bottom edge of the plate is placed incontact with solvent, which creeps up the plate by capillary action.
time-of-flight mass spectrometer Ions of different mass acceleratedthrough the same electric field have different velocities: The lighter ionsmove faster than the heavier ions. The time-of-flight spectrometer finds themass-to-charge ratio by measuring the time that each group of ions requiresto travel a fixed distance to the detector.
titer A measure of concentration, usually defined as how many milligramsof reagent B will react with 1 mL of reagent A. One milliliter of solution with a titer of 1.28 mg NaCl/mL will be consumed by 1.28 mgNaCl in the reaction The same solution of
has a titer of 0.993 mg of because 1 mL of AgNOsolution will be consumed by 0.993 mg to precipitate
titrant Substance added to the analyte in a titration.
titration A procedure in which one substance (titrant) is carefully added toanother (analyte) until complete reaction has occurred. The quantity oftitrant required for complete reaction tells how much analyte is present.
titration curve A graph showing how the concentration of a reactant or aphysical property of the solution varies as one reactant (the titrant) is addedto another (the analyte).
titration error Difference between the observed end point and the trueequivalence point in a titration.
tolerance Manufacturer’s stated uncertainty in the accuracy of a devicesuch as a buret or volumetric flask. A 100-mL flask with a tolerance of
may contain 99.92 to 100.08 mL and be within tolerance.
total carbon In a natural water or industrial effluent sample, the quantityof produced when the sample is completely oxidized by oxygen at
in the presence of a catalyst.
total ion chromatogram A graph of detector response versus time when amass spectrometer monitors all ions above a selected m/z ratio emergingfrom a chromatograph.
total organic carbon In a natural water or industrial effluent sample, thequantity of produced when the sample is first acidified and purged toremove carbonate and bicarbonate and then completely oxidized by oxygenat in the presence of a catalyst.
total oxygen demand In a natural water or industrial effluent sample, thequantity of required for complete oxidation of species in the water at
in the presence of a catalyst.
trace analysis Chemical analysis of very low levels of analyte, typicallyppm and lower.
transition range For an acid-base indicator, the pH range over which thecolor change occurs. For a redox indicator, the potential range over whichthe color change occurs.
900°CO2
900°C
CO2
900°CCO2
�0.08 mL
Ag3PO4.KH2PO4
KH2PO4/mL,AgNO3
Ag� � Cl S AgCl(s).
AgNO3
[W/(m�K)][J/ (s � m2)] � �(dT/dx), transmission quadrupole mass spectrometer A mass spectrometer that
separates ions by passing them between four metallic cylinders to whichare applied direct current and oscillating electric fields. Resonant ionswith the right mass-to-charge ratio pass through the chamber to thedetector while nonresonant ions are deflected into the cylinders andare lost.
transmittance, T Defined as where is the radiant power oflight striking the sample on one side and P is the radiant power of lightemerging from the other side of the sample.
treated data Concentrations or amounts of analyte found from raw datawith a calibration curve or some other calibration method.
triple point The one temperature and pressure at which the solid, liquid,and gaseous forms of a substance are in equilibrium with one another.
triplet state An electronic state in which there are two unpaired electrons.
tungsten lamp An ordinary light bulb in which electricity passing througha tungsten filament heats the wire and causes it to emit visible light.
turbidimetry A technique in which the decrease in intensity of lighttraveling through a turbid solution (a solution containing suspendedparticles) is measured. The greater the concentration of suspended particles,the less light is transmitted. See diagram under nephelometry.
turbidity Light-scattering property associated with suspended particles in aliquid. A turbid solution appears cloudy.
turbidity coefficient The transmittance of a turbid solution is given by� e&b, where P is the transmitted radiant power, is the incident
radiant power, b is the pathlength, and & is the turbidity coefficient.
ultraviolet detector Liquid chromatography detector that measuresultraviolet absorbance of solutes emerging from the column.
use objectives In quality assurance, use objectives are a written statementof how results will be used. Use objectives are required beforespecifications can be written for the method.
valence band Energy levels containing valence electrons in a semiconductor.The electrons in these levels are localized in chemical bonds.
van Deemter equation Describes the dependence of chromatographicplate height, H, on linear flow rate, . The constantA depends on band-broadening processes such as multiple flow paths thatare independent of flow rate. B depends on the rate of diffusion of solute inthe mobile phase. C depends on the rate of mass transfer between thestationary and mobile phases.
variance, �2 The square of the standard deviation.
vibrational transition Occurs when a molecule changes its vibrational energy.
viscosity Resistance to flow in a fluid.
void volume, V0 Volume of the mobile phase outside the gel particles in amolecular exclusion chromatography column.
volatile Easily vaporized.
volatilization Selective removal of a component from a mixture bytransforming the component into a volatile (low-boiling) species andremoving it by heating, pumping, or bubbling a gas through the mixture.
Volhard titration Titration of with in the presence of Formation of red marks the end point.
volt, V Unit of electric potential difference. If the potential differencebetween two points is 1 volt, then 1 joule of energy is required to move1 coulomb of charge between the two points.
voltaic cell See galvanic cell.
voltammetry An analytical method in which the relation between currentand voltage is observed during an electrochemical reaction.
voltammogram A graph of current versus electrode potential in anelectrochemical cell.
volume flow rate In chromatography, the volume of mobile phase per unittime eluted from the column.
volume percent Defined as (volume of solute/volume of solution) � 100.
volumetric analysis A technique in which the volume of material neededto react with the analyte is measured.
Fe(SCN)2�
Fe3�.SCNAg�
ux: H � A � B/ux � Cux
P0P/P0
P0T � P /P0,
GL20 Glossary

Glossary GL21
volumetric flask One having a tall, thin neck with a calibration mark.When the liquid level is at the calibration mark, the flask contains itsspecified volume of liquid.
Walden reductor A column packed with silver and eluted with HCl.Analyte is reduced during passage through the column. The reducedproduct is titrated with an oxidizing agent.
wall-coated column Hollow chromatographic column in which thestationary phase is coated on the inside surface of the wall.
watt, W SI unit of power equal to an energy flow of 1 joule per second.When an electric current of 1 ampere flows through a potential differenceof 1 volt, the power is 1 watt.
waveguide A thin layer or hollow structure in which electromagneticradiation is totally reflected.
wavelength, � Distance between consecutive crests of a wave.
wavenumber, �~ Reciprocal of the wavelength,
weak acids and bases Those whose dissociation constants are not large.
weak electrolyte One that only partly dissociates into ions when it dissolves.
weighing paper Paper on which to place a solid reagent on a balance.Weighing paper has a very smooth surface, from which solids fall easily fortransfer to a vessel.
weight percent (Mass of solute/mass of solution) � 100.
weight/volume percent (Mass of solute/volume of solution) � 100.
1/�.
Weston cell A stable voltage source based on the reactionIt was formerly used
to standardize a potentiometer.
wet ashing Destruction of organic matter in a sample by a liquid reagent(such as boiling aqueous ) prior to analysis of an inorganic component.
white light Light of all different wavelengths.
white noise Random noise, also called Gaussian noise, due to randommovement of charge carriers in an electric circuit (called thermal noise,Johnson noise, or Nyquist noise) or from random arrival of photons to adetector (called shot noise or Schottky noise).
Wien displacement law Approximate formula for the wavelength, ofmaximum blackbody emission: where T is temperature in kelvins, h is Planck’s constant, c is the speed oflight, and k is Boltzmann’s constant. Valid for
working electrode One at which the reaction of interest occurs.
Zeeman background correction Technique used in atomic spectroscopyin which analyte signals are shifted outside the detector monochromatorrange by applying a strong magnetic field to the sample. Signal thatremains is the background.
Zeeman effect Shifting of atomic energy levels in a magnetic field.
zwitterion A molecule with a positive charge localized at one position anda negative charge localized at another position.
T 7 100 K.
�max �T � hc/5k � 2.878 � 103 m � K,�max,
HCIO4
Cd(s) � HgSO4(aq) T CdSO4(aq) � Hg(l).

This page intentionally left blank

APPENDIX ALogarithms and Exponents
APPENDIX A Logarithms and Exponents AP1
If a is the base 10 logarithm of then On a calcula-tor, you find the logarithm of a number by pressing the “log” button. If youknow and you wish to find n, use the “antilog” button or raise10 to the power a:
Natural logarithms (ln) are based on the number e instead of 10:
On a calculator, you find the ln of n with the “ln” button. To find n when youknow use the key.
Here are some useful properties to know:
Problems
Test yourself by simplifying each expression as much as possible:
(a) (e) (i)(b) (f) (j)(c) (g) (k)(d) (h) (l) 10[(log 3)(4 log 2)]log (10a2)10log a
e(a� ln b)log (101/a3)log 10alog (2a3 10b2)eln a310log alog (10a2b)eln a3eln a
ab
ac� a(bc)log (ab) � b log a
ab � ac � a(b�c)log aa
bb � log a log b
log 10a � alog (a � b) � log a � log b
exb � ln n,
eb � eln n � n
b � ln n
(� 2.718 281 . . . )
10a � 10log n � n (1 n � antilog a)
a � log n
a � log n
n � 10a.n (a � log n), Solving a logarithmic equation: In working with the Nernst andHenderson-Hasselbalch equations, we will need to solve equations such as
for the variable, x. First isolate the log term:
Then raise 10 to the value of each side of the equation:
But is just so
Converting between ln x and log x: The relation between them is derivedby writing and taking ln of both sides:
ln
because ln
Answers
(a) a (d) (g) ( j)(b) a (e) (h) (k)(c) a (f) (i) (l) 3/16a2 b1/a3
beaa21/a3b2 � log(2a3)1/a31/a
ab � b ln a.
x � ln (10log x) � (log x)(ln 10)
x � 10log x
d
gx� 10(ba)/c 1 x �
d
g10(ba)/c
d/gx,10log (d/gx)
10log(d/gx) � 10(ba)/c
log d
gx�
(b a)
c
a � b c log d
gx

AP2 APPENDIX B Graphs of Straight Lines
APPENDIX BGraphs of Straight Lines
The general form of the equation of a straight line is
The meanings of slope and intercept are illustrated in Figure B-1.
Figure B-1 Parameters of a straight line.
If you know two points and that lie on the line, youcan generate the equation of the line by noting that the slope is the same forevery pair of points on the line. Calling some general point on the line we can write
(B-1)
which can be rearranged to the form
14243 1442443m b
When you have a series of experimental points that should lie on aline, the best line is generally obtained by the method of least squares,described in Chapter 4. This method gives the slope and the interceptdirectly. If, instead, you wish to draw the “best” line by eye, you can derivethe equation of the line by selecting two points that lie on the line andapplying Equation B-1.
y � ay2 y1
x2 x1b x � y1 ay2 y1
x2 x1b x1
y y1 � ay2 y1
x2 x1b (x x1)
y y1
x x1�
y2 y1
x2 x1� m
(x, y),
(x2, y2)][(x1, y1)
Slope = m =
y
b
(x1, y1)∆y = y2 – y1
(x2, y2)
∆x = x2 – x1
x
∆y∆x
b � intercept on y-axis
where m � slope ��y
�x�
y2 y1
x2 x1
y � mx � b
Figure B-2 A linear graph in which one axis is a logarithmic function.
Sometimes you are presented with a linear plot in which x or y or bothare nonlinear functions. An example is shown in Figure B-2, in which thepotential of an electrode is expressed as a function of the activity of analyte.Given that the slope is 29.6 mV and the line passes through the point
find the equation of the line. To do this, first notethat the y-axis is linear but the x-axis is logarithmic. That is, the function Eversus is not linear, but E versus log is linear. The form of the straightline should therefore be
123c c cy m x
To find b, we can use the coordinates of the one known point in Equation B-1:
or
E(mV) � 29.6 (mV) log A � 108.2 (mV)
E � 10.2 � 29.6 log A � (29.6)(4)
y y1
x x1�
E E1
log A log A1�
E (10.2)
log A log (104)� m � 29.6
E � (29.6) log A � b
AA
E � 10.2),(A � 104,
Slope =29.6 mV
E(m
V)
–40
–5 –4log
–3 –2
–20
0
20
10
A
A
–5 10–4 10–3 10–2
40
60
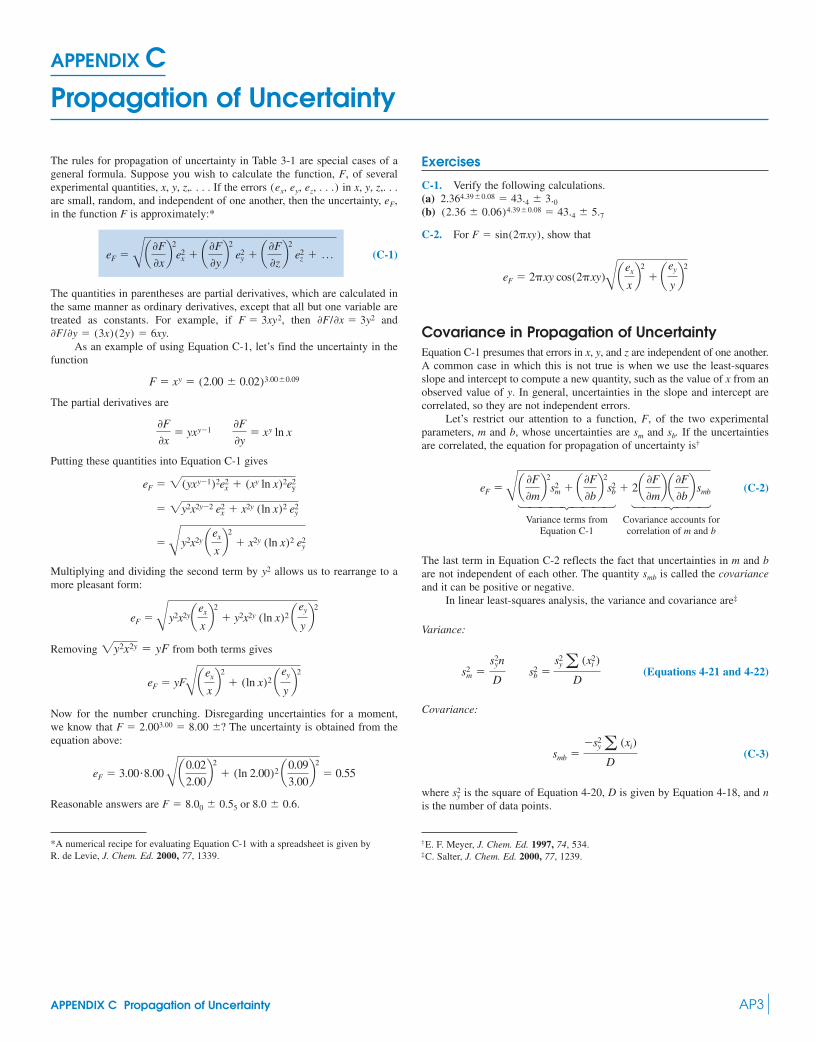
APPENDIX C Propagation of Uncertainty AP3
APPENDIX CPropagation of Uncertainty
The rules for propagation of uncertainty in Table 3-1 are special cases of ageneral formula. Suppose you wish to calculate the function, F, of severalexperimental quantities, x, y, z,. . . . If the errors in x, y, z,. . .are small, random, and independent of one another, then the uncertainty, in the function F is approximately:*
(C-1)
The quantities in parentheses are partial derivatives, which are calculated inthe same manner as ordinary derivatives, except that all but one variable aretreated as constants. For example, if then and
As an example of using Equation C-1, let’s find the uncertainty in thefunction
The partial derivatives are
Putting these quantities into Equation C-1 gives
Multiplying and dividing the second term by allows us to rearrange to amore pleasant form:
Removing from both terms gives
Now for the number crunching. Disregarding uncertainties for a moment,we know that The uncertainty is obtained from theequation above:
Reasonable answers are F � 8.00 � 0.55 or 8.0 � 0.6.
eF � 3.00�8.00 Ba0.02
2.00b2
� (ln 2.00)2 a0.09
3.00b2
� 0.55
F � 2.003.00 � 8.00 �?
eF � yFBaex
xb2
� (ln x)2 aey
yb2
2y2x2y � yF
eF �By2x2yaex
xb2
� y2x2y (ln x)2 aey
yb2
y2
�By2x2y aex
xb2
� x2y (ln x)2 e2y
� 2y2x2y2 e2x � x2y (ln x)2 e2
y
eF � 2(yxy1)2e2x � (xy ln x)2e2
y
0F
0x� yxy1
0F
0y� xy ln x
F � xy � (2.00 � 0.02)3.00�0.09
0F/0y � (3x)(2y) � 6xy.0F/0x � 3y2F � 3xy2,
eF � Ba 0F
0xb2
e2x � a 0F
0yb2
e2y � a 0F
0zb2
e2z � p
eF,(ex, ey, ez, . . .)
Exercises
C-1. Verify the following calculations.(a)(b)
C-2. For , show that
Covariance in Propagation of UncertaintyEquation C-1 presumes that errors in x, y, and z are independent of one another.A common case in which this is not true is when we use the least-squaresslope and intercept to compute a new quantity, such as the value of x from anobserved value of y. In general, uncertainties in the slope and intercept arecorrelated, so they are not independent errors.
Let’s restrict our attention to a function, F, of the two experimentalparameters, m and b, whose uncertainties are and If the uncertaintiesare correlated, the equation for propagation of uncertainty is
(C-2)144424443 1442443
Variance terms from Covariance accounts forEquation C-1 correlation of m and b
The last term in Equation C-2 reflects the fact that uncertainties in m and bare not independent of each other. The quantity is called the covarianceand it can be positive or negative.
In linear least-squares analysis, the variance and covariance are
Variance:
(Equations 4-21 and 4-22)
Covariance:
(C-3)
where is the square of Equation 4-20, D is given by Equation 4-18, and nis the number of data points.
s2y
smb �s2
ya (xi)
D
s2b �
s2ya (x2
i )
Ds2
m �s2
yn
D
‡
smb
eF �Ba 0F
0mb2
s2m � a 0F
0bb2
s2b � 2a 0F
0mba 0F
0bb smb
†sb.sm
eF � 2�xy cos(2�xy)Baex
xb2
� aey
yb2
F � sin(2�xy)
(2.36 � 0.06)4.39�0.08 � 43.4 � 5.7
2.364.39�0.08 � 43.4 � 3.0
*A numerical recipe for evaluating Equation C-1 with a spreadsheet is given by R. de Levie, J. Chem. Ed. 2000, 77, 1339.
†E. F. Meyer, J. Chem. Ed. 1997, 74, 534.C. Salter, J. Chem. Ed. 2000, 77, 1239.‡
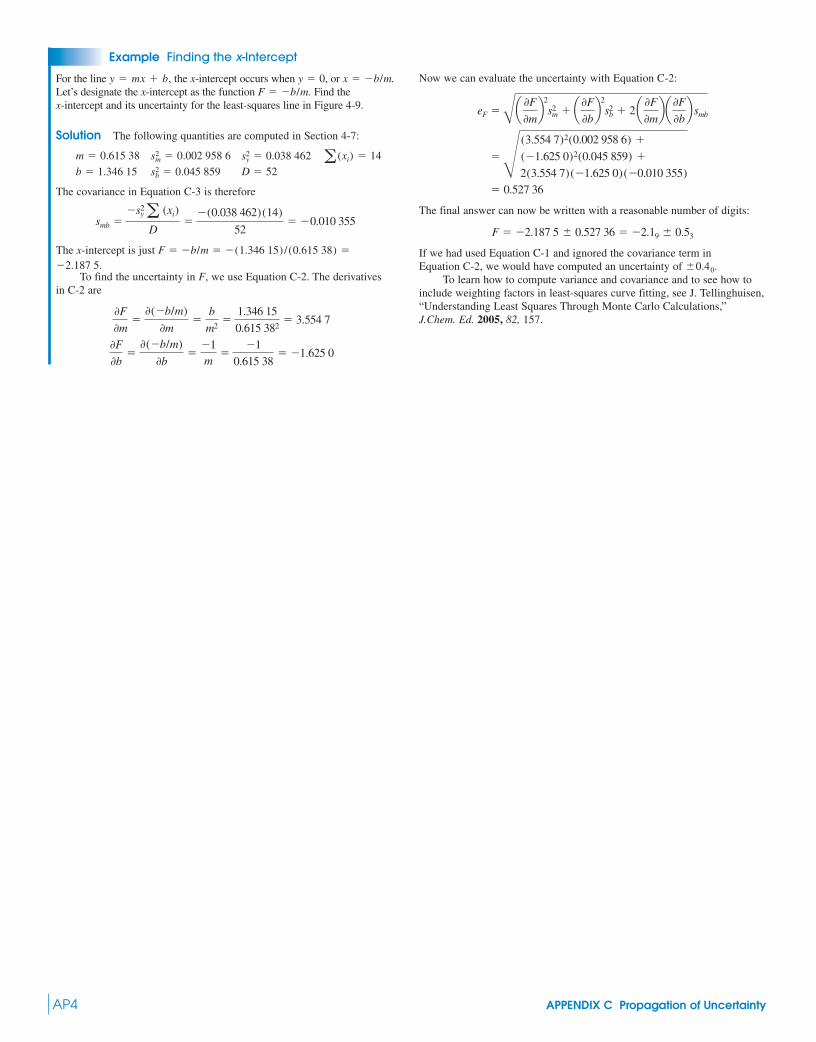
Example Finding the x-Intercept
AP4 APPENDIX C Propagation of Uncertainty
For the line the x-intercept occurs when or Let’s designate the x-intercept as the function Find the x-intercept and its uncertainty for the least-squares line in Figure 4-9.
Solution The following quantities are computed in Section 4-7:
The covariance in Equation C-3 is therefore
The x-intercept is just
To find the uncertainty in F, we use Equation C-2. The derivatives in C-2 are
0F
0b�
0(b/m)
0b�
1m
�1
0.615 38� 1.625 0
0F
0m�
0(b/m)
0m�
b
m2�
1.346 15
0.615 382� 3.554 7
2.187 5.F � b/m � (1.346 15)/(0.615 38) �
smb �s2
ya (xi)
D�
(0.038 462)(14)
52� 0.010 355
D � 52s2b � 0.045 859b � 1.346 15
a (xi) � 14s2y � 0.038 462s2
m � 0.002 958 6m � 0.615 38
F � b/m.x � b/m.y � 0,y � mx � b, Now we can evaluate the uncertainty with Equation C-2:
The final answer can now be written with a reasonable number of digits:
If we had used Equation C-1 and ignored the covariance term in Equation C-2, we would have computed an uncertainty of
To learn how to compute variance and covariance and to see how toinclude weighting factors in least-squares curve fitting, see J. Tellinghuisen,“Understanding Least Squares Through Monte Carlo Calculations,”J.Chem. Ed. 2005, 82, 157.
�0.40.
F � 2.187 5 � 0.527 36 � 2.19 � 0.53
� 0.527 36
�R(3.554 7)2(0.002 958 6) �
(1.625 0)2(0.045 859) �
2(3.554 7)(1.625 0)(0.010 355)
eF �Ba 0F
0mb2
s2m � a 0F
0bb2
s2b � 2a 0F
0mba 0F
0bb smb
APPENDIX D Oxidation Numbers and Balancing Redox Equations AP5
The oxidation number, or oxidation state, is a bookkeeping device used tokeep track of the number of electrons formally associated with a particularelement. The oxidation number is meant to tell how many electrons havebeen lost or gained by a neutral atom when it forms a compound. Becauseoxidation numbers have no real physical meaning, they are somewhat arbi-trary, and not all chemists will assign the same oxidation number to a givenelement in an unusual compound. However, there are some ground rules thatprovide a useful start.
1. The oxidation number of an element by itself—e.g., Cu(s) or (g)—is 0.
2. The oxidation number of H is almost always except in metalhydrides—e.g., NaH—in which H is
3. The oxidation number of oxygen is almost always The onlycommon exceptions are peroxides, in which two oxygen atoms areconnected and each has an oxidation number of Two examples arehydrogen peroxide and its anion . Theoxidation number of oxygen in gaseous is, of course, 0.
4. The alkali metals (Li, Na, K, Rb, Cs, Fr) almost always have anoxidation number of The alkaline earth metals (Be, Mg, Ca, Sr,Ba, Ra) are almost always in the oxidation state.
5. The halogens (F, Cl, Br, I) are usually in the oxidation state.Exceptions occur when two different halogens are bound to each otheror when a halogen is bound to more than one atom. When differenthalogens are bound to each other, we assign the oxidation number to the more electronegative halogen.
The sum of the oxidation numbers of each atom in a molecule mustequal the charge of the molecule. In for example, we have
In , sulfur must have an oxidation number of so that the sum of theoxidation numbers will be
In benzene the oxidation number of each carbon must be ifhydrogen is assigned the number In cyclohexane the oxidationnumber of each carbon must be for the same reason. The carbons in ben-zene are in a higher oxidation state than those in cyclohexane.
The oxidation number of iodine in is This is unusual, becausehalogens are usually However, because chlorine is more electronegativethan iodine, we assign as thereby forcing I to be
The oxidation number of As in is and the value for S is This is arbitrary but reasonable. Because S is more electronegative than As,we make S negative and As positive; and, because S is in the same family asoxygen, which is usually we assign S as thus leaving As as
The oxidation number of S in (tetrathionate) is The frac-tional oxidation state comes about because six O atoms contribute Because the charge is the four S atoms must contribute The aver-age oxidation number of S must be
The oxidation number of Fe in is To make this assign-ment, we first recognize cyanide as a common ion that carriesa charge of Six cyanide ions give and three potassium ions (K�)6,1.
(CN)�3.K3Fe(CN)6
�104 � 2.5.
�10.2,12.
�2.5.S4O26
�3.2,2,
2.�3,As2S3
�1.1,Cl1.
�1.ICl2
2,(C6H12),�1.
1(C6H6),
net charge 2
sulfur � �6oxygen � 4(2) � 8
2:�6SO2
4
net charge 0
oxygen � 22 hydrogen � 2(�1) � �2
H2O,
1
1�2
�1.
O2
(HßOßO)(HßOßOßH)1.
2.1.
�1,Cl2
give Therefore, Fe should have an oxidation number of for the wholeformula to be neutral. In this approach, it is not necessary to assign individ-ual oxidation numbers to carbon and nitrogen, as long as we recognize thatthe charge of CN is
Problems
Answers are given at the end of this appendix.
D-1. Write the oxidation state of the boldface atom in each of the follow-ing species.
(a) AgBr (p)(b) (q)(c) (r)(d) (s)(e) (t) (CO group is neutral)(f) NO (u)(g) (v)(h) (w)(i) (x)(j) (y)(k) (z)(l)(m)(n)(o)
D-2. Identify the oxidizing agent and the reducing agent on the left sideof each of the following reactions.
(a)(b)
(c)(d)
GlycerolFormaldehyde Formic acid
(e)is cyclooctatetraene with the structure
(f)Hypoiodous
acid
Balancing Redox ReactionsTo balance a reaction involving oxidation and reduction, we must first iden-tify which element is oxidized and which is reduced. We then break the netreaction into two imaginary half-reactions, one of which involves only oxi-dation and the other only reduction. Although free electrons never appear ina balanced net reaction, they do appear in balanced half-reactions. If we aredealing with aqueous solutions, we proceed to balance each half-reaction,using and either or as necessary. A reaction is balanced whenthe number of atoms of each element is the same on both sides and the netcharge is the same on both sides.*
OH,H�H2O
I2 � OH S HOI � I
C8H8
C8H8 � 2Na S C8H28 � 2Na�
2H2C¢O � HCO2H � 2IO3 � H2O
HOCH2CHOHCH2OH � 2IO4 S
5CH3CH � 2MnO4 � 6H� B
O
5CH3COH � 2Mn2� � 3H2O
O4I � O2 � 4H� S 2I2 � 2H2OCr2O2
7 � 3Sn2� � 14H� S 2Cr3� � 3Sn4� � 7H2O
Mn(CN)46
ClO2
ClO2
K4Fe(CN)6
C3H�3ClO
Fe3O4Fe(OH)3
VO(SO4)Pb(OH)3
C2H6O (ethanol, CH3CH2OH)MnO2
P4O10Cr3�
(CH3)4Li4
Co2(CO)8HO2
HAsO23HS2O
3
N2H�5SeF6
NH�4S2O2
3
N2
1.
�3�3.
Structure: H — C
—
—
—
—C
C
H
H
�
APPENDIX DOxidation Numbers and Balancing Redox Equations
*A completely different method for balancing complex redox equations byinspection has been described by D. Kolb, J. Chem. Ed. 1981, 58, 642. For somechallenging problems in balancing redox equations, see R. Stout, J. Chem.Ed. 1995, 72, 1125.
Acidic Solutions
Here are the steps we will follow:
1. Assign oxidation numbers to the elements that are oxidized or reduced.2. Break the reaction into two half-reactions, one involving oxidation and
the other reduction.3. For each half-reaction, balance the number of atoms that are oxidized
or reduced.4. Balance the electrons to account for the change in oxidation number by
adding electrons to one side of each half-reaction.5. Balance oxygen atoms by adding to one side of each half-reaction.6. Balance the H atoms by adding to one side of each half-reaction.7. Multiply each half-reaction by the number of electrons in the other
half-reaction so that the number of electrons on each side of the totalreaction will cancel. Then add the two half-reactions and simplify tothe smallest integral coefficients.
Example Balancing a Redox Equation
Balance the following equation using but not
Permanganate
Solution
1. Assign oxidation numbers. They are assigned for Fe and Mn in eachspecies in the above reaction.
2. Break the reaction into two half-reactions.
Oxidation half-reaction:
Reduction half-reaction:
3. Balance the atoms that are oxidized or reduced. Because there is onlyone Fe or Mn in each species on each side of the equation, the atomsof Fe and Mn are already balanced.
4. Balance electrons. Electrons are added to account for the change ineach oxidation state.
In the second case, we need on the left side to take Mn from to
5. Balance oxygen atoms. There are no oxygen atoms in the Fe half-reaction. There are four oxygen atoms on the left side of the Mnreaction, so we add four molecules of to the right side:
6. Balance hydrogen atoms. The Fe equation is already balanced. TheMn equation needs on the left.
At this point, each half-reaction must be completely balanced (thesame number of atoms and charge on each side) or you have made amistake.
7. Multiply and add the reactions. We multiply the Fe equation by 5 andthe Mn equation by 1 and add:
The total charge on each side is and we find the same number ofatoms of each element on each side. The equation is balanced.
�17,
5Fe2� � MnO4 � 8H� T 5Fe3� � Mn2� � 4H2O
MnO4 � 5e � 8H� T Mn2� � 4H2O
5Fe2� T 5Fe3� � 5e
MnO4 � 5e � 8H� S Mn2� � 4H2O
8H�
MnO4 � 5e T Mn2� � 4H2O
H2O
�2.�75e
MnO4 � 5e T Mn2�
Fe2� T Fe3� � e
�2�7
MnO4 T Mn2�
�3�2
Fe2� T Fe3�
�2�3�7�2
Fe2� � MnO4 T Fe3� � Mn2�
OH:H�,
H�
H2O
Example A Reverse Disproportionation
Now try the next reaction, which represents the reverse of a dispropor-tionation. (In a disproportionation, an element in one oxidation statereacts to give the same element in higher and lower oxidation states.)
0Iodine Iodate
Solution
1. The oxidation numbers are assigned above. Note that chlorine has anoxidation number of on both sides of the equation. Only iodine isinvolved in electron transfer.
2. Oxidation half-reaction:0
Reduction half-reaction:
3. We need to balance I atoms in the first reaction and add to eachreaction to balance Cl.
4. Now add electrons to each.
The first reaction needs because there are two I atoms, each ofwhich changes from 0 to
5. The second reaction needs on the right side to balance oxygenatoms.
6. The first reaction is balanced, but the second needs on the left.
As a check, the charge on each side of this half-reaction is andall atoms are balanced.
7. Multiply and add.
(D-1)
We multiplied the first reaction by 2 so that there would be the samenumber of electrons in each half-reaction. You could have multiplied thefirst reaction by 4 and the second by 2, but then all coefficients wouldsimply be doubled. We customarily write the smallest coefficients.
Basic Solutions
The method many people prefer for basic solutions is to balance the equationfirst with The answer can then be converted into one in which is usedinstead. This is done by adding to each side of the equation a number of hydrox-ide ions equal to the number of ions appearing in the equation. For example,to balance Equation D-1 with instead of proceed as follows:
1442443
3H2O2
6H2O
2I2 � IO3 � 10Cl � 6H� � 6OH T 5ICl2 � 3H2O � 6OH
�6OH�6OH
2I2 � IO3 � 10Cl � 6H� T 5ICl2 � 3H2O
H�,OH
H�
OHH�.
2I2 � IO3 � 10Cl � 6H� T 5ICl2 � 3H2O
IO3 � 2Cl � 4e � 6H� T ICl2 � 3H2O
2(I2 � 4Cl T 2ICl2 � 2e)
1,
IO3 � 2Cl � 4e � 6H� T ICl
2 � 3H2O
6H�
IO3 � 2Cl � 4e T ICl
2 � 3H2O
3H2O�1.
2e
IO3 � 2Cl � 4e T ICl2
I2 � 4Cl T 2ICl2 � 2e
IO3 � 2Cl T ICl2
I2 � 4Cl T 2ICl2
Cl
�1�5
IO3 T ICl2
�1
I2 T ICl2
1
�1 11�5
I2 � IO3 � Cl T ICl2
AP6 APPENDIX D Oxidation Numbers and Balancing Redox Equations
Realizing that and canceling on each side,gives the final result:
Problems
D-3. Balance the following reactions by using but not
(a)(b)(c)(d)(e)(f)(g)
(h)(i)( j)(k)
D-4. Balance the following equations by using but not
(a)(b)(c)(d)(e)(f)(g)(h)(i)( j)
(k)(l)
Answers
D-1. (a) (j) (s)(b) (k) (t) 0(c) (l) (u)(d) (m) (v)(e) (n) (w)(f) (o) (x)(g) (p) 0 (y)(h) (q) (z)(i) (r)
D-2. Oxidizing agent Reducing agent
(a)(b)(c)(d) Glycerol(e) Na(f) I2I2
C8H8
IO4
CH3CHOMnO4
IO2
Sn2�Cr2O27
2�22/33�4�8/3�3�4�2�22�31
2
�5�4�24�2�6
�1�2�3�3�1
K3V5O14 � HOCH2CHOHCH2OH T VO(OH)2 � HCO2 � K�
MnO4 � HCCH2CH2OH T
O
CH2(CO2)2 � MnO2
Mn2O3 � Hg � CN T Mn(CN)46 � Hg(CN)2
BH4 � H2O T H3BO3 � H2
Cu2� � H2 T Cu � H2OMn2O3 � CN T Mn(CN)4
6 � (CN)2
WO3 � O2 T HW6O5
21 � OH
ClO2 � OH T ClO2 � ClO
3
HO2 � Cr(OH)
3 T CrO24 � OH
Ag2S � CN � O2 T S � Ag(CN)2 � OH
HNO2 � SbO� T NO � Sb2O5
PbO2 � Cl T ClO � Pb(OH)3
H�.OH
ClO3 T Cl2 � O2
Hg2SO4 � Ca2� � S8 T Hg2�2 � CaS2O3
MnO24 T MnO2 � MnO
4
Cr2O7 � CH3CH T CH3COH � Cr3�
O
2
OClO
3 � As2S3 T Cl � H2AsO4 � SO2
4
S2O23 � I2 T I � S4O2
6
CuS � NO3 T Cu2� � SO2
4 � NOSeO2
4 � Hg � Cl T SeO23 � Hg2Cl2
VO2� � Sn2� T V3� � Sn4�
Ag � NO3 T Ag� � NO
Fe3� � Hg2�2 T Fe2� � Hg2�
OH.H�
2I2 � IO3 � 10Cl � 3H2O T 5ICl2 � 6OH
3H2O6H� � 6OH � 6H2O, Reaction (f) is called a disproportionation, because an element in oneoxidation state is transformed into two different oxidation states—one higherand one lower than the original oxidation state.
D-3. (a)(b)(c)(d)(e)(f)(g)
(h)(i)( j)(k)
The balanced half-reaction for in (g) is
Because is a single compound, we must consider the and reactions together. The net change in oxidation
number for the two As atoms is The net change in oxidationnumber for the three S atoms is Therefore,
are involved in the half-reaction.
D-4. (a)(b)(c)(d)(e)(f)(g)(h)(i)(j)
(k)
For (k), the organic half-reaction is
(l)
For (l), the two half-reactions are and
8e � 8H2O.C3H8O3 � 11OH T 3HCO
2 �5VO(OH)2 � 8OH � 3K�
K3V5O14 � 9H2O � 5e T40VO(OH)2 � 15HCO
2 � 9OH � 24K�
32H2O � 8K3V5O14 � 5HOCH2CHOHCH2OH TC3H2O2
4 � 6e � 6H2O.8OH � C3H6O2 T
2MnO4 � HCCH2CH2OH T 2MnO2 � 2H2O � CH2(CO2
)2
O2Mn(CN)4
6 � Hg(CN)2 � 6OH
3H2O � Mn2O3 � Hg � 14CN TBH
4 � 4H2O T H3BO3 � 4H2 � OH
Cu2� � H2 � 2OH T Cu � 2H2OMn2O3 � 14CN � 3H2O T 2Mn(CN)4
6 � (CN)2 � 6OH
12WO3 � 3O2 � 2H2O T 2HW6O5
21 � 2OH
2ClO2 � 2OH T ClO2 � ClO
3 � H2O2HO
2 � Cr(OH)3 T CrO2
4 � OH � 2H2OAg2S � 4CN � 1
2O2 � H2O T S � 2Ag(CN)2 � 2OH
4HNO2 � 2SbO � 2OH T 4NO � Sb2O5 � 3H2OH2O � OH � PbO2 � Cl T Pb(OH)
3 � ClO
28e
24 � 4 �3[6 (2)] � �24.2(5 3) � �4.
As2S3 S SO24H2AsO
4
As2S3 SAs2S3
�6�5�3 2
As2S3 � 20H2O T 2H2AsO4 � 3SO2
4 � 28e � 36H�
As2S3
2H� � 2ClO3 T Cl2 � 5
2O2 � H2O2Hg2SO4 � 3Ca2� � 1
2S8 � H2O T 2Hg2�2 � 3CaS2O3 � 2H�
4H� � 3MnO24 T MnO2 � 2MnO
4 � 2H2OCr2O2
7 � 3CH3CHO � 8H� T 2Cr3� � 3CH3CO2H � 4H2O14Cl � 6H2AsO
4 � 9SO24 � 24H�
14ClO3 � 3As2S3 � 18H2O T
2S2O23 � I2 T S4O2
6 � 2I
3CuS � 8NO3 � 8H� T 3Cu2� � 3SO2
4 � 8NO � 4H2O2Hg � 2Cl � SeO2
4 � 2H� T Hg2Cl2 � SeO23 � H2O
4H� � 2VO2� � Sn2� T 2V3� � Sn4� � 2H2O3Ag � NO
3 � 4H� T 3Ag� � NO � 2H2O2Fe3� � Hg2�
2 T 2Fe2� � 2Hg2�
APPENDIX D Oxidation Numbers and Balancing Redox Equations AP7

AP8 APPENDIX E Normality
APPENDIX ENormality
The normality, N, of a redox reagent is n times the molarity, where n is thenumber of electrons donated or accepted by that species in a chemicalreaction.
(E-1)
For example, in the half-reaction
(E-2)
the normality of permanganate ion is five times its molarity, because eachaccepts If the molarity of permanganate is 0.1 M, the normality
for the reaction
(E-3)
is (read “0.5 normal”). In this reaction, each ion donatesone electron. The normality of ferrous ion equals the molarity of ferrous ion,even though it takes five ferrous ions to balance the reaction.
In the half-reaction
(E-4)
each ion accepts only three electrons. The normality of permanganatefor this reaction is equal to three times the molarity of permanganate. A 0.06 Npermanganate solution for this reaction contains 0.02 M
The normality of a solution is a statement of the moles of “reactingunits” per liter. One mole of reacting units is called one equivalent. Therefore,the units of normality are equivalents per liter (equiv/L). For redox reagents,one equivalent is the amount of substance that can donate or accept one moleof electrons. It is possible to speak of equivalents only with respect to a partic-ular half-reaction. For example, in Reaction E-2, there are five equivalents permole of but, in Reaction E-4, there are only three equivalents per moleof . The mass of substance containing one equivalent is called the equiva-lent mass. The formula mass of is 158.033 9. The equivalent mass of
for Reaction E-2 is 8 g/equiv. The equivalentmass of for Reaction E-4 is 0 g/equiv.
Example Finding Normality
Find the normality of a solution containing 6.34 g of ascorbic acid in250.0 mL if the relevant half-reaction is
Ascorbic acid Dehydroascorbic acid(vitamin C)
Solution The formula mass of ascorbic acid is 176.124. In6.34 g, there are Becauseeach mole contains 2 equivalents in this example,
equivalent. The normality is(7.20 � 102 equiv) / (0.250 0 L) � 0.288 N.(3.60 � 102 mol) � 7.20 � 102
6.34 g � (2 equiv/mol)(6.34 g) / (176.124 g/mol) � 3.60 � 102 mol.
(C6H8O6)
H2O �
HOOH
—
O
OHHO
O � 2H� � 2e
HOHO OH
OHO
TO
O
158.033 9/3 � 52.678KMnO4
158.033 9/5 � 31.606KMnO4
KMnO4
MnO4
MnO4 ;
MnO4 .
MnO4
MnO4 � 4H� � 3e T MnO2 � 2H2O
Fe2�5 � 0.1 � 0.5 N
MnO4 � 5Fe2� � 8H� T Mn2� � 5Fe3� � 4H2O
5e.MnO4
MnO4 � 8H� � 5e T Mn2� � 4H2O
N � nM
Example Using Normality
How many grams of potassium oxalate should be dissolved in 500.0 mLto make a 0.100 N solution for titration of ?
(E-5)
Solution It is first necessary to write the oxalic acid half-reaction:
It is apparent that there are two equivalents per mole of oxalic acid.Hence, a 0.100 N solution will be 0.050 0 M:
Therefore, we must dissolve in500.0 mL. Because the formula mass of is 166.216, we shoulduse of potassium oxalate.
The utility of normality in volumetric analysis lies in the equation
(E-6)
where is the normality of reagent 1, is the volume of reagent 1, isthe normality of reagent 2, and is the volume of reagent 2. and
may be expressed in any units, as long as the same units are used for both.
Example Finding Normality
A solution containing 25.0 mL of oxalic acid required 13.78 mL of0.041 62 N for titration, according to Reaction E-5. Find thenormality and molarity of the oxalic acid.
Solution Setting up Equation E-6, we write
Because there are two equivalents per mole of oxalic acid in Reaction E-5,
Normality is sometimes used in acid-base or ion-exchange chemistry.With respect to acids and bases, the equivalent mass of a reagent is theamount that can donate or accept 1 mole of With respect to ion exchange,the equivalent mass is the mass of reagent containing 1 mole of charge.
H�.
M �Nn
�0.022 94
2� 0.011 47 M
N1 � 0.022 94 equiv/L
N1(25.0 mL) � (0.041 62 N)(13.78 mL)
KMnO4
V2
V1V2
N2V1N1
N1V1 � N2V2
(0.025 0 mol) � (166.216 g/mol) � 4.15 gK2C2O4
(0.050 0 mol/L)(0.500 0 L) � 0.025 0 mol
0.100 equiv/L
2 equiv/mol� 0.050 0 mol/L � 0.050 0 M
H2C2O4 T 2CO2 � 2H� � 2e
5H2C2O4 � 2MnO4 � 6H� T 2Mn2� � 10CO2 � 8H2O
MnO4

APPENDIX F Solubility Products AP9
APPENDIX FSolubility Products*
Formula pKsp Ksp
Azides: L � N3
CuL 8.31 4.9 � 109
AgL 8.56 2.8 � 109
Hg2L2 9.15 7.1 � 1010
TlL 3.66 2.2 � 104
PdL2(�) 8.57 2.7 � 109
Bromates: L � BrOBaL �H2O (f) 5.11 7.8 � 106
AgL 4.26 5.5 � 105
TlL 3.78 1.7 � 104
PbL2 5.10 7.9 � 106
Bromides: L � Br
CuL 8.3 5 � 109
AgL 12.30 5.0 � 1013
Hg2L2 22.25 5.6 � 1023
TlL 5.44 3.6 � 106
HgL2 (f) 18.9 1.3 � 1019
PbL2 5.68 2.1 � 106
Carbonates: L � COMgL 7.46 3.5 � 108
CaL (calcite) 8.35 4.5 � 109
CaL (aragonite) 8.22 6.0 � 109
SrL 9.03 9.3 � 1010
BaL 8.30 5.0 � 109
Y2L3 30.6 2.5 � 1031
La2L3 33.4 4.0 � 1034
MnL 9.30 5.0 � 1010
FeL 10.68 2.1 � 1011
CoL 9.98 1.0 � 1010
NiL 6.87 1.3 � 107
CuL 9.63 2.3 � 1010
Ag2L 11.09 8.1 � 1012
Hg2L 16.05 8.9 � 1017
ZnL 10.00 1.0 � 1010
CdL 13.74 1.8 � 1014
PbL 13.13 7.4 � 1014
Chlorides: L � Cl
CuL 6.73 1.9 � 107
AgL 9.74 1.8 � 1010
Hg2L2 17.91 1.2 � 1018
TlL 3.74 1.8 � 104
PbL2 4.78 1.7 � 105
23
3
Formula pKsp Ksp
Chromates: L � CrOBaL 9.67 2.1 � 1010
CuL 5.44 3.6 � 106
Ag2L 11.92 1.2 � 1012
Hg2L 8.70 2.0 � 109
Tl2L 12.01 9.8 � 1013
Cobalticyanides: L � Co(CN)Ag3L 25.41 3.9 � 1026
(Hg2)3L2 36.72 1.9 � 1037
Cyanides: L � CN
AgL 15.66 2.2 � 1016
Hg2L2 39.3 5 � 1040
ZnL2 (h) 15.5 3 � 1016
Ferrocyanides: L � Fe(CN)Ag4L 44.07 8.5 � 1045
Zn2L 15.68 2.1 � 1016
Cd2L 17.38 4.2 � 1018
Pb2L 18.02 9.5 � 1019
Fluorides: L � F
LiL 2.77 1.7 � 103
MgL2 8.13 7.4 � 109
CaL2 10.50 3.2 � 1011
SrL2 8.58 2.6 � 109
BaL2 5.82 1.5 � 106
LaL3 18.7 2 � 1019
ThL4 28.3 5 � 1029
PbL2 7.44 3.6 � 108
Hydroxides: L � OH
MgL2 (amorphous) 9.2 6 � 1010
MgL2 (brucite crystal) 11.15 7.1 � 1012
CaL2 5.19 6.5 � 106
BaL2 � 8H2O 3.6 3 � 104
YL3 23.2 6 � 1024
LaL3 20.7 2 � 1021
CeL3 21.2 6 � 1022
UO2 (T U4� � 4OH) 56.2 6 � 1057
UO2L2 (T UO � 2OH) 22.4 4 � 1023
MnL2 12.8 1.6 � 1013
FeL2 15.1 7.9 � 1016
CoL2 14.9 1.3 � 1015
NiL2 15.2 6 � 1016
2�2
46
36
24
*The designations �, �, or � after some formulas refer to particular crystalline forms (which are customarily identified by Greekletters). Data for salts except oxalates are taken mainly from A. E. Martell and R. M. Smith, Critical Stability Constants, Vol. 4 (NewYork: Plenum Press, 1976). Data for oxalates are from L. G. Sillén and A. E. Martell, Stability Constants of Metal-Ion Complexes,Supplement No. 1 (London: The Chemical Society, Special Publication No. 25, 1971). Another source: R. M. H. Verbeeck et al., Inorg.Chem. 1984, 23, 1922.
Conditions are 25°C and zero ionic strength unless otherwise indicated: (a) 19°C; (b) 20°C; (c) 38°C; (d) 0.1 M; (e) 0.2 M; ( f) 0.5 M;(g) 1 M; (h) 3 M; (i) 4 M; ( j) 5 M.
(Continued)
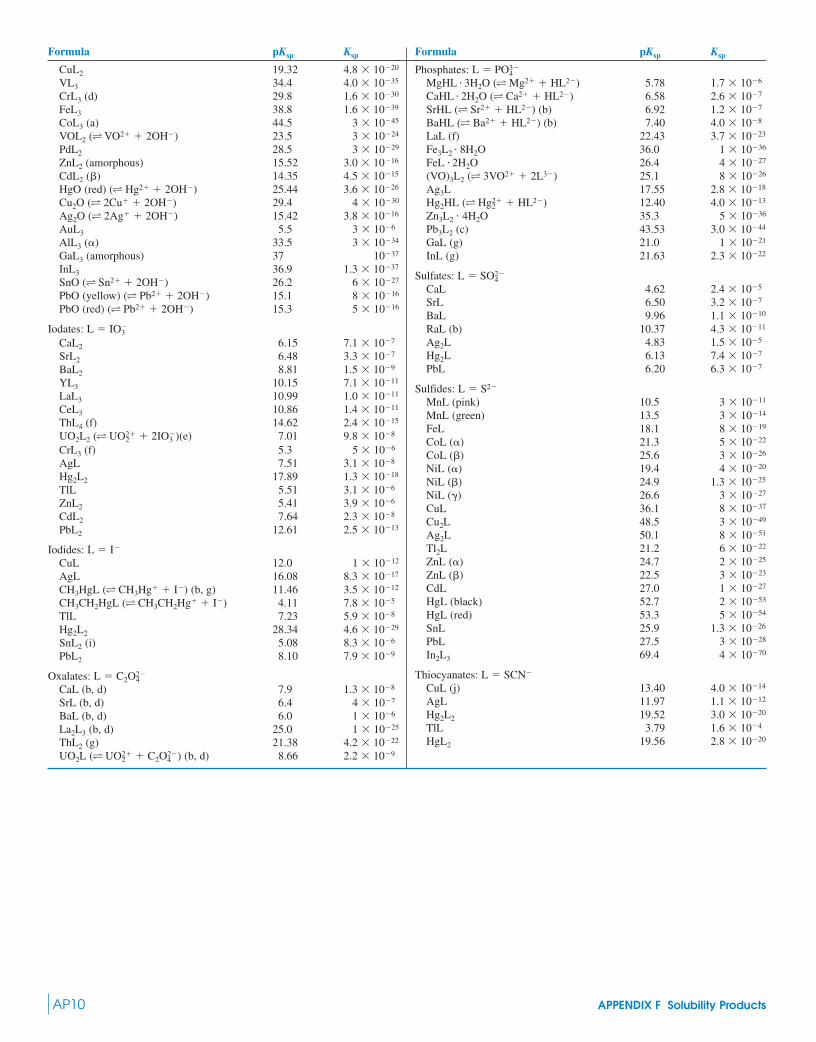
AP10 APPENDIX F Solubility Products
Formula pKsp Ksp
CuL2 19.32 4.8 � 1020
VL3 34.4 4.0 � 1035
CrL3 (d) 29.8 1.6 � 1030
FeL3 38.8 1.6 � 1039
CoL3 (a) 44.5 3 � 1045
VOL2 (T VO2� � 2OH) 23.5 3 � 1024
PdL2 28.5 3 � 1029
ZnL2 (amorphous) 15.52 3.0 � 1016
CdL2 (�) 14.35 4.5 � 1015
HgO (red) (T Hg2� � 2OH) 25.44 3.6 � 1026
Cu2O (T 2Cu� � 2OH) 29.4 4 � 1030
Ag2O (T 2Ag� � 2OH) 15.42 3.8 � 1016
AuL3 5.5 3 � 106
AlL3 (�) 33.5 3 � 1034
GaL3 (amorphous) 37 1037
InL3 36.9 1.3 � 1037
SnO (T Sn2� � 2OH) 26.2 6 � 1027
PbO (yellow) (T Pb2� � 2OH) 15.1 8 � 1016
PbO (red) (T Pb2� � 2OH) 15.3 5 � 1016
Iodates: L � IOCaL2 6.15 7.1 � 107
SrL2 6.48 3.3 � 107
BaL2 8.81 1.5 � 109
YL3 10.15 7.1 � 1011
LaL3 10.99 1.0 � 1011
CeL3 10.86 1.4 � 1011
ThL4 (f) 14.62 2.4 � 1015
UO2L2 (T UO � 2IO )(e) 7.01 9.8 � 108
CrL3 (f) 5.3 5 � 106
AgL 7.51 3.1 � 108
Hg2L2 17.89 1.3 � 1018
TlL 5.51 3.1 � 106
ZnL2 5.41 3.9 � 106
CdL2 7.64 2.3 � 108
PbL2 12.61 2.5 � 1013
Iodides: L � I
CuL 12.0 1 � 1012
AgL 16.08 8.3 � 1017
CH3HgL (T CH3Hg� � I) (b, g) 11.46 3.5 � 1012
CH3CH2HgL (T CH3CH2Hg� � I) 4.11 7.8 � 105
TlL 7.23 5.9 � 108
Hg2L2 28.34 4.6 � 1029
SnL2 (i) 5.08 8.3 � 106
PbL2 8.10 7.9 � 109
Oxalates: L � C2OCaL (b, d) 7.9 1.3 � 108
SrL (b, d) 6.4 4 � 107
BaL (b, d) 6.0 1 � 106
La2L3 (b, d) 25.0 1 � 1025
ThL2 (g) 21.38 4.2 � 1022
UO2L (T UO � C2O ) (b, d) 8.66 2.2 � 10924
2�2
24
3
2�2
3
Formula pKsp Ksp
Phosphates: L � POMgHL � 3H2O (T Mg2� � HL2) 5.78 1.7 � 106
CaHL � 2H2O (T Ca2� � HL2) 6.58 2.6 � 107
SrHL (T Sr2� � HL2) (b) 6.92 1.2 � 107
BaHL (T Ba2� � HL2) (b) 7.40 4.0 � 108
LaL (f) 22.43 3.7 � 1023
Fe3L2 � 8H2O 36.0 1 � 1036
FeL � 2H2O 26.4 4 � 1027
(VO)3L2 (T 3VO2� � 2L3) 25.1 8 � 1026
Ag3L 17.55 2.8 � 1018
Hg2HL (T Hg � HL2) 12.40 4.0 � 1013
Zn3L2 � 4H2O 35.3 5 � 1036
Pb3L2 (c) 43.53 3.0 � 1044
GaL (g) 21.0 1 � 1021
InL (g) 21.63 2.3 � 1022
Sulfates: L � SOCaL 4.62 2.4 � 105
SrL 6.50 3.2 � 107
BaL 9.96 1.1 � 1010
RaL (b) 10.37 4.3 � 1011
Ag2L 4.83 1.5 � 105
Hg2L 6.13 7.4 � 107
PbL 6.20 6.3 � 107
Sulfides: L � S2
MnL (pink) 10.5 3 � 1011
MnL (green) 13.5 3 � 1014
FeL 18.1 8 � 1019
CoL (�) 21.3 5 � 1022
CoL (�) 25.6 3 � 1026
NiL (�) 19.4 4 � 1020
NiL (�) 24.9 1.3 � 1025
NiL (�) 26.6 3 � 1027
CuL 36.1 8 � 1037
Cu2L 48.5 3 � 1049
Ag2L 50.1 8 � 1051
Tl2L 21.2 6 � 1022
ZnL (�) 24.7 2 � 1025
ZnL (�) 22.5 3 � 1023
CdL 27.0 1 � 1027
HgL (black) 52.7 2 � 1053
HgL (red) 53.3 5 � 1054
SnL 25.9 1.3 � 1026
PbL 27.5 3 � 1028
In2L3 69.4 4 � 1070
Thiocyanates: L � SCN
CuL (j) 13.40 4.0 � 1014
AgL 11.97 1.1 � 1012
Hg2L2 19.52 3.0 � 1020
TlL 3.79 1.6 � 104
HgL2 19.56 2.8 � 1020
24
2�2
34

APPENDIX G Acid Dissociation Constants AP11
Name Structure* pKa† Ka
‡
Acetic acid CH3CO2H 4.756 1.75 � 105
(ethanoic acid)
2-Aminoethanethiol HSCH2CH2NH 8.21 (SH) ( � 0.1) 6.2 � 109
(2-mercaptoethylamine) 10.73 (NH3) ( � 0.1) 1.86 � 1011
2-Aminoethanol HOCH2CH2NH 9.498 3.18 � 1010
(ethanolamine)
Ammonia NH 9.245 5.69 � 1010
As(OH)3 9.29 5.1 � 1010
6.9 � 103
1.86 � 1092.16 (CO2H) ( � 0.1)8.73 (NH3) ( � 0.1)
CHCH2CNH2
CO2H
ONH3�
Asparagine
Arsenious acid(hydrogen arsenite)
4.9 � 103
8.9 � 108
1.3 � 1012
2.317.05
11.9As
OH
OHHO
O
Arsenic acid(hydrogen arsenate)
1.50 � 102
1.02 � 109
8 � 1013
1.823 (CO2H)8.991 (NH3)
(12.1) (NH2) ( � 0.1)CHCH2CH2CH2NHC
CO2H
NH2�
NH2
NH3�
Arginine
�4
2.0 � 105
1.05 � 10104.70 (NH3) (20°)9.97 (OH) (20°)
NH3�
OH2-Aminophenol
�3
�3
8.3 � 103
1.10 � 1052.08 (CO2H)4.96 (NH3)
NH3�
CO2H
2-Aminobenzoic acid(anthranilic acid)
5.86 � 1043.232O3S NH3�4-Aminobenzenesulfonic acid
(sulfanilic acid)
2.51 � 1054.601NH3�Aminobenzene
(aniline)
4.53 � 103
1.36 � 10102.344 (CO2H)9.868 (NH3)
CHCH3
CO2H
NH3�
Alanine
*Each acid is written in its protonated form. The acidic protons are indicated in bold type.
† values refer to 25°C and zero ionic strength unless otherwise indicated. Values in parentheses are considered to be lessreliable. Data are from A. E. Martell, R. M. Smith, and R. J. Motekaitis, NIST Database 46 (Gaithersburg, MD: National Instituteof Standards and Technology, 2001).
‡The accurate way to calculate for the conjugate base is and .Kb � 10pKbpKb � 13.995 pKaKb
pKa
(Continued)
APPENDIX GAcid Dissociation Constants

Name Structure pKa Ka
B(OH)3
Bromoacetic acid BrCH2CO2H 2.902 1.25 � 103
CH3CH2CH2CO2H 4.818 1.52 � 105
Butylamine CH3CH2CH2CH2NH 10.640 2.29 � 1011
Chloroacetic acid ClCH2CO2H 2.865 1.36 � 103
3-Chloropropanoic acid ClCH2CH2CO2H 4.11 7.8 � 105
HOCl£O 1.96 1.10 � 102Chlorous acid(hydrogen chlorite)
4.46 � 107
4.69 � 10116.351
10.329C OHHO
OCarbonic acid*(hydrogen carbonate)
�3
9.5 � 104
3.3 � 1053.024.48HO2C
CO2Htrans-Butenedioic acid
(fumaric acid)
1.20 � 102
5.37 � 1071.926.27CO2H
CO2Hcis-Butenedioic acid
(maleic acid)
Butanoic acid
2.2 � 1011
1 � 101210.6612.0
NOH
CH3CH3
HONButane-2,3-dione dioxime
(dimethylglyoxime)
5.79 � 1010
1.82 � 1013
1.58 � 1014
9.237(12.74) (20°)(13.80) (20°)
Boric acid(hydrogen borate)
4.6 � 1054.34�
NH
N2,2�-Bipyridine
4.5 � 10109.35CH2NH3�Benzylamine
6.28 � 1054.202CO2HBenzoic acid
1.38 � 103
5.0 � 105
5.2 � 107
2.864.306.28
CO2H
CO2HCO2H
Benzene-1,2,3-tricarboxylic acid(hemimellitic acid)
9.1 � 1098.04NH2�Aziridine
(dimethyleneimine)
1.02 � 102
1.26 � 104
9.95 � 1011
1.990 (�-CO2H)3.900 (�-CO2H)
10.002 (NH3)CHCH2CO2H
CO2H
NH3�
�
�Aspartic acid
AP12 APPENDIX G Acid Dissociation Constants
*The concentration of “carbonic acid” is considered to be the sum [H2CO3] � [CO2(aq)]. See Box 6-4.
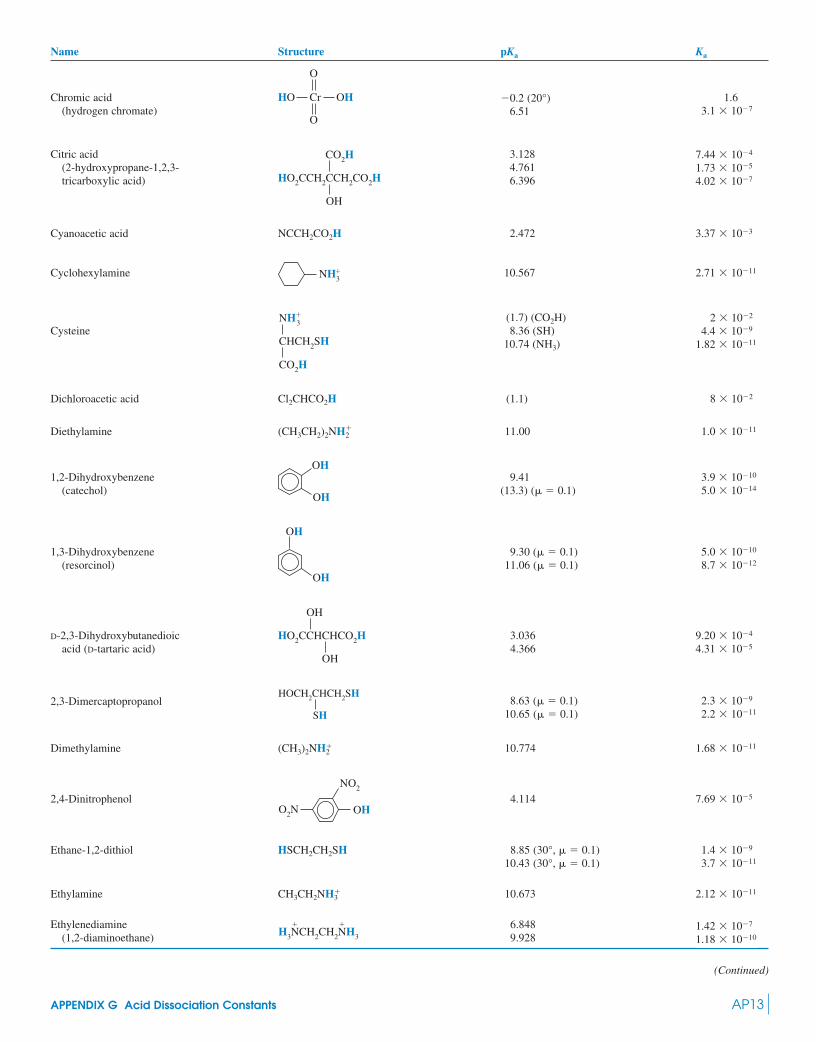
Name Structure pKa Ka
Cyanoacetic acid NCCH2CO2H 2.472 3.37 � 103
Cyclohexylamine 10.567 2.71 � 1011
Dichloroacetic acid Cl2CHCO2H (1.1) 8 � 102
(CH3CH2)2NH 11.00 1.0 � 1011
Dimethylamine (CH3)2NH 10.774 1.68 � 1011
4.114 7.69 � 105
Ethane-1,2-dithiol HSCH2CH2SH 8.85 (30°, � 0.1) 1.4 � 109
10.43 (30°, � 0.1) 3.7 � 1011
Ethylamine CH3CH2NH 10.673 2.12 � 1011
1.42 � 107
1.18 � 1010
6.8489.928H3NCH2CH2NH3
� �Ethylenediamine(1,2-diaminoethane)
�3
OH
NO2
O2N2,4-Dinitrophenol
�2
2.3 � 109
2.2 � 10118.63 ( � 0.1)
10.65 ( � 0.1)
HOCH2CHCH2SH
SH2,3-Dimercaptopropanol
9.20 � 104
4.31 � 1053.0364.366
OH
HO2CCHCHCO2H
OH
D-2,3-Dihydroxybutanedioicacid (D-tartaric acid)
5.0 � 1010
8.7 � 10129.30 ( � 0.1)
11.06 ( � 0.1)OH
OH
1,3-Dihydroxybenzene(resorcinol)
3.9 � 1010
5.0 � 10149.41
(13.3) ( � 0.1)OH
OH1,2-Dihydroxybenzene
(catechol)
�2Diethylamine
2 � 102
4.4 � 109
1.82 � 1011
(1.7) (CO2H)8.36 (SH)
10.74 (NH3)CHCH2SH
CO2H
NH3�
Cysteine
NH3�
7.44 � 104
1.73 � 105
4.02 � 107
3.1284.7616.396HO2CCH2CCH2CO2H
OH
CO2HCitric acid(2-hydroxypropane-1,2,3-tricarboxylic acid)
1.63.1 � 107
0.2 (20°)6.51
Cr
O
OHHO
O
Chromic acid(hydrogen chromate)
APPENDIX G Acid Dissociation Constants AP13
(Continued)

AP14 APPENDIX G Acid Dissociation Constants
Name Structure pKa Ka
Formic acid HCO2H 3.744 1.80 � 104
(methanoic acid)
Guanidine (13.5) ( � 1.0) 3 � 1014
HO2CCH2CH2CH2CH2CO2H
Hexane-2,4-dione 9.38 4.2 � 1010
Hydrazine H3N�
N�
H3
4.65 2.2 � 105
Hydrogen cyanate HOCΩN 3.48 3.3 � 104
Hydrogen cyanide HCΩN 9.21 6.2 � 1010
Hydrogen fluoride HF 3.17 6.8 � 104
Hydrogen peroxide HOOH 11.65 2.2 � 1012
Hydrogen sulfide H2S 7.02 9.5 � 108
14.0* 1.0 � 1014*
Hydrogen thiocyanate HSCΩN (1.1) (20°C) 0.08
Hydroxyacetic acid HOCH2CO2H 3.832 1.48 � 104
(glycolic acid)
HN N N�
Hydrazoic acid(hydrogen azide)
9.89.5 � 109
0.998.02
3 � 102
1.07 � 106
5.2 � 1010
1.6 (CO2H)5.97 (NH)9.28 (NH3)
NH
NH
�
NH3�
CHCH2
CO2H
Histidine
O O
CH3CCH2CCH2CH3
3.77 � 105
3.80 � 106
4.4245.420
1,6-Hexanedioic acid(adipic acid)
�NH2
C NH2H2N
4.47 � 103
1.67 � 10102.350 (CO2H)9.778 (NH3)
CH2
CO2H
NH3�
Glycine(aminoacetic acid)
6.5 � 103
1.00 � 1092.19 (CO2H) ( � 0.1)9.00 (NH3) ( � 0.1)
CHCH2CH2CNH2
CO2H
NH3O�
Glutamine
6.92 � 103
5.0 � 105
1.10 � 1010
2.160 (�-CO2H)4.30 (�-CO2H)9.96 (NH3)
CHCH2CH2CO2H
CO2H
NH3�
�
�
Glutamic acid
1.00.0320.0100.002 0
7.4 � 107
4.3 � 1011
(0.0) (CO2H) ( � 1.0)(1.5) (CO2H) ( � 0.1)2.00 (CO2H) ( � 0.1)2.69 (CO2H) ( � 0.1)6.13 (NH) ( � 0.1)
10.37 (NH) ( � 0.1)
(HO2CCH2)2NHCH2CH2NH(CH2CO2H)2
��
Ethylenedinitrilotetraaceticacid (EDTA)
*D. J. Phillips and S. L. Phillips. “High Temperature Dissociation Constants of HS and the Standard Thermodynamic Values for S2,”J. Chem. Eng. Data 2000, 45, 981.

APPENDIX G Acid Dissociation Constants AP15
Name Structure pKa Ka
9.997 1.01 � 1010
Hydroxylamine
Hypobromous acid HOBr 8.63 2.3 � 109
(hydrogen hypobromite)
Hypochlorous acid HOCl 7.53 3.0 � 108
(hydrogen hypochlorite)
Hypoiodous acid HOI 10.64 2.3 � 1011
(hydrogen hypoiodite)
(1.3) 5 � 102
0.77 0.17
Iodoacetic acid ICH2CO2H 3.175 6.68 � 104
1.7 � 102
8.5 � 1010
1.51 � 1011
(1.77) (CO2H)9.07 (�-NH3)
10.82 ('-NH3)CO2H
NH3�
CHCH2CH2CH2CH2NH3�
�
'Lysine
4.70 � 103
1.80 � 10102.328 (CO2H)9.744 (NH3)
CHCH2CH(CH3)2
CO2H
NH3�
Leucine
4.81 � 103
1.75 � 10102.318 (CO2H)9.758 (NH3)
CHCH(CH3)CH2CH3
CO2H
NH3�
Isoleucine
O
HOI OIodic acid
(hydrogen iodate)
1.41 � 102
1.45 � 103
1.62 � 1010
1.85 (CO2H)2.84 (CO2H)9.79 (NH2)
H2N(CH2CO2H)2
�Iminodiacetic acid
1.02 � 107
3 � 10156.993
(14.5)NH�
NH
Imidazole(1,3-diazole)
O
H2POH
Hypophosphorous acid(hydrogen hypophosphite)
1.15 � 105
1.51 � 10104.94 (NH)9.82 (OH)
HONH�
8-Hydroxyquinoline(oxine)
1.10 � 106
1.8 � 1014
5.96 (NH)(13.74) (OH)
HONH3
�
3.48 � 104
8.00 � 1063.4595.097
OH
HO2CCH2CHCO2HL-Hydroxybutanedioic acid
(malic acid)
1.07 � 103
2 � 10142.972 (CO2H)
(13.7) (OH)OH
CO2H2-Hydroxybenzoic acid
(salicylic acid)
OHHydroxybenzene(phenol)
(Continued)

AP16 APPENDIX G Acid Dissociation Constants
Name Structure pKa Ka
HO2CCH2CO2H
HSCH2CO2H
2-Mercaptoethanol HSCH2CH2OH 9.75 1.8 � 1010
Methylamine 10.645 2.26 � 1011
0.100.010
1.15 � 103
4.63 � 1011
(1.0) (CO2H) (25°, � 0.1)2.0 (CO2H) (25°)2.940 (CO2H) (20°)
10.334 (NH) (20°)
HN(CH2CO2H)3
�Nitrilotriacetic acid
2.67 � 10109.573OH
2-Naphthol
3.84 � 10109.416
OH
1-Naphthol
6.9 � 1054.16CO2H2-Naphthoic acid
2.1 � 1043.67
CO2H
1-Naphthoic acid
3.22 � 1098.492NH 2
�OMorpholine
(perhydro-1,4-oxazine)
5.5 � 101110.269OHCH3
4-Methylphenol(p-cresol)
4.9 � 101110.31CH3
OH
2-Methylphenol(o-cresol)
8.32 � 1065.080NH3
�CH3
4-Methylaniline(p-toluidine)
3.57 � 1054.447CH3
NH3
�
2-Methylaniline(o-toluidine)
CH3NH3
�
4.40 � 1065.357NH3
�CH3O
4-Methoxyaniline(p-anisidine)
2.98 � 1054.526OCH3
NH3
�
2-Methoxyaniline(o-anisidine)
6.6 � 103
8.3 � 10102.18 (CO2H) ( � 0.1)9.08 (NH3) ( � 0.1)
CO2H
NH3�
CHCH2CH2SCH3Methionine
2.3 � 104
2.5 � 10113.64 (CO2H)
10.61 (SH)Mercaptoacetic acid
(thioglycolic acid)
1.42 � 103
2.01 � 106
2.8475.696
Malonic acid(propanedioic acid)

APPENDIX G Acid Dissociation Constants AP17
Name Structure pKa Ka
Nitroethane CH3CH2NO2 8.57 2.7 � 109
4-Nitrophenol 7.149 7.10 � 108
Nitrous acid HON£O 3.15 7.1 � 104
HO2CCO2H
HO2CCH2CH2CH2CO2H
CH3CH2CH2CH2CO2H 4.843 1.44 � 105
1,10-Phenanthroline
Phenylacetic acid 4.310 4.90 � 105CH2CO2H
1.6 � 102
1.23 � 105(1.8) ( � 0.1)4.91HNNH
� �
Pentanoic acid(valeric acid)
4.52 � 105
3.78 � 106
4.3455.422
1,5-Pentanedioic acid(glutaric acid)
3.3 � 1032.48O
CH3CCO2H
2-Oxopropanoic acid(pyruvic acid)
1.26 � 102
3.6 � 105(1.90) ( � 0.5)4.44 ( � 0.5)
O
HO2CCH2CH2CCO2H
2-Oxopentanedioic(�-ketoglutaric acid)
2.8 � 103
4.3 � 1052.564.37
O
HO2CCH2CCO2HOxobutanedioic acid
(oxaloacetic acid)
3.5 � 1043.46O
HCCO2HOxoacetic acid
(glyoxylic acid)
5.4 � 102
5.42 � 105
1.274.266
Oxalic acid(ethanedioic acid)
6.9 � 1054.16 ( � 0.1)NNO
OH
N-Nitrosophenylhydroxylamine(cupferron)
OHO2N
4.3 � 1098.37
NO2
OH
3-Nitrophenol
5.89 � 1087.230NO2
OH2-Nitrophenol
3.61 � 1043.442CO2HO2N4-Nitrobenzoic acid
3.56 � 1043.449
NO2
CO2H
3-Nitrobenzoic acid
6.53 � 1032.185
NO2
CO2H2-Nitrobenzoic acid
(Continued)
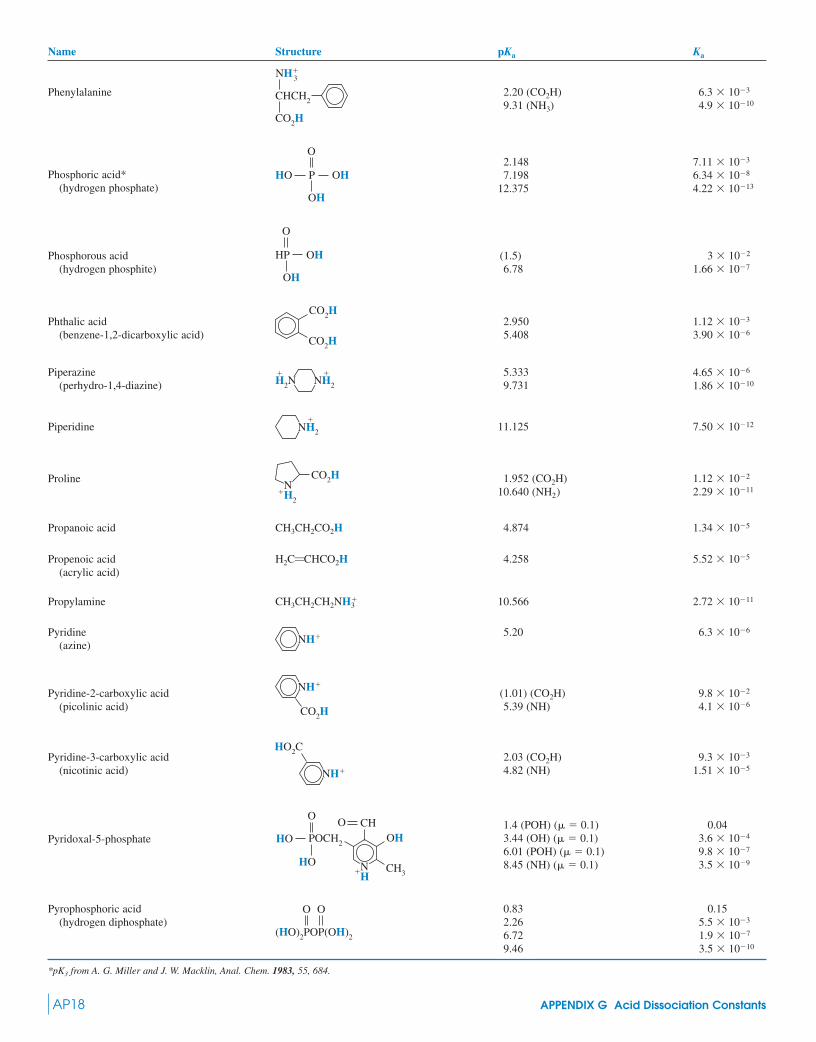
AP18 APPENDIX G Acid Dissociation Constants
Name Structure pKa Ka
Piperidine 11.125 7.50 � 1012
Proline
Propanoic acid CH3CH2CO2H 4.874 1.34 � 105
H2C£CHCO2H 4.258 5.52 � 105
Propylamine CH3CH2CH2NH 10.566 2.72 � 1011
5.20 6.3 � 106
0.155.5 � 103
1.9 � 107
3.5 � 1010
0.832.266.729.46
O
(HO)2POP(OH)2
OPyrophosphoric acid(hydrogen diphosphate)
0.043.6 � 104
9.8 � 107
3.5 � 109
1.4 (POH) ( � 0.1)3.44 (OH) ( � 0.1)6.01 (POH) ( � 0.1)8.45 (NH) ( � 0.1)
POCH2
CHHO
HO
OH
NH� CH3
OO
Pyridoxal-5-phosphate
9.3 � 103
1.51 � 1052.03 (CO2H)4.82 (NH)NH�
HO2CPyridine-3-carboxylic acid
(nicotinic acid)
9.8 � 102
4.1 � 106(1.01) (CO2H)5.39 (NH)
NH�
CO2H
Pyridine-2-carboxylic acid(picolinic acid)
NH�Pyridine(azine)
�3
Propenoic acid(acrylic acid)
1.12 � 102
2.29 � 10111.952 (CO2H)
10.640 (NH2)
CO2HNH2
�
NH2
�
4.65 � 106
1.86 � 10105.3339.731NH2
�H2N�Piperazine
(perhydro-1,4-diazine)
1.12 � 103
3.90 � 1062.9505.408CO2H
CO2HPhthalic acid
(benzene-1,2-dicarboxylic acid)
3 � 102
1.66 � 107(1.5)6.78
HP OH
OH
O
Phosphorous acid(hydrogen phosphite)
7.11 � 103
6.34 � 108
4.22 � 1013
2.1487.198
12.375P OHHO
OH
O
Phosphoric acid*(hydrogen phosphate)
6.3 � 103
4.9 � 10102.20 (CO2H)9.31 (NH3)
CO2H
NH3�
CHCH2Phenylalanine
*pK3 from A. G. Miller and J. W. Macklin, Anal. Chem. 1983, 55, 684.
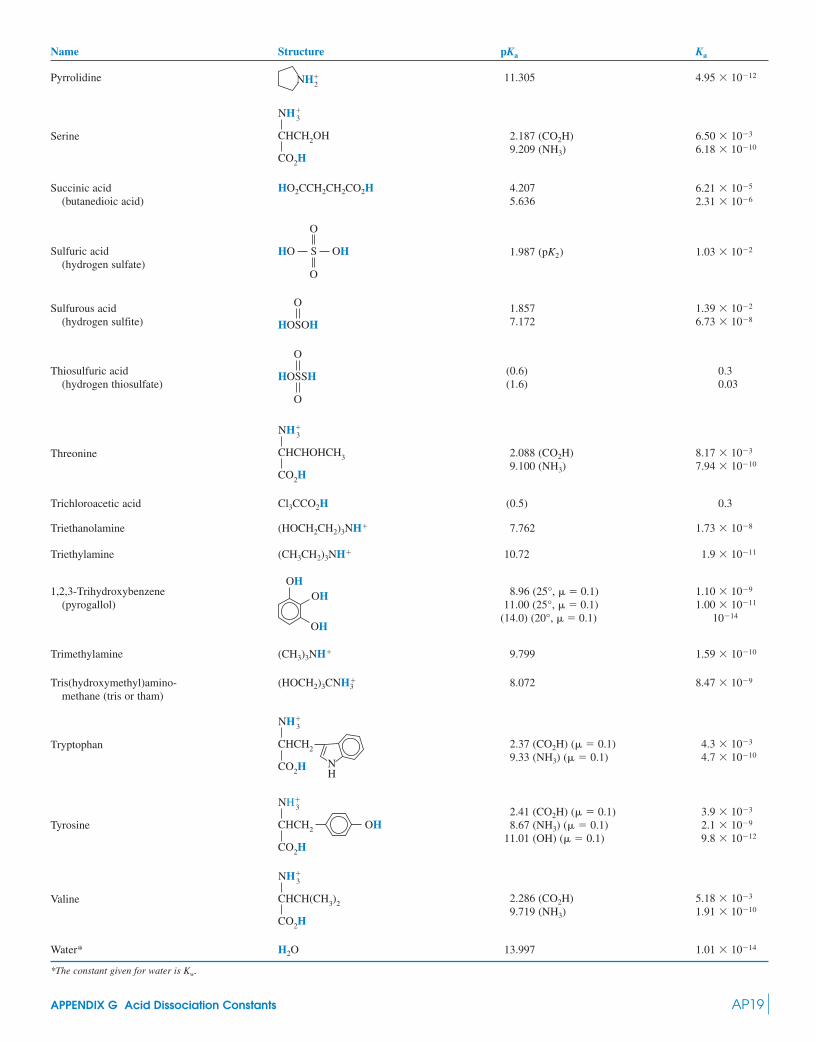
APPENDIX G Acid Dissociation Constants AP19
Name Structure pKa Ka
Pyrrolidine 11.305 4.95 � 1012
Serine
HO2CCH2CH2CO2H
Trichloroacetic acid Cl3CCO2H (0.5) 0.3
Triethanolamine (HOCH2CH2)3NH� 7.762 1.73 � 108
Triethylamine (CH3CH2)3NH� 10.72 1.9 � 1011
Trimethylamine (CH3)3NH� 9.799 1.59 � 1010
(HOCH2)3CNH 8.072 8.47 � 109
Water* H2O 13.997 1.01 � 1014
5.18 � 103
1.91 � 10102.286 (CO2H)9.719 (NH3)
CO2H
NH3�
CHCH(CH3)2Valine
3.9 � 103
2.1 � 109
9.8 � 1012
2.41 (CO2H) ( � 0.1)8.67 (NH3) ( � 0.1)
11.01 (OH) ( � 0.1)CO2H
NH3�
CHCH2 OHTyrosine
4.3 � 103
4.7 � 10102.37 (CO2H) ( � 0.1)9.33 (NH3) ( � 0.1)
CO2H
NH3�
CHCH2
NH
Tryptophan
�3Tris(hydroxymethyl)amino-
methane (tris or tham)
1.10 � 109
1.00 � 1011
1014
8.96 (25°, � 0.1)11.00 (25°, � 0.1)
(14.0) (20°, � 0.1)
OHOH
OH
1,2,3-Trihydroxybenzene(pyrogallol)
8.17 � 103
7.94 � 10102.088 (CO2H)9.100 (NH3)CO2H
NH3�
CHCHOHCH3Threonine
0.30.03
(0.6)(1.6)
HOSSH
O
O
Thiosulfuric acid(hydrogen thiosulfate)
1.39 � 102
6.73 � 1081.8577.172HOSOH
OSulfurous acid(hydrogen sulfite)
1.03 � 1021.987 (pK2)S OHHO
O
O
Sulfuric acid(hydrogen sulfate)
6.21 � 105
2.31 � 1064.2075.636
Succinic acid(butanedioic acid)
6.50 � 103
6.18 � 10102.187 (CO2H)9.209 (NH3)CO2H
NH3�
CHCH2OH
NH2�
*The constant given for water is Kw.

AP20 APPENDIX H Standard Reduction Potentials
APPENDIX HStandard Reduction Potentials*
Reaction E° (volts) dE°/dT (mV/K)
AluminumAl3� � 3e T Al(s) 1.677 0.533AlCl2� � 3e T Al(s) � Cl 1.802AlF � 3e T Al(s) � 6F 2.069Al(OH) � 3e T Al(s) � 4OH 2.328 1.13
AntimonySbO� � 2H� � 3e T Sb(s) � H2O 0.208Sb2O3(s) � 6H� � 6e T 2Sb(s) � 3H2O 0.147 0.369Sb(s) � 3H� � 3e T SbH3(g) 0.510 0.030
ArsenicH3AsO4 � 2H� � 2e T H3AsO3 � H2O 0.575 0.257H3AsO3 � 3H� � 3e T As(s) � 3H2O 0.247 5 0.505As(s) � 3H� � 3e T AsH3(g) 0.238 0.029
BariumBa2� � 2e � Hg T Ba(in Hg) 1.717Ba2� � 2e T Ba(s) 2.906 0.401
BerylliumBe2� � 2e T Be(s) 1.968 0.60
BismuthBi3� � 3e T Bi(s) 0.308 0.18BiCl � 3e T Bi(s) � 4Cl 0.16BiOCl(s) � 2H� � 3e T Bi(s) � H2O � Cl 0.160
Boron2B(s) � 6H� � 6e T B2H6(g) 0.150 0.296B4O � 14H� � 12e T 4B(s) � 7H2O 0.792B(OH)3 � 3H� � 3e T B(s) � 3H2O 0.889 0.492
BromineBrO � 2H� � 2e T BrO � H2O 1.745 0.511HOBr � H� � e T Br2(l) � H2O 1.584 0.75BrO � 6H� � 5e T Br2(l) � 3H2O 1.513 0.419Br2(aq) � 2e T 2Br 1.098 0.499Br2(l) � 2e T 2Br 1.078 0.611Br � 2e T 3Br 1.062 0.512BrO � H2O � 2e T Br � 2OH 0.766 0.94BrO � 3H2O � 6e T Br � 6OH 0.613 1.287
CadmiumCd2� � 2e � Hg T Cd(in Hg) 0.380Cd2� � 2e T Cd(s) 0.402 0.029Cd(C2O4)(s) � 2e T Cd(s) � C2O 0.522Cd(C2O4) � 2e T Cd(s) � 2C2O 0.572Cd(NH3) � 2e T Cd(s) � 4NH3 0.613CdS(s) � 2e T Cd(s) � S2 1.175
CalciumCa(s) � 2H� � 2e T CaH2(s) 0.776Ca2� � 2e � Hg T Ca(in Hg) 2.003Ca2� � 2e T Ca(s) 2.868 0.186
2�4
24
22
24
3
3
12
3
12
3
4
27
4
4
36
*All species are aqueous unless otherwise indicated. The reference state for amalgams is an infinitely dilute solution of the element inHg. The temperature coefficient, allows us to calculate the standard potential, E°(T), at temperature T: E°(T) � E° � (dE°/dT)�T,where is Note the units for Once you know for a net cell reaction at temperature T, you canfind the equilibrium constant, K, for the reaction from the formula where n is the number of electrons in each half-reaction, F is the Faraday constant, and R is the gas constant.
SOURCES: The most authoritative source is S. G. Bratsch, J. Phys. Chem. Ref. Data 1989, 18, 1. Additional data come from L. G.Sillen and A. E. Martell, Stability Constants of Metal-Ion Complexes (London: The Chemical Society, Special Publications Nos. 17and 25. 1964 and 1971); G. Milazzo and S. Caroli, Tables of Standard Electrode Potentials (New York: Wiley, 1978); T. Mussini,P. Longhi, and S. Rondinini, Pure Appl. Chem. 1985, 57, 169. Another good source is A. J. Bard, R. Parsons, and J. Jordan. StandardPotentials in Aqueous Solution (New York: Marcel Dekker, 1985). Reduction potentials for 1 200 free radical reactions are given byP. Wardman, J. Phys. Chem. Ref. Data 1989, 18, 1637.
K � 10nFE°/RT ln 10,E°dE°/dT.mV/KT 298.15 K.�T
dE°/dT,

Reaction E° (volts) dE°/dT (mV/K)
Ca(acetate)� � 2e T Ca(s) � acetate 2.891CaSO4(s) � 2e T Ca(s) � SO 2.936Ca(malonate)(s) � 2e T Ca(s) � malonate2 3.608
CarbonC2H2(g) � 2H� � 2e T C2H4(g) 0.731
0.700
CH3OH � 2H� � 2e T CH4(g) � H2O 0.583 0.039Dehydroascorbic acid � 2H� � 2e T ascorbic acid � H2O 0.390(CN)2(g) � 2H� � 2e T 2HCN(aq) 0.373H2CO � 2H� � 2e T CH3OH 0.237 0.51C(s) � 4H� � 4e T CH4(g) 0.131 5 0.209 2HCO2H � 2H� � 2e T H2CO � H2O 0.029 0.63CO2(g) � 2H� � 2e T CO(g) � H2O 0.103 8 0.397 7CO2(g) � 2H� � 2e T HCO2H 0.114 0.942CO2(g) � 2H� � 2e T H2C2O4 0.432 1.76
Cerium1.72 1.541.70 1 F HClO4
Ce4� � e T Ce3� 1.44 1 F H2SO41.61 1 F HNO31.47 1 F HCl
Ce3� � 3e T Ce(s) 2.336 0.280
CesiumCs� � e � Hg T Cs(in Hg) 1.950Cs� � e T Cs(s) 3.026 1.172
ChlorineHClO2 � 2H� � 2e T HOCl � H2O 1.674 0.55HClO � H� � e T Cl2(g) � H2O 1.630 0.27ClO � 6H� � 5e T Cl2(g) � 3H2O 1.458 0.347Cl2(aq) � 2e T 2Cl 1.396 0.72Cl2(g) � 2e T 2Cl 1.360 4 1.248ClO � 2H� � 2e T ClO � H2O 1.226 0.416ClO � 3H� � 2e T HClO2 � H2O 1.157 0.180ClO � 2H� � e T ClO2 � H2O 1.130 0.074ClO2 � e T ClO 1.068 1.335
ChromiumCr2O � 14H� � 6e T 2Cr3� � 7H2O 1.36 1.32CrO � 4H2O � 3e T Cr(OH)3 (s, hydrated) � 5OH 0.12 1.62Cr3� � e T Cr2� 0.42 1.4Cr3� � 3e T Cr(s) 0.74 0.44Cr2� � 2e T Cr(s) 0.89 0.04
Cobalt1.92 1.23
Co3� � e T Co2� 1.817 8 F H2SO41.850 4 F HNO3
Co(NH3)5(H2O)3� � e T Co(NH3)5(H2O)2� 0.37 1 F NH4NO3Co(NH3) � e T Co(NH3) 0.1CoOH� � H� � 2e T Co(s) � H2O 0.003 0.04Co2� � 2e T Co(s) 0.282 0.065Co(OH)2(s) � 2e T Co(s) � 2OH 0.746 1.02
CopperCu� � e T Cu(s) 0.518 0.754Cu2� � 2e T Cu(s) 0.339 0.011Cu2� � e T Cu� 0.161 0.776CuCl(s) � e T Cu(s) � Cl 0.137Cu(IO3)2(s) � 2e T Cu(s) � 2IO 0.079Cu(ethylenediamine) � e T Cu(s) � 2 ethylenediamine 0.119CuI(s) � e T Cu(s) � I 0.185Cu(EDTA)2 � 2e T Cu(s) � EDTA4 0.216Cu(OH)2(s) � 2e T Cu(s) � 2OH 0.222Cu(CN) � e T Cu(s) � 2CN 0.429CuCN(s) � e T Cu(s) � CN 0.639
2
�2
3
2�6
3�6
24
27
2
3
3
3
4
12
3
12
O � 2H� � 2e T HOO OH
24
APPENDIX H Standard Reduction Potentials AP21
(Continued)
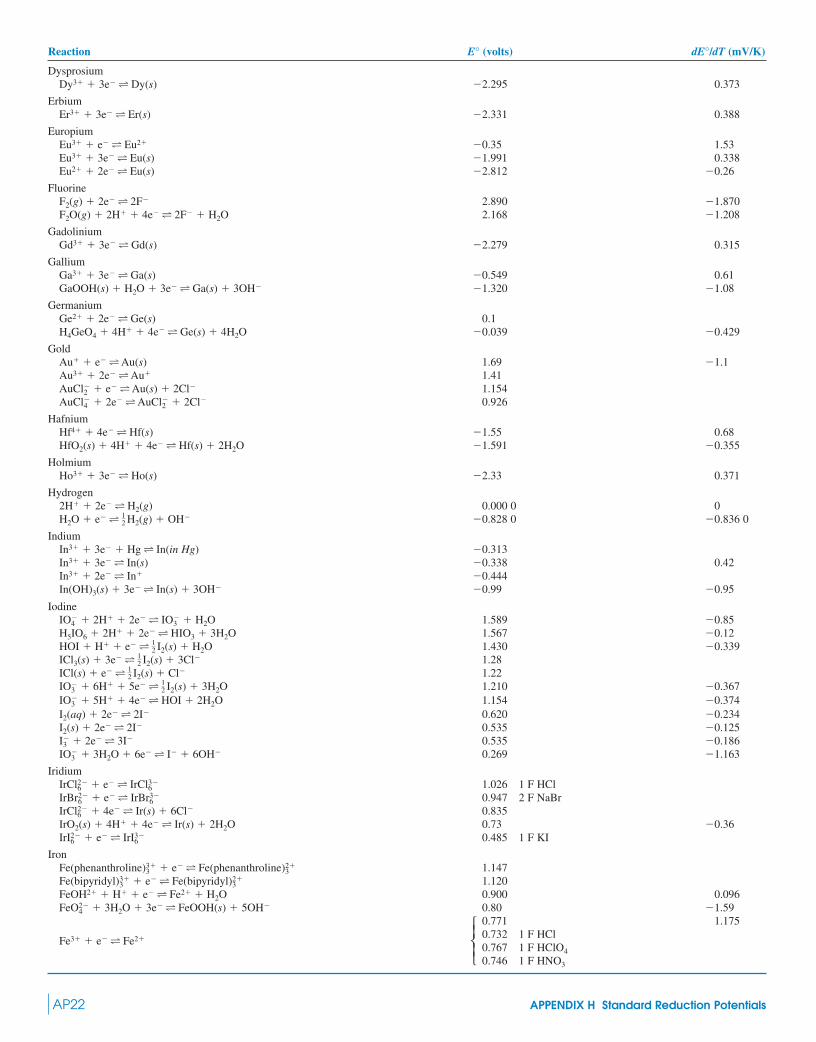
Reaction E° (volts) dE°/dT (mV/K)
DysprosiumDy3� � 3e T Dy(s) 2.295 0.373
ErbiumEr3� � 3e T Er(s) 2.331 0.388
EuropiumEu3� � e T Eu2� 0.35 1.53Eu3� � 3e T Eu(s) 1.991 0.338Eu2� � 2e T Eu(s) 2.812 0.26
FluorineF2(g) � 2e T 2F 2.890 1.870F2O(g) � 2H� � 4e T 2F � H2O 2.168 1.208
GadoliniumGd3� � 3e T Gd(s) 2.279 0.315
GalliumGa3� � 3e T Ga(s) 0.549 0.61GaOOH(s) � H2O � 3e T Ga(s) � 3OH 1.320 1.08
GermaniumGe2� � 2e T Ge(s) 0.1H4GeO4 � 4H� � 4e T Ge(s) � 4H2O 0.039 0.429
GoldAu� � e T Au(s) 1.69 1.1Au3� � 2e T Au� 1.41AuCl � e T Au(s) � 2Cl 1.154AuCl � 2e T AuCl � 2Cl 0.926
HafniumHf4� � 4e T Hf(s) 1.55 0.68HfO2(s) � 4H� � 4e T Hf(s) � 2H2O 1.591 0.355
HolmiumHo3� � 3e T Ho(s) 2.33 0.371
Hydrogen2H� � 2e T H2(g) 0.000 0 0H2O � e T H2(g) � OH 0.828 0 0.836 0
IndiumIn3� � 3e � Hg T In(in Hg) 0.313In3� � 3e T In(s) 0.338 0.42In3� � 2e T In� 0.444In(OH)3(s) � 3e T In(s) � 3OH 0.99 0.95
IodineIO � 2H� � 2e T IO � H2O 1.589 0.85H5IO6 � 2H� � 2e T HIO3 � 3H2O 1.567 0.12HOI � H� � e T I2(s) � H2O 1.430 0.339ICl3(s) � 3e T I2(s) � 3Cl 1.28ICl(s) � e T I2(s) � Cl 1.22IO � 6H� � 5e T I2(s) � 3H2O 1.210 0.367IO � 5H� � 4e T HOI � 2H2O 1.154 0.374I2(aq) � 2e T 2I 0.620 0.234I2(s) � 2e T 2I 0.535 0.125I � 2e T 3I 0.535 0.186IO � 3H2O � 6e T I � 6OH 0.269 1.163
IridiumIrCl � e T IrCl 1.026 1 F HClIrBr � e T IrBr 0.947 2 F NaBrIrCl � 4e T Ir(s) � 6Cl 0.835IrO2(s) � 4H� � 4e T Ir(s) � 2H2O 0.73 0.36IrI � e T IrI 0.485 1 F KI
IronFe(phenanthroline) � e T Fe(phenanthroline) 1.147Fe(bipyridyl) � e T Fe(bipyridyl) 1.120FeOH2� � H� � e T Fe2� � H2O 0.900 0.096FeO � 3H2O � 3e T FeOOH(s) � 5OH 0.80 1.59
0.771 1.175
Fe3� � e T Fe2� 0.732 1 F HCl0.767 1 F HClO40.746 1 F HNO3
24
2�3
3�3
2�3
3�3
36
26
26
36
26
36
26
3
3
3
12
3
12
12
12
3
4
12
2
4
2
AP22 APPENDIX H Standard Reduction Potentials
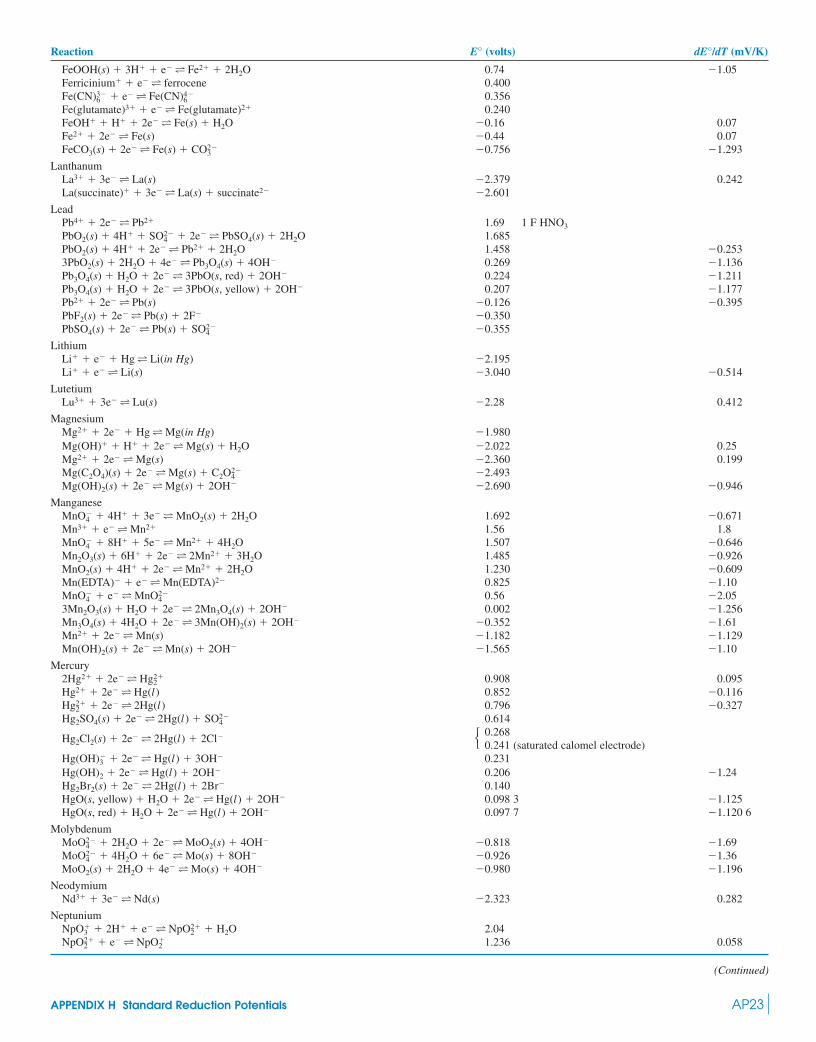
Reaction E° (volts) dE°/dT (mV/K)
FeOOH(s) � 3H� � e T Fe2� � 2H2O 0.74 1.05Ferricinium� � e T ferrocene 0.400Fe(CN) � e T Fe(CN) 0.356Fe(glutamate)3� � e T Fe(glutamate)2� 0.240FeOH� � H� � 2e T Fe(s) � H2O 0.16 0.07Fe2� � 2e T Fe(s) 0.44 0.07FeCO3(s) � 2e T Fe(s) � CO 0.756 1.293
LanthanumLa3� � 3e T La(s) 2.379 0.242La(succinate)� � 3e T La(s) � succinate2 2.601
LeadPb4� � 2e T Pb2� 1.69 1 F HNO3PbO2(s) � 4H� � SO � 2e T PbSO4(s) � 2H2O 1.685PbO2(s) � 4H� � 2e T Pb2� � 2H2O 1.458 0.2533PbO2(s) � 2H2O � 4e T Pb3O4(s) � 4OH 0.269 1.136Pb3O4(s) � H2O � 2e T 3PbO(s, red) � 2OH 0.224 1.211Pb3O4(s) � H2O � 2e T 3PbO(s, yellow) � 2OH 0.207 1.177Pb2� � 2e T Pb(s) 0.126 0.395PbF2(s) � 2e T Pb(s) � 2F 0.350PbSO4(s) � 2e T Pb(s) � SO 0.355
LithiumLi� � e � Hg T Li(in Hg) 2.195Li� � e T Li(s) 3.040 0.514
LutetiumLu3� � 3e T Lu(s) 2.28 0.412
MagnesiumMg2� � 2e � Hg T Mg(in Hg) 1.980Mg(OH)� � H� � 2e T Mg(s) � H2O 2.022 0.25Mg2� � 2e T Mg(s) 2.360 0.199Mg(C2O4)(s) � 2e T Mg(s) � C2O 2.493Mg(OH)2(s) � 2e T Mg(s) � 2OH 2.690 0.946
ManganeseMnO � 4H� � 3e T MnO2(s) � 2H2O 1.692 0.671Mn3� � e T Mn2� 1.56 1.8MnO � 8H� � 5e T Mn2� � 4H2O 1.507 0.646Mn2O3(s) � 6H� � 2e T 2Mn2� � 3H2O 1.485 0.926MnO2(s) � 4H� � 2e T Mn2� � 2H2O 1.230 0.609Mn(EDTA) � e T Mn(EDTA)2 0.825 1.10MnO � e T MnO 0.56 2.053Mn2O3(s) � H2O � 2e T 2Mn3O4(s) � 2OH 0.002 1.256Mn3O4(s) � 4H2O � 2e T 3Mn(OH)2(s) � 2OH 0.352 1.61Mn2� � 2e T Mn(s) 1.182 1.129Mn(OH)2(s) � 2e T Mn(s) � 2OH 1.565 1.10
Mercury2Hg2� � 2e T Hg 0.908 0.095Hg2� � 2e T Hg(l) 0.852 0.116Hg � 2e T 2Hg(l) 0.796 0.327Hg2SO4(s) � 2e T 2Hg(l) � SO 0.614
Hg2Cl2(s) � 2e T 2Hg(l) � 2Cl 0.2680.241 (saturated calomel electrode)
Hg(OH) � 2e T Hg(l) � 3OH 0.231Hg(OH)2 � 2e T Hg(l) � 2OH 0.206 1.24Hg2Br2(s) � 2e T 2Hg(l) � 2Br 0.140HgO(s, yellow) � H2O � 2e T Hg(l) � 2OH 0.098 3 1.125HgO(s, red) � H2O � 2e T Hg(l) � 2OH 0.097 7 1.120 6
MolybdenumMoO � 2H2O � 2e T MoO2(s) � 4OH 0.818 1.69MoO � 4H2O � 6e T Mo(s) � 8OH 0.926 1.36MoO2(s) � 2H2O � 4e T Mo(s) � 4OH 0.980 1.196
NeodymiumNd3� � 3e T Nd(s) 2.323 0.282
NeptuniumNpO � 2H� � e T NpO � H2O 2.04NpO � e T NpO 1.236 0.058�
22�2
2�2
�3
24
24
3
24
2�2
2�2
24
4
4
4
24
24
24
23
46
36
APPENDIX H Standard Reduction Potentials AP23
(Continued)

Reaction E° (volts) dE°/dT (mV/K)
NpO � 4H� � e T Np4� � 2H2O 0.567 3.30Np4� � e T Np3� 0.157 1.53Np3� � 3e T Np(s) 1.768 0.18
NickelNiOOH(s) � 3H� � e T Ni2� � 2H2O 2.05 1.17Ni2� � 2e T Ni(s) 0.236 0.146Ni(CN) � e T Ni(CN) � CN 0.401Ni(OH)2(s) � 2e T Ni(s) � 2OH 0.714 1.02
NiobiumNb2O5(s) � H� � e T NbO2(s) � H2O 0.248 0.460Nb2O5(s) � 5H� � 5e T Nb(s) � H2O 0.601 0.381
NbO2(s) � 2H� � 2e T NbO(s) � H2O 0.646 0.347NbO2(s) � 4H� � 4e T Nb(s) � 2H2O 0.690 0.361
NitrogenHN3 � 3H� � 2e T N2(g) � NH 2.079 0.147N2O(g) � 2H� � 2e T N2(g) � H2O 1.769 0.4612NO(g) � 2H� � 2e T N2O(g) � H2O 1.587 1.359NO� � e T NO(g) 1.462NH3OH� � H� � 2e T N2H � 2H2O 1.40 0.60NH3OH� � 2H� � 2e T NH � H2O 1.33 0.44N2H � 3H� � 2e T 2NH 1.250 0.28HNO2 � H� � e T NO(g) � H2O 0.984 0.649NO � 4H� � 3e T NO(g) � 2H2O 0.955 0.028NO � 3H� � 2e T HNO2 � H2O 0.940 0.282NO � 2H� � e T N2O4(g) � H2O 0.798 0.107N2(g) � 8H� � 6e T 2NH 0.274 0.616N2(g) � 5H� � 4e T N2H 0.214 0.78N2(g) � 2H2O � 4H� � 2e T 2NH3OH� 1.83 0.96N2(g) � H� � e T HN3 3.334 2.141
OsmiumOsO4(s) � 8H� � 8e T Os(s) � 4H2O 0.834 0.458OsCl � e T OsCl 0.85 1 F HCl
OxygenOH � H� � e T H2O 2.56 1.0O(g) � 2H� � 2e T H2O 2.430 1 1.148 4O3(g) � 2H� � 2e T O2(g) � H2O 2.075 0.489H2O2 � 2H� � 2e T 2H2O 1.763 0.698HO2 � H� � e T H2O2 1.44 0.7O2(g) � 2H� � 2e T H2O 1.229 1 0.845 6
O2(g) � 2H� � 2e T H2O2 0.695 0.993O2(g) � H� � e T HO2 0.05 1.3
PalladiumPd2� � 2e T Pd(s) 0.915 0.12PdO(s) � 2H� � 2e T Pd(s) � H2O 0.79 0.33PdCl � 2e T Pd(s) � 6Cl 0.615PdO2(s) � H2O � 2e T PdO(s) � 2OH 0.64 1.2
PhosphorusP4(s, white) � 3H� � 3e T PH3(g) 0.046 0.093P4(s, red) � 3H� � 3e T PH3(g) 0.088 0.030
H3PO4 � 2H� � 2e T H3PO3 � H2O 0.30 0.36H3PO4 � 5H� � 5e T P4(s, white) � 4H2O 0.402 0.340H3PO3 � 2H� � 2e T H3PO2 � H2O 0.48 0.37H3PO2 � H� � e T P4(s) � 2H2O 0.51
PlatinumPt2� � 2e T Pt(s) 1.18 0.05PtO2(s) � 4H� � 4e T Pt(s) � 2H2O 0.92 0.36PtCl � 2e T Pt(s) � 4Cl 0.755PtCl � 2e T PtCl � 2Cl 0.68
PlutoniumPuO � e T PuO2(s) 1.585 0.39PuO � 4H� � 2e T Pu4� � 2H2O 1.000 1.615 1Pu4� � e T Pu3� 1.006 1.441PuO � e T PuO 0.966 0.03PuO2(s) � 4H� � 4e T Pu(s) � 2H2O 1.369 0.38Pu3� � 3e T Pu(s) 1.978 0.23
�2
2�2
2�2
�2
24
26
24
14
14
14
14
46
12
36
26
32
�5
�4
12
3
3
3
�4
�5
�4
�5
�4
52
12
12
12
23
24
�2
AP24 APPENDIX H Standard Reduction Potentials

Reaction E° (volts) dE°/dT (mV/K)
PotassiumK� � e � Hg T K(in Hg) 1.975K� � e T K(s) 2.936 1.074
PraseodymiumPr4� � e T Pr3� 3.2 1.4Pr3� � 3e T Pr(s) 2.353 0.291
PromethiumPm3� � 3e T Pm(s) 2.30 0.29
RadiumRa2� � 2e T Ra(s) 2.80 0.44
RheniumReO � 2H� � e T ReO3(s) � H2O 0.72 1.17ReO � 4H� � 3e T ReO2(s) � 2H2O 0.510 0.70
RhodiumRh6� � 3e T Rh3� 1.48 1 F HClO4Rh4� � e T Rh3� 1.44 3 F H2SO4RhCl � e T RhCl 1.2Rh3� � 3e T Rh(s) 0.76 0.42Rh3� � 2e T Rh 0.7RhCl � 3e T Rh(s) � 6Cl 0.44
RubidiumRb� � e � Hg T Rb(in Hg) 1.970Rb� � e T Rb(s) 2.943 1.140
RutheniumRuO � 6H� � 3e T Ru(OH) � 2H2O 1.53Ru(dipyridyl) � e T Ru(dipyridyl) 1.29RuO4(s) � 8H� � 8e T Ru(s) � 4H2O 1.032 0.467Ru2� � 2e T Ru(s) 0.8Ru3� � 3e T Ru(s) 0.60Ru3� � e T Ru2� 0.24Ru(NH3) � e T Ru(NH3) 0.214
SamariumSm3� � 3e T Sm(s) 2.304 0.279Sm2� � 2e T Sm(s) 2.68 0.28
ScandiumSc3� � 3e T Sc(s) 2.09 0.41
SeleniumSeO � 4H� � 2e T H2SeO3 � H2O 1.150 0.483H2SeO3 � 4H� � 4e T Se(s) � 3H2O 0.739 0.562Se(s) � 2H� � 2e T H2Se(g) 0.082 0.238Se(s) � 2e T Se2 0.67 1.2
SiliconSi(s) � 4H� � 4e T SiH4(g) 0.147 0.196SiO2(s, quartz) � 4H� � 4e T Si(s) � 2H2O 0.990 0.374SiF � 4e T Si(s) � 6F 1.24
Silver2.000 4 F HClO4
Ag2� � e T Ag� 1.989 0.991.929 4 F HNO3
Ag3� � 2e T Ag� 1.9AgO(s) � H� � e T Ag2O(s) � H2O 1.40Ag� � e T Ag(s) 0.799 3 0.989Ag2C2O4(s) � 2e T 2Ag(s) � C2O 0.465AgN3(s) � e T Ag(s) � N 0.293
AgCl(s) � e T Ag(s) � Cl 0.2220.197 saturated KCl
AgBr(s) � e T Ag(s) � Br 0.071Ag(S2O3) � e T Ag(s) � 2S2O 0.017AgI(s) � e T Ag(s) � I 0.152Ag2S(s) � H� � 2e T 2Ag(s) � SH 0.272
SodiumNa� � e � Hg T Na(in Hg) 1.959Na� � H2(g) � e T NaH(s) 2.367 1.550Na� � e T Na(s) 2.714 3 0.757
12
23
32
3
24
12
12
26
24
2�6
3�6
2�3
3�3
2�2
4
36
4�2
36
26
4
4
APPENDIX H Standard Reduction Potentials AP25
(Continued)
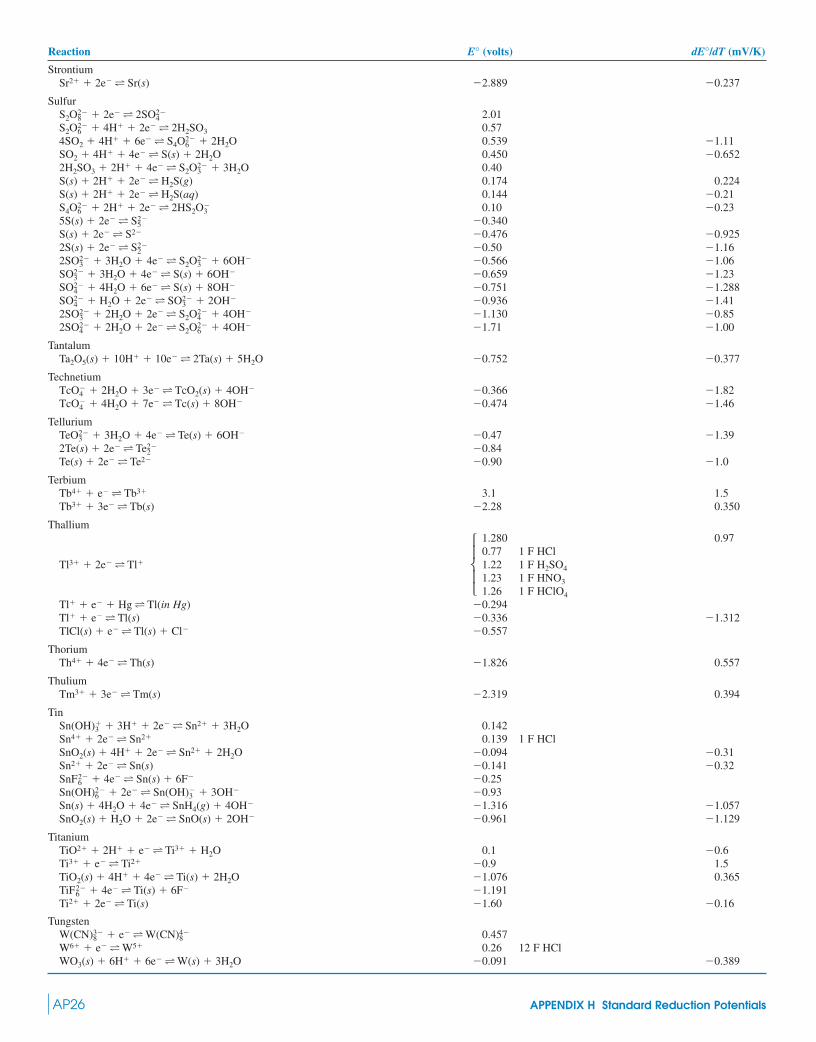
Reaction E° (volts) dE°/dT (mV/K)
StrontiumSr2� � 2e T Sr(s) 2.889 0.237
SulfurS2O � 2e T 2SO 2.01S2O � 4H� � 2e T 2H2SO3 0.574SO2 � 4H� � 6e T S4O � 2H2O 0.539 1.11SO2 � 4H� � 4e T S(s) � 2H2O 0.450 0.6522H2SO3 � 2H� � 4e T S2O � 3H2O 0.40S(s) � 2H� � 2e T H2S(g) 0.174 0.224S(s) � 2H� � 2e T H2S(aq) 0.144 0.21S4O � 2H� � 2e T 2HS2O 0.10 0.235S(s) � 2e T S 0.340S(s) � 2e T S2 0.476 0.9252S(s) � 2e T S 0.50 1.162SO � 3H2O � 4e T S2O � 6OH 0.566 1.06SO � 3H2O � 4e T S(s) � 6OH 0.659 1.23SO � 4H2O � 6e T S(s) � 8OH 0.751 1.288SO � H2O � 2e T SO � 2OH 0.936 1.412SO � 2H2O � 2e T S2O � 4OH 1.130 0.852SO � 2H2O � 2e T S2O � 4OH 1.71 1.00
TantalumTa2O5(s) � 10H� � 10e T 2Ta(s) � 5H2O 0.752 0.377
TechnetiumTcO � 2H2O � 3e T TcO2(s) � 4OH 0.366 1.82TcO � 4H2O � 7e T Tc(s) � 8OH 0.474 1.46
TelluriumTeO � 3H2O � 4e T Te(s) � 6OH 0.47 1.392Te(s) � 2e T Te 0.84Te(s) � 2e T Te2 0.90 1.0
TerbiumTb4� � e T Tb3� 3.1 1.5Tb3� � 3e T Tb(s) 2.28 0.350
Thallium1.280 0.970.77 1 F HCl
Tl3� � 2e T Tl� 1.22 1 F H2SO41.23 1 F HNO31.26 1 F HClO4
Tl� � e � Hg T Tl(in Hg) 0.294Tl� � e T Tl(s) 0.336 1.312TlCl(s) � e T Tl(s) � Cl 0.557
ThoriumTh4� � 4e T Th(s) 1.826 0.557
ThuliumTm3� � 3e T Tm(s) 2.319 0.394
TinSn(OH) � 3H� � 2e T Sn2� � 3H2O 0.142Sn4� � 2e T Sn2� 0.139 1 F HClSnO2(s) � 4H� � 2e T Sn2� � 2H2O 0.094 0.31Sn2� � 2e T Sn(s) 0.141 0.32SnF � 4e T Sn(s) � 6F 0.25Sn(OH) � 2e T Sn(OH) � 3OH 0.93Sn(s) � 4H2O � 4e T SnH4(g) � 4OH 1.316 1.057SnO2(s) � H2O � 2e T SnO(s) � 2OH 0.961 1.129
TitaniumTiO2� � 2H� � e T Ti3� � H2O 0.1 0.6Ti3� � e T Ti2� 0.9 1.5TiO2(s) � 4H� � 4e T Ti(s) � 2H2O 1.076 0.365TiF � 4e T Ti(s) � 6F 1.191Ti2� � 2e T Ti(s) 1.60 0.16
TungstenW(CN) � e T W(CN) 0.457W6� � e T W5� 0.26 12 F HClWO3(s) � 6H� � 6e T W(s) � 3H2O 0.091 0.389
48
38
26
3
26
26
�3
22
23
4
4
26
24
24
23
23
24
24
23
23
23
22
25
3
26
23
26
26
24
28
AP26 APPENDIX H Standard Reduction Potentials
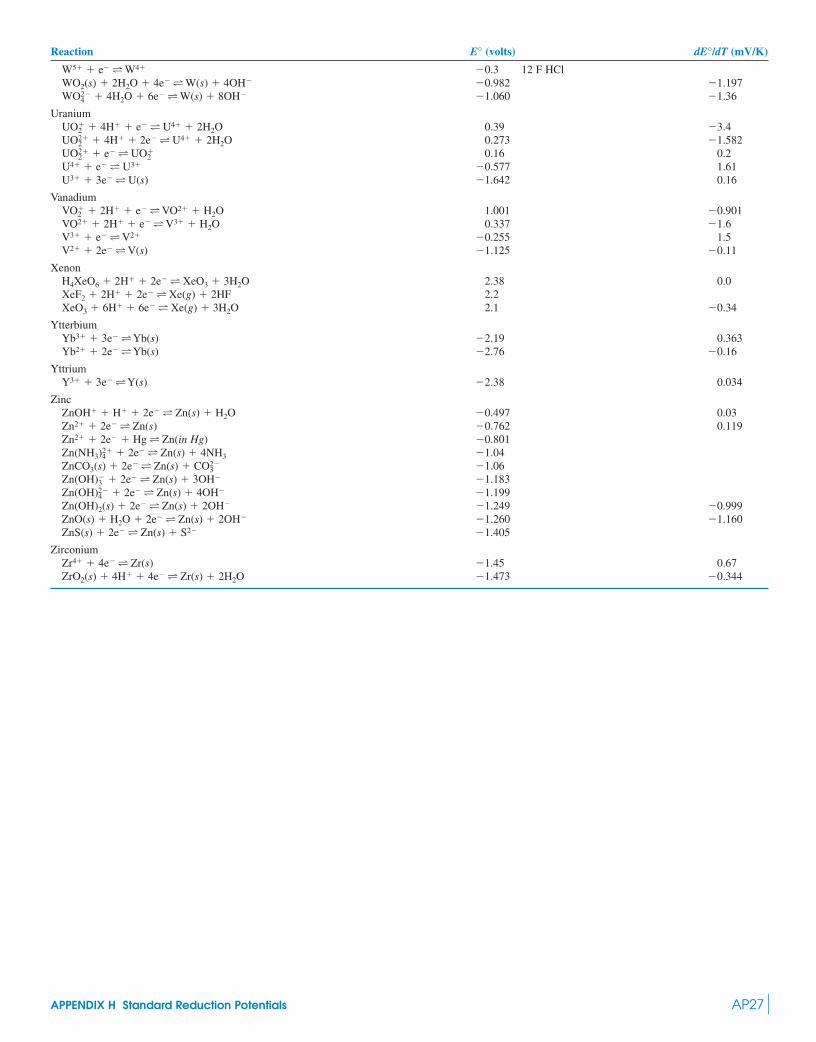
Reaction E° (volts) dE°/dT (mV/K)
W5� � e T W4� 0.3 12 F HClWO2(s) � 2H2O � 4e T W(s) � 4OH 0.982 1.197WO � 4H2O � 6e T W(s) � 8OH 1.060 1.36
UraniumUO � 4H� � e T U4� � 2H2O 0.39 3.4UO � 4H� � 2e T U4� � 2H2O 0.273 1.582UO � e T UO 0.16 0.2U4� � e T U3� 0.577 1.61U3� � 3e T U(s) 1.642 0.16
VanadiumVO � 2H� � e T VO2� � H2O 1.001 0.901VO2� � 2H� � e T V3� � H2O 0.337 1.6V3� � e T V2� 0.255 1.5V2� � 2e T V(s) 1.125 0.11
XenonH4XeO6 � 2H� � 2e T XeO3 � 3H2O 2.38 0.0XeF2 � 2H� � 2e T Xe(g) � 2HF 2.2XeO3 � 6H� � 6e T Xe(g) � 3H2O 2.1 0.34
YtterbiumYb3� � 3e T Yb(s) 2.19 0.363Yb2� � 2e T Yb(s) 2.76 0.16
YttriumY3� � 3e T Y(s) 2.38 0.034
ZincZnOH� � H� � 2e T Zn(s) � H2O 0.497 0.03Zn2� � 2e T Zn(s) 0.762 0.119Zn2� � 2e � Hg T Zn(in Hg) 0.801Zn(NH3) � 2e T Zn(s) � 4NH3 1.04ZnCO3(s) � 2e T Zn(s) � CO 1.06Zn(OH) � 2e T Zn(s) � 3OH 1.183Zn(OH) � 2e T Zn(s) � 4OH 1.199Zn(OH)2(s) � 2e T Zn(s) � 2OH 1.249 0.999ZnO(s) � H2O � 2e T Zn(s) � 2OH 1.260 1.160ZnS(s) � 2e T Zn(s) � S2 1.405
ZirconiumZr4� � 4e T Zr(s) 1.45 0.67ZrO2(s) � 4H� � 4e T Zr(s) � 2H2O 1.473 0.344
24
3
23
2�4
�2
�2
2�2
2�2
�2
24
APPENDIX H Standard Reduction Potentials AP27

AP28 APPENDIX I Formation Constants
APPENDIX IFormation Constants*
Reacting Temperature Ionic strengthions log �1 log �2 log �3 log �4 log �5 log �6 (°C) (�, M)
Acetate, CH3COAg� 0.73 0.64 25 0Ca2� 1.24 25 0Cd2� 1.93 3.15 25 0Cu2� 2.23 3.63 25 0Fe2� 1.82 25 0.5Fe3� 3.38 7.1 9.7 20 0.1Mg2� 1.25 25 0Mn2� 1.40 25 0Na� 0.18 25 0Ni2� 1.43 25 0Zn2� 1.28 2.09 20 0.1
Ammonia, NH3Ag� 3.31 7.23 25 0Cd2� 2.51 4.47 5.77 6.56 30 0Co2� 1.99 3.50 4.43 5.07 5.13 4.39 30 0Cu2� 3.99 7.33 10.06 12.03 30 0Hg2� 8.8 17.5 18.50 19.28 22 2Ni2� 2.67 4.79 6.40 7.47 8.10 8.01 30 0Zn2� 2.18 4.43 6.74 8.70 30 0
Cyanide, CN
Ag� 20 21 20 0Cd2� 5.18 9.60 13.92 17.11 25 ?Cu� 24 28.6 30.3 25 0Ni2� 30 25 0Tl3� 13.21 26.50 35.17 42.61 25 4Zn2� 11.07 16.05 19.62 25 0
Ethylenediamine (1,2-diaminoethane), H2NCH2CH2NH2Ag� 4.70 7.70 9.7 20 0.1Cd2� 5.69 10.36 12.80 25 0.5Cu2� 10.66 19.99 20 0Hg2� 14.3 23.3 23.2 25 0.1Ni2� 7.52 13.84 18.33 20 0Zn2� 5.77 10.83 14.11 20 0
Hydroxide, OH
Ag� 2.0 3.99 25 0Al3� 9.00 17.9 25.2 33.3 25 0
log �22 � 20.3 log �43 � 42.1Ba2� 0.64 25 0Bi3� 12.9 23.5 33.0 34.8 25 0
log �12 6 � 165.3 ( � 1)Be2� 8.6 14.4 18.8 18.6 25 0
log �12 � 10.82 ( � 0.1) log �33 � 32.54 ( � 0.1) log �65 � 66.24 ( � 3) log �86 � 85 ( � 0)Ca2� 1.30 25 0Cd2� 3.9 7.7 10.3 12.0 25 0
( � 3) ( � 3)log �12 � 4.6 log �44 � 23.2
Ce3� 4.9 25 3log �22 � 12.4 log �53 � 35.1
Co2� 4.3 9.2 10.5 9.7 25 0log �12 � 3 log �44 � 25.5
Co3� 13.52 25 3
2
*The overall (cumulative) formation constant, �n, is the equilibrium constant for the reaction �n � [MLn]/([M][L]n).�n is related to stepwise formation constants ( ) by �n (Box 6-2). � is the cumulative formation constant for thereaction �nm � [MmLn]/([M]m[L]n). The subscript n refers to the ligand and m refers to the metal. Data fromL. G. Sillén and A. E. Martell, Stability Constants of Metal-Ion Complexes (London: The Chemical Society. Special PublicationsNo. 17 and 25, 1964 and 1971); and A. E. Martell, R. M. Smith, and R. J. Motekaitis, NIST Critical Stability Constants of MetalComplexes Database 46 (Gaithersburg, MD: National Institute of Standards and Technology, 2001).
mM � nL T MmLn:nm� K1K2 . . . KnKi
M � nL T MLn:
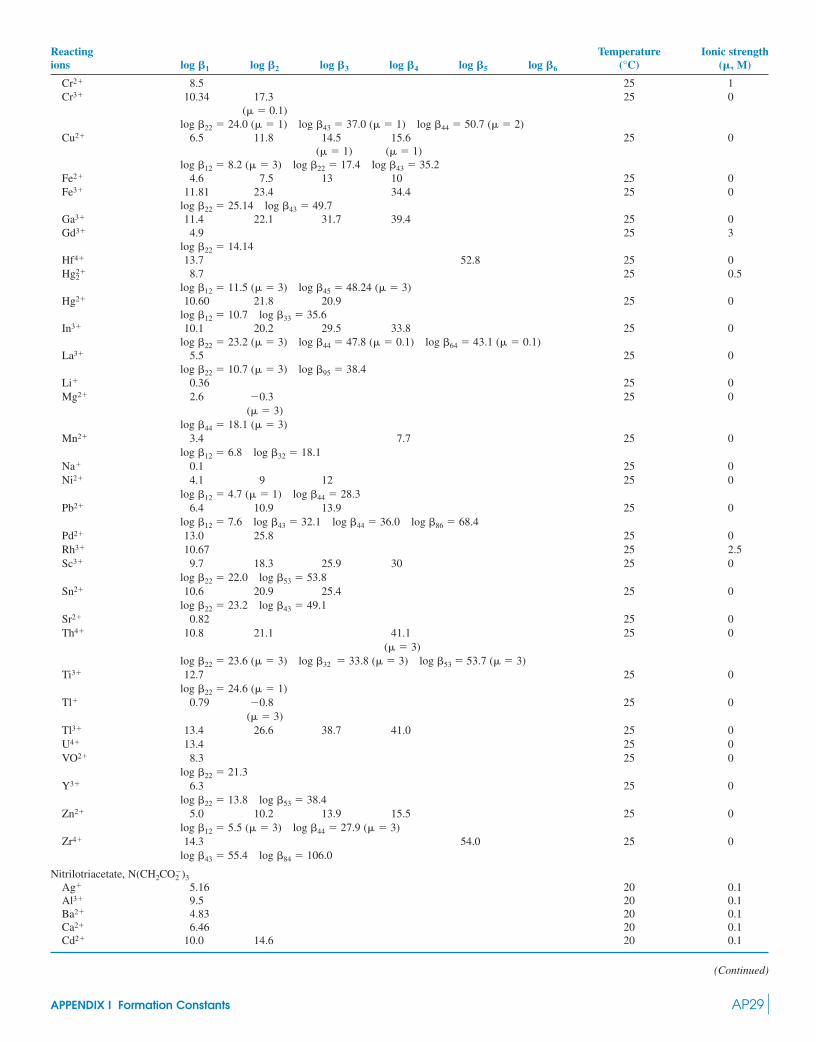
Reacting Temperature Ionic strengthions log �1 log �2 log �3 log �4 log �5 log �6 (°C) (�, M)
Cr2� 8.5 25 1Cr3� 10.34 17.3 25 0
( � 0.1)log �22 � 24.0 ( � 1) log �43 � 37.0 ( � 1) log �44 � 50.7 ( � 2)
Cu2� 6.5 11.8 14.5 15.6 25 0( � 1) ( � 1)
log �12 � 8.2 ( � 3) log �22 � 17.4 log �43 � 35.2Fe2� 4.6 7.5 13 10 25 0Fe3� 11.81 23.4 34.4 25 0
log �22 � 25.14 log �43 � 49.7Ga3� 11.4 22.1 31.7 39.4 25 0Gd3� 4.9 25 3
log �22 � 14.14Hf4� 13.7 52.8 25 0Hg 8.7 25 0.5
log �12 � 11.5 ( � 3) log �45 � 48.24 ( � 3)Hg2� 10.60 21.8 20.9 25 0
log �12 � 10.7 log �33 � 35.6In3� 10.1 20.2 29.5 33.8 25 0
log �22 � 23.2 ( � 3) log �44 � 47.8 ( � 0.1) log �64 � 43.1 ( � 0.1)La3� 5.5 25 0
log �22 � 10.7 ( � 3) log �95 � 38.4Li� 0.36 25 0Mg2� 2.6 0.3 25 0
( � 3)log �44 � 18.1 ( � 3)
Mn2� 3.4 7.7 25 0log �12 � 6.8 log �32 � 18.1
Na� 0.1 25 0Ni2� 4.1 9 12 25 0
log �12 � 4.7 ( � 1) log �44 � 28.3Pb2� 6.4 10.9 13.9 25 0
log �12 � 7.6 log �43 � 32.1 log �44 � 36.0 log �86 � 68.4Pd2� 13.0 25.8 25 0Rh3� 10.67 25 2.5Sc3� 9.7 18.3 25.9 30 25 0
log �22 � 22.0 log �53 � 53.8Sn2� 10.6 20.9 25.4 25 0
log �22 � 23.2 log �43 � 49.1Sr2� 0.82 25 0Th4� 10.8 21.1 41.1 25 0
( � 3)log �22 � 23.6 ( � 3) log �32 � 33.8 ( � 3) log �53 � 53.7 ( � 3)
Ti3� 12.7 25 0log �22 � 24.6 ( � 1)
Tl� 0.79 0.8 25 0( � 3)
Tl3� 13.4 26.6 38.7 41.0 25 0U4� 13.4 25 0VO2� 8.3 25 0
log �22 � 21.3Y3� 6.3 25 0
log �22 � 13.8 log �53 � 38.4Zn2� 5.0 10.2 13.9 15.5 25 0
log �12 � 5.5 ( � 3) log �44 � 27.9 ( � 3)Zr4� 14.3 54.0 25 0
log �43 � 55.4 log �84 � 106.0
Nitrilotriacetate, N(CH2CO )3Ag� 5.16 20 0.1Al3� 9.5 20 0.1Ba2� 4.83 20 0.1Ca2� 6.46 20 0.1Cd2� 10.0 14.6 20 0.1
2
2�2
APPENDIX I Formation Constants AP29
(Continued)

Reacting Temperature Ionic strengthions log �1 log �2 log �3 log �4 log �5 log �6 (°C) (�, M)
Co2� 10.0 13.9 20 0.1Cu2� 11.5 14.8 20 0.1Fe3� 15.91 24.61 20 0.1Ga3� 13.6 21.8 20 0.1In3� 16.9 20 0.1Mg2� 5.46 20 0.1Mn2� 7.4 20 0.1Ni2� 11.54 20 0.1Pb2� 11.47 20 0.1Tl� 4.75 20 0.1Zn2� 10.44 20 0.1
Oxalate, O2CCOAl3� 15.60 20 0.1Ba2� 2.31 18 0Ca2� 1.66 2.69 25 1Cd2� 3.71 20 0.1Co2� 4.69 7.15 25 0Cu2� 6.23 10.27 25 0Fe3� 7.54 14.59 20.00 ? 0.5Ni2� 5.16 6.5 25 0Zn2� 4.85 7.6 25 0
1,10-Phenanthroline,
Ag� 5.02 12.07 25 0.1Ca2� 0.7 20 0.1Cd2� 5.17 10.00 14.25 25 0.1Co2� 7.02 13.72 20.10 25 0.1Cu2� 8.82 15.39 20.41 25 0.1Fe2� 5.86 11.11 21.14 25 0.1Fe3� 14.10 25 0.1Hg2� 19.65 23.4 20 0.1Mn2� 4.50 8.65 12.70 25 0.1Ni2� 8.0 16.0 23.9 25 0.1Zn2� 6.30 11.95 17.05 25 0.1
N N
2
AP30 APPENDIX I Formation Constants

APPENDIX JLogarithm of the Formation Constant for the Reaction M(aq) L(aq) T ML(aq)*
APPENDIX J Logarithm of the Formation Constant for the Reaction M(aq) L(aq) T ML(aq) AP31
L
M F� Cl� Br� I� NO ClO IO SCN� SO CO
Li� 0.23 — — — — — — — 0.64 —Na� 0.2 0.5 — — 0.55 0.7 0.4 — 0.72 1.27K� 1.2a 0.5 — 0.4 0.19 0.03 0.27 — 0.85 —Rb� — 0.4 — 0.04 0.08 0.15 0.19 — 0.60 —Cs� — 0.2 0.03 0.03 0.02 0.23 0.11 — 0.3 —Ag� 0.4 3.31 4.6 6.6 0.1 0.1 0.63 4.8 1.3 —(CH3)4N� — 0.04 0.16 0.31 — 0.27 — — — —Mg2� 2.05 0.6 1.4d — — — 0.72 0.9d 2.23 2.92Ca2� 0.63 0.2b — — 0.5 — 0.89 — 2.36 3.20Sr2� 0.14 0.22a — — 0.6 — 1.00 — 2.2 2.81Ba2� 0.20 0.44a — — 0.7 — 1.10 — 2.2 2.71Zn2� 1.3 0.4 0.07 1.5d 0.4 — — 1.33 2.34 4.76Cd2� 1.2 1.98 2.15 2.28 0.5 — 0.51a 1.98 2.46 3.49b
Hg22� — — — — 0.08f — — — 1.30 f —
Sn2� — 1.64 1.16 0.70e 0.44a — — 0.83a — —Y3� 4.81 0.1a 0.15a — — — — 0.07f 3.47 8.2La3� 3.60 0.1a — — 0.1a — — 0.12a 3.64 5.6d
In3� 4.65 2.32c 2.01c 1.64c 0.18 — — 3.15 1.85a —
2�3
2�4
�3
�4
�3
*Unless otherwise indicated, conditions are 25°C and � � 0. From A. E. Martell, R. M. Smith, and R. J. Motekaitis, NIST CriticalStability Constants of Metal Complexes Database 46 (Gaithersburg, MD: National Institute of Standards and Technology, 2001).
a. � � 1 M; b. � � 0.1 M; c. � � 0.7 M; d. � � 3 M; e. � � 4 M; f. � � 0.5 M.

AP32 APPENDIX K Analytical Standards
The table in this appendix recommends primary standards for many ele-ments. An elemental assay standard must contain a known amount of thedesired element. A matrix matching standard must contain extremely lowconcentrations of undesired impurities, such as the analyte. If you want to pre-pare 10 ppm Fe in 10% aqueous NaCl, the NaCl must not contain significantFe impurity, because the impurity would then have a higher concentrationthan the deliberately added Fe.
Rather than using compounds in the table, many people purchase certi-fied solutions whose concentrations are traceable to standards from theNational Institute of Standards and Technology (NIST or other national insti-tutes of standards). By NIST traceable, we mean that the solution has beenprepared from a standard material certified by NIST or that it has been com-pared with an NIST standard by a reliable analytical procedure.
Manufacturers frequently indicate elemental purity by some number of9s. This deceptive nomenclature is based on the measurement of certainimpurities. For example, 99.999% (five 9s) pure Al is certified to contain
0.001% metallic impurities, based on the analysis of other metals present.However, C, H, N, and O are not measured. The Al might contain 0.1% and still be “five 9s pure.” For the most accurate work, the dissolved gas con-tent in solid elements may also be a source of error.
Carbonates, oxides, and other compounds may not possess the expectedstoichiometry. For example, will have a high Tb content if some is present. Ignition in an atmosphere may be helpful, but the finalstoichiometry is never guaranteed. Carbonates may contain traces ofbicarbonate, oxide, and hydroxide. Firing in a atmosphere may improveCO2
O2
Tb4O7TbO2
Al2O3
�
the stoichiometry. Sulfates may contain some Some chemicalanalysis may be required to ensure that you know what you are really work-ing with.
Most metal standards dissolve in 6 M HCl or or a mixture of thetwo, possibly with heating. Frothing accompanies dissolution of metals orcarbonates in acid, so vessels should be loosely covered by a watchglass orTeflon lid to prevent loss of material. Concentrated (16 M) may pas-sivate some metals, forming an insoluble oxide coat that prevents dissolution.If you have a choice between using a bulk element or a powder as standards,the bulk form is preferred because it has a smaller surface area on whichoxides can form and impurities can be adsorbed. After a pure metal to be usedas a standard is cut, it should be etched (“pickled”) in a dilute solution of theacid in which it will be dissolved to remove surface oxides and contamina-tion from the cutter. The metal is then washed well with water and dried in avacuum desiccator.
Dilute solutions of metals are best prepared in Teflon or plastic ves-sels, because glass is an ion exchanger that can replace analyte species.Specially cleaned glass vials are commercially available for trace organicanalysis. Volumetric dilutions are rarely more accurate than 0.1%, so gravi-metric dilutions are required for greater accuracy. Of course, weightsshould be corrected for buoyancy with Equation 2-1. Evaporation of stan-dard solutions is a source of error that is prevented if the mass of thereagent bottle is recorded after each use. If the mass changes between uses,the contents are evaporating.
HNO3
HNO3
HSO4.
Calibration standards
Element Sourcea Purity Commentsb
Li SRM 924 (Li2CO3) 100.05 � 0.02% E; dry at 200°C for 4 h.Li2CO3 five–six 9s M; purity calculated from impurities. Stoichiometry
unknown.Na SRM 919 or 2201 (NaCl) 99.9% E; dry for 24 h over Mg(ClO4)2.
Na2CO3 three 9s M; purity based on metallic impurities.K SRM 918 (KCl) 99.9% E; dry for 24 h over Mg(ClO4)2.
SRM 999 (KCl) 52.435 � 0.004% K E; ignite at 500°C for 4 h.K2CO3 five–six 9s M; purity based on metallic impurities.
Rb SRM 984 (RbCl) 99.90 � 0.02% E; hygroscopic. Dry for 24 h over Mg(ClO4)2.Rb2CO3 M
Cs Cs2CO3 MBe metal three 9s E, M; purity based on metallic impurities.Mg SRM 929 100.1 � 0.4% E; magnesium gluconate clinical standard.
5.403 � 0.022% Mg Dry for 24 h over Mg(ClO4)2.metal five 9s E; purity based on metallic impurities.
Ca SRM 915 (CaCO3) three 9s E; use without drying.CaCO3 five 9s E, M; dry at 200°C for 4 h in CO2. User must determine
stoichiometry.Sr SRM 987 (SrCO3) 99.8% E; ignite to establish stoichiometry. Dry at 110°C for 1 h.
SrCO3 five 9s M; up to 1% off stoichiometry. Ignite to establishstoichiometry. Dry at 200°C for 4 h.
Ba BaCO3 four–five 9s M; dry at 200°C for 4 h.
Transition metals: Use pure metals (usually �four 9s) for elemental and matrix standards. Assays are based on impurities and do not include dissolved gases.
Lanthanides: Use pure metals (usually �four 9s) for elemental standards and oxides as matrix standards. Oxides may be difficult to dry and stoichiometry isnot certain.
a. SRM is the National Institute of Standards and Technology designation for a Standard Reference Material.
b. E means elemental assay standard; M means matrix matching standard.
SOURCES: J. R. Moody, R. R. Greenberg, K. W. Pratt, and T. C. Rains, “Recommended Inorganic Chemicals for Calibration,” Anal. Chem. 1988, 60, 1203A.
APPENDIX KAnalytical Standards
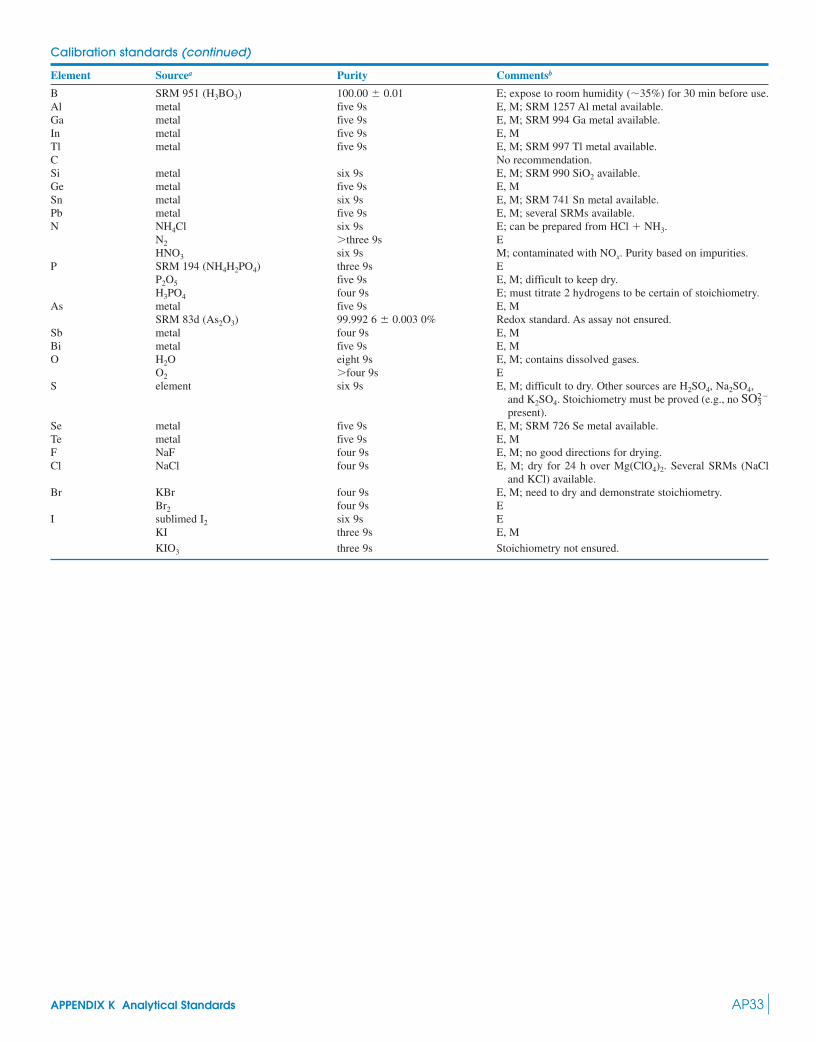
APPENDIX K Analytical Standards AP33
Calibration standards (continued)
Element Sourcea Purity Commentsb
B SRM 951 (H3BO3) 100.00 � 0.01 E; expose to room humidity (�35%) for 30 min before use.Al metal five 9s E, M; SRM 1257 Al metal available.Ga metal five 9s E, M; SRM 994 Ga metal available.In metal five 9s E, MTl metal five 9s E, M; SRM 997 Tl metal available.C No recommendation.Si metal six 9s E, M; SRM 990 SiO2 available.Ge metal five 9s E, MSn metal six 9s E, M; SRM 741 Sn metal available.Pb metal five 9s E, M; several SRMs available.N NH4Cl six 9s E; can be prepared from HCl � NH3.
N2 three 9s EHNO3 six 9s M; contaminated with NOx. Purity based on impurities.
P SRM 194 (NH4H2PO4) three 9s EP2O5 five 9s E, M; difficult to keep dry.H3PO4 four 9s E; must titrate 2 hydrogens to be certain of stoichiometry.
As metal five 9s E, MSRM 83d (As2O3) 99.992 6 � 0.003 0% Redox standard. As assay not ensured.
Sb metal four 9s E, MBi metal five 9s E, MO H2O eight 9s E, M; contains dissolved gases.
O2 four 9s ES element six 9s E, M; difficult to dry. Other sources are H2SO4, Na2SO4,
and K2SO4. Stoichiometry must be proved (e.g., no present).
Se metal five 9s E, M; SRM 726 Se metal available.Te metal five 9s E, MF NaF four 9s E, M; no good directions for drying.Cl NaCl four 9s E, M; dry for 24 h over Mg(ClO4)2. Several SRMs (NaCl
and KCl) available.Br KBr four 9s E, M; need to dry and demonstrate stoichiometry.
Br2 four 9s EI sublimed I2 six 9s E
KI three 9s E, M
KIO3 three 9s Stoichiometry not ensured.
SO23

This page intentionally left blank
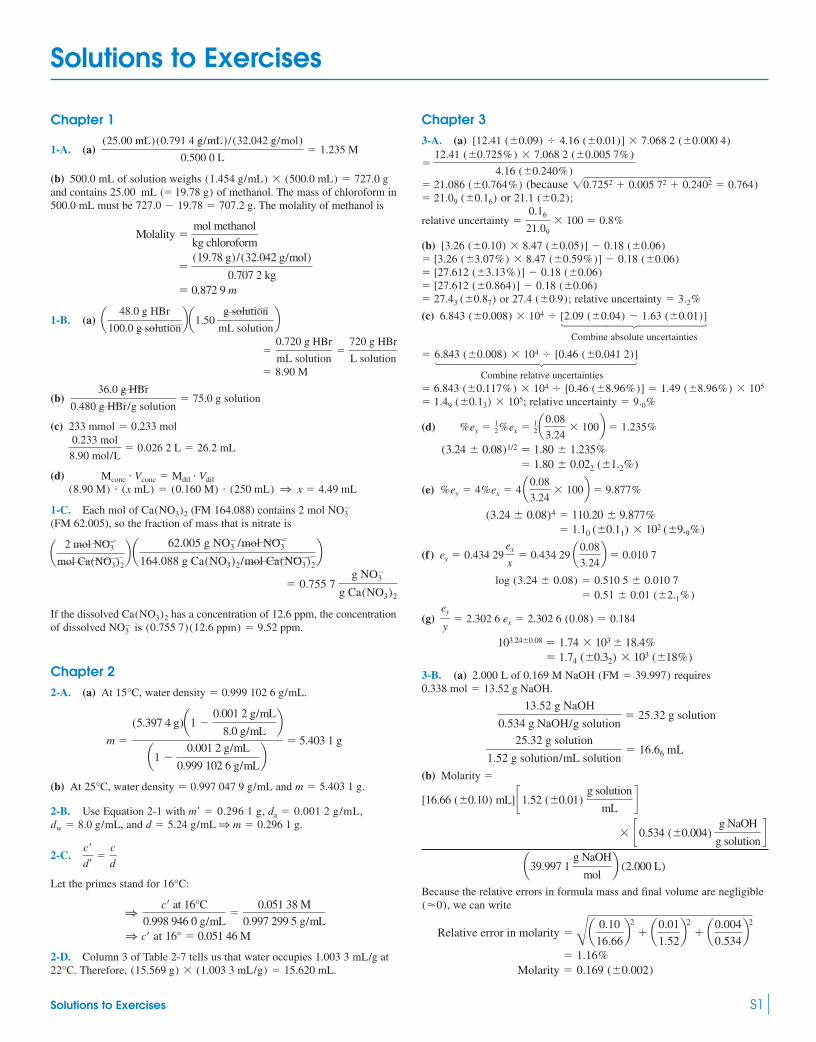
Solutions to Exercises
Solutions to Exercises S1
Chapter 1
1-A. (a)
(b) 500.0 mL of solution weighs and contains of methanol. The mass of chloroform in500.0 mL must be The molality of methanol is
1-B. (a)
(b) solution
(c)
(d)
1-C. Each mol of (FM 164.088) contains 2 mol (FM 62.005), so the fraction of mass that is nitrate is
If the dissolved has a concentration of 12.6 ppm, the concentrationof dissolved is
Chapter 22-A. (a) At
(b) At and
2-B. Use Equation 2-1 with and
2-C.
Let the primes stand for
at
2-D. Column 3 of Table 2-7 tells us that water occupies 1.003 3 mL/g atTherefore, (15.569 g) � (1.003 3 mL/g) � 15.620 mL.22°C.
16° � 0.051 46 M1 c¿
1c¿ at 16°C
0.998 946 0 g/mL�
0.051 38 M
0.997 299 5 g/mL
16°C:
c¿d¿
�c
d
d � 5.24 g/mL 1 m � 0.296 1 g.dw � 8.0 g/mL,m¿ � 0.296 1 g, da � 0.001 2 g/mL,
m � 5.403 1 g.water density � 0.997 047 9 g/mL25°C,
m �
(5.397 4 g)a1 0.001 2 g/mL
8.0 g/mLb
a1 0.001 2 g/mL
0.999 102 6 g/mLb
� 5.403 1 g
water density � 0.999 102 6 g/mL.15°C,
(0.755 7)(12.6 ppm) � 9.52 ppm.NO3
Ca(NO3)2
� 0.755 7 g NO
3
g Ca(NO3)2
a 62.005 g NO3 /mol NO
3
164.088 g Ca(NO3)2/mol Ca(NO3)2ba 2 mol NO
3
mol Ca(NO3)2b
NO3Ca(NO3)2
(8.90 M) � (x mL) � (0.160 M) � (250 mL) 1 x � 4.49 mLMconc � Vconc � Mdil � Vdil
0.233 mol
8.90 mol/L� 0.026 2 L � 26.2 mL
233 mmol � 0.233 mol
36.0 g HBr
0.480 g HBr/g solution� 75.0 g
� 8.90 M
�0.720 g HBr
mL solution�
720 g HBr
L solution
a 48.0 g HBr
100.0 g solutionba1.50
g solution
mL solutionb
� 0.872 9 m
�(19.78 g)/(32.042 g/mol)
0.707 2 kg
Molality �mol methanol
kg chloroform
727.0 19.78 � 707.2 g.25.00 mL (� 19.78 g)
(1.454 g/mL) � (500.0 mL) � 727.0 g
(25.00 mL)(0.791 4 g/mL)/(32.042 g/mol)
0.500 0 L� 1.235 M
Chapter 33-A. (a)
(becauseor
(b)
or
(c)1444442444443
Combine absolute uncertainties
144444444244444443Combine relative uncertainties
(d)
(e)
(f)
(g)
3-B. (a) 2.000 L of 0.169 M NaOH requires
(b) Molarity �
Because the relative errors in formula mass and final volume are negligiblewe can write
Molarity � 0.169 (�0.002)� 1.16%
Relative error in molarity � Ba 0.10
16.66b2
� a0.01
1.52b2
� a0.004
0.534b2
(�0),
� c0.534 (�0.004) g NaOH
g solutiond
a39.997 1 g NaOH
molb (2.000 L)
[16.66 (�0.10) mL] c1.52 (�0.01) g solution
mLd
25.32 g solution
1.52 g solution/mL solution� 16.66 mL
13.52 g NaOH
0.534 g NaOH/g solution� 25.32 g solution
0.338 mol � 13.52 g NaOH.(FM � 39.997)
� 1.74 (�0.32) � 103 (�18%) 103.24�0.08 � 1.74 � 103 � 18.4%
ey
y� 2.302 6 ex � 2.302 6 (0.08) � 0.184
� 0.51 � 0.01 (�2.1%) log (3.24 � 0.08) � 0.510 5 � 0.010 7
ey � 0.434 29ex
x� 0.434 29 a0.08
3.24b � 0.010 7
� 1.10 (�0.11) � 102 (�9.9%) (3.24 � 0.08)4 � 110.20 � 9.877%
%ey � 4%ex � 4 a0.08
3.24� 100b � 9.877%
� 1.80 � 0.022 (�1.2%) (3.24 � 0.08)1/2 � 1.80 � 1.235%
%ey � 12%ex � 1
2a0.08
3.24� 100b � 1.235%
relative uncertainty � 9.0%� 1.49 (�0.13) � 105;� 6.843 (�0.117%) � 104 ( [0.46 (�8.96%)] � 1.49 (�8.96%) � 105
� 6.843 (�0.008) � 104 ( [0.46 (�0.041 2)]
6.843 (�0.008) � 104 ( [2.09 (�0.04) 1.63 (�0.01)]
relative uncertainty � 3.2%27.4 (�0.9);� 27.43 (�0.87)� [27.612 (�0.864)] 0.18 (�0.06)� [27.612 (�3.13%)] 0.18 (�0.06)� [3.26 (�3.07%) � 8.47 (�0.59%)] 0.18 (�0.06)
[3.26 (�0.10) � 8.47 (�0.05)] 0.18 (�0.06)
relative uncertainty �0.16
21.09� 100 � 0.8%
21.1 (�0.2);� 21.09 (�0.16)20.7252 � 0.005 72 � 0.2402 � 0.764)� 21.086 (�0.764%)
�12.41 (�0.725%) � 7.068 2 (�0.005 7%)
4.16 (�0.240%)
[12.41 (�0.09) ( 4.16 (�0.01)] � 7.068 2 (�0.000 4)

S2 Solutions to Exercises
3-C. 0.050 0 (�2%) mol �
Error analysis:
Chapter 44-A.
Therefore, 97.9 should be retained.
4-B.
Qcalculated �106.8 97.9
116.0 97.9� 0.49 6 Qtable (� 0.64)
90% confidence interval � 108.64 �(2.132)(7.14)25
� 108.64 � 6.81
� 7.14
Standard deviation �B (116.0 108.64)2 � p � (108.3 108.64)2
5 1
� 108.64
Mean � 15(116.0 � 97.9 � 114.2 � 106.8 � 108.3)
x � 0.05 mL
(0.02)2 � a x
4.18b2
� a0.01
1.18b2
� a0.005
0.370b2
� c0.370 (�0.005) g HCl
g solutiond
36.461 g HCl
mol
[4.18 (�x) mL] c1.18 (�0.01) g solution
mLd
4-C. (a) We need to find the fraction of the area of the Gaussian curvebetween and h. When
The Gaussian curve is symmetric, so thearea from to is the same as the area from 2.100 0 to Table 4-1 tells us that the area between and is 0.482 1.Because the area from to is 0.500 0, the area from to is The fraction of brakes expectedto be 80% worn in less than 40 860 miles is 0.017 9, or 1.79%.(b) At 57 500 miles, At71 020 miles, The areaunder the Gaussian curve from to is the same as thearea from to which is 0.191 5 in Table 4-1. Thearea from to is 0.288 1. The total area from
to is Thefraction expected to be 80% worn between 57 500 and 71 020 miles is0.479 6, or 47.96%.
4-D. The answers in cells C4 and C9 of the following spreadsheet are (a) 0.052 and (b) 0.361.
0.191 5 � 0.288 1 � 0.479 6.z � �0.800 0z � 0.500 0z � �0.800 0z � 0z � �0.500 0,z � 0
z � 0z � 0.500 0z � (71 020 62 700) /10 400 � �0.800 0.
z � (57 500 62 700) /10 400 � 0.500 0.
0.500 0 0.482 1 � 0.017 9.z � �z � 2.100 0z � �z � 0
x � 2.1z � 0� � .2.100 0�
62 700) /10 400 � 2.100 0.z � (40 860 x � 40 860,x � 40 860x � �
A B C D
1 Computing standard deviation
2
3 Data � x x mean (x-mean)^2
4 17.4 0.44 0.1936
5 18.1 0.26 0.0676
6 18.2 0.36 0.1296
7 17.9 0.06 0.0036
8 17.6 0.24 0.0576
9 sum � 89.2 0.452
10 mean � 17.84
11 std dev � 0.3362
12
13 Formulas: B9 � B4�B5�B6�B7�B8
14 B10 � B9/5
15 B11 � SQRT(D9/(51))
16 C4 � B4$B$10
17 D4 � C4^2
18 D9 � D4�D5�D6�D7�D8
19
20 Calculations using built-in functions:
21 sum � 89.2
22 mean � 17.84
23 std dev � 0.3362
24
25 Formulas: B21 � SUM(B4:B8)
26 B22 � AVERAGE(B4:B8)
27 B23 � STDEV(B4:B8)
A B C
1 Mean � Std dev �
2 62700 10400
3
4 Area from � to 45800 � 0.052081
5 Area from � to 60000 � 0.397580
6 Area from � to 70000 � 0.758637
7
8 Area from 60000 to 70000
9 � C6C5 � 0.361056
10
11 Formula:
12 C4 � NORMDIST(45800,A2,B2,TRUE)
4-E. For 117, 119, 111, 115, 120 and The 95% confidence interval for 4 degrees of freedom is
The 95% confidence interval does not include the accepted value ofso the difference is significant.
4-F. (a) pg/g corresponds to g/g, which is parts per trillion. (b) (for 5 degrees offreedom in both numerator and denominator). Standard deviations are notsignificantly different at 95% confidence level.(c) Because we can use Equations 4-8 and 4-9.
Because for 10 degrees of freedom), thedifference is significant at the 95% confidence level.(d) The standard deviationsare significantly different at the 95% confidence level. Therefore, we useEquations 4-8a and 4-9a to compare the means:
Degrees of freedom � c (s21/n1 � s2
2/n2)2
a (s21/n1)2
n1 � 1�
(s22/n2)2
n2 � 1bs 2
Fcalculated � 3.62/1.22 � 9.00 7 Ftable � 5.05.
tcalculated (� 7.00) 7 ttable (� 2.228
tcalculated �0 x1 x2 0
spooled B n1n2
n1 � n2�0 51.1 34.4 0
4.13 B 6�6
6 � 6� 7.00
� B4.62(6 1) � 3.62(6 1)
6 � 6 2� 4.13
spooled � B s21 (n1 1) � s2
2 (n2 1)
n1 � n2 2
Fcalculated 6 Ftable,
Fcalculated � 4.62/3.62 � 1.63 6 Ftable � 5.051012
111 mol/100 mL,
� 112.0 to 120.8 mol/100 mL
� x �ts2n
� 116.4 �(2.776)(3.58)25
� 116.4 � 4.4
s � 3.58.x � 116.4mol/100 mL,

Because for 7 degrees of freedom), thedifference is significant at the 95% confidence level.
4-G. (a)
xi yi xiyi x di d
0.00 0.466 0 0 0.004 6 2.12 � 105
9.36 0.676 6.327 87.61 �0.001 6 2.58 � 106
18.72 0.883 16.530 350.44 �0.004 8 2.31 � 105
28.08 1.086 30.495 788.49 �0.004 0 1.61 � 105
37.44 1.280 47.923 1 401.75 0.005 8 3.34 � 105
Sum: 93.60 4.391 101.275 2 628.29 9.64 � 105
� 2 061.48 ( 4 380.5 � 0.470 60
�(2 628.29)(4.391) (101.275)(93.60)
D
b � 2 � (x2i )
�xi
�xi yi
�yi2 ( D
� 95.377 ( 4 380.5 � 0.021 773
�(101.275)(5) (93.60)(4.391)
D
m � 2 �xi yi
�yi
�xi
n2 ( D
� (2 628.29)(5) (93.60)(93.60) � 4 380.5
D � 2 � (x2i )
�xi
�xi
n2
2i
2i
tcalculated (� 5.49) 7 ttable(� 2.365
tcalculated �0 x1 x2 02s21/n1 � s2
2/n2
�0 34.4 42.9 023.62/6 � 1.22/6
� 5.49
� •(3.62/6 � 1.22/6)2
a (3.62/6)2
6 � 1�
(1.22/6)2
6 � 1b ¶
2 � 6.54 � 7
Solutions to Exercises S3
�
Equation of the best line:
(c) �
If you keep more digits for m and
Uncertainty in
Final answer is
Chapter 55-A. (a)
(b)
� 8.6 � 108 M
Minimum detectable concentration �3s
m�
(3) (0.000 644)
2.24 � 104 M1
ydl � yblank � 3s � 0.001 18 � (3)(0.000 644) � 0.003 112
Mean blank � yblank � 0.001 189
Standard deviation of 9 samples � s � 0.000 644
23.1 � 0.3 g.
�0.005 67
00.021 77 0 B1
1�
1
5�
(0.973 0.878 2)2
(0.021 77)2 (876.1)� 0.29 g
�sy
0m 0 B1
k�
1n
�(y y)2
m2 � (xi x)2
x (sx)
b, x � 23.07 g.
0.973 0.471
0.021 8� 23.0 gx �
y b
m
y � [0.021 8 (�0.000 2)]x � [0.471 (�0.004)]
� 0.004 39B (3.21 � 105)(2 628.29)
4 380.5sb �B s2
y�(x2i )
D
sm � B s2yn
D� B (3.21 � 105)5
4 380.5� 0.000 191
sy � 0.005 67� 3.21 � 105;
s2y �
� (d 2i )
n 2�
9.64 � 105
3
Least-Squares Spreadsheet
x y
0
18.72
28.08
37.44
0.02177
0.00019
9.36
0.466
0.883
1.086
1.280
0.676
LINEST output:
msm
0.878
876.096
0.973 Input
Input1
23.0739
0.2878
Derived x
sx =
5 B15 = COUNT(B4:B8)
B16 = AVERAGE(C4:C8)
B17 = DEVSQ(B4:B8)
B22 = (C13/B11)*SQRT((1/B20)+(1/B15)+((B19-B16)^2)/(B11^2*B17))
B21 = (B19-C11)/B11
1
2
3
4
5
6
7
8
9
10
12
13
14
15
16
17
18
19
20
21
22
11
A B C D E F G H I
R2 0.99977
0.47060
0.00439
0.00567
b
sb
sy
n =
Mean y =
Measured y =
Number ofreplicatemeasurementsof y (k) =
∑(xi-mean x)2 =
1.2
1.3
1.4
1.1
1.0
0.9
0.8
0.7
0.6
0.5
0.40 10 20 30 40
Protein (�g)
Ab
sorb
ance
at
595
nm
y = 0.0218x + 0.4706
Spreadsheet for Exercise 4-G.
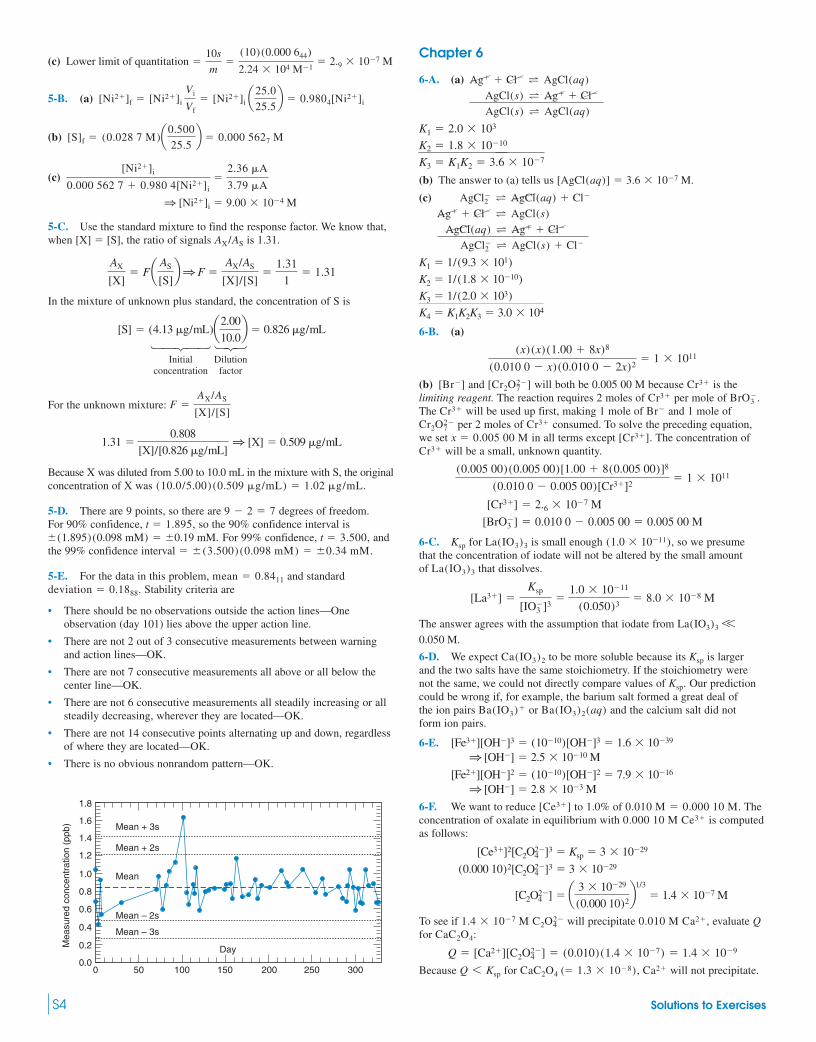
(c)
5-B. (a)
(b)
(c)
5-C. Use the standard mixture to find the response factor. We know that,when [X] � [S], the ratio of signals is 1.31.
In the mixture of unknown plus standard, the concentration of S is
14243 123Initial Dilution
concentration factor
For the unknown mixture:
Because X was diluted from 5.00 to 10.0 mL in the mixture with S, the originalconcentration of X was
5-D. There are 9 points, so there are degrees of freedom. For 90% confidence, so the 90% confidence interval is
For 99% confidence, andthe 99% confidence interval
5-E. For the data in this problem, and standardStability criteria are
• There should be no observations outside the action lines—One observation (day 101) lies above the upper action line.
• There are not 2 out of 3 consecutive measurements between warningand action lines—OK.
• There are not 7 consecutive measurements all above or all below thecenter line—OK.
• There are not 6 consecutive measurements all steadily increasing or allsteadily decreasing, wherever they are located—OK.
• There are not 14 consecutive points alternating up and down, regardlessof where they are located—OK.
• There is no obvious nonrandom pattern—OK.
Mea
sure
d co
ncen
trat
ion
(ppb
)
0.8
0.6
0.4
0.2
0.00 50 100 150 200 250 300
1.8
1.6
1.4Mean + 3s
Mean + 2s
Mean – 2s
Mean – 3s
Mean
Day
1.2
1.0
deviation � 0.1888.mean � 0.8411
� �(3.500) (0.098 mM) � �0.34 mM.t � 3.500,�(1.895)(0.098 mM) � �0.19 mM.
t � 1.895,9 2 � 7
(10.0/5.00) (0.509 g/mL) � 1.02 g/mL.
1.31 �0.808
[X]/[0.826 g/mL]1 [X] � 0.509 g/mL
F �AX/AS
[X]/[S]
[S] � (4.13 g/mL)a2.00
10.0b � 0.826 g/mL
AX
[X]� Fa AS
[S]b1 F �
AX/AS
[X]/[S]�
1.31
1� 1.31
AX/AS
1 [Ni2�]i � 9.00 � 104 M
[Ni2�]i
0.000 562 7 � 0.980 4[Ni2�]i�
2.36 A
3.79 A
[S]f � (0.028 7 M)a0.500
25.5b � 0.000 5627 M
[Ni2�]f � [Ni2�]i
Vi
Vf� [Ni2�]i a25.0
25.5b � 0.9804[Ni2�]i
� 2.9 � 107 MLower limit of quantitation �10s
m�
(10)(0.000 644)
2.24 � 104 M1
S4 Solutions to Exercises
Chapter 6
6-A. (a)
(b) The answer to (a) tells us
(c)
6-B. (a)
(b) and will both be 0.005 00 M because is the limiting reagent. The reaction requires 2 moles of per mole of The will be used up first, making 1 mole of and 1 mole of
per 2 moles of consumed. To solve the preceding equation,we set in all terms except The concentration of
will be a small, unknown quantity.
6-C. for La is small enough so we presume that the concentration of iodate will not be altered by the small amount of that dissolves.
The answer agrees with the assumption that iodate from
6-D. We expect to be more soluble because its is largerand the two salts have the same stoichiometry. If the stoichiometry werenot the same, we could not directly compare values of Our predictioncould be wrong if, for example, the barium salt formed a great deal ofthe ion pairs or and the calcium salt did notform ion pairs.
6-E.
6-F. We want to reduce to 1.0% of Theconcentration of oxalate in equilibrium with is computedas follows:
To see if will precipitate evaluate Qfor
Because for will not precipitate.CaC2O4 (� 1.3 � 108), Ca2�Q 6 Ksp
Q � [Ca2�][C2O24 ] � (0.010)(1.4 � 107) � 1.4 � 109
CaC2O4:0.010 M Ca2�,1.4 � 107 M C2O2
4
[C2O42] � a 3 � 1029
(0.000 10)2b1/3
� 1.4 � 107 M
(0.000 10)2[C2O24 ]3 � 3 � 1029
[Ce3�]2[C2O24 ]3 � Ksp � 3 � 1029
0.000 10 M Ce3�
0.010 M � 0.000 10 M.[Ce3�]
1 [OH] � 2.8 � 103 M [Fe2�][OH]2 � (1010)[OH]2 � 7.9 � 1016
1 [OH] � 2.5 � 1010 M[Fe3�][OH]3 � (1010)[OH]3 � 1.6 � 1039
Ba(IO3)2(aq)Ba(IO3)�
Ksp.
KspCa(IO3)2
0.050 M.
La(IO3)3 V
[La3�] �Ksp
[IO3 ]3
�1.0 � 1011
(0.050)3� 8.0 � 108 M
La(IO3)3
(1.0 � 1011),(IO3)3Ksp
[BrO3 ] � 0.010 0 0.005 00 � 0.005 00 M
[Cr3�] � 2.6 � 107 M
(0.005 00)(0.005 00)[1.00 � 8(0.005 00)]8
(0.010 0 0.005 00)[Cr3�]2� 1 � 1011
Cr3�
[Cr3�].x � 0.005 00 MCr3�Cr2O2
7
BrCr3�
BrO3 .Cr3�
Cr3�[Cr2O27 ][Br]
(x)(x) (1.00 � 8x)8
(0.010 0 x) (0.010 0 2x)2� 1 � 1011
K1 � 1/(9.3 � 101)
K2 � 1/(1.8 � 1010)
K3 � 1/(2.0 � 103)
K4 � K1K2K3 � 3.0 � 104
AgCl2 T AgCl(aq) � Cl
Ag� � Cl T AgCl(s)
AgCl(aq) T Ag� � Cl AgCl
2 T AgCl(s) � Cl
[AgCl(aq)] � 3.6 � 107 M.
K1 � 2.0 � 103
K2 � 1.8 � 1010
K3 � K1K2 � 3.6 � 107
Ag� � Cl T AgCl(aq)
AgCl(s) T Ag� � Cl AgCl(s) T AgCl(aq)

6-G. Assuming that all of the Ni is in the form This uses up just mol of en, which leaves the en
concentration at 0.100 M. Adding the three equations gives
Now we verify that and
6-H. (a) Neutral—Neither nor has any acidic or basic properties.(b) Basic— is the conjugate base of acetic acid, and is neither acidic nor basic.(c) Acidic— is the conjugate acid of and is neither acidicnor basic.(d) Basic— is a base, and is neither acidic nor basic.(e) Neutral—Neither ion is acidic or basic.(f) Basic—The quaternary ammonium ion is neither acidic nor basic, andthe anion is the conjugate base of benzoic acid.(g) Acidic— is acidic, and nitrate is neither acidic nor basic.
6-I.
6-J.
6-K. (a)at 7.082 at and 6.770 at
(b) Because in pure
Chapter 77-A. (a)
(b)
7-B. (a) This many mmol of NaOH is
contained in 0.038 314 kg of NaOH solution
(b) molBecause 2 mol NaOH react with 1 mol
7-C. Let xbe the mass of malonic acid and y be the mass of anilinium chloride. Then
Substituting malonicacid.
7-D. The absorbance must be corrected by multiplying each observedabsorbance by (total volume/initial volume). For example, at
A graph of A (corrected) � (0.399)[(2 025 � 36) /2 025] � 0.406.36.0 L,
Anilinium chloride � 57.93%.y � 0.237 6 x gives x � 0.099 97 g � 42.07%
y
129.59� 2a x
104.06b � 0.002 983 9
0.002 983 9(Moles of anilinium chloride) � 2(moles of malonic acid) �
x � y � 0.237 6 g and
34.02 mL of 0.087 71 M NaOH � 2.983 9 mmol of OH.
[H2SO4] �3.05 mmol
10.00 mL� 0.305 M
H2SO4,NaOH � (0.057 911 kg) (0.105 3 mol/kg) � 6.10 mmol.
� 0.1053 mol/kg solution
1 concentration �4.03 � 103 mol NaOH
0.038 314 kg solution
0.824 g acid
204.221 g/mol� 4.03 mmol.
� 0.211 9 g � 49.94% of the tablet� 1.203 mmol of ascorbic acid
31.63 mL of I3 � 1.203 mmol of I
3
� 0.038 03 M Molarity of I
3 � 1.118 5 mmol/29.41 mL
0.197 0 g of ascorbic acid � 1.118 5 mmolFormula mass of ascorbic acid � 176.124
[D�][OD] � [D�]2 1 [D�] � 3.67 � 108 M 1 pD � 7.435.K � 1.35 � 1015 �D2O,[D�] � [OD]
40°C.20°C,0°C,log 1Kw � 7.469[H�][OH] � x2 � Kw 1 x � 1Kw 1 pH �
K � Kb2 � Kw/Ka2 � 1.2 � 108
Kb2 � Kw/Ka1 � 1.6 � 1010
Kb1 � Kw/Ka2 � 4.4 � 109
Fe3�
C6H5CO2
K�PO34
ClNH3,NH�4
Na�CH3CO2
BrNa�
[Ni(en)2�2 ] � K2[Ni(en)2�][en] � 3.3 � 109 M
[Ni(en)2�] � K1[Ni2�][en] � 1.6 � 1014 M
[Ni(en)2�2 ] V 105 M:[Ni(en)2�]
�(1.00 � 105)
(2.14 � 1018)(0.100)3� 4.7 � 1021 M
[Ni2�] �[Ni(en)2�
3 ]
K[en]3
K � K1K2K3 � 2.14 � 1018
Ni2� � 3en T Ni(en)2�3
3 � 1051.00 � 105 M.Ni(en)2�
3 , [Ni(en)2�3 ] �
Solutions to Exercises S5
corrected absorbance versus volume of is similar to Figure 7-5, with the end point at The moles of in this volume are The concentration of semi-xylenol orange is
7-E. The reaction is The equivalence pointoccurs when moles of Beforethe equivalence point, there is excess remaining in the solution. Wecalculate the molarity of and then find from the relation
For example, when 0.10 mL of has beenadded,
At the equivalence point,
Past the equivalence point, there is excess For example, when
mL pCu mL pCu mL pCu
0.10 13.22 75.0 12.22 100.0 7.1610.0 13.10 95.0 11.46 100.1 4.5725.0 12.92 99.0 10.75 101.0 3.5850.0 12.62 99.9 9.75 110.0 2.60
7-F. for AgBr. At 2.00, 10.00, 22.00, and 23.00 mL,AgBr is partially precipitated and excess remains.
At 2.00 mL:
1442443 14243 14243Fraction Original Dilution
remaining molarity factorof
By similar reasoning, we find
At 24.00, 30.00, and 40.00 mL, AgCl is precipitating and excess remains in solution.
At 24.00 mL:
By similar reasoning, we find
At the second equivalence point (47.32 mL), and wecan write
[Ag�] � [Cl],
at 40.00 mL: pAg� � 7.63at 30.00 mL: pAg� � 8.07
� 5.8 � 109 M 1 pAg� � 8.23
�1.8 � 1010
a47.32 24.00
23.66b (0.050 00)a40.00
64.00b
[Ag�] �Ksp(for AgCl)
[Cl]
Cl
at 23.00 mL: pAg� � 9.25 at 22.00 mL: pAg� � 9.66 at 10.00 mL: pAg� � 10.66
� 1.15 � 1011 M 1 pAg� � 10.94Br
�5.0 � 1013
a23.66 2.00
23.66b (0.050 00) a40.00
42.00b
[Ag�] �Ksp(for AgBr)
[Br]
Br
Ve � 23.66 mL
pCu� � 3.58
[Cu�] � (0.040 0)a101.0 100.0
151.0b � 2.6 � 104 M
V � 101.0 mL,Cu�.
6.9 � 108 1 pCu� � 7.16.[Cu�][SCN] � x2 � Ksp 1 x � [Cu�] �
pCu� � 13.22
� 6.0 � 1014 [Cu�] � 4.8 � 1015/7.98 � 102
� 7.98 � 102 M
[SCN] � a100.0 0.10
100.0b(0.080 0)a50.0
50.1b
Cu�[Cu�] � Ksp/[SCN].[Cu�]SCN
SCN
Cu� � moles of SCN 1 Ve � 100.0 mL.SCN � Cu� S CuSCN(s).
(2.025 � 103 L) � 1.73 � 105 M.(3.510 � 108 mol) /
(46.7 � 106 L) (7.515 � 104 M) � 3.510 � 108 mol.Pb2�46.7 L.
Pb2� (L)

At 50.00 mL, there is an excess of of
7-G. (a) 12.6 mL of are required to precipitate are required to precipitate
(b)
Let the error in 15.1 mL be y%:
Chapter 88-A. (a)
(b)
(c)
8-B. For plus The size of the ion
is for an ion of charge with
8-C. from KSCN, assuming negligible solubility of AgSCN.
The activity coefficients at are and
8-D. At an ionic strength of and
pH � log[(1.2 � 107)(0.86)] � 6.99.[H�] � 1.2 � 107 M.1 x �[H�]�H�[OH]�OH � (x) (0.86) (x) (0.81) � 1.0 � 1014
�OH � 0.81.0.050 M, �H� � 0.86
1 [Ag�] � 2.9 � 1011 M.Ksp � [Ag�](0.79)[0.060](0.80) � 1.1 � 1012
�SCN � 0.80.�Ag� � 0.79 � 0.060 M
Ksp � [Ag�]�Ag�[SCN]�SCN � 1.1 � 1012
� 0.060 M
A � (0.005 0)(0.912) � 0.004 6.� � 800 pm.�1800 pm. At � 0.01 M, � � 0.912
(CH3CH2CH2)4N� � 0.010 M.(CH3)4N�Cl,0.005 0 M0.005 0 M (CH3CH2CH2)4N�Br
� 2.4 mMFrom AlCl3From MgCl2
cc[ 0.4 � 0.9 ] � 1 � [0.3] � 9)� 1
2([0.2] � 4 �
� 12([Mg2�] � 22 � [Cl] � (1)2 � [Al3�] � 32)
� 12([0.4] � 1 � [0.2] � 4) � 0.6 mM
� 12([Cs�] � 12 � [CrO2
4 ] � (2)2)
� 12([K�] � 12 � [NO
3 ] � (1)2) � 0.2 mM
1 0.32 � ?2 � 0.6032 1 ? � 0.5 mL27.7 (�0.3) 12.6 (�?) � 15.1 (�0.603)
1 y � 4.00% � 0.603 mL (4.0%)2 � (y%)2 � (0.146%)2 � (0.100%)2
�[27.7 (�0.3) 12.6 (�?)][0.068 3 (�0.000 1)]
50.00 (�0.05)[SCN](�4.0% )
� 0.020 6 (�0.000 7) M
�[15.1 (�3.31%)][0.068 3 (�0.146%)]
50.00 (�0.100%)
�[15.1 (�0.5)][0.068 3 (�0.000 1)]
50.00 (�0.05)
�[27.7 (�0.3) 12.6 (�0.4)][0.068 3 (�0.000 1)]
50.00 (�0.05)
[SCN] �moles of Ag� needed to react with SCN
original volume of SCN
SCN.(27.712.6) � 15.1 mLI.Ag�
11
10
9
8
7
6
5
4
3
0 10 20 30 40 50VAg+ (mL)
pAg+
pAg� � 2.60
[Ag�] � a 2.68
90.00b(0.084 54 M) � 2.5 � 103 M
Ag�.(50.00 47.32) � 2.68 mL
pAg� � 4.871 [Ag�] � 1.34 � 105 M
[Ag�][Cl] � x2 � Ksp(for AgCl)
S6 Solutions to Exercises
8-E. (a)
(b) Virtually all the has precipitated, along with 3.20 mmol of The ions remaining in solution are
(c)
8-F. (a)
(b)144424443 1444442444443
(c)
8-G. Charge balance:
Mass balance: gives 2 mol F for each mol Ca.
144444444424444444443
1444444442444444443
8-H. Charge balance:
Mass balance:
144444424444443Species containing calcium
14444444444244444444443Species containing phosphate
8-I. Pertinent reactions:
Charge balance:
Mass balance:144424443 144424443
Species containing Species containing
(Mass balance gives the same result as charge balance.)
Equilibrium constant expressions:
From we write
Substitute for in the charge balance:
(A)2[Mn2�] � (Kl/�MnOH�)[Mn2�]�Mn2�[OH]�OH � [H�] � [OH]
[MnOH�]
[MnOH�] � (Kl/�MnOH�)[Mn2�]�Mn2�[OH]�OH.Kl,
Kw � [H�]�H�[OH]�OH
Kl �[MnOH�]�MnOH�
[Mn2�]�Mn2�[OH]�OH
Ksp � [Mn2�]�Mn2�[OH]2�OH2
Mn2�OH
[OH] � [MnOH�] � 25[Mn2�] � [MnOH�]6 � [H�]
2[Mn2�] � [MnOH�] � [H�] � [OH]
Kw � 1.0 � 1014H2O ∆Kw
H� � OH
Kl � 2.5 � 103Mn2� � 2OH ∆Kl
MnOH�
Ksp � 1.6 � 1013Mn(OH)2(s) ∆Ksp
Mn2� � 2OH
� 35[CaPO4] � [PO4
3] � [HPO42] � [H2PO4
] � [H3PO4]6
25[Ca2�] � [CaOH�] � [CaPO4]6
Equate 2(calcium species) � 3(phosphate species).
� [H2PO4] � [OH]
2[Ca2�] � [CaOH�] � [H�] � [CaPO4] � 3[PO4
3] � 2[HPO42]
Species containing Ca2�
� 25[Ca2�] � [CaOH�] � [CaF�] � [CaF2(aq)]6Species containing F
[F] � [CaF�] � 2[CaF2(aq)] � [HF] � 2[HF2 ]
CaF2
� [CaF�] � [H�][F] � [HF2 ] � [OH] � 2[Ca2�] � [CaOH�]
[Cl] � [OH] � 2[Ca2�] � [CaCl�] � [CaOH�] � [H�]
Species containing Ca2�Species containing Cl
[Cl] � [CaCl�] � 25[Ca2�] � [CaCl�] � [CaOH�]6[Cl] � 2[Ca2�]
1 pHg2�2 � log AHg2�
2� 25.03
� 4.6 � 1029/ (0.028 0)2(0.795)2 � 9.3 � 1026
AHg2�2
� Ksp/A2I
� 12�ciz2
i � 0.060 0 M
[K�] �6.00 mmol
100.0 mL� 0.060 0 M
[I] �2.80 mmol
100.0 mL� 0.028 0 M
[NO3 ] �
3.20 mmol
100.0 mL� 0.032 0 M
I.Hg2�2
1 Ve � 32.0 mL(Ve)(0.100 M) � 2(40.0 mL)(0.040 0 M)
Moles of I � 2(moles of Hg2�2 )

In a basic solution, neglect in comparison with and solve(A) for
(B)
Substitute (B) into
(C)Ksp � a �Mn2�[OH]3�OH2
2 � (Kl�Mn2�/�MnOH�)[OH]�OH
bKsp � [Mn2�]�Mn2�[OH]2 �OH
2
Ksp:
[Mn2�] �[OH]
2 � (Kl�Mn2�/�MnOH�)[OH]�OH
[Mn2�]:[OH][H�]
Solutions to Exercises S7
We take the ion size of to be the same as which is600 pm. (But the charge of is not For M,the activity coefficients are and
In the spreadsheet, we use GOAL SEEK to find the valuein cell C4 that makes the right side of Equation
(C) equal to in cell D4. With known, we useand to find:
You can check that the charge balance is satisfied.
2[Mn2�] � [MnOH�] � [OH]
[MnOH�] � (Kl/�MnOH�)([Mn2�]�Mn2�[OH]�OH) � 5.82 � 106 M
[Mn2�] � Ksp/(�Mn2�[OH]2�OH2 ) � 5.36 � 105 M
KlKsp
[OH](� Ksp)1.6 � 1013[OH] � 1.13 � 104 M�OH � 0.76.
�MnOH� � 0.80,�Mn2� � 0.405, � 0.10�2.)�1,MnOH�
Mn2�,MnOH�
1 Mn(OH)2 solubility with activity coefficients
A
2
3 A10*[OH]3*D102/(2+(K1*A10/C10)[OH]*D10) =
0.405 0.80 0.76
D4 = (A10*C4^3*D10^2)/(2+(A6*A10/C10)*C4*D10)
C7 = A4/(A10*C4^2*D10^2)
D7 = (A6/C10)*C7*A10*C4*D10
Ksp = [OH]guess =
K1 =
1.130E-04 1.6000E-13
5.358E-05 5.823E-06
Activity coefficients:
2.5E+03
Mn2+ MnOH+ OH-
[Mn2+] = [MnOH+] =
4
5
6
7
8
9
10
11
12
13
14
B C D
1.6E-13
Spreadsheet for Exercise 8-I.
Chapter 99-A. But For
and (usingTable 8-1, with ionic
9-B. (a) Charge balance:
Mass balance:
Equilibrium:
Setting and the charge balance tells usthat Putting this into the equilibrium gives
(b) Charge balance:
Mass balance:
Equilibrium:
As before, writing and givesand
1.0 � 1014 1 x � 1.10 � 107 M 1 pH � 6.96.[H�][OH] � (x)[x (2.0 � 108)] �[OH] � x 2.0 � 108
[SO24 ] � 1.0 � 108 M[H�] � x
[H�][OH] � Kw
[SO24 ] � 1.0 � 108 M
[H�] � [OH] � 2[SO24 ]
1 pH � 6.981 x � 1.05 � 107 M
(x)(x 1.0 � 108) � 1.0 � 1014
Kw[OH] � x 1.0 � 108.[Br] � 1.0 � 108 M,[H�] � x
[H�][OH] � Kw
[Br] � 1.0 � 108 M
[H�] � [OH] � [Br]
1 pH � log AH� � 11.95� 1.11 � 1012
�1.0 � 1014
(1.0 � 102)(0.900)
AH� �Kw
[OH]�OH
strength � 0.010 M).�OH � 0.900[OH] � 1.0 � 102 M1.0 � 102 M NaOH,
AH� AOH � Kw 1 AH� � Kw/AOH.pH � log AH�.
9-C.2-Nitrophenol FM � 139.11C6H5NO3 Ka � 5.89 � 108
x x
9-D.
F x x x
Butand
� 4.8 � 1011 1 pKa � 10.32
Ka �[H�][A]
[HA]�
(6.9 � 107)2
0.010
[HA] � 0.010 [H�] � 0.010.[H�] � 10pH � 6.9 � 107 M 1 [A] � 6.9 � 107 M
OH
CH3
O
CH3
H� �
1 pH � log x � 4.341 x � 4.56 � 105 M
x2
0.035 4 x� 5.89 � 108
F x
HA T H� � A
� 0.035 4 M
FHA (formal concentration) �1.23 g/(139.11 g/mol)
0.250 L
OH
NO2
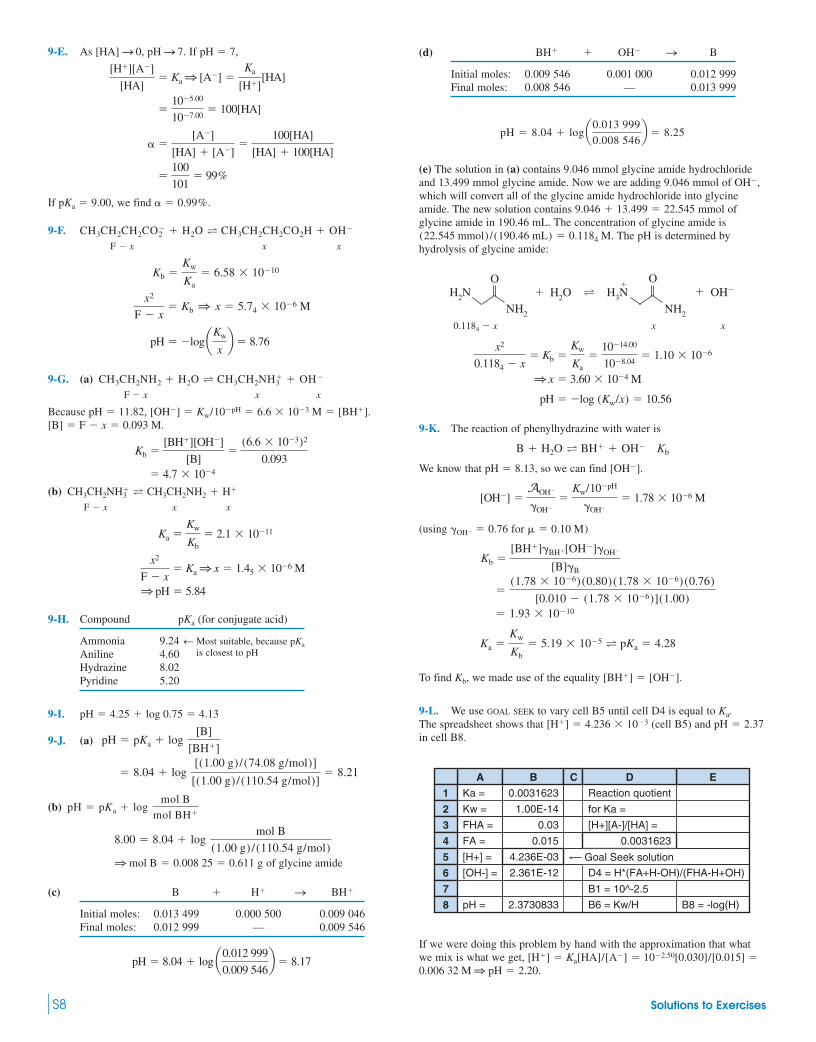
9-E. As If
If we find
9-F.F x x x
9-G. (a)F x x x
Because
(b)F x x x
9-H. Compound pKa (for conjugate acid)
Ammonia 9.24 d Most suitable, because pKa
Aniline 4.60 is closest to pH
Hydrazine 8.02Pyridine 5.20
9-I.
9-J. (a)
(b)
of glycine amide
(c) B � H� S BH�
Initial moles: 0.013 499 0.000 500 0.009 046Final moles: 0.012 999 — 0.009 546
pH � 8.04 � log a0.012 999
0.009 546b � 8.17
1 mol B � 0.008 25 � 0.611 g
8.00 � 8.04 � logmol B
(1.00 g) / (110.54 g/mol)
pH � pKa � log mol B
mol BH�
� 8.04 � log[(1.00 g) / (74.08 g/mol)]
[(1.00 g) / (110.54 g/mol)]� 8.21
pH � pKa � log[B]
[BH�]
pH � 4.25 � log 0.75 � 4.13
1 pH � 5.84
x2
F x� Ka 1 x � 1.45 � 106 M
Ka �Kw
Kb� 2.1 � 1011
CH3CH2NH�3 T CH3CH2NH2 � H�
� 4.7 � 104
Kb �[BH�][OH]
[B]�
(6.6 � 103)2
0.093
[B] � F x � 0.093 M.[OH] � Kw/10pH � 6.6 � 103 M � [BH�].pH � 11.82,
CH3CH2NH2 � H2O T CH3CH2NH�3 � OH
pH � logaKw
xb � 8.76
x2
F x� Kb 1 x � 5.74 � 106 M
Kb �Kw
Ka� 6.58 � 1010
CH3CH2CH2CO2 � H2O T CH3CH2CH2CO2H � OH
� � 0.99%.pKa � 9.00,
�100
101� 99%
� �[A]
[HA] � [A]�
100[HA]
[HA] � 100[HA]
�105.00
107.00� 100[HA]
[H�][A]
[HA]� Ka 1 [A] �
Ka
[H�][HA]
pH � 7,pH S 7.[HA] S 0,
S8 Solutions to Exercises
(d) BH� � OH S B
Initial moles: 0.009 546 0.001 000 0.012 999Final moles: 0.008 546 — 0.013 999
(e) The solution in (a) contains 9.046 mmol glycine amide hydrochlorideand 13.499 mmol glycine amide. Now we are adding 9.046 mmol of which will convert all of the glycine amide hydrochloride into glycineamide. The new solution contains mmol ofglycine amide in 190.46 mL. The concentration of glycine amide is
The pH is determined byhydrolysis of glycine amide:
0.1184 x x x
9-K. The reaction of phenylhydrazine with water is
We know that so we can find
(using for
To find we made use of the equality
9-L. We use GOAL SEEK to vary cell B5 until cell D4 is equal to The spreadsheet shows that (cell B5) and in cell B8.
If we were doing this problem by hand with the approximation that whatwe mix is what we get, 0.006 32 M 1 pH � 2.20.
[H�] � Ka[HA]/[A] � 102.50[0.030]/[0.015] �
1
2
3
4
5
6
7
8
D E
0.0031623
Reaction quotient
for Ka =
[H+][A-]/[HA] =
D4 = H*(FA+H-OH)/(FHA-H+OH)
B1 = 10^-2.5
B6 = Kw/H B8 = -log(H)
Ka =
Kw =
FHA =
FA =
[OH-] =
pH =
[H+] =
0.0031623
A B C
1.00E-14
0.03
0.015
2.361E-12
2.3730833
4.236E-03 Goal Seek solution
pH � 2.37[H�] � 4.236 � 103Ka.
[BH�] � [OH].Kb,
Ka �Kw
Kb� 5.19 � 105 T pKa � 4.28
� 1.93 � 1010
�(1.78 � 106)(0.80)(1.78 � 106)(0.76)
[0.010 (1.78 � 106)](1.00)
Kb �[BH�]�BH�[OH]�OH
[B]�B
� 0.10 M)�OH � 0.76
[OH] �AOH
�OH
�Kw/10pH
�OH
� 1.78 � 106 M
[OH].pH � 8.13,
B � H2O T BH� � OH Kb
pH � log (Kw/x) � 10.56
1 x � 3.60 � 104 M
x2
0.1184 x� Kb �
Kw
Ka�
1014.00
108.04� 1.10 � 106
H2OH2NO
T
NH2
� H3NO
NH2
OH��
(22.545 mmol) / (190.46 mL) � 0.1184 M.
9.046 � 13.499 � 22.545
OH,
pH � 8.04 � loga0.013 999
0.008 546b � 8.25
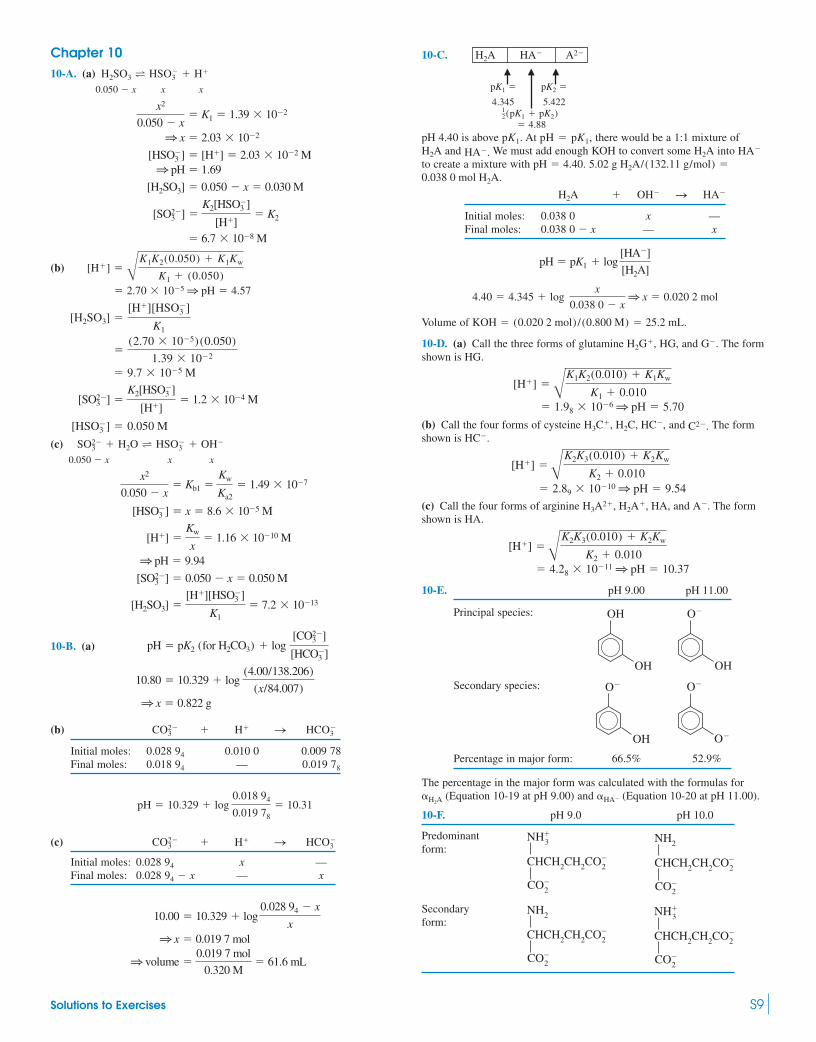
Chapter 1010-A. (a)
0.050 x x x
(b)
(c)0.050 x x x
10-B. (a)
(b) CO � H� S HCO
Initial moles: 0.028 94 0.010 0 0.009 78Final moles: 0.018 94 — 0.019 78
(c) CO � H� S HCO
Initial moles: 0.028 94 x —Final moles: 0.028 94 x — x
1 volume �0.019 7 mol
0.320 M� 61.6 mL
1 x � 0.019 7 mol
10.00 � 10.329 � log0.028 94 x
x
3
23
pH � 10.329 � log0.018 94
0.019 78� 10.31
3
23
1 x � 0.822 g
10.80 � 10.329 � log (4.00/138.206)
(x/84.007)
pH � pK2 (for H2CO3) � log [CO3
2]
[HCO3]
[H2SO3] �[H�][HSO3
]
K1� 7.2 � 1013
[SO32] � 0.050 x � 0.050 M
1 pH � 9.94
[H�] �Kw
x� 1.16 � 1010 M
[HSO3] � x � 8.6 � 105 M
x2
0.050 x� Kb1 �
Kw
Ka2� 1.49 � 107
SO32 � H2O T HSO3
� OH
[HSO3] � 0.050 M
[SO32] �
K2[HSO3]
[H�]� 1.2 � 104 M
� 9.7 � 105 M
�(2.70 � 105)(0.050)
1.39 � 102
[H2SO3] �[H�][HSO3
]
K1
� 2.70 � 105 1 pH � 4.57
[H�] � BK1K2(0.050) � K1Kw
K1 � (0.050)
� 6.7 � 108 M
[SO32] �
K2[HSO3]
[H�]� K2
[H2SO3] � 0.050 x � 0.030 M
1 pH � 1.69 [HSO3
] � [H�] � 2.03 � 102 M
1 x � 2.03 � 102
x2
0.050 x� K1 � 1.39 � 102
H2SO3 T HSO3 � H�
Solutions to Exercises S9
10-C. H2A HA A2
pK1 � pK2 �
4.345 5.422
pH 4.40 is above At there would be a 1:1 mixture of and We must add enough KOH to convert some into
to create a mixture with
H2A � OH S HA
Initial moles: 0.038 0 x —Final moles: 0.038 0 x — x
Volume of
10-D. (a) Call the three forms of glutamine HG, and The formshown is HG.
(b) Call the four forms of cysteine and The formshown is
(c) Call the four forms of arginine and The formshown is HA.
10-E. pH 9.00 pH 11.00
Principal species:
Secondary species:
Percentage in major form: 66.5% 52.9%
The percentage in the major form was calculated with the formulas for (Equation 10-19 at pH 9.00) and (Equation 10-20 at pH 11.00).
10-F. pH 9.0 pH 10.0
NH3�
CHCH2CH2CO2
CO2
NH2
CHCH2CH2CO2
CO2
Secondaryform:
NH2
CHCH2CH2CO2
CO2
NH3�
CHCH2CH2CO2
CO2
Predominantform:
�HA�H2A
O
O
OH
O
OH
O
OH
OH
� 4.28 � 1011 1 pH � 10.37
[H�] �BK2K3(0.010) � K2Kw
K2 � 0.010
A.H3A2�, H2A�, HA,
� 2.89 � 1010 1 pH � 9.54
[H�] �BK2K3(0.010) � K2Kw
K2 � 0.010
HC.C2.H3C�, H2C, HC,
� 1.98 � 106 1 pH � 5.70
[H�] � BK1K2(0.010) � K1Kw
K1 � 0.010
G.H2G�,
KOH � (0.020 2 mol) / (0.800 M) � 25.2 mL.
4.40 � 4.345 � logx
0.038 0 x1 x � 0.020 2 mol
pH � pK1 � log[HA]
[H2A]
0.038 0 mol H2A.5.02 g H2A/(132.11 g/mol) �pH � 4.40.
HAH2AHA.H2ApH � pK1,pK1.
� 4.88
12(pK1 � pK2)
� ��

pH 9.0 pH 10.0
10-G. The isoionic pH is the pH of a solution of pure neutral lysine, which is
10-H. We know that the isoelectric point will be near At this pH, the fraction of lysine in the form is negligible. Therefore,the electroneutrality condition reduces to for which theexpression isoelectric applies.
Chapter 1111-A. The titration reaction is and Three representative calculations are given:
At 1.00 mL:
At 5.00 mL: x x
At 5.01 mL:
pH pH pH
0.00 12.00 4.50 10.96 5.10 3.741.00 11.89 4.90 10.26 5.50 3.052.00 11.76 4.99 9.26 6.00 2.753.00 11.58 5.00 7.00 8.00 2.294.00 11.27 5.01 4.74 10.00 2.08
11-B. The titration reaction is andFor formic acid, Four representative
calculations are given:
At 0.0 mL:x x
At 48.0 mL: HA � OH A � H2O
Initial: 50 48 — —Final: 2 — 48 48
S
1 pH � 2.54
x2
0.050 0 x� Ka 1 x � 2.91 � 103
0.050 0 x
HA T H� � A
Ka � 1.80 � 104.Ve � 50.0 mL.HCO2H � OH S HCO2
� H2O
VaVaVa (mL)
� 1.82 � 105 M 1 pH � 4.74
[H�] � a 0.01
55.01b(0.100)
pH � log x � 7.00
x2 � Kw 1 x � 1.0 � 107 M
H2O T H� � OH
pH � loga Kw
[OH]b � 11.89
� 0.007 84 M
[OH] � a4.00
5.00b(0.010 0)a50.00
51.00b
Ve � 5.00 mL.H� � OH S H2O
pH � 12(pK2 � pK3) � 9.95
[H2L�] � [L],H3L2�
12(pK2 � pK3) � 9.95.
[H�] � A K2K3F � K2Kw
K2 � F1 pH � 9.93
CHCH2CH2CH2CH2NH3
CO2
NH2
�
NH2
CHCH2
CO2
O
NH2
CHCH2
CO2
O
Secondaryform:
NH2
CHCH2
CO2
OH
NH2
CHCH2
CO2
OH
Predominantform:
At 50.0 mL: x x
and
At 60.0 mL:
pH pH pH
0.0 2.54 45.0 4.70 50.5 10.4010.0 3.14 48.0 5.12 51.0 10.6920.0 3.57 49.0 5.43 52.0 10.9925.0 3.74 49.5 5.74 55.0 11.3830.0 3.92 50.0 8.07 60.0 11.6640.0 4.35
11-C. The titration reaction is and Representative calculations:
Atx x
At B � H� BH�
Initial: 50.0 20.0 —Final: 30.0 — 20.0
At All B has been converted into the conjugate acid,The formal concentration of is The
pH is determined by the reaction
x x
At There is excess
pH pH pH
0.0 10.71 30.0 8.23 50.0 4.8010.0 9.01 40.0 7.81 50.1 3.8820.0 8.59 49.0 6.72 51.0 2.8825.0 8.41 49.9 5.71 60.0 1.90
VaVaVa (mL)
1 pH � 2.88
[H�] � a 1.0
151.0b(0.200) � 1.32 � 103
H�:Va � 51.0 mL:
x2
0.066 7 x� Ka �
Kw
Kb1 x � 1.60 � 105 1 pH � 4.80
0.066 7 x
BH� T B � H�
11001502(0.100) � 0.066 7 M.BH�BH�.
Va � Ve � 50.0 mL:
� 8.41 � log30.0
20.0� 8.59
pH � pKa (for BH�) � log[B]
[BH�]
SVa � 20.0 mL:
pH � log aKw
xb � 10.71
x2
0.100 x� 2.6 � 106 1 x � 5.09 � 104
0.100 x
B � H2O T BH� � OHVa � 0.0 mL:
Ve � 50.0 mL.B � H� S BH�
VbVbVb (mL)
� 4.55 � 103 M 1 pH � 11.66
[OH] � a 10.0
110.0b(0.050 0)
pH � log aKw
xb � 8.07
x2
0.025 0 x� 5.56 � 1011 1 x � 1.18 � 106 M
F � a 50
100b(0.05)Kb �
Kw
Ka
F x
A � H2O ∆Kb
HA � OH
pH � pKa � log[A]
[HA]� 3.744 � log
48.0
2.0� 5.12
S10 Solutions to Exercises

11-D. The titration reactions are
and the equivalence points occur at 25.0 and 50.0 mL. We will designatemalonic acid as
At 0.0 mL: x x
At 8.0 mL: H2M � OH HM � H2O
Initial: 25 8 — —Final: 17 — 8 —
At 12.5 mL:
At 19.3 mL: H2M � OH HM � H2O
Initial: 25 19.3 — —Final: 5.7 — 19.3 —
At 25.0 mL: At the first equivalence point, H2M has been converted into HM.
[H�] �
where F � (0.050 0) � 0.033 3 M.
[H�] � 5.23 � 105 M 1 pH � 4.28
At 37.5 mL: Vb � Ve 1 pH � pK2 � 5.70
At 50.0 mL: At the second equivalence point, H2M has been converted into M2:
M2 � H2O T HM � OH
(0.050 0) x x x
� Kb1 �
1 x � 1.12 � 105 M
1 pH � log � 9.05
At 56.3 mL: There are 6.3 mL of excess NaOH.
[OH] � (0.100) � 5.93 � 103 M
1 pH � 11.77
2
3
4
5
6
7
8
9
10
11
12
0 10 20 30 40 50 60
pH
Vb (mL)
a 6.3
106.3b
aKw
xb
Kw
Ka2
x2
0.025 0 x
a 50
100b
32
a50
75b
BK1K2F � K1Kw
K1 � F
pH � pK1 � log19.3
5.7� 3.38
S
Vb � 12 Ve 1 pH � pK1 � 2.85
� 2.52
pH � pK1 � log[HM]
[H2M]� 2.847 � log
8
17
S
1 pH � 2.11
x2
0.050 0 x� K1 1 x � 7.75 � 103
0.050 0 x
H2M T H� � HM
H2M.
O2CCH2CO2H � OH S O2CCH2CO2 � H2O
HO2CCH2CO2H � OH S O2CCH2CO2H � H2O
11-E.
HHis
H2His� H3His2�
The equivalence points occur at 25.0 and 50.0 mL.
At 0 mL: HHis is the second intermediate form derived from the triprotic acid H3His2�.
[H�] �
� 2.37 � 108 M 1 pH � 7.62
At 4.0 mL: HHis � H� S H2His�
Initial: 25 4 —Final: 21 — 4
pH � pK2 � log � 6.69
At 12.5 mL: pH � pK2 � 5.97
At 25.0 mL: The histidine has been converted into H2His� at the formalconcentration F � (0.050 0) � 0.025 0 M.
[H�] �
� 1.16 � 104 1 pH � 3.94
At 26.0 mL: H2His� � H� S H3His2�
Initial: 25 1 —Final: 24 — 1
pH � pK1 � log � 2.98
The approximation that histidine reacts completely with HCl breaks downbetween 25 and 50 mL. If you used the titration equations in Table 11-6,you would find instead of 2.98, at
At 50.0 mL: The histidine has been converted into H3His at the formalconcentration F � (0.050 0) � 0.016 7 M.
H3His2� T H2His� � H�
0.016 7 x x x
� K1 1 x � 0.011 5 M 1 pH � 1.94
11-F. Figure 11-1: bromothymol blue: blue S yellowFigure 11-2: thymol blue: yellow S blueFigure 11-3: thymolphthalein: colorless S blue
11-G. The titration reaction is HA � OH S A � H2O. It requires1 mole of NaOH to react with 1 mole of HA. Therefore, the formalconcentration of A at the equivalence point is
� (0.093 81) � 0.020 31 M123 123
Dilution factor Initial concentration for NaOH of NaOH
Because the pH is 10.99, [OH] � 9.77 � 104 and we can write
A � H2O T HA � OH
a 27.63
127.63b
x2
0.016 7 x
125752
Va � 26.0 mL.pH � 3.28,
24
1
BK1K2F � K1Kw
K1 � F
125502
21
4
BK2K3(0.050 0) � K2Kw
K2 � (0.050 0)
NH3
CHCH2
CO2
NHH�
N
�
�H
NH3
CHCH2
CO2H
NH
N
�
H�
NH3
CHCH2
CO2
NHH�
N
�
Solutions to Exercises S11

Kb � �
� 4.94 � 105
Ka � � 2.03 � 1010 1 pKa � 9.69
For the 19.47-mL point, we have
HA � OH S A � H2O
Initial: 27.63 19.47 — —Final: 8.16 — 19.47 —
pH � pKa � log � 9.69 � log
� 10.07
11-H. When Vb � Ve, [HA] � [A] � 0.033 3 M (using a correction fordilution by NaOH). [Na�] � 0.033 3 M as well. Ionic strength � 0.033 3 M.
pKa � pH log
� 4.62 log � 4.69
The activity coefficient of A was found by interpolation in Table 8-1.
11-I. (a) The derivatives are shown in the spreadsheet below. In the firstderivative graph, the maximum is near 119 mL. In Figure 11-7, the secondderivative graph gives an end point of 118.9 L.(b) Column G in the spreadsheet gives Vb(10pH). In a graph of Vb(10pH)vs Vb, the points from 113 to 117 L give a straight line whose slope is1.178 � 106 and whose intercept (end point) is 118.7 L.
11-J. (a) pH 9.6 is past the equivalence point, so excess volume, V, is given by
[OH] � 104.4 � (0.100 0 M)
1 V � 0.024 mL
(b) pH 8.8 is before the equivalence point:
8.8 � 6.27 � log 1 � 339[A]
[HA]
[A]
[HA]
V
50.00 � 10.00 � V
(0.033 3)(0.854)
(0.033 3)(1.00)
a fromEquation 9-18b
[A]�A
[HA]�HA
12
19.47
8.16[A]
[HA]
Kw
Kb
(9.77 � 104)2
0.020 31 (9.77 � 104)
[HA][OH]
[A]
Titration reaction: HA � OH S A � H2O
Relative initial quantities: 10 V — —Relative final quantities: 10 V — V —
To attain a ratio [A]/[HA] � 339, we need V/(10 V) � 339 1 V �9.97 mL. The indicator error is 10 9.97 � 0.03 mL.
11-K. (a) A � 2 080[HIn] � 14 200[In](b) [HIn] � x; [In] � 1.84 � 104 x
A � 0.868� 2 080x � 14 200(1.84 � 104 x)
1 x � 1.44 � 104 M
pKa � pH log
� 6.23 log
� 6.79
Chapter 1212-A. For every mole of K� entering the first reaction, 4 moles of EDTAare produced in the second reaction.
Moles of EDTA � moles of Zn2� used in titration
12-B. Total Fe3� � Cu2� in 25.00 mL � (16.06 mL) � (0.050 83 M) �0.816 3 mmol.
Second titration:
millimoles EDTA used: (25.00 mL)(0.050 83 M) � 1.270 8millimoles Pb2� needed: (19.77 mL)(0.018 83 M) � 0.372 3millimoles Fe3� present: (difference) 0.898 5
� 1.256 (�0.003) mM� 1.256 (�0.255%) � 103 M
�[1
4(�0%)][28.73 (�0.104%)][0.043 7 (�0.229%)]
250.0 (�0.040 0%)
�14[28.73 (�0.03)][0.043 7 (�0.000 1)]
250.0 (�0.1)
[K�] �14 (moles of Zn2�)
volume of original sample
(1.84 � 104) (1.44 � 104)
1.44 � 104
[In]
[HIn]
S12 Solutions to Exercises
A B C D E F G
1 Derivatives of titration curve
2
3 First Derivative Second Derivative
4 L NaOH pH L Derivative L Derivative Vb*10^-pH
5 107 6.921
6 110 7.117 108.5 6.533E-02
7 113 7.359 111.5 8.067E-02 110 5.11E-03 4.94E-06
8 114 7.457 113.5 9.800E-02 112.5 8.67E-03 3.98E-06
9 115 7.569 114.5 1.120E-01 114 1.40E-02 3.10E-06
10 116 7.705 115.5 1.360E-01 115 2.40E-02 2.29E-06
11 117 7.878 116.5 1.730E-01 116 3.70E-02 1.55E-06
12 118 8.090 117.5 2.120E-01 117 3.90E-02 9.59E-07
13 119 8.343 118.5 2.530E-01 118 4.10E-02 5.40E-07
14 120 8.591 119.5 2.480E-01 119 -5.00E-03 3.08E-07
15 121 8.794 120.5 2.030E-01 120 -4.50E-02 1.94E-07
16 122 8.952 121.5 1.580E-01 121 -4.50E-02 1.36E-07
17
18 C6 � (A6�A5)/2 E7 � (C7�C6)/2 G7 � A7*10^-B7
19 D6 � (B6-B5)/(A6-A5) F7 � (D7-D6)/(C7-C6)
Spreadsheet for Exercise 11-I.

Solutions to Exercises S13
Because 50.00 mL of unknown were used in the second titration,the millimoles of Fe3� in 25.00 mL are 0.449 2. The millimoles ofCu2� in 25.00 mL are 0.816 3 0.449 2 � 0.367 1 mmol/25.00 mL �0.014 68 M.
12-C. Designating the total concentration of free EDTA as [EDTA], wecan write
K�f � � �Y4Kf � (2.9 � 107)(1018.78)
� 1.74 � 1012
Representative calculations are shown here:
At 0.1 mL:
[EDTA] � (0.040 0 M)
� 0.039 8 M
[CuY2] � (0.080 0 M)
� 1.60 � 104 M
[Cu2�] � �
� 2.3 � 1015 M1 pCu2� � 14.64
At 25.0 mL: formal concentration of CuY2 � (0.080 0 M)
� 0.026 7 M
Cu2� � EDTA T CuY2
Initial concentration: — — 0.026 7Final concentration: x x 0.026 7 x
� 1.74 � 1012
1 [Cu2�] � 1.24 � 107 M1 pCu2� � 6.91
At 26.0 mL: [Cu2�] � (0.080 0 M)
� 1.05 � 103 M1 pCu2� � 2.98
Summary:
Volume(mL) pCu2� Volume pCu2�
0.1 14.64 24.0 10.865.0 12.84 25.0 6.91
10.0 12.42 26.0 2.9815.0 12.07 30.0 2.3020.0 11.64
16
14
12
10
8
6
4
230252015
Volume of Cu2+ (mL)
1050
pCu
a 1.0
76.0b
0.026 7 x
x2
a25.0
75.0b
(1.60 � 104 M)
(1.74 � 1012)(0.039 8 M)
[CuY2]
K¿f [EDTA]
a 0.1
50.1b
a50.0
50.1ba25.0 0.1
25.0b
[CuY2]
[Cu2�][EDTA]
12-D.
Using the values and gives
12-E. (a) One volume of will require two volumes of EDTA toreach the equivalence point. The formal concentration of at theequivalence point is
x x
(b) Because the pH is 7.00, the ratio is constant throughoutthe entire titration.
12-F. for
(using and )
At 0 mL:
At 1.00 mL: CCo2� � (1.00 � 103 M)
Fraction Initial Dilution remaining concentration factor
At 2.00 mL: This is the equivalence point.
x x
At 3.00 mL:
� 8.70 � 104 M
Concentration of CoY2 �20.00
23.00(1.00 � 103 M)
� 4.35 � 104 M
Concentration of excess EDTA �1.00
23.00(1.00 � 102 M)
� 2.3 � 1012 M 1 pCo2� � 11.64 [Co2�] � �Co2�CCo2�
1 x � 3.4 � 107 M � CCo2�
K–f �9.09 � 104 x
x2
a20.00
22.00b(1.00 � 103) x
CCo2� � EDTA ∆K–f
CoY2
� 3.2 � 109 M 1 pCo2� � 8.49[Co2�] � �Co2�CCo2�
� 4.76 � 104 M
a20.00
21.00ba1.00
2.00b
� 6.8 � 109 M 1 pCo2� � 8.17[Co2�] � �Co2�(1.00 � 103)
K–f � �Co2��Y4Kf � 7.9 � 109
K¿f � �Y4Kf � 1.16 � 1015
�2 � K1K2 � 107.15�1 � K1 � 104.69
� 6.8 � 106
�Co2� �1
1 � �1[C2O24 ] � �2[C2O2
4 ]2
�Y4 � 0.041 at pH 9.00
CoY2 � 1016.45 � 2.8 � 1016Kf
1[H3Y]
[H2Y2]�
[H�]
K4�
107.00
102.69� 4.9 � 105
[H2Y2][H�]
[H3Y]� K4
[H3Y]/[H2Y2]
1 x � [Mn2�] � 3.4 � 107 M
0.003 33 x
x2� �Y4Kf � (3.8 � 104)1013.89 � 2.9 � 1010
0.003 33 xMn2� � EDTA T MnY2
1132(0.010 0) � 0.003 33 M.MnY2
Mn2�
[H2Y2] � 1.1 � 107 M.1.24 � 107[EDTA] �[H�] � 105.00, �Y4 � 2.9 � 107,
[H2Y2] �[H�]2[Y4]
K5K6�
[H�]2�Y4[EDTA]
K5K6
�[H�]2[Y4]
[H2Y2]
HY3 T H� � Y4
H2Y2 T H� � HY3
H2Y2 T 2H� � Y4
K6
K5
K � K5K6

S14 Solutions to Exercises
Knowing [EDTA] and we can use the equilibrium to find
12-G. 25.0 mL of 0.120 M iminodiacetic acid
� acid T
Initial mmol 1.25 3.00 —Final mmol — 0.50 1.25
Chapter 1313-A.
Mixture contains 0.010 mol HA, 0.030 mol B, and 0.015 mol HCl in 1.00 L
Chemical reactions:
Kw � 1014.00H2O T H� � OH
KBH� � 1010.774BH� T B � H�
KHA � 109.997HA T A � H�
Dimethylamine � B from monoprotic BH� with pKBH� � 10.774
Hydroxybenzene � HA with pKHA � 9.997
1 [Cu2�] � 3.4 � 1010 M
[1.25/50.0]
[Cu2�][(0.50/50.0)(4.6 � 103)]2� 3.5 � 1016
[CuX22 ]
[Cu2�][X2]2� Kf
CuX22Cu2�
2 iminodiacetic
25.0 mL of 0.050 0 M Cu2� � 1.25 mmol� 3.00 mmol
15
14
13
12
11
10
9
8
73.00.0 0.5 1.0 1.5 2.0 2.5
Volume of EDTA (mL)
pCo
1 [Co2�] � 1.7 � 1015 M 1 pCo2� � 14.76
K¿f �[CoY2]
[Co2�][EDTA]�
[8.70 � 104 M]
[Co2�][4.35 � 104 M]
[Co2�]:K¿f[CoY2], Charge balance:
Mass balances:
We have seven equations and seven chemical species.
Fractional composition equations:
Substitute into charge balance:
(A)
We solve Equation A for by using SOLVER in the spreadsheet, with aninitial guess of in cell H10. In the TOOLS menu, select SOLVER andchoose Options. Set Precision to 1e-16 and click OK. In the SOLVER window,Set Target Cell E12 Equal To Value of 0 By Changing Cells H10. ClickSolve and SOLVER finds in cell H10, giving a net charge near 0in cell E12.
13-B. We use effective equilibrium constants, as follows:
KBH� �[B]�B[H�]�H�
[BH�]�BH�
� 1010.774
[A] � �AFA �K¿HAFA
[H�] � K¿HA
[HA] � �HAFA �[H�]FA
[H�] � K¿HA
K¿HA � KHAa �HA
�A�H�
b �[A][H�]
[HA]
KHA �[A]�A[H�]�H�
[HA]�HA� 109.997
K¿,
pH � 10.33
pH � 10[H�]
[H�] � �BH�FB � Kw/[H�] � �AFA � [0.015 M]
[A] � �AFA �KHAFA
[H�] � KHA
[HA] � �HAFA �[H�]FA
[H�] � KHA
[B] � �BFB �KBH�FB
[H�] � KBH�
[BH�] � �BH�FB �[H�]FB
[H�] � KBH�
[HA] � [A] � 0.010 M � FA
[BH�] � [B] � 0.030 M � FB
[Cl] � 0.015 M
[H�] � [BH�] � [OH] � [A] � [Cl]
1 Mixture of 0.010 M HA, 0.030 M B, and 0.015 M HCI
A
2
3
Species in charge balance: Other concentrations:
Positive charge minus negative charge
Formulas:
B5 = 10^-B4 B8 = 10^-H10 H5 = 10^-H4
E5 = 10^-E4 E10 = H5/B8 E9 = H3
B9 = B8*E3/(B8+E5) E8 = B5*B3/(B8+B5)
H9 = E5*E3/(B8+E5) H8 = B8*B3/(B8+B5)
-4.92E-17 = B8+B9-E8-E9-E10
FA = FB = [Cl-] =
1.01E-10 1.68E-11 1.00E-14
pKHA = pKw =pKBH+ =
KHA = Kw =KBH+ =
[OH-] = 2.14E-04 pH =
initial value is a guess
[BH+] = [CI-] = [B] =
[H+] = [A-] = [HA] =4.67E-11 6.83E-03 3.17E-03
2.20E-02 0.015 7.95E-03
4
5
6
7
8
9
10
11
12
13
14
15
16
17
B C D E F G H I
0.030
10.774
0.015
14.000
10.331
0.010
9.997
Spreadsheet for Exercise 13-A.
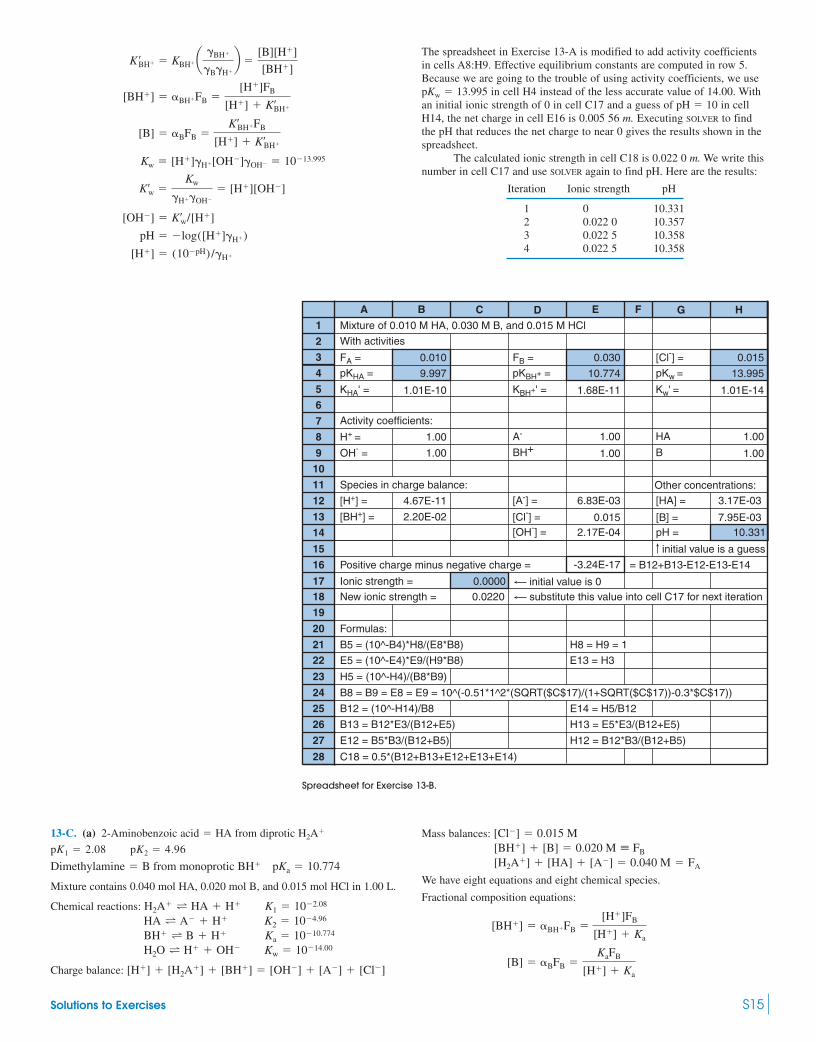
Solutions to Exercises S15
[H�] � (10pH) /�H�
pH � log([H�]�H�)
[OH] � K¿w/[H�]
K¿w �Kw
�H��OH
� [H�][OH]
Kw � [H�]�H�[OH]�OH � 1013.995
[B] � �BFB �K¿BH�FB
[H�] � K¿BH�
[BH�] � �BH�FB �[H�]FB
[H�] � K¿BH�
K¿BH� � KBH�a �BH�
�B�H�
b �[B][H�]
[BH�]
The spreadsheet in Exercise 13-A is modified to add activity coefficientsin cells A8:H9. Effective equilibrium constants are computed in row 5.Because we are going to the trouble of using activity coefficients, we use
in cell H4 instead of the less accurate value of 14.00. Withan initial ionic strength of 0 in cell C17 and a guess of in cellH14, the net charge in cell E16 is 0.005 56 m. Executing SOLVER to findthe pH that reduces the net charge to near 0 gives the results shown in thespreadsheet.
The calculated ionic strength in cell C18 is 0.022 0 m. We write thisnumber in cell C17 and use SOLVER again to find pH. Here are the results:
Iteration Ionic strength pH
1 0 10.3312 0.022 0 10.3573 0.022 5 10.3584 0.022 5 10.358
pH � 10pKw � 13.995
1 Mixture of 0.010 M HA, 0.030 M B, and 0.015 M HCl
With activities
A
2
3
Activity coefficients:
Other concentrations:
[H+] = [A-] =4.67E-11
[BH+] = [Cl-] =[OH-] =
2.20E-02
Positive charge minus negative charge =
Ionic strength =
New ionic strength = 0.0220
Formulas:
B5 = (10^-B4)*H8/(E8*B8) H8 = H9 = 1
E13 = H3E5 = (10^-E4)*E9/(H9*B8)
H5 = (10^-H4)/(B8*B9)
B8 = B9 = E8 = E9 = 10^(-0.51*1^2*(SQRT($C$17)/(1+SQRT($C$17))-0.3*$C$17))
B12 = (10^-H14)/B8 E14 = H5/B12
B13 = B12*E3/(B12+E5) H13 = E5*E3/(B12+E5)
E12 = B5*B3/(B12+B5) H12 = B12*B3/(B12+B5)
C18 = 0.5*(B12+B13+E12+E13+E14)
initial value is 0
FA = FB = [Cl-] =
1.01E-10 1.68E-11 1.01E-14
pKHA = pKw =pKBH+ =
KHA' = Kw' =KBH+' =
2.17E-04 pH =
initial value is a guess
Species in charge balance:
OH- = BH+ B
H+ = A- HA1.00
6.83E-03 3.17E-03[HA] =
1.00
1.00
1.00
1.00
0.015 7.95E-03[B] =
1.00
4
5
6
7
8
9
10
11
12
13
14
15
16
1718
19
20
2122
23
24
25
26
27
28
B C D E F G H
-3.24E-17 = B12+B13-E12-E13-E14
0.030
10.774
0.015
13.995
0.010
9.997
substitute this value into cell C17 for next iteration
0.0000
10.331
13-C. (a) 2-Aminobenzoic acid from diprotic
Mixture contains 0.040 mol HA, 0.020 mol B, and 0.015 mol HCl in 1.00 L.
Chemical reactions:
Charge balance: [H�] � [H2A�] � [BH�] � [OH] � [A] � [Cl]
Kw � 1014.00H2O T H� � OH
Ka � 1010.774BH� T B � H�
K2 � 104.96HA T A � H�
K1 � 102.08H2A� T HA � H�
Dimethylamine � B from monoprotic BH� pKa � 10.774
pK2 � 4.96pK1 � 2.08
H2A�� HA Mass balances:
We have eight equations and eight chemical species.
Fractional composition equations:
[B] � �BFB �KaFB
[H�] � Ka
[BH�] � �BH�FB �[H�]FB
[H�] � Ka
[H2A�] � [HA] � [A] � 0.040 M � FA
[BH�] � [B] � 0.020 M � FB
[Cl] � 0.015 M
Spreadsheet for Exercise 13-B.
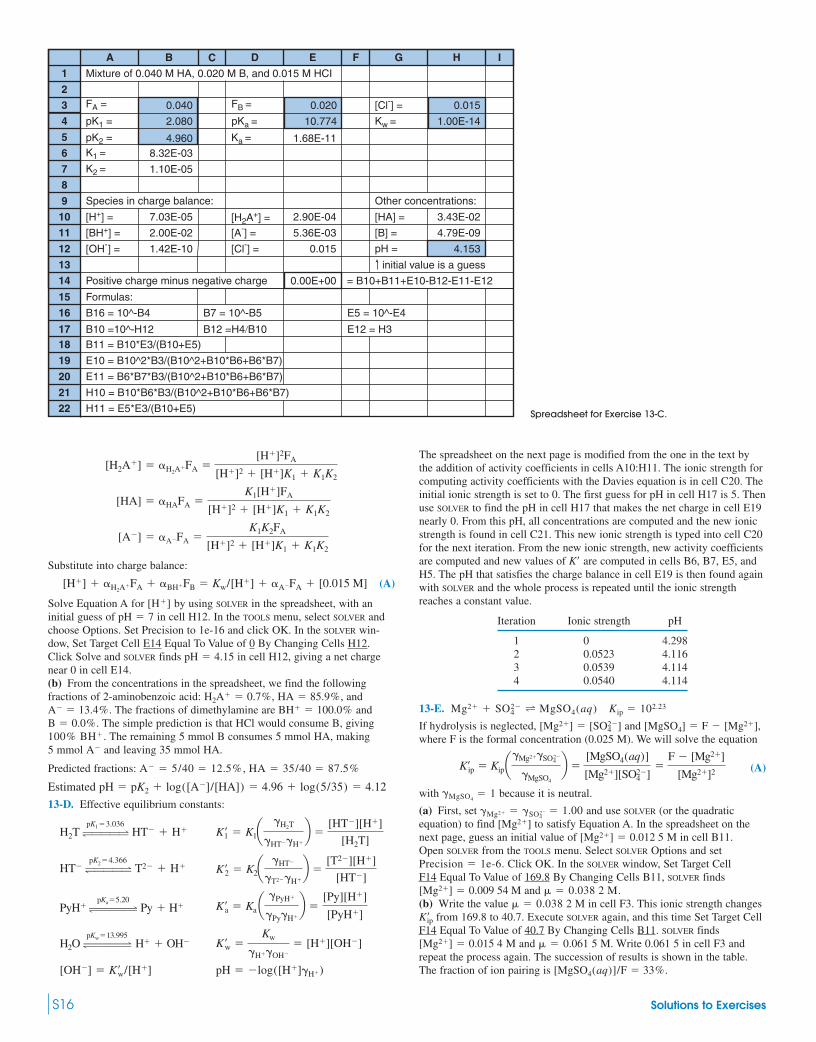
S16 Solutions to Exercises
Substitute into charge balance:
(A)
Solve Equation A for by using SOLVER in the spreadsheet, with aninitial guess of in cell H12. In the TOOLS menu, select SOLVER andchoose Options. Set Precision to 1e-16 and click OK. In the SOLVER win-dow, Set Target Cell E14 Equal To Value of 0 By Changing Cells H12.Click Solve and SOLVER finds in cell H12, giving a net chargenear 0 in cell E14.(b) From the concentrations in the spreadsheet, we find the followingfractions of 2-aminobenzoic acid: and
The fractions of dimethylamine are andThe simple prediction is that HCl would consume B, giving
The remaining 5 mmol B consumes 5 mmol HA, making5 mmol and leaving 35 mmol HA.
Predicted fractions: ,
Estimated
13-D. Effective equilibrium constants:
pH � log([H�]�H�)[OH] � K¿w/[H�]
K¿w �Kw
�H��OH
� [H�][OH]H2O #¢¢¢4pKw�13.995
H� � OH
K¿a � Ka a �PyH�
�Py�H�
b �[Py][H�]
[PyH�]PyH� #¢¢¢4pKa�5.20
Py � H�
K¿2 � K2a �HT
�T2�H�
b �[T2][H�]
[HT]HT #¢¢¢4
pK2�4.366 T2 � H�
K¿1 � K1a �H2T
�HT�H�
b �[HT][H�]
[H2T]H2T #¢¢¢4
pK1�3.036HT � H�
pH � pK2 � log([A]/[HA]) � 4.96 � log(5/35) � 4.12
HA � 35/40 � 87.5%A � 5/40 � 12.5%
A
100% BH�.B � 0.0%.
BH� � 100.0%A � 13.4%.HA � 85.9%,H2A� � 0.7%,
pH � 4.15
pH � 7[H�]
[H�] � �H2A�FA � �BH�FB � Kw/[H�] � �AFA � [0.015 M]
[A] � �AFA �K1K2FA
[H�]2 � [H�]K1 � K1K2
[HA] � �HAFA �K1[H�]FA
[H�]2 � [H�]K1 � K1K2
[H2A�] � �H2A�FA �[H�]2FA
[H�]2 � [H�]K1 � K1K2
The spreadsheet on the next page is modified from the one in the text bythe addition of activity coefficients in cells A10:H11. The ionic strength forcomputing activity coefficients with the Davies equation is in cell C20. Theinitial ionic strength is set to 0. The first guess for pH in cell H17 is 5. Thenuse SOLVER to find the pH in cell H17 that makes the net charge in cell E19nearly 0. From this pH, all concentrations are computed and the new ionicstrength is found in cell C21. This new ionic strength is typed into cell C20for the next iteration. From the new ionic strength, new activity coefficientsare computed and new values of are computed in cells B6, B7, E5, andH5. The pH that satisfies the charge balance in cell E19 is then found againwith SOLVER and the whole process is repeated until the ionic strengthreaches a constant value.
Iteration Ionic strength pH
1 0 4.2982 0.0523 4.1163 0.0539 4.1144 0.0540 4.114
13-E.
If hydrolysis is neglected, and where F is the formal concentration (0.025 M). We will solve the equation
(A)
with because it is neutral.
(a) First, set and use SOLVER (or the quadraticequation) to find to satisfy Equation A. In the spreadsheet on thenext page, guess an initial value of M in cell B11.Open SOLVER from the TOOLS menu. Select SOLVER Options and set
Click OK. In the SOLVER window, Set Target CellF14 Equal To Value of 169.8 By Changing Cells B11, SOLVER finds
and(b) Write the value 2 M in cell F3. This ionic strength changes
from 169.8 to 40.7. Execute SOLVER again, and this time Set Target CellF14 Equal To Value of 40.7 By Changing Cells B11. SOLVER finds
M and 0.061 5 M. Write 0.061 5 in cell F3 andrepeat the process again. The succession of results is shown in the table.The fraction of ion pairing is [MgSO4(aq)]/F � 33%.
�[Mg2�] � 0.015 4
K¿ip � 0.038
� 0.038 2 M.[Mg2�] � 0.009 54 M
Precision � 1e-6.
[Mg2�] � 0.012 5[Mg2�]
�Mg2� � �SO42 � 1.00
�MgSO4� 1
K¿ip � Kipa�Mg2��SO24
�MgSO4
b �[MgSO4(aq)]
[Mg2�][SO42]
�F [Mg2�]
[Mg2�]2
[MgSO4] � F [Mg2�],[Mg2�] � [SO42]
Kip � 102.23Mg2� � SO42 T MgSO4(aq)
K¿
1 Mixture of 0.040 M HA, 0.020 M B, and 0.015 M HCI
A
2
3
Species in charge balance: Other concentrations:
Positive charge minus negative charge
Formulas:
B16 = 10^-B4 B7 = 10^-B5 E5 = 10^-E4
B10 =10^-H12 B12 =H4�B10B11 = B10*E3/(B10+E5)
E10 = B10^2*B3/(B10^2+B10*B6+B6*B7)
E11 = B6*B7*B3/(B10^2+B10*B6+B6*B7)
H10 = B10*B6*B3/(B10^2+B10*B6+B6*B7)
H11 = E5*E3/(B10+E5)
E12 = H3
FA = FB = [Cl-] =
1.68E-11
pK1 = Kw =pKa =
pK2 =K1 = 8.32E-03
K2 = 1.10E-05
Ka =
[H+] = [H2A+] =7.03E-05
[BH+] = [A-] = 5.36E-032.00E-02
[OH-] = [Cl-] = 0.0151.42E-10
2.90E-04
pH =
initial value is a guess
[B] =
[HA] = 3.43E-02
4.79E-09
4
5
6
7
8
9
10
11
12
13
14
15
16
1718
19
20
21
22
B C D E F G H I
0.00E+00 = B10+B11+E10-B12-E11-E12
0.020
10.774
0.015
1.00E-14
4.153
0.040
2.080
4.960
Spreadsheet for Exercise 13-C.
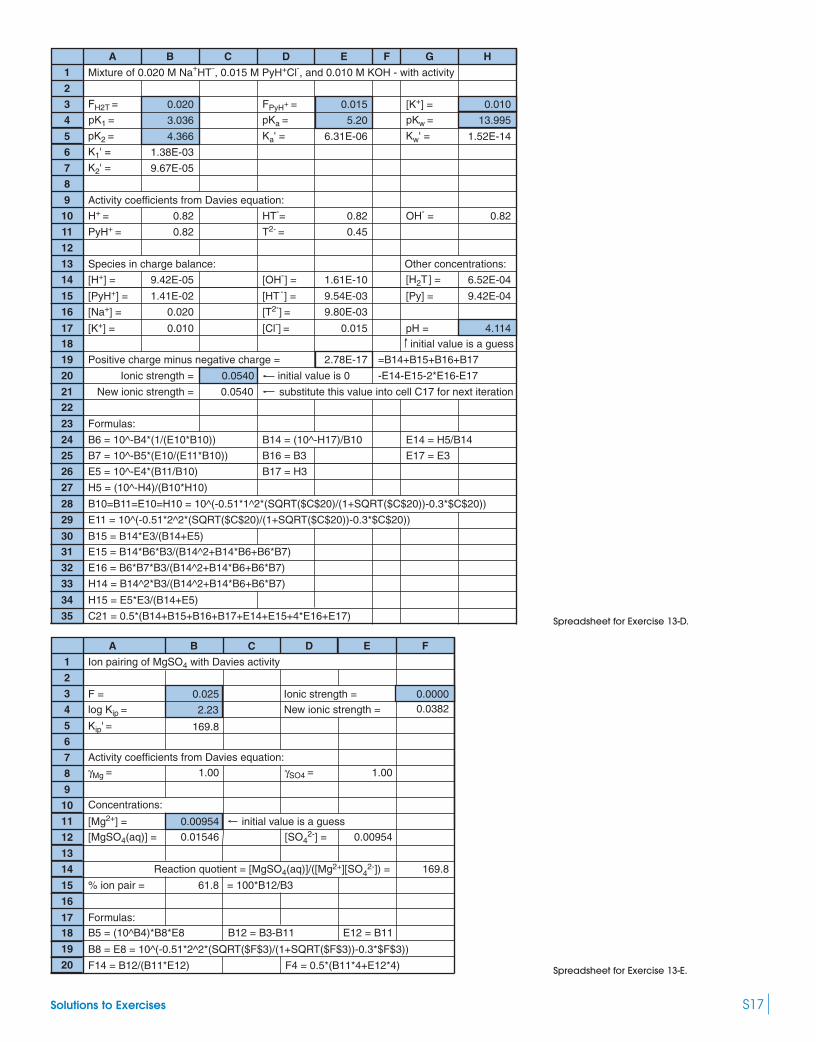
Solutions to Exercises S17
1 Mixture of 0.020 M Na+HT-, 0.015 M PyH+Cl-, and 0.010 M KOH - with activity
A
2
3
Activity coefficients from Davies equation:
[OH-] = 1.61E-10
B6 = 10^-B4*(1/(E10*B10)) B14 = (10^-H17)/B10 E14 = H5/B14
B7 = 10^-B5*(E10/(E11*B10))
B17 = H3
C21 = 0.5*(B14+B15+B16+B17+E14+E15+4*E16+E17)
FH2T = FPyH+ = [K+] =
6.31E-06 1.52E-14
pK1 = pKw =pKa =
pK2 = Kw' =Ka' =
[H2T] = 6.52E-04
Species in charge balance: Other concentrations:
4
5
6 K1' = 1.38E-03
7 K2' = 9.67E-05
8
9
10 H+ = 0.82 HT-= 0.82 0.82OH- =
11 PyH+ = 0.82 T2- = 0.45
12
13
14 [H+] = 9.42E-05
15 [PyH+] = 1.41E-02 [HT-] = 9.54E-03 [Py] = 9.42E-04
16 [Na+] = 0.020 [T2-] = 9.80E-03
17 [K+] = 0.010 0.015 pH =
initial value is a guess
[Cl-] =
2.78E-17 =B14+B15+B16+B17
18
19 Positive charge minus negative charge =
20 Ionic strength =
21 New ionic strength = 0.0540
22
23 Formulas:
24
25 B16 = B3 E17 = E3
26 E5 = 10^-E4*(B11/B10)
27 H5 = (10^-H4)/(B10*H10)
28 B10=B11=E10=H10 = 10^(-0.51*1^2*(SQRT($C$20)/(1+SQRT($C$20))-0.3*$C$20))
29 E11 = 10^(-0.51*2^2*(SQRT($C$20)/(1+SQRT($C$20))-0.3*$C$20))
30 B15 = B14*E3/(B14+E5)
31 E15 = B14*B6*B3/(B14^2+B14*B6+B6*B7)
32 E16 = B6*B7*B3/(B14^2+B14*B6+B6*B7)
33 H14 = B14^2*B3/(B14^2+B14*B6+B6*B7)
34 H15 = E5*E3/(B14+E5)
35
B C D E F G H
0.015
5.20
0.010
13.995
0.020
3.036
substitute this value into cell C17 for next iteration
0.0540 initial value is 0 -E14-E15-2*E16-E17
4.114
4.366
1 Ion pairing of MgSO4 with Davies activity
A
2
3
Reaction quotient = [MgSO4(aq)]/([Mg2+][SO42-]) = 169.8
% ion pair =
Formulas:B12 = B3-B11 E12 = B11B5 = (10^B4)*B8*E8
B8 = E8 = 10^(-0.51*2^2*(SQRT($F$3)/(1+SQRT($F$3))-0.3*$F$3))
F14 = B12/(B11*E12) F4 = 0.5*(B11*4+E12*4)
F = Ionic strength =
log Kip = New ionic strength =
Kip' =
γMg = γSO4 =Activity coefficients from Davies equation:
Concentrations:
[Mg2+] = 0.00954 initial value is a guess
[MgSO4(aq)] = [SO42-] = 0.009540.01546
61.8 = 100*B12/B3
4
5
6
7
8
9
10
11
12
13
14
15
16
1718
19
20
B C D E F
0.025 0.00000.03822.23
169.8
1.00 1.00
Spreadsheet for Exercise 13-D.
Spreadsheet for Exercise 13-E.

S18 Solutions to Exercises
Iteration Ionic strength (mM) (mM)
1 0 9.542 38.2 15.43 61.5 16.54 66.0 16.75 66.7 16.76 66.8 16.7
(c) The ionic strength is 0.067 M, not 0.10 M.
13-F. (a) In addition to Reactions 13-32 through 13-36, we add the reaction
The charge balance becomes
(A)
and the mass balance is
Substitute equilibrium expressions for the various species into the massbalance:
(B)The procedure at this point is the one we used in the text. For a given valueof use SOLVER to find the value of that makes the left side ofEquation B equal to 0. From and [ compute the remainingconcentrations with the equilibrium expressions. Results are shown inthe graph at the right.(b) To find the pH of unbuffered solution, find at which the chargebalance (A) is also satisfied. Because is negligible near neutral pH,the pH is unchanged from the case worked in the text. The pH ofunbuffered solution is 7.10 and concentrations are:
[CaF�] � 3.44 � 107 M[HF2] � 7.11 � 1011 M
[CaOH�] � 5.03 � 1010 M[HF] � 4.67 � 108 M
[Ca2�] � 2.00 � 104 M[F] � 4.00 � 104 M
[HF2]
[H�]
F],[H�][F][H�],
2Ksp
[F]2�
2KaKsp
[H�][F]2�
KipKsp
[F] [F]
[H�][F]
KHF
2KHF2[F]2[H�]
KHF� 0
2[Ca2�] � 2[CaOH�] � [CaF�] [F] [HF] 2[HF2] � 0
25[Ca2�] � [CaOH�] � [CaF�]6 � [F] � [HF] � [CaF�] � 2[HF2]
� [CaF�] [OH] [F] [HF2] � 0[H�] � 2[Ca2�] � [CaOH�]
� KHF2[F]2[H�]/KHF
1 [HF2 ] � KHF2
[F][HF] � KHF2[F]([H�][F]/KHF)
KHF2� 100.58HF(aq) � F T HF2
[Mg2�]
Graph for Exercise 13-F.
13-G.
Express all concentrations in terms of and
Mass balance:
Substitute expressions for concentrations into the mass balance:
(A)[Ag�] �KAg[Ag�]
[H�]�
Ksp
[Ag�]�
[H�]Ksp
KHCN[Ag�]
[Ag�] � [AgOH(aq)] � [CN] � [HCN(aq)]
total silver � total cyanide
[AgOH(aq)] �KAg[Ag�]
[H�]
[HCN(aq)] �[H�][CN]
KHCN�
[H�]Ksp
KHCN[Ag�]
[CN] � Ksp/[Ag�]
[H�]:[Ag�]
pKAg � 12.0Ag� � H2O T AgOH(aq) � H�
pKHCN � 9.21HCN(aq) T CN � H�
pKsp � 15.66AgCN(s) T Ag� � CN
–14
–12
–10
–8
–6
–4
–2
0
140 2 4 6
pH
8 10 12
log
(con
cent
ratio
n, M
)
pH ofsaturatedCaF2
F –
2
Ca2+
CaF+
CaOH+ HF
HF–
1 Solubility of AgCN
A
2
3 pKsp = Ksp = Kw =
1.0E-12
pKHCN = KHCN =
pKAg =
pH
0 1.0E+00
1.0E-02
1.0E-08
1.0E-10
1.0E-12
1.0E-14
2
4
6
8
10
12
14
B8 = 10^-A8 D8 = $E$3/C8 E8 = B8*D8/$E$4 F8 = $E$5*C8/B8
G8 = $H$3/B8 H8 = B8+C8-D8-G8
C8 = SQRT($E$3*($E$4+B8)*(B8)/($E$4*(B8+$E$5)))
7.28
[H+] [Ag+]
KAg =
1.0E-04
1.0E-06
5.3E-08
6.0E-04
6.0E-05
6.1E-08
1.6E-08
1.0E-08
1.5E-09
6.0E-06
6.0E-07
1.4E-07
[CN-]
3.7E-13
3.7E-12
3.6E-09
1.4E-08
2.1E-08
1.5E-07
3.7E-11
3.7E-10
1.6E-09
[HCN]
6.0E-04
6.0E-05
5.8E-08
2.2E-09
3.4E-11
2.4E-12
6.0E-06
6.0E-07
1.4E-07
[AgOH]
6.0E-16
6.0E-15
6.1E-12
1.6E-10
1.0E-08
1.5E-07
6.0E-14
6.0E-13
2.6E-12
[OH-]
1.00E-14
1.00E-12
1.00E-06
1.00E-04
1.00E-02
1.00E+00
1.00E-10
1.00E-08
1.89E-07
charge
Net
1.0E+00
1.0E-02
-9.3E-07
-1.0E-04
-1.0E-02
-1.0E+00
1.1E-04
1.6E-06
3.7E-21
4
5
6
7
8
9
10
11
12
13
14
15
16
1718
19
20
B C D E F G H
2.2E-16
6.2E-10
1.00E-1415.66
9.21
12.00
log
(con
cent
ratio
n, M
)
–10
–12
–2
–4
–6
–8
1412108
pH
HCN, Ag+
CN–
Ag+
AgOH HCN
6420
Spreadsheet for Exercise 13-G. Graph for Exercise 13-G.

Solutions to Exercises S19
Rearrange Equation A to solve for as a function of or use SOLVER
to find as a function of We will use the algebraic solution, whichis easy for this exercise. Multiply both sides by and solve:
(B)
The spreadsheet uses Equation B to find in column C. pH is input incolumn A. To find the pH of unbuffered solution, we find the pH at whichthe net charge in column H is zero. We used SOLVER to find that in cell A12 makes the net charge in cell H12 equal to 0.
13-H. (a)
(A)
Charge balance:
or
Put this expression for into numerator of (A):
Making the same substitutions used in Section 13-4 produces Equation 13-59with The expression for is just
(b) Optimized values of and in cells B9 and B10 in thespreadsheet are 13.869 and 4.726. They were obtained from initialguesses of and after executing SOLVER to minimizethe sum of squared residuals in cell B11. The NIST database lists
at and at M. Our observed � 0.1pKa � 4.56 � 0pKa � 4.757
pKa � 5pK¿w � 14
pKapK¿w�HA � [H�]/ ([H�] � Ka).
nH(theoretical) �nH(theoretical)n � 1.
� 1 �[OH] � [Cl]HCl [H�] [Na�]
FH2A
nH(measured) �FHA � [OH] � [Cl]HCl [H�] [Na�]
FHA
[A]
[A] � [OH] � [Cl]HCl [H�] [Na�]
[H�] � [Na�] � [OH] � [Cl]HCl � [A]
�[HA]
FHA�
FHA [A]
FHA
nH �moles of bound H�
total moles of weak acid�
[HA]
[HA] � [A]
pH � 7.28
[Ag�]
[Ag�] �BKsp(KHCN � [H�])[H�]
KHCN([H�] � KAg)
[Ag�]2a[H�] � KAg
[H�]b � KspaKHCN � [H�]
KHCNb
[Ag�]2 �KAg[Ag�]2
[H�]� Ksp �
[H�]Ksp
KHCN
[Ag�][H�].[Ag�]
[H�][Ag�]
value of 4.726 at M suggests that the titration experiment wasnot very accurate.
Chapter 1414-A. The cell voltage will be 1.35 V because all activities are unity.
14-B. (a)
E°� � 1.098 V
E° � 1.210 V E° � 1.098 1.210 � 0.112 V
K � 1010(0.112)/0.059 16 � 1 � 1019
5Br2(aq) � 10e T 10Br
2IO3 � 12H� � 10e T I2(s) � 6H2O
I2(s) � 5Br2(aq) � 6H2O T 2IO3 � 10Br � 12H�
� 0.578 lb� 1.21 mol HgO/365 days � 0.262 kg HgO� 7.68 � 108 mol e/s � 2.42 mol e/365 days(7.41 � 103 C/s) / (9.649 � 104 C/mol)I � P/E � 0.010 0 W/1.35 V � 7.41 � 103 C/s
� 0.1
1 Difference plot for acetic acid
A
2
3 Titrant NaOH =
C15 = 10^-B15/$B$8
0.4905
200
3.96
0.484
Cb (M)
Vo (mL)
L (mmol)
A (mmol)
1 nγH0.78
Ka = 1.881E-05 = 10^-B10
D15 = 10^-$B$9/C15
Initial volume = E15 = $B$7+($B$6-$B$3*A15
F15 = $C15/($C15+$E$10)
G15 = (E15-F15)^2
-(C15-D15)*($B$4+A15))/$B$5Acetic acid =
HCl added =
Number of H+ =
Activity coeff =
v
mL NaOH
0.00
0.30
:
:
10.20
10.50 11.54
4.80
5.10
pH
2.79 2.08E-03
1.65E-03
2.13E-05
1.81E-05
5.22E-12
3.70E-12
2.89
11.39
4.78
4.85
Σ(resid)2 =
pKa =
pKw' =
[H+] =
(10-pH)/γH
6.50E-12
8.19E-12
6.36E-10
7.47E-10
2.59E-03
3.66E-03
1.017
1.002
0.527
0.490
-0.004
0.016
0.991
0.989
0.531
0.491
0.000
0.000
[OH-] = Measured
(10-pKw)/[H+] nH
Theoretical (residuals)2 =nH = αHA (nmeas -ntheor)2
4
5
6
7
8
9
10
11
12
13
14
15
16
1718
19
20
21
22
B C D E F G
0.000685
0.000163
0.000018
0.000001
0.000014
0.000259
0.0045 = sum of column G
13.869
4.726
nH
1.1
1.0
0.9
0.8
0.7
0.6
0.5
0.4
0.3
0.2
0.1
0.082 3 4 5
pH
6 7
n (measured)n (theory)
Spreadsheet for Exercise 13-H.
Graph for Exercise 13-H.

S20 Solutions to Exercises
(b)
(c)
(d)
An alternate way to answer (d) is:
(e)
(f)
14-C. (a)
E �
� 1.155 (0.50) � 1.65 V
Electrons flow from the more negative Fe electrode to themore positive Pt electrode (1.155 V).
(b) Fe2� � 2e T Fe(s) E°� � 0.44 V
Cu2� � 2e T Cu(s) E° � 0.339 V
Fe2� � Cu(s) T Fe(s) � Cu2�
(0.50 V)
e0.44 0.059 16
2 log
1
0.010f
e1.078 0.059 16
2 log (0.050)2 f
Br2(l) � 2e T 2Br E°� � 1.078 V
Fe2� � 2e T Fe(s) E° � 0.44 V
Br2(l) � Fe(s) T 2Br � Fe2�
E°� � 0.185 V
E° � 0.518 V E° � 0.185 0.518 � 0.703 V
K � 100.703/0.059 16 � 1 � 1012
CuI(s) � e T Cu(s) � I
Cu� � e T Cu(s)
CuI(s) T Cu� � I
E°� � 0.799 V
E° � 0.017 V E° � 0.799 0.017 � 0.782 V
K � 100.782/0.059 16 � 2 � 1013
Ag� � e T Ag(s)
Ag(S2O3)32 � e T Ag(s) � 2S2O2
3
Ag� � 2S2O23 T Ag(S2O3)3
2
E°� � 1.230 V
E° � 1.507 V
E° � 1.230 1.507 � 0.277 V
K � 1010(0.277)/0.059 16 � 2 � 1047
5[MnO2(s) � 4H� � 2e T Mn2� � 2H2O]
2[MnO4 � 8H� � 5e T Mn2� � 4H2O]
5MnO2(s) � 4H� T 2MnO4 � 3Mn2� � 2H2O
E°� � 1.230 V
E° � 1.692 V
E° � 1.230 1.692 � 0.462 V
K � 106(0.462)/0.059 16 � 1 � 1047
3[MnO2(s) � 4H� � 2e T Mn2� � 2H2O]
2[MnO4 � 4H� � 3e T MnO2(s) � 2H2O]
5MnO2(s) � 4H� T 2MnO4 � 3Mn2� � 2H2O
E°� � 1.360 V
E° � 2.360 V E° � 1.360 (2.360) � 3.720 V
K � 102(3.720)/0.059 16 � 6 � 10125
Cl2(g) � 2e T 2Cl
Mg2� � 2e T Mg(s)
Mg(s) � Cl2(g) T Mg2� � 2Cl
E°� � 0.89 V
E° � 0.44 V E° � 0.89 (0.44) � 0.45 V
K � 102(0.45)/0.059 16 � 1015
Cr2� � 2e T Cr(s)
Fe2� � 2e T Fe(s)
Cr2� � Fe(s) T Cr(s) � Fe2�
E �
Electrons flow from the more negative Fe electrode to themore positive Cu electrode (0.289 V).
(c)
E �
Electrons flow from the more negative Hg electrode (0.340 V) to the morepositive Pt electrode (1.434 V).
14-D. (a) H� � e T H2(g) E � 0 V
Ag� � e T Ag(s) E � 0.799 V
E° � E E � 0.799 V
E �
(b) [Ag�] � � � 8.3 � 1016 M
E �
Electrons flow from the more negative Ag electrode ( ) to themore positive Pt electrode (0.038 V).
(c) H� � e T H2(g) E � 0 VAgI(s) � e T Ag(s) � I E � ?
0.055 � {E 0.059 16 log (0.10)}
1 E � 0.153 V
(Appendix H gives E � 0.152 V.)
14-E. Ag(CN) � e T Ag(s) � 2CN E � 0.310 V
Cu2� � 2e T Cu(s) E � 0.339 V
E �
We know that [Ag(CN) ] � 0.010 M and [Cu2�] � 0.030 M. To find[CN] at pH 8.21, we write
� 1 [CN] � 0.10 [HCN]
But, because [CN] � [HCN] � 0.10 M, [CN] � 0.009 1 M.
Putting this concentration into the Nernst equation gives
Electrons flow from the more negative Ag electrode to themore positive Cu electrode (0.294 V).
14-F. (a) PuO � e � 4H� T Pu4� � 2H2O
PuO2�2 S PuO�
2 �G � 1F (0.966)
PuO�2 S Pu4� �G � 1F E°
Pu4� S Pu3� �G � 1F(1.006)
PuO2�2 S Pu3� �G � 3F (1.021)
�2
(0.187 V)
(0.294) � 0.481 V.E � 0.187
Ka
[H�]
[CN]
[HCN]
2
e0.339 0.059 16
2 log
1
[Cu2�]f
e0.310 0.059 16 log [CN]2
[Ag(CN)2 ]f°
°�2
°
°
°e0 0.059 16 log 20.20
0.10f
°
°�12
0.093 V
e0.799 0.059 16 log 1
8.3 � 1016f� 0.038 (0.093) � 0.055 V
e0 0.059 16 log 20.20
0.10f
8.3 � 1017
0.10
Ksp
[I]
e0.799 0.059 16 log 1
[Ag�]f
e0 0.059 16 log P1/2
H2
[H�]f
°°�
°
°�12
e0.268 0.059 16
2 log (0.060)2 f � 1.434 (0.340) � 1.094 V
e1.360 0.059 16
2 log
(0.040)2
0.50f
Cl2(g) � 2e T 2Cl E°� � 1.360 V
Hg2Cl2(s) � 2e T 2Hg(l) � 2Cl E° � 0.268 V
Cl2(g) � 2Hg(l) T Hg2Cl2(s)
(0.48 V)
e0.339 0.059 16
2 log
1
0.020f � 0.48 (0.289) � 0.77 V
e0.44 0.059 16
2 log
1
0.050f

Solutions to Exercises S21
3F (1.021) � 1F (0.966) 1F E° 1F (1.006)1 E° � 1.091 V
(b)
E �
[PuO ] cancels [PuO ] because they are equal. At pH 2.00, we insert [H�] � 102.00 and PO2
� 0.20 to find E � 0.134 V. Because E � 0, thereaction is not spontaneous and water is not oxidized. At pH 7.00, we find E � �0.161 V, so water will be oxidized.
14-G. 2H� � 2e T H2(g) E � 0 VHg2Cl2(s) � 2e T 2Hg(l) � 2Cl E � 0.268 V
E �
We find [H�] in the right half-cell by considering the acid-base chemistry ofKHP, the intermediate form of a diprotic acid:
[H�] � � 6.5 � 105 M
E �
� 0.575 V
14-H. E
To make this much the concentration of must have been reduced from 0.500 M to 0.496 M, because one ion reacts with four ions.
14-I.
14-J. To compare glucose and at we need to know foreach. For For glucose, we find from
Gluconic acid Glucose
But and Putting these into the Nernst
equation gives
E � E° logFG
a [H�]FHA
[H�] � Kab[H�]2
0.059 16
2
[HA] �[H�]FHA
[H�] � Ka.FG � [G]
E � E° 0.059 16
2 log
[G]
[HA][H�]2
HA � 2H� � 2e T G � H2O
E° ¿:E°H2, E° � 0 V.E°pH � 0,H2
E°� � E° � E° � 0.556 � 0.339 � 0.217 V
E° �0.059 16
2 log
1
Kf� 0.556 V
CuY2 � 2e T Cu(s) � Y4 E°� � ?
Cu2� � 2e T Cu(s) E° � 0.339 V
CuY2 #1/Kf
4 Cu2� � Y4 E°
� 7 � 1029
K �[HgI2
4 ]
[Hg2�][I]4�
(0.001 0)
(2.5 � 1032)(0.496)4
I
Hg2�
IHgI24 ,[HgI2
4 ] � 0.001 0 M.
1 [Hg2�] � 2.5 � 1032 M
0.083 � e0.059 16
2 log
1
12f e0.852
0.059 16
2 log
1
[Hg2�]f
E � e0.059 16
2 log
PH2
[H�]2f e0.852
0.059 16
2 log
1
[Hg2�]f
E° � 0.852 VHg2� � 2e T Hg(l)� 0 V°�2H� � 2e T H2(g)
e0.268 0.059 16
2 log (0.10)2 f
e0.059 16
2 log
1
(6.5 � 105)2f
BK1K2(0.050) � K1Kw
K1 � 0.050
e0.268 0.059 16
2 log[Cl]2fe
0.059 16
2 log
PH2
[H�]2f
°
°�
2�2
�2
e1.229 0.059 16
2 log
1
P1/2O2
[H�]2f
e0.966 0.059 16
2 log
[PuO�2 ]2
[PuO2�2 ]2f
2PuO2�2 � 2e T 2PuO�
2 E°� � 0.966 V 1
2 O2(g) � 2H� � 2e T H2O E° � 1.229 V
2PuO2�2 � H2O T 2PuO�
2 � 12 O2(g) � 2H�
� E° log log1444442444443
Because for is more negative than for glucose, is the strongerreducing agent at pH 0.00.
14-K. (a) Each must provide when it passes from outsideto inside.
(b)
(c)
Chapter 1515-A. The reaction at the silver electrode (written as a reduction) is
, and the cell voltage is written as
Titration reactions:
The two equivalence points are at 25.0 and 50.0 mL. Between 0 and 25 mL, there is unreacted in the solution.
At 1.0 mL: [Ag�] � (0.050 0 M)14243
Initial concentration of Ag�
� 0.047 5 M 1 E � 0.521 V
Between 25 mL and 50 mL, all AgBr has precipitated and TlBr is in theprocess of precipitating. There is some unreacted left in solution in thisregion.
At 25.2 mL:
� 3.96 � 102 M
[Tl�] � a24.8
25.0b(0.050 0 M)a100.0
125.2b
Tl�
1 E � 0.374 V� 1.60 � 104 M
At 24.9 mL: [Ag�] � a0.10
25.0b(0.050 0 M)a100.0
124.9b
� 0.001 61 M 1 E � 0.434 V
At 24.0 mL: [Ag�] � a 1.0
25.0b(0.050 0 M)a100.0
124.0b
� 0.017 4 M 1 E � 0.495 V
At 15.0 mL: [Ag�] � a10.0
25.0b(0.050 0 M)a100.0
115.0b
a100.0
101.0ba24.0
25.0b
Ag�
(Ksp � 3.6 � 106)Br � Tl� S TlBr(s)
(Ksp � 5.0 � 1013)Br � Ag� S AgBr(s)
� 0.599 0.059 16 log [Ag�]
� (�0.200) a0.799 0.059 16 log 1
[Ag�]b
E � E� E
Ag� � e T Ag(s)
E ��G(electric)
F� 0.120 V
�G(electric) � [12(34.5) 5.7] kJ � 11.5 kJ
�G(pH) � RT ln 10 � 5.7 � 103 J
If �pH � 1.00, Ahigh/Alow � 10.
12(34.5 � 103 J) � 1FE 1 E � 0.179 V
�G � nFE (where n � charge of H� � 1)
� 3.02 pH units1 �pH � log (1.05 � 103)
Ahigh
Alow� 1.05 � 103
�G � 12(34.5 � 103 J) � RT ln
Ahigh
Alow
12(34.5 kJ)H�
H2E°H2E°
1 E° � �0.066 V for glucose
0.45 V � E° 0.059 16
2 log
107.00 � 103.56
(107.00)3
This is E°¿ � 0.45 V when [H�] � 107
FG
FHA
0.059 16
2
[H�] � Ka
[H�]3
0.059 16
2

S22 Solutions to Exercises
50.0 mL is the second equivalence point, at which
At 60.0 mL, there is excess in the solution:
15-B. The cell voltage is given by Equation C, in which is theformation constant for To find the voltage,we must calculate and at each point. The concentrationof is when and is thereafter affected onlyby dilution because The concentration of
is found from the Mg-EDTA equilibrium at all but the first point.At the Hg-EDTA equilibrium determines
At 0 mL:
Using Equation C, we write
At 10.0 mL: Because of the is in the form and is in the form
Dilutionfactor
� 0.120 V
0.059 16
2 log (1.08 � 109)
E � 0.852 0.241 0.059 16
2 log
1021.5
8.33 � 105
[HgY2] � a50.0
60.0b(1.0 � 104 M) � 8.33 � 105 M
� a10
15b^6.2 � 108 � 1.08 � 109 M
[Y4] �[MgY2]
[Mg2�]^Kf (for MgY2)
Mg2�.1525
MgY2,Mg2�Ve � 25.0 mL, 1025
� 0.242 V
0.059 16
2 log (9.7 � 1014)
0.059 16
2 log
1021.5
1.0 � 104
E � 0.852 0.241
� 9.7 � 1014 M [Y4] � �Y4 [EDTA]
1 x � [EDTA] � 3.2 � 1013 M
1.0 � 104 x
(x)(x)� 9.5 � 1020
[HgY2]
[Hg2�][EDTA]� �Y4Kf (for HgY4) � (0.30)(1021.5)
[Y4].V � 0 mL,Y4
Kf(HgY2) W Kf(MgY2).V � 01.0 � 104 MHgY2
[Y4][HgY2]Hg(EDTA)2 (� 1021.5).
Kf
1 [Ag�] � 4.00 � 1011 M 1 E � �0.016 V
[Br] � a 10.0
160.0b(0.200 M) � 0.012 5 M
Br
1 [Ag�] � 2.64 � 1010 M 1 E � 0.032 V1 [Br] � 1.90 � 103 M1 [Tl�] � 2Ksp � 1.90 � 103 M
At 50.0 mL: [Tl�][Br] � Ksp (for TlBr)
[Tl�] � [Br].
1 E � 0.095 V
1 [Ag�] � 3.08 � 109 M
1 [Br] � 1.62 � 104 M
� 0.022 2 M
At 35.0 mL: [Tl�] � a15.0
25.0b(0.050 0 M)a100.0
135.0b
� 0.110 VE � 0.599 0.059 16 log [Ag�]
[Ag�] � Ksp (for AgBr)/[Br] � 5.5 � 109 M
[Br] � Ksp (for TlBr) /[Tl�] � 9.09 � 105 M At 20.0 mL:
At 25.0 mL: This is the equivalence point, at which
At 26.0 mL: Now there is excess EDTA in the solution:
15-C. At intermediate pH, the voltage will be constant at 100 mV. Whenthe electrode begins to respond to
and the voltage will decrease (i.e., the electrode potential will changein the same direction as if more were being added). Near
reacts with and the concentration of free decreases. At and
A qualitative sketch of this behavior isshown here. The slope at high pH is less than unit, becausethe response of the electrode to is less than the response to
1 2 3 4 5 6 7pH
8 9 10 11 12 13
200
100
0
Pot
entia
l (m
V)
F.OH
59 mV/pHE � 100 � 2(59) � 218 mV.
pH � 1.17, [F] � 1% of 105 M � 107 M,FH�(� pKa for HF), F
pH � 3.17 F
OH
[OH] � [F]/10 � 106 M (pH � 8),
1 E � 0.030 V
[HgY2] � a50.0
76.0b(1.0 � 104 M) � 6.58 � 105 M
� 9.47 � 105 M
[Y4] � �Y4[EDTA] � (0.36) c a 1.0
76.0b(0.020 0 M) d
1 E � 0.021 V� 6.67 � 105 M
[HgY2] � a50.0
75.0b(1.0 � 104 M)
� 1.80 � 106 M [Y4] � �Y4(6.0 � 106 M)
1 x � 5.48 � 106 M
a50.0
75.0b(0.010 0) x
x2� 1.85 � 108
[MgY2]
[Mg2�][EDTA]� �Y4Kf (for MgY2)
[Mg2�] � [EDTA].
1 E � 0.041 V
� 6.68 � 105 M
[HgY2] � a50.0
74.9b(1.0 � 104 M)
� 4.02 � 107 M
[Y4] � a24.9
0.1b^6.2 � 108
At 24.9 mL:
1 E � 0.095 V
[HgY2] � a50.0
70.0b(1.0 � 104 M) � 7.14 � 105 M
[Y4] � a20
5b^6.2 � 108 � 6.45 � 109 M

Solutions to Exercises S23
15-D. (a) For 1.00 mM at pH 8.00, we can write
For 5.00 mM at pH 8.00, we have
(b) For 1.00 mM at pH 3.87, we have
15-E. A graph of versus gives a straight linewhose equation is For
The sample analyzed contains of nitrogen. But this sample represents
just of the food sample. Therefore, the foodcontains
nitrogen.
15-F. The function to plot on the y-axis is wherePutting in
and gives [You can get the relation from the equation
in which the units are
VS (mL) E (V) y
0 0.046 5 0.633 81.00 0.040 7 1.042 52.00 0.034 4 1.781 13.00 0.030 0 2.615 24.00 0.026 5 3.571 7
The data are plotted in Figure 15-23, which has a slope of and an intercept of giving an x-intercept of
The concentration of original unknown is
(We decided that the last significant digit in the x-intercept was the 0.01 decimalplace because the original data were only measured to the 0.01 decimal place.)
Chapter 1616-A. Titration reaction:
Representative calculations:
At 0.100 mL:
At 10.00 mL:
At the equivalence point, and whichmakes the log term 0. Therefore and
E � E� E � 0.583 0.241 � 0.342 V
E� � 0.583 V.3E� � 1.748[Sn2�] � 1
2[Ce4�],[Sn4�] � 12[Ce3�]
2E� � 2(0.139) 0.059 16 log [Sn2�]
[Sn4�]
E� � 1.47 0.059 16 log
[Ce3�]
[Ce4�]
3E� � 1.748 0.059 16 log [Sn2�][Ce3�]
[Sn4�][Ce4�]
E � E� E � 0.080 0.241 � 0.161 V
� 0.139 0.059 16
2 log
9.90
0.100� 0.080 V
E� � 0.139 0.059 16
2 log
[Sn2�]
[Sn4�]
Ve � 10.0 mL
Sn2� � 2Ce4� S Sn4� � 2Ce3�
� 4.2 � 105 M
cX � (x-intercept)cS
V0�
(0.589 65 mL)(1.78 mM)
25.0 mL
0.589 65 mL.b/m �b � 0.439 19,
m � 0.744 84
J � (mol)(C/mol)(V).]�G � nFE,J/C � VJ/C � 0.029 136 V.
S � 0.029 136n � 2T � 298.15 K,F � 96 485.3 C/mol,R � 8.314 472 J/ (mol�K),� is 0.985.S � �RT ln 10/nF.
(V0 � VS) 10E/S,
N � 3.59 wt%0.016/0.020 0 � 0.800 mmol of nitrogen � 11.2 mg of
2.00% (20.0 mL/1.00 L)(1.60 � 104 M) � 0.016 0 mmol
(100 mL) �1.60 � 104 M.[NH3] �E � 339.3 mV,E � 563.4 � 59.05 � log[NH3].
log[NH3(M)]E(mV)
� 0.007 VE � �0.139 � 0.059 16 log[(1.00 � 103) � (36 � 103.87)]
Na�
� 0.003 VE � �0.139 � 0.059 16 log [(5.00 � 103) � (36 � 108)]
Na�
1 constant � �0.139 V� constant � 0.059 16 log [(1.00 � 103) � (36 � 108)]
E � constant � 0.059 16 log([Na�] � 36[H�]) 0.038
Na� At 10.10 mL:
mL E (V) mL E (V)
0.100 10.00 0.3421.00 10.10 1.115.00 12.00 1.199.50
16-B. Standard potentials: indigo tetrasulfonate, The end-point potential will be
between 0.356 and 0.77 V. Indigo tetrasulfonate changes color near 0.36 V.Therefore it will not be a useful indicator for this titration.
16-C. Titration:
The equivalence point comes at 15.0 mL. Before the equivalence point:
At the equivalence point, use Equation E of Demonstration 16-1:
After the equivalence point:
16-D.of of of
But 1 mole of unreacted gives 1 mole of Therefore, ofwas left from the periodate oxidation of the amino acids. The original
amount of was 2.000 mL of The difference is the number of micromoles ofserine threonine in 128.6 mg of protein. But with of2.195 mol � 25.85 � 26 residues/molecule.
(Serine � threonine) /protein � 56.74 mol/protein � 2.195 mol.FM � 58 600, 128.6 mg�
(97.40 40.66 � 56.74)0.048 7 M IO
4 � 97.40 mol.IO4
IO4
40.66 molI3 .IO
4
I3 .S2O2
3 � 40.66 mol0.098 8 M S2O23 � 81.31 mol823 L
I3 � 2S2O2
3 S 3I � S4O26
1.2
1.3
1.1
1.0
0.9
0.8
0.7
0.6
0.5
0.4
0.3
0.20 5 10 15 20 25 30
Volume (mL)
E(V
vs.
S.C
.E.)
1 E � 1.266 V30.0 mL: [Mn2�]/[MnO
4 ] � 15.0/15.0 and [H�] � 1 M
1 E � 1.252 V16.0 mL: [Mn2�]/[MnO
4 ] � 15.0/1.0 and [H�] � 1 M
E � E� E � a1.507 0.059 16
5log
[Mn2�]
[MnO4 ][H�]8
b 0.241
E � E� E � 1.369 0.241 � 1.128 V
6E� � 8.215 0.059 16 log1
[H�]81
pH�0E� � 1.369 V
14.0 mL: [Fe2�]/[Fe3�] � 1.0/14.0 1 E � 0.507 V
7.5 mL: [Fe2�]/[Fe3�] � 7.5/7.5 1 E � 0.439 V
1.0 mL: [Fe2�]/[Fe3�] � 14.0/1.0 1 E � 0.371 V
E � E� E � a0.68 0.059 16 log [Fe2�]
[Fe3�]b 0.241
E° � 1.507 VMnO4 � 8H� � 5e S Mn2� � 4H2O
E° � 0.68 V in 1 M H2SO4Fe3� � e T Fe2�
MnO4 � 5Fe2� � 8H� S Mn2� � 5Fe3� � 4H2O
Fe[CN]46 , 0.356 V; Tl3� 0 Tl3�, 0.77 V.
0.36 V; Fe[CN]36 0
0.0640.1020.1300.161
E � E� E � 1.352 0.241 � 1.11 V
� 1.47 0.059 16 log 10.0
0.10� 1.352 V
E� � 1.47 0.059 16 log [Ce3�]
[Ce4�]

S24 Solutions to Exercises
17-C. (a)
Putting in gives and
123
(b)
E(cathode versus S.C.E.)
Putting in and gives
(c) We can think of the reduction as , for whichBut the concentration of is that tiny amount in equi-
librium with 0.10 M EDTA plus In Table 12-2,we find that the formation constant for is
where F is the formal concentration of and at pH 7.00 (Table 12-1). Putting in
and solving for gives
17-D. (a) 75.00 mL of 0.023 80 M of which gives 1.785 mmol of AgSCN, containing 0.103 7 g of SCN.
(b) Anode:
(c) To remove 99.99% of 0.10 M KI will leave The concentration of in equilibrium with this much is
The concentration of in equilibrium with 0.10 M isTherefore
will begin to precipitate 0.10 M The separationis not possible.
17-E. The corrected coulometric titration time is Because
is equivalent to one the concentration of organohalide is If all halogen is Cl, this corresponds to
17-F. (a) Use the internal standard equation with and From the standard mixture, we find the response factor, F:
For the unknown mixture, we can now say
The concentration of in diluted unknown is In the undilutedunknown, the concentration is 104 M.150.00
25.002 (130.2 M) � 2.60 �
130.2 M.Pb2�
3.00 A
[Pb2�]� 0.7445a 2.00 A
[64.6 M]b1 [Pb2�] � 130.2 M
SignalX
[X]� F asignalS
[S]b
� a10.00
50.00b(3.23 � 10 4 M) � 6.46 � 105 M
[Cd2�] standard added to unknown
1.58 A
[41.8 M]� Fa 1.64 A
[32.3 M]b1 F � 0.7445
SignalX[X]
� FasignalS[S]b
S � Cd2�.X � Pb2�
592 g Cl/L.16.7 M.X,1e
q � It/F � (4.23 mA)(381 s) / (96 485 C/mol) � 16.7 mol e.387 6 � 381 s.
Br.8.3 � 1012 M Ag�
[Ag�] � Ksp/[I] � (5.0 � 1013) / (0.10) � 5.0 � 1012 M.BrAg�
[Ag�] � Ksp/[I] � (8.3 � 1017) / (1.0 � 105) � 8.3 � 1012 M.IAg�
[I] � 1.0 � 105 M.
E � E(cathode) E(anode) � 0.111 VE(cathode) � E(S.C.E.) � 0.241 V
� 0.071 0.059 16 log[0.10] � 0.130 VE(anode) � 0.071 0.059 16 log[Br]
E° � 0.071 VAgBr(s) � e T Ag(s) � Br
Final mass � 12.463 8 � 0.103 7 � 12.567 5 g.
SCN,KSCN � 1.785 mmol
� 1.056 V
E � 0.282 0.059 16
2log
1
9.4 � 1019 0.241
[Co2�] � 9.4 � 1019 M.[Co2�]1.0 � 106 M[Co(EDTA)2] �3.8 � 104
�Y4 �EDTA (� 0.10 M)
Kf �[Co(EDTA)2]
[Co2�][EDTA4]�
[Co(EDTA)2]
[Co2�]�Y4F
1016.45 � 2.8 � 1016.Co(EDTA)2
1.0 � 106 M Co(EDTA)2.Co2�E° � 0.282 V.
Co2� � 2e T Co(s)E � 0.833 V.
[Co(C2O4)22 ] � 1.0 � 106 M[C2O2
4 ] � 0.10 M
� 0.474 0.059 16
2log
[C2O24 ]2
[Co(C2O4)22 ]
0.241
E° � 0.474 VCo(C2O4)22 � 2e T Co(s) � 2C2O2
4
E(S.C.E.)
E(cathode versus S.C.E.) � 0.459 0.241 � 0.700 V
E � 0.459 V[Co2�] � 1.0 � 106 M
E(cathode versus S.H.E.) � 0.282 0.059 16
2log
1
[Co2�]
E° � 0.282 VCo2� � 2e T Co(s)16-E. The Gran plot of versus V is shown in Figure 16-4.The data from 8.5–12.5 mL appear to be on a straight line. The least-squares line through these four points has a slope of
and an intercept of The x-intercept isThe amount of required to reach the equivalence
point is and the concentra-tion of unknown is
Titrant volume, V (mL) E (volts)
6.50 0.6358.50 0.651
10.50 0.66911.50 0.68012.50 0.696
Chapter 1717-A. Cathode:
Anode (written as a reduction):
Anode Cathodeoverpotential overpotential144444424444443
From Table 17-1
For Au electrodes, the overpotentials are 0.963 and 0.390 V, giving
17-B. (a) To electrolyze requires a potential of
E(cathode versus Ag AgCl) � E(versus S.H.E.) E(Ag AgCl)
� 0.169 0.197 � 0.028 V
(b) The concentration of that would be in equilibrium with at 0.169 V is found as follows:
Percentage of Cu2� reduced � 99.998%
�1.8 � 106
0.10� 100 � 1.8 � 103%Percentage of Cu2� not reduced
1 [Cu2�] � 1.8 � 106 M
0.169 � 0.339 0.059 16
2log
1
[Cu2�]
E(cathode) � 0.339 0.059 16
2log
1
[Cu2�]
E° � 0.339Cu2� � 2e T Cu(s)
Cu(s)[Cu2�]
00� 0.169 V
� 0.208 0.059 16
3log
1
(0.010)(1.0)2
E(cathode) � 0.208 0.059 16
3log
1
[SbO�][H�]2
0.010 M SbO�
E � 2.78 V.
0.85 V 0.068 V � 2.35 V� 1.229 (0.100 A)(2.00 �)
E � E(cell) I � R overpotentials
� 1.229 0.059 16
2log PH2
P1/2O2
� 1.229 V
E(cell) � E(cathode) E(anode)
E(anode) � 1.229 0.059 16
2log
1
[H�]2P1/2O2
E(cathode) � 0 0.059 16
2log
PH2
[H�]2
E° � 1.229 V12O2(g) � 2H� � 2e T H2O
2H� � 2e T H2(g) E° � 0 V
2.148 8 � 10113.685 1 � 10115.162 6 � 10118.421 0 � 10111.200 3 � 1010
V*10E/0.059 16
1.385 mmol/50.0 mL � 0.027 7 M.Fe2�
(0.100 mmol/mL) (13.85 mL) � 1.385 mmol,Ce4�b/m � 13.85 mL.
b � 2.170 2 � 1010.1011m � 1.567 3 �
V*10E/0.059 16

Solutions to Exercises S25
(b) First find the relative uncertainty in the response factor:
Then find the uncertainty in
17-G. We see two consecutive reductions. From the value of we find that one electron is involved in each reduction (using Equation 17-16).A possible sequence of reaction is
The equality of the anodic and cathodic peak heights suggests that the reactions are reversible. The expected sampled current (panel a) and square wave (panel b) polarograms are sketched below.
17-H. Electricity required for in 0.847 6 g of
which corresponds to of of
Chapter 1818-A. (a)(b) Absorbance is proportional to concentration, so the absorbance willdouble to 0.694, giving
18-B. (a)
(b)
(c)14243Dilution factor
� 5.87 � 103 M
c � a25.00 mL
2.00 mLb 0.733 0.029
(1.50 � 103 M1 cm1)(1.000 cm)
� 2.31 � 104 Mc �A
'b�
0.375 0.029
(1.50 � 103 M1 cm1) (1.000 cm)
� 1.50 � 103 M1 cm1
' �A
cb�
0.624 0.029
(3.96 � 104 M)(1.000 cm)
T � 10A � 100.694 � 0.202 1 %T � 20.2%.
A � log P/P0 � log T � log(0.45) � 0.347
Water content � 100 �5.502 mg H2O
847.6 mg polymer� 0.649 1 wt%
H2O � 5.502 mg H2OI2 � 0.305 4 mmol1
2(0.610 8) � 0.305 4 mmol
58.93 C
96 485 C/mol� 0.610 8 mmol of e
(63.16 4.23) � 58.93 C.polymer �H2O
−1.38 −2.38
(b)
E (versus S.C.E.)
∆I
−1.38 −2.38
(a)
I
Co(III)(B9C2H11)2 S Co(II)(B9C2H11)2
2 S Co(I)(B9C2H11)32
Epa Epc,
1 [Pb2�] � 2.60 (�0.09) � 104 M
[Pb2�] �
(3.00 � 0.03)(10.00 � 0.05)
(50.00 � 0.05)(3.23 (�0.01) � 104)
(2.00 � 0.03)(0.744 5 � 0.019 9)
[Pb2�]:
1 F � 0.744 5 � 0.019 9 (�2.67%)
F �(1.58 � 0.03)(32.3 � 0.1)
(1.64 � 0.03)(41.8 � 0.1)
18-C. (a) of in In the colored solution, the concentration is
(b)
100.00 mL of unknown
18-D. (a) Milligrams of Cu in flask This entire quantity is in the isoamyl alcohol (20.00 mL), so the concentrationis(b) Observed absorbance
Note that the observed absorbance is equal to the absorbance from Cu inthe rock plus the blank absorbance. In the lab we measure the observedabsorbance and subtract the blank absorbance from it to find the absorbance due to copper.
(c)
18-E. (c) Vol% acetone Corrected absorbance
10 0.21520 0.41130 0.57840 0.74550 0.913
(Your answers will be somewhat different from Dan’s, depending on whereyou draw the baselines and how you measure the peaks.)(e)
(f)
When a spreadsheet with all its extra digits is used, the answer is 32.2 vol%.
Answer: 32.2 � 0.4 vol%.
�0.010 4
0.017 3B1
3�
1
5�
(0.611 0.5724)2
0.017 32 (1 000)� 0.44
�sy
�m �B1
k�
1n
�(y y)2
m2� (x1 x)2
Uncertainty in x (� sX)
vol% �0.611 0.053
0.017 30� 32.3%
y � 0.017 30 (�0.000 33)x � 0.053 (�0.011) (sy � 0.0104)
x mg
1.00 mg�
0.874 0.056
0.180 0.0561 x � 6.60 mg Cu
Cu in unknown
Cu in known�
A of unknown
A of known
� 0.180� (7.90 � 103)(1.00)(1.574 � 105) � 0.056� 'bc � 0.056� absorbance due to Cu in rock � blank absorbance
(2.00 � 105 g) /[(0.020 0 L)(63.546 g/mol)] � 1.57 � 105 M.
C � (1.00)( 10250)(15
30) � 0.020 0 mg.
� 16.1%� (7.043 � 104 g) / (4.37 � 103 g)
1 weight % of N
� 7.043 � 104 g of N� 5.028 � 105 mol of N
� 5.028 � 104 M
� a0.452
0.168b(1.869 � 104)
1 concentration of NH3 in unknown
�concentration of unknown
concentration of reference
�0.592 0.140
0.308 0.140
Absorbance of unknown
Absorbance of reference
4.493 � 103 M1 cm1.' � A /bc � (0.308 0.140) /[(1.00) (3.739 �105)] �3.739 � 105 M.
(1050) (1.869 � 104 M) �
1.00 L � 1.869 � 104 M.NH4Cl1.00 � 102 g
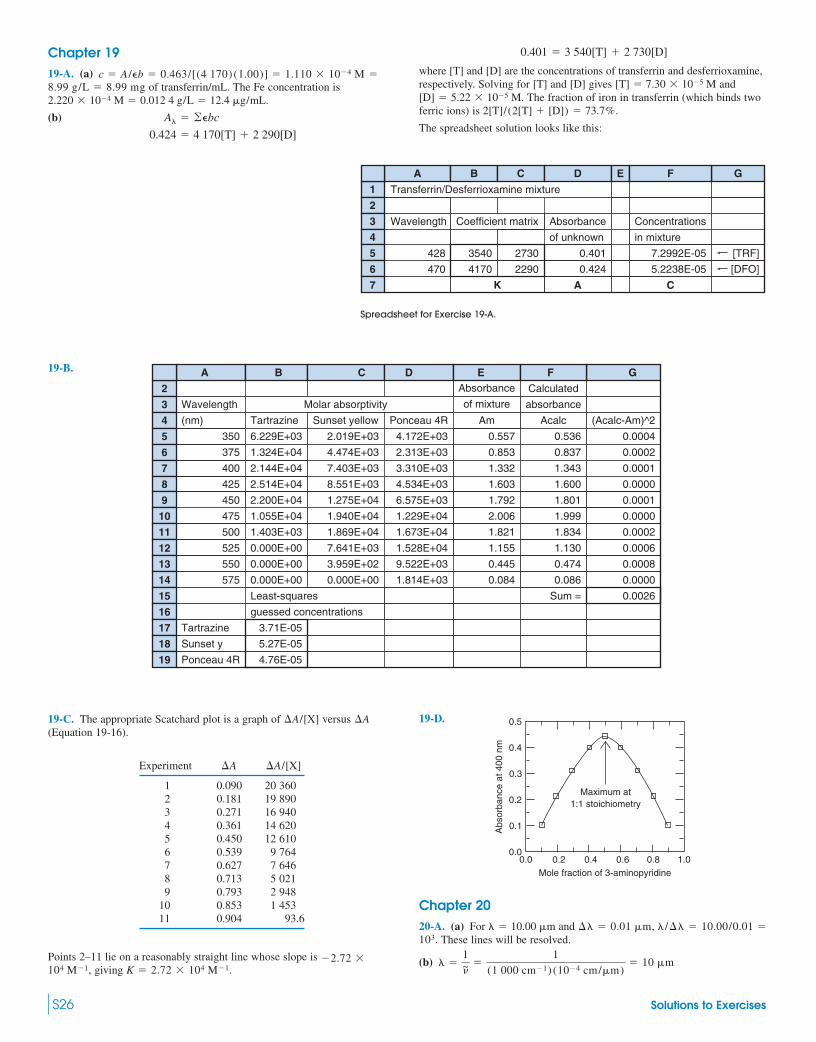
S26 Solutions to Exercises
Chapter 1919-A. (a)
of transferrin/mL. The Fe concentration is
(b)
0.424 � 4 170[T] � 2 290[D]
A� � �'bc
2.220 � 104 M � 0.012 4 g/L � 12.4 g/mL.8.99 g/L � 8.99 mg
c � A /'b � 0.463/[(4 170) (1.00)] � 1.110 � 104 M � where [T] and [D] are the concentrations of transferrin and desferrioxamine,respectively. Solving for [T] and [D] gives and
The fraction of iron in transferrin (which binds twoferric ions) is
The spreadsheet solution looks like this:
2[T]/(2[T] � [D]) � 73.7%.[D] � 5.22 � 105 M.
[T] � 7.30 � 105 M
0.401 � 3 540[T] � 2 730[D]
0.401
0.424
7.2992E-05 [TRF]
[DFO]5.2238E-05
Wavelength Coefficient matrix Absorbance
of unknown
Concentrations
in mixture
Transferrin/Desferrioxamine mixture
4170
K A C
3540
2290
2730
470
428
A B C D E F G
1
2
3
4
5
6
7
Spreadsheet for Exercise 19-A.
Molar absorptivityWavelength
(nm) Tartrazine Sunset yellow Ponceau 4R Am Acalc (Acalc-Am)^2
Absorbance
of mixture
Calculated
absorbance
2
3
4
5
6
7
8
9
10
11
12
13
14
15
16
17
18
19
A B C D E F G
375
400
425
475
500
525
350
450
550
575
0.853
1.332
1.603
2.006
1.821
1.155
0.557
1.792
0.445
0.084
0.837
1.343
1.600
1.999
1.834
1.130
0.536
1.801
0.474
0.086
Sum =
0.0002
0.0001
0.0000
0.0000
0.0002
0.0006
0.0004
0.0001
0.0008
0.0000
0.0026
1.324E+04
2.144E+04
2.514E+04
1.055E+04
1.403E+03
0.000E+00
6.229E+03
2.200E+04
0.000E+00
0.000E+00
Least-squares
guessed concentrations
4.474E+03
7.403E+03
8.551E+03
1.940E+04
1.869E+04
7.641E+03
2.019E+03
1.275E+04
3.959E+02
0.000E+00
2.313E+03
3.310E+03
4.534E+03
1.229E+04
1.673E+04
1.528E+04
4.172E+03
6.575E+03
9.522E+03
1.814E+03
Tartrazine
Sunset y
Ponceau 4R
3.71E-05
5.27E-05
4.76E-05
19-B.
19-C. The appropriate Scatchard plot is a graph of versus (Equation 19-16).
Experiment
1 0.090 20 3602 0.181 19 8903 0.271 16 9404 0.361 14 6205 0.450 12 6106 0.539 9 7647 0.627 7 6468 0.713 5 0219 0.793 2 948
10 0.853 1 45311 0.904 93.6
Points 2–11 lie on a reasonably straight line whose slope is giving K � 2.72 � 104 M1.104 M1,
2.72 �
�A/[X]�A
�A�A/[X] 19-D.
Chapter 2020-A. (a) For and
These lines will be resolved.
(b) � �1
#~�
1
(1 000 cm1) (104 cm/m)� 10 m
103.�� � 0.01 m, �/�� � 10.00/0.01 �� � 10.00 m
0.5
0.4
0.4 0.6 0.8
0.3
0.2
0.2
0.1
0.00.0 1.0
Maximum at1:1 stoichiometry
Mole fraction of 3-aminopyridine
Abs
orba
nce
at 4
00 n
m
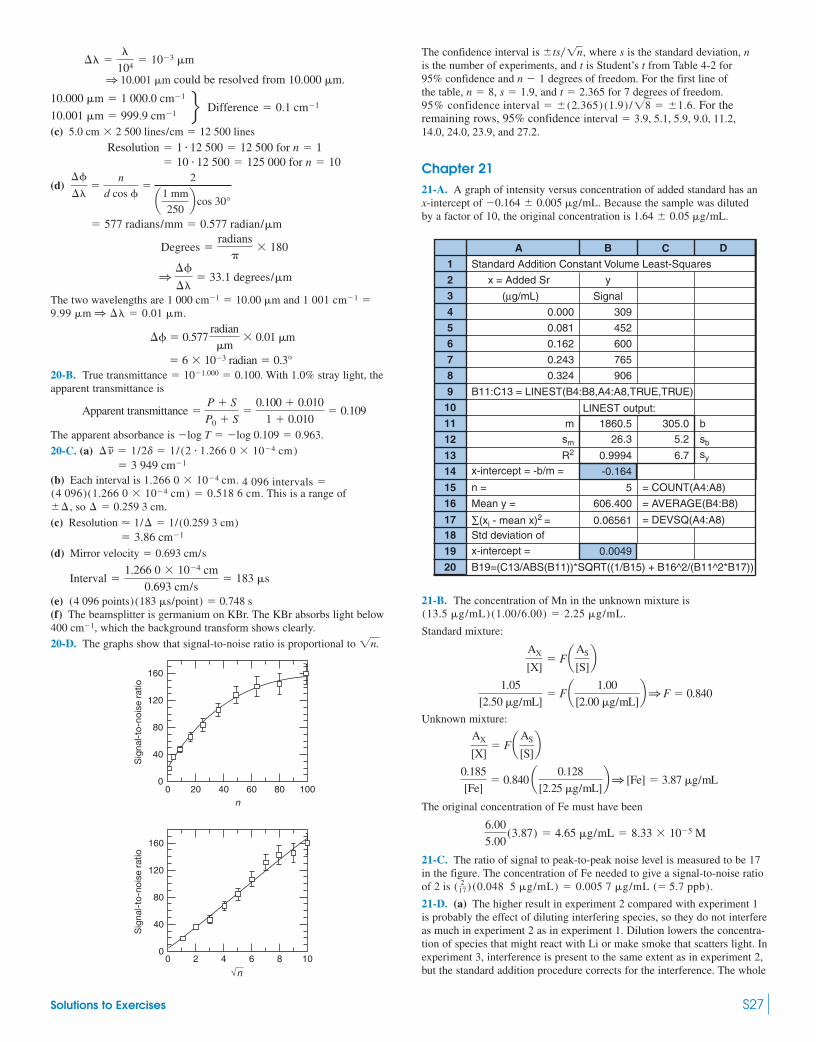
Solutions to Exercises S27
could be resolved from
V(c)
(d)
The two wavelengths are and
20-B. True transmittance With 1.0% stray light, theapparent transmittance is
The apparent absorbance is
20-C. (a)
(b) Each interval is This is a range of
, so
(c)
(d)
(e)(f) The beamsplitter is germanium on KBr. The KBr absorbs light below
which the background transform shows clearly.
20-D. The graphs show that signal-to-noise ratio is proportional to
160
120
80
40
00 20 40 60 80 100
0 2 4 6 8 10
n
160
120
80
40
0
n
Sig
nal-
to-n
oise
rat
ioS
igna
l-to
-noi
se r
atio
2n.
400 cm1,
(4 096 points)(183 s/point) � 0.748 s
Interval �1.266 0 � 104 cm
0.693 cm/s� 183 s
Mirror velocity � 0.693 cm/s
� 3.86 cm1Resolution � 1/� � 1/(0.259 3 cm)
� � 0.259 3 cm.��(1.266 0 � 104 cm) � 0.518 6 cm.(4 096)
4 096 intervals �1.266 0 � 104 cm.� 3 949 cm1
�#~ � 1/2d � 1/ (2 � 1.266 0 � 104 cm)
log T � log 0.109 � 0.963.
Apparent transmittance �P � S
P0 � S�
0.100 � 0.010
1 � 0.010� 0.109
� 101.000 � 0.100.� 6 � 103 radian � 0.3°
�� � 0.577radianm
� 0.01 m
9.99 m 1 �� � 0.01 m.1 001 cm1 �1 000 cm1 � 10.00 m
1��
��� 33.1 degrees/m
Degrees �radians
�� 180
� 577 radians/mm � 0.577 radian/m
��
���
n
d cos ��
2
a1 mm
250b cos 30°
� 10 � 12 500 � 125 000 for n � 10 Resolution � 1 � 12 500 � 12 500 for n � 1
5.0 cm � 2 500 lines/cm � 12 500 lines
10.001 m � 999.9 cm1Difference � 0.1 cm1
10.000 m � 1 000.0 cm1
10.000 m.1 10.001 m
�� ��
104� 103 m
The confidence interval is where s is the standard deviation, nis the number of experiments, and t is Student’s t from Table 4-2 for 95% confidence and degrees of freedom. For the first line ofthe table, , and for 7 degrees of freedom.
For theremaining rows, 95% confidence
Chapter 2121-A. A graph of intensity versus concentration of added standard has an x-intercept of Because the sample was diluted by a factor of 10, the original concentration is
21-B. The concentration of Mn in the unknown mixture is
Standard mixture:
Unknown mixture:
The original concentration of Fe must have been
21-C. The ratio of signal to peak-to-peak noise level is measured to be 17in the figure. The concentration of Fe needed to give a signal-to-noise ratioof 2 is
21-D. (a) The higher result in experiment 2 compared with experiment 1 is probably the effect of diluting interfering species, so they do not interfereas much in experiment 2 as in experiment 1. Dilution lowers the concentra-tion of species that might react with Li or make smoke that scatters light. Inexperiment 3, interference is present to the same extent as in experiment 2,but the standard addition procedure corrects for the interference. The whole
( 217) (0.048 5 g/mL) � 0.005 7 g/mL (� 5.7 ppb).
6.00
5.00(3.87) � 4.65 g/mL � 8.33 � 105 M
0.185
[Fe]� 0.840 a 0.128
[2.25 g/mL]b1 [Fe] � 3.87 g/mL
AX
[X]� FaAS
[S]b
1.05
[2.50 g/mL]� Fa 1.00
[2.00 g/mL]b1 F � 0.840
AX
[X]� FaAS
[S]b
(13.5 g/mL)(1.00/6.00) � 2.25 g/mL.
1 Standard Addition Constant Volume Least-Squares
A
2 x = Added Sr y
3
n =
Mean y = 606.400 = AVERAGE(B4:B8)
x-intercept = -b/m =
∑(xi - mean x)2 = 0.06561 = DEVSQ(A4:A8)Std deviation of
x-intercept = 0.0049
B19=(C13/ABS(B11))*SQRT((1/B15) + B16^2/(B11^2*B17))
(µg/mL)
0.000
0.081
0.162 600
0.243 765
0.324
B11:C13 = LINEST(B4:B8,A4:A8,TRUE,TRUE)
m 1860.5 305.0 b
sm
R2 0.9994 6.7 sy
-0.164
26.3 5.2 sb
5 = COUNT(A4:A8)
4
5
6
7
8
9
10
11
12
13
14
15
16
1718
19
20
B C D
Signal
309
452
906
LINEST output:
1.64 � 0.05 g/mL.0.164 � 0.005 g/mL.
14.0, 24.0, 23.9, and 27.2.interval � 3.9, 5.1, 5.9, 9.0, 11.2,
95% confidence interval � �(2.365) (1.9) /28 � �1.6.t � 2.365s � 1.9n � 8,
n 1
�ts�1n,

S28 Solutions to Exercises
point of standard addition is to measure the effect of the complexinterfering matrix on the response to known quantities of analyte.(b) Experiments 4–6 use a hotter flame than experiments 1–3. High temperature appears to eliminate most of the interference observed at lower temperature. Dilution has only a tiny effect on the results.(c) Because it appears from experiments 1–3 that standard addition gives atrue result, we surmise that experiments 3 and 6, and possibly 5, are withinexperimental error of each other. I would probably report the “true” valueas the mean of experiments 3 and 6 (81.4 ppm). It might also be reasonableto take an average of experiments 3, 5, and 6 (80.8 ppm).
Chapter 22
22-A. Resolving power � � � 88
We should be able to barely distinguish two peaks differing by 1 Da at a mass of 88 Da. We will probably not be able to distinguish two peaks at 100 and 101 Da.
22-B.
We need to distinguish a mass difference of 29.038 58 29.002 18 �0.036 40. The required resolving power is m/�m � 29.0/(0.036 40) �7.97 � 102 � 800.
22-C. 35Cl abundance � a � 0.757 8 37Cl abundance � b � 0.242 2
Relative abundance of C6H435Cl2 � a2 � 0.574 26
Relative abundance of C6H435Cl37Cl � 2ab � 0.367 08
Relative abundance of C6H437Cl2 � b2 � 0.058 661
Relative abundances: 35Cl2 : 35Cl37Cl : 37Cl2 � 1 : 0.639 2 : 0.102 2
Figure 22-7 shows the stick diagram.
22-D. (a) C14H12
R � DB � c h/2 � n/2 � 1 � 14 12/2 � 0/2 � 1 � 9
A molecule with two rings � seven double bonds is trans-stilbene:
(b) C4H10NO�
R � DB � c h/2 � n/2 � 1 � 4 10/2 � 1/2 � 1 � Huh?
We came out with a fraction because the species is an ion in which at leastone atom does not make its usual number of bonds. In the followingstructure, N makes four bonds instead of three:
22-E. (a) The principal difference between the two spectra is theappearance of a significant peak at m/z 72 in A that is missing in B. Thiseven mass represents loss of a neutral molecule with a mass of 28 Da fromthe molecular ion. The McLafferty rearrangement can split C2H4 from3-methyl-2 pentanone, but not from 3,3-dimethyl-2- butanone, which lacksa �-CH group.
A fragment in amass spectrumH2N
—
—
—
C
CH2
HOCH3— —
�
12
HCO�:
e mass
1 � 12.000 00
1 � 1.007 825
�1 � 15.994 91
1 � 0.000 55 29.002 18
C2H�5 :
e mass
2 � 12.000 00
�5 � 1.007 825
1 � 0.000 55 29.038 58
53
0.60
m
m1/2
3-Methyl-2-pentanone Ethylene28 Da
Spectrum A must be from 3-methyl-2-pentanone and spectrum B is from3,3-dimethyl-2-butanone.(b) Expected intensity of M�1 relative to M�� for C6H12O:
Intensity � 6 � 1.08% � 12 � 0.012% � 1 � 0.038% � 6.7% of M��14243 14243 14243
13C 2H 17O
22-F. (a) C6H6O: M�� � 94
Rings � double bonds � c h/2 � n/2 � 1 � 6 6/2 � 0/2 � 1 � 4
Expected intensity of M�1 from Table 22-2:
1.08(6) � 0.012(6) � 0.038(1) � 6.59%Carbon Hydrogen Oxygen
Observed intensity of M�1 � 68/999 � 6.8%
Expected intensity of M�2 � 0.005 8(6)(5) � 0.205(1) � 0.38%
Observed intensity of M�2 � 0.3%
(b) C6H5Br: M�� � 156
The two nearly equal peaks at m/z 156 and 158 scream out “bromine!”
Rings � double bonds � c h/2 � n/2 � 1 � 6 6/2 � 0/2 � 1 � 4c
h includes H � Br
Expected intensity of M�1 � 1.08(6) � 0.012(5) � 6.54%Carbon Hydrogen
Observed intensity of M�1 � 46/566 � 8.1%
Expected intensity of M�2 � 0.005 8(6)(5) � 97.3(1) � 97.5%Carbon Bromine
Observed intensity of M�2 � 520/566 � 91.9%
The M�3 peak is the isotopic partner of the M�2 peak (C6H581Br). M�3
contains 81Br plus either 1 13C or 1 2H. Therefore, the expected intensity ofM�3 (relative to C6H5
81Br at M�2) is 1.08(6) � 0.012(5) � 6.54% ofpredicted intensity of C6H5
81Br at M�2 � (0.065 4)(97.3) � 6.4% of M��.Observed intensity of M�3 is 35/566 � 6.2%.
(c) C7H3O2Cl3: � 224
From Figure 22-7, the M : M�2: M�4 pattern looks like a moleculecontaining three chlorine atoms. The correct structure is shown here, butthere is no way you could assign the composition to one isomer from thegiven data.
Rings � double bonds � c h/2 � n/2 � 1 � 7 6/2 � 0/2 � 1 � 5
Expected intensity of M�1 from Table 22-2:
1.08(7) � 0.012(3) � 0.038(2) � 7.67%Carbon Hydrogen Oxygen
Observed intensity of M�1 � 63/791 � 8.0%.
Expected intensity of M�2 � 0.005 8(7)(6) � 0.205(2) � 32.0(3) �96.7%. Observed intensity of M�2 � 754/791 � 95.4%.
The M�3 peak is the isotopic partner of C7H3O235Cl2
37Cl at M�2. M�3contains one 37Cl plus either 1 13C or 1 2H or 1 17O. Expected intensity of
M��
Cl
CO2H
Cl
Cl
Br
OH
O
C
HC—
—H
CH3
�
——
CH3
:
.
m/z � 72
CH2
CH2
O
C
H �
—CH3
:.McLafferty
rearrangement
α
γ
—
CH3
β

Solutions to Exercises S29
M�3 (relative to C7H3O235Cl2
37Cl at M�2) � 1.08(7) � 0.012(3) �0.038(2) � 7.67% of predicted intensity of C7H3O2
35Cl237Cl at M�2. The
predicted intensity of C7H3O235Cl2
37Cl is 32.0(3) � 96.0% of M��.Expected intensity of M�3 � 7.67% of 96.0% � 7.4% of M��. Observedintensity � 60/791 � 7.6%.
M�4 is composed mainly of C7H3O235Cl37Cl2 plus a small amount of
C7H316O18O35Cl237Cl. Other formulas such as 12C6
13CH216O17O35Cl237Cl also
add up to M�4, but they are even less likely to occur because they havetwo minor isotopes (13C and 17O). Expected intensity of M�4 fromC7H3O2
35Cl37Cl2 is 5.11(3)(2) � 30.7% of M��. The contribution fromC7H3
16O18O35Cl237Cl is based on the predicted intensity of C7H3O235Cl237Cl at
M�2. The predicted intensity of C7H3O235Cl237Cl is 32.0(3) � 96.0% of M��.
The predicted intensity from C7H316O18O35Cl237Cl at M�4 is 0.205(2) �
0.410% of 96.0% � 0.4%. Total expected intensity of M�4 is 30.7% �0.4% � 31.1% of M��. Observed intensity � 264/791 � 33.4%.
Expected intensity of M�5 from 12C613CH3O2
35Cl37Cl2 and12C7H2
2HO235Cl37Cl2 and C7H3
16O17O35Cl37Cl2 is based on the predictedintensity of C7H3O2
35Cl37Cl2 at M�4. M�5 should have 1.08(7) �0.012(3) � 0.038(2) � 7.7% of C7H3O2
35Cl37Cl2 at M�4 �7.7% of 30.7% � 2.4%. Observed intensity � 19/791 � 2.4%.
Expected intensity of M�6 from C7H3O237Cl3 is 0.544(3)(2)(1) � 3.26%
of M��. There will also be a small contribution from C7H316O18O35Cl37Cl2,
which will be 0.205(2) � 0.410% of predicted intensity of
C7H316O35Cl37Cl2 � 0.410% of 30.7% of M�� � 0.13% of M��. The total
expected intensity at M�6 is therefore 3.26 � 0.13 � 3.4% of M��.Observed intensity � 29/791 � 3.7%.
(d) C4H10O2S2: M�� � 154
Sulfur gives a significant M�2 peak (4.52% of M per sulfur). The observedM�2 is 12/122 � 9.8%, which could represent two sulfur atoms. Thecomposition C4H10O2S2 has two sulfur atoms and has a molecular mass of154. The known structure is shown here, but you could not deduce thestructure from the composition.
Rings � double bonds � c h/2 � n/2 � 1� 4 10/2 � 0/2 � 1 � 0
Expected intensity of M�1:
1.08(4) � 0.012(10) � 0.038(2) � 0.801(2) � 6.12%Carbon Hydrogen Oxygen Sulfur
Observed intensity of M�1 � 9/122 � 7.4%
Expected intensity of M�2 � 0.005 8(4)(3) � 0.205(2) � 4.52(2) � 9.52%.Observed intensity of M�2 � 12/122 � 9.8%.
22-G.
HSSH
OH
OH
Analysis of electrospray mass spectrum of lysozyme
Charge � n �Observed mn�1 1.008 Molecular mass
� n � (mn 1.008)
1 789.1 1 589.39 198.7 14 304.71 590.4 1 430.49 158.9 14 304.51 431.5 1 300.49 130.0 14 304.91 301.5 1 192.09 108.4 14 305.41 193.1 — — 12 14 305.1
mean � 14 304.9 (�0.3)
11.00 � 1110.00 � 10
9.00 � 97.99 � 8
mn mn�1mn mn�1mn�1 1.008� mn
m/z
22-H. (a) To find the response factor, we insert values from the first line ofthe table into the equation:
� F
� F � F � 1.040
For the next two sets of data, we find F � 1.020 and 1.064, giving a meanvalue F � 1.041.(b) The concentration of internal standard in the mixture of caffeine-D3plus cola is
(1.11 g/L) � � 52.86 mg/L
The concentration of caffeine in the chromatographed solution is
� F
� 1.041 1 [caffeine] � 76.9 mg/L
The unknown beverage had been diluted from 1.000 to 1.050 mL when thestandard was added, so the concentration of caffeine in the originalbeverage was (1.050)(76.9 mg/L) � 80.8 mg/L.
Chapter 23
23-A. (a) k �tr1 tm
tm¿1
a [caffeine]
52.86 mg/Lb1 733
1 144
a concentration of analyte
concentration of standardbArea of analyte signal
Area of standard signal
0.050 0 mL
1.050 mL
a13.60 � 102
3.70 � 102b11 438
2 992
a concentration of analyte
concentration of standardbArea of analyte signal
Area of standard signal
1 tm � � � 2.00 min
tr2 � tm(k � 1) � 2.00 (5.00 � 1) � 12.0 min
�1 � � � 0.316 min
1 � w1/2 (peak 1) � 2.35�1 � 0.74 min
w1 � 4�1 � 1.26 min
�2 � � � 0.379 min
1 w1/2 (peak 2) � 2.35�2 � 0.89 min
w2 � 4�2 � 1.52 min
(b)
(c) Resolution � � � 1.442
[(1.26 � 1.52) /2]
�tr
wav
1 2 3 8 9 10 11 12 13 14Time (min)
Det
ecto
r re
spon
se
tm = 2 min
w1/2 = 0.74 min
t r1 = 10 min
t r2 = 12 min
w1/2 = 0.89 min
12.021 000
tr22N
10.021 000
tr12N
¿2
10.0
5.00
tr1k¿1 � 1
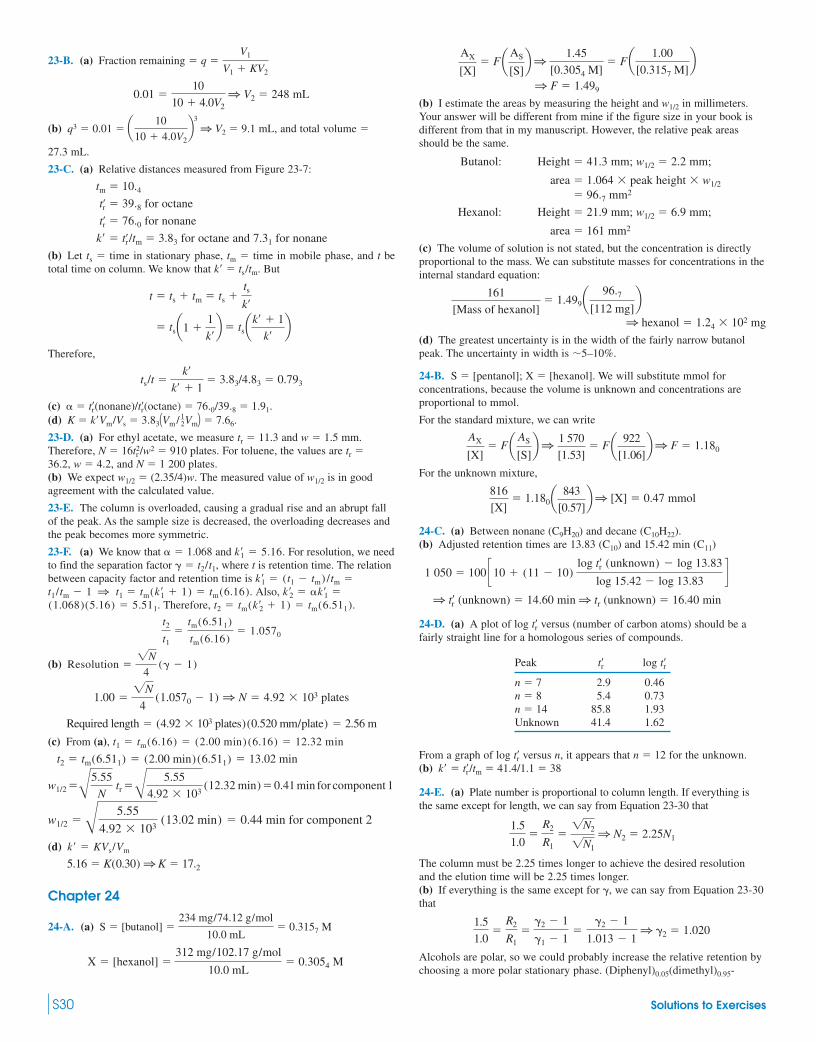
S30 Solutions to Exercises
23-B. (a) Fraction remaining � q �
0.01 � 1 V2 � 248 mL
(b) q3 � 0.01 � 1 V2 � 9.1 mL, and total volume �
27.3 mL.
23-C. (a) Relative distances measured from Figure 23-7:
tm � 10.4t � 39.8 for octane
t � 76.0 for nonane
k� � t /tm � 3.83 for octane and 7.31 for nonane
(b) Let ts � time in stationary phase, tm � time in mobile phase, and t betotal time on column. We know that k� � ts/tm. But
t � ts � tm � ts �
� ts � ts
Therefore,
ts/t � � 3.83/4.83 � 0.793
(c) � � t (nonane)/t (octane) � 76.0/39.8 � 1.91.(d) K � k�Vm/Vs � 3.83 � 7.66.
23-D. (a) For ethyl acetate, we measure tr � 11.3 and w � 1.5 mm.Therefore, N � 16t /w2 � 910 plates. For toluene, the values are tr �36.2, w � 4.2, and N � 1 200 plates.(b) We expect w1/2 � (2.35/4)w. The measured value of w1/2 is in goodagreement with the calculated value.
23-E. The column is overloaded, causing a gradual rise and an abrupt fallof the peak. As the sample size is decreased, the overloading decreases andthe peak becomes more symmetric.
23-F. (a) We know that and For resolution, we needto find the separation factor where t is retention time. The relationbetween capacity factor and retention time is
Also,Therefore,
(b)
plates
(c) From (a),
(d)
Chapter 24
24-A. (a) S � [butanol] � � 0.3157 M
X � [hexanol] � � 0.3054 M312 mg/102.17 g/mol
10.0 mL
234 mg/74.12 g/mol
10.0 mL
5.16 � K(0.30) 1 K � 17.2
k ¿ � KVs/Vm
w1/2 � B 5.55
4.92 � 103 (13.02 min) � 0.44 min for component 2
w1/2 �B5.55
Ntr �B 5.55
4.92 � 103(12.32 min) � 0.41 min for component 1
t2 � tm(6.511) � (2.00 min)(6.511) � 13.02 min
t1 � tm(6.16) � (2.00 min) (6.16) � 12.32 min
Required length � (4.92 � 103 plates)(0.520 mm/plate) � 2.56 m
1.00 �2N
4(1.0570 1) 1 N � 4.92 � 103
Resolution �2N
4(� 1)
t2
t1�
tm(6.511)
tm(6.16)� 1.0570
tm(6.511).t2 � tm(k ¿2 � 1) �(5.16) � 5.511.(1.068)k ¿2 � �k ¿1 �t1/tm 1 1 t1 � tm(k ¿1 � 1) � tm(6.16).
k ¿1 � (t1 tm) /tm �� � t2/t1,
k ¿1 � 5.16.� � 1.068
2r
1Vm / 12Vm2¿r¿r
k¿k¿ � 1
ak¿ � 1
k¿ba1 �
1
k¿b
tsk¿
¿r
¿r
¿r
a 10
10 � 4.0V2b3
10
10 � 4.0V2
V1
V1 � KV2� F 1 � F
1 F � 1.499
(b) I estimate the areas by measuring the height and w1/2 in millimeters.Your answer will be different from mine if the figure size in your book isdifferent from that in my manuscript. However, the relative peak areasshould be the same.
Butanol: Height � 41.3 mm; w1/2 � 2.2 mm;
area � 1.064 � peak height � w1/2
� 96.7 mm2
Hexanol: Height � 21.9 mm; w1/2 � 6.9 mm;
area � 161 mm2
(c) The volume of solution is not stated, but the concentration is directlyproportional to the mass. We can substitute masses for concentrations in theinternal standard equation:
� 1.499
1 hexanol � 1.24 � 102 mg
(d) The greatest uncertainty is in the width of the fairly narrow butanolpeak. The uncertainty in width is �5–10%.
24-B. S � [pentanol]; X � [hexanol]. We will substitute mmol forconcentrations, because the volume is unknown and concentrations areproportional to mmol.
For the standard mixture, we can write
� F 1 � F 1 F � 1.180
For the unknown mixture,
� 1.180 1 [X] � 0.47 mmol
24-C. (a) Between nonane (C9H20) and decane (C10H22).(b) Adjusted retention times are 13.83 (C10) and 15.42 min (C11)
1 050 � 100
1 t (unknown) � 14.60 min 1 tr (unknown) � 16.40 min
24-D. (a) A plot of log t versus (number of carbon atoms) should be afairly straight line for a homologous series of compounds.
Peak t log t
n � 7 2.9 0.46n � 8 5.4 0.73n � 14 85.8 1.93Unknown 41.4 1.62
From a graph of log t versus n, it appears that n � 12 for the unknown.(b) k� � t /tm � 41.4/1.1 � 38
24-E. (a) Plate number is proportional to column length. If everything is the same except for length, we can say from Equation 23-30 that
� � 1 N2 � 2.25N1
The column must be 2.25 times longer to achieve the desired resolution and the elution time will be 2.25 times longer.(b) If everything is the same except for �, we can say from Equation 23-30that
� � 1 �2 � 1.020
Alcohols are polar, so we could probably increase the relative retention bychoosing a more polar stationary phase. (Diphenyl)0.05(dimethyl)0.95-
�2 1
�1 1�
�2 1
1.013 1
R2
R1
1.5
1.0
2N22N1
R2
R1
1.5
1.0
¿r¿r
¿r¿r
¿r
¿r
c10 � (11 10) log t¿r (unknown) log 13.83
log 15.42 log 13.83d
a 843
[0.57]b816
[X]
a 922
[1.06]b1 570
[1.53]a AS
[S]bAX
[X]
a 96.7[112 mg]
b161
[Mass of hexanol]
a 1.00
[0.3157 M]b1.45
[0.3054 M]aAS
[S]bAX
[X]

Solutions to Exercises S31
polysiloxane is listed as nonpolar. We could try an intermediate polarityphase such as (diphenyl)0.35(dimethyl)0.65 polysiloxane. The more polarphase will probably retain alcohols more strongly and increase theretention time. We have no way to predict how much the retention timewill increase.
Chapter 25
25-A. � F 1 � F 1 F � 2.799
The concentration of internal standard (B) mixed with unknown (A) is
12.49 mg/25.00 mL � 0.499 6 mg/mL
� 2.799 1 [A] � 0.1670 mg/mL
[A] in original unknown � (0.1670 mg/mL)
� 0.418 mg/mL
25-B. (a) Equation 23-16: k� � 1 � 1.35
1 t1 � 2.35 min
Equation 23-15: � � � 1 4.53 � 1 t2 � 7.12 min
Equation 23-23: Resolution �
1 7.7 � 1 wav � 0.62 min
(b) From Equation 23-28b, we know that w1/2 is proportional to tr if
N is constant. Therefore, � � � 0.330. We know that
wav, the average width at the base, is 0.62 min. For each peak, w � 4� andw1/2 � 2.35�, so w � 1.70w1/2.
wav � 0.62 � (w1 � w2)� [1.70w1/2 (peak 1) � 1.70w1/2 (peak 2)]
Substituting w1/2 (peak 1) � 0.330w1/2 (peak 2) into the previous equationgives w1/2 (peak 2) � 0.548 min. Then w1/2 (peak 1) � 0.330w1/2 (peak 2) �0.181 min.(c) Because the areas are equal, we can say
HeightR � wR � heightS � wS
1 � � � 3.0
25-C. (a)
A0.25
D0.75
B0.00 0.50 1.000
10
20
30
40
Ret
entio
n tim
e (m
in)
Solvent composition
7
5
6
3
21
4
0.548
0.181
wS
wR
heightR
heightS
12
12
2.35
7.12
t1
t2
w1/2 (peak 1)
w1/2 (peak 2)
7.12 2.35wav
�trwav
t2 1.00
t1 1.00
t¿r2t¿r1
t1 1.00
1.00
tr tm
tm
25.00
10.00
a 6.38
[0.499 6]b5.97
[A]
a 4.37
[1.16]b10.86
[1.03]aAreaB
[B]bAreaA
[A]
SolventPeaks
composition: 1 2 3 4 5 6 7
0.0 5.6 7.2 8.7 21.6 22.3 24.0 25.50.5 7.1 8.5 10.8 19.5 19.0 20.9 35.71.0 8.0 8.0 11.5 13.8 12.8 12.8 37.0Predicted positions (by linear interpolation):0.25 6.35 7.85 9.75 21.05 20.65 22.45 30.600.75 7.55 8.25 11.15 16.65 15.90 16.85 36.35
(b) A: 30% acetonitrile/70% bufferB: 40% methanol/60% bufferD: 15% acetonitrile/20% methanol/65% bufferBetween A and D:
22.5% acetonitrile/10% methanol/67.5% bufferBetween D and B:
7.5% acetonitrile/30% methanol/62.5% buffer
25-D.
[Adapted from L. R. Snyder, J. J. Kirkland, and J. L. Glajch, Practical HPLC Method
Development (New York: Wiley, 1997).]
Initial chromatogram
Increase γ
Increase N
Retention time
MidwaybetweenD and B
12
3 45
6 7
5 10 15 20 30 35 4025Retention time
MidwaybetweenA and D
1
2
3 45
6 7
5 10 15 20 30 25Retention time

S32 Solutions to Exercises
Chapter 2626-A. 13.03 mL of 0.022 74 M NaOH � 0.296 3 mmol of OH, whichmust equal the total cation charge (� 2[VO2�] � 2[H2SO4]) in the 5.00-mLaliquot. 50.0 mL therefore contains 2.963 mmol of cation charge. The VO2�
content is (50.0 mL) (0.024 3 M) � 1.215 mmol � 2.43 mmol of charge.The H2SO4 must therefore be (2.963 2.43)/2 � 0.2665 mmol.
1.215 mmol VOSO4 � 0.198 g VOSO4 in0.244 7-g sample � 80.9%
0.2665 mmol H2SO4 � 0.026 1 g H2SO4 in0.244 7-g sample � 10.7%
H2O (by difference) � 8.4%
26-B. (a) Because the fractionation range of Sephadex G-50 is 1 500–30 000, hemoglobin should not be retained and ought to be eluted in a volume of 36.4 mL.(b) The elution volume of is Inserting into theelution equation gives
26-C. (a)
(b) I has a greater mobility than Cl. Therefore, I swims upstream fasterthan Cl (because electrophoresis opposes electroosmosis) and is elutedlater than Cl. The mobility of Br is greater than that of I in Table 15-1.Therefore, Br will have a longer migration time than I.(c) Bare I is a larger ion than bare Cl, so the charge density in I islower than the charge density in Cl. Therefore, I should have a smallerhydrated radius than Cl. This means that I has less friction than Cl anda greater mobility than Cl.
Chapter 2727-A. 1 mole of ethoxyl groups produces 1 mole of AgI. 29.03 mg of AgI� 0.123 65 mmol. The amount of compound analyzed is 25.42 mg/(417g/mol) � 0.060 96 mmol. There are
� 2.03 (� 2) ethoxyl groups/molecule
27-B. There is 1 mole of SO in each mole of each reactant and of theproduct. Let x � g of K2SO4 and y � g of (NH4)2SO4.
x � y � 0.649 g (1)
� � (2)123 123 123Moles of Moles of Moles ofK2SO4 (NH4)2SO4 BaSO4
Making the substitution y � 0.649 x in Equation 2 gives x � 0.397 g �61.1% of the sample.
27-C. Formula and atomic masses: Ba(137.327), Cl(35.453), K(39.098),H2O(18.015), KCl(74.551), BaCl2 � 2H2O (244.26). H2O lost � 1.783 9 1.562 3 � 0.221 6 g � 1.230 1 � 102 mol of H2O. For every 2 moles ofH2O lost, 1 mole of BaCl2 � 2H2O must have been present. 1.230 1 � 102
mol of H2O implies that 6.150 4 � 103 mol of BaCl2 � 2H2O must have
0.977
233.39
y
132.14
x
174.27
24
0.123 65 mmol ethoxyl groups
0.060 96 mmol compound
Anion electrophoretic flow
Electroosmotic flow
Cation electrophoretic flow
++
−−
Net flow of cations and anions is to the right,because electroosmotic flow is stronger than
electrophoretic flow at high pH
Detectionend
Injectionend
Anode Cathode
Kav �Vr V0
Vm V01 0.65 �
Vr 36.4
109.8 36.41 Vr � 84.1 mL
Vm � 36.4 mLVm.22NaCl
been present. This much BaCl2 � 2H2O equals 1.502 4 g. The Ba and Clcontents of the BaCl2 � 2H2O are
Ba � (1.502 4 g) � 0.844 69 g
Cl � (1.502 4 g) � 0.436 13 g
Because the total sample weighs 1.783 9 g and contains 1.502 4 g of BaCl2 � 2H2O, the sample must contain 1.783 9 1.502 4 � 0.281 5 g ofKCl, which contains
K � (0.281 5) � 0.147 63 g
Cl � (0.281 5) � 0.133 87 g
Weight percent of each element:
Ba � � 47.35%
K � � 8.276%
Cl � � 31.95%
27-D. Let x � mass of Al(BF4)3 and y � mass of Mg(NO3)3. We can saythat x � y � 0.282 8 g. We also know that
� 3(moles of Al(BF4)3) �
� 2(moles of Mg(NO3)2) �
Equating the mass of product to the mass of nitron tetrafluoroborate plusthe mass of nitron nitrate, we can write
1.322 � (400.18) � (375.39)
Mass of Mass of nitron Mass of nitronproduct tetrafluoroborate nitrate
Making the substitution x � 0.282 8 y allows us to find y � 0.158 9 g ofMg(NO3)2 � 1.072 mmol of Mg � 0.026 05 g of Mg � 9.210% of theoriginal solid sample.
Chapter 2828-A. (a) Expected number of red marbles � npred � (1 000)(0.12) �120. Expected number of yellow � nqyellow � (1 000)(0.88) � 880.
(b) Absolute: �red � �yellow �
� � 10.28
Relative: �red/nred � 10.28/120 � 8.56%
�yellow/nyellow � 10.28/880 � 1.17%
(c) For 4 000 marbles, nred � 480 and nyellow � 3 520.
�red � �yellow � � � 20.55.
�red/nred � 4.28%. �yellow/nyellow � 0.58%
(d) 2,
(e) � 0.02 �
1 n � 1.83 � 104
28-B. (a) mR2 � Ks 1 m(10)2 � 36 1 m � 0.36 g
(b) An uncertainty of �20 counts per second per gram is 100 � 20/237 �8.4%.
n � � � 5.4 � 5
1 t � 2.776 (4 degrees of freedom)
(1.96)2(0.10)2
(0.084)2
t2s2s
e2
2n(0.12)(0.88)
(0.12)n
�red
nred
2n
2(4 000)(0.12)(0.88)2npq
2(1 000)(0.12)(0.88)
2npq
a 2y
148.31ba 3x
287.39b
2y
148.31Moles of nitron nitrate
3x
287.39Moles of nitrontetrafluoroborate
0.436 13 � 0.133 87
1.783 9
0.147 63
1.783 9
0.844 69
1.783 9
a35.453
74.551b
a39.098
74.551b
a2(35.453)
244.26b
a137.33
244.26b

Solutions to Exercises S33
n � � 10.9 � 11 1 t � 2.228
n � � 7.0 � 7 1 t � 2.447
n � � 8.5 � 8 1 t � 2.365
n � � 7.9 � 8
28-C. 1. The figure shows that coprecipitation occurs in distilled water, soit should first be shown that coprecipitation occurs in seawater,which has a high salt concentration. This can be done by addingstandard Pb2� to real seawater and to artificial seawater (NaClsolution) and repeating the experiment in the figure.
2. To demonstrate that coprecipitation of Pb2� does not decreasethe concentration of alkyl lead compounds, artificial seawater
(2.365)2(0.10)2
(0.084)2
(2.447)2(0.10)2
(0.084)2
(2.228)2(0.10)2
(0.084)2
(2.776)2(0.10)2
(0.084)2
samples containing known quantities of alkyl lead compounds(but no Pb2�) should be prepared and stripping analysisperformed. Then a desired excess of Pb2� would be added to asimilar solution containing an alkyl lead compound andcoprecipitation with BaSO4 would be carried out. The remainingsolution would then be analyzed by stripping voltammetry. If thesignal is the same as it was without Pb2� coprecipitation, then itis safe to say that coprecipitation does not reduce theconcentration of alkyl lead in the seawater.
28-D. The acid-soluble inorganic matter and the organic material canprobably be dissolved (and oxidized) together by wet ashing with HNO3 �H2SO4 in a Teflon-lined bomb in a microwave oven. The insoluble residueshould be washed well with water and the washings combined with the acidsolution. After the residue has been dried, it can be fused with one of thefluxes in Table 28-6, dissolved in dilute acid, and combined with theprevious solution.

This page intentionally left blank
Answers to Problems
Chapter 13. (a) (b)
(c) (d)(e) (f)(g) (h)
4. (a) 100 fJ or 0.1 pJ (b) 43.172 8 nF (c) 299.79 THz or 0.299 79 PHz (d) 0.1 nm or 100 pm (e) 21 TW (f) 0.483 amol or 483 zmol
5. (a) of C (b)(c)
6.
7. (a) 2.0 W/kg and 3.0 W/kg (b) The person consumes
8. (a) 39.37 inches (b) 0.214 770 mile/h
(c) 1.04 km, 0.643 mile
9.
11. 6 tons/year
14. 1.10 M
15. 5.48 g
16. (a) (b) 11 nM
17. 1 mg/L
18.
19. 26.5 g 11.1 g
20. (a) 1 670 g solution (b) (c) 11.7 mol
21. 1.51 m
22. (a) 6.0 amol/vesicle (b)(c) (d) 0.30 M
23.
24. (a) 1 046 g, 376.6 g/L (b) 9.07 m
25. Cal/g, Cal/ounce: shredded wheat (3.6, 102); doughnut (3.9, 111);hamburger (2.8, 79); apple (0.48, 14)
26.
27. (a) (b)
28. 6.18 g in a 2-L volumetric flask
29. Dissolve 6.18 g in 2.00 kg
30. 3.2 L
31. 8.0 g
32. (a) 55.6 mL (b) 1.80 g/mL
33. 1.51 g/mL
34. 1.29 mL
35. 14.4 g
Chapter 23. is insoluble and will not leach into groundwater.
4. The upper “0” means that the reagent has no fire hazard. The right-hand “0” indicates that the reagent is stable. The “3” tells us that thereagent is corrosive or toxic and we should avoid skin contact or inhalation.
5. The lab notebook must: (1) state what was done; (2) state what wasobserved; and (3) be understandable to a stranger.
7. The buoyancy correction is 1 when the substance being weighed hasthe same density as the weight used to calibrate the balance.
PbSiO3
H2O.B(OH)3
Xe: 3.5 � 109 MKr: 4.60 � 108 M,Ar: 3.77 � 104 M,2.11 � 107 M
5.6 � 106 g NaF2.5 � 106 g F,
6.7 � 103 M4.4 � 103 M,
3.35 � 1017 L3.35 � 1020 m3,3.6 � 106 molecules
HClO41.18 � 103 g
H2OHClO4,
7 � 1010 M
1 g/mL,103 g/L,103 g/L,
1.9 � 107 bar
1.47 � 103 W1.47 � 103J
s,
1.04 � 103 m,
mile
s,
0.025 4 m
1 inch,
1.1 � 102 W.
6.416 � 107 cal/h7.457 � 104 J/s,
CO2 � 4 tons per person2.0 � 1010 tonCO22.0 � 1013 kg5.4 � 1012 kg
decipascal � 101 pascalfemtogram � 1015 gramnanosecond � 109 secondterajoule � 1012 joule
microfarad � 106 faradkiloohm � 103 ohmpicometer � 1012 meter milliwatt � 103 watt
8. 14.85 g
9. smallest: largest: lithium
10. 4.239 1 g; lower by 0.06%
11. (a) 0.000 164 g/mL (b) 0.823 g
12. (a) 979 Pa (b) 0.001 1 g/mL (c) 1.001 0 g
13. 99.999 1 g
20. phosphorus pentoxide
21. 9.979 9 mL
22. 0.2%; 0.499 0 M
23. 49.947 g in vacuum; 49.892 g in air
24.
25. 0.70%
Chapter 31. (a) 5 (b) 4 (c) 3
2. (a) 1.237 (b) 1.238 (c) 0.135 (d) 2.1 (e) 2.00
3. (a) 0.217 (b) 0.216 (c) 0.217
4. (b) 1.18 (three significant figures) (c) 0.71 (two significant figures)
5. (a) 3.71 (b) 10.7 (c) (d)(e) 12.625 1 (f) (g) 242
6. (a) 175.324 (b) 140.093 5 or 140.094
7. (a) 12.3 (b) 75.5 (c) (d) 3.04(e) (f) 11.9 (g) 4.600 (h)
11. low; systematic
12. (a) 25.031 mL—systematic error; —random error(b) 1.98 and 2.03 mL—systematic error; and —randomerror (c) random error (d) random error
13. (a) Carmen (b) Cynthia (c) Chastity (d) Cheryl
14.
15. (a) 2.1 (b) 0.151(c) (d)
16. (a) (b)(c) (d)(e) (f)(g)
18.
19. (b) 0.450 7
20.
21.
22.
23.
Chapter 42. (a) 0.682 6 (b) 0.954 6 (c) 0.341 3 (d) 0.191 5 (e) 0.149 8
3. (a) 1.527 67 (b) 0.001 26 (c)
4. (a) 0.044 6 (b) 0.417 3 (c) 0.404 0
5. (a) 0.5 (b) 0.8% (c) 8.7%
11. 90%: 99%:
12. (1.527 83 to 1.528 03)
13. (a) (b) yes
14. Difference is not significant
15. Difference is not significant (tcalculated � 2.429 7 6 ttable � 2.776 5).
(tcalculated � 2.43 6 ttable � 2.776).
deciliter � 0.1 L
x � 0.000 10
0.148 � 0.0560.148 � 0.028;
1.59 � 106
6.022 136 9 (48) � 1023
0.667 � 0.001 M
16.2 � 0.1 mg
1.035 7 (�0.000 2) g
(�0.000 5) M
255.184 � 0.007
0.4969 (�0.0069 or �1.39%)1.4643 (�0.0078 or �0.53%)2 185.8 (�0.8 or �0.04%)
7.86 (�0.01 or �0.1%)0.147 (�0.003 or �2%)174 (�3 or �2%)10.18 (�0.07 or �0.7%)
(�0.0022 or �2.2%)0.0971(�0 .024 or �11%)0.223
(�0.009 or �6%)(�0.2 or �11%)
3.124 (�0.2%)3.124 (�0.005),
�0.02 mL�0.01�0.009 mL
4.9 � 1073.04 � 10105.520 � 103
6.0 � 1042.85 � 1064.0 � 101
mass in air � 50.484 gtrue mass � 50.506 g;
PbO2;
Answers to Problems AN1

16. Difference is significant
17. yes
18. 1–2 difference is significant; 2–3 difference is not significant.
19. Difference is significant at 95% and 99% levels.
20. Difference is significant in both cases.
21. (a) Differences are not significant. (b) yes
22. Retain 216.
23.
24.
29.
30. (a) (c)
31.
32. (a) (b) 145.0 mV(c)
33. (b)(c)
34.
35. (a) Entire range is linear. (b)(c)
36.
Chapter 511. statement c
14. 1% noise data: 10% noise data:
15. (a) 22.2 ng/mL: 88.2 ng/mL: 314 ng/mL: (b)
16. (a) 4%, 128% (b) 1.4%
18.
19.
20. detection limits: 0.086, 0.102, 0.096, and
23. (c) 1.04 ppm
24. (a) (b) 116 ppm (c)(d)
25. (a) tap water, 0.091 ng/mL; pond water, 22.2 ng/mL (b) This is amatrix effect. Something in pond water decreases the Eu(III) emission.
26. (a) 0.140 (b)95%
27. 95% confidence:
29. (a) (b) 0.847 mM (c) 6.16 mM (d) 12.3 mM
30. 9.09 mM
31.
Chapter 64. (a) (b)
5.
6.
7. (a) decrease (b) give off (c) negative
8.
9. (a) right (b) right (c) neither (d) right (e) smaller
10. (a) (b) 153°C4.7 � 104 bar
5 � 1011
2.0 � 109
1.2 � 1010
K � P6CO2
/P15/2O2
K � 1/[Ag�]3[PO34 ]
� 6.2%0.067deviation �standardresponse factor � slope of graph � 1.076;
0.1684
1.56 (�0.24) mM1.56 (�0.08) mM;
confidence � �0.015 Mstandard deviation � �0.005 M;
�18 ppm�6 ppm8.72 � 0.43 ppb
mean � 0.10 g/mL0.114 g/mL;
concentration � 4.8 � 108 Mminimum detectable detection limit � 130 counts;
concentration detection limit � 0.064 g/Lrecovery � 96%;
quantitation limit � 1.6 � 107 Mdetection limit � 4.8 � 108 M;signal detection limit � 129.6;
accuracy � 3.6%precision � 7.8%,accuracy � 6.5%precision � 13.9%,
accuracy � 6.6%precision � 23.8%,
R2 � 0.973 1y � 23.336x � 141.27R2 � 0.999 3y � 26.075x � 12.455
15.22 � 0.86 g, 15.2 � 1.5 g
4.80 g/mL(concentration) � 1.3390.969 2 loglog (current) �
21.9 g
31.9 (�0.2) Mb � 18.9 (�3.8)m � 15.12 (�0.10),
0.192 (�0.014) vol%b � 22.1 � 8.9m � 869 � 11,
10.1 � 0.2 g
0.262.00 � 0.38
10.1 g
b � 0.93 � 0.26m � 0.64 � 0.12;
b � 3 (�3) � 102(�0.001) � 104;m � 1.299
(tcalculated � 11.3 7 ttable � 2.57). 11. (a) 7.82 kJ/mol (b) A graph of ln K vs 1/T will have a slope of
12. (a) right (b)(c) neither (d) formed
13. 0.663 mbar
14.
15. 8.5 zM
16.
17. (a) (b)
19. no, 0.001 4 M
20. no
21.
23. (a) (b)
24.
25.
26. 15%
27.
30. (a) an adduct (b) dative or coordinate covalent (c) conjugate(d)
34. (a) HI (b)
35.
36. (a)(b)
37. (a) 2.00 (b) 12.54 (c) 1.52 (d) (e) 12.00
38. (a) 6.998 (b) 6.132
39.
40. 7.8
41. (a) endothermic (b) endothermic (c) exothermic
44.
45.
46.
47. (a)
(b)
48. a, c
49.
50.
51.
52.
53. (a) (b) Solubility will be greater.
54. 0.22 g
55. right;[Br2(aq)] � 11.0 M
[H�] � 17.0 mM,[Br] � 15.0 mM,[IO3 ] � 7.00 mM,
1.2 � 102 M
2.9 � 106
Ka3 � 7.1 � 1013Ka2 � 6.29 � 108,Ka1 � 7.04 � 103,
H2C2O4 � OHKb2
HC2O4 � H2O
HPO24 � H�
Ka2H2PO
4
Kb � 1.6 � 105CN � H2O T HCN � OH;
HO2CCH2CO2H � OHKb2
HO2CCH2CO2 � H2O
HO2CCH2CO2 � OH
Kb1O2CCH2CO
2 � H2O
H2NCH2CH2NH3 H2NCH2CH2NH2 � H�� Ka2
H3NCH2CH2NH3 H2NCH2CH2NH3 � H�� � �Ka1
HCO3 � H2O T H2CO3 � OHKb:
HCO3 T H� � CO2
3Ka:
HOCH2CH2S � H2O T HOCH2CH2SH � OH
N � H2O T NH � OH�
La3� � H2O T LaOH2� � H�
NH3 T NH2 � H��
Cl3CCO2H T Cl3CCO2 � H�
1.0 � 1056
0.48
(C5H5NH�, C5H5N)(C6H5CO2H, C6H5CO2 );
(H3NCH2CH2NH3, H3NCH2CH2NH2)� � �
(H3O�, H2O);
2H2SO4 T HSO4 � H3SO�
4
H2O
[H�] 6 [OH][H�] 7 [OH],
1.1 � 105 M
[Zn(OH)24 ] � 8.6 � 1014 M[Zn(OH)
3 ] � 6.9 � 107 M,[ZnOH�] � 2.3 � 105 M,[Zn2�] � 2.9 � 103 M,
0.096 M
AsF5BF3
I 6 Br 6 Cl 6 CrO24
8.4 � 104 M2.1 � 108 M
3.9 � 107 M
5 � 108 M
PHBr � 57.0 PaPBr2� 3 306 Pa,PH2
� 1 366 Pa,
�H°/R.
AN2 Answers to Problems

56.
Chapter 77. 32.0 mL
8. 43.20 mL 270.0 mL
9. 0.149 M
10. 0.100 3 M
11. 92.0 wt%
12. 15.1%
13. (a) 0.020 34 M (b) 0.125 7 g (c) 0.019 83 M
14. 56.28 wt%
15. 8.17 wt%
16. 0.092 54 M
17. (a) 17 L (b) 793 L (c)
19. (a) (b)
20.Ga does not appear to bind in
the absence of oxalate.
22. (a) 13.08 (b) 8.04 (c) 2.53
23.for AgCl
24. (a) 6.06 (b) 3.94 (c) 2.69
25.
26.
27. (a) 14.45 (b) 13.80 (c) 8.07 (d) 4.87 (e) 2.61
28. (a) 19.00, 18.85, 18.65, 17.76, 14.17, 13.81, 7.83, 1.95 (b) no
29.
36. 947 mg
37.
Chapter 82. (a) true (b) true (c) true
3. (a) 0.008 7 M (b)
4. (a) 0.660 (b) 0.54 (c) 0.18 (d) 0.83
5.
6. (a) (b)
7.
8. increase
9.
10.
11.
12. 11.94, 12.00
13. 0.329
17.
18.
19.
20. (a) charge:
mass:(b)
21.
22. [CH3CO2 ] � [CH3CO2H] � 0.1 M
5.2 � 105 pounds2.3 � 106 N,
[MgBr�] � [Br] � 0.4 M[Mg2�] � [MgBr�] � [MgOH�] � 0.2 M;[MgBr�] � [Br] � 25[Mg2�] � [MgBr�] � [MgOH�]6[Br] � [OH]
2[Mg2�] � [H�] � [MgBr�] � [MgOH�] �
[H�] � [OH] � [H2AsO4 ] � 2[HAsO2
4 ] � 3[AsO34 ]
[H�] � [OH] � [HSO4 ] � 2[SO2
4 ]
[OH] � [HCO3 ] � 2[CO2
3 ] � [ClO4 ]
[H�] � 2[Ca2�] � [Ca(HCO3)�] � [Ca(OH)�] � [K�] �
pH � 2.07�H� � 0.86,
6.6 � 107 M
7.0 � 1017 M
0.202
0.4320.422
0.887
0.0012 M
[C] � 0.256 � 0.027 M[B] � 0.440 � 0.027 M,[A] � 0.838 � 0.027 M,
VX � V 0M(C 0
M [M�] � [X]) / (C 0X � [M�] [X])
Ve2 � 37.52 mLVe1 � 18.76 mL,
[AgI(aq)] � 0.32 nM[AgBr(aq)] � 20 nM,[AgCl(aq)] � 370 nM,
Q � [Ag�][Cl] � 2.8 � 1010 7 Ksp[Ag�] � 9.1 � 109 M;
12.2 L � 1.83 Ga/transferrin.point �observed endtheoretical equivalence point � 13.3 L;
5.83 � 105 M2.33 � 107 mol Fe(III)
1.05 � 103 L
H2C2O4KMnO4;
[I2(aq)] � 0.500 mM[H�] � 8.51 � 107 M,[I] � 0.167 mM,[IO
3 ] � 0.834 mM, 23.
24.
25. (b)
26. (a) 0.004 8 M (b) 33% is ion paired,
27.
28. (a) (b) (c) 0.023 bar
29. 70.7, 85.2, 150.4, 243.6, 280.1 mV
Chapter 92. (a) 3.00 (b) 12.00
3. 6.89, 0.61
4. (a) 0.809 (b) 0.791 (c) Activity coefficient depends slightly oncounterion.
5. (a)
(b)
(c)
(d)
6.
7. 5.50
8. 5.51, 0.060 M
10. 99% dissociation when
11. 4.20
12. 5.79
13. (a) 3.03, 9.4% (b) 7.00, 99.9%
14. 5.64, 0.005 3%
15. 2.86, 14%
16. 99.6%, 96.5%
19. 11.00, 0.995%
20. 11.28,
21. 10.95
22. 0.007 6%, 0.024%, 0.57%
23.
24.
25. 0.999, 0.000 999
32. 4-aminobenzenesulfonic acid
33. 4.70
34. (a) 0.180 (b) 1.00 (c) 1.80
35. (a) 14 (b)
36. (a) NaOH (b) 1. Weigh out of HEPES and dissolve in 2. Adjust the pH to 7.45 with NaOH.3. Dilute to 250 mL.
37. 3.38 mL
38. (b) 7.18 (c) 7.00 (d) 6.86 mL
39. (a) 2.56 (b) 2.61 (c) 2.86
40. 16.2 mL
41. (a)
42. (a) Approximate more accurate
43. 6.86
pH � 11.48pH � 11.70,
[A] � 0.004 01 MpH � 5.06, [HA] � 0.001 99 M,
�200 mL.(0.250 L)(0.050 0 M) � 0.012 5 mol
1.4 � 107
4.1 � 105
3.6 � 109
[BH�] � 1.9 � 103 M[B] � 0.058 M,
F � (0.010 2)Ka
3.1 � 106 M,
� � 0.995%pH � 3.00,
NH3 NH2 � H�T Ka
�
NH2 � H2O NH3 � OHT Kb
�
CO2 � H2O CO2H � OHT Kb
CO2H CO2 � H�T Ka
4.9 � 104 M � 20 mg/L4.3 � 105
[LiF(aq)] � 0.002 9 M[Li�] � [F] � 0.050 M,
� 0.027 M[Zn2�] � 0.006 7 M,
solubility � 1.1 g/L[H�] � 4 � 1013 M;[OH] � 0.025 4 M,[CaOH�] � 0.005 1 M,[Ca2�] � 0.010 1 M,
� 25[FeSO�4 ] � [SO2
4 ] � [HSO4 ]6[FeSO�
4 ]635Fe3�] � [Fe(OH)2�] � [Fe(OH)�2 ] � 2[Fe2(OH)4�
2 ] �
[Y2] � [X2Y2�2 ] � 2[X2Y4�]
Answers to Problems AN3

Chapter 10
2. ; pK values apply to , and, insome cases, R.
3.
4. (a)(b) 6.00,
(c) 10.50,
5. (a)(b)
(c)
6.
7.
8. 4.03
9. (a) (b)
10.
11. 2.96 g
12. 2.22 mL
13. Procedure: Dissolve 10.0 mmol (1.23 g) picolinic acid in in a beaker. Add NaOH until the measured pH is 5.50.
Transfer to a 100-mL volumetric flask and use small portions of torinse the beaker into the flask. Dilute to 100.0 mL and mix well.
14.
15. no
16.
Glutamic acid
17. (a) (b)
18. (a) and would be simplest, but other combina-tions such as and or and would work justfine. (b) 4.55 g (c) One of several ways:Weigh out 0.050 0 mol and dissolve it in 900 mL of water. AddHCl while monitoring the pH with a pH electrode. When the pH is 7.45,stop adding HCl and dilute to exactly 1 L with
19.[L] � 2.40 � 1011 M[HL] � 3.68 � 106 M,
[H3L2�] � 1.36 � 106 M,[H2L�] � 0.010 0 M,pH � 5.64,
H2O.
Na2HPO4
Na2HPO4 � 2.15 g NaH2PO4
Na2HPO4H3PO4Na3PO4H3PO4
Na2HPO4NaH2PO4
2.9 � 1082.8 � 103
OCHCH2
NH2
CO2
OHCHCH2
NH2
CO2
K3K2
OHCHCH2
NH3
CO2H
�
OHCHCH2
NH3
CO2
�
Tyrosine
K1
CHCH2CH2CO2
CO2
NH3
�
CO2
NH2K2 K3
CHCH2CH2CO2
NH3
�
CHCH2CH2CO2H
CO2H
NH3
�
CO2
K1CHCH2CH2CO2H
26.5 g Na2SO4 � 1.31 g H2SO4
H2O(�5.63 mL)H2O
�75 mL
pH � 5.67[CO2(aq)] � 104.9 M,
[HA] � 0.006 1 MpH � 4.50,[HA] � 0.009 8 MpH � 6.002,
[A2] � 2.1 � 104 M[HA] � 7.9 � 104 M,[H2A] � 3.0 � 106 M,pH � 3.69,
[BH2�2 ] � 2.15 � 109 M
[BH�] � 3.99 � 103 M,[B] � 0.296 M,pH � 11.60,
[M2] � 0.100 M[HM] � 2.23 � 105 M,[H2M] � 7.04 � 1012 M,pH � 9.35,[M2] � 3.8 � 103 M[HM] � 0.100 M,
[H2M] � 3.7 � 103 M,pH � 4.28,[M2] � 2.01 � 106 M[HM] � 1.12 � 102 M,[H2M] � 0.089 M,pH � 1.95,
9.97 � 102 M3.16 � 104 M,1.00 � 1010 M,1.00 � 103 M
1.00 � 101 M,1.00 � 103 M,[A2] � 1.00 � 108 M[HA] � 3.11 � 103 M,[H2A] � 0.096 9 M,pH � 2.51,
8.93 � 10134.37 � 104,
ßCO2H,NH3
�H3N CH CO2
�
R
20. 78.9 mL
21. (a) 5.88 (b) 5.59
22. (a) HA (b) (c) 1.0, 0.10
23. (a) 4.00 (b) 8.00 (c) (d) (e)
24. (a) 9.00 (b) 9.00 (c) (d)
25.
26.
27. 0.91
28. 0.694
29. 0.500,0.500, 0.651, 0.500,
0.349, 0.500, 0.999 8
30. (b) 0.61, 0.39,
31. 0.36
32. 96%
34. At pH 10:
35. (b)(c)
37. The average charge is 0. There is no pH at which all molecules havezero charge.
38. isoelectric pH 5.59, isoionic pH 5.72
40. pH of zero charge
Chapter 112. 13.00, 12.95, 12.68, 11.96, 10.96, 7.00, 3.04, 1.75
6. 3.00, 4.05, 5.00, 5.95, 7.00, 8.98, 10.96, 12.25
7.
8. 8.18
9.
10. 0.107 M
11. 9.72
14. 11.00, 9.95, 9.00, 8.05, 7.00, 5.02, 3.04, 1.75
15.
16.
17. 10.92, 9.57, 9.35, 8.15, 5.53, 2.74
18. (a) 9.45 (b) 2.55 (c) 5.15
20. positive
21. isoionic
23. 11.49, 10.95, 10.00, 9.05, 8.00, 6.95, 6.00, 5.05, 3.54, 1.79
24. 2.51, 3.05, 4.00, 4.95, 6.00, 7.05, 8.00, 8.95, 10.46, 12.21
25. 11.36, 10.21, 9.73, 9.25, 7.53, 5.81, 5.33, 4.86, 3.41, 2.11, 1.85
26. 5.01
27. (a) 1.99
28. (b) 7.13
29. 2.72
30. (a) 9.54 (b)
31. 6.28 g
32. pK2 � 9.84
7.9 � 1010
2.2 � 109
1
2Ve
5.4 � 107
pH � 11.961.2Ve,pH � 8.65;Ve,pH � 5.60;10Ve/11,pH � 4.60;Ve/2,pH � 3.60;Ve/11,pH � 2.80;Ve � 0,10Ve/11;Ve/11;
� 5.95
[Cr(OH)2�] � 102.04 M[Cr(OH)�2 ] � 104.44 M,[Cr(OH)3(aq)] � 106.84 M
�A3 � 0.085 4�HA2 � 0.874,�H2A � 0.040 9,�H3A
� 1.05 � 109,
1.6 � 1068.6 � 106,
2.2 � 105,�A2 � 5.8 � 107,1.86 � 104�HA � 0.107,
1.55 � 10122.2 � 105,5.4 � 105,�H2A � 0.893,
�HA � 0.123,
[A]/[HA] � 10�A � 0.909,�HA � 0.091,
CH
CH3
O
�
O
POCH2O
O
O
NH
1.0 � 103BH�
A2HAH2A
A
AN4 Answers to Problems
34.
35.
39. HCl, or
40. yellow, green, blue
41. (a) red (b) orange (c) yellow
42. (a) red (b) orange (c) yellow (d) red
43. no (end point pH must be
44. (a) 2.47
45. (a) violet (b) blue (c) yellow
46. (a) 5.62
47. 2.859%
51. 0.079 34 mol/kg
52. calculated HCl molarity is low
53. 0.100 0 M
54. 0.31 g
55. (a) 20.254 wt% (b) 17.985 g
58. (a) acetic acid (b) pyridine
65. (b)
70. 0.139 M
71. 0.815
Chapter 122. (a) (b) 0.57
3. (a) (b)
4. 5.60 g
5. (a) 100.0 mL (b) 0.016 7 M (c) 0.041 (d)(e) (f)
6. (a) 2.93 (b) 6.79 (c) 10.52
7. 1.70, 2.18, 2.81, 3.87, 4.87, 6.85, 8.82, 10.51, 10.82
8. 10.30, 9.52, 8.44, 7.43, 6.15, 4.88, 3.20, 2.93
9.
14. (a) 25 (b) 0.017
15. (a) 11.08 (b) 11.09 (c) 12.35 (d) 15.03 (e) 17.69
16. (b)
17. (d)
19. (b) 1.34 mL, 21.70 mL, 26.23 mL,
23. 1. with metal ion indicators; 2. with a mercury electrode;3. with an ion-selective electrode; 4. with a glass electrode
24. wine-red, blue
25. Buffer (a): other buffers: which isharder to see
29. Temporary hardness, due to is lost by heating. Permanenthardness is derived from other salts, such as and is not affectedby heat.
30. 10.0 mL, 10.0 mL
31. 0.020 0 M
32. 0.995 mg
33. 21.45 mL
34.
35. 0.024 30 M
36. 0.092 28 M
37. observed: 32.7 wt%; theoretical: 32.90 wt%
38. (a) Dominant form of EDTA at pH 4 is Before releases After no
reaction consumes or releases H�.Ve,2H�/EDTA.Cu2� � H2Y2 S CuY2 � 2H�
Ve,H2Y2.
[Zn2�] � 0.007 18 M[Ni2�] � 0.012 4 M,
CaSO4,Ca(HCO3)2,
violet S blue,yellow S blue;
HIn2,
pNi � 17.00pNi � 7.00;pNi � 6.00;
[Fe2T] � 0.077[FebT] � 0.092,[FeaT] � 0.553,[T] � 0.277,
�ML2� 0.70�ML � 0.28,
4.6 � 1011 M
�,
2.49 � 1010 M7.8 � 107 M4.1 � 1010
4.5 � 105 M2.5 � 107
2.7 � 1010
pH � 4.16K � 0.279,
systematic error � 0.08%,1.0238 g,
77)
HClO4HNO3,H2SO4,
end point � 10.727 mL
end point � 23.39 mL (b) Dominant form of EDTA at pH 8 is Before releases After the
reaction consumes 1 per EDTA.
Chapter 131.
2. (a) (b) (c)
3.
4. predicted values:
5. from spreadsheet and 10.197 by hand method
6.
7.
8.
9. (a) (b)
10.
11. (d)
(e)
(f, g, h, i)
( j)
12. (a)
(b) ionic strength of strongactual ionic (c) 28.5%
(d) for is 1.99 and we expect the solution to be near neutral pH. (e) no;for
13.
14. fraction of Fe in each form: 2.4%; , 58.4%; 38.9%; 0.14%; 0.11%.fraction of glycine in each form: 0.50%; [HG], 31.2%; 0.000 1%; 29.2%; 38.9%; 0.21%
Chemistry: followed by released when dissolves requires HCl to lower the pH to 8.50.
15. (b) Fixing at 13.797 causes to deviate systematically above at the end of the titration when
should approach 0.
16. (a)
(b) ,
17. (b) In the absence of precipitation, at pH 4.61, theconcentrations are
and the other specieshave lower concentrations.
[Cu2(OH)2�2 ] � 5.8 M;[Cu2(OH)3�] � 28 M,
[CuOH�] � 12 M,[HSO4 ] � 20 M,[CuSO4(aq)] � 6.3 mM,
[SO24 ] � 18.7 mM,[Cu2�] � 18.6 mM,
pH � 4.61.
pK3 � 10.19pK2 � 9.48,pK1 � 8.33pK¿w � 13.819,nH(theoretical) � 3�H3A
� 2�H2A� �HA
nH(experimental) � 3 �[OH] � [Cl]HCl [H�] [Na�]
FH3A
nH
nH(theoretical)nH(measured)pK¿w
FeG2
GG � H� T HG.FeG2 T FeG� � G
ionic strength � 32.9 mMHCl added � 31.1 mmol;
3[FeG3 ],2[FeG2],[FeG�],
[H2G�],[G],[FeOH�],[FeG
3 ],[FeG2],[FeG�][Fe2�],
ionic strength � 0.113 M[K�] � 0.100 M,[Na�] � 0.013 0 M,[HCN] � 1.90 nM,[Ag(CN)2
3 ] � 1.94 M,[Ag(CN)2 ] � 0.100 M,
[Ag(OH)(CN)] � 101 M,[AgOH] � 0.187 nM,[Ag�] � 1.86 nM,[OH] � 0.012 9 M,[H�] � 1.29 � 1012 M,[CN] � 3.26 M,
La(OH)3 � 2 � 1021[La3�][OH]3�La3 ��3
OH � 2.3 � 1028 6 Ksp
HSO4pKa
strength � 6.3 mMelectrolyte � 15.0 mM;pH � 5.98ionic strength � 0.006 29 M,
[LaOH2�] � 1.13 M,[La(SO4)2 ] � 67 M,[La(SO4)�] � 1.36 mM,
[H�] � 1.14 M,[La3�] � 0.57 mM,[SO24 ] � 1.50 mM,
[Fe(SCN)2�]
5[Fe3�] � [FeOH2�]6[SCN]� 156
pH � 1.94,ionic strength � 0.243 9 M,� 0.546 mM,[FeOH2�][Fe(SCN)�
2 ] � 0.068 nM,[Fe(SCN)2�] � 2.19 M,[H�] � 15.5 mM,[Fe3�] � 4.45 mM,[SCN] � 2.81 M,
[Fe(SCN)2�]
5[Fe3�] � [FeOH2�]6[SCN]� 293
pH � 1.88,ionic strength � 0.043 4 M,0.802 mM,[FeOH2�] �[Fe(SCN)�
2 ] � 0.106 nM,[Fe(SCN)2�] � 2.97 M,[H�] � 15.8 mM,[Fe3�] � 4.20 mM,[SCN] � 2.03 M,
[H�] �K¿a[Fe3�]
FFe [Fe3�] �¿1[Fe3�][SCN] �¿2[Fe3�][SCN]2
[Fe3�] �FSCN [SCN]
�¿1[SCN] � 2�¿2[SCN]2
pH � 4.44
pH � 7.403pH � 7.420
pH � 4.94ionic strength � 0.025 M,
pH � 5.00
pH � 4.52
pH � 10.194
pK¿2 � 9.562pK¿1 � 2.350,
pH � 9.95
pH � 9.45pH � 10.00pH � 9.98
PbCO3(s) � H� T Pb2� � HCO3
PbS(s) � H� T Pb2� � HS
OHOH � H2Y2 S HY3 � H2OVe,2H�/EDTA.Mg2� � H2Y2 S MgY2 � 2H�
Ve,HY3.
Answers to Problems AN5
(c) The solubility of is exceeded above solubility is exceeded above solubility is
exceeded above At pH 4.61, willprecipitate from 0.025 M
18. (b)
(c)
(d)
Chapter 142. (a) (b) 96 485.338 3
3. (a) (b) 4.35 A (c) 79 W
4. (a) (b) (c)(d) 447 V
5. (a) (b) (c) 861 C (d) 14.3 A
6. (a) and reducing agents; oxidizing agent(b) 9.576 kJ/g
8. (a)
(b)
9.
10. (a) Electrons flow from Zn to C. (b) 1.32 kg
11. (a) and(b) 24–120 mA (c) 7–36 mW
(d) and
12. has the most positive
13. (a) Fe(III) (b) Fe(II)
15. (a) (b)
16. (b)
17. (a)(b) flow from Al to Pt (c) (d) 1.31 kJ(e)
19. (a) 0.572 V (b) 0.568 V
20. 0.799 2 V
21. 1.341 V
22.
23. 0.580 V
24. (a) 1.33 V (b)
25. (a) (b)
26. (b) (c) (d) 10 kJ (e) 0.21
27.
28. 0.101 V
29. 34 g/L
30. 0.116 V
31. 1.664 V
K � 1.0 � 109
0.020 VK � 2 � 1016
K � 1.9 � 106K � 1047
1 � 1045
3X� T X3� � 2X(s); E°2 7 E°1
HOBr � 2e � H� T Br � H2O;
2.69 � 108 g/sBr2eE � 2.854 V,
Pt(s) 0 Br2(l) 0 HBr(aq, 0.10 M) Al(NO3)3(aq, 0.010 M) 0 Al(s)
0.356 V
Zn2�Cu2� � Zn(s) T Cu(s) � Zn2�
E°.Cl2
HS T S � H� � eO2 � 4H� � 4e T 2H2OCO2 � 4H� � 4e
CH2O � H2O TO2 � 4H� � 4e T 2H2O
Cr2O27 � 14H� � 6e T 2Cr3� � 7H2OFe3� � e T Fe2�;
PbO2(s) � 4H� � SO24 � 2e T PbSO4(s) � 2H2O
PbSO4(s) � 2e T Pb(s) � SO24
PbO2(s) 0 Pb(s)Pb(s) 0 PbSO4(s) 0 K2SO4(aq) H2SO4(aq) 0 PbSO4(s) 0Ag2O(s) � H2O � 2e T 2Ag(s) � 2OH
FeO(s) � H2O � 2e T Fe(s) � 2OH
Fe(s) 0 FeO(s) 0 KOH(aq) 0 Ag2O(s) 0 Ag(s)
ClO4 ,Al,NH�
4
S2O23I2
5.60 � 105 mol9.63 � 1019 J/e1.87 � 1016 e/s
71.5 A
6.241 509 48 � 1018
[NaHT] � 2.97 � 104 M[Py] � 0.001 56,[H2T] � 5.93 � 104,[NaT] � 0.001 17,[Cl] � 0.015 0,
[T2] � 0.007 92,[HT] � 0.010 0,[OH] � 1.84 � 1010,[K�] � 0.010 0,[Na�] � 0.018 5,[PyH�] � 0.013 4,pH � 4.264,
[H2T] �FH2T
1 �K1
[H�]�
K1K2
[H�]2� KNaT[Na�]
K1K2
[H�]2� KNaHT[Na�]
K1
[H�]
[HT] �FH2T
[H�]
K1� 1 �
K2
[H�]� KNaT[Na�]
K2
[H�]� KNaHT[Na�]
[T2] �FH2T
[H�]2
K1K2�
[H�]
K2� 1 � KNaT[Na�] � KNaHT[Na�]
[H�]
K2
CuSO4.Cu(OH)1.5(SO4)0.25(s)pH � 5.5.
Cu(OH)2(s)pH � 5.CuO(s)pH � 4.5.Cu(OH)1.5(SO4)0.25(s) 32.
33. (a)(b) (c)
35. (b)
36. (b) (c)
37.
38.
39. 0.76
40.
42. (c) 0.317 V
43.
44.
45.
46.
47.
48. (a)(b) (c)
Chapter 151. (b) 0.044 V
2. (a) 0.326 V (b) 0.086 V (c) 0.019 V (d) (e) 0.021 V
3. 0.684 V
4. 0.243 V
5. 0.627
6. (c) 0.068 V
8. 0.481 V; 0.445 V; 0.194 V;
9. (a) (b) (d)
10.
11. (b)
12.
15. left
16. (a) 42.4 s (b) 208 s
17. (a) (b) 8% (c) 49.0, 8%
19. (c) 0.1 M HCl 1 mM KCl, 93.6 mV; 0.1 M HCl 4 M KCl, 4.7 mV
22. 10.67
23. potassium hydrogen tartrate and potassium hydrogen phthalate
25.
26. (a) 274 mV (b) 285 mV
27. unit;unit;
28. (b) 0.465 (c) and
30. Smaller is better.
34. (a) (b) (c)
35.
36. 0.211 mg/L
37. Group 1: Group 2: and
38.
39. (a)(b) 0.951 (c)
40.
41.
42.
44. (a) (b) 1.90 mmol
46. (a) (b) 4.8 � 1041.13 � 104
8.9 � 108 M
E � 120.2 � 28.80 log ([Ca2�] � 6.0 � 104 [Mg2�])
3.0 � 105 M
0.331 V
2.43 (�0.04) � 103 M(sy � 0.27)E � 51.10 (�0.24) � 28.14 (�0.085) log [Ca2�]
3.8 � 109 M
[K�] � 100[Li�]Ba2�;Sr2�K�;
�0.029 6 V
1.52 � 102 M1.55 � 102 M0.407 V
kA,X
KH2PO4 � 0.019 6 mNa2HPO4 � 0.026 8 m
� � 0.983slope � 58.17 mV/pHtheoreticalslope � 57.173 mV/pHpH � 5.686;
�0.10 pH unit
003.2 � 1013
0.296 M
1 � 1011
3 � 1021
2.2 � 106KCl/0.020 0KI/0.033 3
0.039 V
0.021 V
0.092 V[S] � [Red][S] � [Ox],[Red] � 1.88 � 105 M[Ox] � 3.82 � 105 M,
0.447 V
7.2 � 104
0.036 V
0.268 V
0.041 V
7.5 � 108
5.7 � 1014
9.6 � 107
Hg S PtB � 0.059 16 VA � 0.414 V,
0.143 M
�S° � 5.90 J/ (K � mol)�H° � 23.60 kJ/mol,29.51 kJ/molAl2O3(s) � MgO(s) T MgAl2O4(s)
K � 3 � 105
AN6 Answers to Problems

Chapter 161. (d) 0.490, 0.526, 0.626, 0.99, 1.36, 1.42, 1.46 V
2. (d) 1.58, 1.50, 1.40, 0.733, 0.065, 0.005,
3. (d) 0.21, 0.48, 0.53 V
4. (b) 0.570, 0.307, 0.184 V
5. (d) 0.096, 0.408, 0.450
6. diphenylamine sulfonic acid: colorless red-violet; diphenylbenzidinesulfonic acid: colorless violet; bipyridine)iron: red paleblue; ferroin: red pale blue
7. no
13. (a)(b)(c)
14. 0.011 29 M
15. 0.586 4 M
16. (a) Scheme 1: Scheme 2: (b) Scheme 1: 25.43 mL; Scheme 2: 42.38 mL
17. 3.826 mM
18. 41.9 wt%
19. 78.67 wt%
20.
23. iodometry
24. (a) 1.433 mmol (b) 0.076 09 M (c) 12.8 wt%(d) Do not add starch until right before the end point.
25. 11.43 wt%; just before the end point
26. 0.007 744 M; just before the end point
27. (a) (b) 1.0 (c) 0.34 g/L
28.
29. (a) no, no (b)(c) 406.6 mg/L (d) no:
30. 5.730 mg
31. (a) 0.125 (b)
33. (a) 0.191 5 mmol (b) 2.80 (c) 0.20 (d) 0.141 3
34.
Chapter 171. Difference is due to overpotential.
2. 2.68 h
3.
4. (a) (b) 0.20 V (c) (d)
5.
6. (a) (b) 0.012 4 g/h
9. anode, 54.77 wt%
10. negative
11.
14. (a) (b)
15. (a) (b) (c)
16.
17. (a)(b) (c) 1.160 V (d)
18.
19. (a) pH(b) cathode:
anode: 3I S I3 � 2e
H2O � e S 12H2(g) � OHSO2
3 7 pH 7.171.86 6 HSO
3 6 pH 7.17;H2SO3 6 pH 1.86;
96 486.67 � 0.28 C/mol
2.57 V0.036 Voverpotential � 0.85 Vcurrent density � 1.00 � 102 A/m2,
151 g/mL
5.32 � 103 M2.66 � 105 mol5.32 � 105 mol
0.000 26 mL5.2 � 109 mol
0.744 V
0.619 V,
6.64 � 103 J
V2
2.82 V2.71 V1.906 V
1.228 8 V
Formula � Bi2Sr2CaCu2O8.4001 (�0.005 7)�2.200 1 (�0.004 6)state �Cu oxidationBi oxidation state � �3.200 0 (�0.003 3)
6.875 � 0.038
tcalculated � 2.56 6 ttable � 2.7765.079 � 103 M,I3 � SO2
3 � H2O S 3I � SO24 � 2H�
mol NH3 � 2 (initial mol H2SO4) mol thiosulfate
7 � 102
oxidation number � 3.761; 217 g/g
6H� � 2MnO4 � 3H2O2 S 2Mn2� � 4O2 � 6H2O
6H� � 2MnO4 � 5H2O2 S 2Mn2� � 5O2 � 8H2O
MnO4 � e T MnO2
4
MnO4 � 4H� � 3e T MnO2(s) � 2H2OMnO
4 � 8H� � 5e T Mn2� � 4H2O
SStris-(2,2¿-S
S0.061,0.102,0.143,
0.052,0.102,0.120,
0.036 V
(c)(d) 3.64 mM
20. (a)
(b) (c) (d) 52.7 mg (e)
23.
26. 0.12%
27. 0.096 mM
29. (a) (b) (c) 313 ppb
30. Estimated relative peak heights are 1, and
31. peak B: peak C: There was no RNO present before the initial scan.
32.
Chapter 181. (a) double, (b) halve, (c) double
2. (a) 184 kJ/mol (b) 299 kJ/mol
3. 213 kJ/mol
5. and andand
10.
11. violet-blue
12.
13. (a) 325 nm: 300 nm: (b) 2.0% (c) 49%
14. (a) 40.0 kJ/mol (b)
16. (a) (b)(c) 1.02 mg
17. yes
18. (a) (b)
19. (a) (b) 4.69 mg
20.
23.
25. Fluorescence is proportional to concentration up to (with 5%).
26. 95% confidence interval:
Chapter 191.
2.
5.
6.
7.
8.
9. (f) (g) yes
10. to 0.84
11. (b)
12. (b)
13. (b)
14. (a) 1:1 (b) K must not be very large. (c) to maintain constantionic strength
� � 1.073 � 104 M1 cm1K � 0.464,
� � 1.074 � 104 M1 cm1K � 0.464,
K � 88
S � 0.29K � 4.0 � 109 M1,
� 104 M,[CO2(aq)] � 3.0 M
pKa � 4.00
[ethylbenzene] � 0.076 1 M[o-xylene] � 0.075 9 M,[m-xylene] � 0.079 5 M,[p-xylene] � 0.062 7 M,
[MTB] � 1.32 � 105 M[STB] � 9.30 � 106 M,[TB] � 1.22 � 105 M,
[B] � 4.68 � 103 M[A] � 9.11 � 103 M,
[MnO4 ] � 8.36 � 105 M[Cr2O2
7 ] � 1.78 � 104 M,
[Y] � 2.62 � 104 M[X] � 8.03 � 105 M,
� 104 wt%3.56 (�0.22)3.56 (�0.07) � 104 wt%;
5 M
wavelength: absorption 6 fluorescence 6 phosphorescence
�E(S1 T1) � 36 kJ/mol
4.97 � 104 M1 cm1
1.98 � 106 M7.87 � 104 M1 cm1
6.97 � 104 M6.97 � 105 M
1.97 � 102 M1 cm1
Tsummer � 0.095;Twinter � 0.142;A � 1.22T � 0.061,A � 0.045;T � 0.90,
2.19 � 104 M
3.56 � 104 M1 cm1
1.696 114 4 � 104 cm1#� � 1.697 834 5589.582 86 nm,� � 588.985 545.083 335 8 � 1014 Hz,# � 5.088 491 0
3.53 � 1019 J/photon,1.78 � 104 cm1,5.33 � 1014 Hz,
7.8 � 1010 m2/s
RNO � 2H� � 2e S RNHOHRNHOH S RNO � 2H� � 2e
Fe(III) in seawater � 1.0 � 102 pM1.98.1.56,
Cu(s) S Cu2� � 2eCu2� � 2e S Cu(s)
7.8 � 102 A/m215 m,
2.26 � 104 MO2/L2.223 � 108 molF/4F � E C � h � 4c 2o 3n c � h c/2 � o 3n
E � h � 4c 2o 3n1h � 2(2c o) � 3n � E1h � 2A � 3D � EA � 2c o1o � A � 2c1o � A � 2B
D � nC � x;B � c;
I3 � 2S2O2
3 T 3I � S4O26
I3 � HSO
3 � H2O S 3I � HSO4 � 2H�
Answers to Problems AN7

16. yes
20.
21. (b) (c) moleculesper micelle (d)
Chapter 203.
8. (a) (b) 143
10. (a) (b) 0.05 nm (c) (d)
11.
12. 0.124 2 mm
13. 77 K:
14. (a) at 2.00 m;at 10.00 m (b) (c)
(d) at 1 000 K,
15.
16. (a) (b)
19. (a) (b) 0.955
20. (a) (b)
21.
22. (b) (b) 0.20
23. (a) 0.964 (b) 343 nm,
24. (b) blue
25. (a) (c) (d) 2.5 mm
27. 7
29. [at cycles, predicted S/N ] at 1 000, 60.0 (observed); at 300, 32.9;at 100, 19.0; at 1, 1.90
Chapter 2110. Pb: Tl: Cd: Zn: Al:
11. 589.3 nm
12. 0.025
13. Na: Hg:
14. (a) 283.0 kJ/mol (b) (c) (d)
15. wavelength (nm): 591 328 154at 2 600 K in flame:at 6 000 K in plasma:
18.
19. (a) (b)
20.
21.
22. (a) CsCl inhibits ionization of Sn. (b)(c) Little interference at 189.927 nm,
which is the better choice of wavelengths. At 235.485 nm, there isinterference from Fe, Cu, Mn, Zn, Cr, and, perhaps, Mg.(d)(e)
Chapter 223.
4. from the spectrum in the text
5. yes
6. 3 100�1.5 � 104,
58.51
83.5 (�2.3) fg1 Da � 1.660 54 � 1024 g,
0.8 mg/kglimit of quantitation � 31 g/Llimit of detection � 9 g/L;
R2 � 0.997b � 0.86 � 1.56;m � 0.782 � 0.019;
4.54 M
17.4 � 0.3 g/mL
25.6 g/mL7.49 g/mL
0.429 � 0.012 wt%
1.2 � 1072.0 � 1035.2 � 102N*/N0
1.8 � 10161.4 � 1072.6 � 104N*/N0
1.03 � 102�8.4%3.67 � 106
0.000 56 nm0.0038 nm;
7 (�2) � 101 ng/cm22.0 � 0.3;0.04 � 0.01;0.005 � 0.001;1.2 � 0.2;
0.5 cm1�2 cm
5.83 � 1014 Hz
76°
nprism 7 12
51.06°61.04°
80.7°
0°34°
2.51 � 106
M2.00 m
M10.00 m� 3.17 � 1022 at 100 K
M2.00 m
M10.00 m� 7.55
2.3 � 101 W/m21.8 � 102 W/m2Ml � 1.164 � 109 W/m3Ml � 8.79 � 109 W/m3
298 K: 447 W/m21.99 W/m2;
A � 1.439T � 0.036 4,
0.000 43°, 0.013°5.9 � 1041.7 � 104
2.38 � 103 lines/cm
D2
P2 � 0.161P1 � 0.365;P0 � 0.414;[M] � 0.227 mM; Q � 0.881Nav � 55.9
pKa � 10.8
7.
8.
9.
10. 1:1.946:0.946 3
11. 1:8.05:16.20
12. (a) 4 (b) 6 (c)
13. (a)
(b)
(c)
(d) (e)
(f) ,
(g) , ferrocene,
14.
16. (a) mass of (b) mass of Da; mass of
(c) (d) (e)
17. 0.342 7:1:0.972 8:0.315 4
18. (mass, intensity): (84, 1) (85, 0.152) (86, 0.108) (87, 0.010 3) (88, 0.003 62) (89, 0.000 171) (90, 0.000 037)
20.
22. 93 m
27. (a) negative ion mode, neutral solution (b) 14.32
28. and mean molecular mass (disregarding peak G)is 15 126 Da
29.
30. 37:3:41.2% predicted 40.8% predicted35.8% observed 23.0% observed7.9% predicted 7.9% predicted7.0% observed 8.0% observed
37:2:41.3% predicted 40.8% predicted40.8% observed 33.4% observed7.9% predicted 7.9% predicted3.7% observed 8.4% observed
32. (d)
Chapter 232. 3
7. (a) 0.080 M (b) 0.50
8. 0.088
9. (c) 4.5 (d) greater
11. (a) 0.16 M in benzene (b) in benzene
12. 2 pH units
13. (a) at pH 1 and at pH 4 (b)
15. 1-C, 2-D, 3-A, 4-E, 5-B
18. (a) 17.4 cm/min (b) 0.592 min (c) 6.51 min
19. (a) 13.9 m/min, 3.00 mL/min (b) fraction of(c) 295
20. (a) (b) 5.5 mL/min(c) 1.11 cm/min for both
21. (a) 2.0 (b) 0.33 (c) 20
40 cm long � 4.25 cm diameter
time � 0.875k¿ � 7.02,
3.8 � 1042.6 � 10102.6 � 104
2 � 106 M
7.639 mol V/g
X � 2:
X � 1:[MH]� � C37H71O[MNH4]� � C37H74ON
X � 2:
X � 1:[MH]� � C37H69O[MNH4]� � C37H72ON
molecular mass � 7 848.48 Dacharge � 4;
nI � 20;nA � 12
1.56 � 104 spectra/s2.20 � 104 spectra/s;45.6 s;4.39 � 104 m/s;
5 � 1051.31 � 103 kJ/mol2.15 � 108 kJ/mol
2H � 2.014 10 Dap� � n � e � 2.016 489 963p� � e � mass of 1H
CH79Br235ClM�
#� 206,
M�#
� 186C10H10Fe:Fe
M�#
� 180C12H8N2:1,10-phenanthroline,
N N
M�#
� 172CH2Br2:M�#
� 228(CH3)2Hg:
NH2, C6H7N M� � 93
Cl, C6H4Cl2 M� � 146Cl
Cl, C6H5Cl M� � 112
112
14N16OH� � 31.005 2515N16O� � 30.994 47,31P� � 30.973 21,
C6H�11
3.4 � 1062.0 � 106,
AN8 Answers to Problems

22. 19 cm/min
23. 0.6, 6
24.
25. 603, 0.854
26. (a) (b) (c) 0.72
27. (a) 1 (b) 2 (c) 1 (d) neither (e) B (f) B (g) 1.25
29. 0.1 mm
32. 33 mL/min
36. 2.65 mm
37. (a) (b) 0.89 mm
38. (a) (b) Equation 23-28: Equation 23-29:
39.
40. 10.4 mL
41. 26.9 s
42.
43. (a)
44. (a) 11.45 (b) 1.018 (c) 1.017 (d) 60 800plates,(e) (f) 0.96 (g) 0.97
Chapter 248. (a)
(b)(c)
9. (a) 3, 1, 2, 4, 5, 6 (b) 3, 4, 1, 2, 5, 6 (c) 3, 4, 5, 6, 2, 1
10. (a) 4.7 min, 1.3 (b) 1.8
11. 836
12.
17. (b) 0.16 ng (narrow bore), 56 ng (wide bore)
19. (a) (c) 77.6 mM
20.
21. 932
23. (d) nonsmoker: nonsmoker whose parents smoke:
24.
25. (a) (b)
(c)
(d)
26. (a) 0.58, 1.9 (b) 0.058 mm, 0.19 mm (c) (d) 4.0
27.
28. (b) limiting (c) 0.69%, 41%
29. (a) 6 (b) 350 (c) 350, 315, 280, 245, 210(d) For 5Cl, predicted
relative For 4Cl,For 3Cl,
For 2Cl,
Chapter 251. (b) pressure gradient
4. (a) 17, 10, 5 cm
5. 0.14 min; 0.30 min
10. (a) 1 560 for L enantiomer and 1 310 for D enantiomer (b) 1.25(c) 1.35
L � 33,
(� density gradient)
abundances � 100:64.0:10.2.100:95.9:30.7:3.3.abundances �abundances � 78.2:100:48.0:10.2:0.8.
abundances � 62.5:100:64.0:20.4:3.3:0.2.(M-5Cl)�(M-4Cl)�,(M-3Cl)�,(M-2Cl)�,
(M-Cl)�,M�,�
m � KVfC0
Ds � 5.0 � 1010 m2/sDm � 3.0 � 105 m2/s,
3.0 � 105
Hmin � 22B(Cs � Cm)(optimum) � BB
C;ux
C � Cs � Cm �2k¿
3(k¿ � 1)2
d2
Ds�
1 � 6k¿ � 11k¿2
24(k¿ � 1)2
r2
Dm
B � 2DmA � 0
[14NO3 ] � 384 M[14NO
2 ] � 1.8 M;
192 � 6 g/L78 � 5 g/L;
0 .41 M
1.253
27.1 minb � 3.36,a � 1.69 � 103 K,
hexane 6 heptane 6 octane 6 benzene 6 2-pentanone 6 butanolhexane 6 heptane 6 butanol 6 benzene 6 2-pentanone 6 octane
heptane 6 octanehexane 6 butanol 6 benzene 6 2-pentanone 6
C6H6: 48 800 platesC6HF5: 55 700 plates;height � 0.455 mmC6H6: 66 000 plates,height � 0.493 mm;
C6HF5:k¿ � 11.25,
N � 6 400� � 1.10,N � 25 600;� � 1.05,N � 640 000;� � 1.01,
1.3 � 103
43 s2,110 s2,
resolution � 0.83
N � 7.75 � 103N � 7.72 � 103,4.1 � 103
1.1 � 102
40 m1.26 � 104
K � 4.69k¿ � 3.59,
11. (a) 18 (b) 10
12. (a) bonded reversed-phase chromatography (b) bondednormal-phase chromatography (c) ion-exchange or ion chromatography(d) molecular exclusion chromatography (e) ion-exchange chromatography (f) molecular exclusion chromatography
14.
15. (a) shorter (b) amine
16. 126 mm
18. (a) for column A and 0.26 min for column B(d) for morphine 3-�-D- and 3.3 for morphine(e) 6.2
19. (a) 304 is (cocaine protonated at N) (b) loss of(e) phenyl group
20. (a) 234 is 84 is (b)
21. 1.1 min for both
29. 27.8 min predicted, 20.2 min observed
30. 36 min
31. (b) between B and F: 30% methanol/8% tetrahydrofuran/62% buffer;between F and C: 10% methanol/24% tetrahydrofuran/66% buffer
32. D: 25% acetonitrile/30% methanol/45% bufferE: 25% acetonitrile/20% tetrahydrofuran/55% bufferF: 30% methanol/20% tetrahydrofuran/50% bufferG: 16.7% acetonitrile/20% methanol/13.3% tetrahydrofuran/50% buffer
33. 38%
34. (a) lower (b) higher
35. 40 to 70% acetonitrile in 60 min
36. (a) Change solvent strength, temperature, or pH. Use a differentsolvent or a different kind of stationary phase. (b) slower flow rate,different temperature, longer column, smaller particle size
37. (a) 29 min (b)
Chapter 266. 38–75 m; 200/400 mesh
8. (a) 30 (b) 3.3 (c) increase
9. eithersome concentrations are inaccurate or some ionic material was not detected.
10. 38.0%
12. (b) 29 ng/mL
14. (a) (b) 8.0 mA, 0.16 A
16. (b)
17. (a) 40.2 mL (b) 0.53
18. 0.16
19. (a) 2 000 Da (b) 300 Da
20. (a) 5.7 mL (b) 11.5 mL (c) Solutes must be adsorbed.
21. 320 000
26. (a) 0.167 mm (b) 0.016 s (c) 0.000 40 s (d) 0.064 s
29. (a) (b) 1.17 m
30. (a) 29.5 fmol (b)
31. (My measurements are about 1/3lower than the values labeled in the figure from the original source.)
32. (a) maleate (b) Fumarate is eluted first. (c) Maleate is eluted first.
33. (a) pH 2: 920 s; pH 12: 150 s (b) pH 2: never; pH 12: 180 s
34. (a)(b) (c) (d) Increasingvoltage decreases migration time, giving bands less time to spread apartby diffusion.
36. 30 m1.35 � 104 plates,
�120 kV/�28 kV � 0.48N120 kV/N28 kV � 4.3(observed ratio � 3.9)t120 kV/t28 kV � 4.3
4.1 � 103 plates9.2 � 104 plates,
3.00 � 103 V
1.15 � 104 Pa
10 m
3.8 � 102 h
anion charge � 0.001 59 M;cation charge � 0.002 02 M,
tG � 11.5 minm � 4.7 mg,F � 4.7 mL/min,k* � 12.9,�
�
237 S 84C5H10N�m/zMH�,m/z
C6H5CO2HBH�m/z
glucuronidek¿ � 1.3tm � 0.38 min
0.27 m2
Answers to Problems AN9

37. 20.5 min
38.
39.
40.
41. Thiamine ismost soluble.
42. Cyclobarbital and thiopental each separate into two peaks becauseeach has a chiral carbon atom.
44. 5.55
41. (c) (d) 1.6
Chapter 279. 38 Hz/ag;
10. 0.022 86 M
11. 1.94 wt%
12. 225.3 g/mol
13. 0.085 38 g
14. 50.79 wt%
15. 0.191 4 g calcium carbonate, 0.107 3 g calcium oxide
16. 104.1 ppm
17. 7.22 mL
18. 0.339 g
19. (a) 19.98%
20. 14.5 wt% 14.6 wt%
21. 40.4 wt%
22. 22.65 wt%
23. (a) 40.05 wt% (b) 39%
24. (a) 1.82 (b) Y2O2(OH)Cl or Y2O(OH)4
25. (b) 0.204 (�0.004)
NH4ClK2CO3,
1 ag � 6 000 molecules
ntheory � 2.06 � 105nobs � 1.45 � 105,
thiamine 6 (niacinamide � riboflavin) 6 niacin.
2.0 � 105 plates
z0 � 3.28
heavy chain � 23 500 Dalight chain � 17 300 Da,
26. (a) 5.5 mg/100 mL (b) 5.834 mg, yes
27. (a) Fe (98.3%), Pb (104.0%), Cd (98.6%), In (97.6%), Cr Mn Co (6.4%), Ni , and Cu (b) and (c) 10
32. 11.69 mg 2.051 mg
33.
34.
35. 10.5 wt%
36.
37. 12.4 wt%
38. (a) 95% confidence: (Experiment 1),(Experiment 2) (b) difference is not significant
(c) (d) 4.35%
Chapter 283. (a) 5% (b) 2.6%
4. 1.0 g
5. 120/170 mesh
6.
7. (a) 15.8 (b) 1.647 (c) 474–526
8. 95%: 8; 90%: 6
9. (a) 5.0 g (b) 7
10.
11. (a)(b) (c) 3.28%;
0.131%
12. Zn, Fe, Co, Al
13. prevents possible explosion
17. (a) 53
18. 64.90 wt%
K2CO3:Na2CO3:2.33 � 1042.24 � 107 particles
K2CO3: 4.29 g,8.94 � 105 particles;Na2CO3: 4.47 g,
0.34 � 0.14 pg
104 � 0.99%
24.295 mg BaSO4
Cl10.770 � 2.293 molCl10.160 � 1.936 mol
C8H9.06�0.17N0.997�0.010
C4H9NO2
SO2 � HBr � HClC8H7NO2SBrCl � 914O2 S 8CO2 � 5
2H2O � 12N2 �
H2OCO2,
In3�Cd2�,Pb2�,Fe3�,(44.2%)(6 0.3%)(36.5%),(6 0.3%),
AN10 Answers to Problems

Index I1
A (ampere), 9t, 271Å (angstrom), 11tA (activity), 143a (atto), 10t� (fraction of association), 166� (fraction of dissociation), 164� (fractional composition equations),
191–192, 221t�Y4 (fraction of EDTA in form Y4),
232–233Ablation, 453Abscissa, 10Absolute reference, 35Absolute uncertainty, 44Absorbance, 381, 382b, 424
accuracy, 384corrected, 70, 126mixture, 402Spectronic 20 scale, 40i
Absorption, 27, 633atomic, 455icross section, 378i, 400plight, 380ispectrum, 382, 383d
Absorptivity, 381Accuracy, 39, 43, 54m, 81m, 84ACES, 175tAcetaldehyde hydration number,
140tN-2-Acetamido-2-aminoethanesulfonic
acid, 175tN-2-Acetamidoiminodiacetic
acid, 174tAcetaminophen, 360, 490Acetanilide, 640Acetate:
hydration number, 140tocean floor, 270
Acetic acid, 4m, 12, 113b, 174t, 635
hydration number, 140tnonaqueous titrations, 218
Acetic anhydride, 608Acetoacetic acid, 289tAcetone:
chemical ionization, 487eluent strength, 563textraction, 656hydration number, 140tultraviolet cutoff, 563t
Acetonitrile:aprotic solvent, 107mchromatography solvent, 576disposal, 576m, NR16 (25.23)eluent strength, 563t, 579ihydration number, 140tultraviolet cutoff, 563t
Acetophenone, 586pAcetoxyquinoline, 633tAcetylation, 608Acetylene flame, 457tAcetylsalicylic acid, 162m, 556i
Index
Abbreviations
App. = Appendix f = footnote NR = Notes and Referencesb = box i = illustration p = problemd = demonstration m = marginal note t = table
Acid:amphiprotic, 184Brønsted-Lowry, 105carboxylic, 110conjugate, 105, 112–114, 161, 167definition, 105digestion, 650, 651–652, 654–655diprotic, 181–188, 221tdisposal, 21bdissociation constant, 109, 112–114,
161, App. Gerror, 311intermediate form, 184, 188–189Lewis, 103, 229mine drainage, 96, 108inature of H�, 106pH scale, 108pickling, App. KpKa, 161polyprotic, 112–114, 188–189primary standard, 216, 217train, 108i, 250, 260, 261i, 310bsolvent extraction, 503–504strong, 108t, 109, 159–161, 214btitration of dibasic compound,
206–208titration of strong base with strong
acid, 200–201titration of weak acid with strong
base, 202–204titration of weak acid with weak
base, 218–219titration of weak base with strong
acid, 205–206tooth decay, 257triprotic, 221tultrapure, 123busing App. G, 162wash, 27weak, 110–114, 162–166
Acid-base:blood chemistry, 312tequilibria, 105–114, 159–176,
181–195, 251–254titration, 124, 199–221titration spreadsheet, 218–221, 221t
Acidic flux, 653Acidic pH, 108Acidity, 209bAcidity function, 214bAcridine yellow, 391iAcrylamide, 441, 601i, 662p3-Acrylamidophenylboronic acid, 441Acrylic acid, 177pACS reagent, 123bActinide extraction, 656mAction line, 81bActivation energy, 113b, 351Activity, 143
calculations, 146chloride in 1 M KCl, 323peffect on buffers, 173
equilibrium constant, 143free energy, 304–305gradient (free energy), 293pHenderson-Hasselbalch
equation, 169pH calculation, 147relation to free energy, 293p
Activity coefficient, 143, 145i, 146i,254–257
ammonia, 146mcarbon dioxide, 146mcharge balance, 148mcharge effect, 145Davies equation, 254extended Debye-Hückel equation,
144, 155pGran plot, 211–212ionic size effect, 144–145ionic strength effect, 145, 146iion pair, 146mKw, 147mass balance, 149mneutral compound, 146Pitzer equation, NR4 (8.7)spreadsheet, 145table, 144ttemperature dependence, 155p
ADA, 174tAdams, B. A., 508mAddition:
propagation of error, 44–45significant figures, 40–41uncertainty, 49t
Additive:food, 63bHPLC solvent, 560i, 568
Adduct, 103Adenosine triphosphate (ATP), 229,
293p, 435bAdenylate kinase, 601iAdjusted retention time, 509, 522bAdrenal cell, 270iAdrenal gland, 18pAdrenaline, 18p, 114, 321Adsorbent, 548Adsorption, 27, 632
chromatography, 507i, 508, 566ielectrode, 365bglass, 318mindicator, 133, 134ttime, 522btube, 548i
Advanced equilibrium calculations,250–265
Aequorin, 397Aerosol, 456, 457i, 460Affinity chromatography, 507i, 508,
602–603Agar, 277Agate mortar, 650Air:
density, 24, NR1 (2.11)
H2O2 analysis, 411initrogen content, 60pollution, 336refractive index, 438m
Airport security, 487Airway gas measurement, 379mAjax, 650Alanine, 181i, 182t
isoelectric pH, 193isoionic pH, 193
Albumin, diffusion coefficient, 513tAlcohol:
electrochemical detection, 574oxidation, 338
Aldehyde, 338, 659Aldolase, 625pAliquot, 8, 645Alizarin red S, 134tAlizarin yellow, 215tAlkali flame detector, 544Alkali metals, reduction, 363Alkaline error, 311Alkalinity, 209bAlkane, 14Alkylammonium ion
exchanger, 590tAltitude effect on weight, 37pAlumina:
chromatography stationaryphase, 534
drying agent, 31tmortar, 650
Aluminosilicate, 534iAluminum:
atomic absorption analysis, 460EDTA titration, 245electrolytic production, 349mgravimetric analysis, 630t, 636hydroxide, 634hydroxide complexes, 179pglass, 38pmasking, 8m, 245natural water, 260, 261ioxide, 460
Alzheimer’s disease, 260Amalgam, 336, 363Amberlite, 590tAmbient temperature, 23American Chemical Society, 123bAmide, 167i, 228Amine, 111Amino acid, 180, 181, 182t
electrophoresis, 625penantiomers, 533bisoelectric pH, 193isoionic pH, 193pH calculations, 181–188sequence, 474titration in ribonuclease, 199
p-Aminobenzoate, 599iAminocarboxylic acid, 2301-Aminonaphthalene, 401p

I2 Index
1-Aminooctane, 5853-Aminopyridine, 418p5-Aminoquinoline, 554pAmino stationary phase, 561, 579tAmmeter, 349iAmmonia:
acid-base chemistry, 15activity coefficient, 146manalysis, 659tauxiliary complexing agent,
239–241, 244biochemical oxygen demand, 339bbuffer, 175tchemical ionization, 477, 487critical constants, 568telectrode, 316emissions, 250hydration number, 140thydroxide, 15Kjeldahl analysis, 124–125principal species, 190reaction with water, 97spectrophotometric analysis, 398pthermal conductivity, 542ttotal oxygen demand, 338btrapping, 659t
Ammonium acetate, 569Ammonium bifluoride, 311Ammonium carbonate, 634Ammonium chloride, 459, 634mAmmonium hexanitratocerate(IV),
338Ammonium ion, 111
analysis, 659tfield effect transistor, 321gravimetric analysis, 630thydration number, 140tion exchanger, 590tion pairing, 165f
Ammonium nitrate, 459, 634Ammonium nitrite, 60Amount of substance, 9tAmpere, 9t, 271, 349Amperometric detection, 348, 614Amperometry, 357–361, 614i, 645iAmphiprotic species, 184Ampholyte, 194bt-Amyl methyl ether, 553pAmylose, 334Analine hydrochloride, 137pAnalysis on a chip, 620–622Analyte, 3Analytical balance, 22–25Analytical chromatography, 511Analytical separations, 501–523Analytical standards, App. KAnalytical variance, 646mAnemia, 260Angiotensin, 562iAngstrom, 11tAnhydrone, 31tAnhydrous, 14Aniline, 137p, 375pAnilinium, 120p, 420pAnimal tissue, 655Anion chromatography, 594Anion exchanger, 589Anode, 275, 603mAnodic depolarizer, 355mAnodic wave, 367Anoxic water, 138pAntarctica, 427bAntarctic snow, 594mAnthracene, 395i, 572iAnthropology puzzle, 453Antibody, 20, 229–230, 357m, 402,
411, 602, 603, 604Antibonding orbital, 388
Antifreeze, 18pAntigen, 229, 357m, 411, 602Antilogarithm:
definition, 41significant figures, 41uncertainty, 47–48
Antimony:emission spectrum, 391bfurnace atomic absorption, 460permanganate titration, 337t
Apigenin, 580Apotransferrin, 126Apparent mobility, 607, 609Appendix G (how to use), 162Apple pH, 108i“Approximately equal to” symbol,
15m“Approximately” symbol, 16mApproximation, successive, 152mAprotic solvent, 107mAptamer, 413Aqua regia, 651Aquarium, 138p, 467–468Aqueous solution, 3m, 12Aragonite, 120p, 296pArchaeology, 13, 14iArchiving, 645Area, Gaussian peak, 542Argentometric titration, 133Arginine, 182t, 190Argon:
critical constants, 568tdiscovery, 60isotope abundance, 479treactivity, 469msupercritical fluid extraction, 656thermal conductivity, 542t
Arsenate, 94pprecipitation titration, 134t
Arsenic:atomic absorption, 458–459drinking water, 1iodimetric titration, 341tiodometric titration, 343tpermanganate titration, 337tremoval, 634msoil analysis, 661p
Arsenic(III) oxide, 137p, 341Arsenite, 1, 94pArsR, 1Ascarite, 637Ascorbate, 369Ascorbic acid, 136p, 232b, 245b, 328t,
341t, 343, 360, 371d, 386formal reduction potential,
289–291, 289tAsh, 629Ashing, 654Ashless filter paper, 30Asparagine, 182tAspartic acid, 182tAspiration, 454Aspirator trap, 30iAspirin, 162m, 556Aston, F. W., 474mAsymmetric band (chromatography),
514, 515i, 521, 569Asymmetric bend, 389iAsymmetric stretch, 389iAtmosphere:
carbon dioxide, 427bpressure, 11t
Atmospheric pressure chemicalionization, 490–491
Atomic absorption, 9, 454Atomic emission, 454i, 455, 460
detector, 546Atomic fluorescence, 454i, 455, 456b
Atomic mass, 12, 476b, 629Atomic number, 629mAtomic oxygen, 328tAtomic spectroscopy, 453–468
absorption, 454atomization, 454, 456background correction, 465–466burner, 456–457comparison of methods, 468tdetection limits, 461t, 466direct solid sampling, 459emission, 454i, 455fluorescence, 454i, 455graphite furnace, 457hollow-cathode lamp, 454inductively coupled plasma,
460–461, 463–464, 468instrumentation, 462–466interference, 466–468linewidth, 462–463multielement detection, 463–464precision, 468tspectrometer, 455itemperature effect, 461–462
Atomization, 454, 456Atom transfer, 328bATP, 229, 293p, 435bAttention deficit disorder, 561iAttenuated total reflectance,
439–440Atto, 10tAutoclave, 655iAutomobile:
exhaust, 545ioxygen sensor, 359b
Autoprotolysis, 107Autosampler, 454Autotitrator, 209Auxiliary complexing agent, 238–241,
243i, 244Auxiliary electrode, 353Average, 54AVERAGE (Excel), 55Average capacity factor, 582bAvogadro’s number, 12, 52p,
NR2 (3.2)Azeotrope, 217tAzide, 339b, 564iAzobenzene, 375p
� (buffer capacity), 172� (cumulative formation constant),
104b�-Blocker, 616i�-Emission, 487Background correction (atomic
spectroscopy), 465–466Background electrolyte, 610mBackplate, 485iBack titration, 122, 244Bacteria, 138pBad data, 65Baking soda pH, 108iBalance, 22–25, 629i
weights, 24tBalancing redox equations, App. DBall mill, 650Band broadening:
chromatography, 513–522electrophoresis, 604–605spectrophotometry, 431i
Band gap, 437mBand-pass filter, 433iBand shape:
chromatography, 515i, 521,569–570
electrophoresis, 612–613Band spreading, 516–522
Bandwidth:atomic spectroscopy, 462mchromatography, 522bmonochromator, 431
Bangladesh, 1, 634mBar, 11tBarbital, 662pBarbituric acid, 178pBardeen, J., 629mBarium:
gravimetric analysis, 630t, 634permanganate titration, 337t
Barium chloride hydrate, 118pBarium hydroxide, 109tBarium oxalate, 260–262Barium oxide (drying agent), 31tBarium sulfate, 244–245,
632m, 634Barium titanate, 663pBarton-on-Humber, 528Basal metabolism, 11, 293pBase:
alkali metal equilibria, 109talkaline earth equilibria, 109tamines, 111Brønsted-Lowry, 105conjugate, 105, 112–114,
161, 167definition, 105diprotic, 183, 221tdisposal, 21betching glass, 26hydrolysis constant, 109t,
110, 161intermediate form, 184Lewis, 103, 229nature of OH, 106pH scale, 108pKb, 161polyprotic, 112–114, 188–189primary standard, 216, 217treaction with glass, 216solvent extraction, 503–504strong, 108t, 109, 159–161titration of dibasic compounds,
206–208titration of strong base with strong
acid, 200–201titration of weak acid with strong
base, 202–204titration of weak acid with weak
base, 218–219titration of weak base with strong
acid, 205–206triprotic, 221tweak, 110–114, 166–167
Baseline separation, 83Baseline spectrum, 384, 425Base peak, 477Basic flux, 653Basic pH, 108Bates College, 2Battery, NR6 (14.5)
mercury, 292pnickel-metal hydride, 295ppH, 108i
Bauxite, 260B cell, 603BD ion-exchanger, 591tBead:
fluorescent, 158ion-exchange, 644
Beam chopper, 425, 425i, 449, 465Beamsplitter, 443, 446Beckman, A., 307mBeckman pH meter, 307mBecquerel, H., 629mBeer, 348, 530i
Index I3
Beer’s law, 381, 382–383, 382b,385–387, 462m
history, NR11 (18.6)mixture, 402
Belousov-Zhabotinskii reaction, 302dBending, molecular, 389iBenzene:
hydration number, 140tionization energy, 477imass spectrum, 479irefractive index, 438mresonance structures, 114mretention index, 537tuse, 502f
Benzene-1,4-diammonium cation,595m
Benzenethiol, 289tBenzoate, 119p, 161, 598Benzoic acid, 119p, 161, 190Berson, S., 411mBeryllium:
gravimetric analysis, 634masking, 245
Beta particles (rays), 543Bias, 319Bicarbonate, 250
blood test, 312treference buffer, 308t
BICINE, 175tBidentate C18, 561mBidentate ligand, 229Bifluoride, 311Bilayer, 611, 611iBindschedler’s green leuco
base, 243iBinning, 436mBio-Gel P, 600BINOMDIST, 555pBinomial distribution, 555pBinomial expansion, 555pBiochemical oxygen demand (BOD),
339b, 439Biochip, 621–622Biorecognition, 402Biosensor, 1, 357, 402, 439, 645i,
NR9 (17.8)Biphenyl, 479iBipotentiometric titration,
371, 371dBis(aminoethyl)glycolether-
N,N,N�,N�-tetraacetic acid, 230iBis(benzylimido)perylene, 392i(Biscyanopropyl)(cyanopropyl-
phenyl)polysiloxame, 532tN,N-bis(2-hydroxyethyl)glycine, 175tBismuth:
masking, 245oxidation states, 327, 347ppermanganate titration, 337t
Bismuthate, 328t, 335Bismuth strontium calcium copper
oxide, 347pBismuth strontium calcium yttrium
copper oxide, 3271,3-Bis[tris(hydroxymethyl)methyl-
amino]propane, 174t, 175tBIS-TRIS propane, 174t, 175tBisulfide, 314Bisulfite, 171d, 341, NR4 (9.10)Bjerrum, N., 263mBjerrum plot, 263–265Blackbody, 426b, 427Blackbody radiation, 426b, 427bBlank, 80
distribution, 85iKarl Fischer titration, 371reagent, 386sample, 43m
solution, 69, 70mtitration, 122
Blanket, 22Blaze angle, 429i, 431Bleach, 169Bleaching, 435bBleed, 531Blind sample, 78, 81Blocking, 242Blood:
chemistry, 311–312clotting, 53i, 298, 358bgenetic analysis, 621–622glucose monitor, 357–361kidney dialysis, 632bmicrodialysis, 556nitrogen content, 125toxygen sensor, 358bpH, 108iplasma, 385red cell count, 53sample cleanup, 658serum, 385serum iron determination, 385–387siloxanes, 501urea nitrogen, 312t
Blooming, 464Blue cone, 457iBNC connector, 277mBOD, 339b, 439Boltzmann distribution, 461Bomb, 125, 651, 654, 656Bond:
coordinate covalent, 103dative, 103
Bonded phase, 531, 561, 579–580,579t
Bone, 260, 528Borate:
buffer preparation, NR17 (26.32)flux, 653tvolatilitiy, 651
Borax:dehydration, NR5 (11.16)flux, 628, 653primary standard, 217treference buffer, 308t
Boric acid, 19p, 175tBoric oxide flux, 653tBorides, 651Borohydride, 134t, 328tBoron carbide mortar, 650Boronic acid, 441Boron isotopes, 479tBorosilicate glass, 33Bottle, weighing, 23, 31iBound nitrogen, 339bBovine serum albumin, 619i, 626pBradford protein analysis, 74pBrazil nut, 396–397Breakdown, 319mBreast implant, 501Breast tumor, 74pBreath, 379m, 424British thermal unit, 11tBroadening, absorption band, 431iBromate, 94p, 302d, 328t, 343t,
346p, 367, 500pBromide:
field effect transistor, 321gravimetric analysis, 630tion-selective electrode, 314tpermanganate titration, 337tprecipitation titration, 134t
Bromine:bromine chloride, 456biodometric titration, 343tisotope abundance, 479t
isotope patterns, 480ioxidant, 328tprimary standard, 346preaction with cyclohexene, 355redox potentials, 295prefractive index, 438m
Bromine chloride, 456bBromite, 500pBromobutane, 480iBromocresol green, 215tBromocresol purple, 215tBromophenol blue, 134t, 383dBromopyrogallol red, 243iBromothymol blue, 215tBronze, 465iBrønsted, J. N., 105mBrønsted-Lowry acids and bases, 105Btu (British thermal unit), 11tBubble cell, 614, 614iBuckminsterfullerene, 368iBuffer, 167–176
acid-base titration, 202–203,205–206
activity effects, 173capacity, 172, 204chromatography/mass spectrometry,
488mdiprotic, 187–188gradient formation, 194bHenderson-Hasselbalch equation,
168HPLC, 564m, NR16 (25.9)ionic strength effect, 173, 174fmetal ion, 318method of operation, 171, 171dNIST standard, 308tpH 7.00, 324phosphate pH, 254pH range, 173preparation, 172primary standard, 254table, 174ttemperature dependence, 173, 174fultraviolet absorbance, NR17
(26.32)volatile, 574
Bulb, pipet, 28Bulk sample, 645, 650Buoyancy, 24Buret, 25–26
calibration, 38, 42i, 43cleaning, 26history, 121reading, 40tolerance, 25t, 43uncertainty, 45
Burner, 457Butane, ionization energy, 477iButanol, 537tButene, ionization energy, 477itrans-Butenedioic acid, 192in-Butylaniline, 570iButyl bonded phase, 579tBuzzer, 165d
c (centi), 10tc (speed of light), 379C (coulomb), 10t�C, 11tC60, 368iCacodylic acid, 197pCadmium:
amine complexes, 229electrode, 302iodimetric titration, 341tion-selective electrode, 314, 316mmasking, 245polarogram, 363i, 365i
reductor, 336spectrophotometric analysis, 504d
Cadmium selenide, 601–602Cadmium sulfide, 314, 315iCaffeine, 2, 6t, 603bcal (calorie), 11tCalcein, 397Calcite, 137p, 250, 296pCalcium:
blood test, 312tbuffer, 318EDTA complex, 234EDTA titration, 235i, 245bfield effect transistor, 321fluorescence analysis, 397gravimetric analysis, 630t, 634ion-selective electrode, 316mpermanganate titration, 337tvolumetric analysis, 123water hardness, 245b
Calcium carbonate:chromatography, 506mequilibria, 120plaser ablation, 470limestone and marble dissolution,
250mussel shell, 470paper mill, 96rivers, 150b
Calcium fluorapatite, 345pCalcium fluoride, 257–260Calcium gluconate, 245, 651mCalcium halophosphate, 391bCalcium hydroxide, 109tCalcium hydroxyapatite, 257Calcium oxalate, 123Calcium salicylate (ignition), 634Calcium sulfate:
Drierite, 31tsolubility, 101i, 141, 151–153
Calibration:buret, 38, 42i, 43check, 81glass electrode, 308–309glassware, 31–33, 38internal standard, 90–91inverse, NR2 (4.7)isotope dilution, 500pmass spectrometer, 481nonlinear, 397ipH electrode, 310bstandard addition, 87–90, 317ultraviolet absorbance standard,
432tCalibration curve, 5, 6i, 65, 69–71,
70i, 71b, 386–387, 574linear, 69–71nonlinear, 69i, 71b
Calmagite, 241d, 242tCalomel electrode, 300Calorie, 11, 11m, 11t, 18–19pCamera, 436mCancer, 1, 10, 229–230Candela, 9tCantilever, 20Caoutchouc, 121Capacitance, 10t, 369Capacitor current, 364Capacity factor, 509
average, 582bCapacity ratio, 509mCapillary, 604iCapillary electrochromatography,
588, 618Capillary electrophoresis, 603–620
apparatus, 604iapparent mobility, 607, 609books, NR17 (26.17)

I4 Index
Capillary electrophoresis (Cont.)capillary electrochromatography,
588, 618capillary environment, 610–611capillary gel electrophoresis,
618–619capillary preparation, 610capillary wall coating, 611capillary zone electrophoresis, 615charge ladder, 608, 626pchiral analysis, NR17 (26.39),
NR18 (26.46)Cl isotope separation, 614–615detection limit, 615mdetectors, 613–615electroosmosis, 606–607electrophoresis, 605enantiomer separation, 616high voltage, 610iinjection, 611–612internal standard, 608mass spectrometry, 490, 490imethod development, 620micellar electrokinetic chromatog-
raphy, 615, 616mobility standard, 608nonaqueous solvent, NR17 (26.38),
NR18 (26.53)normalized peak area, 607organic solvents, 616peak area, 607peak shape, 612–613peak width, 605iplates, 604–605, 609quantitative analysis, 607resolution, 604–605, 610sample buffer, 612sample injection, 611–612separation modes, 615–619stacking, 612–613, 616surfactant, 616sweeping, 616–618theoretical plates, 609van Deemter equation, 518mzone electrophoresis, 615
Capillary gel electrophoresis, 618–619Capillary zone electrophoresis, 615CAPS, 175tCapsule (elemental analysis), 639Carbides, 651Carbohydrate, 18–19p, 402, 574, 599iCarbon:
analysis, 638–640carbon-13, 528electrode, 301, 358ienvironmental, 338binorganic, 338bisotopes, 479t, 482b, 528molecular sieve, 548organic, 338bporous graphitic, 562
Carbonate:analysis, 659tEDTA titration, 245flux, 653gravimetric analysis, 630tisotopic composition, 482blimestone and marble dissolution,
250precipitation titration, 134treference buffer, 308ttitration curve, 225ptransferrin binding, 126ivolatility, 651
Carbon dioxide:acidity, 113b, 214dactivity coefficient, 146matmospheric, 96, 150b, 427b
blood test, 312tcarbonic acid, 113bcollection by ion exchange, 659tcritical constants, 568tdissolved, 108electrode, 316exclusion from basic solutions, 216field effect transistor, 321Gran plot, 212isotopic composition, 482boptical sensor, 420ppH, 196pphase diagram, 568brespiration, 96, 379mring-down spectroscopy, 424separation, 534supercritical fluid, 568b, 656thermal conductivity, 542t
Carbon disulfide, diffusioncoefficient, 513t
Carbon-fiber electrode, 369Carbonic acid, 113b, 225pCarbonic anhydrase, 113b, 562i, 608,
619i, 626pCarboniferous era, 628Carbonization, 654Carbon monoxide, 180i, 359bCarbon tetrachloride, 502f, 513tCarbonyl, 659Carbowax, 532tCarboxylate anion, 110Carboxylic acid, 110
ion exchanger, 590toxidation, 338
Carcinogen, 502fCarius digestion, 654Carrier gas, 528, 537–538,
542, 543Cary 3E spectrophotometer, 425iCasein, 494bCatalyst, 125, 638Catalytic converter, 359bCatalytic oxidation, 338bCatalytic stripping, 366–367, 368Cathedral, 250Cathode, 275, 603mCathodic depolarizer, 355mCathodic wave, 367Cation chromatography, 593Cation exchanger, 311i, 589Cavity ring-down spectroscopy, 424CCD, 436–437, 464cd (candela), 9tCefotaxime, 83iCell:
blood, 53classification, 474flow, 571galvanic, 274line notation, 277mass measurement, 474membrane, 228positioning error, 385separation by isoelectric focusing,
194bsingle-cell analysis, 604
Cell separation, 194bCellulose, 164b, 590Celsius, 11tCement, 459, 653Centi, 10tCentigrade, 11tCentrifuge, 3Centrifuge tube, 4iCentripetal force, 476bCeric ammonium sulfate, 338Ceric hydroxide, 339Ceric oxide, 339
Cerium:formal potential, 337gravimetric analysis, 630tiodometric titration, 343toxidation of malonic acid, 302dpermanganate titration, 337tpotentiometric titration calculations,
327–331standardization, 338
Cerium(IV)electron transfer, 328boxidant, 328t, 337–339titrations, 337–339
Cesium, EDTA titration, 249pCesium bismuth iodide, 249pCesium bromide, 384mCesium chloride, 467Cesium hydroxide, 108tCesium iodide, 384mCetylpyridinium chloride, 423pCetyltrimethyammonium ion, 598bCH5
�, 477iChain of custody, 81Characteristic, logarithm, 42Charge:
balance, 148electric, 10t, 271ladder, 608, 626pprecipitate, 133relation to current, 349
Charge coupled device, 436–437, 464Charge injection device, 464Charging current, 363i, 364Charring, 458CHART (Excel), 35–36, 51p, 72Chatechin, 580Chela, 229mChelate:
calcein, 397cancer treatment, 230definition, 229effect, 229etymology, 229mextraction, 504–505, 504d, 506bsupercritical CO2 extraction, 656m
Chelating ligand, 229Chelation therapy, 232bChelex 100, 658Chem 7 test, 312Chemical Abstracts, 2mChemical concentration, 12–14Chemical gel, 618Chemical hazard label, 21iChemical interference, 467Chemical ionization, 477–478Chemically-pure-grade chemical, 123bChemical oxygen demand,
338b, 376pChemical-sensing field effect
transistor, 320–321Chemical waste, 21, 21bChemiluminescence, 339b, 397, 411CHES, 175tChicago, 18pChip, capillary electrophoresis,
620–622Chiral chromatography, NR16 (26.3)Chiral separation, 561iChiral stationary phase, 533b, 584pChlor-alkali process, 374pChloramine T, 328tChloramphenicol, 377pChlorate:
dichromate titration, 339drinking water, 500p
Chloride:diffusion coefficient, 513tgravimetric analysis, 629, 630t
ion-selective electrode, 314tprecipitation titration, 134tsolvation, 140
Chlorine:chemical ionization, 487generation by electrolysis, 374piodometric titration, 343tisotope abundance, 479tisotope patterns, 480iisotopic separation, 615ioxidant, 328t, 651thermal conductivity, 542t
Chlorine dioxide, 328tChlorine monoxide, 378Chlorine nitrate, 378Chlorite, 94p, 500pChloroacetic acid, 120pChloroethane, hydration number, 140tChlorofluorocarbon, 378, 426b, 543iChloroform:
eluent strength, 563tpreservative, 341ultraviolet cutoff, 563tuse, 502f
Chlorophenol red, 215tN-p-Chlorophenylcinnamohydroxamic
acid, 634Chlorotrimethylsilane, 561mChocolate, 2, 6tCholesterol, 528Choosing sample size, 648Chopper, 425, 425i, 465Chopping, beam, 449Chromate:
EDTA titration, 245electrophoresis indirect detection,
615homogeneous precipitant, 633toxidant, 339precipitation titration, 134tremediation, 327m
Chromatogram, 5, 5i, 508reconstructed total ion, 491i, 492selected ion, 491–492, 491i
Chromatograph, 529i, 556, 557iChromatography, 4, 4i, 506–523,
528–551, 556–583, 588–603additives for mass spectrometry,
488–495adjusted retention time, 509, 522badsorption, 507i, 508, 566iaffinity, 507i, 508, 602–603alternate pumping, 515ianalytical, 511asymmetric band, 514, 515i, 521band shape, 512i, 513–522band spreading, 516–522bandwidth, 522bbonded phase, 561buffers for mass spectrometry, 488capacity factor, 509chiral separation, 561i, 569b,
NR16 (26.3)co-chromatography, 541column, 506i, 520, 528–535, 559column equilibration, 568dead space, 517detector, 541–546, 543t, 571–575,
597detector variance, 517diffusion, 513Donnan equilibrium, 592eddy diffusion, 520mefficiency, 511–516electrochemical detector, 348eluate, 507eluent, 507elution, 507
Index I5
equipment, 529, 556, 557ifinite equilibration time, 519flow rate, 508, 518i, 520mgas, 528–551gas-liquid partition, 528gas-solid adsorption, 529Gaussian bandshape, 511–512gel, 591t, 600, 601igel filtration, 508, 599gel permeation, 508, 599gradient elution, 565, 569b, 571t,
582, 593, 593iguard column, 559H.E.T.P. (height equivalent to a
theoretical plate), 514high-performance, 556–583history, NR14 (23.2)HPLC, 556–583HPLC column selection, 566–567hydrophilic interaction, 567hydrophobic interaction,
567, 567iindustrial, 511injector variance, 517inorganic ion exchangers, 593internal standard, 542ion, 594–597ion exchange, 507i, 508, 566i,
589–594ion-exchange gels, 590m, 591tion-exchange resins, 590tion exchangers, 589–591ion-exchange selectivity, 590t,
591, 592tion exclusion, 593ion pair, 598–599isotopic separation, 515iKav, 600longitudinal diffusion, 518mass spectrometer interface,
488–495mass transfer, 519method development, 579microporous particles, 559microscopic description, 522bmobile phase, 506molecular exclusion, 507i, 508,
566i, 599–602molecularly imprinted polymer,
603bmolecular mass determination,
601–602multiple flow paths, 520normal phase, 563, 566iopen tubular column, 510, 529–534,
550toverloading, 521particle size, 558ipartition, 507i, 508partition coefficient, 510peak broadening, 523bplate height, 514, 523b, 537iplate number, 514precolumn, 559preconcentration, 658–659preparative, 511, 594quantitative analysis, 541–542recycle, 515irelative retention, 509, 510resolution, 511–512, 515–516retention time, 509retention volume, 509, 511reversed phase, 563, 566iscaling, 511, 557, 582bsilanization, 521, 561msimulation, NR16 (25.7)solvent, 563standard deviation, 522b
stationary phase, 506, 531, 532t,559–562, 600–601
summary of equations, 516tsupercritical fluid, 568bsuperficially porous particle, 562tailing, 521, 560i, 565temperature effect, 519, 536theoretical performance, 554ptheoretical plate, 514, 523btypes, 507–508van Deemter equation, 517, 518ivoid volume, 600
Chromatography/mass spectrometry,488–495
chromatos, 506mChromium:
disposal, 21bgravimetric analysis, 630thydrolysis, 197poxidation states, 327, 345p
Chromium(II), 328t, 335Chromium(II) chloride, 336Chromium(III) hydroxo complexes,
197pChromium(III) oxide, 639Chromium(IV), 327Chromium(VI) oxide, 651Chromium hydrolysis, 178pChromophore, 164b, 382Chromous chloride, 336Chymotrypsin, 167iCID, 464Cigarette smoke, 323p, 659Circuit, 274iCircular reference (spreadsheet), 269pCitrate, 632mCitric acid, 174tCitrulline, 413Cladding, fiber-optic, 438iClark electrode, 358bClass A/Class B glassware, 27iClaw, 229mCleaning solution, 26, NR1 (2.13)Clean room, 645Climate, 395bClock reaction, 171dClotting, 53, 298, 358bCluster ion, 106iCM ion-exchanger, 591tCoagulation, 632Coat, laboratory, 21Coating, capillary wall, 611Cobalt:
gravimetric analysis, 630tmasking, 245permanganate titration, 337t
Cobalt oxide (Co3O4), 639Cocaine, 166, 586pCo-chromatography, 541Cocoa, 6tCOD (chemical oxygen demand),
338b, 376pCoefficient of variation, 54, 85bCoffee, 6t, 468, 469iCoffee can, 514mCoherence, 428Coin, 13, 14iCo-ion, 613Cola, 348Cold trapping, 540Cold vapor atomic fluorescence,
456bCollimation, 428m, 429, 572Collisionally activated dissociation,
489i, 490, 493Collision cell, 469, 492, 492iCollision cross section, 499pCollision gas, 492i
Collision-induced dissociation, 490Colloid, 195, 245b, 630, 632d, 632iColor, 380i, 382, 383d, 383tColor code (voltmeter), 277Colorimetry, 379Column (chromatography):
cleaning HPLC column, NR16(25.14)
equilibration, 568gas chromatography, 528–535, 550theater, 559liquid chromatography, 557i, 559open tubular, 507, 510, 520,
529–534packed, 507, 520porous-layer, 529, 534pressure, 558pressure programming, 536selection in HPLC, 566–567support-coated, 529tailing, 531temperature programming, 536theoretical performance, 554pwall-coated, 529washing, 568
Combination electrode, 306Combustion:
acid rain, 260analysis, 629, 637–640catalyst, 638dynamic flash, 638–639gas, 359bisotope analysis, 482bsample preparation, 650
Comma (in numbers), 9mCommon, 277Common ion effect, 101, 102bCompact layer, 365bComparison of means, 59–62, 64–65Complementary color, 382, 383tComplex, sandwich, 360mComplex formation, 102–104, 229
E�, 285spreadsheet, 247p
Complex ion, 102Complexometric titration, 129, 230
spreadsheet, 237–238Composite sample, 7bComposition of precipitates, 634Compound electrode (ion-selective),
316Computer, chromatography method
development, 579Concentrated acid, 652tConcentrating sample, 658–659Concentration, 12–14
polarization, 352, 367mtable, 114–115
Concrete, 245bCondenser current, 364Conditional formation constant,
234, 240bConductance, 273bConduction band, 414bConduction blood test, 312tConduction electron, 318Conductive polymer, 316m, 360bConductivity, 165d, 612,
NR8 (15.30)detector, 571t, 597, 614thermal, 542t
Conductor, 318Cone cell, 435bCone of acceptance, 438iConfidence interval, 44, 57–59,
68m, 72mConfirmation ion, 541Congo red, 215t
Conjugate acids and bases, 105, 112,161–162, 167
Constant-boiling HCl, 225pConstant-current coulometry, 357“Constant mass,” 30–31Constellation image, 464iConstructive interference, 430iContact lens, 21Continuous variation, 408–410Contraction blood test, 312tControl chart, 81b, 82Controlled-potential coulometry, 357Controlled-potential electrolysis, 353Convection, 361Conversion between units, 11Conversion dynode, 475Conversion factors, 11tCoordinate covalent bond, 103Copper:
ammonia complexes, 103mattenuated total reflectance, 440copper(I), 357copper(III), 327, 342bcopper sulfate, 14, 598EDTA titration, 242, 410ielectrode, 302, 348, 574electrolysis, 353–355gravimetric analysis, 630tiodometric titration, 343tion-selective electrode, 314masking, 245, 245bneocuproine complex, 387oxidation states, 327, 342b,
346p, 347preduction of SO3, 638spectrophotometric analysis,
398p, 504dCopper-hydroxide equilibria, 269pCopper hydroxysulfate, 118p, 269pCopper sulfate, solubility, 269pCoprecipitation, 102, 132, 633, 634mCoral, 96, 150bCorona discharge, 474, 490Corona needle, 490iCorrected absorbance, 70, 126Corrected response, 90Correlation coefficient, 83, 84Coulomb, 10t, 271, 349Coulomb’s law, 155pCoulometric titration, 356Coulometry, 355–357
generation of O2, NR9 (17.12)Karl Fischer titration, 370–372mediators, 360
Counterelectrode, 353iCounterion, 613Coupled equilibria, 250Covariance, App. CCracking, 639Creatinine, 312tCremer, M., 306mo-Cresol, 177po-Cresolphthalein complexone, 243iCresol purple, 215tCresol red, 215tCritical angle, 438Critical care profile, 312Critical density, 568tCritical micelle concentration,
598b, 615Critical point, 568bCritical pressure, 568tCritical temperature, 568tCross-linking, 531, 589, 589i, 601iCross section, absorption, 378i, 400pCrown ether, 506bCrucible, 30, 30i, 652Cryogenic focusing, 540

I6 Index
Cryolite, 349mCrystallization, 630Crystal vacancy, 313iC-terminal residue, 180Cubo-octahedron, 534iCumulative formation constant,
104b, 239Cupferron, 504, 630t, 631t, 642pCurie, M., 629mCurie, P., 629mCurrent:
capacitor, 364charging, 364condenser, 364density, 351diffusion, 364electric, 9t, 271faradaic, 364pH meter, 284brelation to coulombs, 349residual, 364rotating disk electrode, 376p
Cuvet, 384, 384iCyanate, 134tCyanide:
analysis, 659tatomic absorption analysis, 473pgravimetric analysis, 630tion-selective electrode, 314tligand, 229masking/demasking, 245, 634precipitation titration, 134t
Cyanoacetic acid, 113bCyano bonded phase, 579tCyanogen flame, 457t(Cyanopropylphenyl)(dimethyl)poly-
siloxane, 532tCyano stationary phase, 561Cyclic GMP, 435bCyclic voltammetry, 367–368Cyclobarbital, 627pCyclodextrin, 533b, 616, 616iCyclohexylaminoethanesulfonic
acid, 175t3-(Cyclohexylamino)propanesulfonic
acid, 175tCysteine, 182t, 289t, 341tCystine, 289tCytochrome a, 289tCytochrome c, 194b, 289t, 493i,
495t, 601iCzerny-Turner monochromator, 429i,
467i
d (deci), 10t� 13C, 482bda (deka), 10tDalton, 476bDark chocolate, 6tData rejection, 65Data types, 79Dating, 533b, 628Dative bond, 103Davies equation, 254DCTA, 230iDead space, 517Dead volume, 570DEAE ion-exchanger, 591tDebye-Hückel equation, 144, 155p,
254iDecant, 3deci, 10tDecision tree, HPLC, 566iDeferiprone, 232bDegeneracy, 461Degrees of freedom, 54, 61, 68Dehydration, glass electrode, 309Dehydroascorbic acid, 136p, 289t, 343
Deionization, 594, 644Deionized water, 594deka, 10tDelaney Amendment, 63bDemasking, 245Dementia, 260Demonstrations:
absorption spectra, 383books, NR3 (6.10)buffers, 171colloids and dialysis, 632common ion effect, 102conductivity of weak electrolytes,
165electrochemical writing, 350extraction with dithizone, 504Fajans titration, 134HCl fountain, 109human salt bridge, 277indicators and the acidity of
CO2, 214ionic strength/ion dissociation, 141Karl Fischer jacks of pH meter, 371metal ion indicators, 241oscillating reaction, 302potentiometric titration, 332potentiometry with oscillating
reaction, 302Denaturation, 619Densitometer, 194bDensity:
air, 24, NR1 (2.11)concentrated acid, 652tcritical, 568tdefinition, 13, 39water, 32t, 33
Density gradient elution, 569bDeoxyribonucleic acid (DNA),
402, 413Depletion region, 319Depolarizer, 355DEPP, 174t, 175tDerivative, 210–211Derivatization, 396, 528i, 547,
572, 659Derived units, 10tDesalting, 600Descroizilles buret, 121Desferrioxamine, 232b, 417pDesiccant, 31Desiccator, 31Desorption time, 522bDESPEN, 174t, 175tDestructive interference, 430iDetection, indirect, 614, 615iDetection limit, 84–87, 572m
atomic spectroscopy, 461t, 466electrophoresis, 615mgas chromatography, 543tion-selective electrode, 316liquid chromatography, 571tstripping analysis, 366t
Detector:alkali flame, 544atomic emission, 546charge coupled device, 436–437chromatography, 541–546, 549,
557i, 571–575, 597conductivity, 571t, 597effect of gradient, 571telectrochemical, 571t, 574electron capture, 543, 549electrophoresis, 613–615evaporative light scattering, 571t,
573–574flame ionization, 542–543,
544i, 549flame photometric, 543t, 544, 549
flow cell, 571fluorescence, 571t, 572indirect, 598infrared, 437, 543t, 571t, 638mass spectrometric, 543t, 571tnitrogen, 544, 549, 571tnitrogen-phosphorus, 543t, 544,
548i, 549photodiode array, 434–436, 436tphotoionization, 544, 549photomultiplier, 433–434, 436trefractive index, 571t, 572–573spectrophotometric, 433–437, 597sulfur chemiluminescence, 543t,
544, 544i, 549thermal conductivity, 542, 543t,
549, 638ultraviolet, 571, 571tvariance, 517
Determinant, 66, 405Determinate error, 42–43Deuterated triglycine sulfate, 437Deuterium lamp, 426, 426i, 465, 571Devonian era, 628Dextran, 590, 591iDextrin, 134dDiabetes, 357Dialysate, 556Dialysis, 194, 556, 632dDiaminoethane, 2292,3-Diaminonapthalene, 396Diaminopropane, 611Diamond electrode, 363m,
NR10 (17.19)Diamond mortar, 650Diaphragm, electrode, 306iDibenzo-30-crown-10, 506b5,7-Dibromo-8-hydroxyquinoline,
630tDichloroacetic acid, 120pDichlorofluorescein, 134Dichloromethane:
eluent strength, 563tultraviolet cutoff, 563t
2,6-Dichlorophenolindophenol, 289tDichromate:
absorbance standard, 432tchemical oxygen demand, 338bdisposal, 21biodometric titration, 343toxidant, 328t, 339redox titrations, 339spectrum, 383d, 419p
N,N-Dicyclohexyl-N�,N�-dioctadecyl-3-oxapentane diamide, 315
Didodecyldimethyammonium ion, 611
Dielectric, 440Dielectric constant, 155f, 155p, 218Diet, ancient, 528Diethanolamine, 370Diethylene glycol monomethyl
ether, 370Diethylenetriaminepentaacetic acid,
230iDiethyl ether:
aprotic solvent, 107mcritical constants, 568teluent strength, 563tionization energy, 477isalting out, 155psolubility in water, 155pultraviolet cutoff, 563t
N,N�-Diethylethylenediamine-N,N’-bis(3-propanesulfonic acid),174t, 175t
N,N�-Diethylpiperazine dihydrochlo-ride, 174t, 175t
Difference plot, 263–265Diffraction:
definition, 429grating, 383d, 425i, 429–431order, 464i
Diffuse part of double layer, 365b, 606Diffuse reflectance, 384Diffusion:
coefficient, 513, 609current, 361, 364electrophoresis, 609layer, 361i, 365b, 376plongitudinal (chromatography),
518microburet, 216bsingle molecule, 392
Digestion, 125, 167i, 396, 456b, 633,651–655
Digital camera, 436mDigital titrator, 25i, 26Dihydrogen phosphate, 1122,5-Dihydroxybenzoic acid, 494b2,3-Dihydroxybenzylamine, 624p2,3-Dihydroxynaphthalene, 367Dilution factor, 88, 128Dilution formula, 15Dimer, 100m2,3-Dimercaptopropanol, 245Dimethylarsinate, 94p3,3-Dimethyl-2-butanone, 496pDimethyl ether hydration number,
140t1,1�-Dimethylferrocene, 360Dimethylglyoxime, 630t, 631t, 635Dimethylmercury, 21mDimethyloctylamine, 569Dimethyloctylammonium acetate, 569Dimethyl oxalate, 633t2,6-Dimethyl phenol, 423p2,4-Dinitrophenylhydrazine, 659Dinosaur, 474Dioctyl sebacate, 304iDiode, 319Diol stationary phase, 561Dioxane:
eluent strength, 563tultraviolet cutoff, 563t
Dioxygen, 328tDiphenylamine, 134t, 333t, 339Diphenylamine sulfonic acid, 333tDiphenylbenzidine sulfonic acid,
333t, 339(Diphenyl)(dimethyl)polysiloxane,
532tDiphenyldisulfide, 289t4,7-Diphenyl-1,10-phenanthroline,
416Diphenylthiocarbazone, 504dDipole interaction, 579tDiprotic acids and bases, 181–188
buffer, 187–188fractional composition equations,
191–192titration, 206–208, 221t
Direct solid sampling, 459Direct titration, 122, 244Disinfection by-product, 79, 94pDisks (rod cell), 435bDisorder (entropy), 98Dispensing reagent, 123bDispersion:
sodium, 139pspectroscopic, 430
Dispersive spectrophotometer, 435Displacement titration, 244Disposal:
acetonitrile, 576mchemicals, 21b

Index I7
Disportionation, 100m, 101b, 335, 341Dissolution, sample, 651–655Distillation, 125i, 514mDistribution coefficient, 503, 505Disulfide bond, 619Dithionite, 328t, 624pDithizone, 504d, 505iDiuretic, 2Divinylbenzene, 589iDivision:
significant figures, 41uncertainty, 45, 49t
DNA, 1, 20, 366t, 413, 439,618–619, 621, 622i
DNA microarray, 397Dobson unit, 400pDocumentation, spreadsheet, 35Dodecanethiol, 602iDonnan equilibrium, 592Dopamine, 369, 572Dopant, 391bDoppler effect, 463Double-beam spectrophotometer,
384, 425, 425iDouble-focusing mass spectrometer,
481, 484Double junction electrode, 300Double layer, 365b, 369m, 606Double peaks in HPLC, 569Dowex resin, 590tDrain, 320Drierite, 31tDrift:
noise, 448pH electrode, 311region, 485itime, 627ptube, 487
Drinking water, 1, 19p, 634mDroplet electrospray, 474Droplet size, nebulizer, 457iDropping-mercury electrode,
362–363Drug:
enantiomers, 603metabolism, 556tablet, 573i, 574
Dry ashing, 650, 654Dry ice, 214dDrying, 26m, 30–31, 31t, 534, 650DTPA, 230iDust, 18p, 657iDwell time, 581Dwell volume, 581Dyeing fabric, 164bDynamic flash combustion, 638–639Dynamic range, 71, 572mDyne, 11tDynode, 433–434, 475, 475i
E (exa), 10tE� (standard reduction potential),
277, App. HE�’ (formal potential), 288, 289tEpa, 367, 368iEpc, 367, 368i
(molar absorptivity), 381ex series expansion, 396Earth, temperature, 426bE. coli, 1ECTEOLA ion exchanger, 591tEDDS, 244mEddy diffusion, 520mEDTA, 228, 229i, 230i
acid-base properties, 231–233auxiliary complexing agent,
238–241back titration, 244
�
books, NR6 (12.19)calcium complex, 234conditional formation constant,
234, 240bdirect titration, 244displacement titration, 244effective formation constant,
234, 240bformation constant, 234tformation constant/cell potential,
287–288fraction of Y4 (�Y4), 232–233glass extraction, 38pindirect titration, 244–245iron complex, 234imanganese complex, 229imasking, 8m, 245, 574metal complexes, 229i, 234, 234imetal ion buffer, 316metal ion indicators, 241–243,
241d, 242tmicrotitration, 216bpH-stat titration, 249ppotentiometric titration, 322pprimary standard, NR5 (12.12)releasing agent, 467solubility of complexes, 504spectrophotometric titration, 410istability constants, 234ttitration curve, 235–238, 235ititration guide, 243i
Effective electric field, 612Effective formation constant,
234, 240bEfficiency:
chromatography, 511–516, 557–558grating, 431quantum, 436
Egg, nitrogen content, 125tEGTA, 230iEight coordination, 234iEinstein, A., 392, 443mElectrical modulation, 465Electrical work, 272Electric capacitance, 10tElectric charge, 10t, 271Electric circuit, 274iElectric current, 9t, 271Electric double layer, 365b, 369m,
606, 633Electric field, 604m, 607m
effective, 612evanescent wave, 439–440
Electricity:cost, 415bfrom light, 414bgeneration in ocean, 270
Electric potential, 272, 604mfree energy, 273, 282bion-selective electrode, 304–305units, 10t
Electric power, 273Electric resistance, 10t, 273Electric resistivity, 318, NR8 (15.30)Electric sector, 484Electroactive species, 299, 353Electrochemical cell (chemical
probe), 285–288Electrochemical detector, 348,
571t, 574Electrochemical microscopy, 370Electrochemical writing, 350dElectrochemistry:
amperometry, 357–361basic electrical quantities, 270–274books, NR6 (14.1), NR9 (17.3)charging current, 364coulometry, 355–357
current-flow effect, 350–352cyclic voltammetry, 367–368electrogravimetric analysis,
353–355electrolysis, 349–353equilibrium constant and E�,
283–285faradaic current, 364field effect transistor, 318i, 320–321formal potential (E��), 288galvanic cell, 274, 285–288glass electrode, 306–311indicator electrodes, 301–302ion-selective electrodes, 303–318junction potential, 303mercury electrode, 322pNernst equation, 279oxidation-reduction reactions, 271pH electrode, 306–311polarography, 362–364reference electrodes, 299–301reversible reaction, 367square wave polarography, 364–366standard potentials, 277–279stripping analysis, 366–367voltammetry, 362–370
Electrochromatography, 588, 618Electrode, 272
ammonia, 316auxiliary, 353cadmium, 302carbon, 301, 358i, 574carbon dioxide, 316carbon fiber, 369conversion scale, 300copper, 302, 348, 574diamond, 363m, NR10 (17.19)double junction, 300field effect transistor pH electrode,
321free diffusion junction, NR7 (15.20)glass, 306–311glassy carbon, 574gold, 301, 369–370, 574halide, 302heparin, 298, 315hydrazoic acid, 317hydrogen sulfide, 316, 317iindicator, 301–302inert, 272interdigitated, 360bmercury, 235i, 302, 322p, 574metal, 301microelectrode, 369Nafion, 369nitrogen oxide, 316nonaqueous acid-base titration, 218inonpolarizable, 353overpotential, 351ioxide layer, 369oxygen, 358bpH, 306–311, 311iplatinum, 301, 574polarizable, 353potential range, 363mPt gauze, 354ireference, 299–301, 353reference electrode drift, 311irotating, 298, 361, 362isilver, 131i, 301–302sulfur dioxide, 316symbols, 353itransparent, 414bworking, 349, 353, 353izinc, 302
Electroendosmosis, 606Electrogravimetric analysis, 353–355Electrokinetic injection, 612
Electrolysis, 349–363, 593–596, 597controlled potential, 353demonstration, 350dtwo-electrode cell, 353–354
Electrolyte:balance (blood test), 312tcharge type, 142conductivity, 165dgravimetric analysis, 632–633strong, 12volatile, 634weak, 12, 165d
Electrolytic eluent generator, 596iElectrolytic suppressor, 597Electromagnetic radiation, 380, 380iElectromagnetic spectrum, 380Electromotive efficiency, 307Electromotive force, 10tElectron capture, 491
detector, 543, 549Electron flow diagram, 282iElectronic balance, altitude effect, 37pElectronic buret, 25i, 26Electronic nose, 360bElectronic transition, 388Electron ionization, 475, 475iElectron mass, 479tElectron multiplier, 475Electron transfer mechanism, 328bElectron volt, 11t, 472pElectroosmosis, 589, 606–607, 611Electroosmotic flow, 606iElectroosmotic mobility, 607, 608, 609Electroosmotic velocity, 607m, 609Electropherogram, 83Electropherographer, 620Electrophoresis, 82, 605
capillary, 603–620detection limit, 615mgas-phase, 487isoelectric focusing, 194b
Electrophoretic injection, 611–612Electrophoretic mobility, 605, 607,
608, 609Electrospray, 474, 488–490, 493–495Electrostatic sector, 484iElemental analysis, 638–640Elemental assay standard, App. KElephant, 449ELISA, 411Eluate, 507Eluent, 507
generator, 596istrength, 563, 563t, 569,
569b, 579iEluotropic series, 563Elution, 507
gradient, 565, 569b, 593, 593iisocratic, 564i, 565
Emergency facilities, 21Emission, 380i
atomic, 454i, 455effect of temperature, 461–462fluorescence, 390–391luminescence, 390–397,
391b, 455imonochromator, 394iphosphorescence, 390–391quenching, 414–416, 423pspectrum, 394, 472pstimulated, 428
Emittance, 426bEmulsion, 370Enantiomer, 533b
ion exchange, 594separation, 533b, 584p, 603, 616i,
NR16 (26.3)Endothermic, 98

I8 Index
End point, 122acid-base titration, 200i, 201, 203,
205, 205i, 206i, 208amperometric, 356bipotentiometric, 371, 371dcoulometry, 356derivatives, 210–211EDTA titration, 235, 236, 237i,
241–243, 241dindistinct, 208precipitation titration, 129, 131, 133redox titration, 330, 331, 332spectrophotometric titration,
126, 410iEnergy
electrical, 273electromagnetic radiation, 379, 380iflux, 542tunits, 10, 10t, 11m, 11t
Energy-level blood test, 312tEnglish unit, 11mEnolase kinase, 601iEnthalpy, 98Entrance slit, 425iEntropy, 98Environmental analysis:
carbon, 338bimmunoassay, 412oxygen demand, 338–339b
Enzyme, 167, 317, 357m, 602Enzyme-linked immunosorbent
assay, 411Eosin, 134EOSULF, NR1 (2.13)Epilepsy, 43bEpinephrine, 18p, 114, 572Equilibrium:
acid-base, 108–114advanced treatment, 250–265calculations, NR4 (8.10)cell voltage, 283–285chelate effect, 229complex formation, 233–235,
238–241concentration table, 114–115consecutive reactions, 97constant, 97, 143coupled, 250EDTA complex formation,
233–235electrochemical cell, 285Le Châtelier’s principle, 99–100reverse reaction, 97Scatchard plot, 407–408spectrophotometric, 407–408strong plus weak acids and
bases, 170bsystematic treatment, 147–154,
250–262temperature effect, 99–100
Equilibrium constant:compilations, NR3 (6.12)free-energy relation, 99relation to E�, 284–285variation, 104
Equivalence point, 122acid-base titrations, 200i, 201,
203, 204i, 205, 206i, 208derivatives, 210–211EDTA, 235, 236, 237i, 241–243,
241dindistinct, 208precipitation titrations, 129, 131redox titrations, 330, 331, 332
Equivalent mass, App. EErg, 11tEriochrome black T, 241d,
242t, 243i
Error:determinate, 42–43experimental, 42–44, 58indicator, 223ppH measurement, 311propagation, 44–50random, 43spectrophotometry, 385systematic, 42–43, 310bweighing, 23–24
Erythrocyte, 53iErythrosine, 215tEstrogen, 492–493Ethanethiol, hydration number, 140tEthanol:
hydration number, 140tpKa, 225pprotic solvent, 107m
Ether (see diethyl ether)Ethosuximide, 43b4�-Ethoxy-2,4-diaminoazobenzene,
333tEthoxyl group gravimetric analysis,
640pEthyl acetate:
eluent strength, 563pultraviolet cutoff, 563t
Ethylene, thermal conductivity, 542tEthylenediamine, 117p, 229S,S-Ethylenediaminedisuccinic acid,
244mEthylenediamine tetraacetic acid,
228, 229i, 230i, 574Ethylene diammonium ion, 120pEthylene glycol, 18p, 574Ethyl orange, 215tEthyl t-butyl ether, 553pEuropium, 95i
fluorescence, 412Europium fluoride, 313eV (electron volt), 11tEvanescent wave, 439–440Evaporative light scattering, 571t,
573–574Exa, 10tExcel (see spreadsheet)Excipient, 83Excitation energy, 392Excitation monochromator, 394iExcitation spectrum, 394, 472pExcited state, 380, 380iExhaust, automobile, 545iExitance, 426bExit slit, 425iExothermic, 98Expansion:
glass, 33water, 32, 32t
Experimental design, 134–135,NR3 (5.7)
Explosives, 402, 412, 487iExponent:
algebra, App. Acalculator, 47muncertainty, 47–48
Exponential series expansion, 396Extended Debye-Hückel equation,
144, 155pExtinction coefficient, 381Extra-column volume, 570Extraction:
actinides, 656mcrown ether, 506bdistribution coefficient, 503, 505dithizone, 504d, 505iefficiency, 502–503fat from chocolate, 3lanthanides, 656m
liquid extraction, 656–657membrane, 644metal chelator, 504–505, 504d, 506bpartition coefficient, 502pH effect, 503–504solid-phase microextraction,
547–548solid phase, 644, 658solvent extraction, 502–506strategies, 505supercritical fluid, 656, 657i
Extrapolation, 145mEye, 435bEyewash, 21
F (farad), 10tF (Faraday constant), 271F (formal concentration), 12�F, 11tf (femto), 10t� (fraction of titration), 2191/f noise, 448Fabric, emission, 391bFabric dyeing, 164bFAD, 289tFADH2, 289tFahrenheit, 11tFajans titration, 133–134, 134tFalse positive, 79Farad, 10tFaradaic current, 363i, 364Faraday constant, 271Fat, 3, 18–19pFemto, 10tFenn, J. B., 488mFensulfothione, 546Fenton’s reagent, 328t, 655,
NR19 (28.15)Ferrate(VI), 327m, 328tFerric hydroxide, 634Ferricinium ion, 360Ferric ion, 16Ferric nitrilotriacetate, 126Ferric oxide, hydrous, 30Ferricyanide, 294p, 339b, 343t, 362Ferrioxamine B, 232bFerrioxamine E, 232bFerritin, 458, 625pFerrocene, 360mFerrocyanide, 134t, 294p, 362Ferroelectric material, 437Ferroin, 332Ferrous ammonium sulfate, 138p,
332d, 337, 386Ferrous chloride, 138pFerrous ethylenediammonium
sulfate, 337, 386Ferrous ion, 16, 328tFerrozine, 386Fiber optic, 414i, 438, 439Fibrin, 53iFick’s law, 513mField, electric, 604m, 605, 607mField blank, 80Field effect transistor, 318i, 320–321Filament, 542Filling solution, 316Filter, optical, 432–433Filterability of precipitate, 630Filter paper:
ashless, 30folding, 30i
Filtrate, 30Filtration, 4i, 29–30
chromatography sample, 571mFingerprint, 385, 397Finite equilibration time (chromatog-
raphy), 519
Firefly, 397First aid for HF, 245First derivative, 210–211First-order diffraction, 430Fish, 108i, 260, 261iFlame, 456–457
profile, 457itemperature, 457t
Flame ionization detector, 542–543,544i, 549, 568b
Flame photometric detector, 543t,544, 549
Flash combustion, 638–639Flask:
Kjeldahl, 125, 125ivolumetric, 26–27
Flavin adenine dinucleotide (FAD),289t
Flexural plate wave, NR1 (2.3)Flocculation, 195, 245bFlour, nitrogen content, 125tFlow:
cell, 384i, 571, 614, 614ielectroosmotic, 606, 611hydrodynamic, 606
Flow injection analysis, 410–411Flow rate:
column dimensions, 520meffect on plate height, 558ieffect on pressure, 558gas chromatography, 538, 542linear, 508optimum, 518ivolume, 508
Fluorapatite, 257Fluorescein, 158, 397Fluorescence, 390–397
analytical applications, 414–417,423p
assay, 396–397atomic, 454i, 455, 456bbead, 158, 439biosensor, 402demonstration, 383dderivatization, 625pdetector, 572, 614, 621iDNA, 439emission spectrum, 391b, 392–397excitation spectrum, 394, 472pintensity, 395–396, 397iintracellular pH, 158lifetime, 412microspheres, 158, 439quenching, 414–416, 423presonance energy transfer, 402spectrophotometer, 394itime-resolved, 412
Fluorescence resonance energytransfer, 402
Fluorescent lamp, 391bFluorescent whitener, 391bFluoride:
drinking water, 19pelectrode, 157pgravimetric analysis, 630thydrogen bonding, 110bion-selective electrode, 313–314,
314tmasking, 8mmasking agent, 245precipitation titration, 134tprotonation, 651tooth decay, 257
Fluorine:combustion, 640isotope abundance, 479t
Fluorine-doped tin oxide, 414bFluorite, 257

Index I9
Fluorocarbon, 481Fluorometer, 394iFluorosulfuric acid, 214bFlux:
energy, 542tmolecular, 513molten salt, 652–653solar, 426b
FM (formula mass), 12Folding filter paper, 30iFood:
additive, 63bancient diet, 528calorie content, 19pimmunoassay, 412nitrogen content, 125t
Foot, 18pForce:
electric, 605gravity, 23units, 10, 10t, 11t
Forensic analysis, 397, 620Forgery, 13, 14iFormal concentration, 12, 163mFormaldehyde:
clock reaction with sulfite, 171ddemasking agent, 245geometry, 387iiodimetric titration, 341tionization energy, 476, 477imolecular orbitals, 388–389vibrations, 389, 389i
Formal potential, 288, 289–291, 337Formate, 161Formation constant:
cell voltage, 287–288EDTA complexes, 233–235,
234t, 239notation, 104btabulation, App. I, App. J
Formic acid, 113b, 161, 214b, 338, 631
Formula mass, 12Fortification, 80Forward bias, 319Fossil, 533b, 628Fossil fuel, 415b, 482bFourier series, 442Fourier transform, 445Fourier transform infrared detector,
543t, 571tFourier transform spectroscopy,
442–448Fraction:
association, 166dissociation, 164saturation, 408
Fractional composition, 191–192,219, 221t, 251, 252, 255, 289
Fractional factorial experimentaldesign, 87
Fragmentation pattern, 483–484Franck-Condon principle, 393mFree energy:
activity, 304–305concentration gradient, 293pelectrochemical reactions, 273electrode, 351tenthalpy and entropy, 99Gibbs, 98–99half reactions, 282bion-selective electrode, 304–305solvation, 304–305
French fries, 662pFreon, 378Frequency, 10t, 379Friction coefficient, 605Fringe, interference, 450p
Frit, cleaning, 569Fritted-glass funnel, 29, 30iFront, solvent, 574, 575Fructose, 348, 614iF test, 63–64, 63tFugacity, 146Fugacity coefficient, 146Fulcrum, 23iFumarate, 16m, 626pFumaric acid:
formal potential, 289tfractional composition, 192i
Fume hood, 21Fuming sulfuric acid, 214bFunnel, 29, 30iFurnace, 457–459Fused silica:
capillary preparation, 610cuvet, 384refractive index, 438m, 452p
Fusion, 628, 650, 652
G (giga), 10t� (activity coefficient), 143–146�-Galactosidase, 1, 619i, 626pGallium, isotopes, 74pGallium arsenide, 318Gallium hydroxide gathering, 662pGallium nitride photoresponse, 433iGalvanic cell, 270, 274Gamma ray, 380iGap, 65Garden hose analogy, 272Gas:
activity coefficient, 146drying, 31tstandard state, 97trapping, 659
Gas chromatography, 528–551bonded phase, 531carrier gas, 537–538, 542, 543chromatograph, 529column, 529–535column bore size, 550tcolumn capacity, 550tcolumn diameter, 530column film thickness, 550tcolumn length, 530, 531icolumn selection, 550combustion analysis, 638–639detection limits, 543tdetectors, 541–546, 543t, 549elemental analysis, 638flow rate, 538, 542headspace, 530ihomologous series, 552pinjection, 538–541, 551internal standard, 542isotope ratio mass spectrometer,
482bKovats index, 535, 537tlinear range, 543tliquid phases, 531method development, 549–551molecular sieve, 534open tubular column, 550packed column, 534–535particle size, 535peak area, 541–542polarity of stationary phase,
532t, 535ipressure programming, 536qualitative analysis, 541resolution, 530, 550mretention gap, 538retention index, 535, 536msample injection, 538–541, 551sample preparation, 547–549
sensitivity, 543tstationary phase, 529, 531, 532tsupercritical fluid extraction, 657itemperature programming, 536theoretical performance, 554pvan Deemter curve, 537viscosity effects, NR15 (24.11)
Gas chromatography/mass spectrom-etry, 501, 545–546, 549
Gas constant, 18pGas law, 18pGas-liquid partition chromatography,
528Gasoline additive, 553pGas-phase electrophoresis, 487Gas-phase hydronium ion, 106iGas-sensing electrode, 317Gas-solid adsorption chromatography,
529Gas-tight syringe, 539Gate, 320Gathering, 634, 643p, 662pGathering agent, 634Gaussian bandshape, 511–512, 542Gaussian distribution, 53–57Gaussian error curve, 54, 56tGaussian noise, 448Gauze electrode, 354iGay-Lussac buret, 121Gel, 508m, 590m, 591t, 600, 601i, 618
hydrated glass, 307Gel electrophoresis, 194b, 618–619Gel filtration chromatography,
508, 599Gel permeation chromatography,
508, 599Geminal silanol groups, 560iGene, 1Gene chip, 397Gene gun, 416General elution problem, 564mGenetic engineering, 1Genome sequencing, 618Geologic time scale, 628Geothermal power, 415bGermanium, 318
beamsplitter, 446Gibbs free energy, 98Giga, 10tGlass:
adsorption of ions, 318m, 645attack by base, 216cuvet, 384drying, 26metching by NaOH, 26metal content, 38psilanization, 521storage of base, 216structure, 307vessel for acid digestion, 651
Glass electrode, 306–311calibration, 308–309compound electrode, 316EDTA titrations, 241errors, 311history, NR7 (15.13)reconditioning, 311reference electrode, 131i, 301
Glassware calibration, 31–33, 38Glassy carbon, 362i, 363m, 574Globar, 427Glove, 21Gluconate, 289tGluconic acid, 292pGluconolactone, 359Glucose, 18p, 334
anion-exchange separation, 348blood test, 312t
cyclodextrin, 533belectrophoresis, 614iformal potential, 289t, 292piodimetric titration, 341tmonitor, 357–361
Glucose oxidase, 359, 360Glutamate dehydrogenase, 601iGlutamic acid, 182tGlutamine, 182tGlutathione, 289t, 341tGlutathione peroxidase, 396Glycerol, 345pGlycine:
acid-base properties, 182tdiffusion coefficient, 513tiron equilibria, 268pnickel complex, 285titration, 265i
Glycine amide, 175t, 177pGlycinecresol red, 243iGlycinethymol blue, 243iGlycolate, 289tGlycolic acid, 113bGlycylglycine, 175tGlyoxalate, 289tGMP, 435bGOAL SEEK (Excel), 115, 154, 176Goggles, 21Gold:
coins, 13, 14ielectrode, 301, 574mercury absorption, 456bmicroelectrode, 369potential range, 363mrecovery, NR1 (2.6)surface plasmon resonance, 440thiol binding, 20, 273bvessel, 651
Gooch filter crucible, 30, 30iGood Chemist, 152, 184Gosset, W. S., 57mGradient elution, 565, 593
continuous, 580–583effect on detector, 571tion-exchange, 593isegmented, 580, 583supercritical fluid density gradient,
569bGradient time, 582, 582bGramicidin, 228Grand Canyon, 628Gran plot, 211–212, 224p, 334Graph:
linear least squares, 65–69nonlinear calibration curve, 70i, 71bsignificant figures, 42spreadsheet, 35–36standard addition, 88–90
Graphite, 458, 459Graphite furnace, 9, 457–459Grating, 383d, 425i, 429–431Gravimetric analysis, 16, 29, 628–637
atomic masses, 629history, NR18 (27.1)
Gravimetric factor, 635Gravimetric titration, 123Gravitational force, 23Great Barrier Reef, 96“Green” chemistry, 339b, 504dGreenhouse gas, 426bGreenland ice core, 395bGrinding, 650Gross sample, 645Ground state, 380, 380iGrout, 245bGuard column, 538, 559, 568Guard tube, 637Guldenberg, C. M., 97m
I10 Index
h (hecto), 10tH� (see hydronium ion)Haber, F., 306mHalf-cell, 276Half-life, 628Half-reaction, 275, 282bHalf-wave potential, 363Half-width, 512Halide:
electrode, 302, 314tion pair, 165ftitration, 127–134
Hall, C. M., 349mHall-Heroult process, 349mHalocarbons in air, 543iHalogen:
atomic emission, 462, 464elemental analysis, 640organohalide analysis, 139pTOX determination, 373p
Halogen lamp, 425Hamilton syringe, 29iHammett acidity function, 214bHardness, water, 209b, 245b, 594mHasselbalch, K. A., 168mHazard label, 21iHeadspace, 530iHeat:
enthalpy, 98equilibrium constant effect,
99–100units, 10t, 11m, 11tvaporization, 400p
Hecto, 10tHeight equivalent to a theoretical
plate, 514Heisenberg uncertainty principle,
462Heliobacter pylori, 424Helium:
gas chromatography, 529, 537–538
liquid, 327thermal conductivity, 542turanium decay, 628
Helium-neon laser, 428Helmholtz layer, 365bHematocrit, 312tHeme, 180iHemoglobin, 232bHemorrhage, 298Henderson, L. J., 168mHenderson equation, 324pHenderson-Hasselbalch equation,
168Henry buret, 121Henry’s law, 118p, 196pHeparin, 298, 315HEPES, 175t, 308tHEPPS, 175tHeptane:
eluent strength, 563tultraviolet cutoff, 563t
Heroin, 620Hertz, 10t, 379Heterogeneous material, 2,
12m, 644random, 7bsegregated, 7b
Heterolytic cleavage, 483mH.E.T.P. (height equivalent to a
theoretical plate), 514Hexachlorohexanes, 73pHexacyanoferrate(III), 339b, 343tHexamethyldisilazine, 521Hexane:
eluent strength, 563textraction, 656
ultraviolet cutoff, 563tuse, 502f
Hexanitratocerate(IV), 3382-Hexanone, 483iHexapole collision cell, 469iHeyrovský, J., 363iHigh-performance liquid
chromatography (HPLC),556–583
additives, 568bandshape, 569–570bonded phase selection, 579–580,
579tbuffer, 564m, 576t, NR16 (25.9)chiral separation, 561i, 569bcolumn, 576tcolumn equilibration, 568column washing, NR16 (21.14)dead volume, 570decision tree, 566idetection, 571tdetector, 571–575double peaks, 569dwell time, 581dwell volume, 581electrochemical detector, 348eluent strength, 569, 579iflow rate, 576tgradient elution, 565, 580–583high pH operation, NR16 (25.6)hydrophilic interaction, 567hydrophobic interaction, 567injection, 557i, 570, 571iinjection valve, 571isocratic elution, 564i, 565,
576–577, 582method development, 575–583method selection, 566imobile phase, 576tnormal phase, 563, 566ioverloading, 570particle size effect, 557–558, 559tpeak asymmetry, 576preparative, 569bpressure, 558pressure limit, 576pump, 557i, 570, 570iresolution, 579mreversed phase, 563, 566isample size, 576tscaling gradient, 582bselecting mode of separation,
566–567silica, 559i, 560isolvent, 563, 568starting conditions, 576tstationary phase, 559–562, 576tsupercritical fluid chromatography,
568bsyringe, 571mtailing, 560i, 569temperature, 576t, 579theoretical plates, 558, 559twaste reduction, 568m
High-pressure autoclave, 655iHigh-resolution mass spectrometry,
481, 481iHigh-temperature superconductor,
327, 342b, 346p, 347pHistidine, 117p, 182t, 189History:
analytical chemistry, NR3 (7.3)atomic absorption, NR13 (21.3)atomic emission, NR13 (21.5)buret, 121chromatography, NR14 (23.3)classical analysis, NR18 (27.1)glass electrode, NR7 (15.13)
Henderson-Hasselbalch equation,NR4 (9.8)
ion chromatography, NR16 (26.5)ion-selective electrode, NR7
(15.23)pH meter, NR7 (15.15)
Hole, 318Hollow-cathode lamp, 454, 463Holmes, A., 628Holmes, E. L., 508mHomogeneous material, 2, 12m, 644mHomogeneous precipitation, 631, 633tHomolytic cleavage, 483mHoney, 366iHood, 21Hormone, 270, 397, 602Horsepower, 11tHorwitz trumpet, 85bHot dog, 277dHouse dust, 657iHuman eye, 435bHuman genome, 618Human salt bridge, 277dHumidity, 37pHydrate, 14Hydrated gel (glass electrode), 307Hydrated radius, 140Hydration, 140Hydrazine, 120p, 328t, 339b, 341t,
355mHydrazoic acid, 317Hydrobromic acid, 108t, 159m, 652tHydrocarbon trap, 539iHydrochloric acid:
digestion, 652tentropy of solution, 98fountain, 109dfree energy of solution, 98heat of solution, 98Ka, 159mliquid junction, 303tprimary standard, 217t, 225prole in gravimetric analysis, 634solubility in water, 98, 109dstandardization, 226–227strength, 214bstrong acid, 108ttitrant in acetic acid, 218
Hydrodynamic flow, 606, 606iHydrodynamic injection, 611Hydrodynamic radius, 606Hydroelectric power, 415bHydrofluoric acid:
burns, 651mdigestion, 652tfirst aid, 245, 651mstrength, 110b, 214b
Hydrogen:analysis, 638–640atom transfer, 328bformal potential, 289tgas chromatography, 537–538isotope abundance, 479toverpotential, 351tseparation, 534thermal conductivity, 542t
Hydrogen bond, 106, 106i, 110b,163, 181i, 535, 579t
Hydrogen bromide, 108t, 159m, 652tHydrogen chloride (see hydrochloric
acid)Hydrogen cyanate, 633tHydrogen cyanide, 341t, 659tHydrogen electrode, 278Hydrogen fluoride, 439Hydrogen halide, 639Hydrogen iodide, 108tHydrogen ion (see hydronium ion)
Hydrogen-oxygen flame, 457tHydrogen peroxide:
demasking agent, 245digestion, 125Fenton’s reagent, 655glucose electrode, 359iodometric titration, 343toxidant, 16, 328t, 335, 651permanganate titration, 337tpolarography, 364rainwater, 361trace analysis, 411i
Hydrogen selenate, 396Hydrogen sulfide:
electrode, 316, 317iiodimetric titration, 341t, 346pion, 314, 659tprecipitant, 633treductant, 336remediation, 327mtotal oxygen demand, 338b
Hydrogen sulfite, 21bHydroiodic acid, Ka, 159mHydrolysis, 100b, 110m, 161m, 183m
constant, 110EDTA complex, 240bmetal ion, 111, 111i, 240bsilica, 561
Hydronium ion, 105, 106activity, 146i, 306–311diffusion coefficient, 513tgas-phase structure, 106ihydrogen bonding to fluoride, 110bion exchange with glass, 307
Hydrophilic, 228, 359Hydrophilic interaction
chromatography, 567, 567iHydrophobic, 228, 303, 567Hydrophobic anion, 315Hydrophobic interaction
chromatography, 567, 567iHydroquinone, 296p, 328tHydrosulfide, 339bHydrous iron oxide, 16Hydroxamate group, 232bHydroxide:
alkali metal equilibria, 109talkaline earth equilibria, 109taluminum complexes, 179pchromium complexes, 197pdiffusion coefficient, 513tflux, 653tformation constants, App. Ihomogeneous precipitant, 631, 633treaction with glass, 216structure, 106zinc complexes, 119p
Hydroxonium ion, 106Hydroxyapatite, 257Hydroxybenzene, 218io-Hydroxybenzoic acid, 162–164,
218ip-Hydroxybenzoic acid, 162–164, 597L-�-Hydroxybutyrate, 289tN-2-Hydroxyethylpiperazine-N�-2-
ethanesulfonic acid, 175t, 308tN-2-Hydroxyethylpiperazine N�-3-
propanesulfonic acid, 175tHydroxylamine, 245b, 328t, 355m,
386, 396, 456bHydroxyl radical, 655m8-Hydroxyquinoline, 346p, 467, 504,
630t, 631t, 633t, 636Hygroscopic substance, 23, 634Hypobromite, 659tHypochlorite, 328tHypochlorous acid, 343tHypoiodous acid, 340m

Index I11
Hypophosphorous acid, 328tHypoxanthine, 289tHz (hertz), 10t
Ipa, 368iIpc, 368iIbuprofen, 499pIce core, 395bICP, 461tIdeal gas law, 18pIgnition, 30, 634Imazaquin, 490i, 492Imidazole, 370Imidazole hydrochloride, 175tIminodiacetic acid, 246p, 594mImmiscible liquids, 502mImmobilized pH gradient, 194bImmunoassay, 411–412Immunoglobulin, 413, 602Imperial College, 628Implant, 501“Implies that” symbol, 15mImprinted polymer, 441, 442i, 603bImpurities in reagents, 123bin. (inch), 11tInclusion, 633Independent equations, 251mIndeterminate error, 43Index of refraction, 452pIndia rubber, 121Indicator, 122
acid-base, 212–216, 214d, 215tadsorption, 133, 134delectrode, 299, 301–302, 302d, 329error, 213, 223pmetal ion, 241–243, 241d, 242tprecipitation, 133, 134tredox, 333t, 338solution preparation, 215t
Indigo tetrasulfonate, 333tIndirect detection, 598, 614, 615iIndirect titration, 244–245, 339Individual hardness, 245bInduction coil, 460Inductively coupled plasma,
460–461, 463–464, 468mass spectrometry, NR13 (21.17)
Inductively coupled plasma/massspectrometry, 313, 453, 468–470
Inert electrode, 272Inert salt, 141Inflection point, 129, 200i, 201, 204iInfrared cutoff, 384mInfrared detector, 437, 543t, 571t, 638Infrared radiation, 380iInfrared window, 384mInjection:
capillary electrophoresis, 611–612gas chromatography, 538–541, 551graphite furnace, 457iHPLC, 571precision, 84variance (chromatography), 517valve, 571
Inorganic carbon, 338bInorganic ion exchanger, 593Inorganic material, dissolution,
652–654In situ, 357mInstrument detection limit, 87Instrument noise, 385Instrument precision, 84Insulator, 318Insulin, 562iIntegration (peak area), 541–542Intensity (irradiance), 381mIntercalation, 413
Intercept, 66–67INTERCEPT (Excel), 69Interconversion, salt, 594Interdigitated electrodes, 360bInterference:
atomic spectroscopy, 466–468chemical, 8m, 387filter, 433fringes, 450pgravimetric analysis, 630tion-selective electrodes, 312, 314tisobaric, 469light rays, 430inoise, 449
Interferogram, 444i, 445Interferometer, 443iInterferometry, 443–445Interlaboratory precision, 84, 85bIntermediate form of diprotic acid, 184Intermediate precision, 84Internal conversion, 390Internal standard, 90–91, 542Interpolation, 40m, 145Interpretation of results, 8Intersystem crossing, 390Intestine, 167iIntra-assay precision, 84Intracellular O2, 416–417Intracellular pH, 158Inulin, 506mInverse matrix, 406Inversion, population, 428In vivo microdialysis, 556Iodate, 21b, 94p, 130, 328t, 340m,
343t, 500pIodide:
complexes, 103–104, 119pdiffusion coefficient, 513telectrolysis, 350dgravimetric analysis, 630tion-selective electrode, 314t, 316m,
NR7 (15.6)precipitation titration, 134tstripping analysis, 366t
Iodimetry, 340, 341t, 371dIodine:
isotope abundance, 479tKarl Fischer titration, 371, 371doxidant, 328tredox potentials, 282bredox titrations, 340–343, 341t, 343trefractive index, 438mstandardization, 340starch indicator, 334–335, 340
Iodometry, 340, 343tsuperconductor analysis, 327,
342b, 347pIon:
diffusion coefficient, 513thydration, 140size, 144t, 145snow composition, 594msolvation, 140
Ion chromatography, 594–597, NR16 (26.5)
Ion exchangebead, 644enantiomer separation, 594equilibrium, 307glass surface, 307liquid ion exchanger, 314–316preconcentration, 659treference electrode drift, 311iwater purification, 594
Ion-exchange chromatography, 507i,508, 566i, 589–594
applications, 594deionization, 594
Donnan equilibrium, 592functional groups, 589, 590t, 591tgels, 590m, 591t, 593gradient elution, 593, 593iinterconversion of salts, 594ion chromatography, 594–597ion exchangers, 589–591, 591t, 593ion-exclusion, 593ion-pair chromatography, 598–599preconcentration, 594resins, 589, 590m, 592t, 593salt interconversion, 594selectivity, 590t, 591, 592tsugar separation, 348
Ion exchanger:drug stabilization, 594drug tablets, 594
Ion-exclusion chromatography, 593Ionic atmosphere, 141, 632m, 633Ionic liquid, NR15 (24.8)Ionic radius, 140Ionic strength effects:
activity coefficient, 145, 146ibuffer pKa effect, 174fion dissociation, 141dmolecular exclusion, 601pH, 147solubility, 141–142
Ionization:energy, 468, 476, 477iinterference, 467mass spectrometry, 475–477suppressor, 467
Ion mobility, 303tIon mobility spectrometer, 487–488,
627pIonophore, 304, 313Ion pair, 100–101, 110b, 142, 143b,
146m, 165f, 218, 253–254, 257,App. J
Ion pore, 228Ion-selective electrode, 303–318
advantages, 317bromide, 314tcadmium, 316mcalcium, 314–315, 316mchloride, 314tcompound, 316cyanide, 314tdetection limit, 316fluoride, 313–314, 314tgas-sensing, 317halide, 314theparin, 298, 315history, NR7 (15.7)hydrazoic acid, 317iodide, 314t, 316m, NR7 (15.6)lead, 313, 316leakage, 316liquid-based, 314–316mechanism, 303–306mercury, 325–326poperating tips, 317perchorate, 316mpotassium, 316mrelative error, 317mselectivity coefficient, 312silver, 316msodium, 316msolid-state, 313–315, 316m, 318–321standard addition, 317sulfide, 314tthiocyanate, 314t
Ion source, 475iIon spray, 488Ion-trap spectrometer, 486Iridium, 651
pH electrode, NR7 (15.14)
Iron:blood, 385–387colloid, 630ideposition on electrode, 369i, 370DTPA complex, 231iEDTA complex, 234iferrozine complex, 386iglycine equilibria, 268pgravimetric analysis, 16, 630t, 631hollow-cathode spectrum, 455ihydrolysis, 632disotope abundance, 479tJones reductor, 336masking, 245, 245bnitrilotriacetate complex, 231ioverload, 232bpermanganate standardization, 337permanganate titration, 337trainwater, 385mreaction with thiocyanate, 141redox titration, 327–332, 332dserum iron determination,
385–387spectrophotometric titration, 126standard, 337transferrin complex, 126transferrin reduction, 291waste remediation, 327m
Iron(II), electron transfer, 328bIron(III):
hydroxide, 634ocean floor, 270oxide, 16, 30stripping analysis, 366–367thiocyanate, 133, 141, 267p, 421p
Iron(VI), 327m, 328tIrradiance, 381, 424Irrigation water, 209b, 245bIsobaric interference, 469Isobutane, chemical ionization, 477Isobutyl groups on silica, 561iIsocratic elution, 564i, 565, 576–577,
582Isoelectric focusing, 194bIsoelectric point (pH), 193, 194b, 199iIsoionic point (pH), 193, 199Isoleucine, 182tIsosbestic point, 406, 419pIsotherm, 521Isotope:
abundance, 479t, 480tdilution, 500pdiscovery, 474mdistribution, 555plead, 475imass, 479tmeasurement, 394, 395bpatterns, 479–481, 480t,
496p, 499pratio, 395b, 424, 474, 528separation, 515i, 615itable, 479t
Isotope ratio mass spectrometry, 482bIteration (Excel), 156p
J ( joule), 10tJellyfish, 397Jet Propulsion Laboratory, 11mJob’s method, 408Jones reductor, 336, 655Jorgensen, J. W., 604mJoule, 10, 10t, 11m, 272Joule heating, 607Junction, pn, 319Junction potential, 303, 310b,
311, 324pfree diffusion junction, NR7
(15.20)

I12 Index
K (kelvin), 9tk* (average capacity factor), 582bk (kilo), 10tKa (acid dissociation constant), 110,
112–114Kb (base hydrolysis constant), 110,
112–114Kw, 107, NR6 (13.10)Kaolinite, 260Karl Fischer jacks of pH meter, 371dKarl Fischer titration, 370–372Kelvin, 9tKetone, 338, 659kg (kilogram), 9tKHP (potassium hydrogen phthalate),
185, 217tKidney dialysis, 632dKilo, 10tKilogram, 9tKimax, 26mKinetic energy, 476b, 485mKinetic prediction, 100Kjeldahl flask, 125, 125iKjeldahl nitrogen analysis, 124–125,
339bdigestion, 654functional groups, NR4 (7.4)iodometric titration, 346ptitration, 225p
Klemensiewicz, 306mKnife edge, 23Kohlrausch, F., 108Kovats index, 535, 537t
L (liter), 11t, 12� (wavelength), 379Label, chemical hazard, 21iLab-on-a-chip, 620–622Laboratory coat, 21Laboratory notebook, 22Laboratory sample, 645, 650Lactalbumin, 494b, 619i, 626pLactate, 289t, 312tLactate dehydrogenase, 601iLactic acid, 257mLactoglobulin, 194b, 494bLactose, 348, 614ilacZ, 1Lake water, 261iLamp, 426–427
deuterium, 571fluorescent, 391bquartz-halogen, 425
Lanthanide elements, 144fextraction, 656mseparation, 593i
Lanthanum:permanganate titration, 337tprecipitation titration, 157preleasing agent, 467
Lanthanum fluoride, 157p, 313, 314tLanthanum phosphate, 643pLanthanum-sulfate equilibria, 257pLaser, 424, 427–428, 455i
ablation, 453, 470, NR13 (21.1)crystal, 327, 345pdesorption, 494bdiode, 428
Latimer diagram, 282bLaw, 63bLaw of mass action, 97, 143lb (pound), 11tLead:
analysis, 660patomic fluorescence, 455icarbonate, 455icoprecipitation, 660pdisposal, 21b
dust, 18pEDTA titration, 244, 245flame photometric detector, 549gravimetric analysis, 630tiodide complexes, 103–104iodimetric titration, 341tion-selective electrode, 313,
314, 316isotopes, 475i, 479tmasking, 245metal ion buffer, 316permanganate titration, 337tremediation with plants, 244mspectrophotometric analysis,
504dtrace analysis, 78, 645uranium decay, 628
Lead(II) iodide, 101iLead(IV) acetate, 328tLead silicate, 21bLean flame, 457Least squares:
error analysis, 67–69intercept, 67–68linear, 65–69nonlinear, NR2 (4.6)slope, 67–68spreadsheet, 71–72standard addition, 90
Le Châtelier’s principle, 99–100,141d, 168, 250, 467m
Lemon pH, 108iLength, 9t, 11tLeucine, 181–185, 182tLeucosafranine, 289tLeveling effect, 216Levitation, 327Lewis acid, 103, 229Lewis base, 103, 229Library (mass spectra), 476Lifetime, fluorescence, 391, 412Ligand, 102, 229Light:
absorbance, 381, 382babsorption, 380–383absorption spectrum, 383dBeer’s law, 381, 382b, 402blackbody radiation, 426b, 427coherence, 428collimation, 428m, 429color, 380i, 382, 383tcomplementary color, 382, 383tdiffraction, 429Doppler effect, 463effect on silver, 134electric field, 379electromagnetic spectrum, 380,
380i, 383demission, 391b, 392–397, 455ifluorescence, 383d, 390–391,
392–397frequency, 379, 380igamma ray, 380iinfrared, 380iinterference, 430iluminescence, 392–397magnetic field, 379microwave, 380iphosphorescence, 390–391plane-polarized, 379polarization, 428properties, 379–380quantitative analysis, 385–387,
402–406radio wave, 380irefraction, 437–438refractive index, 379, 437sources, 426–428
spectrophotometer, 394i, 424–437,425i
spectrum, 380ispeed, 9t, 379, 443mstray, 432time-resolved fluorescence, 412transmittance, 381–383ultraviolet, 378, 380ivisible, 380iwavelength, 379, 380iwavenumber, 379white, 435X-ray, 380i
Light bulb, 54, 391bLight scattering detector, 573–574Light stick, 397Light switch, 413Limestone, 137p, 250Limit of detection, 84–87Lincomycin, 371Line (graph), App. BLinear calibration curve, 69–71Linear equations, 405–406Linear flow rate, 508, 558Linear interpolation, 145Linearity, 83Linear range, 71, 468, 543t, 572mLinear regression, 65–69Linear response, 70Line noise, 449Line notation, 277LINEST (Excel), 68–69, 83, 135
multiple regression, 135Linewidth, atomic spectroscopy,
454, 455i, 462–463Lipophilicity, 199Liquid, standard state, 97Liquid-based ion-selective electrode,
303, 314–316Liquid chromatography:
additives, 568affinity chromatography, 602–603bandshape, 569–570bonded phase selection, 579–580,
579tbuffer, 576tchiral separation, 561i, 569bcolumn, 566–567, 568, 576tdead volume, 570detection limit, 571tdetector, 571–575dwell time, 581dwell volume, 581electrochemical detector, 348eluent strength, 569, 579iequipment, 557iflow rate, 576tgradient elution, 580–583HPLC, 556–583injection, 571, 571iion chromatography, 594–597ion exchange, 589–594isocratic elution, 576–577, 582method development, 575–583mobile phase, 576tmolecular exclusion, 599–602particle-size effect, 557–558, 559tpeak asymmetry, 576preparative, 569bpressure, 558, 5761-propanol in solvent, 568resolution, 579mrule of three, 577msample size, 576tscaling gradient, 582bselecting mode, 566–567silica, 559i, 560isolvent additive, 568
solvent use, 568starting conditions, 576tstationary phase, 559–562, 576ttailing, 560i, 569temperature, 576t, 579theoretical plates, 558, 559t
Liquid chromatography/massspectrometry, 488–495
Liquid junction, 310bLiquid-liquid extraction, 656–657Liter, 11t, 12Lithium:
diffusion coefficient, 513tisotopes, 75psolvation, 140
Lithium battery, 346pLithium borate, flux, 653, 653tLithium cobalt oxide, 346pLithium fluoride:
ion pair, 156psolubility, 156p
Lithium hydroxide, 108t, 119pLitmus, 215tLobster, 229mLogarithm, App. A
significant figures, 41–42, 128uncertainty, 47–48
Longitudinal diffusion, 518, 609Longitudinal heating, 458Loop, sample, 571Lord Rayleigh, 60Lot, 645Lower limit of detection, 84Lower limit of quantitation, 86Luggin capillary, 353iLuminescence:
absorption and emission, 392–397analytical applications, 416–417,
423pintensity, 395–396, 397ilifetime, 412quenching, 414–416, 423psensor, 416, 439
Luminol, 397Luminous intensity, 9tLutetium-177, 230Lutidine buffers, 174fL’vov platform, 458iLye pH, 108iLysine, 182t, 608Lysosome, 158Lysozyme, 562i
m (meter), 9tm (milli), 10tm (molality), 12M (mega), 10tM (molarity), 12 (ionic strength), 142 (mean), 54 (micro), 10tMacKinnon, R., 228Macrophage, 158Magnesium:
EDTA titration, 241d, 245electrolyte balance, 312tgravimetric analysis, 630t, 634, 636ocean, 12permanganate titration, 337twater hardness, 245b
Magnesium chloride, 12ion pair, 143b
Magnesium hydroxide, 109tsolubility, 153–154
Magnesium nitrate, 460Magnesium oxide, 460Magnesium perchlorate, 31t, 637iMagnesium pyrophosphate, 635
Index I13
Magnesium sulfate ion pair, 142, 143bMagnetic field, mass spectrometry,
476bMagnetic force, 476bMagnetic levitation, 327Magnetic sector mass spectrometer,
475, 476bMagnetic stirring, 122iMakeup gas, 538, 543Malate, 289tMALDI, 494bMaleate, 626pMalic acid, 186bMalonate, 120pMalonic acid, 136p, 302d, 338Maltose, 348Manganate, 336Manganese:
atomic absorption, 459iEDTA complex, 229iemission, 391bgravimetric analysis, 630tmasking, 245serum, 645t
Manganese(III), 357Manganese dioxide, 336, 343tManganese hydroxide, solubility, 155pManganous ion, 336Man-in-vat problem, 643pMantissa, 42Marble, 250, 260Marble table, 23Marine diet, 528Mars Climate Orbiter, 11mMartin, A. J. P., 508m, 514mMasking, 8m, 245b, 387, 634Mass:
atomic, 476bbalance, 132, 148, 191equivalent, App. Eisotopes, 479tmolecular, 476bnominal, 476bsingle cell, 474units, 9t, 11t
Mass action law (equilibriumconstant), 97, 143
Mass spectrometer:atmospheric pressure chemical
ionization, 490–491calibration, 481detector, 571tdouble focusing, 484electrospray, 488–490gas chromatography, 537high-resolution, 484ion spray, 488magnetic sector, 475, 476bMALDI, 494bMS/MS, 492i, 492mresolving power, 484, 486tandem, 492i, 492mtime-of-flight, 485–486triple quadrupole, 492i
Mass spectrometry, 453, 474–495,NR13 (22.5)
atmospheric pressure chemicalionization, 490–491
calibration, 481capillary electrophoresis, 490, 490icharge reduction, NR14 (22.22)chemical ionization, 477chromatography, 488–495, 541,
543tcollisionally activated dissociation,
490, 493double focusing, 481, 484electron ionization, 475
electrophoresis/mass spectrometry,490, 490i
electrospray, 488–490, 493fragmentation pattern, 483–484high-resolution, 481, 481i, 484inductively coupled plasma, 453,
468–470ion spray, 488ion-trap, 486isotope dilution, 500pisotope patterns, 479–481, 496p,
499pisotope ratio, 482b, 528magnetic sector, 475MALDI, 494bmass spectrum, 474, 477,
478–484matrix-assisted laser
desorption/ionization, 494bmolecular ion, 478–483MS/MS, 492mnominal mass, 476bproteins, 493–495, 494bquadrupole ion-trap, 486quadrupole transmission, 484resolving power, 478, 484, 486selected ion monitoring, 491–492selected reaction monitoring,
491–493spectral interpretation, 478–484tandem, 492mtime-of-flight, 485–486transmission quadrupole, 484
Mass spectrometry/mass spectrometry,492m
Mass spectrum, 474, 477, 478–484data base, NR14 (22.8)library, 476
Mass titration, 26Mass transfer, 519, 538, 562Mast cell, 298Material balance, 148Material Safety Data Sheet, 22Matrix, 80, 87, 317, 459, 494b
effect, 87modifier, 459
Matrix (mathematics), 406Excel, 68–69multiplication, NR11 (19.3)
Matrix-assisted laser desorption/ionization, 494b
Matrix-matched standard, 470, App. K
Mauna Loa, 427bMcLafferty rearrangement, 483iMean, 54
comparison, 59–62, 64–65Mean free path, 499pMeasuring pipet, 27Meat nitrogen content, 125tMechanical balance, 23Mechanism of electron transfer, 328bMediator, 360Mega, 10tMeissner effect, 327Membrane:
cell, 228extraction, 644glass, 306–307semipermeable, 316, 556, 632d
Memory effect, 458Meniscus, 25, 27i2-Mercaptoethanol, 120p, 341t, 619Mercuric chloride, 651Mercurous ion, 100mMercury:
amalgam, 456bbattery, 292p
cleanup, NR10 (17.15)coffee bean, 468, 469icold vapor atomic fluorescence,
456bdensity, 33mEDTA titration, 244EDTA titration electrode, 235i, 322pelectrode, 302, 362–363, 574emission, 391bglobal distribution, 456bgold absorption, 456biodimetric titration, 341tion-selective electrode, 325–326pisotope abundance, 479tlamp, 571masking, 245metal ion buffer, 325–326ppoisoning, 21mpotential range, 363mspectrophotometric analysis, 504dtrace analysis, 645
Mercury cadmium telluride, 437Mercury(I), 100m, 134t
disproportionation, 100m, 101bhydrolysis, 101b
Mercury(I) chloride, 300Mercury(II) acetate, 356iMercury(II) iodate, 335Mercury(II) oxide, 217tMES (2-(N-morpholino)ethanesul-
fonic acid), 174t, 202–204Mesh size, 535, 593, 646–647, 647tMesitylene, 421pMesityl oxide, 608iMetabisulfite, sodium, NR4 (9.10)Metabolism, 11, 556Metal, in glass, 38pMetal dissolution, 651–652Metal electrode, 301Metal hydride battery, 295pMetal ion
buffer, 316, 318extraction, 504–505, 504d, 506bhydrolysis, 111, 111iindicator, 241–243, 241d, 242t, 243inatural water, 260snow, 472p, 594m
Metal-ligand equilibria, 238–241Metaphosphoric acid, 652tMetasilicate, 21bMeter, 9tMethane:
chemical ionization, 477chromatography, 509greenhouse gas, 426bisotopic composition, 482bprotonated, 477iseparation, 534
Methanesulfonate, hydration number, 140t
Methanesulfonic acid hydrationnumber, 140t
Methanol:critical constants, 568tdensity, 17pdiffusion coefficient, 513teluent strength, 563t, 579iHPLC solvent, 576oxidation, 138ppKa, 225pultraviolet cutoff, 563t
Methionine, 182tMethod blank, 80Method detection limit, 87Method development:
electrophoresis, 620gas chromatography, 549–551HPLC, 575–583
Method of continuous variation,408–410
Method validation, 82Methoxide, 106Methyl acetamide hydration
number, 140tMethylamine, 105, 140t, 229Methylammonium chloride, 111Methylammonium ion, 105Methylarsonate, 94pMethyl borate, 653t, 654N,N�-Methylenebisacrylamide,
441, 601iMethylene blue, 289t, 333tN-Methylformamide, 616Methyl oleate, 520tMethyl orange, 215t3-Methyl-2-pentanone, 496p4-Methyl-2-pentanone, 483iMethyl red, 215t, 241d, 406i, 407Methyl stearate, 520tMethyl t-butyl ether, 553p, 563tMethylthymol blue, 243i, 419pMethyl violet, 215tMetric ton, 11tMicellar electrokinetic
chromatography, 83i, 615–618Micelle, 422p, 423p, 504d, 598b, 615Michelson, A., 443mMichelson-Morley experiment, 443mMicro, 10tMicroarray, 397Microbalance, quartz, NR1 (2.3)Microbe, 270Microburet, 216bMicrocantilever, 20Micro cell, 384iMicrodialysis, 556Microelectrode, 369Microequilibrium constant, 247pMicrofluidic device, 621–622Microliter pipet, 28iMicromechanical device, 20Micropipet, 28–29
calibration, NR2 (2.18)Microporous particle, 559Microreactor, 621Microscale titration, 26Microscopic description of
chromatography, 522bMicroscopy, electrochemical, 370Microsphere, 439Microwave:
bomb, 125digestion, 396, 651, 654extraction, 656oven, 31radiation, 380ispectroscopy, 181i
Migration, 361Migration time, 610, 619Mile, 11m, 18pMilk, 108i, 125t, 494bMilk of magnesia pH, 108iMilli, 10tMilliliter, 11tMillimeter Hg, 11tMine, acid drainage, 96, 108iMineral, 628Minimum detectable concentra-
tion, 86MINVERSE, 406Mirror image spectra, 392i, 395iMiscibility, 502mMitochondrion, 293p, 397Mixed operations, uncertainty, 46Mixing chamber, 539Mixture, titration, 124, 131–132

I14 Index
Mixture analysis, 402–406mL (milliliter), 11tMMULT, 406Mobile phase, 506Mobility, 303, 487, 605–609MOBS, 175tModulation, 465Mohr buret, 121Mohr pipet, 27iMoisture removal, 31tmol, 9t, 12Molality, 12Molality–molarity conversion, 107tMolar absorptivity, 381Molarity, 12, 32Molarity–molality conversion, 107tMole, 9t, 12, 16mMole balance, 132Molecular conductance, 273bMolecular exclusion chromatography,
507i, 508, 566i, 599–602desalting, 600gels, 600, 601iKav, 600molecular mass determination, 601void volume, 600
Molecular imprinting, 441, 442i, 603b
Molecular ion, 476, 477m, 478–483Molecular light switch, 413Molecularly imprinted polymer,
441, 442iMolecular mass, 12, 476b
calibration standard, 602idetermination, 601–602, 619electrospray of proteins, 493–495uncertainty, 49
Molecular orbital, 388Molecular sieve, 534, 539iMolecular vibration, 389Molecular wire, 273bMolybdenum, permanganate titration,
337tMonochromatic light, 381m, 382Monochromator, 381
bandwidth, 431dispersion, 430emission, 394iexcitation, 394ifilter, 432–433grating, 425i, 429–431resolution, 430slit, 425i
Monoclonal antibody, 229, 602i, 603
Monodentate ligand, 229Monohydrogen phosphate, 112Monohydrogen phthalate, 185Monolithic column, 562b, 588Monoprotic system, 191MOPS, 175tMOPSO, 175t, 308tMorphine, 197p, 5864-(N-Morpholino)butanesulfonic
acid, 175t2-(N-Morpholino)ethanesulfonic
acid, 174t, 202–2043-(N-Morpholino)-2-
hydroxypropanesulfonic acid,175t, 308t
3-(N-Morpholino)propanesulfonicacid, 175t
Mortar, 2i, 650Mother liquor, 30, 633mMTBE, 118pMull, 384Mullite mortar, 650Multidentate ligand, 229
Multielement detection, 463–464Multiple flow paths, 520Multiple regression with LINEST,
135Multiplication:
significant figures, 41uncertainty, 45
Murexide, 242t, 243iMuscle, 180Mussel, 470iMylar beam splitter, 446Myoglobin, 180i, 194b, 562iMyosin, 619i, 626pMyricetin, 580Mysoline, 43b
n (nano), 10tN (newton), 10t# (frequency), 379NAD�, 441, 442NADH, 289t, 321, 442NADP�, 442
field effect transistor, 321NADPH, 289t, 321Nafion, 31t, 369, 374–375p, 482bNano, 10tNanometer, 380iNanoparticle, 601Naphtholphthalein, 215t1-Naphthylammonium, 618iNaproxen, 658Narcolepsy, 561iNaringenin, 580Narrow-bore column, 550tNational Fire Protection Association
label, 21i, 22National Institute of Standards and
Technology, 43bpH reference buffers, 308t
Natural gas, 544iNatural logarithm, 47Natural water:
acidity, 209balkalinity, 209bions, 596imetal ions, 260
Nebulization, 456, 457iNebulizer, 488, 489iNegative pH, 214bNeocuproine, 387Neon isotopes, 474mNernst equation, 279
glass electrode, 307ion-selective electrode, 312,
313, 315Nerve cell, 228Nessler’s reagent, 659tNeurotensin, 562iNeurotransmitter, 369, 604Neutralization, 105Neutral pH, 108Neutral red, 215tNeutron mass, 479tNewton, 10, 10tNewton’s law, 18pNickel vessel, 640Nickel:
crucible, 653tEDTA titration, 245gravimetric analysis, 630t, 635isotopes, 498pmasking, 245ore, 647San Francisco Bay, 228
Nickel-63, 487Nickel-metal hydride battery, 295pNicolsky-Eisenman equation,
NR7 (15.24)
Nicotinamide adenine dinucleotides,289t, 321, 441, 442
Nicotine, 206i, 208, 553p, 586p“Nines” (puritiy nomenclature),
App. KNIST traceable standard, App. KNitramine, 215tNitrate:
aquarium, 138pdepolarizer, 355dichromate titration, 339field effect transistor, 321gravimetric analysis, 630tlakes, 645imass spectrometry, 554pocean floor, 270reduction, 336
Nitric acid:digestion, 651, 655Ka, 159boxidant, 328trole in gravimetric analysis, 634strength, 108t, 214b
Nitric oxide, 60, 250, 339b, 358b,398p, 477, 554p
Nitrides, 651Nitrilotriacetic acid, 126m, 230i,
231i, 318, 593mNitrite, 75p, 138p, 336, 343t, 401p,
452p, 554p, NR19 (28.25)p-Nitroaniline, 214bNitrogen:
air, 60analysis, 638–640atomic emission, 462, 464bound, 339bchemiluminescence detector,
544, 549detector, 544, 571tdiffusion coefficient, 513telemental analysis, 640gas chromatography, 537–538isotope abundance, 479tKjeldahl analysis, 124–125, 654liquid, 327purification, NR10 (17.21)separation, 534thermal conductivity, 542t
Nitrogen dioxide, iodometrictitration, 343t
Nitrogen oxide, 336, 359belectrode, 316
Nitrogen-phosphorus detector, 543t,544, 548i, 549
Nitrogen rule, 478Nitromethane hydration number,
140tNitron, 630t, 631t, 641pp-Nitrophenol, 215t2-Nitrophenyl octyl ether, 3151-Nitropropane, 537t2-Nitropropane, 368i1-Nitroso-2-naphthol, 630t, 631tNitrous acid, permanganate titration,
337tNitrous oxide (N2O), 60, 339b, 426b,
457t, 645iNoble gas, 19pNobel Prize, 60, 228, 362i, 411m,
443m, 474m, 488m, 508m, 629,629m, NR10 (18.1)
Noise, 385, 448–449, 466iNominal mass, 476bNomograph, eluent strength, 579iNonaqueous titration, 218,
NR5 (11.19)Nonbonding electrons, 477iNonbonding orbital, 388
Nonlinear calibration curve, 70i, 71bNonlinear least-squares curve fitting,
NR2 (4.6)Nonpolar, 228Nonpolarizable electrode, 353Nonsuppressed ion chromatography,
597Nonwetting agent, 653Norepinephrine, 572, 624pNormal alkane, 14Normal distribution, 53mNormal error curve, 55Normality, App. ENormalization, 55Normalized peak area, 607Normal-phase chromatography,
563, 566iNORMDIST, 56Nose, electronic, 360bNotebook, 22NOx, 359bNTA (nitrolotriacetic acid), 126m,
230i, 231i, 318N-terminal residue, 180Nuclear energy, 415bNucleation, 630Nujol, 384Null hypothesis, 59Number, spaces in, 9m
�, 10tOberlin College, 349mOcclusion, 633Ocean, 12
CO2 sensor, 420pelectricity generation, 270pH, 96
Octadecyl bonded phase, 561, 579tOctadentate ligand, 229Octanoic acid, 585Octanol, 199mOctyl bonded phase, 561, 579tODS (octadecylsilane), 561mOfficial Methods of Analysis,
NR1 (0.6)Ohm (�), 10t, 273Ohmic drop, 369Ohmic potential, 352Ohm’s law, 273
plot (electrophoresis), 610Oil, 370Oleum, 214bOn-column injection, 540i, 541, 551One-tail t-test, 64, 65mOpen tubular column, 507, 510, 518m,
520, 529–534, 539i, 550Open-circuit voltage, 350mOperator, 1Opium, 620Opsin, 435bOptical fiber, 438Optical isomer (see enantiomer)Optic nerve, 435bOptimization, 87, NR3 (5.8)Optode, 438–439Optrode, 438Orange peel, 545Orbital, 388Ordinate, 10Ore, 647, 653Organic carbon, 338bOrganic material, dissolution,
654–655Organic peroxide, dichromate
titration, 339Organic structures, 114Organohalide determination, 139pOscillating reaction, 302d
Index I15
Osmium tetroxide, 651Osmolality blood test, 312tOuter cone, 457iOvalbumin, 562i, 619i, 626pOverall formation constant,
104b, 239Overloading (chromatography),
521, 570Overpotential, 351, 351t, 354, 363Ovotransferrin, 194bOxalate:
barium oxalate solubility, 260-262
homogeneous precipitant, 633tpermanganate standardization,
337precipitation titration, 134ttransferrin binding, 138p
Oxalic acid:acid dissociation, 112buffer, 187–188permanganate titration, 122, 337tprincipal species, 190
Oxaloacetate, 289tOxidant, 271Oxidation, 270, 271m
catalyst, 638mcatalytic, 338b, 339bnumber, App. Dorganic material, 654–655photochemical, 338b, 339b
Oxidizing acid, 651Oxidizing agent, 270, 652tOxidizing strength, 279tOxine, 346p, 504m, 631tOxygen:
blood test, 312tcell consumption, 416–417COD, 376pcyclic voltammetry, 368idemand, 338bdiffusion coefficient, 513telectrode, 358–359belemental analysis, 640formal potential, 289tindicator beads, 417iiodometric titration, 343tisotope abundance, 479tmyoglobin binding, 180ioptode, 438–439overpotential, 351toxidant, 328tpolarographic waves, 364pyrolysis analysis, 639removal, 60, 364, 539i,
NR10 (17.21)respiration, 379msensor, 358–359b, 414i, 416–417separation, 534thermal conductivity, 542tzirconia O2 generator, NR9 (17.12)
Ozone, 10, 10i, 328t, 339b, 343t,400p, 426b
Ozone hole, 10, 10i, 378, 379
p (pico), 10tP (peta), 10tPa (pascal), 10tPAB ion exchanger, 591tPacked column, 507, 518m, 520,
534–535Paired t-test, 62Palladium, masking, 245Palladium nitrate, 460PAN, 440mPaper mill, 96Parallax, 25Parr oxidation, 654
Particle:growth (precipitate), 630–631sampling, 646–650size (in chromatography), 535,
557–558, 559tPartition chromatography, 507i, 508Partition coefficient, 502, 510, 521Partition ratio, 509mParts per billion, 13Parts per million, 13Pascal, 10, 10tPassivation, App. KPatent, 22mPathlength, optical, 614iPatton & Reeder’s dye, 243iPauling, L., 629mPeak:
area measurement, 541–542broadening (chromatography),
522bcurrent, 367, 368idoubling (HPLC), 569shape (electrophoresis), 612–613
Pee Dee belemnite, 482bPenetration depth, 440Pentafluorobenzyl bromide, 554pPentagonal bipyramidal coordination,
231iPentane:
eluent strength, 563tultraviolet cutoff, 563t
2-Pentanone, 537tPentobarbital, 477iPeptide bond, 180Peptization, 634Percent composition, 13Percent transmittance, 381Perchlorate, 87i, 316m, 630tPerchloric acid:
density, 18pdigestion, 652t, 655hydrate, 106oxidant, 328tprecautions, 655strength, 108t, 214btitrant in acetic acid, 218use, NR19 (28.15)
Perfluorokerosene, 481Perflurotributylamine, 481Performance test sample, 81Perfusion blood test, 312tPeriodate, 328t, 343t, 344p, 624pPermanent hardness, 245bPermanganate:
dichromate titration, 339iodometric titration, 343toxalate titration, 122oxidant, 328t, 336–337spectrum, 419ptitration, 332d
Peroxide:catalytic decomposition, 396dichromate titration, 339flux, 653, 653t, 654preoxidation, 335
Peroxyborate, 345pPeroxydisulfate, 328t, 335, 337t,
338b, 343tcleaning solution, 26, NR1 (2.13)
Persian coin, 13, 14iPersistence of end point, 372Persulfate (see peroxydisulfate)Pesticide, 321, 412, 533b, 546,
656, 658Pestle, 2i, 650Peta, 10tPewter, 453p Function, 127
pH, 108, 147common substances, 108icritical care profile, 312telectrode (see glass electrode)fish survival, 108ifluorescent beads, 158from cell voltage, 285–286glass electrode, 306–311intracellular, 158iridium electrode, NR7 (15.14)measurement errors, 311negative, 214bocean, 96pOH, 160phosphorylation, 293pprincipal species, 190–191scale, 108standards, NR7 (15.16)uncertainty, 48zero charge, 194–195, 197p
Phagocytosis, 158Phase boundary, 277Phase diagram, 568bPhase transfer catalyst, 506bpH effects:
affinity chromatography, 603capillary electrophoresis, 607EDTA complex formation,
234–235enzyme reaction rate, 167iextractions, 503–504formal potential, 289–291molecular wire, 273bsilica, 560, 561
Phenanthroline, 294pPhenobarbital, 43b, 627pPhenol, 111m, 142, 397Phenolate, 111m, 142Phenolphthalein, 213m, 215t, 383dPhenol red, 215tPhenosafranine, 333tPhenylalanine, 182t, 515iPhenyl bonded phase, 579tPhenylboronic acid, 441Phenylhydrazine, 177pPhenylmethylpolysiloxane, 548Phenyl stationary phase, 561Phenytoin, 43bpH meter, 277d, 302d, 371d
Beckman, 307mcalibration, 308–309history, NR7 (15.15)resistance, 284bterminals, 277muse, 308–309US Standard connector, 277m
pH of zero charge, 194–195, 197pPhosphate:
buffer, 173, 576tgravimetric analysis, 630tpermanganate titration, 337tprecipitation titration, 134tprotonated forms, 112reference buffers, 308t
Phosphide, 651Phosphor, 391bPhosphorescence, 390–391Phosphoric acid, 112, 174t, 175t,
652tPhosphorous acid, 341tPhosphorus:
atomic emission, 462, 464detector, 544, 548iflame photometric detector, 549isotope abundance, 479tphosphomolybdate analysis, 643p
Phosphorus pentoxide, 31t, 637Phosphorylase, 619i, 626p
Photoaction spectrum, 415bPhotocell, 414bPhotochemical oxidation, 339bPhotoconductive detector, 437Photodiode array, 434–436, 436t,
572, 572iPhotoelectron spectroscopy, 477iPhotoionization detector, 544, 549Photomultiplier, 426, 433–434, 436tPhotooxidation, 338–339b, 376pPhotosynthesis, 415bPhototube, 433Photovoltaic detector, 437pH-sensitive field effect transistor,
321pH-stat titration, 249pPhthalate, 185, 308t, 597Phthalic acid, 185Physical gel, 618Phytoplankton, 500pPhytoremediation, 244mPi bonding electrons, 477iPickling, App. KPico, 10tPicolinic acid, 196pPicric acid, 418pPiezo alerting buzzer, 165dPiezoelectric crystal, 20, 460Piezoelectric mixer, 621–622Pigment separation, 506mPinch clamp, 121P ion exchanger, 591tPi orbital, 388PIPBS, 174t, 175tPiperazine, 162, 635Piperazine-N,N�-bis(4-butanesulfonic
acid), 174tPiperazine-N,N�-bis(2-ethanesulfonic
acid), 174t, 175tPiperazine-N,N�-bis(3-propanesulfonic
acid), 174t, 175tPiperidine, ionization energy, 477iPIPES, 174t, 175tPipet, 27–29
bulb, 28calibration, 33tolerance, 27t, 29tuncertainty, 49–50
pi-pi interactions, 579tPIPPS, 174t, 175tPiranha solution, 651Piston pump, HPLC, 570, 570iPitzer equation, 144, NR4 (8.7)Pixel, 436pK (pKa, pKb), 161
Gran plot, 212principal species, 190–191protein titration, 199strong acids, 214btitration curve, 204i, 206i
pKw, 1610.1 M KCl, 265
Planck distribution, 427bPlanck’s constant, 379Plane angle, 9tPlane-polarized light, 379Plankton, 500pPlant, 244mPlant pigment, 506mPlasma, 385, 453, 474Plasma wave, 440Plasmon, 440Plaster, 245bPlasticizer, 304iPlate height, 514, 523b, 537i, 554p,
558i, 604, 609Plate number, 558Platform, L’vov, 458i

I16 Index
Platinum:diaphragm, 326ielectrode, 299, 301, 302d, 354i,
574masking, 245potential range, 363mvessel, 651
PLOT, 529Plutonium, 292pPneumatically assisted electrospray,
488Pneumatic nebulizer, 456pn Junction, 319pOH, 160Poisson distribution, 423p,
NR12 (19.23)Polar, 228Polarity, 532t, 535iPolarizability, 592mPolarizable electrode, 353Polarization, 413, 428
concentration, 352Polarized light, 379Polarogram, oscillation, 363mPolarographic wave, 363Polarography, 362–364
apparatus, 363ascorbic acid, 290idiffusion current, 364dropping-mercury electrode,
362–363half-wave potential, 290i, 363oxygen waves, 364polarographic wave, 363residual current, 364sampled current, 363square wave, 364–366stripping analysis, 366–367wave shape, 364–366
Polar stratospheric clouds, 378, 379Pollution, 244mPolonium-210, 477Polyacrylamide, 441, 601i, 611mPolyalkylamine ion exchanger, 590tPolybasic species, 112Polybutadiene, 519iPolychromatic light, 429mPolychromator, 435, 572iPolycyclic aromatic hydrocarbon, 397Poly(diethylene glycol succinate), 520tPoly(dimethylsiloxane), 501Polyethylene, 316, 384, 645, 651Poly(ethylene glycol), 339b, 532t, 567Polyimide, 529Polymer:
conductive, 360bmolecularly imprinted, 441, 442i,
603bPolymerase chain reaction, 618, 621Polypeptide, 180Polypropylene flask, 27Polyprotic acid, 112–114, 188–189Polyprotic base, 112Polyprotic fractional composition
equations, 192mPolypyrrole, 360bPolysaccharide, 298i, 590, 591iPolysiloxanes, 532tPolystyrene, 447i, 559, 589, 589i,
590t, 601i, 602iPolytetrafluoroethylene, 644Poly(vinyl chloride), 304i, 315Ponceau, 418pPooled standard deviation, 61Population:
inversion, 428mean, 54standard deviation, 54
Porcelain, 650Pore, size, 600Porosity, 559iPorous carbon, 530iPorous graphitic carbon, 562Porous-layer open tubular column,
529, 534Port, injection, 539iPost-column derivatization, 572Postprecipitation, 634Potassium:
blood test, 312tchannel, 228diffusion coefficient, 513tEDTA titration, 246pgravimetric analysis, 630tion-selective electrode, 316mprecipitation titration, 134tvalinomycin complex, 304iVolhard titration, 134t
Potassium bromate, 346pPotassium bromide:
beam splitter, 446infrared cutoff, 384mpellet, 384
Potassium chloride:density, 646entropy of solution, 98liquid junction, 303tsalt bridge, 277solubility, 102b
Potassium cyanate, 633tPotassium dichromate:
absorbance standard, 432tredox titrations, 339spectrum, 383d
Potassium dihydrogen citrate buffer,308t
Potassium hydrogen fluoride, 653Potassium hydrogen iodate, 217tPotassium hydrogen phthalate, 185,
217t, 226, 308tPotassium hydrogen tartrate, 142, 308tPotassium hydroxide, 108t
flux, 653, 653tsolution preparation, 216
Potassium iodate, 340Potassium iodide, 653Potassium nitrate, 141, 646Potassium permanganate, 332d,
336–337Potassium peroxydisulfate, 338bPotassium pyrosulfate, flux, 653, 653tPotassium tetraphenylborate,
134t, 630tPotato chips, 662Potential:
cell membrane, 293pdifference, 10telectric, 272electrode conversion scale, 300electrode range, 363menergy, 476bglass electrode, 307half-cell, 280b, 282iion-selective electrode, 305ohmic, 352standard, 277–279zero charge, 365b
Potential differences, 272, 274mPotentiometer, 275i, 277d, 302dPotentiometric titration:
Gran plot, 334precipitation, 131i, 301redox, 332d
Potentiometry, 299, 349Potentiostat, 353Potomac River, 96
Pound, 11m, 11tconversion to newton, 156p
Pound per square inch, 11tPowder, grinding, 650Power:
calculator, 47melectric, 273uncertainty, 47–48units, 10t, 11t
Power supply, 349ippb, 13ppm, 13Practical-grade chemical, 123bPrecambrian era, 628Precipitant, 630Precipitate
composition, 634electric charge, 133
Precipitation:crystal growth, 630–631digestion, 633electrolyte role, 632–633filterability of product, 630homogeneous, 631, 633tproduct composition, 634separations, 101–102titration, 127–134, 157p, 301
Precision, 39, 43, 54m, 81matomic spectroscopy, 468tinjection, 84instrument, 84interlaboratory, 84, 85bintermediate, 84intra-assay, 84
Precolumn (guard column), 568Preconcentration, 444m, 458, 492,
547, 594, 658–659Precursor ion, 492Prefix (multiplier), 10Preheating region, 457iPremix burner, 456, 457iPreoxidation, 335Preparation of sample, 547–549,
644–659Preparative chromatography,
511, 569bPreparing solutions, 14–15Prereduction, 336Preservative, 335, 341Pressure:
critical, 568tequilibrium constant, 97gas chromatography, 536HPLC, 557–558, 559t, 576programming, 536units, 10, 10t, 11t
Pressure broadening, 463Primary amine, 111Primary standard, 122, 123b,
NR5 (11.17)acids and bases, 216, 217tbuffer, 254
Primer, 618Primidone, 43bPrincipal species, 190–191Principle of Le Châtelier, 99–100Prism, 429, 440Procion Brilliant Blue M-R, 164bProduct, 15mProduct ion, 493Proline, 182tPropagation of uncertainty, 44–50,
App. Caddition and subtraction, 44–45, 49tcalibration curve, 71exponents, 49tlogs, 49tmixed operations, 46
multiplication and division, 45, 49tstandard addition, 90x2, 48b
Propane:hydration number, 140tthermal conductivity, 542t
2-Propanol:eluent strength, 563tultraviolet cutoff, 563t
1-Propanol chromatography solvent,568
Protein:aptamer assay, 413arsenic sensor, 1charge ladder, 608, 626pcolorimetric analysis, 69, 74pdigestion, 167ifood, 19pisoelectric focusing, 194bKjeldahl analysis, 125mass spectrometry, 493–495, 494bmolecular mass, 619sequence, 474structure, 180titration, 199transferrin, 126, 385–387
Protein A, 602Proteoglycan, 298iProtic solvent, 105, 107Protocol, 82Proton, 105Protonated molecule, 477Protonated methane, 477iProton mass, 479tPseudomonas bacteria, 138ppsi (pounds per square inch), 11tPt gauze electrode, 354iPulsed electrochemical detector, 574Pulse height, 364iPump, 570, 570iPurge, septum, 539Purge and trap, 548Purified grade chemical, 123bPurity:
“nines” nomenclature, App. Kprecipitate, 633–634reagent, 123b
PVC, 339bPyrene, 423pPyrex, 26m, 33Pyridine, 119p, 205, 537tPyridinium, 119p, 251Pyridoxal phosphate, 162Pyridylazonaphtol, 243i1-(2-Pyridylazo)-2-naphtol, 440mPyridylazonapthol plus Cu-EDTA,
243iPyrocatechol violet, 242t, 243iPyroelectric effect, 437Pyrogallol red, 243iPyrolysis, 458, 639Pyrolytic graphite, 458Pyrophosphate, 635Pyrophosphoric acid, 652tPyrosulfate, flux, 653tPyruvate, 289t
QAE ion exchanger, 591tQ test, 65Quadratic equation, 71b, 160mQuadrupole ion-trap mass
spectrometer, 486Quadrupole mass spectrometer, 484Qualitative analysis, 5, 476Quality assessment, 81bQuality assurance, 78–87Quality control sample, 81Quantitative analysis, 5

Index I17
Quantitative transfer, 3Quantum dot, 601–602Quantum efficiency, 436Quantum yield, 415Quartz, 20Quartz crystal microbalance,
NR1 (2.3)Quartz-halogen lamp, 425Quartz plate sieve, 619iQuaternary ammonium hydroxide,
108tQuaternary ammonium ion exchanger,
590tQuenching, 396, 414–416, 423p, 438Quercitin, 580Quinhydrone electrode, 296pQuinone, 296p
rad (radian), 9tRadian, 9tRadiant flux, 10tRadiant power, 381mRadiationless transition, 390Radiation treatment, 230Radioactivity, 628, 629Radioisotope, 230Radio wave, 380iRadium, 629Radium chloride, 629Radius:
hydrated, 140hydrodynamic, 606ionic, 140
Radon, 628Rain, acid, 250, 260Rainwater, 108i, 310b, 361, 385mRaman spectrum, 159bRamp, voltage, 363Random error, 43Random heterogeneous material, 7bRandom sample, 7bRandom variable, 522bRandom walk, 392Range, 65, 84
dynamic, 71linear, 71
Rare earth, 453Raw data, 79Rayleigh, Lord, 60RDX, 487iReactant, 15mReaction quotient, 99, 279Reagent blank, 80, 386Reagent gas, 477, 487Reagent-grade chemical, 123bReceptor, 602
transferrin, 291Reciprocal centimeter, 379Reconstructed total ion
chromatogram, 491i, 492Recycling, 21
HPLC solvent, 568mRed blood cell, 53Redox indicator, 332–334, 333tRedox reaction, 270
balancing, App. DRedox reagents, 328tRedox titrations, 327–343
calculating curve shape, 327–332,332d
cerium(IV), 337–339dichromate, 339end point, 331Gran plot, 334indicators, 332–334iodine, 340–343permanganate, 336–337preoxidation, 335
prereduction, 336procedures, NR8 (16.2)spreadsheet, 331msuperconductor, 327, 342b,
346p, 347pReducing agent, 271Reducing strength, 279tReductant, 271Reduction, 271mReduction catalyst, 638mReduction potential:
acid dissolution, 651electron flow, 282iLatimer diagram, 282brelation to K, 284standard, 277tables, App. Htransferrin, 291use of tables, 278–279
Reductor, 336Referee, 480iReference cell, 424Reference cuvet, 384Reference electrode, 299–301
calomel, 300, 329iconversion scale, 300glass electrode, 131i, 301silver-silver chloride, 300symbol, 353i3-electrode cell, 353
Reflection grating, 425i, 429Reflectivity, 440iReflectron, 485i, 486Reflux cap, 654, 655iRefraction, 429, 437–438Refractive index, 379, 437, 438m
detector, 571t, 572–573fused silica, 452p
Refractory element, 457Refractory material, 651Regression (least squares), 65–69Rejection of data, 65Relative humidity, 37pRelative migration time, 619Relative reference, 35Relative retention, 509, 510Relative standard deviation, 54Relative uncertainty, 44Releasing agent, 467Remediation, 327mRenal function blood test, 312tReplicate measurement, 8, 649Reporting limit, 87Reporting results, 8Reprecipitation, 634Representative sample, 7b, 644Reproducibility, 84Residence time, 457Residual current, 354, 364Residual sodium carbonate, 209bResin, 508m, 589, 590m
preconcentration, 658–659Resistance, 273
electric, 10t, 273glass electrode, 307pH meter, 284bsuperconductor, 327units, 10t
Resistivity, NR8 (15.30)water, 594
Resolution:capillary electrophoresis, 604–605chromatography, 511–512,
515–516, 579m, NR15 (23.8)electrophoresis, 610FTIR, 445gas chromatography, 530, 531,
538, 550m
mass spectrometry, 478mmonochromator, 467ispectroscopy, 430
Resolving power, 478Respirator, 21Response factor, 90, 542Results, 79
conclusions, 8interpretation, 8reporting, 8
Retardation, 445Retention factor, 509mRetention gap, 538Retention index, 535, 536mRetention time, 509Retention volume, 511Retina, 435b, 604Retinal, 435bRetinol, 328tReverse bias, 319Reversed-phase chromatography,
563, 566i, 575–583Reverse osmosis, 594Reversible electrochemical reaction,
367Rhodamine G, 392Rhodopsin, 435bRiboflavin, 289t, 397Ribonuclease, 199, 513t, 562iRibonucleic acid (see RNA)Ribose, 614iRichards, T. W., 628Rich flame, 457, 467Ring-down spectroscopy, 424Rings and double bonds, 481Ritalin, 561i, 587pRiver:
bicarbonate content, 150bcalcium content, 150blead analysis, 78sediment, 197p
RMS noise, 448RNA (ribonucleic acid), 199, 366t,
402, 413Robustness, 87Rock, 640Rod cell, 435bRoot (mathematics), 47Root-mean-square (rms) noise, 448Ross electrode, NR7 (15.22)Rotating disk electrode, 298, 361,
362i, 376pRotational energy, 389Rotational transition, 390Rouleaux formation, 53iRound robin testing, 43mRounding-off rules, 41Ru(II):
luminescence, 413, 416–417,423p, 438
sensitizer, 414bRubber, 316
glove, 21policeman, 30
Rubidium, 9Rubidium hydroxide, 108tRubidium sulfate, 544Ruggedness, 84, 575Rule of three, 577m, 587pRun buffer, 610Ruthenium tetroxide, 651Rutin, 580
s (second), 9ts (standard deviation), 54, 61, 68� (population standard deviation), 54Σ (summation sign), 54Safety, 20–22
Safety glasses, 21iSafranine T, 289tSalicylaldoxime, 631tSalicylate, 634Salicylic acid, 162, 556, 586pSaliva pH, 108iSalt, 100m, 105Salt bridge, 276, 277, 277dSalting out, 155pSample:
composite, 7bdigestion, 651–655injection (chromatography),
538–541, 551, 571, 571iloop, 571, 571ipreconcentration, 658–659preparation, 2, 3, 8, 547–549,
644–659random, 7bselection, 7, 645size for analysis, 648storage, 645
Sampled current polarography, 363Sample preparation, 492, 655–659Sampling, 2, 7, 644, NR19 (28.16)
constant, 648direct solid, 459statistics, 646–650time, 363ivariance, 646m
Sandwich complex, 360mSandwich injection, 538, 539iSan Francisco Bay, 228Sanger, F., 629mSapphire, 384m, 570Sarin, 548iSaturated calomel electrode, 300Saturated solution, 100Saturation fraction, 408Scale, 245bScale up:
chromatography, 511, 557gradient, 582b
Scandinavia, 453Scanning electrochemical
microscopy, 370Scanning tunneling microscope, 273bScatchard plot, 407–408S.C.E. (saturated calomel electrode),
300Schematic circuit diagram, 274iSchliera, 27Scifinder, 2mSCOT, 529Screen, 535Seawater, 12, 108i, 420p, 459, 548i,
658, 662pSecond, 9tSecondary amine, 111Second derivative, 210–211Second-order diffraction, 430Sediment, 197p, 270, 459, 645iSegmented gradient, 565i, 580, 583Segregated heterogeneous material, 7bSE ion exchanger, 591tSelected ion monitoring, 491–492,
491i, 545Selected reaction monitoring,
491–493, 545Selection of sample, 7, 645Selectivity, 80Selectivity coefficient:
ion exchange, 591ion-selective electrode, 312
Selenite, 396Selenium:
fluorescence assay, 396–397isotopes, 470

I18 Index
Self-absorption, 396, 468Semiconductor, 318, 437Semipermeable barrier, 277dSemipermeable membrane, 316,
556, 632dSemithymol blue, 419pSemi-xylenol orange, 137pSensitivity, 80
balance, 22gas chromatography, 543tHPLC detector, 571t
Sensitizer, 414bSensor:
glucose, 357–361heparin, 298, 315oxygen, 358b
Separation factor, 610Separations, 501–523, 528–551,
556–583, 588–622, 655–659adsorption chromatography, 508affinity chromatography, 508,
602–603capillary electrophoresis, 603–620chromatography, 508controlled-potential electrolysis, 353enantiomers, 533b, 584p, 594,
603, 616i, NR16 (26.3)gas chromatography, 528–551gel filtration, 508, 599–602gel permeation, 508high-performance liquid
chromatography, 556–583ion chromatography, 594–597ion-exchange chromatography,
508, 589–594isotopes, 615imolecular exclusion, 508, 599–602molecularly imprinted polymer,
441, 442i, 603bpartition chromatography, 508precipitation, 101–102preparative, 569bselecting HPLC separation mode,
566–567solvent extraction, 502–506
Separator column, 594Sephadex, 590, 591i, 600tSeptum, 529, 539
purge, 539Sequencing DNA, 618Series expansion, 396Serine, 182t, 344pSerum, 385, 658Serum albumin, 513t, 609Serum iron determination, 385–387Servomotor, 22iSeven coordination, 234iSewage, 96, 492–493Shatterbox, 650, 651iS.H.E. (standard hydrogen electrode),
278Shell, 470iShorthand (organic structures), 114Shower, 22Siemens, 273bSieve, 647t
molecular, 534Sieving, 618, 619iSigma bonding electrons, 477iSigma orbital, 388Signal averaging, 448Signal detection limit, 86Signal-to-noise ratio, 448, 466i
monochromator, 431Significant figure:
addition and subtraction, 40–41graphs, 42least-square parameters, 68
logarithms and antilogarithms,41–42
mean and standard deviation, 55multiplication and division, 41real rule, 46zeros, 40
Silanization, 521, 561mSilanol, 531, 560, 606Silica:
acidity, 194–195chromatography, 4, 559i, 560i, 600fluorescent beads, 416fused, 384, 529gel, 31tgrating protective layer, 429hydrolysis, 519i, 561monolithic column, 562bstationary phase, 579t
Silica capillary preparation, 610Silica gel, 392Silicate, 307i, 640, 653Silicon:
charge coupled device, 436–437isotope abundance, 479tphotodiode array, 434–436photoresponse, 433isemiconductor, 318
Silicon cantilever, 20Silicon carbide, 427, 459, 640Silicon dioxide, 320Silicone breast implant, 501Silicon nitride, 320i, 640Silicon tetrafluoride, 640Siloxane, 501, 532t, 560iSilurian era, 628Silver:
adsorption on Teflon, 645bromide, 314tcoins, 13, 14icyanide equilibria, 266p, 268pEDTA titration, 244electrode, 131i, 301–302field effect transistor, 320–321iodide, 314tiodide equilibria, 119pion-selective electrode, 314, 316mmasking, 245permanganate titration, 337treducing agent, 336stripping analysis, 366tsulfide, 314, 314tthiocyanate, 314tvessel, 651
Silver(II), 335, 357Silver chloride:
colloidal particle, 632ielectric charge, 133equilibria, 116pinfrared window, 384mion-selective electrode, 314tlight sensitivity, 134solubility in KCl, 311
Silver-silver chloride electrode, 300combination electrode, 306
Simplex optimization, 87, NR3 (5.8)Simultaneous equations, 405–406Single-beam spectrophotometer,
381i, 384, 424Single-column ion chromatography,
597Single-molecule spectroscopy, 392Singlet state, 388, 416Sintering, 414bSI units, 9–11Size, particle, 535Size distribution, nebulizer, 457iSkimmer cone, 489iSkin cancer, 10
Skin disease, 1Slit, monochromator, 425iSlope, App. B
least-squares calculation, 66–67titration curve, 129, 210
SLOPE (Excel), 67Slurry, 3, 30Smallest titration, 216bSmith, John, 39Smoke, 323p, 659Snell’s law, 438Snow, 472p, 594mSoap, 245bSodium:
channel, 228critical care profile, 312tdiffusion coefficient, 513tdispersion, 139pD line, 437error, 311ion-selective electrode, 316mmobility in glass, 307vision, 435b
Sodium aluminosilicate, 534iSodium azide, 564iSodium bicarbonate, 124Sodium bismuthate, 335Sodium bisulfite, NR4 (9.10)Sodium borate, flux, 653, 653tSodium carbonate:
flux, 653, 653tprimary standard, 217t, 227residual, 209btitration, 124, 225p
Sodium chloride:infrared cutoff, 384mion pair, 143bliquid junction, 303tmatrix, 459ocean, 12
Sodium D line, 437Sodium dodecyl sulfate, 422p, 615mSodium dodecyl sulfate-gel electro-
phoresis, 619iSodium hydrogen carbonate, 124Sodium hydrogen sulfite, 21bSodium hydroxide:
equilibrium, 119pflux, 653, 653tpreparation, 216reaction with glass, 216standardization, 226–227strong electrolyte, 108t
Sodium hypochlorite, 19p, 169Sodium metabisulfite, NR4 (9.10)Sodium metasilicate, 21bSodium nitrate in HPLC, 576Sodium octyl sulfate, 624pSodium oxalate, 337Sodium peroxide, flux, 653, 653t, 654Sodium peroxyborate, 345pSodium sulfate ion pair, 143bSodium tetraphenylborate, 631t,
642pSodium thiosulfate, 340–341,
NR9 (16.22)Soft drink, 6tSoil, 244m, 412, 656Solar energy, 414–415b, 426bSolid, standard state, 97Solid angle, 9tSolid-phase extraction, 492, 644, 658Solid-phase microextraction,
547–548Solid-state chemical sensor, 318–321Solid-state ion-selective electrode,
316mSolomon, S., 379
Solubility:calcium sulfate, 151–153common ion effect, 101Eº, 285ionic-strength effect, 141–142ligand-concentration effect, 103ilithium fluoride, 156pmagnesium hydroxide, 153–154metal complexes, 504–505minerals, 260separations, 101–102solubility product, 100, 285,
App. FSolute, 12
polarity, 532tstandard state, 97
Solution preparation, 14–15Solvent, 12
additive (HPLC), 568chromatography, 563, 564m, 568front, 574, 575sample, 569standard state, 97triangle, 577i, 578iwater content, 568
Solvent extraction, 502–506crown ether, 506bdistribution coefficient, 503, 505dithizone, 504d, 505iefficiency, 502–503metal chelator, 504–505, 504d,
506bpH effect, 503–504partition coefficient, 502strategies, 505
Solvent trapping, 540SOLVER, 253, 265, 404, 421pSoman, 548iSonication, 366Sørenson, S. P. L., 168mSource:
field effect transistor, 320spectrophotometer, 426–428
South Pole, 10iSoybean trypsin inhibitor, 194bSpace focus plane, 485i, 486Space shuttle, 293pSparkman, O. D., 478mSpecies, 8mSpecific adsorption, 365bSpecification, 79Specific gravity, 13mSpecificity, 80, 82Spectral interference, 467Spectral width, FTIR, 446Spectrometer, ion mobility, 487–488Spectronic 20 spectrophotometer, 40Spectrophotometer, 424–437
atomic absorption, 455iatomic spectroscopy, 462–466cuvet, 384detector, 433–437dispersive, 435double-beam, 384, 425emission, 394ifilter, 432–433Fourier transform (FTIR), 442–448light sources, 426–428monochromator, 429–433photodiode, 435single-beam, 381i, 384, 424Spectronic 20, 40stray light, 432Varian Cary 3E, 425i
Spectrophotometric titration, 126, 410iSpectrophotometry, 379
absorption of light, 380–383, 383daccuracy, 384–385

Index I19
analysis of mixture, 402–406Beer’s law, 381, 382b, 402detectors, 433–437dispersion, 430double-beam, 425iemission, 380i, 383d, 390–391,
392–397equilibrium constant measurement,
407–408errors, 385flow injection analysis, 410–411fluorescence, 383d, 390–391,
392–397Fourier transform, 442–448grating, 429–431isosbestic point, 406, 419pJob’s method, 408luminescence, 392–397method of continuous variation,
408–410phosphorescence, 390–391properties of light, 379–380resolution, 430Scatchard plot, 407–408serum iron determination, 385–387signal averaging, 448time-resolved fluorescence, 412titration, 410i
Spectroscopy, single-molecule, 392Spectrum, 380, 380i, 383d
blackbody, 426b, 427bSpeed of light, 9m, 379, 443mSphalerite, 249pSpherogel, 601iSpike, 80, 492Spike recovery, 80Spills, 22SP ion exchanger, 591tSpleen, 603Split injection, 539, 540i, 551Splitless injection, 539–541, 551Split point, 539iSplit ratio, 539Split vent, 540iSpreadsheet:
absolute reference, 35acid-base titration, 218–221, 221tADD-INS (Excel), 64ANALYSIS TOOL PACK, 64arithmetic operations, 34auxiliary complexing agent, 248pAVERAGE, 55BINOMDIST, 555pbinomial distribution, 555pcell, 33CHART, 35–36, 51p, 72circular reference, 156p, 269pcomplex formation, 247pDATA ANALYSIS, 64documentation, 35EDTA titration, 237–238formula, 34function, 34GOAL SEEK, 115, 154, 176graphing, 35–36, 51pintercept, 68–69INTERCEPT (Excel), 67introduction, 33–36iteration, 156plabel, 34least squares, 71–72LINEST, 68–69, 83, 135matrix, 68–69matrix functions, 405–406MINVERSE, 406MMULT, 406naming cells, 176NORMDIST, 56
number, 34order of operations, 35parentheses, 35pooled variance, 64precipitation titrations, 132, 139predox titrations, 331mrelative reference, 35SLOPE, 67, 68–69SOLVER, 253, 265, 404, 421psolving equations, 115solving linear equations, 405–406standard deviation, 55STDEV, 55TOOLS, 64TRENDLINE, 72t test, 64–65trial-and-error solution, 115variance, 64–65
Square, uncertainty, 48bSquare wave polarography, 364–366Squaric acid, 110bsr (steradian), 9tStability constant, App. I
cell voltage, 287–288EDTA complexes, 234t
Stacking, 612–613, 616Stadium analogy for luminescence,
392Staircase:
voltage ramp, 363wave, 364i
Stallion, 184Standard:
acids and bases, 226–227analytical, App. Kelemental assay, App. Kmatrix matched, 470matrix matching, App. KNIST traceable, App. KpH, 308tsolution, 5, 69, 122, 466state, 97, 98fstoichiometry, App. Ktest sieve, 647tultraviolet absorbance, 432tultraviolet/visible wavelength,
NR12 (20.9)Standard addition, 87–90, 317, 467Standard curve, 5Standard deviation, 6
additivity, 517mchromatography, 522bdiffusive broadening, 514F test, 63–64Least-squares parameters, 68–69measure of experimental error, 44pooled, 61sampling, 646–650
Standard enthalpy change, 98Standard HCl, 217t, 225p, 227Standard hydrogen electrode, 278Standardization, 122, 226–227Standard operating procedure, 81, 82Standard reduction potential, 277,
280bequilibrium constant, 284Latimer diagram, 282bmeasurement, 295prelation to equilibrium constant, 284tables, App. Huse of tables, 278–279
Standard Reference Material, 43b,80, 84, 122, NR2 (3.1)
Stannic chloride, 651Stannous chloride, 336, 456bStannous ion, 328tStarch, 334–335, 340Stationary phase, 506
bonded, 531chiral, 584pgas chromatography, 531, 532tHPLC, 579tion exchange, 589–591liquid chromatography, 559–562molecular exclusion, 600, 601i
Statistics, 53–721-tailed test, 64, 65m, NR2 (4.5)2-tailed test, 64, 65m, NR2 (4.5)comparison of means, 59–62confidence interval, 57–59detection limit, 84–87F test, 63–64Gaussian distribution, 53–57least-squares, 65–69linear regression, 65–69Q test, 65rejection of data, 65sampling, 646–650standard deviation, 62, 67–69Student’s t, 57–62, 64–65
STDEV (Excel), 55Steel mortar, 650Stefan-Boltzmann constant, 426bStep height, 363iSteps in chemical analysis, 7–8Stepwise formation constants, 104b,
239m, App. ISteradian, 9tStern layer, 365bStern-Volmer equation, 416iSteroid, 658Stimulated emission, 428Stirring bar, 122iStirring motor, 122iStochastic theory, 522bStoichiometry, 16–17, 16m, 408–410
standards, App. KStokes equation, 605Stopcock, 121Storage:
chemicals, 22dilute solutions, 318msample, 645
St. Paul’s Cathedral, 250Straight line graph, 65–69, App. BStrata, 628Stratosphere, 378Stray light, 432Streamlined calculation, titration, 128Streptomyces pilosus, 232bStretching, molecular, 389iStripping analysis, 366–367Strong acid, 109
pH calculation, 159–161reaction with weak base, 170btitration of strong base, 200–201titration of weak base, 205–206
Strong base, 109pH calculation, 159–161reaction with weak acid, 170btitration of strong acid, 200–201titration of weak acid, 202–204
Strong electrolyte, 12Strongly acidic ion exchanger,
589, 590tStrongly basic ion exchanger,
589, 590tStrontium, 337t, 467–468Strontium hydroxide, 109tStrutt, J. W., 60Student (W. S. Gosset), 57mStudent’s t:
comparison of means, 59–62, 64–65confidence interval, 57–59table, 58t
Styrene, 589i
Sublimation, 568bSubstituent, 180, 181Subtraction:
significant figures, 40–41uncertainty, 44–45
Successive approximations, 152m,186b
Succinate, 144, 289tSuccinic acid, 117pSucrose:
chromatography, 506mdiffusion coefficient, 513telectrophoresis, 614i
Sugar, 18p, 257, 341t, 348, 533b,599i, 614i
Sulfamic acid, 137p, 217t, 633tSulfanilic acid, 401p, 420pSulfate:
acid mine drainage, 108icopper equilibria, 269pEDTA titration, 245formal potential, 289tgravimetric analysis, 630thomogeneous precipitant, 633tocean floor, 270precipitation titration, 134t
Sulfide:EDTA titration, 245, 249pgas trapping, 659thomogeneous precipitant, 633tion-selective electrode, 314, 314tocean floor, 270precipitation titration, 134tvolatility, 651
Sulfite, 346p, 375panalysis, 659tbuffer demonstration, 171dclock reaction, 171dformal potential, 289treductant, 328t
Sulfonic acid, ion exchange, 590tSulfosalcylic acid, 217tSulfur:
analysis, 638–640, 643patomic emission, 462, 464detector, 543t, 544, 544iflame photometric detector, 549isotope abundance, 479t
Sulfur chemiluminescence detector,543t, 544, 549
Sulfur dioxide:acid rain, 260, 310bblood test, 312telectrode, 316emissions, 250food preservative, 375pgas trapping, 659tiodimetric titration, 341tKarl Fischer titration, 370prereduction, 336reductant, 328ttrapping gas, 659t
Sulfur hexafluoride, 479Sulfuric acid:
digestion, 125, 652tdrying agent, 31strength, 108t, 214b
Sulfurous acid, 310bSulfur oxides, 638Summation sign, 54Sunset yellow, 418p“Super acid,” 214bSuperconductor, 327, 342b, 346p,
347p, 642pSupercritical fluid, 568b
chromatography, 568bextraction, 656, 657i
Superficially porous particle, 562

I20 Index
Supernatant liquid, 3Supernate, 386mSupersaturation, 630Support-coated open tubular column,
529, 529iSuppressed-ion chromatography,
594–597Suppressor column, 594–595, 597Surface acidity, 194–195Surface area, silica, 559iSurface plasmon resonance, 440–442Surface tension, 598bSurfactant, 504d, 598, 598b, 611, 616Suspension, 630Sweeping, 616–618Sweep rate, cyclic voltammetry, 368Symbol:
approximately, 16mapproximately equal to, 11melectrodes, 353iimplies that, 15m
Symmetric bend, 389iSymmetric stretch, 389iSynapse, 435bSynge, R. L. M., 508mSyringe, 29, 539, 571m, 644
“sandwich” injection, 538, 539iSystematic error, 42–43, 310b
Karl Fischer titration, 371propagation of uncertainty, 49–50
Systematic treatment of equilibrium,147–154, 250–262
precipitation titration, 132strong acids and bases, 160–161weak acids, 163
Système International d’Unités, 9
T (tera), 10tTabun, 548iTailing, 521, 531, 560i, 565, 569Tanaka, K., 488mTare, 22Target value, 81bTartaric acid, 238i, 251Tartrate, 142, 594mTartrazine, 418p, 632dTaylor cone, 489iTC (to contain), 26TD (to deliver), 26Tea, 6tTEAE ion exchanger, 591tTechnical-grade chemical, 123bTEEN, 174t, 175tTeeth, 453, 456bTeflon, 118p, 122i, 316, 358b, 534,
644, 645, 651Teflon bomb, 651, 654Television, toxic waste, NR1 (2.4)TEMN, 175tTemperature:
atomic spectroscopy, 461–462buffer, 173, 174f, 308tchromatography, 519, 536, 579climatic changes, 395bcritical, 568tEarth, 426b, 427bequilibrium constant, 99–100flame, 457tgravimetric analysis, 631molarity of solution, 12, 32ocean, 500ppH measurement, 311plasma, 460iprogramming, 536thermal conductivity detector, 542units, 9t, 11tvolume of glassware, 31–33volume of water, 32t, 33
Template, 603bTemporary hardness, 245bTenax, 548mTera, 10tTerbium, fluorescence, 572Terrestrial diet, 528Terror, 121Tertiary amine, 111TES (N-tris(hydroxymethyl)
methyl-2-aminoethanesulfonicacid), 175t
Tesla coil, 460Test strip, 1Testosterone, 366tTetraalkylamonium salt, ion pair, 165fTetraborate, 653Tetrabromofluorescein, 134Tetrabutylammonium hydroxide,
108t, 218Tetrabutylammonium ion, 599iTetrabutylammonium salt, ion pair,
165fTetracyanonickelate, 138p, 244Tetradentate ligand, 229Tetraethylammonium salt, ion pair,
165fN, N,N,N�-Tetraethylenediamine
dihydrochloride, 174tN,N,N�,N�–Tetraethylethylmethylene-
diamine dihydrochloride, 175tTetrafluoroethylene, 118pTetrahydrofuran:
eluent strength, 563t, 579iHPLC solvent, 576storage, NR16 (25.24)ultraviolet cutoff, 563t
Tetrakis [3,5-bis(trifluoromethyl)phenyl] borate, 315
Tetramethylammonium hydroxide,119p
Tetramethylammonium salt, ion pair, 165f
Tetramethylrhodamine, 158Tetraphenylarsonium chloride, 631tTetraphenylborate, 134t, 246p, 304,
630t, 631tTetrapropylamonium salt, ion
pair, 165fTetrathionate, 293p, 340Thalassemia, 232bTheobromine, 2, 6tTheophylline, 603bTheoretical performance of column,
554pTheoretical plate, 514, 523b, 558,
559t, 604, 609Thermal cell, 384iThermal conductivity, 542
detector, 542, 543t, 549, 638Thermal desorption, 548–549Thermal expansion, 12, 31–33Thermistor, 318iThermocouple, 437Thermodynamic data, NR3 (6.5)Thermodynamic prediction, 100Thermodynamics, 98–99Thermogravimetric analysis, 634, 642pThick-film column, 550tThin-film column, 550tThioacetamide, 633tThiocyanate:
Fe(III) complex, 141, 421pgravimetric analysis, 630tion-selective electrode, 314tiron complexes, 267pprecipitation titration, 134tVolhard titration, 133
Thioglycolic acid, 341t, 386
Thiol, 273bThiopental, 627pThiosulfate, 293p, 328t, 340–341
anhydrous standard, NR9 (16.22)Thiourea, 245, 387Thorium, permanganate titration, 337tThreonine, 182t, 344pThrombosis, 298Thymol, 335Thymol blue, 213, 215t, 419pThymolphthalein, 215tThymolphthalein complexone, 243iThyroxine, 397Time, 9tTime-of-flight mass spectrometer,
481, 485–486, 494bTime-resolved fluorescence
immunoassay, 412Tin:
capsule for elemental analysis, 639flame photometric detector, 549food content, 473pgravimetric analysis, 630tiodometric titration, 341treductant, 328t
Tin can, 473pTin chloride, 336Tin(II) chloride, 456bTin(IV) chloride, 651Titanium:
gravimetric analysis, 630tmasking, 245permanganate titration, 337t
Titanium dioxide, 338b, 339b, 376p, 414b
Titanium(III), 357Titanium(IV) spectrum, 403iTitrant, 121Titration, 121
acid-base, 124, 199–221, 306macid-base spreadsheet, 218–221, 221targentometric, 133autotitrator, 209auxiliary complexing agent, 238–241back, 244blank, 122blurred end point, 208calculation for redox titration,
327–332, 332dcerium(IV), 337–339complexometric, 129m, 230,
NR6 (12.19)derivatives, 210–211dichromate, 339diprotic system, 206–208direct, 122, 244displacement, 244EDTA, 229–245, 410iEDTA end point, 241–243effect of concentration, 205iend point, 122, 129, 133–134, 208,
241d, 410ierror, 122Fajans, 133–134, 134tglass electrode, 306mGran plot, 334indirect, 244, 339iodine, 340, 341t, 343tKarl Fischer, 370–372mass, 26, NR1 (2.14)microscale, 26mixture, 124, 131–132nonaqueous, 218, NR5 (11.19)permanganate, 336–337pH-stat, 249ppK effect, 205i, 206ipotentiometric, 131i, 327–332, 332dprecipitation, 127–134
primary-standard acids and bases,216, 217t
principles, 122protein, 199record small, 216bredox, 327–343, NR8 (16.2)redox indicators, 332–334spectrophotometric, 126, 410istoichiometry calculations, 123–124techniques with EDTA, 244–245Volhard, 133, 134tweak acid–strong base, 202–204weak acid–weak base, 218–219weak base–strong acid, 205–206
Titrator, 25i, 26, 209Titrimetric analysis, history, NR18
(27.1)tm (chromatography), 575TNT, 402, 422p, 487i�-Tocopherol, 328tTolerance, 24, 31
buret, 25tmicropipet, 29tpipet, 27tvolumetric flask, 27tweights, 24t
Toluene:eluent strength, 563tultraviolet cutoff, 563tuse, 502f
Tomato juice pH, 108iTon, 11tTooth:
atomic analysis, 453decay, 257enamel, 94p
Torch, plasma, 460Torr, 11tTotal carbon, 338bTotal organic halide (TOX), 373pTotal oxygen demand, 338bTOX, 373pToxin, 412Trace, 7Trace analysis, 123b, 645Trace metal grade chemical, 123bTrace metal grade HNO3, 470Transfer pipet, 27–28Transferrin, 126, 138p, 247p, 291,
385–386, 417pTransformer oil, 370Transfusion, 232bTransistor, 318i, 320–321Transition, 388
rotational, 390vibrational, 390
Transition range:acid-base indicator, 213, 215, 215tredox indicator, 332, 333t
Transmission quadrupole massspectrometer, 484
Transmittance, 381, 382b, 424Spectronic 20 scale, 40i
Transversely heated furnace, 458Trap, mercury, 456bTreated data, 79Tree ring, 427bTRENDLINE (Excel), 72Triangle, solvent, 577i, 578iTrichloroacetic acid, 386Trichlorotrifluoroethane, 563tTRICINE, 174t, 175tTridodecylmethylammonium
chloride, 315Triethanolamine, 238i, 245Triethylamine, 560i, 569Triethylammonium acetate, 569Trifluoroacetic acid, 110b, 214b, 560i

Index I21
Triiodide, 340Trimethylammonium chloride, 165Trimethylphosphate, 633tTrimethylsilyl derivative, 528iTrinitrotoluene, 422pTrioctylphosphine, 602iTriple point, 9t, 568bTriplet state, 388, 416Triprotic acid, 114, 188–189,
191i, 221tTRIS, 169, 174t, 175t, 217tTris (2-aminoethyl) amine, 268pTris(2,2�-bipyridine)iron, 333tTris(2,2�-bipyridine)ruthenium(II),
333t, 423pTris(hydroxymethyl aminomethane),
169, 174t, 175t, 217tN-Tris(hydroxymethyl)methyl-2-
aminoethanesulfonic acid, 175tN-Tris(hydroxymethyl)methylglycine,
174t, 175tTris(5-nitro-1,10-phenanthroline)iron,
333tTris(1,10-phenanthroline)iron, 333tTrititrotoluene, 402Tritium, 307Triton X-100, 504dTropaeolin O, 215tTryptophan, 182tTSK silica, 600tTswett, M. S., 506mt Test, 59–62, 64–65, NR2 (4.5)Tumor, 74p, 229–230Tungsten, 337t, 459Tungsten carbide, 650, 651Tungsten lamp, 426, 426i, 571Tungsten trioxide, 467, 638Turbidity, 131mTwo-tail t-test, 64, 65mTylenol, 360Type A silica, 560Type B silica, 560Type C silica, 560Tyrosine, 182t, 199
Ulcer, 424Ultrapure acid, 123bUltrasonic mixing, 622Ultrasonic nebulizer, 460Ultrasonic vibration, 366Ultraviolet:
absorbance standard, 432tcutoff, 563tdetector, 571, 571t, 613radiation, 10, 338b, 378, 380i
Uncertainty, 44–50, 58, App. Ccalibration curve, 71confidence interval, 58exponents, 47–48least-squares parameters, 68–69logarithms, 47–48molecular mass, 49pipet, 49–50principle, 462propagation, 49tsampling, 646–650standard addition, 90x-intercept, 90
Uncle Wilbur, 400pUnified atomic mass unit, 476bUnit matrix, 406Units, 11Units of measurement, 9–11Unmentionables, 391bUracil, 576Uranium, 337t, 628Urea, 120p, 218, 424, 631, 633tUric acid, 360
Urine, 108i, 123, 553p, 655, 658Use objective, 79
V (volt), 10tVacancy, 313iVacuum desiccator, 31iVacuum pump, 537Vacuum tube, 307mVacuum ultraviolet, 462Valine, 182tValinomycin, 304Vanadium(V) oxide, 651Vanadium(V) spectrum, 403iVanadate, 630tVanadyl sulfate, 623pvan Deemter equation, 517, 538
electrophoresis, 604–605experimental graph, 518i, 537i,
558i, 627pmicellar electrokinetic
chromatography, 627pVariable voltage source, 349iVariamine blue B base, 243iVarian Cary E3 spectrophotometer,
425iVariance, 54
additivity, 517, 646F test, 63–64
Vascular disease, 1Vasodilator, 2Vector, 406Velocity, electroosmotic, 607m, 609Ventilation blood test, 312tVernier scale, 51pVesicle, 18p, 604Vessel:
digestion, 651, 655extraction, 657i
Vibration, molecular, 389Vibrational frequency, 20Vibrational relaxation, 390Vibrational states, 390–391Vibrational structure, 393Vibrational transition, 390Vicinal silanol groups, 560iVinegar pH, 108iVirginia Polytechnic Institute, 277dViscosity, 558, 605, 607Visible light, 380iVision, 435bVitamin A, 328t, 435bVitamin C, 232b, 289t, 290i, 343, 360
formal potential, 289–291Vitamin E, 328tVoid volume, 600Vol%, 13Volatile buffers, 574Volatile electrolyte, 634Volhard titration, 133, 134tVolt, 10t, 272Voltage, 272
breakdown, 319mcapillary electrophoresis, 609, 610open circuit, 350mramp, 363scale, 300source, 349iunit, 10t
Voltaic cell, 274Voltammetry, 362–370Voltammogram, 362Voltmeter, 277Volume:
column, 600flow rate, 508gravimetric analysis, 631units, 11t
Volume percent, 13
Volumetric analysis, 121Volumetric flask, 14, 14i, 26–27
W (watt), 10tWaage, P., 97mWalden reductor, 336Wall-coated open tubular column, 529Warning line, 81bWaste:
disposal, 21b, 576m, NR1 (2.5)reduction in HPLC, 568mremediation, 327m
Wastewater, 228r, 338bWatchglass, 31iWater:
acid-base effect on dissociation,161
analysis, 1, 596iarsenic removal, 634mcarbon dioxide content, 108coordination, 140critical constants, 568tdensity, 32t, 33diffusion coefficient, 513tdistillation, 645telectrolysis, 350dexpansion, 31–33hardness, 209b, 245b, 594minfrared absorption, 394ion chromatography, 596iionization, 150–151, 161irrigation, 209b, 245bisotopic molecules, 394Karl Fischer titration, 370–372lead, 466imetal content impurities, 504dpH, 108“polishing,” 594potential range, 563tpurity, 564mrefractive index, 438mresistivity, 594softener, 594msolvation of ions, 140temperature dependence of Kw, 107tthermal expansion, 31–33triple point, 9twater of hydration, 140
Watt, 10t, 273Waveform, 367iWaveguide, 439–440Wavelength, 379
color, 380iselection for analysis, 384
Wavenumber, 379WCOT, 529Weak acid, 110–114
conjugate, 167diprotic, 181–188fraction of dissociation, 164,
191–192intermediate form, 184pH calculation, 162–166polyprotic, 188–189reaction with strong base, 170btitration with strong base, 202–204titration with weak base, 218–219
Weak base, 110–114pH calculation, 166–167reaction with strong acid, 170btitration with weak acid, 218–219
Weak electrolyte, 12, 164, 165dWeakly acidic ion exchanger, 589,
590tWeakly basic ion exchanger, 589, 590tWeighing bottle, 23, 31iWeighing errors, 23–24Weighing procedure, 22–24
Weight:effect of altitude, 37ptolerance of lab standards, 24t
Weight percent, 13Wenzel, T., 2Weston cell, 374pWet ashing, 650, 654Wetterhahn, K., 21mWhistle noise, 449White blood cell, 158White chocolate, 6tWhite light, 435Whitener, 391bWhite noise, 448Wide-bore column, 550tWig-L-Bug, 650, 651iWind power, 415bWine, 346p, 375pWork, 10t, 272–273Working electrode, 349, 353
potential range, 363mrotating disk, 361, 362i
Wright, W.H., 307mWt%, 13
(mean value), 54Xanthine, 289tXenon lamp, 571X-Gal, 1x-intercept, 90X-ray, 380ip-Xylene in iodine titrations, 340mXylenol orange, 210i, 242t, 243i, 419p
y (yocto), 10tY (yotta), 10tYalow, R., 411mYeast, 194b, 439YO, 467iYocto, 10tYoctomole, 9Yotta, 10tYttrium-90, 230Yttrium aluminum garnet, 431iYttrium barium copper oxide, 327,
342b, 467i, 642pYttrium hydroxychloride, 642pYttrium oxide, 642p
z (multiple of standard deviation), 55z (zepto), 10tZ (Zetta), 10tZarontin, 43bZeeman effect, 466Zeolite, 534iZepto, 10tZeptomole, 9Zeros, 40Zetta, 10tZinc:
ammonia complexes, 239EDTA titrations, 244electrode, 302gravimetric analysis, 630thydroxide complexes, 119pimpurity in tungsten, 459iodimetric titration, 341tJones reductor, 336masking, 245permanganate titration, 337tprecipitation titration, 134tspectrophotometric analysis, 504d
Zinc sulfate reagent, 123bZirconia, 519i, 650Zirconia oxygen sensor, 359bZone broadening, electrophoresis, 609Zorbax silica, 560iZwitterion, 181Zwitterionic bonded phase, 567i
x
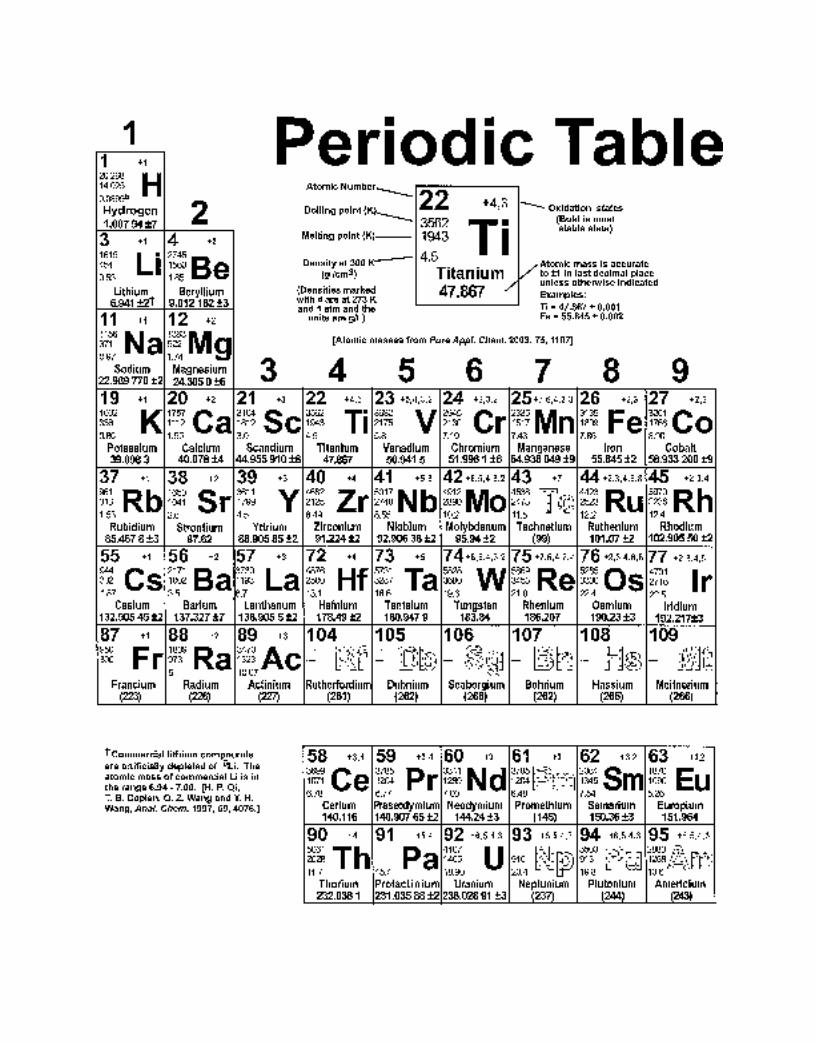


Physical Constants
Term Symbol Value
Elementary charge e 1.602 176 53 (14)† � 1019 C4.803 204 40 (42) � 1010 esu
Speed of light in vacuum c 2.997 924 58 � 108 m/s� 1010 cm/s
Planck’s constant h 6.626 069 3 (11) � 1034 J � s� 1027 erg � s
h/2� � 1.054 571 68 (18) � 1034 J � s� 1027 erg � s
Avogadro’s number N 6.022 141 5 (10) � 1023 mol1
Gas constant R 8.314 472 (15) J/(mol � K)V � C/(mol � K)� 102 L � bar/(mol � K)� 107 erg/(mol � K)
8.205 746 (15) � 105 m3 � atm/(mol � K)� 102 L � atm/(mol � K)
1.987 207 (4) cal/(mol � K)Faraday constant (� Ne) F 9.648 533 83 (83) � 104 C/molBoltzmann’s constant (� R/N) k 1.380 650 5 (24) � 1023 J/K
� 1016 erg/KElectron rest mass me 9.109 382 6 (16) � 1031 kg
� 1028 gProton rest mass mp 1.672 621 71 (29) � 1027 kg
� 1024 gDielectric constant (permittivity) �0 8.854 187 817 � 1012 C2/(N � m2)
of free spaceGravitational constant G 6.674 2 (10) � 1011 m3/(s2 � kg)†Numbers in parentheses are the one-standard-deviation uncertainties in the last digits.
SOURCE: P. J. Mohr and B. N. Taylor, 2002 CODATA values, from http://physics.nist.gov/constants (June 2004).
Concentrated Acids and Bases
mL of reagentApproximate Molecular Approximate Approximate needed to prepare
Name weight percent mass molarity density (g/mL) 1 L of �1.0 M solution
AcidAcetic 99.8 60.05 17.4 1.05 57.3Hydrochloric 37.2 36.46 12.1 1.19 82.4Hydrofluoric 49.0 20.01 31.8 1.30 31.4Nitric 70.4 63.01 15.8 1.41 63.5Perchloric 70.5 100.46 11.7 1.67 85.3Phosphoric 85.5 97.99 14.7 1.69 67.8Sulfuric 96.0 98.08 18.0 1.84 55.5
BaseAmmonia† 28.0 17.03 14.8 0.90 67.6Sodium hydroxide 50.5 40.00 19.3 1.53 51.8Potassium hydroxide 45.0 56.11 11.5 1.44 86.6
†28.0 wt% ammonia is the same as 56.6 wt% ammonium hydroxide.

0 10 20Volume of base added (Vb)
30 40 50 60
4
6
2
8
10
12pH
0 10 20Volume of acid added (Va)
30 40 50 60
3
5
1
7
9
11
pH
B + H+ → BH+
Titration of weak base B with strong acid H+
Excess H+
pH = − log [H+]
HA + OH− → A− + H2O
Titration of weak acid HA with strong base OH−
Excess OH−
pH = − logKw
[OH−]
Buffer region
pH = pKa + log[A−][HA]
HA H+ + A−
F − x
x2
F − x= Ka
Initial point
A− + H2O HA + OH−
F' − x
x2
F' − x= Kb
Equivalence point
Buffer region
pH = pKa + log[B]
[BH+]
B + H2O BH+ + OH−
F − x
x2
F − x= Kb
Initial point
BH+ B + H+
F' − x
x2
F' − x= Ka
Equivalence point
x x
x x
xx
x x
Copyright © 2022 FDOKUMEN