Quantification of DNA Adducts Formed in Liver, Lungs, and Isolated Lung Cells of Rats and Mice...
14
Quantification of DNA Adducts Formed in Liver, Lungs, and Isolated Lung Cells of Rats and Mice Exposed to 14 C-Styrene by Nose-Only Inhalation Peter J. Boogaard,* ,1 Kees P. de Kloe,* Brian A. Wong,² Susan C. J. Sumner,² William P. Watson,* and Nico J. van Sittert* *Department of Molecular Toxicology, Shell Research and Technology Center, Amsterdam, Shell International Chemicals B. V., P.O. Box 38000, 1030 BN Amsterdam, The Netherlands; and ² Chemical Industry Institute of Toxicology, Research Triangle Park, North Carolina 27709 Received April 19, 2000; accepted May 30, 2000 Bronchiolo-alveolar tumors were observed in mice exposed chron- ically to 160 ppm styrene, whereas no tumors were seen in rats up to concentrations of 1000 ppm. Clara cells, which are predominant in the bronchiolo-alveolar region in mouse lungs but less numerous in rat and human lung, contain various cytochrome P450s, which may oxidize styrene to the rodent carcinogen styrene-7,8-oxide (SO) and other reactive metabolites. Reactive metabolites may form specific DNA adducts and induce the tumors observed in mice. To determine DNA adducts in specific tissues and cell types, rats and mice were exposed to 160 ppm [ring-U- 14 C]styrene by nose-only inhalation for 6 h in a recirculating exposure system. Liver and lungs were isolated 0 and 42 h after exposure. Fractions enriched in Type II cells and Clara cells were isolated from rat and mouse lung, respectively. DNA adduct profiles differed quantitatively and qualitatively in liver, total lung, and enriched lung cell fractions. At 0 and 42 h after exposure, the two isomeric N7-guanine adducts of SO (measured together, HPEG) were present in liver at 3.0 6 0.2 and 1.9 6 0.3 (rat) and 1.2 6 0.2 and 3.2 6 0.5 (mouse) per 10 8 bases. Several other, unidentified adducts were present at two to three times higher concentrations in mouse, but not in rat liver. In both rat and mouse lung, HPEG was the major adduct at ;1 per 10 8 bases at 0 h, and these levels halved at 42 h. In both rat Type II and non-Type II cells, HPEG was the major adduct and was about three times higher in Type II cells than in total lung. For mice, DNA adduct levels in Clara cells and non- Clara cells were similar to total lung. The hepatic covalent binding index (CBI) at 0 and 42 h was 0.19 6 0.06 and 0.14 6 0.03 (rat) and 0.25 6 0.11 and 0.44 6 0.23 (mouse), respectively. The pulmonary CBIs, based on tissues combined for 0 and 42 h, were 0.17 6 0.04 (rat) and 0.24 6 0.04 (mouse). Compared with CBIs for other genotoxi- cants, these values indicate that styrene has only very weak adduct- forming potency. The overall results of this study indicate that DNA adduct formation does not play an important role in styrene tumor- igenicity in chronically exposed mice. Key Words: styrene; DNA adducts; Clara cells; Type II cells; inhalation exposure; carcinogenicity; liver, lung; genotoxic po- tency; rat; mouse. Styrene is an important industrial chemical used for the production of reinforced plastics and various polymers. Re- view of 11 long-term toxicity studies to evaluate the carcino- genic potential of styrene led to the conclusion that there was no convincing evidence of carcinogenic activity of styrene in animals, although some of the studies were considered inade- quate (McConnell and Swenberg, 1994). Recent state-of-the- art carcinogenicity studies in CD-1 mice and Sprague-Dawley rats exposed to styrene for 2 years via inhalation revealed an increased incidence of masses in the bronchiolo-alveolar re- gion in the lungs of mice exposed to 160 ppm styrene, but no increases in tumor incidence in rats exposed to up to 1000 ppm styrene (Cruzan et al., 1998, in press). In 1994, IARC concluded that there was inadequate evi- dence in humans and limited evidence in experimental animals for the carcinogenicity of styrene. Nevertheless, styrene was classified as a Type 2B carcinogen, i.e., a possible human carcinogen, because it is extensively metabolized in human and animal tissues to the genotoxic metabolite styrene-7,8-oxide (SO) (IARC, 1994a,b). However, the concentration of SO or other reactive metabolites available for macromolecular bind- ing will be the net result of formation and subsequent detoxi- fication reactions. SO is rapidly detoxified to more water- soluble compounds and excreted in the urine. In this study, approximately 95% and 85% of the styrene retained upon inhalation was excreted as urinary metabolites by rats and mice, respectively (Boogaard et al., 2000). As depicted in Figure 1, important routes of detoxification of SO are gluta- thione conjugation, eventually leading to the urinary excretion of the corresponding mercapturic acids, and epoxide hydroly- sis, eventually leading to the urinary excretion of mandelic, phenylglyoxylic, and hippuric acid. Quantitatively, the gluta- thione pathway was equally important in rats and mice, ac- counting for about a quarter of the total urinary metabolites in the present study (data not shown), whereas the EH pathway accounted for 63% and 31% of total urinary metabolites in rats and mice, respectively. The excretion of phenylaceturic acid, probably derived from phenylacetaldehyde, was also an impor- 1 To whom correspondence should be addressed. Fax: 131 70 377 6380. E-mail: peter. [email protected]. TOXICOLOGICAL SCIENCES 57, 203–216 (2000) Copyright © 2000 by the Society of Toxicology 203
-
Upload
wageningen-ur -
Category
Documents
-
view
2 -
download
0
Transcript of Quantification of DNA Adducts Formed in Liver, Lungs, and Isolated Lung Cells of Rats and Mice...

Quantification of DNA Adducts Formed in Liver, Lungs,and Isolated Lung Cells of Rats and Mice Exposed
to 14C-Styrene by Nose-Only Inhalation
Peter J. Boogaard,*,1 Kees P. de Kloe,* Brian A. Wong,† Susan C. J. Sumner,†William P. Watson,* and Nico J. van Sittert*
*Department of Molecular Toxicology, Shell Research and Technology Center, Amsterdam, Shell International Chemicals B. V., P.O. Box 38000,1030 BN Amsterdam, The Netherlands; and†Chemical Industry Institute of Toxicology, Research Triangle Park, North Carolina 27709
Received April 19, 2000; accepted May 30, 2000
Bronchiolo-alveolar tumors were observed in mice exposed chron-ically to 160 ppm styrene, whereas no tumors were seen in rats up toconcentrations of 1000 ppm. Clara cells, which are predominant inthe bronchiolo-alveolar region in mouse lungs but less numerous inrat and human lung, contain various cytochrome P450s, which mayoxidize styrene to the rodent carcinogen styrene-7,8-oxide (SO) andother reactive metabolites. Reactive metabolites may form specificDNA adducts and induce the tumors observed in mice. To determineDNA adducts in specific tissues and cell types, rats and mice wereexposed to 160 ppm [ring-U-14C]styrene by nose-only inhalation for6 h in a recirculating exposure system. Liver and lungs were isolated0 and 42 h after exposure. Fractions enriched in Type II cells andClara cells were isolated from rat and mouse lung, respectively. DNAadduct profiles differed quantitatively and qualitatively in liver, totallung, and enriched lung cell fractions. At 0 and 42 h after exposure,the two isomeric N7-guanine adducts of SO (measured together,HPEG) were present in liver at 3.0 6 0.2 and 1.9 6 0.3 (rat) and 1.2 60.2 and 3.2 6 0.5 (mouse) per 108 bases. Several other, unidentifiedadducts were present at two to three times higher concentrations inmouse, but not in rat liver. In both rat and mouse lung, HPEG wasthe major adduct at ;1 per 108 bases at 0 h, and these levels halvedat 42 h. In both rat Type II and non-Type II cells, HPEG was themajor adduct and was about three times higher in Type II cells thanin total lung. For mice, DNA adduct levels in Clara cells and non-Clara cells were similar to total lung. The hepatic covalent bindingindex (CBI) at 0 and 42 h was 0.19 6 0.06 and 0.14 6 0.03 (rat) and0.25 6 0.11 and 0.44 6 0.23 (mouse), respectively. The pulmonaryCBIs, based on tissues combined for 0 and 42 h, were 0.17 6 0.04 (rat)and 0.24 6 0.04 (mouse). Compared with CBIs for other genotoxi-cants, these values indicate that styrene has only very weak adduct-forming potency. The overall results of this study indicate that DNAadduct formation does not play an important role in styrene tumor-igenicity in chronically exposed mice.
Key Words: styrene; DNA adducts; Clara cells; Type II cells;inhalation exposure; carcinogenicity; liver, lung; genotoxic po-tency; rat; mouse.
Styrene is an important industrial chemical used for theproduction of reinforced plastics and various polymers. Re-view of 11 long-term toxicity studies to evaluate the carcino-genic potential of styrene led to the conclusion that there wasno convincing evidence of carcinogenic activity of styrene inanimals, although some of the studies were considered inade-quate (McConnell and Swenberg, 1994). Recent state-of-the-art carcinogenicity studies in CD-1 mice and Sprague-Dawleyrats exposed to styrene for 2 years via inhalation revealed anincreased incidence of masses in the bronchiolo-alveolar re-gion in the lungs of mice exposed to 160 ppm styrene, but noincreases in tumor incidence in rats exposed to up to 1000 ppmstyrene (Cruzanet al., 1998, in press).
In 1994, IARC concluded that there was inadequate evi-dence in humans and limited evidence in experimental animalsfor the carcinogenicity of styrene. Nevertheless, styrene wasclassified as a Type 2B carcinogen, i.e., a possible humancarcinogen, because it is extensively metabolized in human andanimal tissues to the genotoxic metabolite styrene-7,8-oxide(SO) (IARC, 1994a,b). However, the concentration of SO orother reactive metabolites available for macromolecular bind-ing will be the net result of formation and subsequent detoxi-fication reactions. SO is rapidly detoxified to more water-soluble compounds and excreted in the urine. In this study,approximately 95% and 85% of the styrene retained uponinhalation was excreted as urinary metabolites by rats andmice, respectively (Boogaardet al., 2000). As depicted inFigure 1, important routes of detoxification of SO are gluta-thione conjugation, eventually leading to the urinary excretionof the corresponding mercapturic acids, and epoxide hydroly-sis, eventually leading to the urinary excretion of mandelic,phenylglyoxylic, and hippuric acid. Quantitatively, the gluta-thione pathway was equally important in rats and mice, ac-counting for about a quarter of the total urinary metabolites inthe present study (data not shown), whereas the EH pathwayaccounted for 63% and 31% of total urinary metabolites in ratsand mice, respectively. The excretion of phenylaceturic acid,probably derived from phenylacetaldehyde, was also an impor-
1 To whom correspondence should be addressed. Fax:131 70 377 6380.E-mail: peter. [email protected].
TOXICOLOGICAL SCIENCES57, 203–216 (2000)Copyright © 2000 by the Society of Toxicology
203

tant pathway in mice, accounting for 22% of the total urinarymetabolites, whereas in rats phenylaceturic acid accounted foronly 3% of the total urinary metabolites.
In some cases lung selective injury is simply related to thelevels of toxicant reaching the respiratory tract. The apparentlevels of microsomal cytochrome P450 monooxygenases inboth animal and human lungs are less than 10% of thosepresent in the liver (Bond, 1993). Nevertheless, the highlyfocal localization of these enzymes to only a few of the manycell types within the lung predisposes these cells to a dispro-portionate susceptibility to chemicals that undergo metabolicactivation. This may also apply to styrene, as metabolic acti-vation to SO has often been considered to be responsible for itscarcinogenic effects (Phillips and Farmer, 1994). Alternatively,ringoxidation of styrene or SO (see Fig. 1), catalyzed byspecific isoforms of cytochrome P450, which might subse-quently lead to reactive ringopened products, might explain thesusceptibility differences. Evidence for pathways involvingringopening of styrene, accounting for up to 10% of the me-tabolism of styrene in mice but almost absent in rats, has beenreported (Sumneret al., 1995).
Clara cells in mouse lung and Type II cells in rat lung areconsidered to be responsible for a significant proportion of theoxidative metabolizing capacity of this tissue (Pinkertonet al.,1997). Clara cells, the target cells for styrene-induced pneu-
motoxicity (Cruzanet al., 1997), are a predominant cell type inmouse lung but not in rat lung. In human lung, nonciliated cellsare present in the bronchiolar epithelium, but the morphologyof these cells differs significantly from the Clara cell morphol-ogy seen in rodents. The most striking difference is the lowproportion of agranular endoplasmatic reticulum, which ac-counts for 556 8% and 666 10% of the cellular componentsin mouse and rat Clara cells, but for only 3.16 3.5% in humannonciliated bronchiolar epithelial cells (Pinkertonet al., 1997).Therefore, an important question to answer is whether theeffects of styrene observed in mouse lungs are relevant forhumans. In the mechanistic studies described here, we inves-tigated the covalent binding of styrene metabolites to DNA inmouse Clara cells and in rat Type II cells to provide informa-tion to assist in understanding the causes of the sensitivity ofthe mouse to the effects of styrene and help determine therelevance of the effects in mice for human risk assessment. Inthe past,in vivo experiments with radiolabeled styrene and SOdemonstrated in rodents that both compounds cause a low levelof DNA binding (reviewed by Phillips and Farmer, 1994).Following ip administration of styrene, the two regio-isomersof the N7-guanine alkylation product of SO,N7-(2-hydroxy-1-phenylethyl)guanine andN7-(2-hydroxy-2-phenylethyl)gua-nine (HPEG), were the main DNA adducts formed, whereasthe correspondingN2- andO6-guanine adducts were formed inmuch lower concentrations (Byfa¨lt-Nordqvistet al., 1985; Pau-wels et al., 1996). In vitro reactions of SO with DNA ornucleosides also results in HPEG as the major adduct, butseveral other minor adducts, such as theN2- and O6-guanineand theN6-adenine adducts of SO, were also found (reviewedby Phillips and Farmer, 1994, and Segerba¨ck, 1994). To thebest of our knowledge, adducts from styrene metabolites otherthan SO have never been reported. In the present study, styrenewith a high specific radioactivity was used, which enableddetection of DNA adducts without any preselection at a level ofapproximately one adduct per 108 nucleotides in a sample of 1mg DNA.
MATERIALS AND METHODS
Safety
Styrene (CAS no. 100-42-5) is a flammable, toxic agent. Ventilation, bothlocal and general, must be utilized as necessary to minimize exposure tostyrene. Minimum standard protective apparel and equipment for work withstyrene includes disposable, chemical-resistant gloves, laboratory coats, andsafety glasses with side shields. Personnel transferring styrene must also weara respirator and must use containers that are electrically grounded to transferthe styrene.
Chemicals
For the pilot studies, [ring-U-14C]-styrene with a specific radioactivity of55.2 Ci/mol (2.04 TBq/mol) and a radiopurity of 96% (major contaminant 4%14C-benzaldehyde) was prepared as described elsewhere (Boogaardet al.,2000). For the inhalation studies [ring-U-14C]-styrene with a specific radioac-
FIG. 1. Proposed scheme for the metabolism of styrene.
204 BOOGAARD ET AL.

tivity of 52 Ci/mol (1.92 TBq/mol) was prepared in two batches as describedelsewhere (Boogaardet al., 2000). Chemical purity was. 96%. Radiochem-ical purities were 96.8 and 96.7%, the major contaminant being 3.0 and 3.2%[ring-U-14C]-benzaldehyde for the first and second batch, respectively.
The diastereomers ofN7-2-hydroxy-1-phenylethyl-29-deoxyguanosine 39-monophosphate were a gift from Dr. K. Hemminki (Finnish Institute ofOccupational Health, Helsinki, Finland). Guanidinium hydrochloride,N-[2-hydroxyethyl]piperazine-N9-[2-ethanesulfonic acid] (HEPES), 3-[N-morpholi-no]propanesulphonic acid (MOPS), sodium chloride, sodium edetate dihy-drate, sodium hydroxide, TRIS base, Triton-X100, and Tween-20 were allmolecular biology grade (DNase-free) and purchased from Sigma (Sigma-Aldrich, Zwijndrecht, The Netherlands). Acid phosphatase (Type I, fromwheat germ), adenosine, adenosine 59-monophosphate monohydrate (AMP),alkaline phosphatase (Type III, fromEscherichia coli), benzaldehyde (BA),calf thymus DNA (Type I), corn oil, crystalline trypsin (Type I, from bovinepancreas), guanosine, Harris hematotoxylin, HEPES and phosphate-bufferedsaline (HEPES-PBS), methylene green,N7-methylcytosine,N7-methylgua-nine, Percoll, reducedb-nicotinamide adenine dinucleotide phosphate tetraso-dium salt (NADPH), and venom phosphodiesterase I (Type VII, fromCrotalusatrox), were purchased from Sigma. Benzoic acid, mandelic acid,N3-methyl-adenine, 1-phenylethanol, 2-phenylethanol, 1-phenyl-1,2-ethanediol werefrom Aldrich (Sigma-Aldrich). Nuclease P1 (from Penicillium citrinum) waspurchased from ICN Biomedicals (Zoetermeer, The Netherlands). Nitrotetra-zolium blue and methanol (Lichrosorb, HPLC grade) were obtained fromMerck (Darmstadt, Germany), deoxyribonuclease I (DNase I, Grade II, frombovine pancreas) was obtained from Boehringer Mannheim (Mannheim, Ger-many),n-pentane (. 99.5%) and lithium heparin were obtained from Fluka(Buchs, Switzerland) and styrene oxide (SO,. 97%) was obtained fromRiedel de Hae¨n (Seelze, Germany). All other chemicals were of the highestpurity available.
Adduct Syntheses
Reaction of styrene-7,8-oxide (SO) with guanosine.N7-(2-hydroxy-1-phenylethyl)guanine andN7-(2-hydroxy-2-phenylethyl)guanine were preparedas a mixture of two regio-isomers (HPEG; see Fig. 2) from guanosine and SOas described earlier (Pauwels and Veulemans, 1998). HPLC analysis (SystemA) showed two adducts, with retention times of 25.9 and 26.9 min, for whichthe UV spectra were typical forN7-guanine adducts:lmax 5 284 nm,lmin 5260 nm (first peak, diastereomericN7-(2-hydroxy-1-phenylethyl)guanines)and 262 nm (second peak, diastereomericN7-(2-hydroxy-2-phenylethyl)gua-nines),lshoulder 5 248 nm. The two diastereomeric adduct pairs were isolatedand purified by semipreparative HPLC (System B). The UV spectra (Lambda16, Perkin Elmer, Norwalk, CT) showedlmax 280 nm,lmin 258 nm in 0.1 MNH4OH, lmax 282 nm,lmin 263 nm in 0.1 M TRIS/HCl pH5 7.4, andlmax 251nm,lmin 233 nm in 0.1 M HCl, which are strongly indicative for HPEG (Byfa¨ltNordqvist et al., 1985; Savelaet al., 1986). Further identification was byLC-MS and1H-NMR. LC-MS showed a molecular ion peak at m/z 272 (MH1)for both adducts. The spectrum forN7-(2-hydroxy-2-phenylethyl)guanine
showed one additional peak at m/z 152, corresponding to protonated guanine.No further fragmentation details were seen. The adducts were dissolved inperdeuterated dimethylformamide for1H-NMR: d 8.09 (1H, s, N1-H), 7.95(1H, s, C-8 H), 7.58, 7.40 (5H, m, C6H5), 6.69, (2H, br, NH2), 5.21, 5.19 (1H,dd, CH), 4.62, 4.59 (1H, dd, CH2), 4.37, 4.30 (1H, dd, CH2). The observedsplitting pattern atd 5.20, 4.60, and 4.32 ppm was typical for an ABX-system(JAB 5 13 Hz,JBX 5 9 Hz, JAX 5 3.5 Hz) corresponding to the structure of ahydroxyethylphenyl adduct.N7-(2-hydroxy-1-phenylethyl)guanine was alsoprepared by neutral thermal hydrolysis (vide infra) of the two diastereomericN7-(2-hydroxy-1-phenylethyl)-29-deoxyguanine 39-monophosphate adductsthat were obtained from Dr. Hemminki. Both diastereomers co-eluted with thesynthesizedN7-(2-hydroxy-1-phenylethyl)guanine and showed the same char-acteristics in UV and MS as the synthesized product. The diastereomericmixtures ofN7-(2-hydroxy-1-phenylethyl)guanine andN7-(2-hydroxy-2-phe-nylethyl)guanine (HPEG) were used as nonlabeled reference standardsthroughout the study.
A small portion of the reaction product of guanosine and SO was nothydrolyzed with hydrochloric acid, but directly analyzed by HPLC (System C).The UV trace showed several peaks atl 5 254 nm, representing the variousdiastereomers of the guanosine adducts of SO. Analysis of the peaks with UVindicated that the peak with a retention time of 30.2 min represented mostlikely the N2-hydroxyethylphenylguanosine isomers. The peak was isolatedand analyzed with UV and LC-MS. The UV spectra for the adduct showed thefollowing characteristics: in 0.1 M NH4OH lmax 257 nm andlmin 281 nm, in0.1 M TRIS/HCl (pH5 7.4) lmax 269 nm, and in 0.1 M HCllmax 267 nm.LC-MS analysis showed a single large peak at m/z 272 (MH1), confirming theattribution as theN2-guanine adducts of SO to the isolated product.
Reaction of styrene-7,8-oxide (SO) with adenosine.Adenosine was sus-pended in water:ethanol (1:1). The mixture was heated to 50°C; after additionof a 10-fold molar excess of SO, the solution was stirred for 24 h at 50°C. Aftercooling to room temperature, the solvent was evaporated. The white residuewas suspended in 0.1 M HCl and refluxed for 1 h at100°C. After cooling toroom temperature, the mixture was neutralized with 1M KOH and the solventevaporated. The resulting yellow solid was suspended in acidified water andfiltered over a P3 glass filter. The filtrate was applied to a Sep-PAK solid-phaseextraction cartridge (Baker, Phillipsburg, NJ), by-products were removed bywashing with 10% methanol, and the adducts were eluted with 60% methanol.The solvent was evaporated to give a white solid. HPLC analysis (System C)of this solid showed two sharp peaks atl 5 254 nm, with retention times of33.0 and 34.6 min. Both adducts were isolated and purified by semipreparativeHPLC (System B). Further identification was by LC-MS and UV analysis(diode array spectrometer). The UV spectra for the first peak showedlmax 268nm, lmin 233 nm (in 0.1 M NH4OH); lmax 275 nm,lmin 235 nm (in 0.1 MTRIS/HCl pH 5 7.4); lmax 269 nm,lmin 231 nm (in 0.1 M HCl). LC-MSanalysis showed the molecular ion peak at m/z 256 (MH1). Both adductsshowed one additional fragment in the spectrum at m/z 136, corresponding tothe protonated adenine ion. Based on UV and LC-MS evidence, the two adductpeaks were identified asN6-(2-hydroxy-1-phenylethyl)adenine andN6-(2-hy-droxy-2-phenylethyl)adenine.
Reaction of SO with single-strand calf thymus DNA.Double-strand calfthymus DNA was slowly heated in TRIS/HCl buffer (pH 7.40) and thenrapidly cooled to obtain single-strand DNA, which was subsequently reactedwith 10-fold molar excess of SO at 37°C for 48 h. The DNA was extracted,purified, and subjected to neutral thermal hydrolysis. Depurination productswere isolated by ultrafiltration and analyzed by HPLC-UV and LC-MS. Thetwo major adducts (accounting for 90% of the total) were the diastereomericmixtures ofN7-(2-hydroxy-1-phenylethyl)guanine andN7-(2-hydroxy-2-phe-nylethyl)guanine.
Reaction of benzaldehyde (BA) with calf thymus DNA.Double-strandcalf thymus DNA (90.7 mg) was dissolved overnight in 25 ml 10 mMTRIS/HCl buffer (pH 7.40). A 10-fold molar excess of BA (281ml) was addedin 10 ml ethanol, and the mixture was incubated at 37°C for 24 h. The excessBA was extracted twice with 30 mln-pentane followed by a single extraction
FIG. 2. Structure of HPEG, a mixture ofN7-(2-hydroxy-1-phenylethyl)-guanine andN7-(2-hydroxy-2-phenylethyl)guanine, the two stereoisomers ofthe N7-guanine adduct of styrene-7,8-oxide. *represents a chiral carbon atom.
205DNA ADDUCTS OF STYRENE IN LIVER, LUNG, AND LUNG CELLS

with 30 ml diethyl ether, then with 30 mln-pentane. The DNA was isolatedfrom an aliquot of the extracted reaction mixture by micro-ultrafiltrationthrough a filter with a molecular weight cutoff of 10,000 daltons (Microcon-10,Amicon, Etten-Leur, The Netherlands). The residual DNA was dissolved inpurified water and subjected to neutral thermal hydrolysis (NTH) and subse-quent micro-ultrafiltration through a filter with a molecular weight cutoff of3000 daltons (Centricon-3). The filtrate was analyzed by HPLC (System C)and LC-MS.
Reaction of benzaldehyde (BA) with adenosine 5*-monophosphate (AMP).AMP (125 mg) was dissolved in 10 ml 10 mM TRIS/HCl buffer (pH 7.40) and10 ml ethanol. A 10-fold molar excess BA (367ml) was added, and the mixturewas incubated for 24 h at 37°C. After the reaction was completed, the mixturewas extracted three times with 30 mln-pentane to remove any remaining BA.The extracted aqueous mixture was then subjected to NTH and subsequentlyanalyzed by HPLC (System C) and LC-MS.
High-Performance Liquid Chromatography (HPLC)
System A. Apparatus: HP1100 liquid chromatograph with UV detection(l 5 254 nm) (Hewlett Packard, Amstelveen, The Netherlands) and on-lineUV scanning over the rangel 5 200–300 nm (Rapiscan SA 6508 multiplewavelength detector, Severn Analytical, Shefford, UK). Column: BeckmanUltrasphere (Fullerton, CA), 3mm ODS, 2503 4.6 mm. Eluent: purified water(A) and methanol (B). Flow: 1.0 ml/min. Gradient: 0–30 min, linear increasefrom 6 to 50% B; 30–50 min 50% B.
System B. Apparatus: HP1100 liquid chromatograph with UV detection(l 5 254 nm) (Hewlett Packard, Amstelveen, The Netherlands). Column:Macherey-Nagel (Du¨ren, Germany), 7mm ODS, 2503 10.0 mm. Eluent:purified water (A) and methanol (B). Flow: 3.5 ml/min. Gradient: 0–30 min,linear increase from 6 to 30% B; 30–50 min 30% B.
System C. Apparatus: Shimadzu Class VP liquid chromatograph equippedwith SPD-10Avp variable wavelength detector set atl 5 254 nm, FRC-10Afraction collector (Shimadzu, Kyoto, Japan), and a Ramona 2000 on-lineradioactivity detector (Raytest, Straubenhardt, Germany). Column: BeckmanUltrasphere, 3mm ODS, 2503 4.6 mm. Eluent: 50 mM ammonium formatepH 5.1 (A) and methanol (B). Flow: 1.0 ml/min. Gradient: 0–30 min, linearincrease from 0 to 50% B; 30–40 min 50% B.
Liquid Chromatography-Mass Spectrometry (LC-MS)
LC-MS analyses were performed using a HP 1050 liquid chromatographwith UV detection (l 5 254 nm) coupled to a Micromass Quattro quadrupolemass spectrometer. Electrospray was used as the LC-MS interfacing andionization technique (positive ions). The scan range was 100–1500 Daltonwith 0.5 scan/s. The chromatographic conditions (column, eluent, flow, andgradient) were identical to those of System C.
Liquid Scintillation Counting (LSC)
Radioactivity in solutions was measured using TriCarb 2200 CA liquidscintillation counters (Canberra Packard, Groningen, The Netherlands) inantistatic scintillation vials with 10 volumes of Ultima Gold scintillationcocktail (Canberra-Packard). The machine was calibrated using a commercial14C internal standard kit for organic solvents (Wallac, Turku, Finland). Thecalibration was checked daily by counting a set of quenched standards com-mercially prepared in sealed glass vials. Counting efficiency was determinedusing the spectral index of the internal standard (SIE), and cpm values wereautomatically transformed to dpm. Samples were corrected for background.Individual samples were counted for at least 60 min; samples with low activitywere counted for up to 360 min each in order to obtain a relative standarddeviation of less than 0.05.
Animals
Pilot studies. Male Sprague-Dawley rats and CD1 mice, 8 and 10 weeksof age, respectively, were purchased from Harlan (Horst, The Netherlands) andacclimatized for at least 1 week. The animals were housed in macrolon cageswith hardwood bedding and had free access to food (MRH-B, Hope FarmsB.V., Woerden, The Netherlands) and tap water in a climate-controlled room(relative humidity 55%, temperature 216 1°C) on a 12 h light-dark cycle. Thepilot studies were conducted according to the Dutch law on ExperimentalAnimals and were approved by the Ethical Committee for Animal Studies(DEC) of Leiden University.
Inhalation studies. Male Sprague-Dawley rats and CD1 mice were pur-chased at the age of 9–10 weeks from Charles River Co. (Raleigh, NC). Theanimals were housed according to standard animal care procedures with freeaccess to food (NIH-07, Zeigler Brothers, Gardner, PA) and tap water in aclimate-controlled room (relative humidity 55%, temperature 226 2°C) on a12 h light-dark cycle. This study was approved by the Institutional AnimalCare and Use Committee and was performed in accordance with the declara-tion of Helsinki and the Guide for the Care and Use of Laboratory Animals asadopted and promulgated by the U.S. National Institutes of Health. Followingacclimatization, the rats were used at an age of approximately 12 weeks(; 350 g) and the mice at the age of 10–12 weeks (; 30 g). The animals wereexposed to a target concentration of 160 ppm14C-styrene (0.34 Ci/m3; 12.6GBq/m3) using a recirculating nose-only exposure system with concurrentcollection of14C volatile organics and14CO2 as described in a companion paper(Boogaardet al., 2000). Twelve rats were exposed. The actual exposureconcentration was 1596 3 ppm 14C-styrene for 6 h. Separate inhalationexperiments were conducted on each group of 30 mice. The actual styreneconcentrations were 1606 3 and 1586 5 ppm, respectively. In addition, tworats and five mice served as controls and did not receive treatment. Six ratswere killed immediately after the exposure; the other six rats were transferredto metabolism cages and were killed 42 h later. Total lung was isolated fromone rat from each of those two groups. Specific lung cells were isolated fromthe other animals. The two mouse exposure experiments were identical. Fromeach experiment 15 mice were killed immediately after exposure; total lungswere harvested from two animals, whereas specific lungs cells were isolatedfrom the other animals. The other 15 mice were transferred to metabolismcages and killed 42 h later. Total lung was taken from two mice, and specificlung cells were prepared from the remaining animals.
Pilot Studies
The methods used for lung cell isolations were based on published methodsfor Clara cell isolation from mouse lungs (Oreffoet al., 1990) and Type II cellsfrom rat lungs (Clouter and Richards, 1997; Richardset al., 1987). A series ofpilot studies was carried out. The first pilot studies were aimed at optimizationand simplification of the mouse Clara cell isolation procedure and led to theprocedure described below. In a second set of pilot studies, we investigatedwhether exposure to styrene affected the results of the isolation procedures ofClara and Type II cells in terms of yield and purity. Styrene dissolved in cornoil was administered to five rats (weights varied from 310 to 375 g) and fivemice at a concentration of 200 mg/kg body weight. Weights varied from 32 to39 g. Control animals received only the vehicle (2 and 5 ml corn oil per kgbody weight for rats and mice, respectively). Lung cells were isolated 5–7 hafter treatment using the procedures described below. A third pilot study wascarried out to assess the sensitivity of the detection methods, i.e. to determinethe number of animals needed in the main study with respect to the specificradioactivity of the styrene. Two male Sprague-Dawley rats (weight 250 g) and10 male CD-1 mice (weights from 26–37 g) were given [ring-14C]-styrene witha specific radioactivity of 17.9 Ci/mol (0.66 TBq/mol), prepared from styrenewith a specific radioactivity of 55.2 Ci/mol by dilution with nonlabeledstyrene, dissolved in corn oil by ip injection. The styrene (150 mg) wasdissolved in half a volume DMSO (85ml) and mixed with 2.75 ml corn oil(final concentration 50 mg styrene/ml). The doses were 120 and 200 mg/kg
206 BOOGAARD ET AL.

body weight for rats and mice, respectively, the equivalent of the calculatedtheoretical uptake during a 160-ppm inhalation exposure for 6 h assumingventilation rates of 250 and 45 ml/min for rats and mice, respectively, and 50%retention. The animals were subsequently housed in metabolism chambers for48 h. Rats were housed individually and mice in groups of five animals perchamber. After 48 h the animals were anesthetized with a lethal dose (1 ml/kgbody weight) of pentobarbital (60 mg/ml) in saline. Once under deep anesthe-sia, the abdominal cavity was opened, and the animals were bled by collectionof blood from the abdominal aorta. Livers and lungs were harvested for DNAisolation, snap-frozen in liquid N2, and stored at –80°C until analysis.
Necropsy and Lung Cell Isolation of Mice
Mice were anesthetized with a lethal dose (1 ml/kg body weight) of asolution of pentobarbital (60 mg/ml) and lithium heparin (300 IU/ml) in saline.Once under deep anesthesia, the abdominal cavity was opened, and the animalswere bled. The liver and other abdominal organs were removed withoutpuncturing the diaphragm. The liver was snap-frozen in liquid N2 and subse-quently stored at –80°C. The skin was removed from abdomen to throat andthe trachea exposed. A Luer cannula (no. 200/300/030, Portex Ltd., Hythe,UK) was tied into the trachea through a small incision at its top. The diaphragmwas punctured carefully by means of a small incision just below the xiphister-num to deflate the lungs and subsequently removed. The rib cage over thelungs and heart was removed, and the lungs were perfused via the pulmonaryartery with PBS through the right ventricle using a syringe. Excess fluid wasallowed to flow out through a cut in the left atrium. Perfusion of the lungs wasperformed with concomitant ventilation through the tracheal cannula using asyringe until they were fully perfused from blood. The lungs and heart werethen dissected free from the cavity. The heart, esophagus, and excess tissuewere removed. The lungs were lavaged five times with PBS to removemacrophages and secretions and once with 0.25% crystalline trypsin in Solu-tion I (133 mM NaCl, 10.3 mM HEPES, 5.6 mM glucose, 5.2 mM KCl, 1.89mM CaCl2, and 1.29 mM MgSO4 in 2.59 mM phosphate buffer, adjusted to pH7.40). The cells from the combined lavage fluid fractions were collected bycentrifugation (2500g for 10 min at 4°C), snap-frozen in liquid N2, and storedat –80°C. Subsequently, a clean syringe was attached to the trachea cannula,and the lungs were filled completely with fresh 0.25% crystalline trypsin inSolution I to expand all lobes fully. The lungs were suspended in PBS kept at37°C in a waterbath for about 20 min, during which time the trypsin solutionwas constantly topped up. After 20 min, the lungs were transferred into a Petridish, the trachea and main bronchi were removed, and the parenchymal tissuewas chopped into 1- to 2-mm cubes in 1 ml fetal calf serum (FCS) and 3 mlof 0.025% (w/v) DNase I in Solution II (133 mM NaCl, 10.3 mM HEPES, 5.6mM glucose, and 5.2 mM KCl in 2.59 mM phosphate buffer pH 7.40) per lungusing two pairs of scissors. The suspension was transferred using a serumpipette to a 50-ml tube and inverted repeatedly for 2 min by hand. Thesuspension was then sequentially filtered through a 150-mm and a 30-mmnylon filter. Finally, the filtrate was centrifuged at 32g for 6 min at 10°C tocollect Clara cells at the bottom of the tube. The supernatant was centrifugedtwice more at 32g for 6 min at 10°C. The three Clara cell-enriched fractionswere combined, washed with PBS, and snap-frozen in liquid N2 after taking asmall sample for staining (Clara cells). The cells that remained in the super-natant were centrifuged at 1000g for 10 min at 4°C, washed with PBS, andsnap-frozen in liquid N2 (non-Clara cells). The frozen cells were stored at–80°C until analysis.
Necropsy and Lung Cell Isolation of Rats
The first part of the procedure was identical to that described for mice,except that a larger Luer cannula (no. 200/300/050) was tied in the trachea.Following lavage, a clean syringe was attached to the trachea cannula, and thelungs were filled completely with fresh 0.25% crystalline trypsin in Solution Ito expand all lobes fully. The lungs were suspended in PBS kept at 37°C in awaterbath for about 30 min, during which time the trypsin solution was
constantly topped up. After 30 min, the lungs were transferred into a Petri dish,the trachea and main bronchi were removed, and the parenchymal tissue waschopped into 1- to 2-mm cubes in 5 ml fetal calf serum and 15 ml 0.025%(w/v) DNase I in Solution II per lung using two pair of scissors. The suspen-sion was transferred using a serum pipette to a 50-ml tube and shaken by handfor 4 min in a water bath at 37°C. The suspension was subsequently filteredthrough a 150-mm and a 30-mm nylon filter. Ten milliliters of a heavy Percollsolution (1.089 g/l), prepared by mixing 1.0 ml of a 103 concentrated SolutionI, 100 ml of fetal calf serum, 6.5 ml Percoll, and 2.4 ml purified water, wasbrought into a 50-ml tube. Ten ml of a light Percoll solution (1.040 g/l),prepared by mixing 1.0 ml of a 10 times concentrated Solution I, 100ml offetal calf serum, 2.7 ml Percoll, and 6.2 ml purified water, was carefullylayered on top. The crude cell suspension was layered on top of the lightPercoll solution and centrifuged at 250g for 20 min at 10°C. Type II cellsgathered at the intersection of the heavy and light Percoll solution. The TypeII cell-enriched fraction was collected, washed with PBS, and snap-frozen inliquid N2 after taking a small sample for staining (Type II cells). The Percollsolutions were diluted with an equal volume of PBS, and the remaining cells,depleted from Type II cells, were centrifuged at 1000g for 10 min at 4°C,washed with PBS, and snap-frozen in liquid N2 (non-Type II cells). The frozencells were stored at –80°C until analysis.
Staining
The mouse Clara cell or rat Type II cell fractions were diluted with threevolumes of a 4% (w/v) solution of bovine serum albumin in PBS and centri-fuged at 600 rpm for 5 min against the surface of a glass slide using a Cytospin(Shandon Instruments, Pittsburgh, PA). The preparations of Clara cells wereair fixed and incubated at 37°C with a drop of a 0.1% (w/v) solution ofnitrotetrazolium blue in HEPES-buffered PBS and a drop of 0.1% (w/v)NADPH solution in HEPES-buffered PBS for 5 min. The slides were drainedand counterstained with 1% (w/v) aqueous methylene green, and blue-purple(formazan) cells were scored as Clara cells (NTB1) (Devereux and Fouts,1980). The air-fixed preparations of Type II cells were incubated with a dropof Harris hematoxylin for 3 min. The slides were dipped in purified water,incubated with a aqueous lithium carbonate solution (1 volume of a saturatedLi 2CO3 solution diluted with 84 volumes of purified water) for 5 min, andwashed with purified water again. Cells with dark-blue granules (lamellarbodies) were scored as Type II cells (PAP1) (Kikkawa and Yoneda, 1974).
DNA Isolation
Lungs were pulverized in liquid N2 using a hammer mill (6700 Freezer/Mill,Glen Creston Inc., Stanmore, UK), liver was minced with scissors, and cellswere processed as such. Tissue or cells were homogenized using a Braunhomogenizer with 20–25 strokes at 700 rpm in an aqueous buffer of 0.8 Mguanidinium hydrochloride with RNase A (54 U/ml) and T1 (13.8 U/ml), 0.03M TRIS base, 0.03 M ethhylenediaminetetraacetic acid (EDTA), 5% (w/v)Tween-20 and 0.5% (w/v) Triton-X100, adjusted with NaOH to pH 8.0(approximately 50 ml/g tissue). After addition of 1 ml proteinase K solution(400 U/ml) per gram of tissue, the homogenized suspension was incubated for5 h at 37°C in a shaking waterbath. Following the incubation, the suspensionwas stored overnight at –80°C. Anion exchange columns (Qiagen 500/Ggenomic tip) were washed with 10 ml equilibration buffer [0.75 M NaCl in15% aqueous ethanol with 0.15 % (w/v) Triton-X100, buffered with 50 mMMOPS, and adjusted to pH 7.0 with NaOH], and 20 ml of the suspension waseluted through the column by gravity. The columns were subsequently washedtwice with 15 ml wash buffer (1.0 M NaCl in 15% aqueous ethanol, bufferedwith 50 mM MOPS, adjusted to pH 7.0 with NaOH) at room temperature.Benzoic acid, phenyl ethanol (PE), styrene glycol, and various other metabo-lites of styrene were completely eluted from the column using this procedure.Finally, the DNA was eluted from the columns with 15 ml elution buffer (1.25M NaCl in 15% aqueous ethanol, buffered with 50 mM TRIS/HCl adjusted topH 8.5) at 37°C. The DNA was then precipitated by addition of half a volume
207DNA ADDUCTS OF STYRENE IN LIVER, LUNG, AND LUNG CELLS

of isopropanol and collected by centrifugation at 7800g and 4°C for 15 min.The pellet was washed with ice-cold 70% (w/v) ethanol and centrifuged oncemore at 7800g and 4°C for 15 min. The pellet was then lyophilized anddissolved in a small volume of purified water. In contrast to more commonDNA isolation methods based on phenol/chloroform extraction or hydroxyap-atite column chromatography, which both leave minor impurities in the DNA,the anion exchange resin method used in this study provides highly purifiedDNA preparations, without any protein or metabolite contamination. DNAconcentrations were determined in aqueous solution by UV measurements atl 5 260 and 280 nm, assuming that A260 5 20.4 for a DNA solution of 1mg/ml. An aliquot of the purified DNA solution was used to determine the totalradioactivity by LSC.
Analysis of DNA Adducts
DNA was prepared for analysis by NTH (Fig. 3). The DNA solution washeated to 95–100°C for 1 h in a Thermomixer 5437 (Eppendorf, Hamburg,Germany), and the released adducts were isolated by micro-ultrafiltrationthrough a filter with a molecular weight cutoff of 3000 daltons (Centricon-3,Amicon). The remaining depurinated DNA was washed from the filter andlyophilized (Modulyo, Edwards, Crawley, UK). The dry residue was recon-stituted in a small volume of purified water (approximately 5 mg DNA/ml).
The radioactivity in an aliquot of this solution was determined by LSC. Thedepurinated DNA was reconstituted with purified water at a concentration ofabout 1 mg/ml and hydrolyzed enzymatically by subsequent treatment with anequal volume of nuclease P1 suspension (in 100 mMbis[2-hydroxymeth-yl]imino-tris[hydroxymethyl]methane (bis-tris) buffer pH 6.5 with 0.25 mMZnCl2 and 2 mM MgCl2 at a final concentration 50 U/ml) for 4 h at37°C ina shaking waterbath and a mixture and alkaline phosphatase (final concentra-tion 6.0 U/ ml) and acid phosphatase (final concentration 0.4 U/ml) overnightat 37°C. The released nucleosides were separated from the enzymes bymicro-ultrafiltration (Centricon-3) (Fig. 3). The filtrates with released adductsor nucleosides were lyophilized, and the residue was dissolved in the HPLCbuffer containing the nonlabeled reference standards and analyzed by HPLC(System C) with on-line UV and radioactivity detection while fractions werecollected for subsequent LSC or with MS.
For further identification of adducts, a series of reference compounds wasanalyzed by the same HPLC system (System C). The methylated base adductsand 1-phenyl-1,2-ethanediol were dissolved in 0.1 N HCl at a concentration of1 mg/ml. The phenethyl alcohols were dissolved in a 1:1 mixture of 0.1 N HCland methanol. The standards were analyzed as such and as a 1:1 dilution witha solution of HPEG in the HPLC buffer.
Statistics
Unless otherwise indicated, values are arithmetic mean6 SE. Comparisonsfor between-time and across-species differences were tested for statisticalsignificance using Student’st-test. A probability ofp , 0.05 was consideredsignificant.
RESULTS
Pilot Studies
Published procedures for Clara cell isolation aim at obtain-ing enriched Clara-cell fractions in which the number of fibro-blasts is decreased and the viability increased at the expense ofyield. The method by Oreffoet al. (1990) was thereforeadapted, with the most important alteration being the omissionof the differential attachment procedure to reduce the numberof contaminating fibroblasts. This adaptation resulted in highercell numbers (1.06 0.1 (SE) 3 106 cells/lung) than thoseobtained with the original method (0.66 0.23 106 cells/lung)with similar purity. The adapted procedure yielded 62mgDNA/106 cells. Because styrene is pneumotoxic, there is apossibility that certain cell characteristics such as specificdensity are altered due to the exposure to styrene. Such cellalterations might seriously affect the cell isolation procedures,as they are based on specific gravity and isopycnic centrifuga-tion. However, identical numbers of Clara cells (1.03 106
cells/mouse) with similar purities (60% NTB1) and Type IIcells (2.4 3 106 cells/rat; 70% PAP1) were isolated fromcontrol and styrene-treated animals, indicating that the expo-sure to styrene did not affect the isolation procedures. Normalamounts of DNA, 1.06 0.1(SE) mg and 2.36 0.3 mg DNA/gfor liver and lung, respectively, were isolated from rats andmice treated with14C-styrene by ip administration. For bothrats and mice, the total adduct level in liver was about an orderof magnitude higher than in lungs. From the data it wasconfirmed that the sensitivity of the method allows detection of
FIG. 3. Schematic representation of the isolation and purification ofDNA and the analysis of DNA adducts. Neutral thermal hydrolysis (NTH)releases all adducts that have a delocalized positive charge in the aromaticring, such as N7-guanine or N3-adenine adducts. The released adducts areisolated by micro-ultrafiltration. Enzymatic digestion using nuclease P1 andphosphatases releases all remaining adducts from the DNA backbone, suchas N1- or N6-adenine adducts. These adducts are also isolated by micro-ultrafiltration.
208 BOOGAARD ET AL.

adducts in a 1-mg sample of DNA at a concentration as low as1 adduct/108 nucleotides using14C-styrene with a specificradioactivity of 50 Ci/mol (1.85 TBq/mol).
Inhalation Studies
Hepatic DNA adducts. DNA was isolated from livers ofrats sacrificed immediately after inhalation exposure and 42 hafter cessation of exposure. DNA was also isolated from threeof the liver pools (each from five animals) from mice killedimmediately after exposure and from three of the liver poolsfrom mice killed 42 h after exposure. The radioactivity asso-ciated with the hepatic DNA from rats killed immediately afterexposure was almost completely released by NTH. The majoradducts were the N7-guanine adducts of SO (HPEG) at aconcentration of 3.06 0.2 adducts/108 nucleotides in five ofthe animals (Fig. 4A). In one rat, a different adduct profile wasfound with very little of HPEG. In the livers of the rats killed42 h after exposure, HPEG was still the major adduct, but theconcentration was lower (1.96 0.3 adducts/108 nucleotides);the other adducts that were observed earlier had decreased tovery low levels or were no longer detectable (Fig. 4B). Theprofile of adducts in mice was different, showing quantitativeand qualitative differences from rats. In addition, the timecourse of the adduct formation was different compared to rats:immediately after exposure, total hepatic DNA adduct levelsare higher than in rats (Fig. 4C); 42 h later, the adduct levelshave increased considerably (Fig. 4D), whereas in rats theadducts almost disappeared in the same time span. HPEG, themajor adduct in rats, was only a minor adduct in mice imme-diately after exposure, although the concentration 42 h afterexposure (3.26 0.5 adducts/108 nucleotides) was higher thanin rats after 42 h. In mice, there were two major unidentifiedadducts immediately after exposure that eluted at;31 and;37 min at concentrations of 2.66 1.5 and 3.86 1.9 adducts/108 nucleotides, respectively (Fig. 4C). HPEG represented only1.2 6 0.2 adducts/108 nucleotides. At 42 h, the adduct elutingat ;37 min had increased to 86 7 adducts/108 nucleotides,whereas the other major peak had decreased (Fig. 4D). Inaddition, one of the minor unidentified early eluting peaks hadincreased to about 116 6 adducts/108 nucleotides. In both ratsand mice the concentrations of adducts released upon enzy-matic hydrolysis of the recovered depurinated DNA were aboutan order of magnitude lower than those released and measuredupon NTH. Again, the adduct profiles differed between miceand rats both quantitatively and qualitatively. The adductslevels in rats were too low for reliable quantification. The totaladduct levels in mice were higher: 26 1 and 36 1 adducts/108
nucleotides at 0 and 42 h after exposure, respectively.From the total amount of adducts in liver, i.e., the sum of
adducts released by NTH and enzymatic hydrolysis (total ra-dioactivity), the covalent binding index (CBI) was calculated.For rats, the CBI was 0.196 0.06 (SE) and 0.146 0.03 at 0
and 42 h after cessation of exposure, respectively. For mice,the CBI was 0.256 0.11 and 0.446 0.23 at 0 and 42 h afterexposure, respectively.
FIG. 4. Adduct profile following neutral thermal hydrolysis of liver DNAisolated from animals exposed to 160 ppm [ring-U-14C]styrene by nose-onlyinhalation during 6 h. See text for details. (A) Rats killed immediately afterexposure. (B) Rats killed 42 h after exposure. (C) Mice killed immediatelyafter exposure. (D) Mice killed 42 h after exposure.
209DNA ADDUCTS OF STYRENE IN LIVER, LUNG, AND LUNG CELLS

Pulmonary DNA adducts.DNA from whole lung was iso-lated from one rat killed immediately after exposure and fromone rat killed 42 h after exposure (yields 3.1 and 5.6 mg DNA,respectively). For mice, DNA was isolated from the pooledlungs from two animals killed immediately after exposure andfrom two animals killed at 42 h after cessation of exposure inboth inhalation experiments with total yields of 1.67 and 1.76mg DNA, respectively. NTH of the DNA showed very lowadduct levels for both rats and mice (Fig. 5). For most peaks,the levels were too low for reliable quantification. In both ratand mouse lung, the major adduct peak corresponded to HPEGat a concentration of about 1 adduct/108 nucleotides (Figs. 5Aand 5C). At 42 h after exposure, this level was halved (Figs. 5Band 5D). Qualitatively, the adduct profiles in lung DNA re-sembled those for liver DNA. The adduct concentrations inlung DNA that were released upon NTH were low, and, fromthe results observed in liver, it was expected that the levelsdetectable upon enzymatic hydrolysis of the DNA backbonewould be even lower. Therefore, the recovered, depurinatedDNA of both rats and of all mice from the different time pointswere pooled prior to enzymatic hydrolysis. Indeed, only verylow concentrations of adducts were present in the depurinatedDNA. From the total amount of adducts in lungs, i.e., the sumof adducts released by neutral thermal and enzymatic hydro-lysis, the covalent binding index (CBI) was calculated. Sincethe depurinated DNA was pooled for both time points, thecalculated CBIs are averages from 0 and 42 h after exposure.The CBIs for rat and mouse lung were 0.176 0.04 and 0.2460.04, respectively.
DNA adducts in pulmonary macrophages.Only a rela-tively small number of macrophages was present in the pul-monary lavage fluid from both rats and mice. As a conse-quence, the amounts of extracted DNA were also small(ranging from 6 to 14mg per group), thus limiting the sensi-tivity of the adduct analysis. Although lymphocyte DNA waspooled for rats and for mice to increase sensitivity, the overalladduct level was low, and the profiles give no indication forany specific adduct.
DNA adducts in rat lung cells. In the first isolation (im-mediate sacrifice), 656 6 (SE) % of the cells were PAP1, and0.93 mg DNA was isolated. In the second isolation (42 hpostexposure), 736 4 (SE) % of the cells were PAP1, and1.11 mg DNA was isolated. HPEG was clearly present in theType II cell DNA at a concentration of about 1 adduct/108
nucleotides immediately after exposure (Fig. 6A) and at 2adducts/108 nucleotides 42 h later (Fig. 6B). The yield ofnon-Type II cells was much lower, and only 10 and 210mg ofDNA could be isolated from the rats sacrificed at 0 and 42 hfollowing exposure, respectively. The low yield of DNA fromnon-Type II cells isolated from rat lungs immediately afterexposure made it impossible to accurately determine the con-centration of adducts. The profile, however, suggests that
FIG. 5. Adduct profile following neutral thermal hydrolysis oflung DNA isolated from animals exposed to 160 ppm [ring-U-14C]sty-rene by nose-only inhalation during 6 h. See text for details. (A) Ratskilled immediately after exposure. (B) Rats killed 42 h after exposure.(C) Mice killed immediately after exposure. (D) Mice killed 42 h afterexposure.
210 BOOGAARD ET AL.

HPEG was present (Fig. 6C). No distinct adduct pattern wasdiscernible in the non-Type II cells at 42 h (Fig. 6D).
DNA adducts in mouse lung cells.Clara cell-enriched frac-tions isolated immediately after exposure stained 576 2 (SE)% and 616 3% NTB1 for the first and second inhalationexperiment, respectively. Clara cell-enriched fractions isolated42 h postexposure stained 706 3 (SE) % and 636 2%NTB1, for the first and second exposures, respectively. TheClara cell fractions as well as the non-Clara cell fractions fromthe two inhalation experiments were pooled. The DNA yieldwas 0.90 mg from the Clara cells and 0.45 mg from thenon-Clara cells isolated from the mice killed immediately afterexposure, and 1.12 and 0.17 mg from Clara and non-Clara cellsisolated 42 h after exposure, respectively. DNA adduct con-centrations in the Clara cell fractions were relatively low andcomparable with the DNA adduct levels in total mouse lungs(Fig. 7A). At 42 h after exposure, the concentration of adductswas higher than immediately after exposure. The major peak at42 h, equivalent to a level of approximately 6 adducts/108
nucleotides, eluted at;9 min (Fig. 7B). This same peak wasvery prominent in the non-Clara cell fraction at 42 h (Fig. 7D).Its concentration was measured at approximately 80 adducts/108 nucleotides, but there is a large relative error (approxi-mately 30%) associated with this value, as it was determinedusing a very small amount of available DNA (170mg).
Further identification of adducts.The retention time of thecompound eluting at;9 min, observed in mouse non-Claracells and Clara cells, did not match with the retention times ofdepurinating methylated base adducts such asN3-methylcy-tosine,N3-methyladenine, orN7-methylguanine, nor with gua-nine or adenine, nor did these compounds co-elute with any ofthe other, minor peaks in the chromatograms. A series ofstyrene metabolite standards was also analyzed using the sameHPLC system, and benzoic acid appeared to co-elute with theunknown compound. Large amounts of DNA were isolatedfrom the remaining liver tissue from mice. The DNA wasdepurinated by NTH, and the adducts were collected by ultra-filtration and concentrated by lyophilization. The concentratedadducts were analyzed by HPLC (System C), and the fractionswith the same retention time as the unknown adduct fromnon-Clara cells were collected. The combined fractions wereconcentrated by lyophilization and analyzed by LC-MS. Massfragments strongly indicative for benzoic acid (m/z 121) werefound.
Benzoic acid itself was not retained on the extraction col-umns during the DNA isolation and, if present in the tissue,would not be isolated as an impurity along with the DNA. Themost likely source for the benzoic acid is benzaldehyde (BA),which might form a reversible Schiff base adduct with theexocyclic amino groups of the purines in the DNA (Fig. 8).Therefore, we investigated whether BA would form DNAadducts that would be stable enough to be isolated and labile
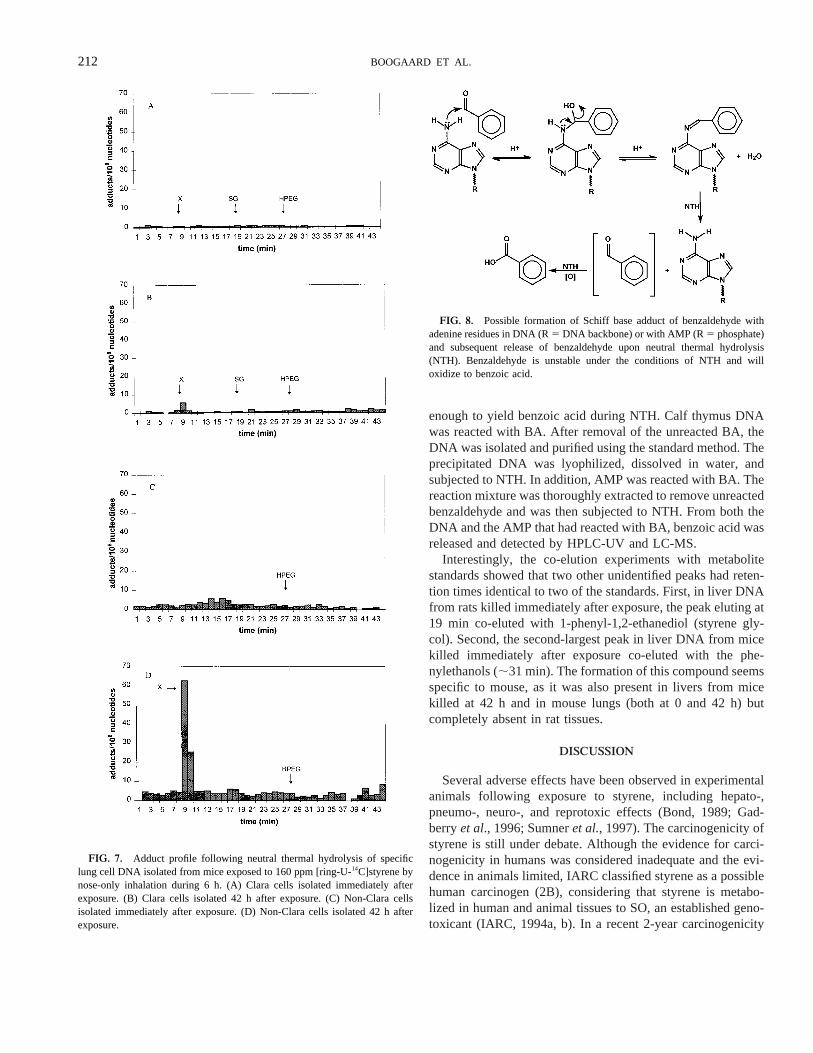
FIG. 6. Adduct profile following neutral thermal hydrolysis of specificlung cell DNA isolated from rats exposed to 160 ppm [ring-U-14C]styrene bynose-only inhalation during 6 h. (A) Type II cells isolated immediately afterexposure. (B) Type II cells isolated 42 h after exposure. (C) Non-Type II cellsisolated immediately after exposure Note: y-axis label is not quantitative, asthe amount of DNA isolated was too small for a reliable determination of thenumber of adducts/108 nucleotides. (D) Non-Type II cells isolated 42 h afterexposure.
211DNA ADDUCTS OF STYRENE IN LIVER, LUNG, AND LUNG CELLS
enough to yield benzoic acid during NTH. Calf thymus DNAwas reacted with BA. After removal of the unreacted BA, theDNA was isolated and purified using the standard method. Theprecipitated DNA was lyophilized, dissolved in water, andsubjected to NTH. In addition, AMP was reacted with BA. Thereaction mixture was thoroughly extracted to remove unreactedbenzaldehyde and was then subjected to NTH. From both theDNA and the AMP that had reacted with BA, benzoic acid wasreleased and detected by HPLC-UV and LC-MS.
Interestingly, the co-elution experiments with metabolitestandards showed that two other unidentified peaks had reten-tion times identical to two of the standards. First, in liver DNAfrom rats killed immediately after exposure, the peak eluting at19 min co-eluted with 1-phenyl-1,2-ethanediol (styrene gly-col). Second, the second-largest peak in liver DNA from micekilled immediately after exposure co-eluted with the phe-nylethanols (;31 min). The formation of this compound seemsspecific to mouse, as it was also present in livers from micekilled at 42 h and in mouse lungs (both at 0 and 42 h) butcompletely absent in rat tissues.
DISCUSSION
Several adverse effects have been observed in experimentalanimals following exposure to styrene, including hepato-,pneumo-, neuro-, and reprotoxic effects (Bond, 1989; Gad-berryet al., 1996; Sumneret al., 1997). The carcinogenicity ofstyrene is still under debate. Although the evidence for carci-nogenicity in humans was considered inadequate and the evi-dence in animals limited, IARC classified styrene as a possiblehuman carcinogen (2B), considering that styrene is metabo-lized in human and animal tissues to SO, an established geno-toxicant (IARC, 1994a, b). In a recent 2-year carcinogenicity
FIG. 7. Adduct profile following neutral thermal hydrolysis of specificlung cell DNA isolated from mice exposed to 160 ppm [ring-U-14C]styrene bynose-only inhalation during 6 h. (A) Clara cells isolated immediately afterexposure. (B) Clara cells isolated 42 h after exposure. (C) Non-Clara cellsisolated immediately after exposure. (D) Non-Clara cells isolated 42 h afterexposure.
FIG. 8. Possible formation of Schiff base adduct of benzaldehyde withadenine residues in DNA (R5 DNA backbone) or with AMP (R5 phosphate)and subsequent release of benzaldehyde upon neutral thermal hydrolysis(NTH). Benzaldehyde is unstable under the conditions of NTH and willoxidize to benzoic acid.
212 BOOGAARD ET AL.

study in Sprague-Dawley rats and CD-1 mice exposed tostyrene by inhalation mice were more susceptible to styrenetoxicity than rats. Mice, but not rats, developed bronchiolo-alveolar adenomas (Cruzanet al., in press). In a subchronicinhalation study of styrene in rats and mice, no increase incell proliferation was found in liver of rats or mice or in ratlung cells. No increase in labeling index of Type II cells inmouse lung was seen, but an increased cell proliferation ofClara cells was observed after 2 weeks, but not after 5 and13 weeks, at concentrations of 150 ppm and higher (Cruzanet al., 1997). Phillips and Farmer suggested that the adverseeffects of styrene are mediated through SO (Phillips andFarmer, 1994). Because SO concentrations in blood were lowerin mice exposed to 160 ppm styrene than in rats exposed to200–1000 ppm styrene, it is unlikely that differences in hepaticconversion of styrene to SO would be responsible for theobserved effects in mouse lungs. However, styrene is alsometabolized to SO in the lung. Clara cells and Type II cells areresponsible for a significant portion of the oxidative metabo-lizing capacity of the lung, with Clara cells being the predom-inant cell type in mouse lung and Type II cells in rat lung.Recently the styrene-metabolizing capacity was shown to bemuch greater in Clara cells than in Type II cells, which showedlittle activity towards styrene (Hyneset al., 1999). The highrate of oxidation of styrene to SO in Clara cells might explainthe greater susceptibility of the mouse to styrene-induced tu-morigenicity. Another explanation for the mouse-specific ad-verse effects might be given by alternative pathways in themetabolism of styrene or SO, such as ringoxidation of styreneor SO, catalyzed by specific isoforms of cytochrome P450,which might subsequently lead to reactive ringopened prod-ucts. In the present study we wanted to detect and quantifyDNA adducts of styrene in mouse Clara cells and in rat TypeII cells. To the best of our knowledge, specific adducts have notpreviously been identified in isolated lung cells.
The methods used for lung cell isolations in the current studywere based on published methods. The methodology for theisolation of rat Type II alveolar cells was applied as reported byRichards and coworkers, as it was expected that sufficientDNA could be obtained from the isolated cells. Indeed, theactual yield was similar to that reported (Clouter and Richards,1997; Richardset al., 1987). The method for isolation ofmouse Clara cells was based on the method by Oreffo andcoworkers (1990) which was adapted to increase the yield ofClara cells without compromising purity. Higher yields willresult in larger amounts of DNA that can be extracted and,consequently, in an increased sensitivity of the analyses, as thesensitivity is limited by the amount of DNA available foranalysis. A number of modifications to the original methodresulted in almost a doubling of the yield of Clara cells com-pared to the original method without a significant deteriorationof purity. The DNA yield from the Clara-cell–enriched frac-tions in the actual inhalation exposure studies, however, were
significantly less than in the pilot studies. These relatively lowyields may partly be explained by the observed toxicity in themice exposed to styrene by inhalation. In one of the pilotstudies, the effects of styrene on the isolation procedure wereinvestigated. This was deemed essential because the isolationprocedures are based on the specific density of the cells, whichmight be affected by styrene, as it is a pneumotoxicant. In thepilot studies, styrene was administered at relatively high dosesas an ip bolus. No obvious signs of toxicity were observed inthe animals following the ip administration of styrene untilnecropsy 5 to 7 h later. In contrast, some of the mice that hadbeen exposed to styrene by inhalation showed clear signs oftoxicity immediately after exposure, despite the fact that theactual dose of styrene in the inhalation exposure was substan-tially less than in the ip exposure study. Although the animalsthat were kept for an additional 42 h seemed to recover, grosssigns of toxicity such as dehydration were observed duringnecropsy. Cell yields may have been affected by toxicity, thusexplaining the lower yields of DNA.
DNA adduct profiles in mice and rats differed, not onlyquantitatively but also qualitatively, in both liver and lung,suggesting that different reactive metabolites are formed in ratsand mice. In both liver and lung, and in both rats and mice,most adducts were purine adducts that could be released byNTH. Enzymatic hydrolysis resulted in release of a few ad-ducts at levels just above the detection limit. HPEG was themajor adduct in livers of rats killed immediately after expo-sure. Reaction of DNA with SOin vitro also resulted mainly inthe formation of HPEG (;90% of all adducts), and the adductprofile observed closely resembles that found in rat liver,indicating that SO is the major DNA-reactive metabolite ofstyrene in the rat. There were no indications for the formationof the N2-guanine adduct of SO, which is the second largestreaction product of SO with double-stranded DNAin vitro(Savelaet al., 1986). Formation ofO6-guanine orN6-adenineadducts of SO, both reported as minor adducts in DNA treatedwith SO in vitro, was not observed in rat or mouse liver.However, based on the ratio of formation of these adductscompared to the formation of HPEGin vitro (Phillips andFarmer, 1994) and on the actual concentration of HPEG mea-sured in the current study, it is expected that even the concen-tration of the N2-guanine adduct of SO, the second largestadduct of SO, would be around or just below the limit ofdetection. In rats killed 42 h after exposure, the concentrationof HPEG had decreased, but HPEG was still the major adduct.The major adduct in mouse liver was not HPEG, although thelevels were higher at 42 h than in rats, but three unknownadducts, suggesting that SO itself is not the major DNA-reactive metabolite from styrene in mice. Preliminary results ofstudies on the excretion of urinary metabolites by the animalsof this study also point to a significant qualitative difference inthe metabolism of styrene in rats and mice. Mice excrete atleast four mouse-specific metabolites, of which one accounts
213DNA ADDUCTS OF STYRENE IN LIVER, LUNG, AND LUNG CELLS

for 9% of the total amount of radioactivity excreted (unpub-lished observation). The DNA adduct profiles in lung weresimilar to those in liver, in both rats and mice, but the adductlevels were significantly lower. An adduct level in lungs thatwas approximately an order of magnitude lower than in liverwas also observed in rats and mice dosed with14C-styrene byip injection, suggesting that the route of exposure is not a majordeterminant of the generation of DNA adduct forming metab-olites in the lung. Although many adducts involving alkylationof the N7 position of guanine cause destabilization of theglycosidic bond and lead to depurination, it is not expected thatspontaneous depurination has influenced the results of thisstudy to a significant extent, as for the depurination of HPEGa half-life of approximately 10 days was found in double-strand DNA (Vodicka and Hemminki, 1988).
Significant amounts of adducts could not be measured in thelymphocytes isolated from the lung lavage fluid. Although theamount of DNA that could be isolated from the lymphocytes waslimited, adduct levels should have been measurable if the reactivemetabolites that formed adducts in the specific lung cells had beenpresent in the general circulation. This suggests that if the DNAadducts in the specific lung cells result from reactive metabolites,they must have been generatedin situ in these cell types.
The DNA adduct levels in rat Type II as well as non-TypeII cells were low. The amount of DNA that could be isolatedfrom the Type II cell-depleted fraction isolated from rats killedimmediately after exposure was too low to allow quantificationof the adducts. However, the radioactivity profiles suggestedthat HPEG might be present. HPEG was the major adduct inthe Type II cells both 0 and 42 h after exposure, and the levelswere a few times higher than in total lung. This is in agreementwith the fact that Type II cells are capable of oxidation ofstyrene to SO. In mouse Clara cells, a single unknown peakwas observed as a concentration of approximately 6 adductsper 108 nucleotides at 42 h after exposure. Surprisingly, thesame peak was also observed in the non-Clara cell fraction, butat a level of about 80 adducts per 108 nucleotides. Because theClara cell fractions are not completely pure (about 63%), itcannot be ruled out that this unknown adduct in the Clara cellfraction is due to contamination by non-Clara cells. At a firstconsideration, it seems surprising that this peak was not ob-served in the total lung. However, the lungs of only two micewere used to prepare DNA to determine the adduct profile oftotal lung, whereas lungs of 24 mice were used to prepare DNAfrom the specific lung cell fractions. Preliminary analysis of theurine of the mice indicates that there were substantial quanti-tative and some qualitative interindividual differences in uri-nary metabolite patterns (unpublished observation). Consider-able variations in toxicokinetics and susceptibility to styrene inmice has also been observed by other investigators (Cruzanetal., 1997; Sumneret al., 1995, 1997). It was therefore consid-ered feasible that the unknown peak is the result of metabolismthat occurred in some of the 24 mice used for preparation of the
specific lung cells, but not in the 4 mice used for total lung. Itshould be noted that this unknown peak was also present in thehepatic DNA from some of the mice killed 42 h after exposure,albeit at much lower levels. In calf thymus, DNA reacted withSO; however, this peak was not detectable, indicating that it isnot an adduct directly formed from SO.
Several attempts were made to identify the unknown com-pound. Because some exhaled14CO2 could be detected, weinvestigated whether the unknown peak might represent adepurinating methylated base adduct, which might have beenformed through degradation of the14C-styrene and subsequentincorporation of the14C through the S-adenosylmethioninepathway. It was demonstrated that the unknown peak did notrepresent a depurinating methylated base. The relatively shortretention time of the unknown compound on reverse-phaseHPLC suggests that it is rather polar in nature. A series ofstyrene metabolite standards was tested to see whether they hadthe same relative retention time as the unknown adduct. Itappeared that the unknown compound exactly co-eluted withbenzoic acid. A large amount of hepatic DNA, isolated frommice killed 42 h after exposure, was isolated and hydrolyzed.Following semipreparative HPLC (System C) of the hydroly-sate, mass fragments indicative for benzoic acid (m/z 121),were identified by LC-MS analysis in the pooled fractionscorresponding to the unknown peak. The most likely source forbenzoic acid is benzaldehyde (BA), as BA is rapidly oxidizedto benzoic acid, and we showed experimentally that BA formsa thermolabile adduct with adenine that releases benzoic acidduring NTH. Most probably, BA forms a Schiff base adductwith the exocyclic NH2 group of adenine. This adduct wasstable enough to be isolated during the DNA extraction pro-cedure, but so thermolabile that BA would be released duringNTH and rapidly converted to benzoic acid (Fig. 8). BA is aputative intermediate in the metabolism of styrene in the routefrom mandelic acid to hippuric acid (Fig. 1). It would thereforebe possible that the adduct is formed from BA escaping thenormal route of metabolism to benzoic acid and derived me-tabolites. However, both mandelic acid and hippuric acid arecommon metabolites of styrene in rats as well as mice. Al-though there are differences in metabolism between rats andmice, with rats producing significantly more hippuric acid andmice significantly more of other metabolites derived frombenzoic acid, the overall flux from mandelic acid via benzyl-alcohol and BA to benzoic acid is quantitatively similar (un-published observations). It is feasible that the local metabolismin the lung differs between rats and mice, with mice eitherproducing more BA or being less efficient in the detoxificationof BA than rats. However, the BA adduct was not found afterip administration of14C-styrene in either rat or mouse lungs.An alternative explanation for the presence in the mouse lungcells is that the BA adduct is an artifact introduced by thestyrene used for exposure. [ring-U-14C]-BA was the immediateprecursor in the synthesis of the [ring-U-14C]-styrene used for
214 BOOGAARD ET AL.

the generation of the exposure atmosphere, and about 3% ofthe precursor was still present in the final product. The reasonthat the unknown peak was not found in the pulmonary DNAof animals from the pilot study, despite the fact that the styreneused for the pilot study contained more BA (4%) than thestyrene used for the main studies, may be explained by ipadministration of the compound. Ip administration ensuresrapid hepatic detoxification of BA, either by cytochrome P450-mediated oxidation to benzoic acid or by GSH conjugation, asthe material is primarily distributed to the liver, where both thecytochrome P450 and GSH concentrations are high. In mice,the presumed BA adducts were observed in the specific lungcells fractions but also in livers from mice killed 42 h afterexposure at low concentrations and only in the second expo-sure group. The most likely explanation is that the GSH in thepulmonary tissue was depleted in the mice at the end of theexposure period. Such a depletion would occur more rapidly inmice, as the uptake in mice is larger than in rats. Such a GSHdepletion would also explain the gross signs of toxicity ob-served in some of the mice.
1-Phenyl-1,2-ethanediol and phenylethanols were alsoamong the metabolites tested to see whether they had the samerelative retention time as the unknown adduct, as these com-pounds might have been generated through hydrolysis of aphosphate triester, formed from the attack of SO on one of thephosphate groups in the DNA, during NTH. However, 1-phe-nyl-1,2-ethanediol had a retention time of 18.3 min, and 1-phe-nylethanol and 2-phenylethanol had retention times of 29.4 and29.7 min, respectively. In some of the adduct profiles, peaks atthe same retention time were observed. Interestingly, the phen-ethyl alcohols co-eluted exactly with an adduct peak (retentiontime in HPLC-LSC;31 min), which was observed only inmouse, and might be derived from phenylacetaldehyde, a pro-posed intermediate in the metabolism of styrene (Fig. 1).
From the total amount of radioactivity in the DNA isolatedfrom the whole liver and lungs, the covalent binding indices(CBIs), as defined by Lutz (1979), were calculated. For ratliver, the CBIs calculated at 0 and 42 h after exposure were0.196 0.06 and 0.146 0.03, respectively. The correspondingvalues for mouse liver were 0.256 0.11 and 0.446 0.23. TheCBIs for rat lungs, 0.176 0.04, and mouse lungs, 0.246 0.04,were similar to the CBIs calculated in the liver of both species.The values calculated for lungs include the presumed DNAadduct of BA and might thus be slightly overestimated. Ourresults for liver corroborate the findings obtained with [7-3H]-styrene by Cantoreggi and Lutz (1993), who found CBIs for ratand mouse liver of, 0.1 (detection limit) and 0.05–0.18,respectively. Compared to CBIs for other genotoxic compounds(Lutz, 1979) and assuming that these binding values are due tomonofunctional metabolites, the evidence indicates that styrenehas only very weak genotoxic carcinogenic potency.
In conclusion, DNA adducts were measured in whole liver,whole lung, and specific lung cells of rats and mice following
nose-only exposure to 160 ppm14C-styrene for 6 h. Qualitativedifferences between the nature of the adducts were observed inlungs and liver for both mouse and rats, which indicates thatdifferent reactive metabolites are formed in the two tissues andspecies. CBIs for rat and mouse liver and lung were similar andwith values less than 1, which is similar to the CBIs ofcompounds with only very weak genotoxic properties. In theClara cell-depleted fractions from mouse lungs, a single adductat relatively high concentration was measured, but there arestrong indications that this adduct is an artifact caused by aradioactive impurity in the styrene exposure atmosphere. Theoverall results of this study demonstrate that DNA adductformation does not play a significant role in the formation ofthe lung tumors that were observed in mice chronically ex-posed to styrene. It is more likely that a nongenotoxic orepigenetic mechanism, possibly caused by a cytotoxic metab-olite, is involved in this process.
ACKNOWLEDGMENTS
We are indebted to Dr. Roy J. Richards, University of Wales, Cardiff,United Kingdom, and Dr. Gary P. Carlson, Purdue University, Lafayette,Indiana, for valuable discussions and guidance in setting up the lung cellisolation techniques. This study was in part sponsored by the Styrene Infor-mation and Research Center.
REFERENCES
Bond, J. A. (1989). Review of the toxicology of styrene.CRC Crit. Rev.Toxicol.19, 227–249.
Bond, J. A. (1993).Toxicology of the Lung(D. E. Gardner, J. D. Crapo, andR. O. McClellan, Eds.), pp. 187–215. Raven Press, New York.
Boogaard, P. J., Wong, B. A., Van Elburg, P. A., Sumner, S. C. J., and VanSittert, N. J. (2000). Disposition of14C-styrene in rats and mice exposed byrecirculating nose-only exposure.Toxicol. Sci.(in press).
Byfalt Nordqvist, M., Lof, A., Osterman-Golkar, S., and Walles, S. A. S.(1985). Covalent binding of styrene and styrene-7,8-oxide to plasma pro-teins, hemoglobin and DNA in the mouse.Chem.-Biol. Interact. 55, 63–73.
Cantoreggi, S., and Lutz, W. K. (1993). Covalent binding of styrene to DNAin rat and mouse.Carcinogenesis14, 355–360.
Clouter, A., and Richards, R. J. (1997). Extracellular biotransformation poten-tial in mouse airways.Int. J. Biochem. Cell Biol.29, 521–527.
Cruzan, G., Cushman, J. R., Andrews, L. S., Johnson, K. A., Bevan, C., Hardy,C. J., and Brown, W. R. (2000). Chronic toxicity/oncogenicity study ofstyrene in CD-1 mice by inhalation exposure for 104 weeks.J. Appl.Toxicol. (in press).
Cruzan, G., Cushman, J. R., Andrews, L. S., Granville, G. C., Johnson, K. A.,Hardy, C. J., Coombs, D. W., Mullins, P. A., and Brown, W. R. (1998).Chronic toxicity/oncogenicity study of styrene in CD rats by inhalationexposure for 104 weeks.Toxicol. Sci.46, 266–281.
Cruzan, G., Cushman, J. R., Andrews, L. S., Granville, G. C., Miller, R. R.,Hardy, C. J., Coombs, D. W. and Mullins, P. A. (1997). Subchronicinhalation studies of styrene in CD rats and CD-1 mice.Fund. Appl. Toxicol.35, 152–165.
Devereux, T. R., and Fouts, J. R. (1980). Isolation and identification of Claracells from rabbit lung.In Vitro 16, 958–968.
Gadberry, M. G., DeNicola, D. B., and Carlson, G. P. (1996). Pneumotoxicity
215DNA ADDUCTS OF STYRENE IN LIVER, LUNG, AND LUNG CELLS

and hepatotoxicity of styrene and styrene oxide.J. Toxicol. Environ. Health48, 273–294.
Hynes, D. E., DeNicola, D. B., and Carlson, G. P. (1999). Metabolism ofstyrene by mouse and rat isolated lung cells.Toxicol. Sci.51, 195–201.
IARC (1994a). Styrene. InIARC Monographs on the evaluation of carcino-genic risks to humans,Vol. 60, pp. 233–320. International Agency forResearch on Cancer, Lyon, France.
IARC (1994b). Styrene-7,8-oxide. InIARC Monographs on the evaluation ofcarcinogenic risks to humans,Vol. 60, pp. 321–346. International Agencyfor Research on Cancer, Lyon, France.
Kikkawa, Y., and Yoneda, K. (1974). The type II epithelial cell of the lung. I.Method of isolation.Lab. Invest. 30, 76–84.
Lutz, W. K. (1979).In vivo covalent binding of organic chemicals to DNA asa quantitative indicator in the process of chemical carcinogenesis.Mutat.Res.65, 289–356.
McConnell, E. E., and Swenberg, J. A. (1994). Review of styrene and styreneoxide long-term animal studies.Crit. Rev. Toxico.24, S49–S55.
Oreffo, V. I. C., Morgan, A., and Richards, R. J. (1990). Isolation of Clara cellsfrom the mouse lung.Environ. Health Perspect.85, 51–64.
Pauwels, W. Vodice`ka, P., Severi, M., Plna´, K., Veulemans, H., and Hem-minki, K. (1996). Adduct formation on DNA and haemoglobin in miceintraperitoneally administered with styrene.Carcinogenesis17,2673–2680.
Pauwels, W., and Veulemans, H. (1998). Comparison of ethylene, propylene andstyrene 7,8-oxidein vitro adduct formation on N-terminal valine in humanhaemoglobin and on N-7-guanine in human DNA.Mutat. Res.418,21–33.
Phillips, D. H., and Farmer, P. B. (1994). Evidence for DNA and proteinbinding by styrene and styrene oxide.Crit. Rev. Toxicol.24, S35–S46.
Pinkerton, K. E., Avadhanam, K. P., Peake, J. L., and Plopper, C. G. (1997).Tracheobronchial airways. In:Comprehensive Toxicology.(I. G. Sipes,C. A. McQueen, and A. J. Gandolfi, Eds.). Vol. 8, (R. A. Roth, Volume Ed.)pp. 23–44.Toxicology of the Respiratory System, Pergamon, ElseviersScience, Ltd., Oxford, UK.
Richards, R. J., Davies, N., Atkins, J., and Oreffo, V. I. C. (1987). Isolation,biochemical characterization, and culture of lung type II cells of the rat.Lung 165,143–158.
Savela, K., Hesso, A., and Hemminki, K. (1986). Characterization of reactionproducts between styrene oxide and deoxynucleosides and DNA.Chem.Biol. Interact.60, 235–246.
Segerba¨ck, D. (1994). DNA alkylation by ethylene oxide and some mono-substituted epoxides.IARC Sci. Publ. 125,37–47.
Sumner, S. C., Asgharian, B., Moss, O., Cattley, R. C., and Fennel, T. R.(1995). Correlating styrene metabolism and distribution with hepatotoxicity.The Toxicologist15, 4.
Sumner, S. C. J., Cattley, R. C., Asgharian, B., Janszen, D. B., and Fennell,T. R. (1997). Evaluation of the metabolism and hepatotoxicity of styrene inF344 rats, B6C3F1 mice, and CD-1 mice following single and repeatedinhalation exposures.Chem. Biol. Interact.106,47–65.
Vodicka, P., and Hemminki, K. (1988). Depurination and imidazole ring-opening in nucleosides and DNA alkylated by styrene oxide.Chem.Biol.Interact.68, 117–126.
216 BOOGAARD ET AL.