Inhibition of precartilaginous chick somites by oncogenic virus
Upload
independentCategory
view
4download
0
AL/OE-TR-1995-0135
UNITED STATES AIR FORCE ARMSTRONG LABORATORY
1994 TOXIC HAZARDS RESEARCH UNIT (THRU) ANNUAL REPORT
Daro! E. Dodd MANTECH ENVIRONMENTAL TECHNOLOGY, INC.
P.O. BOX 31009 DAYTON, OHIO 45437
19990316 063 April 1995
Occupational and Environmental Health Directorate
Toxicology Division 2856 G Street Wright-Patterson AFB OH 45433-7400
Approved for public release; distribution is unlimited.
j)<UlC QUALITY DfSPK3TBD1
NOTICES
When US Government drawings, specifications or other data are used for any purpose other than a definitely related Government procurement operation, the Government thereby incurs no responsibility nor any obligation whatsoever, and the fact that the Government may have formulated, furnished, or in any way supplied the said drawings, specifications, or other data is not to be regarded by implication or otherwise, as in any manner licensing the holder or any other person or corporation, or conveying any rights or permission to manufacture, use, or sell any patented invention that may in any way be related thereto.
Please do not request copies of this report from the Air Force Armstrong Laboratory. Additional copies may be purchased from:
National Technical Information Service 5285 Port Royal Road Springfield, Virginia 22161
Federal Government agencies and their contractors registered with the Defense Technical Information Center should direct requests for copies of this report to:
Defense Technical Information Service 8725 John J. Kingman Rd., Ste 0944 Ft. Belvoir, Virginia 22060-6218
DISCLAIMER
This Technical Report is published as received and has not been edited by the Technical Editing Staff of the Air Force Armstrong Laboratory.
TECHNICAL REVIEW AND APPROVAL
AL/OE-TR-1995-0135
The animal use described in this study was conducted in accordance with the principles stated in the "Guide for the Care and Use of Laboratory Animals", National Research Council, 1996, and the Animal Welfare Act of 1966, as amended.
This report has been reviewed by the Office of Public Affairs (PA) and is releasable to the National Technical Information Service (NTIS). At NTIS, it will be available to the general public, including foreign nations.
This technical report has been reviewed and is approved for publication.
FOR THE DIRECTOR
STEPHEN R. CHANNEL, Maj, USAF, BSC Branch Chief, Operational Toxicology Branch Air Force Armstrong Laboratory
REPORT DOCUMENTATION PAGE Form Approved OMB No. 0704-0188
Public repotting burden for this collection of information is estimated to average 1 hour per response, including the time for reviewing instructions, searching existing data sources, gathering and maintaining the data needed, and completing and reviewing the collection of information. Send comments regarding this burden estimate or any other aspect of this collection of information including suggestions for reducing this burden to Washington Headquarters Services, Directorate for Information Operations and Reports, 1215 Jefferson Davis Highway, Suite 1204, Arlington, VA 22202- 4302, and to the Office of Management and Budget, Paperwork Reduction Project (0704-0188), Washington, DC 20503
AGENCY USE ONLY (Leave Blank) 2. REPORT DATE
April 1995 REPORT TYPE AND DATES COVERED
Annual -1 October 1993 - 30 September 1994 4. TITLE AND SUBTITLE
1994 Toxic Hazards Research Unit (THRU) Annual Report
6. AUTHOR(S)
D.E. Dodd
7. PERFORMING ORGANIZATION NAME(S) AND ADDRESS(ES)
ManTech Environmental Technology, Inc. P.O. Box 31009 Dayton, OH 45437-0009
11.
SPONSORING/MONITORING AGENCY NAME(S) AND ADDRESS(ES)
Armstrong Laboratory, Occupational and Environmental Health Directorate Toxicology Division, Human Systems Center Air Force Materiel Command Wright-Patterson AFB OH 45433-7400 SUPPLEMENTARY NOTES
5. FUNDING NUMBERS
Contract F33615-90-C-0532 PE 62202F PR 6302 TA 630200 WU 63020002
PERFORMING ORGANIZATION REPORT NUMBER
10. SPONSORING/MONITORING AGENCY REPORT NUMBER
AL/OE-TR-1995-0135
12a. DISTRIBUTION/AVAILABILITY STATEMENT
Approved for public release; distribution is unlimited.
13. ABSTRACT (Maximum 200 words)
12b. DISTRIBUTION CODE
This reports presents a review of the activities of the Toxic Hazards Research Hunt (THRU) for the period 01 October 1993 through 30 September 1994. The THRU conducts descriptive, mechanistic, and predictive toxicology research and toxicological risk assessments to provide data to predict health hazards and to assess health risks associated with human exposure to chemicals and materials associated with military systems and operational environments. This report includes summaries of ongoing or completed research activities for major project efforts tasked by the Tri-Service Toxicology; highlights of the research support elements and conference activities of the THRU; and appendicies that describe the THRU organization and its publications and presentations. The majority of the report describes the progress attained in toxicological investigations on a wide variety of chemicals and materials to include trichloroethylene; Halon 1301 or 1211 replacement candidates iodotrifluoromethane, HFC- 227ea, HFC-125, HCFC-123, and FC-218; and nitrate explosive and propellant candidates 1,3,5-trinitrobenzene, liquid propellant XM465, ammonium dinitramide, and 1,3,3-trinitoazetidine. The THRUalso summarized the research findings of select jet fuel studies conducted in the 1970s and 1980s, conducted research on lactational transfer modeling, and evaluated statistical methods for assessing military populations as a subgroup of the public at-large.
14. SUBJECT TERMS Trichloroethylene Trichloacetic acid HCF-227ea
dichloroacetic acid Ammonium dinitrimide HFC-125 1,3,5-trinitrobenzene Iodotrifluoromethane HCFC-123 Liquid propellant XM46 Ammonium dinitramide FC-218
Halon 1301 Jet fuel JIM
1,3,5-trinitoazetidine 17. SECURITY CLASSIFICATION
OF REPORT
UNCLASSIFIED
18. SECURITY CLASSIFICATION OF THIS PAGE
UNCLASSIFIED
19. SECURITY CLASSIFICATION OF ABSTRACT
UNCLASSIFIED
15. NUMBER OF PAGES
260 16. PRICE CODE
20. LIMITATION OF ABSTRACT
UL
NSN 7540-01-280-5500 Standard Form 298 (Rev. 2-89) Prescribed by ANSI Std. Z39-18 298-102

PREFACE
The 31st Annual Report of the Toxic Hazards Research Unit (THRU) presents research and
research support efforts conducted by ManTech Environmental Technology, Inc. on behalf of the
U.S. Air Force, the U.S. Army, and the U.S. Navy under Department of the Air Force Contract
No. F33615-90-C-0532. This document represents the fourth annual report for the current THRU
contract and describes accomplishments from 01 October 1993 through 30 September 1994.
Operation of the THRU under this contract was initiated on 16 January 1991 under Project
No. 6302, "Occupational and Environmental Toxic Hazards in Air Force Operations," Work Unit No.
63020002, "Toxic Hazards Research." This research effort is cosponsored by the Army Medical
Research Detachment, Walter Reed Army Institute of Research (WRAIR), Work Unit Nos.
611102.S15L and 612787.878L, and by the Naval Medical Research Institute
Detachment/Toxicology (NMRI/TD), Work Unit No. M0096.004.0006, "Criteria for Exposure Limits in
Navy Operational Environments."
The Toxicology Division, Occupational and Environmental Health Directorate, Armstrong
Laboratory (AL/OET), Wright-Patterson Air Force Base, Ohio, provided the technical direction for
this contract. Lt Col Terry A. Childress, Director of the Toxicology Division, served as the Contract
Technical Monitor. That portion of the work effort sponsored by the Army was under the direction of
LTC Roland E. Langford, Detachment Commander, and LTC Daniel Caldwell, Senior Scientist of
the Medical Research Detachment. That portion of the work effort sponsored by the Navy was
under the direction of the NMRI/TD Officer-in-Charge, CAPT David A. Macys, MSC, USN. Darol E.
Dodd, Ph.D. served as the ManTech Environmental THRU Program Manager.
The contents and the preparation of this report represent the combined effort of the
ManTech Environmental staff of the THRU and the staff of the ManTech Environmental Technical
Publications and Graphics Department. Acknowledgment is made to Ms. Susie Godfrey, Betsy
Huber, Suzanne Bomemann, Cindy Matthews, and James A. Miller for their assistance in the
preparation of this report.
XIX

TABLE OF CONTENTS
SECTION PAGE
PREFACE iü
TABLE OF CONTENTS iv
1 ABBREVIATIONS vii
2 INTRODUCTION 1
3 TRICHLOROETHYLENECARCINOGENICITY PROJECT
3.1 Analyses of Dichloroacetic Acid, Trichloroacetic Acid, Trichloroethanol and Trichloroethanol Glucuonide Metabolites of Trichloroethylene 4
3.2 Developing Alternatives for Risk Assessment of Exposure to Trichloroethylene 17
3.3 Application of Physiologically Based Pharmacokinetics Model to Cancer Risk Assessment for Breast-Fed Infants 32
4 HALON 1301 REPLACEMENT TOXICITY PROJECT
4.1 Partition Coefficients and Gas Uptake Kinetics of Halon 1301 Replacement Candidates, CF3I, HFC-227ea, HFC-125, and FC-218 48
4.2 Acute 15-Minute, Nose-Only Inhalation Exposures of Halon 1301 to Male and Female Sprague-Dawley Rats 53
4.3 Cardiac Sensitization Potential of CF31 58
4.4 Results of Genotoxicity Tests on CF3I and HFC-227ea 63
4.5 Subchronic Inhalation Toxicity of Trifluoroiodomethane (CF3I) in Rats 74
5 HALON 1211 REPLACEMENT TOXICITY PROJECT
5.1 Pharmacokinetics of HCFC-123 in Dogs 83
5.2 Metabolism of 2,2-Dichloro-1,1,1-Trifluoroethane (HCFC-123) by Human Hepatic Microsomes 96
iv

6 NITRATE EXPLOSIVES AND PROPELLANTS PROJECT
6.1 General Protocol for a Reproductive Toxicity Screen of Nitrate-Containing Explosives and Propellants Administered in the Diet or Drinking Water of Sprague-Dawley Rats 103
6.2 Reproductive Toxicity Screen of 1,3,5-Trinitrobenzene Administered in the Diet of Sprague-Dawley Rats 112
6.3 Reproductive Toxicity Screen of Liquid Propellant XM46 Administered in the Drinking Water of Sprague-Dawley Rats 126
6.4 Reproductive Toxicity Screen of Ammonium Dinitramide Administered in me Drinking Water of Sprague-Dawley Rats 135
6.5 Results of Genotoxicity Tests on Ammonium Dinitramide 143
6.6 Genotoxicity of 1,3,3-Trinitroazetidine 153
6.7 Cardiovascular Screening of Nitrated Explosives and Propellants in Male Sprague-Dawley Rats 164
7 TOTAL PETROLEUM HYDROCARBON PROJECT
7.1 The Toxicologic and Oncogenic Potential of JP-4 Vapor: 90-Day Continuous Exposure 174
7.2 Overview of the Vapor Generation and Analysis Parameters of the Petroleum-and Shale-Derived Fuel Studies Conducted in Thomas Dome Exposure Chambers at the Toxic Hazards Research Unit, Wright-Patterson AFB (Dayton), Ohio, 1973-1983 185
8 APPLICATION OF STATISTICS IN HUMAN HEALTH HAZARD ASSESSMENT
8.1 Statistical Description for Seven Naval Populations 199
9 CONFERENCE AND WORKSHOP SUPPORT
9.1 1994 Conference on Temporal Aspects in Risk Assessment for Noncancer Endpoints 209
9.2 1994 HAZMAT/Pollution Prevention Symposium 211
9.3 1995 Conference on Risk Assessment Issues for Sensitive Human Populations 212
10 RESEARCH SUPPORT
10.1 Research Engineering Special Projects 213
10.2 Mathematics and Statistics 223
10.3 Pathology Support (Necropsy and Histology) 224
10.4 Computer/Electronics Support 227
10.5 Quality Assurance 229
10.6 Health and Safety 231
11 APPENDICES
A Toxic Hazards Research Unit List of Personnel 233
B Products List for 1994 235
C Toxic Hazards Research Unit Guest Speakers 244
VI
SECTION 1
ABBREVIATIONS
JJQ Microgram
fjL Microliter
//m Micrometer
ACSL Advanced Continuous Simulation Language
ADN Ammonium dinitramide
AFSC Air Force Development Test Center
AL/OET Armstrong Laboratory, Toxicology Division
AL/OEVM Armstrong Laboratory, Comparative Medicine Branch
ALD Approximate lethal dose
ALKP Alkaline phosphatase
ALT Alanine aminotransaminase
ANOVA Analysis of variance
AP Ammonium perchlorate
AST Aspartate aminotransaminase
AvGas Aviation gasoline
BBDR Biological based dose-response
BF Body Fat
BHCM Body Height in Centimeters
BUDS Basic underwater demolition (team)
BW Body weight
BWKG Body Weight in Kilograms
C Celsius
CF3I Trifluoroiodomethane
CFC Chlorofluorocarbon
CH Chloral hydrate
CHO Chinese hamster ovary
cm Centimeter
CNS Central nervous system
C02 Carbon dioxide
CV Coefficient of variation
DCA Dichloroacetic acid
DFM Diesel fuei marine
DMN Dimethylnitrosamine
Vli

DMSO Dimethylsulfoxide
DNB 1,3-Dinitrobenzene
DoD Department of Defense
DOT Department of Transportation
DPA 2,2,Dichloropropionic acid
EA Exposure Assessment
ECD Electron Capture Detection
ECG Electrocardiogram
EEGL Emergency exposure guidance level
EM Electron microscopy
EMH Extramedullary hematopoiesis
EMS Ethyl methanesulfonate
EPA U.S. Environmental Protection Agency
F Farenheit
F-344 Fischer 344
FC-218 Octafluoropropane
FID Flame ionization detector
ft Foot
g Gram
g/dl Grams per deciliter
GC Gas chromatograph(y)
GC/MS Gas chromatography / mass spectrometry
GD Gestation days
GGT Gamma-Glutamyl transferase
Gl Gastrointestinal
GLP Good Laboratory Practice
GSH Glutathione
h Hour
HAN Hydroxylammonium nitrate
HCT Hematocrit
HFC-125 Pentafluoroethane
HFC-227ea 1,1,1,2,3,3,3-Heptafluoropropane
HGB Hemoglobin
HGPRT Hypoxanthine-guanine phosphoribosyl-transferase
HMX Octahydro-1,3,5,7-tetranitro-1,3,5,7-tetrazocine
HPLC High performance liquid chromatograph(y)
VHl
HSR Health & Safety Representative
HTG Thyroglobulin
Hz Hertz
IMF Induced mutant frequency
in. Inch
ip Intraperitoneal
IR Infrared
IU/L International units per liter
kg Kilogram
L Liter
LAN Local area network
lb Pound
LC Lowest concentration
m Meter
MCH Mean corpuscular hemoglobin
MCHC Mean corpuscular hemoglobin concentration
MCV Mean corpuscular volume
MF Mutant frequency
mg Milligram
min Minute
mL Milliliter
mm Millimeter
mmHg Millimeters of mercury
MN Micronuclei
msec Millisecond
N Number
N2 Nitrogen
NCE Normochromatic Erythrocyte
NGM/ML Nanogram per milliliter
NMRI/TD Naval Medical Research Institute, Toxicology Detachment
NOAEL No observable adverse effect level
NOEL No observable effect level
NZW New Zealand White
O.D. Outer diameter
02 Oxygen
OHEA Office of Health and Environmental Assessment
IX
OSHA Occupational Safety and Health Administration
P Probability
PBPK Physiologically based pharmacokinetic
PC Personal computer
PCE Polychromatophilic erythrocytes
PCE/NCE Polychromatophilic erythrocyte / normochromatic erythrocyte
P9 Picogram
ppb Parts per billion
ppm Parts per million
psi Pounds per square inch
QAA Quality Assurance Associate
QAC Quality Assurance Coordinator
QAU Quality Assurance Unit
RBC Red Blood Cells
RT3 Reverse T3
RTG Relative total growth
SD Standard deviation
SDFM Shale-derived diesel fuel marine
SEALS . Sea, air, land (team)
sec Second
SEM Standard error of the mean
SF Slope Factor
SFE Solid Fuel Extinguishant
SIDS Screening Information Data Set
TBARS Thiobarbituric acid reactive substances
TBD To be determined
TBG Thyroxine-binding globulin
TCA Trichloroacetic acid
TCE Trichloroethylene
TCOG Trichloroethanol glucuronide
TCOH Trichloroethanol
TEM Triethylenemelamine
TFA Trifluoroacetic acid
TFT Trifluorothymidine
TH Total hydrocarbon
THRU Toxic Hazards Research Unit
X
TK Thymidine kinase
TMP Thymidine monophosphate
TNAZ 1,3,3-Trinitroazetidine
TNB 1,3,5-Trinitrobenzene
TNT 2,4,6-Trinitrotoluene
TPH Total petroleum hydrocarbon
TSCA Toxic Substances Control Act
U/mL Units per milliliter
v/v Volume per volume
VC Viable count
w/v Weight per volume
WBC White blood cell
WPAFB Wright-Patterson Air Force Base
wt Weight
XM46 Liquid Propellant formulation 1846
XJ
SECTION 2
INTRODUCTION
This report presents a review of the activities of the ManTech Environmental Technology, Inc.,
Toxic Hazards Research Unit (THRU), for the period 01 October 1993 through 30 September 1994.
ManTech Environmental's THRU is an on-site, contractor-operated, United States Air Force, Army,
and Navy multidisciplinary research program. The THRU conducts descriptive, mechanistic, and
predictive toxicology studies and toxicological risk assessments to provide data to predict health
hazards and to assess the health risks associated with human exposure to chemicals and chemical
materials of interest to the military. The major goal of the THRU's research efforts is to contribute to
safe military operations, including safe occupational and environmental conditions. An additional
goal of the THRU is to advance the state-of-the-art in toxicology research and risk assessment
techniques.
The THRU conducts research on a variety of materials that may range from pure chemicals to
poorly defined mixtures. They include, but are not limited to fuels, lubricants, solvents, additives,
components of explosives, propellants, paints, solvents, structural materials, training agents, and
combustion products. Descriptive toxicology is used to identify toxic effects, target organs, and
dose-response effects associated with different exposure routes, concentrations, and durations.
Mechanistic toxicology is performed to determine toxicokinetics, mechanisms of action, and
dynamics of expression of the toxic effects of the material of interest. Predictive toxicology involves
the development, validation, and application of computer simulation models to describe quantitative
dose-response relationships based on quantified input parameters such as exposure concentration,
partition coefficients, respiratory rate, blood flows, rate of metabolite formation, rate of chemical
excretion, and metabolic enzyme constants. These models are used to define target organ toxicity
based on the tissue-specific dose and are used in intra- and interspecies extrapolation. Data
generated via descriptive, mechanistic, and predictive toxicology studies are used together with
interpreted literature data to produce human health hazard risk assessments.
In accordance with the THRU contract's Statement of Work and specific technical directives
(study requests) provided by the Contract Technical Monitor, the THRU also coordinates toxicology
conferences, expert workshops, and program reviews. Research support benefiting both THRU and
government research efforts is provided in the areas of special test equipment design, fabrication,
validation, modification, and maintenance; mathematics and biometry; computer systems
management and programming; necropsy and histology techniques; toxicology information
databases and library management; quality assurance; health and safety; and documentation and
report preparation. The THRU's research support and administrative elements are integral to the
quality, continuity, and productivity of its scientific research efforts.
The research and support efforts of the THRU represent a continuum of activities that may
overlap two or more years depending upon the study scheduling and the extent of the research that
is required. During this reporting period, studies performed in response to requirements of the Air
Force included analyses of metabolites of trichloroethylene (TCE); development of alternatives for
risk assessment of exposure to TCE; application of physiologically based pharmacokinetic models to
cancer risk assessment for breast-fed infants; acute/subchronic toxicity testing, genotoxicity testing,
cardiac sensitization screening, gas uptake kinetics, partition coefficient determinations,
toxicokinetics and in vivo/in vitro metabolism studies of select Halon 1211 and Halon 1301
replacement candidates, such as HCFC-123, CF3I, or HFC-227ea; and data analysis of jet fuel
inhalation toxicity studies that were conducted in the 1970s and 1980s.
During this reporting period, the THRU received several study requests for toxicology research
in support of the Army. The THRU conducted studies to evaluate the reproductive toxicity and/or
genotoxicity potential of 1,3,5-trinitrobenzene (TIMB), Liquid Propellant XM46, ammonium
dinitramide and 1,3,3-trinitroazetidine. Additionally, mechanistic studies to determine the toxicity of
nitrate-containing chemicals were initiated, and quality assurance support was provided for the
teratologic evaluation of TNB on a study performed by Air Force personnel.
Toxic Hazards Research Unit technical directives that supported the Navy included continuation
of a statistical methods study to define techniques for assessing the variability in sensitivity of the
human population and subpopulations for developing a basis for altering safety factors used in risk
assessments applicable to military populations. Additionally, a number of technical support efforts in
animal necropsy, histology, and equipment design and fabrication were conducted.
During this reporting period, the THRU provided work effort in support of several toxicology
conferences and workshops, including the series of annual toxicology conferences that have been
coordinated by the THRU since 1965. The proceedings of the 1993 toxicology conference, "The
Risk Assessment Paradigm After Ten Years: Science, Policy, and Practice Then, Now, and in the
Future," were compiled by the THRU and distributed as a publication by the journal Risk Analysis
(Vol. 14, No. 3, 1994). The 1994 toxicology conference, "Temporal Aspects in Risk Assessment
for Noncancer Endpoints," was conducted in April at the Hope Hotel and Conference Center at
Wright-Patterson Air Force Base (WPAFB). The proceedings of this conference have been compiled
by the THRU for publication as a special issue of the journal Inhalation Toxicology. In August 1994,
the THRU initiated its planning efforts for the 1995 toxicology conference, "Risk Assessment Issues
for Sensitive Human Populations." The THRU provided support for the "1994 HazMat/Pollution
Prevention Symposium," arranged for Aeronautical Systems Center/Environmental Management at
WPAFB, and four additional workshops, including a TCE Science Workshop in Williamsburg, VA,
and a Perchlorate Study Group Meeting at WPAFB.
The execution of the THRU contract Statement of Work involves the integrated effort of a
multidisciplinary staff of scientists, research technicians, research support, and administrative
personnel. Sections 3 through 8 of this report emphasize the technical activities of the THRU.
Sections 9 and 10 present highlights of the conferences and research support activities, including
research engineering, mathematics and statistics, pathology support, computer and electronic
support, quality assurance, and health and safety. Section 11 of this report is a set of appendices
that describe the THRU organization, its personnel, and its awards, publications and presentations.
Historically, the THRU has prepared annual reports on its research efforts since 1963. In
general, these annual reports present summaries or highlights of the technical projects (study
requests) that were directed by the Air Force, Army, and Navy. More descriptive reports on the
THRU's research activities are prepared upon completion of study requests and are published as
technical reports or peer-review publications (refer to "Products List for 1994" in Section 11).
Technical reports also are prepared following the conferences and most workshops coordinated by
the THRU. Copies of these technical reports are available from the National Technical Information
Service or the Defense Technical Information Center.

3.1 ANALYSES OF DICHLOROACETIC ACID, TRICHLOROACETIC ACID, TRICHLOROETHANOL, AND TRICHLOROETHANOL GLUCURONIDE: METABOLITES OF TRICHLOROETHYLENE
W.T. Brashear, M.M. Ketcha1, C.T. Bishop2, and H.A. Barton
ABSTRACT
Trichloroethylene (TCE) has been identified as an environmental contaminant in groundwater.
Trichloroacetic acid (TCA), dichloroacetic acid (DCA), trichloroethanol (TCOH), and trichloroethanol
glucuronide (TCOG) have been identified as metabolites of TCE. Studies have shown that TCA and
DCA can induce liver tumors in B6C3F1 mice. Methods for the analysis of these metabolites are
important for conducting pharmacokinetic studies. TCA and DCA were derivatized to their methyl
esters by dimethyl sulfate under acidic conditions and analyzed by gas chromatography with
electron capture detection (GC/ECD). TCOG was hydrolyzed to free TCOH by ß-glucuronidase or
acid hydrolysis. TCOH was analyzed by GC/ECD after solvent extraction. Two important artifacts
that can occur in analyzing the carboxylic acid metabolites of TCE are the conversion of TCA to
DCA in fresh blood under acidic conditions and the loss of DCA from fresh liver homogenate. These
artifacts can be prevented by freezing blood samples prior to analysis, and by deactivating liver
enzymes with lead acetate.
INTRODUCTION
Trichloroethylene (TCE), a widely used degreasing and cleaning solvent, is an environmental
contaminant commonly found in groundwater. Exposure to TCE is of concern because it has been
found to be a rodent carcinogen {Bruckner et al., 1989). TCE is reported to be metabolized to
chloral hydrate (CH), trichloroacetic acid (TCA), dichloroacetic acid (DCA), trichloroethanol (TCOH),
and trichloroethanol glucuronide (TCOG) (Hathaway, 1980; Tanaka and Ikeda, 1968). DCA and
TCA, like TCE, cause mouse liver tumors (Bull et al., 1990; DeAngelo et al., 1991).
Analytical methods have been developed to analyze biological samples for TCE and its
metabolites (Breimer et al., 1974; Chen et al., 1993; Humbert and Fernandez, 1976; Ikeda et al.,
1972,). However, new findings regarding the interconversion of DCA and TCA, and the ex vivo
degradation of DCA are reported here. Precautions are needed to conduct proper quantitative
analysis.
Previous methods have recognized the need to prevent the interconversion of metabolites.
Breimer et al. (1974) used lead acetate to prevent the conversion of CH to TCOH in blood. They
also reported that sulfuric acid will prevent the conversion of CH to TCOH by erythrocytes. Their
1 Current Address: Proctor and Gamble, Miami Valley Research Labs, Cincinnati, OH. 2 Armstrong Laboratory, Toxicology Division, Wright-Patterson Air Force Base, OH.
recommendation is that blood samples be immediately mixed with lead acetate or sulfuric acid.
Other methods have treated biological samples with sulfuric acid in order to extract DCA and TCA
into an organic solvent (Goreki et al., 1990; Hathaway, 1980). It is known that the addition of acid
will affect TCOH levels since acid has been shown to hydrolyze TCOG to free TCOH (Breimer et al.,
1974; Garrett and Lambert, 1966). Therefore, acid-treated samples analyzed for TCOH will yield
total TCOH since blood and urine have both free and conjugated TCOH (Goreki et al., 1990).
Our experiments show that TCA and DCA levels are also affected by the addition of sulfuric
acid. This metabolite interconversion and evidence of ex vivo DCA metabolism are addressed in this
paper. The method developed to analyze DCA, TCA, TCOH, and TCOG has been designed to
minimize the interconversion and loss of analytes from biological samples.
MA TERIALS AND METHODS
Laboratory Animals
Laboratory animals were obtained from Charles River Laboratories (Kingston, NY). Male B6C3F1
mice weighing 17-23g (6-7 weeks) were used for this study. Animals were exposed to 600 ppm
TCE for 4 h, and placed into metabolism cages for 24-h urine collection. Unexposed mice were
sacrificed by C02 asphyxiation for control tissue samples.
Chemicals & Equipment
TCOH Glucuronide. E. coli ß-Glucuronidase (G-8271) and sodium acetate were obtained from
Sigma Chemical Co. (St. Louis, MO). TCE (99 + %, 25,642-0) and TCOH (99 + %, T5,480-1) were
obtained from Aldrich Chemical Co. (Milwaukee, Wl). Ethyl acetate was obtained from Mallinckrodt
(Paris, KY) and acetic acid was obtained from J.T. Baker (Phillipsburg, NJ). Tissue samples were
homogenized using a Tekmar Tissuemizer (Cincinnati, OH) and a Haake-Buchler vortex evaporator
(Saddlebrook, NJ) was used to vortex and heat samples. Samples were analyzed on a Hewlett
Packard 5890 gas Chromatograph with a Hewlett Packard 7673A liquid autosampler (Hewlett
Packard, Avondale, PA). The Chromatograph was equipped with an electron capture detector and a
30 m x 0.53 mm Supelco Wax 10 column (Supelco, Belfonte, PA).
TCA, DCA, and Total TCOH. TCA (99 + %, 25,139-9), DCA (99 + %, D5,470-2),
2,2-dichloropropionic acid (94%, 29,115-3), and dimethyl sulfate (99 + %, D18, 630-9) were
obtained from Aldrich Chemical Company (Milwaukee, Wl). Lead acetate was obtained from
Mallinckrodt (Paris, KY). Sulfuric acid and hexane were obtained from Fisher Scientific (Fair Lawn,
NJ). Samples were analyzed on a gas Chromatograph with a liquid autosampler as previously
described.
Assay Procedures
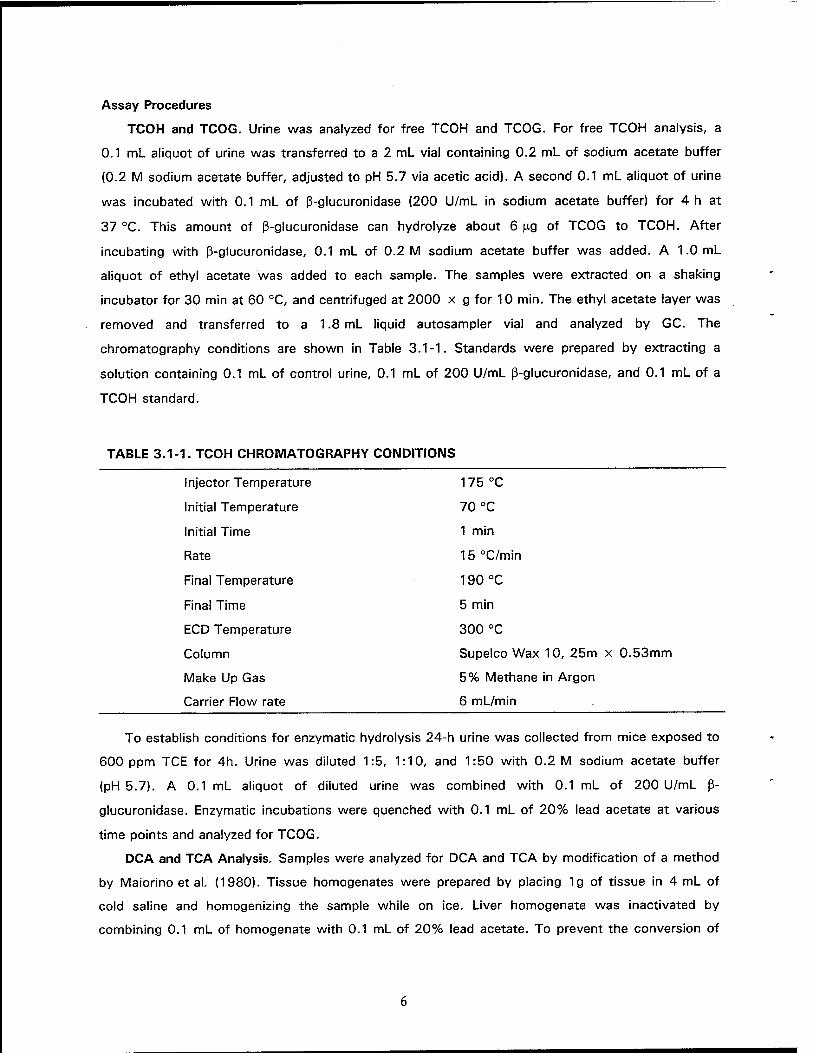
TCOH and TCOG. Urine was analyzed for free TCOH and TCOG. For free TCOH analysis, a
0.1 ml_ aliquot of urine was transferred to a 2 ml_ vial containing 0.2 mL of sodium acetate buffer
(0.2 M sodium acetate buffer, adjusted to pH 5.7 via acetic acid). A second 0.1 mL aliquot of urine
was incubated with 0.1 mL of ß-glucuronidase (200 U/mL in sodium acetate buffer) for 4 h at
37 °C. This amount of ß-glucuronidase can hydrolyze about 6 (J.g of TCOG to TCOH. After
incubating with ß-glucuronidase, 0.1 mL of 0.2 M sodium acetate buffer was added. A 1.0 mL
aliquot of ethyl acetate was added to each sample. The samples were extracted on a shaking
incubator for 30 min at 60 °C, and centrifuged at 2000 x g for 10 min. The ethyl acetate layer was
removed and transferred to a 1.8 mL liquid autosampler vial and analyzed by GC. The
chromatography conditions are shown in Table 3.1-1. Standards were prepared by extracting a
solution containing 0.1 mL of control urine, 0.1 mL of 200 U/mL ß-glucuronidase, and 0.1 mL of a
TCOH standard.
TABLE 3.1-1. TCOH CHROMATOGRAPHY CONDITIONS
Injector Temperature 175 °C
Initial Temperature 70 °C
Initial Time 1 min
Rate 15 °C/min
Final Temperature 190 °C
Final Time 5 min
ECD Temperature 300 °C
Column Supelco Wax 10, 25m x 0.53mm
Make Up Gas 5% Methane in Argon
Carrier Flow rate 6 mL/min
To establish conditions for enzymatic hydrolysis 24-h urine was collected from mice exposed to
600 ppm TCE for 4h. Urine was diluted 1:5, 1:10, and 1:50 with 0.2 M sodium acetate buffer
(pH 5.7). A 0.1 mL aliquot of diluted urine was combined with 0.1 mL of 200 U/mL ß-
glucuronidase. Enzymatic incubations were quenched with 0.1 mL of 20% lead acetate at various
time points and analyzed for TCOG.
DCA and TCA Analysis. Samples were analyzed for DCA and TCA by modification of a method
by Maiorino et al. (1980). Tissue homogenates were prepared by placing 1g of tissue in 4 mL of
cold saline and homogenizing the sample while on ice. Liver homogenate was inactivated by
combining 0.1 mL of homogenate with 0.1 mL of 20% lead acetate. To prevent the conversion of

TCA to DCA, freshly collected blood samples were frozen at -20 °C for 24 h. A 0.1 mL sample of
blood, urine, or tissue homogenate was placed in a 2 mL vial with 0.1 mL of water and 0.1 mL of
10 p.g/mL 2,2-dichloropropionic acid (internal standard). The vials were placed on ice and allowed to
cool for 30 min, then 0.5 mL of concentrated sulfuric acid and a 0.1 mL aliquot of dimethyl sulfate
were added. The vials were capped and vortexed on a shaking incubator for 30 min at 60 °C. After
vortexing the vials were allowed to cool and 1 mL of hexane was added. The samples were
extracted on the incubator shaker for 60 min at 55 °C and centrifuged at 2000 x g for 10 min. The
hexane layer was removed and analyzed by GC as described in Table 3.1-2. Standards were made
from blood, urine, or tissue homogenates from control animals. A 0.1 mL aliquot was combined
with 0.1 mL of 10 ng/mL 2,2-dichloropropionic acid (internal standard) and a 0.1 mL aliquot of an
aqueous standard of DCA and TCA. The samples were derivatized and analyzed as previously
described.
TABLE 3.1-2. DCA AND TCA CHROMATOGRAPHY CONDITIONS
Injector Temperature 175 °C
Initial Temperature 70 °C
Initial Time 15 min
Rate 15 °C/min
Final Temperature 190 °C
Final Time 5 min
ECD Temperature 300 °C
Column Supelco Wax 10, 25m x 0.53mm
Make Up Gas 5% Methane in Argon
Carrier Flow Rate 6 mL/min
Preparation of Microsomes. Livers were perfused in situ with ice cold buffer containing 10 mM
Tris, 154 mM KCI, pH 7.4, and quickly removed to cold buffer. Aliquots were homogenized in four
volumes of the same buffer and centrifuged 20 min at 9000 x g to remove cellular debris,
mitochondria, nuclei, and residual red blood cells. The resulting supernatant was centrifuged 1 h at
105,000 x g to separate the cytosolic fraction and microsomal fraction. Cytosolic supernatant was
removed and the microsomal pellet was resuspended in buffer (above) to a concentration of
approximately 15 mg protein/mL.
RESULTS
TCOH and TCOG
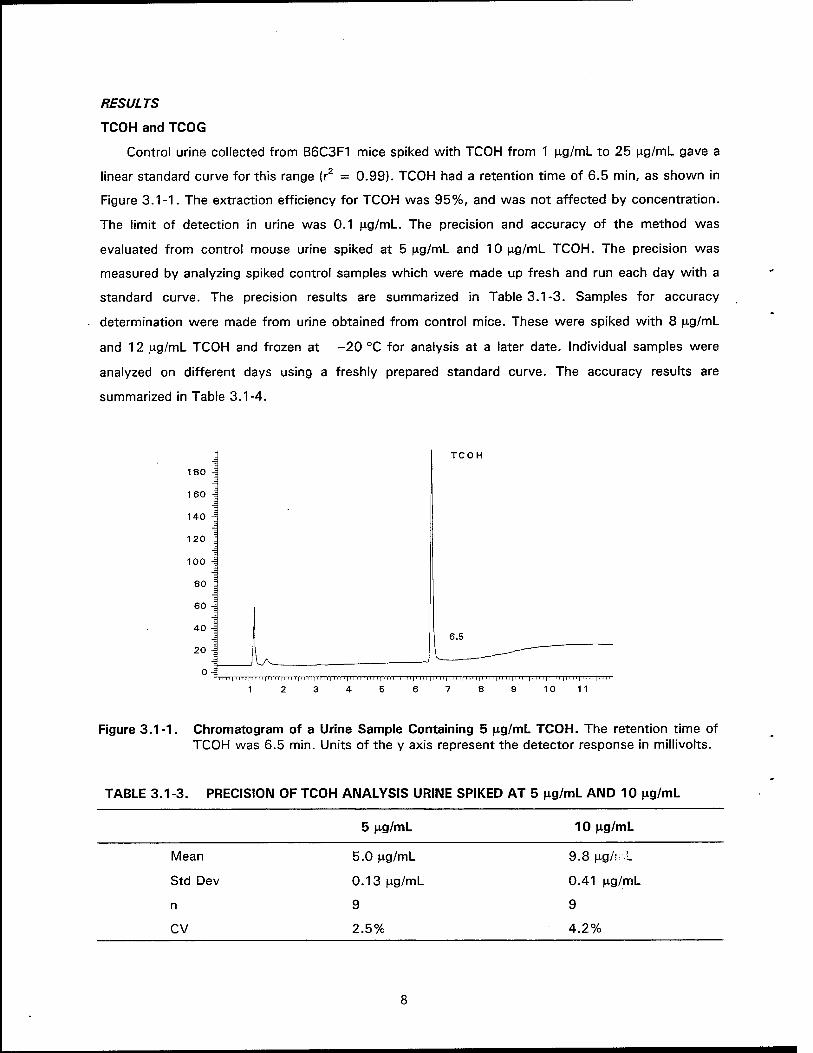
Control urine collected from B6C3F1 mice spiked with TCOH from 1 ng/mL to 25 p.g/mL gave a
linear standard curve for this range (r2 = 0.99). TCOH had a retention time of 6.5 min, as shown in
Figure 3.1-1. The extraction efficiency for TCOH was 95%, and was not affected by concentration.
The limit of detection in urine was 0.1 |j.g/mL. The precision and accuracy of the method was
evaluated from control mouse urine spiked at 5 ng/mL and 10 jxg/mL TCOH. The precision was
measured by analyzing spiked control samples which were made up fresh and run each day with a
standard curve. The precision results are summarized in Table 3.1-3. Samples for accuracy
determination were made from urine obtained from control mice. These were spiked with 8 (xg/mL
and 12 fxg/mL TCOH and frozen at -20 °C for analysis at a later date. Individual samples were
analyzed on different days using a freshly prepared standard curve. The accuracy results are
summarized in Table 3.1-4.
TCOH
180
160
140 4
120 4
100
80 -=
60 -i
40
J: I l 6.5 20 I————""■" 0 -^
ll mill nil
1
1 M ' ' 'I l " H1
5 6 7 8 9 10 11
Figure 3.1-1. Chromatogram of a Urine Sample Containing 5 fxg/mL TCOH. The retention time of TCOH was 6.5 min. Units of the y axis represent the detector response in millivolts.
TABLE 3.1 -3. PRECISION OF TCOH ANALYSIS URINE SPIKED AT 5 ng/mL AND 10 ng/mL
5 (xg/mL 10 p.g/mL
Mean
Std Dev
n
CV
5.0 fxg/mL
0.13 ng/mL
9
2.5%
9.8 |xg/r:L
0.41 (xg/mL
9
4.2%
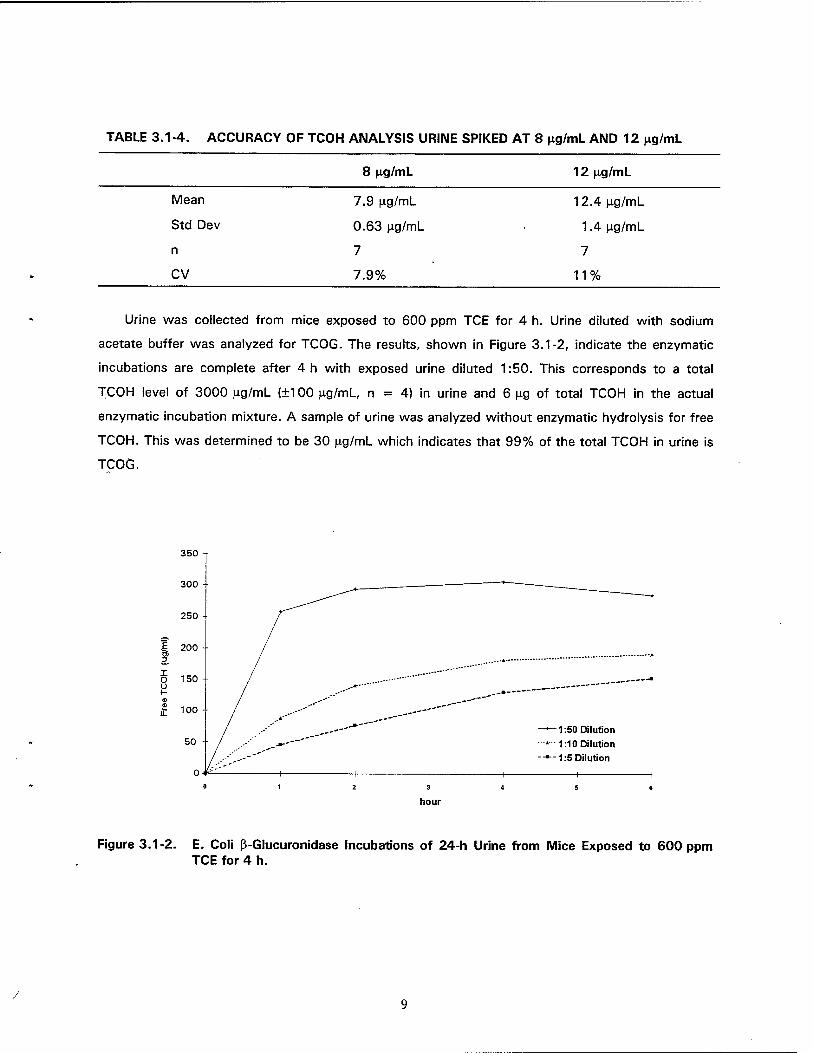
TABLE 3.1-4. ACCURACY OF TCOH ANALYSIS URINE SPIKED AT 8 ng/mL AND 12 ng/mL
8 (xg/mL 12 |xg/mL
Mean
Std Dev
n
CV
7.9 ra/mL
0.63 n-g/mL
7
7.9%
12.4 ng/mL
1.4 ng/mL
7
11%
Urine was collected from mice exposed to 600 ppm TCE for 4 h. Urine diluted with sodium
acetate buffer was analyzed for TCOG. The results, shown in Figure 3.1-2, indicate the enzymatic
incubations are complete after 4h with exposed urine diluted 1:50. This corresponds to a total
TCOH level of 3000 ng/mL (+100 ng/mL, n = 4) in urine and 6 ng of total TCOH in the actual
enzymatic incubation mixture. A sample of urine was analyzed without enzymatic hydrolysis for free
TCOH. This was determined to be 30 ng/mL which indicates that 99% of the total TCOH in urine is
TCOG.
350
hour
Figure 3.1-2. E. Coli ß-Glucuronidase Incubations of 24-h Urine from Mice Exposed to 600 ppm TCE for 4 h.

To determine the effect of analyzing TCOH samples in the presence of strong acid, a sample of
the same urine was incubated with sulfuric acid. A 100 M-I aliquot of urine diluted 1:100 with 0.2 M
sodium acetate buffer was combined with 0.5 mL of concentrated sulfuric acid, placed on an
incubator shaker for 30 min at 60 °C, and extracted with ethyl acetate. This sample was determined
to have 2800 ng/mL TCOH indicating that the TCOG glucuronide linkage is acid labile.
DCA and TCA Analysis
The assay developed for DCA and TCA had a limit of detection of 1.0 (ig/mL for the analysis of
0.1 mL of blood or urine, and 1^g/g for a 0.1 mL sample of liver homogenate (1 g liver
homogenized in 4 mL of saline). Standard curves were linear up to 25 ng/mL (r2 = 0.99). As shown
in Figure 3.1-3, the retention times of TCA, DCA, and DPA (internal standard) were 7.3, 8.3, and
4.6 min, respectively. From liver homogenate (1g of tissue in 4 mL of saline) and liver slice samples
(6 mg/mL total protein), the reaction efficiency of the dimethyl sulfate derivatization was 95%, and
the extraction efficiency was 50%.
60
50 1
40
30
20
10 1
DPA
4.6
TCA
7.3
DCA
8.3 l|'lll|l'll|llll|llll|llll|l|ll|MII|llll|MII|llll|llll|iril|IMI|lll||IIN|llll|llll|l|U|NII|llll|llll|IIU|llll|ll|l|IMI|llll|llll|llll|MM
1 8 10 11 12 13 14
Figure 3.1-3. Chromatogram of 10p.g/mL TCA and DCA with Internal Standard DPA from Liver Homogenate. Retention times of DPA, TCA, and DCA were 4.6, 7.3, and 8.3 min, respectively. Units of the y axis is detector response in millivolts.
10

The precision of this method was also evaluated from microsomes (15 mg protein/mL) and liver
homogenate (1g liver in 4 mL of saline). The precision was measured by analyzing spiked control
samples which were made up fresh and run daily with a standard curve. The precision results are
summarized in Table 3.1-5. Samples for accuracy determination were made from microsomes
obtained from control mice. These were spiked with DCA and TCA and frozen at -20 °C for
analysis at a later date. Individual samples were analyzed on different days using a freshly prepared
standard curve over a period of 3 months. The accuracy results are summarized in Table 3.1-6.
TABLE 3.1-5. PRECISION OF DCA AND TCA ANALYSIS LIVER HOMOGENATE AND MICROSOMES SPIKED AT 10 jxg/mL
Liver Homogenate Microsomes
DCA TCA DCA TCA
Mean 9.8 ng/mL 10.7 ng/mL
Std Dev 0.40 ng/mL 0.75 ng/mL
n 14 14
CV 4% 7%
9.8 ng/mL
0.69 ng/mL
34
7%
10.2 ng/mL
0.87 ng/mL
34
9%
TABLE 3.1 -6. ACCURACY OF DCA AND TCA ANALYSIS MICROSOME SAMPLES SPIKED AT 5 jxg/mL
DCA TCA
Mean
Std Dev
n
CV
5.0 ng/mL
0.65 ng/mL
16
13%
5.1 jag/mL
0.57 ng/mL
16
11%
Samples of crude liver homogenate were spiked with DCA and TCA in order to develop
standard curves. Liver homogenate from a control animal was spiked with DCA and TCA. From the
analysis it was noted that DCA appeared to be lost from samples that were allowed to stand at
room temperature for 30 min. To investigate this, a crude liver homogenate from control mice was
spiked with different concentrations of DCA and allowed to stand at room temperature for 30 min.
After standing, the samples were quenched with 0.5 mL sulfuric acid and derivatized with dimethyl
sulfate. The results shown in Figure 3.1-4 indicate that DCA is metabolized by liver homogenate
under these conditions.
11

Further testing indicated that the loss of DCA could be inhibited by pretreating the liver homogenate
with 0.5 mL sulfuric acid or 0.5 mL of 20% lead acetate. Inactivated liver homogenate produced
concentrations of DCA consistent with the expected values. A similar experiment conducted with
TCA indicated that TCA is not metabolized by a crude liver homogenate under these conditions.
16 -r
14
12
10
8 =3
Q 6
4-
2-
0
O Active Homogenate
S Deactivated Homogenate
KSSSSM
OJ05 025 0.50 125 250 500
Amount DCA Added (ug/rri)
10.00 1500
Figure 3.1-4. DCA Loss from Crude Liver Homogenate over 30 min at Room Temperature. Inactivated homogenate was inactivated with sulfuric acid.
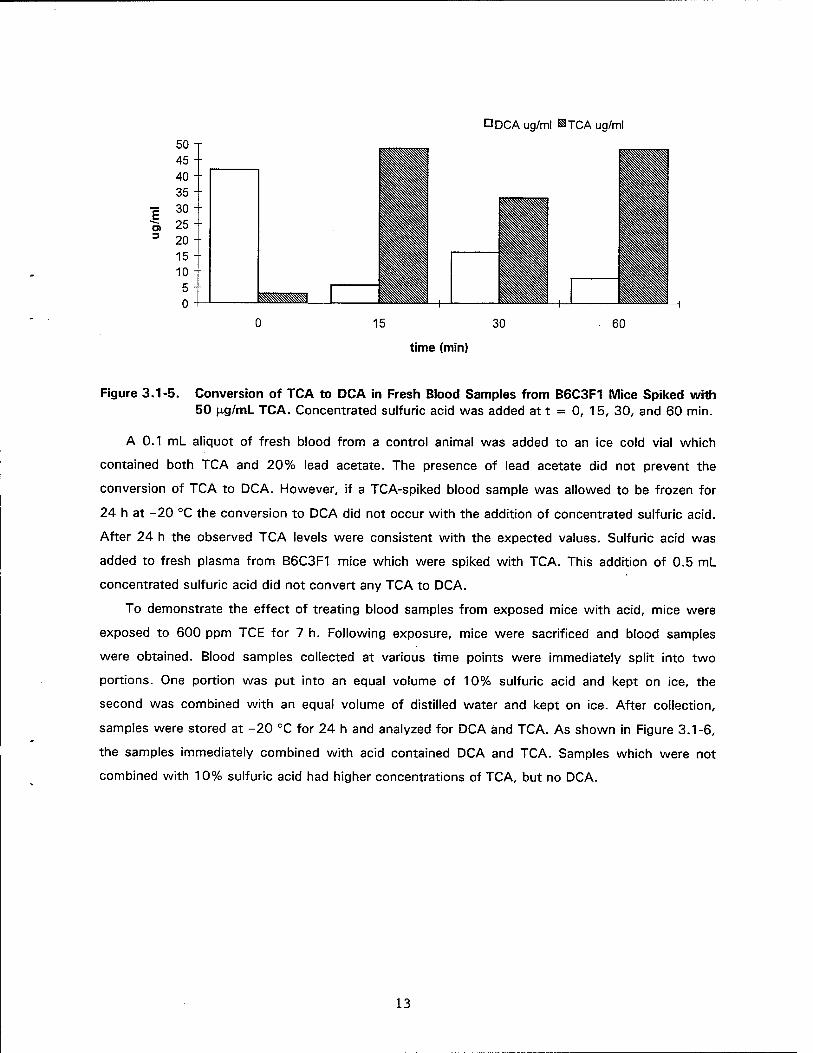
Fresh blood samples spiked with TCA were found to convert TCA to DCA when treated with
concentrated sulfuric acid. Fresh control blood was collected from mice and 0.1 mL aliquots were
placed into tubes kept at room temperature which contained 0.1 mL of 50 |ag/mL TCA. At time
intervals of 0, 15, 30, and 60 min, 0.1 mL of concentrated sulfuric acid was added. Three hours
after the blood was taken, the samples were derivatized with dimethyl sulfate and analyzed. The
results, shown in Figure 5, suggest that TCA is converted to DCA by the action of concentrated
sulfuric acid in freshly drawn blood. The conversion of TCA to DCA also occurred when 5%, 10%,
25%, and 50% sulfuric acid was added to fresh blood samples. The data in Figure 3.1-5 are a
representative example of experiments in which TCA in fresh mouse blood converts to DCA under
acidic conditions. The amount of conversion of TCA to DCA at the zero time point varied from zero
to ninety percent.
12
3
ÖDCAug/ml ^TCA ug/ml
15 30
time (min)
60
Figure 3.1-5. Conversion of TCA to DCA in Fresh Blood Samples from B6C3F1 Mice Spiked with 50 ng/mL TCA. Concentrated sulfuric acid was added at t = 0, 15, 30, and 60 min.
A 0.1 mL aliquot of fresh blood from a control animal was added to an ice cold vial which
contained both TCA and 20% lead acetate. The presence of lead acetate did not prevent the
conversion of TCA to DCA. However, if a TCA-spiked blood sample was allowed to be frozen for
24 h at -20 °C the conversion to DCA did not occur with the addition of concentrated sulfuric acid.
After 24 h the observed TCA levels were consistent with the expected values. Sulfuric acid was
added to fresh plasma from B6C3F1 mice which were spiked with TCA. This addition of 0.5 mL
concentrated sulfuric acid did not convert any TCA to DCA.
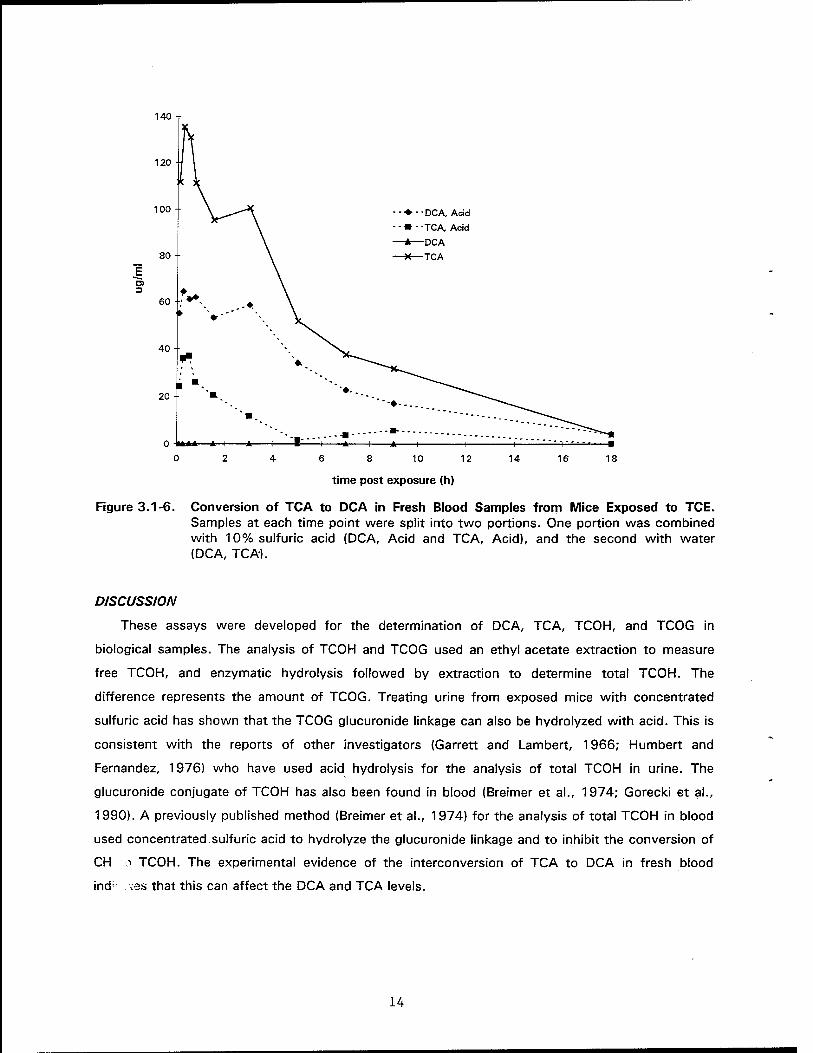
To demonstrate the effect of treating blood samples from exposed mice with acid, mice were
exposed to 600 ppm TCE for 7 h. Following exposure, mice were sacrificed and blood samples
were obtained. Blood samples collected at various time points were immediately split into two
portions. One portion was put into an equal volume of 10% sulfuric acid and kept on ice, the
second was combined with an equal volume of distilled water and kept on ice. After collection,
samples were stored at -20 °C for 24 h and analyzed for DCA and TCA. As shown in Figure 3.1-6,
the samples immediately combined with acid contained DCA and TCA. Samples which were not
combined with 10% sulfuric acid had higher concentrations of TCA, but no DCA.
13
140
120
100
O) 3
--♦- ■ DCA, Acid
--»■ -TCA, Acid
—X- -TCA
6 8 10 12
time post exposure (h)
Figure 3.1-6. Conversion of TCA to DCA in Fresh Blood Samples from Mice Exposed to TCE. Samples at each time point were split into two portions. One portion was combined with 10% sulfuric acid (DCA, Acid and TCA, Acid), and the second with water (DCA, TCA).
DISCUSSION
These assays were developed for the determination of DCA, TCA, TCOH, and TCOG in
biological samples. The analysis of TCOH and TCOG used an ethyl acetate extraction to measure
free TCOH, and enzymatic hydrolysis followed by extraction to determine total TCOH. The
difference represents the amount of TCOG. Treating urine from exposed mice with concentrated
sulfuric acid has shown that the TCOG glucuronide linkage can also be hydrolyzed with acid. This is
consistent with the reports of other investigators (Garrett and Lambert, 1966; Humbert and
Fernandez, 1976) who have used acid hydrolysis for the analysis of total TCOH in urine. The
glucuronide conjugate of TCOH has also been found in blood (Breimer et al., 1974; Gorecki et al.,
1990). A previously published method (Breimer et al., 1974) for the analysis of total TCOH in blood
used concentrated sulfuric acid to hydrolyze the glucuronide linkage and to inhibit the conversion of
CH > TCOH. The experimental evidence of the interconversion of TCA to DCA in fresh blood
ind; xe.s that this can affect the DCA and TCA levels.
14
The conversion of TCA to DCA in fresh blood is an important concern for the analysis of these
metabolites of TCE. Published methods for the analysis of TCA (Breimer et al., 1974; Gorecki et al.,
1990, Humbert and Fernandez, 1976) in biological fluids acidify samples with strong acid. This step
is necessary in order to extract strong acids such as DCA (pKa 1.3) and TCA (pKa 0.7) into an
organic solvent for methylation. Our work has shown that the acidification of fresh whole blood
samples can lead to erroneous results. This has been demonstrated to occur in vitro with fresh
blood spiked with TCA, as well as with fresh blood obtained from mice exposed to TCE. Conversion
of TCA to DCA can be prevented by freezing the samples at -20 °C overnight before adding acid
for derivatization. Plasma proteins do not appear to be responsible for the conversion of TCA to
DCA since the reaction does not occur in fresh plasma from mice. The finding that pretreating blood
with lead acetate does not prevent the TCA to DCA conversion also indicates that the conversion
may not be due to enzymatic activity. The mechanism of the TCA to DCA interconversion is
unknown. However, it is known that cx-haloacetic acids can undergo electrocatalytic reductive
dehalogenation (Rusling et al., 1990). This reaction is catalyzed by the reduced form of vitamin B12,
and does not require the electrochemical reduction of vitamin B12 oc-haloacetic acid complex. It is
possible that reduced metal porphyrins in fresh blood may be involved in reductive dehalogenation
of TCA to DCA.
The loss of DCA from liver homogenate is another problem associated with the analysis of TCE
metabolites. Homogenized liver samples need to be quenched with lead acetate as rapidly as
possible prior to derivatization. The loss of DCA is due to ex vivo activity of liver enzymes
(unpublished results). This can be inhibited by the addition of sulfuric acid or lead acetate. In
Fischer-344 rats, DCA has been reported to be metabolized to glycolic acid, glyoxylic acid, oxalic
acid, and carbon dioxide. The metabolism of DCA is saturable, and metabolites of DCA have a
longer plasma half-life than DCA (Lin et al., 1993). Therefore, it is reasonable to expect the loss of
DCA from biologically active samples.
SUMMARY
The results reported here show that it is critically important to evaluate the ability of
metabolites to interconvert during analytical procedures, particularly when collecting data for
pharmacokinetic analysis and assessing the metabolite(s) of TCE responsible for its carcinogenicity.
Previous work has shown that erythrocytes can reduce CH to TCOH (Breimer et al., 1974). Our
data has shown that the addition of acid to fresh blood samples can convert TCA to DCA. Blood
samples need to be frozen overnight at -20 °C prior to the addition of acid for DCA/TCA analysis.
The enzymatic activity in liver homogenate metabolizes DCA. Liver samples need to be deactivated
with 20% lead acetate prior to DCA analysis.
15
REFERENCES
Breimer, D., H.C.J. Ketelaars, and J.M. Van Rossum. 1974. Gas Chromatographie determination of chloral hydrate, trichloroethanol and trichloroacetic acid in blood and urine employing head-space analysis. J. Chromatogr 88:55-63.
Bruckner, J.V., B.D. Davis, and J.N. Blancato. 1989. Metabolism, toxicity, and carcinogenicity of trichloroethylene. Crit. Rev. Toxicol. 20(1):31-50.
Bull, R.J., I.M. Sanchez, M.A. Nelson, J.L. Larson, and A.J. Lansing. 1990. Liver tumor induction in B6C3F1 mice by dichloroacetate and trichloroacetate, in mouse liver. Toxicology63:341 -359.
Chen, X.M., C.E.Dallas, S. Muralidhara, V. Srivatsan, and J.V. Bruckner. 1993. Analysis of volatile C2 haloethanes and haloethenes in tissues: sample preparation and extraction. J. Chromatogr. 612:199-208.
DeAngelo, A.B., F.B. Daniel, J.A. Stober, and G.R. Olson. 1991. The Carcinogenicity of dichloroacetic acid in male B6C3F! mouse. Fundam. Appl. Toxicol. 16:337-347.
Garrett, E.R. and H.J. Lambert. 1966. Gas Chromatographie analysis of trichloroethanol, chloral hydrate, trichloroacetic acid, and trichloroethanol glucuronide. J. Pharm. Sei. 55(8):812-817.
Gorecki, D.K.J., K.W. Hindmarsh, C.A. Hall, and D.J. Mayers. 1990. Determination of chloral hydrate metabolism in adult and neonate biological fluids after single-dose. J. Chromatogr. 528:333-341.
Hathaway, D.E. 1980. Consideration of the evidence for mechanisms of 1,1,2-trichloroethylene metabolism, including new identification of its dichloroacetic acid and trichloroacetic acid metabolites in mice. Cancer Letters 8:263-269.
Humbert, B.E. and J.G. Fernandez. 1976. Simultaneous determination of trichloroacetic acid and trichloroethanol by gas chromatography. int. Arch. Occup. Environ. Health 36:235-241.
Ikeda, M., H. Ohtsuji, T. Imamura, and Y. Komoike. 1972. Urinary excretion of total trichloro-compounds trichloroethanol, and trichloroacetic acid as a measure of exposure to trichloroethylene and tetrachloroethylene. Br. J. Ind. Med. 29:328-333.
Lin, E.L.C., J.K. Mattox, and F.B. Daniel. 1993. Tissue distribution, excretion, and urinary metabolites of dichloroacetic acid in the male fischer 344 rat. J. Toxicol. Environ. Health 38:19-32.
Maiorino, R.M., A.J. Gandolfi, and I.G. Sipes. 1980. Gas-Chromatographic method for the halothane metabolites, trifluoroacetic acid and bromide, in biological fluids. J. Anal. Toxicol. 4:250- 254.
Rusling, J.F.. C.L. Miaw, and E.C. Couture. 1990. Electrocatalytic dehalogenation of ot-haloacetic acids by vitamin B12. Inorg. Chem. 29:2025-2027.
Tanaka, S. and M. Ikeda. 1968. A method for determination of trichloroethanol and trichloroacetic acid in urine. Br. J. Ind. Med. 35:214-219.
16
3.2 DEVELOPING ALTERNATIVES FOR CANCER RISK ASSESSMENT: TRICHLOROETHYLENE AND ITS METABOLITES
H. A. Barton, D. J. Caldwell1, S. R. Channel2, and J. W. Fisher2
ABSTRACT
Chemical contamination of groundwater and soil is a national problem that consumes extensive
technological and financial resources. Development of alternatives for cancer risk assessment can play an
important role in making site remediation a health protective and cost effective activity. This project
addresses trichloroethylene (TCE) as a case study for alternative risk assessment methods because it is
one of the most widespread groundwater contaminants. TCE has been shown to be a carcinogen in
rodents, but it appears to be a tumor promoter rather than a genotoxic initiator. Currently, dose-response
values for cancer risk assessment are all derived using the linearized multistage model regardless of the
likely mode of action of the chemical. This results in very low estimates of acceptable concentrations in
groundwater, making remediation an expensive process. Alternative methods will be explored including
development of physiologically based pharmacokinetic (PBPK) models for TCE and its metabolites and
exploration of methods to address the pharmacodynamic processes of tumor promotion. This paper
describes the overall plan and context for the project and reports the ongoing work.
INTRODUCTION
Chemical contamination of groundwater and soil is a national problem that consumes extensive
technological and financial resources. Cleanup levels are determined on the basis of risk calculations,
usually requiring extrapolation from laboratory animal studies. Determining acceptable levels for humans
from animal studies is a conservative, policy-driven process that involves extrapolation and interpretation
of scientific findings. Scientific uncertainties in this process are often compensated for by conservative
assumptions that result in lower cleanup levels with inherent increased costs.
Current costs to clean up to the low ppb range in water and soil are in the hundreds of millions of
dollars. Operating costs of a groundwater treatment system for a single plume at Wright-Patterson AFB,
contaminated with high levels of trichloroethylene (TCE), are $1.3 million/year. TCE remediation at 31
Department of Defense (DoD) installations has cost $670 million to date, while work for all solvents has
cost $2 billion. It has been estimated that for 125 Air Force sites with TCE contamination, raising the
drinking water standard from 5 to 50 ppb would save $620 million.
1 Army Medical Research Department, Walter Reed Army Institute of Research, Wright-Patterson Air Force Base, OH.
2 Armstrong Laboratory, Toxicology Division, Wright-Patterson Air Force Base, OH.
17
Trichloroethylene, tetrachloroethylene (PCE), and other volatile organics are priority groundwater
contaminants for the DoD and the U.S. Environmental Protection Agency (EPA). These chemicals often
greatly exceed current risk-based cleanup levels at Superfund landfill sites. This project is designed to
further the development of newer risk assessment methodologies for developing reasonable health
protective criteria for important groundwater contaminants for use in establishing cleanup requirements.
This project furthers the utilization of newer risk assessment methodologies for establishing cleanup
criteria that incorporate more scientific information and minimize the use of conservative default
assumptions. These methods would also be useful for other risk-based processes such as evaluating
alternatives under consideration for pollution prevention purposes. TCE and its metabolites will be the
chemicals used as case studies in this project due to the great importance of TCE as the most common
groundwater contaminant in the country.
The four-step paradigm for risk assessment provides a framework for integration of scientific
research and environmental policy analysis. Therefore, this project has been organized around the use of
(1) hazard assessment, (2) exposure assessment (EA), (3) dose-response assessment (DR), and (4) risk
characterization in the development of health based cleanup criteria.
Newer risk assessment methods include: physiologically based pharmacokinetic (PBPK) modeling to
improve exposure and tissue dosimetry (EA & DR), biologically based dose-response (BBDR) modeling
describing toxicity processes (DR), benchmark dose estimation using complete dose-response data (DR),
and probability (Monte Carlo) analysis (EA & DR). These methods incorporate molecular toxicology into
the risk assessment process. Alternative risk assessment approaches have been developed by
researchers from the Toxicology Division, Occupational and Environmental Health Directorate, Armstrong
Laboratory, (AL/OET), EPA, and academia.
The goals and objectives outlined below were developed by scientists from the participating agencies
with modifications subsequent to the international TCE Science Workshop. Emphasis was given at that
meeting to developing PBPK models for TCE and its metabolites (see Objective 2) and to evaluating the
carcinogenicity of metabolites in relation to the parent chemical (Objective 3). Due to recent revisions to
the EPA guidance for cancer risk assessment, a unique opportunity exists for developing risk assessment
methods for TCE.
18
TCE Cancer Science Workshops
Revisions of EPA cancer risk assessment guidance have been drafted to incorporate modern
knowledge about cancer mechanisms. Implementation of the proposed guidelines within the agency has
been considered using a case study approach. This provided the framework for recent meetings
considering the current science for TCE.
The Trichloroethylene Science Workshop held on 2-3 December 1993 was cosponsored by the Air
Force, Trichloroethylene Issues Group, and EPA. It was preceded by a smaller research issues meeting
held 31 November 1993 at WPAFB, OH. This first meeting included presentations and research
discussions with the Triservices TCE research team. Presentations were made by Drs. R. Bull
(Washington State), A. DeAngelo (EPA), T. Green (Zeneca, Ltd), J. Bruckner (U. Georgia), W. Dekant
(Universität Wurzburg), and H. Barton (ManTech Environmental, WPAFB). Research plans of the
Toxicology Division and other scientists were reviewed to develop useful collaborations and limit
unnecessary duplication.
Nearly 40 scientists met in Williamsburg, VA, for the TCE Workshop, including leading researchers
and policy analysts in the areas of epidemiology, metabolism, pharmacokinetics, tumor promotion,
biological effects modeling, and risk assessment. Attendees included the toxicology researchers listed
above and Drs. J. Popp (Sterling Winthrop) and J. Fisher (AL/OET). EPA attendees included the Office of
Health and Environmental Assessment (OHEA) Deputy Director, Dr. J. Wiltse, Drs. J. Cotruvo (the Office
of Pollution Prevention and Toxics), H. Gibb (OHEA), and J. Parker (OHEA). Developers of alternative risk
assessment methods included H. Clewell (Crump Associates), and Drs. M. Andersen (EPA), and R.
Connolly (Chemical Industry Institute of Toxicology). Industrial producers and users were also
represented.
Discussion sections reviewed the wealth of data accumulated concerning TCE and its metabolites in
the seven years since EPA prepared its last cancer risk assessment. The goal was to discuss issues and
identify areas of agreement or disagreement to assist those with policy responsibilities in formulating their
action plan.
Recent negative epidemiological studies strongly buttressed the assumption at the meeting that TCE
has very weak, if any, activity in humans. One of the largest studies of workers at Hill AFB, UT, was
presented by Dr. R. Spirtas (National Institutes of Health) (Spirtas et al., 1991). It was agreed that animal
carcinogenicity for TCE and its two major metabolites to depend upon the species (rat, mouse). These
findings, together with metabolism, clearly distinguish TCE from a classic genotoxic carcinogen such as
vinyl chloride. The mode of action appears to be nongenotoxic tumor promotion, but activity of a minor
glutathione (GSH) metabolite associated with male rat kidney tumors remains to be determined.
The meeting concluded with a review of EPA's draft guidance for cancer risk assessment and its
application to TCE. This guidance uses a weight of evidence approach to incorporate the extensive
database for TCE into the risk assessment process, rather than using a single default approach based
19
solely upon animal bioassays. It is highly likely that in the near future EPA will reconsider the risk for TCE
using this guidance. Advice and assistance in carrying out this process will likely be provided by many of
those who attended the workshop, including representatives of AL/OET. This would begin a process that,
over the next few years, could affect site-specific risk assessments for TCE.
A TCE research exchange meeting was held on May 16, 1994, attended by researchers from the
THRU, AL/OET, Drs. R. Bull and D. Stevens (Washington State), L. Lash (Wayne State), and J. Parker.
Presentations and discussions were held concerning pharmacokinetics and pharmacodynamics in mouse
liver and kidney of TCE and its metabolites, particularly DCA.
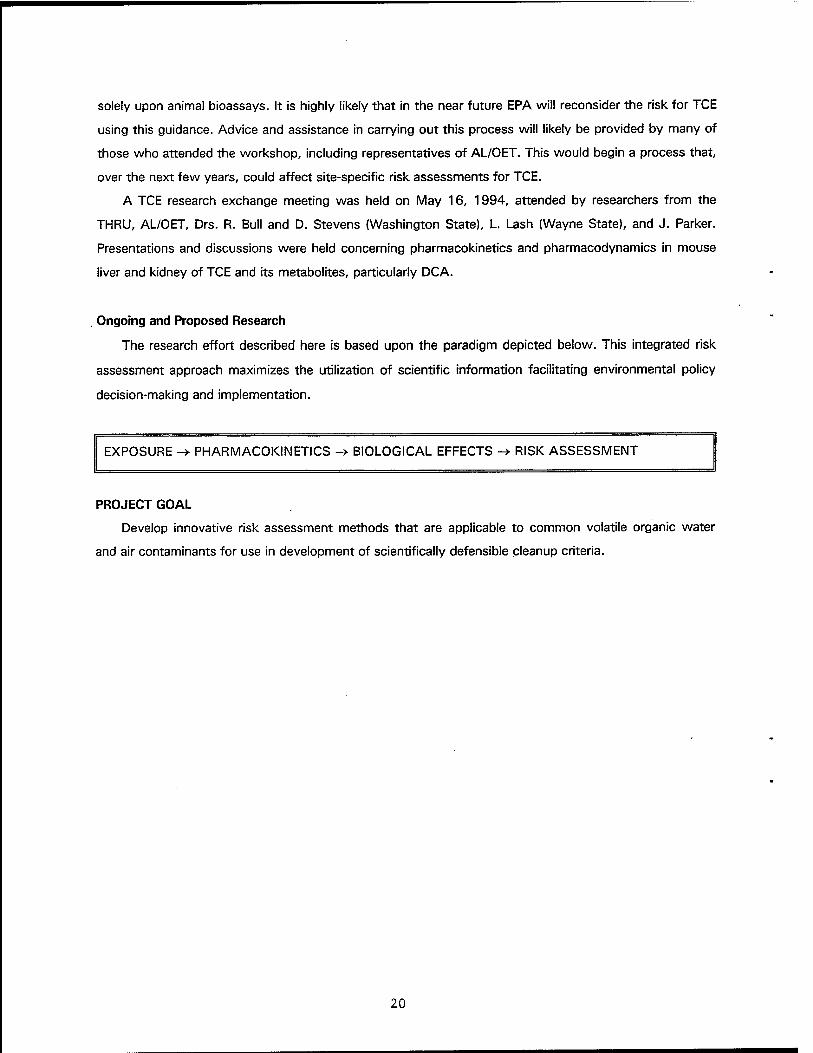
Ongoing and Proposed Research
The research effort described here is based upon the paradigm depicted below. This integrated risk
assessment approach maximizes the utilization of scientific information facilitating environmental policy
decision-making and implementation.
EXPOSURE -> PHARMACOKINETICS -> BIOLOGICAL EFFECTS -* RISK ASSESSMENT
PROJECT GOAL
Develop innovative risk assessment methods that are applicable to common volatile organic water
and air contaminants for use in development of scientifically defensible cleanup criteria.
20
SPECIFIC RESEARCH PLANS BY OBJECTIVES
OBJECTIVE 1: Evaluate new exposure assessment approaches to address the future use scenarios used to derive cleanup criteria.
1.1 Evaluate Utilization of Probability (Monte Carlo) Analysis for Future Use Exposure Scenarios for Volatile Organics in Water such as Drinking (Oral) or Showering (Inhalation)
Development of innovative dose-response assessments can alter exposure data needs. Traditional
approaches are designed to use exposure concentrations averaged over a day or a lifetime, but
biologically based dose-response modeling may address episodic and variable exposures.
Exposures to TCE are expected to occur predominantly through inhalation and oral pathways.
Consumption of water containing TCE is the major expected oral route although, generally, people have
been provided with other sources of potable water if TCE levels exceed the maximum contaminant level.
Swimming in surface water containing TCE could also result in some oral intake. Inhalation of ambient air
may result in exposure, but inhalation while showering may be more significant because TCE volatilizes
from hot water. Extensive experimental and modeling efforts have already been directed towards the
showering scenario for numerous chemicals (McKone, 1987).
Implementation of probability (Monte Carlo) analyses for describing exposure variations within a
population will be investigated. Emphasis will be given to future use scenarios, since it is these, rather
than the actual current use, that drive the development of cleanup criteria. At this time, actual current
exposure appears minimal with drinking water supplies treated to meet the current maximum contaminant
level of 5 ppb. Publication of the results in the peer-reviewed literature will provide supporting
documentation for application of the findings to DoD site-specific risk assessments.
OBJECTIVE 2: Improve DOSE estimation across species (mouse, rat and human) using PBPK modeling and supporting research.
2.1 Improve Quantitative Descriptions of the Metabolic Pathways and Uptake Mechanisms for TCE and its Metabolites in Mice, Rats, and Humans Using Appropriate In Vfvo and In Vitro Laboratory Studies
2.1.A. Analytical methods capable of measuring all metabolites in the presence of other metabolites in biological samples including liver and blood.
Methods are available for measuring TCE, trichloroethanol (TCOH), TCOH-glucuronide (TCOG), and
trichloroacetate (TCA) in blood and urine (Breimer et al., 1974). Currently analyses for TCE, TCOH, and
TCA are routinely used in AL/OET laboratories. We are also implementing methods for TCOG, chloral
hydrate (CH), and dichloroacetate (DCA).
21
Analytical difficulties are associated with CH and DCA in blood and liver. This is, in part, because
these chemicals are rapidly metabolized in those tissues subsequent to removal from the animal. Our
laboratory has shown that DCA also is metabolized in crude liver homogenate, and that the metabolism
can be quenched by the addition of acid. Efforts to quench the ex vivo metabolism of CH and DCA have
typically involved treatment with strong acid which may affect the concentration of other metabolites.
This is a topic of ongoing research. The interconversion of metabolites prior to or during quenching could
lead to erroneous data.
Dichloroacetate is of particular interest because it is a short-lived minor metabolite in liver, yet it is a
potent inducer of mouse liver tumors. Chloral hydrate is the product of TCE oxidation, however, it is so
rapidly metabolized that it is present at very low levels in liver and blood. It is an important metabolite to
model quantitatively, because it is feasible to expose humans to CH for purposes of obtaining
pharmacokinetic data (see 2.1 .c). This presents an invaluable opportunity to collect data that can be used
to validate models in humans and rats for the products of CH metabolism (see 2.1 .c).
Extensive analytical work at the Toxicology Division has resulted in a modified method for
measurement of the two strong acid metabolites, TCA and DCA (W. Brashear and M. Ketcha, personal
communication). This method uses derivitization to form a methyl ester followed by gas chromatography
with electron capture detection (GC/ECD). The limits of detection for this method are 0.5 mg/ml. It would
be ideal to have a much lower detection limit, but the current method seems to be a reasonable
compromise given the difficulty of working with this strong acid (pKa = 1.3).
2.1 .B. Metabolic pathways in mice.
Extensive research has identified metabolites of TCE (Bruckner et al, 1989). Chloral hydrate is the
initial product of TCE oxidation by cytochrome P450, but it is highly unstable. Major metabolites include
TCOH, TCOG and TCA. A minor product is DCA. Several other minor metabolites have been identified
arising from conjugation of glutathione to TCE and additional metabolism of all the metabolites. Of these
chemicals, TCE, CH, TCA, and DCA have all been shown to cause liver tumors in mice. Some of the GSH
derivatives have been shown to be mutagenic raising concerns about their potential for toxicity. Studies
for this task are designed to fill gaps in the existing literature and ongoing research in other laboratories.
Ongoing research has been focussing on the metabolism of TCE measured with subcellular fractions
to obtain estimates of enzymatic rates. This work wiil be extended to measure rates of TCE
disappearance in liver slices, a more complete in vitro system. The data from these studies will be critical
for implementing PBPK modeling using both in vivo and in vitro studies for comparisons across species
(see section 2.1 .c).
The metabolism in liver and kidney of other metabolites is under investigation. The disposition in
several in vitro systems will be evaluated. These systems include liver slices, isolated hepatocytes, and
subcellular fractions (microsomes and cytosol). Isolated hepatocytes of rat and mouse are routinely
22
produced in AL/OET laboratories and liver slice methodology has been implemented. With this method,
liver architecture, the proportion of cell types, cell-to-cell communication, and cell membrane transport
processes are maintained, and normal cellular metabolism remains largely intact. Subcellular fractionation
is a widely used technique in several of the participating laboratories.
The metabolism of DCA by subcellular fractions from livers of mice, rats, and humans is being
determined. This work is intended to (1) help determine if the lack of DCA formation from TCE and CH in
vitro is due to rapid degradation and (2) specify the appropriate structure for PBPK modeling. It has been
speculated in the literature that the metabolism of DCA required cytochromes P450 and involved
reductive dehalogenation. Using supernatant from a 9000 x g spin (S9), it was found that P450
inhibitors did not decrease DCA degradation (W. Brashear and M. Ketcha, personal communication).
Further studies using subcellular fractions showed that DCA was degraded by cytosol with little or no
activity in microsomes or mitochondria (J. Lipscomb and D. Mahle, personal communication). DCA
degradation occurred in cytosols from several tissues; activity from highest to lowest was found in liver
> lung > intestine > > kidney = muscle.
As required for the development of PBPK modeling, additional metabolism work is expected to
analyze CH, TCOH, TCOG, and GSH conjugates. The GSH conjugates are formed in the liver and other
tissues but undergo unique metabolic pathways in the kidneys. The studies described are critical for
providing information that will be used subsequently for linking the PBPK models for each metabolite.
2.1.C. Species comparisons.
Quantitative risk assessment for TCE may be done using epidemiological studies or positive findings
from the laboratory rodent bioassays. In the latter case, extrapolation across species is required. It will be
addressed in several parts because TCE-induced tumors are dependent upon exposure route and exposed
species. Research efforts will focus on appropriate species, tissues, and metabolic steps. For instance,
liver tumors in mice are clearly associated with CH, TCA, and DCA; no liver tumors were seen in rats. On
the other hand, kidney tumors in rats may be associated with the GSH pathway, but no kidney tumors
were seen in mice.
These differences in tumor response may be due to species-specific metabolism, other
pharmacokinetic factors, or the subsequent toxicity process (pharmacodynamics). Comparative
metabolism studies will begin to address this issue and help determine how to appropriately develop a
biologically based dose-response model.
Each of the steps discussed above for metabolism in mouse will then be compared with metabolism
in rats and humans. Ongoing studies with liver slices from human tissues are determining the kinetics of
DCA metabolism. Subsequent studies will be required for metabolism of the parent TCE and each
metabolite. These studies are critical to providing estimates for PBPK modeling of humans and for
improving methodologies for cross species extrapolation. Results will be published in the peer-reviewed
23

literature to provide appropriate documentation for utilization in risk assessments by EPA and state
agencies.
2.2 Expand PBPK Modeling Beyond its Current Strength with Volatile Organics, to Better Address Water Soluble Compounds, Such as Metabolites of TCE, that are Toxicologically Relevant
2.2.A. Develop model for trichloroethanol and chloral hydrate.
Chloral hydrate (also known as trichloroacetaldehyde) and TCOH represent chemicals with properties
intermediate between the volatile hydrophobic compounds (e.g., TCE) and water soluble nonvolatiles
(e.g., TCA and DCA). Both are fairly water soluble, but also volatile. Chloral hydrate is used medicinally
and is the subject of research and modeling in humans (Strategic Environmental Research and
Development Program — EPA). Limited pharmacokinetic studies with both chemicals in mice will need to
be supplemented. More extensive studies are available in the literature using other species. Critical issues
for modeling will include partitioning into tissue, metabolism (see 2.1), and enterohepatic recirculation.
Protocols have been approved for carrying out studies including partition coefficient determination and i.v.
dosing pharmacokinetics. Determination of CH and TCOH partition coefficients using an in vitro method
for nonvolatile compounds has recently been completed (J. Creech, B. Garrity, and C. Seckel, personal
communication).
2.2.B. Develop models for chloroacetic acids.
Two chloroacetic acids, DCA and TCA, are metabolites of TCE. Both are fully charged at
physiological pH and, therefore, are water soluble nonvolatiles. Each chemical induces tumors in the livers
of mice. Both chemicals are the subject of extensive biological research funded by EPA and the American
Water Works Research Foundation. Therefore, these chemicals are excellent choices for extending PBPK
modeling beyond its common use for volatile organic. Pharmacokinetic studies in mice and in vitro
experiments to estimate model parameters will support model development. Critical issues will be cellular
uptake, metabolism (see 2.1), binding to serum proteins, and excretion. Protocols have been approved for
carrying out studies including partition coefficient determination and i.v. dosing pharmacokinetics. Initial
studies of the distribution of DCA and TCA between red blood cells and serum, and binding to serum
proteins have been carried out and additional work will continue as required (S. Neurath and H. Barton,
personal communication).
24
2.3 Evaluate the Pharmacokinetic Competency of Carcinogenic Metabolites of TCE to Account for the Cancer Induced by the Parent Compound
2.3 A. Link 1he models for TCE and its metabolites.
TCE toxicity, particularly its carcinogenicity, arises from its metabolites. Thus, linking the PBPK
models for the individual metabolites to each other and parent TCE is a critical step. In at least one case
metabolism gives rise to two compounds, CH goes to TCOH and TCA. Correctly modeling this split will
be dependent upon in vitro data (see 2.1), particularly for developing human models. Detailed
experimental approaches will be designed once modeling of the metabolites has significantly advanced.
An extensive initial draft of a model linking PBPK models for TCE and its metabolites with
pharmcodynamic and statistical models has been prepared (J. Byczkowski, personal communication).
This model has been fit to selected data sets for TCE, CH, TCA, and DCA. The model helps to
demonstrate the complexity of this task, the strengths and weaknesses of the available data for
estimating paramater values, and the need for additional modeling of individual metabolites and
pharmacodynamic processes.
2.3.B. Evaluate existing TCA and DCA cancer studies.
Once models for the metabolites and TCE in mice have been linked, it will be possible to address the
critical question of accounting for the carcinogencity of TCE based upon one or both of these two
metabolites. This information will be obtained by modeling existing chronic bioassays in which mice were
exposed to TCA or DCA in drinking water.
OBJECTIVE 3: Improve RESPONSE comparisons across species using alternative modeling approaches and supporting research.
3.1 Evaluate the Correlation of Biomarkers of the Cancer Process with Production of Radicals During TCE Metabolism
Few studies have addressed the mechanisms by which TCE produces tumors in the livers of B6C3F1
mice, although it has been suggested that TCE acts as a tumor promoter. Neither TCE nor its metabolites,
TCA and DCA, are mutagenic in standard assays (Greim et al., 1975; Waskell, 1978). Neither direct TCE-
DNA adduction nor indirect effects, such as strand breaks, have been consistently observed in mice
(Bergman, 1983; Nelson and Bull, 1988). Indirect effects clearly do not occur in rats (Chang et al.,
1992).
The literature consensus suggests that DNA's effect, if a necessary step in the tumor-forming
process, may be a consequence of lipid peroxidation by TCA and/or DCA (Bull et al., 1990; Larson and
Bull, 1992a; Larson and Bull, 1992b). Generation of chemical free radical species, particularly carbon
centered free radicals, may give rise to the histopathology observed with TCA or DCA exposure and is
25
consistent with other reports linking lipid peroxidation and tumorigenicity. Preliminary work at AL/OET
has demonstrated that TCE exposure to B6C3F1 mouse liver explants does produce radical species.
Recent studies of the mechanism of carcinogenesis have focussed on the central role of cell
proliferation in chemically induced tumors. Selected cell populations must increase in number beyond
normal growth constraints to produce tumors. Moolgavkar (1990) and others have proposed a two-stage
model incorporating cell proliferation rates and programmed cell death (apoptosis) for predicting risk of
cancer. TCE has been shown to increase cell proliferation and/or DNA synthesis (Elcombe et al., 1985).
DCA has been shown to produce a rapid increase in DNA synthesis which shows a dose-response
relationship (Sanchez and Bull, 1990). Other researchers have reported cellular proliferation activity to be
confined to putative preneoplastic lesions (DeAngelo et al., 1993). DCA produces marked cytomegaly
and subsequent focal necrosis. In contrast, TCA treatment produces a uniform distribution of labeled
cells, which was identical to control animals. Even at the high dose, necrotic areas were of such low
frequency (2/20 sections) that is was impossible to determine if they were treatment-related. Although
cytomegaly was observed, it was mild compared to that of DCA.
The effects of both compounds at Day 5 and TCA at Day 14 did not correlate with replicative DNA
synthesis. Increased repair synthesis is one possible explanation of this phenomena; i.e., cells were not
dividing, rather, they were repairing DNA. This would be consistent with results from this laboratory
showing a prolonged G2M cell cycle phase, the period for DNA repair activity, in a rat hepatocyte cell line
treated with TCA (Channel and Hancock, 1992).
Work by Phelps and Pereira (1993) suggests that precancerous (initiated) cells may remain sensitive
to TCA or DCA for a longer period than uninitiated cells, which could result in their clonal expansion. This
is a sort of "promotion" effect which has been demonstrated for TCA, although it is much weaker than
that of a classical promoter such as phenobarbital (Pamell et al., 1986). This effect may be due to the
production of radical species, which have been linked to tumor promotion (Kensler and Trush, 1984).
TCA and DCA act to produce tumors through processes that appear to be compound specific.
Although cell proliferation must be a common event for both, the magnitude and time course differences
cited previously suggest that other factors, such as their generation and subsequent metabolism (see
2.1), must be accounted for in order to produce a complete mechanistic explanation of the tumorigenicity
of the parent compound.
Several studies are proposed for completion of this task. These will determine if radicals produced
during TCE metabolism correlate with DNA damage, lipid peroxidation, or cell proliferation. Such effects
may be biomarkers of the tumor development process that could then be incorporated in biologically
based dose-response modeling. Studies of biomarkers will also provide support for the involvement of
TCA, DCA, or both, in the induction of tumors by TCE.
26
3.1 .A. Correlation study: in vivo. 60-day TCE exposure(s) in B6C3F1 male mice.
This project will determine correlations among radical formation, DNA oxidant damage, lipid
peroxidation, and cell proliferation in liver. Because the definitive tumor chronic bioassay in the B6C3F1
mouse was performed using TCE in corn oil gavage, that exposure route will be employed here, initially.
The exposure period of 60 days was selected as the optimum for observing both lipid peroxidation and
cell proliferation changes.
DNA oxidant damage, as measured by 8-hydroxy-deoxyguanosine, will be quantitated in isolated
nuclei to minimize interference from non-nuclear DNA. Lipid peroxidation will be measured by analysis of
thiobarbituric acid reactive substance assay. Tissue sections will be assessed for cell proliferation by
immunohistochemistry and/or in situ hybridization staining. Each endpoint will be evaluated for time
course and dose-response. Correlations between each endpoint will be evaluated to establish the linkage
among these mechanistic endpoints. Comparisons of this data with published accounts of TCA or DCA
treatment effects may establish one of these metabolites as a predominant influence in TCE toxicity.
The gavage dosing for the 60-day study was completed. Male B6C3F1 mice were exposed to 400,
800, or 1200 mg/kg/day TCE in corn oil, corn oil alone (vehicle control), or no exposure (controls).
Animals were euthanized at multiple time points ranging from 0 to 56 days. Shortly before sacrifice
animals were injected i.p. with spin trap to capture radicals present. Livers were removed from animals
for use in analyzing several different endpoints described above. These analyses are currently ongoing (S.
Channel, K. Geiss, J. Kidney, J. Latendresse, and G. Randall, personal communication).
Chemical absorption, distribution, and elimination can vary depending on the route by which it
enters the body. Thus, the route of exposure may play a significant role in both the character and
quantity(s) of metabolites produced from a given dose of TCE (see 2.3). Consequently, this study may be
repeated using other exposure routes such as inhalation, drinking water suspension, or non-corn oil
vehicle (e.g., Emulphor) gavage. These studies would determine to what extent the linked mechanistic
scheme is influenced by route of entry (metabolism) considerations.
3.2 Develop Conceptual Frameworks for BBDR Modeling to Integrate Pharmacokinetics (Exposure, Dose, Tissue-Dose) with Markers of Early and Late Biological Responses
3.2.A. Evaluate use of the benchmark dose approach for BBDR modeling of tumor promoters.
Current EPA risk assessments for the cancer endpoint have assumed the chemical could be
genotoxic (i.e., DNA damaging) and a nonthreshold low dose extrapolation was appropriate. Current
scientific literature clearly demonstrates that many chemicals act as tumor promoters rather than
genotoxic initiators. Several possible approaches for risk assessment of tumor promotors are currently
under consideration by EPA and others. These include clonal growth models (e.g., Moolgavkar-Venzon-
27
Knudsen model) and de novo biological effects models, such as that proposed for dioxin. Another
approach would be to utilize the benchmark dose method.
The applicability of the benchmark dose method for tumor promotion will be evaluated. Issues of the
appropriateness of this method for this endpoint, implications of background exposures to other
genotoxic and nongenotoxic chemicals, and applicability to different classes of promoters will be
considered. After consideration of the general applicability of the method, TCE will be used as a case
study to evaluate the strength of the evidence that it acts as a promoter and application of the
benchmark dose method. Comparisons to other methods will also be made, particularly the default
linearized multistage model.
Initial work has focused upon the application of the benchmark dose to noncancer effects because
this is the area to which it is most frequently applied (S. Das and H. Barton, personal communication). A
review of the literature on noncarcinogenic effects of TCE identified liver alterations as the most widely
reported and best documented toxic endpoint at lower concentrations. TCE is, by and large not toxic to
male or female reproductive systems or to developing fetuses. However, limited recent data suggest it
may increase the incidence of cardiac malformations. Comparison of the results of application of the
benchmark dose method and the traditional no-observed-adverse-effect-level method is underway.
3.2.B. Evaluate the use of biomarkers in modeling correlations of TCE metabolism and biological effects.
Another aspect of the proposed modeling will be to explicitly extend the PBPK models into
pharmacodynamic modeling of lipid peroxidation, a potential causitive factor in cell damage and tumor
promotion by TCE. B6C3F1 mice will be exposed to various concentrations of TCE by inhalation in a
controlled atmosphere chamber. Ethane is produced in the mouse as a consequence of lipid peroxidation,
and thus may serve as a non-invasive indicator for the formation of radicals during metabolism. Animals
will be removed at time points, and tissues (blood, liver) will be analyzed for each metabolite, CH, TCA,
DCA, and TCOH, as well as residual TCE. In addition, thiobarbituric acid reactive substances (TBARS, see
3.1 .a) will be measured. Metabolism rate estimates will then be correlated to the ethane and TBARS data
to refine the model. The mathematical description of the linked metabolism and lipid peroxidation will be
validated by reconciling model predictions with actual laboratory sample data.
28
OBJECTIVE 4: Propose new risk characterization strategies for utilization in development of cleanup criteria.
4.1 Evaluate the Implications of Alternate Dose-Response Modeling Methods for Acceptable Risk Levels
4.1 .A. Evaluate the implications of species- and tissue-specific tumors for risk assessment.
TCE, like many other chemicals that are not genotoxic initiators, causes tumors in different tissues in
each species. The finding of tumors in multiple tissues and species is a criteria that EPA uses for
indicating that the chemical is more likely to cause cancer in humans. This interpretation was based upon
experience with genotoxic initiators, which frequently induced DNA damage in many species and often in
more than one tissue. However, in the absence of data supporting genotoxicity, the finding of tissue and
species specificity of tumors should be evaluated differently.
This task will involve reviewing the literature and defining general guidelines for evaluating tissue and
species specificity of tumors. TCE will be used as a key case study, but other volatile organics may
provide additional case studies. Publication in the peer-reviewed literature will raise this issue in the risk
assessment community and provide supporting documentation for EPA to reevaluate this issue under its
new cancer risk assessment guidelines.
4.1 .B. Evaluate the implications of alternate dose-response models for acceptable risk levels.
Acceptable exposure levels are determined by a range of scientific and policy factors, including legal
language. In particular, they are dependent upon the methods used for exposure and dose-response
assessment. As newer risk assessment approaches are implemented it is necessary to revisit the question
of what the acceptable risk level should be.
The traditional methods for developing criteria for chemicals assume that there is a threshold or level
below which no significant effects are expected. This was formalized as the Hazard Index or Margin of
Safety approachs. These define methods for developing and applying chemical specific criteria. The
assumption of a threshold was not considered valid for genotoxic carcinogens by analogy with the
effects of radiation. This led to the common application of the linearized multistage model for estimating
cancer risks for individuals and populations. In this context, the concept of de minimus risk levels
developed at which there is some risk, albeit acceptably small.
Determining the level of acceptable risk has come to be called "risk management" and involves many
factors, such as economics, technical feasibility, and site-specific characteristics, that are outside the
scope of this project. This task will prepare a draft DoD position paper describing the implications of
current scientific knowledge and risk assessment methods in the setting of acceptable risk levels. This
document is anticipated to be applicable to a range of chemicals, in addition to TCE.
29

4.2 Recommend Provisional Remediation Goals for TCE to DoD and Draft Suggestions to EPA for TCE Risk Assesment under New EPA Guidelines
Development of cleanup criteria uses standard risk assessment procedures. To estimate risk, the
chemical concentration must be estimated, and then used with the products of the exposure and
dose-response assessments as shown here.
Fate and Exposure Dose-Response Risk Transport Assessment Assessment Characterization
Chemical Exposure Toxicity Value Risk Concentration Pathway
in Media
To estimate cleanup criteria the equation is reversed:
CC = R / (E x T)
This requires defining an acceptable risk level (see 4.1), defining potential future site use and
exposure scenarios (see 1.1), and deriving dose-response criteria (see 2 & 3). All of these combine
science and policy, though the first two are particularly dependent upon policy decisions. Cleanup criteria
or provisional remediation guidance will be proposed for TCE in water and air, based upon selected
exposure scenarios (see 1.1) and dose-response criteria (see 2 & 3). In addition, comments will be
provided to the EPA concerning risk assessment for TCE under their new cancer risk assessment
guidance.
REFERENCES
Bergman, K. 1983. Interactions of trichloroethylene with DNA in vitro and with RNA and DNA of various mouse tissues in vivo. Arch. Toxicol. 54:181 -193.
Bruckner, J.V., B.D. Davis, and J.N. Blancato. 1989. Metabolism, toxicity, and carcinogenicity of trichloroethylene. Crit. Rev. Toxicol. 20:31-50.
Breimer, D.D., C.J. Ketelaars, and J.M. van Rossum. 1974. Gas Chromatographie determination of chloral hydrate, trichloroethanol, and trichloroacetic acid in blood and in urine employing head-space analysis. J Chromatog 88:55-63.
Bull, R.J., I.M. Sanchez, M.A. Nelson, J.L. Larson, and A.J. Lansing. 1990. Liver tumor induction in B6C3F1 mice by dichloroacetate and trichloroacetate. Toxicology 63:341 -359.
Chang, L.W., F.B. Daniel, and A.B. DeAngelo. 1992. Analysis of DNA strand breaks induced in rodent liver in vivo, hepatocytes in primary culture, and a human cell line by chlorinated acetic acids and chlorinated acetaldehydes. Environ. Mol. Mutagen. 20:277-288.
Channel, S.R. and B.L. Hancock. 1992. Cell cycle and growth effects of trichloroacetic acid in WB344 cells. In Vitro Toxicol. 5(4):241-250.
30
DeAngelo, A.B., F.B. Daniel, J.A. Stober, and G.R. Olson. 1991. The carcinogenicity of dichloroacetic acid in the male B6C3F1 mouse. Fundam. Appl. Toxicol. 16:337-347.
Elcombe, C.R., M.S. Rose, and I.S. Pratt. 1985. Biochemical, histological and ultrastructural changes in rat and mouse liver following the administration of trichloroethylene: Possible relevance to species differences in hepatocarcinogenicity. Toxicol. Appl. Pharmacol. 79:365-376.
Greim, H., G. Bonse, Z. Radwas, D. Reichert, and D. Henschler. 1975. Mutagenicity in vitro and potential carcinogenicity of chlorinated ethylenes as a function of metabolic oxirane formation. Biochem. Pharmacol. 24:2013-2017.
Kensler, T.W. and M.A. Trush. 1984. Role of oxygen radicals in tumor promotion. Environ. Mutagen. 6:593-616.
Larson, J.L. and R.J. Bull. 1992a. Metabolism and lipoperoxidative activity of trichloroacetate and dichloroacetate in rats and mice. Toxicol. Appl. Pharmacol. 115:268-277.
Larson, J.L. and R.J. Bull. 1992b. Species differences in the metabolism of trichloroethylene to the carcinogenic metabolites trichloroacetate and dichloroacetate. Toxicol. Appl. Pharmacol. 115:278-285.
McKone, T.E. 1987. Human exposure to volatile organic compounds in household tap water: The indoor inhalation pathway. Environ. Sei. Techol. 2"\:\ 194-1201.
Moolgavkar, S.H., ed. 1990. Two mutation models for carcinogenesis: Relative roles of sometic mutations and cell proliferation in determining risk. Scientific Issues in Quantitative Cancer Risk Assessment (Birkhauser, Boston, pp.136-152).
Nelson, M.A. and R.J. Bull. 1988. Induction of strand breaks in DNA by trichloroethylene and metabolites in rat and mouse liver in vivo. Toxicol. Appl. Pharmacol. 94:45-54.
Parnell, M.J., L.D. Koller, J.H. Exon, and Ü.M. Arnzen. 1986. Trichloroacetic acid effects on rat liver peroxisomes and enzyme-altered foci. Environ. Health Perspect. 69:73-79.
Phelps, B. and M.A. Pereira. 1993. Effect of dichloroacetic acid and trichloroacetic acid on cell proliferation in liver and precancerous lesions of B6C3F1 mice. Poster, Annual Toxicology Conference, Wright-Patterson AFB, OH.
Sanchez, I.M. and R.J. Bull. 1990. Early induction of reparative hyperplasia in the liver of B6C3F1 mice treated with dichloroacetate and trichloroacetate. Toxicology 64:33-46.
Spirtas, R., P.A. Stewart, J.S. Lee, D.E. Marano, CD. Forbes, D.J. Grauman, H.M. Pettigrew, A. Blair, R.H.Hoover, and J.L. Cohen. 1991. Retrospective cohort mortality study of workers at an aircraft maintenance facility. I. Epidemiological results. Brit. J. Ind. Med. 48:515-530.
Waskell, L. 1978. A study of the mutagenicity of anaesthetics and their metabolites. Mutat. Res. 57:141-153.
31
3.3 APPLICATION OF PHYSIOLOGICALLY BASED PHARMACOKINETIC MODEL TO CANCER RISK ASSESSMENT FOR BREAST-FED INFANTS
J.Z. Byczkowski and J.W. Fisher1
ABSTRACT
The risk assessment process predicts the chances of adverse health effects that the toxicant possibly
can do to the target organism under expected conditions of exposure. Regulators chose among several
mathematical approaches to estimate the risk, but in each case it was necessary to link the dosemetrics
of the toxicant with its predicted health effect. In this paper, a computer program is described that allows
us to link a physiologically based pharmacokinetic (PBPK) model for tetrachloroethylene (PCE) in the
lactating mother with the estimate of extra cancer risk for breast-fed infants, according to the U.S.
Environmental Protection Agency (EPA) methodology. When inhaled by a lactating woman, PCE may
partition into breast milk and may be transferred to the breast-fed infant. We have developed and
experimentally validated a PBPK model for lactational transfer of PCE in rats, including a quantitative
description of a milk compartment and the nursing pup. Subsequently, the model has been scaled to
describe human physiology, and was validated with literature data for human cases of PCE exposure.
Finally, we linked the dosage predictions of the PBPK model with equations used by EPA to estimate the
cancer risk from PCE. The model predictions are in good agreement with both the measured values and
those reported in the literature for exposure to PCE. This comparison confirms the usefulness of PBPK
modeling in risk assessments.
INTRODUCTION
Toxicological research has been carried out traditionally through animal experiments and experimental
data interpretation. Results of laboratory experimentation are used to quantify the toxicity by relating
effects to the dose level. Toxicokinetic studies are used to determine the behavior of toxicant in
organisms, and thus, what dose level of a toxicant may be expected in the organism and how it is
distributed among the tissue compartments. The risk assessment process is used to predict the adverse
health effects that the toxicant possibly can bring about to the human organism, usually at dose levels
below the experimentally observable range. To perform risk assessment, it is necessary to determine the
exposure of a particular human population to the toxicant. This determination may be especially difficult
in the case of risk assessment of infants. Regulators have chosen several mathematical approaches to
estimate risk, but in each case it is necessary to link the dosemetrics of the toxicant with its predicted
health effect. Physiologically based pharmacokinetic (PBPK) models have proven particularly useful,
1 Armstrong Laboratory, Toxicology Division, Wright-Patterson Air Force Base, OH.
32

through computer simulations, in defining the dosemetrics and in mathematical description of
toxicokinetics.
In this paper, a computer program is described that allowed us to link a PBPK model for
tetrachloroethylene (PCE) in the lactating mother with a theoretical estimate of extra cancer risk for
breast-fed infants, according to the U.S. Environmental Protection Agency (EPA, 1989) methodology.
The chlorinated hydrocarbon, PCE, is a volatile organic solvent extensively used for dry-cleaning and
degreasing. The agent has exhibited carcinogenic effects in experimental animals (ACGIH, 1993) and
some U.S. agencies are considering its possible carcinogenic potential for humans (CDHS, 1991).
MA TERIALS AND METHODS
Hardware and Software Specifications
A PBPK model was written in Advanced Continuous Simulation Language (ACSL), a FORTRAN-
based language (Mitchell and Gauthier Assoc, 1987), and simulations were performed using SIMUSOLV
software with optimization capabilities (DOW Chemical Co., Midland, Ml; Steiner et al., 1990) on a
VAX/VMS mainframe computer (VAX8530, Digital Equipment Corp., Maynard, MA).
Computational Methods and Theory
Toxicokinetics is the branch of toxicology that deals with movements and changes of toxicant in the
organism, and thus can be used to describe the dose level of a toxicant expected in the organism and
how it is distributed among the tissue compartments. There are significant differences between the
classical pharmacokinetic approach of linear compartmental models and computer-assisted PBPK
modeling.
In classical toxicokinetics, the concentration of a toxicant in a one-compartment system is calculated
in the following way (Figure 3.3-1): the change in the amount of toxicant (dA) over time interval (dt) is
proportional to the amount present in the compartment (A). Therefore, if the volume of distribution (V)
stays constant, the concentration (C) is described by a similar relationship as the amount (Figure 3.3-1).
Integrating this simple proportionality equation, one may calculate the concentration of toxicant at a given
time. The constant of proportionality (k), usually referred to as the elimination rate constant, is inversely
related to the half-life (t1/2; Figure 3.3-1).
33
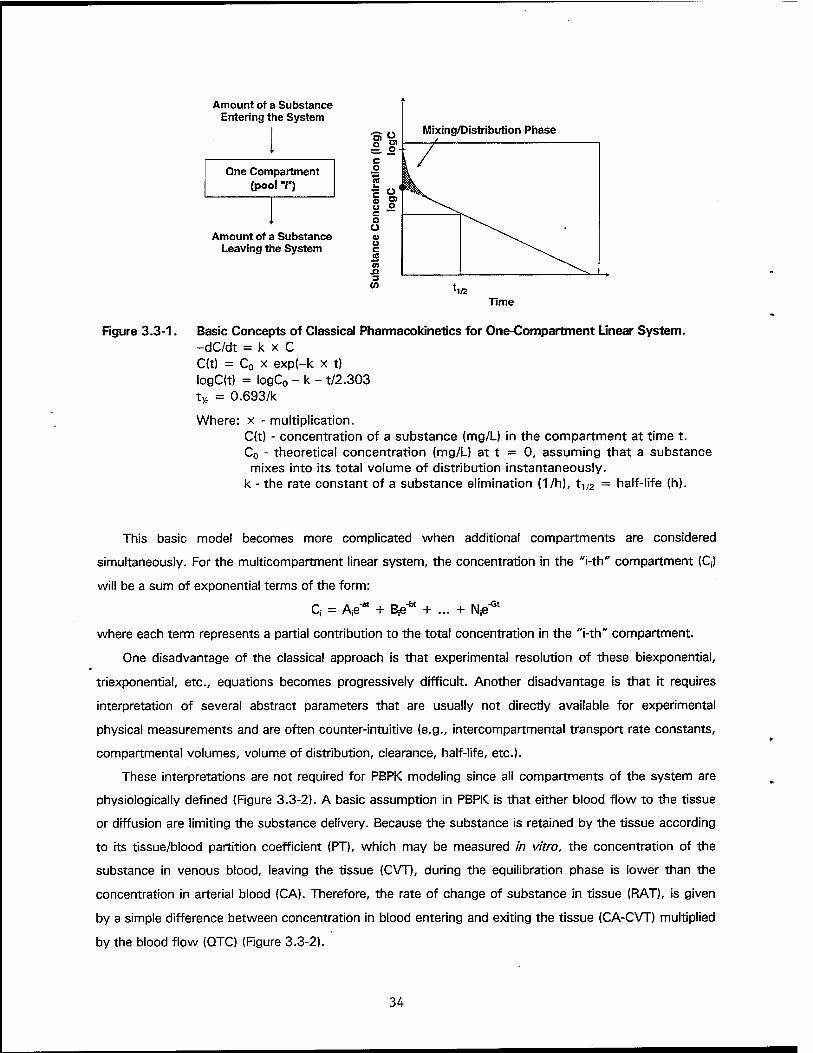
Amount of a Substance Entering the System
One Compartment (pool V)
Amount of a Substance Leaving the System
Time
Figure 3.3-1. Basic Concepts of Classical Pharmacokinetics for One-Compartment Linear System. -dC/dt = k x C C(t) = C0 x exp(-k x t) logC(t) = logCo - k - t/2.303 t* = 0.693/k
Where: x - multiplication. C(t) - concentration of a substance (mg/L) in the compartment at time t. C0 - theoretical concentration (mg/L) at t = 0, assuming that a substance mixes into its total volume of distribution instantaneously,
k - the rate constant of a substance elimination (1/h), t-,/2 = half-life (h).
This basic model becomes more complicated when additional compartments are considered
simultaneously. For the multicompartment linear system, the concentration in the "i-th" compartment (Q)
will be a sum of exponential terms of the form:
Q = Ap* + Bß** + ... + NieGt
where each term represents a partial contribution to the total concentration in the "i-th" compartment.
One disadvantage of the classical approach is that experimental resolution of these biexponential,
triexponential, etc., equations becomes progressively difficult. Another disadvantage is that it requires
interpretation of several abstract parameters that are usually not directly available for experimental
physical measurements and are often counter-intuitive (e.g., intercompartmental transport rate constants,
compartmental volumes, volume of distribution, clearance, half-life, etc.).
These interpretations are not required for PBPK modeling since all compartments of the system are
physiologically defined (Figure 3.3-2). A basic assumption in PBPK is that either blood flow to the tissue
or diffusion are limiting the substance delivery. Because the substance is retained by the tissue according
to its tissue/blood partition coefficient (PT), which may be measured in vitro, the concentration of the
substance in venous blood, leaving the tissue (CVT), during the equilibration phase is lower than the
concentration in arterial blood (CA). Therefore, the rate of change of substance in tissue (RAT), is given
by a simple difference between concentration in blood entering and exiting the tissue (CA-CVT) multiplied
by the blood flow (QTC) (Figure 3.3-2).
34

CA CT
Tissue Compartment
PT
CVT
QTC
Arterial Blood
Venous Blood
Figure 3.3-2. Basic Concepts of Physiologically Based Pharmacokinetic (PBPK) Modeling. RAT = QTC x (CA - CVT) AT = JV RAT dt CVT = AT/(VTC x PT) CT = AT/VTC
Where: x - multiplication. RAT - rate of change of amount in tissue (mg/h). QTC - fractional blood flow to tissue (L/h). CA - concentration in arterial blood (mg/L). CVT - concentration in blood leaving tissue (mg/L). AT - amount in tissue (mg). VTC - volume of tissue (L). PT - partition coefficient tissue/blood (ratio). CT - concentration in tissue (mg/L).
By integrating this equation over a given time, one can calculate the amount of substance present in
tissue (AT) and, therefore, if the actual volume of tissue (VTC) is known, one can calculate the
concentration of substance in the tissue (CT) at any time (Figure 3.3-2).
Multicompartmental PBPK models are built by interlinking several tissue compartments with arterial
blood flow as an input and venous blood as an output (Ramsey and Andersen, 1984). The difference
between classical and PBPK modeling approaches becomes apparent in the multicompartmental systems.
PBPK models use experimentally verifiable physiological values for ventilation rate and blood flows to the
organs and the physicochemical affinity (solubility) of the toxicant to particular bodily fluid or tissue. The
solubility of a chemical in a tissue may be experimentally measured at steady state by its distribution
(partitioning), for instance, between blood and air, liver and blood, milk and blood, and so on, and is
called a partition coefficient. Metabolism of the substance can be measured and expressed in a way
analogous to the Michaelis-Menten description of enzymatic activity. In addition, PBPK models employ
35

physically real volumes of organs, expressed as fractions of the body weight, that may be allometrically
scaled up or scaled down, according to the size of the individual.
Thus, PBPK models require experimental determination of basic physiological parameters: blood
flows, ventilation rates, organ volumes; physicochemical parameters: blood/air, and tissue/blood partition
coefficients (Gargas et al., 1989); and biochemical parameters: apparent Michaelis-Menten constant of
substance metabolism, pseudo-maximal velocity or first-order metabolism rate for its biotransformation
(Gargas et al., 1986).
PBPK models are useful for mathematical description of pharmacokinetics and determination of
biologically active doses in tissues which may be used for risk assessment. It is also possible, using PBPK
models, to extrapolate between high and low concentrations, high and low body weight, and between
different species.
Figure 3.3-3 depicts the concept of the relationship between cancer risk and a dose of toxicant
(Figure 3.3-3a) along with the problems in extrapolation from high to low dose (Figure 3.3-3b). Usually,
experiments on animals provide some data for carcinogenic effects of high, and occasionally, of moderate
doses of toxicants. Unfortunately, there is usually no experimental confirmation of the dose-effect
relationship for low doses of toxicant relevant to human exposure (Figure 3.3-3a). Simply, it is impossible
to measure the effect in animals exposed to very low doses. What usually can be done in this situation is
to extrapolate cancer risk from high to low exposure doses (Figure 3.3-3b). However, there is no
universal consensus as to how to extrapolate the extra cancer risk from high to low exposure doses and
different regulatory agencies use different approaches and recommend different algorithms. None of the
methods used to date has been demonstrated to be scientifically and mechanistically accurate.
36

en
0) o c CO o
For High Doses Cancer Risk = 100%
Some Data Exist for Moderate Doses
No Data for Low Doses
Absorbed Dose
CO
0) U c CG C
Linearized Multistage Model
9 a
SF -Upper 95th Percent Confidence Limit of th
Low Absorbed Dose
Figure 3.3-3. (a) Relationship between Cancer Risk and Absorbed Dose of Toxicant, (b) Problems with Cancer Risk Extrapolation from High to Low Exposure Doses.
In this program we followed the EPA methodology linking the low dose exposure to PCE with extra
cancer risk by a slope factor (SF), calculated as an upper 95th percent confidence limit according to the
linearized multistage model (Figure 3.3-b). The equation linking extra cancer risk (ECRI or TCRI) with a
daily absorbed dose of PCE (IDM or TOTINF) is calculated simply by the product of slope factor (SF
calculated for oral exposure to PCE (CDHS, 1991), dose and years of exposure, divided by expected life
span of theinfant (assumed to be 70 years):
ECRI = SF x IDM x Y/70 and TCRI = SF x TOTINF x Y/70
where: x is multiplication, SF is the upper 95th percent confidence limit of the slope of the dose-
response curve, expressed as (mg/kg/day)-1, and Y represents years of exposure (EPA, 1989).
RESULTS
Program Description
Figure 3.3-4 shows a block scheme of the compartments of the PBPK model developed for
lactational transfer of PCE. Initially, the model was built and then experimentally validated in nursing
female rats and rat pups exposed to PCE via mother's milk. The physiological parameters were either
measured experimentally in rats in our laboratory, or were taken from the literature (Byczkowski et al.,
1994a,b,c). Once the model was satisfactorily calibrated in rats, we scaled it up to reflect human
physiology (Byczkowski and Fisher, 1994).
37
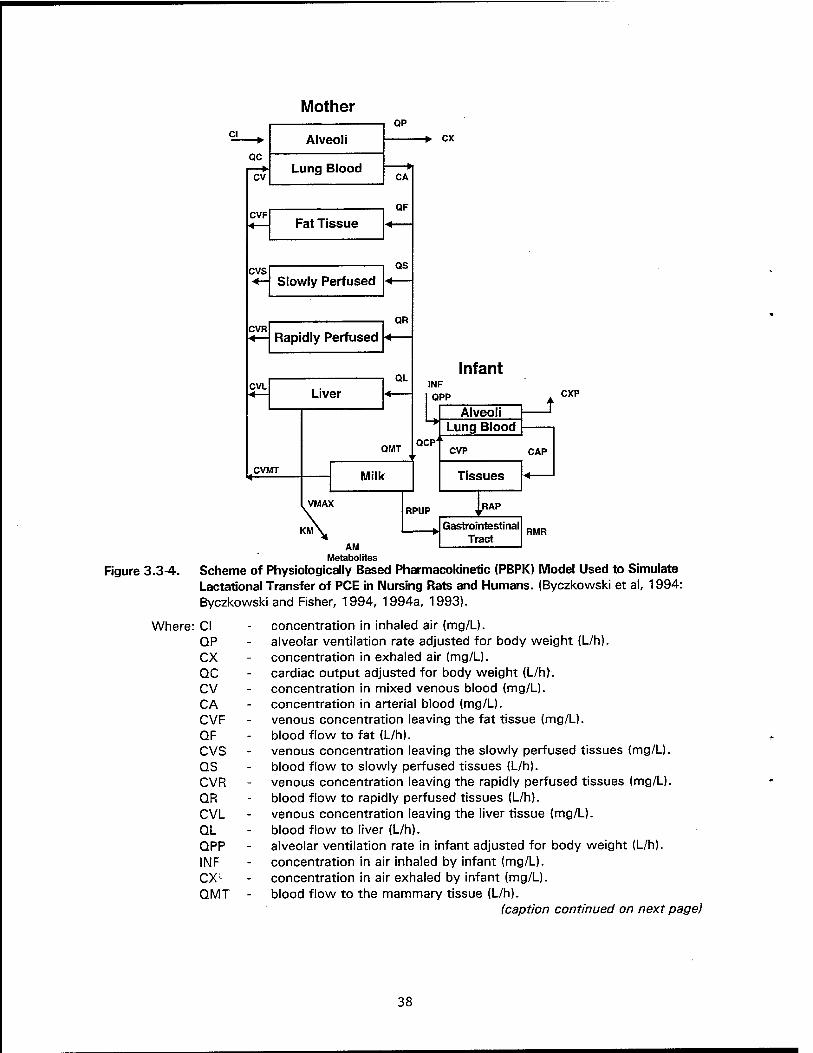
Mother
Cl
QC
CV
CVF ■4
Alveoli
Lung Blood
QP
-+- CX
Fat Tissue
CA
QF
CVS
CVR «—
Slowly Perfused QS
Rapidly Perfused QR
CVL ■4 Liver
CVMT
QL
QMT
Milk
VMAX
Infant INF QPP CXP
QCP
Alveoli Lung Blood
CVP CAP
Tissues
RPUP
AM Metabolites
RAP
Gastrointestinal Tract
RMR
Figure 3.3-4. Scheme of Physiologically Based Pharmacokinetic (PBPK) Model Used to Simulate Lactational Transfer of PCE in Nursing Rats and Humans. (Byczkowski et al, 1994: Byczkowski and Fisher, 1994, 1994a, 1993).
Where: Cl - concentration in inhaled air (mg/L). QP - alveolar ventilation rate adjusted for body weight (L/h). CX - concentration in exhaled air (mg/L). QC - cardiac output adjusted for body weight (L/h). CV - concentration in mixed venous blood (mg/L). CA - concentration in arterial blood (mg/L). CVF - venous concentration leaving the fat tissue (mg/L). QF - blood flow to fat (L/h). CVS - venous concentration leaving the slowly perfused tissues (mg/L). QS - blood flow to slowly perfused tissues (L/h). CVR - venous concentration leaving the rapidly perfused tissues (mg/L). QR - blood flow to rapidly perfused tissues (L/h). CVL - venous concentration leaving the liver tissue (mg/L). QL - blood flow to liver (L/h). QPP - alveolar ventilation rate in infant adjusted for body weight (L/h). INF - concentration in air inhaled by infant (mg/L). CX; - concentration in air exhaled by infant (mg/L). QMT - blood flow to the mammary tissue (L/h).
(caption continued on next page)
38

QCP - cardiac output in infant adjusted for body weight (L/h). CVP - concentration venous blood in infant (mg/L). CAP - concentration in arterial blood in infant (mg/L). CVMT - venous concentration leaving the mammary tissue (mg/L). VMAX - pseudo-maximal velocity of PCE metabolism (mg/h). RPUP - elimination rate for PCE from milk to infant (mg/h). RAP - the rate of gastrointestinal absorption of PCE in infant (mg/h). KM - apparent Michaelis-Menten constant for PCE metabolism (mg/L). RMR - the rate of gastrointestinal tract loading with PCE in infant (mg/h). AM - the amount of PCE metabolized (mg).
For well-stirred tissue compartments, with one mass input (arterial blood) and one output (venous
blood), such as fat, slowly perfused and rapidly perfused tissues, as well as infant solid tissues, the
toxicant mass transfer is given by the differential equation:
dA/dt = Qi(CA - CVi)
CVi = Q/Pi
Ci = A/V,
where: subscript ■, indicates the "i-th" compartment. A, is the amount in "i-th" compartment, Q, is the
blood flow through the "i-th" compartment, CA is the arterial concentration, CVj is the venous
concentration leaving the "i-th" compartment, C, is a concentration in the tissue in the "i-th"
compartment, Vi is the volume of the "i-th" compartment, Pj is the tissue/blood partition coefficient for
the "i-th" compartment.
For lung compartments with two mass inputs (mixed venous blood and inhaled air) and two outputs
(arterial blood and exhaled air), at steady state the amount in alveolar air is in equilibrium with the amount
in lung blood:
QP(CI - CX) = QC(CA - CV)
CX = CA/PB
where: QP is the air flow through the lungs (alveolar ventilation rate), CI is the concentration in inhaled
air, CX is the concentration in alveolar air, CA is the arterial concentration (leaving the lungs), PB is
blood/air partition coefficient, QC is the blood flow through the lungs (rate of cardiac output), CV is the
venous concentration (entering the lungs). This equation is solved for CA.
For the liver compartment with mass input from blood and two outputs (venous blood and
metabolism, without biliary excretion which in the case of PCE was negligible), the toxicant mass transfer
is given by the equation:
dAL/dt = QL(CA - CVL) - dAM/dt
dAM/dt = (VMAX X CVL)/(Km + CVL) + KF x CVL x VL
CVL = AL/(VL x PL)
where: AL is the amount in liver, QL is the blood flow through the liver, CA is the arterial concentration,
CVL is the venous concentration, AM is the amount metabolized, x is the multiplication, V,,^ is pseudo-
39
maximal velocity rate of metabolism, Km is apparent Michaelis-Menten metabolism constant, KF is first
order metabolism rate, VL is liver volume, and PL is liver/blood partition coefficient.
For the milk compartment with mass input from blood and two outputs (venous blood and milk), the
toxicant mass transfer is given by the equation:
dAMAT/dt = QMT(CA - CVMT) - RPUP
RPUP = OUTX x AMAT/VMILK
where: AMAT is the amount in mammary tissue, QMT is the blood flow through the mammary tissue,
CA is the arterial concentration, CVMT is the venous concentration (leaving the mammary tissue), RPUP
is the rate of toxicant elimination with milk, OUTX = OUTI (zero order milk yield) during feeding, or
OUTX = 0 during non feeding period, V^ is volume of milk in mammary tissue.
For the infant's gastrointestinal tract compartment with mass input with milk and output with
gastrointestinal absorption to blood, the toxicant mass transfer is given by the equation:
dMR/dt = RPUP - RAP
RAP = MR x KAP
where: MR is the amount remaining in the gastrointestinal tract, RPUP is the rate of toxicant input with
milk, RAP is the rate of absorption from gastrointestinal tract, x is multiplication, KAP is gastrointestinal
absorption constant (fecal excretion has not been included as in the case of PCE it was negligible).
The daily dose of toxicant received with milk (IDM) is defined as the integral of RPUP over time
divided by the number of days. Similarly, the total daily dose of toxicant (TOTINF) received by infant
(with air and milk) is defined as the sum of IDM and IDI, the integral of the inhalation rate over given time
divided by the number of days.
Extra cancer risk is defined as the product of the slope factor (SF), daily dose (IDM or TOTINF) and
years of exposure (Y) divided by expected life span (70 years).
DISCUSSION
Examples and Program Validation
Several computer simulations of PCE concentrations in human blood and exhaled air were run with
the milk compartment turned off, using exposure scenarios described in the literature (Stewart et al.,
1970, 1961a,b; Fernandez et al., 1976; Bolanowska and Golacka, 1972). The set of physiological
parameters used for model validation and simulations in humans is shown in Table 3.3-1. Results from
the only documented case of the lactational transfer of PCE from mother to infant (Bagnell and
Ellenberger, 1977) were also simulated with satisfactory fit of predicted PCE maternal blood and milk
concentrations to the reported experimental data (Byczkowski and Fisher, 1993).
40

To test the program further, seven exposure scenarios for PCE were simulated using the
measurements of PCE concentrations in indoor air made by the New York State Department of Health
and published by Schreiber (1992). They determined PCE concentrations in dry-cleaning facilities,
residential apartments, and apartments located just above the dry-cleaning facilities. It was assumed that
a 7.2 kg infant ingests 0.7 L of breast milk per day for up to 1 year. The results of extra cancer risk
assessment generated with our program are compared with those published by Schreiber (1992) in Table
3.3-2.
41
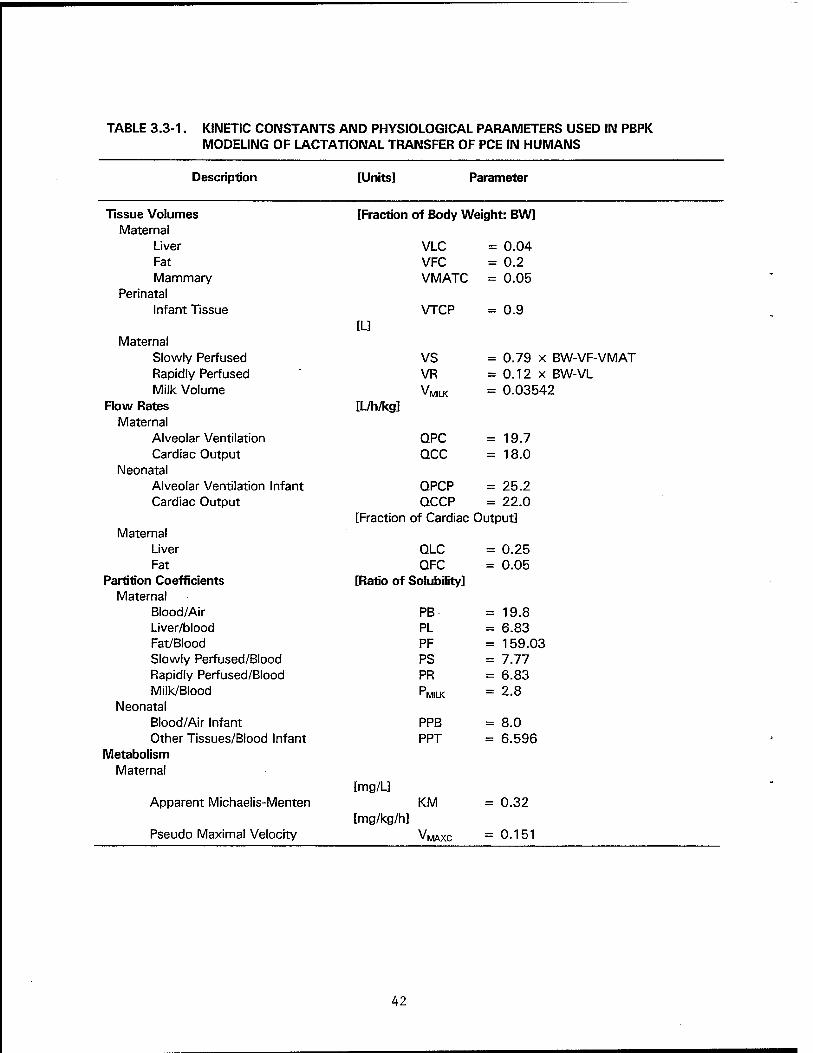
TABLE 3.3-1. KINETIC CONSTANTS AND PHYSIOLOGICAL PARAMETERS USED IN PBPK MODELING OF LACTATIONAL TRANSFER OF PCE IN HUMANS
Description [Units] 3arameter
Tissue Volumes [Fraction of Body Weight: BW] Maternal
Liver VLC = 0.04 Fat VFC = 0.2 Mammary VMATC = 0.05
Perinatal Infant Tissue VTCP
[L] = 0.9
Maternal Slowly Perfused VS = 0.79 x BW-VF-VMAT Rapidly Perfused VR = 0.12 x BW-VL Milk Volume VMILK = 0.03542
Flow Rates [L/h/kg] Maternal
Alveolar Ventilation QPC = 19.7 Cardiac Output QCC = 18.0
Neonatal Alveolar Ventilation Infant QPCP = 25.2 Cardiac Output QCCP = 22.0
[Fraction of Cardiac Output] Maternal
Liver QLC = 0.25 Fat QFC = 0.05
Partition Coefficients [Ratio of Solubility] Maternal
Blood/Air PB = 19.8 Liver/blood PL = 6.83 Fat/Blood PF = 159.03 Slowly Perfused/Blood PS = 7.77 Rapidly Perfused/Blood PR = 6.83 Milk/Blood PMILK = 2.8
Neonatal Blood/Air Infant PPB = 8.0 Other Tissues/Blood Infant PPT = 6.596
Metabolism Maternal
[mg/L] Apparent Michaelis-Menten KM
[mg/kg/h] = 0.32
Pseudo Maximal Velocity VMAXC = 0.151
42
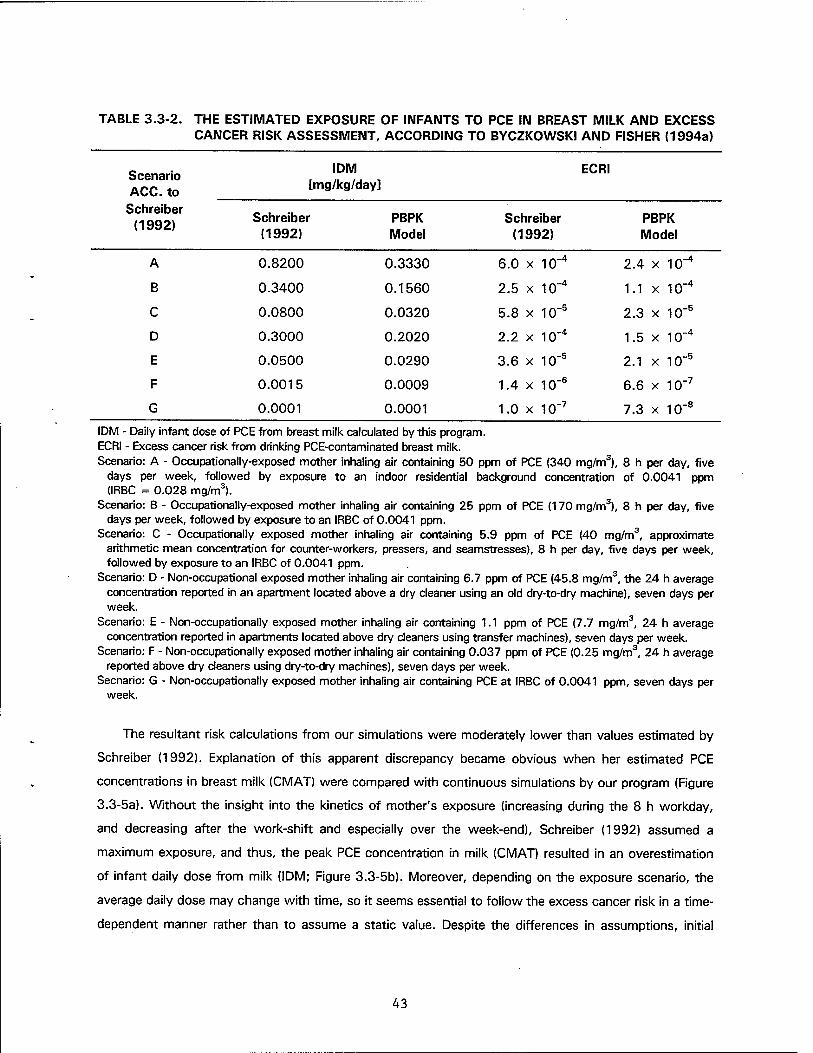
TABLE 3.3-2. THE ESTIMATED EXPOSURE OF INFANTS TO PCE IN BREAST MILK AND EXCESS CANCER RISK ASSESSMENT, ACCORDING TO BYCZKOWSKI AND FISHER (1994a)
Scenario ACC. to
IDM [mg/kg/day I
ECRI
Schreiber (1992) Schreiber PBPK Schreiber PBPK
(1992) Model (1992) Model
A 0.8200 0.3330 6.0 x 10~4 2.4 x 10~4
B 0.3400 0.1560 2.5 x 10~4 1.1 x 10~4
C 0.0800 0.0320 5.8 x 10~5 2.3 x 10"5
D 0.3000 0.2020 2.2 x 10~4 1.5 x 10~4
E 0.0500 0.0290 3.6 x 10"5 2.1 x 10"5
F 0.0015 0.0009 1.4 x 10"6 6.6 x 10"7
G 0.0001 0.0001 1.0 x 10~7 7.3 x 10"8
IDM - Daily infant dose of PCE from breast milk calculated by this program. ECRI - Excess cancer risk from drinking PCE-contaminated breast milk. Scenario: A - Occupationally-exposed mother inhaling air containing 50 ppm of PCE (340 mg/m3), 8 h per day, five
days per week, followed by exposure to an indoor residential background concentration of 0.0041 ppm (IRBC = 0.028 mg/m3).
Scenario: B - Occupationally-exposed mother inhaling air containing 25 ppm of PCE (170 mg/m3), 8 h per day, five days per week, followed by exposure to an IRBC of 0.0041 ppm.
Scenario: C - Occupationally exposed mother inhaling air containing 5.9 ppm of PCE (40 mg/m3, approximate arithmetic mean concentration for counter-workers, pressers, and seamstresses), 8 h per day, five days per week, followed by exposure to an IRBC of 0.0041 ppm.
Scenario: D - Non-occupational exposed mother inhaling air containing 6.7 ppm of PCE (45.8 mg/m3, the 24 h average concentration reported in an apartment located above a dry cleaner using an old dry-to-dry machine), seven days per week.
Scenario: E - Non-occupationally exposed mother inhaling air containing 1.1 ppm of PCE (7.7 mg/m3, 24 h average concentration reported in apartments located above dry cleaners using transfer machines), seven days per week.
Scenario: F - Non-occupationally exposed mother inhaling air containing 0.037 ppm of PCE (0.25 mg/m3, 24 h average reported above dry cleaners using dry-to-dry machines), seven days per week.
Secnario: G - Non-occupationally exposed mother inhaling air containing PCE at IRBC of 0.0041 ppm, seven days per week.
The resultant risk calculations from our simulations were moderately lower than values estimated by
Schreiber (1992). Explanation of this apparent discrepancy became obvious when her estimated PCE
concentrations in breast milk (CMAT) were compared with continuous simulations by our program (Figure
3.3-5a). Without the insight into the kinetics of mother's exposure (increasing during the 8 h workday,
and decreasing after the work-shift and especially over the week-end), Schreiber (1992) assumed a
maximum exposure, and thus, the peak PCE concentration in milk (CMAT) resulted in an overestimation
of infant daily dose from milk (IDM; Figure 3.3-5b). Moreover, depending on the exposure scenario, the
average daily dose may change with time, so it seems essential to follow the excess cancer risk in a time-
dependent manner rather than to assume a static value. Despite the differences in assumptions, initial
43
conditions, and PBPK model construction, our exposure assessments come very close to those published
by Schreiber (1992). Consequently, the excess cancer risk estimates calculated by our model for an
infant breast-fed for 1 year, are quite close to the estimates presented by Schreiber (1992). It is
suggested that modeling the toxicokinetics with our program gave more realistic approximations of PCE
dose received by nursing infants than the estimates based on peak level dosemetrics. It seems that the
exposure assessment by PBPK model may serve as a valuable tool in the overall risk assessment process
for nursing infants.
44
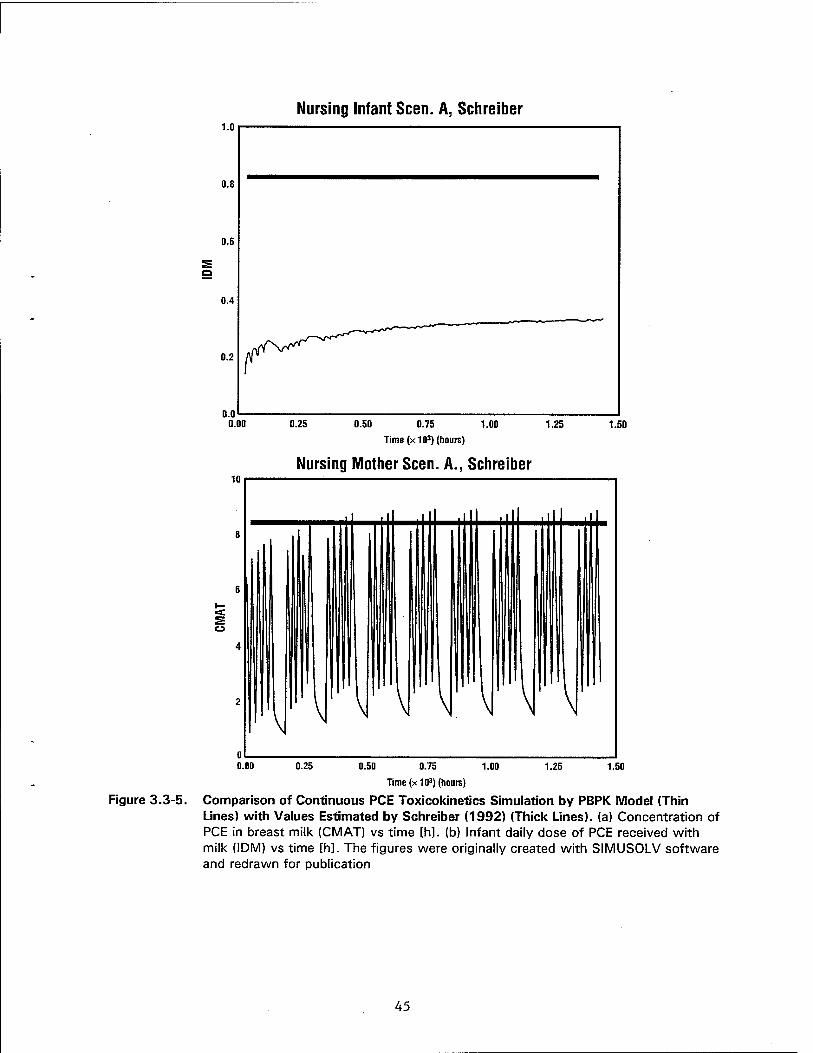
Nursing Infant Seen. A, Schreiber
0.00 0.25 0.50 0.75
Time (xlO3) (hours)
1.00 1.25 1.50
Nursing Mother Seen. A., Schreiber
0.00 0.25 1.00 1.25 1.50 0.50 0.75
Time (x 103) (hours)
Figure 3.3-5. Comparison of Continuous PCE Toxicokinetics Simulation by PBPK Model (Thin Lines) with Values Estimated by Schreiber (1992) (Thick Lines), (a) Concentration of PCE in breast milk (CMAT) vs time [h]. (b) Infant daily dose of PCE received with milk (IDM) vs time [h]. The figures were originally created with SIMUSOLV software and redrawn for publication
45
REFERENCES
ACGIH. 1993. Threshold limit values for chemical substances and physical agents and biological exposure indices, pp. 28-38 (American Conference of Governmental Industrial Hygienists, Cincinnati, OH).
Bagnell, P.C. and H.A. Ellenberger. 1977. Obstructive jaundice due to a chlorinated hydrocarbon in breast milk. Can. Med. Assoc. J. 117:1047-1048.
Bolanowska W. and J. Golacka. 1972. Inhalation and excretion of tetrachloroethylene in men in experimental conditions. Medycyna Pracy 23:109-119.
Byczkowski, J.Z. and J.W. Fisher. 1993. Quantitative approach to assess risk from lactational transfer of tetrachloroethylene to breast-fed infants. Soc. Risk Analysis Annual Meeting, Program and Abstracts, pp. E-10 (Savannah, GA).
Byczkowski, J.Z. and J.W. Fisher. 1994a. Lactational transfer of tetrachloroethylene in rats. Risk Analysis 14:339-349.
Byczkowski, J.Z. and J.W. Fisher. 1994b. Tetrachloroethylene exposure assessment of breast-fed infants. Toxicologist 14:86(45).
Byczkowski, J.Z. and J.W. Fisher. In Press. A computer program linking physiologically based pharmacodynamic model with cancer risk assessment for breast-fed infants. Comp. Meth. Progr. Biomed.
Byczkowski, J.Z., E.R. Kinkead, H.F. Leahy, G.M. Randall, and J.W Fisher. 1994. Computer simulation of the lactational transfer of tetrachloroethylene in rats using a physiologically based model. Toxicol. Appl. Pharmacol. 125:228-236.
CDHS. 1991. Health effects of tetrachloroethylene (PCE). pp. 5-1-5-36 (Scientific Review Panel Version Technical Support Document Part B, State of California Air Resources Board, California Department of Health Services).
EPA. 1989. Risk assessment guidance for superfund. vol. 1, pp. 8-1-8-10. Document EPA/540/1- 89/002 (U.S. Environmental Protection Agency, Washington, DC).
Fernandez, J., E. Guberan, and J. Caperos. 1976. Experimental human exposures to tetrachloroethylene vapor and elimination in breath after inhalation. Amer. Ind. Hyg. Assoc. J. 37:143-150.
Gargas, M.L., R.J. Burgess, D.E. Voisard, G.H. Cason and M.E. Andersen. 1989. Partition coefficients of low-molecular weight volatile chemicals in various liquids and tissues. Toxicol. Appl. Pharmacol. 98:87- 99.
Gargas, M.L., M.E. Andersen, and H.J. Clewell III. 1986. A physiologically based simulation approach for determining metabolic constants from gas uptake data. Toxicol. Appl. Pharmacol. 86:341-352.
Mitchell and Gauthier Associates. 1987. Advanced Continuous Simulation Language (ACSL) Reference Manual (Concord, MA).
Ramsey, J.C., and M.E. Andersen. 1984. A physiologically based description of inhalation pharmacokinetics of styrene in rats and humans. Toxicol. Appl. Pharmacol. 73:159-175.
Schreiber, J.S. 1992. An assessment of tetrachloroethene in human breast milk. J. Exp. Anal. Environ. Epidem. 2:15-26.
46

Steiner, E.C., T.D. Rey, and P.S. McCroskey. 1990. Reference Guide Simusolv Modeling and Simulation Software (The Dow Chemical Co., Midland, MI).
Stewart, R.D., E.D. Baretta, H.C. Dodd, and T. Torkelson. 1970. Experimental human exposure to tetrachloroethylene. Arch. Environ. Health 20:224-229.
Stewart, R.D., D.S. Erley, A.W. Schaffer, and H.H. Gay. 1961a. Accidental vapor exposure to anesthetic concentrations of a solvent containing tetrachloroethylene. Ind. Med. Surg. 30:327-330.
Stewart, R.D., H.H. Gay. D.S. Erley, C. Hake, and A.W. Schaffer. 1961b. Human exposure to tetrachloroethylene vapor. Arch. Environ. Health 2:516-522.
47
4.1 PARTITION COEFFICIENTS AND GAS UPTAKE KINETICS OF HALON 1301 REPLACEMENT CANDIDATES, CF3I, HFC-227ea. HFC-125, and FC-218
A. Vinegar, J.R. Creech1, R.K. Black1, S.K. Neurath1, M.C. Carcacci1, G.W. Jepson1. R.J. Williams1
ABSTRACT
Currently the Air Force uses Halon 1301 (trifluorobromomethane), a gaseous fluorocarbon, for
aircraft fire fighting systems. CF3I (trifluoroiodomethane), HFC-227ea (heptafluoropropane), HFC-125
(pentafluoroethane), and FC-218 (octafluoropropane) have been proposed as possible replacements for
Halon 1301. Preliminary pharmacokinetics and metabolism of Halon 1301, CF3I, HFC-227ea, HFC-215,
and FC-218 were investigated. This was accomplished by exposing male Fischer-344 rats to Halon 1301,
CF3I, HFC-227ea, HFC-125, and FC-218 at starting chamber concentrations ranging from 100 to 5000
ppm in a closed system recirculating gas uptake chamber for a six-hour period. Samples were taken from
the chamber and gas chromatography (GO was used to determine the concentration in the chamber
atmosphere. Data were used with a physiologically based pharmacokinetic (PBPK) model to estimate the
metabolic constants Kfdhr"1 kg"1), KJmg L"1) and V^ftng hr"1 kg"1). Halon 1301, HFC-227ea, and HFC-
125 data were simulated without necessity of attributing any metabolic capacity by the rats. Simulation
of CF3I required some attribution of metabolic capacity. Simulation of FC-218 also required some
attribution of metabolic capacity, although the amount of first order metabolism estimated was
inconsistent due to the inability to detect any metabolites. The chemicals investigated generally showed a
relatively low level of partitioning into tissues and were relatively inert metabolically.
INTRODUCTION
The purpose of this study was to measure the tissue-to-air partition coefficients and to describe the
uptake kinetics of bromotrifluoromethane (Halon 1301) and its proposed replacement chemicals,
iodotrifluoromethane (CF3I), heptafluoropropane (HFC-227ea), pentafluoroethane (HFC-125), and
octafluoropropane (FC-218), via closed chamber recirculating gas uptake methods.
Inhalation pharmacokinetics for all chemicals were determined experimentally in Fischer-344 (F-344)
male rats. A physiologically based pharmacokinetic (PBPK) model was used to estimate the metabolism of
the chemicals employing chemical-specific parameters and standard physiological constants.
Armstrong Laboratory, Toxicology Division, Wright-Patterson Air Force Base, OH.
48
MATERIALSAND METHODS
Test Materials
CF3I and Halon 1301 were obtained from PCR Inc., Gainesville, FL. HFC-227ea was obtained from
Great Lakes Chemical Corp., West Lafayette, IN. FC-218 was obtained from 3M Inc., St. Paul, MN. HFC-
125 was obtained from DuPont Chemicals Inc., Wilmington, DE. Mass spectral analysis revealed no
impurities in any of the chemicals.
Animals
Male F-344 (200 to 350 g) rats (Rattus norvegicus) were obtained from Charles River Breeding
Laboratories (Kingston, NY). Animals received Purina Formulab #5008 and softened water ad libitum.
They were housed in plastic cages (2-3/cage) with hardwood chip bedding prior to exposure and were
maintained on a 12-hour light /12-hour dark light cycle at constant temperature (22 ± 1 °C) and humidity
(40-60%). Cages were changed twice per week. Animals were marked for identification with a tail
tattoo.
The animals used in this study were handled in accordance with the principles stated in the Guide for
the Care and Use of Laboratory Animals, prepared by the Committee on Care and Use of Laboratory
Animals of the Institute of Laboratory Animals Resources, National Research Council, DHHS. National
Institute of Health Publication #86-23, 1985, and the Animal Welfare Act of 1966, as amended.
Partition Coefficients
Partition coefficients were determined by using a modified version of the vial-equilibration technique
described by Gargas et al. (1989). Whole tissue was harvested and minced into a tissue slurry versus
prepared as a tissue homogenate in saline. Rats used to determine partition coefficients were sacrificed
with C02. Blood was collected from the posterior vena cava using a heparinized syringe. Liver, muscle
(quadriceps), fat (epididymal and perirenal), and gastrointestinal (Gl) tract (stomach and small intestine)
were also removed for analysis. Blood samples (1.0 mL for all chemicals, except for FC-218, which was
2.0 mL) were placed in 12.4 mL glass vials and incubated/mixed for 3 h at 37 °C with 800 ppm of
chemical in the vial head space. Whole tissue samples (1.0 g of liver and muscle, and 0.5 g of fat and Gl
for all chemicals, except FC-218, which was 2.0 g) were minced and incubated/mixed under the same
condition as for blood, except fat was which equilibrated for 5-8 h. Partition coefficients were also
determined at 80 and 400 ppm to show that they were concentration independent.
49
The chemical concentrations in the head space were analyzed using a HP19395A head space
sampler (Hewlett-Packard, Avondale, PA) connected to a HP5890A gas Chromatograph (GO (Hewlett-
Packard, Palo Alto, CA) equipped with a hydrogen flame ionization detector. Column selection and GC
conditions varied for each chemical. For Halon 1301, HFC-227ea, HFC-125, and FC-218, a Chromopack
PoraPLOT Q (Plot Fused Silica) 25m x 0.53 mm column was used. GC conditions were set with the
detector temperature at 250 °C, injector temperature at 125 °C, helium carrier gas at 13.0 mL/min
column flow, plus 13.0 mL/min make-up flow, and an oven temperature held constant at 70 °C for Halon
1301 and FC-218, 100 °C for HFC-227ea, and 75 °C for HFC-125. For CF3I, a 12' x 1/8" stainless steel
10% SE-30, WHP 80/100 mesh Chromsorb column was used. Gas chromatography conditions were set
with the detector temperature at 250 CC, injector temperature at 125 °C, nitrogen carrier gas flow at 30.0
mL/min, and an oven temperature held constant at 60 °C.
Metabolic Constants
A closed chamber recirculating gas uptake system with a volume of 8.0 L was used for the
estimation of the whole animal metabolic constants (Vj^lmg hr"1 kg"1), K^mg L"1), and/or K^rir"1 kg"1)).
Three F-344 rats were exposed to each study chemical using a gas uptake system similar to that
described by Gargas et al. (1986). Initially, a predetermined concentration of the test chemical was
introduced into the system so that the concentration in the chamber atmosphere would decrease as the
chemical was taken up and metabolized by the rat. Four to five exposure concentrations were performed
for 6 h for each chemical (Halon 1301 concentrations were 122, 1202, 2993, and 5557 ppm; CF3I
concentrations were 112, 648, 1228, 2727, and 5867 ppm; HFC-227ea concentrations were 112, 648,
1228, 2715, and 5867 ppm; HFC-125 concentrations were 132, 1005, 2725, and 5305 ppm; and FC-
218 concentrations were 126, 1035, 1730, and 4825 ppm). Ascarite (75-150 g) was used as the C02
absorber. Oxygen concentrations were maintained at (+ 1 %) during the exposures. The system flow was
maintained at 2.1 L/min with the flow to the sample loop of the GC at 100 mL/min.
The chemical concentrations in the chamber atmosphere were monitored every 5 min for the first 30
min and every 15 min thereafter using an automated gas sampling valve connected to a HP5890A GC.
Chromatography was performed on a 25 m x 0.53 mm Chrompack PoraPLOT Q (Plot Fused Silica)
column. The GC was equipped with a hydrogen flame ionization detector with a temperature of 250 °C,
helium carrier flow at 12.1 mL/min with make-up flow of 14.2 mL/min, injector at 125 °C, and an oven
temperature held constant at 80 °C for Halon 1301, at 125 °C for CF3I, at 100 °C for HFC-227ea, at 70
°C for HFC-125, and at 70 °C for FC-218.
50
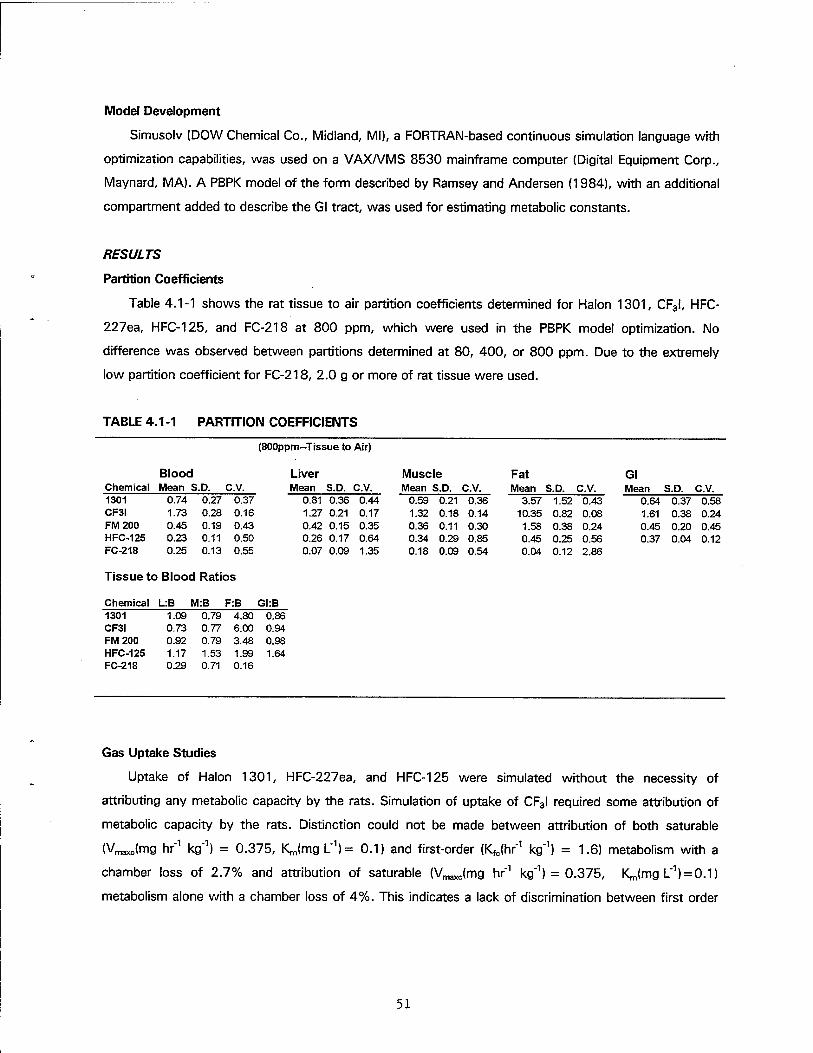
Model Development
Simusolv (DOW Chemical Co., Midland, Ml), a FORTRAN-based continuous simulation language with
optimization capabilities, was used on a VAX/VMS 8530 mainframe computer (Digital Equipment Corp.,
Maynard, MA). A PBPK model of the form described by Ramsey and Andersen (1984), with an additional
compartment added to describe the Gl tract, was used for estimating metabolic constants.
RESULTS
Partition Coefficients
Table 4.1-1 shows the rat tissue to air partition coefficients determined for Halon 1301, CF3l, HFC-
227ea, HFC-125, and FC-218 at 800 ppm, which were used in the PBPK model optimization. No
difference was observed between partitions determined at 80, 400, or 800 ppm. Due to the extremely
low partition coefficient for FC-218, 2.0 g or more of rat tissue were used.
TABLE 4.1-1 PARTITION COEFFICIENTS
(800ppm-Tissue to Air)
Blood Liver Muscle Fat Gl Chemical Mean S.D. CV. Mean S.D. CV. Mean S.D. CV. Mean S.D. CV. Mean S.D. c.v. 1301 0.74 0.27 0.37 0.81 0.36 0.44 0.59 0.21 0.36 3.57 1.52 0.43 0.64 0.37 0.58 CF3I 1.73 0.28 0.16 1.27 0.21 0.17 1.32 0.18 0.14 10.35 0.82 0.08 1.61 0.38 0.24 FM200 0.45 0.19 0.43 0.42 0.15 0.35 0.36 0.11 0.30 1.58 0.38 0.24 0.45 0.20 0.45 HFC-125 0.23 0.11 0.50 0.26 0.17 0.64 0.34 0.29 0.85 0.45 0.25 0.56 0.37 0.04 0.12 FC-218 0.25 0.13 0.55 0.07 0.09 1.35 0.18 0.09 0.54 0.04 0.12 2.86
Tissue to Blood Ratios
Chemical L:B M:B F:B GI:B 1301 1.09 0.79 4.80 0.86 CF3I 0.73 0.77 6.00 0.94 FM200 0.92 0.79 3.48 0.98 HFC-125 1.17 1.53 1.99 1.64 FC-218 0.29 0.71 0.16
Gas Uptake Studies
Uptake of Halon 1301, HFC-227ea, and HFC-125 were simulated without the necessity of
attributing any metabolic capacity by the rats. Simulation of uptake of CF3I required some attribution of
metabolic capacity by the rats. Distinction could not be made between attribution of both saturable
(Vn^lmg hr"1 kg"1) = 0.375, KJmg L"1)= 0.1) and first-order (KJhr"1 kg"1) = 1.6) metabolism with a
chamber loss of 2.7% and attribution of saturable (V^mg hr"1 kg"1) = 0.375, KJmg L"1) = 0.1)
metabolism alone with a chamber loss of 4%. This indicates a lack of discrimination between first order
51
metabolism and chamber loss for CF3I. Simulation of uptake of FC-218 required some attribution of first-
order metabolic capacity by the rats.
DISCUSSION
Halon 1301, HFC-227ea, and HFC-125 gas uptake data were simulated successfully by assuming
that no metabolism of the chemical was occurring and that after initial uptake by the animal, further
losses were those occurring in the uptake system itself. Simulation of the CF3I and FC-218 required some
attribution of metabolism by the rats beyond losses to the system. Another indication that the chemical
CF3I was disappearing beyond that taken up by the chamber is demonstrated by the chromatograms of
the chamber air. As gas uptake experiments progressed, a second peak appeared and increased in size
(data not shown). This could represent a metabolite resulting from the metabolism of the chemical by the
rats or could represent a product resulting from spontaneous breakdown of CF3I in the chamber. The
peak appeared only when live rats were in the chamber with the presence of the parent chemical.
However, further experiments would be necessary to determine the identity and origin of the second
Chromatographie peak. The need to attribute first-order metabolism to FC-218 is problematic as no
metabolites could be detected and because of the expected inertness of a perfluorinated compound.
Problems with the gas uptake methodology are still being investigated before any final conclusions can be
reached about the metabolism of FC-218.
REFERENCES
Gargas, M.L., M.E. Andersen, and H.J. Clewell III. 1986. A physiologically based simulation approach for determining metabolic constants from gas uptake data. Toxicol Appl. Pharmacol. 86:341-352.
Gargas, M.L., R.J. Burgess, D.E. Voisard, G.H. Cason, and M.E. Andersen. 1989. Partition coefficients of low-molecular weight volatile chemicals in various liquids and tissues. Toxicol. Appl. Pharmacol. 98:87- 99.
Ramsey, J.C. and M.E. Andersen. 1984. A physiologically based description of the inhalation pharmacokinetics of styrene in rats and humans. Toxicol. Appl. Pharmacol. 73:159-175.
52
4.2 ACUTE 15-MIIMUTE, NOSE-ONLY INHALATION EXPOSURES OF HALON 1301 TO MALE AND FEMALE SPRAGUE-DAWLEY RATS
E.R. Kinkead, M.L. Freedman, R.E. Wolfe, and H.F. Leahy
ABSTRACT
Acute 15-minute, nose-only inhalation exposures were performed on male and female Sprague-
Dawley rats at 30%, 50%, and 80% Halon 1301. Slight tremors and ataxia were noted following 50%
and 80% Halon 1301 exposures. All animals survived and gross examination at 14 days postexposure
indicated normal findings. Results were compared with the potential Halon 1301 replacement candidate,
trifluoroiodomethane.
INTRODUCTION
The flooding agent for extinguishing in-flight aircraft and electronic equipment fires currently being
used by the Air Force is Halon 1301 (bromotrifluoromethane). Halon 1301 is a fully halogenated
hydrocarbon of relatively low toxicity. However, environmental concerns about the contribution of halons
to depletion of stratospheric ozone and global warming has resulted in an attempt to find adequate
replacements. A compound being considered, because it is believed to have less ozone-depleting activity,
is trifluoroiodomethane (CF3I). Extensive testing is being performed on CF3I, including short-term acute
toxicity evaluations. Kinkead et al. (1994) reported nose-only inhalation exposures of CF3I to male F-344
rats at concentrations of 0.5 and 1.0% in which all rats survived 4-hour exposures. Histopathologic
examination of tissues at various time points following exposure indicated normal findings. Fifteen-
minute, nose-only inhalation exposures have been performed on CF3I at concentrations ranging between
13% and 29% (Skaggs etal., 1993; Ledbetter, 1994). A 15-minute inhalation median lethal
concentration (LC50) value for Sprague-Dawley rats is 27% CF3I.
To make comparisons on short-term lethality of CF3I and Halon 1301, it was necessary to perform
15-minute, nose-only inhalation exposures of Halon 1301 under conditions similar to those used to
establish the toxicity of CF3I. This will provide information necessary to make valid judgments in
assessing the comparative risks of the two fire extinguishants.
53
MA TERIALS AND METHODS
Test Compound
The Halon 1301, supplied from the Air Force inventory, is a liquid and was stored in a cylinder under
pressure. Pertinent physical and chemical properties follow:
CAS No. 75-63-8 Systematic Name Bromotrifluoromethane Molecular Weight 148.91 Empirical Formula CBrF3
Physical State Colorless gas Vapor Density (Air =1) 5.12 Melting Point -168 °C Boiling Point -57.8 °C Flash Point Not flammable Vapor Pressure 205 psi @ 21 °C
(Approx. 10,600 mmHg) Solubility in water Very slight
Test Animals
Twenty male and twenty female Sprague-Dawley rats were purchased from Charles River Breeding
Laboratories, Raleigh, NC. The rats were 7 weeks of age upon arrival and 9 weeks of age at the time of
exposure. All rats were identified by tail tattoo and were subjected to a 2-week quarantine period. Water
and feed (Purina Formulab #5008) were available ad libitum, except during exposure. Animal room
temperatures were maintained at 21-25 °C, and the light/dark cycle was set at 12-hour intervals. The
animals were group housed (2 per cage, except during exposure) in clear plastic cages with wood chip
bedding (Betta-Chip, Northeastern Products Corp., Warrensburg, NY).
Generation and Analysis of Exposure Atmospheres
Halon 1301 vapor was generated from a cylinder through a calibrated Matheson rotometer
(Matheson Gas Products, Secaucus, NJ). The Halon 1301 vapor was combined with oxygen (20-21 % of
total flow) and nitrogen (N2) which was added as required to produce a combined N2 and 1301 mixture
of 79-80%. The Halon 1301 concentration was continuously monitored using a flow-through, 10-cm
path cell, with a Miran 1A infrared analyzer (Foxboro, S. Norwalk, CN) at the absorption band of 11.7 m.
Calibration curves were developed using Tedlar sample bags (SKC, Eighty-four, PA). The flow-through
chamber was monitored and the exposure concentration maintained prior to introducing the test animals.
The animals were introduced to the exposure in a staggered fashion. Each rat was removed from the
chamber and the port was resealed following 15 min exposure. Because the animals were introduced to
the exposure system in a staggered fashion, the total chamber monitoring time was 20 min. The
exposure concentrations were monitored continuously. A digital value was recorded at 5-minute intervals
54
and used for concentration calculation. Temperature and humidity within the Cannon chamber were not
monitored. Oxygen concentration was monitored using a Hudson Oxygen Monitor (Model #5590,
Hudson Electronics Division, Temeculda, CA), calibrated with room air as 21 %.
The nose-only chamber was a stainless-steel flow past chamber as described by Cannon et al.,
1983. The chamber had 52 ports; 10 were randomly selected for rat exposure. Plexiglas rat restraining
tubes that extended radially outward were plugged into the ports. The remaining ports were capped or
used for monitoring chamber atmosphere conditions.
Exposure Regimen
Each nose-only exposure was for 15 min. The flow-through exposure system was maintained at the
target concentration prior to the introduction of the test animals. The containment tubes with animals
were attached to the exposure system, one at a time, at 30-second intervals. The animals were
withdrawn from the system in a similar manner. The exposure groups consisted of 5 male and 5 female
rats per concentration level, and the rats were maintained 14 days postexposure for evaluation. A total of
15 male and 15 female rats were included in each of 3 exposures, at target concentrations of 30%,
50%, and 80% Halon 1301.
Toxicity Assessments
Records were maintained of body weights and signs of toxicity. Euthanasia was via halothane
inhalation overdose. At sacrifice, gross pathology was performed on all rats.
RESULTS
Exposure System Analysis
The specified target concentrations of 30%, 50%, and 80% Halon 1301 were maintained during the
15-minute exposure periods. The exposure mean concentrations were maintained within ±2% of the
desired concentrations. Mean concentrations for each exposure, along with the mean high and low
concentrations, are provided in Table 4.2-1.
55
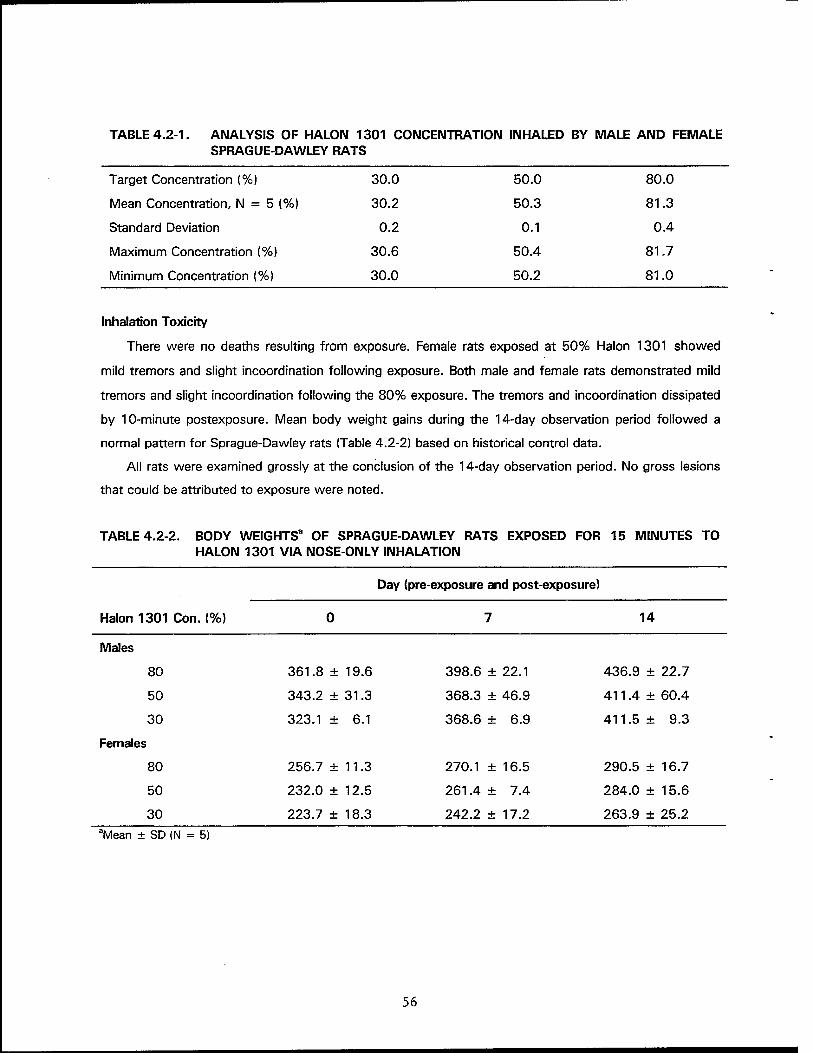
TABLE 4.2-1. ANALYSIS OF HALON 1301 CONCENTRATION INHALED BY MALE AND FEMALE SPRAGUE-DAWLEY RATS
Target Concentration (%) 30.0 50.0 80.0
Mean Concentration, N = 5 (%) 30.2 50.3 81.3
Standard Deviation 0.2 0.1 0.4
Maximum Concentration (%) 30.6 50.4 81.7
Minimum Concentration (%) 30.0 50.2 81.0
Inhalation Toxicity
There were no deaths resulting from exposure. Female rats exposed at 50% Halon 1301 showed
mild tremors and slight incoordination following exposure. Both male and female rats demonstrated mild
tremors and slight incoordination following the 80% exposure. The tremors and incoordination dissipated
by 10-minute postexposure. Mean body weight gains during the 14-day observation period followed a
normal pattern for Sprague-Dawley rats (Table 4.2-2) based on historical control data.
All rats were examined grossly at the conclusion of the 14-day observation period. No gross lesions
that could be attributed to exposure were noted.
TABLE 4.2-2. BODY WEIGHTS3 OF SPRAGUE-DAWLEY RATS EXPOSED FOR 15 MINUTES TO HALON 1301 VIA NOSE-ONLY INHALATION
Day (pre-exposure and post-exposure)
Halon 1301 Con. (%) 0 7 14
Males
80 361.8 ± 19.6 398.6 ± 22.1 436.9 ± 22.7
50 343.2 ± 31.3 368.3 ± 46.9 411.4 + 60.4
30 323.1 ± 6.1 368.6 ± 6.9 411.5+ 9.3
Females
80 256.7 ±11.3 270.1 ± 16.5 290.5 ± 16.7
50 232.0 ± 12.5 261.4 ± 7.4 284.0 ± 15.6
30 223.7 ± 18.3 242.2 ± 17.2 263.9 ± 25.2 aMean ± SD (N = 5)
56
DISCUSSION
Acute (15 min) inhalation of Halon 1301 at concentrations of 30%, 50%, and 80% (300,000,
500,000, and 800,000 ppm) did not result in mortality to either male or female Sprague-Dawley rats.
Signs of toxic stress were limited to slight tremors and slight loss of coordination following exposure to
50% or 80% Halon 1301, which dissipated by 10-minute postexposure. Gross examination of tissues at
14 days postexposure indicated normal findings.
The lack of mortality in rats at these "exposure concentrations is in agreement with that reported by
Chambers and Krackow, 1950; Comstock et al., 1950; and MaclMamee, 1950, in which rats survived
exposures to high concentrations of Halon 1301 for 15 min. The lack of mortality in the rats exposed at
these concentrations would indicate that Halon 1301 is less potent than CF3I (15 min LC50 of 27%).
REFERENCES
Cannon, W.C., E.F. Blanton, and K.E. McDonald. 1983. The Flow-Past Chamber: An Improved Nose- Only Exposure System for Rodents. Am. Ind. Hyg. Assoc. J. 44(12):923-933.
Chambers, W.H. and E. H. Krackow. 1950. An investigation of the toxicity of fire extinguishing liquids. Part I. Summary. Medical Division Research Report No. 23, Chemical Corps, Army Chemical Center, MD.
Comstock, C.C., F.P. McGrath, S.B. Goldberg, and L.H. Lawson. 1950. An investigation of the toxicity of proposed fire extinguishing fluids. Part II. The approximate lethal concentration to rats by inhalation of vapors for 15 min. Medical Division Research Report No. 23, Chemical Corps, Army Chemical Center, Md.
Kinkead, E.R., S.A. Salins, R.E. Wolfe, H.F. Leahy, and J.H. English. In Press. Acute Toxicity Evaluation of Halon Replacement Trifluoroiodomethane (CF3I). AL-TR-1994, Armstrong Laboratory, Wright-Patterson Air Force Base, OH.
Ledbetter, A. 1994. Personal communication.
MacNamee, J.K. 1950. An investigation of the toxicity of proposed fire extinguishing fluids. Part III. The pathology in rats produced by inhalation of proposed fire extinguishing fluids. Medical Division Research Report No. 23, Chemical Corps, Army Chemical Center, Md.
Skaggs, S.R., D.S. Dierdorf, and R.E. Tapscott. 1993. Update on Iodides as Fire Extinguishing Agents. International CFE and Halon Alternatives Conference, Washington, DC. pp. 800-808.
ACKNOWLEDGMENTS
The authors would like to thank Caryle Flemming for statistical analysis. Acknowledgment is also
made to Richard Godfrey and Jerry Nicholson for their excellent technical assistance.
57

4.3 CARDIAC SENSITIZATION POTENTIAL OF CF3I (TRIFLUOROIODOMETHANE)
A. Vinegar and D.E. Dodd
ABSTRACT
CF3I is being considered by the U.S. Air Force as a candidate for replacement of Halon 1301
(CF3Br), the fire extinguishant currently used as a total flooding agent in both occupied and
unoccupied spaces. As part of the preliminary screening of CF3I, an initial evaluation of its toxicity,
including cardiac sensitization potential, was undertaken. Cardiac sensitization testing of CF3I using
beagle dogs showed a no observable effect level at 0.2% and a lowest observable adverse effect
level at 0.4%. Since the proposed use concentration for fire extinguishing is 7.0%, the cardiac
sensitization results eliminate neat CF3I for use as a flooding agent in occupied spaces, but it is still
a viable option for use in unoccupied spaces.
INTRODUCTION
In response to the requirements of the Montreal Protocol of 1987, alternatives are being
considered to ozone-depleting halons (used widely as fire-fighting agents). Halons, due to their
chemical stability (contain bromine, chlorine, fluorine, and carbon), do not decompose in the lower
atmosphere but instead migrate slowly into the stratosphere. When these compounds react with
ultraviolet radiation, they release chlorine and bromine which then break apart the ozone molecule,
leading to the stratospheric depletion of ozone. CF3I has been considered by the military and Federal
Aviation Administration as a replacement for Halon 1301 for use as a flooding agent in both
occupied and non-occupied spaces.
Cardiac sensitization to adrenaline is a phenomenon associated with the inhalation of a number
of unsubstituted and halogenated hydrocarbons (Beck et al., 1973; Clark and Tinston, 1973, 1982;
Hardy et al., 1994). After inhalation of the sensitizing agent, challenge with adrenaline causes
cardiac arrhythmias. The U.S. Environmental Protection Agency (EPA) has been mandated under
Title VI of the U.S. Clean Air Act of 1990 (Public Law 101-549) to evaluate alternatives to Class I
ozone depleting substances, including halon fire and explosion protection agents. Under the
Significant New Alternatives Policy Program the EPA considers the cardiac sensitization potential as
the most sensitive biological endpoint because of the potent sensitizing effect of these chemicals in
the epinephrine-challenged dog model. Therefore, the cardiac sensitization test was performed on
CF3I.
58
METHODS
The Toxic Hazards Research Unit subcontracted the performance of this investigation with
Huntingdon Research Centre Ltd. (HRC), Huntingdon, England. T.J. Kenny, C.K. Shepherd, and
C.J. Hardy of HRC were the primary scientists involved in conducting the study. A brief
presentation of the methods and results follow. Details of the methods and results are given in an
Air Force technical report (In Press).
Test Compound
The CF3I (CAS 2314-97-8) used in this study was purchased from PCR, Inc., Gainesville, FL.
The compound has a formula weight of 195.91 and a boiling point of -22.5 °C. The compound is a
liquid and is stored in a cylinder under pressure. Purity was confirmed by gas chromatography/mass
spectrometry (GC/MS) analysis to be > 99.8%.
Test Animals, Accommodation and Husbandry
Nine purebred male beagle dogs (12.7-15.7 kg), approximately 6 to 7 months old, were used
for the study. They were obtained from Interfauna UK Ltd, Abbots Ripton Rd., Wyton, Huntingdon,
England. Fresh tap water and 400 g of dry diet (Diet A, Special Diets Services Ltd.) were provided
daily. The dogs were acclimatized to laboratory conditions and handling procedures for
approximately 4 weeks before experimental work began.
Exposure System
Dogs were exposed to the test gas by a snout-only system. A Halls face mask (Veterinary Drug
Co.) was used. To ensure a reasonably airtight fit around the dog's snout, a latex sheet with a hole
was placed over the snout end of the face mask, and the dog's snout protruded through the sheet
into the mask. The test gas was metered from a pressurized cylinder through a flowmeter and
added to a supply of air passing into the face mask. The relative flows of test gas and diluent air
were adjusted individually to result in a total air flow of approximately 40 L/min at the mask. The
test atmosphere was sampled continuously using a metal bellows pump and analyzed using a Miran
1A CVF infrared gas analyzer. The measuring wavelength for CF3I was 8.55 (J.m for the
concentration of range of 0.05-50% v/v in air. The analyzer was calibrated using gas sampling bags
(SKC, Inc., USA) containing known concentrations of the test gas.
59

Measurement of the Electrocardiogram (ECG)
The standard lead II electrocardiogram was used throughout the study. Standard ECG limb leads
were then connected to the prepared areas on the dog with blunt clips. The electrocardiograph
(Devices 3442 ECG amplifier with a two-channel chart recorder) was calibrated with 1 mV peaks.
Experimental Procedure
The experimental procedure was based on published techniques (Reinhardt et al., 1971).
Adrenaline solutions were prepared immediately prior to each exposure session from a stock
solution (adrenaline 1:1000) and sterile pyrogen-free water. Injections were given at a rate of 0.1
mL/sec. Appropriate dilutions were used so that the volume of adrenaline solution used was
consistently 0.1 mL/kg body weight.
Experimental Design
Stage 1: Each of the nine dogs on the study was tested with fresh air supplied to the face
mask. Various concentrations of adrenaline solution were used in order to establish the response of
each individual dog to adrenaline alone. An appropriate initial adrenaline dose was selected for each
dog following review of the results of Stage 1 of the study.
Stage 2: Two dogs were selected for exposure to CFC to show that the experimental model
used gave a positive response with a known cardiac sensitizer.
Stage 3: Each of the six dogs selected for exposures received air only for 17 min. At this point
the adrenaline response of each dog was assessed and compared to previously reported responses.
Each of the dogs selected was exposed to CF3I according to the following schedule:
Exposure Session Test Gas Concentration in Air % v/v
1 Air only
2 CF3I 0.1
3 CF3I 1.0
4 CF3I 0.2
5 CF3I 0.4
60
At least one calendar day was allowed between each exposure session to allow the dogs to
recover. When a clear positive response was seen in any dog, no further exposures were
undertaken on that animal. If a dog died as a result of exposure to the test gas, no further
exposures at that concentration or higher concentrations were performed.
Interpretation of Results
The study was designed to provide information on any dose level that would give rise to clear
signs of test gas-related cardiac sensitization. The criterion for a positive effect was the appearance
of a burst of multifocal ventricular ectopic activity or ventricular fibrillation. Ventricular tachycardia
alone was not necessarily considered definitive evidence of a positive response.
RESULTS AND DISCUSSION
Stage 1 — Challenges with Adrenaline Alone
The response of a dog to administration of adrenaline was dependent on the dose given and the
responsiveness of each individual animal. Typically, the response consisted of a transient increase in
heart rate followed by a slowing of heart rate and an increase in the height of the T-wave. In some
dogs multiple unifocal ventricular tachycardia occurred. On the basis of the results, the adrenaline
dose selected for the dogs was 1, 4, 8, or 12 ng/kg.
Stage 2 — Exposure to CFC
Two dogs were selected for Stage 2. The first dog produced a positive response at 2% in air
with fatal ventricular fibrillation. The other was not exposed due to humane considerations. These
data are consistent with previously published data (Reinhardt et al., 1971) and show that the test is
capable of detecting substances that are cardiac sensitizers.
Stage 3 — Exposure to CF3I
All dogs were tested at 0.1% CF3I in air. All dogs were negative and nothing abnormal was
observed. One dog (1147) was tested at 1.0% CF3I in air. The dog responded positively and died.
All remaining dogs were tested at 0.2% CF3I in air. All dogs were negative and nothing abnormal
was observed. One dog (1149) was tested at 0.4% CF3I in air. The dog responded positively and
died. Exposures were terminated. A summary of cardiac responses to adrenaline administration
during CF3I is shown in Table 4.3-1.
61
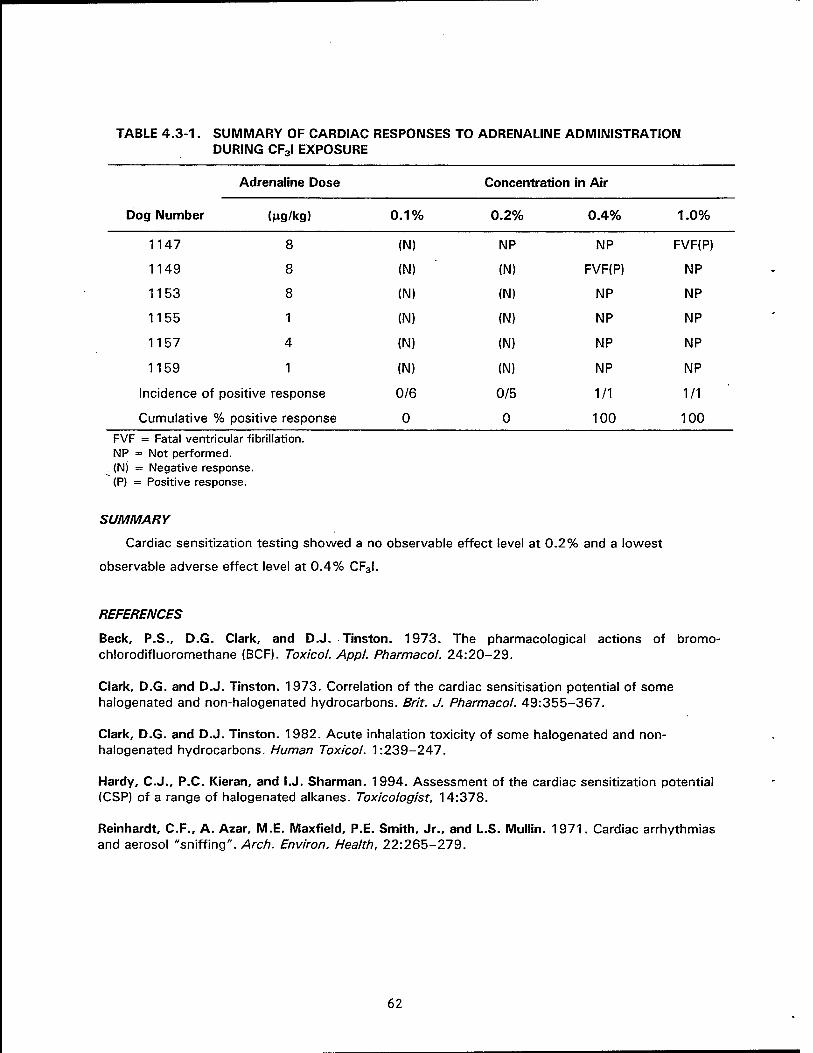
TABLE 4.3-1. SUMMARY OF CARDIAC RESPONSES TO ADRENALINE ADMINISTRATION DURING CF3I EXPOSURE
Adrenaline Dose Concentration in Air
Dog Number (|j.g/kg) 0.1% 0.2% 0.4% 1.0%
1147 8 (N) NP NP FVF(P)
1149 8 (N) (N) FVF(P) NP
1153 8 (N) (IM) NP NP
1155 1 (N) (N) NP NP
1157 4 (N) (N) NP NP
1159 1 (N) (N) NP NP
Incidence of positive response 0/6 0/5 1/1 1/1
Cumulative °/ 4> positive response 0 0 100 100
FVF = Fatal ventricular fibrillation. NP = Not performed. (N) = Negative response. (P) = Positive response.
SUMMARY
Cardiac sensitization testing showed a no observable effect level at 0.2% and a lowest
observable adverse effect level at 0.4% CF3I.
REFERENCES
Beck, P.S., D.G. Clark, and D.J. Tinston. 1973. The pharmacological actions of bromo- chlorodifluoromethane (BCF). Toxicol. Appl. Pharmacol. 24:20-29.
Clark, D.G. and D.J. Tinston. 1973. Correlation of the cardiac sensitisation potential of some halogenated and non-halogenated hydrocarbons. Brit. J. Pharmacol. 49:355-367.
Clark, D.G. and D.J. Tinston. 1982. Acute inhalation toxicity of some halogenated and non- halogenated hydrocarbons. Human Toxicol. 1:239-247.
Hardy, C.J., P.C. Kieran, and I.J. Sharman. 1994. Assessment of the cardiac sensitization potential (CSP) of a range of halogenated alkanes. Toxicologist, 14:378.
Reinhardt, C.F., A. Azar, M.E. Maxfield, P.E. Smith, Jr., and L.S. Mullin. 1971. Cardiac arrhythmias and aerosol "sniffing". Arch. Environ. Health, 22:265-279.
62
4.4 RESULTS OF GENOTOXICITY TESTING ON TRIFLUOROIODOMETHANE (CF3I) AND 1,1,1.2,3.3,3-HEPTAFLUOROPROPANE(HFC-227ea)
D.E. Dodd and A. Vinegar
ABSTRACT
CF3I and HFC-227ea are being considered by the U.S. Air Force as candidates for replacement
of Halon 1301 (CF3Br), the fire extinguishant currently used as a total flooding agent in both
occupied and unoccupied spaces. As part of the preliminary screening of CF3I and HFC-227ea, an
initial evaluation of their genotoxicity was undertaken. CF3I was positive in the Ames Salmonella
typhimurium histidine reversion mutagenesis assay. The L5178Y/f/c mouse lymphoma cell
mutagenesis assay showed that CF3I did not induce gene or chromosomal mutations in mammalian
cells in vitro. A positive evaluation in the mouse bone marrow micronucleus test indicated CF3I was
clastogenic in vivo. For HFC-227ea, negative results were obtained from the Ames assay, the
mouse micronucleus test, and the mouse lymphoma cell assay.
INTRODUCTION
In response to the requirements of the Montreal Protocol of 1987 alternatives are being
considered to ozone-depleting halons (used widely as fire-fighting agents). Halons, due to their
chemical stability(contain bromine, chlorine, fluorine, and carbon), do not decompose in the lower
atmosphere but instead migrate slowly into the stratosphere. When these compounds react with
ultraviolet radiation, they release chlorine and bromine which then break apart the ozone molecule,
leading to the stratospheric depletion of ozone. CF3I and HFC-227 ea are being considered by the
military and the Federal Aviation Administration as potential replacements for Halon 1301 as a
flooding agent in both occupied and non-occupied spaces.
An initial battery of genotoxicity tests were performed to evaluate the potential for tumorogenic
activity of CF3I and HFC-227ea. This battery included the Ames Salmonella typhimurium histidine
reversion assay, the L5178Y/f/r+/" mouse lymphoma cell mutagenesis assay, and the in vivo mouse
bone marrow erythrocyte micronucleus test.
METHODS
The Toxic Hazards Research Unit subcontracted the performance of these investigations with
Genesys Research, Inc., Research Triangle Park, NC. Dr. A. Mitchell of Genesys was the Study
Director for these studies. A brief presentation of the methods and results follow. Details of the
methods and results are given in six Air Force technical reports (AL/OE-TR-1995-0008, Vol. I, II,
and III, and AL/OE-TR-1995-0009, Vol. I, II, and III).
63
Test Compound
The CF3I (CAS 2314-97-8) used in this study was purchased from PCR, Inc., Gainesville, FL.
The compound has a formula weight of 195.91 and a boiling point of -22.5 °C. The compound is a
liquid and is stored in a cylinder under pressure. Purity was confirmed by Gas
Chromatography/Mass Spectrometry (GC/MS) analysis to be > 99.8%. The HFC-227ea (CAS 431-
89-0) was received from Great Lakes Chemical Corporation in a steel gas container. HFC-227ea has
a formula weight of 170 and is a colorless gas. Purity was confirmed by GC/MS analysis to be
99.0%.
General Procedures
Testing was conducted in accordance with the provisions of the United States Environmental
Protection Agency/Toxic Substances Control Act Good Laboratory Practice (GLP) Standards as
defined in the Federal Register, August 17, 1989 (40 CFR, Part 792), TSCA Test Guidelines,
Federal Register, September 27, 1985 (Vol. 50, #188, Part 798.5265, 798.5300, and 798.5395),
and its revision (May 20, 1987, Vol. 52, #97). CF3I and HFC-227ea concentrations were
determined by infrared (IR) which was calibrated using a "closed-loop" method. The IR settings
were: wavelength, 9.05 or 9.7 \x; absorbance, 0.25; and range, X1 for all genotoxicity studies.
Pathlength ranged from 6.75 to 15.75 m and slit ranged from 1 to 2, dependent on the conditions
of the study. Analyses were performed by withdrawing a test atmosphere sample into a gas-tight
syringe and injecting it into the IR instrument.
SALMONELLA TYPHIMURIUM HISTIDINE REVERSION ASSA Y
Tester Strains
The tester strains used in this study were TA1535, TA1537, TA1538, TA98, and TA100,
obtained from Dr. Bruce Ames of the University of California at Berkeley (Ames et al., 1975).
Method
The specific test method has been described in detail (Ames et al., 1975; Maron and Ames,
1983). After the top agar had set, the test material (or negative control) plates for all five strains
that were to be exposed to one concentration of the test material (or to air, the negative control)
were placed on a shelf on the bottom section of a plastic exposure chamber (Modular Incubator
64

Chamber, Billups-Rothenberg, Del Mar, CA) with an internal volume of approximately 1 L. The
chambers, which consisted of an upper and lower section connected by a gasket and a large
stainless steel adjustable squeeze clamp, were then closed by connecting and sealing the upper and
lower sections.
Exposure Method
The test material and dilution air were metered through calibrated flowmeters into the exposure
chambers, and chamber atmosphere samples were collected, via a gas-tight syringe, and injected
into the IR instrument for analysis. The test material and the dilution air were adjusted until the
desired chamber concentration was obtained. The chamber exhaust was first disconnected, and
then the gases were shut off. This was done to prevent diluting the chamber atmosphere. The inlet
and exhaust ports were then sealed with screw clamps. During the mutagenesis assay, two
chambers per exposure level were required to hold all the petri plates. To ensure that both chambers
received the same concentration, the gas was introduced to the inlet port of one chamber which
was exhausted into the inlet of the second chamber. The exhaust from the second chamber was
then analyzed by IR.
L5178Y/tk+/~ MOUSE LYMPHOMA CELL MUTAGENESIS ASSAY
Cell Culture
L5178Y mouse lymphoma cells, clone 3.7.2C, provided by Dr. Donald Clive, Burroughs
Wellcome Co., Research Triangle Park, NC, were stored in liquid nitrogen. The cells were grown as
a suspension culture in F10HP medium (see composition below), cleansed of homozygous (tk~l~)
cells with medium containing 0.1 //g/ml_ methotrexate, as described by Mitchell et al., 1988, and
used as target cells for chemical exposure.
Exposure of Cell Cultures
For testing these volatile materials in the preliminary concentration range-finding and
mutagenesis assays, three sterile 15 mL round-bottom glass blood tubes, sealed with red rubber
serum stoppers, were prepared for each concentration level: a tube for the culture tested without
activation, a tube for the culture tested with activation, and a sham tube that contained medium
only (no cells or S9) which was used to estimate postexposure infrared (IR) analysis of the
concentration of test material in the other two tubes.
65
MOUSE BONE MARROW MICRONUCLEUS TEST
Animal Source, Environment, Husbandry, and Evaluation
Thirty male and 30 female Swiss Webster mice, approximately 42 days old at receipt, were
purchased from Charles River Laboratories in Raleigh, NC.
Administration of the Test Materials
Eight groups (group size = 5/sex) of Swiss Webster mice were exposed 6 h per day for 3
consecutive days at concentrations of either 0% (air-only control), 2.5%, 5.0%, or 7.5% CF3I or
0%, 2.6%, 5.3%, or 10.5% HFC-227ea via nose-only inhalation. Additional groups served as
positive controls and were dosed on exposure Day 3 via ip injection. The CF3I or HFC-227ea mice
were exposed in Cannon 52-port nose only chambers (Lab Products, Maywood, NJ), and the
negative control mice were exposed in a nose-only chamber made by IN-TOX Products
(Albuquerque, NM). For each exposure group, the test atmosphere was generated by metering the
CF3I or HFC-227ea gas from the cylinder into either a 2000 or 4000 mL Erlenmeyer flask that
served as a mixing plenum. Oxygen levels from the chamber exhausts were determined using an
02/Explosion meter (MSA Model 421).
Positive Control
Approximately 24 h prior to sacrifice positive control animals received one ip dose of 0.4 mg/kg
triethylenemelamine.
Sacrifice and Slide Preparation
Slides of peripheral blood smears were made for all animals at 24 ± 3 h after the last exposure
by the following procedure.
Each mouse was sacrificed by cervical dislocation and 2-3 |iL of blood was obtained from the tail
vein. The blood was mixed with 2-3 (J.L of calf serum, spread thinly on a slide and allowed to dry. Three
slides were prepared per mouse. Slides were fixed in methanol, allowed to dry, stained with 5% Giemsa,
rinsed and dried. Slides were divided into three sets, coded and inspected (without knowledge of the
code) by two separate observers (one set/observer). Slides were first observed under low microscopic
power, then scored at 100 x magnification (oil immersion). Cells contained more than one micronucleus
were scored as a single micronucleated cell.
66
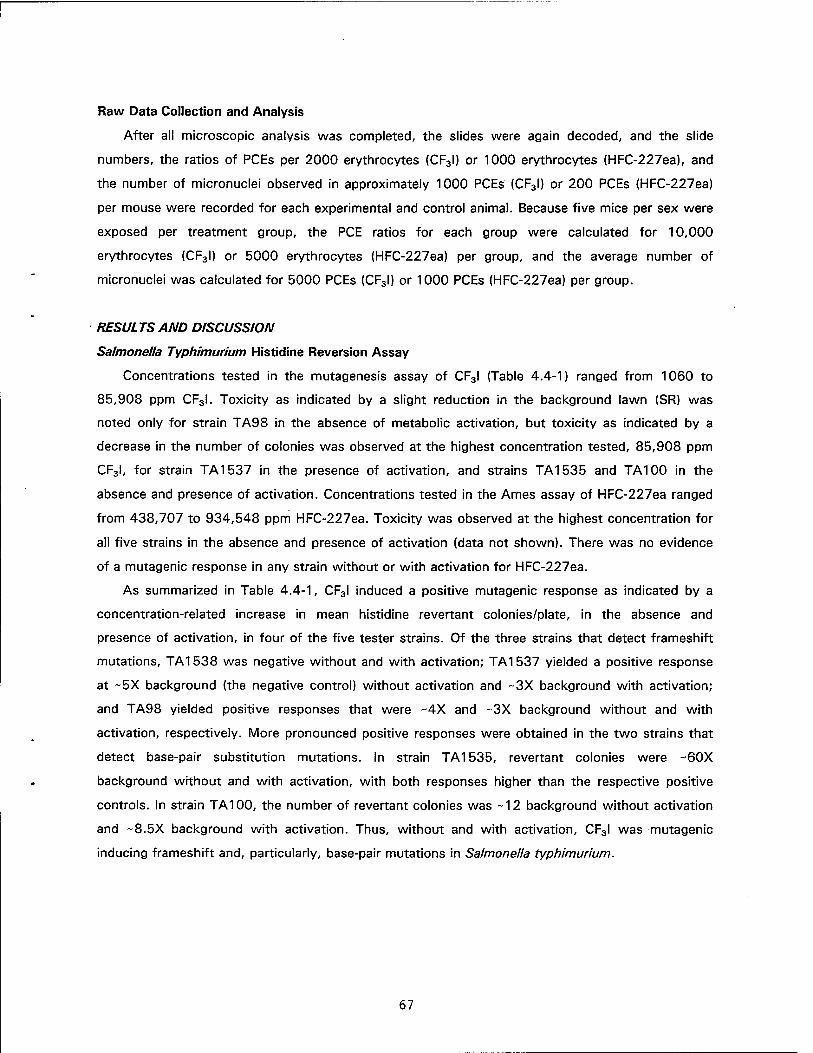
Raw Data Collection and Analysis
After all microscopic analysis was completed, the slides were again decoded, and the slide
numbers, the ratios of PCEs per 2000 erythrocytes (CF3I) or 1000 erythrocytes (HFC-227ea), and
the number of micronuclei observed in approximately 1000 PCEs (CF3I) or 200 PCEs (HFC-227ea)
per mouse were recorded for each experimental and control animal. Because five mice per sex were
exposed per treatment group, the PCE ratios for each group were calculated for 10,000
erythrocytes (CF3I) or 5000 erythrocytes (HFC-227ea) per group, and the average number of
micronuclei was calculated for 5000 PCEs (CF3I) or 1000 PCEs (HFC-227ea) per group.
RESULTS AND DISCUSSION
Salmonella Typhimurium Histidine Reversion Assay
Concentrations tested in the mutagenesis assay of CF3I (Table 4.4-1) ranged from 1060 to
85,908 ppm CF3I. Toxicity as indicated by a slight reduction in the background lawn (SR) was
noted only for strain TA98 in the absence of metabolic activation, but toxicity as indicated by a
decrease in the number of colonies was observed at the highest concentration tested, 85,908 ppm
CF3I, for strain TA1537 in the presence of activation, and strains TA1535 and TA100 in the
absence and presence of activation. Concentrations tested in the Ames assay of HFC-227ea ranged
from 438,707 to 934,548 ppm HFC-227ea. Toxicity was observed at the highest concentration for
all five strains in the absence and presence of activation (data not shown). There was no evidence
of a mutagenic response in any strain without or with activation for HFC-227ea.
As summarized in Table 4.4-1, CF3I induced a positive mutagenic response as indicated by a
concentration-related increase in mean histidine revertant colonies/plate, in the absence and
presence of activation, in four of the five tester strains. Of the three strains that detect frameshift
mutations, TA1538 was negative without and with activation; TA1537 yielded a positive response
at ~5X background (the negative control) without activation and ~3X background with activation;
and TA98 yielded positive responses that were ~4X and ~3X background without and with
activation, respectively. More pronounced positive responses were obtained in the two strains that
detect base-pair substitution mutations. In strain TA1535, revertant colonies were ~60X
background without and with activation, with both responses higher than the respective positive
controls. In strain TA100, the number of revertant colonies was -12 background without activation
and -8.5X background with activation. Thus, without and with activation, CF3I was mutagenic
inducing frameshift and, particularly, base-pair mutations in Salmonella typhimurium.
67
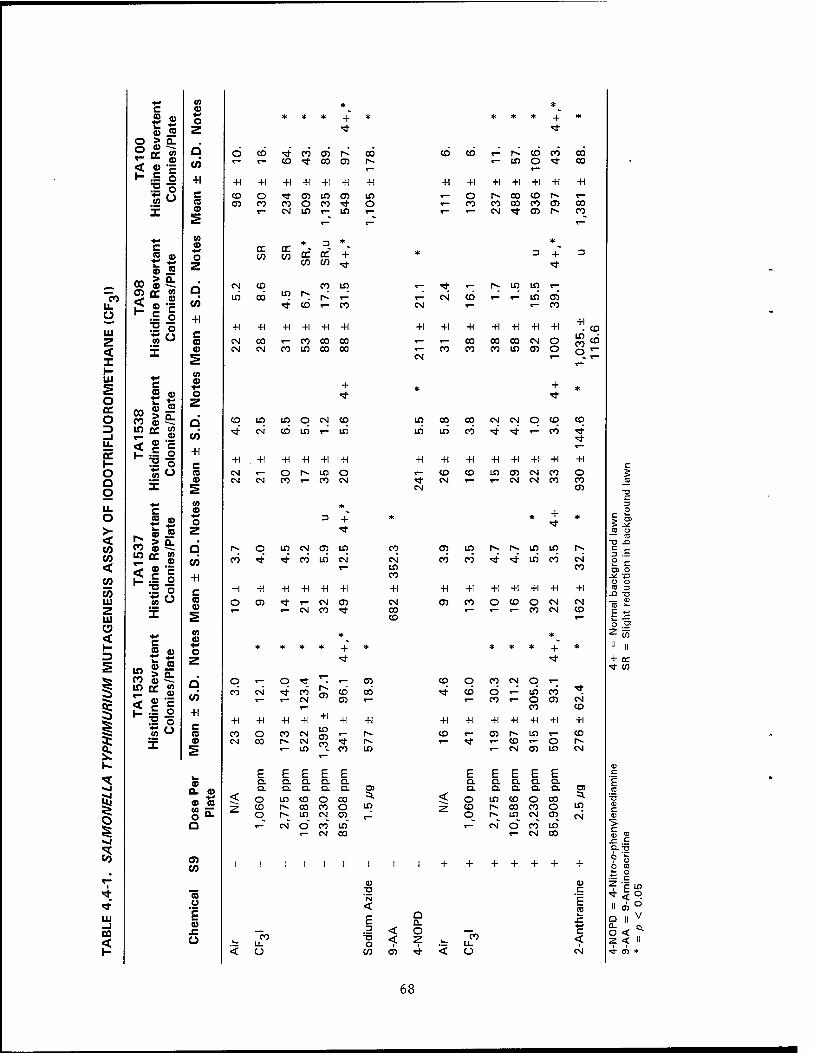
+* CO gfc c 09 (0 09
(0 o * * * + *
k. 0) Z <tf
O > O- . O cn q o CD "* co 0) Is- co < 09 CO r* T~ co <tf co CJ) r*-
H c '•5
o o O
+i +1 +1 +1 +i +1 +1 +1 "■P c CD O <tf CJ) LO 0) LO (0 CO cn CO CO o co ■* O X 09 *"" CM LO t— LO
c CO 09
DC cc * 3 * (0 09 o CO CO DC DC + 09 03 z CO CO «tf
CO > 0)
E Q CN CD co LO
co cn <
cc (0 09 LO cö LO r- r~ rZ
LL O
09 c "c
o CO
+1 -* co *" co
*"^ '■p "5 +1 +1 +1 +1 +1 •H 111
z '■p 01 o c
CO CM CO r_ co co co < X
if 09
2 CM CN CO LO co co
1- CO LU
2 c 09
09
O +
»3- o cc O
00 CO
k. 09 > 09
(0
Q.
Z
Q CD LO LO o CM CO
3 -i
LO CC CO
<* CN CO LO <- LO
u. cc
< 09 c
'■5
'E o o
+1 c +1 +1 -H +1 +1 +1
o 03 CJ CO CM v— O Is- LO o Q g X
09
2 CM CM CO
" CO CM
LL CO 09
* O >-
eo
09 >
09 o z 3 +
<* < Is» Q. . CO CO 09 q Is- o LO CM CJ) LO
CO
< CO
If)
< CC 09 c
CO
.22 'E
CO
+i
CO ■*" -* CO LO CM
CO LU
|5 03
o o c CO 09
s
+1 O
+1 CJ>
+1 +1 +1 CM
+1 0)
z LU
X *~ *~ CN CO «*
UJ <0 < 1-
1 1
LO CO LO
<
■k" c CD
k. 09 > 09
CC 09 c
09
a a. CO 09
'E _g o
09
o z q CO +i
o CO
+1
*
CM
+1
*
o
+1
*
CO CM
+1
*
CJ)
+1
+
CO
C3)
+1
*
CJ)
CO r—
+! ■-p (0 o c
CO CO o co CM LO CJ) co
r- 5: X 09 CN CO r- CN 5 r--
5 *" LO CO LO
F £ £ E E © Q. a. a. a. a.
-.1 Q- <D a. Q. a. a. a. o>
1 O
CD CD C/3 2T
< O LO CD o CO 5. 2 CD Is- CO CO O LO
o *■ Q
O r--_ CN
LO
a CM_
co" LO~ T—
r— CM 00 -i
5 CO cn
co 1 1 i 1 1 1 1
r™ <D
"cö ü
E 09
< LU _l
E 3
< Ü k. ~co LL o
H < Ü CO
CM LO co +1 CM CO CO
< <
I O)
a o_ o
+
co i- Is- co co t- LO o t
co CO
-H +1 t- O r- CO
+1 +1 +1 +1 +1 Is- oo co r-- co oo co o) N ^t O) N
CO co
* 3 + 3
,- <tf ,- Is- LO LO ,- T—
CN CN CO "~ *~ LO CJ)
co
+1 +1 +1 +1 +1 +1 +1 *<D
CM co
co co
co co
oo LO
CN CJ)
o o
&CO
* + *
LO 00 00 CM CN O CO CO
LO LO co ^1- "* '"" CO "* ■*
+1 +1 +i +1 -H +1 +1 +1
5 CM
CO CM
CO LO 0) CM
<N CM
CO 00
o CO CJ)
73 J3 CJ)
CO
LO
CO
Is- r-- LO
LO
LO
CO
Is-
CN co 2 c
CO o
o o +1 +1 +1 +1 +1 +1 +1
■n T3 O) CO o CO o CM CM _ OJ
r— ^ v— CO CM CO ££ ^ O C)
* zs * * * + * « ii
+ a: ■st CO
CO o CO CM o T-
>* CO o ,— LO co rt
*" CO T— o CO
O) CM CO
+1 +1 +1 +1 +1 +1 +1 CO r— CJ) r-. LO ,_ CO r- ^ r— co T— o Is-
r~ CN CJ) LO CM
F F F F E a a a a a £ o. a a. a. a. a> <0
< o CO
LO r-
CO 00
o CO
00 o
=1. LO a:
o Is- LO CM 0) CM tD
r-■ <N o CO LO >■
T— CM 00
+ + + +
co LL. Ü
CO c E CO
JZ *•> c <
°-~5 9 '5 o CO
E w
68
L5178Y/?Ar+/~ Mouse Lymphoma Cell Mutagenesis Assay
It may be noted that although the provided material safety data sheet for CF3I indicated that this
test material is not soluble in water, apparently CF3I is at least partially soluble in medium, as the
concentration-related depressions in relative suspension growth that were observed in the
preliminary assay (data not shown) would not be expected with an insoluble material. For HFC-
227ea, there was no toxicity in either the range-finding or mutagenesis assay (data not shown).
Nominal concentrations of HFC-227ea ranged from 100,000 to 900,000 ppm. Thus, HFC-227ea
may have been insoluble in cell culture medium. In the mutagenesis assay, HFC-227ea did not
induce gene or chromosomal mutations (data not shown).
In the mutagenesis assay of CF3I (Table 4.4-2), the average absolute cloning efficiencies of the
negative controls (air) were 127.3% in the absence of activation and 136.1% in the presence of
metabolic activation (data not shown); the spontaneous mutation frequencies averaged 57 x 10-^
in the absence of activation and 62 x 10"^ in the presence of activation. Therefore, both the
cloning efficiencies and the spontaneous mutation frequencies met the criteria for acceptability.
Positive control mutant frequencies were within the historical ranges for the laboratory. For both
positive controls, primarily small (s) colony mutants were produced.
69
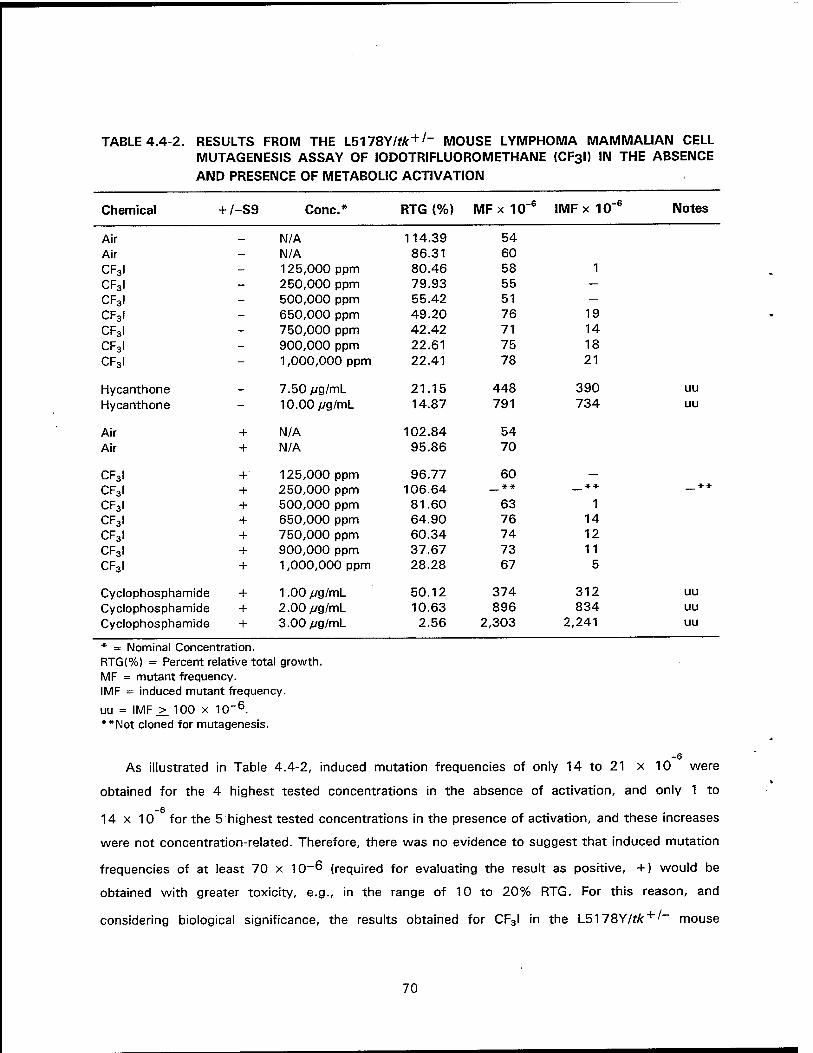
TABLE 4.4-2. RESULTS FROM THE L5178Y/fAr+/" MOUSE LYMPHOMA MAMMALIAN CELL MUTAGENESIS ASSAY OF IODOTRIFLUOROMETHANE {CF3D IN THE ABSENCE
AND PRESENCE OF METABOLIC ACTIVATION
Chemical + /-S9 Cone* RTG (%) MFx 10~6 IMFx 10~6 Notes
Air _ N/A 114.39 54 Air - N/A 86.31 60 CF3I - 125,000 ppm 80.46 58 1
CF3I - 250,000 ppm 79.93 55 — CF3I - 500,000 ppm 55.42 51 — CF3I - 650,000 ppm 49.20 76 19 CF3I - 750,000 ppm 42.42 71 14
CF3I - 900,000 ppm 22.61 75 18 CF3I - 1,000,000 ppm 22.41 78 21
Hycanthone — 7.50 //g/mL 21.15 448 390 uu
Hycanthone - 10.00 fjg/mL 14.87 791 734 uu
Air + N/A 102.84 54 Air + N/A 95.86 70
CF3I +' 125,000 ppm 96.77 60 —
CF3I + 250,000 ppm 106.64 * * ** **
CF3I + 500,000 ppm 81.60 63 1 CF3I + 650,000 ppm 64.90 76 14 CF3I + 750,000 ppm 60.34 74 12 CF3I + 900,000 ppm 37.67 73 11 CF3I + 1,000,000 ppm 28.28 67 5
Cyclophosphamide + 1.00 fjg/ml 50.12 374 312 uu Cyclophosphamide + 2.00 /C/g/mL 10.63 896 834 uu Cyclophosphamide + 3.00//g/mL 2.56 2,303 2,241 uu
* = Nominal Concentration. RTG(%) = Percent relative total growth. MF = mutant frequency. IMF = induced mutant frequency.
uu = IMF >. 100 x 10"6. **Not cloned for mutagenesis.
As illustrated in Table 4.4-2, induced mutation frequencies of only 14 to 21 x 10 were
obtained for the 4 highest tested concentrations in the absence of activation, and only 1 to
-6 14x10 for the 5 highest tested concentrations in the presence of activation, and these increases
were not concentration-related. Therefore, there was no evidence to suggest that induced mutation
frequencies of at least 70 x 10~6 (required for evaluating the result as positive, +) would be
obtained with greater toxicity, e.g., in the range of 10 to 20% RTG. For this reason, and
considering biological significance, the results obtained for CF3I in the L5~\78Y/tk + '~ mouse
70
lymphoma cell mutagenesis assay in the absence and presence of activation are evaluated as
negative (-). Therefore, when tested to the maximum concentrations that could be obtained under
the conditions of testing, iodotrifluoromethane (CF3I) did not induce gene or chromosomal mutations
in mammalian cells in vitro.
Mouse Bone Marrow Micronucleus Test
No mice died during the CF3I or HFC-227ea studies. All mice appeared normal throughout the
studies. When weighed before exposure to CF3I in the micronucleus assay, male mice weighed 27.4
to 33.0 g and female mice weighed 24.0 to 28.8 g. When weighed after exposure and immediately
before sacrifice, male mice weighed 23.5 to 31.0 g and female mice weighed 19.9 to 27.2 g. The
majority of the mice in all exposure groups, including the negative control group, lost weight from
Day 1 (randomization) to Day 4 (sacrifice). Weight loss averaged 2.3 g for the male mice and 2.1 g
for the female mice, and the 5.0% and 7.5% animals lost more weight than the negative controls
and 2.5% animals. Thus, in addition to effects attributable to the mice being in the nose-only tubes
for approximately 7 h per day, CF3l-related weight loss was observed. For HFC-227ea, weight loss
was also observed, but it was not test-material related.
Summaries of the results obtained in the micronucleus assay of CF3I in male and female mice
are presented in Table 4.4-3. Negative control values were within historical ranges, and each
positive control group yielded a positive response that was significant at p < 0.01. The key
indicators for this assay are the number of newly formed PCEs per 1000 erythrocytes, which is a
measure of toxicity, and the number of MN per 1000 PCEs, which is an index of potential
chromosome breakage.
In the negative control animals, PCE ratios were 11.1%o for male mice and 20.8%o for female
mice. Both ratios were within historical control ranges for the laboratory, and no physiological basis
for the difference in ratios between the sexes was apparent. Appropriately low numbers of
MN/1000 PCEs were observed in the negative control mice: 2.0%o in male mice and 1.0%o in female
mice, values which were also within historical ranges for the laboratory.
71

TABLE 4.4-3. MICRONUCLEUS ASSAY OF IODOTRIFLUOROMETHANE (CF3I) IN MICE
Average per Dose
Chemical Average Dose PCEs/1000 Erythrocytes MN/1000PCES
Males
Air
CF3I
CF3I
CF3i
TEM
Females
Air
CF3I
CF3I
CF3I
TEM
N/A
2.5%
5.0%
7.5%
0.4 mg/kg
N/A
2.5%
5.0%
7.5%
0.4 mg/kg
11.1
12.8
6.7
8.7
2.8**
20.8
7.3**
5.3**
4.9**
3.3**
2.0
3.4
5.2*
9.0**
24.6**
1.0
2.4
3.0*
4.8**
34.1**
MN = Micronuclei. PCE = Polychromatic erythrocytes. TEM = Triethylenemelamine. * = p < 0.05. ** = p < 0.01.
PCE/erythrocyte ratios were depressed and MN/PCE ratios were elevated in the positive control
mice. The PCE ratios had normal residuals and equal variances among all potential effects (dose,
sex, and dose by sex), and the sex of the animals influenced the effect of the positive control
(p = 0.0290). The MN ratios did not have normal residuals or equal variances; therefore, the
natural log transformation was used on MN ratios. The natural logs of MN ratios had normal
residuals and equal variances. The interaction between the dose of TEM and the sex of the animals
was not statistically significant (p = 0.0541), but the effect of TEM dose was statistically
significant (p = 0.01) for both sexes, as indicated in Table 4.4-3.
Toxicity of CF3I was evidenced by dose-related depressions in weight for both sexes,
statistically significant dose-related depressions in PCE ratios for female mice, and apparently
biologically relevant depressions in PCE ratios for all except one male mouse. Positive responses, as
72

indicated by dose-related increases in micronuclei were observed in erythrocytes from both male
and female mice, results which indicate that CF3I is capable of inducing structural chromosomal
aberrations in vivo.
For HFC-227ea, neither criterion for a positive response - a dose-related increase in micronuclei
and the induction by one or more of the doses of a statistically significant (p < 0.5) increase in
micronuclei induction - were observed in the male or female mice (data not shown). Therefore,
HFC-227ea was evaluated as negative in the mouse bone marrow micronucleus test. Hence,
HFC-227ea was not clastogenic in vivo.
SUMMARY
• CF3I was positive in the Salmonella typhimurium histidine reversion mutagenesis assay.
HFC-227ea was negative in the Ames assay.
• The L5178Y/#: mouse lymphoma cell mutagenesis assay showed that neither CF3I nor
HFC-227ea induced gene or chromosomal mutations in mammalian cells in vitro.
• Positive results in the mouse bone marrow micronucleus test indicated CF3I was clastogenic
in vivo. HFC-227ea was not clastogenic in vivo.
The animals used in this study were handled in accordance with the principles stated in the
Guide for the Care and Use of Laboratory Animals, prepared by the Committee on Care and Use of
Laboratory Animals of the Institute of Laboratory Animal Resources, National Research Council,
Department of Health and Human Services, National Institute of Health Publication #86-23, 1985,
and the Animal Welfare Act of 1966, as amended.
REFERENCES
Ames, B.N., J. McCann, and E. Yamasaki. 1975. Methods for detecting carcinogens and mutagens with the Sa/mone/Za/mammalian microsome mutagenicity test. Mutat. Res. 31:47-364.
Maron, D.M. and B.INI. Ames. 1983. Revised methods for the Salmonella mutagenicity test. Mutat. Res. 113:173-215.
Mitchell, A. D., B. C. Myhr, C. J. Rudd, W. J. Caspary and V. C. Dunkel. 1988. Evaluation of the L5178Y mouse lymphoma cell mutagenesis assay: Methods used and chemicals evaluated. Environ. Molec. Mutagen. 12, Suppl. 13:1-18.
73
4.5 TWO-WEEK RANGE-FINDING, NOSE-ONLY INHALATION EXPOSURE OF F-344 MALE RATS TO TRIFLUOROIODOMETHANE (CF3I)
E.R. Kinkead, R.E. Wolfe, M.L. Freedman, H.F. Leahy, and J.H. English1
ABSTRACT
Trifluoroiodomethane (CF3I) is being considered as a replacement compound for Halon 1301.
The material would be used as a flooding agent for in-flight aircraft and electronic equipment fires
and for fire extinguishment in confined spaces. As part of the process to develop environmental and
health effects criteria, inhalation exposure during routine or repeated use conditions was examined.
This study was a range-finding, nose-only inhalation study designed to determine target
concentration levels for a 90-day nose-only inhalation study. Daily 2-hour exposures at 12%, 6%,
3%, and 0% CF3I were performed for 2 weeks (10 exposures). Suppression of body weight gains,
incoordination, and lethargy were significant findings in the high-level animals. Transient body
weight suppression was noted in the mid-level animals. Thyroglobulin and reverse T3 values were
increased at all levels. No gross lesions or histopathological (thyroid and parathyroid) effects were
noted at necropsy.
INTRODUCTION
Environmental concern over the depletion of stratospheric ozone and global warming has led to
an international treaty called the Montreal Protocol (1987) which calls for the phaseout of halons by
the year 2000. Presently, the Air Force is using Halon 1301 as a flooding agent for extinguishing in-
flight aircraft and electronic equipment fires and for fire extinguishment in confined spaces. Because
it is believed to have less ozone-depleting activity, trifluoroiodomethane (CF3I) is being considered as
a possible replacement for Halon 1301.
Little toxicity information is available in the literature concerning CF3I toxicity. A modified acute
inhalation toxicity test was performed in which rats were exposed in a nose-only chamber to 12%
CF3I for 15 min (Skaggs et al., 1993). Salivation was observed in the rats upon removal from the
chamber; however, all rats appeared to be fully recovered by 2-hour postexposure. A 15-minute,
nose-only inhalation median lethal concentration (LC50) value is 27% CF3I (Ledbetter, 1994). No
deaths occurred following an acute 4-hour nose-only inhalation exposure to either 0.5% or 1.0%
CF3I (Kinkead et al., 1994). Additionally, no treatment-related signs of toxic stress were noted
immediately following exposure. Histopathologic examination of selected tissues from animals
examined immediately following exposure, 3-day postexposure, or after a 14-day postexposure
observation period, showed no lesions of pathologic significance.
1 Army Medical Research Unit, Wright-Patterson Air Force Base, OH.
74
Department of Defense (DoD) instructors may undergo repeated exposure to low level CF3I
vapor during routine training sessions. Although the anticipated use of this compound is in confined
areas, such as engine compartments, there is potential for personnel confined to crew
compartments to experience acute inhalation exposures from leakage of CF3I. There is also
occupational concern for those filling, storing, and transporting cylinders of CF3I. The DoD is in the
process of developing a complete toxicity profile that includes the results of extensive toxicity
testing. Results from subchronic inhalation studies will be useful in providing safety
recommendations for personnel assigned to training operations during which CF3I will routinely be
used. The Air Force must assure the safety of this compound in the environment and assure health
hazard information is available to the individuals responsible for the safe handling of this compound.
Preliminary to the start of a 90-day nose-only inhalation study, a 2-week range-finding study
was performed to identify target organ toxicity, clinical signs of toxic stress, and establish exposure
concentrations for the long-term study. This study reports the findings of the 2-week nose-only,
range-finding study.
MA TERIALS AND METHODS
Test Material
Trifluoroiodomethane is a fluoroalkane. Decomposition products are likely to include hydrogen
fluoride and hydrogen iodide. The test material used in this study will be supplied by Pacific Scientific,
Tulsa, OK. Pertinent physical and chemical properties follow.
75

Structure:
C - I
CAS No.
Systematic Name
Molecular Weight
Empirical Formula
Physical State
Specific Gravity
Melting Point
Boiling Point
Flash Point
Vapor Pressure
Solubility in H20
2314-97-8
lodotrifluoromethane
195.91
CF3I
Colorless gas
2.3608 g/mL (-42 °C)
Not applicable
-22.5 °C
Not flammable
85 psi @ 20 °C
Insoluble
CF3I, a liquid under pressure at room temperature, was obtained from Deepwater, Carson, CA
90746, through Combat Systems Test Activity, Aberdeen Proving Ground, MD. Eleven propane
tanks were received each containing between 36 to 69 lbs. The purity analysis supplied by the
manufacturer was confirmed to be 99.6 + % by gas chromatography/mass spectrometry (GC/MS)
(Teckmar 7000 Headspace Analyzer, Forster City, CA; Hewlett-Packard 5890A GC, HP 5970B
Mass Selective Detector, and HP Vectra 386/25 Data System, Palo Alto, CA). The supply was also
tested for the presence of fluoride ion using a Combination Fluoride Ion Electrode, Model 96-09-00,
with an Orion Model 701A Digital lonalyzer (Orion Research Inc., Cambridge, MA). Using a 1 ppm
(w/v) standard as absorber and interpreting the increase in fluoride content similar to a known
addition, the material used in the pre-study was found to contain less than 0.5 ppm (w/v)
fluoride ion.
Test Animals
Twenty male Fischer-344 (F-344) rats were purchased from Charles River Breeding
Laboratories, Raleigh, NC. The rats were 6 weeks of age upon arrival and 9 weeks of age at the
initiation of exposures. All rats were identified by tail tattoo and were subjected to a 2-week
76
quarantine period. Water and feed (Purina Formulab #5002) were available ad libitum, except during
exposure. Animal room temperatures were maintained at 21 to 25 °C, and the light/dark cycle was
set at 12-hour intervals. The animals were single housed in clear plastic cages with wood chip
bedding (Betta-Chip, Northeastern Products Corp., Warrensburg, NY). The animals used in this
study were handled in accordance with the principles stated in the Guide for the Care and Use of
Laboratory Animals, prepared by the U.S. Department of Health and Human Services (1985).
Contaminant Generation
The CF3I and the dilution air were delivered from pressurized systems and were controlled
through flowmeters. Fine control of the concentration was by minor adjustment of the CF3I flow in
response to analysis. The total air flow provided more than 300 mL/min delivered at each exposure
port. Target concentrations of CF3I during the 2-week study were 12%, 6%, 3%, and 0% (v/v). No
oxygen was added to the exposure atmosphere.
A portion of the input air passed through a gas washing bottle (Model 7166-26, Ace Glass,
Vinland, NJ) containing water to provide adequate relative humidity to the input air stream.
Humidity and temperature of the exposure atmosphere were constantly monitored and recorded
using H-CAL dual probes (Models CT830, HY-CAL, Atlanta, GA) and a data acquisition system.
The nose-only chamber used was a stainless steel flow-past chamber as described by Cannon
et al., 1983. The chamber has 52 ports; 5 were randomly selected for rat exposure. Plexiglass rat-
restraining tubes that extend radially outward were plugged into the ports.
Chamber Analysis
Continuous analysis of the CF3I was performed using infrared absorption spectrometers (Miran
1A, Foxboro Analytical, South Norwalk, CT). A 10-cm short path cell in combination with a low
intensity absorption band at 9.6 to 9.7 microns facilitated the analysis of the high concentrations
involved in these studies. Instrumental calibration was performed using known concentrations of
CF3I in air contained in Tedlar sample bags (231 series, SKC, Eighty Four, PA).
TOXICITY ASSESSMENT
Records were maintained of body weights (BW), signs of toxicity, and mortality. Euthanasia
was via C02 inhalation overdose. At sacrifice, gross pathology was performed on all animals and
thyroid and parathyroid tissues were harvested for histopathologic evaluation. Wet tissue weights
were determined on heart, liver, kidney, lungs, testes, and thyroid/parathyroid. Tissues were fixed in
10% neutral buffered formalin, trimmed, and further processed via routine methods for hematoxylin-
eosin-stained, paraffin-embedded sections. Additionally, blood was drawn for select hematology and
77
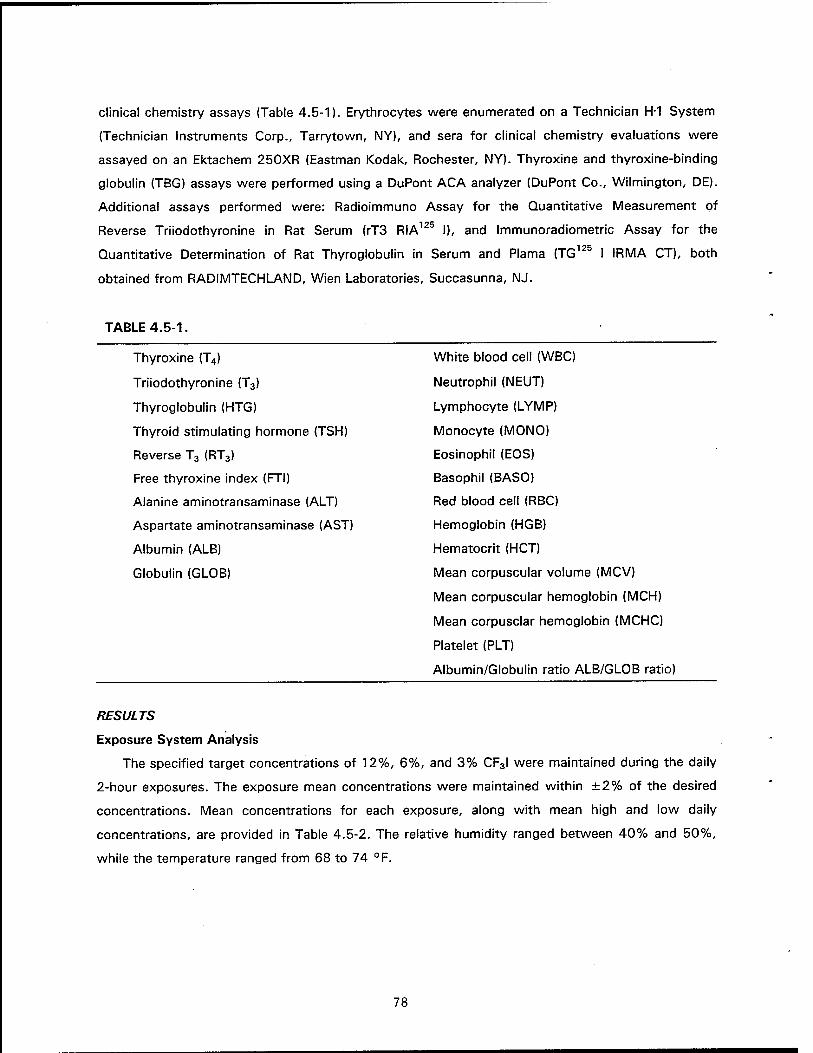
clinical chemistry assays (Table 4.5-1). Erythrocytes were enumerated on a Technician H-1 System
(Technician Instruments Corp., Tarrytown, NY), and sera for clinical chemistry evaluations were
assayed on an Ektachem 250XR (Eastman Kodak, Rochester, NY). Thyroxine and thyroxine-binding
globulin (TBG) assays were performed using a DuPont ACA analyzer (DuPont Co., Wilmington, DE).
Additional assays performed were: Radioimmuno Assay for the Quantitative Measurement of
Reverse Triiodothyronine in Rat Serum (rT3 RIA125 I), and Immunoradiometric Assay for the
Quantitative Determination of Rat Thyroglobulin in Serum and Plama (TG125 I IRMA CT), both
obtained from RADIMTECHLAND, Wien Laboratories, Succasunna, NJ.
TABLE 4.5-1.
Thyroxine (T4)
Triiodothyronine (T3)
Thyroglobulin (HTG)
Thyroid stimulating hormone (TSH)
Reverse T3 (RT3)
Free thyroxine index (FTI)
Alanine aminotransaminase (ALT)
Aspartate aminotransaminase (AST)
Albumin (ALB)
Globulin (GLOB)
White blood cell (WBC)
Neutrophil (NEUT)
Lymphocyte (LYMP)
Monocyte (MONO)
Eosinophil (EOS)
Basophil (BASO)
Red blood cell (RBC)
Hemoglobin (HGB)
Hematocrit (HCT)
Mean corpuscular volume (MCV)
Mean corpuscular hemoglobin (MCH)
Mean corpusclar hemoglobin (MCHC)
Platelet (PLT)
Albumin/Globulin ratio ALB/GLOB ratio)
RESULTS
Exposure System Analysis
The specified target concentrations of 12%, 6%, and 3% CF3I were maintained during the daily
2-hour exposures. The exposure mean concentrations were maintained within ±2% of the desired
concentrations. Mean concentrations for each exposure, along with mean high and low daily
concentrations, are provided in Table 4.5-2. The relative humidity ranged between 40% and 50%,
while the temperature ranged from 68 to 74 °F.
78
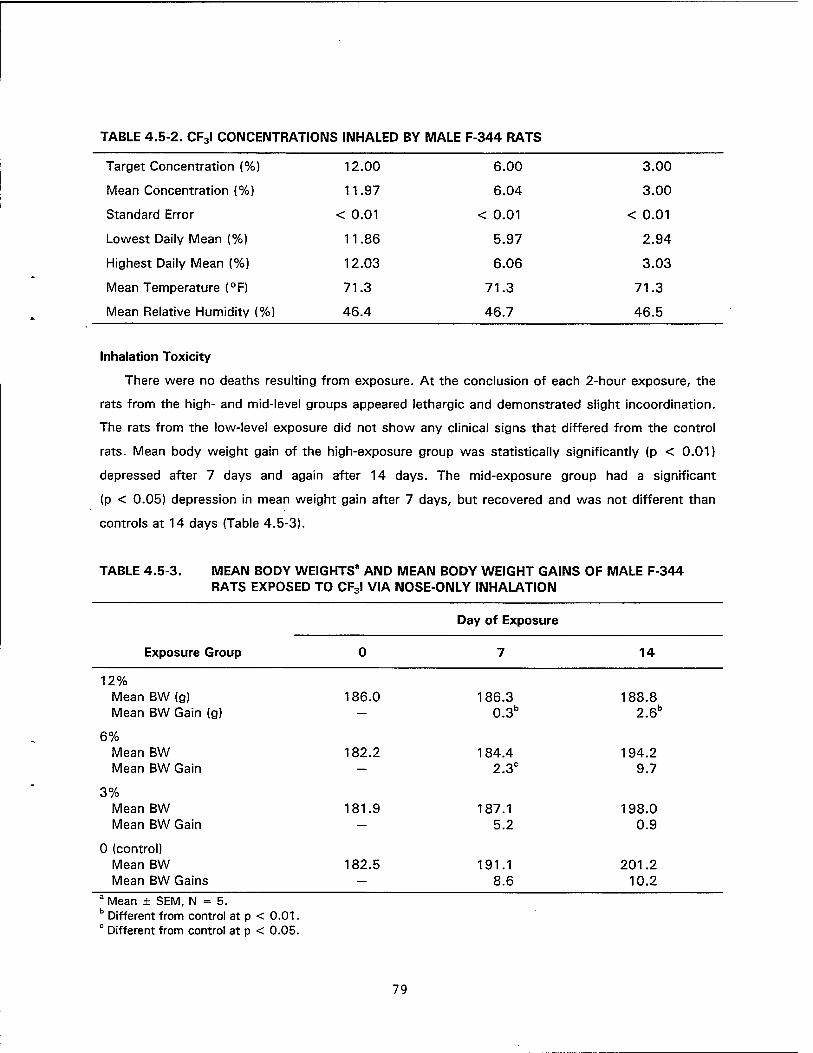
TABLE 4.5-2. CF3I CONCENTRATIONS INHALED BY MALE F-344 RATS
Target Concentration (%) 12.00 6.00
Mean Concentration (%) 11.97 6.04
Standard Error < 0.01 < 0.01
Lowest Daily Mean (%) 11.86 5.97
Highest Daily Mean (%) 12.03 6.06
Mean Temperature (°F) 71.3 71.3
Mean Relative Humidity (%) 46.4 46.7
3.00
3.00
< 0.01
2.94
3.03
71.3
46.5
Inhalation Toxicity
There were no deaths resulting from exposure. At the conclusion of each 2-hour exposure, the
rats from the high- and mid-level groups appeared lethargic and demonstrated slight incoordination.
The rats from the low-level exposure did not show any clinical signs that differed from the control
rats. Mean body weight gain of the high-exposure group was statistically significantly (p < 0.01)
depressed after 7 days and again after 14 days. The mid-exposure group had a significant
(p < 0.05) depression in mean weight gain after 7 days, but recovered and was not different than
controls at 14 days (Table 4.5-3).
TABLE 4.5-3. MEAN BODY WEIGHTS3 AND MEAN BODY WEIGHT GAINS OF MALE F-344 RATS EXPOSED TO CF3I VIA NOSE-ONLY INHALATION
Day of Exposure
Exposure Group 14
12% Mean BW (g) Mean BW Gain (g)
6% Mean BW Mean BW Gain
3% Mean BW Mean BW Gain
0 (control) Mean BW Mean BW Gains
186.0
182.2
181.9
182.5
186.3 0.3b
184.4 2.3°
187.1 5.2
191.1 8.6
188.8 2.6b
194.2 9.7
198.0 0.9
201.2 10.2
Mean ± SEM, N = 5. Different from control at p < 0.01. Different from control at p < 0.05.
79
A number of hematology and clinical chemistry values of exposed rats were statistically
different than control values (Table 4.5-4). The WBC count was decreased and the albumin values
of the high-exposure group were elevated when compared with control values. Neutrophils and
platelet counts were high, while lymphocytes, red cell count, and hemoglobin values were low in
the mid-exposure rats. Thyroglobulin (HTG) and reverse T3 (RT3) values were significantly increased
at all exposure levels.
At necropsy, the high-level rats appeared unthrifty grossly. However, no gross lesions were
found at any exposure level and no differences were noted in absolute or relative organ weights.
Histopathologic examination of thyroids and parathyroid glands determined no differences in CF3I-
exposed rats.
80
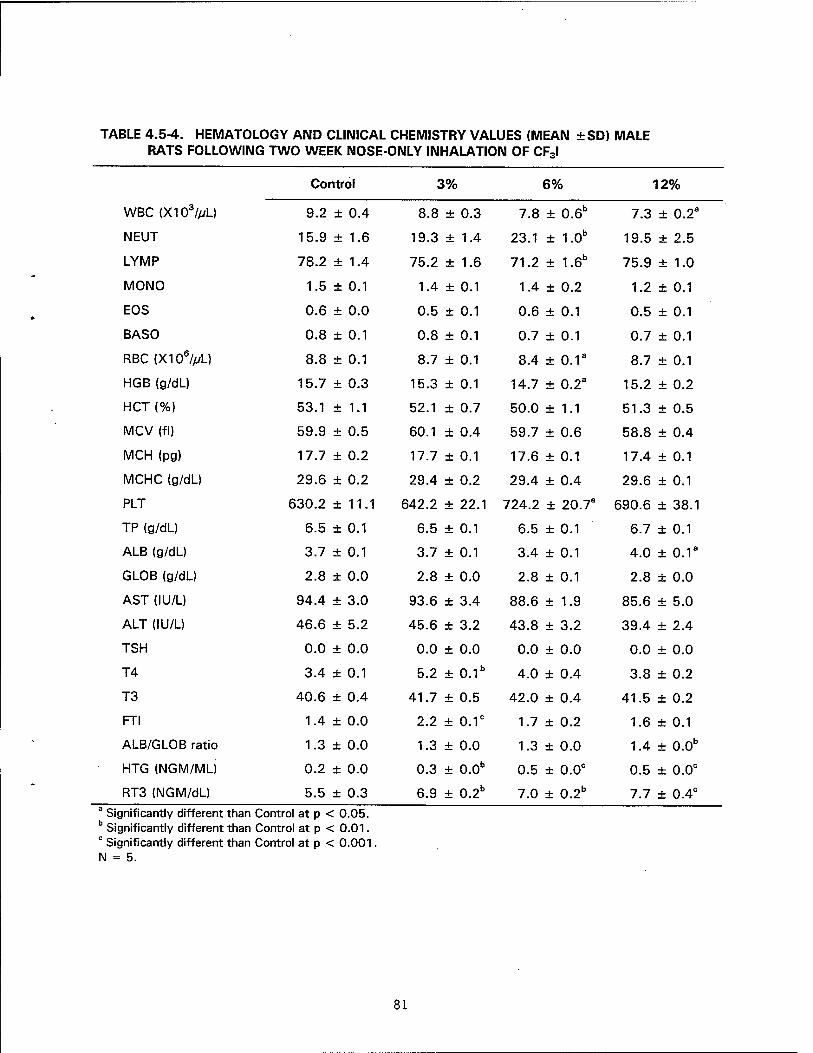
TABLE 4.5-4. HEMATOLOGY AND CLINICAL CHEMISTRY VALUES (MEAN ±SD) MALE RATS FOLLOWING TWO WEEK NOSE-ONLY INHALATION OF CF3I
Control 3% 6% 12%
WBC{X103//iU
NEUT
LYMP
MONO
EOS
BASO
RBC (X106//;L)
HGB (g/dL)
HCT (%)
MCV (fl)
MCH (pg)
MCHC (g/dL)
PLT
TP (g/dL)
ALB (g/dL)
GLOB (g/dL)
AST (IU/L)
ALT (IU/L)
TSH
T4
T3
FTI
ALB/GLOB ratio
HTG (NGM/ML)
RT3 (NGM/dL)
9.2 ± 0.4
15.9 ± 1.6
78.2 ± 1.4
1.5 ± 0.1
0.6 ± 0.0
0.8 ± 0.1
8.8 ± 0.1
15.7 ± 0.3
53.1 ± 1.1
59.9 ± 0.5
17.7 ± 0.2
29.6 ± 0.2
630.2 ±11.1
6.5 ± 0.1
3.7 ± 0.1
2.8 ± 0.0
94.4 ± 3.0
46.6 ± 5.2
0.0 ± 0.0
3.4 ± 0.1
40.6 ± 0.4
1.4 ± 0.0
1.3 ± 0.0
0.2 ± 0.0
5.5 ± 0.3
8.8 ± 0.3
19.3 ± 1.4
75.2 ± 1.6
1.4 ± 0.1
0.5 ± 0.1
0.8 ± 0.1
8.7 ± 0.1
15.3 ± 0.1
52.1 ± 0.7
60.1 ± 0.4
17.7 ± 0.1
29.4 ± 0.2
7.8 ± 0.6b
23.1 ± 1.0b
71.2 ± 1.6b
1.4 ± 0.2
0.6 ± 0.1
0.7 ± 0.1
8.4 ± 0.1a
14.7 ± 0.2a
50.0 ± 1.1
59.7 ± 0.6
17.6 ± 0.1
29.4 ± 0.4
642.2 ± 22.1 724.2 ± 20.7a
6.5 ± 0.1 6.5 ± 0.1
3.7 ± 0.1
2.8 ± 0.0
93.6 ± 3.4
45.6 ± 3.2
0.0 ± 0.0
5.2 ± 0.1b
41.7 ± 0.5
2.2 ± 0.1°
1.3 ± 0.0
0.3 ± 0.0b
6.9 ± 0.2b
3.4 ± 0.1
2.8 ± 0.1
88.6 ± 1.9
43.8 ± 3.2
0.0 ± 0.0
4.0 + 0.4
42.0 ± 0.4
1.7 ± 0.2
1.3 ± 0.0
0.5 ± 0.0C
7.0 ± 0.2b
7.3 ± 0.2a
19.5 ± 2.5
75.9 ± 1.0
1.2 ± 0.1
0.5 ± 0.1
0.7 ± 0.1
8.7 ± 0.1
15.2 ± 0.2
51.3 ± 0.5
58.8 ± 0.4
17.4 ± 0.1
29.6 ± 0.1
690.6 ± 38.1
6.7 ± 0.1
4.0 ± 0.1a
2.8 ± 0.0
85.6 ± 5.0
39.4 ± 2.4
0.0 ± 0.0
3.8 ± 0.2
41.5 ± 0.2
1.6 ± 0.1
1.4 ± 0.0b
0.5 ± 0.0C
7.7 ± 0.4C
Significantly different than Control at p < 0.05. b Significantly different than Control at p < 0.01. c Significantly different than Control at p < 0.001. N = 5.
81

D/SCUSS/ON
This was a range-finding study, the results of which were to be used to determine
concentration levels for use in a 90-day study. The failure of the high-level (12%) group to gain
weight over the 2-week period, as well as the significant clinical signs of stress and increases in
HTG and RT3, indicated that a 12% concentration would be inappropriate for a 90-day study. The
mid-level (6%) group showed some clinical signs of stress, transient weight gain suppression, and
increases in HTG and RT3. The HTG and RT3 values were increased in the low-level (3%) animals,
but the increase is not believed to be biologically significant.
Recommended CF3I concentrations for the 90-day study are 8%, 4%, and 2%. The high level
should produce clinical signs and demonstrate effects on the thyroid glands but no fatalities. The
mid level should result in minimal effects and the low level is expected to be a no observable effect
level (NOEL).
REFERENCES
Cannon, W. C, E.F. Blanton, and K.E. McDonald. 1983. The Flow-Past Chamber: An Improved Nose-Only Exposure System for Rodents. Am. Ind. fiyg. Assoc. J. 44(12):923 -933.
Kinkead, E.R., S.A. Salins. R.E. Wolfe, H.F. Leahy, and J.H. English. In Press. Acute Toxicity Evaluation of Ha/on Replacement Trifluoroiodomethane (CF3I). AL-TR-1994, Armstrong Laboratory, Wright-Patterson Air Force Base, OH.
Ledbetter, A. 1994. Personal communication.
Skaggs, S.R., D.S. Dierdorf, and R.E. Tapscott. 1993. Update on Iodides as Fire Extinguishing Agents. International CFE and Halon Alternatives Conference, Washington, DC. pp. 800-808.
A CKNO WLEDGMENT
The authors would like to thank Carlyle Flemming for statistical analysis. Acknowledgment is
also made to David Courson, Richard Godfrey, Willie Malcomb, Jerry Nicholson, and Peggy Parish
for their excellent technical assistance.
82
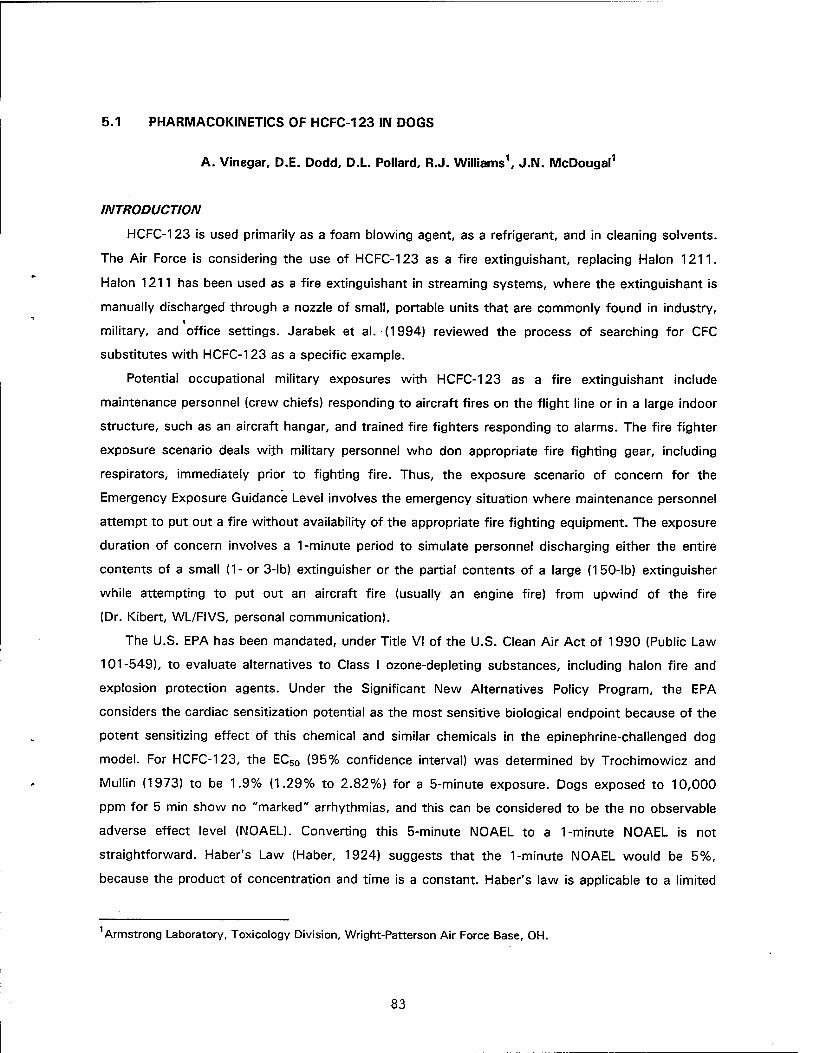
5.1 PHARMACOKINETICS OF HCFC-123 IN DOGS
A. Vinegar, D.E. Dodd, D.L. Pollard, R.J. Williams1, J.N. McDougal1
INTRODUCTION
HCFC-123 is used primarily as a foam blowing agent, as a refrigerant, and in cleaning solvents.
The Air Force is considering the use of HCFC-123 as a fire extinguishant, replacing Halon 1211.
Halon 1211 has been used as a fire extinguishant in streaming systems, where the extinguishant is
manually discharged through a nozzle of small, portable units that are commonly found in industry,
military, and office settings. Jarabek et al. (1994) reviewed the process of searching for CFC
substitutes with HCFC-123 as a specific example.
Potential occupational military exposures with HCFC-123 as a fire extinguishant include
maintenance personnel (crew chiefs) responding to aircraft fires on the flight line or in a large indoor
structure, such as an aircraft hangar, and trained fire fighters responding to alarms. The fire fighter
exposure scenario deals with military personnel who don appropriate fire fighting gear, including
respirators, immediately prior to fighting fire. Thus, the exposure scenario of concern for the
Emergency Exposure Guidance Level involves the emergency situation where maintenance personnel
attempt to put out a fire without availability of the appropriate fire fighting equipment. The exposure
duration of concern involves a 1-minute period to simulate personnel discharging either the entire
contents of a small (1- or 3-lb) extinguisher or the partial contents of a large (150-lb) extinguisher
while attempting to put out an aircraft fire (usually an engine fire) from upwind of the fire
(Dr. Kibert, WL/FIVS, personal communication).
The U.S. EPA has been mandated, under Title VI of the U.S. Clean Air Act of 1990 (Public Law
101-549), to evaluate alternatives to Class I ozone-depleting substances, including halon fire and
explosion protection agents. Under the Significant New Alternatives Policy Program, the EPA
considers the cardiac sensitization potential as the most sensitive biological endpoint because of the
potent sensitizing effect of this chemical and similar chemicals in the epinephrine-challenged dog
model. For HCFC-123, the EC50 (95% confidence interval) was determined by Trochimowicz and
Mullin (1973) to be 1.9% (1.29% to 2.82%) for a 5-minute exposure. Dogs exposed to 10,000
ppm for 5 min show no "marked" arrhythmias, and this can be considered to be the no observable
adverse effect level (NOAEL). Converting this 5-minute NOAEL to a 1-minute NOAEL is not
straightforward. Haber's Law (Haber, 1924) suggests that the 1-minute NOAEL would be 5%,
because the product of concentration and time is a constant. Haber's law is applicable to a limited
Armstrong Laboratory, Toxicology Division, Wright-Patterson Air Force Base, OH.
83
number of situations in which all processes are linear and the toxic moiety is the parent chemical.
Results of the dog pharmacokinetic study described above, show that Haber's law is not followed in
this situation. Cardiac sensitization might be explained by a chemical interfering with neural
transmission in the heart. The mechanism of action would be expected to be similar to the physical
effects of anesthetics which act at the membrane level by changing fluidity according to their
affinity to interact with lipids. This phenomenon is proportional to concentration. From these
assumptions, it follows that it is important to know the concentration in the heart or blood at the
time of the arrhythmias.
The objective of this study was to evaluate the pharmacokinetic behavior of HCFC-123 in an
exposure scenario that mimics the cardiac sensitization test in dogs and use the data to support the
development of a PBPK model. Specific emphasis was placed on the measurement of blood and
tissue samples following exposure of 1 % or 5% HCFC-123 for 1 to 5 minutes duration.
84

METHODS
Test Material
1,1 -DICHLORO-2,2,2-TRIFLUOROETHANE (HCFC-123)
Physical and Chemical Properties
Chemical Formula: CHCI2CF3
Molecular Weight:
Synonyms:
CAS No.:
Physical state:
Boiling point:
Freezing point:
Vapor pressure:
Vapor density:
Solubility in water:
Flash point:
Auto ignition:
Flame limits:
152.9
HCFC-123
306-83-2
Liquid at normal temperatures
27.9 oC@ 760 mm Hg
-107°C
11 psi (20 °C)
(Air = 1) 3.6
0.21% (wt) @70°F
N.A. — No flash point
Unknown, probably not applicable
(In air, % by vol), none
General Procedure
Two male beagle dogs per time-point were exposed to HCFC-123 at either 1% or 5% for
various exposure durations (Table 5.1-1). Exposure was "nose-only" via a specially adapted canine
anesthesia mask equipped with a two-way non-rebreathing valve. The exposure system was
designed to provide instantaneous exposure of the dogs to the target concentrations and permit the
drawing of blood samples. Blood samples were collected (as applicable) at 0 (preexposure), 1, 2, 3,
4, 5, 7.5, 10, 15, 30, 45, and 60 min (during exposure), and 1, 3, 6, 16, and 31 min (postexpo-
sure recovery) and analyzed for HCFC-123. At the end of the exposure periods (or postexposure
recovery periods), animals were euthanized and samples from selected tissues (heart, liver, fat, and
skeletal muscle) were collected as rapidly as possible for analysis of HCFC-123.
85

TABLE 5.1-1. EXPERIMENTAL DESIGN
Number of Dogs
Dog I.D. Number
Exposure Concentration (HCFC-123)
Exposure Time
Postexposure Time
2 1974/ 1999 1% 1 min na*
2 1975 / 1986 1% 5 min na
2 1992 / 1995 1% 60 min na
2 1993 / 1994 1% 60 min 30 min
2 1979 / 1990 5% 1 min na
2 1983 / 1997 5% 5 min na
na = not applicable.
Exposure System
Liquid HCFC-123 was evaporated by heating a glass reservoir, while air passed across the test
article surface. The HCFC-123 was first brought to target concentrations in a 500 L NYU-type
inhalation chamber, then supplied to the animal via a sideport. Concentrations in the exposure
chamber were monitored with a Miran 1A Gas Analyzer. Chamber air flow, temperature, relative
humidity, and oxygen were monitored as well. Each animal was exposed individually. The animal
was first secured in a sling, and the snout placed in a modified dog anesthesia mask. The snout
went through a small hole in a rubber diaphragm to provide a seal. The animal breathed either
chamber atmosphere or room air via a valve on the exposure line sideport. The animal breathed the
HCFC-123 through a two-way non-rebreathing valve to maintain a unidirectional flow of chemical.
Blood and Tissue Sampling
A 5.0 cm over-the-needle teflon catheter was inserted into a saphenous vein. The catheter was
attached to a three-way valve so that heparinized saline could be used to flush the catheter. A
three-mL glass syringe was used to draw blood samples. Three, approximately 100 mL samples
were place into preweighed headspace vials and reweighed for analysis of HCFC-123 concentration.
For tissue sampling, animals were euthanized by lethal injection. The dead animals were transferred
as rapidly as possible to a necropsy suite to harvest tissues for HCFC-123 analysis. The intact heart
was removed first, followed by samples of fat (perirenal), liver, and skeletal muscle. For each tissue,
three subsamples of approximately 500 mg were weighed and sealed in headspace vials. In general,
the entire necropsy procedure was completed in less than 5 minutes.
86

Analysis of Blood and Tissue Samples for HCFC-123
Blood and tissue samples were stored in a -80 °C freezer until analysis. Headspace vials
containing blood or standards were loaded onto a Tekmar 7050 static headspace sampler for
injection onto a Varian 3700 Gas Chromatograph. The gas Chromatograph was equipped with a
0.53 mm x 25 m PoraPlot Q column and an electron capture detector. Tissue samples were first
digested with sodium hydroxide solution to release the HCFC-123 into the headspace. The digestion
process occurred within the headspace vial. The digested samples were analyzed in the same
manner as the blood. Sample headspace HCFC-123 concentrations were calculated from a standard
curve.
RESULTS
The blood and tissue (heart, muscle, liver and fat) concentrations for all exposure scenarios are
given in Tables 5.1-2 and 5.1-3, respectively. Results for exposure durations of 1 to 5 min are
shown in a summarized form in Table 5.1-4. In animals exposed for 60 min (n = 4), the maximum
venous blood concentrations (mean values) were attained within 30 min, with less than a 3%
increase over the next 30 min (Figure 5.1-1 and Table 5.1-2). Animals allowed to recover for
30 min (n = 2), had rapid decreases in the venous blood concentrations within the first 16 min with
concentrations approaching the limits of detection by 31 min postexposure (Figure 5.1-2 and
Table 5.1-2).
Figures 5.1-3 and 5.T-4 are graphs of the triplicate blood concentrations at the early time points
for all animals exposed to 1 % and 5% HCFC-123, respectively. The experimental design allowed for
the sampling of 8 animals at 1.0 minute during the 1 % exposure. Due to problems in sampling, half
of the 1.0-minute samples were not available for analysis.
The rise and fall in tissue concentrations paralleled that of blood. Heart, liver and muscle tissue
appeared to take up HCFC-123 much quicker than fat tissue (Table 3). It should be noted that the
concentration of chemical in fat, in animals exposed for 60 minutes, was 3 to 5 fold higher than the
other tissues as expected. The solubility of HCFC-123 in fat (partition coefficient = 52.9) is
approximately 25 times greater than muscle (2.3), liver (1.9) or heart (2.5) tissues. Subsequently,
the washout of chemical in fat tissue was much slower than any other tissue. In general, the blood
and tissue concentrations of HCFC-123 both increased with exposure time and increasing
concentration.
87
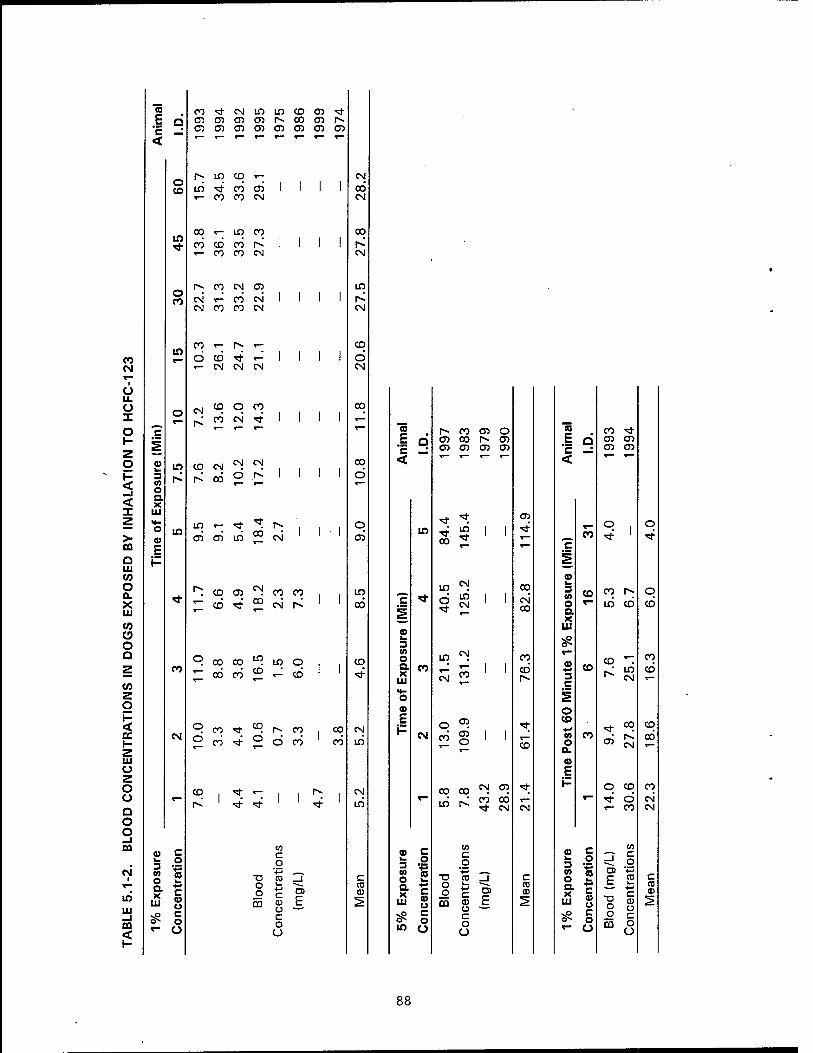
CO CM
o u. O X o H Z g < <
> CO.
Q UJ CO
O a. X in CO o o a
CO z g i- < H z UJ O z o o a o o -i CO
CM
r- iri UJ _i
<
CO
.§ Q c — <
o CO
w *
o CO
m
o ^™
c S «•■•••
» in 3 r^ o a X
UJ «*- o m a> E H
<*
CO
CM
-
co c b o 3 ~ «2 «5 O w
Exp
cent
ö~ o o
00 ^ CM in in CD en >* 05 cn en CO i^ 00 en r*> <J) 05 O) en CO CO en en
r~* in CD
d <* 00 d 1 1 1 1 *" 00 00 CM
00 ,_ in q 00 CD oö r^ 1 1 1 1 T— 00 CO CM
r-< 00 CM q CN ^- 00 CM 1 1 1 1 CM 00 00 CM
00 ,_ 1^ ,_ d CO <j ^-- 1 1 1 1 1 CM CM CM
CN CO q CO 1 1 1 1
1^ 00 CM *t 1 1 1 1 1 *— ^-
CD CM CM q 1 1 1 1
1^ CO d r^ 1 1 1 1
q 1— ^ •*t l""; 1 i . i
d d in 00 CM 1 i i
r> CO °? q q q i i «- CD *t CO CM r»' 1 1
o 00 00 q q q i i «■" 00 oö d ,J d 1 1
q 00 ^ q r>- q ■ q d oö «* d d oö 1 oo
CO 1 <* i i r^ l r^ 1 ^
■a o o
i
05 C o (0 +-" c
i
"ab E
"=t i
CQ 0} Ü ~—~" c o a
CO
CO
.§ D C —" <
in
*c -* S «■**■•
CD k. 3 en o X
CO
UJ »^ o co E i- CM
*—
CB C fc o 5 ■■!= 2 « o c.
Exp
cent
o- O in ü
t»>. oo en o en co iv 5) en en en en
oo
in
in
CM
CO
in
q in CM
CM
00
cn
I I
I I
2 I I
q q d r^
q q oö d <* CM
■a o
_o OQ
to c o
c CO u c o u
o
CO 00 >* E Q cn cn c cn en <
cn ■<+ <^ o 1 o «r- ^. 00 ■* ^J-
c 1 CO
°°. 1» 3 CO 00 r~. o
CM 00 O
a X
UI
^ in CO CO
00 CO
3
CO «- 00
CO CO r^ in CM
CO
c S o
<* CO «3- 00 CO
CO en o 0-
CO
E
C) en CM 00
«* j- o CO 00 ,_ »- ■* O CM CM ^~ 00 CM
co c co
3 CO
o CO k.
■*■» c
_j g c CO CD
o a E CD c
CD CD
^ UJ CO ü
c o Ü
■a o o
ca
CD Ü C o o
:>
88
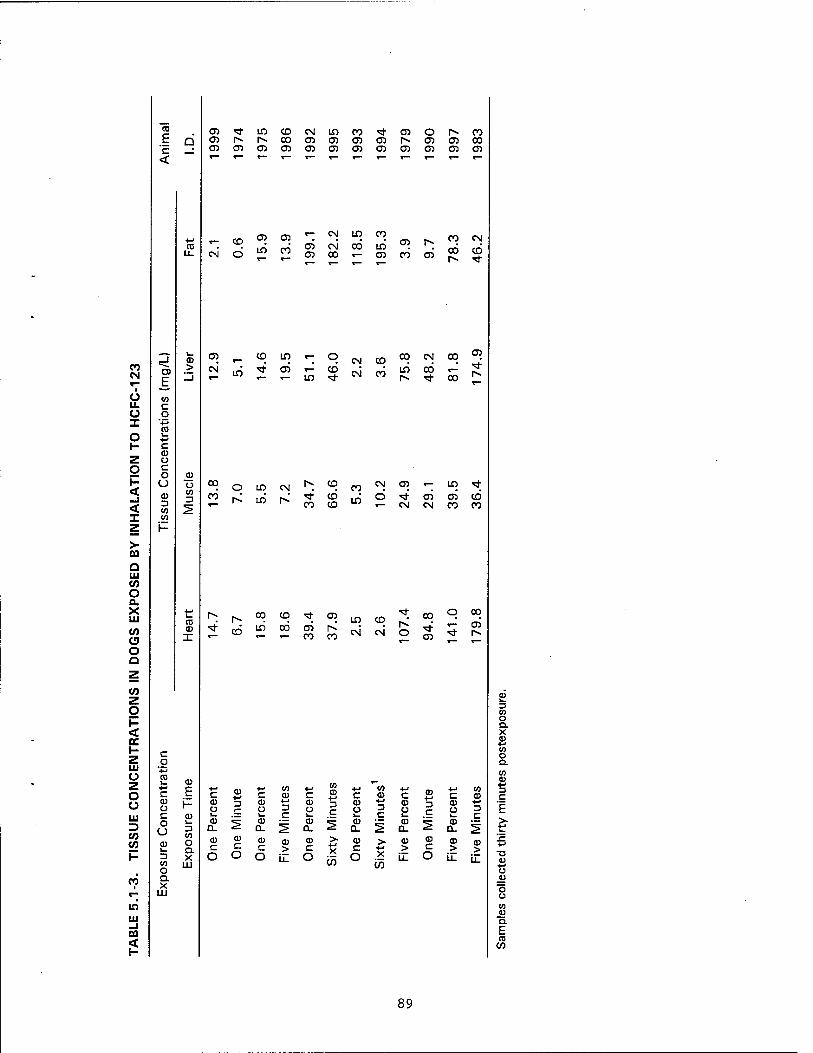
cc .§ Q c _: <
CO CM
o LL u X o H Z o < < X z > 00
Q ui CO O Q. X UJ
CO CJJ O D
CO
o H < DC 1- c Z n UJ o CD
z +J
o c o o UI c 3 CO
u U
CO CD
H 3 05 O
CO a X
r- UI
m UJ _i CQ
< H
03
E i-
3 m O D. X
O) *$ ID CD CM ID CO ■* as o r^ CO G> 1^ r^ 00 as 05 O) (35 1^ CJ5 CJ CO O) en 05 Gi as 01 <3> 05 05 en en en
CM
CD
6 C35
ID CO
en CM' ID
«- CM ID CO
C) CM CO ID o> 1^ en CO «— O CO en
CD ID r— O <tf en
ID CD
00 O ID CM r^ CD
CO 1^ ID r» CO
CD CD
r^ r-. 00 CD <tf 05
<tf CO ID 00 05
CO CO
CM
CM
CD
CO
00 ID
CM
CO
ID CD o
00
en
CO CM
CO CO
CO
00
en
iv
m CM en *— ID ■=*
ID O CM
en CM
en CO
CD CO
o CO «•^ en
+-» 03 4-* <n +-* 03 03 to
03 c c 03 c c 03 c c 03 3 03
3 C
03 3 03 3 C
03 3 03 o C I.
Ü C Ü I— 1— C U
03 GL 2 03
a. 2 03 a. ^ 03
2 03 a. 2 03
Q_
03 03 a> 03 03 > 03 >. 03 03 03 sz C c > c X
CO
C 4-» > C > O O O i±_ O O X
CO u_ U U-
3 03 o a. x 03 4-< 03 O Q.
03 03 4-< 3 C
■D CO
•4-» u V
■5 u 03 v o. E CO
CO
89
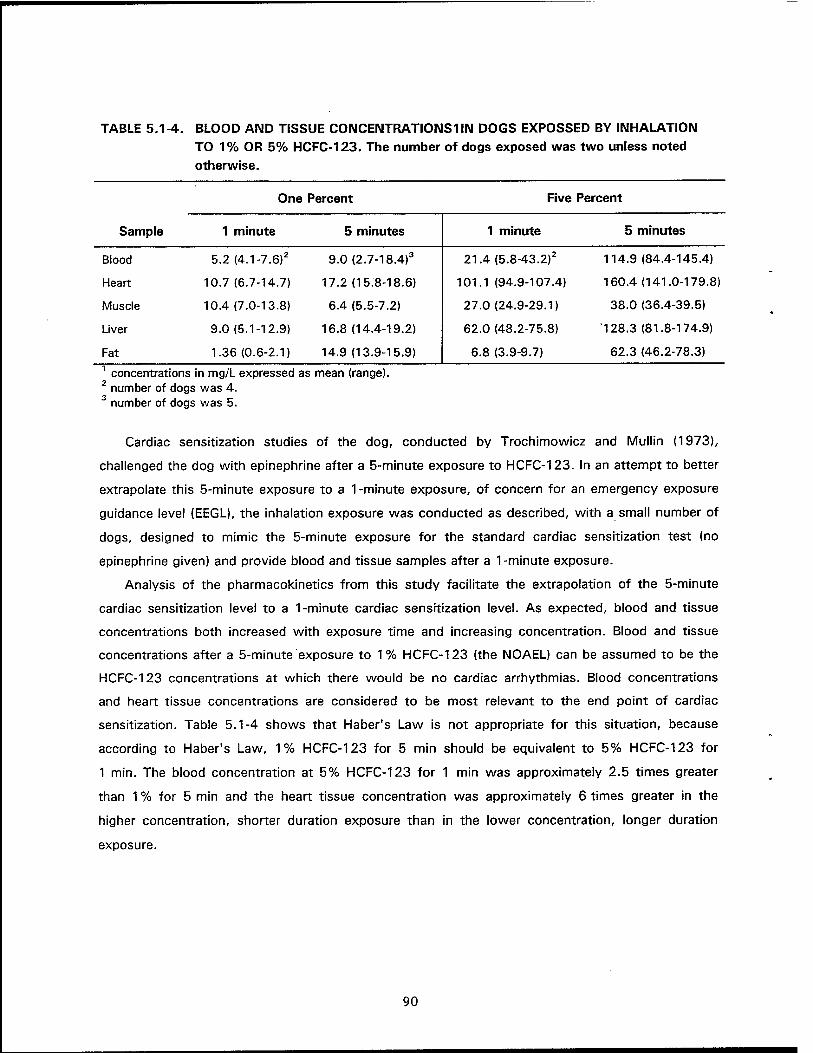
TABLE 5.1-4. BLOOD AND TISSUE CONCENTRATIONS 1IIM DOGS EXPOSSED BY INHALATION TO 1% OR 5% HCFC-123. The number of dogs exposed was two unless noted otherwise.
One Percent Five Percent
Sample 1 minute 5 minutes 1 minute 5 minutes
Blood 5.2 (4.1-7.6)2 9.0 (2.7-18.4)3 21.4(5.8-43.2)2 114.9 (84.4-145.4)
Heart 10.7 (6.7-14.7) 17.2 (15.8-18.6) 101.1 (94.9-107.4) 160.4(141.0-179.8)
Muscle 10.4(7.0-13.8) 6.4 (5.5-7.2) 27.0(24.9-29.1) 38.0 (36.4-39.5)
Liver 9.0 (5.1-12.9) 16.8 (14.4-19.2) 62.0 (48.2-75.8) '128.3 (81.8-174.9)
Fat 1.36 (0.6-2.1) 14.9 (13.9-15.9) 6.8 (3.9-9.7) 62.3 (46.2-78.3) 1 concentrations in mg/L expressed as mean (range). 2 number of dogs was 4. 3 number of dogs was 5.
Cardiac sensitization studies of the dog, conducted by Trochimowicz and Mullin (1973),
challenged the dog with epinephrine after a 5-minute exposure to HCFC-123. In an attempt to better
extrapolate this 5-minute exposure to a 1-minute exposure, of concern for an emergency exposure
guidance level (EEGL), the inhalation exposure was conducted as described, with a small number of
dogs, designed to mimic the 5-minute exposure for the standard cardiac sensitization test (no
epinephrine given) and provide blood and tissue samples after a 1-minute exposure.
Analysis of the pharmacokinetics from this study facilitate the extrapolation of the 5-minute
cardiac sensitization level to a 1-minute cardiac sensitization level. As expected, blood and tissue
concentrations both increased with exposure time and increasing concentration. Blood and tissue
concentrations after a 5-minute exposure to 1 % HCFC-123 (the NOAEL) can be assumed to be the
HCFC-123 concentrations at which there would be no cardiac arrhythmias. Blood concentrations
and heart tissue concentrations are considered to be most relevant to the end point of cardiac
sensitization. Table 5.1-4 shows that Haber's Law is not appropriate for this situation, because
according to Haber's Law, 1% HCFC-123 for 5 min should be equivalent to 5% HCFC-123 for
1 min. The blood concentration at 5% HCFC-123 for 1 min was approximately 2.5 times greater
than 1 % for 5 min and the heart tissue concentration was approximately 6 times greater in the
higher concentration, shorter duration exposure than in the lower concentration, longer duration
exposure.
90
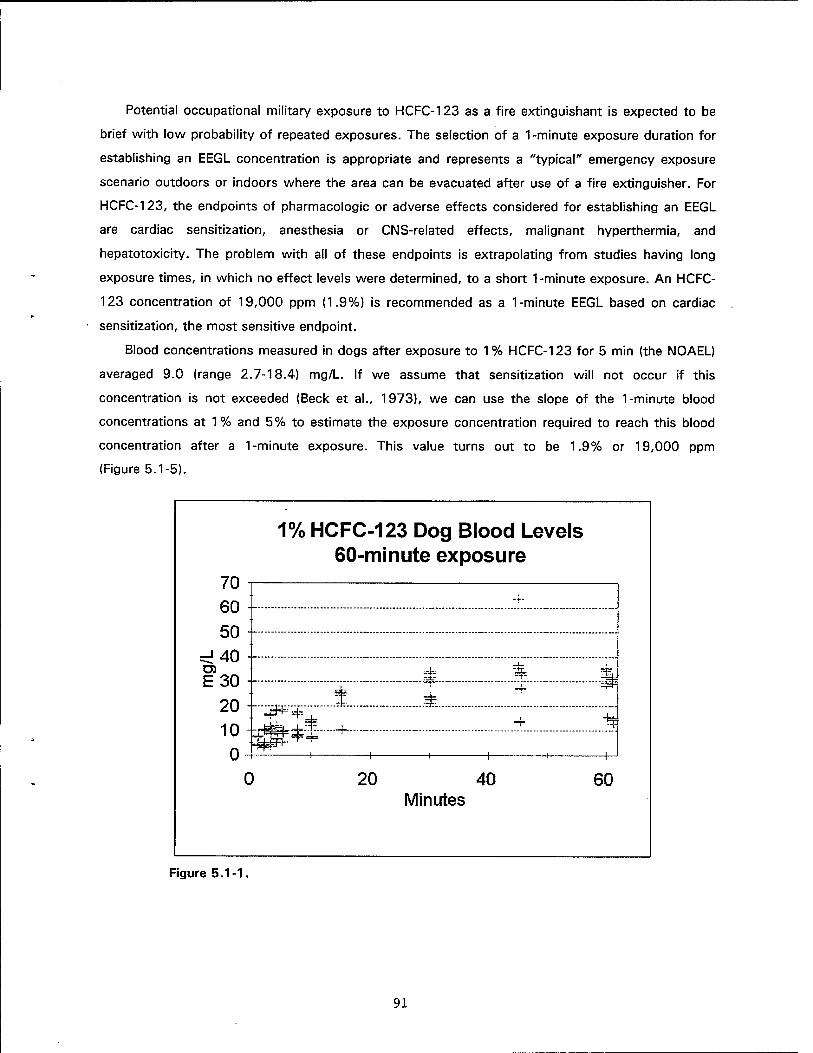
Potential occupational military exposure to HCFC-123 as a fire extinguishant is expected to be
brief with low probability of repeated exposures. The selection of a 1-minute exposure duration for
establishing an EEGL concentration is appropriate and represents a "typical" emergency exposure
scenario outdoors or indoors where the area can be evacuated after use of a fire extinguisher. For
HCFC-123, the endpoints of pharmacologic or adverse effects considered for establishing an EEGL
are cardiac sensitization, anesthesia or CNS-related effects, malignant hyperthermia, and
hepatotoxicity. The problem with all of these endpoints is extrapolating from studies having long
exposure times, in which no effect levels were determined, to a short 1-minute exposure. An HCFC-
123 concentration of 19,000 ppm (1.9%) is recommended as a 1-minute EEGL based on cardiac
sensitization, the most sensitive endpoint.
Blood concentrations measured in dogs after exposure to 1 % HCFC-123 for 5 min (the NOAEL)
averaged 9.0 (range 2.7-18.4) mg/L. If we assume that sensitization will not occur if this
concentration is not exceeded (Beck et al., 1973), we can use the slope of the 1-minute blood
concentrations at 1 % and 5% to estimate the exposure concentration required to reach this blood
concentration after a 1-minute exposure. This value turns out to be 1.9% or 19,000 ppm
(Figure 5.1-5).
1% HCFC-123 Dog Blood Levels 60-minute exposure
70 60
50 =d40 E30
20 10 0
•' —I--
•'
•'
■■ 1 =s= If
:_.._Ä. 1 m. + m
—j=teb .4.5. -L. + fflf + T
-, 1 1 1 1 1 (_l
20 40 Minutes
60
Figure 5.1-1.
91
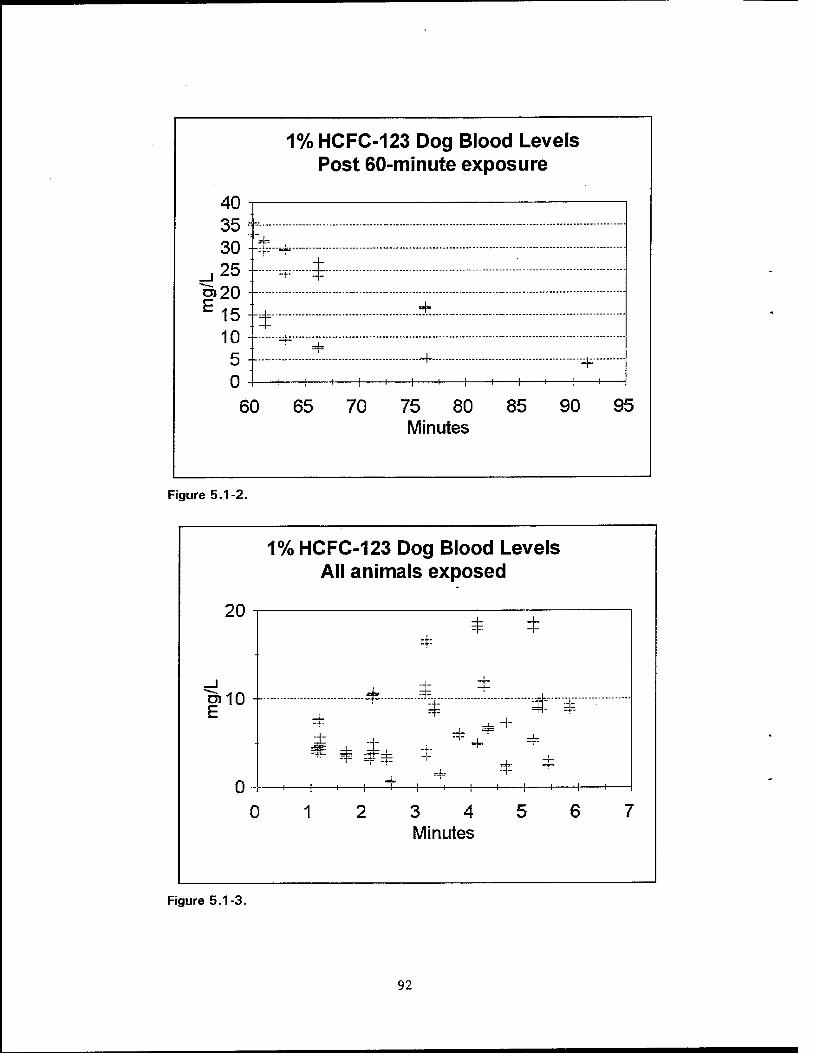
1% HCFC-123 Dog Blood Levels Post 60-minute exposure
40 35 30
^25 |>20 E 15
10 5
-■*= $
*■
H h ■H 1 H H 1 1-
60 65 70 75 80 85 90 95 Minutes
Figure 5.1-2.
1% HCFC-123 Dog Blood Levels All animals exposed
20
|>10
* ±
i *
.£
N-ti -+ H-
+ =+=
0 -r 1 1 1 1 *- -+-
H h H 1 1-
2 3 4 5 6 Minutes
Figure 5.1-3.
92
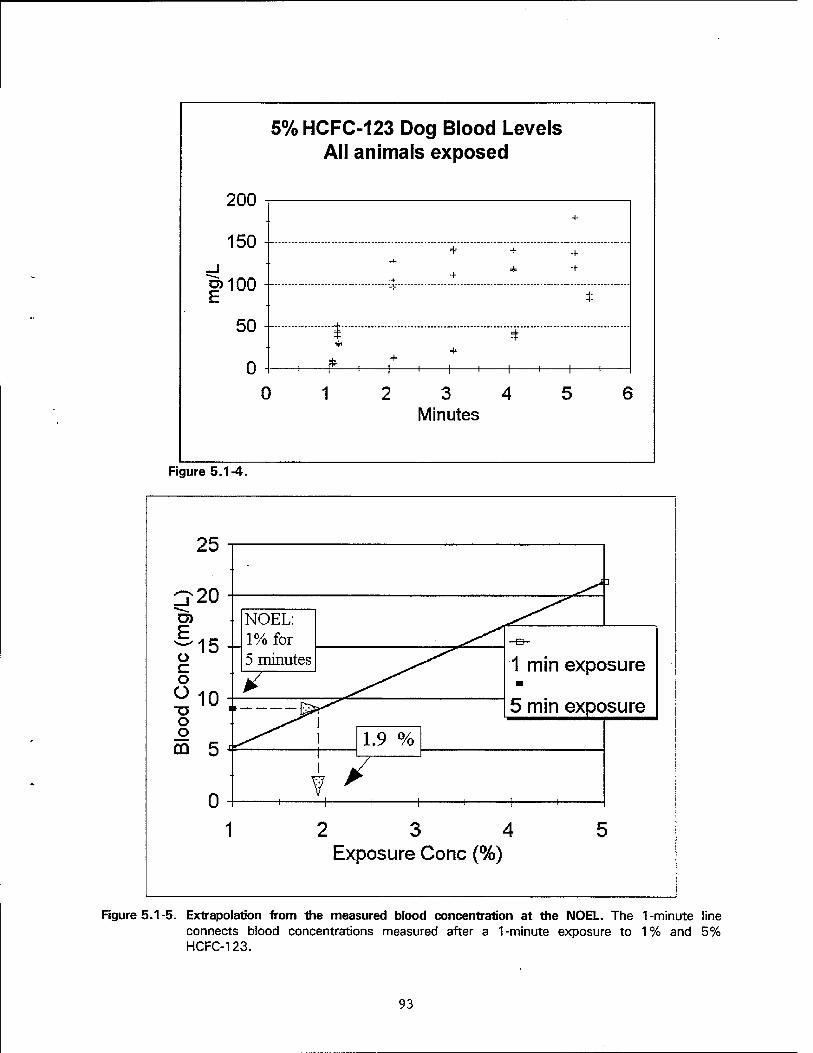
5% HCFC-123 Dog Blood Levels All animals exposed
200
150 f _i ö)100
50 I
0
-t-
■t- H h H I 1 h
0 3 4 Minutes
Figure 5.1-4.
E, o c o O TJ O
_o CO
25
20
15
10
5
0
NOEL: 1% for 5 minutes 1 min exposure
5 min exposure
1.9 %
H 1 1 h H y-
1 2 3 4 Exposure Cone (%)
Figure 5.1-5. Extrapolation from the measured blood concentration at the NOEL. The 1-minute line connects blood concentrations measured after a 1-minute exposure to 1% and 5% HCFC-123.
93
The EEGL based on cardiac sensitization makes several conservative assumptions. First, the dog
cardiac sensitization model incorporates priming and challenge doses of epinephrine which are
supraphysiological, or about 10 times that of human adrenal release during times of stress. The
original purpose of this test was to rank chemicals which might be cardiac sensitizers. In this test,
the epinephrine dose is maximized to be just below the point where it causes arrhythmias by itself.
DuPont (Trochomowicz, personal communication) has compared the cardiac sensitization test with
epinephrine to tests where exogenous epinephrine was replaced with a "treadmill" or "fright". In
these tests, the test chemical concentration required to produce the same effect was 2 to 4 times
that required in the epinephrine-challenge test. Second, the EEGL is set based on the NOEL, which
is a function of the doses chosen for the test. The EEGL would be higher if it were based on the
lower 95% confidence interval of the EC50, or blood concentrations at 1.29%.
Although the mechanism of action of cardiac sensitization is unknown, there is good evidence
that like, anesthetic effects, the concentration of chemical in the membrane causes the effect (Clark
and Tinston, 1982). The physical rather than chemical mechanism of action argues against using
safety factors for the EEGL based on cardiac sensitization (Bellin, 1992).
Laboratory animal studies indicate that HCFC-123 is approximately three times less potent than
halothane for producing anesthesia. Concentrations of approximately 1 % halothane produce
anesthesia. A subanesthetic exposure of 4,000 ppm halothane for 30 min causes transient
impairment in mental performance in humans. In HCFC-123 inhalation studies, mild CNS depression
is observed in rats exposed (for 6 h) to 5,000 ppm, but these effects are rapidly reversible upon
cessation of exposure. Dogs exposed to 10,000 ppm HCFC-123 for 5 min show signs of CNS
depression (details were not given). In studies performed by Clark and Tinston (1982) involving
acute exposure of rats and dogs to a series of halogenated hydrocarbons, CNS effects and cardiac
sensitization appear together at the same concentration, and the more potent a chemical to produce
CNS effects, the more potent it was to produce cardiac sensitization. For select halogenated
hydrocarbons, it would be difficult to choose one of these biological endpoints over the other as the
most sensitive measure of pharmacological or toxicological effect. For the purposes of the EEGL it
was assumed that anesthetic effects would occur at the concentration which might cause cardiac
sensitization.
A CKNO WLEDGMENTS
Exposures of the dogs were conducted under contract to Wil Research Laboratories, Inc.,
Ashland, OH.
94
REFERENCES
Beck, P.S., D.G. Clark, and DJ. Tinston. 1973. The pharmacologic actions of bromochloro- difluoromethane (BCF). Toxicol. Appl. Pharmacol. 24:20-29.
Beilin, J.S. 1992. Supporting document for evaluation of the significance of cardiac sensitization. prepared for USEPA Global Change Division under Contract 68D90068: WA 3-20 by ICF Incorporated, Fairfax VA.
Clark, D. G. and D.J. Tinston. 1982. Acute inhalation toxicity of some halogenated and non- halogenated hydrocarbons. Human Toxicol. 1:239-247.
Haber, F. 1924. Zur Geschichte des Gaskrieges. In Fünf Vortraege aus den Jahren 1920-1923, pp. 75-92. Verlag Julius Springer, Berlin.
Jarabek, A.M., J.W. Fisher, R. Rubenstein, J.C. Lipscomb, R.J. Williams, A. Vinegar, and J.N. McDougal. 1994. Mechanistic insights aid the search for CFC substitutes: Risk assessment of HCFC-123 as an example. Risk Analysis 14:231-250.
Trochimowicz, H.J. and L.S. Mullin. 1973. Cardiac sensitization potential (EC50) of trifluorodichlo- roethane. Haskell Laboratory Report No. 132-73.
95

5.2 METABOLISM OF 2,2-DICHLORO-1.1,1-TRIFLUOROETHANE (HCFC-123) BY HUMAN HEPATIC MICROSOMES
1C. S. Godin1, M.M. Ketcha2, J.M. Drerup, A. Vinegar
INTRODUCTION
Increasing atmospheric levels of chlorofluorocarbons (CFCs) have resulted in stratospheric
ozone depletion (Molina and Rowland, 1974). As a result, the Montreal Protocol of 1987 called for
a phaseout of CFCs by the year 2000. One of these CFCs, Halon 1211, is commonly used as a fire
extinguishant. One candidate considered as a replacement for Halon 1211 is 2,2-dichloro-1,1,1-
trifluoroethane (HCFC-123), an analog of the anesthetic halothane. The metabolism of halothane has
been described both in vivo and in vitro (Van Dyke and Gandolfi, 1976; Cousins et al., 1979), but
the metabolism of HCFC-123 has not been as extensively studied, and no metabolism studies in
humans have been reported. A single in vivo metabolism study, in which rats were exposed to 1 %
HCFC-123 for 2 h, has shown that HCFC-123 is oxidatively metabolized to trifluoroacetic acid
(TFA). In that study levels of trifluoroacetylated liver proteins were nearly identical to those detected
after an exposure to 1% halothane for 2 h (Harris et al., 1991). These liver protein adducts are
formed from a trifluoroacetyl halide intermediate arising from the oxidative metabolism of the
substrate and are believed to be involved in the development of halothane-induced hepatitis in
humans (Pohl et al., 1989; Satoh et al., 1989). Because the structure of HCFC-123 is similar to that
of halothane, and because the potential for environmental and occupational exposure to HCFC-123
exists, the rates of HCFC-123 metabolism by human hepatic microsomes were assessed as part of
the safety assessment of this chemical.
MA TERIALS AND METHODS
HCFC-123 (CAS No. 306-83-6) was supplied by Allied Signal, Inc. (Morristown, NJ) and was
found to contain about 5% 1,2-dichloro-1,1,2-trifluoroethane as an impurity. All other reagents
were obtained from Sigma Chemical Co. except as specified. The human liver specimens used in
this study were obtained from Stanford Research Institute, Menlo Park, CA. Liver specimens from
organ donors were stored at -135 °C, shipped frozen, and stored at -70 °C until used for the
preparation of microsomes. Prior to the original acquisition of the livers, the organs had been
perfused in preparation for possible organ transplant. The livers were negative for the presence of
hepatitis A and B viruses as well as human immunodeficiency virus.
1 Current Address: Cephalon, Inc., Westchester, PA. 2 Current Address: Procter and Gamble, Miami Valley Research Labs, Cincinnati, OH.
96

Livers were thawed at room temperature and homogenized in 4 voi of ice-cold 0.154 M
KCI/0.05 M Tris-HCI (pH 7.4). The homogenate was centrifuged at 4 °C at 500 and 10,000 x g
for 10 min each. The supernatant fraction, obtained after the final spin, was centrifuged at 104,000
x g for 60 min at 4 °C, to obtain the microsomal pellet. The pellet was washed with and
resuspended in the 0.154 M KCI/0.05 M Tris-HCKpH 7.4) prior to storage at -80 °C. Protein
concentrations were determined by the BCA method (Pierce Chemical Co., Rockford, IL). The
cytochrome P450 content of sodium dithionite-reduced microsomes in 0.1 M Tris-HCI (pH 7.6) was
determined by the method of Omura and Sato (1964).
Initial experiments were conducted to establish conditions leading to linear reaction rates of TFA
formation with respect to time and protein concentration. Experiments also were conducted to
determine the optimal pH and saturating substrate concentration. Microsomal incubations were
conducted in 25 ml_ Erlenmeyer flasks sealed with Teflon-lined silicon septa. The headspace
atmosphere was prepared by mixing compressed air and nitrogen with gas-flow controllers (Dwyer
Instruments, Michigan City, IN) to yield an oxygen concentration of 5%. The headspace of each
flask was purged with this gas mixture, which was chosen because the hepatic vein of humans
contains approximately 4% to 5% oxygen (Nauck et al., 1981). Microsomes were thawed, diluted
with 0.1 M Tris buffer (pH 7.0) to give the appropriate protein concentration, and bubbled for 2 min
with the same gas mixture used to purge the flasks. A 2-mL volume of the diluted microsomal
suspension was added to each flask with a gas-tight syringe, HCFC-123 was added to the
headspace of each flask with a Hamilton syringe, and the flasks were preincubated at 4 °C with
vigorous shaking for 15 min. The reactions were initiated by the injection of 25 JJL of ß-NADPH
solution through the septum to yield a final concentration of 1 mM, and terminated after the
appropriate incubation period by rapidly heating the flasks to 60 °C.
For physiological metabolism studies, incubations were conducted as described above.
Incubations contained 2 mg/mL of human hepatic microsomal protein in 0.1 M Tris buffer adjusted
to a pH of 7.37. HCFC-123 (7.3 JJL) was added to the flasks that were incubated for 7 min
following the addition of ß-NADPH. This amount of HCFC-123 resulted in a 1.13 mM concentration
in solution as quantitated from determining the partitioning of HCFC-123 into the reaction mixture.
This concentration (1.13 mM) was derived from physiologically based pharmacokinetic (PBPK)
estimates of the steady-state concentration of HCFC-123 in human liver following an exposure to
1% (v/v) of HCFC-123.
The supernatants of all incubations were analyzed for TFA by derivitization to form volatile
methyl esters using the method of Maiorino et al. (1980). The Chromatographie separation of the
TFA-methyl ester was conducted according to the method described by Brashear et al. (1992).
97
RESULTS
As shown in Figure 5.2-1 A, the optimal pH value was approximately 7.0 for the oxidative
metabolism of HCFC-123 to TFA. Therefore, 0.1 M Tris buffer at this pH was used for all
subsequent optimization experiments. The rate of TFA formation with respect to time is presented
in Figure 5.2-1 B. The rate was approximately linear for the first 7 min, and became distinctly
nonlinear between 7 and 60 min. A time of 7 min was chosen for determination of optimal rates of
TFA formation. The effect of increasing the amount of microsomal protein is presented in
Figure 5.2-1 C. The reaction is apparently nonlinear over the entire range of concentrations, but a
concentration of 2 mg/mL was chosen for determination of optimal rates of TFA formation.
When HCFC-123 was introduced into the headspace of the flasks, the amount of TFA formed
(normalized per mg of microsomal protein) increased in response to increasing halocarbon
concentration (Figure 5.2-2) up to a concentration of 36% (v/v). However, the relationship was
nonlinear indicating possible substrate saturation. Above a concentration of 36% in the headspace,
the rate of TFA formation was apparently suppressed. Although there is no clear evidence of
substrate saturation, a double reciprocal transformation of the first 4 data points on this curve
suggested an apparent maximum velocity of 4 nmoles TFA/mg protein/20 min and a half-maximal
substrate concentration of 2.9% (v/v) HCFC-123 (Figure 5.2-2 inset).
The linear rates of TFA formation from HCFC-123 conducted under optimal and physiological
conditions are presented in Table 5.2-1. Under conditions of physiological pH, and with substrate
concentrations in the liver representing those expected under steady-state conditions, the
metabolism of HCFC-123 to TFA was approximately 67% of that observed under optimal
conditions.
98
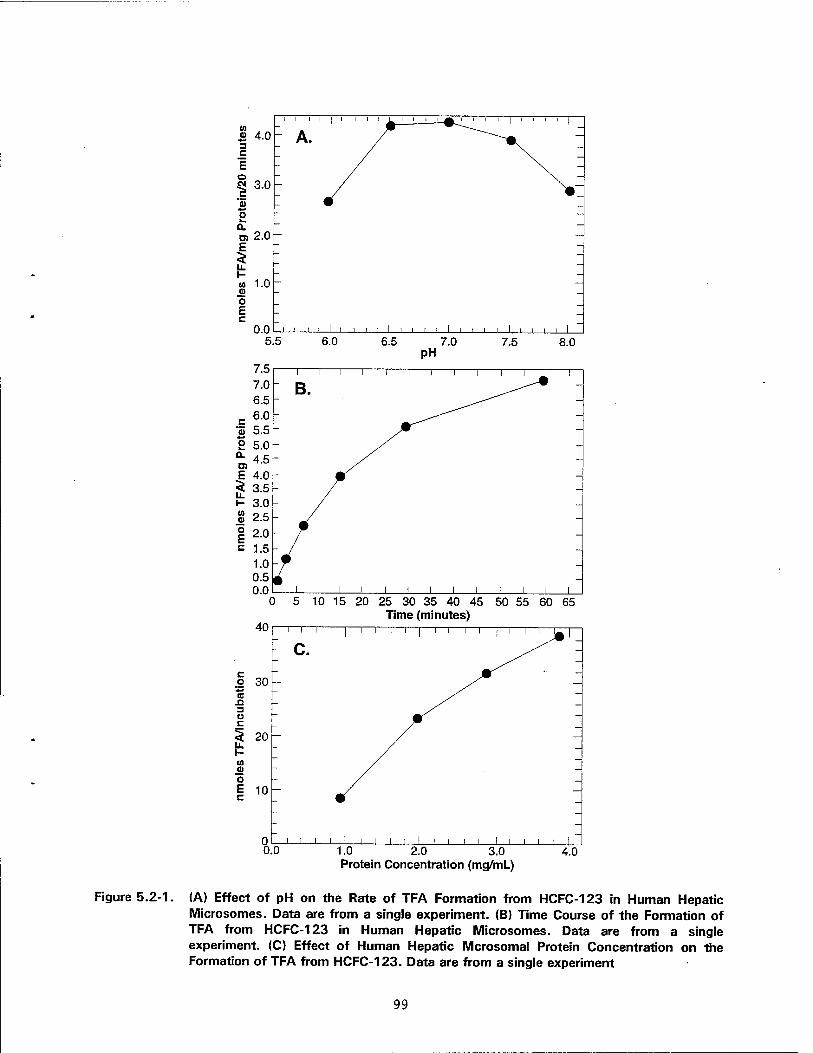
10 .Q 3 U c 5: u. h- 01
JO o E c
J I I L 5 10 15 20 25 30 35 40 45 50 55 60 65
Time (minutes)
1.0 2.0 3.0 Protein Concentration (mg/mL)
4.0
Figure 5.2-1. (A) Effect of pH on the Rate of TFA Formation from HCFC-123 in Human Hepatic Microsomes. Data are from a single experiment. (B) Time Course of the Formation of TFA from HCFC-123 in Human Hepatic Microsomes. Data are from a single experiment. (C) Effect of Human Hepatic Mcrosomal Protein Concentration on the Formation of TFA from HCFC-123. Data are from a single experiment
99
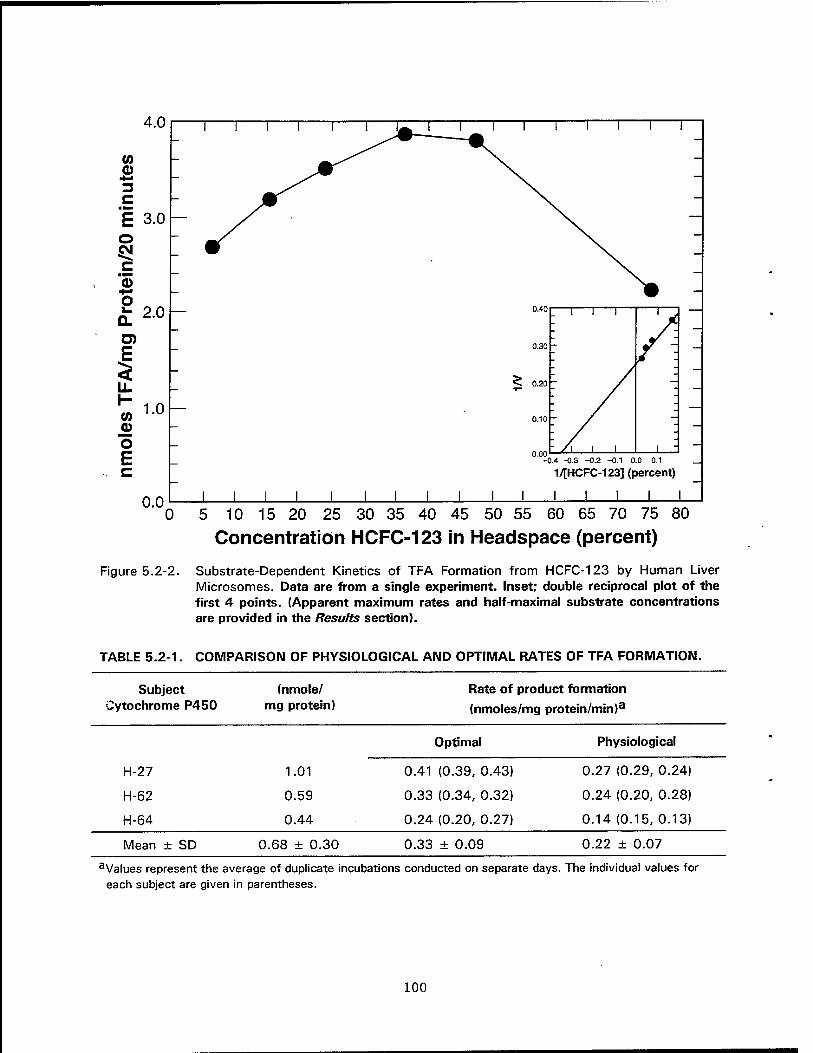
4.0
2.0
(0 CD
C
£ 3.0 o
c ©
o 1-
Q_
I H w © o E c
0.0
1.0
-0.4 -0.3 -0.2 -0.1 0.0 0.1
1/[HCFC-123] (percent)
I I I I I I
0 5 10 15 20 25 30 35 40 45 50 55 60 65 70 75 80 Concentration HCFC-123 in Headspace (percent)
Figure 5.2-2. Substrate-Dependent Kinetics of TFA Formation from HCFC-123 by Human Liver Microsomes. Data are from a single experiment. Inset; double reciprocal plot of the first 4 points. (Apparent maximum rates and half-maximal substrate concentrations are provided in the Results section).
TABLE 5.2-1. COMPARISON OF PHYSIOLOGICAL AND OPTIMAL RATES OF TFA FORMATION.
Subject Cytochrome P450
(nmole/ mg protein)
Rate of product formation (nmoles/mg protein/min)a
1.01
0.59
0.44
Optimal Physiological
H-27
H-62
H-64
0.41 (0.39, 0.43)
0.33 (0.34, 0.32)
0.24 (0.20, 0.27)
0.27 (0.29, 0.24)
0.24 (0.20, 0.28)
0.14 (0.15, 0.13)
Mean ± SD 0.68 ± 0.30 0.33 ± 0.09 0.22 ± 0.07 aValues represent the average of duplicate incubations conducted on separate days. The individual values for
each subject are given in parentheses.
100

DISCUSSION
The biotransformation of halothane has been reported in several animal species in vitro
(Gruenke et al., 1988; Ghantous et al., 1990; Nakao et al., 1991). Although studies describing the
metabolism of halothane by humans in vivo have been reported (Rehder et al., 1967; Cohen et al.,
1975), there are only limited reports concerning the metabolism of halothane by humans in vitro
(Gruenke et al., 1988). The metabolism of HCFC-123 results in the qualitative production of the
same metabolites afforded by the metabolism of halothane (Harris et al., 1991; Brashear et al.,
1992; Godin et al., 1993); however there have been no reports, to our knowledge, of the
metabolism of HCFC-123 by humans either in vivo or in vitro. Thus, the results of this study provide
the first indication that HCFC-123 is metabolized by the human.
Gruenke et al. (1988) examined the rate of TFA formation from human hepatic microsomes
exposed to a concentration of 0.6% (v/v) halothane in the headspace and obtained a rate of
2.05 nmol TFA/mg protein/30 min. In the present study, 5.6 nmol TFA/mg protein/30 min was
obtained in incubations containing 36% (v/v) HCFC-123 in the headspace. However, a rate of
1.7 nmol TFA/mg protein/20 min has been obtained in our laboratory from an incubation of human
hepatic microsomes containing 0.6% (v/v) HCFC-123 in the headspace indicating that the two
substrates are probably metabolized to the same extent in vitro (Godin, unpublished observation).
Thus the findings reported in the present study are significant because they indicate that humans
are capable of producing TFA from HCFC-123 at rates similar to those reported for halothane. The
extent to which this reaction occurs in humans in vivo is unknown but is important in light of the
hepatotoxicity associated with halothane metabolism. Trifluoroacetyl halide intermediates are
produced from halothane in vivo and form covalent adducts with several hepatic proteins
(Pohl et al., 1989; Satoh et al., 1989). Humans develop serum antibodies that have been shown to
recognize these adducts (Pohl et al., 1989; Satoh et al., 1989), and their reaction has been linked to
the onset of halothane-induced hepatitis. Products from the metabolism of halothane also are
thought to be responsible for the hepatotoxicity observed in up to 20% of patients anesthetized
with halothane (Pohl et al., 1989; Wright et al., 1975). The metabolism of HCFC-123 also affords
the production of trifluoroacetylated adducts (Harris et al., 1991), but it must be pointed out that
the system used in this study places an enriched cell fraction in direct contact with the chemical in
solution. Whereas a PBPK prediction of liver steady-state concentrations of HCFC-123 in humans
following an exposure to a 1 % (v/v) atmosphere suggested that the incubations should be
conducted at this same concentration, it is unlikely that humans would be exposed to a high enough
concentration of HCFC-123, and for sufficient periods of time to result in a similar internal
concentration. Although the amount of adduct formation resulting from brief accidental exposure
101
may be low, there is currently no information on the amount of adduct required to induce an
immune response. In sensitized individuals therefore, hepatitis may develop after subsequent
exposure to HCFC-123 or after anesthesia with halothane but this risk cannot be assessed.
REFERENCES
Brashear, W.T., M.M. Ketcha, D.L. Pollard, C.S. Godin, H.F. Leahy, P.P. Lu, E.R. Kinkead, and R.E.Wolfe. 1992. AL-TR-1992-0078, Armstrong Laboratory, Wright-Patterson Air Force Base, Ohio.
Cohen, E.N., J. R. Trudell, H.IM. Edmunds, and E. Watson. 1975. Anesthesiology 43, 392-401.
Cousins, M.J., J.H. Sharp, G.K. Gourlay, J.F. Adams, W.D. Haynes, and R. Whitehead. 1979. Anaesth. Intens. Care 7, 9-24.
Ghantous, H.N., J. Fernando, A.J. Gandolfi, and K. Brendel. 1990. Drug. Metab. D/'spos. 18, 514-518.
Godin, C.S., J.M. Drerup, and A. Vinegar. 1993. Drug Metab. D/'spos. in press.
Gruenke, L.D., K. Konoptka, D.R. Koop, and L.A. Waskell. 1988. J. Pharmacol. Exp. Ther. 246, 454-459.
Harris, J.W., L.R. Pohl, J.L. Martin, and M.W. Anders. 1991. Proc. Natl. Acad. Sei. USA 88, 1407-1410.
Maiorino, R.M., A.J. Gandolfi, and I.G. Sipes. 1980. J. Anal. Toxicol. 4, 250-254.
Molina, D.M. and F.S. Rowland. 1974. Nature 249, 810-812.
Nakao, M., K. Fujii, H. Kinoshita, O. Yuge, and M. Morio. 1991. Hiroshima J. Med. Sei. 40,23-28.
IMauck, M., D. Wolfle, and N. Katz. 1981. Eur. J. Biochem. 119, 657-661.
Omura, T. and R. Sato. 1964. J. Bio/. Chem. 239, 2370-2378.
Pohl, L.R., G. Kenna, H. Satoh, D.D. Christ, and J.L. Martin. 1989. Drug Metab. Rev. 20, 203-217.
Rehder, K., J. Forbes, H. Alter, O. Hessler, and A. Stier. 1967. Anesthesiology 28, 711-715.
Satoh, H., J.M. Martin, A.H. Schulick, D.D. Christ, and J.G. Kenna. 1989. Proc. Natl. Acad. Sei. USA 86, 322-326.
Van Dyke, R.A. and A.J. Gandolfi 1976. Drug Metab. D/'spos. 4, 40-44.
Wright, R., O.E. Eade, M. Chisholm, M. Hawksley, B. Lloyd, T.M. Moles, J.C. Edwards, and J.M. Gardner. 1975. Lancet 1, 817-820.
102
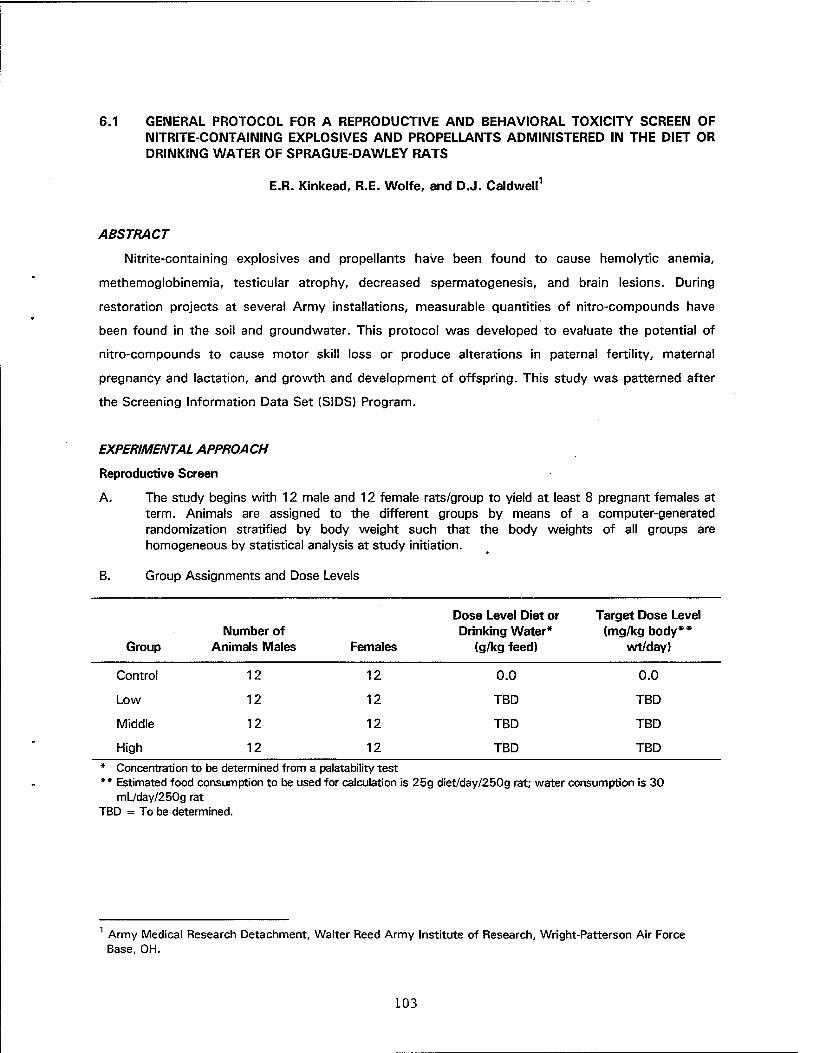
6.1 GENERAL PROTOCOL FOR A REPRODUCTIVE AND BEHAVIORAL TOXICITY SCREEN OF NITRITE-CONTAINING EXPLOSIVES AND PROPELLANTS ADMINISTERED IN THE DIET OR DRINKING WATER OF SPRAGUE-DAWLEY RATS
E.R. Kinkead, R.E. Wolfe, and D.J. Caldwell1
ABSTRACT
Nitrite-containing explosives and propellants have been found to cause hemolytic anemia,
methemoglobinemia, testicular atrophy, decreased spermatogenesis, and brain lesions. During
restoration projects at several Army installations, measurable quantities of nitro-compounds have
been found in the soil and groundwater. This protocol was developed to evaluate the potential of
nitro-compounds to cause motor skill loss or produce alterations in paternal fertility, maternal
pregnancy and lactation, and growth and development of offspring. This study was patterned after
the Screening Information Data Set (SIDS) Program.
EXPERIMENTAL APPROACH
Reproductive Screen
A. The study begins with 12 male and 12 female rats/group to yield at least 8 pregnant females at term. Animals are assigned to the different groups by means of a computer-generated randomization stratified by body weight such that the body weights of all groups are homogeneous by statistical analysis at study initiation.
B. Group Assignments and Dose Levels
Group Number of
Animals Males Females
Dose Level Diet or Drinking Water*
(g/kg feed)
Target Dose Level (mg/kg body**
wt/day)
Control 12 12 0.0 0.0
Low 12 12 TBD TBD
Middle 12 12 TBD TBD
High 12 12 TBD TBD
* Concentration to be determined from a palatability test ** Estimated food consumption to be used for calculation is 25g diet/day/250g rat; water consumption is 30
mL/day/250g rat TBD = To be determined.
1 Army Medical Research Detachment, Walter Reed Army Institute of Research, Wright-Patterson Air Force Base, OH.
103
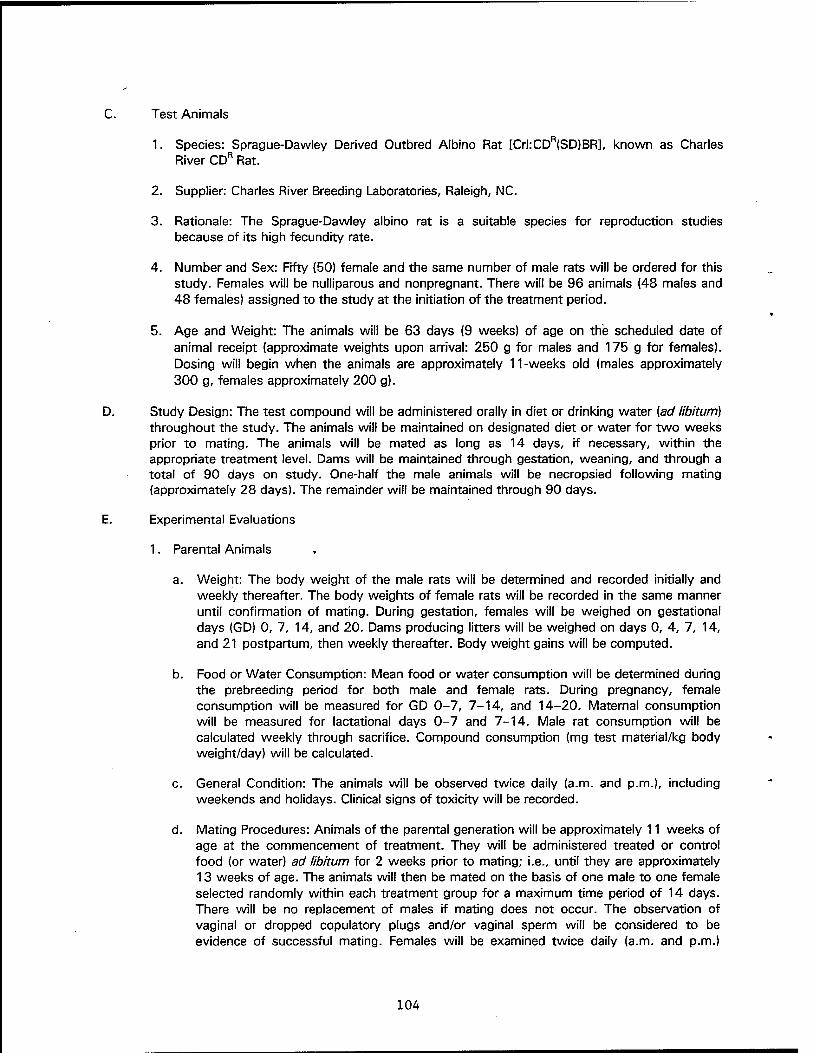
C. Test Animals
1. Species: Sprague-Dawley Derived Outbred Albino Rat [Crl:CDR(SD)BR], known as Charles River CDR Rat.
2. Supplier: Charles River Breeding Laboratories, Raleigh, NC.
3. Rationale: The Sprague-Dawley albino rat is a suitable species for reproduction studies because of its high fecundity rate.
4. Number and Sex: Fifty (50) female and the same number of male rats will be ordered for this study. Females will be nulliparous and nonpregnant. There will be 96 animals (48 males and 48 females) assigned to the study at the initiation of the treatment period.
5. Age and Weight: The animals will be 63 days (9 weeks) of age on the scheduled date of animal receipt (approximate weights upon arrival: 250 g for males and 175 g for females). Dosing will begin when the animals are approximately 11 -weeks old (males approximately 300 g, females approximately 200 g).
D. Study Design: The test compound will be administered orally in diet or drinking water (ad libitum) throughout the study. The animals will be maintained on designated diet or water for two weeks prior to mating. The animals will be mated as long as 14 days, if necessary, within the appropriate treatment level. Dams will be maintained through gestation, weaning, and through a total of 90 days on study. One-half the male animals will be necropsied following mating (approximately 28 days). The remainder will be maintained through 90 days.
E. Experimental Evaluations
1. Parental Animals
a. Weight: The body weight of the male rats will be determined and recorded initially and weekly thereafter. The body weights of female rats will be recorded in the same manner until confirmation of mating. During gestation, females will be weighed on gestational days (GD) 0, 7, 14, and 20. Dams producing litters will be weighed on days 0, 4, 7, 14, and 21 postpartum, then weekly thereafter. Body weight gains will be computed.
b. Food or Water Consumption: Mean food or water consumption will be determined during the prebreeding period for both male and female rats. During pregnancy, female consumption will be measured for GD 0-7, 7-14, and 14-20. Maternal consumption will be measured for lactational days 0-7 and 7-14. Male rat consumption will be calculated weekly through sacrifice. Compound consumption (mg test material/kg body weight/day) will be calculated.
c. General Condition: The animals will be observed twice daily (a.m. and p.m.), including weekends and holidays. Clinical signs of toxicity will be recorded.
d. Mating Procedures: Animals of the parental generation will be approximately 11 weeks of age at the commencement of treatment. They will be administered treated or control food (or water) ad libitum for 2 weeks prior to mating; i.e., until they are approximately 13 weeks of age. The animals will then be mated on the basis of one male to one female selected randomly within each treatment group for a maximum time period of 14 days. There will be no replacement of males if mating does not occur. The observation of vaginal or dropped copulatory plugs and/or vaginal sperm will be considered to be evidence of successful mating. Females will be examined twice daily (a.m. and p.m.)
104

during the cohabitation period for dropped copulation plugs. Any female not exhibiting a dropped copulation plug will be examined for the presence of a copulation plug or sperm in the vaginal tract once daily (a.m.). The day a copulation plug or vaginal sperm is observed will be designated GD 0. Once a plug or vaginal sperm have been observed, the male and female from that mating pair will be individually housed. For any female which does not show evidence of successful mating after 14 days of cohabitation, the last scheduled mating day will be considered GD 0 for that female, and the animal will be treated accordingly for subsequent events. Females will be observed twice daily beginning on gd 20 for evidence of littering. The dams will be allowed to rear their young to Day 21 postpartum. On Day 21 postpartum, each litter will be weaned.
At the conclusion of the mating period, 6 males per treatment group will be sacrificed. In addition to tissues taken for histopathology, sperm motility and sperm count will be evaluated. The same parameters will be evaluated on the remaining male rats, which will continue to be treated through the conclusion of the study.
2. Progeny
a. Mortality and Survival: All pups will be examined as soon as possible after birth to determine the number of viable and stillborn members of each litter. Survival indices will be calculated at 0, 4, 7, 14, and 21 days after birth.
b. Body Weight and Sex Determination: All live pups will be counted, sexed, and examined grossly at birth (Postnatal day 0) and weighed individually at Days 1, 4, 7, 14, and 21 after birth. Standardization of litter sizes, 4 per sex selected randomly, when possible, will occur on Day 4. At weaning. Postnatal Day 21, one male and one female per litter will be maintained on the appropriate diet through the completion of the study. Pups maintained through the conclusion of the 90-day study will be weighed weekly.
c. Clinical Signs: All pups will be examined for physical abnormalities at birth and observed daily throughout the postpartum period. All pups dying during this period will be necropsied when possible to investigate the cause of death.
3. Pathology
a. All parental animals will be fasted 12 hours prior to sacrifice. All parental animals shall be subjected to a complete gross examination at necropsy. Pups sacrificed at weaning will be subjected to an external examination only. Pups maintained through the end of the study will have a complete gross necropsy. Sacrifice of all animals will occur following the completion of the 90-day study period. All of the male and female adults from the control and high-dose group will be subjected to histopathologic examination. Target organs only, identified during examination of the high-dose and control groups, will be examined from animals at the mid- and low-dose groups. Histopathologic evaluation will be conducted on the tissues specified below:
105
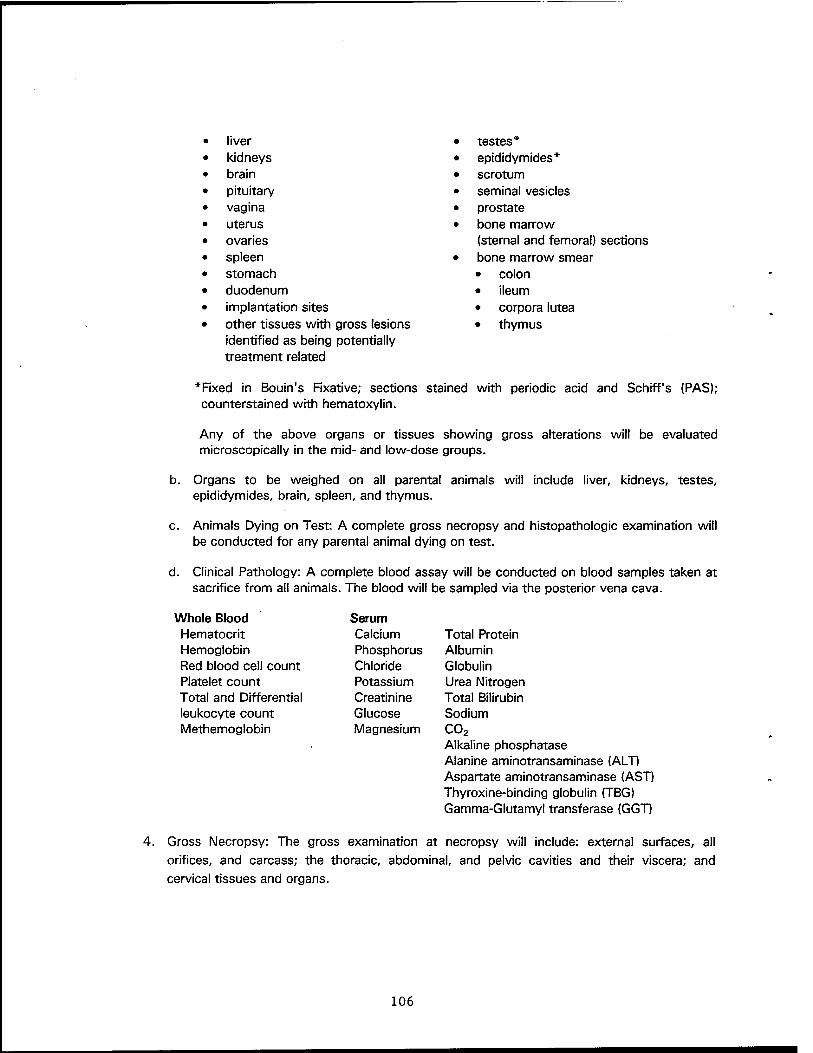
liver kidneys brain pituitary vagina uterus ovaries spleen stomach duodenum implantation sites other tissues with gross lesions identified as being potentially treatment related
testes epididymides* scrotum seminal vesicles prostate bone marrow (sternal and femoral) sections bone marrow smear • colon • ileum • corpora lutea • thymus
* Fixed in Bouin's Fixative; sections stained with periodic acid and Schiff's (PAS); counterstained with hematoxylin.
Any of the above organs or tissues showing gross alterations will be evaluated microscopically in the mid- and low-dose groups.
Organs to be weighed on all parental animals will include liver, kidneys, testes, epididymides, brain, spleen, and thymus.
Animals Dying on Test: A complete gross necropsy and histopathologic examination will be conducted for any parental animal dying on test.
Clinical Pathology: A complete blood assay will be conducted on blood samples taken at sacrifice from all animals. The blood will be sampled via the posterior vena cava.
Whole Blood Hematocrit Hemoglobin Red blood cell count Platelet count Total and Differential leukocyte count Methemoglobin
Serum Calcium Total Protein Phosphorus Albumin Chloride Globulin Potassium Urea Nitrogen Creatinine Total Bilirubin Glucose Sodium Magnesium C02
Alkaline phosphatase Alanine aminotransaminase (ALT) Aspartate aminotransaminase (AST) Thyroxine-binding globulin (TBG) Gamma-Glutamyl transferase (GGT)
Gross Necropsy: The gross examination at necropsy will include: external surfaces, all orifices, and carcass; the thoracic, abdominal, and pelvic cavities and their viscera; and cervical tissues and organs.
106
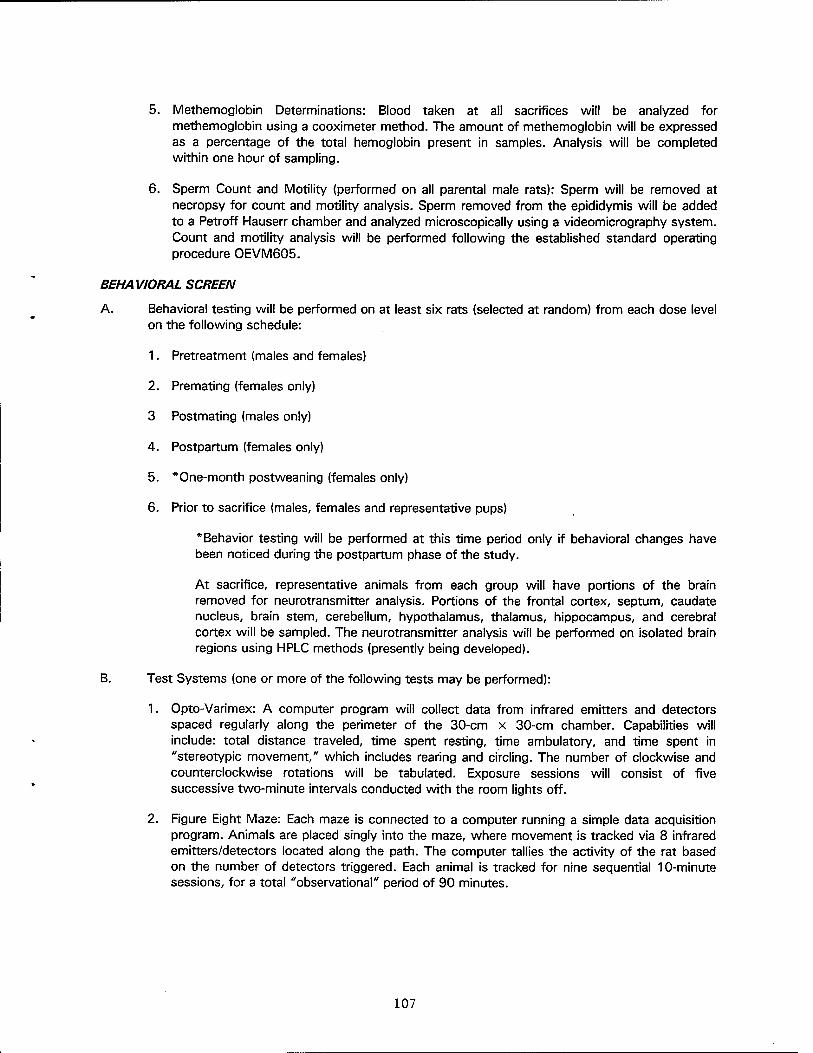
5. Methemoglobin Determinations: Blood taken at ail sacrifices will be analyzed for methemoglobin using a cooximeter method. The amount of methemoglobin will be expressed as a percentage of the total hemoglobin present in samples. Analysis will be completed within one hour of sampling.
6. Sperm Count and Motility (performed on all parental male rats): Sperm will be removed at necropsy for count and motility analysis. Sperm removed from the epididymis will be added to a Petroff Hauserr chamber and analyzed microscopically using a videomicrography system. Count and motility analysis will be performed following the established standard operating procedure OEVM605.
BEHAVIORAL SCREEN
A. Behavioral testing will be performed on at least six rats (selected at random) from each dose level on the following schedule:
1. Pretreatment (males and females)
2. Premating (females only)
3 Postmating (males only)
4. Postpartum (females only)
5. * One-month postweaning (females only)
6. Prior to sacrifice (males, females and representative pups)
* Behavior testing will be performed at this time period only if behavioral changes have been noticed during the postpartum phase of the study.
At sacrifice, representative animals from each group will have portions of the brain removed for neurotransmitter analysis. Portions of the frontal cortex, septum, caudate nucleus, brain stem, cerebellum, hypothalamus, thalamus, hippocampus, and cerebral cortex will be sampled. The neurotransmitter analysis will be performed on isolated brain regions using HPLC methods (presently being developed).
B. Test Systems (one or more of the following tests may be performed):
1. Opto-Varimex: A computer program will collect data from infrared emitters and detectors spaced regularly along the perimeter of the 30-cm x 30-cm chamber. Capabilities will include: total distance traveled, time spent resting, time ambulatory, and time spent in "Stereotypie movement," which includes rearing and circling. The number of clockwise and counterclockwise rotations will be tabulated. Exposure sessions will consist of five successive two-minute intervals conducted with the room lights off.
2. Figure Eight Maze: Each maze is connected to a computer running a simple data acquisition program. Animals are placed singly into the maze, where movement is tracked via 8 infrared emitters/detectors located along the path. The computer tallies the activity of the rat based on the number of detectors triggered. Each animal is tracked for nine sequential 10-minute sessions, for a total "observational" period of 90 minutes.
107
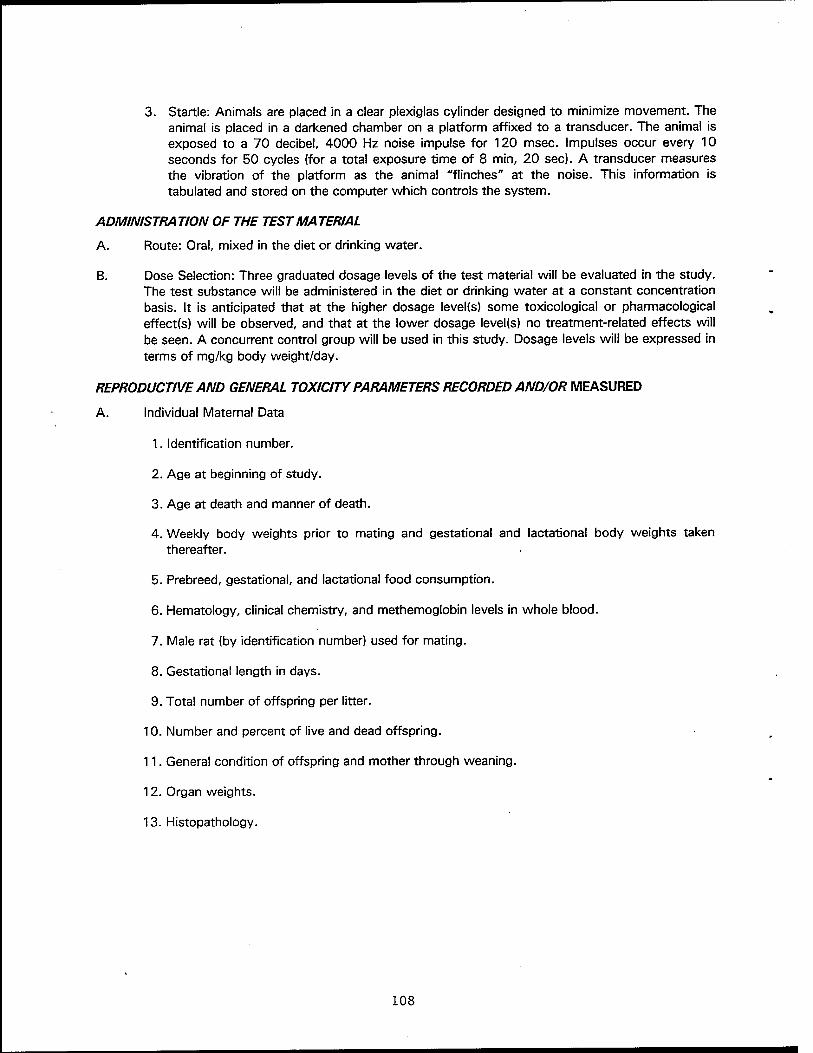
3. Starte: Animals are placed in a clear plexiglas cylinder designed to minimize movement. The animal is placed in a darkened chamber on a platform affixed to a transducer. The animal is exposed to a 70 decibel, 4000 Hz noise impulse for 120 msec. Impulses occur every 10 seconds for 50 cycles (for a total exposure time of 8 min, 20 sec). A transducer measures the vibration of the platform as the animal "flinches" at the noise. This information is tabulated and stored on the computer which controls the system.
ADMINISTRATION OF THE TEST MATERIAL
A. Route: Oral, mixed in the diet or drinking water.
B. Dose Selection: Three graduated dosage levels of the test material will be evaluated in the study. The test substance will be administered in the diet or drinking water at a constant concentration basis. It is anticipated that at the higher dosage level(s) some toxicological or pharmacological effect(s) will be observed, and that at the lower dosage level(s) no treatment-related effects will be seen. A concurrent control group will be used in this study. Dosage levels will be expressed in terms of mg/kg body weight/day.
REPRODUCTIVE AND GENERAL TOXICITY PARAMETERS RECORDED AND/OR MEASURED
A. Individual Maternal Data
1. Identification number.
2. Age at beginning of study.
3. Age at death and manner of death.
4. Weekly body weights prior to mating and gestational and lactational body weights taken thereafter.
5. Prebreed, gestational, and lactational food consumption.
6. Hematology, clinical chemistry, and methemoglobin levels in whole blood.
7. Male rat (by identification number) used for mating.
8. Gestational length in days.
9. Total number of offspring per litter.
10. Number and percent of live and dead offspring.
11. General condition of offspring and mother through weaning.
12. Organ weights.
13. Histopathology.
108
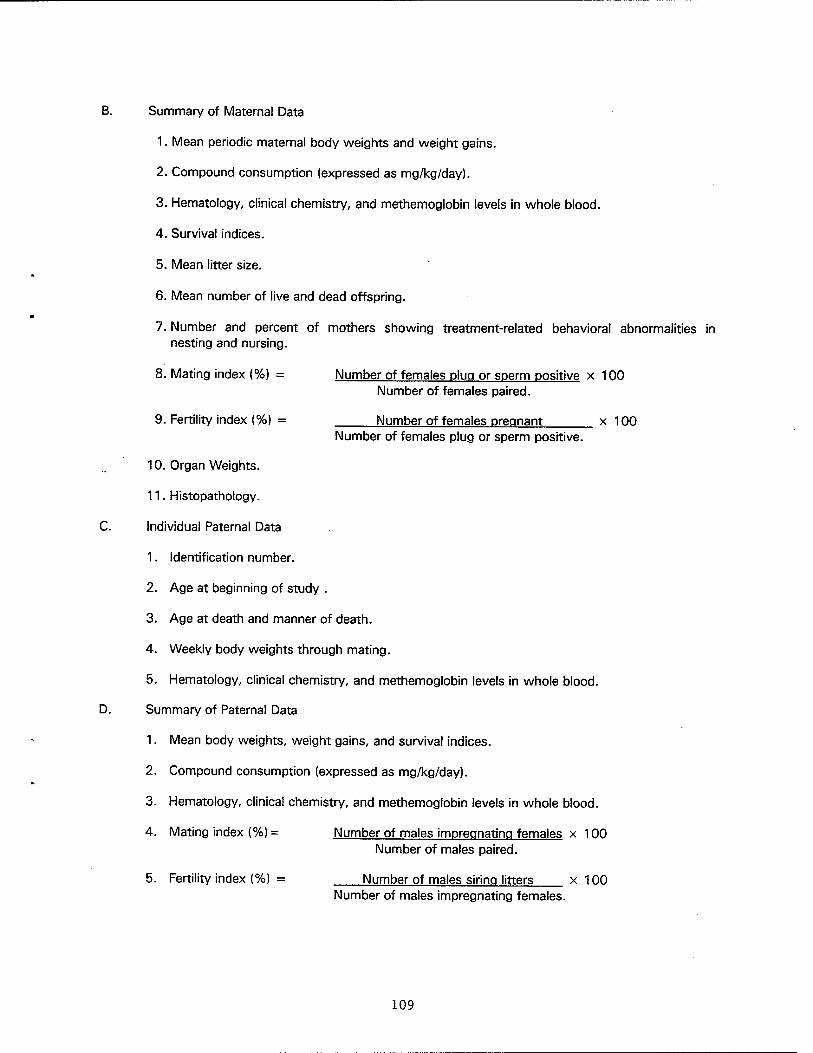
Summary of Maternal Data
1. Mean periodic maternal body weights and weight gains.
2. Compound consumption (expressed as mg/kg/day).
3. Hematology, clinical chemistry, and methemoglobin levels in whole blood.
4. Survival indices.
5. Mean litter size.
6. Mean number of live and dead offspring.
7. Number and percent of mothers showing treatment-related behavioral abnormalities in nesting and nursing.
8. Mating index (%) = Number of females plug or sperm positive x 100 Number of females paired.
9. Fertility index (%) = Number of females pregnant x 100 Number of females plug or sperm positive.
10. Organ Weights.
11. Histopathology.
Individual Paternal Data
1. Identification number.
2. Age at beginning of study .
3. Age at death and manner of death.
4. Weekly body weights through mating.
5. Hematology, clinical chemistry, and methemoglobin levels in whole blood.
Summary of Paternal Data
1. Mean body weights, weight gains, and survival indices.
2. Compound consumption (expressed as mg/kg/day).
3. Hematology, clinical chemistry, and methemoglobin levels in whole blood.
4. Mating index (%)= Number of males impregnating females x 100 Number of males paired.
5. Fertility index (%) = Number of males siring litters x 100 Number of males impregnating females.
109

6. Organ weights.
7. Histopathology.
E. Summary of Litter Data
1. Total litter size.
2. Number and percent of stillborn.
3. Number and percent of live births. ,
4. Periodic viability counts.
5. Periodic body weights by sex per litter from day 1 of life through weaning (taken on days 1, 4, 7, 14, and 21 of lactation by individual pup), weekly thereafter.
6. Pup survival indices (also expressed as percentages).
7. Sex ratio.
8. Indices:
Gestational Index = Number of females with live litter Number of females pregnant.
Live birth index = Number of live DUDS at birth Total number of pups born.
4-Day Survival index = Number of DUDS survivina 4 davs Total number of live pups at birth.
7-Day Survival index = Number of DUDS survivina 7 davs Total number of live pups at 4 days (postcull).
14-Dav Survival index = Number of DUDS survivina 14 davs Total number of live pups at 7 days.
21-Dav Survival index = Number of DUDS survivina 21 davs Total number of live pups at 14 days.
Lactation index = Number of DUDS survivina 21 davs -
Total number of live pups at 4 days (postcull).
STATISTICAL ANALYSIS *
The unit of comparison will be the male or the pregnant female (or the litter). Results of the
quantitative continuous variables (e.g., parental and pup body weights) will be intercompared for the
three treatment groups and one control group by the use of Levene's test of equal variances, and analysis
110
of variance (ANOVA). When Levene's test indicates homogenous variances and the ANOVA is
significant, a Bonferroni t-test will be used for pairwise comparisons. When Levene's test indicates
heterogeneous variances, all groups will be compared by an ANOVA for unequal variances or an
appropriate transformation will be done.
Nonparametric data will be statistically evaluated using the Kruskal-Wallis test followed by the Mann-
Whitney U-test for pairwise comparisons when appropriate. Frequency data (such as the various indices)
will be compared using the Fisher's Exact Test. For all statistical tests, the fiducial limit of 0.05 (two-
tailed) will be used as the criterion for significance.
Ill
6.2 REPRODUCTIVE TOXICITY SCREEN OF 1,3,5-TRINITROBENZENE ADMINISTERED IN THE DIET OF SPRAGUE-DAWLEY RATS
E.R. Kinkead, R.E. Wolfe, CD. Flemming, D.J. Caldwell1, C.R. Miller1, and G.B. Marit2
ABSTRACT
Several Army installations targeted for restoration have measurable quantities of 1,3,5-
trinitrobenzene (TNB) in the soil and groundwater. As part of the process to develop environmental
and health effects criteria for restoration, a modified Screening Information Data Set (SIDS)
reproductive study was performed. Male and female Sprague-Dawley rats received a diet containing
approximately 300, 150, or 30 mg TNB/kg diet. Mating occurred following 14 days of treatment.
All dams, one-half the males, and representative pups were maintained for a total of 90 days of
treatment. No mortality occurred during the study; however, a decrease in mean body weights was
noted in both sexes of high-dose rats. A dose-related effect was noted in measurements of sperm
function/activity. Sperm depletion and degeneration of the seminiferous tubules were noted
histopathologically. Methemoglobinemia and splenic hemosiderosis were common findings in the
high- and mid-dose levels of both sexes at necropsy. No adverse effects were noted in mating or
fertility indices. No significant treatment-related differences were found in length of gestation, sex
ratio, gestation index, or mean number of pups per litter.
INTRODUCTION
Several Army installations targeted for restoration have measurable quantities of 1,3,5-
trinitrobenzene (TNB) in the soil and groundwater. 1,3,5-Trinitrobenzene is a dimorphic crystalline
solid that is easily dissolved in organic solvents (Fedoroff et al., 1962). It is produced during the
nitration step of trinitrotoluene synthesis as a result of methyl group oxidation (Budavari et al.,
1989). It is primarily used as an explosive, but has also had limited use in the vulcanization of
rubber (Bamhart, 1981). 1,3,5-Trinitrobenzene and a similar compound, 1,3-dinitrobenzene (DNB),
are used to produce plastics, herbicides, and paints and can enter domestic drinking water
reservoirs via domestic effluent (Ryon et al., 1984; U.S. EPA, 1989). These compounds are not
readily biodegradable and have a tendency to leach out into the groundwater near production or
disposal sites.
1 Army Medical Research Detachment, Walter Reed Army Institute of Research Unit, Wright-Patterson Air Force Base, OH.
2 Army Medical Research Unit, Wright-Patterson Air Force Base, OH.
112
Fitzgerald et al. (1992) reported acute toxicity and irritancy data for TNB. The acute oral toxicity
of TNB suspended in corn oil was reported as 298 and 275 mg/kg in male and female rats, and
>900 and 702 mg/kg in male and female mice, respectively. No deaths occurred when neat TNB
was in contact with rabbit skin for 24 h (2 g/kg limit test). 1,3,5-Trinitrobenzene was found to be a
mild skin sensitizer in guinea pigs, but did not cause acute irritation on rabbit skin. When applied as
a powder, the treated eyes of all test rabbits were scored "severe" for redness, chemosis, and
opacity through 96 h posttreatment. 1,3,5-Trinitrobenzene caused irreversible damage to ocular
tissue and is considered to be corrosive.
Munition workers exposed to 2,4,6-trinitrotoluene (TNT) have developed skin irritation, liver
damage, and anemia (Hathaway, 1977; Morton et al., 1976; Stewart et al., 1945). Animal studies
have shown that oral treatment with structurally similar DNB or TNT causes anemia, increases
methemoglobin concentration, and produces hypertrophy of the liver and spleen. Degeneration of
the germinal epithelial lining of the seminiferous tubules also occurs, resulting in decreased
spermatogenesis (Cody et al., 1981; Levine et al., 1983, 1984; Furedi et al., 1984a,b; Linder et al.,
1986).
A range-finding reproduction study in which Sprague-Dawley rats received TNB-treated diet at
concentrations of approximately 800, 400, and 67 mg TNB/kg diet resulted in testicular atrophy and
sperm depletion in male rats receiving the two highest concentrations (Kinkead et al., 1994). Head
tilt and loss of equilibrium occurred in the high-dose female rats during the postpartum period, and
both sexes had brain lesions in the olivary region of the medulla at the conclusion of the range-
finding study. Head tilt and loss of equilibrium (Under et al., 1990), as well as brain and brain stem
lesions (Philbert et al., 1987), have also been reported in rats following treatment with DNB.
MA TERIALS AND METHODS
Test Agent and Doses
The TNB/diet mixture was provided by the U.S. Army through a contract with the
Environmental Protection Agency. Pertinent chemical and physical properties of the test compound
are listed below:
1,3,5-Trinitrobenzene (TNB)
Synonyms: Trinitrobenzene
Benzite
CAS #: 99-35-4
Empirical Formula: C6H3N306
Formula Weight: 213.11
Vapor Pressure 3.2 x 10"6 mmHg at 20 °C
113
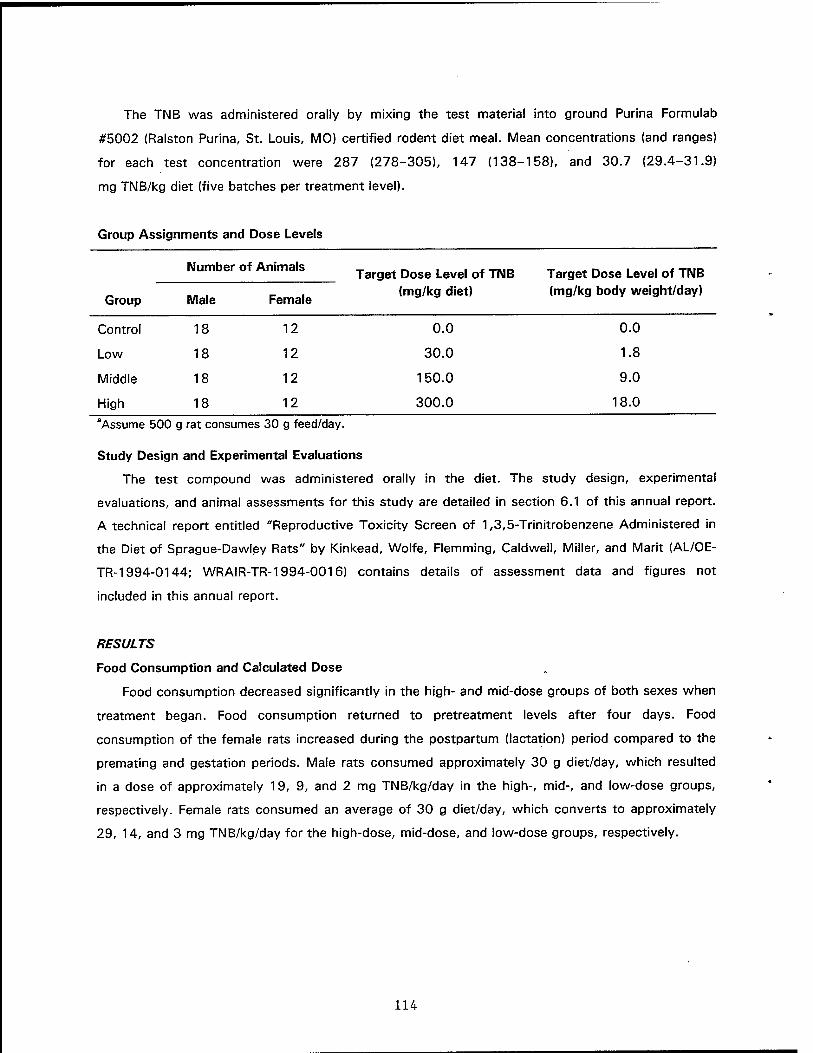
Target Dose Level of TNB
Group Male Female (mg/kg diet)
Control 18 12 0.0
Low 18 12 30.0
Middle 18 12 150.0
High 18 12 300.0
The TNB was administered orally by mixing the test material into ground Purina Formulab
#5002 (Ralston Purina, St. Louis, MO) certified rodent diet meal. Mean concentrations (and ranges)
for each test concentration were 287 (278-305), 147 (138-158), and 30.7 (29.4-31.9)
mg TNB/kg diet (five batches per treatment level).
Group Assignments and Dose Levels
Number of Animals ,. . x „,„ Jarget Dose Leve| of TNB
(mg/kg body weight/day)
0.0
1.8
9.0
18.0
"Assume 500 g rat consumes 30 g feed/day.
Study Design and Experimental Evaluations
The test compound was administered orally in the diet. The study design, experimental
evaluations, and animal assessments for this study are detailed in section 6.1 of this annual report.
A technical report entitled "Reproductive Toxicity Screen of 1,3,5-Trinitrobenzene Administered in
the Diet of Sprague-Dawley Rats" by Kinkead, Wolfe, Hemming, Caldwell, Miller, and Marit (AL/OE-
TR-1994-0144; WRAIR-TR-1994-0016) contains details of assessment data and figures not
included in this annual report.
RESULTS
Food Consumption and Calculated Dose
Food consumption decreased significantly in the high- and mid-dose groups of both sexes when
treatment began. Food consumption returned to pretreatment levels after four days. Food
consumption of the female rats increased during the postpartum (lactation) period compared to the
premating and gestation periods. Male rats consumed approximately 30 g diet/day, which resulted
in a dose of approximately 19, 9, and 2 mg TNB/kg/day in the high-, mid-, and low-dose groups,
respectively. Female rats consumed an average of 30 g diet/day, which converts to approximately
29, 14, and 3 mg TNB/kg/day for the high-dose, mid-dose, and low-dose groups, respectively.
114
General Toxicity
No mortality occurred in the parental animals during the study. Mean body weights of the high-
dose male rats were significantly less than the mean body weights of the control group beginning
on Day 21 and continuing through the 90-day treatment period. Male rat groups maintained
posttreatment; all showed increased weight gain when returned to untreated diet for the final two
months. However, the mean body weight of the high-dose group, although not significantly
different, remained lower than the control group. Mean body weights of the high-dose female rats
were slightly less than the control group throughout the study; however, the difference was
statistically significant only at Lactation Day 0.
No clinical signs of motor skill loss were noted during the study. This was confirmed by the
Opto-Varimex tests in which no differences in locomotor skills were noted in either treated or
control animals.
Six male rats per group were necropsied following the mating period (28 days of treatment),
after 90 days of treatment, and following a two-month recovery period. No treatment-related
differences were noted in absolute or relative organ weights in male rats at any of the evaluation
periods. An increase in absolute and relative spleen weights was noted in the high-dose female rats
necropsied following 90 days of treatment. Relative liver weights were increased in the high-dose
group and relative kidney weights were increased in both the high- and mid-dose female groups
(Table 6.2-1).
115
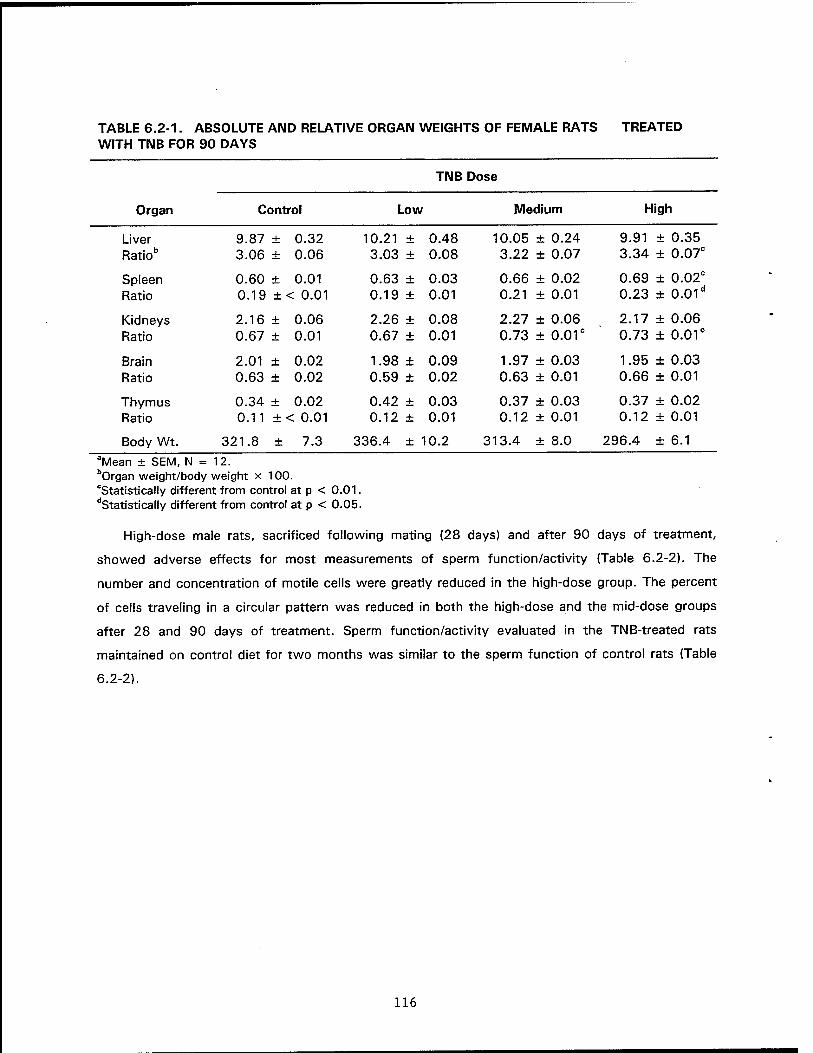
TABLE 6.2-1. ABSOLUTE AND RELATIVE ORGAN WEIGHTS OF FEMALE RATS TREATED WITH TNB FOR 90 DAYS
TNB Dose
Organ Control Low Medium High
Liver 9.87 ± 0.32 10.21 ± 0.48 10.05 ± 0.24 9.91 ± 0.35 Ratio" 3.06 ± 0.06 3.03 ± 0.08 3.22 ± 0.07 3.34 ± 0.07c
Spleen 0.60 ± 0.01 0.63 ± 0.03 0.66 ± 0.02 0.69 ± 0.02c
Ratio 0.19 ±< 0.01 0.19 ± 0.01 0.21 ± 0.01 0.23 ± 0.01d
Kidneys 2.16 ± 0.06 2.26 ± 0.08 2.27 ± 0.06 2.17 ± 0.06 Ratio 0.67 ± 0.01 0.67 ± 0.01 0.73 ± o.or 0.73 ± 0.01°
Brain 2.01 ± 0.02 1.98 ± 0.09 1.97 ± 0.03 1.95 + 0.03 Ratio 0.63 ± 0.02 0.59 ± 0.02 0.63 ± 0.01 0.66 ± 0.01
Thymus 0.34 ± 0.02 0.42 ± 0.03 0.37 ± 0.03 0.37 ± 0.02 Ratio 0.11 ±< 0.01 0.12 ± 0.01 0.12 ± 0.01 0.12 ± 0.01
Body Wt. 321.8 ± 7.3 336.4 ± 10.2 313.4 ± 8.0 296.4 ± 6.1 aMean ± SEM, N = 12. bOrgan weight/body weight x 100. Statistically different from control at p < 0.01. Statistically different from control at p < 0.05.
High-dose male rats, sacrificed following mating (28 days) and after 90 days of treatment,
showed adverse effects for most measurements of sperm function/activity (Table 6.2-2). The
number and concentration of motile cells were greatly reduced in the high-dose group. The percent
of cells traveling in a circular pattern was reduced in both the high-dose and the mid-dose groups
after 28 and 90 days of treatment. Sperm function/activity evaluated in the TNB-treated rats
maintained on control diet for two months was similar to the sperm function of control rats (Table
6.2-2).
116
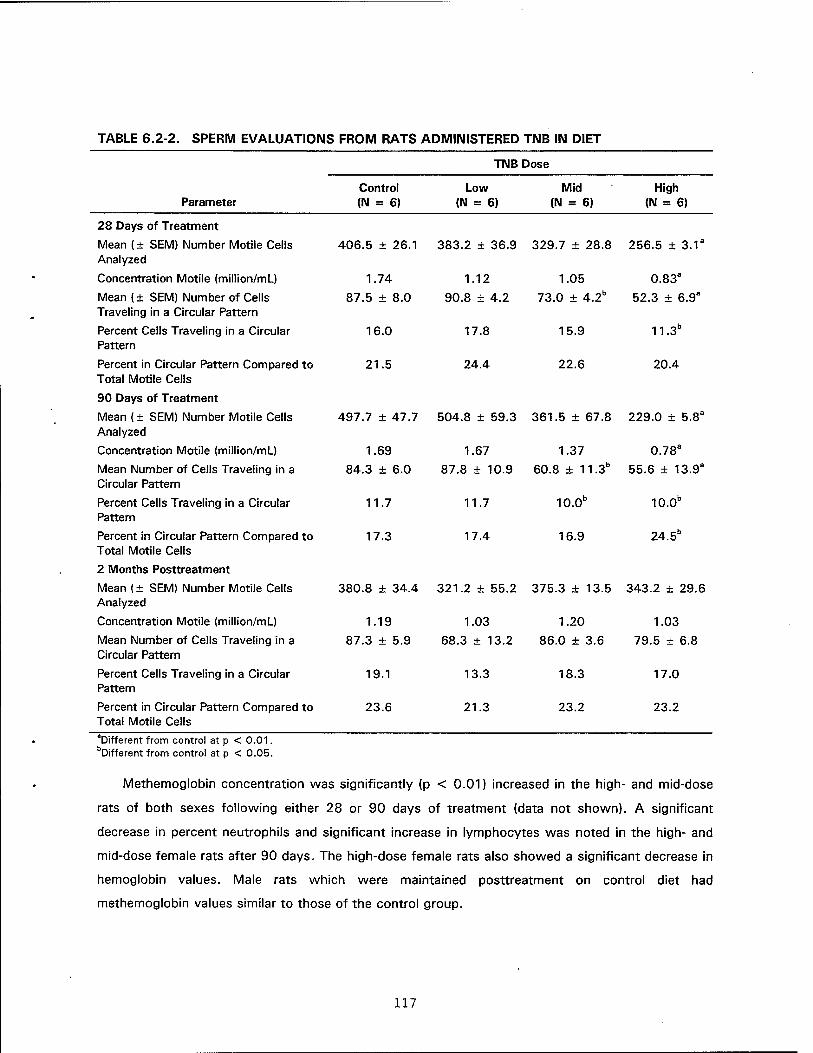
TABLE 6.2-2. SPERM EVALUATIONS FROM RATS ADMINISTERED TNB IN DIET
TNB Dose
Control Low Mid High Parameter (N = 6) (IM = 6) (N = 6) (N = 6)
28 Days of Treatment
Mean (± SEM) Number Motile Cells 406.5 ± 26.1 383.2 ± 36.9 329.7 ± 28.8 256.5 ± 3.1a
Analyzed
Concentration Motile (million/mL) 1.74 1.12 1.05 0.83a
Mean (± SEM) Number of Cells 87.5 + 8.0 90.8 ± 4.2 73.0 ± 4.2b 52.3 ± 6.9a
Traveling in a Circular Pattern
Percent Cells Traveling in a Circular 16.0 17.8 15.9 11.3b
Pattern
Percent in Circular Pattern Compared to 21.5 24.4 22.6 20.4 Total Motile Cells
90 Days of Treatment
Mean (± SEM) Number Motile Cells 497.7 ± 47.7 504.8 ± 59.3 361.5 + 67.8 229.0 ± 5.8a
Analyzed
Concentration Motile (million/mL) 1.69 1.67 1.37 0.78a
Mean Number of Cells Traveling in a 84.3 ± 6.0 87.8 ± 10.9 60.8±11.3b 55.6 ± 13.9a
Circular Pattern
Percent Cells Traveling in a Circular 11.7 11.7 10.0b 10.0b
Pattern
Percent in Circular Pattern Compared to 17.3 17.4 16.9 24.5b
Total Motile Cells
2 Months Posttreatment
Mean (± SEM) Number Motile Cells 380.8 ± 34.4 321.2 ± 55.2 375.3 ± 13.5 343.2 ± 29.6 Analyzed
Concentration Motile (million/mL) 1.19 1.03 1.20 1.03
Mean Number of Cells Traveling in a Circular Pattern
87.3 ± 5.9 68.3 ± 13.2 86.0 ± 3.6 79.5 ± 6.8
Percent Cells Traveling in a Circular Pattern
19.1 13.3 18.3 17.0
Percent in Circular Pattern Compared to Total Motile Cells
23.6 21.3 23.2 23.2
Different from control at p < 0.01. Different from control at p < 0.05.
Methemoglobin concentration was significantly (p < 0.01) increased in the high- and mid-dose
rats of both sexes following either 28 or 90 days of treatment (data not shown). A significant
decrease in percent neutrophils and significant increase in lymphocytes was noted in the high- and
mid-dose female rats after 90 days. The high-dose female rats also showed a significant decrease in
hemoglobin values. Male rats which were maintained posttreatment on control diet had
methemoglobin values similar to those of the control group.
117
After 28 days of treatment, calcium levels were increased in the high-dose male rat group and
alkaline phosphatase values were low in the low-dose male rat group (data not shown). There were
no abnormalities noted in the selected clinical chemistry parameters measured in male rats following
90 days of treatment or after the 2-month recovery period. Cholesterol values were significantly
increased in the high-dose female rat group and LDH values were significantly decreased in the mid-
dose female rat group at the conclusion of the study.
At necropsy all animals used in the study were in good general condition. Dilation of the uterus
by clear fluid was noticed in two rats from both the high- and mid-dose groups, and in one rat from
the low-dose group. This finding was not observed in any of the control female rats. Discoloration
of the kidneys was observed exclusively in males involving two to three animals per group,
including controls. Other nontreatment-related gross observations included testicular atrophy,
splenomegaly, and discoloration of the thymus and liver (each observed only once). Gross
examination of the pups revealed foci of tan discoloration in the liver of one animal from the control
group.
Histopathology
Observed histopathologic lesions of statistical, clinical, or pathologic significance were limited to
the spleen, kidney, and testes (Tables 6.2-3 through 6.2-6). After 28 days of treatment, severity
and incidence of splenic hemosiderosis was significantly increased in the mid- (p < 0.05) and high-
dose (p < 0.01) male rats. At 90 days, the severity of splenic hemosiderosis was increased
(p < 0.01) in the high-dose males when compared to controls. The severity of splenic
hemosiderosis was also significantly (p < 0.01) increased in the mid- and high-dose female rats
examined after 90 days.
118
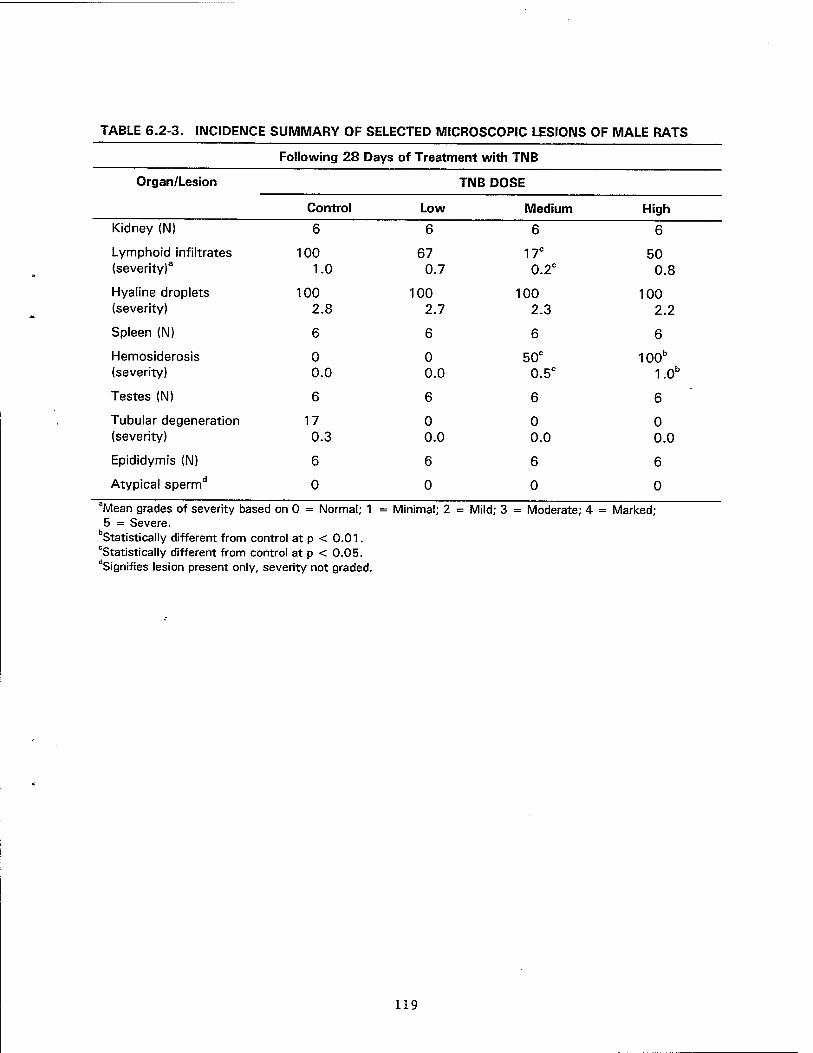
TABLE 6.2-3. INCIDENCE SUMMARY OF SELECTED MICROSCOPIC LESIONS OF MALE RATS
Following 28 Days of Treatment with TNB
Organ/Lesion TNB DOSE
Control Low Medium High Kidney (N) 6 6 6 6
Lymphoid infiltrates (severity)3
100 1.0
67 0.7
17c
0.2° 50
0.8
Hyaline droplets (severity)
100 2.8
100 2.7
100 2.3
100 2.2
Spleen (N) 6 6 6 6
Hemosiderosis (severity)
0 0.0
0 0.0
50c
0.5C 100b
1.0b
Testes (N) 6 6 6 6
Tubular degeneration (severity)
17 0.3
0 0.0
0 0.0
0 0.0
Epididymis (N) 6 6 6 6
Atypical spermd 0 0 0 0 aMean grades of severity based on 0 = Normal; 1 = Minimal; 2 = Mild; 3 = Moderate; 4 = Marked; 5 = Severe.
""Statistically different from control at p < 0.01. "Statistically different from control at p < 0.05. dSignifies lesion present only, severity not graded.
119
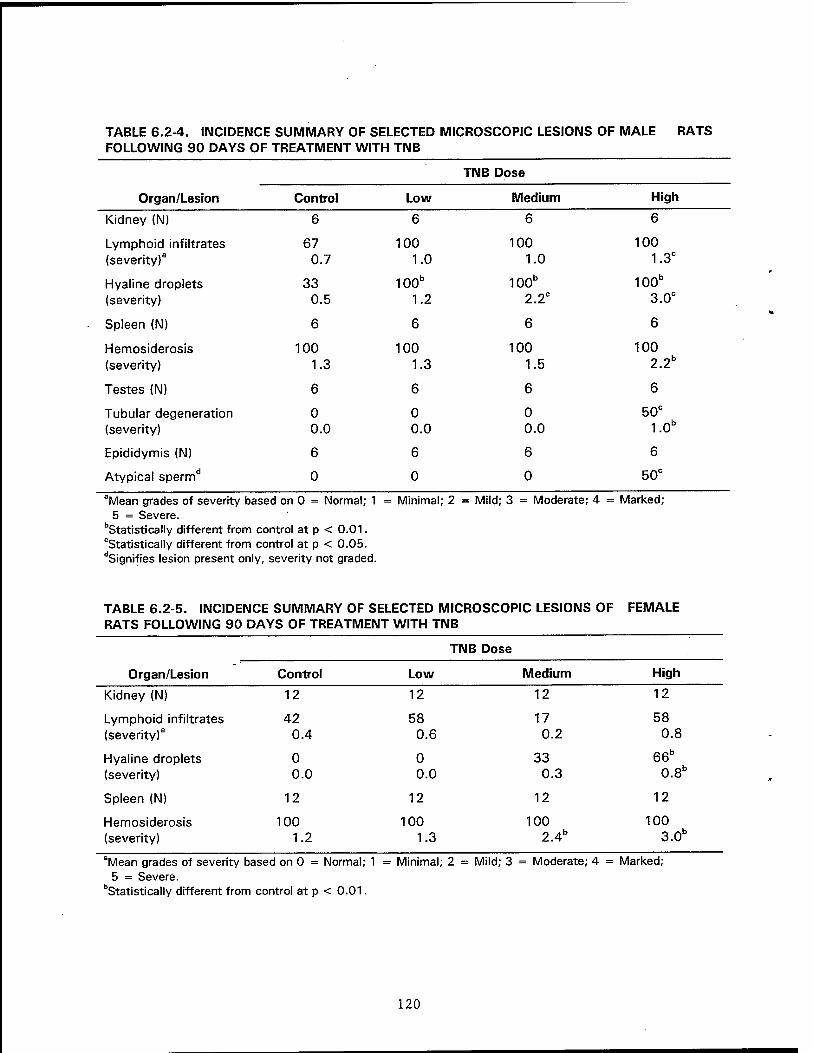
TABLE 6.2-4. INCIDENCE SUMMARY OF SELECTED MICROSCOPIC LESIONS OF MALE RATS FOLLOWING 90 DAYS OF TREATMENT WITH TNB
TNB Dose
Organ/Lesion Control Low Medium High
Kidney (N) 6 6 6 6
Lymphoid infiltrates (severity)3
67 0.7
100 1.0
100 1.0
100 1.3°
Hyaline droplets (severity)
33 0.5
100" 1.2
100" 2.2°
100" 3.0°
Spleen (N) 6 6 6 6
Hemosiderosis (severity)
100 1.3
100 1.3
100 1.5
100 2.2"
Testes (N) 6 6 6 6
Tubular degeneration (severity)
0 0.0
0 0.0
0 0.0
50c
1.0"
Epididymis (N) 6 6 6 6
Atypical spermd 0 0 0 50°
"Mean grades of severity based 5 = Severe.
on 0 = Normal; 1 = Minimal; 2 = Mild; 3 = Moderate; 4 = = Marked;
bStatistically different from control at p < 0.01. cStatistically different from control at p < 0.05. dSignifies lesion present only, severity not graded.
TABLE 6.2-5. INCIDENCE SUMMARY OF SELECTED MICROSCOPIC LESIONS OF FEMALE RATS FOLLOWING 90 DAYS OF TREATMENT WITH TNB
TNB Dose
Organ/Lesion Control Low Medium High
Kidney (N) 12 12 12 12
Lymphoid infiltrates (severity)3
42 0.4
58 0.6
17 0.2
58 0.8
Hyaline droplets (severity)
0 0.0
0 0.0
33 0.3
66" 0.8"
Spleen (N) 12 12 12 12
Hemosiderosis (severity)
100 1.2
100 1.3
100 2.4"
100 3.0"
aMean grades of severity based on 0 = Normal; 1 = Minimal; 2 = Mild; 3 = Moderate; 4 = Marked; 5 = Severe.
bStatistically different from control at p < 0.01.
120

TABLE 6.2-6. INCIDENCE SUMMARY OF SELECTED MICROSCOPIC LESIONS OF MALE RATS TWO MONTHS FOLLOWING TREATMENT WITH TNB
TNB Dose
Organ/Lesion Control Low Medium High
Kidney (N) 6 6 6 6
Lymphoid infiltrates (severity)3
100 1.3
100 .1.0
83 0.8
100 1.3
Hyaline droplets (severity)
100 1.0
100 1.0
83 0.8
83 0.8
Spleen (N) 6 6 6 6
Hemosiderosis (severity)
83 1.2
100 1.5
100 1.8
100 1.8
Testes (N) 6 6 6 5
Tubular degeneration (severity)
0 0.0
0 0.0
0 0.0
40c
0.6C
Epididymis (N) 6 6 6 5
Atypical spermd 0 0 17 20
Mean grades of severity based on 0 = Normal; 1 = Minimal; 2 = Mild; 3 = Moderate; 4 = Marked; 5 = Severe.
bStatistically different from control at p < 0.01. "Statistically different from control at p < 0.05. dSignifies lesion present only, severity not graded.
There was a significant decrease in the incidence and severity of renal interstitial lymphoid
infiltrates in the mid-dose male rats examined after 28 days of treatment. At 90 days, there was
increased incidence and severity of hyaline droplets in all TNB-treated male rats. There was also an
increased (p < 0.05) severity in renal lymphoid filtrates in the high-dose male rats. Severity and
incidence of hyaline droplet change was also significantly increased (p < 0.01) in the high-dose
female rats after 90 days.
There was a significant increase in the incidence and severity of testicular seminiferous tubular
degeneration after 90 days of treatment, and after 2-months recovery, that was not noted after 28
days of treatment. There was also a corresponding increased (p < 0.05) incidence of sperm
abnormality seen in the epididymides of the high-dose rats following 90 days of treatment.
However, there was recovery after two months, as both incidence and severity of the lesions were
reduced.
121
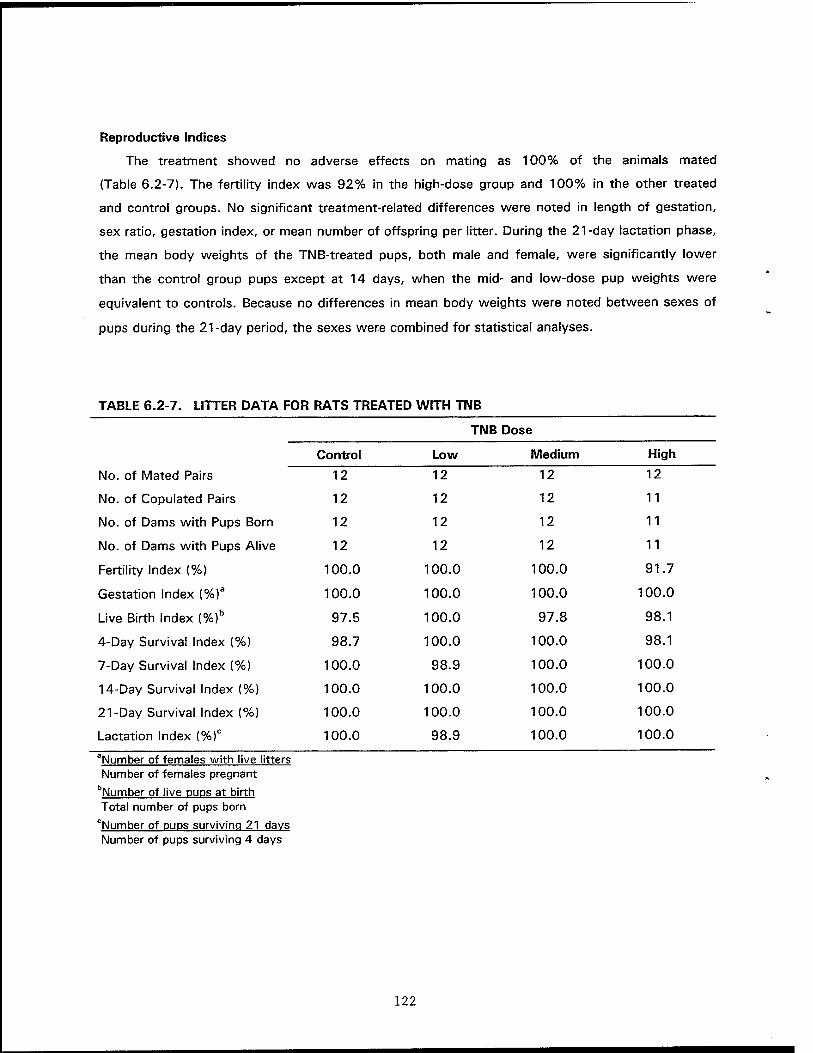
Reproductive Indices
The treatment showed no adverse effects on mating as 100% of the animals mated
(Table 6.2-7). The fertility index was 92% in the high-dose group and 100% in the other treated
and control groups. No significant treatment-related differences were noted in length of gestation,
sex ratio, gestation index, or mean number of offspring per litter. During the 21-day lactation phase,
the mean body weights of the TNB-treated pups, both male and female, were significantly lower
than the control group pups except at 14 days, when the mid- and low-dose pup weights were
equivalent to controls. Because no differences in mean body weights were noted between sexes of
pups during the 21-day period, the sexes were combined for statistical analyses.
TABLE 6.2-7. LITTER DATA FOR RATS TREATED WITH TNB
TNB Dose
Control Low
"Number of females with live litters Number of females pregnant
bNumber of live PUPS at birth Total number of pups born
cNumber of pups surviving 21 days Number of pups surviving 4 days
Medium High
No. of Mated Pairs 12 12 12 12
No. of Copulated Pairs 12 12 12 11
No. of Dams with Pups Born 12 12 12 11
No. of Dams with Pups Alive 12 12 12 11
Fertility Index (%) 100.0 100.0 100.0 91.7
Gestation Index (%)a 100.0 100.0 100.0 100.0
Live Birth Index (%)b 97.5 100.0 97.8 98.1
4-Day Survival Index (%) 98.7 100.0 100.0 98.1
7-Day Survival Index (%) 100.0 98.9 100.0 100.0
14-Day Survival Index (%) 100.0 100.0 100.0 100.0
21-Day Survival Index (%) 100.0 100.0 100.0 100.0
Lactation Index (%)° 100.0 98.9 100.0 100.0
122

DISCUSSION
Administering TNB in the diet of Sprague-Dawley rats at calculated dose levels of approximately
19, 9, and 2, or 29, 14, and 3 mg TNB/kg body weight/day of males and females, respectively,
produced no adverse effects on reproductive performance or litter parameters. Treatment-related
decreases in mean body weights of pups (as great as 15% in the high-dose group) were observed
during the 21-day postpartum period.
Anemia and increased methemoglobin production are common characteristics of nitrate
poisoning. Although anemia was not noted in this study, the increased incidence and/or severity of
splenic hemosiderosis suggests an increased removal (phagocytosis) of erythrocytes. The change in
leukocyte parameters in the mid- and high-dose female rats, as well as alteration in cholesterol
values in the high-dose females, is not believed to be biologically significant.
Brain lesions or motor skills loss were not noted following treatment at these dose levels as was
noted following treatment with DNB or higher doses of TNB (Under et al., 1990; Kinkead et al.,
1994). However, sperm depletion and degeneration of the seminiferous tubules at the high-dose
level during the treatment period was clearly a treatment-related effect, typical of nitrate toxicity
(Under et al., 1986, 1990; Cody et al., 1981). Sperm loss and degeneration had no effect on
mating as the fertility index of the TNB-treated rats was > 90%. Full recovery from testicular
lesions did not occur within 60 days after removal from TNB-treated diet; however, sperm
concentration did return to control levels.
In summary, TNB has been shown to disrupt spermatogenic activity at doses as low as 9 mg
TNB/kg/day, but the testicular effects are not nearly as potent as with DNB. Although the sperm
concentration in TNB-treated rats was reduced, fertility of the male rats appeared to be unaffected.
ACKNOWLEDGMENT
The authors gratefully acknowledge the technical assistance of Marcia L. Freedman, Richard
J. Godfrey, Willie J. Malcomb, Jerry W. Nicholson, Margaret A. Parish, Stephanie A. Salins, SrA.
Stacie L. Southwell, SPC Mark Sovik, Maj. Donald R. Tocco, and Merry J. Walsh.
REFERENCES
Barnhart, R.R. 1981. Rubber Compounding. In: Kirk-Othmer Encyclopedia of Chemical Technology, 3rd Ed., Vol. 20. (A. Stannden, Ed.) John Wiley and Sons, New York, NY. pp. 393-468.
Budavari, S., M.J. O'Neil, and A. Smith, Eds. 1989. In: The Merck Index. Merck & Co., Inc., Rahway, NJ. pp. 1530.
Cody, T.E., S. Witherup, L. Hastings, K. Stemmer, and R.T. Christian. 1981. 1,3-Dinitrobenzene: Toxic effect in vivo and in vitro. J. Toxicol. Environ. Health 7(5):829-847.
123
Fedoroff, B.T., O.E. Sheffield, E.F. Reese, and G.D. Clift, Eds. 1962. In: Encyclopedia of Explosives and Related Items. PATR 2700, Vol. 2. Picatinny Arsenal, Dover, NJ. pp. B48-B49.
Fitzgerald, C.B., N. DiGiulio, L.S. Desai, and G. Reddy. 1992. Acute toxicological evaluation of 1,3,5-Trinitrobenzene. Acute Toxicity Data 1 (3): 169-170.
Furedi, E.M., B.S. Levine, D.E. Gordon, V.S. Rac, and P.M. Lish. 1984a. Determination of the chronic mammalian toxicologic effects of TNT (Twenty-four month chronic toxicity/carcinogenicity study of trinitrotoluene (TNT) in the Fischer 344 rat); Final Report - Phase III, Vol. 1. IIT Research Institute, Project No. L6116, Study No. 11, Chicago, IL. DAMD17-79-C-9120. AD-A168 754.
Furedi, E.M., B.S. Levine, J.W. Sagartz, V.S. Rac, and P.M. Lish. 1984b. Determination of the chronic mammalian toxicologic effects of TNT (Twenty-four month chronic toxicity/carcinogenicity study of trinitrotoluene (TNT) in the B6C3FT hybrid mouse). Final Report - Phase IV, Vol. 1. IIT Research Institute, Project No. L6116, Study No. 11, Chicago, IL. DAMD17-79-C-9120. AD- A168 754.
Hathaway, J.A. 1977. Trinitrotoluene: A review of reported dose-related effects providing documentation for a workplace standard. J. Occup. Med. 19(5):341-345.
Kinkead, E.R., R.E. Wolfe, S.A. Salins, CD. Flemming, D.J. Caldwell, C.R. Miller, and J.R. Latendresse. 1994. Range-Finding Study for a Reproductive Assessment of 1,3,5-Trinitrobenzene Administered in the Diet of Sprague-Dawley Rats. AL-TR-1994-072/WRAIR-TR-1994-0006. Wright- Patterson Air Force Base, OH: Armstrong Laboratory and Walter Reed Army Institute of Research.
Levine, B.S., J.H. Rust, J.M. Burns, and P.M. Lish. 1983. Determination of the chronic mammalian toxicological effects of TNT (Twenty-six week subchronic oral toxicity study of trinitrotoluene (TNT) in the beagle dog). Phase II, Final Report, IIT Research Institute, Report No. L6116, Study No. 5, Chicago, IL. DAMD 17-79-C-9120, AD-A157 082.
Levine, B.S., E.M. Furedi, D.E. Gordon, P.M. Lish, and J.J. Barkely. 1984. Subchronic toxicity of trinitrotoluene in Fischer 344 rats. Toxicology 32:253-265.
Linder, R.E., R.A. Hess, and L.F. Strader. 1986. Testicular toxicity and infertility in male rats treated with 1,3-dinitrobenzene. J. Tox. and Environ. Health 19:477-489.
Linder, R.E., L.F. Strader, R.R. Barbee, G.L. Rehnberg, and S.D. Perreault. 1990. Reproductive toxicity of a single dose of 1,3-dinitrobenzene in two ages of young adult male rats. Fundam. Appl. Tox. 14:284-298.
Morton, A.R., M.V. Ranadive, and J.A. Hathaway. 1976. Biological effects of trinitrotoluene from exposure below the threshold limit value. Am. Ind. Hyg. Assoc. J. 37(1):56-60.
Philbert, M.A., A.J. Gray, and T.A. Connors. 1987. Preliminary investigations into the involvement of the intestinal microfluora in CNS toxicity induced by 1,3-dinitrobenzene in male F-344 rats. Tox Letters 38:307-314.
Ryon, M.G., B.C. Pal, S.S. Talmage, and R.H. Ross. 1984. Database assessment of the health and environmental effects of munition production waste products. Final Report. ORNL-6018. (NTIS DE84-016512). Oak Ridge National Laboratory, Oak Ridge, TN.
124
Stewart, A., L.T. Witts, G. Higgins, et al. 1945. Some early effects of exposure to trinitrotoluene. Br. J. Ind. Med. 2:74-82. (Cited in Hathaway, 1977)
U.S. EPA. 1989. Health and Environmental Effects Profile for 1,3,5-Trinitrobenzene. Environmental Criteria and Assessment Office, Office of Health and Environmental Assessment, Cincinnati, OH, ECAO-CIN-G071.
125
6.3 REPRODUCTIVE TOXICITY SCREEN OF LIQUID PROPELLAIMT XM46 ADMINISTERED IN THE DRINKING WATER OF SPRAGUE-DAWLEY RATS
E.R. Kinkead, R.E. Wolfe, S.A. Salins, CD. Flemming, H.F. Leahy, D.J. Caldwell1, C.R. Miller1, and G.B. Marit2
ABSTRACT
Liquid propellant (XM46) is being considered as a replacement for solid propellants, both as part of a
regenerative injection gun system and as a working fluid in an electrothermal gun system. The XM46
formulation contains hydroxylammonium nitrate, triethanolammonium nitrate, and water. Male and female
Sprague-Dawley rats received XM46 in drinking water containing 2.0, 1.0, 0.2, or 0.0 g XM46/L
throughout 90 days of study. Mating occurred following 14 days of treatment. One half the male rats per
group were necropsied after 28 days of treatment and the remaining males and all dams were necropsied
following 90 days. No mortality occurred in any of the parental animals during the study. The study did
not produce any adverse effects on reproduction or litter parameters. Hemolytic anemia and
methemoglobinemia were common findings in both sexes of rats. Splenomegaly was found in both
sexes; in male rats as early as 28 days. Exposures via drinking water containing XM46 for 90 days did
not result in any decrease in reproductive performance in male or female rats, but it did result in clinical
signs of hemolytic anemia at calculated doses as low as 17 mg/kg/day.
INTRODUCTION
Liquid propellant 1846 (XM46) is a developmental propellant for the next generation Advanced Field
Artillery System. It will be used as part of the regenerative injection gun system instead of powder
charges for the 155-mm cannon and as a working fluid in an electrothermal gun system. The
components of XM46 (hydroxylammonium nitrate [HAN] and triethanolammonium nitrate) are both
strongly reducing and oxidizing agents and can react with many organic and inorganic materials (Jet
Propulsion Laboratory, 1989). Impurities are generated by reaction of XM46 with components of the gun
systems (e.g., metals), manufacturing intermediates, or materials introduced by improper handling after
production. Decomposition leads to the formation of nitric acid and ammonium nitrate with subsequent
destabilization of the propellant mixture (Klein et al., 1991; Hansen et al., 1990).
Individuals working with XM46 have reported burning sensations and lesions within 24 h following
exposure. Sensitization has been reported in one worker that handled HAN (Parmer et al., 1991). XM46
is a moderate to severe skin irritant and may cause a burning sensation immediately upon contact. If the
1 Army Medical Research Detachment, Walter Reed Army Institute of Research, Wright-Patterson Air Force Base, OH.
2 Army Meidcal Research Unit, Wright-Patterson Air Force Base, OH.
126

material is not flushed, erythema will occur on contaminated areas within several hours, followed by
severe dermatitis within 24 h (Weller et al., 1989).
When applied to guinea pig skin, XM46 proved to be a strong skin sensitizer. The sensitization
response to XM46 may be associated with hydroxylamine, a potent skin sensitizer (Gross, 1985) and to
triethylamine, also reported to be a skin sensitizer (Grosselin et al., 1984). Single- and repeat-dose dermal
studies on animals have shown that XM46 and HAN penetrate the skin to produce systemic effects. A
21-day repeated dermal application of XM46 and HAN to rabbit skin produced erythrocyte destruction,
Heinz body formation, anemia, spleen enlargement, and dermal necrosis (Asaki et al., 1982). Rinsing the
skin within four hours of exposure effectively reduces the severity of the skin lesions (Witt et al., 1992).
XM46 is also a strong eye irritant, producing iritis, chemosis, and corneal opacity which lasts for up
to one week. Washing the eye 30 seconds after application eliminated the corneal opacity and reduced
the duration and severity of the remaining effects. Washing at 10 minutes postapplication further reduced
the symptoms, but signs of ocular irritation were still present (Justus and Korte, 1988).
Inhalation of XM46 vapor is not a hazard since the vapor decomposes almost entirely to water.
Inhalation of HAN aerosol, however, may produce respiratory irritation, blood dyscrasia, and elevated
methemoglobin (Snodgrass et al., 1985). Extensive genotoxicity studies have been negative (Jagannath,
1979; Balter et al., 1982; Bakke, 1990; Rudd and Lee, 1990; Blachman, 1990) and XM46 is classified
as a nonmutagen.
The purpose of this study was to evaluate the potential of XM46 to produce alterations in paternal
and/or maternal fertility, maternal gestation and lactation, and growth and development of offspring of
Sprague-Dawley rats. The XM46 was administered to rats via drinking water.
Test Compound
The XM46 formulation is a mixture of hydroxylammonium nitrate (61 %), triethanolammonium nitrate
(19%), and water (20%). The compound is a eutectic salt and does not exist as an aqueous solution. The
XM46 formulation is acidic and has a density of 1.42 g/mL at 20 °C.
127

Group Assignments and Dose Levels
Number of Animals Dose Level of XM46
(mg/L drinking water)
Target Dose Level of XM46
Group Males Females (mg/kg body wt/day)a
Control 12 12 0.0 0.0
Low 12 12 200.0 12.0
Middle 12 12 1000.0 60.0
High 12 12 2000.0 120.0
"Assumed daily water consumption of 30 mL per 500 g rat.
Study Design and Experimental Evaluations
The test compound was administered orally in drinking water (ad libitum). The study design,
experimental evaluations and animal assessments for this study are detailed in Section 6.1 of this Annual
Report. A technical report entitled "Reproductive Toxicity Screen of Liquid Propellant 1846 (XM46)
Administered in the Drinking Water of Sprague-Dawley Rats" by Kinkead, Wolfe, Salins, Flemming, Miller,
Caldwell, and Marit (AL/OE-TR-1994-0101; WRAIR/TR-94-0008) contains details of assessment data and
figures not included in this Annual Report.
RESULTS
General Toxicity
No mortality occurred in parental rats during the study. No treatment-related differences were noted
in mean body weights of treated rats when compared to their respective control group. Water
consumption (not shown) decreased significantly in both sexes of treated rats when treatment began and
continued to be significantly less than controls throughout the 90-day study. For the duration of the
study male rats consumed approximately 30, 30, and 37 mL/day resulting in a mean dose of 136, 67,
and 17 mg XM46/kg/day for the high-, mid-, and low-dose groups, respectively. Female rats consumed
approximately 18, 22, and 25 mL/day during the premating and postweaning periods resulting in a mean
dose of 140, 80, and 20 mg XM46/kg/day for the high-, mid-, and low-dose groups, respectively. During
gestation the dose increased to 230, 120, and 30, and during lactation the dose was 375, 220, and 50
mg XM46/kg/day for each group, respectively. Because of the wide variation in water consumption of
the female rats, a median value was used to determine the overall dose of 155, 107, and 25 mg
XM46/kg/day for the respective dose groups.
128
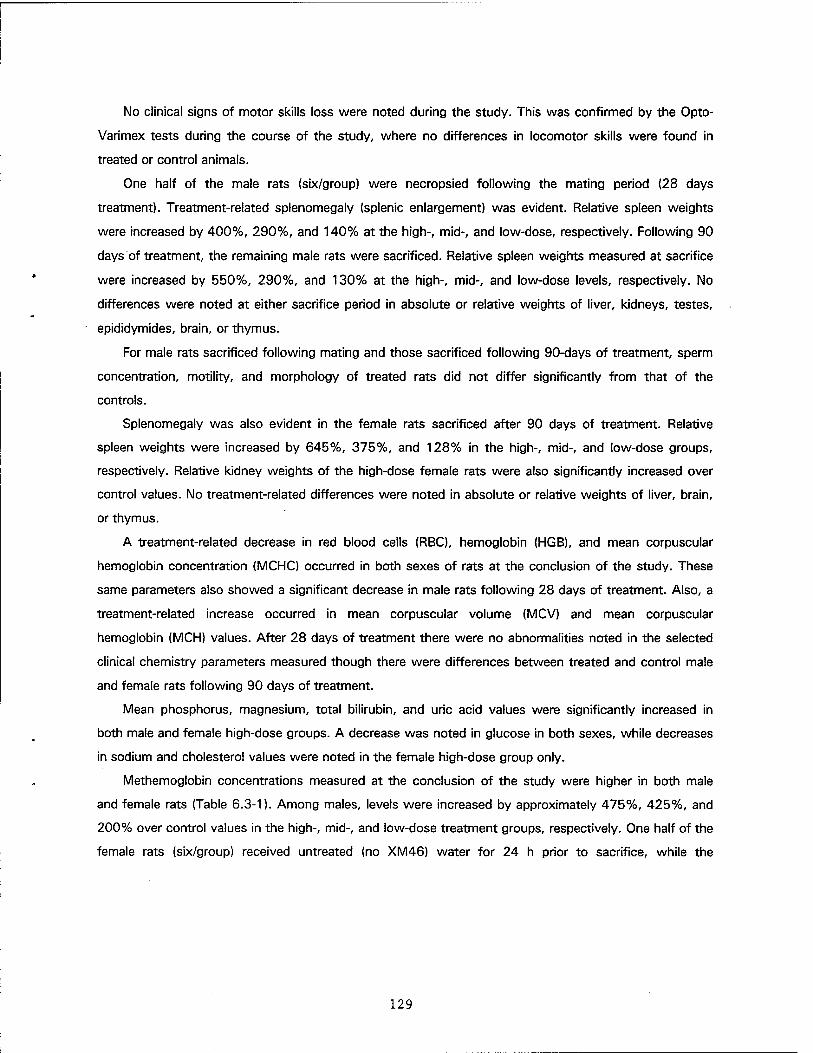
No clinical signs of motor skills loss were noted during the study. This was confirmed by the Opto-
Varimex tests during the course of the study, where no differences in locomotor skills were found in
treated or control animals.
One half of the male rats (six/group) were necropsied following the mating period (28 days
treatment). Treatment-related splenomegaly (splenic enlargement) was evident. Relative spleen weights
were increased by 400%, 290%, and 140% at the high-, mid-, and low-dose, respectively. Following 90
days of treatment, the remaining male rats were sacrificed. Relative spleen weights measured at sacrifice
were increased by 550%, 290%, and 130% at the high-, mid-, and low-dose levels, respectively. No
differences were noted at either sacrifice period in absolute or relative weights of liver, kidneys, testes,
epididymides, brain, or thymus.
For male rats sacrificed following mating and those sacrificed following 90-days of treatment, sperm
concentration, motility, and morphology of treated rats did not differ significantly from that of the
controls.
Splenomegaly was also evident in the female rats sacrificed after 90 days of treatment. Relative
spleen weights were increased by 645%, 375%, and 128% in the high-, mid-, and low-dose groups,
respectively. Relative kidney weights of the high-dose female rats were also significantly increased over
control values. No treatment-related differences were noted in absolute or relative weights of liver, brain,
or thymus.
A treatment-related decrease in red blood cells (RBC), hemoglobin (HGB), and mean corpuscular
hemoglobin concentration (MCHC) occurred in both sexes of rats at the conclusion of the study. These
same parameters also showed a significant decrease in male rats following 28 days of treatment. Also, a
treatment-related increase occurred in mean corpuscular volume (MCV) and mean corpuscular
hemoglobin (MCH) values. After 28 days of treatment there were no abnormalities noted in the selected
clinical chemistry parameters measured though there were differences between treated and control male
and female rats following 90 days of treatment.
Mean phosphorus, magnesium, total bilirubin, and uric acid values were significantly increased in
both male and female high-dose groups. A decrease was noted in glucose in both sexes, while decreases
in sodium and cholesterol values were noted in the female high-dose group only.
Methemoglobin concentrations measured at the conclusion of the study were higher in both male
and female rats (Table 6.3-1). Among males, levels were increased by approximately 475%, 425%, and
200% over control values in the high-, mid-, and low-dose treatment groups, respectively. One half of the
female rats (six/group) received untreated (no XM46) water for 24 h prior to sacrifice, while the
129
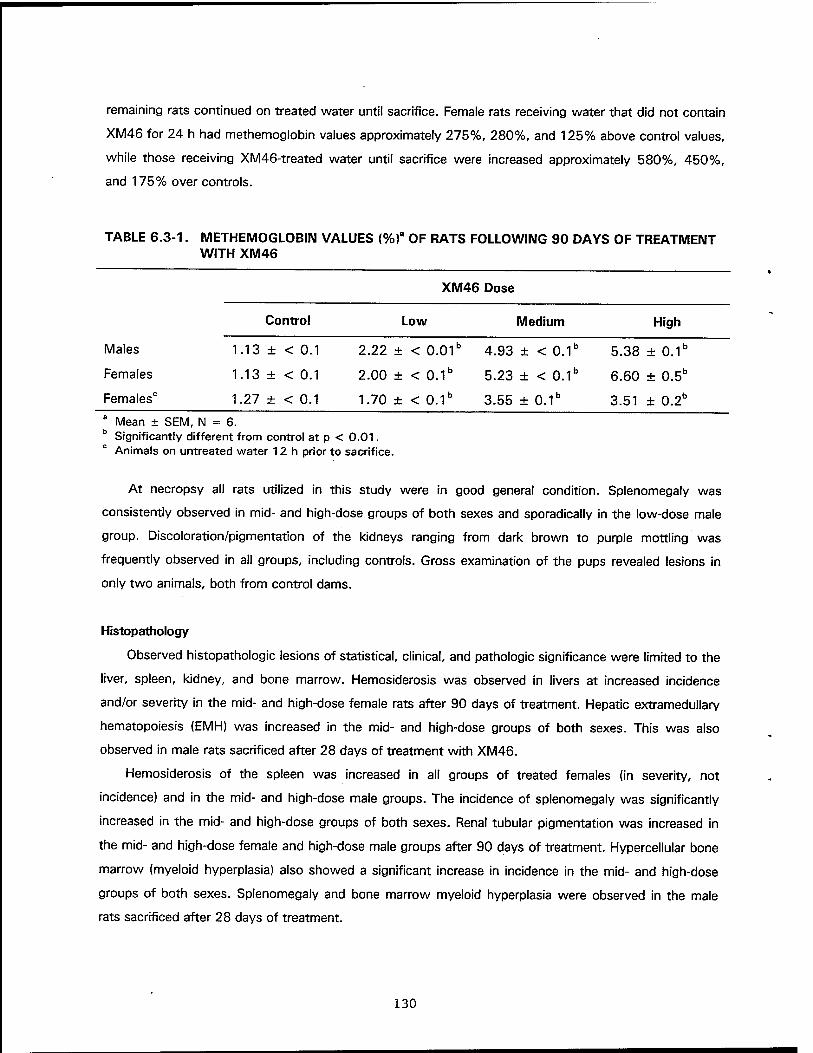
remaining rats continued on treated water until sacrifice. Female rats receiving water that did not contain
XM46 for 24 h had methemoglobin values approximately 275%, 280%, and 125% above control values,
while those receiving XM46-treated water until sacrifice were increased approximately 580%, 450%,
and 175% over controls.
TABLE 6.3-1. METHEMOGLOBIN VALUES (%)a OF RATS FOLLOWING 90 DAYS OF TREATMENT WITH XM46
XM46 Dose
Control Low Medium High
Males
Females
Females0
1.13 ± < 0.1
1.13 ± < 0.1
1.27 ± < 0.1
2.22 ± < 0.01"
2.00 ± < 0.1"
1.70 ± < 0.1"
4.93 ± < 0.1"
5.23 ± < 0.1"
3.55 ± 0.1"
5.38 ± 0.1"
6.60 ± 0.5"
3.51 ± 0.2" a Mean ± SEM, N = 6.
Significantly different from control at p < 0.01. Animals on untreated water 12 h prior to sacrifice.
At necropsy all rats utilized in this study were in good general condition. Splenomegaly was
consistently observed in mid- and high-dose groups of both sexes and sporadically in the low-dose male
group. Discoloration/pigmentation of the kidneys ranging from dark brown to purple mottling was
frequently observed in all groups, including controls. Gross examination of the pups revealed lesions in
only two animals, both from control dams.
Histopathology
Observed histopathologic lesions of statistical, clinical, and pathologic significance were limited to the
liver, spleen, kidney, and bone marrow. Hemosiderosis was observed in livers at increased incidence
and/or severity in the mid- and high-dose female rats after 90 days of treatment. Hepatic extramedullary
hematopoiesis (EMH) was increased in the mid- and high-dose groups of both sexes. This was also
observed in male rats sacrificed after 28 days of treatment with XM46.
Hemosiderosis of the spleen was increased in all groups of treated females (in severity, not
incidence) and in the mid- and high-dose male groups. The incidence of splenomegaly was significantly
increased in the mid- and high-dose groups of both sexes. Renal tubular pigmentation was increased in
the mid- and high-dose female and high-dose male groups after 90 days of treatment. Hypercellular bone
marrow (myeloid hyperplasia) also showed a significant increase in incidence in the mid- and high-dose
groups of both sexes. Splenomegaly and bone marrow myeloid hyperplasia were observed in the male
rats sacrificed after 28 days of treatment.
130
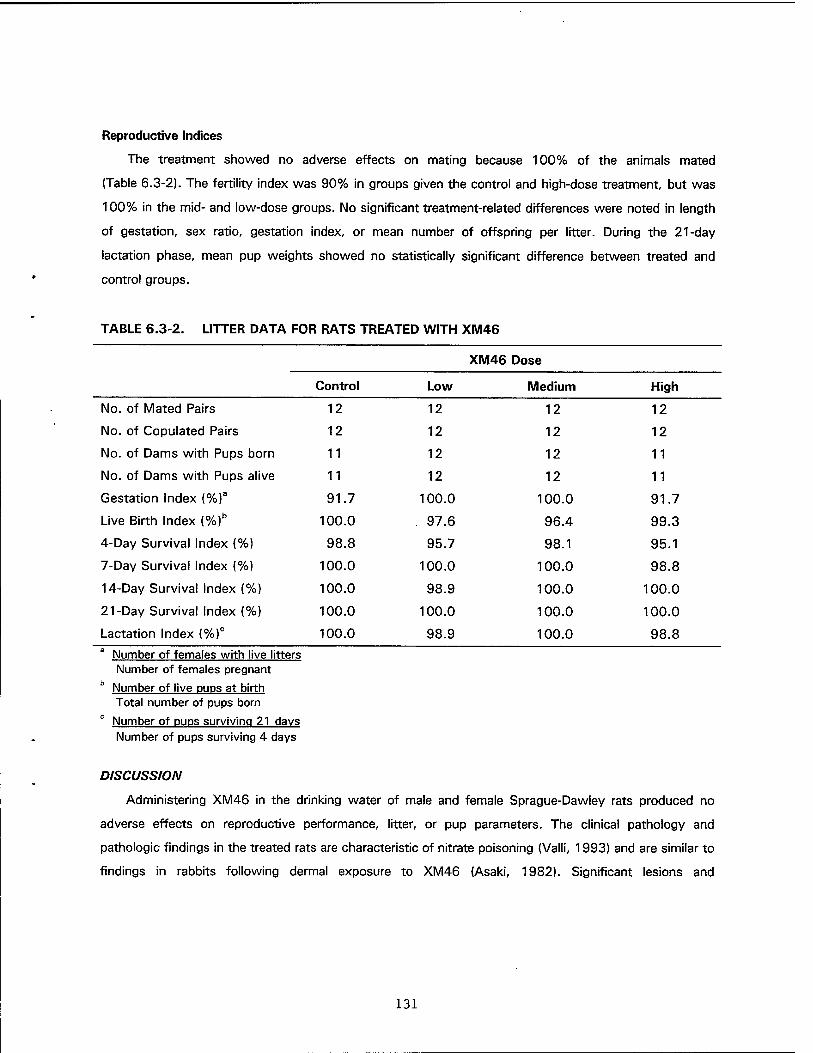
Reproductive Indices
The treatment showed no adverse effects on mating because 100% of the animals mated
(Table 6.3-2). The fertility index was 90% in groups given the control and high-dose treatment, but was
100% in the mid- and low-dose groups. No significant treatment-related differences were noted in length
of gestation, sex ratio, gestation index, or mean number of offspring per litter. During the 21-day
lactation phase, mean pup weights showed no statistically significant difference between treated and
control groups.
TABLE 6.3-2. LITTER DATA FOR RATS TREATED WITH XM46
XM46 Dose
Control Low Medium High
No. of Mated Pairs 12 12 12 12
No. of Copulated Pairs 12 12 12 12
No. of Dams with Pups born 11 12 12 11
No. of Dams with Pups alive 11 12 12 11
Gestation Index (%)a 91.7 100.0 100.0 91.7
Live Birth Index (%)b 100.0 . 97.6 96.4 99.3
4-Day Survival Index (%) 98.8 95.7 98.1 95.1
7-Day Survival Index (%) 100.0 100.0 100.0 98.8
14-Day Survival Index (%) 100.0 98.9 100.0 100.0
21-Day Survival Index (%) 100.0 100.0 100.0 100.0
Lactation Index (%)c 100.0 98.9 100.0 98.8
Number of females with live litters Number of females pregnant
Number of live pups at birth Total number of pups born
0 Number of pups surviving 21 days Number of pups surviving 4 days
DISCUSSION
Administering XM46 in the drinking water of male and female Sprague-Dawley rats produced no
adverse effects on reproductive performance, litter, or pup parameters. The clinical pathology and
pathologic findings in the treated rats are characteristic of nitrate poisoning (Valli, 1993) and are similar to
findings in rabbits following dermal exposure to XM46 (Asaki, 1982). Significant lesions and
131
abnormalities noted in the clinical pathology data are attributed to the effects of XM46 on erythrocytes.
Exposure to high doses of nitrates can result in hemolytic anemia and icterus (Valli, 1993), though icterus
was not observed in this study. Nitrates that are converted to high levels of nitrites can produce
methemoglobinemia (Menzer, 1991).
Gross examination failed to reveal the brown discoloration of blood characteristic of
methemoglobinemia (Valli, 1993); however, chemical analysis did reveal its presence, icterus was not
evident at necropsy and although total bilirubin tended to increase in a dose-related manner, the values
were within normal reference ranges. Anemia was noted, using hemoglobin concentration and red blood
cell count decreases as the basis of comparison. Females showed statistically significant dose-related
decreases in hematocrit (HCT), but the values were within the normal reference range. Therefore, based
on RBC and hemoglobin values, what was observed was a compensated hemolytic anemia (Duncan and
Prasse, 1987).
It is hypothesized that at the time blood and tissues were collected for examination the bone marrow
had compensated for the hemolytic anemia. The hemolysis is interpreted as occurring extravascularly
based on the gross and histologic evidence of hypersplenism and the decreased MCHC. The increased
MCH and MCV and decreased MCHC indicate the presence of large numbers of circulating reticulocytes
(Duncan and Prasse, 1987). Because of their larger size and the exposure period allowing for a continued
maximal bone marrow response, marked reticulocytosis could elevate the hematocrit into the low normal
range. Unfortunately, automated hematology analyzers do not count reticulocytes or nucleated red blood
cells, and blood smears were not taken from these animals.
The increased white blood cell count (leukocytosis; primarily in the females) is attributed to an
absolute neutrophilia, which is common in hemolytic conditions and may be in response to erythrocyte
breakdown products or stress. The eosinopenia observed in the females is most likely induced by stress.
The monocytosis observed in the males may also be due to stress, but frequently accompanies the need
for phagocytic removal of abnormal red cells seen in hemolytic anemia (Duncan and Prasse, 1987).
Increases in total serum bilirubin is indicative of the hemolytic breakdown. An Increase in mean
phosphorus and magnesium levels is also related to lyses of erythrocytes. The cause of the increase in
uric acid levels is unknown. An increase in glucose levels is of questionable relevance in rats (Meeks,
1989; Loeb, 1989). Slight increases in the total bilirubin concentration with increasing dose is consistent
with an extravascular hemolytic anemia (Duncan and Prasse, 1987). The consistent, and at times,
statistically significant dose-related elevations of magnesium and phosphorus may be the result of
hemolysis, although the ion in the highest concentrations in RBCs (potassium) is only slightly elevated
(Riley and Cornelius, 1989). This may be an adaptive response because potassium concentration is
regulated by a sensitive homeostatic mechanism.
132
Gross and histological examination supports the clinical pathologic interpretations of a compensated
extravascular hemolytic anemia. Two key anatomical features for this diagnosis are splenomegaly, due to
EMH and/or increased phagocytosis of damaged erythrocytes by splenic macrophages with resulting
hemosiderosis, and a hypercellular erythroid bone marrow. These lesions are present in this study and
follow a dose-response relationship that is statistically significant. Related hepatic lesions include
hemosiderosis and EMH (erythroid). Another related and statistically significant change is pigmentation
(hemosiderosis) of renal tubular epithelial cells.
ACKNOWLEDGMENT
The authors gratefully acknowledge the technical assistance of Marcia L. Freedman, Richard J.
Godfrey, Willie J. Malcomb, Jerry W. Nicholson, Margaret A. Parish, Stephanie A. Salins, SrA. Stacie L.
Southwell, SPC Mark Sovik, Maj. Donald R. Tocco, and Merry J. Walsh.
REFERENCES
Asaki, A.E., L.W. Metker, J.G. Harvey, and E.A. Haight. 1982. Health hazard evaluation of liquid monöpropellants. Phase 3, Range findings studies on the effects of hydroxylammonium nitrate in animals, Special Study No. 75-51-0132-84. U.S. Army Environmental Hygiene Agency, Aberdeen Proving Ground, MD.
Bakke, J. 1990. Evaluation of the potential of LP1846 liquid gun propellant to induce unscheduled DNA synthesis in the In Vitro hepatocyte DNA repair assay. Final Report, SRI Project LSC-7662-2, SRI Study No. 7662-A01-89. U.S. Army Medical Research and Development Command, Fort Detrick, Frederick, MD.
Baiter, N., R. Davis, G. Cortes, M. Rosario, and B. Rivera. 1982. Determination of the acute oral LD50 and dominant lethal effects of HAN in mice. Omni Research, Inc., Baltimore, MD, Contract No. 82-MD-441, U.S. Army Environmental Hygiene Agency, Aberdeen Proving Ground, MD.
Blachman, D. 1990. An assessment of the clastogenic potential of LP1846 utilizing the mammalian cell cytogenetics assay with Chinese hamster ovary (CHO) cells. Final Report, SRI Project No. LSC-7662-4, SRI Study No. 7662-C01-89, Project No. 89M4505. U.S. Army Medical Research and Development Command, Fort Detrick, Frederick, MD.
Duncan, J.R. and K.W. Prasse. 1987. Veterinary Laboratory Medicine: Clinical Pathology. Iowa State University Press, Ames, Iowa. pp. 1-27, 236-238.
Gross, P. 1985. Biological activity of hydroxylamine: A Review. CRC Crit. Rev. Toxicol. 14(1):87-115.
Grosselin, R.E, R.P. Smith, and H.C. Hodge. 1984. Clinical Toxicology of Commercial Products. 5th Edition.
Hansen, R., E. Backoff, H.J. DeGrieff, and N. Klein. 1990. Processes for assessing the thermal stability of HAN-based liquid propellants, Final Report. U.S. Army Ballistics Research Laboratory Contractor Report 635. U.S. Army Ballistics Research Laboratory, Aberdeen Proving Ground, MD 21005.
133
Jagannath, D.R. 1979. Mutagenic evaluation of HAN 13.2 Batch #R149/151 in the Ames Salmonella/Microsome plate test. Final Report, Litton Bionetics, Inc., Kensington, MD. LBI Project No. 20988, U.S. Army Environmental Hygiene Agency, Aberdeen Proving Ground, MD.
Jet Propulsion Laboratory. 1989. Safe liquid propellant technology. Report on liquid propellant logistics systems study. Phase II. JPL Report D-6876. U.S. Army Armament Research, Development and Engineering Center.
Justus, J.D. and D.W. Korte. 1988. Ocular irritation evaluation with eye wash regimen of liquid propellant 1846. Institute Report No. 299, Letterman Army Institute of Research, Presidio of San Francisco, CA94129.
Klein, N., C.S. Leveritt, and P.G. Baer. 1991. The effects of composition variation and nitric acid on the stability and reactivity of the HAN-based liquid propellants. U.S. Army Ballistics Research laboratory Technical Report 3179. U.S. Army Ballistics Research Laboratory, Aberdeen Proving Ground, MD 21005.
Loeb, W.F. 1989. The primate. In: The Clinical Chemistry of Laboratory Animals. W.F. Loeb and F.W. Quimby, eds. Pergamon Press, New York, New York. pp. 56-60.
Meeks, R.G. 1989. The rat. In: The Clinical Chemistry of Laboratory Animals. W.F. Loeb and F.W. Quimby, eds. Pergamon Press, New York, New York. pp. 19-25.
Menzer, R.E. 1991. Water and soil pollutants. In: Casarett and Dou/I's Toxicology: The Basic Science of Poisons, Fourth Edition. M.O. Amdur, J. Doull, and CD. Klaassen, eds. Pergamon Press, New York, New York. pp. 893-894.
Parmer, D.L., W.G. Palmer, D.A. Smart, and R.A. Finch. 1991. Developmental medical research on liquid gun propellants. In: Conference on Chemical Risk Assessment in the DOD: Science, Policy, and Practice. H.J. Clewell III ed., ACGIH, Cincinnati, pp. 95-104.
Riley, J.H. and L.M. Cornelius. 1989. Electrolytes, blood gases, and acid base balance. In: The Clinical Chemistry of Laboratory Animals. W.F. Loeb and F.W. Quimby, eds. Pergamon Press, New York, New York. pp. 360-372.
Rudd, C.J. and P.S. Lee. 1990. CHO/HGPRT gene mutation assay of LP1846 liquid gun propellant. Final Report, SRI Project No. LSC-7662-3, SRI Study No. 7662-B01-89. U.S. Army Medical Research and Development Command, Fort Detrick, Frederick, MD.
Snodgrass, H.L., A.E. Asaki, J.G. Harvey, and L.W. Metker. 1985. Health hazard evaluation of liquid monopropellants, Phase 4, Subchronic inhalation of hydroxylammonium nitrate. Special Study No. 75-51- 1-0132-85, U.S. Army Environmental Hygiene Agency, Aberdeen Proving Ground, MD.
Valli, V.E.O. 1993. The hematopoietic system. In: Pathology of Domestic Animals, Vol. 3. K.V.F. Jubb, P.C. Kennedy, and N. Palmer, eds. Academic Press, New York, New York. pp. 208-209.
Weller, R.E., J.E. Morris, B.J. McClanahan, and R.F. Jostes. 1989. Evaluate the dermal toxicity of nitrate compounds and liquid gun propellants. Final Report, Project Number 87PP7806, U.S. Army Medical Research and Development Command, Fort Detrick, Frederick, MD.
Witt, v '.ML. R.M. Parker, J.D. Thurman, and P.A. Gosnell. 1992. LP1846 Liquid Gun Propellant Dermal Toxic; Study in M^e Miniature Hanford Swine. Final Report, Project No. 3E162720A835, U.S. Army Medical Research and Development Command, Fort Detrick, Frederick, MD.
134

6.4 REPRODUCTIVE TOXICITY SCREEN OF AMMONIUM DINITRAMIDE ADMINISTERED IN THE DRINKING WATER OF SPRAGUE-DAWLEY RATS
E.R. Kinkead, R.E. Wolfe. CD. Flemming, H.F. Leahy, D.J. Caldwell1
C.R. Miller1, and G.B. Marit2
ABSTRACT
The Department of Defense is currently considering replacing ammonium perchlorate (AP) with
ammonium dinitramide (ADN). The ADIM, a class 1.1 explosive oxidizer, will be used in solid rocket
propellant mixtures and explosives. This study was intended to evaluate the potential of ADN to produce
alterations in paternal fertility, maternal pregnancy and lactation, and growth and development of
offspring. Male and female rats received drinking water treated with 200, 100, or 20 mg ADN/100 mL
throughout the study. Mating occurred following 14 days of treatment. All dams, one-half the males, and
representative pups were maintained for a total of 90 days of treatment. No mortality occurred in parental
animals during the study. Treatment with ADN resulted in no adverse effects on mating as 92-100% of
the animals mated. No treatment-related effects were seen in parental animals clinically or
histopathologically. Adverse treatment-related decreases were noted in the maternal and paternal fertility
indices, gestational indices, and live birth indices of the high- and mid-dose groups. Litter sizes in the
high- and mid-dose groups were significantly smaller than those of the low-dose and control groups.
Mean pup weights showed no statistically significant differences between ADN-treated pups and
controls. Gross and histopathological examination of the animals failed to identify the cause for the
decrease in litter production in the high- and mid-dose dams. This study indicates that ADN is a
reproductive toxicant. The no observable effect level (NOEL) is 29 mg/kg/day, the median dose of the
low-level female rats.
INTRODUCTION
The Department of Defense is currently considering replacing ammonium perchlorate (AP) with
ammonium dinitramide (ADN), a class 1.1 explosive oxidizer, for use in solid rocket engine propellent
mixtures and explosives. The immediate application for ADN is as a clean-burning replacement for AP in a
propellent formulation that provides better performance. Burning AP produces a heavy smoke trail with
high hydrochloric acid content. Chlorine in the smoke trail has been identified as a major contributor to
1 Army Medical Research Detachment, Walter Reed Army Institute of Research, Wright-Patterson Air Force Base, OH.
2 Army Medical Research Unit, Wright-Patterson Air Force Base, OH.
135
ozone depletion in the stratosphere, and the visible smoke trail makes rockets more vulnerable to
detection and tracking. The dinitramide anion is a uniquely stable, high oxygen density grouping that can
be prepared in many different combinations including the ammonium salt that should be of most interest
for rocket propulsion. Since the dinitramide anion has never been investigated before, there is great
interest in its properties.
A minimal amount of acute toxicity data on ADN are available. Ammonium dinitramide did not kill
rabbits at the dermal EPA exposure limit test dose of 2 g/kg body weight. The oral median lethal dose
(LD50) of ADN in male Fischer 344 rats is 832 mg/kg (Kinkead and Wolfe, 1994). Mortality was observed
within an hour of dosing and death was preceded by convulsions. No repeated exposure toxicity
information is currently available; however, field reports from exposed personnel indicate that the
compound is readily absorbed by the skin, resulting in numbness of the fingers (Koppes, 1993).
Munition workers exposed to other nitrate containing explosives (e.g., nitrotoluene and
1,3-dinitrobenzene) have experienced skin irritation, liver damage, and anemia (Hathaway, 1977; Morton
et al., 1976; Stewart et al., 1945). In laboratory animals, these compounds induced methemoglobin
formation, liver and spleen hypertrophy, and degeneration of the seminiferous tubules resulting in
decreased spermatogenesis (Cody et al., 1981; Levine et al., 1983, 1984; Furedi et al., 1984a,b). A
recently completed range-finding reproduction toxicity screen performed in this laboratory with 1,3,5-
trinitrobenzene resulted in testicular atrophy and decreased spermatogenesis in male rats (Kinkead et al.,
1994a). Head tilt and loss of equilibrium occurred in the high-dose female rats during the postpartum
period and both sexes had brain lesions in the olivary region of the medulla at the conclusion of the
range-finding study. Head tilt and loss of equilibrium (Under et al., 1990), as well as brain and brain stem
lesions (Philbert et al., 1987), have been reported in rats following treatment with similar nitrate
compounds.
MA TERIALS AND METHODS
Test Compound
The ammonium dinitramide [NH4N(N02)2] was supplied by SRI International, Menlo Park, CA.
Because ADN is a DOT explosive class "A" compound, only limited quantities were stored and no archive
sample was maintained in the THRU laboratory. The ADN sample was known to be contaminated with
1% to 2% ammonium nitrate (Koppes, 1993). The test compound, a water-soluble powder, was
maintained in an enclosed cabinet due to light sensitivity (Koppes, 1993).
136
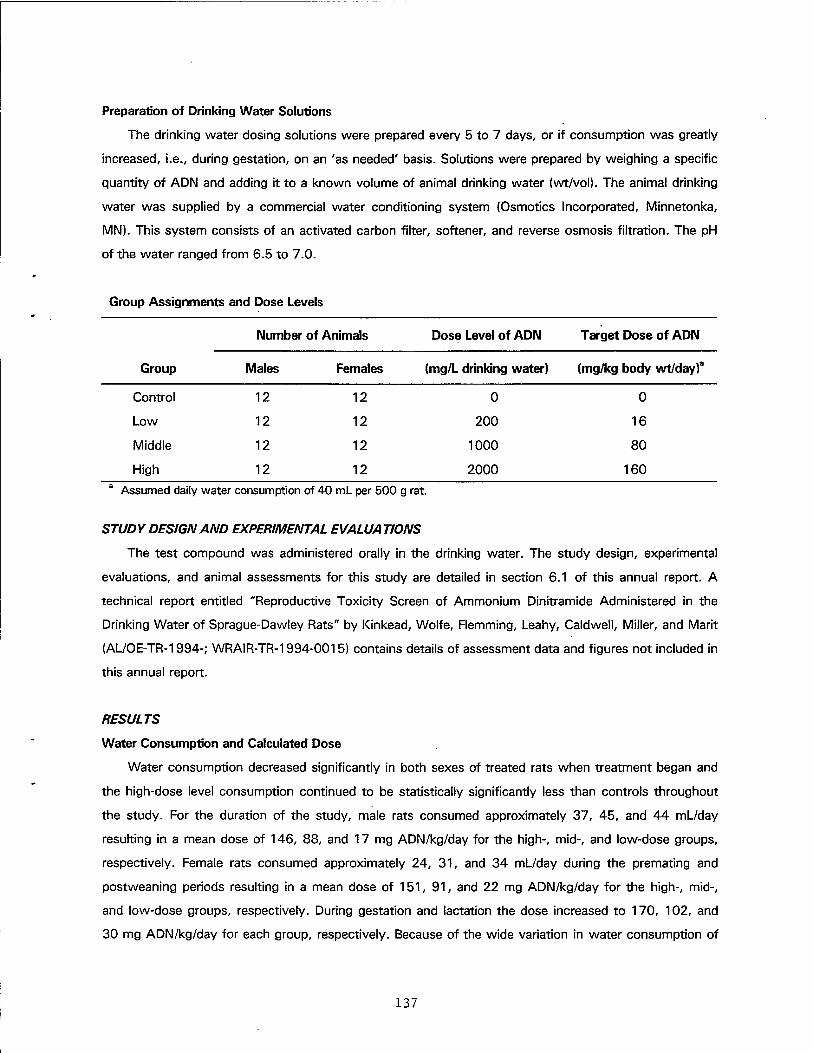
Preparation of Drinking Water Solutions
The drinking water dosing solutions were prepared every 5 to 7 days, or if consumption was greatly
increased, i.e., during gestation, on an 'as needed' basis. Solutions were prepared by weighing a specific
quantity of ADN and adding it to a known volume of animal drinking water (wt/vol). The animal drinking
water was supplied by a commercial water conditioning system (Osmotics Incorporated, Minnetonka,
MN). This system consists of an activated carbon filter, softener, and reverse osmosis filtration. The pH
of the water ranged from 6.5 to 7.0.
Group Assignments and Dose Levels
Number of Animals Dose Level of ADN Target Dose of ADN
Group Males Females (mg/L drinking water) (mg/kg body wt/day)a
Control 12 12 0
Low 12 12 200
Middle 12 12 1000
High 12 12 2000
0
16
80
160
Assumed daily water consumption of 40 mL per 500 g rat.
STUDY DESIGN AND EXPERIMENTAL EVALUATIONS
The test compound was administered orally in the drinking water. The study design, experimental
evaluations, and animal assessments for this study are detailed in section 6.1 of this annual report. A
technical report entitled "Reproductive Toxicity Screen of Ammonium Dinitramide Administered in the
Drinking Water of Sprague-Dawley Rats" by Kinkead, Wolfe, Flemming, Leahy, Caldwell, Miller, and Marit
(AL/OE-TR-1994-; WRAIR-TR-1994-0015) contains details of assessment data and figures not included in
this annual report.
RESULTS
Water Consumption and Calculated Dose
Water consumption decreased significantly in both sexes of treated rats when treatment began and
the high-dose level consumption continued to be statistically significantly less than controls throughout
the study. For the duration of the study, male rats consumed approximately 37, 45, and 44 mL/day
resulting in a mean dose of 146, 88, and 17 mg ADN/kg/day for the high-, mid-, and low-dose groups,
respectively. Female rats consumed approximately 24, 31, and 34 mL/day during the premating and
postweaning periods resulting in a mean dose of 151, 91, and 22 mg ADN/kg/day for the high-, mid-,
and low-dose groups, respectively. During gestation and lactation the dose increased to 170, 102, and
30 mg ADN/kg/day for each group, respectively. Because of the wide variation in water consumption of
137
the female rats, a median value was used to determine the overall dose of 162, 103, and 29 mg
ADN/kg/day for the respective dose groups.
General Toxicity
No mortality occurred in parental rats during the study. No treatment-related differences were noted
in mean body weights of treated male rats when compared to their respective control group. However, a
treatment-related decrease in mean body weights of female rats occurred at days 14 and 20 of gestation.
No clinical signs of alteration in motor skills were noted during the study. This was confirmed by the
Opto-Varimex tests during the course of the study, where no differences in locomotor skills were found
in treated or control animals.
One half of the male rats (6/group) were necropsied following the mating period (28 days of
treatment). Following 90 days of treatment the remaining male rats were examined. No treatment-related
differences in absolute or relative organ weights were noted at either sacrifice. Also, sperm
concentration, motility, and morphology of treated rats did not differ significantly from that of the control
rats following 28 or 90 days of treatment. Likewise, no treatment-related differences were noted in
absolute or relative organ weights of the female rats necropsied after 90 days of treatment.
No treatment-related differences were noted in male rat hematologic parameters following necropsy.
However, a treatment-related decrease in red blood cells (RBC) and hemoglobin (HGB) occurred in the
high-dose female rats at the conclusion of the study. A treatment-related increase was observed in mean
corpuscular volume (MCV) and mean corpuscular hemoglobin (MCH) in both the high- and mid-dose
female rats. Methemoglobin concentration measured at each necropsy indicated no differences between
treated and control rats.
A decrease in mean serum potassium levels was noted at 28 and 90 days in the mid- and high-dose
groups of both sexes. The hypokalemia ranged from a decrease of 24% in the mid-dose male rats
necropsied at 28 days to 18% in the high-dose rats necropsied at that same time period.
At necropsy, all rats utilized in this study were in good general condition. Marked dilation of the
uterus by clear fluid mixed with remnants of fetal skeletons was observed in one control female rat.
Nodular masses were observed in the subcutaneous tissue of a mid-dose female rat and attached to the
thoracic surface of the diaphragm of a low-dose male rat. Atrophy of the seminal vesicles was observed
in four male rats representing all treatment groups except controls. Other gross observations included an
enlarged, yellow, mottled liver in a control male and a fluid-filled scrotum in a low-dose male. Gross
examination of pups revealed a renal cyst in a pup from a low-dose dam, and one case of renal
discoloration in a pup from a control dam.
138
Histopathology
Statistical analysis revealed a significant (p < 0.01) decreased incidence of nephropathy in mid- and
high-dose males at 28 days and decreased incidence of renal hyaline casts in the high-dose males at 90
days. There was an increased incidence of renal tubular alteration in the high-dose female rats. Mid- and
high-dose females had a significant (p < 0.01) decreased incidence of uterine ceroid-lipofuscinosis. There
were no statistically significant differences in the average severity scores for any lesion.
Reproductive Indices
The ADN-treated drinking water had no adverse effects on mating as 92% to 100% of the animals
mated (Table 6.4-1). Nine of the 11 control dams and 11 of 12 low-dose dams that mated produced
litters. Only 3 of the 12 mated mid-dose dams and 1 of the 11 mated high-dose dams produced litters.
Litter sizes (mean of 7 pups) in the high- and mid-dose groups were significantly (p < 0.01) smaller than
the litter sizes of the low-dose and control groups (mean of 16 pups). The gestational index showed an
adverse treatment-related effect at the high- and mid-dose levels. No significant treatment-related
differences were noted in the length of gestation or in the sex ratio of the pups. During the 21-day
lactation phase, mean pups weights showed no statistically significant difference between treated and
control groups.
DISCUSS/ON
Previous reproductive screens on nitrate-containing explosive compounds performed in this
laboratory produced both clinical and histopathologic signs of hemolytic anemia and methemoglobinemia
(Kinkead et al., 1994b,c) as well as brain lesions and loss of motor skills (Kinkead et al., 1994a).
Exposure to high concentrations of nitrates can result in hemolytic anemia (Valli, 1993). Nitrates that are
converted to high levels of nitrites can produce methemoglobinemia (Mener, 1991). Administering ADN
in the drinking water of male and female Sprague-Dawley rats did not produce the typical clinical
pathology or pathologic findings that are characteristic of nitrate poisoning.
Significant findings noted in the hematology data can be attributed to the effects of ADN on
erythrocytes. Anemia is an absolute decrease in hematocrit, hemoglobin concentration, and red blood cell
count. Although there was the tendency for a dose-related decrease in these parameters following 90
days of exposure to ADN in both sexes, statistically significant differences were observed only in the
high-dose females (RBC and HGB, only). Significant increases in MCV and MCH in the mid- and high-dose
females could be due to dehydration (which would also tend to artificially increase MCHC and HCT
values) or to reticulocytosis, a bone marrow response to anemia. Neither of these conditions can be
confirmed in this study. The only significant clinical finding was a loss of serum potassium in the mid-
and high-dose groups of both sexes at all time points. A common cause of potassium depletion is an
139
increased rate of excretion by either the kidneys or the gastrointestinal tract (Mudge, 1985). The rats in
the treated groups did not display signs of diarrhea during the study, and the mid- and high-dose rats had
a lower water intake during the course of the study, which would infer that their renal excretion rate was
not abnormally high. Although food consumption was not measured in this study, mean body weights of
the hypokalemic rat groups did not differ significantly from controls indicating that these groups probably
had normal dietary intake. Mohammed et al. (1992) reported a study in which placental transfer of
potassium was unaltered in fetuses during maternal hypokalemia. Fetal umbilical arterial plasma
concentrations were higher than maternal plasma concentrations and comparable to fetal concentrations
of control animals.
The failure of the high- and mid-dose dams to produce live litters appears to be the major effect
noted in this study. Gross and histopathological examination of the animals failed to identify a cause for
the lack of the fetuses in the high- and mid-dose dams. It is the absence of full term pregnancy in these
groups that is most likely responsible for the decreased incidence of uterine ceroid-lipofuscinosis noted in
those dams. Lipofuscin is a golden-brown, finely-granular, intracellular pigment derived from the
breakdown products of lipids (usually from cell membranes). It is most commonly observed in aged or
chronically injured cells; therefore, it is commonly referred to as a "wear and tear" pigment. Ceroid is a
variant of lipofuscin. Distinguishing the two usually requires special stains (acid fast). In this study, the
pigment was observed in the uterine muscle (myometrium) or broad ligament. Stretching of the uterus
during pregnancy results in membrane damage to myocytes causing deposition of this pigment. In
contrast, females that did not conceive/carry pups to term did not have this change. The pigment, in this
location, is not pathologically significant. The significant differences in the incidence of renal lesions are
not interpreted to be biologically significant as they are common background lesions.
The results of this study indicate that ADN is a reproductive toxicant. The NOEL is 29 mg/kg/day,
the median dose of the low-dose female animals.
A CKNO WLEDGMENT
The authors gratefully acknowledge the technical assistance of Marcia L. Freedman, Richard J.
Godfrey, Willie J. Malcomb, Jerry W. Nicholson, Margaret A. Parish, Stephanie A. Salins, SrA. Stacie L.
Southwell, SPC Mark Sovik, Naj. Donald R. Tocco, and Merry J. Walsh
14G
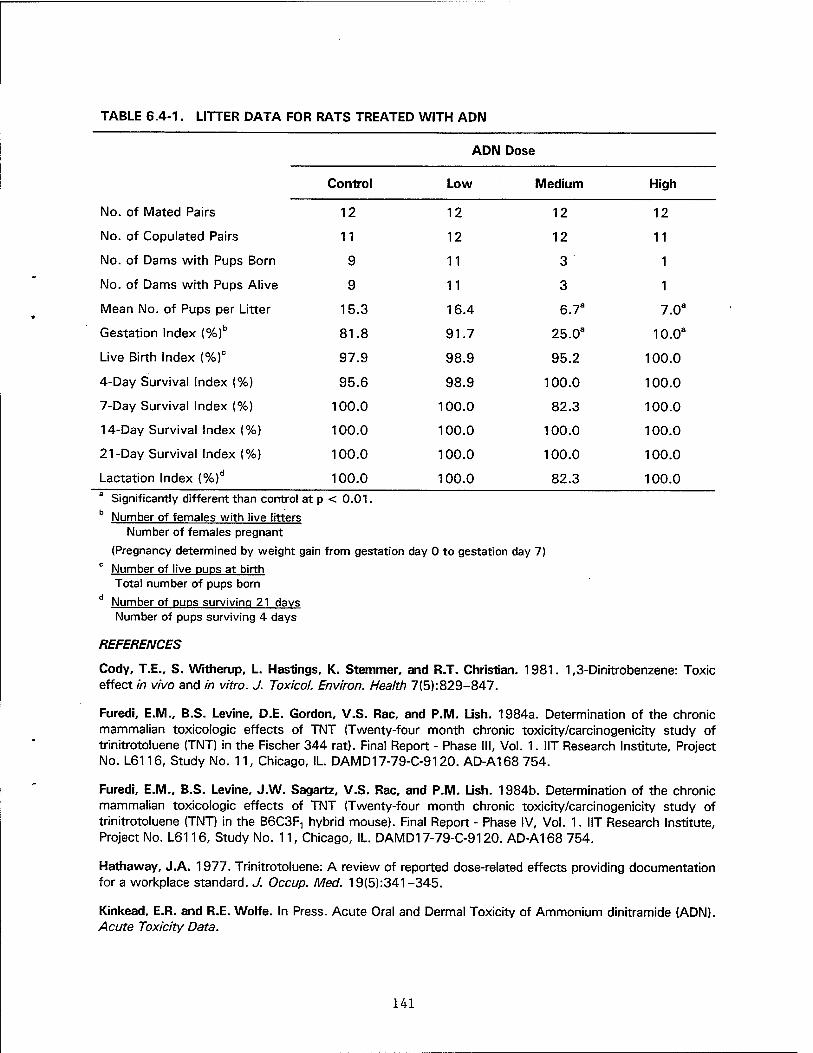
TABLE 6.4-1. LITTER DATA FOR RATS TREATED WITH ADIM
No. of Mated Pairs
No. of Copulated Pairs
No. of Dams with Pups Born
No. of Dams with Pups Alive
Mean No. of Pups per Litter
Gestation Index (%)b
Live Birth Index (%)°
4-Day Survival Index (%)
7-Day Survival Index (%)
14-Day Survival Index (%)
21-Day Survival Index (%)
Lactation Index (%)d
ADN Dose
Control Low Medium High
12 12 12 12
11 12 12 11
9 11 3 1
9 11 3 1
15.3 16.4 6.7a 7.0a
81.8 91.7 25.0a 10.0a
97.9 98.9 95.2 100.0
95.6 98.9 100.0 100.0
100.0 100.0 82.3 100.0
100.0 100.0 100.0 100.0
100.0 100.0 100.0 100.0
100.0 100.0 82.3 100.0 Significantly different than control at p < 0.01.
b Number of females with live litters Number of females pregnant
(Pregnancy determined by weight gain from gestation day 0 to gestation day 7)
Number of live pups at birth Total number of pups born
d Number of PUPS surviving 21 days Number of pups surviving 4 days
REFERENCES
Cody, T.E., S. Witherup, L. Hastings, K. Stemmer, and R.T. Christian. 1981. 1,3-Dinitrobenzene: Toxic effect in vivo and in vitro. J. Toxicol. Environ. Health 7(5):829-847.
Furedi, E.M., B.S. Levine, D.E. Gordon, V.S. Rac, and P.M. Lish. 1984a. Determination of the chronic mammalian toxicologic effects of TNT (Twenty-four month chronic toxicity/carcinogenicity study of trinitrotoluene (TNT) in the Fischer 344 rat). Final Report - Phase III, Vol. 1. NT Research Institute, Project No. L6116, Study No. 11, Chicago, IL. DAMD17-79-C-9120. AD-A168 754.
Furedi, E.M., B.S. Levine, J.W. Sagartz, V.S. Rac, and P.M. Lish. 1984b. Determination of the chronic mammalian toxicologic effects of TNT (Twenty-four month chronic toxicity/carcinogenicity study of trinitrotoluene (TNT) in the B6C3F, hybrid mouse). Final Report - Phase IV, Vol. 1. NT Research Institute, Project No. L6116, Study No. 11, Chicago, IL. DAMD17-79-C-9120. AD-A168 754.
Hathaway, J.A. 1977. Trinitrotoluene: A review of reported dose-related effects providing documentation for a workplace standard. J. Occup. Med. 19(5):341-345.
Kinkead, E.R. and R.E. Wolfe. In Press. Acute Oral and Dermal Toxicity of Ammonium dinitramide (ADN). Acute Toxicity Data.
141
Kinkead, E.R., R.E. Wolfe, S.A. Salins, CD. Flemming, DJ. Caldwell, C.R. Miller, and J.R. Latendresse. 1994a. Range-Finding Study for a Reproductive Assessment of 1,3,5-Trinitrobenzene Administered in the Diet of Sprague-Dawley Rats. AL-TR-1994-072/WRAIR-TR-94-0006. Wright-Patterson Air Force Base, OH: Armstrong Laboratory and Walter Reed Army Institute of Research.
Kinkead, E.R., R.E. Wolfe, CD. Flemming, DJ. Caldwell, C.R. Miller, and G.B. Marit. In Press. Reproductive Toxicity Screen of 1,3,5-Trinitrobenzene Administered in the Diet of Sprague-Dawley Rats. AL-TR-1994/WRAIR-TR-94-0016. Wright-Patterson Air Force Base, OH: Armstrong Laboratory and Walter Reed Army Institute of Research.
Kinkead, E.R., R.E. Wolfe, S.A. Salins, CD. Flemming, H.F. Leahy, DJ. Caldwell, C.R. Miller, and G.B. Marit. In Press. Reproductive Toxicity Screen of Liquid Propellant XM46 Administered in the Drinking Water of Sprague-Dawley Rats. AL-TR-1994/WRAIR-TR-94-0008. Wright-Patterson Air Force Base, OH: Armstrong Laboratory and Walter Reed Army Institute of Research.
Koppes, William. 1993. Personal communication.
Levine, B.S., J.H. Rust, J.M. Burns, and P.M. Lish. 1983. Determination of the chronic mammalian toxicological effects of TNT (Twenty-six week subchronic oral toxicity study of trinitrotoluene (TNT) in the beagle dog). Phase II, Final Report, NT Research Institute, Report No. L6116, Study no. 5, Chicago, IL. DAMD 17-79-C-9120, AD-A157 082.
Levine, B.S., E.M. Furedi, D.E. Gordon, P.M. Lish, and JJ. Barkely. 1984. Subchronic toxicity of trinitrotoluene in Fischer 344 rats. Toxicology 32:253-265.
Linder, R.E., L.F. Strader, R.R. Barbee, G.L. Rehnberg, and S.D. Perreault. 1990. Reproductive toxicity of a single dose of 1,3-dinitrobenzene in two ages of young adult male rats. Fundam. Appl. Tox. 14:284- 298.
Mener, R.E. 1991. Water and soil pollutants. In: Casarett and Doull's Toxicology: The Basic Science of Poisons, Fourth Edition. M.O. Amdur, J. Doull, and CD. Klaassen, eds. Pergamon Press, New York, New York. pp. 893-894.
Mohammed, T., J. Steele, CP. Sibley, and R.D. Boyd. 1992. Effects of Maternal Hypokalemia on Unidirectional Maternofetal and Net Potassium Fluxes Across the Placenta of the Anesthetized Rat. /%ce/7fc?13(3):231-240.
Morton, A.R.. M.V. Ranadive, and J.A. Hathaway. 1976. Biological effects of trinitrotoluene form exposure below the threshold limit value. Am. Ind. Hyg. Assoc. J. 37(1):56-60.
Mudge, G.H. 1985. Agents effecting volume and composition of body fluids. In: Goodman and Gilman's The Pharmacological Basis of Therapeutics. 7th Ed. A.G. Goodman, L.S. Goodman, T.W. Rail, and F. Murad, eds. MacMillan Publishing Co., NY. pp. 866-874.
Philbert, M.A., AJ. Gray, and T.A. Connors. 1987. Preliminary investigations into the involvement of the intestinal microfluora in CNS toxicity induced by 1,3-dinitrobenzene in male F-344 rats. Tox Letters 38:307-314.
Stewart, A., L.T. Witts, G. Higgins. 1945. Some early effects of exposure to trinitrotoluene. Br. J. Ind. Med. 2:74-82. (Cited in Hathaway, 1977)
Valli, V.E.O. 1993. The hematopoietic system. In: Pathology of Domestic Animals, Vol. 3. K.V.F. Jubb, P.C. Kennedy, and N. Palmer, eds. Academic Press, New York, New York. pp. 208-209.
142

6.5 GEIMOTOXICITY OF AMMONIUM DINITRAMIDE
D.E. Dodd, S. Zhu1, and S. Sharma1
ABSTRACT
Ammonium dinitramide (ADN) was examined for its genetic toxicology effects using a battery of
short-term mutagenicity screening assays, which included Salmonella/microsome mutagenesis
(Ames test), mouse lymphoma cell mutagenesis (L5178Y-TK test), and in vivo mouse bone marrow
micronuclei assay (MN test). Results from the Ames Test indicated that ADN (at a dose of 5000
//g/plate) was a base-pair substitution mutagen, causing about twofold (without S9) or threefold
(with S9) increases of revertants in TA100 as compared with the controls. Results were negative in
TA1535 and the frame shift mutation sensitive strains TA98 and TA1537. At a dose of
5000 //g/mL (highest dose tested), ADN induced mutations at the TK locus of mouse lymphoma
cells, causing 40-95% (without S9) or 130-220% (with S9) increases of trifluorothymidine-
resistant mutants. The in vivo micronuclei examination revealed a dose-dependent increase of
micronucleated cells in the bone marrow of both male and female mice treated with ADN in a dose
range of 62.5-750 mg/kg (single doses for three consecutive days), with a maximal induction of
threefold increase at the highest dose. Toxicity, determined as a decrease in the polychromatophilic
erythrocyte / normochromatic erythrocyte (PCE/NCE) ratio, was observed in the same dose range.
The above results demonstrate that ADN is mutagenic to both bacteria and mammalian cells and
causes chromosomal damage in mouse bone marrow cells in vivo.
INTRODUCTION
Background and Objective
The Department of Defense is developing a new generation of explosives and propellants for
potential military and space applications (Borman, 1994). Ammonium dinitrimide (ADN) was
selected as a candidate for study. ADN has the formula NH4N (N02)2 and is considered to be of
chemical interest as a new type of oxide of nitrogen. ADN can act as an explosive, and its
anticipated use is as an oxidizer in solid-fuel rocket propellants. The propellant currently used in the
space shuttle is ammonium perchlorate (AP). However, burning AP produces a heavy smoke trail
with high hydrochloric acid content. The chlorine in the smoke trail contibutes to ozone depletion in
the stratosphere, and the visible smoke trail makes rockets more vulnerable to detection and
tracking.
ManTech Environmental Technology, Inc., Research Triangle Park, NC.
143
A minimal amount of toxicity data on ADN exists. A dermal dose of 2 g/kg ADN was not lethal
to rabbits. The oral LD50 value in rats is 832 mg/kg (Kinkead and Wolfe, 1994). Kinkead et al.,
1994, conducted a reproductive toxicity screen of ADN administered in the drinking water of rats.
Adverse effects were observed in maternal and paternal fertility indices, gestational indices, and live
birth indices at doses of 200 and 100 mg ADN/100 ml_. Gross and histopathological examination of
the animals failed to provide an explanation of the observations; additional reproductive studies are
underway. In general, the toxicity of nitrates includes blood abnormalities due to methemoglobin
formation and histopathologic effects in select organs, such as the spleen, liver, and testes. Nitrates
that metabolize to nitroso compounds may be tumorgenic. The genotoxicity of a compound
indicates its mutagenic and carcinogenic potential in mammalian systems. No investigations have
examined ADN for potential genotoxicity effects; thus, the overall objective of the study was to
determine the genotoxicity associated with exposure to ADN.
Proposed Genotoxicity Studies
The Sa/mone/fe/mammalian microsome reverse mutation system (Ames test) measures the
reversion from his- (histidine dependent) to his -i- (histidine independent) induced by chemicals
which cause base changes or frameshift mutations in the genome of this organism. In this assay,
bacteria are exposed to the test agent with and without a metabolic activation system and plated
onto minimum agar medium which is deficient in histidine. After incubation, revertant colonies are
counted and compared with the number of spontaneous revertants in an untreated and/or vehicle
control culture. The mutagenicity of the test agents is evident by the increased number of
revertants.
The mouse lymphoma cell mutagenesis (L5178Y-TK test) detects the mutations at the
thymidine kinase locus and is used to test the mutagenicity of the test agent in mammalian cell
cultures. In DNA replication, the thymidine monophosphate (TMP) pool size is quite small and
constant under normal growth conditions. If the TMP is replaced by other lethal TMP analogues, the
cell will be killed. The phosphorylation of these analogues is mediated by the enzyme thymidine
kinase (TK), which normally phosphorylates thymidine to TMP. TK-deficient cells lack this enzyme
activity and therefore are resistant to the cytotoxic effect of the lethal analogues. In the mouse
lymphoma cell forward mutation assay, the TK-competent L5178Y (TK + /+ or TK + /-) cells are
treated with the test agents. After a certain period of expression, the cells are shifted to a selective
medium containing the lethal analogue trifluorothymidine (TFT). Only the mutant cells (TK-/-) can
survive under the selection condition, and the mutagenicity of the test compound is evident by the
increase in the number of mutants.
144
The in vivo mouse bone marrow micronucleus assay (MN test), which detects the damage of
chromosome or mitotic apparatus caused by chemicals, is used to examine the chromosome-
damaging effect of the test agent. PCEs in bone marrow of rodents are used in this assay. The
assay is based on an increase in the frequency of micronucleated PCEs in bone marrow of the
treated animals. Micronuclei are small particles consisting of acentric fragments of chromosome or
entire chromosomes, which lag behind at anaphase of cell division. After telophase these fragments
may not be included in the nuclei of the daughter cells and form single or multiple micronuclei in the
cytoplasm. The clastogenic effect or mitotic apparatus damaging effect of the test agent will be
evident by the increased frequency of micronucleated PCEs in the bone marrow.
MA TERIALS AND METHODS
The methodology for the three assays was given in detail in the report "Genotoxicity Assays of
Ammonium Dinitramide" (Sharma and Zhu, 1994) and briefly described as follows.
All assays were conducted in accordance with the provisions of the U.S. Environmental
Protection Agency/Toxic Substances Control Act (EPA/TSCA) Good Laboratory Practice Standards
as defined in the Federal Register (40 CFR, Part 792, 1992) and the TSCA Test Guidelines (40 CFR
798.5265, 40 CFR 798.5300, and 40 CFR 5395, 1992). All the procedures were performed in
accordance with the standard operating procedures of ManTech Environmental for the
Salmonella/microsome mutagenesis assay, L5178Y mouse lymphoma cell mutagenesis, and mouse
bone marrow cell micronucleus test.
Salmonella/Microsome Mutagenesis (Ames Test)
A preliminary range-finding assay was performed using TA100 to determine the test doses of
ADN. Four tester strains were used in the mutagenicity assay, which include TA1535, TA100,
TA1537, and TA98. Ammonium dinitramide dissolved in distilled water was tested in all four tester
strains at a dose range of 0.3125-5 mg/plate with and without S9 activation. Cultures were set up
in triplicates, and a second independent experiment was also conducted. Appropriate positive
controls were included in each test (2-aminofluorene with S9, 20 /yg/plate for both TA100 and
TA98; sodium azide without S9, 2 //g/plate for TA1535; 9-aminoacridine without S9, 10 //g/plate
forTA1537).
145
Mouse Lymphoma Cell Mutagenesis (L5178Y-TK Test)
The doses of ADN in the mutagenesis study were determined by a preliminary range finding
assay using cell growth as the indicator for toxicity. Range finding doses of ADN were 0 (medium
only), 0.25, 0.5, 2.5, 5, 25, 50, 250, 500, 2500, and 5000 mg/mL. In the mutagenesis studies,
cells (6 x 10⁶ cells in 10 mL medium for each culture) were treated with test agents with and
without S9 mixture as the activation system. For each dose group, three cultures containing 200
cells/dish in non-selective medium were set up for viability measurement, another set of three
cultures with 1 x 10⁶ cells/dish in selective medium containing TFT were used for mutant counting.
The mutant frequency was calculated and adjusted based on the survival percentage. Ethyl
methanesulfonate (EMS, 250 nl/mL) without S9, and 3-methyIcholanthrene (3-MCA, 2.5 fjg/ml)
with S9, were used as the positive controls in the assays. A second experiment was repeated
separately.
In Vivo Mouse Bone Marrow Micronucleus Assay (MN Test)
Swiss CD-1 mice (5 males and 5 females per group), 8-10 weeks old were used in the study.
ADN dissolved in distilled water was administered by gavage dosing for 3 consecutive days (62.5-
750 mg/kg/dose). Cyclophosphamide (20 mg/kg/dose by i.p. injection) was used as the positive
control. Twenty-four hours after the last dosing, mice were sacrificed, bone marrow cells were
collected and smears were prepared. The frequency of micronucleated cells was observed in 1000
PCEs per animal. The PCE/NCE ratio was determined by counting 1000 erythrocytes, and used as
an indicator of toxicity. Micronuclei are defined as round bodies in cytoplasm with a diameter of
1/20 to 1/5 of an erythrocyte.
RESULTS
Salmonella/Microsome Mutagenesis (Ames Test)
Five log doses (0.0005 to 5 mg/plate) of ADN were tested in TA100 for dose selection in the
definitive study. The highest dose did not show toxicity to the tester strain, and was selected as the
top dose along with five twofold dilutions.
The results of TA100, TA98, TA1535, and TA1537 are summarized in Tables 1 through 4,
where the data is expressed as the average revertant number per plate from the triplicates.
146
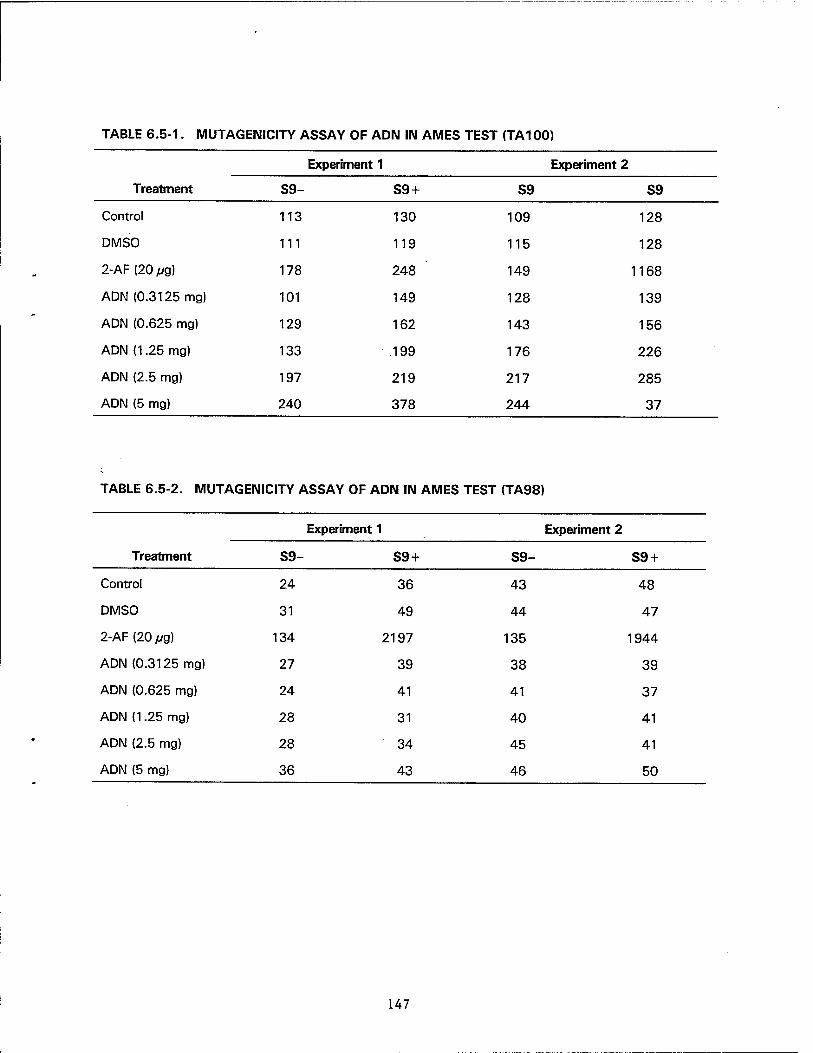
TABLE 6.5-1. MUTAGENICITY ASSAY OF ADIM IN AMES TEST (TA100)
Experiment 1 Experiment 2
Treatment S9- S9 + S9 S9
Control 113 130 109 128
DMSO 111 119 115 128
2-AF(20/vg) 178 248 149 1168
ADN (0.3125 mg) 101 149 128 139
ADN (0.625 mg) 129 162 143 156
ADN (1.25 mg) 133 .199 176 226
ADN (2.5 mg) 197 219 217 285
ADN (5 mg) 240 378 244 37
TABLE 6.5-2. MUTAGENICITY ASSAY OF ADN IN AMES TEST (TA98)
Experiment 1 Experiment 2
Treatment S9- S9 + S9- S9 +
Control 24 36 43 48
DMSO 31 49 44 47
2-AF(20/;g) 134 2197 135 1944
ADN (0.3125 mg) 27 39 38 39
ADN (0.625 mg) 24 41 41 37
ADN (1.25 mg) 28 31 40 41
ADN (2.5 mg) 28 34 45 41
ADN (5 mg) 36 43 46 50
147
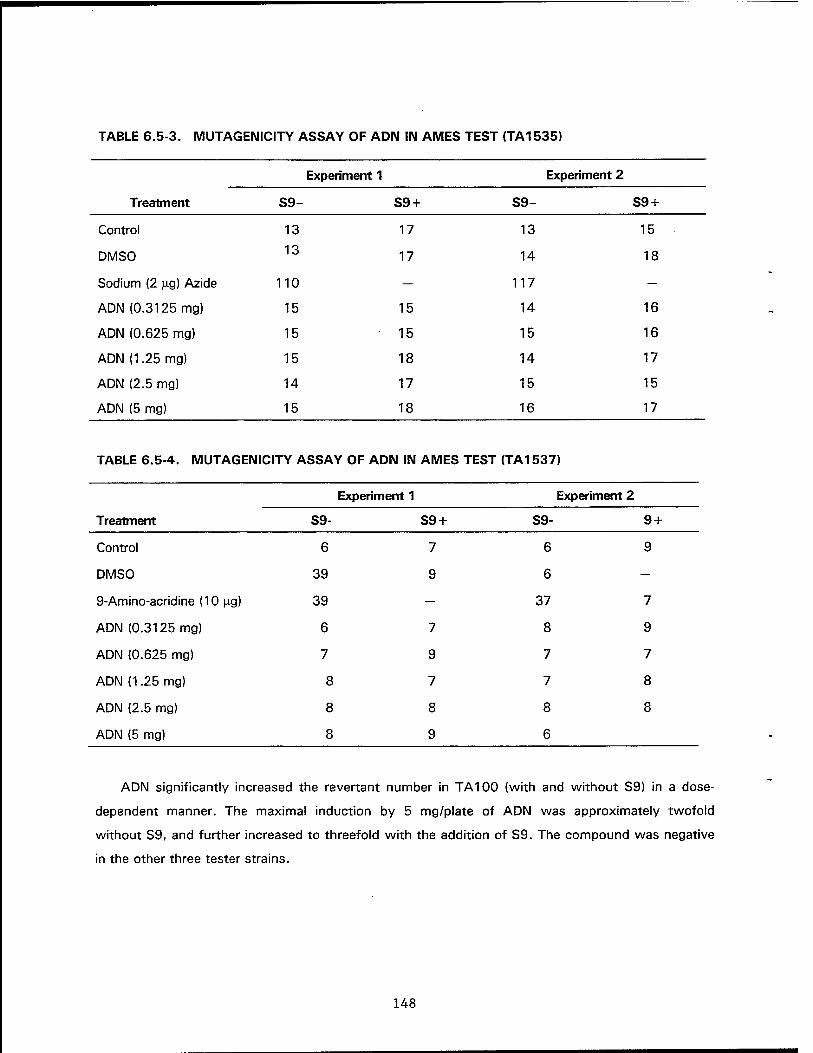
TABLE 6.5-3. MUTAGENICITY ASSAY OF ADN IN AMES TEST (TA1535)
Experiment 1 Experiment 2
Treatment S9- S9 + S9- S9 +
Control 13 17 13 15
DMSO 13 17 14 18
Sodium (2 jo.g) Azide 110 — 117 —
ADN (0.3125 mg) 15 15 14 16
ADN (0.625 mg) 15 15 15 16
ADN (1.25 mg) 15 18 14 17
ADN (2.5 mg) 14 17 15 15
ADN (5 mg) 15 18 16 17
TABLE 6.5-4. MUTAGEIMICITY ASSAY OF ADIM IN AMES TEST (TA1537)
Experiment 1 Experiment 2
Treatment S9- S9 + S9- 9 +
Control 6 7 6 9
DMSO 39 9 6 —
9-Amino-acridine (10 p.g) 39 — 37 7
ADN (0.3125 mg) 6 7 8 9
ADN (0.625 mg) 7 9 7 7
ADN (1.25 mg) 8 7 7 8
ADN (2.5 mg) 8 8 8 8
ADN (5 mg) 8 9 6
ADN significantly increased the revertant number in TA100 (with and without S9) in a dose-
dependent manner. The maximal induction by 5 mg/plate of ADN was approximately twofold
without S9, and further increased to threefold with the addition of S9. The compound was negative
in the other three tester strains.
148

Mouse Lymphoma Cell Mutagenesis (L5178Y-TK Test)
The results of the range finding cell growth assay for ADN (data not shown) indicated that the
highest dose tested (5000 /vg/mL) inhibited cell growth about 30% (p < 0.001), and thus was
selected as the top dose in the mutagenesis study, which included 5 two-fold diluted
concentrations.
Table 6.5-5 summarizes the results of the two mutagenesis assays for ADN. ADN at doses
above 250/yg/mL significantly increased the mutant number in one or both experiments. The
mutation induction was not dose-dependent. Without S9 activation, ADN at 5000 fjg/mL increased
the mutation frequency at TK locus by approximately 40-95%. The mutagenicity of ADN was
further enhanced by the addition of the S9 activation system, as indicated by a 130-220% increase
of the TFT resistant mutant frequency over the controls.
149

.2 =
u. o
c
£
a a. x
CO _l _l til O
o X a.
UJ CO => O
a < u. O > O z 111 CD <
in i
in to LLI _i CO <
o in rt co ID co o <o •- •- r- •- ^ ID ^ ^ ,-' ^
CM
CM
O CM o *• •^ CO
r-~ CM « o oo o CM q * r-
CO ■* r~ O
CD CO CO co ■H ■H •H +i O CM CM
CO CO ID CD
'^ o ■0- >-
CO O CM f— I— -^*- CM »- CM
CO
-H
CD O
05 IS
■H
05
CM
o o CO ID O
CO 05
CO •* >- •* ,- O *- *-
a 05 co" 05 co •>* w CM o ■H c cs
+1 •H •H •H •H
O O T- ID O
ID
d ■H
•* <r- 05
■H +1 -H
5 CO o
CM 05
O O o O ID o o O CM 10 ID O
< u CO
ID i:
co CM CM * 05 CM CM
CO
+1 ID
■H
CM
+1 +1 CO
+1 o ID ID
01 CD
CO ID
0) CD
10 CM
CD
co" o ID
ID CO
05
CO
05 ^
•H +1 ■H ■H ■H -H -H
CO <* CM
CO
CM
CM CM CM
CO CO CM
CO CM
CO
CM
CO 05
<* CO
CM CO
•<t CM
ID CM
CO CM
co"
CO
d CO
ID 05
ID d 05
■H -H ■H ■H •H ■H ■H ■H ■H M +i -H
CO 05 CO
ID CO 05
O CO
CO ID CO
o CM CO
CO CO CO
O o
o ID 1^ co 05
•* 05 CM
T- CO T- t- O T- CM
Ü
c 0
£ 3
LO O o
F -a
m© 3 fc £ V <D
c 3 ±i a. b
O
*1 CD 10
a .2 o ■M ad cü +-" V
Ü CD '
-a £ CD £
c O
CO CD
.£ Ü C
o CO (0
i
CD
CC
CD C
.2 II
CD Ü
3 cr CD
it Q (0
CD
CO a E o
II » 5 T3 >
c o
2t ILILCCS
150
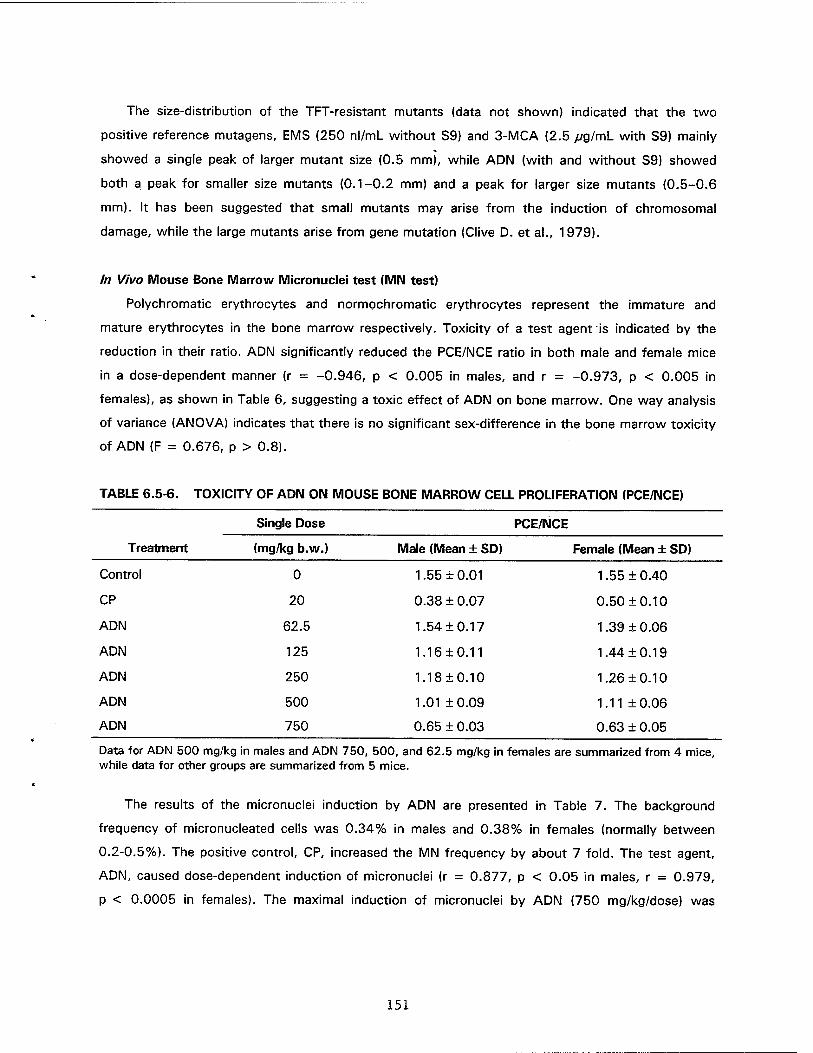
The size-distribution of the TFT-resistant mutants (data not shown) indicated that the two
positive reference mutagens, EMS (250 nl/mL without S9) and 3-MCA (2.5 jug/mL with S9) mainly
showed a single peak of larger mutant size (0.5 mm), while ADN (with and without S9) showed
both a peak for smaller size mutants (0.1-0.2 mm) and a peak for larger size mutants (0.5-0.6
mm). It has been suggested that small mutants may arise from the induction of chromosomal
damage, while the large mutants arise from gene mutation (Clive D. et al., 1979).
In Vivo Mouse Bone Marrow Micronuclei test (MN test)
Polychromatic erythrocytes and normochromatic erythrocytes represent the immature and
mature erythrocytes in the bone marrow respectively. Toxicity of a test agent is indicated by the
reduction in their ratio. ADN significantly reduced the PCE/NCE ratio in both male and female mice
in a dose-dependent manner (r = -0.946, p < 0.005 in males, and r = -0.973, p < 0.005 in
females), as shown in Table 6, suggesting a toxic effect of ADN on bone marrow. One way analysis
of variance (ANOVA) indicates that there is no significant sex-difference in the bone marrow toxicity
of ADN (F = 0.676, p > 0.8).
TABLE 6.5-6. TOXICITY OF ADN ON MOUSE BONE MARROW CELL PROLIFERATION (PCE/NCE)
Single Dose PCE/NCE
Treatment (mg/kg b.w.) Male (Mean ± SD) Female (Mean ± SD)
Control 0 1.55 + 0.01 1.55 + 0.40
CP 20 0.38 ± 0.07 0.50 ±0.10
ADN 62.5 1.54 ±0.17 1.39 ±0.06
ADN 125 1.16 ±0.11 1.44 ±0.19
ADN 250 1.1810.10 1.26 ±0.10
ADN 500 1.01 ±0.09 1.11 ±0.06
ADN 750 0.65 ± 0.03 0.63 ± 0.05
Data for ADN 500 mg/kg in males and ADN 750, 500, and 62.5 mg/kg in females are summarized from 4 mice, while data for other groups are summarized from 5 mice.
The results of the micronuclei induction by ADN are presented in Table 7. The background
frequency of micronucleated cells was 0.34% in males and 0.38% in females (normally between
0.2-0.5%). The positive control, CP, increased the MN frequency by about 7 fold. The test agent,
ADN, caused dose-dependent induction of micronuclei (r = 0.877, p < 0.05 in males, r = 0.979,
p < 0.0005 in females). The maximal induction of micronuclei by ADN (750 mg/kg/dose) was
151
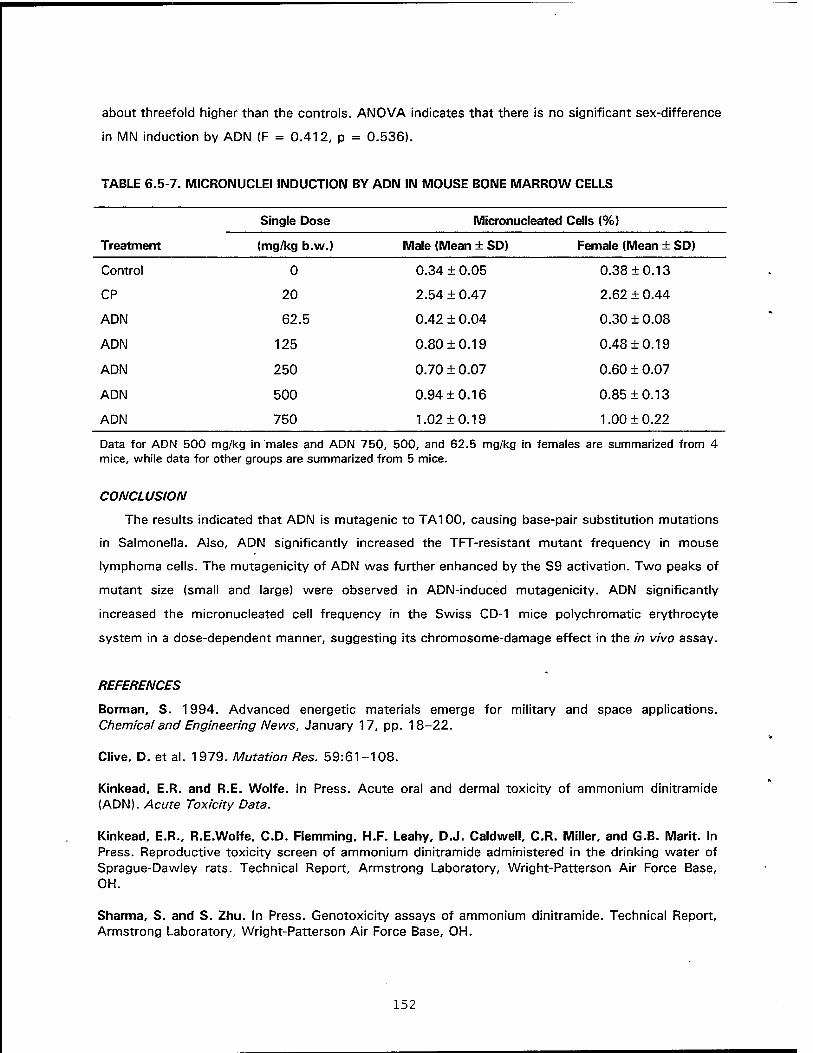
about threefold higher than the controls. ANOVA indicates that there is no significant sex-difference
in MIM induction by ADN (F = 0.412, p = 0.536).
TABLE 6.5-7. MICROIMUCLEI INDUCTION BY ADN IN MOUSE BONE MARROW CELLS
Single Dose Micronucleated Cells (%)
Treatment (mg/kg b.w.) Male (Mean + SD) Female (Mean ± SD)
Control
CP
ADN
ADN
ADN
ADN
ADN
0
20
62.5
125
250
500
750
0.34 ± 0.05
2.54 ± 0.47
0.42 ± 0.04
0.80 ±0.19
0.70 ± 0.07
0.94 + 0.16
1.02 + 0.19
0.38 + 0.13
2.62 ± 0.44
0.30 ± 0.08
0.48 + 0.19
0.60 ± 0.07
0.85 + 0.13
1.00 ± 0.22
Data for ADN 500 mg/kg in males and ADN 750, 500, and 62.5 mg/kg in females are summarized from 4 mice, while data for other groups are summarized from 5 mice.
CONCLUSION
The results indicated that ADN is mutagenic to TA100, causing base-pair substitution mutations
in Salmonella. Also, ADN significantly increased the TFT-resistant mutant frequency in mouse
lymphoma cells. The mutagenicity of ADN was further enhanced by the S9 activation. Two peaks of
mutant size (small and large) were observed in ADN-induced mutagenicity. ADN significantly
increased the micronucleated cell frequency in the Swiss CD-1 mice polychromatic erythrocyte
system in a dose-dependent manner, suggesting its chromosome-damage effect in the in vivo assay.
REFERENCES
Borman, S. 1994. Advanced energetic materials emerge for military and space applications. Chemical and Engineering News, January 17, pp. 18-22.
Clive, D. et al. 1979. Mutation Res. 59:61-108.
Kinkead, E.R. and R.E. Wolfe. In Press. Acute oral and dermal toxicity of ammonium dinitramide (ADN). Acute Toxicity Data.
Kinkead, E.R., R.E.Wolfe, CD. Flemming, H.F. Leahy, D.J. Caldwell, C.R. Miller, and G.B. Marit. In Press. Reproductive toxicity screen of ammonium dinitramide administered in the drinking water of Sprague-Dawley rats. Technical Report, Armstrong Laboratory, Wright-Patterson Air Force Base, OH.
Sharma, S. and S. Zhu. In Press. Genotoxicity assays of ammonium dinitramide. Technical Report, Armstrong Laboratory, Wright-Patterson Air Force Base, OH.
152
6.6 GENOTOXICITY OF 1,3,3-TRINITROAZETiDINE
D.E. Dodd
ABSTRACT
1,3,3-Trinitroazetidine (TNAZ) is a highly energetic, castable explosive that is being considered
by the Department of Defense for military and space applications. Toxicity information is needed to
evaluate this compound for potential use as an explosive replacement. A structurally related
compound, 1-nitroazetidine can be converted to 1 -nitrosoazetidine, a rodent carcinogen. Genetic
toxicity studies with TNAZ were initiated on the possibility that it also might convert or metabolize
to a nitroso derivative. The following assays, capable of detecting mutations at the gene level, were
employed: a bacterial (Ames Salmonella) test, an in vitro forward mutation assay at the
hypoxanthine-guanine phosphoribosyl-transferase locus in Chinese hamster ovary cells, and an
in vivo cytogenetic (mouse bone marrow erythrocyte micronucleus) test. Confirmatory assays were
conducted for the in vitro bacterial and mammalian cell test systems. The results of the genetic
toxicity studies indicated that TNAZ was negative in the three test systems. Thus, TNAZ was
negative for the gene mutations in bacterial and mammalian cells and for chromosomal mutations of
mouse bone marrow erythrocytes.
INTRODUCTION
The Air Force Armament Laboratory is investigating new explosive ingredients at their High
Explosive Research and Development Facility. One compound that shows promise for replacing
octahydro-1,3,5,7-tetranitro-1,3,5,7-tetrazocine (HMX), CAS No. 2691-41-0, a highly energetic,
castable explosive, is 1,3,3-trinitroazetidine (TNAZ), CAS No. 97645-24-4. HMX is used
predominantly as a propellant and also in maximum-performance explosives (Rosenblatt et al.,
1991). TNAZ is a white granular solid, it can be synthesized with 98% to 99% purity, and is
recrystallizable from alcohols. Acute toxicity studies with TNAZ on laboratory animals indicate that
it is nontoxic dermally, presents no sensitization potential, causes transient eye irritation, and is
moderately toxic orally. The Air Force requested information on the genotoxicity potential of this
high explosive candidate. Three mutagenic tests were selected for genotoxicity screening; the Ames
Salmonella test, the hypoxanthine-guanine phosphoribosyl-transferase (HGPRT) test in Chinese
hamster ovary (CHO) cells, and the mouse micronucleus assay.
153

Background Toxicity Data on TIMAZ
Pursuant to the request by the U.S. Army Armament Research, Development, and Engineering
Center to perform toxicity studies on TNAZ, the U.S. Army Environmental Hygiene Agency initiated
acute toxicity, irritancy, and sensitization tests. Results of these tests follow (Weeks, private
communication). Sprague-Dawley rats were administered single oral doses of TNAZ dissolved in
dimethylsulfoxide (DMSO). The approximate lethal dose (ALD) was 2222 mg/kg; the ALD for DMSO
was > 3333 mg/kg. No deaths were observed when TNAZ acetone solutions were applied dermally
to the occluded, shaved skin of New Zealand White (NZW) rabbits and albino-Hartley guinea pigs at
dosages up to 1480 and 3333 mg/kg, respectively. Technical grade TNAZ (50% solution in
acetone) did not induce a delayed contact sensitization reaction in guinea pigs following the Buehler
sensitization protocol. Primary skin and eye irritancy tests (Draize method) were performed on NZW
rabbits. TNAZ was not irritating to the intact skin. Neat TNAZ produced slight injury to the cornea
and moderate to severe injury to the conjuctivae. These eye irritation results were resolved within
two days after exposure. In summary, TNAZ was nontoxic and nonirritating dermally, produced no
sensitization potential, was of moderate toxicity orally, and caused transient eye irritation.
Proposed Genotoxicity Studies
A chemical related to TNAZ is 1-nitroazetidine. 1-Nitroazetidine can be converted to
1-nitrosoazetidine, which has been extensively investigated for its carcinogenicity and has been
shown to be strongly positive in the rat, mouse, and hamster (Lijinsky et al., 1984). This
information leads to the concern that TNAZ also might be converted or metabolized -to
corresponding nitroso derivatives that are carcinogenic. There are no literature citations on TNAZ to
support or refute this proposal. Because the genotoxicity of a compound may reflect its
carcinogenicity potential, three common assays were selected to investigate the genotoxicity
potential of TNAZ. The assays chosen were the Ames Sa//77o/7e//a/microsomal test, the CHO/HGPRT
forward mutation test, and the mouse in vivo bone marrow micronucleus test. These assays were
chosen because of their high sensitivity and reliability.
The Ames assay detects both base pair substitution point mutations and/or frameshift
mutations. A high percentage of chemicals that elicit a mutagenic response in the Ames assay are
potential animal and human mutagens and carcinogens (McCann and Ames, 1976). Because the
Salmonella assay has been shown to indicate mechanisms of chemical interaction with DNA and has
produced few false positives for noncarcinogens, it has been used as the cornerstone of any battery
of genotoxicity testing.
154

The CHO/HGPRT forward mutation assay has been used to determine the mutagenicity of
chemicals in mammalian germ cells. The gene for HGPRT is located on the X-chromosome. In an
evaluation of Phase III of the U.S. Environmental Protection Agency's (EPA) genetic toxicology
program (Li et al., 1988), the high sensitivity value of the CHO/HGPRT assay was supported. This
assay detected mutagenicity of industrial and environmental chemicals from 25 chemical classes
and, of the 43 proven carcinogens tested, 40 were found to be positive.
The mouse bone marrow micronucleus assay is a rapid, in vivo cytogenetic assay based on the
observation that cells with broken chromosomes or impairments of the spindle apparatus often have
disturbances in the distribution of chromatin during cell division. Micronuclei are formed from
chromosomes or chromosomal fragments left behind during anaphase. In this assay,
polychromatophilic erythrocytes (PCE) in the bone marrow are scored for the presence of
micronuclei. During maturation from erythroblast to erythrocyte the nucleus is extruded, whereas
micronuclei, if present, remain in the cytoplasm. Detection of the micronuclei in nonnucleated cells
is thus facilitated and provides a useful index of clastogenicity or anaphase-lag in erythrocytes
(Schmid, 1976).
MA TERIALS AND METHODS
The Toxic Hazards Research Unit subcontracted the performance of the three genotoxicity
assays with a Good Laboratory Practice (GLP)-certified commercial laboratory. The statement of
work for the subcontract requested that the three tests be carried out according to EPA's Health
Effects Testing Guidelines (40 CFR, Parts 798.5265, 798.5300, and 798.5395, 1 July 1990
edition). Confirmatory assays were conducted for the in vitro bacterial and mammalian cell test
systems. A brief presentation of the materials and procedures employed for each assay follows.
Details of the materials and methods for each test are given in reports by Paika (1994 a,b,c).
TNAZ Test Substance
The TNAZ has a structural formula of C3N4H406 and is a white granular solid with a particle size
of approximately 100 microns. The crystal density is 1.84 and the onset exotherm temperature is
200 °C. The test material was supplied by J.W. Mitchell, Jr., Director, Systems Safety,
Headquarters Air Force Development Test Center (AFSC), Eglin AFB, FL. Solubility tests were
performed by R.B. Nolan, Chemical Research Officer, Eglin AFB, FL. Results of the solubility tests
indicated TNAZ to be nonsoluble in water, slightly (10%) soluble in saline, 100% soluble in DMSO
or acetone, and nonsoluble in corn oil.
155
Salmonella typhimurium Reverse Mutation Assay (Ames assay)
The Salmonella typhimurium strains used in this assay were TA98, TA100, TA1535, TA1537,
and TA1538. The preincubation technique was used to enhance the sensitivity of the plate
incorporation assay. The TNAZ test substance was dissolved in DMSO and administered in vitro
directly into the test system. Bacteria were exposed to the test substance both in the presence and
absence of a metabolic activation system (S9 microsomal fraction of rat liver homogenate obtained
from Aroclor 1254-treated rats). Positive control substances with and without metabolic activation
systems for all strains and negative control substances were used. Ten concentrations (10000 to
0.1 mg/plate) were used in the dose range finding assay; six concentrations (500 to 0.01 mg/plate)
were used in the reverse mutation assay.
Gene Mutation at the HGPRT Locus in Cultured CHO Cells Assay
The CHO-K1 cell line was originally derived from the ovary of a female Chinese hamster
(Cricetalus griseus) obtained from American Type Culture Collection, Rockville, MD. The TNAZ test
substance was dissolved in 0.5% DMSO and administered in vitro directly into the test system. The
CHO cells were exposed to the test substance both in the presence and absence of a metabolic
activation system (S9 microsomal fraction of rat liver homogenate obtained from Aroclor
1254-treated rats). Positive control substances with and without metabolic activation systems and
negative control (including solvent control) substances were used. Ten concentrations (5.00 to
0.008 mg/mL) were used in the dose range-finding assay; seven concentrations (0.500 to
0.008 mg/mL) were used in the activated mutagenic test; and seven concentrations (0.250 to
0.004 mg/mL) were used in the non-activated mutagenic test. Duplicate cultures seeded with
5 x 10⁵ cells/flask were used at each dose level. Post-expression, the cells were harvested and
reseeded in selection medium at 2 x 10⁵ cells per 100 mm dish. Five dishes were plated per dose
level for a total of 1 x 10⁶ cells. Concurrently, 200 cells per 100 mm dish were seeded in complete
medium for the Parallel Cloning Efficiency Assay.
Mouse Bone Marrow Erythrocyte Micronucleus Test
Healthy male and female albino Swiss mice (Mus musculus) were obtained from Charles River
Breeding Laboratories (Wilmington, MA). The animals were 7 to 12 weeks of age at the start of the
study. The TNAZ test substance was suspended in corn oil and administered by intraperitoneal
injection. Mice received 3 single doses, 24 h apart. In a dose range-finding study, death was
observed in mice administered doses @ 100 mg/kg (body weight). Five doses were selected for the
156
definitive study: 40, 20, 10, 5, and 1 mg/kg. Positive (mitomycin C) and negative (corn oil)
substances also were administered to naive mice. Mice were sacrificed 24 h after the last dose.
Bone marrow slides were prepared from the femur. A total of 1000 PCEs was scored for the
presence of micronuclei. The slides were scored blindly to reduce bias associated with the analysis.
RESULTS
Salmonella typhimurium Reverse Mutation Assay (Ames Assay)
Range-Finding Assay: The range-finding assay was performed with strain TA100, negative
control substance plates, with and without microsomal activation. Some toxicity was observed, as
determined by a reduction in the number of. spontaneous revertants, a clearing of the background
lawn, and by the degree of survival of treated cultures.
The negative control substance plates gave a reference point from which to compare the data.
The negative control substance values fell within two standard deviations of the historical mean
value for the laboratory or reference literature.
The mean number of revertants per plate was calculated for each concentration (data not
shown). A positive result was not observed for any strain since a significant increase in the number
of revertant colonies over its corresponding negative control substance was not observed. Since
toxicity was detected, dose levels were chosen to bracket toxic and non-toxic levels.
Reverse Mutation Assay: The positive control substance assays consisted of direct-acting
mutagens and mutagens requiring metabolic biotransformation. All positive controls exhibited twice
the number of colonies as the negative control substances, demonstrating that the test system was
functional with known mutagens (Tables 6.6-1 and 6.6-2). The negative control substance plates,
for each strain, gave a reference point to compare the test data. Their values fell within two
standard deviations of the historical or literature mean values.
157
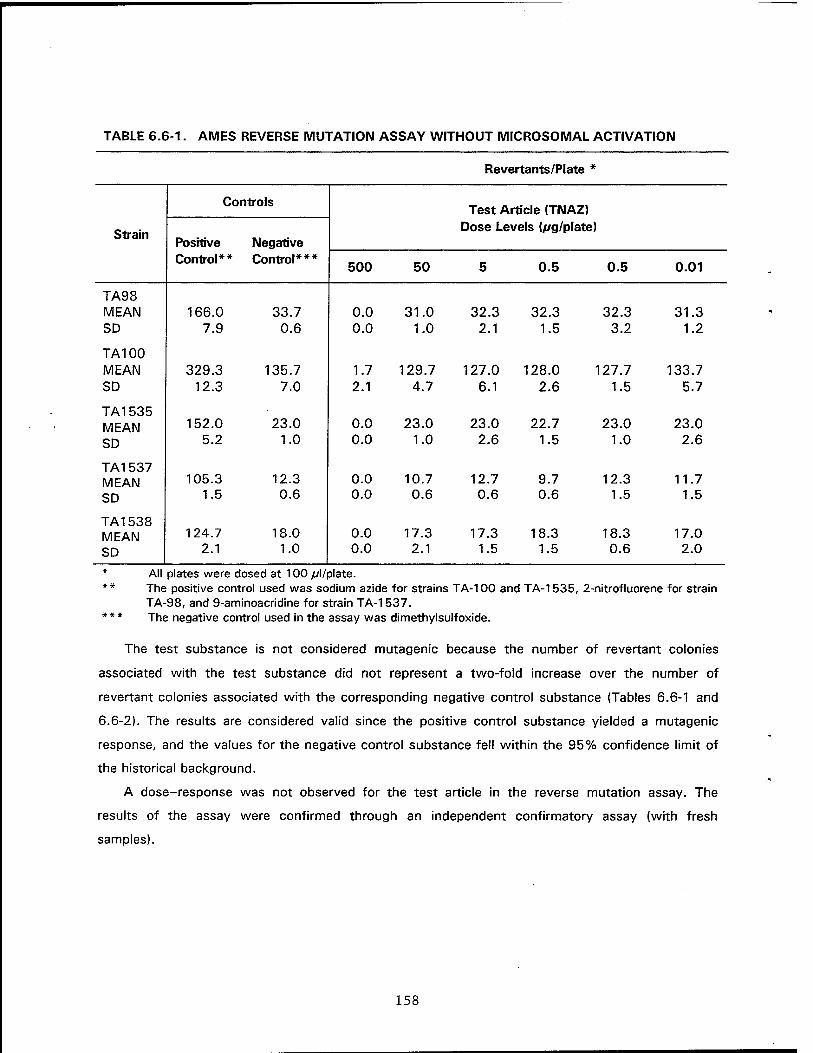
TABLE 6.6-1. AMES REVERSE MUTATION ASSAY WITHOUT MICROSOMAL ACTIVATION
Revertants/Plate *
Controls Test Article (TNAZ)
Dose Levels (//g/plate Strain Positive Control**
Negative Control***
500 50 5 0.5 0.5 0.01
TA98 MEAN 166.0 33.7 0.0 31.0 32.3 32.3 32.3 31.3 SD 7.9 0.6 0.0 1.0 2.1 1.5 3.2 1.2
TA100 MEAN 329.3 135.7 1.7 129.7 127.0 128.0 127.7 133.7 SD 12.3 7.0 2.1 4.7 6.1 2.6 1.5 5.7
TA1535 MEAN 152.0 23.0 0.0 23.0 23.0 22.7 23.0 23.0
SD 5.2 1.0 0.0 1.0 2.6 1.5 1.0 2.6
TA1537 MEAN 105.3 12.3 0.0 10.7 12.7 9.7 12.3 11.7 SD 1.5 0.6 0.0 0.6 0.6 0.6 1.5 1.5
TA1538 MEAN 124.7 18.0 0.0 17.3 17.3 18.3 18.3 17.0 SD 2.1 1.0 0.0 2.1 1.5 1.5 0.6 2.0
* All plates were dosed at 100 /vl/plate. ** The positive control used was sodium azide for strains TA-100 and TA-1535, 2-nitrofluorene for strain
TA-98, and 9-aminoacridine for strain TA-1537. * * * The negative control used in the assay was dimethylsulf oxide.
The test substance is not considered mutagenic because the number of revertant colonies
associated with the test substance did not represent a two-fold increase over the number of
revertant colonies associated with the corresponding negative control substance (Tables 6.6-1 and
6.6-2). The results are considered valid since the positive control substance yielded a mutagenic
response, and the values for the negative control substance fell within the 95% confidence limit of
the historical background.
A dose-response was not observed for the test article in the reverse mutation assay. The
results of the assay were confirmed through an independent confirmatory assay (with fresh
samples).
158
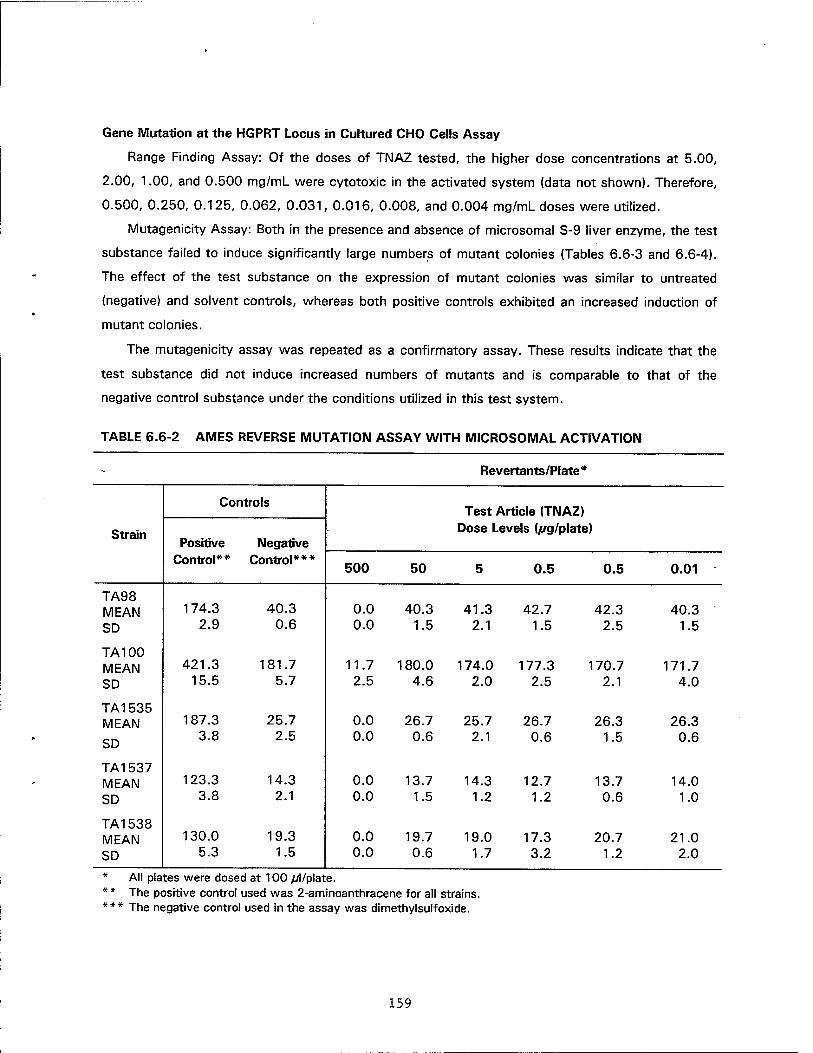
Gene Mutation at the HGPRT Locus in Cultured CHO Cells Assay
Range Finding Assay: Of the doses of TNAZ tested, the higher dose concentrations at 5.00,
2.00, 1.00, and 0.500 mg/mL were cytotoxic in the activated system (data not shown). Therefore,
0.500, 0.250, 0.125, 0.062, 0.031, 0.016, 0.008, and 0.004 mg/mL doses were utilized.
Mutagenicity Assay: Both in the presence and absence of microsomal S-9 liver enzyme, the test
substance failed to induce significantly large numbers of mutant colonies (Tables 6.6-3 and 6.6-4).
The effect of the test substance on the expression of mutant colonies was similar to untreated
(negative) and solvent controls, whereas both positive controls exhibited an increased induction of
mutant colonies.
The mutagenicity assay was repeated as a confirmatory assay. These results indicate that the
test substance did not induce increased numbers of mutants and is comparable to that of the
negative control substance under the conditions utilized in this test system.
TABLE 6.6-2 AMES REVERSE MUTATION ASSAY WITH MICROSOMAL ACTIVATION
Revertants/Plate*
Controls Test Article (TNAZ)
Dose Levels (//g/plate) Strain Positive
Control** Negative
Control*** 500 50 5 0.5 0.5 0.01
TA98 MEAN 174.3 40.3 0.0 40.3 41.3 42.7 42.3 40.3 SD 2.9 0.6 0.0 1.5 2.1 1.5 2.5 1.5
TA100 MEAN 421.3 181.7 11.7 180.0 174.0 177.3 170.7 171.7 SD 15.5 5.7 2.5 4.6 2.0 2.5 2.1 4.0
TA1535 MEAN 187.3 25.7 0.0 26.7 25.7 26.7 26.3 26.3
SD 3.8 2.5 0.0 0.6 2.1 0.6 1.5 0.6
TA1537 MEAN 123.3 14.3 0.0 13.7 14.3 12.7 13.7 14.0 SD 3.8 2.1 0.0 1.5 1.2 1.2 0.6 1.0
TA1538 MEAN 130.0 19.3 0.0 19.7 19.0 17.3 20.7 21.0 SD 5.3 1.5 0.0 0.6 1.7 3.2 1.2 2.0
* All plates were dosed at 100 /yl/plate. * * The positive control used was 2-aminoanthracene for all strains. * * * The negative control used in the assay was dimethylsulf oxide.
159
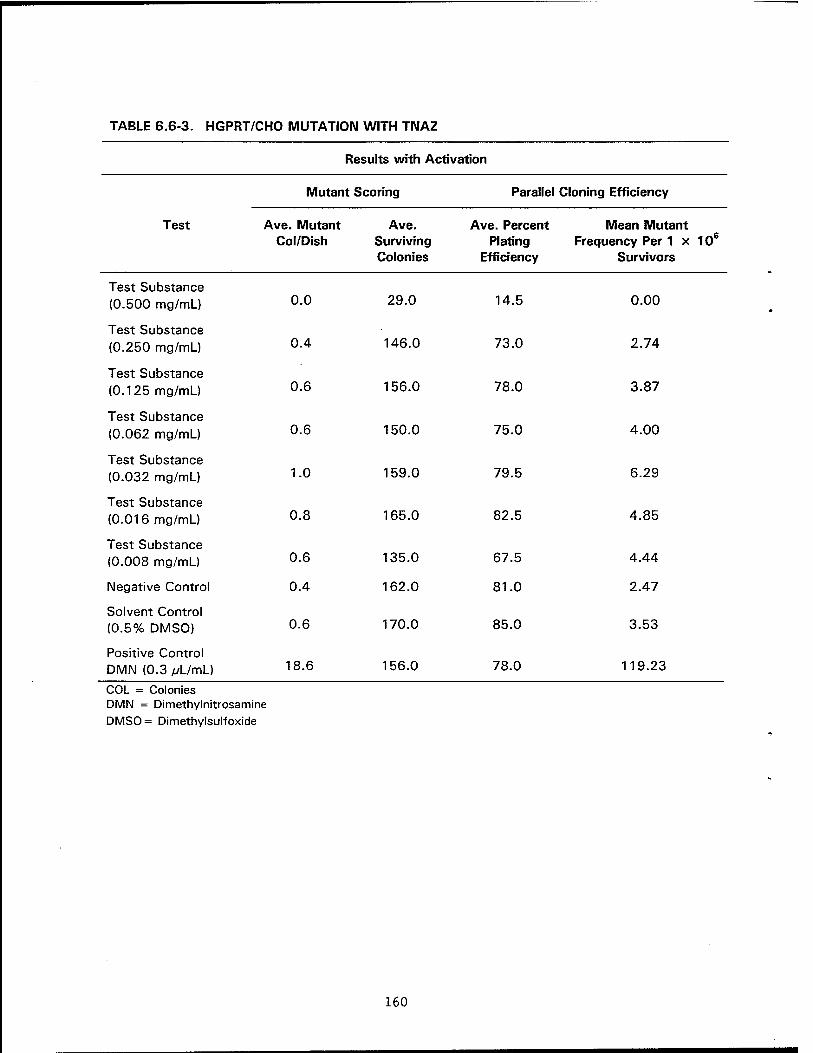
TABLE 6.6-3. HGPRT/CHO MUTATION WITH TNAZ
Results with Activation
Mutant Scoring Parallel Cloning Efficiency
Test Ave. Mutant Ave. Ave. Percent Mean Mutant Col/Dish Surviving
Colonies Plating
Efficiency Frequency Per 1 x 10⁶
Survivors
Test Substance (0.500 mg/mU 0.0 29.0 14.5 0.00
Test Substance (0.250 mg/mL) 0.4 146.0 73.0 2.74
Test Substance (0.125 mg/mL) 0.6 156.0 78.0 3.87
Test Substance (0.062 mg/mL) 0.6 150.0 75.0 4.00
Test Substance (0.032 mg/mL) 1.0 159.0 79.5 6.29
Test Substance (0.016 mg/mL) 0.8 165.0 82.5 4.85
Test Substance (0.008 mg/mL) 0.6 135.0 67.5 4.44
Negative Control 0.4 162.0 81.0 2.47
Solvent Control (0.5% DMSO) 0.6 170.0 85.0 3.53
Positive Control DMN (0.3 //L/mL) 18.6 156.0 78.0 119.23
COL = Colonies DMN = Dimethylnitrosamine DMSO = Dimethylsulf oxide
160
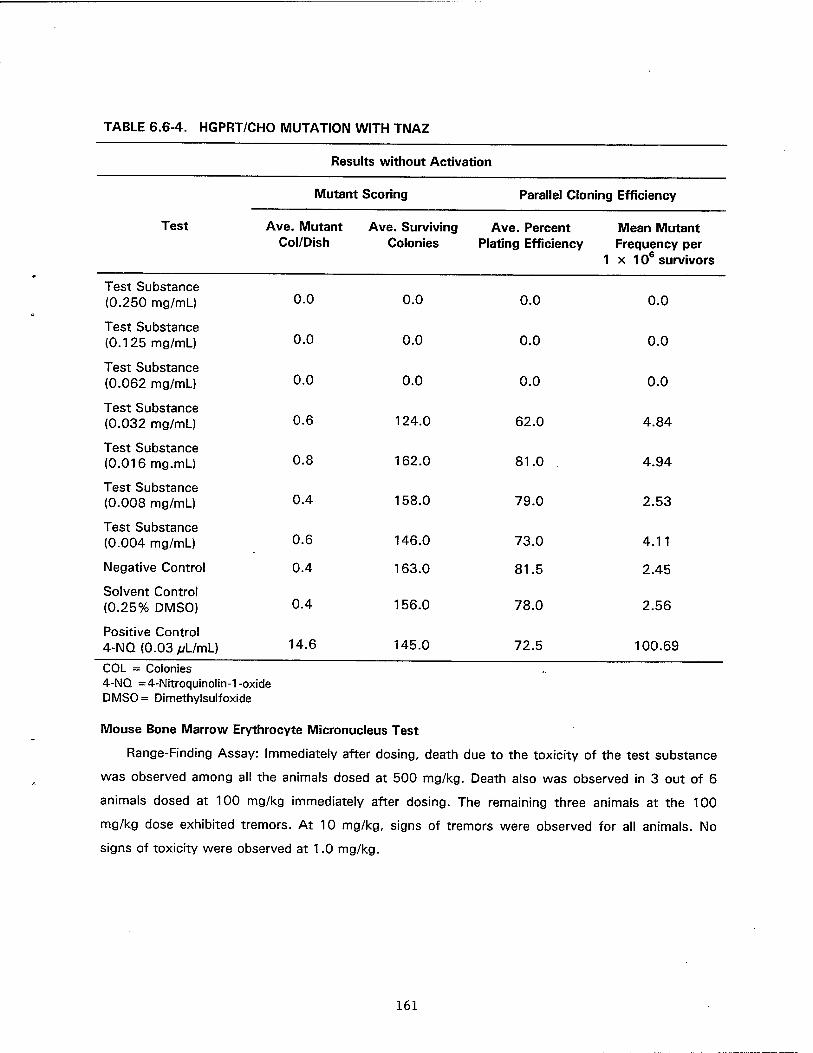
TABLE 6.6-4. HGPRT/CHO MUTATION WITH TNAZ
Results without Activation
Mutant Scoring Parallel Cloning Efficiency
Test Ave. Mutant Col/Dish
Ave. Surviving Colonies
Ave. Percent Plating Efficiency
Mean Mutant Frequency per
1 x 10⁶ survivors
Test Substance (0.250 mg/mL) 0.0 0.0 0.0 0.0
Test Substance (0.125 mg/mL) 0.0 0.0 0.0 0.0
Test Substance (0.062 mg/mL) 0.0 0.0 0.0 0.0
Test Substance (0.032 mg/mL) 0.6 124.0 62.0 4.84
Test Substance (0.016 mg.mL) 0.8 162.0 81.0 4.94
Test Substance (0.008 mg/mL) 0.4 158.0 79.0 2.53
Test Substance (0.004 mg/mL) 0.6 146.0 73.0 4.11
Negative Control 0.4 163.0 81.5 2.45
Solvent Control (0.25% DMSO) 0.4 156.0 78.0 2.56
Positive Control 4-NQ (0.03 j/L/mL) 14.6 145.0 72.5 100.69
COL = Colonies 4-NQ =4-Nitroquinolin-1-oxide DMSO= Dimethylsulfoxide
Mouse Bone Marrow Erythrocyte Micronucleus Test
Range-Finding Assay: Immediately after dosing, death due to the toxicity of the test substance
was observed among all the animals dosed at 500 mg/kg. Death also was observed in 3 out of 6
animals dosed at 100 mg/kg immediately after dosing. The remaining three animals at the 100
mg/kg dose exhibited tremors. At 10 mg/kg, signs of tremors were observed for all animals. No
signs of toxicity were observed at 1.0 mg/kg.
161
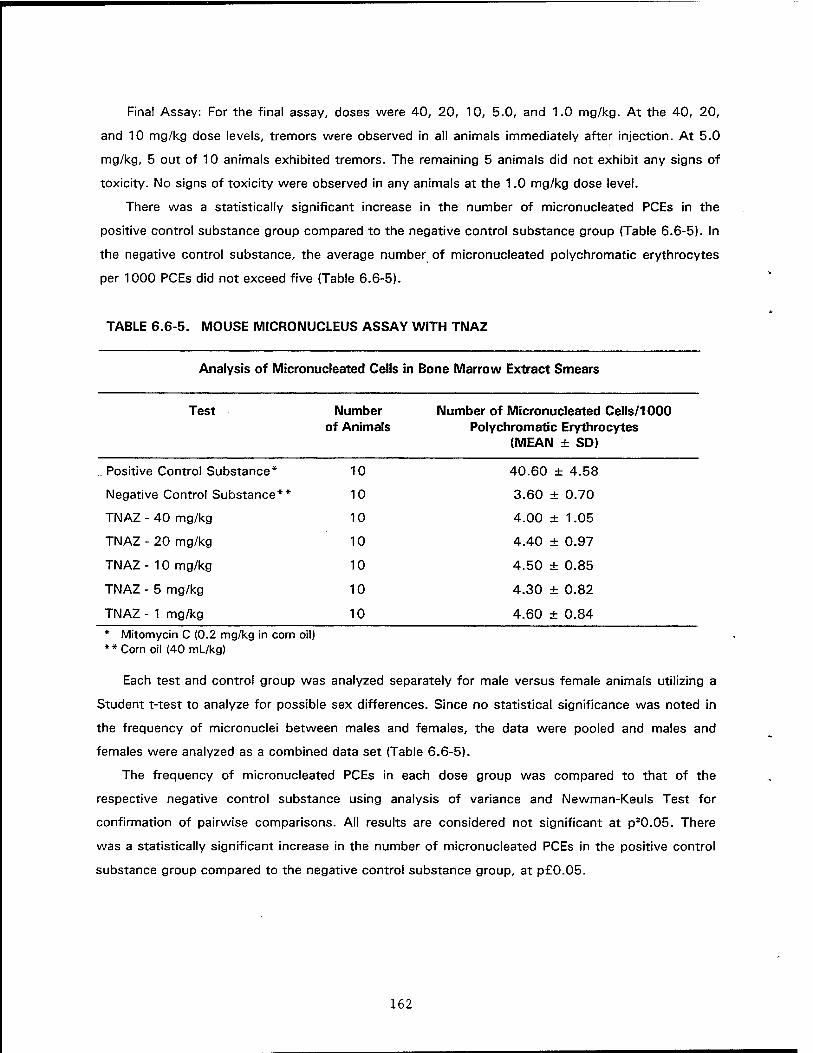
Final Assay: For the final assay, doses were 40, 20, 10, 5.0, and 1.0 mg/kg. At the 40, 20,
and 10 mg/kg dose levels, tremors were observed in all animals immediately after injection. At 5.0
mg/kg, 5 out of 10 animals exhibited tremors. The remaining 5 animals did not exhibit any signs of
toxicity. No signs of toxicity were observed in any animals at the 1.0 mg/kg dose level.
There was a statistically significant increase in the number of micronucleated PCEs in the
positive control substance group compared to the negative control substance group (Table 6.6-5). In
the negative control substance, the average number of micronucleated polychromatic erythrocytes
per 1000 PCEs did not exceed five (Table 6.6-5).
TABLE 6.6-5. MOUSE MICRONUCLEUS ASSAY WITH TNAZ
Analysis of Micronucleated Cells in Bone Marrow Extract Smears
Number of Micronucleated Cells/1000 Polychromatic Erythrocytes
(MEAN ± SD)
40.60 ± 4.58
3.60 ± 0.70
4.00 + 1.05
4.40 ± 0.97
4.50 ± 0.85
4.30 ± 0.82
4.60 ± 0.84
* Mitomycin C (0.2 mg/kg in corn oil) * * Corn oil (40 mL/kg)
Each test and control group was analyzed separately for male versus female animals utilizing a
Student t-test to analyze for possible sex differences. Since no statistical significance was noted in
the frequency of micronuclei between males and females, the data were pooled and males and
females were analyzed as a combined data set (Table 6.6-5).
The frequency of micronucleated PCEs in each dose group was compared to that of the
respective negative control substance using analysis of variance and Newman-Keuls Test for
confirmation of pairwise comparisons. All results are considered not significant at p30.05. There
was a statistically significant increase in the number of micronucleated PCEs in the positive control
substance group compared to the negative control substance group, at p£0.05.
Test Number of Animals
Positive Control Su bstance* 10
Negative Control Substance** 10
TNAZ - 40 mg/kg 10
TNAZ - 20 mg/kg 10
TNAZ - 10 mg/kg 10
TNAZ - 5 mg/kg 10
TNAZ - 1 mg/kg 10
162

The test substance did not produce a statistically significant dose-related increase in the number
of micronucleated PCEs or a statistically significant and reproducible positive response at any one of
the test substance concentrations.
CONCLUSION
The results of the genetic toxicity studies indicated that TNAZ was negative in all three test
systems. Results of the in vitro bacterial and mammalian cell gene mutation assays were confirmed
with independent confirmatory tests. In the three test systems, the positive control substance gave
clearly positive results of mutagenicity indicating that the test systems were able to detect changes
in mutation rates. Thus, TNAZ is not considered to have mutagenic potential based on the
experimental conditions described and the results obtained from these three genotoxicity assays.
REFERENCES
Li, A.P., R.S. Gupta, R.H. Heflich, and J.S. Wassom. 1988. A review and analysis of the Chinese hamster ovary/hypoxanthine guanine phosphoribosyl transferase assay to determine the mutagenicity of chemical agents. A Report of Phase III of the U.S. Environmental Protection Agency Gene-Tox Program. Mutat. Res. 196: 17-36.
Lijinsky, W., R.M. Kovatch, and G.L. Knutsen. 1984. Carcinogenesis by nitrosomorpholines, nitrosooxazolidines and nitrosoazetidine given by gavage to Syrian golden hamsters. Carcinogenesis 5: 875-878.
McCann, J. and B.IM. Ames. 1976. Detection of carcinogens as mutagens in the Salmonella/microsome test. Assay of 300 chemicals: Discussion. Proc. Nat/. Acad. Sei. U.S.A. 72: 5135-5139.
Paika, I.J. 1994a. Genetic toxicity evaluation of 1,3,3-trinitroazetidine. Volume I of IV: Results of Salmonella typhimurium reverse mutation assay (Ames assay). Technical Report, in press. Armstrong Laboratory, Wright-Patterson Air Force Base, OH.
Paika, I.J. 1994b. Genetic toxicity evaluation of 1,3,3-trinitroazetidine. Volume II of IV: Results of mouse bone marrow micronucleus test. Technical Report, in press. Armstrong Laboratory, Wright- Patterson Air Force Base, OH.
Paika, I.J. 1994c. Genetic toxicity evaluation of 1,3,3-trinitroazetidine. Volume III of IV: Results of gene mutation at the HGPRT locus in cultured Chinese hamster ovary cells. Technical Report, in press. Armstrong Laboratory, Wright-Patterson Air Force Base, OH.
Rosenblatt, D.H., E.P. Burrows, W.R. Mitchell, and D.L. Palmer. 1991. Organic explosives and related compounds. In: 0. Hutzinger, ed. The Handbook of Environmental Chemistry, Vol. 3, Part G, pp. 195-234. Berlin Heidelberg: Springer-Verlog.
Schmid, W. 1976. The micronucleus test for cytogenetic analysis. In: A. Hollaender, ed. Chemical Mutagens Vol. 4A, pp. 31-53. NY: Plenum Press.
Weeks, M.H. 1989. Letter to Commander, USAEHA, regarding toxicity study results with TNAZ, 21 September.
163

6.7 CARDIOVASCULAR SCREENING OF NITRATED EXPLOSIVES AND PROPELLANTS IN MALE SPRAGUE-DAWLEY RATS
F.W. Abernathy
ABSTRACT
The effects of nitrated explosives and propellants like nitroglycerin and propylene glycol
dinitrate on the cardiovascular system of munitions workers are well-documented. Symptoms of
exposure vary from headaches and angina to sudden death. It is important to screen various nitrated
compounds and blends to determine their immediate and long-term effects on the cardiovascular
system and identify biomarkers for use in the field. The purpose of this study was to screen nitrated
explosives and propellants for their long-term effects on the cardiovascular system of conscious,
male Sprague-Dawley rats. Parameters evaluated were heart rate, mean blood pressure, systolic
pressure, and diastolic pressure. Validation studies comparing non-invasive tailcuff
sphygmomanometry and implanted telemetric devices suggest that additional testing and data
evaluation be performed before final conclusions and recommendations are made regarding the
continued use or abandonment of either of these methodologies. Therefore, until further notice,
both procedures should be used to acquire parallel data involving toxicological effects of nitrated
explosives and propellants on blood pressure and heart rate in rats.
INTRODUCTION
Nitrated explosives and propellants used by the military are heterogenous with respect to their
physical, chemical and toxicological properties. Some, like nitroguanidine (Hiatt et al., 1986, 1988;
Morgan et al., 1986; Brown et al., 1988; Reddy and Korte, 1988; Ho et al., 1988) and
nitrocellulose (Montgomery, 1982), are relatively nontoxic. Others, like nitroglycerin and propylene
glycol dinitrate, have profound pharmacologic effects {NIOSH, 1978; Carmichael and Lieben, 1963;
Stewart et al., 1974; Kylin et al., 1964). Tolerance to these chemicals can lead to rebound effects
when individuals are no longer exposed to them. Effects can range from mild vasoconstriction to
sudden death.
Traditional methods for monitoring the effects of pharmacologically active chemicals on the
cardiovascular system in animals involve direct cannulation of major arteries and direct injection of
drugs into the vessels of anesthesized animals. The direct injection of drugs into anesthetized
animals is not an ideal model for determining the effects of inhalation, ingestion, or dermal exposure
164
of conscious individuals to pharmacologically active agents. Direct cannulation requires invasive
procedures for placement of cannulas, maintenance of patency in the externalized portion, and a
physical connection between the exteriorized portion and a blood pressure/heart rate monitor. It has
been reported that long-term, chronic in-dwelling arterial catheters affect food consumption and
weight gain in rats (O'Neill and Kaufman, 1990).
A major non-invasive alternative to direct cannulation in animals is tailcuff
syphygmomanometry. A variety of studies have been done to validate this procedure against direct
cannulation (Lucas, 1971; Andrews and Jones, 1978; Palbol and Henningsen, 1979; Yamakoshi et
al., 1979; Borg and Viberg, 1980; Bunag and Butterfield, 1982; Borkowski and Quinn, 1983;
Bunag, 1983; Wen et al., 1988; Ferrari et al., 1990; Kuwahara et al., 1991; O'Neill and Kaufman,
1990; Ikeda et al., 1991; Spanos et al., 1991). A disadvantage to this method is the need to
restrain the animal to minimize movements that would interefere with readings. Therefore, animals
must either be trained or anesthetized. In rodents, additional problems arise because of their ability
to use their tail arteries as thermoregulators. Body temperatures must be elevated to induce a tail
pulse. However, excessive heating can cause artifactual increases in blood pressure (Wen et al.,
1988; Kuwahara et al., 1991). Under ideal conditions, tailcuff syphygmomanometry appears to
correlate well with direct cannulation although readings are generally 5 mm of mercury lower than
those obtained from direct cannulation.
A third and more recent approach for measuring blood pressure is cannulation of a major artery
with an implantable transmitter sewn into place inside a body cavity (Brockway et al., 1991). The
technique has been validated against long-term, direct, tethered cannulation (Guiol et al., 1992;
DePasquale et al., 1994). The animal is allowed to recover and then placed in its cage near a
receiving unit that detects radio signals emitted by the implanted telemetry device. The receiver
converts the radio waves into electronic signals that are sent to a computer and recorded as blood
pressure, heart rate, temperature, electocardiograms, or combinations thereof. The principal
advantage of this technique over conventional cannulation is the elimination of an exteriorized
cannula that may have problems with patency and sterility. The elimination of the requirement that
an animal be tethered to a blood pressure monitor removes a potential source of stress and
concommittent undesirable rises in baseline blood pressure.
A developmental study at Wright-Patterson Air Force Base compared tailcuff
syphygmomanometry and radiotelemetry implants in the same rats to determine if one or both of
these procedures would be appropriate to use as a means for monitoring cardiovasular responses to
pharmacologically active agents. Results have shown the tailcuff data to be about 20 mm lower
than telemetric implant data. Preliminary analyses of tailcuff data have shown internal correlations
of systolic pressure, mean blood pressure, diastolic pressure, and heart rate to be considerably
165
lower than the correlations acquired for implants. Weight gain in implanted animals appears to be
poorer than in their nonimplanted counterparts. Whether this reduction in weight gain is due to poor
eating habits or physiological stress needs to be evaluated. Therefore, the preliminary data and
analyses obtained thus far require that further investigations be made prior to abandonment of either
of these methodologies.
EXPERIMENTAL DESIGN
Validation Study
A. Male Sprague-Dawley rats were subjected for 5 consecutive days to 2 daily series of triplicate
tailcuff analyses within an ambient temperature chamber (29-30 °C). The animals were trained
in restraints so readings could be obtained without anesthesia.
B. After baseline studies were completed, some of the animals were subjected to surgery for
implantation of telemetric devices into the lower abdominal aorta. The animals were allowed to
recover from surgery prior to continued analyses.
C. All animals were subjected to an additional 5-day series of tailcuff readings as previously
described.
D. Blood pressure (systole, diastole, and mean blood pressure) and heart rate were evaluated
beginning in the morning Monday through Friday. As many as 6 valid readings per rat were
taken each day by tailcuff, and 10 second scans were taken every 5 minutes throughout the
day by radiotelemetry.
E. The data were consolidated into spreadsheets for statistical evaluations to compare
cardiovascular parameters as measured by tailcuff sphygmomanometry before and after
telemetric implantation and to compare tailcuff and telemetric implant readings obtained
simultaneously from the same animals.
Long Term Studies
A. Male Sprague-Dawley rats will be divided into 4 groups (maximum of 3 per group): control, low,
medium, and high dose corresponding to dose levels used in the ancillary nitrate reproductive
studies.
B. The test compound will be administered either by diet or drinking water. Animals to be tested
will be from the same lot used in the ancillary reproductive study.
166
C. Experimental Evaluations
1. Body Weight: Body weights will be determined in conjunction with animals in the
reproductive study and will be used to determine dosages of test compound consumed.
2. Food or Water Consumption: Food or water consumption will be determined in conjunction
with animals in the reproductive study and will be used to determine dosages of test
compound consumed.
3. Cardiovascular Monitoring: Blood pressure (systole, diastole, and mean blood pressure) and
heart rate will be evaluated beginning in the morning Monday through Friday. As many as
three valid readings per rat will be taken each day and averaged.
Statistical Analysis
Statistical procedures will be based on the assumption of a normal distribution. A one-factorial,
multivariate analysis of variance with multiple comparisons will be done using Bonferroni
adjustment. It will be assumed that variance is equal among dose groups and each group is normally
distributed. We will test for equality of variance using the multivariate Leven's test for normality
using the Wilk-Shapiro test. If one of the above assumptions is found not to be homogenous,
appropriate transformations of the data will be used, e.g., log, rank, etc.
RESULTS
Blood pressure and heart rate data from 5 male Sprague-Dawley rats were acquired 1 week
prior to implantation (base cuff) and one week post implantation (exp cuff and implants). Descriptive
statistics for systolic, mean blood pressure, diastolic, and heart rate data are described in Tables
6.7-1 through 6.7-4. There were no significant differences noted between tailcuff readings taken
before and after implantation as determined by a two-sample, multivariant, independent t-test
analysis. However, except for systolic readings, all postimplantation tailcuff readings were slightly
higher than preimplantation readings. The tailcuff blood pressure and heart rate readings were
significantly lower than those obtained by telemetry (p < 0.01). The magnitude of the differences
was considerably greater between blood pressure readings than between heart rate readings.
Tailcuff readings for systole, mean blood pressure, diastole, and heart rate prior to implantation
were 119, 90, 75, and 339, respectively. Postimplantation tailcuff readings were 118, 94, 81, and
341, and telemetric readings were 136, 114, 97, and 364.
Pearson correlation coefficients were obtained from within each group of data, i.e., base cuff,
exp cuff, and implants (Table 6.7-5). Comparisons were made between systole versus mean blood
pressure (SYS/MBP), systole versus diastole (SYS/DIA), mean blood pressure versus diastole
(MBP/DIA), systole versus heart rate (SYS/HR), mean blood pressure versus heart rate (MBP/HR),
167
and diastole versus heart rate (DIA/HR). Significant correlations at p < 0.0001 in all three data
groups were detected when systolic, mean blood pressure, and diastolic readings were compared to
each other. Correlations were considerably lower in tailcuff data as compared to implant data with
the exception of the MBP/DIA group. Correlations ranged from 0.40 to 0.50 and 0.65 to 0.72 for
tailcuff comparisons between systole and diastole and systole and mean blood pressure,
respectively. Tailcuff correlations for mean blood pressure and diastole were much higher (0.96).
Correlations for implant comparisons between systole and mean blood pressure, systole and
diastole, and mean blood pressure and diastole were 0.98, 0.93, and 0.97, respectively.
Correlations of blood pressure parameters (systole, mean blood pressure, and diastole) to heart rate
in tailcuff data were poor and/or inversely related. Similar correlations in implant data were higher,
positively related, and highly significant (p < 0.0001), but still relatively low. Tailcuff correlations of
systole to heart rate, mean blood pressure to heart rate, and diastole to heart rate ranged from
-0.43 to -0.13, -0.21 to 0.10, and -0.09 to 0.18, respectively. Telemetric correlations of systole
to heart rate, mean blood pressure to heart rate, and diastole to heart rate were 0.37, 0.44, and
0.45, respectively.
Tables 6.7-1 through 6.7-4 includes descriptive statistics on 5 male Sprague-Dawley rats
1 week prior to implantation (base cuff) and 1 week post implantation (exp cuff and implants).
Tables 6.7-1 through, 6.7-4 represent descriptive statistics for systole, mean blood pressure,
diastole, and heart rate, respectively. Readings in columns 2 and 3 were acquired by tailcuff
sphygmomanometry. Those in column 4 were acquired by radiotelemetry. Readings in columns
3 and 4 were acquired on the same days. Readings were taken during 5 consecutive days before
implantation and 5 consecutive days after implantation. The statistics described in column 1 include:
total number of readings for all 5 animals (N), average of all readings (MEAN), standard deviation
from the mean (SD), standard error of the mean (SEM), coefficient of variation (CV), minimum
reading (MIN), maximum reading (MAX), and range of readings (RANGE).
168
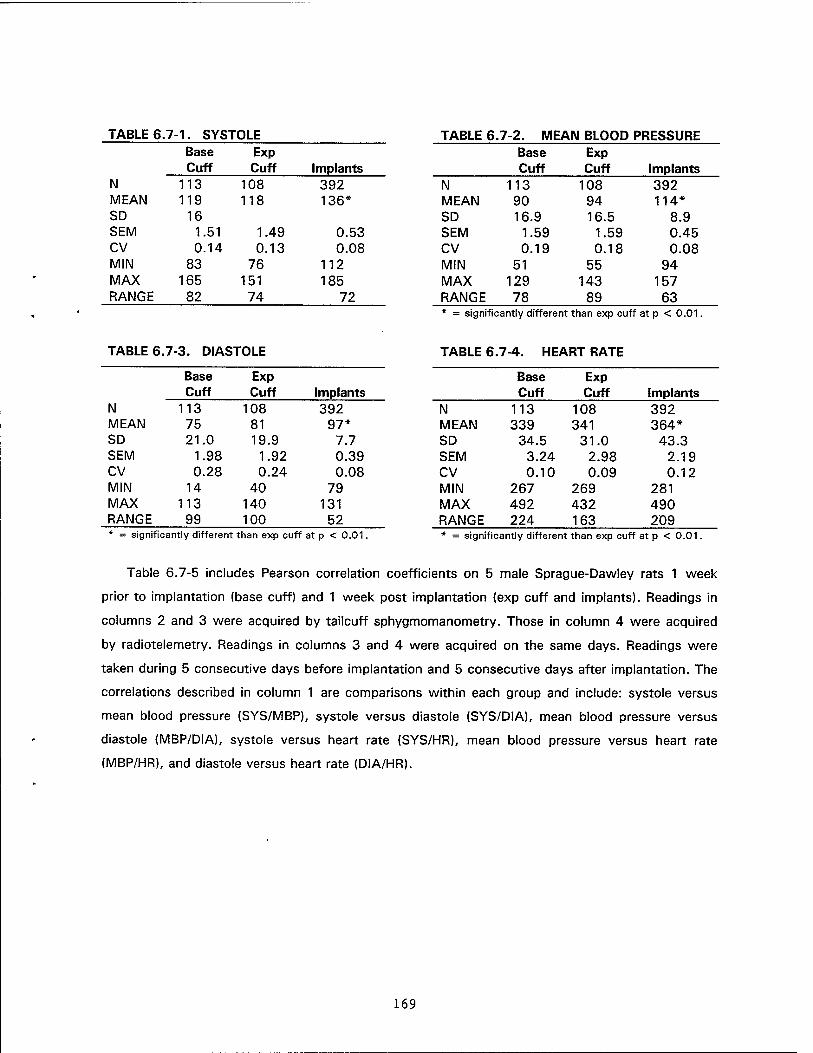
TABLE 6.7-1. SYSTOLE TABLE 6.7-2. MEAN BLOOD PRESSURE Base Exp Base Exp Cuff Cuff Implants Cuff Cuff Implants
N 113 108 392 N 113 108 392 MEAN 119 118 136* MEAN 90 94 114* SD 16 SD 16.9 16.5 8.9 SEM 1.51 1.49 0.53 SEM 1.59 1.59 0.45 CV 0.14 0.13 0.08 CV 0.19 0.18 0.08 MIN 83 76 112 MIN 51 55 94 MAX 165 151 185 MAX 129 143 157 RANGE 82 74 72 RANGE 78 89 63
= significantly different than exp cuff at p < 0.01.
TABLE 6.7-3. DIASTOLE TABLE 6.7-4. HEART RATE
Base Exp Base Exp Cuff Cuff Implants Cuff Cuff Implants
N 113 108 392 N 113 108 392 MEAN 75 81 97* MEAN 339 341 364* SD 21.0 19.9 7.7 SD 34.5 31.0 43.3 SEM 1.98 1.92 0.39 SEM 3.24 2.98 2.19 CV 0.28 0.24 0.08 CV 0.10 0.09 0.12 MIN 14 40 79 MIN 267 269 281 MAX 113 140 131 MAX 492 432 490 RANGE 99 100 52 RANGE 224 163 209
significantly different than exp cuff at p < 0.01. significantly different than exp cuff at p < 0.01.
Table 6.7-5 includes Pearson correlation coefficients on 5 male Sprague-Dawley rats 1 week
prior to implantation (base cuff) and 1 week post implantation {exp cuff and implants). Readings in
columns 2 and 3 were acquired by tailcuff sphygmomanometry. Those in column 4 were acquired
by radiotelemetry. Readings in columns 3 and 4 were acquired on the same days. Readings were
taken during 5 consecutive days before implantation and 5 consecutive days after implantation. The
correlations described in column 1 are comparisons within each group and include: systole versus
mean blood pressure (SYS/MBP), systole versus diastole (SYS/DIA), mean blood pressure versus
diastole (MBP/DIA), systole versus heart rate (SYS/HR), mean blood pressure versus heart rate
(MBP/HR), and diastole versus heart rate (DIA/HR).
169
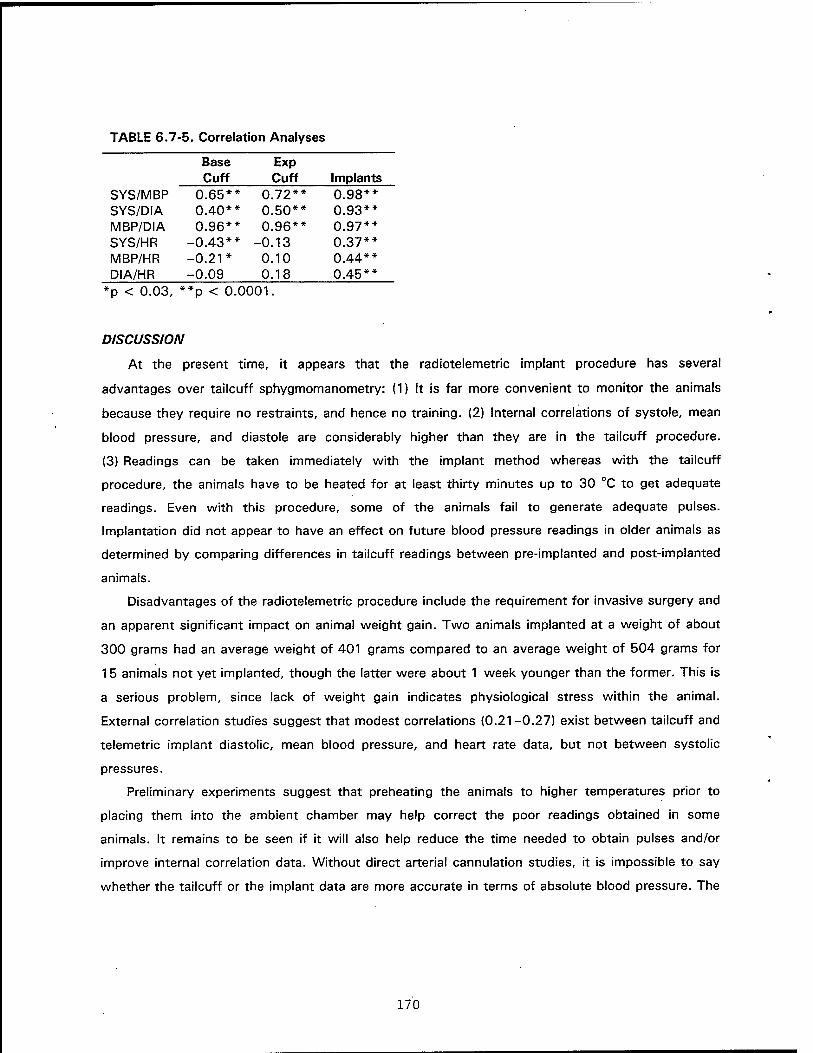
TABLE 6.7-5. Correlation Analyses
Base Exp Cuff Cuff Implants
SYS/MBP 0.65** 0.72** 0.98** SYS/DIA 0.40** 0.50** 0.93** MBP/DIA 0.96** 0.96** 0.97** SYS/HR -0.43** -0.13 0.37** MBP/HR -0.21* 0.10 0.44** DIA/HR -0.09 0.18 0.45**
*p < 0.03, **p < 0.0001.
DISCUSSION
At the present time, it appears that the radiotelemetric implant procedure has several
advantages over tailcuff sphygmomanometry: (1) It is far more convenient to monitor the animals
because they require no restraints, and hence no training. (2) Internal correlations of systole, mean
blood pressure, and diastole are considerably higher than they are in the tailcuff procedure.
(3) Readings can be taken immediately with the implant method whereas with the tailcuff
procedure, the animals have to be heated for at least thirty minutes up to 30 °C to get adequate
readings. Even with this procedure, some of the animals fail to generate adequate pulses.
Implantation did not appear to have an effect on future blood pressure readings in older animals as
determined by comparing differences in tailcuff readings between pre-implanted and post-implanted
animals.
Disadvantages of the radiotelemetric procedure include the requirement for invasive surgery and
an apparent significant impact on animal weight gain. Two animals implanted at a weight of about
300 grams had an average weight of 401 grams compared to an average weight of 504 grams for
15 animals not yet implanted, though the latter were about 1 week younger than the former. This is
a serious problem, since lack of weight gain indicates physiological stress within the animal.
External correlation studies suggest that modest correlations (0.21-0.27) exist between tailcuff and
telemetric implant diastolic, mean blood pressure, and heart rate data, but not between systolic
pressures.
Preliminary experiments suggest that preheating the animals to higher temperatures prior to
placing them into the ambient chamber may help correct the poor readings obtained in some
animals. It remains to be seen if it will also help reduce the time needed to obtain pulses and/or
improve internal correlation data. Without direct arterial cannulation studies, it is impossible to say
whether the tailcuff or the implant data are more accurate in terms of absolute blood pressure. The
170
tailcuff data are in good agreement with some other studies described in the literature (Bidani et al.,
1993; Bunag and Butterfield, 1982), including one study involving radiotelemetric implants (Guiol
et al., 1992). However, higher blood pressure ranges for tailcuff studies in Sprague-Dawley rats
have also been described (Spanos et al., 1991).
Since these data are important in determining which procedure (tailcuff, implants, or both) will
be used to monitor changes in blood pressure and/or heart rate in response to exposure of animals
to nitrated explosives and/or propellants, absolute blood pressure and heart rate measurements may
be less critical than the ability of the procedure(s) to detect changes in data from baseline values in
response to exposure to nitrated compounds.
Acknowledgement
The author wishes to thank Col. James Cooper and Ms. Susan Young for their assistance in the
implantation of the radiotelemeters. Bill Sonntag and Willie Malcomb for the construction of the
ambient temperature chamber and rat restraints, Carlyle Flemming for statisical evaluations, and Dan
Fell for DTIC and other library database searches.
REFERENCES
Andrews, D.I. and D.R. Jones. 1978. Comparison of a tail-cuff method of measuring rat blood pressure with direct arterial recordings of blood pressure in conscious rats. Proc. Univ. Otago Med. Sch. 56:3-4
Bidani, A.K., K.A. Griffin, M. Picken, and D.M. Lansky. 1993. Continuous telemetric blood pressure monitoring and glomerular injury in the rat remnant kidney model. Amer. Physio/. Soc. F391-F398.
Borg, E. and A. Viberg. 1980. Role of heating in non-invasive blood pressure measurements in rats. Acta Physio/. Scand. 108:73-75.
Borkowski K.R. and P. Quinn. 1983. Validation of indirect systolic blood pressure measurement in ether anaesthetised rats. J. Auton. Pharmac. 3:157-160.
Brockway, B.P., P.A. Mills, and S.H. Azar. 1991. A new method for continuous chronic measurement and recording of blood pressure, heart rate and activity in the rat via radio-telemetry. Clin. Exper. Hyper.-Theory and Practice. A13:885-895.
Brown, L.D., C.R. Wheeler, and D.W. Korte. 1988. Oral toxicity of nitroguanidine in male and female rats. Letterman Army Institute of Research, LAIR Report No. 264. Presidio of San Francisco, CA.
Bunag, R. D. 1983. Facts and fallacies about measuring blood pressure in rats. Clin. Exper. Hyper.- Theory and Practice. A5:1659-1681.
Bunag, R.D. and J. Butterfield. 1982. Tail-cuff blood pressure measurement without external preheating in awake rats. Hypertension. 4:898-903.
171

Carmichael, P. and J. Lieben. 1963. Sudden death in explosive workers. Archives of Environmental Health. 7:50-65.
Depasquale, M.J., L.W. Ringer, R.L. Winslow, R.A. Buchholz, and A.A. Fossa. 1994. Chronic monitoring of cardiovascular function in the conscious guinea pig using radio-telemetry- Clin. Exper. Hypertension. 16:245-260.
Ferrari, A.U., A. Daffonchio, F. Albergati, P. Bertoli, and G. Mancia. 1990. Intra-arterial pressure alterations during tail-cuff blood pressure measurements in normotensive and hypertensive rats. J. Hypertension. 8:909-911.
Guiol, C, C. Ledoussal, and J.M. Surge. 1992. A radiotelemetry system for chronic measurement of blood pressure and heart rate in the unrestrained rat validation of the method. J. Pharmacol Toxicol. Methods. 28:99-105.
Hiatt, G. F. S., S.K. Sano, and D.W. Korte. 1986. Primary eye irritation potential of nitroguanidine in rabbits. Letterman Army Institute of Research, AD-A164675. Presidio of San Francisco, San Francisco, CA.
Hiatt, G.F.S., S.K. Sano, C.R. Wheeler, and D.W. Korte. 1988. Acute oral toxicity of nitroguanidine in mice. Letterman Army Institute of Research, LAIR report No. 265. Presidio of San Francisco, San Francisco, CA.
Ho, B., J.A. Tillotson, L.S. Kincannon, P.B. Simboli, and D.W. Korte, Jr. 1988. The fate of nitroguanidine in the rat. Fund. Appl. Toxicol. 10:438-458.
Ikeda, K., Y. Nara, and Y. Yamori. 1991. Indirect systolic and mean blood pressure determination by a new tailcuff method in spontaneously hypertensive rats. Lab. Animals. 25:26-29.
Kuwahara, M., S. Sugano, K.I. Yayou, H. Tsubone, and H. Kobayashi. 1991. Evaluation of a new tail-cuff method for blood pressure measurement in rats with special reference to the effects of ambient temperature. Exp. Anim. 40:331-336.
Kylin, B.A., H. Englund, S Ehiner. and S. Yllner. 1964. A comparative study on the toxicology of nitroglycerin, nitroglycol and propylene glycol dinitrate. International Congress of Occup. Health. Proc. 15th. Vienna. 3: 191-195.
Lucas, J.A. 1971. A modified indirect method of blood pressure measurement in the conscious and anaesthetized rat. Proc. Physio/. Soc. 218:1P-3P.
Montgomery, R. 1982. Polymers. Patty's Industrial Hygiene and Toxicology. 3rd Ed., lie. 4385-4386.
Morgan, E.W., S.K. Sano, and D.W. Korte. 1986. Primary dermal irritation potential of nitroguanidine in rabbits. Letterman Army Institute of Research, LAIR Report No. 220. Presidio of San Francisco, San Francisco, CA.
NIOSH. 1978. Criteria for a recommended standard. Occupational exposure to nitroglycerin and ethylene glycol dinitrate.
O'Neill, P.J. and L.N. Kaufman. 1990. Effects of indwelling arterial catheters or physical restraint on food consumption and growth patterns of rats: advantages of noninvasive blood pressure measurement techniques. Lab. Animal Sei. 40:641-643.
172
Palbol, J. and J. Henningsen. 1979. Blood pressure measurements in the conscious rat. Scand. J. Urol. Nephrol. 13:319-321.
Reddy, G. and D.W. Korte. 1988. Mammalian toxicity studies with nitroguanidine. Proceedings of the 13th Annual Environmental Quality R&D Symposium. 436-449.
Ruben, D.B. and J. Butterfield. 1982. Tail-cuff blood pressure measurement without external preheating in awake rats. Hypertension. 4:898-903.
Spanos, H.G., R. DiNicolantionio, and T.O. Morgan. 1991. The use of non-invasive blood pressure measurements to measure pressor responses in rats during air stress. Clin. Exp. Pharmacol. Physio/. 18:761-765.
Stewart R.D., J.E. Peterson, P.E. Newton, C.L. Hake, M.J. Hosko, A.J. Lebrun, and G.M. Lawton. 1974. Experimental human exposure to propylene glycol dinitrate. Toxicol. Appl. Pharmacol. 30:377-395.
Wen, S.F, J.M. Trembley, M. Qu, and J.G. Webster. 1988. An impedence method for blood pressure measurement in awake rats without preheating. Hypertension. 11:371-375.
Yamakoshi, K.I., H. Shimazu, and T. Togawa. 1979. Indirect measurement of instantaneous arterial blood pressure in the rat. Amer. J. Physiol. 237:H632-H637.
173

7.1 THE TOXICOLOGIC AND ONCOGENIC POTENTIAL OF JP-4 VAPOR: 90-DAY CONTINUOUS INHALATION EXPOSURE
E.R. Kinkead, R.E. Wolfe, CD. Hemming, R.A. Solomon1, J.H. Grabau2, and G.B. Marit3
ABSTRACT
Male and female Fischer-344 rats, female C57BL/6 mice, and male and female beagle dogs were
divided into three treatment groups and exposed nearly continuously (23 h/day, 7 days/week) to JP-4 jet
fuel vapor at concentrations of 0, 500, and 1000 mg/m3 for 90 days. At exposure termination, all dogs
and 1/3 of the rodents were euthanatized and the remaining animals were held for either a 19- or
21-month postexposure tumorigenesis observation period. Pathologic findings in male rats revealed
treatment-related renal toxicity consistent with male rat oc2M-globulin nephropathy. No treatment-related
respiratory toxicity was noted in any species. This study did not demonstrate target-organ toxicity or
carcinogenesis which could be extrapolated to other species.
INTRODUCTION
JP-4 is a complex mixture of aliphatic and aromatic hydrocarbon compounds with physicochemical
properties similar to gasoline. It was the principal fuel used in U.S. Air Force flight operations until
conversion to JP-8 and meets Military Specification MIL-J-5624E. When this study was initiated (1979),
JP-4 fuel accounted for approximately 85% of the turbine engine fuel used by the Department of
Defense. Because of its widespread use within the military, investigations were conducted to determine
the acute, subchronic, and chronic toxicity of JP-4 vapor.
Single oral doses of neat fuel were administered to Sprague-Dawley rats at 8 g JP-4/kg. No deaths
were observed. In CF, mice, deaths occurred at lower doses (JP-4 diluted in corn oil) of 0.5 g/kg, but
only 33% mortality was achieved at the highest gavage dose of 1.0 g JP-4/kg. An inhalation study of 6 h
duration to an estimated JP-4 concentration of 38,000 mg/m3 (based on weight loss) resulted in poor
coordination and convulsions in several rats, but no mortality (Kinkead et al., 1993). Dermal sensitization
studies with guinea pigs indicated that JP-4 was not a skin sensitizer. Rabbit eye irritation tests were
negative while dermal application of the jet fuel resulted in slight skin irritation in that same species
(Kinkead et al., 1992). An 8-month inhalation study (6 h/day, 5 days/week) at 5000 mg JP-4/m3 to
beagle dogs, Rhesus monkeys, Sprague-Dawley rats, and C57BL/6 mice produced increased organ-to-
body weight ratios of liver, kidney, lung, and splenic tissue, bronchial irritation in male rats, and a
1 Armstrong Laboratory, Toxicology Division, Wright-Patterson Air Force Base, OH. 2 Geo-Center, Inc., Wright-Patterson Air Force Base, OH. 3 Army Medical Research Unit, Wright Patterson Air Force Base, OH.
174
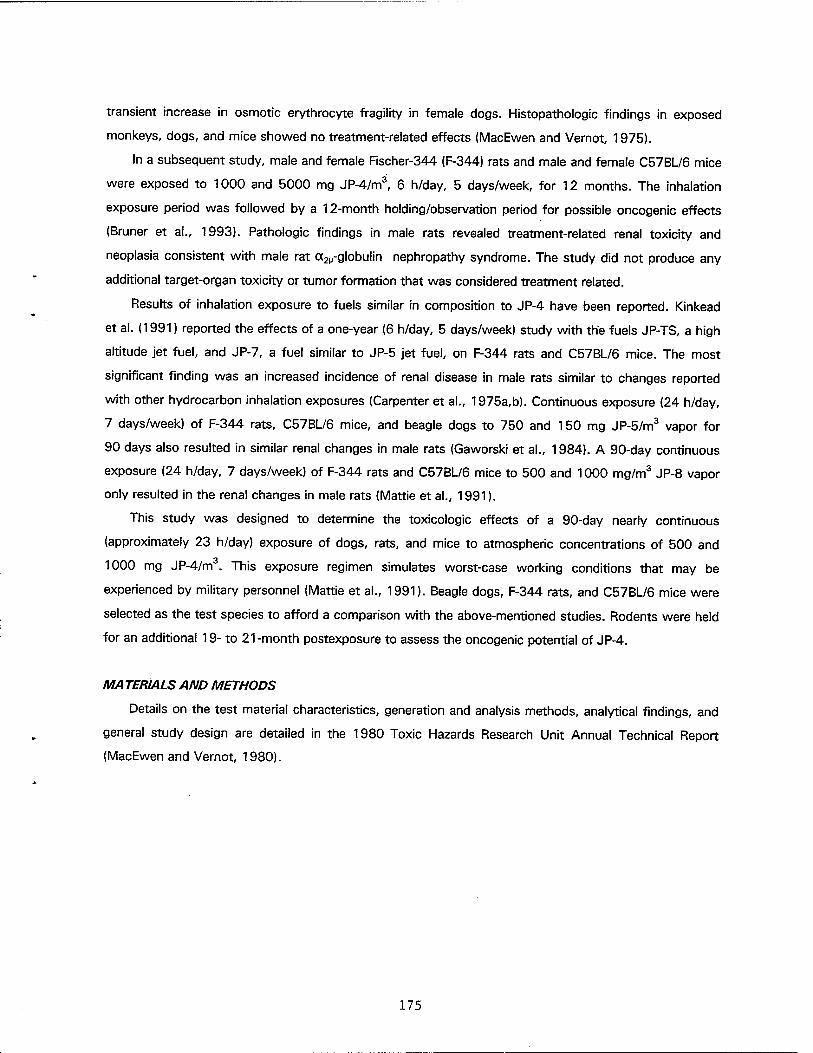
transient increase in osmotic erythrocyte fragility in female dogs. Histopathologic findings in exposed
monkeys, dogs, and mice showed no treatment-related effects (MacEwen and Vernot, 1975).
In a subsequent study, male and female Fischer-344 (F-344) rats and male and female C57BL/6 mice
were exposed to 1000 and 5000 mg JP-4/m3, 6 h/day, 5 days/week, for 12 months. The inhalation
exposure period was followed by a 12-month holding/observation period for possible oncogenic effects
(Bruner et al., 1993). Pathologic findings in male rats revealed treatment-related renal toxicity and
neoplasia consistent with male rat a2M-globulin nephropathy syndrome. The study did not produce any
additional target-organ toxicity or tumor formation that was considered treatment related.
Results of inhalation exposure to fuels similar in composition to JP-4 have been reported. Kinkead
et al. (1991) reported the effects of a one-year (6 h/day, 5 days/week) study with the fuels JP-TS, a high
altitude jet fuel, and JP-7, a fuel similar to JP-5 jet fuel, on F-344 rats and C57BL/6 mice. The most
significant finding was an increased incidence of renal disease in male rats similar to changes reported
with other hydrocarbon inhalation exposures (Carpenter et al., 1975a,b). Continuous exposure (24 h/day,
7 days/week) of F-344 rats, C57BL/6 mice, and beagle dogs to 750 and 150 mg JP-5/m3 vapor for
90 days also resulted in similar renal changes in male rats (Gaworski et al., 1984). A 90-day continuous
exposure (24 h/day, 7 days/week) of F-344 rats and C57BL/6 mice to 500 and 1000 mg/m3 JP-8 vapor
only resulted in the renal changes in male rats (Mattie et al., 1991).
This study was designed to determine the toxicologic effects of a 90-day nearly continuous
(approximately 23 h/day) exposure of dogs, rats, and mice to atmospheric concentrations of 500 and
1000 mg JP-4/m3. This exposure regimen simulates worst-case working conditions that may be
experienced by military personnel (Mattie et al., 1991). Beagle dogs, F-344 rats, and C57BL/6 mice were
selected as the test species to afford a comparison with the above-mentioned studies. Rodents were held
for an additional 19- to 21-month postexposure to assess the oncogenic potential of JP-4.
MATERIALSAND METHODS
Details on the test material characteristics, generation and analysis methods, analytical findings, and
general study design are detailed in the 1980 Toxic Hazards Research Unit Annual Technical Report
(MacEwen and Vernot, 1980).
175
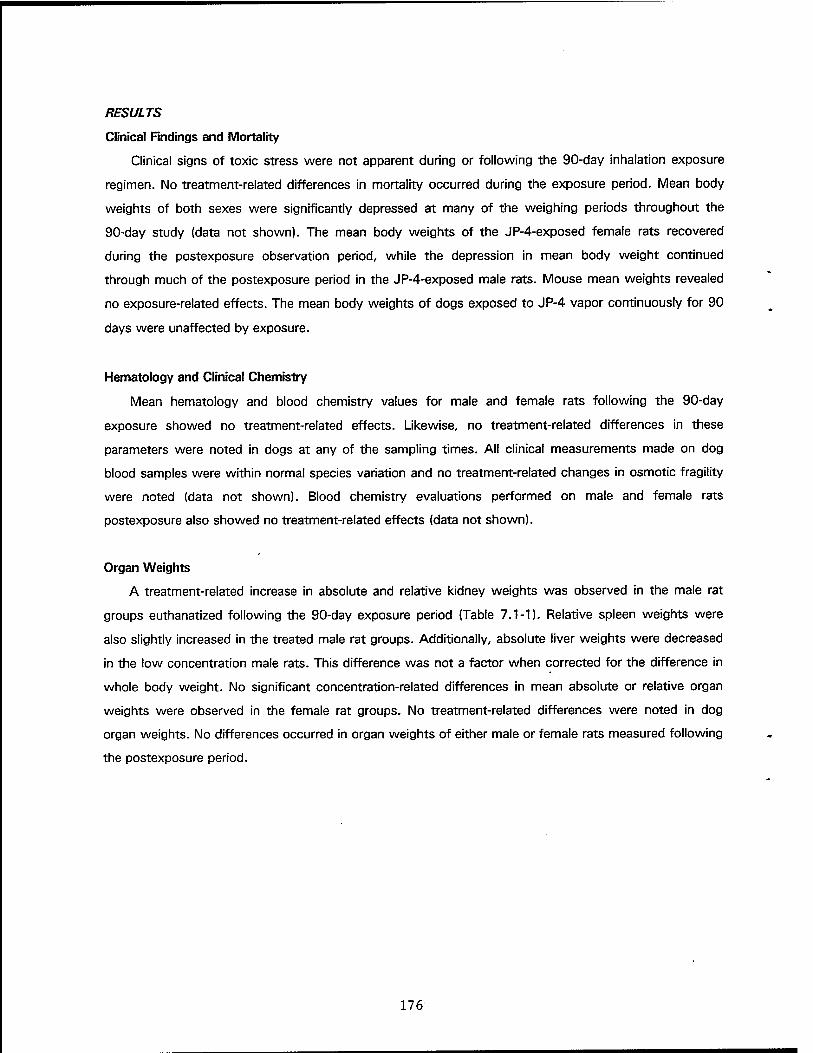
RESULTS
Clinical Findings and Mortality
Clinical signs of toxic stress were not apparent during or following the 90-day inhalation exposure
regimen. No treatment-related differences in mortality occurred during the exposure period. Mean body
weights of both sexes were significantly depressed at many of the weighing periods throughout the
90-day study (data not shown). The mean body weights of the JP-4-exposed female rats recovered
during the postexposure observation period, while the depression in mean body weight continued
through much of the postexposure period in the JP-4-exposed male rats. Mouse mean weights revealed
no exposure-related effects. The mean body weights of dogs exposed to JP-4 vapor continuously for 90
days were unaffected by exposure.
Hematology and Clinical Chemistry
Mean hematology and blood chemistry values for male and female rats following the 90-day
exposure showed no treatment-related effects. Likewise, no treatment-related differences in these
parameters were noted in dogs at any of the sampling times. All clinical measurements made on dog
blood samples were within normal species variation and no treatment-related changes in osmotic fragility
were noted (data not shown). Blood chemistry evaluations performed on male and female rats
postexposure also showed no treatment-related effects (data not shown).
Organ Weights
A treatment-related increase in absolute and relative kidney weights was observed in the male rat
groups euthanatized following the 90-day exposure period (Table 7.1-1). Relative spleen weights were
also slightly increased in the treated male rat groups. Additionally, absolute liver weights were decreased
in the low concentration male rats. This difference was not a factor when corrected for the difference in
whole body weight. No significant concentration-related differences in mean absolute or relative organ
weights were observed in the female rat groups. No treatment-related differences were noted in dog
organ weights. No differences occurred in organ weights of either male or female rats measured following
the postexposure period.
176
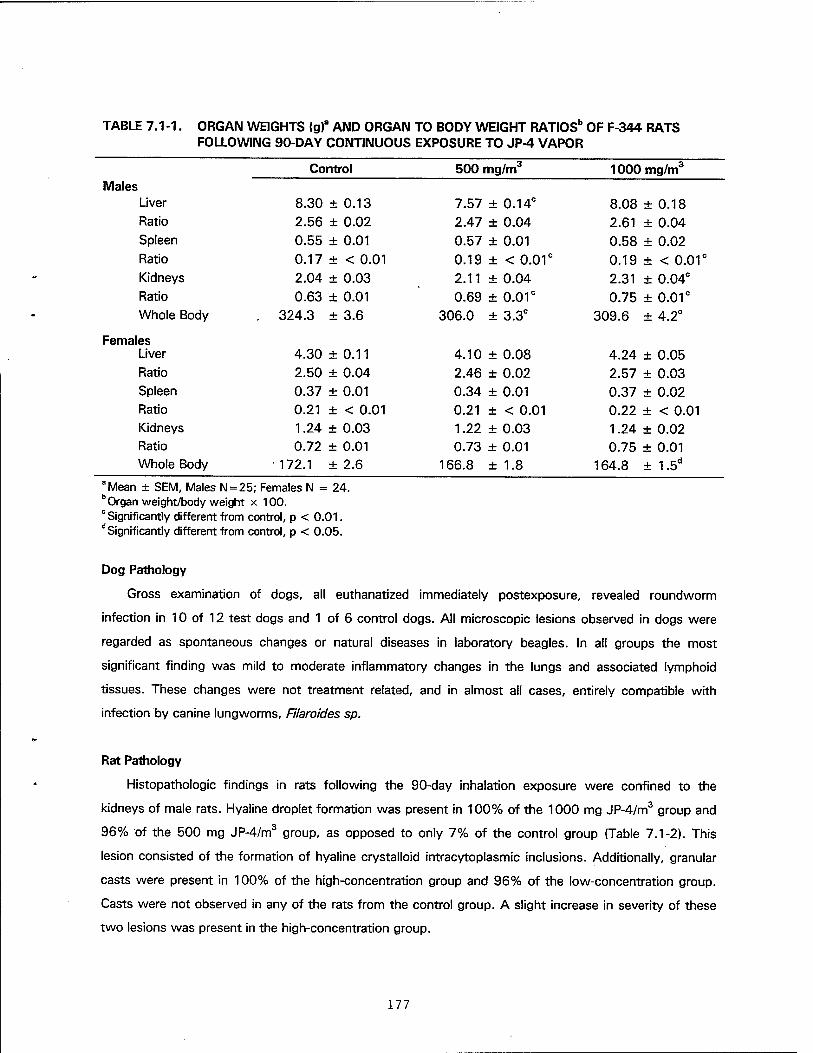
TABLE 7.1 -1. ORGAN WEIGHTS (g)a AND ORGAN TO BODY WEIGHT RATIOS" OF F-344 RATS FOLLOWING 90-DAY CONTINUOUS EXPOSURE TO JP-4 VAPOR
Control 500 mg/m3 1000 mg/m3
Males Liver 8.30 ± 0.13 7.57 ± 0.14° 8.08 + 0.18 Ratio 2.56 ± 0.02 2.47 + 0.04 2.61 ± 0.04 Spleen 0.55 ± 0.01 0.57 + 0.01 0.58 + 0.02 Ratio 0.17 ± < 0.01 0.19 + < 0.01c 0.19 + < 0.01c
Kidneys 2.04 ± 0.03 2.11 + 0.04 2.31 + 0.04c
Ratio 0.63 ± 0.01 0.69 + 0.01c 0.75 ± 0.01c
Whole Body . 324.3 ± 3.6 306.0 ± 3.3C 309.6 ± 4.2C
Females Liver 4.30 ± 0.11 4.10 ± 0.08 4.24 ± 0.05 Ratio 2.50 ± 0.04 2.46 ± 0.02 2.57 ± 0.03 Spleen 0.37 ± 0.01 0.34 ± 0.01 0.37 ± 0.02 Ratio 0.21 ± < 0.01 0.21 ± < 0.01 0.22 ± < 0.01 Kidneys 1.24 ± 0.03 1.22 ± 0.03 1.24 ± 0.02 Ratio 0.72 ± 0.01 0.73 ± 0.01 0.75 ± 0.01 Whole Body 172.1 ± 2.6 166.8 ± 1.8 164.8 ± 1.5d
aMean ± SEM, Males N = 25; Females N = 24. b Organ weight/body weight x 100. c Significantly different from control, p < 0.01. dSignificantly different from control, p < 0.05.
Dog Pathology
Gross examination of dogs, all euthanatized immediately postexposure, revealed roundworm
infection in 10 of 12 test dogs and 1 of 6 control dogs. All microscopic lesions observed in dogs were
regarded as spontaneous changes or natural diseases in laboratory beagles. In all groups the most
significant finding was mild to moderate inflammatory changes in the lungs and associated lymphoid
tissues. These changes were not treatment related, and in almost all cases, entirely compatible with
infection by canine lungworms, Filaroides sp.
Rat Pathology
Histopathologic findings in rats following the 90-day inhalation exposure were confined to the
kidneys of male rats. Hyaline droplet formation was present in 100% of the 1000 mg JP-4/m3 group and
96% of the 500 mg JP-4/m3 group, as opposed to only 7% of the control group (Table 7.1-2). This
lesion consisted of the formation of hyaline crystalloid intracytoplasmic inclusions. Additionally, granular
casts were present in 100% of the high-concentration group and 96% of the low-concentration group.
Casts were not observed in any of the rats from the control group. A slight increase in severity of these
two lesions was present in the high-concentration group.
177
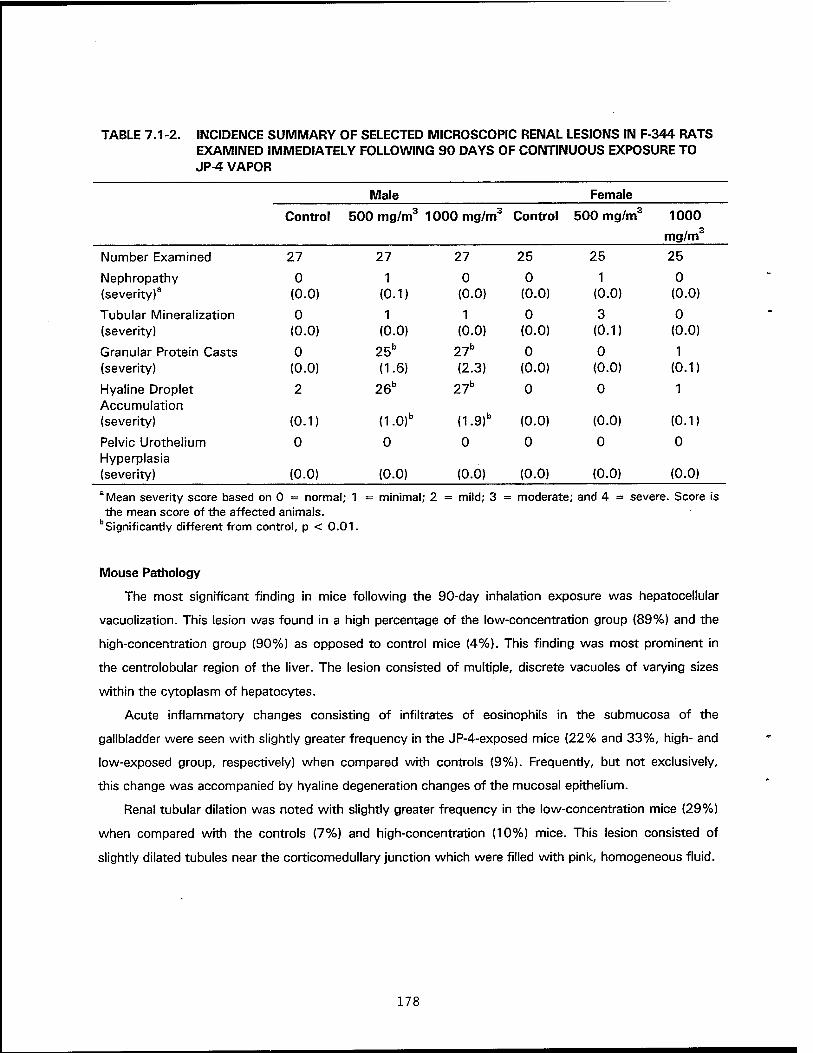
TABLE 7.1-2. INCIDENCE SUMMARY OF SELECTED MICROSCOPIC RENAL LESIONS IN F-344 RATS EXAMINED IMMEDIATELY FOLLOWING 90 DAYS OF CONTINUOUS EXPOSURE TO JP-4 VAPOR
Male Female
Control 500 mg/m3 1000 mg/m3 Control 500 mg/m3 1000
mg/m3
Number Examined 27 27 27 25 25 25
Nephropathy (severity)3
0 (0.0)
1 (0.1)
0 (0.0)
0 (0.0)
1 (0.0)
0 (0.0)
Tubular Mineralization (severity)
0 (0.0)
1 (0.0)
1 (0.0)
0 (0.0)
3 (0.1)
0 (0.0)
Granular Protein Casts (severity)
0 (0.0)
25b
(1.6) 27b
(2.3) 0
(0.0) 0
(0.0) 1
(0.1)
Hyaline Droplet Accumulation (severity)
2
(0.1)
26b
(1.0)b
27b
(1.9)b
0
(0.0)
0
(0.0)
1
(0.1)
Pelvic Urothelium Hyperplasia (severity)
0
(0.0)
0
(0.0)
0
(0.0)
0
(0.0)
0
(0.0)
0
(0.0) aMean severity score based on 0 = normal; 1 = minimal; 2 = mild; 3 = moderate; and 4 = severe. Score is the mean score of the affected animals.
bSignificantly different from control, p < 0.01.
Mouse Pathology
The most significant finding in mice following the 90-day inhalation exposure was hepatocellular
vacuolization. This lesion was found in a high percentage of the low-concentration group (89%) and the
high-concentration group (90%) as opposed to control mice (4%). This finding was most prominent in
the centrolobular region of the liver. The lesion consisted of multiple, discrete vacuoles of varying sizes
within the cytoplasm of hepatocytes.
Acute inflammatory changes consisting of infiltrates of eosinophils in the submucosa of the
gallbladder were seen with slightly greater frequency in the JP-4-exposed mice (22% and 33%, high- and
low-exposed group, respectively) when compared with controls (9%). Frequently, but not exclusively,
this change was accompanied by hyaline degeneration changes of the mucosal epithelium.
Renal tubular dilation was noted with slightly greater frequency in the low-concentration mice (29%)
when compared with the controls (7%) and high-concentration (10%) mice. This lesion consisted of
slightly dilated tubules near the corticomedullary junction which were filled with pink, homogeneous fluid.
178

Ultrastructural Examination
Examination of kidney ultrastructure of JP-4-exposed male rats revealed hyaline, crystalloid
intracytoplasmic inclusions in the proximal tubule cells. The severity of the inclusions was greater in the
high dose group, although occasional proximal tubule cells from the low-concentration group contained
crystalloid inclusions equal in size and number to the high-concentration proximal tubules. Mitochondria
and endoplasmic reticulum, which were not affected until proximal tubules became engorged with
inclusions, exhibited excessive dilation of the albuminal cell membrane, or began to form a cast. The
appearance of the mitochondria then became more irregular in shape and the cristae appeared more
dilated than in the control group. The casts were composed of necrotic, exfoliated tubular epithelial cells
which formed prominent tubular plugs near the corticomedullary junction and resulted in focal tubular
dilation. Distal tubules appeared normal in both low and high dose groups. Glomeruli were unaffected by
JP-4 exposure.
Histopathology — Postexposure Results
Histopathologic findings at 19- and 21-month postexposure were limited to male rats. Protein casts
and hyaline droplets were no longer significant findings in the kidneys of treated animals (Tables 7.1-3
and 7.1-4). Instead, an increased incidence of medullary tubular mineralization and hyperplasia of pelvic
urothelium was noted.
No JP-4-related lesions were noted in the mice examined postexposure. Incidence of lesions noted in
the JP-4-exposed mouse groups did not differ significantly from those of the control mouse group.
179
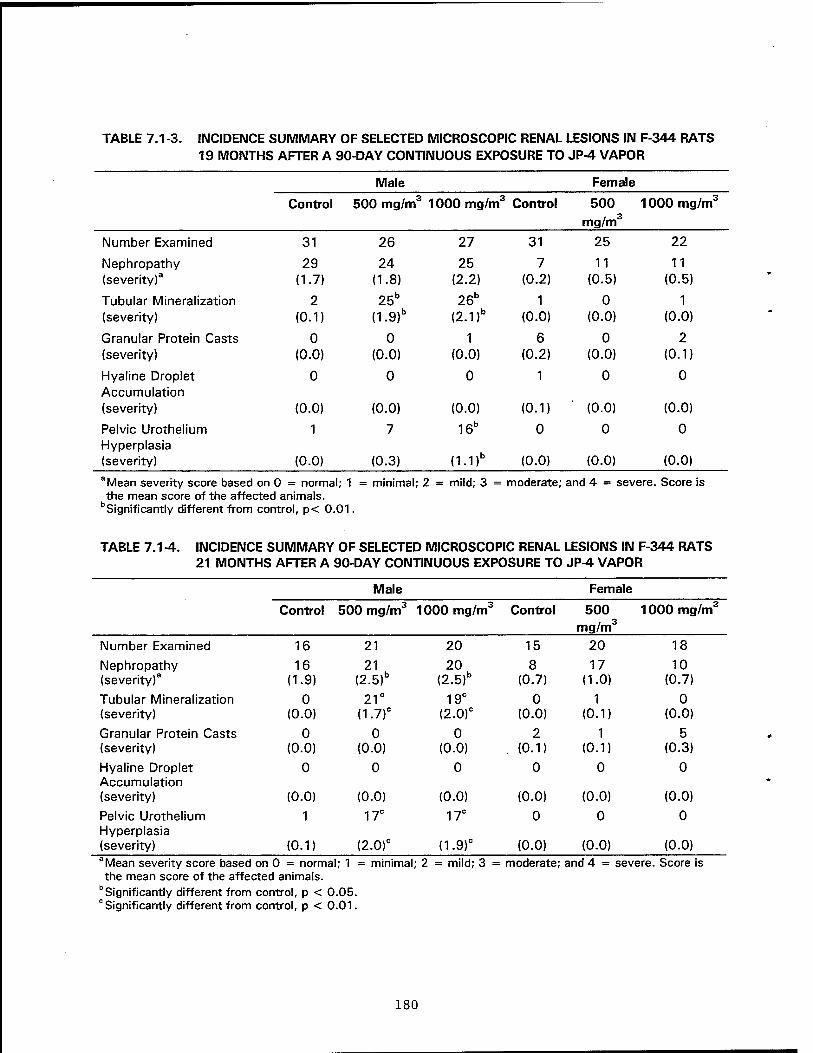
TABLE 7.1-3. INCIDENCE SUMMARY OF SELECTED MICROSCOPIC RENAL LESIONS IN F-344 RATS 19 MONTHS AFTER A 90-DAY CONTINUOUS EXPOSURE TO JP-4 VAPOR
Male Female
Control 500 mg/m3 1000 mg/m3 Control 500
mg/m3
1000 mg/m3
Number Examined 31 26 27 31 25 22
Nephropathy (severity)3
29 (1.7)
24 (1.8)
25 (2.2)
7 (0.2)
11 (0.5)
11 (0.5)
Tubular Mineralization (severity)
2 (0.1)
25" (1.9)"
26" (2.1)"
1 (0.0)
0 (0.0)
1 (0.0)
Granular Protein Casts (severity)
0 (0.0)
0 (0.0)
1 (0.0)
6 (0.2)
0 (0.0)
2 (0.1)
Hyaline Droplet Accumulation (severity)
0
(0.0)
0
(0.0)
0
(0.0)
1
(0.1)
0
(0.0)
0
(0.0)
Pelvic Urothelium Hyperplasia (severity)
1
(0.0)
7
(0.3)
16"
(1.1)"
0
(0.0)
0
(0.0)
0
(0.0)
"Mean severity score based on 0 = normal; 1 the mean score of the affected animals.
bSignificantly different from control, p< 0.01.
minimal; 2 = mild; 3 = moderate; and 4 = severe. Score is
TABLE 7.1-4. INCIDENCE SUMMARY OF SELECTED MICROSCOPIC RENAL LESIONS IN F-344 RATS 21 MONTHS AFTER A 90-DAY CONTINUOUS EXPOSURE TO JP-4 VAPOR
Male Female
Control 500 mg/m3 1000 mg/m3 Control 500 mg/m3
1000 mg/m3
Number Examined 16 21 20 15 20 18
Nephropathy (severity)3
16 (1.9)
21 (2.5)"
20 (2.5)"
8 (0.7)
17 (1.0)
10 (0.7)
Tubular Mineralization (severity)
0 (0.0)
21c
(1.7)c 19c
(2.0)c 0
(0.0) 1
(0.1) 0
(0.0)
Granular Protein Casts (severity)
0 (0.0)
0 (0.0)
0 (0.0)
2 . (0.1)
1 (0.1)
5 (0.3)
Hyaline Droplet Accumulation (severity)
0
(0.0)
0
(0.0)
0
(0.0)
0
(0.0)
0
(0.0)
0
(0.0)
Pelvic Urothelium Hyperplasia (severity)
1
(0.1)
17c
(2.0)c
17c
(1.9)°
0
(0.0)
0
(0.0)
0
(0.0)
"Mean severity score based on 0 = normal; 1 = minimal; 2 = mild; 3 = moderate; and 4 the mean score of the affected animals.
"Significantly different from control, p < 0.05. "Significantly different from control, p < 0.01.
severe. Score is
180
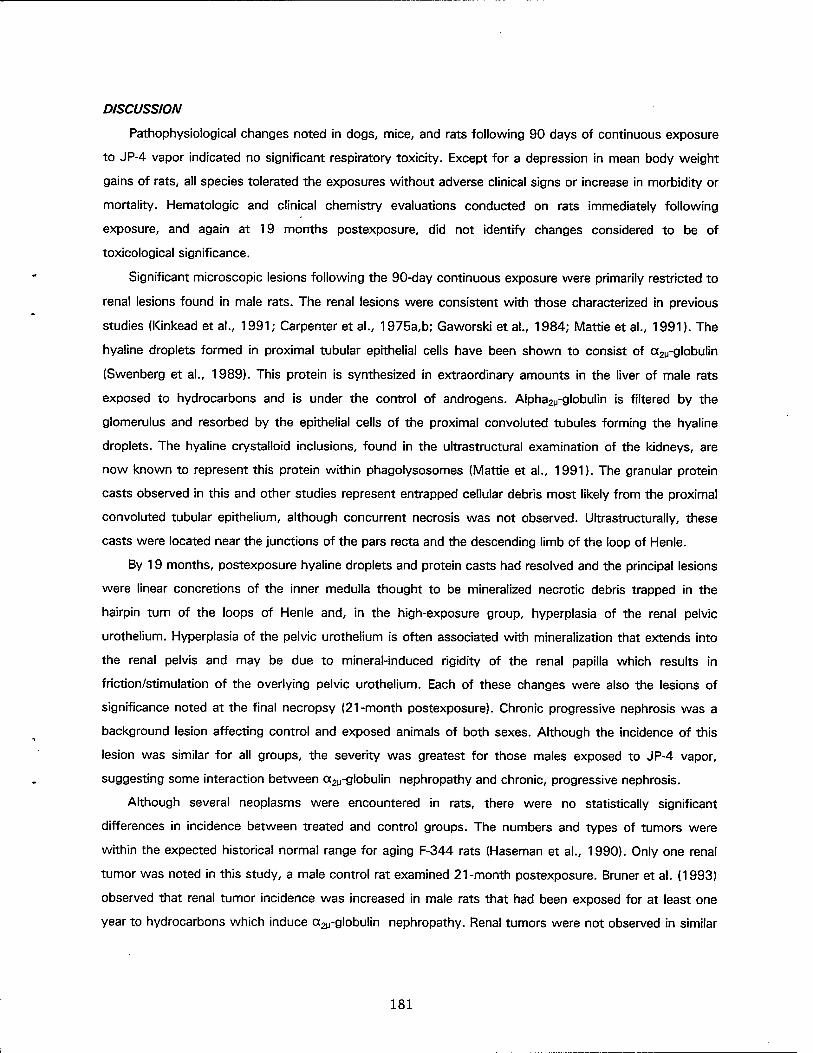
DISCUSSION
Pathophysiological changes noted in dogs, mice, and rats following 90 days of continuous exposure
to JP-4 vapor indicated no significant respiratory toxicity. Except for a depression in mean body weight
gains of rats, all species tolerated the exposures without adverse clinical signs or increase in morbidity or
mortality. Hematologic and clinical chemistry evaluations conducted on rats immediately following
exposure, and again at 19 months postexposure, did not identify changes considered to be of
toxicological significance.
Significant microscopic lesions following the 90-day continuous exposure were primarily restricted to
renal lesions found in male rats. The renal lesions were consistent with those characterized in previous
studies (Kinkead et al., 1991; Carpenter et al.,.1975a,b; Gaworski et al., 1984; Mattie et al., 1991). The
hyaline droplets formed in proximal tubular epithelial cells have been shown to consist of a2p-globulin
(Swenberg et al., 1989). This protein is synthesized in extraordinary amounts in the liver of male rats
exposed to hydrocarbons and is under the control of androgens. Alpha2M-globulin is filtered by the
glomerulus and resorbed by the epithelial cells of the proximal convoluted tubules forming the hyaline
droplets. The hyaline crystalloid inclusions, found in the ultrastructural examination of the kidneys, are
now known to represent this protein within phagolysosomes (Mattie et al., 1991). The granular protein
casts observed in this and other studies represent entrapped cellular debris most likely from the proximal
convoluted tubular epithelium, although concurrent necrosis was not observed. Ultrastructurally, these
casts were located near the junctions of the pars recta and the descending limb of the loop of Henle.
By 19 months, postexposure hyaline droplets and protein casts had resolved and the principal lesions
were linear concretions of the inner medulla thought to be mineralized necrotic debris trapped in the
hairpin turn of the loops of Henle and, in the high-exposure group, hyperplasia of the renal pelvic
urothelium. Hyperplasia of the pelvic urothelium is often associated with mineralization that extends into
the renal pelvis and may be due to mineral-induced rigidity of the renal papilla which results in
friction/stimulation of the overlying pelvic urothelium. Each of these changes were also the lesions of
significance noted at the final necropsy (21-month postexposure). Chronic progressive nephrosis was a
background lesion affecting control and exposed animals of both sexes. Although the incidence of this
lesion was similar for all groups, the severity was greatest for those males exposed to JP-4 vapor,
suggesting some interaction between a2M-globulin nephropathy and chronic, progressive nephrosis.
Although several neoplasms were encountered in rats, there were no statistically significant
differences in incidence between treated and control groups. The numbers and types of tumors were
within the expected historical normal range for aging F-344 rats (Haseman et al., 1990). Only one renal
tumor was noted in this study, a male control rat examined 21-month postexposure. Bruner et al. (1993)
observed that renal tumor incidence was increased in male rats that had been exposed for at least one
year to hydrocarbons which induce a2M-globulin nephropathy. Renal tumors were not observed in similar
181
hydrocarbon studies in which the animals were held up to 21-month postexposure following 90 days of
continuous exposure. Bruner et al. (1993) concluded that increased renal neoplasia may be expected
when male rats were exposed for one year or longer to hydrocarbons which promote tubular cell death
(and proliferation) following perturbations in the renal handling of a2M-globulin .
The hepatocellular vacuolization noted in mice examined at exposure termination was presumably an
indication of fatty change. The presence of this lesion was undoubtedly exposure related, occurring in a
large majority of exposed mice. Reversibility was demonstrated by the reduced incidence of fatty changes
in exposed mice examined postexposure. With no other signs of liver damage noted in exposed mice, the
fatty changes can be regarded as a mild, reversible response to JP-4 vapor exposure.
Renal tubular dilation found in mice following the 90-day exposure is produced by a fluid which is
thought to originate from an incompetent glomerular filtration mechanism secondary to mild membranous
glomerulonephritis. Glomerulonephritis is a lesion common in aging C57BL/6 mice (Frith et al., 1983) and
was equally distributed between treated and control mouse groups at the 19- and 21-month examination.
CONCLUSION
The most significant finding in this study was the increased incidence of renal disease in the male
rats. No renal neoplasms were found in the JP-4-exposed male rats. Many organic chemicals, including
military aviation fuels can produce hyaline droplet nephropathy in the male rat (Bruner, 1984; Bruner et
al., 1993; Kinkead et al., 1974, 1991; Gaworski et al., 1984, 1985; Mattie et al., 1991). The
mechanisms associated with this syndrome is specific for the male rats and involves the production and
accumulation of a2M-globulin . Renal hyperplasia and neoplasia develop subsequently (Alden et al., 1984;
Ridder et al., 1990; Borghaff et al., 1991). Because a2M-globulin is nonexistent in humans, chemicals
producing nephropathy and/or renal tumors via this mechanism are not considered to produce similar
renal effects in humans.
182

REFERENCES
Alden, C.L., R.L. Kanerva, G. Ridder, and L.C. Stone. 1984. The pathogenesis of the nephrotoxicity of volatile hydrocarbons in the male rat. In: Advances in Modem Environmental Toxicology: Renal Effects of Petroleum Hydrocarbons. M.A. Mehlman, C.P. Hemstreet III, J.J. Thorpe, and N.K. Weaver, eds. Vol. VII. New Jersey: Princeton Scientific Publishers, Inc.
Borghaff, S.J., A.B. Miller, J.P. Bowen, and J.A. Swenberg. 1991. Characteristics of chemical binding to oc2M-gIobulin in vitro: Evaluating structure-activity relationships. Toxicol. Appl. Pharmacol. 107:228-238.
Bruner, R.H. 1984. Pathologic findings in laboratory animals exposed to hydrocarbon fuels of military interest. In: Renal Effects of Petroleum Hydrocarbons. M.A. Mehlman, C.P. Hemstreet, J.J. Thorpe III, and N.K. Weaver, eds. pp. 133-140. New Jersey: Princeton Scientific Publishers, Inc.
Bruner, R.H., E.R. Kinkead, T.P. O'Neill, CD. Flemming, D.R. Mattie, C.A. Russell, and H.G. Wall. 1993. The toxicologic and oncogenic potential of JP-4 jet fuel vapors in rats and mice: 12-month intermittent inhalation exposures. Fundam. Appl. Toxicol. 20:97-110.
Carpenter, C.P., E.R. Kinkead, D.L. Geary, Jr., L.J. Sullivan, and J.M. King. 1975a. Petroleum hydrocarbon toxicity studies: VI. Animals and human response to vapors of "60 solvent." Toxicol. Appl. Pharmacol. 34:374.
Carpenter, C.P., E.R. Kinkead, D.L. Geary, Jr., L.J. Sullivan, and J.M. King. 1975b. Petroleum hydrocarbon toxicity studies: VI. Animals and human response to vapors of "70 solvent." Toxicol. Appl. Pharmacol. 34:395.
Frith, C.H., B. Highman, G. Burger, and W.D. Sheldon. 1983. Spontaneous lesions in virgin and retired breeder BALB/c and C57BL/6 mice. Lab. Anim. Sei. 33:273-286.
Gaworski, C.L., J.D. MacEwen, E.H. Vernot, R.H. Bruner, and M.J. Cowan. 1984. Comparison of the subchronic inhalation toxicity of petroleum and oil shale JP-5 jet fuels. In: Applied Toxicology of Petroleum Hydrocarbons. M.A. Mehlman, ed. Vol. 6, pp. 33-47. New Jersey: Princeton Scientific Publishers, Inc.
Gaworski, C.L., C.C. Haun, J.D. MacEwen, E.H. Vernot, R.H. Bruner, R.L. Amster, and M.J. Cowan. 1985. A 90-day vapor inhalation toxicity study of Decalin. Fundam. Appl. Toxicol. 5:785-793.
Haseman, J.K., J. Arnold, and S.L. Eustis. 1990. Tumor incidences in Fischer 344 rats: NTD historical data. In: Pathology of the Fischer Rat. G.A. Boorman et al., eds. pp. 555-564. New York: Academic Press.
Kinkead, E.R., L.C. DiPasquale, E.H. Vernot, and J.D. MacEwen. 1974. Chronic toxicity of JP-4 jet fuel. In: Proceedings of the Fifth Annual Conference on Environmental Toxicology, AMRL-TR-74-125 (ADA- 011563), pp. 145-154. Wright-Patterson Air Force Base, OH: Aerospace Medical Research Laboratory.
Kinkead, E.R., C.L. Gaworski, CD. Flemming, R.H. Harris, W.M. Witt, H. Davis, and R.E. Schmidt. 1991. Tumorigenic Evaluation of Jet Fuels JP-TS and JP-7. AL-TR-1991-0020 (ADA-252012). Wright-Patterson Air Force Base, OH: Armstrong Laboratory.
Kinkead, E.R., S.A. Salins, and R.E. Wolfe. 1992. Acute irritation and sensitization potential of petroleum- derived JP-4 jet fuel. Acute Toxicity Data, Vol. 11, No. 6, p. 702.
Kinkead, E.R., R.E. Wolfe, and S.A. Salins. 1993. Acute oral and inhalation toxicity of petroleum-derived JP-4 jet fuel. Acute Toxicity Data, Vol. 12, No. 6, p. 635.
183
MacEwen, J.D. and E.H. Vernot. 1975. Toxic Hazards Research Unit Annual Technical Report, AMRL- TR-75-57 (ADA-019456). Wright-Patterson Air Force Base, OH: Aerospace Medical Research Laboratory.
MacEwen, J.D. and E.H. Vernot. 1980. Toxic Hazards Research Unit Annual Technical Report, AFAMRL- TR-80-79 (ADA-075976). Wright Patterson Air Force Base, OH: Aerospace Medical Research Laboratory.
Mattie, D.R., C.L. Aldren, T.K. Newell, C.L. Gaworski, and CD. Flemming. 1991. A 90-day continuous inhalation study of JP-8 jet fuel followed by 20 or 21 months of recovery in Fischer 344 rats and C57BL/6 mice. Toxicologic Pathology 19:77-88.
Ridder, G.M., E.C. Van Barger, C.L. Alden, and R.D. Parker. 1990. Increased hyaline droplet formation in male rats exposed to Decalin is dependent on the presence of a2M-globulin. Fundam. Appl. Toxicol. 15:732-743.
Swenberg, J., B. Short, S. Borghaff, J. Strasser, and M. Charbonneau. 1989. The comparative pathobiology of alpha2M-globulin nephropathy. Toxicol. Appl. Pharm. 97(1):35-47.
184
7.2 OVERVIEW OF THE VAPOR GENERATION AND ANALYSIS PARAMETERS OF THE PETROLEUM- AND SHALE-DERIVED FUEL STUDIES CONDUCTED IN THOMAS DOME EXPOSURE CHAMBERS AT THE TOXIC HAZARDS RESEARCH UNIT. WRIGHT-PATTERSON AFB (DAYTON), OHIO, 1973-1983
H. F. Leahy
ABSTRACT
From 1973 to 1983, a series of subchronic, multiple-species, inhalation exposures were
performed to evaluate the toxicity of aviation and marine fuels derived from petroleum or shale. The
fuels included JP-4, JP-5, JP-7, JP-8, JP-TS, and diesel marine. The inhalation chambers used for
these studies were the Thomas Domes. The target total hydrocarbon (TH) concentrations ranged
from 0.05 to 5.0 mg/L. The TH vapor concentrations were limited by the vapor pressure of the type
of fuel and, if exceeded, the formation of condensate aerosols. The generation and analytical
monitoring of the TH vapor exposures are described. A qualitative perspective of the neat fuel,
vapor, and waste TH components is provided. Under the conditions defined for these studies,
hydrocarbons above C14 were in very low concentrations in any of the fuel vapors.
INTRODUCTION
Inhalation toxicology of fuels, solvents, and hydraulic fluids has been an important part of the
work at the Toxic Hazards Research Unit over the past 20 years. During this time, there were many
changes in the equipment available to describe the exposures, while at the same time, equipment to
produce them was only slightly modified. This report will be limited to some of the petroleum and
shale fuels tested and will describe the basic methods involved in generation and analysis of the
chamber atmospheres and problems encountered in the process. These studies were performed in
the Thomas Dome inhalation chambers (Thomas, 1965), which are located in the Armstrong
Laboratory at Wright-Patterson Air Force Base. The Thomas Domes are unique exposure chambers
adaptable to both altitude and ambient continuous studies of both aerosols and vapors.
ANALYSIS
Mass Composition
All petroleum-and shale-derived fuels are complex mixtures of mainly aliphatic and some
aromatic compounds, while the most distinguishing feature is the relative composition of these
compounds based on the distillation cut temperatures. The specific mixture is not only influenced by
185
end use, which determines the physical characteristics such as volatility and viscosity, but the
chemical composition is also a function of the source of the crude and the cracking process. Each of
the fuels used in these studies was obtained from a single batch of fuel passing the physical
requirements for that fuel type.
Quantifying the total petroleum (or shale) hydrocarbon (TPH) of such a complex mixture is
possible with the use of a flame ionization detector (FID) adapted for continuous analysis. The FID
response to the mixed alkyls is based essentially on the mass concentration of the vapor,
independent of the chain length. This fact permitted calibration using known mass concentrations of
a convenient hydrocarbon. Beckman 400 hydrocarbon analyzers (Beckman Inst. Co., Fullerton, CA)
were used for all TPH analyses. Propane, hexane, and heptane, as well as benzene, have been used
as quantifying standards. Hexane has been recommended as a universal standard for TPH
calibration.
Initially, the number of hydrocarbon analyzers was limited, and sample dilution was necessary
for analysis of two chambers of different concentrations with a single analyzer. Attention to the
dilution was essential for accuracy. Later, each chamber, as well as an industrial hygiene system,
was equipped with an analyzer.
Component Composition
During the initial studies, gas chromatography was used to determine the benzene
concentration of the fuel and the chamber atmosphere. Samples from each of the supply drums
were chromatographed and areas of a number of the peaks eluting during the first 20 min were
used to compare the supply drums of fuel for quality control.
The use of packed columns, the lack of column oven temperature programming, and no
automatic integration limited data acquisition for the first studies. But with the availability in time of
increased analytical capability, more information was made available. These data were not always
part of the study request but were an attempt to expand analytical capability and to supply quality
control information. The study protocols called for a mass concentration without a definitive cut
description, while the authors of the protocols assumed the exposure would resemble that which
follows a fuel spill. A representative set of the available chromatograms is presented in a
Department of Defense (DoD) technical report (Leahy, 1994).
186
Chromatography Equipment
A Varian 1200 (Varian Inst. Corp., Walnut Creek, CA) with packed columns supplied the
information for benzene analysis in studies conducted prior to 1978. Chromatograms were limited
to the first 20 min of an isothermal run; a System One computing integrator (Spectra Physics, Santa
Clara, CA) was used for some quality control data.
When the Varian 3700 Chromatograph (Varian Inst. Corp., Walnut Creek, CA) was obtained and
the first temperature programmed chromatograms were developed, the complexity of fuels was first
appreciated and the problems of integration were encountered. The System One memory was
insufficient for the number of peaks obtained when capillary columns were introduced.
A constant problem for any fuel's chromatography is the overwhelming number of peaks of
very similar materials, which results in a rising baseline from both overlapping peaks and
temperature programming. Accurate integration of these factors becomes a difficult problem, if not
an impossibility. Although hard numbers from very similar integrations are not available from all of
the different studies represented here, visualization of some representative chromatograms is of
value for comprehension of the fact that the exposures were more alike qualitatively than one might
have expected (data not shown).
The acquisition of an HP-5780 computing integrator in 1978 allowed better data analysis with
improved integration and the ability to reintegrate and run area slices programs (Figures 7.2-1 and
7.2-2). These demonstrate the significant differences of liquid, vapor, and waste.
Aerosol
Shortly after the start of the petroleum JP-5 study in 1977 (MacEwen and Vernot, 1978), a
condensate aerosol caused the loss of many of the mice, necessitating a restart of the study with
replacements and at a lower concentration. Cold chamber temperatures, a high vaporization
temperature, and low chamber air flow contributed to the problem. Generation conditions were
thereafter tested with respect to the potential for an aerosol episode before the start of each new
exposure, and target concentrations were scaled downwards if a problem was encountered. Also,
routine aerosol counting was introduced using a Model 225 aerosol particle counter (Royco
Instruments, Inc., Menlo Park, CA) for the remainder of the fuel studies.
187
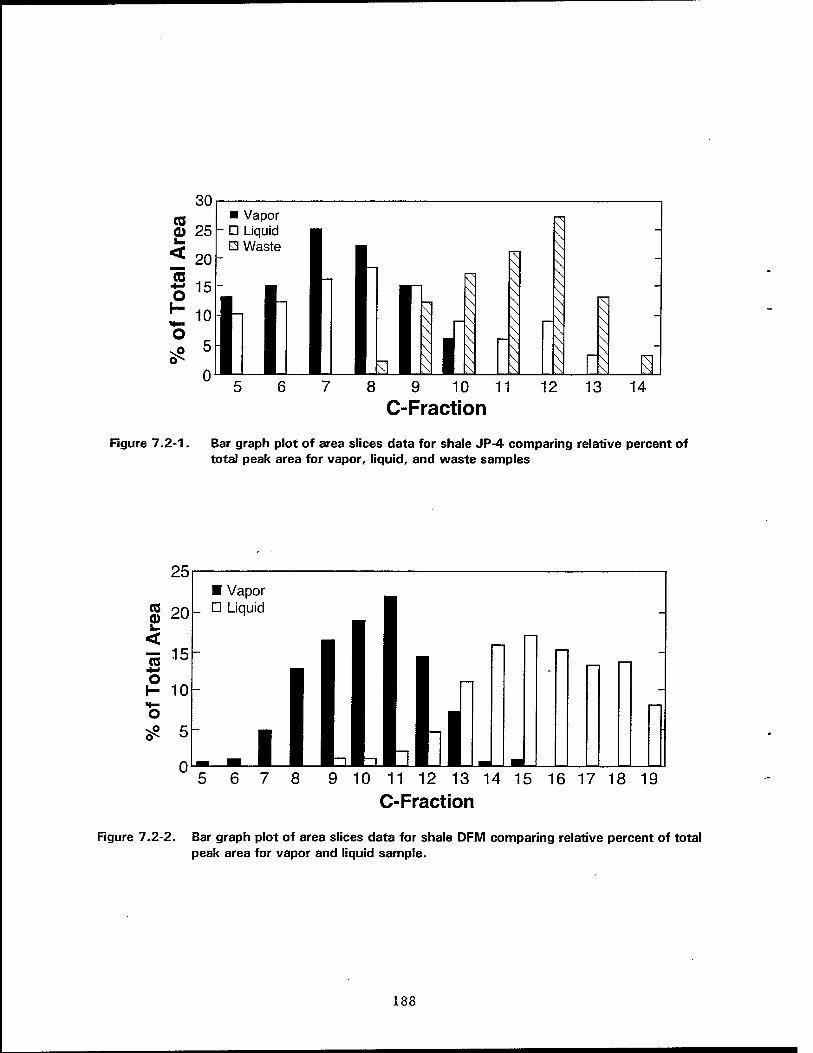
30 ■ Vapor
- D Liquid
\
\
\ N
\
fi 11 12 13 14
C-Fraction
Figure 7.2-1. Bar graph plot of area slices data for shale JP-4 comparing relative percent of total peak area for vapor, liquid, and waste samples
6 7 8 9 10 11 12 13 14 15 16 17 18 19 C-Fraction
Figure 7.2-2. Bar graph plot of area slices data for shale DFM comparing relative percent of total peak area for vapor and liquid sample.
188

Formation of the condensate aerosol appeared to be a critical event triggered by evaporator
temperature that was too high, or chamber temperature that was too low. The only effective way to
increase the TPH for the heavier fuels was some combination of an increase of fuel flow and
evaporator air supply, thereby supplying more of the lighter chain components for vaporization.
For valid sampling with the Royco particle counter, attention had to be paid to the dome/dome
room differential pressure due to the type of sample pump in the instrument.
Target Concentrations
The first study of petroleum-based JP-4 (MacEwen and Vernot, 1974) targeted a specific
benzene concentration in the atmosphere as well as the total hydrocarbon present. At that time, the
benzene concentration of fuels was significantly higher than any fuels used during subsequent
studies. With the 5 and 2.5 mg/L TPH vapor exposures, a 25 and 12.5 ppm exposure to benzene
was accomplished. High fuel flow rates (30 to 40 mL/min) and low generator temperatures were
combined in this study to favor an increase of benzene in the vapor.
The study on petroleum JP-5 (MacEwen and Vernot, 1978) targeted a 1.5 mg/L TPH
concentration with 10 ppm benzene. The fuel not only contained insufficient benzene to attain
10 ppm, but the total quantity of fuel available was limited. Only enough supply was available for
use of 10 mL/min/tower for the length of the exposure. The attempt to operate at 1.5 mg/L with the
limited flow and a generation temperature about 135 °F ended with an aerosol excursion. The study
was restarted with fresh animals at a lower target concentration of 0.75 mg/L.
After experiencing the aerosol problem, the requested TPH concentrations for all further studies
were tested and modified when determined necessary. The fuel evaporating temperature was kept
below 135 °F and fuel flow rate, as well as evaporator air flow, were increased to raise TPH vapor
output. If all else failed, the target concentration was lowered to prevent formation of aerosol.
GENERATION
Evaporation Tower System
The evaporation towers used were common for all of the fuel studies, as well as for a number
of solvent and specialty fuel studies where an output of a high volume of vapor was required.
The central zone of the glass tower was a cylinder 13 in. long by 1-3/4 in. O.D. It had a
13-turn spiral, 9 in. long, impressed in the wall to hold a heating coil and lengthen the vaporization
path. The top reduced to a "T" with a 1-in. O.D. right arm for vapor exhaust and a 1/4-in.
connector for input fuel. The bottom reduced to a 1-in. O.D. glass tubing connected to a double "1"
of stainless steel tubing. Pipe fittings at this connection served for waste fuel drain and carrier air
input.
189
Up to three towers were used to generate the total amount of fuel vapor required. To ensure
qualitatively comparable exposures in the chambers, the tower outputs were combined in a manifold
and routed to the domes by controlled volume flow proportional to the specified dome
concentration. Fine chamber concentration control was accomplished during normal operation by
minor changes of the individual dome flows.
Some of the heat energy for vaporization was supplied with the incoming air, but most came
from an electrically heated coil wrapped around the tower. This was composed of a 1/4-in. close
coiled nicrome wire (B&S 20-gauge, 1.1 W/in., Wooge Manufacturing Co., Chicago, IL)
approximately 6 ft long. The temperature of the tower output (air and vapor mix) was monitored
using probes in the fittings at the top. There was no measure of the internal tower wall
temperature. The waste fuel temperature was also monitored.
During the initial studies, the desired output temperature was obtained using 120V AC power
rheostats, which supplied a constant voltage to the coil. The efficiency of the vapor output was
affected by the temperature of the incoming air as well as that of the vaporization surface area. The
input power was manually modified in response to the output temperature. The later studies made
use of a proportional temperature controller that continuously monitored the tower output
temperature and modified the input power to maintain a set temperature automatically.' This
eliminated the decreased output from cold temperatures, and actually replaced it with a slight
increase of vapor output during cold external conditions.
The input fuel flow rate was controlled with a needle valve and monitored using Fisher & Porter
rotameters (Warminster, PA). Fuel was supplied to the system directly from a 55-gallon drum
pressurized at 5 to 8 psi. The control valve was positioned after the rotameter to prevent
effervescence in the flow tube. The waste fuel flow was partially throttled to reduce the loss of
tower vapor output and was pumped from an intermediate catch tank to a waste collecting drum.
Redundant supply and waste systems allowed continuous operation while replacing drums.
The generation system was protected from fire by monitoring probes and a solenoid switch set
to shut off the fuel flow in case of temperature overrun of either the fuel vapors or the waste fuel.
Evaporation Tower Operation
Except for the first two studies where a specific benzene concentration also was expected, the
goal was to supply a specific and constant TPH concentration without creating an aerosol. The
conditions required to attain the target concentrations were, in general, established empirically.
The evaporator towers operated as counter flow systems. The fuel entered the top of the
towers in a 1/8-in. O.D. teflon tube and the air entered at the bottom, bypassing the spent fuel. The
fuel flowed from a point above the heating coil where the tube touched the glass, then down the
190

sidewall of the evaporator in an uncontrolled stream. As it descended, the composition of both the
fuel and the vapors generated were in a dynamic state of change. The upper tower temperature
sensor monitored the mixed air and fuel vapor leaving the tower and not that of the evaporating
surface area of the tower, while the lower tower sensor monitored the temperature of the spent
fuel. Consistent tower operation and pooling of the outputs of two or more towers provided
qualitatively similar output for the operation of up to three chambers.
At a specific temperature, the effective vapor pressure of an individual component in a mixture
is a function of its vapor pressure times its mole percent concentration multiplied by an activity
coefficient of the system. The activity coefficient is related to the solvent, the temperature, and the
pressure. For the mixed components of the paraffinic series, this latter effect should be a minor
factor due to the similarity of the components (Bishop, 1981). The complexity of the evaporation of
the fuel was not only due to the multiplicity of components, but also of its changing percent
composition and temperature as it flowed down the tower wall. The composition of vapors obtained
was a compromise somewhere between a headspace sample and the original fuel with a significant
reduction after C13 due to the effectively low vapor pressures of the longer chain hydrocarbons.
In the system as operated, increasing the fuel flow rate, short of initiating splashing, while
maintaining air flow rates resulted in a greater TPH output due to the presence of more volatile
components available for stripping, as well as from the additional heat supplied to maintain the
output temperature of the vapor and air mix. This would favor a relative increase in the front end
component of the vapor. An increase of the carrier air flow alone also increased the TPH output by
removing more air per unit time while also causing more heat input to maintain the same output
temperature. This would shift the vapor to contain somewhat more of the less volatile component.
On the other hand, from the same fuel and air flow, but at a higher operational temperature, the
TPH vapor output also could be readily increased. However, as the fuel temperature increases, the
vapor pressures of the heavier hydrocarbons increase relatively faster than those of lighter ones,
while upon cooling, the reverse occurs, thus contributing to the probability of an oversaturated
system, followed by formation of a condensate aerosol. An upper tower temperature of about
135 °F was empirically determined to be near a critical upper limit for operation of the system with
acceptable aerosol measurement.
191
RESULTS
Vapor
The overall effect due to (a) the nature of the fuels (broad distillation cuts), (b) the manner of
achieving the target concentrations, and (c) the temperature restriction on vapor generation was to
favor whatever lighter fraction was present. The target concentrations for JP-4 were easily met
because of the predominance of the light hydrocarbon fraction. In an attempt to achieve the
targeted concentration with increased heat due to a limitation of available fuel for the project, the
first JP-5 study experienced a condensate aerosol on cooling of the vapors. That study was
restarted at a lower target concentration. The most extreme example of the difference of vapor from
the parent fuel was the chamber atmosphere produced from shale-derived diesel fuel marine
(SDFM), where over 50% of the TPH vapors were from decane (C10) and lower molecular weight
components, which had represented less than 2% of the original fuel (Table 7.2-1 and Figure
7.2-2). The volatility restrictions of heavier fuels were overcome by the increased flow rate of fuels
through the towers and the lower targeted chamber TPH concentrations. Thus, the exposure
atmospheres of both petroleum and diesel, JP-5 and DFM, also JP-7, JP-TS, and JP-8, were more
similar qualitatively than would have been expected if considering only the starting fuel composition.
A series of chromatograms, where available, qualitatively compared the chamber vapors with input
fuels and spent fuels.
192
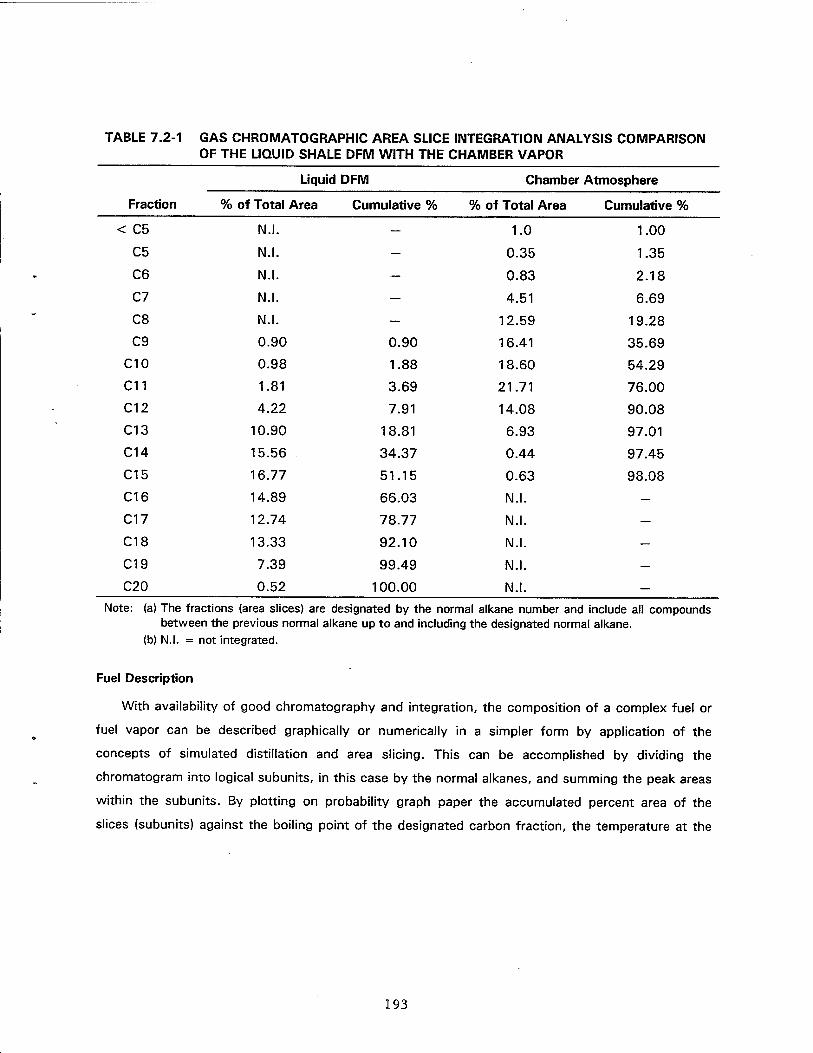
TABLE 7.2-1 GAS CHROMATOGRAPHIC AREA SLICE INTEGRATION ANALYSIS COMPARISON OF THE LIQUID SHALE DFM WITH THE CHAMBER VAPOR
Liquid DFM Chamber Atmosphere
Fraction % of Total Area Cumulative % % of Total Area Cumulative %
< C5 N.I. — 1.0 1.00
C5 N.I. — 0.35 1.35
C6 N.I. — 0.83 2.18
C7 N.I. — 4.51 6.69
C8 N.I. — 12.59 19.28
C9 0.90 0.90 16.41 35.69
C10 0.98 1.88 18.60 54.29
C11 1.81 3.69 21.71 76.00
C12 4.22 7.91 14.08 90.08
C13 10.90 18.81 6.93 97.01
C14 15.56 34.37 0.44 97.45
C15 16.77 51.15 0.63 98.08
C16 14.89 66.03 N.I. —
C17 12.74 78.77 N.I. —
C18 13.33 92.10 N.I. —
C19 7.39 99.49 N.I. —
C20 0.52 100.00 N.I. —
Note: (a) The fractions (area slices) are designated by the normal alkane number and include all compounds between the previous normal alkane up to and including the designated normal alkane.
(b) N.I. = not integrated.
Fuel Description
With availability of good chromatography and integration, the composition of a complex fuel or
fuel vapor can be described graphically or numerically in a simpler form by application of the
concepts of simulated distillation and area slicing. This can be accomplished by dividing the
chromatogram into logical subunits, in this case by the normal alkanes, and summing the peak areas
within the subunits. By plotting on probability graph paper the accumulated percent area of the
slices (subunits) against the boiling point of the designated carbon fraction, the temperature at the
193
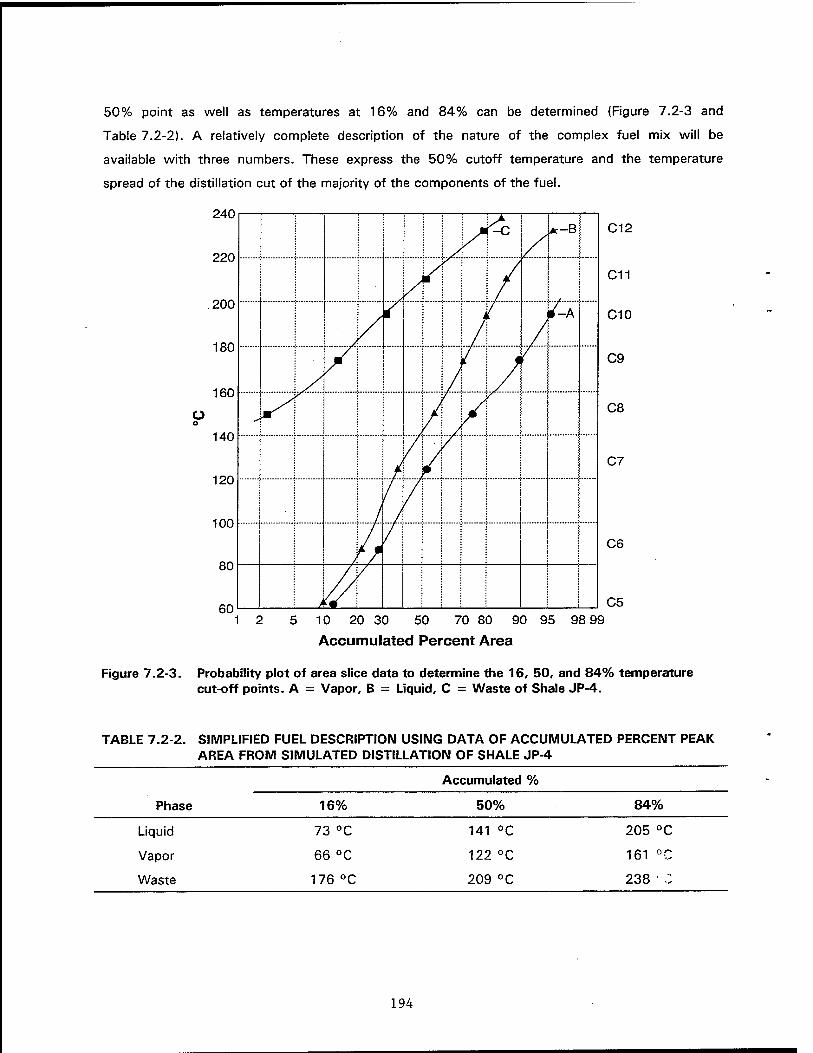
50% point as well as temperatures at 16% and 84% can be determined (Figure 7.2-3 and
Table 7.2-2). A relatively complete description of the nature of the complex fuel mix will be
available with three numbers. These express the 50% cutoff temperature and the temperature
spread of the distillation cut of the majority of the components of the fuel.
240
220
.200
180
160
140
120
100
80
60
\ J(-c A-B
/-A
C12
C11
C10
C9
C8
C7
C6
C5 10 20 30 50 70 80 90 95 98 99
Accumulated Percent Area
Figure 7.2-3. Probability plot of area slice data to determine the 16, 50, and 84% temperature cut-off points. A = Vapor, B = Liquid, C = Waste of Shale JP-4.
TABLE 7.2-2. SIMPLIFIED FUEL DESCRIPTION USING DATA OF ACCUMULATED PERCENT PEAK AREA FROM SIMULATED DISTILLATION OF SHALE JP-4
Accumulated %
Phase 16% 50% 84%
Liquid 73 °C 141 °C 205 °C
Vapor 66 °C 122 °C 161 °C
Waste 176 °C 209 °C 238 C
194
Operational Problems
1. Temperature
The input air and fuel temperatures and that of the generation area itself were not completely
controlled, having daily as well as seasonal, and sometimes, emergency fluctuations. These
temperature fluctuations affected the tower efficiency, especially when the heat input was
controlled with a specific rheostat setting and required adjustments to make up for changing
conditions.
Variations in fuel viscosity due to temperature shifts affected the rotameter ball position for the
same flow rate. Because a specific setting was predetermined for a study, corrections were made to
return the ball to that position slightly lowered flow when the fuel was colder and raised it when it
was warmer.
During continuous studies, the operating parameters were checked at least hourly, and TPH
concentrations were adjusted when outside a range of ± 5% of targeted concentrations. Audible
alarms were activated if the concentration exceeded ± 10% of the desired concentration, and
immediate attention was given to the problem. Minor adjustments were made using the chamber
flow rate within limits rather than the generation system.
2. Splashing
The splashing of fuel at the bottom of the tower became a potential problem whenever the fuel
input went above 13 mL/min. The droplets of the spent fuel hitting the hot glass wall in the zone of
incoming air changed the composition of the vapor to include more of the heavier diesel range
organics. When it occurred, this contributed to (a) the potential for aerosolization on cooling of the
vapor, (b) greater similarity of the chamber atmosphere with that of the supply material, and (c)
very rapid changes of chamber TPH concentration. A tower air input line modification extended the
line above the pool of the spent fuel, thus reducing the probability of splashing from the bottom.
A similar result could have occurred if the inlet line separated from the glass wall and fuel falling
through the air stream was blown against the hot glass or blown through as an aerosol. One report
of the JP-8 study (Mattie et al., 1991) states that the entire fuel was vaporized. This idea may have
resulted from misidentification of samples, sampling problems, or the dropping through of liquid
fuel. On searching archived records, it was observed that at times the record showed little
difference between the atmosphere and the parent material as judged from the areas of a number of
marker peaks. But with the inclusion of more of the available data and the comparison of a number
195
of chamber vapor chromatograms, it appeared that at times fuel splashing or dropping through had
occasionally occurred. However, most of the time the vapor was composed as in the other studies
favoring the more volatile components. As a method for getting a vapor more representative of the
fuel itself, this phenomenon might deserve study.
3. Sampling
The Beckman 400 hydrocarbon analyzers were operated continuously. Samples were drawn
from the chambers which operated at 20 mmHg negative to ambient, through 1 /4 in. stainless steel
lines, and pressurized by diaphragm pumps (Diapump, Model 08-800-70, Air Control Inc.,
Norristown, PA) to about 3 psi with flow about 3 to 4 L/min. Calibration was performed before each
of the studies, and routine calibration checks were performed during the studies. The analyzers
performed very well for extended periods without significant drifting of output signal. One early
problem was a bleed-off of hydrocarbons from the pump check valves. This was corrected when
each dome analytical system became independent and baseline air was delivered with a separate
pump.
4. Chromatography
Headspace samples were used initially for determination of the benzene content. They were
convenient and reasonably reproducible while serving the purpose intended. They also provided a
method for quality control.
Dilution in hexane permitted an injection of a minute sample of the fuel presenting the first full
chromatograms. But the presence of the hexane masked a problem encountered where
approximately one-third of the barrels (the first five received) of shale JP-5 contained 3% aviation
gasoline (AvGas), a contaminant from a tank at Rickenbacker Air Force Base. Even in the less
contaminated samples from the rest of the supply, there was enough AvGas to cause a bimodal
distribution in the vapor phase (data not shown).
Delivering a valid vapor sample was a problem with the back pressures of the old packed
column systems while the very low concentration studies created problems for the capillary
systems. Generator output samples were sometimes invalid because of contamination with splashed
or condensed fuels. Some apparent discrimination in TPH component distribution could be caused
due to incomplete vaporization from the needle or the injection port. Generator output samples were
potentially contaminated by recondensing vapors at the sample port. These required judgment
whenever there was disagreement with the chamber samples. Their advantage was that the
concentration was much higher and the chromatograms more reliably integrated because they had
flatter baselines.
196
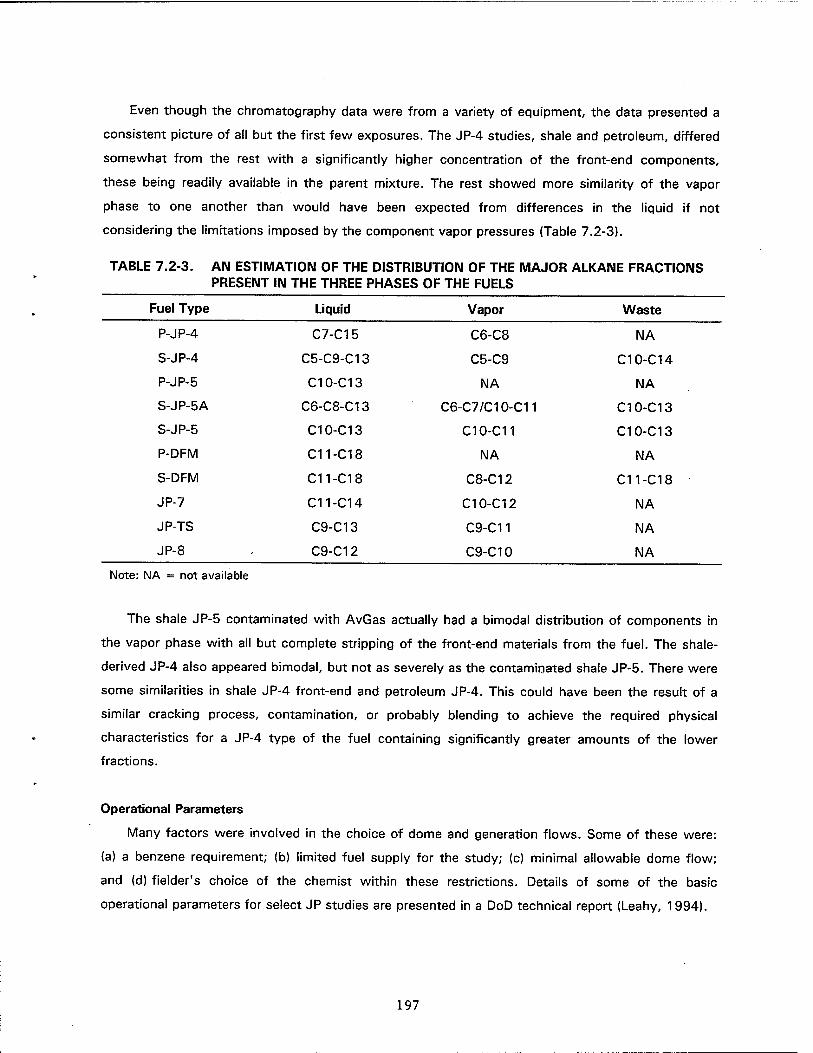
Even though the chromatography data were from a variety of equipment, the data presented a
consistent picture of all but the first few exposures. The JP-4 studies, shale and petroleum, differed
somewhat from the rest with a significantly higher concentration of the front-end components,
these being readily available in the parent mixture. The rest showed more similarity of the vapor
phase to one another than would have been expected from differences in the liquid if not
considering the limitations imposed by the component vapor pressures (Table 7.2-3).
TABLE 7.2-3. AN ESTIMATION OF THE DISTRIBUTION OF THE MAJOR ALKANE FRACTIONS PRESENT IN THE THREE PHASES OF THE FUELS
Fuel Type Liquid Vapor Waste
P-JP-4 C7-C15 C6-C8 NA
S-JP-4 C5-C9-C13 C5-C9 C10-C14
P-JP-5 C10-C13 NA NA
S-JP-5A C6-C8-C13 C6-C7/C10-C11 C10-C13
S-JP-5 C10-C13 C10-C11 C10-C13
P-DFM C11-C18 NA NA
S-DFM C11-C18 C8-C12 C11-C18
JP-7 C11-C14 C10-C12 NA
JP-TS C9-C13 C9-C11 NA
JP-8 C9-C12 C9-C10 NA
Note: NA = not available
The shale JP-5 contaminated with AvGas actually had a bimodal distribution of components in
the vapor phase with all but complete stripping of the front-end materials from the fuel. The shale-
derived JP-4 also appeared bimodal, but not as severely as the contaminated shale JP-5. There were
some similarities in shale JP-4 front-end and petroleum JP-4. This could have been the result of a
similar cracking process, contamination, or probably blending to achieve the required physical
characteristics for a JP-4 type of the fuel containing significantly greater amounts of the lower
fractions.
Operational Parameters
Many factors were involved in the choice of dome and generation flows. Some of these were:
(a) a benzene requirement; (b) limited fuel supply for the study; (c) minimal allowable dome flow;
and (d) fielder's choice of the chemist within these restrictions. Details of some of the basic
operational parameters for select JP studies are presented in a DoD technical report (Leahy, 1994).
197

REFERENCES
Bishop, Edward C. 1981. Evaluating Health Hazards Associated With Aircraft Fuel Cell Maintenance. AFAMRL-TR-81-149, Proceedings of the Twelth Conference on Environmental Toxicology, 3-5 November 1981.
Leahy, H.F. 1994. Overview of the vapor generation and analysis parameters of the petroleum- and shale-derived fuel studies conducted in Thomas Dome exposure chambers at the Toxic Hazards Research Unit Wright-Patterson AFB (Dayton), Ohio, 1973-1983 (in press).
Mattie, D.R., C.L. Alden, T.K. Newell, C.L. Gaworski, and CD. Flemming. 1991. A 90-day continuous vapor inhalation toxicity study of JP-8 jet fuel followed by 20 or 21 months of recovery in Fischer 344 rats and C57BL/6 mice. Toxicol. Pathol. 19, 77.
MacEwen, J.D., and E.H. Vernot. 1974. Toxic Hazards Research Unit Annual Technical Report: 1974. AMRL-TR-74-78. pp. 5-26.
MacEwen, J.D., and Vernot, E.H. 1978. Toxic Hazards Research Unit Annual Technical Report: 1978. AMRL-TR-78-55. pp. 49-71.
Thomas, A.A. 1965. Low ambient pressure environments and toxicity. Arch. Environ. Health 11, 316-322.
198
8.1 STATISTICAL DESCRIPTION FOR SEVEN NAVAL POPULATIONS
CD. Flemming, O.M. Little1, R.L. Carpenter2
INTRODUCTION
This project explores the effects of considering specific military subpopulations in estimating the
potential for chemical toxicity. Populations of interest may be identified due to differences in
exposure characteristics or differences in response to an exposure dose. In some cases, such as
chemicals in drinking water, the populations exposed are quite varied. In other cases, exposures
occur for specific groups that are actively using a chemical or closely associated to such use.
Civilian or military workers would be an example of this latter case.
Physiological variations can also define populations of interest. These variations may affect the
absorption, distribution, metabolism, or elimination (pharmacokinetics) of a chemical, or the
mechanism of toxicity (pharmacodynamics) of a chemical. Evaluation of differences in
pharmacokinetics using physiologically based pharmacokinetic models (PBPK) is the focus of this
study.
The general choices for considering military subpopulations included known population samples
and characteristics of SEALS (SEa, Air, Land), divers, aviators, and fleet sailors. The SEALS and
divers were believed to be a trimmer, more athletic community. The aviators were known to have
stringent flight physicals they were required to pass periodically. The fleet sailors were chosen to
provide a benchmark for comparisons and represent most of the active duty personnel.
The results of this project will be used to describe the statistical distribution of each
subpopulation and perform Monte Carlo simulations on the subpopulations to evaluate differences in
pharmacokinetics. Another use of the results will be to aid the Navy in revising physical fitness
standards.
METHODS
Collection of Data
The populations and sample sizes used in this report were largely dependent upon the
availability of data from the various communities within the Navy. All data were obtained from
various Naval research/data holding facilities.
United States Naval Reserve, Institute for Biological Research and Development, Irvine, CA. 2 Naval Medical Research Institute/Toxicology Detachment, Wright-Patterson Air Force Base, OH.
199
Sample sizes were chosen to avoid statistical inadequacy. In selecting the number from each
community there was no intention of having a "proportionate sample" of the communities in the
Navy. For mixed-sex populations, aviators and fleet, every effort was made to ensure that females
were adequately represented.
Outliers
Through descriptive statistics (minimum and maximum), the potential for outliers was evaluated
among the Naval populations. Age, body fat, body weight, and body height were correlated; hence,
a multivariate method of outlier identification was used. The method was principal component
analysis. The method determines factors (axes) that represent the correlational structure of the
original variables (Barnett, 1984). The Mahalanobis distances from each case to the centroid (mean
of age, mean of body fat, mean of body weight, mean of body height) for the original data is
computed. Also, the Mahalanobis distances from each case to the factor scores is computed. The
difference between the above distances is computed. Distances have a chi-squared distribution for
large samples. If the chi-squared for the difference is significant (p < 0.01), the case is considered
an outlier. An outlier was eliminated if it was an obvious data entry error.
Estimate the Distribution for Each Population
The determination of a distribution requires measuring the following components: central
tendency (mean and median), variation (standard deviation, minimum, and maximum), correlation
among the variables (correlation and covariance), and the theoretical distribution (normal, log-
normal, and others). The distributional properties of body fat (%), body weight (kilograms), and
body height (centimeters) were calculated for each population. The Wilk-Shapiro (5 <. n <. 2000)
test of normality (Dixon, 1990) or the skewiness-kurtosis chi-squared test of normality (n > 2000)
were used to test the normality of the data or the log of the data.
200
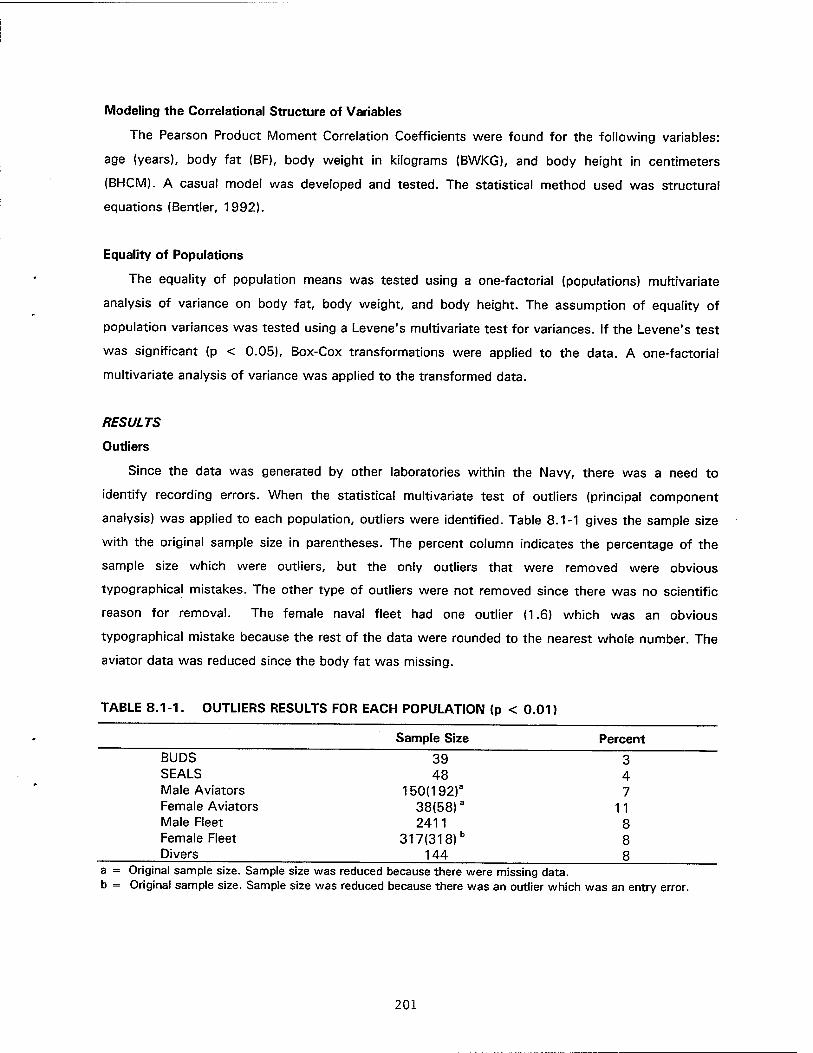
Modeling the Correlational Structure of Variables
The Pearson Product Moment Correlation Coefficients were found for the following variables:
age (years), body fat (BF), body weight in kilograms (BWKG), and body height in centimeters
{BHCM). A casual model was developed and tested. The statistical method used was structural
equations (Bentler, 1992).
Equality of Populations
The equality of population means was tested using a one-factorial (populations) multivariate
analysis of variance on body fat, body weight, and body height. The assumption of equality of
population variances was tested using a Levene's multivariate test for variances. If the Levene's test
was significant (p < 0.05), Box-Cox transformations were applied to the data. A one-factorial
multivariate analysis of variance was applied to the transformed data.
RESULTS
Outliers
Since the data was generated by other laboratories within the Navy, there was a need to
identify recording errors. When the statistical multivariate test of outliers (principal component
analysis) was applied to each population, outliers were identified. Table 8.1-1 gives the sample size
with the original sample size in parentheses. The percent column indicates the percentage of the
sample size which were outliers, but the only outliers that were removed were obvious
typographical mistakes. The other type of outliers were not removed since there was no scientific
reason for removal. The female naval fleet had one outlier (1.6) which was an obvious
typographical mistake because the rest of the data were rounded to the nearest whole number. The
aviator data was reduced since the body fat was missing.
TABLE 8.1-1. OUTLIERS RESULTS FOR EACH POPULATION (p < 0.01)
Sample Size Percent
BUDS 39 3 SEALS 48 4 Male Aviators 150(192)a 7 Female Aviators 38(58)a 11 Male Fleet 2411 8 Female Fleet 317(318)b 8 Divers 144 8 a = Original sample size. Sample size was reduced because there were missing data. b = Original sample size. Sample size was reduced because there was an outlier which was an entry error.
201

Determine the Distributions of the Population
The body fat (%) was either normally distributed (BUDS, male aviators, female aviators, and
male fleet) or log-normally distributed (SEALS and female fleet) (Table 8.1-2). The SEALS showed a
different distribution for body fat than the BUDS, who are trainee SEALS. The SEALS increase their
body fat to prepare for a mission because a meal schedule during the mission is unknown. The body
weight (kg) was either normally distributed (BUDS, SEALS, male aviators, and female aviators) or
log-normally distributed (male fleet and female fleet) (Table 8.1-3). The body height (cm) was
normally distributed for all the military populations (Table 8.1-4).
TABLE 8.1-2. DISTRIBUTION TEST FOR BODY FAT (%)
Distribution Statistic p-value
BUDS Normal 0.96
SEALS Log-Normal 0.97
Male Aviators Normal 0.98
Female Aviators Normal 0.96
Male Fleet Normal 2.68(2)
Female Fleet Log-Normal 0.98
Divers Normal 0.97
Distribution Statistic
0.24
0.40
0.18
0.20
0.26
0.29
0.16 a = Skewiness-kurtosis test of normality using a chi-squared (degrees of freedom).
TABLE 8.1-3. DISTRIBUTION TEST FOR BODY WEIGHT (kilograms)
p-value
BUDS Normal 0.99
SEALS Normal 0.96
Male Aviators Normal 0.98
Female Aviators Normal 0.96
Male Fleet Log-Normal 1.96(2)
Female Fleet Log-Normal 0.99
Divers Normal 0.98
1.00
0.13
0.61
0.12
0.37
0.78
0.22
a = Skewiness-kurtosis test of normality using a chi-squared (degrees of freedom).
202

TABLE 8.1-4. DISTRIBUTION TEST FOR BODY HEIGHT (centimeters)
Distribution Statistic p-value
BUDS Normal
SEALS Normal
Male Aviators Normal
Female Aviators Normal
Male fleet Normal
Female fleet Normal
Divers Normal
0.98 0.86
0.98 0.79
0.97 0.06
0.96 0.18
5.90(2)a 0.05
2.73(2)a 0.25
0.98 0.66
a = Skewiness-kurtosis test of normality using a chi-squared (degrees of freedom).
The age ranges for the Naval populations seem to reflect the amount of training required for the
population and to reflect the amount of physical fitness required for the population.
TABLE 8.1-5. AGE (years) BASIC STATISTICS
Mean Median Std. Dev. Minimum Maximum
BUDS 22.00 21.00 2.40 19.00 28.00
SEALS 26.00 25.00 4.50 19.00 36.00
Male Aviators 32.00 30.00 7.60 21.00 51.00
Female Aviators 28.00 26.00 6.30 21.00 45.00
Male Fleet 30.00 28.00 7.30 18.00 56.00
Female Fleet 29.00 28.00 6.20 18.00 50.00
Divers 25 24 4.3 18 37
The body fat means divided into three groups: (i) BUDS, (ii) SEALS, male aviators, male fleet,
and (iii) female aviators, female fleet. In body fat, the average distance from the mean (standard
deviation) differed significantly among the subpopulations.
203

TABLE 8.1-6. BODY FAT (%) BASIC STATISTICS
Mean Median Std. Dev. Minimum Maximum
BUDS 10.44abcde 10.85 2.15 5.44 15.23
SEALS 14.18ce 13.51 3.44 8.57 25.98
Male Aviators 14.56cde 14.45 4.47 2 30
Female Aviators 22d 22 6 10 36
Male Fleet 16 16 5.39 1 33
Female Fleet 24° 24 5.57 10 44
Divers 12.780de 13 3.68 4 23
a = Significantly different than SEALS at p < 0.05. b = Significantly different than male aviators at p < 0.01. c = Significantly different than female aviators at p < 0.01. d = Significantly different than male fleet at p < 0.01. e = Significantly different than female fleet at p < 0.01.
The body weight means separated into two groups: (i) BUDS, SEALS, male aviators, male fleet
and (ii) female aviators, female fleet. The body weight variances were not equal among the
populations.
TABLE 8.1-7. BODY WEIGHT (kilograms) BASIC STATISTICS
Mean Medium Std. Dev. Minimum Maximum
BUDS 76OB 76 5.74 63 91
SEALS 79ce 79 7.94 67 103
Male Aviators 81oe 81 9.17 54 86
Female Aviators 61.5d 61.5 7.87 48 83
Male Fleet 81e 79 12.21 46 143
Female Fleet 62 61 8.66 41 96
Divers 77.33ce 76.43 8.14 58.97 98.2
a = Significantly different than SEALS at p < 0.05. b = Significantly different than male aviators at p < 0.01. c = Significantly different than female aviators at p < 0.01. d = Significantly different than male fleet at p < 0.01. e = Significantly different than female fleet at p < 0.01.
The body height means separated into two groups: (i) BUDS, SEALS, male aviators, male fleet
and (ii) female aviators, female fleet. The variances for the body height were not equal among the
populations.
204
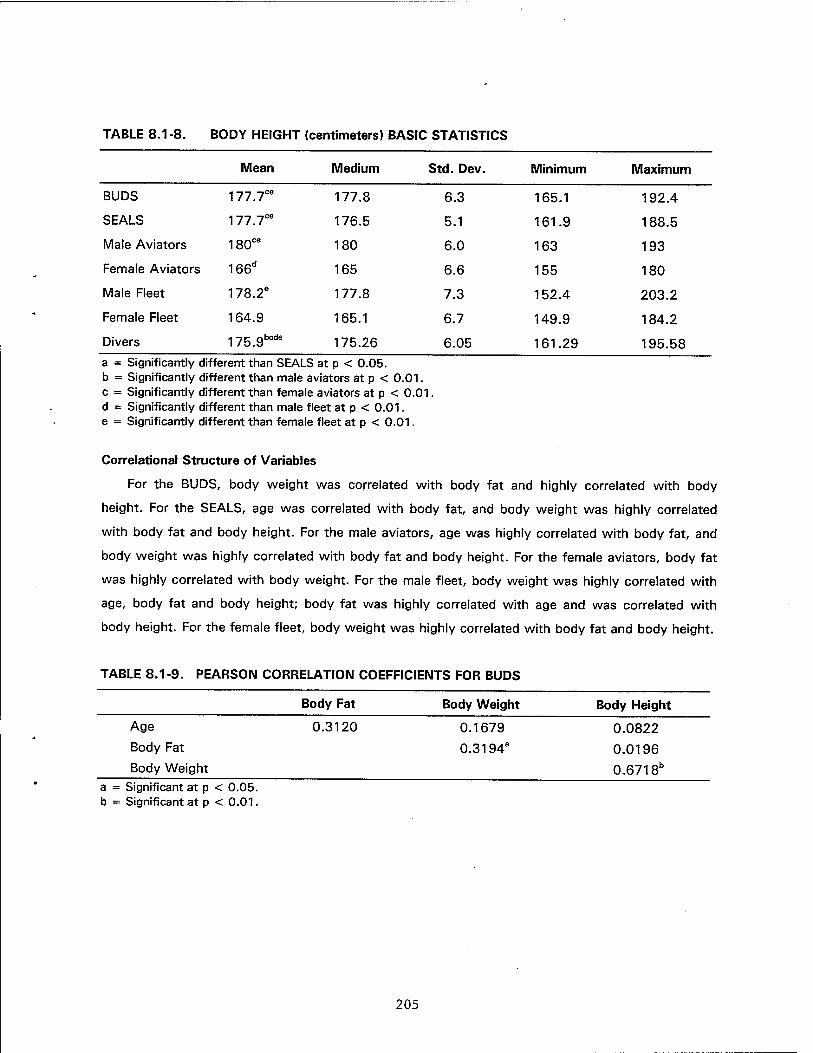
TABLE 8.1-8. BODY HEIGHT (centimeters) BASIC STATISTICS
Mean Medium Std. Dev. Minimum Maximum
BUDS 177.7ce 177.8 6.3 165.1 192.4
SEALS 177.7ce 176.5 5.1 161.9 188.5
Male Aviators 180ce 180 6.0 163 193
Female Aviators 166d 165 6.6 155 180
Male Fleet 178.2° 177.8 7.3 152.4 203.2
Female Fleet 164.9 165.1 6.7 149.9 184.2
Divers 175gbcde 175.26 6.05 161.29 195.58 a = Significantly different than SEALS at p < 0.05. b = Significantly different than male aviators at p < 0.01. c = Significantly different than female aviators at p < 0.01. d = Significantly different than male fleet at p < 0.01. e = Significantly different than female fleet at p < 0.01.
Correlational Structure of Variables
For the BUDS, body weight was correlated with body fat and highly correlated with body
height. For the SEALS, age was correlated with body fat, and body weight was highly correlated
with body fat and body height. For the male aviators, age was highly correlated with body fat, and
body weight was highly correlated with body fat and body height. For the female aviators, body fat
was highly correlated with body weight. For the male fleet, body weight was highly correlated with
age, body fat and body height; body fat was highly correlated with age and was correlated with
body height. For the female fleet, body weight was highly correlated with body fat and body height.
TABLE 8.1-9. PEARSON CORRELATION COEFFICIENTS FOR BUDS
Body Fat Body Weight Body Height
Age 0.3120 0.1679 0.0822
Body Fat 0.3194a 0.0196 Body Weight 0.6718b
a = Significant at p < 0.05. b = Significant at p < 0.01.
205
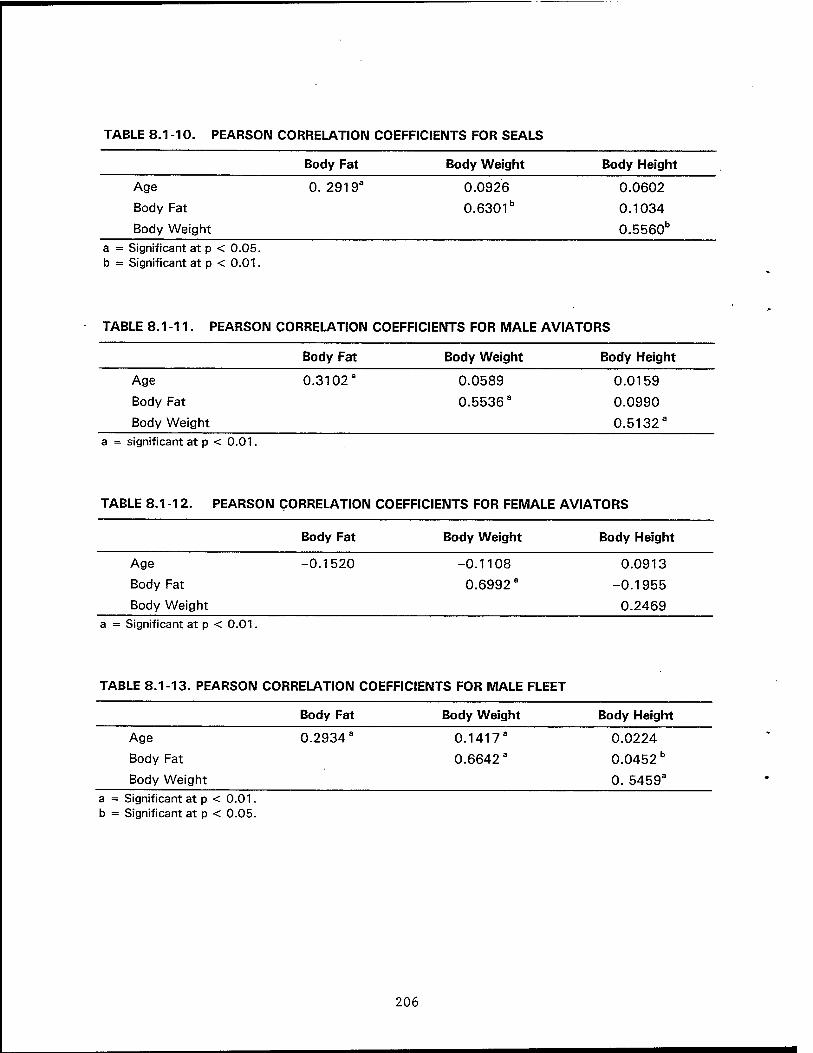
TABLE 8.1 -10. PEARSON CORRELATION COEFFICIENTS FOR SEALS
Body Fat Body Weight Body Height
Age 0. 2919a 0.0926 0.0602
Body Fat 0.6301b 0.1034
Body Weight 0.5560b
a = Significant at p < 0.05. b = Significant at p < 0.01.
TABLE 8.1 -11. PEARSON CORRELATION COEFFICIENTS FOR MALE AVIATORS
Body Fat Body Weight Body Height
Age 0.3102a 0.0589 0.0159
Body Fat 0.5536a 0.0990
Body Weight 0.51323
a = significant at p < 0.01.
TABLE 8.1-12. PEARSON CORRELATION COEFFICIENTS FOR FEMALE AVIATORS
Body Fat Body Weight Body Height
Age -0.1520 -0.1108 0.0913
Body Fat 0.6992a -0.1955
Body Weight 0.2469 a = Significant at p < 0.01.
TABLE 8.1-13. PEARSON CORRELATION COEFFICIENTS FOR MALE FLEET
Body Fat Body Weight Body Height
Age 0.2934 a 0.14178 0.0224
Body Fat 0.6642 a 0.0452 b
Body Weight 0. 5459a
a = Significant at p < 0.01. b = Significant at p < 0.05.
206
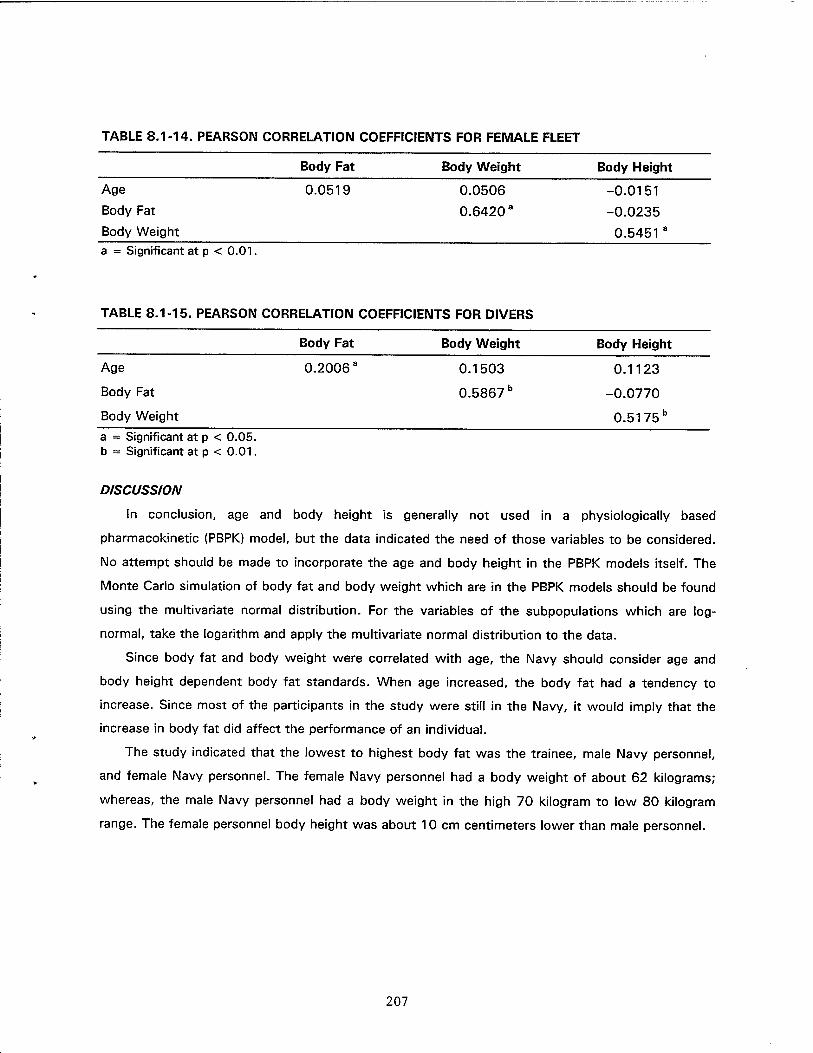
TABLE 8.1-14. PEARSON CORRELATION COEFFICIENTS FOR FEMALE FLEET
Body Fat Body Weight Body Height
Age
Body Fat
Body Weight
0.0519 0.0506
0.6420'
-0.0151
-0.0235
0.5451 ' a = Significant at p < 0.01,
TABLE 8.1-15. PEARSON CORRELATION COEFFICIENTS FOR DIVERS
Body Fat Body Weight Body Height
Age
Body Fat
Body Weight
0.2006' 0.1503
0.5867'
0.1123
-0.0770
0.51751
a = Significant at p < 0.05. b = Significant at p < 0.01.
DISCUSSION
In conclusion, age and body height is generally not used in a physiologically based
pharmacokinetic (PBPK) model, but the data indicated the need of those variables to be considered.
No attempt should be made to incorporate the age and body height in the PBPK models itself. The
Monte Carlo simulation of body fat and body weight which are in the PBPK models should be found
using the multivariate normal distribution. For the variables of the subpopulations which are log-
normal, take the logarithm and apply the multivariate normal distribution to the data.
Since body fat and body weight were correlated with age, the Navy should consider age and
body height dependent body fat standards. When age increased, the body fat had a tendency to
increase. Since most of the participants in the study were still in the Navy, it would imply that the
increase in body fat did affect the performance of an individual.
The study indicated that the lowest to highest body fat was the trainee, male Navy personnel,
and female Navy personnel. The female Navy personnel had a body weight of about 62 kilograms;
whereas, the male Navy personnel had a body weight in the high 70 kilogram to low 80 kilogram
range. The female personnel body height was about 10 cm centimeters lower than male personnel.
207
REFERENCES:
Barnett, V. and T. Lewis. 1984. Outliers in Statistical Data, Second Edition. New York: John Wiley & Sons.
BBIM Software Products Corporation. 1988. RS/1 User's Guide, Version 4. Cambridge, MA.: BBN Software Products Corporation.
Bentler, P.M. 1992. EQS: Structural Equations Program Manual. Los Angeles: BMDP Statistical Software.
Dixon, W.J., M.B. Brown. L. Engeiman, and R. I. Jennrich. 1990. BMDP Statistical Software Manual, Volume 1. Berkeley: University of California Press.
SAS Institute Inc. 1990. SAS Procedures Guide, Version 6. Cary, NC: SAS Institute Inc.
SAS Institute Inc. 1990. SAS/STATUser's Guide, Version 6. Cary, NC: SAS Institute Inc.
208
9.1 1994 CONFERENCE ON TEMPORAL ASPECTS IN RISK ASSESSMENT FOR NONCANCER ENDPOINTS
L. A. Doncaster
The Conference on Temporal Aspects in Risk Assessment for Noncancer Endpoints was held at
the Hope Hotel and Conference Center, Wright-Patterson Air Force Base, OH, from 18 through 20
April 1994. The conference was sponsored by the Toxicology Division, Occupational and
Environmental Health Directorate, Armstrong Laboratory; the Naval Medical Research Institute
Detachment (Toxicology); the U.S. Army Medical Research Detachment of Walter Reed Army
Institute of Research; the Office of Research and Development, United States Environmental
Protection Agency; and the Division of Toxicology, Agency for Toxic Substances and Disease
Registry, with the cooperation of the National Research Council Committee on Toxicology; and was
coordinated by ManTech Environmental Technology, Inc., Toxic Hazards Research Unit.
The goals of the conference were (1) recognition of temporal issues in the risk assessment
process; (2) examination of critical time factors in hazard identification, dose-response, and
exposure characterization; and (3) exploration of limitations in risk characterization.
Session I of the conference previewed the conference themes, namely, applications, including
the integration of scientific advances into the protection of human health, and basic research
approaches, including scientific examples for addressing temporal issues.
Session II dealt with temporal factors of exposure in identifying hazards and included
discussions of critical periods of exposure; timing and duration of exposure; the reversibility of
effects; temporal factors affecting immunologic, neurologic (e.g., cholinesterase inhibitors), and
reproductive systems; and temporal effects of inhaled vapors and particles on upper and lower
respiratory tract and the implications for human health risk assessment.
Session III concerned the effects of exposure patterns on dose-response relationships.
Discussions included the definition of dose; the effect of multiple route exposure patterns and the
use of external markers and internal markers to determine dose; and the incorporation of exposure
patterns in dose extrapolation across time. The final paper of this session included a summary of
considerations and concerns on this issue.
The subject of Session IV was exposure assessment and the life cycle timeline. Included were
discussions on bioaerosols and the exposure assessment during routine operations; histopathology,
now and in the future, as the primary means for identifying male reproductive effects; the Kuwait oil
well fires and risk characterization during emergency response; national priority list (NPL) site
exposure assessment; and refinements in the exposure assessment process.
209
Session V addressed characterization of risk in a temporal context. Topics discussed included
the assessment of health risk to occupationally exposed Navy personnel; time-response profiles of
noncarcinogenic effects in the respiratory tract; temporal aspects of risk characterization for
pesticide exposures; and pediatric lead toxicity—temporal aspects of risk communication.
Evening poster and database sessions provided additional scientific information exchange in an
informal manner. There were 21 oral presentations, 31 poster presentations, 10 database
presentations, and 209 participants in the three-day conference. The conference was highly rated
by the participants. Proceedings of the conference will be published in Inhalation Toxicology. In
addition, the full proceedings, including abstracts of the poster presentations, are being compiled for
submission to the Air Force as a technical report.
210

9.2 1994 HAZMAT/POLLUTION PREVENTION SYMPOSIUM
L. A. Doncaster
The 1994 HazMat/Pollution Prevention Symposium was held at the Hope Hotel and Conference
Center, Wright-Patterson Air Force Base, OH, 21 and 22 April 1994. The symposium was
sponsored by the Acquisition Environmental Management Directorate, Aeronautical Systems Center,
and was coordinated by ManTech Environmental Technology, Inc., Toxic Hazards Research Unit.
The symposium consisted of three sessions. The introductory session included remarks by
Lt Gen James A. Fain, Jr., Commander of the Aeronautical Systems Center; Col Joe B.
Hollingsworth, Director of Acquisition Environmental Management; and by Mr. Gary Vest, Principal
Assistant Under Secretary of Defense for Environmental Security.
Session II addressed pollution prevention program management from the perspective of the Air
Force and contractors, and included presentations on the Pollution Prevention Handbook; the C-17
HazMat Elimination Plan; the T-1A Program HazMat Usage Baseline Study; the Northrop B-2
Pollution Prevention Program; the McDonnell Douglas Aerospace—East (MDA-E) Strategic Planning
for Pollution Prevention; and the qualification of new cleaning alternatives in aircraft maintenance
and overhaul as seen from the perspective of the Environmental Management Division of Lockheed.
The last session was a technical session and discussed material substitutions, again from the
perspective of the Air Force and defense contractors.
An evening reception provided the opportunity for interaction between the military and
contractors in an informal manner. There were 12 oral presentations in the two technical sessions,
and 147 participants in the two-day symposium. A proceedings, consisting of the program and
copies of handouts/slides of various presenters, was compiled by the Aeronautical Systems Center.
211
9.3 1995 CONFERENCE ON RISK ASSESSMENT ISSUES FOR SENSITIVE HUMAN POPULATIONS
L. A. Doncaster
Planning was initiated in September 1994 for the 1995 toxicology conference, "Conference on
Risk Assessment Issues for Sensitive Human Populations." It will be held 25 through 27 April 1995
at the Hope Hotel and Conference Center at Wright-Patterson Air Force Base, OH. The conference
will be sponsored by Tri-Service Toxicology, Wright-Patterson Air Force Base; the Office of
Research and Development, United States Environmental Protection Agency; and the Division of
Toxicology, Agency for Toxic Substances and Disease Registry. The planning committee for the
conference includes representatives from each sponsoring agency and the Toxic Hazards Research
Unit (THRU).
The goals of the conference are (1) identification of sensitive populations in the risk assessment
process; (2) understanding biological differences and species variability; and (3) examination of the
mechanisms for dealing with sensitivities in hazard identification, dose response, and exposure
characterization.
The THRU's Work Plan, which designated a conference coordinator and described invitation and
registration procedures, publication procedures, technical support, and the administration of
continuing education credits, was submitted to and approved by the Contract Technical Monitor.
Initial conference announcements have been placed in four major scientific journals and a "Call
for Papers" flyer has been mailed to over 2700 individuals.
212
10.1 RESEARCH ENGINEERING SPECIAL PROJECTS
D.L. Courson, H.F. Leahy, W.J. Malcolm, and W.B. Sonntag
The Toxic Hazards Research Unit (THRU) Research Engineering staff has provided technical
assistance on a number of research and special projects. This report describes the devices,
instruments, and systems that were designed, fabricated, and applied to support several THRU
projects. In addition to performing routine maintenance of specialized research systems at the
THRU, major renovations of existing systems were undertaken to address efficiency and safety of
operation. Additional systems that were developed by the Research Engineering group are described
in separate sections of this report.
Design and Construction of a Combustion Atmosphere Inhalation Exposure System.
The THRU Research Engineering group was tasked to design and construct a combustion
atmosphere exposure system. This exposure system is being used to evaluate the combustion
toxicity of specific materials and examine endpoints of combustion product insult. The exposure
system was designed to gather data on settling velocities and rates of dispersal of materials.
Original plans were to examine these endpoints at 5, 10, and 15 mph wind speeds in an exposure
tunnel. Attempts to imitate 10 mph (880 ft3/minute) wind speed were unsuccessful using a 12.5 in.
duct. After a number of unsuccessful attempts at lower wind speeds, 12 ft3/min was selected.
Exposures are being performed at 12 ft3/min wind speed.
The exposure system was originally constructed in Building 433, but because of facility
constraints, the system was dismantled and rebuilt in Building 824. Utilities had to be modified
and/or upgraded to accommodate the exposure system in the new location. Problems with heat
dissipation resulted in a redesign of the system. Sixty feet of ductwork were added to the system to
allow for accurate measurement of settling velocities of the combustion products. A Spencer turbine
blower provided vacuum to the system. Lovelace impactors, particle collectors for electron
microscopic sizing, Pitot tubes, and filter samplers were placed in the system to accurately evaluate
particle size and distribution. An electrostatic precipitator and gas analyzers were added to provide
additional quantitative and qualitative analyses.
213
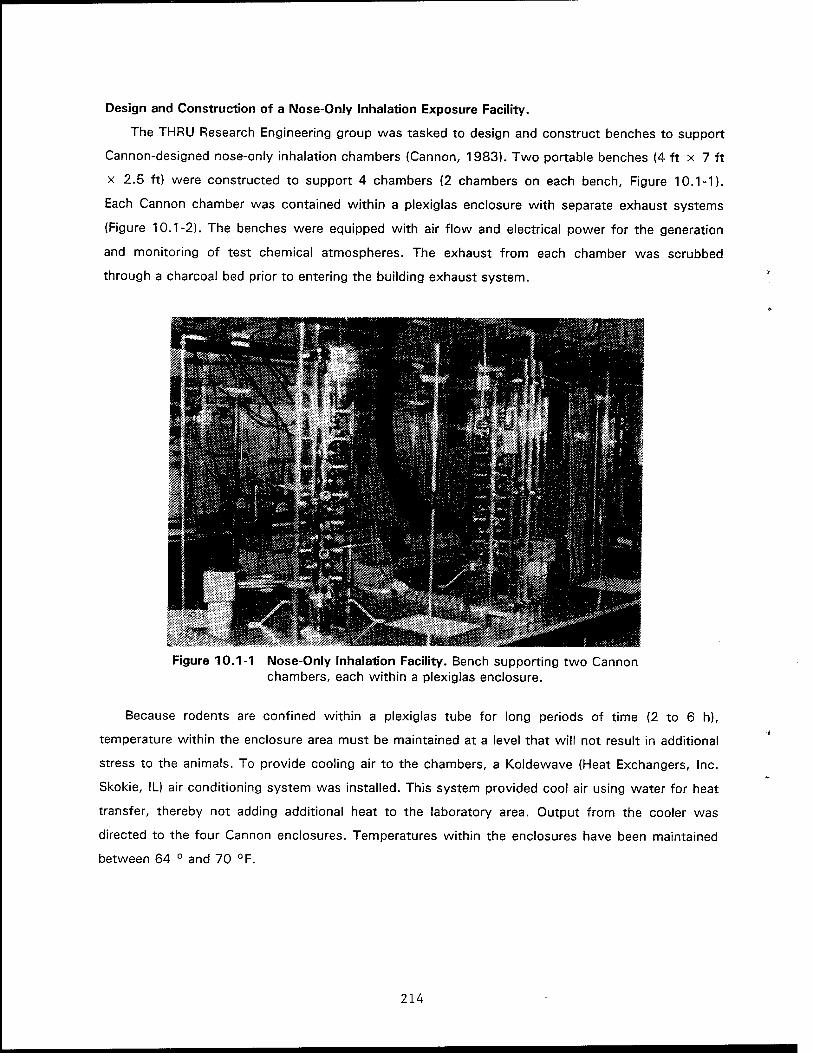
Design and Construction of a Nose-Only Inhalation Exposure Facility.
The THRU Research Engineering group was tasked to design and construct benches to support
Cannon-designed nose-only inhalation chambers (Cannon, 1983). Two portable benches (4 ft x 7 ft
x 2.5 ft) were constructed to support 4 chambers (2 chambers on each bench, Figure 10.1-1).
Each Cannon chamber was contained within a plexiglas enclosure with separate exhaust systems
(Figure 10.1-2). The benches were equipped with air flow and electrical power for the generation
and monitoring of test chemical atmospheres. The exhaust from each chamber was scrubbed
through a charcoal bed prior to entering the building exhaust system.
Figure 10.1-1 Nose-Only Inhalation Facility. Bench supporting two Cannon chambers, each within a plexiglas enclosure.
Because rodents are confined within a plexiglas tube for long periods of time (2 to 6 h),
temperature within the enclosure area must be maintained at a level that will not result in additional
stress to the animals. To provide cooling air to the chambers, a Koldewave (Heat Exchangers, Inc.
Skokie, IL) air conditioning system was installed. This system provided cool air using water for heat
transfer, thereby not adding additional heat to the laboratory area. Output from the cooler was
directed to the four Cannon enclosures. Temperatures within the enclosures have been maintained
between 64 ° and 70 °F.
214
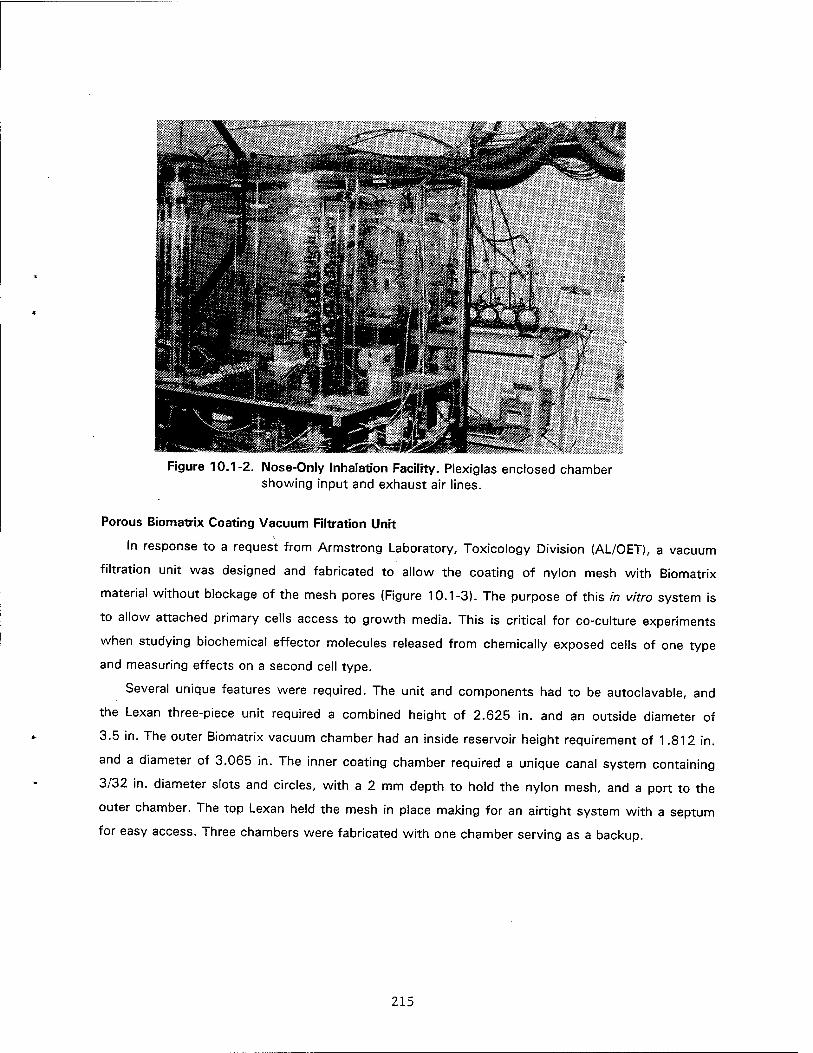
Figure 10.1-2. Nose-Only Inhalation Facility. Plexiglas enclosed chamber showing input and exhaust air lines.
Porous Biomatrix Coating Vacuum Filtration Unit
In response to a request from Armstrong Laboratory, Toxicology Division (AL/OET), a vacuum
filtration unit was designed and fabricated to allow the coating of nylon mesh with Biomatrix
material without blockage of the mesh pores (Figure 10.1-3). The purpose of this in vitro system is
to allow attached primary cells access to growth media. This is critical for co-culture experiments
when studying biochemical effector molecules released from chemically exposed cells of one type
and measuring effects on a second cell type.
Several unique features were required. The unit and components had to be autoclavable, and
the Lexan three-piece unit required a combined height of 2.625 in. and an outside diameter of
3.5 in. The outer Biomatrix vacuum chamber had an inside reservoir height requirement of 1.812 in.
and a diameter of 3.065 in. The inner coating chamber required a unique canal system containing
3/32 in. diameter slots and circles, with a 2 mm depth to hold the nylon mesh, and a port to the
outer chamber. The top Lexan held the mesh in place making for an airtight system with a septum
for easy access. Three chambers were fabricated with one chamber serving as a backup.
215
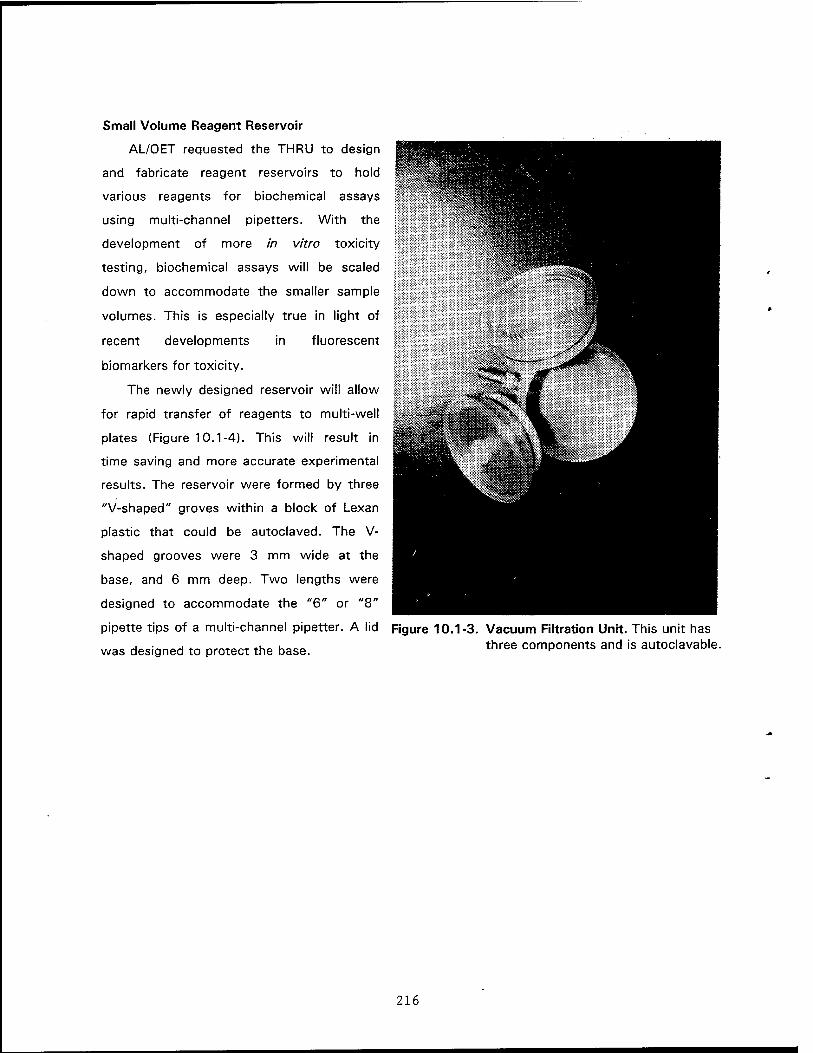
Small Volume Reagent Reservoir
AL/OET requested the THRU to design
and fabricate reagent reservoirs to hold
various reagents for biochemical assays
using multi-channel pipetters. With the
development of more in vitro toxicity
testing, biochemical assays will be scaled
down to accommodate the smaller sample
volumes. This is especially true in light of
recent developments in fluorescent
biomarkers for toxicity.
The newly designed reservoir will allow
for rapid transfer of reagents to multi-well
plates (Figure 10.1-4). This will result in
time saving and more accurate experimental
results. The reservoir were formed by three
"V-shaped" groves within a block of Lexan
plastic that could be autoclaved. The V-
shaped grooves were 3 mm wide at the
base, and 6 mm deep. Two lengths were
designed to accommodate the "6" or "8"
pipette tips of a multi-channel pipetter. A lid Figure 10.1-3. Vacuum Filtration Unit. This unit has
was designed to protect the base. three components and is autoclavable.
216
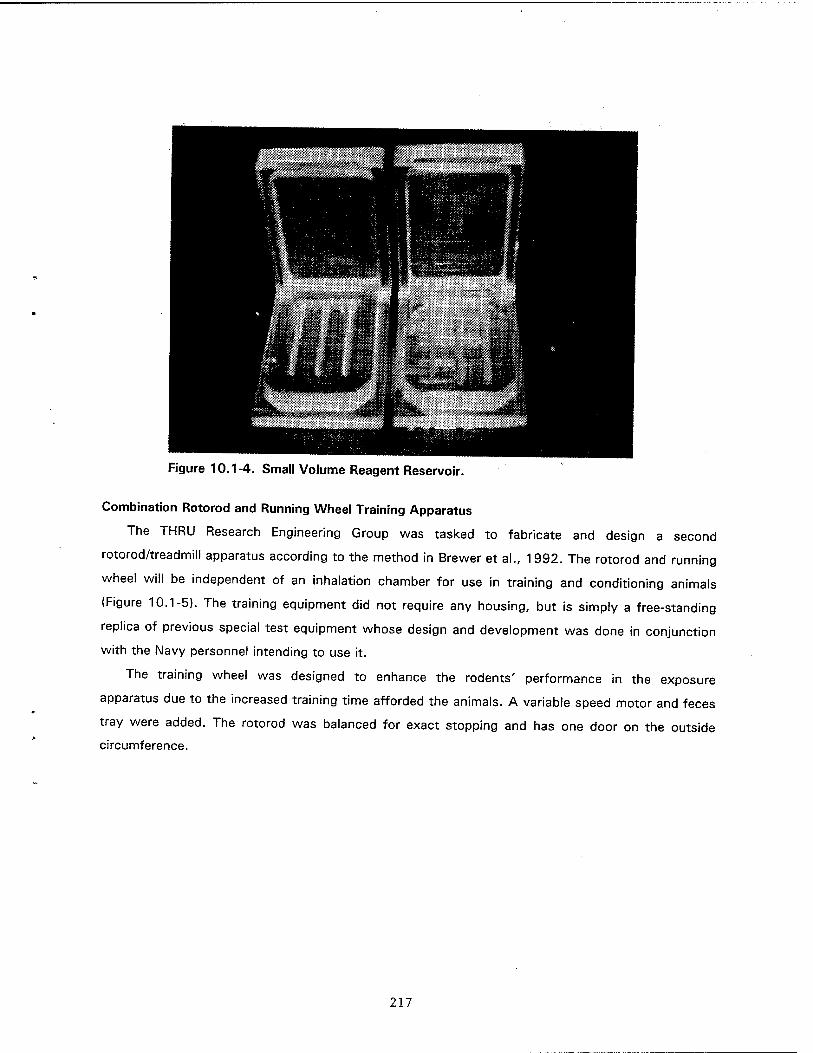
Figure 10.1-4. Small Volume Reagent Reservoir.
Combination Rotorod and Running Wheel Training Apparatus
The THRU Research Engineering Group was tasked to fabricate and design a second
rotorod/treadmill apparatus according to the method in Brewer et al., 1992. The rotorod and running
wheel will be independent of an inhalation chamber for use in training and conditioning animals
(Figure 10.1-5). The training equipment did not require any housing, but is simply a free-standing
replica of previous special test equipment whose design and development was done in conjunction
with the Navy personnel intending to use it.
The training wheel was designed to enhance the rodents' performance in the exposure
apparatus due to the increased training time afforded the animals. A variable speed motor and feces
tray were added. The rotorod was balanced for exact stopping and has one door on the outside
circumference.
217

Figure 10.1-5. Combination Rotorod and Running Wheel Training Appartus. This rotorod/running wheel was designed to function independent of inhalation chambers.
Gas-Uptake System The Air Force Medical Research Unit requested the design and fabrication of a gas-uptake
system. The system included the construction of racks, panels, and lids (Figure 10.1-6). The lids
were made of stainless steel and consisted of a gas flow line, return line, oxygen sensor, humidity
probe, and a thermocouple.
Figure 10.1-6. Gas-Uptake System. Stainless steel lid and exposure system with ancillary connections is shown on left.
218
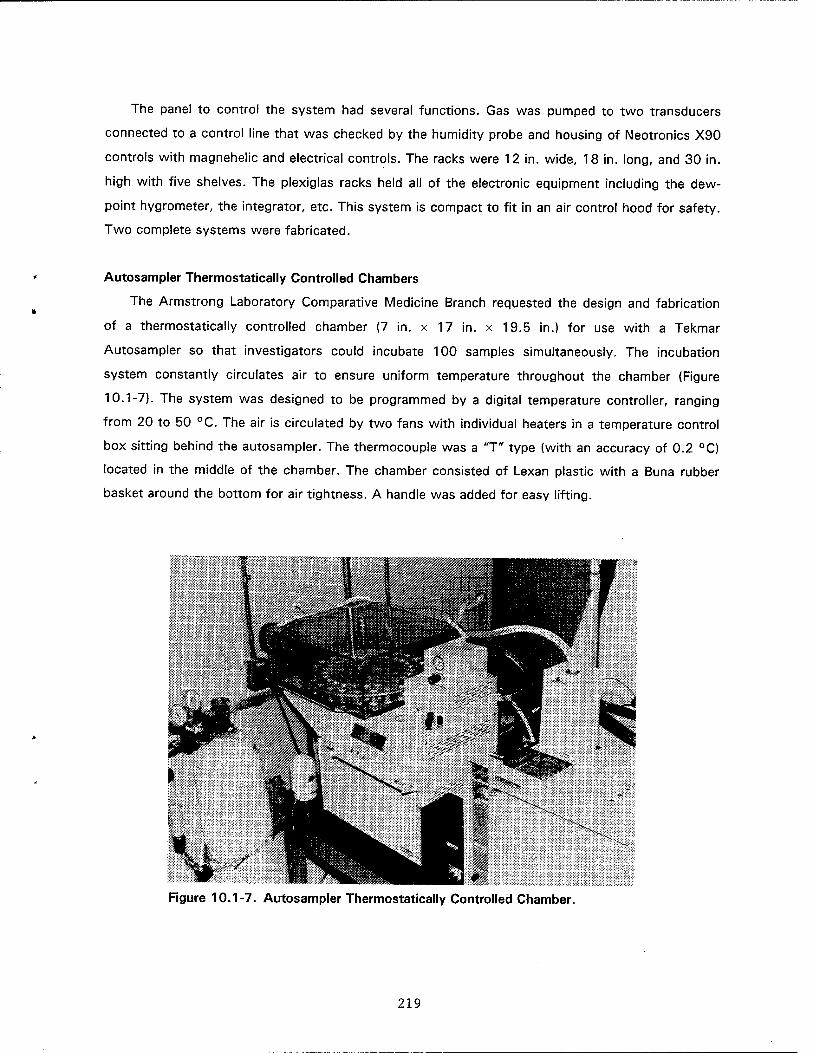
The panel to control the system had several functions. Gas was pumped to two transducers
connected to a control line that was checked by the humidity probe and housing of Neotronics X90
controls with magnehelic and electrical controls. The racks were 12 in. wide, 18 in. long, and 30 in.
high with five shelves. The plexiglas racks held all of the electronic equipment including the dew-
point hygrometer, the integrator, etc. This system is compact to fit in an air control hood for safety.
Two complete systems were fabricated.
Autosampler Thermostatically Controlled Chambers
The Armstrong Laboratory Comparative Medicine Branch requested the design and fabrication
of a thermostatically controlled chamber (7 in. x 17 in. x 19.5 in.) for use with a Tekmar
Autosampler so that investigators could incubate 100 samples simultaneously. The incubation
system constantly circulates air to ensure uniform temperature throughout the chamber (Figure
10.1-7). The system was designed to be programmed by a digital temperature controller, ranging
from 20 to 50 °C. The air is circulated by two fans with individual heaters in a temperature control
box sitting behind the autosampler. The thermocouple was a "T" type (with an accuracy of 0.2 °C)
located in the middle of the chamber. The chamber consisted of Lexan plastic with a Buna rubber
basket around the bottom for air tightness. A handle was added for easy lifting.
Figure 10.1-7. Autosampler Thermostatically Controlled Chamber.
219
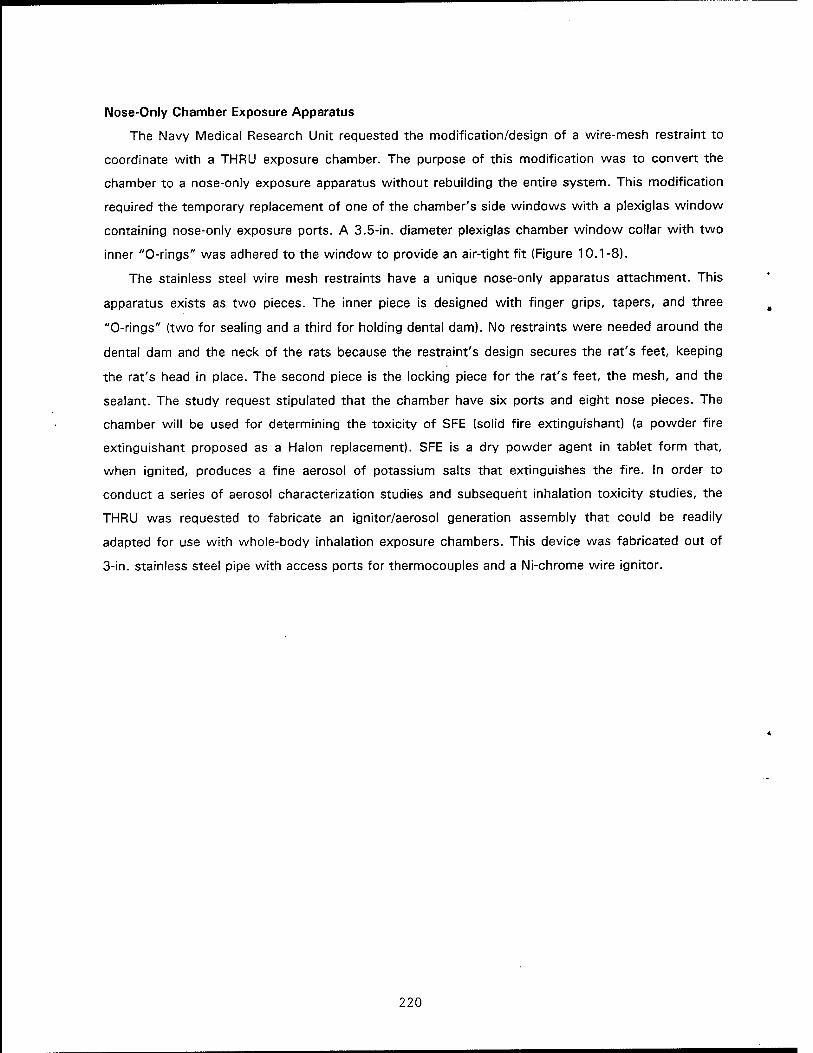
Nose-Only Chamber Exposure Apparatus
The Navy Medical Research Unit requested the modification/design of a wire-mesh restraint to
coordinate with a THRU exposure chamber. The purpose of this modification was to convert the
chamber to a nose-only exposure apparatus without rebuilding the entire system. This modification
required the temporary replacement of one of the chamber's side windows with a plexiglas window
containing nose-only exposure ports. A 3.5-in. diameter plexiglas chamber window collar with two
inner "O-rings" was adhered to the window to provide an air-tight fit (Figure 10.1-8).
The stainless steel wire mesh restraints have a unique nose-only apparatus attachment. This
apparatus exists as two pieces. The inner piece is designed with finger grips, tapers, and three
"O-rings" (two for sealing and a third for holding dental dam). No restraints were needed around the
dental dam and the neck of the rats because the restraint's design secures the rat's feet, keeping
the rat's head in place. The second piece is the locking piece for the rat's feet, the mesh, and the
sealant. The study request stipulated that the chamber have six ports and eight nose pieces. The
chamber will be used for determining the toxicity of SFE (solid fire extinguishant) (a powder fire
extinguishant proposed as a Halon replacement). SFE is a dry powder agent in tablet form that,
when ignited, produces a fine aerosol of potassium salts that extinguishes the fire. In order to
conduct a series of aerosol characterization studies and subsequent inhalation toxicity studies, the
THRU was requested to fabricate an ignitor/aerosol generation assembly that could be readily
adapted for use with whole-body inhalation exposure chambers. This device was fabricated out of
3-in. stainless steel pipe with access ports for thermocouples and a Ni-chrome wire ignitor.
220

Rodent Ambient Temperature Box and Restrainers
In response to a request from AL/OET, a
12-place ambient temperature isolation box
and 24 rodent restrainers were designed and
fabricated to be used as a non-invasive tail-
cuff method for determining the
cardiovascular effects of xenobiotics. The
objective of the project was to design a
system to minimize the data variability
caused by fluctuations in ambient
temperature during tail-cuff monitoring.
The isolation box has a programmable
controller to control and adjust the
temperature for accurate settings ranging
from 20° to 37 °C (Figure 10.1-9).
Constant fresh air circulates through
concentric holes in the top level of four
double shelves. The bottom of the box is
used as an excreta tray. The double walls
feature built-in shutters for blowing air
through the adjustable louvers on each side
of every shelf, creating air movement similar
to laminar flow. The box is 1 6.5 in. x 24 in.
x 27 in. with holes in the back for Figure 10.1-8. Nose-Only Chamber Exposure Apparatus. Animal Restraints are
connecting test equipment wires, and there shown connected to the top and
are sliding doors in the front for easy bottom right ports,
access.
221
Two sizes of restrainers were
fabricated. The first was a 2.5 in. (inside
diameter) by 8.5 in. (length) restrainer to fit
200 to 400 g rats; the second was a 3 in.
by 10 in. restrainer to fit 400 to 600 g rats.
Reducing inserts were constructed for both
restrainers for better animal fitting. All
holders were made of clear plexiglas and
provided mounting arrangements for the
IITC tail-cuff sensors. The restrainers
contain adjustable sizers with tail sections
that are held by snaps. The restrainers
allow the animal to walk forward into the
restrainer instead of being strapped
backwards in their holders. The holders
have grooves along the bottom to keep the
animals and the restrainers clean of excreta.
at :-r "
ii
&:#
Figure 10.1-9. Rodent Ambient Temperature Box and Restrainers.
REFERENCES
Brewer, J.A., W.B. Sonntag, and E.C. Kimmel. 1992. Combination Rotorod/Treadmill for Rodents. In: 1991 Toxic Hazards Research Unit Annual Report. (H. Wall, D. Dodd, A. Vinegar, H. Clewell eds.) AL-TR-1 992-0142, NMRI 92-97, Wright Patterson AF Base, Ohio, p 271.
Cannon, W.C., E.F. Blanton, and K.E. McDonald. 1983. The flow-past chamber: An improved nose- only exposure system for rodents. Am. Ind. Hyg. Assoc. J. 44: 923-928.
222
10.2 MATHEMATICS AND STATISTICS
C.D.FIemming
The THRU's Biometry staff was actively involved in the support of several research projects
such as the species differences in skin penetration study, a review of risk analysis procedures for
trichloroethylene using the Monte Carlo method coupled with physiologically based pharmacokinetic
models, the JP-8 urine analysis study, and the Naval subpopulation statistical study. Important
papers reviewed by the Biometry staff included a reproductive toxicology paper presented at the last
Tri-Service Toxicology Conference and a paper about a novel model-based approach to the
mathematical analysis of dose-response curves. Biometry personnel also assisted with the
development of a method for non-cancer risk analysis.
The THRU's statistician assisted various Tri-Service Toxicology personnel in the use of RS/1,
SAS, BMDP, and other software packages and aided several investigators with the development of
protocols. Power analysis was used on several protocols. The statistician was involved with the
incorporation of mathematics and statistics in research plans that will also be applied to new
research projects. Programming in FORTRAN, SAS, BMDP, and RPL was performed when required.
Informal training in mathematics, statistics, programming and computers was provided to individual
Tri-Service Toxicology personnel.
223

10.3 PATHOLOGY SUPPORT (NECROPSY AND HISTOLOGY)
J.R. Latendresse
Necropsy support was provided in accordance with protocol requirements, standard operating
procedures, or as determined by the veterinary pathologists. Routine, accepted methods of
anesthesia were followed for terminal bleeding or euthanasia of laboratory animals. Necropsy
procedures included determination of terminal body weights, detailed dissection, weighing of
required organs, and collections and fixation of gross lesions and other required tissues for light
microscopic examination.
Histologie processing of tissues included trimming, orientation of tissues in embedding
cassettes, paraffin embedding, microtome sectioning of tissues to specified thickness, and
applications for routine or special staining and coverslipping. uniformly processed, high quality slides
were prepared for reviewing by veterinary pathologists. A pathology specimen archive is maintained
with controlled access as required by Good Laboratory Practices.
The histology/necropsy support technicians have acquired and implemented new skills in tissue
processing required for molecular pathology methods now being used extensively in the laboratory.
These new tissue processing requirements include unique fixation protocols, sterile sectioning
procedures, and microwave processing of tissue to enhance antigen, DNA and RNA retrieval. The
tissue staining methods are also unique. The stains are largely performed on a state-of-the-art,
computer-based automated stainer operated by histology personnel.
Necropsy personnel played a significant role in the assessment of a computer-based Toxicology
Data Management System that is being considered as a potential replacement for the current
system. Necropsy personnel worked in concert with the pathologists to evaluate two of the
interactive modules (necropsy and histopathology). The tentative replacement program would be
able to be operated from a network platform, eliminating the VAX as an operational requirement for
the management of toxicology data.
Pathology support was recently expanded by the addition of an electron microscopy
technologist to the Toxic Hazards Research Unit (THRU) staff. This has enhanced our
ultrastructural-assessment capability and function utilizing both transmission and scanning electron
microscopy (EM). In less than six months, the EM laboratory has become fully operational and is
already being utilized for two THRU studies (F35 & A05).
Necropsy/histology staff members processed the following research animals during the past
reporting period (Tables 10.3.1 and 10.3.2).
224
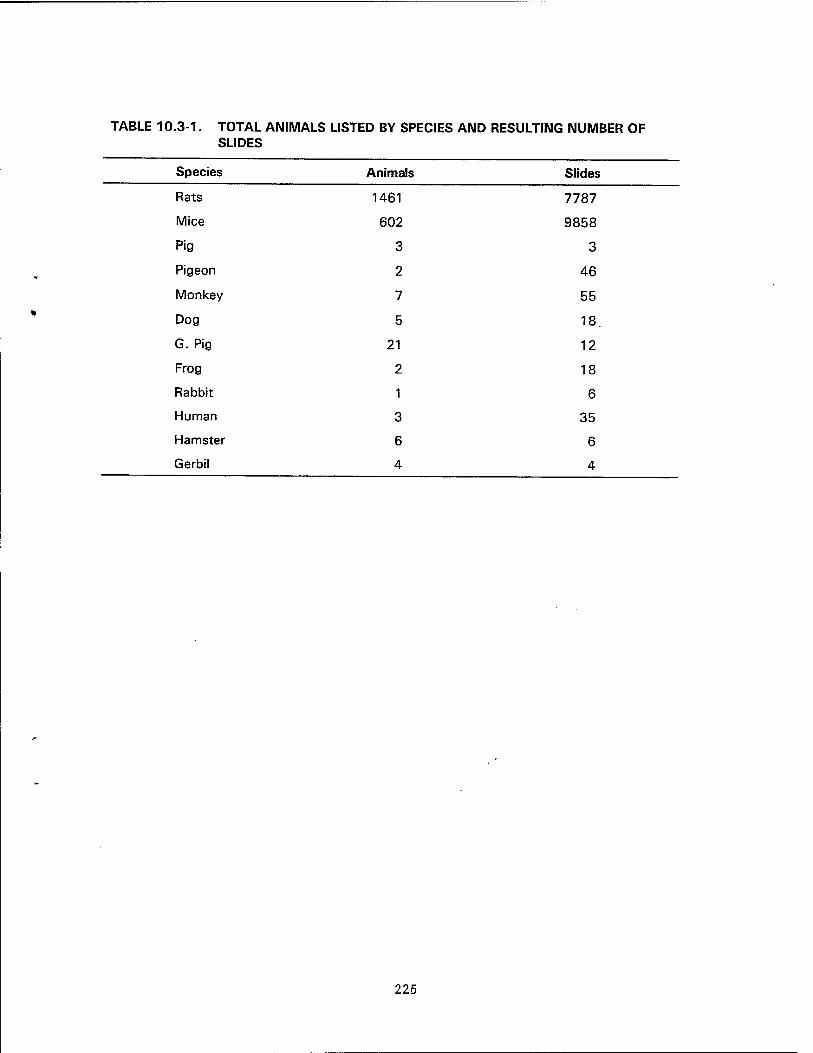
TABLE 10.3-1. TOTAL ANIMALS LISTED BY SPECIES AND RESULTING NUMBER OF SLIDES
Species Animals Slides
Rats 1461 7787
Mice 602 9858
Pig 3 3
Pigeon 2 46
Monkey 7 55
Dog 5 18.
G. Pig 21 12
Frog 2 18
Rabbit 1 6
Human 3 35
Hamster 6 6
Gerbil 4 4
225
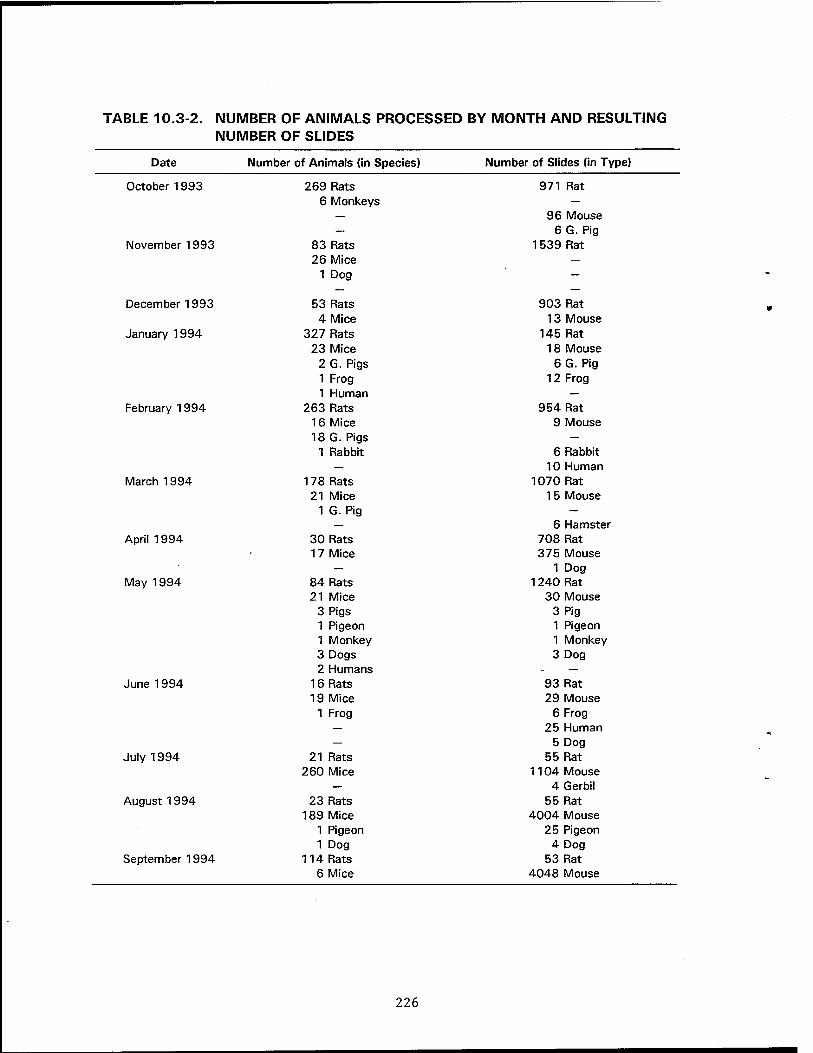
TABLE 10.3-2. NUMBER OF ANIMALS PROCESSED BY MONTH AND RESULTING NUMBER OF SLIDES
Date Number of Animals (in Species) Number of Slides (in Type)
October 1993
November 1993
December 1993
January 1994
February 1994
March 1994
April 1994
May 1994
June 1994
July 1994
August 1994
September 1994
269 Rats 6 Monkeys
83 Rats 26 Mice
1 Dog
53 Rats 4 Mice
327 Rats 23 Mice
2 G. Pigs 1 Frog 1 Human
263 Rats 16 Mice 18 G. Pigs
1 Rabbit
178 Rats 21 Mice
1 G. Pig
30 Rats 17 Mice
84 Rats 21 Mice
3 Pigs 1 Pigeon 1 Monkey 3 Dogs 2 Humans
16 Rats 19 Mice
1 Frog
21 Rats 260 Mice
23 Rats 189 Mice
1 Pigeon 1 Dog
114 Rats 6 Mice
971 Rat
96 Mouse 6 G. Pig
1539 Rat
903 Rat 13 Mouse
145 Rat 18 Mouse
6 G. Pig 12 Frog
954 Rat 9 Mouse
6 Rabbit 10 Human
1070 Rat 15 Mouse
6 Hamster 708 Rat 375 Mouse
1 Dog 1240 Rat
30 Mouse 3 Pig 1 Pigeon 1 Monkey 3 Dog
93 Rat 29 Mouse
6 Frog 25 Human
5 Dog 55 Rat
1104 Mouse 4 Gerbil
55 Rat 4004 Mouse
25 Pigeon 4 Dog
53 Rat 4048 Mouse
226
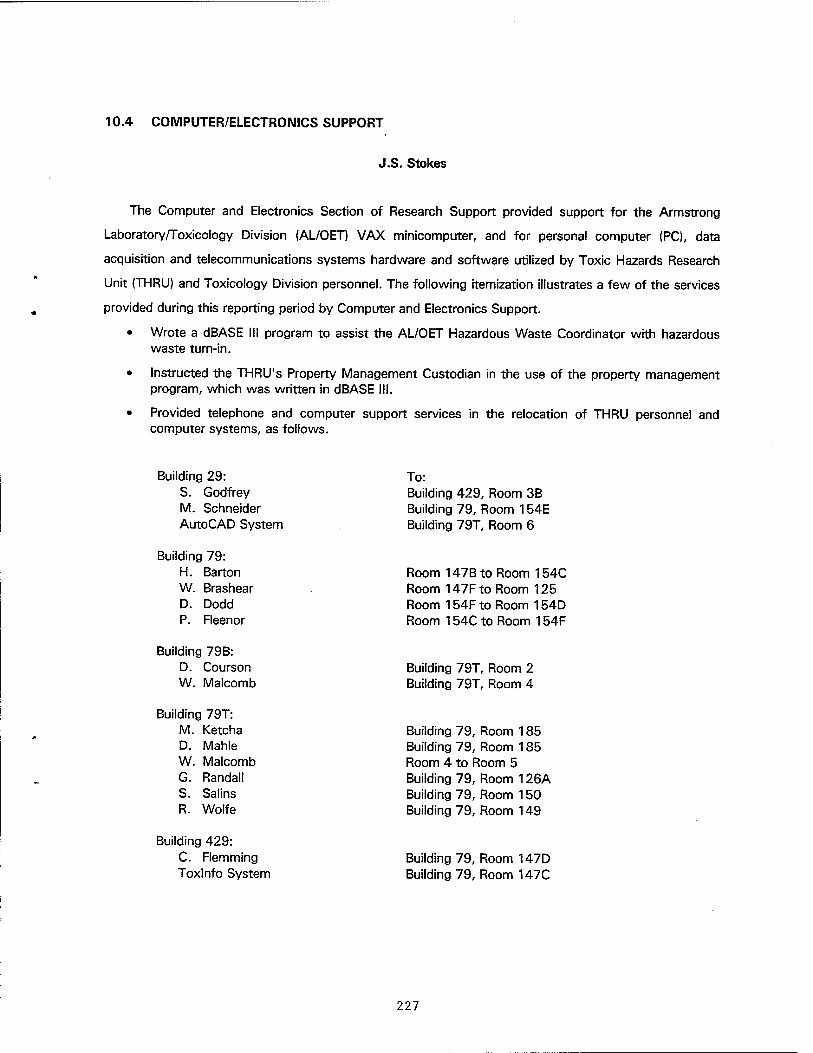
10.4 COMPUTER/ELECTRONICS SUPPORT
J.S. Stokes
The Computer and Electronics Section of Research Support provided support for the Armstrong
Laboratory/Toxicology Division (AL/OET) VAX minicomputer, and for personal computer (PC), data
acquisition and telecommunications systems hardware and software utilized by Toxic Hazards Research
Unit (THRU) and Toxicology Division personnel. The following itemization illustrates a few of the services
provided during this reporting period by Computer and Electronics Support.
• Wrote a dBASE III program to assist the AL/OET Hazardous Waste Coordinator with hazardous waste turn-in.
• Instructed the THRU's Property Management Custodian in the use of the property management program, which was written in dBASE III.
• Provided telephone and computer support services in the relocation of THRU personnel and computer systems, as follows.
Building 29: S. Godfrey M. Schneider AutoCAD System
To: Building 429, Room 3B Building 79, Room 154E Building 79T, Room 6
Building 79: H. Barton W. Brashear D. Dodd P. Fleenor
Room 147Bto Room 154C Room 147F to Room 125 Room 154F to Room 154D Room 154C to Room 154F
Building 79B: D. Courson W. Malcomb
Building 79T, Room 2 Building 79T, Room 4
Building 79T: M. Ketcha D. Mahle W. Malcomb G. Randall S. Salins R. Wolfe
Building 79, Room 185 Building 79, Room 185 Room 4 to Room 5 Building 79, Room 126A Building 79, Room 150 Building 79, Room 149
Building 429: C. Flemming Toxlnfo System
Building 79, Room 147D Building 79, Room 147C
227
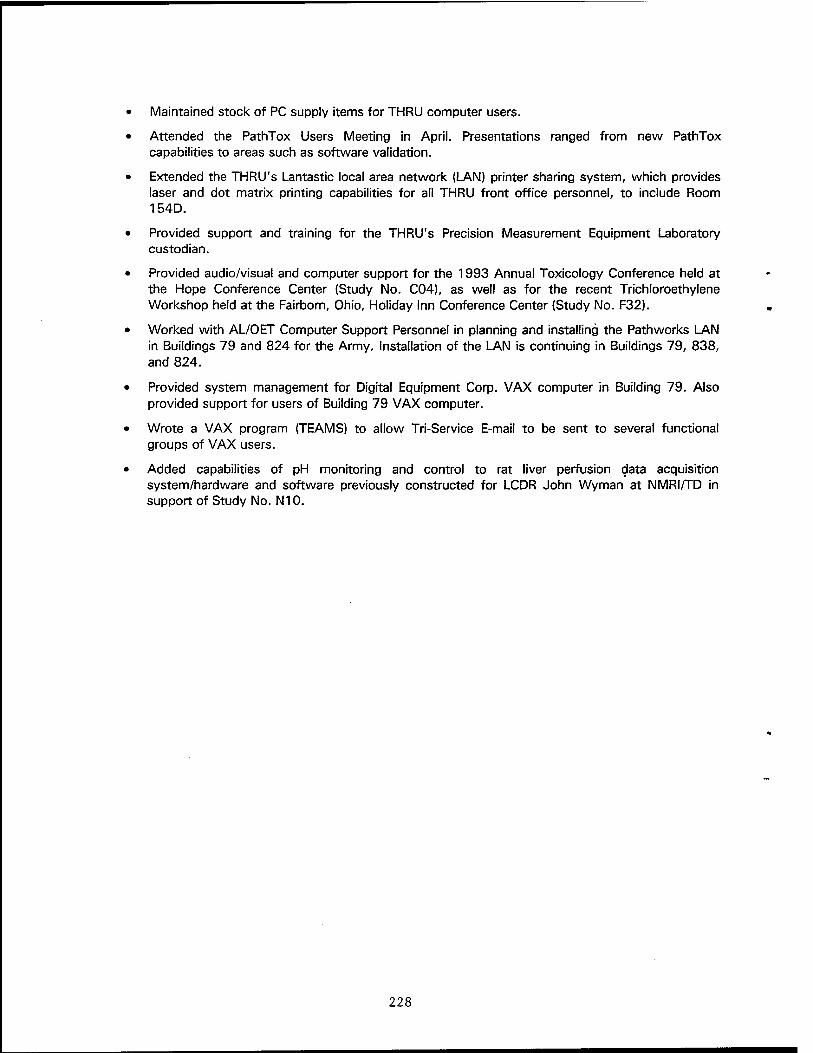
Maintained stock of PC supply items for THRU computer users.
Attended the PathTox Users Meeting in April. Presentations ranged from new PathTox capabilities to areas such as software validation.
Extended the THRU's Lantastic local area network (LAN) printer sharing system, which provides laser and dot matrix printing capabilities for all THRU front office personnel, to include Room 154D.
Provided support and training for the THRU's Precision Measurement Equipment Laboratory custodian.
Provided audio/visual and computer support for the 1993 Annual Toxicology Conference held at the Hope Conference Center (Study No. C04), as well as for the recent Trichloroethylene Workshop held at the Fairborn, Ohio, Holiday Inn Conference Center (Study No. F32).
Worked with AL/OET Computer Support Personnel in planning and installing the Path works LAN in Buildings 79 and 824 for the Army. Installation of the LAN is continuing in Buildings 79, 838, and 824.
Provided system management for Digital Equipment Corp. VAX computer in Building 79. Also provided support for users of Building 79 VAX computer.
Wrote a VAX program (TEAMS) to allow Tri-Service E-mail to be sent to several functional groups of VAX users.
Added capabilities of pH monitoring and control to rat liver perfusion data acquisition system/hardware and software previously constructed for LCDR John Wyman at NMRI/TD in support of Study No. N10.
228

10.5 QUALITY ASSURANCE
M. G. Schneider
The Quality Assurance Coordinator (QAC) presented a poster, "Building an Effective Training
Program," at the Society of Quality Assurance Annual meeting held in San Francisco, CA. This
material was published in the journal, "Quality Assurance: Good Practice, Regulation, and Law," as
part of the meeting proceedings. Training in total Quality Assurance and training methodology was
received at this meeting. The QAC participated in the activities of the Mid West Regional Chapter of
the Society of Quality Assurance as chair of the By-Laws Committee and attendance at two regional
meetings. Training covering computer validation policies, sponsor/subcontractor relationships,
personal leadership, and clinical Good Laboratory Practices (GLP) was received at these meetings.
The Quality Assurance Unit (QAU) hosted a seminar and visit by Mrs. Patricia O'Brien
Pomerleau, Quality Assurance Manager for the Chemical Industry Institute of Toxicology. The
subject of her seminar and one-on-one discussions with Tri-Service Toxicology staff was Quality
Assurance for Life Science research. All staff involved in the Tri-Service Toxicology research effort
were invited to participate. Follow-up with attendees indicated the information presented was very
useful and that the approach to Quality Assurance described could serve as a basis for a Tri-Service
Toxicology QA program.
The QAU staff attended specialized training on the software installed on the new computers
received during the past year, a one-day course in technical writing, and a one-day seminar on self-
directed work teams. The QAC also attended a one-day course on project management. The QAC
conducted orientation training in the quality assurance program for all new ManTech staff. The QA
Associate (QAA) attended training for GLP compliant archiving. The QAA participated on the
program management team during the Conference on Temporal Aspects in Risk Assessment for
Noncancer Endpoints and the 1994 HazMat/PoIlution Prevention Conference.
The QAC was relocated to office space located in Room 3, Building 429. Systems office
furniture was installed to permit housing of three staff in this space.
The QAC conducted protocol reviews, and procedure, data, and final report audits for Study
Requests A02(TNB), A03(LP1846), A04(TNB), A08(Unicharge), F04((JP-4), F11 (Mixtures),
F22(ADN), F23(TCA), F25(CF3I), F26(Toluene), F29(ADN), F29A(ADN), F35(TCE), and F37(CF3I).
The QAC acted as ManTech study coordinator for A01(QA program), A04(QA Program and
fetal evaluation subcontract), and F27(Building 79 research quality water system).
The QAA completed technical editing for one letter report for the Toluene Study Request F26.
Six manuscripts for peer-reviewed publication were edited for Study Requests F04(JP-4), F08(Halon
229
Replacements), F11 (Mixtures), F15(Lactational Transfer), and F23(TCA). Nine technical reports
were edited by the QAA for Study Requests A02(TNB), A03(LP1846), F12(Partition coefficients),
F20IQSAR Models), F21(Halon Replacements), F22(ADN), F25(CF3I), F28(TPH), and
N12(Hydrazine).
Ten SOPs were reviewed, prepared for approval, distributed, and placed in the SOP Manuals
located in laboratory work areas by the Quality Assurance staff. Equipment to reestablish the study
records archive was purchased and installed in Room 3D, Building 429. The useable space in this
archive was effectively doubled, and the backlog of filing study records can be completed. The
pathology slides archive was relocated from an unsecured area of Building 79 to Room 3D, Building
429. Space was provided to allow for an approximate 20% growth of the slide archive. Thirty-two
thousand records were sorted and catalogued for microfilming. Duplicate rolls of microfilm were
produced and stored at separate locations as has been standard procedure. The records were then
filed in the records archive.
230
10.6 HEALTH AND SAFETY
M. G. Schenider
The ManTech Health and Safety Representative (HSR) worked with the Technical Area Group
leaders and the Facilities Space Committee in the development of a Room Monitor Program. The
intent of this program was to identify an individual with responsibility for activity, equipment, and
supplies in each of the Armstrong Laboratory/Toxicology Division (AL/OET) work spaces. The HSR
developed and coordinated the initial training for the thirty-plus individuals named as room monitors.
Room monitors were drawn from the Department of Defense (DoD) military and civilian, as well as
contractor staff.
A Tri-Service Toxicology bloodborne pathogen exposure control plan was developed by the HSR
using various existing documents as a basis. The HSR attended local safety seminars where training
and updates on occupational health arid safety regulations were received.
The four Thomas Domes located in Room 151, Building 79, were removed during the past year.
The HSR monitored the planning and operational process to assure staff safety and to minimize
disruption of normal laboratory operations.
Mr. W.J. Malcomb, Research Engineering, provided instruction in CPR and first aid to twelve
staff members. Mr. Malcomb is certified by the American Red Cross. ManTech staff who work in
laboratory areas received training in Wright-Patterson Air Force Base (WPAFB) hazardous waste
management policy and procedures. Occupational Safety and Health Administration's (OSHA's)
laboratory chemical standard, and the OSHA bloodborne pathogen standard. ManTech staff who
were designated as hazardous waste satellite point managers received specialized training from
2Lt W. Hurtle, AL/OET Hazardous Waste Coordinator. Formal documentation of safety training was
implemented using a format which complements Air Force policy. The HSR provided safety
orientation training for all new ManTech staff.
The process of integrating the AL/OET hazardous material program into the WPAFB HazMat Cell
continued at a cautious pace. The HSR continued to maintain the chemical inventory for AL/OET.
The chemical tracking system which has been in place for five years was continued. The process of
obtaining material safety data sheets for all chemicals present in the laboratory continued. The HSR
provided WPAFB Environmental Management with data for tracking use of materials identified in the
EPA-17 and the Ozone Layer Depleting Chemicals listings.
231
ManTech staff were provided with appropriate safety equipment as required by specific Work
Assignments. Purchase agreements were established with local vendors for safety glasses, safety
shoes, and labwear. During the past year the labwear agreement was canceled, and items such as
labcoats and scrubs were purchased by the Air Force for ManTech use. Laundry of these items was
brought into the lab using equipment purchased and maintained by AL/OET.
The medical surveillance program was continued. This program included pre-employment,
annual, and exit physicals. The vendor provided emergency care for work related injuries, follow-up
examinations for work release, consultation for pregnant staff or suspected work related illness, and
initiation of Workers Compensation paperwork. Hepatitis B immunization was offered to staff who
might encounter bloodborne pathogens in their jobs. The HSR arranged for the reading of tuberculin
test results by ManTech staff, thereby saving the time and expense of employees traveling back to
the physical site. All ManTech staff were offered annual physicals.
The formal THRU safety committee ceased to function during the past year. A critical point had
been reached where greatly expanded membership was needed to continue committee practices
such as the monthly safety inspections of areas where ManTech employees worked. A Tri-Service
Safety Council that will address the overall safety program is in the stages of development. Issues
and requirements specific to ManTech will be handled by the HSR. The committee hosted a safety
appreciation lunch for all ManTech staff to recognize the total organizational safety program results.
Work areas occupied by ManTech staff were subject to quarterly safety inspections by Air
Force safety personnel from Brooks AFB, WPAFB, and Armstrong Laboratory North. Specific
programs as Environmental Compliance and Management Program, Radiation Safety, Hazardous
Waste (chemical and biological), and Explosives Safety were also inspected by the Air Force. The
HSR accompanied these inspection teams. Response by ManTech to the findings was always
timely. The HSR also conducted spot and monthly safety inspections. Issues of immediate concern
were addressed with staff and supervisors on-the-spot.
'321
APPENDIX A
TOXIC HAZARDS RESEARCH UNIT PERSONNEL AS OF 30 SEPTEMBER 1994
Darol E. Dodd, Ph.D., DABT LABORATORY DIRECTOR
RESEARCH SUPPORT TOXICOLOGY Patricia M. Smith Därol E. Dodd, Ph.D., DABT
a Supervisor Manager
Staff: Angell, Mary Ann Brooks, Shelia D. Stokes, James
QUALITY ASSURANCE/SAFETY Mathias G. Schneider, Jr. Coordinator
Staff: Godfrey, Susan M.
ADMINISTRATION Lois A. Doncaster Supervisor
RISK ASSESSMENT Hugh A. Barton, Ph.D. Supervisor
Staff: Flemming, Carlyle D.
Staff: Abernathy, Frank W. Ph.D. Courson, David L. Drerup, Joanne M. Freedman, Marcia L. Godfrey, Richard J. Kinkead, Edwin R. Lane, John W. Latendresse, John R., D.V.M. Leahy, Harold F. Malcomb, Willie J. Neely, Gloria A. Nicholson, Jerry W. Parish, Margaret A. Randall, Gia M. Salins, Stephanie A. Sonntag, William B. Wolfe, Robin E.
BIOLOGICAL SIMULATION Allen Vinegar, Ph.D. Manager
Ph.D., DACVP
Staff: Brashear, Wayne T., Ph.D. Buttler, Gerry W. Byczkowski, Janusz Z., Ph.D., D.Sc. Collins, Richard, Ph.D. Frazier, John M., Ph.D. Ketcha, Marcia M. Kuhlmann, Karl J. Mahle, Deirdre A. Pollard, Daniel L. Seckel, Constance S.
233
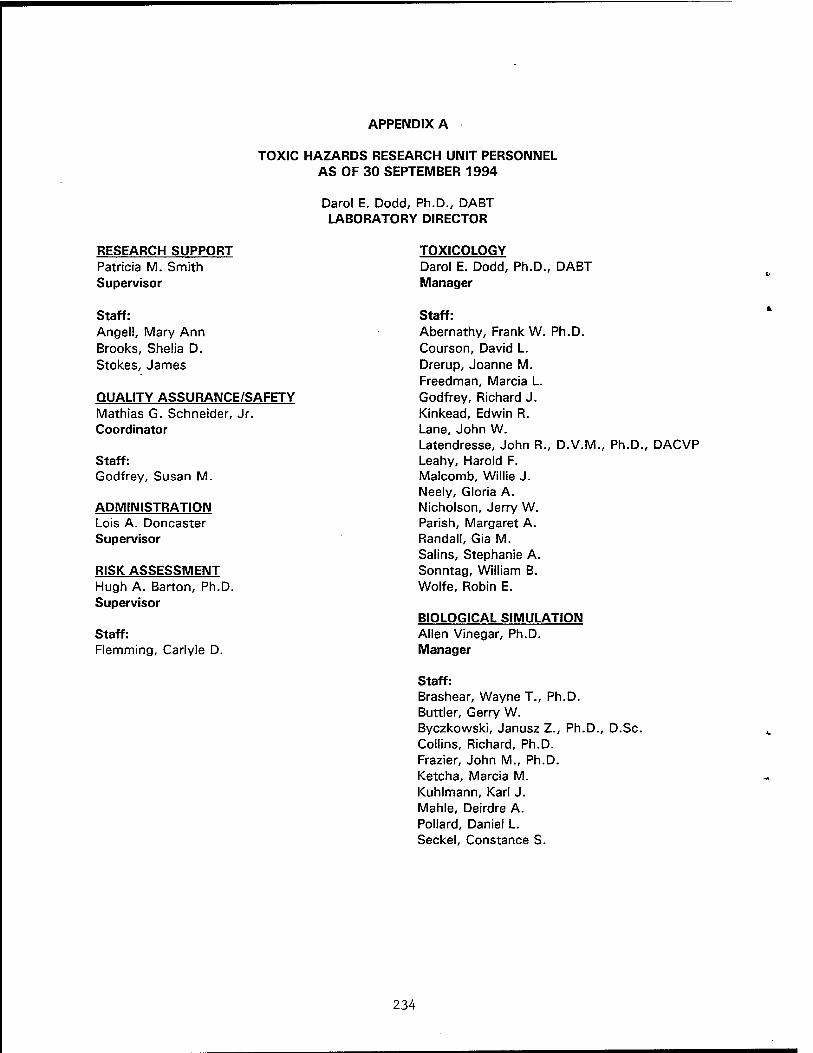
APPENDIX A
TOXIC HAZARDS RESEARCH UNIT PERSONNEL AS OF 30 SEPTEMBER 1994
Darol E. Dodd, Ph.D., DABT LABORATORY DIRECTOR
RESEARCH SUPPORT TOXICOLOGY Patricia M. Smith Darol E. Dodd, Ph.D., DABT Supervisor Manager
Staff: Staff: Angell, Mary Ann Abernathy, Frank W. Ph.D. Brooks, Shelia D. Courson, David L. Stokes, James Drerup, Joanne M.
Freedman, Marcia L. QUALITY ASSURANCE/SAFETY Godfrey, Richard J. Mathias G. Schneider, Jr. Kinkead, Edwin R. Coordinator Lane, John W.
Latendresse, John R., D.V.M., Ph.D., DACVP Staff: Leahy, Harold F. Godfrey, Susan M. Malcomb, Willie J.
Neely, Gloria A. ADMINISTRATION Nicholson, Jerry W. Lois A. Doncaster Parish, Margaret A. Supervisor Randall, Gia M.
Salins, Stephanie A. RISK ASSESSMENT Sonntag, William B. Hugh A. Barton, Ph.D. Wolfe, Robin E. Supervisor
BIOLOGICAL SIMULATION Staff: Allen Vinegar, Ph.D. Flemming, Carlyle D. Manager
Staff: Brashear, Wayne T., Ph.D. Buttler, Gerry W. Byczkowski, Janusz Z., Ph.D., D.Sc. Collins, Richard, Ph.D. Frazier, John M., Ph.D. Ketcha, Marcia M. Kuhlmann, Karl J. Mahle, Deirdre A. Pollard, Daniel L. Seckel, Constance S.
234
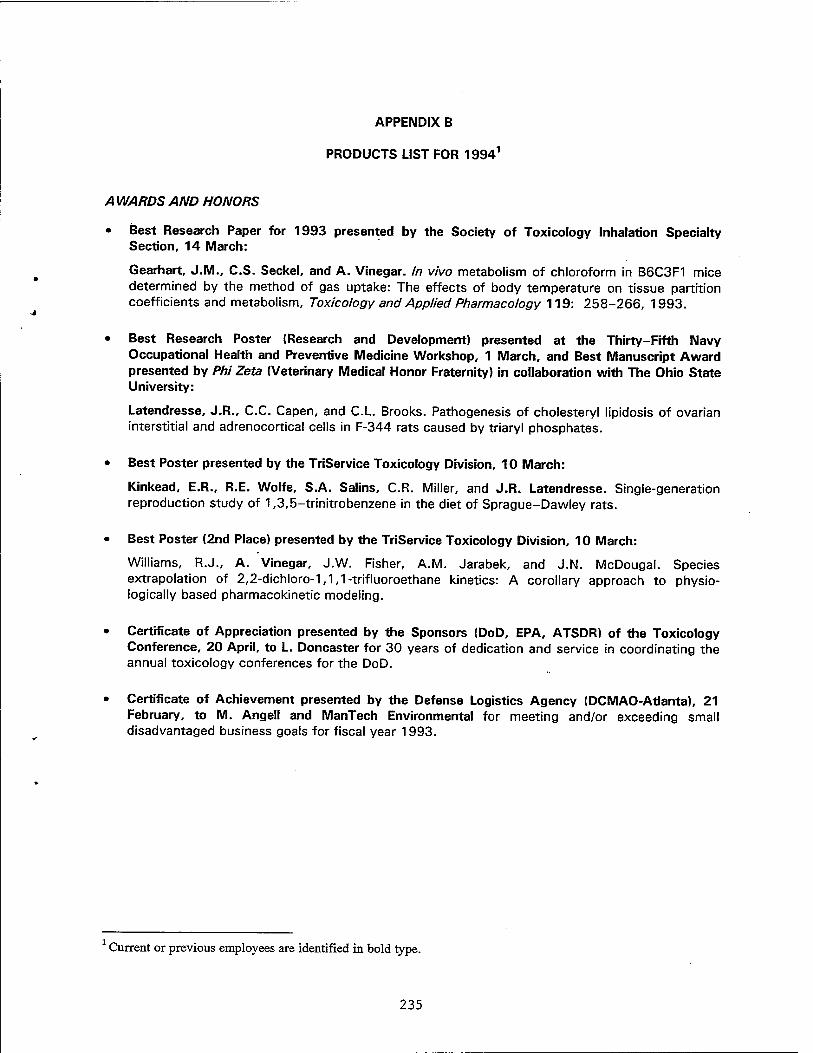
APPENDIX B
PRODUCTS LIST FOR 19941
A WARDS AND HONORS
• Best Research Paper for 1993 presented by the Society of Toxicology Inhalation Specialty Section, 14 March:
Gearhart, J.M., C.S. Seckel, and A. Vinegar. In vivo metabolism of chloroform in B6C3F1 mice determined by the method of gas uptake: The effects of body temperature on tissue partition coefficients and metabolism. Toxicology and Applied Pharmacology 119: 258-266, 1993.
• Best Research Poster (Research and Development) presented at the Thirty-Fifth Navy Occupational Health and Preventive Medicine Workshop, 1 March, and Best Manuscript Award presented by Phi Zeta (Veterinary Medical Honor Fraternity) in collaboration with The Ohio State University:
Latendresse, J.R., C.C. Capen, and C.L. Brooks. Pathogenesis of cholesteryl lipidosis of ovarian interstitial and adrenocortical cells in F-344 rats caused by triaryl phosphates.
• Best Poster presented by the TriService Toxicology Division, 10 March:
Kinkead, E.R., R.E. Wolfe, S.A. Salins. C.R. Miller, and J.R. Latendresse. Single-generation reproduction study of 1,3,5-trinitrobenzene in the diet of Sprague-Dawley rats.
• Best Poster (2nd Place) presented by the TriService Toxicology Division, 10 March:
Williams, R.J., A. Vinegar, J.W. Fisher, A.M. Jarabek, and J.N. McDougal. Species extrapolation of 2,2-dichloro-1,1,1-trifluoroethane kinetics: A corollary approach to physio- logically based pharmacokinetic modeling.
• Certificate of Appreciation presented by the Sponsors (DoD, EPA, ATSDR) of the Toxicology Conference, 20 April, to L. Doncaster for 30 years of dedication and service in coordinating the annual toxicology conferences for the DoD.
• Certificate of Achievement presented by the Defense Logistics Agency (DCMAO-Atlanta), 21 February, to M. Angell and ManTech Environmental for meeting and/or exceeding small disadvantaged business goals for fiscal year 1993.
Current or previous employees are identified in bold type.
235

INVITED PRESENTATIONS
• Barton, H.A., at the Trichloroethylene Science Workshop, Williamsburg, 2-3 December, 1993:
Animal evidence for the carcinogenicity of trichloroethylene.
• Byczkowski, J.Z., at the annual meeting of the Drug Information Association, Washington, D.C., 6-7 June:
Linked PBPK model and cancer risk assessment for breast-fed infants.
• Frazier, J.M., at "IIMVITRO 94", 8th International Workshop on In Vitro Toxicology, Kartause Ittingen, Switzerland, 20-23 September:
Application of in vitro systems to the predictions of in vivo biokinetics.
• Frazier, J.M., keynote speaker at the European Center for the Validation of Alternative Methods Symposium (opening), Ispra, Italy, 17-18 October :
Interdisciplinary approach to toxicity test development and validation.
• Latendresse, J.R., at the Lilly Pharmaceutical Research Laboratories, Greenfield, 5 July:
Pathogenesis of cholesteryl lipidosis in adrenocortical and ovarian interstitial cells in F-344 rats ~ caused by triaryl phosphates.
JOURNAL PUBLICATIONS
Andersen, M.E., H.J. Clewell III, D.A. Mahle, and J.M. Gearhart. Gas uptake studies of deuterium isotope effects on dichloromethane metabolism in female B6C3F1 mice in vivo, Toxicology and Applied Pharmacology 128: 158-165, 1994.
Barton, H.A., J.R. Creech, C.S. Godin, G.M. Randall, and C.S. Seckel. Chloroethylene mixtures: Pharmacokinetic modeling and in vitro metabolism of vinylchloride, trichloroethylene, and transA ,2-dichloroethylene in rats. Toxicology and Applied Pharmacology, in press.
Barton, H.A., D.R. Mattie, and W.B. Peirano. Introduction [to the Conference on the Risk Assessment Paradigm After Ten Years], Risk Analysis 14: 217, 1994.
Barton, H.A., D.R. Mattie, and W.B. Peirano (eds.). Special Issue: The Risk Assessment Paradigm After Ten Years, Risk Analysis 14: 217-378, 1994.
Byczkowski, J.Z. Linked PBPK model and cancer risk assessment for breast-fed infants, Drug Information Journal, in press.
Byczkowski, J.Z. and J.W. Fisher. Lactational transfer of tetrachloroethylene in rats. Risk Analysis 14: 339-349, 1994.
Byczkowski, J.Z. and J.W. Fisher. A computer program linking physiologically based pharmacokinetic model with cancer risk assessment for breast-fed infants, Computer Methods and Programs in Biomedicine, in press.
236
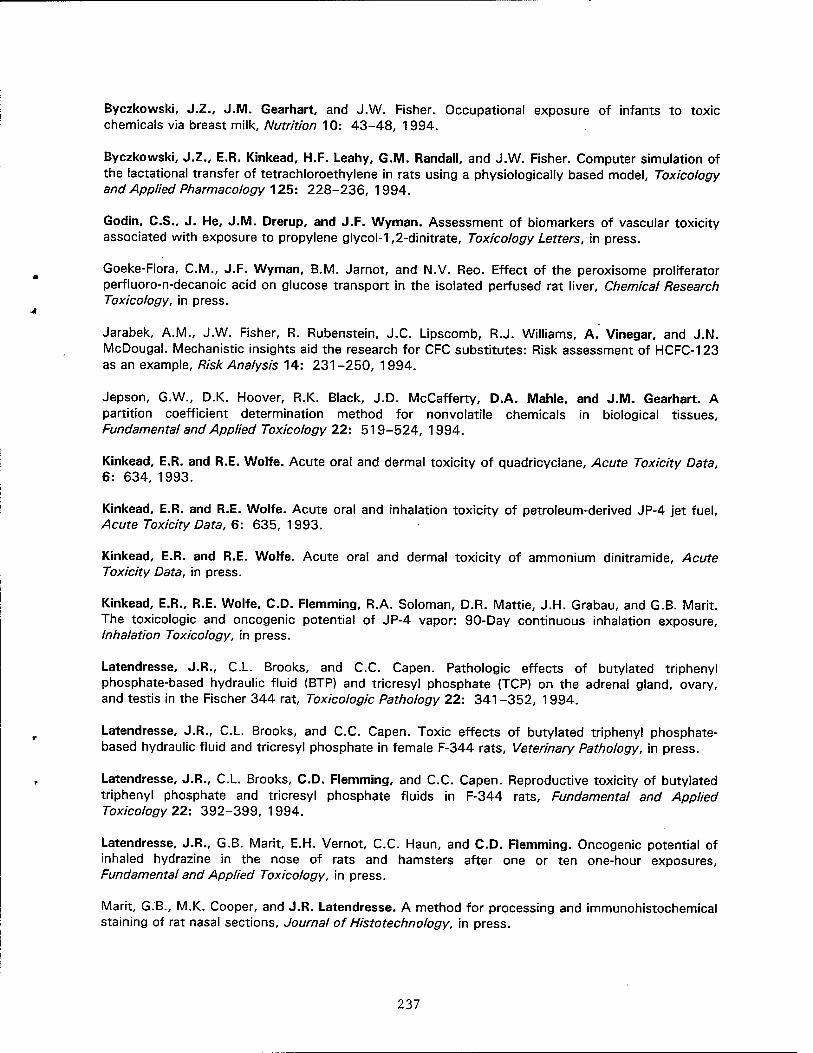
Byczkowski, J.Z., J.M. Gearhart, and J.W. Fisher. Occupational exposure of infants to toxic chemicals via breast milk, Nutrition 10: 43-48, 1994.
Byczkowski, J.Z., E.R. Kinkead, H.F. Leahy, G.M. Randall, and J.W. Fisher. Computer simulation of the lactational transfer of tetrachloroethylene in rats using a physiologically based model, Toxicology and Applied Pharmacology 125: 228-236, 1994.
Godin, C.S., J. He, J.M. Drerup, and J.F. Wyman. Assessment of biomarkers of vascular toxicity associated with exposure to propylene glycol-1,2-dinitrate, Toxicology Letters, in press.
Goeke-Flora, CM., J.F. Wyman, B.M. Jarnot, and N.V. Reo. Effect of the peroxisome proliferator perfluoro-n-decanoic acid on glucose transport in the isolated perfused rat liver. Chemical Research Toxicology, in press.
Jarabek, A.M., J.W. Fisher, R. Rubenstein, J.C. Lipscomb, R.J. Williams, A. Vinegar, and J.N. McDougal. Mechanistic insights aid the research for CFC substitutes: Risk assessment of HCFC-123 as an example, Risk Analysis 14: 231-250, 1994.
Jepson, G.W., D.K. Hoover, R.K. Black, J.D. McCafferty, D.A. Mahle, and J.M. Gearhart. A partition coefficient determination method for nonvolatile chemicals in biological tissues. Fundamental and Applied Toxicology 22: 519-524, 1994.
Kinkead, E.R. and R.E. Wolfe. Acute oral and dermal toxicity of quadricyclane, Acute Toxicity Data, 6: 634, 1993.
Kinkead, E.R. and R.E. Wolfe. Acute oral and inhalation toxicity of petroleum-derived JP-4 jet fuel, Acute Toxicity Data, 6: 635, 1993.
Kinkead, E.R. and R.E. Wolfe. Acute oral and dermal toxicity of ammonium dinitramide, Acute Toxicity Data, in press.
Kinkead, E.R., R.E. Wolfe, CD. Flemming, R.A. Soloman, D.R. Mattie, J.H. Grabau, and G.B. Marit. The toxicologic and oncogenic potential of JP-4 vapor: 90-Day continuous inhalation exposure. Inhalation Toxicology, in press.
Latendresse, J.R., CL. Brooks, and C.C Capen. Pathologic effects of butylated triphenyl phosphate-based hydraulic fluid (BTP) and tricresyl phosphate (TCP) on the adrenal gland, ovary, and testis in the Fischer 344 rat, Toxicologic Pathology 22: 341-352, 1994.
Latendresse, J.R., CL. Brooks, and C.C. Capen. Toxic effects of butylated triphenyl phosphate- based hydraulic fluid and tricresyl phosphate in female F-344 rats, Veterinary Pathology, in press.
Latendresse, J.R., CL. Brooks, CD. Flemming, and C.C. Capen. Reproductive toxicity of butylated triphenyl phosphate and tricresyl phosphate fluids in F-344 rats. Fundamental and Applied Toxicology 22: 392-399, 1994.
Latendresse, J.R., G.B. Marit, E.H. Vernot, C.C Haun, and CD. Flemming. Oncogenic potential of inhaled hydrazine in the nose of rats and hamsters after one or ten one-hour exposures, Fundamental and Applied Toxicology, in press.
Marit, G.B., M.K. Cooper, and J.R. Latendresse. A method for processing and immunohistochemical staining of rat nasal sections. Journal of Histotechnology, in press.
237

Marit, G.B., D.E. Dodd, M.E. George, and A. Vinegar. Hepatotoxicity in guinea pigs following acute inhalation exposure to 1,1-dichloro-2,2,2-trifluoroethane, Toxicologic Pathology 22: 404-414, 1994.
Rivera, J., J. Wyman, D. von Minden, N. Lacy, and D.A. Macys. A facile synthetic procedure for the preparation of highly-pure 2,6-di-tert-butyl-4-nitrophenol (DBNP), Environmental Toxicology and Chemistry, in press.
Roth, R.A. and A.Vinegar. Action by the lungs on circulating xenobiotic agents, with a case study of physiologically based pharmacokinetic modeling of benzo(a)pyrene disposition. In: Gram, T.E., (ed.), Metabolic activation and toxicity of chemical agents to lung tissue and cells, International Encyclopedia of Pharmacology and Therapeutics, Sect. 138: 89-105, 1993.
Schneider, M.G. Building an effective training program, Quality Assurance: Good Practice, Regulation, and Law 3: 316-318, 1994.
Vinegar, A., R.J. Williams, J.W. Fisher, and J.N. McDougal. Dose-dependent metabolism of 2,2- dichloro-1,1,1-trifluoroethane: A physiologically based pharmacokinetic model in the male Fischer 344 rat, Toxicology and Applied Pharmacology 129: 103-113, 1994.
Wyman, J., J.S. Stokes, M. Goehring,, M- Buring, and T. Moore. Data collection interface for isolated perfused rat liver: Recording oxygen consumption, perfusion pressure and pH, Toxicology Methods, in press.
JOURNAL SUBMISSIONS
Cronin, W.J., EJ. Oswajd, M. Shelley, J.W. Fisher, and CD. Flemming. A trichloroethylene risk assessment using a Monte Carlo analysis of parameter uncertainty in conjunction with physiologically based pharmacokinetic modeling, Risk Analysis.
Ketcha, M.M., D.A. Warren, C.T. Bishop, H.A. Barton, and W.T. Brashear. Analyses of dichloroacetic acid, trichloroacetic acid, trichloroethanol and trichloroethanol glucuronide: Metabolites of trichloroethylene, Analytical Biochemistry.
Kinkead, E.R., R.E. Wolfe, CD. Flemming, DJ. Caldwell, C.R. Miller, arid G.B. Marit. Reproductive toxicity screen of 1,3,5-trinitrobenzene administered in the diet of Sprague-Dawley rats. Toxicology and Industrial Health.
Kinkead, E.R., R.E. Wolfe, S.A. Salins, CD. Flemming, H.F. Leahy, DJ. Caldwell, C.R. Miller, and G.B. Marit. Reproductive toxicity screen of liquid propellant XM46 administered in the drinking water of Sprague-Dawley rats. Toxicology and Industrial Health.
Lipscomb, J.C., D.A. Mahle, CM. Garrett, and H.A. Barton. Dichloroacetic acid: Metabolism in cytosol from mice, rats and humans. Drug Metabolism and Disposition.
Rossi, J., M.S. Buring, W.B. Sonntag, and G.D. Ritchie. The NMRI/TD roto-wheel: A new apparatus for multiple measures of nysical incapacitation, Behavior Research Methods, Instruments, and Computers.
Seckel, C.S., H.G. Wall, D.R. Mattie, C.E. Jones, M. Andersen, and A. Vinegar. Effects of polychlorotrifluoroethylene (PCTFE) on two Rhesus monkeys following long-term oral dosing, Journal of Applied Toxicology.
238
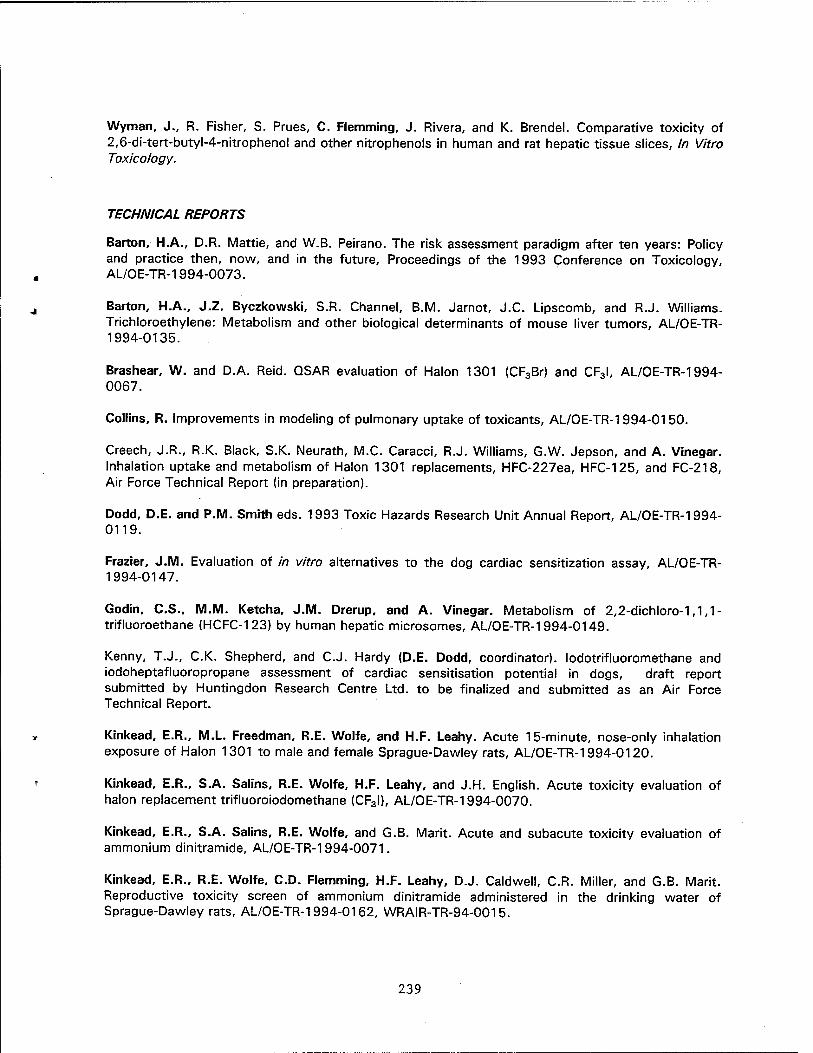
Wyman, J., R. Fisher, S. Prues, C. Flemming, J. Rivera, and K. Brendel. Comparative toxicity of 2,6-di-tert-butyl-4-nitrophenol and other nitrophenols in human and rat hepatic tissue slices, In Vitro Toxicology.
TECHNICAL REPORTS
Barton, H.A., D.R. Mattie, and W.B. Peirano. The risk assessment paradigm after ten years: Policy and practice then, now, and in the future, Proceedings of the 1993 Conference on Toxicology, AL/OE-TR-1994-0073.
Barton, H.A., J.Z. Byczkowski, S.R. Channel, B.M. Jarnot, J.C. Lipscomb, and R.J. Williams. Trichloroethylene: Metabolism and other biological determinants of mouse liver tumors, AL/OE-TR- 1994-0135.
Brashear, W. and D.A. Reid. QSAR evaluation of Halon 1301 (CF3Br) and CF3I, AL/OE-TR-1994- 0067.
Collins, R. Improvements in modeling of pulmonary uptake of toxicants, AL/OE-TR-1994-0150.
Creech, J.R., R.K. Black, S.K. Neurath, M.C. Caracci, R.J. Williams, G.W. Jepson, and A. Vinegar. Inhalation uptake and metabolism of Halon 1301 replacements, HFC-227ea, HFC-125, and FC-218, Air Force Technical Report (in preparation).
Dodd, D.E. and P.M. Smith eds. 1993 Toxic Hazards Research Unit Annual Report, AL/OE-TR-1994- 0119.
Frazier, Ü.M. Evaluation of in vitro alternatives to the dog cardiac sensitization assay, AL/OE-TR- 1994-0147.
Godin, C.S.. M.M. Ketcha, Ü.M. Drerup, and A. Vinegar. Metabolism of 2,2-dichloro-1,1,1- trifluoroethane (HCFC-123) by human hepatic microsomes, AL/OE-TR-1994-0149.
Kenny, T.J., C.K. Shepherd, and C.J. Hardy (D.E. Dodd, coordinator), lodotrifluoromethane and iodoheptafluoropropane assessment of cardiac sensitisation potential in dogs, draft report submitted by Huntingdon Research Centre Ltd. to be finalized and submitted as an Air Force Technical Report.
Kinkead, E.R., M.L. Freedman, R.E. Wolfe, and H.F. Leahy. Acute 15-minute, nose-only inhalation exposure of Halon 1301 to male and female Sprague-Dawley rats, AL/OE-TR-1994-0120.
Kinkead, E.R., S.A. Salins, R.E. Wolfe, H.F. Leahy, and J.H. English. Acute toxicity evaluation of halon replacement trifluoroiodomethane (CF3I), AL/OE-TR-1994-0070.
Kinkead, E.R., S.A. Salins, R.E. Wolfe, and G.B. Marit. Acute and subacute toxicity evaluation of ammonium dinitramide, AL/OE-TR-1994-0071.
Kinkead, E.R., R.E. Wolfe, CD. Flemming, H.F. Leahy, DJ. Caldwell, C.R. Miller, and G.B. Marit. Reproductive toxicity screen of ammonium dinitramide administered in the drinking water of Sprague-Dawley rats, AL/OE-TR-1994-0162, WRAIR-TR-94-0015.
239
Kinkead. E.R., R.E. Wolfe, CD. Flemming, DJ. Caldwell, C.R. Miller, and G.B. Marit. Reproductive toxicity screen of 1,3,5-trinitrobenzene administered in the diet of Sprague-Dawley rats, AL/OE-TR- 1994-0144, WRAIR-TR-94-0016.
Kinkead, E.R., R.E. Wolfe. S.A. Salins. CD. Flemming, DJ. Caldwell, C.R. Miller, and J.R. Latendresse. Range-finding study of a reproductive assessment of 1,3,5-trinitrobenzene administered in the diet of Sprague-Dawley rats, AL/OE-TR-1994-0072, WRAIR-TR-94-0006.
Kinkead, E.R., R.E. Wolfe, S.A. Salins, CD. Flemming, H.F. Leahy, DJ. Caldwell, C.R. Miller, and G.B. Marit. A reproductive toxicity screen of a liquid propellant XM46 administered in the drinking water of Sprague-Dawley rats, AL/OE-TR-1994-0101, WRAIR-TR-94-0008.
Leahy, H.F. Overview of the vapor generation and analysis parameters of the petroleum- and shale- derived fuel studies conducted in Thomas dome exposure chambers at the Toxic Hazards Research Unit Wright-Patterson AFB (Dayton), Ohio 1973-1983, AL/OE-TR-1994-0075.
Mitchell, A.D. (D.E. Dodd, coordinator). "Mutagenesis testing of 1,1,1,2,3,3,3-heptafluoropropane (HFC-227ea) using the Ames Salmonella typhimurium histitine reversion assay for volatile chemicals, with and without metabolic activation," Final report submitted by Genesys Research, Inc. to be submitted as an Air Force Technical Report.
Mitchell, A.D. (D.E. Dodd, coordinator). "In vivo mouse bone marrow erythrocyte micronucleus testing of 1,1,1,2,3,3,3-heptafluoropropane (HFC-227ea)," Final report submitted by Genesys Research, Inc. to be submitted as an Air Force Technical Report.
Mitchell, A.D. (D.E. Dodd, coordinator). "In vitro forward mutation assay of 1,1,1,2,3,3,3- heptafluoropropane (HFC227ea) using the L5178Y/tk+/" mouse lymphoma cell mutagenesis assay (MLA) with colony sizing, with and without metabolic activation," Final report submitted by Genesys Research, Inc. to be submitted as an Air Force Technical Report.
Mitchell, A.D. (D.E. Dodd, coordinator). "Mutagenesis testing of iodotrifluoromethane (CF3I) using the Ames Salmonella typhimurium histidine reversion assay for volatile chemicals, with and without metabolic activation," Final report submitted by Genesys Research, Inc. to be submitted as an Air Force Technical Report.
Mitchell, A.D. (D.E. Dodd, coordinator). "In vivo bone marrow erythrocyte testing of iodotrifluoromethane (CF3I)," Final report submitted by Genesys Research, Inc. to be submitted as an Air Force Technical Report.
Mitchell, A.D. (D.E. Dodd, coordinator). "In vitro forward mutation assay of iodotrifluoromethane (CF3I) using the L5178Y/tk+/" mouse lymphoma cell mutagenesis assay (MLA) with colony sizing, with and without metabolic activation," Final report submitted by Genesys Research, Inc. to be submitted as an Air Force Technical Report.
Paika, IJ. (D.E. Dodd, coordinator). Genetic toxicity evaluation of 1,3,3-trinitroazetidine. Volume I of IV: Results of Salmonella typhimurium reverse mutation assay (Ames assay), AL/OE-TR-1994- 0069, vol. I.
Paika, IJ. (D.E. Dodd, coordinator). Genetic toxicity evaluation of 1,3,3-trinitroazetidine. Volume II of IV: Results of mouse bone marrow micronucleus test, AL/OE-TR-1994-0069, vol. II.
240
Paika, IJ. (D.E. Dodd, coordinator). Genetic toxicity evaluation of 1,3,3-trinitroazetidine. Volume III of IV: Results of gene mutation at the HGPRT locus in cultured Chinese hamster ovary cells, AL/OE- TR-1994-0069, vol. III.
Prezioso, J.A., L. Desai, G. FitzGerald, I. Paika, N. DiGiulio, and D.E. Dodd. Genetic toxicity evaluation of 1,3,3-trinitroazetidine. Volume IV of IV: Summary report on the genotoxicity of TIMAZ, AL/OE-TR-1994-0069, vol. IV.
Williams, R.J., J.R. Creech, R.K. Black, S.K. Neurath, G.W. Jepson, A. Vinegar, and J.Z. Byczkowski. Gas uptake kinetics of bromotrifluoromethane (Halon 1301) and its proposed replacement iodotrifluoromethane (CF3I), AL/OE-TR-1994-0068.
Zhu, S., E. Korytnyski, and S Sharma (D.E. Dodd, coordinator). Genotoxicity assays of ammonium dinitramide: I. Salmonella/microsome mutagenesis, II. Mouse lymphoma cell mutagenesis. III. In vivo mouse bone marrow micronuclei test, AL/OE-TR-1994-0148.
LETTER REPORTS
Dodd, D.E. Genotoxicity of 1,3,3-trinitroazetidine, 31 May.
ABSTRACTS AND PRESENTATIONS
Barton, H.A., C.S. Seckel, G.M. and Randall. Correlating P450 activity in vivo and in vitro for pharmacokinetic modeling of trichloroethylene, Toxicologist 14: 40, 1994. (Presented at the annual meeting of the Society of Toxicology, Dallas, 13-18 March).
Bel, P., M.M. Ketcha, D.L. Pollard, D.J. Caldwell, J.P. Martin, L. Narayanan, and J.W. Fisher. In vivo metabolism of 1,3,5-trinitrobenzene in rats. (Presented at the 42nd meeting of the American Society for Mass Spectrometry, Chicago, 29 May-3 June).
Byczkowski, J.Z. and J.W. Fisher. Tetrachloroethylene exposure assessment of breast-fed infants, Toxicologist 14: 45, 1994. (Presented at the annual meeting of the Society of Toxicology, Dallas, 13-18 March).
Byczkowski, J.2., T. Pravecek, and S. Channel. Computer simulations of lipid peroxidation in precision cut mouse liver slices and experimental calibration of the mathematical model. (Presented at the Miami Valley regional meeting of the Society of Toxicology, Cincinnati, 7 October).
Channel, S.R., T. Pravecek, and W.T. Brashear. Metabolism of trichloroethylene in precision-cut human and mouse liver slices, Toxicologist 14: 283, 1994. (Presented at the annual meeting of the Society of Toxicology, Dallas, 13-18 March).
Das, S., J.Z. Byczkowski, and J.W. Fisher. Probability analysis of TCE cancer bioassay data in B6C3F1 mice using PBPK/PBPD modeling: A conceptual framework. (Presented at the annual meeting of the Society of Risk Analysis, Baltimore, 4-7 December).
Gearhart, J.M., H.A. Clewell III, and M.E. Andersen. Identification of metabolic parameters in the B6C3F1 mouse for use in a pharmacokinetic risk assessment for methylene chloride, Toxicologist 14: 114, 1994. (Presented at the annual meeting of the Society of Toxicology, Dallas, 13-18 March).
»41
Jarnot, B.M., C.R. Miller, and M.M. Ketcha. Pharmacokinetics of TCA and DCA in B6C3F1 mice following drinking water exposure, Toxicologist 14: 116, 1994. (Presented at the annual meeting of the Society of Toxicology, Dallas, 13-18 March).
Kinkead, E.R., R.E. Wolfe. S.A. Salins, J.R. Latendresse, DJ. Caldwell, and C.R. Miller. A reproductive toxicity screen of a liquid propellant (LP) formulation administered in the drinking water of Sprague-Dawley rats. (Presented at the annual meeting of the American College of Toxicology, Williamsburg, 23-26 October).
Kinkead, E.R., R.E. Wolfe, S.A. Salins, J.R. Latendresse, D.J. Caldwell, and C.R. Miller. Single- generation reproduction study of 1,3,5-trinitrobenzene administered in the diet of Sprague-Dawley rats. (Presented at the annual meeting of the American College of Toxicology, Williamsburg, 23-26 October).
Kinkead, E.R., R.E. Wolfe, S.A. Salins, C.R. Miller, and J.R. Latendresse. Single-generation reproduction study of 1,3,5-trinitrobenzene in the diet of Sprague-Dawley rats, Toxicologist 14: 161, 1994. (Presented at the annual meeting of the Society of Toxicology, Dallas, 13-18 March).
Kuhlmann, K.J. Smoke production from advanced composite materials. (Presented at a meeting of the American Chemical Society, Washington, D.C., 22-24 August).
Latendresse, J.R., C.C. Capen, and C.L. Brooks. Pathogenesis of cholesteryl lipidosis of ovarian interstitial and adrenocortical cells in F-344 rats caused by triaryl phosphates. (Presented at the Thirty-Fifth Navy Occupational Health and Preventive Medicine Workshop, Virginia Beach, 1 March).
Latendresse, J.R. and G.B. Marit. Oncogenic potential of inhaled hydrazine in rats after a series of one-hour exposures and then held a lifetime. (Presented at the 20th Annual Conference of the American Chemical Society, San Diego, 15-18 March).
Latendresse, J.R., G.B. Marit, and CD. Flemming. Oncogenic potential of inhaled hydrazine in the nose of rats after a series of one-hour weekly exposures. (Presented at the 29th Annual Meeting of the American College of Veterinary Pathologists, Montreal, December).
Lipscomb, J.C., W.T. Brashear, G.W. Buttler, H.A. Barton, and D.A. Mahle. In vitro metabolism of dichloroacetic acid, a trichloroethylene metabolite, ISSX Proceedings 6: 129, 1994. (ISSN 1061- 3439) (Presented at the 6th meeting of the North American International Society for the Study of Xenobiotics, Raleigh, 23-27 October).
Mahle, D.A., W.T. Brashear, and J.C. Lipscomb. Interspecies comparison of trichloroethylene metabolism in vitro, Toxicologist 14: 282, 1994. (Presented at the annual meeting of the Society of Toxicology, Dallas, 13-18 March).
Paika, I.J., G.B. Fitzgerald, D.E. Dodd, and D.J. Caldwell. Mutagenic evaluation of a highly energetic castable explosive chemical: 1,3,3-Trinitroazetidine (TNAZ). (Presented at the 25th annual meeting of the Environmental Mutagen Society, Portland, 7-12 May).
Tocco, D.R., S.A. Salins, R.E. Wolfe, and E.R. Kinkead. Acute and subacute toxicity of ammonium dinitramide. (Presented at JANNAF workshops, Houston, 18-20 April, and San Diego, 1-5 August).
Vinegar, A. Status report on CF3I toxicity. (Presented at the CF3I Working Group meeting at the New Mexico Engineering Research Institute, Albuquerque, 22 August).
242
Vinegar, A. Toxicity summary of Halon 1301 replacement candidates. (Presented at the Halon Replacement Program for Aviation Systems Technology Transition (T2) Team Meeting hosted by the National Institute of Standards and Technology (NIST) at the Gaithersburg Hilton, Gaithersburg, 27- 28 October).
Williams, R.J., A. Vinegar, J.W. Fisher, A.M. Jarabek, and J.N. McDougal. Species extrapolation of 2,2-dichloro-1,1,1-trifluoroethane kinetics: A corollary approach to physiologically based pharmacokinetic modeling, Toxicologist 14: 40, 1994. (Presented at the annual meeting of the Society of Toxicology, Dallas, 13-18 March).
Wolfe, R.E., S.A. Salins, E.R. Kinkead, DJ. Caldwell, C.R. Miller, and G.B. Marit. A reproductive toxicity screen of a liquid propellant (XM46) formulation administered in the drinking water of Sprague-Dawley rats. (Presented at the annual meeting of the American Industrial Hygiene Conference and Exposition, Anaheim, 24 May).
Yu, K.O., A. Burton, S.R. Channel, J.W. Fisher, J. Drerup, and D. Tillitt. Carrier effects of dosing the H4II cells with PCB (3,3',4,4'-tetrachlorobiphenyl) in DMSO or isooctane. (Presented at the meeting of the Society of Environmental Toxicology and Chemistry, Denver, 31 October-2 November).
COLLABORATIVE JOURNAL PUBLICATIONS
Abernathy, F. and E. Pacht. Alteration of ATP and other cellular nucleotides following sublethal oxidant injury to the rat type II alveolar epithelial cells. American Journal of Medical Science, in press.
Abernathy, F. and E. Pacht. Prevention of intracellular ATP depletion following sublethal oxidant injury to the type II alveolar epithelial cells with exogenous glutathione and n-acetyl cysteine. American Journal of Medical Science, submitted.
Barton, H.A. and M.A. Marietta. Comparison of aniline hydroxylation by hemoglobin and microsomal cytochrome P450 using isotopes, Toxicology Letters 70: 147-153, 1994.
Byczkowski, J.Z. and A.P. Kulkarni. Oxidative stress and asbestos. In: Environmental Oxidants, Nriagu, J.O. (ed), John Wiley & Sons, New York, pp. 459-474, 1994.
Dodd, D.E., B.O. Stuart, S.J. Rothenberg, M. Kershaw, P.C. Mann, J.T. James, and C.W. Lam. Acute, 2-week, and 13-week inhalation toxicity studies on dimethylethoxysilane vapor in Fischer 344 rats, Inhalation Toxicology 6: 151-166, 1994.
Joseph, P., S.N. Srinivasan, J.Z. Byczkowski, and A.P. Kulkarni. Bioactivation of benzo(a)pyrene- 7,8-dihydrodiol catalyzed by lipoxygenase purified from human term placenta and conceptual tissues, Reproductive Toxicology 8: 307-313, 1994.
Kulkarni, A.P. and J.Z. Byczkowski. Effects of transition metals on biological oxidations. In: Environmental Oxidants, Nriagu, J.O. (ed), John Wiley & Sons, New York, pp. 475-496, 1994.
Tyl, R.W., B. Ballantyne, L.C. Fisher, D.L. Fait, T.A. Savine, I.M. Pritts, and D.E. Dodd. Evaluation of exposure to water aerosol or air by nose-only or whole-body inhalation procedures for CD-1 mice in developmental toxicity studies. Fundamental and Applied Toxicology 23: 251-260, 1994.
243

APPENDIX C
TOXIC HAZARDS RESEARCH UNIT GUEST SPEAKERS
DATE TITLE PRESENTER
10 December 1993 The Historical Practice of Health Risk Assessment M. Gargas in the United States: How That Experience Can Benefit Local Cleanup Initiatives
14 February 1994 Electrical Analog Models of Plant-Water Relations D. Aim
25 February 1994 Biomathematical Modeling in Life Sciences Research R. Collins
4 May 1994
14 July 1994
1 6 August 1 994
Quality Assurance for Life Science Research
Analytical Chemistry for TCE and Metabolites
Cellular Electrophysiology in Neurotoxicology
1 September 1994 Biologically Based-Dose Response Modeling for TCE and its Metabolites
P. O'Brien Pomerleau
W. Brashear and M. Ketcha
J. Lin
H. Clewell
244
Copyright © 2022 FDOKUMEN