Search for supersymmetry in proton-proton collisions at ... - arXiv
Upload
independentCategory
view
2download
0
Proton-assisted Two-electron Transfer in Natural Variants ofTetraheme Cytochromes from Desulfomicrobium Sp.*
Received for publication, August 2, 2004, and in revised form, September 17, 2004Published, JBC Papers in Press, September 28, 2004, DOI 10.1074/jbc.M408763200
Ilıdio J. Correia‡§, Catarina M. Paquete‡, Ana Coelho‡¶, Claudia C. Almeida‡, Teresa Catarino‡�,Ricardo O. Louro‡, Carlos Frazao‡, Lıgia M. Saraiva‡, Maria Armenia Carrondo‡,David L. Turner‡**, and Antonio V. Xavier‡ ‡‡
From the ‡Instituto de Tecnologia Quımica e Biologica, Universidade Nova de Lisboa, Rua da Quinta Grande 6, 2780-156 Oeiras, §Centro de Investigacao em Ciencias da Saude, Faculdade de Ciencias da Saude, Universidade da BeiraInterior, 6201-001 Covilha, ¶Departamento de Quımica, Universidade de Evora, P-7000 Evora, �Departamento deQuımica, Faculdade de Ciencias e Tecnologia, Universidade Nova de Lisboa, Quinta da Torre, 2829-516 Caparica,Portugal, and **School of Chemistry, University of Southampton, Southampton SO17 1BJ, United Kingdom
The tetraheme cytochrome c3 isolated from Desulfo-microbium baculatum (DSM 1743) (Dsmb) was cloned,and the sequence analysis showed that this cytochromediffers in just three amino acid residues from the cyto-chrome c3 isolated from Desulfomicrobium norvegicum(Dsmn): (DsmnXXDsmb) Thr-373 Ser, Val-453 Ala, andPhe-88 3 Tyr. X-ray crystallography was used to deter-mine the structure of cytochrome c3 from Dsmb, show-ing that it is very similar to the published structure ofcytochrome c3 from Dsmn. A detailed thermodynamicand kinetic characterization of these two tetraheme cy-tochromes c3 was performed by using NMR and visiblespectroscopy. The results obtained show that the net-work of cooperativities between the redox and protoniccenters is consistent with a synergetic process to stim-ulate the hydrogen uptake activity of hydrogenase. Thisis achieved by increasing the affinity of the cytochromefor protons through binding electrons and, reciprocally,by favoring a concerted two-electron transfer assistedby the binding of proton(s). The data were analyzedwithin the framework of the differences in the primaryand tertiary structures of the two proteins, showing thatresidue 88, close to heme I, is the main cause for thedifferences in the microscopic thermodynamic parame-ters obtained for these two cytochromes c3. This com-parison reveals how replacement of a single amino acidcan tune the functional properties of energy-transduc-ing proteins, so that they can be optimized to suit thebioenergetic constraints of specific habitats.
A variety of mechanisms used by nature to perform coupledreactions, a fundamental requirement for energy transduction
processes, can now be established in detail for relatively smallmacromolecules that can couple the transfer of electrons andprotons.
The tetraheme cytochrome c3 is found in all organisms be-longing to the Desulfovibrionaceae family as well as in othersulfate-reducing bacteria including Desulfomicrobium (Dsm)species, where it is produced in large quantities (1). It is asoluble protein of low molecular weight, with the c-type hemescovalently bound to the polypeptide chain by two thioetherbridges provided by cysteine residues arranged in the typical-CXX(XX)CH-heme binding sequences, and axially coordinatedby two histidines.
Recently, tetraheme cytochromes c3 have been classified astype I and type II (2), and the Dsm cytochromes studied in thiswork have mixed characteristics of both types. Like type I,these cytochromes have a heme-binding site of type-CXXXXCH-, acidic residues around heme I, and long N- andC-terminal regions. However, the region of positive chargessurrounding heme IV, which is characteristic of type I cyto-chromes c3, is not well defined in these cytochromes.
The close proximity of the hemes in cytochrome c3 results inhomotropic redox cooperativities. Furthermore, their reductionpotentials are very negative and pH-dependent in the physio-logical range (redox-Bohr effect) (3, 4). Together, these proper-ties allow cytochromes c3 to couple the transfer of electrons andprotons (5), which for type I cytochrome c3 (2) is fundamentalfor its physiological function as partner of the periplasmichydrogenase (6, 7). The Desulfomicrobium norvegicum (Dsmn)cytochrome c3 has been proposed to be involved in electrontransfer between the [NiFeSe] hydrogenase and the octahemecytochrome c3 (8) in a similar way as that for type I and type IIcytochromes c3 from Desulfovibrio africanus (2).
Recent studies allowed the identification of the key residuesinvolved in homotropic and/or heterotropic cooperativities intype I cytochromes c3 from Desulfovibrio gigas (Dg) (9) andDesulfovibrio vulgaris Hildenborough (DvH) (10, 11). Site-di-rected mutagenesis studies were used to further probe the roleof some specific residues in the modulation of the redox prop-erties of these proteins (12–14). In these cytochromes an anti-electrostatic (conformationally mediated)-positive homotropiccooperativity between two hemes governs a coordinated two-electron transfer, whereas a positive redox-Bohr effect controlstheir proton thrusting activity. Subsequent characterization ofthe cytochrome c3 from Desulfovibrio desulfuricans ATCC27774 (15, 16) illustrated yet another mechanism to facilitate acoordinated two-electron transfer even when there are no pos-itive homotropic redox cooperativities. This alternative mech-
* This work was supported by Fundacao para a Ciencia e TecnologiaContracts POCTI/1999/BME/35021, POCTI/2001/QUI/43435, andPOCTI/2002/QUI/47866 and Doctoral Fellowships BD/19870/99 (toI. J. C.) and SFRH/BD/6495/2001 (to C. M. P.). The costs of publicationof this article were defrayed in part by the payment of page charges.This article must therefore be hereby marked “advertisement” in ac-cordance with 18 U.S.C. Section 1734 solely to indicate this fact.
The atomic coordinates and structure factors (code 1w7o) have beendeposited in the Protein Data Bank, Research Collaboratory for Struc-tural Bioinformatics, Rutgers University, New Brunswick, NJ(http://www.rcsb.org/).
The nucleotide sequence(s) reported in this paper has been submittedto the GenBankTM/EBI Data Bank with accession number(s) AY240938.
‡‡ To whom correspondence should be addressed. Tel.: 351-214469821; Fax: 351-214428766; E-mail: [email protected].
1 The abbreviations used are: Dsmb, Desulfomicrobium baculatum(DSM 1743); Dsmn, Desulfomicrobium norvegicum; DvH, Desulfovibriovulgaris (Hildenborough); EXSY, NMR exchange spectroscopy.
THE JOURNAL OF BIOLOGICAL CHEMISTRY Vol. 279, No. 50, Issue of December 10, pp. 52227–52237, 2004© 2004 by The American Society for Biochemistry and Molecular Biology, Inc. Printed in U.S.A.
This paper is available on line at http://www.jbc.org 52227
by on August 29, 2006
ww
w.jbc.org
Dow
nloaded from
anism is achieved by the concerted effect of two positive redox-Bohr effects governing a proton-assisted coordinated two-electron transfer. Furthermore, these positive redox-Bohreffects are also responsible for the proton thrusting activity ofthis cytochrome (17).
Tetraheme cytochromes c3 from Dsm were isolated from or-ganisms that live in different habitats. D. norvegicum (Dsmn)(18) was isolated in a pure culture from a saltwater samplefrom Oslo harbor (19), and Desulfomicrobium baculatum (DSM1743) (Dsmb) was isolated from the mud of the Kujalnik estu-ary near Odessa and Lake Saksky (Crimea) (20) as part of asymbiotic consortium with a green sulfur bacterium (21). How-ever, these two strains have virtually identical 16 S ribosomalRNAs (18), indicating a very close evolutionary proximity. Inline with this observation, these Dsm cytochromes c3 have ahighly similar primary structure, with Thr-37, Val-45, andPhe-88 in the cytochrome c3 from Dsmn being substituted bySer, Ala, and Tyr, respectively, in the cytochrome c3 fromDsmb. Also, as shown in this work, its three-dimensional struc-ture, determined by x-ray crystallography, is almost identicalto that of Dsmn (22). Nevertheless, as might be expected fromthe difference in habitat, their microscopic thermodynamicproperties are different.
The study of closely similar proteins, such as the naturalvariants of cytochromes c3 from Dsmn and Dsmb, presents theadvantage of probing modifications in the primary sequencethat are obviously compatible with the maintenance of func-tion. Thus, it may help to characterize the biological factorsrelevant to the evolution of the protein function.
MATERIALS AND METHODS
Structure Determination of Cytochrome c3 from Dsmb
Crystallization—The conditions that successfully crystallized cyto-chrome c3 from Dsmn (23) did not induce any crystals of cytochrome c3
from Dsmb, which was crystallized in 25% PEG6K at a pH between 7.5and 8.0 using Tris/HCl, 0.1 M as buffer. Thin needles of cytochrome c3
from Dsmb were obtained using the hanging-drop vapor diffusionmethod. Thicker crystals were obtained when the hanging-drop tech-nique was substituted by the batch technique, which improved theintensity and resolution of the diffraction pattern. Cytochrome c3 fromDsmb crystallizes in the trigonal space group P31, with cell parametersa � 43.0 Å, b � 43.0 Å, and c � 64.7 Å, with one molecule in theasymmetric unit and a solvent content of 53.3%.
Data Collection—Room temperature diffraction data were collectedon a MAR Research detector at station 9.5 at the SRS, CCLRC Dares-bury Laboratory, Warrington, UK, using a wavelength of 0.99 Å. Thediffraction images were processed and scaled by programs DENZO andSCALEPACK (24); structure factor magnitudes were calculated withthe CCP4 package (25). The statistics of the data processing are sum-marized in Table I.
Structure Determination and Refinement—The structure of cyto-chrome c3 from Dsmb was solved by molecular replacement using theprogram AMoRe (26) with the 1.7-Å structure of the cytochrome c3 fromDsmn (22) as a search model. A clear solution with a correlation coef-ficient of 59.6% and an R factor of 34.0% was found.
The first refinement steps, including rigid body minimization, sim-ulated annealing, and a gradual refinement of B factors, were per-formed with X-PLOR (27) using the molecular replacement solution anddata to 1.8 Å. The calculated R factor at that point was 26.9%. A furtherstage of refinement was carried out using SHELXL-96 (28) using a
restrained conjugated gradient weighted least squares procedure on F2.During each cycle of refinement a free R factor (29) was calculated from8% of the input 11633 reflections. Following each refinement run,2m�Fo� � D�Fc� and m�Fo� � D�Fc� electron density maps were calculatedand inspected on a graphics workstation using TURBO software (30) toadjust incorrect side chain positions to the electron density, to check forpreviously unseen side chain atoms, and to add water molecules to themodel. The criteria followed throughout for including a water moleculewere that the corresponding peak should be visible on both the 2m�Fo� �D�Fc� and m�Fo� � D�Fc� Fourier maps, and there should be at least onehydrogen bond (between 2.5 and 3.2 Å). The heme irons were refinedanisotropically. The main chain positions of loop residues Lys-21 andGly-22 were not clear, so an omit map was calculated and used forrebuilding the loop. As a result of this procedure the R factor waslowered to 16.4% and the final free R value to 23.2%. The large differ-ence between the two R factors suggested the existence of severe bias inthe refined model.
NMR data had shown that Phe-88 was substituted by a Tyr (31), butthe sequencing of the cytochrome c3 gene, which was finished only whenthe refinement process was started, showed two more differences,Thr-37 and Val-45. Those mutations were introduced in the model andrefinement continued with REFMAC version 5.1.24 (32). This programuses maximum likelihood implementation, described as a good tool forimproving the diffraction information quality all over the structure. Thefinal refinement statistics are presented in Table II. The refined coor-dinates and structures factors have been deposited at the Protein DataBank with the accession code 1w7o.
Cloning and Sequencing of the Dsmb Cytochrome c3 Gene
Standard protocols were used for DNA manipulation (33). The N-terminal sequence of the first 29 residues of Dsmb cytochrome c3 wasfound to be identical to the residues of cytochrome c3 from Dsmn. Hence,based on the amino acid sequence available and assuming that theC-terminal sequences of the two cytochromes are also identical, twodegenerate oligonucleotides were designed: 5�GAYGCVCCSGGBGAY-GAYTAYG-3� and 5�RTTSGTSGTRTGRCACTTVCC-3�. By using theseprimers, Pfu polymerase (Stratagene) amplified a 351-bp DNA se-quence from the Dsmb genomic DNA. The reaction product was clonedinto EcoRV cut pZErOTM-1 (Invitrogen) vector and transformed intocompetent cells of Escherichia coli XL-2 Blue (Stratagene). Recombi-nant plasmids were isolated, sequenced on both strands with the ABIPrism BigDye Terminator Cycle Sequencing Ready Reaction kit (PEBiosystems), and analyzed on an Applied Biosystems 377A DNASequencer.
Thermodynamic Studies
Sample Preparation—Cytochromes c3 from Dsmn and Dsmb werepurified as described previously (1), and the NMR samples were pre-pared at a concentration of 0.5 mM. The ionic strength of the sampleswas set to �360 mM through the addition of a concentrated solution ofKCl in D2O to reduce the intermolecular electron transfer rate. The pHof the sample was adjusted for each experiment by adding small vol-umes of concentrated solutions of DCl and NaOD inside an anaerobicglove box. The pH values reported were not corrected for the isotopeeffect (34) and cover the range of 4.8–9.6 in Dsmn and 4.5–8.8 in Dsmb.The reduced and intermediate oxidation states of the protein wereobtained by the method described previously (35), using catalytic
TABLE ISummary of data processing statistics
Nominal resolution range (Å) 21.50–1.81No. observations 22,339No. unique reflections 11,633Completeness (%) 94.4 (80.0)a
Multiplicity 1.9 (1.7)a
Merging R factor (%) 8.0 (18.3)a
�I�/��(I)� 9.1 (3.0)a
Wilson B value 31.0 Å2
a Values in parentheses refer to the outer resolution shell 1.88–1.80 Å.
TABLE IIFinal refinement statistics summary
Resolution limits (Å) 21.50–1.81Final free R factor (%) 19.1Final R factor (%) 17.6
No. reflections usedWorking set 10,752Test set 876
No. non-hydrogen protein atoms 1049No. solvent molecules 72Model r.m.s. deviations from idealitya
Bond lengths (Å) 0.02Bond angles (°) 1.84
a Root mean square (r.m.s.) � square root of (sum(Geomideal �Geommodel)
2/Nrestraints), where Geomideal is the ideal value for the geo-metric parameter taken from the dictionary, Geommodel is the value ofthe geometric parameter calculated from the current model, andNrestraints is the number of restraints for this particular geometricparameter, over which the summation runs.
Proton-assisted Two-electron Transfer in Cytochromes52228
by on August 29, 2006
ww
w.jbc.org
Dow
nloaded from
amounts of the periplasmic iron hydrogenase isolated from DvH underan H2 atmosphere as electron donor.
NMR Spectroscopy—Two-dimensional 1H NMR spectra were ob-tained on a Bruker DRX-500 spectrometer equipped with a 5-mm in-verse detection probe with an internal B0 gradient coil and a BVT3000temperature controller. The temperature of the samples was kept at297.0 � 0.1 K.
The EXSY spectra were acquired with a mixing time of 25 ms and asweep width of 35 kHz (in both dimensions). The spectra were processedwith 1024 � 1024 data points using a Gaussian function in F2 and sinebell function in F1. They were calibrated using Tris as internal refer-ence, with the pH-dependent chemical shift of Tris calibrated sepa-rately against 2,2-dimethyl-2-silapentanesulfonic acid.
Redox Titrations Followed by Visible Spectroscopy—The redox titra-tions of both cytochromes were performed at 297.0 � 1.0 K using anadaptation of the method described previously (15) using �80 �M pro-tein solutions in 360 mM Tris/maleic acid buffer, pH 6.0, 7.0, and 8.0.The high protein concentration required the use of an optical cell with1-mm path length to acquire the data. The redox mediators were chosenaccording to the procedures defined in the literature (36, 37). A mixtureof anthraquinone 2-sulfonate (Aldrich), diquat (Riedel den Haan), in-digo disulfonate (Merck), indigo trisulfonate (Sigma), methyl viologen(Sigma), neutral red (Sigma), and safranine O (Sigma) was used in allthree experiments. In addition to the previous list, gallocyanine(Sigma), 2-hydroxy-1,4-naphthoquinone (Aldrich), indigo tetrasulfonate(Aldrich), and methylene blue (Sigma) were also used at pH 8. At pH 7,anthraquinone 2,7-disulfonate (Aldrich), benzyl viologen (Sigma), 2-hy-droxy-1,4-naphthoquinone (Aldrich), indigo tetrasulfonate (Aldrich),and phenosafranine (BDH) were also used, whereas at pH 6 anthraqui-none 2,7-disulfonate (Aldrich) and phenosafranine (BDH) were added tothe basic mixture of mediators. The final concentration of each mediatorwas between 4 and 7 �M. To ensure that the results were not subject tointerference resulting from specific interactions between the proteinand the mediators, several ratios of protein versus mediator weretested. A combined Pt/Ag/AgCl electrode was used for measuring thesolution potential/ and the reported values are relative to the standardhydrogen electrode.
Kinetic Studies
Sample Preparation—Stock solutions of cytochromes c3 from Dsmnand Dsmb were degassed with alternate cycles of argon and vacuum inorder to remove the dissolved oxygen and placed in an anaerobic cham-ber. Dilutions to the desired concentrations were made using 100 mM
Tris maleate, pH 5.9, 7.1, and 8.4 for cytochrome c3 of Dsmn and at pH5.9, 7.2, and 8.4 for cytochrome c3 of Dsmb. The ionic strength was setto �360 mM through the addition of KCl. After each experiment theactual pH of the reaction was measured, and the concentration of theproteins was determined by UV-visible spectroscopy using �552 �120,000 M�1 cm�1.
Sodium dithionite was used as the reducing agent. A large excess ofthis reagent was used to guarantee pseudo-first order kinetics, irrevers-ible electron transfer steps, and the complete reduction of the cyto-chrome at every pH value. In order to obtain 95% pure material, thereducing agent was recrystallized inside an anaerobic glove box accord-ing to the method described in the literature (38). The solution ofsodium dithionite was obtained by adding solid sodium dithionite todegassed 10 mM Tris maleate buffer, pH 8.5, with 360 mM KCl, insidethe anaerobic chamber, to give approximately the final desired concen-tration. The actual concentration of the reducing agent was determinedafter the experiment, by UV-visible spectroscopy inside the anaerobicchamber, using �314 � 8,000 M�1 cm�1 (39).
Data Collection—The kinetic data were obtained using a stopped-flow instrument (SF-61 HI-TECH Scientific), placed inside an anaerobicchamber. The traces were acquired at 552 nm, and the temperature wasmaintained at 298.0 � 1.0 K by the use of an external circulating bath.To perform rapid mixing kinetic experiments starting with variousdegrees of reduction of the protein sample, a few microliters of concen-trated sodium dithionite solution were added to the protein solutionsbefore running the experiments.
Shots of the protein against potassium ferricyanide were made inorder to get the reference value for ODox. To obtain the reference valuefor ODred, the final absorbance was taken at effectively infinite timeafter each experiment.
The kinetic curves obtained at different values of solution pH werenormalized in order to report oxidized fraction versus time. The time scaleof the traces was corrected to account for the dead time of the apparatus.
Thermodynamic and Kinetic Modeling—In the redox titrations fol-
lowed by NMR spectroscopy, the resonance positions and the linewidths of one methyl group resonance from each heme were followed indifferent stages of oxidation, defined by the number of oxidized hemesin the molecule from 0 (fully reduced) to 4 (fully oxidized), and atdifferent pH values. The heme methyl groups M181 I, M181 II, M121 III,and M181 IV (IUPAC-IUB nomenclature is used to identify the methylgroups and the hemes are indicated by roman numbers according to theorder of attachment to the polypeptide chain) were chosen because theypoint toward the protein surface. Thus, their chemical shifts includeonly a small extrinsic paramagnetic contribution from the oxidation ofthe other hemes, which nevertheless was corrected on the basis ofcalculations using the information from magnetic susceptibility tensors,according to the methods previously described (40–42). After this cor-rection the paramagnetic chemical shift of any heme substituent, ineach oxidation stage, is a weighted average of the populations that havethis particular heme oxidized in that oxidation stage.
The data obtained by NMR, visible, and stopped-flow kinetics werefitted simultaneously to a thermodynamic model (4, 43) and to a kineticmodel (44). The thermodynamic and kinetic models are applicable tosystems in fast intramolecular electron transfer and slow intermolecu-lar electron transfer in the time scale of the experiments (3, 44).
Based on the NMR data it is only possible to establish the relativeorder of oxidation of the hemes, because the solution potential was notmeasured inside the NMR tube. The calibration of the heme potentials,the heme-heme interactions, and of the redox-Bohr effect was achievedthrough the redox titrations followed by visible spectroscopy, performedat different pH values.
The kinetic model makes use of the thermodynamic parameters toobtain information on the rate constants for the reduction of the indi-vidual hemes. Each heme is characterized by a reference rate constant(ki
0) that accounts for differences in binding, accessibility to the electrondonor, and other structural factors, and it is assumed that this refer-ence constant does not change throughout the reduction process. Theactual 64 microscopic rate constants are the product of the referenceconstant of the heme that is being reduced in a particular microstep anda factor �i (Equation 1), derived from Marcus theory (45) that accountsfor the thermodynamic driving force (G) of the electron transfer proc-ess in that microstep:
�i � exp � eiF2RT�1 �
eDF�
�eiF2��
�� (Eq. 1)
Here, ei is the reduction potential of center i in a particular microstep;eD is the midpoint potential of the electron donor (SO2
�), �0.3 V, whichis pH-independent (44, 46); and � is the reorganization energy, assumedto be constant and estimated to be 1 eV (47).
In proteins with intramolecular electron exchange faster than theintermolecular electron transfer from the electron donor, the distribu-tion of electrons inside the multicenter protein is thermodynamicallycontrolled, and it can be considered to equilibrate instantaneously aftereach one-electron reduction step (44). Therefore, the shape of the kineticcurves contains information about the reduction potentials of the redoxcenters and their interactions.
The Marquardt method was used to optimize the parameters. Thehalf-height line widths of the NMR signals were used as an estimate ofthe uncertainty of each chemical shift. The total amplitude of the opticalsignal in the visible titrations and kinetic experiments were consideredto have experimental errors of 3 and 5%, respectively. In addition to thethermodynamic parameters and the four reference rate constants, thechemical shifts for the fully oxidized signals in the deprotonated andprotonated forms and the normalization of the visible curves were alsooptimized (15).
The thermodynamic and kinetic parameters were obtained by thesimultaneous fit of thermodynamic and kinetic data. Fitting only theNMR and visible data did not change the thermodynamic parameterssignificantly (results not shown), showing that the data sets are consistentwith the model. However, the simultaneous fit of the NMR, visible, andkinetic data increases the precision of the thermodynamic parameters.Thus, the pH dependence of the kinetic data improved the definition of thepKa of the acid-base center and the redox-Bohr interactions.
RESULTS
Cloning and Sequencing of the Dsmb Cytochrome c3 Gene—The complete nucleotide sequence of Dsmb cytochrome c3 wasdeposited in the EMBL/GenBankTM sequence data base underthe accession number AY240938. The amino acid sequencederived from the gene sequence showed that, in fact, the tet-
Proton-assisted Two-electron Transfer in Cytochromes 52229
by on August 29, 2006
ww
w.jbc.org
Dow
nloaded from

raheme cytochromes c3 from Dsmb and Dsmn are highly ho-mologous, and only three residues (out of 118) were found to bedifferent: (DsmnXXDsmb) Thr-37 3 Ser, Val-45 3 Ala, andPhe-88 3 Tyr.
Analysis of X-ray Structure—The Rfree/R ratio determinedusing the final REFMAC refinement values of the structure is1.08. This value is within the expected range for the number ofatoms, refined parameters, and reflections used in a 1.8-Åresolution refinement (48).
The PROCHECK software package (49) was used to analyzethe stereochemical quality of the model, and all parameterswere found to be within their confidence intervals. In the Ra-machandran plot (50) for the refined model of this polypeptide,no residue lies outside the normally allowed regions for non-glycine and non-proline residues, 11.1% lie in the additionalallowed regions, and all the others (88.9%) lie in the mostfavored regions. The �, � plots for proline and glycine residuesindicate that only Pro-35 presents unusual �, � conformation.This residue is positioned between cytochrome c3 conservedresidues Phe-34 and His-36 at the beginning of a small helixregion. The electron density map is well defined for that regionof the structure. The calculated model G factor, 0.0, is withinthe normal range for 1.8-Å resolution structures. The disper-sion precision indicator was estimated as 0.143 Å (51).
A good connectivity was found for the whole structure, exceptfor the 20–26 external loop. In the final Fourier maps, it wasnot possible to locate the side chain atoms of some residues;therefore, these atoms were included in the model with zerooccupancy. Almost all residues in this situation have long sidechains and are located at the protein surface.
The highest main chain B factors correspond to mobile loopregions, and the highest side chain B factors correspond to longside chain residues located on the protein surface. The averageB factor for all protein atoms is 28.1 Å2; the solvent moleculeshave an average B factor of 35.4 Å2, and the heme groups havean average of 21.4 Å2. The amino acid sequence differencesbetween cytochrome c3 from Dsmn and from Dsmb becameevident during the refinement.
Comparison with the Structure of Cytochrome c3 fromDsmn—Cytochromes c3 from Dsmb and from Dsmn, whichhave only three amino acid residues different, present verysimilar structures. The root mean square of the main chain,and all atom coordinate deviations, calculated after superpos-ing both main chain structures are 0.265 and 0.605 Å, respec-tively. The largest main chain deviation occurs for loop 20–26,an external loop in a solvent channel without any packinginteractions. Other main chain deviations and side chain devi-ations occur mainly for surface residues.
The intramolecular iron-iron distances and the interplanarangles for the heme porphyrin rings, the hydrogen-bondingschemes of the heme-coordinating histidine residues, and theangle between the planes of their imidazole rings of cytochromec3 from Dsmb are very similar to those observed for cytochromec3 from Dsmn.
The relative solvent accessibility to the heme groups wascalculated using X-PLOR and the Lee and Richards algorithm(52) with an H2O probe radius of 1.6 Å. First, the solvent-accessible surface was calculated for each residue in the struc-ture; next the same calculation was performed for the sameresidue, in the same conformation as in the molecule but iso-lated from the rest of the structure. The ratio of these twovalues for each residue is its relative solvent accessibility.Comparing these results with those obtained for cytochrome c3
from Dsmn in a similar calculation, it can be seen that allvalues are very similar, as expected. The larger difference is forheme II, where propionate 13 has a completely different con-
formation from that found in cytochrome c3 from Dsmn. Incytochrome c3 from Dsmb, O1D is H-bonded to a water mole-cule that interacts with His-49 N-�1 and Lys-97 N-. Thisconformation of propionate 13 induces a different conformationin the side chain of Ile-81; no interactions are observed for O1Dof propionate 13 of heme II from Dsmn cytochrome c3.
In cytochrome c3 from Dsmb Ser-37 C- and O-� positionssuperimpose with cytochrome c3 from Dsmn Thr-37 C- andO-�1 positions, and in cytochrome c3 from Dsmb Ala-45 substi-tutes another non-polar residue, Val-45, localized at the proteinsurface in a solvent channel. In both cases, no significant struc-tural differences were noticed. However, the replacement ofPhe-88 by a polar residue in cytochrome c3 from Dsmb allowsthe establishment of two additional H-bonds, between Tyr-88OH, a water molecule, and an oxygen atom of propionate 13 ofheme I. Lys-60 side chain adopts a different conformation, andthe N- is H-bonded to propionate 17 oxygen atoms in Dsmb,instead of propionate 13. Although the crystallization condi-tions of the two proteins are different, they are not expected tolead to the observed differences in the hydrogen bonding net-work because the pH values were similar and above the func-tional pKa values (see below). Fig. 1 shows the H-bondingnetwork involving the propionates of heme I, Tyr-8, Tyr-88,and Lys-60.
Thermodynamic and Kinetic Properties—The proteins stud-ied in this work, cytochromes c3 from Dsmn and Dsmb (bothwith pI �7), present a small formal charge in a wide range ofpH values around neutrality, which facilitates a close contactamong different molecules in solution and increases the inter-molecular electron exchange rate (31). As a consequence, pre-vious redox titrations followed by NMR spectroscopy of thesetwo proteins were performed in conditions of intermediate tofast intermolecular electronic exchange on the NMR time scale(31, 53), which only allowed the determination of macroscopicthermodynamic parameters. A different set of macroscopicthermodynamic parameters was obtained through EPR studies
FIG. 1. Propionate interactions of heme I in cytochrome c3from Dsmb and Dsmn structures. The distance between Tyr-8 OHand O2A is 2.61 Å for both structures. The additional interactionobserved in cytochrome c3 from Dsmb structure is established betweenTyr-88 OH and O2D (distance 2.56 Å). Drawings were made with Pymolsoftware (DeLano Scientific, San Carlos, CA).
Proton-assisted Two-electron Transfer in Cytochromes52230
by on August 29, 2006
ww
w.jbc.org
Dow
nloaded from
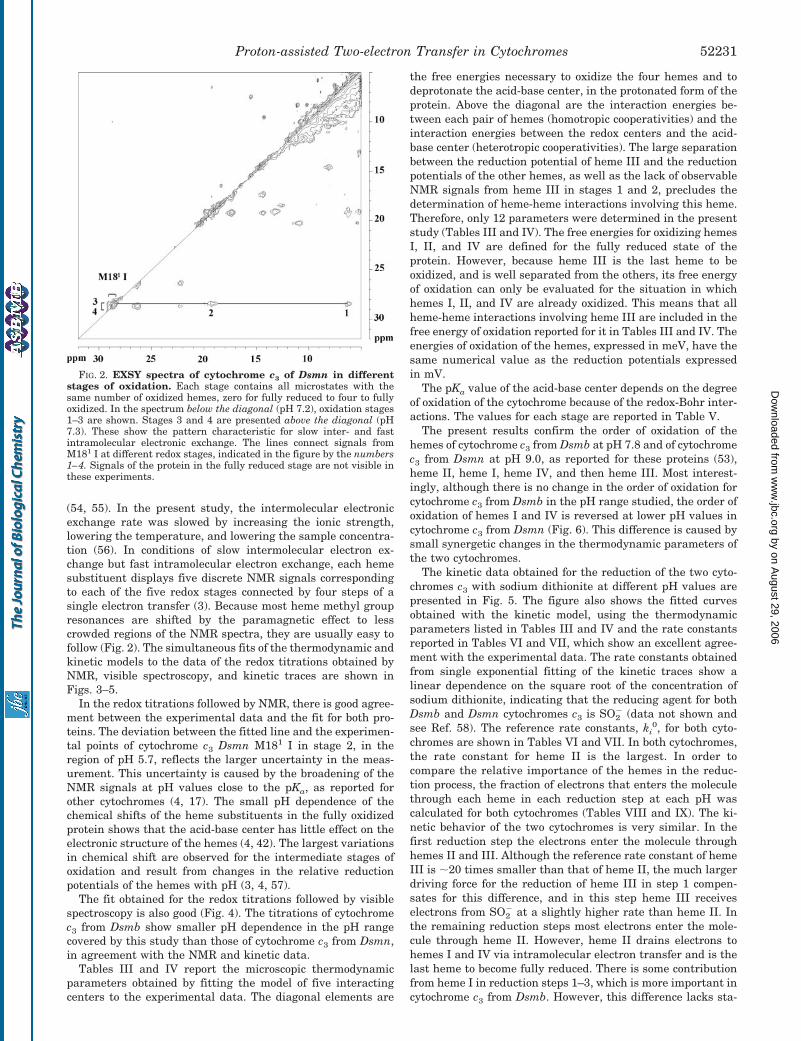
(54, 55). In the present study, the intermolecular electronicexchange rate was slowed by increasing the ionic strength,lowering the temperature, and lowering the sample concentra-tion (56). In conditions of slow intermolecular electron ex-change but fast intramolecular electron exchange, each hemesubstituent displays five discrete NMR signals correspondingto each of the five redox stages connected by four steps of asingle electron transfer (3). Because most heme methyl groupresonances are shifted by the paramagnetic effect to lesscrowded regions of the NMR spectra, they are usually easy tofollow (Fig. 2). The simultaneous fits of the thermodynamic andkinetic models to the data of the redox titrations obtained byNMR, visible spectroscopy, and kinetic traces are shown inFigs. 3–5.
In the redox titrations followed by NMR, there is good agree-ment between the experimental data and the fit for both pro-teins. The deviation between the fitted line and the experimen-tal points of cytochrome c3 Dsmn M181 I in stage 2, in theregion of pH 5.7, reflects the larger uncertainty in the meas-urement. This uncertainty is caused by the broadening of theNMR signals at pH values close to the pKa, as reported forother cytochromes (4, 17). The small pH dependence of thechemical shifts of the heme substituents in the fully oxidizedprotein shows that the acid-base center has little effect on theelectronic structure of the hemes (4, 42). The largest variationsin chemical shift are observed for the intermediate stages ofoxidation and result from changes in the relative reductionpotentials of the hemes with pH (3, 4, 57).
The fit obtained for the redox titrations followed by visiblespectroscopy is also good (Fig. 4). The titrations of cytochromec3 from Dsmb show smaller pH dependence in the pH rangecovered by this study than those of cytochrome c3 from Dsmn,in agreement with the NMR and kinetic data.
Tables III and IV report the microscopic thermodynamicparameters obtained by fitting the model of five interactingcenters to the experimental data. The diagonal elements are
the free energies necessary to oxidize the four hemes and todeprotonate the acid-base center, in the protonated form of theprotein. Above the diagonal are the interaction energies be-tween each pair of hemes (homotropic cooperativities) and theinteraction energies between the redox centers and the acid-base center (heterotropic cooperativities). The large separationbetween the reduction potential of heme III and the reductionpotentials of the other hemes, as well as the lack of observableNMR signals from heme III in stages 1 and 2, precludes thedetermination of heme-heme interactions involving this heme.Therefore, only 12 parameters were determined in the presentstudy (Tables III and IV). The free energies for oxidizing hemesI, II, and IV are defined for the fully reduced state of theprotein. However, because heme III is the last heme to beoxidized, and is well separated from the others, its free energyof oxidation can only be evaluated for the situation in whichhemes I, II, and IV are already oxidized. This means that allheme-heme interactions involving heme III are included in thefree energy of oxidation reported for it in Tables III and IV. Theenergies of oxidation of the hemes, expressed in meV, have thesame numerical value as the reduction potentials expressedin mV.
The pKa value of the acid-base center depends on the degreeof oxidation of the cytochrome because of the redox-Bohr inter-actions. The values for each stage are reported in Table V.
The present results confirm the order of oxidation of thehemes of cytochrome c3 from Dsmb at pH 7.8 and of cytochromec3 from Dsmn at pH 9.0, as reported for these proteins (53),heme II, heme I, heme IV, and then heme III. Most interest-ingly, although there is no change in the order of oxidation forcytochrome c3 from Dsmb in the pH range studied, the order ofoxidation of hemes I and IV is reversed at lower pH values incytochrome c3 from Dsmn (Fig. 6). This difference is caused bysmall synergetic changes in the thermodynamic parameters ofthe two cytochromes.
The kinetic data obtained for the reduction of the two cyto-chromes c3 with sodium dithionite at different pH values arepresented in Fig. 5. The figure also shows the fitted curvesobtained with the kinetic model, using the thermodynamicparameters listed in Tables III and IV and the rate constantsreported in Tables VI and VII, which show an excellent agree-ment with the experimental data. The rate constants obtainedfrom single exponential fitting of the kinetic traces show alinear dependence on the square root of the concentration ofsodium dithionite, indicating that the reducing agent for bothDsmb and Dsmn cytochromes c3 is SO2
� (data not shown andsee Ref. 58). The reference rate constants, ki
0, for both cyto-chromes are shown in Tables VI and VII. In both cytochromes,the rate constant for heme II is the largest. In order tocompare the relative importance of the hemes in the reduc-tion process, the fraction of electrons that enters the moleculethrough each heme in each reduction step at each pH wascalculated for both cytochromes (Tables VIII and IX). The ki-netic behavior of the two cytochromes is very similar. In thefirst reduction step the electrons enter the molecule throughhemes II and III. Although the reference rate constant of hemeIII is �20 times smaller than that of heme II, the much largerdriving force for the reduction of heme III in step 1 compen-sates for this difference, and in this step heme III receiveselectrons from SO2
� at a slightly higher rate than heme II. Inthe remaining reduction steps most electrons enter the mole-cule through heme II. However, heme II drains electrons tohemes I and IV via intramolecular electron transfer and is thelast heme to become fully reduced. There is some contributionfrom heme I in reduction steps 1–3, which is more important incytochrome c3 from Dsmb. However, this difference lacks sta-
FIG. 2. EXSY spectra of cytochrome c3 of Dsmn in differentstages of oxidation. Each stage contains all microstates with thesame number of oxidized hemes, zero for fully reduced to four to fullyoxidized. In the spectrum below the diagonal (pH 7.2), oxidation stages1–3 are shown. Stages 3 and 4 are presented above the diagonal (pH7.3). These show the pattern characteristic for slow inter- and fastintramolecular electronic exchange. The lines connect signals fromM181 I at different redox stages, indicated in the figure by the numbers1–4. Signals of the protein in the fully reduced stage are not visible inthese experiments.
Proton-assisted Two-electron Transfer in Cytochromes 52231
by on August 29, 2006
ww
w.jbc.org
Dow
nloaded from

tistical significance because the standard errors associatedwith the reference rate constants of heme I are very large.
The central assumption of the kinetic model, that the
changes in the rate constants for electron transfer are deter-mined by variations in the driving force, is tested most clearlyin relation to the pH dependence of the rates. The fact that
FIG. 3. pH dependence of the 1H chemical shifts of one methyl group from each of the four hemes of cytochrome c3 from Dsmn (A)and from Dsmb (B), in different stages of oxidation at 297 � 0.1 K. Stages of oxidation 1–4 are represented by the symbols as follows: stage1, �; stage 2, E; stage 3, ƒ; and stage 4, ‚. The full lines represent the best fit of the data to the model of the five charged centers (Tables III andIV). The chemical shifts for stage 1 and 2 of M121 III were not determined because they could not be identified unequivocally in the crowdeddiamagnetic region of the spectra.
Proton-assisted Two-electron Transfer in Cytochromes52232
by on August 29, 2006
ww
w.jbc.org
Dow
nloaded from
simultaneous fitting of thermodynamic and kinetic data did notchange the values of the thermodynamic parameters obtainedfrom fitting the thermodynamic data alone shows that the dataare consistent with the model.
The relative accessibility of the hemes to the reducing agent,which can be determined from the crystal structure, is one ofthe factors that may influence the reference rate constants.This was calculated on the basis of the surface accessibility ofthe heavy atoms of the porphyrin to a sphere of radius of 2.5 Å,assuming that the contribution of the �-substituents have 10times less weight than those of the macrocycle. The valuesobtained for the two cytochromes are presented in Tables Xand XI.
The exposure of the hemes to the reducing agent appears tobe the most important factor in determining which heme actsas the main gate for entrance of electrons in these proteins,when using dithionite as the reducing agent. In both cyto-chromes, heme II is the most exposed (Tables X and XI) and isthe heme with the larger reference rate constant. Nevertheless,the absence of a direct relationship between the relative acces-sibilities and the values of the reference rate constants of thedifferent hemes shows that accessibility is not the only struc-tural factor controlling the rates, as would be expected becausethe reducing agent is a small charged molecule.
Because the experimental conditions of the kinetic experi-ments were the same and the two proteins studied are almostidentical structurally, the reference rate constants of the twoproteins should be very similar, and this is confirmed by theresults (Tables VI and VII).
DISCUSSION
Structural Interpretation of the Thermodynamic Properties—The redox parameters presented in Tables III and IV show thatheme II has the lowest reduction potential in both proteins,which correlates with the largest solvent exposure (22). HemesI and IV of both cytochromes c3 have similar reduction poten-tials. Heme III, which is partly shielded from the solvent by thepolypeptide chain, has the highest midpoint reduction poten-tial, well separated from those of the other three hemes.
The polypeptide chains of the two proteins differ only bythree amino acid residues, in positions 37, 45, and 88. In bothcases, the side chains of the amino acid residues in positions 37and 45 are pointing toward the surface of the protein and arerelatively far from the hemes and the acid-base center involvedin the redox-Bohr effect (see Ref. 22 and present work). Con-sequently, these residues should have a negligible effect incontrolling the redox and acid-base properties of any of thecenters. In contrast, the only non-neutral mutation, residue 88that is a Phe in the cytochrome from Dsmn and a Tyr in thecytochrome from Dsmb, is buried in the interior of the proteinclose to heme I. The reduction potentials of the hemes incytochrome c3 from Dsmb are more negative than those ofDsmn, with heme I displaying the larger difference, 37 mV,compared with differences around 20 mV for the other threehemes (Tables III and IV). The more negative reduction poten-tials in Dsmb may be a consequence of the stabilization of thecharged form of the hemes (the oxidized one) in the more polarenvironment of the Tyr 88 hydroxyl group, which makes thereduction of this cytochrome more difficult. The location ofTyr-88 close to heme I is compatible with the larger differenceobserved for the reduction potential of this heme.
The heme-heme interactions are all anticooperative (positivefree energies). Their values are very similar in the two cyto-chromes, as expected, given the high degree of structural sim-ilarity between the two proteins.
The redox and acid-base centers display positive cooperativi-ties (negative free energies). All interactions are well defined,
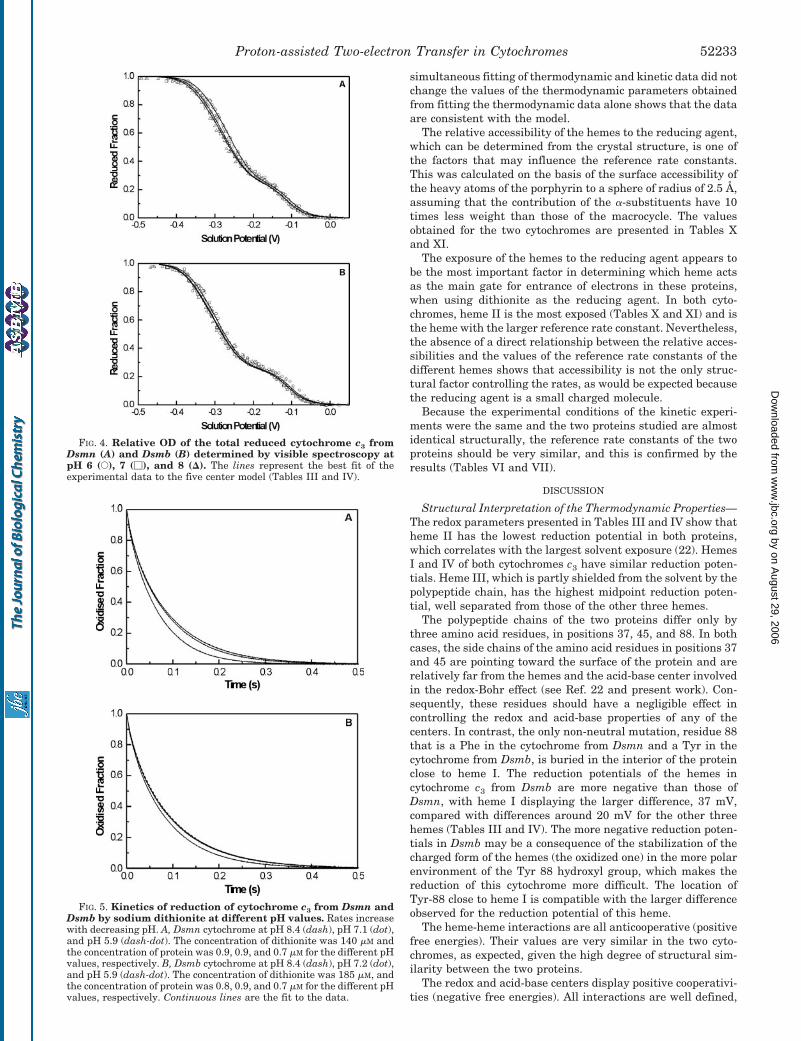
FIG. 4. Relative OD of the total reduced cytochrome c3 fromDsmn (A) and Dsmb (B) determined by visible spectroscopy atpH 6 (E), 7 (�), and 8 (�). The lines represent the best fit of theexperimental data to the five center model (Tables III and IV).
FIG. 5. Kinetics of reduction of cytochrome c3 from Dsmn andDsmb by sodium dithionite at different pH values. Rates increasewith decreasing pH. A, Dsmn cytochrome at pH 8.4 (dash), pH 7.1 (dot),and pH 5.9 (dash-dot). The concentration of dithionite was 140 �M andthe concentration of protein was 0.9, 0.9, and 0.7 �M for the different pHvalues, respectively. B, Dsmb cytochrome at pH 8.4 (dash), pH 7.2 (dot),and pH 5.9 (dash-dot). The concentration of dithionite was 185 �M, andthe concentration of protein was 0.8, 0.9, and 0.7 �M for the different pHvalues, respectively. Continuous lines are the fit to the data.
Proton-assisted Two-electron Transfer in Cytochromes 52233
by on August 29, 2006
ww
w.jbc.org
Dow
nloaded from

with the exception of the redox-Bohr interactions with heme IIIin both cytochromes. The uncertainty in this value is linked toa poor definition of the pKa of the oxidized form, due to lack ofexperimental data at low pH values. Therefore, there is littlepurpose in any comparison involving the value of the pKa
ox orthe heme-proton interaction with heme III, but this does notaffect the main points of discussion because, as mentionedabove, heme III essentially titrates on its own. In this context,heme I has the strongest of all the significant interactions withthe protonic center in both proteins. This makes propionate 13of heme I a likely candidate for the redox-Bohr group, asproposed previously for other cytochromes c3 (4, 13, 17, 40, 59).In Dsmb the hydroxyl group of Tyr-88 is pointing to propionate13 of heme I and is at a distance of 2.56 Å. This distance iscompatible with the formation of hydrogen bonds (Fig. 1). Theextra hydrogen bond between Tyr-88 and propionate 13 ofheme I of cytochrome c3 from Dsmb contributes to an extrastabilization of the deprotonated form of this propionate. In-deed, the acid-base center of cytochrome c3 from Dsmb has alower pKa value in the reduced state (Table V), which corre-sponds to the uncharged form of the heme. The difference inmacroscopic pKa values between the two cytochromes fades asoxidation progresses, possibly due to a difference in shielding ofthe electrostatic interaction between the positive charge of theheme and the negative charge of the propionate (60). Thestabilization of the propionate, when going from the reduced tothe oxidized form (causing a pKa drop), should be smaller in thecytochrome from Dsmb, due to the presence of the more polarTyr-88, and this is indeed the case (Table V). This effect is also
reflected by the smaller redox-Bohr interactions found in Dsmbcytochrome c3 when compared with those of Dsmn. The differ-ence in the redox-Bohr interactions determined for the twoproteins is easily detected in the pH dependence of their visibletitrations (Fig. 4) and the kinetic curves (Fig. 5).
Mechanistic Interpretation of the Functional ThermodynamicProperties—The hypothesis is that the physiological function oftype I cytochrome c3 is to accept electrons and protons from theperiplasmic hydrogenase and deliver them to membrane-linkedproteins, including the type II cytochrome c3, with a net energytransfer from the redox to the protonic centers (5, 7, 17). Thereare several requirements for a soluble protein to act as anefficient electron-proton energy transducer, not all of which canbe established by studying the protein in isolation (61, 62). Thefirst requirement is that the centers are thermodynamicallycoupled, which is clearly demonstrated by the results presentedhere. Second, the coupling should be effective under physiolog-ical conditions, which is apparent when the redox state-de-pendent pKa values span the physiological pH range. Withreference to Fig. 7, and by analogy with other cytochromes c3
that have been characterized (4, 63), the best candidates forelectron-proton energy transduction in the Dsm cytochromesare states of the redox stages 1 and 3; a deprotonated state ofthe cytochrome in stage 3 is ready to receive electrons andprotons from hydrogenase, giving a protonated state of stage 1(Fig. 7). Fig. 7A shows the populations of the various mi-crostates as a function of solution potential at pH 6.15. Stages1 and 3 both have significant populations at intermediatepotentials. The lowest energy microstates at pH 6.15 and asolution potential �260 mV are shown in Fig. 7B. Clearly, atransfer of two electrons coupled to protonation is thermody-namically favorable, whereas the transfer of a second electronwithout protonation would be thermodynamically less favor-able. In fact, docking studies suggest that electrons will betransferred from hydrogenase to cytochrome c3 via heme IV(64). This fits very well with the energies of the microstatesshown in Fig 7B. The most stable form in stage 3 is deproto-nated and has hemes I, II, and IV oxidized; reducing heme IV
TABLE IIIThermodynamic parameters determined by fitting the 5-center model to the NMR, visible and kinetic data from Dsmn cytochrome c3
The fully reduced and protonated protein was taken as the reference state for all hemes except heme III. The reference for heme III is theprotonated protein in stage 3. The diagonal terms, in boldface, are the energies for oxidation of the hemes and for the deprotonation of the ionizablecenters, whereas the off-diagonal terms are the redox and redox-Bohr interaction energies. All values are reported in meV. Values withinparentheses are the S.E. The pKa value of the acid-base center can also be calculated from the G (in meV) using the relationship pKa �G/60.
Dsmn c3
Energies
Heme I Heme II Heme III Heme IV Ionizable center
meV
Heme I �257 (2) 15 (2) 12 (2) �37 (3)Heme II �312 (2) 20 (2) �24 (2)Heme III �62 (2) �53 (8)Heme IV �274 (2) �13 (3)Ionizable center 413 (4)
TABLE IVThermodynamic parameters determined by fitting the 5-center model to the NMR, visible, and kinetic data from Dsmb cytochrome c3
The fully reduced and protonated protein was taken as the reference state for all hemes except heme III. The reference for heme III is theprotonated protein in stage 3. The diagonal terms, in boldface, are the energies for oxidation of the hemes and for the deprotonation of the ionizablecenters, whereas the off-diagonal terms are the redox and redox-Bohr interaction energies. All values are reported in meV. Values withinparentheses are the S.E. The pKa value of the acid-base center can also be calculated from the G (in meV) using the relationship pKa �G/60.
Dsmb c3
Energies
Heme I Heme II Heme III Heme IV Ionizable center
meV
Heme I �293 (2) 13 (2) 14 (2) �23 (3)Heme II �336 (2) 18 (2) �13 (2)Heme III �79 (2) �31 (10)Heme IV �294 (3) �9 (3)Ionizable center 378 (5)
TABLE VMacroscopic pKas for the ionizable center associated with each of the
five stages of oxidation for cytochromes c3 of Dsmn and Dsmb
Ionizable center
Stage 0 Stage 1 Stage 2 Stage 3 Stage 4
Dsmn 7.0 6.6 6.2 5.7 4.8
Dsmb 6.4 6.2 5.9 5.6 5.1
Proton-assisted Two-electron Transfer in Cytochromes52234
by on August 29, 2006
ww
w.jbc.org
Dow
nloaded from
allows rapid conversion through protonation and intramolec-ular electron transfer to a microstate that has hemes II andIV oxidized. Transferring a second electron to heme IV yieldsthe most stable microstate of stage 1, a protonated form withonly heme II oxidized. Thus, the redox-Bohr effects on hemesI and IV result in a reduction of the electrostatic penaltyassociated with the coordinated transfer of two electrons,which in cytochrome c3 from Dsmn even leads to a permuta-tion of the order of oxidation of these two hemes in thephysiological pH range.
As both reductions have positive redox-Bohr effects, cf. Ta-bles III and IV, it is ensured that the affinity for protons of thecytochrome increases, which is critical for stimulating the ac-tivity of hydrogenase at low pH values (7). However, and most
importantly, the involvement of the positive redox-Bohr coop-erativities is not confined to the activation of protons. In fact,the obligatory reciprocity of interactions results in promoting acoordinated transfer of two electrons. Subsequently, the elec-trons are released to a transmembrane electron transfer com-plex, and the protonic center of the reoxidized cytochrome isacidified, releasing protons that can be thrusted to activateATP synthase (17, 61, 62), thus avoiding uncoupled transfer ofelectrons and protons that would lead to short-circuiting theenergy-transducing process. However, this order of events, al-though probable on the basis of typical electron and protontransfer rates, cannot be deduced from the thermodynamicproperties of the isolated cytochrome. Nevertheless, the reduc-tion potentials of the isolated cytochrome are sufficiently close
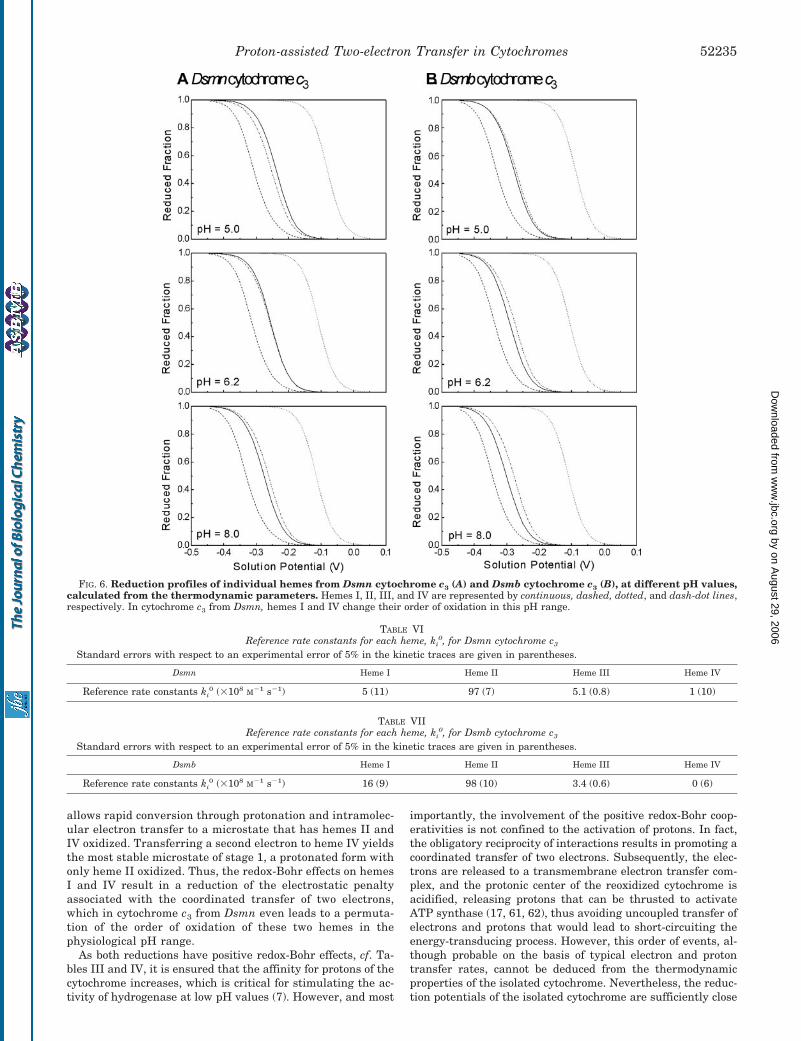
FIG. 6. Reduction profiles of individual hemes from Dsmn cytochrome c3 (A) and Dsmb cytochrome c3 (B), at different pH values,calculated from the thermodynamic parameters. Hemes I, II, III, and IV are represented by continuous, dashed, dotted, and dash-dot lines,respectively. In cytochrome c3 from Dsmn, hemes I and IV change their order of oxidation in this pH range.
TABLE VIReference rate constants for each heme, ki
0, for Dsmn cytochrome c3
Standard errors with respect to an experimental error of 5% in the kinetic traces are given in parentheses.
Dsmn Heme I Heme II Heme III Heme IV
Reference rate constants ki0 (�108 M�1 s�1) 5 (11) 97 (7) 5.1 (0.8) 1 (10)
TABLE VIIReference rate constants for each heme, ki
0, for Dsmb cytochrome c3
Standard errors with respect to an experimental error of 5% in the kinetic traces are given in parentheses.
Dsmb Heme I Heme II Heme III Heme IV
Reference rate constants ki0 (�108 M�1 s�1) 16 (9) 98 (10) 3.4 (0.6) 0 (6)
Proton-assisted Two-electron Transfer in Cytochromes 52235
by on August 29, 2006
ww
w.jbc.org
Dow
nloaded from

to make a coordinated two-electron transfer possible, such thata slight change in conformation caused by the protein-proteininteraction can easily shift the balance to make it effective. It isreasonable to assume that this small but complex molecule hasevolved to a high degree of efficiency to carry both the protonsand the electrons generated from the oxidation of hydrogen.Although at present there is no experimental evidence for asecond proton-binding site, an extra proton could be accommo-dated through small changes in the populations at a number ofother sites and assist the two-electron transfer as seen incytochrome c3 from D. desulfuricans 27774 (15, 16).
It is likely that the changes in thermodynamic parametersthat occur when the transducer donor-acceptor complex isformed will improve the functional properties. Thus, novelmethodologies must be developed to characterize the functional
multicomponent systems to discover how this potential is real-ized in the physiological context.
Conclusions—The thermodynamic parameters obtained forthese two Dsm cytochromes suggest that they are capable ofperforming e�/H� energy transduction using a different mech-anism from that described previously (4, 17, 40, 43, 65) forD. vulgaris and D. gigas type I cytochromes c3. The variationsin the microscopic thermodynamic parameters of these twophylogenetically related strains are caused by a small differ-ence in their amino acid sequences and may have resulted fromevolutionary advantages associated with the different habitatsfrom which these two organisms were isolated. Dsmn wasobtained as a pure culture, and consequently this strain is more
TABLE IXFraction of electrons that enter the molecule through each heme in
each one-electron reduction step, calculated using the thermodynamicparameters of Tables III and IV and the reference rate
constants of Table VI and VIIFor Dsmb, cytochrome c3 the values were calculated for pH 5.9, 7.2,
and 8.4.
pH Step Heme I Heme II Heme III Heme IV
5.9 1 0.11 0.36 0.53 0.002 0.24 0.76 0.00 0.003 0.19 0.81 0.00 0.004 0.07 0.93 0.00 0.00
7.2 1 0.11 0.37 0.52 0.002 0.22 0.77 0.00 0.003 0.19 0.81 0.00 0.004 0.08 0.92 0.00 0.00
8.4 1 0.11 0.37 0.52 0.002 0.22 0.78 0.00 0.003 0.19 0.81 0.00 0.004 0.08 0.92 0.00 0.00
TABLE XRelative accessibility of SO2
� to the hemes of cytochrome c3 from DsmnThe values were calculated for a sphere of radius 2.5 Å.
Dsmn Heme I Heme II Heme III Heme IV
Relative accessibility 2.60 7.62 1.58 4.49
TABLE XIRelative accessibility of SO2
� to the hemes of cytochrome c3 from DsmbThe values were calculated for a sphere of radius 2.5 Å.
Dsmb Heme I Heme II Heme III Heme IV
Relative accessibility 2.22 5.88 2.00 4.72
TABLE VIIIFraction of electrons that enter the molecule through each heme in
each one-electron reduction step, calculated using the thermodynamicparameters of Tables III and IV and the reference rate
constants of Table VI and VIIFor Dsmn, cytochrome c, the values were calculated for pH 5.9, 7.1,
and 8.4.
pH Step Heme I Heme II Heme III Heme IV
5.9 1 0.04 0.38 0.57 0.012 0.10 0.87 0.01 0.023 0.07 0.92 0.00 0.014 0.02 0.98 0.00 0.00
7.1 1 0.04 0.39 0.56 0.012 0.09 0.88 0.01 0.023 0.07 0.91 0.00 0.014 0.02 0.98 0.00 0.00
8.4 1 0.04 0.39 0.56 0.012 0.09 0.88 0.01 0.023 0.08 0.91 0.00 0.014 0.02 0.97 0.00 0.00
FIG. 7. A, populations of microstates at pH 6.15 plotted as a functionof solution potential. The populations were calculated from the values ofthe thermodynamic parameters in Tables III and IV using the equa-tions reported in Turner et al. (4). Note that stage 2 (two hemes oxi-dized) is never highly populated. The situation for the most highlypopulated (lowest energy) microstates at an intermediate solution po-tential (indicated by a dashed line) is shown in more detail in B. B,energy level diagram of microstates in stages 1–3. Energies (relative tothe fully reduced and protonated protein) were calculated from thevalues of the thermodynamic parameters in Tables III and IV using theequations reported in the literature (4). The conditions chosen, a solu-tion potential of �260 mV and pH 6.15, should approximate those in theperiplasm. Only the 8 microstates with lower energies are shown, out ofa total of 32 for the 5 oxidation stages. Protonated microstates arerepresented with solid lines and deprotonated forms with dashed lines.The relevant microstates in stage 3 have hemes I, II, and IV oxidized;those in stage 2 have either hemes I and II or II and IV oxidized, andonly heme II is oxidized in stage 1. If a cytochrome molecule in stage 3receives two electrons, the most stable (lowest energy) form clearlyswitches from being deprotonated to protonated; the path for consecu-tive electron transfers to heme IV is indicated by arrows (see text). Forclarity, arabic numbers were used for the hemes in the figure.
Proton-assisted Two-electron Transfer in Cytochromes52236
by on August 29, 2006
ww
w.jbc.org
Dow
nloaded from
dependent on the environmental conditions of the habitat. Onthe other hand, Dsmb was isolated from a symbiotic associationbetween green sulfur bacteria and sulfate-reducing bacteria(21). Curiously, the primary electron acceptor of the anoxicphototrophic process is poised at a very low redox potential.The maintenance of a closed sulfur cycle by the symbioticassociation involving Dsmb may require a different tuning ofthe thermodynamic properties of proteins involved in thebioenergetic processes.
Acknowledgments—We thank Prof. A. Netrusov for providing thereferences to identify the place from which the symbiont Chloropseudo-monas ethylica was isolated. We thank the fermentation plant at theUniversity of Georgia, Athens, for growing the bacteria, and we alsothank Isabel Pacheco and Dr. Isabel Coutinho (Instituto de TecnologiaQuımica e Biologica, Universidade Nova de Lisboa) for the purifiedsamples used for crystallization. Crystallographic studies were fundedby European Union Grant HCM-CHRX-CT93–0143 and were sup-ported by the Council for the Central Laboratory of the Research Coun-cils in the Daresbury Laboratory (Warrington, UK).
REFERENCES
1. Coutinho, I. B., and Xavier, A. V. (1994) Methods Enzymol. 243, 119–1402. Valente, F. M., Saraiva, L. M., LeGall, J., Xavier, A. V., Teixeira, M., and
Pereira, I. A. (2001) Chembiochem. 2, 895–9053. Santos, H., Moura, J. J., Moura, I., LeGall, J., and Xavier, A. V. (1984) Eur.
J. Biochem. 141, 283–2964. Turner, D. L., Salgueiro, C. A., Catarino, T., LeGall, J., and Xavier, A. V. (1996)
Eur. J. Biochem. 241, 723–7315. Xavier, A. V. (1986) J. Inorg. Biochem. 28, 239–2436. Yagi, T., Honya, M., and Tamiya, N. (1968) Biochim. Biophys. Acta 153,
699–7057. Louro, R. O., Catarino, T., LeGall, J., and Xavier, A. V. (1997) J. Biol. Inorg.
Chem. 2, 488–4918. Aubert, C., Brugna, M., Dolla, A., Bruschi, M., and Giudici-Orticoni, M. T.
(2000) Biochim. Biophys. Acta 1476, 85–929. Brennan, L., Turner, D. L., Messias, A. C., Teodoro, M. L., LeGall, J., Santos,
H., and Xavier, A. V. (2000) J. Mol. Biol. 298, 61–8210. Matias, P. M., Frazao, C., Morais, J., Coll, M., and Carrondo, M. A. (1993) J.
Mol. Biol. 234, 680–69911. Messias, A. C., Kastrau, D. H., Costa, H. S., LeGall, J., Turner, D. L., Santos,
H., and Xavier, A. V. (1998) J. Mol. Biol. 281, 719–73912. Saraiva, L. M., Salgueiro, C. A., LeGall, J., van Dongen, W. M. A. M., and
Xavier, A. V. (1996) J. Biol. Inorg. Chem. 1, 542–55013. Saraiva, L. M., Salgueiro, C. A., da Costa, P. N., Messias, A. C., LeGall, J., van
Dongen, W. M., and Xavier, A. V. (1998) Biochemistry 37, 12160–1216514. Salgueiro, C. A., da Costa, P. N., Turner, D. L., Messias, A. C., van Dongen,
W. M., Saraiva, L. M., and Xavier, A. V. (2001) Biochemistry 40, 9709–971615. Louro, R. O., Catarino, T., LeGall, J., Turner, D. L., and Xavier, A. V. (2001)
Chembiochem. 2, 831–83716. Louro, R. O., Bento, I., Matias, P. M., Catarino, T., Baptista, A. M., Soares,
C. M., Carrondo, M. A., Turner, D. L., and Xavier, A. V. (2001) J. Biol.Chem. 276, 44044–44051
17. Louro, R. O., Catarino, T., Turner, D. L., Picarra-Pereira, M. A., Pacheco, I.,LeGall, J., and Xavier, A. V. (1998) Biochemistry 37, 15808–15815
18. Genthner, B. R. S., Friedman, S. D., and Devereux, R. (1997) Int. J. Syst.Bacteriol. 47, 889–892
19. Miller, J. D. A., and Saleh, A. M. (1964) J. Gen. Microbiol. 37, 419–42320. Shaposhnikov, V. V., Kondratieva, E. N., and Fedorov, V. D. (1960) Nature
187, 167–16821. Pfennig, N., and Biebl, H. (1976) Arch. Microbiol. 110, 3–1222. Czjzek, M., Payan, F., Guerlesquin, F., Bruschi, M., and Haser, R. (1994) J.
Mol. Biol. 243, 653–66723. Frey, M., Haser, R., Pierrot, M., Bruschi, M., and Le Gall, J. (1976) J. Mol.
Biol. 104, 741–74324. Otwinowski, Z. (1993) in Data Collection and Processing (Sawyer, L., Isaacs,
N. W., and Bailey, S., eds) pp. 71–79, Daresbury Laboratory, Warrington,UK
25. CCP4 (1994) Acta Crystallogr. Sect. D Biol. Crystallogr. 50, 760–76326. Navaza, J. (1994) Acta Cryst. Sect. A 50, 157–163
27. Brunger, A. T. (1992) X-plor: A System for Protein Crystallography and NMR,Version 3.1, Yale University Press, New Haven
28. Sheldrick, G. M., and Schneider, T. R. (1997) Methods Enzymol. 277, 319–34329. Brunger, A. T. (1992) Nature 355, 472–47530. Roussel, A., Fontecilla-Camps, J. C., and Cambilllau, C. (1990) XV IUCr
Congress (Authier, A., ed) pp. C66–C67, Bordeaux, France31. Coutinho, I. B., Turner, D. L., LeGall, J., and Xavier, A. V. (1993) Biochem. J.
294, 899–90832. Murshudov, G. N., Vagin, A. A., and Dodson, E. J. (1997) Acta Crystallogr.
Sect. D Biol. Crystallogr. 53, 240–25533. Ausubel, F. M., Brent, R., Kingston, R. E., Moore, D. D., Seidman, J. G., Smith,
J. A., and Struhl, K. (1999) Current Protocols in Molecular Biology (Aus-ubel, F. M., Brent, R., Kingston, R. E., Moore, D. D., Seidman, J. G., Smith,J. A., and Struhl, K., eds) John Wiley & Sons, Inc, New York
34. Delgado, R., Frausto da Silva, J. J. R., Amorim, M. T. S., Cabral, M. F., Chaves,S., and Costa, J. (1991) Anal. Chim. Acta 245, 271–282
35. Salgueiro, C. A., Turner, D. L., Santos, H., LeGall, J., and Xavier, A. V. (1992)FEBS Lett. 314, 155–158
36. Dutton, P. L. (1978) Methods Enzymol. 54, 411–43537. Catarino, T. (1998) Thermodynamic and Kinetic Modelling of the Redox Prop-
erties of Tetrahaem Cytochromes c3. Ph.D. thesis, Universidade Nova deLisboa
38. McKenna, C. E., Gutheil, W. G., and Song, W. (1991) Biochim. Biophys. Acta1075, 109–117
39. Dixon, M. (1971) Biochim. Biophys. Acta 226, 241–25840. Salgueiro, C. A., Turner, D. L., and Xavier, A. V. (1997) Eur. J. Biochem. 244,
721–73441. Turner, D. L., Brennan, L., Chamberlin, S. G., Louro, R. O., and Xavier, A. V.
(1998) Eur. Biophys. J. 27, 367–37542. Louro, R. O., Correia, I. J., Brennan, L., Coutinho, I. B., Turner, D. L., and
Xavier, A. V. (1998) J. Am. Chem. Soc. 120, 13240–1324743. Turner, D. L., Salgueiro, C. A., Catarino, T., LeGall, J., and Xavier, A. V. (1994)
Biochim. Biophys. Acta 1187, 232–23544. Catarino, T., and Turner, D. L. (2001) ChemBioChem. 2, 416–42445. Marcus, R. A., and Sutin, N. (1985) Biochim. Biophys. Acta 811, 265–32246. Neta, P., Huie, R. E., and Harriman, A. (1987) J. Phys. Chem. 91, 1606–161147. Christiansen, H. E. M., Coutinho, I., Conrad, L. S., Hammerstad-Pedersen,
J. M., Iversen, G., Jensen, M. H., Karlsson, J. J., Ulstrup, J., and Xavier,A. V. (1994) J. Photochem. Photobiol. 82, 103–115
48. Tickle, I. J., Laskowski, R. A., and Moss, D. S. (1998) Acta Crystallogr. Sect. DBiol. Crystallogr. 54, 547–557
49. Morris, A. L., MacArthur, M. W., Hutchinson, E. G., and Thornton, J. M. (1992)Proteins 12, 345–364
50. Ramachandran, G. N., and Sasisekharan, V. (1968) Adv. Protein Chem. 23,283–438
51. Cruickshank, D. W. J. (1996) in Proceedings of Collaborative ComputationalProject 4 Study Weekend (Dodson, E., Moore, M., Ralph, A., and Bailey, S.,eds) pp. 11–22, Daresbury
52. Lee, B., and Richards, F. M. (1971) J. Mol. Biol. 55, 379–40053. Coutinho, I. B., Turner, D. L., Legall, J., and Xavier, A. V. (1995) Eur.
J. Biochem. 230, 1007–101354. Gayda, J. P., Benosman, H., Bertrand, P., More, C., and Asso, M. (1988) Eur.
J. Biochem. 177, 199–20655. Moura, I., Teixeira, M., Huynh, B. H., LeGall, J., and Moura, J. J. (1988) Eur.
J. Biochem. 176, 365–36956. Correia, I. J., Paquete, C. M., Louro, R. O., Catarino, T., Turner, D. L., and
Xavier, A. V. (2002) Eur. J. Biochem. 269, 5722–573057. Coletta, M., Catarino, T., LeGall, J., and Xavier, A. V. (1991) Eur. J. Biochem.
202, 1101–110658. Capeillere-Blandin, C., Guerlesquin, F., and Bruschi, M. (1986) Biochim. Bio-
phys. Acta 848, 279–29359. Park, J. S., Ohmura, T., Kano, K., Sagara, T., Niki, K., Kyogoku, Y., and
Akutsu, H. (1996) Biochim. Biophys. Acta 1293, 45–5460. Louro, R. O., Catarino, T., Paquete, C. M., and Turner, D. L. (2004) FEBS Lett.
576, 77–8061. Xavier, A. V. (2002) FEBS Lett. 532, 261–26662. Xavier, A. V. (2004) Biochim. Biophys. Acta 1658, 23–3063. Louro, R. O. (1998) Proton-thrusters: Energy Transduction Performed by Tet-
rahaem Cytochromes c3 and Its Physiological Relevance. Ph.D. thesis, Uni-versidade Nova de Lisboa
64. Matias, P. M., Soares, C. M., Saraiva, L. M., Coelho, R., Morais, J., Le Gall, J.,and Carrondo, M. A. (2001) J. Biol. Inorg. Chem. 6, 63–81
65. Louro, R. O., Catarino, T., Salgueiro, C. A., LeGall, J., and Xavier, A. V. (1996)J. Biol. Inorg. Chem. 1, 34–38
Proton-assisted Two-electron Transfer in Cytochromes 52237
by on August 29, 2006
ww
w.jbc.org
Dow
nloaded from
Copyright © 2022 FDOKUMEN