Proteomic analysis of circulating monocytes in Chinese premenopausal females with extremely...
25
Proteomic analysis of circulating monocytes in Chinese premenopausal females with extremely discordant bone mineral density Fei-Yan Deng 1,2 , Yao-Zhong Liu 2 , Li-Ming Li 1 , Chen Jiang 1 , Shan Wu 1 , Yuan Chen 1 , Hui Jiang 1 , Fang Yang 1 , Ji-Xian Xiong 3 , Peng Xiao 4 , Su-Mei Xiao 1 , Li-Jun Tan 1 , Xiao Sun 1 , Xue- Zhen Zhu 1 , Man-Yuan Liu 1 , Shu-Feng Lei 1 , Xiang-Ding Chen 1 , Jing-Yun Xie 3 , Gary G. Xiao 1,3,4,* , Song-Ping Liang 3,* , and Hong-Wen Deng 1,2 1 Laboratory of Molecular and Statistical Genetics, College of Life Sciences, Hunan Normal University, Changsha, Hunan, P. R. China 2 Departments of Orthopedics Surgery and Basic Medical Sciences, University of Missouri, Kansas City, MO, USA 3 Key Laboratory of Protein Chemistry and Developmental Biology of Ministry of Education, College of Life Sciences, Hunan Normal University, Changsha, Hunan, P. R. China 4 Osteoporosis Research Center, Creighton University Medical Center, Omaha, NE, USA Abstract Osteoporosis (OP) is a major public health problem, mainly characterized by low bone mineral density (BMD). Circulating monocytes (CMCs) may serve as progenitors of osteoclasts and produce a wide variety of factors important to bone metabolism. However, the specific action mechanism of CMCs in the pathogenesis of OP is far from clear. We performed a comparative protein expression profiling study of CMCs in Chinese premenopausal females with extremely discordant BMD, identified a total of 38 differentially expressed proteins, and confirmed with Western blotting five proteins: ras suppressor protein1 (RSU1), gelsolin (GSN), manganese-containing superoxide dismutase (SOD2), glutathione peroxidase 1(GPX1), and prolyl 4-hydroxylase β subunit (P4HB). These proteins might affect CMCs’ trans-endothelium, differentiation, and/or downstream osteoclast functions, thus contribute to differential osteoclastogenesis and finally lead to BMD variation. The findings promote our understanding of the role of CMCs in BMD determination, and provide an insight into the pathogenesis of human OP. Keywords Bone mineral density; Circulating monocyte; Osteoclastogenesis; Protein Correspondence: Dr. Hong-Wen Deng, Laboratory of Molecular and Statistical Genetics, College of Life Sciences, Hunan Normal University, Changsha, Hunan 410081, P. R. China, [email protected], Fax: 86-731-8872791. * Additional corresponding authors: Dr. G. G. Xiao, [email protected]; Dr. S.-P. Liang, [email protected] The authors have declared no conflict of interest. NIH Public Access Author Manuscript Proteomics. Author manuscript; available in PMC 2009 October 13. Published in final edited form as: Proteomics. 2008 October ; 8(20): 4259–4272. doi:10.1002/pmic.200700480. NIH-PA Author Manuscript NIH-PA Author Manuscript NIH-PA Author Manuscript
-
Upload
independent -
Category
Documents
-
view
0 -
download
0
Transcript of Proteomic analysis of circulating monocytes in Chinese premenopausal females with extremely...

Proteomic analysis of circulating monocytes in Chinesepremenopausal females with extremely discordant bone mineraldensity
Fei-Yan Deng1,2, Yao-Zhong Liu2, Li-Ming Li1, Chen Jiang1, Shan Wu1, Yuan Chen1, HuiJiang1, Fang Yang1, Ji-Xian Xiong3, Peng Xiao4, Su-Mei Xiao1, Li-Jun Tan1, Xiao Sun1, Xue-Zhen Zhu1, Man-Yuan Liu1, Shu-Feng Lei1, Xiang-Ding Chen1, Jing-Yun Xie3, Gary G.Xiao1,3,4,*, Song-Ping Liang3,*, and Hong-Wen Deng1,21 Laboratory of Molecular and Statistical Genetics, College of Life Sciences, Hunan NormalUniversity, Changsha, Hunan, P. R. China2 Departments of Orthopedics Surgery and Basic Medical Sciences, University of Missouri, KansasCity, MO, USA3 Key Laboratory of Protein Chemistry and Developmental Biology of Ministry of Education, Collegeof Life Sciences, Hunan Normal University, Changsha, Hunan, P. R. China4 Osteoporosis Research Center, Creighton University Medical Center, Omaha, NE, USA
AbstractOsteoporosis (OP) is a major public health problem, mainly characterized by low bone mineraldensity (BMD). Circulating monocytes (CMCs) may serve as progenitors of osteoclasts and producea wide variety of factors important to bone metabolism. However, the specific action mechanism ofCMCs in the pathogenesis of OP is far from clear. We performed a comparative protein expressionprofiling study of CMCs in Chinese premenopausal females with extremely discordant BMD,identified a total of 38 differentially expressed proteins, and confirmed with Western blotting fiveproteins: ras suppressor protein1 (RSU1), gelsolin (GSN), manganese-containing superoxidedismutase (SOD2), glutathione peroxidase 1(GPX1), and prolyl 4-hydroxylase β subunit (P4HB).These proteins might affect CMCs’ trans-endothelium, differentiation, and/or downstream osteoclastfunctions, thus contribute to differential osteoclastogenesis and finally lead to BMD variation. Thefindings promote our understanding of the role of CMCs in BMD determination, and provide aninsight into the pathogenesis of human OP.
KeywordsBone mineral density; Circulating monocyte; Osteoclastogenesis; Protein
Correspondence: Dr. Hong-Wen Deng, Laboratory of Molecular and Statistical Genetics, College of Life Sciences, Hunan NormalUniversity, Changsha, Hunan 410081, P. R. China, [email protected], Fax: 86-731-8872791.*Additional corresponding authors: Dr. G. G. Xiao, [email protected]; Dr. S.-P. Liang, [email protected] authors have declared no conflict of interest.
NIH Public AccessAuthor ManuscriptProteomics. Author manuscript; available in PMC 2009 October 13.
Published in final edited form as:Proteomics. 2008 October ; 8(20): 4259–4272. doi:10.1002/pmic.200700480.
NIH
-PA Author Manuscript
NIH
-PA Author Manuscript
NIH
-PA Author Manuscript

1 IntroductionOsteoporosis (OP), mainly characterized by low bone mineral density (BMD) [1], is a majorpublic health problem among females [2]. Genetic factors play an important role in OP, asevidenced by the high heritability (>50%) of BMD [3–5].
Great progress has been made in the field of genetic epidemiology for the identification ofgenes important for OP. At the DNA level, a list of genes has been found associated with BMDor other phenotypes of OP [6]. At the mRNA expression level, Liu et al. [7] performed an invivo microarray study of circulating monocytes (CMCs) in Caucasians and suggested a novelpathophysiological mechanism for OP. However, so far, little effort has been made tosystemically explore OP in humans at the protein level. Proteins are direct executors andregulators in almost all processes of life. Therefore, profiling study at the protein level willprovide insights into the disease that are biologically and clinically relevant.
OP is attributed to imbalanced bone remodeling, in which osteroclastic bone resorption exceedsosteoblastic bone formation [8,9]. Studying osteoclastogenesis and/or osteoblastogenesis maycontribute to the understanding of the pathogenesis of OP. It has been shown that all osteoclastsin peripheral skeleton such as femur [10,11], and a considerable amount of osteoclasts in thecentral skeleton such as spine [12] originate from CMCs [13–16]. CMCs can differentiate invitro into active osteoclasts [17,18]. In addition, CMCs produce a wide variety of factorsinvolved in bone metabolism, such as interleukin-1, tumor necrosis factor-α, interleukin-6,platelet-derived growth factor, transforming growth factor-α, and 1,25(OH)2D3 [19–22]. Giventhe importance of CMCs for bone metabolism, functional profiling of CMCs in vivo in humansmight provide insights into the pathophysiology of OP.
For healthy women, BMD increases progressively with age from infancy to adulthood [23].After reaching its peak at the age of ~20–25 [24], BMD remains relatively stable until the ageof 45–55 (before menopause in females). Due to a drastic change of physiological status, i.e.,menopause, BMD then is subject to large changes in hormonal and environmental factors anddecreases rapidly. Upregulation of osteoclast formation has been recognized as the mainmechanism of estrogen deficiency induced bone loss [25,26]. Peak BMD is a determinant ofOP later in life. During the stage of peak BMD (i.e., premenopausal period aged 20–45),women’s BMD is in a status of relative balance between bone formation by osteoblasts andbone resorption by osteoclasts. Compared with the periods before (i.e., childhood andadolescence) or after (i.e., perimenopausal stage) this stage, in vivo expression of relevant genesin CMCs, which reflects bone homeostasis at this stage, should be to a much less extentinfluenced by factors of inner (e.g., hormones) or outside environments (e.g., nutrition), makingthe effect of the intrinsic genetic factors for bone mass more prominent. Therefore, this peakBMD stage provides us a unique “window” to explore the intrinsic genetic factors responsiblefor BMD variation among different individuals, which leads to differential susceptibility to OPlater in life.
In the present study, using 2-DE coupled with MS, we compared protein expression profilesof CMCs from Chinese premenopausal females with extremely high BMD versus those withextremely low BMD, and identified differentially expressed proteins (DEPs) that might becrucial to osteoclastogenesis in relation to the pathogenesis of OP.
2 Materials and methods2.1 Subjects
The project was approved by the involved Institutional Review Board. All subjects signedinformed-consent documents before entering the project. We recruited a total of 30 unrelated
Deng et al. Page 2
Proteomics. Author manuscript; available in PMC 2009 October 13.
NIH
-PA Author Manuscript
NIH
-PA Author Manuscript
NIH
-PA Author Manuscript
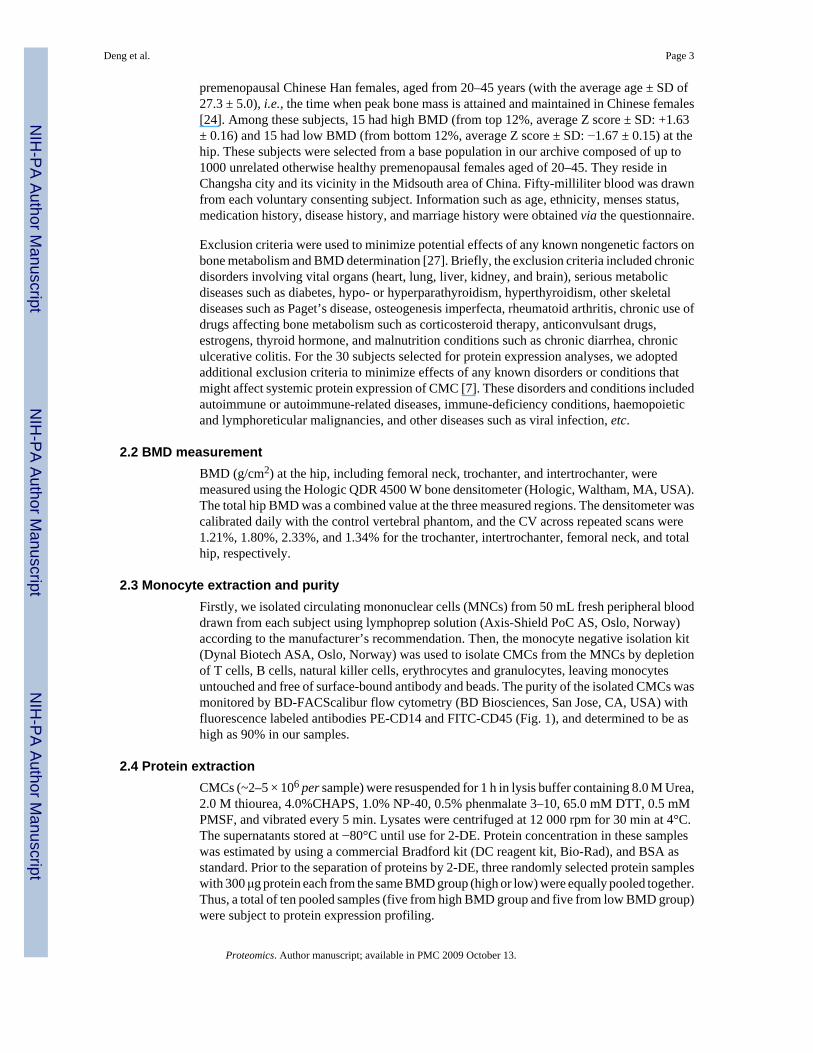
premenopausal Chinese Han females, aged from 20–45 years (with the average age ± SD of27.3 ± 5.0), i.e., the time when peak bone mass is attained and maintained in Chinese females[24]. Among these subjects, 15 had high BMD (from top 12%, average Z score ± SD: +1.63± 0.16) and 15 had low BMD (from bottom 12%, average Z score ± SD: −1.67 ± 0.15) at thehip. These subjects were selected from a base population in our archive composed of up to1000 unrelated otherwise healthy premenopausal females aged of 20–45. They reside inChangsha city and its vicinity in the Midsouth area of China. Fifty-milliliter blood was drawnfrom each voluntary consenting subject. Information such as age, ethnicity, menses status,medication history, disease history, and marriage history were obtained via the questionnaire.
Exclusion criteria were used to minimize potential effects of any known nongenetic factors onbone metabolism and BMD determination [27]. Briefly, the exclusion criteria included chronicdisorders involving vital organs (heart, lung, liver, kidney, and brain), serious metabolicdiseases such as diabetes, hypo- or hyperparathyroidism, hyperthyroidism, other skeletaldiseases such as Paget’s disease, osteogenesis imperfecta, rheumatoid arthritis, chronic use ofdrugs affecting bone metabolism such as corticosteroid therapy, anticonvulsant drugs,estrogens, thyroid hormone, and malnutrition conditions such as chronic diarrhea, chroniculcerative colitis. For the 30 subjects selected for protein expression analyses, we adoptedadditional exclusion criteria to minimize effects of any known disorders or conditions thatmight affect systemic protein expression of CMC [7]. These disorders and conditions includedautoimmune or autoimmune-related diseases, immune-deficiency conditions, haemopoieticand lymphoreticular malignancies, and other diseases such as viral infection, etc.
2.2 BMD measurementBMD (g/cm2) at the hip, including femoral neck, trochanter, and intertrochanter, weremeasured using the Hologic QDR 4500 W bone densitometer (Hologic, Waltham, MA, USA).The total hip BMD was a combined value at the three measured regions. The densitometer wascalibrated daily with the control vertebral phantom, and the CV across repeated scans were1.21%, 1.80%, 2.33%, and 1.34% for the trochanter, intertrochanter, femoral neck, and totalhip, respectively.
2.3 Monocyte extraction and purityFirstly, we isolated circulating mononuclear cells (MNCs) from 50 mL fresh peripheral blooddrawn from each subject using lymphoprep solution (Axis-Shield PoC AS, Oslo, Norway)according to the manufacturer’s recommendation. Then, the monocyte negative isolation kit(Dynal Biotech ASA, Oslo, Norway) was used to isolate CMCs from the MNCs by depletionof T cells, B cells, natural killer cells, erythrocytes and granulocytes, leaving monocytesuntouched and free of surface-bound antibody and beads. The purity of the isolated CMCs wasmonitored by BD-FACScalibur flow cytometry (BD Biosciences, San Jose, CA, USA) withfluorescence labeled antibodies PE-CD14 and FITC-CD45 (Fig. 1), and determined to be ashigh as 90% in our samples.
2.4 Protein extractionCMCs (~2–5 × 10⁶ per sample) were resuspended for 1 h in lysis buffer containing 8.0 M Urea,2.0 M thiourea, 4.0%CHAPS, 1.0% NP-40, 0.5% phenmalate 3–10, 65.0 mM DTT, 0.5 mMPMSF, and vibrated every 5 min. Lysates were centrifuged at 12 000 rpm for 30 min at 4°C.The supernatants stored at −80°C until use for 2-DE. Protein concentration in these sampleswas estimated by using a commercial Bradford kit (DC reagent kit, Bio-Rad), and BSA asstandard. Prior to the separation of proteins by 2-DE, three randomly selected protein sampleswith 300 μg protein each from the same BMD group (high or low) were equally pooled together.Thus, a total of ten pooled samples (five from high BMD group and five from low BMD group)were subject to protein expression profiling.
Deng et al. Page 3
Proteomics. Author manuscript; available in PMC 2009 October 13.
NIH
-PA Author Manuscript
NIH
-PA Author Manuscript
NIH
-PA Author Manuscript

2.5 2-DEThe 2-DE was performed with the Amersham Pharmacia system. Three hundred microgramof total protein for each pooled sample was applied to an 18 cm length IPG DryStrip (pH 3–10 L), which was rehydrated for 13 h at 20°C in 8.0 M Urea, 2% CHAPS, 0.5% IPG Buffer(pH 3.0–10.0 L), 18 mM DTT, and 0.001% bromphenol blue. The pre-IEF and IEF wereperformed on IPGphor IEF system (Amersham Pharmacia Biotech). The pre-IEF wasperformed at 500 V for 1 h and 1000 V for 1 h. Formal IEF was then performed with a linearincrease up to 8000 V over 0.5 h, and then held at 8000 V for 5 h. For the second dimension,the IPG strips were equilibrated first for 15 min in a buffer containing 50 mM Tris-HCl, pH8.8, 30% glycerol, 1.0% SDS, and 6.0 M urea, and 0.2% DTT (Sigma), second for 15 min ina buffer containing 50 mM Tris-HCl, pH 8.8, 30% glycerol, 1% SDS, 6.0 M urea, and 3%iodoacetamide, followed by 10% SDS-PAGE on a Protean Plus Dodeca Cell (Bio-RadLaboratories, Hercules, CA, USA). Gels were stained with silver nitrate and visualized underultraviolet light with a Tsinghua Unigroup scanner at an optical resolution of 300 dpi intransmission model (Tsinghua Unigroup, Beijing, China). To check the reproducibility of thedata, three independent 2-DE’s were performed on each pooled sample.
2.6 Differential expression analysesProtein spots were detected based on staining intensity of silver nitrate as determined by thePDQuest software v7.2 (Bio-Rad Laboratories, Hercules). We first set up a primary matchsetfrom the three replicates for each sample. Then, a higher level of matchset was generated fromseven mixtures in either high or low BMD group. The differentiated proteins were detected bycomparing matchset in low BMD group to that in high BMD group. In order to justify forvariability due to silver staining, the intensity of each spot was normalized to the total intensityof all the spots in the gel. The normalized data were exported as expression values for furtherstatistical analyses.
In order to select spots for protein identification, using the normalized data, we performed fourtypes of statistical analyses: t-test, Kruskal–Wallis test, weighted gene analysis (WGA) [28],and significance analysis of microarrays (SAM) [29]. t-Test and Kruskal–Wallis test are twocommonly used paramatric and nonparamatric statistical methods, respectively, which testwhether the mean values between the two group of samples are equal. The Kruskal–Wallis testis performed on ranked data; it might be relatively less powerful due to the transformation ofinformative data into rank data, but it does not make assumptions about normality andhomoscedasticity. The cutoff significance levels for both the two tests were set to be p<0.05.In WGA, a discriminative weight (w) for each protein can be evaluated by w = dB/(k1dw1 +k2dw2 + α), where dB is the center-to-center distance (between-group Euclidean distance),dwi is the average Euclidean distance among all sample pairs within group i, with a total oft1 and t2 sample pairs within groups 1 and 2, respectively, k1 = t1/(t1 + t2), and k2 = t2/(t1 +t2). α is a small constant to prevent a zero denominator. Proteins may then be ranked based onw. The larger the w, the larger the difference of the protein expression [28]. The significantcutoff point for WGA was set to be w>2.5. SAM was applied to protein expression analysis inthis study [29]. The statistic “relative difference” d(i) in protein expression is d(i) = (x̄1(i) −x̄2(i))/(s(i) + s0), where x̄1(i) and x̄2(i) are the average expression levels for protein (i) in thehigh BMD group versus the low BMD group, respectively. The protein-specific scatter s(i) isthe SD of repeated expression measurements:
where Σm and Σn are sums of the expression measurements in two groups, respectively, a =(1/n1 + 1/n2)/(n1 + n2 − 2), n1 and n2 are the numbers of measurements in two groups,
Deng et al. Page 4
Proteomics. Author manuscript; available in PMC 2009 October 13.
NIH
-PA Author Manuscript
NIH
-PA Author Manuscript
NIH
-PA Author Manuscript
respectively. s0 is to ensure that the variance in d(i) is independent of protein expression. Thevalue for s0 will be chosen to minimize the CV. The larger the d(i), the larger the differnce ofthe protein expression. The significant cutoff point for SAM was set to be d(i) = 1.0. Tominimize missing improtant proteins, all spots that meet at least one of the above criteria forstatistical significance were analyzed by MS.
2.7 Protein identificationThe interesting protein spots, based on our statistical analyses, were excised from the gels anddigested with trypsin. Briefly, each spot was destained in 15.0 mM K3Fe(CN)6 and 50.0 mMNa2S2O3, dehydrated in 50% and 100% ACN, and then marinated in 25 mM NH4HCO3 andredehydrated and dried. Then the protein in the dried gel piece was reduced (in 25 mMNH4HCO3 and 10 mM DTT), alkylated (in 25 mM NH4HCO3 and 55 mM IAA), and thendigested overnight at 37°C with trypsin (0.02 g/L) in 25 mM NH4HCO3 containing 10% ACN.
The digested peptides were extracted and spotted onto MALDI plate. MALDI peptidefingerprint mass spectra and peptide sequencing spectra were acquired with a MALDI-TOF/TOF Ultraflex mass spectrometer equipped with a reflector and controlled by the FlexControl2.2 software package (Bruker Daltonics, Bremen, Germany), using cyano-4-hydroxycinnamicacid (Sigma) as the matrix. In MALDI-TOF MS reflector mode, ions generated by a pulsedUV laser beam (nitrogen laser, λ = 337 nm, 50 Hz) were accelerated to a kinetic energy of 25kV. Metastable ions generated by laser-induced decomposition of the selected precursor ionswere analyzed with Ar as collision gas. In MALDI-LIFT-TOF/TOF mode, precursor ions wereaccelerated to 8 kV and selected in a timed ion gate. The fragments were further acceleratedby19 kV in the LIFT cell (LIFT, “lifting” the potential energy for the second acceleration ofion source), and their masses were analyzed after the ion reflector passage.
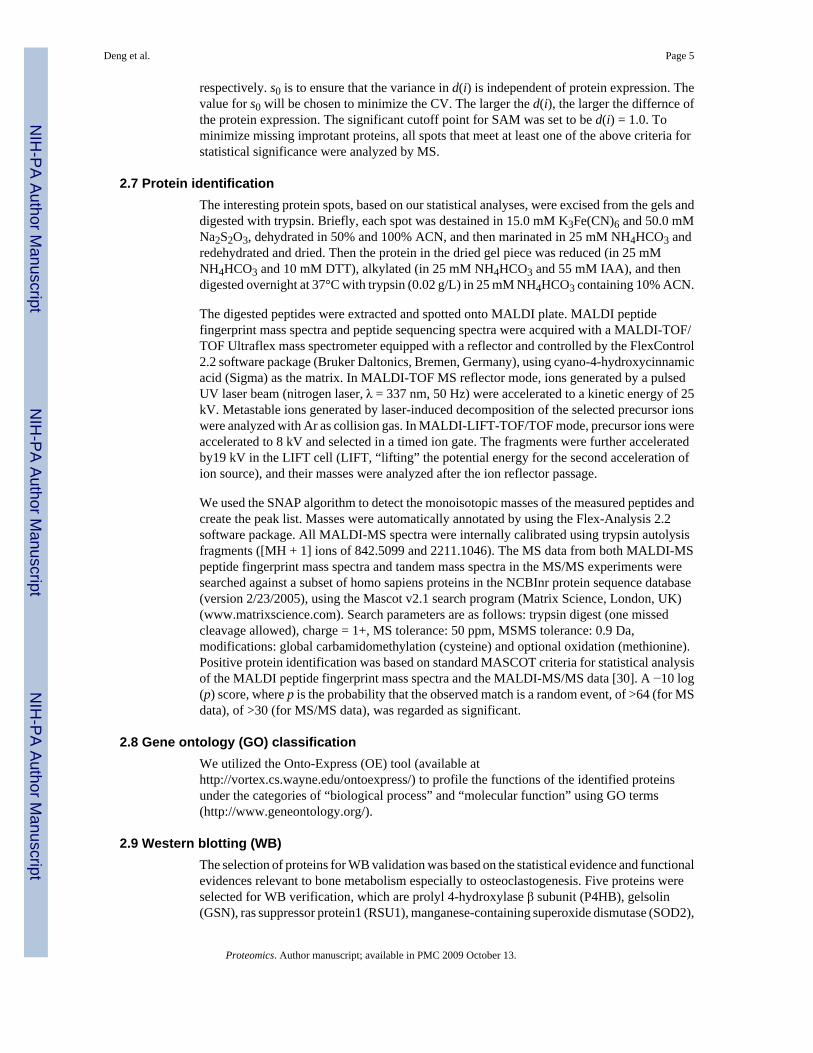
We used the SNAP algorithm to detect the monoisotopic masses of the measured peptides andcreate the peak list. Masses were automatically annotated by using the Flex-Analysis 2.2software package. All MALDI-MS spectra were internally calibrated using trypsin autolysisfragments ([MH + 1] ions of 842.5099 and 2211.1046). The MS data from both MALDI-MSpeptide fingerprint mass spectra and tandem mass spectra in the MS/MS experiments weresearched against a subset of homo sapiens proteins in the NCBInr protein sequence database(version 2/23/2005), using the Mascot v2.1 search program (Matrix Science, London, UK)(www.matrixscience.com). Search parameters are as follows: trypsin digest (one missedcleavage allowed), charge = 1+, MS tolerance: 50 ppm, MSMS tolerance: 0.9 Da,modifications: global carbamidomethylation (cysteine) and optional oxidation (methionine).Positive protein identification was based on standard MASCOT criteria for statistical analysisof the MALDI peptide fingerprint mass spectra and the MALDI-MS/MS data [30]. A −10 log(p) score, where p is the probability that the observed match is a random event, of >64 (for MSdata), of >30 (for MS/MS data), was regarded as significant.
2.8 Gene ontology (GO) classificationWe utilized the Onto-Express (OE) tool (available athttp://vortex.cs.wayne.edu/ontoexpress/) to profile the functions of the identified proteinsunder the categories of “biological process” and “molecular function” using GO terms(http://www.geneontology.org/).
2.9 Western blotting (WB)The selection of proteins for WB validation was based on the statistical evidence and functionalevidences relevant to bone metabolism especially to osteoclastogenesis. Five proteins wereselected for WB verification, which are prolyl 4-hydroxylase β subunit (P4HB), gelsolin(GSN), ras suppressor protein1 (RSU1), manganese-containing superoxide dismutase (SOD2),
Deng et al. Page 5
Proteomics. Author manuscript; available in PMC 2009 October 13.
NIH
-PA Author Manuscript
NIH
-PA Author Manuscript
NIH
-PA Author Manuscript

and glutathione peroxidase 1 (GPX1). Herein, selection of P4HB was based on significantstatistical evidences (p<0.05 for both t-test of Kruskal–Wallis test); selection of GSN, RSU1,SOD2, and GPX1 was based on suggestive or tentative statistical evidence (p = 0.086 for GSN,w = 2.884 for RSU1, w = 2.061 for SOD2, w = 1.519 and expression ratio (L:H) = 0.83 forGPX1), and known functional evidences (detailed in Section 4).
The primary antibodies used in this study included chicken anti-human RSU1 pAb (cat. no.ab26225, 1:1000 dilution), mouse anti-human GSN mAb[GS-2C4] (cat. no. ab11081, 1:1000dilution), rabbit antirat full length protein SOD2 pAb (cat. no. ab13534, 1:2000 dilution), rabbitanti-human GPX1 pAb (cat. no. ab16798, 1:1000 dilution), which are purchased from Abcam(Abcam plc, Cambridge, UK), and mouse antirat P4HB mAb (cat. no. MAB2073, 1:2000dilution) from Chemicon (Chemicon International, Temecula, CA, USA). Due to unavailabilityof the anti-human P4HB and anti-human SOD2 primary antibodies, we used anti-rat P4HBand SOD2 antibodies instead because of the highly conserved amino acid sequences of P4HBand SOD2 in both rat and human (percent sequence similarity: 96 and 92%, respectively).GAPDH was used as internal control. WB images were obtained through film X-ray exposuredeveloped by using LumiGLO chemiluminescent substrates (KPL, 2 Cessna Court,Gaithersburg, MD, USA). The target protein bands in images were analyzed and quantifiedusing QuantityOne software (Bio-Rad Laboratories, Hercules). Independent sample t-test wasused to compare the expression level of the target proteins between the two groups of samples.
3 Results3.1 Identified proteins differentially expressed between high and low BMD samples
For the ten pooled biological samples (five random pairs of 2-DE samples), we have performeda total of 30 2-DE experiments. Supporting Information 1 showed the replicate 2-DE gels forten pooled samples. We detected an average of 526 spots per gel. No presence/absence proteinsin high versus low BMD groups were detected. A total of 210 spots matched and quantified inmore than eight out of the ten pooled samples were compared in the two groups of samples(Supporting Information 2). Statistical analyses showed that 67 protein spots are of significantor marginally significant differential expression. Besides these differential spots, we analyzedadditional spots by MS, with an attempt to identify more potentially function-related proteinsthough their differential expression did not reach statistical significance level. Totally, wesuccessfully identified 74 spots (corresponding to 58 proteins) with significant Mowse scores,including 46 differentially expressed spots which corresponded to 38 DEPs (SupplortingInformation 3). Listed in Table 1 is the mass identification information for the 38 DEPs. Figure2 showed representatively the mass spectra of a protein spot (ssp6406, GSN). These DEPs arenovel or known relevant to bone metabolism. The majority of these identified proteins wereupregulated in high BMD group.
Note that a protein with a differentially expressed spot does not necessarily mean that thisprotein, as a whole, is differentially expressed. For example, multiple spots (including adifferentially expressed spot SSP 9313 as shown in Table 1) on 2-DE gels were identified tobe the same protein GAPDH, which is a tetramer enzyme. However, quantitative analysissummarizing the data of the multiple spots showed no significant differential expression forthe whole protein between the two groups of samples (p = 0.248). Based on the analysis,GAPDH was used as an internal control in WB analysis. We avoided using cytoskeletonproteins such as β-actin or β-tubulin as an internal control in WB, since quite a fewnonredundant cytoskeleton proteins (ACTG1, TUBA1B, TUBA6, VCL, TLN1, GSN, WDR1,and TPM4) were found differentially expressed in our samples.
Deng et al. Page 6
Proteomics. Author manuscript; available in PMC 2009 October 13.
NIH
-PA Author Manuscript
NIH
-PA Author Manuscript
NIH
-PA Author Manuscript
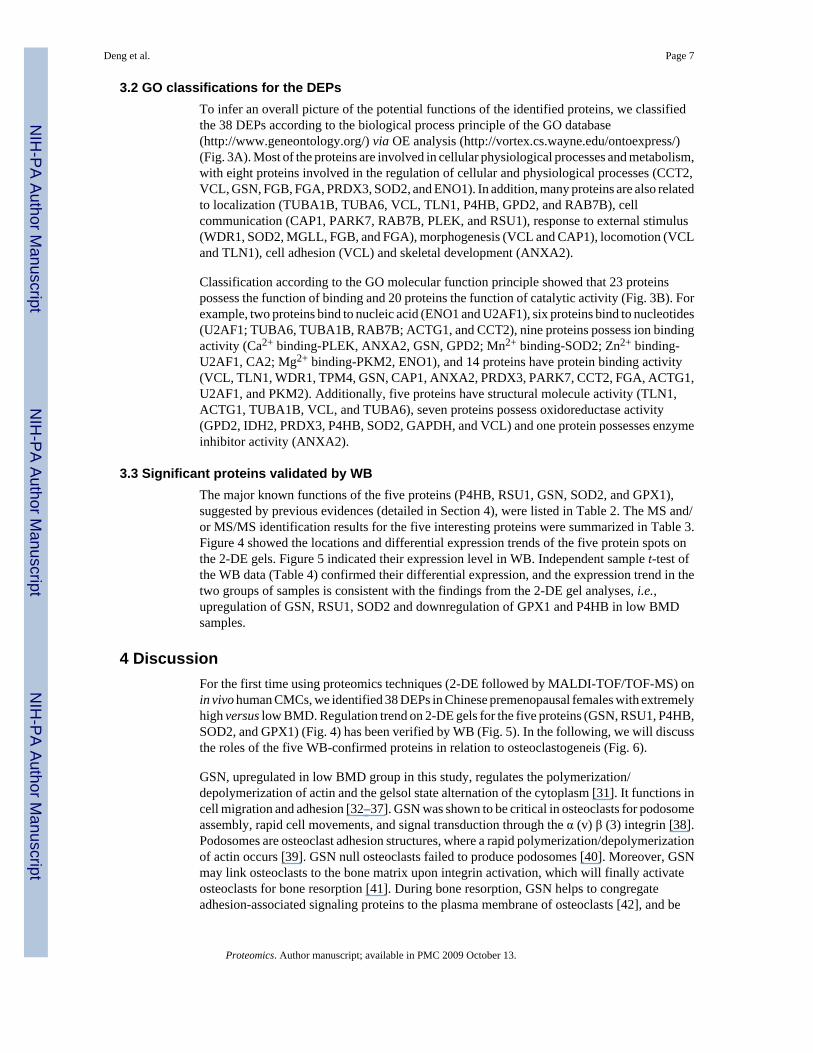
3.2 GO classifications for the DEPsTo infer an overall picture of the potential functions of the identified proteins, we classifiedthe 38 DEPs according to the biological process principle of the GO database(http://www.geneontology.org/) via OE analysis (http://vortex.cs.wayne.edu/ontoexpress/)(Fig. 3A). Most of the proteins are involved in cellular physiological processes and metabolism,with eight proteins involved in the regulation of cellular and physiological processes (CCT2,VCL, GSN, FGB, FGA, PRDX3, SOD2, and ENO1). In addition, many proteins are also relatedto localization (TUBA1B, TUBA6, VCL, TLN1, P4HB, GPD2, and RAB7B), cellcommunication (CAP1, PARK7, RAB7B, PLEK, and RSU1), response to external stimulus(WDR1, SOD2, MGLL, FGB, and FGA), morphogenesis (VCL and CAP1), locomotion (VCLand TLN1), cell adhesion (VCL) and skeletal development (ANXA2).
Classification according to the GO molecular function principle showed that 23 proteinspossess the function of binding and 20 proteins the function of catalytic activity (Fig. 3B). Forexample, two proteins bind to nucleic acid (ENO1 and U2AF1), six proteins bind to nucleotides(U2AF1; TUBA6, TUBA1B, RAB7B; ACTG1, and CCT2), nine proteins possess ion bindingactivity (Ca2+ binding-PLEK, ANXA2, GSN, GPD2; Mn2+ binding-SOD2; Zn2+ binding-U2AF1, CA2; Mg2+ binding-PKM2, ENO1), and 14 proteins have protein binding activity(VCL, TLN1, WDR1, TPM4, GSN, CAP1, ANXA2, PRDX3, PARK7, CCT2, FGA, ACTG1,U2AF1, and PKM2). Additionally, five proteins have structural molecule activity (TLN1,ACTG1, TUBA1B, VCL, and TUBA6), seven proteins possess oxidoreductase activity(GPD2, IDH2, PRDX3, P4HB, SOD2, GAPDH, and VCL) and one protein possesses enzymeinhibitor activity (ANXA2).
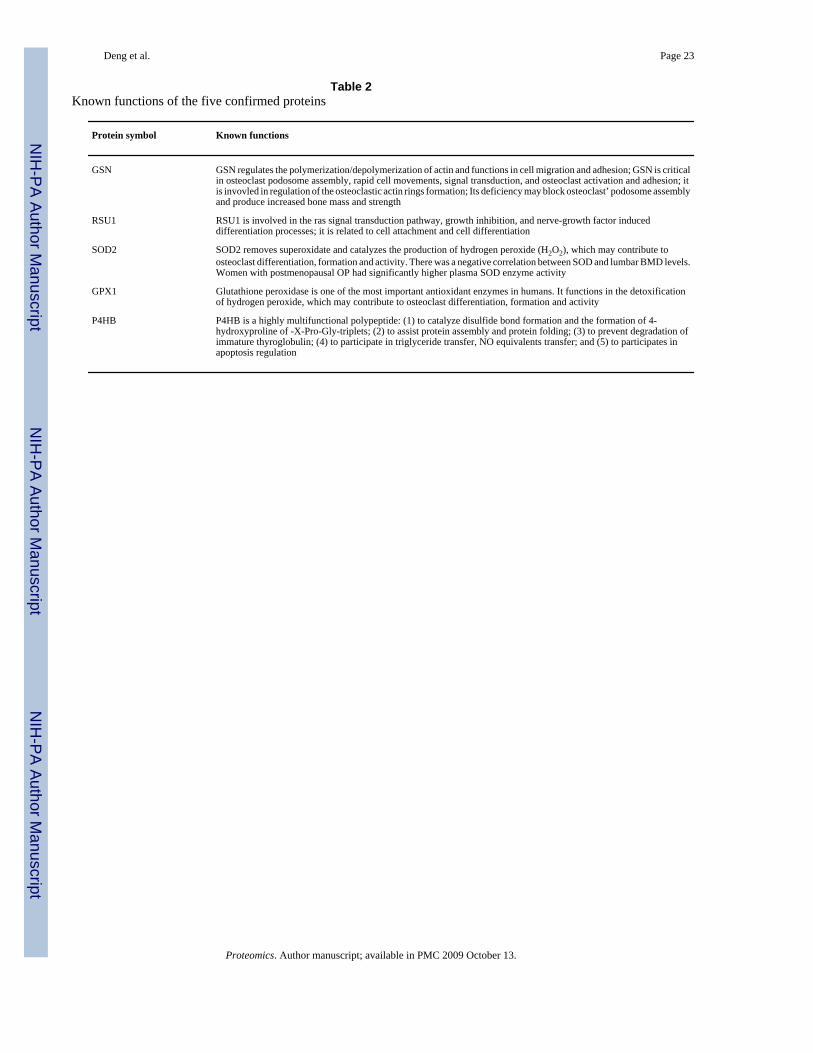
3.3 Significant proteins validated by WBThe major known functions of the five proteins (P4HB, RSU1, GSN, SOD2, and GPX1),suggested by previous evidences (detailed in Section 4), were listed in Table 2. The MS and/or MS/MS identification results for the five interesting proteins were summarized in Table 3.Figure 4 showed the locations and differential expression trends of the five protein spots onthe 2-DE gels. Figure 5 indicated their expression level in WB. Independent sample t-test ofthe WB data (Table 4) confirmed their differential expression, and the expression trend in thetwo groups of samples is consistent with the findings from the 2-DE gel analyses, i.e.,upregulation of GSN, RSU1, SOD2 and downregulation of GPX1 and P4HB in low BMDsamples.
4 DiscussionFor the first time using proteomics techniques (2-DE followed by MALDI-TOF/TOF-MS) onin vivo human CMCs, we identified 38 DEPs in Chinese premenopausal females with extremelyhigh versus low BMD. Regulation trend on 2-DE gels for the five proteins (GSN, RSU1, P4HB,SOD2, and GPX1) (Fig. 4) has been verified by WB (Fig. 5). In the following, we will discussthe roles of the five WB-confirmed proteins in relation to osteoclastogeneis (Fig. 6).
GSN, upregulated in low BMD group in this study, regulates the polymerization/depolymerization of actin and the gelsol state alternation of the cytoplasm [31]. It functions incell migration and adhesion [32–37]. GSN was shown to be critical in osteoclasts for podosomeassembly, rapid cell movements, and signal transduction through the α (v) β (3) integrin [38].Podosomes are osteoclast adhesion structures, where a rapid polymerization/depolymerizationof actin occurs [39]. GSN null osteoclasts failed to produce podosomes [40]. Moreover, GSNmay link osteoclasts to the bone matrix upon integrin activation, which will finally activateosteoclasts for bone resorption [41]. During bone resorption, GSN helps to congregateadhesion-associated signaling proteins to the plasma membrane of osteoclasts [42], and be
Deng et al. Page 7
Proteomics. Author manuscript; available in PMC 2009 October 13.
NIH
-PA Author Manuscript
NIH
-PA Author Manuscript
NIH
-PA Author Manuscript

involved in regulation of the osteoclastic actin rings formation [43]. GSN-deficient osteoclastswere found to display increased bone mass and strength [38]. Our finding of up-regulation ofGSN in low BMD subjects is consistent with the above findings that the protein promotesosteoclastogenesis and bone resorption by enhancing osteoclast migration, adhesion, andactivity.
For peripheral skeleton, circulation provides the sole access route of blood monocytes to bonesurfaces [10–12,44]. Naturally, as the precursors of osteoclasts, transendothelial movement ofCMCs to bone micro-environment is a fundamental step to their later differentiation into activeosteoclasts. It has been demonstrated that there is no significant difference in the number ofCMCs between the osteoporotic and normal subjects [45], which suggested that the increasedosteoclastogenesis in osteoporotic subjects may not result from the absolute quantity of CMCsbut more CMCs moving into the bone micro-environment to differentiate into osteoblasts.Therefore, CMCs’ adhesion to vascular endothelium, morphologic changes, and trans-endothelial locomotion, as regulated by the protein GSN, is critical for osteoclastogenesis andthus OP.
RSU1 is a highly conserved leucine rich repeat protein, expressed ubiquitously in mammaliancells. Reduction in expressed RSU1 mRNA and protein inhibited cell attachment [46]. Itsexpression was also related to enhanced differentiation [47]. Based on these evidences, wespeculate that upregulation of RSU1 may lead to lower BMD, mainly by inducing osteoclastdifferentiation and by enhancing the attachment of monocytes to the vascular wall, thuspromoting their trans-endothelium. Further molecular and cellular studies of RSU1 in CMCsare needed to confirm its effects on osteoclastogenesis.
SOD2 catalyzes the production of hydrogen peroxide (H2O2) from superoxide. GPX1 playsan important role in the detoxification of H2O2; it is one of the most important anti-oxidantenzymes in humans. Taken together, SOD2 and GPX1 may act together to regulate the cellularlevel of H2O2. Interestingly, H2O2 may stimulate osteoclast differentiation [48–50], RANKLexpression in human osteoblast-like MG63 cell line [51], and osteoclast formation, and enhanceactivity of mature osteoclasts in mouse calvariae [52]. In addition, over-expression of GPX inRAW 264.7 cells may abolish its differentiation and osteoclast formation [53]. Therefore, wespeculate that upregulation of SOD2 and downregulation of GPX1, as detected in our low BMDgroup, may promote osteroclast differentiation, formation, and activity. Consistent with ourfindings, previous studies showed that women with postmenopausal OP had significantlyhigher plasma SOD enzyme activity than controls [54], and osteoporotic males showed anegative correlation between serum SOD and lumbar BMD [52]. All these evidences indicatedthat SOD2 and GPX1 may play significant roles in pathogenesis of OP.
Prolyl 4-hydroxylase may catalyze the formation of 4-hydroxyproline by hydroxylation of -X-Pro-Gly-triplets [55]. It recognizes and retains unfolded procollagen molecules within theER until they were folded correctly [56,57]. The β subunit of prolyl 4-hydroxylase (P4HB),also named protein disulfide isomerase (PDI), is a highly multifunctional polypeptide. Itfunctions to catalyze the formation of disulfide bond and the formation of 4-hydroxyprolineof -X-Pro-Gly-triplets, to assist protein assembly and protein folding, and to participate inapoptosis regulation, etc. [55,58–63]. The detailed mechanism whereby P4HB regulatesosteoclastogenesis leading to low BMD phenotype, as shown in our study, needs furtherinvestigation.
In this study, an extremely sampling scheme was utilized. The study subjects with high or lowBMD were recruited from the top or bottom 12% of the BMD distribution in a healthypremenopausal female population. Such an extreme sampling scheme helps to increases thepower to detect the significantly DEPs. According to the method of sample pooling suggested
Deng et al. Page 8
Proteomics. Author manuscript; available in PMC 2009 October 13.
NIH
-PA Author Manuscript
NIH
-PA Author Manuscript
NIH
-PA Author Manuscript
by Zhang and Gant [64], we pooled three samples in the same group together in this study,which decreased the experiment cost but retained equivalent power [65].
In summary, for the first time using proteomics techniques on in vivo human CMCs, weidentified a list of DEPs in Chinese premenopausal females with high versus low BMD andverified five proteins (GSN, RSU1, SOD2, GPX1, and P4HB) by WB. These proteins may beimportant for monocytes’ trans-endothelium, differentiation, and/or maturation, thuscontribute to differential osteoclastogenesis and lead to BMD variation. In this study,proteomics techniques and extreme sampling scheme proved effective and promising toidentify proteins important to pathogenesis of OP. This strategy may also benefit systematicresearch of novel unknown proteins for OP and other human complex diseases. The findingsof this study promote our understanding of the role of CMCs in BMD determination, andprovide an insight into pathogenesis of human OP.
Supplementary MaterialRefer to Web version on PubMed Central for supplementary material.
AcknowledgmentsThe study was partially supported by grants from Natural Science Foundation of China (nos. 30230210, 30470534,and 30600364) and Scientific Research Initiated Fund of Hunan Normal University (531120-1113). HWD, YZL, andGX were partially supported by NIH grants R21 AG027110-01A1, R01 GM60402, R01 AR050496, K01AR02170-01A2, and P50 AR055081.
AbbreviationsBMD
bone mineral density
CMCs circulating monocytes
DEP differentially expressed protein
GO gene ontology
GPX1 glutathione peroxidase 1
GSN gelsolin
MNCs circulating mononuclear cells
OE Onto-Express
OP osteoporosis
P4HB prolyl 4-hydroxylase β subunit
Deng et al. Page 9
Proteomics. Author manuscript; available in PMC 2009 October 13.
NIH
-PA Author Manuscript
NIH
-PA Author Manuscript
NIH
-PA Author Manuscript

RSU1 ras suppressor protein1
SAM significance analysis of microarrays
SOD2 manganese-containing superoxide dismutase
WB Western blotting
WGA weighted gene analysis
References1. Cummings SR, Nevitt MC, Browner WS, Stone K, et al. Risk factors for hip fracture in white women.
Study of osteoporotic fractures research group. N Engl J Med 1995;332:767–773. [PubMed: 7862179]2. Melton LJ III. How many women have osteoporosis now? J Bone Miner Res 1995;10:175–177.
[PubMed: 7754796]3. Deng HW, Mahaney MC, Williams JT, Li J, et al. Relevance of the genes for bone mass variation to
susceptibility to osteoporotic fractures and its implications to gene search for complex human diseases.Genet Epidemiol 2002;22:12–25. [PubMed: 11754470]
4. Liu PY, Qin YJ, Recker RR, Deng HW. Evidence for a major gene underlying bone size variation inthe Chinese. Am J Hum Biol 2004;16:68–77. [PubMed: 14689517]
5. Jian WX, Long JR, Li MX, Liu XH, Deng HW. Genetic determination of variation and covariation ofbone mineral density at the hip and spine in a Chinese population. J Bone Miner Metab 2005;23:181–185. [PubMed: 15750698]
6. Liu YJ, Shen H, Xiao P, Xiong DH, et al. Molecular genetic studies of gene identification forosteoporosis: A 2004 update. J Bone Miner Res 2006;21:1511–1535. [PubMed: 16995806]
7. Liu YZ, Dvornyk V, Lu Y, Shen H, et al. A novel pathophysiological mechanism for osteoporosissuggested by an in vivo gene expression study of circulating monocytes. J Biol Chem 2005;280:29011–29016. [PubMed: 15965235]
8. Nakamura M, Udagawa N, Matsuura S, Mogi M, et al. Osteoprotegerin regulates bone formationthrough a coupling mechanism with bone resorption. Endocrinology 2003;144:5441–5449. [PubMed:14500574]
9. Martin TJ, Sims NA. Osteoclast-derived activity in the coupling of bone formation to resorption. TrendsMol Med 2005;11:76–81. [PubMed: 15694870]
10. Zambonin ZA, Teti A, Primavera MV. Monocytes from circulating blood fuse in vitro with purifiedosteoclasts in primary culture. J Cell Sci 1984;66:335–342. [PubMed: 6378944]
11. Horton MA, Spragg JH, Bodary SC, Helfrich MH. Recognition of cryptic sites in human and mouselaminins by rat osteoclasts is mediated by beta 3 and beta 1 integrins. Bone 1994;15:639–646.[PubMed: 7532981]
12. Parfitt AM. Osteonal and hemi-osteonal remodeling: The spatial and temporal framework for signaltraffic in adult human bone. J Cell Biochem 1994;55:273–286. [PubMed: 7962158]
13. Fujikawa Y, Quinn JM, Sabokbar A, McGee JO, Athanasou NA. The human osteoclast precursorcirculates in the monocyte fraction. Endocrinology 1996;137:4058–4060. [PubMed: 8756585]
14. Higuchi S, Tabata N, Tajima M, Ito M, et al. Induction of human osteoclast-like cells by treatmentof blood monocytes with anti-fusion regulatory protein-1/CD98 monoclonal antibodies. J BoneMiner Res 1998;13:44–49. [PubMed: 9443789]
15. Matayoshi A, Brown C, DiPersio JF, Haug J, et al. Human blood-mobilized hematopoietic precursorsdifferentiate into osteoclasts in the absence of stromal cells. Proc Natl Acad Sci USA 1996;93:10785–10790. [PubMed: 8855258]
Deng et al. Page 10
Proteomics. Author manuscript; available in PMC 2009 October 13.
NIH
-PA Author Manuscript
NIH
-PA Author Manuscript
NIH
-PA Author Manuscript

16. Purton LE, Lee MY, Torok-Storb B. Normal human peripheral blood mononuclear cells mobilizedwith granulocyte colony-stimulating factor have increased osteoclastogenic potential compared tononmobilized blood. Blood 1996;87:1802–1808. [PubMed: 8634426]
17. Udagawa N, Takahashi N, Akatsu T, Tanaka H, et al. Origin of osteoclasts: Mature monocytes andmacrophages are capable of differentiating into osteoclasts under a suitable microenvironmentprepared by bone marrow-derived stromal cells. Proc Natl Acad Sci USA 1990;87:7260–7264.[PubMed: 2169622]
18. Quinn JM, Neale S, Fujikawa Y, McGee JO, et al. Human osteoclast formation from blood monocytes,peritoneal macrophages, and bone marrow cells. Calcif Tissue Int 1998;62:527–531. [PubMed:9576981]
19. Nathan CF. Secretory products of macrophages. J Clin Invest 1987;79:319–326. [PubMed: 3543052]20. Cohen-Solal ME, Graulet AM, Denne MA, Gueris J, et al. Peripheral monocyte culture supernatants
of menopausal women can induce bone resorption: Involvement of cytokines. J Clin EndocrinolMetab 1993;77:1648–1653. [PubMed: 8263153]
21. Pacifici R. Estrogen, cytokines, and pathogenesis of post-menopausal osteoporosis. J Bone MinerRes 1996;11:1043–1051. [PubMed: 8854239]
22. Cohen-Solal ME, Boitte F, Bernard-Poenaru O, Denne MA, et al. Increased bone resorbing activityof peripheral monocyte culture supernatants in elderly women. J Clin Endocrinol Metab1998;83:1687–1690. [PubMed: 9589677]
23. Carrascosa A, Gussinye M, Yeste D, del Rio L, et al. Bone mass acquisition during infancy, childhoodand adolescence. Acta Paediatr Suppl 1995;411:18–23. [PubMed: 8563063]
24. Yao WJ, Wu CH, Wang ST, Chang CJ, et al. Differential changes in regional bone mineral densityin healthy Chinese: Age-related and sex-dependent. Calcif Tissue Int 2001;68:330–336. [PubMed:11685419]
25. Manolagas SC, Jilka RL. Bone marrow, cytokines, and bone remodeling. Emerging insights into thepathophysiology of osteoporosis. N Engl J Med 1995;332:305–311. [PubMed: 7816067]
26. Pacifici R. Estrogen, cytokines, and pathogenesis of post-menopausal osteoporosis. J Bone MinerRes 1996;11:1043–1051. [PubMed: 8854239]
27. Deng HW, Deng XT, Conway T, Xu FH, et al. Determination of bone size of hip, spine, and wrist inhuman pedigrees by genetic and lifestyle factors. J Clin Densitom 2002;5:45–56. [PubMed:11940728]
28. Yu Y, Khan J, Khanna C, Helman L, et al. Expression profiling identifies the cytoskeletal organizerezrin and the developmental homeoprotein Six-1 as key metastatic regulators. Nat Med 2004;10:175–181. [PubMed: 14704789]
29. van de Wiel MA. Significance Analysis of Microarrays using Rank Scores. Kwantitatieve Methoden2004;71:25–37.
30. Perkins DN, Pappin DJ, Creasy DM, Cottrell JS. Probability-based protein identification by searchingsequence databases using mass spectrometry data. Electrophoresis 1999;20:3551–3567. [PubMed:10612281]
31. Silacci P, Mazzolai L, Gauci C, Stergiopulos N, et al. Gelsolin superfamily proteins: Key regulatorsof cellular functions. Cell Mol Life Sci 2004;61:2614–2623. [PubMed: 15526166]
32. Stossel TP, Hartwig JH, Yin HL, Southwick FS, Zaner KS. The motor of leukocytes. Fed Proc1984;43:2760–2763. [PubMed: 6540718]
33. Perez Castrillon JL, Garcia Palomo JD, Perez Arellano JL, Jimenez LA. Leukocyte chemotaxis.Allergol Immunopathol (Madr) 1988;16:279–283. [PubMed: 3067567]
34. Chaponnier C, Kocher O, Gabbiani G. Modulation of gelsolin content in rat aortic smooth musclecells during development, experimental intimal thickening and culture. An immunohistochemicaland biochemical study. Eur J Biochem 1990;190:559–565. [PubMed: 2164930]
35. Cunningham CC, Stossel TP, Kwiatkowiski DJ. Enhanced motility in NIH3T3 fibroblasts thatoverexpress gelsolin. Science 1991;251:1233–1236. [PubMed: 1848726]
36. Arora PD, McCulloch CA. Dependence of fibroblast migration on actin severing activity of gelsolin.J Biol Chem 1996;271:20516–20523. [PubMed: 8702793]
37. Kwiatkowski DJ. Functions of gelsolin: Motility, signaling, apoptosis, cancer. Curr Opin Cell Biol1999;11:103–108. [PubMed: 10047530]
Deng et al. Page 11
Proteomics. Author manuscript; available in PMC 2009 October 13.
NIH
-PA Author Manuscript
NIH
-PA Author Manuscript
NIH
-PA Author Manuscript
38. Chellaiah M, Kizer N, Silva M, Alvarez U, et al. Gelsolin deficiency blocks podosome assembly andproduces increased bone mass and strength. J Cell Biol 2000;148:665–678. [PubMed: 10684249]
39. Akisaka T, Yoshida H, Inoue S, Shimizu K. Organization of cytoskeletal F-actin, G-actin, and gelsolinin the adhesion structures in cultured osteoclast. J Bone Miner Res 2001;16:1248–1255. [PubMed:11450700]
40. Chellaiah MA. Regulation of actin ring formation by rho GTPases in osteoclasts. J Biol Chem2005;280:32930–32943. [PubMed: 16006560]
41. Duong LT, Lakkakorpi P, Nakamura I, Rodan GA. Integrins and signaling in osteoclast function.Matrix Biol 2000;19:97–105. [PubMed: 10842093]
42. Chellaiah MA, Biswas RS, Yuen D, Alvarez UM, Hruska KA. Phosphatidylinositol 3,4,5-trisphosphate directs association of Src homology 2-containing signaling proteins with gelsolin. JBiol Chem 2001;276:47434–47444. [PubMed: 11577104]
43. Wang Q, Xie Y, Du QS, Wu XJ, et al. Regulation of the formation of osteoclastic actin rings byproline-rich tyrosine kinase 2 interacting with gelsolin. J Cell Biol 2003;160:565–575. [PubMed:12578912]
44. Parfitt AM. Osteoclast precursors as leukocytes: Importance of the area code. Bone 1998;23:491–494. [PubMed: 9855456]
45. Jevon M, Hirayama T, Brown MA, Wass JA, et al. Osteoclast formation from circulating precursorsin osteoporosis. Scand J Rheumatol 2003;32:95–100. [PubMed: 12737328]
46. Dougherty GW, Chopp T, Qi SM, Cutler ML. The Ras suppressor Rsu-1 binds to the LIM 5 domainof the adaptor protein PINCH1 and participates in adhesion-related functions. Exp Cell Res2005;306:168–179. [PubMed: 15878342]
47. Masuelli L, Ettenberg S, Vasaturo F, Vestergaard-Sykes K, Cutler ML. The ras suppressor, RSU-1,enhances nerve growth factor-induced differentiation of PC12 cells and induces p21CIP expression.Cell Growth Differ 1999;10:555–564. [PubMed: 10470855]
48. Lee NK, Choi YG, Baik JY, Han SY, et al. A crucial role for reactive oxygen species in RANKL-induced osteoclast differentiation. Blood 2005;106:852–859. [PubMed: 15817678]
49. Kim HJ, Chang EJ, Kim HM, Lee SB, et al. Anti-oxidant alpha-lipoic acid inhibits osteoclastdifferentiation by reducing nuclear factor-kappaB DNA binding and prevents in vivo bone resorptioninduced by receptor activator of nuclear factor-kappaB ligand and tumor necrosis factor-alpha. FreeRadical Biol Med 2006;40:1483–1493. [PubMed: 16632109]
50. Steinbeck MJ, Kim JK, Trudeau MJ, Hauschka PV, Karnovsky MJ. Involvement of hydrogenperoxide in the differentiation of clonal HD-11EM cells into osteoclast-like cells. J Cell Physiol1998;176:574–587. [PubMed: 9699510]
51. Bai XC, Lu D, Liu AL, Zhang ZM, et al. Reactive oxygen species stimulates receptor activator ofNF-kappaB ligand expression in osteoblast. J Biol Chem 2005;280:17497–17506. [PubMed:15731115]
52. Fraser JH, Helfrich MH, Wallace HM, Ralston SH. Hydrogen peroxide, but not superoxide, stimulatesbone resorption in mouse calvariae. Bone 1996;19:223–226. [PubMed: 8873962]
53. Lean JM, Jagger CJ, Kirstein B, Fuller K, Chambers TJ. Hydrogen peroxide is essential for estrogen-deficiency bone loss and osteoclast formation. Endocrinology 2005;146:728–735. [PubMed:15528306]
54. Ozgocmen S, Kaya H, Fadillioglu E, Aydogan R, Yilmaz Z. Role of antioxidant systems, lipidperoxidation, and nitric oxide in postmenopausal osteoporosis. Mol Cell Biochem 2007;295:45–52.[PubMed: 16841180]
55. Helaakoski T, Annunen P, Vuori K, MacNeil IA, et al. Cloning, baculovirus expression, andcharacterization of a second mouse prolyl 4-hydroxylase alpha-subunit isoform: Formation of analpha 2 beta 2 tetramer with the protein disulfide-isomerase/beta subunit. Proc Natl Acad Sci USA1995;92:4427–4431. [PubMed: 7753822]
56. Chessler SD, Byers PH. Defective folding and stable association with protein disulfide isomerase/prolyl hydroxylase of type I procollagen with a deletion in the pro alpha 2(I) chain that preserves theGly-X-Y repeat pattern. J Biol Chem 1992;267:7751–7757. [PubMed: 1339453]
Deng et al. Page 12
Proteomics. Author manuscript; available in PMC 2009 October 13.
NIH
-PA Author Manuscript
NIH
-PA Author Manuscript
NIH
-PA Author Manuscript

57. Walmsley AR, Batten MR, Lad U, Bulleid NJ. Intra-cellular retention of procollagen within theendoplasmic reticulum is mediated by prolyl 4-hydroxylase. J Biol Chem 1999;274:14884–14892.[PubMed: 10329688]
58. Tian R, Li SJ, Wang DL, Zhao Z, et al. The acidic C-terminal domain stabilizes the chaperone functionof protein disulfide isomerase. J Biol Chem 2004;279:48830–48835. [PubMed: 15358778]
59. Zhao TJ, Ou WB, Xie Q, Liu Y, et al. Catalysis of creatine kinase refolding by protein disulfideisomerase involves disulfide cross-link and dimer to tetramer switch. J Biol Chem 2005;280:13470–13476. [PubMed: 15695804]
60. Wetterau JR, Combs KA, McLean LR, Spinner SN, Aggerbeck LP. Protein disulfide isomeraseappears necessary to maintain the catalytically active structure of the microsomal triglyceride transferprotein. Biochemistry 1991;30:9728–9735. [PubMed: 1911761]
61. Sliskovic I, Raturi A, Mutus B. Characterization of the S-denitrosation activity of protein disulfideisomerase. J Biol Chem 2005;280:8733–8741. [PubMed: 15611098]
62. Mezghrani A, Courageot J, Mani JC, Pugniere M, et al. Protein-disulfide isomerase (PDI) in FRTL5cells. pH-dependent thyroglobulin/PDI interactions determine a novel PDI function in the post-endoplasmic reticulum of thyrocytes. J Biol Chem 2000;275:1920–1929. [PubMed: 10636893]
63. Ko HS, Uehara T, Nomura Y. Role of ubiquilin associated with protein-disulfide isomerase in theendoplasmic reticulum in stress-induced apoptotic cell death. J Biol Chem 2002;277:35386–35392.[PubMed: 12095988]
64. Zhang SD, Gant TW. Effect of pooling samples on the efficiency of comparative studies usingmicroarrays. Bioinformatics 2005;21:4378–4383. [PubMed: 16234321]
65. Peng X, Wood CL, Blalock EM, Chen KC, et al. Statistical implications of pooling RNA samples formicroarray experiments. BMC Bioinformatics 2003;4:26. [PubMed: 12823867]
Deng et al. Page 13
Proteomics. Author manuscript; available in PMC 2009 October 13.
NIH
-PA Author Manuscript
NIH
-PA Author Manuscript
NIH
-PA Author Manuscript

Figure 1.An example of flow cytometry report. CD45 and CD14 are MNCs and CMCs specificmembrane marker, respectively.
Deng et al. Page 14
Proteomics. Author manuscript; available in PMC 2009 October 13.
NIH
-PA Author Manuscript
NIH
-PA Author Manuscript
NIH
-PA Author Manuscript

Deng et al. Page 15
Proteomics. Author manuscript; available in PMC 2009 October 13.
NIH
-PA Author Manuscript
NIH
-PA Author Manuscript
NIH
-PA Author Manuscript

Figure 2.Mass spectra for SSP6406 (GSN). A1: peptide fingerprint mass spectra of GSN; A2, A3:tandem mass spectra of precursor ion (m/z) 1275.674 and 1722.804.
Deng et al. Page 16
Proteomics. Author manuscript; available in PMC 2009 October 13.
NIH
-PA Author Manuscript
NIH
-PA Author Manuscript
NIH
-PA Author Manuscript

Figure 3.Classifications of the DEPs According to the GO principles. The analysis was performed bythe OE, available at http://vortex.cs.wayne.edu/ontoexpress/servlet/UserInfo; only 33 geneswith definite gene ID and known functions were categorized in the analyses; the number to theleft is the number and percentage of the proteins in each category.
Deng et al. Page 17
Proteomics. Author manuscript; available in PMC 2009 October 13.
NIH
-PA Author Manuscript
NIH
-PA Author Manuscript
NIH
-PA Author Manuscript

Figure 4.Locations and differential expression of the five protein spots on 2-DE gels. For each pooledsample, 300 μg of total protein from the CMC lysate were profiled by a first dimensionalelectrophoresis on an 18 cm IPG DryStrip (pH 3–10 L), followed by a second dimensionalelectrophoresis on a 10% 1.0 mm thick SDS-PAGE gel. The 2-DE was performed with theAmersham Pharmacia system. The proteins on 2-DE gel was stained by silver nitrate,quantified by PDQuest v7.2, and identified by MALDI-TOF/TOF-MS instrument. A, anexample of expression profile in a CMC sample with low BMD; SSP610, 3002 and SSP6406,7105, 7006 are proteins significantly down- and upregulated in low BMD samples,respectively. B, magnified proteins spots indicating the differential expression trend in low andhigh BMD samples.
Deng et al. Page 18
Proteomics. Author manuscript; available in PMC 2009 October 13.
NIH
-PA Author Manuscript
NIH
-PA Author Manuscript
NIH
-PA Author Manuscript

Figure 5.WB images for the five proteins and internal control protein GAPDH. The image presentedfor each target protein represented for one of the triplicate WB experiments; 25 μg of totalprotein for each sample are loaded for each WB experiment; the images were obtained throughfilm X-ray exposure developed by using horseradish peroxidase – labeled secondary antibodyand LumiGLO chemiluminescent substrates.
Deng et al. Page 19
Proteomics. Author manuscript; available in PMC 2009 October 13.
NIH
-PA Author Manuscript
NIH
-PA Author Manuscript
NIH
-PA Author Manuscript

Figure 6.Potential roles of the proteins in osteoclastogenesis. This figure depicts how CMCs migratefrom blood vessels to bone surface and activate into bone-resorbing osteoclasts. The majorprocess, on which the proteins may exert their effects, was indicated by arrows. Plus signmeans stimulate, minus sign means inhibit. ↓↑ Up- or downregulation in low BMD samples;
CMCs; monocyte; monocyte committed to osteoclast differentiation; multinucleatecell; mature osteoclast; and active osteoclast.
Deng et al. Page 20
Proteomics. Author manuscript; available in PMC 2009 October 13.
NIH
-PA Author Manuscript
NIH
-PA Author Manuscript
NIH
-PA Author Manuscript

NIH
-PA Author Manuscript
NIH
-PA Author Manuscript
NIH
-PA Author Manuscript
Deng et al. Page 21Ta
ble
1In
form
atio
n of
the
38 D
EPs i
dent
ified
by
MS
or M
S/M
S
SSP
L:H
aPr
otei
n sy
mbo
lPr
otei
n fu
ll na
me
giM
atch
ed p
eptid
esSe
quen
ce c
over
age
(%)
5719
0.71
GPD
2G
lyce
rol-3
-pho
spha
te d
ehyd
roge
nase
4504
085
1424
610
0.52
P4H
BPr
olyl
4-h
ydro
xyla
se, β
subu
nit p
recu
rsor
2007
0125
1239
5726
b0.
73W
DR
1W
D re
peat
dom
ain
112
6528
9114
28
3105
b0.
78PG
LS6-
Phos
phog
luco
nola
cton
ase
6912
586
626
102
0.77
PSM
A5
Prot
easo
me
(pro
som
e, m
acro
pain
) sub
unit,
α ty
pe,
571
0638
77
39
5716
0.63
ATI
C5-
Am
inoi
mid
azol
e-4-
carb
oxam
ide
ribon
ucle
otid
efo
rmyl
trans
fera
se/IM
P cy
cloh
ydro
lase
2012
7454
1427
5627
0.70
OX
CT1
OX
CT
4814
6215
828
6406
b1.
54G
SNG
SN is
ofor
m b
3804
4288
1824
5207
0.79
PNP
Purin
e nu
cleo
side
pho
spho
ryla
se10
8935
929
1858
8102
b0.
61TL
N1
talin
116
7532
334
2
4613
0.75
CC
T2C
hape
roni
n co
ntai
ning
TC
P1, s
ubun
it 2
5453
603
925
201
0.63
TPM
4Tr
opom
yosi
n 4
4507
651
1161
2303
0.81
TUB
A1B
TUB
A1B
pro
tein
1820
4869
628
9313
b0.
73G
APD
HG
lyce
rald
ehyd
e-3-
phos
phat
e de
hydr
ogen
ase
3164
514
35
4408
0.72
ENO
1En
olas
e 1
4503
571
721
5405
0.72
Unk
now
nA
ctin
-rel
ated
pro
tein
3819
647
23
4009
0.68
RA
B7B
RA
B7B
pro
tein
1687
7705
545
7203
0.74
MG
LLM
onog
lyce
ride
lipas
e is
ofor
m 2
5124
2953
1255
2208
0.65
AC
TG1
γ-ac
tin17
8045
428
1303
0.76
U2A
F1U
2 sm
all n
ucle
ar R
NA
aux
iliar
y fa
ctor
131
4552
286
42
4007
0.85
PAR
K7
DJ-
1 pr
otei
n31
5433
8011
50
7003
0.83
PSM
A2
PSM
A2
prot
ein
3964
4890
731
4010
0.80
PRD
X3
Pero
xire
doxi
n 3
isof
orm
b32
4833
776
17
1001
0.68
Unk
now
nT6
69 k
inas
e13
6299
114
28
6104
b0.
82TP
I1C
hain
B, t
riose
phos
phat
e is
omer
ase
(Tim
) (E.
C.
5.3.
1.1)
com
plex
ed w
ith 2
-pho
spho
glyc
olic
aci
d99
9893
941
3705
b0.
80V
CL
Vin
culin
2465
7579
88
106
0.70
PLEK
Plec
kstri
n45
0587
95
15
8404
0.79
Unk
now
nC
hain
, ald
olas
e A
2296
7410
42
Proteomics. Author manuscript; available in PMC 2009 October 13.

NIH
-PA Author Manuscript
NIH
-PA Author Manuscript
NIH
-PA Author Manuscript
Deng et al. Page 22
SSP
L:H
aPr
otei
n sy
mbo
lPr
otei
n fu
ll na
me
giM
atch
ed p
eptid
esSe
quen
ce c
over
age
(%)
7213
0.79
FGA
Fibr
inog
en α
cha
in p
repr
opro
tein
, iso
form
α-E
1359
1824
77
2304
0.79
TUB
A6
Tubu
lin α
614
3893
097
24
8505
1.12
FGB
Fibr
in β
2230
0215
51
5401
0.74
PKM
2Py
ruva
te k
inas
e, m
uscl
e31
4169
896
19
7105
b1.
32R
SU1
RSU
1 pr
otei
n14
2504
9913
65
7115
0.85
CA
2C
hain
, car
boni
c an
hydr
ase
Ii (E
.C.4
.2.1
.1) m
utan
tw
ith P
ro 2
02 re
plac
ed b
y A
la (P
202a
)44
3135
1151
9405
1.05
IDH
2Is
ocitr
ate
dehy
drog
enas
e 2
(NA
DP+
),m
itoch
ondr
ial p
recu
rsor
2817
8832
923
6203
b0.
91C
AP1
Ade
nyly
1 c
ycla
se-a
ssoc
iate
d pr
otei
n54
5359
56
22
8301
1.08
AN
XA
2A
nnex
in A
218
6451
677
28
7006
1.06
SOD
2SO
D2
3084
1309
627
3002
c0.
83G
PX1
Glu
tath
ione
per
oxid
ase
1471
7805
161
All
the
prot
eins
wer
e id
entif
ied
with
a M
ALD
I-TO
F/TO
F U
ltraf
lex
mas
s spe
ctro
met
er, a
nd th
e qu
ality
of m
atch
was
eva
luat
ed a
t the
sign
ifica
nce
leve
l (p<
0.05
) for
pep
tide
finge
rprin
t mas
s spe
ctra
and
/or
pep
tide
sequ
enci
ng sp
ectra
; SSP
: the
spot
iden
tity
on th
e 2-
DE
gel d
esig
nate
d by
the
PDQ
uest
; gi:
the
acce
ssio
n nu
mbe
r of p
rote
ins i
n N
CB
I pro
tein
dat
abas
e.
a The
ratio
of m
ean
norm
aliz
ed v
alue
s for
the
corr
espo
ndin
g pr
otei
n sp
ot in
low
BM
D g
roup
to h
igh
BM
D g
roup
.
b The
spot
with
the
high
est M
ASC
OT
scor
e an
d/or
with
mos
t sig
nific
ant d
iffer
entia
l exp
ress
ion
amon
g m
ultip
le sp
ots o
f the
sam
e pr
otei
n.
c An
exce
ptio
nal p
rote
in, f
or w
hich
the
diff
eren
tial e
xpre
ssio
n is
stat
istic
ally
insi
gnifi
cant
; it s
how
ed 2
0% h
ighe
r exp
ress
ion
in h
igh
BM
D g
roup
than
in lo
w B
MD
gro
up (L
:H =
0.8
3).
Proteomics. Author manuscript; available in PMC 2009 October 13.
NIH
-PA Author Manuscript
NIH
-PA Author Manuscript
NIH
-PA Author Manuscript
Deng et al. Page 23
Table 2Known functions of the five confirmed proteins
Protein symbol Known functions
GSN GSN regulates the polymerization/depolymerization of actin and functions in cell migration and adhesion; GSN is criticalin osteoclast podosome assembly, rapid cell movements, signal transduction, and osteoclast activation and adhesion; itis invovled in regulation of the osteoclastic actin rings formation; Its deficiency may block osteoclast’ podosome assemblyand produce increased bone mass and strength
RSU1 RSU1 is involved in the ras signal transduction pathway, growth inhibition, and nerve-growth factor induceddifferentiation processes; it is related to cell attachment and cell differentiation
SOD2 SOD2 removes superoxidate and catalyzes the production of hydrogen peroxide (H2O2), which may contribute toosteoclast differentiation, formation and activity. There was a negative correlation between SOD and lumbar BMD levels.Women with postmenopausal OP had significantly higher plasma SOD enzyme activity
GPX1 Glutathione peroxidase is one of the most important antioxidant enzymes in humans. It functions in the detoxificationof hydrogen peroxide, which may contribute to osteoclast differentiation, formation and activity
P4HB P4HB is a highly multifunctional polypeptide: (1) to catalyze disulfide bond formation and the formation of 4-hydroxyproline of -X-Pro-Gly-triplets; (2) to assist protein assembly and protein folding; (3) to prevent degradation ofimmature thyroglobulin; (4) to participate in triglyceride transfer, NO equivalents transfer; and (5) to participates inapoptosis regulation
Proteomics. Author manuscript; available in PMC 2009 October 13.

NIH
-PA Author Manuscript
NIH
-PA Author Manuscript
NIH
-PA Author Manuscript
Deng et al. Page 24Ta
ble
3M
S an
d/or
MS/
MS
Iden
tific
atio
n R
esul
ts fo
r the
Fiv
e K
ey P
rote
ins
SSP
Prot
ein
sym
bol
giSc
ore
MW
pISe
quen
ceco
vera
ge
Mat
ched
pept
ides
num
ber
Unm
atch
edpe
ptid
esnu
mbe
rPe
ptid
e se
quen
ced
6406
GSN
3804
4288
240
80 8
765.
5824
%18
46R
.EV
QG
FESA
TFLG
YFK
.SK
.HV
VPN
EVV
VQ
R.L
7006
SOD
230
8413
0911
523
772
6.87
27%
615
K.G
DV
TAQ
IALQ
PALK
.F
7105
RSU
169
1263
813
431
521
8.57
65%
1324
Non
e
610
P4H
B20
0701
2523
957
480
4.76
39%
126
K.V
DA
TEES
DLA
YG
VR
.GK
.ILFI
FID
SDH
TDN
QR
.I
3002
GPX
114
7178
0512
822
218
6.15
61%
1124
K.F
LVG
PDG
VPL
RR
.Y
Proteomics. Author manuscript; available in PMC 2009 October 13.

NIH
-PA Author Manuscript
NIH
-PA Author Manuscript
NIH
-PA Author Manuscript
Deng et al. Page 25Ta
ble
4Q
uant
ifica
tion
and
com
paris
on o
f pro
tein
exp
ress
ion
leve
l in
WB
Prot
ein
SOD
2G
SNR
SU1
GPX
1P4
HB
SSP
7006
6406
7105
3002
610
L:H
in 2
-DE
1.06
1.54
1.32
0.83
0.52
L:H
in W
B1.
451.
251.
590.
880.
64
L147
33.8
901.
312
39.3
2031
.550
8.7
L248
56.1
914.
613
18.9
2148
.967
3.2
L354
07.9
967.
614
33.7
2125
.368
9.7
L466
79.9
787.
413
88.2
2077
.875
8.6
L571
32.5
725.
910
59.1
2114
.368
3.2
H1
5121
.476
4.5
886.
821
69.1
1001
.8
H2
4581
.967
4.9
935.
222
74.3
1153
.7
H3
4295
.679
1.1
662.
525
14.7
1185
.5
H4
3512
.456
6.4
665.
225
27.1
771.
5
H5
2295
.963
1.4
912.
624
72.7
1038
.5
p10.
03a
0.02
a0.
000.
01a
0.00
L, lo
w B
MD
sam
ple;
H, h
igh
BM
D sa
mpl
e; p
1 re
fers
to th
e t-t
est r
esul
t bas
ed o
n no
rmal
ized
WB
dat
a ag
ains
t bac
kgro
und.
a Mea
ns si
gnifi
cant
t-te
st re
sult
(p<0
.05)
bas
ed o
n no
rmal
ized
WB
dat
a ag
ains
t GA
PDH
.
Proteomics. Author manuscript; available in PMC 2009 October 13.