Eating problems at age 6 years in a whole population sample of extremely preterm children
30
University of Warwick institutional repository: http://go.warwick.ac.uk/wrap This paper is made available online in accordance with publisher policies. Please scroll down to view the document itself. Please refer to the repository record for this item and our policy information available from the repository home page for further information. To see the final version of this paper please visit the publisher’s website. Access to the published version may require a subscription. Author(s): SAMARA, MUTHANNA; JOHNSON, SAMANTHA; LAMBERTS, KOEN; MARLOW, NEIL; WOLKE, DIETER Article Title: Eating problems at age 6 years in a whole population sample of extremely preterm children Year of publication: 2010 Link to published version: http://dx.doi.org/ 10.1111/j.1469-8749.2009.03512.x Publisher statement: The definitive version is available at www.blackwell-synergy.com
Transcript of Eating problems at age 6 years in a whole population sample of extremely preterm children

University of Warwick institutional repository: http://go.warwick.ac.uk/wrap
This paper is made available online in accordance with publisher policies. Please scroll down to view the document itself. Please refer to the repository record for this item and our policy information available from the repository home page for further information.
To see the final version of this paper please visit the publisher’s website. Access to the published version may require a subscription.
Author(s): SAMARA, MUTHANNA; JOHNSON, SAMANTHA; LAMBERTS, KOEN; MARLOW, NEIL; WOLKE, DIETER
Article Title: Eating problems at age 6 years in a whole population sample of extremely preterm children
Year of publication: 2010 Link to published version: http://dx.doi.org/ 10.1111/j.1469-8749.2009.03512.x Publisher statement: The definitive version is available at www.blackwell-synergy.com

1
Eating problems at six years of age in a whole population sample of
extremely preterm children
Muthanna Samara, Ph.D.*
Samantha Johnson, Ph.D.‡
Koen Lamberts, PhD.*
Neil Marlow M.D.‡
Dieter Wolke, Ph.D.* †
From the * University of Warwick, Department of Psychology, Coventry (UK); ‡
Institute for Women's Health, University College, London (UK); † University of
Warwick, Health Science Research Institute, Warwick Medical School, Coventry
(UK).
.
Corresponding Author:
Professor Dieter Wolke
Department of Psychology
The University of Warwick
Coventry CV4 7AL
Tel: +44 24 7652 3537
Fax: +44 24 7652 4225
Email: [email protected]

2
Acknowledgement:
The research reported was supported by grants from BLISS, the premature infant
charity, the Health Foundation, and Well-Being of Women (Drs Marlow and Wolke).
The EPICure Investigator Group included K. Costeloe (London), A. T. Gibson
(Sheffield), E. M. Hennessy (London), N. Marlow (Nottingham), A. R. Wilkinson
(Oxford), and D. Wolke (Warwick). Data were acquired by Drs Wolke and Marlow
and the Developmental Panel researchers, as follows: psychologists: Emma Luck,
Catherine Bamford, Helen Betteridge, Hanne Bruhn, Sandra Johnson, Iliana Magiati,
Maria Morahan, Isabel Tsverik, and Muthanna Samara; pediatricians: Melanie
Bracewell, Michele Cruwys, Ruth MacGregor, Lesley McDonald, Margaret Morton,
Margaret Morris, and Sue Thomas. Administrative, technical, and material support
was provided by Heather Palmer, Catherine Bamford, Emma Luck, and Melanie
Bracewell.
Word Count: 3386

3
Abstract
Aim: To investigate the prevalence of eating problems and their association with
neurological and behavioural disabilities and growth amongst extremely preterm
children (EPC) at 6 years of age.
Method: A standard questionnaire about eating was completed by 223 parents of EPC
(boys: N: 125, 56.1%; girls: N: 98, 43.9%) aged six years and born at 25 weeks of
gestation or less (Mean: 24.5; SD: 0.7; Mean birth weight: 749.1g; SD: 116.8), and
148 parents of classmates born at term (boys: N: 66, 44.6%; girls: N: 82, 55.4%). All
children had a neurological, cognitive and anthropometric assessment, and parents
and teachers completed a behaviour scale.
Results: Extremely preterm children (EPC) were found to have more eating problems
(OR: 3.6; CI 95%: 2.1-6.3) including oral-motor (OR: 5.2; CI 95%: 2.8-9.9),
hypersensitivity (OR: 3.0; CI 95%: 1.6-5.6) and behavioural (OR: 3.8; CI 95%: 1.9-
7.6) problems compared to control children. Group differences reduced after
adjustment for cognitive impairment, neuromotor disability and other behaviour
problems. EPC with eating problems were shorter, lighter, had lower mid arm
circumference and lower Body Mass Index (BMI) even after adjusting for disabilities,
gestational age, birth weight and feeding problems at 30 months.
Conclusions: Eating problems are still frequent in EPC at school age. They are only
partly related to other disabilities but make an additional contribution to continued
growth failure in extreme preterm children and may require early recognition and
intervention.
Running Head: Eating problems of extremely preterm children.
Key words: Extreme Prematurity; growth; Eating Problems; Neurological
Disabilities; learning difficulties.

4
Abbreviations: EP: Extremely Preterm; CC: Control Children; ES: Effect Size; IQ:
Intelligence Quotient; HC: Head Circumference; BMI: Body Mass Index.

5
Surviving extremely preterm (EP) infants are at a significantly increased risk
for long-term cognitive, motor, or behavioural impairments (1-3). Preterm infants
often have feeding problems while in neonatal care including swallowing problems,
oral sensory and motor dysfunction or fatigue during feeding. After discharge these
include delayed feeding skill development, food refusal (4) and difficulty with the
transition to solid foods often accompanied by growth faltering (5). Reasons proposed
for these difficulties include immaturity and treatment related to preterm birth
including parenteral or tube feeding, adverse oral motor experiences (6), and post-
discharge health problems such as neurological or cognitive disabilities, all of which
could complicate eating skill development for the child and increase parents’ distress,
depression, and feeling less confident in feeding (7).
There are few estimates concerning the prevalence of feeding problems of
extremely preterm infants and none at school age (4) despite eating remaining a
primary concern for parents post-discharge (8). Furthermore, it is unclear whether
eating problems are specific or can be fully or mostly accounted for by general
cognitive deficits, neuromotor or other behavioural problems often found in very
preterm children (1, 3).
In this report we describe eating behaviour at 6 years of age for children
born at a gestational age of 25 weeks or less in a whole population study. Firstly, do
children born extremely preterm have clinically relevant eating problems more often
compared to a full term children? Secondly, can eating problems be accounted for by
co-morbidity including cognitive deficits or other neurological or behavioural
disabilities? Finally, do eating problems in the clinical range have a significant impact
on attained growth (height, weight, head circumference, mid-arm circumference and
body mass index) at 6 years of age?

6
Methods
Participants
The population comprised all surviving children in the United Kingdom and Ireland,
born at 25 weeks and 6 days of gestation or less from March through December 1995
(The EPICure Study; (3)). Of the 308 children known to be alive at 30 months,
parents of 241 children (78%) consented to the study. Two hundred and four children
were in mainstream education. Two hundred and twenty three parents (72%; out of a
potential 308) completed the eating questionnaire. For each child assessed in
mainstream school, we sought an age and sex-matched classmate as a comparison (3).
One hundred and forty eight parents completed the eating questionnaire for the
comparison children.
This study was approved by the Trent Multicentre Research Ethics Committee and the
local education authorities in Scotland.
Assessments
Feeding and Eating Behaviour Assessment: When the children were 30 months of
age parents were asked whether their children had any feeding problems in a single
item (9). At 6 years of age parents completed a specially developed eating
questionnaire designed on the basis of a comprehensive review of the type of eating
problems in general population studies (6). The scale included 19 items (see
Appendix 1). A principal component factor analysis with varimax rotation yielded
four factors with distinct high loadings of .48 or higher and acceptable eigenvalues >
1: Refusal-faddy eating problems (7 items: e.g., refuses to eat, is a faddy eater); Oral-
motor problems (6 items: e.g., dribbles when drinking, has problems with biting
crackers); Oral hypersensitivity problems (2 items: e.g., does not like things to be put
7
in his/her mouth); and Behavioural problems around meals (4 items: e.g., makes a
mess, has tantrum during meals). A total eating difficulties score was also constructed
and higher scores on each scale indicate more problems. See appendix 1 for the
Cronbach’s α (CA) of total eating problems and each subscale.
To derive clinical categories, each scale was dichotomized into normal versus clinical
(score >90th percentile or near according to the control group) as suggested by other
standard behaviour scales (1). If the child scored <90th percentile the eating behaviour
was considered as normal (no eating difficulty). Parents were also asked if they felt
that their child had an eating problem (mild or severe) or not and if the eating
difficulties upset or distressed their child (a little, quite a lot, or a great deal).
Pervasive Behaviour Problems: Child behaviour was assessed with the Strengths and
Difficulties Questionnaire (SDQ) (10), by parent and teacher report (1). Child
behaviour was classified as follows: If the child scored <90th percentile in both parent
and teacher report, the behaviour was considered as normal (no behaviour difficulty);
mild difficulty refers to the classification of the child in the clinical range (>90th
percentile) reported by either parent or teacher, while clinical pervasive behaviour
problems refers to the classification of the child in the clinical range by both parent
and teacher (1).
Cognitive Ability: Children were assessed with the Kaufman Assessment Battery for
Children (K-ABC) at 6 years of age (11). The Mental Processing Component (MPC)
provides an “overall cognitive score” (see (2)). Cognitive impairment was categorised
according to conventional SD-banded cut-offs using the scores of the comparison
group as reference data (mild – 1-2 SD below the mean; moderate – 2-3 SD below the
mean; severe – more than 3 SD below the mean).

8
Disability Classification (neurological assessment): Mild disability included
neurological signs with minimal functional consequences. Moderate disability
included reasonable independence and ambulant cerebral palsy. Severe disability
included non-ambulant cerebral palsy (see table 2) (3).
Growth Parameters: Weight was measured on identical weighing scales (Salter
Housewares Ltd, UK), height using a standard stadiometer (Child Growth
Foundation) and maximum occipito-frontal head circumference (OFC) and mid-arm
circumference using a LASSO-O tape. Each measure was taken twice and the mean
value computed. BMI was computed as weight/height2.
Developmental Panel: The children were assessed by seven experienced
developmental pediatricians and eight psychologists, who received formal training
Every second child’s session was videotaped and randomly quality checked by the
senior assessment pediatrician or psychologist (agreement of more than 90 percent).
Statistical Analysis
ANOVA was performed to compare between CC and EP groups and between sexes
and effect sizes are reported as eta squared. Categorical outcomes were evaluated with
chi-square tests for trends or Fisher’s exact test as appropriate (SPSS 15.0). All
statistical tests were two-sided. Odds ratios are reported with 95% confidence
intervals comparing EP and CC, and boys and girls. The 95% confidence intervals
were obtained using bootstrapping (e.g., (12, 13) on 20,000 bootstrap samples, using
the Bias Corrected and accelerated (BCa) method in MatLab R2009a (the Statistics
Toolbox for MatLab). Odds ratios approximate risk ratios when the incidence of the
outcome in the study population (control group) is low (<.10%) (14). Selective
dropout was determined by comparing neonatal, 12 and 30 months follow-up data of

9
those assessed at 6 years and those who were lost to follow-up. To test for the
presence of specific eating problems, logistic regressions adjusted for cognitive
disability (no/mild vs. moderate/severe), neuromotor disability (no vs. others), or
pervasive behaviour disability (no vs. mild/severe) were computed. Logistic
regressions were also performed to test whether eating difficulties predict parent’s
acknowledgment of eating problems and distress of the child within the EP group.
Correlations and partial correlations (adjusting for disabilities, gestational age, birth
weight and feeding problems at 30 months) were performed to test the relationship
between total eating problems and growth measures. Graph Pad Prism 51 software
was used to design the graphs.
Results
Children lost to follow up (Drop-outs)
Compared to children who were assessed, dropouts (max. N: 85) were more likely to
be from non-white ethnic origin (34.1% vs. 18.9%; p = 0.004), to have young mothers
(> 21 years age: 24.7 % vs. 9.4%; p = 0.001), to live in overcrowded homes (49.4%
vs. 21.5%; p < 0.001), to have experienced more than 1 serious life event by 30
months (48.2% vs. 23.3%, p < 0.001), to suffer from cerebral palsy at 30 months
(30.8% vs. 15.6%; p = 0.007), to have a lower psychomotor development index score
(PDI mean 78.7 vs. 84.8; p = 0.015), to have more feeding problems (42.4% vs.
30.4%; p = 0.049) and more likely to be diagnosed with overall severe disability (40%
vs. 25%; p = 0.014) at 30 months of age. No differences were found in any of the
assessed 9 neonatal complications (e.g., prenatal steroid treatment), 5 other
1 GraphPad Software, Inc., San Diego, CA, USA

10
socioeconomic factors (e.g., mother is single or separated), and 6 developmental and
growth parameters (e.g., weight, height) up to 30 months (see: (1, 3)).
Eating behaviour differences
EP children were found to have more problems in the total eating problems scale (p <
0.001; Effect Size “ES” = .080); oral-motor (p < 0.001; ES = .099); refusal-faddy (p =
0.026; ES = .016); behavioural (p < 0.001; ES = .076) and hypersensitivity subscales
(p < 0.001; ES = .052) compared to control children (see table 1). Boys were found to
have more oral-motor difficulties (p = 0.001; ES = .124) and higher behavioural
problems (p = 0.013; ES = .087) compared to girls (see table 1). The interaction
between group and sex was not significant.
Table 1
Compared to CC, EP children had more frequent total eating difficulties in the
clinical range (Odds Ratio (OR): 3.6; 95% CI: 2.1-6.3; p < 0.001), oral-motor
problems (OR: 5.2; 95% CI: 2.8-9.9; p < 0.001), behavioural problems (OR: 3.0; 95%
CI: 1.6-5.6; p < 0.001) and hypersensitivity problems (OR: 3.8; 95% CI: 1.9-7.6; p <
0.001) (table 1).
Both boys and girls in the EP group had more total eating difficulties (boys: p
< 0.001; girls: p = 0.001), oral-motor problems (p < 0.001), behavioural (boys: p =
0.005; girls: p = 0.023) and hypersensitivity (boys: p = 0.001; girls: p = 0.031)
problems than their same-sexed counterparts in the CC group (table 1). Within the EP
group boys were more likely to have oral-motor problems than girls (OR: 2.2; 95%
CI: 1.2-3.9; p = 0.007). EP boys compared to EP girls also had more often
hypersensitivity problems (OR: 2.1; 95% CI: 1.1-4.2; p = 0.019).

11
Gestation, disability and eating difficulties
Significant associations between gestation at birth and total eating difficulties (p =
0.003) and hypersensitivity problems (p = 0.038) in EP children were found (table 2).
Cognitive impairment and neuromotor disability were associated with an increased
prevalence of clinical oral-motor problems (p = 0.022; p < 0.001), and
hypersensitivity problems (p < 0.001; p < 0.001). Pervasive behaviour difficulties
showed significant associations with all eating problem scales: total eating difficulties
(p < 0.001), oral-motor problems (p = 0.001), refusal faddy problems (p = 0.010),
behavioural eating problems (p < 0.001), and hypersensitivity problems (p = 0.001) in
the clinical range (table 2).
Table 2
Group differences between EP and CC in Hypersensitivity and Behavioural
problems became non-significant after adjustment for cognitive abilities, neuromotor
disability and pervasive behavioural difficulties together (table 3). In contrast, even
after adjustment for all variables, Total eating difficulties and Oralmotor problems
still differed between EP and controls and are thus only partly explained by these
disabilities.
Table 3
Table 4 shows that total eating difficulties and the subscales significantly
predicted parents’ judgment of significant eating difficulties and distress of the child
within the EP group.
Table 4
12
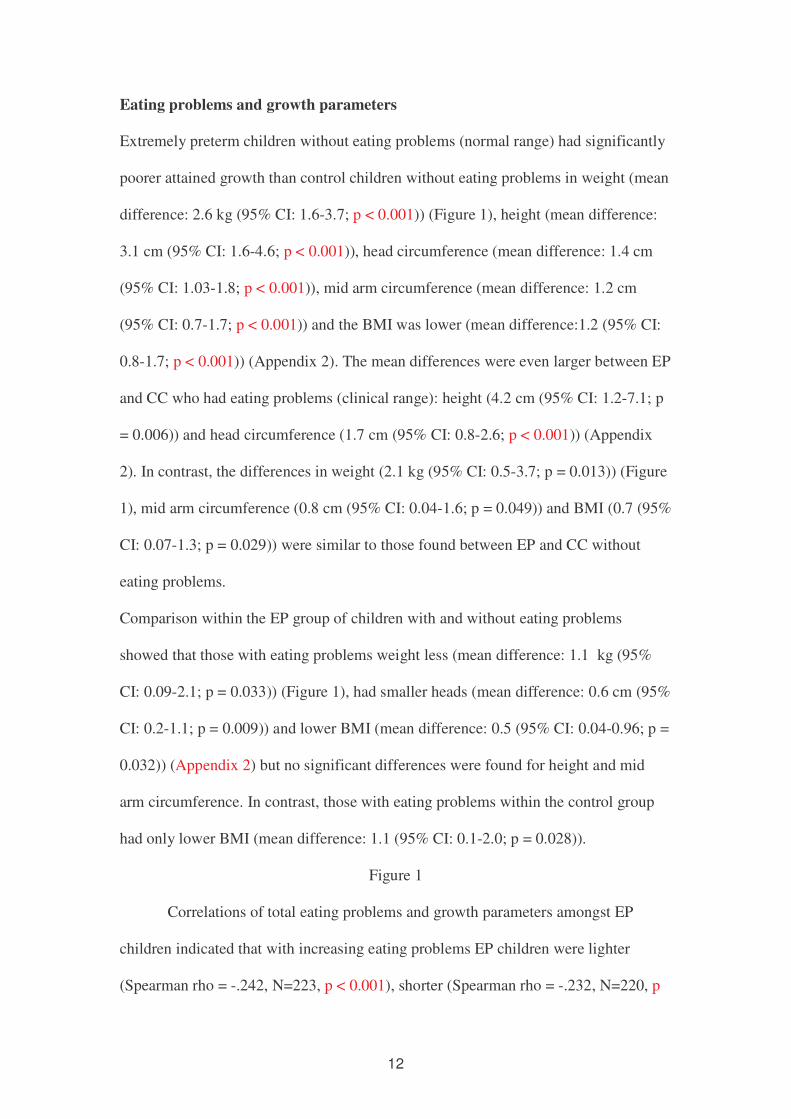
Eating problems and growth parameters
Extremely preterm children without eating problems (normal range) had significantly
poorer attained growth than control children without eating problems in weight (mean
difference: 2.6 kg (95% CI: 1.6-3.7; p < 0.001)) (Figure 1), height (mean difference:
3.1 cm (95% CI: 1.6-4.6; p < 0.001)), head circumference (mean difference: 1.4 cm
(95% CI: 1.03-1.8; p < 0.001)), mid arm circumference (mean difference: 1.2 cm
(95% CI: 0.7-1.7; p < 0.001)) and the BMI was lower (mean difference:1.2 (95% CI:
0.8-1.7; p < 0.001)) (Appendix 2). The mean differences were even larger between EP
and CC who had eating problems (clinical range): height (4.2 cm (95% CI: 1.2-7.1; p
= 0.006)) and head circumference (1.7 cm (95% CI: 0.8-2.6; p < 0.001)) (Appendix
2). In contrast, the differences in weight (2.1 kg (95% CI: 0.5-3.7; p = 0.013)) (Figure
1), mid arm circumference (0.8 cm (95% CI: 0.04-1.6; p = 0.049)) and BMI (0.7 (95%
CI: 0.07-1.3; p = 0.029)) were similar to those found between EP and CC without
eating problems.
Comparison within the EP group of children with and without eating problems
showed that those with eating problems weight less (mean difference: 1.1 kg (95%
CI: 0.09-2.1; p = 0.033)) (Figure 1), had smaller heads (mean difference: 0.6 cm (95%
CI: 0.2-1.1; p = 0.009)) and lower BMI (mean difference: 0.5 (95% CI: 0.04-0.96; p =
0.032)) (Appendix 2) but no significant differences were found for height and mid
arm circumference. In contrast, those with eating problems within the control group
had only lower BMI (mean difference: 1.1 (95% CI: 0.1-2.0; p = 0.028)).
Figure 1
Correlations of total eating problems and growth parameters amongst EP
children indicated that with increasing eating problems EP children were lighter
(Spearman rho = -.242, N=223, p < 0.001), shorter (Spearman rho = -.232, N=220, p

13
< 0.001), had smaller head circumference (Spearman rho = -.211, N=221, p = 0.002),
smaller mid arm circumference (Spearman rho = -.165, N=221, p = 0.014) and lower
BMIs (Spearman rho = -.164, N=220, p = 0.015). The partial correlations remained
significant between total eating problems and weight (r = -.204, N=203, p = 0.003),
height (r = -.149, N=203, p = 0.033), mid arm (r = -.156, N=203, p = 0.025) and BMI
(r = -.162, N=203, p = 0.021) even when adjusting for gestational age, birth weight,
feeding problems at 30 months, and cognitive, neuromotor and pervasive behaviour
disabilities but not anymore for head circumference (r = -.087, N=213, p = 0.213).
Discussion
In this whole population cohort of extremely preterm children, we found a
considerable excess of eating problems. These difficulties continue to cause
significant distress and are perceived as significant problems by the parents. Total
eating problems at 6 years of age in extremely preterm children are only partly
explained by other disabilities; in particular differences to control children in total and
oral motor problems remain after adjustment for disabilities. The eating problems in
EP children significantly correlate with poorer attained growth at 6 years of age
beyond the prediction afforded by disabilities, gestation, birthweight and early feeding
problems.
Both extremely preterm boys and girls were more likely to have eating
problems than their classmates. However, EP boys, as previously shown (2, 3) had
twice as often cognitive and neurological problems, factors that partly explain the sex
difference in oral hypersensitivity. Boys in the EP group were also more likely than
girls to suffer oral-motor problems, an indicator of generally more delayed
development in boys compared to girls. Our findings add that oral-motor dysfunction

14
persists beyond infancy (7) in a third of extremely preterm children. Furthermore, oral
hypersensitivity and behavioural eating problems are still found in a quarter of
extremely preterm children at early school-age while food refusal or faddy eating is
only slightly more common. Infants and toddlers with neurological impairments (4,
15) are more likely to experience eating problems and have more difficulties in
dealing with higher textured food. Our findings indicate that those EP children with
neurological or cognitive disabilities, often occurring together in the same child (3),
contribute but do not fully account for eating problems observed (15). In particular ,
oral motor and oral hypersensitivity are increased in children with cerebral palsy (15)
found in 12% of EP children (3). Furthermore, learning disabilities as indicated by
low cognitive scores are also associated with overall and specifically oral-motor and
hypersensitivity problems but did not explain them (16). While impaired oral motor
eating skills may be transient and likely to resolve in some EP infants, others may be
early indicators of neurodevelopmental impairment (17) due to brain damage (18) and
both the neurodevelopmental and eating problems are persistent. The more preterm
the infant the longer the dependency on tube feeding. As shown here, those infants
born at extremely low gestation with neurodevelopmental problems are at greatest
risk of developing tactile defensiveness and oral hypersensitivity (6, 19).
In contrast, refusal to eat, the most frequent problem encountered in general
population samples of infants (20) was only slightly increased compared to control
children. Refusal to eat is often related to difficult and irregular temperament and
negative emotionality (21) and frequently leads to higher levels of conflict, non-
contingency, and maternal intrusiveness during feeding interactions (22) resulting
more often in secondary problems including hyperactive behaviour (23) or distress
(24). The behavioural eating problems were explained by general behavioural

15
problems of the children both at home and at school rather than confined to the eating
situation. This is another indicator that the pervasive and multiple problems common
among extremely preterm children (1, 2), rather than parenting difficulties, are a
major contributor to eating problems in these children. Nevertheless, the eating, and
in particular, the behavioural and oral hypersensitivity problems were perceived by
the parents as difficulties and as distressing. Thus eating problems put an additional
burden on families of impaired extremely preterm children (25).
EP children (with and without eating problems) were smaller than control
children (26). However, EP children with eating problems were significantly smaller
and had less muscle mass than those without eating problems. In particular, poor
weight gain and the development of muscle was lowest within EP children with eating
problems as reported previously (4, 9). The relationship of eating problems with poor
growth in our study was not explained by other disabilities, gestation, birth weight or
more physical activity (i.e., hyperactivity). Thus, although disabilities partly
contribute to eating problems, it appears that the poor nutritional intake associated
with eating problems in EP children explain some of the growth deficits in these
children. Eating problems in infants are highly persistent throughout childhood (27)
and have been found to increase the risk of other cognitive, behavioural and
psychosocial problems (28) in general population samples due to malnutrition. Thus,
even in children with significant disability rectifying eating problems may potentially
improve their growth and possibly their cognitive development (29).
Overall, considering the stress caused to the child and caretaker, eating
problems are not trivial for the families (30). Interventions suggested include oral
motor therapy to reduce oral-motor deficits and oral hypersensitivity (31).
Furthermore, Fucile et al. (32) have shown that intervention before the transition from

16
tube to oral feeding may prevent some of the ‘early’ feeding difficulties in preterm
children. On the other hand, behavioural therapy can be effective in treating
behavioural eating problems (15). Early advice and support to parents whose preterm
infants experience eating problems may reduce perceived eating difficulties (33) and
increase the parental confidence in parenting and nurturing children .
This study has a number of strengths including large sample size, and the
inclusion of a control group in the same neighborhood. The logistic regressions
before and after adjusting for disability factors included bootstrapping to determine
95% confidence intervals and provided very similar values to those produced by SPSS
but safer estimates of effect size ranges. Limitations are that we were unable to recruit
a comparison child for each preterm child in mainstream classes (see: (3)). Previous
research (34), has shown that eating disorder questionnaires and interviews are highly
correlated but may slightly overestimate the rate of eating problems (35). A structured
feeding assessment including direct observation or structured testing of oral motor
skills (36) would have been desirable but not feasible within a half day
comprehensive psychological and medical examination. Furthermore, those
participants who did not attend the assessments were more likely to be from socially
disadvantaged families. While there were no differences regarding medical variables,
early feeding behaviour or growth, cerebral palsy and overall disability were more
frequent in those lost to follow-up than those assessed (see: (1, 3). Thus, the reported
rate of eating problems, often associated with other disability or social deprivation
(15) reported here is likely to be an underestimation of the true rate in the total EP
population (37).
In conclusion, at school age, extremely preterm children still have a 2 to 5
times increased risk of eating problems and these are only partly accounted for by co-

17
existing neurological, developmental or pervasive behavioural impairments. Eating
problems in EP children increase the risk of growth problems. Clinicians should be
aware of the distress caused to the children and families and early intervention and
identification and early referral may alleviate some of the problems for the children
and caretakers (38).

18
References
1. Samara M, Marlow N, Wolke D. Pervasive Behavior Problems at 6 Years of Age in a Total-Population Sample of Children Born at <=25 Weeks of Gestation. Pediatrics 2008;122(3):562-573.
2. Wolke D, Samara M, Bracewell M, Marlow N. Specific Language Difficulties and School Achievement in Children Born at 25 Weeks of Gestation or Less. The Journal of Pediatrics 2008;152(2):256-262.e1.
3. Marlow N, Wolke D, Bracewell MA, Samara M. Neurologic and Developmental Disability at Six Years of Age after Extremely Preterm Birth. N Engl J Med 2005;352(1):9-19.
4. Cerro N, Zeunert S, Simmer KN, Daniels LA. Eating behaviour of children 1.5-3.5 years born preterm: Parents' perceptions. Journal of Paediatrics and Child Health 2002;38(1):72-78.
5. Gewolb IH, Vice FL. Maturational changes in the rhythms, patterning, and coordination of respiration and swallow during feeding in preterm and term infants. Developmental Medicine & Child Neurology 2006b;48(7):589-594.
6. Reilly S, Skuse D, Wolke D. The nature and consequences of feeding problems in infancy. In: Cooper PJ, Stein A, editors. Childhood Feeding Problems and Adolescent Eating Disorders. London: Routledge; 2006. p. 7-40.
7. Mathisen B, Worrall L, O’Callaghan MO, Wall C, Shepherd RW. Feeding problems and dysphagia in six-month-old extremely low birth weight infants. Advances in Speech-Language Pathology 2000;2:9-17.
8. Pridham K, Saxe R, Limbo R. Feeding issues for mothers of very low-birth-weight, premature infants through the first year Journal of Perinatal and Neonatal Nursing Research 2004;18:161-169.
9. Wood NS, Costeloe K, Gibson AT, Hennessy EM, Marlow N, Wilkinson AR. The EPICure study: growth and associated problems in children born at 25 weeks of gestational age or less Archives of Disease in Childhood. Fetal and Neonatal Edition 2003 88:F492-500.
10. Goodman R. Psychometric properties of the strengths and difficulties questionnaire. J Am Acad Child Adolesc Psychiatry 2001;40(11):1337-45.
11. Kaufman A, Kaufman N. Kaufman Assessment Battery for Children. Minnesota: Circle Pines; 1983.
12. Efron B. Nonparametric estimates of standard error: The jackknife, the bootstrap and other methods. Biometrika 1981;3:589-599.

19
13. Efron B, Tibshirani R. An Introduction to the Bootstrap: Chapman & Hall/CRC; 1993.
14. Zhang J, Yu KF. What's the Relative Risk? A Method of Correcting the Odds Ratio in Cohort Studies of Common Outcomes. JAMA 1998;280:1690-1691.
15. Schädler G, Süss-Burghart H, Toschke A, von Voss H, von Kries R. Feeding disorders in ex-prematures: causes - response to therapy - long term outcome. European Journal of Pediatrics 2007;166(8):803-808.
16. Bosma JF. Postnatal ontogeny of performances of the pharynx, larynx, and mouth. American Review of Respiratory Disease 1985;131:510-515.
17. Palmer MM, Heyman MB. Developmental outcome for neonates with dysfunctional and disorganized sucking patterns: Preliminary findings Infant-Toddler Intervention: The Transdisciplinary Journal 1999 9:299-308.
18. Braun M, Palmer MM. A pilot study of oral-motor dysfunction in 'at risk' infants. Pediatrics 1985;5:13-25.
19. Dodrill P, McMahon S, Ward E, Weir K, Donovan T, Riddle B. Long-term oral sensitivity and feeding skills of low-risk pre-term infants. Early Human Development 2004;76(1):23-37.
20. Wolke D, Skuse D, Reilly S. The management of infant feeding problems. In: Cooper PJ, Stein A, editors. Childhood Feeding Problems and Adolescent Eating Disorders. London: Routledge; 2006. p. 41-91.
21. McDermott BM, Mamun AA, Najman JM, Wiliams GM, O'Callaghan MJ, Bor W. Preschool Children Perceived by mothers as Irregular Eaters: Physical and Psychosocial Predictors from a Birth Cohort Study. Journal of Developmental and Behavioral Pediatrics 2008;29(3):197-205.
22. Lindberg L, Bohlin G, Hagekull B, Palmerus K. Interactions between mothers and infants showing food refusal. Infant Mental Health Journal 1996;17(4):334-347.
23. Dahl M, Rydell AM, Sundelin C. Children with early refusal to eat: follow-up during primary school. Acta Paediatrica 1994;83:54-58.
24. Jacobi C, Agras WS, Bryson S, Hammer LD. Behavioral validation, Precursors and Concomitants of picky Eating in Childhood. J Am Acad Child Adolesc Psychiatry 2003;42:76-84.
25. Mathisen B, Worrall L, Masel J, Wall C, Shepherd RW. Feeding problems in infants with gastrooesophageal reflux disease: a controlled study. Journal of Paediatrics and Child Health 1999;35:163 - 169

20
26. Elliman A, Bryan E, Walker J, Harvey D. The growth of low-birthweight children. Acta Paediatr Scand 1992;81:311-314.
27. Dahl M, Rydell AM, Sundelin C. Children with early refusal to eat: Follow-up during primary school. Acta Paediatricia Scandinavia 1994;83:54-58.
28. Esparo G, Canals J, Jane C, Ballespi S, Vinas F, Domenech E. Feeding problems in nursery children: prevalence and psychosocial factors Acta Paediatrica 2004;93:663 - 668.
29. Heird WC. Determination of nutritional requirements in preterm infants, with special reference to 'catch-up' growth. Seminars in Neonatology 2001;6(5):365-375.
30. Blissett J, Meyer C, Haycraft E. Maternal mental health and child feeding problems in a non-clinical group. Eating Behaviours 2007;8:311-318.
31. Carroll L, Reilly S. The therapeutic approach to the child with feeding difficulty: II. management and treatment. In: Sullivan PB, Rosenbloom L, editors. Feeding the Disabled Child. London: Mac Keith Press; 1996.
32. Fucile S, Gisel EG, Lau C. Effect of an oral stimulation program on sucking skill maturation of preterm infants. Developmental Medicine & Child Neurology 2005;47(3):158-162.
33. Satter E. The feeding relationship: Problems and interventions. J. Pediatr. 1990;117:S191-S189.
34. Mond JM, Hay PJ, Rodgers B, Owen C, Beumont PJV. Validity of the Eating Disorder Examination Questionnaire (EDE-Q) in screening for eating disorders in community samples. Behaviour Research and Therapy 2004;42(5):551-567.
35. Wilfley DE, Schwartz MB, Spurrell EB, Fairburn CG. Assessing the specific psychopathology of binge eating disorder patients: interview or self-report? Behaviour Research and Therapy 1997;35:1151-1159.
36. Reilly S, Skuse D, Mathisen B, Wolke D. The objective rating of oral-motor functions during feeding. Dysphagia 1995;10:177-191.
37. Wolke D, Söhne B, Ohrt B, Riegel K. Follow-up of preterm children: important to document dropouts. The Lancet 1995;345 (8947):447.
38. Wolke D. Frequent problems in infancy and toddler years: excessive crying, sleeping and feeding difficulties. In: Bergmann KE, Bergmann RL, editors. Health promotion and disease prevention in the family. Berlin: De Gruyter; 2003. p. 44-88.

21

22
Table 1. Total eating difficulties and its subscales assessed at 6 years for 223 children born at 25 weeks of gestation or less and 148 age matched classmates for comparison (Mean and standard deviation are shown together with the proportion of the clinical range of the comparison group by sex). Comparison group Extremely preterm group
Eating Difficulties Number/number with information
Mean (SD) Clinical Range (%)
Number/number with information
Mean (SD) Clinical Range (%)
Odds Ratio1 for clinical range
Total Eating Difficulties Boys Girls
19/148 8/66
11/82
6.1 (4.9)* 6.1 (5.1) 6.1 (4.7)
12.8%* 12.1%* 13.4%†
76/218 43/122 33/96
10.0 (7.4)* 10.5 (7.3) 9.4 (7.5)
34.9%* 35.2%* 34.4%†
3.6 (2.1-6.5) 3.9 (1.7-9.0) 3.4 (1.6-7.2)
Oralmotor Difficulties Boys Girls
13/148 9/66 4/82
0.4 (1.0)* 0.6 (1.3)† 0.3 (0.6)†
8.8%* 13.6%* 4.9%*
72/215 49/120 23/95
1.8 (2.5)* 2.2 (2.7)† 1.4 (2.3)†
33.5%* 40.8%* 24.2%*
5.2 (2.8-10.3) 4.4 (1.9-9.6)
6.2 (2.1-18.9) Refusal Faddy Problems Boys Girls
16/148 7/66 9/82
3.9 (3.5)‡ 3.6 (3.4) 4.3 (3.5)
10.8% 10.6% 11.0%
38/223 19/125 19/98
4.9 (4.0)‡ 4.8 (3.7) 5.3 (4.3)
17.0% 15.2% 19.4%
1.7 (0.9-3.3) 1.5 (0.6-3.8) 1.9 (0.8-4.6)
Behavioural Problems Boys Girls
14/148 6/66 8/82
1.4 (1.4)* 1.6 (1.4)‡ 1.3 (1.4)‡
9.5%* 9.1%† 9.8%‡
52/219 31/123 21/96
2.3 (1.7)* 2.5 (1.8)‡ 2.1 (1.7)‡
23.7%* 25.2%† 21.9%‡
3.0 (1.6-5.8) 3.4 (1.3-8.5) 2.6 (1.1-6.2)
Hypersensitivity Problems Boys Girls
11/148 6/66 5/82
0.1 (0.5)* 0.1 (0.4) 0.1 (0.5)
7.4%* 9.1%† 6.1%‡
50/213 35/120 15/93
0.5 (1.0)* 0.6 (1.1) 0.4 (0.9)
23.5%* 29.2%† 16.1%‡
3.8 (1.9-8.0)
4.1 (1.6-10.4) 2.9 (1.0-8.5)
1 95% Confidence Intervals based on 20,000 bootstrap samples, using the Bias Corrected and accelerated (BCa) method * p<0.001; † p<0.01; ‡ p<0.05 for differences between extremely preterm and comparison groups

23
Table 2. Gestational age at birth, severity and type of disability and total eating difficulties and its subscales at six years of age among extremely preterm children
� Total Eating Difficulties (N: 218) Oral-motor Problems (N: 215) Refusal Faddy Problems (N:
223)
Behavioural Problems (N:
219)
Hypersensitivity Problems
(N: 213)
Normal Clinical Normal/Bord
erline
Clinical Normal Clinical Normal Clinical Normal Clinical
Gestational age
<=23 weeks
24
25
13 (59.1%)
34 (50%)
95 (74.2%)
†
9 (40.9%)
34 (50.0%)
33 (25.8%)
12 (60%)
39 (59.1%)
92 (71.3%)
8 (40%)
27 (40.9%)
37 (28.7%)
19 (86.4%)
57 (83.8%)
109 (82%)
3 (13.6%)
11 (16.2%)
24 (18%)
14 (63.6%)
50 (74.6%)
103 (79.2%)
8 (36.4%)
17 (25.4%)
27 (20.8%)
18 (81.8%)
41 (65.1%)
104 (81.3%)
‡
4 (18.2%)
22 (34.9%)
24 (18.8%)
Overall Cognition
No disability (score, >94)
Mild disability (score, 82–94)
Moderate disability (score, 70–81)
Severe disability (score, >69)
44 (68.8%)
49 (71%)
27 (60%)
22 (55%)
20 (31.3%)
20 (29%)
18 (40%)
18 (45%)
46 (71.9%)
51 (75%)
28 (62.2%)
18 (47.4%)
‡
18 (28.1%)
17 (25%)
17 (37.8%)
20 (52.6%)
54 (84.4%)
57 (80.3%)
34 (73.9%)
40 (95.2%)
10 (15.6%)
14 (19.7%)
12 (26.1%)
2 (4.8%)
53 (85.5%)
52 (75.4%)
31 (67.4%)
31 (73.8%)
9 (14.5%)
17 (24.6%)
15 (32.6%)
11 (26.2%)
57 (90.5%)
54 (80.6%)
35 (81.4%)
17 (42.5%)
*
6 (9.5%)
13 (19.4%)
8 (18.6%)
23 (57.5%)
Neuromotor
No disability
Abnormal signs
CP ambulatory
CP, nonambulatory
113 (66.1%)
14 (66.7%)
10 (66.7%)
5 (45.5%)
58 (33.9%)
7 (33.3%)
5 (33.3%)
6 (54.5%)
125 (74%)
10 (47.6%)
7 (50%)
1 (9.1%)
*
44 (26%)
11 (52.4%)
7 (50%)
10 (90.9%)
141 (82%)
18 (81.8%)
15 (100%)
11 (78.6%)
31 (18%)
4 (18.2%)
0 (0%)
3 (21.4%)
134 (79.8%)
13 (59.1%)
10 (66.7%)
10 (71.4%)
34 (20.2%)
9 (40.9%)
5 (33.3%)
4 (28.6%)
135 (81.6%)
14 (70%)
10 (66.7%)
4 (30.8%)
*
30 (18.2%)
6 (30%)
5 (33.3%)
9 (69.2%)
Pervasive Total Difficulties-SDQ
No Disability
Mild Disability
Severe Disability
89 (80.9%)
36 (50.7%)
17 (47.2%)
*
21 (19.1%)
35 (49.3%)
19 (52.8%)
85 (78.7%)
40 (57.1%)
18 (50%)
*
23 (21.3%)
30 (42.9%)
18 (50%)
100 (90.9%)
56 (75.7%)
28 (75.7%)
‡
10 (9.1%)
18 (24.3%)
9 (24.3%)
103 (93.6%)
43 (60.6%)
20 (55.6%)
*
7 (6.4%)
28 (39.4%)
16 (44.4%)
94 (85.5%)
49 (74.2%)
20 (55.6%)
†
16 (14.5%)
17 (25.8%)
16 (44.4%)
����������������������������� ����������������������������� ������������������������ ����
�

24
Table 3. Odds ratios1 for clinical scores for total eating difficulties and the subscales before and after adjustment for general cognitive scores,
neuromotor or/and pervasive total behavioural difficulties (SDQ).
Unadjusted Adjusted for
categorized MPC+
Adjusted for
neuromotor
Adjusted for
pervasive total
behaviour
difficulties SDQ
Adjusted for all
variables$
Total Eating Difficulties 3.6 (2.1-6.5)* 3.0 (1.6-5.5)* 3.5 (1.9-6.4)* 2.7 (1.5-5.0)† 2.5 (1.3-4.8)†
Oralmotor Problems 5.2 (2.8-10.3)* 3.7 (1.8-7.8)* 3.6 (1.8-7.4)* 4.1 (2.2-8.2)* 2.7 (1.3-5.7)†
Refusal Faddy Problems 1.7 (0.9-3.3) 1.8 (0.9-3.6) 1.8 (0.9-3.6) 1.3 (0.7-2.6) 1.6 (0.8-3.3)
Behavioural Problems 3.0 (1.6-5.8)† 2.4 (1.2-5.0)‡ 2.4 (1.2-5.0)† 1.7 (0.8-3.5) 1.6 (0.7-3.6)
Hypersensitivity Problems 3.8 (1.9-8.0)* 2.5 (1.1-6.0)‡ 2.8 (1.3-6.3)† 3.0 (1.5-6.4)† 1.9 (0.8-4.7)
1 95% Confidence Intervals based on 20,000 bootstrap samples, using the Bias Corrected and accelerated (BCa) method * p<0.001; † p<0.01; ‡ p<0.05 for differences between extremely preterm and comparison groups + < -2 SD vs. > -2SD (No and mild vs. moderate and severe); $ Cognitive, neuromotor and pervasive behaviour difficulties

25

26
Table 4. Odds ratios1 for total eating difficulties and the subscales predicting parents’
acknowledgment of eating problems and the distress caused to their children among
extremely preterm children.
Parents’
acknowledgment of
eating problems
Distress
Total Eating Difficulties 1.4 (1.3-1.6)* 1.3 (1.1-1.4)*
Oralmotor Problems 1.6 (1.3-1.9)* 1.5 (1.2-2.0)*
Refusal Faddy Problems 1.6 (1.4-1.8)* 1.2 (1.01-1.4)‡
Behavioural Problems 1.8 (1.5-2.2)* 1.5 (1.1-2.2)‡
Hypersensitivity Problems 2.2 (1.7-3.1)* 1.8 (1.1-3.1)†
1 95% Confidence Intervals based on 20,000 bootstrap samples, using the Bias Corrected and accelerated (BCa) method * p<0.001; † p<0.01; ‡ p<0.05

27
Normal Clinical 16
17
18
19
20
21
22
23
24
Total Eating Problems
Wei
ght
EP Control
Figure 1: Measured weight (kg) parameters at 6 years for EP and control children
with (clinical) and without (normal) eating problems

28
-Appendix 1- Eating Questionnaire
Refusal-faddy eating problems (Cronbach’s α (CA) for total sample: 0.90; extremely
preterm (EP) 0.91; control children (CC): 0.89; eigenvalue 6.5):
1. Refuses to eat.
2. Has no appetite.
3. Is a faddy eater.
4. Leaves most of the food offered.
5. Is a slow eater.
6. Eats too little.
7. Is a picky eater.
Oral-motor problems (CA: 0.84; EP: 0.83; CC: 0.70; eigenvalue 2.7):
1. Dribbles when drinking.
2. Has problems with biting crackers.
3. Has problems with chewing meat/dried fruits.
4. Gags or chokes on food.
5. Has problems with swallowing.
6. Needs help with eating.
Oral hypersensitivity problems (CA: 0.79; EP 0.81; CC: 0.64; eigenvalue 1.3):
1. Does not like things to be put in his/her mouth (e.g. toothbrush).
2. Does not like to be touched around the mouth.
Behavioural problems around meals (CA: 0.55; EP 0.52; CC: 0.53; eigenvalue 1.2):
1. Makes a mess.
2. Has tantrums during meals.
3. Can’t sit still during mealtimes.
4. Eats too much.
Total eating difficulties score: CA: 0.88; EP 0.88; CC: 0.84

29
Normal Clinical100
105
110
115
120
125
Total Eating Problems
Hei
ght
Normal Clinical47484950515253545556
Total Eating Problems
Hea
d C
ircu
mfe
renc
e
Normal Clinical15.015.516.016.5
17.017.518.018.519.019.5
Total Eating Problems
Mid
Arm
Normal Clinical13.013.514.014.5
15.015.516.016.517.017.5
Total Eating Problems
BM
I
EP Control
Appendix 2: Measured growth parameters at 6 years for EP and control children (Height (cm), Head Circumference (cm), Mid Arm (cm) and Body Mass Index (BMI)) with (clinical) and without (normal) eating problems.