
Analysis and Modeling of an Extremely Dense Fog Event in Southern Ontario
14
VOLUME 43 JANUARY 2004 JOURNAL OF APPLIED METEOROLOGY 3 Analysis and Modeling of an Extremely Dense Fog Event in Southern Ontario MARIUSZ PAGOWSKI, * ISMAIL GULTEPE, AND PATRICK KING Meteorological Service of Canada, Downsview, Ontario, Canada (Manuscript received 10 December 2002, in final form 12 July 2003) ABSTRACT In this study, a dense fog episode that occurred near Windsor, Ontario, Canada, on 3 September 1999 is investigated. The fog patch, with a spatial scale of several kilometers, reduced visibility on a major highway to a few meters and led to a series of collisions and loss of life. Satellite imagery and surface observations are used to analyze the physics of the event, and several hypotheses on the origin of the fog are presented. A series of simulations of the event with the fifth-generation Pennsylvania State University–National Center for Atmo- spheric Research Mesoscale Model (MM5) suggest that the fog formed because of convergence of land breezes developing along the shores of a lake and subsequent advection of moisture over the site of the accident. Tests indicate that the small scale of the modeled event contributes to sensitivity of the results to a broad range of factors. Sensitivity to the initial and boundary conditions, including initial soil moisture content and parame- terization of turbulence, is discussed. 1. Introduction Fog presents a serious hazard in areas of intense traf- fic, such as airports, highways, and harbors, and its pre- diction is essential for public safety and has a high eco- nomic value (Leigh 1995). Thick fog was very likely a factor in a recent (3 November 2002) collision of 194 vehicles on a California highway. These facts stress the importance of fog studies. Radiative cooling and mixing (humidification) are the two main physical processes responsible for fog for- mation. Fogs can be classified as radiative when the first mechanism dominates, and as advective when the sec- ond is prominent. Surface observations of fog are common and date back about 200 years (see, e.g., Wells 1814; Taylor 1917; Willet 1928; Duynkerke 1991; Guedalia and Ber- got 1994). They demonstrate the processes involved in fog formation and development, including the primary role of radiation, microphysics, turbulence, and moisture transport over heterogeneous terrain. Numerical models can be used for fog forecasting and to investigate the relative importance of the pro- cesses affecting fog formation and evolution. Applica- tion of one-dimensional models for fog simulations, de- * Current affiliation: Forest System Laboratory, Cooperative In- stitute for Research in the Atmosphere, Colorado State University/ NOAA, Boulder, Colorado. Corresponding author address: Dr. Mariusz Pagowski, NOAA Bldg., 325 Broadway, FSL/FS, Boulder, CO 80305-3328. E-mail: [email protected] spite ignoring horizontal heterogeneities, provides many insights into fog physics. For example, Zdunkowski and Nielsen (1969) and Brown and Roach (1976) showed the importance of radiative cooling at the fog top on surface layer destabilization and on downward propa- gation of the fog. Brown (1980) and Mason (1982) in- vestigated the effect of radiative cooling on droplet growth and modification of the droplet spectrum. Mod- eling by Musson-Genon (1987) emphasized the impor- tance of turbulence in fog formation and evolution. Bott et al. (1990) and Bott (1991) studied effects of aerosol activation and composition on fog droplet distribution and visibility. Siebert et al. (1992) and Duynkerke (1991) showed that vegetation and its type strongly in- fluence fog formation by changing the surface heat and moisture budget. To further illustrate the complexity of fog physics, we present findings of Bergot and Guedalia (1994) who performed a series of experiments with a one-dimen- sional model. They emphasize the importance of precise knowledge of initial humidity profiles, especially for fogs forming during the second half of the night. They also showed the strong sensitivity of fog simulations to horizontal advection (by assuming a constant gradient in the model) and the effects of low- and midlevel clouds, through radiative balance, on the boundary layer. The effect of atmospheric pollution on fog was dem- onstrated by shifting the droplet spectrum toward the smaller sizes, causing a decrease in gravitational set- tling. Authors also pointed out that radiative balance of the surface layer is influenced by the soil heat conduc- tivity, which affects the cooling rate of the surface. Dew
Transcript of Analysis and Modeling of an Extremely Dense Fog Event in Southern Ontario

VOLUME 43 JANUARY 2004J O U R N A L O F A P P L I E D M E T E O R O L O G Y
3
Analysis and Modeling of an Extremely Dense Fog Event in Southern Ontario
MARIUSZ PAGOWSKI,* ISMAIL GULTEPE, AND PATRICK KING
Meteorological Service of Canada, Downsview, Ontario, Canada
(Manuscript received 10 December 2002, in final form 12 July 2003)
ABSTRACT
In this study, a dense fog episode that occurred near Windsor, Ontario, Canada, on 3 September 1999 isinvestigated. The fog patch, with a spatial scale of several kilometers, reduced visibility on a major highwayto a few meters and led to a series of collisions and loss of life. Satellite imagery and surface observations areused to analyze the physics of the event, and several hypotheses on the origin of the fog are presented. A seriesof simulations of the event with the fifth-generation Pennsylvania State University–National Center for Atmo-spheric Research Mesoscale Model (MM5) suggest that the fog formed because of convergence of land breezesdeveloping along the shores of a lake and subsequent advection of moisture over the site of the accident. Testsindicate that the small scale of the modeled event contributes to sensitivity of the results to a broad range offactors. Sensitivity to the initial and boundary conditions, including initial soil moisture content and parame-terization of turbulence, is discussed.
1. Introduction
Fog presents a serious hazard in areas of intense traf-fic, such as airports, highways, and harbors, and its pre-diction is essential for public safety and has a high eco-nomic value (Leigh 1995). Thick fog was very likely afactor in a recent (3 November 2002) collision of 194vehicles on a California highway. These facts stress theimportance of fog studies.
Radiative cooling and mixing (humidification) are thetwo main physical processes responsible for fog for-mation. Fogs can be classified as radiative when the firstmechanism dominates, and as advective when the sec-ond is prominent.
Surface observations of fog are common and dateback about 200 years (see, e.g., Wells 1814; Taylor1917; Willet 1928; Duynkerke 1991; Guedalia and Ber-got 1994). They demonstrate the processes involved infog formation and development, including the primaryrole of radiation, microphysics, turbulence, and moisturetransport over heterogeneous terrain.
Numerical models can be used for fog forecastingand to investigate the relative importance of the pro-cesses affecting fog formation and evolution. Applica-tion of one-dimensional models for fog simulations, de-
* Current affiliation: Forest System Laboratory, Cooperative In-stitute for Research in the Atmosphere, Colorado State University/NOAA, Boulder, Colorado.
Corresponding author address: Dr. Mariusz Pagowski, NOAABldg., 325 Broadway, FSL/FS, Boulder, CO 80305-3328.E-mail: [email protected]
spite ignoring horizontal heterogeneities, provides manyinsights into fog physics. For example, Zdunkowski andNielsen (1969) and Brown and Roach (1976) showedthe importance of radiative cooling at the fog top onsurface layer destabilization and on downward propa-gation of the fog. Brown (1980) and Mason (1982) in-vestigated the effect of radiative cooling on dropletgrowth and modification of the droplet spectrum. Mod-eling by Musson-Genon (1987) emphasized the impor-tance of turbulence in fog formation and evolution. Bottet al. (1990) and Bott (1991) studied effects of aerosolactivation and composition on fog droplet distributionand visibility. Siebert et al. (1992) and Duynkerke(1991) showed that vegetation and its type strongly in-fluence fog formation by changing the surface heat andmoisture budget.
To further illustrate the complexity of fog physics,we present findings of Bergot and Guedalia (1994) whoperformed a series of experiments with a one-dimen-sional model. They emphasize the importance of preciseknowledge of initial humidity profiles, especially forfogs forming during the second half of the night. Theyalso showed the strong sensitivity of fog simulations tohorizontal advection (by assuming a constant gradientin the model) and the effects of low- and midlevelclouds, through radiative balance, on the boundary layer.The effect of atmospheric pollution on fog was dem-onstrated by shifting the droplet spectrum toward thesmaller sizes, causing a decrease in gravitational set-tling. Authors also pointed out that radiative balance ofthe surface layer is influenced by the soil heat conduc-tivity, which affects the cooling rate of the surface. Dew

4 VOLUME 43J O U R N A L O F A P P L I E D M E T E O R O L O G Y
deposition, which leads to the dehydration of the layer,also affects the likelihood of fog formation.
The above summary outlines the potential difficultiesin fog modeling and prediction. The lack of accurateinitial humidity profiles in the boundary layer and theuncertainties in the parameterization of radiation, mi-crophysics, turbulence, and surface processes make fogmodeling and prediction a very challenging task in com-plex cases.
For regional fog studies and forecasting, the use ofthree-dimensional models with their computational bur-den and necessary simplifications in parameterization isunavoidable. Ballard et al. (1991) were the first to at-tempt fog prediction with a regional model. Experi-mental forecasts of fog off the coast of northern Scot-land, using the United Kingdom Meteorological Office(UKMO) mesoscale model, were relatively successfuland showed that results were critically dependent on themodel initial conditions and the parameterization of tur-bulence. In this model an extension of the 1.5-orderclosure of Mellor and Yamada (1982), to include liquidwater and phase changes after Sommeria and Deardorff(1977), was included. More recently, Gayno (1994) andStauffer et al. (1999) took a similar approach, includingvertical mixing corrected for countergradient flux in theconvective conditions. Model simulations compared fa-vorably with visibility, wind, temperature, humidity, andradiative fluxes recorded at the 215-m Cabauw, Neth-erlands, tower during a fog event on 3 August 1977(Wessels 1984; Musson-Genon 1987).
In the present work we analyze a fog episode thatoccurred near Windsor, Ontario, Canada, in the earlymorning of 3 September 1999. The extremely dense,small-scale fog patch reduced visibility to several meterson a stretch of a major highway and led to a series ofcollisions, involving 82 vehicles, that left 8 people deadand 33 injured. The fog moved or dissipated withinseveral minutes. Observations collected during the fogepisode and the results of simulations with the fifth-generation Pennsylvania State University–NationalCenter for Atmospheric Research (NCAR) MesoscaleModel (MM5) were examined to better understand fogformation and development in this case.
We begin by analyzing the physics of the episode anddeveloping hypotheses on the origin of the fog patch.The modeling approach and simulations are then de-scribed. The paper concludes with a discussion of theresults.
2. Case analysis
For the analysis of the physics of the fog episode,high-resolution satellite imagery provided the mostvaluable information. Canadian Meteorological Centre(CMC) weather analyses and surface reports of wind,temperature, and dewpoint from stations in the area ofinterest were also used.
CMC analyses (Fig. 1) show that the weather on 2
and 3 September 1999 was dominated by a stationaryhigh pressure system elongated in northeast (NE)–southwest (SW) direction, with the center in the middleof a triangle bounded by Lakes Erie, Ontario, and Hu-ron. Surface winds over southern Ontario and easternMichigan were weak—no precipitation was observedand no atmospheric fronts passed over the area. Surfaceair temperatures over land in this area reached 258–308Con 2 September and dropped by about 108C overnight.
It can be noted (Fig. 2) that a narrow strip of landbetween Lakes St. Clair and Erie (star denotes site ofthe accident) lacks any significant topographical fea-tures that could contribute to the fog formation. Also,dominant land use/vegetation (pasture) and soil type(clay) are uniform over the area where the accident oc-curred. However, we draw attention to the fact that theterrain slopes upward in the northwesterly direction westof Lake St. Clair. We believe that the presence of theridge seen in Fig. 2 resulted in channeling of the flowtoward Lake St. Clair. This will be demonstrated in theanalysis of the model simulations (see section 3).
Both lakes are very shallow with depths of the orderof 20 m or less within the area shown. Analysis of datafrom two buoys moored on eastern Lake Erie (no buoyswere deployed on Lake St. Clair until June 2000)showed that on the 2 September the average water tem-perature was about 238C and had a diurnal amplitudeof about 28C. The average air temperature was about228C with a diurnal amplitude of about 48C. Surfaceobservations for September 2000 showed that the waterand air temperature at Lake St. Clair are only slightlywarmer (by about 0.58C) than those measured by thetwo buoys on Lake Erie.
CMC analyses (Figs. 1c,d) show that at night and inthe early morning of 3 September, Lake St. Clair andits surroundings were in the weak NE flow stream. Sur-face observations [Fig. 3 and Aviation Routine WeatherReport (METAR), not included] indicate that the flowstream was modified at the lake shores by thermal gra-dients between land and water. It can be seen in Fig. 3that land breezes developed at night along the north-western and southern shores of the lake as indicated bywinds at Mt. Clemens, Michigan (KMTC), Bell River,Ontario, Canada (WDD), and possibly Windsor (YQG)at 0800 and 1000 UTC. At 1200 UTC (0800 LDT),about 1 h after the sunrise, a change in the wind directionat KMTC and YQG signals the onset of lake breezes.After midnight (from 0830 to 1215 UTC, METAR re-ports) very dense fog with near-zero visibility appearedat KMTC and led to two deadly accidents. From 1100to 1330 UTC fog was also observed at Detroit, Michigan(KDET), and from 1218 to 1300 UTC at YQG. Becauseof the wide spacing of surface stations, it is difficult todetermine the exact extent of fog banks with time.
Satellite data provide additional information on fogor low clouds and complement the surface observations.During daylight hours fog banks or low clouds can bedetermined by visible satellite imagery. During night-

JANUARY 2004 5P A G O W S K I E T A L .
FIG. 1. CMC analyses of (a), (b) sea level pressure (hPa) and (c), (d) surface wind (full barb is 10 m s 21) at (a), (c) 1800 UTC 2 Sep1999 and (b), (d) 1200 UTC 3 Sep 1999.
time, it is difficult to distinguish fog or low clouds usinga single IR channel because the temperature of the fogor low clouds is usually close to the surrounding cloud-free areas. Ellrod (1995) developed a technique basedon earlier work by Hunt (1973) to delineate fog or lowclouds at night using the difference between the Geo-stationary Operational Environmental Satellite (GOES)channel 4 (11 mm) and channel 2 (3.7 mm). Becausechannel 2 also detects reflected solar IR, this methodfails during daylight hours. Ellrod (1995) claims thatthe areas where the difference in brightness temperaturebetween channels 4 and 2 is below 2.5 K can be partiallyor completely filled with the semitransparent fog. Adifference in temperature from 2.5 to 5 K correspondsto clouds from 3 to 400 m thick and above 5 K to cloudsfrom 500 to 700 m thick. Figure 4 shows a sequence
of high-resolution (1.5 km) images from GOES-8. Dif-ferential infrared and visible images for nighttime anddaytime hours, respectively, are displayed in Fig. 4.
In Figs. 4a–c (at 0945, 1032, and 1102 UTC), greenareas denote temperature differences greater than 2 Kand red areas have differences greater than 4 K. It shouldbe noted that at least a part of the cloudy area extendingover the northwestern shore of Lake St. Clair from about1000 to 1100 UTC corresponds with the ground-levelfog as reported by the surface station at KMTC. Thesequence of nightly images combined with visible im-agery shows southerly propagation of the cloud and itswesterly spread. The first usable visible image at 1132UTC (Fig. 4d) shows the southern edge of the cloudabout 6 km northwest of the accident site (shorelinesand station locations are accurate within about 2 km).

6 VOLUME 43J O U R N A L O F A P P L I E D M E T E O R O L O G Y
FIG. 2. Topography (m MSL) of the area of accident (contourinterval 10 m).
FIG. 3. Observations from surface stations in southern Ontario on 3 Sep 1999: (a) 0800, (b) 1000, and (c) 1200 UTC.
By 1145 UTC (Fig. 4e, about 15 min before the acci-dent) the edge of the cloud was just north of the accidentsite. By 1215 UTC (Fig. 4f) the cloud edge appearedto be west of the accident site. At 1227 UTC, near-zerovisibility was reported at Windsor Airport, about 10 kmwestward from the accident site. The cloud dissipatedentirely over land by 1400 UTC.
The formation of the cloud can be explained as aresult of wind convergence along the northwestern shoreof Lake St. Clair induced by land breezes during thenight. Its southerly drift is consistent with the generaldirection of the synoptic flow and the weakening of landbreezes and onset of lake breezes at the southern lakeshore at a later time. Dissipation of the cloud most likelyoccurred because of the warming of the ground, sub-
sequently leading to a change in the breeze circulationpattern and disappearance of the previous convergencezones. It is important to note that the presence of thecloud in the imagery is not equivalent to the existenceof ground-level fog. At the time of the accident ground-level visibility was poor only at the easternmost edgeof the cloud, while fair visibility conditions were re-ported several kilometers westward from the site of theaccident where the cloud on the imagery is more opaque(Windsor Airport observations, drivers’ reports).
Scarcity of observations and lack of measurementsof wind, temperature, and dewpoint in the area wherethe accident occurred does not allow us to provide adefinitive explanation of the physics of the episode, but,rather, to formulate several hypotheses on the possiblescenarios.
First, we note that because of the direction of theprevailing flow and proximity of the accident site toLake St. Clair, it is unlikely that land breezes developingat the shores of Lake Erie had much influence on thefog event under consideration. Second, it is quite pos-sible that the poor air quality, confirmed by smog warn-ings issued in the Windsor area on 2 and 3 September,could have affected the fog formation and evolution aswell as its opacity. Fine atmospheric aerosols (with radiismaller than 2 mm), present on smoggy days, providecloud condensation nuclei (CCN) for water droplets.High concentrations of CCN under saturated conditionsleads to the formation of a large number of small drop-lets (Gultepe and Isaac 1999), resulting in slower grav-itational settling of droplets and thus, fogs with largerliquid water content. As shown by the experimental re-lation of Jiusto (1981),
rV 5 k , (1)
qL
where V is visibility, denotes the average cloud dropletrradius, qL is liquid cloud water content, and k is a pro-portionality constant that is in the range of 1–3 3 1023

JANUARY 2004 7P A G O W S K I E T A L .
FIG. 4. GOES-8 1.5-km resolution satellite imagery of area of accident on 3 Sep 1999. (a)–(c) Differential infrarednighttime imagery [channel 4 (11 mm) 2 channel 2 (3.7 mm); 2 K , DT , 4 K (green), 4 K , DT (red) (see textfor explanation)] and (d)–(f ) visible daytime imagery.
for SI units, small, average-sized droplets accompaniedby increased liquid cloud water content result in dras-tically decreased visibility.
As shown above, the presence of the cloud seen onthe imagery (Fig. 4) might be associated in some areasbelow it with ground-level fog. It is possible that thelow-level cloud was mixed downward in the surfacelayer, destabilized by radiative cooling at the cloud topand warming of air at the surface (Fleagle et al. 1952;
Pilie et al. 1975). This scenario is supported by obser-vations of some witnesses claiming that the fog appearedto ‘‘fall from the sky.’’
The time of the fog formation over the site of accident(about 1 h after sunrise), as well as its proximity to thelake, suggest that both nighttime radiative cooling andmoisture advection contributed to its presence. The roleof dew in fog formation and evolution was investigatedby Pilie et al. (1975) who noted that evaporation of dew

8 VOLUME 43J O U R N A L O F A P P L I E D M E T E O R O L O G Y
FIG. 5. Modeling domains (see text for details).
FIG. 6. Winds (plotted every 5 km, full barb at 10 m s21) at (a) 100 and (b) 10 m at 1100 UTC.
after sunrise can saturate the surface layer. To maintaina saturated layer a constant supply of moisture is nec-essary. Our estimates (see the appendix) suggest thatovernight water vapor condensation on vegetation sur-face elements might have played a certain role in fogformation in the early morning of 3 September.
In the second scenario, the fog would form whenwarm and moist air from over Lake St. Clair movedsouthward and became saturated over cooler land. Thetiming of the event is very much related to the weak-ening of land breeze circulations at the southern andwestern shores of Lake St. Clair, the onset of the lakebreeze, and the resulting southerly flow. We stress thatthis hypothesis is not inconsistent with the satellite im-agery because the cloud seen in Fig. 4 would obscureany shallow fog layer forming at the ground.
Modeling provides some support to the latter sce-nario.
3. Modeling
a. Design
To study the event, MM5 (Grell et al. 1994) wasemployed. It is an Eulerian nonhydrostatic regionalmodel with multinesting capability. It employs a verticalterrain-following pressure-based coordinate system andprovides various options for the parameterization of tur-bulence, grid-resolved and unresolved cloud processes,and radiation, as well as recently included coupling toland surface models. MM5 has been used extensivelyfor modeling studies, and there is a significant body ofliterature on the model itself and its applications (whichwas available online at http://www.mmm.ucar.edu/mm5/mm5home.html).
Lateral and initial conditions for MM5 simulationswere obtained by interpolation of CMC analyses to themodel grid. The analyses are produced in the three-dimensional variational data assimilation cycle, whichuses the Global Environmental Model (GEM; Cote etal. 1998a,b) results as the background. Rawinsondes,standard surface measurements, satellite temperature(SATEM) thickness, aircraft reports (AIREP), satellite-observation cloud-drift (SATOB) winds, dewpoint fromGOES, Television and Infrared Observation Satellite(TIROS) Operational Vertical Sounder (TOVS) radi-ances, and precipitable water from the Special SensorMicrowave Imager (SSM/I) are also included in the dataassimilation (Gauthier et al. 1999; Laroche et al. 1999).GEM is a semi-Lagrangian primitive equation globalmodel, which can be used on a rotated variable reso-lution mesh. The flexibility of this design allows forhigh resolution over the area of primary interest, in oursimulations approximately 24 km over North Americaand its surrounding oceans. In the incremental three-dimensional variational data assimilation (3DVAR) al-
JANUARY 2004 9P A G O W S K I E T A L .
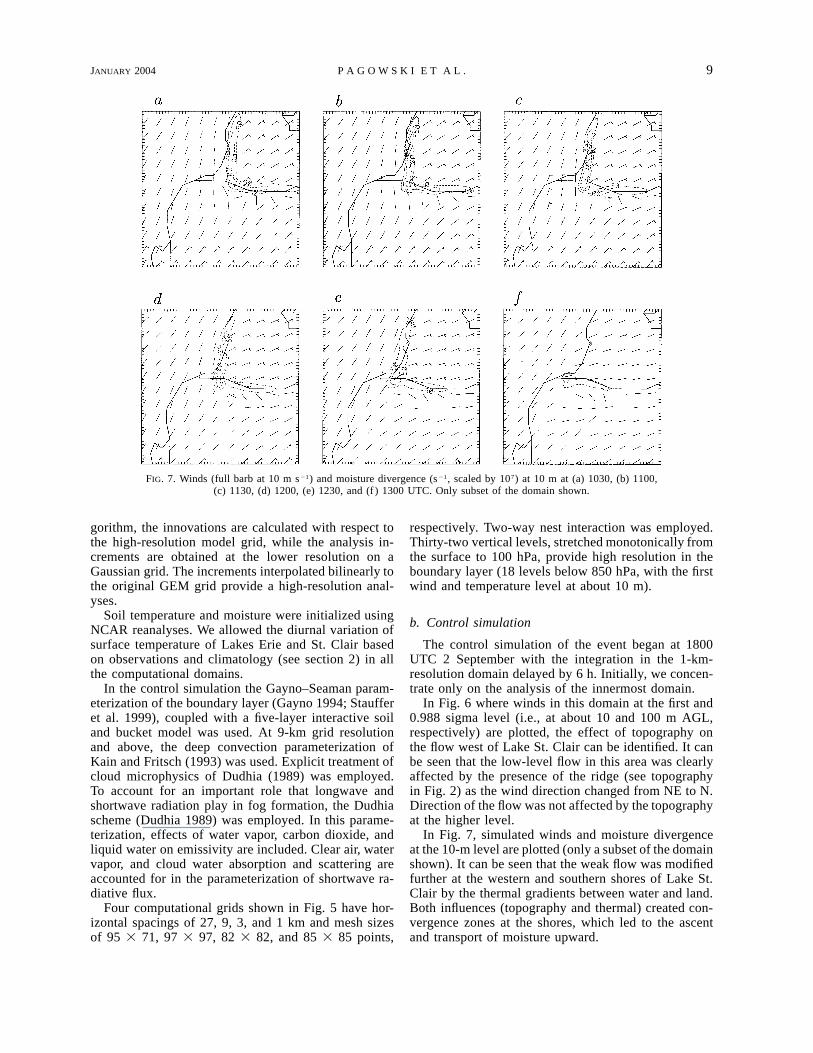
FIG. 7. Winds (full barb at 10 m s21) and moisture divergence (s21, scaled by 107) at 10 m at (a) 1030, (b) 1100,(c) 1130, (d) 1200, (e) 1230, and (f ) 1300 UTC. Only subset of the domain shown.
gorithm, the innovations are calculated with respect tothe high-resolution model grid, while the analysis in-crements are obtained at the lower resolution on aGaussian grid. The increments interpolated bilinearly tothe original GEM grid provide a high-resolution anal-yses.
Soil temperature and moisture were initialized usingNCAR reanalyses. We allowed the diurnal variation ofsurface temperature of Lakes Erie and St. Clair basedon observations and climatology (see section 2) in allthe computational domains.
In the control simulation the Gayno–Seaman param-eterization of the boundary layer (Gayno 1994; Staufferet al. 1999), coupled with a five-layer interactive soiland bucket model was used. At 9-km grid resolutionand above, the deep convection parameterization ofKain and Fritsch (1993) was used. Explicit treatment ofcloud microphysics of Dudhia (1989) was employed.To account for an important role that longwave andshortwave radiation play in fog formation, the Dudhiascheme (Dudhia 1989) was employed. In this parame-terization, effects of water vapor, carbon dioxide, andliquid water on emissivity are included. Clear air, watervapor, and cloud water absorption and scattering areaccounted for in the parameterization of shortwave ra-diative flux.
Four computational grids shown in Fig. 5 have hor-izontal spacings of 27, 9, 3, and 1 km and mesh sizesof 95 3 71, 97 3 97, 82 3 82, and 85 3 85 points,
respectively. Two-way nest interaction was employed.Thirty-two vertical levels, stretched monotonically fromthe surface to 100 hPa, provide high resolution in theboundary layer (18 levels below 850 hPa, with the firstwind and temperature level at about 10 m).
b. Control simulation
The control simulation of the event began at 1800UTC 2 September with the integration in the 1-km-resolution domain delayed by 6 h. Initially, we concen-trate only on the analysis of the innermost domain.
In Fig. 6 where winds in this domain at the first and0.988 sigma level (i.e., at about 10 and 100 m AGL,respectively) are plotted, the effect of topography onthe flow west of Lake St. Clair can be identified. It canbe seen that the low-level flow in this area was clearlyaffected by the presence of the ridge (see topographyin Fig. 2) as the wind direction changed from NE to N.Direction of the flow was not affected by the topographyat the higher level.
In Fig. 7, simulated winds and moisture divergenceat the 10-m level are plotted (only a subset of the domainshown). It can be seen that the weak flow was modifiedfurther at the western and southern shores of Lake St.Clair by the thermal gradients between water and land.Both influences (topography and thermal) created con-vergence zones at the shores, which led to the ascentand transport of moisture upward.

10 VOLUME 43J O U R N A L O F A P P L I E D M E T E O R O L O G Y
FIG. 8. Relative humidity (%) at 200 m at (a) 1130 and (b) 1230 UTC.
FIG. 9. Liquid cloud water content (g kg21) at 10 m at (a) 1100, (b) 1130, (c) 1200, (d) 1230, (e) 1300, and (f ) 1330 UTC. Accident siteis marked with a star.

JANUARY 2004 11P A G O W S K I E T A L .
FIG. 10. (a) Ground temperature (8C) and (b) TKE (J kg21, scaled by 104) at 10 m at 1130 UTC.
FIG. 11. Vertical cross sections showing (a)–(c) potential temperature (K) and tangential wind vectors and (d)–(f ) vertical velocity (cms21) and cloud liquid water content (g kg21) along the line shown in Fig. 10 at (a), (d) 1130, (b), (e) 1200, and (c), (f ) 1230 UTC. Arrowsindicate shoreline.

12 VOLUME 43J O U R N A L O F A P P L I E D M E T E O R O L O G Y
FIG. 12. Vertical cross sections showing (a)–(c) radiative tendency (K h21) and (d)–(f ) TKE (J kg21, scaled by 104) along the line shownin Fig. 10 at (a), (d) 1130, (b), (e) 1200, and (c), (f ) 1230 UTC. Arrows indicate shoreline.
In Figs. 8 and 9, relative humidity at about 200 m(0.979 sigma level) and liquid cloud water content atabout 10 m are displayed, respectively. It can be seenthat, in the current simulation, relative humidity westand south of Lake St. Clair was higher than 90%, thoughthe cloud seen on the satellite imagery was not repro-duced. As noted in section 2, it is possible that theformation of the cloud on the western shore of Lake St.Clair did not affect the ground-level fog formation. Inthis scenario, low-level moisture convergence lead tothe formation of a moist blob of air at the ground andits subsequent advection over land with the prevailingnortheasterly flow. Cooling of the blob over landthrough its interaction with a relatively cold surface andradiation lead to saturation and formation of fog overthe site of the accident. It can be seen that the narrowstrip of land between Lakes St. Clair and Erie was, at1130 UTC, approximately 48C cooler than the surfaceof Lake St. Clair (Fig. 10a). Mechanical turbulence gen-erated by weak winds [see plots of turbulent kineticenergy (TKE) at 10 m in Fig. 10b] was suppressed by
the strong static stability above, inhibiting mixing and,thus, creating favorable conditions for the fog forma-tion. The concave shape of the shoreline of Lake St.Clair might have strengthened convergence at the shore.This would occur as a consequence of the fact that thewind acquires an additional component in the directionof the thermal gradient, that is, in the case of the landbreeze perpendicular to the shoreline, and toward thelake.
Additional insight can be gained by the analysis ofvertical cross sections in Figs. 11 and 12 (along the lineshown in Fig. 10). In these figures potential temperature,tangential wind vectors, vertical velocity, liquid cloudwater content, radiative tendency, and TKE during thesimulation are displayed. Evolution of a shallow frontresulting from temperature contrast between lake andland can be seen in Fig. 11. Convergence at the leadingedge of the front, which is generated by a land breeze(see also Fig. 7) and enhanced by deceleration of theNE flow over land, leads to the development of verticalmotions (Fig. 11d–f). Ascent is compensated by the des-

JANUARY 2004 13P A G O W S K I E T A L .
FIG. 13. Liquid cloud water content (g kg21) at 10 m in 3-km-resolution domain at 1200 UTC. Only a subset of the domain isshown. Accident site is marked with a star.
FIG. 14. Liquid cloud water content (g kg21) at 10 m at 1200 UTC for different simulations: (a) Medium-Range Forecast Model (MRF)PBL with bucket soil moisture scheme, (b) MRF PBL with the Oregon State University land surface model, and (c) Gayno–Seaman schemewith initial soil moisture based on land use type. Accident site is marked with a star.
cent, which originates at the inversion behind the sur-face front. Downward motions suppress vertical buildupof fog by advecting dryer air from above and increasingstratification in the lower atmosphere behind the front(Figs. 11e and 12e). As the land breeze loses strengthafter sunrise vertical motions weaken (Fig. 11c). This,combined with radiative cooling due to fog (Figs. 12band 12c), leads to a less stable surface layer, increasedturbulence, and vertical buildup of the fog.
The fog started to dissipate at the surface around 1230UTC because of the warming of the ground. By 1330UTC (not shown) dissipation of the fog patch was al-most complete.
Simulation within a coarser 3-km-resolution domain
(see cloud water at 10 m in Fig. 13, the only subset ofthe 3-km-domain shown) also shows the presence of thefog patch at the location similar to that in the 1-km-resolution domain. Its cloud liquid water content is,however, lower. Thus, processes leading to the accidentwere already resolved at 3 km. Simulations in domains1 and 2 (27- and 9-km resolution), where lake and landbreezes along shores of Lake St. Clair were not resolved,do not show the presence of the fog in the area ofinterest.
Scarcity of observations allows only for limited ver-ification of the model results. Based on the availabledata it is quite possible that the simulation accuratelyreproduced the arrival and dissipation of the fog at thesite of the accident and correctly represented the se-quence of events. However, uncertainty associated withinterpreting the cloud feature seen on the satellite im-agery in this simulation needs to be acknowledged.
c. Sensitivity studies
Series of simulations were performed with varyingphysics and initial and boundary conditions. Otherboundary layer schemes available in MM5 (Blackadar1979; Zhang and Anthes 1982; Hong and Pan 1996)yielded poor results even when coupled with the OregonState University land surface model (Pan and Mahrt1987; Chen et al. 1996). It was noted that the initiali-zation of soil moisture with NCAR reanalysis improvedquality of simulations with the Gayno–Seaman scheme(Gayno 1994; Stauffer et al. 1999), even though thecomparison of initial soil moisture obtained from NCARreanalysis with soil moisture, based on land use type(not shown), revealed differences smaller than 10% overthe modeling domains. In Fig. 14 results of the abovesimulations are shown.
Below, sensitivity of the model results to the initialand boundary conditions is investigated. Table 1 liststhe three different numerical experiments.

14 VOLUME 43J O U R N A L O F A P P L I E D M E T E O R O L O G Y
TABLE 1. List of model simulations.
Simulation Starting date Duration (h) Remarks
Control
II
III
1800 UTC 2 Sep 1999
0000 UTC 3 Sep 1999
1800 UTC 3 Sep 1999
24
18
24
CMC analyses used to specify initial and lateralboundary conditions
CMC analyses used to specify initial and lateralboundary conditions
GEM forecast results used to specify initial andlateral boundary conditions
FIG. 15. (a) Simulation II: winds (full barb at 10 m s21) and moisture divergence (s21, scaled by 107) at 10 m at 1200 UTC, (b) liquidcloud water content (g kg21) at 300 m at 1200 UTC, and (c) liquid cloud water content (g kg21) at 10 m at 1200 UTC. Accident site ismarked with a star.
Simulation II had all of the features of the control,except it began in all four nests at 0000 UTC 3 Sep-tember. In Fig. 15 wind and moisture divergence andliquid cloud water content at about 300 (0.966 sigmalevel) and 10 m are displayed, respectively. It can beseen that the cloud feature seen on the imagery wasreproduced, but the fog patch developed at locationsabout 10–15 km west of the site of accident. Also, anal-ysis of vertical cross sections at different model levelsshowed that the cloud- and ground-level fog were de-coupled and, thus, formed independently. This is similarto the control simulation where air at 200 m was nearlysaturated (Fig. 8) but separate from the ground fogpatch. We believe that the sequence of events and salientfeatures of this simulation are very similar to the controlrun. As mentioned previously, the moist blob of air thatformed at the lake shore traveled with the mean flowover the cooler ground where it saturated and formedfog. Because of the small differences in wind directionand location of the convergence zones in comparisonwith the control case, the location of the fog patch wasinaccurate.
We point out that the above runs were not ‘‘true’’forecasts but rather were diagnostic studies, becauseweather analyses obtained in the data assimilation cyclewere used to specify boundary conditions for the sim-ulations. To obtain a true forecast, a 30-h simulationwith GEM starting at 1200 UTC 2 September was per-formed to obtain initial and lateral boundary conditionsfor MM5. This MM5 simulation (III) was apparently
inferior to the control and simulation II because it pro-duced fog already at 1000 UTC 3 September. The fogspread over the wide area by 1200 UTC, that is, whenthe accident occurred (Fig. 16).
We are convinced that the scale of the fog event andthe number of factors that could possibly affect the re-sults make this study highly suitable for ensemble mod-eling with a carefully designed set of the initial con-ditions.
4. Conclusions
An extremely dense fog event that occurred in south-ern Ontario and led to multiple collisions on a highwaywas analyzed. Because of the small scale of the eventand lack of in situ measurements in the area of theaccident, the analysis of the fog is difficult and no de-finitive answers on fog formation can be given. Satelliteimagery provided valuable information on the presenceand movement of a cloud feature in the vicinity of theaccident site. Downward mixing of this cloud could leadto ground-level fog formation.
Numerical investigation with MM5 favored a sce-nario in which a moist mass of air formed at the shoreof a nearby lake, which was subsequently advected overcooler land, leading to air saturation at the accident site.The role of the land and lake breeze circulations wascrucial for the fog formation in this case. Sensitivity ofthe model results to the initial conditions and physicalparameterizations suggest that the authors’ persistence,

JANUARY 2004 15P A G O W S K I E T A L .
FIG. 16. Simulation III: liquid cloud water content (g kg21) at 10 m at (a) 1000 and (b) 1200 UTC. Accident site ismarked with a star.
and not only the model skill, contributed to the apparentaccuracy of simulation of such a small-scale event. Also,different scenarios of the fog formation cannot be ex-cluded, especially because the model lacks comprehen-sive parameterizations of vegetation and aerosol micro-physics. We suggest that further insight into the fogformation in this area could be gained by climatologicalanalysis of fogs in the Windsor region. Such analysiswas not attempted in this study.
Acknowledgments. We thank Dr. Sylvie Gravel (fromMSC) for help with GEM and data assimilation. Com-ments of Drs. John Walmsley, Jianmin Ma, Kit Szeto,and Monika Bailey (all from MSC) on the early versionof the manuscript improved the quality of the text andfigures. The manuscript was further improved by thecriticism from the reviewers. Dr. Nelson Seaman kindlyprovided details on the Gayno–Seaman PBL scheme inMM5.
APPENDIX
Role of Local Evaporation in Fog Formationon 3 September
Monteith (1957) notes that there are two importantprocesses contributing to dew formation: distillation,when there is an upward flux of water vapor from warm-er soil to the top of a vegetation canopy, followed bya condensation on the leaves; and dewfall, which occurswhen surface cools to the dewpoint. In addition, whenfog is present gravitational settling of droplets on thecanopy can occur.
Below, we assess the likelihood of these processes informing dew on 3 September 1999. Because of the lackof measurements of soil/ground temperature in the area
of the accident, certain assumptions based on obser-vations from nearby hourly stations and model simu-lations are necessary.
First, we note that no precipitation on 1 and 2 Sep-tember was observed near the site of the accident and,based on NCAR reanalysis, soil moisture availabilitysouth of Lake St. Clair was below 40%. According toGarratt (1992, p. 139, their Fig. 5.9a), relative humidityat the surface for clay soil in such conditions is about40%. Model simulations suggest that soil skin temper-ature south of Lake St. Clair was about 208C, whilesurface stations in the area recorded 2-m air temperaturefrom 178 to 188C. Based on the above, and taking intoaccount measurements from Cabauw, Netherlands, fora grass canopy on a summer cloudless night (Duynkerke1991), we assume that the temperature difference be-tween soil skin temperature and the top of the canopyis about 108C. These assumptions give specific humidityat the soil surface equal to 5.9 g kg21 and specific hu-midity at the top of canopy equal to 7.7 g kg21, resultingin moisture flux downward toward the soil. Thus, weconclude that distillation did not have, or had very small,contributions to dew formation at the top of the canopy.
Based on dewpoint values at surface stations nearbyfrom 148 to 178C, it is possible that vapor condensedon the canopy, which could have cooled down to 108C(dewfall).
Because no fog in the area south of Lake St. Clairwas observed during the night, it is unlikely that grav-itational settling contributed to droplet deposition on thecanopy overnight.
REFERENCES
Ballard, S. P., B. W. Golding, and R. N. B. Smith, 1991: Mesoscalemodel experimental forecasts of the haar of northeast Scotland.Mon. Wea. Rev., 119, 2107–2123.

16 VOLUME 43J O U R N A L O F A P P L I E D M E T E O R O L O G Y
Bergot, T., and D. Guedalia, 1994: Numerical forecasting of radiationfog. Part I: Numerical model and sensitivity tests. Mon. Wea.Rev., 122, 1218–1230.
Blackadar, A. K., 1979: High resolution models of the planetaryboundary layer. Advances in Environmental Science and Engi-neering, J. R. Pfafflin and E. N. Ziegler, Eds., Vol. 1, Gordonand Breach, 50–85.
Bott, A., 1991: On the influence of the physico-chemical propertiesof aerosols on the life cycle of radiation fogs. Bound. LayerMeteor., 56, 1–31.
——, U. Sievers, and W. Zdunkowski, 1990: A radiation fog modelwith a detailed treatment of the interaction between radiativetransfer and fog microphysics. J. Atmos. Sci., 47, 2153–2166.
Brown, R., 1980: A numerical study of radiation fog with an explicitformulation of the microphysics. Quart. J. Roy. Meteor. Soc.,106, 781–802.
——, and W. T. Roach, 1976: The physics of radiation fog: II—Anumerical study. Quart. J. Roy. Meteor. Soc., 102, 335–354.
Chen, T. H., and Coauthors, 1996: Modeling of land-surface evap-oration by four schemes and comparison with FIFE observations.J. Geophys. Res., 101, 7251–7268.
Cote, J., J.-G. Desmarais, S. Gravel, A. Methot, A. Patoine, M. Roch,and A. Staniforth, 1998a: The operational CMC–MRB GlobalEnvironmental Multiscale (GEM) model. Part II: Results. Mon.Wea. Rev., 126, 1397–1418.
——, S. Gravel, A. Methot, A. Patoine, M. Roch, and A. Staniforth,1998b: The operational CMC–MRB Global Environmental Mul-tiscale (GEM) model. Part I: Design considerations and for-mulation. Mon. Wea. Rev., 126, 1373–1395.
Dudhia, J., 1989: Numerical study of convection observed during thewinter monsoon experiment using a mesoscale two-dimensionalmodel. J. Atmos. Sci., 46, 3077–3107.
Duynkerke, P. G., 1991: Radiation fog: A comparison of model sim-ulation with detailed observations. Mon. Wea. Rev., 119, 324–341.
Ellrod, G. P., 1995: Advances in the detection and analysis of fog atnight using GOES multispectral infrared imagery. Wea. Fore-casting, 10, 606–619.
Fleagle, R. G., W. H. Parrott, and M. L. Barad, 1952: Theory andeffects of vertical temperature distribution in turbid air. J. Atmos.Sci., 9, 53–61.
Garratt, J. R., 1992: The Atmospheric Boundary Layer. CambridgeUniversity Press, 316 pp.
Gauthier, P., C. Charette, L. Fillion, P. Koclas, and S. Laroche, 1999:Implementation of a 3D variational data assimilation system atthe Canadian Meteorological Centre. Part I: The global analysis.Atmos.–Ocean, 37, 103–156.
Gayno, G. A., 1994: Development of a higher-order, fog producingboundary layer model suitable for use in numerical weather pre-diction. M.S. thesis, Dept. of Meteorology, The PennsylvaniaState University, 104 pp.
Grell, G. A., J. Dudhia, and D. R. Stauffer, 1994: A description ofthe fifth-generation Penn State/NCAR Mesoscale Model (MM5).NCAR Tech. Note NCAR/TN-3921STR, 122 pp.
Guedalia, D., and T. Bergot, 1994: Numerical forecasting of radiationfog. Part II: A comparison of model simulation with severalobserved fog events. Mon. Wea. Rev., 122, 1231–1246.
Gultepe, I., and G. A. Isaac, 1999: Scale effects on averaging of clouddroplet and aerosol number concentrations: Observations andmodels. J. Climate, 12, 1268–1279.
Hong, S.-Y, and H.-L. Pan, 1996: Non-local boundary layer verticaldiffusion in medium-range forecast model. Mon. Wea. Rev., 124,1215–1238.
Hunt, G. E., 1973: Radiative properties of terrestrial clouds at visibleand infrared thermal window wavelenghts. Quart. J. Roy. Me-teor. Soc., 99, 346–369.
Jiusto, J. E., 1981: Fog structure. Clouds, Their Formation, OpticalProperties, and Effects, P. V. Hobbs and A. Deepak, Eds., Ac-ademic Press, 187–239.
Kain, J. S., and M. Fritsch, 1993: Convective parameterization formesoscale models: The Kain–Fritsch scheme. The Representa-tion of Cumulus Convection in Numerical Models, Meteor. Mon-ogr., No. 46, Amer. Meteor. Soc., 165–177.
Laroche, S., P. Gauthier, J. St-James, and J. Morneau, 1999: Imple-mentation of a 3D variational data assimilation system at theCanadian Meteorological Centre. Part II: The regional analysis.Atmos.–Ocean, 37, 281–307.
Leigh, R. J., 1995: Economic benefits of Terminal Aerodrome Fore-casts (TAFs) for Sydney Airport, Australia. Meteor. Appl., 2,239–247.
Mason, J., 1982: The physics of radiation fog. J. Meteor. Soc. Japan,60, 486–498.
Mellor, G. L., and T. Yamada, 1982: Development of turbulence clo-sure model for geophysical fluid problems. Rev. Geophys. SpacePhys., 20, 851–875.
Monteith, J. L., 1957: Dew. Quart. J. Roy. Meteor. Soc., 83, 322–341.
Musson-Genon, L., 1987: Numerical simulation of a fog event witha one-dimensional boundary layer model. Mon. Wea. Rev., 115,592–607.
Pan, H.-L., and L. Mahrt, 1987: Interaction between soil hydrologyand boundary-layer development. Bound.-Layer Meteor., 38,185–202.
Pilie, R. J., E. J. Mack, W. C. Kocmond, W. J. Eadie, and C. W.Rogers, 1975: The life cycle of valley fog. Part I: Micromete-orological characteristics. J. Appl. Meteor., 14, 347–363.
Siebert, J., U. Sievers, and W. Zdunkowski, 1992: A one dimensionalsimulation of the interaction between land surface processes andthe atmosphere. Bound.-Layer Meteor., 59, 1–34.
Sommeria, G., and J. W. Deardorff, 1977: Subgrid-scale condensationin models of nonprecipitating clouds. J. Atmos. Sci., 34, 344–355.
Stauffer, D. R., R. C. Munoz, and N. L. Seaman, 1999: In-cloudturbulence and explicit microphysics in the MM5. Proc. NinthPSU/NCAR Mesoscale Model User’s Workshop, Boulder, CO,NCAR, 177–180.
Taylor, G. I., 1917: The formation of fog and mist. Quart. J. Roy.Meteor. Soc., 43, 241–268.
Wells, W. C., 1814: Essay on Dew, and Several Appearances Con-nected with It. Taylor and Hessey, 146 pp.
Wessels, H. R. A., 1984: Cabauw meteorological data tapes 1973–1984. Description of instrumentation and data processing for thecontinuous measurements. Royal Netherlands Meteorological In-stitute Scientific Rep. WR-84-6.
Willet, H. C., 1928: Fog and haze. Mon. Wea. Rev., 56, 435–467.Zdunkowski, W. B., and B. C. Nielsen, 1969: A preliminary prediction
analuysis of radiation fog. Pure Appl. Geophys., 75, 278–299.Zhang, D.-L., and R. A. Anthes, 1982: A high-resolution model of
the planetary boundary layer—Sensitivity tests and comparisonswith SESAME-79 data. J. Appl. Meteor., 21, 1594–1609.