Module 1: Meteorology and Climatology - Project: Training ...
Upload
independentCategory
view
1download
0
A Climatology and Case Study of Continental Cold Season Dense FogAssociated with Low Clouds
NANCY E. WESTCOTT AND DAVID A. R. KRISTOVICH
Illinois State Water Survey, Institute for Natural Resource Sustainability, University of Illinois
at Urbana–Champaign, Urbana, Illinois
(Manuscript received 27 March 2008, in final form 17 April 2009)
ABSTRACT
This study focuses on dense fog cases that develop in association with low clouds and sometimes precipi-
tation. A climatology of weather conditions associated with dense fog at Peoria, Illinois, for October–March
1970–94 indicated that fog forming in the presence of low clouds is common, in 57% of all events. For events
associated with low pressure systems, low clouds precede dense fog in 84% of cases. Therefore, continental
fogs often do not form under the clear-sky conditions that have received the most attention in the literature.
Surface cooling is usually observed prior to fog on clear nights. With low cloud bases, warming or no change in
temperature is frequent. Thus, fog often forms under conditions that are not well understood, increasing the
difficulty of forecasting fog. The possible mechanisms for fog development under low cloud-base conditions
were explored for an event when dense fog covered much of Illinois on 7 November 2006. Weather Sur-
veillance Radar-1988 Doppler (WSR-88D) and rawinsonde observations indicated that evaporating precip-
itation aloft was important in moistening the lower atmosphere. Dense fog occurred about 6 h following light
precipitation at the surface. The surface was nearly saturated following precipitation, but relative cooling was
needed to overcome weak warm air advection and supersaturate the lower atmosphere. Surface (2 m)
temperatures were near or slightly cooler than ground temperatures in most of the region, suggesting surface
sensible heat fluxes were not important in this relative cooling. Sounding data indicated drying of the at-
mosphere above 800 hPa. Infrared satellite imagery indicated deep clouds associated with a low pressure
system moved east of Illinois by early morning, leaving only low clouds. It is hypothesized that radiational
cooling of the low cloud layer was instrumental in promoting the early morning dense fog.
1. Introduction
In the Midwest fog can be a significant safety hazard,
greatly impacting ground (e.g., Goodwin 2002; Westcott
2007) and air (e.g., Keith and Leyton 2007) trans-
portation. Continental fogs are generally thought to
occur when air is cooled to the point of saturation by
radiation under clear-sky conditions, or when moist air
is advected over a cold surface, such as snow, resulting in
cooling of the overlying air to saturation (Roach 1995).
In fact, much of the current understanding of conti-
nental fogs is based on field studies of radiation fogs
under clear-sky conditions (e.g., Roach et al. 1976;
Meyer and Lala 1990; Jiusto and Lala 1980; Mason 1982;
Turton and Brown 1987). Based on observations taken
in the October–March cold season from 1970 to 1994,
Westcott (2005) found that precipitation is often present
at the onset of dense fog in the Midwest. Tardif and
Rasmussen (2007) likewise found for New York City,
and the nearby metropolitan areas, that fog often occurs
with precipitation or low cloud bases. Fogs forming in
association with or between low pressure systems or
nearby fronts were often observed by early researchers
(e.g., George 1951; Byers 1959) and more recently by
Westcott (2005), Croft and Burton (2006), and Tardif
and Rasmussen (2008). While forecasters are aware that
continental fogs can be associated with low clouds and
precipitation (George 1940; Byers 1959; Croft et al.
1997), few case studies examining processes leading to
the development of fogs over land (e.g., Tardif 2006)
have been reported.
A climatology of fog occurrence is presented for a site
in the continental Midwest. Furthermore, a case study is
presented to illustrate some of the physical processes
Corresponding author address: Nancy E. Westcott, Illinois State
Water Survey, 2204 Griffith Dr., Champaign, IL 61801.
E-mail: [email protected]
VOLUME 48 J O U R N A L O F A P P L I E D M E T E O R O L O G Y A N D C L I M A T O L O G Y NOVEMBER 2009
DOI: 10.1175/2009JAMC1999.1
� 2009 American Meteorological Society 2201

that may be important for the development of dense fog
under low cloud conditions, or following the passage of
a precipitation system.
2. Methods
a. Climatology
A climatology of surface conditions, before and at the
time of dense fog formation, was developed for all dense
fog events observed at Peoria, Illinois, using hourly
surface airways data for the period 1951–96 (Westcott
2005, 2007). These hourly observations consist of hori-
zontal visibility, as well as standard surface observations
including cloud-base height and prevailing weather. The
areal extent of each fog event was based on surface
airways data collected at National Weather Service
(NWS) first-order stations in the Midwest region. Dense
fog events were defined as having at least one hour of
visibility #400 m (1/4 mi) when fog was reported, simi-
lar to the definition of fog events by Meyer and Lala
(1990). Peoria, located in central Illinois, was found
by Westcott (2007) to be representative of the Midwest.
The Champaign, Illinois, area is about 110-km southeast
of Peoria, and the location of some of the surface ob-
servation sites used in the current case study is similar to
Peoria in that topographic features and urban influences
do not greatly affect the surface observations.
The majority (.80%) of widespread, long-duration
events in the Midwest occur during the October–March
cold season period. These events are the basis of the
present climatology (Westcott 2007). During the 1970–94
cold seasons, 302 dense fog events were identified. Each
of these events was classified by synoptic type based on
3-h surface weather maps. Ten synoptic types were
considered in Westcott (2005). The most notable feature
was that precipitation often occurred within one hour of
the onset of dense fog events associated with low pres-
sure systems and approaching or nearby fronts. Because
of the similarity in the distribution of surface conditions
and prevailing weather at dense fog onset and for sim-
plicity of analysis, the 10 original classifications were
combined into 5 synoptic types for this study. The syn-
optic classification was made with respect to Peoria, at
the time of dense fog onset (Table 1). Examples of the 5
synoptic types are presented in Fig. 1, based on images
from the U.S. Daily Weather Map Series. [Available on-
line at http://docs.lib.noaa.gov/rescue/dwm/data_rescue_
daily_weather_maps.html archived by the National
Oceanic and Atmospheric Administration (NOAA)
Central Library Data Imaging Project for dates prior to
2003, and by the National Centers for Environmental
Prediction (NCEP; available online at www.hpc.ncep.
noaa.gov/dailywxmap/pdffiles.html) for later dates.] Of
the 302 dense fog events, 23% occurred when weather in
Illinois was dominated by a low pressure system cen-
tered in Illinois or one of the surrounding states at
the time dense fog formed, as was the case for the event
on 7 November 2006. Other synoptic categories in-
cluded events associated with approaching or nearby
fronts (35%), with high pressure system (26%) events
that occurred following the passage of a front (7%), or
were between synoptic features (termed transition
events, 9%).
The original climatology was expanded upon for this
study by the inclusion of upper-air data from Peoria. The
current study focuses on available rawinsonde pairs for
those events when the 0000 UTC (1800 LT) sounding
was launched before dense fog onset, and when the 1200
UTC (0600 LT) sounding launch occurred at fog onset
(21%), during dense fog (73%), or within 2 h of the end
of dense fog (6%). There were 120 sounding pairs that
characterized about 40% of the dense fog event sample.
These were employed to characterize the depth of the
moist layer near the time of dense fog events, and de-
termine the possibility of cold or warm air advection at
low levels.
TABLE 1. Synoptic classification of 302 dense fog events occurring at Peoria, during the Oct–Mar period of 1970–94.
Pattern Definition based on 3-h surface maps near time of dense fog onset Sample
Percent
of sample
High pressure High pressure dominates IL weather, often with a low in Canada, off the east coast
or in the southwestern United States, or with a cold front in the high plains states.
78 26
Postfrontal Behind warm front (front north of Peoria, often in south or central WI),
or behind cold front (front east or south of Peoria, often in eastern IL or IN).
22 7
Transition Peoria between some combination of fronts, lows or troughs with the
primary synoptic condition ambiguous; sometimes with an identifiable col.
27 9
Low pressure Low pressure center to southwest or west of Peoria, sometimes ahead of a cold front,
a warm front, or both.
68 23
Frontal Ahead of a nearby or approaching front. Cold fronts often slow moving, to the north
or northwest of IL; warm or stationary fronts often positioned across southern IL.
107 35
All 302 100
2202 J O U R N A L O F A P P L I E D M E T E O R O L O G Y A N D C L I M A T O L O G Y VOLUME 48

FIG. 1. Examples of the five synoptic weather pat-
terns employed in this study: (a) high pressure, (b)
postfrontal, (c) transition, (d) low pressure, and (e)
frontal, adapted from the U.S. Daily Weather Map
Series valid at 1200 UTC. Shown are isobars (black
lines), and precipitation during the previous 24 h ending
at 0600 UTC (shading). Dense fog onset was within
several hours of 1200 UTC.
NOVEMBER 2009 W E S T C O T T A N D K R I S T O V I C H 2203

Precipitation data for the 302 dense fog events at
Peoria were obtained from 3 sources: 1) daily precipi-
tation totals at Peoria, ending at midnight; 2) the NOAA
Daily Map Series daily precipitation analyses for the
surrounding region, ending at 1200 UTC (0600 LT); 3)
hourly observations of prevailing weather (precipitation
type) at Peoria. The midnight observation at Peoria and
the Daily Weather Map Series data provide an indication
of availability of moisture for fog development at Peoria
and in the general region. Peoria is not one of the sites
analyzed on the Daily Weather Maps, so there is not
perfect agreement between the maps and precipitation at
Peoria. In all cases in which precipitation was observed
near the time of dense fog onset and in most cases (.90%)
in which precipitation was observed to occur within the
previous 24 h at Peoria, an area of precipitation was ob-
served on the Daily Weather maps. In cases in which
precipitation was not specifically observed at Peoria, it
usually was observed within about 100 km. This suggests
that there may be cases where precipitation was in the
immediate area, but not reaching the ground.
b. Case study
Operational observations taken by NOAA facilities
and local field experiment observations in central Illi-
nois were examined to obtain as complete a description
as possible of the 6–7 November 2006 dense fog event
(Fig. 2). Surface observations from NWS Automated
Surface Observing System (ASOS) and Federal Aviation
Administration (FAA) Automated Weather Observing
System (AWOS) locations in Illinois and Indiana, taken
at time intervals of 20 min to 1 h, were obtained from
NOAA’s Midwestern Regional Climate Center (avail-
able online at http://mrcc.isws.illinois.edu) at the Illinois
State Water Survey. These sites record visibility, cloud-
base height, and precipitation, as well as standard me-
teorological variables. Hourly-averaged data from the
Illinois Climate Network (ICN) gave valuable addi-
tional information on standard meteorological variables,
precipitation, net radiation, ground temperatures, and
10 cm (4 in.) soil temperature and moisture at 19 sites
throughout Illinois. In addition, data taken at the Uni-
versity of Illinois Willard Airport AWOS (KCMI) about
5 km south of Champaign gave detailed information on
the evolution of the fog. An AmeriFlux site (Billesbach
et al. 2004), located about 4 km south–southwest of
KCMI, provided information on surface sensible heat
fluxes, and 2-m air and ground temperatures; a duplicate
set of most instrumentation was located at a second tower
about 4 km south of KCMI. The two AmeriFlux towers
were separated by 2 km. While visibility was not mea-
sured by AmeriFlux, the temperature, humidity, wind
measurements, and temporal trends were quite similar to
those at KCMI and at the ICN sites at Bondville, Illinois,
and Champaign.
For fog development in cases of low clouds and pre-
cipitation, it is anticipated that variations in atmospheric
conditions throughout the lower troposphere might be
important. High-resolution (6 s) rawinsonde observa-
tions taken near the center of the area of dense fog
development were obtained from the NOAA Weather
Service Forecast Office in Lincoln, Illinois (KILX). These
observations were taken at 0000 and 1200 UTC (1800 and
0600 LT) on 6–7 November 2007 and examined using the
Universal Rawindsonde Observation Program (RAOB)
software (Environmental Research Services 2006).
Weather Surveillance Radar-1988 Doppler (WSR-88D)
observations taken at Lincoln, were examined to under-
stand the potential impacts of precipitation on fog de-
velopment in central Illinois. Archived level II data
were obtained from the National Climatic Data Center
(NCDC; available online at http://hurricane.ncdc.noaa.
gov/pls/plhas/has.dsselect) and viewed using the software
program GRLevel2Analyst (Gibson Ridge Software
2006). Satellite observations gave critical information on
the spatiotemporal evolution of cloud systems in the re-
gion of fog development. Visible and infrared imagery
taken by Geostationary Operational Environmental
Satellite (GOES-8) were examined. This imagery was
obtained from the National Aeronautics and Space
Administration (NASA) Langley Cloud and Radiation
Research Group Web page (available online at http://
www-angler.larc.nasa.gov/).
FIG. 2. Location of AWOS/ASOS (labeled METAR) and ICN
surface data sites and the Lincoln, (ILX) radar and rawinsonde site.
Inset indicates location of AmeriFlux, AWOS site, and ICN sites
in the Champaign (CMI) area. Vertical line indicates location of
radar cross section of Fig. 5.
2204 J O U R N A L O F A P P L I E D M E T E O R O L O G Y A N D C L I M A T O L O G Y VOLUME 48

3. Climatology
In a number of ways, fogs forming under differing
synoptic conditions in Illinois are quite similar (Table 2).
Dense fog is usually a nighttime event. It often occurs
with low wind speeds and when surface flow is from the
south or east. Further, it often occurs when snow is not
present within 100 km of Peoria. There also are some
obvious differences. Winds are usually lighter when high
pressure dominates Illinois (median 2.6 m s21), or when
the weather is not clearly dominated by a major surface
feature (median 2.1 m s21). In comparison with events as-
sociated with high pressure systems, when a low pressure
system is nearby fog is more likely during daytime hours
and with higher (although still light) surface winds (me-
dian 3.6 m s21). However, within any particular synoptic
class, fog forms under a wide variety of surface conditions.
Clouds are known to impact fog development by
delaying its onset or in leading to the rapid termination
of a fog event (e.g., Saunders 1960). Examination of
cloud-base heights (Table 3), however, suggests that fog
in the Midwest often occurs under cloudy conditions.
Employing the cloud-base height threshold of 1 km used
by Tardif and Rasmussen (2007), low cloud-base events
are common, particularly when low pressure centers
(84%) dominate Illinois weather. Low cloud bases also
are common when fronts are approaching or nearby
(67%). The majority of all dense fog events (57%) were
associated with low cloud bases in the 6 h prior to the
onset of dense fog. The impact of cloudiness on changes
at the surface and in the moist layer is examined in the
next two sections.
a. Cloud-base height with surface temperature andmoisture changes
Typically under clear-sky conditions during nighttime
hours, divergence of radiation fluxes cools the surface and
lowest region of the atmosphere. In cases where the sky
was clear, or where cloud bases were higher than 1 km in
the 6 h prior to dense fog onset, made up only 34% of the
dense fog events (Table 3) and were usually associated
with high pressure or followed the passage of a warm or
cold front, or a front without precipitation. Figure 3 re-
veals that temperature falls of 0.68C or more in 6 h can be
expected when cloud bases are greater than 1 km. Dew-
point temperatures were also observed to decrease, but
not as frequently as did temperature. Relative humidity
in the 6 h prior to dense fog onset often increased by
more than 5% when cloud bases were higher than 1 km.
This suggests that radiational cooling occurred, allowing
the relative humidity to increase perhaps without the
addition of moisture. By 3 h prior to dense fog onset,
however, while cooling still frequently occurred, the at-
mosphere was nearly saturated, and so only small changes
in relative humidity were seen. It should be noted that
particularly at nearly saturated conditions, relative hu-
midity changes of 5% may be within sensor accuracy, and
TABLE 2. Percentage of dense fog events by synoptic type at Peoria: occurring when snow was present at 1200 UTC (0600 LT); during
daytime hours 1600–2300 UTC (1000–1700 LT); above or below wind speed thresholds; the median wind speed; and occurring within
direction categories (1358–2258S, 2258–3158W, 3158–458N, 458–1358E), for the 302 events during the Oct–Mar period of 1970–94.
Percent occurrence Speed (m s21) Percent occurrence direction
Synoptic category Snow Daytime ,2 m s21 .4 m s21 Median S E N W
High pressure 27 1 35% 19% 2.6 47 15 17 21
Postfrontal 18 5 28% 34% 2.9 28 22 22 28
Transition 26 11 15% 30% 2.1 46 27 12 15
Low pressure 26 28 13% 41% 3.6 41 28 22 9
Frontal 17 14 18% 32% 3.1 54 32 6 8
All 22 13 22% 31% 48 26 13 13
TABLE 3. Percentage of dense fog events at Peoria, with cloud-base heights .1 km AGL, variable cloud bases, or cloud base ,1 km in 6 h
prior to dense fog onset, for the Oct–Mar period of 1970–94.
Synoptic category Cloud-base height within 26 h of fog onset
Sample Percent of sample .1-km Variable ,1-km no precipitation at onset ,1-km precipitation at onset
High pressure 78 26 62% 11% 23% 4%
Postfrontal 22 7 50% 9% 23% 18%
Transition 27 9 22% 26% 15% 37%
Low pressure 68 23 10% 6% 25% 59%
Frontal 107 35 28% 5% 18% 49%
All 302 100 34% 9% 21% 36%
NOVEMBER 2009 W E S T C O T T A N D K R I S T O V I C H 2205

thus variations at these high values are likely within
sensor noise. When cloud bases are variable in the 6 h
prior to dense fog onset, a weaker but similar pattern of
temperature and relative humidity change is observed.
For low cloud-base dense fog events, small or positive
changes in temperature, dewpoint temperature, and rel-
ative humidity are common in the 6 h (Fig. 3a) and 3 h
prior to dense fog onset (Fig. 3b). In the majority of cases
a warming of $0.68C or no temperature change occurred
over the 3 and 6 h prior to dense fog onset. If precipitation
was present at or near dense fog onset, warming was most
common. Note that hourly temperature was recorded in
FIG. 3. Frequency of relative humidity, temperature, and dewpoint temperature change in the (a) 6 and (b) 3 h
prior to dense fog onset for fog events for cloud-base heights .1 km AGL, variable cloud-base heights, and for cloud-
base heights ,1 km by precipitation occurrence at fog onset for Peoria, during October–March 1970–94. Temper-
ature and dewpoint temperature were recorded in increments of 0.68C (18F).
2206 J O U R N A L O F A P P L I E D M E T E O R O L O G Y A N D C L I M A T O L O G Y VOLUME 48

whole degrees Fahrenheit (0.68C), so more subtle changes
in temperature may have gone undetected. An exami-
nation of dewpoint temperature by cloud-base height
indicated that under low cloud conditions with and
without precipitation at fog onset, the dewpoint temper-
ature often increased by $0.68C in the pre-fog hours. This
occurred with more frequency than did increasing tem-
perature cases, suggesting the addition of moisture into
the surface layer.
For low cloud cases with precipitation at dense fog
onset, the atmosphere often was nearly saturated, with
only 15% of the cases exhibiting increasing humidity by
more than 5% in the 3 h prior to dense fog onset, and
30% increasing more than 5% in the 6 h prior to dense
fog onset. Similar results were presented in Tardif and
Rasmussen (2008) for precipitation fog events. Within
3 h of dense fog onset, in the majority of cases, the at-
mosphere was saturated or nearly saturated no matter
the cloud-base height.
b. Vertical structure of the moist layer fromsounding data
Sounding pairs were examined for 120 events when
dense fog onset occurred after the 0000 UTC (1800 LT)
sounding, with the 1200 UTC (0600 LT) sounding
generally representative of the fog event (94% of the
1200 UTC soundings occurred when dense fog was pres-
ent). The data for this subset of dense fog events showed
some similarity in vertical structure among the events. It
was found that an inversion was nearly always present in
the early morning, no matter the synoptic type or cloud
base presence or height. Of all soundings, the inversion
generally (86%) lowered and/or strengthened from what
was found 12 h previously. The inversion layer was typ-
ically (86%) within or corresponded to the moist layer.
At 1200 UTC (0600 LT), 50% of inversion layers were
less than 172 m AGL (970 hPa), 90% ,500 m AGL
(935 hPa), and 95% ,1000 m AGL (850 hPa).
At 1200 UTC, the depth of the moist layer (T 2 Td #
18C) differed by synoptic type and by cloud-base height
(Table 4). The events with no or high clouds had the
shallowest moist layers. These were dominated by high
pressure and post frontal cases, but many of the frontal
cases likewise showed shallow moist layers. When low
clouds were present, the moist layer was generally deeper.
While it might be expected the moist layer would be
deepest when precipitation was observed near the time of
dense fog onset, this was not always the case (Table 4).
This suggests that observed precipitation sometimes may
have resulted from settling within the fog layer. The depth
of the moist layers found here for no/high cloud events
and for low cloud events, are similar to those for radiation
and coastal advection fog events, respectively, reported
by both Jiusto (1981) and Croft et al. (1997).
Other differences could be observed between synop-
tic type and cloud-base categories regarding changes
in conditions overnight and in conditions present at
1200 UTC. The 0000 and 1200 UTC sounding pairs were
compared to determine the percentage of cases when
cooling or moistening predominated in the moist layer
during the intervening 12-h period. The results were
similar to those found examining surface observations.
Cooling or no change in temperature predominated
in the no and high cloud cases (100%), and in the vari-
able cloud-base cases (.90%). Cooling or no change in
temperature, however, was also often present in the
low cloud cases when precipitation was not occurring
at dense fog onset (;70%), but was less frequent when
precipitation was present (38%). When precipitation
was occurring at onset, temperatures often increased
(62%). Overnight, dewpoint temperature was often ob-
served to increase or remain constant in cases where
precipitation was occurring at dense fog onset (;90%),
and when lows or fronts were present (;75%). This
overnight increase, or constant dewpoint temperature,
suggests that warm moist advection and/or the occurrence
of precipitation preconditioned the atmosphere for fog
formation. In addition, it should be noted that wind pro-
files exhibiting a veering (suggesting low-level warm air
advection) or no obvious shear pattern predominated; no
TABLE 4. Median height of the moist layer (m AGL) from 1200 UTC soundings for dense fog events at Peoria with cloud-base heights
.1 km AGL, variable cloud bases, or cloud base ,1 km in 6 h prior to dense fog onset, for the Oct–Mar period of 1970–94. The sample
size for each category is in parentheses.
Synoptic category Cloud-base height (m) within 6 h of fog onset
Sample 1200 UTC RAOB .1 km Variable ,1 km, no rain at onset ,1 km, rain at onset
High pressure 36 192 (22) 233 (3) 409 (11) (0)
Postfrontal 10 307 (8) (0) 767 (2) (0)
Transition 12 326 (3) 396 (4) 1143 (2) 647 (3)
Low pressure 22 740 (2) 22 (1) 814 (7) 595 (12)
Frontal 39 309 (19) 562 (2) 595 (5) 1267 (13)
All 119 286 (54) 395 (10) 595 (27) 893 (28)
NOVEMBER 2009 W E S T C O T T A N D K R I S T O V I C H 2207

matter the cloud-base height, the synoptic type, or
the height of the moist layer at 1200 UTC (0600 LT).
Backing occurred infrequently and was not associated
with any particular synoptic type, moist layer height, or
synoptic type.
It was suggested by Croft et al. (1997) that radiational
cooling was important in both radiation and coastal
advection fog cases. They found T 2 Td differences of
;208C above the layer of dense fog in their study cases
(excluding cases where precipitation occurred at dense
fog onset), and a rapid warming and drying above the
fog layer (i.e., ‘‘goal post’’ structure). In the Peoria fog
sample, approximately 60% of the soundings showed a
difference of 208C or more above the near-surface moist
layer at 1200 UTC. A T 2 Td difference of 208C or more
was found for 75% of no cloud or high cloud-base events
and for 70% of nonprecipitating low cloud-base cases.
Only 35% of precipitating low cloud-base cases showed
a 208C temperature difference. When cooling rates at
the surface and at 950 hPa were examined over the 12-h
period with regard to the presence of a drying region, no
discernable difference could be found within synoptic or
cloud-base categories. This may not be surprising, as
over the 12-h period between soundings, temperature
change rates could result from changes in air mass, from
storm outflows, and advection, as well as the rate of
radiation flux divergence, or other processes. Nearly
all of the 1200 UTC soundings (95%) had a T 2 Td
difference of at least 128C above the fog layer.
c. Precipitation
Precipitation fogs were described by George (1940),
Byers (1959), and recently by Tardif and Rasmussen
(2008). Light precipitation often occurs at the onset of
dense fog events (Westcott 2005; Tardif and Rasmussen
2007, 2008). This precipitation may be from deep clouds,
or the result of settling from shallow clouds. While the
available datasets do not allow for determination of
precipitation fog processes, the current study quantifies
the frequency of occurrence of regional precipitation
and thus, the potential for precipitation to precondition
the atmosphere for later fog development (Westcott
2004; Westcott 2005; and for the New York City region
by Tardif and Rasmussen 2008).
The Peoria climatology indicated that some 71% of all
dense fog events occurred where precipitation had been
observed within the previous 24 h (Table 5). Precipita-
tion generally occurred during the prior 24 h for low
pressure (;95%) and frontal system (81%) synoptic
categories, and more than half of low pressure or frontal
system events had precipitation at the time of dense fog
onset. In most cases (76%) 24-h precipitation totals were
small (,0.63 cm, ,0.25 in.), and in only four cases were
totals more than 2.54 cm (1 in.). When precipitation was
observed at or near dense fog onset, it was almost always
light (#0.25 cm, 95%), and usually unfrozen (86%).
The frequent presence of regional precipitation sug-
gests that it may aid in preconditioning the low levels of
the atmosphere for fog development, and thus would
have an important impact on forecasts of fog occurrence
and coverage.
4. Case study
To illustrate how some of the events with low clouds and
prior precipitation may give rise to dense fog, as well as
limitations in operational observations for understanding
and predicting fog formation, the widespread dense fog
event of 6–7 November 2006 is explored. In this event,
dense fog developed over much of eastern Illinois. This
event exhibited many of the features found to be common
in the climatological analyses, such as small temperature
changes prior to fog onset, a warm–dry layer above the low
clouds, and precipitation prior to dense fog development.
TABLE 5. Percentage of dense fog events at Peoria, with precipitation observed within 100 km of Peoria on the daily weather maps,
within the previous 24 h at Peoria, or at dense fog onset at Peoria, by synoptic type and cloud-base height categories, for the Oct–Mar
period of 1970–94.
Synoptic category Precipitation
Sample Percent of sample Precipitation within 100 km PIA precipitation Precipitation at onset
High pressure 78 26 42% 33% 5%
Postfrontal 22 7 68% 59% 18%
Transition 27 9 74% 81% 45%
Low pressure 68 23 97% 94% 66%
Frontal 107 35 81% 81% 53%
All .1000 m 102 34 38% 37% 5%
Variable 28 9 64% 64% 29%
250–1000 m 43 14 95% 86% 67%
All ,250 m 129 43 95% 91% 62%
All 302 100 73% 71% 41%
2208 J O U R N A L O F A P P L I E D M E T E O R O L O G Y A N D C L I M A T O L O G Y VOLUME 48
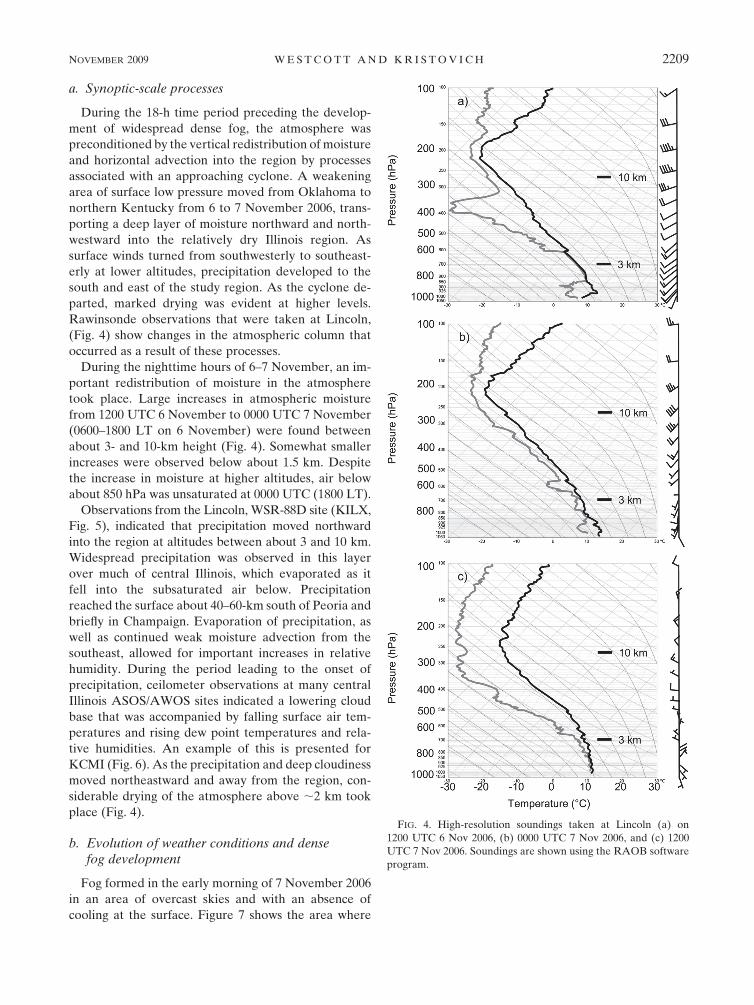
a. Synoptic-scale processes
During the 18-h time period preceding the develop-
ment of widespread dense fog, the atmosphere was
preconditioned by the vertical redistribution of moisture
and horizontal advection into the region by processes
associated with an approaching cyclone. A weakening
area of surface low pressure moved from Oklahoma to
northern Kentucky from 6 to 7 November 2006, trans-
porting a deep layer of moisture northward and north-
westward into the relatively dry Illinois region. As
surface winds turned from southwesterly to southeast-
erly at lower altitudes, precipitation developed to the
south and east of the study region. As the cyclone de-
parted, marked drying was evident at higher levels.
Rawinsonde observations that were taken at Lincoln,
(Fig. 4) show changes in the atmospheric column that
occurred as a result of these processes.
During the nighttime hours of 6–7 November, an im-
portant redistribution of moisture in the atmosphere
took place. Large increases in atmospheric moisture
from 1200 UTC 6 November to 0000 UTC 7 November
(0600–1800 LT on 6 November) were found between
about 3- and 10-km height (Fig. 4). Somewhat smaller
increases were observed below about 1.5 km. Despite
the increase in moisture at higher altitudes, air below
about 850 hPa was unsaturated at 0000 UTC (1800 LT).
Observations from the Lincoln, WSR-88D site (KILX,
Fig. 5), indicated that precipitation moved northward
into the region at altitudes between about 3 and 10 km.
Widespread precipitation was observed in this layer
over much of central Illinois, which evaporated as it
fell into the subsaturated air below. Precipitation
reached the surface about 40–60-km south of Peoria and
briefly in Champaign. Evaporation of precipitation, as
well as continued weak moisture advection from the
southeast, allowed for important increases in relative
humidity. During the period leading to the onset of
precipitation, ceilometer observations at many central
Illinois ASOS/AWOS sites indicated a lowering cloud
base that was accompanied by falling surface air tem-
peratures and rising dew point temperatures and rela-
tive humidities. An example of this is presented for
KCMI (Fig. 6). As the precipitation and deep cloudiness
moved northeastward and away from the region, con-
siderable drying of the atmosphere above ;2 km took
place (Fig. 4).
b. Evolution of weather conditions and densefog development
Fog formed in the early morning of 7 November 2006
in an area of overcast skies and with an absence of
cooling at the surface. Figure 7 shows the area where
FIG. 4. High-resolution soundings taken at Lincoln (a) on
1200 UTC 6 Nov 2006, (b) 0000 UTC 7 Nov 2006, and (c) 1200
UTC 7 Nov 2006. Soundings are shown using the RAOB software
program.
NOVEMBER 2009 W E S T C O T T A N D K R I S T O V I C H 2209

visibilities of 400 m (1/4 mi) or less were observed during
the early morning hours of 7 November, overlaid on an
IR satellite image from 0445 UTC (2245 LT). This shows
that the area of eventual dense fog development was
located in the wake of, and was closely oriented with, a
departing widespread area of deep clouds associated
with the low pressure system. Fog began to develop in
south–central Illinois between 0800 and 0900 UTC (0200
and 0300 LT) and developed to the northeast throughout
Illinois between 1100 and 1400 UTC (0500 and 0800 LT).
Most dense fog dissipated between 1400 and 1530 UTC
(0800 and 0930 LT), except at sites close to Lake Mich-
igan. Sunrise was at 1230 UTC (0630 LT) on this day.
During the evening of 6 November, little or no pre-
cipitation was observed at the surface in the northern
and western portions of the state, while continuous light
precipitation was observed in the southern third of Illi-
nois. After about 0600 UTC (0000 LT), precipitation
became much lighter and more scattered. It was ob-
served at several locations in east–central Illinois until
about 1000 UTC (0400 LT). Virtually no precipitation
was indicated by the WSR-88D in the central Illinois fog
region after 1000 UTC (0400 LT). While precipitation
occurred overnight at many of the sites that later
reported fog, no precipitation was reported within 4 h of
the fog formation or during the fog event at these sites.
In the hours after the movement of precipitation
across the region and before initial development of
widespread dense fog, surface relative humidities in
excess of 90% and low cloud bases were observed over a
very large region, in Illinois and surrounding states.
Despite this, fog only developed in a rather narrow
band stretching much of the length of the eastern and
central regions of Illinois (Fig. 7). Examination of the
evolution of surface and higher-level atmospheric
conditions both in and out of the area of dense fog
formation gives important clues as to the processes that
may have led to fog.
c. Possible processes related to the development ofdense fog
In order for fog to develop in the region after 1200 UTC
(0600 LT), atmospheric moisture must have remained at
near-saturated levels, and a mechanism was needed
to cause the air to become supersaturated. Examination
of the surface temperature field and wind velocities re-
veals that modest warm air advection was present
over most of Illinois with the exception of a small area in
southwestern Illinois. Surface dewpoint and wind fields
indicate that most regions had weak positive moisture
advection, except for a few areas with negative moisture
advection in far southern and far northern Illinois.
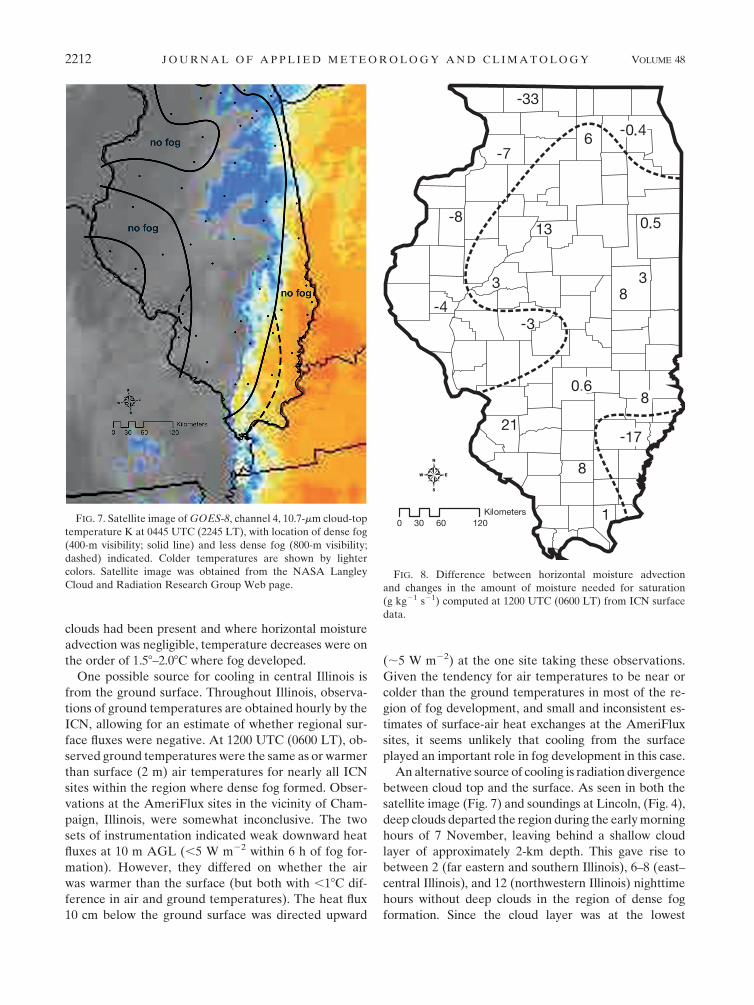
In the absence of any other processes (i.e., vertical
mixing, condensation on the surface, etc.), the balance
between moisture advection and changes in the amount
of moisture needed for saturation would determine
temporal trends in the surface relative humidity field.
Figure 8 shows the difference in horizontal moisture and
saturation moisture fluxes (determined by temperature
advection) at 1200 UTC (0600 LT), near the time of
widespread dense fog development. Regions with neg-
ative difference values, where less moisture was ad-
vected than needed to keep the air saturated, are seen in
much of northern and western Illinois and in a small
portion of southeastern Illinois. A comparison between
the remaining areas of positive differences shown here,
and the overall area of dense fog development shown in
Fig. 7, show reasonably good correspondence despite
the small advection values. It should be noted that cal-
culation of small differences between moisture and
temperature advection with available operational data
will have significant errors. Such errors could result in
local changes in the sign of the differences. However, the
overall pattern of horizontal winds, temperature, and
moisture fields suggest that the presence of a narrow
band of positive values in the region is a reasonable
conclusion.
While moisture advection can give rise to saturated
conditions, another process, such as mixing between two
saturated air masses of different temperatures or cooling,
must be present to allow fog to form. In this case, weak
shear was evident in the Lincoln, sounding near the top of
the moist layer. Weak and variable winds within the
moist layer, however, suggest that shear-driven turbulent
FIG. 5. North–south cross section of smoothed radar reflectivity
observed by the WSR-88D at Lincoln, (KILX), at 2245 UTC
(1645 LT) 6 Nov 2006. The horizontal distance is approximately
55 km. Maximum effective reflectivity factor values, within the
area of lightest shading, are approximately 11 dBZ. Radar data are
shown using the GR2Analyst software program. Cross-sectional
location is indicated in Fig. 1.
2210 J O U R N A L O F A P P L I E D M E T E O R O L O G Y A N D C L I M A T O L O G Y VOLUME 48

mixing was unlikely to have been an important process
on this date. Theoretically, horizontal mixing of air
masses could also give rise to regions of supersaturation.
However, no mechanism has been proposed to allow for
a region of horizontal mixing on the size scale of Illinois.
Supersaturated conditions also could be generated
through cooling of the near-surface air relative to ad-
vective warming by the presence of external heat sinks.
Based on horizontal sensible heat fluxes (used in devel-
opment of Fig. 8), surface temperatures would be ex-
pected to increase by 0.18–0.58C throughout most of the
region with dense fog formation. However, temperatures
remained constant or decreased at all sites in the dense
fog region between 0400 and 0700 LT. In central Illinois,
where low clouds were observed, the decreases were
0.18–0.58C. In far northwestern Illinois, where no deep
FIG. 6. Horizontal visibility, cloud-base height, and precipitation from KCMI. Temperature, winds, momentum
flux, and relative humidity from AmeriFlux site for 6–7 Nov 2006. See Fig. 1 for site locations. The period of dense fog
(vertical gray bars) and the period of light fog (thin vertical lines) are shown.
NOVEMBER 2009 W E S T C O T T A N D K R I S T O V I C H 2211
clouds had been present and where horizontal moisture
advection was negligible, temperature decreases were on
the order of 1.58–2.08C where fog developed.
One possible source for cooling in central Illinois is
from the ground surface. Throughout Illinois, observa-
tions of ground temperatures are obtained hourly by the
ICN, allowing for an estimate of whether regional sur-
face fluxes were negative. At 1200 UTC (0600 LT), ob-
served ground temperatures were the same as or warmer
than surface (2 m) air temperatures for nearly all ICN
sites within the region where dense fog formed. Obser-
vations at the AmeriFlux sites in the vicinity of Cham-
paign, Illinois, were somewhat inconclusive. The two
sets of instrumentation indicated weak downward heat
fluxes at 10 m AGL (,5 W m22 within 6 h of fog for-
mation). However, they differed on whether the air
was warmer than the surface (but both with ,18C dif-
ference in air and ground temperatures). The heat flux
10 cm below the ground surface was directed upward
(;5 W m22) at the one site taking these observations.
Given the tendency for air temperatures to be near or
colder than the ground temperatures in most of the re-
gion of fog development, and small and inconsistent es-
timates of surface-air heat exchanges at the AmeriFlux
sites, it seems unlikely that cooling from the surface
played an important role in fog development in this case.
An alternative source of cooling is radiation divergence
between cloud top and the surface. As seen in both the
satellite image (Fig. 7) and soundings at Lincoln, (Fig. 4),
deep clouds departed the region during the early morning
hours of 7 November, leaving behind a shallow cloud
layer of approximately 2-km depth. This gave rise to
between 2 (far eastern and southern Illinois), 6–8 (east–
central Illinois), and 12 (northwestern Illinois) nighttime
hours without deep clouds in the region of dense fog
formation. Since the cloud layer was at the lowest
FIG. 7. Satellite image of GOES-8, channel 4, 10.7-mm cloud-top
temperature K at 0445 UTC (2245 LT), with location of dense fog
(400-m visibility; solid line) and less dense fog (800-m visibility;
dashed) indicated. Colder temperatures are shown by lighter
colors. Satellite image was obtained from the NASA Langley
Cloud and Radiation Research Group Web page.FIG. 8. Difference between horizontal moisture advection
and changes in the amount of moisture needed for saturation
(g kg21 s21) computed at 1200 UTC (0600 LT) from ICN surface
data.
2212 J O U R N A L O F A P P L I E D M E T E O R O L O G Y A N D C L I M A T O L O G Y VOLUME 48

measureable altitude for 4 h before dense fog formation,
and was therefore apparently linked to the surface, it
might be speculated that convective motions driven by
cloud-top radiative processes could distribute the cooling
throughout the layer as suggested by previous studies.
As a fog layer forms, the level of maximum radiation
flux divergence is known to migrate to the top of the fog
layer (e.g., Jiusto and Lala 1980; Brown 1987; Fitzjarrald
and Lala 1989). Similarly, a maximum in net radiation
flux divergence has been found at the top of stratiform
cloud layers (e.g., Caughey et al. 1982; Slingo et al. 1982;
Frish et al. 1995; Nakanishi 2000). Curry (1986) dem-
onstrated that negative net radiation fluxes can pene-
trate downward, well into shallow stable cloud layers.
While radiational cooling is likely important in fog de-
velopment and maintenance, with an existing cloud
layer, it often is not observable at the surface. On 7
November, the net radiation flux measured at the
AmeriFlux site was negligible in the 3 h prior to and at
dense fog onset. The cloud layer and weak warm air
advection likely masked any radiational contribution
toward cooling at the surface.
Drying of the atmosphere above about 800 hPa (Fig. 4),
with the departure of deep clouds in satellite imagery
(Fig. 7), would allow for radiational cooling at the top of a
fog (e.g., Jiusto and Lala 1980; Brown 1987; Fitzjarrald
and Lala 1989; Croft et al. 1997). With vertical mixing,
radiational cooling at fog or cloud top may generate su-
persaturated conditions (Jiusto and Lala 1980). In stratus
clouds, buoyancy fluctuations may occur when the mixed
layer beneath is destabilized as radiationally cooled
air from above sinks and is replaced by warmer air
from below (e.g., Caughey et al. 1982; Frish et al. 1995;
Nakanishi 2000). Fluctuations in wind speed, direction,
and momentum flux noted in the surface data (Fig. 6)
suggest that this process may be acting. However, the
exact cause of the fluctuation in winds could not be
determined.
Without additional measurements above the surface,
including information on the cloud structure and depth,
the exact mechanism leading to dense fog when clouds
are present is ambiguous. As noted by Curry (1986) and
others, the heat budget of low-level clouds is very com-
plex. The profile of all sources and sinks of heat is required
to understand the balance of radiative cooling, latent heat
exchanges, entrainment, and surface heat fluxes.
Regardless of the specific mechanism, it is hypothe-
sized that cooling of the layer between the top of the low
clouds and the surface, in combination with a region of
favorable moisture advection, allowed the near-surface
air to cool at a rate slower than expected because of
warm air advection, but sufficient to allow a wide region
of supersaturation and dense fog to develop. Qualita-
tively, this is consistent with the close correspondence
between the southwest–northeast orientation of the fog
region and the western edge of the departing deep
clouds.
5. Conclusions
Cold-season fogs in the Midwest are often associated
with low pressure systems or fronts. Based on a clima-
tology of dense fog events in Peoria, Illinois, the majority
of these continental fog events form when precipitation
has occurred in the region and sometimes when it is
still occurring, and when cloud bases in the 6 h prior to
dense fog formation are less than 1000 m. When fog
forms in the presence of a low cloud base, an unchanging
or increasing surface air temperature is not uncommon.
The processes by which saturation and supersaturation
occur in these cases are unclear. Despite the frequency
of these prefog conditions, little quantitative work has
been reported on low cloud-base continental fog events.
The variability found in the frequency of surface changes,
precipitation occurrence, and synoptic classifications
suggests that low cloud-base fogs form under a variety
of conditions. Clearly, further case studies would be in-
valuable in determining the processes by which super-
saturation occurs in these cases.
The 6–7 November 2006 case study observations fit
well within the Peoria climatology of dense fog events
associated with low cloud bases and with low pressure
systems. For this event, precipitation and continued
moisture advection associated with a nearby cyclone
played a critical role in lowering of the cloud base. Pre-
cipitation developed above about 3 km over a wide re-
gion of central Illinois, but based on ceilometer, radar,
and surface observations, evaporated before reaching
the surface for several hours. The preconditioning helped
saturate the lower atmosphere prior to fog formation.
After precipitation ended, the surface temperature
remained nearly constant, and the relative humidity was
saturated or nearly saturated. AmeriFlux observations
taken near Champaign, Illinois, suggest that surface
sensible heat fluxes were small, and results from various
other methods of estimating the direction of heat fluxes
were inconsistent. Therefore, processes at the surface
likely played a minimal role in fog development in this
case. With small differences between the ground and the
2-m air temperature and the low wind speeds, this would
not be considered an advection fog event in any case.
The drying and clearing of the upper-level cloudiness
following precipitation and prior to fog formation,
however, suggests that radiational cooling at cloud top
played an important role leading to supersaturation and
the development of fog.
NOVEMBER 2009 W E S T C O T T A N D K R I S T O V I C H 2213

Thus, it is hypothesized that the primary mechanism
for cooling of the surface layer relative to sensible
heat advection was radiative cooling of the cloud and
subcloud layer. However, verification of this hypothesis
is not possible with the datasets available on this day.
With upper-air observations available only at 0000 and
1200 UTC (1800 and 0600 LT), timing of the changes
in the cloud, temperature, and moisture structure is
unknown. A radiative transfer model could shed further
light on processes involved in fog formation, and would
be most useful if supported by intervening nighttime
soundings, a profiling radiometer, above-cloud aircraft
observations, and/or a cloud radar to document the
changes of the temperature and moisture fields, and the
presence and depth of clouds aloft.
Acknowledgments. The authors thank Robert Scott
at the Illinois State Water Survey for providing ICN
observations, and Carl Bernacchi for providing the
AmeriFlux observations. We also thank the personnel
at the National Weather Service Forecast Office at
Lincoln, Illinois, and in particular James Auten for
useful discussions and Dan Kelly for providing high-
resolution rawinsonde data. We also appreciate the
advice of James Angel, Michael Palecki, and three anon-
ymous reviewers, which led to important improvements
in this manuscript. This research was partially supported
by NOAA Cooperative Agreement NA67RJ0146. Any
opinions, findings, conclusions, or recommendations are
those of the authors and do not necessarily reflect the
views of the Illinois State Water Survey or NOAA.
REFERENCES
Billesbach, D. P., M. L. Fischer, M. S. Torn, and J. A. Berry, 2004:
A portable eddy covariance system for the measurement of
ecosystem–atmosphere exchange of CO2, water papor, and
Energy. J. Atmos. Oceanic Technol., 21, 639–650.
Brown, R., 1987: Observations of the structure of a deep fog.
Meteor. Mag., 116, 329–338.
Byers, H. R., 1959: Fog. General Meteorology, McGraw Hill, 480–510.
Caughey, S. J., B. A. Crease, and W. T. Roach, 1982: A field study
of nocturnal stratocumulus. II. Turbulence structure and en-
trainment. Quart. J. Roy. Meteor. Soc., 108, 125–144.
Croft, P. J., and A. N. Burton, 2006: Fog during the 2004–2005 winter
season in the northern mid-Atlantic states: Spatial characteristics
and behaviors as a function of synoptic weather types. Preprints,
12th Conf. on Aviation Range and Aerospace, Atlanta, GA,
Amer. Meteor. Soc., P3.3. [Available online at http://ams.
confex.com/ams/Annual2006/techprogram/paper_97843.htm.]
——, R. L. Pfost, J. M. Medlin, and G. A. Johnson, 1997: Fog
forecasting for the southern region: A conceptual model ap-
proach. Wea. Forecasting, 12, 545–556.
Curry, J. A., 1986: Interactions among turbulence, radiation, and
microphysics in Arctic stratus clouds. J. Atmos. Sci., 43, 90–106.
Environmental Research Services, cited 2006: RAOB version 5.7
for Windows. [Available online at http://www.raob.com.]
Fitzjarrald, D. R., and G. G. Lala, 1989: Hudson Valley fog envi-
ronment. J. Appl. Meteor., 28, 1303–1328.
Frish, A. S., D. H. Lenschow, and C. W. Fairall, 1995: Doppler
radar measurements of turbulence in marine stratiform cloud
during ASTEX. J. Atmos. Sci., 52, 2800–2808.
George, J. J., 1940: Fog: Its causes and forecasting with special
reference to eastern and southern United States. Bull. Amer.
Meteor. Soc., 21, 135–148.
——, 1951: Fog. Compendium of Meteorology, T. F. Malone, Ed.,
Amer. Meteor. Soc., 1193–1197.
Gibson Ridge Software, 2006: GRLevel2Analyst version 1.05.
[Available online at http://www.grlevelx.com/.]
Goodwin, L. C., cited 2002: Analysis of weather-related crashes on
U.S. highways. Mitretek Systems. [Available online at http://ops.
fhwa.dot.gov/weather/best_practices/CrashAnalysis2001.pdf.]
Jiusto, J. E., 1981: Fog structure. Clouds Their Formation, Optical
Properties, and Effects, P. V. Hobbs and A. Deepak, Eds.,
Academic Press, 187–235.
——, and G. G. Lala, 1980: Radiation fog formation and dissipa-
tion: A case study. J. Rech. Atmos., 14, 391–397.
Keith, R., and S. M. Leyton, 2007: An experiment to measure the
value of statistical probability forecasts for airports. Wea.
Forecasting, 22, 928–935.
Mason, J., 1982: The physics of radiation fog. J. Meteor. Soc. Japan,
60, 486–498.
Meyer, M. B., and G. G. Lala, 1990: Climatological aspects of radia-
tion fog occurrence at Albany, New York. J. Climate, 3, 577–586.
Nakanishi, M., 2000: Large-eddy simulation of radiation fog.
Bound.-Layer Meteor., 94, 461–493.
Roach, W. T., 1995: Back to basics: Fog: Part 2 - The formation and
dissipation of land fog. Weather, 50, 7–11.
——, R. Brown, S. J. Caughey, J. A. Garland, and C. J. Reading,
1976: The physics of radiation fog: I – A field study. Quart.
J. Roy. Meteor. Soc., 102, 313–333.
Saunders, W. L., 1960: The clearance of water fog following the
arrival of a cloud sheet during the night. Meteor. Mag., 89, 8–10.
Slingo, A., R. Brown, and C. L. Wrench, 1982: A field study of noc-
turnal stratocumulus: III. High resolution radiative and micro-
physical observations. Quart. J. Roy. Meteor. Soc., 108, 145–165.
Tardif, R., 2006: A climatological study of low ceiling and fog
events associated with the occurrence of precipitation in the
northeastern United States. Preprints, 12th Conf. on Aviation
Range and Aerospace Meteorology. Atlanta, GA, Amer.
Meteor. Soc., 5.1. [Available online at http://ams.confex.com/
ams/Annual2006/techprogram/paper_101782.htm.]
——, and R. M. Rasmussen, 2007: Event-based climatology and
typology of fog in the New York City region. J. Appl. Meteor.
Climatol., 46, 1141–1168.
——, and ——, 2008: Process oriented analysis of environmental
conditions associated with precipitation fog events in the New
York City region. J. Appl. Meteor. Climatol., 47, 1682–1703.
Turton, J. D., and R. Brown, 1987: A comparison of a numerical
model of radiation fog with detailed observations. Quart. J.
Roy. Meteor. Soc., 113, 37–54.
Westcott, N. E., 2004: Synoptic conditions associated with dense
fog in the Midwest. Preprints, 14th Conf. on Applied Clima-
tology. Seattle, WA, Amer. Meteor. Soc., P2.4. [Available
online at http://ams.confex.com/ams/pdfpapers/72954.pdf.]
——, 2005: Conditions associated with cold season dense fog in the
midwestern United States. Ph.D. dissertation, University of
Illinois at Urbana–Champaign, 117 pp.
——, 2007: Some aspects of dense fog in the midwestern United
States. Wea. Forecasting, 22, 457–465.
2214 J O U R N A L O F A P P L I E D M E T E O R O L O G Y A N D C L I M A T O L O G Y VOLUME 48
Copyright © 2022 FDOKUMEN