Synoptic climatology of major floods in the Negev Desert, Israel
16
INTERNATIONAL JOURNAL OF CLIMATOLOGY Int. J. Climatol. 22: 867–882 (2002) Published online in Wiley InterScience (www.interscience.wiley.com). DOI: 10.1002/joc.766 SYNOPTIC CLIMATOLOGY OF MAJOR FLOODS IN THE NEGEV DESERT, ISRAEL RON KAHANA, a,b BARUCH ZIV, c * YEHOUDA ENZEL a,d and URI DAYAN d a Institute of Earth Sciences, The Hebrew University of Jerusalem, Israel b Ramon Science Center, Mitspe-Ramon, Israel c The Open University, Tel Aviv, Israel d Department of Geography, The Hebrew University of Jerusalem, Israel Received 4 January 2001 Revised 3 December 2001 Accepted 3 December 2001 ABSTRACT This study examines the extent to which the floods in the Negev Desert, an area that constitutes the southern half of Israel, are not the outcome of purely local weather conditions but are, rather, the result of distinct synoptic-scale events. This was done through compiling and analysing a hydro-climatological database of all the major floods in the Negev, and then categorizing them manually into synoptic types that cause the major floods. The type analysis is based on the US National Meteorological Center data sets with 2.5 ° × 2.5 ° resolution analysed by GrADS. Data were compiled and studied for 52 floods for the period 1965–94, with peak discharge above the magnitude of 5 year recurrence intervals (RI > 5 years) in at least one drainage basin. Distinct extreme synoptic patterns are indeed associated with 42 of the 52 floods. They were grouped into four synoptic types, two of which were associated with 37 events: (a) an active Red Sea trough, defined as a surface trough extending from East Africa through the Red Sea toward the eastern Mediterranean, accompanied by a pronounced trough at the 500 hPa level over eastern Egypt: (b) a Syrian low, defined as a well-developed Mediterranean cyclone accompanied by a pronounced upper-level trough, both located over Syria. Each of the four synoptic types has its own evolution course, and a unique seasonal and spatial distribution of its associated flooded basins. These findings imply that the major floods in the Negev can be considered as signatures of exceptional synoptic-scale evolutions, and that major floods reflect extreme climatic events. Our results indicate that it is possible to use a set of dynamic and thermodynamic variables for predicting the occurrence and location of major flash floods. Copyright 2002 Royal Meteorological Society. KEY WORDS: synoptic climatology; hydroclimatology; flash flood; major flood; Negev Desert 1. INTRODUCTION Flash floods are the major causes of losses in infrastructure, property and life in many arid regions over the world. This is also true for the Negev Desert, southern Israel, as well as for the neighbouring deserts. There were, for example, 21 casualties in October 1997 in Egypt, Israel and Jordan (Dayan et al., 2001) and over 500 casualties in November 1994 in the entire Mediterranean region (Krichak and Alpert, 1998). In addition, flash floods play a primary role in modifying the fluvial desert environment (Inbar, 1987). Floods in the Negev Desert have been studied extensively. Previous research has largely relied on ‘case studies’ to point out the atmospheric circulation systems associated with a specific flood, or to analyse their mesoscale characteristics (Dayan and Abramski, 1983; Inbar, 1987; Schick and Lekach, 1987; Zangvil and Isakson, 1995; Greenbaum et al., 1998; Krichak and Alpert, 1998). However, to date, there has been no comprehensive study of the overall cause of the largest floods. The present study demonstrates how *Correspondence to: Baruch Ziv, The Open University of Israel, P.B. 39328, Ramat-Aviv, Tel Aviv 61392, Israel; e-mail: [email protected] Copyright 2002 Royal Meteorological Society
Transcript of Synoptic climatology of major floods in the Negev Desert, Israel

INTERNATIONAL JOURNAL OF CLIMATOLOGY
Int. J. Climatol. 22: 867–882 (2002)
Published online in Wiley InterScience (www.interscience.wiley.com). DOI: 10.1002/joc.766
SYNOPTIC CLIMATOLOGY OF MAJOR FLOODS IN THE NEGEVDESERT, ISRAEL
RON KAHANA,a,b BARUCH ZIV,c* YEHOUDA ENZELa,d and URI DAYANd
a Institute of Earth Sciences, The Hebrew University of Jerusalem, Israelb Ramon Science Center, Mitspe-Ramon, Israel
c The Open University, Tel Aviv, Israeld Department of Geography, The Hebrew University of Jerusalem, Israel
Received 4 January 2001Revised 3 December 2001
Accepted 3 December 2001
ABSTRACT
This study examines the extent to which the floods in the Negev Desert, an area that constitutes the southern half ofIsrael, are not the outcome of purely local weather conditions but are, rather, the result of distinct synoptic-scale events.This was done through compiling and analysing a hydro-climatological database of all the major floods in the Negev,and then categorizing them manually into synoptic types that cause the major floods.
The type analysis is based on the US National Meteorological Center data sets with 2.5° × 2.5° resolution analysed byGrADS. Data were compiled and studied for 52 floods for the period 1965–94, with peak discharge above the magnitudeof 5 year recurrence intervals (RI > 5 years) in at least one drainage basin.
Distinct extreme synoptic patterns are indeed associated with 42 of the 52 floods. They were grouped into four synoptictypes, two of which were associated with 37 events: (a) an active Red Sea trough, defined as a surface trough extendingfrom East Africa through the Red Sea toward the eastern Mediterranean, accompanied by a pronounced trough at the500 hPa level over eastern Egypt: (b) a Syrian low, defined as a well-developed Mediterranean cyclone accompanied bya pronounced upper-level trough, both located over Syria. Each of the four synoptic types has its own evolution course,and a unique seasonal and spatial distribution of its associated flooded basins.
These findings imply that the major floods in the Negev can be considered as signatures of exceptional synoptic-scaleevolutions, and that major floods reflect extreme climatic events. Our results indicate that it is possible to use a set ofdynamic and thermodynamic variables for predicting the occurrence and location of major flash floods. Copyright 2002Royal Meteorological Society.
KEY WORDS: synoptic climatology; hydroclimatology; flash flood; major flood; Negev Desert
1. INTRODUCTION
Flash floods are the major causes of losses in infrastructure, property and life in many arid regions over theworld. This is also true for the Negev Desert, southern Israel, as well as for the neighbouring deserts. Therewere, for example, 21 casualties in October 1997 in Egypt, Israel and Jordan (Dayan et al., 2001) and over500 casualties in November 1994 in the entire Mediterranean region (Krichak and Alpert, 1998). In addition,flash floods play a primary role in modifying the fluvial desert environment (Inbar, 1987).
Floods in the Negev Desert have been studied extensively. Previous research has largely relied on ‘casestudies’ to point out the atmospheric circulation systems associated with a specific flood, or to analysetheir mesoscale characteristics (Dayan and Abramski, 1983; Inbar, 1987; Schick and Lekach, 1987; Zangviland Isakson, 1995; Greenbaum et al., 1998; Krichak and Alpert, 1998). However, to date, there has beenno comprehensive study of the overall cause of the largest floods. The present study demonstrates how
* Correspondence to: Baruch Ziv, The Open University of Israel, P.B. 39328, Ramat-Aviv, Tel Aviv 61392, Israel;e-mail: [email protected]
Copyright 2002 Royal Meteorological Society

868 R. KAHANA ET AL.
a systematic analysis of the flood-producing atmospheric patterns can improve our understanding of thehydroclimatology of the extreme floods and perhaps lead to a predictive procedure even in a complexregion.
In other arid and semiarid areas, for example in the southwestern USA, hydroclimatological studiesexamined both the synoptic and the climatic conditions leading to flood events (e.g. Maddox et al., 1979, 1980;Hirschboeck, 1987, 1988; Enzel et al., 1989; Ely et al., 1994). Recently, a few investigators have used synopticclimatology and flood hydroclimatology to study connections between synoptic-scale atmospheric circulationand local basin responses and have defined representative discharge events (e.g. Yarnal and Frakes, 1997).
The weather systems that cause heavy precipitation in the Negev may vary substantially from one eventto another and from one sub-region to another. Previous studies indicate cases in which one catchmentwas flooded, while neighbouring catchments remained dry (e.g. Greenbaum et al., 1998). In other cases,all drainage basins in the Negev were flooded (e.g. Dayan and Abramsky, 1983). The prevalence of localrainstorms (Kutiel, 1978; Sharon, 1978) raises the question of whether extreme floods in the Negev are anunpredictable local response to atmospheric conditions, or whether they are an outcome of distinct and perhapsextreme atmospheric conditions on a synoptic scale.
In this study, we first produced a large hydrologic database of the major floods in the Negev. This databasedictated the selection of synoptic data and allowed us to identify the atmospheric circulation associated witheach extreme hydrological event. We categorized the floods into synoptic classes by manual classification,which yielded four ‘synoptic types’ (Yarnal, 1993), each of which has unique characteristics in both weatherelements and features of the resulting floods, such as their intensity, seasonality, and spatial distribution. Theapplication of a synoptic climatic framework for a well-established and scrutinized database of the largestfloods in this relatively complicated hydroclimatic region enabled the determination of the synoptic-scaleconditions that are likely to lead to major flooding in that area.
2. HYDROLOGICAL AND CLIMATOLOGICAL SETTINGS
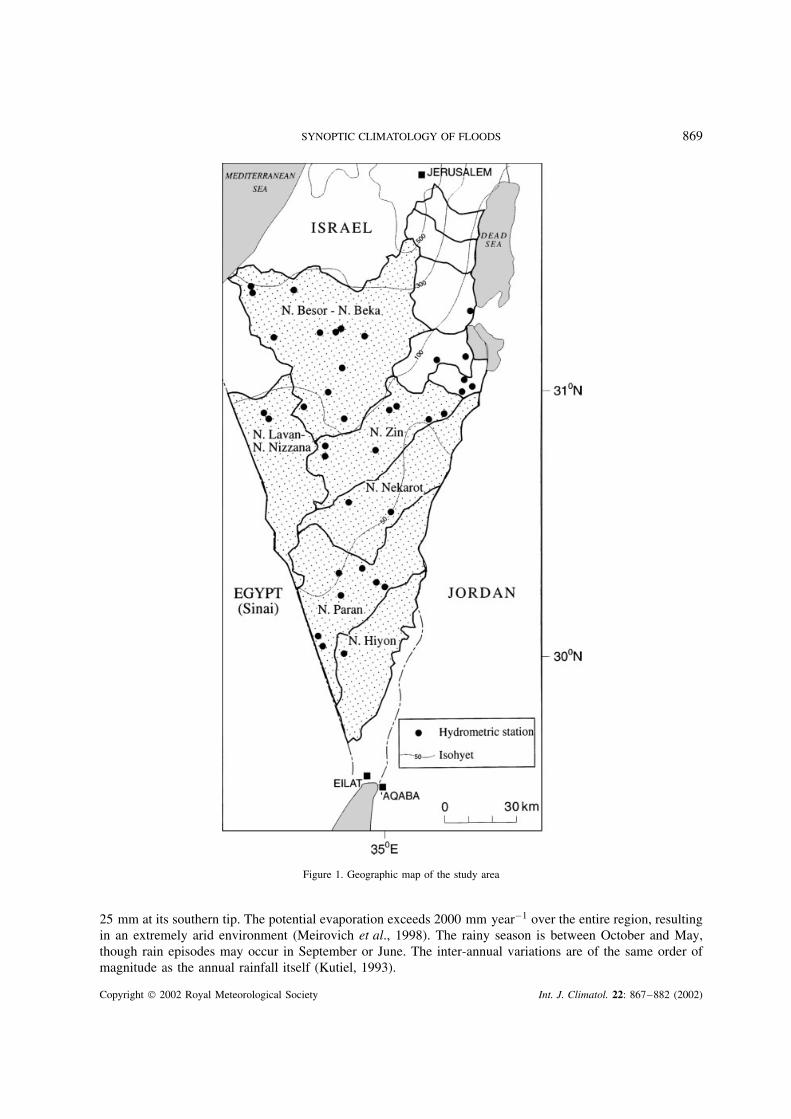
The Negev is an arid region of about 10 000 km2 covering the southern half of Israel and extending between 29and 31°20′N latitudes. It has the shape of an inverted isosceles triangle whose corners touch the MediterraneanSea in the northwest, the Dead Sea in the northeast, and the Gulf of Aqaba in the south (Figure 1). Althoughour database and research focus on the Negev, we postulate that the results are applicable to the adjacentregions of Sinai, southeastern Jordan and northwestern Saudi Arabia.
The central Negev Mountains, reaching an elevation of about 1000 m above sea level, are drained by sixmajor drainage basins (Figure 1). The Nahal Besor–Nahal Beka and Nahal Lavan–Nahal Nizzana catchmentsdrain the western flanks of these mountains into the Mediterranean; Nahal Nekarot and Nahal Zin drain theeastern flanks into the Dead Sea; and Nahal Hiyon and Nahal Paran drain large areas of the southern Negevand northern Sinai into the Arava Valley and then into the Dead Sea. A relatively small part of the Negev,south of the area dealt with in this study, is drained by a comparatively large number of small drainage basinsinto the Gulf of Aqaba. The watersheds included in the study are categorized here as small (50–200 km2),medium (200–1000 km2) and large (1000–3500 km2).
Exposed hard carbonate rocks with occasional colluvial mantle characterize the terrain. Vegetation, whichis extremely scarce, is concentrated along the main stream channels. Runoff events in small catchments canbe generated from 5 mm of rainfall. In larger catchments, runoff generally results from rainfall of at least10–20 mm (Meirovich et al., 1998). The channel beds tend to be gravelly, and transmission losses controlthe hydrology (Shentsis et al., 1997).
The spatial variability of the Negev climate is far more complex than implied by its location at the northernedge of the global subtropical highs. The northern border of the Negev is located in a region characterizedby a steep north–south gradient in annual rainfall, dropping from 500 to 200 mm between 32 and 31 °N(Zangvil and Druian, 1990). This is attributed to the shape of the Mediterranean coastline (see Figure 1),which determines whether air masses reaching the area from the west are of continental or maritime origin(Zangvil and Druian, 1990). Average annual precipitation varies from about 350 mm in the northern Negev to
Copyright 2002 Royal Meteorological Society Int. J. Climatol. 22: 867–882 (2002)
SYNOPTIC CLIMATOLOGY OF FLOODS 869
Figure 1. Geographic map of the study area
25 mm at its southern tip. The potential evaporation exceeds 2000 mm year−1 over the entire region, resultingin an extremely arid environment (Meirovich et al., 1998). The rainy season is between October and May,though rain episodes may occur in September or June. The inter-annual variations are of the same order ofmagnitude as the annual rainfall itself (Kutiel, 1993).
Copyright 2002 Royal Meteorological Society Int. J. Climatol. 22: 867–882 (2002)

870 R. KAHANA ET AL.
Rainfall in the Negev can be either localized or widespread (Dayan and Sharon, 1980). Localized stormsoccur mainly in conjunction with the presence of a Red Sea trough (RST), or, to a lesser extent, in conjunctionwith a low-pressure centre over the southern part of Israel. The relative frequency of high-intensity localizedshowers is higher in the arid Negev than in the humid parts of northern Israel (Sharon, 1978; Sharon andKutiel, 1986).
3. DATA SOURCES AND METHODOLOGY
We first established a criterion for defining a major flood, based on the instantaneous peak discharge in eachdrainage basin. We then compiled a database, composed of discharge values of all the major floods in theNegev. For each major flood we assigned its causative rainstorm, then developed a procedure that categorizedthe set of rainstorms according to the synoptic-scale variables and their deviations from the respective monthlynormals over the region.
3.1. Data
Discharge data were collected from 37 hydrometric stations operated by the Israeli Hydrological Service,covering the entire Negev. The atmospheric data were taken from the US National Meteorological Center(NMC) data set DS 195.5–Ver III. A description of the NMC data set, including details concerning data sourcesand processing procedures, can be found in National Meteorological Center (1996). The data analysed hereinclude: sea-level pressure; 500 and 250 hPa geopotential heights; 850 hPa temperature and 500 and 250 hPawind components, all dating from 1965 to 1994 (the first two fields are also available from 1947), with2.5° × 2.5° spatial resolution and 12 h temporal resolution. The data were processed and displayed by theGrid Analysis and Display System (GrADS) developed by Doty (1988). The selected window, of 408 gridpoints, encompassing the eastern Mediterranean and the northern Red Sea areas, extends between 0–60 °Eand 20–60 °N.
3.2. Methodology
The period between September 1965 and December 1994 was chosen as the study period, since sufficienthydrometric stations were in operation during this period and because there are too many gaps in theatmospheric data before 1965.
A flood in which the recorded peak discharge reached the magnitude of a 5 year recurrence interval(20% annual probability) in at least one of the hydrometric stations was considered a ‘major flood’. Thedetermination of the 5 year discharge threshold for each hydrometric station is based on the event-basedregional model of the Israeli Hydrological Service (Meirovitch et al., 1998) and was calculated for 23 stationswhich have been in operation for over 10 years. Fifty-two major floods were selected. The 5 year thresholdwas found as a reasonable compromise between the need for a sufficiently large sample of floods required toproduce significant results and the constraint resulting from the short observation period. For example, whenthe threshold was raised to a 10 year recurrence interval, the number of major floods dropped from 52 toonly 18 (though synoptic analysis results were similar to those of 5 year floods).
The major floods were subdivided according to their magnitude into three groups.
• Smallest major floods. These were defined by one of two methods.
° Method A used the peak discharge as the criterion. A major flood was defined as ‘smallest’ if the peakdischarge was <15% above the 5 year threshold at any of the hydrometric stations (28% of the floods).
° Method B is based on the spatial coverage of the flood as a criterion. Here a major flood is regarded‘smallest’ when only one hydrometric station recorded a magnitude of a 5 year flood and all otherstations recorded a <5 year flood or no discharge at all (33% of the major floods).
About two-thirds (64%) of the floods defined ‘smallest’ according to method A were also found to be‘smallest’ by method B.
Copyright 2002 Royal Meteorological Society Int. J. Climatol. 22: 867–882 (2002)

SYNOPTIC CLIMATOLOGY OF FLOODS 871
• Medium major floods. These were defined as floods with a peak discharge >15% above the 5 year thresholdin at least one hydrometric station (36% of the floods), but do not exceed the 10 year threshold.
• Extreme floods. These were defined as floods with a peak discharge >10 year threshold in at least onestation (36% of the floods).
Since a flash flood is an accumulated outcome of extremely large amounts of rain, the atmospheric conditionsthat cause the flood are assumed to have taken place before the initial recording of its resulting flood in thehydrometric station. Following this idea, the size of the catchment area was considered while assigningatmospheric data to each major flood. The lag time between the rain event and the flood was determinedaccording to radar data recently available for the area (Efrat Morin, personal communication). In most of thecases we chose the synoptic data of the 3–6 h preceding the onset of the flood. For catchments larger than1000 km2, in several cases the synoptic data of 12–24 h prior to the flood were chosen.
The specific flood-producing rainstorms were classified manually into four synoptic types. This approachhas the advantage of capturing the variety of potential factors that may combine to generate a major flood,rather than relying merely on statistical similarities between pressure charts during flood events. Each synoptictype was initially identified according to its dominant synoptic feature, i.e. surface cyclone, upper-level jet,etc., and was further fine-tuned by incorporating thermodynamic and dynamic elements offered by the data setthat are not reflected by synoptic maps, such as static stability and vorticity advection. Sea-level pressure and500 hPa level fields for several days prior to each event were also examined in order to study the evolutionof the storms and to observe possible cumulative effects.
Composite maps were used to characterize the various synoptic types. The seasonal variations weresmoothed out by using average normalized anomaly maps, in which the variables were replaced by theirdeviation from the 30 year monthly mean and normalized by the grid-point monthly standard deviation(STD).
4. SYNOPTIC TYPES
Forty-two of the 52 major floods were grouped into four distinct synoptic types. Of these, 37 are almostevenly divided into two types. For the remaining ten events, no common distinct feature was identified at thesynoptic scale.
4.1. Active RST (ARST)
This is the most frequent synoptic type accounting for 20 of the 52 (38%) major floods that occurred in theNegev during the study period. Two events, for which no atmospheric data were available on the NMC dataset, were classified as belonging to this type based on synoptic charts of the Israeli Meteorological Service.This type is associated with the presence of a RST, defined as a surface low-pressure trough extending fromeastern Africa along the Red Sea toward the Middle East (e.g. Ashbel, 1938).
The composite sea-level pressure chart for the 18 cases for which NMC data exist is shown in Figure 2,where the typical features of the RST (e.g. Ashbel, 1938, El Fandy, 1948; Ziv, 1994) are clearly seen. Therespective average normalized anomaly field for this type shows a minimum of less than −0.8 STDs over theNegev and Sinai, centred at 28°30′N, 34 °E, surrounded by a region of positive anomalies over the CaspianSea and the Black Sea, with a maximum of >0.6 STD at 37°30′N, 52°30′E.
The respective 500 hPa geopotential height field (Figure 3) reflects a distinct trough extending from theeastern Mediterranean toward the Nile River along the 30 °E meridian. The trough is very pronounced, as maybe inferred from the orientation of the isohypses, which imply an almost pure southerly wind over Israel. TheNegev is positioned under the inflection point ahead of the trough, where positive vorticity advection takesplace, which is favourable for rain formation. The respective normalized anomaly field shows a minimum of−2 STDs centred at 24 °N, 29 °E, reflecting the exceptional intensity of the trough.
The average sea-level pressure field of this type does not differ substantially from the monthly averagesfor October and November (in which 14 of the 20 events occurred), when a RST dominates. The abnormal
Copyright 2002 Royal Meteorological Society Int. J. Climatol. 22: 867–882 (2002)

872 R. KAHANA ET AL.
Figure 2. Composite sea-level pressure, with 1 hPa interval, of the 18 cases belonging to ARST. The region in which the averagenormalized anomaly exceeds 0.8 is shaded
Figure 3. As Figure 2, but for the 500 hPa level geopotential height, with 40 m interval. The region in which the average normalizedanomaly exceeds 1.5 is shaded
conditions, with which the major floods are associated, exist at the upper levels (Figure 3) and suggestthat the upper-level troughs play a controlling role in their formation. A RST that is accompanied by apronounced upper-level trough, favouring the development of severe convective storms, was termed by Ziv(1994) as an ARST. The temperature lapse rate in ARST floods is large throughout the majority of thetroposphere (Dayan et al., 2001), and suggests that this lapse rate results from the differential heating betweenthe surface (where a warm advection from the southeast takes place) and the upper levels, implying thermalinstability.
Copyright 2002 Royal Meteorological Society Int. J. Climatol. 22: 867–882 (2002)

SYNOPTIC CLIMATOLOGY OF FLOODS 873
4.2. Mediterranean cyclone over Syria
The second most frequent type, with 17 of the 52 major floods (33%), is related to a surface cyclonecentred over Syria. The composite sea-level pressure chart for this type (Figure 4) shows a distinct cyclonewith a minimum of 1006 hPa over Syria (35 °N, 40 °E) and a trough extending southeastward toward SaudiArabia, surrounded by an arc-like high extending from the Balkans toward Libya. The respective averagenormalized anomaly field has a pronounced negative anomaly with a minimum of −2.2 STDs over easternSyria (34–35 °N, 40–43 °E). We term this type a ‘Syrian low’ (SL hereafter).
The respective 500 hPa level composite chart (Figure 5) shows a pronounced trough extending from easternTurkey towards Jordan. The respective average normalized anomaly field has a minimum of −2.2 STDs overJordan, centred at 30 °N, 37°30′E. The trough has a slight northeast–southwest orientation along the 37°30′Elongitude, which enables advection of moisture from the Mediterranean toward the Negev (Zangvil andDruian, 1990). The Negev is then situated at the rear of the trough, a location that is normally not favourablefor heavy rains, due to the absence of positive vorticity advection there. The occurrence of major floods inspite of this can be explained by three factors:
• the location of the surface cyclone (Figure 4) implies a northwesterly flow over the region, with a longfetch over the Mediterranean Sea, implying moisture transport towards the Negev Desert;
• the intensity of the upper troughs in these situations (Figure 5) implies an intrusion of polar air at the upperlevels that enhance static instability; and
• the surface northwesterly flow is perpendicular to the alignment of the topographic upslope at the northernNegev (see Section 2), which enhances forced convection by air parcels ascending there.
The existence of extreme anomalies at both surface and upper levels indicate that such an event is an extremesituation in which a pronounced disturbance exists throughout the troposphere. The anomalous atmosphericcirculation of this type of storm is exemplified by seven of these events, in which either torrential rains(>50 mm) or snowstorms were observed north of the study area (Amiran, 1995) 1 day prior to the occurrenceof major floods in the Negev.
Figure 4. As Figure 2, but for 17 cases belonging to Mediterranean cyclone over Syria (SL). The region in which the average normalizedanomaly exceeds 1.8 is shaded
Copyright 2002 Royal Meteorological Society Int. J. Climatol. 22: 867–882 (2002)

874 R. KAHANA ET AL.
Figure 5. As Figure 3, but for the SL. The region in which the average normalized anomaly exceeds 1.5 is shaded
4.3. Jet stream
There were four major floods of this type, all characterized by the existence of a pronounced trough in theSubtropical Jet (STJ) over northeastern Africa combined with a ridge over Syria (exemplified in Figure 6),but no common distinct system at the surface or at the 500 hPa level was found. A marked STJ with windspeed exceeding 65 m s−1 at the 250 hPa level (∼30% above normal) was observed during two extremelywidespread major floods: 21 February 1975 (STJ) and 26 December 1980 (ARST). It is worth noting thatthis pattern in the STJ was also found in events belonging to other synoptic types.
Figure 6. The 250 hPa wind field for 20 February 1975, in which a disturbance in the STJ is seen over northeastern Africa, composedof a trough over western Egypt and a ridge over Syria. The STJ is shaded
Copyright 2002 Royal Meteorological Society Int. J. Climatol. 22: 867–882 (2002)

SYNOPTIC CLIMATOLOGY OF FLOODS 875
Owing to the small sample size, this category is represented here by an example rather than by a compositeor by an average normalized anomaly field. Figure 6 exemplifies this category by showing the streamlinesand wind speed at the 250 hPa level on 21 February 1975. The atmospheric conditions that lead to this floodtype are described in detail by Ziv (2001). He found that prior to such rainstorms a tropical plume extendstoward the subtropics, injecting moisture of tropical origin that is captured by the STJ, and, if a pronouncedtrough develops there, extensive cloudiness and widespread rains result. Dayan and Abramski (1983) foundan abnormal feature in the STJ’s structure, i.e. a reversed position of its axis, that leads to the formation ofa large and humid warm air mass up to very high levels in the atmosphere above the Middle East.
4.4. Sharav cyclone (SC)
Only one event was associated with a SC over northern Egypt (Figure 7). This system is discussedextensively by Alpert and Ziv (1989), who regard it as a shallow frontal cyclone that moves eastwardalong the northern coast of Africa and occurs mainly in the spring season. The typical SC is accompaniedby a weak upper-level trough and does not result in any significant rain. In our specific event, the surfacecyclone was located ahead of a pronounced upper-level closed cyclone (Figure 7). Pedgly (1972) refers alsoto the occurrence of rain showers and thunderstorms over North Africa, in association with SC when closedvortices, or cold pools, in the middle and upper troposphere penetrate as far south as 30 °N.
4.5. Unclassified
For the remaining ten major flood events, no distinct common synoptic signature was found. In four ofthem the discharge of a 5 year flood was observed at only one hydrometric station, whereas all the otherstations recorded ‘no discharge’ at all. Therefore, these floods are regarded as ‘localized floods’. It is worthnoting that only one additional ‘localized flood’ occurred during the study period, categorized as an ARSTflood. The remaining six floods can be attributed to sub-grid mesoscale factors or to static instability with nosignificant contribution made by synoptic-scale forcing.
Figure 7. Sea-level pressure and 500 hPa geopotential height for a SC on 11 April 1971, 12 UTC
Copyright 2002 Royal Meteorological Society Int. J. Climatol. 22: 867–882 (2002)

876 R. KAHANA ET AL.
5. INTER-ANNUAL VARIATIONS OF THE FLOOD-PRODUCING SYNOPTIC TYPES
Figure 8 shows the inter-annual distribution of the major floods in the Negev from 1960 to 1994. Majorfloods occurred in 25 of these 35 years (71%); 16 years experienced more than one event (46% of the totalyears, 64% of the flood years). Furthermore, years with major floods appeared in sequences, with no caseof a single isolated major flood during the entire study period. The time series contains three gaps of 1 yearwithout a major flood, one gap of 3 years, and one gap of 4 years.
The distribution indicates the existence of two periods, the 1960s and the late 1980–early 1990, in whichrainstorms inducing major floods were relatively frequent, separated by a period in which they were relativelyrare. This tendency is further emphasized when the floods belonging to an ARST and a SL are separated(Figure 9). Nine of the 20 ARST floods occurred within four hydrological years (1965–1968), followed byan 11 year period (1969–1980) in which no major ARST flood was recorded in the Negev. Furthermore,during the 16 year period between 1969 and 1985 only one ARST flood occurred. The temporal distributionof the SL is relatively more evenly spaced.
6. MAGNITUDE OF FLOODS
The synoptic types differ also in the magnitude distributions of their related floods. The major floods associatedwith the ARST and the STJ are found as ‘extreme’ or ‘medium’. The floods belonging to the SL category,on the other hand, distribute more or less evenly among the three intensity groups, implying that the SLproduces, in general, floods with lower magnitude than the ARST and STJ do. The only flood associated withthe passage of a SC is categorized as a ‘smallest major flood’.
Two of the ten unclassified major floods are ‘extreme’, two are ‘medium’ and the remaining six are‘smallest’. Four of these six are also ‘localized floods’ (i.e. discharge was measured at only one hydrometricstation). This implies that the majority of these rainstorms, which have weak synoptical signatures, tend alsoto be hydrologically weak, in both intensity and spatial coverage.
Though the smallest major floods as defined by method A (peak discharge) and B (spatial coverage, seeSection 3.2) are not identical, it seems that the intensity of the hydrologic response of the synoptic typesaccording to either of these two approaches yields a similar division (differing by only one case in eachcategory). The above suggests that these synoptic types actually represent distinct hydrologic groups offloods.
1960
1962
1964
1966
1968
1970
1972
1974
1976
1978
1980
1982
1984
1986
1988
1990
1992
1994
0
1
2
3
4
5
6
Nu
mb
er o
f fl
oo
ds
Figure 8. A time series of major floods for the 1960–94 period
Copyright 2002 Royal Meteorological Society Int. J. Climatol. 22: 867–882 (2002)

SYNOPTIC CLIMATOLOGY OF FLOODS 877
1965
1968
1971
1974
1977
1980
1983
1986
1989
1992
MED-floods
0
1
2
3
4
Nu
mb
er o
f fl
oo
ds
RST-floods
MED-floods
Figure 9. As Figure 8, but for the major floods caused by ARST and SL, 1965–94
7. SEASONALITY OF THE SYNOPTIC TYPES
Figure 10 shows the monthly distribution of the major floods according to synoptic type. ARST floods aremost frequent during October and November, with eight and six floods respectively. Though the surfacetrough (RST) is frequent in winter as well as in the autumn (Ziv, 1994), ARST floods did not occur at allin the months January–March during the study period. Only two of the 20 floods belonging to an ARSToccurred in December. The spring ARST floods are less frequent than those in the autumn two floods in Apriland two in May. This seasonality of RST-associated storms has already been noted in the earliest studies byAshbel (1938) and El Fandy (1948).
0
1
2
3
4
5
6
7
8
Oct
ober
Nov
embe
r
Dec
embe
r
Janu
ary
Feb
ruar
y
Mar
ch
Apr
il
May
Nu
mb
er o
f fl
oo
ds
1965
-199
4 ARST
SL
STJ
SC
Figure 10. Monthly distribution of the classified types of major floods
Copyright 2002 Royal Meteorological Society Int. J. Climatol. 22: 867–882 (2002)
878 R. KAHANA ET AL.
Major floods associated with a SL occurred predominantly during the winter season (December–March).No distinct seasonal course was found for events associated with the STJ and SC due to the small number ofevents. It is interesting to note that during 1965–94 no major flood occurred during January.
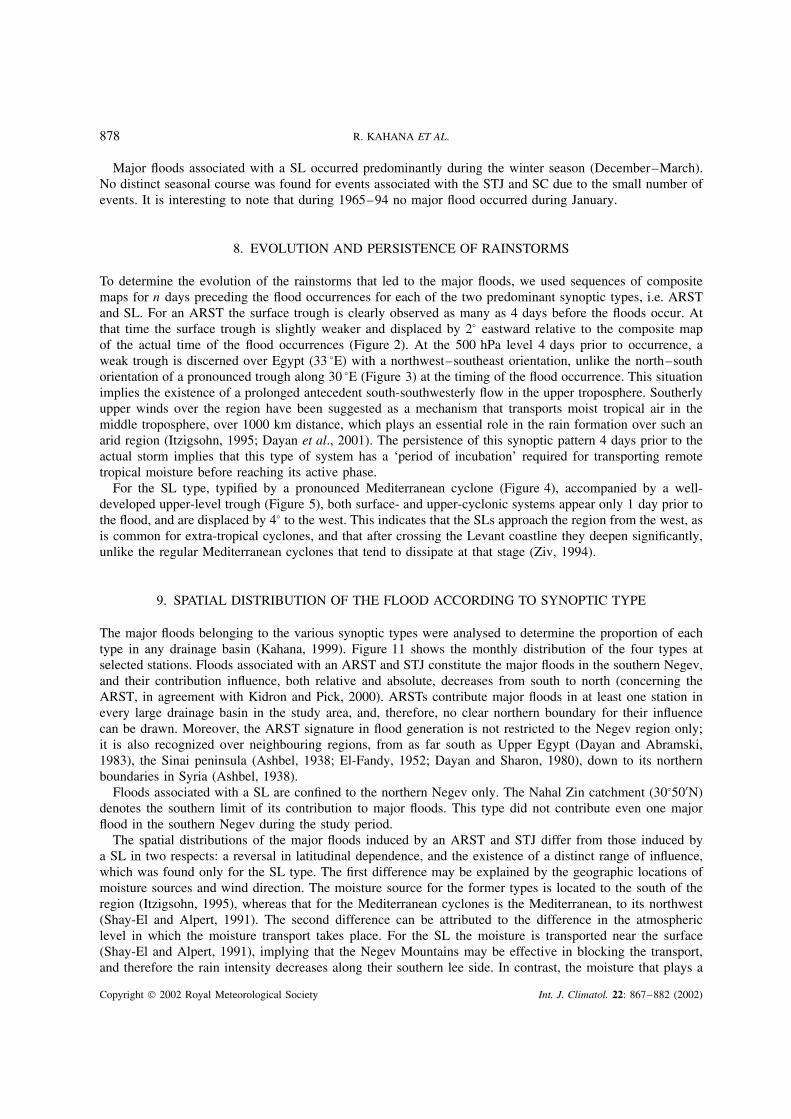
8. EVOLUTION AND PERSISTENCE OF RAINSTORMS
To determine the evolution of the rainstorms that led to the major floods, we used sequences of compositemaps for n days preceding the flood occurrences for each of the two predominant synoptic types, i.e. ARSTand SL. For an ARST the surface trough is clearly observed as many as 4 days before the floods occur. Atthat time the surface trough is slightly weaker and displaced by 2° eastward relative to the composite mapof the actual time of the flood occurrences (Figure 2). At the 500 hPa level 4 days prior to occurrence, aweak trough is discerned over Egypt (33 °E) with a northwest–southeast orientation, unlike the north–southorientation of a pronounced trough along 30 °E (Figure 3) at the timing of the flood occurrence. This situationimplies the existence of a prolonged antecedent south-southwesterly flow in the upper troposphere. Southerlyupper winds over the region have been suggested as a mechanism that transports moist tropical air in themiddle troposphere, over 1000 km distance, which plays an essential role in the rain formation over such anarid region (Itzigsohn, 1995; Dayan et al., 2001). The persistence of this synoptic pattern 4 days prior to theactual storm implies that this type of system has a ‘period of incubation’ required for transporting remotetropical moisture before reaching its active phase.
For the SL type, typified by a pronounced Mediterranean cyclone (Figure 4), accompanied by a well-developed upper-level trough (Figure 5), both surface- and upper-cyclonic systems appear only 1 day prior tothe flood, and are displaced by 4° to the west. This indicates that the SLs approach the region from the west, asis common for extra-tropical cyclones, and that after crossing the Levant coastline they deepen significantly,unlike the regular Mediterranean cyclones that tend to dissipate at that stage (Ziv, 1994).
9. SPATIAL DISTRIBUTION OF THE FLOOD ACCORDING TO SYNOPTIC TYPE
The major floods belonging to the various synoptic types were analysed to determine the proportion of eachtype in any drainage basin (Kahana, 1999). Figure 11 shows the monthly distribution of the four types atselected stations. Floods associated with an ARST and STJ constitute the major floods in the southern Negev,and their contribution influence, both relative and absolute, decreases from south to north (concerning theARST, in agreement with Kidron and Pick, 2000). ARSTs contribute major floods in at least one station inevery large drainage basin in the study area, and, therefore, no clear northern boundary for their influencecan be drawn. Moreover, the ARST signature in flood generation is not restricted to the Negev region only;it is also recognized over neighbouring regions, from as far south as Upper Egypt (Dayan and Abramski,1983), the Sinai peninsula (Ashbel, 1938; El-Fandy, 1952; Dayan and Sharon, 1980), down to its northernboundaries in Syria (Ashbel, 1938).
Floods associated with a SL are confined to the northern Negev only. The Nahal Zin catchment (30°50′N)denotes the southern limit of its contribution to major floods. This type did not contribute even one majorflood in the southern Negev during the study period.
The spatial distributions of the major floods induced by an ARST and STJ differ from those induced bya SL in two respects: a reversal in latitudinal dependence, and the existence of a distinct range of influence,which was found only for the SL type. The first difference may be explained by the geographic locations ofmoisture sources and wind direction. The moisture source for the former types is located to the south of theregion (Itzigsohn, 1995), whereas that for the Mediterranean cyclones is the Mediterranean, to its northwest(Shay-El and Alpert, 1991). The second difference can be attributed to the difference in the atmosphericlevel in which the moisture transport takes place. For the SL the moisture is transported near the surface(Shay-El and Alpert, 1991), implying that the Negev Mountains may be effective in blocking the transport,and therefore the rain intensity decreases along their southern lee side. In contrast, the moisture that plays a
Copyright 2002 Royal Meteorological Society Int. J. Climatol. 22: 867–882 (2002)

SYNOPTIC CLIMATOLOGY OF FLOODS 879
5
4
3
2
1
1
3
4
2
1 1
1
1
1
0 1 2 3 4 5 6 7 8 9
Nahal Paran
Nahal Neqarot
Nahal Tsin
Nahal Beqa
Nahal Besor
Number of Major floods
ARST
SL
STJ
Localized
UNCLASSIFIED
North
South
Figure 11. Occurrences of floods with intensity of over 5 year recurrence interval (RI > 5 years) at selected catchments
central role in the ARST and STJ types is concentrated mainly in the middle troposphere (Ziv, 1994; Krichaket al., 1997, Ziv, 2001), implying that the Negev Mountains are less effective in hindering moisture transportacross them.
10. SHORT-TERM PREDICTION OF MAJOR FLOODS IN THE NEGEV
After defining the synoptic and climatological characteristics of the flood-producing synoptic types, we testedthe ability of this categorization in actually forecasting Negev floods, which have so far been considered asan unpredictable response to local convective conditions.
While analysing the ARST type it became clear that the southerly winds over Israel at the 500 hPa levelare the key feature of this type, which activate the common surface barometric trough (RST) and transportmoisture from tropical origin to the Negev. As a preliminary effort, the results for the 1800 bi-daily maps forNovember were scanned. The data set was searched for all the dates in which the ratio of the meridional tozonal wind components (v/u) was >5.5 and the wind speed was >11 m s−1. These conditions were foundto be common for all the four November storms, which caused six dates of major floods in the Negev during1965–1994. These conditions were met on eight dates (0.44% only) during the entire study period. Thesedates constitute five storms (including the four actual November ARST storms).
The same set of dates was retrieved by scanning the database for the v/u ratio, together with an alternativecondition, i.e. that the 500 hPa geopotential height was <5755 m at the intersection of the trough axis with thelatitude 30 °N (over Egypt). Additionally, two alternative conditions were incorporated, i.e. the temperaturedifference between the 850 and 500 hPa levels (as an indicator for static instability) over the Negev and themaximum vorticity along the trough axis. They yielded a skill of 100%, i.e. only the four actual events werecaptured.
This promising process of selecting key parameters that predict the occurrence of each flood type for eachmonth is now in progress. After a set of conditions for the various synoptic types has been established forthe study period, their predictive power will be tested for the 1995–2001 period, which will be used as anindependent sample. The high skill of the current medium-range forecast models implies that, if the proposedprocedure yields similar results for the other types and months, it should be possible to forecast major floodsin the Negev and surrounding areas 24 h in advance. Moreover, since the floods belonging to each type werefound to have a unique spatial distribution, such a forecast would be able to determine the regions that willbe mostly affected by the flood.
It must be stressed that such a set of criteria for large flood forecasting should not be used as a simplistic‘rule of thumb’. However, we think that by understanding the entire combination of weather elements of asynoptic type, as described above, a forecaster will be better able to predict the storm flood before it affectsthe Negev.
Copyright 2002 Royal Meteorological Society Int. J. Climatol. 22: 867–882 (2002)

880 R. KAHANA ET AL.
Table I. Main characteristics of the four synoptic types and their resulting major floods
ARST SL STJ SC
Occurrence frequency (%) 38 33 8 2Flood intensity extreme
mediumall intensitycategories
extrememedium
smallest
Main season autumn, spring winter autumn, winter springRegion affected all the region,
mainly in thesouth
north only all the region
11. SUMMARY
A systematic analysis of the Negev flood database, together with the NMC atmospheric data set, was used toinvestigate the climatological and meteorological conditions with which the major floods in this region areassociated. A classification of the climatological and hydrological elements reveals that several synoptic typesproduce the majority of the largest Negev floods. These types provide a synoptic climatological frameworkin which smaller-scale processes cause the floods in each of the specific basins.
Forty-two of the 52 cases analysed were attributed to four well-defined synoptic types. Each type is definedby the atmospheric conditions that prevailed when the flood evolved and by its evolution several days priorto its initiation. These types resemble synoptic systems that are common in this region except for their rareposition and intensity, which makes them favourable for producing major floods. They differ from each otherin their associated thermodynamic and dynamic features and also in the spatio-temporal distribution andmagnitude of their resulting floods (Table I).
The most frequent type (38%) is the RST, accompanied by a pronounced upper-trough to its west (ARST). Itis an exceptional situation, in which a common surface barometric trough (RST) is activated by the dynamicsimplied by vorticity advection ahead of an anomalous deep upper trough that evolves gradually, over severaldays, over Egypt. Our results support the observed tendency of the RST to persist before reaching its activephase (Itzigsohn, 1995; Krichak et al., 1997). The next most frequent type (33%) is a Mediterranean cyclonethat approaches Syria from the west (SL) while deepening considerably, accompanied by a pronouncedupper-level trough. This is a rather unusual evolution course for Mediterranean cyclones, which usually tendto dissipate while crossing the Levant region (Air Ministry, Meteorological Office, 1962; Ziv, 1994). Thethird type is the combination of a tropical plume extending toward the STJ (Ziv, 2001), while a pronouncedridge develops along the jet to the east of the Negev and a deep trough over Egypt. The fourth type is an SCaccompanied by a pronounced-upper level trough, which is unusual for SCs (Alpert and Ziv, 1989).
The linkage that was found between the aforementioned 42 major floods in the Negev and well-definedexceptional synoptic situations indicates that extreme floods in the Negev are, indeed, the outcome of distinctand extreme atmospheric conditions on the synoptic scale. In other words, major floods are significantenvironmental processes that may serve as a signature of synoptic events. Since each type has a uniqueseasonal and spatial distribution of its related floods, long-term variations in the distribution of extreme floodsmay serve as an indicator for climatic variations over the region. Our results indicate that it may be possiblein the future to use ‘key features’ of these types in order to forecast better the occurrence and location ofmajor flash floods. This subject is now under investigation.
ACKNOWLEDGEMENTS
We thank B. Shentsis, L. Meirovich and A. Ben-Zvi, Israeli Hydrological Service, for the hydrological data,Adina Margalit, David Sharon, and Efrat Morin, Institute of Earth Sciences, The Hebrew University ofJerusalem, Rami Garti and the Soil Erosion Research Station for useful advice and discussions. Also thankedare the Ramon Science Center for their continuous support and M. Kidron, Geography Department, HebrewUniversity, for preparing Figure 1.
Copyright 2002 Royal Meteorological Society Int. J. Climatol. 22: 867–882 (2002)

SYNOPTIC CLIMATOLOGY OF FLOODS 881
We wish to thank Robert Maddox and Katherine Hirschboeck from the University of Arizona for theirvaluable comments and suggestions.
This research was funded by a grant from the Israel Ministry of Science to Y. Enzel (Hebrew University)and D. Ward and Y. Avni (Ramon Science Center). Funds were also provided by the International Arid LandsConsortium (IALC) by the USDA Forest Service and Cooperative State Research, Education, and ExtensionService.
REFERENCES
Air Ministry, Meteorological Office. 1962. Weather in the Mediterranean. HMSO: London.Alpert P, Ziv B. 1989. The Sharav cyclone: observations and some theoretical considerations. Journal of Geophysical Research 94:
18 495–18 514.Amiran D. 1995. Climatic Data for Jerusalem. The Jerusalem Institute for Israel Studies: Jerusalem.Ashbel D. 1938. Great floods in Sinai peninsula, Palestine, Syria and the Syrian desert, and the influence of the Red Sea on their
formation. Quarterly Journal of the Royal Meteorological Society 64: 635–639.Dayan U, Abramski R. 1983. Heavy rain in the Middle East related to unusual Jet Stream properties. Bulletin of the American
Meteorological Society 64: 1138–1140.Dayan U, Sharon D. 1980. Meteorological parameters discriminating between widespread and spotty storms in the Negev. Israel Journal
of Earth Sciences 29: 253–256.Dayan U, Ziv B, Margalit A, Morin E Sharon D. 2001. A severe autumn storm over the Middle-East: synoptic and mesoscale convection
analysis. Theoretical and Applied Climatology 69(1–2): 103–122.Doty BE. 1988. Grid Analysis and Display System (GrADS). Center for Ocean–Land–Atmosphere Interactions, Institute for Global
Environment and Society, Calverton, MD.El-Fandy MG. 1948. The effect of the Sudan monsoon low on the development of thundery conditions in Egypt, Palestine and Syria.
Quarterly Journal of the Royal Meteorological Society 74: 31–38.El-Fandy MG. 1952. Forecasting thunder-storms in the Red Sea. Bulletin of the American Meteorological Society 33: 332–338.Ely LL, Enzel Y, Cayan DR. 1994. Anomalous North Pacific atmospheric circulation and large winter floods in the southwestern United
States. Journal of Climate 7: 977–987.Enzel Y, Cayan DR, Anderson RY, Wells SG. 1989. Atmospheric circulation during Holocene lake stands in the Mojave Desert:
evidence of regional climate change. Nature 341(6237): 44–47.Greenbaum N, Margalit A, Sharon D, Schick PA, Baker VR. 1998. A high magnitude storm and flood in a hyperarid catchment, Nahal
Zin, Negev Desert, Israel. Hydrological Processes 12: 1–23.Hirschboeck KK. 1987. Catastrophic flooding and atmospheric circulation anomalies. In Catastrophic Flooding, Mayer L, Nash D (eds).
Allen and Unwin: London; 25–56.Hirschboeck KK. 1988. Flood hydroclimatology. In Flood Geomorphology, Baker VR, Kochel RC, Patton PC (eds). Wiley: New York;
27–49.Inbar M. 1987. Effects of a high magnitude flood in a Mediterranean climate: a case study in the Jordan River basin. In Catastrophic
Flooding, Mayer L, Nash D (eds). Allen and Unwin: London; 333–353.Itzigsohn D. 1995. A climatological and dynamical analysis of the interaction between the tropics and mid-latitudes over the Red Sea
region. Master’s Thesis, Department of Geophysics and Planetary Sciences, Tel Aviv University (in Hebrew).Kahana R. 1999. Synoptic hydroclimatology of major floods in the Negev and Arava, southern Israel. Master’s Thesis, Institute of Earth
Sciences, The Hebrew University of Jerusalem (in Hebrew).Kidron GJ, Pick K. 2000. The limited role of localized convective storms in runoff production in the western Negev Desert. Journal of
Hydrology 229: 281–289.Krichak SO, Alpert P. 1998. Role of large scale moist dynamics in November 1–5, 1994, hazardous Mediterranean weather. Journal
of Geophysical Research 103(D16): 19 453–19 468.Krichak SO, Alpert P, Krishnamurti TN. 1997. Interaction of topography, tropospheric flow: a possible generator for the Red Sea
Trough? Meteorology and Atmospheric Physics 63: 149–158.Kutiel H. 1978. The statistical and spatial distribution of rain intensity in Israel. Master’s Thesis, Department of Physical Geography,
The Hebrew University of Jerusalem (in Hebrew).Kutiel H. 1993. Rethinking on the interpretation of climatological maps. Horizons in Geography 37–38: 121–132, (in Hebrew).Maddox RA, Chappell CF, Hoxit LR. 1979. Synoptic and meso-scale aspects of flash flood events. Bulletin of the American
Meteorological Society 60(2): 115–123.Maddox RA, Canova F, Hoxit LR. 1980. Meteorological characteristics of flash flood events over the western United States. Monthly
Weather Review 108: 1866–1877.Meirovich L, Ben-Zvi A, Shentsis I, Yanovich E, 1998. Frequency and magnitude of runoff events in the arid Negev of Israel. Journal
of Hydrology 207: 204–219.National Meteorological Center (US). 1996. Grid point data set — CDROM: version 3, general information and user guide. University
of Washington, Department of Atmospheric Sciences and National Center for Atmospheric Research, Data Support Section.Pedgly DE. 1972. Desert depression over north-east Africa. Meteorological Magazine 101: 228–243.Schick AP, Lekach J. 1987. A high magnitude flood in the Sinai desert. In Catastrophic Flooding, Mayer L, Nash D (eds). Allen and
Unwin: London; 381–410.Sharon D. 1978. Rainfall fields in Israel and Jordan and the effect of cloud seeding on them. Journal of Applied Meteorology 17: 40–48.Sharon D, Kutiel H, 1986. The distribution of rainfall intensity in Israel, its regional and seasonal variations and its climatological
evaluation. Journal of Climatology 6: 277–291.
Copyright 2002 Royal Meteorological Society Int. J. Climatol. 22: 867–882 (2002)

882 R. KAHANA ET AL.
Shay-El Y, Alpert P. 1991. A diagnostic study of winter diabatic heating in the Mediterranean in relation to cyclones. Quarterly Journalof the Royal Meteorological Society 117: 715–747.
Shentsis I, Meirovich L, Ben-Zvi A, Rosenthal E. 1997. Estimation of water losses from the Tsin channel and its contribution to theregional aquifer. Rep. HYD/1/97, Israel Hydrological Service, Jerusalem, Israel (in Hebrew).
Yarnal B, 1993. Synoptic Climatology in Environmental Analysis. Belhaven Press: London.Yarnal B, Frakes B. 1997. Using synoptic climatology to define representative discharge events International Journal of Climatology
17: 323–341.Zangvil A, Druian P. 1990. Upper air trough axis orientation and the spatial distribution of rainfall over Israel. International Journal of
Climatology 10: 57–62.Zangvil A, Isakson A. 1995. Structures of water vapor field associated with an early spring rainstorm over the eastern Mediterranean.
Israel Journal of Earth Sciences 44: 159–168.Ziv B. 1994. The weather in Israel. In: Introduction to Meteorology, Ziv B, Yair Y (eds). The Open University Press: Tel Aviv, Israel;
(Unit 5) 8–59 (in Hebrew).Ziv B. 2001. A subtropical rainstorm associated with a tropical plume over Africa and the Middle-East. Theoretical and Applied
Climatology 69(1–2): 91–102.
Copyright 2002 Royal Meteorological Society Int. J. Climatol. 22: 867–882 (2002)