Synoptic climatology of major floods in the Negev Desert, Israel

Discussion
Pa
per|
Discussion
Pa
per|
Discussion
Paper
|D
iscussionP
aper|
Atmos. Chem. Phys. Discuss., 14, 7425–7468, 2014www.atmos-chem-phys-discuss.net/14/7425/2014/doi:10.5194/acpd-14-7425-2014© Author(s) 2014. CC Attribution 3.0 License.
Atmospheric Chemistry
and Physics
Open A
ccess
Discussions
This discussion paper is/has been under review for the journal Atmospheric Chemistryand Physics (ACP). Please refer to the corresponding final paper in ACP if available.
A climatology of dust emission eventsfrom northern Africa using long-termsurface observationsS. M. Cowie1, P. Knippertz2, and J. H. Marsham1
1Institute for Climate and Atmospheric Science, School of Earth and Environment, Universityof Leeds, Leeds, LS2 9JT, UK2Karlsruher Institute of Technology, Kaiserstr. 12, 76131, Karlsruhe, Germany
Received: 6 February 2014 – Accepted: 4 March 2014 – Published: 18 March 2014
Correspondence to: S. M. Cowie ([email protected])
Published by Copernicus Publications on behalf of the European Geosciences Union.
7425
Discussion
Paper
|D
iscussionP
aper|
Discussion
Paper
|D
iscussionP
aper|
Abstract
Long-term (1984–2012) surface observations from 70 stations in the Sahara and Sahelare used to explore the diurnal, seasonal and geographical variations in dust emissionevents and thresholds. The frequency of dust emission (FDE) is calculated using thepresent weather codes of SYNOP reports. Thresholds are estimated as the wind speed5
for which there is a 50 % probability of dust emission and are then used to calculatestrong wind frequency (SWF) and dust uplift potential (DUP), where the latter is anestimate of the dust-generating power of winds. Stations are grouped into six coherentgeographical areas for more in-depth analysis.
FDE is highest at stations in Sudan and overall peaks in spring north of 23◦ N. South10
of this, where stations are directly influenced by the summer monsoon, the annual cy-cle in FDE is more variable. Thresholds are highest in northern Algeria, lowest in thelatitude band 16–21◦ N and have greatest seasonal variations in the Sahel. Spatial vari-ability in thresholds partly explain spatial variability in frequency of dust emission eventson an annual basis. However, seasonal variations in thresholds for the six grouped ar-15
eas are not the main control on seasonal variations in FDE. This is demonstrated byhighly correlated seasonal cycles of FDE and SWF which are not significantly changedby using a fixed, or seasonally varying, threshold. The likely meteorological mecha-nisms generating these patterns such as low-level jets and haboobs are discussed.
1 Introduction20
Northern Africa is firmly established as the biggest contributor of mineral dust intothe atmosphere (Prospero, 2002; Goudie and Middleton, 2001). There are large geo-graphical variations across the region with the intensity of a source area depending onsurface properties (soil moisture, vegetation, roughness, soil composition and particlesize), meteorological parameters (wind, stability), and even on the extent of anthro-25
pogenic activity (Ozer, 2001; Mahowald et al., 2002; Ginoux et al., 2012). The Sahara
7426
Discussion
Pa
per|
Discussion
Pa
per|
Discussion
Paper
|D
iscussionP
aper|
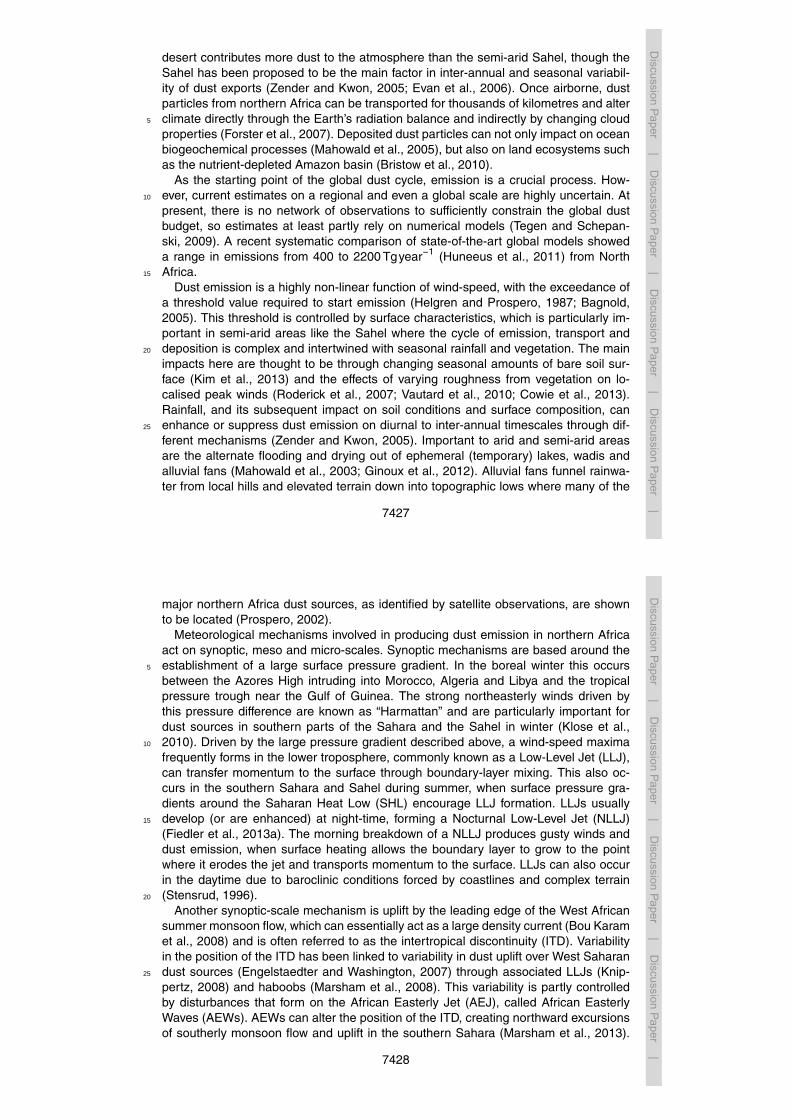
desert contributes more dust to the atmosphere than the semi-arid Sahel, though theSahel has been proposed to be the main factor in inter-annual and seasonal variabil-ity of dust exports (Zender and Kwon, 2005; Evan et al., 2006). Once airborne, dustparticles from northern Africa can be transported for thousands of kilometres and alterclimate directly through the Earth’s radiation balance and indirectly by changing cloud5
properties (Forster et al., 2007). Deposited dust particles can not only impact on oceanbiogeochemical processes (Mahowald et al., 2005), but also on land ecosystems suchas the nutrient-depleted Amazon basin (Bristow et al., 2010).
As the starting point of the global dust cycle, emission is a crucial process. How-ever, current estimates on a regional and even a global scale are highly uncertain. At10
present, there is no network of observations to sufficiently constrain the global dustbudget, so estimates at least partly rely on numerical models (Tegen and Schepan-ski, 2009). A recent systematic comparison of state-of-the-art global models showeda range in emissions from 400 to 2200 Tgyear−1 (Huneeus et al., 2011) from NorthAfrica.15
Dust emission is a highly non-linear function of wind-speed, with the exceedance ofa threshold value required to start emission (Helgren and Prospero, 1987; Bagnold,2005). This threshold is controlled by surface characteristics, which is particularly im-portant in semi-arid areas like the Sahel where the cycle of emission, transport anddeposition is complex and intertwined with seasonal rainfall and vegetation. The main20
impacts here are thought to be through changing seasonal amounts of bare soil sur-face (Kim et al., 2013) and the effects of varying roughness from vegetation on lo-calised peak winds (Roderick et al., 2007; Vautard et al., 2010; Cowie et al., 2013).Rainfall, and its subsequent impact on soil conditions and surface composition, canenhance or suppress dust emission on diurnal to inter-annual timescales through dif-25
ferent mechanisms (Zender and Kwon, 2005). Important to arid and semi-arid areasare the alternate flooding and drying out of ephemeral (temporary) lakes, wadis andalluvial fans (Mahowald et al., 2003; Ginoux et al., 2012). Alluvial fans funnel rainwa-ter from local hills and elevated terrain down into topographic lows where many of the
7427
Discussion
Paper
|D
iscussionP
aper|
Discussion
Paper
|D
iscussionP
aper|
major northern Africa dust sources, as identified by satellite observations, are shownto be located (Prospero, 2002).
Meteorological mechanisms involved in producing dust emission in northern Africaact on synoptic, meso and micro-scales. Synoptic mechanisms are based around theestablishment of a large surface pressure gradient. In the boreal winter this occurs5
between the Azores High intruding into Morocco, Algeria and Libya and the tropicalpressure trough near the Gulf of Guinea. The strong northeasterly winds driven bythis pressure difference are known as “Harmattan” and are particularly important fordust sources in southern parts of the Sahara and the Sahel in winter (Klose et al.,2010). Driven by the large pressure gradient described above, a wind-speed maxima10
frequently forms in the lower troposphere, commonly known as a Low-Level Jet (LLJ),can transfer momentum to the surface through boundary-layer mixing. This also oc-curs in the southern Sahara and Sahel during summer, when surface pressure gra-dients around the Saharan Heat Low (SHL) encourage LLJ formation. LLJs usuallydevelop (or are enhanced) at night-time, forming a Nocturnal Low-Level Jet (NLLJ)15
(Fiedler et al., 2013a). The morning breakdown of a NLLJ produces gusty winds anddust emission, when surface heating allows the boundary layer to grow to the pointwhere it erodes the jet and transports momentum to the surface. LLJs can also occurin the daytime due to baroclinic conditions forced by coastlines and complex terrain(Stensrud, 1996).20
Another synoptic-scale mechanism is uplift by the leading edge of the West Africansummer monsoon flow, which can essentially act as a large density current (Bou Karamet al., 2008) and is often referred to as the intertropical discontinuity (ITD). Variabilityin the position of the ITD has been linked to variability in dust uplift over West Saharandust sources (Engelstaedter and Washington, 2007) through associated LLJs (Knip-25
pertz, 2008) and haboobs (Marsham et al., 2008). This variability is partly controlledby disturbances that form on the African Easterly Jet (AEJ), called African EasterlyWaves (AEWs). AEWs can alter the position of the ITD, creating northward excursionsof southerly monsoon flow and uplift in the southern Sahara (Marsham et al., 2013).
7428

Discussion
Pa
per|
Discussion
Pa
per|
Discussion
Paper
|D
iscussionP
aper|
The AEW surface vortex itself can also produce winds strong enough for emission(Knippertz and Todd, 2010). In addition to the leading edge, dust emission has beenobserved within the moist south-westerly monsoon flow from the Gulf of Guinea. Someevidence suggests that the dominant mechanism is gusty cold-pool outflows from con-vection (Marsham et al., 2008), though LLJs are also known to be embedded in the5
monsoonal flow (Parker et al., 2005). Acting on the meso-scale, these gusty cold-pooloutflows, or density currents, create large dust storms which can extend to severalhundred kilometres. These are commonly referred to as “haboobs”. Dust emission dueto haboobs has been documented in the north-west Sahara (Knippertz et al., 2007;Emmel et al., 2010), in the Sahel (Sutton, 1925; Williams et al., 2009) and southern10
Sahara (Knippertz and Todd, 2010; Marsham et al., 2013; Allen et al., 2013). It is dif-ficult to assess the frequency of haboobs due to satellite sensing limitations in cloudyconditions (Heinold et al., 2013; Kocha et al., 2013) and the sparse network of surfaceobservation stations.
Micro-scale dust emission mechanisms take place under strong surface heating and15
light background winds. These conditions support the formation of rotating dust devils,and longer-lived, non-rotating dust plumes (Koch and Renno, 2005). Due to their smallscales it is hard to compile a comprehensive climatology for a large area like north-ern Africa. Current estimations are based on extrapolating field campaign analysis toa wider area. Recent advances in remote sensing of atmospheric dust from satellites20
have been invaluable, but are not without limitations such as cloud contamination, as-sumptions made on optical properties, variability in surface albedo and emissivity overland (Knippertz and Todd, 2012). It is also very hard to separate airborne dust from dustemission in remotely sensed data. Some products are only available daily, making themunsuitable to investigate the large diurnal cycle in dust emission. While routine surface25
observations can only give point measurements, they do provide long-term recordsand are not subject to the limitations of satellite data mentioned above. In this paper,we use long-term observations from standard surface weather stations across NorthAfrica which report at 3 and 6 h intervals to compile climatological statistics, including
7429
Discussion
Paper
|D
iscussionP
aper|
Discussion
Paper
|D
iscussionP
aper|
the diurnal cycle. Despite the sparse area coverage of northern Africa, these data havea high value for dust emission studies and have been explored surprisingly little in theliterature. Up to now, surface observations of visibility and present weather have beenused for statistical analysis in the Sahel and Sahara (Mbourou et al., 1997; Mahowaldet al., 2007; Klose et al., 2010), but have not isolated dust emission events specifically.5
Climatological studies of dust emission, from surface SYNOP present weather reports,have only been conducted for East Asia (Kurosaki and Mikami, 2005), the southwestsummer monsoon region (Ackerman and Cox, 1989; Middleton, 1986) and Australia(McTainsh and Pitblado, 1987).
This paper presents a climatology of dust emission events from SYNOP observa-10
tions from northern Africa, objectively determines wind-speed thresholds for emissionand applies new diagnostics and statistics to assess seasonal and diurnal cycles ofthese events. Section 2 will focus on how dust emission is identified from surface ob-servations, on the criteria and quality flags applied to the station data and on diagnostictools used for analysis. Section 3 presents the results of the seasonal and diurnal cycle15
of dust emission, with discussion on individual stations followed by stations grouped to-gether in Sect. 3.2. Changes in emission threshold, both geographically and temporally,will also be discussed in Sect. 3.
2 Data and methods
2.1 Observational data20
2.1.1 Routine surface SYNOP observations
Long-term surface observations are recorded as SYNOP reports, which include3 hourly observations of 10 m 10 min mean wind-speed based on anemometer mea-surements and present weather subjectively judged by a human station observer usinga code defined by the World Meteorological Organisation (WMO). The present weather25
7430
Discussion
Pa
per|
Discussion
Pa
per|
Discussion
Paper
|D
iscussionP
aper|
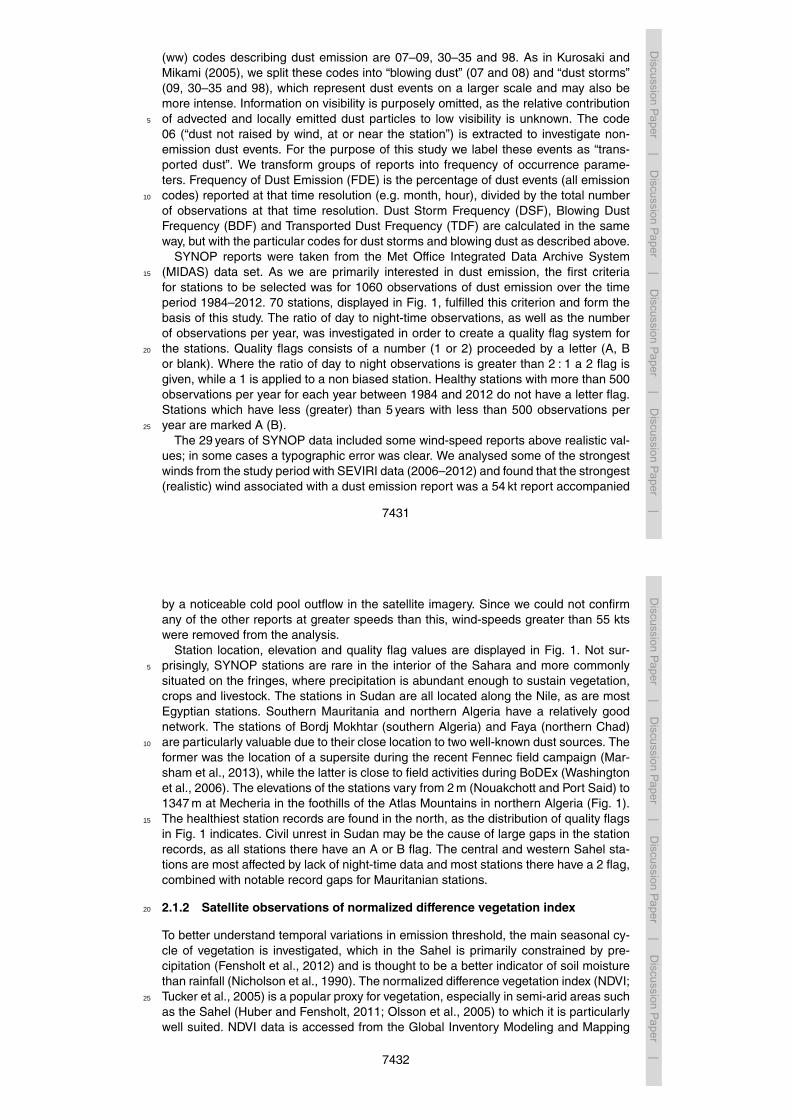
(ww) codes describing dust emission are 07–09, 30–35 and 98. As in Kurosaki andMikami (2005), we split these codes into “blowing dust” (07 and 08) and “dust storms”(09, 30–35 and 98), which represent dust events on a larger scale and may also bemore intense. Information on visibility is purposely omitted, as the relative contributionof advected and locally emitted dust particles to low visibility is unknown. The code5
06 (“dust not raised by wind, at or near the station”) is extracted to investigate non-emission dust events. For the purpose of this study we label these events as “trans-ported dust”. We transform groups of reports into frequency of occurrence parame-ters. Frequency of Dust Emission (FDE) is the percentage of dust events (all emissioncodes) reported at that time resolution (e.g. month, hour), divided by the total number10
of observations at that time resolution. Dust Storm Frequency (DSF), Blowing DustFrequency (BDF) and Transported Dust Frequency (TDF) are calculated in the sameway, but with the particular codes for dust storms and blowing dust as described above.
SYNOP reports were taken from the Met Office Integrated Data Archive System(MIDAS) data set. As we are primarily interested in dust emission, the first criteria15
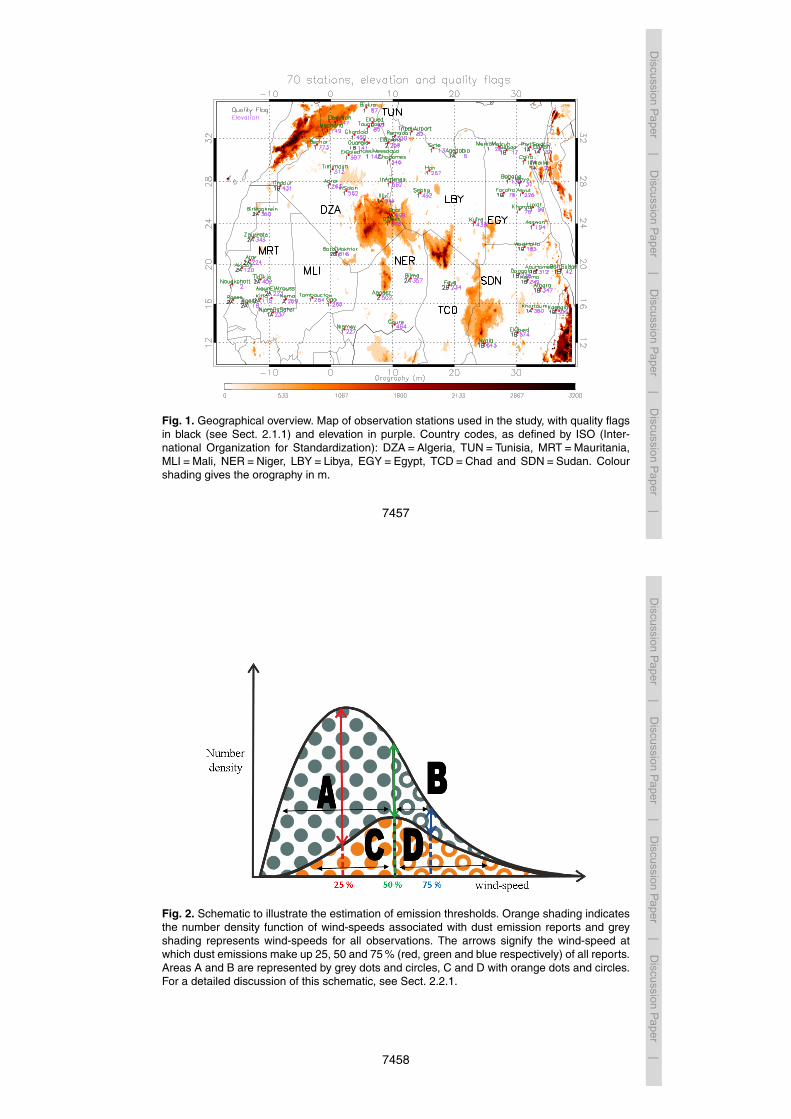
for stations to be selected was for 1060 observations of dust emission over the timeperiod 1984–2012. 70 stations, displayed in Fig. 1, fulfilled this criterion and form thebasis of this study. The ratio of day to night-time observations, as well as the numberof observations per year, was investigated in order to create a quality flag system forthe stations. Quality flags consists of a number (1 or 2) proceeded by a letter (A, B20
or blank). Where the ratio of day to night observations is greater than 2 : 1 a 2 flag isgiven, while a 1 is applied to a non biased station. Healthy stations with more than 500observations per year for each year between 1984 and 2012 do not have a letter flag.Stations which have less (greater) than 5 years with less than 500 observations peryear are marked A (B).25
The 29 years of SYNOP data included some wind-speed reports above realistic val-ues; in some cases a typographic error was clear. We analysed some of the strongestwinds from the study period with SEVIRI data (2006–2012) and found that the strongest(realistic) wind associated with a dust emission report was a 54 kt report accompanied
7431
Discussion
Paper
|D
iscussionP
aper|
Discussion
Paper
|D
iscussionP
aper|
by a noticeable cold pool outflow in the satellite imagery. Since we could not confirmany of the other reports at greater speeds than this, wind-speeds greater than 55 ktswere removed from the analysis.
Station location, elevation and quality flag values are displayed in Fig. 1. Not sur-prisingly, SYNOP stations are rare in the interior of the Sahara and more commonly5
situated on the fringes, where precipitation is abundant enough to sustain vegetation,crops and livestock. The stations in Sudan are all located along the Nile, as are mostEgyptian stations. Southern Mauritania and northern Algeria have a relatively goodnetwork. The stations of Bordj Mokhtar (southern Algeria) and Faya (northern Chad)are particularly valuable due to their close location to two well-known dust sources. The10
former was the location of a supersite during the recent Fennec field campaign (Mar-sham et al., 2013), while the latter is close to field activities during BoDEx (Washingtonet al., 2006). The elevations of the stations vary from 2 m (Nouakchott and Port Said) to1347 m at Mecheria in the foothills of the Atlas Mountains in northern Algeria (Fig. 1).The healthiest station records are found in the north, as the distribution of quality flags15
in Fig. 1 indicates. Civil unrest in Sudan may be the cause of large gaps in the stationrecords, as all stations there have an A or B flag. The central and western Sahel sta-tions are most affected by lack of night-time data and most stations there have a 2 flag,combined with notable record gaps for Mauritanian stations.
2.1.2 Satellite observations of normalized difference vegetation index20
To better understand temporal variations in emission threshold, the main seasonal cy-cle of vegetation is investigated, which in the Sahel is primarily constrained by pre-cipitation (Fensholt et al., 2012) and is thought to be a better indicator of soil moisturethan rainfall (Nicholson et al., 1990). The normalized difference vegetation index (NDVI;Tucker et al., 2005) is a popular proxy for vegetation, especially in semi-arid areas such25
as the Sahel (Huber and Fensholt, 2011; Olsson et al., 2005) to which it is particularlywell suited. NDVI data is accessed from the Global Inventory Modeling and Mapping
7432

Discussion
Pa
per|
Discussion
Pa
per|
Discussion
Paper
|D
iscussionP
aper|
Studies (GIMMS) database (www.landcover.org), covers the time period 1984–2006and is calculated for a 24 km by 24 km box over each station location.
2.2 Methods
2.2.1 Analysis of dust emission thresholds from SYNOP data
For any land surface, there is a minimum surface stress that must be exerted by the5
wind to generate dust emission. This stress closely corresponds to a threshold speedfor the low-level wind (Helgren and Prospero, 1987). The threshold wind-speed fora surface is determined by the surface roughness and soil properties (such as parti-cle shapes and sizes, soil composition, moisture content and aerodynamic properties)but can also be influenced by previous disturbance of the soils (Gillette et al., 1980).10
Although we do not have long-term measurements of soil conditions, it is possible tostatistically evaluate which wind-speeds are most likely to be associated with reporteddust emissions.
We use two alternative approaches to measure the relationship between reporteddust events and anemometer wind-speed. The first method compares the probabil-15
ity density function (pdf) of winds during dust emission events (bottom black curve inFig. 2) with those considering all reports for a given station (top black curve in Fig. 2,and is based on work by Morales (1979); Helgren and Prospero (1987); Kurosaki andMikami (2007)). Based on these pdfs the wind-speeds at which 25, 50 and 75 % ofall observations contain a dust emission report can be computed (herein T25, T5020
and T75; see vertical lines in Fig. 2). Within the remainder of the paper we focus onT50, but T25 and T75 are useful to describe the range of observed thresholds. A realworld example from the station of Faya in Chad is shown in Fig. 3. The large major-ity of observed wind-speeds are in the range of 2–6 ms−1 (black bars). Dust emissionstarts around 4 ms−1, but remains a small fraction of all observations up to 7 ms−1.25
Beyond this value the dust fraction increases quickly and from 10 ms−1 onwards prac-tically all observations contain dust emission reports. This is an example of well-defined
7433
Discussion
Paper
|D
iscussionP
aper|
Discussion
Paper
|D
iscussionP
aper|
threshold behaviour with T25 (7.5 ms−1), T50 (8.25 ms−1) and T75 (9.25 ms−1) all be-ing close together.
In order to test the relationship between the occurrence of dust emission and theoccurrence of strong winds, we define the parameter strong wind frequency (SWF)as the percentage of all wind observations exceeding T50. If the threshold behaviour5
is well defined (as in Fig. 3), FDE and SWF should behave in a similar way, but thisis not generally the case and differences will depend on the exact shapes of the twopdfs. To illustrate the effect, four areas are distinguished in Fig. 2. Area A representswinds below T50 without dust emission, B winds above T50 without dust emission, Cwinds below T50 with dust emission and D winds above T50 with dust emission. All10
observations are then N = A+B+C+D. Consequently, Area C+D represents all dustemission events and therefore FDE is the fraction (C+D)/N. SWF is represented bythe fraction (B+D)/N. If FDE = SWF then this implies that C = B. Four cases can bedistinguished. If both C and B are small, FDE≈SWF and the threshold must be sharp.If both C and B are large, then still FDE≈SWF, but a large fraction of strong winds15
are not accompanied by dust emission events, implying a large difference betweenT25 and T75. This could be caused by varying threshold behaviour due to changesin soil moisture or vegetation, for example. If B > C, then SWF > FDE and thereforea relatively large fraction of strong winds occur without dust. This implies a rather abruptstart of emissions, and a larger difference between T50 and T75. If B < C, then SWF <20
FDE and therefore a relatively large fraction of weak winds create dust events, mostlikely accompanied by a larger difference between T25 and T50.
The SWF concept is used in the second method to determine an emission threshold.Here, SWF is first calculated for a range of wind-speed thresholds. The value thatgives the smallest total squared difference between the seasonal mean diurnal cycles25
of FDE and SWF is then selected. A seasonal approach is preferred here in order togive stable pdfs. This method will be referred to as “Least Squares” (LS, hereafter). Weexpect it to give results on the same order as T50 and use it to test the robustnessof the threshold identification approach. A comparison between the threshold values
7434
Discussion
Pa
per|
Discussion
Pa
per|
Discussion
Paper
|D
iscussionP
aper|
of T25, T50, T75 and LS gives more insight into the relationship between winds andemission than a single value and highlights the fact that emission occurs over a rangeof wind-speed values.
2.2.2 Dust-emitting power of winds: Dust Uplift Potential
FDE provides occurrence frequency of emission, but not its intensity or quantity. To5
investigate the dust emitting power of the wind, we use the diagnostic parameter dustuplift potential (DUP; (Marsham et al., 2011), based on the emission parameterisationof Marticorena and Bergametti (1995)):
DUP = U3(1+Ut/U)(1−U2t /U
2) (1)
for U > Ut, where U is the measured wind speed and Ut is a threshold wind speed for10
dust emission. DUP is zero when U < Ut. This diagnostic takes into consideration thehighly nonlinear impact of changes in winds on dust emission. DUP is very closelyrelated to the power of the wind: if the land-surface did not vary and the underlyingemission parameterisation was accurate, dust emission would depend only on DUP.For DUP calculations, we use the seasonally varying T50 for Ut at each SYNOP station.15
The dust-emitting power per strong wind event is given by DUP mean (all DUP values,including 0 values)/fraction of strong wind events (SWF×100) and is referred to as“DUP Intensity”.
3 Results and discussion
3.1 Single-station climatologies20
3.1.1 Annual frequencies of dust emission and transported dust
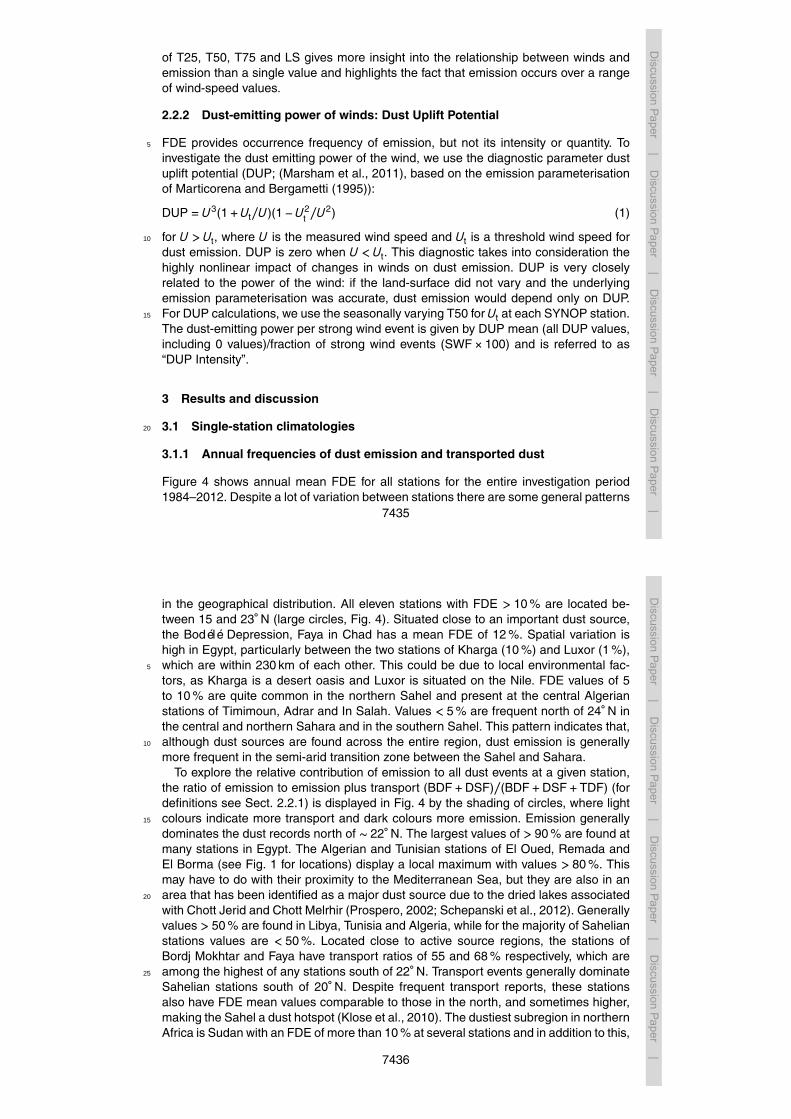
Figure 4 shows annual mean FDE for all stations for the entire investigation period1984–2012. Despite a lot of variation between stations there are some general patterns
7435
Discussion
Paper
|D
iscussionP
aper|
Discussion
Paper
|D
iscussionP
aper|
in the geographical distribution. All eleven stations with FDE > 10 % are located be-tween 15 and 23◦ N (large circles, Fig. 4). Situated close to an important dust source,the Bodélé Depression, Faya in Chad has a mean FDE of 12 %. Spatial variation ishigh in Egypt, particularly between the two stations of Kharga (10 %) and Luxor (1 %),which are within 230 km of each other. This could be due to local environmental fac-5
tors, as Kharga is a desert oasis and Luxor is situated on the Nile. FDE values of 5to 10 % are quite common in the northern Sahel and present at the central Algerianstations of Timimoun, Adrar and In Salah. Values < 5 % are frequent north of 24◦ N inthe central and northern Sahara and in the southern Sahel. This pattern indicates that,although dust sources are found across the entire region, dust emission is generally10
more frequent in the semi-arid transition zone between the Sahel and Sahara.To explore the relative contribution of emission to all dust events at a given station,
the ratio of emission to emission plus transport (BDF+DSF)/(BDF+DSF+TDF) (fordefinitions see Sect. 2.2.1) is displayed in Fig. 4 by the shading of circles, where lightcolours indicate more transport and dark colours more emission. Emission generally15
dominates the dust records north of ∼ 22◦ N. The largest values of > 90 % are found atmany stations in Egypt. The Algerian and Tunisian stations of El Oued, Remada andEl Borma (see Fig. 1 for locations) display a local maximum with values > 80 %. Thismay have to do with their proximity to the Mediterranean Sea, but they are also in anarea that has been identified as a major dust source due to the dried lakes associated20
with Chott Jerid and Chott Melrhir (Prospero, 2002; Schepanski et al., 2012). Generallyvalues > 50 % are found in Libya, Tunisia and Algeria, while for the majority of Sahelianstations values are < 50 %. Located close to active source regions, the stations ofBordj Mokhtar and Faya have transport ratios of 55 and 68 % respectively, which areamong the highest of any stations south of 22◦ N. Transport events generally dominate25
Sahelian stations south of 20◦ N. Despite frequent transport reports, these stationsalso have FDE mean values comparable to those in the north, and sometimes higher,making the Sahel a dust hotspot (Klose et al., 2010). The dustiest subregion in northernAfrica is Sudan with an FDE of more than 10 % at several stations and in addition to this,
7436

Discussion
Pa
per|
Discussion
Pa
per|
Discussion
Paper
|D
iscussionP
aper|
a high frequency of transport events. Overall this analysis demonstrates that emissionevents contribute significantly to all reported dust events in this region.
3.1.2 Annual mean dust-emission thresholds
Spatial variations in annual mean dust emission thresholds are displayed in red, greenand blue, representing T25, T50 and T75, in Fig. 5. Thresholds are generally higher5
north of 22◦ N, with T50 between 10 and 15 ms−1 at many stations in Algeria, Tunisia,central Libya and Niger. Moderate T50 values of 7–10 ms−1 are found in Egypt, south-ern Sudan and in parts of the west Sahelian countries of Mali and Mauritania. Thelowest thresholds are found between 16◦ N and 20◦ N in the northern Sahel, in the westover Mauritania and particularly in central/northern Sudan, where T50 values of 5 ms−1
10
and 6 ms−1 are present at five adjacent stations. Differences between T25, T50 andT75 tend to be largest in the Sahel, consistent with possible influences from seasonalprecipitation and vegetation there. Larger differences are also found for some stationsalong the Mediterranean coast, where occasional cool season rains may have a simi-lar effect. There is no clear pattern in the relationship between T25, T50 and T75. For15
many stations, the three values are quite equally spaced. At some stations however,particularly in the Sahel, there is a much larger difference between T75 and T50 thanbetween T25 and T50. This result suggests that these areas are occasionally charac-terised by soil states that do not allow dust emission, even for rather high winds. Thiscould occur in summer when soils are wetter and more vegetated.20
It is interesting to question the extent to which these spatial differences in thresh-olds affect dust emission or whether meteorological factors dominate. Figure 6 showsa scatter plot of annual mean FDE and T50 for all 70 stations plotted in Fig. 5. Theanti-correlation of −0.54 shows that stations with low thresholds tend to have morefrequent dust events, but the explained variance is only 30 %. The two prominent out-25
liers are Dongola and Abu Hamed in Sudan, which have both very low thresholds andextremely high mean FDEs of almost 20 %.
7437
Discussion
Paper
|D
iscussionP
aper|
Discussion
Paper
|D
iscussionP
aper|
3.1.3 Seasonal cycles in frequency of dust emission and vegetation
Figure 7 shows station-mean monthly values of FDE split into the contribution from BDF(green) and DSF (red). Not surprisingly BDF dominates at all stations. DSF are quiterare, but relatively more common in the Sahel, particularly between 15◦ N to 20◦ N.At many stations across Algeria, Tunisia, Libya, Egypt and Sudan FDE is highest in5
spring. The remaining stations, mostly situated in the central and western Sahel, havevariable seasonal cycles, though most display reduced FDE in autumn. At the south-ernmost stations FDE is practically zero in late summer/early autumn when rainfall andvegetation cover are high. FDE peaks in summer at the central Saharan station BordjMohktar, which could be related to the SHL and the arrival of convective cold pools from10
the northern Sahel during the peak of the summer monsoon as discussed in Marshamet al. (2013). Faya, the only station in Chad, shows high values of both FDE and DSFduring the winter half year, when the Harmattan is strongest, while monsoon relatedsummer dust storms are much rarer here.
Some of the seasonality evident from Fig. 7 is consistent with the seasonal cycle15
of vegetation cover. The most southerly stations, including Nioro Du Sahel, Niamey,Gouré, Nyala and El Obeid, show a marked increase in NDVI (blues lines in Fig. 7) inautumn following the summer rainfall maximum. These signals get weaker towards thenorthern Sahel and are absent in central Mauritania and at Bordj Mohktar. In Egypt,the 3 stations situated on the banks of the Nile (Minya, Asyut and Luxor) contrast with20
desert oasis stations of Baharia, Farafra and Kharga, which have no seasonal cycle invegetation. As the Nile river flow in Egypt is controlled by the upstream Aswan Dam,and this region experiences little rainfall, it is possible that the seasonal cycle is drivenby agriculture and anthropogenic activities. There are some subtle changes in seasonalvegetation at northern Algerian stations, but overall in Algeria and Libya it is unlikely25
that vegetation has a major influence on seasonal dust cycles.
7438
Discussion
Pa
per|
Discussion
Pa
per|
Discussion
Paper
|D
iscussionP
aper|
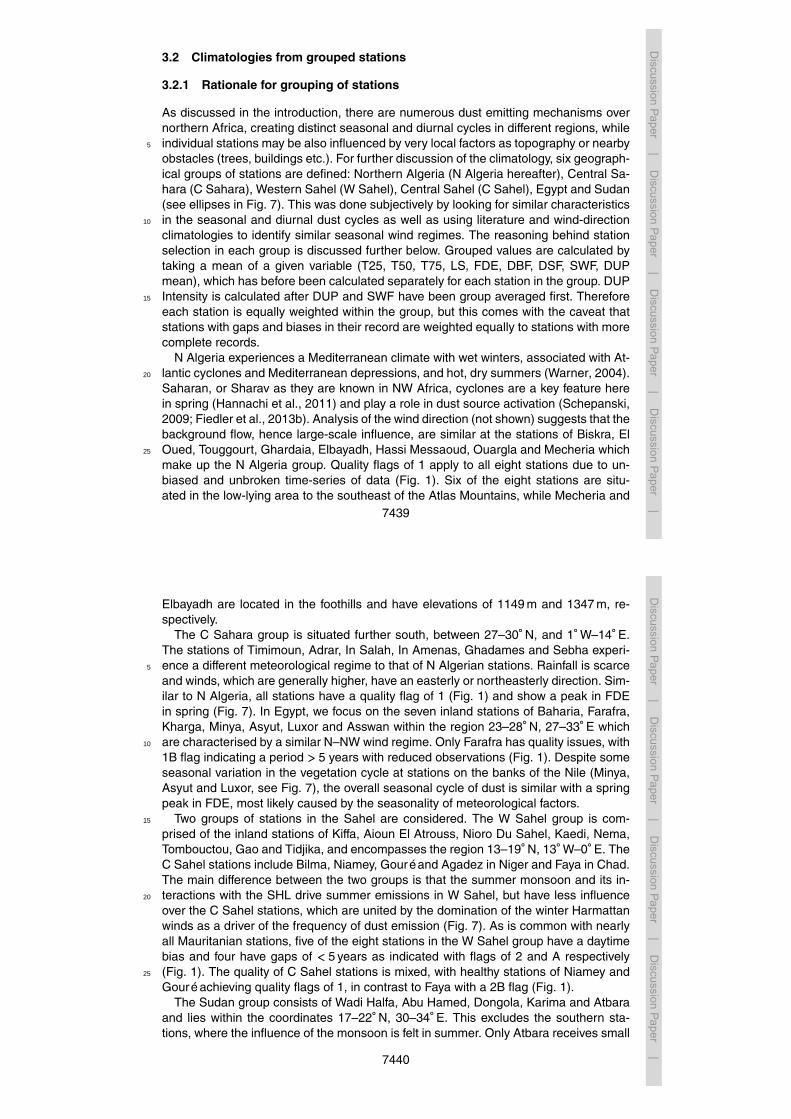
3.2 Climatologies from grouped stations
3.2.1 Rationale for grouping of stations
As discussed in the introduction, there are numerous dust emitting mechanisms overnorthern Africa, creating distinct seasonal and diurnal cycles in different regions, whileindividual stations may be also influenced by very local factors as topography or nearby5
obstacles (trees, buildings etc.). For further discussion of the climatology, six geograph-ical groups of stations are defined: Northern Algeria (N Algeria hereafter), Central Sa-hara (C Sahara), Western Sahel (W Sahel), Central Sahel (C Sahel), Egypt and Sudan(see ellipses in Fig. 7). This was done subjectively by looking for similar characteristicsin the seasonal and diurnal dust cycles as well as using literature and wind-direction10
climatologies to identify similar seasonal wind regimes. The reasoning behind stationselection in each group is discussed further below. Grouped values are calculated bytaking a mean of a given variable (T25, T50, T75, LS, FDE, DBF, DSF, SWF, DUPmean), which has before been calculated separately for each station in the group. DUPIntensity is calculated after DUP and SWF have been group averaged first. Therefore15
each station is equally weighted within the group, but this comes with the caveat thatstations with gaps and biases in their record are weighted equally to stations with morecomplete records.
N Algeria experiences a Mediterranean climate with wet winters, associated with At-lantic cyclones and Mediterranean depressions, and hot, dry summers (Warner, 2004).20
Saharan, or Sharav as they are known in NW Africa, cyclones are a key feature herein spring (Hannachi et al., 2011) and play a role in dust source activation (Schepanski,2009; Fiedler et al., 2013b). Analysis of the wind direction (not shown) suggests that thebackground flow, hence large-scale influence, are similar at the stations of Biskra, ElOued, Touggourt, Ghardaia, Elbayadh, Hassi Messaoud, Ouargla and Mecheria which25
make up the N Algeria group. Quality flags of 1 apply to all eight stations due to un-biased and unbroken time-series of data (Fig. 1). Six of the eight stations are situ-ated in the low-lying area to the southeast of the Atlas Mountains, while Mecheria and
7439
Discussion
Paper
|D
iscussionP
aper|
Discussion
Paper
|D
iscussionP
aper|
Elbayadh are located in the foothills and have elevations of 1149 m and 1347 m, re-spectively.
The C Sahara group is situated further south, between 27–30◦ N, and 1◦ W–14◦ E.The stations of Timimoun, Adrar, In Salah, In Amenas, Ghadames and Sebha experi-ence a different meteorological regime to that of N Algerian stations. Rainfall is scarce5
and winds, which are generally higher, have an easterly or northeasterly direction. Sim-ilar to N Algeria, all stations have a quality flag of 1 (Fig. 1) and show a peak in FDEin spring (Fig. 7). In Egypt, we focus on the seven inland stations of Baharia, Farafra,Kharga, Minya, Asyut, Luxor and Asswan within the region 23–28◦ N, 27–33◦ E whichare characterised by a similar N–NW wind regime. Only Farafra has quality issues, with10
1B flag indicating a period > 5 years with reduced observations (Fig. 1). Despite someseasonal variation in the vegetation cycle at stations on the banks of the Nile (Minya,Asyut and Luxor, see Fig. 7), the overall seasonal cycle of dust is similar with a springpeak in FDE, most likely caused by the seasonality of meteorological factors.
Two groups of stations in the Sahel are considered. The W Sahel group is com-15
prised of the inland stations of Kiffa, Aioun El Atrouss, Nioro Du Sahel, Kaedi, Nema,Tombouctou, Gao and Tidjika, and encompasses the region 13–19◦ N, 13◦ W–0◦ E. TheC Sahel stations include Bilma, Niamey, Gouré and Agadez in Niger and Faya in Chad.The main difference between the two groups is that the summer monsoon and its in-teractions with the SHL drive summer emissions in W Sahel, but have less influence20
over the C Sahel stations, which are united by the domination of the winter Harmattanwinds as a driver of the frequency of dust emission (Fig. 7). As is common with nearlyall Mauritanian stations, five of the eight stations in the W Sahel group have a daytimebias and four have gaps of < 5 years as indicated with flags of 2 and A respectively(Fig. 1). The quality of C Sahel stations is mixed, with healthy stations of Niamey and25
Gouré achieving quality flags of 1, in contrast to Faya with a 2B flag (Fig. 1).The Sudan group consists of Wadi Halfa, Abu Hamed, Dongola, Karima and Atbara
and lies within the coordinates 17–22◦ N, 30–34◦ E. This excludes the southern sta-tions, where the influence of the monsoon is felt in summer. Only Atbara receives small
7440

Discussion
Pa
per|
Discussion
Pa
per|
Discussion
Paper
|D
iscussionP
aper|
amounts of summer rains. From Karima up to Wadi Halfa, the stations remain in a con-sistently northerly flow and experience almost no rainfall. B quality flags apply to thesestations to indicate gaps in the record > 5 years, which coincide with periods of civilunrest (Fig. 1).
3.2.2 Seasonal cycle in dust-emission thresholds5
To summarise and complement the discussion based on Fig. 5 in Sect. 3.1.2, seasonalvalues of T25, T50, T75 and LS dust emission thresholds are presented here (Fig. 8),which are first calculated for each station and then averaged over the group. The LSvalues are typically within 1 ms−1 from T50, but deviations of up to 2.5 ms−1 also occurfor some groups in some seasons. Consistent with Fig. 5, Fig. 8 shows that the highest10
thresholds are observed at the N Algeria stations with an annual mean of 11.5 ms−1
followed by the C Sahara group. The lowest thresholds are observed in Sudan witha mean of 5.7 ms−1. The maximum seasonal threshold of 12.5 ms−1 occurs in the wetN Algerian winter, while Sudan thresholds fall to a minimum of 5.5 ms−1 in spring.
Seasonal variability is highest in the summer monsoon influenced Sahel, particularly15
the C Sahel where thresholds are a mean of 2.8 ms−1 higher in summer than in winter.In contrast to this Sudan thresholds vary by only 0.5 ms−1. The seasonal transitionfrom low thresholds to high thresholds takes place in summer in W Sahel and in springin the C Sahel, where two of the southernmost stations are located. In both regionsT75 increases before T50 and T25. We hypothesise that this is due to infrequent early-20
season precipitation events, which moisten soils so that no emission can take place.Just a few of these events could create the increase in D75, while for the majority ofthe time it is still dry enough to allow for dust emission such that T25 and T50 do notrise similarly.
Standard deviations in thresholds between stations within each group (indicated by25
error bars in Fig. 8) are largest in summer in the C Sahara and C Sahel, in winter in NAlgeria and in autumn in the W Sahel and Egypt. Interestingly these increases in spatialvariability within a region are usually accompanied by an increase of the threshold
7441
Discussion
Paper
|D
iscussionP
aper|
Discussion
Paper
|D
iscussionP
aper|
itself. This may indicate that the changes in soil moisture and vegetation that cause thethreshold to rise are inhomogeneous across the region. However, higher thresholdstypically also coincide with fewer dust observations, which reduces confidence in thethreshold estimates.
3.2.3 Seasonal cycle in dust emission5
Figure 9 shows the seasonal evolutions of BDF, DSF and FDE (bars) together withthose of SWF, DUP and DUP Intensity (lines) for the six groups. The latter three arebased on seasonal, rather than monthly, T50 values (season boundaries are indicatedby thin vertical lines in Fig. 9). This slight inconsistency is undesirable, but necessaryto obtain sufficient data to estimate stable thresholds. The influence of using seasonal,10
instead of annual mean, thresholds is rather insignificant and consistent with the rela-tively minor changes seen in Fig. 8. For example, monthly correlations between FDEand SWF vary on average by only 0.08 from when using either a seasonally varying,or a fixed annual-mean, T50 threshold.
Spring is the dominant season in the N Algeria group as expected from Fig. 7, with15
a maximum FDE of 7 % in April. DSF is very low in this region throughout the yearwith largest values also in April. The annual cycle of SWF follows that of FDE closelywith a correlation of 0.99, but with values consistently 1–2 % lower. As discussed inSect. 2.2.1, this implies a relatively large area C (winds below T50 which do produceemission) in Fig. 2 and is consistent with the slightly larger difference between T5020
and T25 than that between T50 and T75 in Fig. 8a. As the region with the highestthreshold of all groups, T25 is already well above typical emission thresholds found inthe literature, creating this rather broad range of wind speeds which can and cannotproduce dust. The annual cycle of DUP agrees with FDE on the overall peak in spring.The ratio of DUP to SWF (“DUP Intensity”) indicates a relatively low mean intensity from25
February to July and much higher values from September to January. This suggeststhat less frequent dust events during the cool season are more intense when theyoccur. Mediterranean cyclones could be the meteorological mechanism creating high
7442

Discussion
Pa
per|
Discussion
Pa
per|
Discussion
Paper
|D
iscussionP
aper|
intensity events in the cool season. As shown by Fig. 8a, winter is also the time whenthresholds are slightly increased, requiring a more extreme meteorological event togenerate dust.
Several of these features are broadly reproduced in the C Sahara (Fig. 9b), butvalues of both FDE and DUP are significantly higher than in N Algeria (note identical5
FDE and DUP scales in all panels of Fig. 9). Here, FDE peaks at 10 % in April witha secondary autumn maximum in both DUP and FDE which is less significant than thespring maximum. DUP Intensity is less seasonally variable than in N Algeria with typicalvalues around 14 000 m3 s−3, which is slightly lower than in N Algeria (note variableDUP Intensity scales between panels in Fig. 9). Egypt (Fig. 9c) also agrees with the10
former two regions with respect to the spring maximum and secondary maximum inautumn FDE. The annual FDE peak is 10 % in April and the annual mean is ∼ 2 %higher than N Algeria. SWF is considerably lower here than FDE but shows a similarannual cycle. Less frequent strong winds could, to some extent, explain the lower DUPmean values. The clearest difference is the clear peak in DUP Intensity in November,15
though overall DUP Intensity is lower than N Algeria and C Sahara. High DUP Intensityin autumn could be due to occasional storms from the Mediterranean affecting north-eastern Africa, during a time when thresholds are slightly increased (Fig. 8c).
Behaviour is fundamentally different over the two Sahelian regions (Fig. 9d and e).FDE is high during winter and spring and dips during the summer and autumn, when20
the monsoon influence reduces emission by changing the soil type and wind regime(Fig. 8d and e). C Sahel, which contains more southern stations, displays a longer lowdust season. W Sahel is located closer to the centre of the SHL in summer, which maycontribute to dust emissions into June and even July. In both regions the agreementin magnitude between FDE and SWF is better than for the three northern regions,25
indicating a better balance between low winds with dust and high winds without dust.Annual mean DSF is higher than in the three northern regions, possibly pointing tomore productive dust sources. DUP mean and SWF correlate well with FDE (0.94 and0.98, respectively) in W Sahel with absolute values similar to N Algeria. DUP Intensity
7443
Discussion
Paper
|D
iscussionP
aper|
Discussion
Paper
|D
iscussionP
aper|
is lowest in winter, despite February being the month of highest FDE. This could bedue to the lack of haboobs in this season which have a significant contribution to DUPthe rest of the year. The annual cycle in FDE is very different in the C Sahel. BothDUP and SWF have correlations of 0.97 with FDE, but here the winter is the only maindust season, driven by strong NE Harmattan winds and frequent LLJ breakdown in this5
season (Washington et al., 2006; Schepanski et al., 2009). The southern stations in thisregion have a clear vegetation increase in autumn (Fig. 7) which could also decreaseFDE levels and contribute to higher dust emission thresholds (Fig. 8e), though this maynot necessarily be representative of the more northern and arid stations of Bilma andFaya (Fig. 1).10
It is interesting to compare the C and W Sahel regions with that at Bordj Mokhtar,immediately to the north of the Sahel (Fig. 10). High year round dust emission reachesa maximum of 18 % in July, followed by August and June and all 3 months have highDSF. This station is too far north to get enough monsoonal precipitation to suppresssource strength. However, it is likely that cold pools from Sahelian squall lines could15
reach Bordj Mokhtar during the summer to cause the observed peak. This leads tohigh DUP values in June, July and August, likely underestimated due to the fact thatonly daytime cold pools are detected (no data from 21:00–03:00 UTC) which will haveweakened by the time they reach the station, if formed the previous night.
Northern Sudan (Fig. 9f) stands out as having the highest FDE year round (annual20
mean of 13 %), though DUP values are not comparably increased, suggesting frequentlower energy events. DSF is a little higher than in the three northern regions here,particularly during June–September, but not as high as in the W and C Sahel. The mostactive month is March with an FDE of 20 %, while September shows a secondary peaksimilar to that in the three northern groups (Fig. 9a–c). DUP Intensity is the lowest of the25
six regions but peaks during the second maximum in September. SWF is consistentlyhigher than FDE (annual mean of 17 %), but with a similar annual cycle resulting ina correlation of 0.95. This may well be a reflection of the very low threshold in thisregion (Fig. 8f), below which dust emission will be very rare.
7444

Discussion
Pa
per|
Discussion
Pa
per|
Discussion
Paper
|D
iscussionP
aper|
3.2.4 Diurnal cycle and meteorological mechanisms
The 3 hourly resolution of SYNOP reports also allows the investigation of seasonal-mean diurnal cycles of FDE, DUP and DUP Intensity (as defined in Figs. 9 and 10) foreach group (Figs. 11 and 12). For N Algeria (left column of Fig. 11), there are starkcontrasts between day and night during all seasons. Maximum FDE is at 15:00 UTC5
(16:00 Local Time, (LT)) in all seasons but summer, when values are slightly higher at12:00 UTC and emission extends longer into the night. The minimum is at 06:00 UTCyear-round. The diurnal cycle of DUP largely follows that of FDE with some minorshifts, such as a maximum at 12:00 UTC in winter and autumn. Consistent with previ-ous discussions, FDE and DUP reach comparable magnitudes in winter, summer and10
autumn, but are higher in spring (note the different scales). DUP Intensity tends to op-pose the FDE and DUP diurnal cycles, with peaks at night and smaller values duringthe day, though this is less pronounced in N Algeria spring (Fig. 11b). During winterand autumn, when nights are comparably long and column water vapour tends to below, radiative cooling can create strong surface inversions that can only be broken by15
the strongest storms with wind-speed well above the emission threshold, leading tofewer events with larger DUPs. This behaviour is still evident in summer and spring,but less pronounced. Overall the diurnal cycle found for this region suggests that NLLJbreakdown in the morning could play a role, leading to rapid increases in FDE andDUP between 0600 and 12:00 UTC. The continuation of high values into the afternoon,20
when the boundary layer typically is deepest, indicates additional momentum sourcesabove that of the NLLJ. These are likely related to thermal wind contributions causedby baroclinic zones due to mountains (Stensrud, 1996), land-sea contrasts (Todd et al.,2013) or the presence of the subtropical jet. The growth of the boundary layer due toheating of the surface will also contribute by accessing these upper level thermal wind25
contributions around 12:00–15:00 UTC and mixing down more intense turbulence. Insummer, the extension of FDE and DUP into the evening may be related to convective
7445
Discussion
Paper
|D
iscussionP
aper|
Discussion
Paper
|D
iscussionP
aper|
cold pools as discussed in Knippertz et al. (2007) for the Atlas Mountains and in Emmelet al. (2010) for Morocco.
The C Sahara regions (middle column in Fig. 11) also shows a marked day-nightcontrast, but with some remarkable deviations from N Algeria. The FDE maximum isat 09:00 UTC in all seasons but winter (where it is 12:00 UTC), suggesting a relatively5
more important role of the morning breakdown of NLLJs. This is most likely related toa larger distance from baroclinic zones, which reduces the likelihood of afternoon LLJbreakdown as the boundary layer grows. An additional factor could be that LT is slightlylater for the Libyan stations in this region, possibly resulting in some later emissionsbeing included at an earlier SYNOP hour. Consistent with previous figures, FDE and10
DUP are highest in spring, followed by summer and winter, then lowest in autumn. DUPIntensity drops during the day in summer and autumn, but actually increases in winterand spring daytime following a dip before sunrise. Diurnal DUP Intensity varies less inwinter and spring and dips before sunrise in contrast to summer and autumn whereDUP Intensity is high at night. In summer, when nights are relatively short and stability15
is weaker, early breakdowns of NLLJ could play a role as well as ageing cold poolsfrom afternoon convection over the Hoggar Mountains.
In Egypt (right column in Fig. 11) diurnal cycles in FDE and DUP are stable through-out the year with minimum at 03:00 UTC (05:00 LT) and maximum at 12:00 UTC(14:00 LT), suggesting some influence of NLLJ breakdown, deep boundary layer mixing20
during the afternoon and perhaps the general presence of daytime dry convection. DUPIntensity is consistent all year, with a peak at 03:00 UTC and minimum at 15:00 UTC.This is related to the diurnal cycle of stability as discussed before.
The analysis of the diurnal cycles in W and C Sahel is complicated by fewer night-time observations compared with day-time (2 in quality flags, Fig. 1). This introduces25
larger random error in night-time values in these locations. This is unfortunate, as con-vective cold pools are expected to affect these regions during the evening and night.Both groups of stations show a clear daytime peak in FDE all year. In the W Sahel (leftcolumn of Fig. 12) this occurs at 12:00 UTC, in the C Sahel (middle column of Fig. 12)
7446
Discussion
Pa
per|
Discussion
Pa
per|
Discussion
Paper
|D
iscussionP
aper|
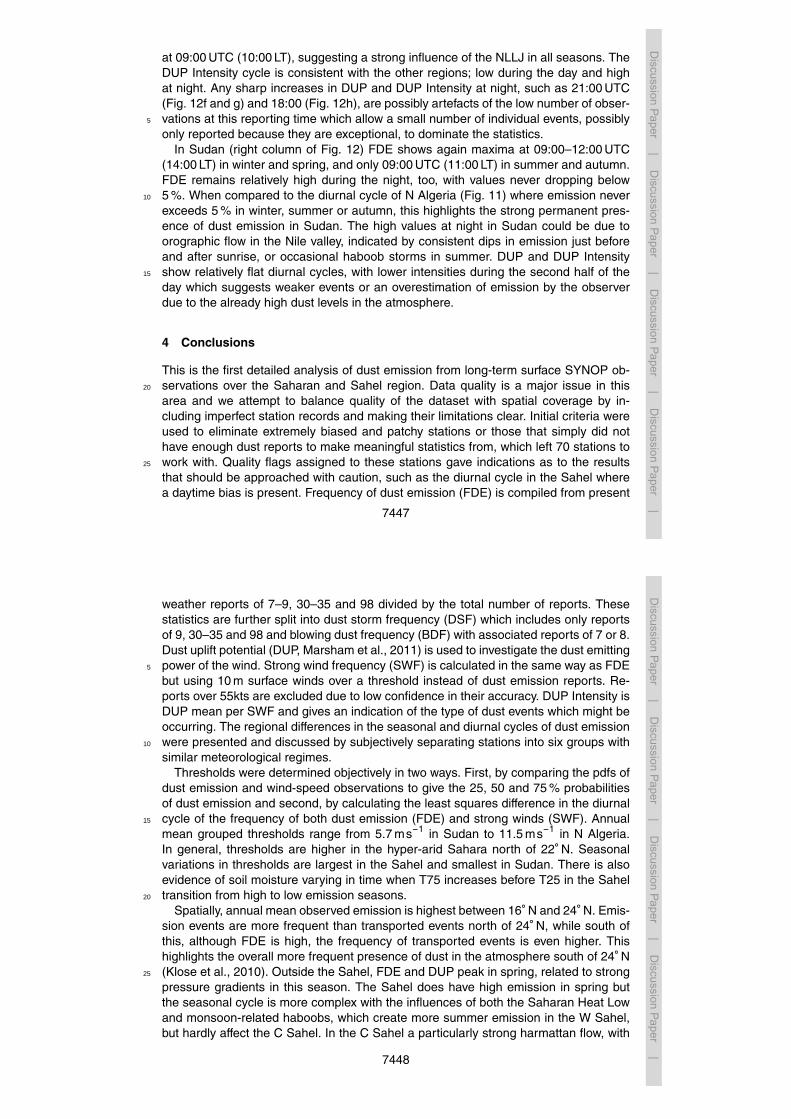
at 09:00 UTC (10:00 LT), suggesting a strong influence of the NLLJ in all seasons. TheDUP Intensity cycle is consistent with the other regions; low during the day and highat night. Any sharp increases in DUP and DUP Intensity at night, such as 21:00 UTC(Fig. 12f and g) and 18:00 (Fig. 12h), are possibly artefacts of the low number of obser-vations at this reporting time which allow a small number of individual events, possibly5
only reported because they are exceptional, to dominate the statistics.In Sudan (right column of Fig. 12) FDE shows again maxima at 09:00–12:00 UTC
(14:00 LT) in winter and spring, and only 09:00 UTC (11:00 LT) in summer and autumn.FDE remains relatively high during the night, too, with values never dropping below5 %. When compared to the diurnal cycle of N Algeria (Fig. 11) where emission never10
exceeds 5 % in winter, summer or autumn, this highlights the strong permanent pres-ence of dust emission in Sudan. The high values at night in Sudan could be due toorographic flow in the Nile valley, indicated by consistent dips in emission just beforeand after sunrise, or occasional haboob storms in summer. DUP and DUP Intensityshow relatively flat diurnal cycles, with lower intensities during the second half of the15
day which suggests weaker events or an overestimation of emission by the observerdue to the already high dust levels in the atmosphere.
4 Conclusions
This is the first detailed analysis of dust emission from long-term surface SYNOP ob-servations over the Saharan and Sahel region. Data quality is a major issue in this20
area and we attempt to balance quality of the dataset with spatial coverage by in-cluding imperfect station records and making their limitations clear. Initial criteria wereused to eliminate extremely biased and patchy stations or those that simply did nothave enough dust reports to make meaningful statistics from, which left 70 stations towork with. Quality flags assigned to these stations gave indications as to the results25
that should be approached with caution, such as the diurnal cycle in the Sahel wherea daytime bias is present. Frequency of dust emission (FDE) is compiled from present
7447
Discussion
Paper
|D
iscussionP
aper|
Discussion
Paper
|D
iscussionP
aper|
weather reports of 7–9, 30–35 and 98 divided by the total number of reports. Thesestatistics are further split into dust storm frequency (DSF) which includes only reportsof 9, 30–35 and 98 and blowing dust frequency (BDF) with associated reports of 7 or 8.Dust uplift potential (DUP, Marsham et al., 2011) is used to investigate the dust emittingpower of the wind. Strong wind frequency (SWF) is calculated in the same way as FDE5
but using 10 m surface winds over a threshold instead of dust emission reports. Re-ports over 55kts are excluded due to low confidence in their accuracy. DUP Intensity isDUP mean per SWF and gives an indication of the type of dust events which might beoccurring. The regional differences in the seasonal and diurnal cycles of dust emissionwere presented and discussed by subjectively separating stations into six groups with10
similar meteorological regimes.Thresholds were determined objectively in two ways. First, by comparing the pdfs of
dust emission and wind-speed observations to give the 25, 50 and 75 % probabilitiesof dust emission and second, by calculating the least squares difference in the diurnalcycle of the frequency of both dust emission (FDE) and strong winds (SWF). Annual15
mean grouped thresholds range from 5.7 ms−1 in Sudan to 11.5 ms−1 in N Algeria.In general, thresholds are higher in the hyper-arid Sahara north of 22◦ N. Seasonalvariations in thresholds are largest in the Sahel and smallest in Sudan. There is alsoevidence of soil moisture varying in time when T75 increases before T25 in the Saheltransition from high to low emission seasons.20
Spatially, annual mean observed emission is highest between 16◦ N and 24◦ N. Emis-sion events are more frequent than transported events north of 24◦ N, while south ofthis, although FDE is high, the frequency of transported events is even higher. Thishighlights the overall more frequent presence of dust in the atmosphere south of 24◦ N(Klose et al., 2010). Outside the Sahel, FDE and DUP peak in spring, related to strong25
pressure gradients in this season. The Sahel does have high emission in spring butthe seasonal cycle is more complex with the influences of both the Saharan Heat Lowand monsoon-related haboobs, which create more summer emission in the W Sahel,but hardly affect the C Sahel. In the C Sahel a particularly strong harmattan flow, with
7448

Discussion
Pa
per|
Discussion
Pa
per|
Discussion
Paper
|D
iscussionP
aper|
embedded NLLJs, create strong emissions in winter and early spring. Bordj Mokhtar(southern Algeria), the only station between the Sahel and the central Sahara, hasa strong summer peak in FDE and DUP. Despite an absence of night-time data, thepresence of haboobs at this location in the Sahara is indicated by the jump in FDE,DUP and DUP Intensity in June.5
Seasonal variation in emission frequency is mostly controlled by strong wind fre-quency, indicated by high correlations between FDE and SWF in all areas, whichchanges little when SWF is calculated with a seasonally variable or annually fixedthreshold. However, the relationship between FDE and DUP is more complex as morefrequent events do not necessarily mean more emission. DUP is most closely related10
to FDE in the C Sahara, and so intensity (DUP per SWF) is relatively constant. Thisshows that here the strength of the winds that generate emission does not vary muchseasonally. DUP and FDE are typically higher during the day, relative to night, whenatmospheric stability increases and inhibits strong winds. As a consequence, any emis-sion which does take place is likely to require a stronger wind in order to overcome this15
stability. High night-time DUP Intensity values support this conclusion.Our results are consistent with currently understanding of vegetation growth in the
Sahel and its role in decreasing emissions in late summer and autumn. We find highlevels of summer emissions in the SHL region, despite the fact that the only stationin this area, Bordj Mohktar, may be missing up to 50 % of emission events (Marsham20
et al., 2013) through absent night-time observations. The NLLJ is observed in the diur-nal cycle of Niger and Chad stations which is in line with past work close to the BodéléDepression by Washington et al. (2006, 2009). Evidence here suggests NLLJs, creat-ing frequent morning emission, are the dominant mechanism in the central Sahara andcentral Sahel, while in other regions it is difficult to separate NLLJ breakdown with other25
factors, such as boundary layer growth eroding daytime LLJs. These daytime LLJs canbe formed in response to complex terrain, mountains or land-sea air temperature con-trasts.
7449
Discussion
Paper
|D
iscussionP
aper|
Discussion
Paper
|D
iscussionP
aper|
The results of this climatology are a stepping stone towards improving our under-standing of the overall mechanisms which influence the frequency of dust events andstrong winds. By characterising the data-set limitations and advantages we are in a bet-ter position to use it to evaluate other datasets such as reanalyses, output from dustmodels and satellite data, which come with their own caveats. Moving on from the5
work presented here we aim to combine these results with additional information fromreanalysis data to further explore the relative contribution of different mechanisms tothe dust cycle.
Acknowledgements. This work is funded by the European Research Council as part of the“Desert Storms” project under grant 257543. NDVI is compiled from Advanced Very High Res-10
olution Radiometer data and is available from the Global Inventory Modeling and MappingStudies (GIMMS) database (www.landcover.org) for the time period 1984–2006.
References
Ackerman, S. and Cox, S.: Surface weather observations of atmospheric dust overthe southwest summer monsoon region, Meteorol. Atmos. Phys., 41, 19–34,15
doi:10.1007/BF01032587, 1989. 7430Allen, C. J. T., Washington, R., and Engelstaedter, S.: Dust emission and transport mecha-
nisms in the central Sahara: fennec ground-based observations from Bordj Badji Mokhtar,June 2011, J. Geophys. Res.-Atmos., 118, 6212–6232, doi:10.1002/jgrd.50534, 2013. 7429
Bagnold, R.: The physics of blown sand and desert dunes, Dover Publications, Mineola, NY,20
USA, 2005. 7427Bou Karam, D., Flamant, C., Knippertz, P., Reitebuch, O., Pelon, J., Chong, M., and Dabas, A.:
Dust emissions over the Sahel associated with the West African monsoon intertropical dis-continuity region: a representative case-study, Q. J. Roy. Meteor. Soc., 134, 621–634, 2008.742825
Bristow, C. S., Hudson-Edwards, K. A., and Chappell, A.: Fertilizing the Amazonand equatorial Atlantic with West African dust, Geophys. Res. Lett., 37, L14807,doi:10.1029/2010GL043486, 2010. 7427
7450
Discussion
Pa
per|
Discussion
Pa
per|
Discussion
Paper
|D
iscussionP
aper|
Cowie, S. M., Knippertz, P., and Marsham, J. H.: Are vegetation-related roughness changesthe cause of the recent decrease in dust emission from the Sahel?, Geophys. Res. Lett., 40,1868–1872, doi:10.1002/grl.50273, 2013. 7427
Emmel, C., Knippertz, P., and Schulz, O.: Climatology of convective density currents inthe southern foothills of the Atlas Mountains, J. Geophys. Res.-Atmos., 115, D11115,5
doi:10.1029/2009JD012863, 2010. 7429, 7446Engelstaedter, S. and Washington, R.: Atmospheric controls on the annual cycle of North
African dust, J. Geophys. Res.-Atmos., 112, D03103, doi:10.1029/2006JD007195, 2007.7428
Evan, A. T., Heidinger, A. K., and Knippertz, P.: Analysis of winter dust activity off the coast of10
West Africa using a new 24-year over-water advanced very high resolution radiometer satel-lite dust climatology, J. Geophys. Res.-Atmos., 111, D12210, doi:10.1029/2005JD006336,2006. 7427
Fensholt, R., Langanke, T., Rasmussen, K., Reenberg, A., Prince, S. D., Tucker, C., Sc-holes, R. J., Le, Q. B., Bondeau, A., Eastman, R., Epstein, H., Gaughan, A. E., Hellden, U.,15
Mbow, C., Olsson, L., Paruelo, J., Schweitzer, C., Seaquist, J., and Wessels, K.: Greenness insemi-arid areas across the globe 1981–2007 – an Earth Observing Satellite based analysisof trends and drivers, Remote Sens. Environ., 121, 144–158, doi:10.1016/j.rse.2012.01.017,2012. 7432
Fiedler, S., Schepanski, K., Heinold, B., Knippertz, P., and Tegen, I.: Climatology of noctur-20
nal low-level jets over North Africa and implications for modeling mineral dust emission, J.Geophys. Res.-Atmos., 118, 6100–6121, doi:10.1002/jgrd.50394, 2013a. 7428
Fiedler, S., Schepanski, K., Knippertz, P., Heinold, B., and Tegen, I.: How important are cy-clones for emitting mineral dust aerosol in North Africa?, Atmos. Chem. Phys. Discuss., 13,32483–32528, doi:10.5194/acpd-13-32483-2013, 2013b. 743925
Forster, P., Ramaswamy, V., Artaxo, P., Berntsen, T., Betts, R., Fahey, D., Haywood, J., Lean, J.,Lowe, D., Myhre, G., Nganga, J., Prinn, R., Raga, G., Schulz, M., and Dorland, R. V.:Changes in atmospheric constituents and in radiative forcing, in: Climate Change 2007: ThePhysical Science Basis. Contribution of Working Group I to the Fourth Assessment Reportof the Intergovernmental Panel on Climate Change, 2007. 742730
Gillette, D., Adams, J., Endo, A., Smith, P. H., D., and Kihl, R.: Threshold velocities for inputof soil particles into the air by desert soils, J. Geophys. Res.-Oc. Atm., 85, 5621–5630,doi:10.1029/JC085iC10p05621, 1980. 7433
7451
Discussion
Paper
|D
iscussionP
aper|
Discussion
Paper
|D
iscussionP
aper|
Ginoux, P., Prospero, J. M., Gill, T. E., Hsu, N. C., and Zhao, M.: Global scale attribution of an-thropogenic and natural dust sources and their emission rates based on MODIS Deep Blueaerosol products, Rev. Geophys., 50, RG3005, doi:10.1029/2012RG000388, 2012. 7426,7427
Goudie, A. S. and Middleton, N. J.: Saharan dust storms: nature and consequences, Earth-Sci.5
Rev., 56, 179–204, 2001. 7426Hannachi, A., Awad, A., and Ammar, K.: Climatology and classification of Spring Saharan cy-
clone tracks, Clim. Dynam., 37, 473–491, doi:10.1007/s00382-010-0941-9, 2011. 7439Heinold, B., Knippertz, P., Marsham, J. H., Fiedler, S., Dixon, N. S., Schepanski, K., Laurent, B.,
and Tegen, I.: The role of deep convection and nocturnal low-level jets for dust emission10
in summertime West Africa: estimates from convection-permitting simulations, J. Geophys.Res.-Atmos., 118, 4385–4400, doi:10.1002/jgrd.50402, 2013. 7429
Helgren, D. M. and Prospero, J. M.: Wind velocities associated with dust deflation events in theWestern Sahara, J. Clim. Appl. Meteorol., 26, 1147–1151, 1987. 7427, 7433
Huber, S. and Fensholt, R.: Analysis of teleconnections between AVHRR-based sea surface15
temperature and vegetation productivity in the semi-arid Sahel, Remote Sens. Environ., 115,3276–3285, doi:10.1016/j.rse.2011.07.011, 2011. 7432
Huneeus, N., Schulz, M., Balkanski, Y., Griesfeller, J., Prospero, J., Kinne, S., Bauer, S.,Boucher, O., Chin, M., Dentener, F., Diehl, T., Easter, R., Fillmore, D., Ghan, S., Ginoux, P.,Grini, A., Horowitz, L., Koch, D., Krol, M. C., Landing, W., Liu, X., Mahowald, N., Miller, R.,20
Morcrette, J.-J., Myhre, G., Penner, J., Perlwitz, J., Stier, P., Takemura, T., and Zender, C. S.:Global dust model intercomparison in AeroCom phase I, Atmos. Chem. Phys., 11, 7781–7816, doi:10.5194/acp-11-7781-2011, 2011. 7427
Kim, D., Chin, M., Bian, H., Tan, Q., Brown, M. E., Zheng, T., You, R., Diehl, T., Ginoux, P., andKucsera, T.: The effect of the dynamic surface bareness on dust source function, emission,25
and distribution, J. Geophys. Res.-Atmos., 118, 871–886, doi:10.1029/2012JD017907, 2013.7427
Klose, M., Shao, Y., Karremann, M. K., and Fink, A. H.: Sahel dust zone and synoptic back-ground, Geophys. Res. Lett., 37, L09802, doi:10.1029/2010GL042816, 2010. 7428, 7430,7436, 744830
Knippertz, P.: Dust emissions in the West African heat trough – the role of the diurnal cycle andof extratropical disturbances, Meteorol. Z., 17, 553–563, 2008. 7428
7452

Discussion
Pa
per|
Discussion
Pa
per|
Discussion
Paper
|D
iscussionP
aper|
Knippertz, P. and Todd, M. C.: The central west Saharan dust hot spot and its relation to Africaneasterly waves and extratropical disturbances, J. Geophys. Res.-Atmos., 115, D12117,doi:10.1029/2009JD012819, 2010. 7429
Knippertz, P. and Todd, M. C.: Mineral dust aerosols over the Sahara: meteorological con-trols on emission and transport and implications for modeling, Rev. Geophys., 50, RG1007,5
doi:10.1029/2011RG000362, 2012. 7429Knippertz, P., Deutscher, C., Kandler, K., Müller, T., Schulz, O., and Schütz, L.: Dust mobilization
due to density currents in the Atlas region: observations from the Saharan Mineral Dust Ex-periment 2006 field campaign, J. Geophys. Res., 112, D21109, doi:10.1029/2007JD008774,2007. 7429, 744610
Koch, J. and Renno, N. O.: The role of convective plumes and vortices on the global aerosolbudget, Geophys. Res. Lett., 32, L18806, doi:10.1029/2005GL023420, 2005. 7429
Kocha, C., Tulet, P., Lafore, J. P., and Flamant, C.: The importance of the diurnal cycle of aerosoloptical depth in West Africa, Geophys. Res. Lett., 40, 785–790, doi:10.1002/grl.50143, 2013.742915
Kurosaki, Y. and Mikami, M.: Regional difference in the characteristic of dust event in East Asia:relationship among dust outbreak, surface wind, and land surface condition, J. Meteorol. Soc.Jpn. A, 83, 1–18, doi:10.1029/2003JD003913, 2005. 7430, 7431
Kurosaki, Y. and Mikami, M.: Threshold wind speed for dust emission in east Asia and itsseasonal variations, J. Geophys. Res.-Atmos., 112, D17202, doi:10.1029/2006JD007988,20
2007. 7433Mahowald, N., Zender, C., Luo, C., Savoie, D., Torres, O., and del Corral, J.: Under-
standing the 30-year Barbados desert dust record, J. Geophys. Res.-Atmos., 107, 4561,doi:10.1029/2002JD002097, 2002. 7426
Mahowald, N., Bryant, R., del Corral, J., and Steinberger, L.: Ephemeral lakes and desert dust25
sources, Geophys. Res. Lett., 30, 1074, doi:10.1029/2002GL016041, 2003. 7427Mahowald, N., Baker, A., Bergametti, G., Brooks, N., Duce, R., Jickells, T., Kubilay, N., Pros-
pero, J., and Tegen, I.: Atmospheric global dust cycle and iron inputs to the ocean, GlobalBiogeochem. Cy., 19, GB4025, doi:10.1029/2004GB002402, 2005. 7427
Mahowald, N. M., Ballantine, J. A., Feddema, J., and Ramankutty, N.: Global trends in visibility:30
implications for dust sources, Atmos. Chem. Phys., 7, 3309–3339, doi:10.5194/acp-7-3309-2007, 2007. 7430
7453
Discussion
Paper
|D
iscussionP
aper|
Discussion
Paper
|D
iscussionP
aper|
Marsham, J. H., Parker, D. J., Grams, C. M., Taylor, C. M., and Haywood, J. M.: Upliftof Saharan dust south of the intertropical discontinuity, J. Geophys. Res., 113, D21102,doi:10.1029/2008JD009844, 2008. 7428, 7429
Marsham, J. H., Knippertz, P., Dixon, N. S., Parker, D. J., and Lister, G. M. S.: The importanceof the representation of deep convection for modeled dust-generating winds over West Africa5
during summer, Geophys. Res. Lett., 38, L16803, doi:10.1029/2011GL048368, 2011. 7435,7448
Marsham, J. H., Hobby, M., Allen, C. J. T., Banks, J. R., Bart, M., Brooks, B. J., Cavazos-Guerra, C., Engelstaedter, S., Gascoyne, M., Lima, A. R., Martins, J. V., McQuaid, J. B.,O’Leary, A., Ouchene, B., Ouladichir, A., Parker, D. J., Saci, A., Salah-Ferroudj, M.,10
Todd, M. C., and Washington, R.: Meteorology and dust in the central Sahara: observationsfrom Fennec supersite-1 during the June 2011 Intensive Observation Period, J. Geophys.Res.-Atmos., 118, 4069–4089, doi:10.1002/jgrd.50211, 2013. 7428, 7429, 7432, 7438, 7449
Marticorena, B. and Bergametti, G.: Modeling the atmosphere dust cycle. 1. Design of a soil-derived dust emission scheme, J. Geophys. Res.-Atmos., 100, 16415–16430, 1995. 743515
Mbourou, G., Bertrand, J., and Nicholson, S.: The diurnal and seasonal cycles of wind-bornedust over Africa north of the equator, J. Appl. Meteorol., 36, 868–882, 1997. 7430
McTainsh, G. and Pitblado, J.: Dust storms and related phenomena measured from meteorolog-ical records in Australia, Earth Surf. Proc. Land., 12, 415–424, doi:10.1002/esp.3290120407,1987. 743020
Middleton, N. J.: A geography of dust storms in Southwest Asia, J. Climatol., 6, 183–196, 1986.7430
Morales, C.: Saharan Dust Mobilization, Transport, Deposition, John Wiley Sons Ltd., 1979.7433
Nicholson, S., Davenport, M., and Malo, A.: A Comparison of the vegetation response to rain-25
fall in the Sahel and East-Africa, using normalized difference vegetation index from NOAAAVHRR, Climatic Change, 17, 209–241, doi:10.1007/BF00138369, 1990. 7432
Olsson, L., Eklundh, L., and Ardo, J.: A recent greening of the Sahel – trends, patterns andpotential causes, J. Arid Environ., 63, 556–566, doi:10.1016/j.jaridenv.2005.03.008, 2005.743230
Ozer, P.: Les lithometeores en region sahelienne, Int. J. Trop. Ecol. Geogr., 24, 1–137, 2001.7426
7454

Discussion
Pa
per|
Discussion
Pa
per|
Discussion
Paper
|D
iscussionP
aper|
Parker, D. J., Burton, R. R., Diongue-Niang, A., Ellis, R. J., Felton, M., Taylor, C. M., Thorn-croft, C. D., Bessemoulin, P., and Tompkins, A. M.: The diurnal cycle of the West Africanmonsoon circulation, Q. J. Roy. Meteor. Soc., 131, 2839–2860, 2005. 7429
Prospero, J. M.: Environmental characterization of global sources of atmospheric soil dust iden-tified with the NIMBUS 7 Total Ozone Mapping Spectrometer (TOMS) absorbing aerosol5
product, Rev. Geophys., 40, 1002, doi:10.1029/2000RG000095, 2002. 7426, 7428, 7436Roderick, M. L., Rotstayn, L. D., Farquhar, G. D., and Hobbins, M. T.: On the attribution of
changing pan evaporation, Geophys. Res. Lett., 34, L17403, doi:10.1029/2007GL031166,2007. 7427
Schepanski, K.: Characterising Saharan Dust Sources and Export using Remote Sensing and10
Regional Modelling, Ph.D. thesis, Christian-Albrechts-Universität, Kiel, 2009. 7439Schepanski, K., Tegen, I., Todd, M. C., Heinold, B., Bonisch, G., Laurent, B., and Macke, A.:
Meteorological processes forcing Saharan dust emission inferred from MSG-SEVIRI obser-vations of subdaily dust source activation and numerical models, J. Geophys. Res.-Atmos.,114, D10201, doi:10.1029/2008JD010325, 2009. 744415
Schepanski, K., Tegen, I., and Macke, A.: Comparison of satellite based observations of Saha-ran dust source areas, Remote Sens. Environ., 123, 90–97, doi:10.1016/j.rse.2012.03.019,2012. 7436
Stensrud, D.: Importance of low-level jets to climate: a review, J. Climate, 9, 1698–1711, 1996.7428, 744520
Sutton, L.: Haboobs, Q. J. Roy. Meteor. Soc., 51, 25–30, 1925. 7429Tegen, I. and Schepanski, K.: The global distribution of mineral dust, in: Wmo/Geo Expert
Meeting on an International Sand and Dust Storm Warning System, edited by: Perez, J. C.and Baldasano, J. M., IOP Conference Series Earth and Environmental Science, vol. 7,WMO/GEO Expert Meeting on an International Sand amd Dust Storm Warning System 7–925
November, 2007, Barcelona, Spain, 2009. 7427Todd, M. C., Allen, C. J. T., Bart, M., Bechir, M., Bentefouet, J., Brooks, B. J., Cavazos-
Guerra, C., Clovis, T., Deyane, S., Dieh, M., Engelstaedter, S., Flamant, C., Garcia-Carreras, L., Gandega, A., Gascoyne, M., Hobby, M., Kocha, C., Lavaysse, C., Mar-sham, J. H., Martins, J. V., McQuaid, J. B., Ngamini, J. B., Parker, D. J., Podvin, T.,30
Rocha-Lima, A., Traore, S., Wang, Y., and Washington, R.: Meteorological and dust aerosolconditions over the western Saharan region observed at Fennec Supersite-2 during the
7455
Discussion
Paper
|D
iscussionP
aper|
Discussion
Paper
|D
iscussionP
aper|
intensive observation period in June 2011, J. Geophys. Res.-Atmos., 118, 8426–8447,doi:10.1002/jgrd.50470, 2013. 7445
Tucker, C., Pinzon, J., Brown, M., Slayback, D., Pak, E., Mahoney, R., Vermote, E., and El Sa-leous, N.: An extended AVHRR 8-km NDVI dataset compatible with MODIS and SPOT veg-etation NDVI data, Int. J. Remote Sens., 26, 4485–4498, doi:10.1080/01431160500168686,5
2005. 7432Vautard, R., Cattiaux, J., Yiou, P., Thepaut, J.-N., and Ciais, P.: Northern Hemisphere atmo-
spheric stilling partly attributed to an increase in surface roughness, Nat. Geosci., 3, 756–761, doi:10.1038/NGEO979, 2010. 7427
Warner, T. T.: Desert Meteorology, Cambridge University Press, Cambridge, 2004. 743910
Washington, R., Todd, M. C., Engelstaedter, S., Mbainayel, S., and Mitchell, F.: Dust and thelow-level circulation over the Bodele Depression, Chad: observations from BoDEx 2005, J.Geophys. Res.-Atmos., 111, D03201, doi:10.1029/2005JD006502, 2006. 7432, 7444, 7449
Washington, R., Bouet, C., Cautenet, G., Mackenzie, E., Ashpole, I., Engelstaedter, S., Liz-cano, G., Henderson, G. M., Schepanski, K., and Tegen, I.: Dust as a tipping element: the15
Bodele Depression, Chad, P. Natl. Acad. Sci. USA, 106, 20564–20571, 2009. 7449Williams, E., Nathou, N., Hicks, E., Pontikis, C., Russell, B., Miller, M., and Bartholomew, M. J.:
The electrification of dust-lofting gust fronts (“haboobs”) in the Sahel, Atmos. Res., 91, 292–298, 2009. 7429
Zender, C. and Kwon, E.: Regional contrasts in dust emission responses to climate, J. Geophys.20
Res.-Atmos., 110, D13201, doi:10.1029/2004JD005501, 2005. 7427
7456
Discussion
Pa
per|
Discussion
Pa
per|
Discussion
Paper
|D
iscussionP
aper|
Fig. 1. Geographical overview. Map of observation stations used in the study, with quality flags in black
(see section 2.1.1) and elevation in purple. Country codes, as definedby ISO (International Organization
for Standardization): DZA=Algeria, TUN=Tunisia, MRT=Mauritania, MLI=Mali, NER=Niger, LBY=Libya,
EGY=Egypt, TCD=Chad and SDN=Sudan. Colour shading gives the orography in m.
24
Fig. 1. Geographical overview. Map of observation stations used in the study, with quality flagsin black (see Sect. 2.1.1) and elevation in purple. Country codes, as defined by ISO (Inter-national Organization for Standardization): DZA=Algeria, TUN=Tunisia, MRT=Mauritania,MLI=Mali, NER=Niger, LBY=Libya, EGY=Egypt, TCD=Chad and SDN=Sudan. Colourshading gives the orography in m.
7457
Discussion
Paper
|D
iscussionP
aper|
Discussion
Paper
|D
iscussionP
aper|
Fig. 2. Schematic to illustrate the estimation of emission thresholds. Orange shading indicates the number
density function of wind-speeds associated with dust emission reports and grey shading represents wind-speeds
for all observations. The arrows signify the wind-speed at which dustemissions make up 25%, 50% and 75%
(red, green and blue respectively) of all reports. Areas A and B arerepresented by grey dots and circles, C and
D with orange dots and circles. For a detailed discussion of this schematic, see section 2.2.1.
25
Fig. 2. Schematic to illustrate the estimation of emission thresholds. Orange shading indicatesthe number density function of wind-speeds associated with dust emission reports and greyshading represents wind-speeds for all observations. The arrows signify the wind-speed atwhich dust emissions make up 25, 50 and 75 % (red, green and blue respectively) of all reports.Areas A and B are represented by grey dots and circles, C and D with orange dots and circles.For a detailed discussion of this schematic, see Sect. 2.2.1.
7458

Discussion
Pa
per|
Discussion
Pa
per|
Discussion
Paper
|D
iscussionP
aper|
Fig. 3. Example wind climatology for Faya (WMO no. 64753) in Chad (see Fig. 1 for location). Number distri-
bution of surface wind-speed for the time period 1984-2012. Black bars and grey bars give the distribution of all
winds and those associated with dust emission only, respectively. Dust emission frequency ((grey/black)*100)
for each wind-speed bin is given by the blue dots. T25, T50 and T75 threshold values are given in red, green
and blue, respectively.
26
Fig. 3. Example wind climatology for Faya (WMO no. 64753) in Chad (see Fig. 1 for location).Number distribution of surface wind-speed for the time period 1984–2012. Black bars and greybars give the distribution of all winds and those associated with dust emission only, respectively.Dust emission frequency ((grey/black) ·100) for each wind-speed bin is given by the blue dots.T25, T50 and T75 threshold values are given in red, green and blue, respectively.
7459
Discussion
Paper
|D
iscussionP
aper|
Discussion
Paper
|D
iscussionP
aper|
Fig. 4. Annual emission climatology. Spatial distribution of mean annual FDE (dotsize) and % ratio of emission
to all dust events (including transported events) (dot colour) at 70 stations in northern Africa for the time period
1984-2012.
27
Fig. 4. Annual emission climatology. Spatial distribution of mean annual FDE (dot size) and %ratio of emission to all dust events (including transported events) (dot colour) at 70 stations innorthern Africa for the time period 1984–2012.
7460

Discussion
Pa
per|
Discussion
Pa
per|
Discussion
Paper
|D
iscussionP
aper|
Fig. 5. Geographical distribution of emission thresholds. Shown are annual values of T25, T50 and T75
(for definitions, see section 2.2.1) in red, green and blue, respectively. Country codes, as defined by ISO
(International Organization for Standardization): DZA=Algeria, TUN=Tunisia, MRT=Mauritania, MLI=Mali,
NER=Niger, LBY=Libya, EGY=Egypt, TCD=Chad and SDN=Sudan.
28
Fig. 5. Geographical distribution of emission thresholds. Shown are annual values of T25, T50and T75 (for definitions, see Sect. 2.2.1) in red, green and blue, respectively. Country codes, asdefined by ISO (International Organization for Standardization): DZA=Algeria, TUN=Tunisia,MRT=Mauritania, MLI=Mali, NER=Niger, LBY=Libya, EGY=Egypt, TCD=Chad andSDN=Sudan.
7461
Discussion
Paper
|D
iscussionP
aper|
Discussion
Paper
|D
iscussionP
aper|
Fig. 6. Scatter of annual mean frequency of dust events (FDE) against annual mean T50 (for definition, see
section 2.2.1) for each of the 70 individual stations for the period 1984-2012. Correlation coefficient, gradient
of best-fit line and goodness of fit test are given in the top right corner.
29
Fig. 6. Scatter of annual mean frequency of dust events (FDE) against annual mean T50 (fordefinition, see Sect. 2.2.1) for each of the 70 individual stations for the period 1984–2012.Correlation coefficient, gradient of best-fit line and goodness of fit test are given in the top rightcorner.
7462
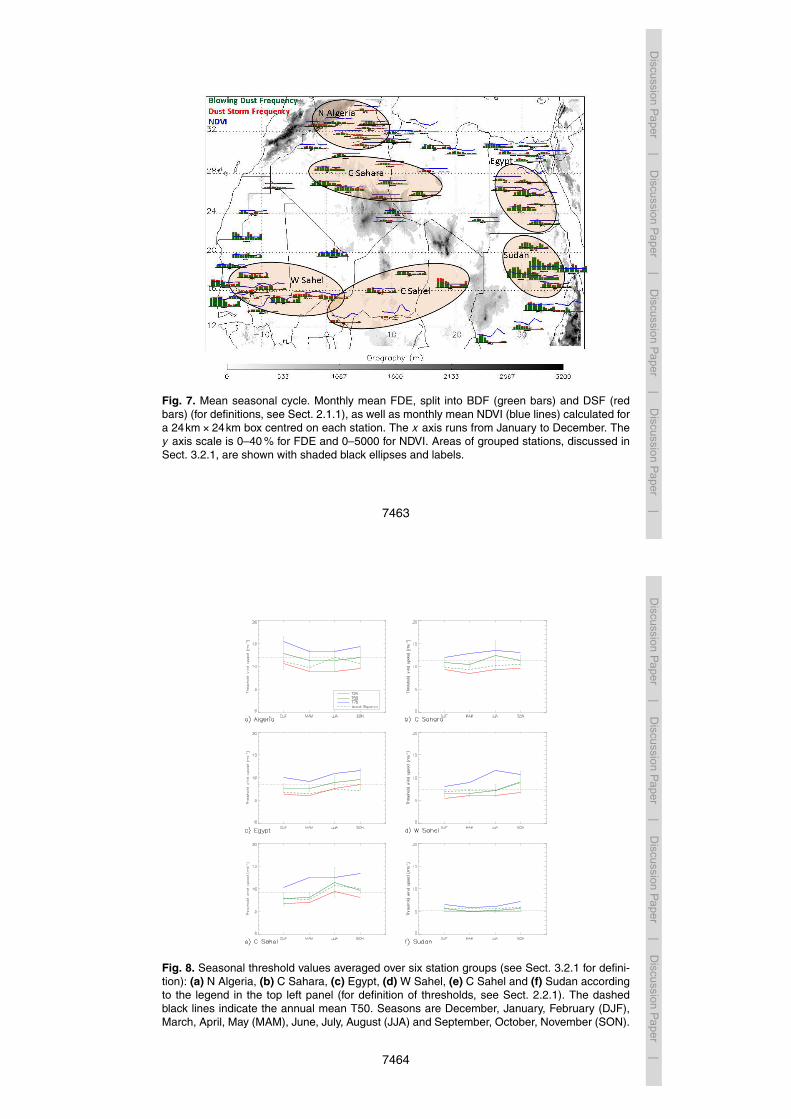
Discussion
Pa
per|
Discussion
Pa
per|
Discussion
Paper
|D
iscussionP
aper|
Fig. 7. Mean seasonal cycle. Monthly mean FDE, split into BDF (green bars) and DSF (red bars) (for defini-
tions, see section 2.1.1), as well as monthly mean NDVI (blue lines) calculated for a 24 km x 24 km box centred
on each station. The x-axis runs from January to December. The y-axis scale is 0-40% for FDE and 0-5000 for
NDVI. Areas of grouped stations, discussed in section 3.2.1, are shown with shaded black ellipses and labels.
30
Fig. 7. Mean seasonal cycle. Monthly mean FDE, split into BDF (green bars) and DSF (redbars) (for definitions, see Sect. 2.1.1), as well as monthly mean NDVI (blue lines) calculated fora 24km×24km box centred on each station. The x axis runs from January to December. They axis scale is 0–40 % for FDE and 0–5000 for NDVI. Areas of grouped stations, discussed inSect. 3.2.1, are shown with shaded black ellipses and labels.
7463
Discussion
Paper
|D
iscussionP
aper|
Discussion
Paper
|D
iscussionP
aper|
Fig. 8. Seasonal threshold values averaged over six station groups (see section 3.2.1 for definition): a) N
Algeria, b) C Sahara, c) Egypt, d) W Sahel, e) C Sahel and f) Sudan according to the legend in the top left panel
(for definition of thresholds, see section 2.2.1). The dashed black lines indicate the annual mean T50. Seasons
are December, January, February (DJF), March, April, May (MAM), June, July, August (JJA) and September,
October, November (SON).
31
Fig. 8. Seasonal threshold values averaged over six station groups (see Sect. 3.2.1 for defini-tion): (a) N Algeria, (b) C Sahara, (c) Egypt, (d) W Sahel, (e) C Sahel and (f) Sudan accordingto the legend in the top left panel (for definition of thresholds, see Sect. 2.2.1). The dashedblack lines indicate the annual mean T50. Seasons are December, January, February (DJF),March, April, May (MAM), June, July, August (JJA) and September, October, November (SON).
7464

Discussion
Pa
per|
Discussion
Pa
per|
Discussion
Paper
|D
iscussionP
aper|
Fig. 9. Mean seasonal cycle for the six station groups (see section 3.2.1 for definitions): a) N Algeria, b) C
Sahara, c) Egypt, d) W Sahel, e) C Sahel and f) Sudan. Monthly frequency of FDE, split into BDF (green bars)
and DSF (red bars), as well as SWF (blue line), DUP mean (solid purple)and DUP Intensity (DUP mean/SWF,
dashed purple, maximum values given), all computed using the seasonally varying T50 (for definitions of
parameters, see section 2.2.1). Thin vertical black lines indicate seasonal boundaries where thresholds change.
Note the different vertical axes for DUP intensity.
32
Fig. 9. Mean seasonal cycle for the six station groups (see Sect. 3.2.1 for definitions): (a) NAlgeria, (b) C Sahara, (c) Egypt, (d) W Sahel, (e) C Sahel and (f) Sudan. Monthly frequencyof FDE, split into BDF (green bars) and DSF (red bars), as well as SWF (blue line), DUP mean(solid purple) and DUP Intensity (DUP mean/SWF, dashed purple, maximum values given), allcomputed using the seasonally varying T50 (for definitions of parameters, see Sect. 2.2.1). Thinvertical black lines indicate seasonal boundaries where thresholds change. Note the differentvertical axes for DUP intensity.
7465
Discussion
Paper
|D
iscussionP
aper|
Discussion
Paper
|D
iscussionP
aper|
Fig. 10. As Fig. 9 but for Bordj Mokhtar (WMO number 60686).
33
Fig. 10. As Fig. 9 but for Bordj Mokhtar (WMO number 60686).
7466

Discussion
Pa
per|
Discussion
Pa
per|
Discussion
Paper
|D
iscussionP
aper|
Fig. 11. Diurnal cycles of FDE (solid black), DUP mean (solid purple) and DUP Intensity (dashed purple) for
N Algeria (column 1), C Sahara (column 2) and Egypt (column 3) for DJF (row 1), MAM (row 2), JJA (row 3)
and SON (row 4) (see section 3.2.1 for definition of regions). For definitions of parameters, see section 2.1.1.
34
Fig. 11. Diurnal cycles of FDE (solid black), DUP mean (solid purple) and DUP Intensity(dashed purple) for N Algeria (column 1), C Sahara (column 2) and Egypt (column 3) for DJF(row 1), MAM (row 2), JJA (row 3) and SON (row 4) (see Sect. 3.2.1 for definition of regions).For definitions of parameters, see Sect. 2.1.1.
7467
Discussion
Paper
|D
iscussionP
aper|
Discussion
Paper
|D
iscussionP
aper|
Fig. 12. As Fig. 11 but for W Sahel (column 1), C Sahel (column 2) and Sudan (column 3).
35
Fig. 12. As Fig. 11 but for W Sahel (column 1), C Sahel (column 2) and Sudan (column 3).
7468
Copyright © 2022 FDOKUMEN