
An analysis of pavement heat flux to optimize the water efficiency of a pavement-watering method
Upload
khangminh22Category
view
0download
0
Experimental Investigation of “Smart Dust”for Pavement Condition Monitoring
Nadim A. Ferzli
School of Electrical & Computer EngineeringUniversity of Oklahoma
Norman, OK 73019
Colby J. Sandburg
School of Civil Engineering & Environmental ScienceUniversity of Oklahoma
Norman, OK 73019
Timothy King
School of Electrical & Computer EngineeringUniversity of Oklahoma
Norman, OK 73019
Jin-Song Pei
School of Civil Engineering & Environmental ScienceUniversity of Oklahoma
Norman, OK 73019
Musharraf M. Zaman
School of Civil Engineering & Environmental ScienceUniversity of Oklahoma
Norman, OK 73019
Hazem H. Refai
School of Electrical & Computer EngineeringUniversity of Oklahoma
Norman, OK 73019
Richard A. Ivey
Department of Industrial & Systems EngineeringAuburn UniversityAuburn, AL 36849
Oluwaseun Harris
School of Chemical EngineeringUniversity of Oklahoma
Norman, OK 73019
1

ABSTRACT
Pavement maintenance is vital for travel safety; detecting road weather conditions using a wirelesssensing network poses many challenges due to the harsh environment. This paper presents somepreliminary results of an ongoing effort to apply a “Smart Dust” sensor network for monitoringpavement temperature and moisture presence to detect icy road condition. Careful considerationsyielded effective solutions to various hardware and software development issues including the selec-tion of sensors and antenna, design of casing, interfacing motes with alien sensors and programmingof motes. A series of experiments was carried out to study how traffic interference affected packetdelivery performance of a small-scale sensor network in a pseudo-field environment. The results areanalyzed and challenges are identified in this smart sensing application. The research activities willbenefit robust real-world implementations of off-the-shelf sensor network products.
1 INTRODUCTION
Pavement maintenance is vital for travel safety and thus remains a major issue for transportationagencies nationwide. It is essential to provide warnings of dangerous traffic conditions such as wetand iced pavement in a real-time fashion. This project investigates a densely distributed sensornetwork technology, “Smart Dust”, for its potential benefits in monitoring pavement conditions.The goal is to embed a proper algorithm into “Smart Dust” processors, which is developed toclassify pavement surface conditions into four categories of (1) dry, (2) wet, (3) frozen, and (4)others, based on the measurements collected by “Smart Dust”. In this paper, a preliminary icedetection algorithm was proposed to categorize pavement surface conditions based on these typesof measurements, as shown in Fig. 1.
Temperature
Reading
Moisture
Reading
Ice
Reading
Condition 1:
Dry
Condition 2:
Wet
Condition 3:
Icy
Temperature Sensor
Measurement
Moisture Sensor
Measurement
InfraredSensor
Measurment
Condition 1:Dry
Condition 2:Wet
Condition 3:Icy
T>0
T<=0
M=1 I=1
Figure 1: Proposed ice detection algorithm, where T , M , I denote the readings from the selected temperature,moisture and infrared sensors, respectively. In detail, T is the absolute reading of the measured temperature. M = 1denotes the presence of moisture, and I = 1, the presence of ice.
2

2 LITERATURE REVIEW
In this study, the essential sources for “Smart Dust” are from Crossbow Technology Inc. [6] and theTinyOS online forum [2]. To carry out the proposed tasks, literature review was conducted focusingon transmission range, network stability and packet delivery performance of “Smart Dust” as wellas application case studies of “Smart Dust”. Table 1 outlines some of these relevant publications.
Ref. Network Application Transmitting Antenna Sampling Carrier Antenna
Size Range Height Rate Frequency Type
[6]∗ 256 N/A 1000 ft N/A 19.2 Kbps∗∗ 433 MHz stock Mica 2433 MHz (6.8 in)
[5] 55 lab testing 1 m unspecified 1 Hz unspecified unspecified
[3] 2 outdoor in 10-55 m 1 m above unspecified 900 MHz stock Mica 2various the ground
conditions and lower
[10] 40-60 inside an 0.5 m ground 1 Hz 433 MHz omni-directionaloffice building whip antennaand outdoor
[4] 2 lab testing unspecified unspecified 15.625 Hz 916 MHz stock Mica 2(shown in (shown inthe paper) the paper)
[7] 20, 25, outdoor and unspecified a wall and unspecified 916 MHz 80 mm long34 large-scale a beam or 100 Hz copper wire
lab testing
[8] 1 lab testing unspecified unspecified unspecified 916 MHz stock Mica 2
Table 1: Some applications using motes and their testing Configurations.∗ Information cited from [6] follows the maximum values provided by the Crossbow Technology Inc.∗∗ Maximum transmission rate.
3 SELECTED SENSORS
Based on the proposed algorithm to detect the existence of ice, three types of “alien” sensors wereselected to be interfaced to “Smart Dust” (consisting of Mica 2 motes in this study). With manypossible choices at hand, main factors in selecting these sensors are cost, power consumption, size,and durability. As shown in Fig. 2, the final selected sensors for this project are:
Thermistor This 10 KΩ thermistor is used to take temperature reading.
Leaf Sensor This moisture sensor detects the conductivity of a wet pavement so as to detect theexistence of free moisture.
Infrared Sensor This infrared sensor is composed of an infrared emitter and receiver of sameinfrared wave length. The infrared sensor detects ice by emitting a near infrared light that isreflected by the ice and detected by the infrared receiver. Note that water is transparent tothe infrared sensor.
3

Figure 2: Selected sensors: (a) A thermistor, (b)a leaf sensor, and (c) an infrared sensor
These three sensors used three input channels (two digital and one analog) and one output (usedto power the sensors) from the mote.
4 HARDWARE INTERFACE
The hardware interface refers to the one that connects a mote to the sensors; an overview of thehardware interface is presented in Fig. 3. An integrated sensor and road button structure, called a“sensor-road button”, houses the three sensors as shown in Fig. 3(a). The top surface of the sensor-road button contains the moisture and infrared sensors, and the bottom, the thermistor. Such asensor-road button prototype was merely for testing purposes; the final product would be made to
4

withstand high speed traffic and harsh road conditions. An MTS101 prototyping board as shown inFig. 3(b) was used to ease the connection of the sensors to a mote. All the sensors were able to bepowered by the mote due to their low power consumption. Each sensor was then connected to theMTS101 board through a simple circuit that furnished the correct voltage to control the sensor.
Figure 3: Hardware interface: (a) a “sensor-road button” prototype with the selected three sensors, (b) aprototyping/connection board, and (c) a Mica 2 mote in a casing with a selected antenna.
The MTS101 board was then placed on top of the mote after being connected to the sensor-roadbutton through a shielded wire, which protected the circuitry from any external interferences. Asshown in Fig. 3(c), the MTS101 board and a Mica 2 mote were placed into a casing. The water-tight aluminum casing was a carefully selected off-the-shelf product integrated with an upgradedantenna. Mica 2 motes come equipped with a “primitive” quarter wave length antenna consisting ofa wire sticking out of the mote with a swivel connection. Since this connection was reported to beunstable and the antenna to have bad transmission/reception capabilities [3, 10], a permanent stud-
5
mount 1/4-wave whip antenna model ANT-418-PW-QW Linx Technologies, Inc. [9] was selectedas a replacement antenna, connected to the mote with an MMCX connector and customized to fiton the top of the casing. The aluminum casing also acted as a reflecting ground and simulated adipole effect thus doubling the motes transmitting range [6].
5 SOFTWARE INTERFACE
The software implementation refers to programming motes to take readings from input ports andtransmit them. In accordance with the low power constraint of this project, Surge Time Synchro-
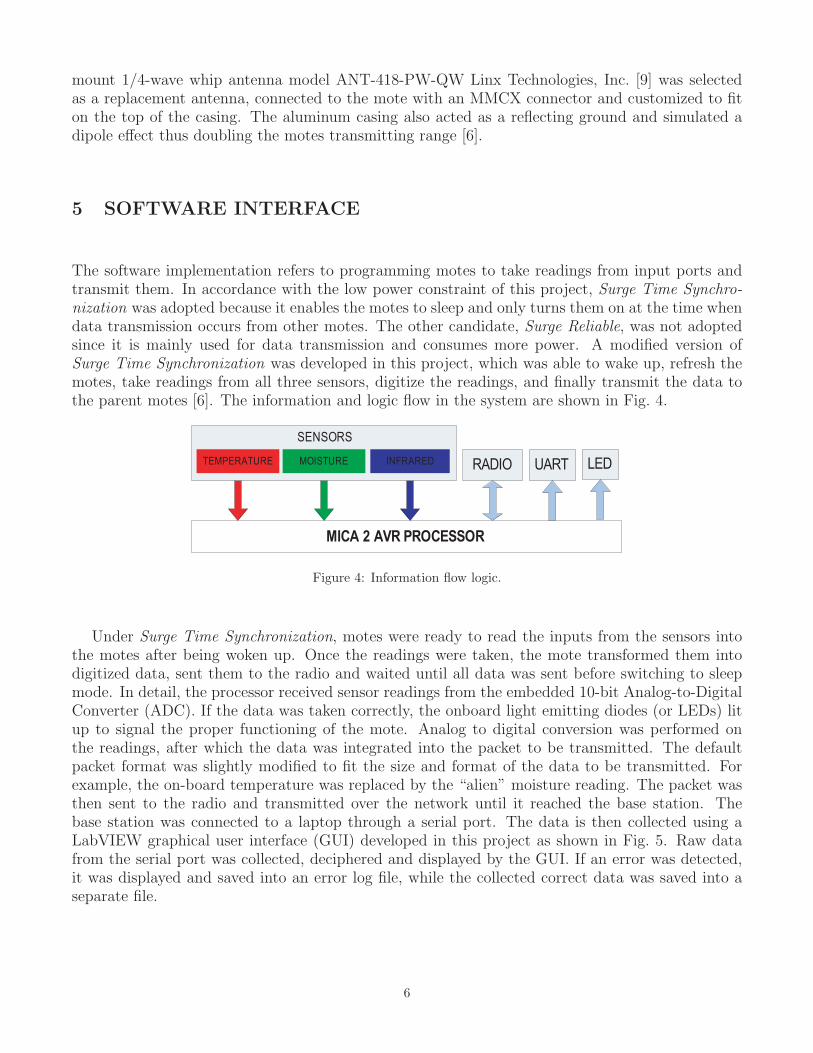
nization was adopted because it enables the motes to sleep and only turns them on at the time whendata transmission occurs from other motes. The other candidate, Surge Reliable, was not adoptedsince it is mainly used for data transmission and consumes more power. A modified version ofSurge Time Synchronization was developed in this project, which was able to wake up, refresh themotes, take readings from all three sensors, digitize the readings, and finally transmit the data tothe parent motes [6]. The information and logic flow in the system are shown in Fig. 4.
MICA 2 AVR PROCESSOR
SENSORS
RADIO UART LEDMOISTURE INFRAREDTEMPERATURE
Figure 4: Information flow logic.
Under Surge Time Synchronization, motes were ready to read the inputs from the sensors intothe motes after being woken up. Once the readings were taken, the mote transformed them intodigitized data, sent them to the radio and waited until all data was sent before switching to sleepmode. In detail, the processor received sensor readings from the embedded 10-bit Analog-to-DigitalConverter (ADC). If the data was taken correctly, the onboard light emitting diodes (or LEDs) litup to signal the proper functioning of the mote. Analog to digital conversion was performed onthe readings, after which the data was integrated into the packet to be transmitted. The defaultpacket format was slightly modified to fit the size and format of the data to be transmitted. Forexample, the on-board temperature was replaced by the “alien” moisture reading. The packet wasthen sent to the radio and transmitted over the network until it reached the base station. Thebase station was connected to a laptop through a serial port. The data is then collected using aLabVIEW graphical user interface (GUI) developed in this project as shown in Fig. 5. Raw datafrom the serial port was collected, deciphered and displayed by the GUI. If an error was detected,it was displayed and saved into an error log file, while the collected correct data was saved into aseparate file.
6

SERIAL
PORT
Figure 5: LabVIEW GUI developed in this study for data collection at the server end.
6 LABORATORY TESTING OF SENSORS
A series of laboratory tests was conducted at the Asphalt Laboratory at the University of Oklahomausing an environmental chamber to study the effect of temperature and moisture on the sensors (andlater, the motes). The environmental chamber was used to produce well-controlled temperature andhumidity variations. The sensor-road button unit shown in Fig. 3(a) was tested, the results of athawing process were presented in Fig. 6. The test was performed to (1) test the full functionalitywhen all the sensors were combined together, and (2) collect data to aid refinement and furtherdevelopment of the proposed ice detection algorithm shown in Fig. 1.
The entire test shown in Fig. 6 was completed in a four-hour time frame. Note that weatherchanges in reality could be much slower than this testing rate; thus such a test could be morestringent than a real-world situation. Three zones in Fig. 6 can be identified. In Zone I (the areaon the left of the blue dashed line), the sensors detected ice without the presence of water whilethe infrared and moisture sensors’ voltage outputs were high. In Zone 3 (the area to the right ofthe green dashed line), the sensors detected the presence of water without ice while the infraredand moisture sensors’ voltage outputs dropped and stabilized. In Zone 2 (the area between theblue and green dashed lines), the sensors detected a mix of ice and water while the infrared andwater sensors voltage outputs dropped erratically. These results validate the proposed ice detectionalgorithm shown in Fig. 1. It also demonstrates the need to collect more data, especially those fromthe moisture and infrared sensors to form proper decision boundaries to implement the proposedice detection algorithm.
7

Figure 6: Sensor voltage readings from moisture and infrared sensors vs. measured temperature in a thawing process.
7 PRELIMINARY FIELD TESTING OF “SMART DUST”
To understand the performance of “Smart Dust” in a high traffic environment, preliminary testswere conducted since the summer of 2005 to simulate traffic interference and study how it wouldaffect the packet delivery performance of the “Smart Dust” sensor network. Two major programswere used separately in a series of network tests, and they are Surge Reliable and Surge Time
Synchronization. All the tests were performed in the vicinity of the Fears Structural EngineeringLaboratory (abbreviated as Fears Lab thereafter), an open-space at the campus of the Universityof Oklahoma with some low-rise buildings, several large trees, and a generally very low trafficvolume. In such a testing environment, traffic interference could be introduced almost at a totallycontrollable manner by driving a truck at a speed of about 15 mph. Throughout this study, a smallsensor network was formed with four motes. All the tests were conducted under a weather of sunnyto cloudy. A typical test setup is presented in Fig. 7.
The software of Surge Reliable was merely used for testing network capability and transmittingranges in this study, when the default data acquisition GUI was used. Following the packet lossanalysis in [3], a series of transmitting range tests using the Surge Reliable algorithm running at the
8

Figure 7: Test setup when (a) six-foot high steel posts and (b) thirty-three-inch high timber posts were used. (c) Amap showing the layout of motes and the driving route to introduce traffic interference.
maximum transmission power was performed. The separation distance of two motes was found tobe 250 and 200 ft with the height of motes at 6 ft and 33 inches, respectively. In addition to thesetransmitting range tests, all four motes were lined up to form a straight line as shown in Fig. 7(c)to perform traffic interference tests while varying the interval from 100, 150, 200 to 250 ft.
As a procedure adopted in all of the tests, all of the motes were turned on one by one andthen left for initialization for half an hour to an hour before any data was collected. After such awaiting period, however, not all the motes could always be detected in the default Surge Reliable
GUI, which led to some “debugging” effort on site, e.g., reassuring good connections at each mote,turning off all the motes and restarting all of them at the base station before placing individualmotes back to the field. Fig. 8 presents one set of the complete test results using Surge Reliable afterthe network was “debugged”, when the distance between two adjacent motes was 100 ft and theheight of the motes was fixed at six feet. The 30-minute control test with the presence of traffic wasintroduced by driving the truck 10 times following the driving routes shown in Fig. 7(c). Shown inFig. 8 are the time histories of (a) the sequential number of the received packets, (b) errors (whichrefer to repetitive consecutive sequential numbers received at the same mote) [1], (c) yield (i.e., thecumulative ratio of packet received and packet sent) and (d) parent. Note that the shaded interval
9

of traffic interface is indicated roughly on the time history plots. From this set of the results, theinterference from traffic is not clear, while the error and data loss are fairly outstanding.
The software of Surge Time Synchronization was further tested using the GUI developed in thisproject (see Fig. 5). With a mote interval of 100 ft, the tests were conducted under a configurationsimilar to that using Surge Reliable. A correct network hierarchy was expected to be that Mote 0parents Mote 1, Mote 1 parents Mote 2, etc. (see Fig. 7(c) for the mote IDs). On many occasions,the motes would not be connected together in the expected way. For example,
• The synchronize time was at least 20 minutes for the first mote to connect to the base station.
• Very often, motes could be disconnected from the network at random times without any ex-ternal interference.
• On several occasions, a mote would fail to connect to the network, even when the network wasrepeatedly reset.
To overcome this connection problem, several setup procedures were exercised in the field tests,however, none of these always guaranteed to work. These procedures are summarized as follows:
Procedure 1 : Place all the motes in the field and then turn them on approximately all at once.
Procedure 2 : Place Mote 1 out in the field, turn it on and wait for it to connect to the basestation (Mote 0). Then place Mote 2 and wait for it to connect to the network, etc.
Procedure 3 : Turn on all the motes at the base station. Wait until all the motes connect to thenetwork, and then place individual motes to the field.
8 CONCLUSION
In this study, efforts have been made to interface “alien” sensors to “Smart Dust” Mica 2 motes.Several hardware and software interfacing issues and proposed solutions have been discussed inthis paper, which shows the potential of applying this off-the-shelf sensor network for robust real-world applications. Preliminary field tests of networking performance, however, have revealed thecomplexity of this off-the-shelf product and challenges in real-world implementations. More testsand analysis are being carried out in this ongoing study.
9 ACKNOWLEDGMENTS
This project is primarily sponsored by the Oklahoma Transportation Center. The grant fromResearch Council at the University of Oklahoma is greatly appreciated. The technical assistance
10
offered by Mr. Michael F. Schmitz throughout the project is deeply appreciated. The assistanceoffered by Mr. Yohanes P. Sugeng in preparing the steel posts and Mr. Chase Sandburg in assistingthe transmitting range test in the summer of 2005 is also acknowledged.
References
[1] May/June 2005. A telecommunication between the technical support from Crossbow Technol-ogy Inc. and Mr. Nadim A. Ferliz.
[2] TinyOS Community Forum. http://www.tinyos.net/, 2005.
[3] G. Anastasi, M. Conti, A. Falchi, E. Gregori, and A. Passarella. Performance measurementsof motes sensor networks. In MSWiM’04: Proceedings of ACM, pages 174–181, Venice, Italy,October 2004. Association for Computing Machinery, New York, NY 10036-5701, United States.
[4] F. Casciati, L. Faraveli, and F. Borghetti. Wireless links between sensor-device control stationsin long span bridges. In Smart Structures and Materials 2003: Smart Systems and Nondestruc-
tive Evaluation for Civil Infrastructures, pages 1–7, San Diego, CA, March 2003. Proceedingsof SPIE Vol. 5057(2003), edited by S.-C. Liu.
[5] A. Cerpa, J.L. Wong, M. Potkonjak, and D. Estrin. Temporal properties of low power wirelesslinks: modeling and implications on multi-hop routing. Technical report, Center for EmbeddedNetworked Sensing, University of California at Los Angeles, January 2005.
[6] Crossbow Technology Inc., California, USA. Smart Dust Seminar, December 2004.
[7] S. Glaser. Some real-world applications of wireless sensor nodes. In Proceedings of SPIE - The
International Society for Optical Engineering, volume 5391, pages 344–355, San Diego, CA,March 2004.
[8] N. Kurata, B.F.Jr. Spencer, M. Ruiz-Sandoval, Y. Miyamoto, and Y. Sako. A study on buildingrisk monitoring using wireless sensor network mica mote. In Structural Health Monitoring and
Intelligent Infrastructure, pages 353–357, Tokyo, Japan, 13-15 November 2003. Proceedings ofthe First International Conference on Structural Health Monitoring and Intelligent Infrastruc-ture, edited by Z.S. Wu and M. Abe, Swets & Zeitlinger B.V., Lisse, The Netherlands.
[9] Linx Technologies Inc., Oregon, USA. ANT-418-PW-QW Antenna Datasheet.
[10] J. Zhao and R. Govindan. Understanding packet delivery performance in dense wireless sensornetworks. In Proceedings of the 1st international conference on Embedded networked sensor
systems, pages 1 – 13, Los Angles, CA, November 2003. ACM Press.
11

12
Copyright © 2022 FDOKUMEN